MSI Summit E14 laptop review: GeForce GTX graphics without the GeForce GTX weight
The relatively new MSI Summit series will streamline and eventually replace both the older MSI Modern and Prestige series of laptops. These models are generally geared towards prosumers or office users in the same vein as the Lenovo ThinkBook, Dell XPS 13, Huawei MateBook X Pro, or Microsoft Surface series.
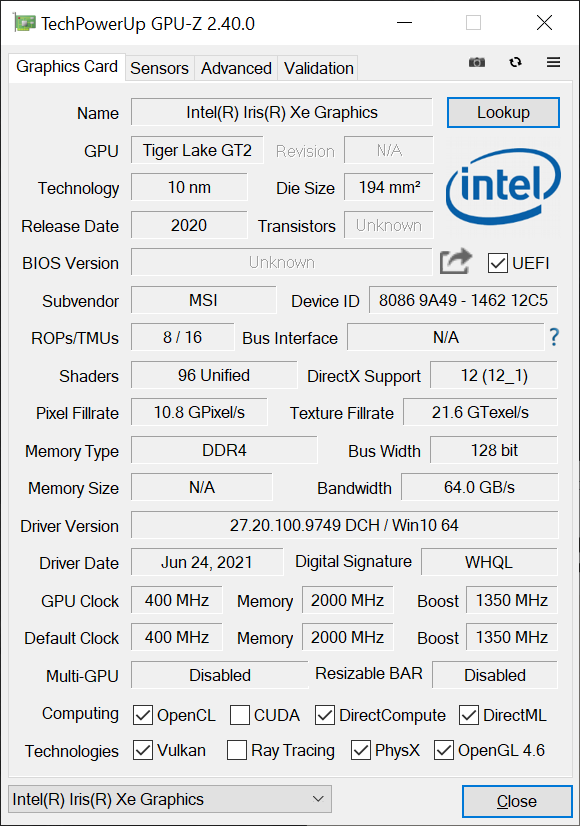
Our configuration in review is the MSI Summit E14 A11SCS equipped with 16 GB of RAM and a 4K display for $1900 USD at Xotic PC. Other SKUs may come with 32 GB of RAM and a 1080p display instead, but all options at the moment have the same Core i7-1185G7 vPro CPU and GeForce GTX 1650 Ti Max-Q GPU. The model can be best described as a Prestige 14 but with dedicated Nvidia GTX graphics.
More MSI reviews:
potential competitors in comparison
Rating | Date | Model | Weight | Height | Size | Resolution | Price |
|---|---|---|---|---|---|---|---|
| 82.3 % v7 (old) | 07 / 2021 | MSI Summit E14 A11SCS i7-1185G7, GeForce GTX 1650 Ti Max-Q | 1.3 kg | 16 mm | 14.00" | 3840x2160 | |
| 82.2 % v7 (old) | 07 / 2021 | MSI Modern 14 B11SB-085 i7-1165G7, GeForce MX450 | 1.3 kg | 16.9 mm | 14.00" | 1920x1080 | |
| 82.5 % v7 (old) | 12 / 2020 | MSI Prestige 14 Evo A11M-005 i7-1185G7, Iris Xe G7 96EUs | 1.2 kg | 16 mm | 14.00" | 1920x1080 | |
| 87.6 % v7 (old) | 07 / 2021 | ADATA XPG Xenia 14 i7-1165G7, Iris Xe G7 96EUs | 996 g | 15 mm | 14.00" | 1920x1200 | |
| 89.4 % v7 (old) | 07 / 2021 | Lenovo ThinkPad T14s G2 20WM003TGE i7-1165G7, Iris Xe G7 96EUs | 1.3 kg | 16.14 mm | 14.00" | 1920x1080 | |
| 83.8 % v7 (old) | 02 / 2021 | VAIO Z VJZ141C11L i7-11375H, Iris Xe G7 96EUs | 1 kg | 16.9 mm | 14.00" | 3840x2160 |
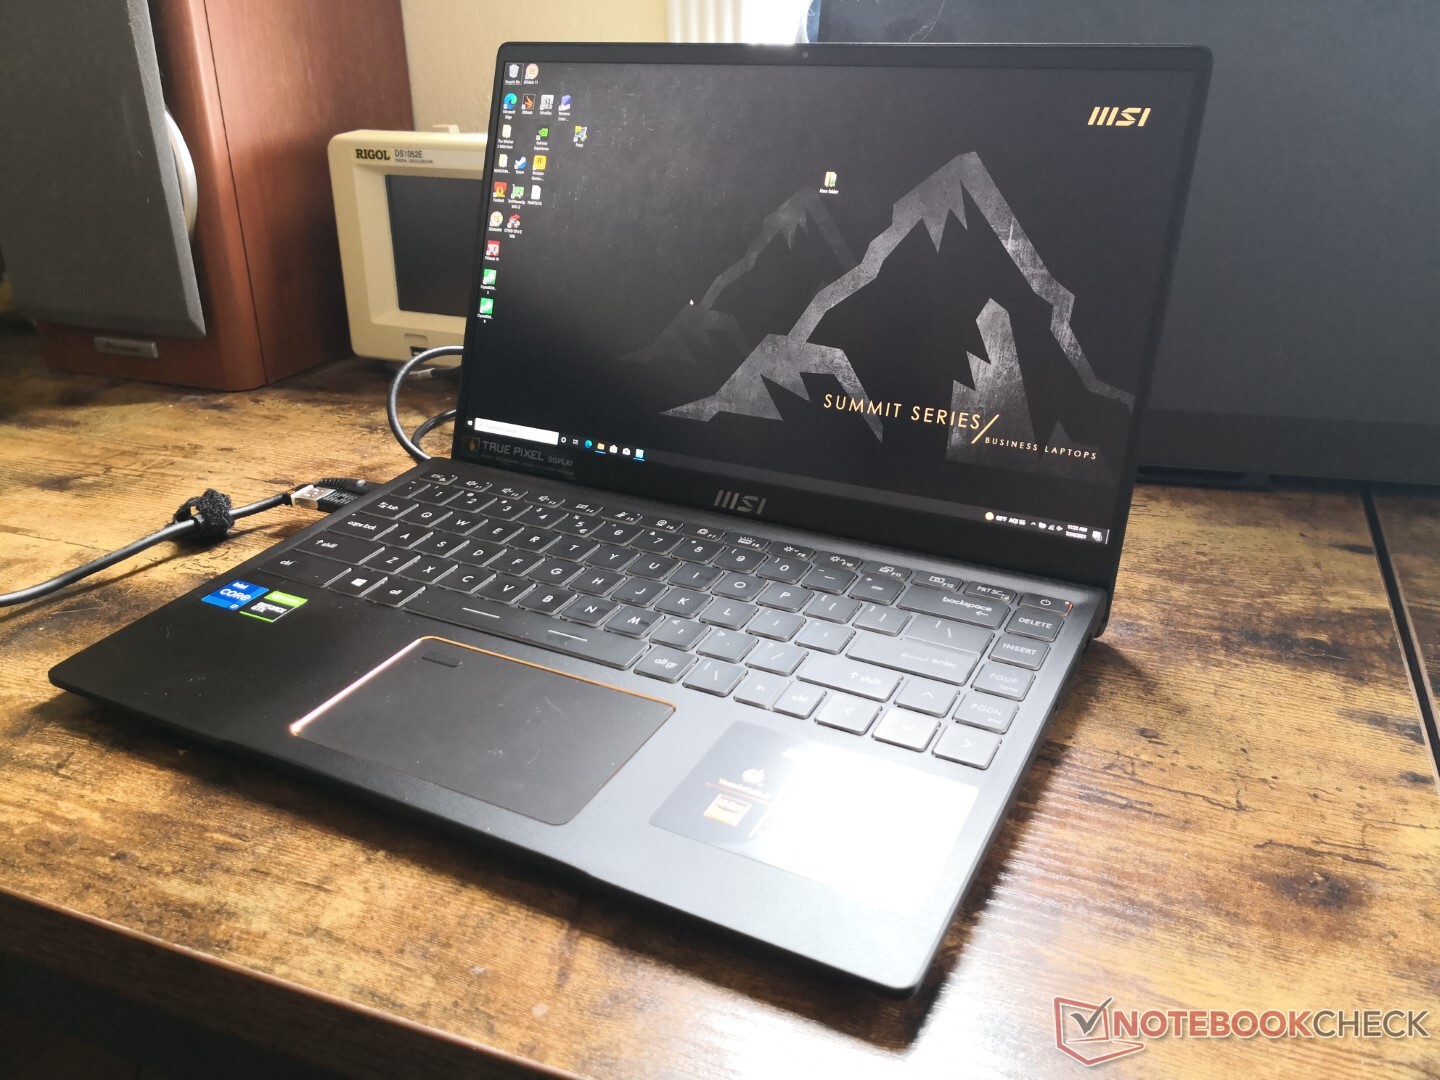
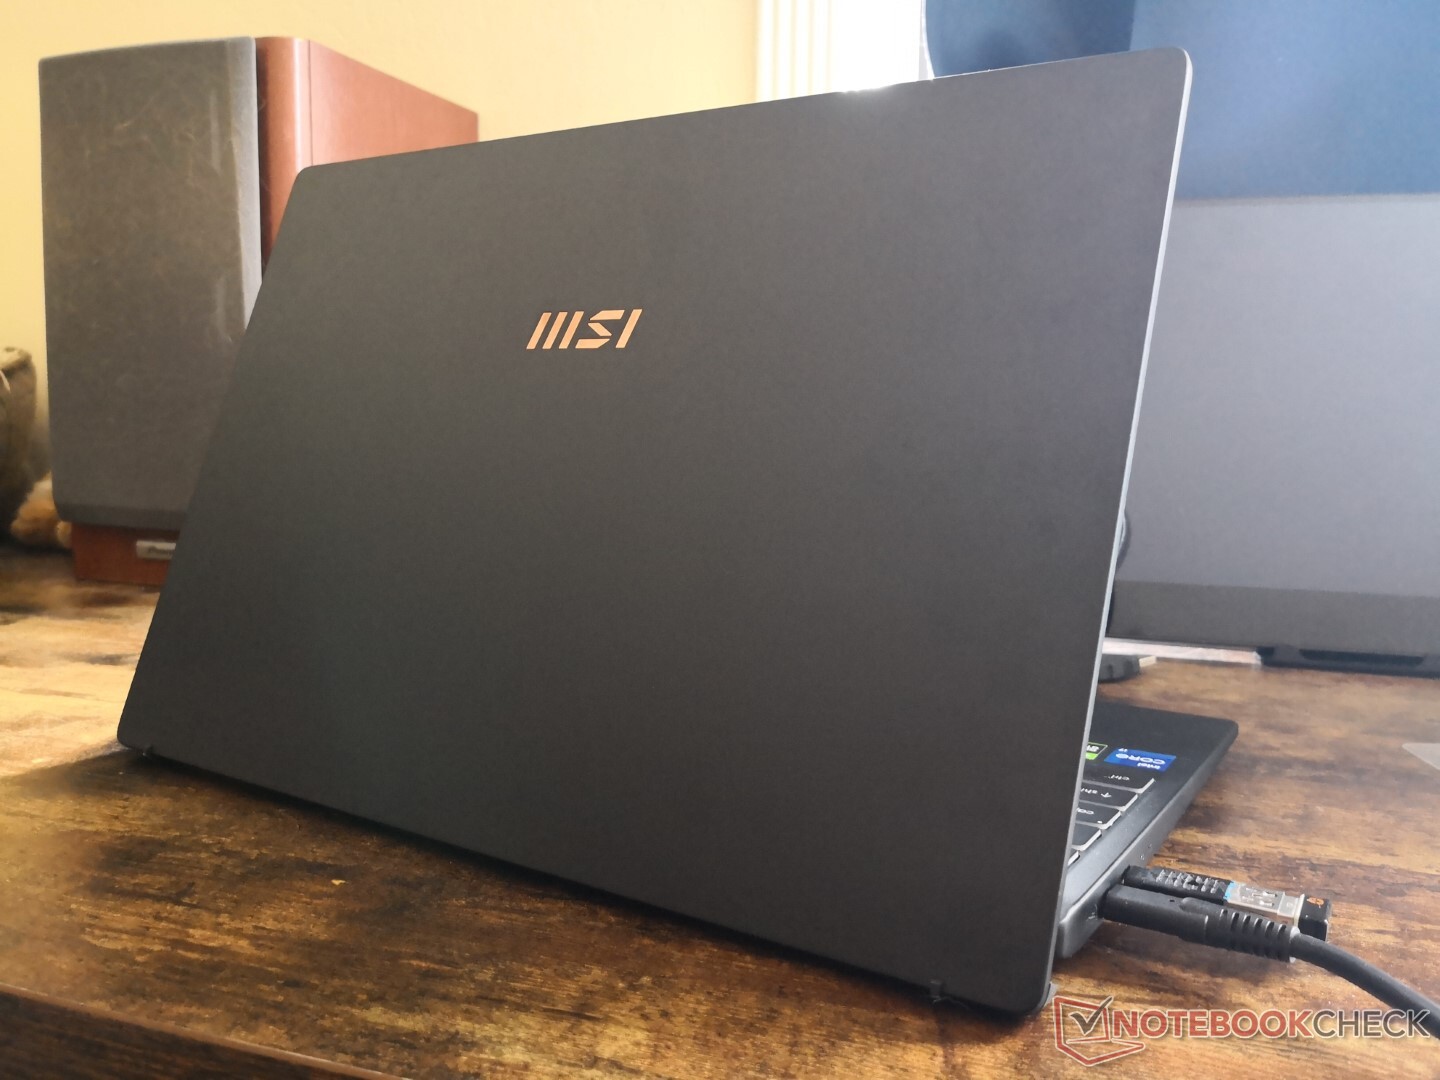
Case — Prestigiously Modern
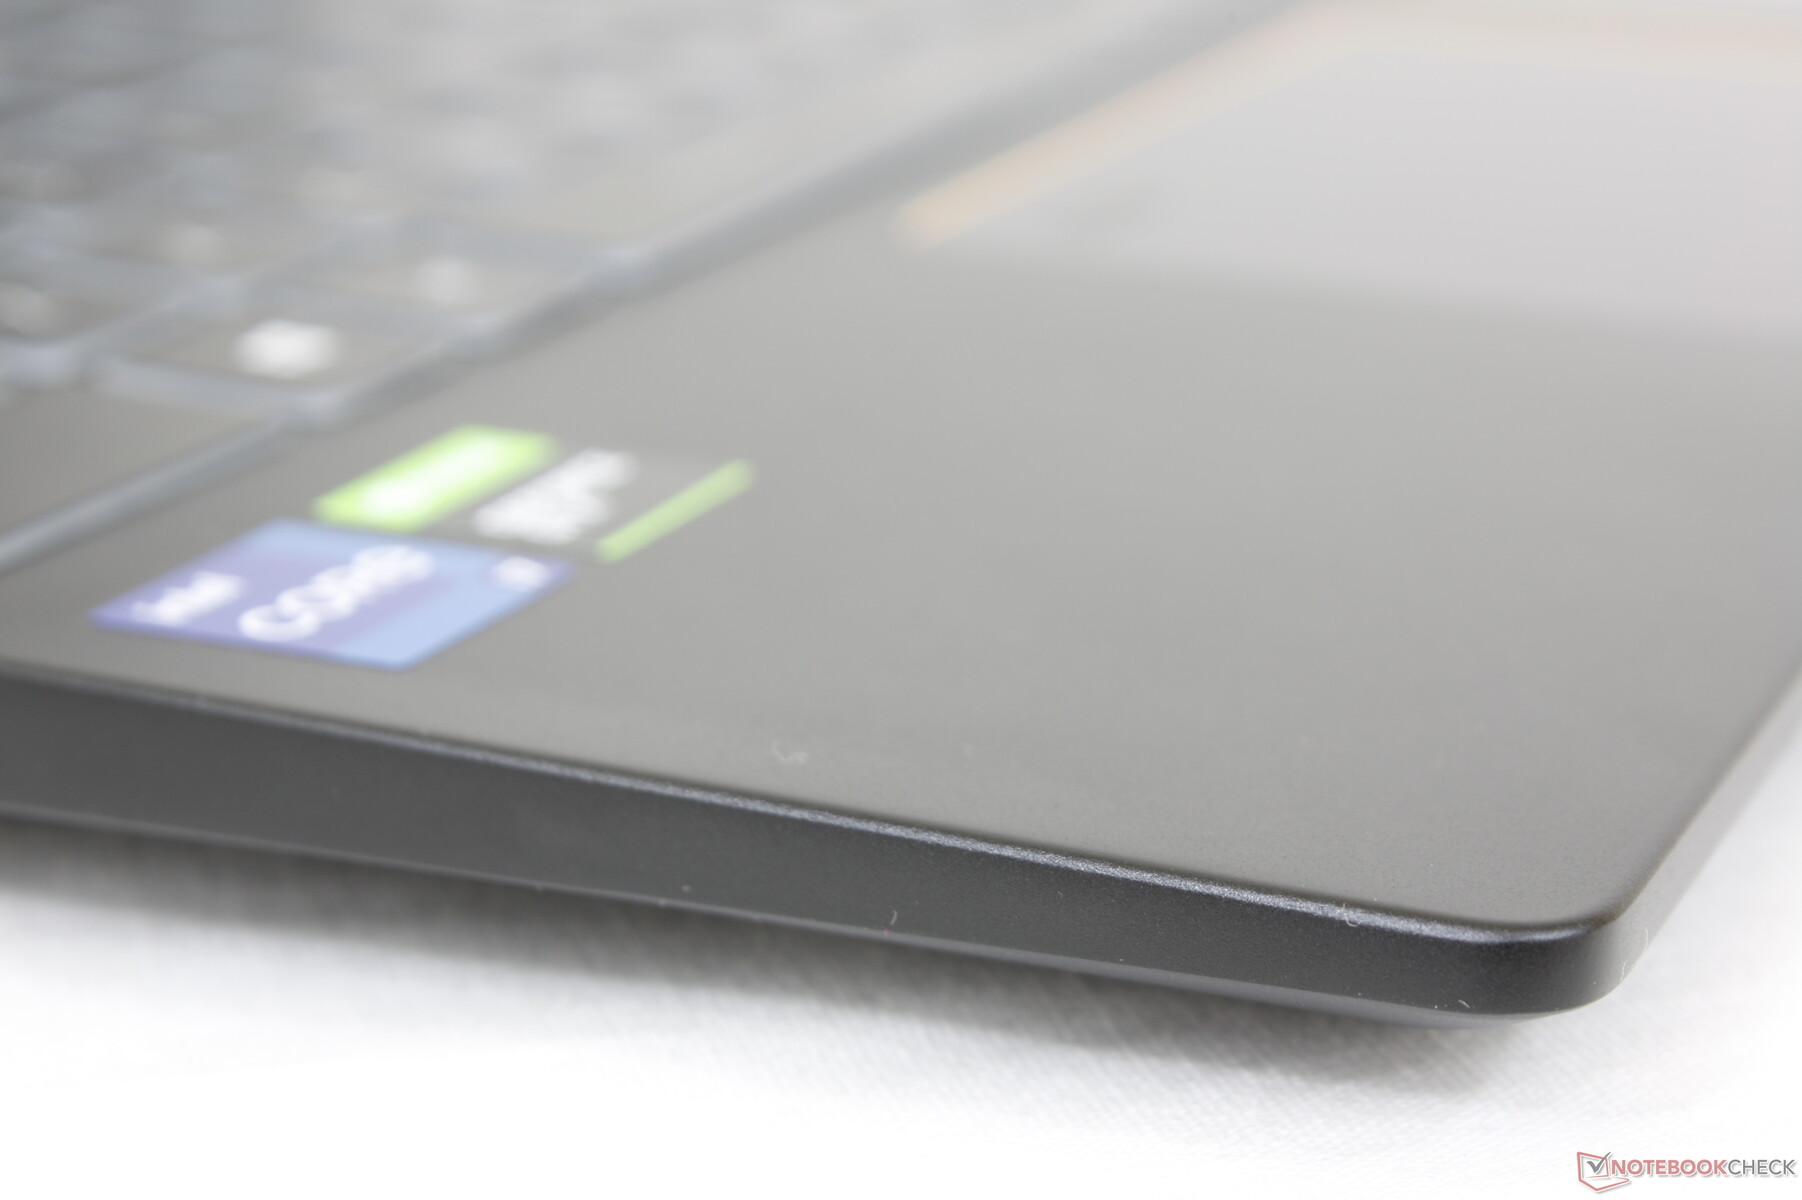
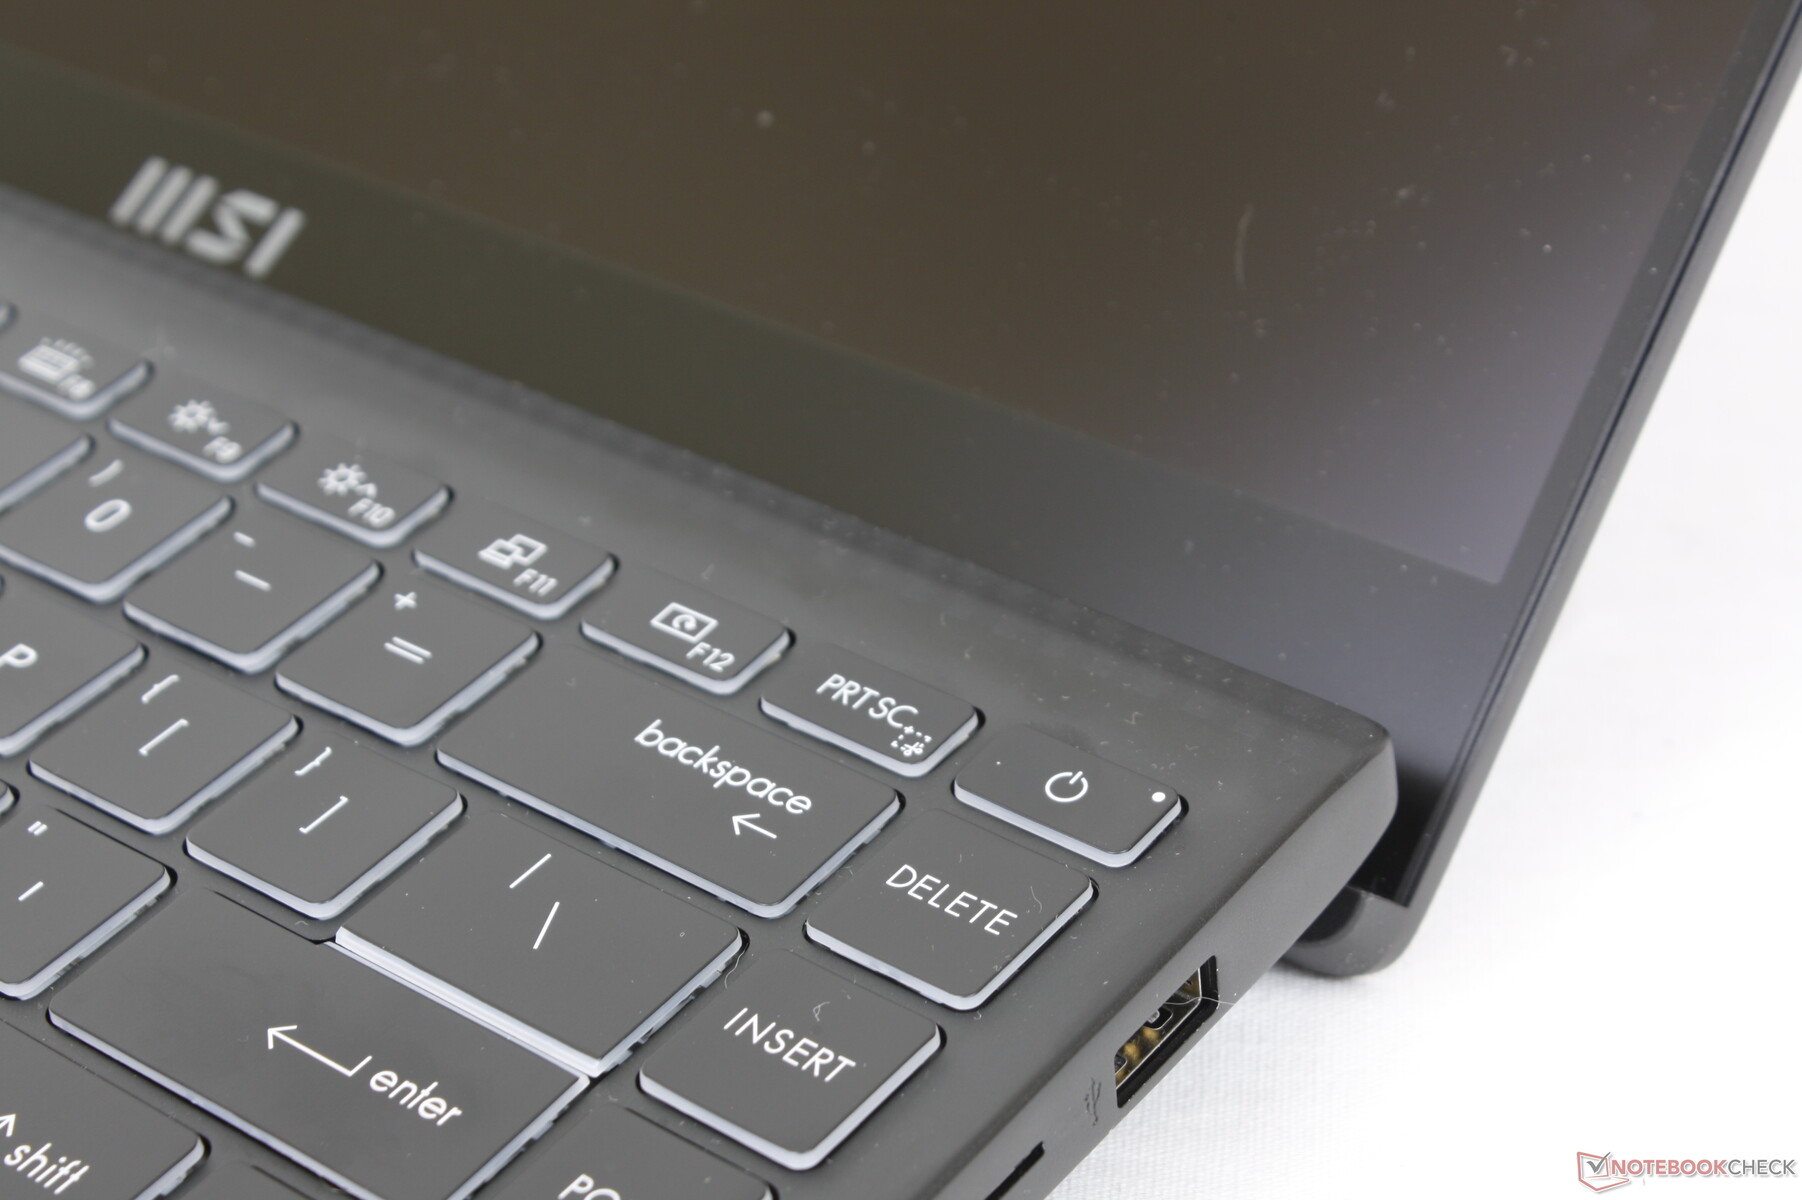
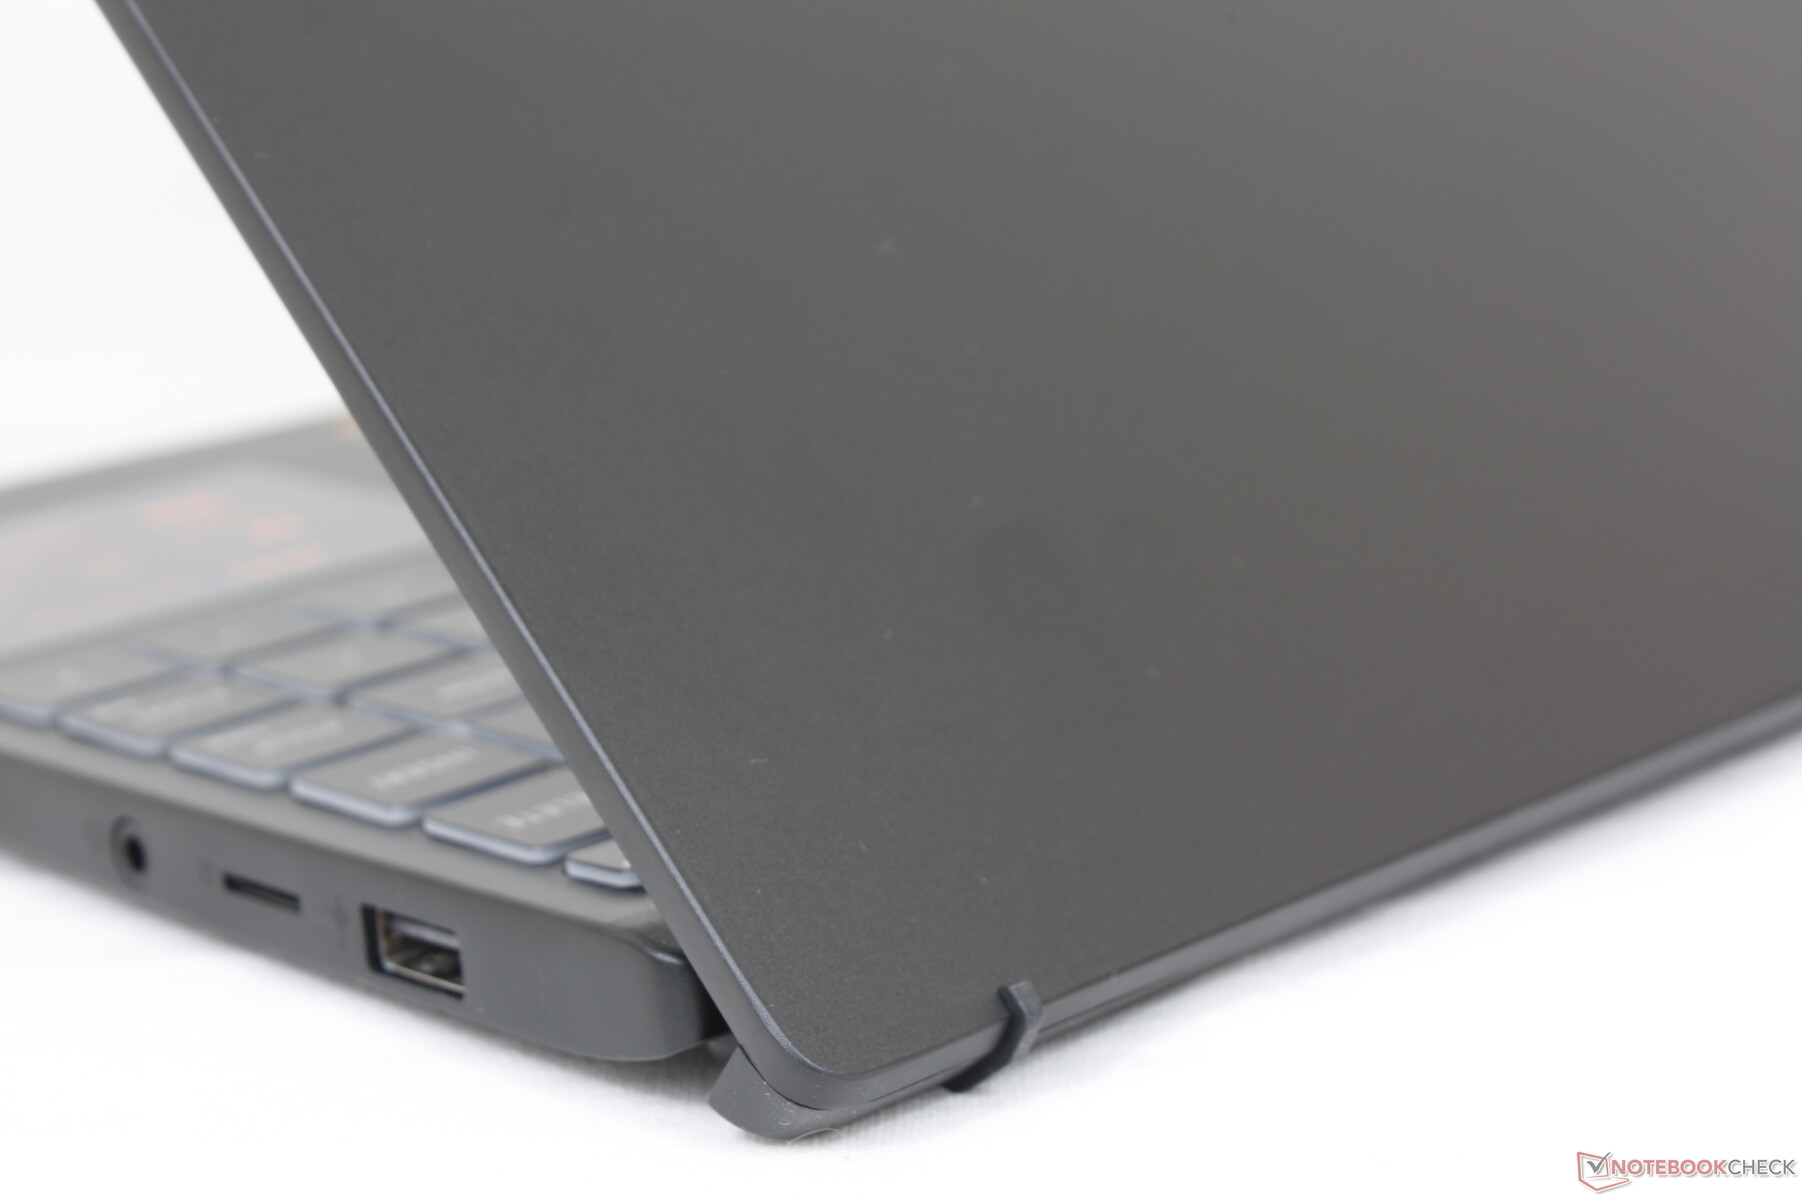
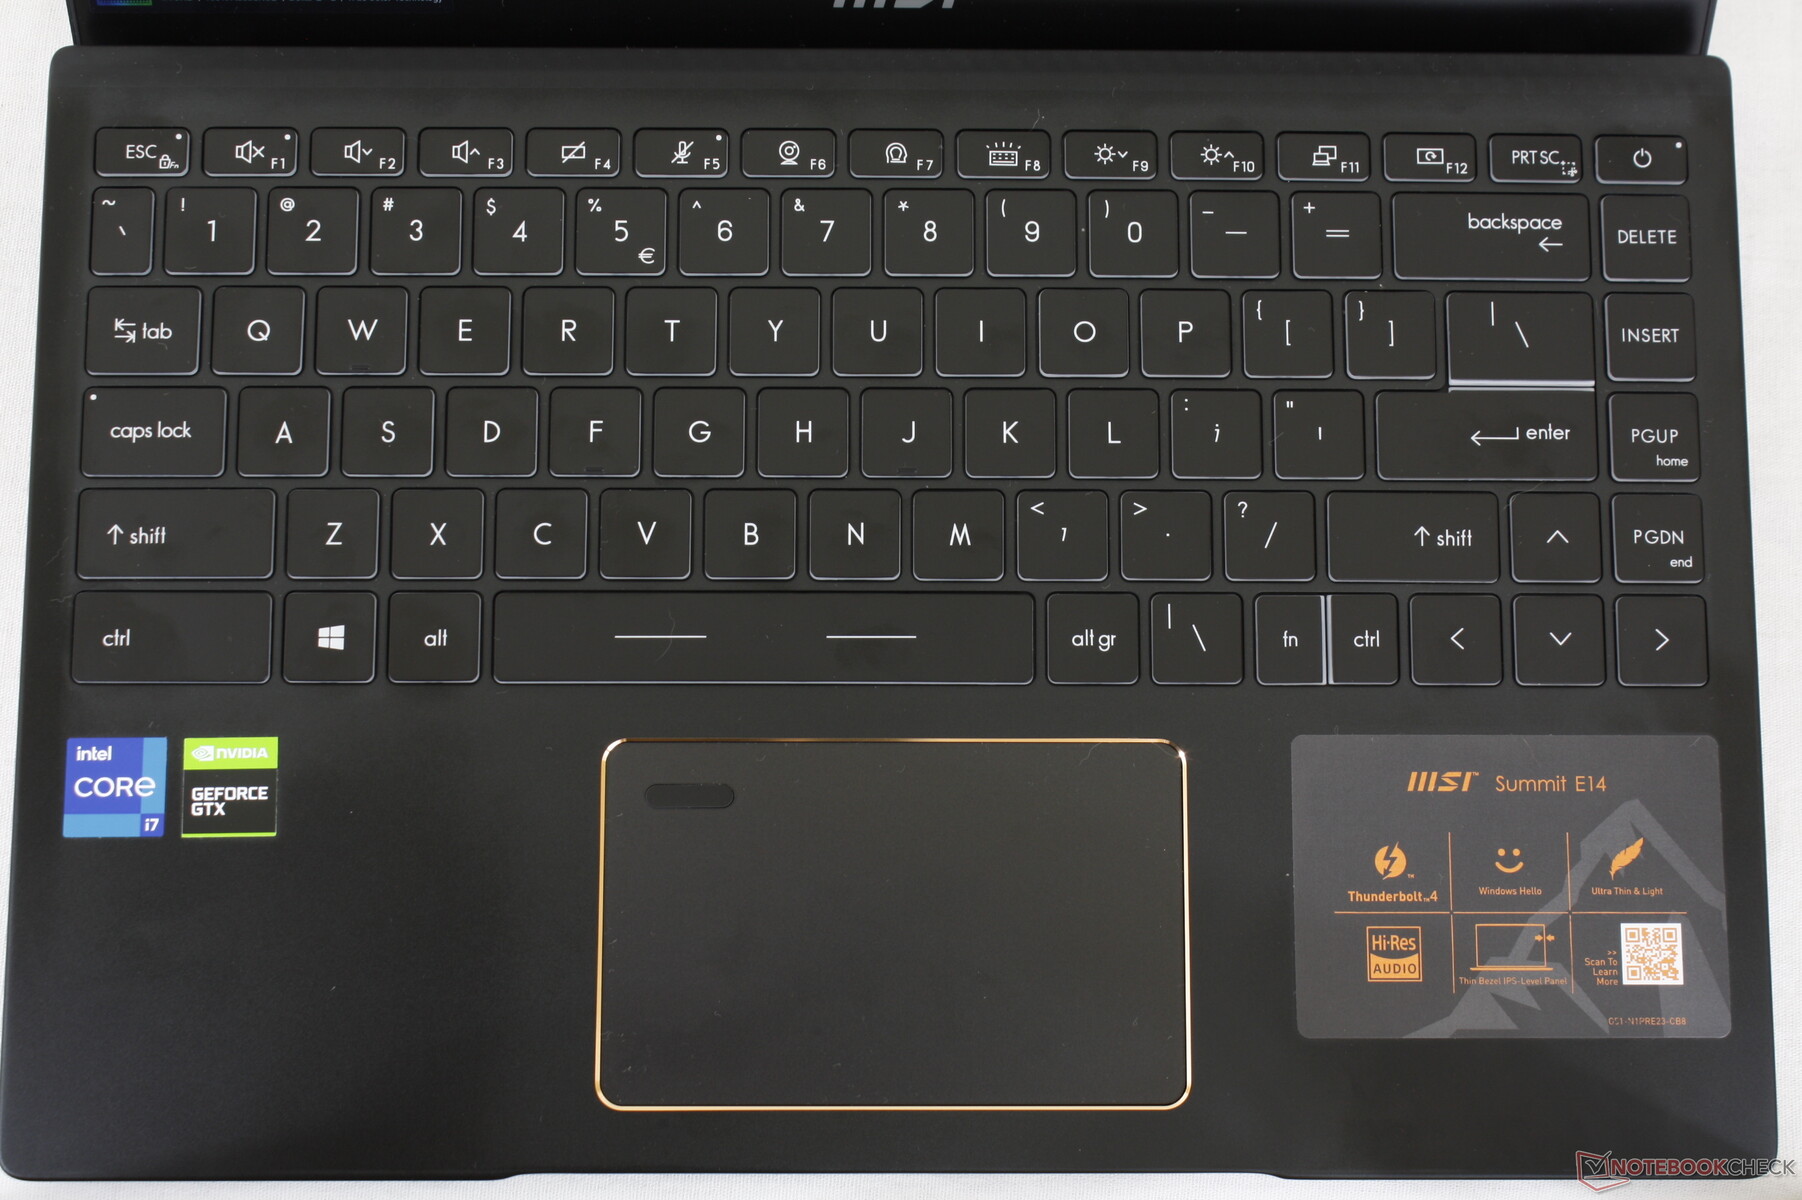
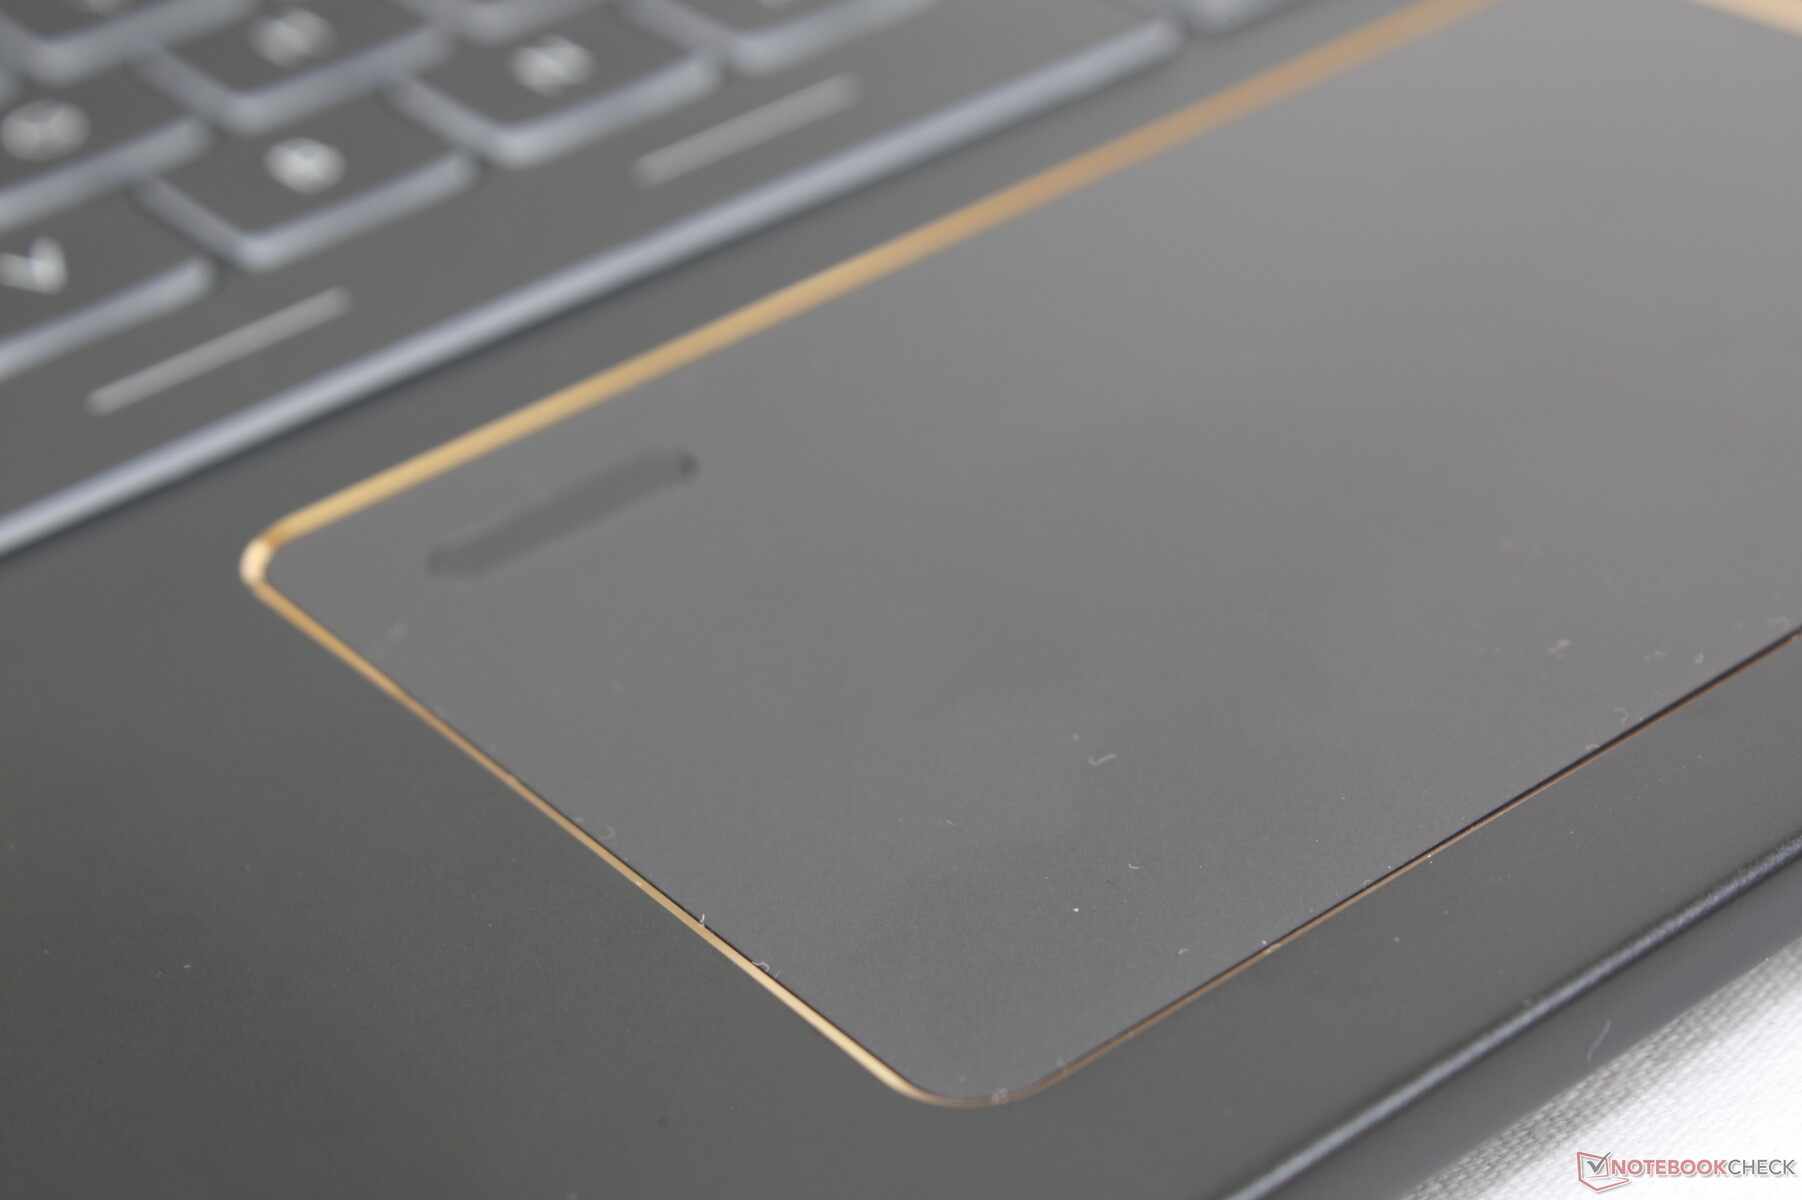
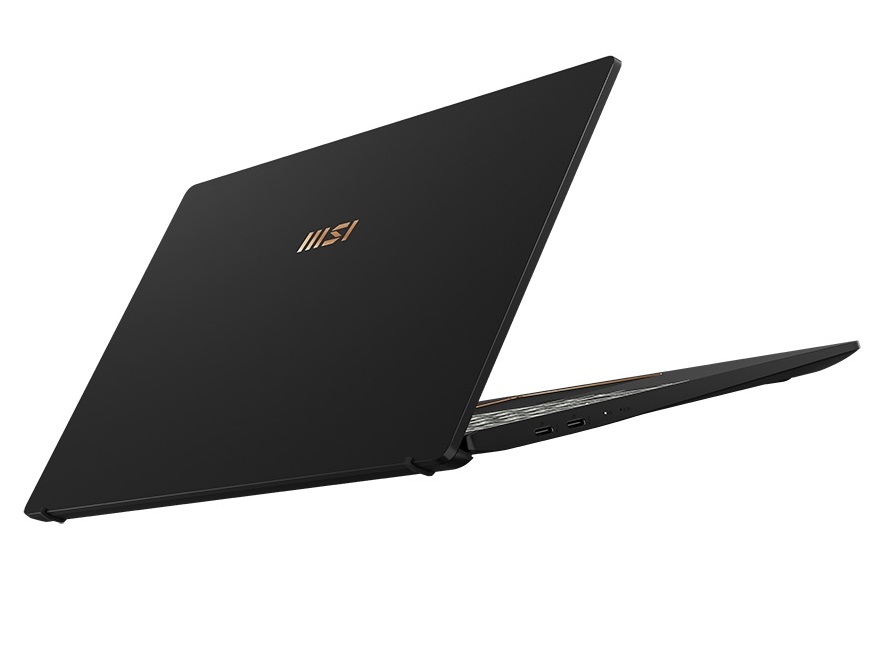
The chassis is similar to the Prestige 14 but with a short list of superficial updates. The outer lid and clickpad perimeter, for example, are now glossy golden in color for a more luxurious visual appeal while the clickpad itself is now actually smaller and shorter in length. The outer lid also loses the shiny cut edges and corners for a more subdued and flatter look when closed. The updates are minor in the grand scheme of things, but they do help to distinguish the Summit E14 from the older Modern and Prestige models.
What hasn't changed, however, is chassis rigidity. We didn't particularly like the build quality of the Prestige 14 relative to its high asking price and this remains true on the Summit E14.
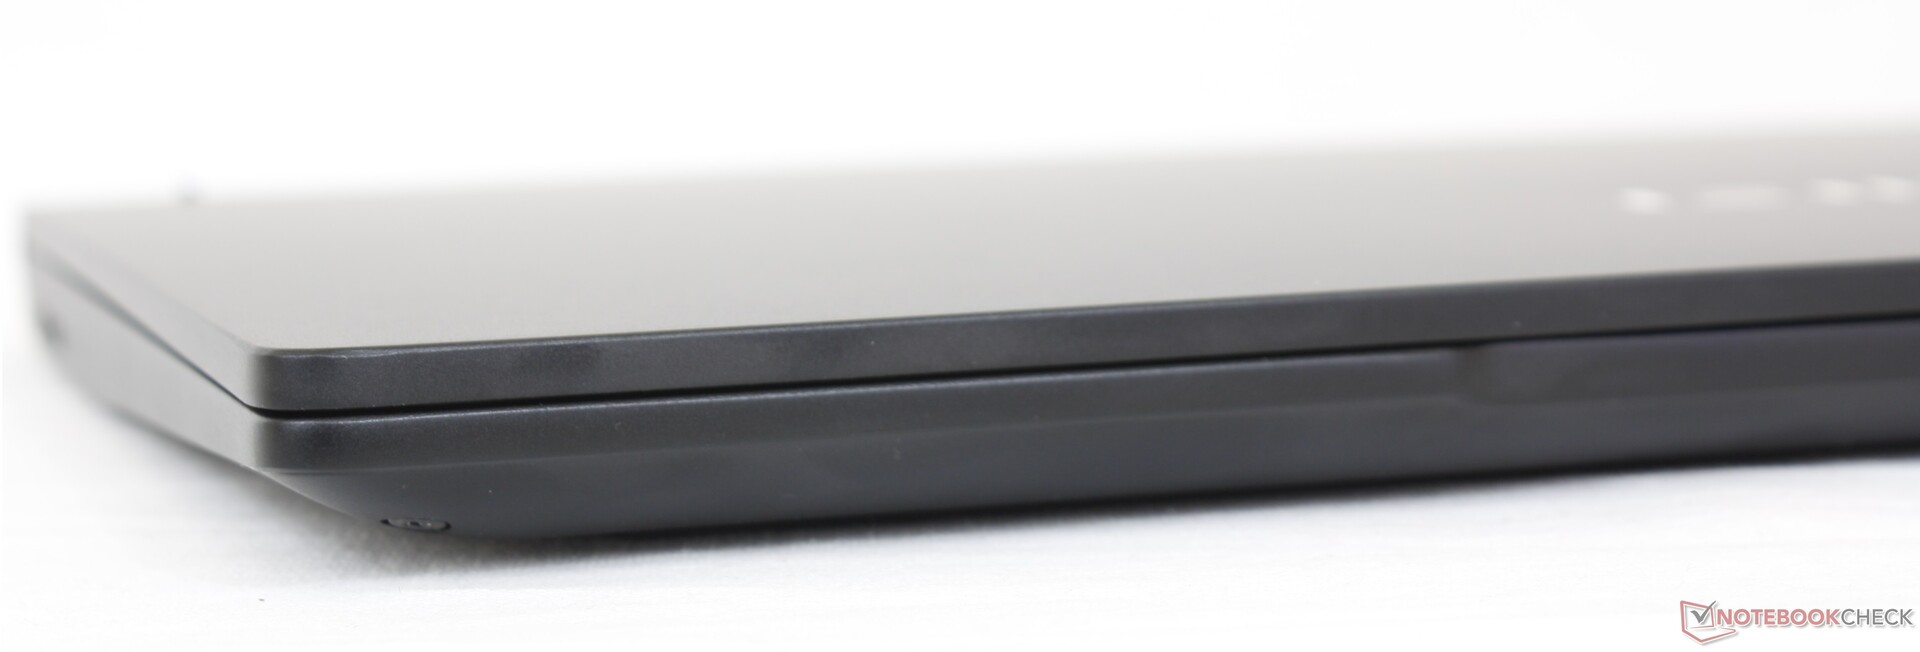
Dimensions and weight are nearly identical to the Prestige 14 Evo or Modern 14 despite the use of a dedicated GeForce GTX GPU. The system weighs as much as most other 14-inch ULV Ultrabooks meaning you're not sacrificing portability for the faster graphics. A notable exception is the ADATA XPG Xenia 14 which is smaller and over 300 g lighter for users who don't need a GeForce GPU.
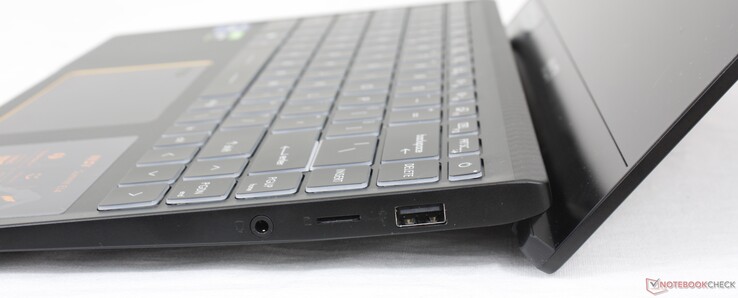
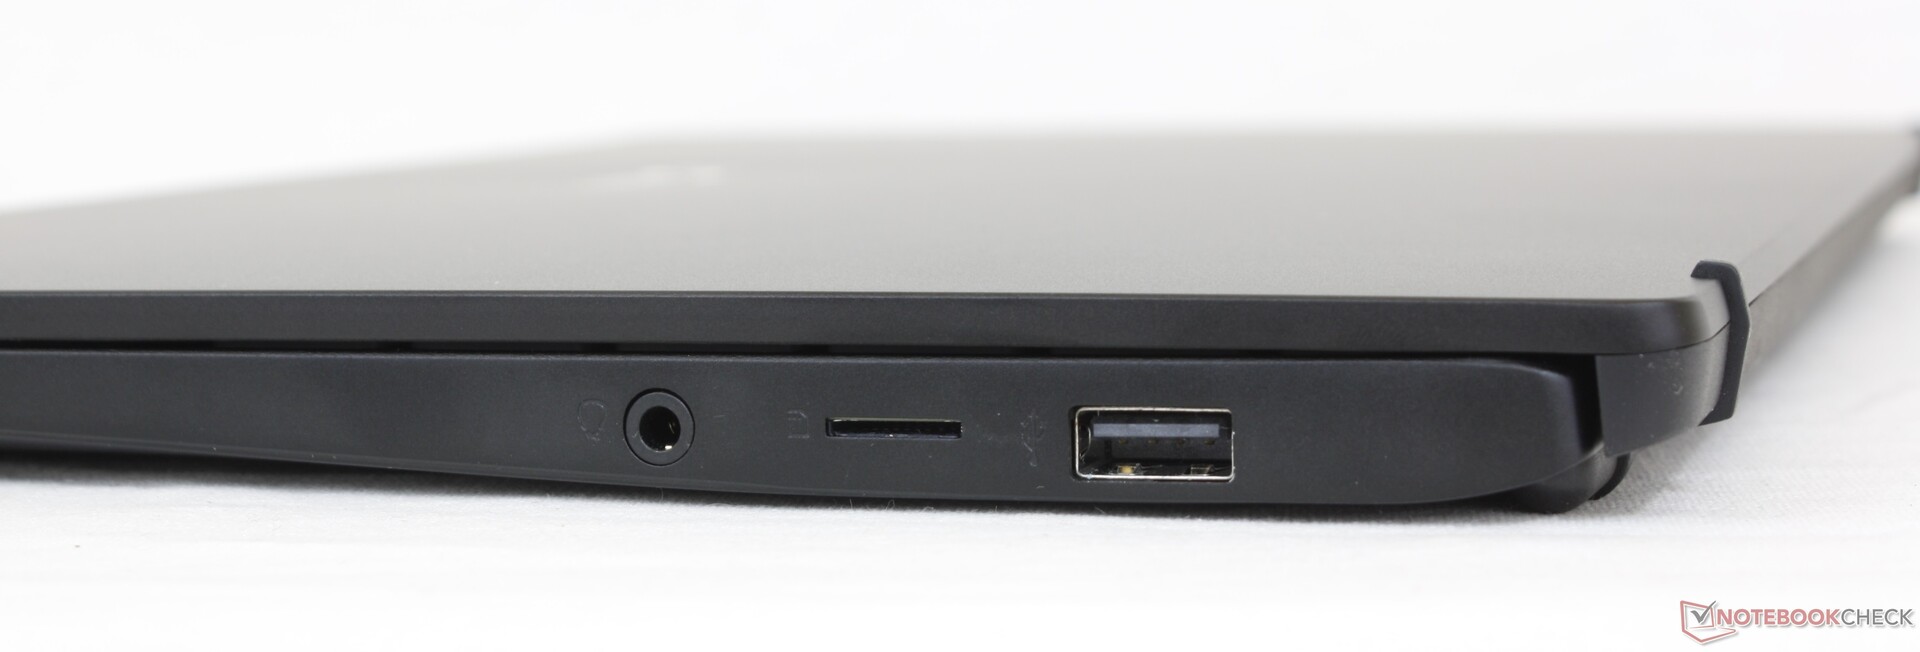
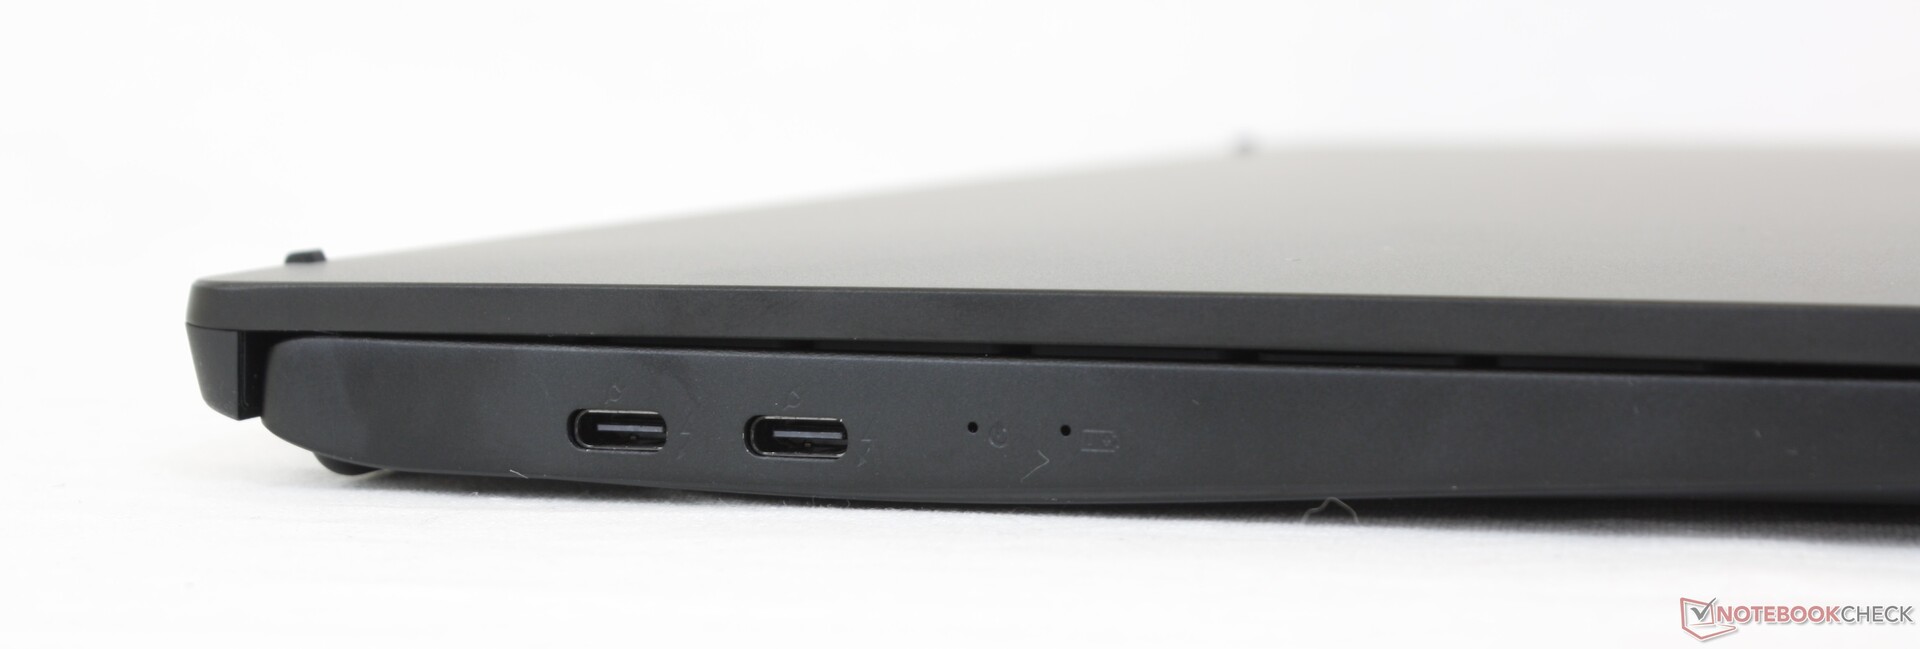
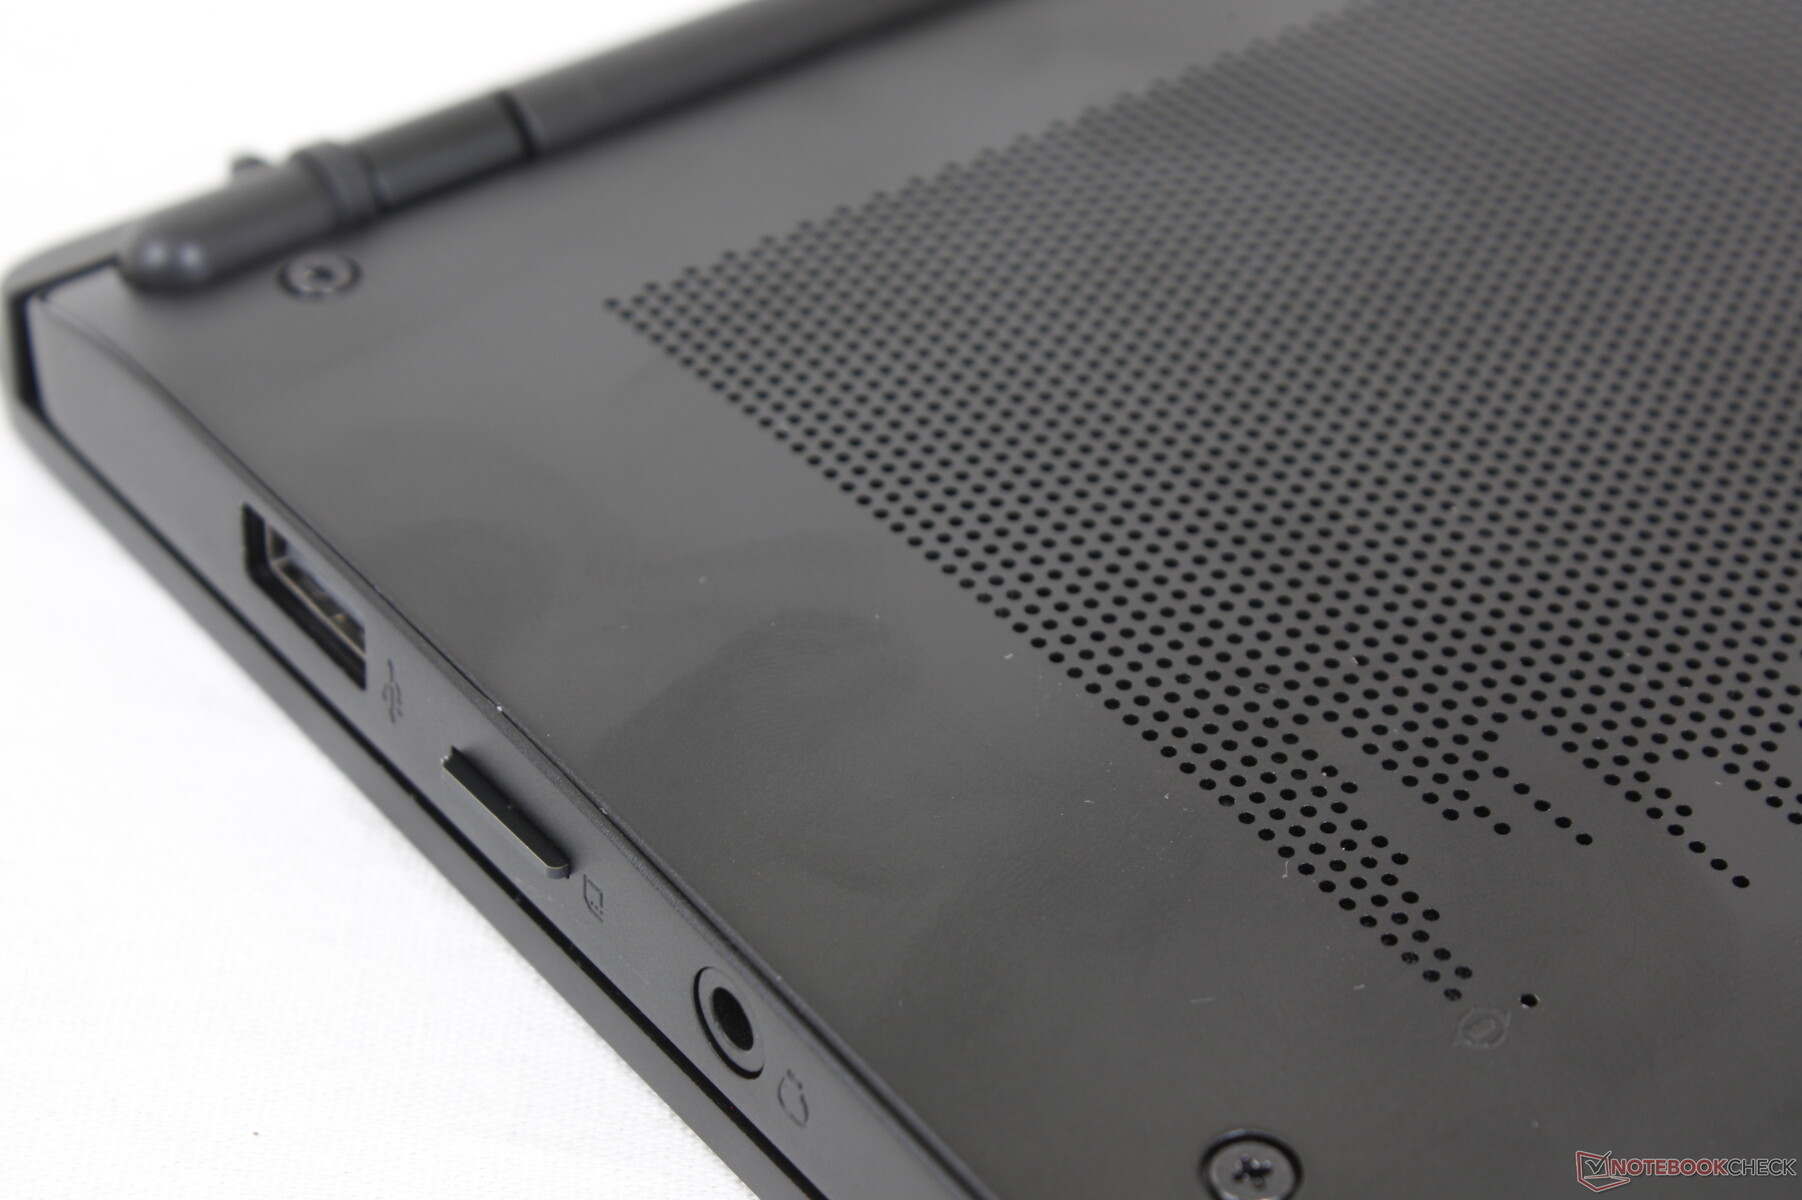
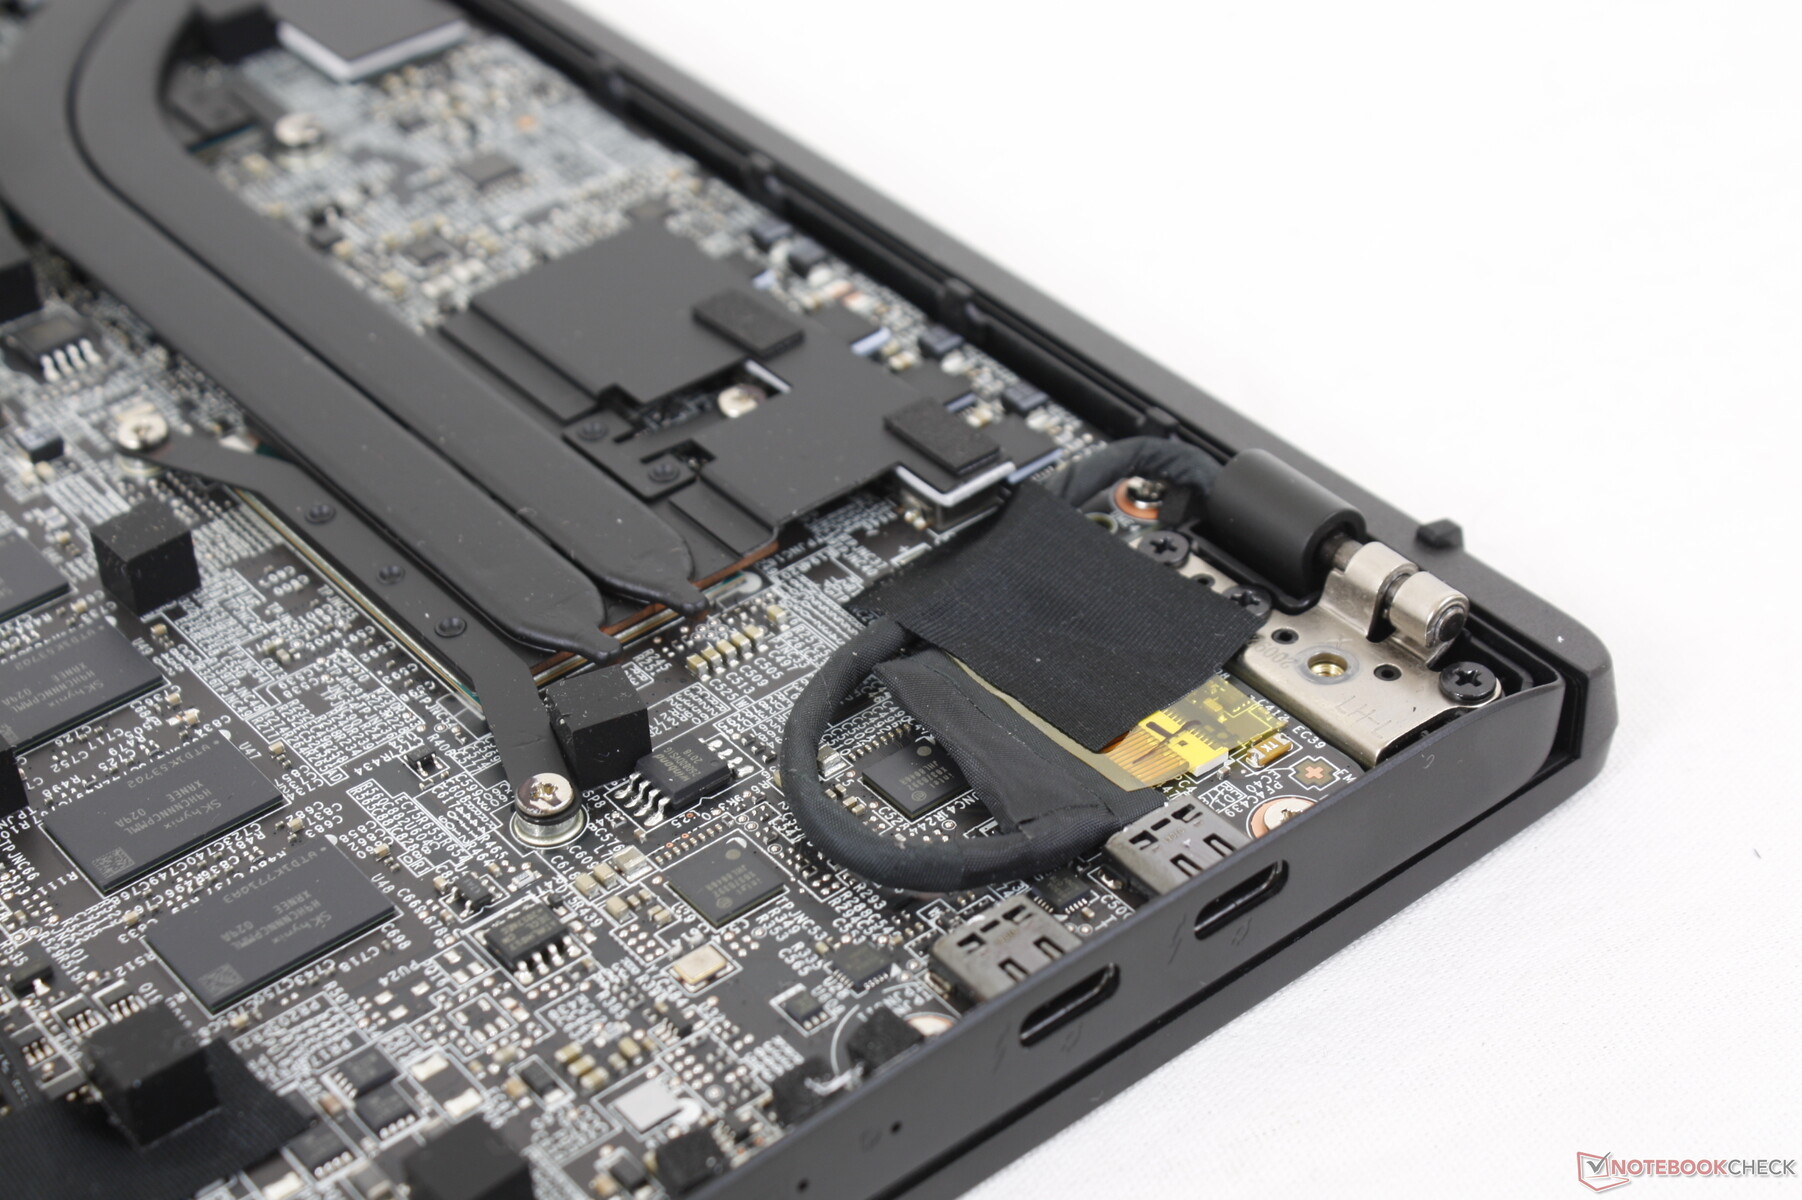
Connectivity — USB 2.0!?
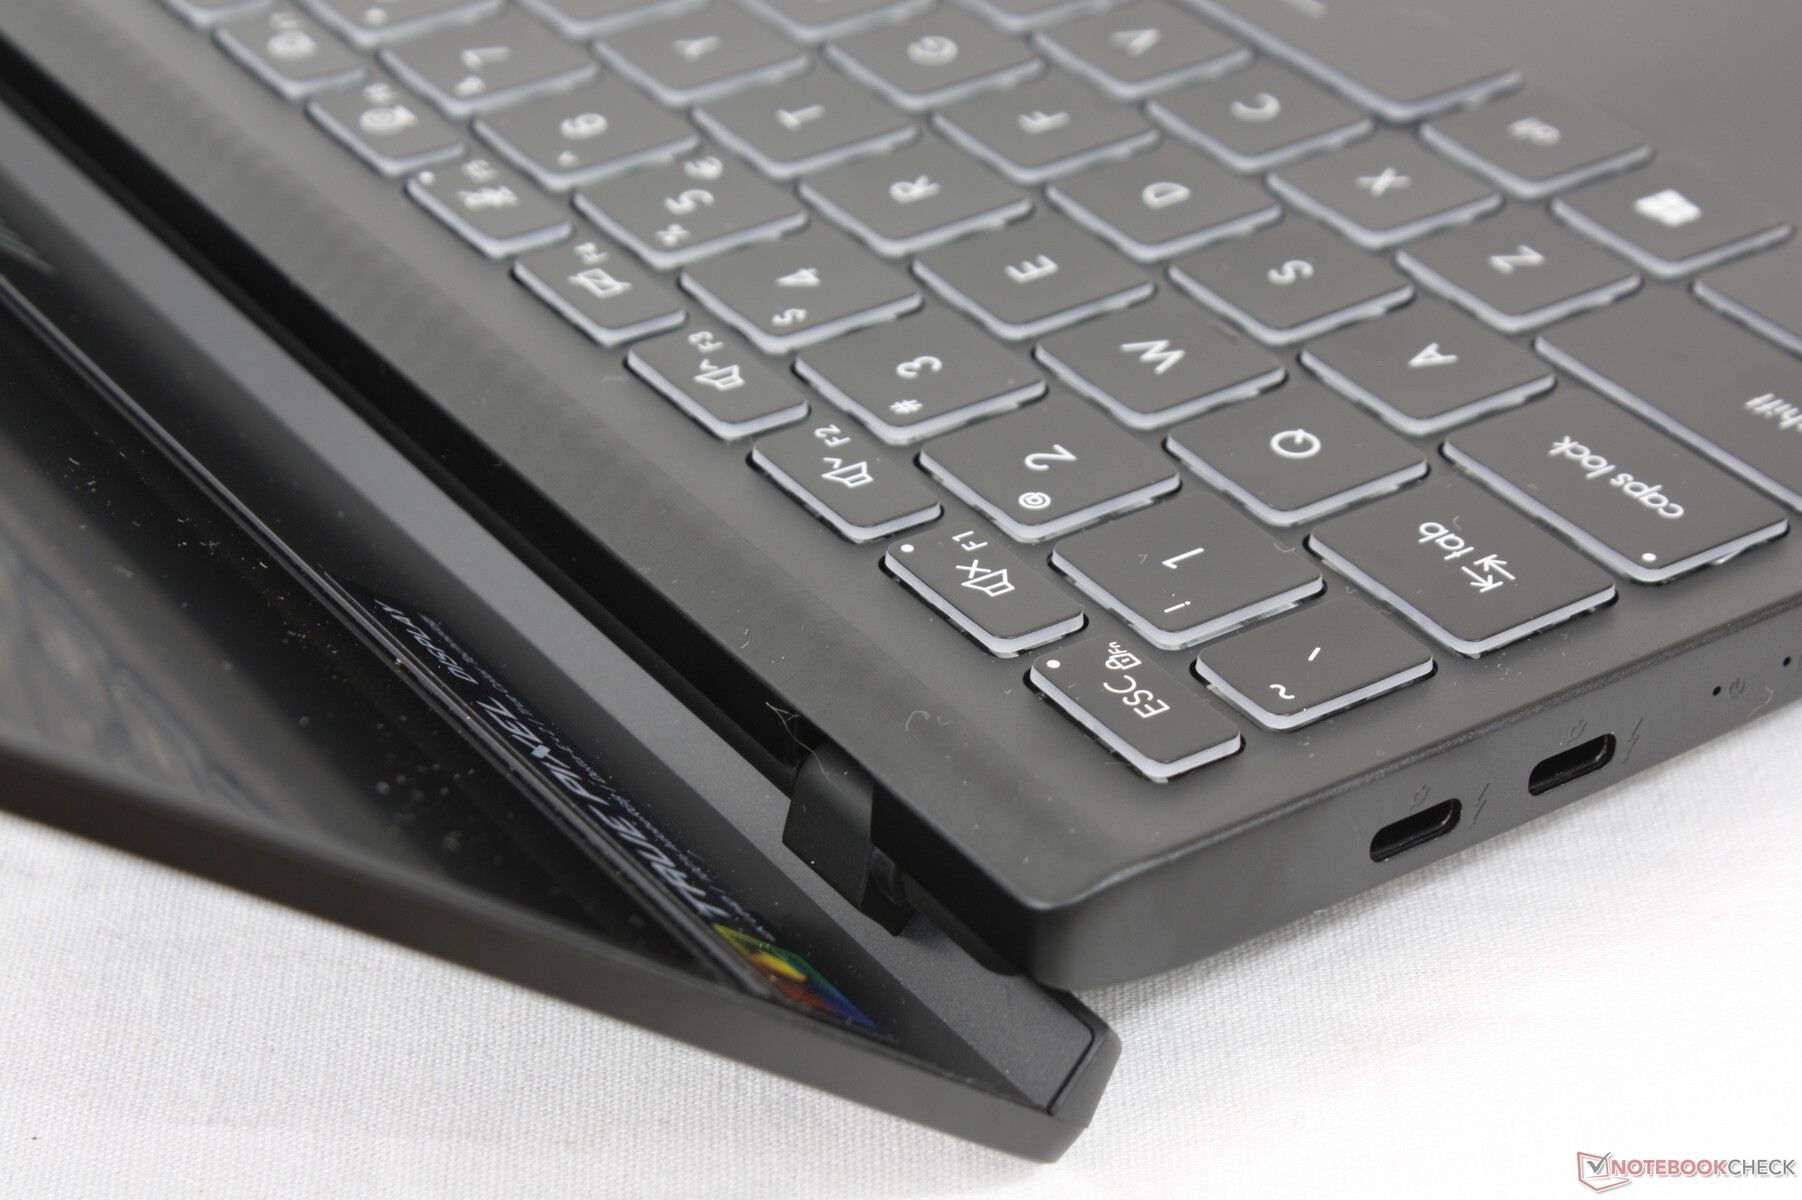
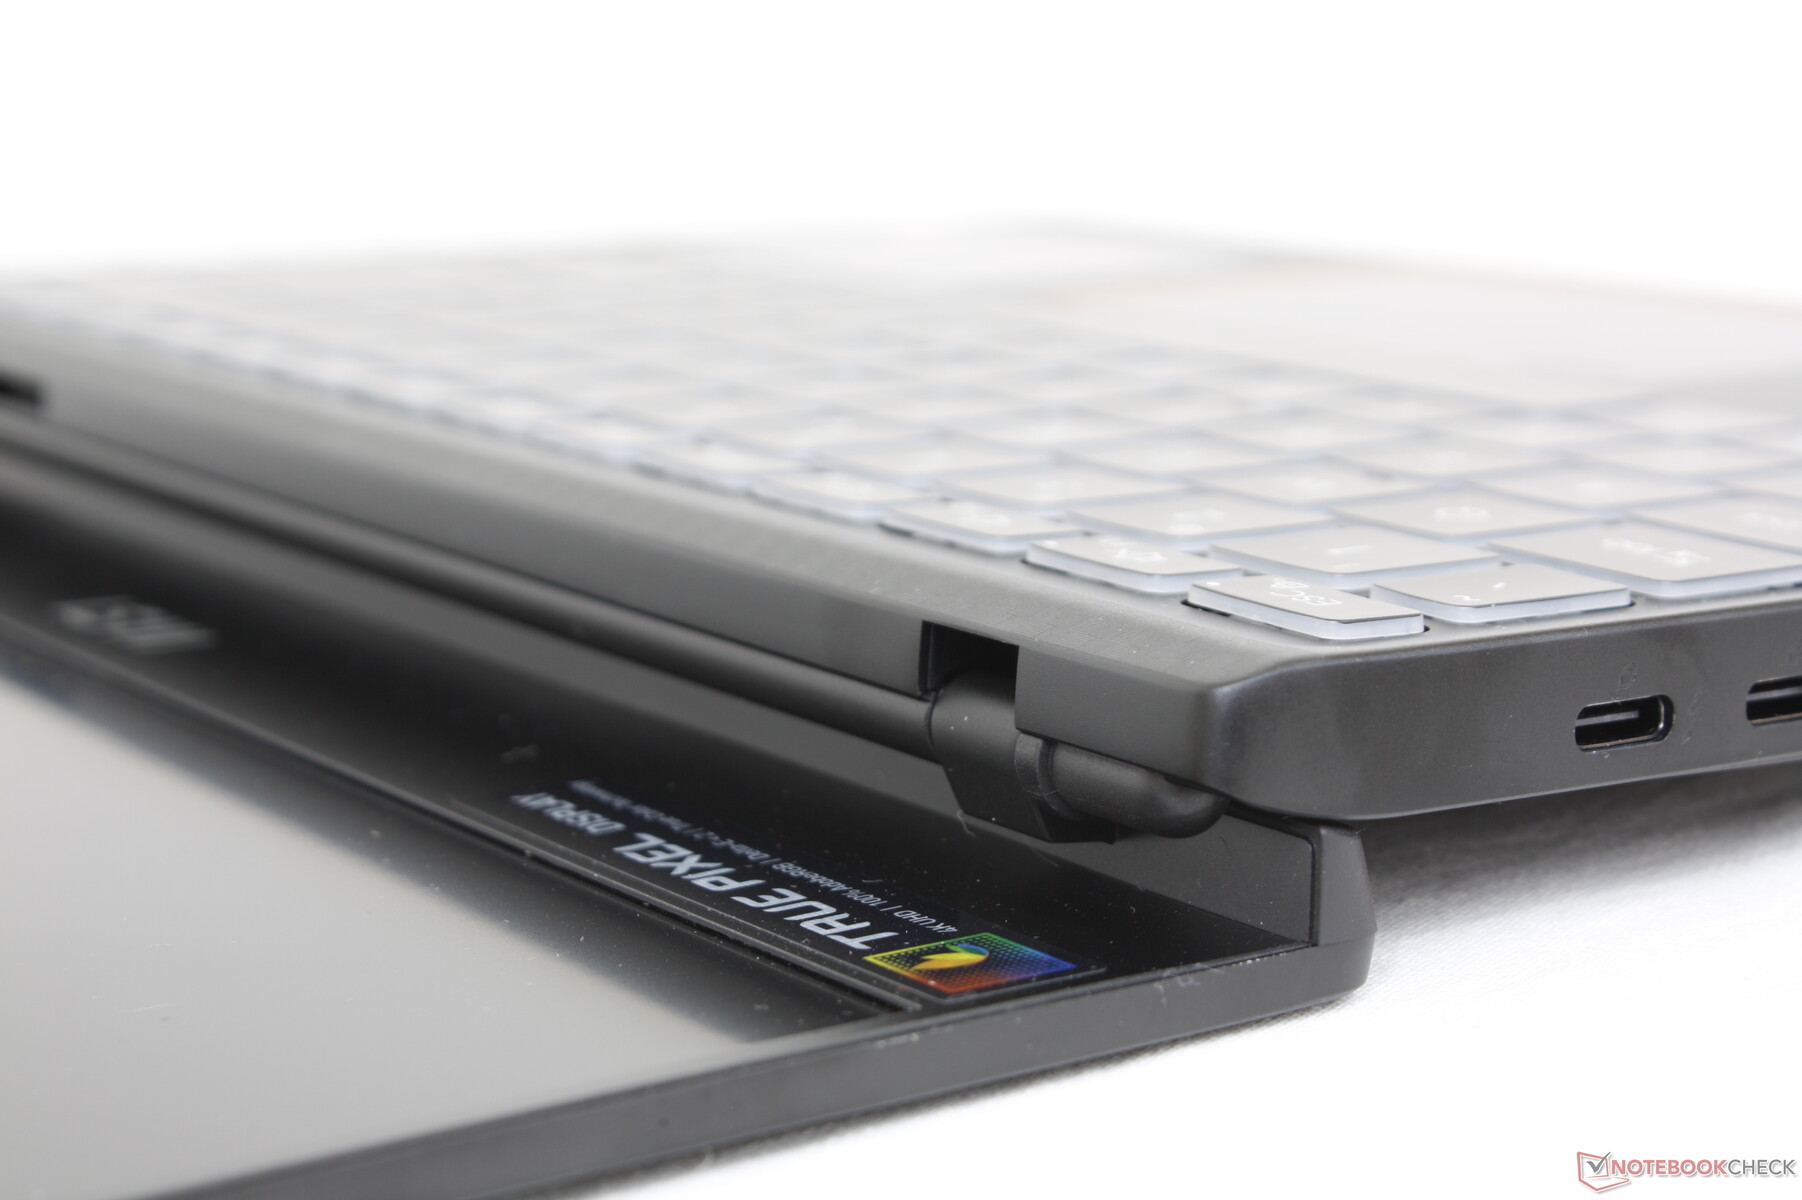
Ports are limited to two USB-C ports and a single USB-A 2.0 port. We're not sure why MSI opted for USB 2.0 instead of 3.0 on such an expensive laptop, but at least the USB-C ports each support Thunderbolt 4. Thunderbolt-based docking stations and monitors are recommended to make the most of the Summit E14.
SD Card Reader
Transfer rates from the integrated MicroSD reader are much faster than the same card reader on the Modern 14. Moving 1 GB of pictures from our UHS-II card to desktop takes about 6 seconds here compared to 50 seconds on the aforementioned model.
| SD Card Reader | |
| average JPG Copy Test (av. of 3 runs) | |
| MSI Summit E14 A11SCS (AV Pro V60) | |
| ADATA XPG Xenia 14 (AV Pro V60) | |
| MSI Modern 14 B11SB-085 (Toshiba Exceria Pro M501 microSDXC 64GB) | |
| maximum AS SSD Seq Read Test (1GB) | |
| MSI Summit E14 A11SCS (AV Pro V60) | |
| ADATA XPG Xenia 14 (AV Pro V60) | |
| MSI Modern 14 B11SB-085 (Toshiba Exceria Pro M501 microSDXC 64GB) | |
Communication
Webcam
Though there is no physical webcam shutter, MSI has an electronic one via the F6 key. The feature merely disabled the webcam meaning the camera itself is never covered or turns opaque.


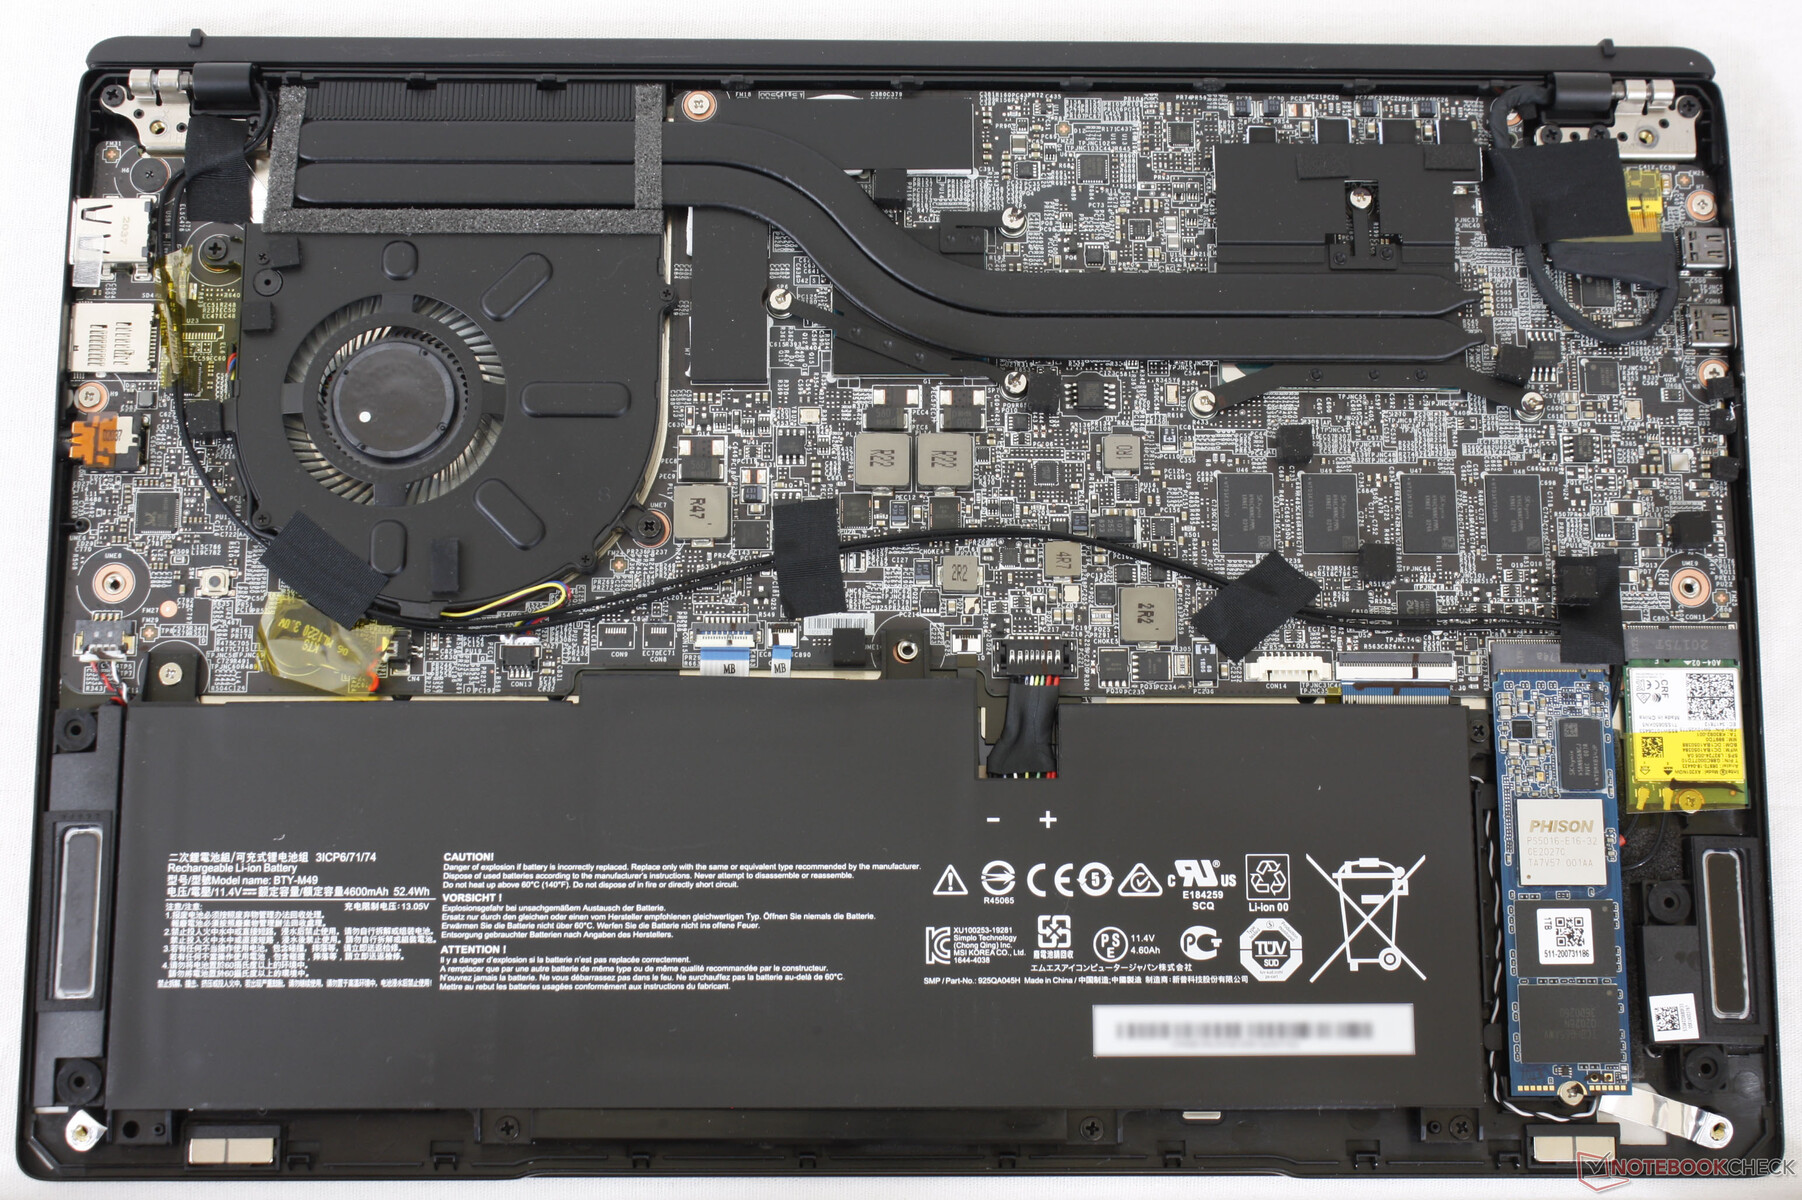
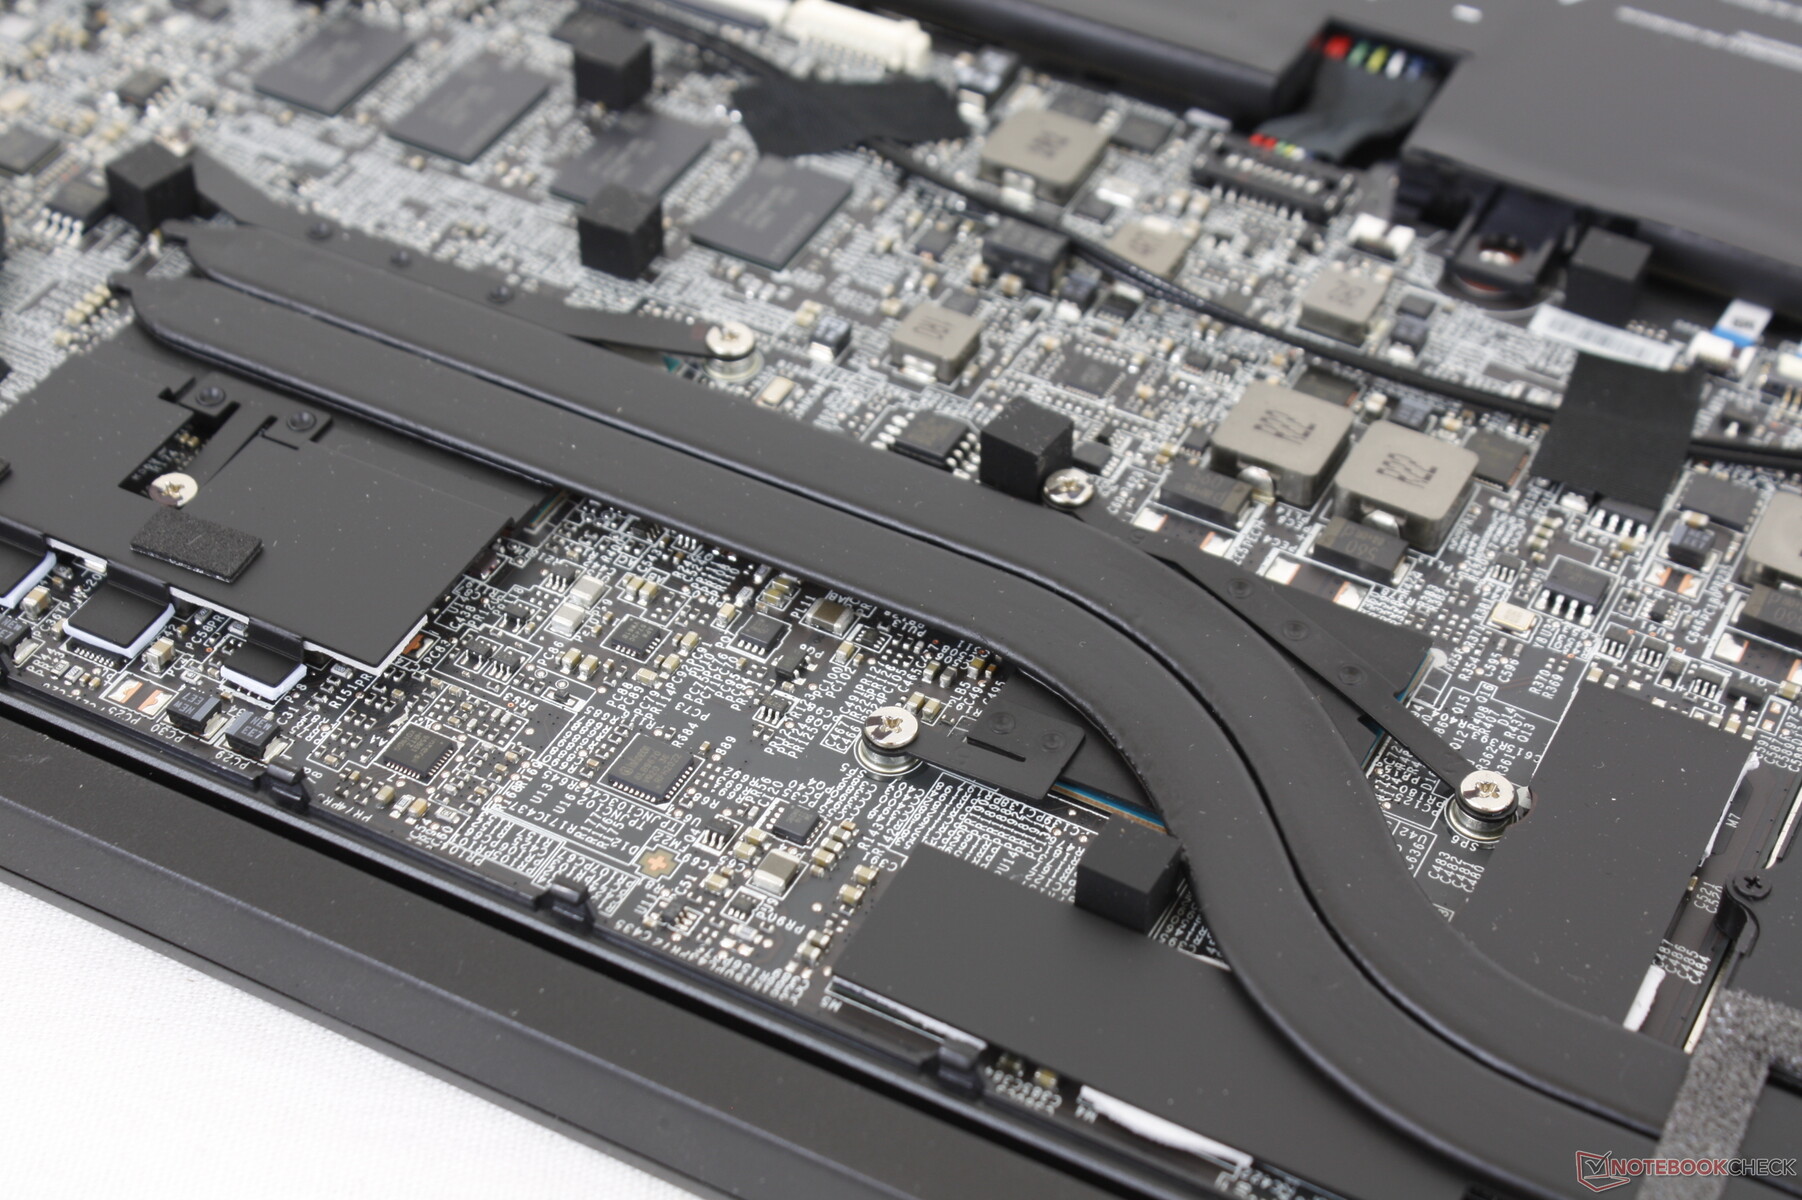
Maintenance
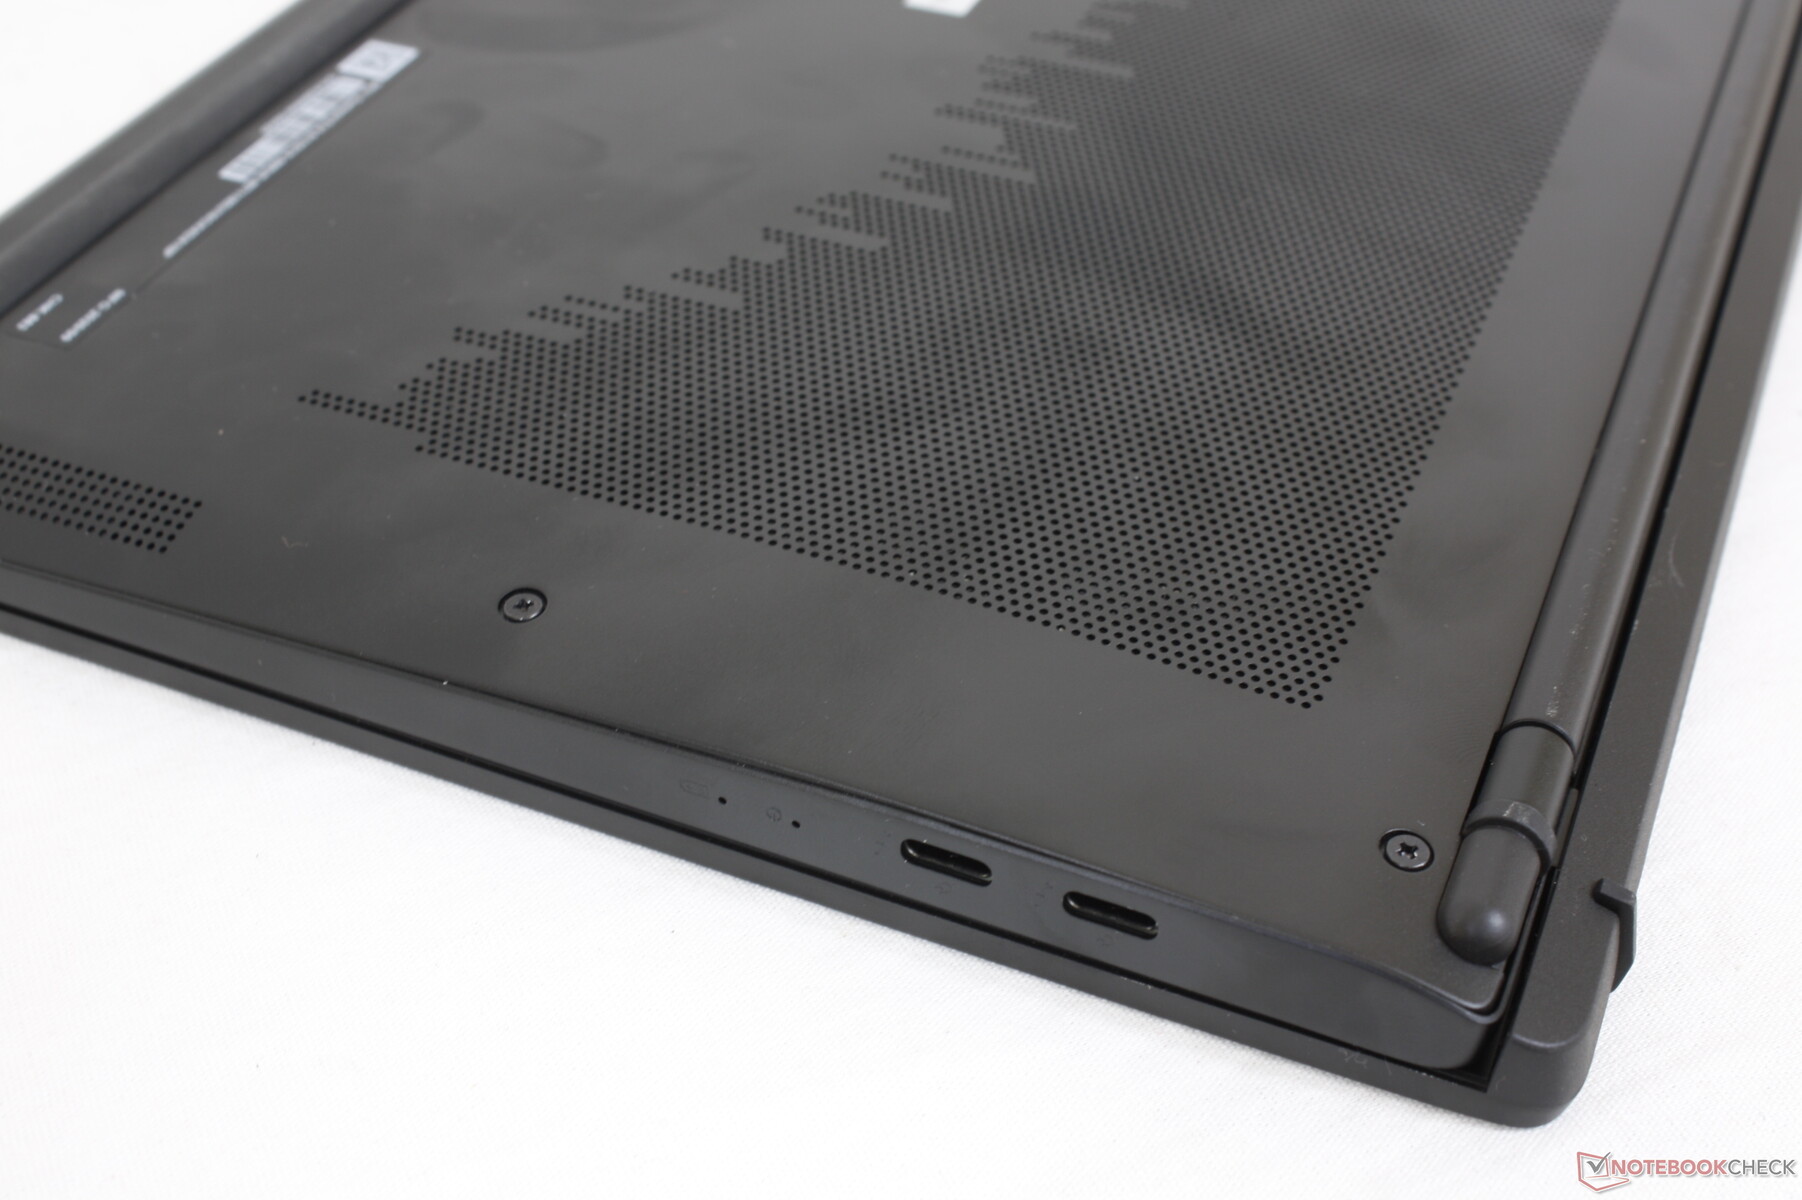
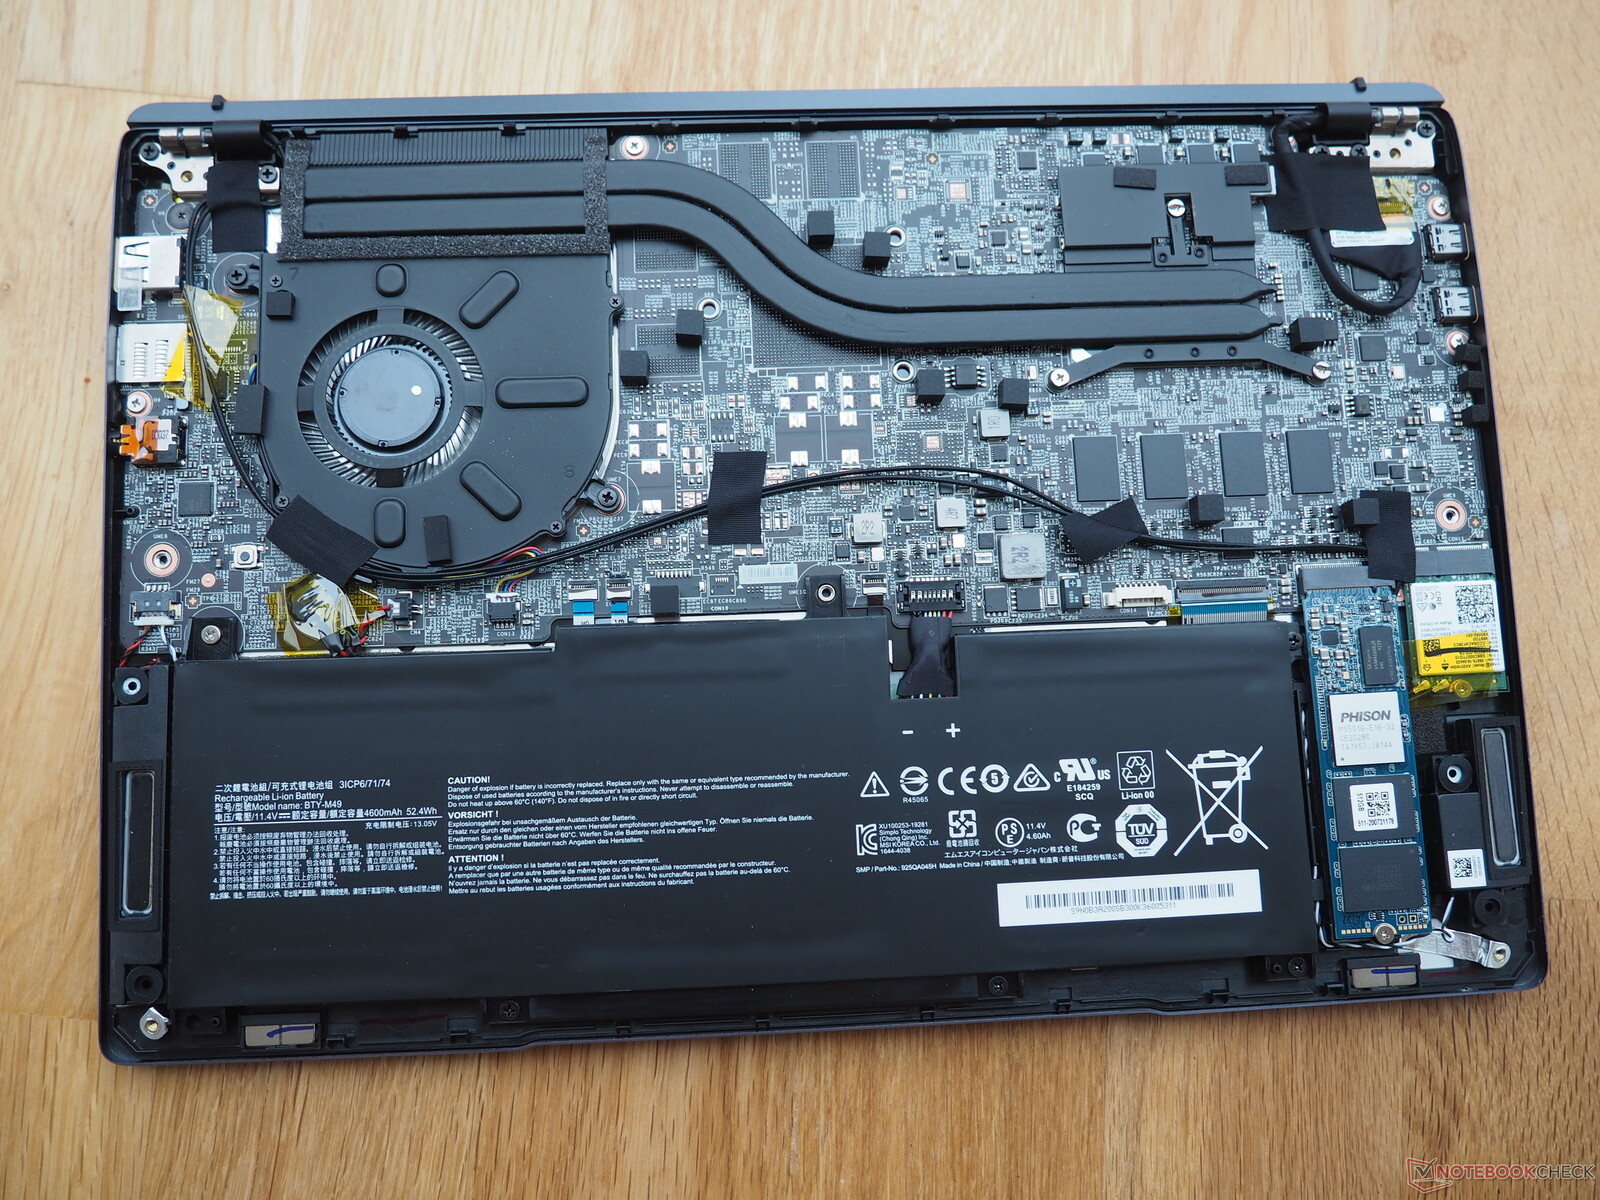
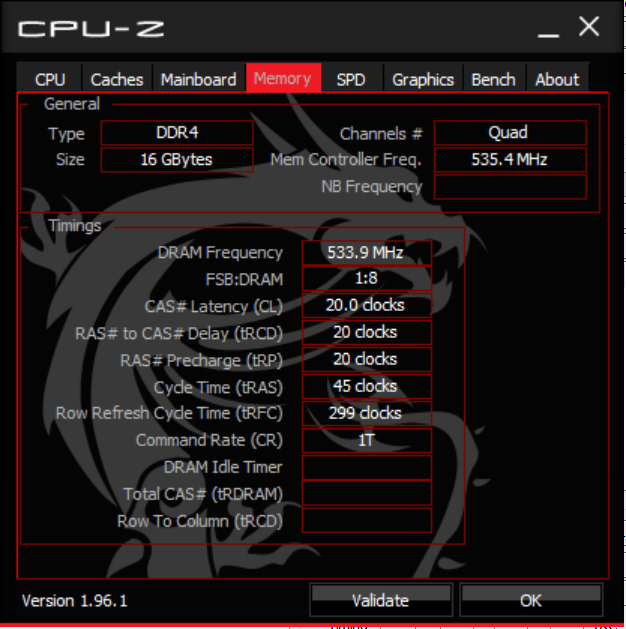
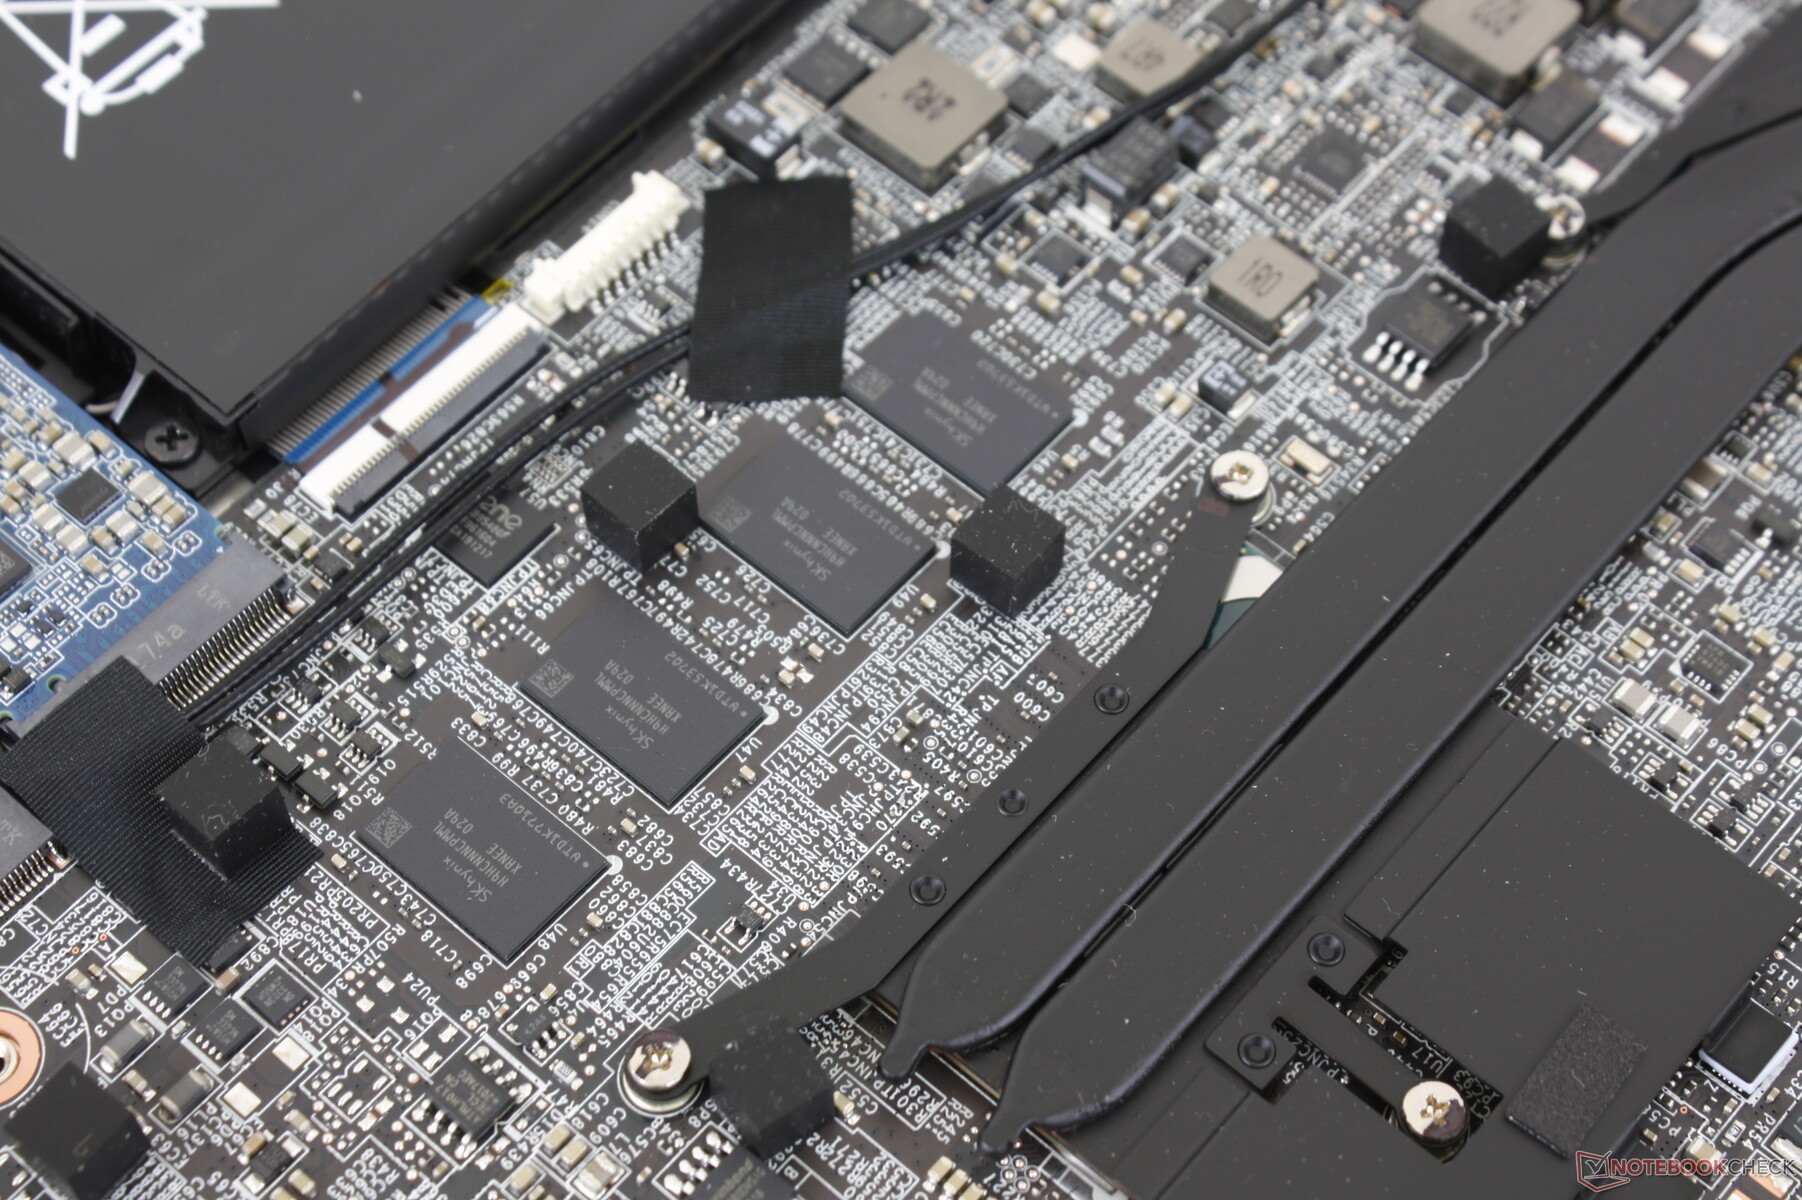
The bottom panel comes off easily with just a Philips screwdriver and sharp edge. The internals nearly identical to the Prestige 14 including the soldered RAM.
Accessories and Warranty
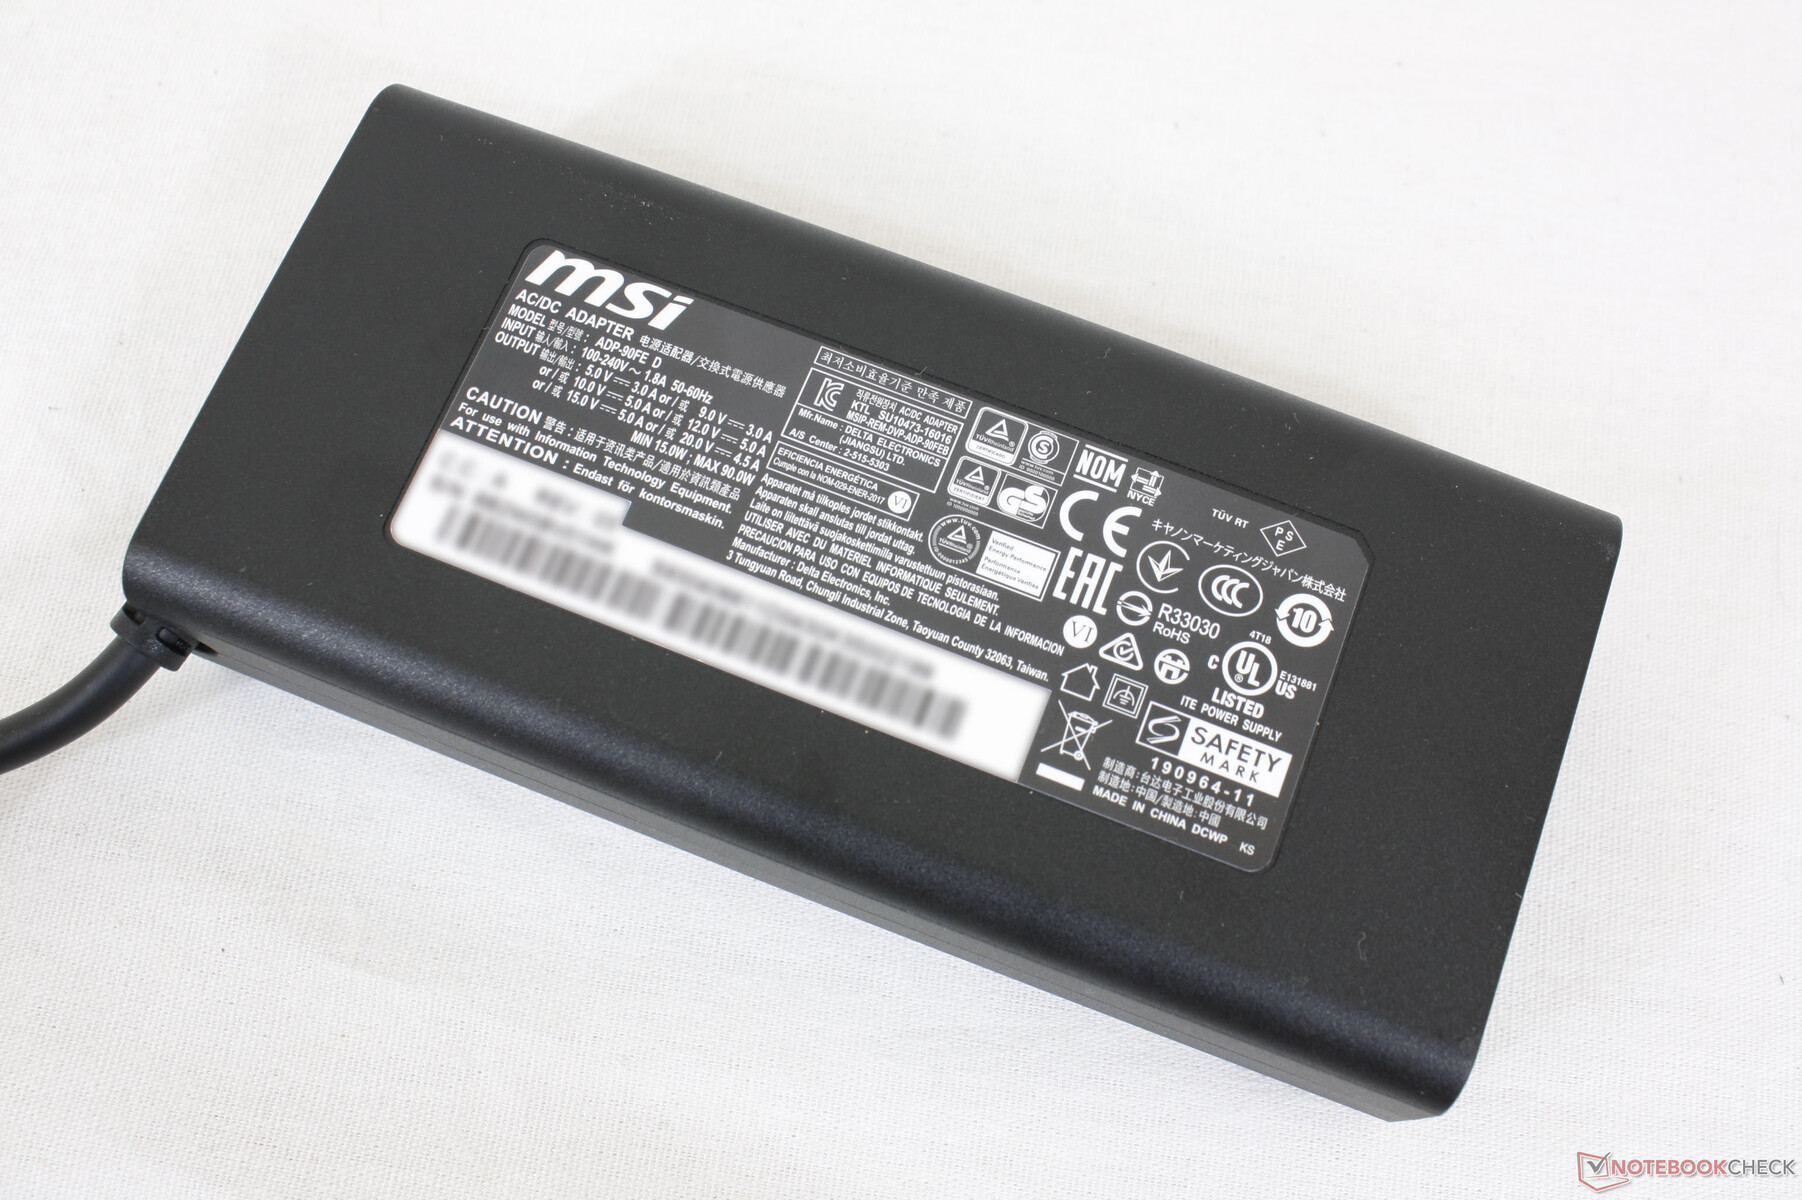
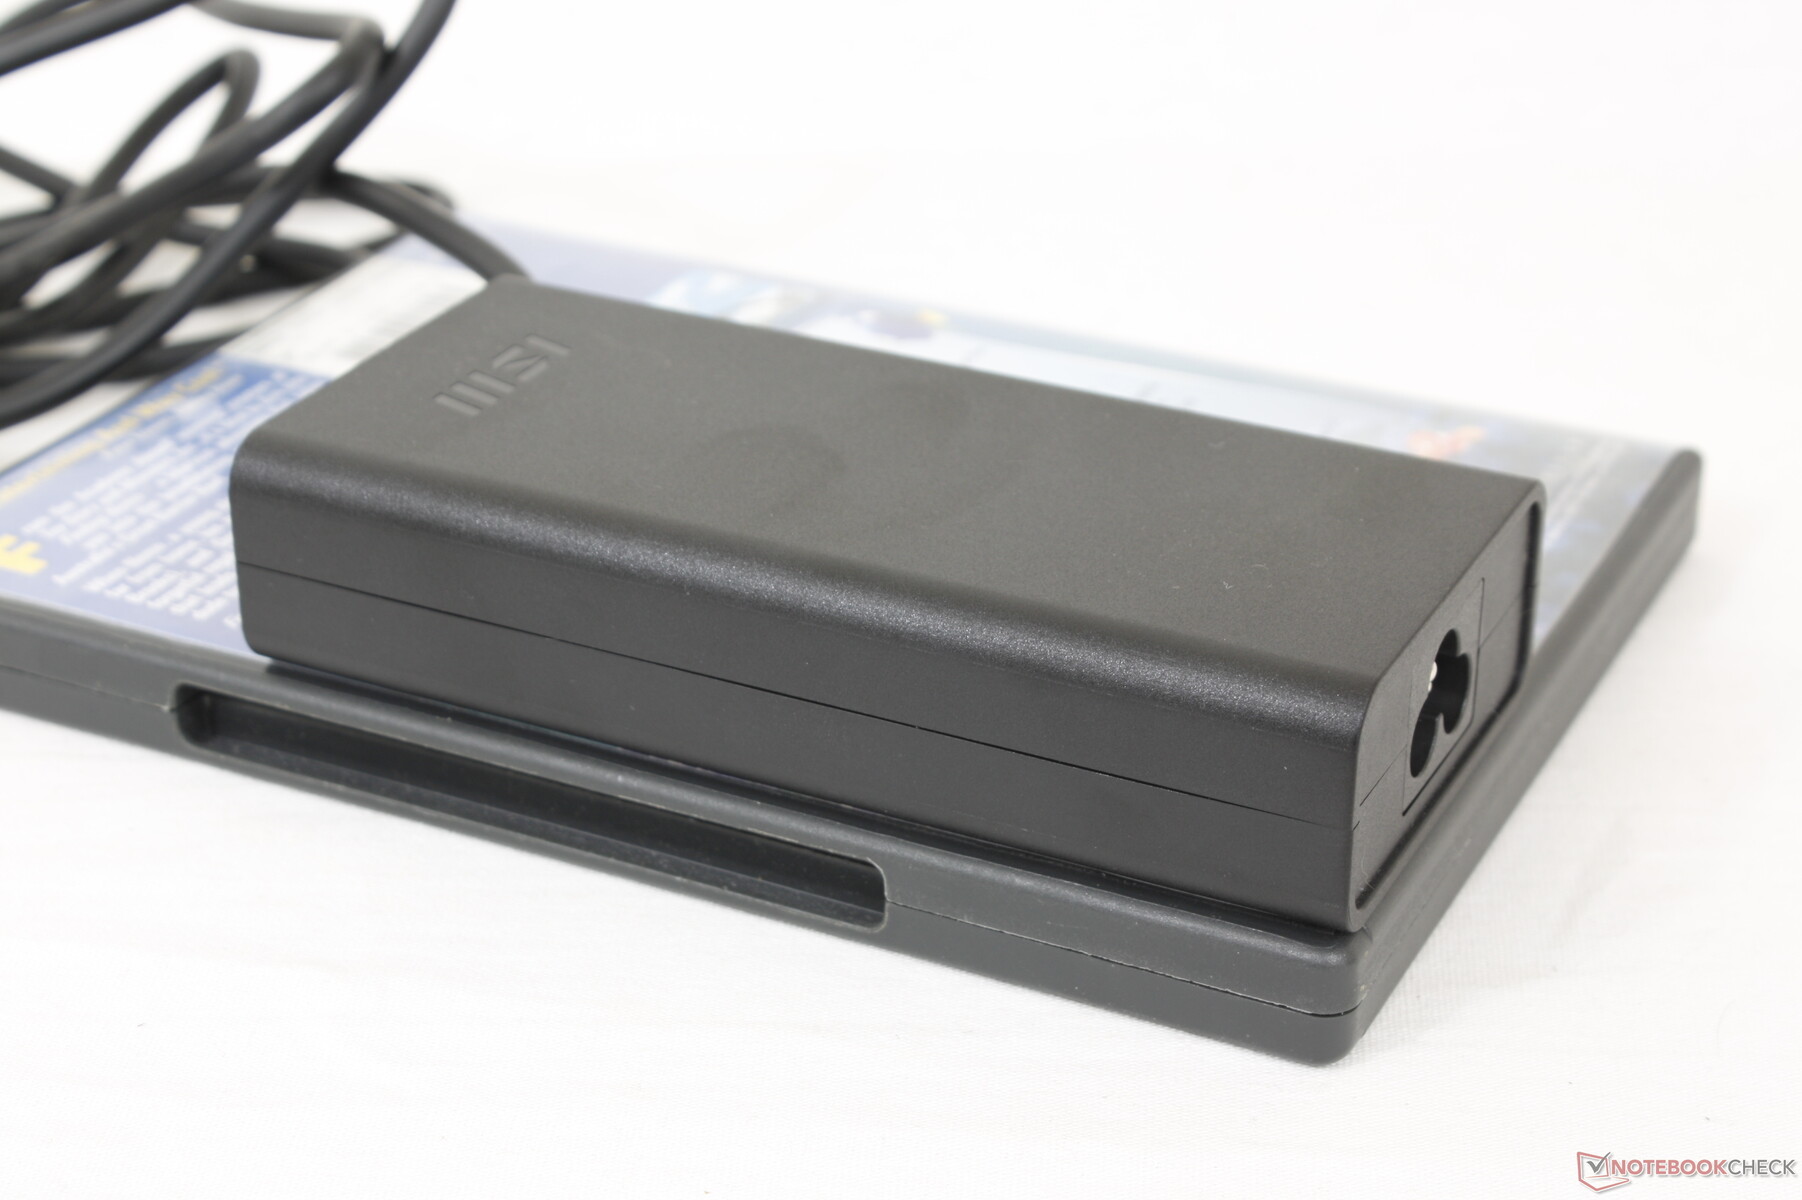
The retail box includes the AC adapter, paperwork, and a USB-A to RJ-45 adapter. The usual one year manufacturer warranty applies in the U.S. while users in the U.K. may get two years. Xotic PC offers additional protection options.
Input Devices — Old Modern Take
Keyboard
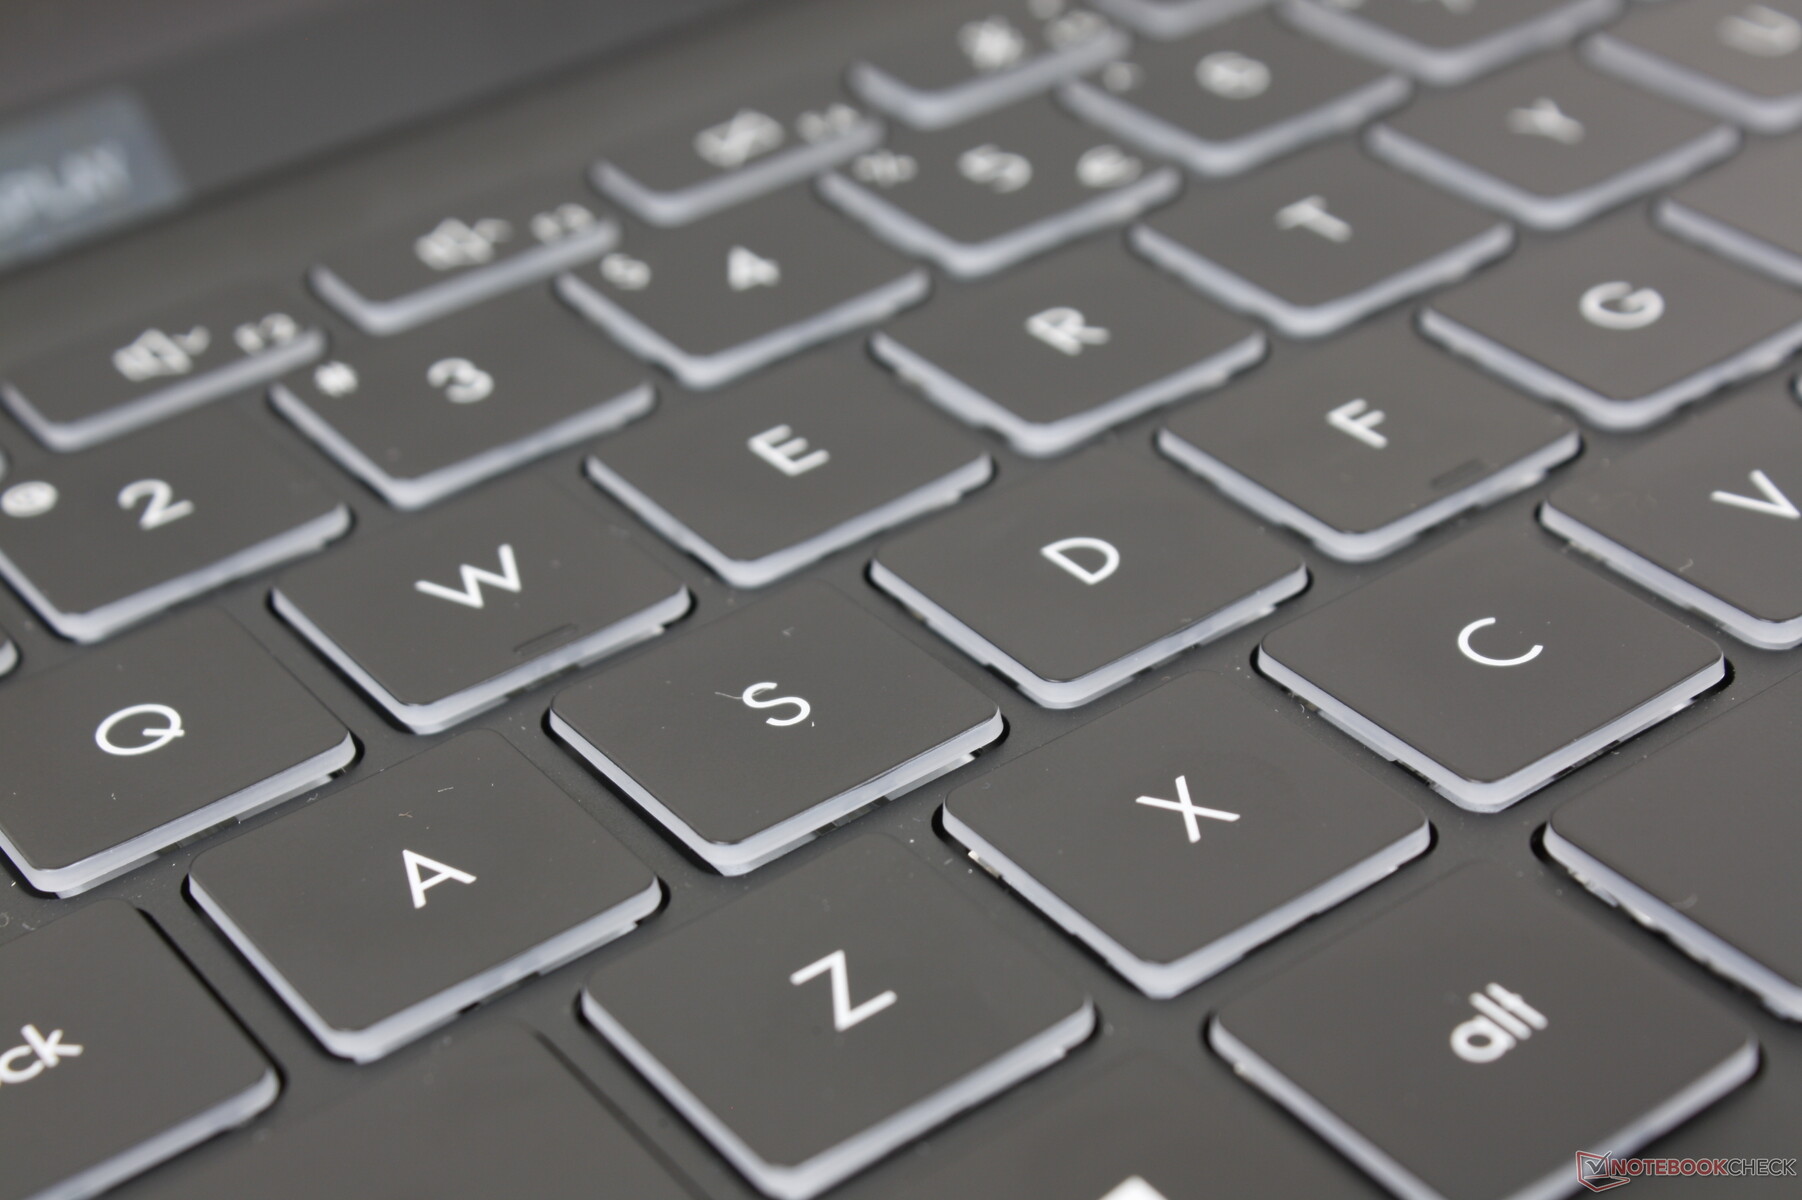
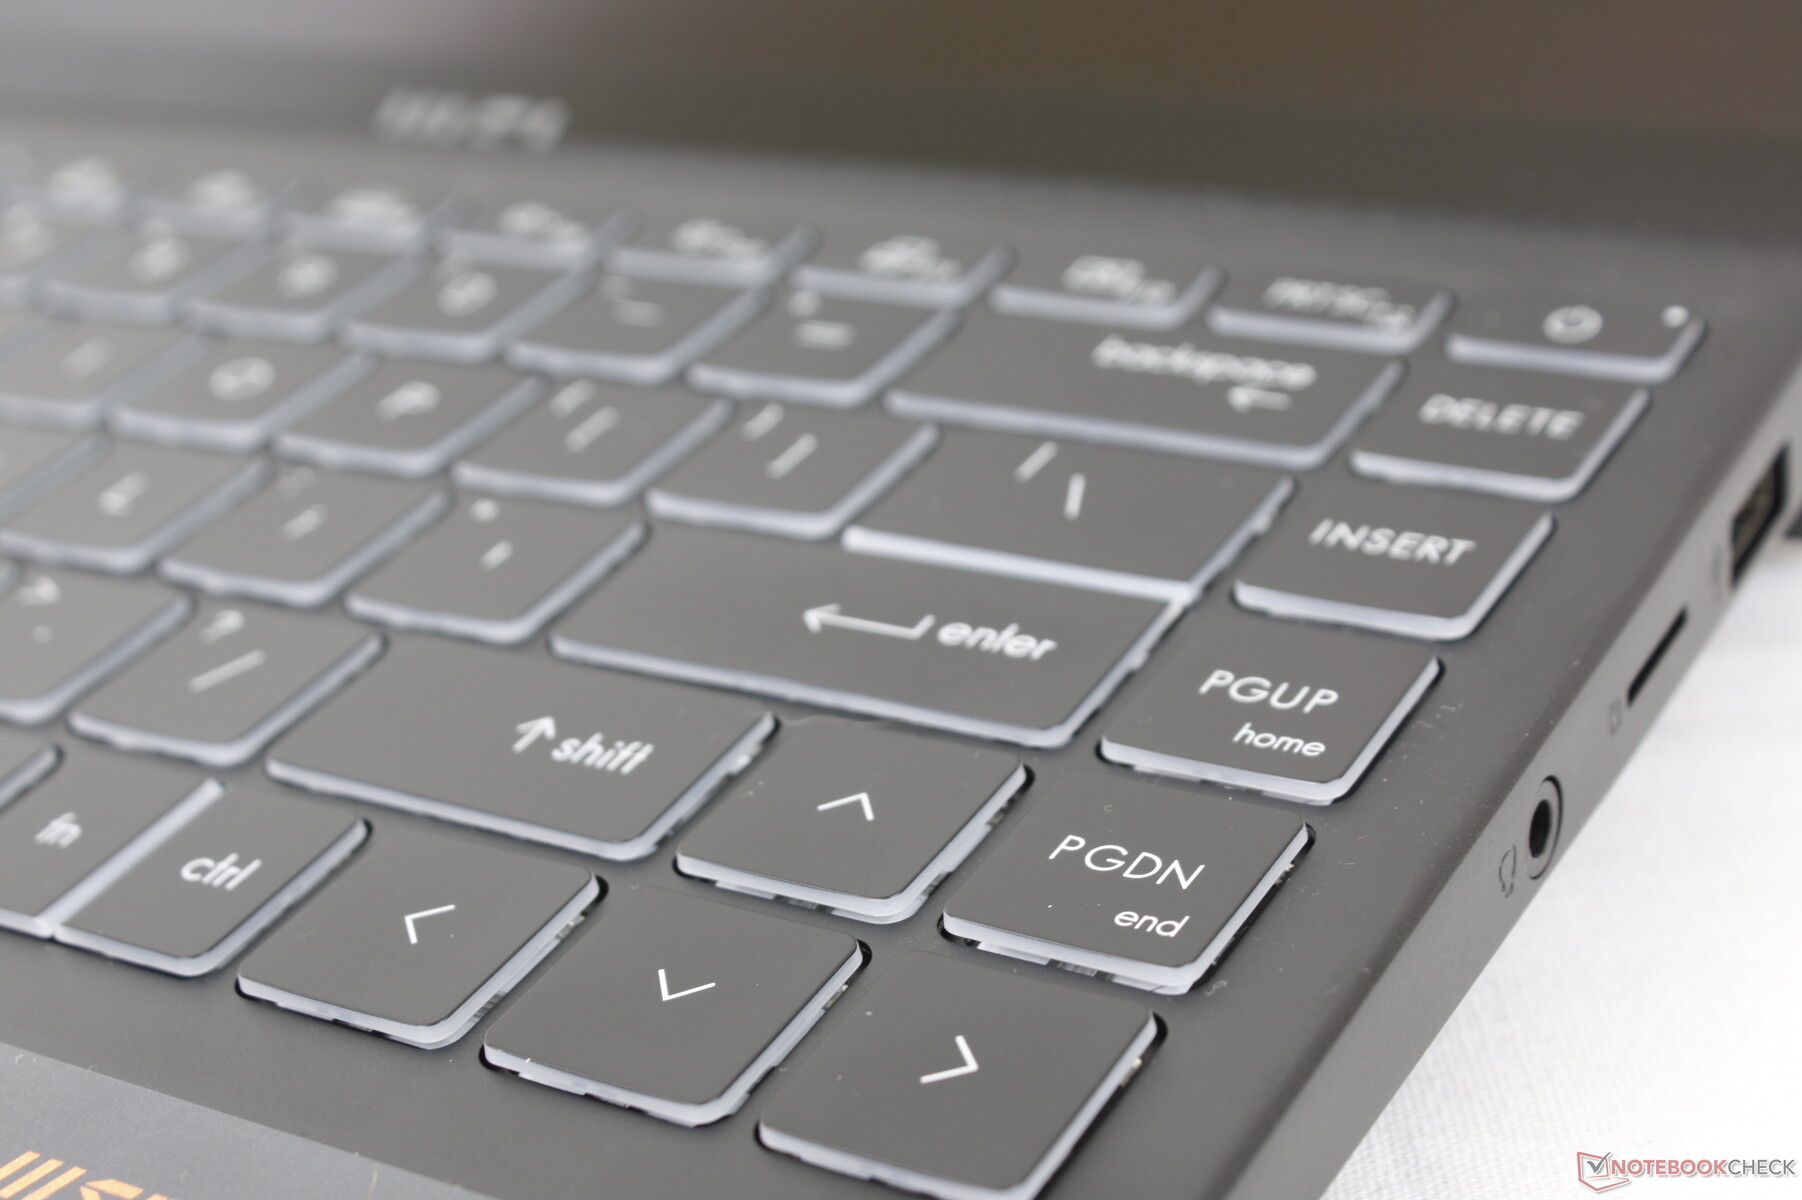
Both key layout and feedback are similar to the Summit B15 or Modern 14. Thus, our original comments on the B15 keyboard apply here on the E14 including the firm-but-light feedback with moderately loud clatter. The awkwardly squished Fn and Ctrl keys remain as well but at least the arrow keys are full-size unlike on the Summit E13.
Touchpad
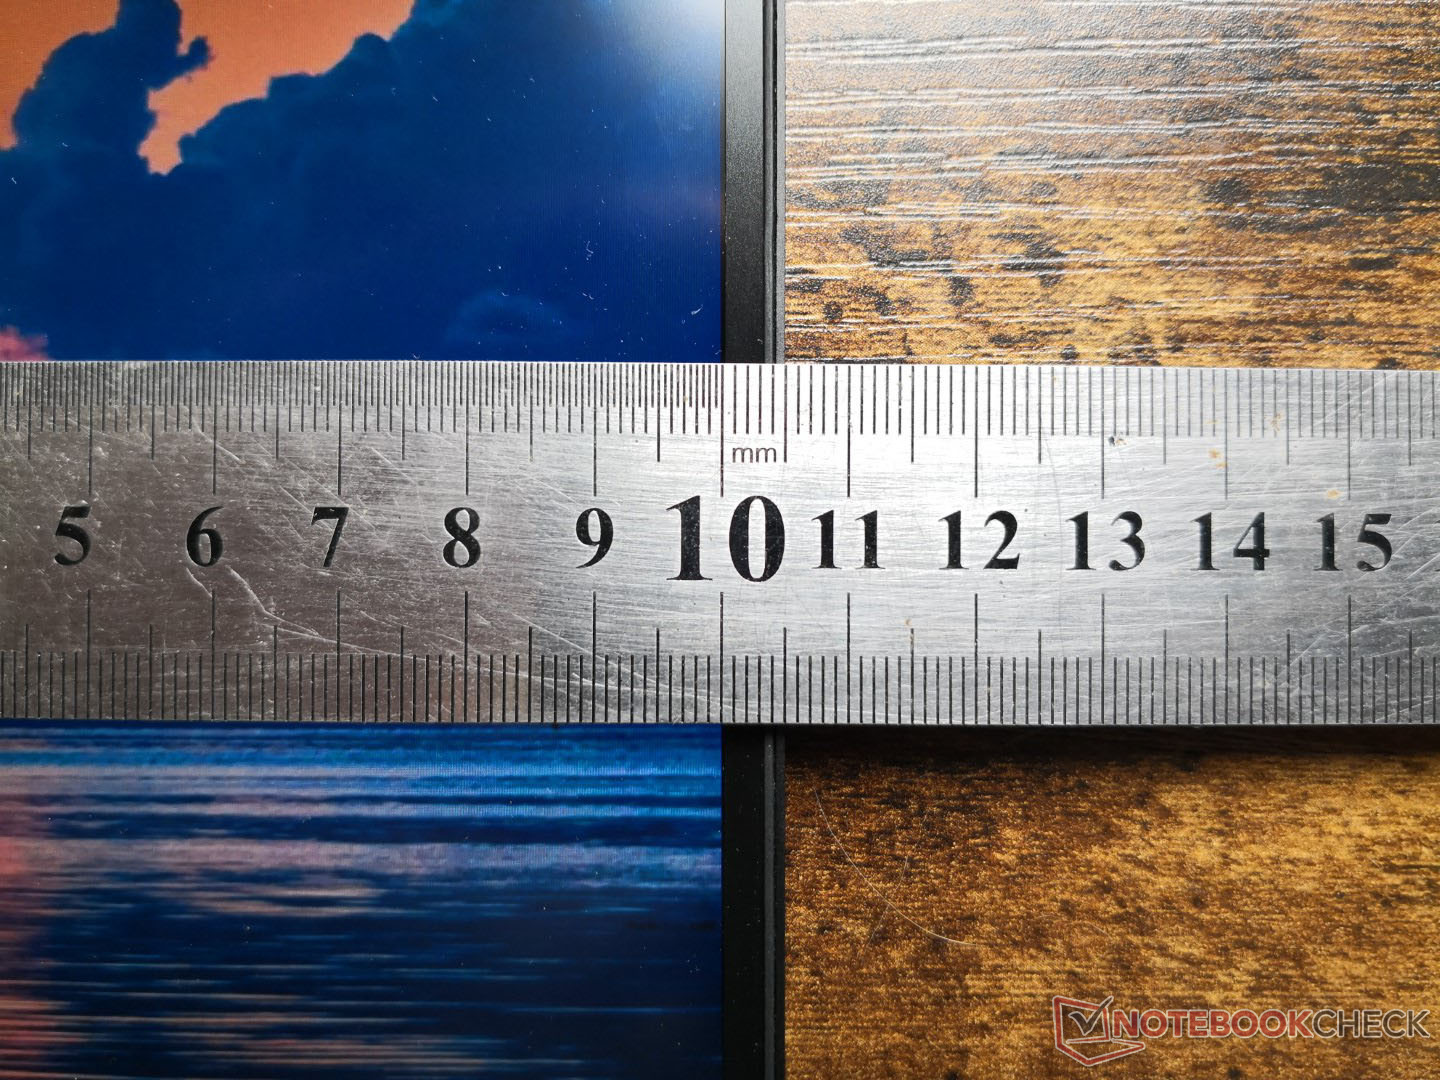
The clickpad is larger than the one on the older Modern 14 (10.5 x 6.5 cm vs. 10 x 5.7 cm). Traction is smooth when gliding at medium or faster speeds for comfortable cursor control. When gliding at slower speeds, however, there is more sticking than on most other laptops including on the Microsoft Surface.
The integrated clickpad buttons are shallow in travel with relatively soft feedback and moderately loud clatter when pressed. Multi-touch actions such as drag and drop are slightly more difficult than it needs to be.
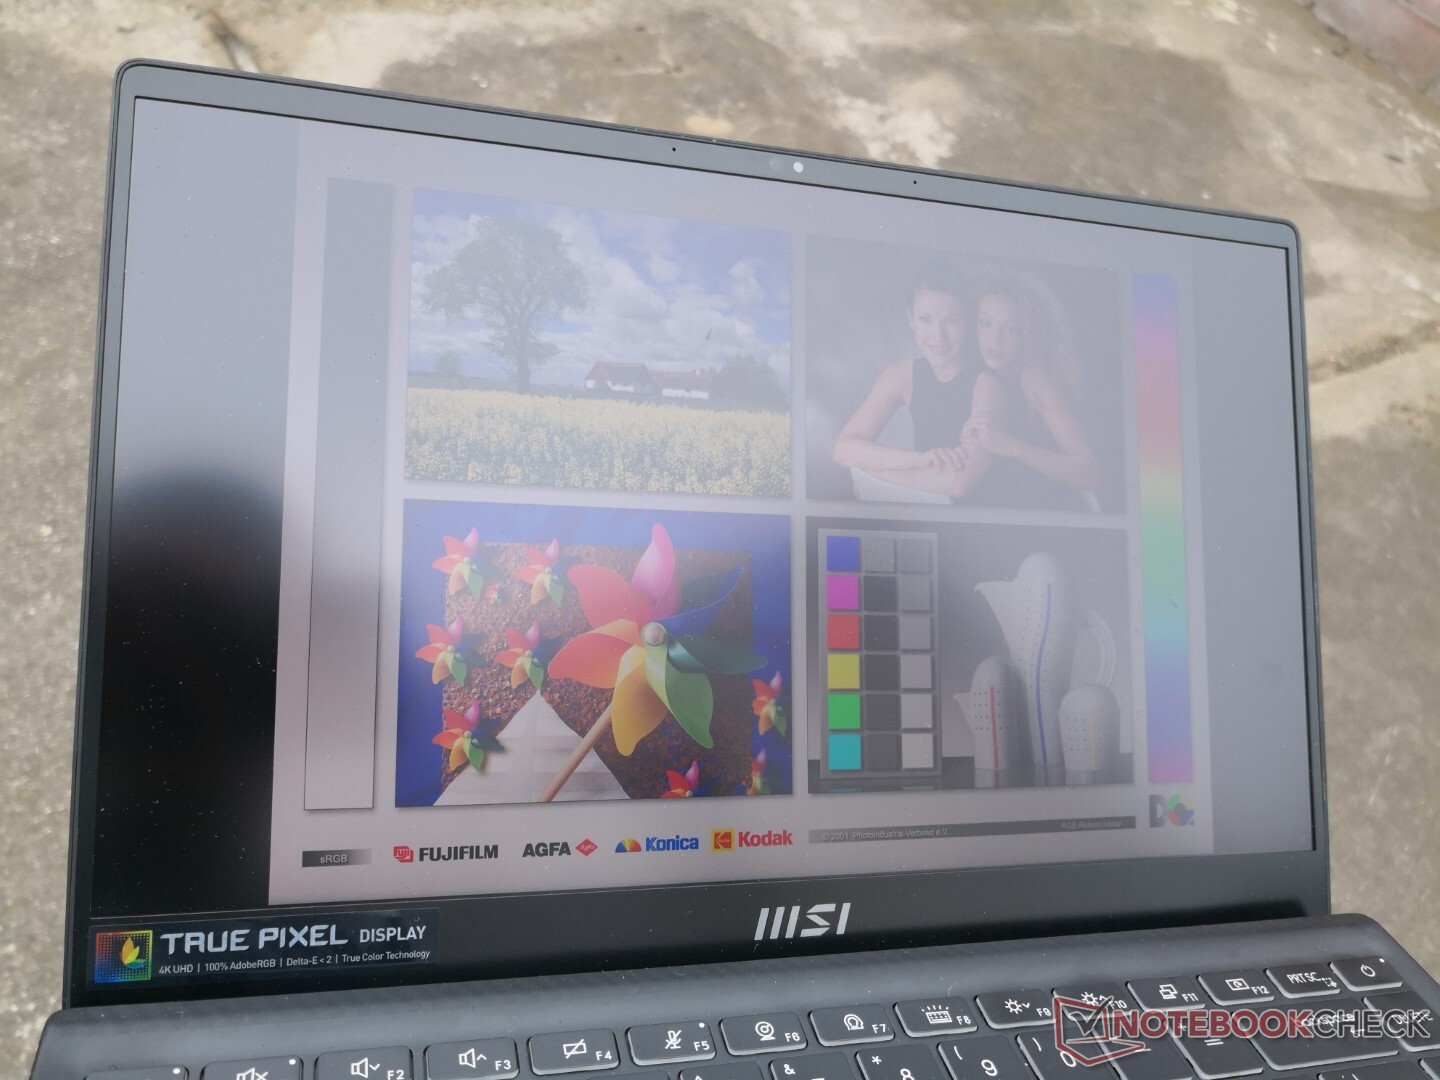
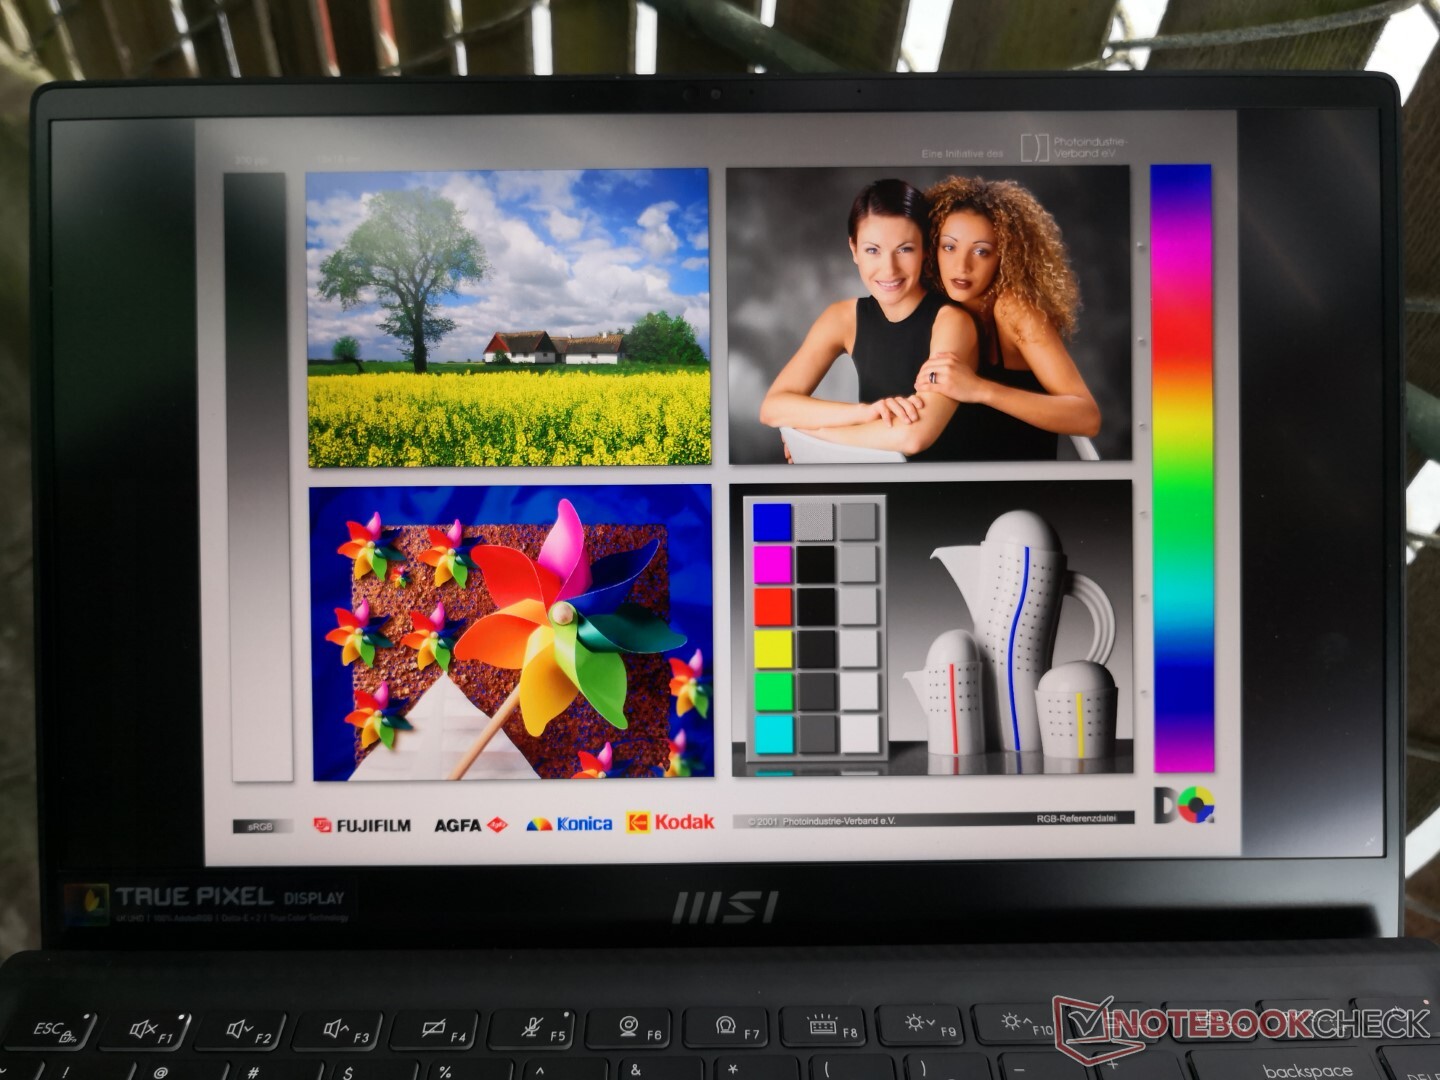
Display — Super Bright 4K
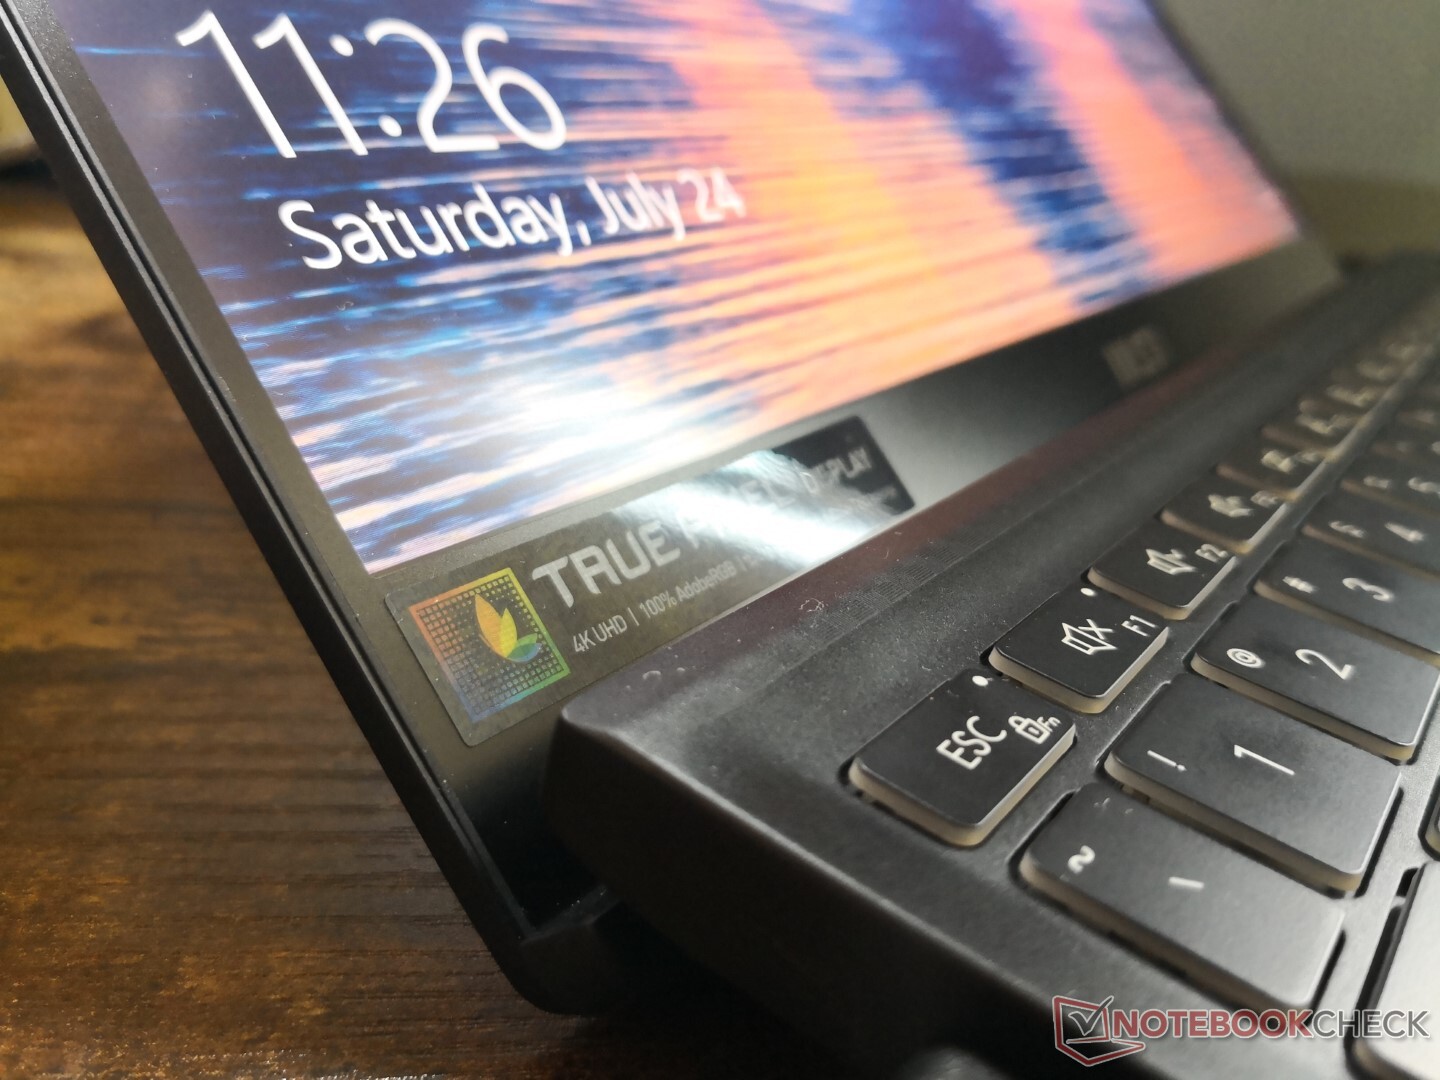
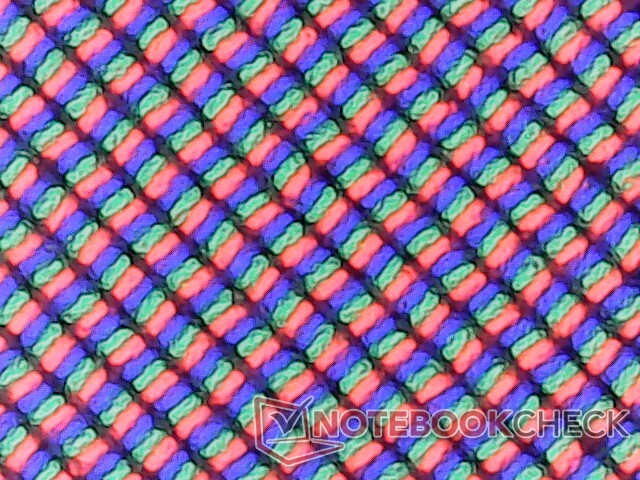
While HWiNFO is unable to identify the exact panel name, we can at least confirm an AU Optronics controller. The 4K panel on the Summit E14 is brighter than expected and of high quality as evident by its respectable contrast ratio of over 1000:1 and deep colors. It suffers from a slight graininess issue, however, due to its overlying matte layer instead of sharper glossy.
Black-white and gray-gray response times are average at best meaning ghosting is noticeable especially if gaming. It's recommended to use an external monitor if the ghosting is an issue.
| |||||||||||||||||||||||||
Brightness Distribution: 87 %
Center on Battery: 593.3 cd/m²
Contrast: 1119:1 (Black: 0.53 cd/m²)
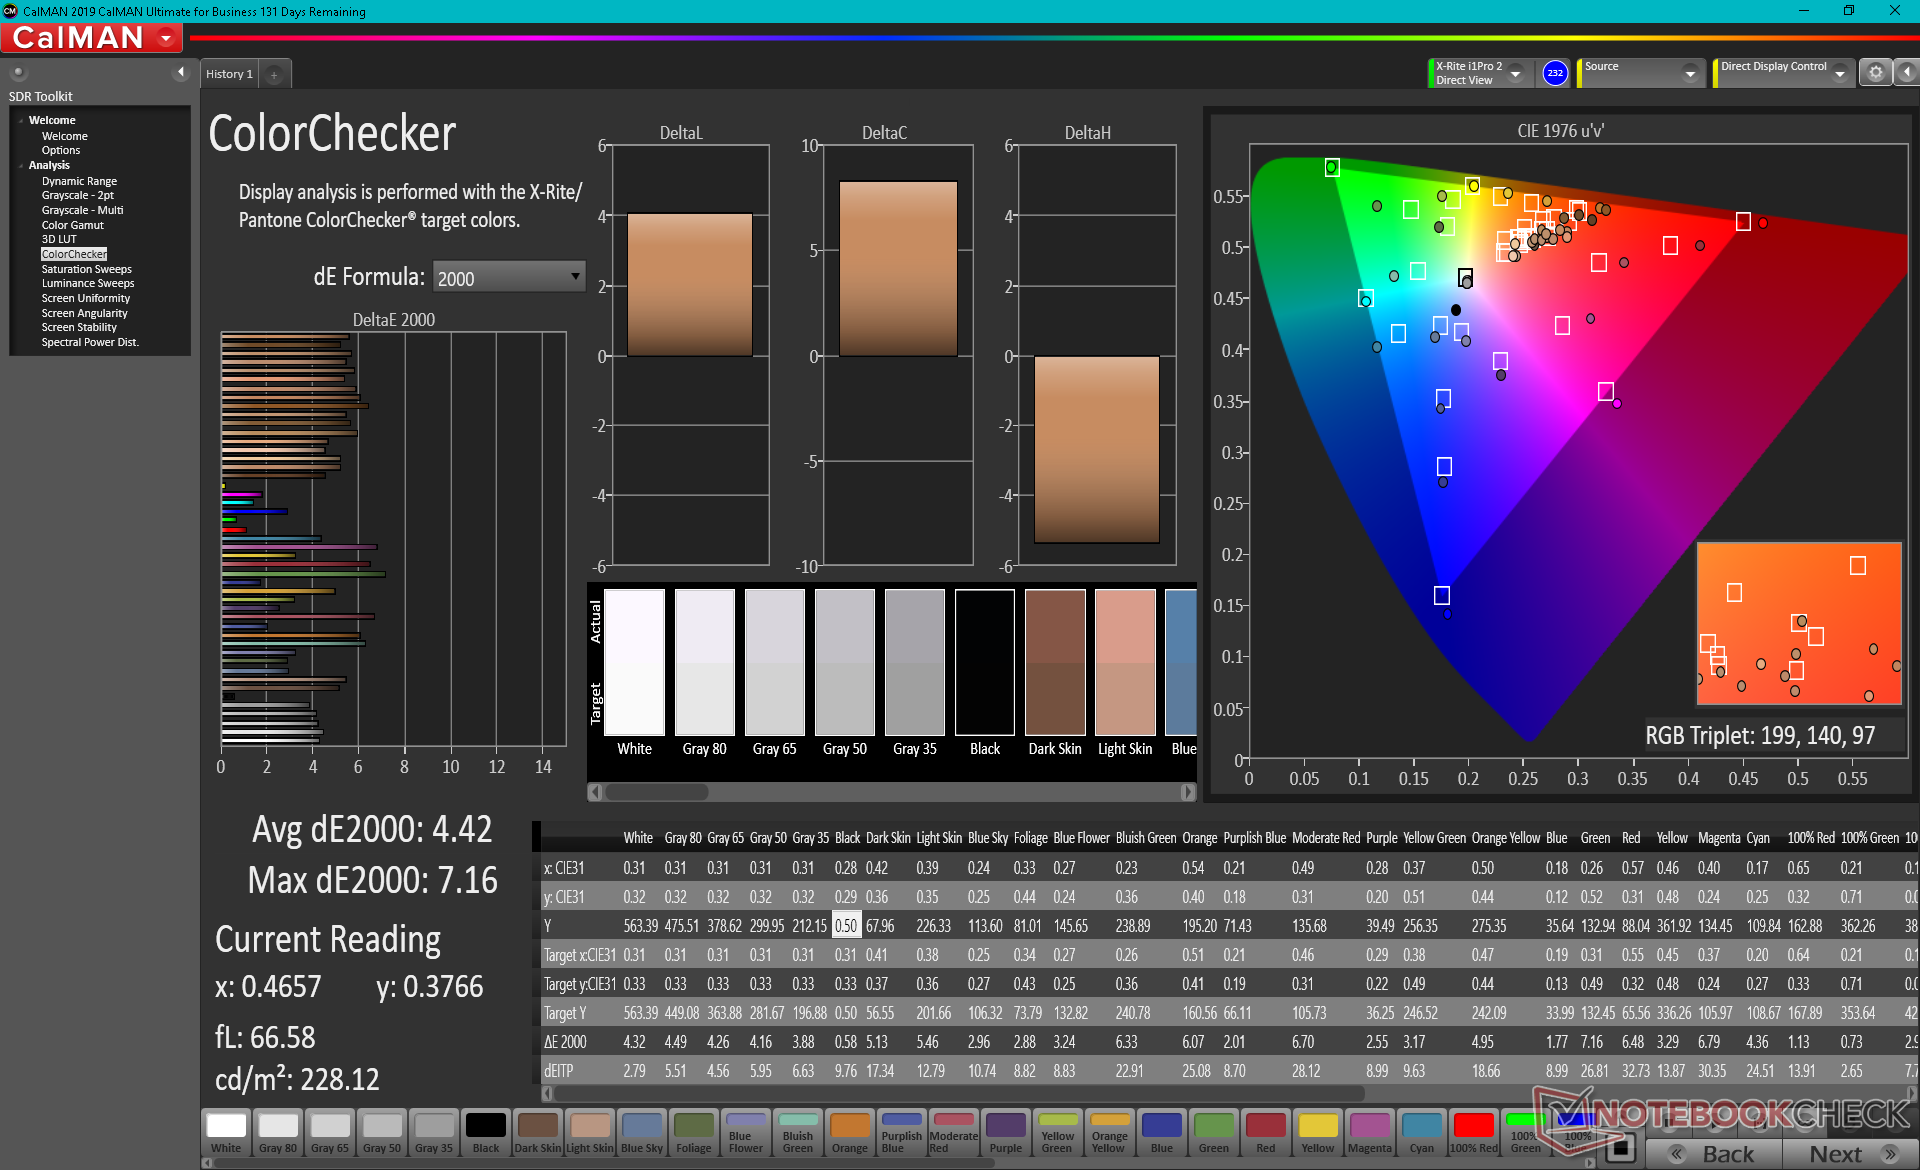
ΔE ColorChecker Calman: 4.42 | ∀{0.5-29.43 Ø4.71}
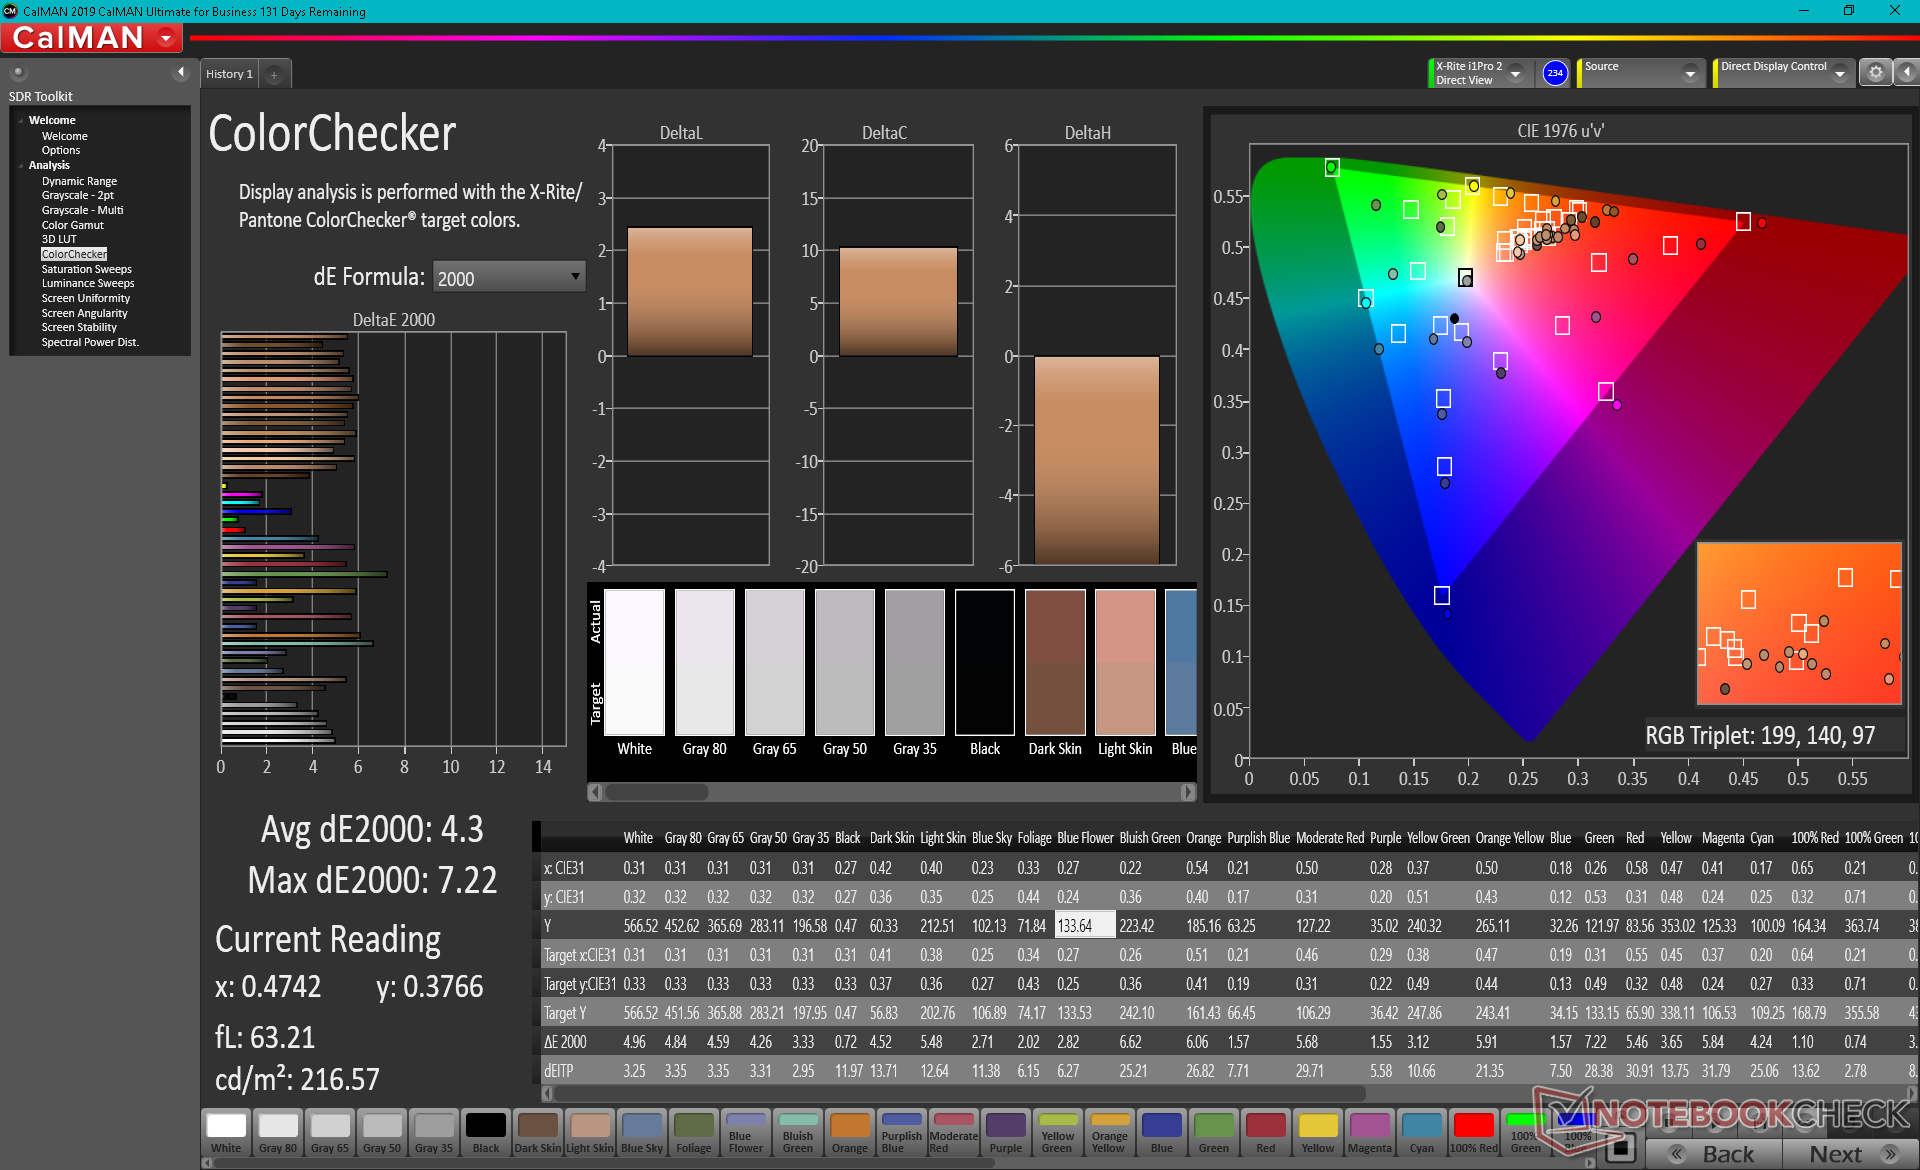
calibrated: 4.3
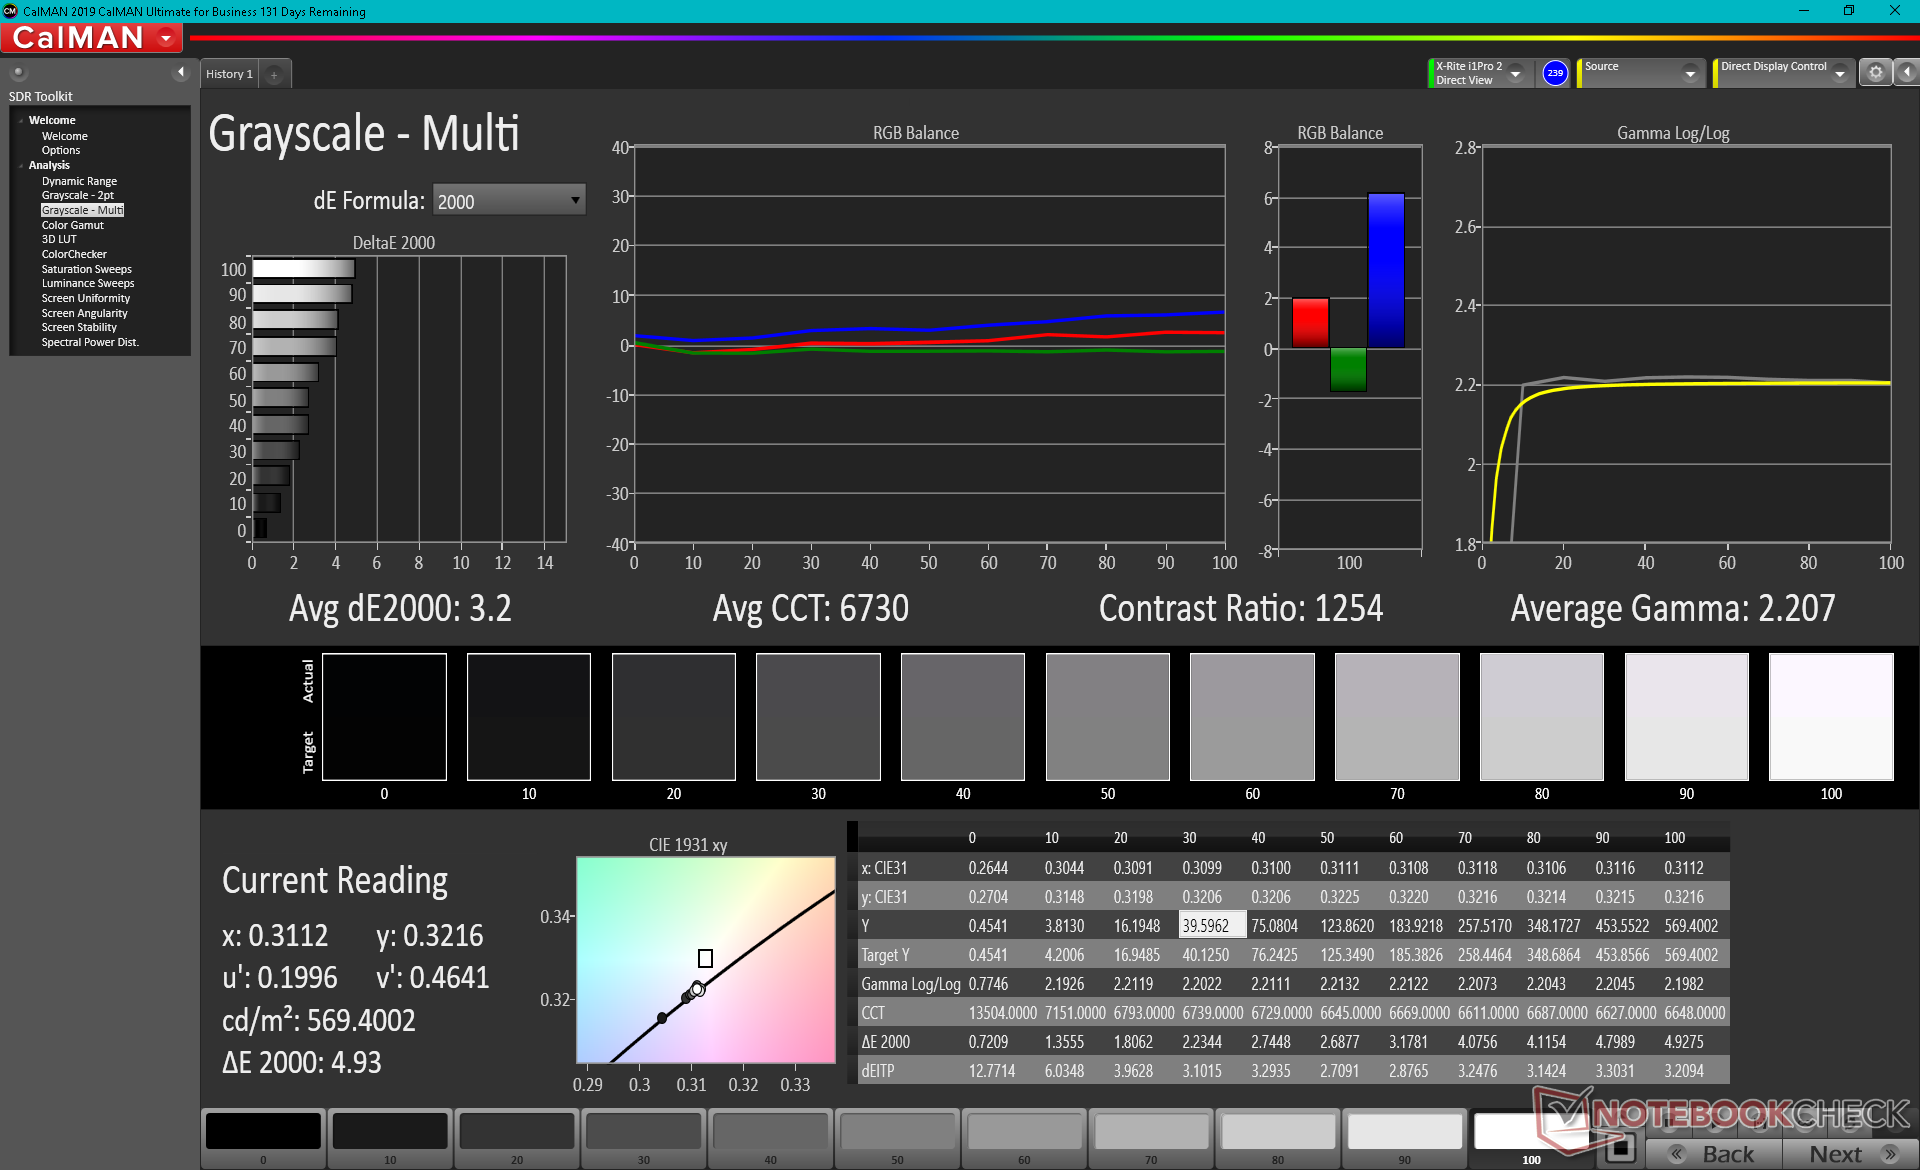
ΔE Greyscale Calman: 3.2 | ∀{0.09-98 Ø4.96}
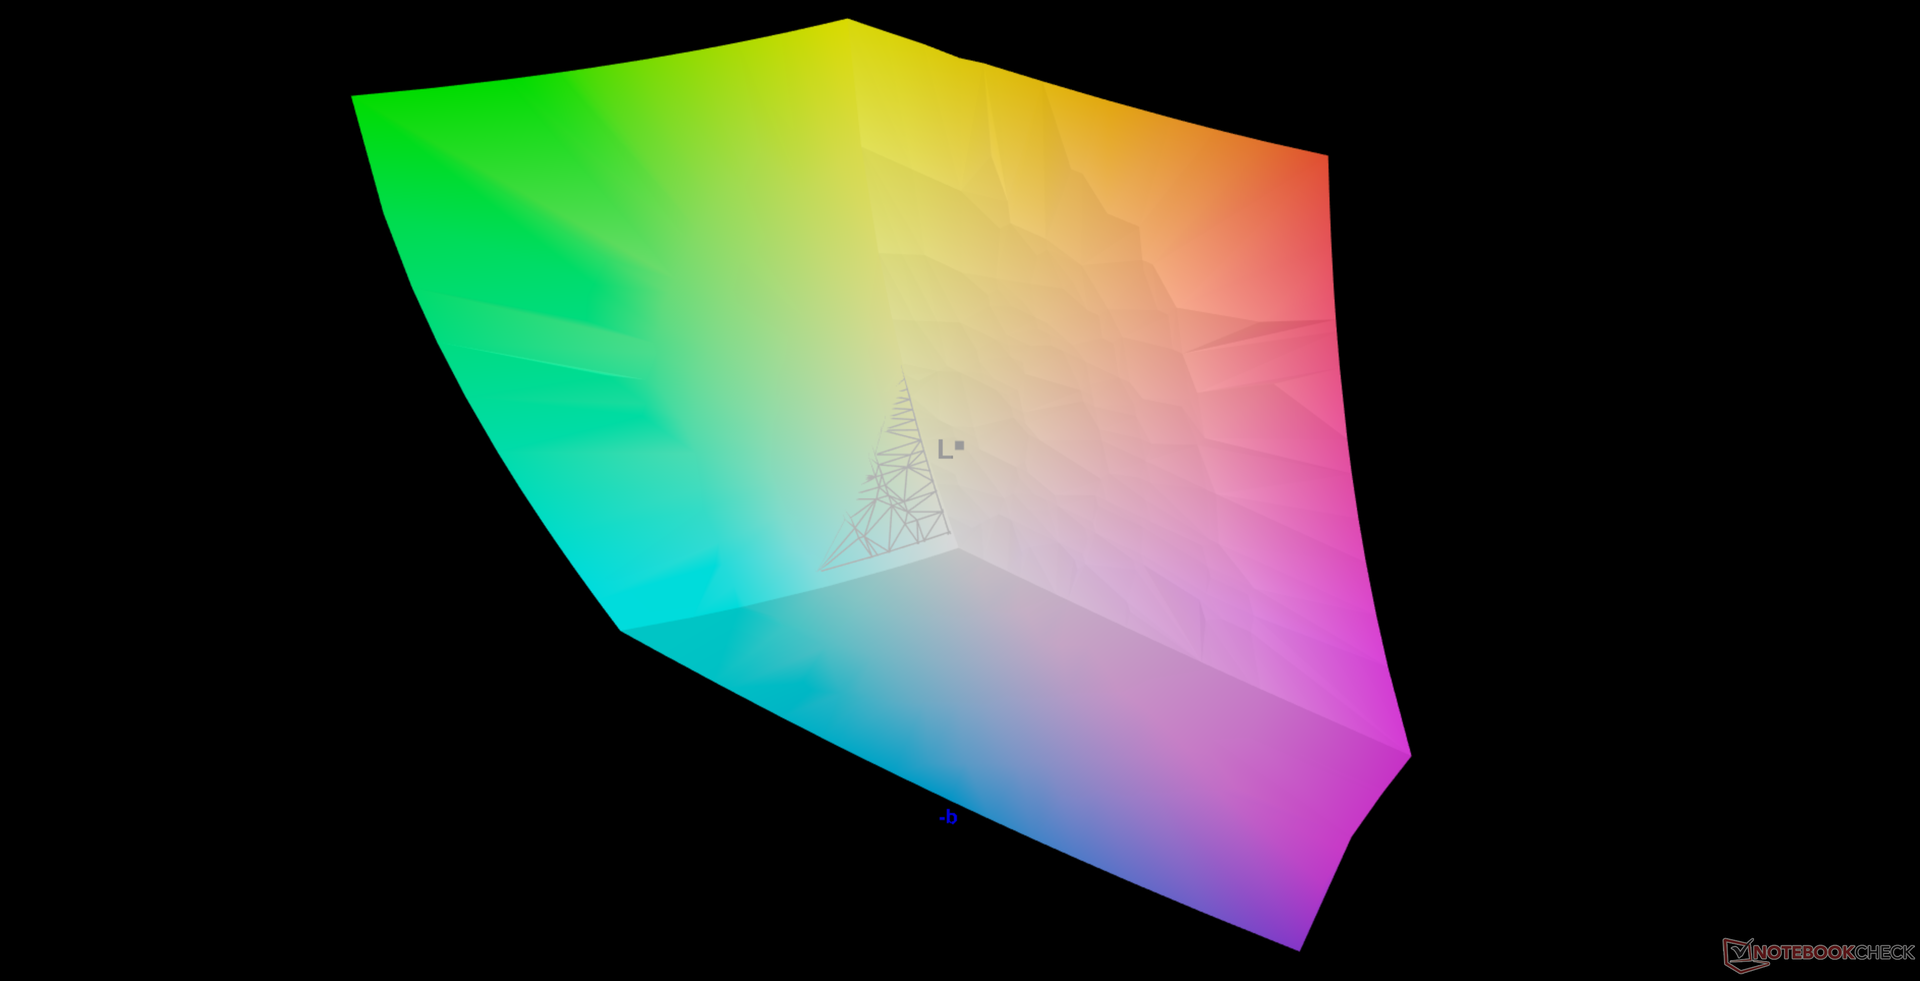
99.4% AdobeRGB 1998 (Argyll 3D)
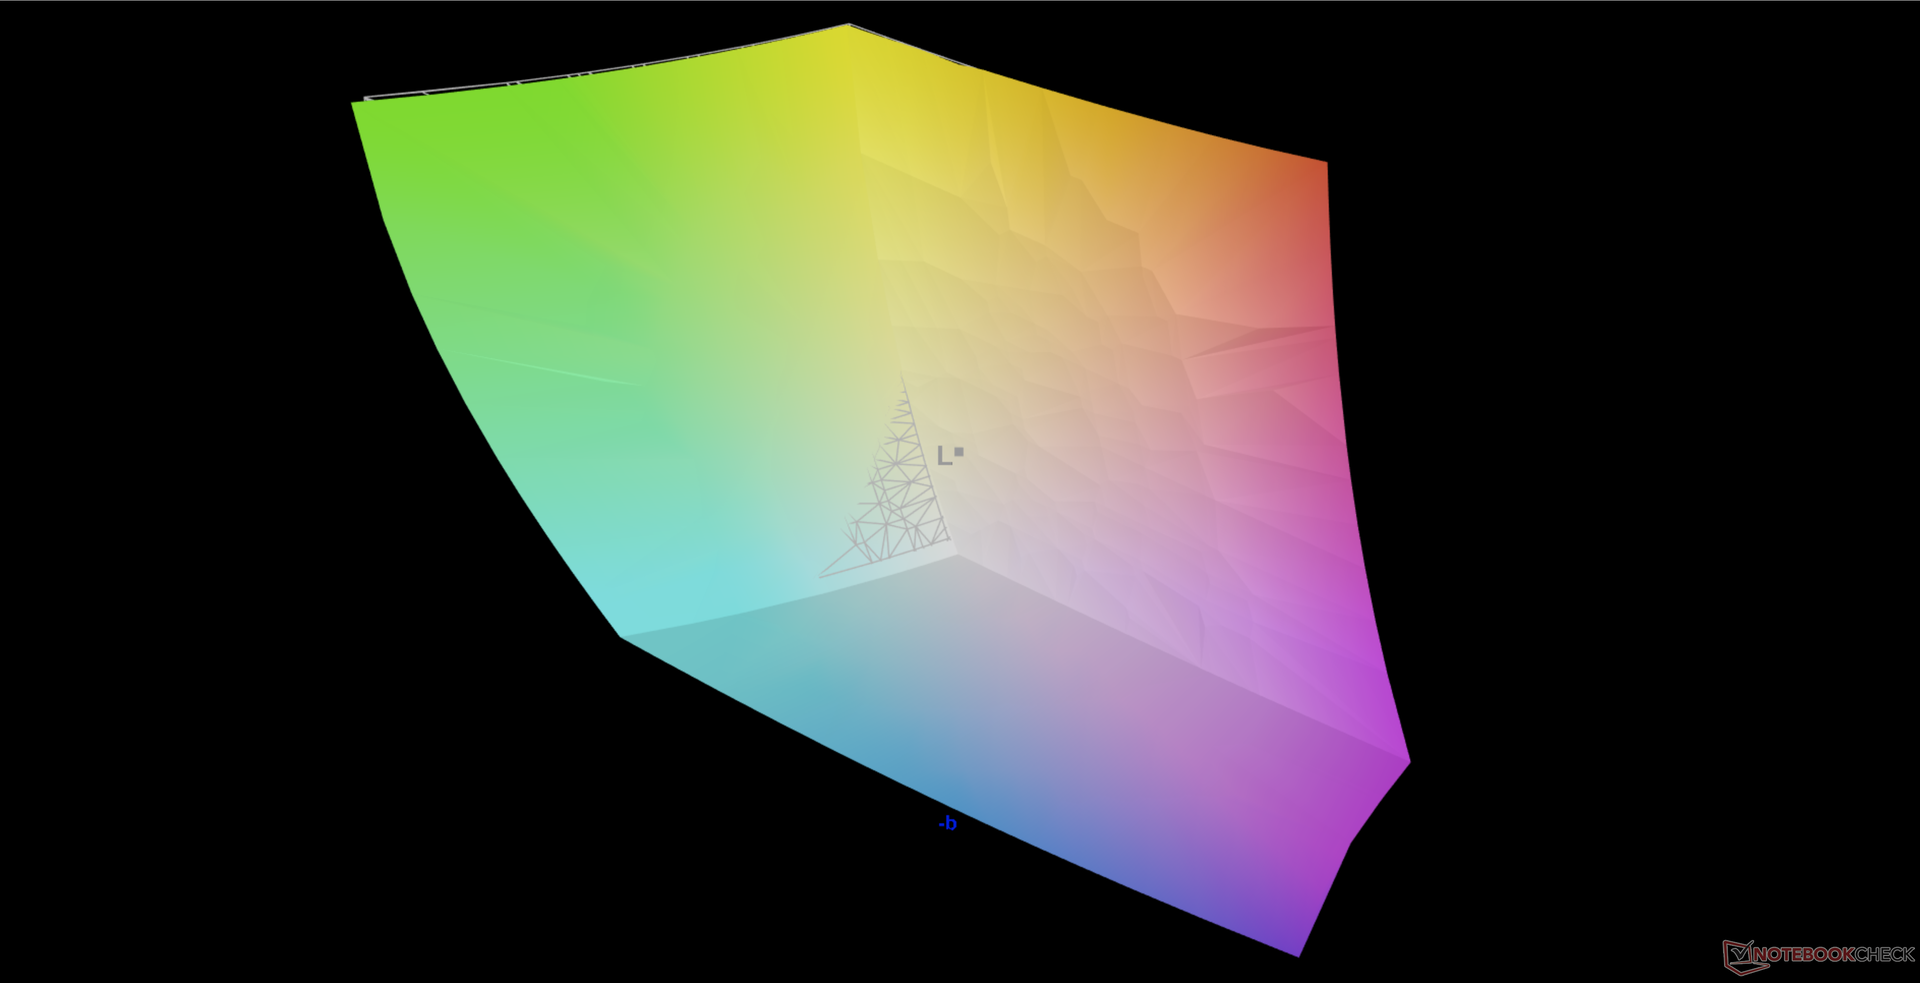
100% sRGB (Argyll 3D)
87.5% Display P3 (Argyll 3D)
Gamma: 2.04
CCT: 6737 K
| MSI Summit E14 A11SCS AU Optronics AUO123B, IPS, 14", 3840x2160 | MSI Modern 14 B11SB-085 BOE CQ NV140FHM-N4V, IPS, 14", 1920x1080 | MSI Prestige 14 Evo A11M-005 AUO B140HAN06.2 (AUO623D), IPS-Level, 14", 1920x1080 | ADATA XPG Xenia 14 BOE NE140WUM-N63, IPS, 14", 1920x1200 | Lenovo ThinkPad T14s G2 20WM003TGE NE140FHM-N61, IPS LED, 14", 1920x1080 | VAIO Z VJZ141C11L BOE NE140QUM-N62, IPS, 14", 3840x2160 | |
|---|---|---|---|---|---|---|
| Display | -51% | -17% | -16% | -21% | -1% | |
| Display P3 Coverage (%) | 87.5 | 39.9 -54% | 68.8 -21% | 70 -20% | 68.1 -22% | 95.7 9% |
| sRGB Coverage (%) | 100 | 58.8 -41% | 99.4 -1% | 99.1 -1% | 91.7 -8% | 99.5 0% |
| AdobeRGB 1998 Coverage (%) | 99.4 | 41.2 -59% | 70.9 -29% | 72 -28% | 67.1 -32% | 86.4 -13% |
| Response Times | 50% | -11% | 3% | -21% | 10% | |
| Response Time Grey 50% / Grey 80% * (ms) | 52 ? | 25 ? 52% | 59.6 ? -15% | 50 ? 4% | 68 ? -31% | 46.8 ? 10% |
| Response Time Black / White * (ms) | 30.8 ? | 16 ? 48% | 32.8 ? -6% | 30.4 ? 1% | 34 ? -10% | 28 ? 9% |
| PWM Frequency (Hz) | 92 ? | 22730 ? | ||||
| Screen | 5% | 12% | 28% | -7% | 16% | |
| Brightness middle (cd/m²) | 593.3 | 347 -42% | 293 -51% | 344.6 -42% | 422.9 -29% | 368.3 -38% |
| Brightness (cd/m²) | 571 | 311 -46% | 277 -51% | 321 -44% | 397 -30% | 361 -37% |
| Brightness Distribution (%) | 87 | 81 -7% | 89 2% | 89 2% | 91 5% | 90 3% |
| Black Level * (cd/m²) | 0.53 | 0.12 77% | 0.18 66% | 0.22 58% | 0.32 40% | 0.22 58% |
| Contrast (:1) | 1119 | 2892 158% | 1628 45% | 1566 40% | 1322 18% | 1674 50% |
| Colorchecker dE 2000 * | 4.42 | 5.05 -14% | 2.95 33% | 1.51 66% | 4.8 -9% | 3.27 26% |
| Colorchecker dE 2000 max. * | 7.16 | 16.98 -137% | 6.03 16% | 4.1 43% | 8.7 -22% | 5.43 24% |
| Colorchecker dE 2000 calibrated * | 4.3 | 0.9 79% | 0.52 88% | 1.9 56% | 2.33 46% | |
| Greyscale dE 2000 * | 3.2 | 1.63 49% | 4.2 -31% | 1.9 41% | 6.1 -91% | 2.9 9% |
| Gamma | 2.04 108% | 2.3 96% | 2.099 105% | 2.17 101% | 2.23 99% | 2.2 100% |
| CCT | 6737 96% | 6666 98% | 6622 98% | 6787 96% | 7635 85% | 6071 107% |
| Color Space (Percent of AdobeRGB 1998) (%) | 38 | 71 | 76.8 | |||
| Color Space (Percent of sRGB) (%) | 58 | 93 | 99.5 | |||
| Total Average (Program / Settings) | 1% /
-1% | -5% /
3% | 5% /
15% | -16% /
-12% | 8% /
11% |
* ... smaller is better
Color space covers all of AdobeRGB as advertised by the manufacturer to be wider than most Ultrabooks with only 1080p panels.
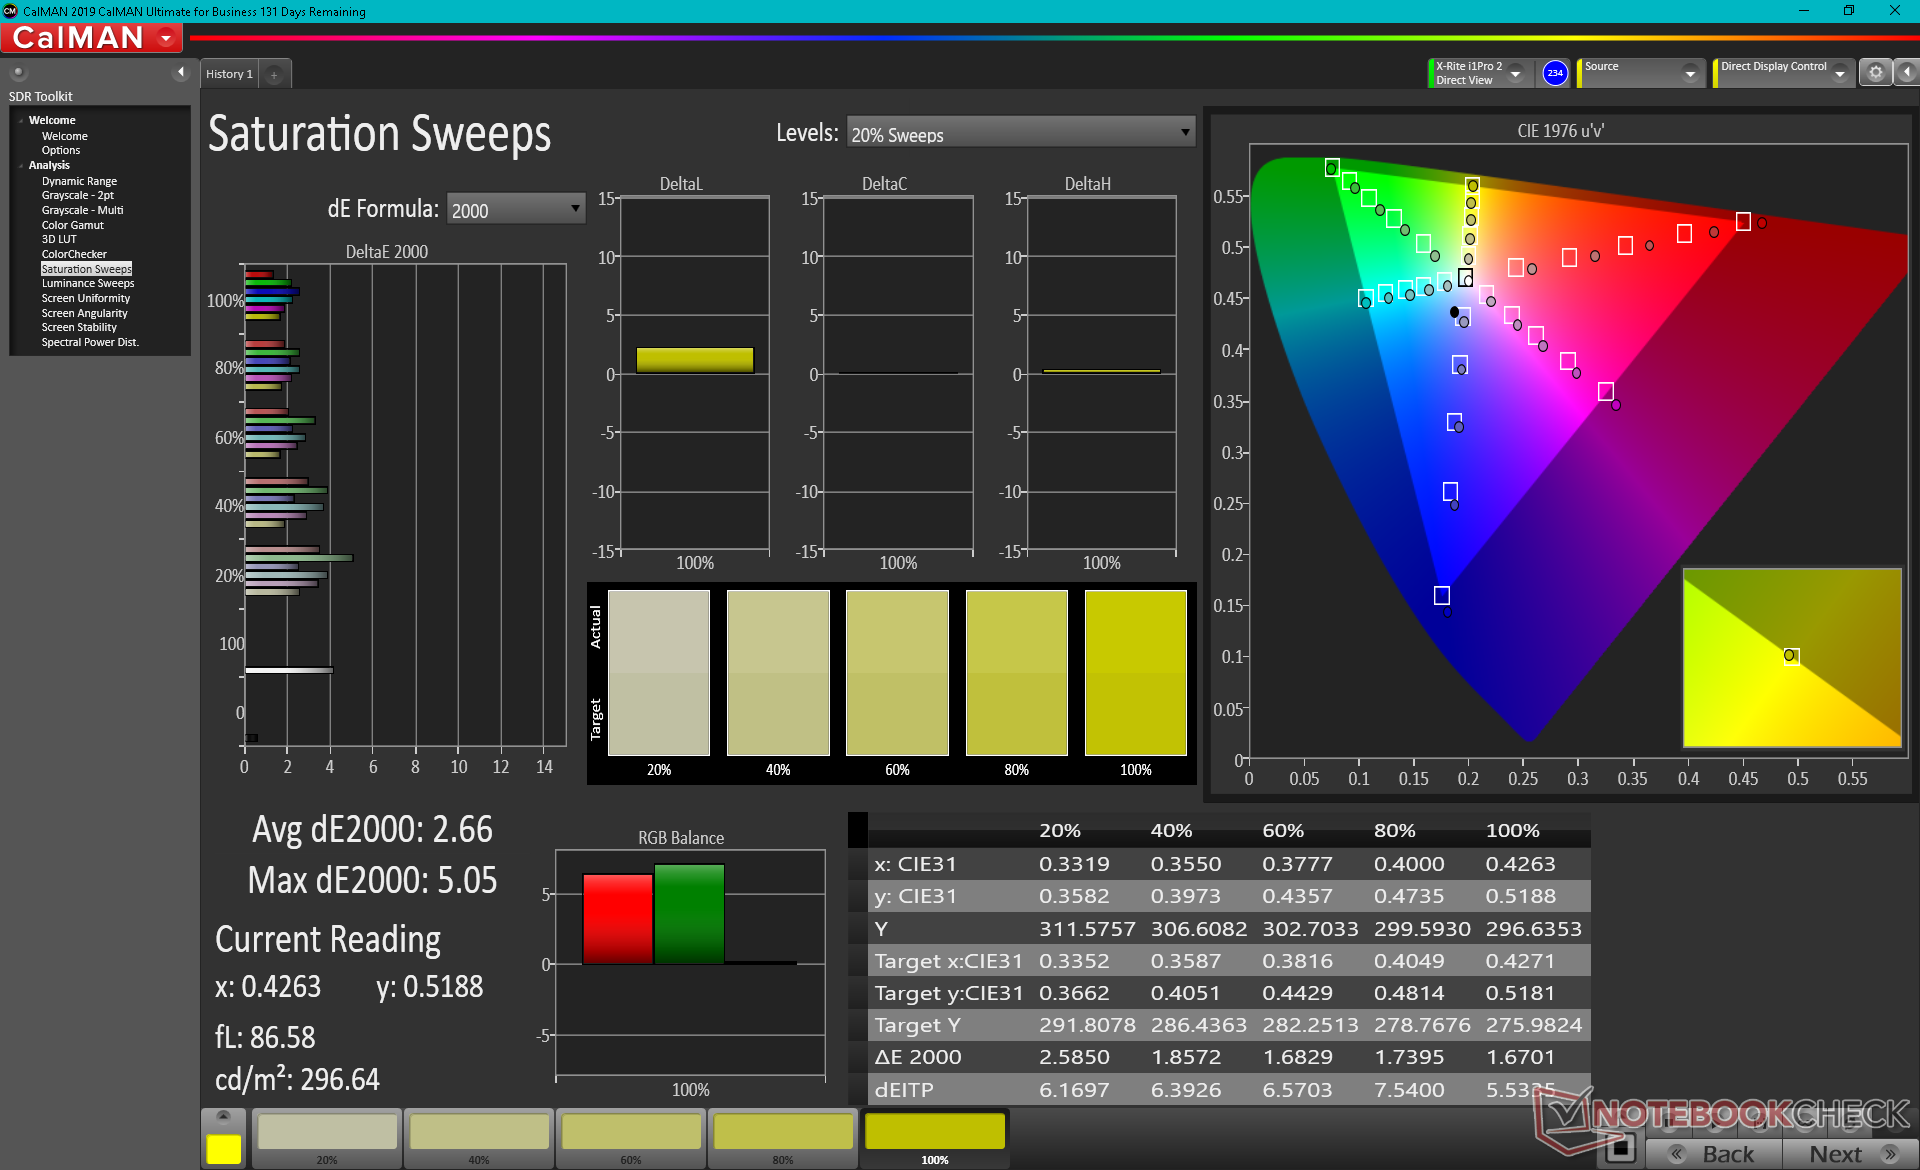
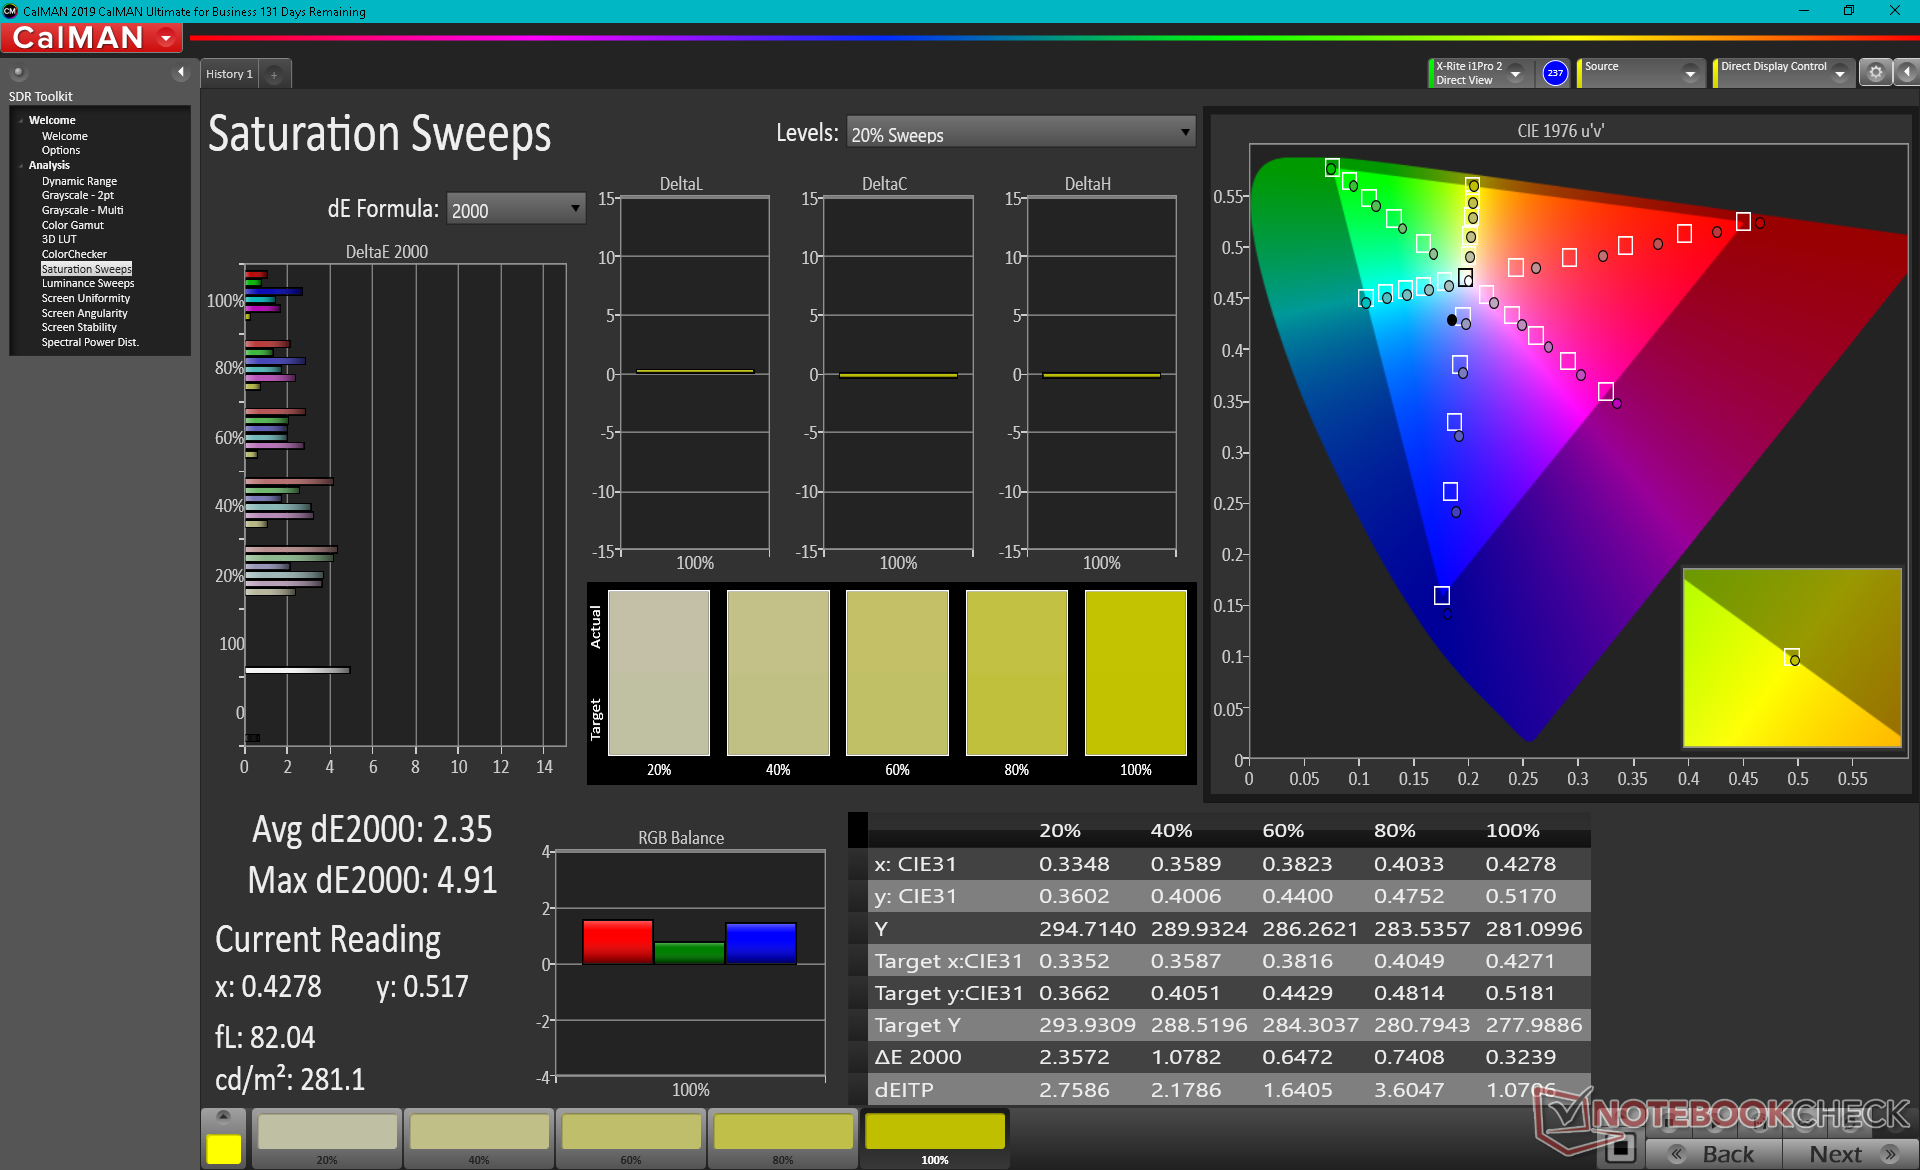
X-Rite colorimeter measurements show colors to be slightly more accurate at higher saturation levels than on lower saturation levels. Average DeltaE values are still good at only 3 to 4, but additional fine-tuning may be needed to reach 2 or lower.

Display Response Times
| ↔ Response Time Black to White | ||
|---|---|---|
| 30.8 ms ... rise ↗ and fall ↘ combined | ↗ 17.6 ms rise | 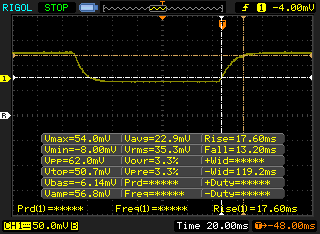 |
| ↘ 13.2 ms fall | ||
| The screen shows slow response rates in our tests and will be unsatisfactory for gamers. In comparison, all tested devices range from 0.1 (minimum) to 240 (maximum) ms. » 83 % of all devices are better. This means that the measured response time is worse than the average of all tested devices (19.8 ms). | ||
| ↔ Response Time 50% Grey to 80% Grey | ||
| 52 ms ... rise ↗ and fall ↘ combined | ↗ 27.6 ms rise | 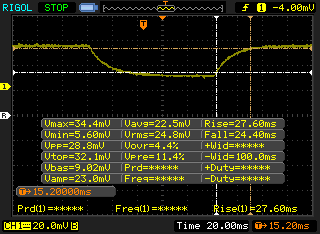 |
| ↘ 24.4 ms fall | ||
| The screen shows slow response rates in our tests and will be unsatisfactory for gamers. In comparison, all tested devices range from 0.165 (minimum) to 636 (maximum) ms. » 88 % of all devices are better. This means that the measured response time is worse than the average of all tested devices (30.9 ms). | ||
Screen Flickering / PWM (Pulse-Width Modulation)
| Screen flickering / PWM not detected | 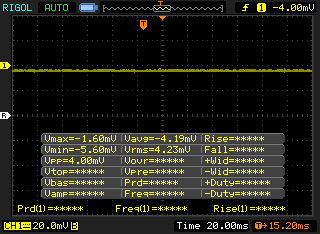 | ||
In comparison: 52 % of all tested devices do not use PWM to dim the display. If PWM was detected, an average of 7748 (minimum: 5 - maximum: 343500) Hz was measured. | |||
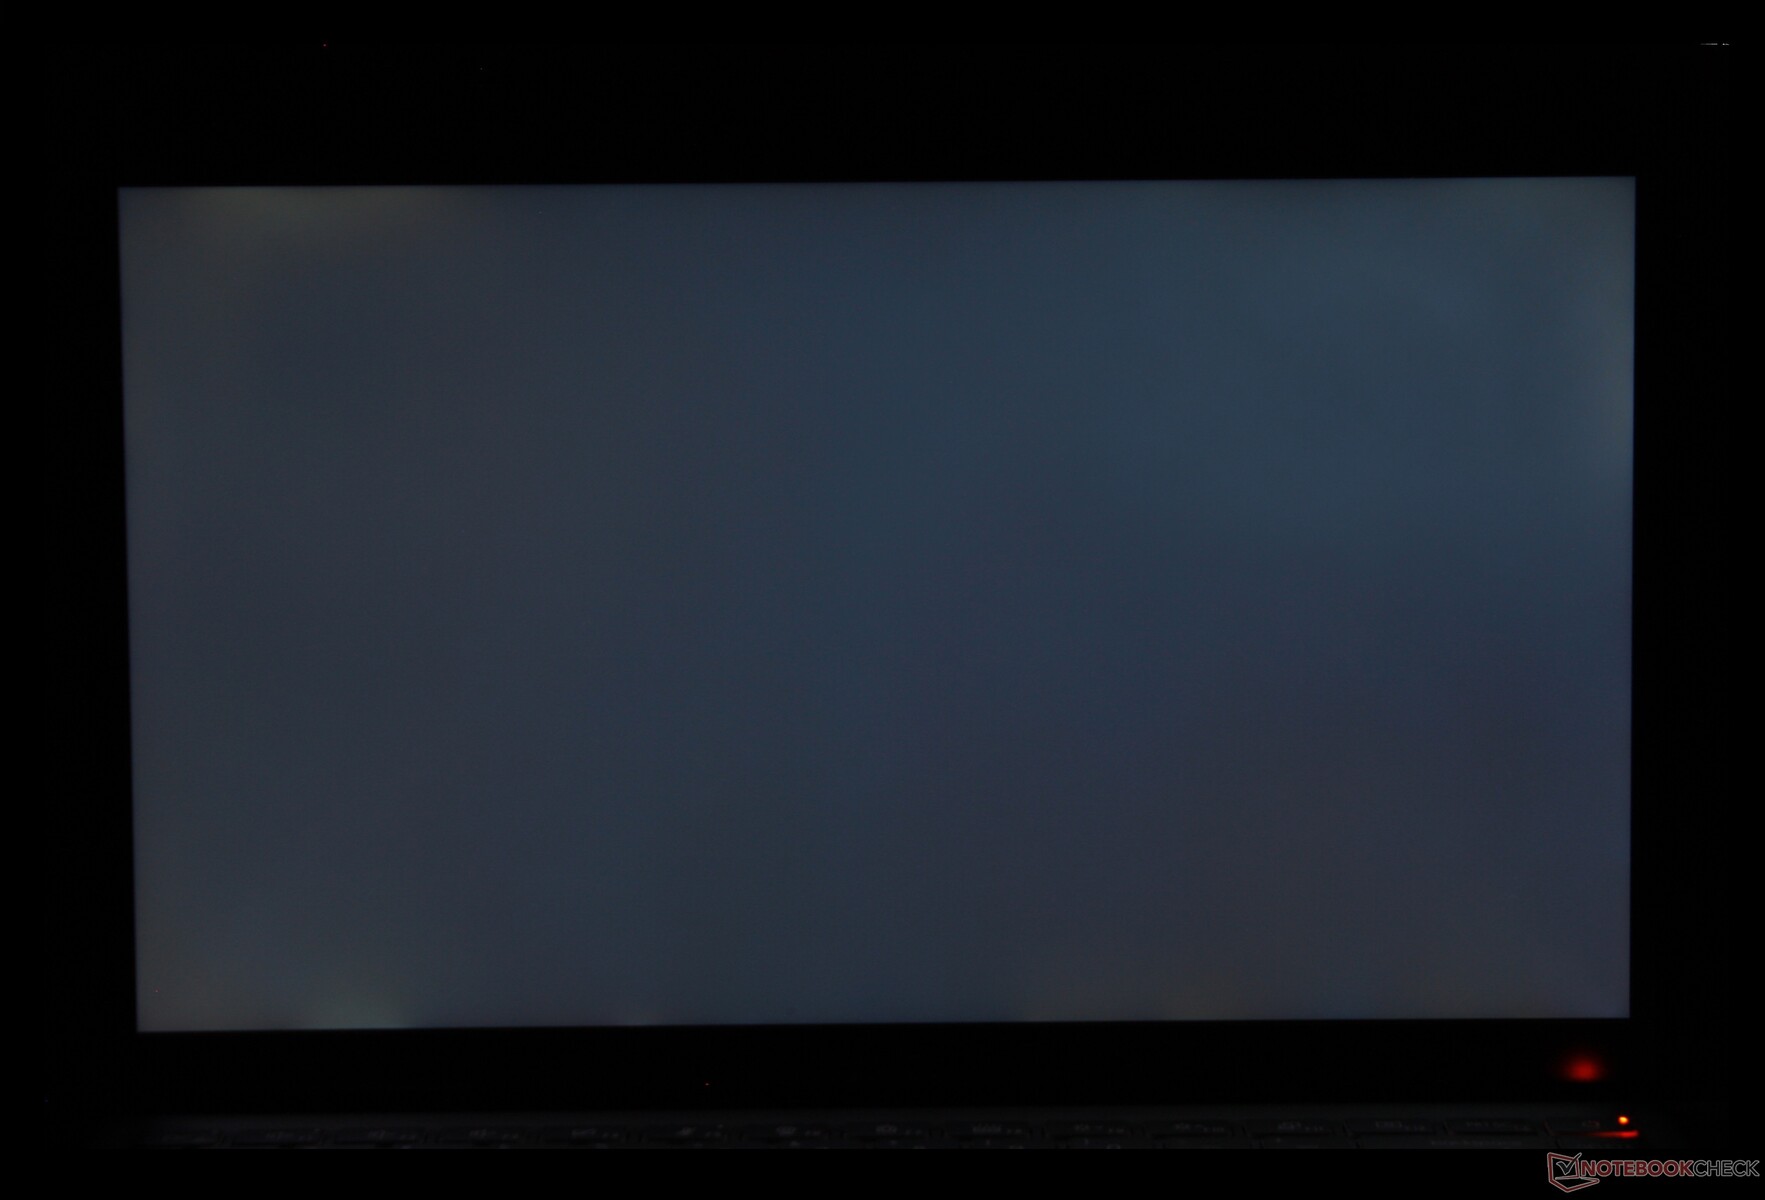
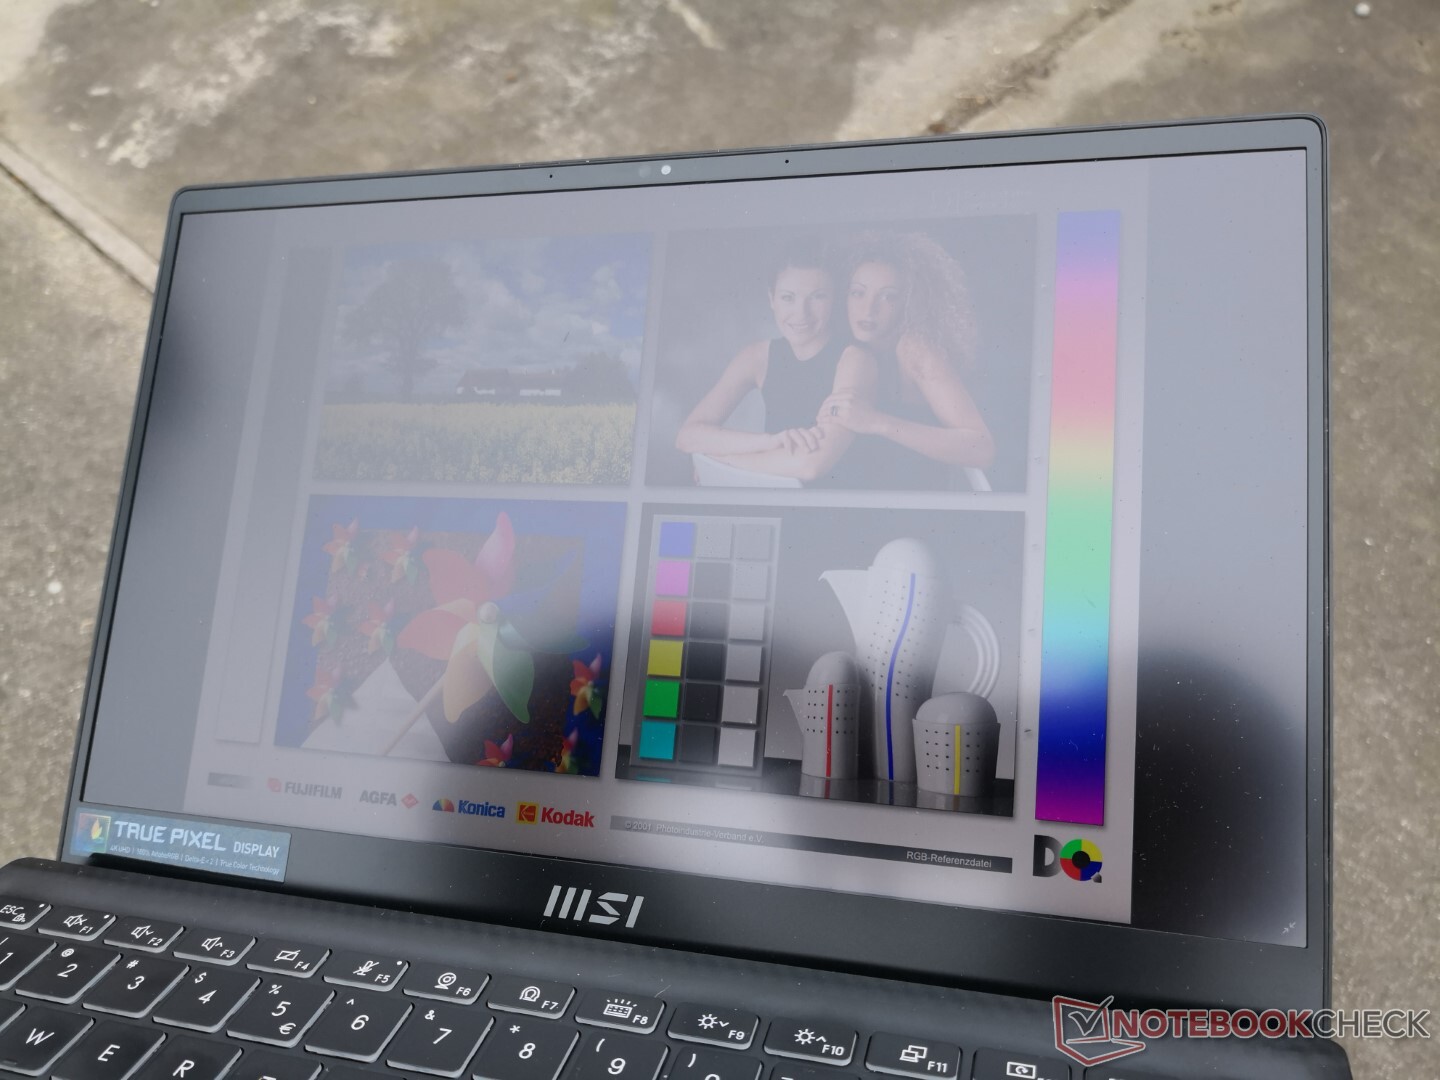
Outdoor visibility is better than on most other Ultrabooks due to the bright 600-nit matte panel to reduce glare. The display here is nearly two times brighter than the displays on the Modern 14, XPG Xenia 14, and even Prestige 14. We had no issues reading onscreen content when under shade while brighter ambient lighting can still be tricky.
Performance
The Summit E14 is notable for being one of the few 14-inch laptops to pair a Core U-series vPro CPU with a GeForce GTX GPU. This fact alone will give the MSI system a huge advantage in graphics performance when compared to most other 14-inch Ultrabooks available where slower integrated graphics are much more common.
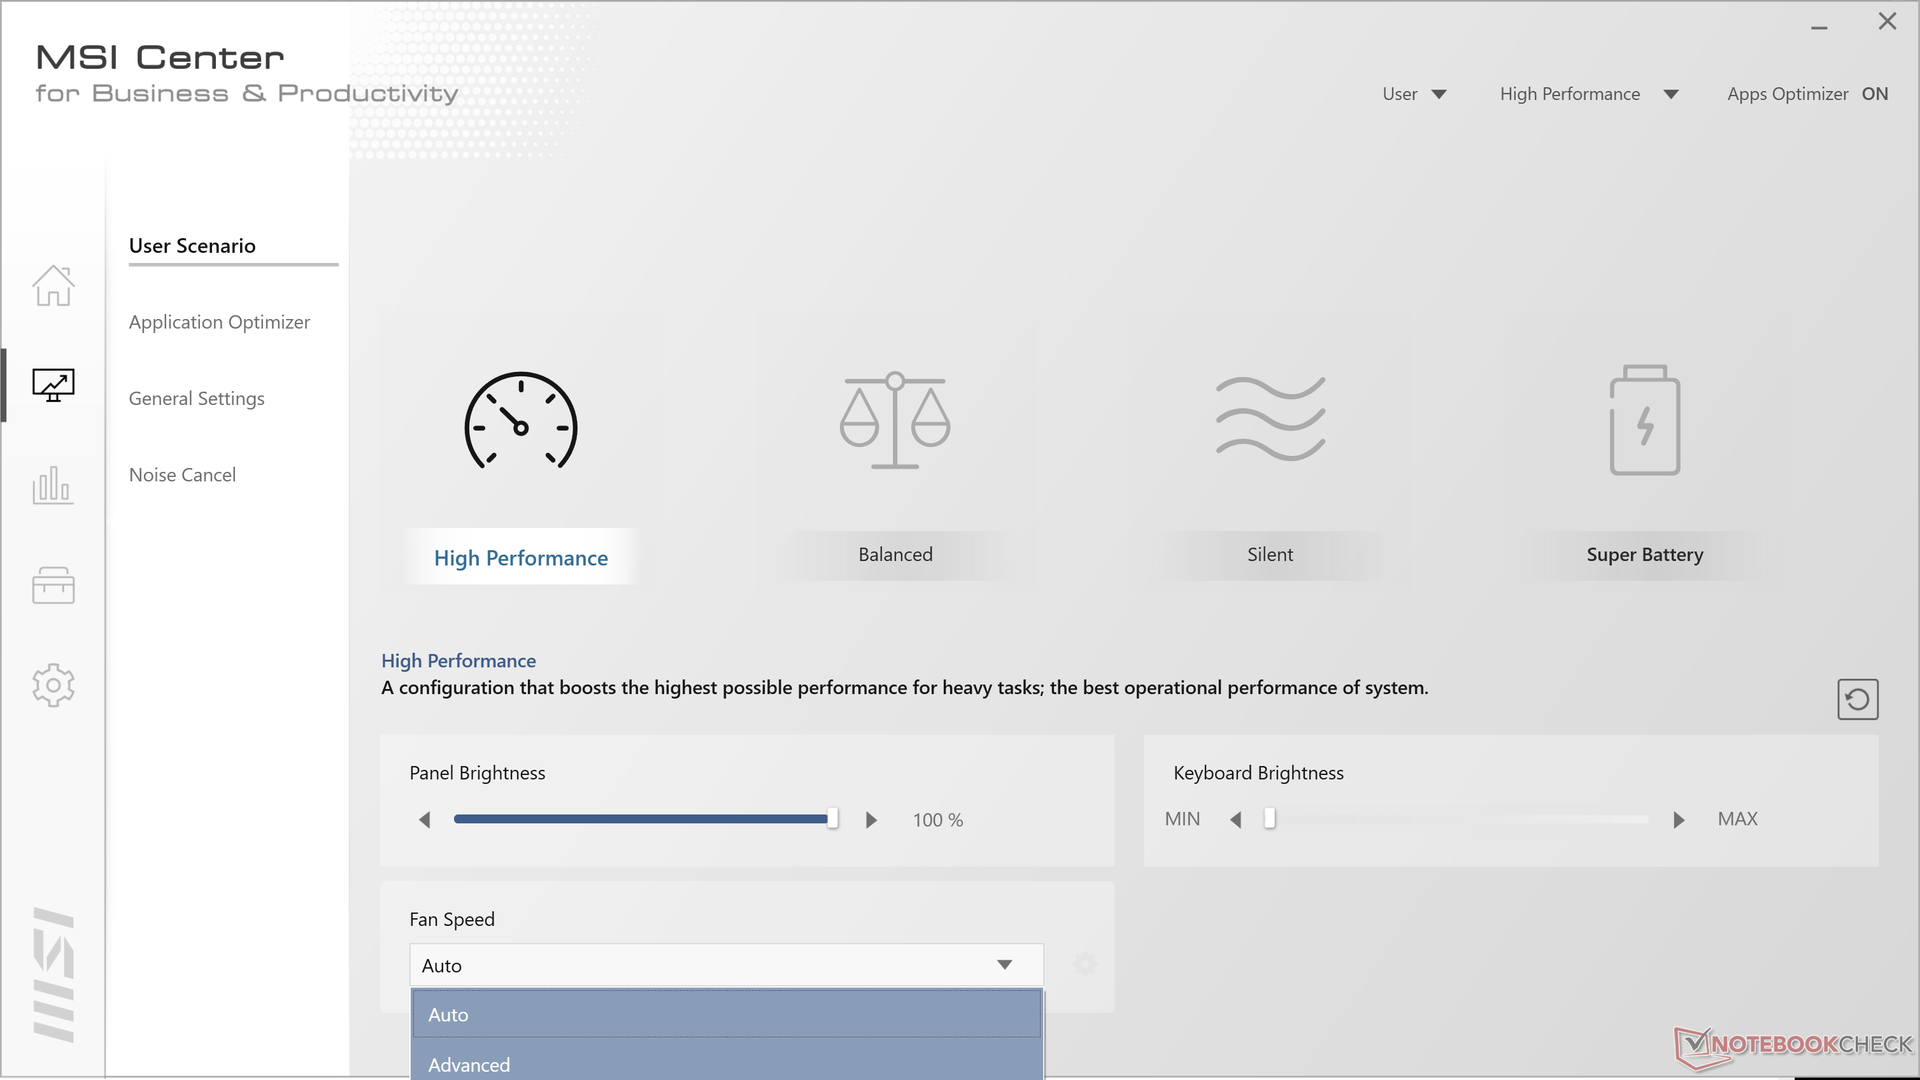
Our unit was set to High Performance mode via MSI Business Center prior to running any benchmarks below for the highest possible scores. Users should become familiar with the MSI software as key features can be toggled here including Cooler Boost (or maximum fan mode).
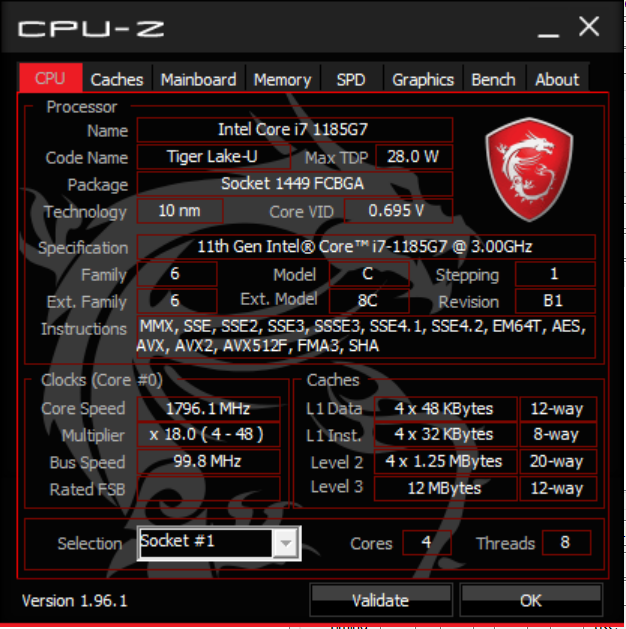
Processor — Tiger Lake-U To The Rescue
CPU performance is good with results that are a few percentage points higher than the average laptop in our database equipped with the same Core i7-1185G7 CPU. Models with the Core i7-1165G7 like the Xenia 14 may be slightly faster since they have no vPro overhead, but the difference will be unnoticeable when running most loads. AMD Ryzen CPUs like the Ryzen 5 5500U or Ryzen 7 4700U can offer faster multi-thread performance at the cost of slower single-thread performance.
Performance sustainability is good but not perfect with CineBench R15 xT loop test scores that can fall by as much as 16 percent temporarily before bouncing back. Rerunning this test with Cooler Boost enabled will negate these drops.
Cinebench R15 Multi Loop
Cinebench R23: Multi Core | Single Core
Cinebench R15: CPU Multi 64Bit | CPU Single 64Bit
Blender: v2.79 BMW27 CPU
7-Zip 18.03: 7z b 4 -mmt1 | 7z b 4
Geekbench 5.5: Single-Core | Multi-Core
HWBOT x265 Benchmark v2.2: 4k Preset
LibreOffice : 20 Documents To PDF
R Benchmark 2.5: Overall mean
| Cinebench R23 / Multi Core | |
| Lenovo IdeaPad Flex 5 14ALC05 82HU002YUS | |
| Lenovo Yoga Slim 7 14ARE05 82A20008GE | |
| Lenovo ThinkPad E14 G3-20Y7003SGE | |
| ADATA XPG Xenia 14 | |
| HP Envy 14-eb0010nr | |
| MSI Summit E14 A11SCS | |
| Average Intel Core i7-1185G7 (3610 - 6383, n=24) | |
| Infinix INBook X1 Pro | |
| Acer Spin 3 SP314-54N-56S5 | |
| Cinebench R23 / Single Core | |
| ADATA XPG Xenia 14 | |
| MSI Summit E14 A11SCS | |
| Average Intel Core i7-1185G7 (1251 - 1532, n=24) | |
| HP Envy 14-eb0010nr | |
| Lenovo IdeaPad Flex 5 14ALC05 82HU002YUS | |
| Lenovo Yoga Slim 7 14ARE05 82A20008GE | |
| Infinix INBook X1 Pro | |
| Lenovo ThinkPad E14 G3-20Y7003SGE | |
| Acer Spin 3 SP314-54N-56S5 | |
| Geekbench 5.5 / Single-Core | |
| Average Intel Core i7-1185G7 (1398 - 1626, n=21) | |
| HP Envy 14-eb0010nr | |
| Acer Spin 3 SP314-54N-56S5 | |
| Lenovo IdeaPad Flex 5 14ALC05 82HU002YUS | |
| Asus ZenBook 14 UX434FL-DB77 | |
| Lenovo Yoga Slim 7 14ARE05 82A20008GE | |
| Lenovo ThinkPad E14 G3-20Y7003SGE | |
| Lenovo ThinkPad L14-20U50003GE | |
| Geekbench 5.5 / Multi-Core | |
| Lenovo IdeaPad Flex 5 14ALC05 82HU002YUS | |
| Lenovo Yoga Slim 7 14ARE05 82A20008GE | |
| Average Intel Core i7-1185G7 (4620 - 5944, n=21) | |
| Lenovo ThinkPad E14 G3-20Y7003SGE | |
| HP Envy 14-eb0010nr | |
| Lenovo ThinkPad L14-20U50003GE | |
| Acer Spin 3 SP314-54N-56S5 | |
| Asus ZenBook 14 UX434FL-DB77 | |
* ... smaller is better
System Performance
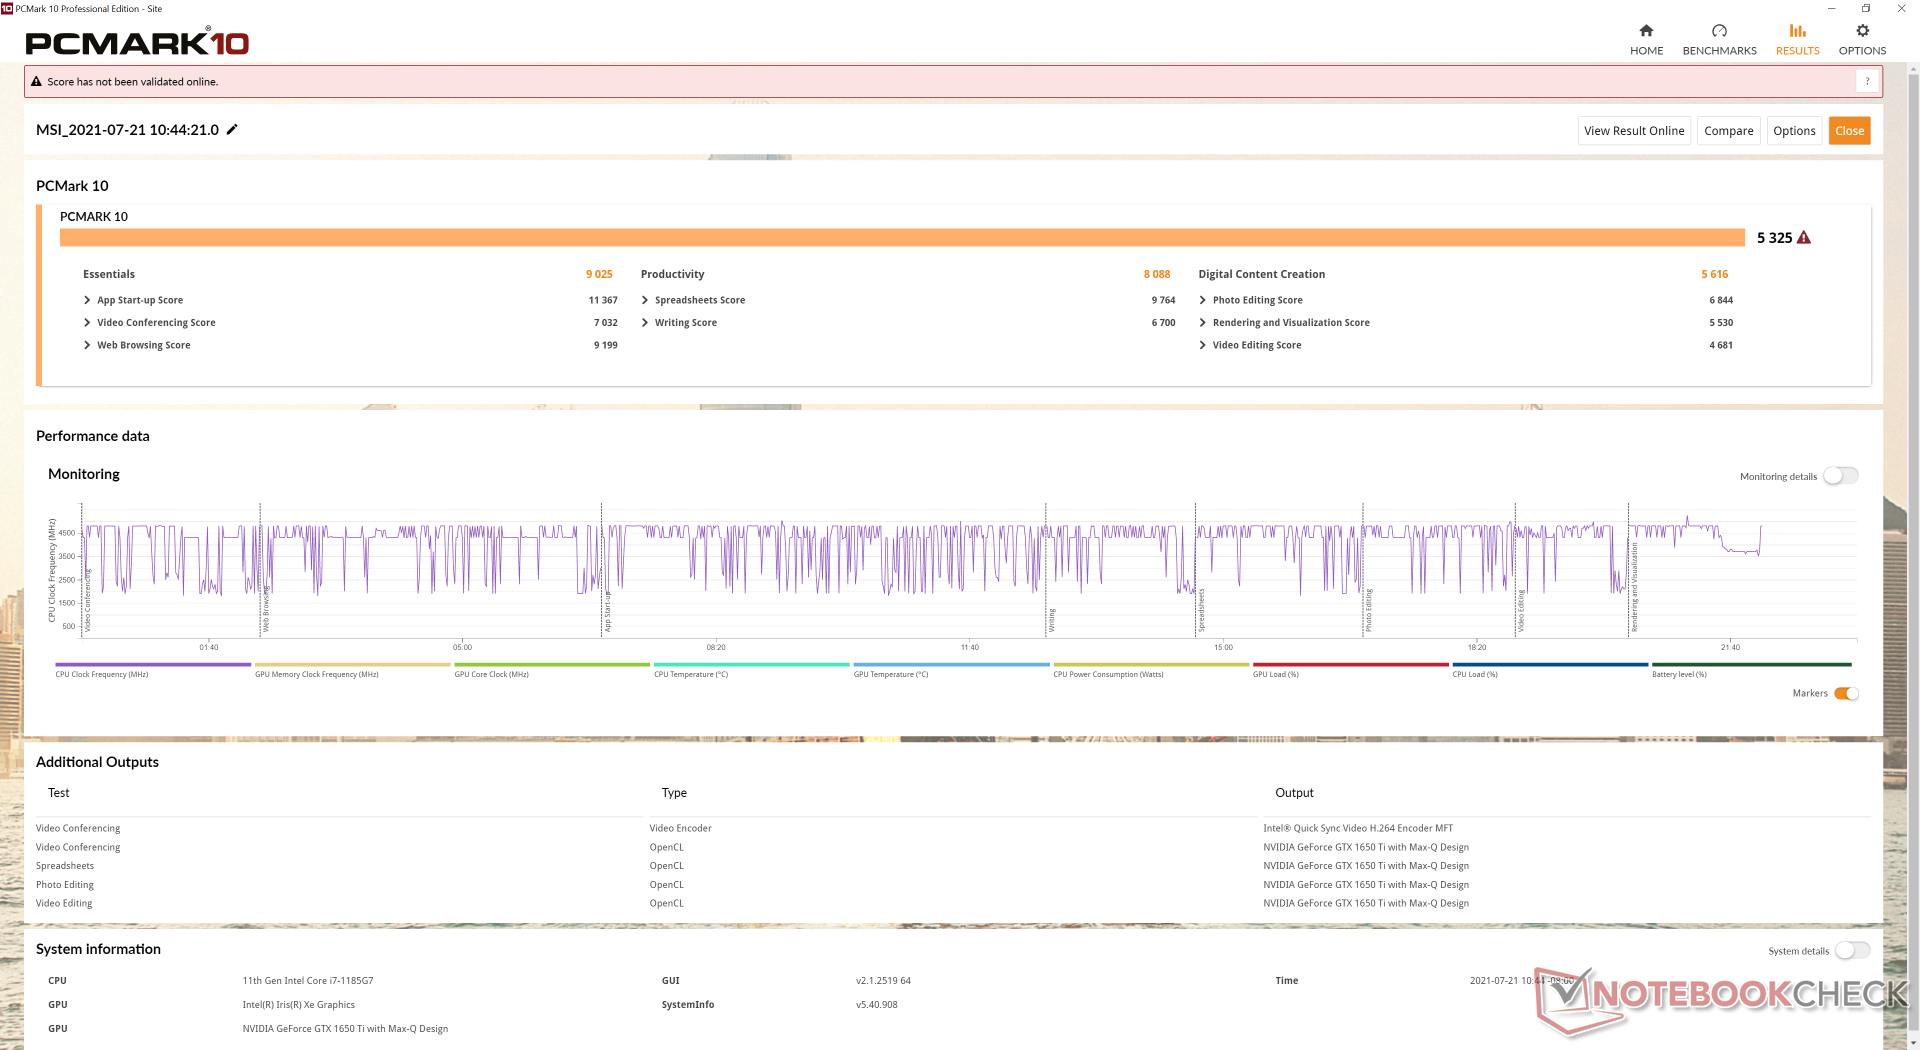
PCMark 10 scores are generally higher than other 14-inch Ultrabooks including both the Prestige 14 Evo or Modern 14 due to the much faster GeForce GTX graphics. If your daily workloads depend on graphics performance, then the Summit E14 will be the fastest option of the three MSI models.
| PCMark 10 / Score | |
| MSI Summit E14 A11SCS | |
| Average Intel Core i7-1185G7, NVIDIA GeForce GTX 1650 Ti Max-Q (5288 - 5325, n=2) | |
| VAIO Z VJZ141C11L | |
| Lenovo ThinkPad T14s G2 20WM003TGE | |
| ADATA XPG Xenia 14 | |
| MSI Prestige 14 Evo A11M-005 | |
| MSI Modern 14 B11SB-085 | |
| PCMark 10 / Essentials | |
| VAIO Z VJZ141C11L | |
| ADATA XPG Xenia 14 | |
| Lenovo ThinkPad T14s G2 20WM003TGE | |
| MSI Prestige 14 Evo A11M-005 | |
| MSI Summit E14 A11SCS | |
| Average Intel Core i7-1185G7, NVIDIA GeForce GTX 1650 Ti Max-Q (8566 - 9025, n=2) | |
| MSI Modern 14 B11SB-085 | |
| PCMark 10 / Productivity | |
| MSI Summit E14 A11SCS | |
| Average Intel Core i7-1185G7, NVIDIA GeForce GTX 1650 Ti Max-Q (7935 - 8088, n=2) | |
| MSI Modern 14 B11SB-085 | |
| ADATA XPG Xenia 14 | |
| Lenovo ThinkPad T14s G2 20WM003TGE | |
| VAIO Z VJZ141C11L | |
| MSI Prestige 14 Evo A11M-005 | |
| PCMark 10 / Digital Content Creation | |
| Average Intel Core i7-1185G7, NVIDIA GeForce GTX 1650 Ti Max-Q (5616 - 5904, n=2) | |
| MSI Summit E14 A11SCS | |
| VAIO Z VJZ141C11L | |
| Lenovo ThinkPad T14s G2 20WM003TGE | |
| ADATA XPG Xenia 14 | |
| MSI Prestige 14 Evo A11M-005 | |
| MSI Modern 14 B11SB-085 | |
| PCMark 10 Score | 5325 points | |
Help | ||
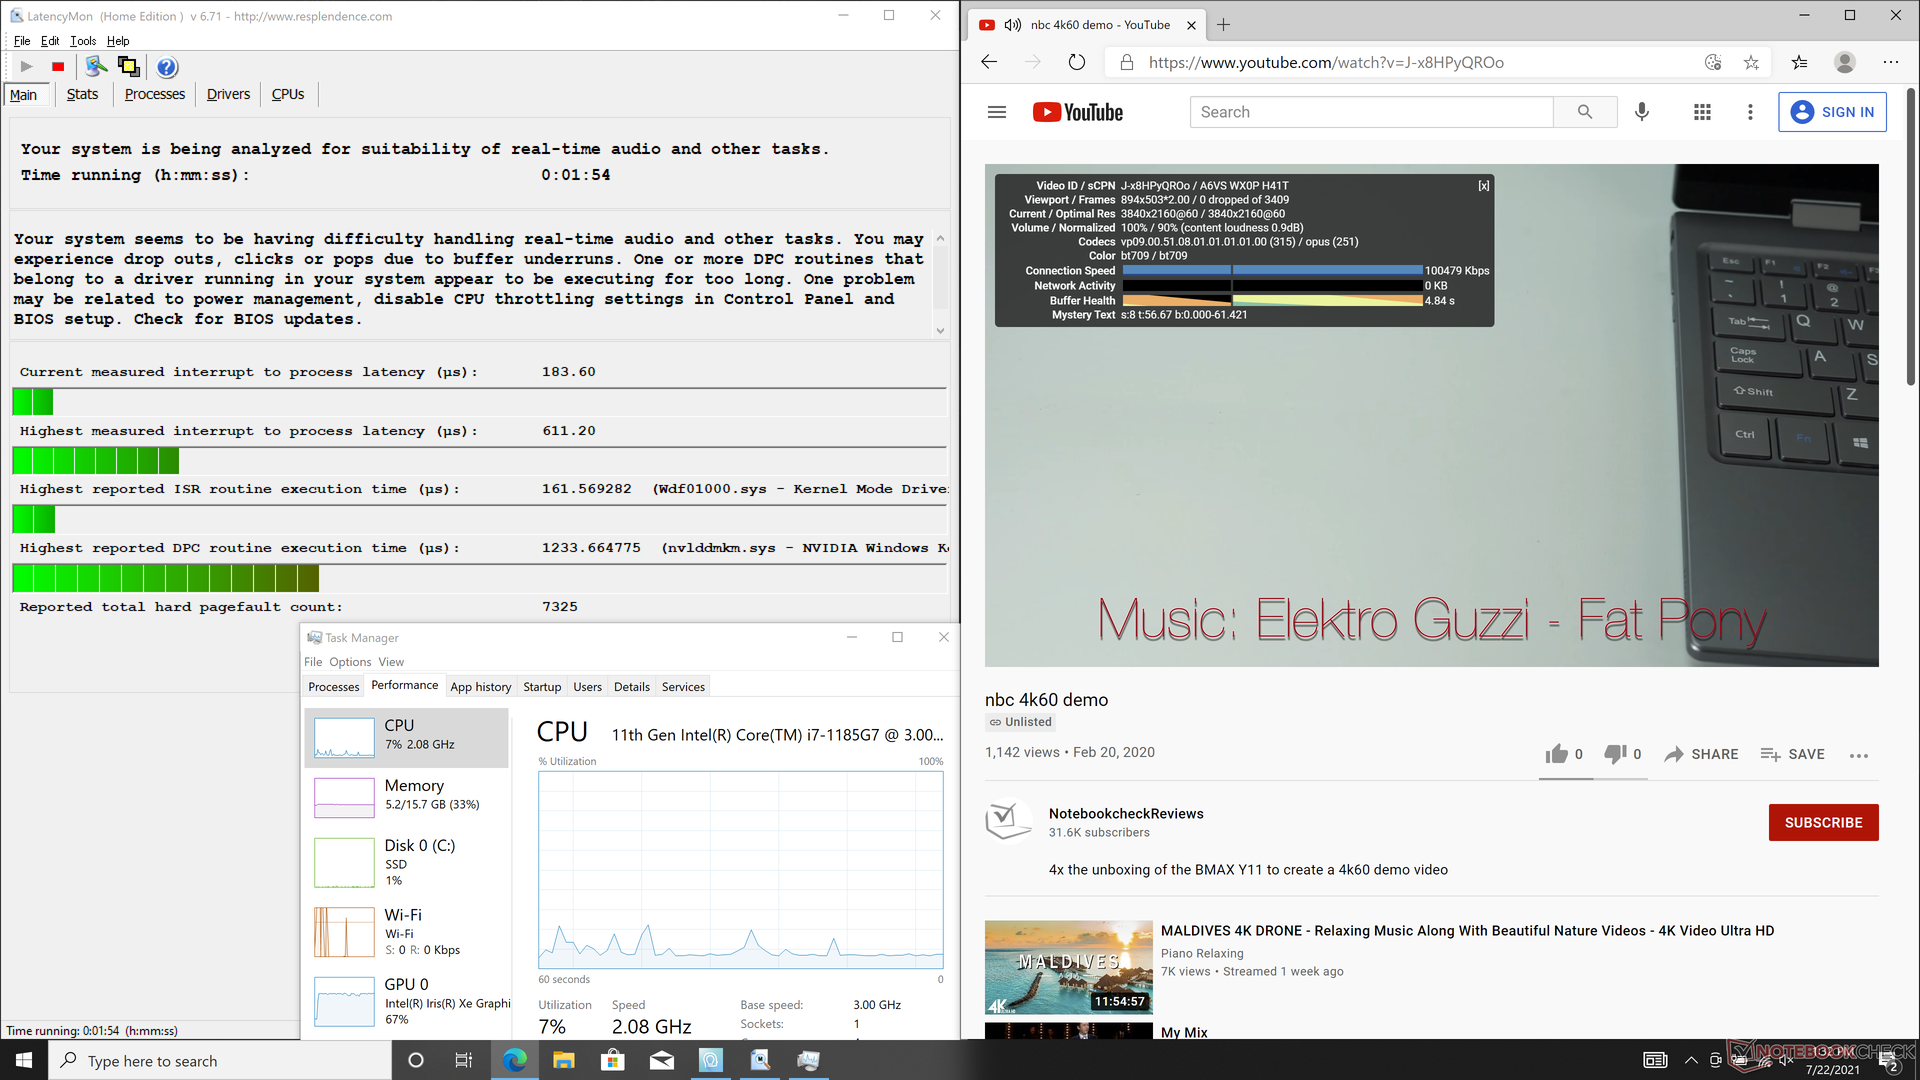
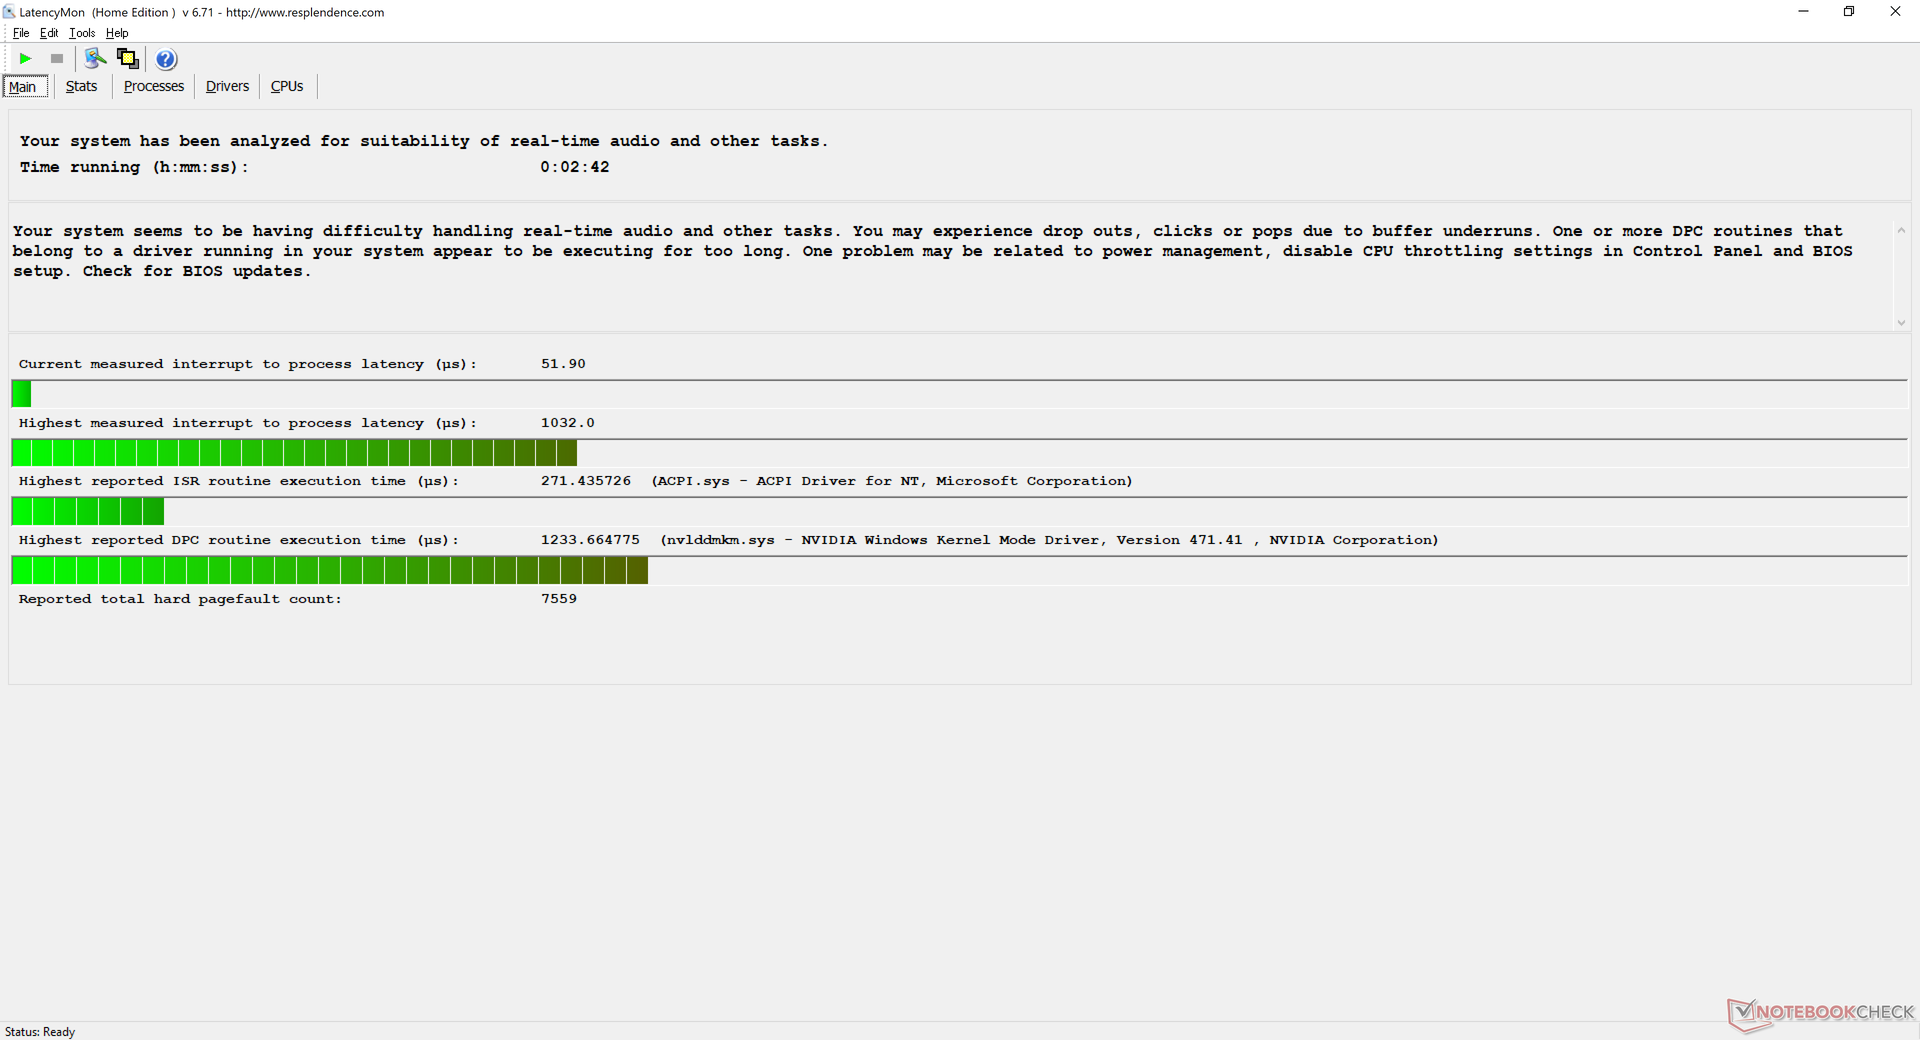
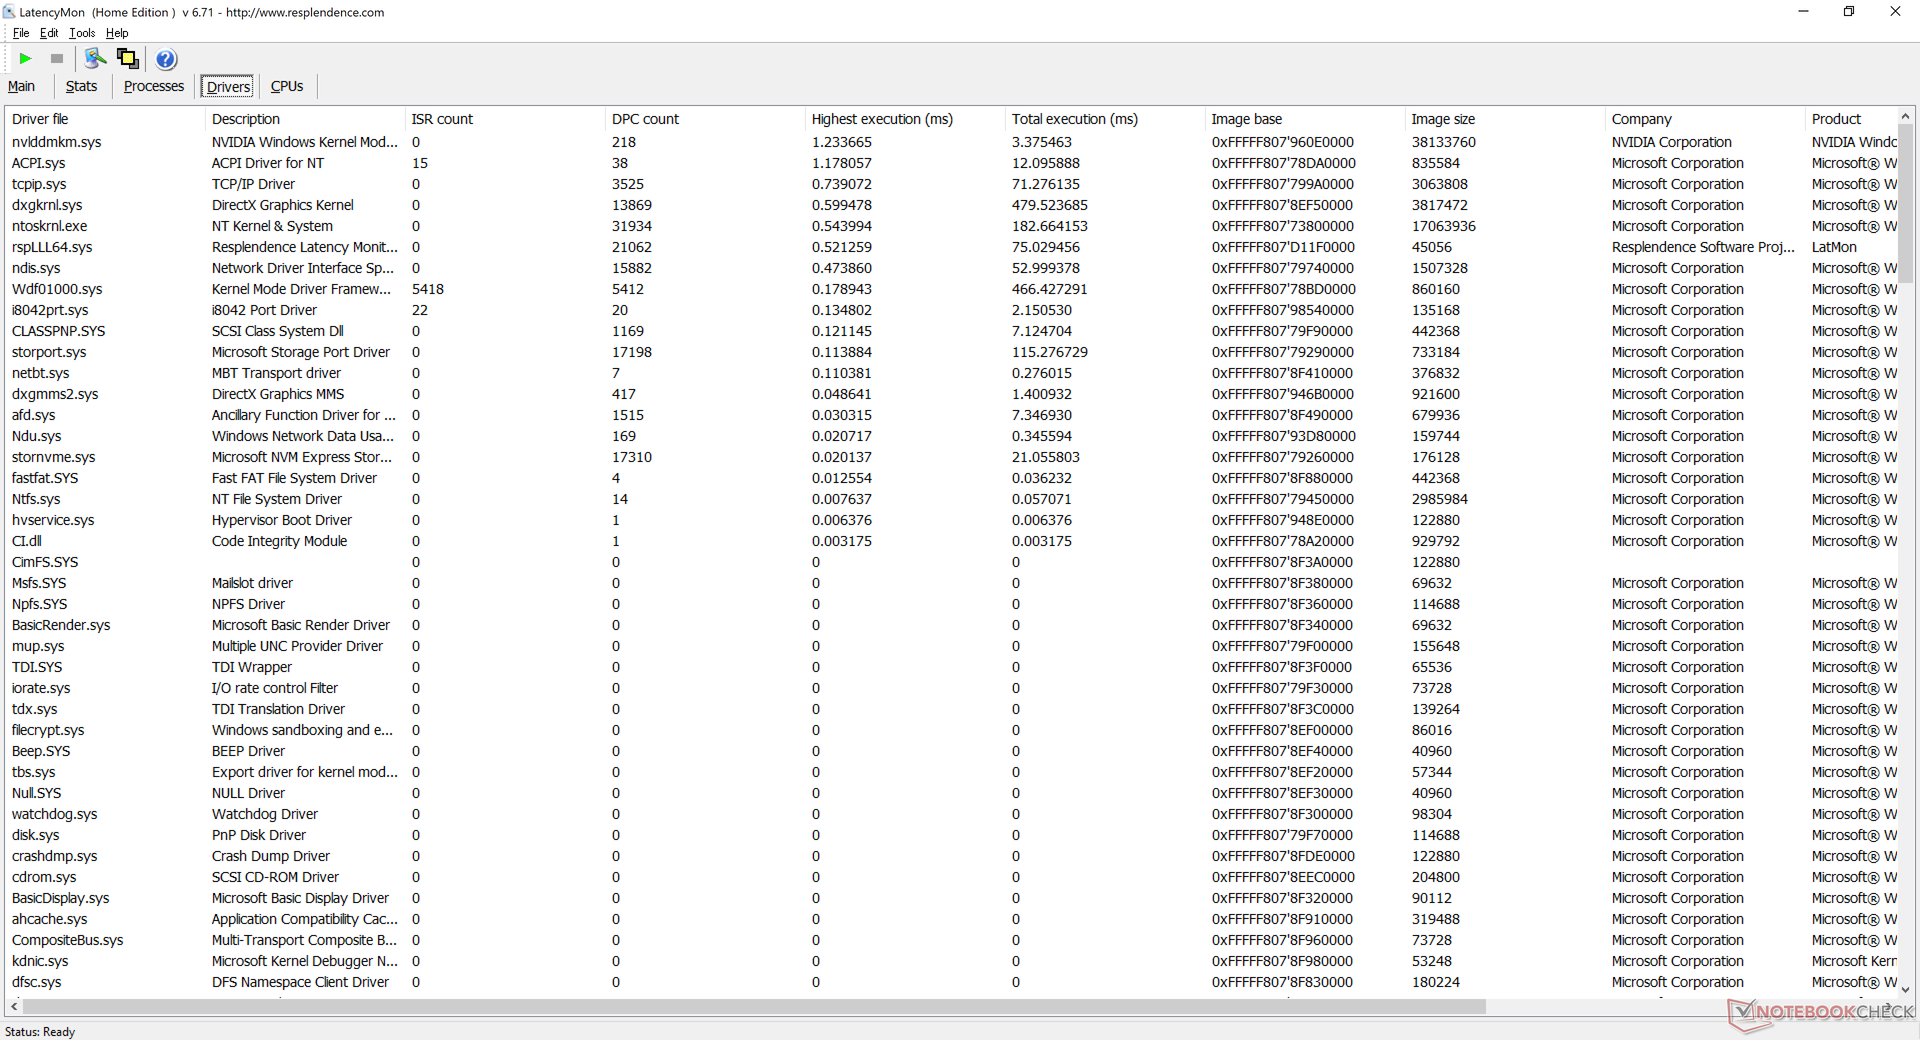
DPC Latency
LatencyMon shows DPC latency issues when opening multiple browser tabs on our homepage and also when the CPU is at 100 percent utilization via Prime95 stress. 4K video playback at 60 FPS is otherwise smooth and without dropped frames.
| DPC Latencies / LatencyMon - interrupt to process latency (max), Web, Youtube, Prime95 | |
| Lenovo ThinkPad T14s G2 20WM003TGE | |
| MSI Summit E14 A11SCS | |
| MSI Modern 14 B11SB-085 | |
| MSI Prestige 14 Evo A11M-005 | |
| VAIO Z VJZ141C11L | |
| ADATA XPG Xenia 14 | |
* ... smaller is better
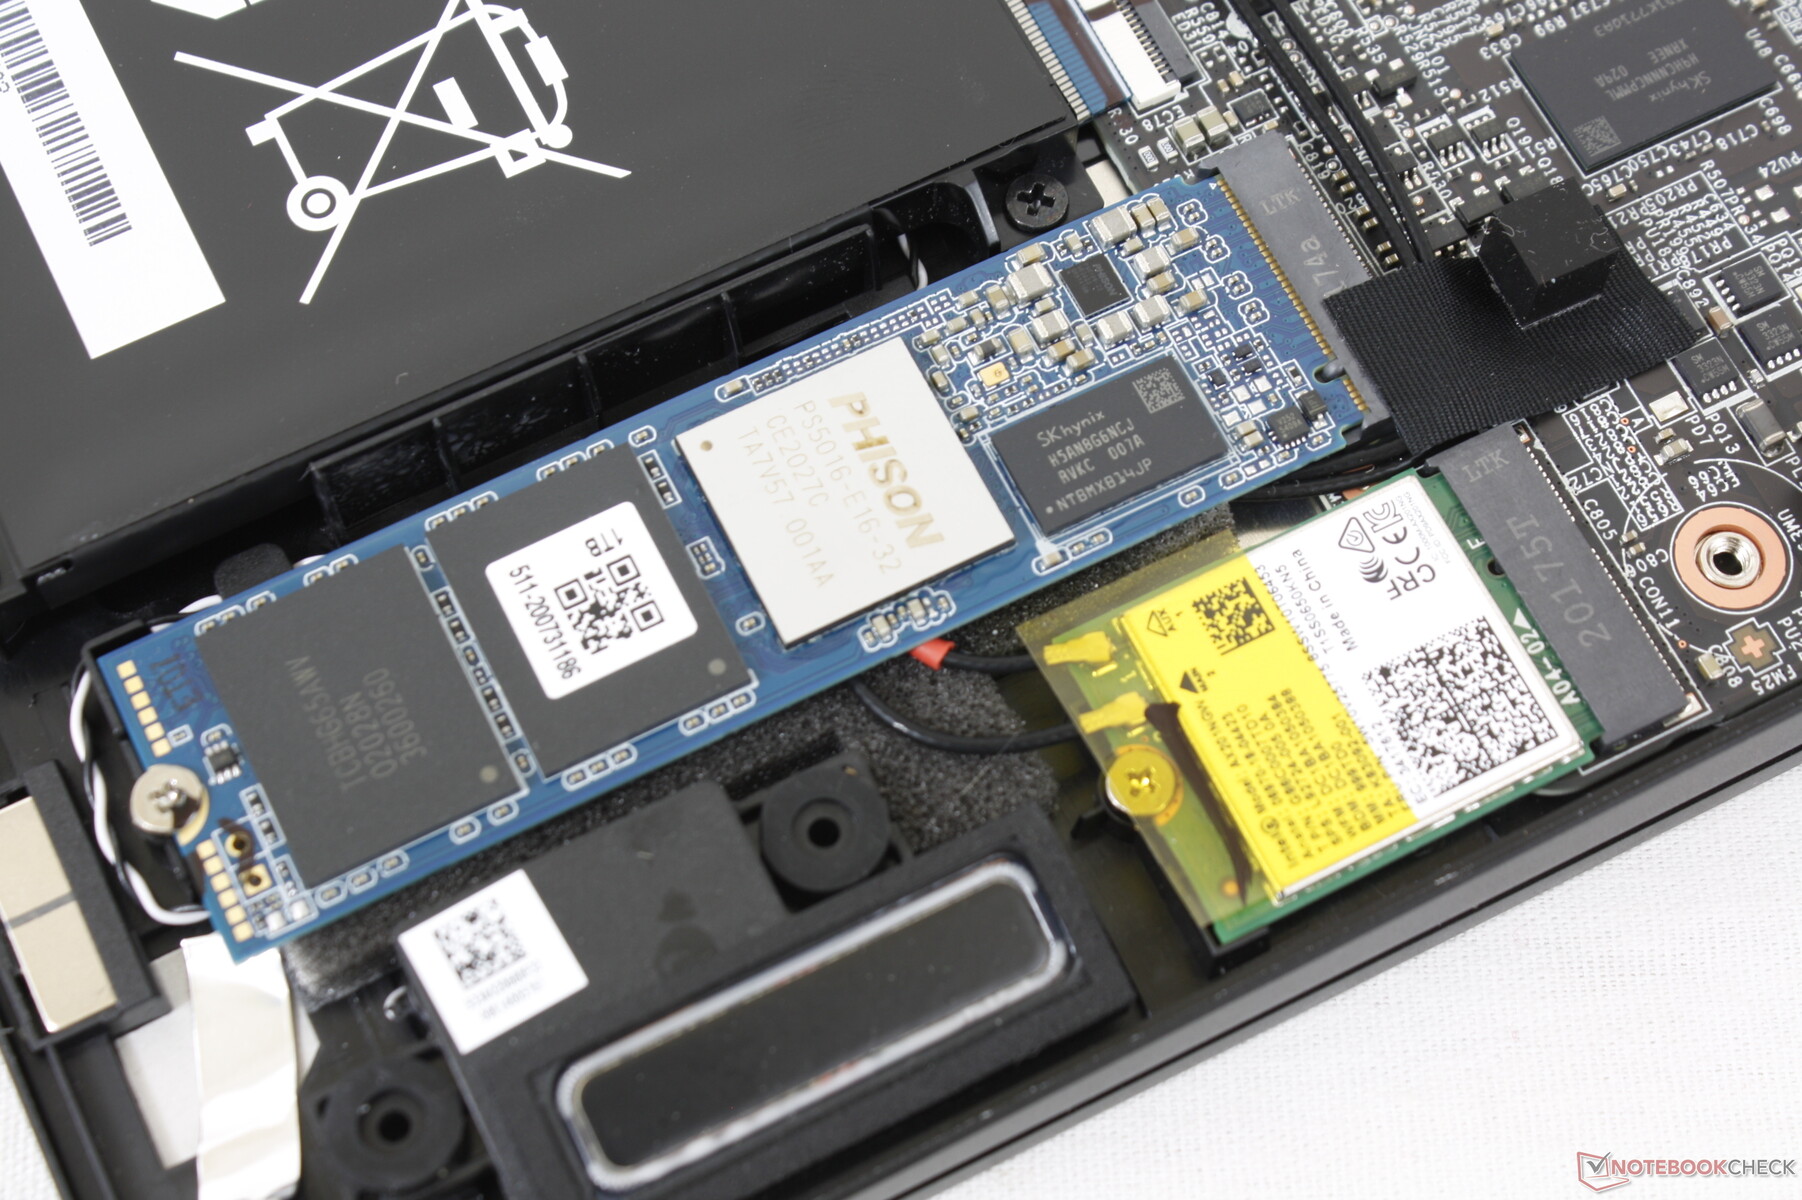
Storage Devices
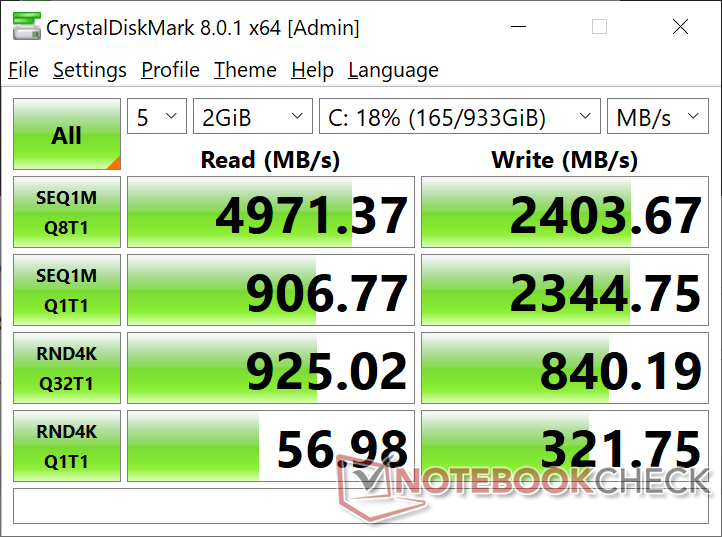
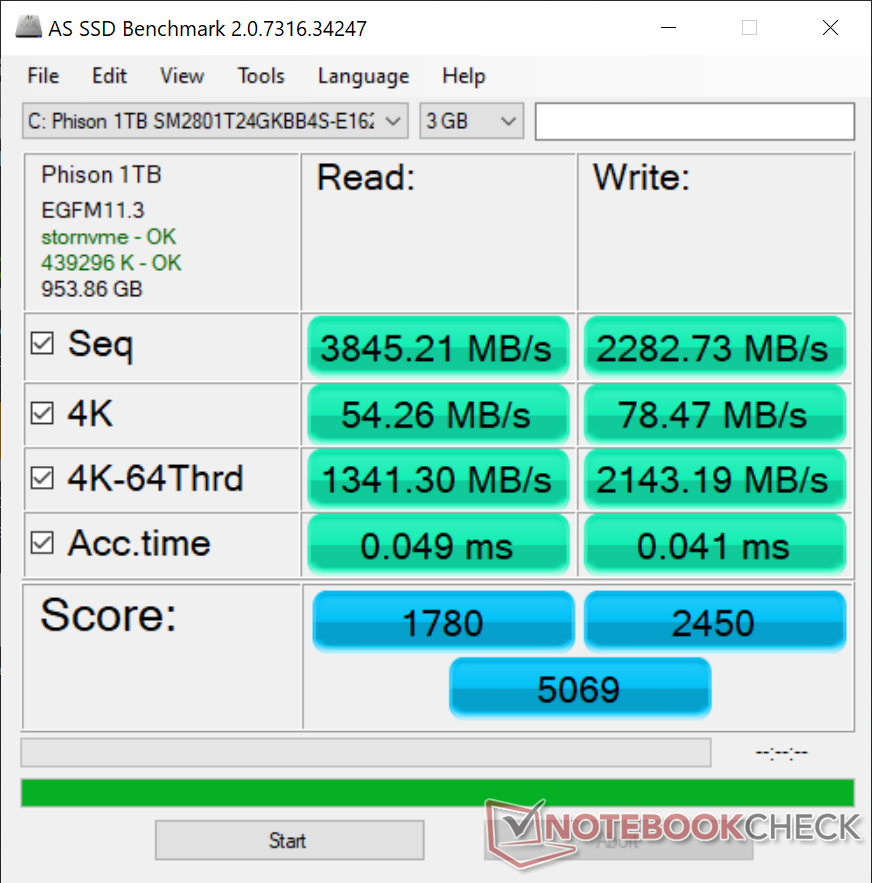
Our unit ships with a 1 TB Phison NVMe M.2 2280 SSD with sequential read and write rates that are not unlike what we recorded on the Prestige 14 Evo laptop. Its read rate of almost 5000 MB/s surpasses any PCIe 3 NVMe SSD while being slower than the PCIe 4 Samsung PM9A1.
The system supports only one internal drive with no secondary slot.
| MSI Summit E14 A11SCS Phison 1TB SM2801T24GKBB4S-E162 | MSI Modern 14 B11SB-085 Kingston OM8PCP3512F-AB | MSI Prestige 14 Evo A11M-005 Phison 512GB SM280512GKBB4S-E162 | Lenovo ThinkPad T14s G2 20WM003TGE Samsung PM981a MZVLB1T0HBLR | VAIO Z VJZ141C11L Samsung PM9A1 MZVL2512HCJQ | |
|---|---|---|---|---|---|
| AS SSD | -36% | 7% | 5% | 28% | |
| Seq Read (MB/s) | 3845 | 1610 -58% | 3760 -2% | 2825 -27% | 5533 44% |
| Seq Write (MB/s) | 2283 | 931 -59% | 2335 2% | 1288 -44% | 3289 44% |
| 4K Read (MB/s) | 54.3 | 36.18 -33% | 66.8 23% | 61.2 13% | 72.5 34% |
| 4K Write (MB/s) | 78.5 | 170.5 117% | 184.3 135% | 190.6 143% | 213.7 172% |
| 4K-64 Read (MB/s) | 1341 | 457.3 -66% | 1801 34% | 1147 -14% | 2128 59% |
| 4K-64 Write (MB/s) | 2143 | 914 -57% | 1754 -18% | 1827 -15% | 2032 -5% |
| Access Time Read * (ms) | 0.049 | 0.092 -88% | 0.135 -176% | 0.055 -12% | 0.039 20% |
| Access Time Write * (ms) | 0.041 | 0.019 54% | 0.018 56% | 0.019 54% | 0.06 -46% |
| Score Read (Points) | 1780 | 655 -63% | 2244 26% | 1491 -16% | 2754 55% |
| Score Write (Points) | 2450 | 1178 -52% | 2172 -11% | 2146 -12% | 2574 5% |
| Score Total (Points) | 5069 | 2144 -58% | 5500 9% | 4336 -14% | 6629 31% |
| Copy ISO MB/s (MB/s) | 2035 | 1277 -37% | 2235 10% | ||
| Copy Program MB/s (MB/s) | 956 | 438.4 -54% | 796 -17% | ||
| Copy Game MB/s (MB/s) | 1951 | 977 -50% | 1652 -15% | ||
| CrystalDiskMark 5.2 / 6 | -47% | -9% | -18% | 28% | |
| Write 4K (MB/s) | 314.4 | 236.2 -25% | 248.4 -21% | 149.7 -52% | 236.7 -25% |
| Read 4K (MB/s) | 55.9 | 47.53 -15% | 56.4 1% | 64.5 15% | 78.6 41% |
| Write Seq (MB/s) | 2402 | 974 -59% | 2513 5% | 1933 -20% | 3689 54% |
| Read Seq (MB/s) | 2408 | 1043 -57% | 2250 -7% | 2512 4% | 4340 80% |
| Write 4K Q32T1 (MB/s) | 840 | 603 -28% | 589 -30% | 514 -39% | 646 -23% |
| Read 4K Q32T1 (MB/s) | 925 | 299.3 -68% | 696 -25% | 475.9 -49% | 717 -22% |
| Write Seq Q32T1 (MB/s) | 2405 | 974 -60% | 2515 5% | 2968 23% | 4396 83% |
| Read Seq Q32T1 (MB/s) | 4927 | 1983 -60% | 4915 0% | 3542 -28% | 6804 38% |
| Total Average (Program / Settings) | -42% /
-40% | -1% /
0% | -7% /
-5% | 28% /
28% |
* ... smaller is better

Disk Throttling: DiskSpd Read Loop, Queue Depth 8
GPU Performance — Outstanding For The Size
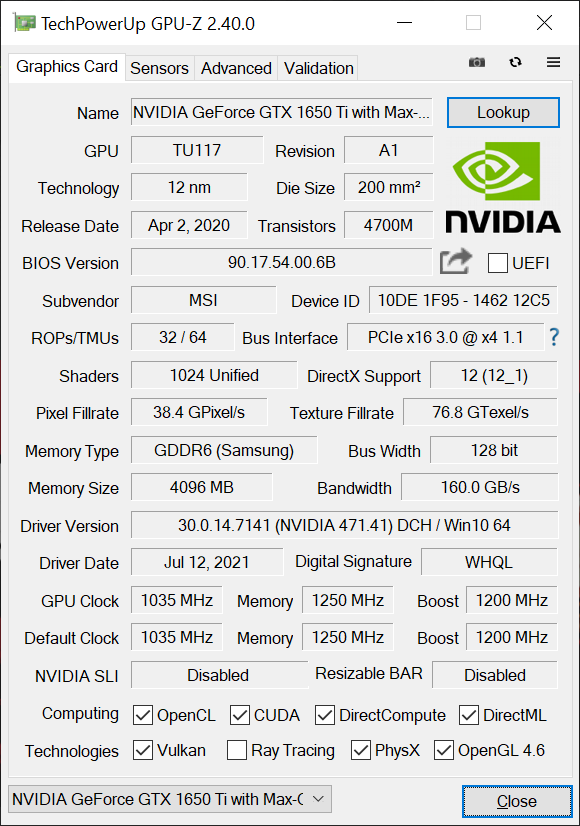
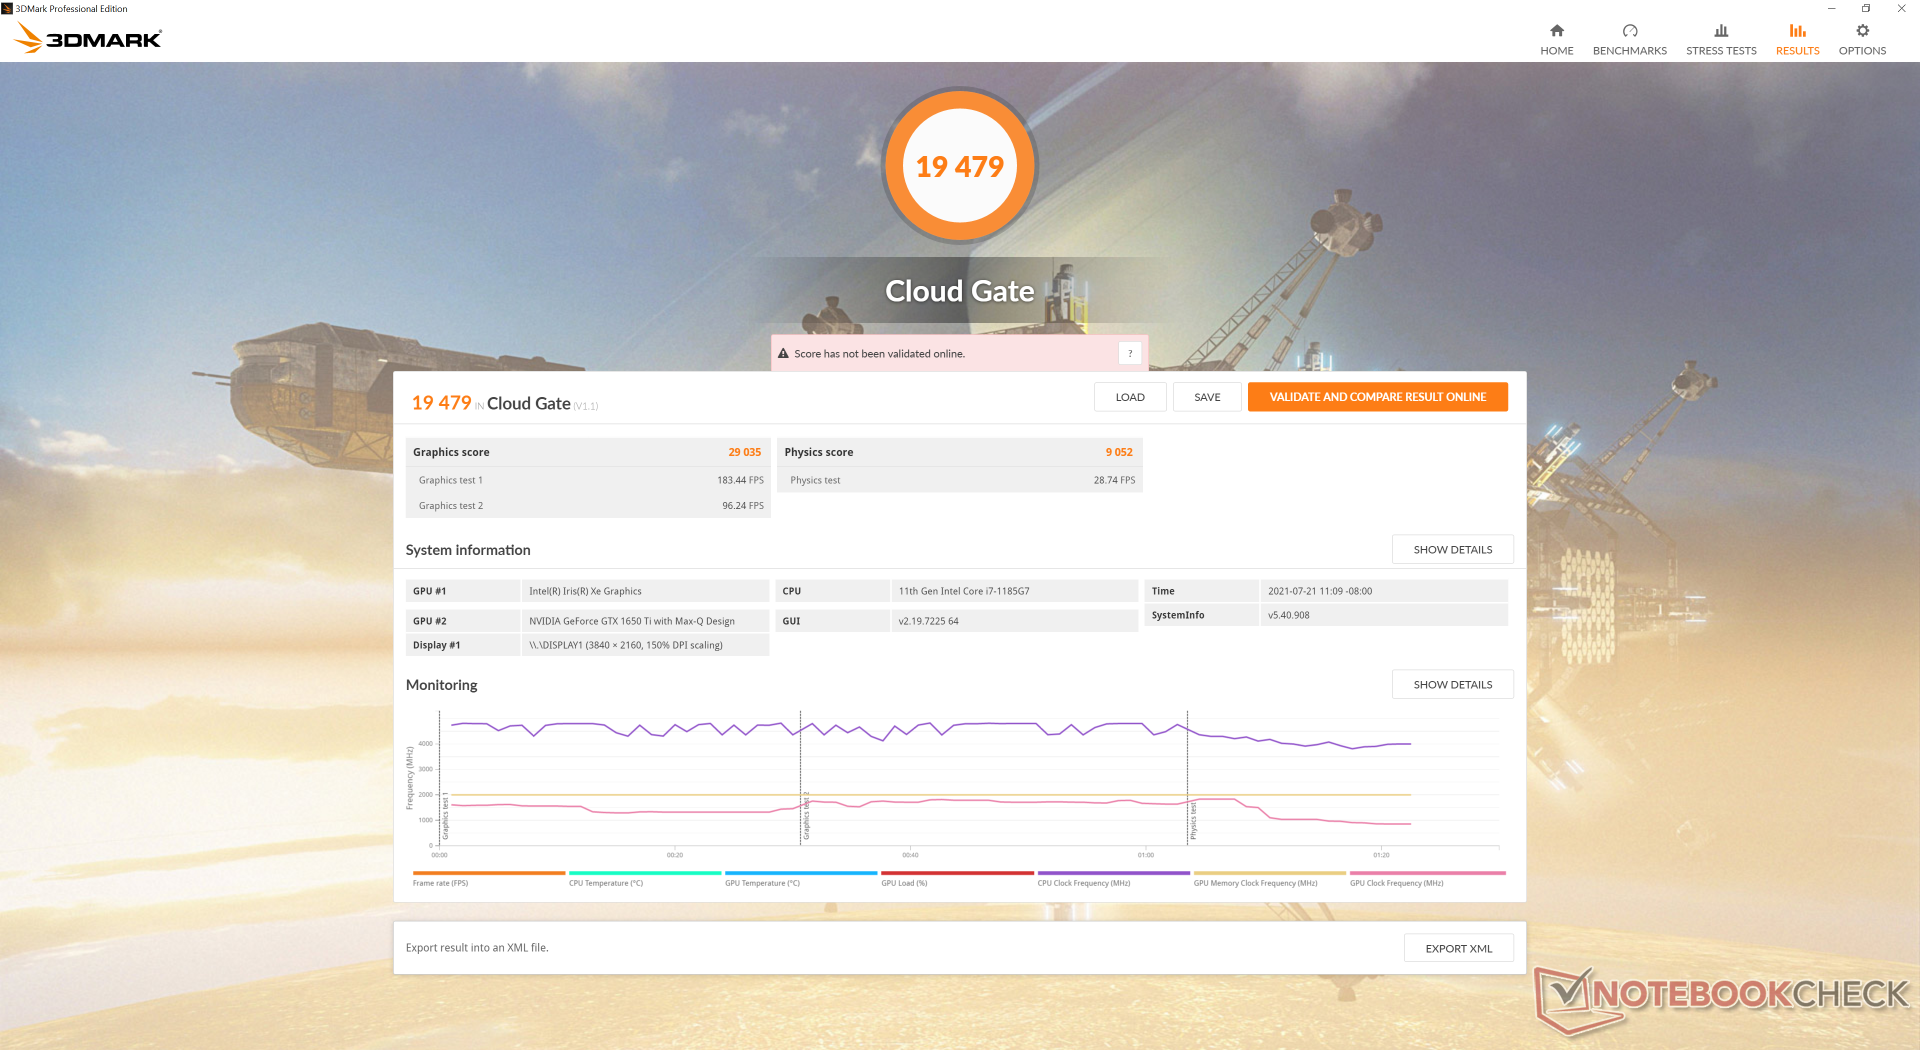
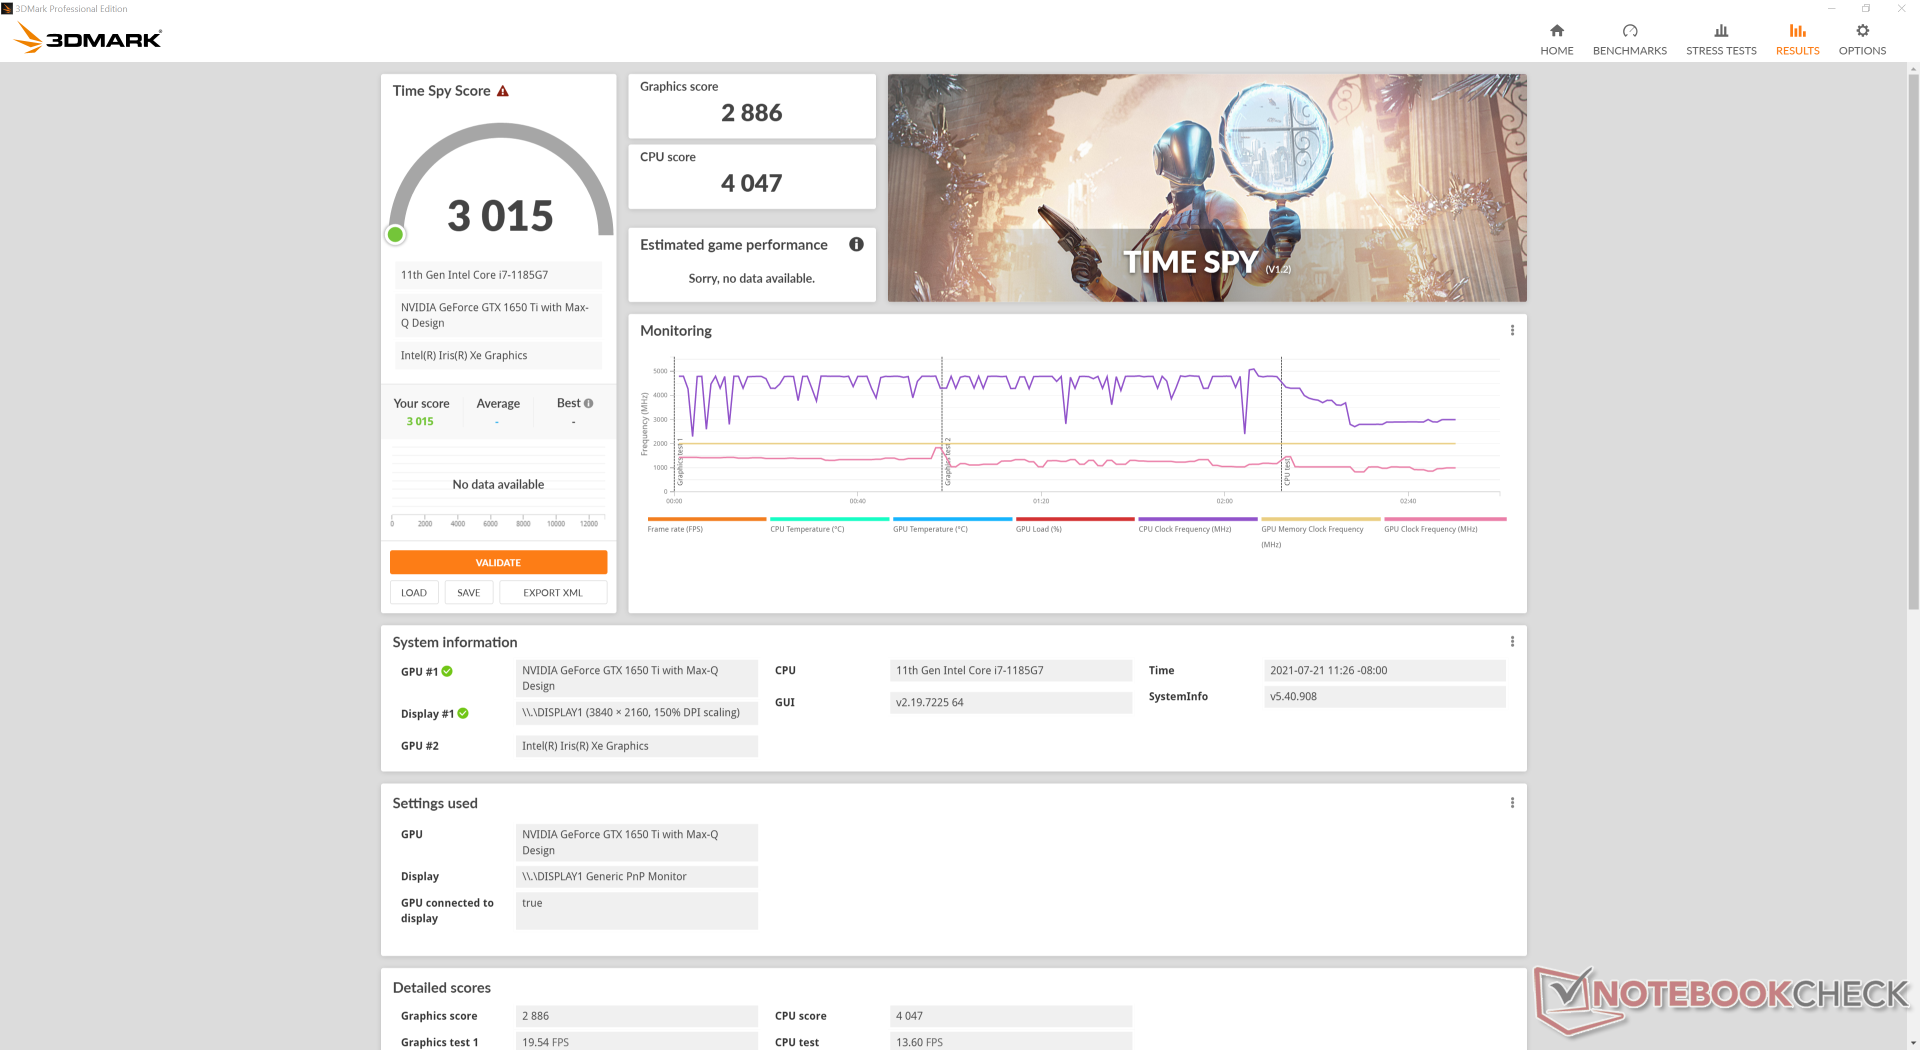
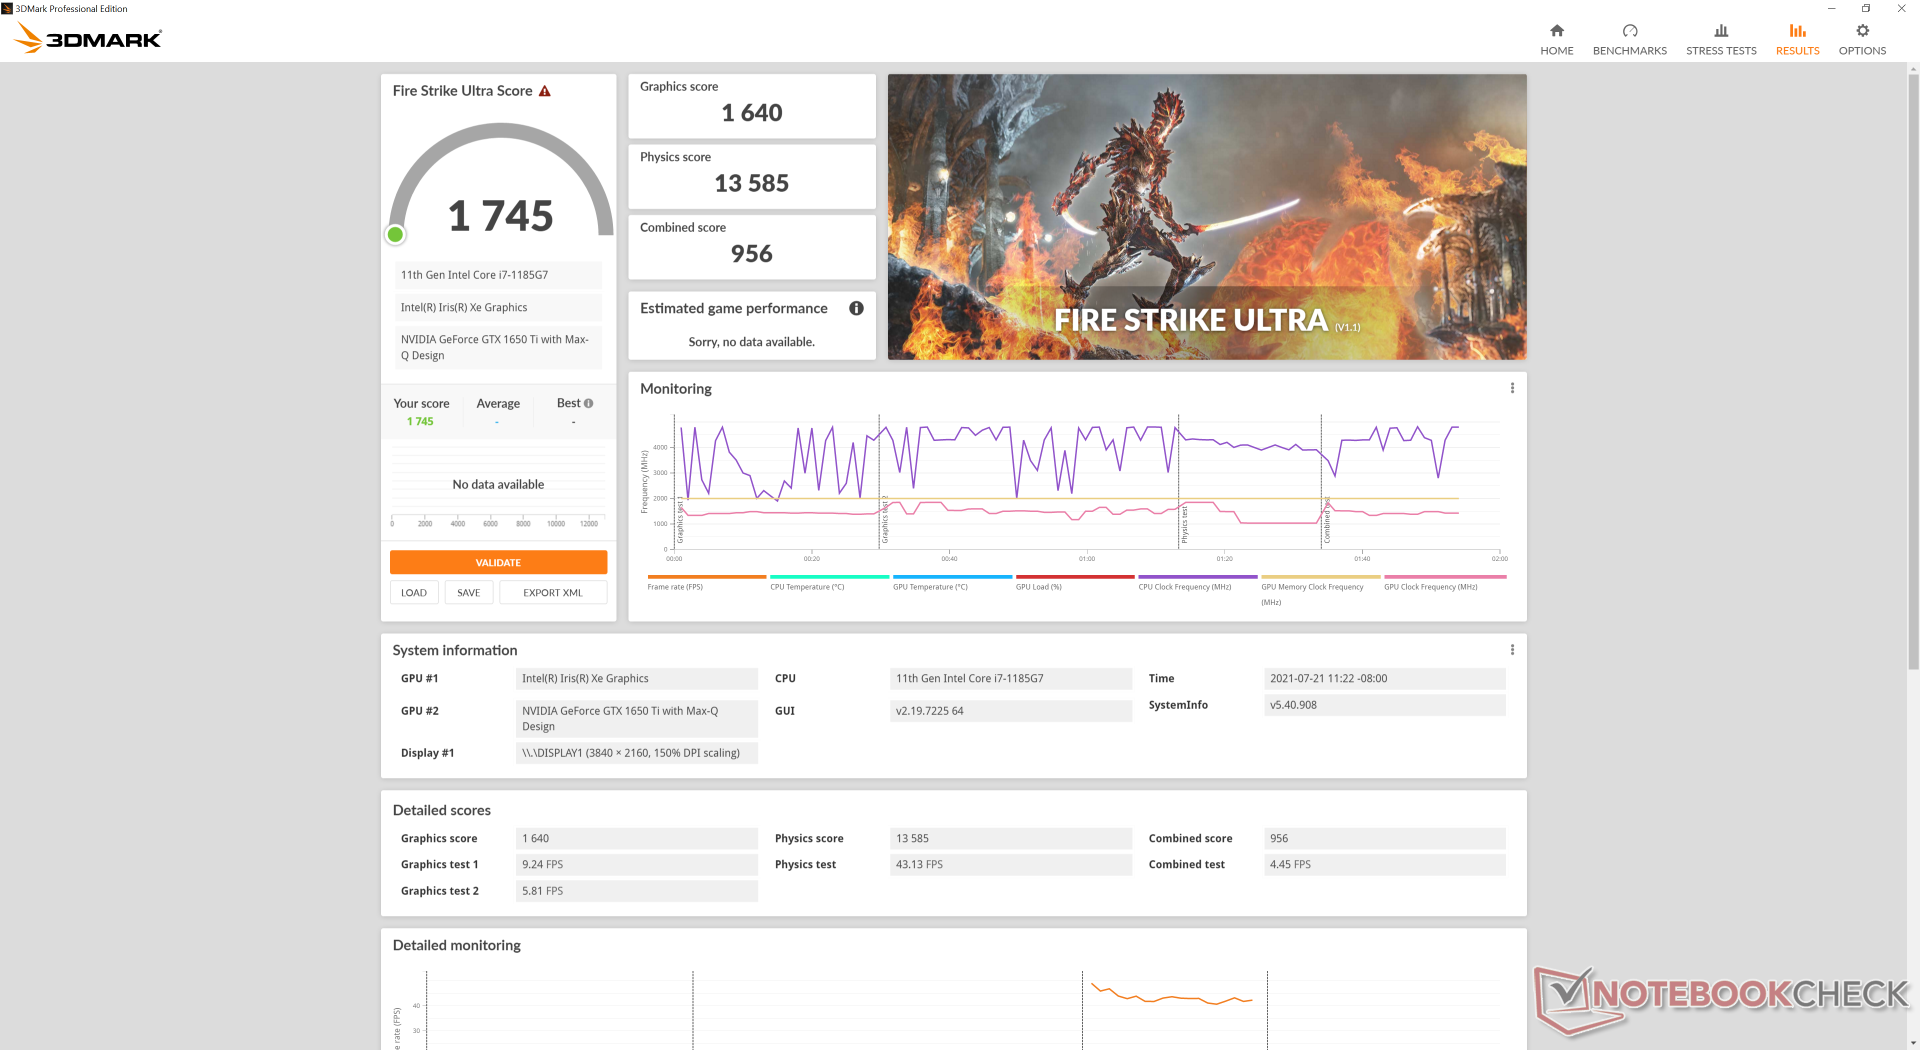
The GeForce GTX 1650 Ti Max-Q is one of the slower GTX-based graphics options currently in the current market, but it is still over 2x faster than the integrated Intel Iris Xe that's now become commonplace on most Ultrabooks. While 3DMark results don't properly show this, real-world games like GTA V or DOTA 2 show frame rates to be more than two times higher on our MSI system when compared to Tiger Lake-U laptops running only on Iris Xe.
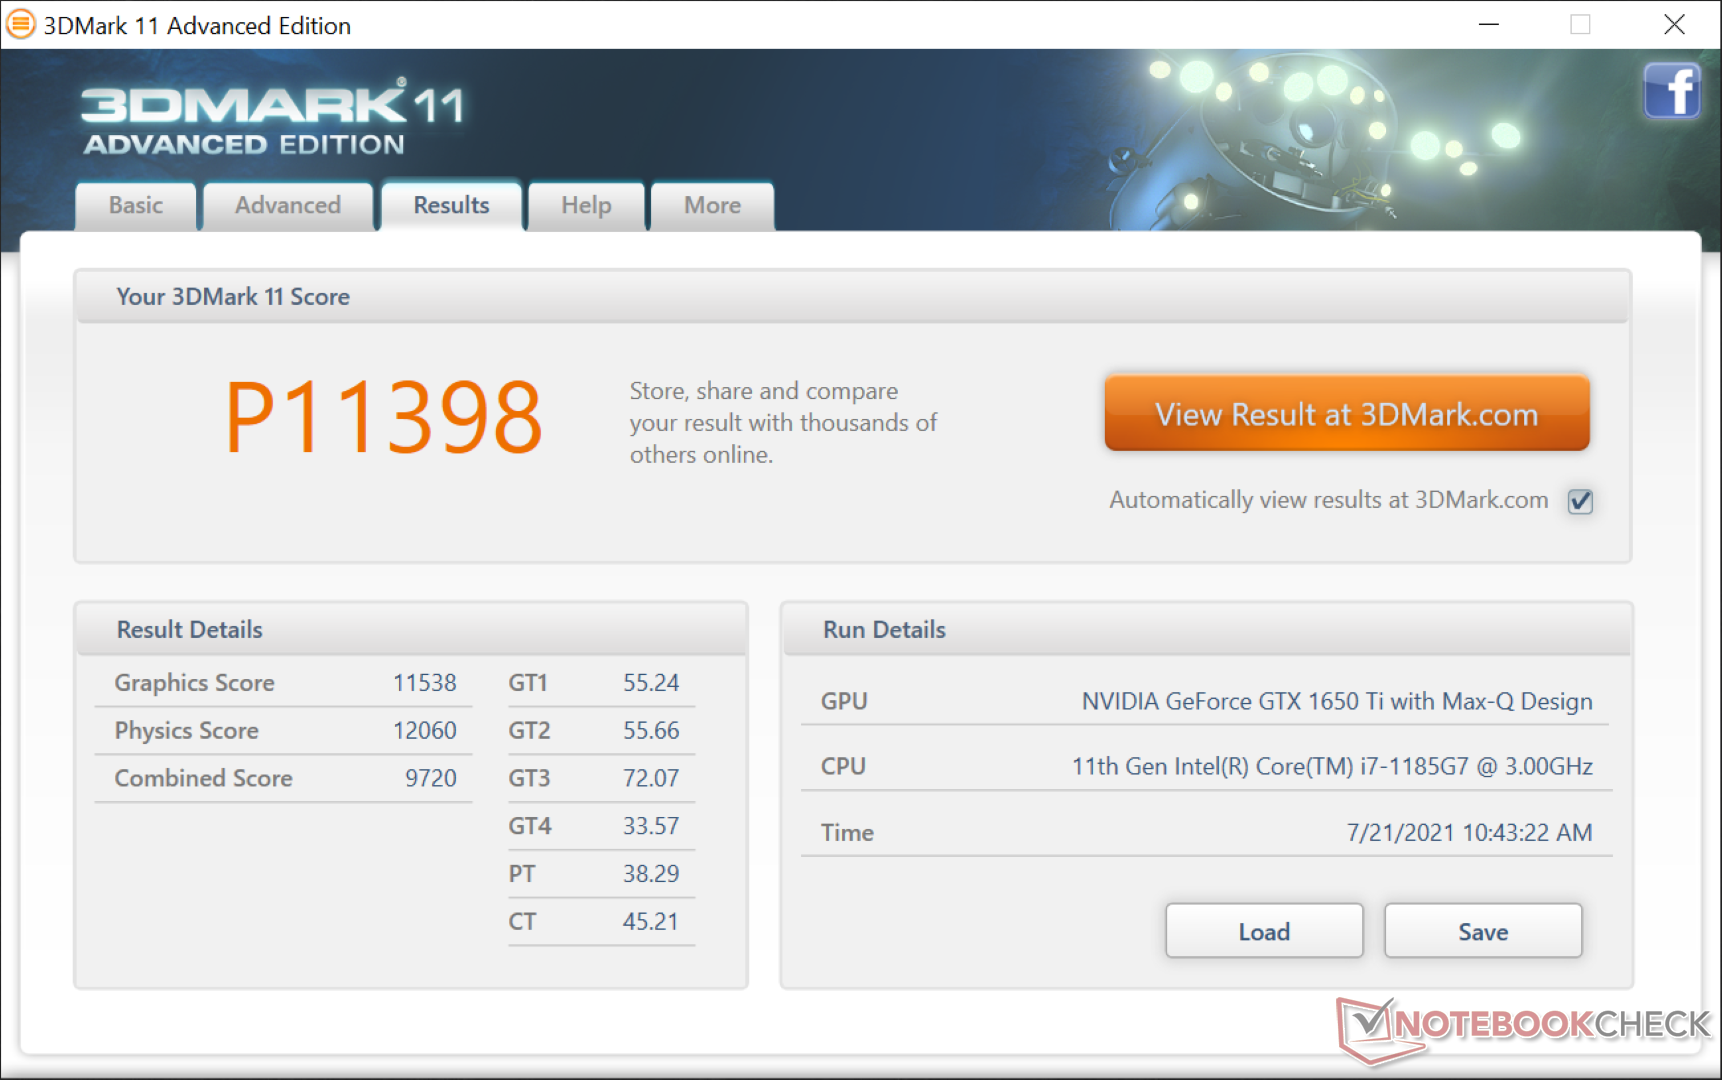
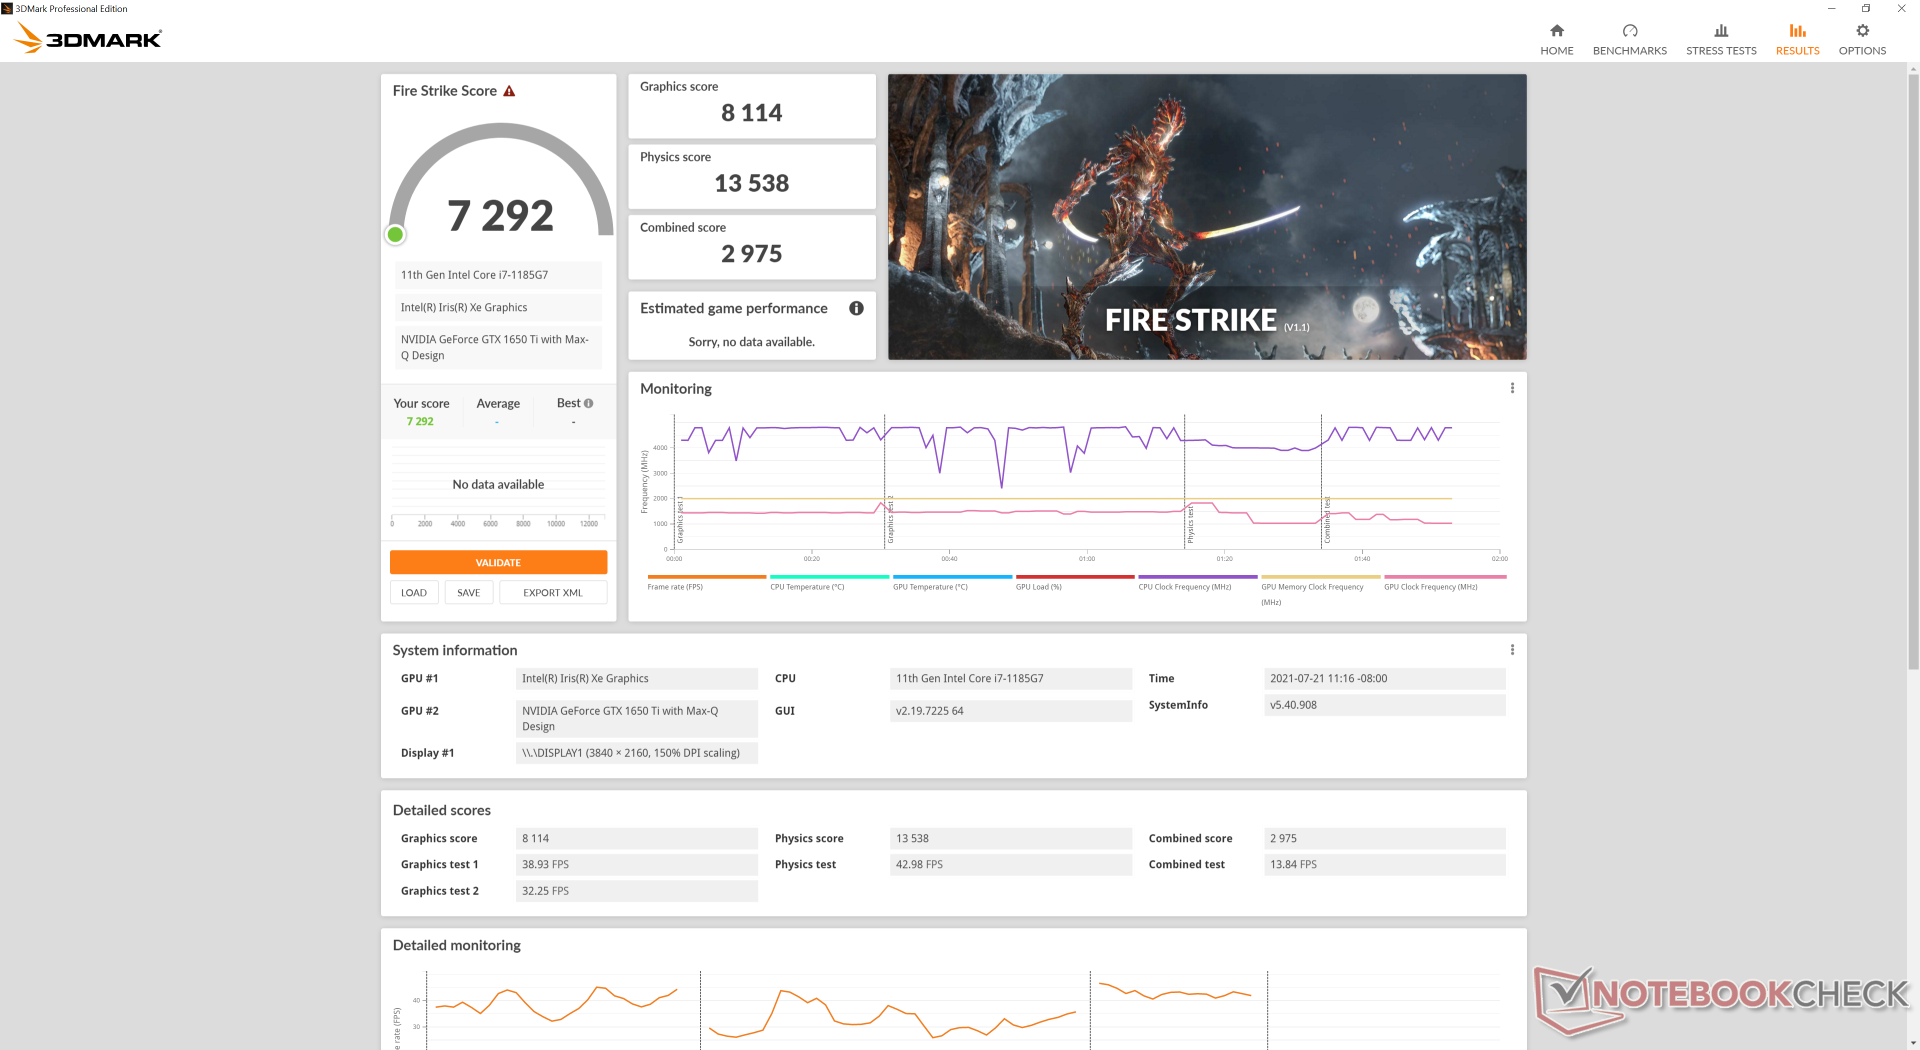
| 3DMark 11 Performance | 11398 points | |
| 3DMark Cloud Gate Standard Score | 19479 points | |
| 3DMark Fire Strike Score | 7292 points | |
| 3DMark Time Spy Score | 3015 points | |
Help | ||
Witcher 3 FPS Chart
| low | med. | high | ultra | QHD | 4K | |
|---|---|---|---|---|---|---|
| GTA V (2015) | 167 | 157 | 73.2 | 37.1 | 26 | 24.8 |
| The Witcher 3 (2015) | 144.3 | 76.3 | 47.9 | 25.3 | 19.3 | |
| Dota 2 Reborn (2015) | 142 | 118 | 113 | 103 | 41.5 | |
| Final Fantasy XV Benchmark (2018) | 72 | 38.3 | 26.1 | 19.3 | 10.1 | |
| X-Plane 11.11 (2018) | 93.9 | 80.7 | 69.7 | 39.2 | ||
| Far Cry 5 (2018) | 90 | 46 | 42 | 39 | 27 | 14 |
| Strange Brigade (2018) | 167 | 68.6 | 54.9 | 47.9 | 35 | 21.4 |
| Assassin´s Creed Valhalla (2020) | 47 | 30 | 19 | 12 | 12 | 5 |
Emissions
System Noise — High-Pitched Fan
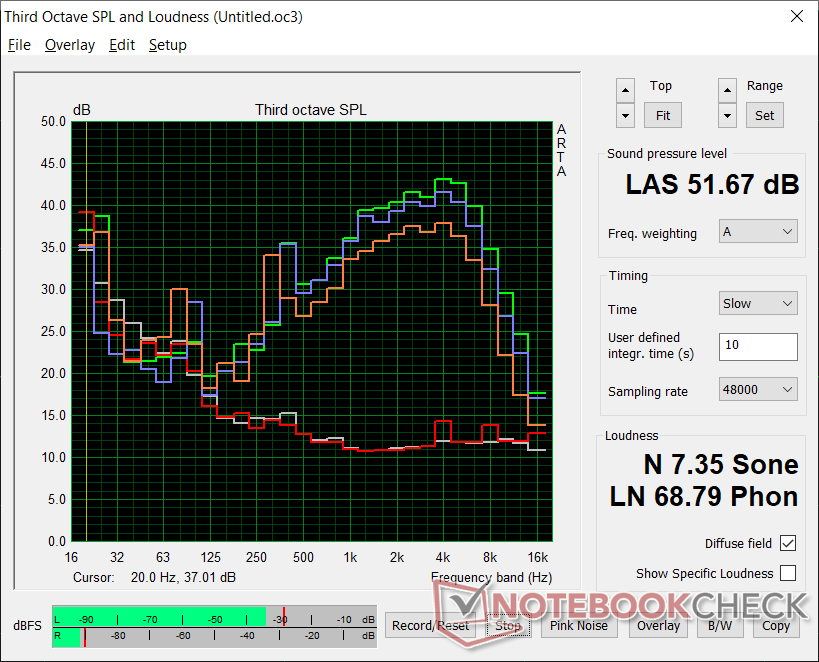
The fans are generally quiet at up to 30.5 dB(A) against a silent background of 23.9 dB(A) when browsing or video streaming. The low 30 dB(A) is loud enough to be noticeable but still quiet enough to be unobtrusive. Slight coil whine or electronic noise on our test unit, however, prevents it from being truly silent.
Running higher loads will ramp up the fan quite quickly. For example, the fan would reach 50 dB(A) when running the first benchmark scene of 3DMark 06 to be much louder than what we've recorded on other Ultrabooks by more than 10 dB(A) in many cases.
Enabling Cooler Boost mode (i.e., Turbo mode) will raise the fan noise ceiling from 50 dB(A) to 51.7 dB(A).
| MSI Summit E14 A11SCS GeForce GTX 1650 Ti Max-Q, i7-1185G7, Phison 1TB SM2801T24GKBB4S-E162 | MSI Modern 14 B11SB-085 GeForce MX450, i7-1165G7, Kingston OM8PCP3512F-AB | ADATA XPG Xenia 14 Iris Xe G7 96EUs, i7-1165G7, ADATA XPG Gammix S50 Lite 512GB | VAIO Z VJZ141C11L Iris Xe G7 96EUs, i7-11375H, Samsung PM9A1 MZVL2512HCJQ | |
|---|---|---|---|---|
| Noise | -3% | 6% | -3% | |
| off / environment * (dB) | 23.9 | 26 -9% | 25.2 -5% | 26.1 -9% |
| Idle Minimum * (dB) | 24.2 | 26 -7% | 25.2 -4% | 26.1 -8% |
| Idle Average * (dB) | 24.2 | 26 -7% | 26.5 -10% | 26.1 -8% |
| Idle Maximum * (dB) | 24.2 | 26 -7% | 26.5 -10% | 29.9 -24% |
| Load Average * (dB) | 50.2 | 46.3 8% | 30.9 38% | 36.3 28% |
| Witcher 3 ultra * (dB) | 47 | 46.3 1% | 37.4 20% | 43.7 7% |
| Load Maximum * (dB) | 51.7 | 52.9 -2% | 46.7 10% | 55.4 -7% |
* ... smaller is better
Noise level
| Idle |
| 24.2 / 24.2 / 24.2 dB(A) |
| Load |
| 50.2 / 51.7 dB(A) |
 | ||
30 dB silent 40 dB(A) audible 50 dB(A) loud |
||
min: | ||
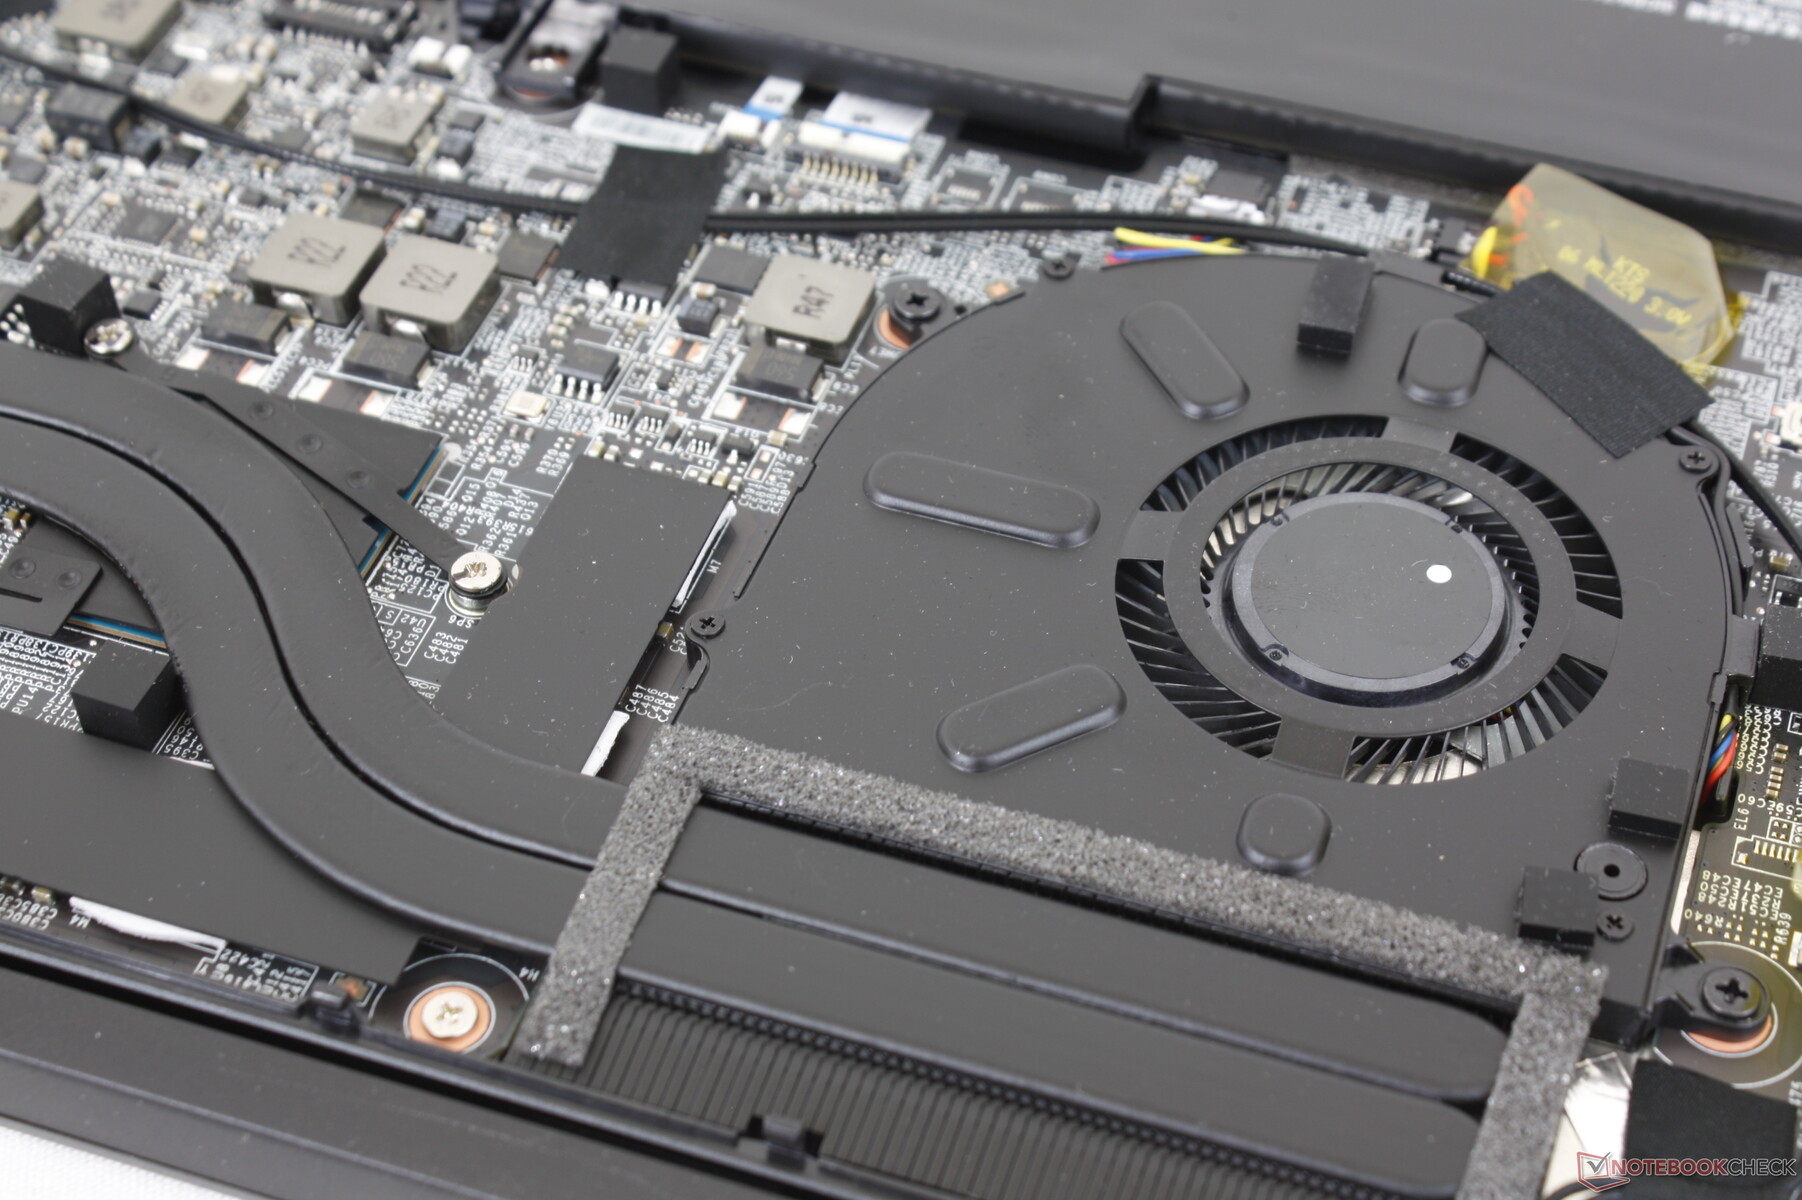
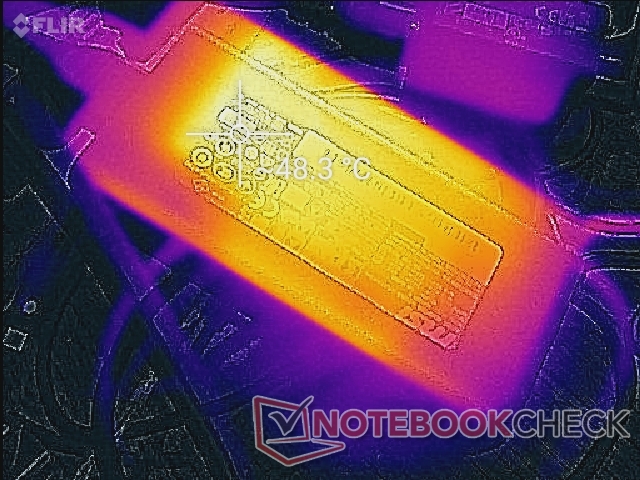
Temperature — Very Warm Hot Spots
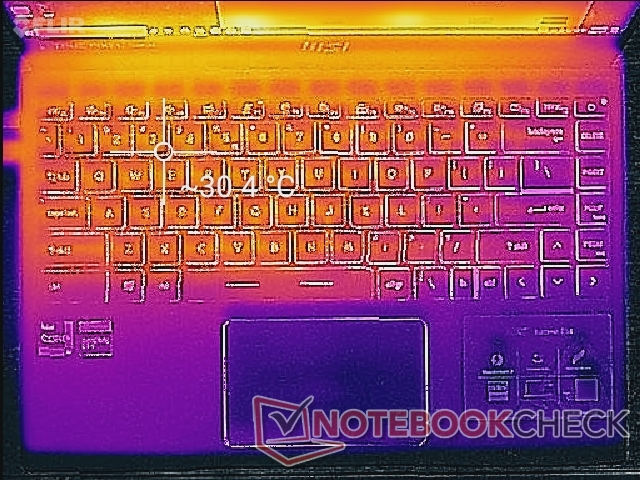
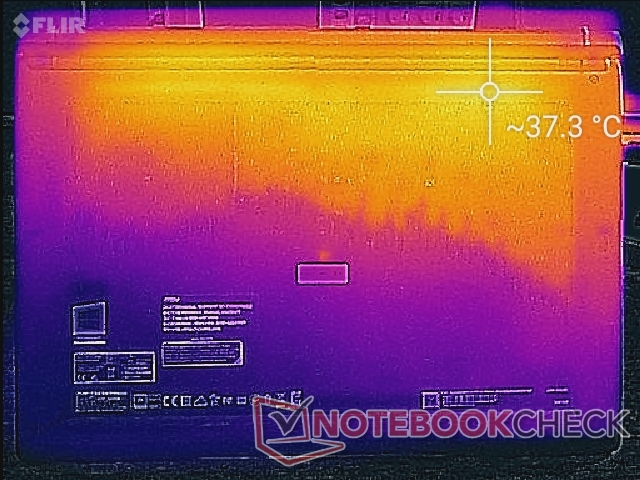
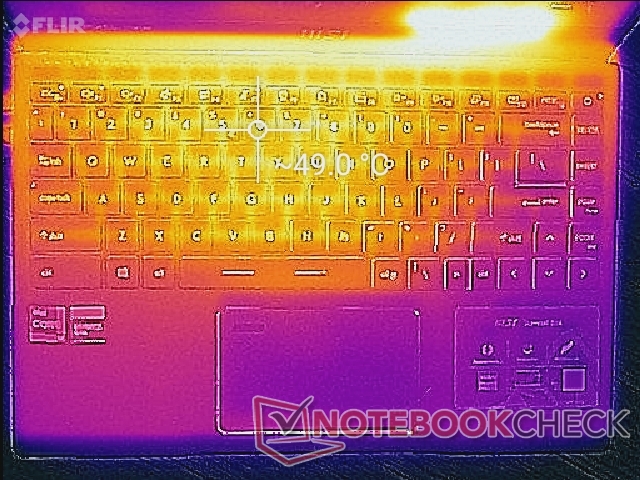
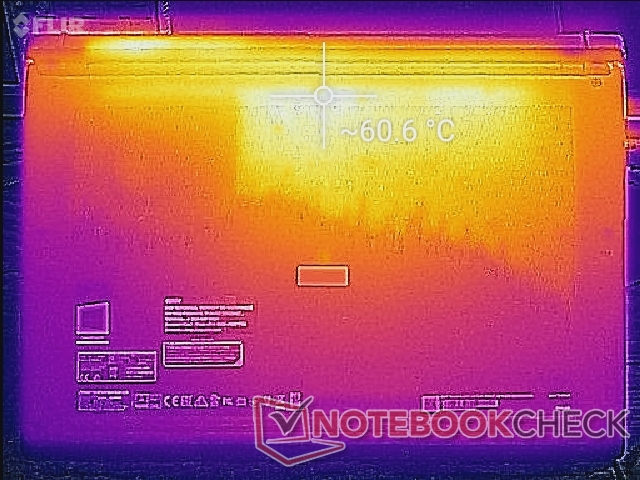
Surface temperatures are very warm likely owing to the fact that there is a GeForce GTX GPU stuffed inside an Ultrabook-size chassis. Hot spots when idling on desktop can be as warm as 37 C as shown by our temperature maps below compared to just 29 C on the Prestige 14 Evo with no dedicated graphics. When running high loads like games, the keyboard center and bottom rear can be as warm as 49 C and 61 C, respectively, which is warmer than on most ULV Ultrabooks and even warmer than we recorded on the more powerful Razer Blade 14.

(-) The maximum temperature on the upper side is 49.4 °C / 121 F, compared to the average of 34.3 °C / 94 F, ranging from 21.2 to 62.5 °C for the class Office.
(-) The bottom heats up to a maximum of 60.6 °C / 141 F, compared to the average of 36.8 °C / 98 F
(+) In idle usage, the average temperature for the upper side is 27.8 °C / 82 F, compared to the device average of 29.5 °C / 85 F.
(+) The palmrests and touchpad are reaching skin temperature as a maximum (34.2 °C / 93.6 F) and are therefore not hot.
(-) The average temperature of the palmrest area of similar devices was 27.5 °C / 81.5 F (-6.7 °C / -12.1 F).
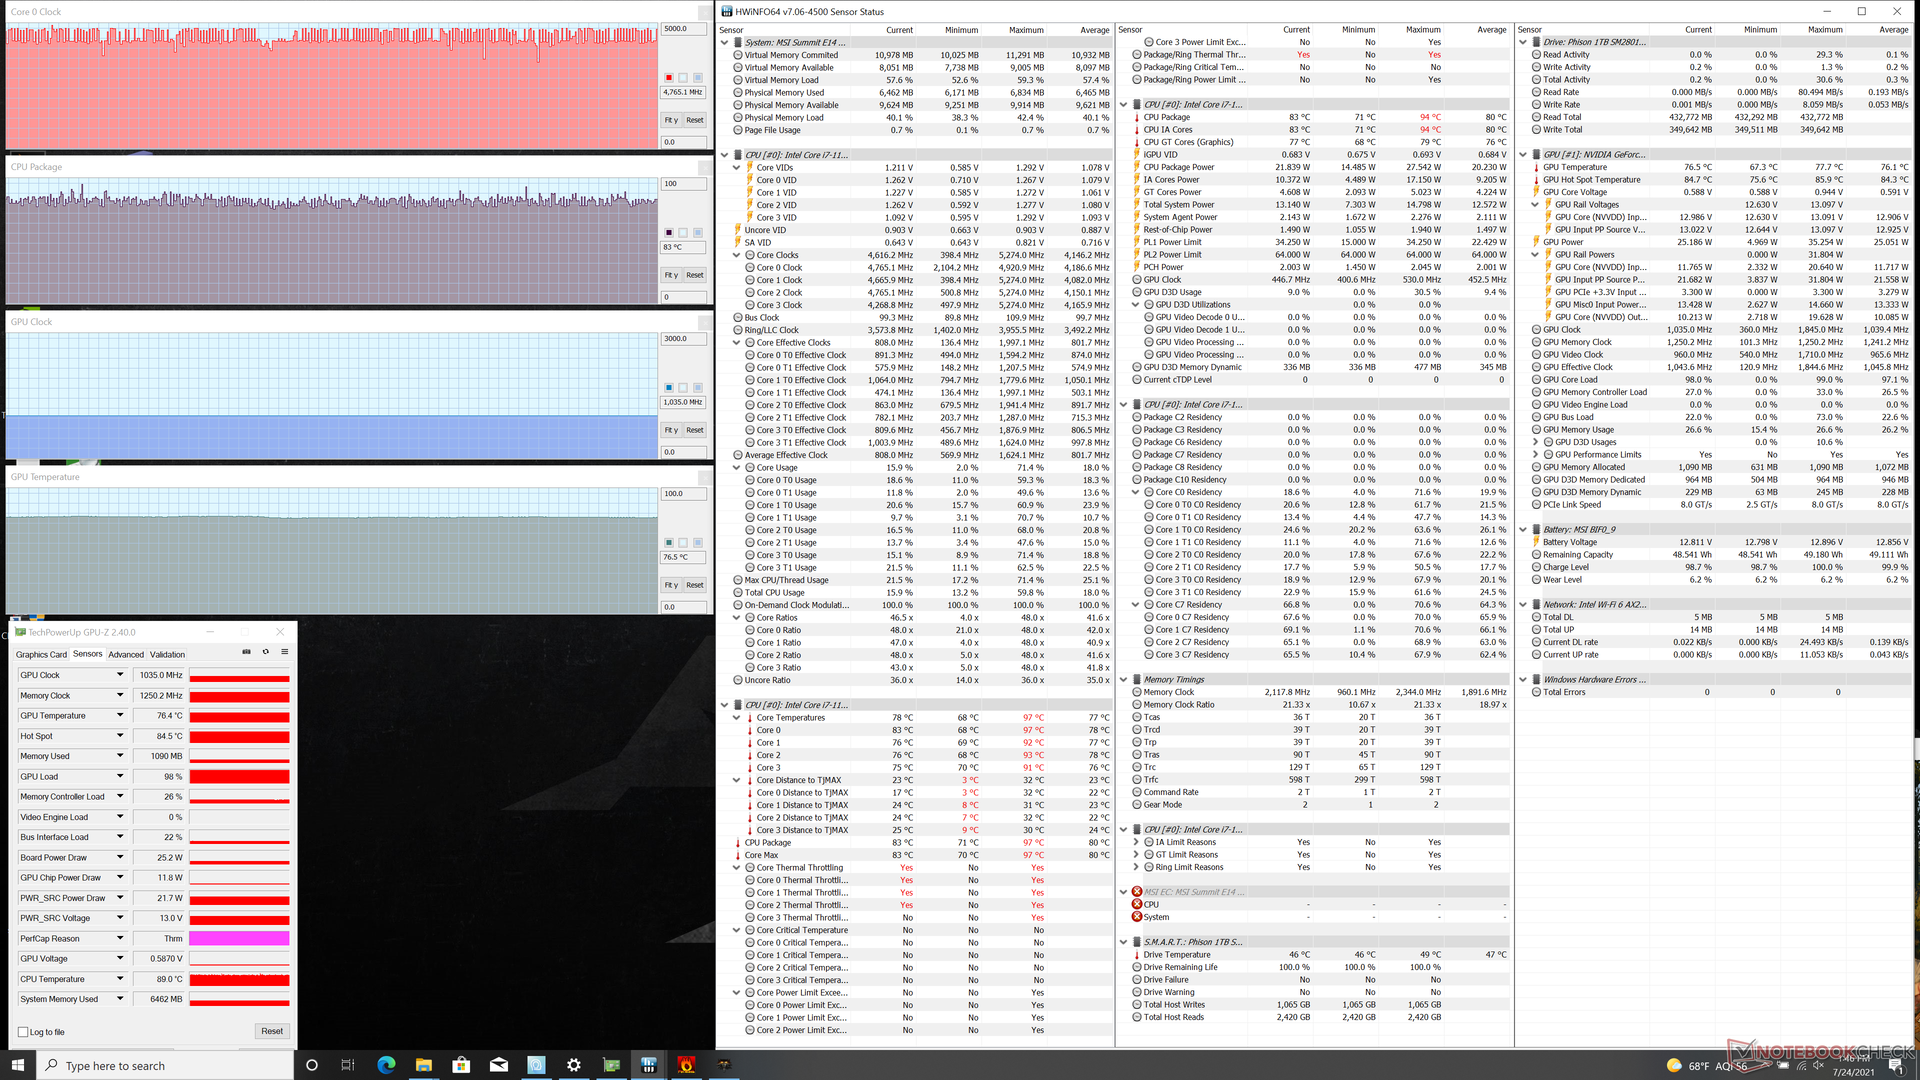
Stress Test
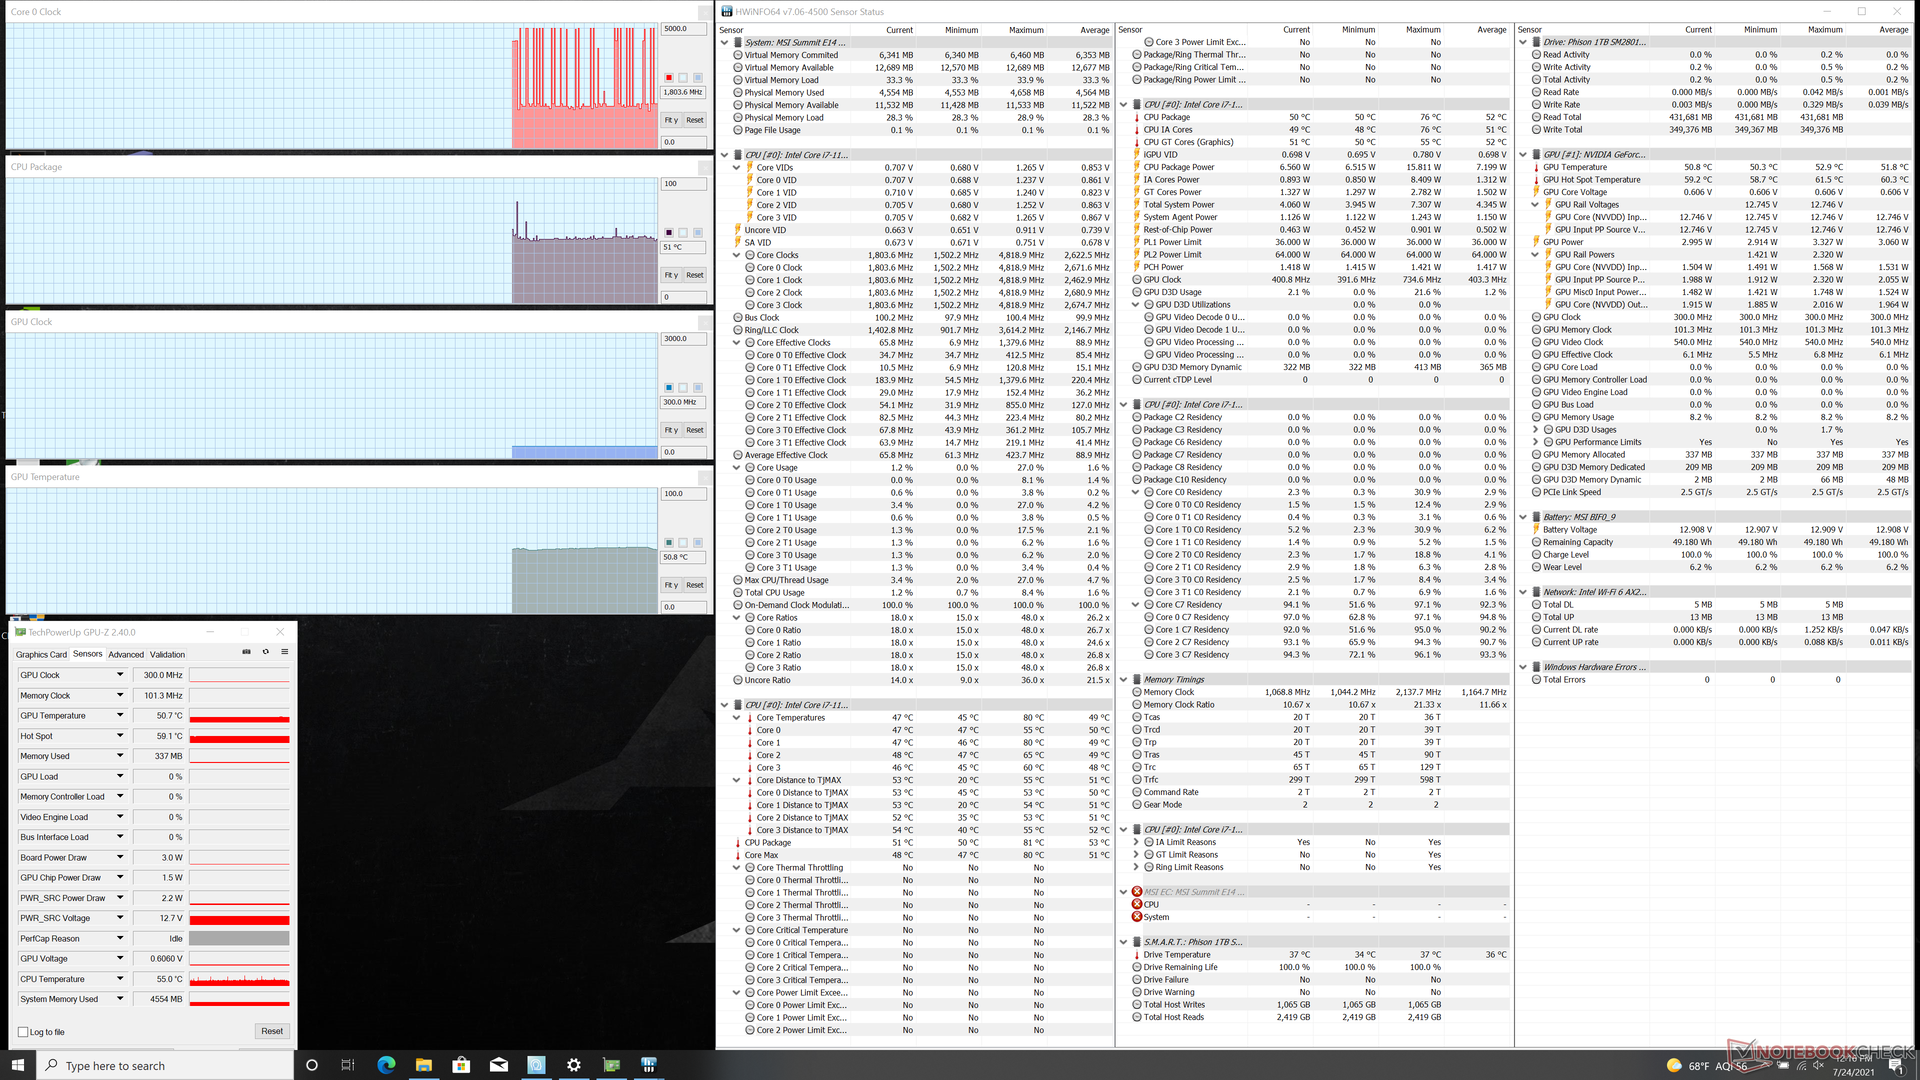
When running Prime95, the CPU would boost to 3.6 GHz for about 2 to 3 seconds before falling to 3.2 GHz for the next 20 seconds. Core temperature would plateau at a high 94 C during this initial period as well. Thereafter, clock rates would dip even further to the 3.0 to 3.1 GHz range in order to maintain a slightly cooler 91 C temperature. In comparison, the same Core i7-1185G7 CPU in the HP Dragonfly Max would stabilize at a cooler 63 C to 71 C temperature range and slower 1.2 to 1.5 GHz clock rate range when under similar conditions.
When running Witcher 3, the CPU and GPU would stabilize at 83 C and 77 C, respectively. CPU temperature and clock rate would stabilize at cooler and slower values, respectively, if Cooler Boost is disabled as shown by the table and screenshots below.
Running on batteries will impact performance just slightly. A 3DMark 11 test on battery power would result in Physics and Graphics scores of 11508 and 10544 points, respectively, compared to 12060 and 11538 points when on mains.
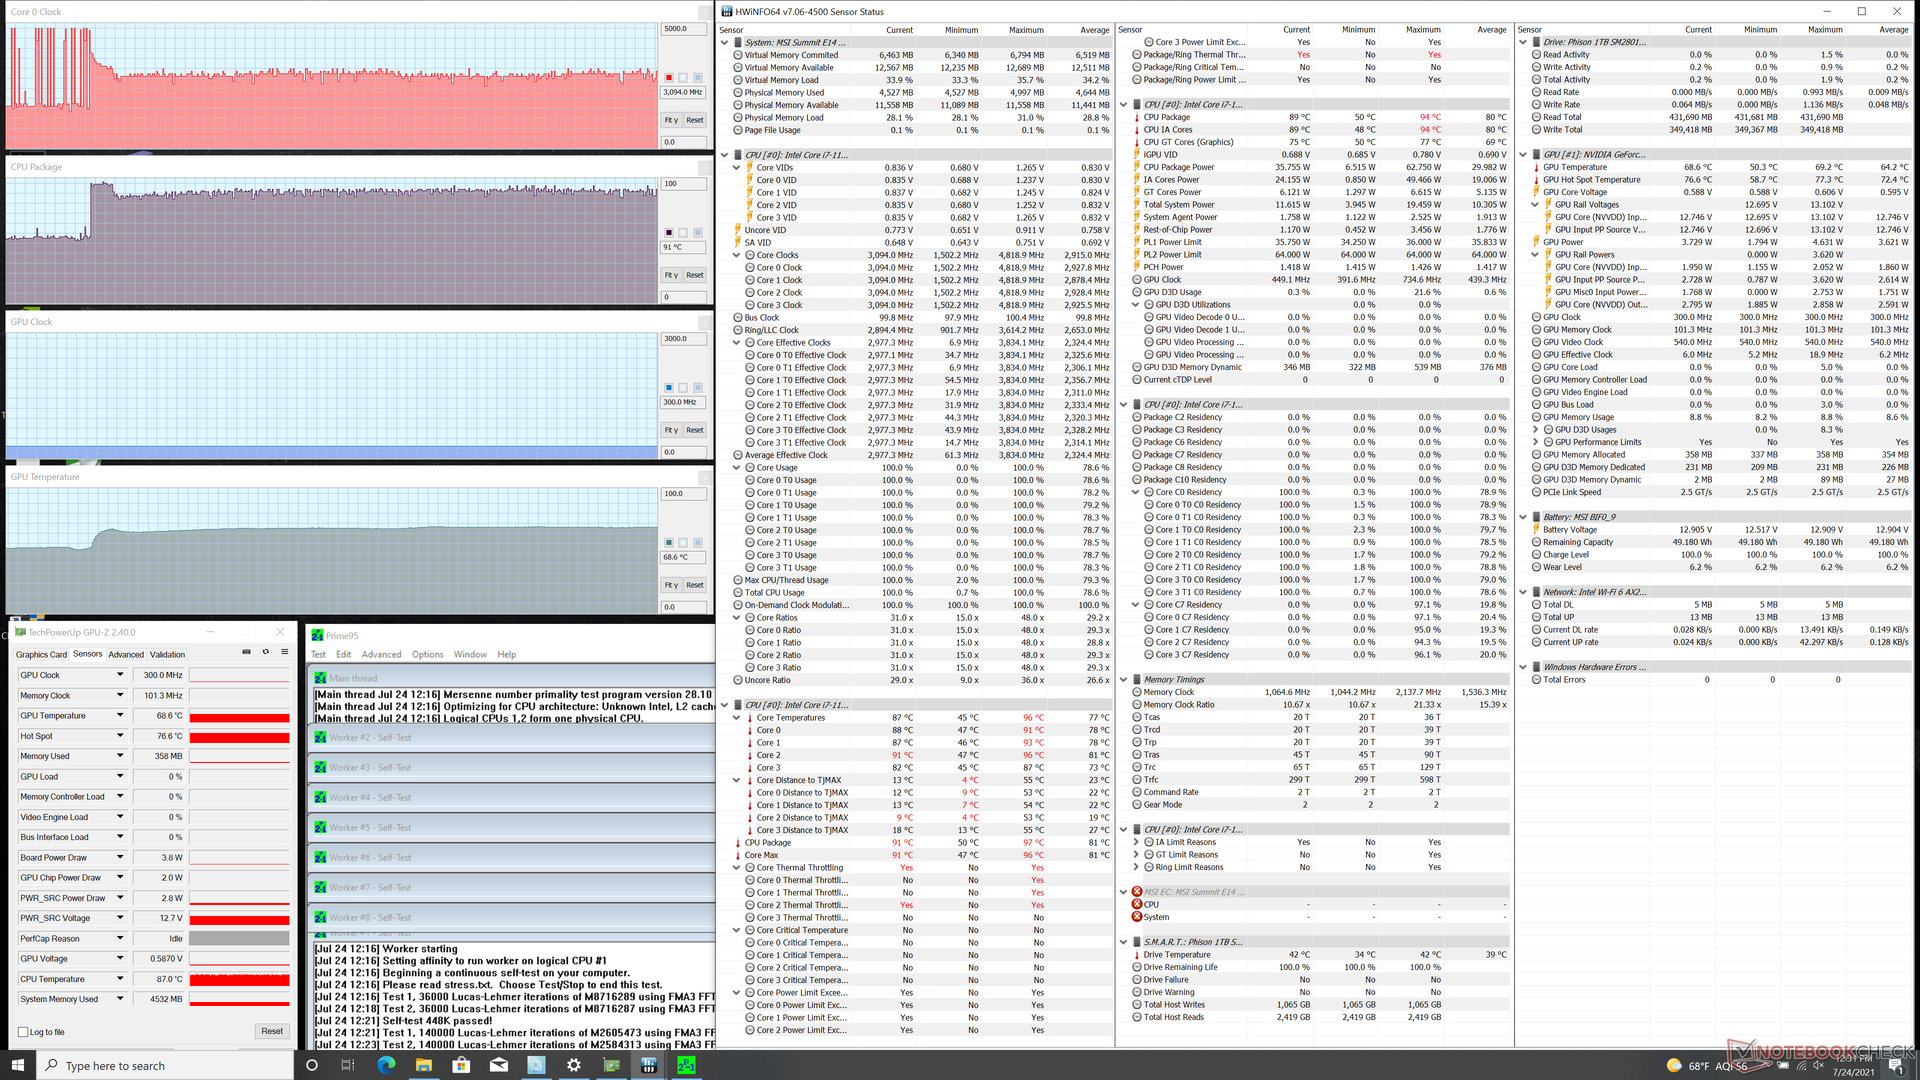
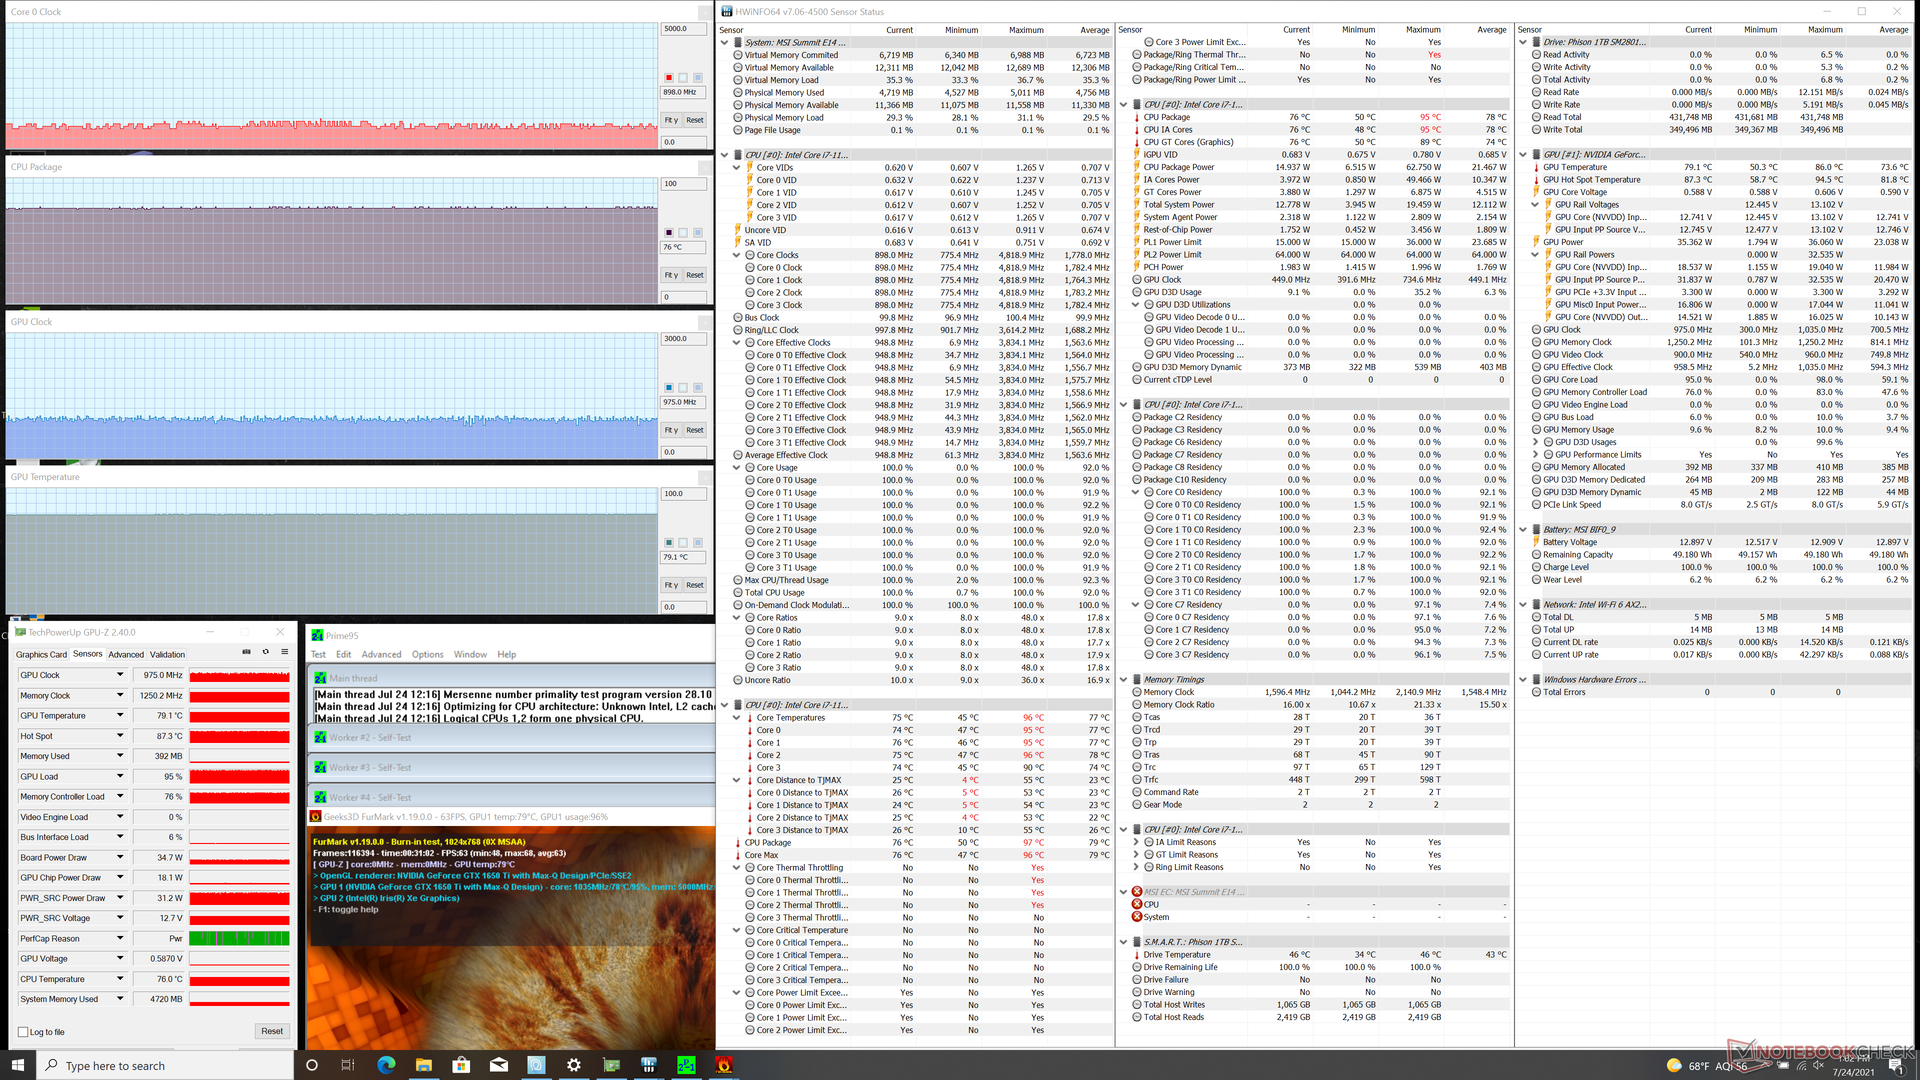
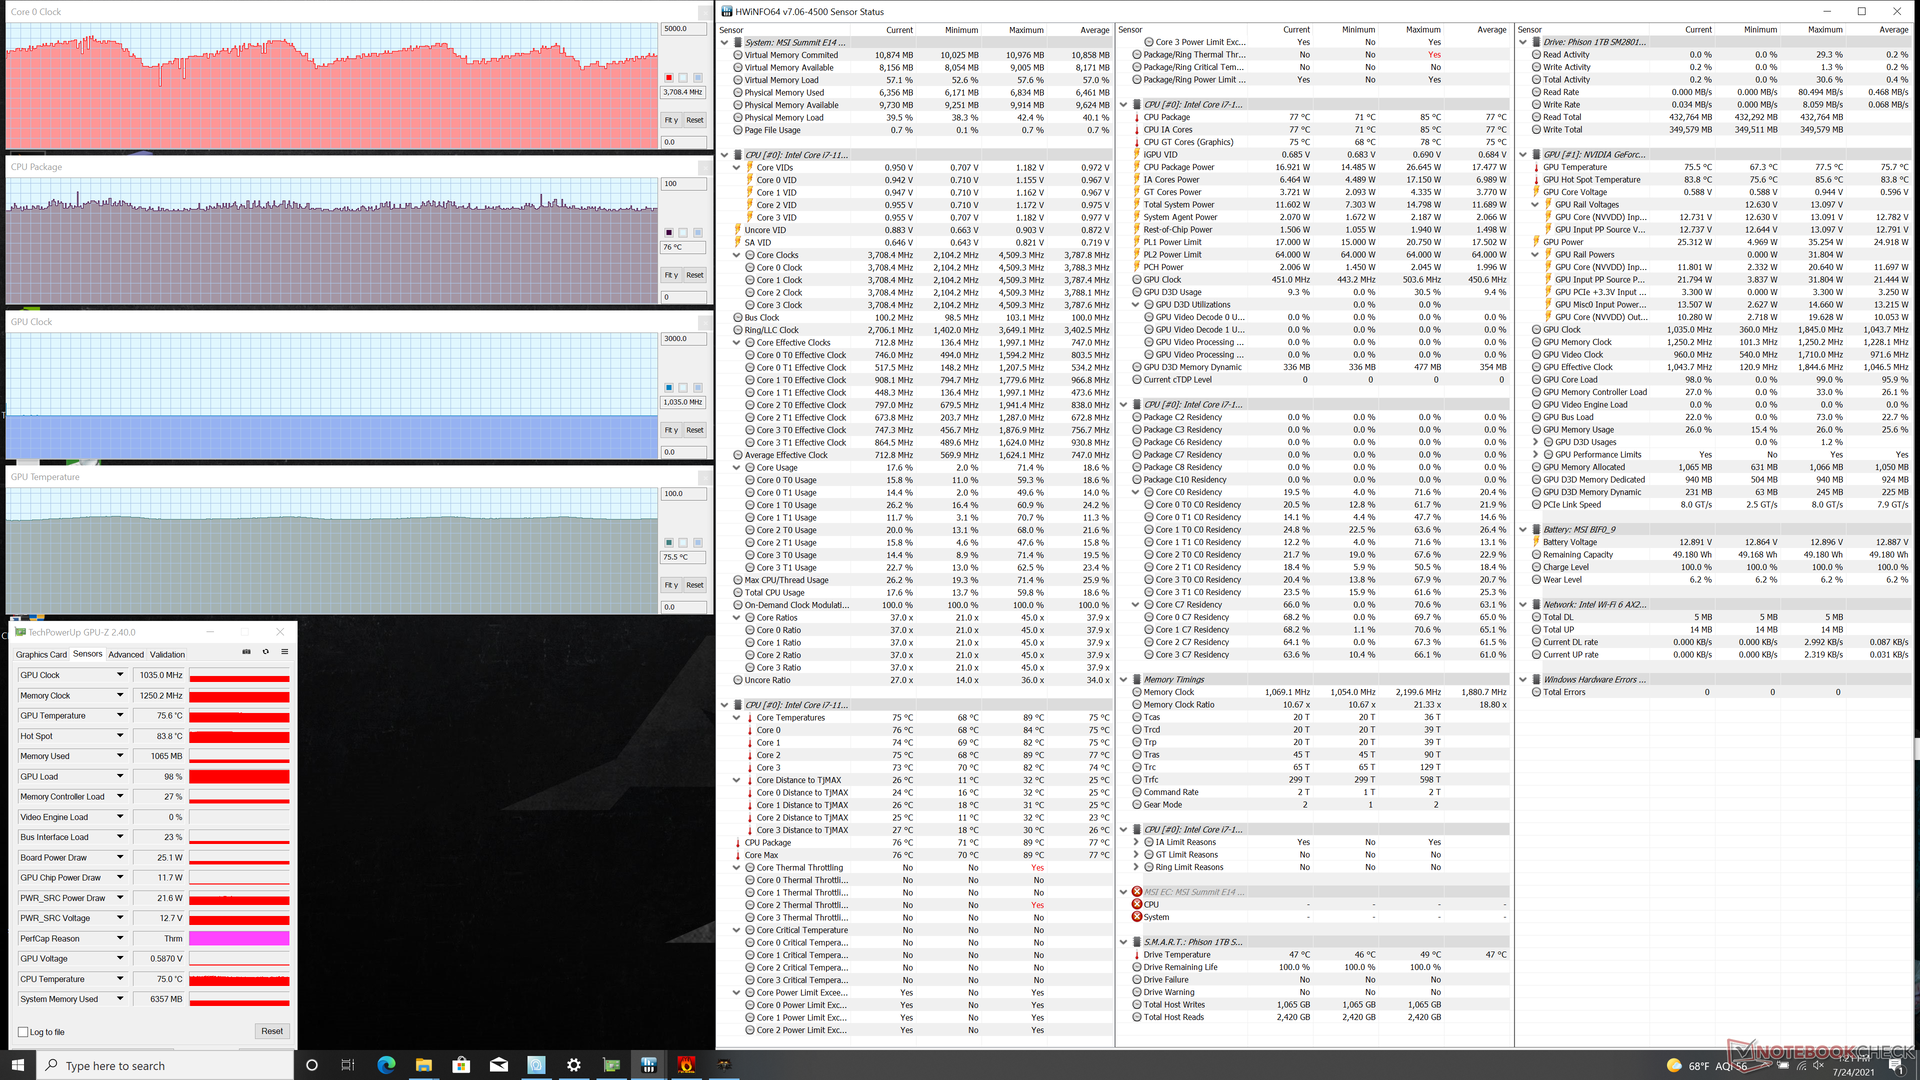
| CPU Clock (GHz) | GPU Clock (MHz) | Average CPU Temperature (°C) | Average GPU Temperature (°C) | |
| System Idle | -- | -- | 51 | 51 |
| Prime95 Stress | ~3.0 | -- | 91 | 69 |
| Prime95 + FurMark Stress | 0.9 | 975 | 76 | 79 |
| Witcher 3 Stress (Cooler Boost off) | 3.4 - 4.2 | 1035 | 76 | 76 |
| Witcher 3 Stress (Cooler Boost on) | 4.4 - 4.7 | 1035 | 83 | 77 |
Speakers


MSI Summit E14 A11SCS audio analysis
(±) | speaker loudness is average but good (80.6 dB)
Bass 100 - 315 Hz
(-) | nearly no bass - on average 25.6% lower than median
(±) | linearity of bass is average (9.6% delta to prev. frequency)
Mids 400 - 2000 Hz
(±) | higher mids - on average 6.8% higher than median
(±) | linearity of mids is average (8.6% delta to prev. frequency)
Highs 2 - 16 kHz
(+) | balanced highs - only 2.8% away from median
(+) | highs are linear (3.4% delta to prev. frequency)
Overall 100 - 16.000 Hz
(±) | linearity of overall sound is average (21.7% difference to median)
Compared to same class
» 55% of all tested devices in this class were better, 9% similar, 36% worse
» The best had a delta of 7%, average was 21%, worst was 53%
Compared to all devices tested
» 62% of all tested devices were better, 7% similar, 31% worse
» The best had a delta of 4%, average was 23%, worst was 134%
Apple MacBook 12 (Early 2016) 1.1 GHz audio analysis
(+) | speakers can play relatively loud (83.6 dB)
Bass 100 - 315 Hz
(±) | reduced bass - on average 11.3% lower than median
(±) | linearity of bass is average (14.2% delta to prev. frequency)
Mids 400 - 2000 Hz
(+) | balanced mids - only 2.4% away from median
(+) | mids are linear (5.5% delta to prev. frequency)
Highs 2 - 16 kHz
(+) | balanced highs - only 2% away from median
(+) | highs are linear (4.5% delta to prev. frequency)
Overall 100 - 16.000 Hz
(+) | overall sound is linear (10.2% difference to median)
Compared to same class
» 7% of all tested devices in this class were better, 2% similar, 90% worse
» The best had a delta of 5%, average was 18%, worst was 53%
Compared to all devices tested
» 5% of all tested devices were better, 1% similar, 94% worse
» The best had a delta of 4%, average was 23%, worst was 134%
Energy Management
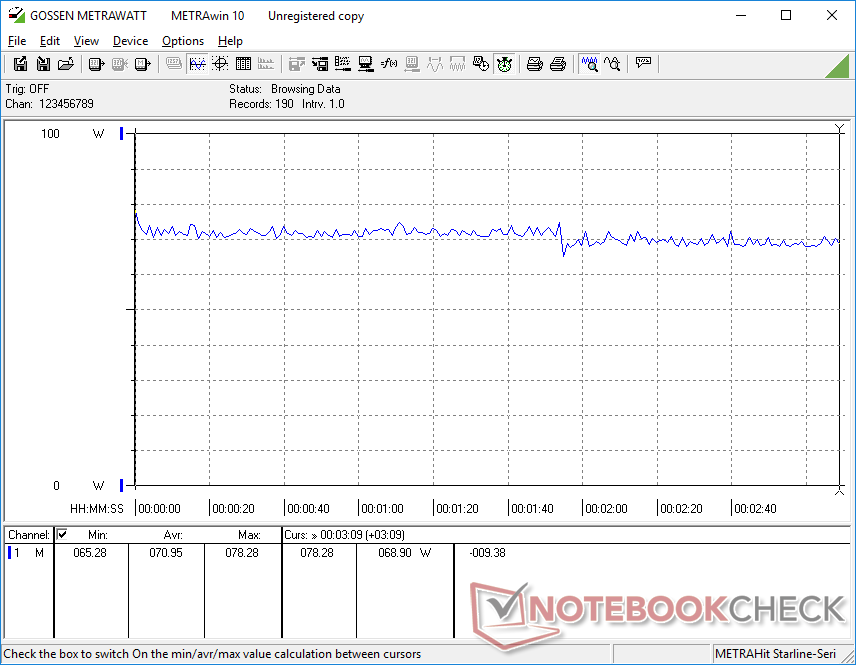
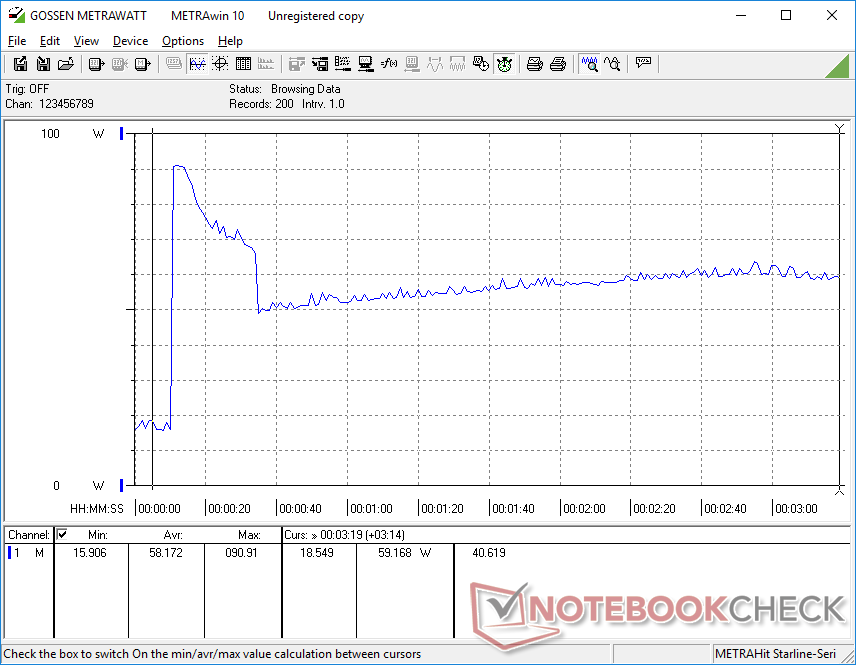
Power Consumption — Higher Than Most Ultrabooks
Power consumption readings are relatively high when idling which may explain the poor battery life in our next section. Simply sitting on desktop at the lowest brightness setting with Power Saver mode and the integrated GPU active would consume almost 10 W to be 2x or 3x more than other 14-inch laptops under similar conditions.
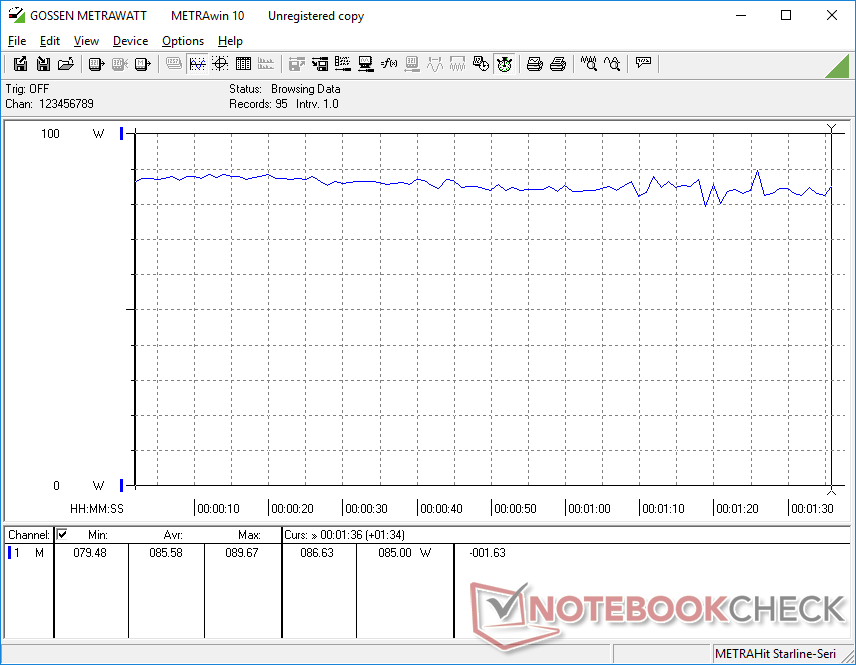
Performance-per-watt is still excellent when running high loads. Gaming, for example, would consume 70 W to 86 W compared to 66 W on the slower MX450-powered Modern 14.
Battery charge will not decrease when running high loads while connected to an outlet. Battery charge rate, however, will slow to a crawl.
| Off / Standby | |
| Idle | |
| Load |
|
Key:
min: | |
| MSI Summit E14 A11SCS i7-1185G7, GeForce GTX 1650 Ti Max-Q, Phison 1TB SM2801T24GKBB4S-E162, IPS, 3840x2160, 14" | MSI Modern 14 B11SB-085 i7-1165G7, GeForce MX450, Kingston OM8PCP3512F-AB, IPS, 1920x1080, 14" | MSI Prestige 14 Evo A11M-005 i7-1185G7, Iris Xe G7 96EUs, Phison 512GB SM280512GKBB4S-E162, IPS-Level, 1920x1080, 14" | ADATA XPG Xenia 14 i7-1165G7, Iris Xe G7 96EUs, ADATA XPG Gammix S50 Lite 512GB, IPS, 1920x1200, 14" | Lenovo ThinkPad T14s G2 20WM003TGE i7-1165G7, Iris Xe G7 96EUs, Samsung PM981a MZVLB1T0HBLR, IPS LED, 1920x1080, 14" | VAIO Z VJZ141C11L i7-11375H, Iris Xe G7 96EUs, Samsung PM9A1 MZVL2512HCJQ, IPS, 3840x2160, 14" | |
|---|---|---|---|---|---|---|
| Power Consumption | 36% | 45% | 52% | 58% | 27% | |
| Idle Minimum * (Watt) | 9.9 | 3 70% | 5 49% | 2.9 71% | 2.2 78% | 9.5 4% |
| Idle Average * (Watt) | 17.4 | 6.3 64% | 7 60% | 5.5 68% | 5.5 68% | 13.7 21% |
| Idle Maximum * (Watt) | 22.5 | 10.3 54% | 11 51% | 5.9 74% | 6.1 73% | 14.4 36% |
| Load Average * (Watt) | 85.6 | 66 23% | 54 37% | 44.4 48% | 41.3 52% | 54.3 37% |
| Witcher 3 ultra * (Watt) | 70.9 | 66.6 6% | 39 45% | 46.6 34% | 34.5 51% | 46.1 35% |
| Load Maximum * (Watt) | 91.1 | 90.6 1% | 65 29% | 76.4 16% | 67.3 26% | 65.5 28% |
* ... smaller is better
Power Consumption Witcher 3 / Stresstest
Battery Life — Don't Expect Too Much
Runtimes are poor despite the reasonably-sized 52 Wh battery. We're only able to squeeze 4.5 hours of real-world WLAN use when on Balanced mode with the integrated GPU active compared to twice that on the Prestige 14 Evo or ADATA XPG Xenia 14. The maximum runtime we recorded was only 6.5 hours when idling on desktop at the lowest brightness setting and power setting available.
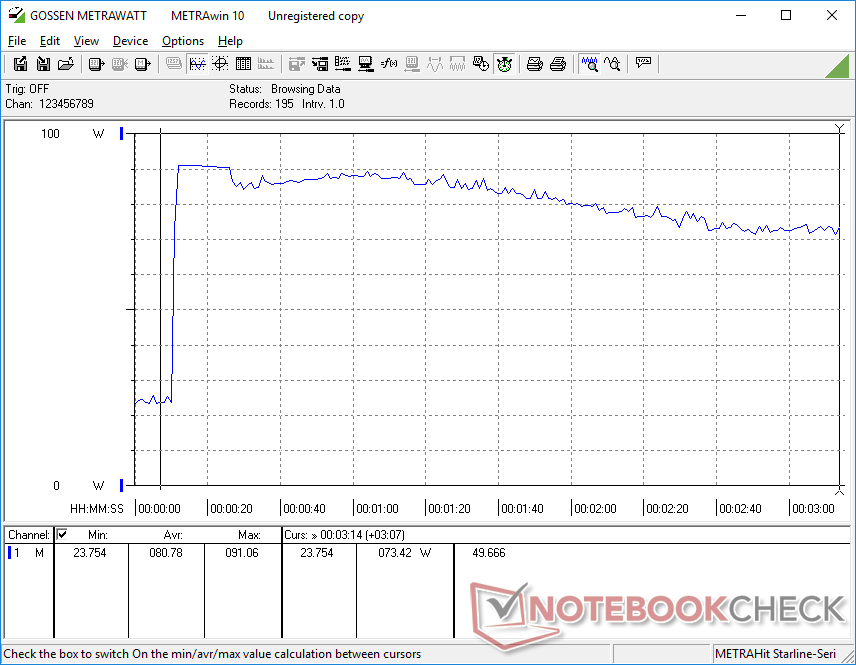
Charging from empty to full capacity is fortunately speedy at just under 80 minutes.
| MSI Summit E14 A11SCS i7-1185G7, GeForce GTX 1650 Ti Max-Q, 52 Wh | MSI Modern 14 B11SB-085 i7-1165G7, GeForce MX450, 52.4 Wh | MSI Prestige 14 Evo A11M-005 i7-1185G7, Iris Xe G7 96EUs, 52.4 Wh | ADATA XPG Xenia 14 i7-1165G7, Iris Xe G7 96EUs, 53 Wh | Lenovo ThinkPad T14s G2 20WM003TGE i7-1165G7, Iris Xe G7 96EUs, 57 Wh | VAIO Z VJZ141C11L i7-11375H, Iris Xe G7 96EUs, 53 Wh | |
|---|---|---|---|---|---|---|
| Battery runtime | 93% | 62% | 120% | 78% | 58% | |
| Reader / Idle (h) | 6.6 | 13.8 109% | ||||
| WiFi v1.3 (h) | 4.5 | 8.7 93% | 7.5 67% | 9.9 120% | 9.7 116% | 7.1 58% |
| Load (h) | 1 | 1.1 10% | 1.4 40% |
Pros
Cons
Verdict — High Performance, High Consequences

Intel Iris Xe and AMD Radeon Vega have made long strides when it comes to integrated graphics, but they are still far behind even elementary Nvidia GTX graphics like the GTX 1650 Ti oftentimes by 2x or more. If you want that extra GPU performance while keeping the travel-friendly weight and form factor of a typical Ultrabook, then the MSI Summit E14 will fulfill those needs. The extra-bright 600-nit display is also a plus and worthy mention.
The MSI Summit E14 packs a ton of power in an Ultrabook-size chassis that performance users will appreciate. Just be prepared for the heat and noise that entail.
All that power in a typical Ultrabook chassis comes at cost. If you plan on running high loads like games or other GPU-intensive applications frequently, then expect both very warm palm rests and high-pitched fan noise. Battery life is also poorer than most other Ultrabooks likely due to the more powerful GPU inside. In short, you would have to accept noticeably higher temperatures, louder fan noise, and shorter runtimes for that significant boost in graphics power.
If you're certain that Nvidia GTX graphics won't be necessary for your daily workloads, then more traditional Ultrabooks with integrated graphics might be better options such as the Spectre x360 13, XPS 13, or Asus ZenBook 14. Such models are built tougher than our MSI system not to mention much less expensive.
Price and availability
MSI Summit E14 A11SCS
- 07/28/2021 v7 (old)
Allen Ngo
Price comparison
