Infinix INBook X1 Pro Laptop Review: Surprisingly Solid All Around

The Infinix INBook X1 Pro is the company's first ever laptop. SKUs start with the Core i3-1005G1 CPU, 8 GB RAM, and 256 GB SSD for about $530 USD up to over $700 USD for our Core i7-1065G7, 16 GB RAM, and 512 GB SSD Pro version as reviewed here. The manufacturer is launching in limited markets for now with older 10th gen Intel parts instead of the newer 11th gen series to keep costs under control.
Competitors in this space include other budget 14-inch Ultrabooks like the Honor MagicBook 14, Asus VivoBook S14, or HP Pavilion 14.
potential competitors in comparison
Rating | Date | Model | Weight | Height | Size | Resolution | Price |
|---|---|---|---|---|---|---|---|
| 80.4 % v7 (old) | 06 / 2021 | Infinix INBook X1 Pro i7-1065G7, Iris Plus Graphics G7 (Ice Lake 64 EU) | 1.5 kg | 16.3 mm | 14.00" | 1920x1080 | |
| 89.1 % v7 (old) | 06 / 2021 | Schenker Vision 14 i7-1165G7, Iris Xe G7 96EUs | 1 kg | 15.6 mm | 14.00" | 2880x1800 | |
| 84.9 % v7 (old) | 05 / 2021 | Honor Magicbook 14 i7-1165G7 i7-1165G7, Iris Xe G7 96EUs | 1.4 kg | 15.9 mm | 14.00" | 1920x1080 | |
| 83.9 % v7 (old) | 04 / 2021 | Lenovo ThinkBook 14 G2 ITL 20VD008WGE i5-1135G7, Iris Xe G7 80EUs | 1.5 kg | 17.9 mm | 14.00" | 1920x1080 | |
| 80.7 % v7 (old) | 07 / 2020 | Asus VivoBook S14 S433FL i7-10510U, GeForce MX250 | 1.4 kg | 16 mm | 14.00" | 1920x1080 | |
| 77.8 % v7 (old) | 01 / 2020 | HP Pavilion 14-ce3040ng i7-1065G7, GeForce MX250 | 1.6 kg | 18 mm | 14.00" | 1920x1080 |
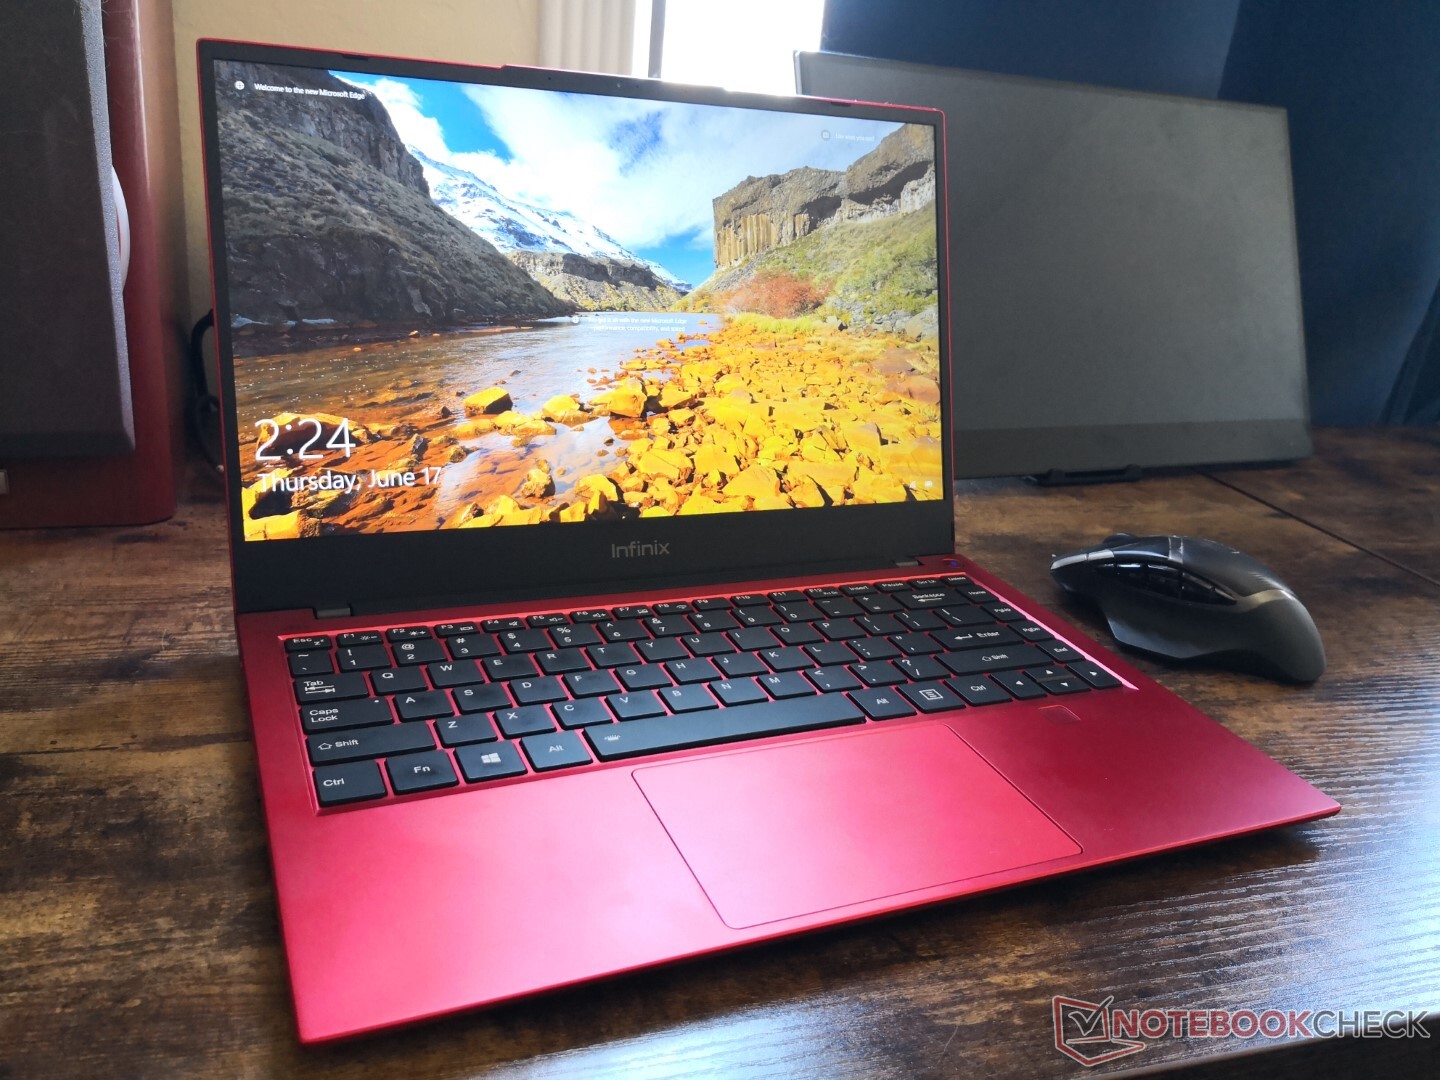
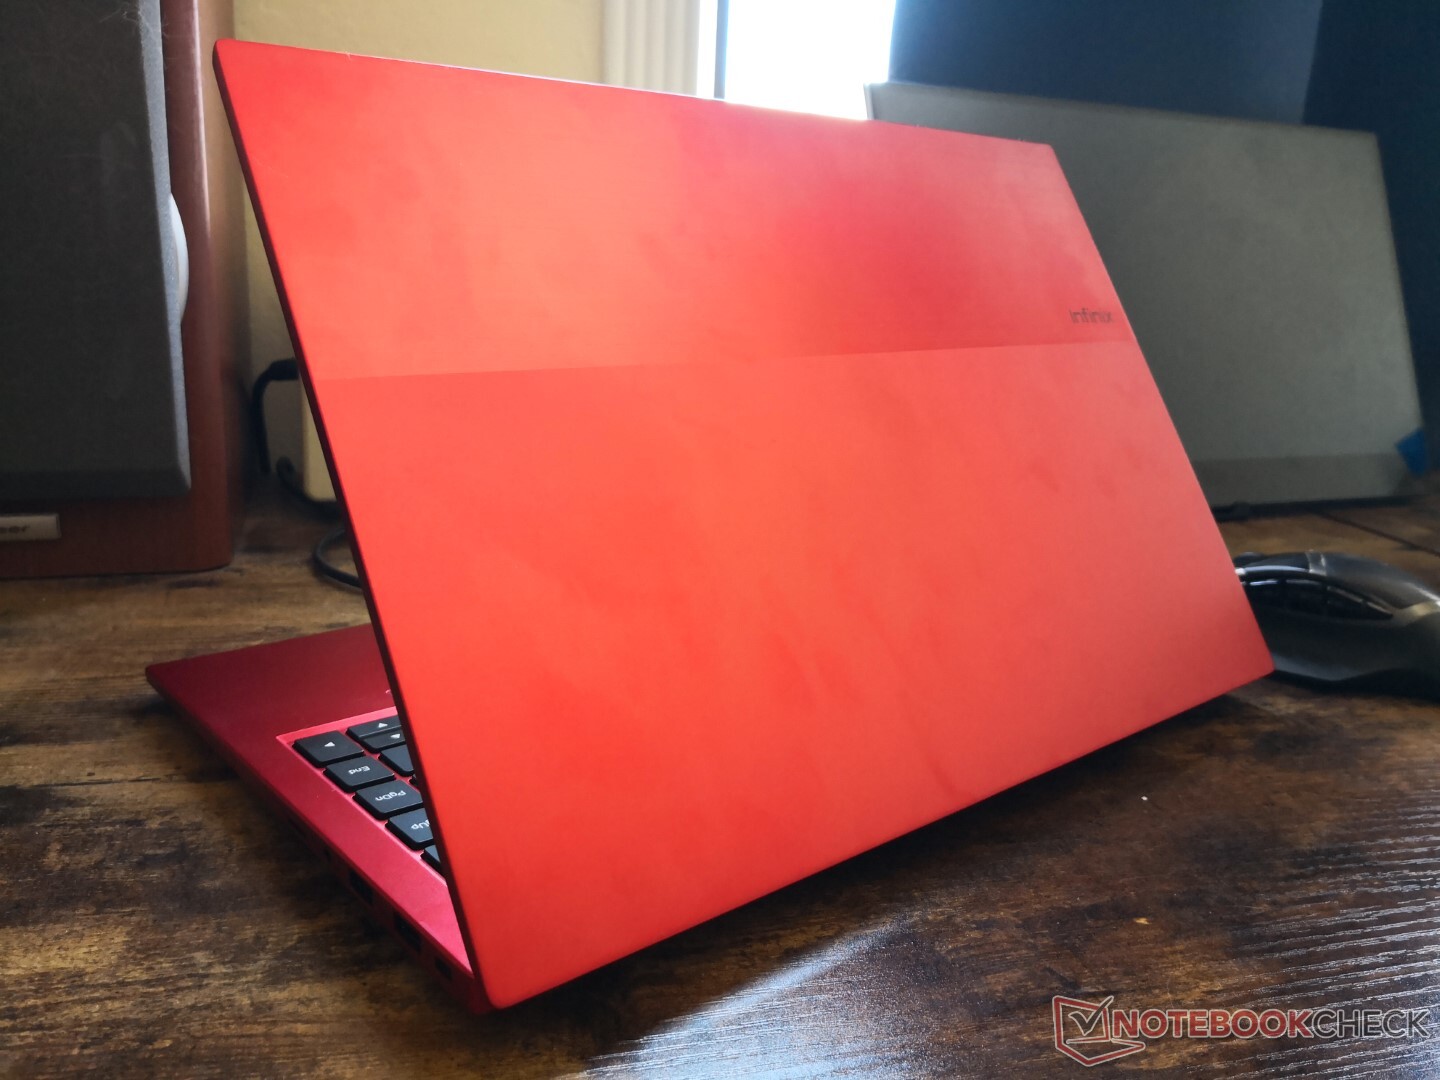
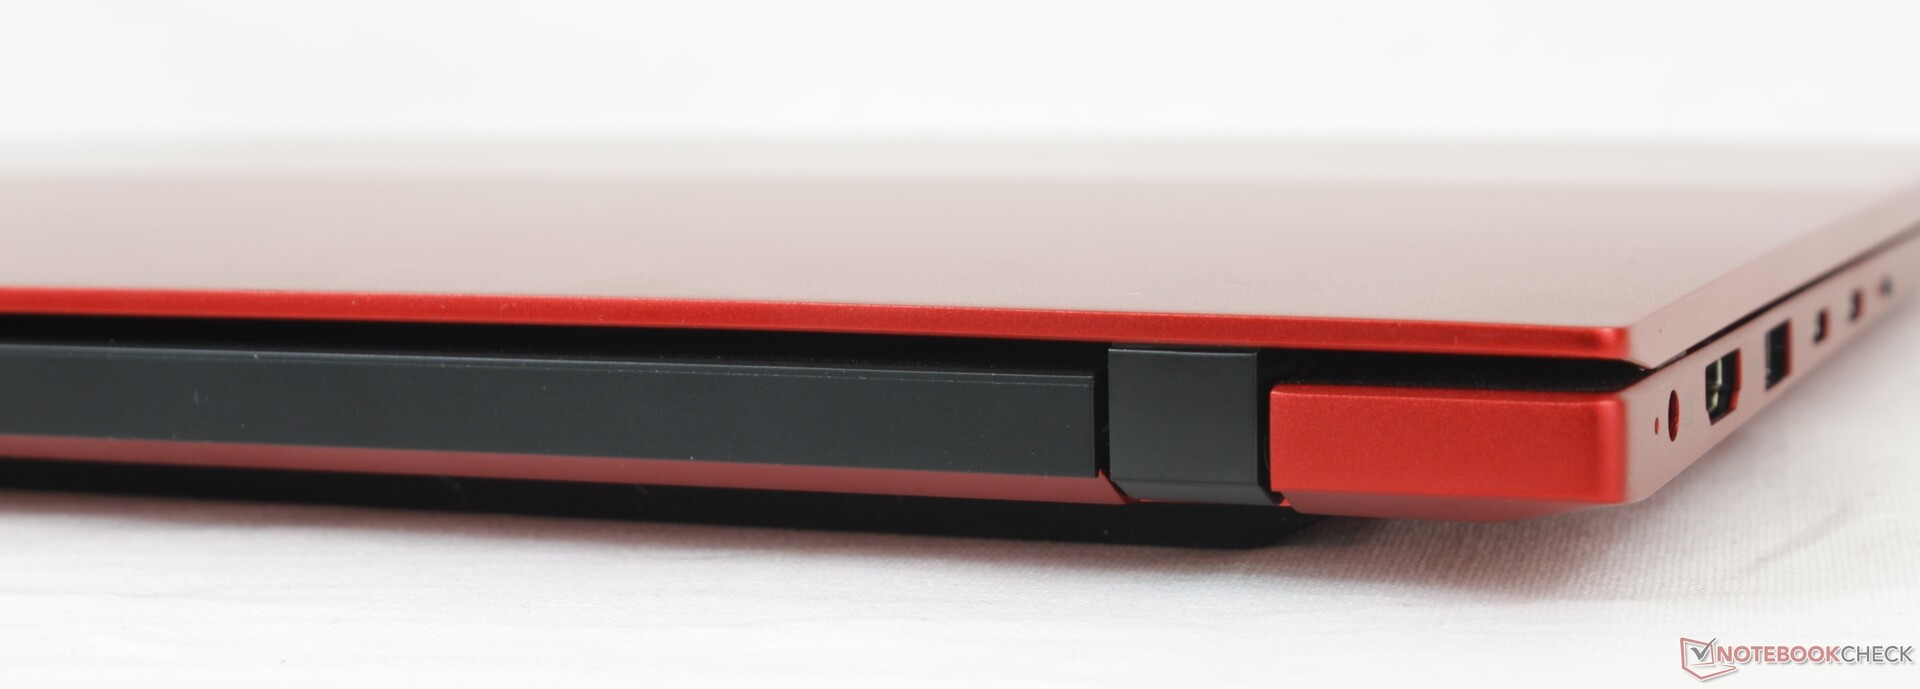
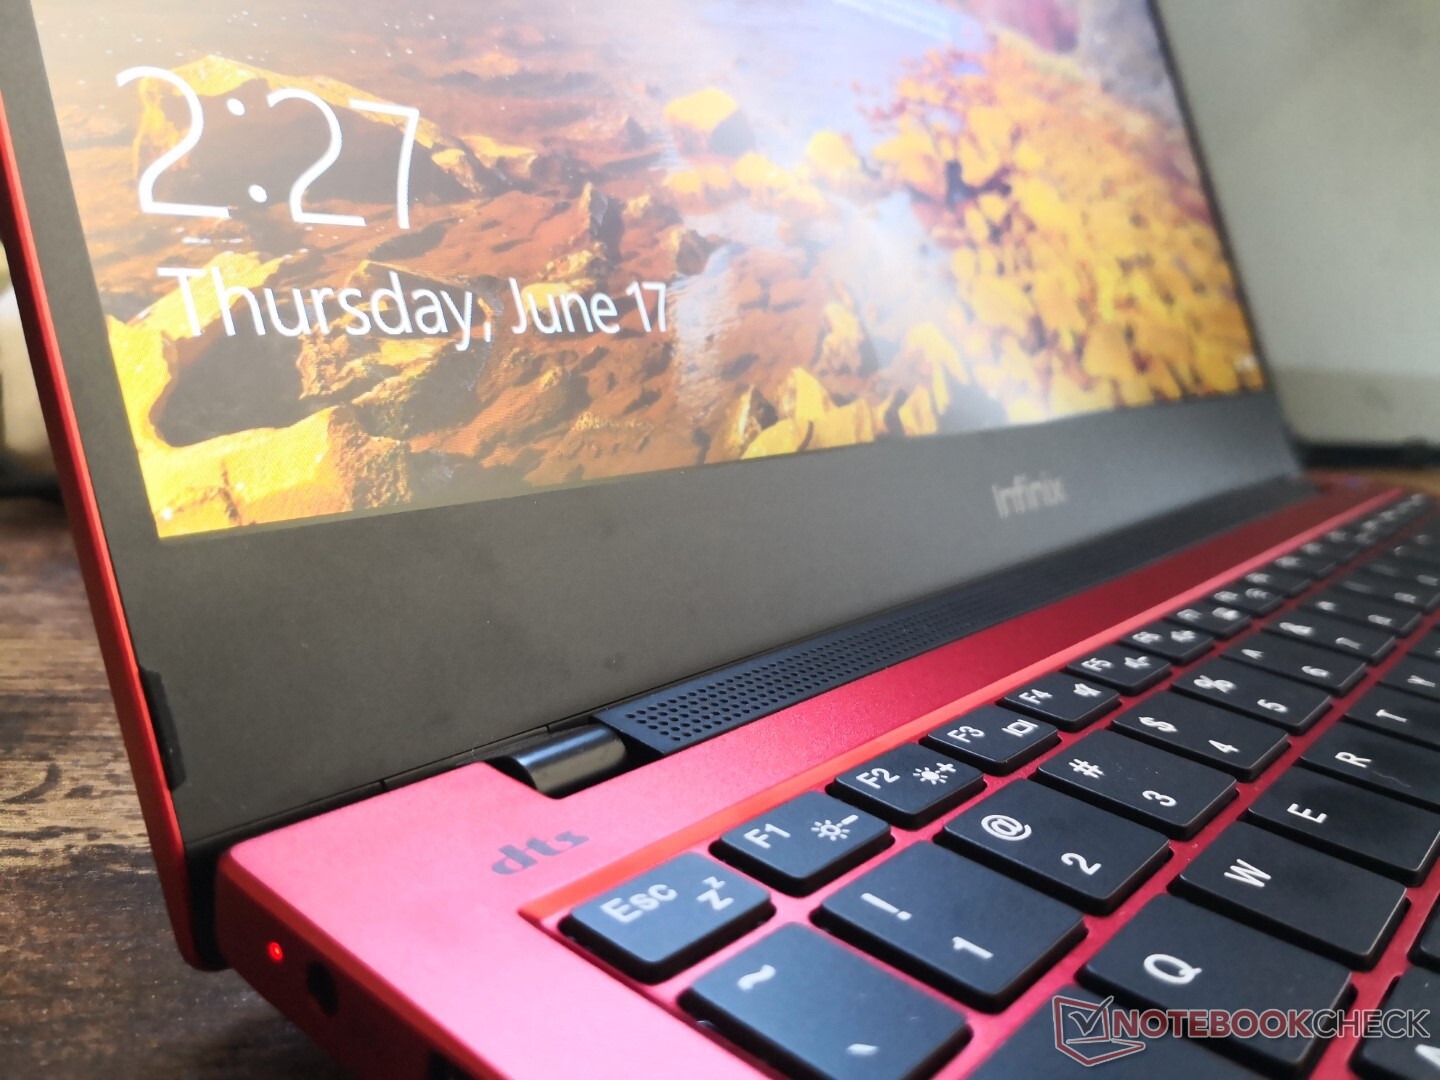
Case — Great First Impressions
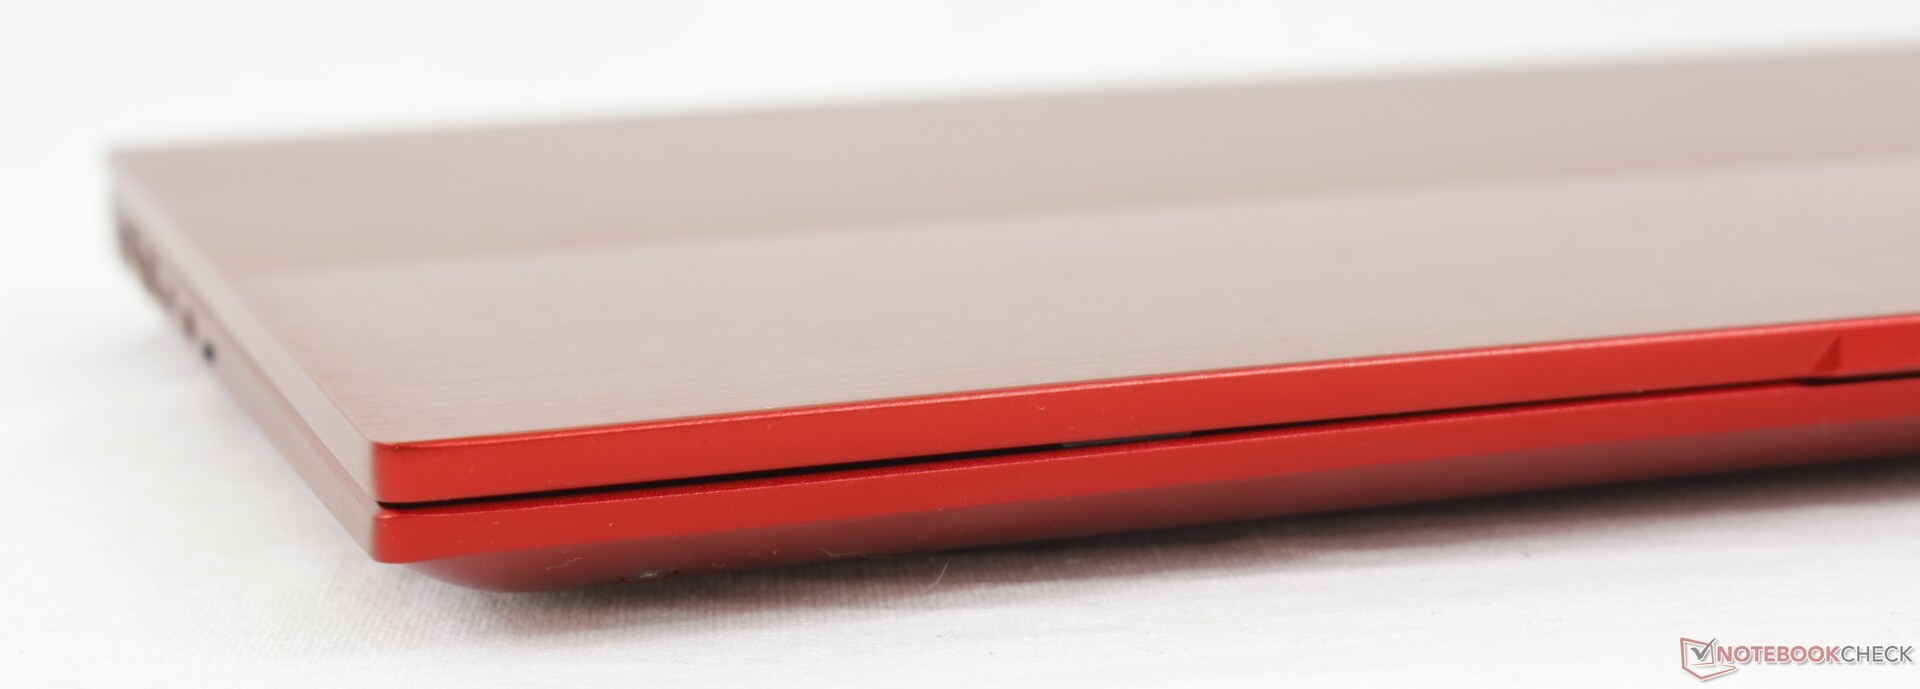
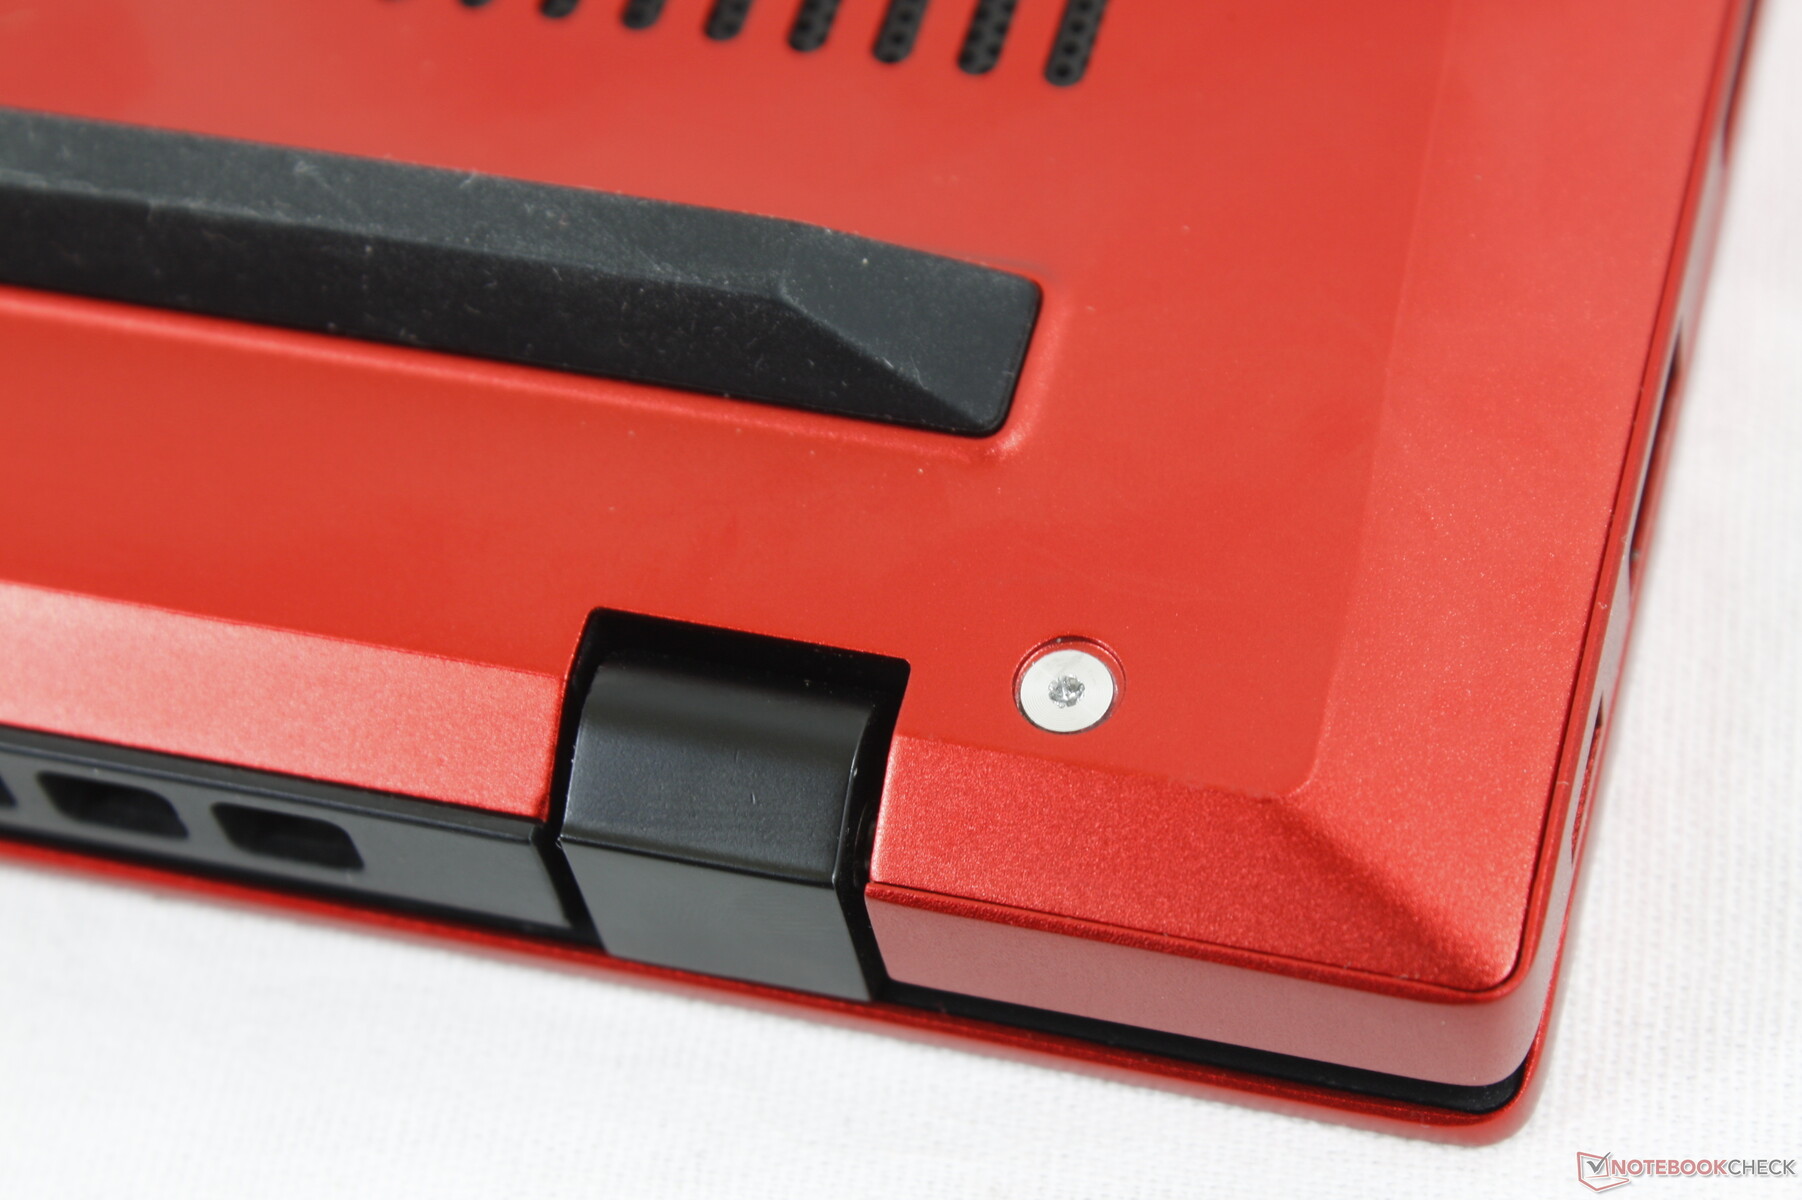
Build quality and design are better than expected from a budget laptop. The metal surfaces are firm, warping is minimal, and we can notice no creaking or visual faults. The chassis feels as good as it looks unlike some Chuwi laptops that tend to suffer from QA issues like creaky hinges or broken keyboard keys.
For future models, we would like to see stiffer hinges and a narrower chin bezel. The hinges here aren't terrible, but making them stronger would give a better sense of longevity.
Dimensions and weight are comparable to budget-to-midrange Ultrabooks from other OEMs including the Asus VivoBook S14, Lenovo ThinkBook 14, and the Honor MagicBook 14. Infinix certainly did their research when designing a laptop that can compete in its category.
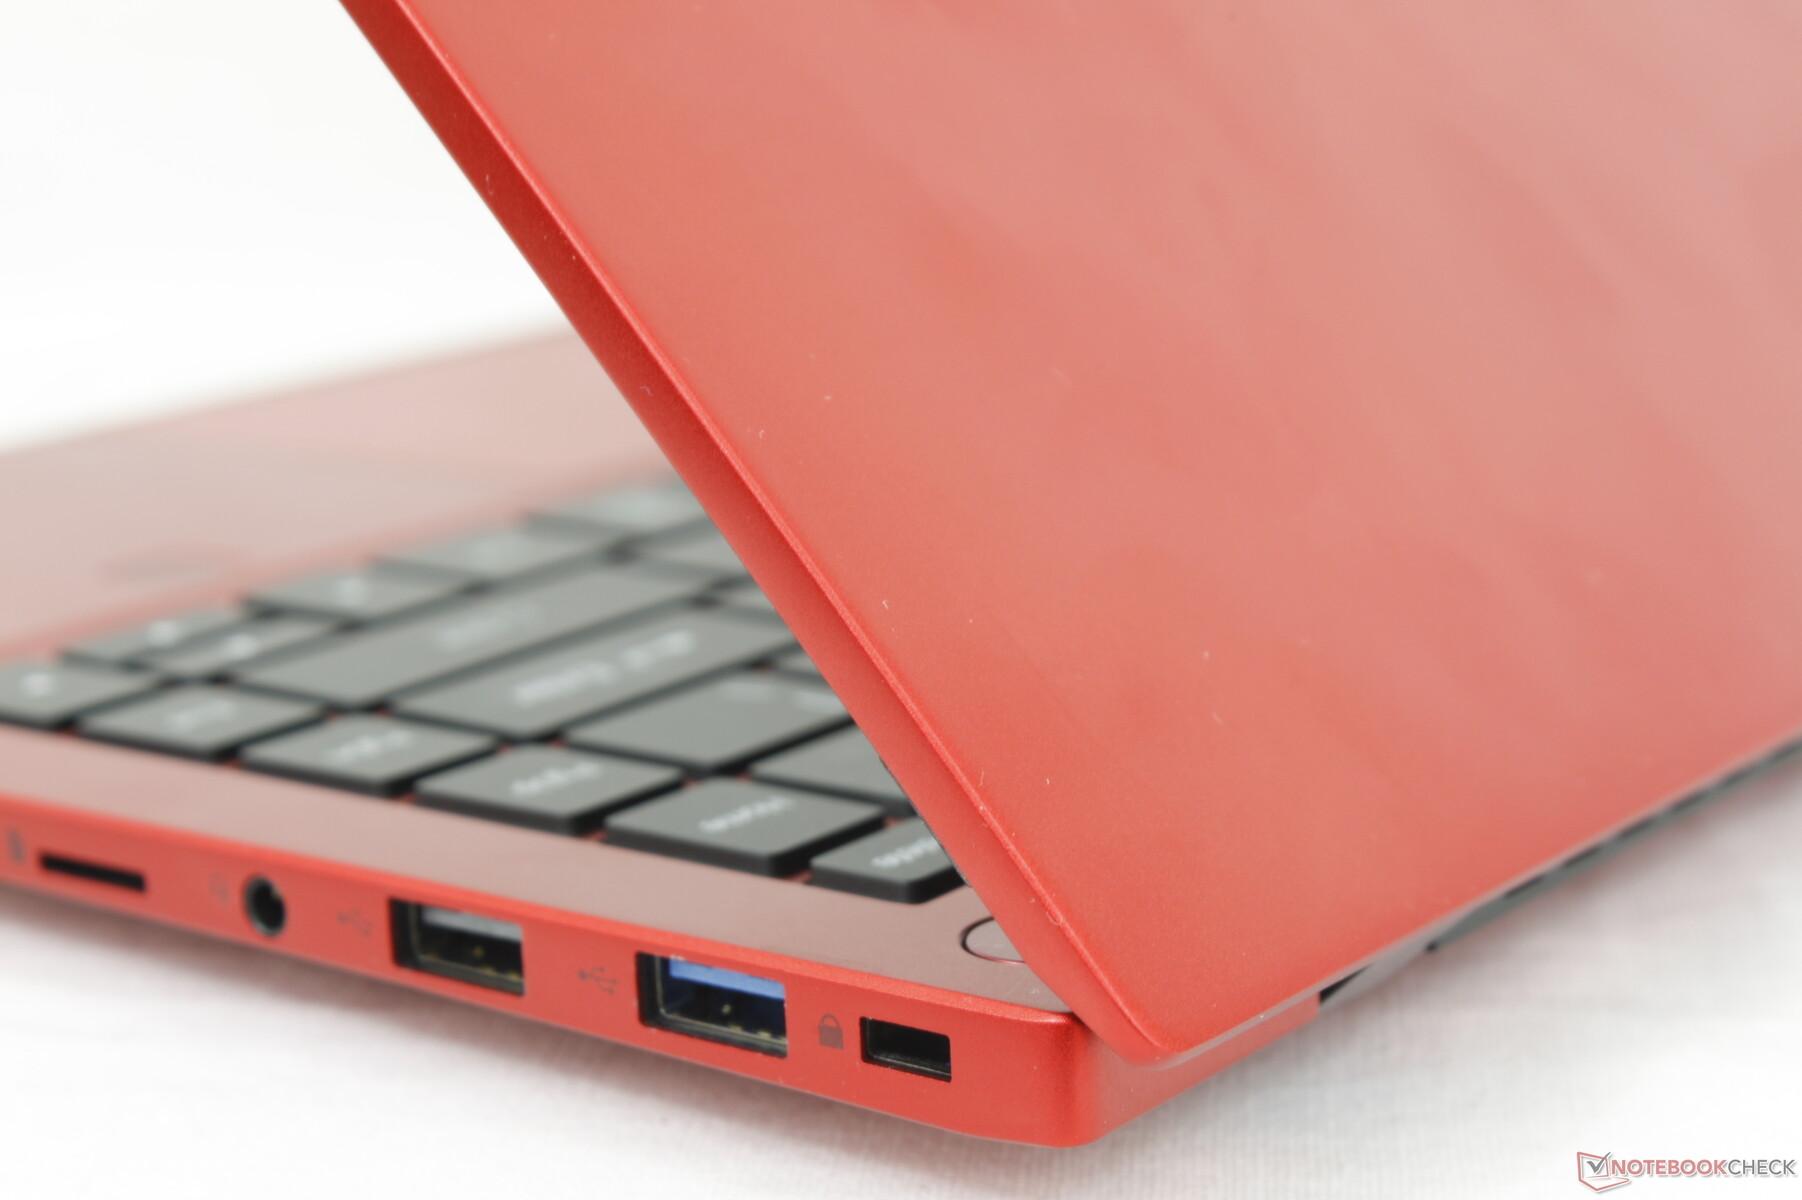
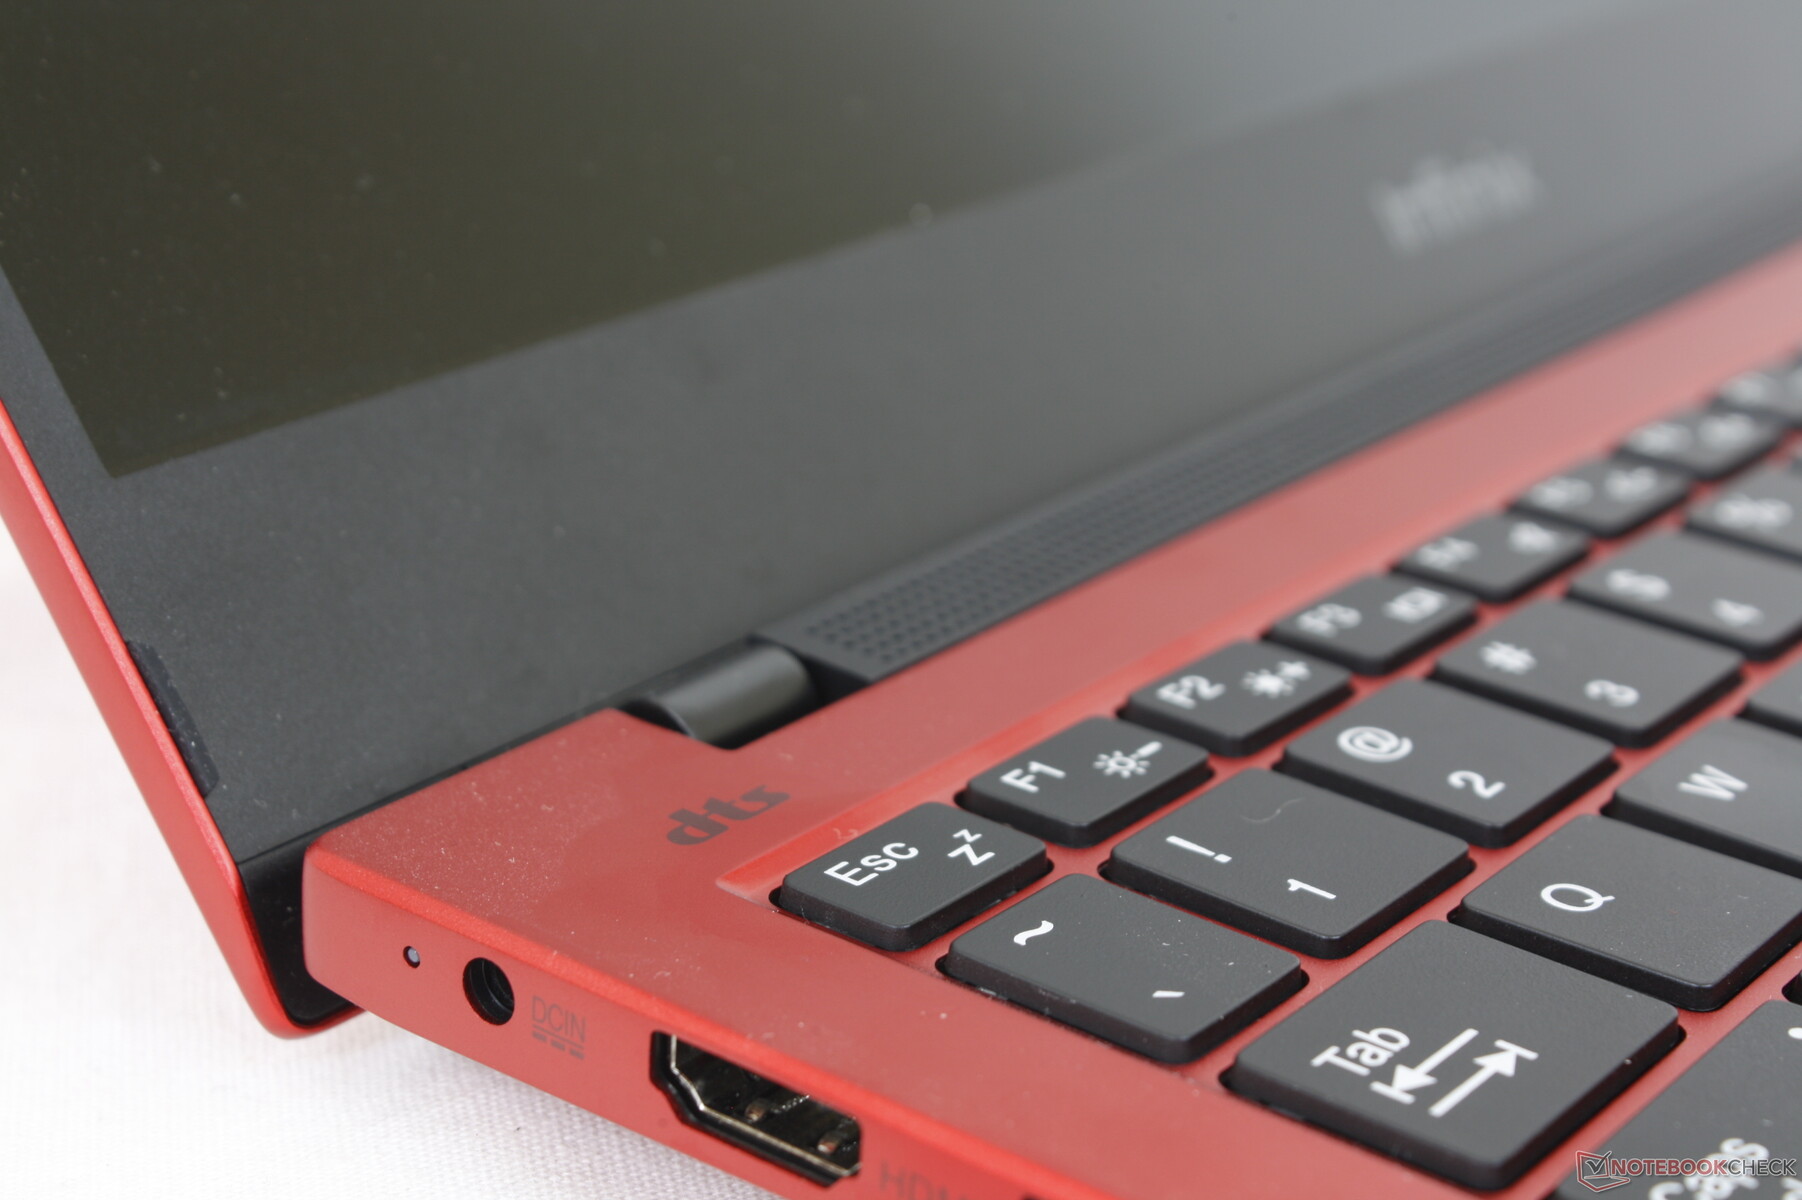

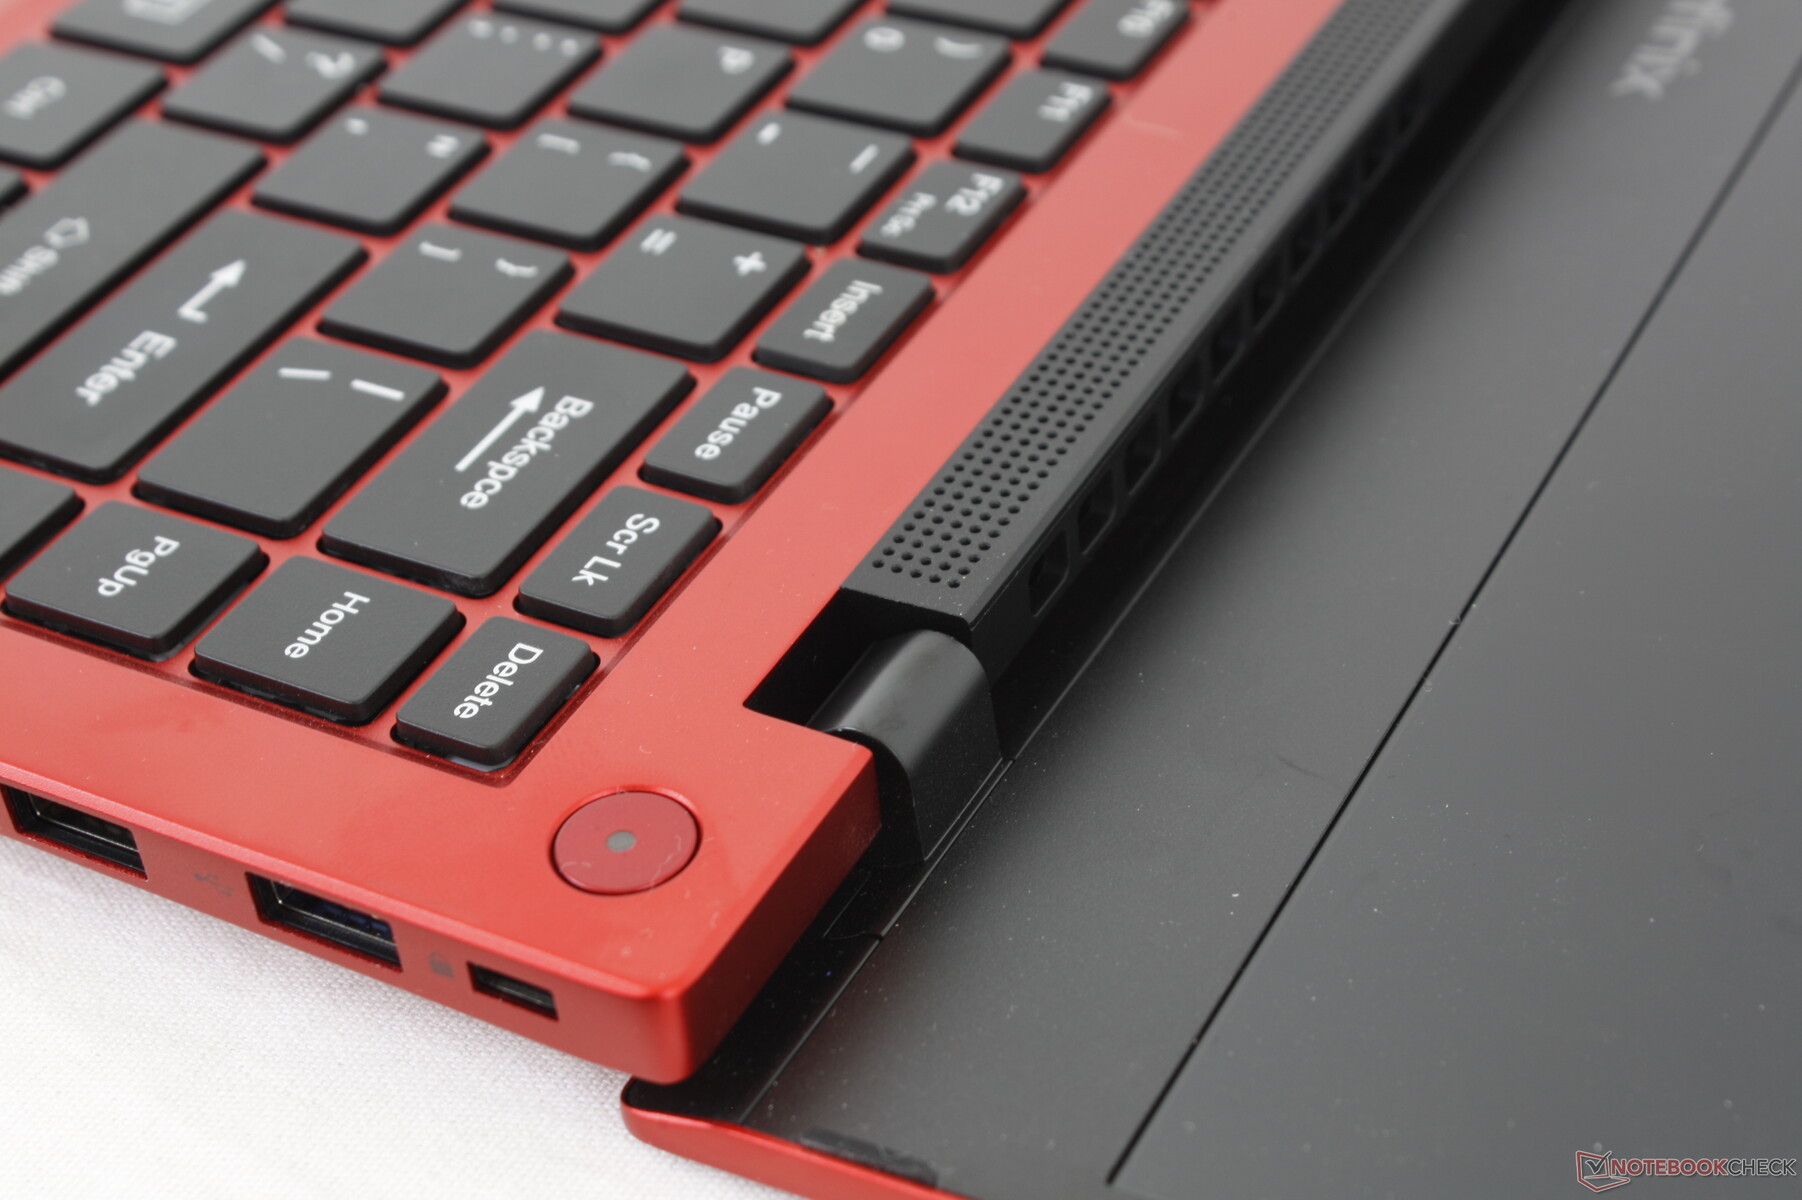
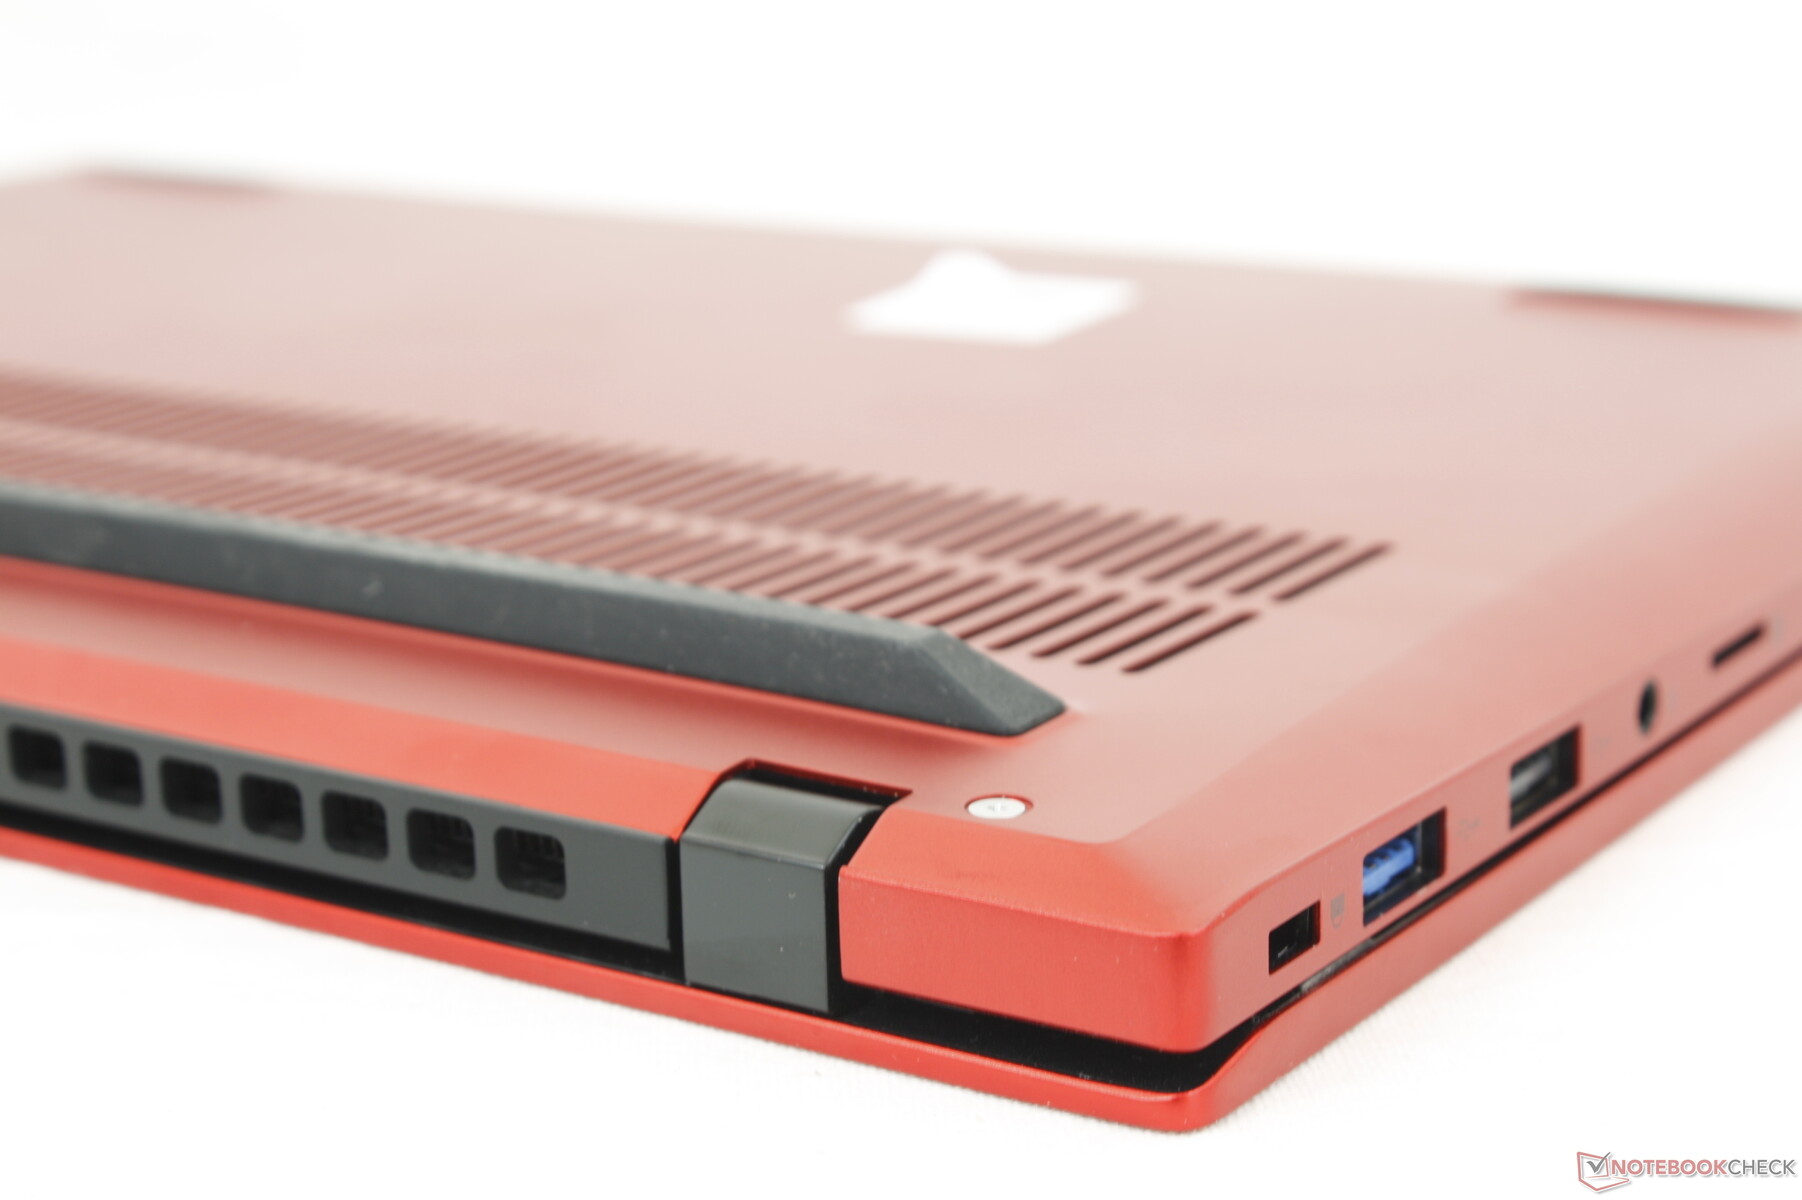
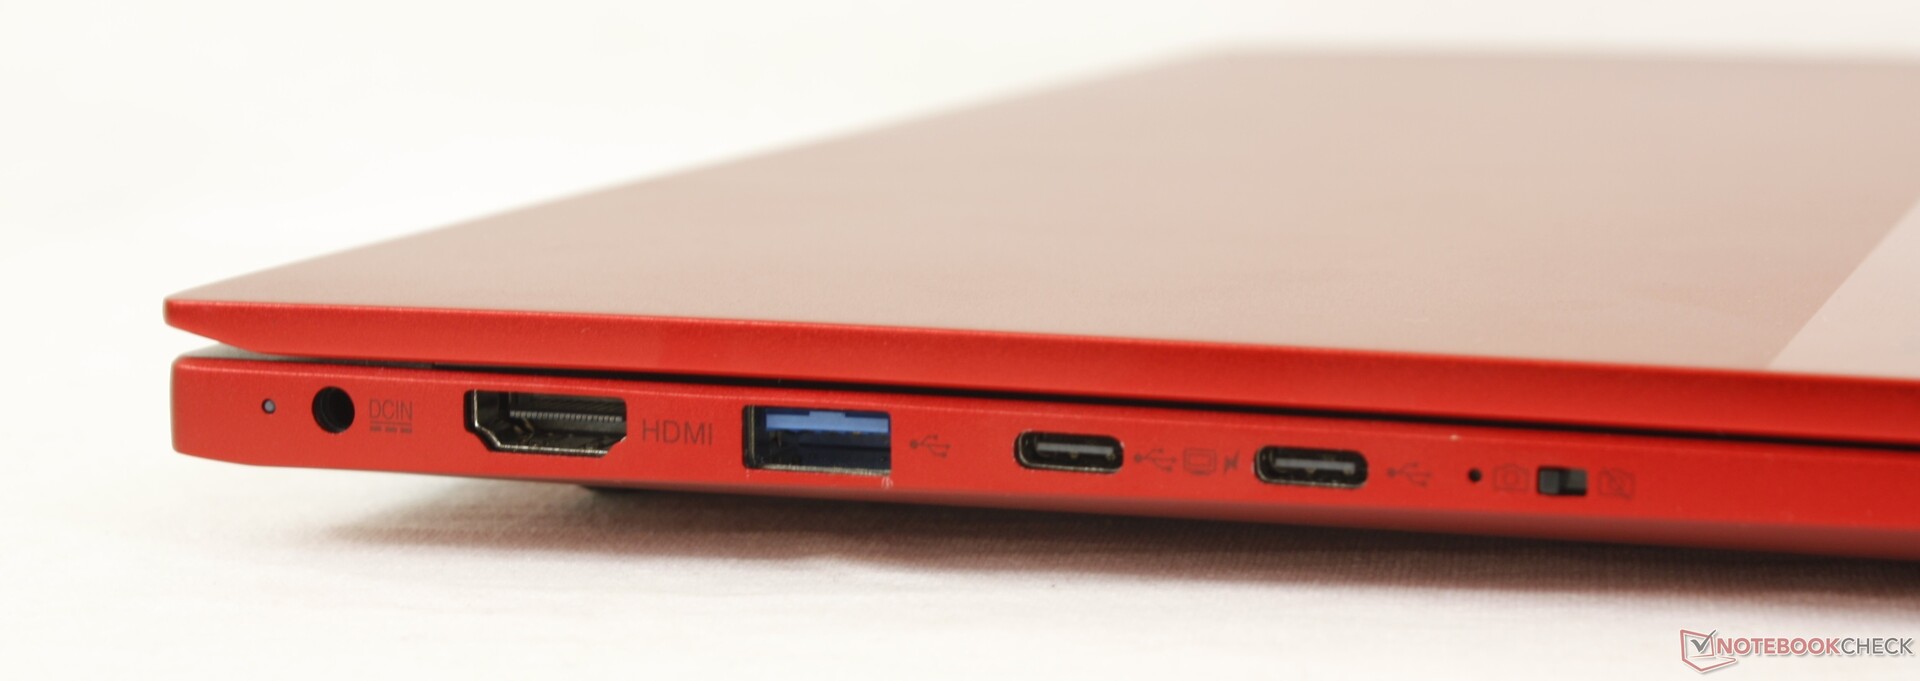
Connectivity — Lots of Ports
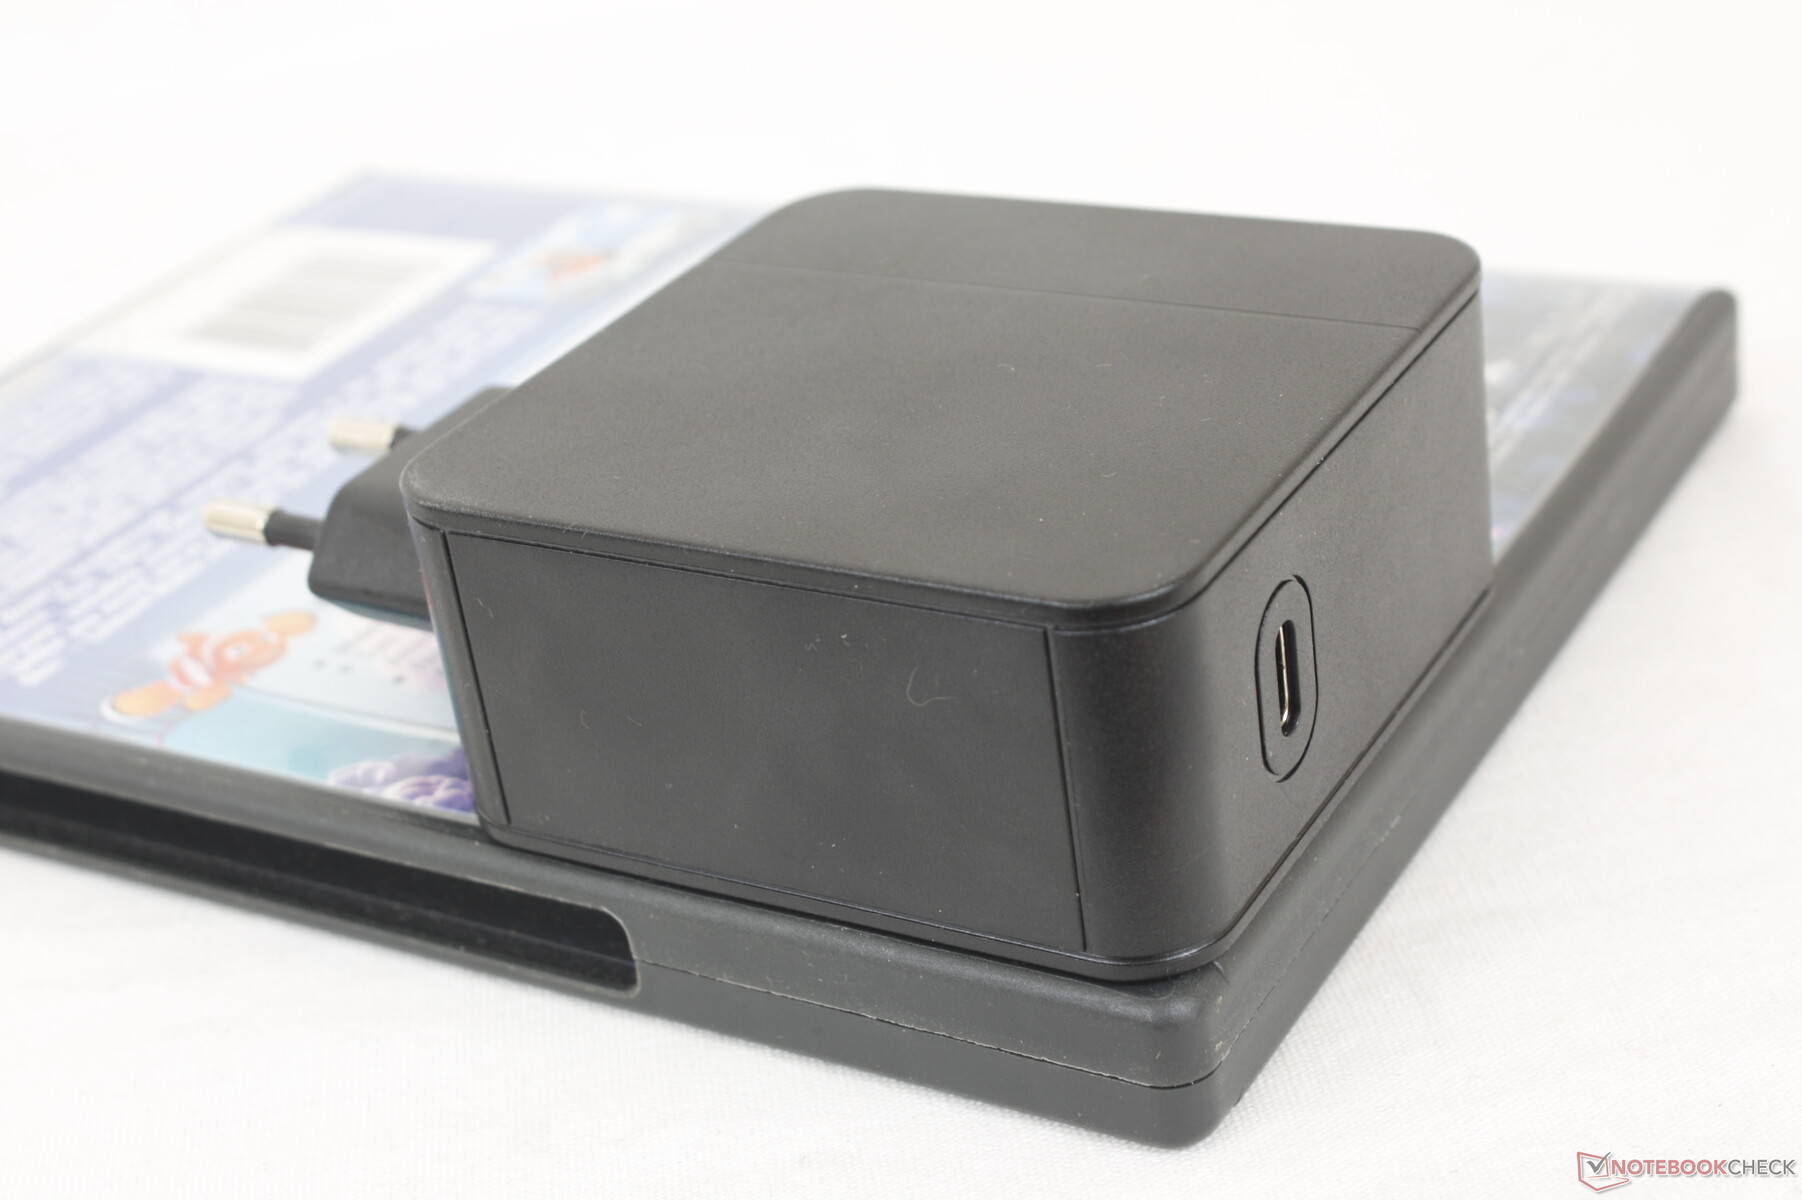
There is no short supply of USB ports as the system integrates five in total. The proprietary AC adapter port, however, seems extraneous as the system supports USB-C charging anyway. Even the retail packaging includes a universal USB-C charger instead of the special barrel-type charger meaning most owners won't even be using the proprietary AC adapter port at all.
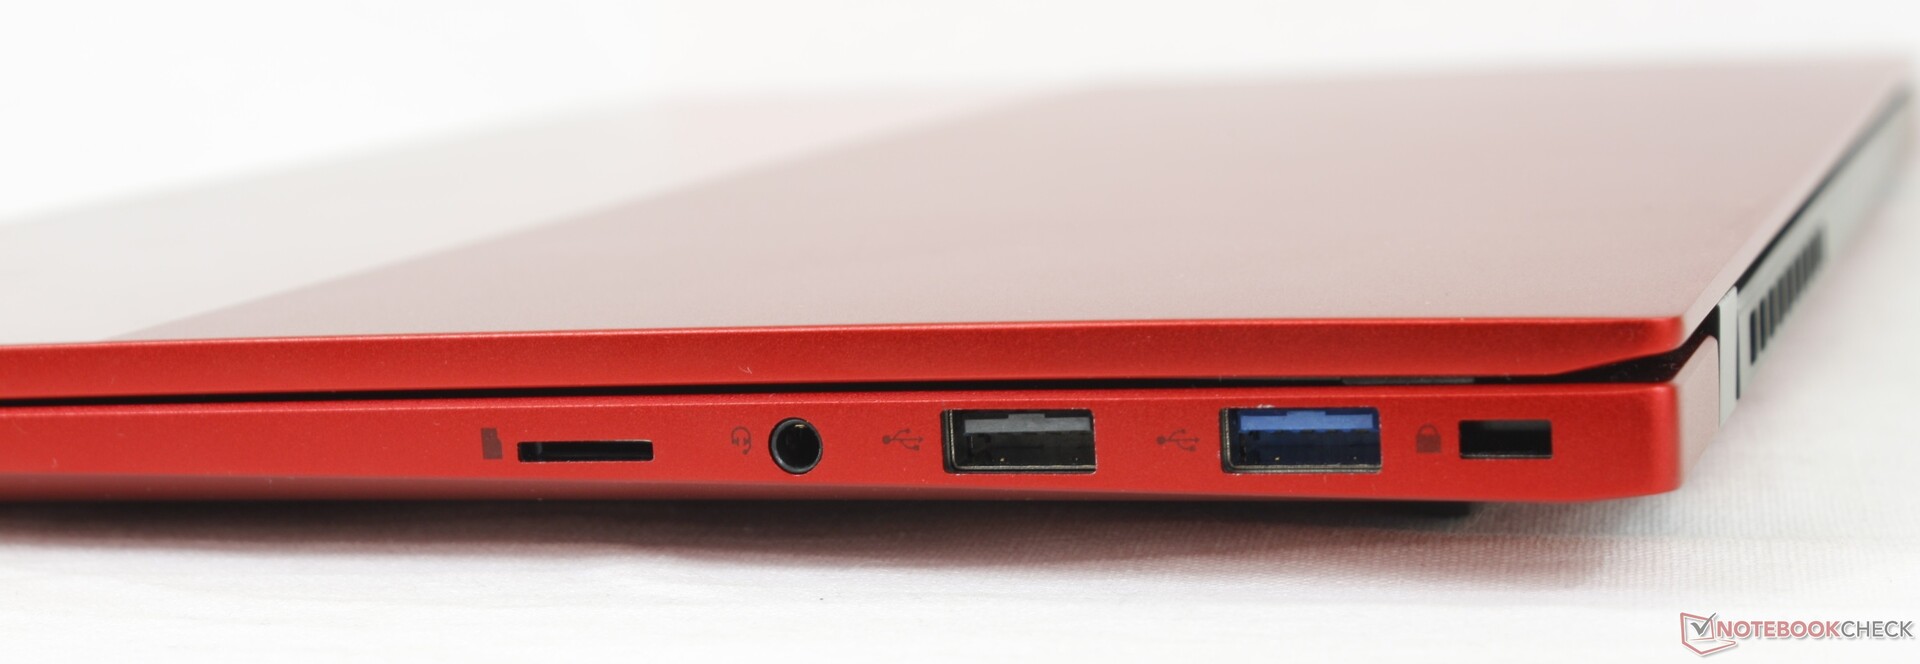
SD Card Reader
Transfer rates are slow with the integrated MicroSD reader. Moving 1 GB of pictures from our UHS-II test card to desktop takes about 43 seconds.
| SD Card Reader | |
| average JPG Copy Test (av. of 3 runs) | |
| Schenker Vision 14 (AV PRO V60) | |
| Lenovo ThinkBook 14 G2 ITL 20VD008WGE (AV Pro V60) | |
| HP Pavilion 14-ce3040ng (Toshiba Exceria Pro SDXC 64 GB UHS-II) | |
| Infinix INBook X1 Pro (AV Pro V60) | |
| Asus VivoBook S14 S433FL (Toshiba Exceria Pro M501 microSDXC 64GB) | |
| maximum AS SSD Seq Read Test (1GB) | |
| Schenker Vision 14 (AV PRO V60) | |
| Lenovo ThinkBook 14 G2 ITL 20VD008WGE (AV Pro V60) | |
| HP Pavilion 14-ce3040ng (Toshiba Exceria Pro SDXC 64 GB UHS-II) | |
| Infinix INBook X1 Pro (AV Pro V60) | |
| Asus VivoBook S14 S433FL (Toshiba Exceria Pro M501 microSDXC 64GB) | |
Communication
The system comes with the same Intel AX201 module as most pricier Ultrabooks for the same Wi-Fi 6 capabilities. Transfer rates are a bit slower, however, though not by much to make any real difference when browsing the web or streaming video.
Webcam

, i7-1065G7, Phison C-E80T512G4-P3D3B3E13")
, i7-1065G7, Phison C-E80T512G4-P3D3B3E13")
Maintenance
The Philips screws securing the bottom panel are smaller, weaker, and more susceptible to cam out than on other laptops. In fact, after reviewing hundreds of different laptops, this is the first time we experienced a cam out on one of the screws. We recommend owners be very careful if attempting to remove the bottom panel as a result. RAM is soldered anyway meaning users can only upgrade the M.2 storage.
Accessories and Warranty
There are no extras in the box outside of the AC adapter. Claiming warranty may also be difficult depending on region as owners may have to ship the unit overseas.
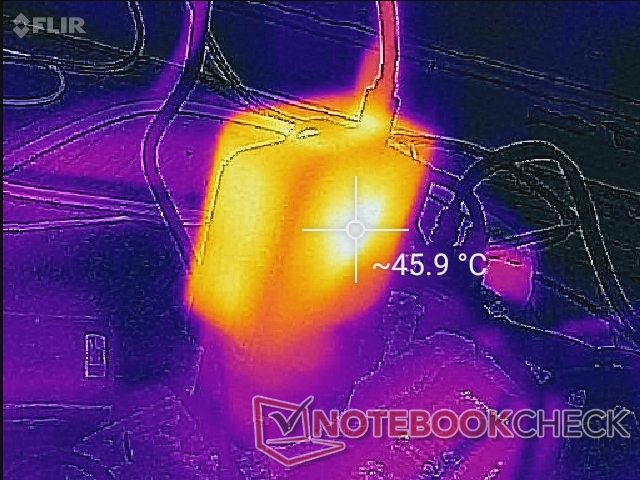
It's worth mentioning that the AC adapter provided by the manufacturer suddenly stopped working towards the end of our testing period.
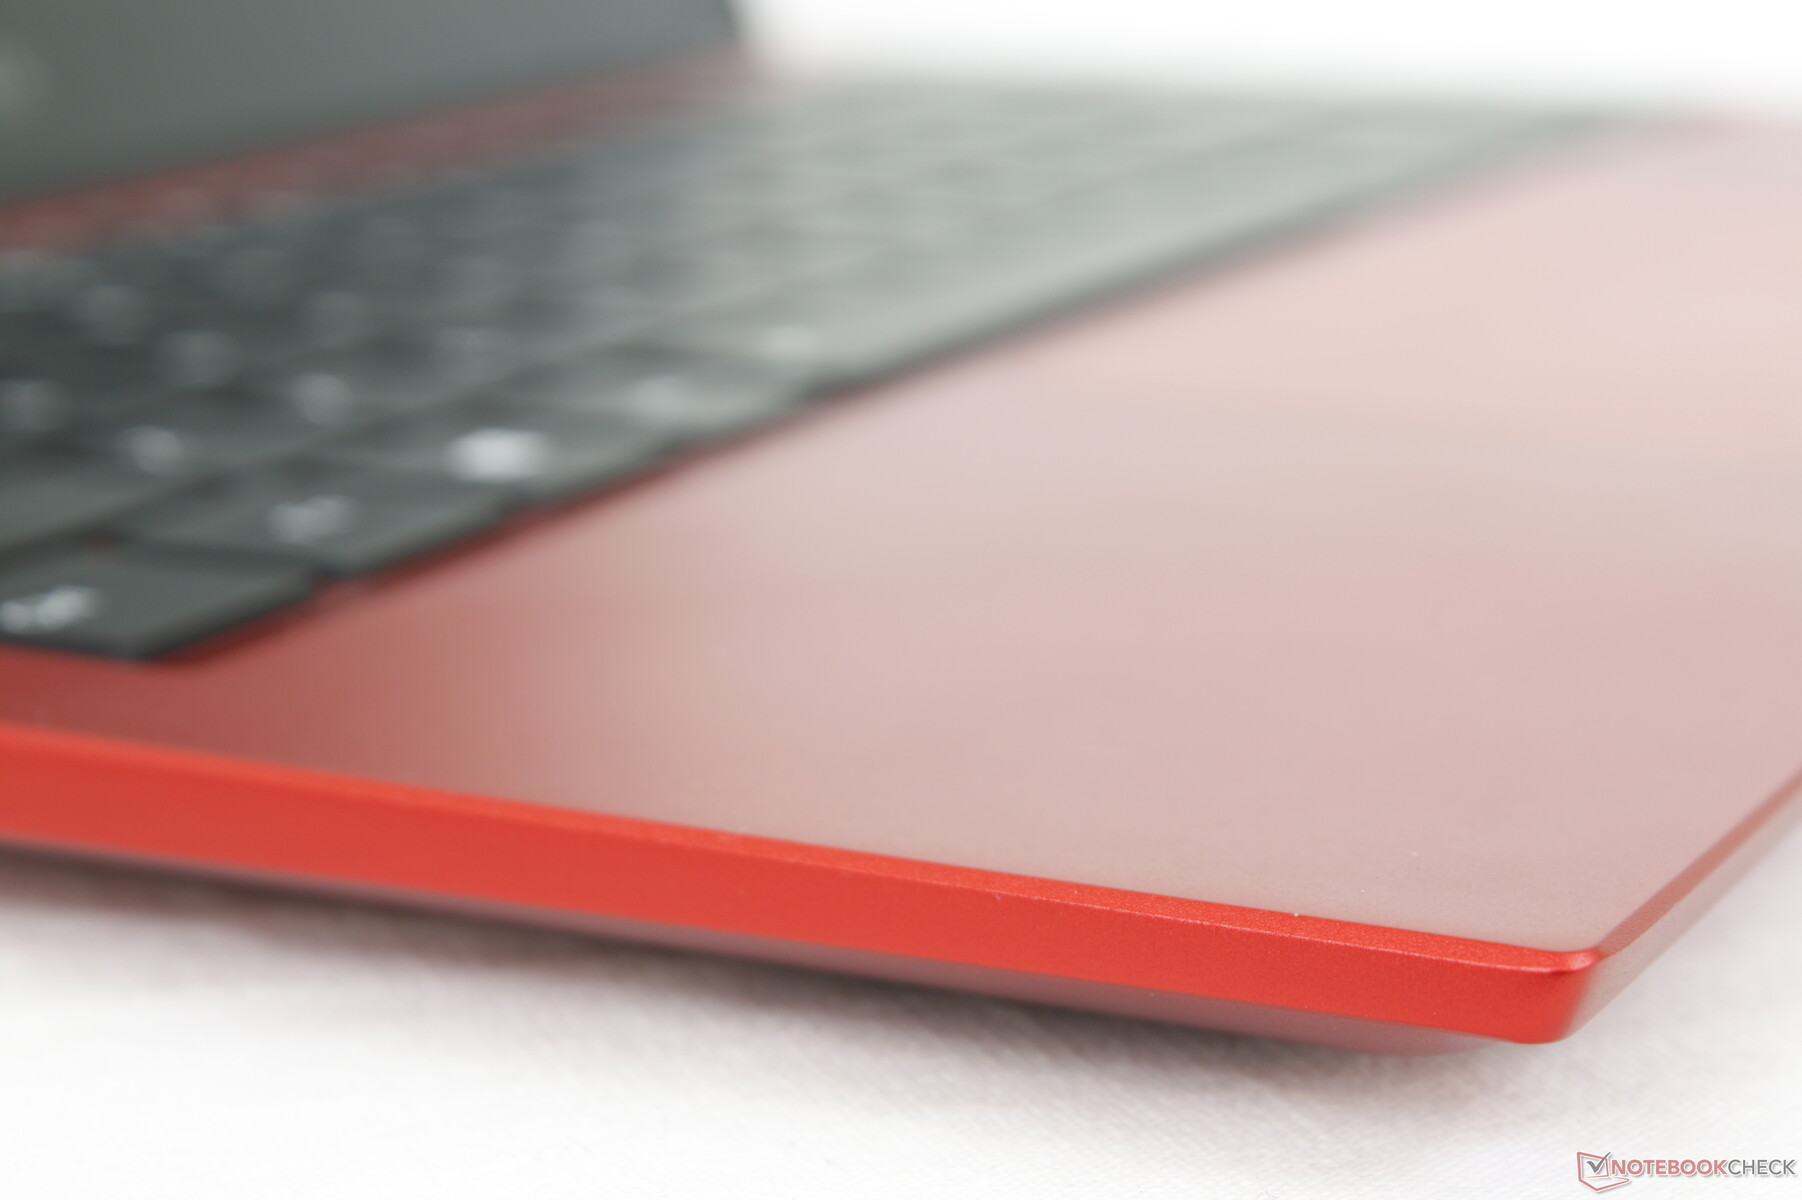
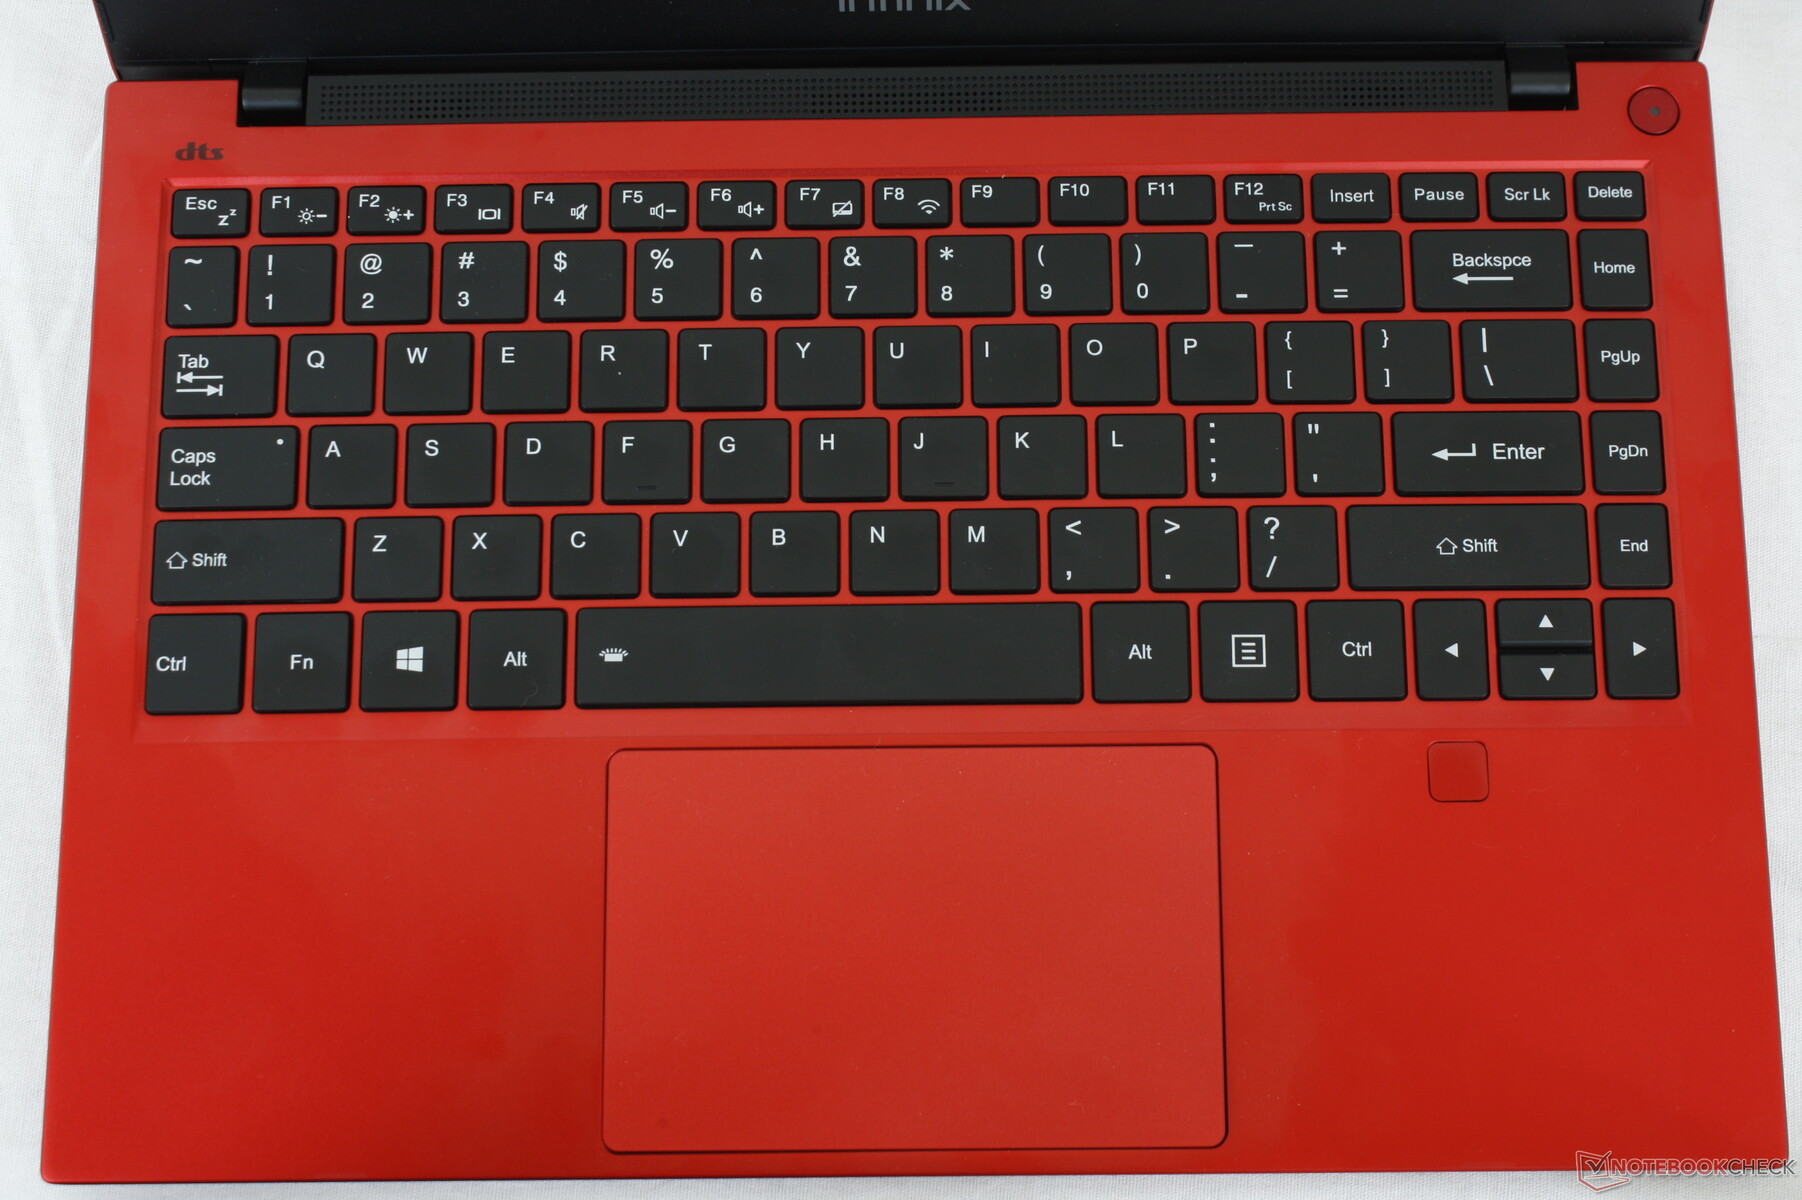
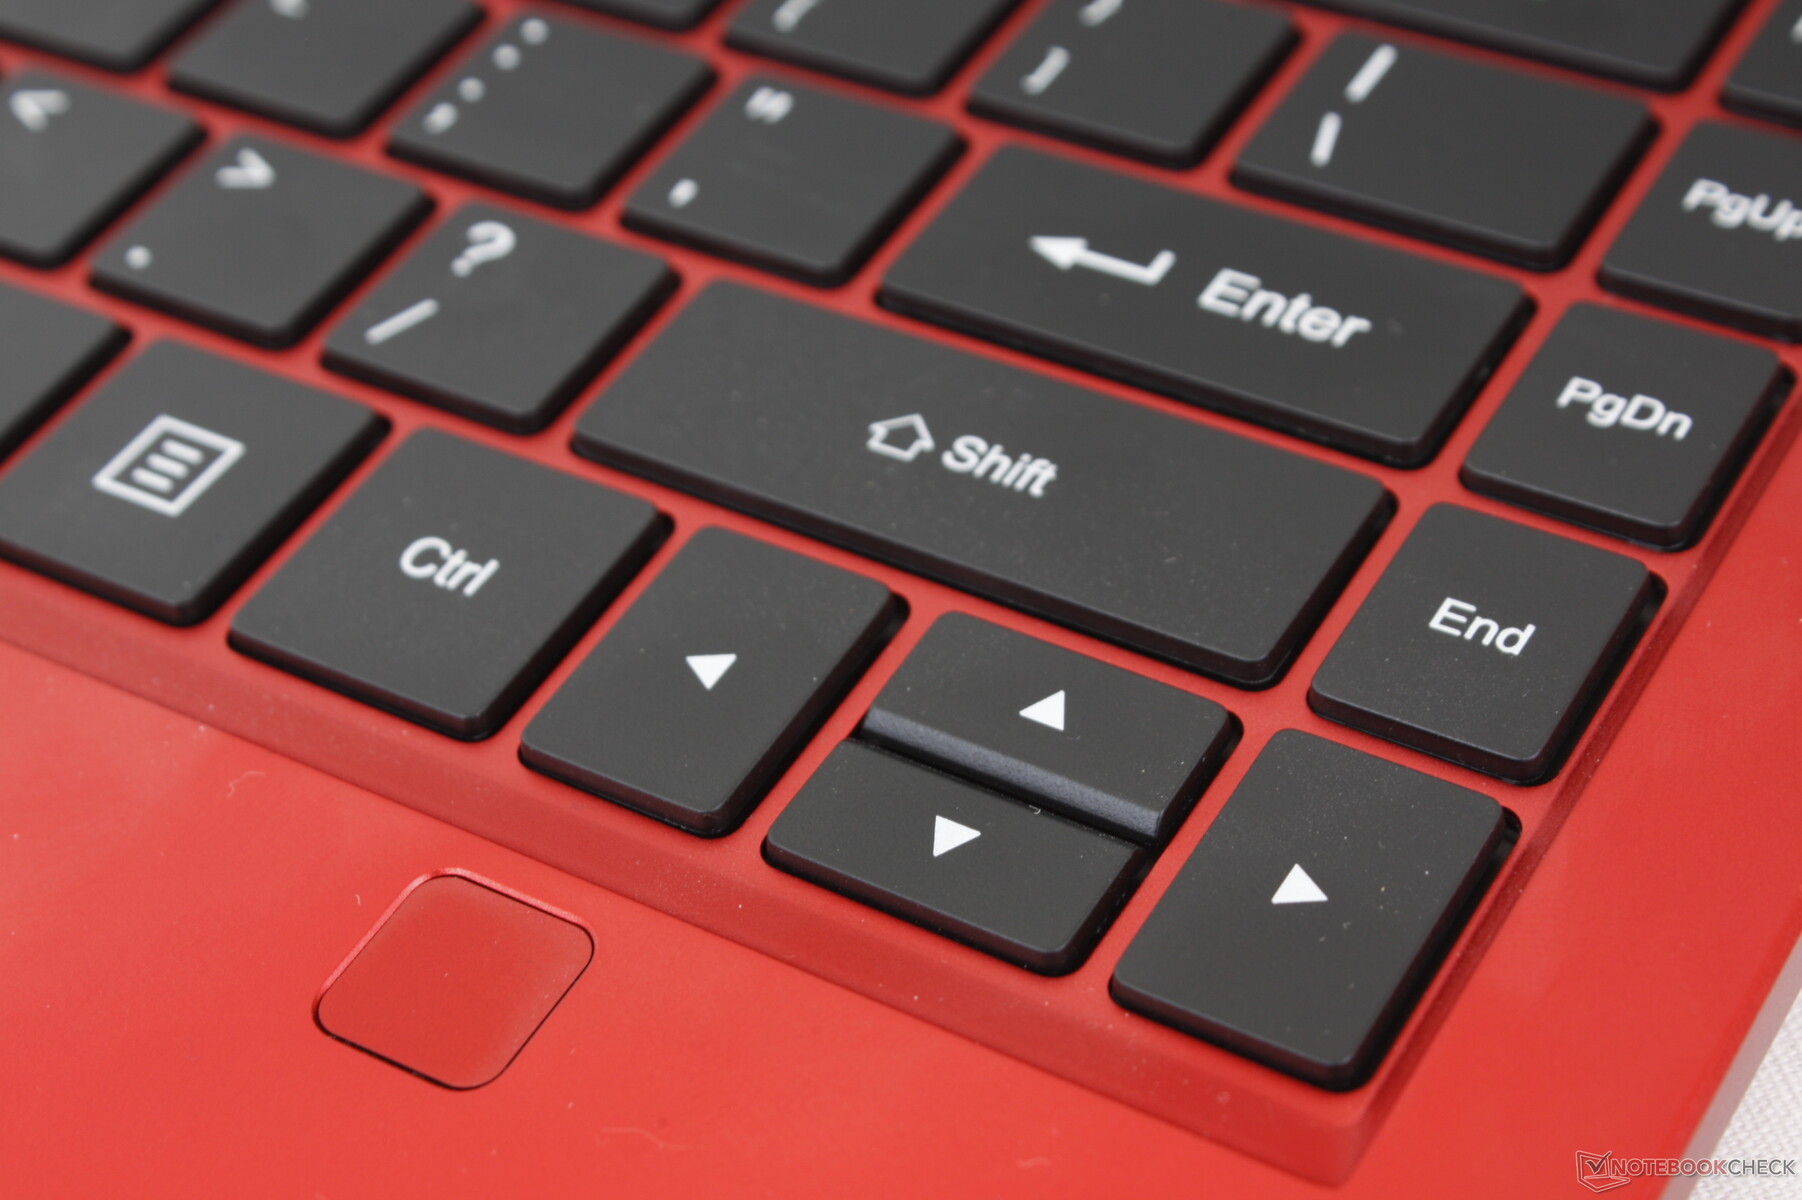
Input Devices — Loud Keys and Clickpad
Keyboard
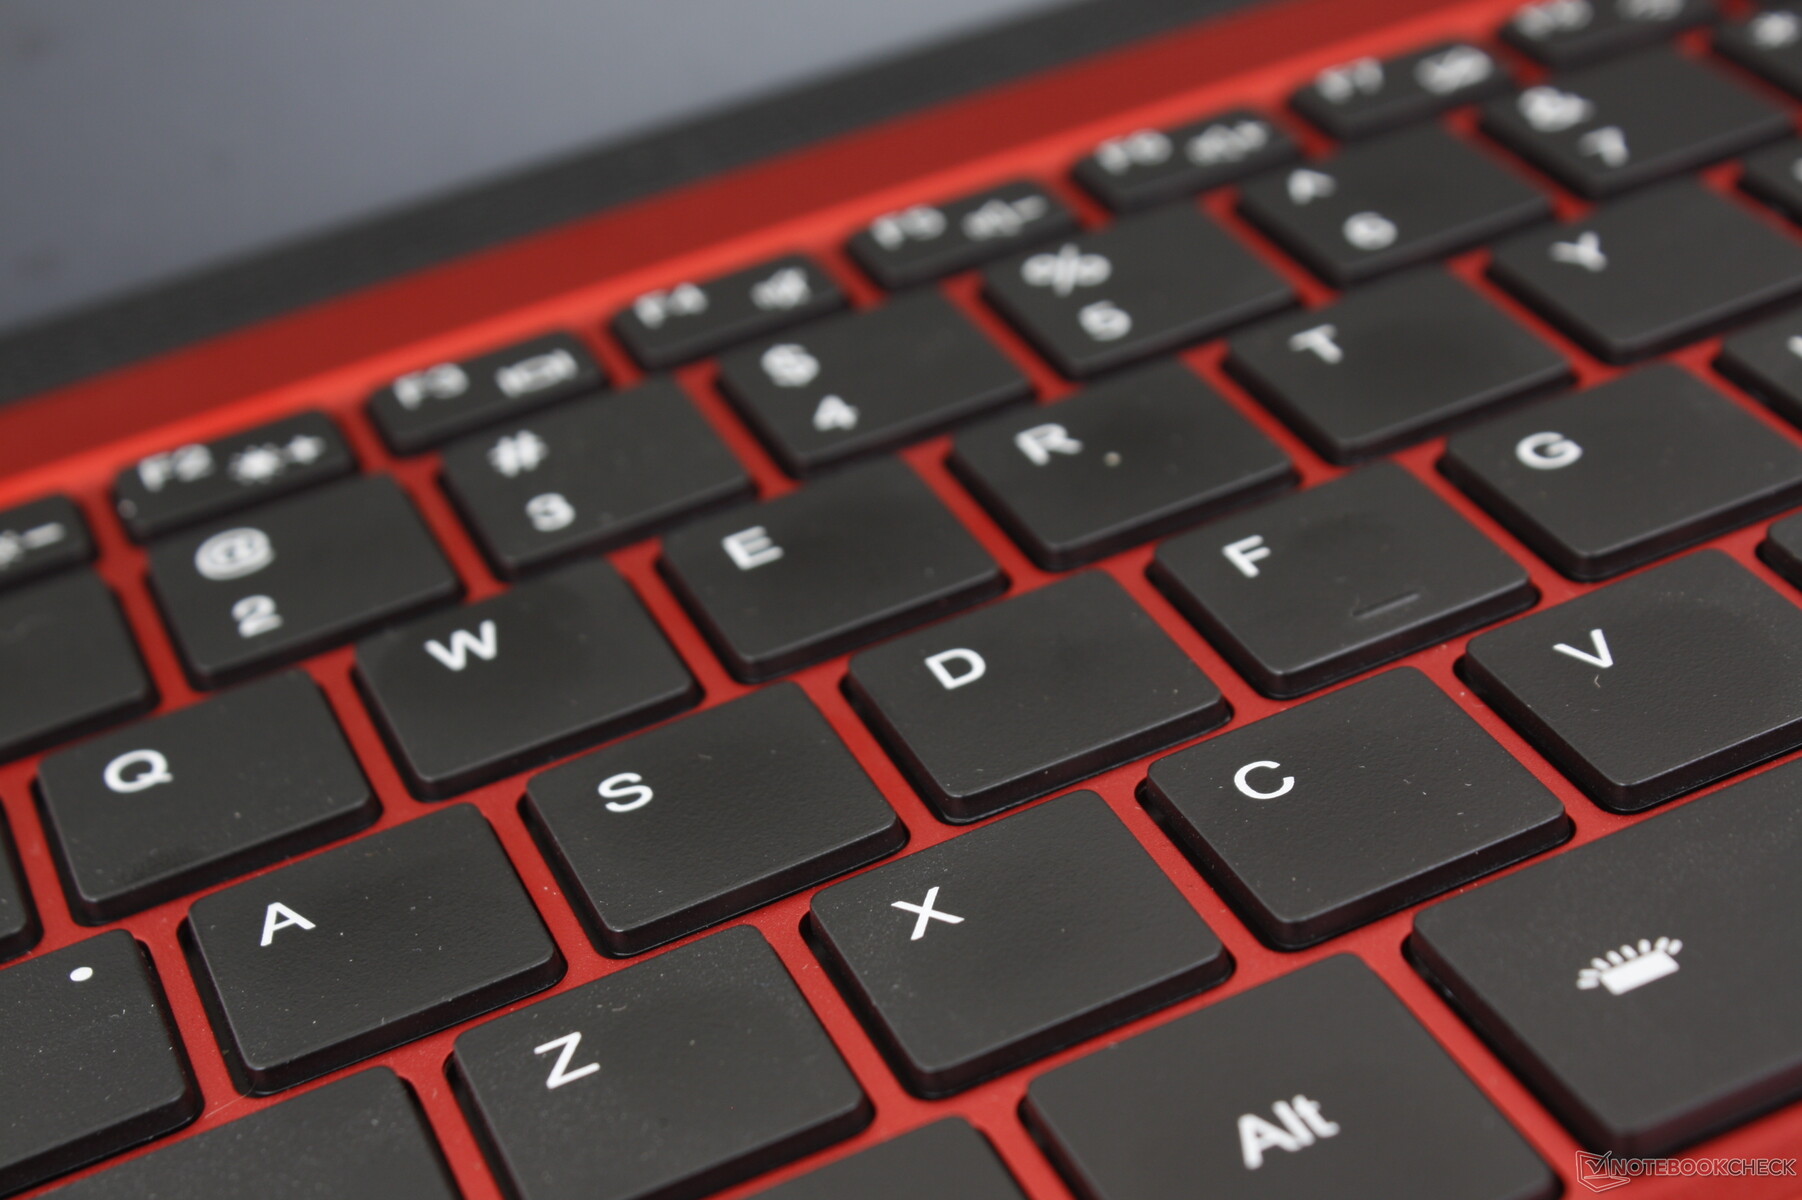
Key feedback is unusual in that clatter is loud even though the keys are shallow, light, and somewhat spongy. The Enter key, for example, is loud when pressed but it doesn't offer enough of a "give" when compared to the Enter keys on pricier laptops like the HP Spectre or Lenovo ThinkPad. If you're used to typing on cheap Ultrabooks, then you'll probably become accustomed to the Infinix in just a few days.
There is no keyboard backlight likely to save on costs.
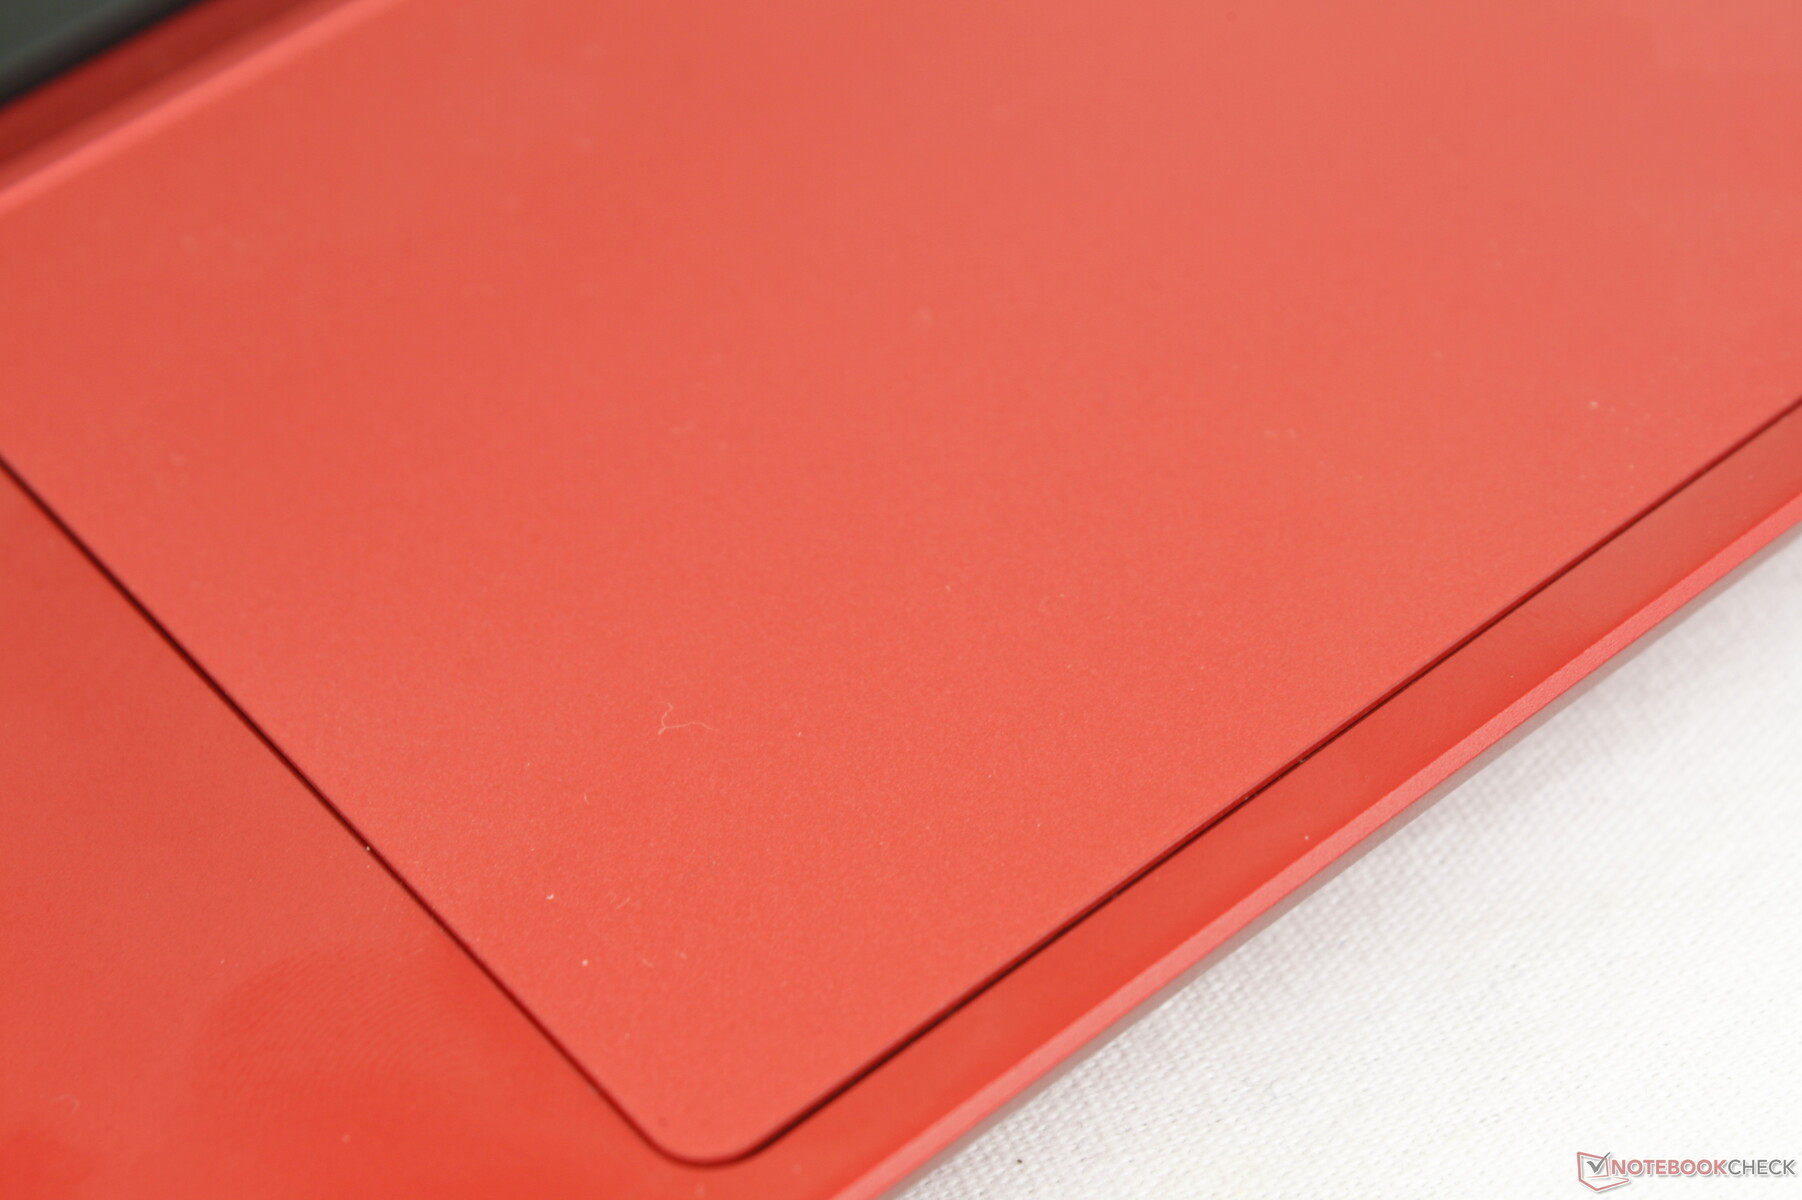
Touchpad
The roomy clickpad is larger than the one on the XPS 13 (11.5 x 7.5 cm vs. 11.2 x 6.5 cm). Travel is shallow, but feedback is actually quite firm and satisfying to click on. The major downside is the relatively loud click when pressed.
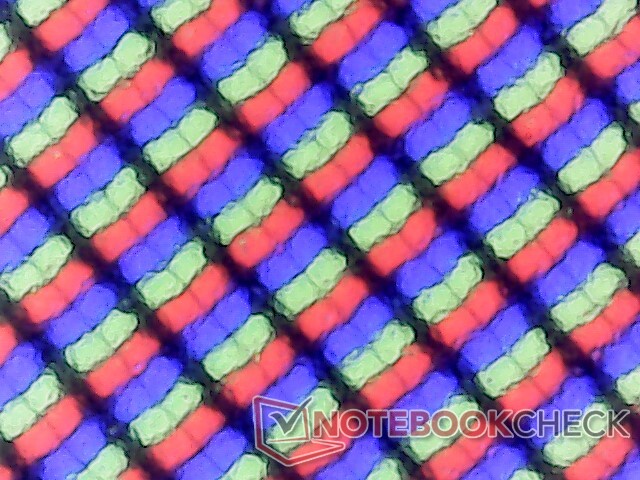
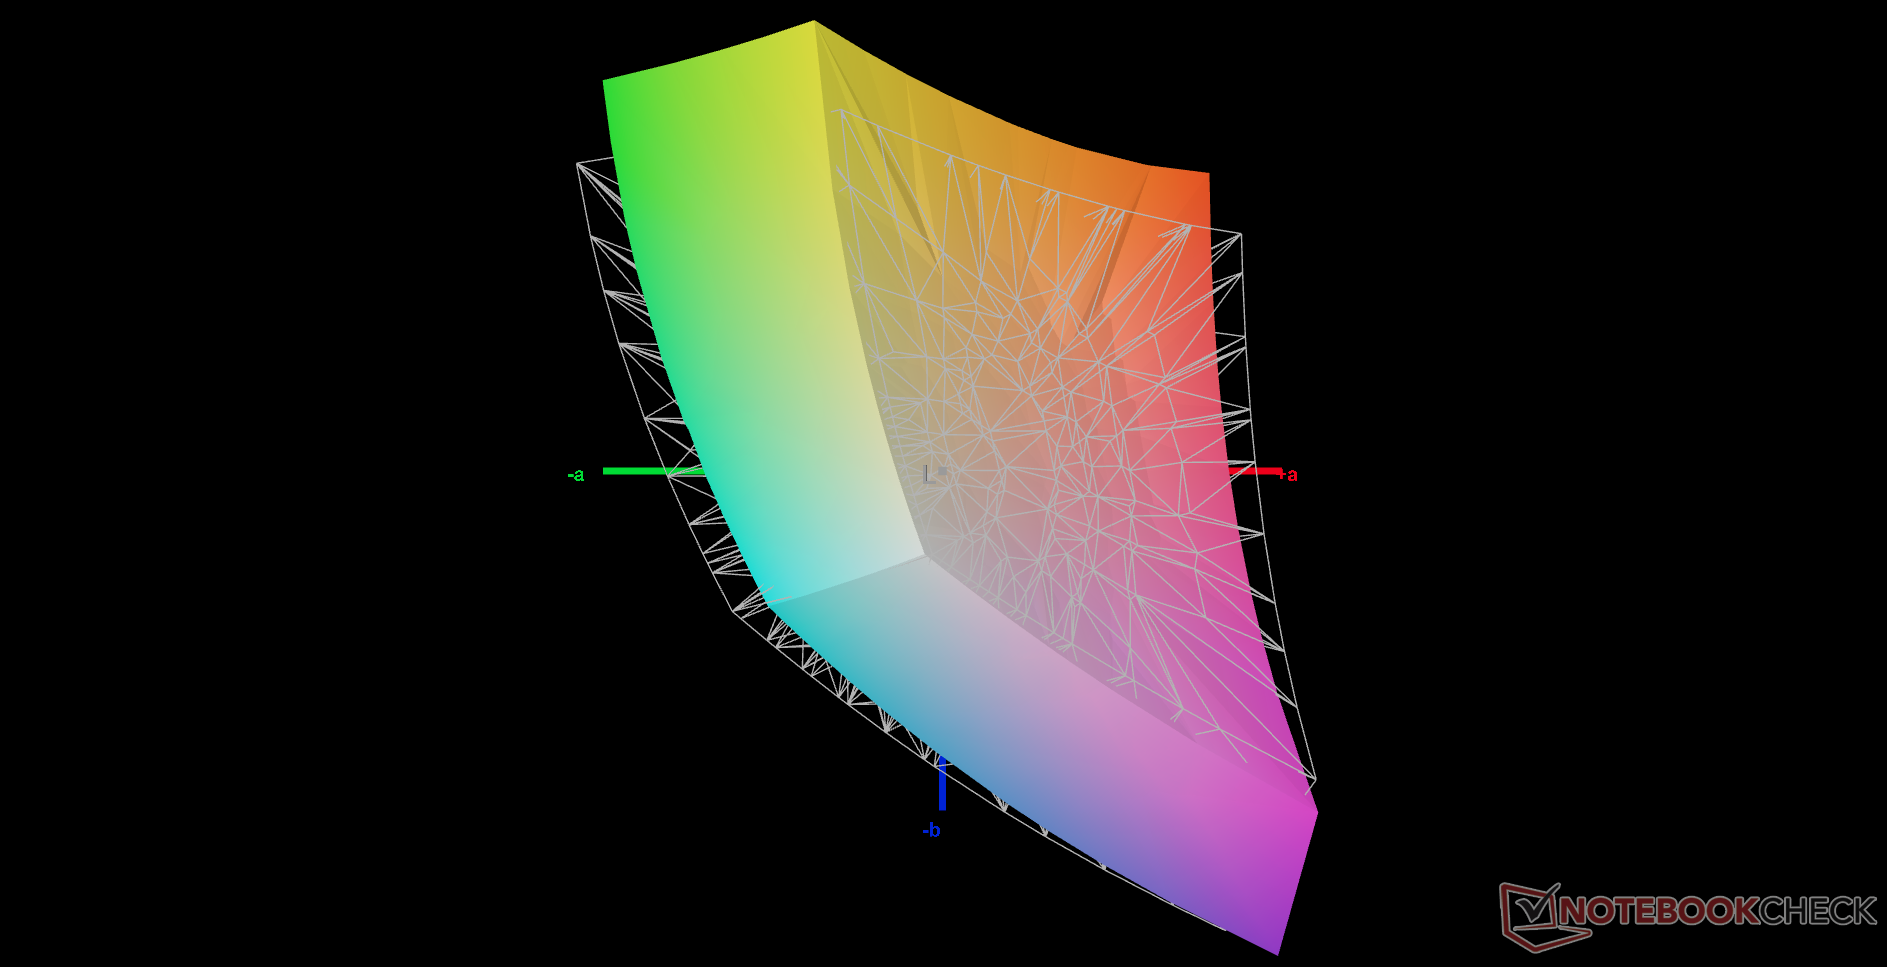
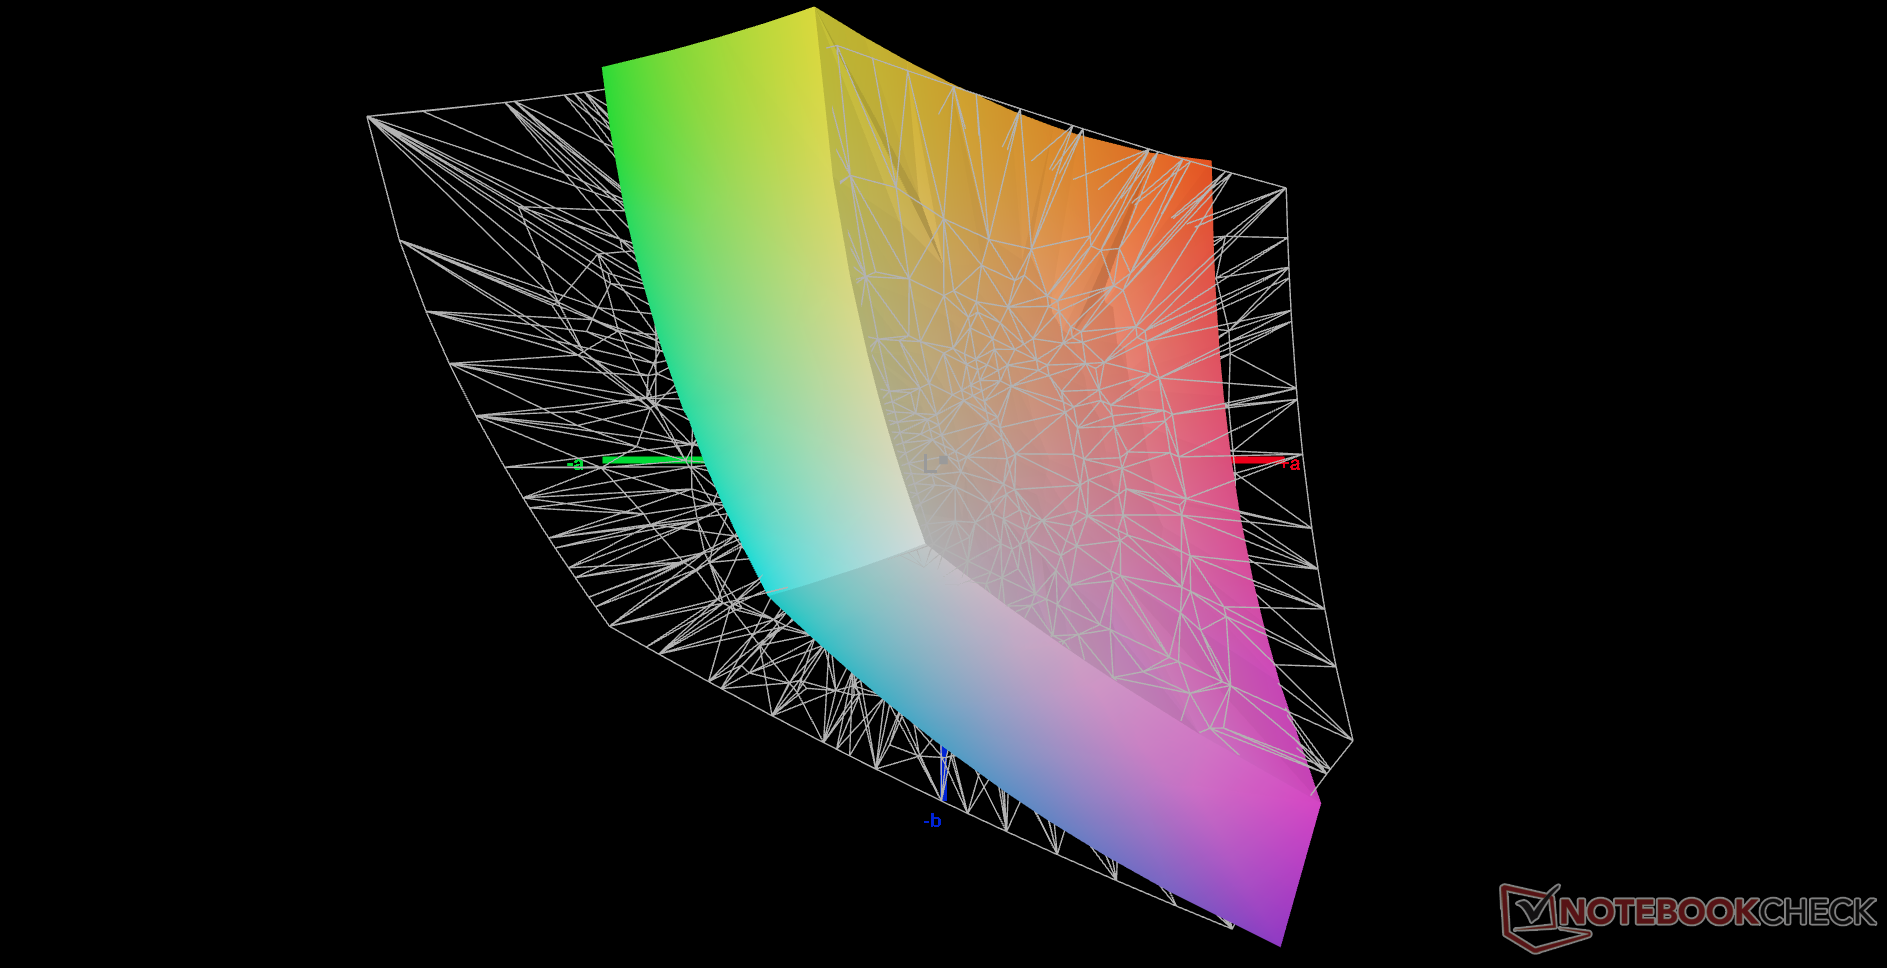
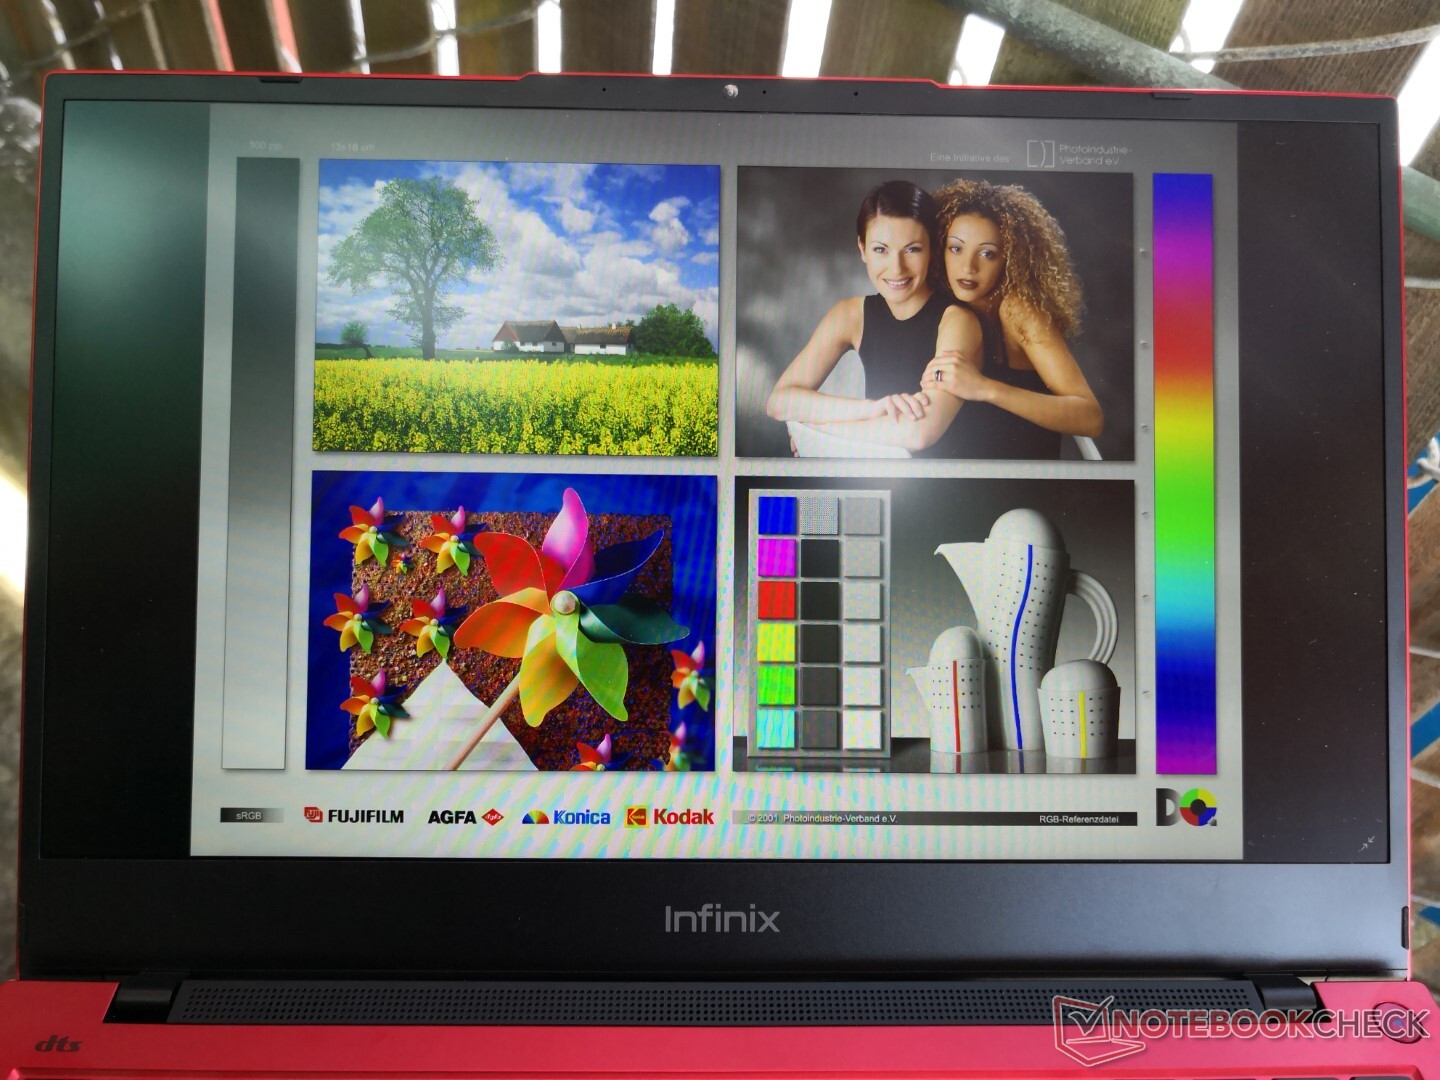
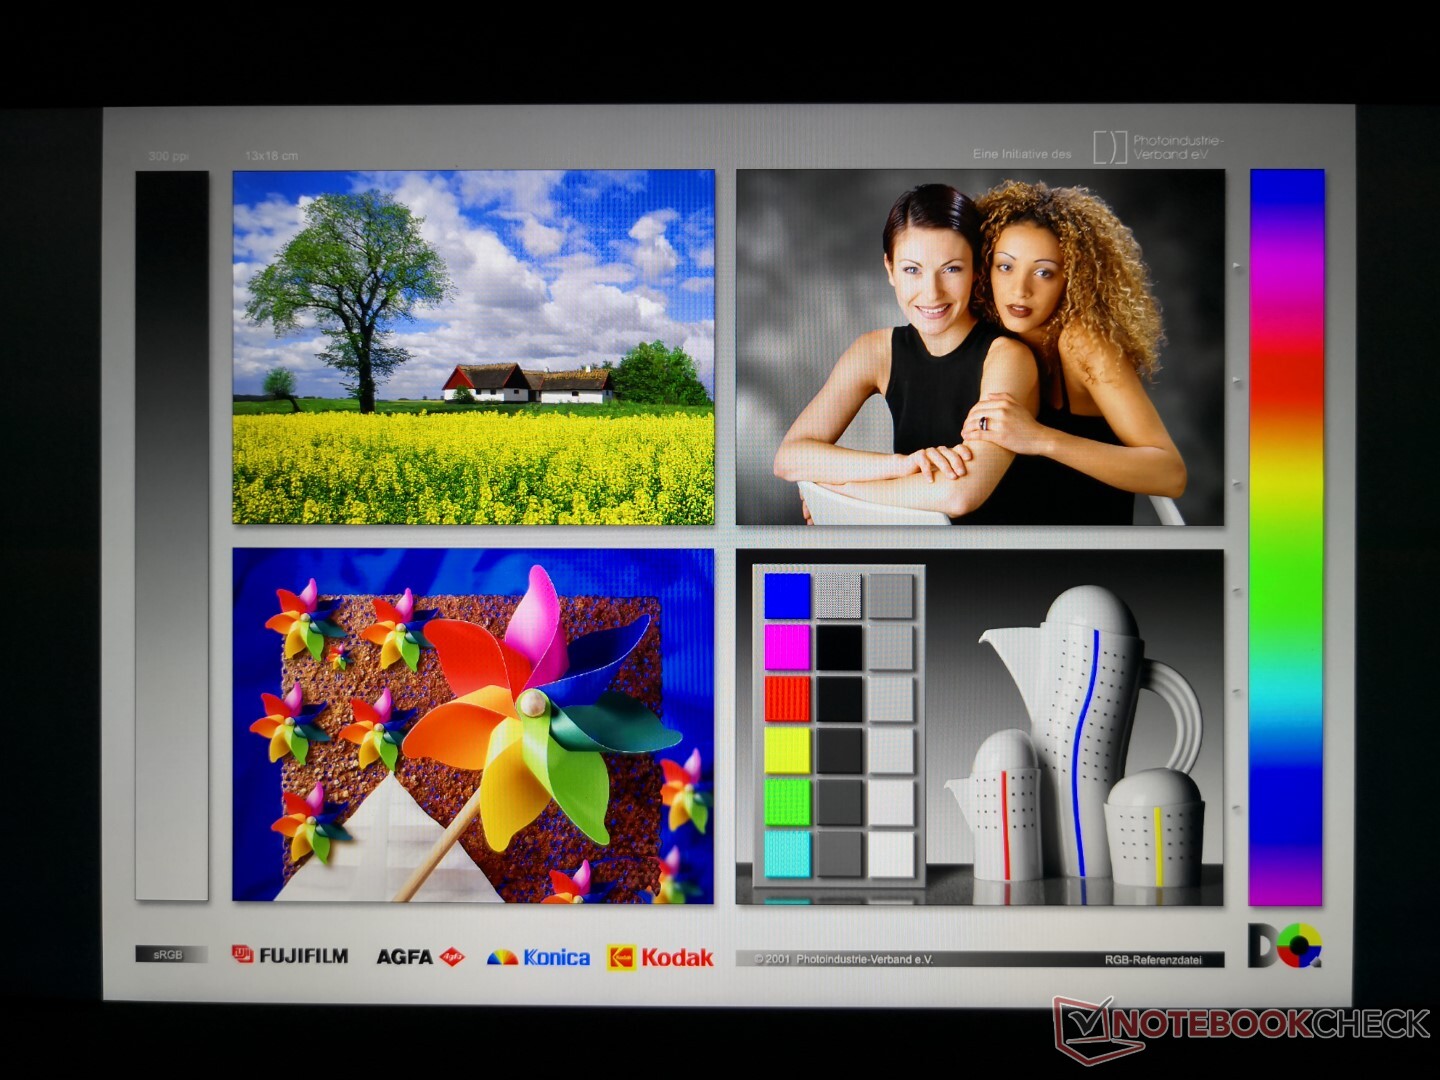
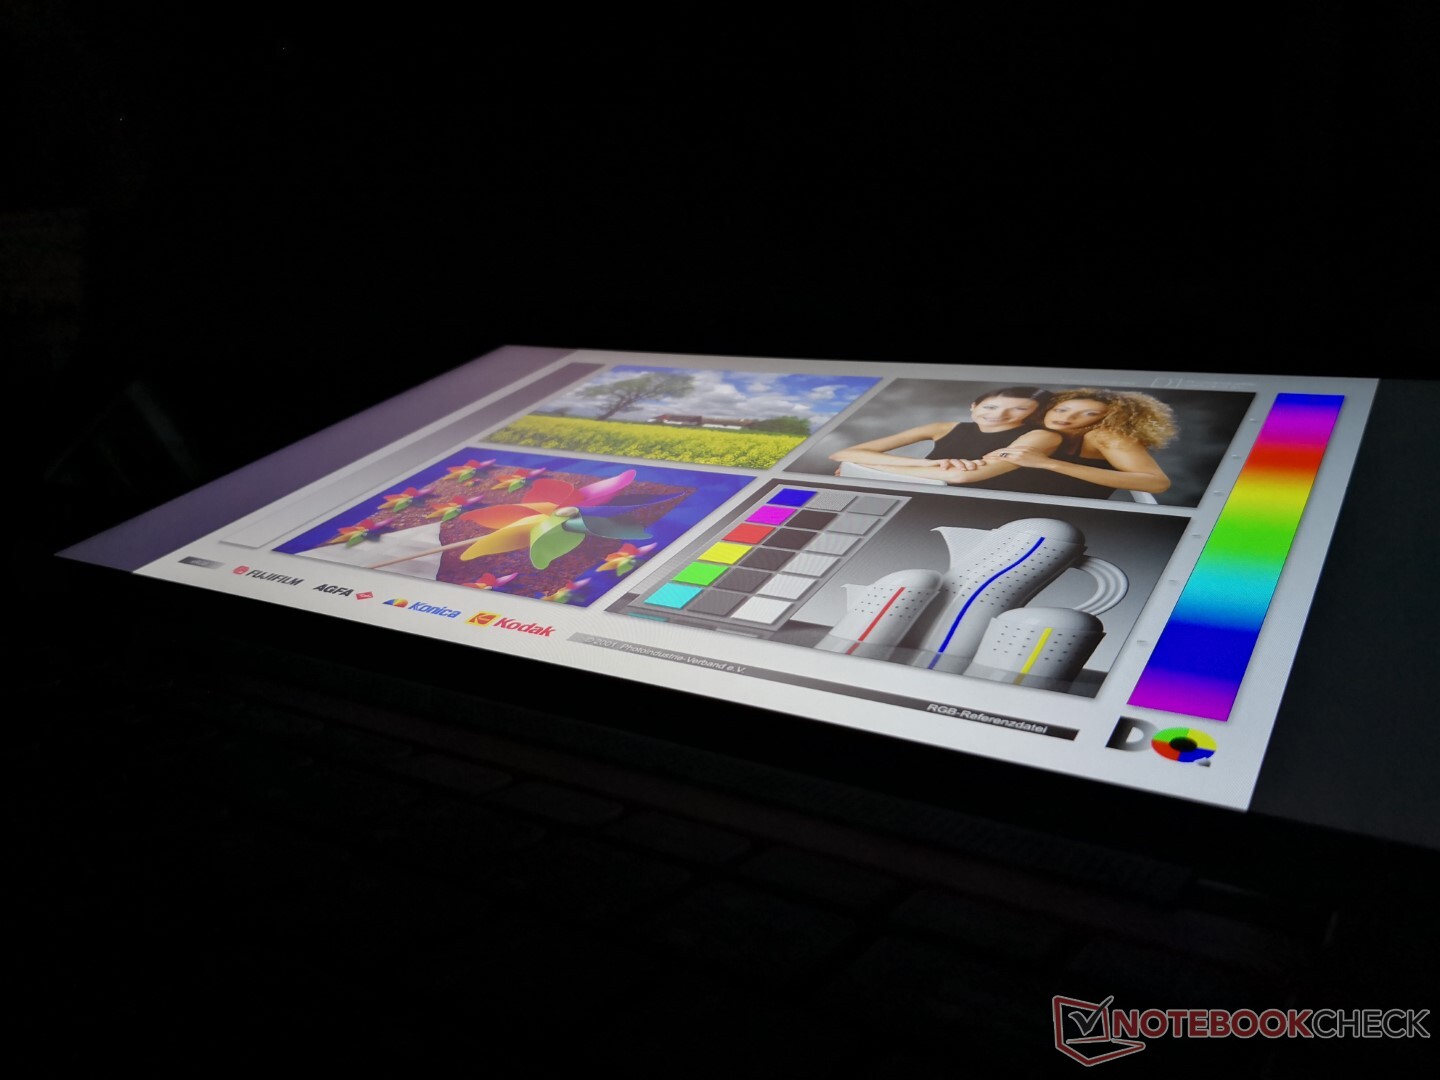
Display — Good Contrast and Color Coverage
The 1080p BOE NV140FHM-N62 IPS panel here can be found on many other 14-inch laptops including the Asus ZenBook UX430 and ZenBook Flip 14 UX461. Contrast is actually very good for a budget laptop at over 1000:1 and colors are better than average as well. However, note that pulse-width modulation is present on all brightness levels up to 99 percent which can cause eyestrain for some users.

| |||||||||||||||||||||||||
Brightness Distribution: 74 %
Center on Battery: 281.3 cd/m²
Contrast: 1175:1 (Black: 0.24 cd/m²)
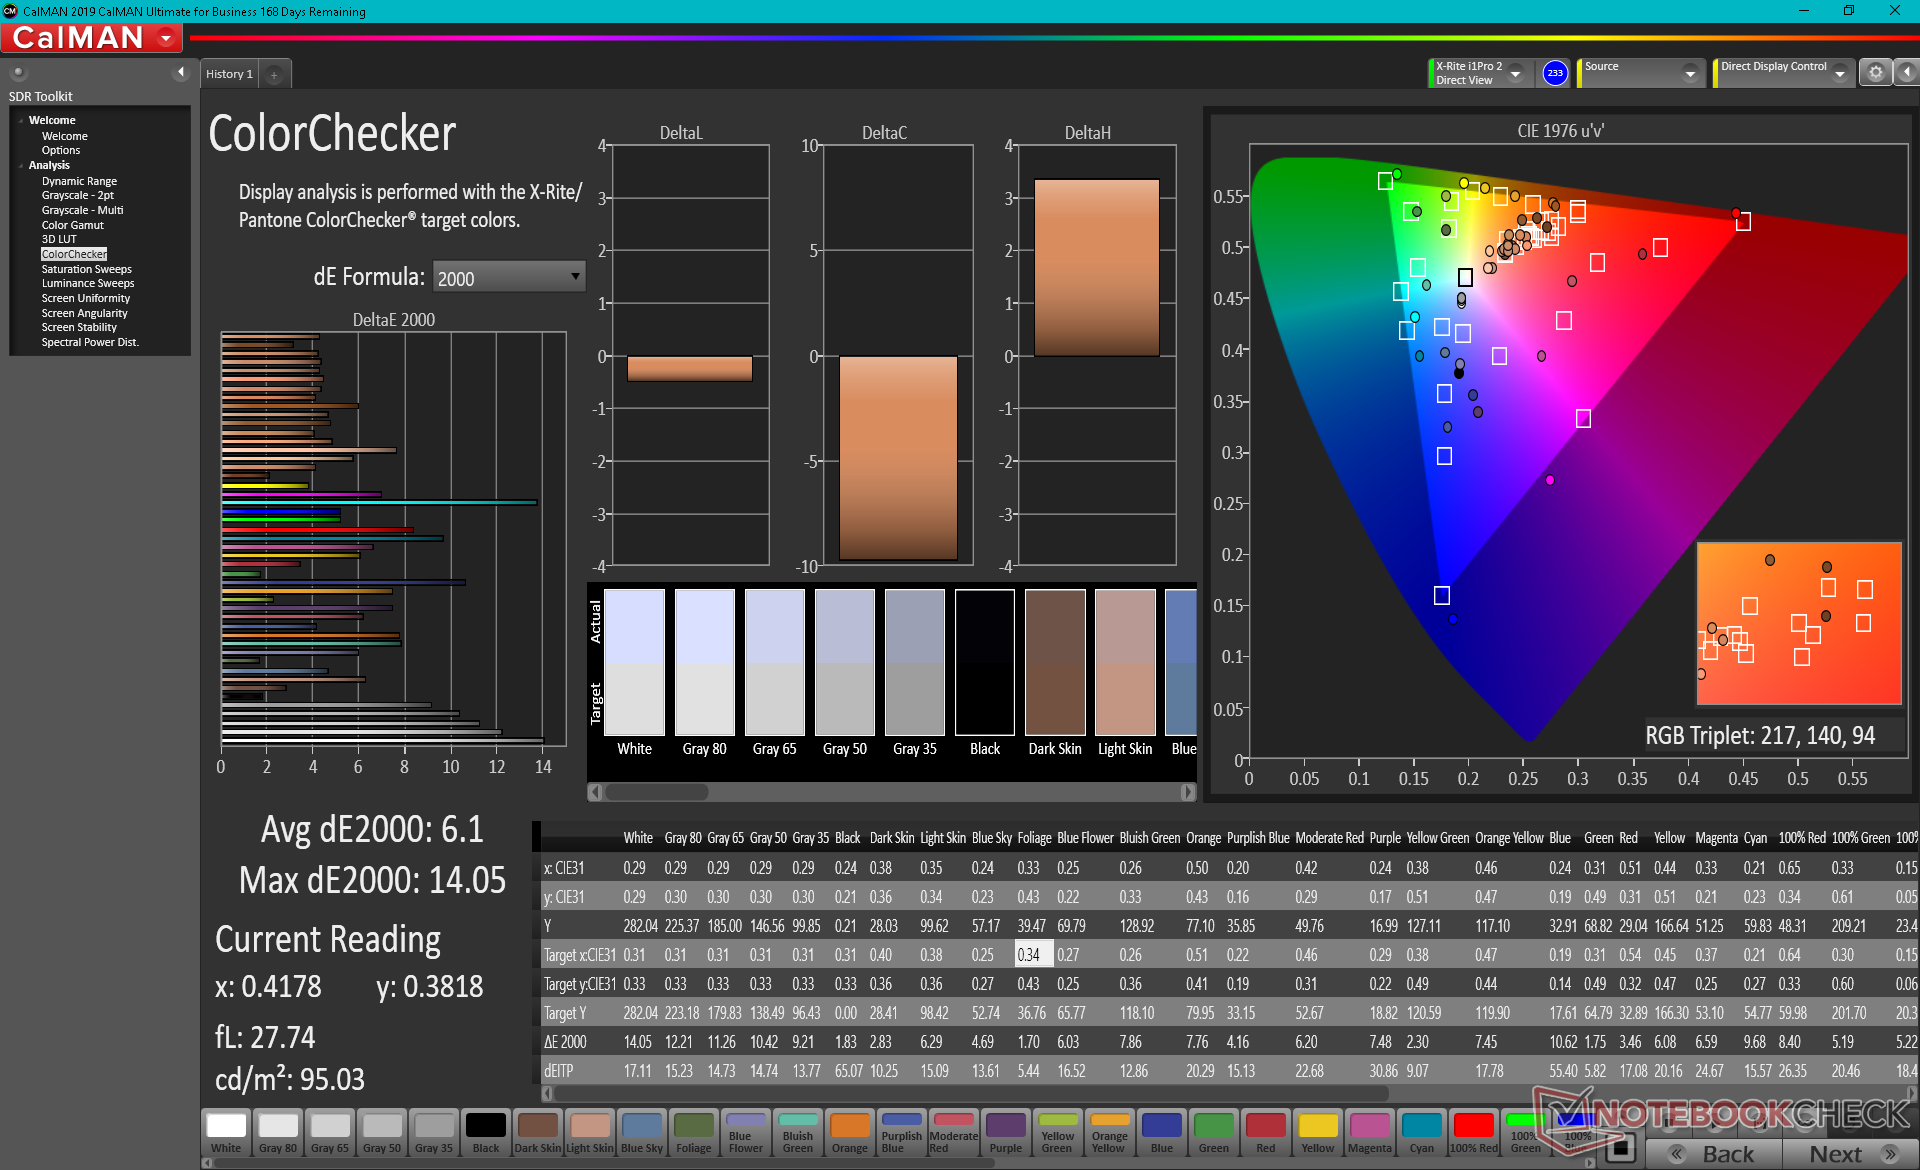
ΔE ColorChecker Calman: 6.1 | ∀{0.5-29.43 Ø4.71}
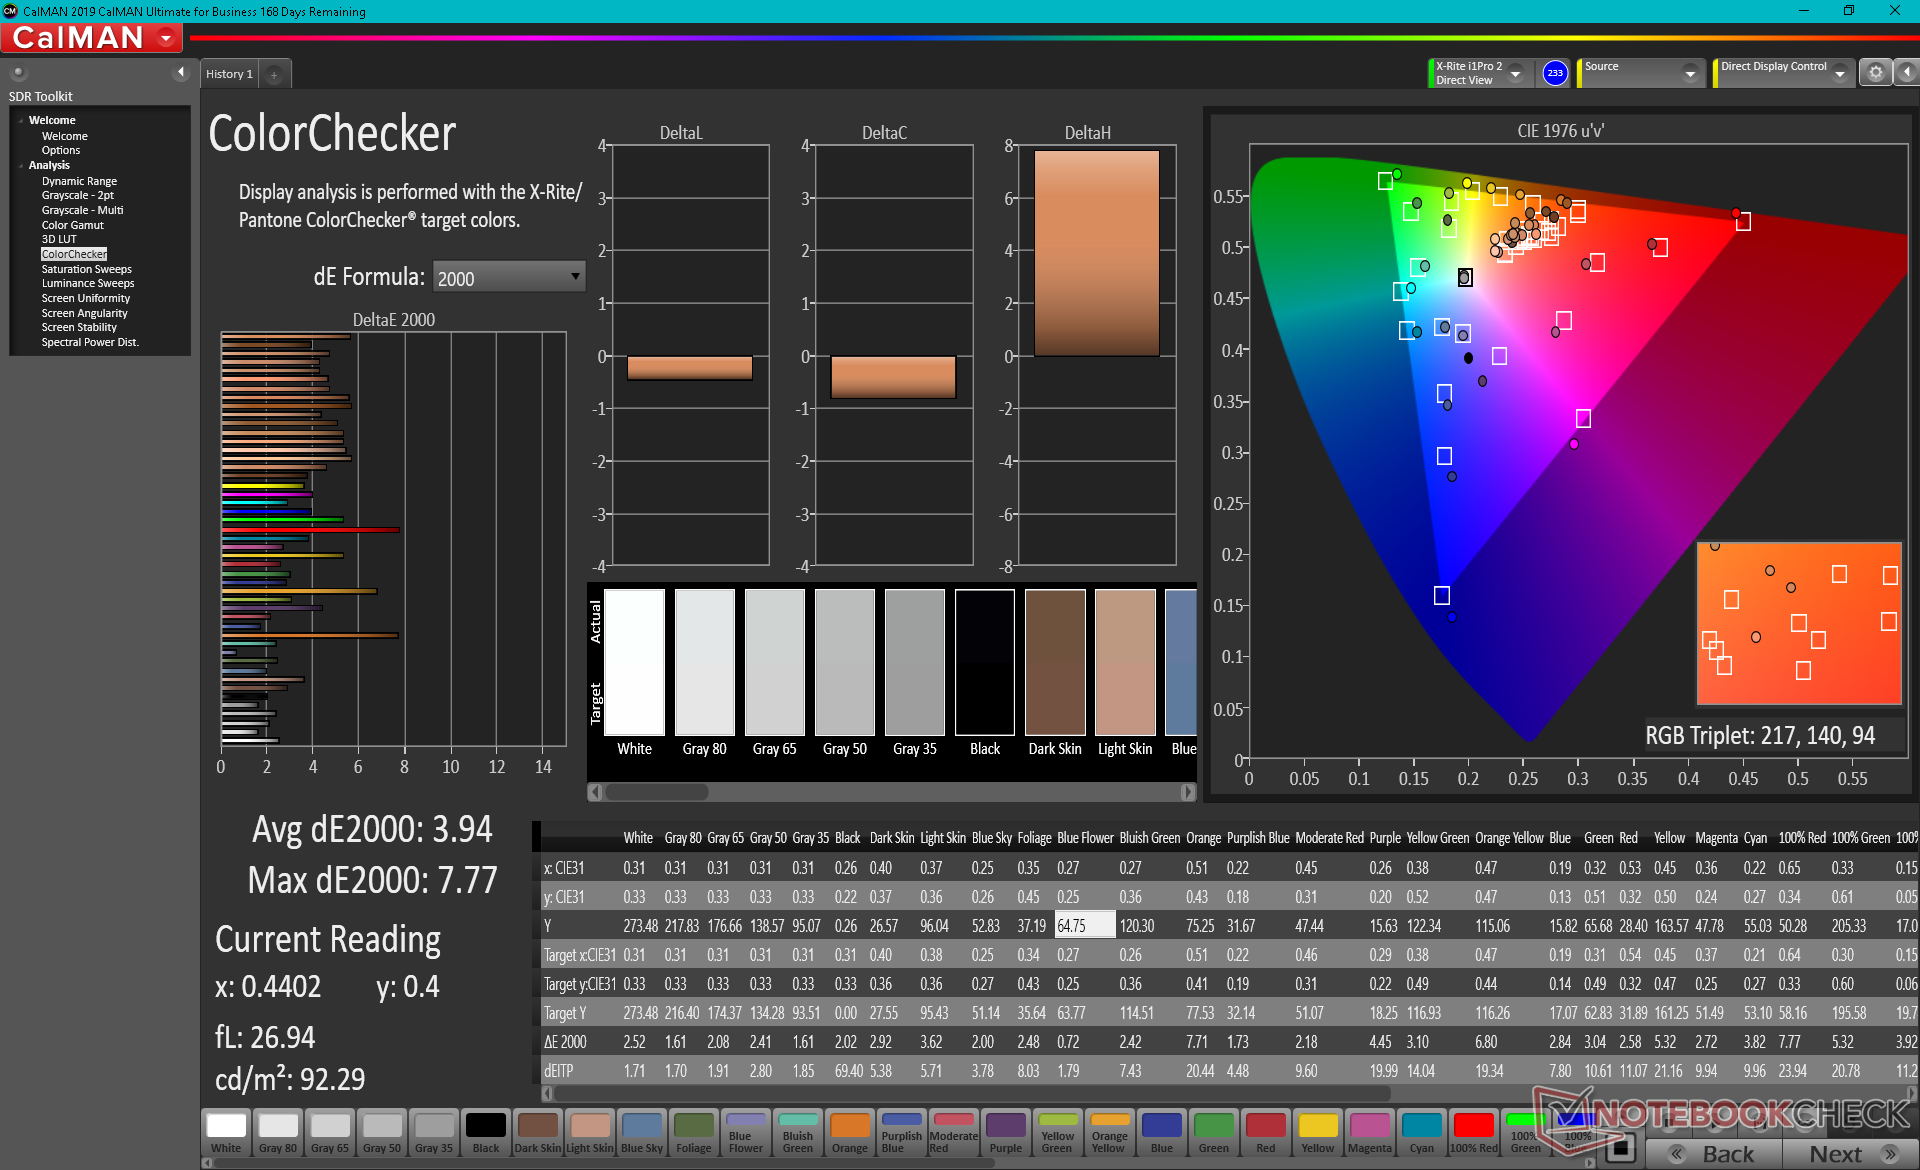
calibrated: 3.94
ΔE Greyscale Calman: 8.7 | ∀{0.09-98 Ø4.96}
63.3% AdobeRGB 1998 (Argyll 3D)
86.6% sRGB (Argyll 3D)
65.7% Display P3 (Argyll 3D)
Gamma: 2.14
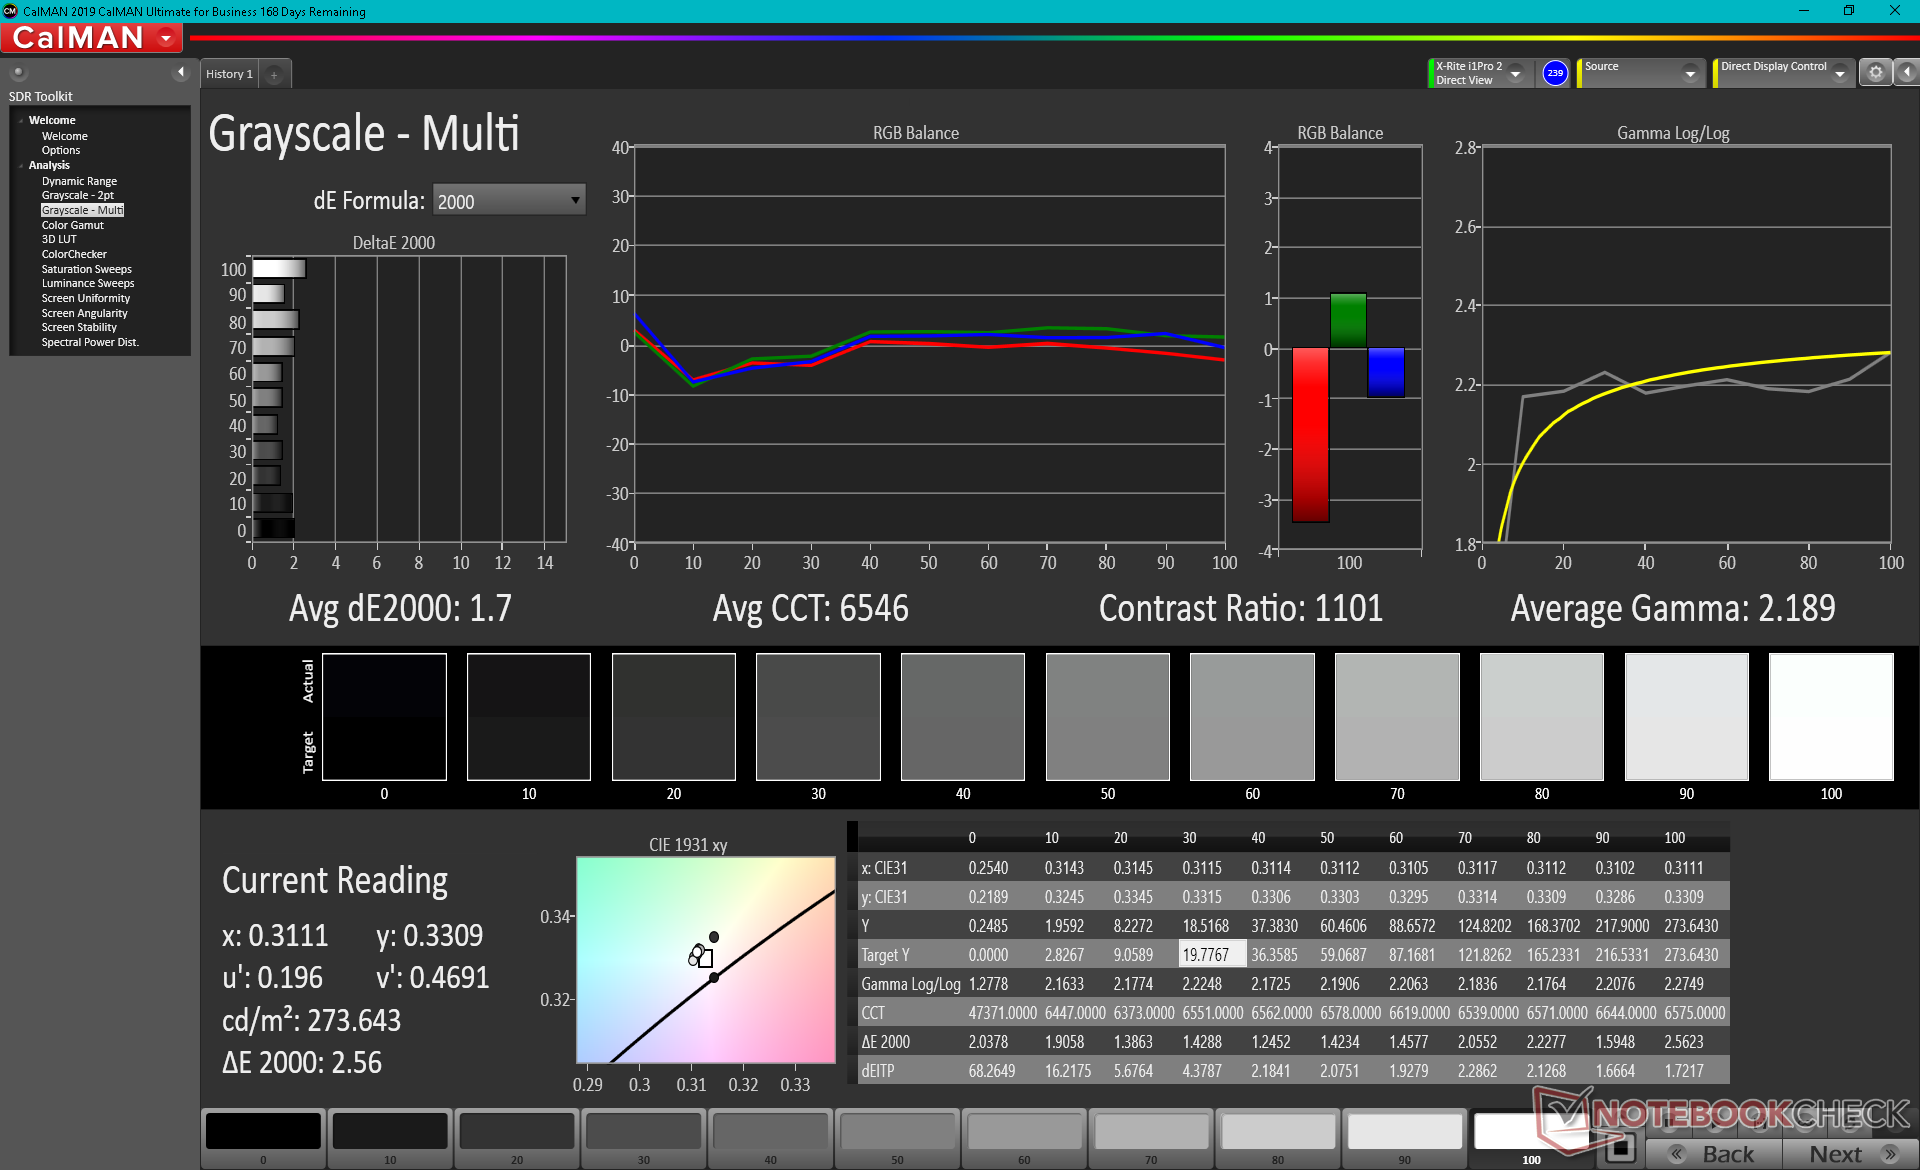
CCT: 8672 K
| Infinix INBook X1 Pro BOE NV140FHM-N62, IPS, 14", 1920x1080 | Honor Magicbook 14 i7-1165G7 BOE092E, IPS, 14", 1920x1080 | Lenovo ThinkBook 14 G2 ITL 20VD008WGE B140HAN04.0, a-Si IPS LED, 14", 1920x1080 | Asus VivoBook S14 S433FL Chi Mei CMN14D4, IPS, 14", 1920x1080 | HP Pavilion 14-ce3040ng AUO543D, IPS, 14", 1920x1080 | |
|---|---|---|---|---|---|
| Display | 5% | -39% | -32% | 8% | |
| Display P3 Coverage (%) | 65.7 | 64.8 -1% | 37.23 -43% | 41.55 -37% | 66.5 1% |
| sRGB Coverage (%) | 86.6 | 96.3 11% | 55.9 -35% | 62 -28% | 98.4 14% |
| AdobeRGB 1998 Coverage (%) | 63.3 | 66.1 4% | 38.47 -39% | 42.99 -32% | 68.2 8% |
| Response Times | 34% | -9% | 23% | -17% | |
| Response Time Grey 50% / Grey 80% * (ms) | 43.2 ? | 31.2 ? 28% | 51.6 ? -19% | 34 ? 21% | 60.8 ? -41% |
| Response Time Black / White * (ms) | 32 ? | 19.2 ? 40% | 31.6 ? 1% | 24 ? 25% | 29.6 ? 7% |
| PWM Frequency (Hz) | 200 ? | 250 ? | |||
| Screen | 36% | -4% | 1% | 28% | |
| Brightness middle (cd/m²) | 282 | 341 21% | 240 -15% | 220 -22% | 395 40% |
| Brightness (cd/m²) | 271 | 313 15% | 226 -17% | 204 -25% | 375 38% |
| Brightness Distribution (%) | 74 | 87 18% | 69 -7% | 68 -8% | 91 23% |
| Black Level * (cd/m²) | 0.24 | 0.27 -13% | 0.23 4% | 0.155 35% | 0.26 -8% |
| Contrast (:1) | 1175 | 1263 7% | 1043 -11% | 1419 21% | 1519 29% |
| Colorchecker dE 2000 * | 6.1 | 1.76 71% | 5.4 11% | 5.23 14% | 5.92 3% |
| Colorchecker dE 2000 max. * | 14.05 | 4.85 65% | 21.9 -56% | 21.51 -53% | 9.79 30% |
| Colorchecker dE 2000 calibrated * | 3.94 | 1.01 74% | 4.8 -22% | 4.4 -12% | 0.91 77% |
| Greyscale dE 2000 * | 8.7 | 3.3 62% | 2.3 74% | 3.77 57% | 6.69 23% |
| Gamma | 2.14 103% | 2.26 97% | 2.37 93% | 2.35 94% | 2.78 79% |
| CCT | 8672 75% | 7233 90% | 6706 97% | 6666 98% | 7596 86% |
| Color Space (Percent of AdobeRGB 1998) (%) | 66 | 35.4 | 40 | 63 | |
| Color Space (Percent of sRGB) (%) | 89 | 55.8 | 62 | 98 | |
| Total Average (Program / Settings) | 25% /
29% | -17% /
-12% | -3% /
-3% | 6% /
17% |
* ... smaller is better
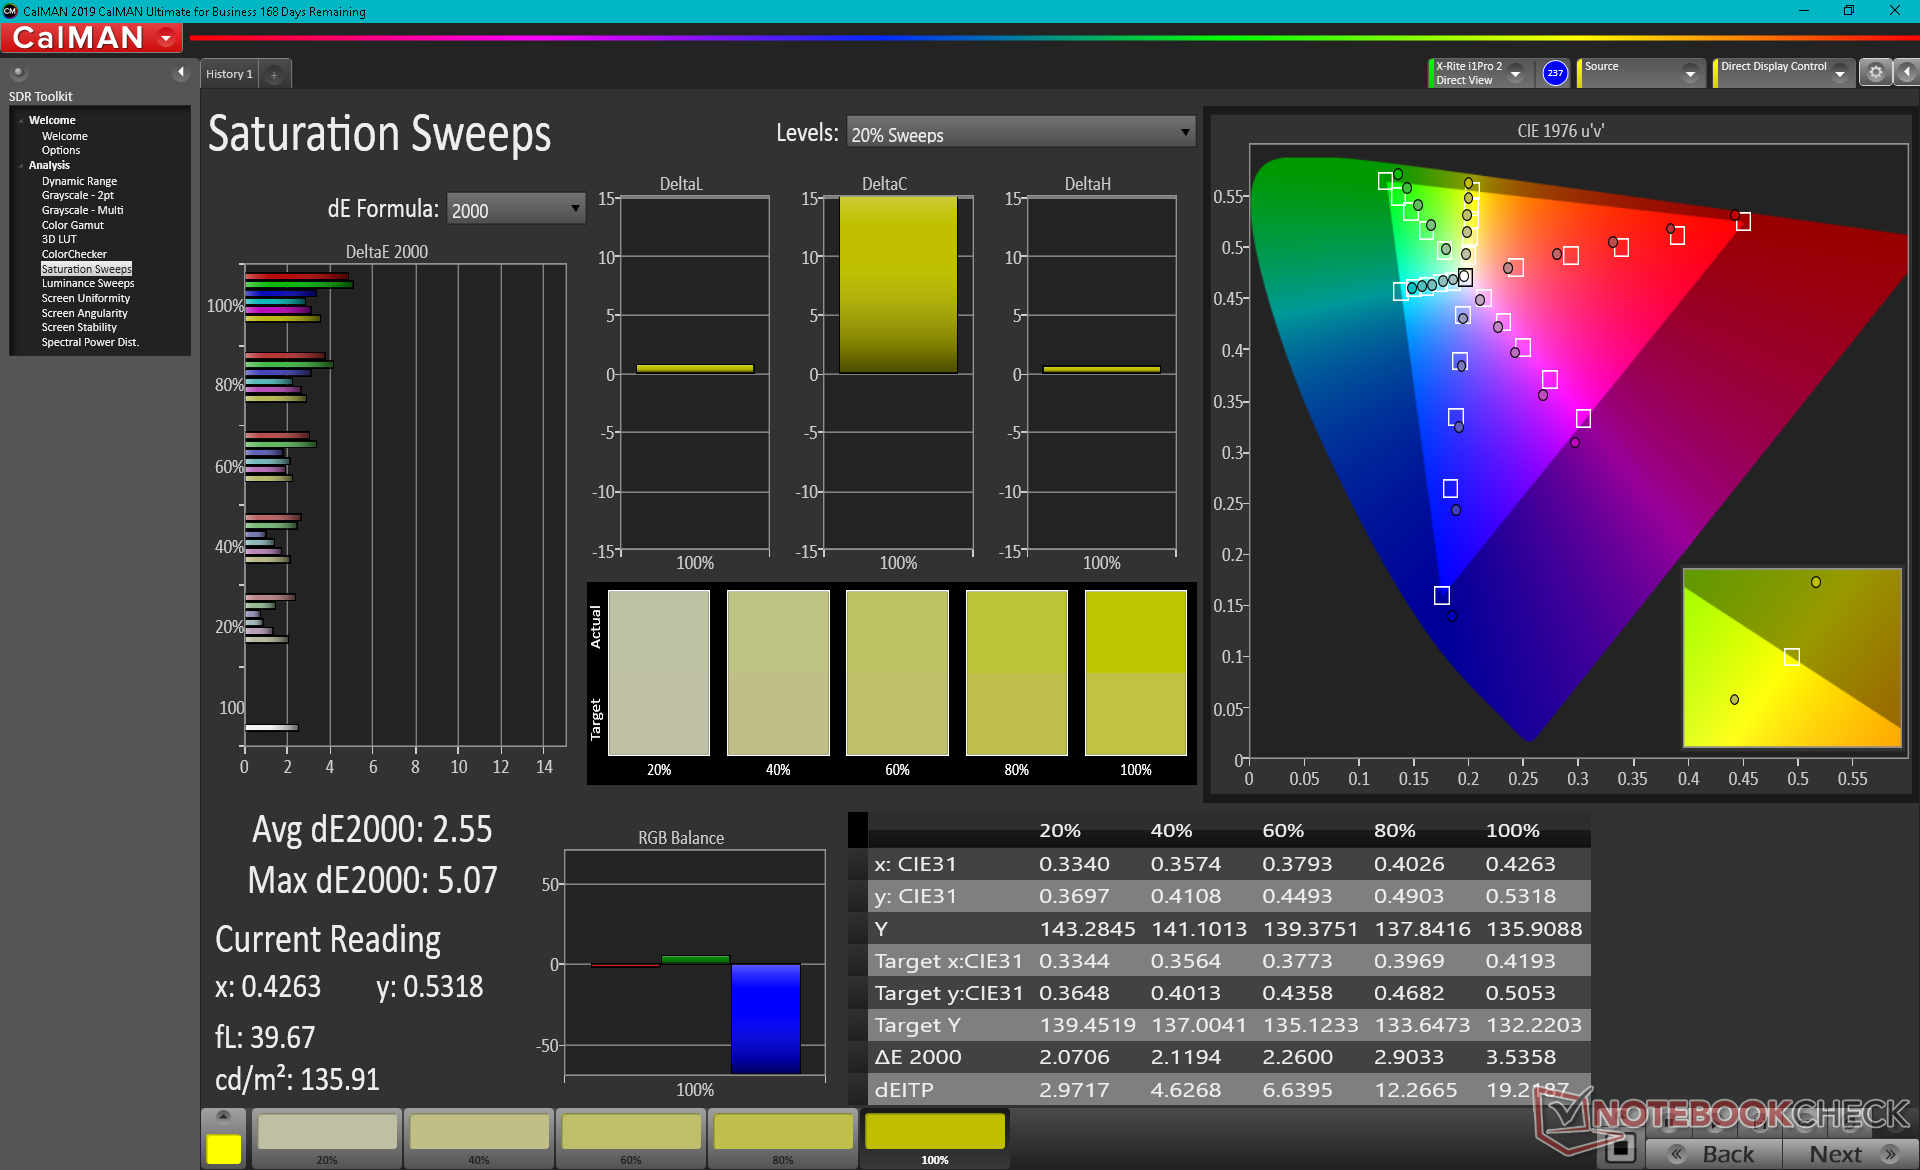
Color space is wider than on most other budget laptops at about 87 percent of sRGB compared to just ~60 percent on competing models like the Asus VivoBook S14. It's not not quite full sRGB coverage, but it's still excellent for the category.
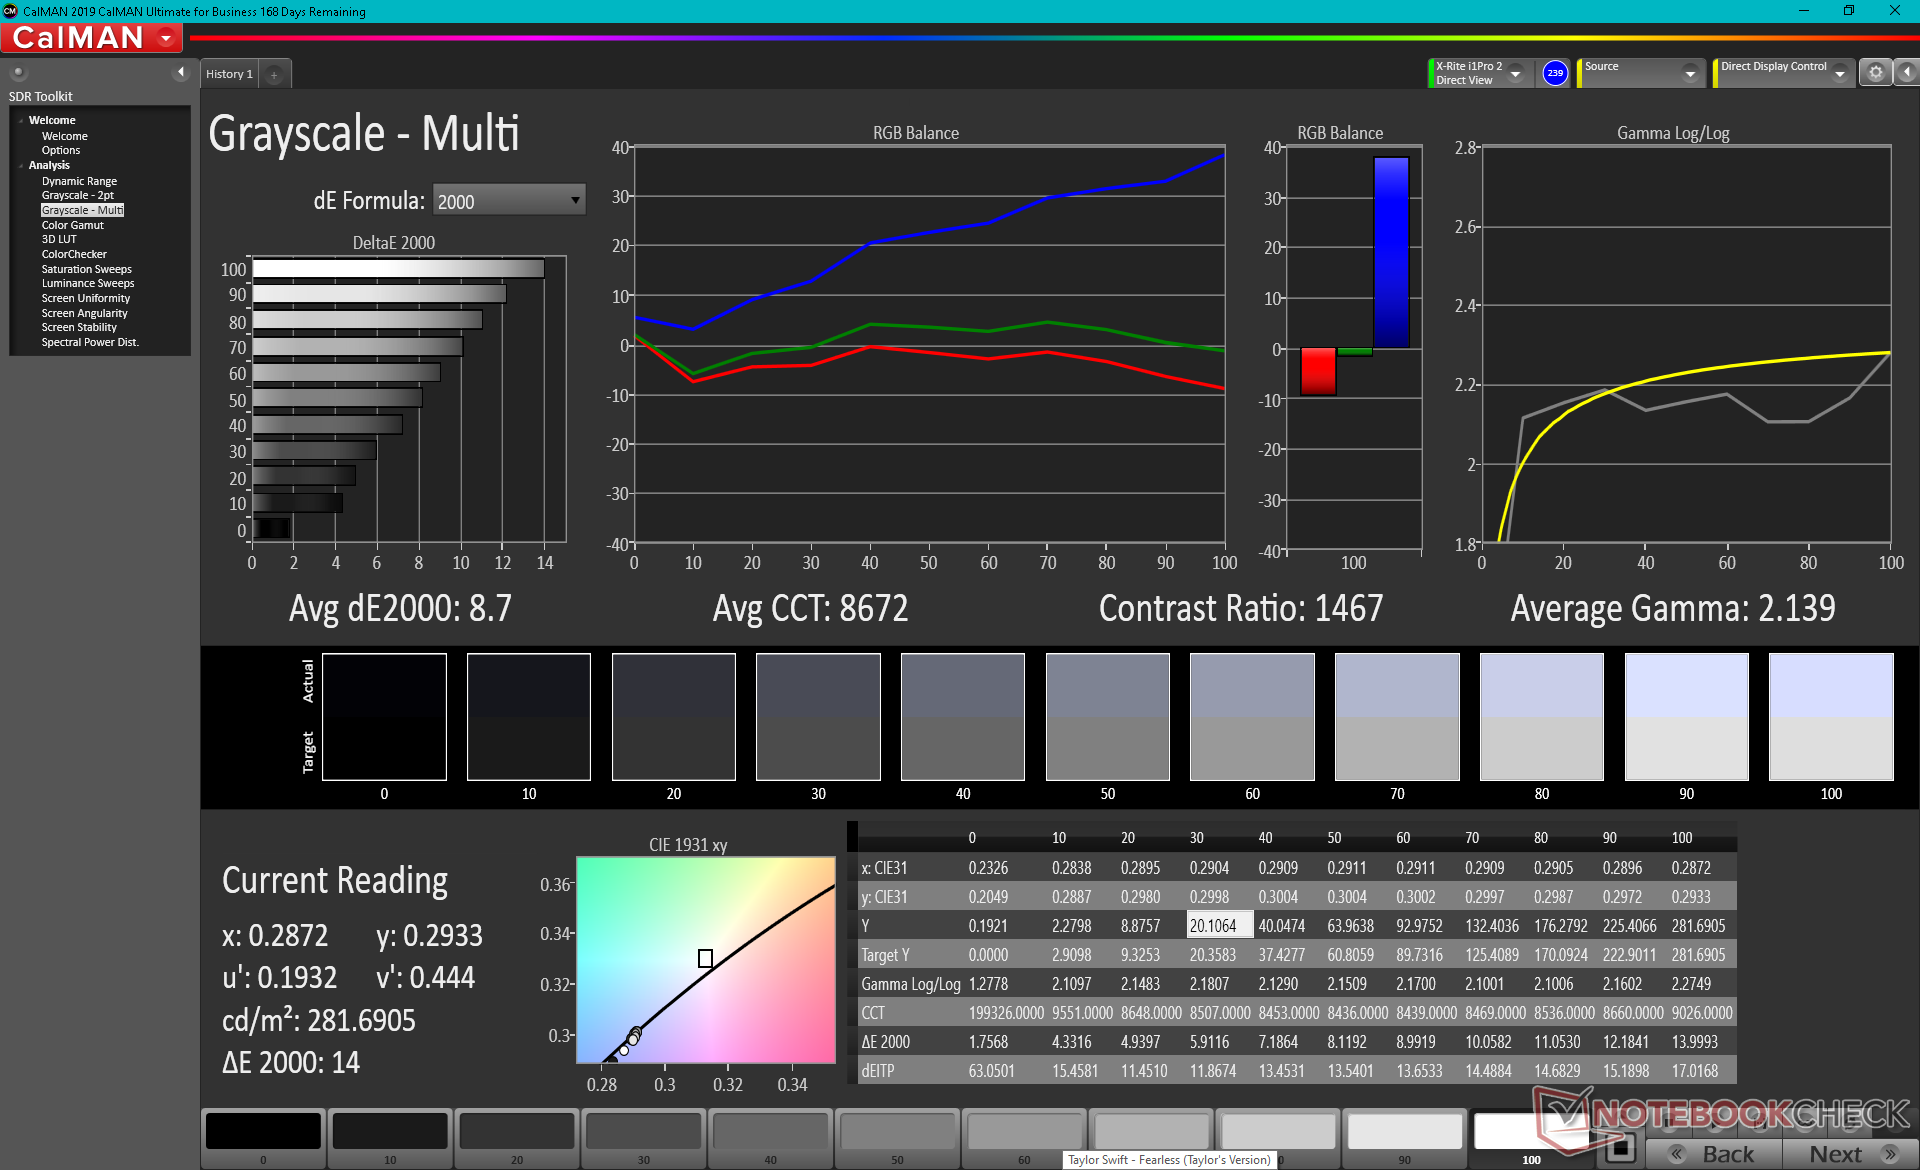
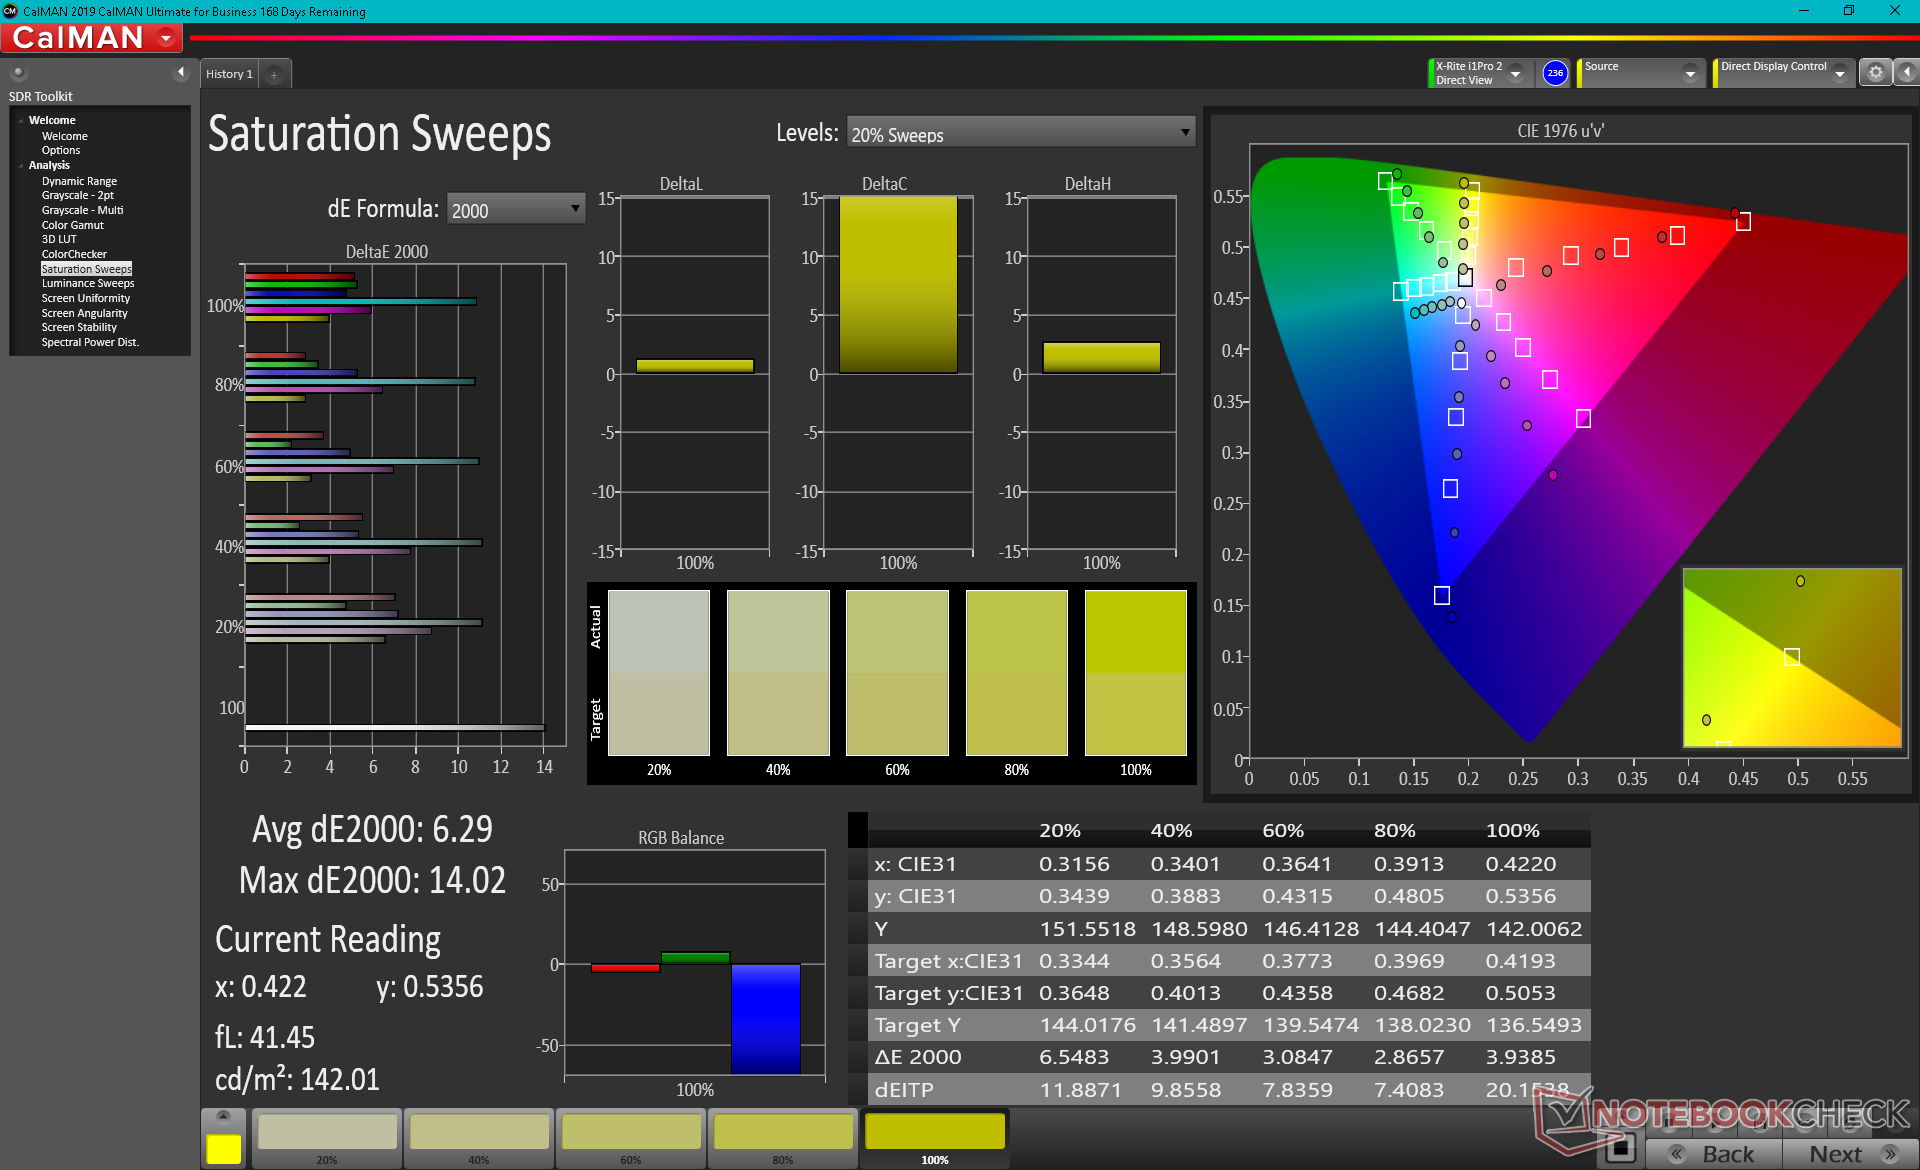
The display is poorly calibrated out of the box as demonstrated by the overly cool color temperature of 8672 and dreadful average grayscale DeltaE of 8.7. Calibrating the panel ourselves improves things dramatically as shown by our CalMan screenshots below. We highly recommend applying our ICM profile above to better exploit the relatively high sRGB coverage and contrast ratio of the display.
Display Response Times
| ↔ Response Time Black to White | ||
|---|---|---|
| 32 ms ... rise ↗ and fall ↘ combined | ↗ 19.6 ms rise | 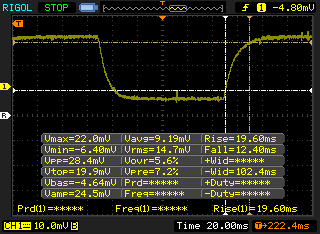 |
| ↘ 12.4 ms fall | ||
| The screen shows slow response rates in our tests and will be unsatisfactory for gamers. In comparison, all tested devices range from 0.1 (minimum) to 240 (maximum) ms. » 86 % of all devices are better. This means that the measured response time is worse than the average of all tested devices (19.8 ms). | ||
| ↔ Response Time 50% Grey to 80% Grey | ||
| 43.2 ms ... rise ↗ and fall ↘ combined | ↗ 24.8 ms rise | 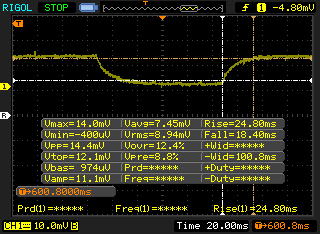 |
| ↘ 18.4 ms fall | ||
| The screen shows slow response rates in our tests and will be unsatisfactory for gamers. In comparison, all tested devices range from 0.165 (minimum) to 636 (maximum) ms. » 72 % of all devices are better. This means that the measured response time is worse than the average of all tested devices (31 ms). | ||
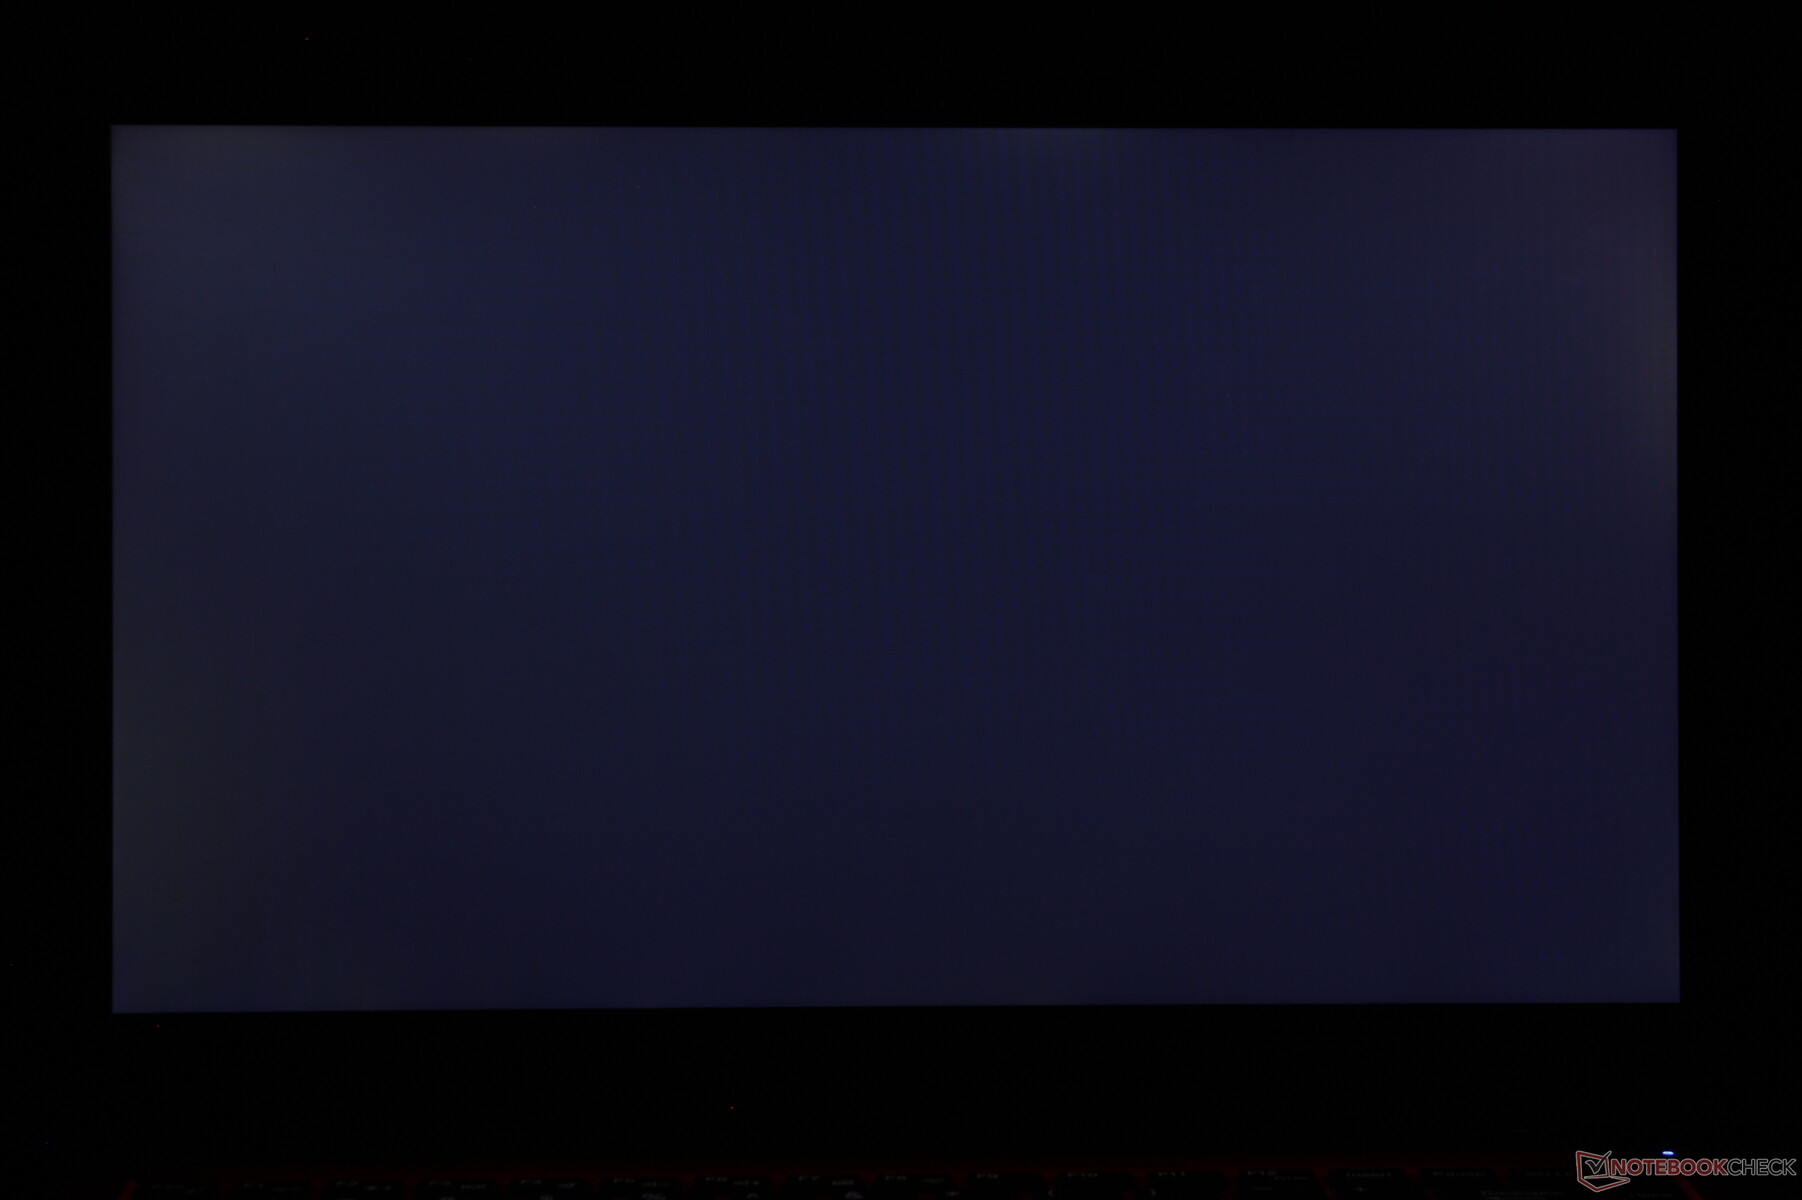
Screen Flickering / PWM (Pulse-Width Modulation)
| Screen flickering / PWM detected | 200 Hz | ≤ 99 % brightness setting | 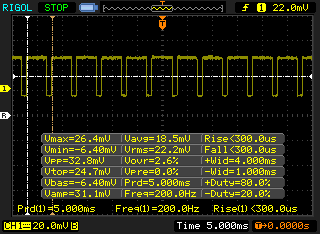 |
The display backlight flickers at 200 Hz (worst case, e.g., utilizing PWM) Flickering detected at a brightness setting of 99 % and below. There should be no flickering or PWM above this brightness setting. The frequency of 200 Hz is relatively low, so sensitive users will likely notice flickering and experience eyestrain at the stated brightness setting and below. In comparison: 52 % of all tested devices do not use PWM to dim the display. If PWM was detected, an average of 7754 (minimum: 5 - maximum: 343500) Hz was measured. | |||
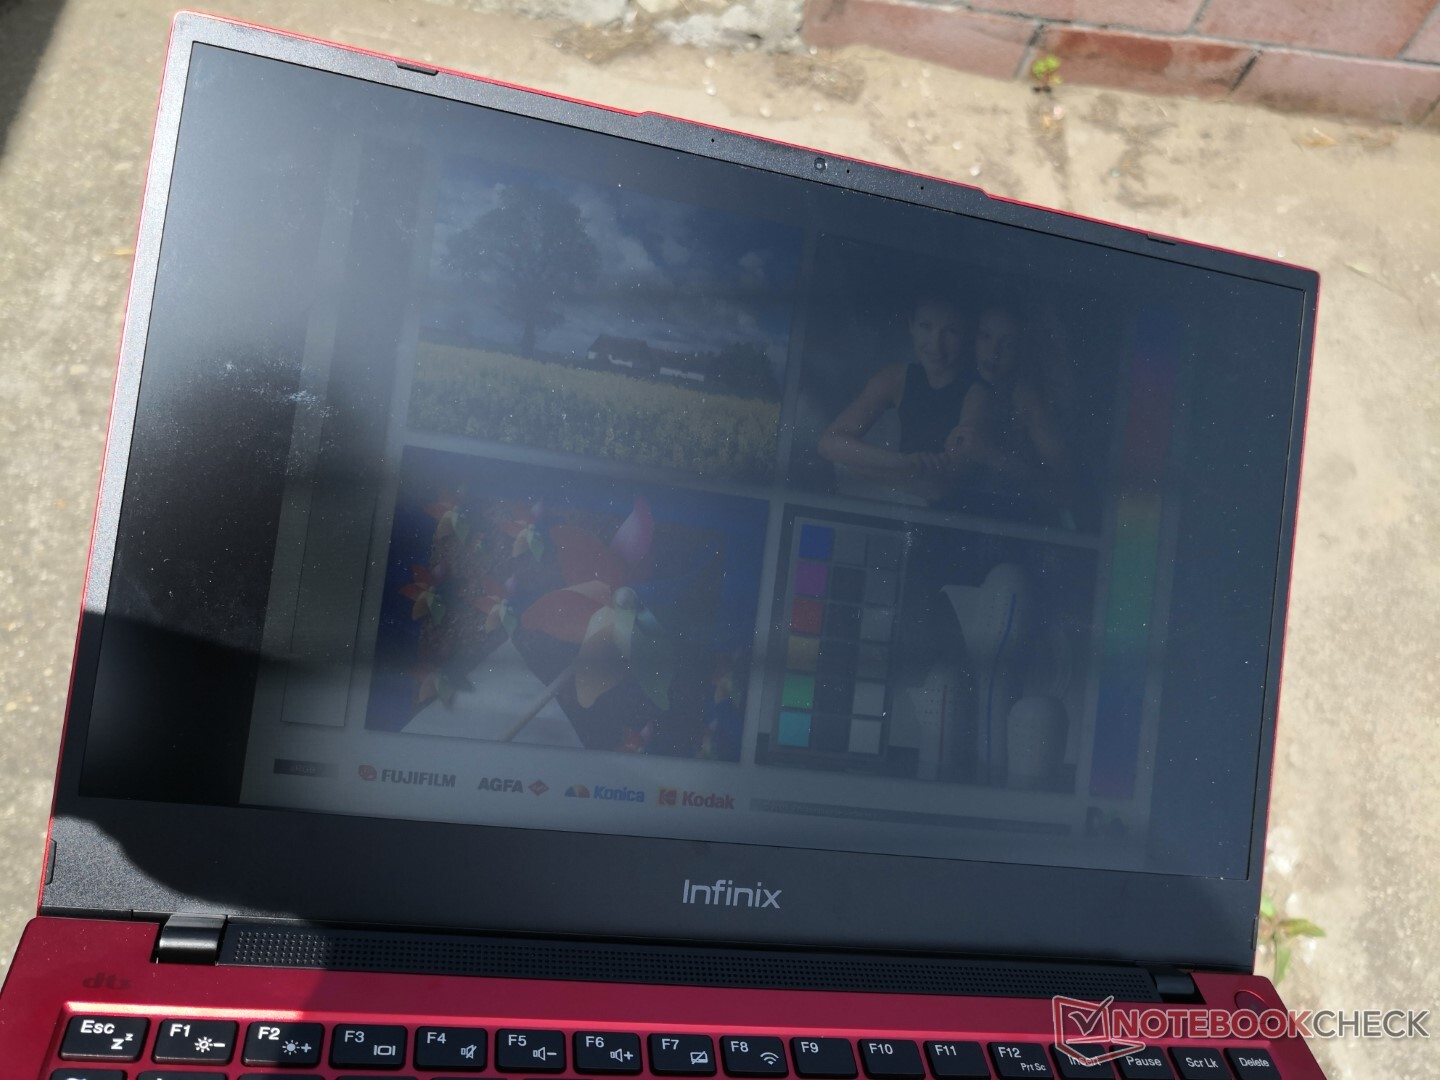
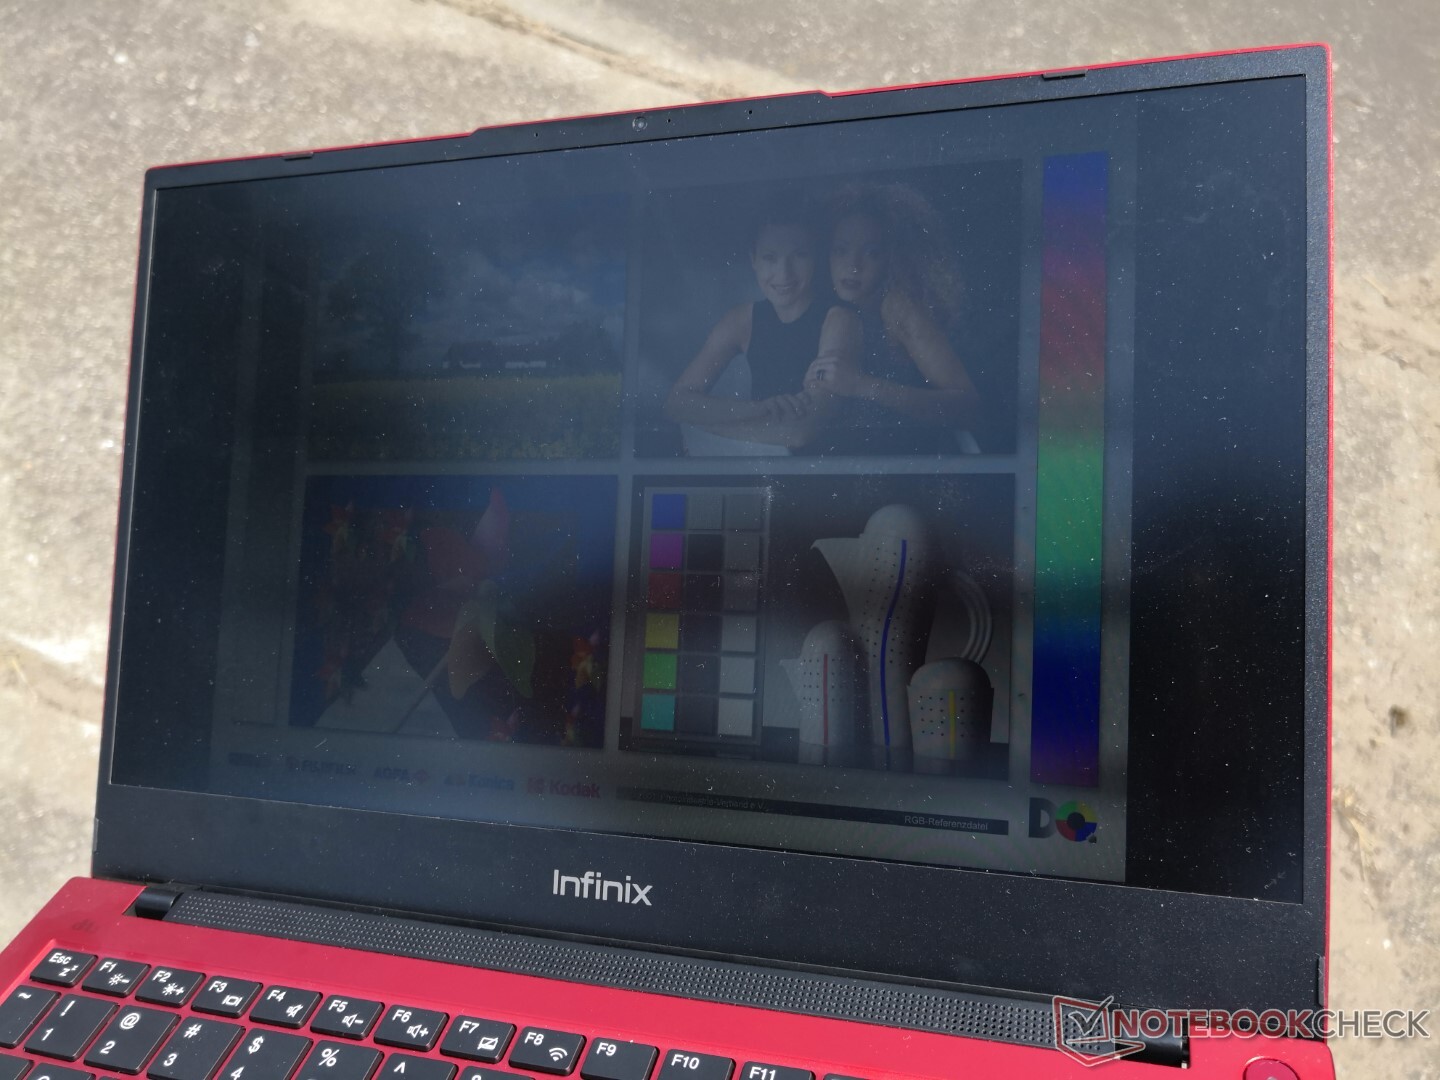
Outdoor visibility is just barely decent when under shade. Maximum brightness is not enough to abate ambient lighting under these conditions.
Performance — Intel 10th Gen is Still Good
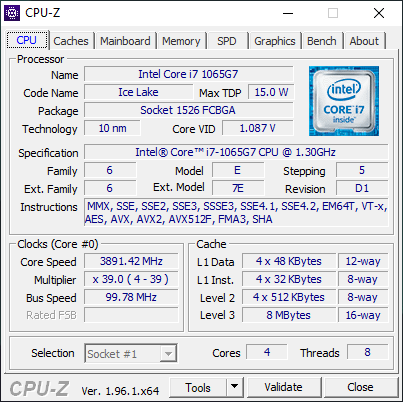
Processor
CPU performance is within a few percentage points of the average Core i7-1065G7 in our database. However, running CineBench R15 xT in a loop shows that clock rates are susceptible to fluctuations when the CPU is stressed.
Cinebench R23: Multi Core | Single Core
Cinebench R15: CPU Multi 64Bit | CPU Single 64Bit
Blender: v2.79 BMW27 CPU
7-Zip 18.03: 7z b 4 -mmt1 | 7z b 4
Geekbench 5.5: Single-Core | Multi-Core
HWBOT x265 Benchmark v2.2: 4k Preset
LibreOffice : 20 Documents To PDF
R Benchmark 2.5: Overall mean
| Cinebench R23 / Multi Core | |
| Lenovo IdeaPad 5 14ALC05 82LM005YGE | |
| Lenovo ThinkBook 14 G2 ITL 20VD008WGE | |
| Infinix INBook X1 Pro | |
| Average Intel Core i7-1065G7 (3127 - 4281, n=3) | |
| Cinebench R23 / Single Core | |
| Lenovo ThinkBook 14 G2 ITL 20VD008WGE | |
| Infinix INBook X1 Pro | |
| Lenovo IdeaPad 5 14ALC05 82LM005YGE | |
| Average Intel Core i7-1065G7 (1050 - 1212, n=2) | |
| Geekbench 5.5 / Single-Core | |
| Honor Magicbook 14 i7-1165G7 | |
| Lenovo ThinkBook 14 G2 ITL 20VD008WGE | |
| Lenovo Yoga Slim 7-14IIL05 | |
| Average Intel Core i7-1065G7 (948 - 1348, n=18) | |
| Asus VivoBook S14 S433FL | |
| Asus ZenBook 14 UX434FL-DB77 | |
| Lenovo IdeaPad 5 14ALC05 82LM005YGE | |
| Lenovo IdeaPad 5 14ARE05 | |
| LG Gram 14Z90N | |
| HWBOT x265 Benchmark v2.2 / 4k Preset | |
| Lenovo IdeaPad 5 14ALC05 82LM005YGE | |
| Honor Magicbook 14 i7-1165G7 | |
| Lenovo IdeaPad 5 14ARE05 | |
| Lenovo ThinkBook 14 G2 ITL 20VD008WGE | |
| Lenovo Yoga Slim 7-14IIL05 | |
| Infinix INBook X1 Pro | |
| Asus ZenBook 14 UX434FL-DB77 | |
| Asus VivoBook S14 S433FL | |
| Average Intel Core i7-1065G7 (2.2 - 6.38, n=22) | |
| LG Gram 14Z90N | |
| HP 14-dk0008ng | |
| LibreOffice / 20 Documents To PDF | |
| Asus ZenBook 14 UX434FL-DB77 | |
| Lenovo IdeaPad 5 14ALC05 82LM005YGE | |
| LG Gram 14Z90N | |
| Average Intel Core i7-1065G7 (46.9 - 85.3, n=19) | |
| Lenovo IdeaPad 5 14ARE05 | |
| Infinix INBook X1 Pro | |
| Asus VivoBook S14 S433FL | |
| Lenovo Yoga Slim 7-14IIL05 | |
| Lenovo ThinkBook 14 G2 ITL 20VD008WGE | |
| Honor Magicbook 14 i7-1165G7 | |
Cinebench R23: Multi Core | Single Core
Cinebench R15: CPU Multi 64Bit | CPU Single 64Bit
Blender: v2.79 BMW27 CPU
7-Zip 18.03: 7z b 4 -mmt1 | 7z b 4
Geekbench 5.5: Single-Core | Multi-Core
HWBOT x265 Benchmark v2.2: 4k Preset
LibreOffice : 20 Documents To PDF
R Benchmark 2.5: Overall mean
* ... smaller is better
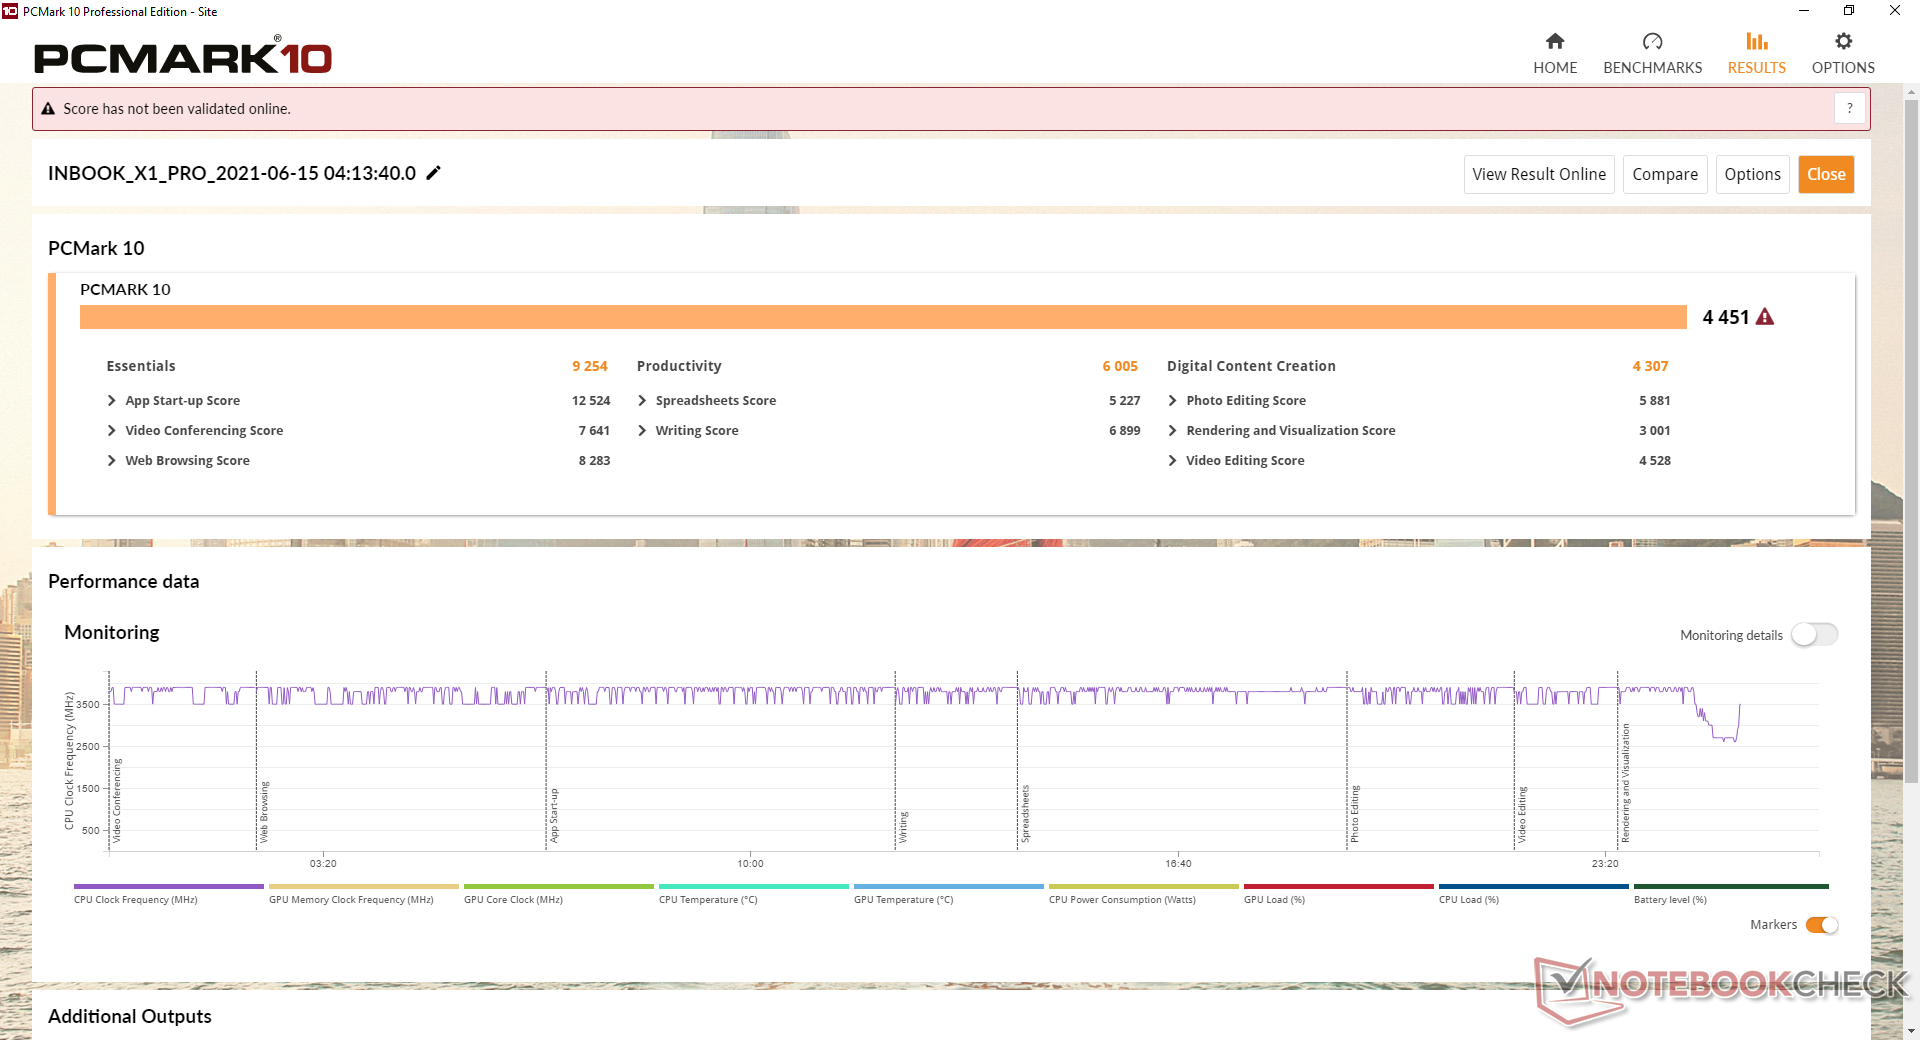
System Performance
| PCMark 10 / Score | |
| Schenker Vision 14 | |
| Honor Magicbook 14 i7-1165G7 | |
| Lenovo ThinkBook 14 G2 ITL 20VD008WGE | |
| Infinix INBook X1 Pro | |
| Average Intel Core i7-1065G7, Intel Iris Plus Graphics G7 (Ice Lake 64 EU) (3878 - 4679, n=20) | |
| HP Pavilion 14-ce3040ng | |
| Asus VivoBook S14 S433FL | |
| Huawei MateBook X Silver Frost (2020) | |
| PCMark 10 / Essentials | |
| Schenker Vision 14 | |
| Honor Magicbook 14 i7-1165G7 | |
| Lenovo ThinkBook 14 G2 ITL 20VD008WGE | |
| Infinix INBook X1 Pro | |
| Average Intel Core i7-1065G7, Intel Iris Plus Graphics G7 (Ice Lake 64 EU) (8302 - 9902, n=20) | |
| HP Pavilion 14-ce3040ng | |
| Asus VivoBook S14 S433FL | |
| Huawei MateBook X Silver Frost (2020) | |
| PCMark 10 / Productivity | |
| HP Pavilion 14-ce3040ng | |
| Asus VivoBook S14 S433FL | |
| Schenker Vision 14 | |
| Honor Magicbook 14 i7-1165G7 | |
| Average Intel Core i7-1065G7, Intel Iris Plus Graphics G7 (Ice Lake 64 EU) (5462 - 7379, n=20) | |
| Lenovo ThinkBook 14 G2 ITL 20VD008WGE | |
| Infinix INBook X1 Pro | |
| Huawei MateBook X Silver Frost (2020) | |
| PCMark 10 / Digital Content Creation | |
| Schenker Vision 14 | |
| Honor Magicbook 14 i7-1165G7 | |
| Lenovo ThinkBook 14 G2 ITL 20VD008WGE | |
| Infinix INBook X1 Pro | |
| Average Intel Core i7-1065G7, Intel Iris Plus Graphics G7 (Ice Lake 64 EU) (3260 - 4424, n=20) | |
| HP Pavilion 14-ce3040ng | |
| Asus VivoBook S14 S433FL | |
| Huawei MateBook X Silver Frost (2020) | |
| PCMark 10 Score | 4451 points | |
Help | ||
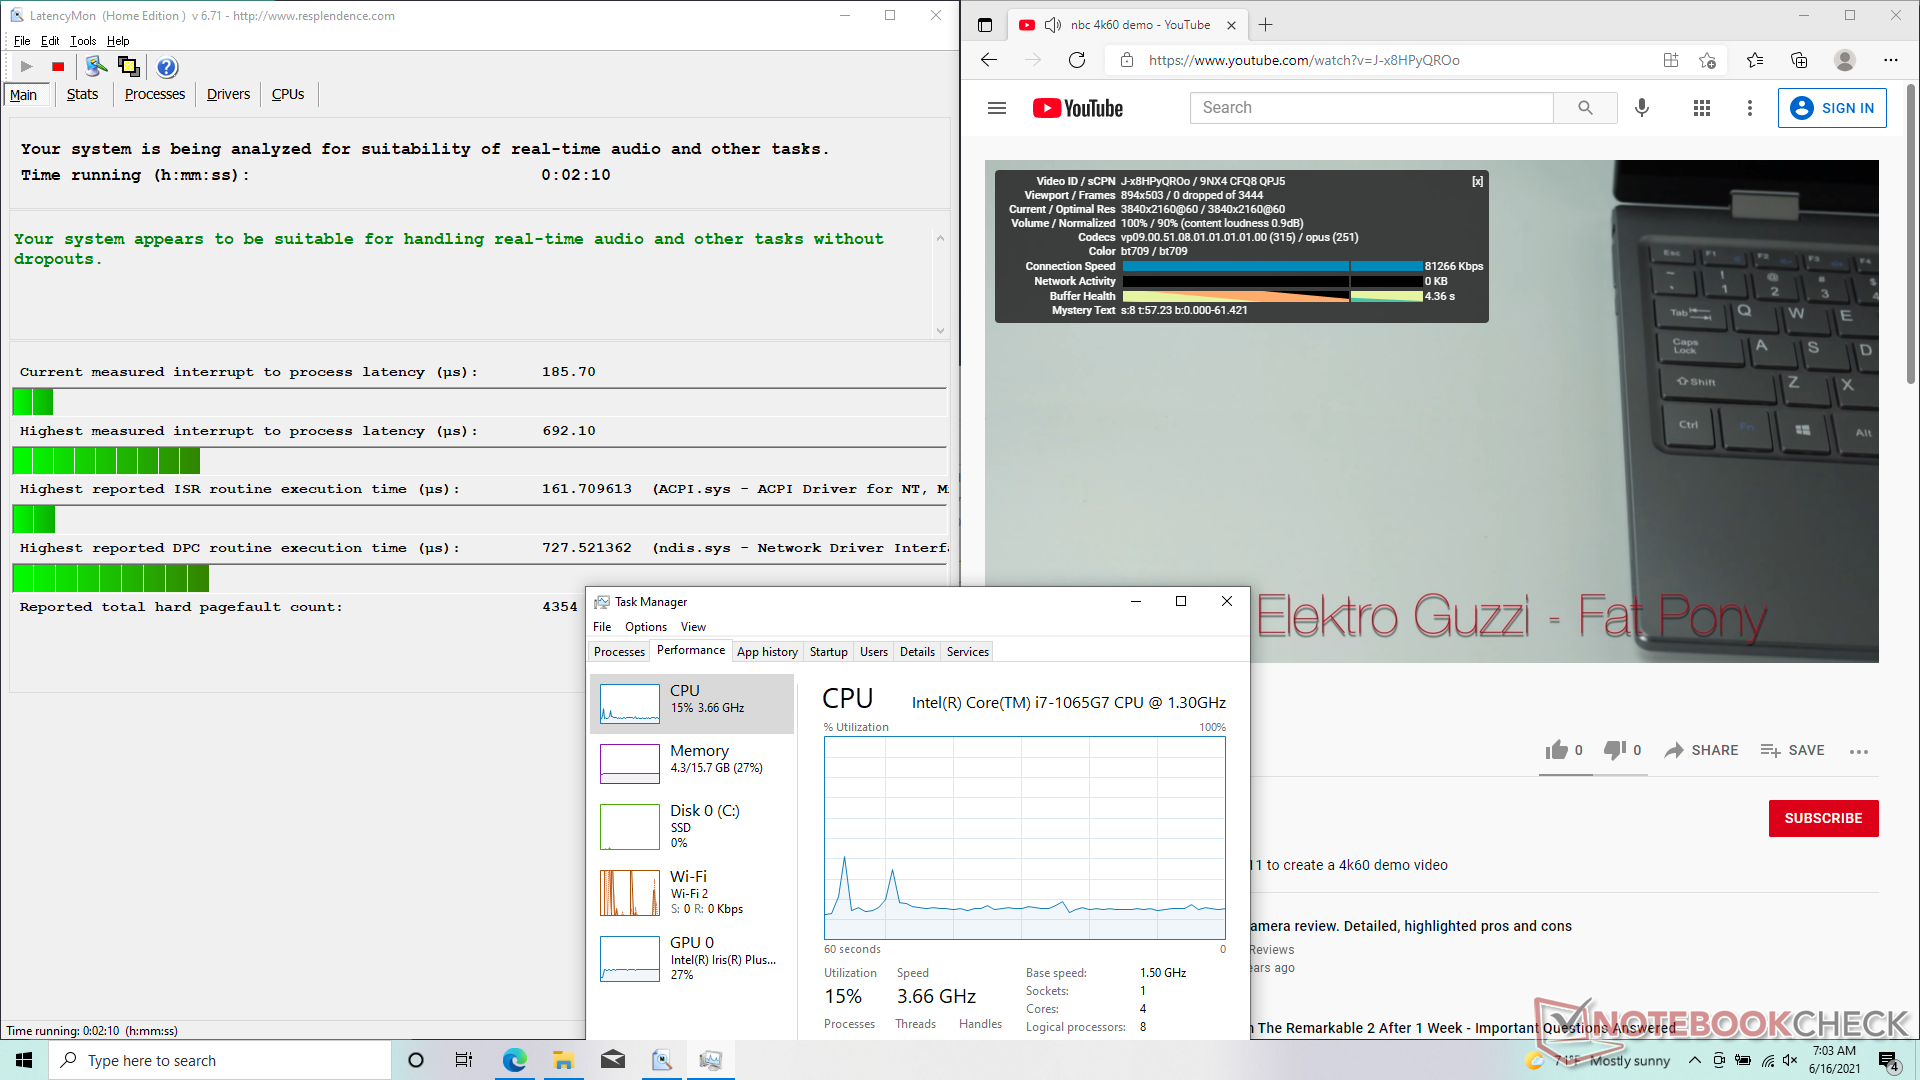
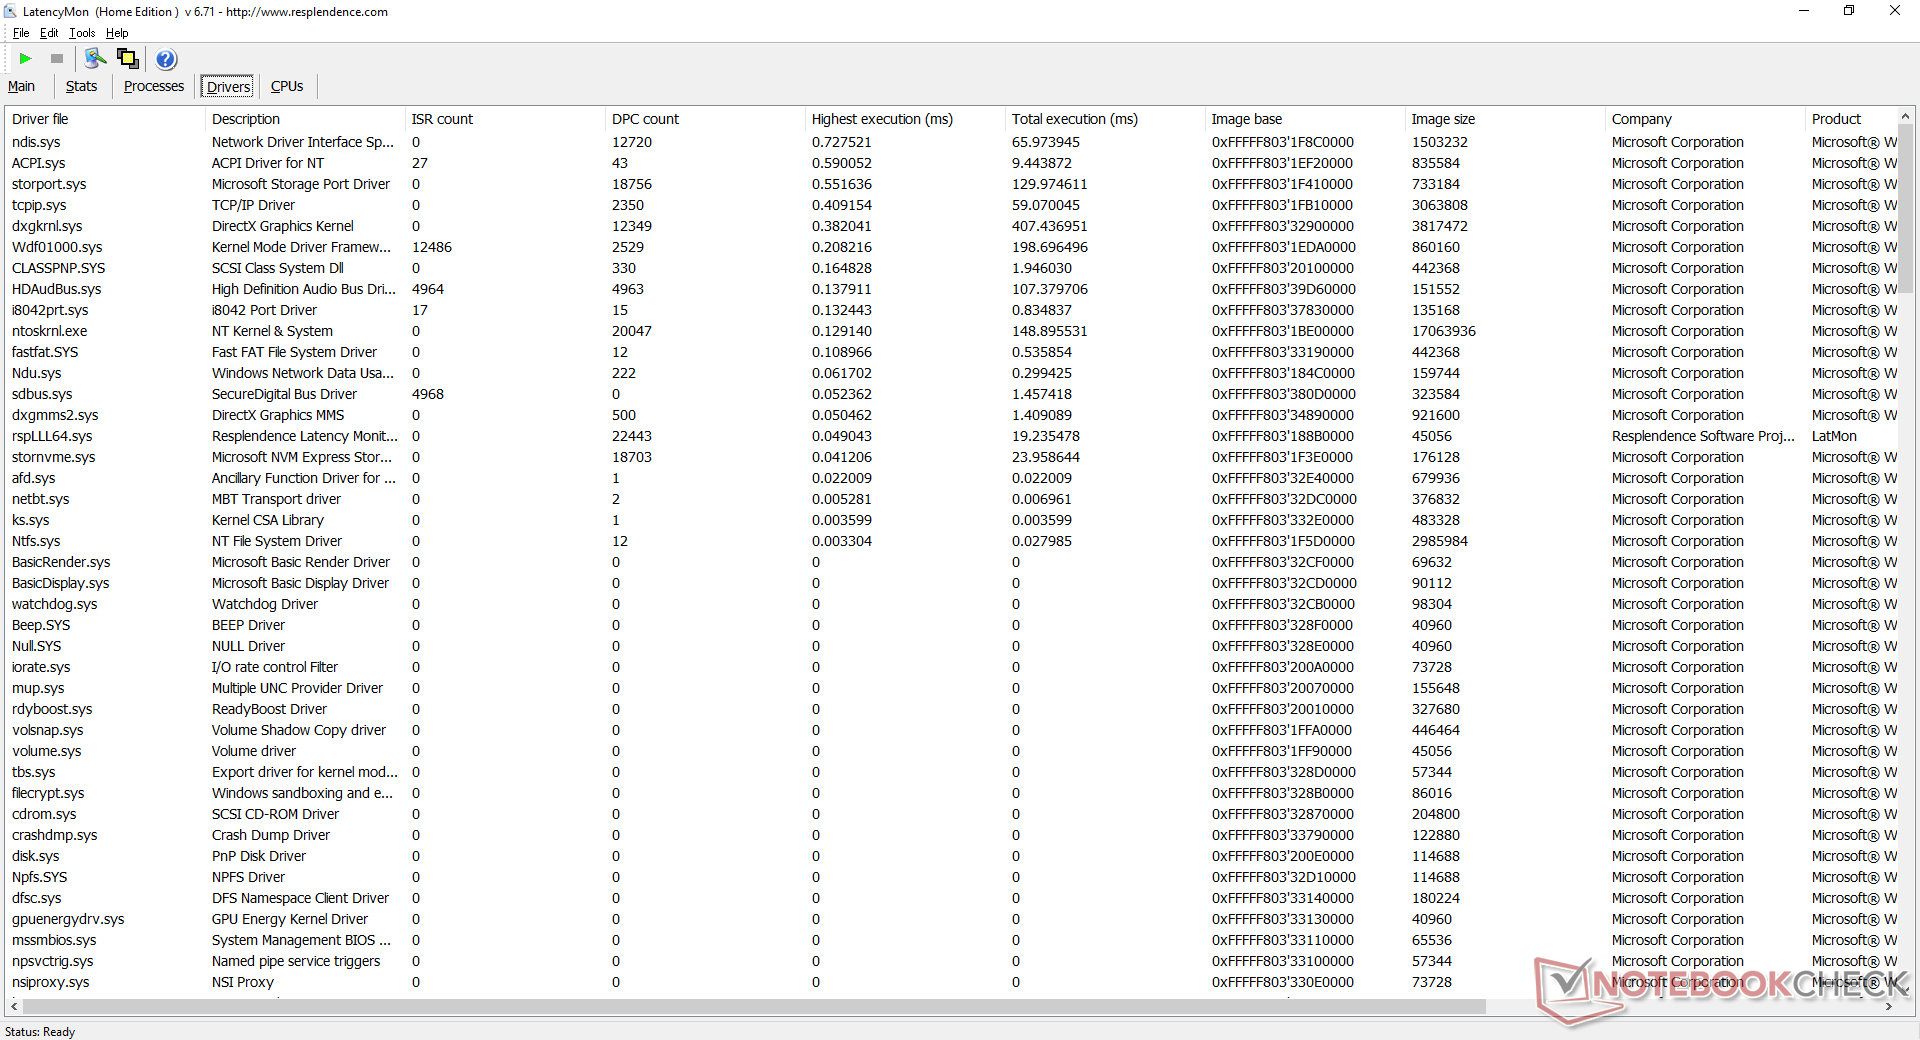
DPC Latency
LatencyMon reveals no DPC latency issues even when opening multiple browser tabs on our homepage. 4K UHD video playback at 60 FPS is also smooth and with no dropped frames in our experience.
| DPC Latencies / LatencyMon - interrupt to process latency (max), Web, Youtube, Prime95 | |
| Lenovo ThinkBook 14 G2 ITL 20VD008WGE | |
| Schenker Vision 14 | |
| Infinix INBook X1 Pro | |
| Honor Magicbook 14 i7-1165G7 | |
| Asus VivoBook S14 S433FL | |
* ... smaller is better
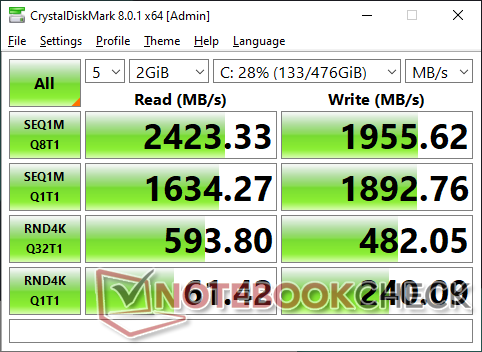
Storage Devices — NVMe for Cheap
The 512 GB NVMe SSD from Phison isn't as fast as the usual solutions from WD, Toshiba or Samsung, but performance is balanced when considering the hardware surrounding it.
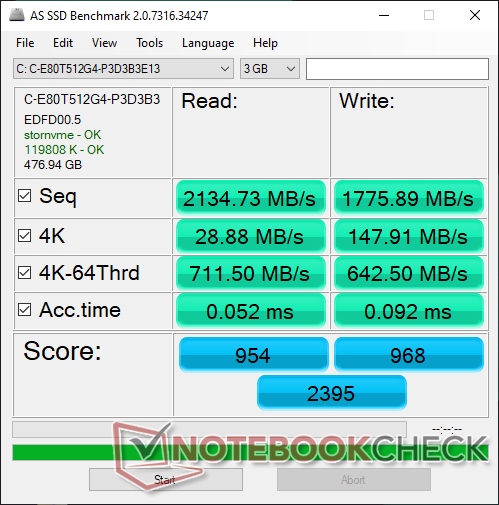
| Infinix INBook X1 Pro Phison C-E80T512G4-P3D3B3E13 | Honor Magicbook 14 i7-1165G7 WDC PC SN730 SDBPNTY-512G | HP Pavilion 14-ce3040ng Toshiba XG6 KXG60ZNV1T02 | Schenker Vision 14 Samsung SSD 980 Pro 1TB MZ-V8P1T0BW | Lenovo IdeaPad 5 14ALC05 82LM005YGE Samsung SSD PM981a MZVLB512HBJQ | |
|---|---|---|---|---|---|
| AS SSD | 77% | 58% | 137% | 51% | |
| Seq Read (MB/s) | 2135 | 3021 41% | 2762 29% | 4899 129% | 2645 24% |
| Seq Write (MB/s) | 1776 | 2341 32% | 2493 40% | 3952 123% | 2627 48% |
| 4K Read (MB/s) | 28.88 | 47.9 66% | 52.1 80% | 83.8 190% | 55.2 91% |
| 4K Write (MB/s) | 147.9 | 186.7 26% | 147.5 0% | 205 39% | 119.4 -19% |
| 4K-64 Read (MB/s) | 712 | 1472 107% | 1473 107% | 2938 313% | 1308 84% |
| 4K-64 Write (MB/s) | 643 | 1829 184% | 1456 126% | 2077 223% | 1816 182% |
| Access Time Read * (ms) | 0.052 | 0.06 -15% | 0.094 -81% | 0.025 52% | 0.057 -10% |
| Access Time Write * (ms) | 0.092 | 0.021 77% | 0.03 67% | 0.02 78% | 0.031 66% |
| Score Read (Points) | 954 | 1822 91% | 1801 89% | 3512 268% | 1628 71% |
| Score Write (Points) | 968 | 2249 132% | 1853 91% | 2677 177% | 2198 127% |
| Score Total (Points) | 2395 | 4973 108% | 4568 91% | 7939 231% | 4667 95% |
| Copy ISO MB/s (MB/s) | 1296 | 2100 62% | 1476 14% | ||
| Copy Program MB/s (MB/s) | 900 | 994 10% | 538 -40% | ||
| Copy Game MB/s (MB/s) | 1588 | 1859 17% | 1185 -25% | ||
| CrystalDiskMark 5.2 / 6 | 27% | 10% | 92% | 8% | |
| Write 4K (MB/s) | 228.3 | 223.7 -2% | 181.6 -20% | 240 5% | 93.3 -59% |
| Read 4K (MB/s) | 60.7 | 51.2 -16% | 57.4 -5% | 90.9 50% | 38.87 -36% |
| Write Seq (MB/s) | 1895 | 2579 36% | 1982 5% | 4236 124% | 2834 50% |
| Read Seq (MB/s) | 1573 | 2553 62% | 1899 21% | 4101 161% | 2452 56% |
| Write 4K Q32T1 (MB/s) | 476.6 | 671 41% | 509 7% | 662 39% | 386.6 -19% |
| Read 4K Q32T1 (MB/s) | 592 | 761 29% | 545 -8% | 720 22% | 495.5 -16% |
| Write Seq Q32T1 (MB/s) | 2136 | 2721 27% | 3072 44% | 5222 144% | 2981 40% |
| Read Seq Q32T1 (MB/s) | 2413 | 3358 39% | 3281 36% | 7102 194% | 3566 48% |
| Total Average (Program / Settings) | 52% /
56% | 34% /
38% | 115% /
121% | 30% /
35% |
* ... smaller is better

Disk Throttling: DiskSpd Read Loop, Queue Depth 8
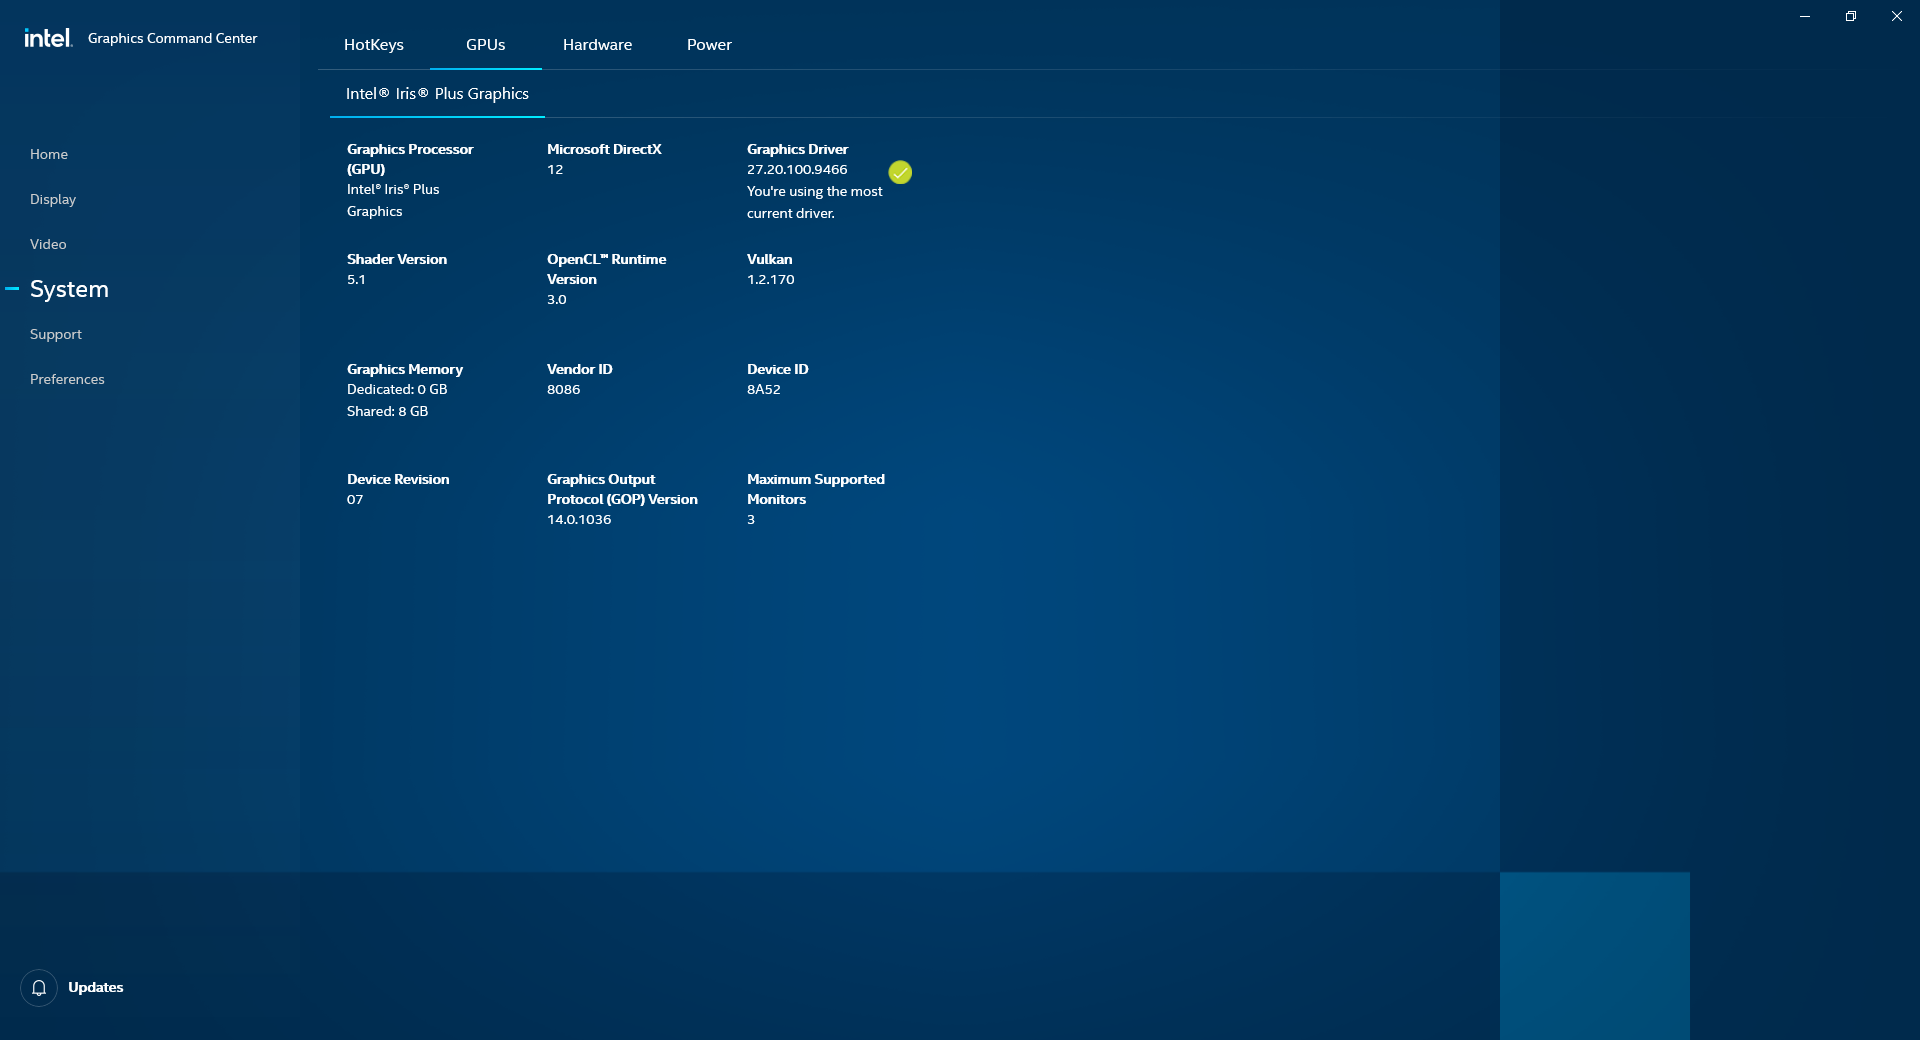
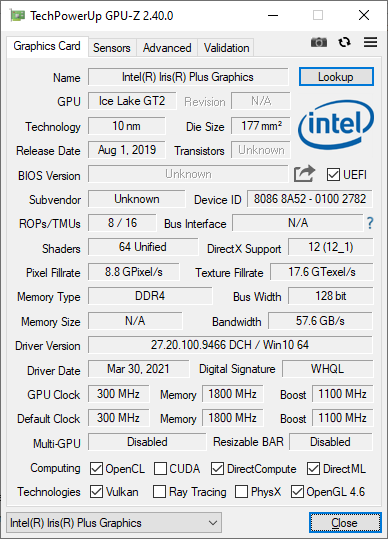
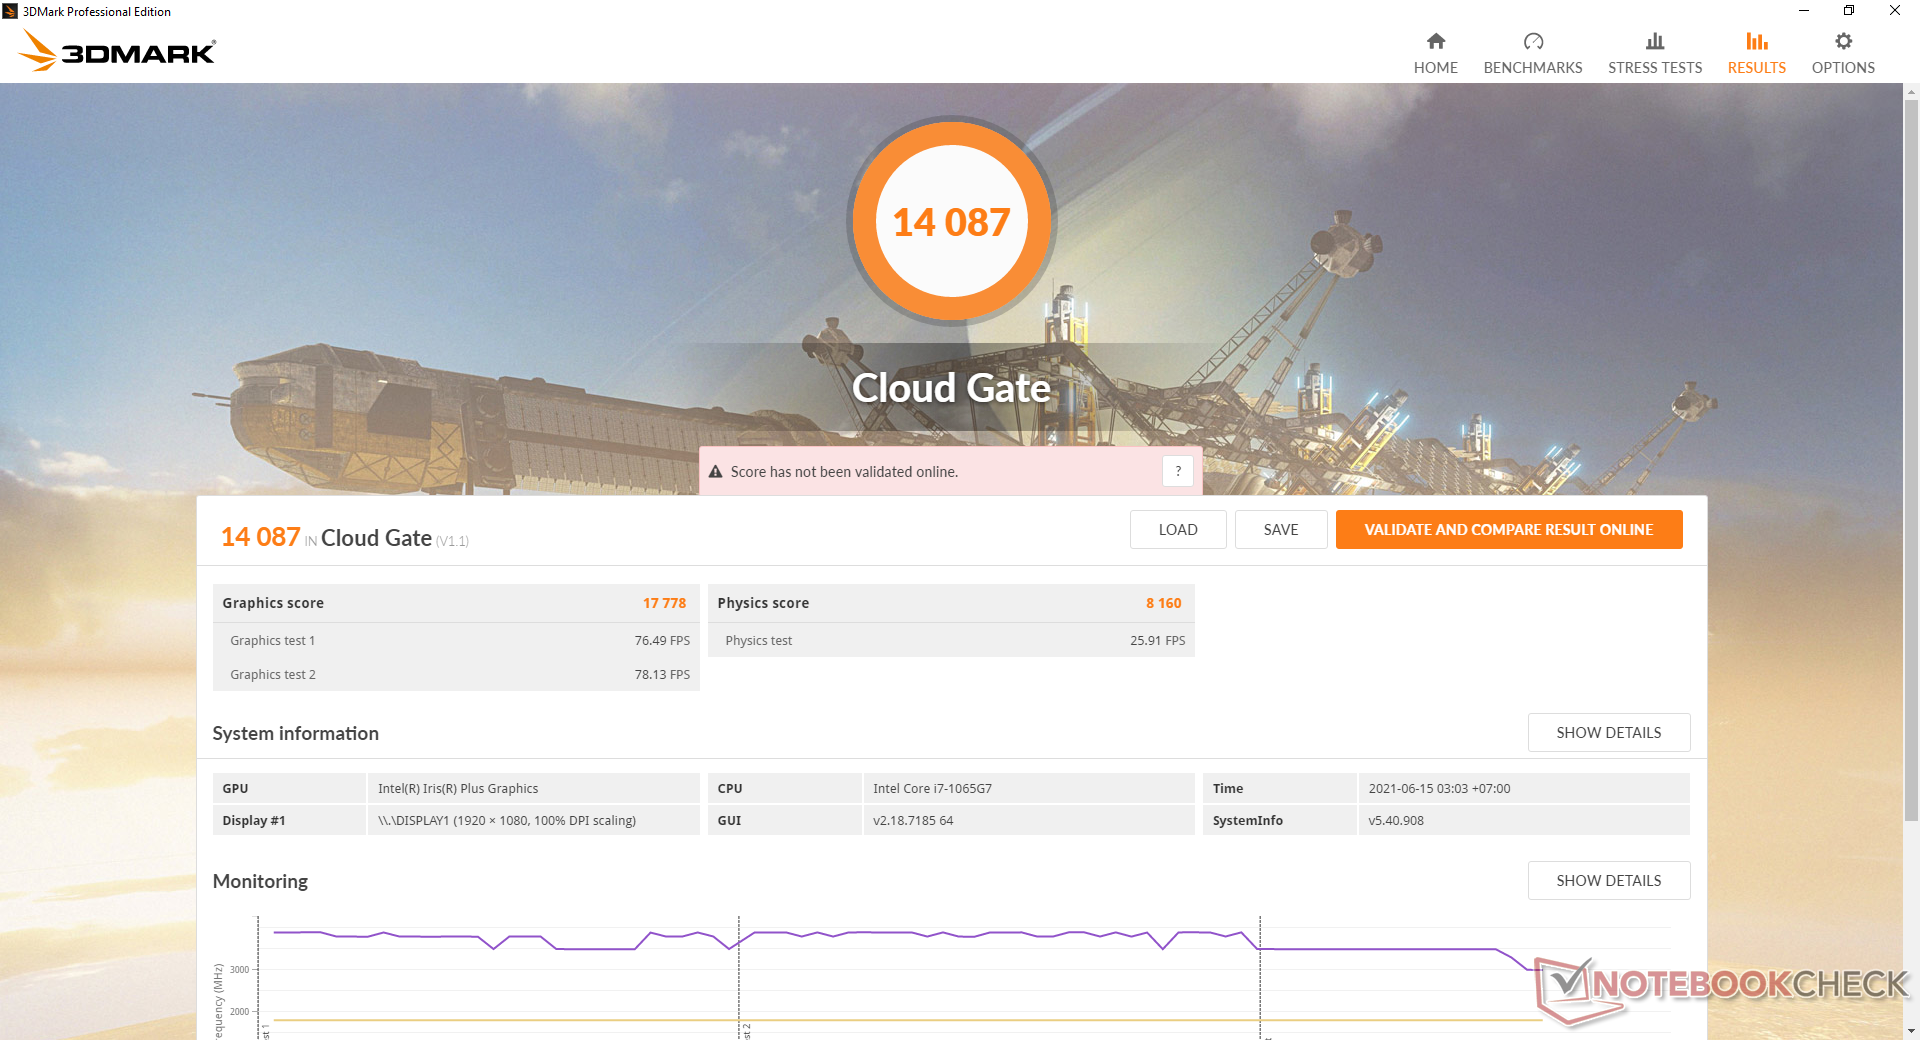
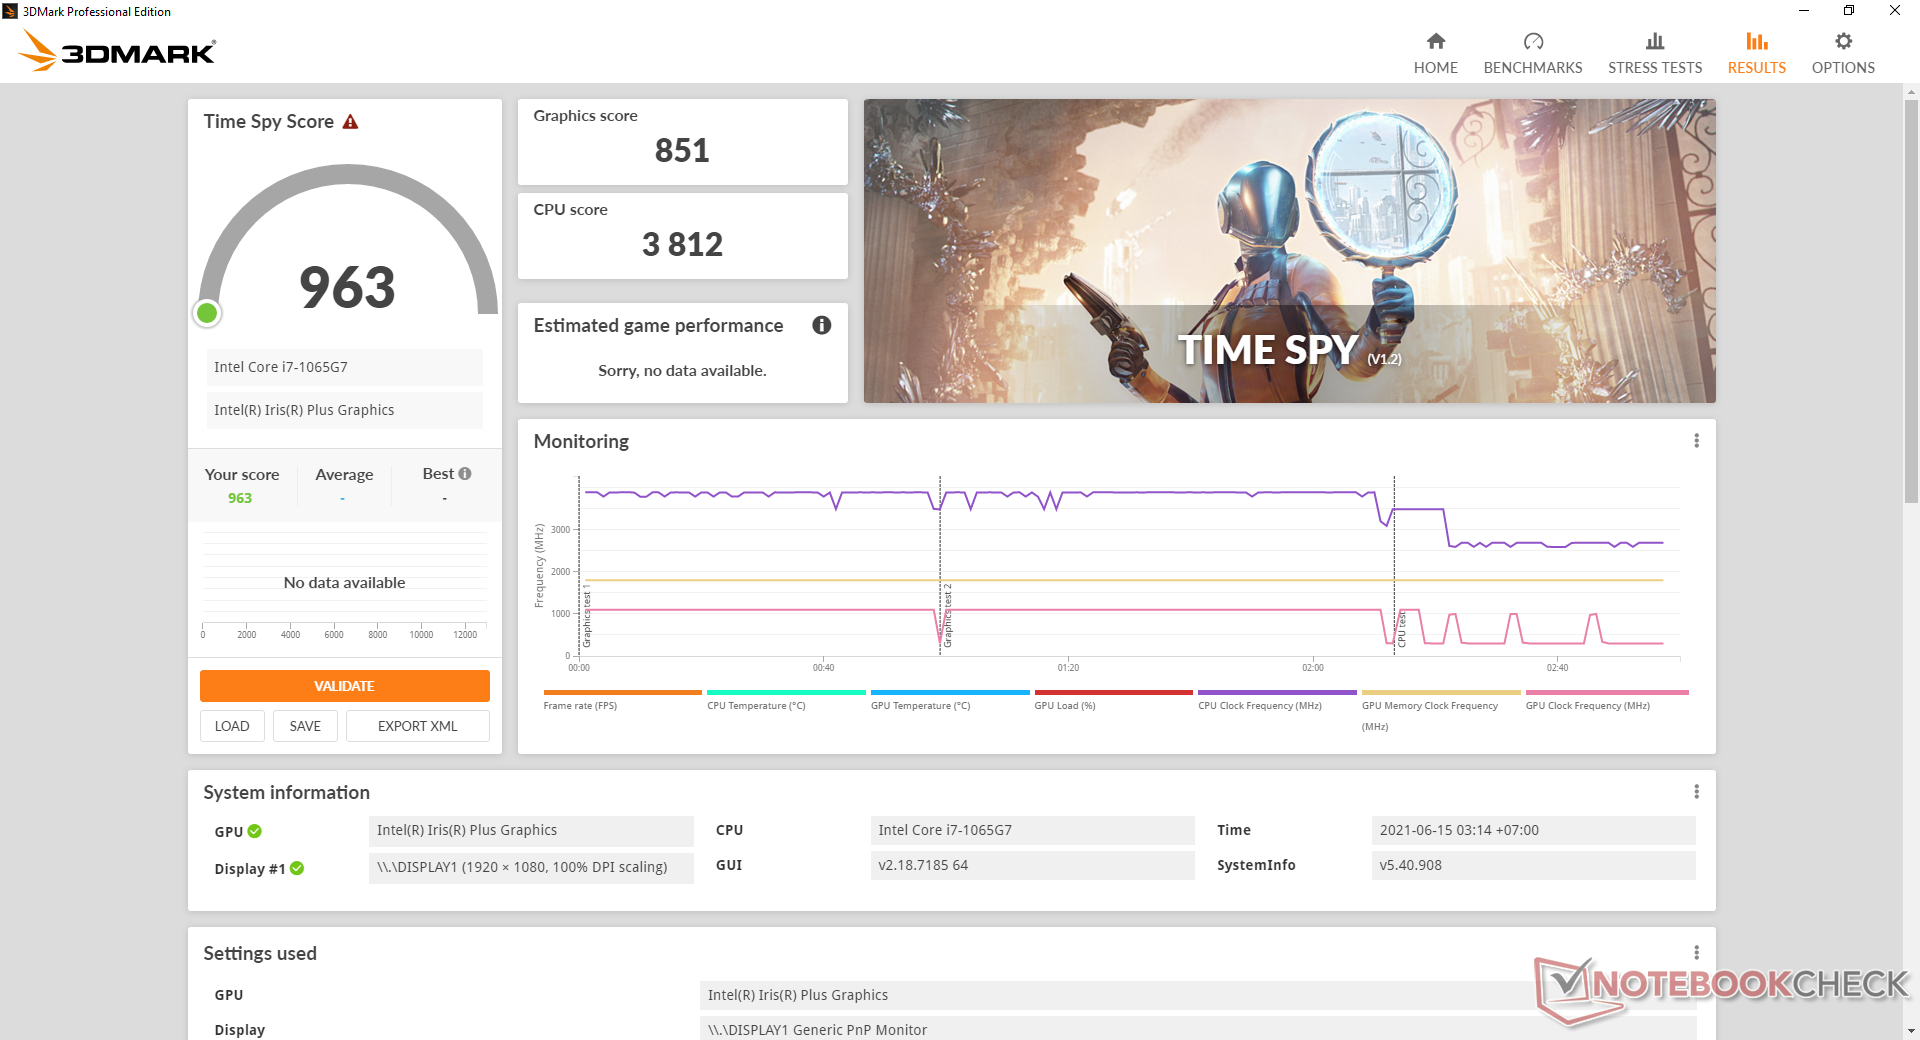
GPU Performance
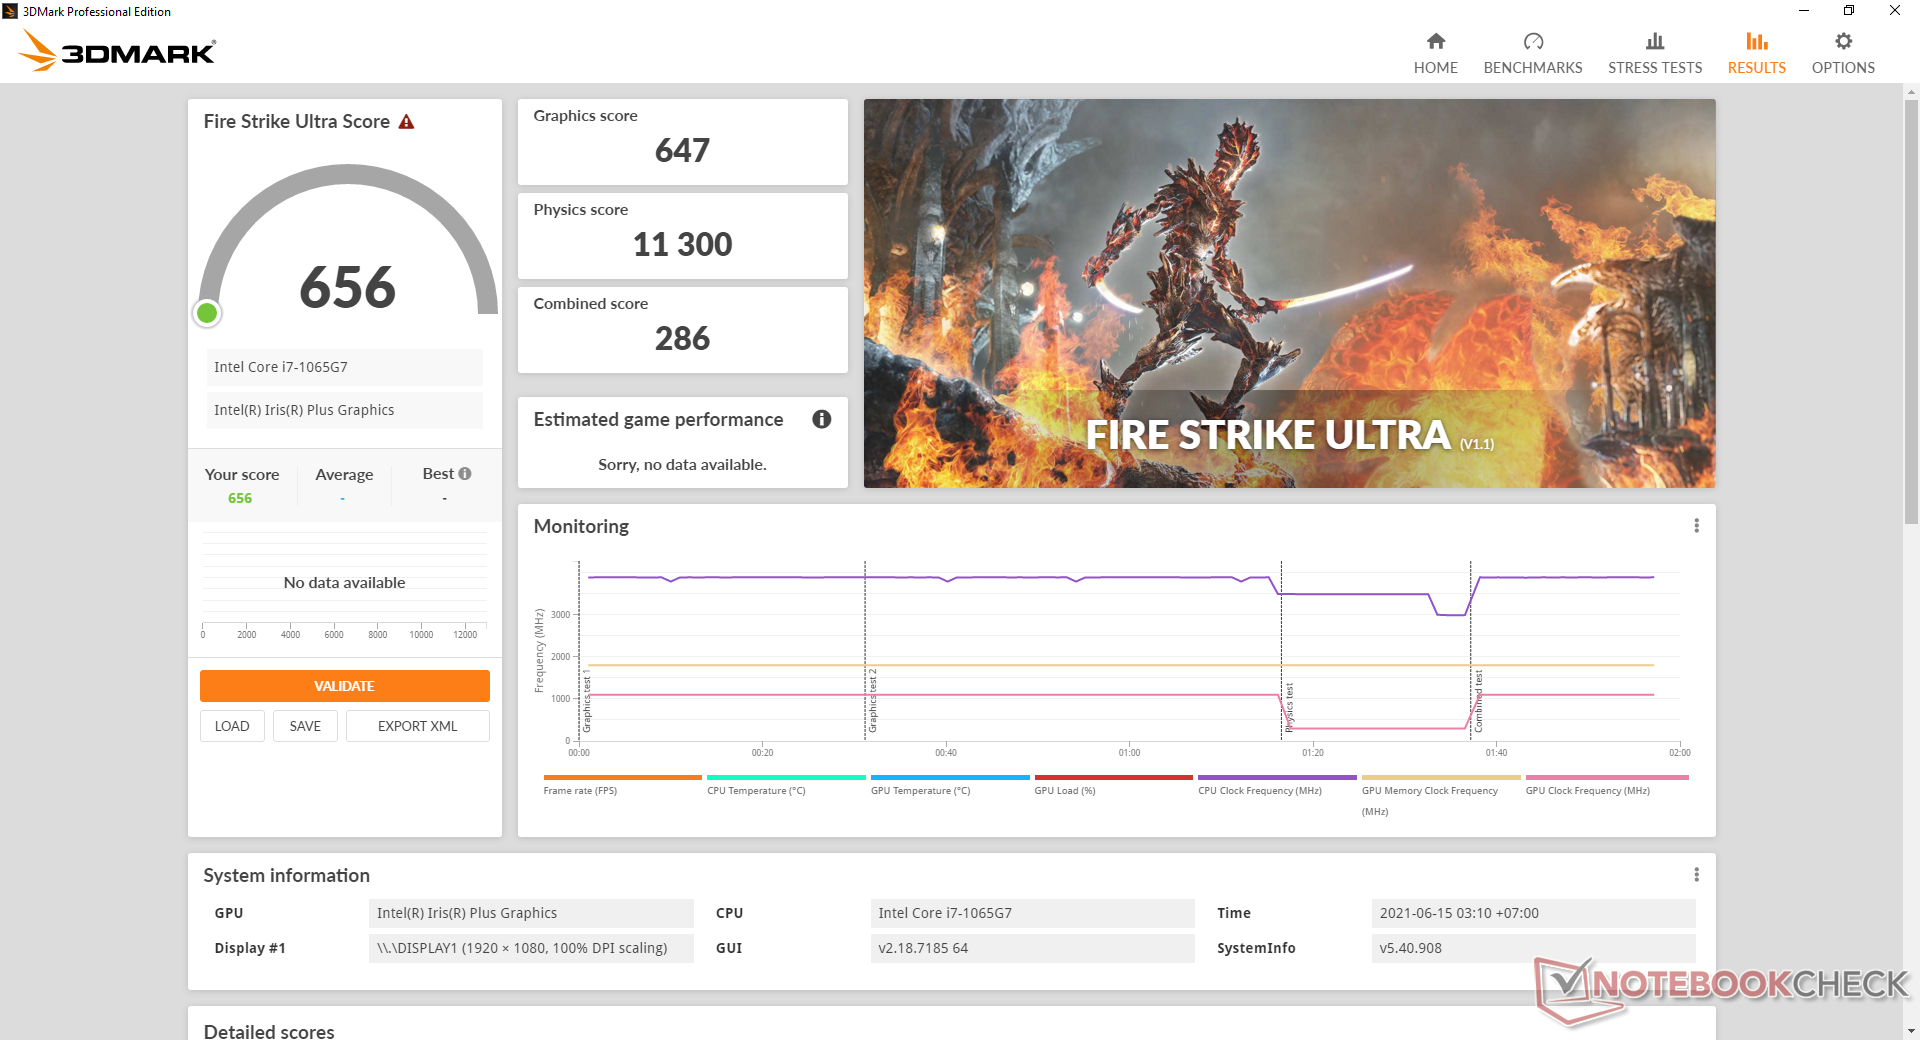
Graphics performance is where we expect it to be relative to other laptops with the same integrated Iris Plus G7 GPU. Though a huge upgrade from the older UHD Graphics series, the newer Iris Xe 96 EUs series can offer a significant boost of up to 100 percent in certain cases. Of course, such laptops also tend to be more expensive than our Infinix.
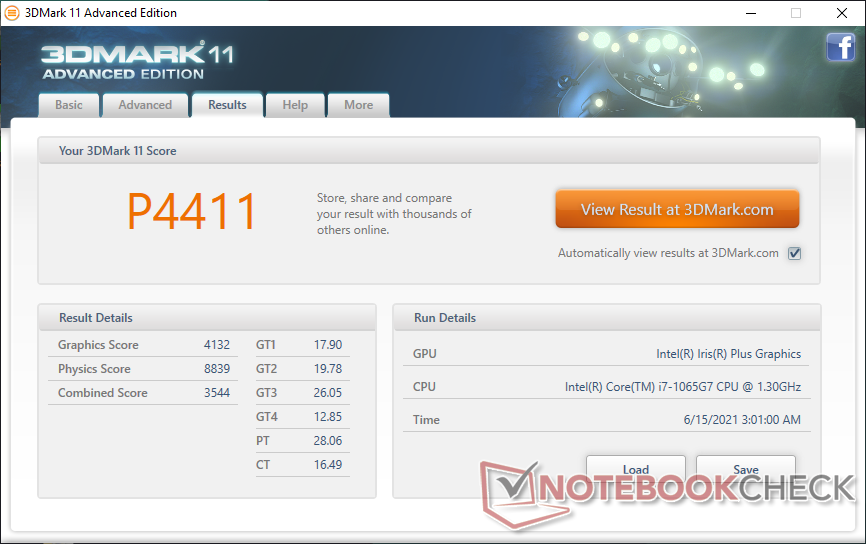
| 3DMark 11 Performance | 4411 points | |
| 3DMark Cloud Gate Standard Score | 14087 points | |
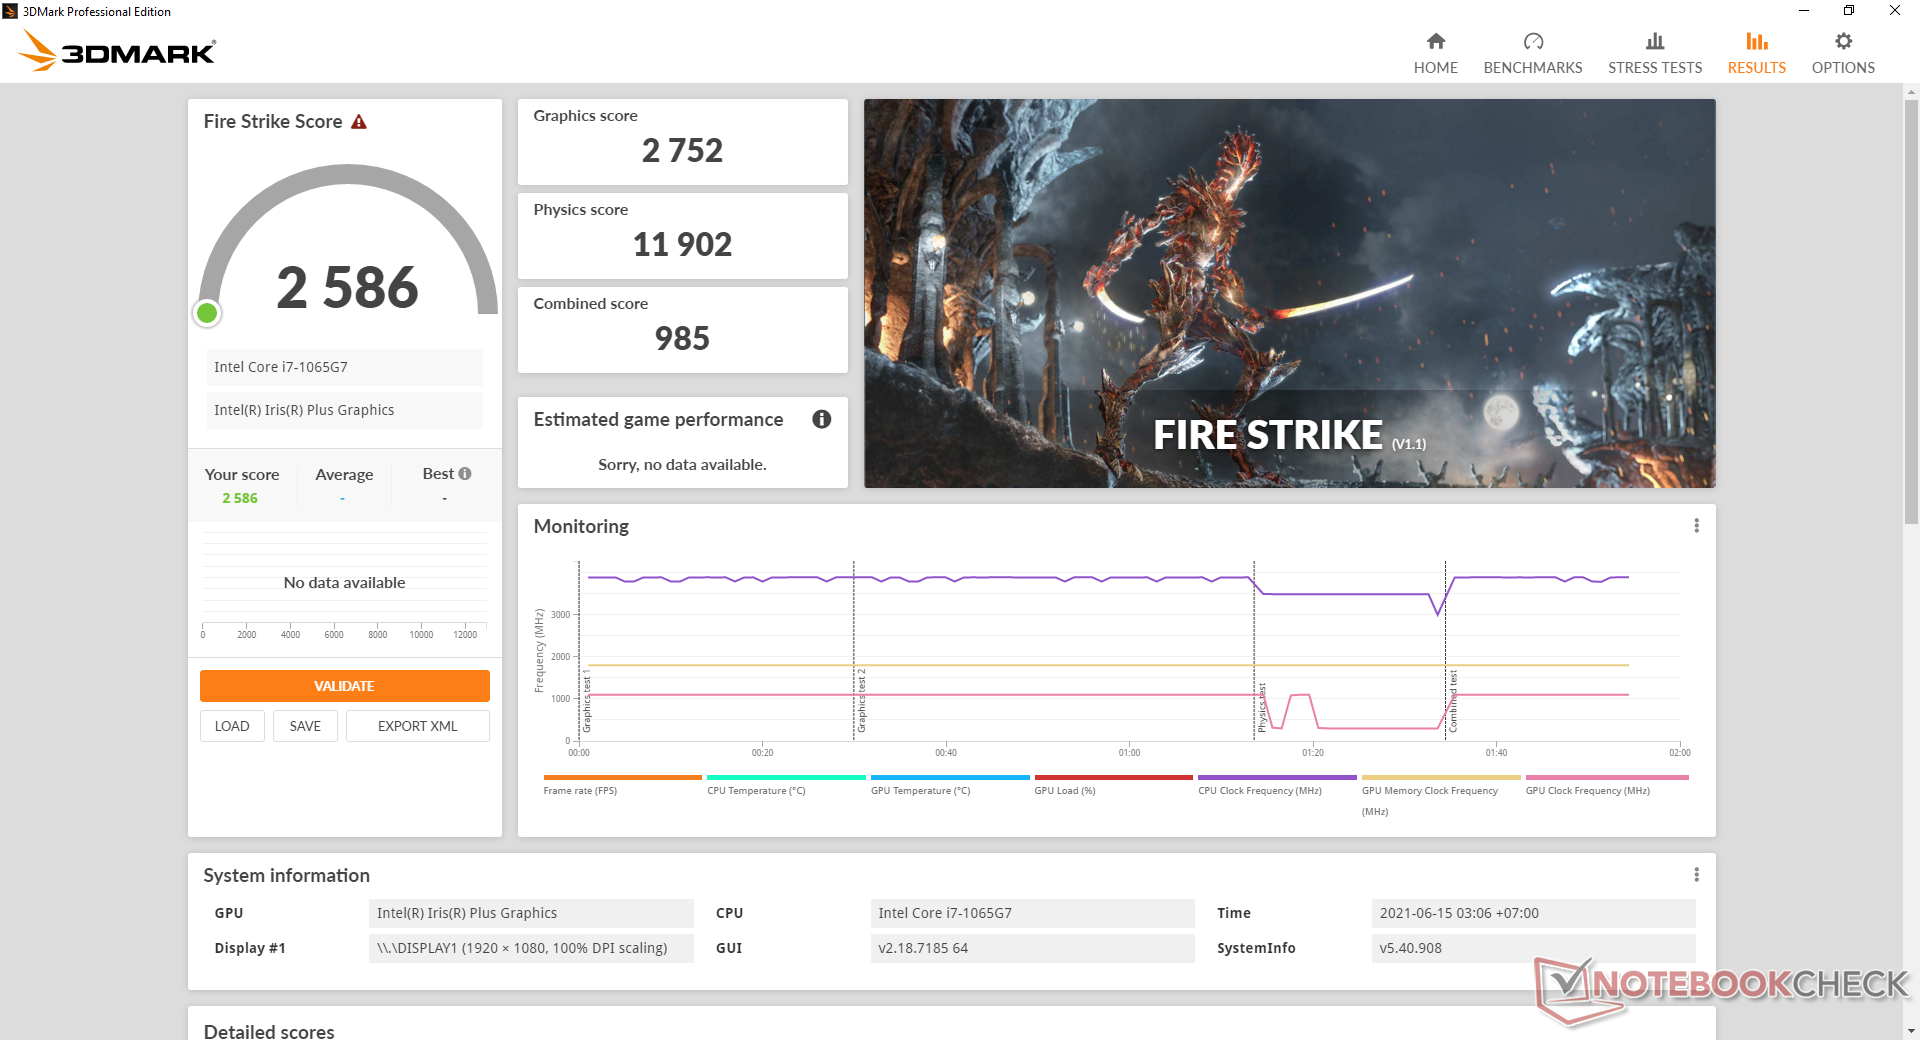
| 3DMark Fire Strike Extreme Score | 985 points | |
| 3DMark Time Spy Score | 963 points | |
Help | ||
Performance appears to be unsteady when idling on Witcher 3 on low settings. Frame rates would cycle between 43 FPS and 54 FPS at least five times during our hour-long test.
Witcher 3 FPS Chart
| low | med. | high | ultra | |
|---|---|---|---|---|
| The Witcher 3 (2015) | 54.3 | 34.8 | 18.2 | 9.4 |
| Dota 2 Reborn (2015) | 96.6 | 56 | 32.1 | 28.1 |
| Final Fantasy XV Benchmark (2018) | 20.2 | 10.9 | 7.58 | |
| X-Plane 11.11 (2018) | 16.4 | 16.3 | 15.3 |
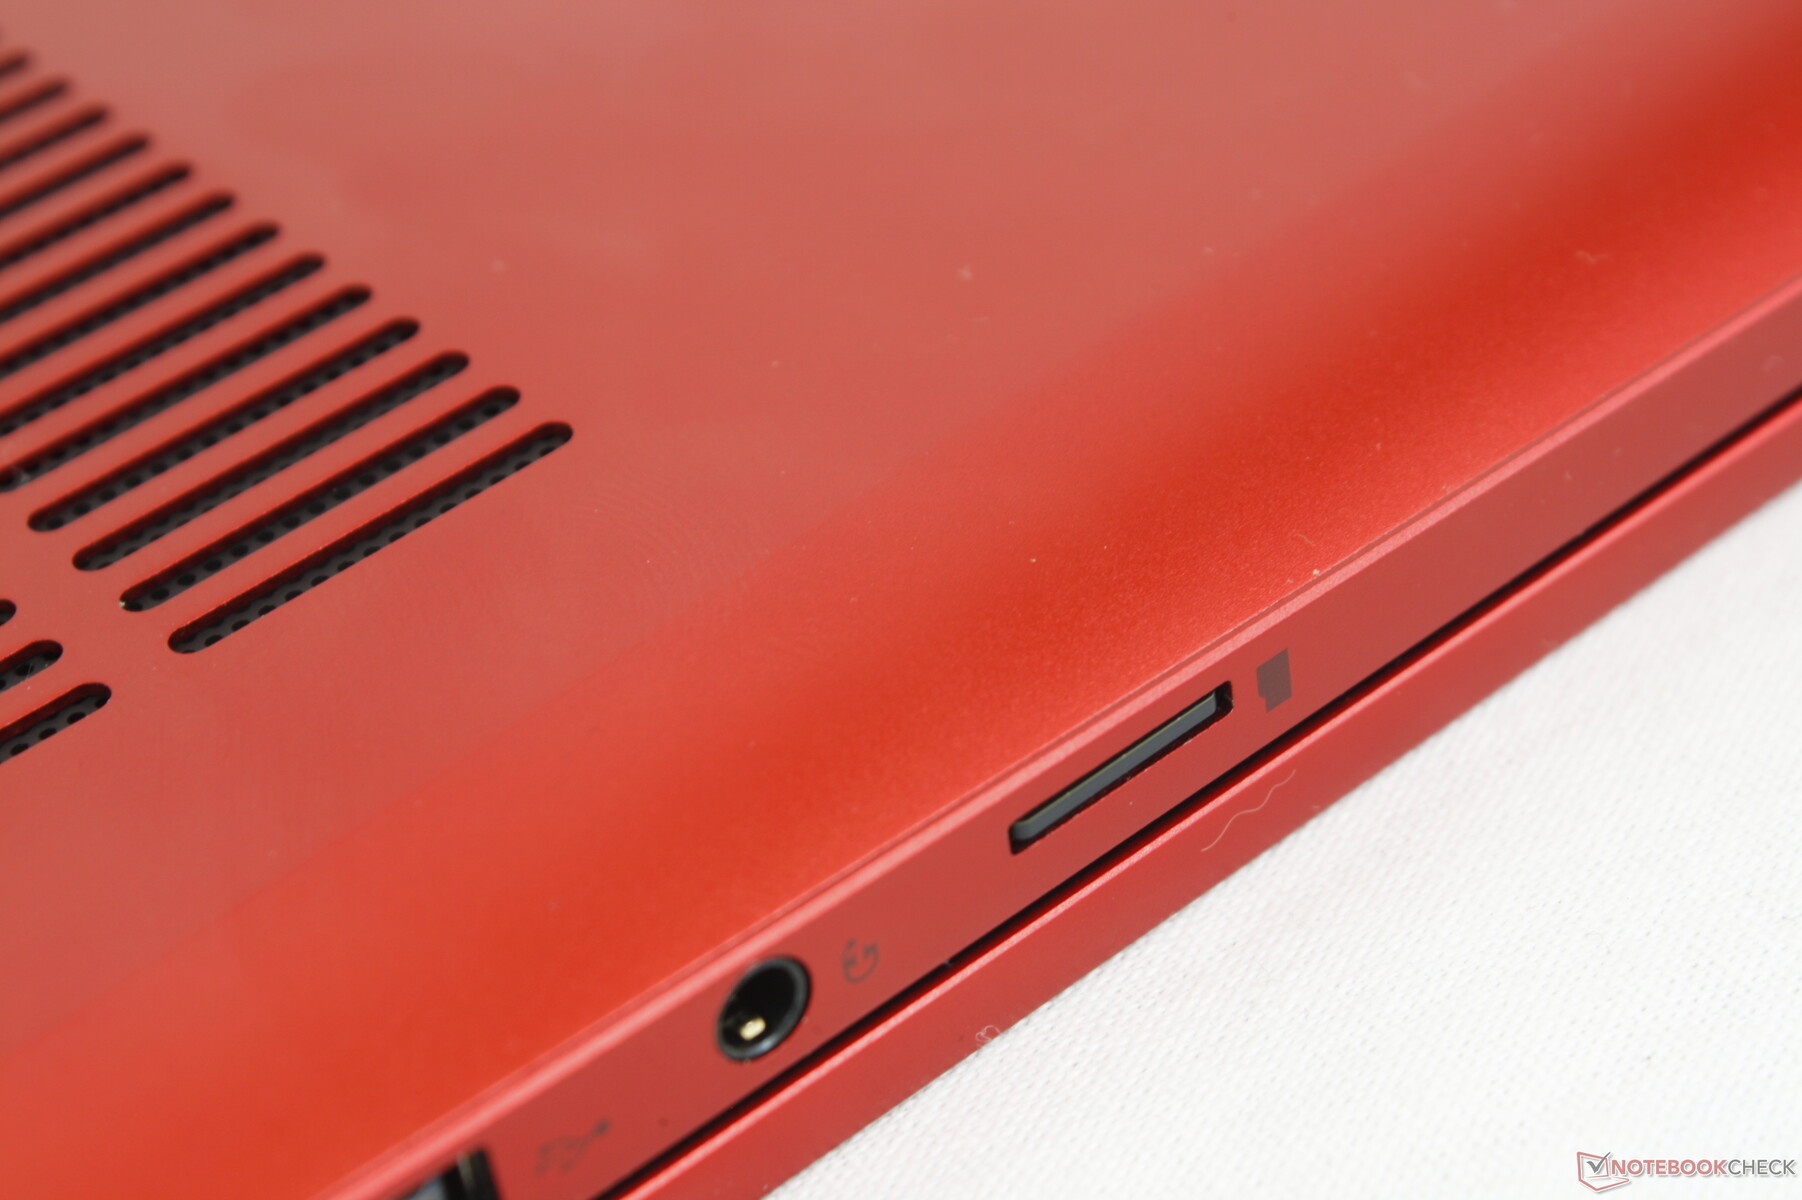
Emissions — Never Too Loud
System Noise
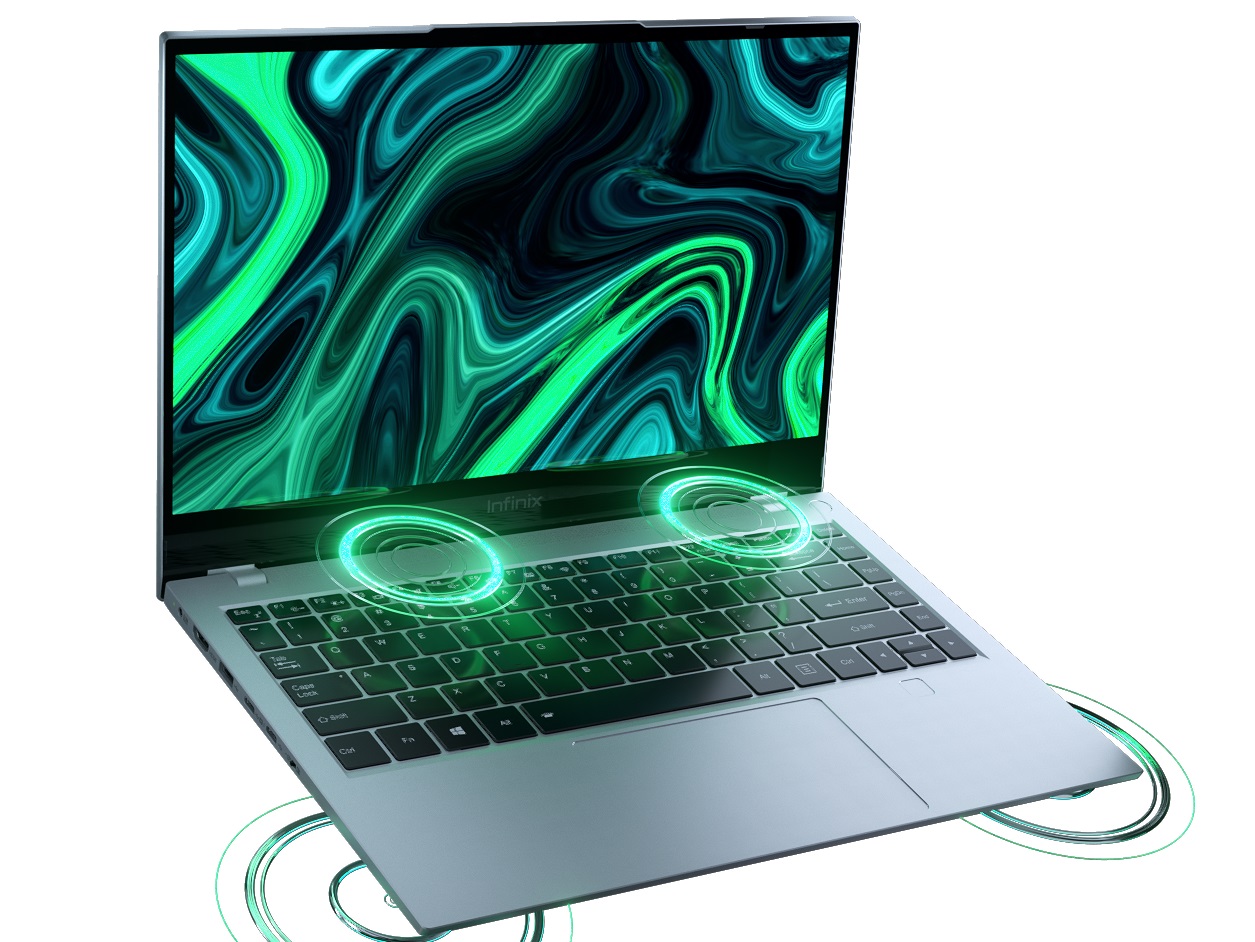
Fan noise is quiet under most conditions. We're able to measure a fan noise of about 28 dB(A) against a silent background of 24.6 dB(A) when running mundane tasks like web browsing or video streaming to be essentially inaudible in a typical office environment. Higher loads like games will bump fan noise up to 33.4 dB(A) which is still a lot quieter than other Ultrabooks under similar loads. Interestingly, our unit would remain stable at 33.4 dB(A) when gaming or running other demanding loads despite the fluctuations in clock rates.
| Infinix INBook X1 Pro Iris Plus Graphics G7 (Ice Lake 64 EU), i7-1065G7, Phison C-E80T512G4-P3D3B3E13 | Schenker Vision 14 Iris Xe G7 96EUs, i7-1165G7, Samsung SSD 980 Pro 1TB MZ-V8P1T0BW | Honor Magicbook 14 i7-1165G7 Iris Xe G7 96EUs, i7-1165G7, WDC PC SN730 SDBPNTY-512G | Lenovo ThinkBook 14 G2 ITL 20VD008WGE Iris Xe G7 80EUs, i5-1135G7, Samsung PM991 MZALQ512HALU | Asus VivoBook S14 S433FL GeForce MX250, i7-10510U, Intel Optane Memory H10 with Solid State Storage 32GB + 512GB HBRPEKNX0202A(L/H) | HP Pavilion 14-ce3040ng GeForce MX250, i7-1065G7, Toshiba XG6 KXG60ZNV1T02 | |
|---|---|---|---|---|---|---|
| Noise | -10% | -9% | -17% | -26% | -41% | |
| off / environment * (dB) | 24.6 | 25 -2% | 24 2% | 28.7 -17% | 30.7 -25% | 30 -22% |
| Idle Minimum * (dB) | 25.1 | 25 -0% | 24 4% | 28.7 -14% | 31 -24% | 31 -24% |
| Idle Average * (dB) | 25.1 | 25 -0% | 25 -0% | 28.7 -14% | 31 -24% | 36 -43% |
| Idle Maximum * (dB) | 25.1 | 26.9 -7% | 28 -12% | 28.7 -14% | 31.3 -25% | 41 -63% |
| Load Average * (dB) | 32.7 | 38.6 -18% | 36 -10% | 35.5 -9% | 43.4 -33% | 49 -50% |
| Witcher 3 ultra * (dB) | 33.4 | 41.2 -23% | 41.6 -25% | 42.8 -28% | 47 -41% | |
| Load Maximum * (dB) | 33.4 | 41.2 -23% | 46 -38% | 41.6 -25% | 41.5 -24% | 49 -47% |
* ... smaller is better
Noise level
| Idle |
| 25.1 / 25.1 / 25.1 dB(A) |
| Load |
| 32.7 / 33.4 dB(A) |
 | ||
30 dB silent 40 dB(A) audible 50 dB(A) loud |
||
min: | ||
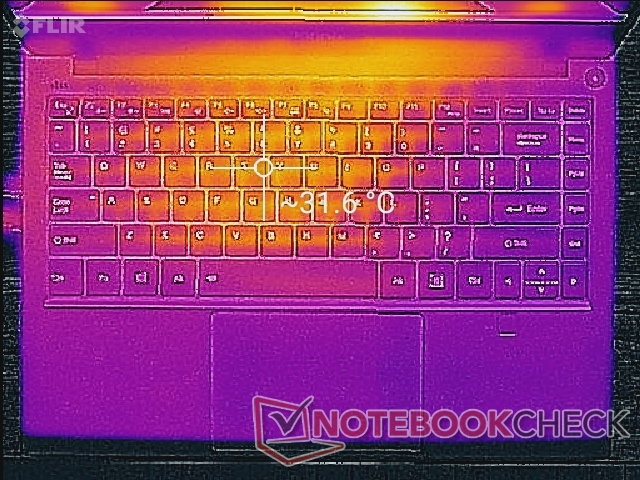
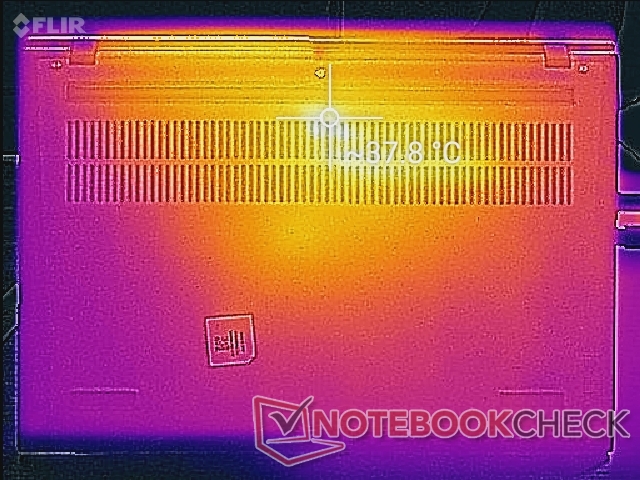
Temperature
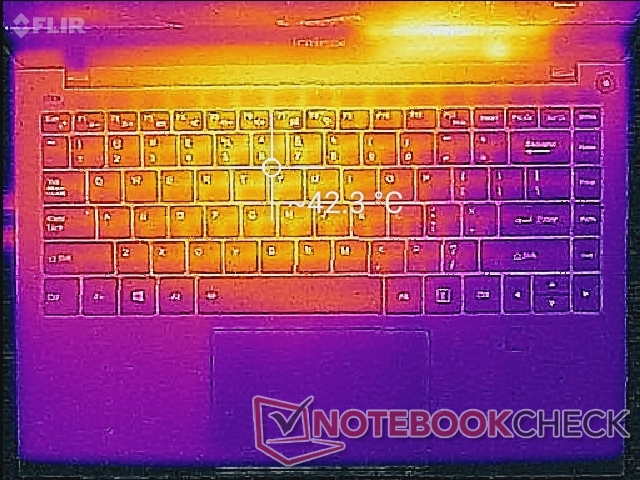
Surface temperatures are warmest near the center of the keyboard where they can be as warm as 42 C when running demanding loads. Its temperature range is comparable to the Honor MagicBook 14 which also experiences very warm keys under similar conditions.
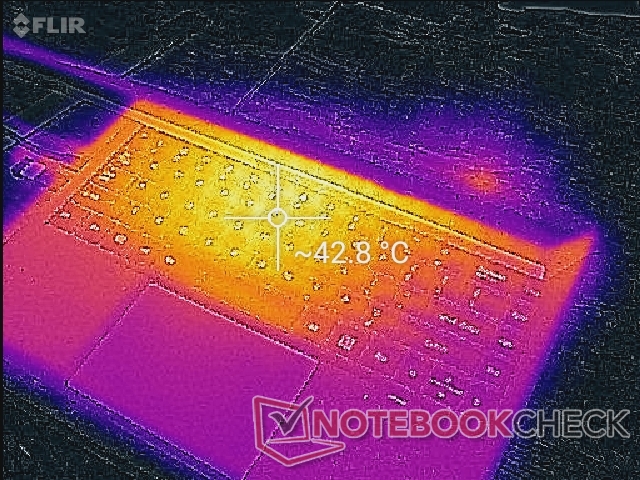
(±) The maximum temperature on the upper side is 43 °C / 109 F, compared to the average of 36.8 °C / 98 F, ranging from 21 to 71 °C for the class Multimedia.
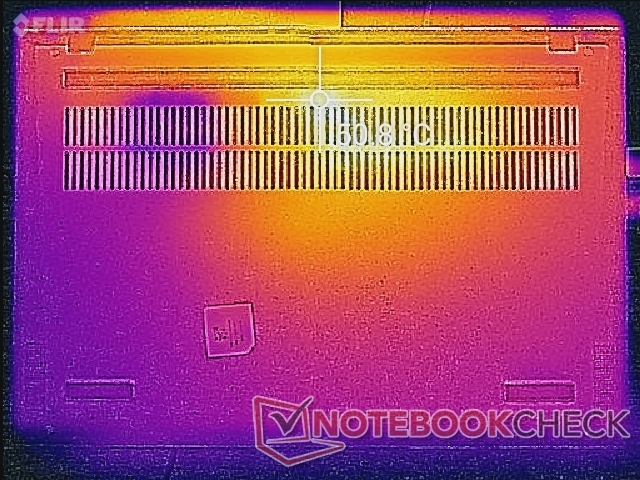
(-) The bottom heats up to a maximum of 51 °C / 124 F, compared to the average of 39.1 °C / 102 F
(+) In idle usage, the average temperature for the upper side is 28.9 °C / 84 F, compared to the device average of 31.3 °C / 88 F.
(+) The palmrests and touchpad are cooler than skin temperature with a maximum of 31.2 °C / 88.2 F and are therefore cool to the touch.
(-) The average temperature of the palmrest area of similar devices was 28.7 °C / 83.7 F (-2.5 °C / -4.5 F).
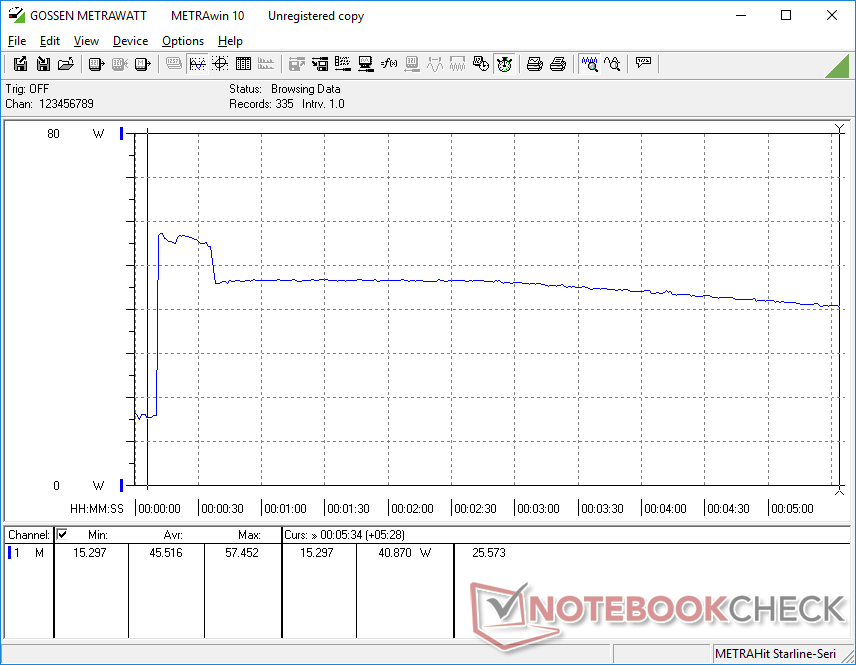
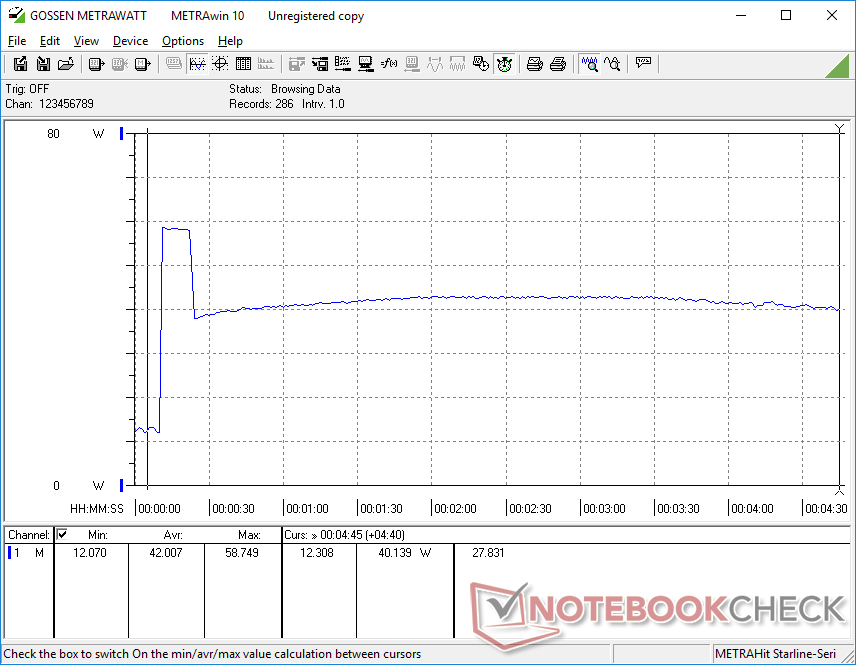
Stress Test
CPU and GPU clock rates tend to cycle when under high loads to explain our CineBench and Witcher 3 results from above. When running Prime95, for example, CPU clock rates would cycle between 1.8 and 2.3 GHz. Similarly, GPU clock rates would cycle between 750 MHz and 1000 MHz when idling on Witcher 3.
Running on battery power will not limit performance. A 3DMark 11 test on batteries would return Physics and Graphics scores of 8965 and 4103 points, respectively, compared to 8839 and 4132 points when on mains.
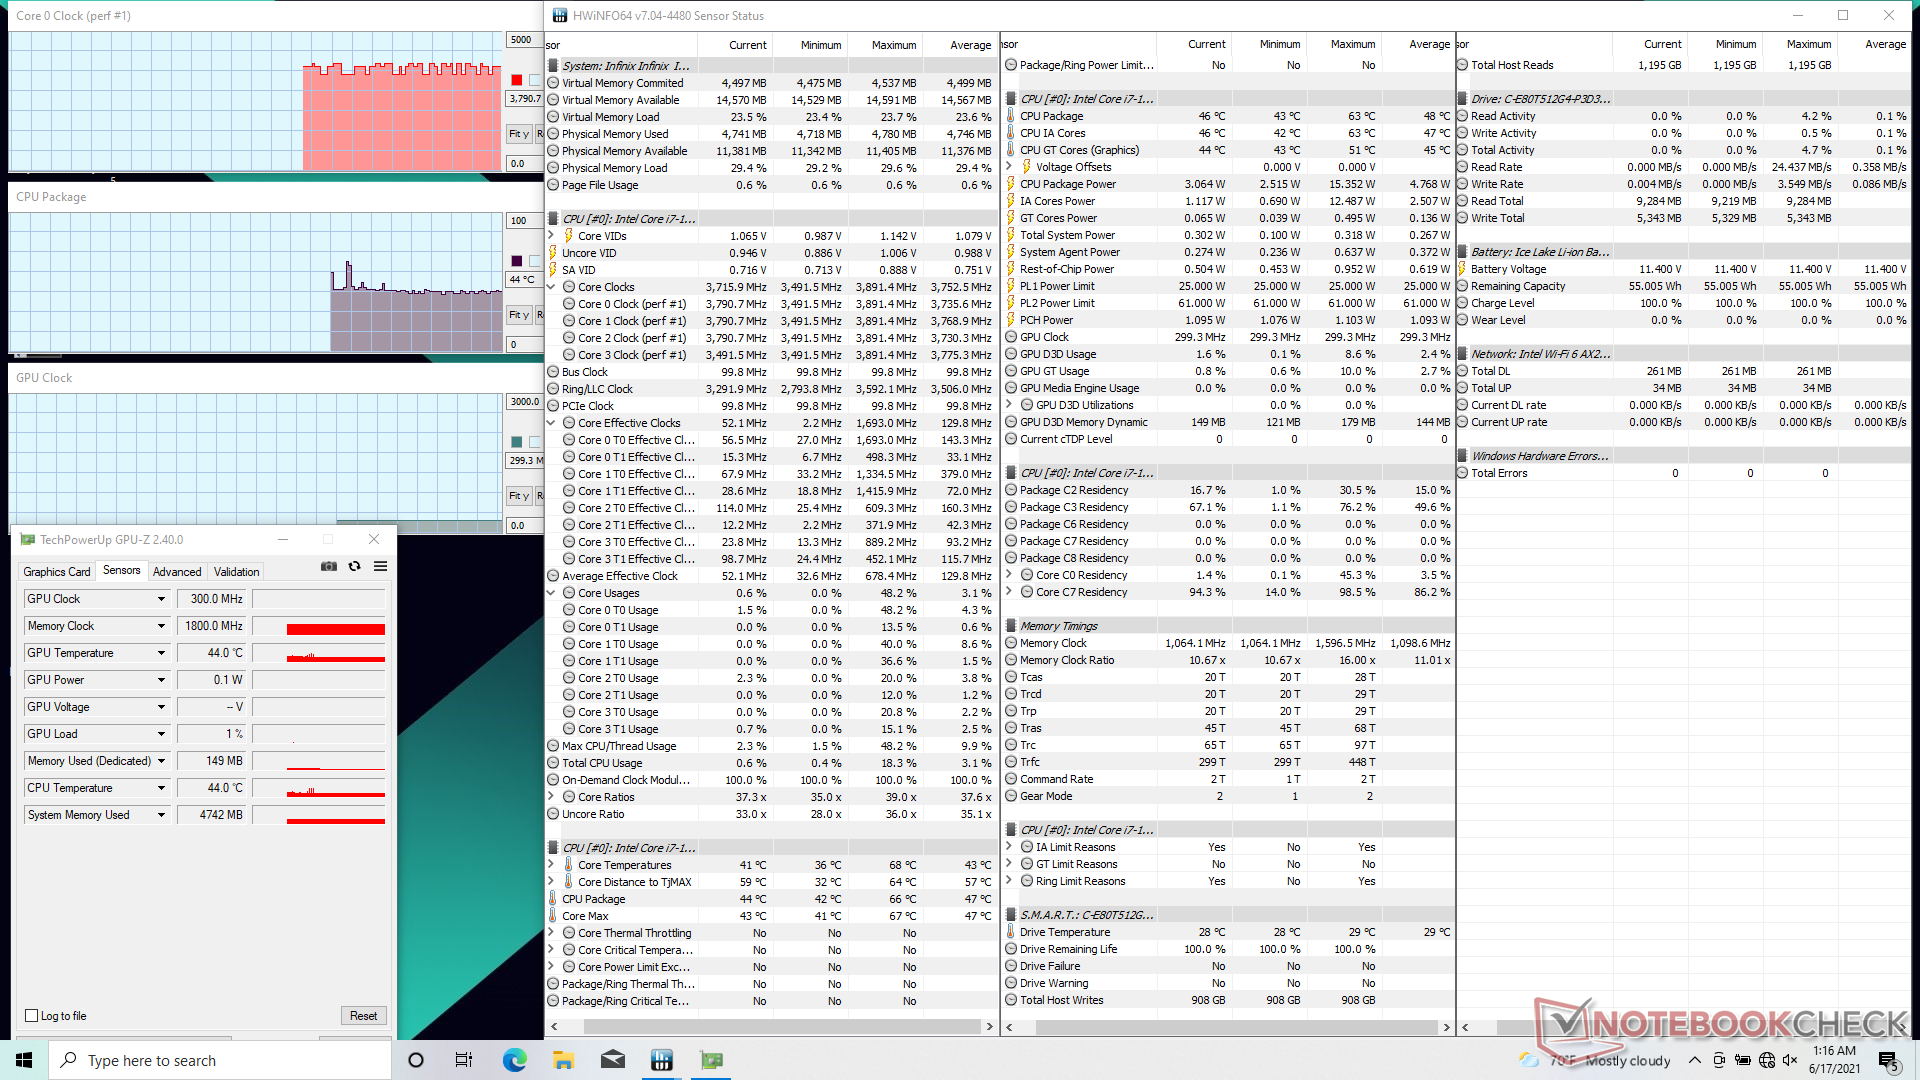
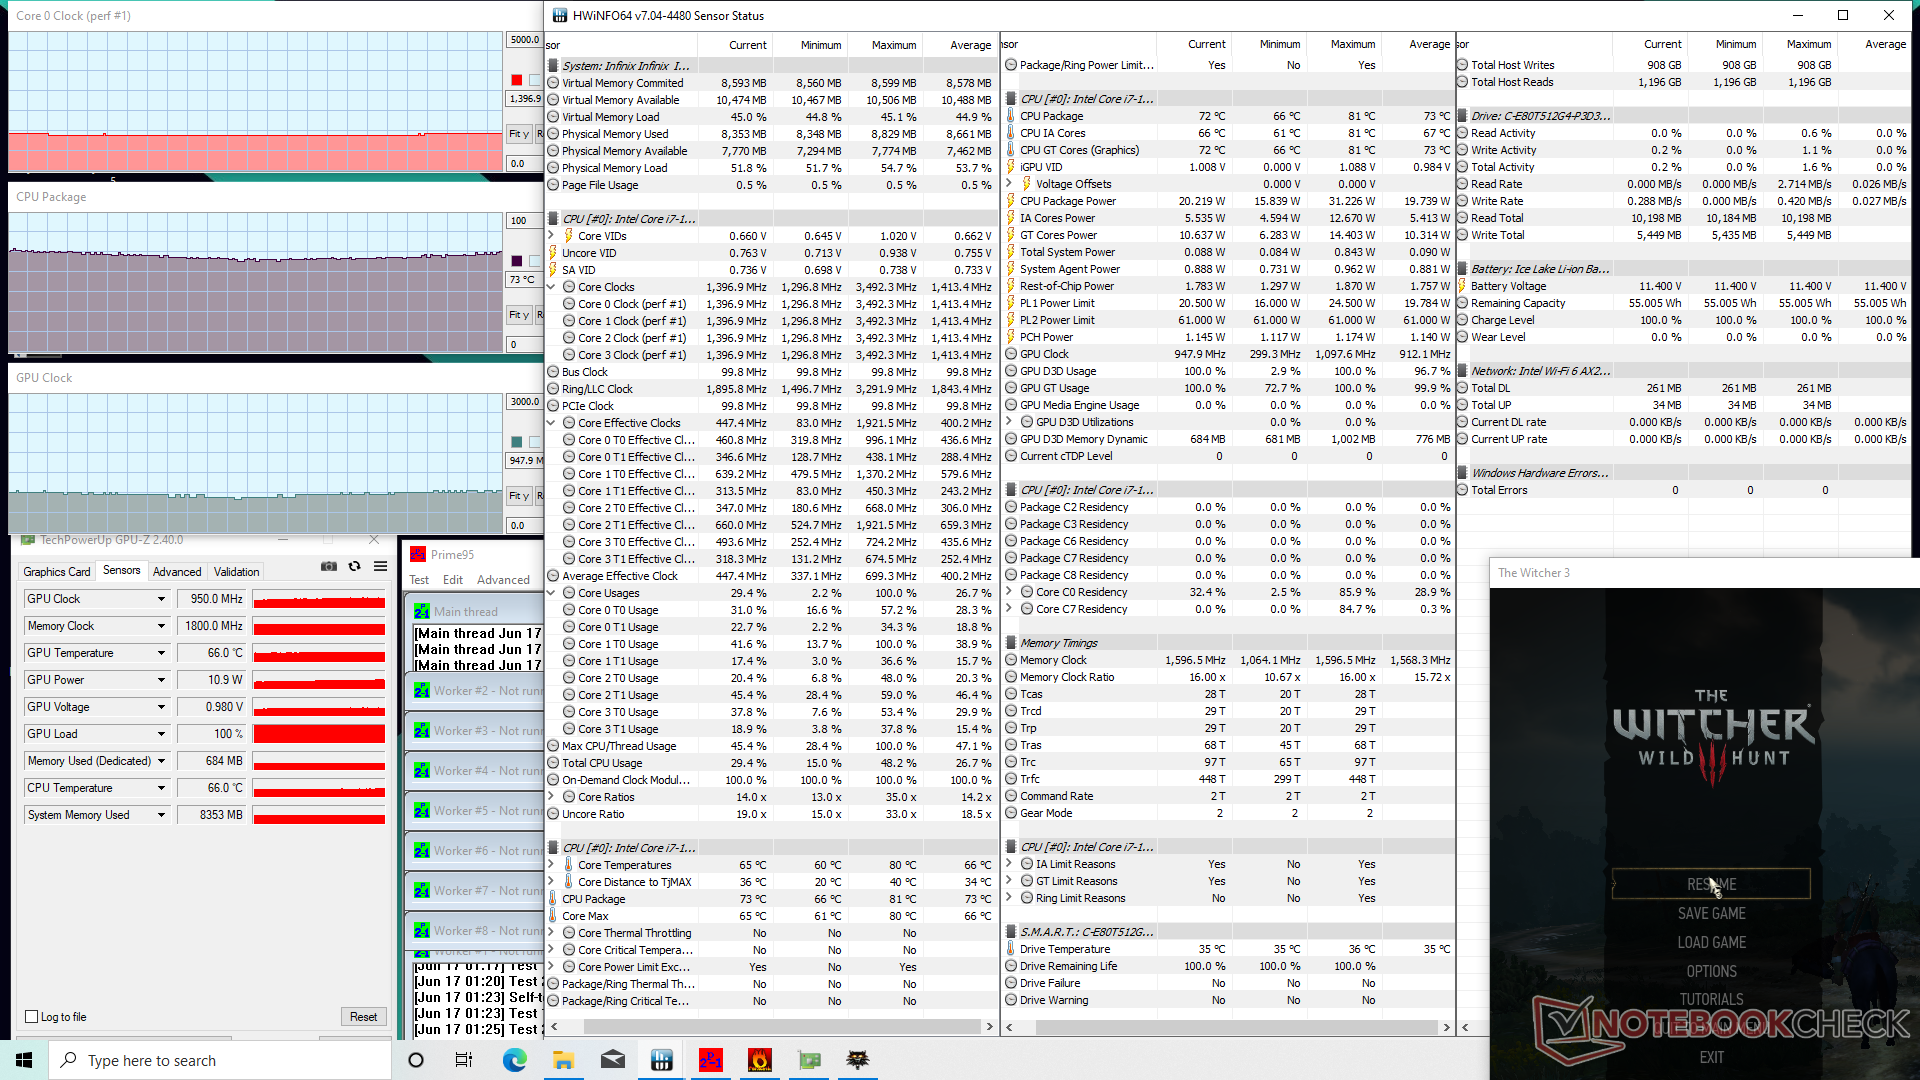
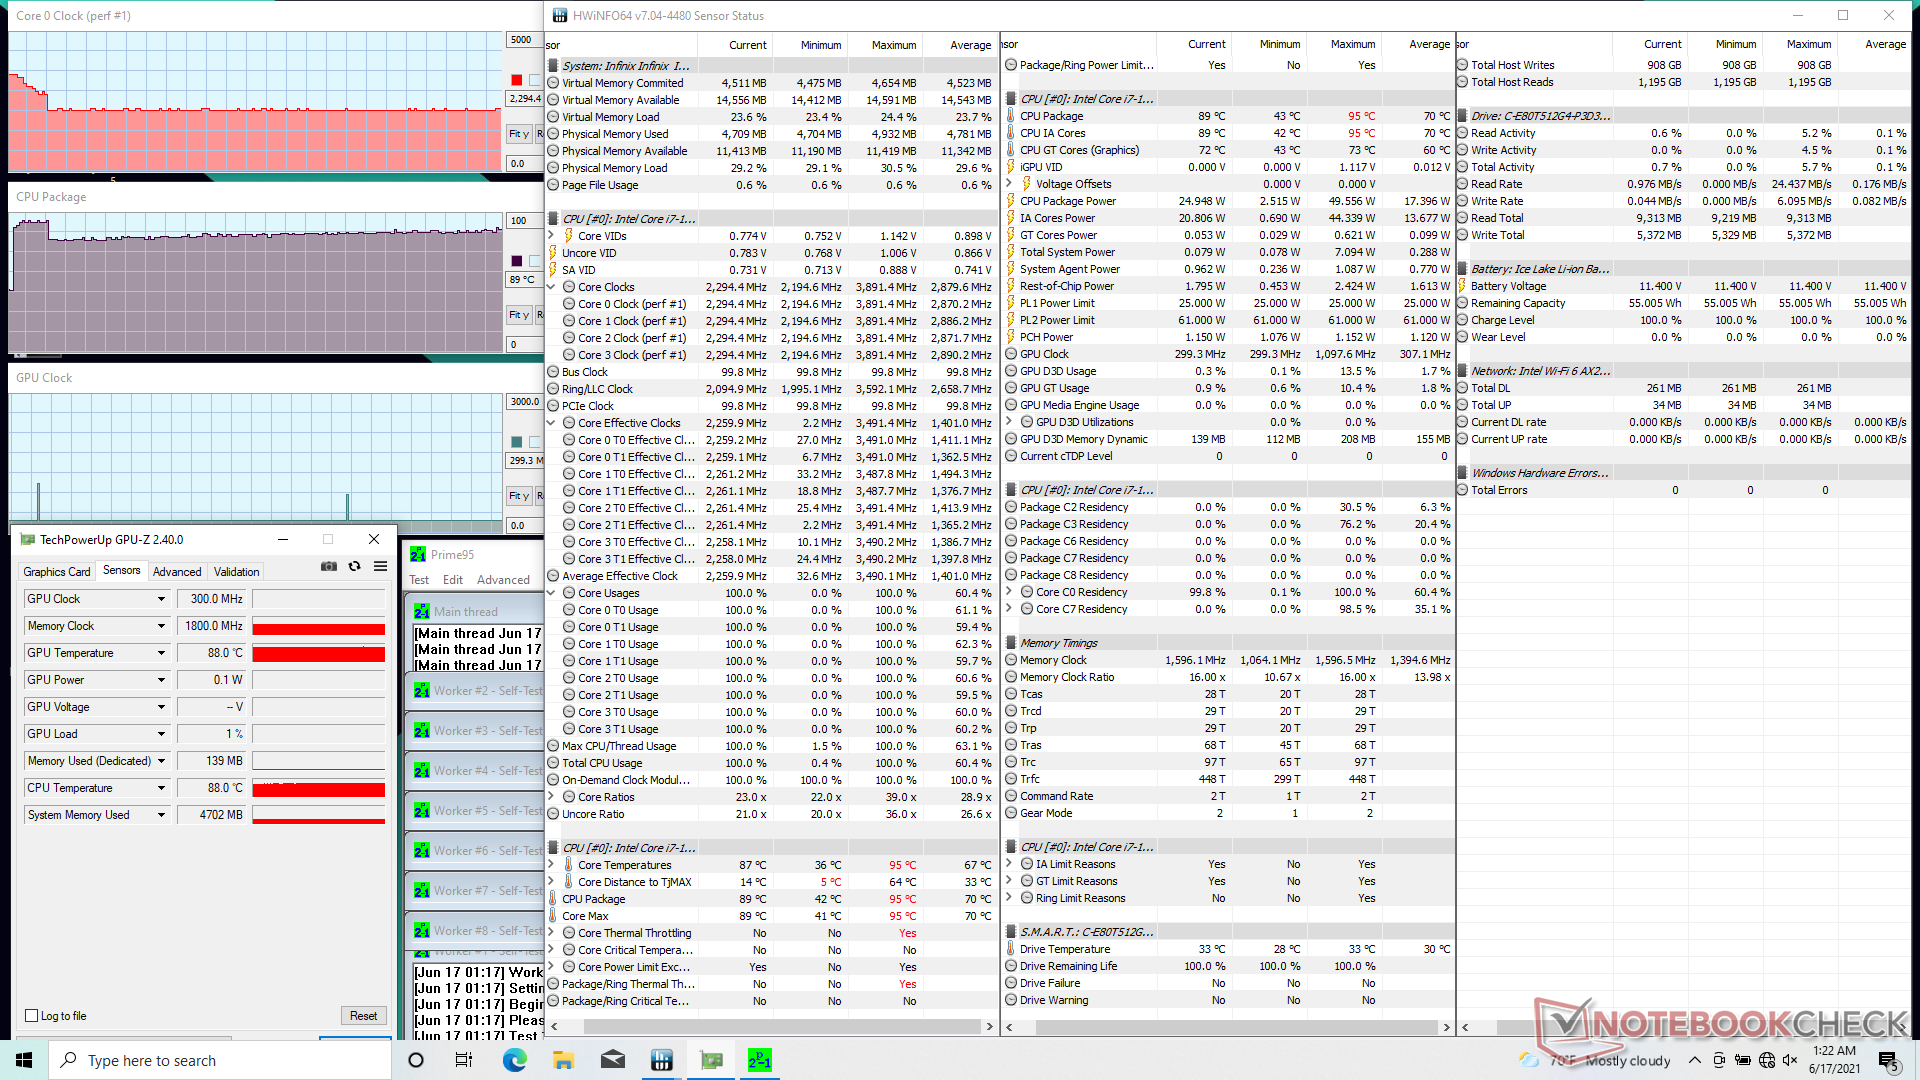
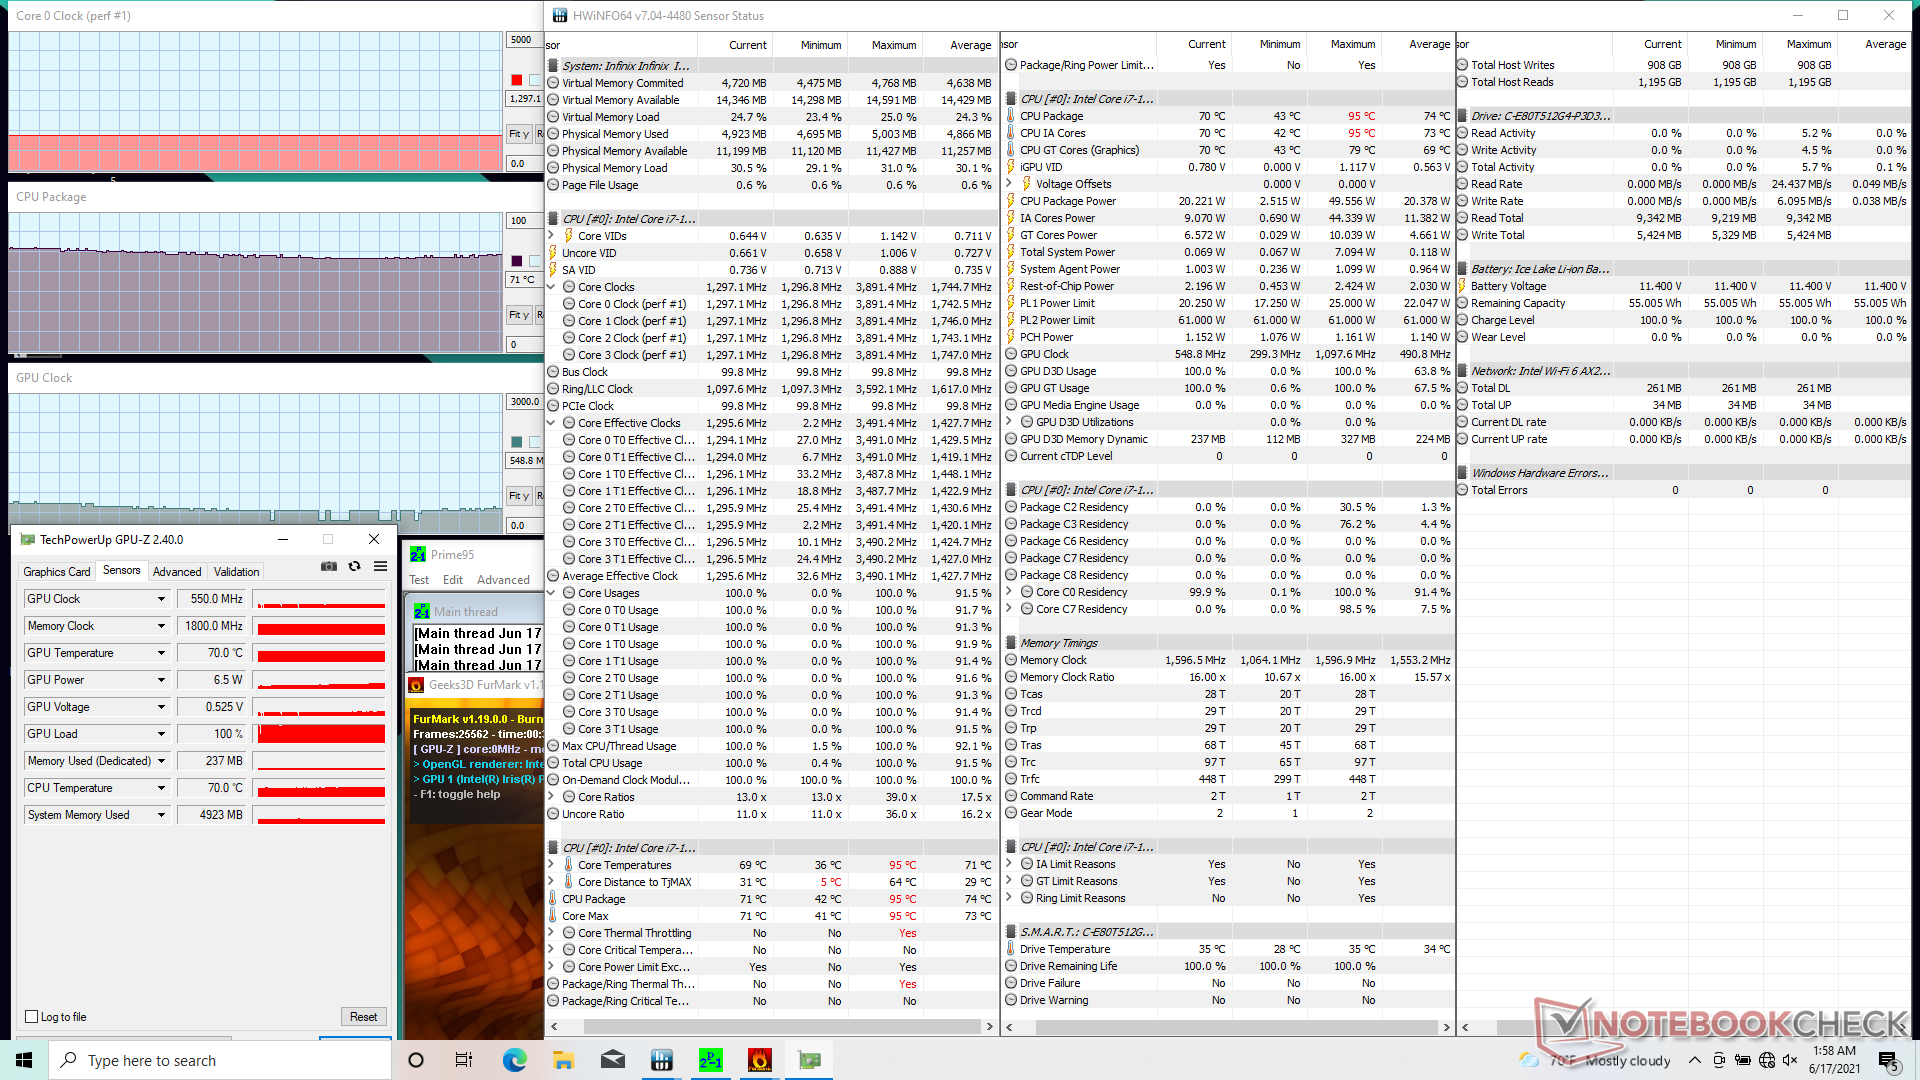
| CPU Clock (GHz) | GPU Clock (MHz) | Average CPU Temperature (°C) | |
| System Idle | -- | -- | 44 |
| Prime95 Stress | 1.8 - 2.3 | -- | 76 - 90 |
| Prime95 + FurMark Stress | 1.3 | 300 - 650 | 68 - 75 |
| Witcher 3 Stress | 1.3 | 750 - 1000 | 66 - 74 |
Speakers

Infinix INBook X1 Pro audio analysis
(±) | speaker loudness is average but good (72 dB)
Bass 100 - 315 Hz
(±) | reduced bass - on average 14.9% lower than median
(±) | linearity of bass is average (12.1% delta to prev. frequency)
Mids 400 - 2000 Hz
(+) | balanced mids - only 2.1% away from median
(+) | mids are linear (5.5% delta to prev. frequency)
Highs 2 - 16 kHz
(+) | balanced highs - only 3.2% away from median
(+) | highs are linear (6% delta to prev. frequency)
Overall 100 - 16.000 Hz
(±) | linearity of overall sound is average (15.6% difference to median)
Compared to same class
» 39% of all tested devices in this class were better, 4% similar, 57% worse
» The best had a delta of 5%, average was 17%, worst was 45%
Compared to all devices tested
» 23% of all tested devices were better, 5% similar, 72% worse
» The best had a delta of 4%, average was 23%, worst was 134%
Apple MacBook 12 (Early 2016) 1.1 GHz audio analysis
(+) | speakers can play relatively loud (83.6 dB)
Bass 100 - 315 Hz
(±) | reduced bass - on average 11.3% lower than median
(±) | linearity of bass is average (14.2% delta to prev. frequency)
Mids 400 - 2000 Hz
(+) | balanced mids - only 2.4% away from median
(+) | mids are linear (5.5% delta to prev. frequency)
Highs 2 - 16 kHz
(+) | balanced highs - only 2% away from median
(+) | highs are linear (4.5% delta to prev. frequency)
Overall 100 - 16.000 Hz
(+) | overall sound is linear (10.2% difference to median)
Compared to same class
» 7% of all tested devices in this class were better, 2% similar, 90% worse
» The best had a delta of 5%, average was 18%, worst was 53%
Compared to all devices tested
» 5% of all tested devices were better, 1% similar, 94% worse
» The best had a delta of 4%, average was 23%, worst was 134%
Energy Management — Great Runtimes
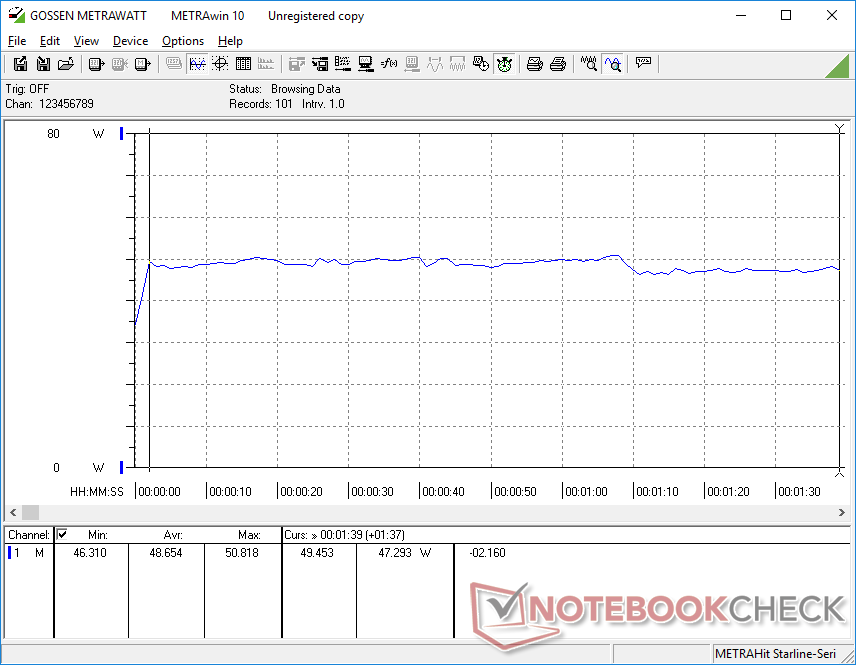
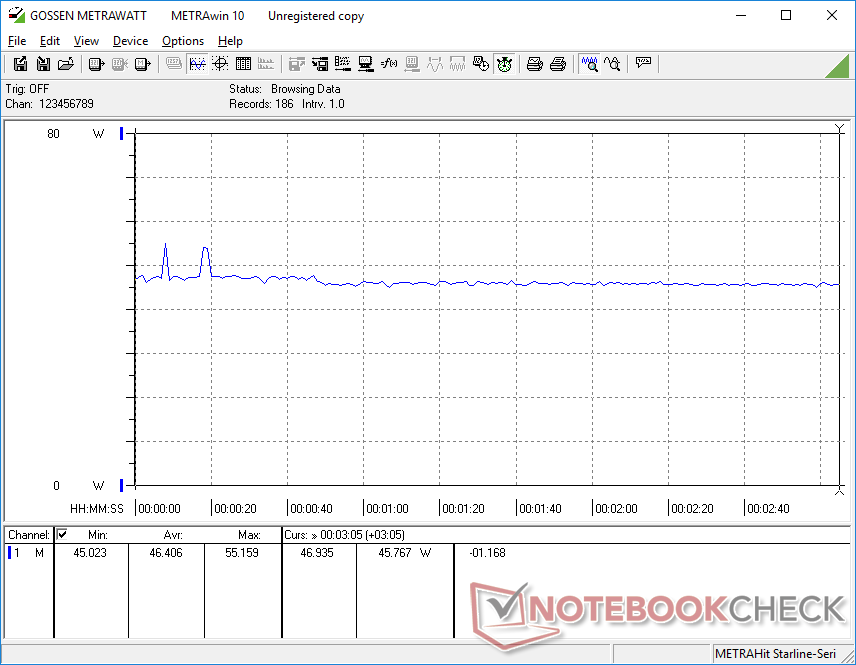
Power Consumption
Overall power consumption is lower than on laptops with dedicated GeForce MX graphics like the VivoBook S14 or Pavilion 14, but it remains comparable to laptops with newer 11th gen Iris Xe graphics meaning performance-per-watt isn't nearly as good as Intel's latest and greatest. We're able to draw a temporary maximum of 58.8 W from the small (~7 x 6.9 x 3.2 cm) 65 W wall wart AC adapter.
| Off / Standby | |
| Idle | |
| Load |
|
Key:
min: | |
| Infinix INBook X1 Pro i7-1065G7, Iris Plus Graphics G7 (Ice Lake 64 EU), Phison C-E80T512G4-P3D3B3E13, IPS, 1920x1080, 14" | Schenker Vision 14 i7-1165G7, Iris Xe G7 96EUs, Samsung SSD 980 Pro 1TB MZ-V8P1T0BW, IPS, 2880x1800, 14" | Honor Magicbook 14 i7-1165G7 i7-1165G7, Iris Xe G7 96EUs, WDC PC SN730 SDBPNTY-512G, IPS, 1920x1080, 14" | Lenovo ThinkBook 14 G2 ITL 20VD008WGE i5-1135G7, Iris Xe G7 80EUs, Samsung PM991 MZALQ512HALU, a-Si IPS LED, 1920x1080, 14" | Asus VivoBook S14 S433FL i7-10510U, GeForce MX250, Intel Optane Memory H10 with Solid State Storage 32GB + 512GB HBRPEKNX0202A(L/H), IPS, 1920x1080, 14" | HP Pavilion 14-ce3040ng i7-1065G7, GeForce MX250, Toshiba XG6 KXG60ZNV1T02, IPS, 1920x1080, 14" | |
|---|---|---|---|---|---|---|
| Power Consumption | -20% | 20% | 11% | 19% | 3% | |
| Idle Minimum * (Watt) | 5 | 9.8 -96% | 4 20% | 4.8 4% | 2.4 52% | 4 20% |
| Idle Average * (Watt) | 11.5 | 12.5 -9% | 6 48% | 7.6 34% | 4.2 63% | 7 39% |
| Idle Maximum * (Watt) | 12 | 13.7 -14% | 10 17% | 10.7 11% | 7.8 35% | 10 17% |
| Load Average * (Watt) | 48.7 | 39.3 19% | 34 30% | 35 28% | 57 -17% | 62 -27% |
| Witcher 3 ultra * (Watt) | 46.4 | 44.8 3% | 46 1% | 52 -12% | 58 -25% | |
| Load Maximum * (Watt) | 58.8 | 72.8 -24% | 68 -16% | 67.6 -15% | 64 -9% | 64 -9% |
* ... smaller is better
Battery Life
We're able to browse the net for 8.5 hours straight before automatic shutdown which is similar to what we've observed on pricier flagship Ultrabooks from Dell or HP. Charging from empty to full capacity takes just under 2 hours.
It's worth reiterating that only one of the two USB-C ports supports recharging.
| Infinix INBook X1 Pro i7-1065G7, Iris Plus Graphics G7 (Ice Lake 64 EU), 55 Wh | Schenker Vision 14 i7-1165G7, Iris Xe G7 96EUs, 53 Wh | Honor Magicbook 14 i7-1165G7 i7-1165G7, Iris Xe G7 96EUs, 56 Wh | Lenovo ThinkBook 14 G2 ITL 20VD008WGE i5-1135G7, Iris Xe G7 80EUs, 45 Wh | Asus VivoBook S14 S433FL i7-10510U, GeForce MX250, 50 Wh | HP Pavilion 14-ce3040ng i7-1065G7, GeForce MX250, 41 Wh | |
|---|---|---|---|---|---|---|
| Battery runtime | -28% | 14% | -32% | 1% | -28% | |
| WiFi v1.3 (h) | 8.5 | 6.1 -28% | 9.7 14% | 5.8 -32% | 8.6 1% | 6.1 -28% |
| Load (h) | 1.8 | 0.9 | 1.2 | |||
| Reader / Idle (h) | 11.6 |
Pros
Cons
Verdict — Well-rounded in Most Aspects
Infinix is striking almost all the right notes with its first laptop. Basic features like display quality, build quality, port options, average processor performance, and battery life are all well above what we've come to expect from lesser-known Chinese manufacturers. We especially appreciate the fairly speedy 10th gen Intel Core-U CPU whereas competing OEMs would typically ship with much slower Celeron or Atom options in this price range instead. It's an excellent alternative to the usual Asus VivoBook, Lenovo IdeaPad, or Dell Inspiron models that retail for similar prices if not slightly higher.
The webcam is the one aspect on the Infinix that might turn some heads back. It's far blurrier than most budget laptops we've tested thus far. You may want to invest in a USB camera if you intend on video conferencing frequently.
Strong first impressions for an inexpensive subnotebook. Even its worst features are about average given the price category.
The keyboard and hinges could both be improved upon for future models. They're average here for the price, but they can further help distinguish Infinix from the sea of budget laptops if they were made stronger.
Price and availability
The INBook X1 series is officially launching later this month in just a few territories including Egypt, Indonesia, and Nigeria starting at approximately $530 USD. Users in North America and Europe would have to import the model.
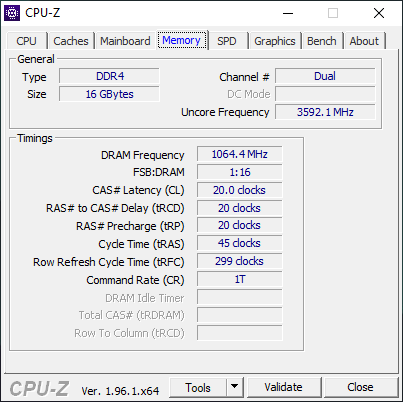
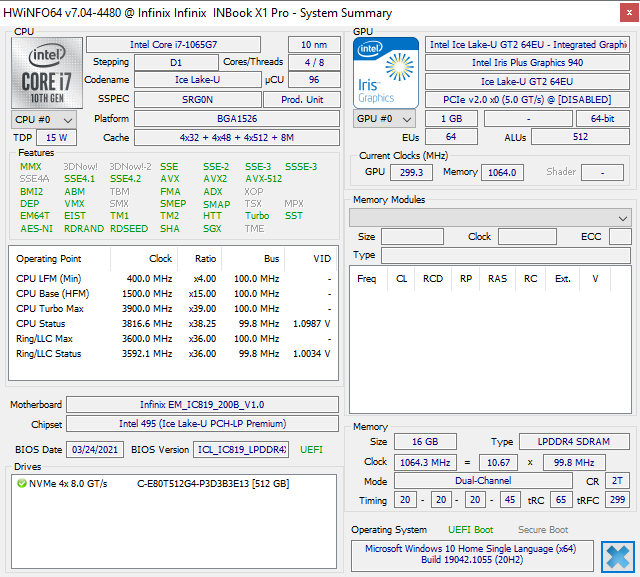
Infinix INBook X1 Pro
- 06/18/2021 v7 (old)
Allen Ngo
Price comparison
