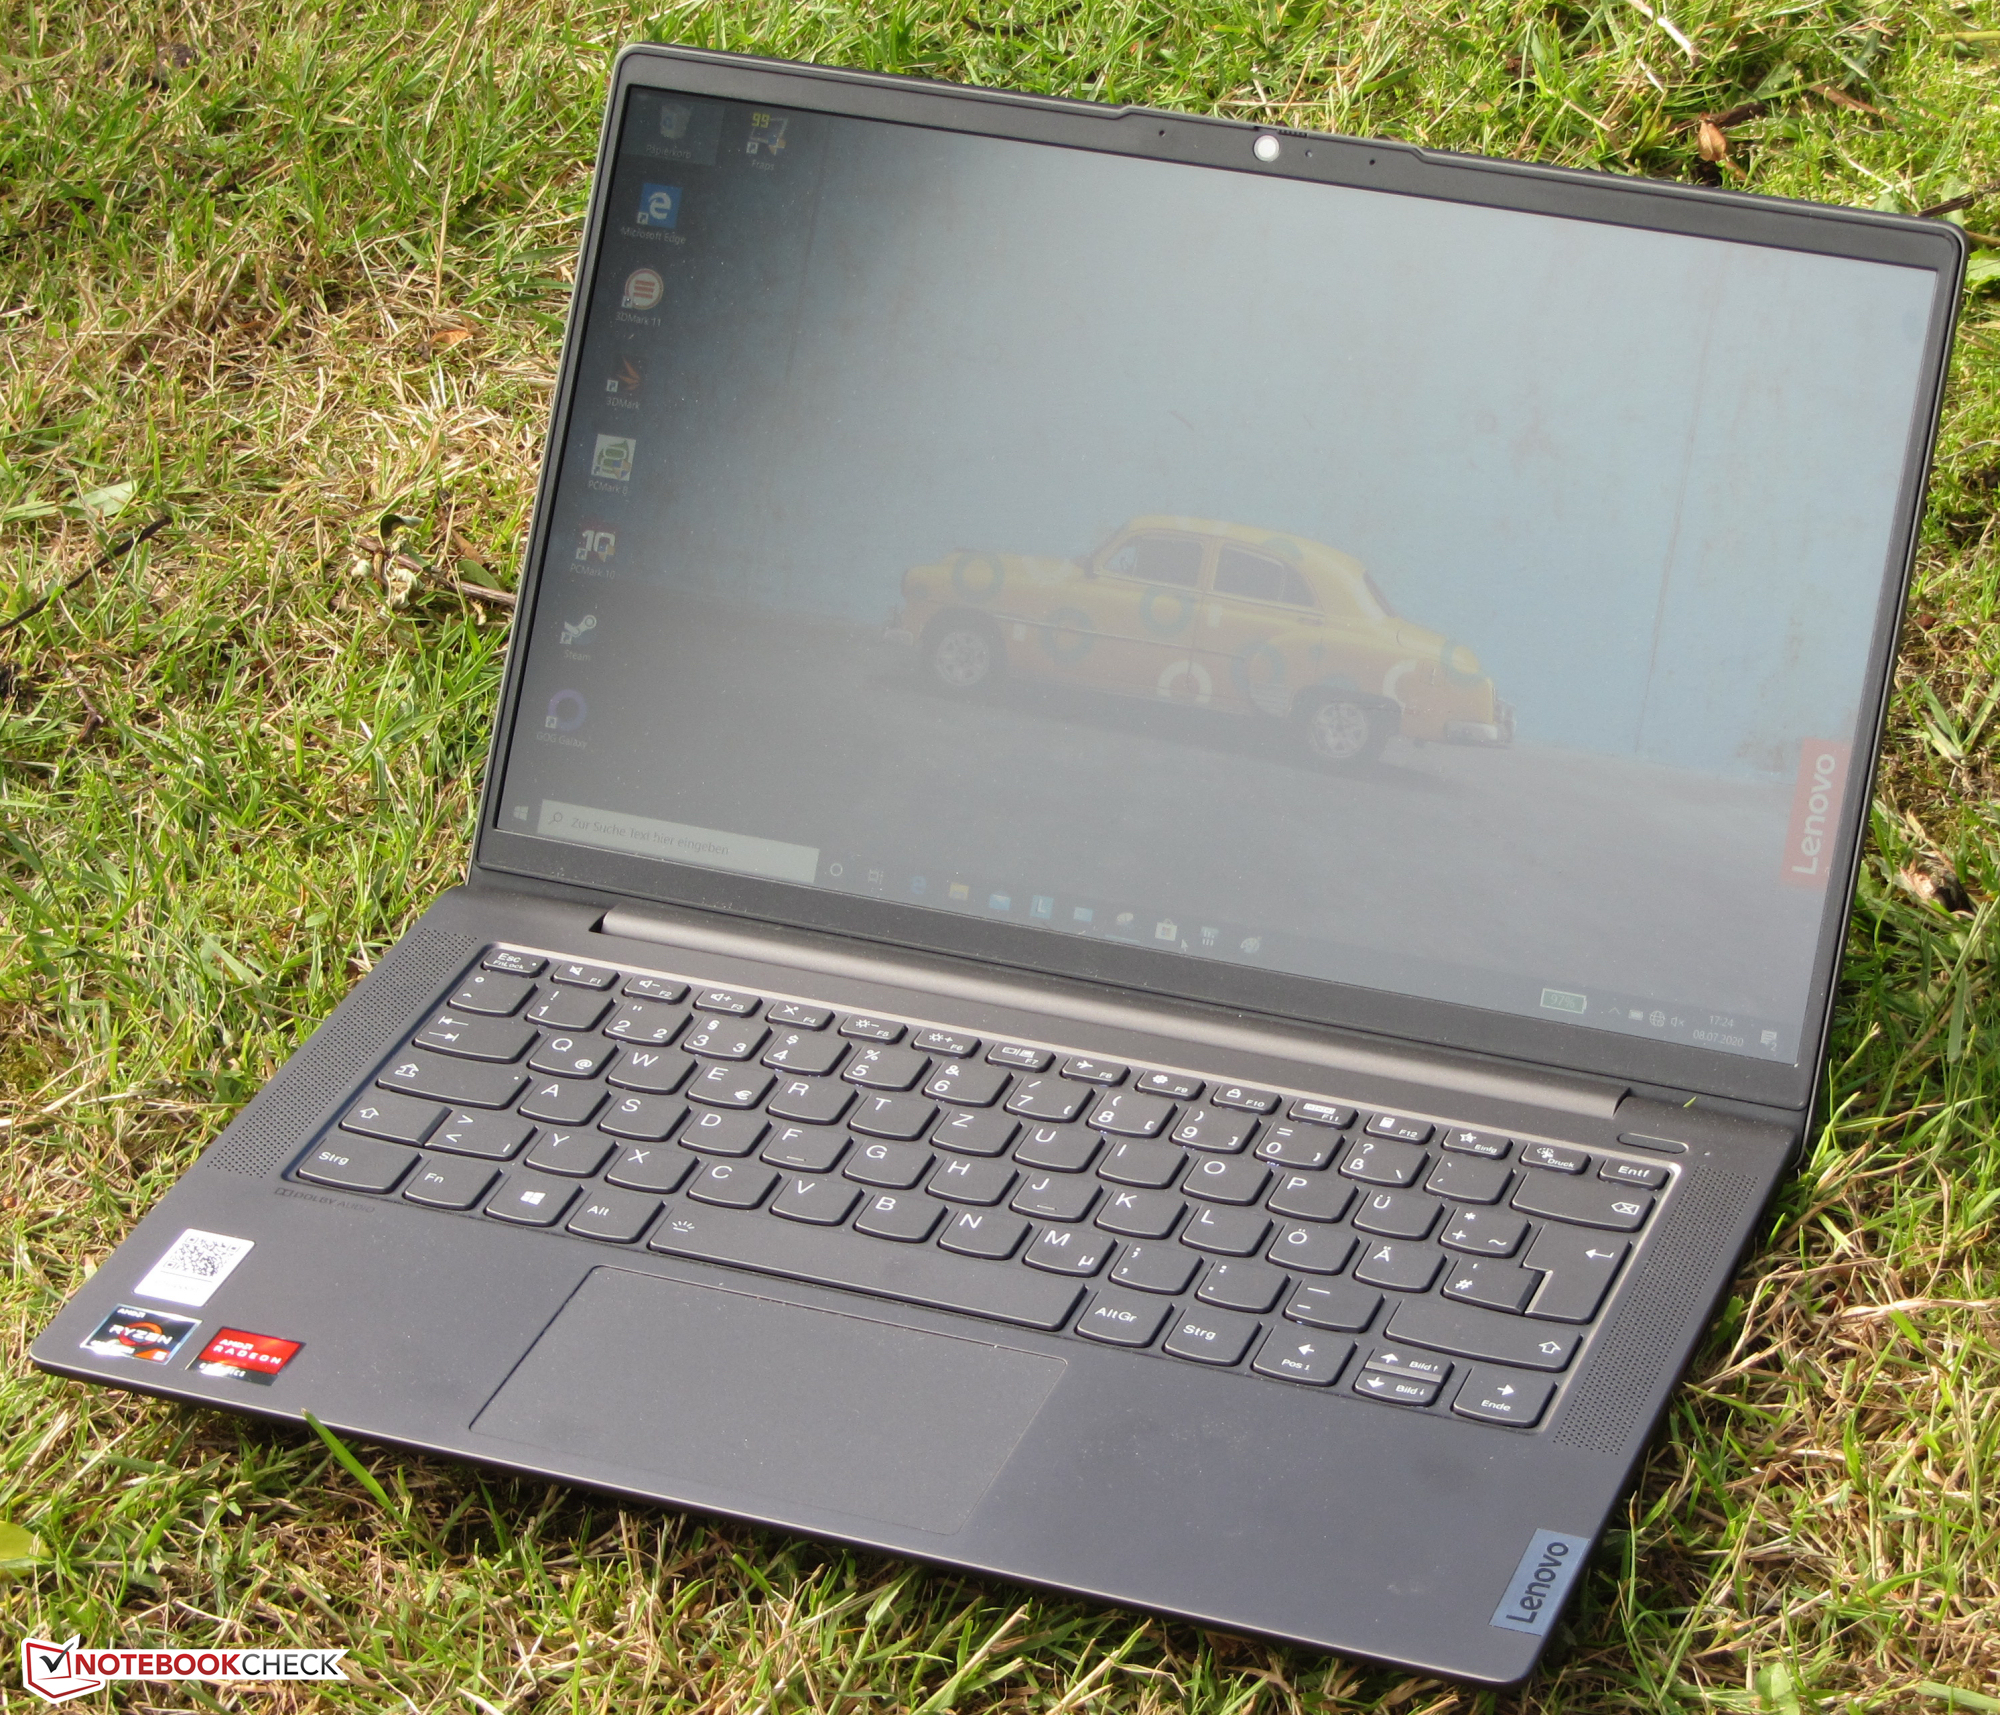
Lenovo IdeaPad 5 14ALC05 in review: Compact, powerful, enduring

Lenovo's new Ideapad 5 14ALC05 is a 14-inch subnotebook powered by a Ryzen-5-5500U-APU. The competitors include devices like the Honor MagicBook 14 and the Acer Swift 3 SF314-42. The Schenker VIA 14 and the HP ProBook 440 G8 are also alternatives, but they are more expensive than the IdeaPad.
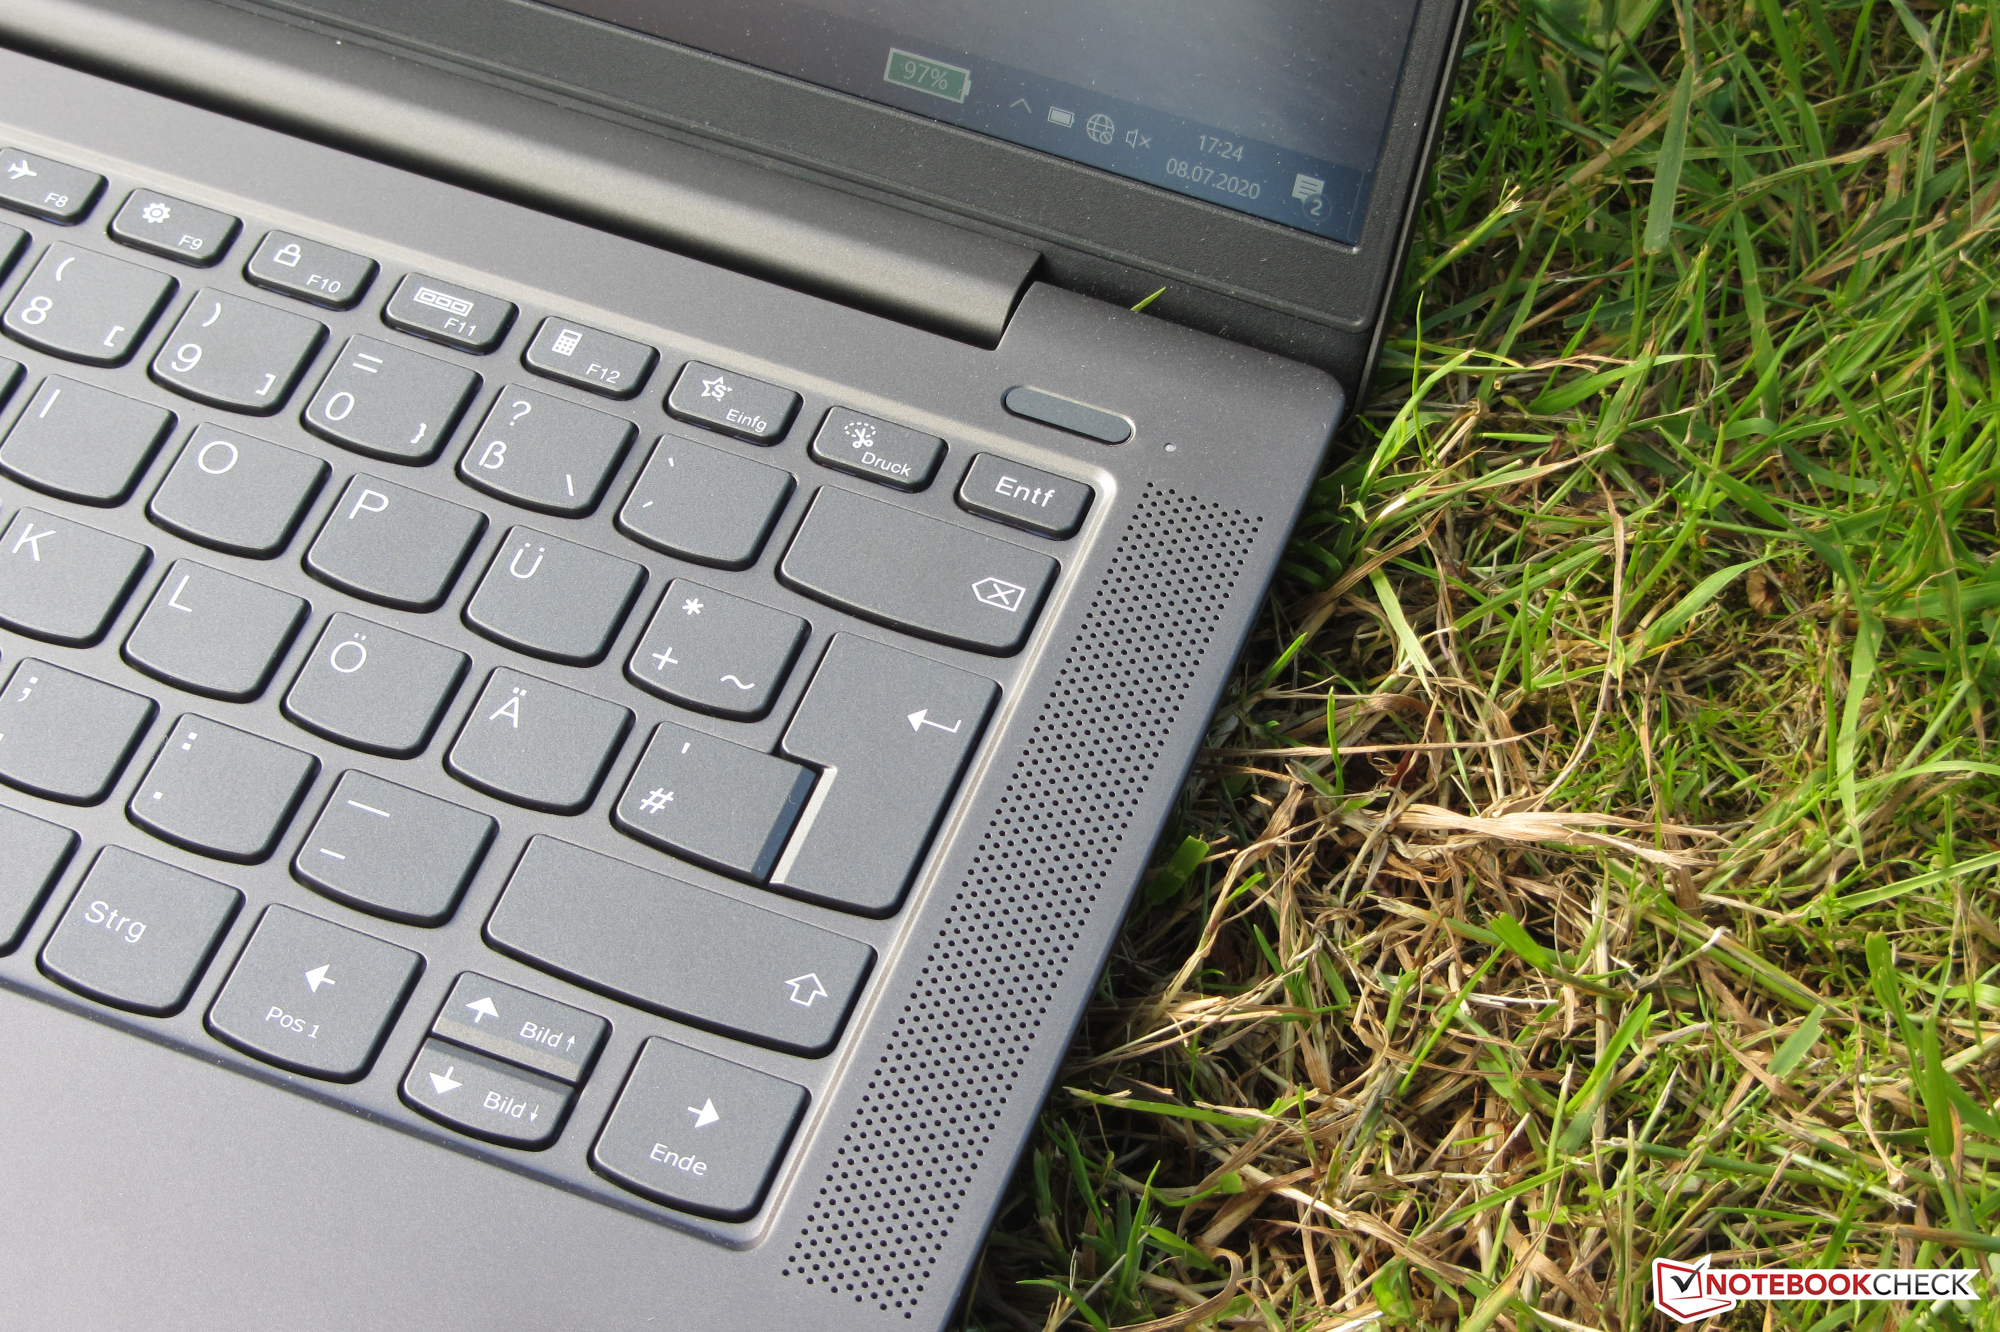
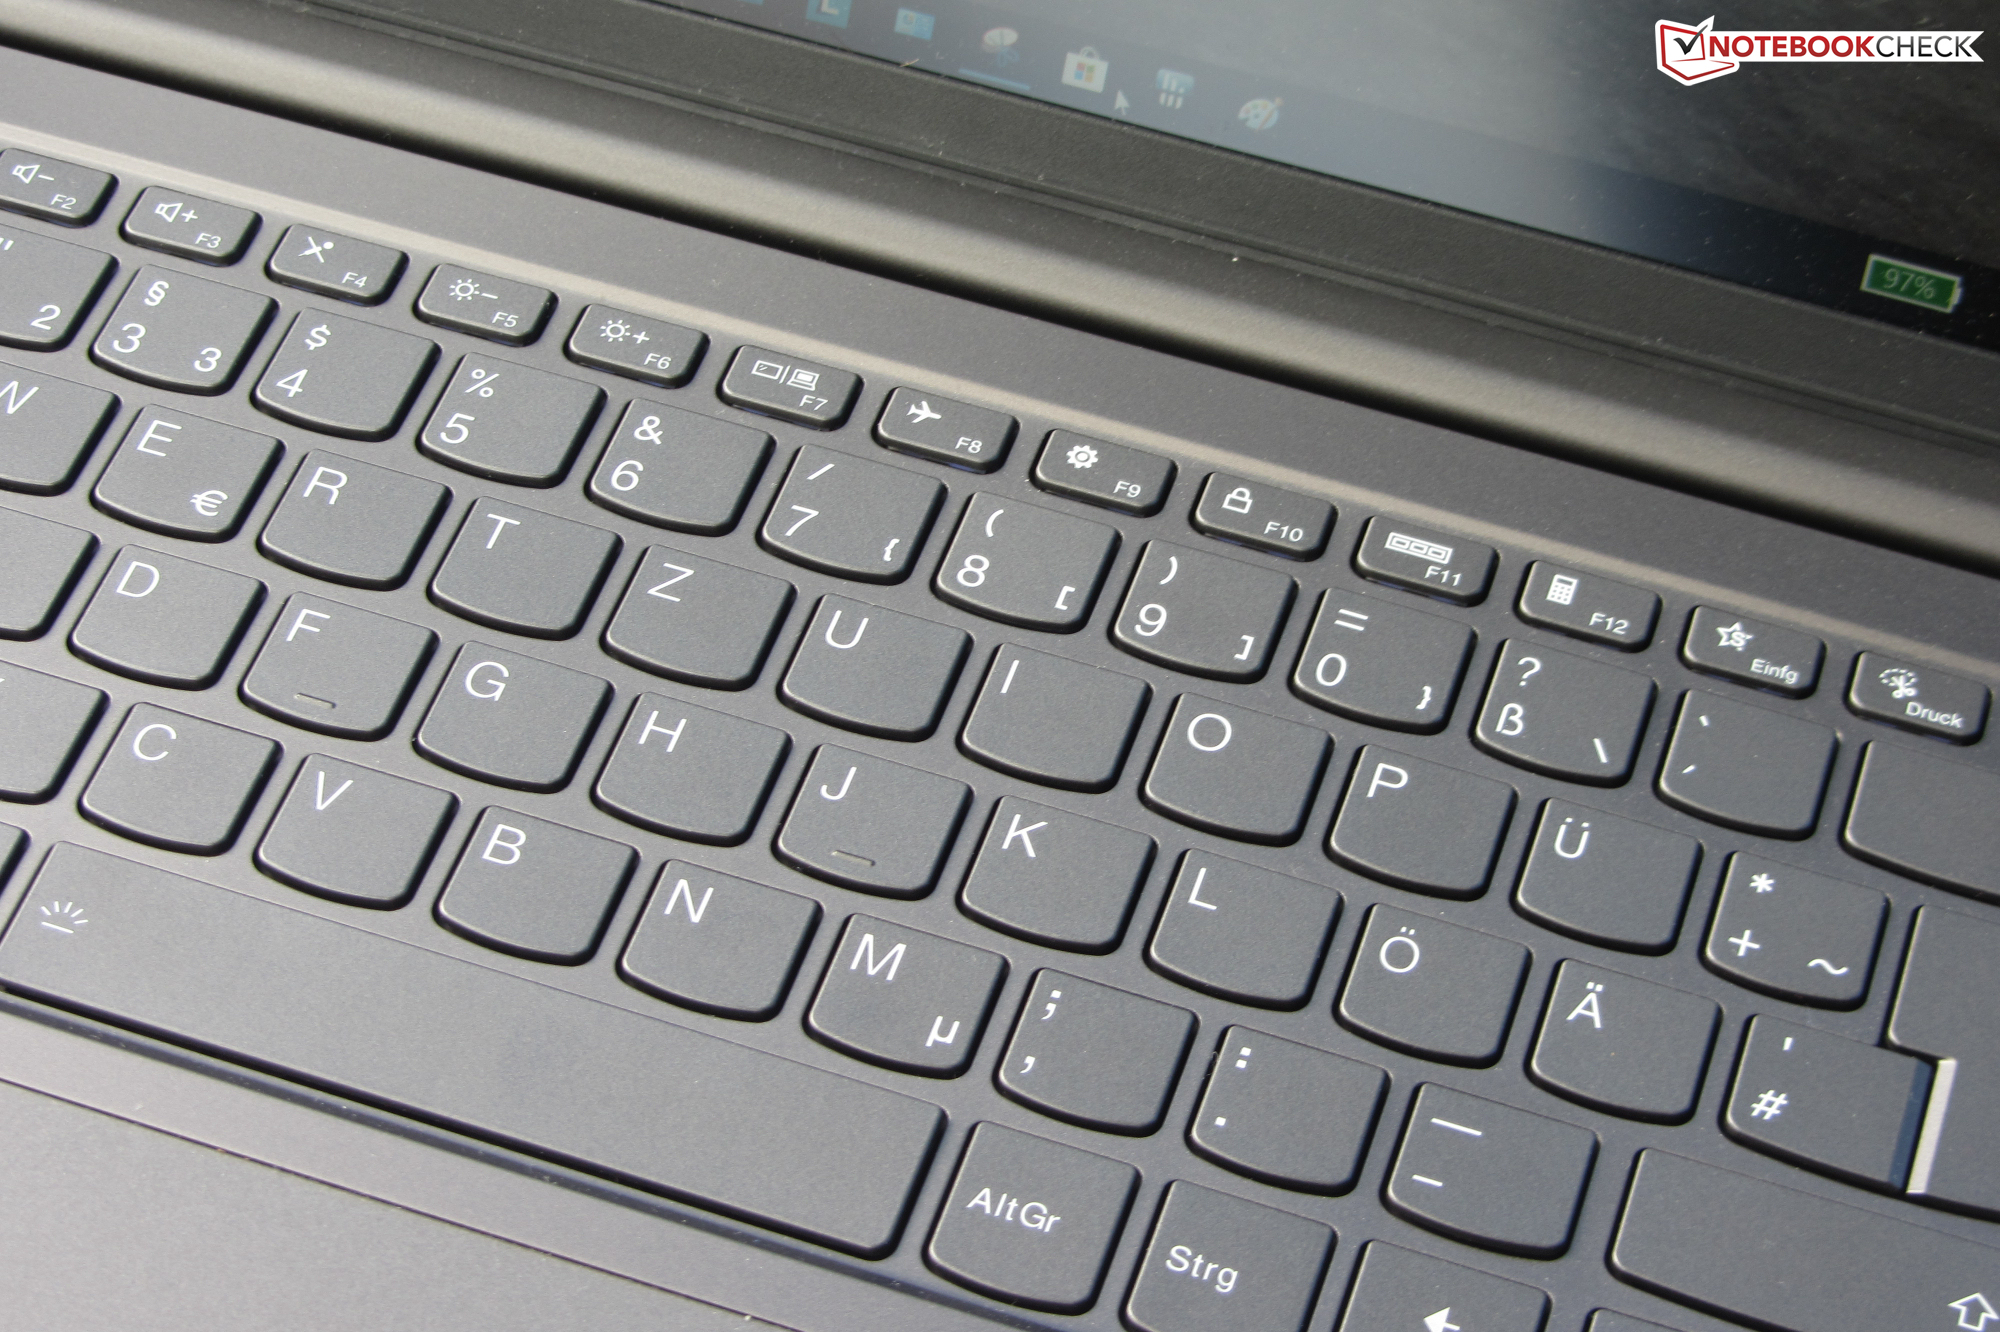
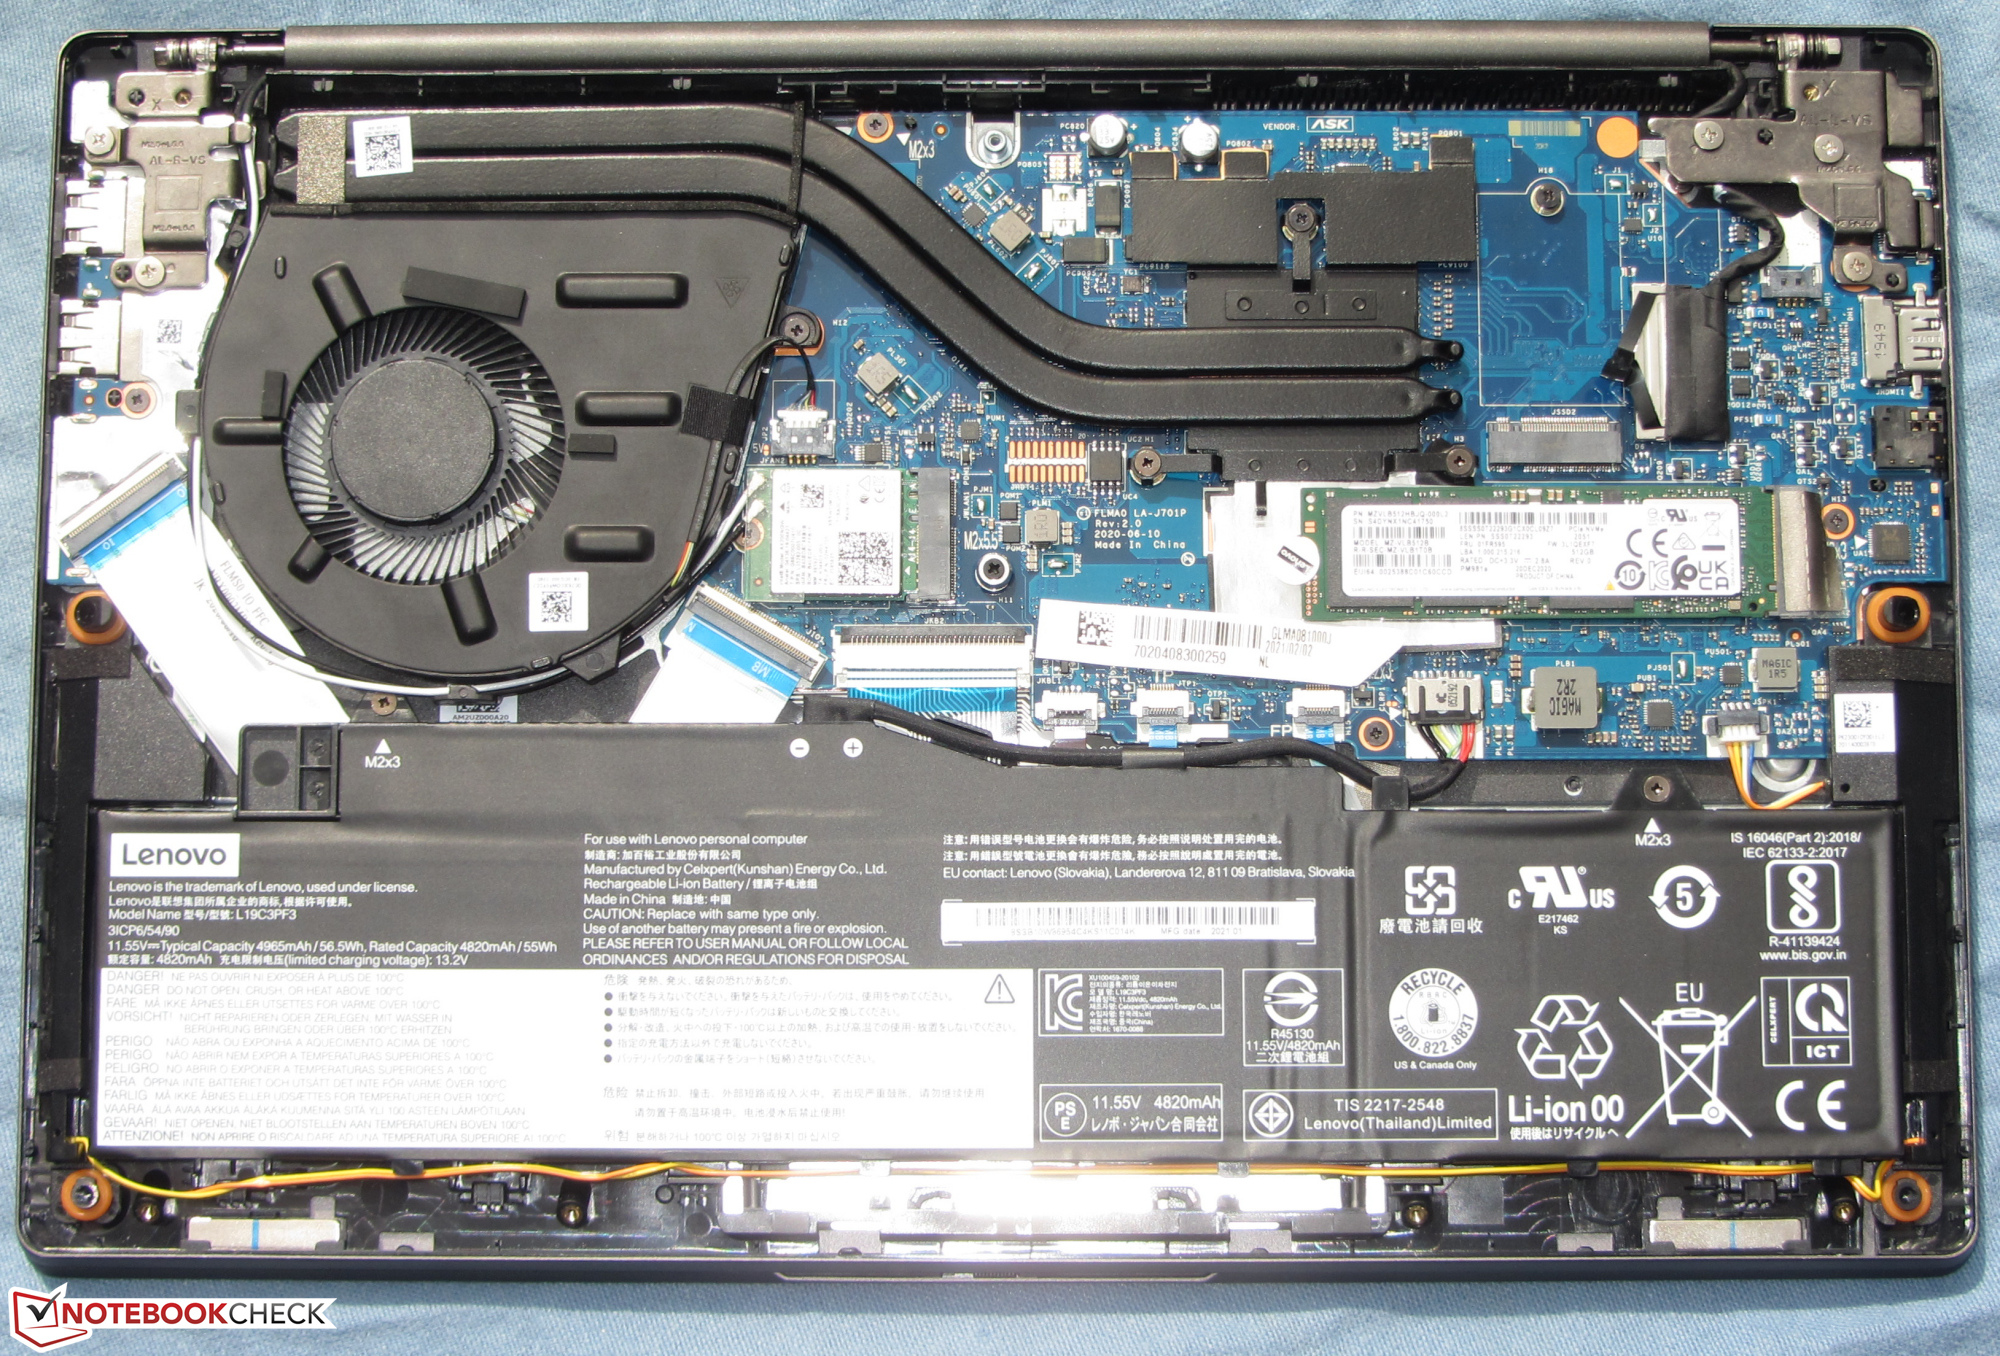
Since we have already tested a sister model with the same build, we will not go into further detail about the case, the ports, the input devices, or the speakers. That information can be found in the review of the Lenovo Ideapad 5 14ARE05.
Possible competitors in comparison
Rating | Date | Model | Weight | Height | Size | Resolution | Price |
|---|---|---|---|---|---|---|---|
| 86.3 % v7 (old) | 05 / 2021 | Lenovo IdeaPad 5 14ALC05 82LM005YGE R5 5500U, Vega 7 | 1.4 kg | 19.1 mm | 14.00" | 1920x1080 | |
| 85.6 % v7 (old) | 12 / 2020 | Honor MagicBook 14, Ryzen 5 4500U R5 4500U, Vega 6 | 1.4 kg | 15.9 mm | 14.00" | 1920x1080 | |
| 88 % v7 (old) | 04 / 2021 | Schenker VIA 14 Late 2020 i5-1135G7, Iris Xe G7 80EUs | 1.1 kg | 16.5 mm | 14.00" | 1920x1080 | |
| 83.3 % v7 (old) | 05 / 2021 | HP ProBook 440 G8-2W1G4EA i7-1165G7, Iris Xe G7 96EUs | 1.4 kg | 19 mm | 14.00" | 1920x1080 | |
| 86.5 % v7 (old) | 06 / 2020 | Acer Swift 3 SF314-42-R4XJ R7 4700U, Vega 7 | 1.2 kg | 16.55 mm | 14.00" | 1920x1080 |

| SD Card Reader | |
| average JPG Copy Test (av. of 3 runs) | |
| HP ProBook 440 G8-2W1G4EA (AV PRO microSD 128 GB V60) | |
| Lenovo IdeaPad 5 14ARE05 (Toshiba Exceria Pro SDXC 64 GB UHS-II) | |
| Lenovo IdeaPad 5 14ALC05 82LM005YGE | |
| Schenker VIA 14 Late 2020 (Toshiba Exceria Pro M501 UHS-II 64 GB) | |
| Average of class Subnotebook (23.7 - 188, n=9, last 2 years) | |
| maximum AS SSD Seq Read Test (1GB) | |
| Average of class Subnotebook (24.9 - 195, n=8, last 2 years) | |
| HP ProBook 440 G8-2W1G4EA (AV PRO microSD 128 GB V60) | |
| Lenovo IdeaPad 5 14ARE05 (Toshiba Exceria Pro SDXC 64 GB UHS-II) | |
| Schenker VIA 14 Late 2020 (Toshiba Exceria Pro M501 UHS-II 64 GB) | |
| Lenovo IdeaPad 5 14ALC05 82LM005YGE | |


Display - IPS with poor color space coverage

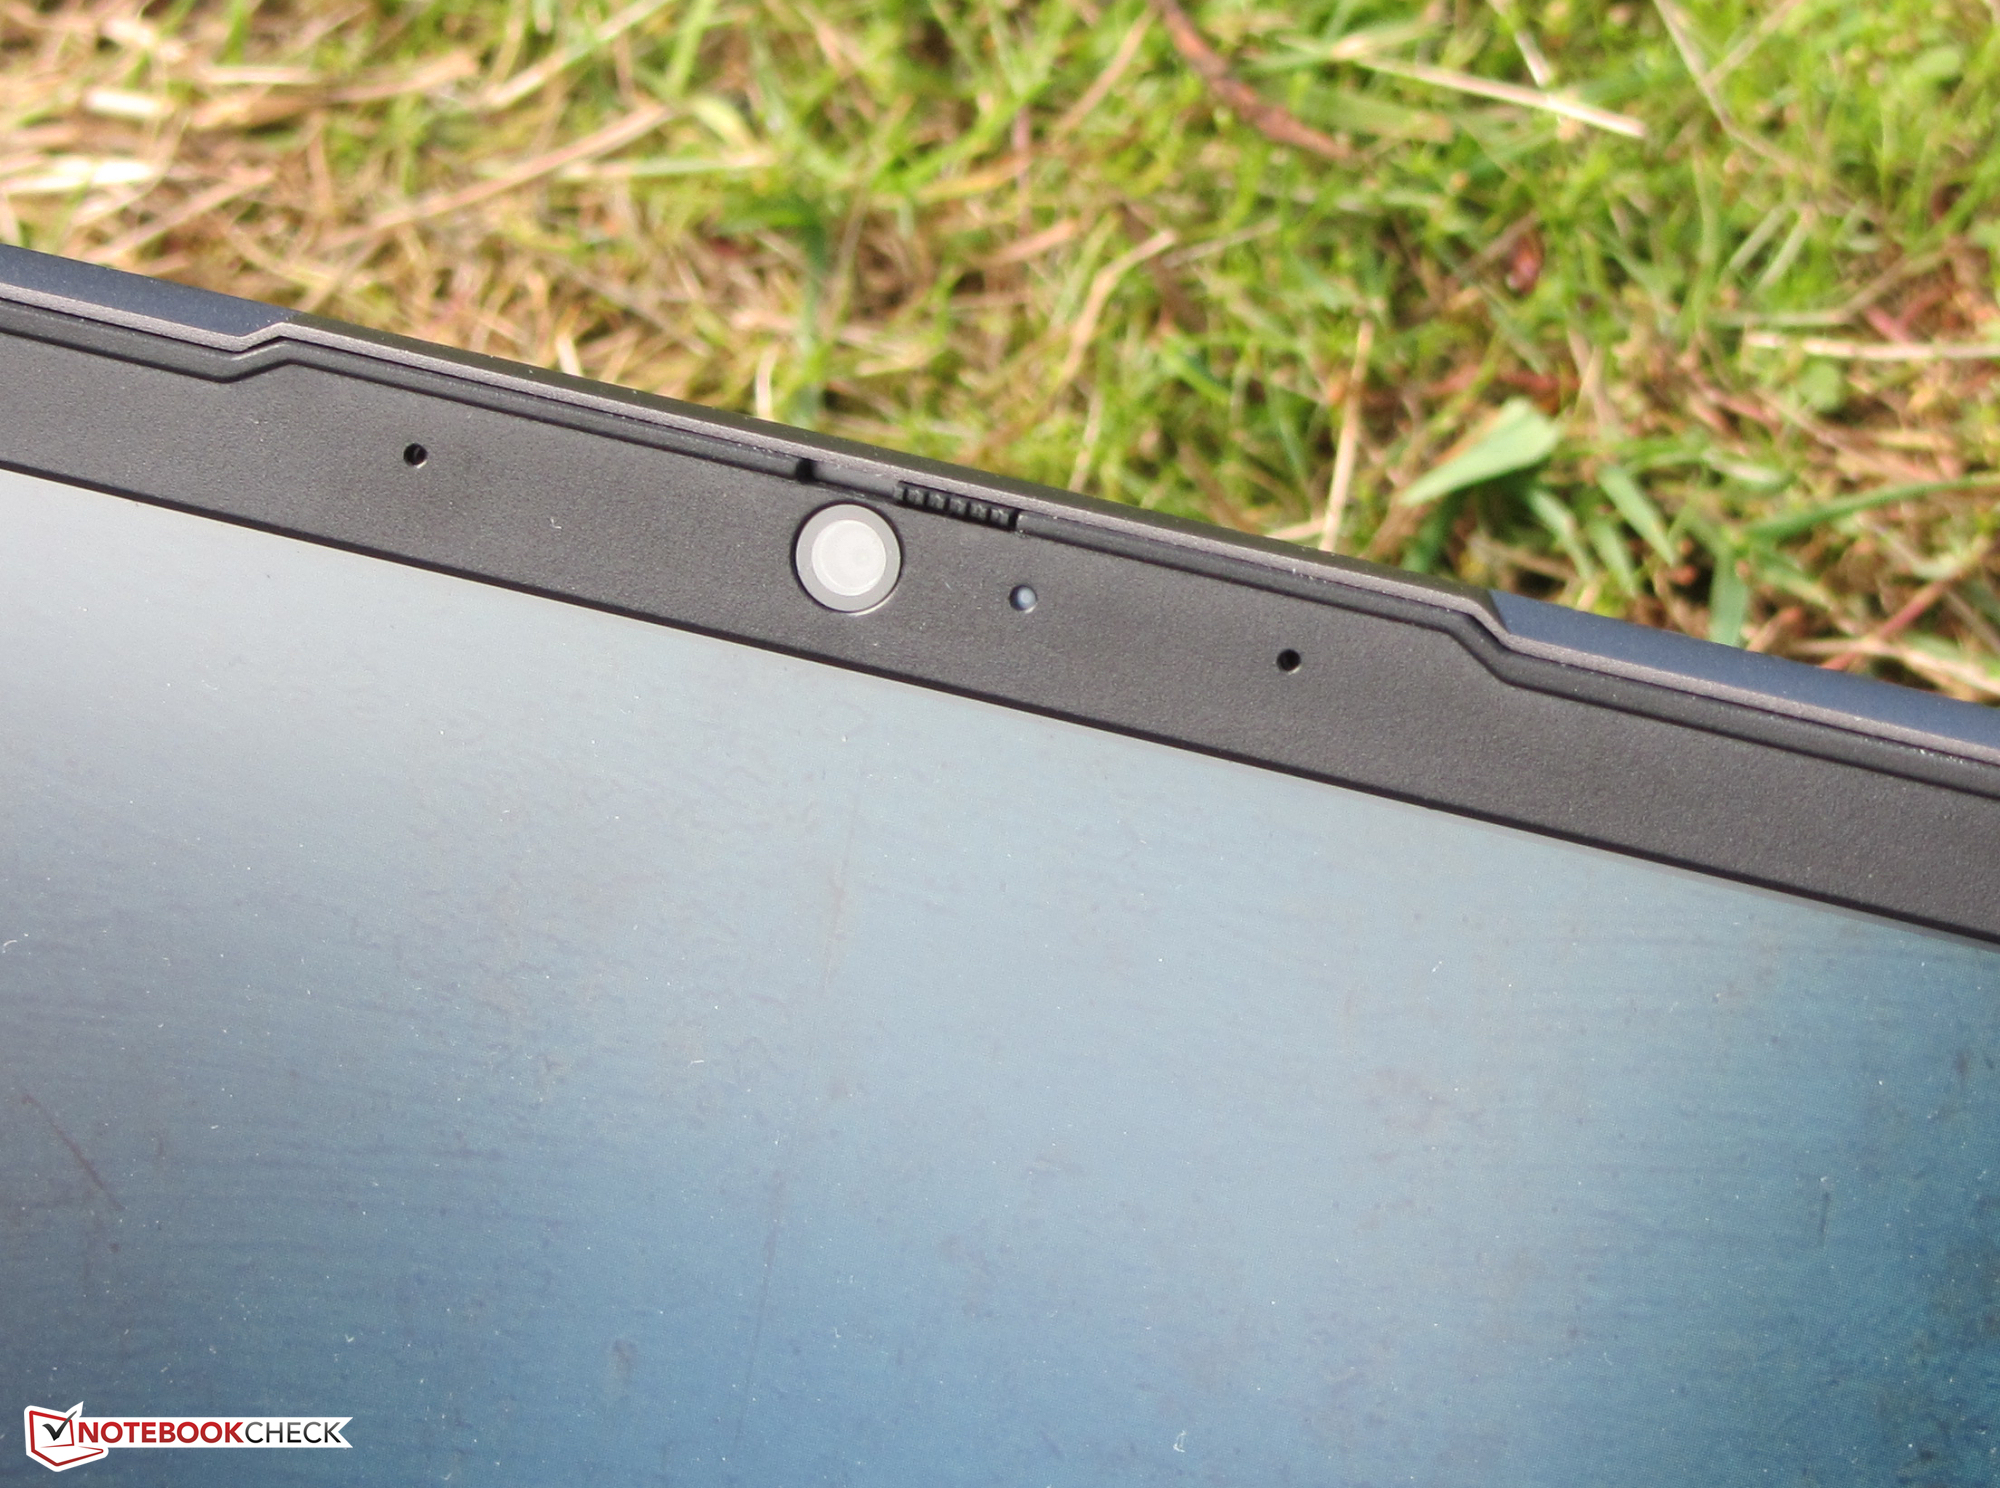
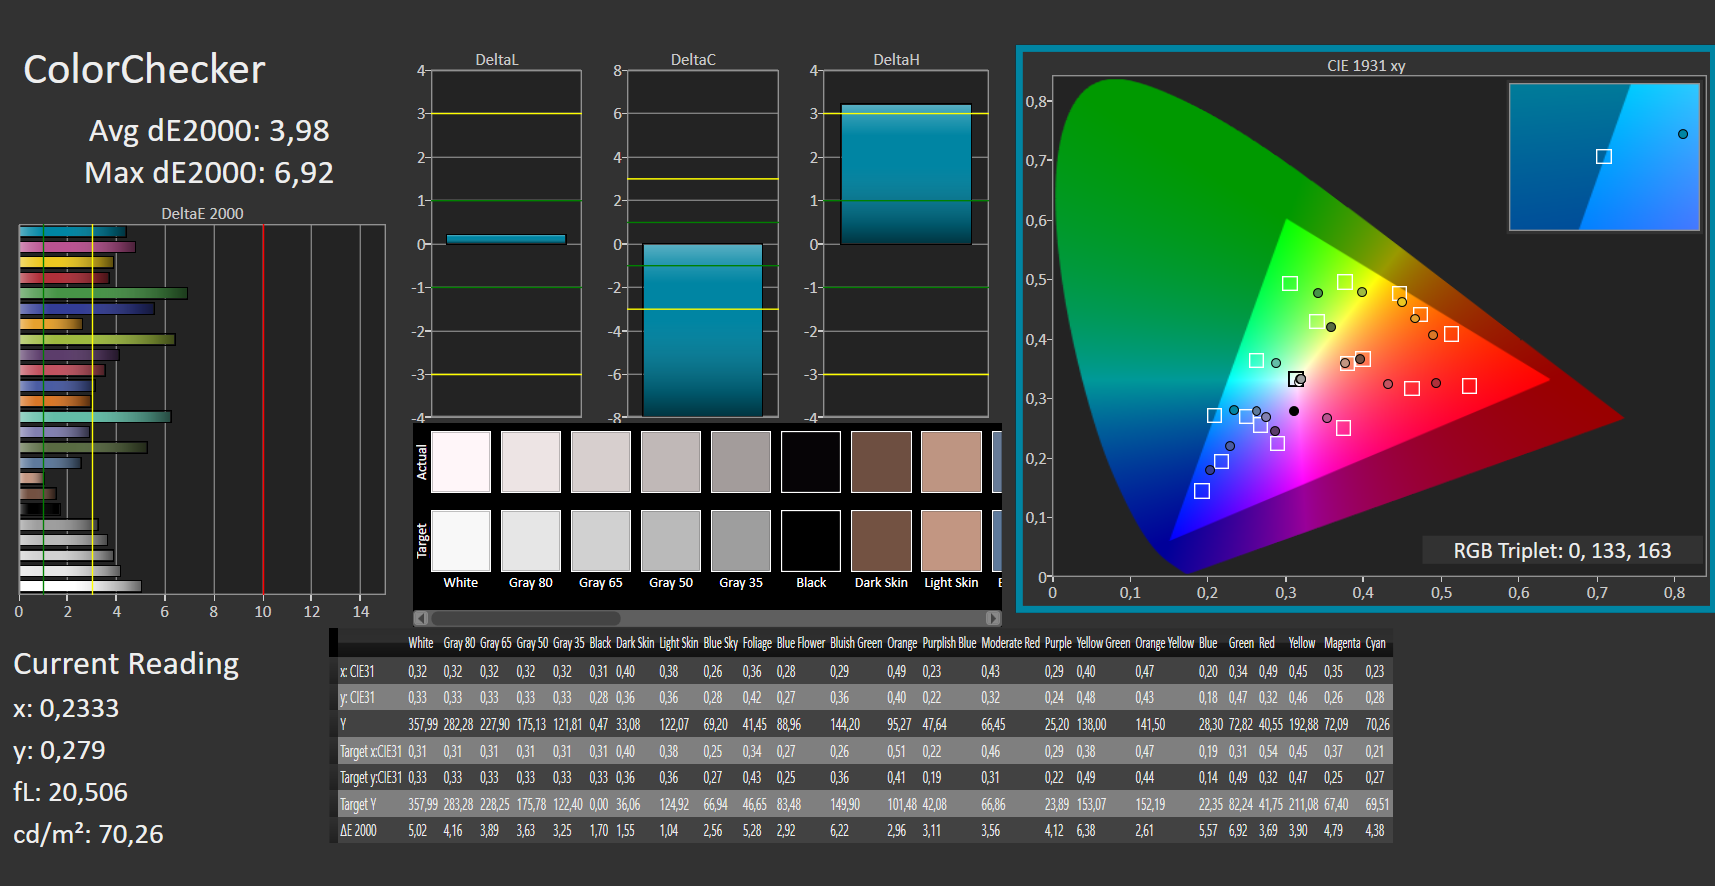
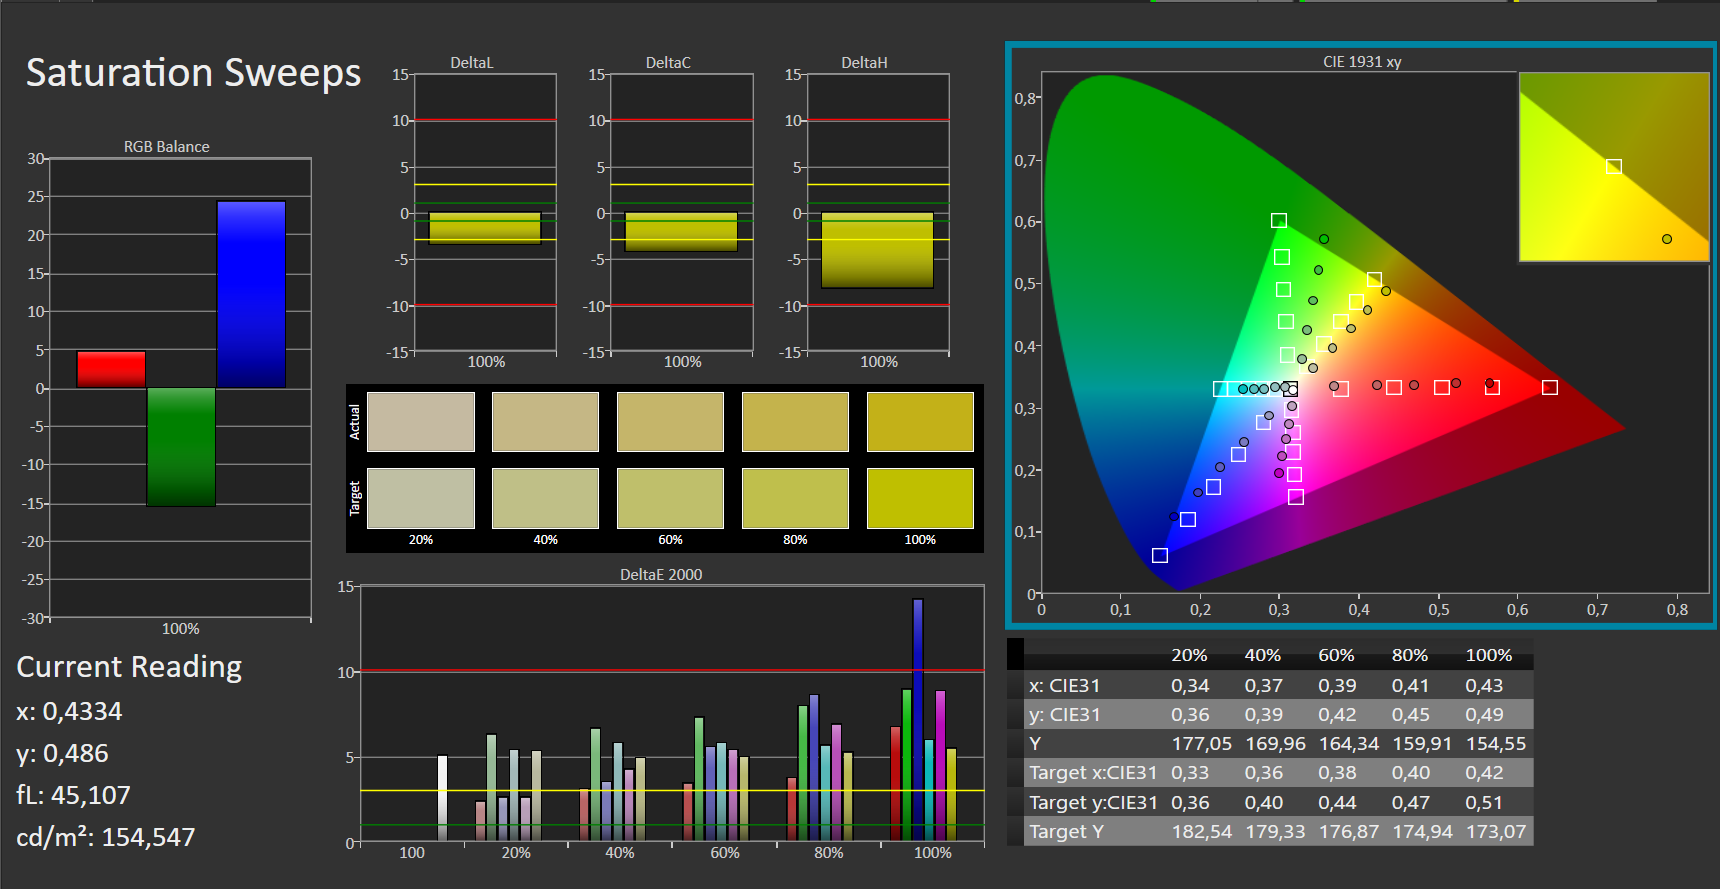
The 14-inch FHD (1920x1080) screen has stable viewing angles thanks to its matte finish. While the display offers good brightness (314.7 cd/m2), the contrast ratio (785:1) is too low. The display has decent color accuracy, but the AdobeRGB and sRGB color spaces are not fully covered (36% and 56% coverage, respectively).
This is the same panel that is also used in the identically built IdeaPad 5 14ARE05. Nevertheless, the measured values differ slightly (this is normal). Two identical displays are never one hundred percent identical.
In contrast to the screen of the sister model, the screen of our review device shows flickering at a frequency of 29,800 Hz at all brightness levels - an indication of brightness regulation via PWM.
| |||||||||||||||||||||||||
Brightness Distribution: 82 %
Center on Battery: 351 cd/m²
Contrast: 785:1 (Black: 0.455 cd/m²)
ΔE ColorChecker Calman: 3.98 | ∀{0.5-29.43 Ø4.73}
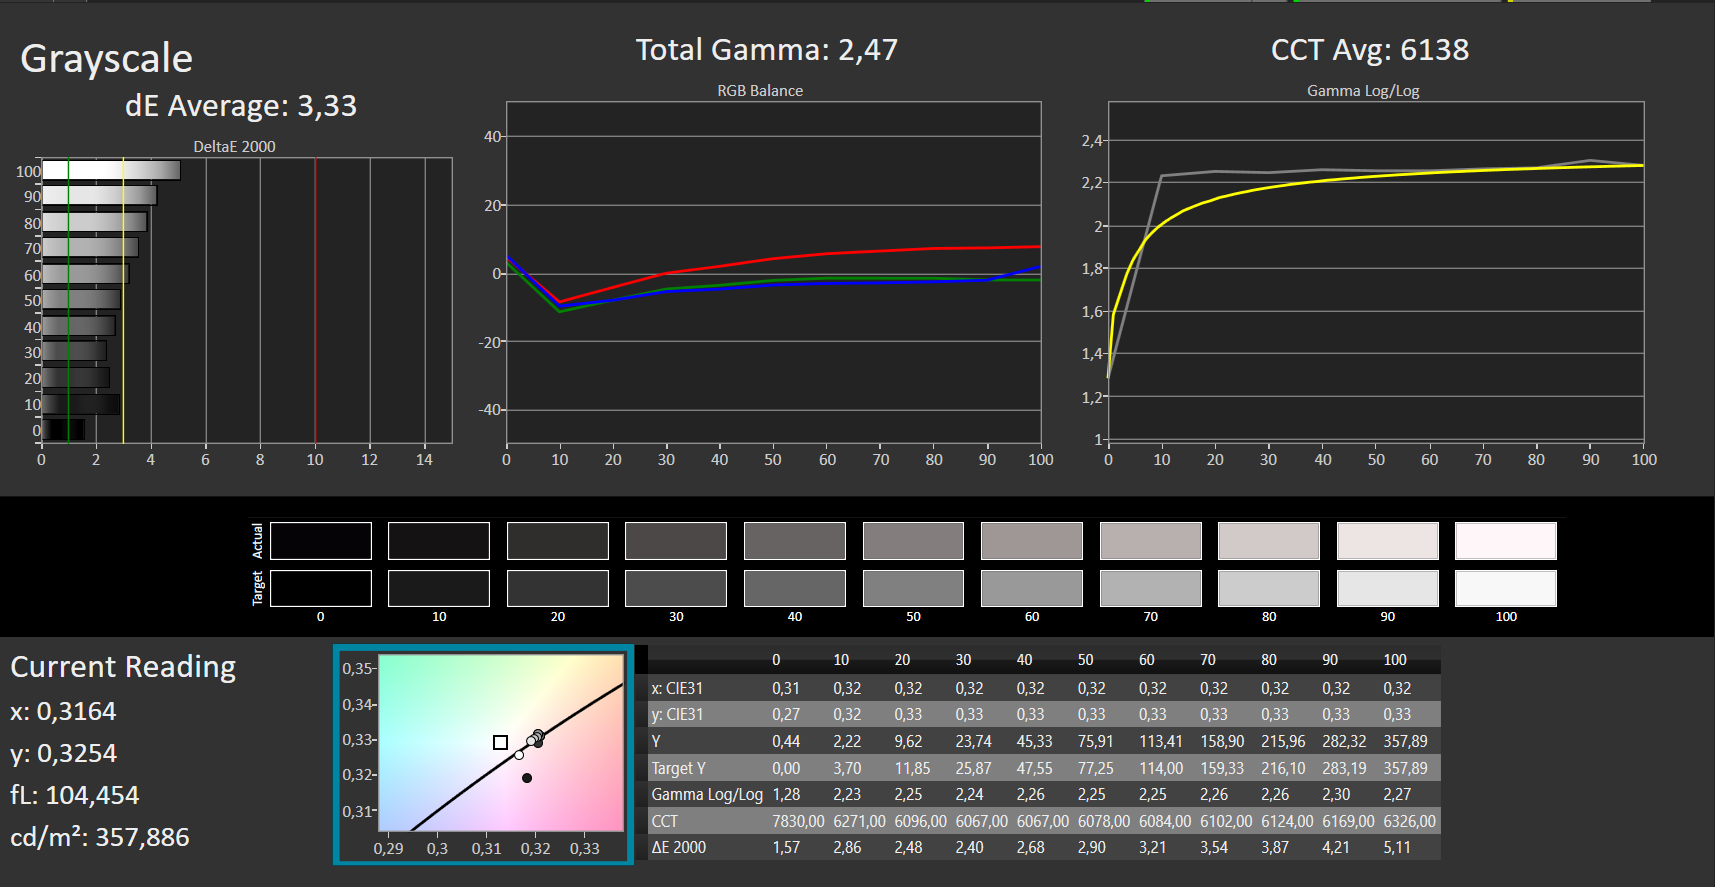
ΔE Greyscale Calman: 3.33 | ∀{0.09-98 Ø4.97}
56% sRGB (Argyll 1.6.3 3D)
36% AdobeRGB 1998 (Argyll 1.6.3 3D)
38.71% AdobeRGB 1998 (Argyll 3D)
56% sRGB (Argyll 3D)
37.47% Display P3 (Argyll 3D)
Gamma: 2.47
CCT: 6138 K
| Lenovo IdeaPad 5 14ALC05 82LM005YGE AU Optronics B140HAN04.E, IPS, 1920x1080, 14" | Lenovo IdeaPad 5 14ARE05 AU Optronics B140HAN04.E, IPS, 1920x1080, 14" | Honor MagicBook 14, Ryzen 5 4500U Chi Mei CMN1404, IPS, 1920x1080, 14" | Acer Swift 3 SF314-42-R4XJ AU Optronics B140HAN04.0, IPS, 1920x1080, 14" | Schenker VIA 14 Late 2020 B140HAN06.2, a-Si AHVA-IPS, 1920x1080, 14" | HP ProBook 440 G8-2W1G4EA AU Optronics AUO818B, VA, 1920x1080, 14" | |
|---|---|---|---|---|---|---|
| Display | -1% | 20% | -1% | 83% | -1% | |
| Display P3 Coverage (%) | 37.47 | 37.23 -1% | 45.1 20% | 37.2 -1% | 70 87% | 37.02 -1% |
| sRGB Coverage (%) | 56 | 55.9 0% | 67.8 21% | 55.9 0% | 99.7 78% | 55.6 -1% |
| AdobeRGB 1998 Coverage (%) | 38.71 | 38.46 -1% | 46.59 20% | 38.43 -1% | 71.3 84% | 38.25 -1% |
| Response Times | 0% | -5% | 6% | -16% | -3% | |
| Response Time Grey 50% / Grey 80% * (ms) | 41 ? | 41 ? -0% | 44 ? -7% | 41 ? -0% | 53.6 ? -31% | 43 ? -5% |
| Response Time Black / White * (ms) | 28 ? | 28 ? -0% | 28.8 ? -3% | 25 ? 11% | 28.4 ? -1% | 28 ? -0% |
| PWM Frequency (Hz) | 29800 | 25000 ? | ||||
| Screen | -2% | -9% | -12% | 58% | -21% | |
| Brightness middle (cd/m²) | 357 | 360 1% | 271 -24% | 269 -25% | 307 -14% | 253 -29% |
| Brightness (cd/m²) | 315 | 317 1% | 252 -20% | 244 -23% | 296 -6% | 230 -27% |
| Brightness Distribution (%) | 82 | 82 0% | 84 2% | 83 1% | 91 11% | 82 0% |
| Black Level * (cd/m²) | 0.455 | 0.41 10% | 0.18 60% | 0.23 49% | 0.16 65% | 0.29 36% |
| Contrast (:1) | 785 | 878 12% | 1506 92% | 1170 49% | 1919 144% | 872 11% |
| Colorchecker dE 2000 * | 3.98 | 4.75 -19% | 5.6 -41% | 4.94 -24% | 1 75% | 5.35 -34% |
| Colorchecker dE 2000 max. * | 6.92 | 7.4 -7% | 18.9 -173% | 20.37 -194% | 2.4 65% | 17.08 -147% |
| Greyscale dE 2000 * | 3.33 | 3.75 -13% | 4.1 -23% | 1.71 49% | 0.8 76% | 3.75 -13% |
| Gamma | 2.47 89% | 2.32 95% | 2.03 108% | 2.52 87% | 2.18 101% | 2.48 89% |
| CCT | 6138 106% | 6543 99% | 7253 90% | 6535 99% | 6492 100% | 6446 101% |
| Color Space (Percent of AdobeRGB 1998) (%) | 36 | 36 0% | 43 19% | 35 -3% | 65.1 81% | 35 -3% |
| Color Space (Percent of sRGB) (%) | 56 | 56 0% | 67.7 21% | 56 0% | 99.6 78% | 55 -2% |
| Colorchecker dE 2000 calibrated * | 4.86 | 3.8 | 5.03 | 1.1 | ||
| Total Average (Program / Settings) | -1% /
-1% | 2% /
-2% | -2% /
-7% | 42% /
53% | -8% /
-14% |
* ... smaller is better
Display Response Times
| ↔ Response Time Black to White | ||
|---|---|---|
| 28 ms ... rise ↗ and fall ↘ combined | ↗ 15 ms rise |  |
| ↘ 13 ms fall | ||
| The screen shows relatively slow response rates in our tests and may be too slow for gamers. In comparison, all tested devices range from 0.1 (minimum) to 240 (maximum) ms. » 71 % of all devices are better. This means that the measured response time is worse than the average of all tested devices (19.9 ms). | ||
| ↔ Response Time 50% Grey to 80% Grey | ||
| 41 ms ... rise ↗ and fall ↘ combined | ↗ 18 ms rise |  |
| ↘ 23 ms fall | ||
| The screen shows slow response rates in our tests and will be unsatisfactory for gamers. In comparison, all tested devices range from 0.165 (minimum) to 636 (maximum) ms. » 65 % of all devices are better. This means that the measured response time is worse than the average of all tested devices (31.1 ms). | ||
Screen Flickering / PWM (Pulse-Width Modulation)
| Screen flickering / PWM detected | 29800 Hz |  | |
The display backlight flickers at 29800 Hz (worst case, e.g., utilizing PWM) . The frequency of 29800 Hz is quite high, so most users sensitive to PWM should not notice any flickering. In comparison: 52 % of all tested devices do not use PWM to dim the display. If PWM was detected, an average of 7798 (minimum: 5 - maximum: 343500) Hz was measured. | |||
Performance - hexacore power
Lenovo's Ideapad 5 14ALC05 is a 14-inch notebook that offers more than enough computing power for office and Internet applications.
Test conditions
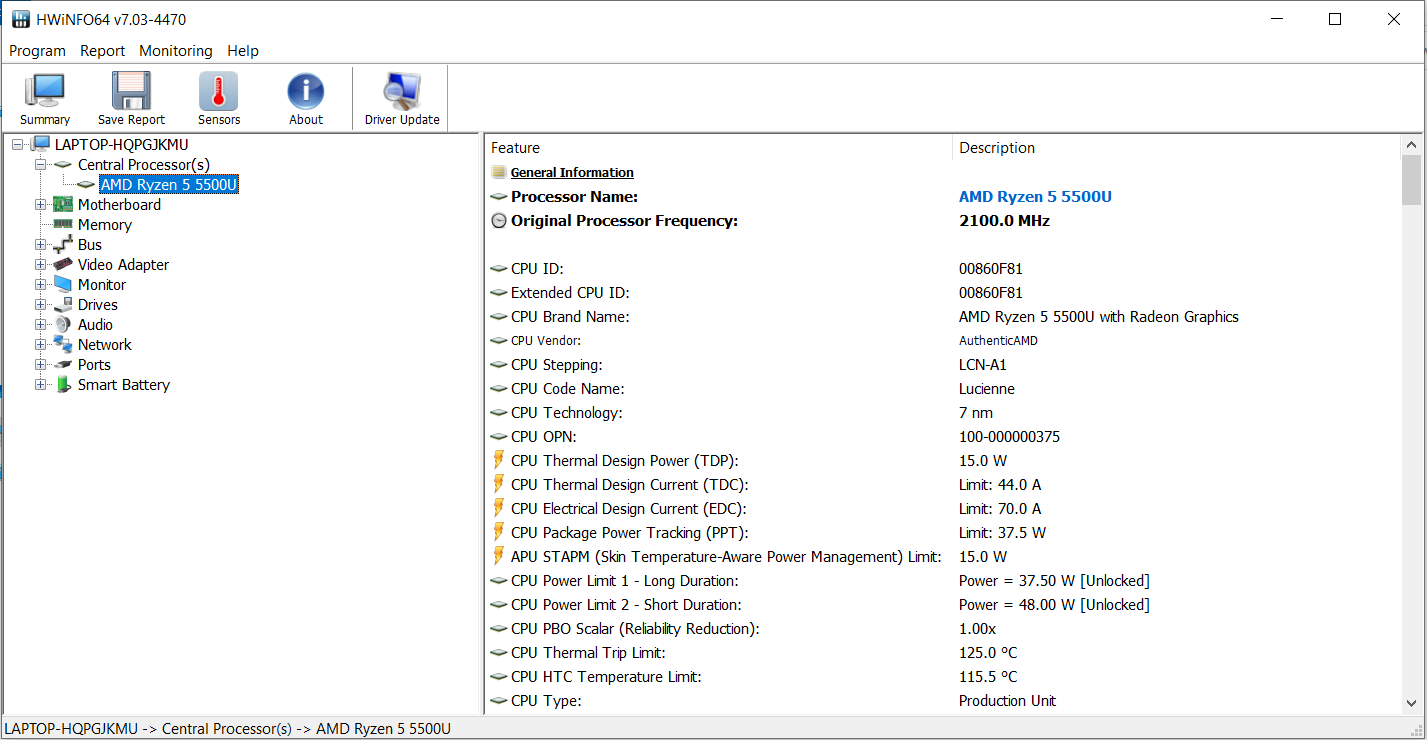
The notebook offers three energy profiles: "Smart Cooling," "High Performance," and "Battery Saving Mode." Users can switch between the profiles via the key combination "Fn" + "Q" or via the preinstalled Lenovo Vantage software. We performed our tests with the "Smart Cooling" mode active. Additionally, we ran some benchmarks with the "High Performance" mode active. The results are in the comparison tables.
Processor
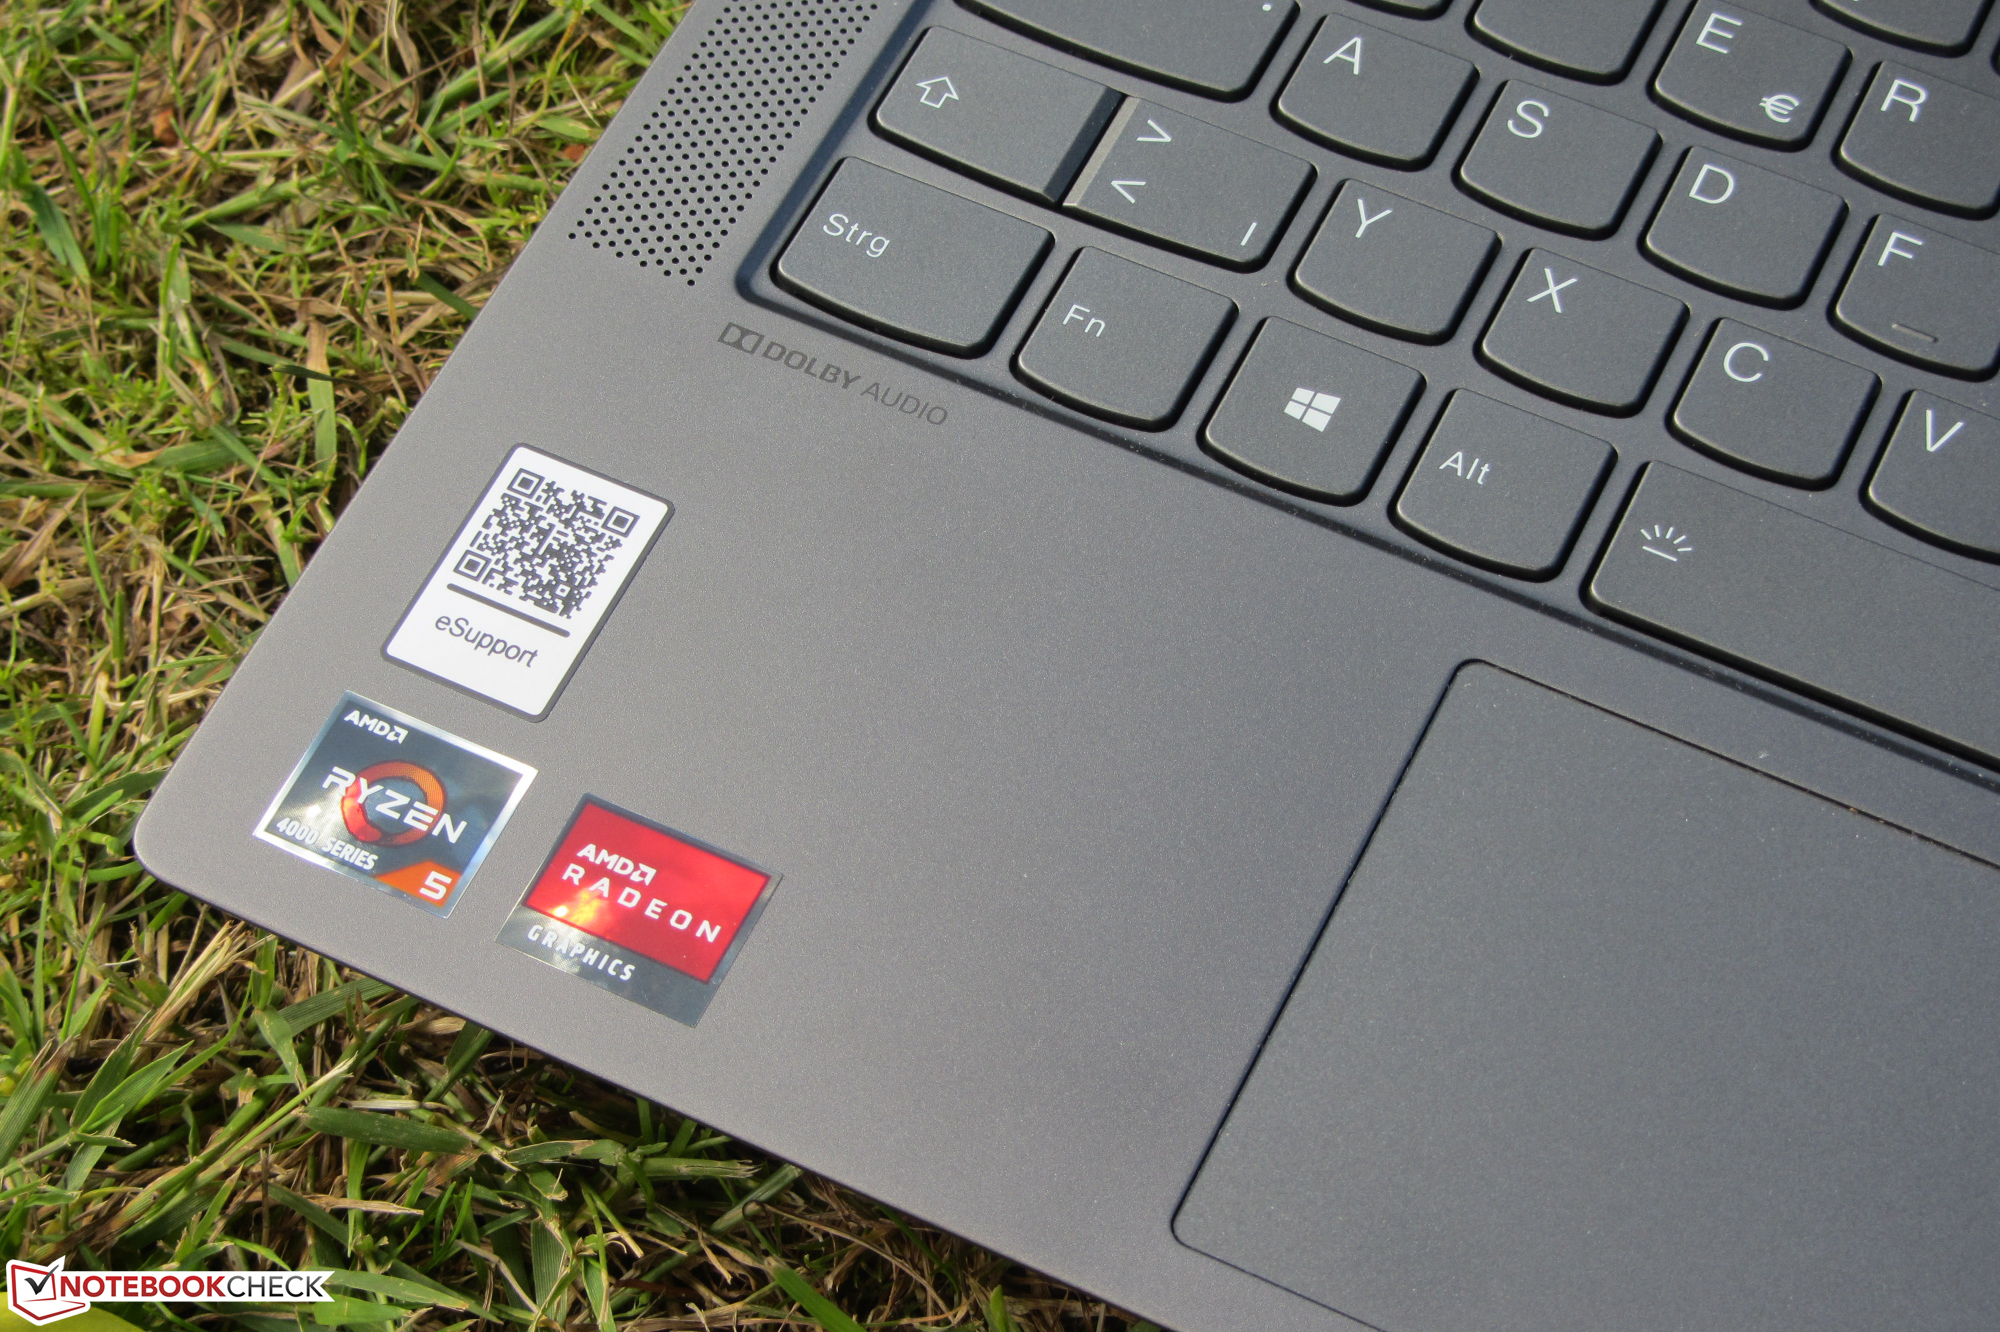
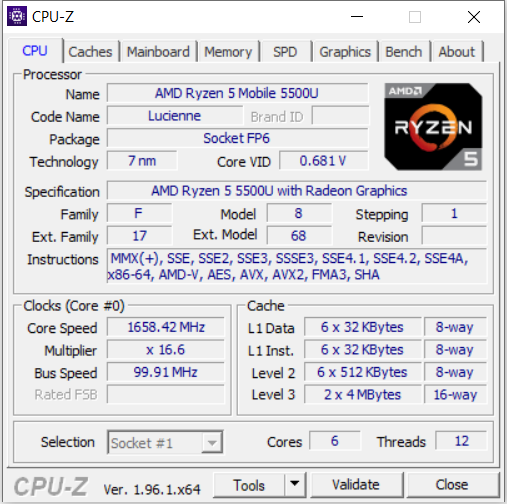
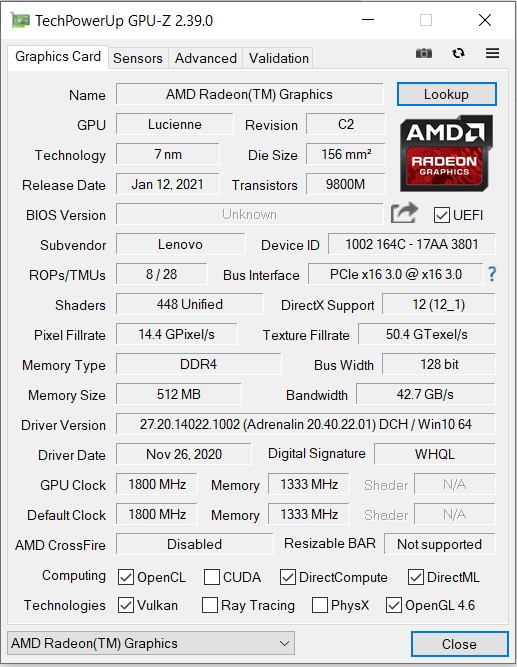
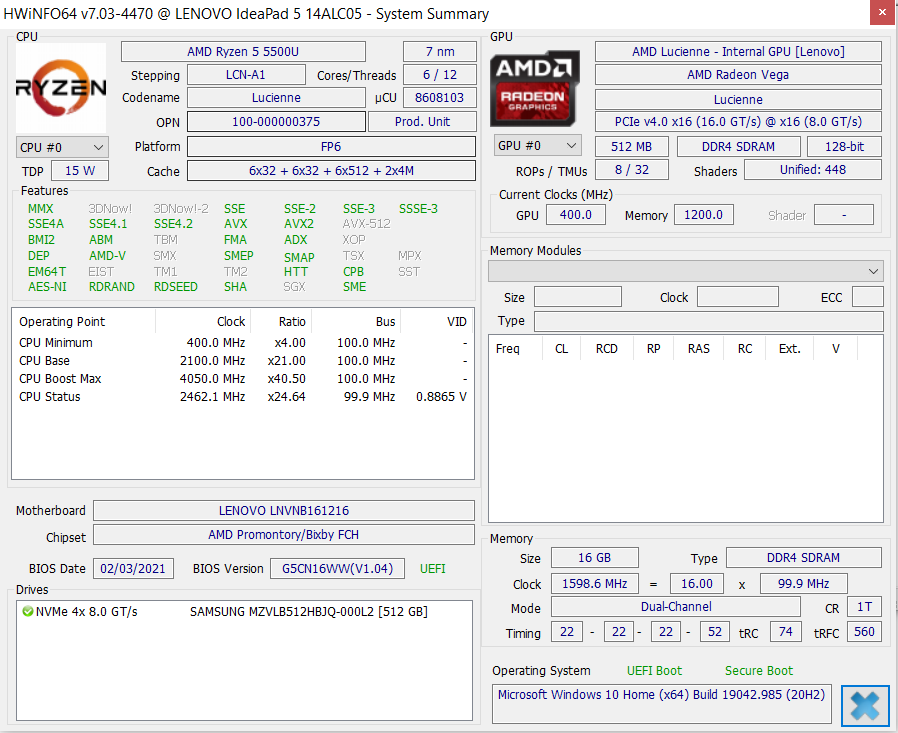
The CPU component of the Ryzen-5-5500U-APU (Lucienne) consists of a six-core processor with a base speed of 2.1 GHz. The CPU can boost up to 4 GHz. Simultaneous multithreading (two threads per core) is supported.
During Cinebench R15's multi-core benchmark, the CPU runs at 3.8 GHz for a short time before dropping to 3.6 GHz. The CPU lands between 1.7 and 4 GHz during the single-core test. In battery mode, the CPU runs at 3.5 GHz and 1.4-3.4 GHz during the multi- and single-core tests, respectively.
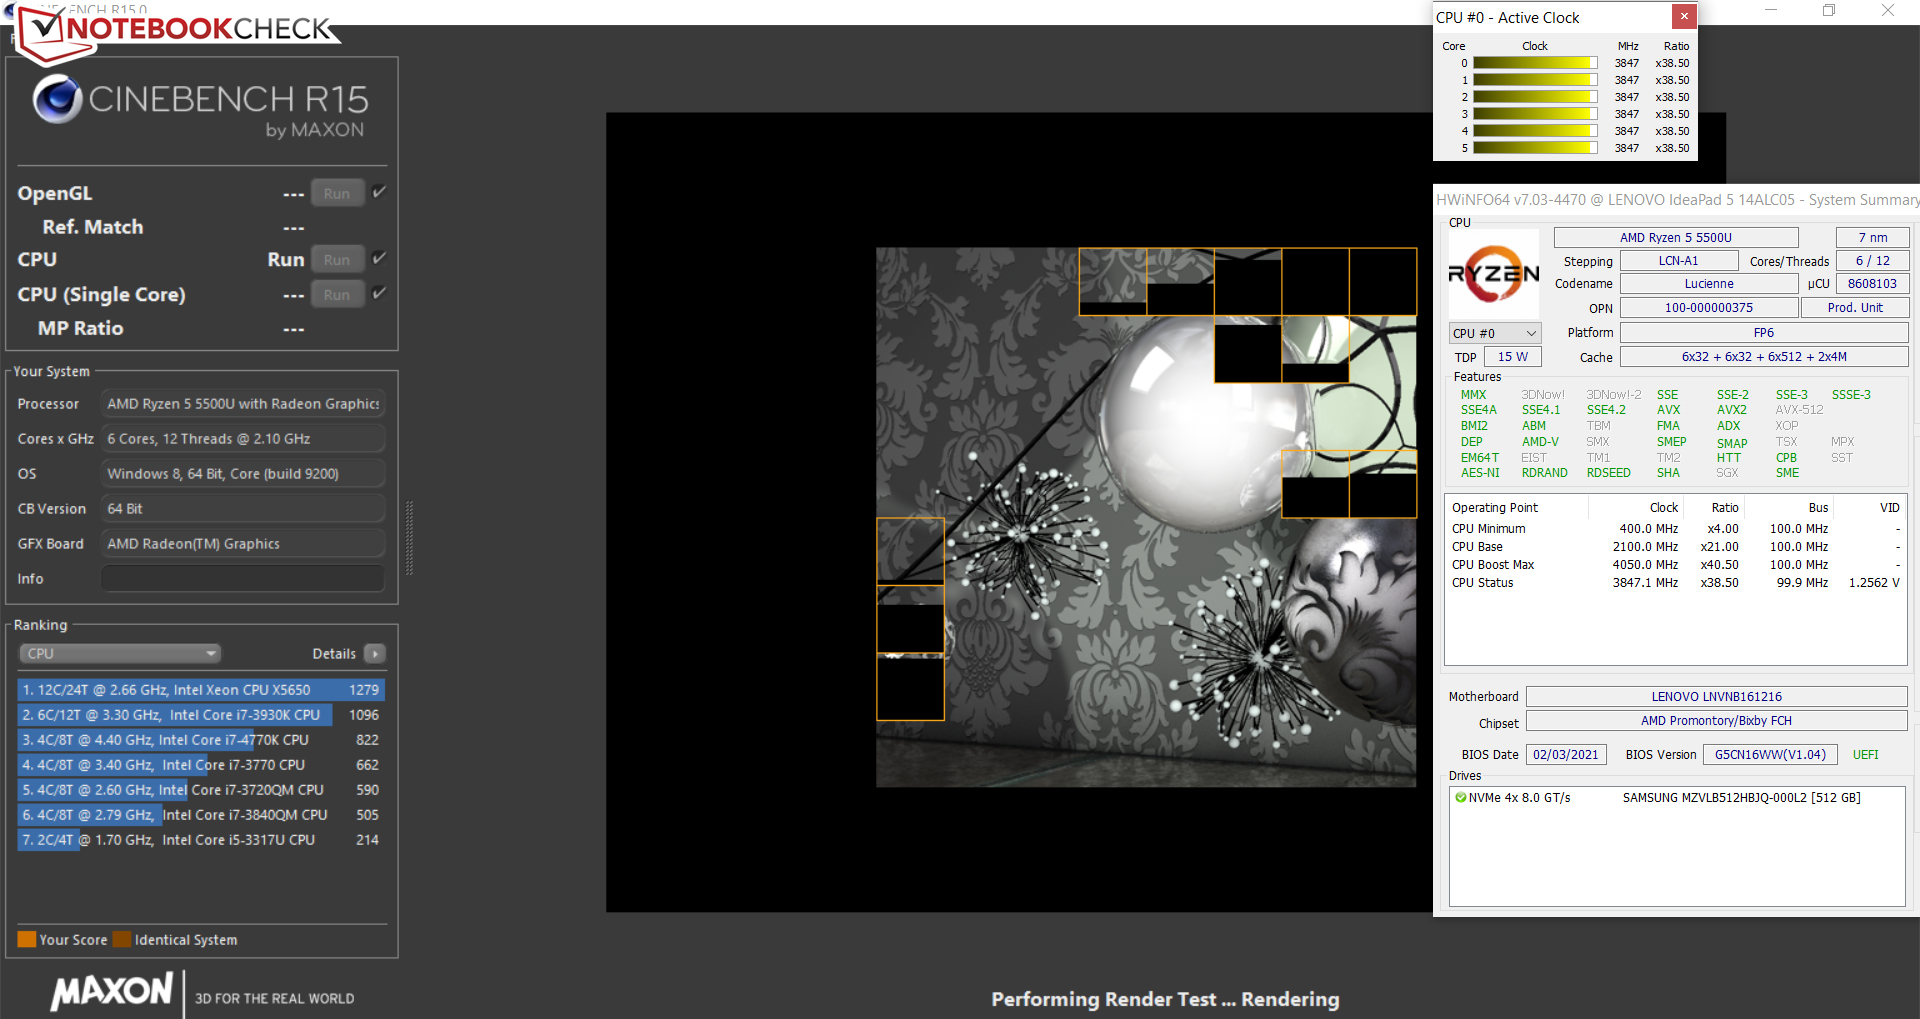
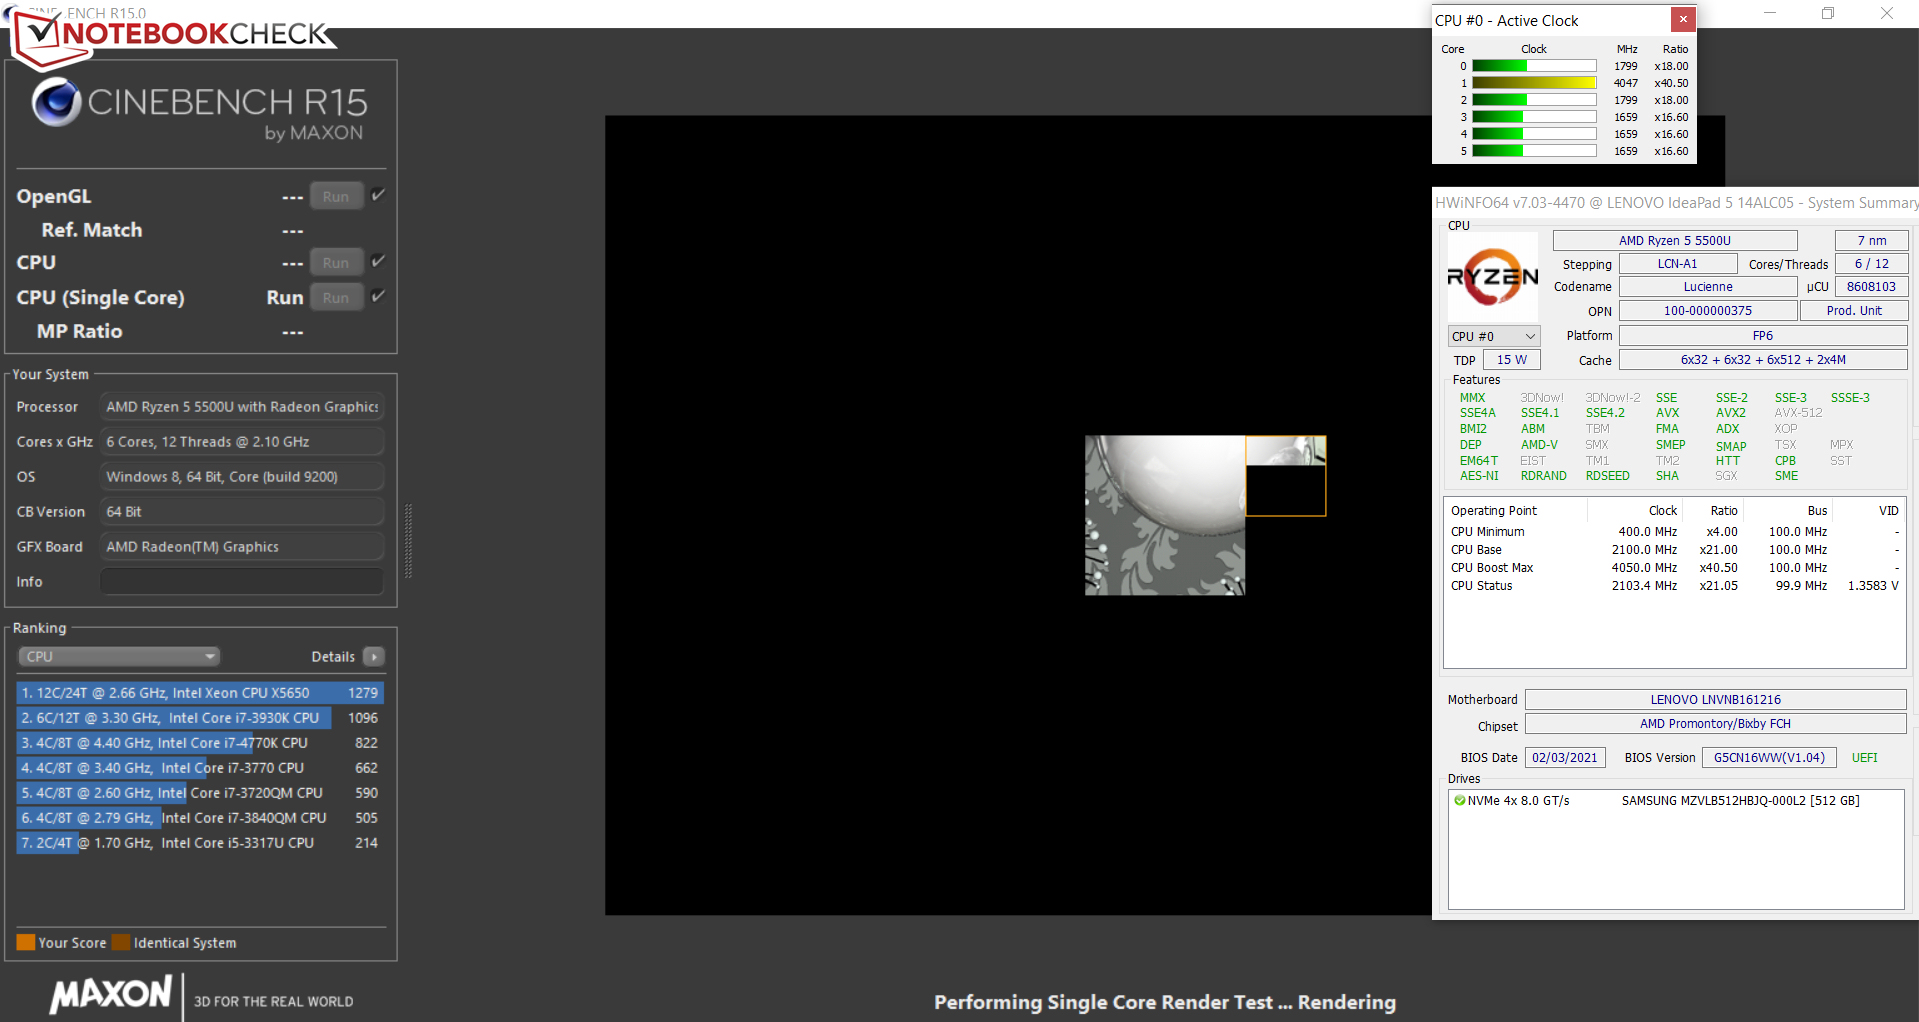
The results in the single-core benchmarks are almost on par with those of the Ryzen-5-4500U APU installed in last year's Ideapad 5. This is not surprising since both APUs are based on the Zen 2 architecture (Zen 3 is only used in the Ryzen-5-5600U APU) and both have a maximum clock of 4 GHz. However, the 5500U APU pulls ahead in terms of multi-threaded performance since it supports simultaneous multithreading (the 4500U does not).
We test how long the CPU can boost by running the Cinebench R15 multi-core test in a loop. After about 2 minutes, the Turbo clock drops to just above 3 GHz. The CPU boost is noticeable in the "Smart Cooling" mode. The "High Performance" profile results in a marginal increase in performance at best.


| Blender - v2.79 BMW27 CPU | |
| Acer Spin 3 SP314-54N-56S5 | |
| HP ProBook 440 G8-2W1G4EA | |
| Schenker VIA 14 Late 2020 | |
| Acer Swift 5 SF514-55T-58DN | |
| Lenovo IdeaPad 5 14ARE05 | |
| Honor MagicBook 14, Ryzen 5 4500U | |
| Acer Swift 3 SF314-42-R4XJ | |
| Lenovo IdeaPad 5 14ALC05 82LM005YGE | |
| Average AMD Ryzen 5 5500U (358 - 490, n=18) | |
| Lenovo IdeaPad 5 14ALC05 82LM005YGE (Hoechstleistung) | |
| Average of class Subnotebook (159 - 2271, n=60, last 2 years) | |
| Cinebench R20 | |
| CPU (Single Core) | |
| Average of class Subnotebook (128 - 832, n=59, last 2 years) | |
| HP ProBook 440 G8-2W1G4EA | |
| Acer Swift 5 SF514-55T-58DN | |
| Schenker VIA 14 Late 2020 | |
| Acer Swift 3 SF314-42-R4XJ | |
| Lenovo IdeaPad 5 14ALC05 82LM005YGE | |
| Lenovo IdeaPad 5 14ALC05 82LM005YGE (Hoechstleistung) | |
| Average AMD Ryzen 5 5500U (449 - 461, n=19) | |
| Lenovo IdeaPad 5 14ARE05 | |
| Honor MagicBook 14, Ryzen 5 4500U | |
| Acer Spin 3 SP314-54N-56S5 | |
| CPU (Multi Core) | |
| Average of class Subnotebook (579 - 8541, n=59, last 2 years) | |
| Average AMD Ryzen 5 5500U (2223 - 3316, n=20) | |
| Lenovo IdeaPad 5 14ALC05 82LM005YGE (Hoechstleistung) | |
| Lenovo IdeaPad 5 14ALC05 82LM005YGE | |
| Acer Swift 3 SF314-42-R4XJ | |
| Lenovo IdeaPad 5 14ARE05 | |
| Honor MagicBook 14, Ryzen 5 4500U | |
| Acer Swift 5 SF514-55T-58DN | |
| HP ProBook 440 G8-2W1G4EA | |
| Schenker VIA 14 Late 2020 | |
| Acer Spin 3 SP314-54N-56S5 | |
| HWBOT x265 Benchmark v2.2 - 4k Preset | |
| Average of class Subnotebook (0.97 - 25.1, n=59, last 2 years) | |
| Lenovo IdeaPad 5 14ALC05 82LM005YGE (Hoechstleistung) | |
| Average AMD Ryzen 5 5500U (6.7 - 9.74, n=20) | |
| Lenovo IdeaPad 5 14ALC05 82LM005YGE | |
| Acer Swift 3 SF314-42-R4XJ | |
| Honor MagicBook 14, Ryzen 5 4500U | |
| Lenovo IdeaPad 5 14ARE05 | |
| Acer Swift 5 SF514-55T-58DN | |
| Schenker VIA 14 Late 2020 | |
| HP ProBook 440 G8-2W1G4EA | |
| Acer Spin 3 SP314-54N-56S5 | |
| LibreOffice - 20 Documents To PDF | |
| Average AMD Ryzen 5 5500U (60 - 80.7, n=17) | |
| Lenovo IdeaPad 5 14ALC05 82LM005YGE | |
| Honor MagicBook 14, Ryzen 5 4500U | |
| Lenovo IdeaPad 5 14ALC05 82LM005YGE (Hoechstleistung) | |
| Acer Swift 3 SF314-42-R4XJ | |
| Acer Spin 3 SP314-54N-56S5 | |
| Lenovo IdeaPad 5 14ARE05 | |
| Average of class Subnotebook (39.9 - 220, n=58, last 2 years) | |
| HP ProBook 440 G8-2W1G4EA | |
| Schenker VIA 14 Late 2020 | |
| Acer Swift 5 SF514-55T-58DN | |
| R Benchmark 2.5 - Overall mean | |
| Acer Spin 3 SP314-54N-56S5 | |
| Honor MagicBook 14, Ryzen 5 4500U | |
| Lenovo IdeaPad 5 14ARE05 | |
| Acer Swift 5 SF514-55T-58DN | |
| Schenker VIA 14 Late 2020 | |
| Average AMD Ryzen 5 5500U (0.607 - 0.67, n=19) | |
| Acer Swift 3 SF314-42-R4XJ | |
| Lenovo IdeaPad 5 14ALC05 82LM005YGE (Hoechstleistung) | |
| Lenovo IdeaPad 5 14ALC05 82LM005YGE | |
| HP ProBook 440 G8-2W1G4EA | |
| Average of class Subnotebook (0.4024 - 1.456, n=60, last 2 years) | |
* ... smaller is better
System performance
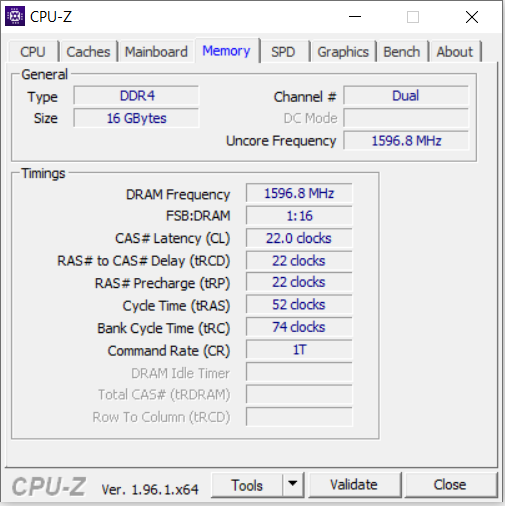
The nimble and smooth system delivers good PCMark results. The Ryzen APU has more than enough computing power for office and Internet applications. Beyond that, it can handle computer games to a limited extent. The RAM (16 GB, DDR4-3200, soldered) runs in dual-channel mode. Expanding the memory is not possible.
| PCMark 8 Home Score Accelerated v2 | 4256 points | |
| PCMark 8 Creative Score Accelerated v2 | 4446 points | |
| PCMark 8 Work Score Accelerated v2 | 5286 points | |
| PCMark 10 Score | 5193 points | |
Help | ||
DPC latencies
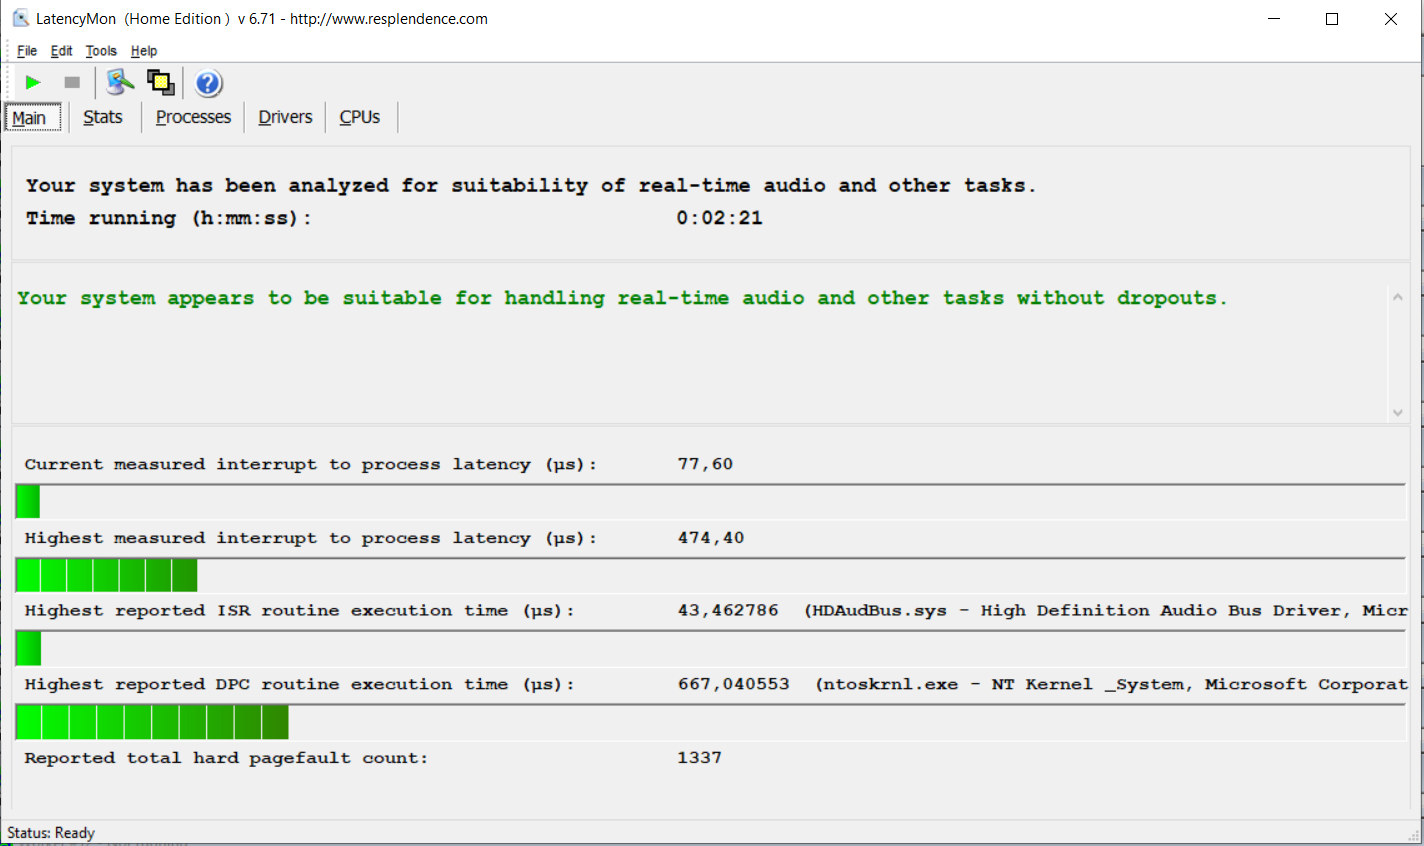
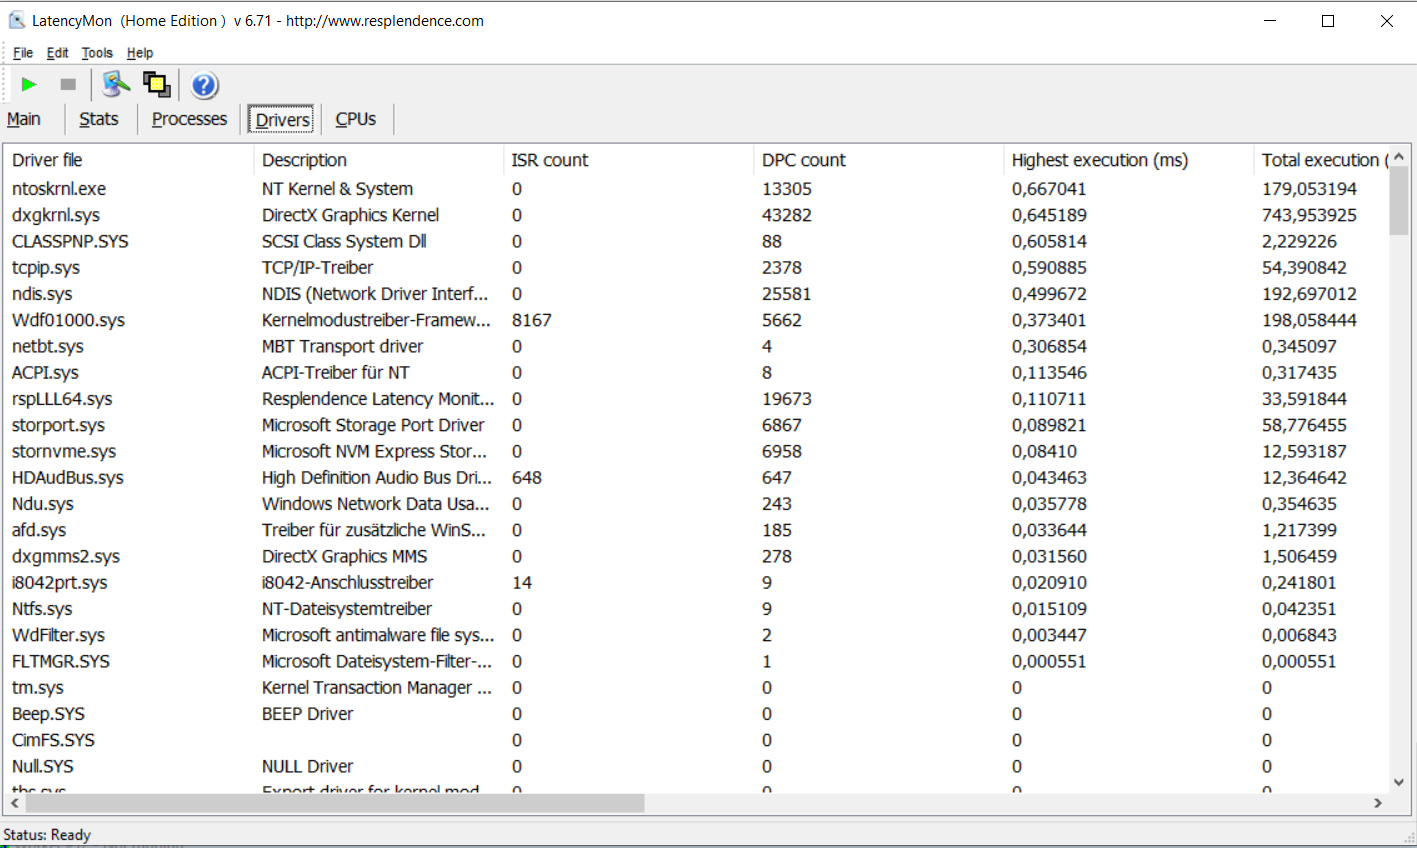
In our standardized latency monitor test (web surfing, 4K video playback, Prime95 high-load), we did not observe any peculiarities in the DPC latencies. The system seems to be suitable for real-time video and audio editing.
| DPC Latencies / LatencyMon - interrupt to process latency (max), Web, Youtube, Prime95 | |
| HP ProBook 440 G8-2W1G4EA | |
| Acer Swift 3 SF314-42-R4XJ | |
| Schenker VIA 14 Late 2020 | |
| Honor MagicBook 14, Ryzen 5 4500U | |
| Lenovo IdeaPad 5 14ALC05 82LM005YGE | |
| Lenovo IdeaPad 5 14ARE05 | |
* ... smaller is better
Mass storage
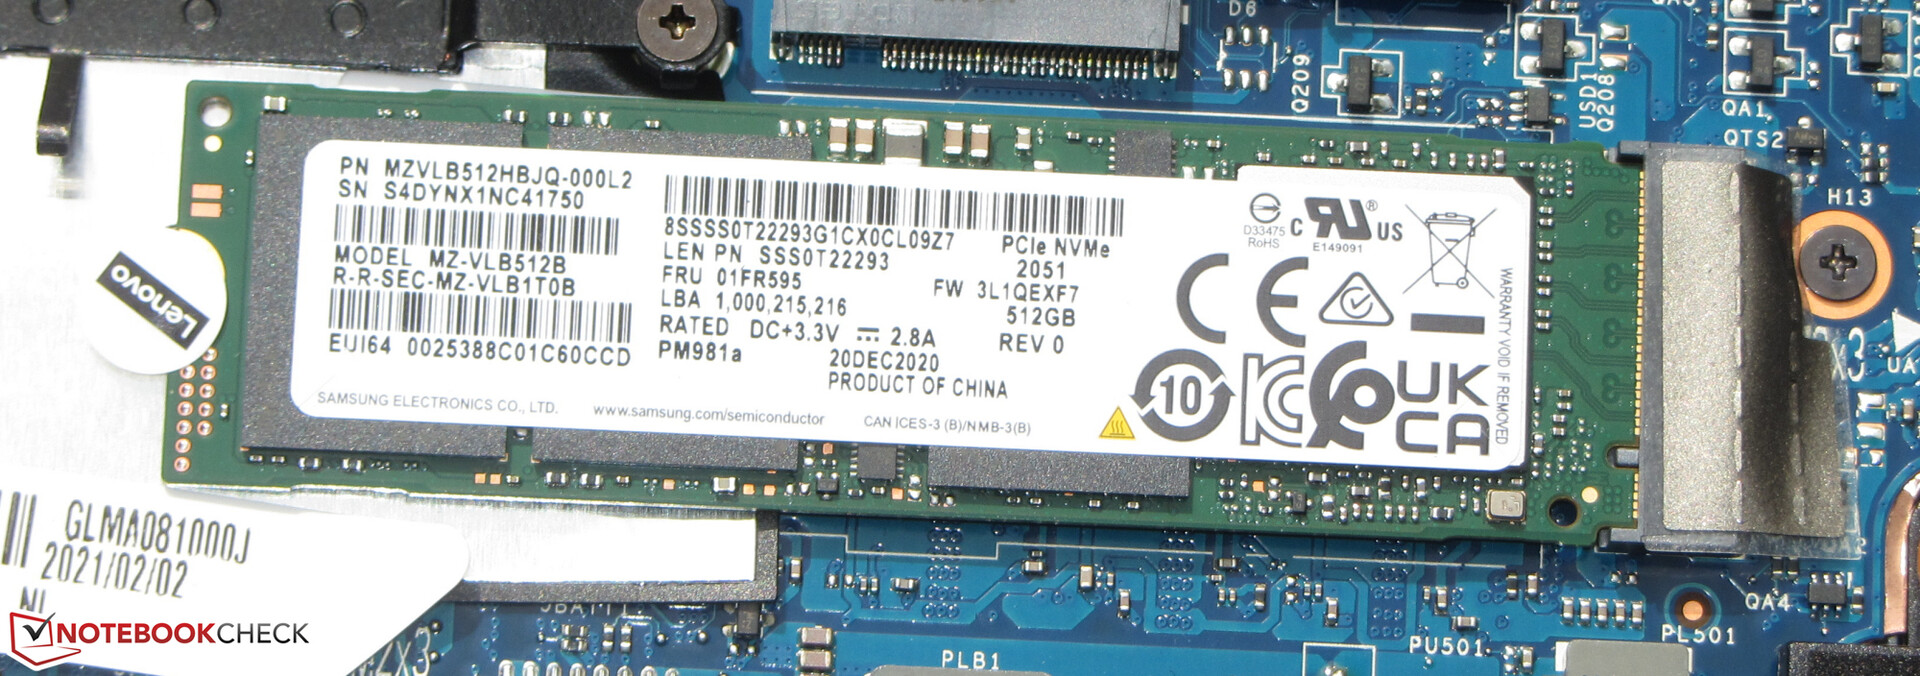
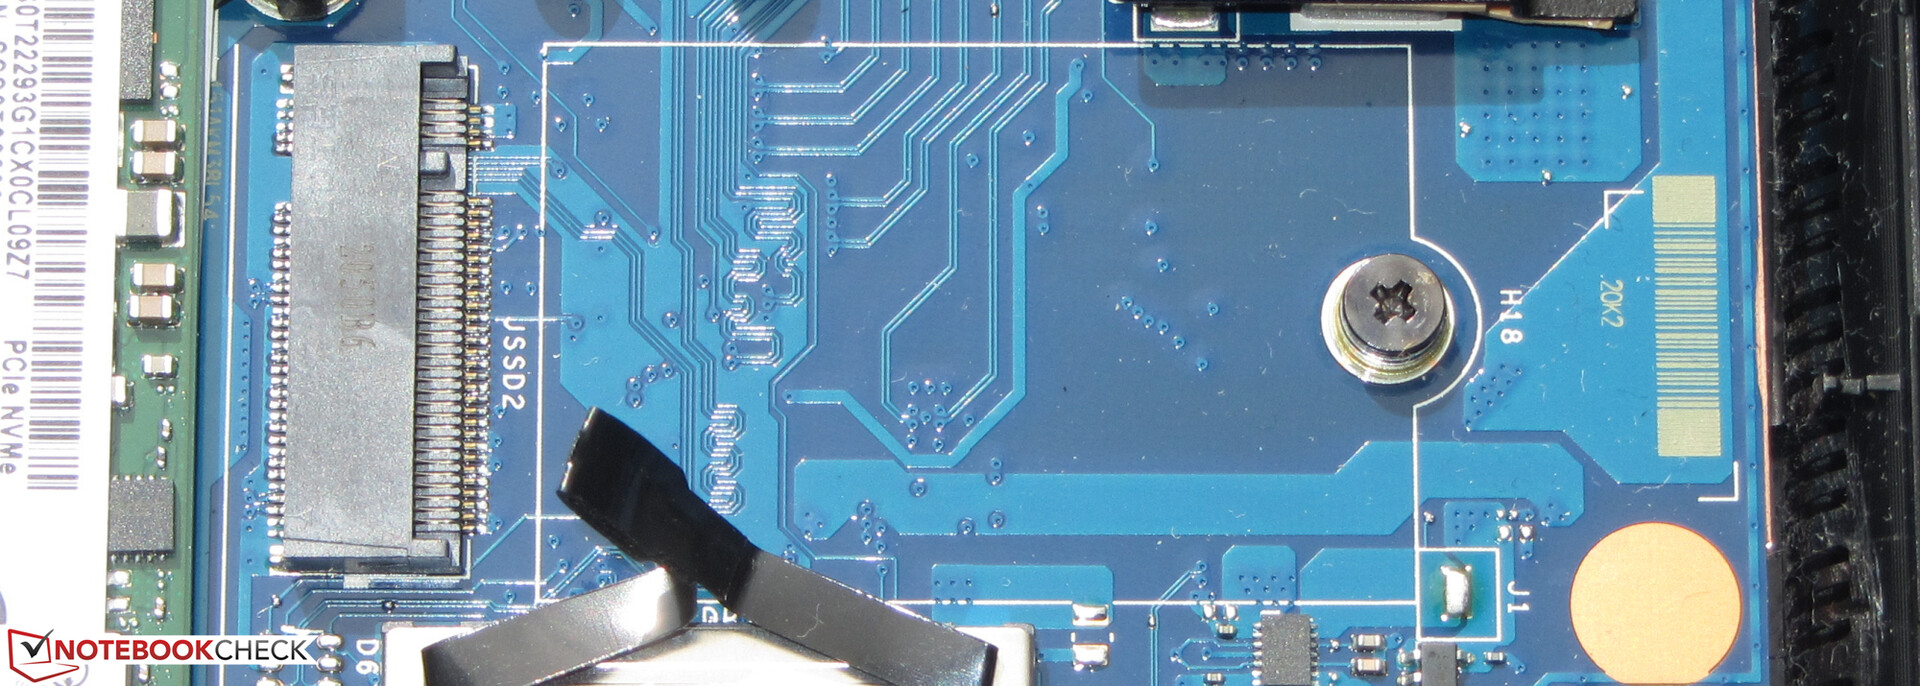
A 512 GB NVMe SSD (M.2-2280) from Samsung serves as the system drive and offers good transfer rates. A second NVMe-SSD (M.2-2242) can be installed.

| Lenovo IdeaPad 5 14ALC05 82LM005YGE Samsung SSD PM981a MZVLB512HBJQ | Honor MagicBook 14, Ryzen 5 4500U WDC PC SN530 SDBPNPZ-512G | Schenker VIA 14 Late 2020 Samsung SSD 980 Pro 500GB MZ-V8P500BW | HP ProBook 440 G8-2W1G4EA Lite-On CL1-8D512 | Lenovo IdeaPad 5 14ARE05 Samsung PM991 MZALQ512HALU | Acer Swift 3 SF314-42-R4XJ Samsung PM991 MZVLQ1T0HALB | Average Samsung SSD PM981a MZVLB512HBJQ | |
|---|---|---|---|---|---|---|---|
| CrystalDiskMark 5.2 / 6 | -3% | 74% | -39% | -19% | -23% | 6% | |
| Write 4K (MB/s) | 93.3 | 161.1 73% | 225.9 142% | 122.4 31% | 102.8 10% | 98.8 6% | 140.8 ? 51% |
| Read 4K (MB/s) | 38.87 | 50 29% | 78.8 103% | 24.99 -36% | 45.48 17% | 32.44 -17% | 48.6 ? 25% |
| Write Seq (MB/s) | 2834 | 1814 -36% | 4016 42% | 653 -77% | 1255 -56% | 1582 -44% | 2106 ? -26% |
| Read Seq (MB/s) | 2452 | 1983 -19% | 3945 61% | 1686 -31% | 1434 -42% | 1471 -40% | 2099 ? -14% |
| Write 4K Q32T1 (MB/s) | 386.6 | 385.3 0% | 595 54% | 298.9 -23% | 441 14% | 375.4 -3% | 451 ? 17% |
| Read 4K Q32T1 (MB/s) | 495.5 | 509 3% | 657 33% | 266.2 -46% | 474.1 -4% | 491.9 -1% | 482 ? -3% |
| Write Seq Q32T1 (MB/s) | 2981 | 1816 -39% | 5077 70% | 460.9 -85% | 1456 -51% | 1574 -47% | 2903 ? -3% |
| Read Seq Q32T1 (MB/s) | 3566 | 2433 -32% | 6721 88% | 1998 -44% | 2085 -42% | 2329 -35% | 3511 ? -2% |
| AS SSD | -32% | 32% | -96% | -32% | -45% | -8% | |
| Seq Read (MB/s) | 2645 | 2119 -20% | 5167 95% | 1681 -36% | 1970 -26% | 1960 -26% | 2412 ? -9% |
| Seq Write (MB/s) | 2627 | 1654 -37% | 1339 -49% | 210.1 -92% | 1268 -52% | 1547 -41% | 1983 ? -25% |
| 4K Read (MB/s) | 55.2 | 43.54 -21% | 72.3 31% | 24.86 -55% | 47.13 -15% | 31.56 -43% | 53.1 ? -4% |
| 4K Write (MB/s) | 119.4 | 144.3 21% | 204.9 72% | 73.6 -38% | 121.6 2% | 116.6 -2% | 131.1 ? 10% |
| 4K-64 Read (MB/s) | 1308 | 1067 -18% | 1890 44% | 291.5 -78% | 855 -35% | 454.7 -65% | 1201 ? -8% |
| 4K-64 Write (MB/s) | 1816 | 846 -53% | 2101 16% | 135.2 -93% | 859 -53% | 262.1 -86% | 1726 ? -5% |
| Access Time Read * (ms) | 0.057 | 0.073 -28% | 0.039 32% | 0.078 -37% | 0.065 -14% | 0.05525 ? 3% | |
| Access Time Write * (ms) | 0.031 | 0.061 -97% | 0.025 19% | 0.152 -390% | 0.032 -3% | 0.034 -10% | 0.05394 ? -74% |
| Score Read (Points) | 1628 | 1322 -19% | 2479 52% | 484 -70% | 1100 -32% | 682 -58% | 1495 ? -8% |
| Score Write (Points) | 2198 | 1156 -47% | 2440 11% | 230 -90% | 1108 -50% | 533 -76% | 2055 ? -7% |
| Score Total (Points) | 4667 | 3138 -33% | 6004 29% | 895 -81% | 2745 -41% | 1552 -67% | 4303 ? -8% |
| Copy ISO MB/s (MB/s) | 1476 | 2104 43% | 982 -33% | 974 -34% | 1894 ? 28% | ||
| Copy Program MB/s (MB/s) | 538 | 649 21% | 276.2 -49% | 356.5 -34% | 539 ? 0% | ||
| Copy Game MB/s (MB/s) | 1185 | 1494 26% | 681 -43% | 621 -48% | 1193 ? 1% | ||
| Total Average (Program / Settings) | -18% /
-20% | 53% /
47% | -68% /
-72% | -26% /
-27% | -34% /
-37% | -1% /
-3% |
* ... smaller is better
Dauerleistung Lesen: DiskSpd Read Loop, Queue Depth 8
Graphics card
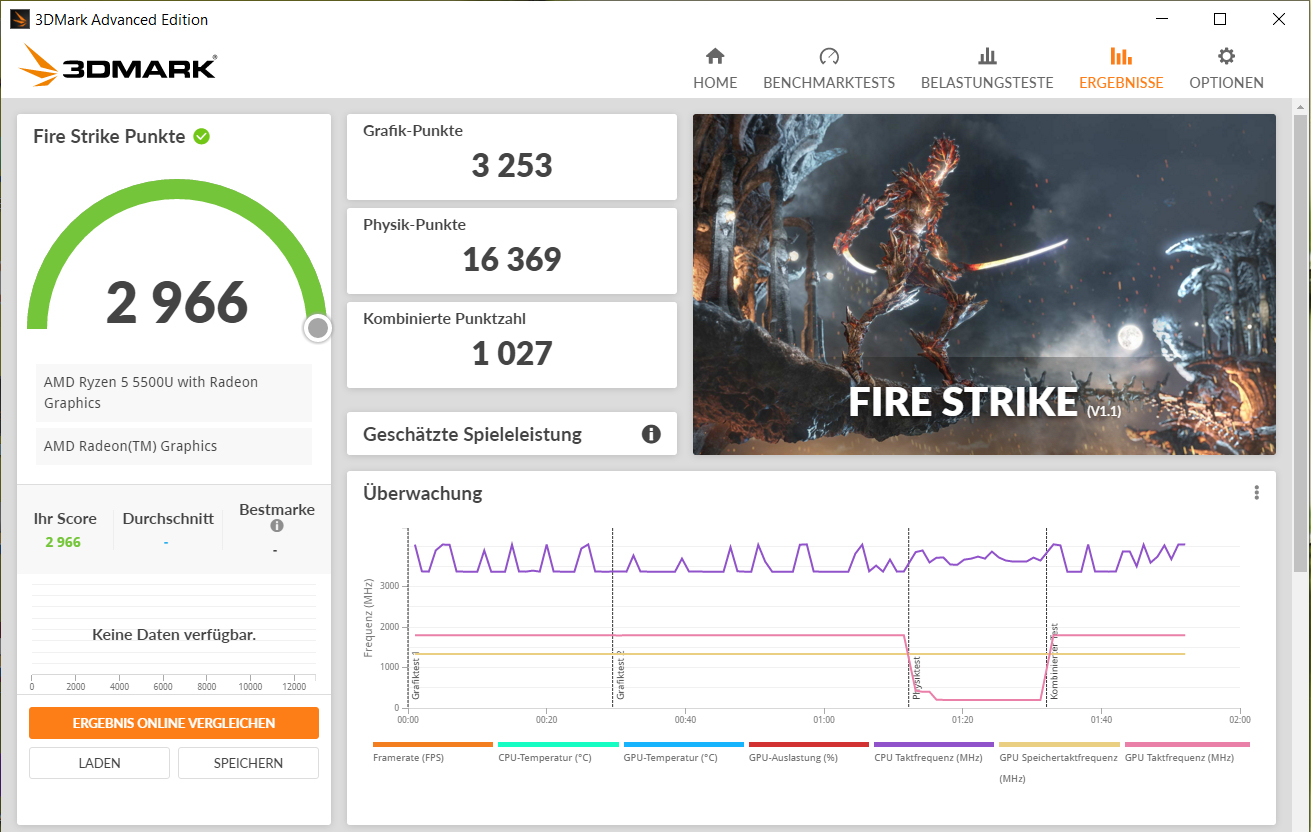
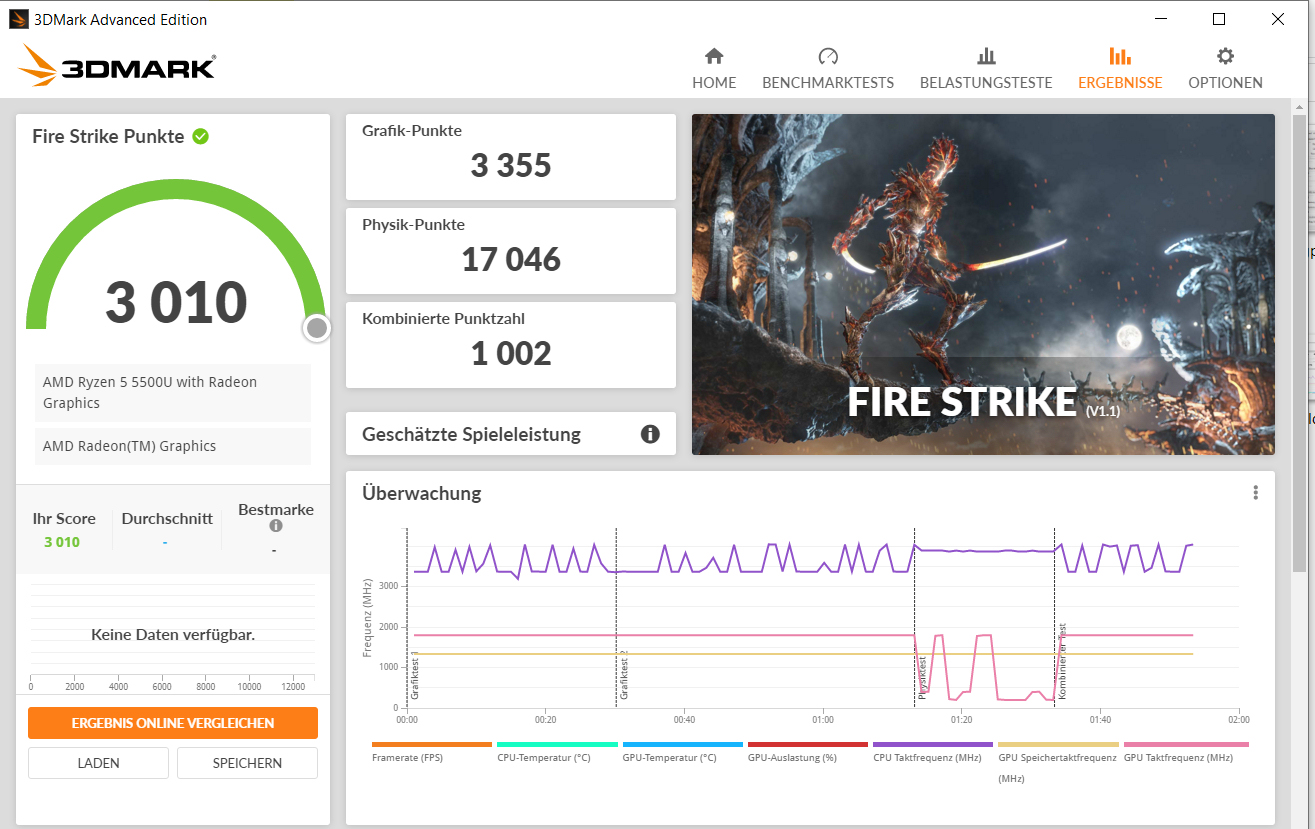
AMD's integrated Vega 7 graphics core supports DirectX 12 and reaches speeds of up to 1,800 MHz. The GPU's top clock speed is steadily hit and held, as shown in extended gameplay of The Witcher 3. The "High Performance" mode has a marginal impact on graphics performance at best.


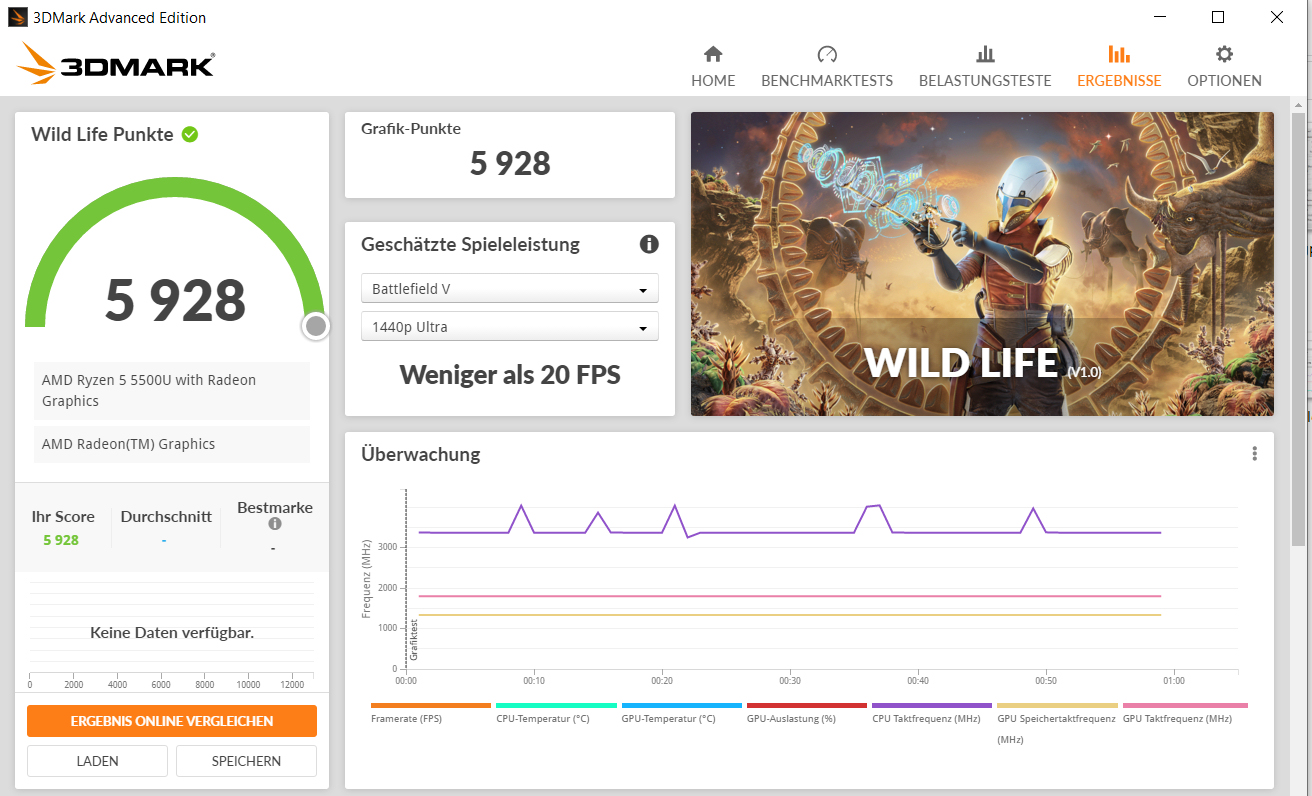
| 3DMark 11 Performance | 5424 points | |
| 3DMark Ice Storm Standard Score | 103860 points | |
| 3DMark Cloud Gate Standard Score | 18701 points | |
| 3DMark Fire Strike Score | 2966 points | |
| 3DMark Time Spy Score | 1120 points | |
Help | ||
| 3DMark | |
| 1280x720 Cloud Gate Standard Graphics | |
| Average of class Subnotebook (5577 - 61591, n=30, last 2 years) | |
| Lenovo IdeaPad 5 14ALC05 82LM005YGE | |
| Average AMD Radeon RX Vega 7 (13713 - 31437, n=47) | |
| Acer Swift 3 SF314-42-R4XJ | |
| Lenovo IdeaPad 5 14ARE05 | |
| HP ProBook 440 G8-2W1G4EA | |
| Schenker VIA 14 Late 2020 | |
| 1920x1080 Fire Strike Graphics | |
| Average of class Subnotebook (832 - 16347, n=58, last 2 years) | |
| Lenovo IdeaPad 5 14ALC05 82LM005YGE (Hoechstleistung) | |
| Lenovo IdeaPad 5 14ALC05 82LM005YGE | |
| HP ProBook 440 G8-2W1G4EA | |
| Average AMD Radeon RX Vega 7 (1772 - 4037, n=66) | |
| Acer Swift 3 SF314-42-R4XJ | |
| Schenker VIA 14 Late 2020 | |
| Lenovo IdeaPad 5 14ARE05 | |
| 2560x1440 Time Spy Graphics | |
| Average of class Subnotebook (804 - 6288, n=57, last 2 years) | |
| HP ProBook 440 G8-2W1G4EA | |
| Lenovo IdeaPad 5 14ALC05 82LM005YGE (Hoechstleistung) | |
| Schenker VIA 14 Late 2020 | |
| Lenovo IdeaPad 5 14ALC05 82LM005YGE | |
| Average AMD Radeon RX Vega 7 (496 - 1249, n=61) | |
| Acer Swift 3 SF314-42-R4XJ | |
| Lenovo IdeaPad 5 14ARE05 | |
Gaming performance
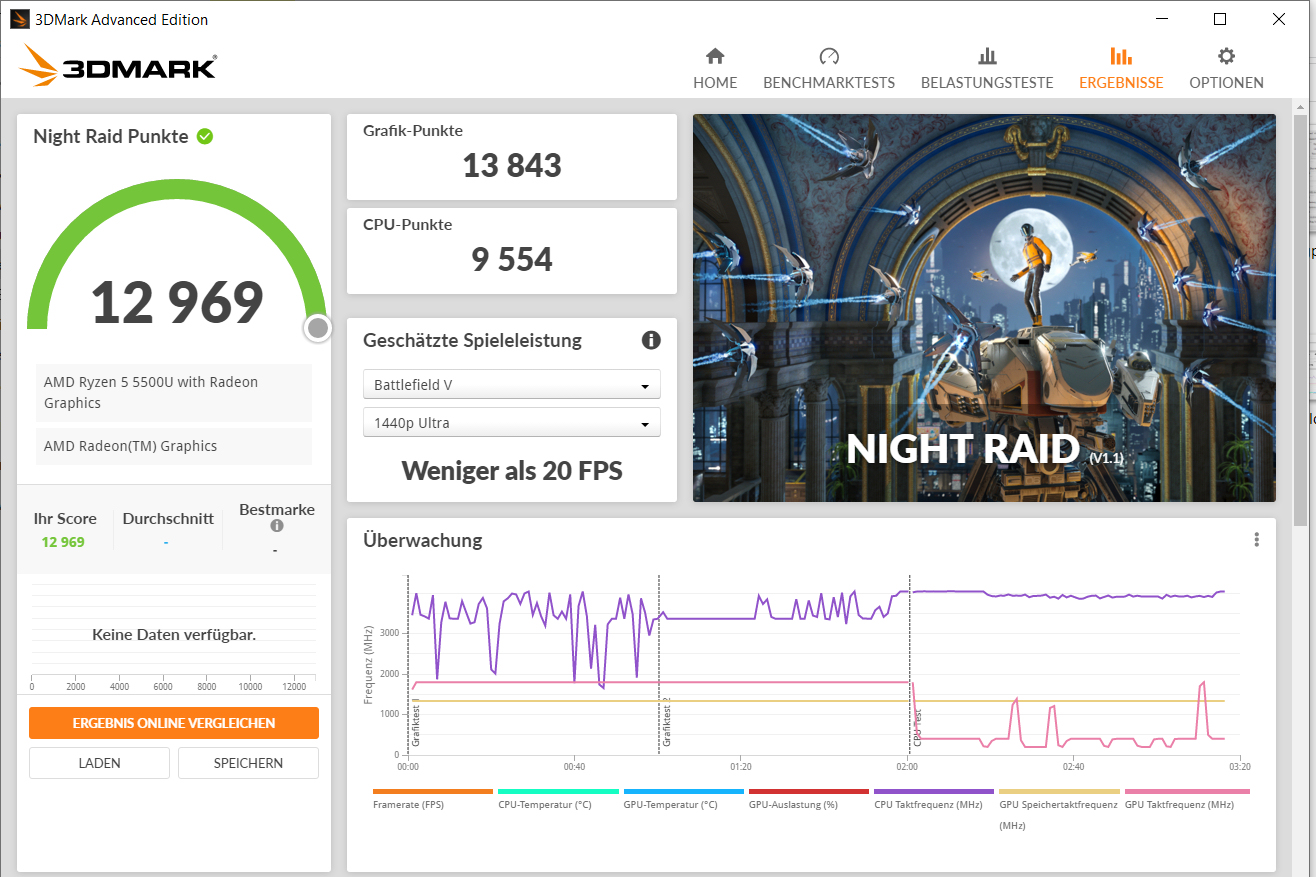
The Ryzen 5 APU smoothly plays through many of the games in our database. Most titles are playable at HD resolution (1280x720) and Medium to mixed-High quality settings. Games with moderate hardware requirements perform better. It is also possible to play some current games, albeit with reduced quality settings.
| The Witcher 3 - 1024x768 Low Graphics & Postprocessing | |
| Average of class Subnotebook (38.8 - 176, n=15, last 2 years) | |
| Lenovo IdeaPad 5 14ALC05 82LM005YGE | |
| Schenker VIA 14 Late 2020 | |
| Average AMD Radeon RX Vega 7 (25.5 - 105.8, n=53) | |
| HP ProBook 440 G8-2W1G4EA | |
| Acer Swift 3 SF314-42-R4XJ | |
| Lenovo IdeaPad 5 14ARE05 | |
| Dota 2 Reborn - 1920x1080 ultra (3/3) best looking | |
| Average of class Subnotebook (13 - 97, n=63, last 2 years) | |
| Lenovo IdeaPad 5 14ALC05 82LM005YGE | |
| Lenovo IdeaPad 5 14ALC05 82LM005YGE (Hoechstleistung) | |
| Acer Swift 3 SF314-42-R4XJ | |
| Lenovo IdeaPad 5 14ARE05 | |
| Average AMD Radeon RX Vega 7 (23.3 - 58.2, n=62) | |
| Honor MagicBook 14, Ryzen 5 4500U | |
| Schenker VIA 14 Late 2020 | |
| HP ProBook 440 G8-2W1G4EA | |
| X-Plane 11.11 - 1280x720 low (fps_test=1) | |
| Average of class Subnotebook (29.9 - 82.5, n=61, last 2 years) | |
| Lenovo IdeaPad 5 14ALC05 82LM005YGE (Hoechstleistung) | |
| Lenovo IdeaPad 5 14ALC05 82LM005YGE | |
| Lenovo IdeaPad 5 14ARE05 | |
| Average AMD Radeon RX Vega 7 (24.7 - 53.4, n=60) | |
| Honor MagicBook 14, Ryzen 5 4500U | |
| Schenker VIA 14 Late 2020 | |
| Acer Swift 3 SF314-42-R4XJ | |
| HP ProBook 440 G8-2W1G4EA | |
| Strange Brigade - 1280x720 lowest AF:1 | |
| Average of class Subnotebook (78.8 - 335, n=52, last 2 years) | |
| Lenovo IdeaPad 5 14ALC05 82LM005YGE (1.47.22.14 D3D12) | |
| Average AMD Radeon RX Vega 7 (19.4 - 95.3, n=43) | |
| Shadow of the Tomb Raider - 1280x720 Lowest Preset | |
| Average of class Subnotebook (41 - 109, n=8, last 2 years) | |
| Lenovo IdeaPad 5 14ALC05 82LM005YGE | |
| Lenovo IdeaPad 5 14ARE05 | |
| Average AMD Radeon RX Vega 7 (20 - 55, n=9) | |
| Acer Swift 3 SF314-42-R4XJ | |
To check whether frame rates remain constant over a longer period, we run the game The Witcher 3 for about 60 minutes at Full HD resolution and maximum settings. Geralt (the player's character) is not moved. A drop in frame rates is not noticed.

| low | med. | high | ultra | |
|---|---|---|---|---|
| The Witcher 3 (2015) | 60.6 | 39.1 | 19.8 | 13.9 |
| Dota 2 Reborn (2015) | 96.9 | 77.2 | 47.6 | 44.9 |
| Ashes of the Singularity (2016) | 30.2 | 15.4 | 13.7 | |
| X-Plane 11.11 (2018) | 41.1 | 33.1 | 30 | |
| Far Cry 5 (2018) | 43 | 21 | 19 | 18 |
| Strange Brigade (2018) | 73.5 | 28.8 | 24.3 | 20.7 |
| Shadow of the Tomb Raider (2018) | 46 | 18 | 16 | 14 |
| Outriders (2021) | 39.3 | 28 | 22.7 | 19 |
| Resident Evil Village (2021) | 39 | 20.4 | 19.6 | |
| Mass Effect Legendary Edition (2021) | 48 | 25.3 |
Emissions - The Lenovo computer keeps its cool
Noise emissions
System noise is within limits. While idle and during low load, the fan often stays off, and silence reigns. Under load, it does not rev up excessively. We measure a maximum sound pressure level of 40.8 dB(A).
Noise level
| Idle |
| 25.5 / 25.5 / 25.5 dB(A) |
| Load |
| 40.6 / 40.8 dB(A) |
 | ||
30 dB silent 40 dB(A) audible 50 dB(A) loud |
||
min: | ||
| Lenovo IdeaPad 5 14ALC05 82LM005YGE R5 5500U, Vega 7 | Honor MagicBook 14, Ryzen 5 4500U R5 4500U, Vega 6 | Schenker VIA 14 Late 2020 i5-1135G7, Iris Xe G7 80EUs | HP ProBook 440 G8-2W1G4EA i7-1165G7, Iris Xe G7 96EUs | Lenovo IdeaPad 5 14ARE05 R5 4500U, Vega 6 | Average AMD Radeon RX Vega 7 | Average of class Subnotebook | |
|---|---|---|---|---|---|---|---|
| Noise | -4% | -2% | 3% | -16% | 1% | 5% | |
| off / environment * (dB) | 25.5 | 29.9 -17% | 25.1 2% | 26 -2% | 30.7 -20% | 25.7 ? -1% | 24.1 ? 5% |
| Idle Minimum * (dB) | 25.5 | 29.9 -17% | 25.1 2% | 26 -2% | 30.7 -20% | 26 ? -2% | 24.2 ? 5% |
| Idle Average * (dB) | 25.5 | 29.9 -17% | 25.1 2% | 26 -2% | 30.7 -20% | 26.3 ? -3% | 24.4 ? 4% |
| Idle Maximum * (dB) | 25.5 | 30.3 -19% | 25.1 2% | 26 -2% | 30.7 -20% | 27.2 ? -7% | 25.1 ? 2% |
| Load Average * (dB) | 40.6 | 30.9 24% | 42.8 -5% | 36.2 11% | 41.3 -2% | 35.4 ? 13% | 33.9 ? 17% |
| Load Maximum * (dB) | 40.8 | 32.5 20% | 47.5 -16% | 34.6 15% | 38.8 ? 5% | 41.9 ? -3% | |
| Witcher 3 ultra * (dB) | 31.5 | 42.8 |
* ... smaller is better
Temperature
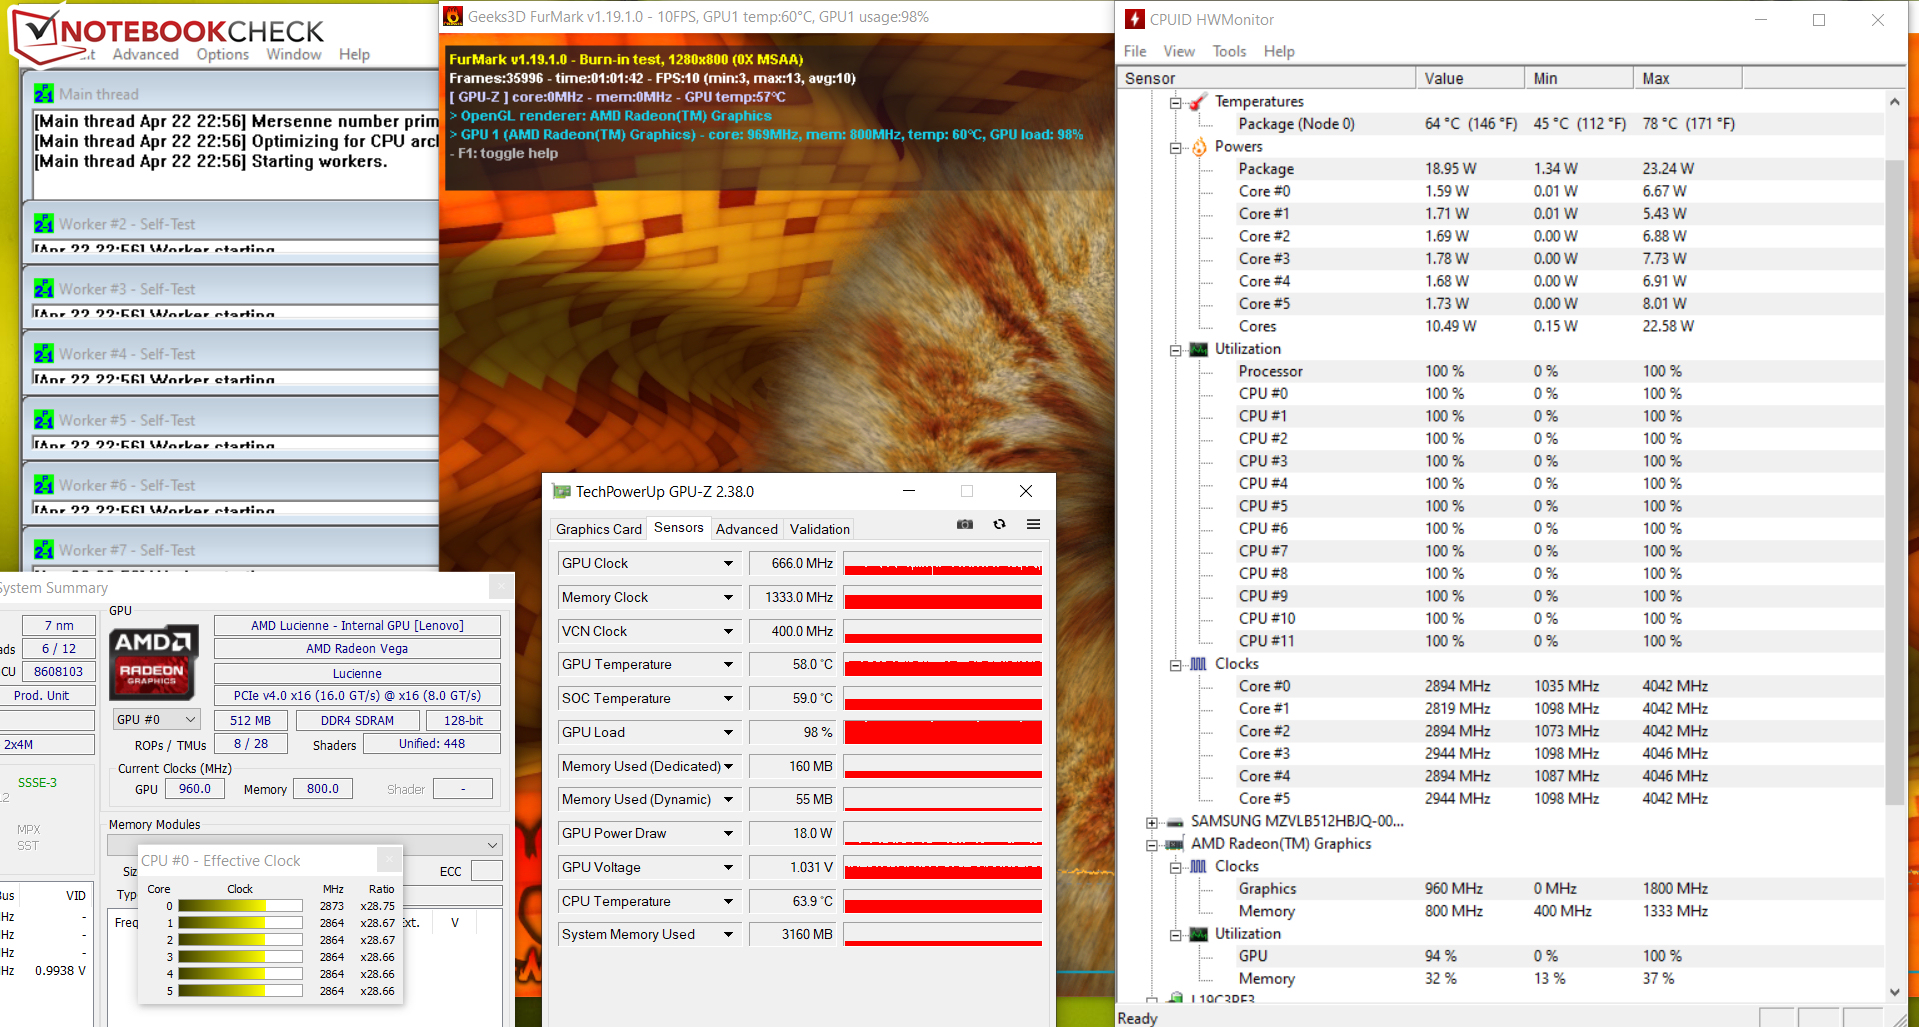
Our stress test (Prime95 and Furmark run for at least one hour) sees the CPU and GPU run at 2.9 GHz and 600-1000 MHz, respectively. The stress test is an extreme scenario that does not occur in everyday use. We use this test to check if the system runs stably even when under full load.
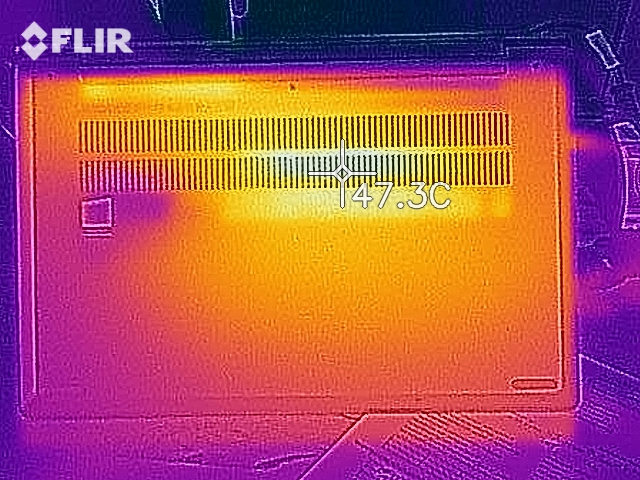
The 14-incher does not heat up excessively. We recorded temperatures just above 40 degrees Celsius at four measuring points during the stress test. The rates are within the green zone for everyday use.
(±) The maximum temperature on the upper side is 40.8 °C / 105 F, compared to the average of 35.9 °C / 97 F, ranging from 21.4 to 59 °C for the class Subnotebook.
(±) The bottom heats up to a maximum of 42.2 °C / 108 F, compared to the average of 39.2 °C / 103 F
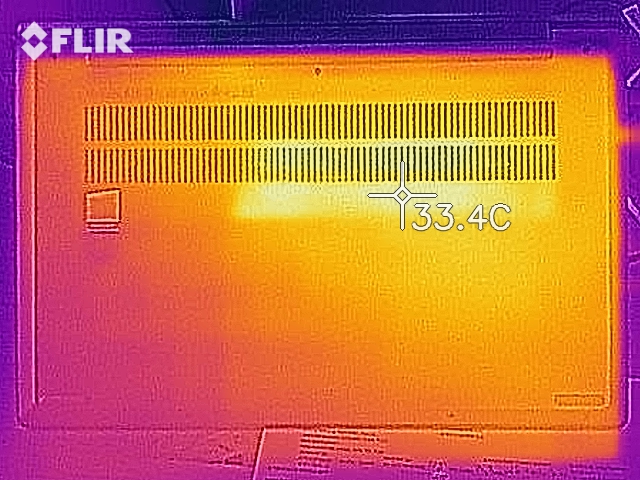
(+) In idle usage, the average temperature for the upper side is 27.6 °C / 82 F, compared to the device average of 30.8 °C / 87 F.
(+) The palmrests and touchpad are cooler than skin temperature with a maximum of 30.3 °C / 86.5 F and are therefore cool to the touch.
(-) The average temperature of the palmrest area of similar devices was 28.2 °C / 82.8 F (-2.1 °C / -3.7 F).


| Lenovo IdeaPad 5 14ALC05 82LM005YGE R5 5500U, Vega 7 | Honor MagicBook 14, Ryzen 5 4500U R5 4500U, Vega 6 | Schenker VIA 14 Late 2020 i5-1135G7, Iris Xe G7 80EUs | HP ProBook 440 G8-2W1G4EA i7-1165G7, Iris Xe G7 96EUs | Lenovo IdeaPad 5 14ARE05 R5 4500U, Vega 6 | Average AMD Radeon RX Vega 7 | Average of class Subnotebook | |
|---|---|---|---|---|---|---|---|
| Heat | 6% | 16% | 7% | 7% | -1% | 3% | |
| Maximum Upper Side * (°C) | 40.8 | 39.9 2% | 35 14% | 36.8 10% | 39.2 4% | 41.3 ? -1% | 41.7 ? -2% |
| Maximum Bottom * (°C) | 42.2 | 44.7 -6% | 35.8 15% | 42.5 -1% | 37 12% | 45 ? -7% | 43.5 ? -3% |
| Idle Upper Side * (°C) | 29.8 | 24.9 16% | 24.2 19% | 25.4 15% | 28.2 5% | 28.3 ? 5% | 27 ? 9% |
| Idle Bottom * (°C) | 29.5 | 25.7 13% | 24.6 17% | 28.5 3% | 27.7 6% | 29.9 ? -1% | 27.5 ? 7% |
* ... smaller is better
Loudspeaker
Lenovo IdeaPad 5 14ALC05 82LM005YGE audio analysis
(-) | not very loud speakers (71.9 dB)
Bass 100 - 315 Hz
(-) | nearly no bass - on average 20% lower than median
(±) | linearity of bass is average (13.1% delta to prev. frequency)
Mids 400 - 2000 Hz
(±) | higher mids - on average 5.8% higher than median
(±) | linearity of mids is average (7.9% delta to prev. frequency)
Highs 2 - 16 kHz
(+) | balanced highs - only 4.2% away from median
(+) | highs are linear (3.6% delta to prev. frequency)
Overall 100 - 16.000 Hz
(±) | linearity of overall sound is average (20% difference to median)
Compared to same class
» 63% of all tested devices in this class were better, 9% similar, 28% worse
» The best had a delta of 5%, average was 18%, worst was 53%
Compared to all devices tested
» 51% of all tested devices were better, 8% similar, 41% worse
» The best had a delta of 4%, average was 24%, worst was 134%
Power management - IdeaPad offers good battery runtimes
Energy consumption
We register a maximum power consumption of 11.3 watts while the system is idle. Under load, power demand increases to up to 63 watts (stress test, peak) and 46.6 watts on average (playing The Witcher 3). The USB-C power supply is rated at 65 watts.
| Off / Standby | |
| Idle | |
| Load |
|
Key:
min: | |
| Lenovo IdeaPad 5 14ALC05 82LM005YGE R5 5500U, Vega 7 | Honor MagicBook 14, Ryzen 5 4500U R5 4500U, Vega 6 | Schenker VIA 14 Late 2020 i5-1135G7, Iris Xe G7 80EUs | HP ProBook 440 G8-2W1G4EA i7-1165G7, Iris Xe G7 96EUs | Lenovo IdeaPad 5 14ARE05 R5 4500U, Vega 6 | Average AMD Radeon RX Vega 7 | Average of class Subnotebook | |
|---|---|---|---|---|---|---|---|
| Power Consumption | 30% | 32% | 31% | 9% | 14% | 18% | |
| Idle Minimum * (Watt) | 5.4 | 4.2 22% | 2.9 46% | 4 26% | 4.4 19% | 4.79 ? 11% | 3.77 ? 30% |
| Idle Average * (Watt) | 8.4 | 6.5 23% | 4.6 45% | 6.2 26% | 7.6 10% | 7.72 ? 8% | 6.56 ? 22% |
| Idle Maximum * (Watt) | 11.3 | 7.9 30% | 7.7 32% | 7.5 34% | 9.9 12% | 9.12 ? 19% | 7.9 ? 30% |
| Load Average * (Watt) | 45.3 | 31.2 31% | 28.4 37% | 34.7 23% | 46 -2% | 38.4 ? 15% | 41.5 ? 8% |
| Witcher 3 ultra * (Watt) | 46.6 | 32 31% | 29.8 36% | ||||
| Load Maximum * (Watt) | 63 | 37 41% | 65.1 -3% | 34 46% | 59 6% | 51.7 ? 18% | 64.1 ? -2% |
* ... smaller is better
Battery life
The IdeaPad achieves runtimes of 10 hours 49 minutes and 12 hours 42 minutes in our WLAN test (surfing through websites via a script) and video test (Big Buck Bunny (H.264, FHD) runs in a loop), respectively. During the tests, the notebook's energy-saving features are disabled and the display brightness is set to about 150 cd/m². The wireless card is disabled during the video test.
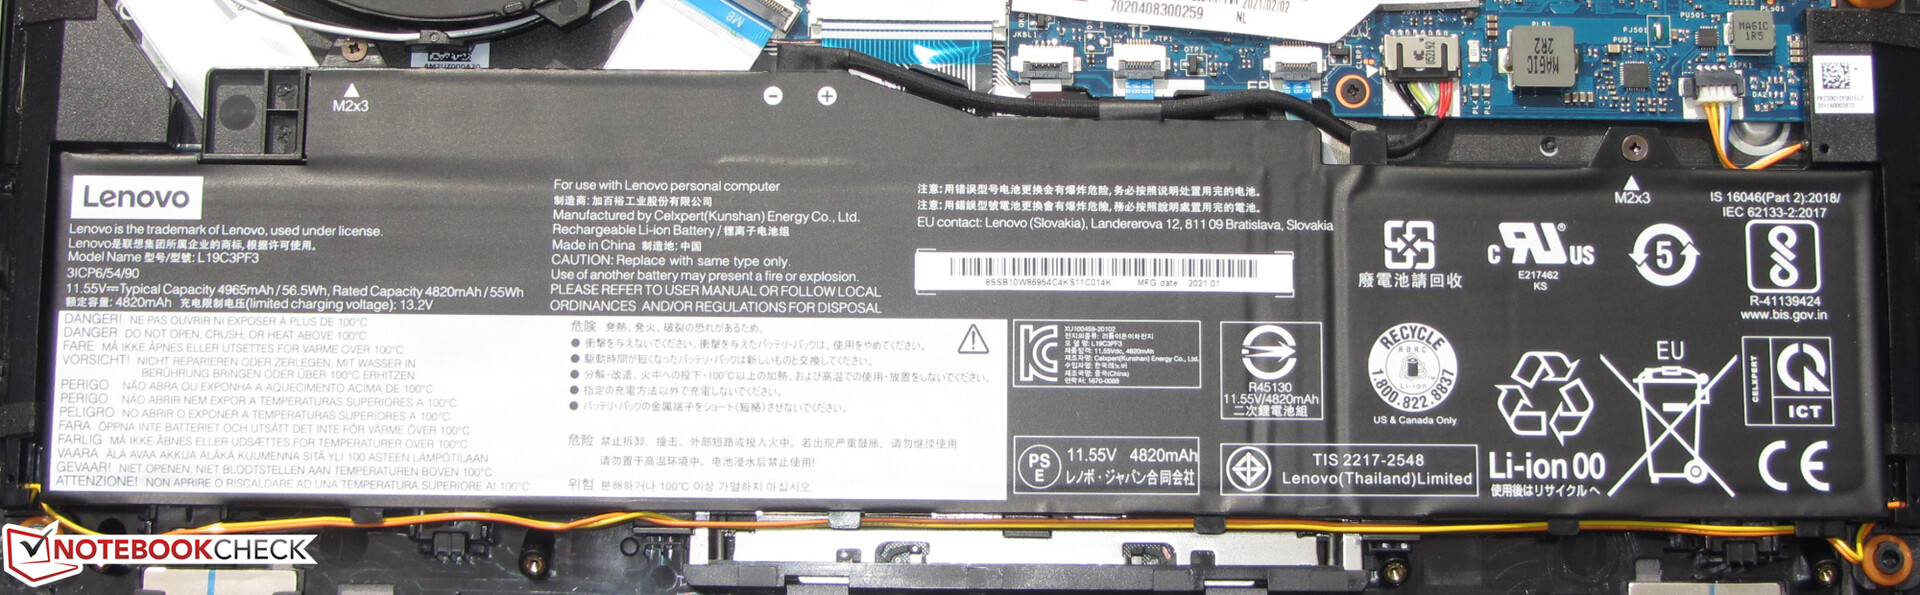
| Lenovo IdeaPad 5 14ALC05 82LM005YGE R5 5500U, Vega 7, 56.5 Wh | Honor MagicBook 14, Ryzen 5 4500U R5 4500U, Vega 6, 56 Wh | Schenker VIA 14 Late 2020 i5-1135G7, Iris Xe G7 80EUs, 73 Wh | HP ProBook 440 G8-2W1G4EA i7-1165G7, Iris Xe G7 96EUs, 45 Wh | Lenovo IdeaPad 5 14ARE05 R5 4500U, Vega 6, 56.5 Wh | Acer Swift 3 SF314-42-R4XJ R7 4700U, Vega 7, 48.85 Wh | Average of class Subnotebook | |
|---|---|---|---|---|---|---|---|
| Battery runtime | 36% | 100% | 60% | -8% | 23% | 33% | |
| Reader / Idle (h) | 19.7 | 28.8 46% | 23.2 18% | 27.8 ? 41% | |||
| H.264 (h) | 12.7 | 17.8 40% | 16.1 27% | 15.6 ? 23% | |||
| WiFi v1.3 (h) | 10.8 | 14.4 33% | 16.6 54% | 7.5 -31% | 9.9 -8% | 11.9 10% | 14 ? 30% |
| Load (h) | 1.4 | 1.8 29% | 4.3 207% | 3.5 150% | 1.9 36% | 1.951 ? 39% |
Pros
Cons
Verdict

A weight of approximately. 1.4 kg and practical battery life of 11-13 hours make the IdeaPad a highly mobile notebook. The power supply uses USB-C to charge the machine. Unfortunately, Lenovo has only equipped the notebook with one USB-C port. Since this also serves as a second video output, a second USB-C port would have been useful.
Despite the high computing power, the Lenovo Ideapad 5 14ALC05 has good battery life.
The Ryzen-5-5500U-APU, 16 GB of RAM (dual-channel, soldered), and a 512 GB NVMe SSD also equip the computer for applications beyond office and Internet. The integrated graphics core enables gaming to a limited extent. If storage space runs out, a second NVMe SSD can be installed.
The screen (FHD, IPS) is not one of the notebook's strengths. It scores with stable viewing angles, a matte surface, decent color reproduction, and good brightness. Contrast and color space coverage are not convincing. The backlit keyboard leaves a good impression.
Price and availability
The IdeaPad is available in the configuration variant 82LM0060GE (Ryzen 5 5500U, 8 GB RAM, 512 GB SSD, Windows 10 Home) for 699 Euros (~$699) at Notebooksbilliger.de. The reviewed configuration is currently only available as B-goods at NBB. Cyberport.de has the configuration 82LM006YGE (Ryzen 5 5500U, 8 GB RAM, 256 GB SSD, Windows 10 Home) for 599 Euros.
Lenovo IdeaPad 5 14ALC05 82LM005YGE
- 05/20/2021 v7 (old)
Sascha Mölck
Price comparison

