Lenovo IdeaPad 5 14ARE05 in review: A lot of computing power in a compact case

With the IdeaPad 5 14ARE05, Lenovo delivers a 14-inch subnotebook that is powered by a Ryzen 5 4500U APU. Competitors include devices such as the Acer Swift 3 SF314-42, the HP 14s, the Honor MagicBook 14, the Asus ZenBook 14 UM431DA, and the Dell Inspiron 14 3493.
Rating | Date | Model | Weight | Height | Size | Resolution | Price |
|---|---|---|---|---|---|---|---|
| 86 % v7 (old) | 07 / 2020 | Lenovo IdeaPad 5 14ARE05 R5 4500U, Vega 6 | 1.4 kg | 16.9 mm | 14.00" | 1920x1080 | |
| 85 % v7 (old) | 06 / 2020 | Acer Swift 3 SF314-42-R27B R3 4300U, Vega 5 | 1.2 kg | 16.55 mm | 14.00" | 1920x1080 | |
| 79.1 % v7 (old) | 06 / 2020 | HP 14s-dq1431ng i5-1035G1, UHD Graphics G1 (Ice Lake 32 EU) | 1.5 kg | 18 mm | 14.00" | 1920x1080 | |
| 86.5 % v7 (old) | 05 / 2020 | Honor Magicbook 14 R5 3500U, Vega 8 | 1.4 kg | 16 mm | 14.00" | 1920x1080 | |
| 81.2 % v7 (old) | 02 / 2020 | Asus ZenBook 14 UM431DA-AM020T R7 3700U, Vega 10 | 1.4 kg | 16 mm | 14.00" | 1920x1080 | |
| 74.5 % v7 (old) | 01 / 2020 | Dell Inspiron 14 3493-4KWCF i7-1065G7, GeForce MX230 | 1.8 kg | 21 mm | 14.00" | 1920x1080 |
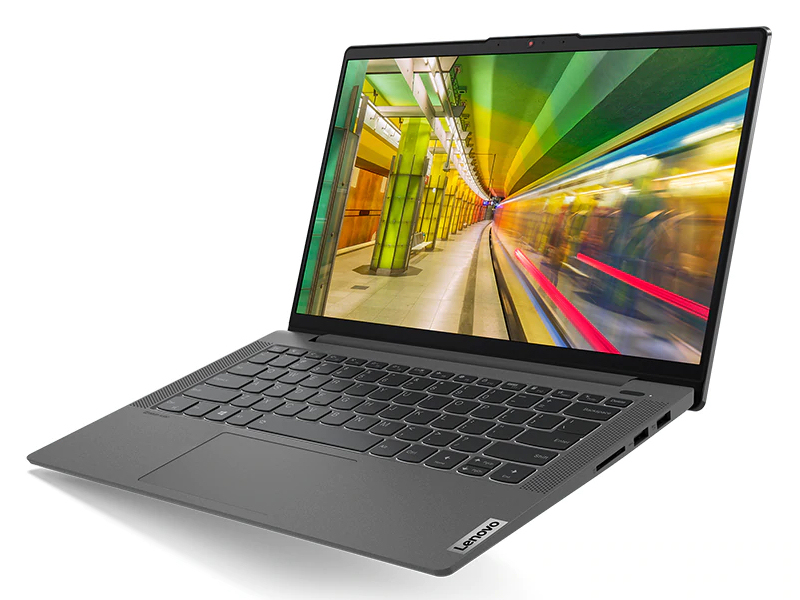
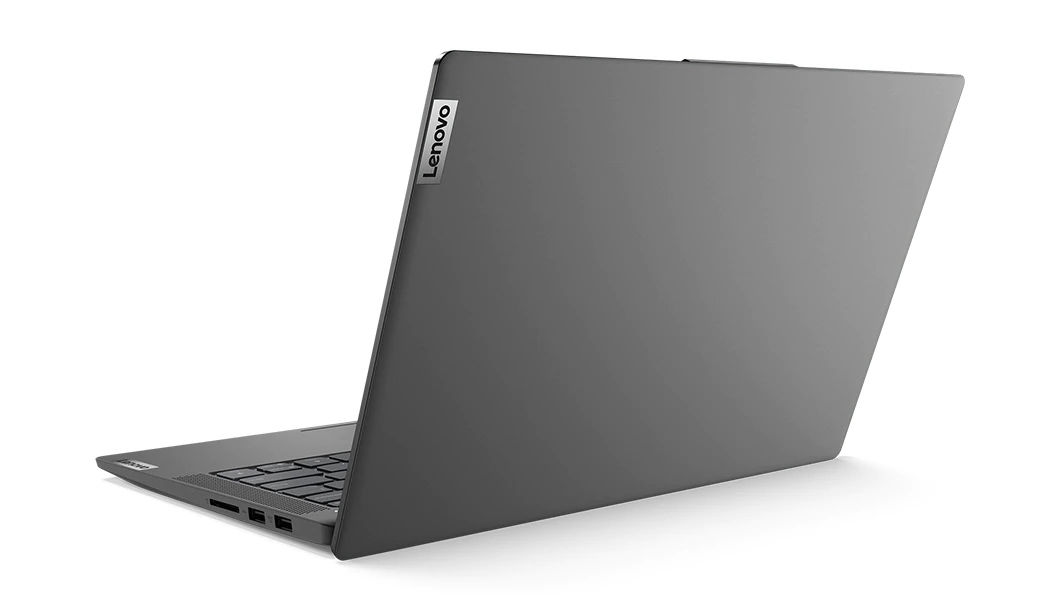
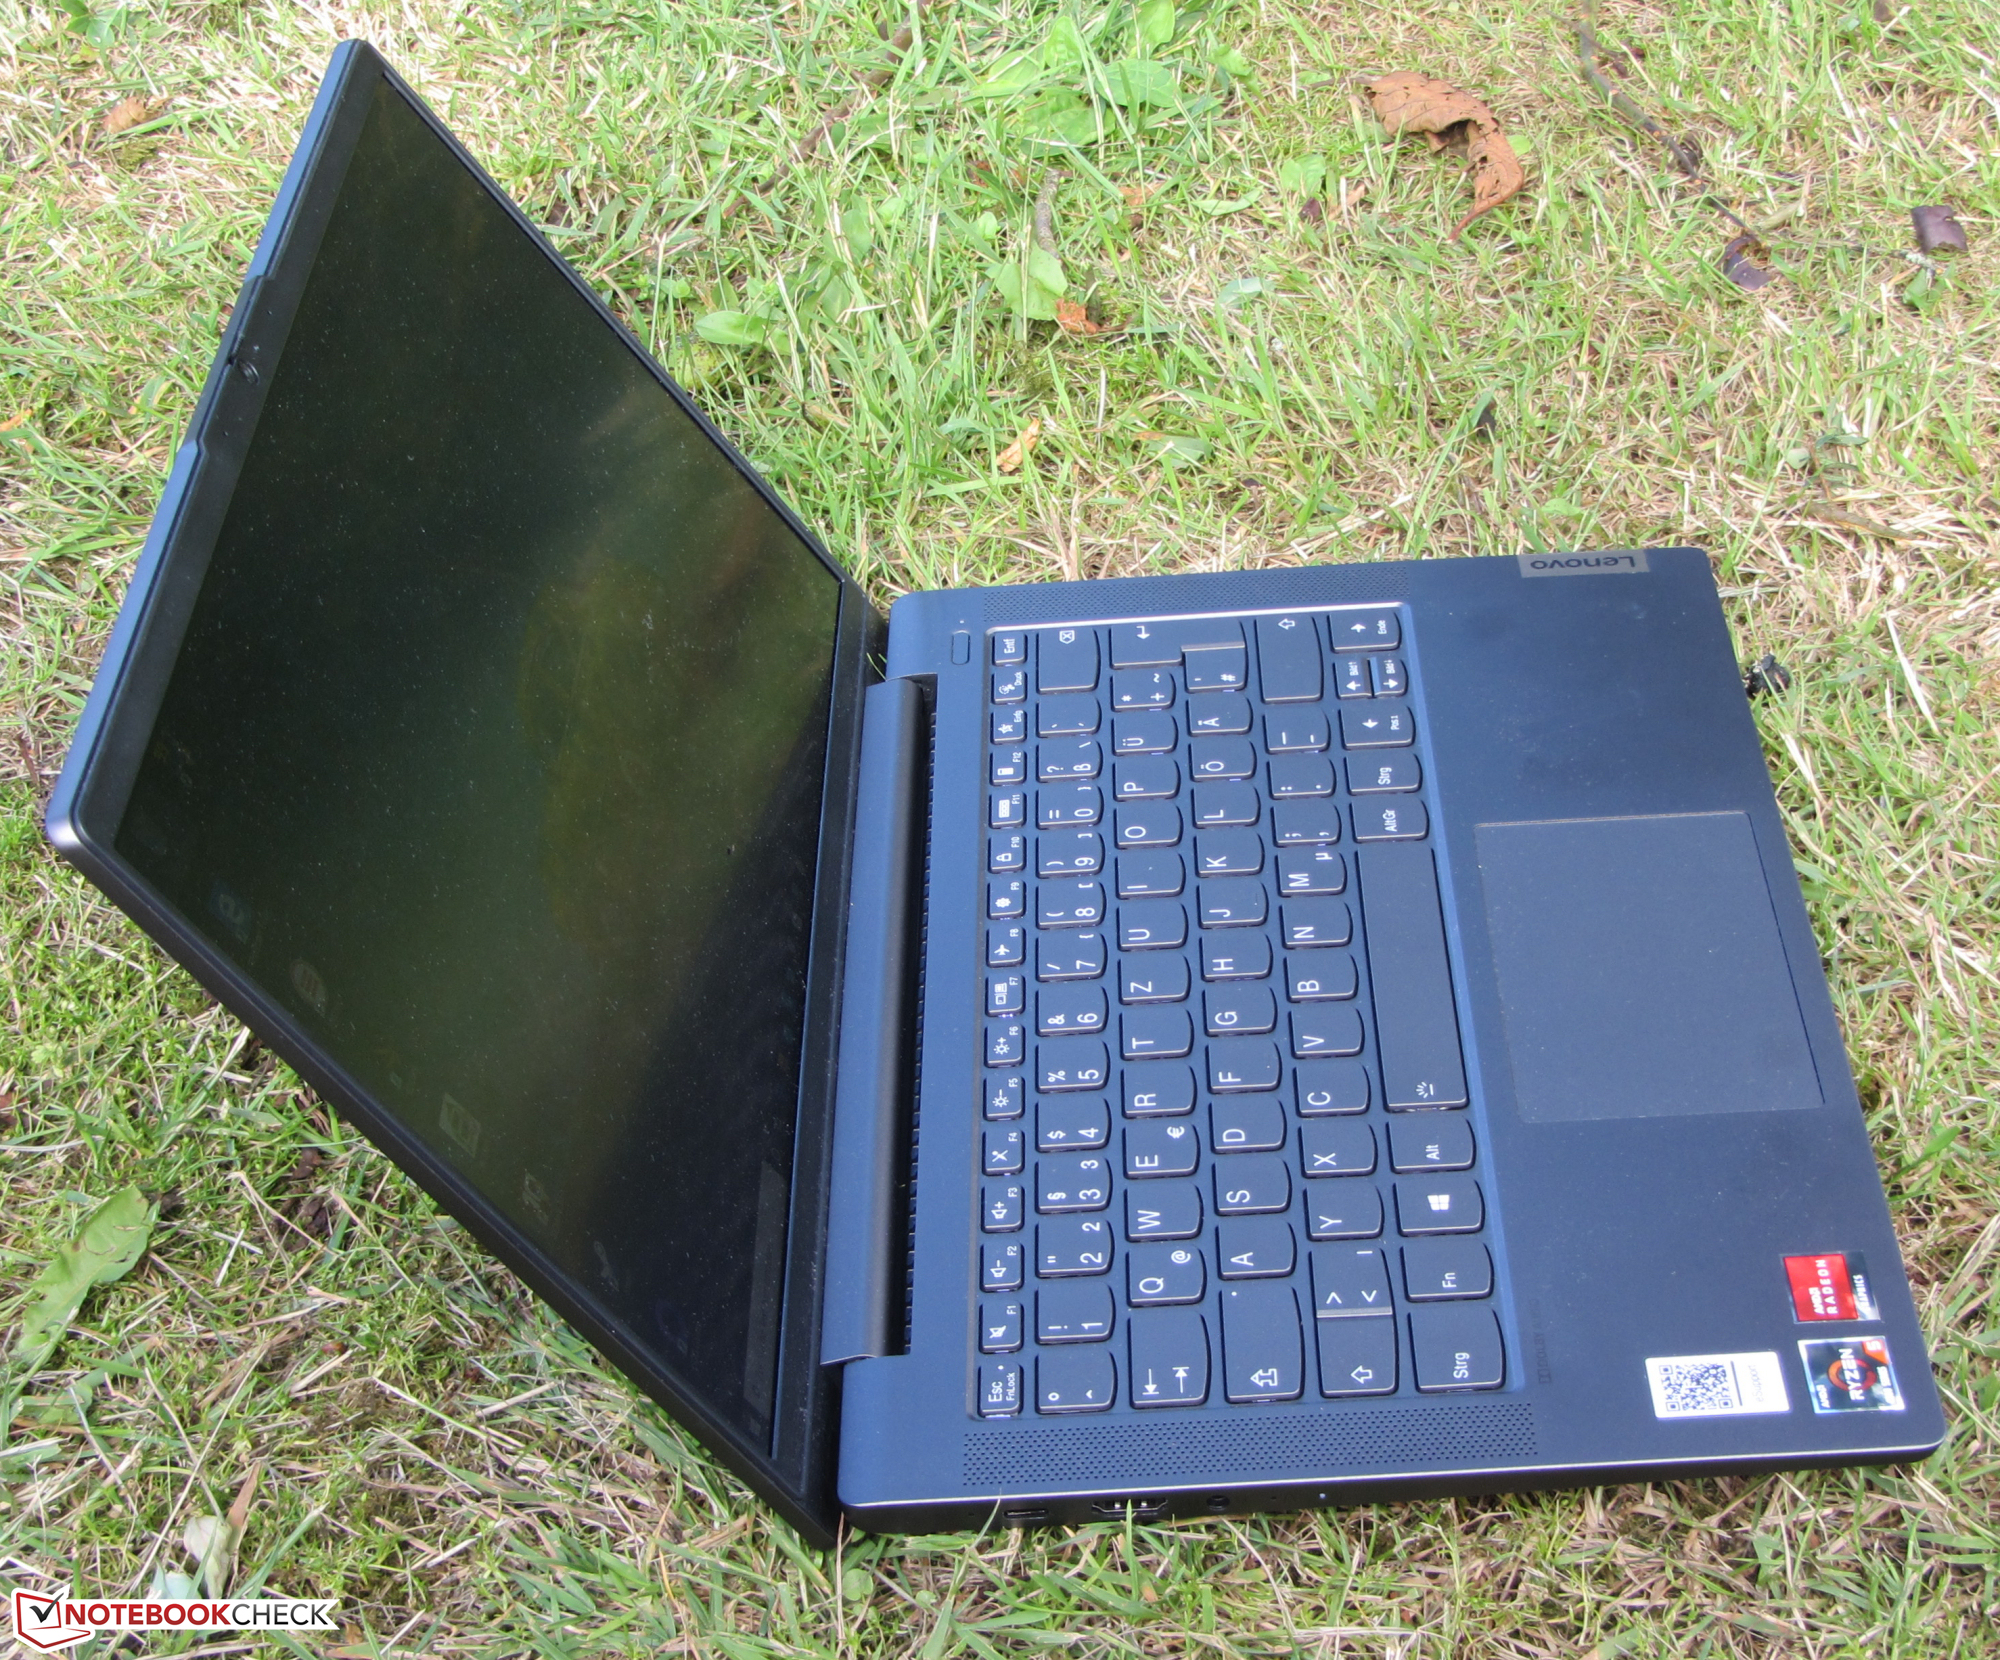
Case and connectivity - Fancy metal case for the IdeaPad 5
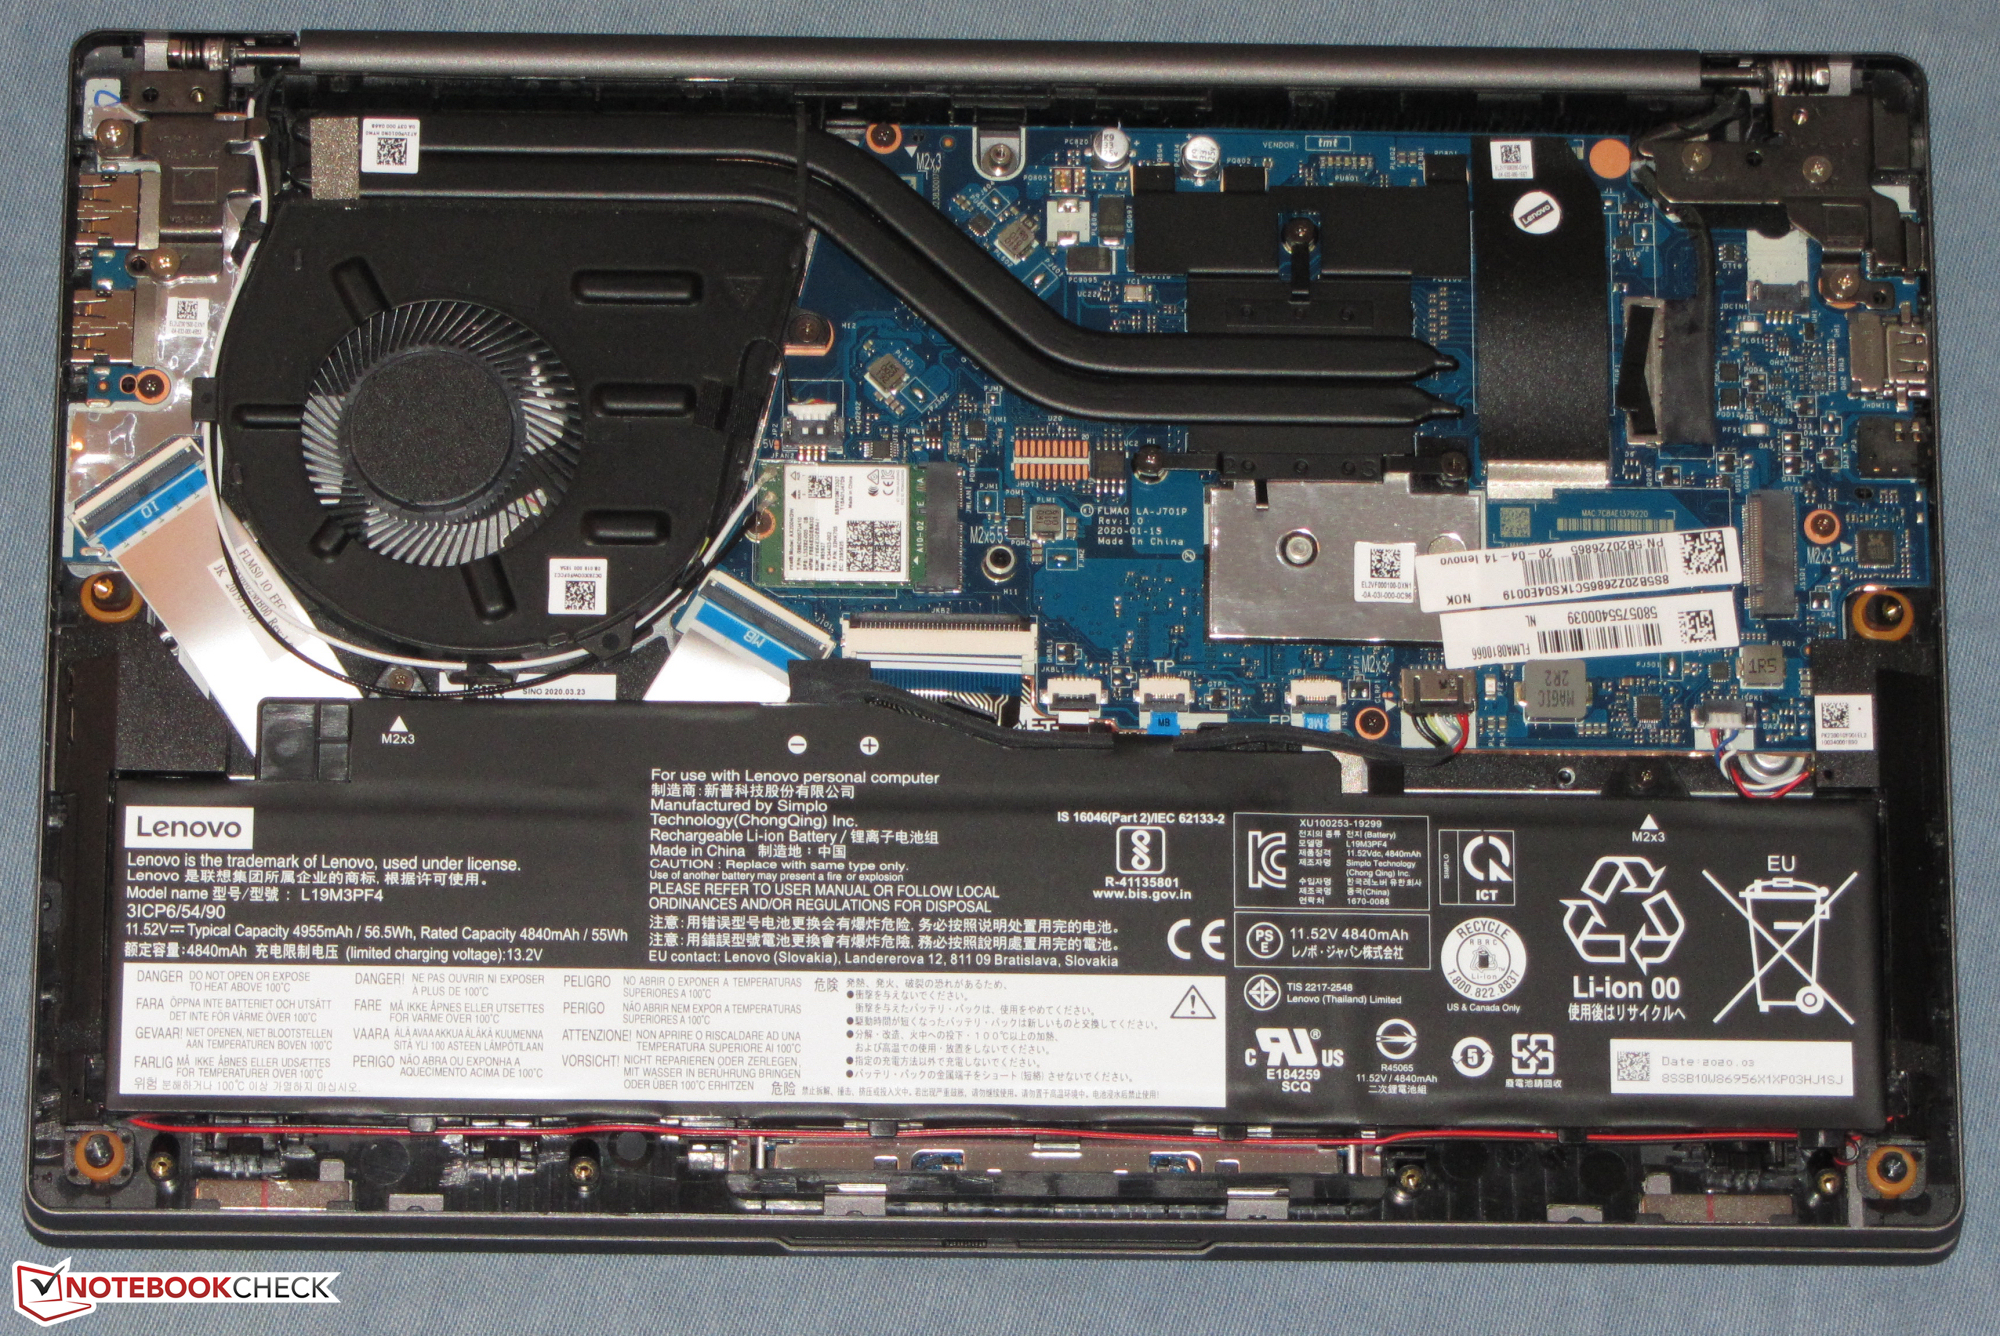
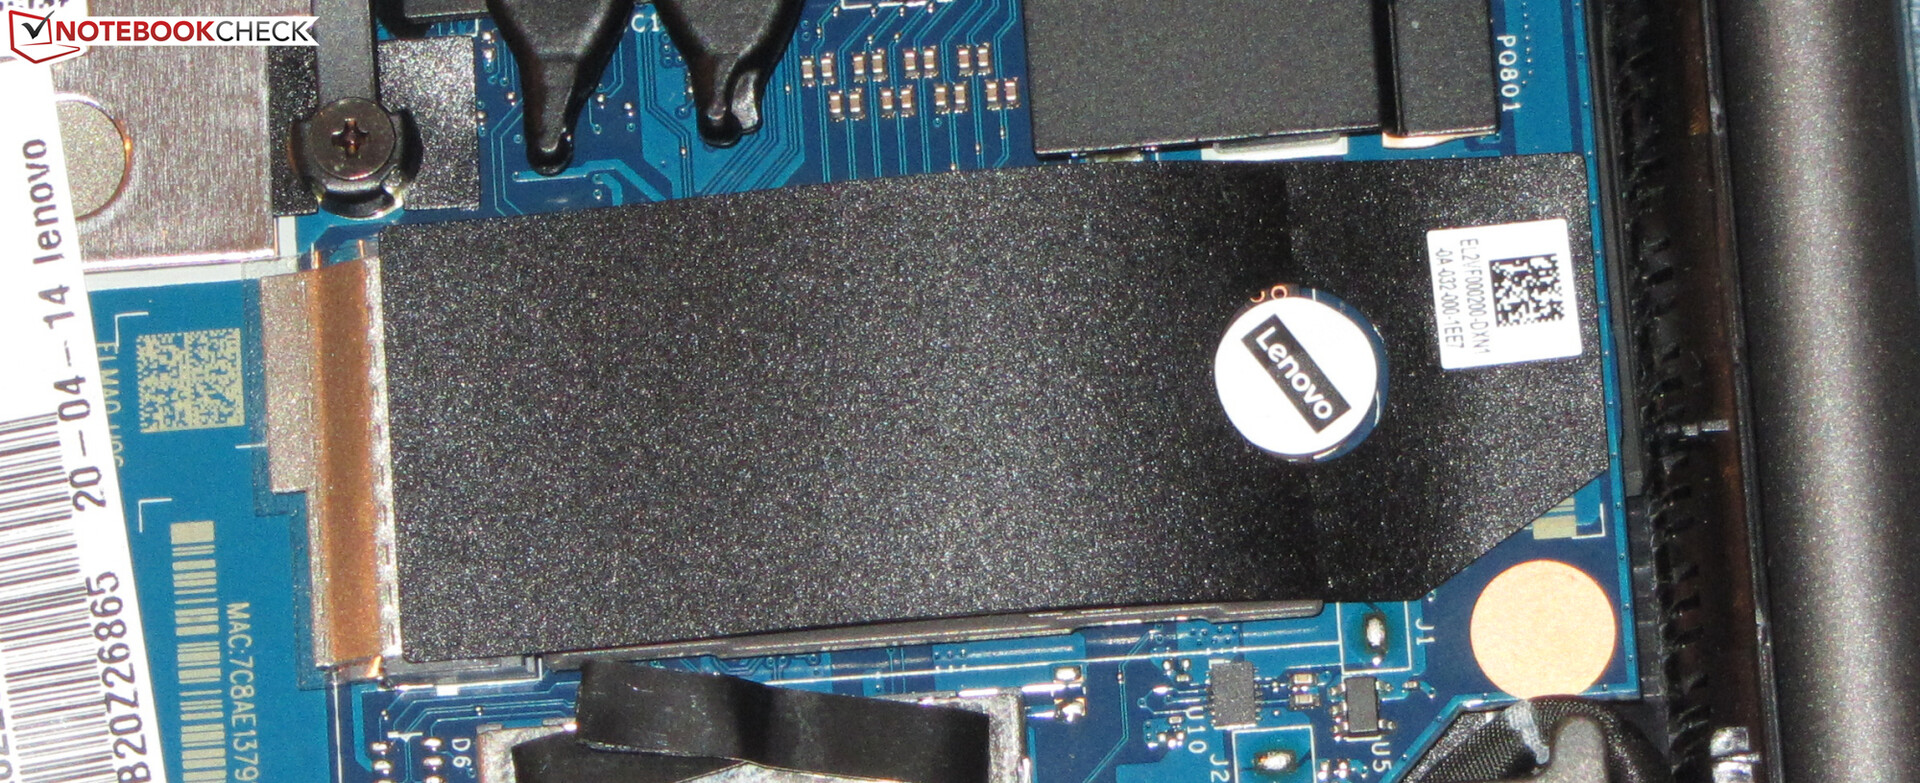
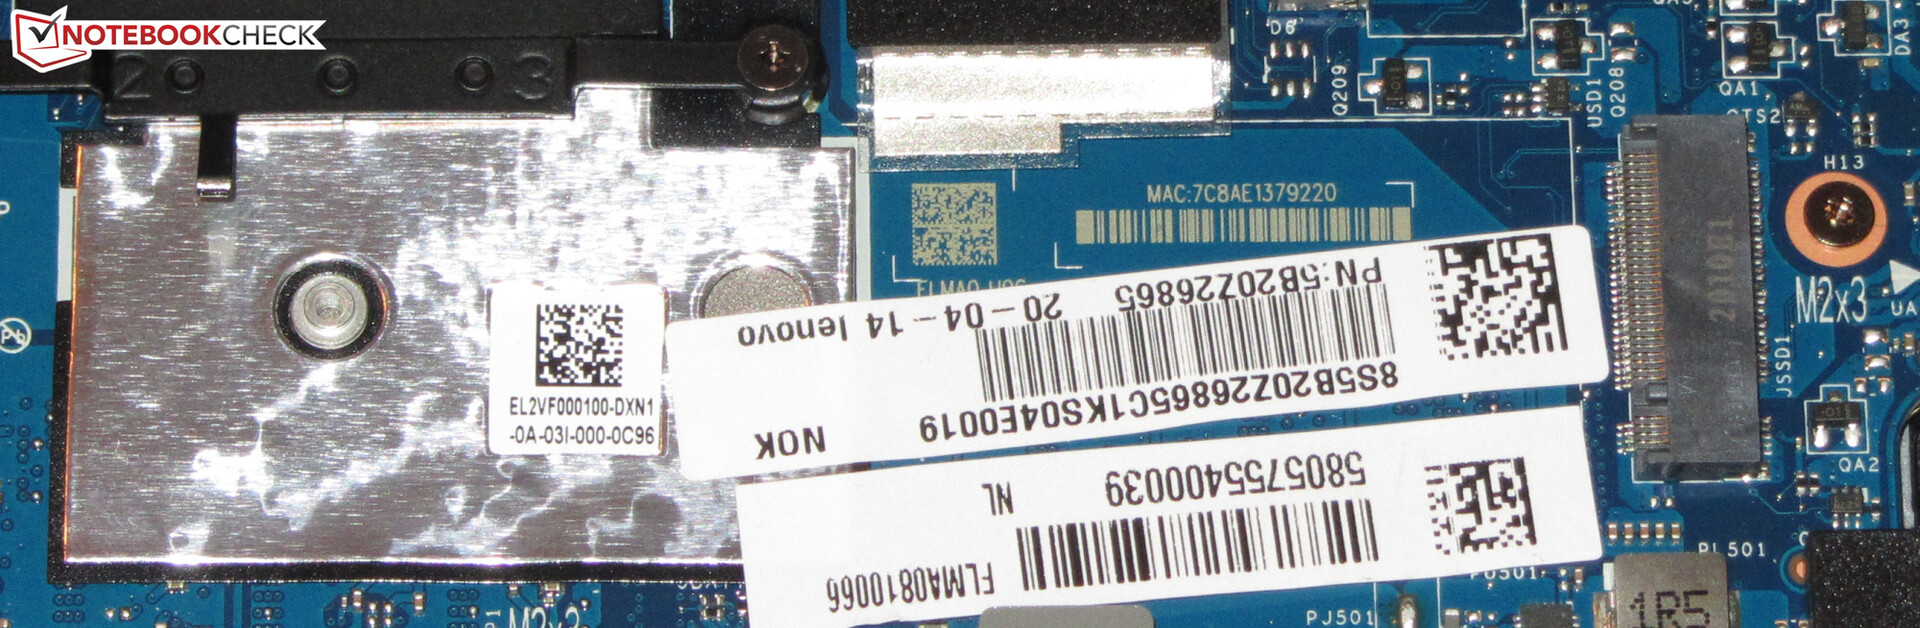
The fancy, slim aluminum case of the IdeaPad comes in a dark gray tone (Graphite Gray). It doesn't show any manufacturing flaws. The base unit and lid could use a greater stiffness, though. The battery is firmly built into the device. There is no maintenance hatch, so the inside is accessed by removing the bottom cover.
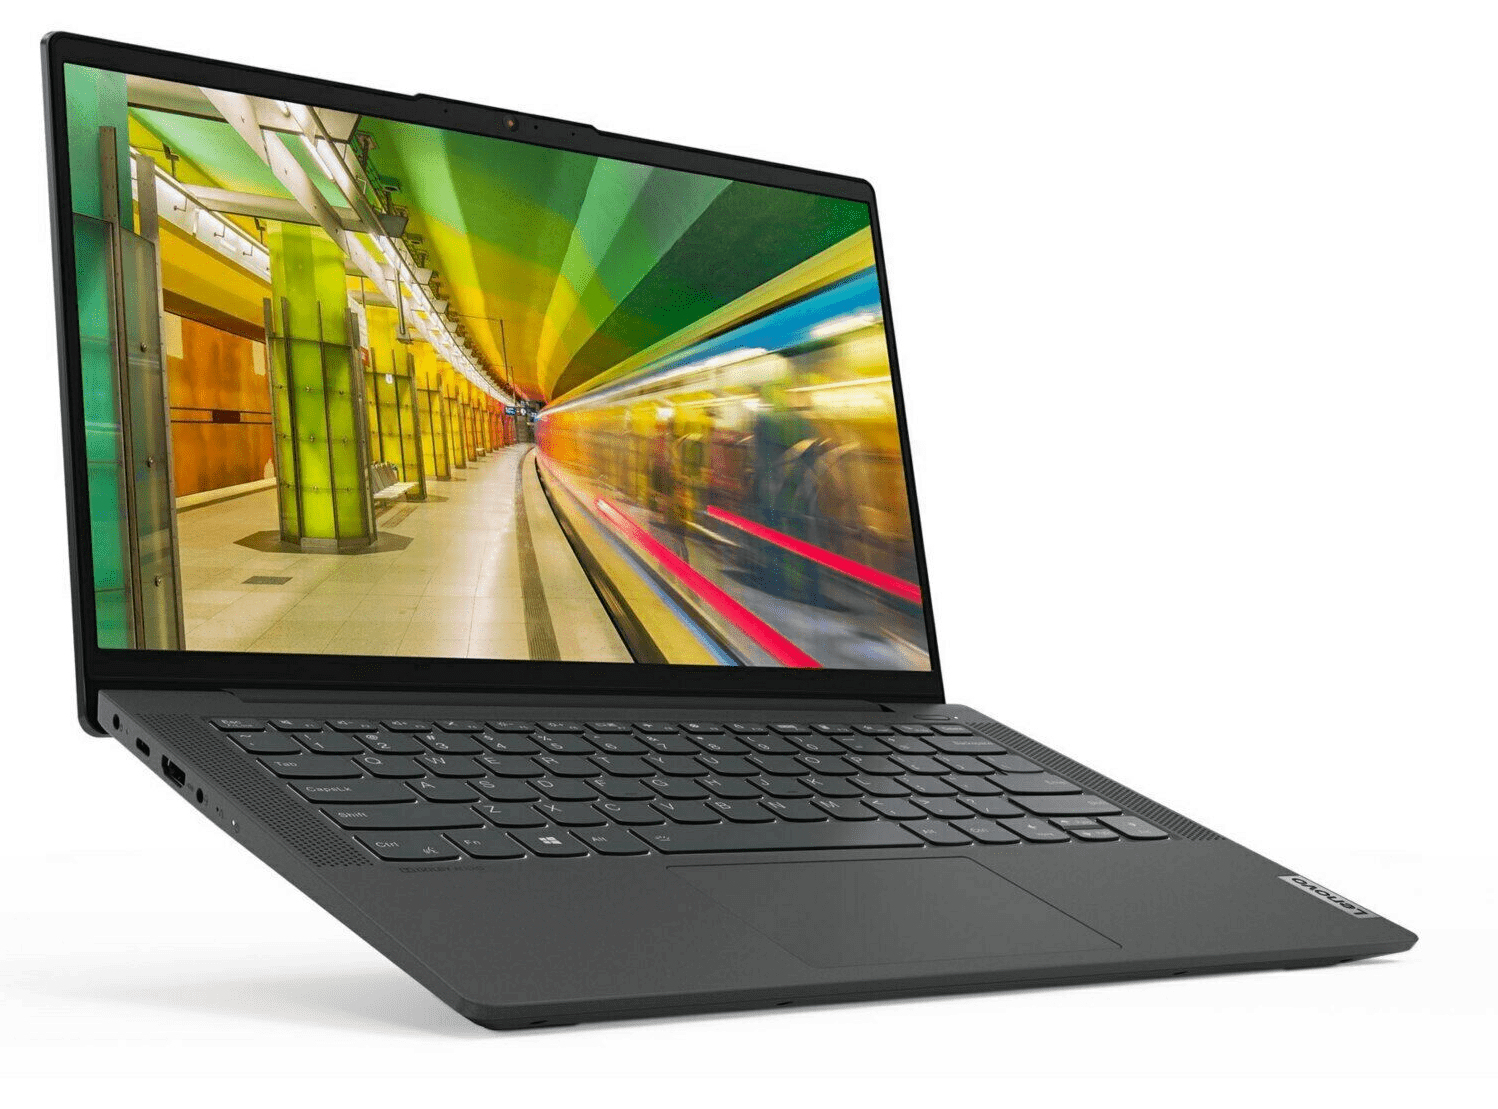
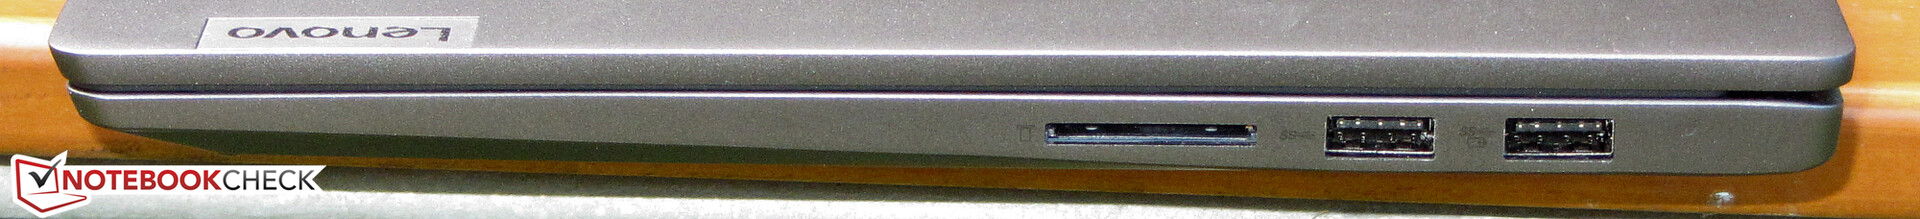
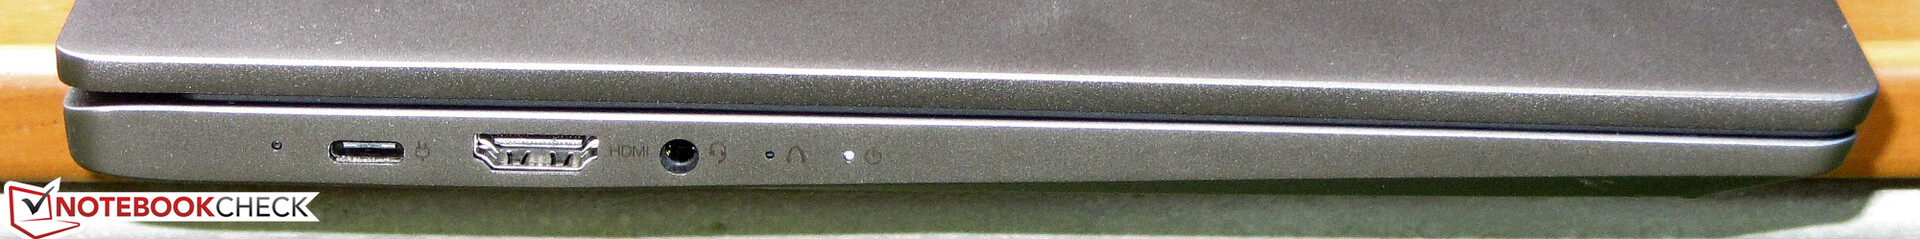
The 14-incher's two USB Type-A ports work according to the USB 3.2 Gen 1 standard. The laptop is supplied with power via the USB Type-C port (USB 3.2 Gen 1). DisplayPort via USB-C is supported. In this way, the IdeaPad has two video outputs together with the HDMI connection.
The built-in memory card reader belongs to the faster models at transfer speeds of 78 MB/s (transfer of 250 jpg image files of about 5 MB each) and 86.5 MB/s (copying of large data blocks), respectively. We test memory card readers using a reference card (64 GB Toshiba Exceria Pro SDXC UHS-II).
The WLAN chip (Intel Wi-Fi 6 AX200) supports the 802.11a/b/g/n/ac/ax WLAN standards. Furthermore, the transfer speeds determined under optimal conditions (no other WLAN devices nearby, short distance between laptop and server PC) are good. We perform our testing with the Netgear Nighthawk AX12 Wi-Fi 6 tri-band router.
Port configuration
| SD Card Reader | |
| average JPG Copy Test (av. of 3 runs) | |
| Lenovo IdeaPad S540-14IWL (Toshiba Exceria Pro SDXC 64 GB UHS-II) | |
| Lenovo IdeaPad 5 14ARE05 (Toshiba Exceria Pro SDXC 64 GB UHS-II) | |
| Average of class Subnotebook (18.4 - 86.7, n=9, last 2 years) | |
| HP 14s-dq1431ng (Toshiba Exceria Pro SDXC 64 GB UHS-II) | |
| Asus ZenBook 14 UM431DA-AM020T (Toshiba Exceria Pro SDXC 64 GB UHS-II) | |
| maximum AS SSD Seq Read Test (1GB) | |
| Lenovo IdeaPad S540-14IWL (Toshiba Exceria Pro SDXC 64 GB UHS-II) | |
| Lenovo IdeaPad 5 14ARE05 (Toshiba Exceria Pro SDXC 64 GB UHS-II) | |
| Average of class Subnotebook (22.5 - 181.1, n=8, last 2 years) | |
| HP 14s-dq1431ng (Toshiba Exceria Pro SDXC 64 GB UHS-II) | |
| Asus ZenBook 14 UM431DA-AM020T (Toshiba Exceria Pro SDXC 64 GB UHS-II) | |


, i5-1035G1, Intel Optane Memory H10 with Solid State Storage 16GB + 256GB HBRPEKNX0101AH")
, i5-1035G1, Intel Optane Memory H10 with Solid State Storage 16GB + 256GB HBRPEKNX0101AH")


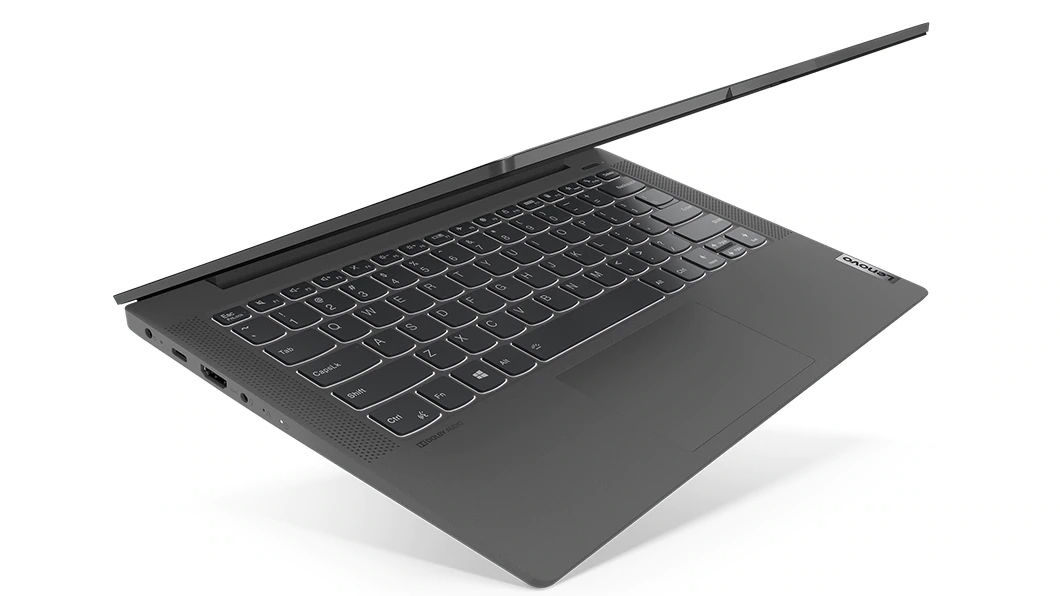
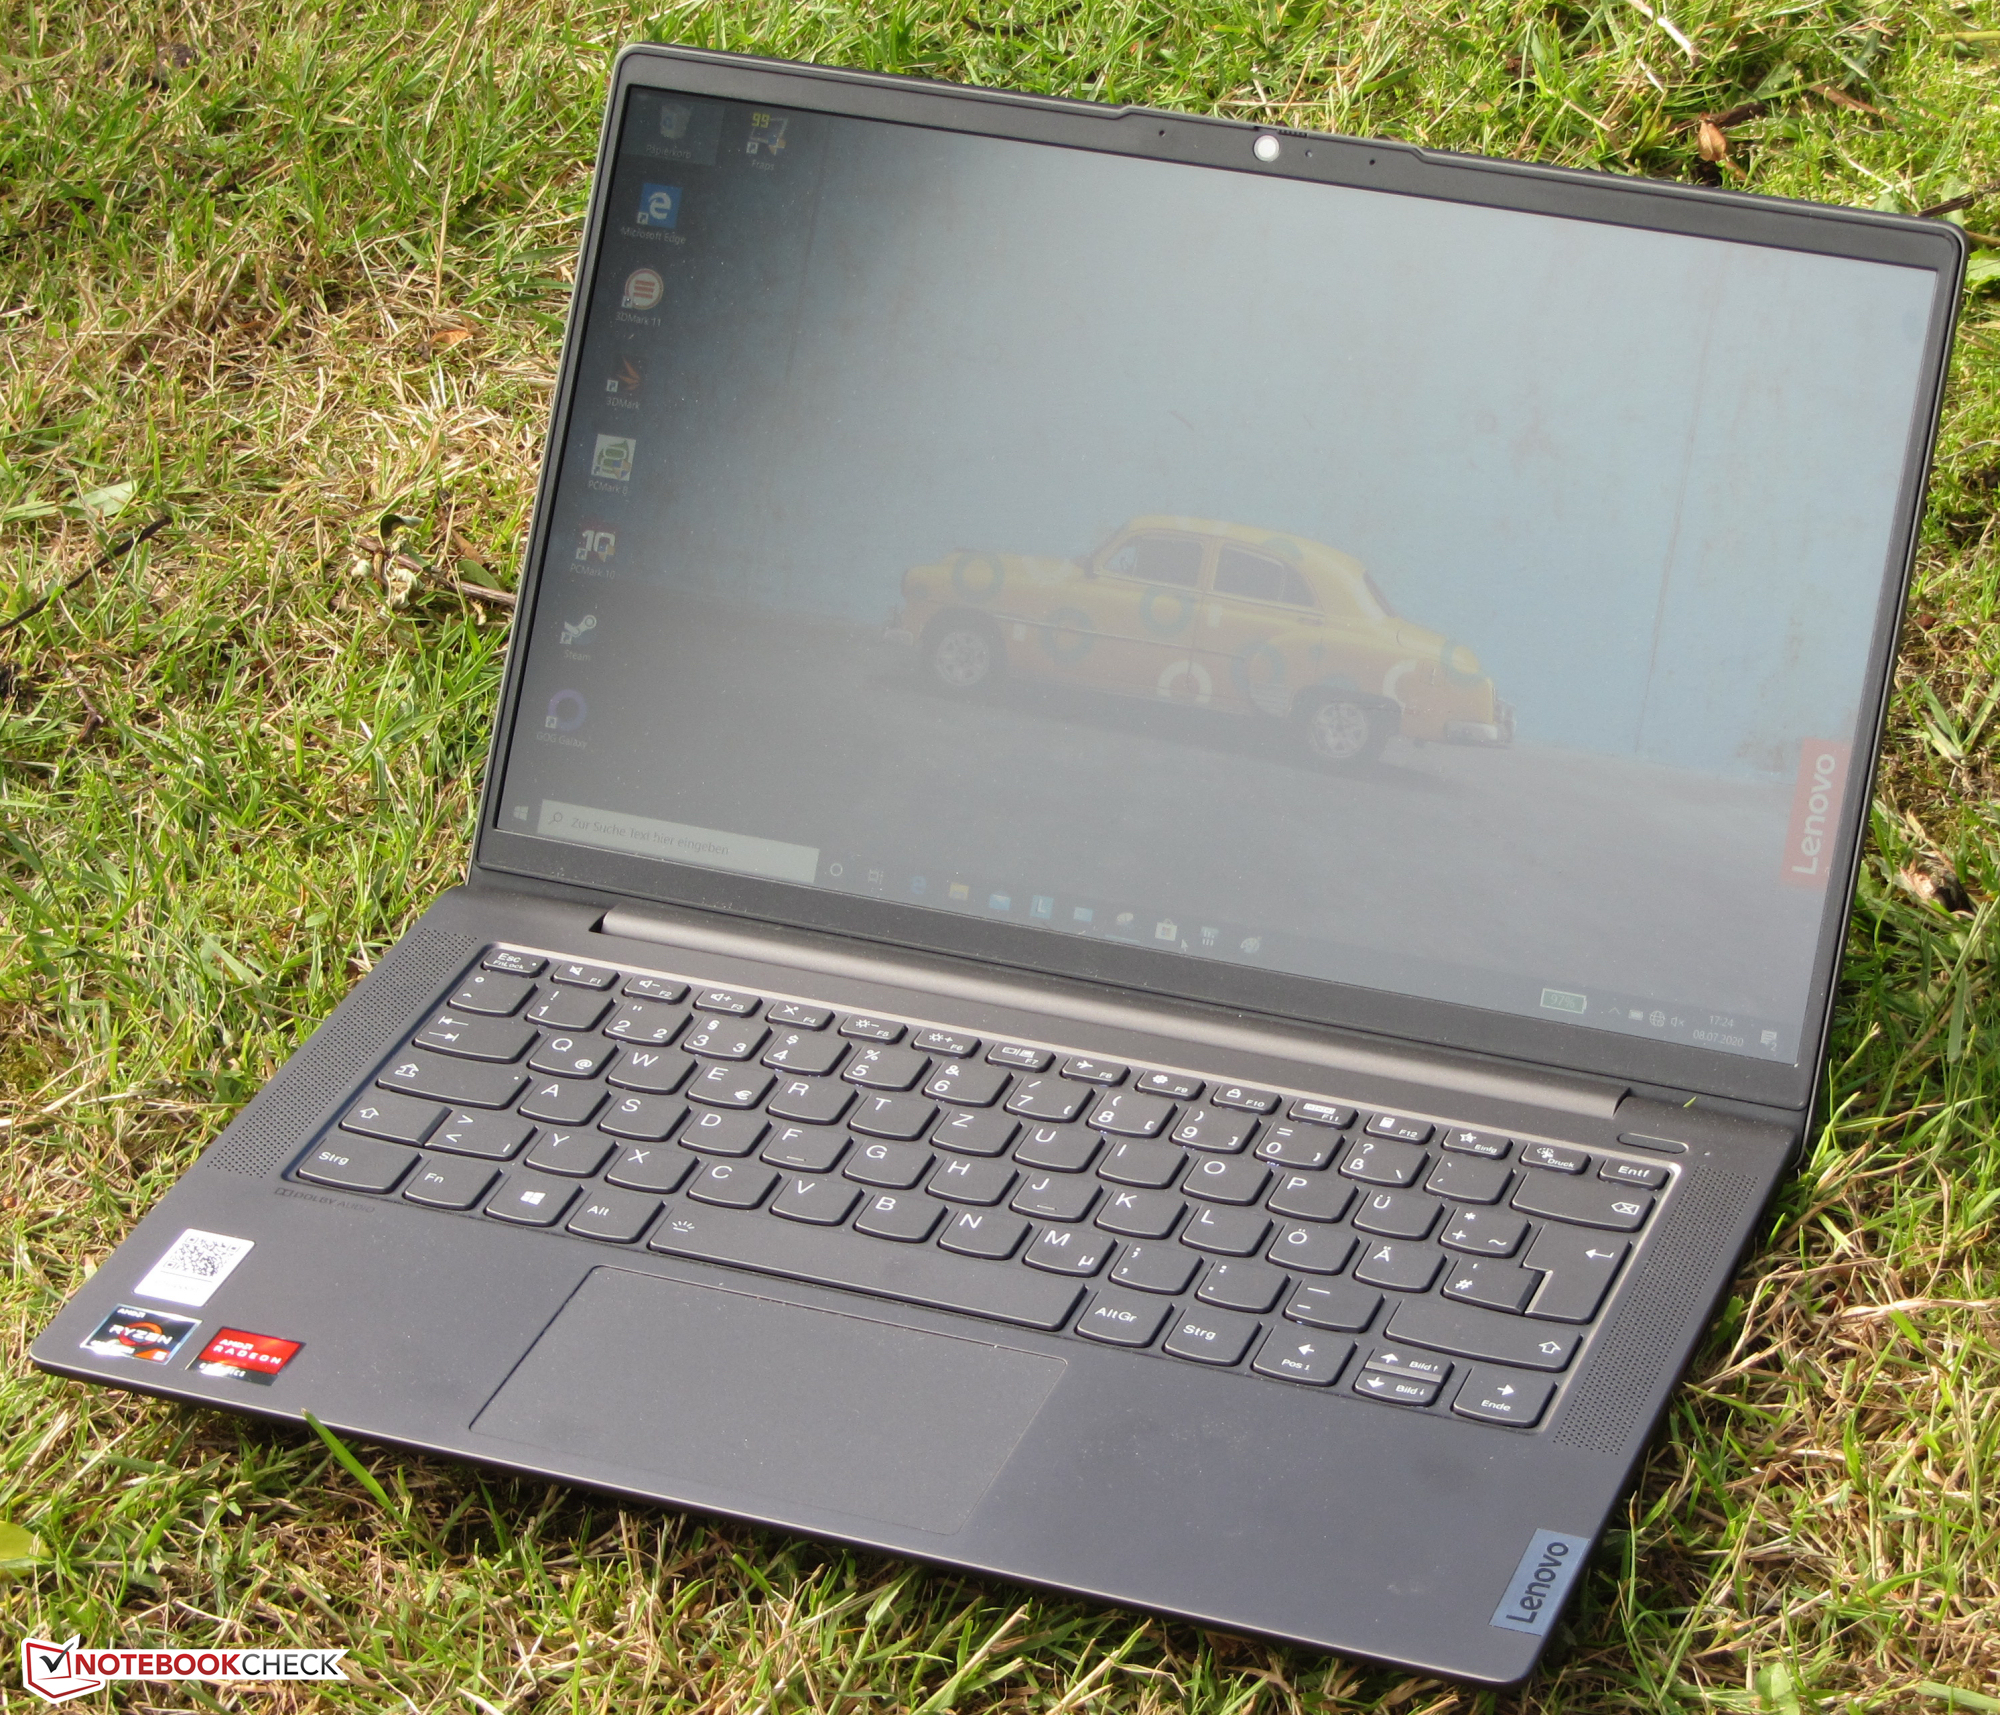
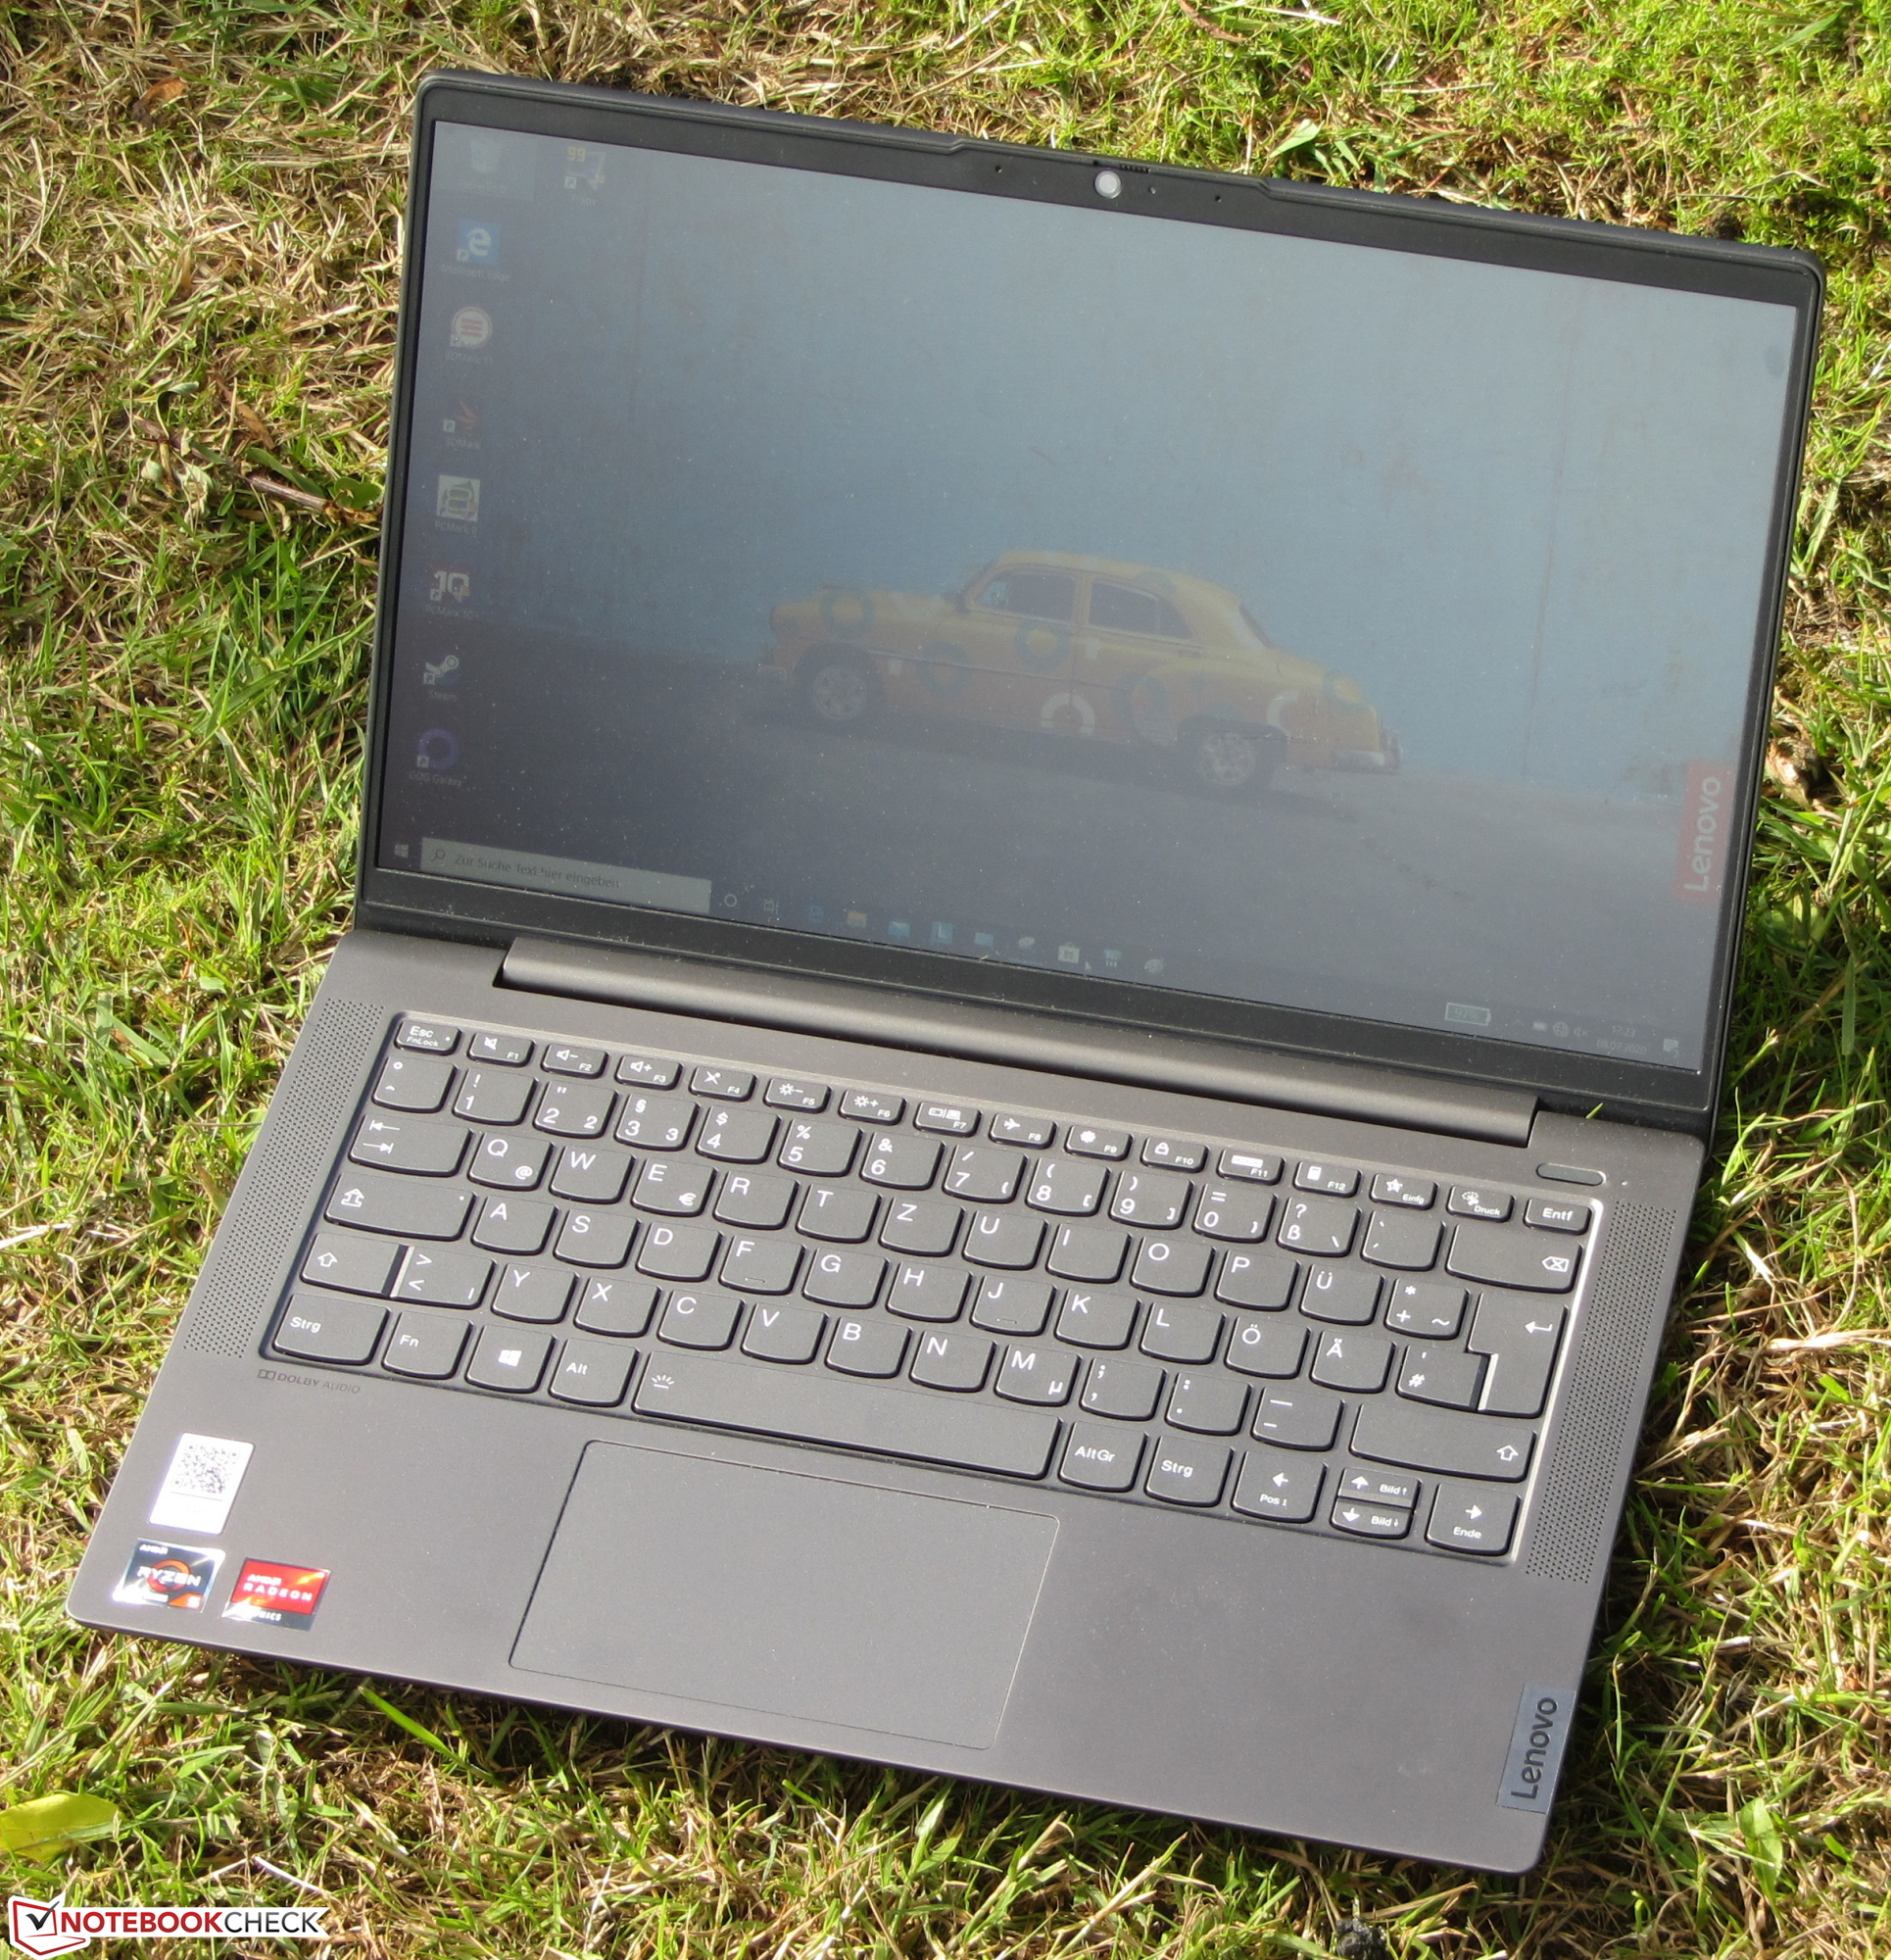
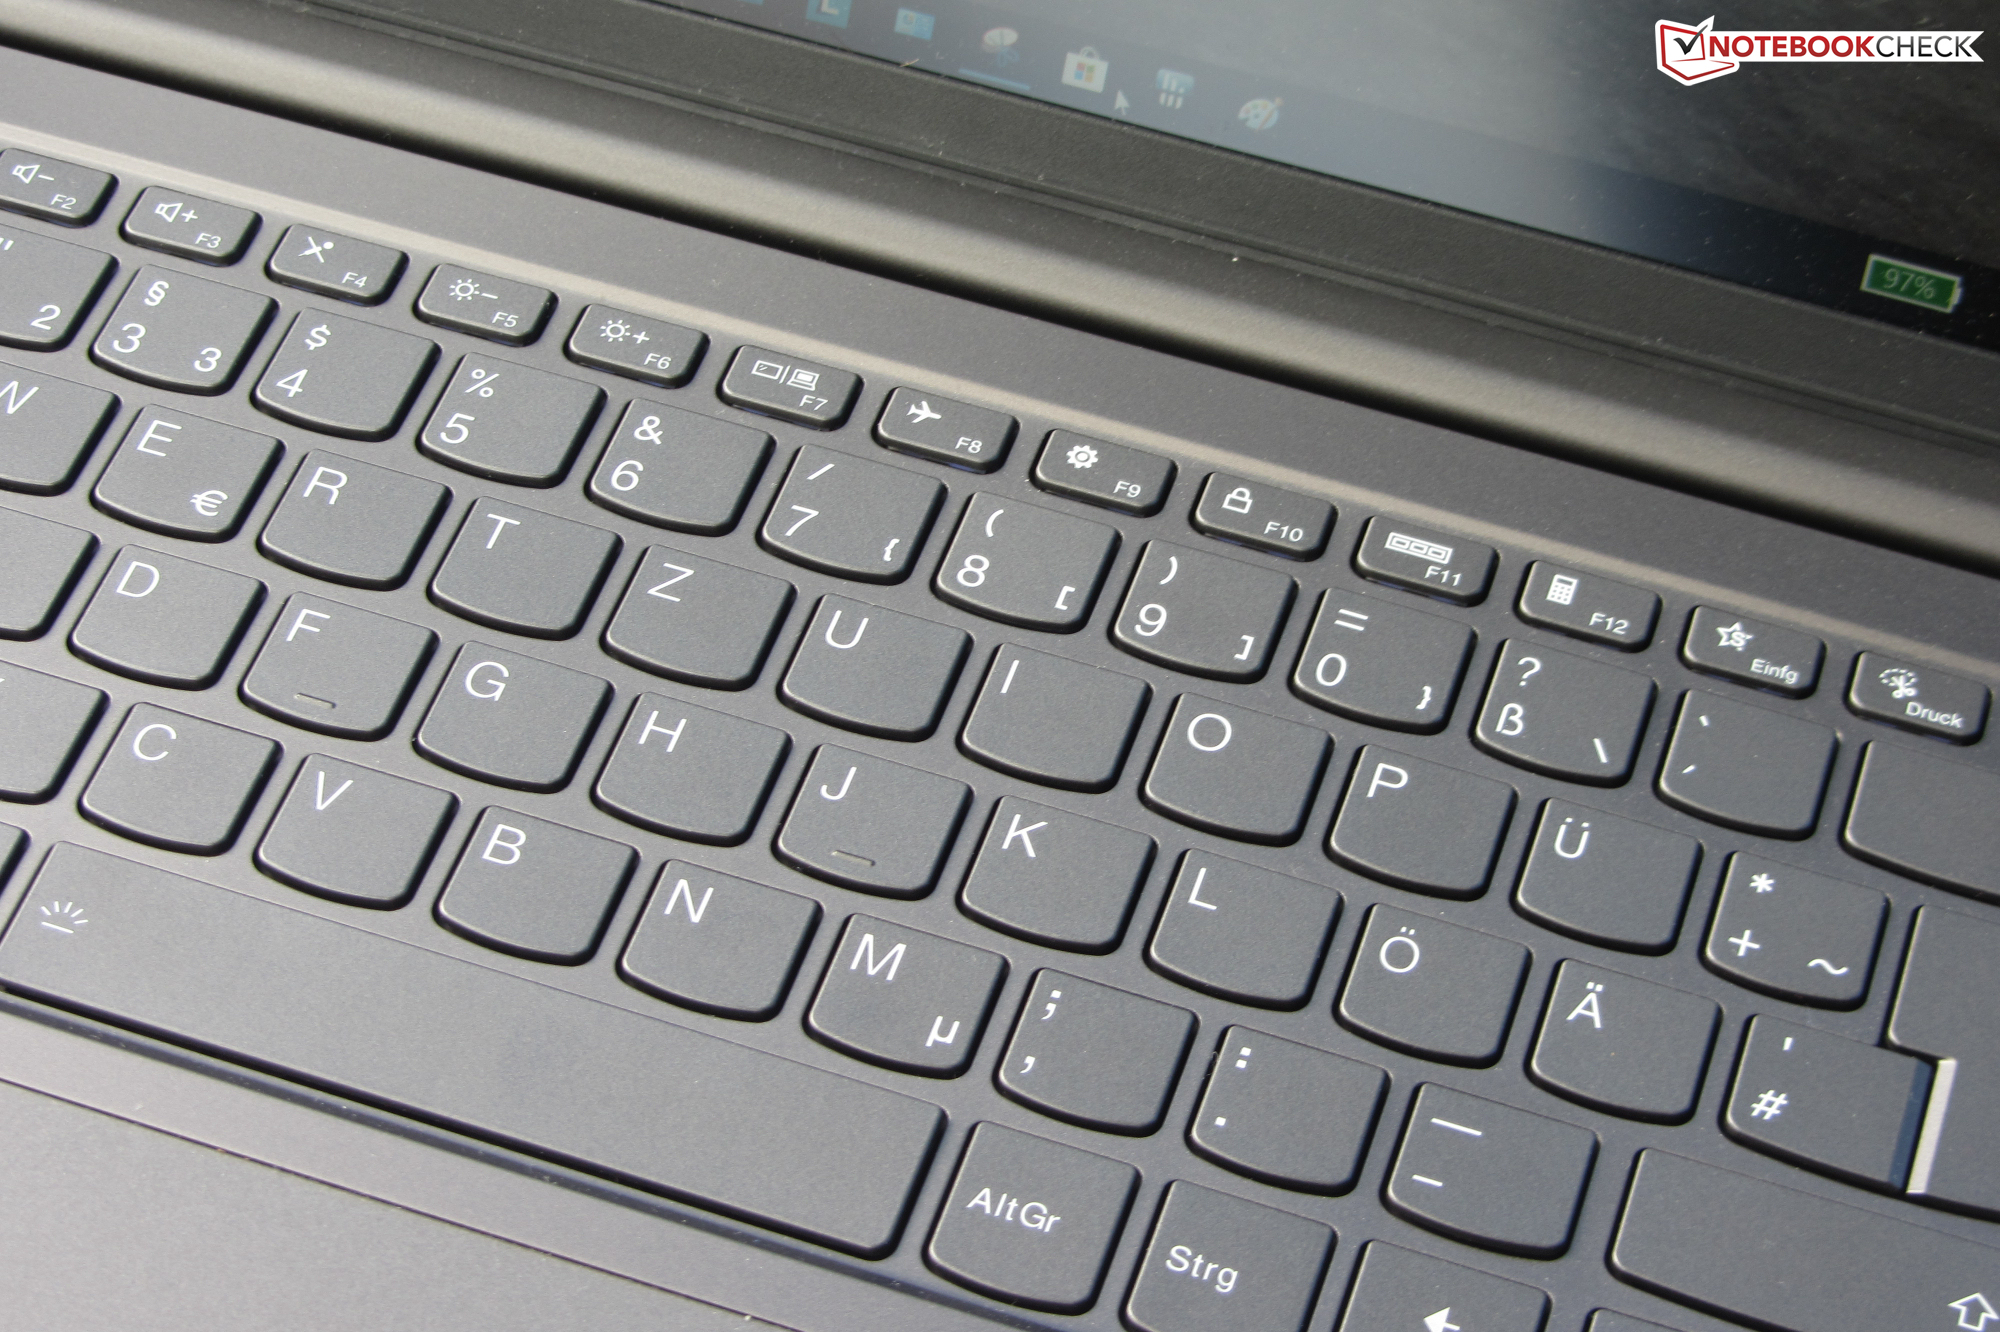
Input devices - Keyboard backlighting on board
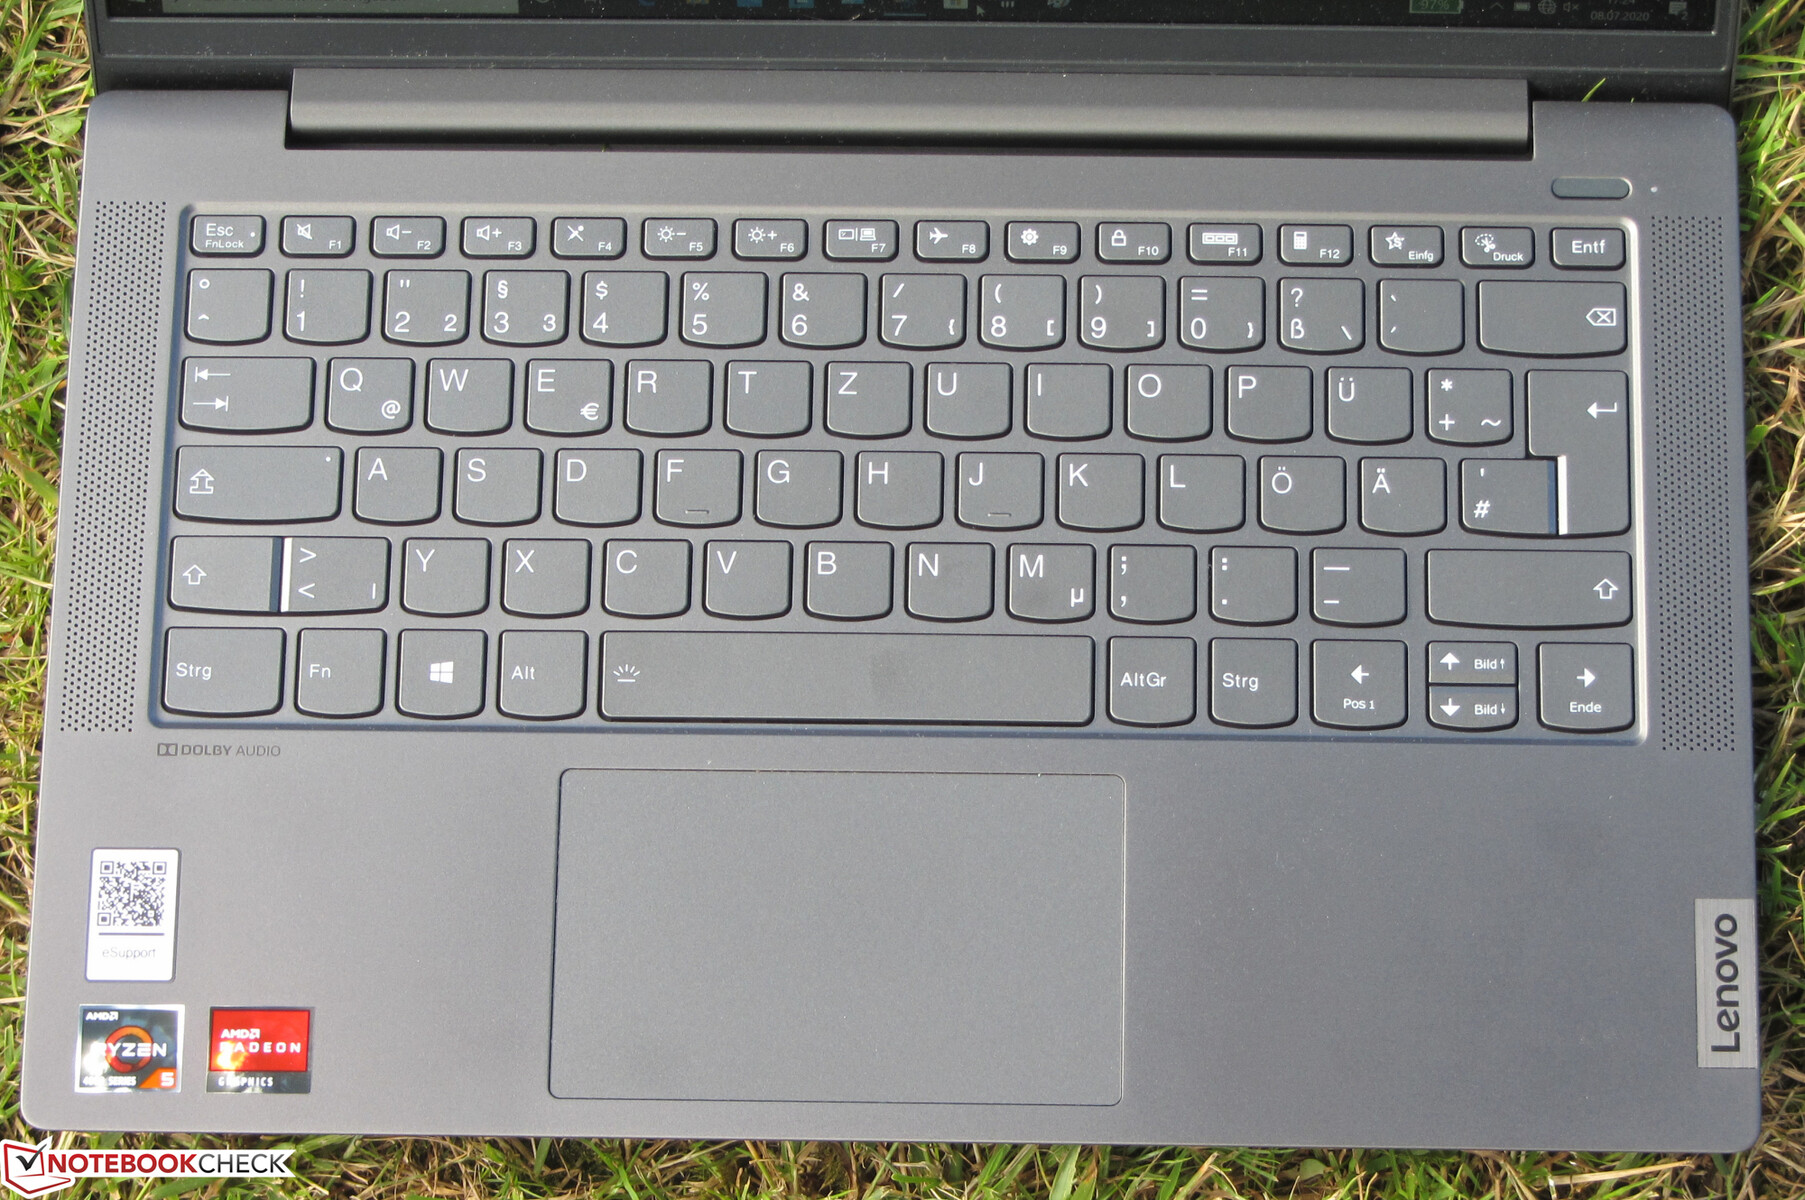
The flat keys of the backlit (two brightness levels) chiclet keyboard offer a short travel and a clear pressure point. We like the firm resistance provided by the keys. Moreover, the keyboard yields slightly during typing, but this hasn't proven to be annoying. Lenovo delivers a keyboard suitable for everyday use here, which is also suitable for regular typing tasks.
The multi-touch capable ClickPad takes up an area of about 10.5 x 6.3 cm (~4.1 x 2.5 in). The smooth pad surface makes it easy for fingers to glide. In addition, the pad also reacts to input in the corners. It has a short travel and a clear pressure point.
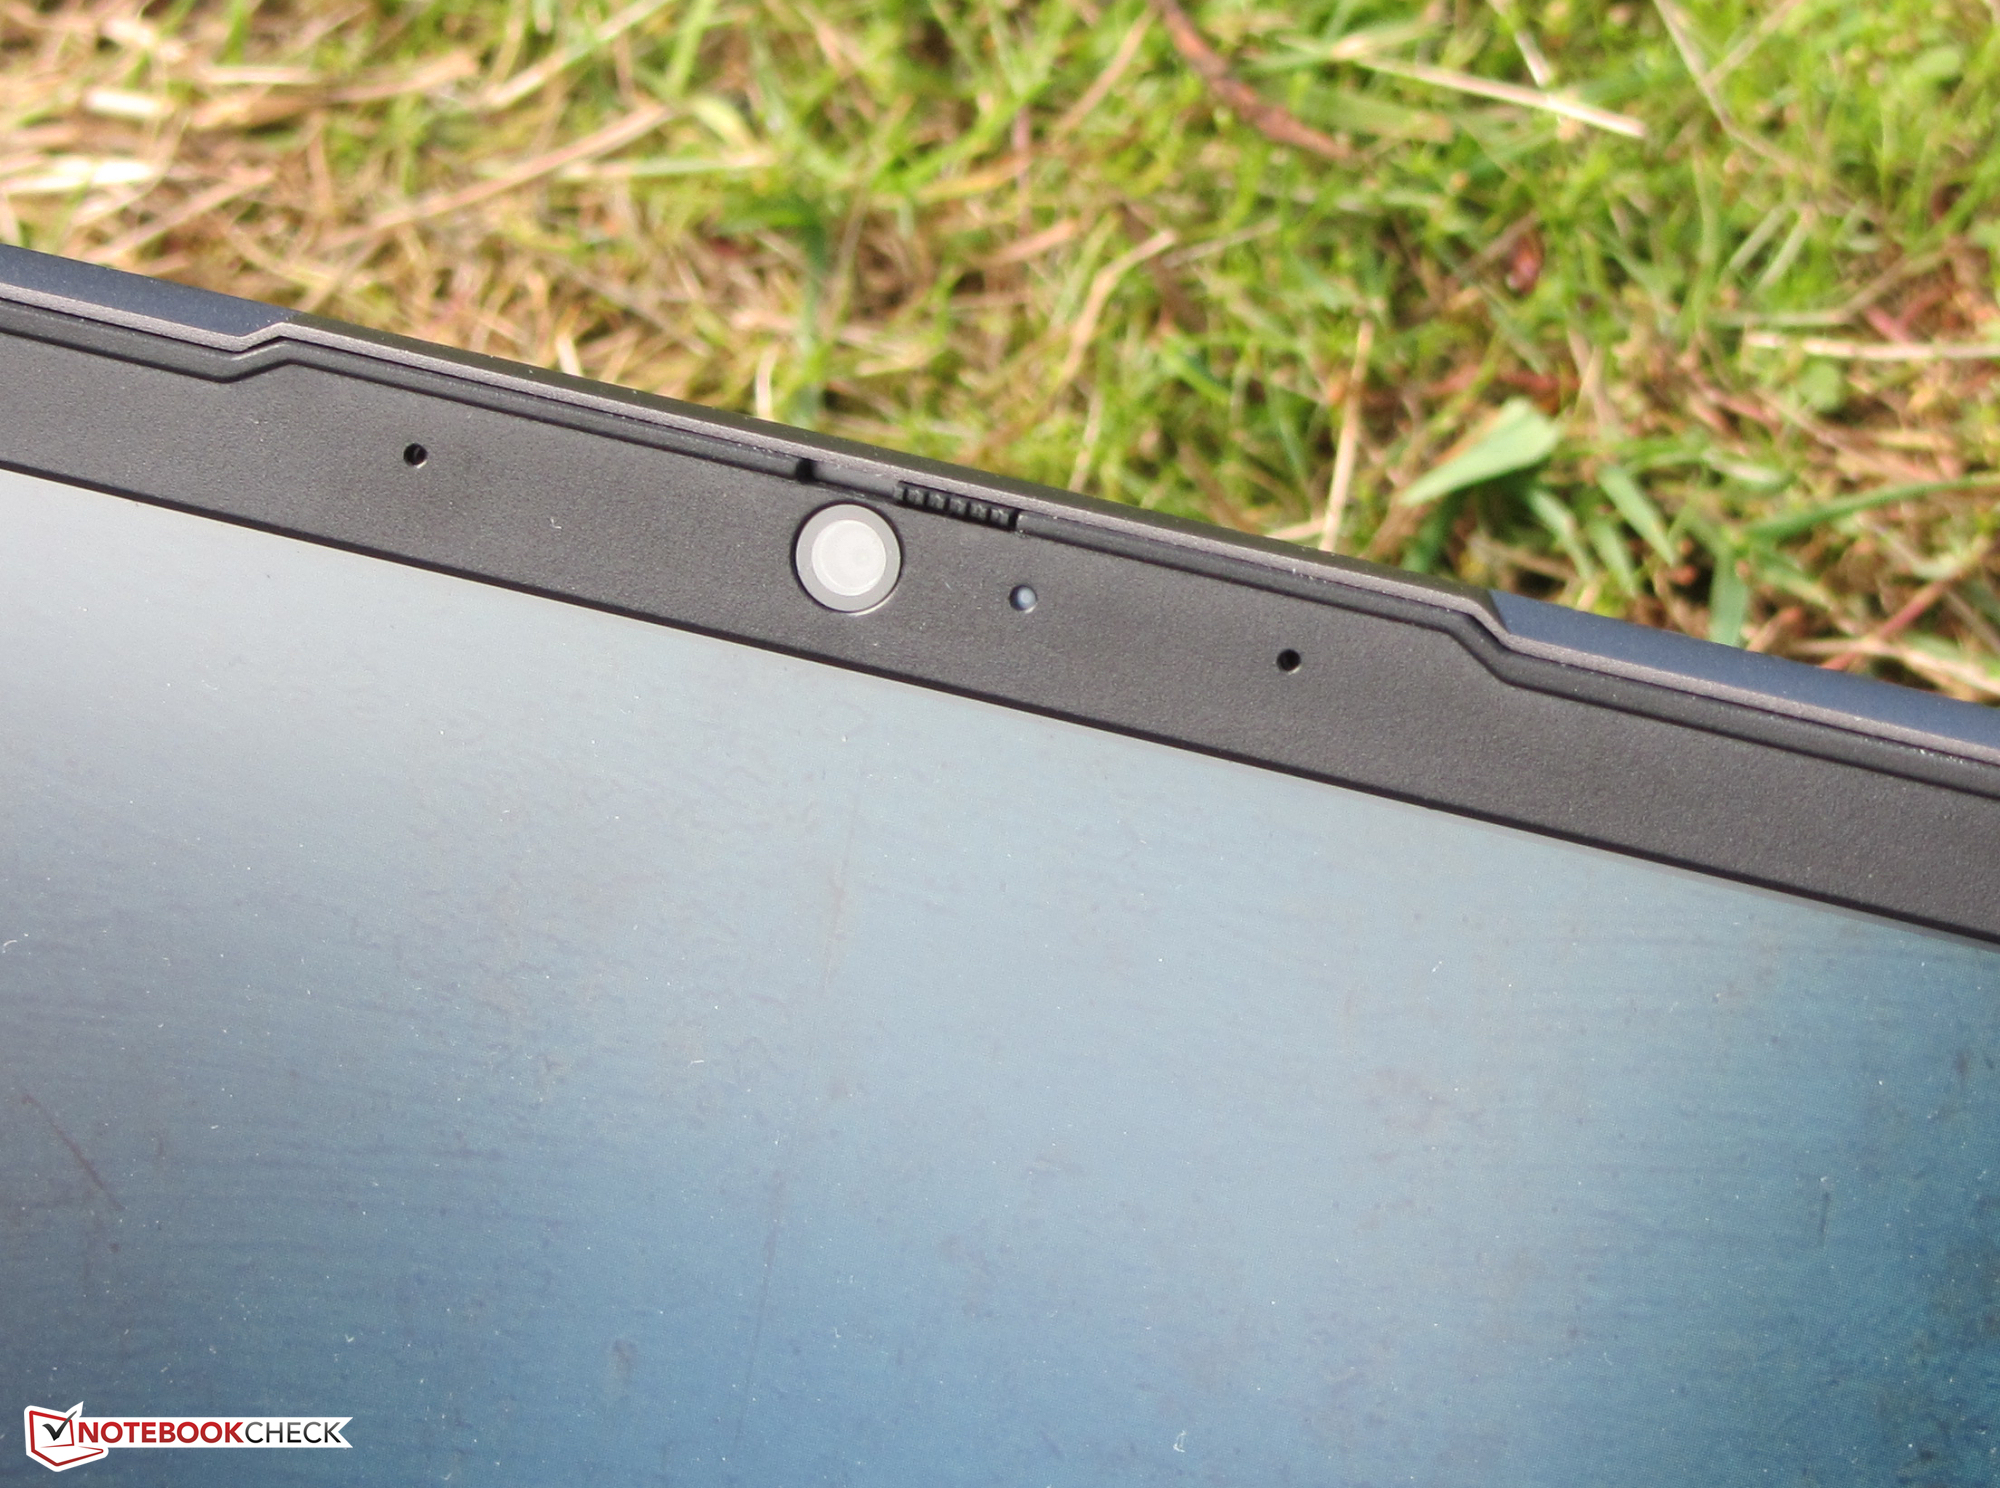
Display - IPS with low color-space coverage
The 14-inch matte display works at a native resolution of 1920x1080 pixels. It offers a good maximum brightness (317.4 cd/m²), but the contrast (878:1) is too low. We consider values beyond 1000:1 to be good. Positive: The display shows no PWM flickering.
| |||||||||||||||||||||||||
Brightness Distribution: 82 %
Center on Battery: 350 cd/m²
Contrast: 878:1 (Black: 0.41 cd/m²)
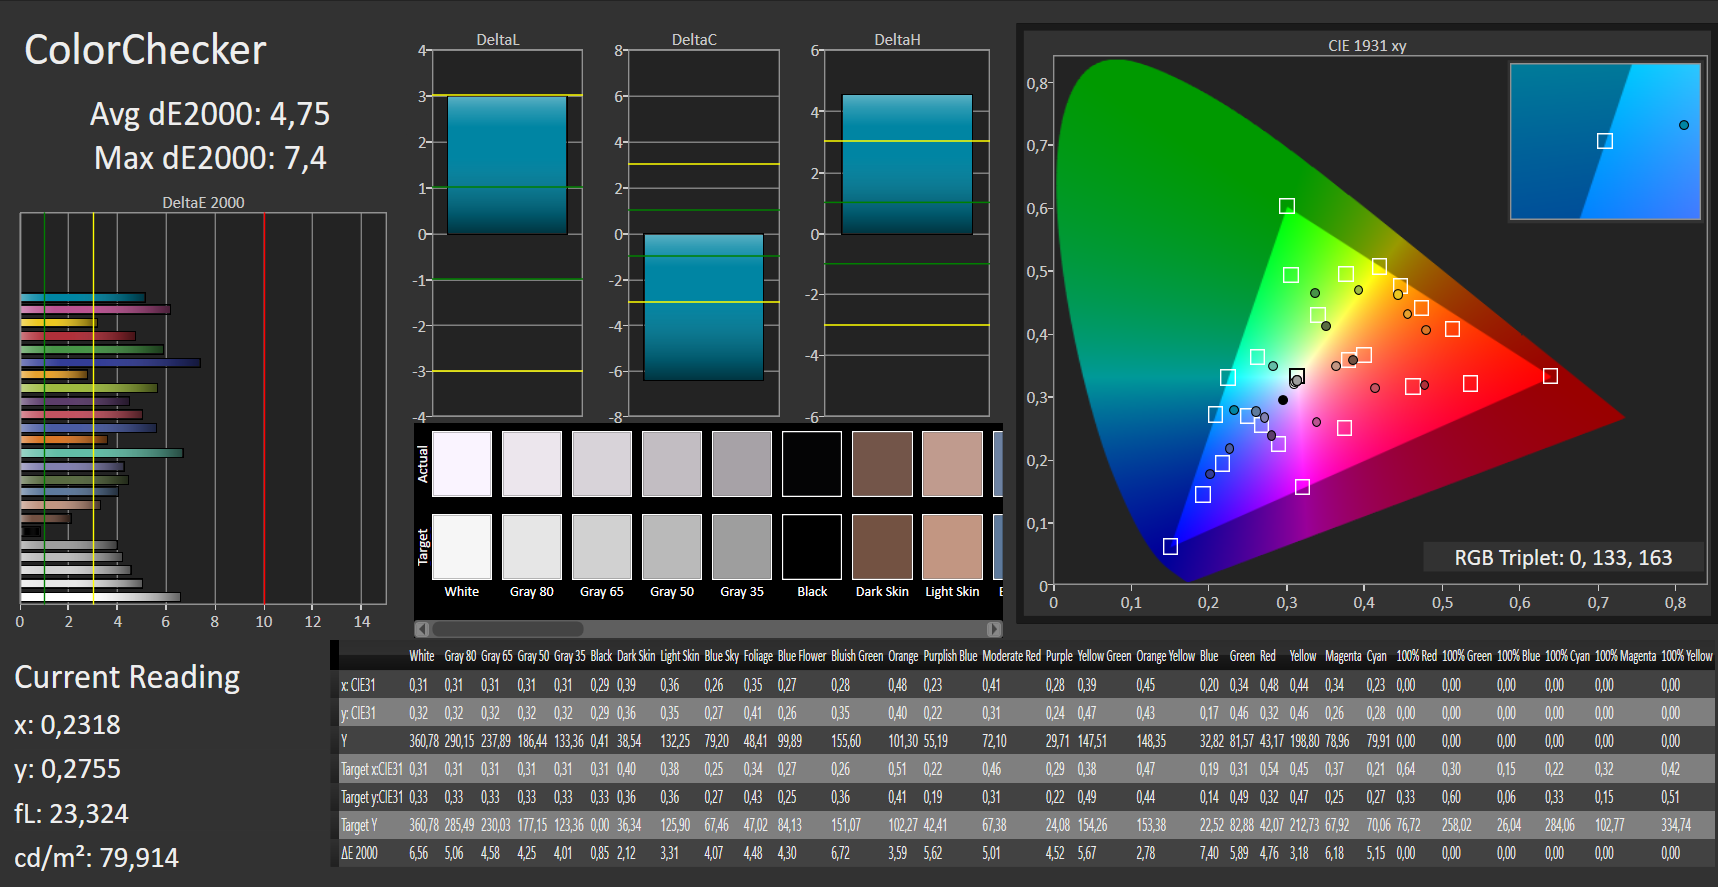
ΔE ColorChecker Calman: 4.75 | ∀{0.5-29.43 Ø4.74}
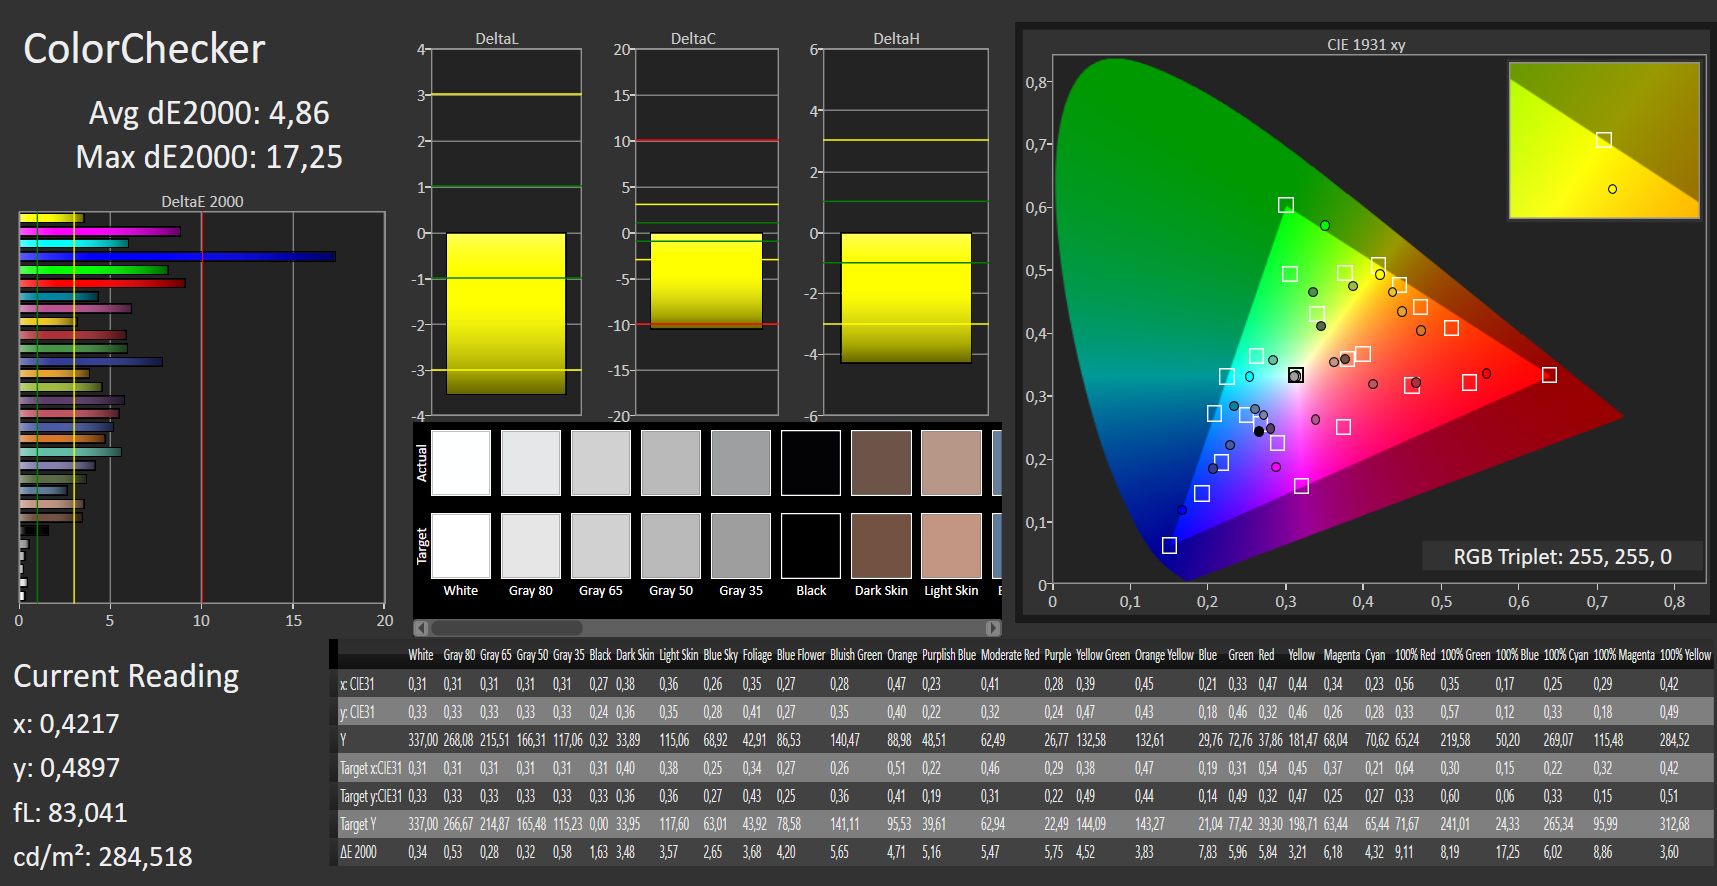
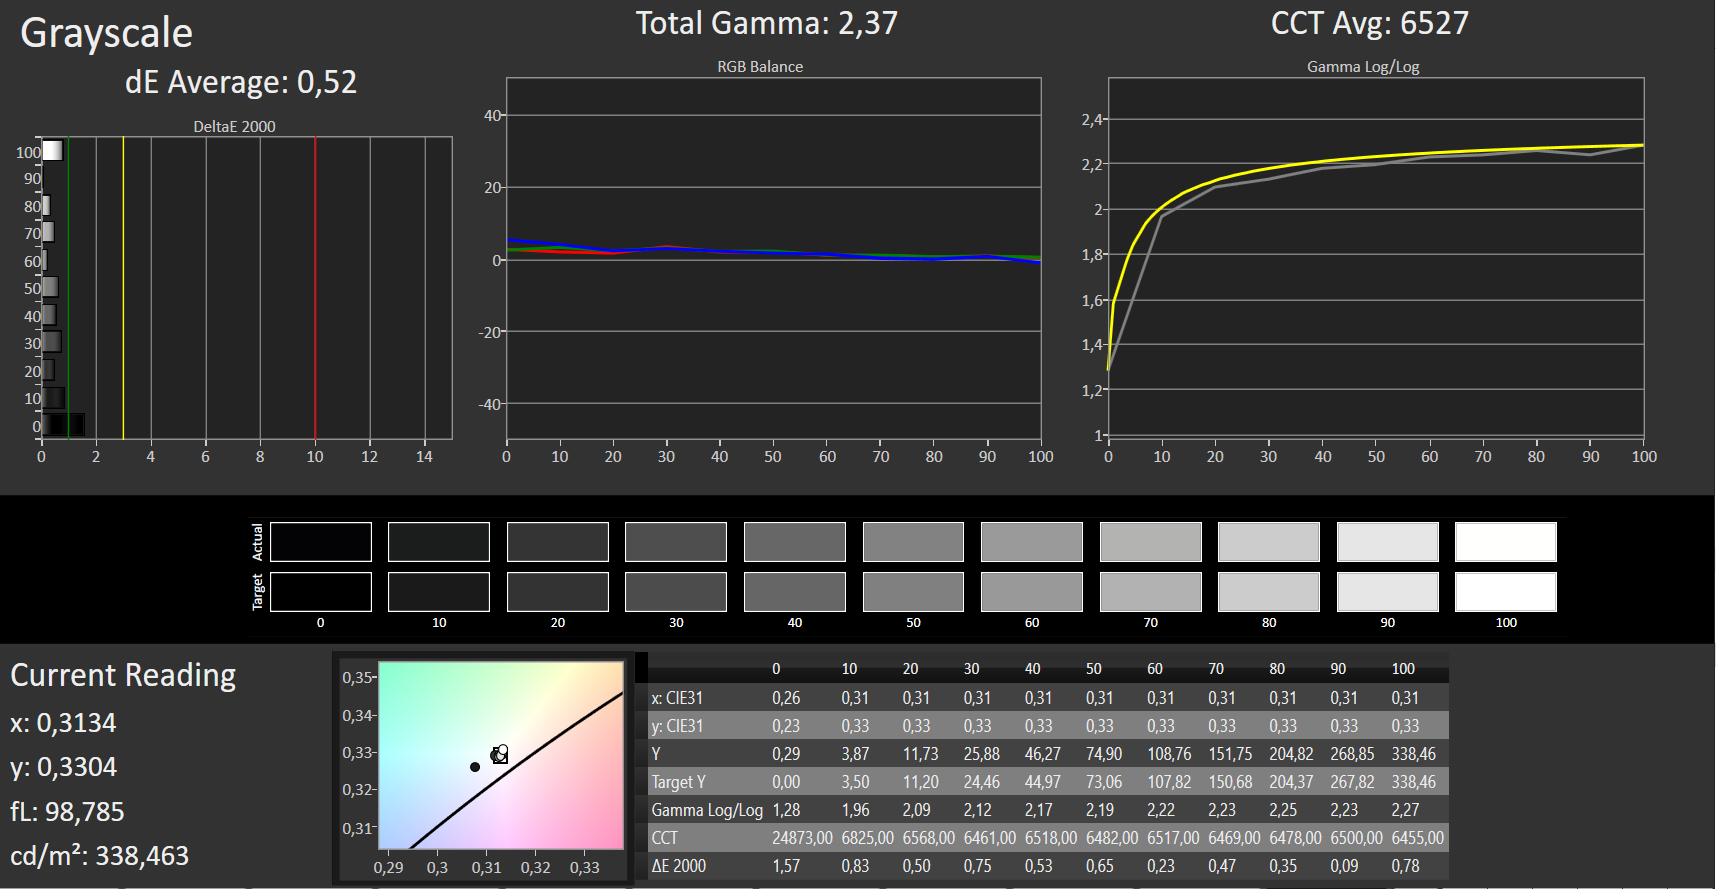
calibrated: 4.86
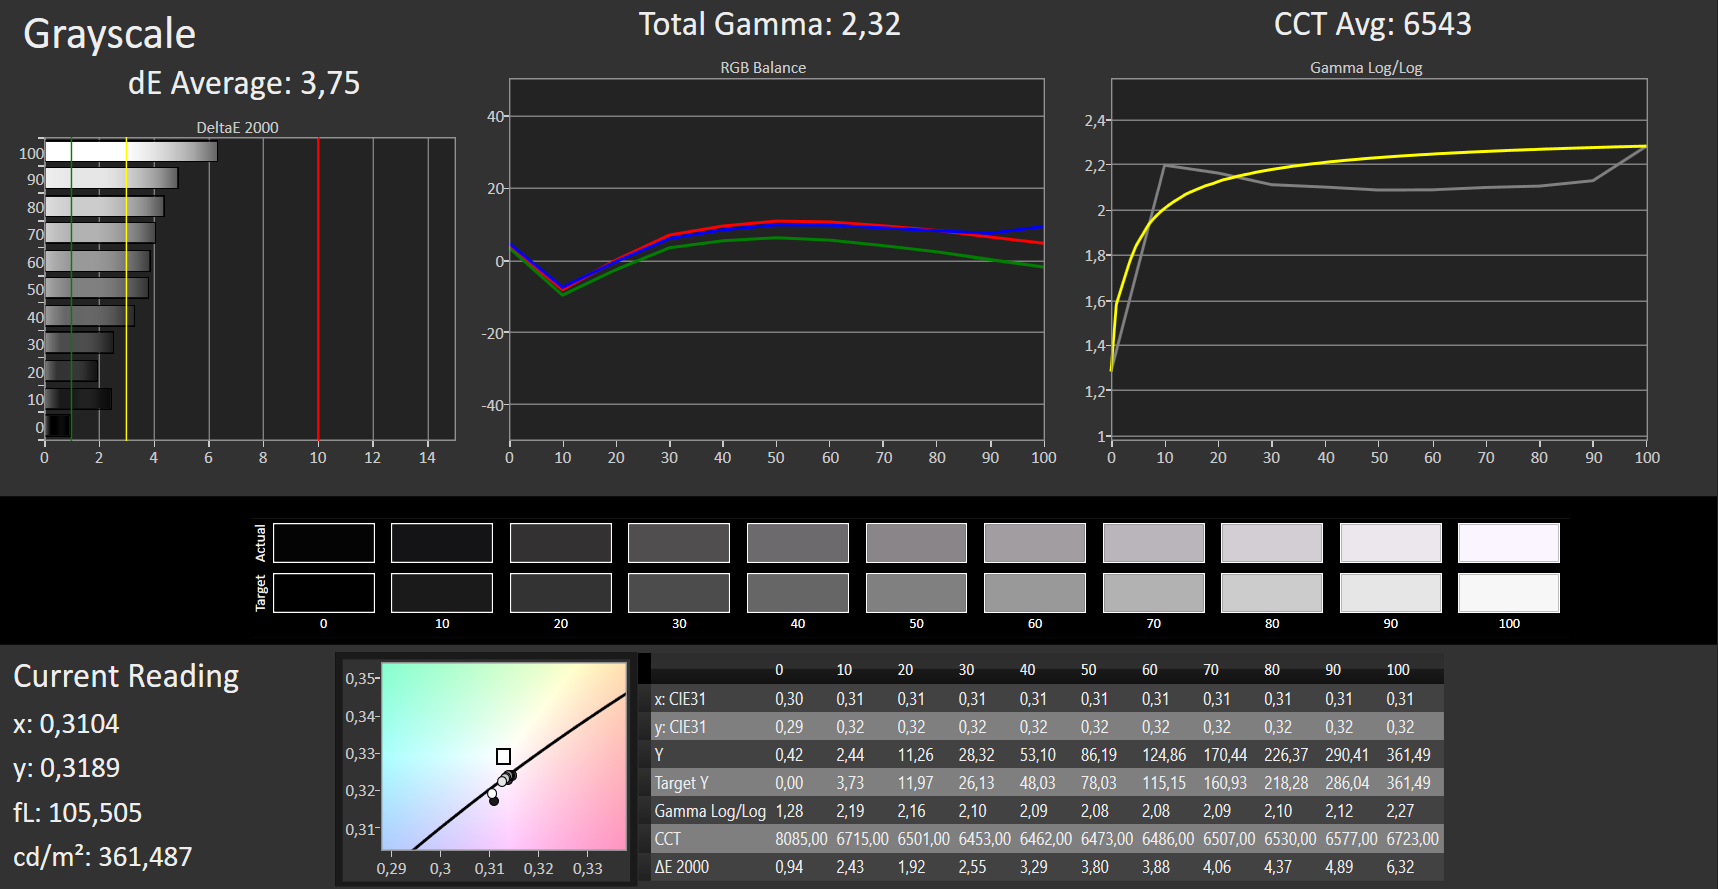
ΔE Greyscale Calman: 3.75 | ∀{0.09-98 Ø4.98}
56% sRGB (Argyll 1.6.3 3D)
36% AdobeRGB 1998 (Argyll 1.6.3 3D)
38.46% AdobeRGB 1998 (Argyll 3D)
55.9% sRGB (Argyll 3D)
37.23% Display P3 (Argyll 3D)
Gamma: 2.32
CCT: 6543 K
| Lenovo IdeaPad 5 14ARE05 AU Optronics B140HAN04.E, IPS, 1920x1080, 14" | Acer Swift 3 SF314-42-R27B AU Optronics B140HAN04.0, IPS, 1920x1080, 14" | HP 14s-dq1431ng AUO403D, IPS, 1920x1080, 14" | Honor Magicbook 14 BOE CQ TV140FHM-NH1, IPS, 1920x1080, 14" | Asus ZenBook 14 UM431DA-AM020T CEC PA LM140LF-3L03, IPS, 1920x1080, 14" | Dell Inspiron 14 3493-4KWCF Chi Mei 140HCA, IPS, 1920x1080, 14" | Lenovo IdeaPad S540-14IWL NV140FHM-N48, IPS, 1920x1080, 14" | |
|---|---|---|---|---|---|---|---|
| Display | 1% | 3% | 20% | 73% | 12% | 7% | |
| Display P3 Coverage (%) | 37.23 | 37.78 1% | 38.42 3% | 44.93 21% | 66.7 79% | 41.84 12% | 40.1 8% |
| sRGB Coverage (%) | 55.9 | 56.8 2% | 57.7 3% | 66.2 18% | 92.3 65% | 62.3 11% | 59.2 6% |
| AdobeRGB 1998 Coverage (%) | 38.46 | 39.03 1% | 39.71 3% | 46.42 21% | 67.5 76% | 43.33 13% | 41.43 8% |
| Response Times | -1% | 6% | -15% | 10% | -6% | -6% | |
| Response Time Grey 50% / Grey 80% * (ms) | 41 ? | 42 ? -2% | 41 ? -0% | 44.8 ? -9% | 36 ? 12% | 41 ? -0% | 39.6 ? 3% |
| Response Time Black / White * (ms) | 28 ? | 28 ? -0% | 25 ? 11% | 34 ? -21% | 26 ? 7% | 31 ? -11% | 32 ? -14% |
| PWM Frequency (Hz) | 5952 ? | 44 ? | 2500 ? | 352.1 ? | |||
| Screen | -8% | -2% | 4% | 2% | -10% | -6% | |
| Brightness middle (cd/m²) | 360 | 256 -29% | 305 -15% | 311 -14% | 253 -30% | 226 -37% | 316 -12% |
| Brightness (cd/m²) | 317 | 237 -25% | 264 -17% | 296 -7% | 245 -23% | 214 -32% | 301 -5% |
| Brightness Distribution (%) | 82 | 81 -1% | 81 -1% | 92 12% | 78 -5% | 92 12% | 88 7% |
| Black Level * (cd/m²) | 0.41 | 0.17 59% | 0.16 61% | 0.18 56% | 0.225 45% | 0.17 59% | 0.28 32% |
| Contrast (:1) | 878 | 1506 72% | 1906 117% | 1728 97% | 1124 28% | 1329 51% | 1129 29% |
| Colorchecker dE 2000 * | 4.75 | 5.43 -14% | 5.44 -15% | 5.3 -12% | 8.89 -87% | 5.21 -10% | 5.3 -12% |
| Colorchecker dE 2000 max. * | 7.4 | 19.73 -167% | 20.42 -176% | 18.5 -150% | 4.56 38% | 22.15 -199% | 18.5 -150% |
| Colorchecker dE 2000 calibrated * | 4.86 | 4.8 1% | 4.72 3% | 4.2 14% | 4.9 -1% | 4.43 9% | 4.8 1% |
| Greyscale dE 2000 * | 3.75 | 3.29 12% | 3.23 14% | 3.5 7% | 6.33 -69% | 3.27 13% | 2.4 36% |
| Gamma | 2.32 95% | 2.52 87% | 2.45 90% | 2.1 105% | 2.52 87% | 2.36 93% | 2.05 107% |
| CCT | 6543 99% | 6840 95% | 7035 92% | 7078 92% | 6745 96% | 6538 99% | 6644 98% |
| Color Space (Percent of AdobeRGB 1998) (%) | 36 | 36 0% | 37 3% | 42.5 18% | 60 67% | 40 11% | 37.6 4% |
| Color Space (Percent of sRGB) (%) | 56 | 57 2% | 58 4% | 65.8 18% | 91 63% | 62 11% | 58.3 4% |
| Total Average (Program / Settings) | -3% /
-6% | 2% /
-0% | 3% /
4% | 28% /
17% | -1% /
-5% | -2% /
-3% |
* ... smaller is better
Display Response Times
| ↔ Response Time Black to White | ||
|---|---|---|
| 28 ms ... rise ↗ and fall ↘ combined | ↗ 16 ms rise | 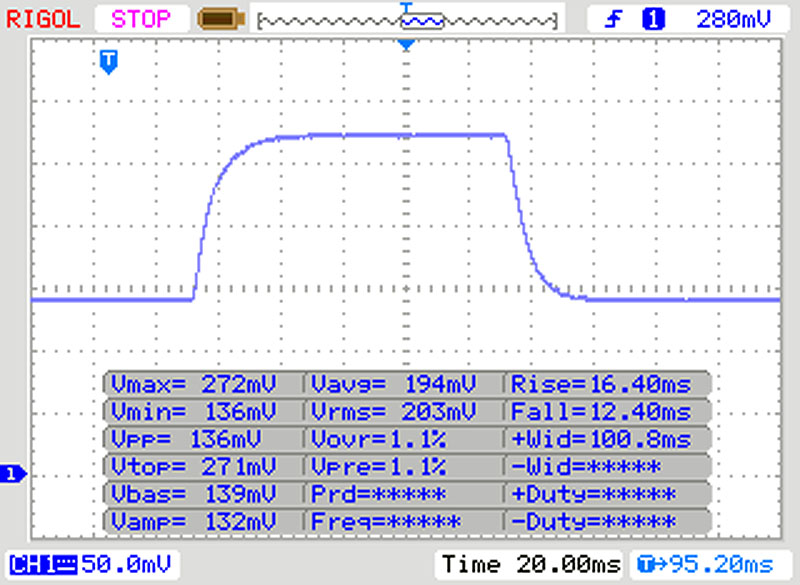 |
| ↘ 12 ms fall | ||
| The screen shows relatively slow response rates in our tests and may be too slow for gamers. In comparison, all tested devices range from 0.1 (minimum) to 240 (maximum) ms. » 71 % of all devices are better. This means that the measured response time is worse than the average of all tested devices (19.9 ms). | ||
| ↔ Response Time 50% Grey to 80% Grey | ||
| 41 ms ... rise ↗ and fall ↘ combined | ↗ 20 ms rise | 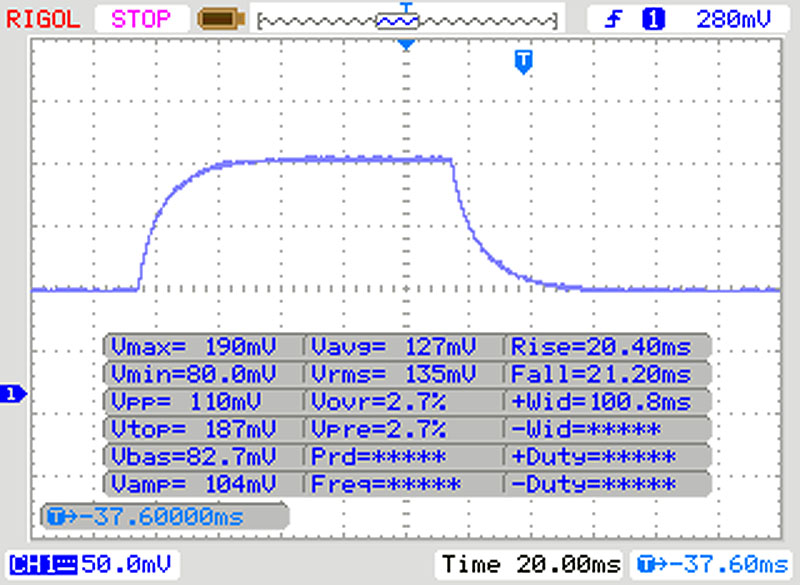 |
| ↘ 21 ms fall | ||
| The screen shows slow response rates in our tests and will be unsatisfactory for gamers. In comparison, all tested devices range from 0.165 (minimum) to 636 (maximum) ms. » 64 % of all devices are better. This means that the measured response time is worse than the average of all tested devices (31.2 ms). | ||
Screen Flickering / PWM (Pulse-Width Modulation)
| Screen flickering / PWM not detected |  | ||
In comparison: 52 % of all tested devices do not use PWM to dim the display. If PWM was detected, an average of 7857 (minimum: 5 - maximum: 343500) Hz was measured. | |||
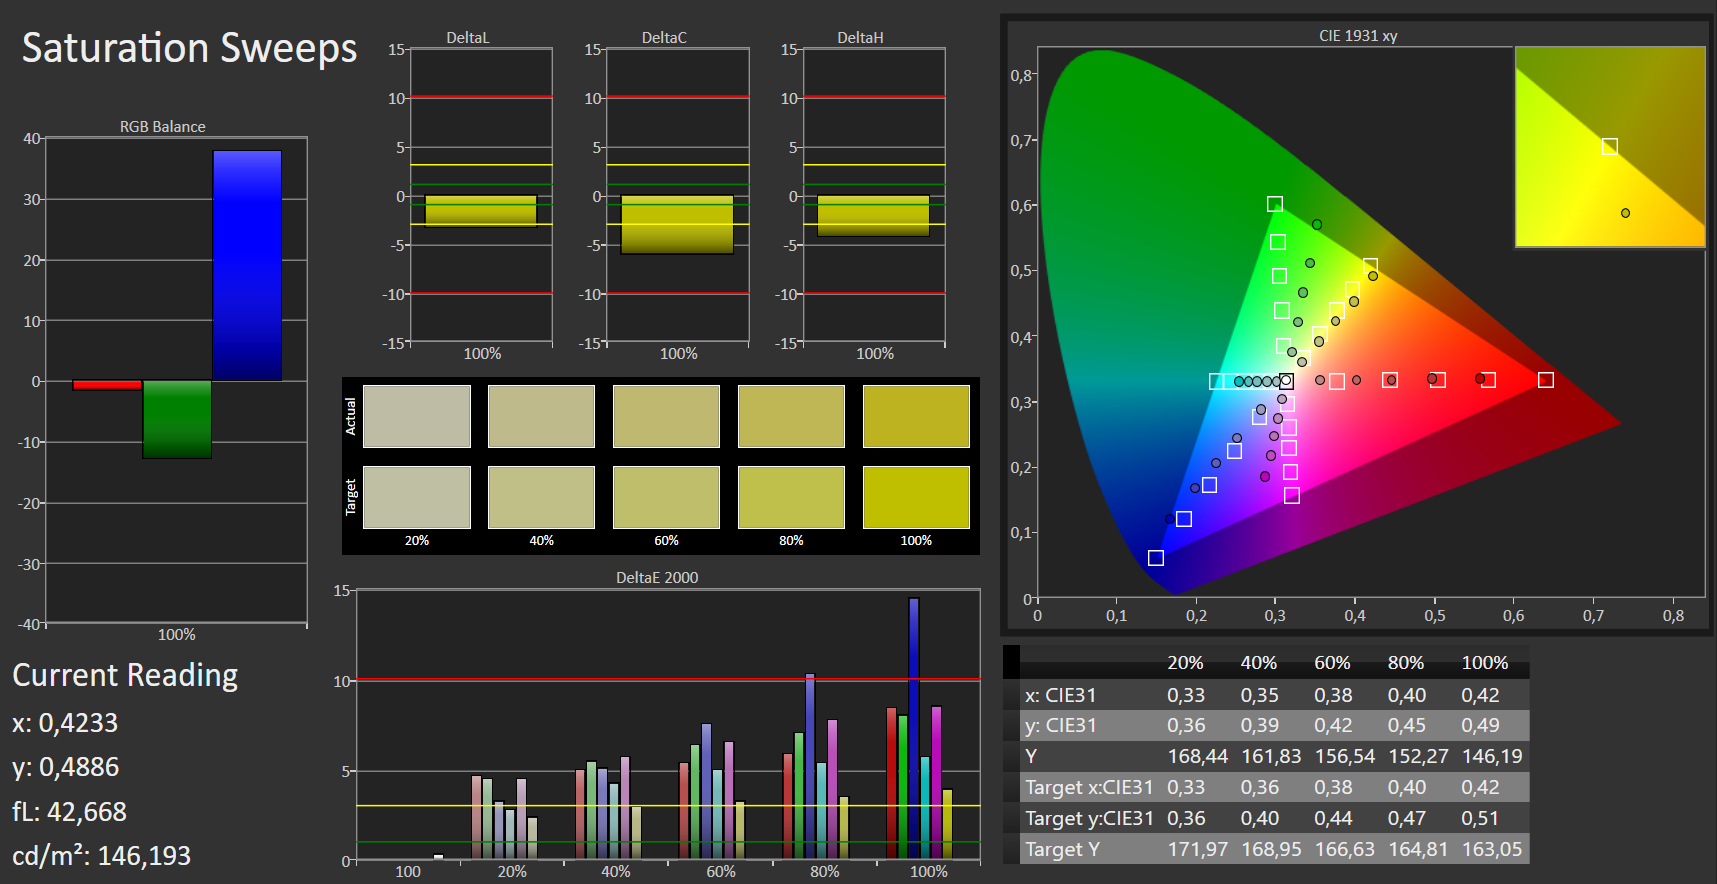
Out of the box, the display shows a quite decent color reproduction. But with a Delta E 2000 color deviation of almost 5, the target (Delta E less than 3) is missed. The display doesn't suffer from a blue tint. Moreover, only a minimal improvement in color reproduction can be reached through calibration. The AdobeRGB (36%) and sRGB (56%) color spaces aren't completely mapped.

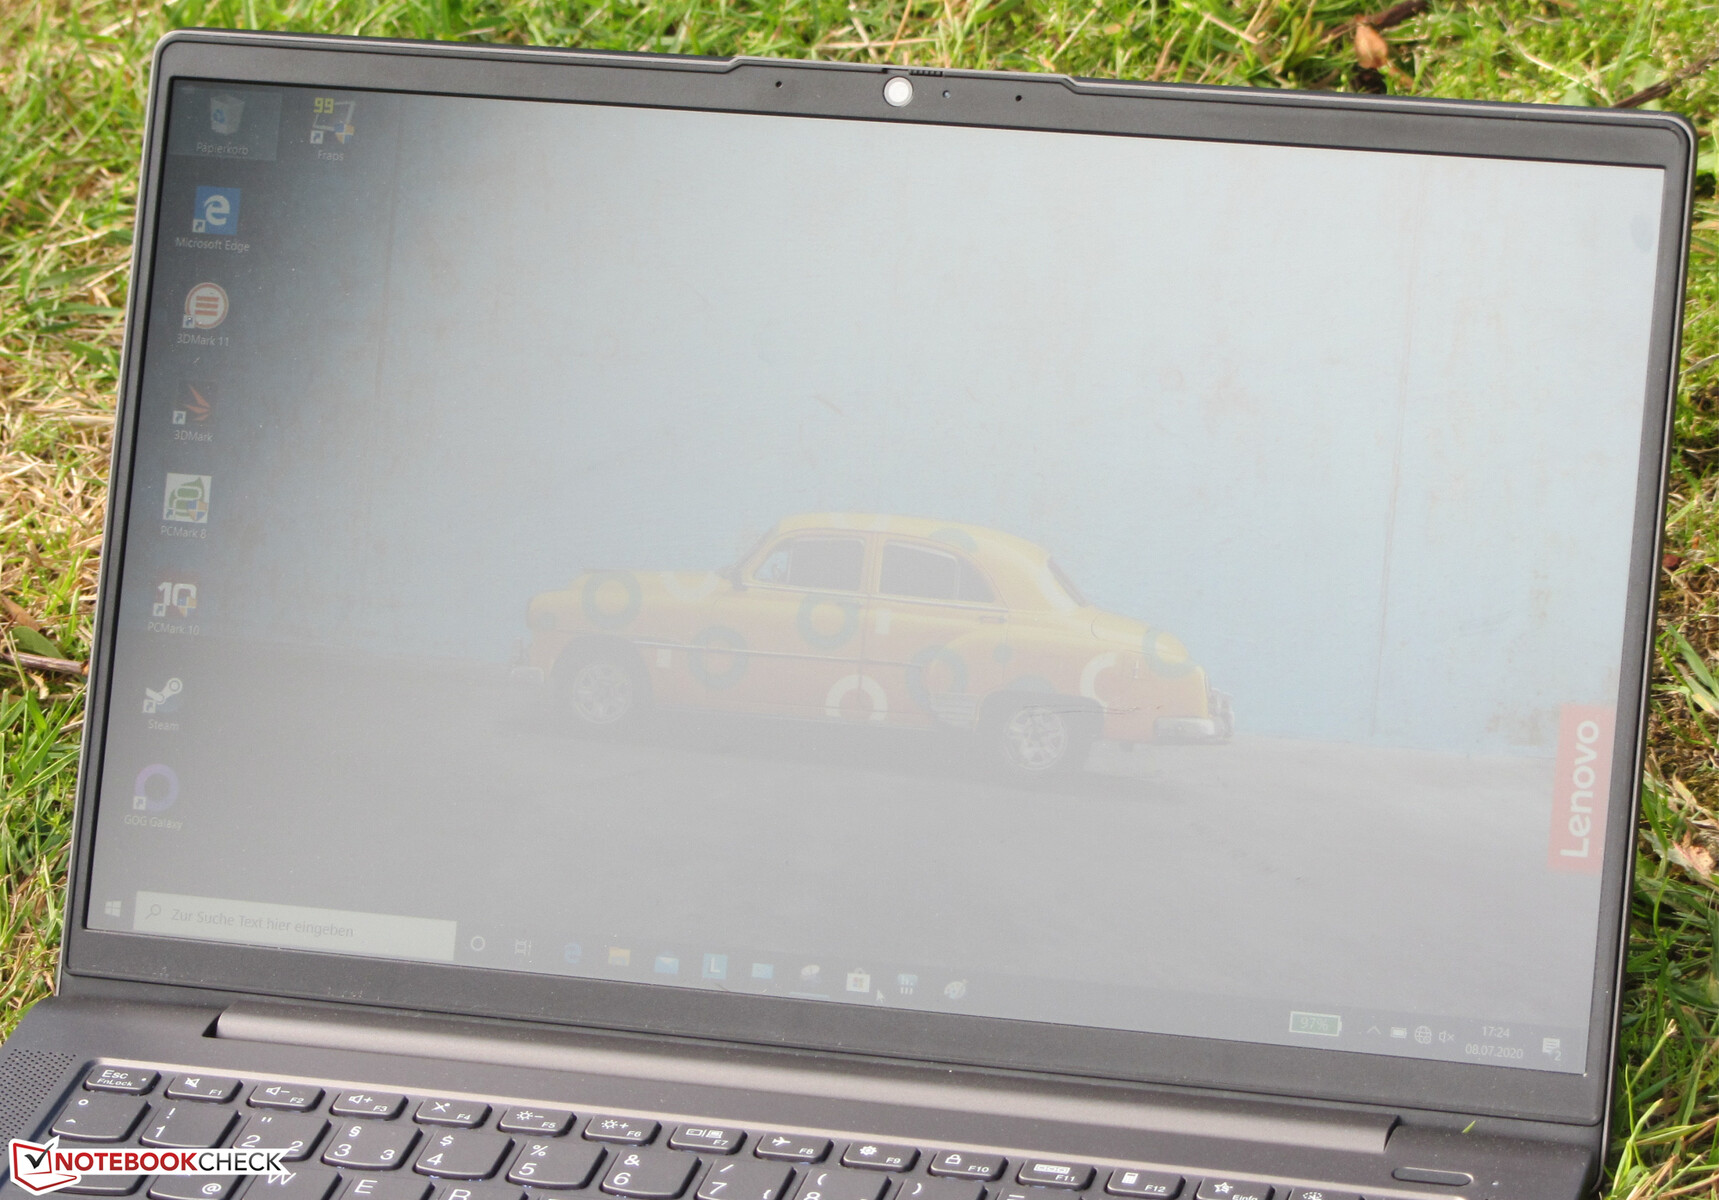
Lenovo equips the 14-incher with a viewing-angle-stable IPS panel. As a result, the screen can be used from any position. The display can definitely be read outdoors - if the sun doesn't shine too brightly.
Performance - Ryzen 5 with good performance development
With the IdeaPad 5 14ARE05, Lenovo has a 14-inch laptop in its product range that offers more than enough computing power for office and Internet applications. Our test device is available for about 650 Euros (~$743). In addition, other configuration variants are available.
Test conditions
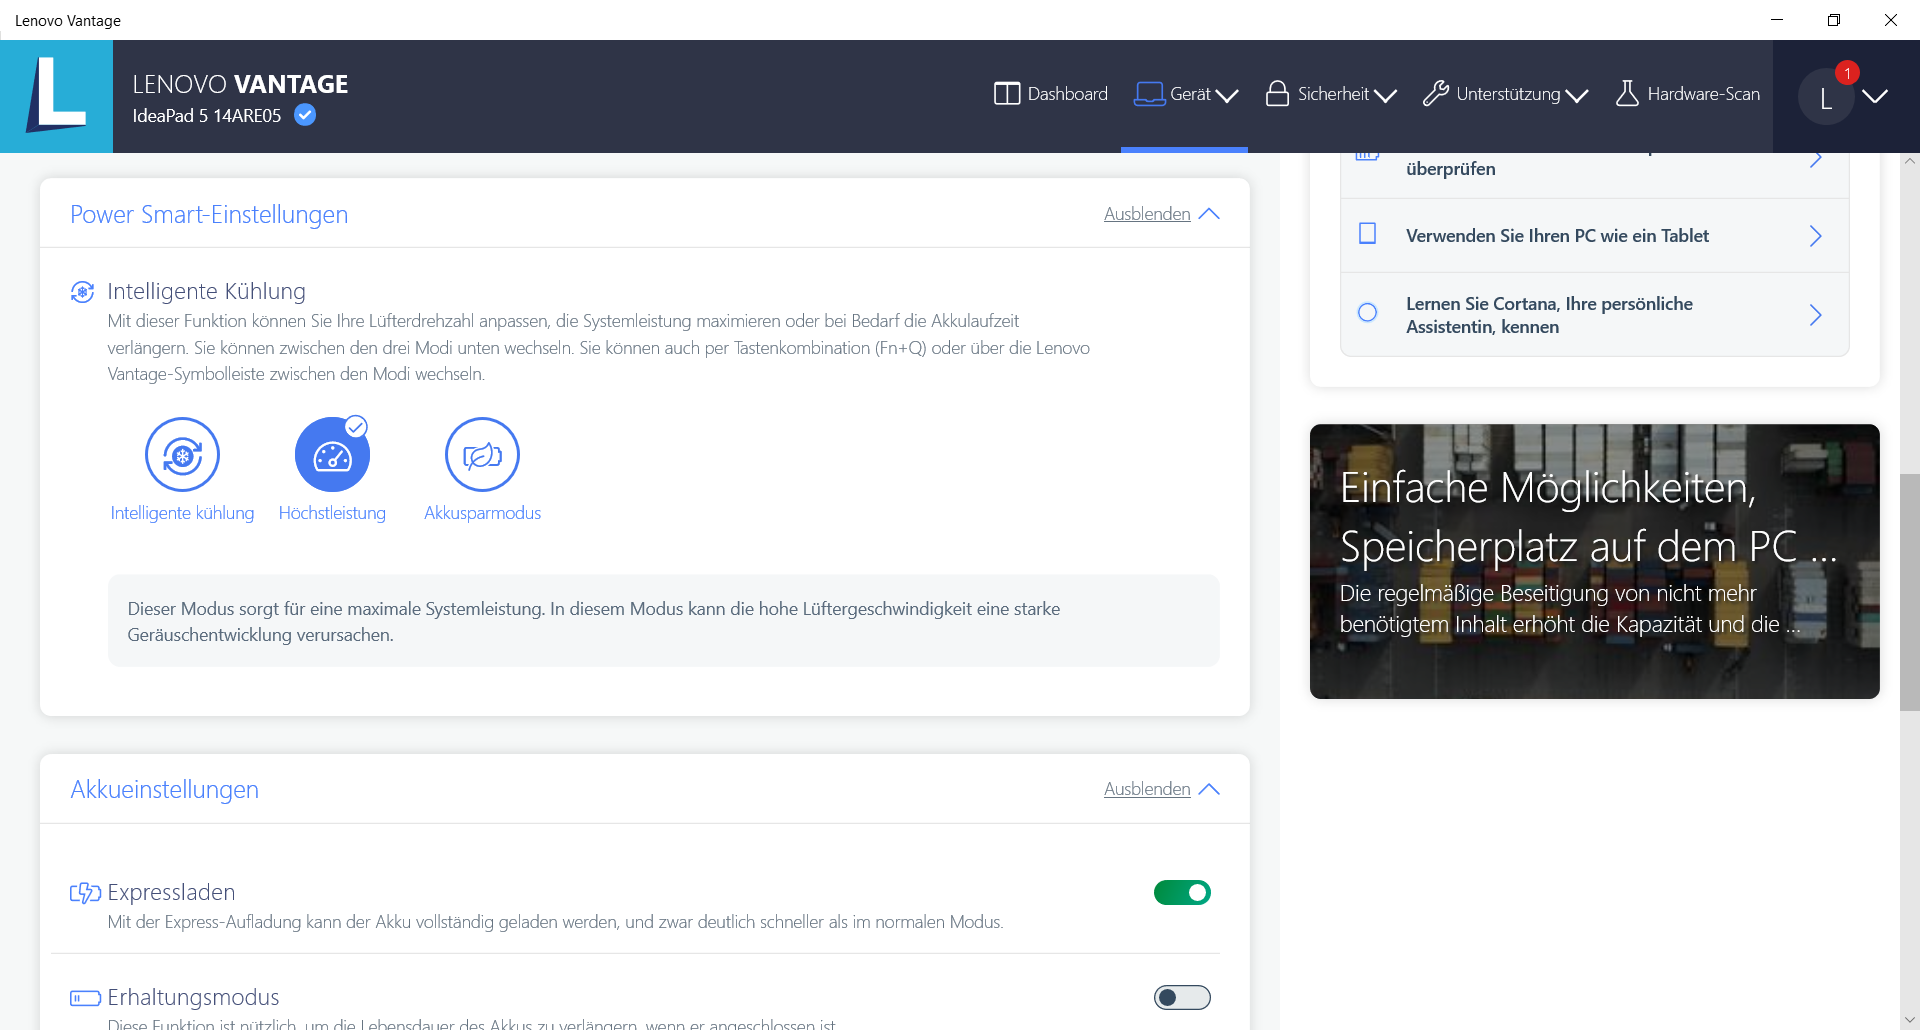
The preinstalled Lenovo Vantage software allows the selection of a performance mode. We conducted our test with the "High Performance" mode active. We also ran some benchmarks under all three modes; we will point this out at the appropriate places.
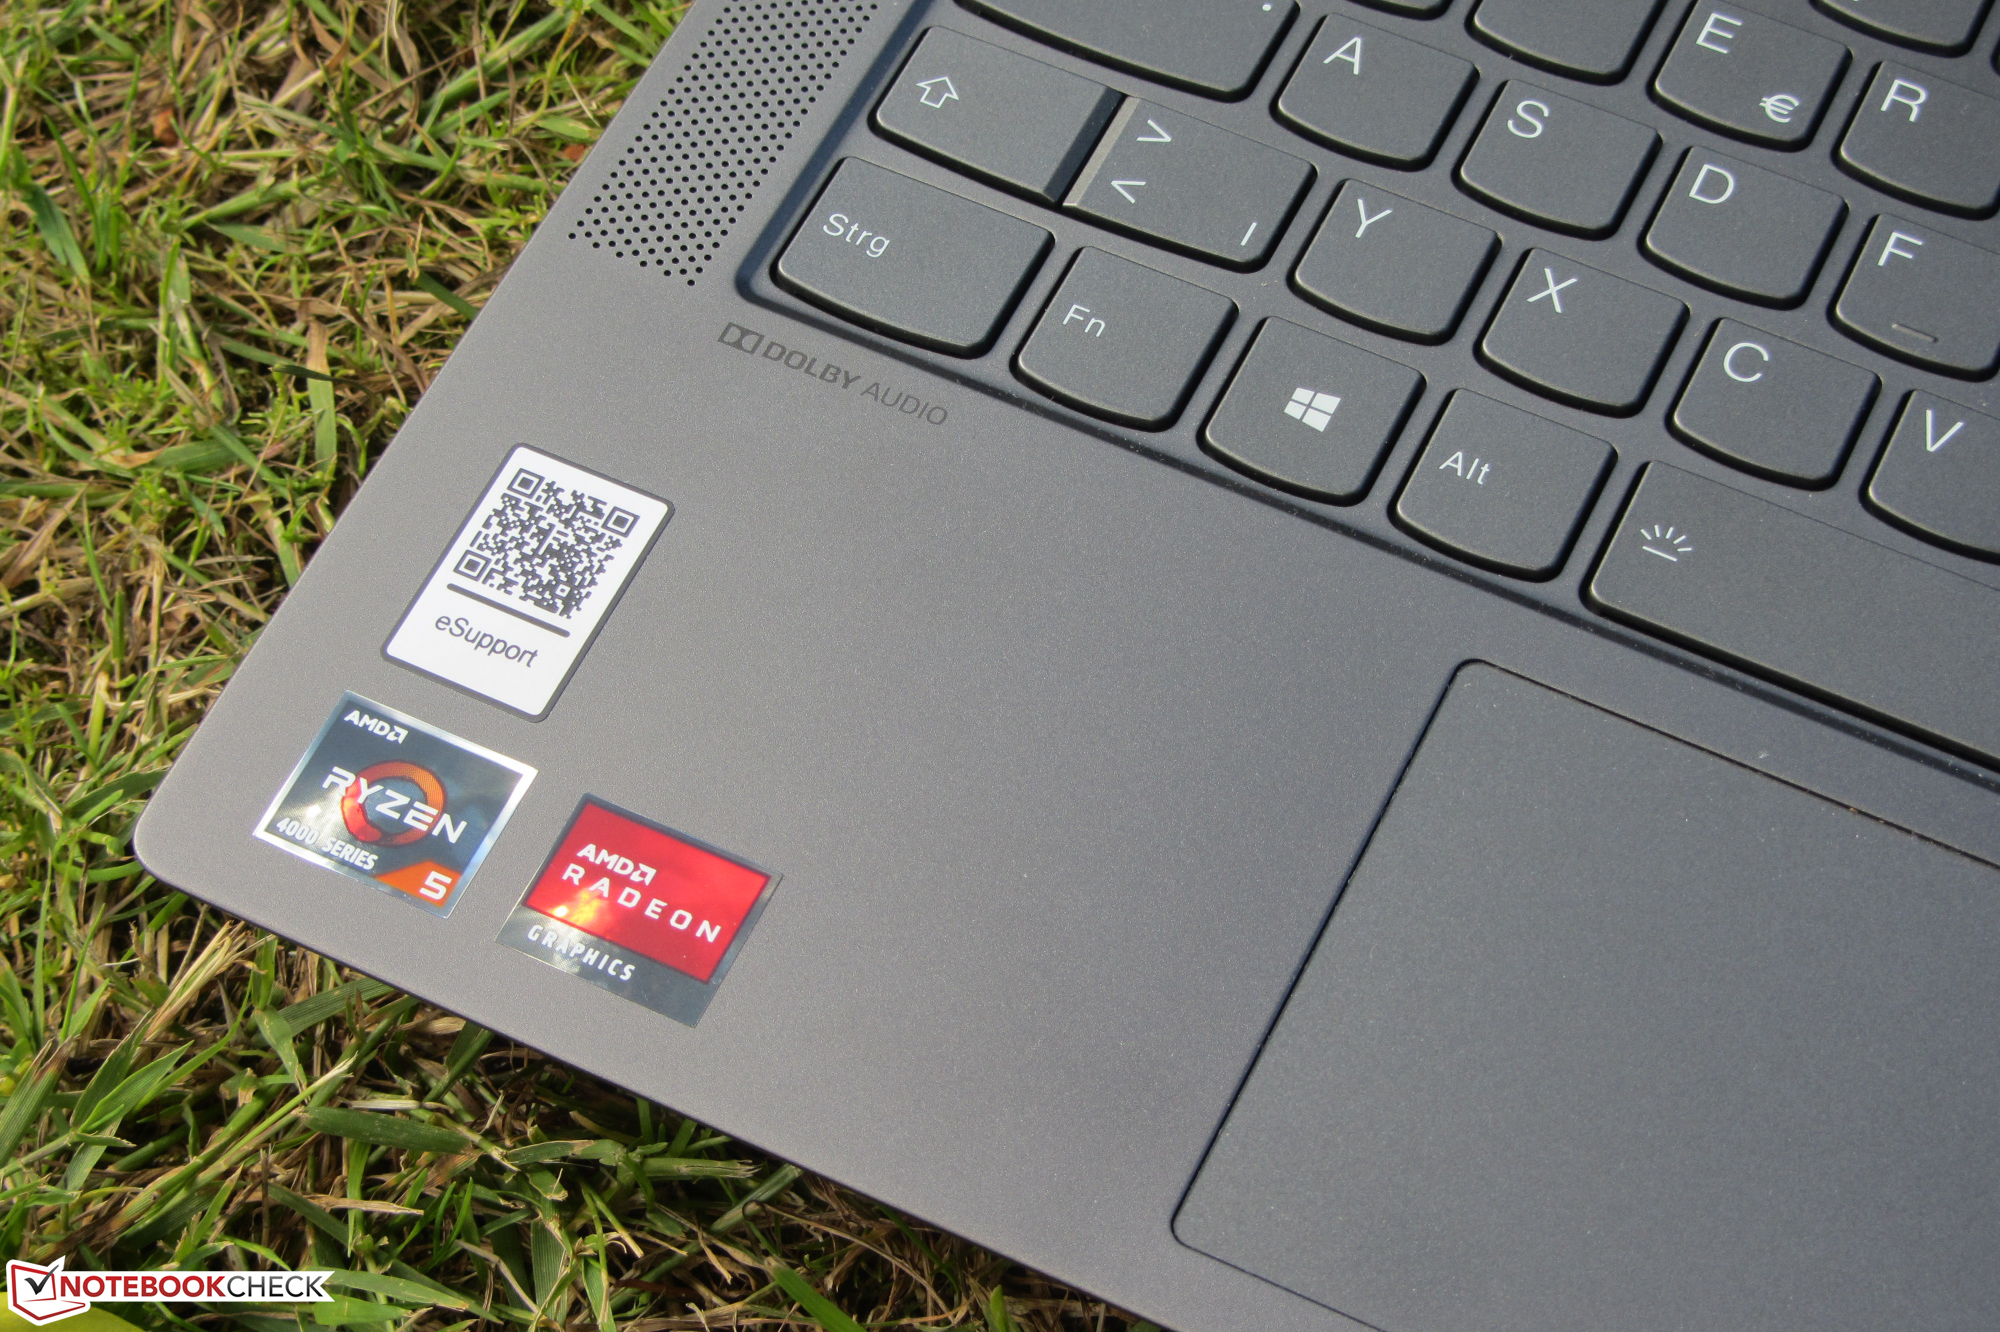
Processor
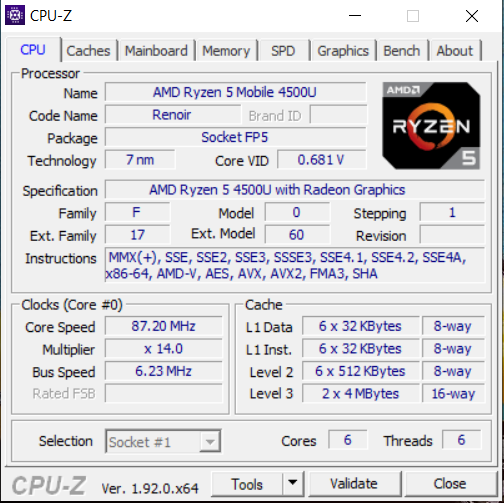
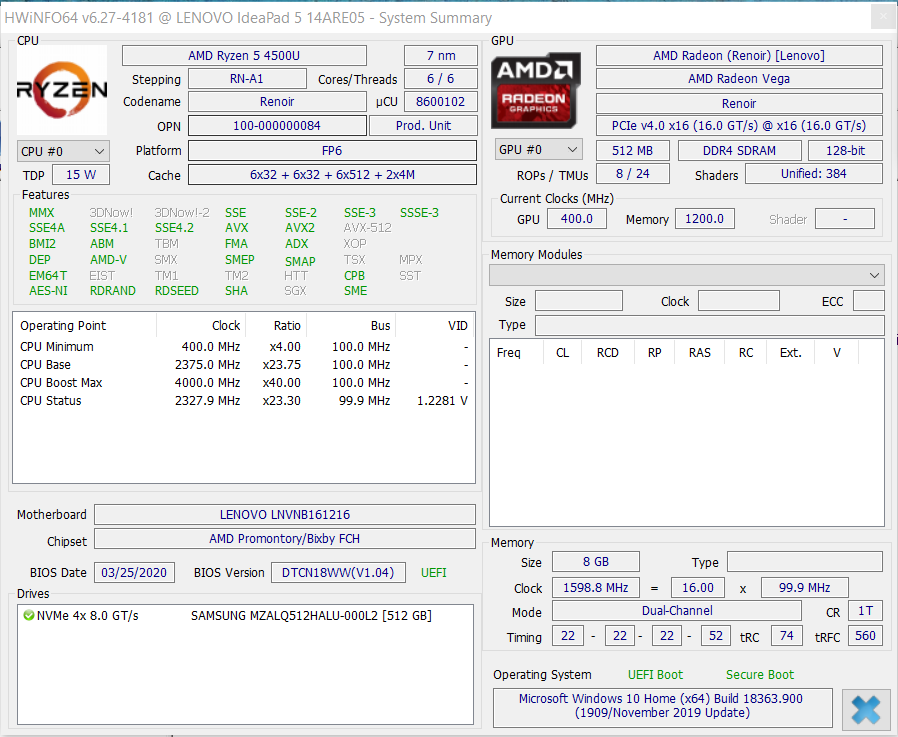
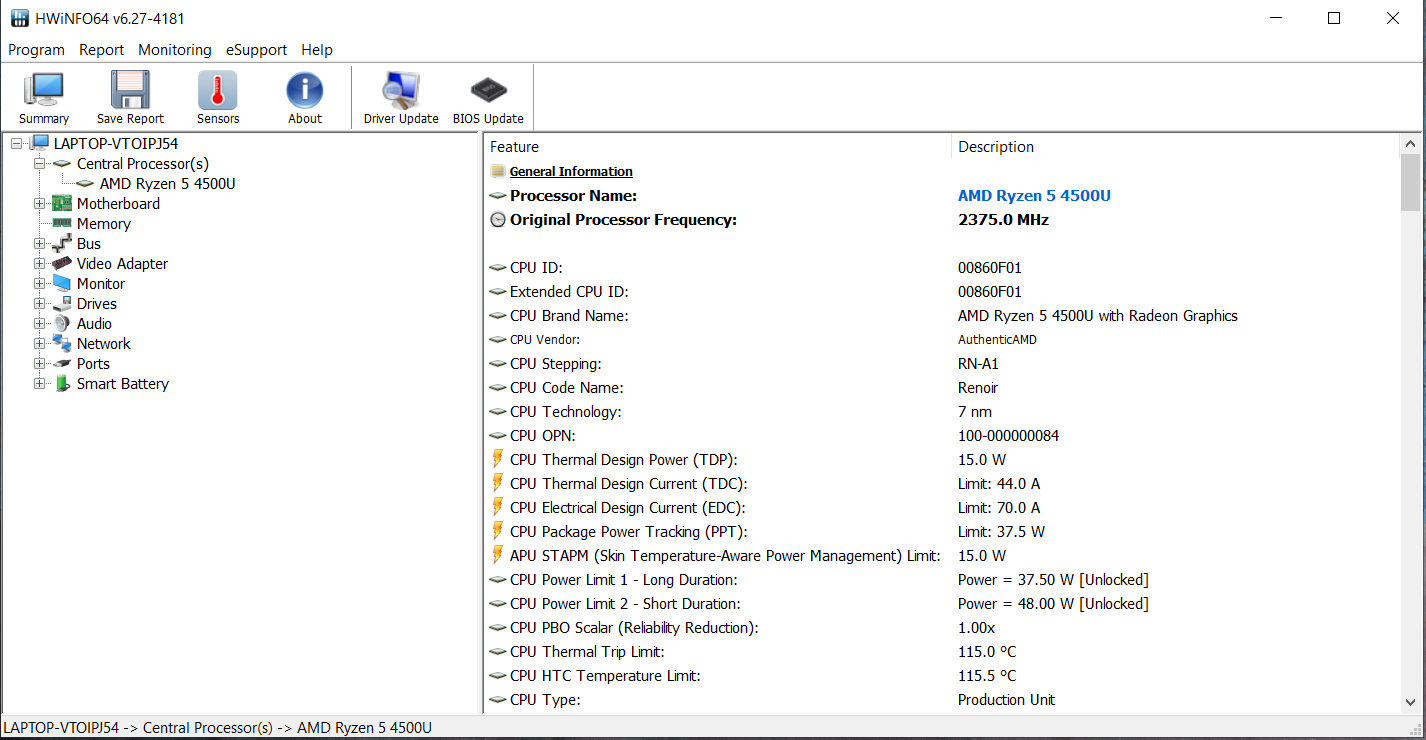
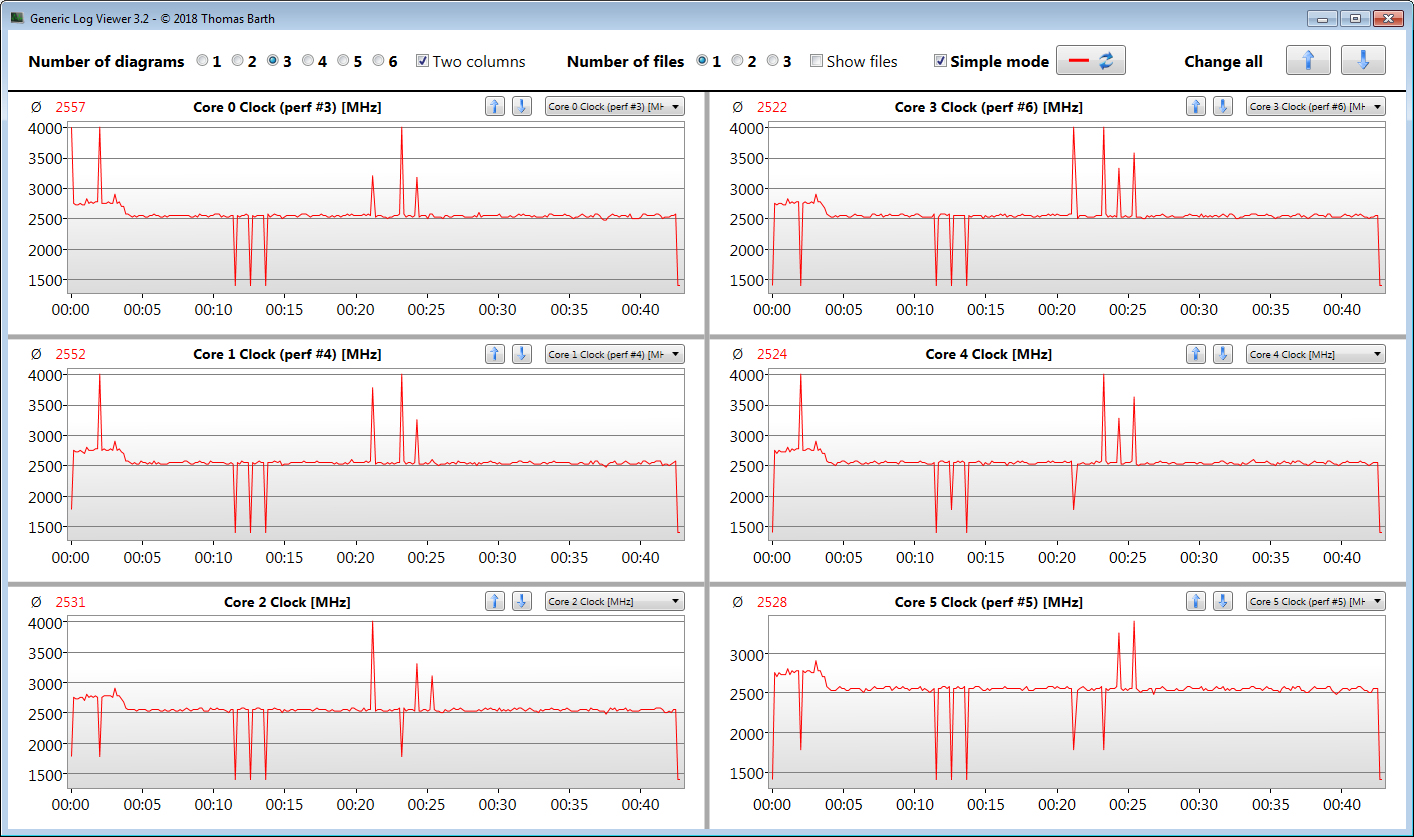
The IdeaPad is powered by a Ryzen 5 4500U (Renoir) APU. The CPU part of the APU consists of a hexa-core processor that operates at a base speed of 2.3 GHz. Turbo can be used to increase the speed up to 4 GHz. Simultaneous multithreading (two threads can be processed per core) is not supported.
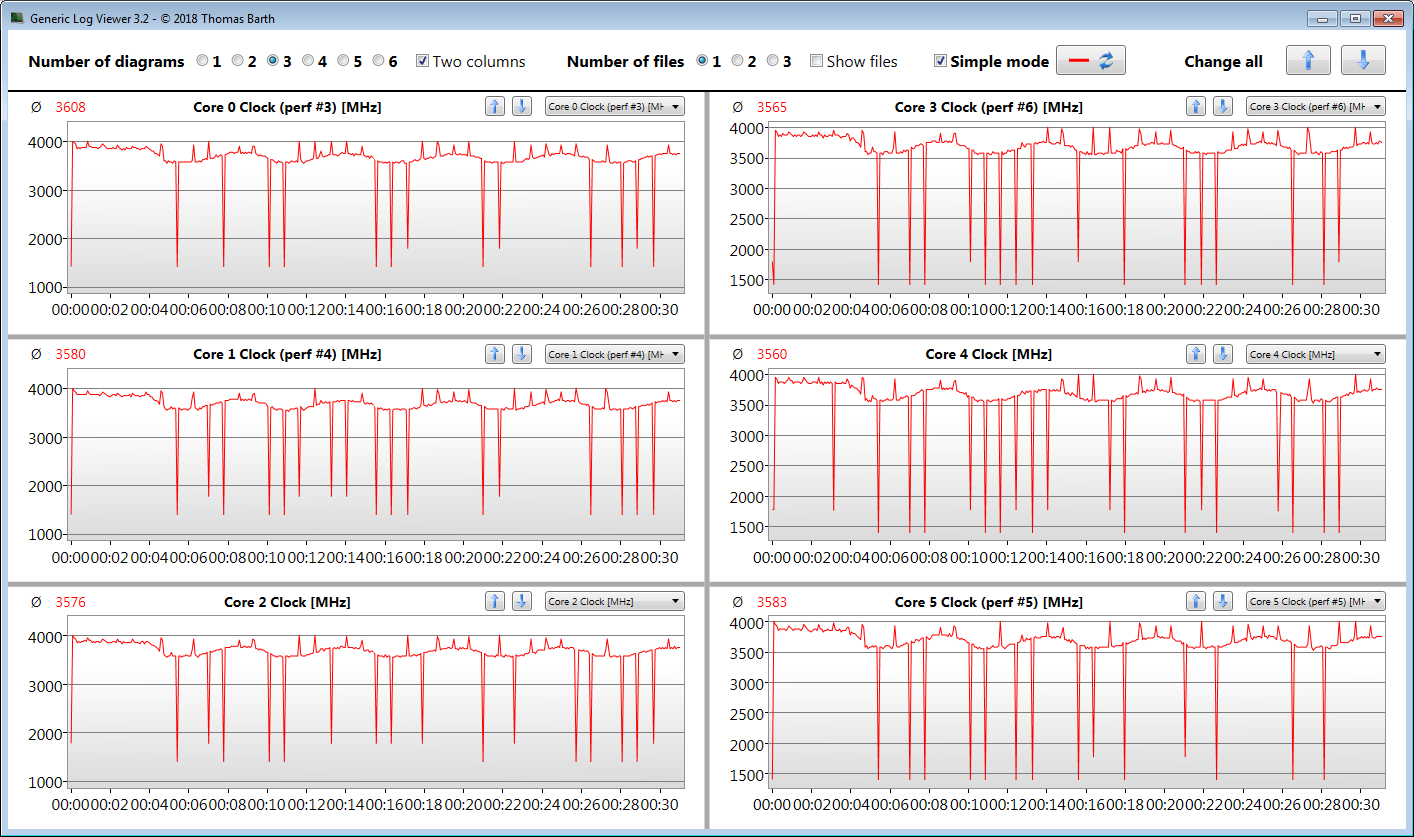
The CPU tests of the Cinebench benchmarks are run at 3.8 to 4 GHz (multithread) and 1.4 to 4 GHz (single-thread), respectively. On battery power, the CPU initially operates at 2.4 GHz (multithread) and 1.4 to 2.4 GHz (single-thread), respectively, in order to then match the clock speeds reached when plugged in.
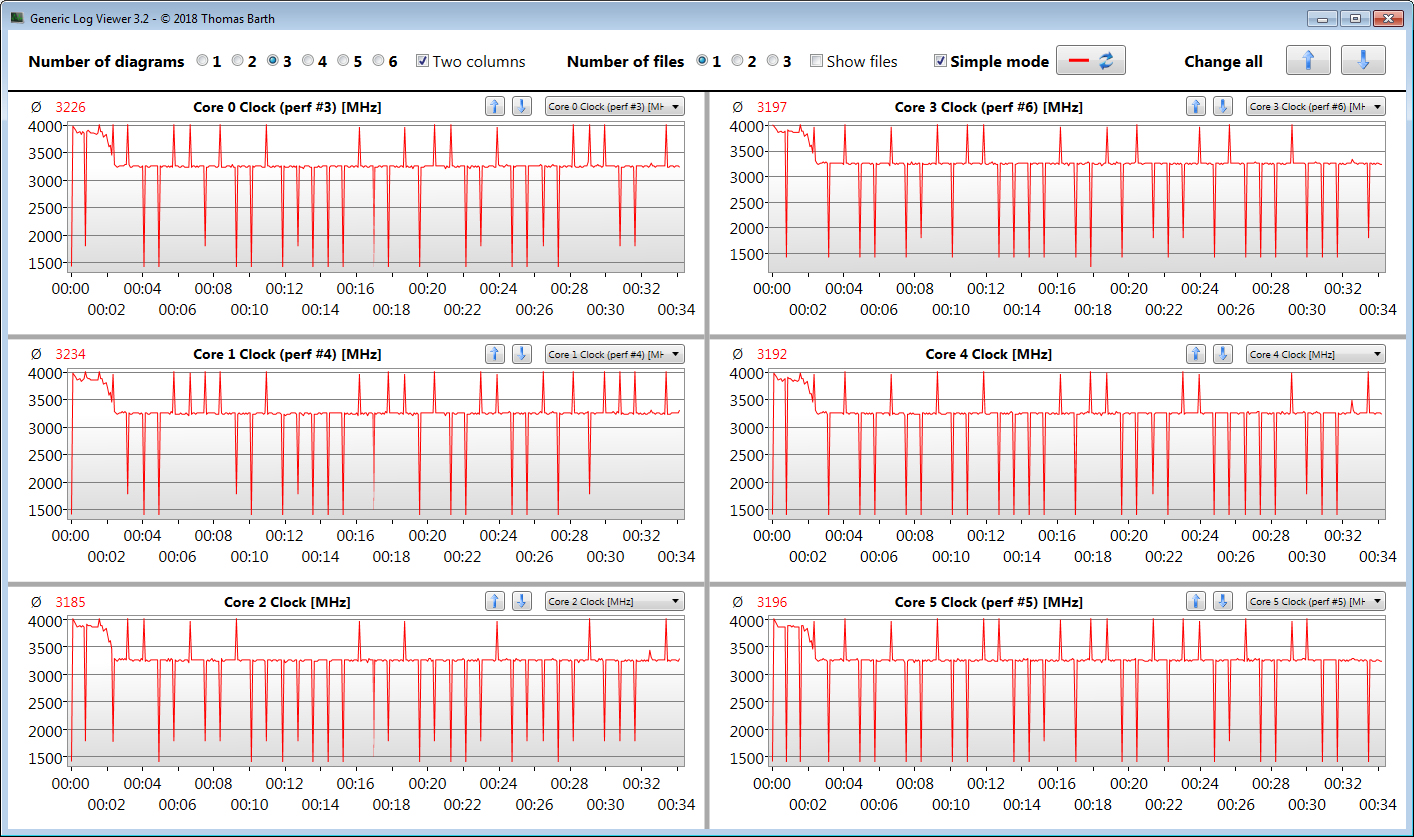
We verify if the CPU Turbo is also consistently used when plugged in by running the Cinebench R15 benchmark's multithread test in a continuous loop for at least 30 minutes. The results fluctuate between 890 and 973 points. Turbo is unevenly used.
For a balanced performance development, the "Intelligent Cooling" mode needs to be selected within the Lenovo Vantage software. The battery-saving mode achieves this too but at a significantly lower level.
* ... smaller is better
System performance
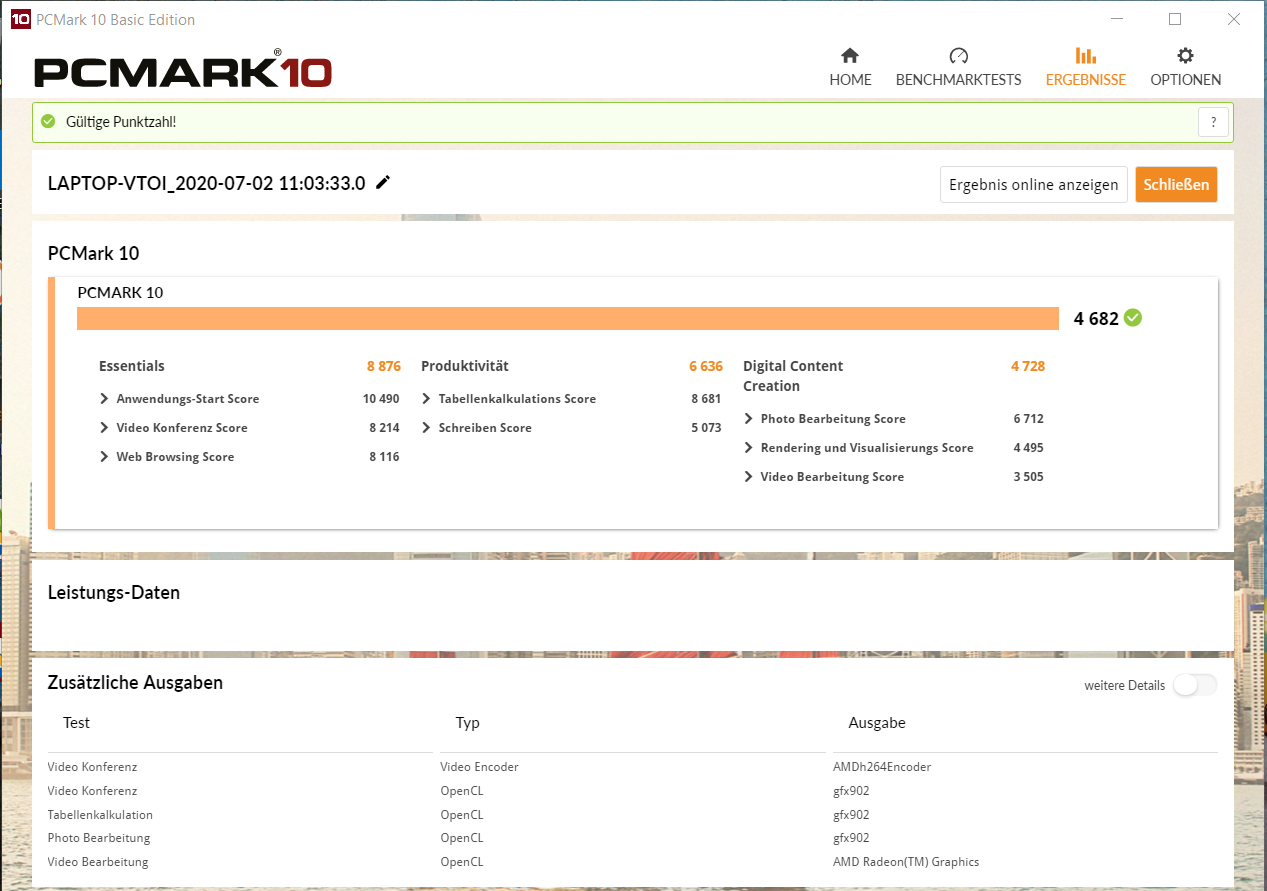
The built-in hardware ensures a fast and smooth system. The CPU provides more than enough processing power for office and Internet applications. Furthermore, the iGPU allows the use of computer games to a limited extent. This is also complemented by good results in the PCMark benchmarks.
| PCMark 8 Home Score Accelerated v2 | 4215 points | |
| PCMark 8 Creative Score Accelerated v2 | 4239 points | |
| PCMark 8 Work Score Accelerated v2 | 5277 points | |
| PCMark 10 Score | 4682 points | |
Help | ||
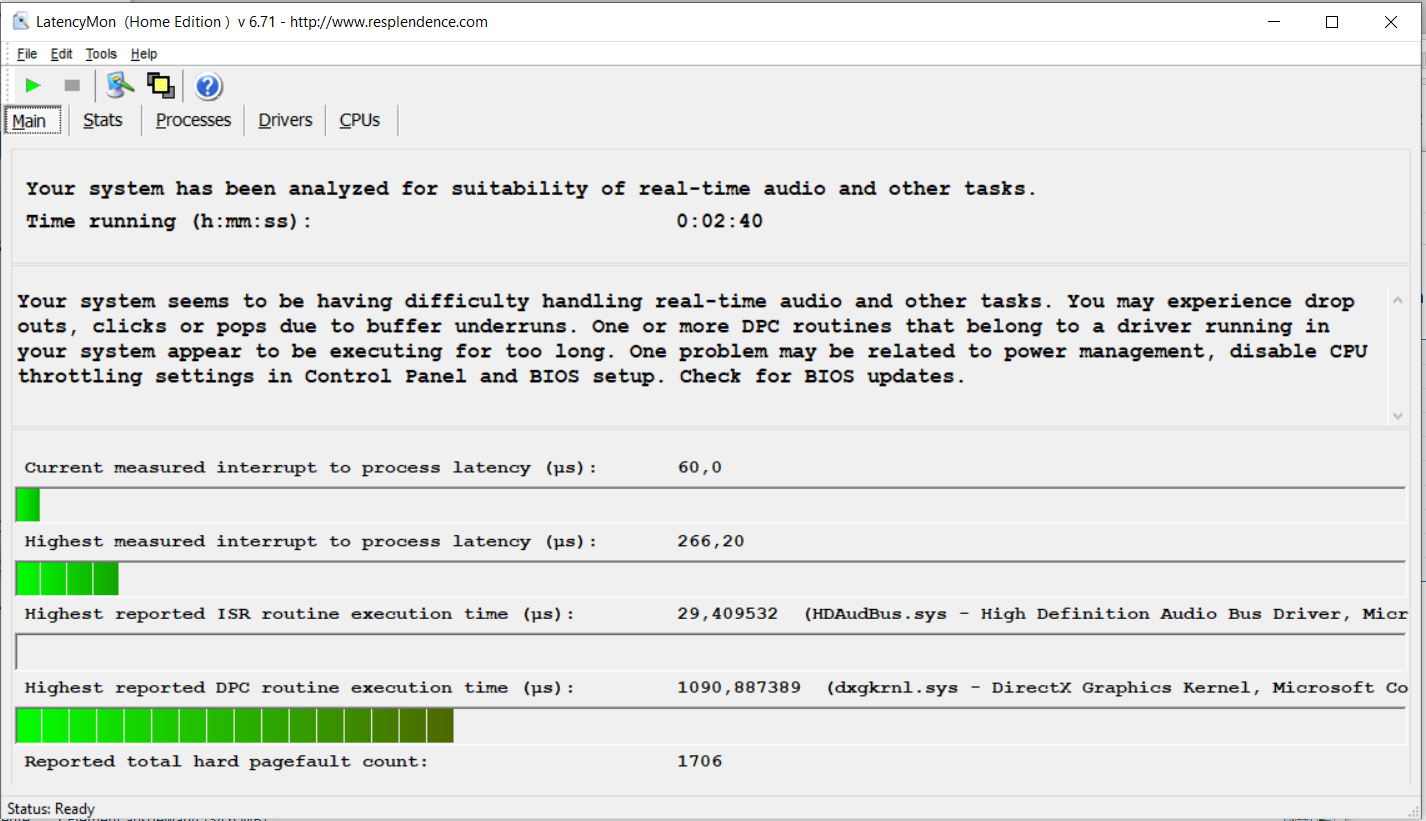
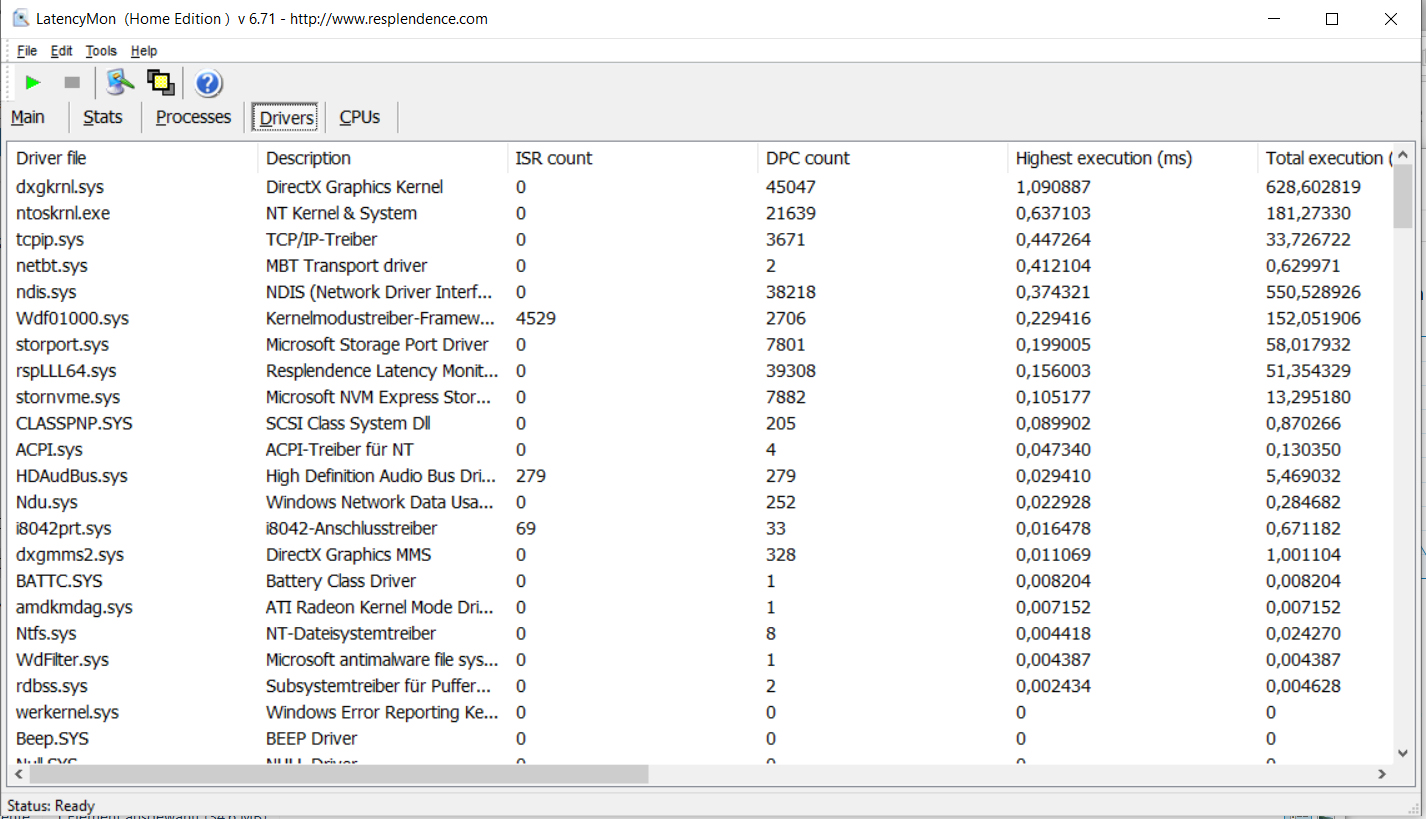
DPC latencies
In our standardized latency monitor test (web surfing, 4K video playback, high-load Prime95) we could observe high DPC latencies. The system is therefore not suitable for real-time video and audio-editing.
| DPC Latencies / LatencyMon - interrupt to process latency (max), Web, Youtube, Prime95 | |
| Honor Magicbook 14 | |
| Acer Swift 3 SF314-42-R4XJ | |
| HP 14s-dq1431ng | |
| Acer Swift 3 SF314-42-R27B | |
| Lenovo IdeaPad 5 14ARE05 | |
* ... smaller is better
Storage
A 512 GB NVMe SSD (M.2 2242) from Samsung, which provides good transfer rates, serves as the system drive. You could install a second NVMe SSD (M.2 2280) as well.

| Lenovo IdeaPad 5 14ARE05 Samsung PM991 MZALQ512HALU | Acer Swift 3 SF314-42-R27B SK hynix BC511 HFM256GDJTNI-82A0 | HP 14s-dq1431ng Intel Optane Memory H10 with Solid State Storage 16GB + 256GB HBRPEKNX0101AH | Honor Magicbook 14 Samsung SSD PM981a MZVLB256HBHQ | Asus ZenBook 14 UM431DA-AM020T SK hynix BC501 HFM512GDHTNG-8310A | Dell Inspiron 14 3493-4KWCF Toshiba KBG40ZNS512G NVMe | Lenovo IdeaPad S540-14IWL Samsung SSD PM981 MZVLB512HAJQ | Average Samsung PM991 MZALQ512HALU | Average of class Subnotebook | |
|---|---|---|---|---|---|---|---|---|---|
| CrystalDiskMark 5.2 / 6 | -14% | 16% | 31% | -25% | 11% | 15% | 2% | 91% | |
| Write 4K (MB/s) | 102.8 | 96.3 -6% | 142.8 39% | 137.7 34% | 118.8 16% | 159.6 55% | 157.6 53% | 129.5 ? 26% | 152.8 ? 49% |
| Read 4K (MB/s) | 45.48 | 35.06 -23% | 167.4 268% | 42.49 -7% | 41.62 -8% | 53.5 18% | 46.39 2% | 45.1 ? -1% | 63.7 ? 40% |
| Write Seq (MB/s) | 1255 | 1001 -20% | 232.1 -82% | 2341 87% | 796 -37% | 1174 -6% | 1214 -3% | 1172 ? -7% | 2769 ? 121% |
| Read Seq (MB/s) | 1434 | 1072 -25% | 1128 -21% | 2436 70% | 1101 -23% | 1648 15% | 1295 -10% | 1496 ? 4% | 3275 ? 128% |
| Write 4K Q32T1 (MB/s) | 441 | 423.9 -4% | 438 -1% | 261 -41% | 234.7 -47% | 420.8 -5% | 370.7 -16% | 448 ? 2% | 432 ? -2% |
| Read 4K Q32T1 (MB/s) | 474.1 | 464.7 -2% | 491.2 4% | 335.4 -29% | 313.8 -34% | 564 19% | 461.1 -3% | 415 ? -12% | 496 ? 5% |
| Write Seq Q32T1 (MB/s) | 1456 | 967 -34% | 622 -57% | 2343 61% | 842 -42% | 1231 -15% | 1888 30% | 1397 ? -4% | 4523 ? 211% |
| Read Seq Q32T1 (MB/s) | 2085 | 2179 5% | 1566 -25% | 3569 71% | 1645 -21% | 2274 9% | 3540 70% | 2307 ? 11% | 5661 ? 172% |
| AS SSD | -21% | -50% | -7% | -19% | -62% | 30% | 3% | 73% | |
| Seq Read (MB/s) | 1970 | 1682 -15% | 677 -66% | 2591 32% | 1417 -28% | 2074 5% | 1939 -2% | 1917 ? -3% | 4354 ? 121% |
| Seq Write (MB/s) | 1268 | 931 -27% | 194.7 -85% | 2133 68% | 781 -38% | 775 -39% | 1755 38% | 1061 ? -16% | 2920 ? 130% |
| 4K Read (MB/s) | 47.13 | 41.53 -12% | 58.1 23% | 50 6% | 37.03 -21% | 37.81 -20% | 61 29% | 45.7 ? -3% | 59.2 ? 26% |
| 4K Write (MB/s) | 121.6 | 109.1 -10% | 124.1 2% | 95.7 -21% | 80.1 -34% | 101.3 -17% | 138.9 14% | 140.1 ? 15% | 169.3 ? 39% |
| 4K-64 Read (MB/s) | 855 | 603 -29% | 219.6 -74% | 607 -29% | 740 -13% | 1265 48% | 1271 49% | 854 ? 0% | 865 ? 1% |
| 4K-64 Write (MB/s) | 859 | 713 -17% | 638 -26% | 482.6 -44% | 748 -13% | 383.5 -55% | 1330 55% | 780 ? -9% | 1706 ? 99% |
| Access Time Read * (ms) | 0.065 | 0.109 -68% | 0.075 -15% | 0.047 28% | 0.081 -25% | 0.04 38% | 0.1031 ? -59% | 0.06369 ? 2% | |
| Access Time Write * (ms) | 0.032 | 0.035 -9% | 0.065 -103% | 0.034 -6% | 0.045 -41% | 0.263 -722% | 0.028 12% | 0.03488 ? -9% | 0.05366 ? -68% |
| Score Read (Points) | 1100 | 813 -26% | 345 -69% | 916 -17% | 918 -17% | 1510 37% | 1526 39% | 1091 ? -1% | 1358 ? 23% |
| Score Write (Points) | 1108 | 915 -17% | 782 -29% | 792 -29% | 906 -18% | 562 -49% | 1645 48% | 1027 ? -7% | 2167 ? 96% |
| Score Total (Points) | 2745 | 2118 -23% | 1305 -52% | 2168 -21% | 2270 -17% | 2781 1% | 3955 44% | 2643 ? -4% | 4163 ? 52% |
| Copy ISO MB/s (MB/s) | 982 | 692 -30% | 716 -27% | 1134 15% | 1310 ? 33% | 2576 ? 162% | |||
| Copy Program MB/s (MB/s) | 276.2 | 226.5 -18% | 335.4 21% | 350.4 27% | 453 ? 64% | 803 ? 191% | |||
| Copy Game MB/s (MB/s) | 681 | 391.5 -43% | 484.8 -29% | 736 8% | 924 ? 36% | 1725 ? 153% | |||
| Total Average (Program / Settings) | -18% /
-18% | -17% /
-22% | 12% /
9% | -22% /
-21% | -26% /
-36% | 23% /
24% | 3% /
3% | 82% /
80% |
* ... smaller is better
Continuous load read: DiskSpd Read Loop, Queue Depth 8
Graphics card
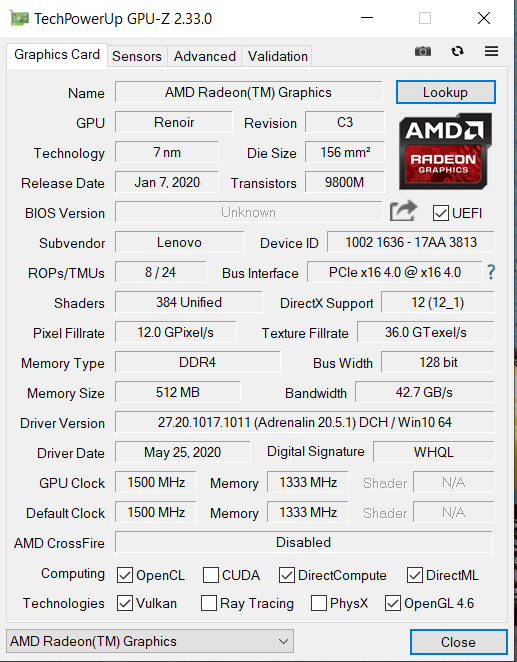
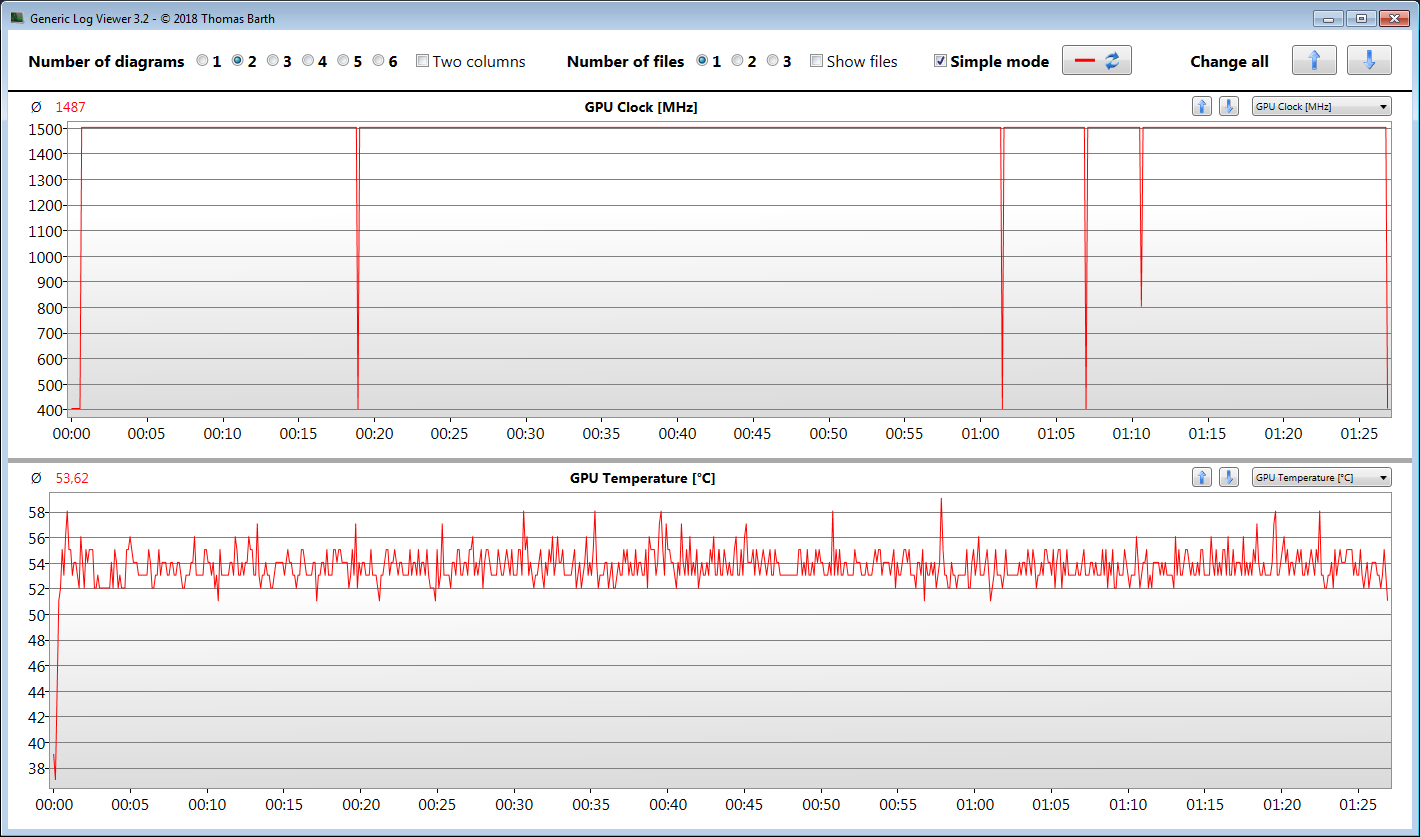
AMD's integrated Vega 6 graphics core supports DirectX 12 and reaches speeds of up to 1,500 MHz. The GPU can also maintain this clock rate over a long period of time, as our The Witcher 3 test shows.
The graphics core scores significantly better in the 3DMark benchmarks than its predecessors found in the Ryzen 2000/3000 series. This is achieved through a higher clock speed and faster memory (DDR4 3200 vs. DDR4 2400).
The performance modes of the Lenovo Vantage software hardly have any impact on graphics performance. Only when the battery-saving mode is active does the graphics performance drop slightly.
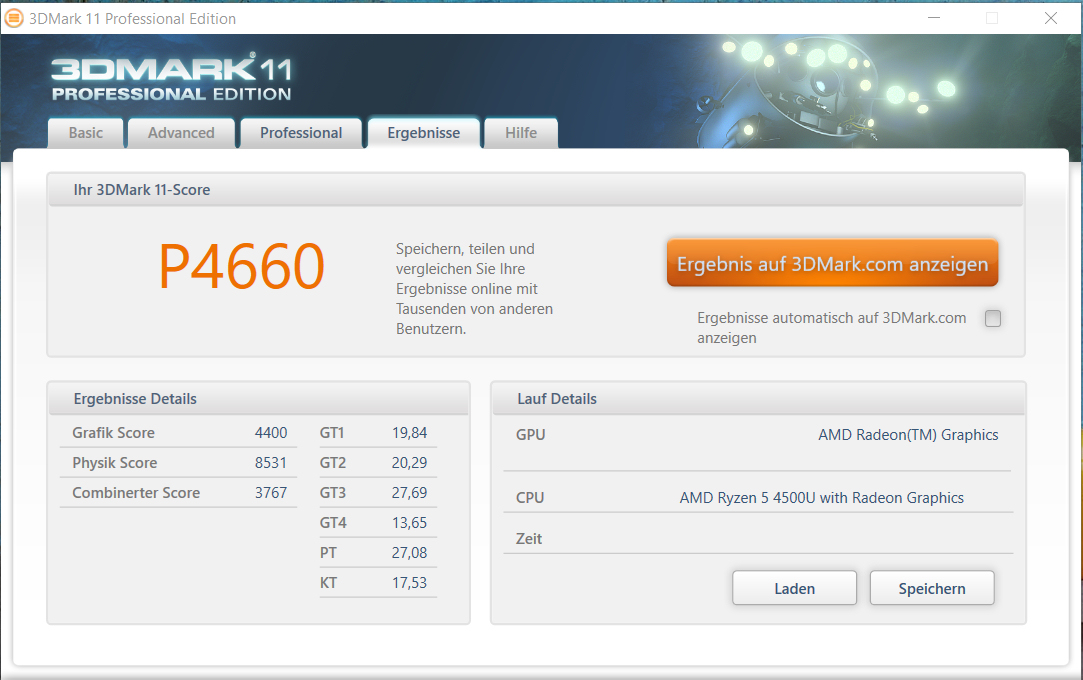
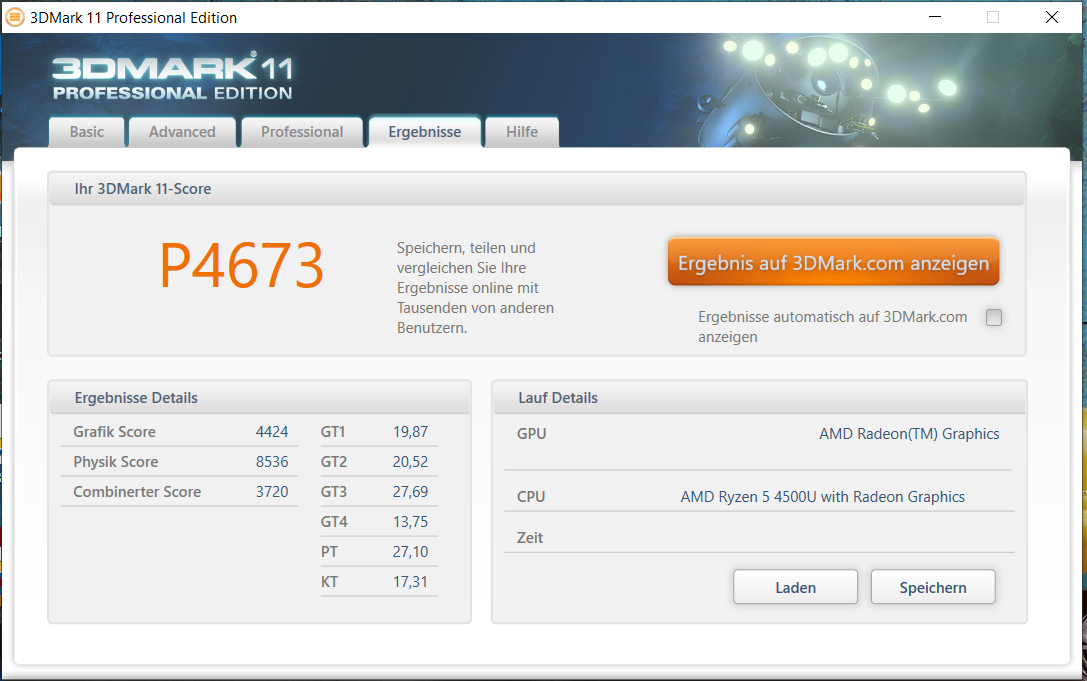

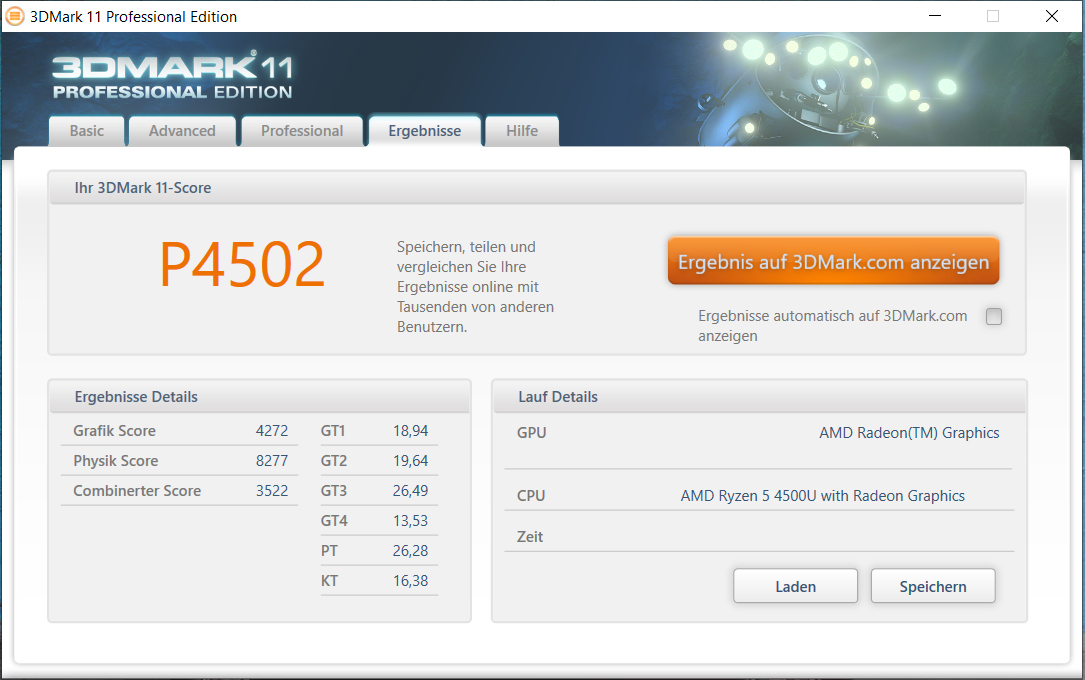
| 3DMark 11 Performance | 4660 points | |
| 3DMark Ice Storm Standard Score | 106965 points | |
| 3DMark Cloud Gate Standard Score | 15653 points | |
| 3DMark Fire Strike Score | 2607 points | |
| 3DMark Time Spy Score | 967 points | |
Help | ||
Gaming performance
The Ryzen 5 APU brings many of the games in our database smoothly onto the screen. Most titles achieve smooth frame rates at HD resolution (1280x720 pixels) and medium to partially high quality settings. Games with moderate hardware requirements allow more. Some modern games give the hardware a hard time, though. The resolution and/or quality level have to be significantly reduced here in order to generate sufficiently high frame rates.
| The Witcher 3 - 1024x768 Low Graphics & Postprocessing | |
| Average of class Subnotebook (38.8 - 176, n=18, last 2 years) | |
| Lenovo IdeaPad 5 14ARE05 | |
| Lenovo IdeaPad S540-14IWL | |
| Honor Magicbook 14 | |
| Average AMD Radeon RX Vega 6 (Ryzen 4000/5000) (32.8 - 60, n=21) | |
| Acer Swift 3 SF314-42-R27B | |
In order to verify whether the frame rates remain largely constant even over a prolonged period of time, we let the game The Witcher 3 run for about 60 minutes at Full HD resolution and maximum quality settings. The character embodied by the player is not moved during this whole period. A drop in frame rates wasn't found.
| low | med. | high | ultra | |
|---|---|---|---|---|
| StarCraft 2 (2010) | 282.4 | 101.5 | 61.8 | 41.1 |
| Counter-Strike: GO (2012) | 188.7 | 150.3 | 98.5 | 58.7 |
| BioShock Infinite (2013) | 115.7 | 92.4 | 73.2 | 25.4 |
| GTA V (2015) | 91.4 | 80.4 | 22.4 | 9.3 |
| The Witcher 3 (2015) | 49.7 | 31.7 | 15.9 | 11 |
| Dota 2 Reborn (2015) | 98.1 | 77.8 | 45.6 | 42.9 |
| Overwatch (2016) | 116.8 | 79.9 | 44 | 21.4 |
| Rocket League (2017) | 121.4 | 50.9 | 32.5 | |
| Fortnite (2018) | 88.6 | 36.2 | 22.4 | |
| X-Plane 11.11 (2018) | 40.2 | 30.8 | 27.4 | |
| Far Cry 5 (2018) | 35 | 16 | 15 | 14 |
| Shadow of the Tomb Raider (2018) | 43 | 16 | 14 | 11 |
| Assassin´s Creed Odyssey (2018) | 32 | 17 | 13 | |
| Battlefield V (2018) | 53.5 | 24.4 | 20.5 | 18.8 |
| Farming Simulator 19 (2018) | 116.3 | 57.5 | 31.8 | 16.9 |
| Apex Legends (2019) | 60.2 | 22.7 | 17.5 | 17.1 |
| Metro Exodus (2019) | 31.3 | 13.7 | 9.7 | |
| Dirt Rally 2.0 (2019) | 104.7 | 33.6 | 26.7 | 13.5 |
| The Division 2 (2019) | 37 | 19 | 13 | |
| Anno 1800 (2019) | 51.3 | 16.4 | 10 | |
| Total War: Three Kingdoms (2019) | 47.8 | 14.8 | 8.9 | |
| F1 2019 (2019) | 62 | 26 | 22 | 18 |
| Control (2019) | 31.9 | 10.5 | 7.8 | |
| Borderlands 3 (2019) | 44.6 | 17.1 | 10.6 | |
| Ghost Recon Breakpoint (2019) | 29 | 14 | 12 | |
| GRID 2019 (2019) | 52.6 | 26.2 | 17.2 | |
| Call of Duty Modern Warfare 2019 (2019) | 34.7 | 19.9 | 14 | |
| Need for Speed Heat (2019) | 38.3 | 17.5 | 14.3 | |
| Star Wars Jedi Fallen Order (2019) | 22.1 | 16.8 | 14.4 | |
| Red Dead Redemption 2 (2019) | 30.9 | 14.6 | ||
| Escape from Tarkov (2020) | 38.7 | 17.8 | 13.6 | |
| Hunt Showdown (2020) | 36.3 | 13.5 | 11.5 | |
| Gears Tactics (2020) | 72.2 | 26.6 | 17 |
Emissions and energy - The Lenovo laptop doesn't lack stamina
Noise emissions
In idle usage, the fan is often quiet, and silence prevails. However, it turns up under load. Consequently, we measure a maximum sound pressure level of 41.3 dB(A).
Noise level
| Idle |
| 30.7 / 30.7 / 30.7 dB(A) |
| Load |
| 41.3 / dB(A) |
 | ||
30 dB silent 40 dB(A) audible 50 dB(A) loud |
||
min: | ||
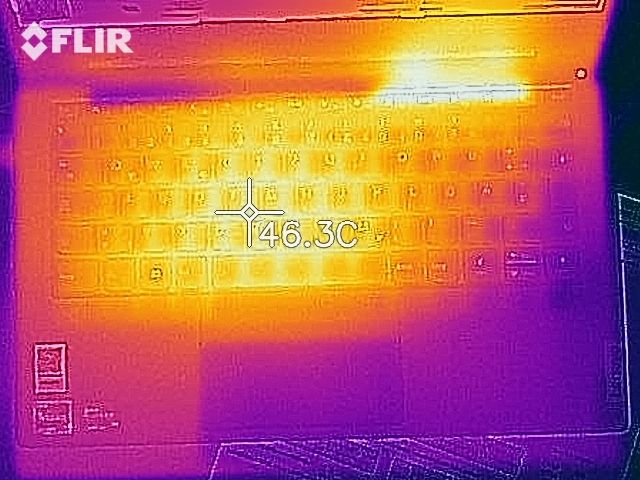
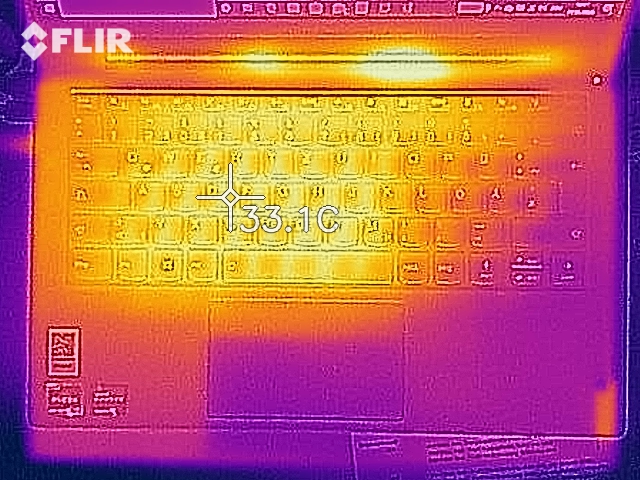
Temperature
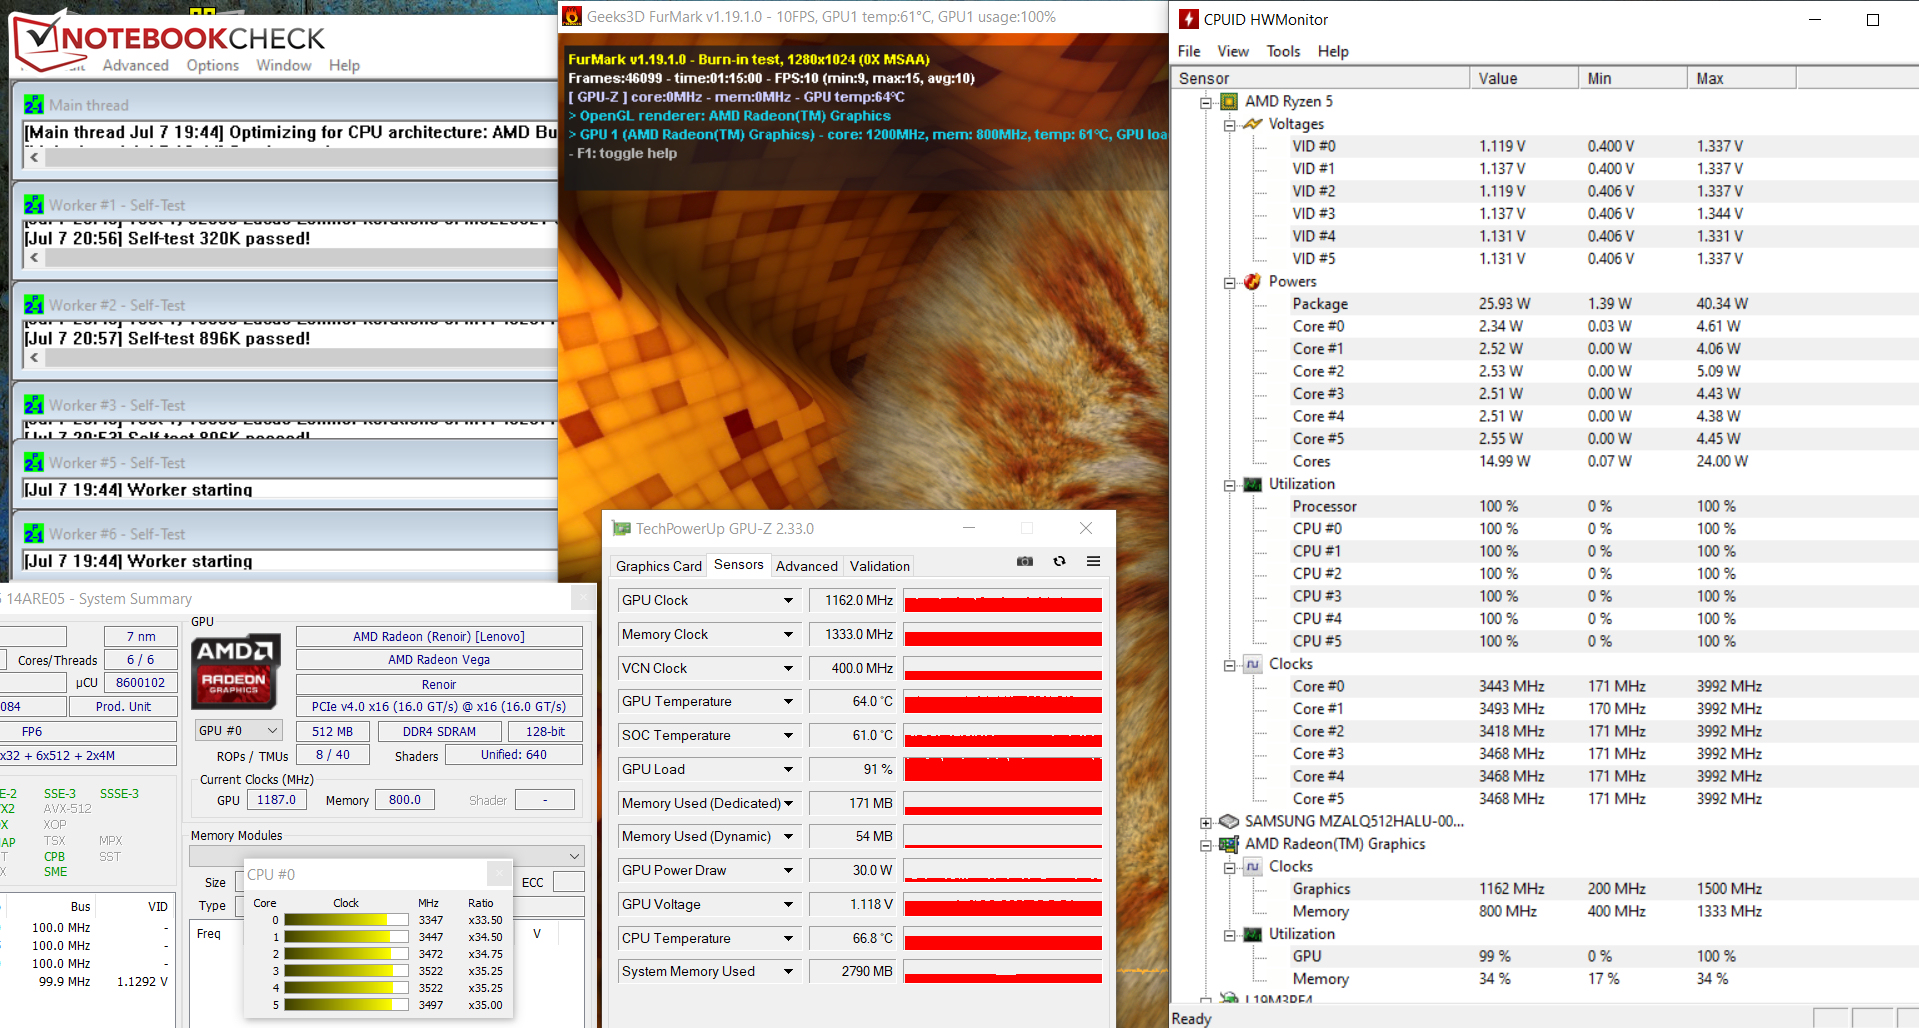
Our stress test (Prime95 and FurMark run for at least an hour) is processed by the CPU and GPU at 3.3 to 3.5 GHz and 1,100 to 1,200 MHz, respectively. On battery power, the values are 2.8 to 2.9 GHz (CPU) and 800 to 900 MHz (GPU), respectively. The stress test represents an extreme scenario that does not occur in everyday life. We use this test to check if the system remains stable even under full load.
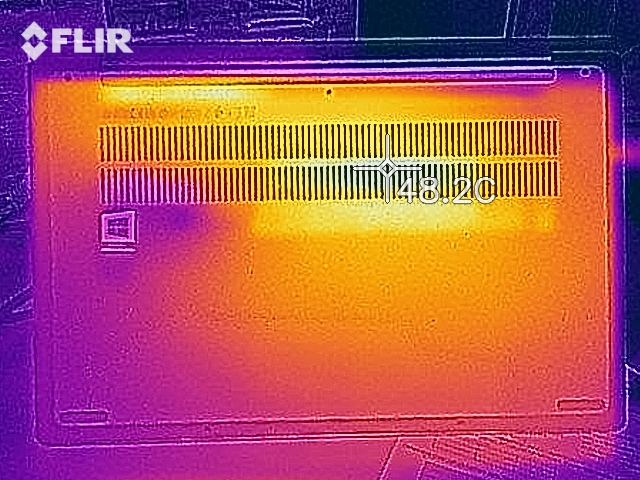
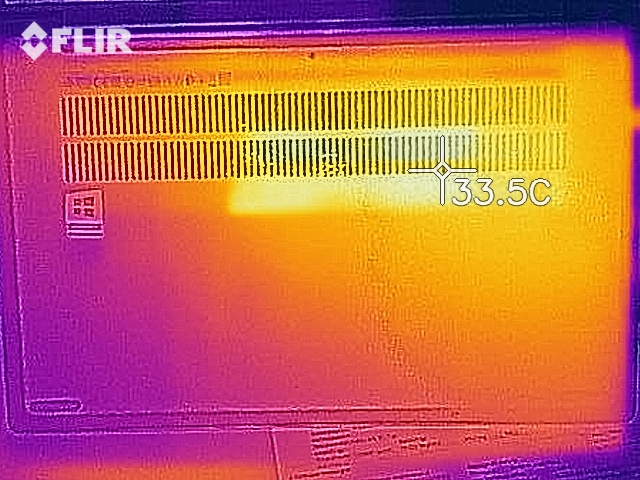
The IdeaPad 5 doesn't warm up particularly strongly. During the stress test, we register temperatures below 40 °C (~104 °F) at all measuring points. The values are in the green range in everyday use.
(+) The maximum temperature on the upper side is 39.2 °C / 103 F, compared to the average of 35.9 °C / 97 F, ranging from 21.4 to 59 °C for the class Subnotebook.
(+) The bottom heats up to a maximum of 37 °C / 99 F, compared to the average of 39.2 °C / 103 F
(+) In idle usage, the average temperature for the upper side is 27 °C / 81 F, compared to the device average of 30.8 °C / 87 F.
(+) The palmrests and touchpad are cooler than skin temperature with a maximum of 30.9 °C / 87.6 F and are therefore cool to the touch.
(-) The average temperature of the palmrest area of similar devices was 28.2 °C / 82.8 F (-2.7 °C / -4.8 F).
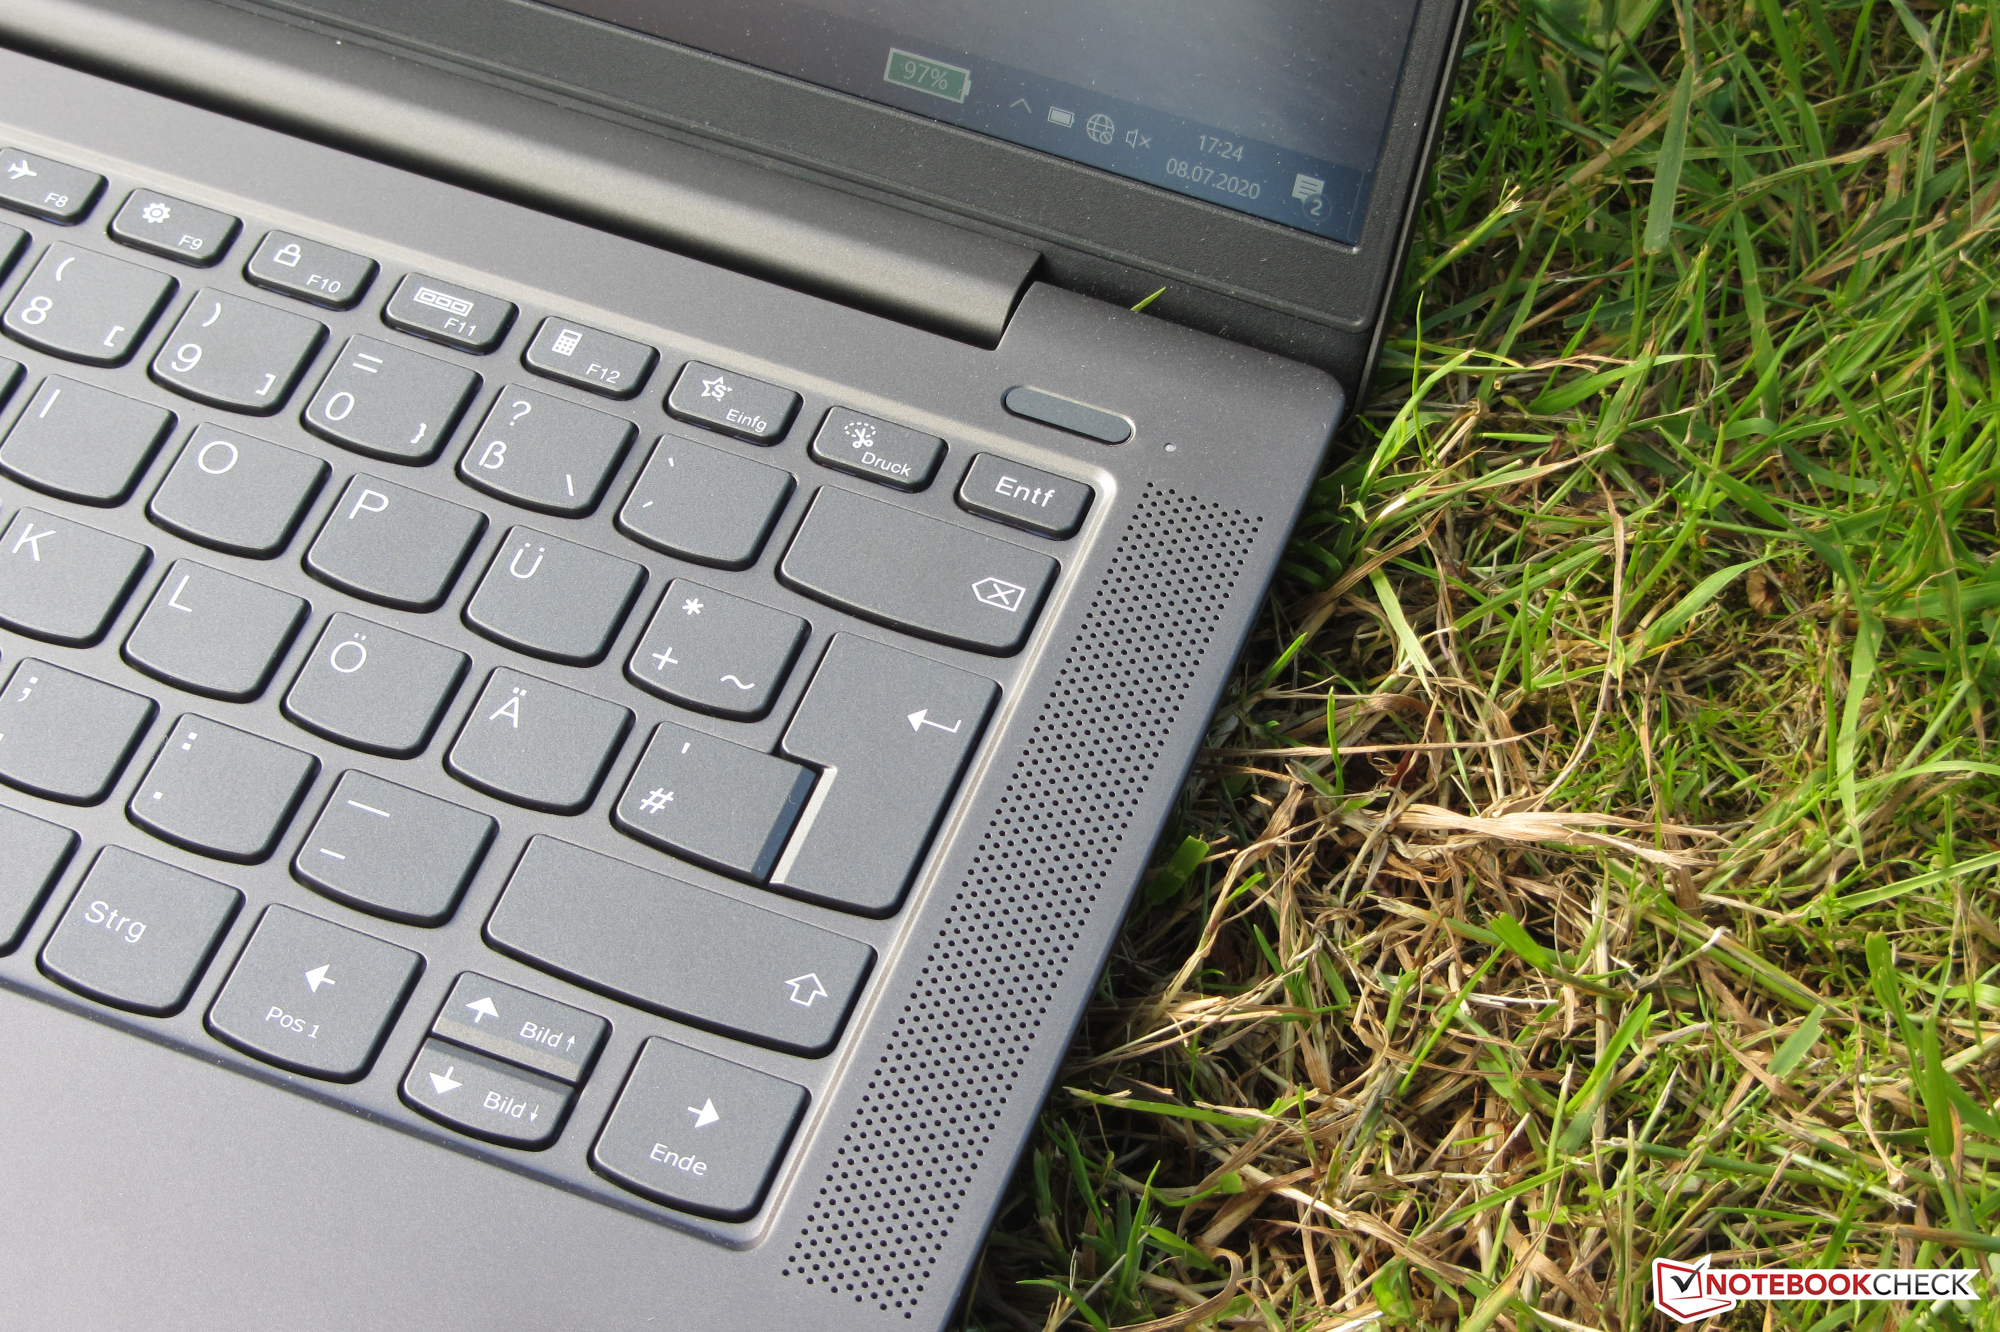
Speakers
The stereo speakers are located next to the right and left sides of the keyboard. They produce a decent sound that barely delivers any bass, though.
Lenovo IdeaPad 5 14ARE05 audio analysis
(-) | not very loud speakers (67.7 dB)
Bass 100 - 315 Hz
(-) | nearly no bass - on average 17.9% lower than median
(±) | linearity of bass is average (12.9% delta to prev. frequency)
Mids 400 - 2000 Hz
(±) | higher mids - on average 5.6% higher than median
(±) | linearity of mids is average (10.4% delta to prev. frequency)
Highs 2 - 16 kHz
(+) | balanced highs - only 2.5% away from median
(+) | highs are linear (5.1% delta to prev. frequency)
Overall 100 - 16.000 Hz
(±) | linearity of overall sound is average (23.2% difference to median)
Compared to same class
» 80% of all tested devices in this class were better, 3% similar, 17% worse
» The best had a delta of 5%, average was 18%, worst was 53%
Compared to all devices tested
» 69% of all tested devices were better, 5% similar, 25% worse
» The best had a delta of 4%, average was 24%, worst was 134%
Energy consumption
The Lenovo laptop doesn't reveal any surprises in terms of power consumption, since the values are on a normal level for the hardware installed here. The power adapter's rated output is 65 watts.
| Off / Standby | |
| Idle | |
| Load |
|
Key:
min: | |
Battery life
The IdeaPad reaches a runtime of 9:51 h in our practical WLAN test. Here, a script is used to simulate the load caused by accessing websites.
Pros
Cons
Verdict
Inside the fancy, compact metal case is a Ryzen 5 4500U APU that provides enough power for office and Internet applications. The integrated Vega 6 GPU enables the use of computer games with hardware requirements that aren't too high. Good: The APU can run at high Turbo speeds for prolonged periods of time.
The IdeaPad 5 14ARE05 is a mobile, long-lasting, high-performance subnotebook in the 14-inch format.
The APU can access 8 GB of RAM (dual-channel mode; soldered). An expansion is not possible due to the lack of memory slots; therefore, an IdeaPad model with 16 GB of RAM is recommended for a certain degree of future-proofing. Furthermore, the built-in NVMe SSD can be replaced. It's also possible to install a second NVMe SSD. At any rate, the case would have to be opened.
The IPS Full HD display pleases with stable viewing angles, a matte surface, a decent color reproduction, and a good brightness. But the contrast and color-space coverage aren't convincing. We expect more here. The backlit keyboard left a good impression; it's suitable for regular typing work.
The battery life is generally very good. Nevertheless, we would have expected more. The Acer Swift 3 SF314-42 models that we reviewed recently (Ryzen 3 4300U, Ryzen 7 4700U) achieve significantly better endurance rates with lower battery capacities (48.85 Wh vs. 56.5 Wh). The Lenovo Vantage software's battery-saving mode doesn't change anything in terms of runtimes. Lenovo still has the potential for optimization here.
Lenovo IdeaPad 5 14ARE05
- 07/14/2020 v7 (old)
Sascha Mölck
Price comparison

