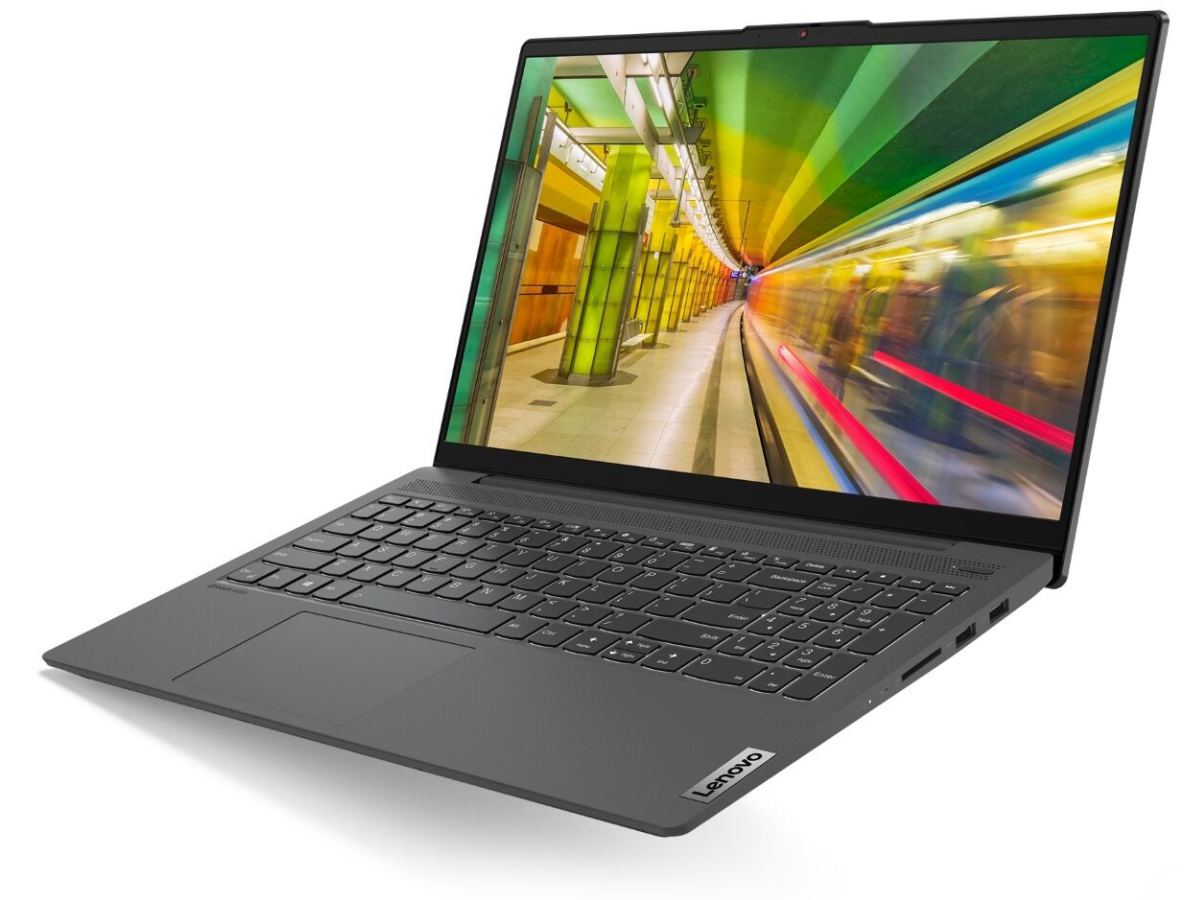
Lenovo IdeaPad 5 15IIL05 Review: Good performance and a long battery life - thanks to the 70-Wh battery

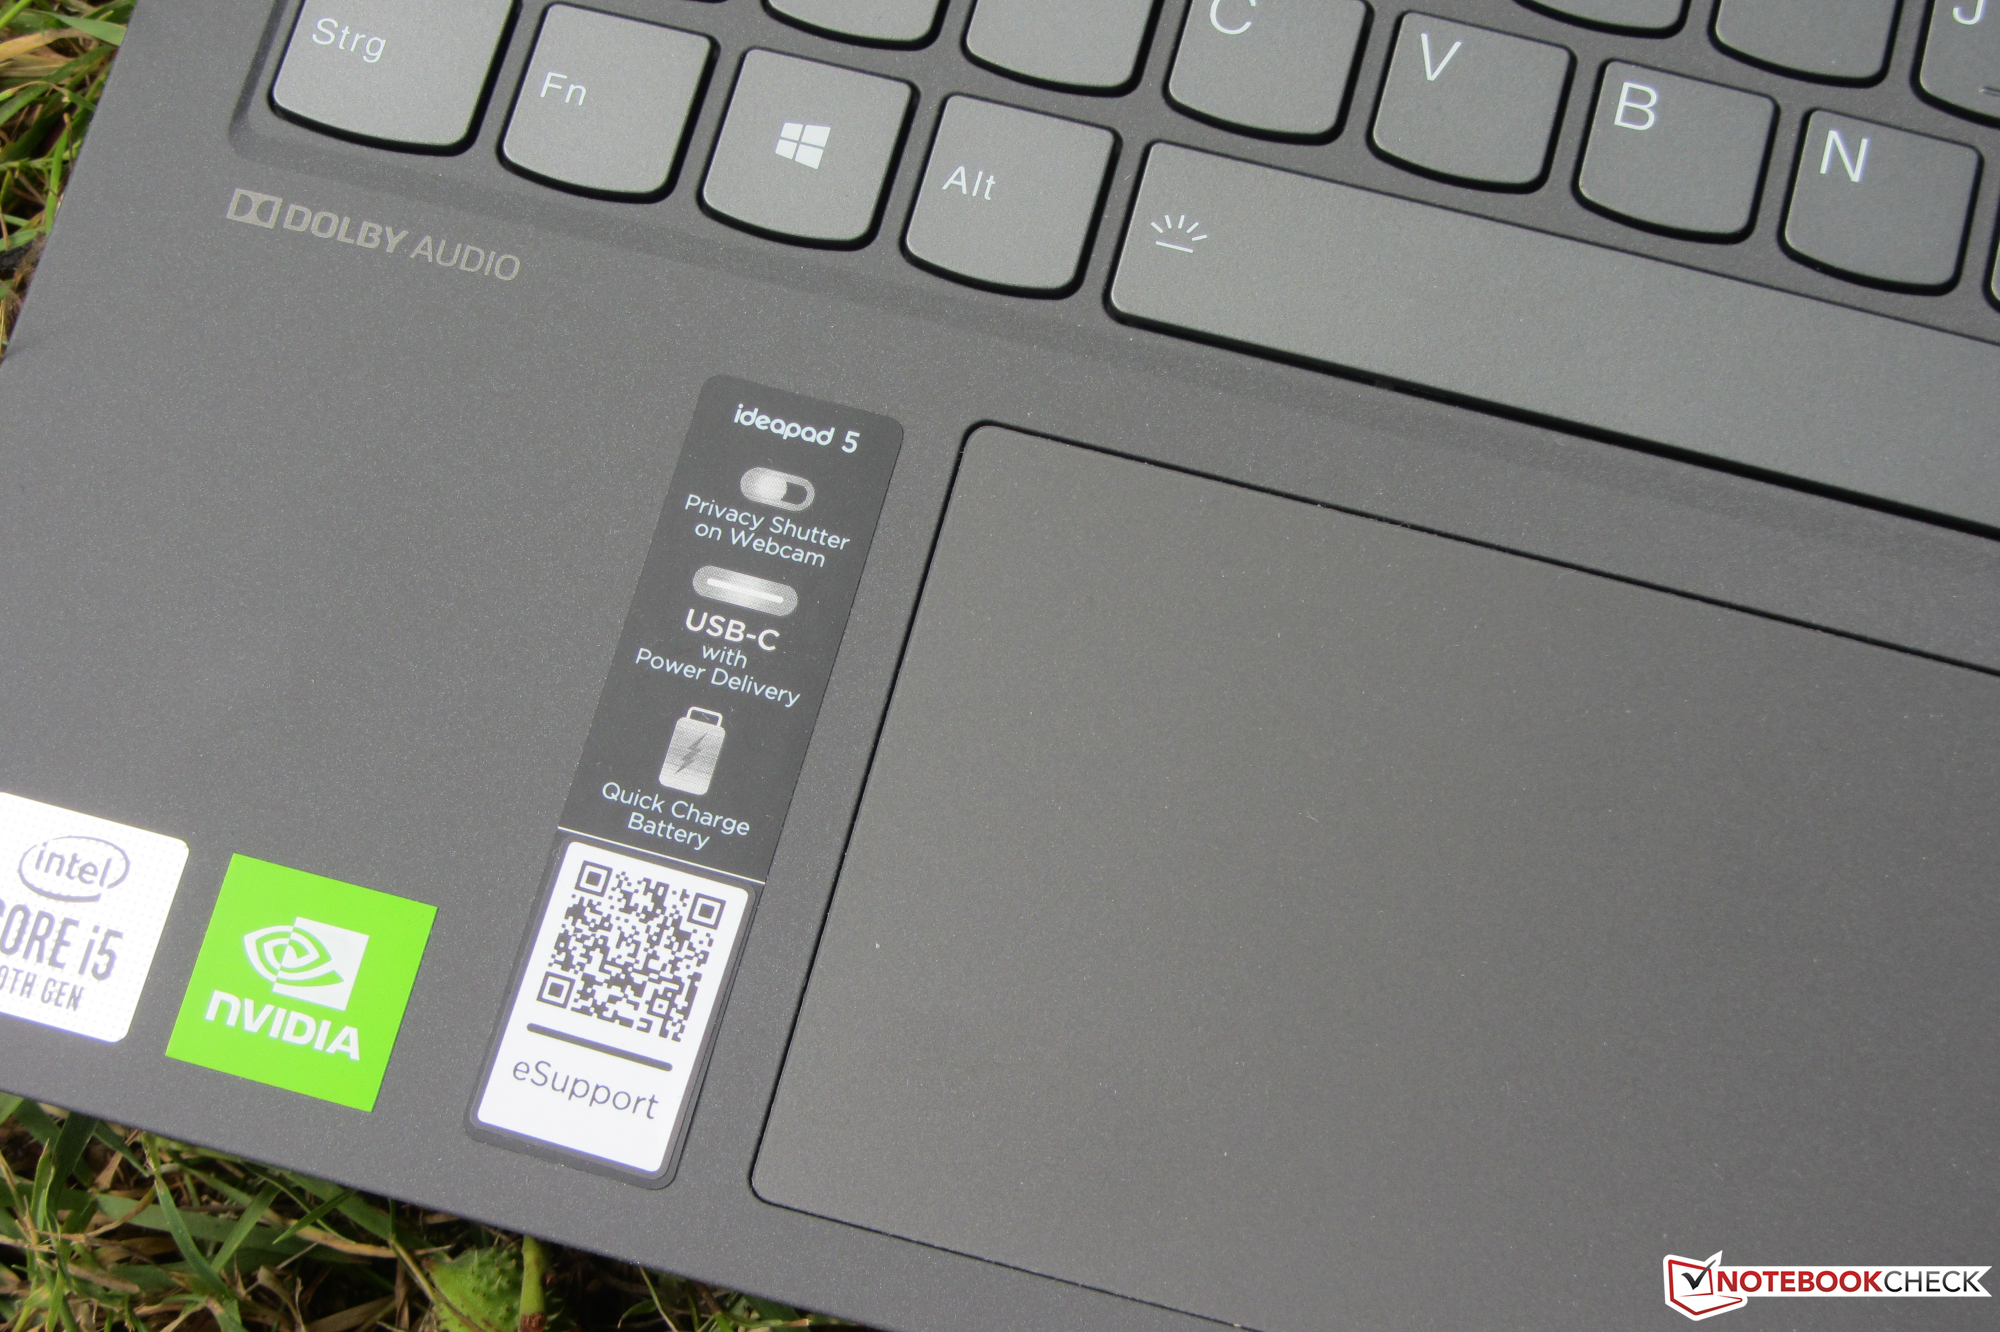
Lenovo has created a real all-rounder: the 15.6-inch IdeaPad 5 15IIL05. The test unit we were provided with is equipped with a Core i5-1035G1 and a GeForce MX350. More affordable models are available with a GeForce MX330. Some of the IdeaPad's competitors are the Acer Aspire 5 A515-54G, the HP Pavilion 15 and the Schenker VIA 15. Due to the fairly powerful GPU, this laptop is a viable alternative for entry-level gamers such as the HP Pavilion Gaming 15.
Rating | Date | Model | Weight | Height | Size | Resolution | Price |
|---|---|---|---|---|---|---|---|
| 83 % v7 (old) | 07 / 2020 | Lenovo IdeaPad 5 15IIL05 i5-1035G1, GeForce MX350 | 1.7 kg | 17.9 mm | 15.60" | 1920x1080 | |
| 81.5 % v7 (old) | 04 / 2020 | Acer Aspire 5 A515-54G i5-10210U, GeForce MX250 | 1.7 kg | 17.9 mm | 15.60" | 1920x1080 | |
| 83 % v6 (old) | 04 / 2019 | HP Pavilion 15-cs2019ng i5-8265U, GeForce MX250 | 1.9 kg | 18 mm | 15.60" | 1920x1080 | |
| 83.3 % v7 (old) | 04 / 2020 | Schenker VIA 15 R5 3500U, Vega 8 | 1.4 kg | 17 mm | 15.60" | 1920x1080 | |
| 75.4 % v7 (old) | 03 / 2020 | HP Pavilion Gaming 15-ec0002ng R5 3550H, GeForce GTX 1050 Mobile | 2.3 kg | 23.5 mm | 15.60" | 1920x1080 |
Case - stability issues
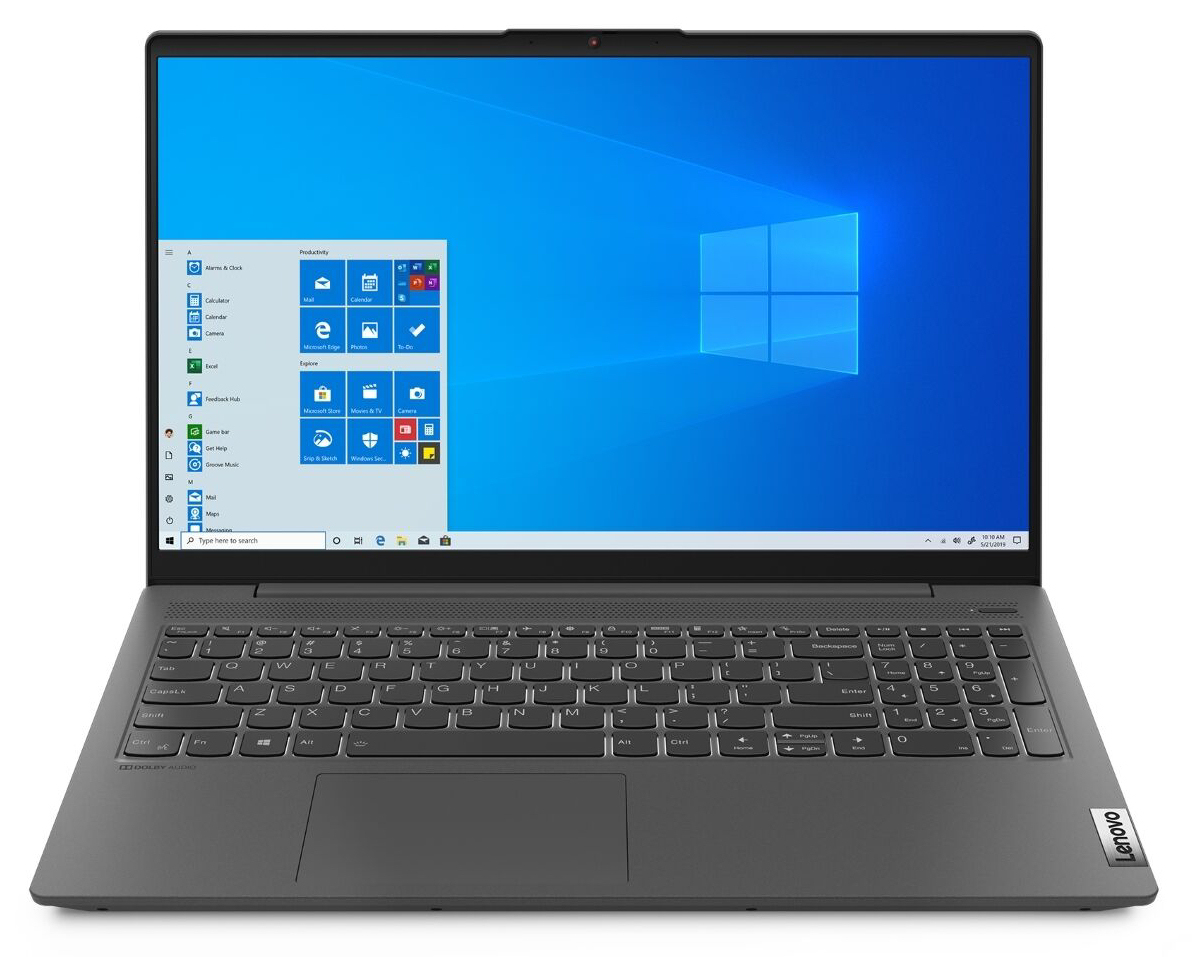
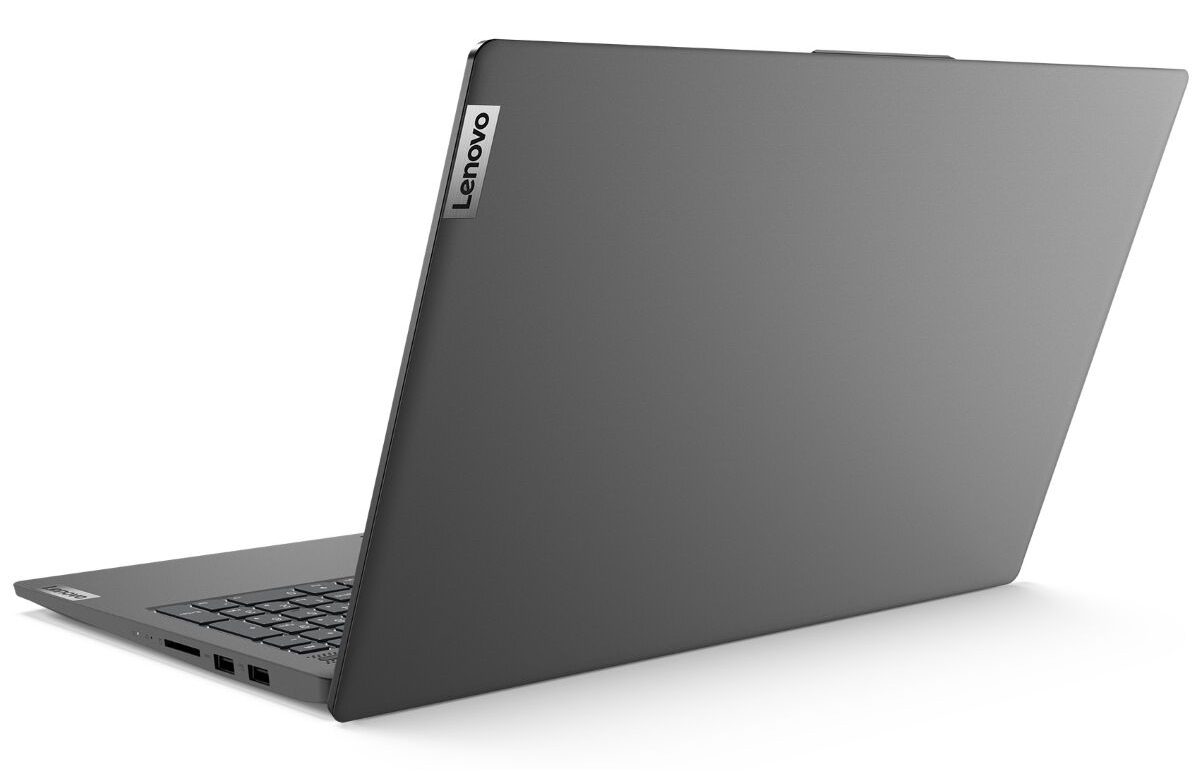
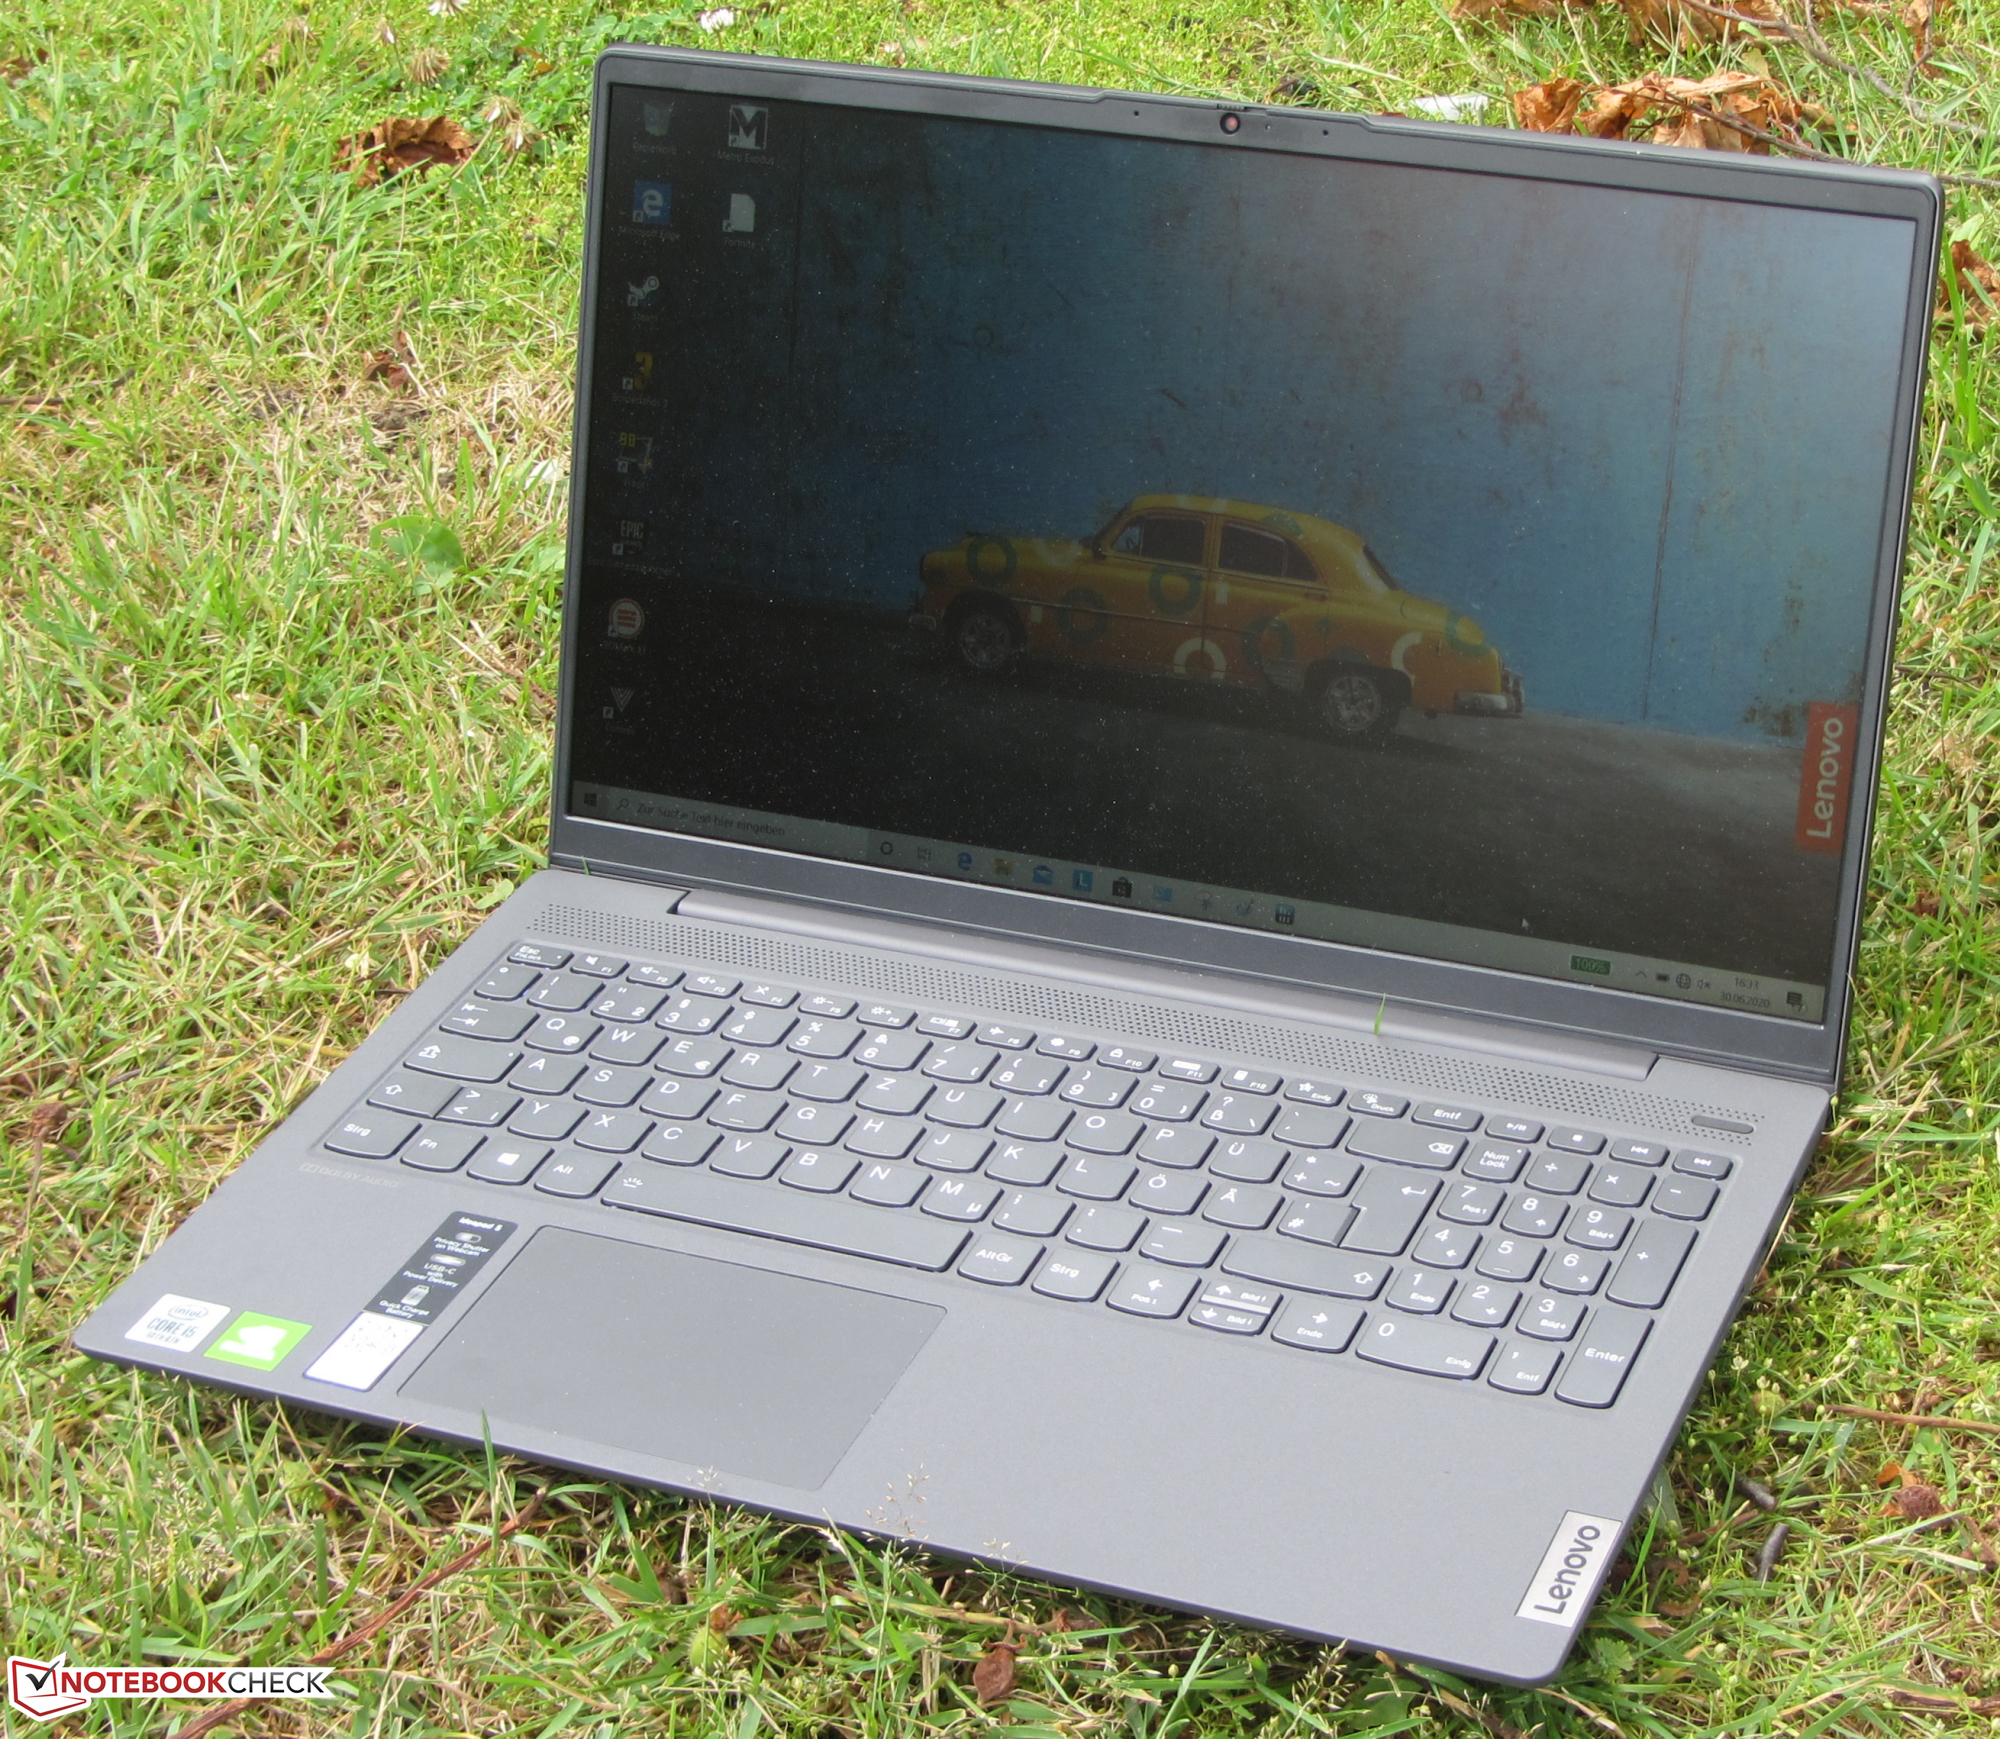
Lenovo has chosen to coat the IdeaPad in a mixture of materials. The back of the display lid is made of aluminum while the remaining components are made of plastic. The entire case is dark gray (Graphite Gray). Both the bottom of the base unit and the back of the display have smooth surfaces, while the top of the base unit is slightly rubberized. The battery is built in and the device does not offer a maintenance hatch.
The workmanship of the notebook is very good. The gap dimensions are regular and we did not notice any overhanging material. Unfortunately, the device is not quite as sturdy as we would have hoped. The base unit can be compressed on the right and left side of the keyboard without a lot of pressure. Both the lid and the base unit can be warped considerably. The device should be a little more stable. Pressure on the back of the display does not cause the image to change. The hinges are tight and keep the lid in position but still enable users to open the device with one hand.
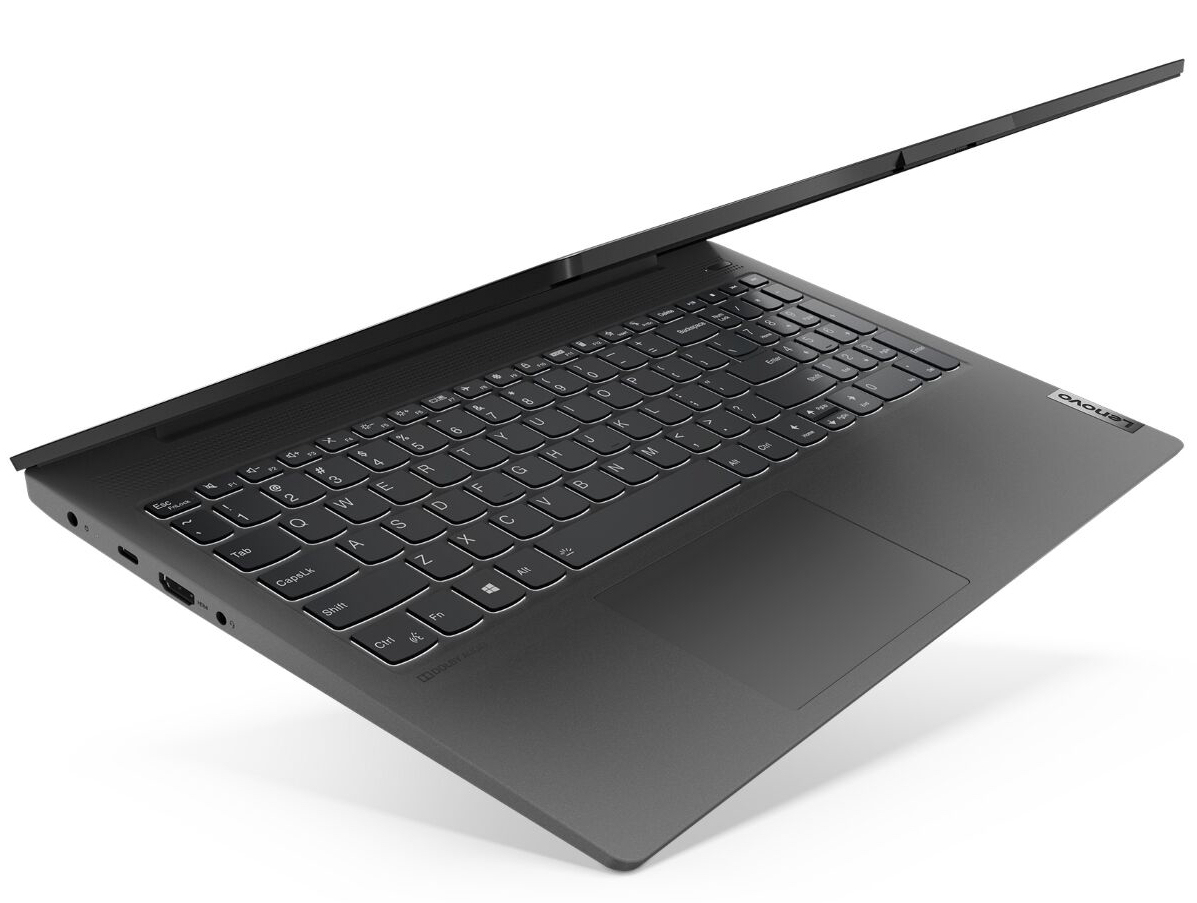
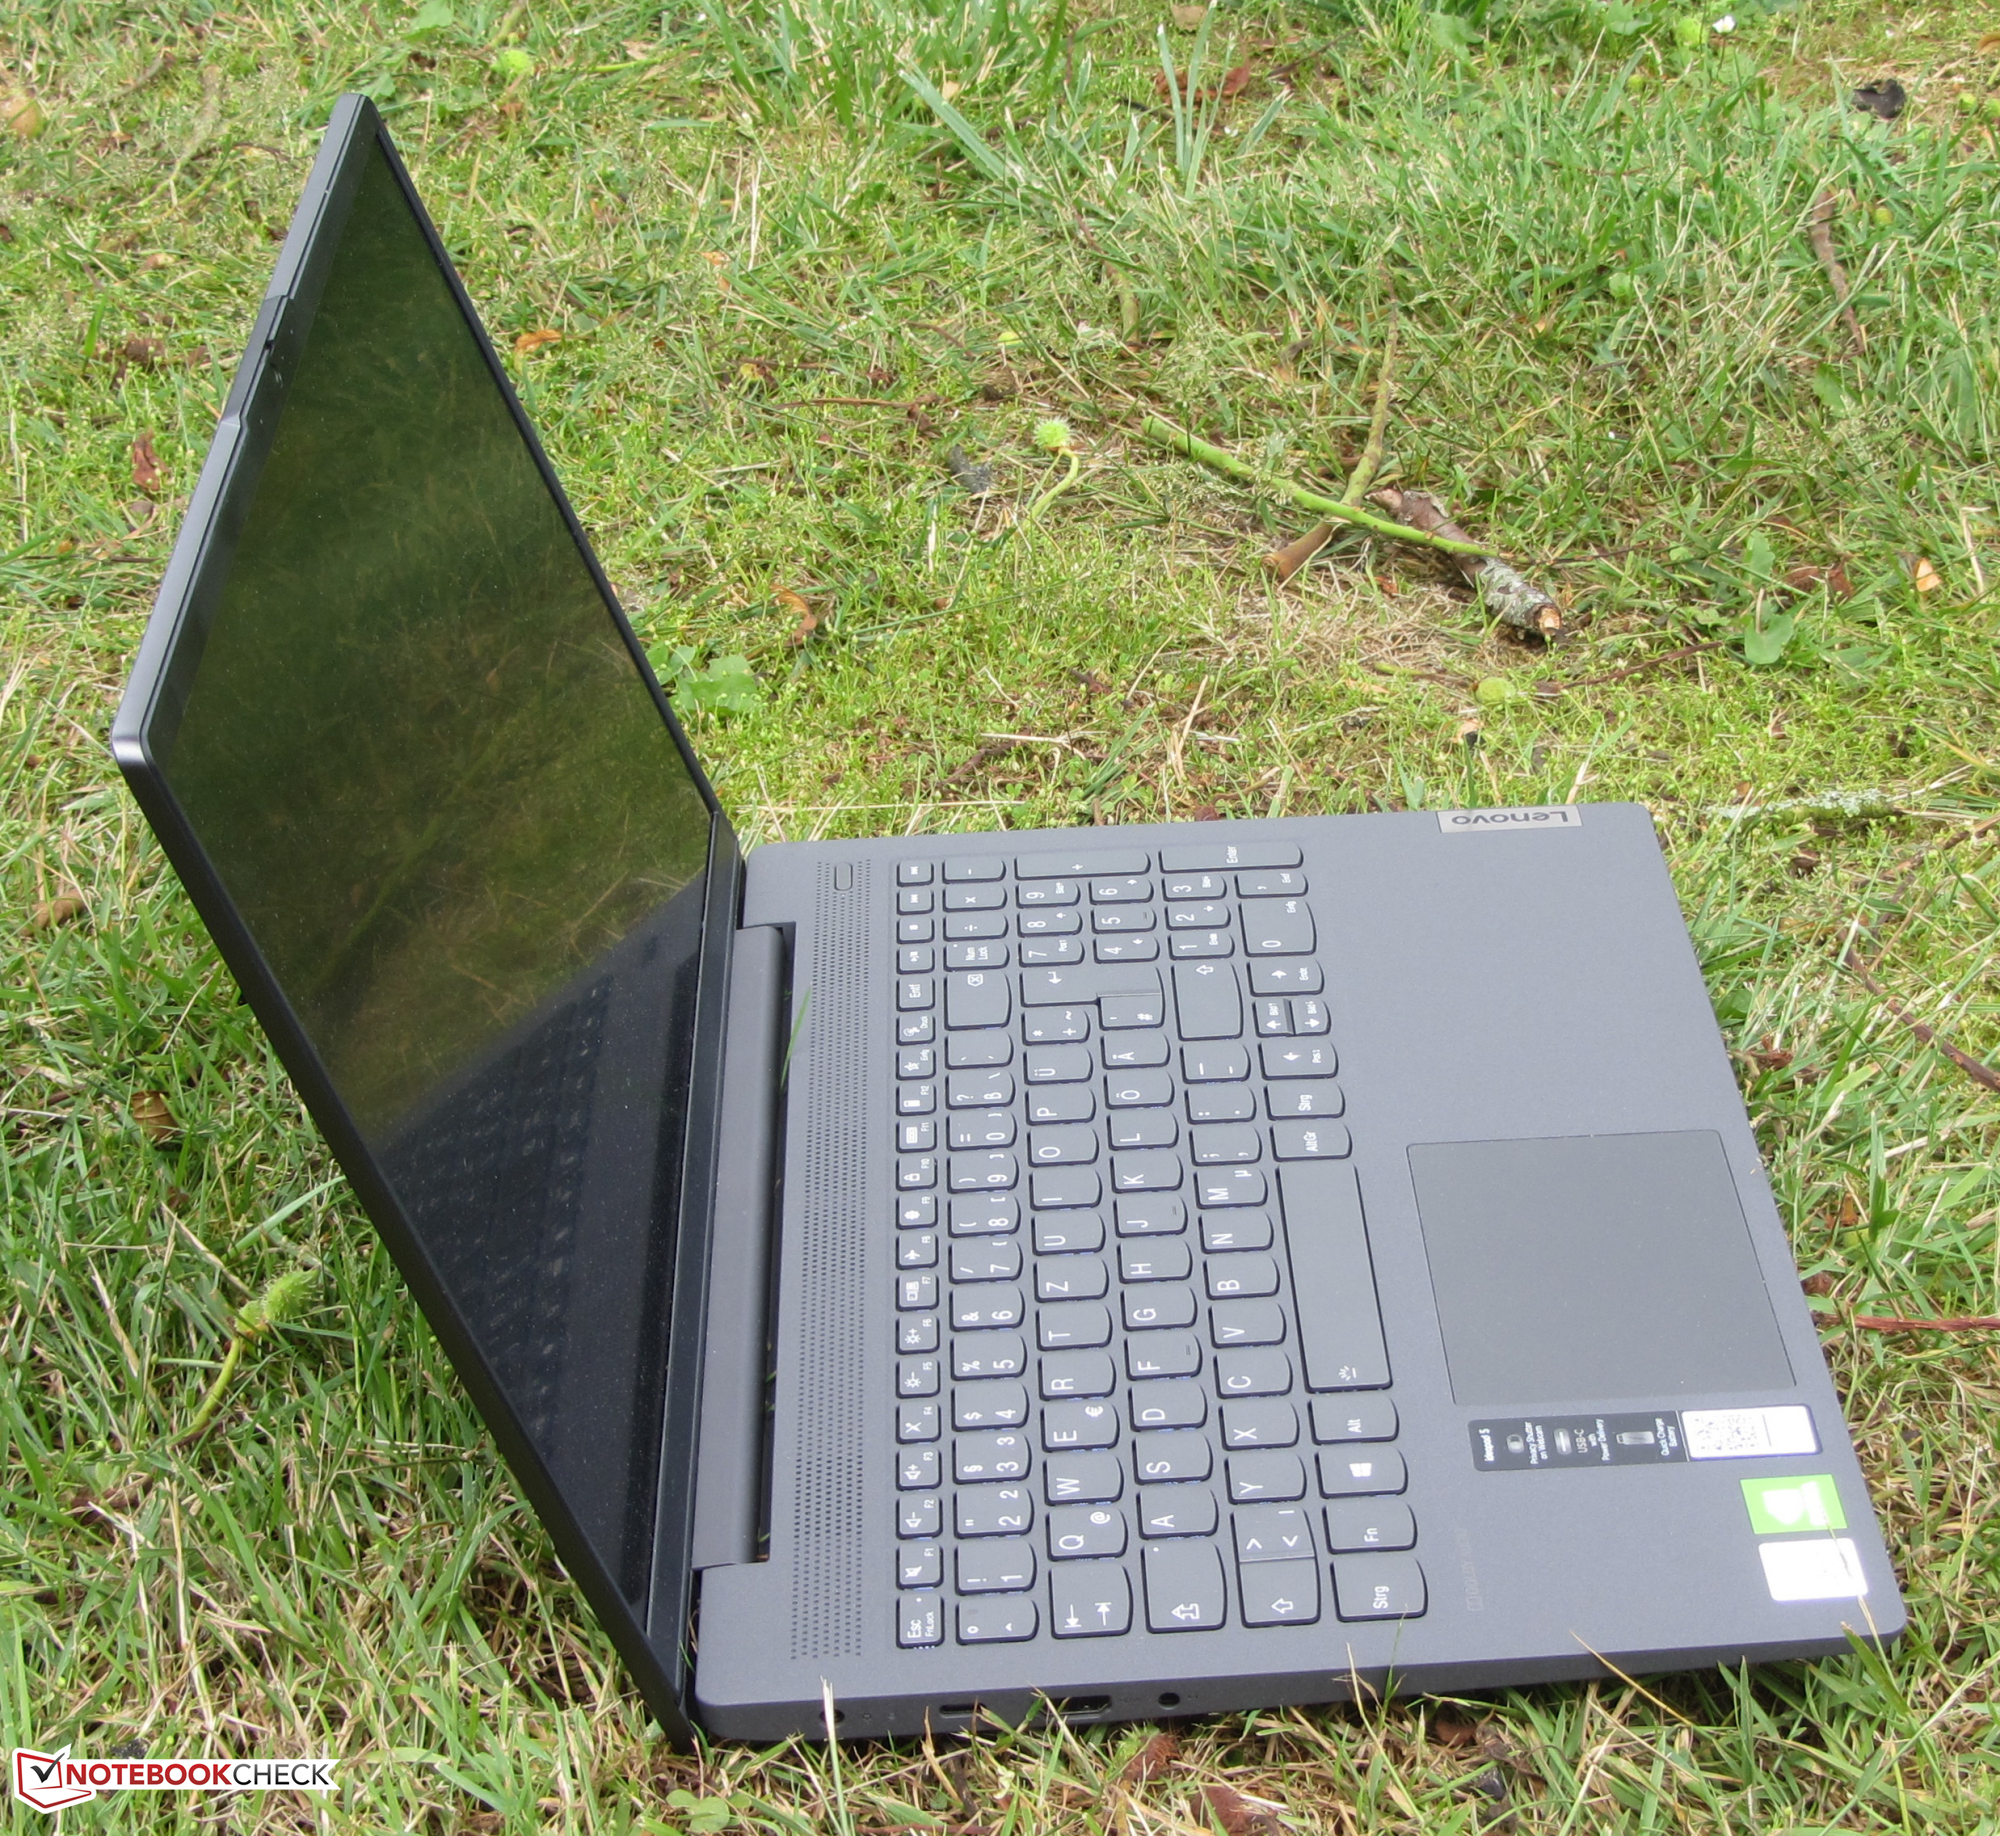
The IdeaPad is the most compact in our comparison field. Together with the Acer Aspire 5, it is also the lightest device.
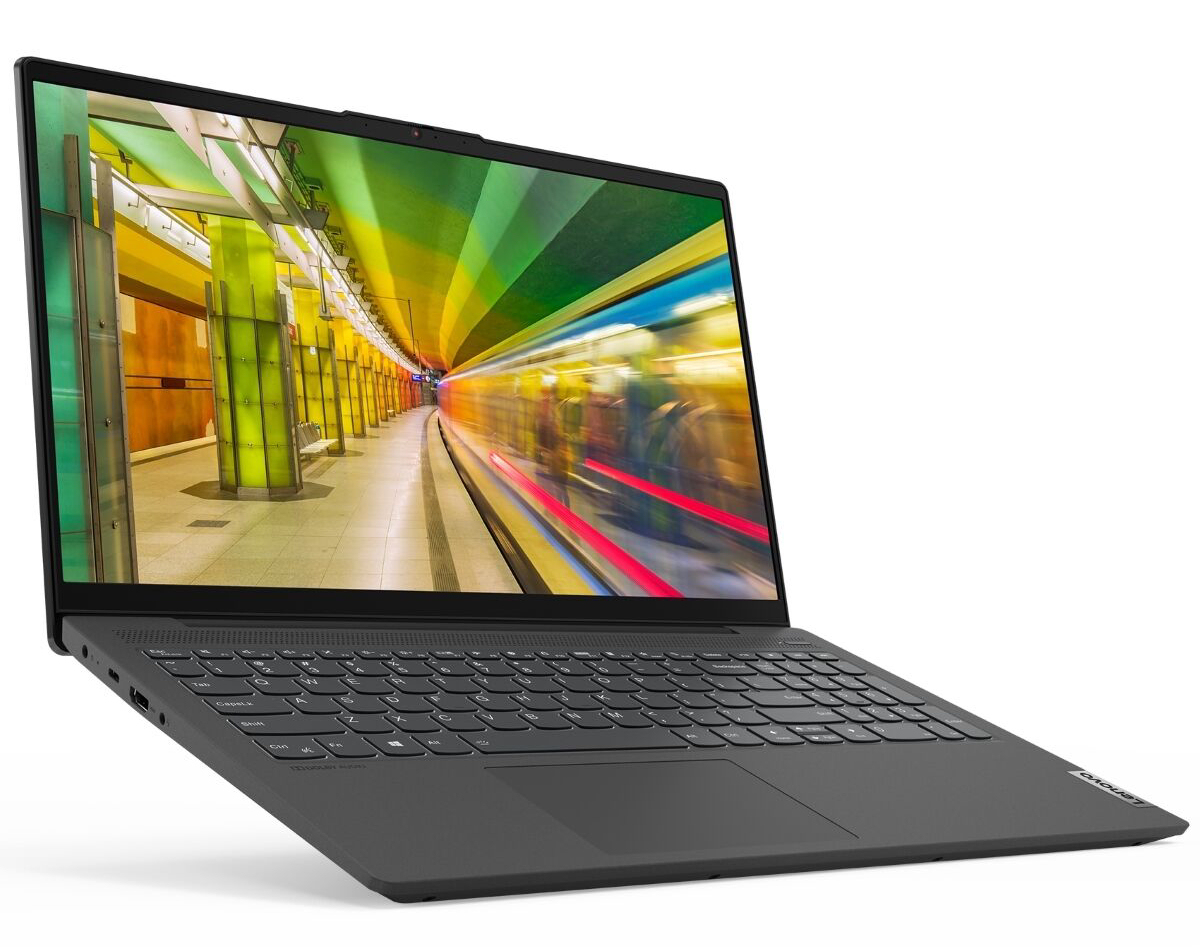
Connectivity - IdeaPad 5 with Type-C-USB
The port selection is limited but covers the most basic requirements. The two USB Type A ports support the USB 3.2 Gen 1 standard, while the USB Type C port (USB 3.2 Gen 2) supports both DisplayPort via USB C and Power Delivery (which means the notebook can be recharged via this port). Together with the HDMI connector this means that the IdeaPad has a total of two video outputs. The ports are positioned towards the back on the left and right side. This means that the area around the wrist rests remains free from cables.


SD Card Reader
The SD card reader does not accommodate the entire SD card, which stands out by about 17 mm (~0.67 in). The model in our device is one of the slower versions. It reaches a maximum transfer rate of 31.9 MB/s when copying larger blocks of data. The transfer of 250 JPG files (each 5 MB) is completed with a speed of 20.8 MB/s. We test all storage card readers with our reference card (Toshiba Exceria Pro SDXC 64 GB UHS-II).
| SD Card Reader | |
| average JPG Copy Test (av. of 3 runs) | |
| Average of class Multimedia (23 - 531, n=37, last 2 years) | |
| Lenovo Ideapad S540-15IML (Toshiba Exceria Pro SDXC 64 GB UHS-II) | |
| HP Pavilion 15-cs2019ng (Toshiba Exceria Pro SDXC 64 GB UHS-II) | |
| Schenker VIA 15 | |
| HP Pavilion Gaming 15-ec0002ng (Toshiba Exceria Pro SDXC 64 GB UHS-II) | |
| Lenovo IdeaPad 5 15IIL05 (Toshiba Exceria Pro SDXC 64 GB UHS-II) | |
| maximum AS SSD Seq Read Test (1GB) | |
| Average of class Multimedia (37.3 - 1455, n=36, last 2 years) | |
| Lenovo Ideapad S540-15IML (Toshiba Exceria Pro SDXC 64 GB UHS-II) | |
| HP Pavilion Gaming 15-ec0002ng (Toshiba Exceria Pro SDXC 64 GB UHS-II) | |
| Schenker VIA 15 (Toshiba Exceria Pro M501 64 GB UHS-II) | |
| HP Pavilion 15-cs2019ng (Toshiba Exceria Pro SDXC 64 GB UHS-II) | |
| Lenovo IdeaPad 5 15IIL05 (Toshiba Exceria Pro SDXC 64 GB UHS-II) | |
Communication
The Wi-Fi module (Wi-Fi 6 AX201) from Intel supports not only the Wi-Fi standards 802.11a/b/g/n/ac, but also the ax standard and Bluetooth 5. The transfer rates measured during our test under ideal conditions (no other Wi-Fi devices in the vicinity, short distance between notebook and server PC) were very good.
Webcam
The included webcam (0.9 MP) has a maximum resolution of 1280x720 pixels. The results are rather washed out and the color accuracy is fairly disappointing as well with a Delta E deviation of 25 instead of the ideal maximum of 3.


Accessories
Apart from the usual documentation (warranty information, quick start guide), the notebook comes without accessories.
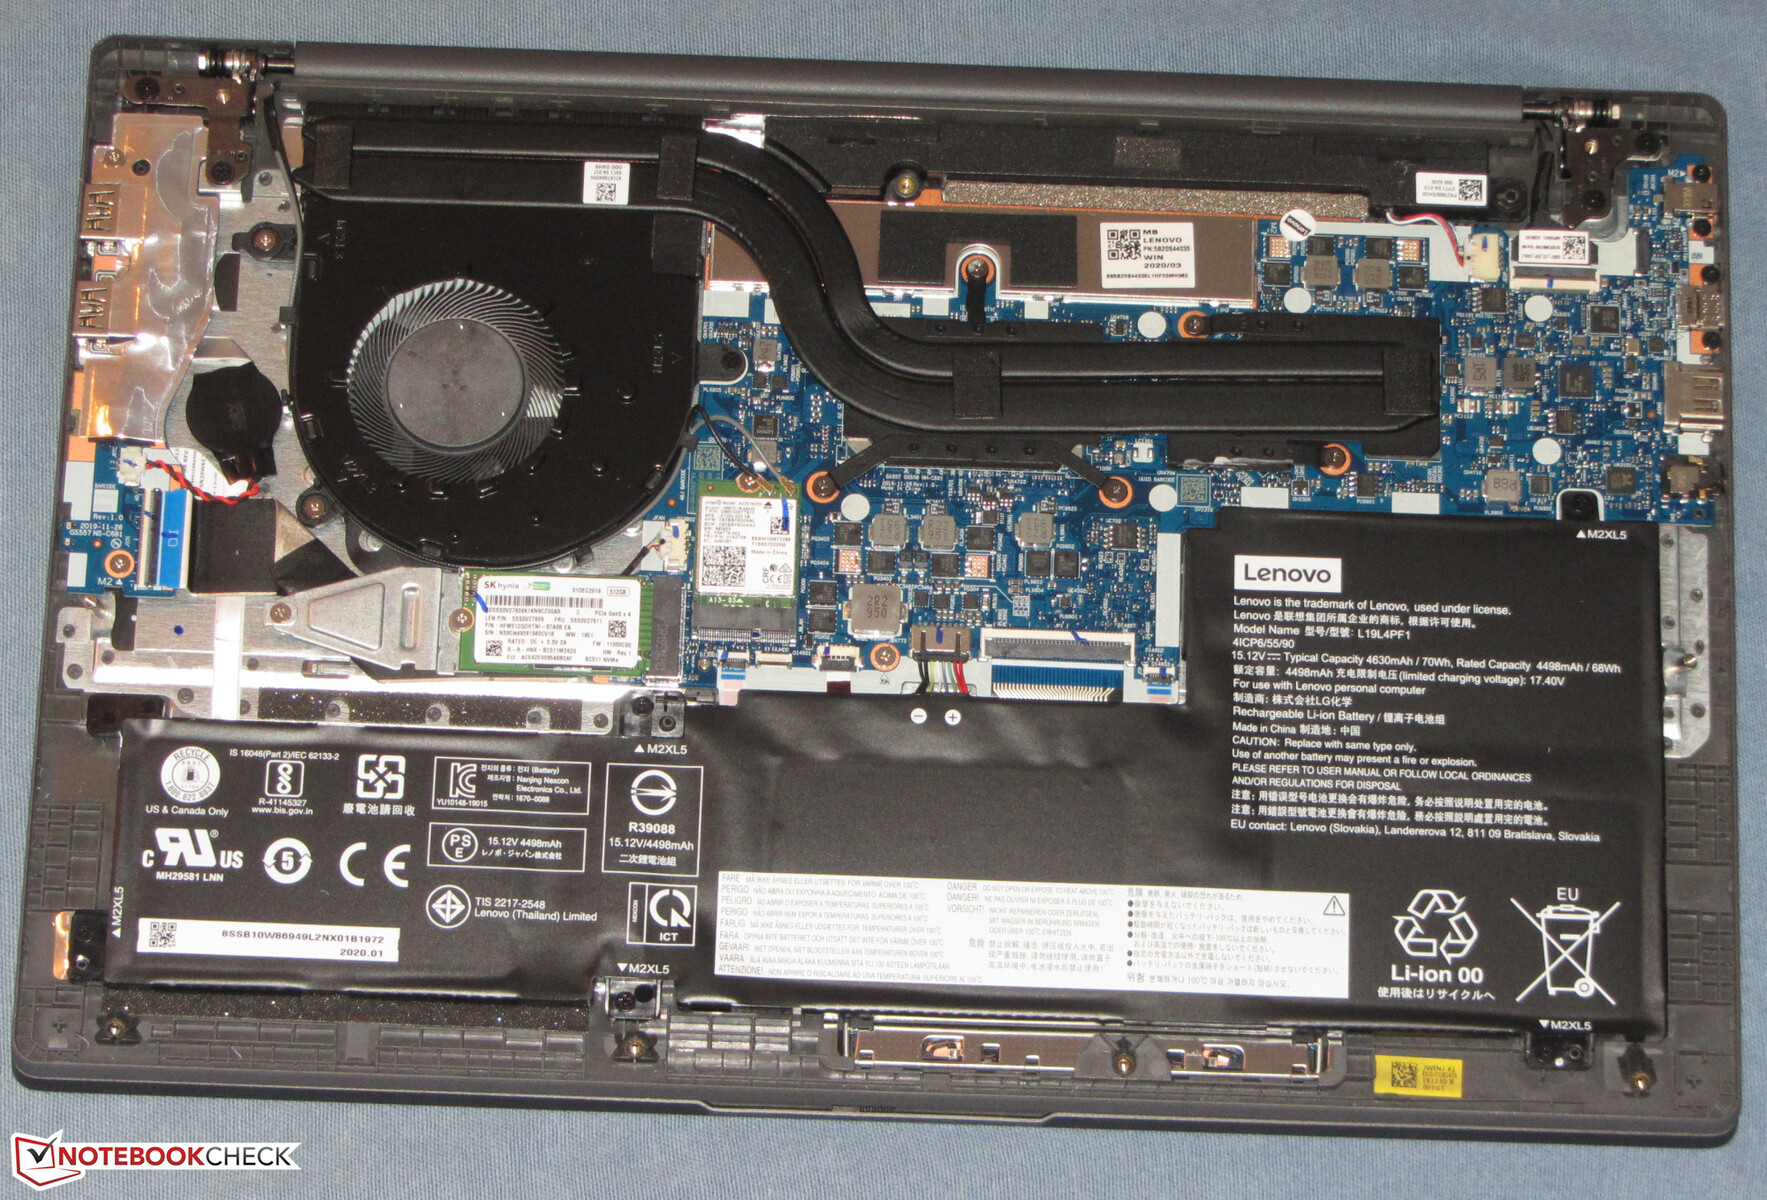
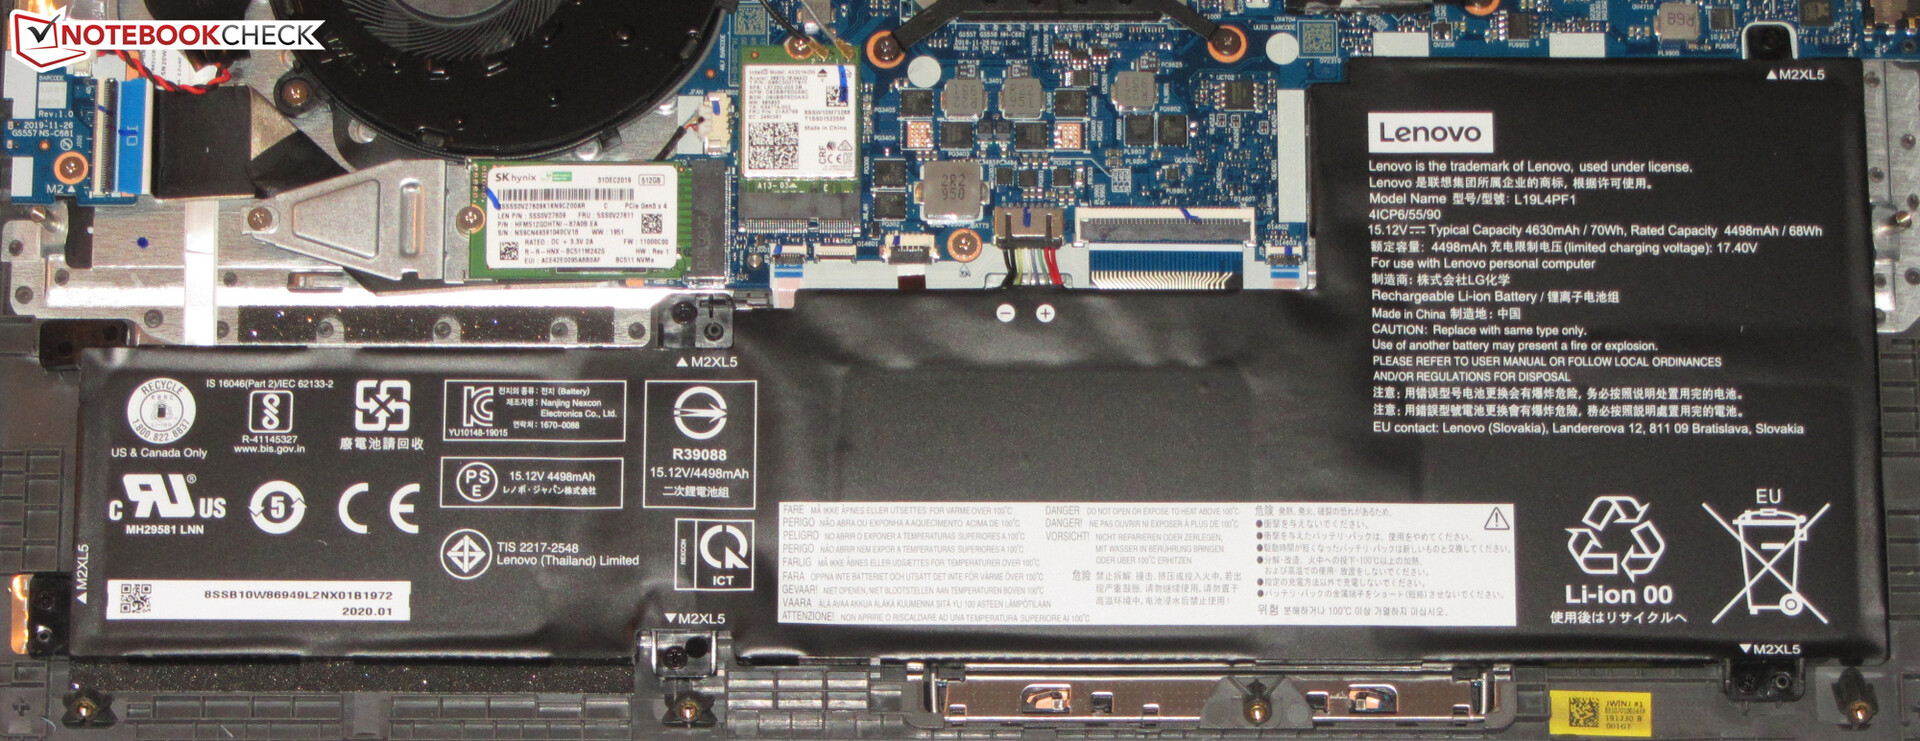
Maintenance
There is no maintenance hatch on the Lenovo IdeaPad 5. Users will have to remove the entire base cover to get to the insides. Luckily, this isn't particularly difficult. After removing all screws from the bottom, you can lift the cover off with the help of a spatula.
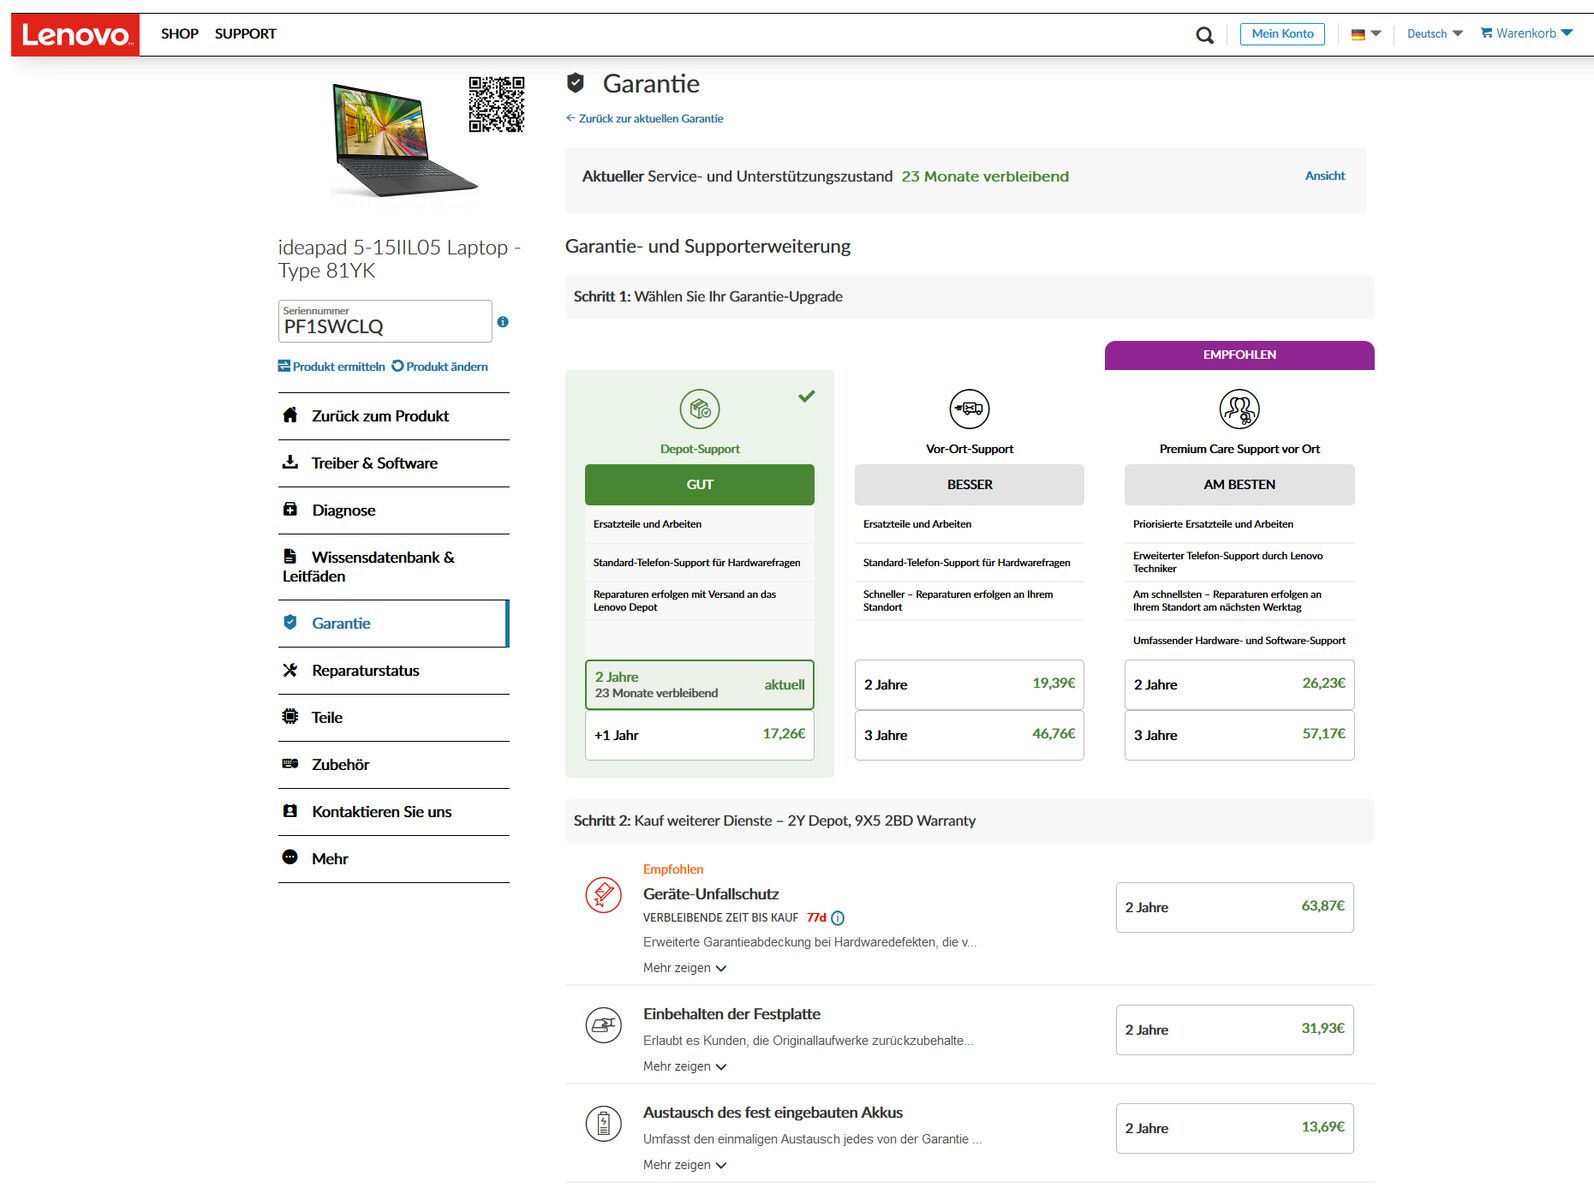
Warranty
Lenovo has equipped the slim 15.6-inch device with a one-year warranty. This can be extended. Three years of on-site warranty, for example, are available for $75.
Input Devices - keyboard backlighting for the Lenovo
Keyboard
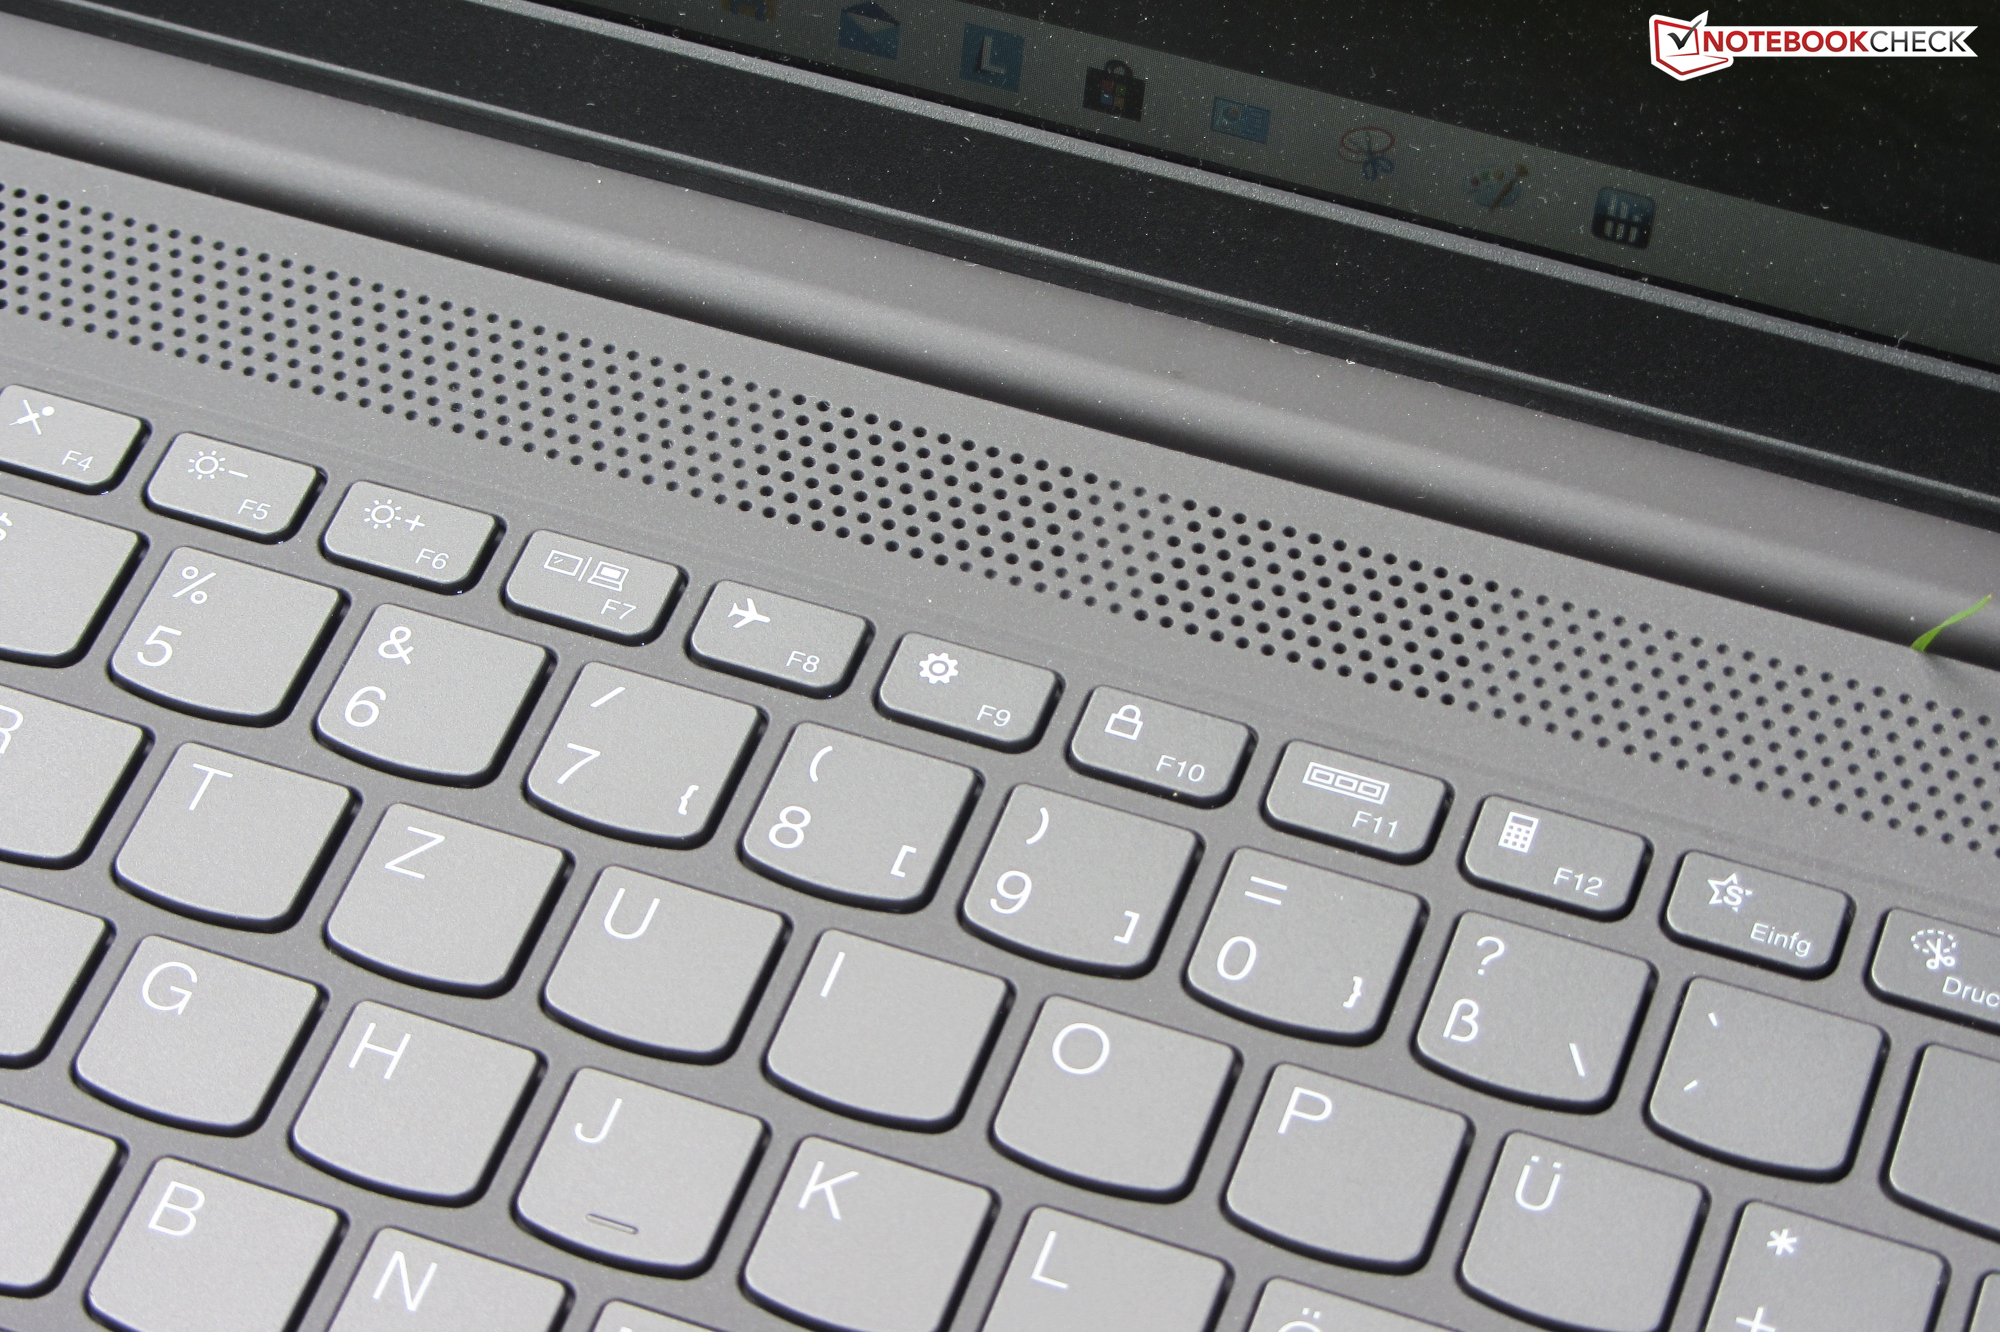
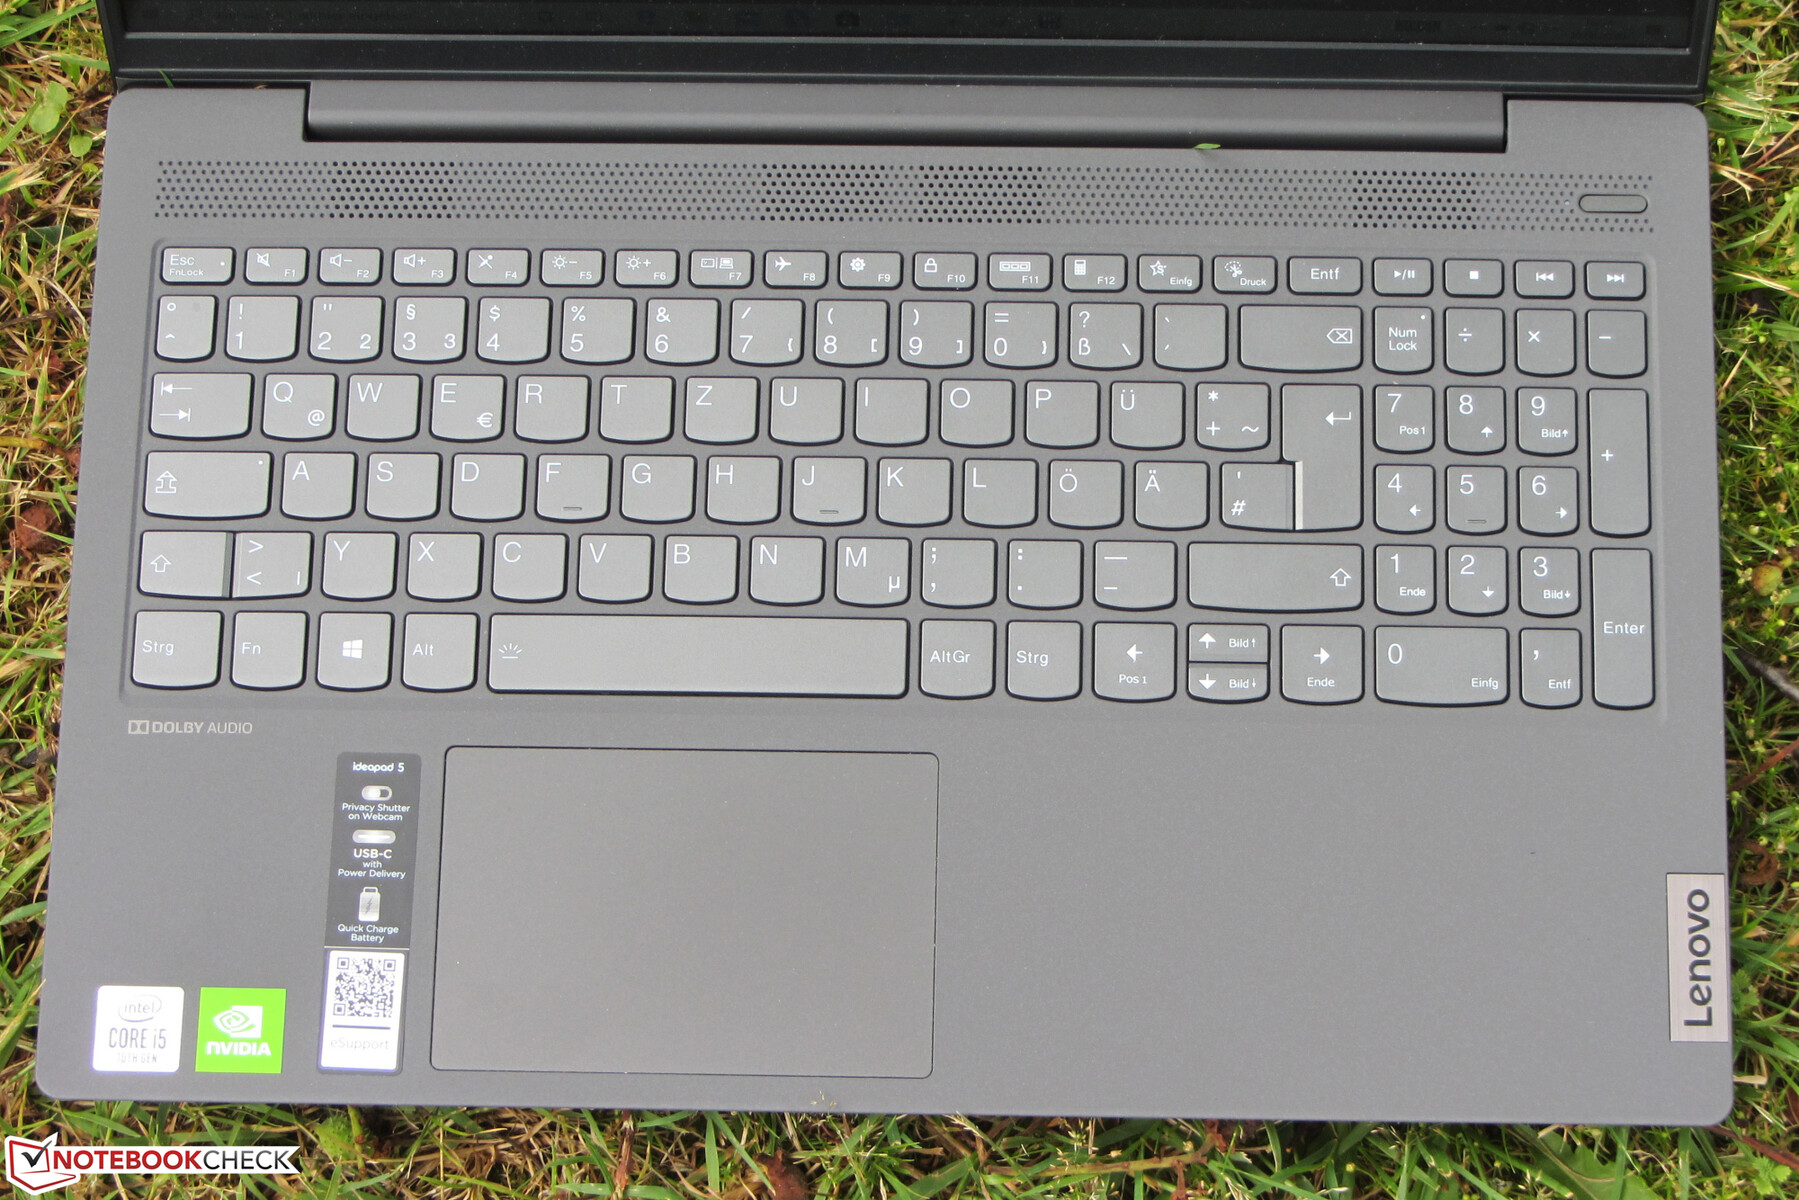
The IdeaPad is equipped with a backlit chicklet keyboard. The flat keys have a short travel and a very clear pressure point. We appreciate the crisp actuation force. The keyboard gives way minimally while typing, but this isn't particularly bothersome. The backlighting (two levels) can be controlled via a function key. Overall, the Lenovo has provided users with a keyboard that is suitable for everyday use and regular typing.
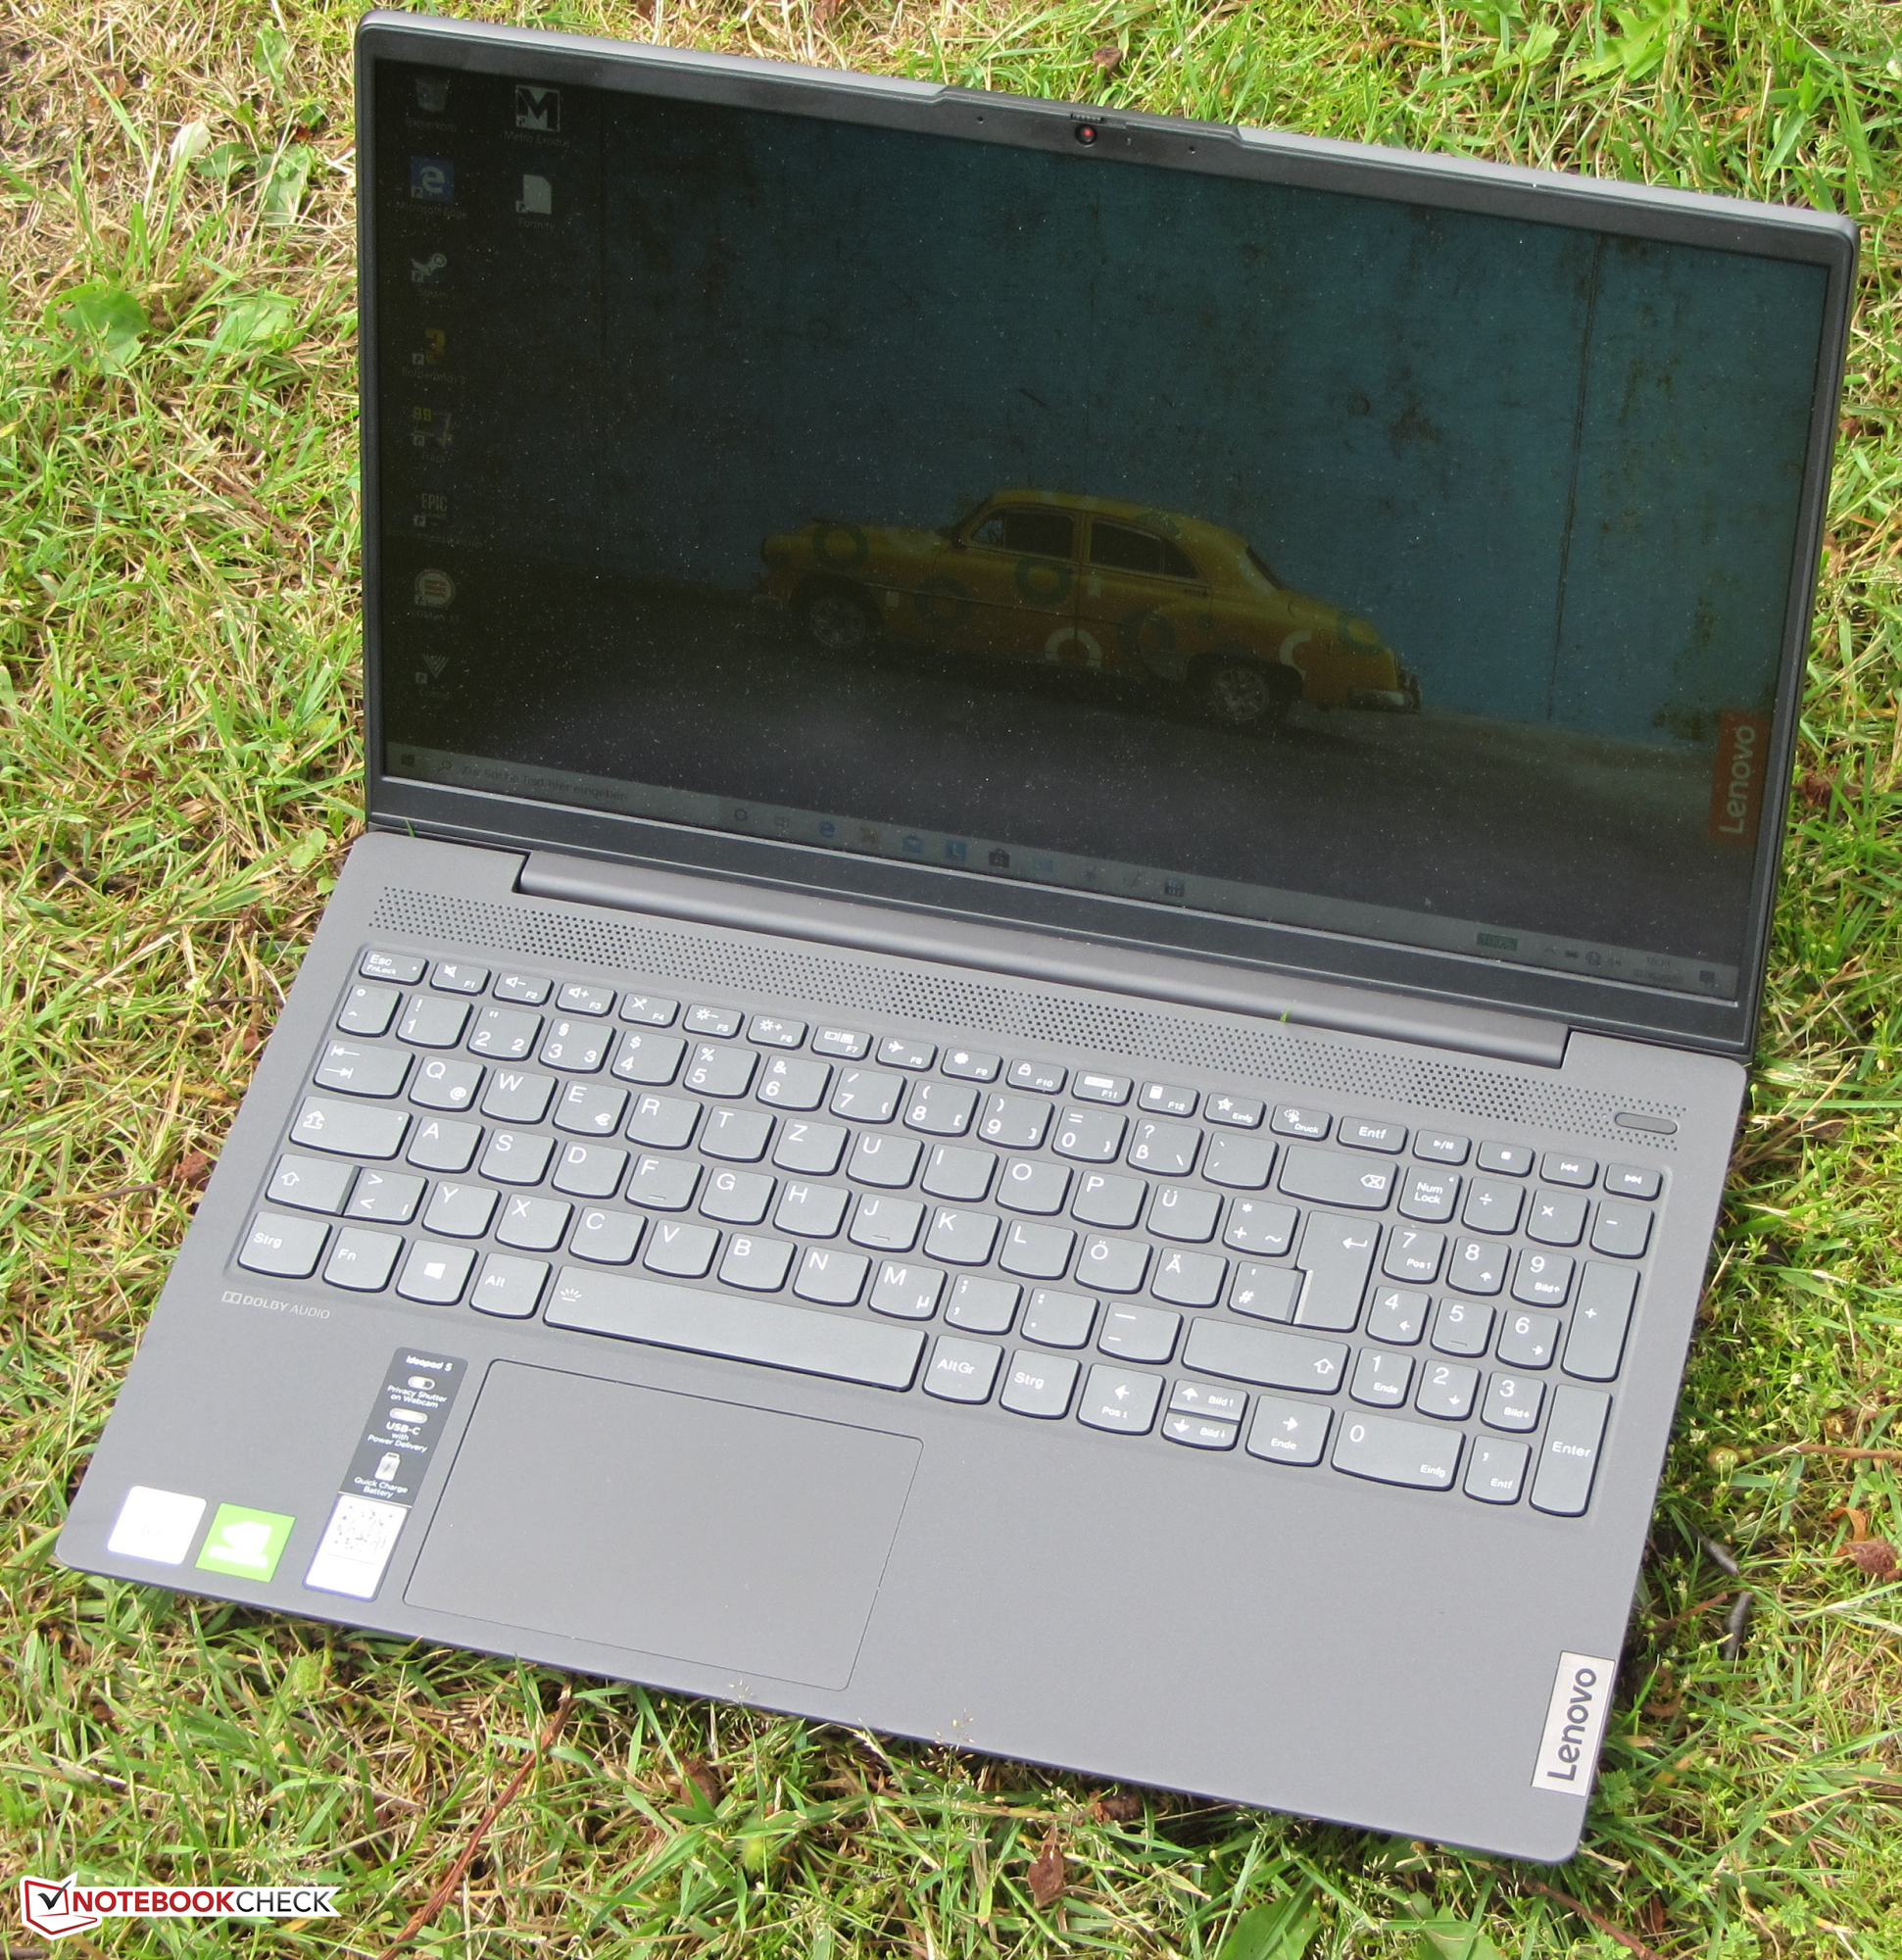
Touchpad
The multi-touch ClickPad takes up 10.5 x 7 cm (~4.13 x 2.76 in) and provides sufficient space for gesture control. The smooth surface of the pad makes it easy for fingers to glide over. It responds to inputs even in the corners, has short travel and a clear pressure point.
Display - IPS with low color space coverage
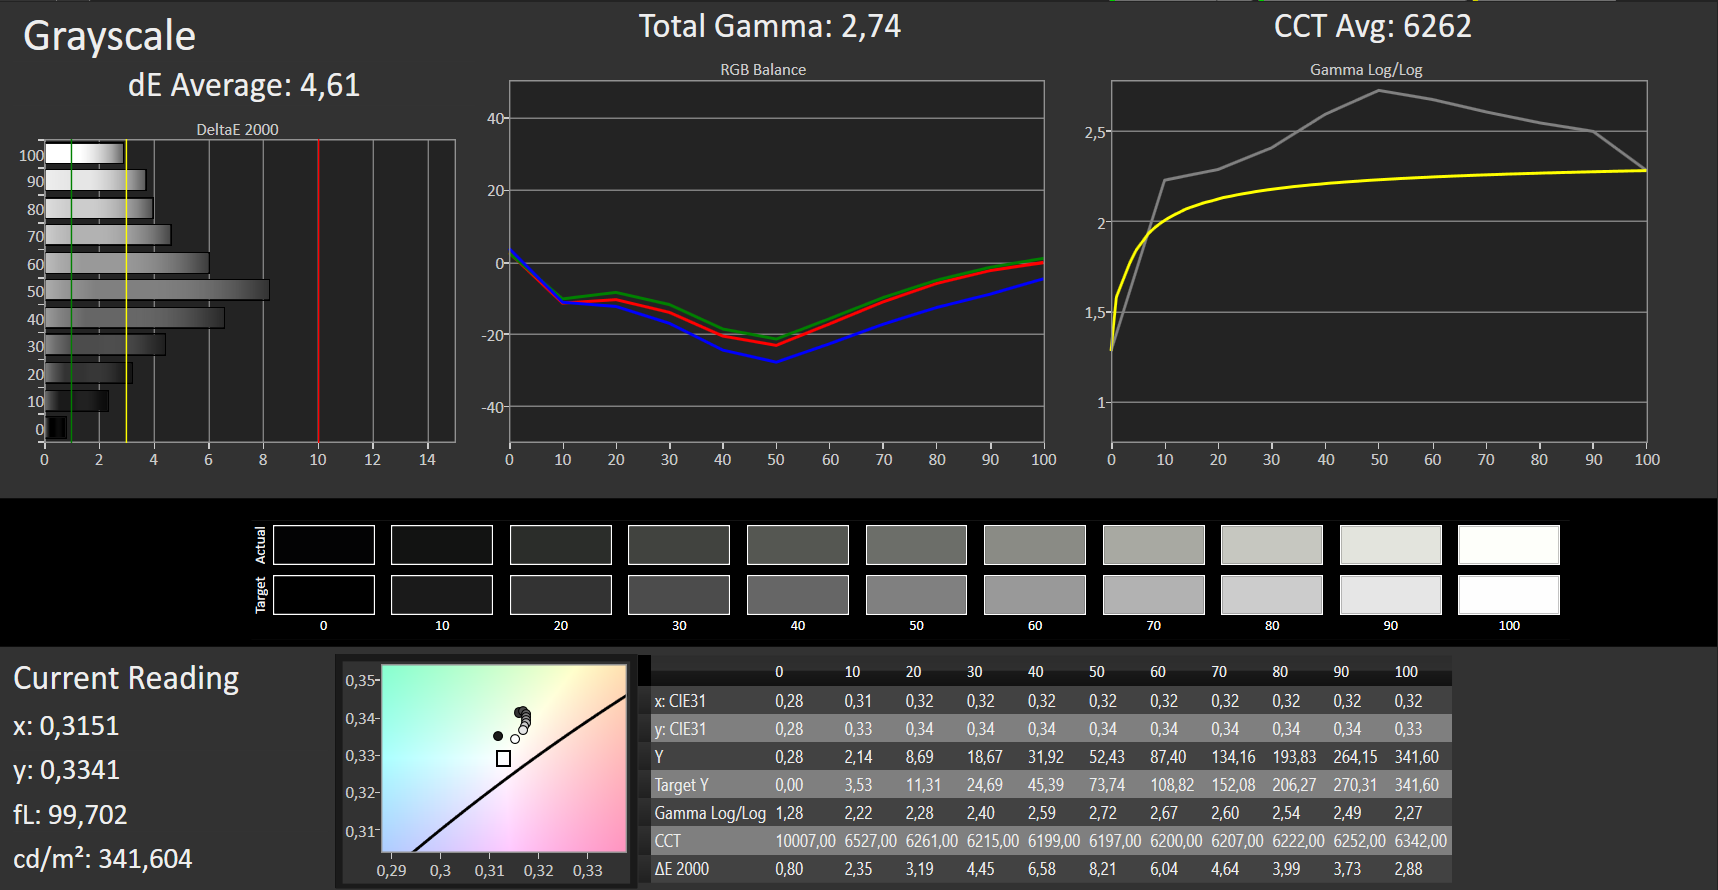
The matte 15.6-inch panel in the IdeaPad 5 has a native resolution of 1920x1080 pixels. It offers a decent brightness (324.6 cd/m²) and a good contrast ratio (1259:1). We were pleased with the fact that the display does not use PWM to regulate brightness.


| |||||||||||||||||||||||||
Brightness Distribution: 88 %
Center on Battery: 344 cd/m²
Contrast: 1259:1 (Black: 0.27 cd/m²)
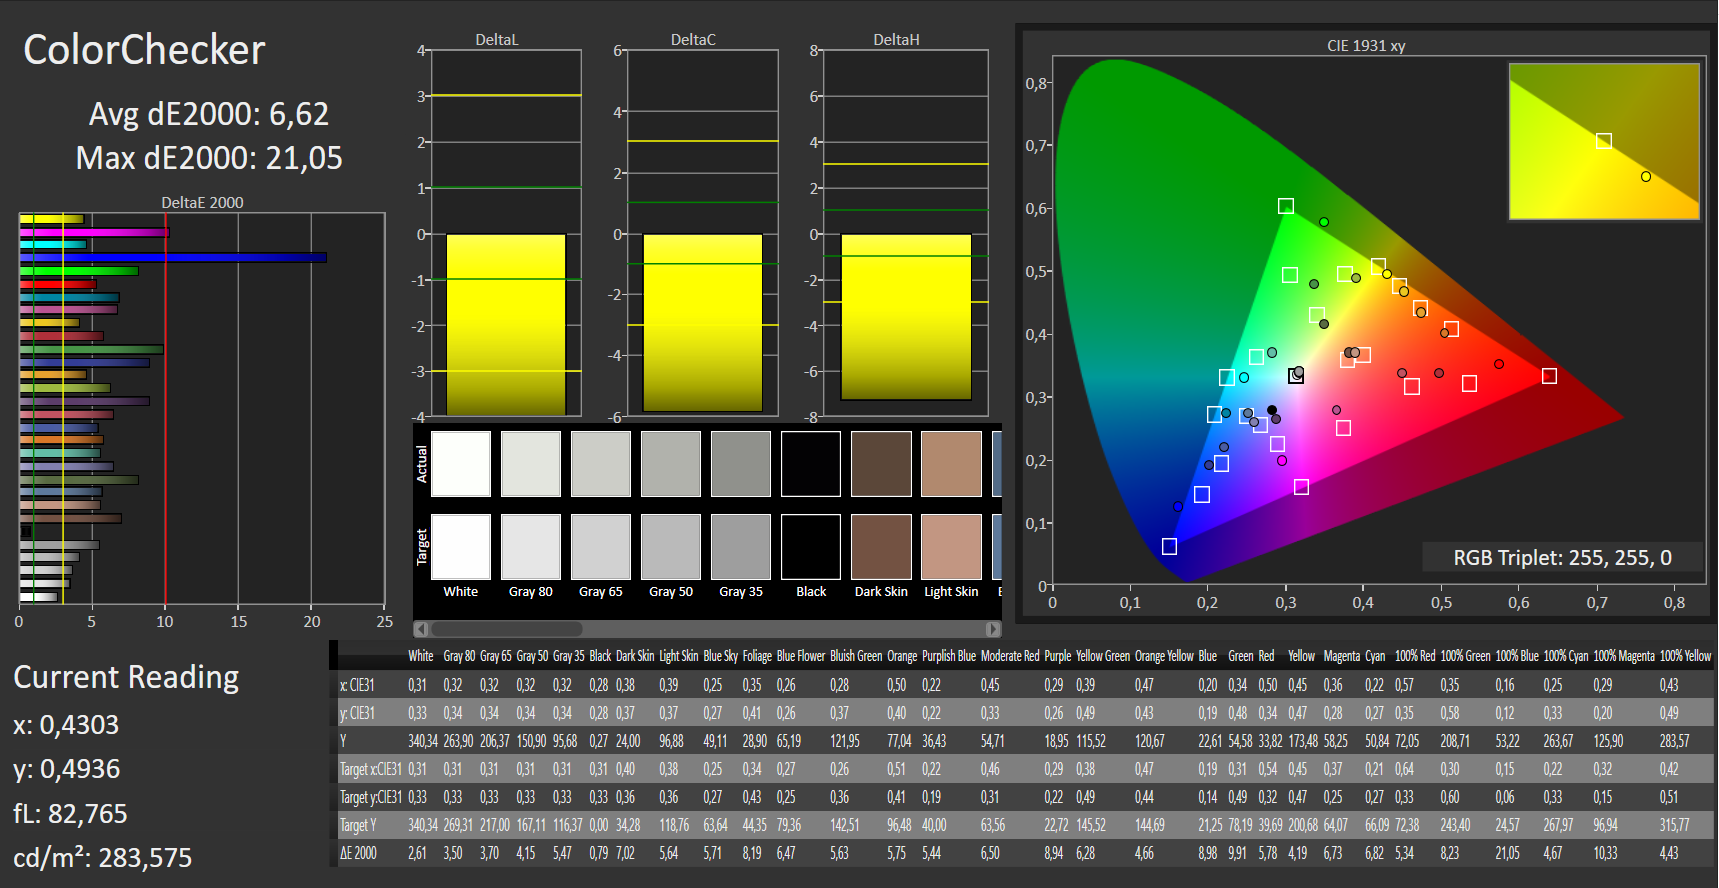
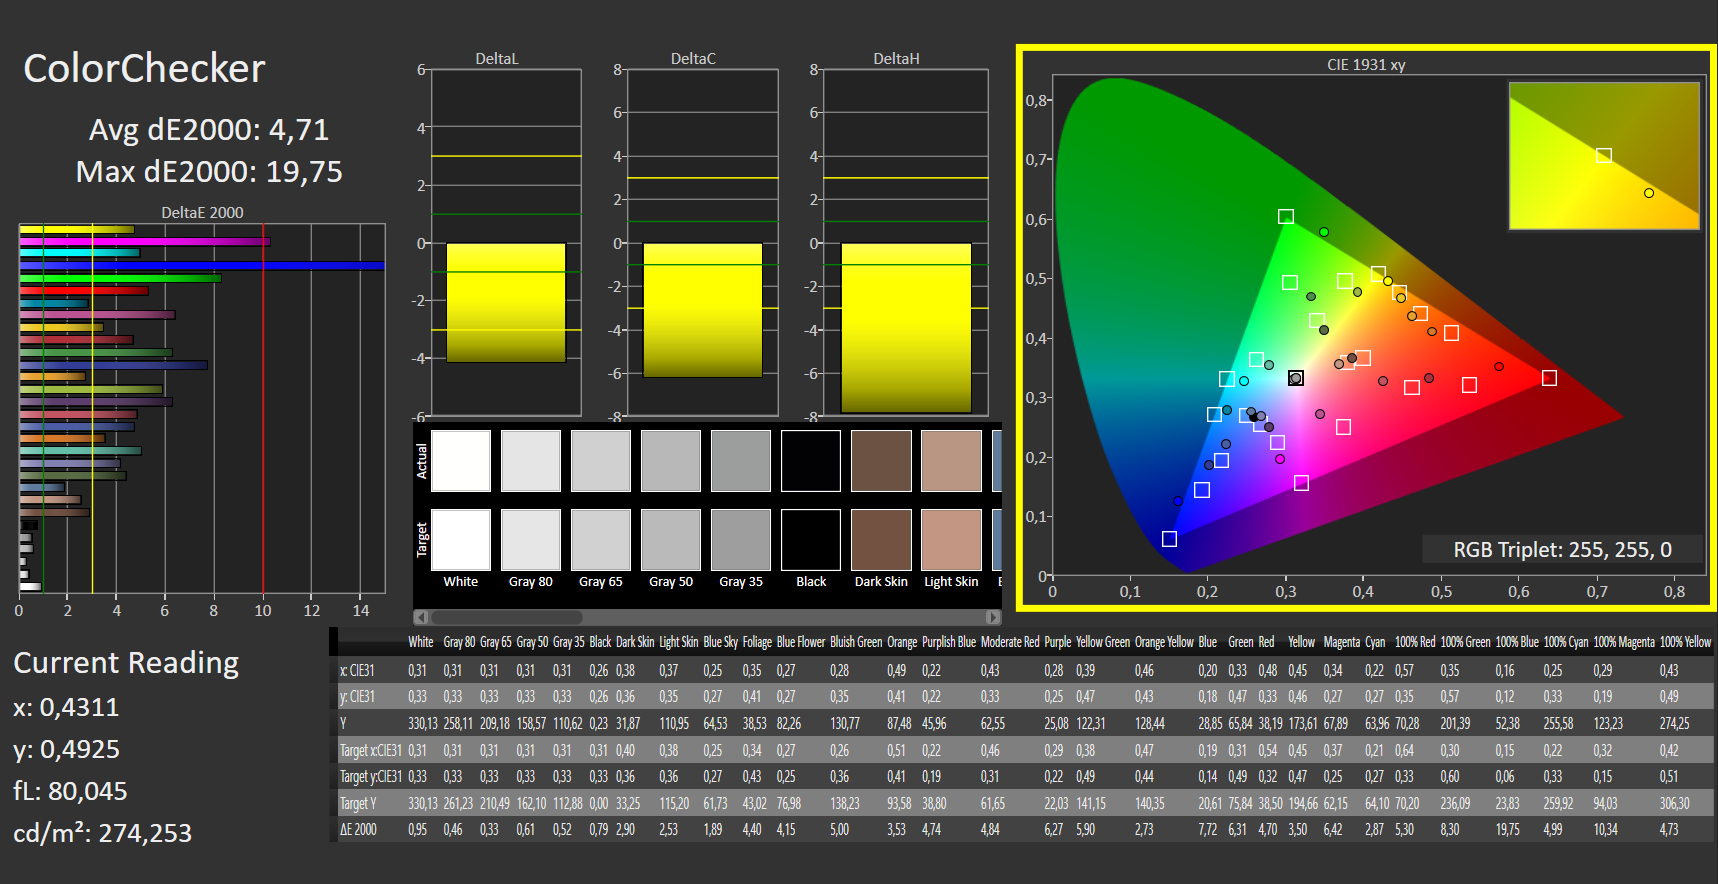
ΔE ColorChecker Calman: 6.62 | ∀{0.5-29.43 Ø4.71}
calibrated: 4.71
ΔE Greyscale Calman: 4.61 | ∀{0.09-98 Ø4.96}
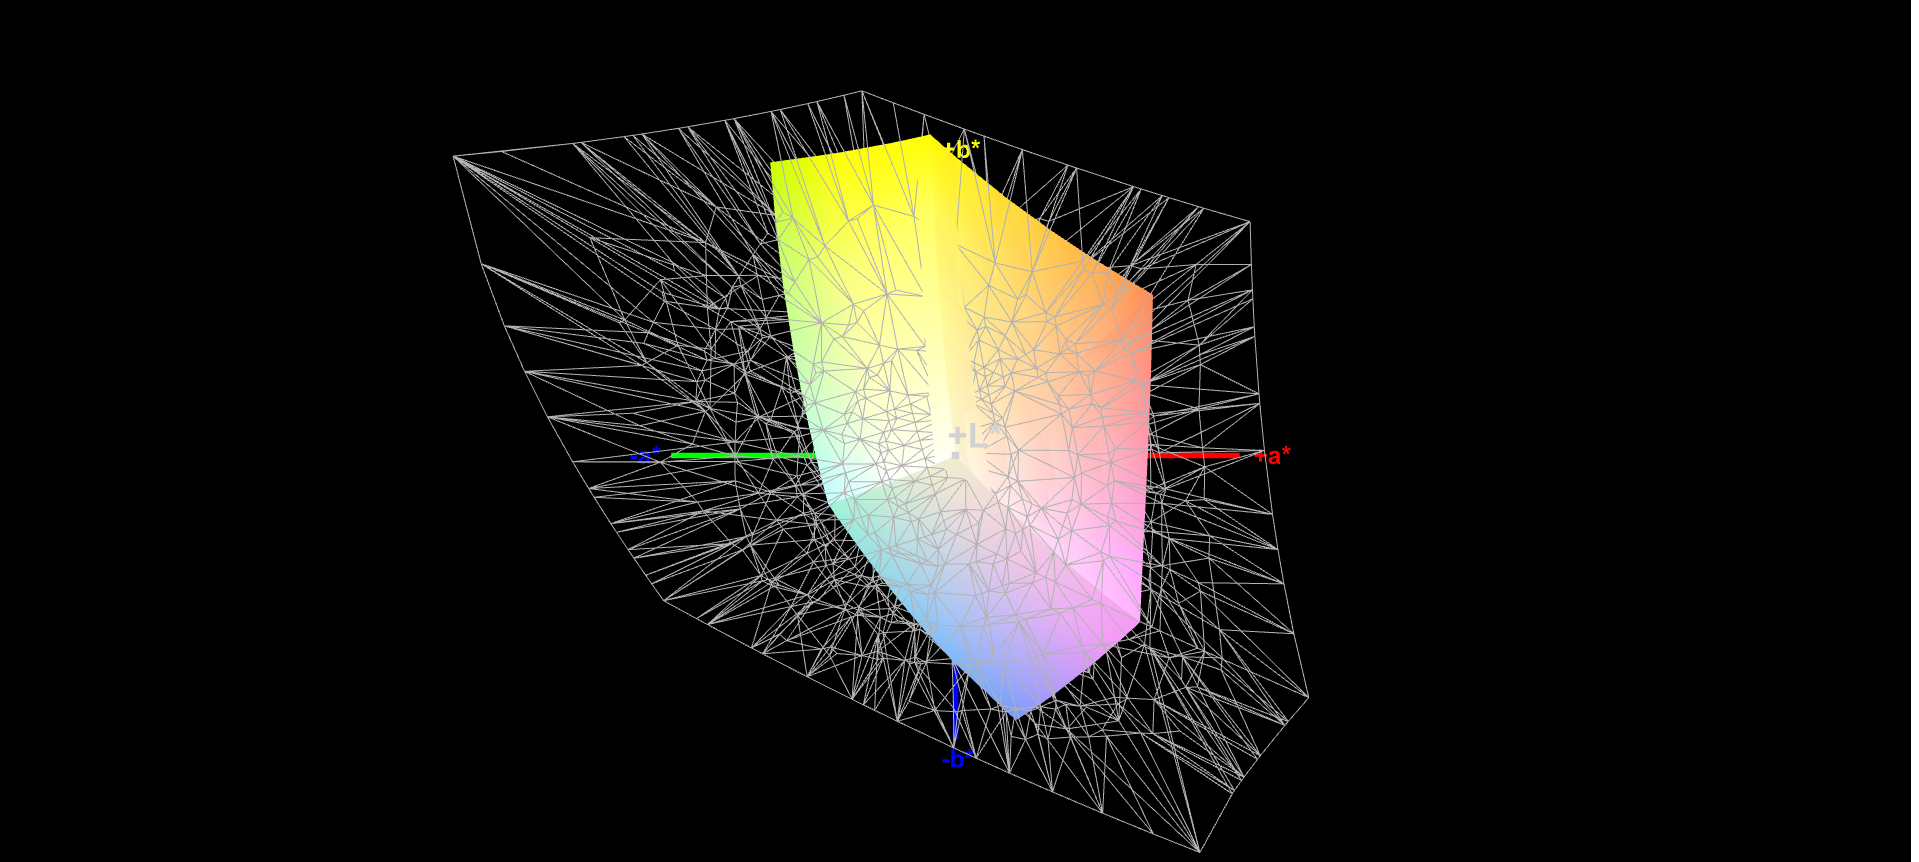
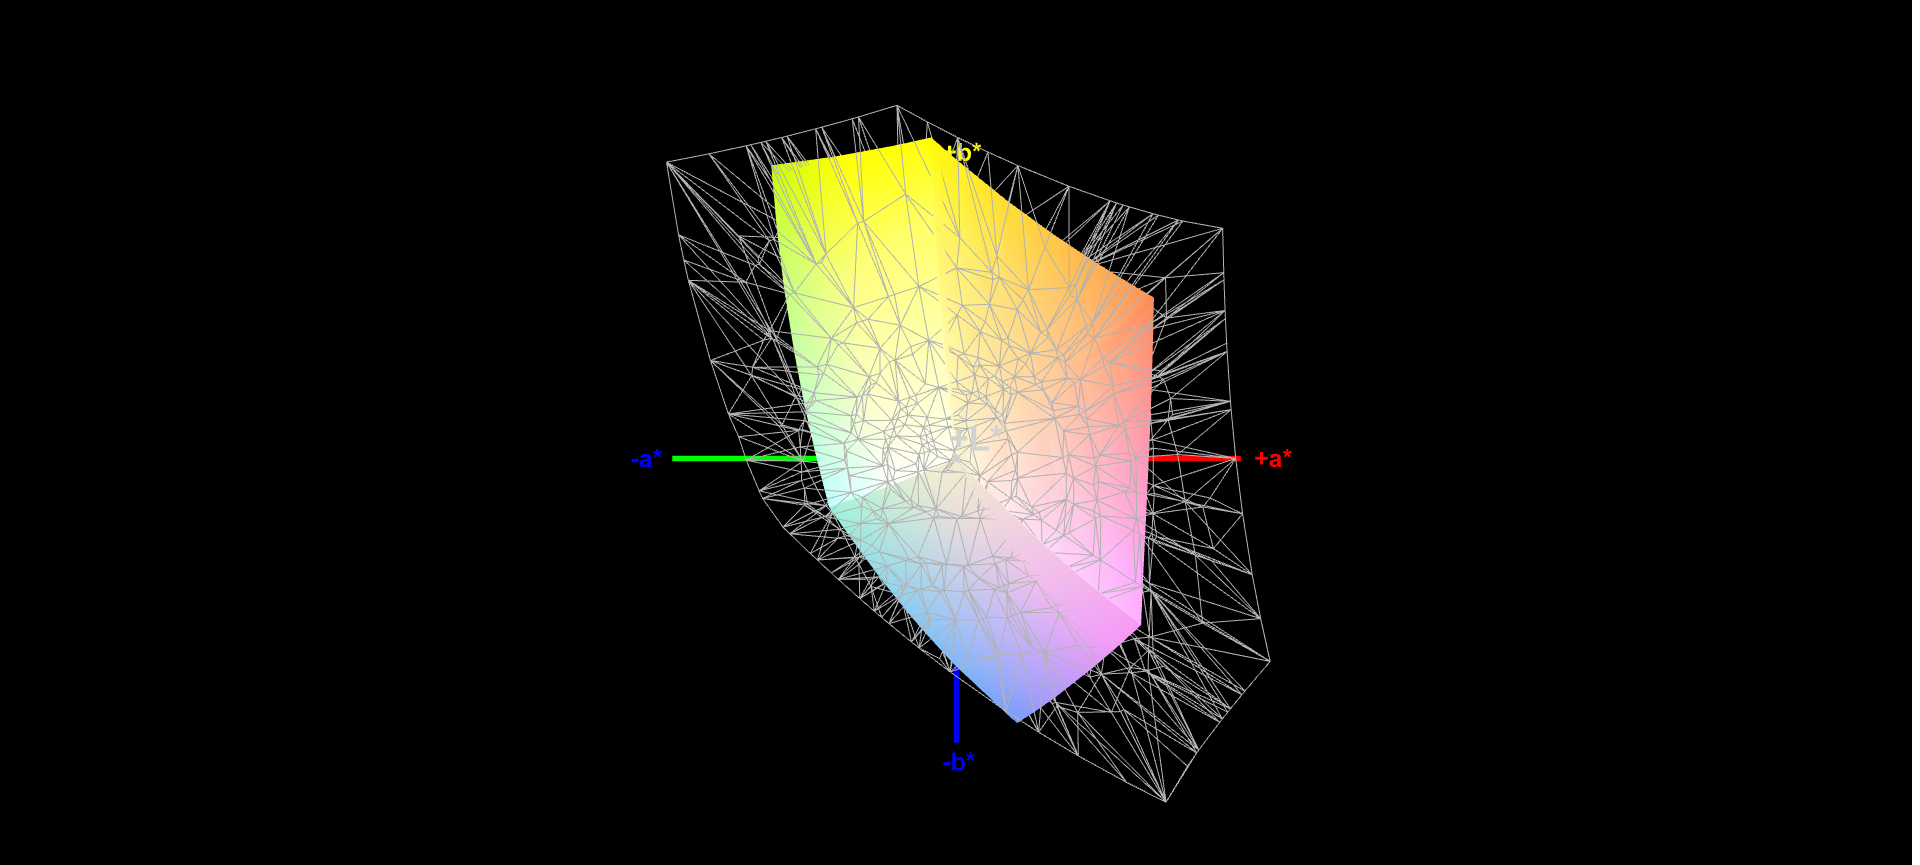
56% sRGB (Argyll 1.6.3 3D)
36% AdobeRGB 1998 (Argyll 1.6.3 3D)
38.88% AdobeRGB 1998 (Argyll 3D)
56.5% sRGB (Argyll 3D)
37.63% Display P3 (Argyll 3D)
Gamma: 2.74
CCT: 6262 K
| Lenovo IdeaPad 5 15IIL05 IPS, 1920x1080, 15.6" | Acer Aspire 5 A515-54G IPS, 1920x1080, 15.6" | HP Pavilion 15-cs2019ng IPS, 1920x1080, 15.6" | Schenker VIA 15 IPS, 1920x1080, 15.6" | HP Pavilion Gaming 15-ec0002ng TN LED, 1920x1080, 15.6" | Lenovo Ideapad S540-15IML IPS, 1920x1080, 15.6" | |
|---|---|---|---|---|---|---|
| Display | -10% | 67% | 81% | 10% | 65% | |
| Display P3 Coverage (%) | 37.63 | 33.78 -10% | 67.2 79% | 68.7 83% | 41.22 10% | 66.8 78% |
| sRGB Coverage (%) | 56.5 | 50.8 -10% | 88.1 56% | 99.8 77% | 61.8 9% | 86.5 53% |
| AdobeRGB 1998 Coverage (%) | 38.88 | 34.9 -10% | 64.4 66% | 70.9 82% | 42.62 10% | 63.2 63% |
| Response Times | 11% | -5% | 5% | 20% | -24% | |
| Response Time Grey 50% / Grey 80% * (ms) | 42 ? | 36 ? 14% | 43 ? -2% | 38.4 ? 9% | 44 ? -5% | 49.6 ? -18% |
| Response Time Black / White * (ms) | 27 ? | 25 ? 7% | 29 ? -7% | 26.8 ? 1% | 15 ? 44% | 34.8 ? -29% |
| PWM Frequency (Hz) | 208 ? | 25910 ? | 250 ? | 202 ? | ||
| Screen | 5% | 19% | 38% | -29% | 21% | |
| Brightness middle (cd/m²) | 340 | 248 -27% | 320 -6% | 296 -13% | 233 -31% | 299 -12% |
| Brightness (cd/m²) | 325 | 238 -27% | 293 -10% | 273 -16% | 211 -35% | 278 -14% |
| Brightness Distribution (%) | 88 | 86 -2% | 86 -2% | 81 -8% | 82 -7% | 87 -1% |
| Black Level * (cd/m²) | 0.27 | 0.23 15% | 0.26 4% | 0.25 7% | 0.405 -50% | 0.25 7% |
| Contrast (:1) | 1259 | 1078 -14% | 1231 -2% | 1184 -6% | 575 -54% | 1196 -5% |
| Colorchecker dE 2000 * | 6.62 | 5.05 24% | 4.5 32% | 1.7 74% | 8.22 -24% | 4.32 35% |
| Colorchecker dE 2000 max. * | 21.05 | 14.34 32% | 8.81 58% | 2.9 86% | 18.6 12% | 9.3 56% |
| Colorchecker dE 2000 calibrated * | 4.71 | 4.76 -1% | 0.8 83% | 2.58 45% | ||
| Greyscale dE 2000 * | 4.61 | 1.37 70% | 4.71 -2% | 2.1 54% | 10.13 -120% | 4.21 9% |
| Gamma | 2.74 80% | 2.4 92% | 2.45 90% | 2.31 95% | 2.27 97% | 2.39 92% |
| CCT | 6262 104% | 6592 99% | 7085 92% | 6759 96% | 11323 57% | 6799 96% |
| Color Space (Percent of AdobeRGB 1998) (%) | 36 | 32 -11% | 58 61% | 64.7 80% | 39 8% | 57 58% |
| Color Space (Percent of sRGB) (%) | 56 | 51 -9% | 88 57% | 99.8 78% | 62 11% | 86 54% |
| Total Average (Program / Settings) | 2% /
3% | 27% /
25% | 41% /
42% | 0% /
-15% | 21% /
24% |
* ... smaller is better
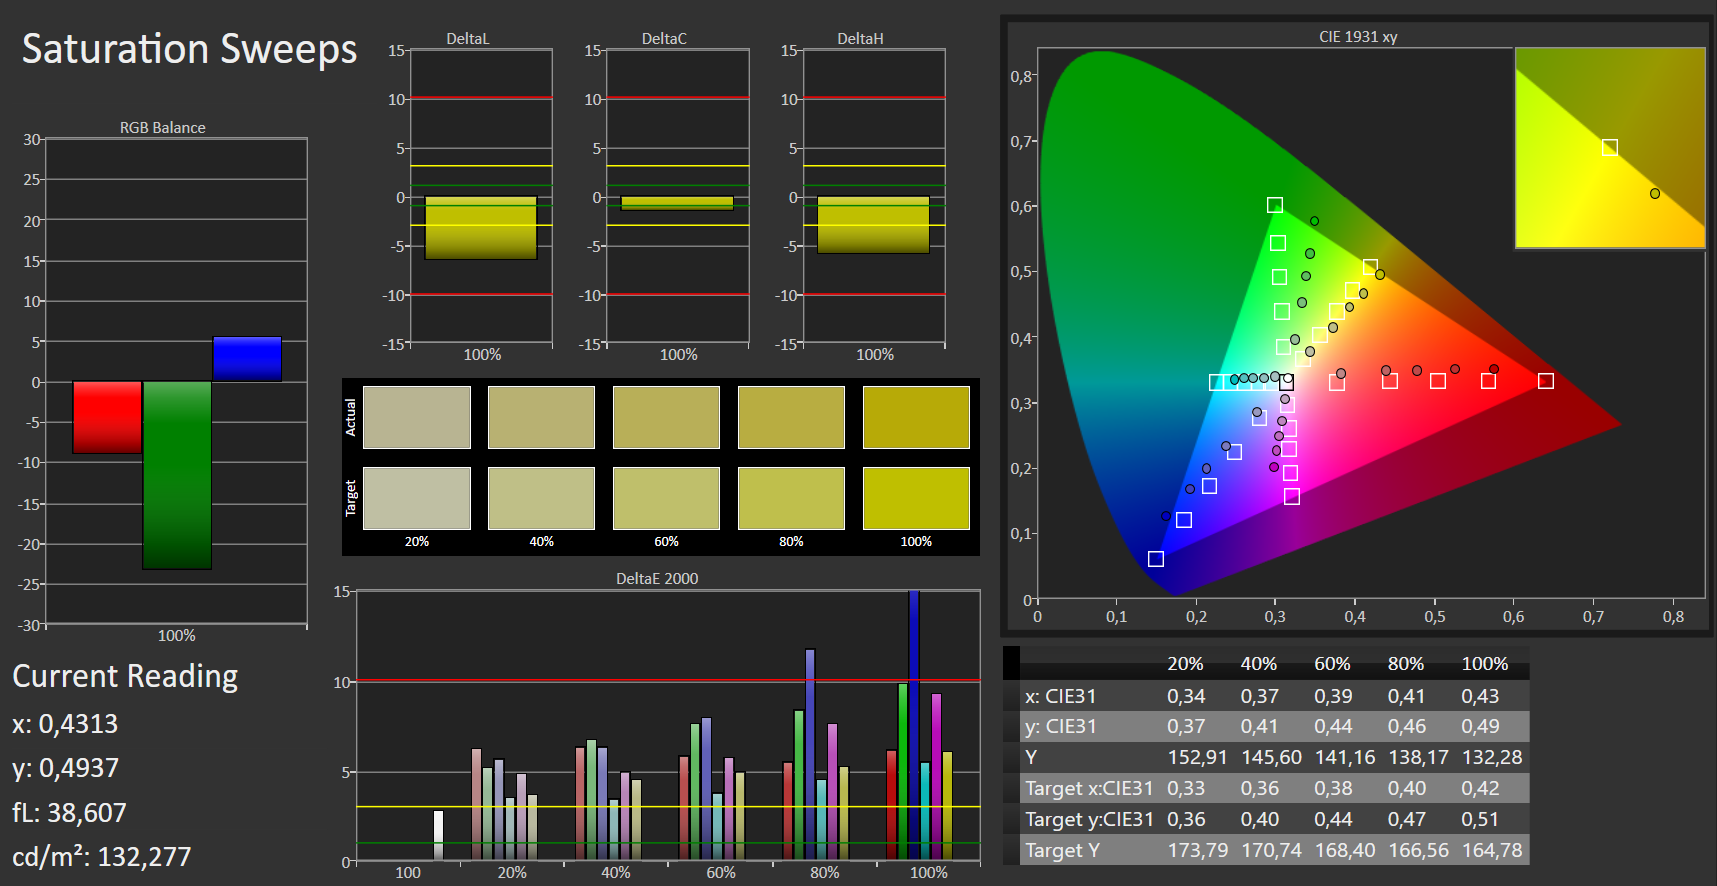
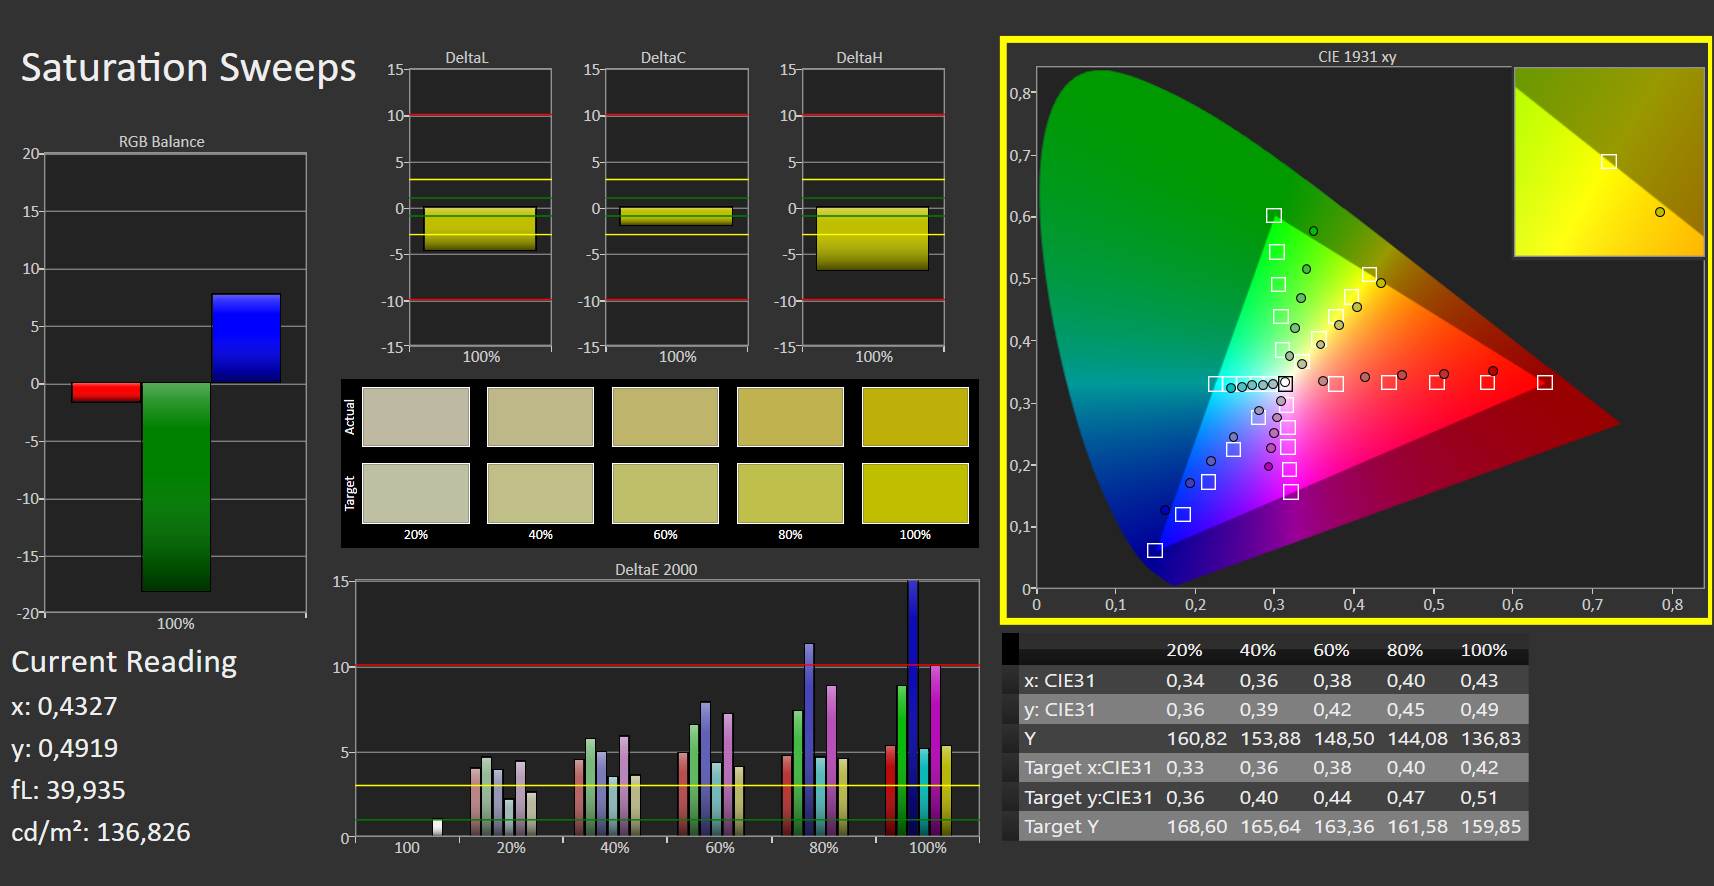
The screen offers decent colors ex-works, but is nowhere near the ideal Delta E values (below 3) with a Delta E 2000 deviation of 6.6. The display does not have a blue cast. Calibrating the display only brings a minimal improvement. The color spaces AdobeRGB (36 percent) and sRGB (56 percent) are not covered entirely.

Display Response Times
| ↔ Response Time Black to White | ||
|---|---|---|
| 27 ms ... rise ↗ and fall ↘ combined | ↗ 16 ms rise | 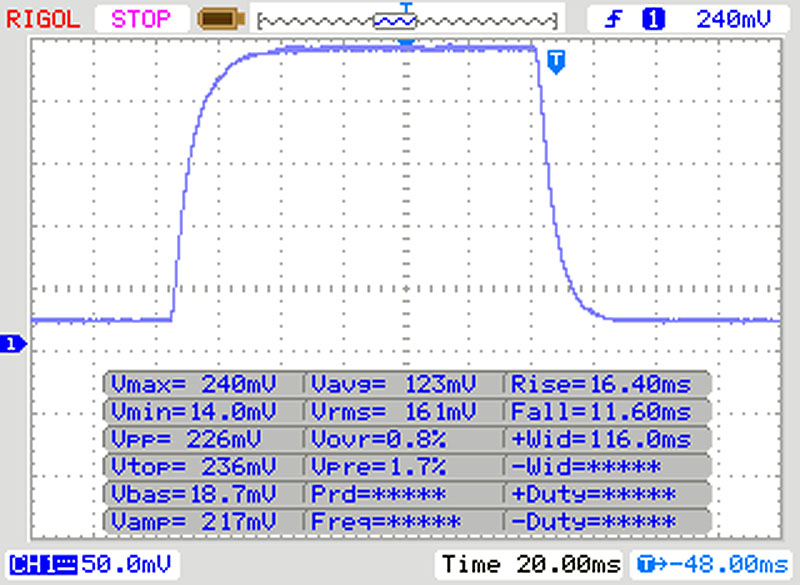 |
| ↘ 11 ms fall | ||
| The screen shows relatively slow response rates in our tests and may be too slow for gamers. In comparison, all tested devices range from 0.1 (minimum) to 240 (maximum) ms. » 67 % of all devices are better. This means that the measured response time is worse than the average of all tested devices (19.8 ms). | ||
| ↔ Response Time 50% Grey to 80% Grey | ||
| 42 ms ... rise ↗ and fall ↘ combined | ↗ 20 ms rise | 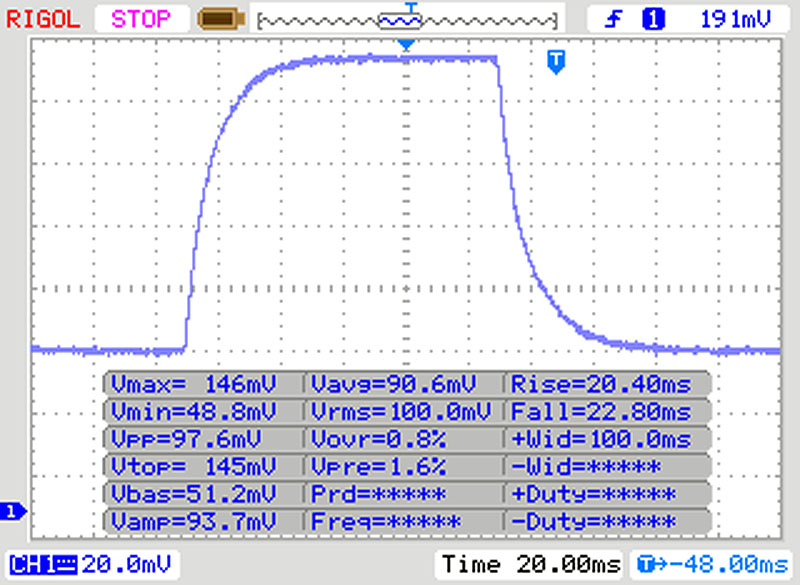 |
| ↘ 22 ms fall | ||
| The screen shows slow response rates in our tests and will be unsatisfactory for gamers. In comparison, all tested devices range from 0.165 (minimum) to 636 (maximum) ms. » 67 % of all devices are better. This means that the measured response time is worse than the average of all tested devices (31 ms). | ||
Screen Flickering / PWM (Pulse-Width Modulation)
| Screen flickering / PWM not detected | 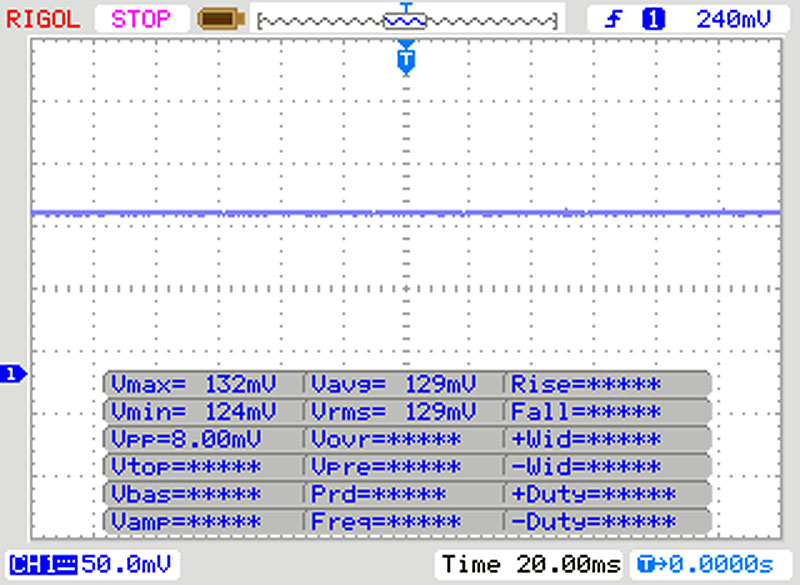 | ||
In comparison: 52 % of all tested devices do not use PWM to dim the display. If PWM was detected, an average of 7754 (minimum: 5 - maximum: 343500) Hz was measured. | |||
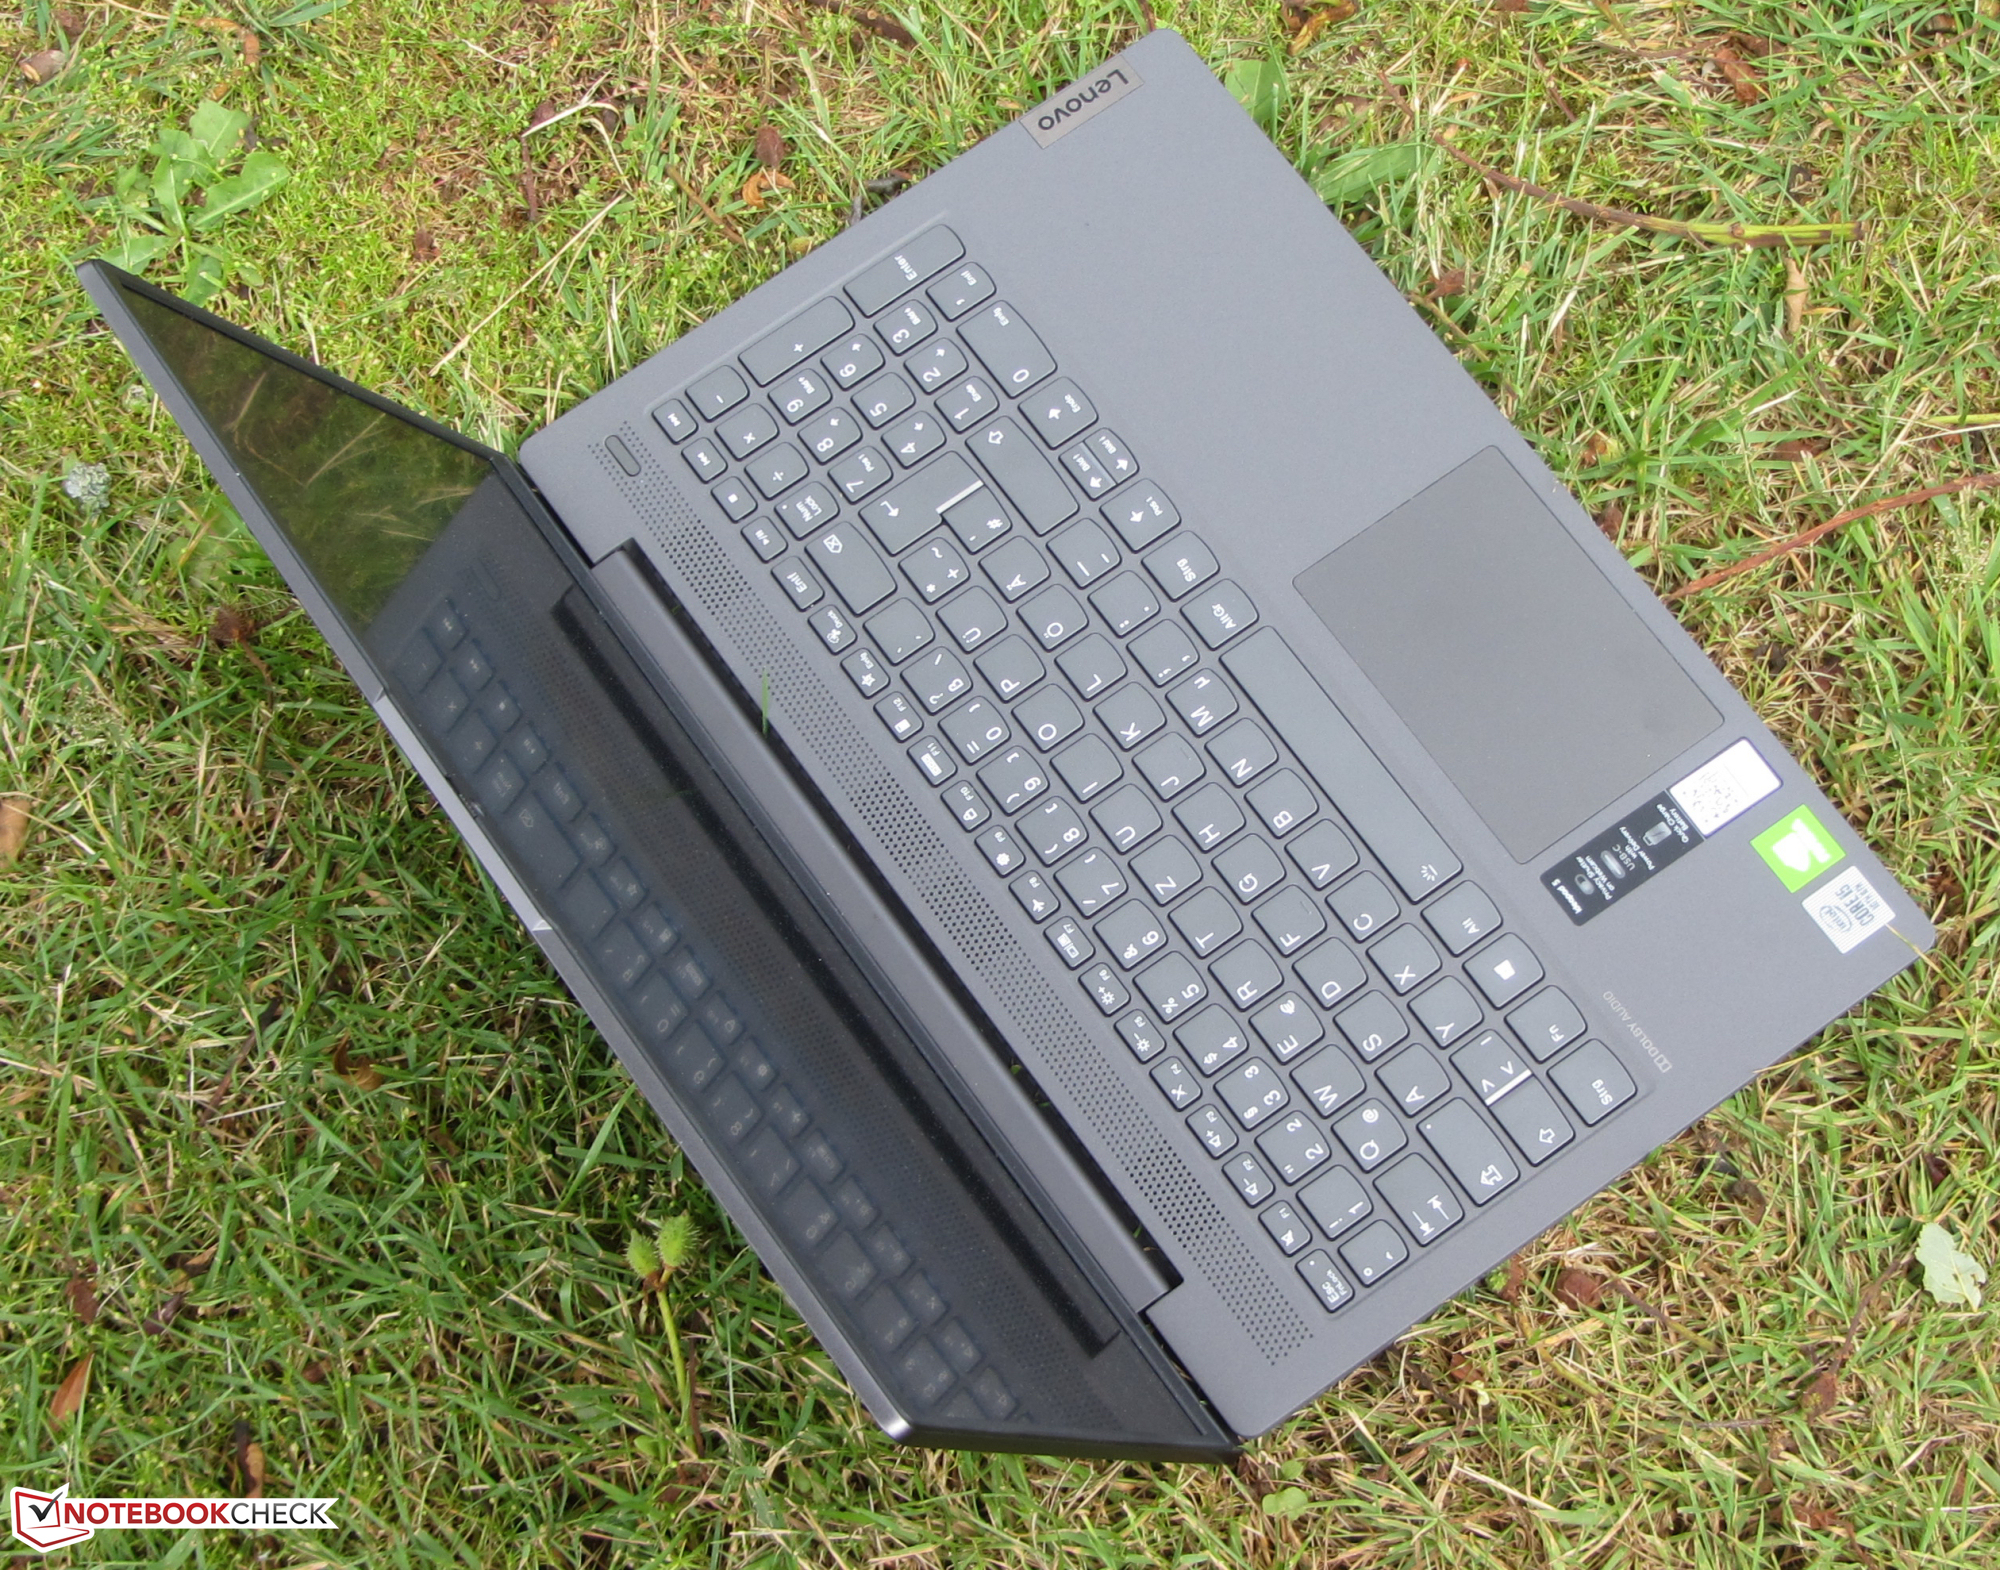
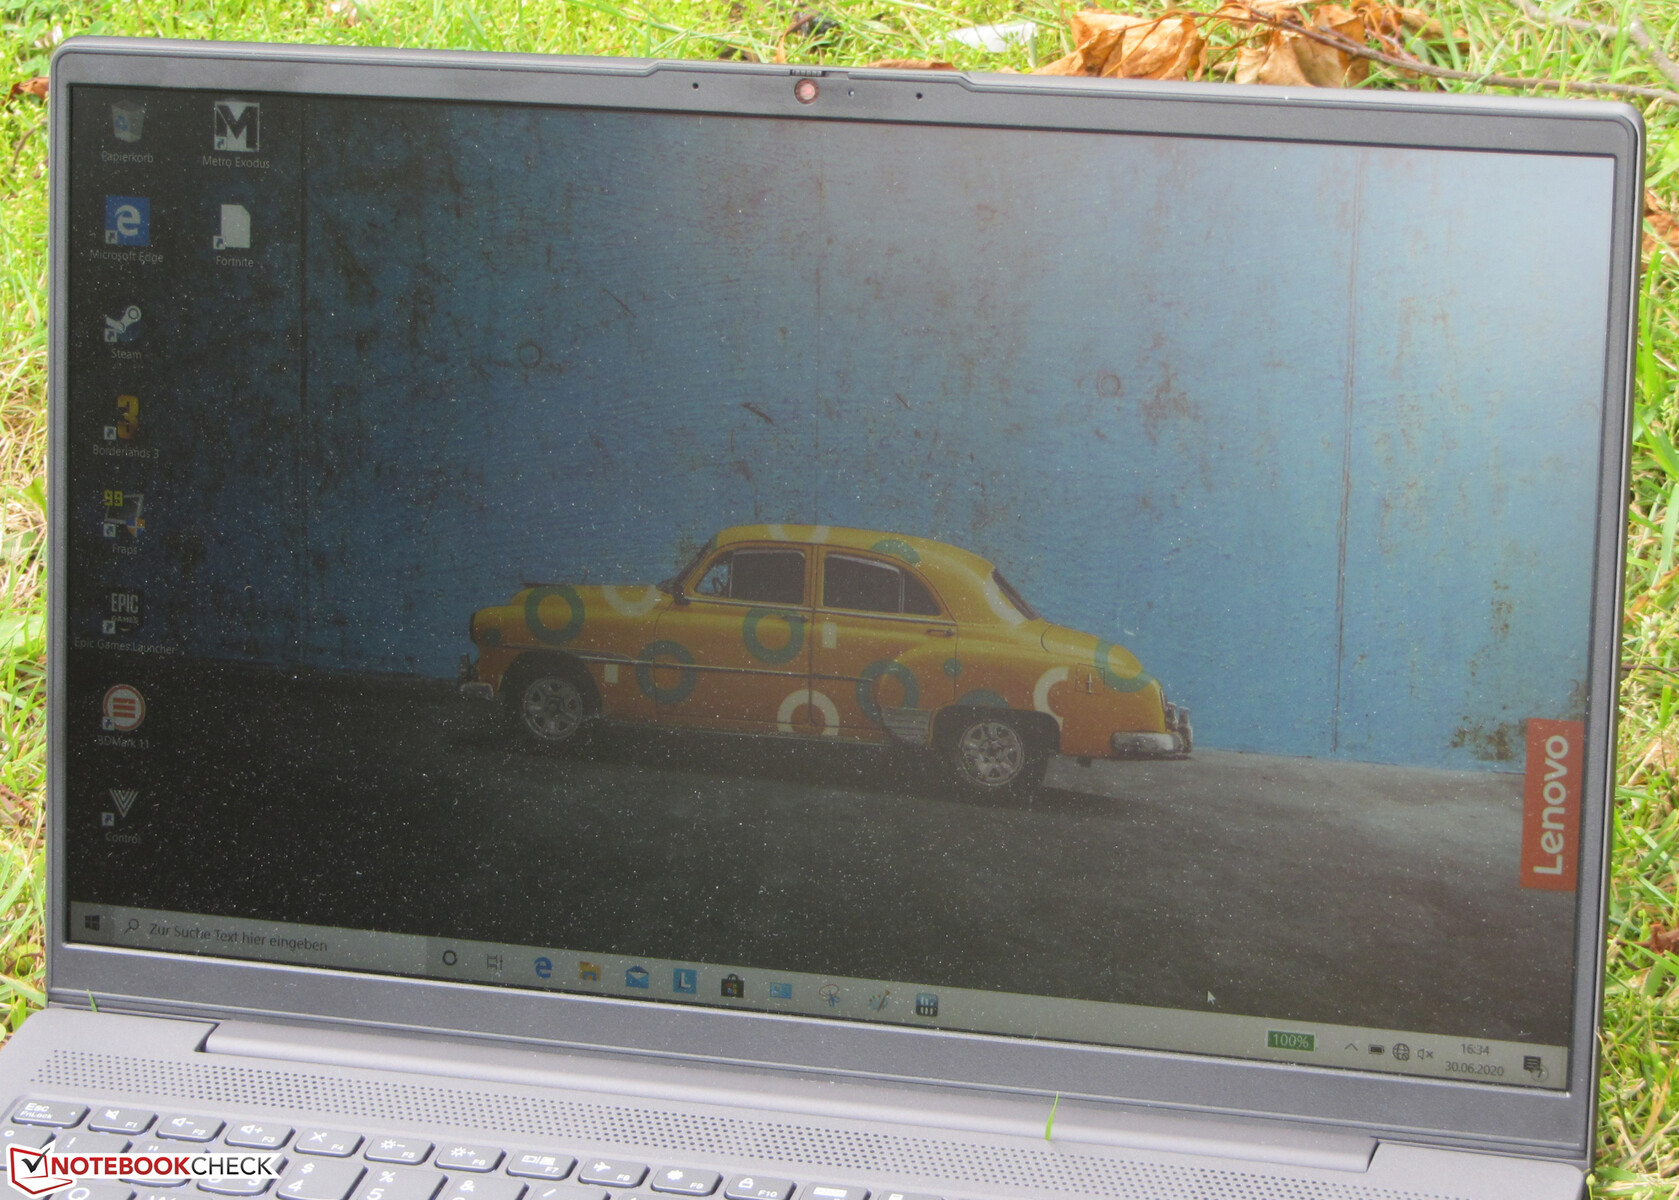
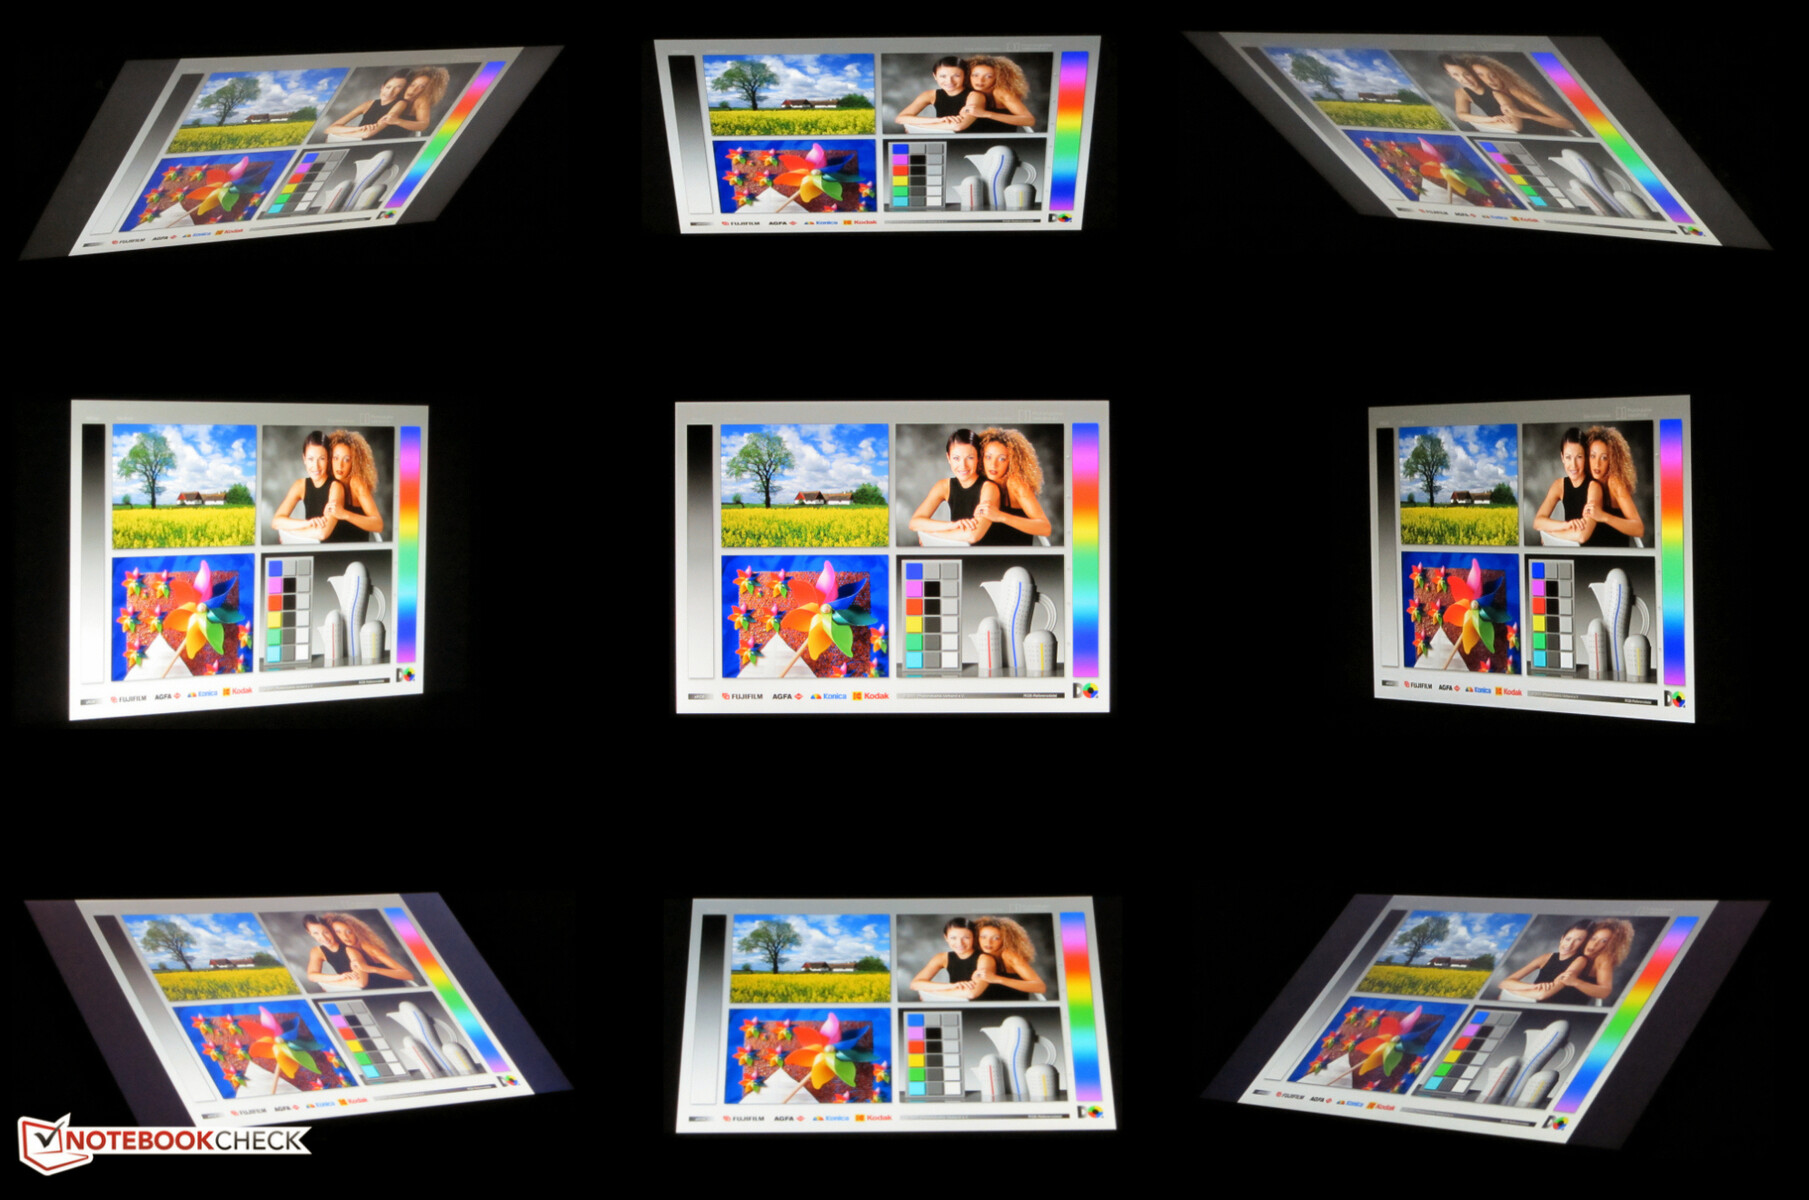
Lenovo has equipped the 15.6-inch device with an IPS panel with stable viewing angles. This means that the screen can be read from every position and even outdoors - provided the sun isn't shining too bright.
Performance - Lenovo laptop has gaming potential
Lenovo has created a real all-rounder with its 15.6-inch IdeaPad 5 15IIL05. The device provides sufficient performance for office and internet applications. It can also display most games in our database smoothly. Our test unit is available for around $800. Other configurations are available.

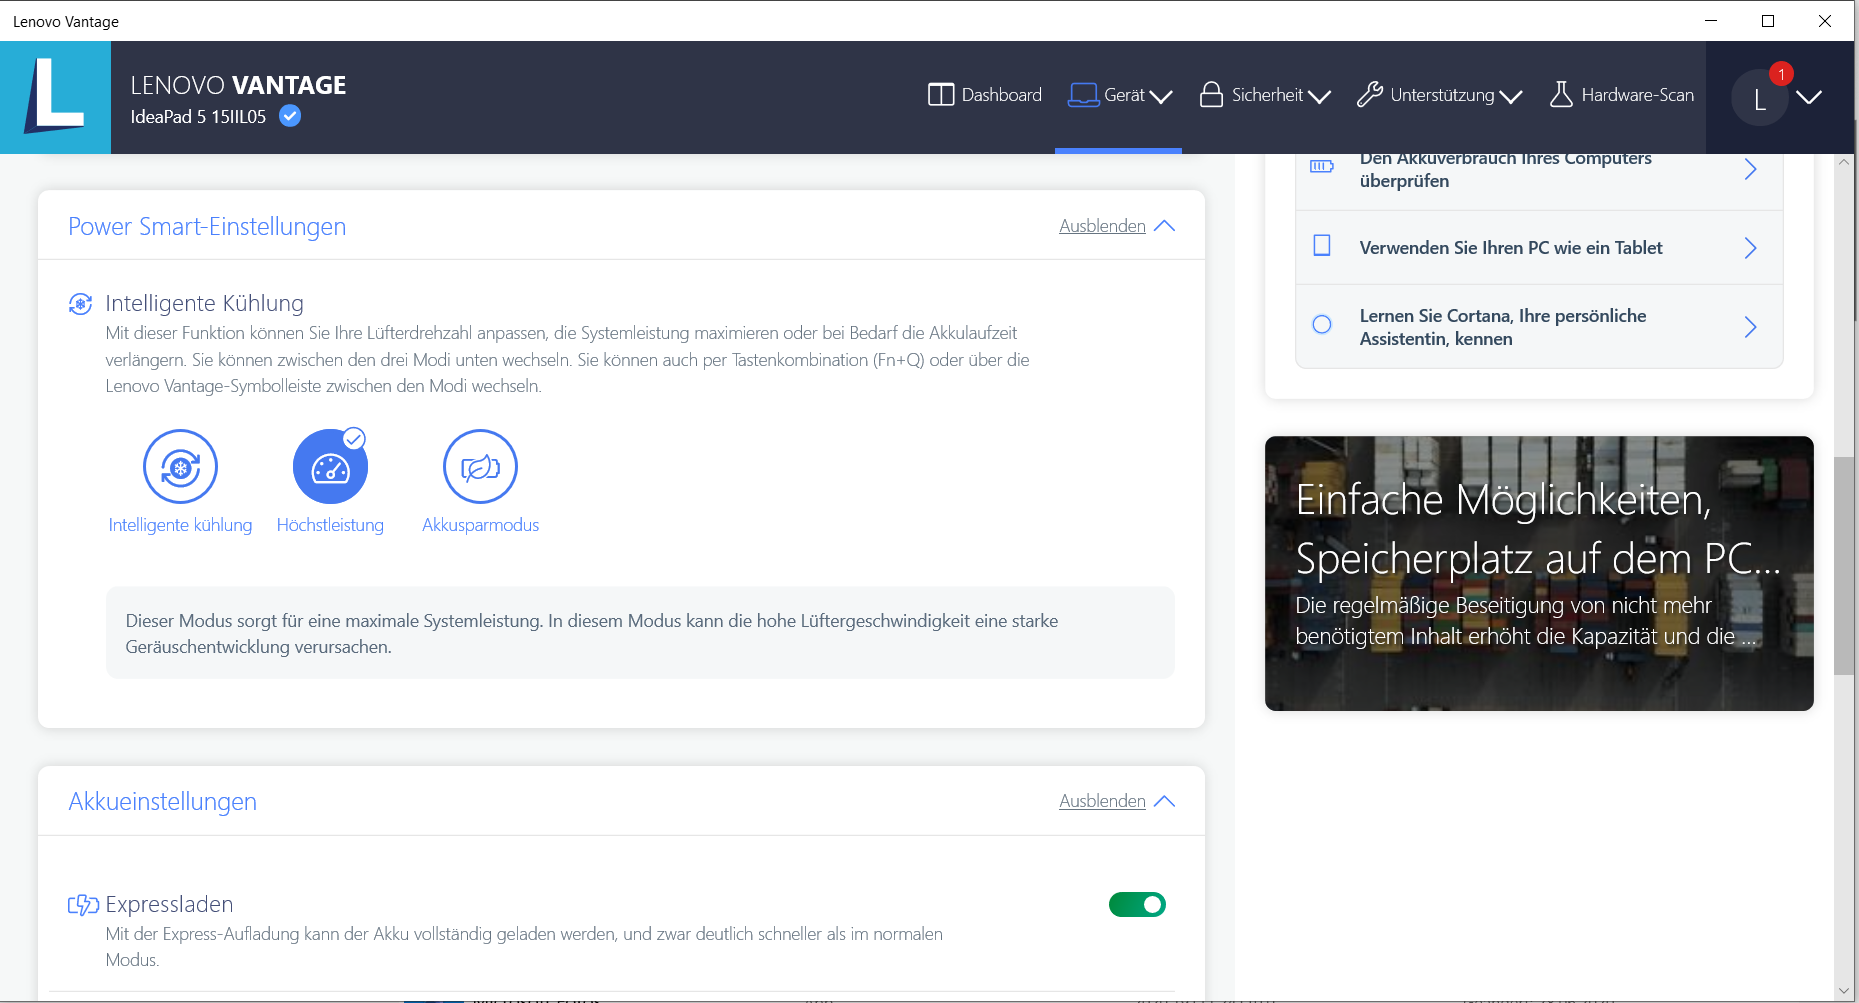
Testing conditions
The preinstalled Lenovo Vantage software enables users to adjust the available computing power and the fan activity. There are three modes available: intelligent cooling, high performance and battery saver. We performed all benchmarks in high performance mode.
In order to get a good idea of the difference these settings make, we also ran some benchmarks in all modes, in which case we mention these results explicitly.
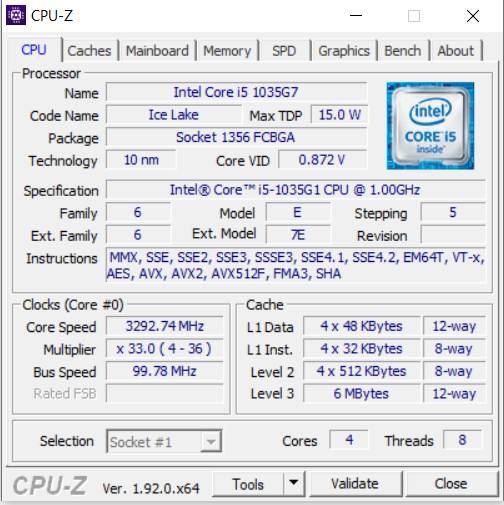
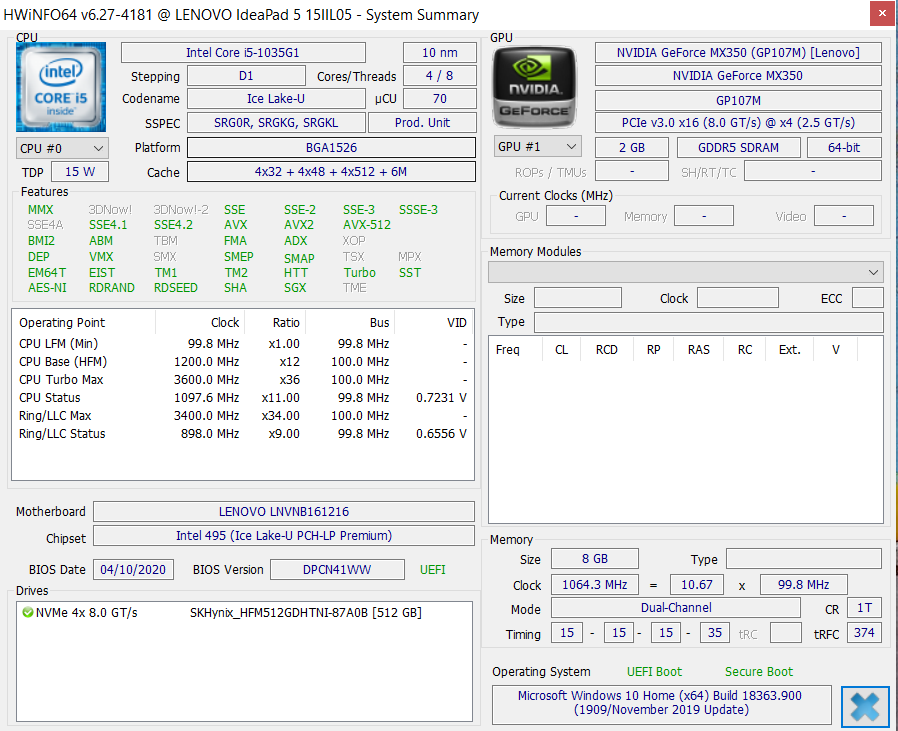
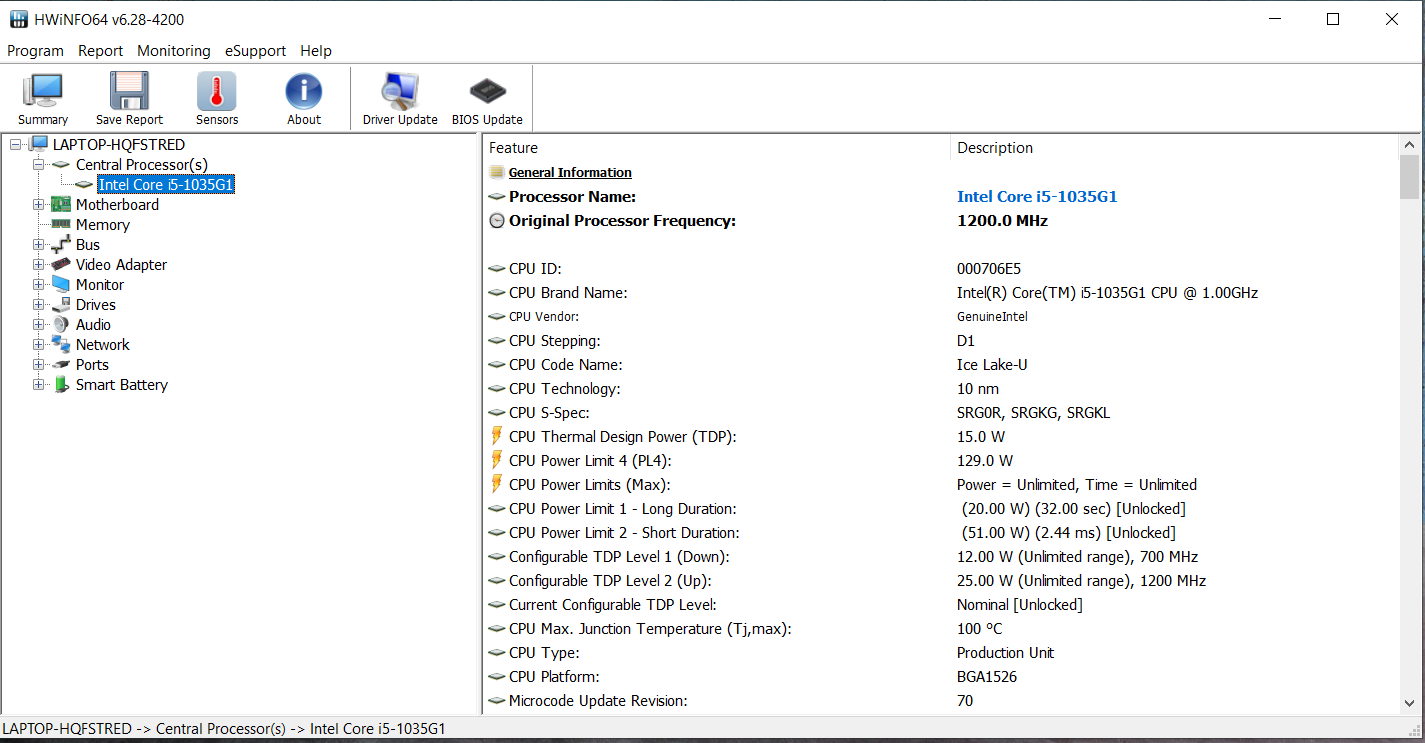
Processor
The IdeaPad is powered by the quad-core processor Core i5-1035G1 (Ice Lake). This is a ULV model with a TDP of 15 Watt. The CPU clocks at a base rate of 1 GHz. This clock rate can be increased to 3.2 GHz (all four cores), 3.5 GHz (two cores) and 3.6 GHz (one core). The chip supports hyperthreading (working two threads per core).
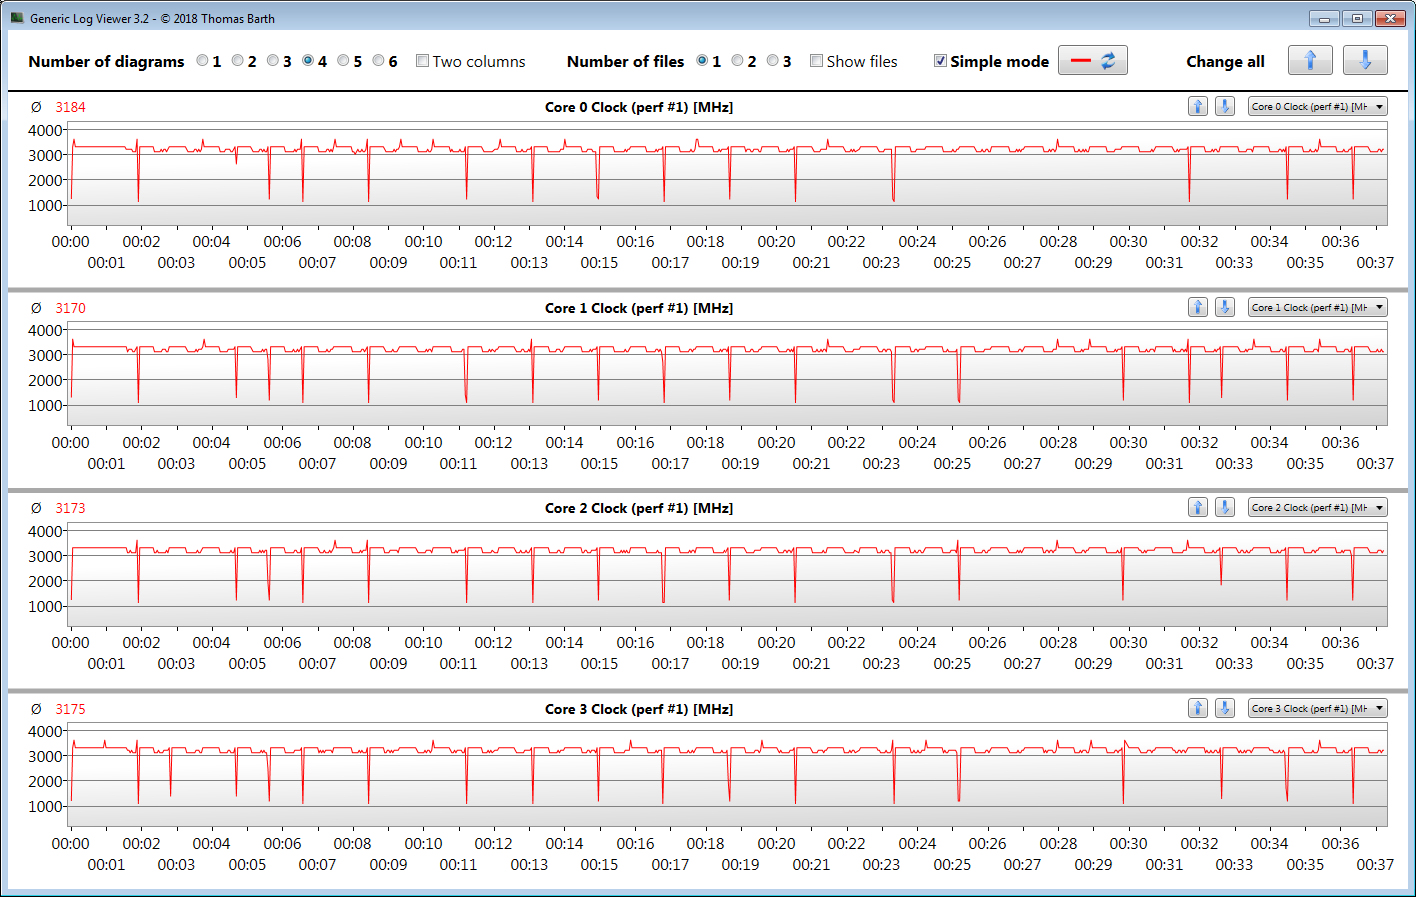
The CineBench CPU benchmarks are completed at 3.3 GHz (multi thread) and 3.3 - 3.6 GHz (single thread). The clock rates drop to 2.1 - 2.3 GHz (multi thread) and 2.4 - 3.6 GHz (single thread) when running on battery.
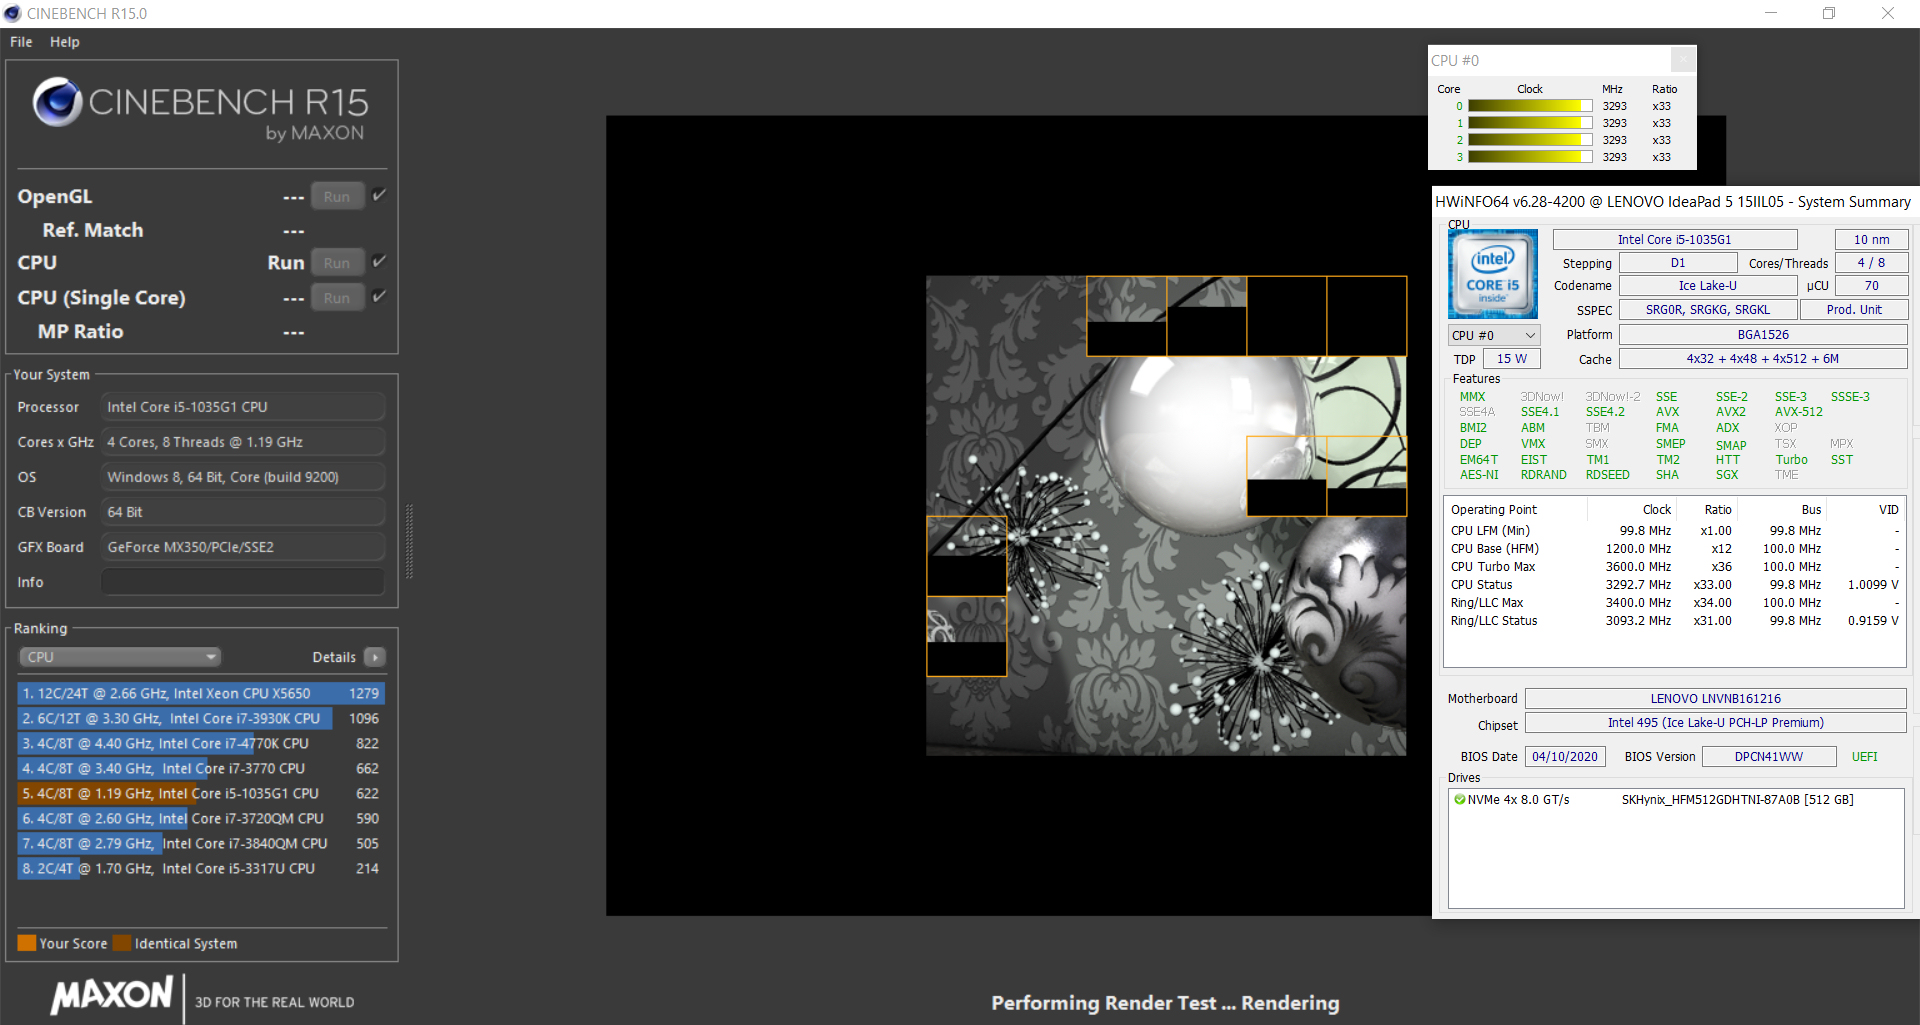
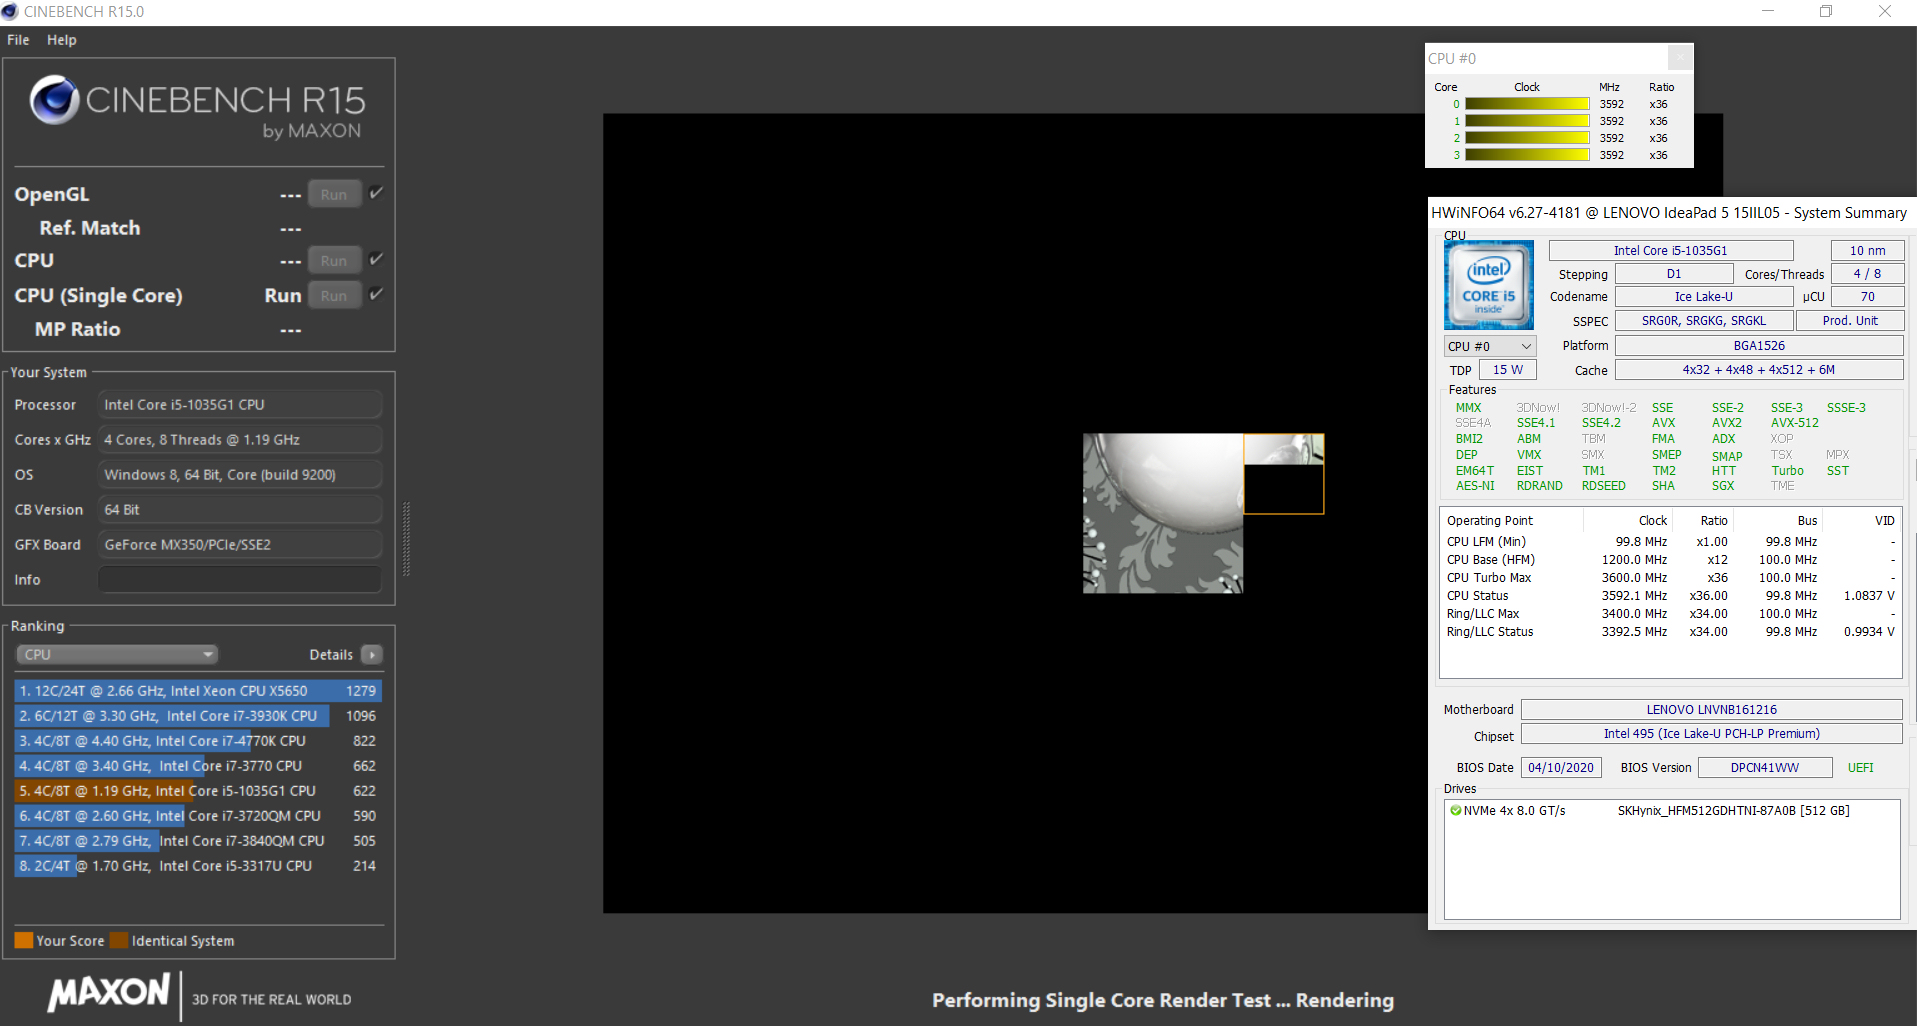
To find out whether the CPU turbo is available for a prolonged period on mains, we run the multi thread Cinebench R15 benchmark in a loop for at least 30 minutes. The results drop minimally between the first and the second round and then remain constant, which means that the turbo is used.
The performance modes that can be set within the Lenovo Vantage software have a significant impact on multi thread performance. The results of the CB15 loop differ greatly from mode to mode. We did not notice any differences during single thread performance.
| Blender - v2.79 BMW27 CPU | |
| Average Intel Core i5-1035G1 (607 - 1002, n=9) | |
| Acer Aspire 5 A515-54G | |
| Schenker VIA 15 | |
| Lenovo IdeaPad 5 15IIL05 | |
| Average of class Multimedia (100 - 557, n=58, last 2 years) | |
| HWBOT x265 Benchmark v2.2 - 4k Preset | |
| Average of class Multimedia (5.26 - 36.1, n=56, last 2 years) | |
| Lenovo IdeaPad 5 15IIL05 | |
| Acer Aspire 5 A515-54G | |
| Average Intel Core i5-1035G1 (3.32 - 6.44, n=8) | |
| Schenker VIA 15 | |
| LibreOffice - 20 Documents To PDF | |
| Acer Aspire 5 A515-54G | |
| Average Intel Core i5-1035G1 (55.3 - 70.9, n=6) | |
| Lenovo IdeaPad 5 15IIL05 | |
| Average of class Multimedia (23.9 - 146.7, n=57, last 2 years) | |
* ... smaller is better
System Performance
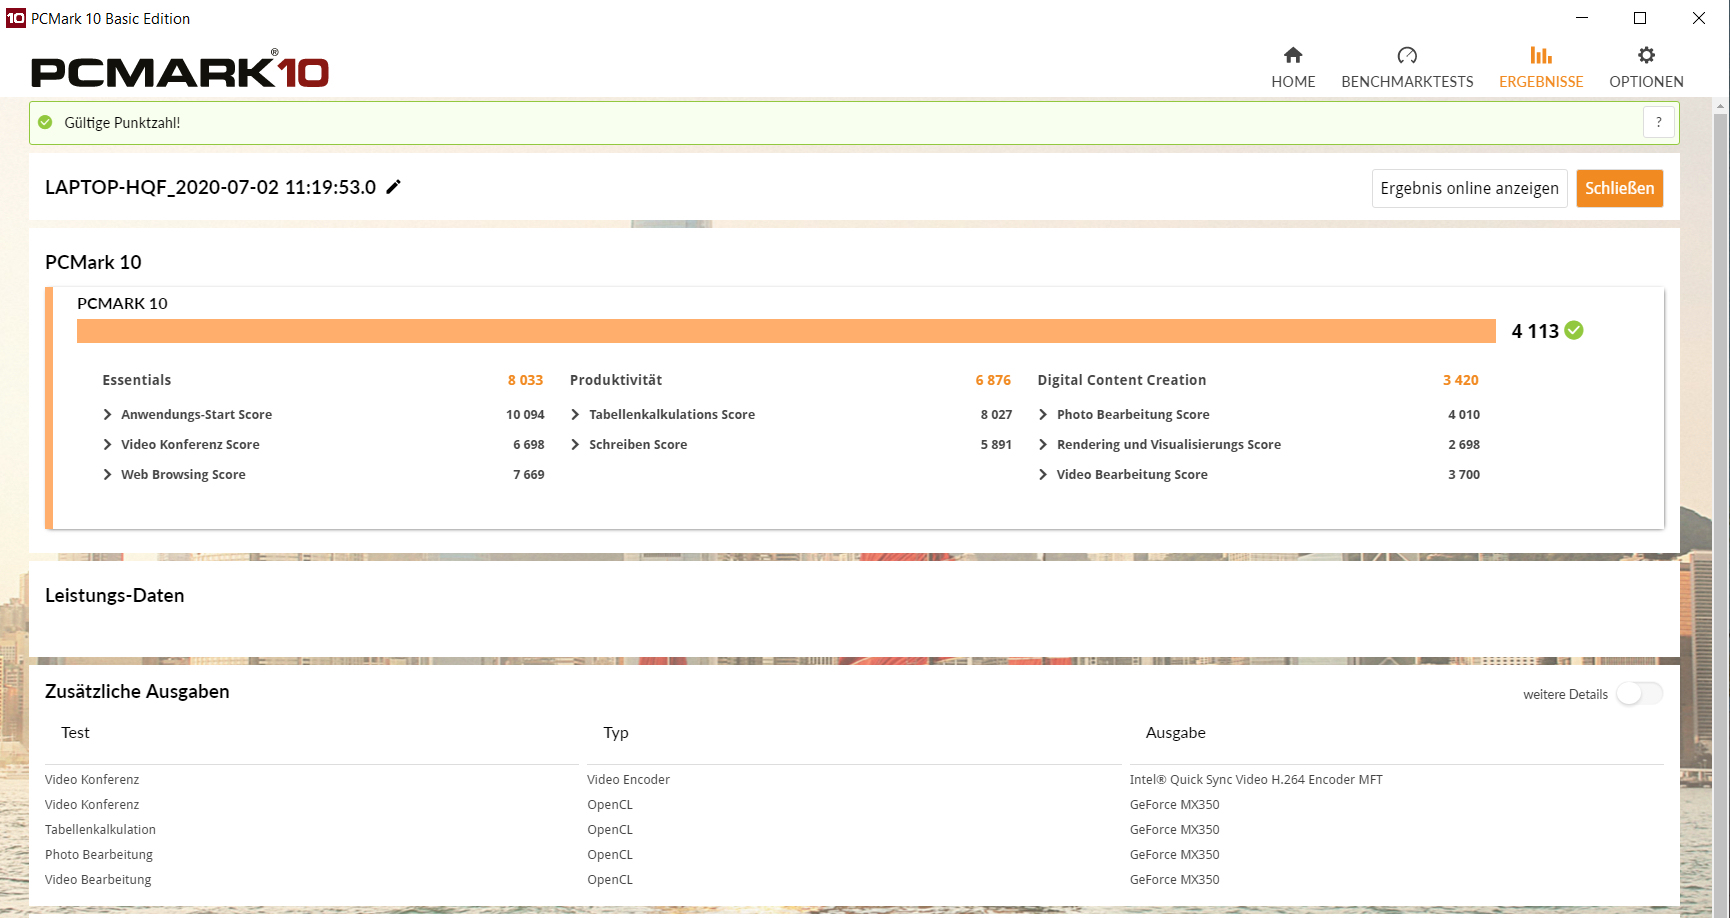
The system works quickly and smoothly and we did not encounter any problems. The notebook has more than enough processing power for office and internet applications and can even be used to play games, thanks to the dedicated GPU. The PCMark benchmark results are very good as well.
| PCMark 8 Home Score Accelerated v2 | 3641 points | |
| PCMark 8 Creative Score Accelerated v2 | 3816 points | |
| PCMark 8 Work Score Accelerated v2 | 5249 points | |
| PCMark 10 Score | 4113 points | |
Help | ||
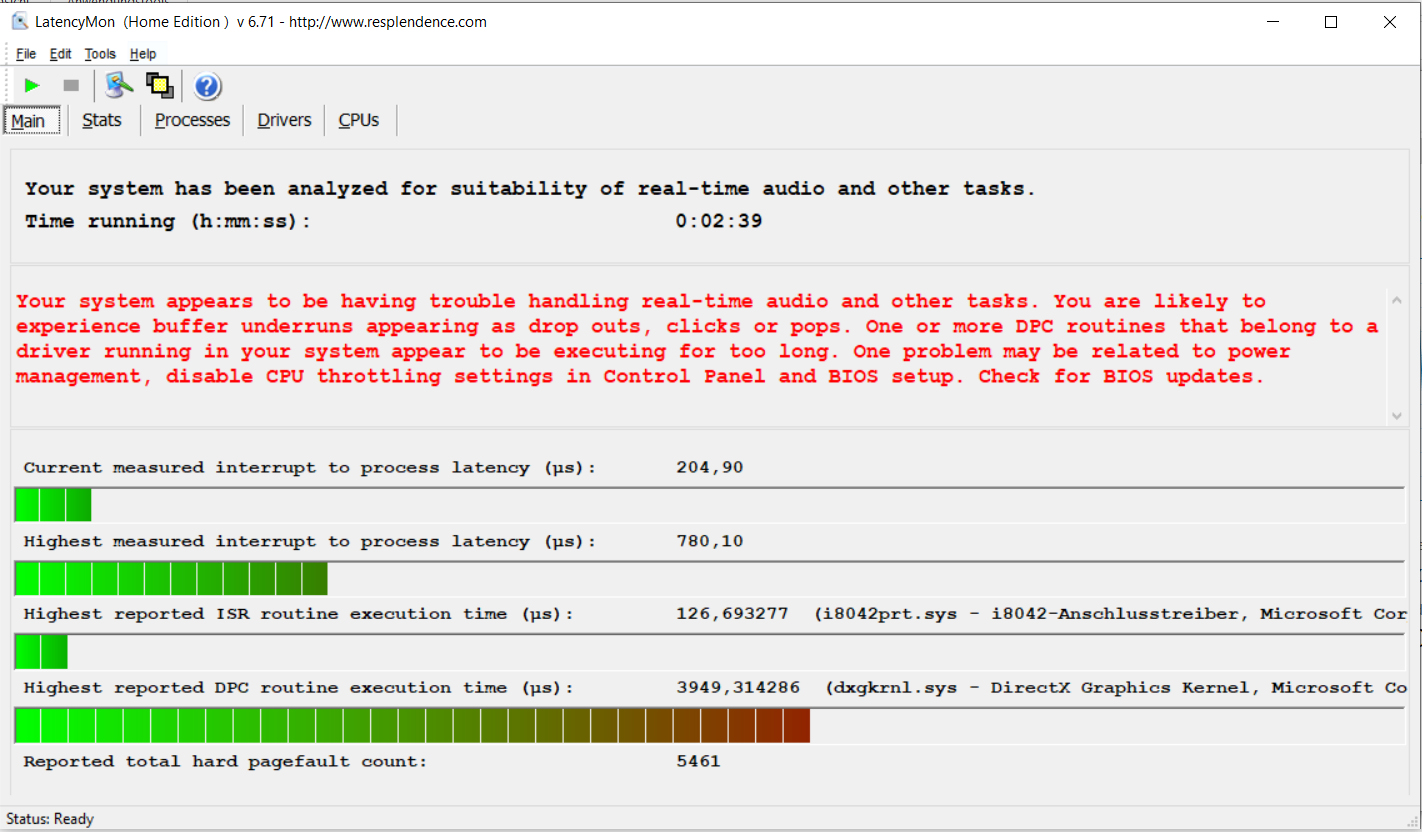
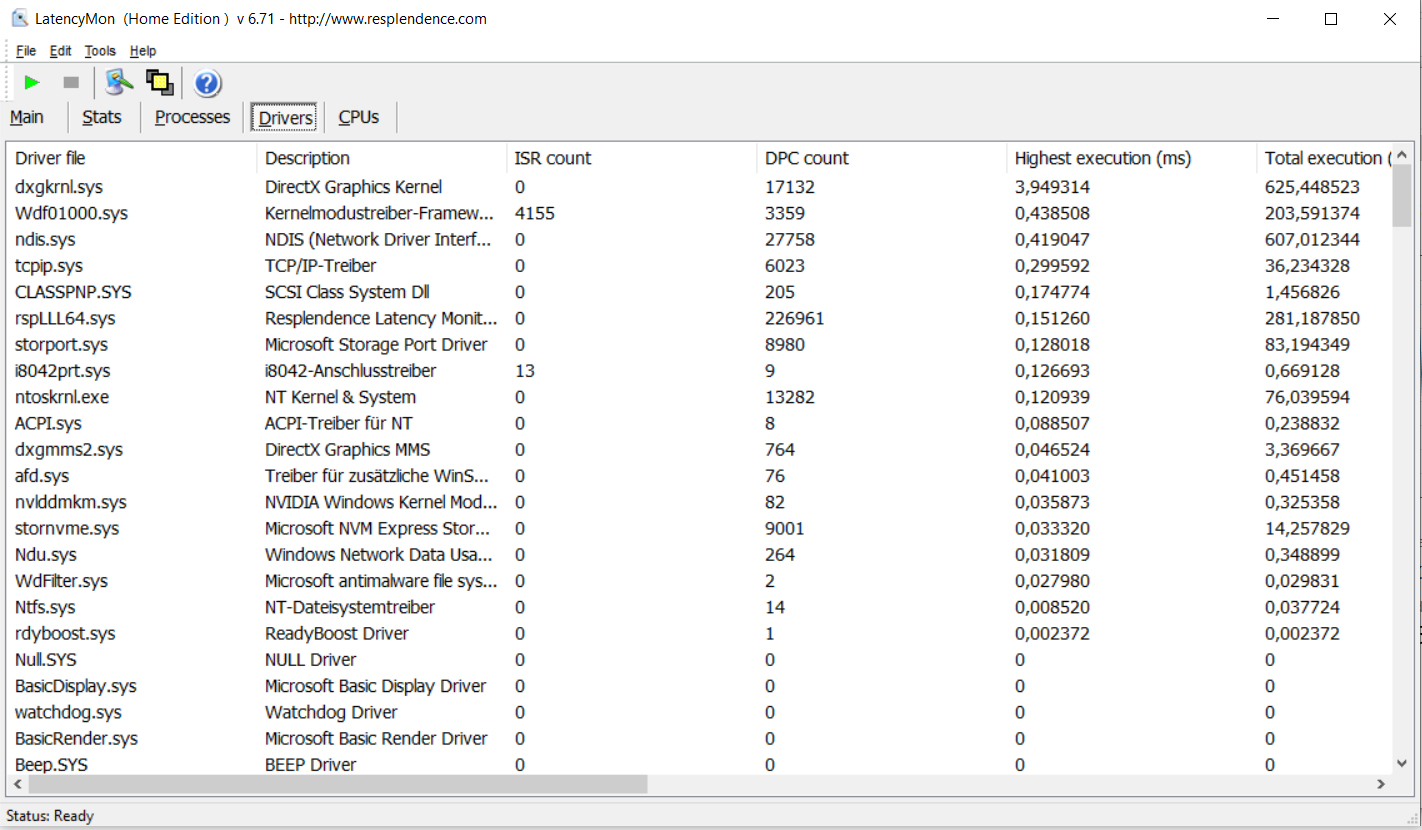
DPC Latencies
We encountered high DPC latencies during our standardized Latency Monitor test (surfing, playing 4K video, Prime95 high load). This means that the system is not suitable for real-time video and audio processing.
| DPC Latencies / LatencyMon - interrupt to process latency (max), Web, Youtube, Prime95 | |
| Lenovo IdeaPad 5 15IIL05 | |
* ... smaller is better
Storage Devices
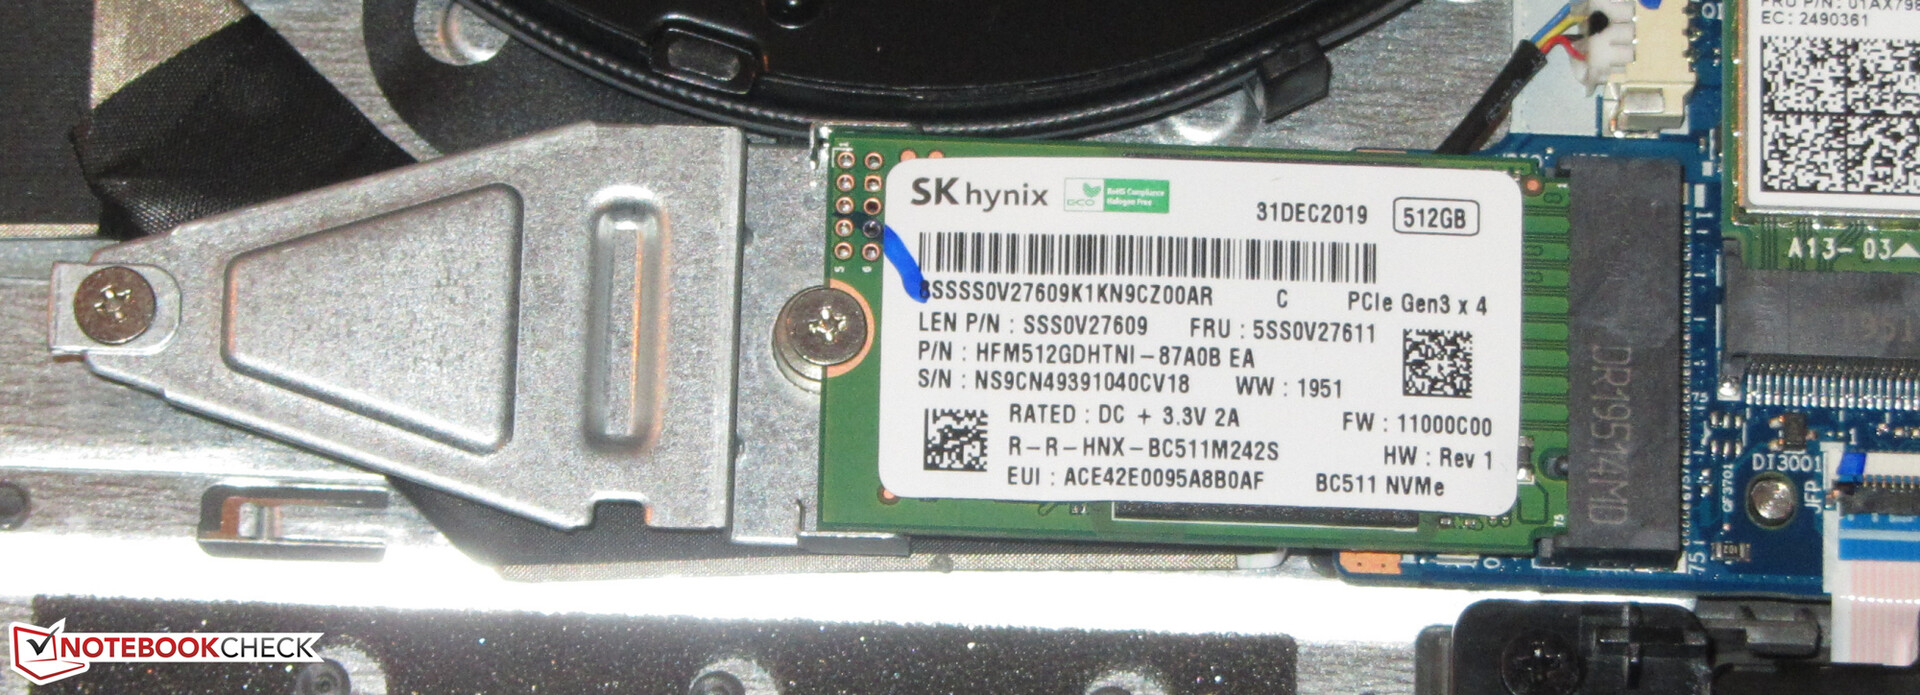
Our device is equipped with an NVMe SSD (M.2 2280) from SK Hynix. It has a capacity of 512 GB and offers good transfer rates.

| Lenovo IdeaPad 5 15IIL05 SK hynix BC511 HFM512GDHTNI-87A0B | Acer Aspire 5 A515-54G Kingston RBUSNS8154P3512GJ1 | HP Pavilion 15-cs2019ng Toshiba KBG30ZMV256G | Schenker VIA 15 Samsung SSD 970 EVO Plus 500GB | HP Pavilion Gaming 15-ec0002ng Intel SSD 660p SSDPEKNW512G8 | Lenovo Ideapad S540-15IML Samsung SSD PM981a MZVLB512HBJQ | Average SK hynix BC511 HFM512GDHTNI-87A0B | |
|---|---|---|---|---|---|---|---|
| CrystalDiskMark 5.2 / 6 | -13% | -18% | 61% | -9% | 31% | -6% | |
| Write 4K (MB/s) | 159.7 | 100.4 -37% | 149.3 -7% | 164.5 3% | 136.9 -14% | 170.7 7% | 135.9 ? -15% |
| Read 4K (MB/s) | 48.31 | 47.16 -2% | 52.7 9% | 46.88 -3% | 57 18% | 49.51 2% | 45.3 ? -6% |
| Write Seq (MB/s) | 1038 | 993 -4% | 667 -36% | 2659 156% | 968 -7% | 1156 11% | 1057 ? 2% |
| Read Seq (MB/s) | 1158 | 1176 2% | 818 -29% | 2623 127% | 1631 41% | 1136 -2% | 1144 ? -1% |
| Write 4K Q32T1 (MB/s) | 493.9 | 354.7 -28% | 332.1 -33% | 310.9 -37% | 237 -52% | 420.5 -15% | 458 ? -7% |
| Read 4K Q32T1 (MB/s) | 522 | 473 -9% | 467.1 -11% | 351.2 -33% | 337.1 -35% | 527 1% | 425 ? -19% |
| Write Seq Q32T1 (MB/s) | 1028 | 1034 1% | 985 -4% | 3236 215% | 963 -6% | 2984 190% | 1040 ? 1% |
| Read Seq Q32T1 (MB/s) | 2280 | 1635 -28% | 1454 -36% | 3547 56% | 1863 -18% | 3550 56% | 2274 ? 0% |
Dauerleistung Lesen: DiskSpd Read Loop, Queue Depth 8
GPU Performance
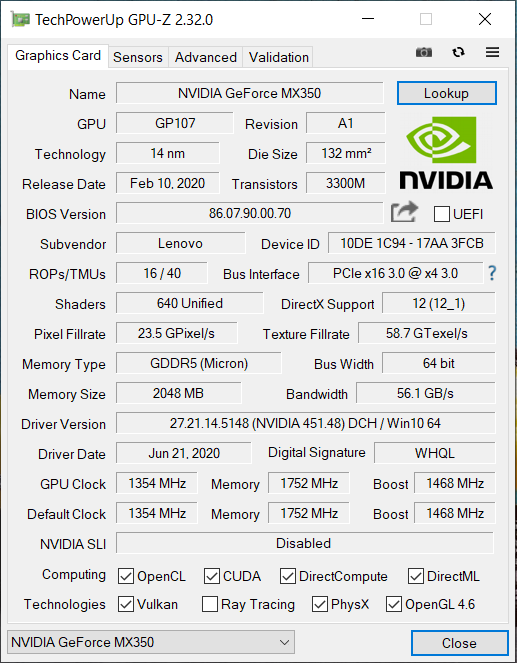
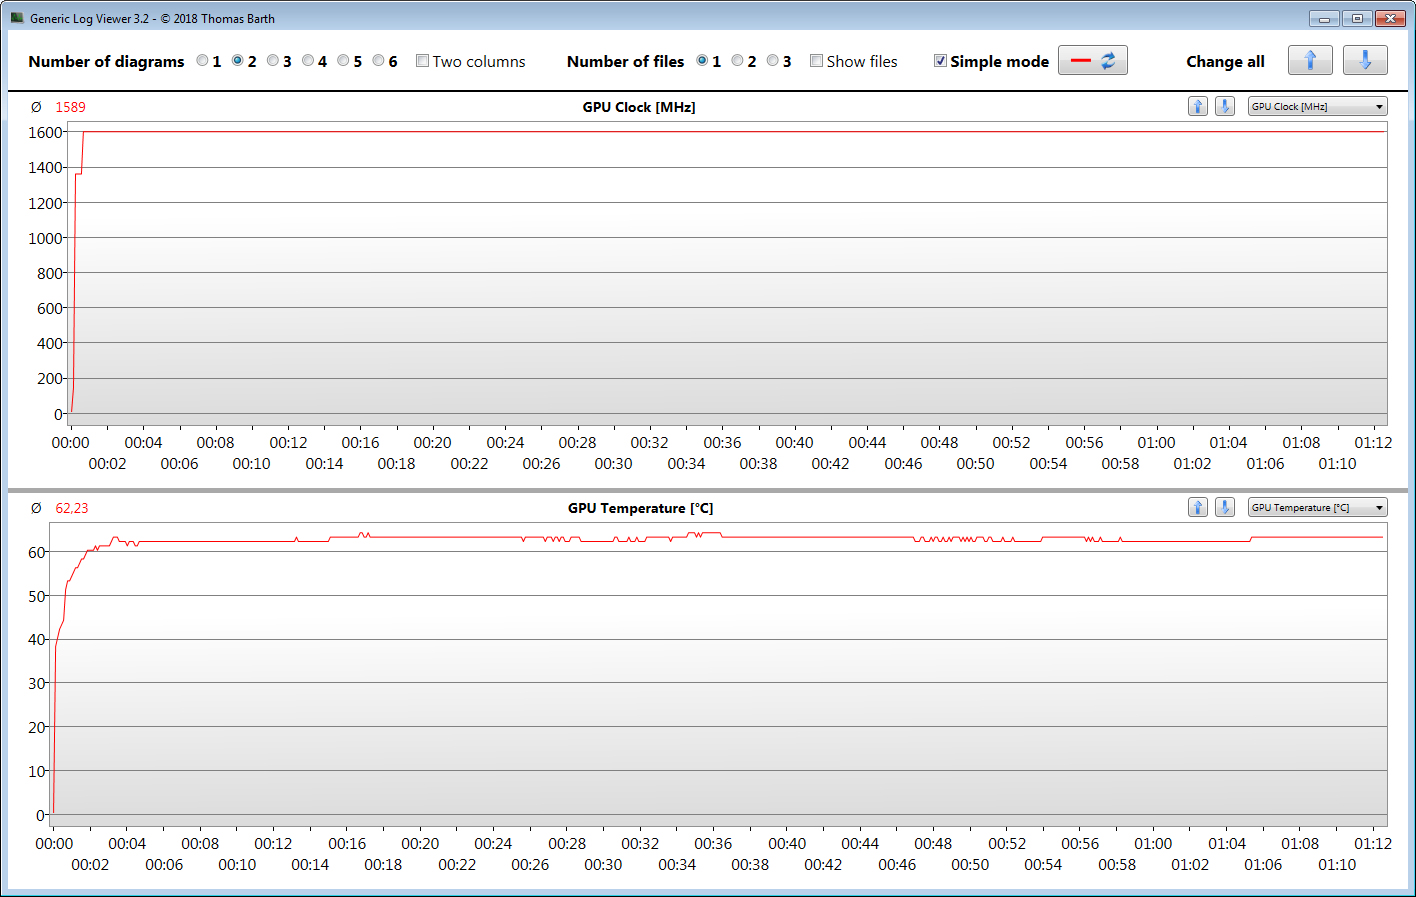
The dedicated GeForce MX350 is based on the same chip as Nivida's GeForce GTX-1050. However, its interface has been reduced from 128 Bit to 64 Bit. The GPU supports DirectX 12 and clocks at a base rate of 1354 MHz. This can be boosted to up to 1468 MHz. Provided the GPU does not reach a certain temperature or energy limit, it can reach even higher speeds. We actually measured a maximum clock rate of 1601 MHz. The Witcher 3 test was completed with an average speed of 1589 MHz. The GPU can make use of fast GDDR5 storage (2048 MB).
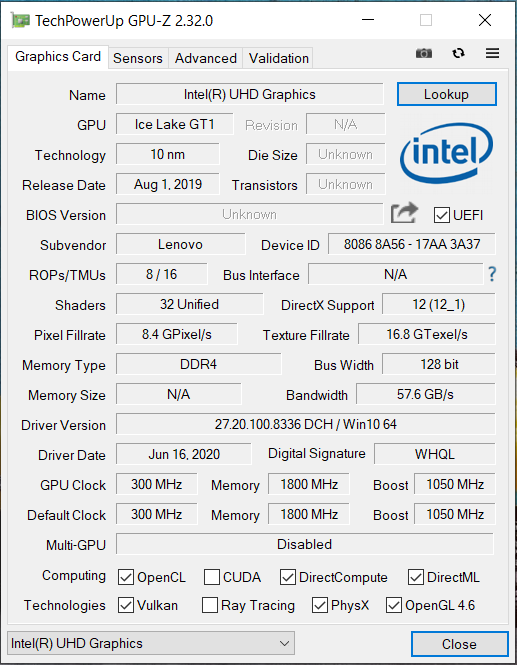
The results of the various 3DMark benchmarks are as expected for this GPU. The MX350 does a lot better than its predecessor, the GeForce MX250, but cannot keep up with the GTX 1050 GPU. The integrated Intel GPU UHD-Graphics-G1 is active and the notebook uses Nvidia Optimus to switch between the two. If necessary, the GeForce can be deactivated in the BIOS.
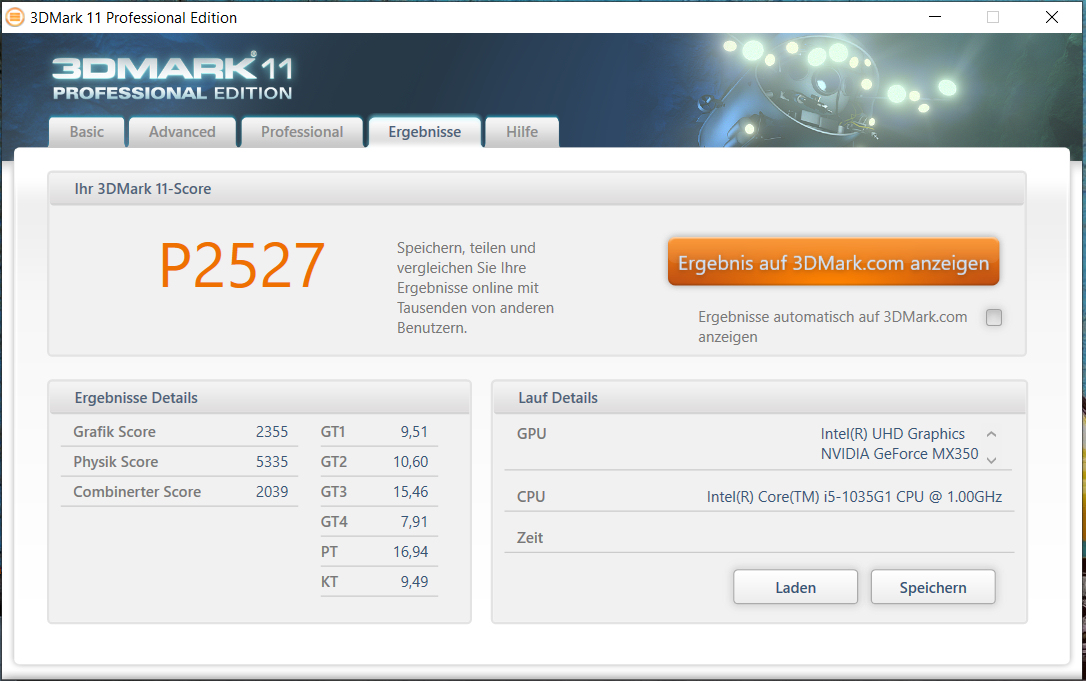
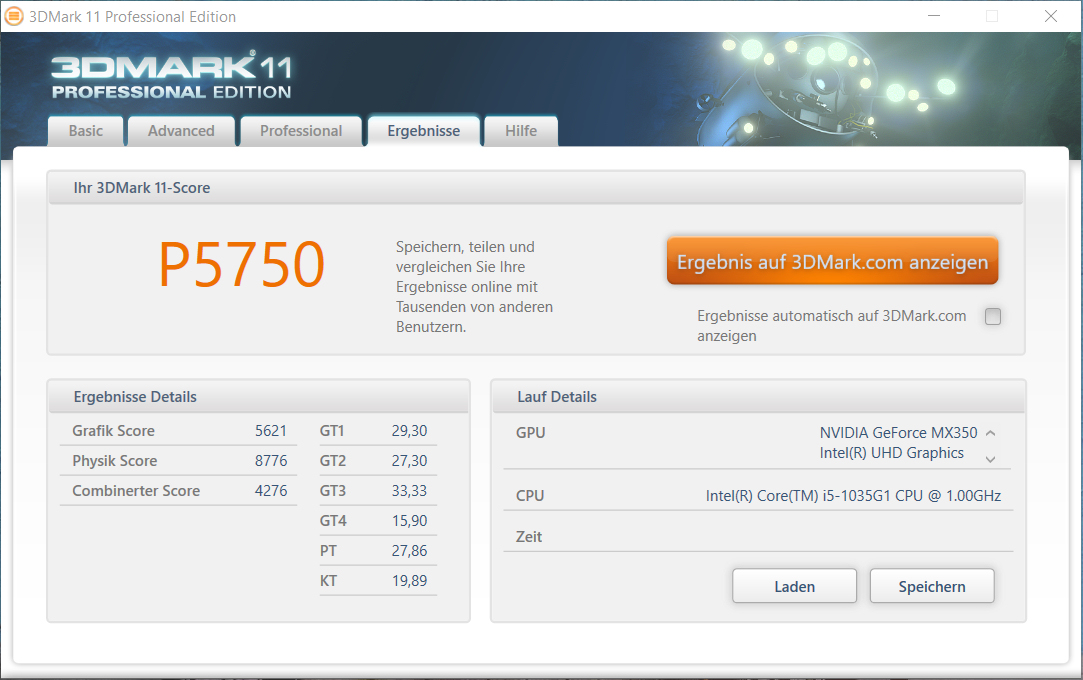
The performance modes of the Lenovo Vantage software have an influence on the graphics performance. While the 3DMark results in high performance and intelligent cooling are very similar, the graphics performance drops significantly in the battery saver mode.

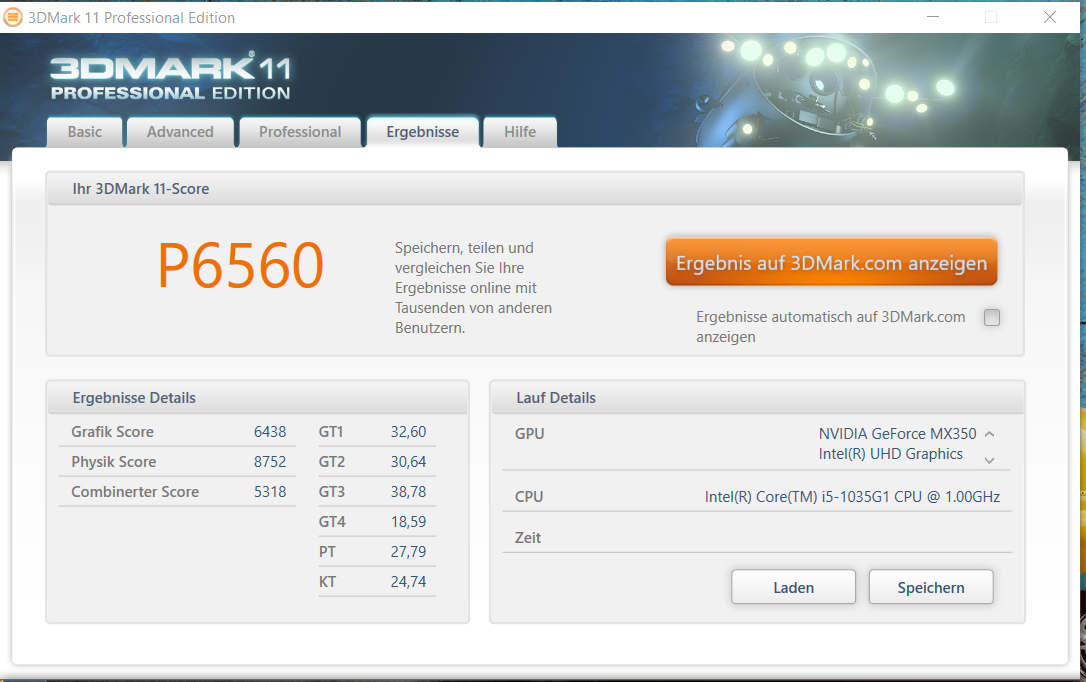
| 3DMark 11 Performance | 6569 points | |
| 3DMark Ice Storm Standard Score | 80377 points | |
| 3DMark Cloud Gate Standard Score | 16929 points | |
| 3DMark Fire Strike Score | 4036 points | |
| 3DMark Time Spy Score | 1522 points | |
Help | ||
Gaming Performance
The IdeaPad 5's CPU/GPU combination can display almost all games in our database smoothly - at low resolution and low to average quality settings. Some games with moderate demands on the hardware can be played at higher settings.
| The Witcher 3 - 1366x768 Medium Graphics & Postprocessing | |
| HP Pavilion Gaming 15-ec0002ng | |
| Average of class Multimedia (41 - 73, n=2, last 2 years) | |
| Lenovo IdeaPad 5 15IIL05 | |
| Average NVIDIA GeForce MX350 (35.2 - 51.9, n=13) | |
| HP Pavilion 15-cs2019ng | |
| Lenovo Ideapad S540-15IML | |
| Acer Aspire 5 A515-54G | |
| BioShock Infinite - 1366x768 High Preset | |
| HP Pavilion Gaming 15-ec0002ng | |
| Average NVIDIA GeForce MX350 (110.6 - 111.4, n=2) | |
| Lenovo IdeaPad 5 15IIL05 | |
| HP Pavilion 15-cs2019ng | |
| Shadow of the Tomb Raider - 1280x720 Lowest Preset | |
| Average of class Multimedia (66 - 204, n=7, last 2 years) | |
| Lenovo IdeaPad 5 15IIL05 | |
| HP Pavilion Gaming 15-ec0002ng | |
| Average NVIDIA GeForce MX350 (54.3 - 68, n=4) | |
| Control - 1280x720 Low Quality Preset | |
| HP Pavilion Gaming 15-ec0002ng | |
| Lenovo IdeaPad 5 15IIL05 | |
| Average NVIDIA GeForce MX350 (51.6 - 53.2, n=2) | |
| Lenovo Ideapad S540-15IML | |
| Fortnite - 1920x1080 High Preset | |
| Average NVIDIA GeForce MX350 (42.7 - 43.8, n=2) | |
| Lenovo IdeaPad 5 15IIL05 | |
| Call of Duty Modern Warfare 2019 - 1280x720 Minimum Settings | |
| HP Pavilion Gaming 15-ec0002ng | |
| Average NVIDIA GeForce MX350 (50.3 - 54.7, n=2) | |
| Lenovo IdeaPad 5 15IIL05 | |
| Lenovo Ideapad S540-15IML | |
| Red Dead Redemption 2 - 1280x720 Minimum Settings | |
| HP Pavilion Gaming 15-ec0002ng | |
| Lenovo IdeaPad 5 15IIL05 | |
| Average NVIDIA GeForce MX350 (27 - 42.1, n=2) | |
| Lenovo Ideapad S540-15IML | |
To find out whether the refresh rates remain the same over a long period, we ran the game "The Witcher 3" for around 60 minutes in Full-HD resolution and maximum quality settings. The character played by the player did not move throughout the test. We did not observe a drop in frame rates. The GPU continued to work at full strength.
| low | med. | high | ultra | |
|---|---|---|---|---|
| Counter-Strike: GO (2012) | 252 | 228.4 | 204.9 | 120.1 |
| BioShock Infinite (2013) | 222.6 | 132.4 | 110.6 | 43.2 |
| GTA V (2015) | 146 | 136.4 | 47 | 9.1 |
| The Witcher 3 (2015) | 80.5 | 46.2 | 27.8 | 16.4 |
| Dota 2 Reborn (2015) | 102.8 | 93.8 | 83.3 | 76.3 |
| Overwatch (2016) | 192.2 | 143.9 | 64 | 42.5 |
| Rocket League (2017) | 220 | 105.8 | 74.4 | |
| Fortnite (2018) | 138.8 | 87.8 | 42.7 | 27 |
| X-Plane 11.11 (2018) | 55.9 | 50 | 45.4 | |
| World of Tanks enCore (2018) | 346.8 | 103.8 | 39.8 | |
| Far Cry 5 (2018) | 59 | 24 | 22 | 20 |
| Shadow of the Tomb Raider (2018) | 68 | 24 | 18 | 14 |
| Assassin´s Creed Odyssey (2018) | 49 | 22 | 12 | |
| Battlefield V (2018) | 73.7 | 37.6 | 29.9 | 23.2 |
| Farming Simulator 19 (2018) | 158.7 | 88.6 | 52.6 | 38.5 |
| Apex Legends (2019) | 94 | 40.6 | 32.6 | 27.4 |
| Far Cry New Dawn (2019) | 56 | 28 | 26 | 22 |
| Metro Exodus (2019) | 39.1 | 14.9 | 12 | 8.6 |
| Dirt Rally 2.0 (2019) | 116.4 | 40.3 | 33.6 | 15.5 |
| The Division 2 (2019) | 53 | 28 | 22 | 13 |
| Anno 1800 (2019) | 79.4 | 35.5 | 20.7 | 11 |
| Rage 2 (2019) | 44 | 16.2 | 14.7 | 14.1 |
| Total War: Three Kingdoms (2019) | 91.9 | 30.1 | 11.9 | 6.7 |
| F1 2019 (2019) | 110 | 49 | 39 | 33 |
| Control (2019) | 53.2 | 18.1 | 12.7 | |
| Borderlands 3 (2019) | 68.2 | 26.3 | 17 | 14.7 |
| Ghost Recon Breakpoint (2019) | 44 | 19 | 15 | |
| GRID 2019 (2019) | 71.9 | 26.4 | 17.8 | |
| Call of Duty Modern Warfare 2019 (2019) | 50.3 | 31.4 | 21.2 | 17.3 |
| Need for Speed Heat (2019) | 51.5 | 29.2 | 24.9 | 21.7 |
| Star Wars Jedi Fallen Order (2019) | 36.9 | 28.3 | 24 | |
| Red Dead Redemption 2 (2019) | 42.1 | 16.7 | ||
| Escape from Tarkov (2020) | 73.9 | 35.2 | 36.8 | 22.1 |
| Hunt Showdown (2020) | 59.1 | 25.7 | 21.6 | |
| Gears Tactics (2020) | 141.5 | 52.1 | 32.7 | 21.7 |
Emissions - heat and noise development are acceptable
System Noise
The fan is often turned off while idling, in which case the device is silent. But this changes under load - we measured a maximum noise level of 43.4 dB(A) (stress test) and 43.2 dB(A) (Witcher 3 test).
Noise level
| Idle |
| 30.7 / 30.7 / 30.7 dB(A) |
| Load |
| 43.4 / 43.7 dB(A) |
 | ||
30 dB silent 40 dB(A) audible 50 dB(A) loud |
||
min: | ||
| Lenovo IdeaPad 5 15IIL05 i5-1035G1, GeForce MX350 | Acer Aspire 5 A515-54G i5-10210U, GeForce MX250 | HP Pavilion 15-cs2019ng i5-8265U, GeForce MX250 | Schenker VIA 15 R5 3500U, Vega 8 | HP Pavilion Gaming 15-ec0002ng R5 3550H, GeForce GTX 1050 Mobile | Lenovo Ideapad S540-15IML i5-10210U, GeForce MX250 | Average NVIDIA GeForce MX350 | Average of class Multimedia | |
|---|---|---|---|---|---|---|---|---|
| Noise | 6% | -1% | 9% | 2% | -0% | 10% | 14% | |
| off / environment * (dB) | 30.7 | 29.8 3% | 30.5 1% | 29.4 4% | 30.3 1% | 30 2% | 26.6 ? 13% | 24.1 ? 21% |
| Idle Minimum * (dB) | 30.7 | 29.8 3% | 31.5 -3% | 29.6 4% | 30.3 1% | 30 2% | 26.6 ? 13% | 24.3 ? 21% |
| Idle Average * (dB) | 30.7 | 29.8 3% | 31.5 -3% | 29.6 4% | 30.3 1% | 32 -4% | 26.7 ? 13% | 24.7 ? 20% |
| Idle Maximum * (dB) | 30.7 | 29.8 3% | 31.5 -3% | 29.6 4% | 31 -1% | 37 -21% | 27.5 ? 10% | 26.3 ? 14% |
| Load Average * (dB) | 43.4 | 37.3 14% | 42.5 2% | 33.4 23% | 39.3 9% | 41 6% | 40.3 ? 7% | 37.4 ? 14% |
| Witcher 3 ultra * (dB) | 43.2 | 42.9 1% | 39 10% | |||||
| Load Maximum * (dB) | 43.7 | 40.1 8% | 42.5 3% | 38.1 13% | 43.3 1% | 42 4% | 43 ? 2% | 46.2 ? -6% |
* ... smaller is better
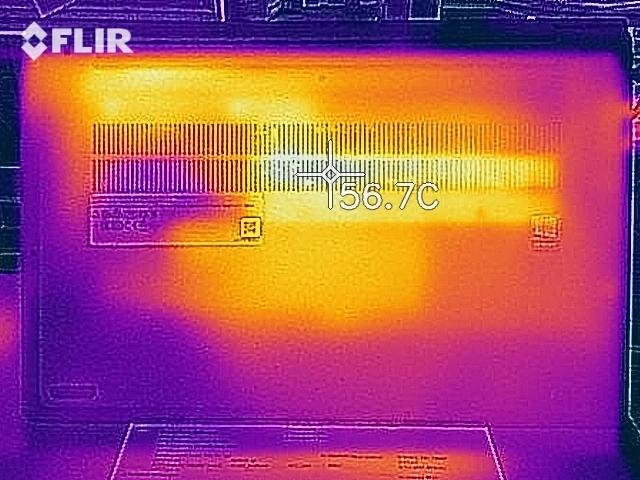
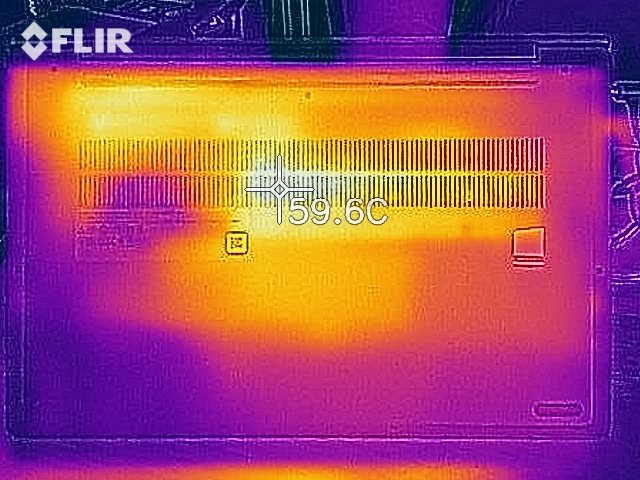
Temperature
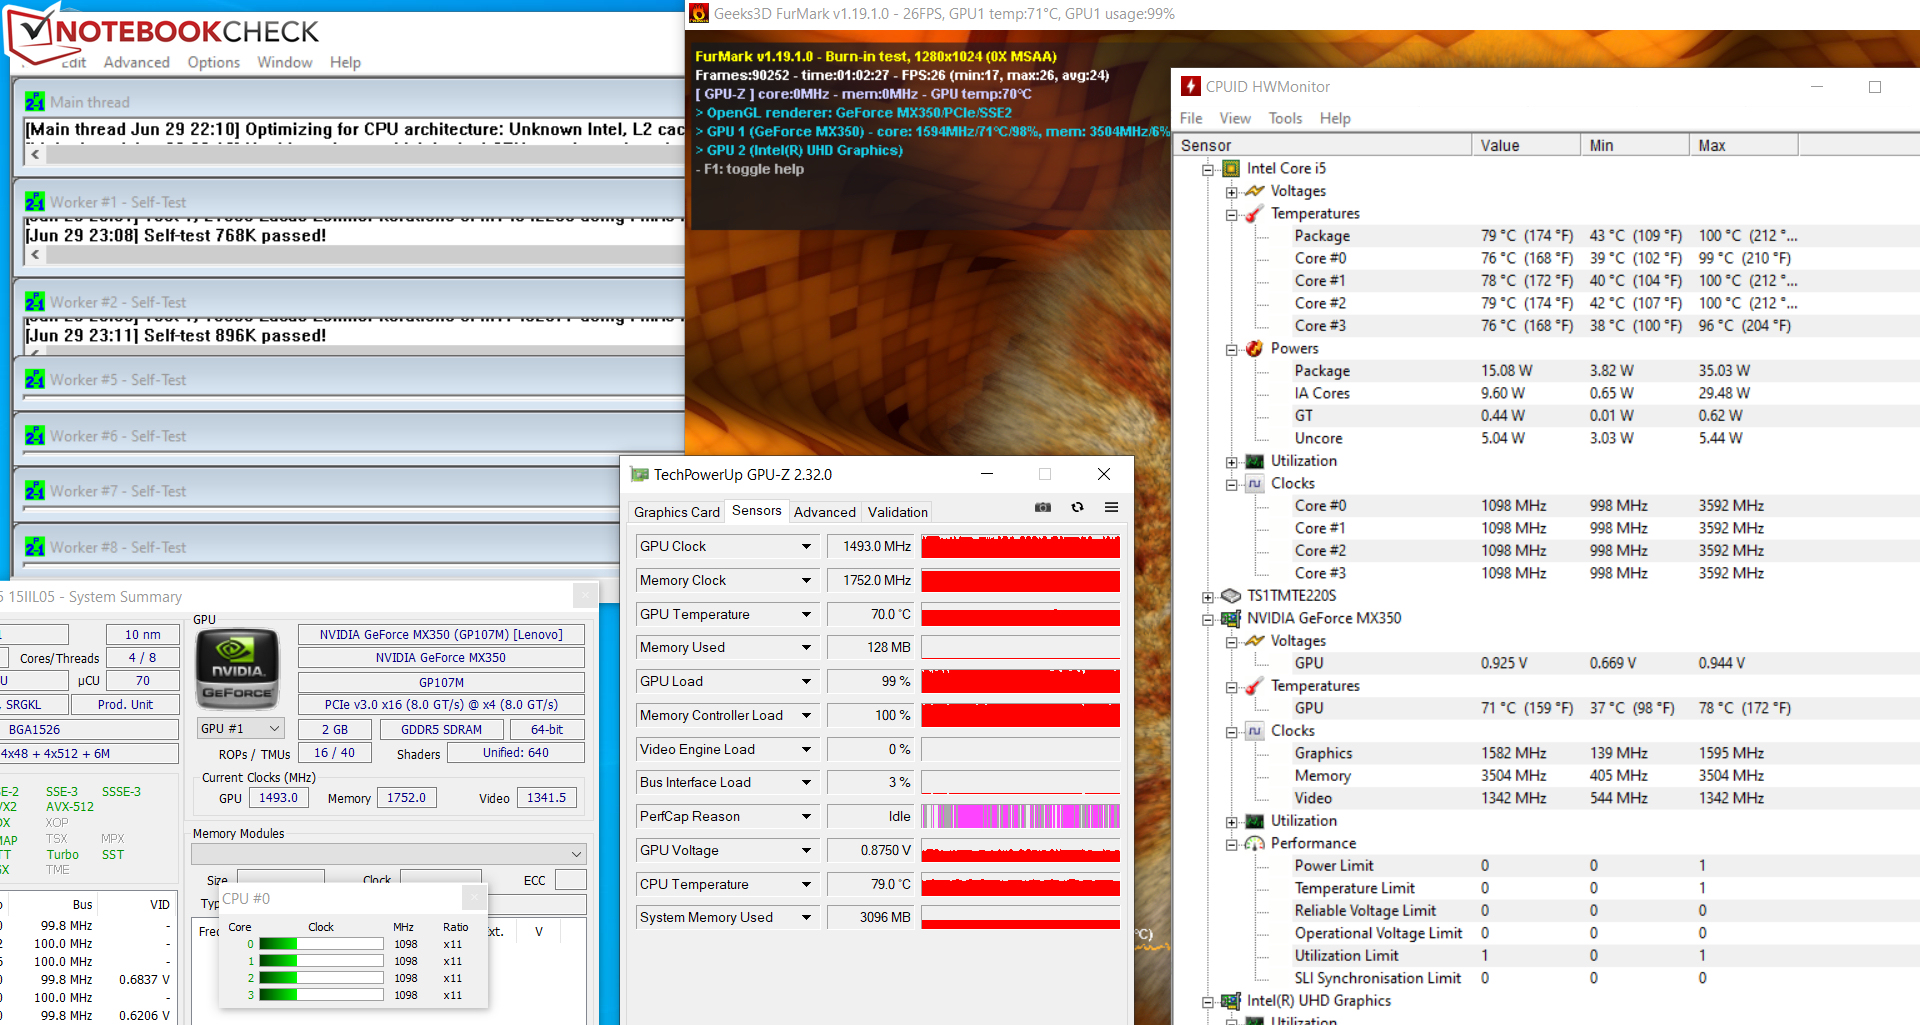
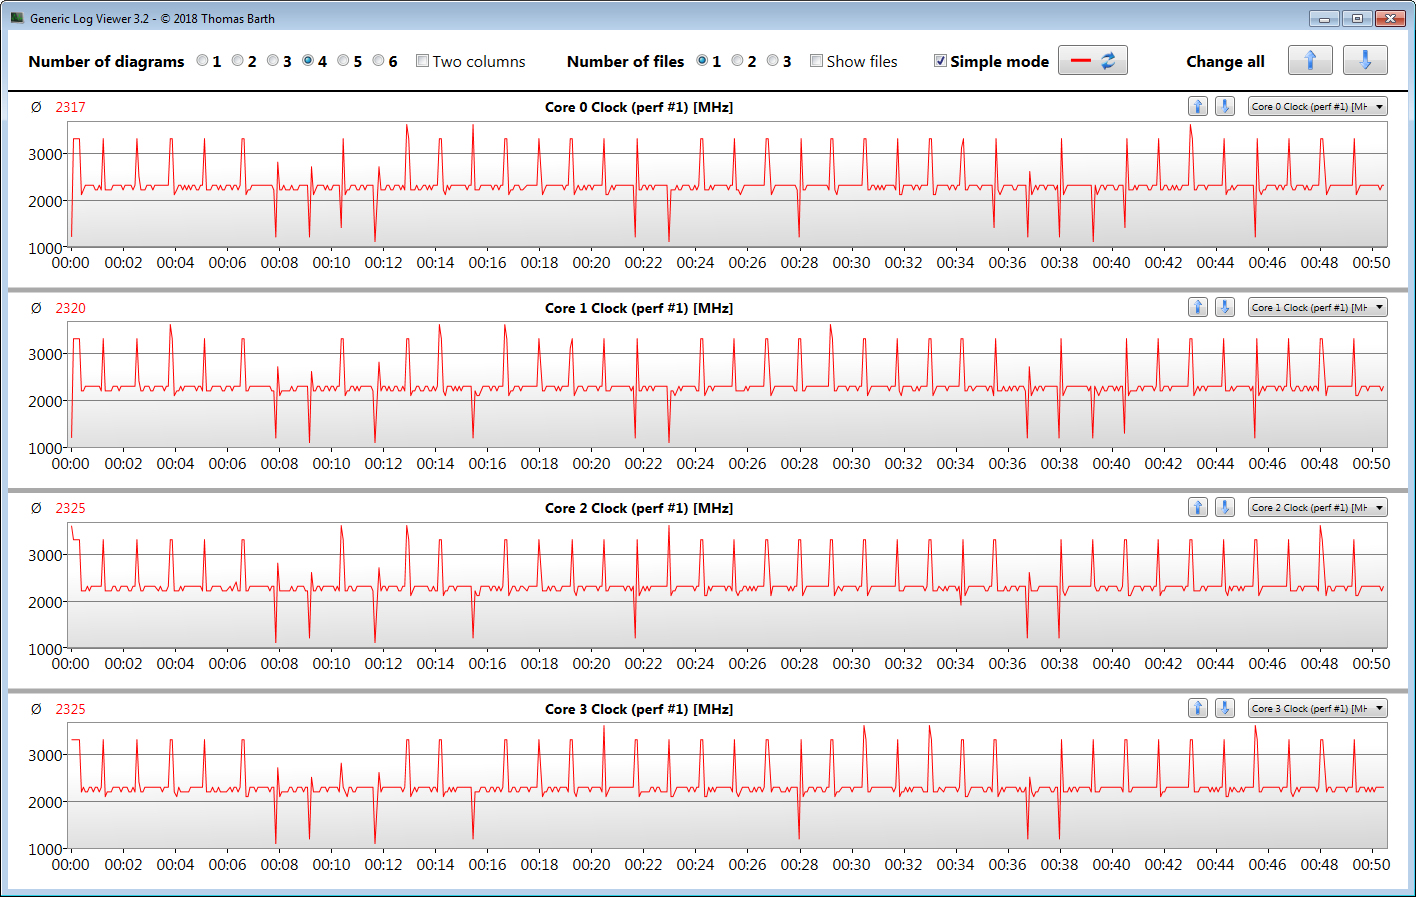
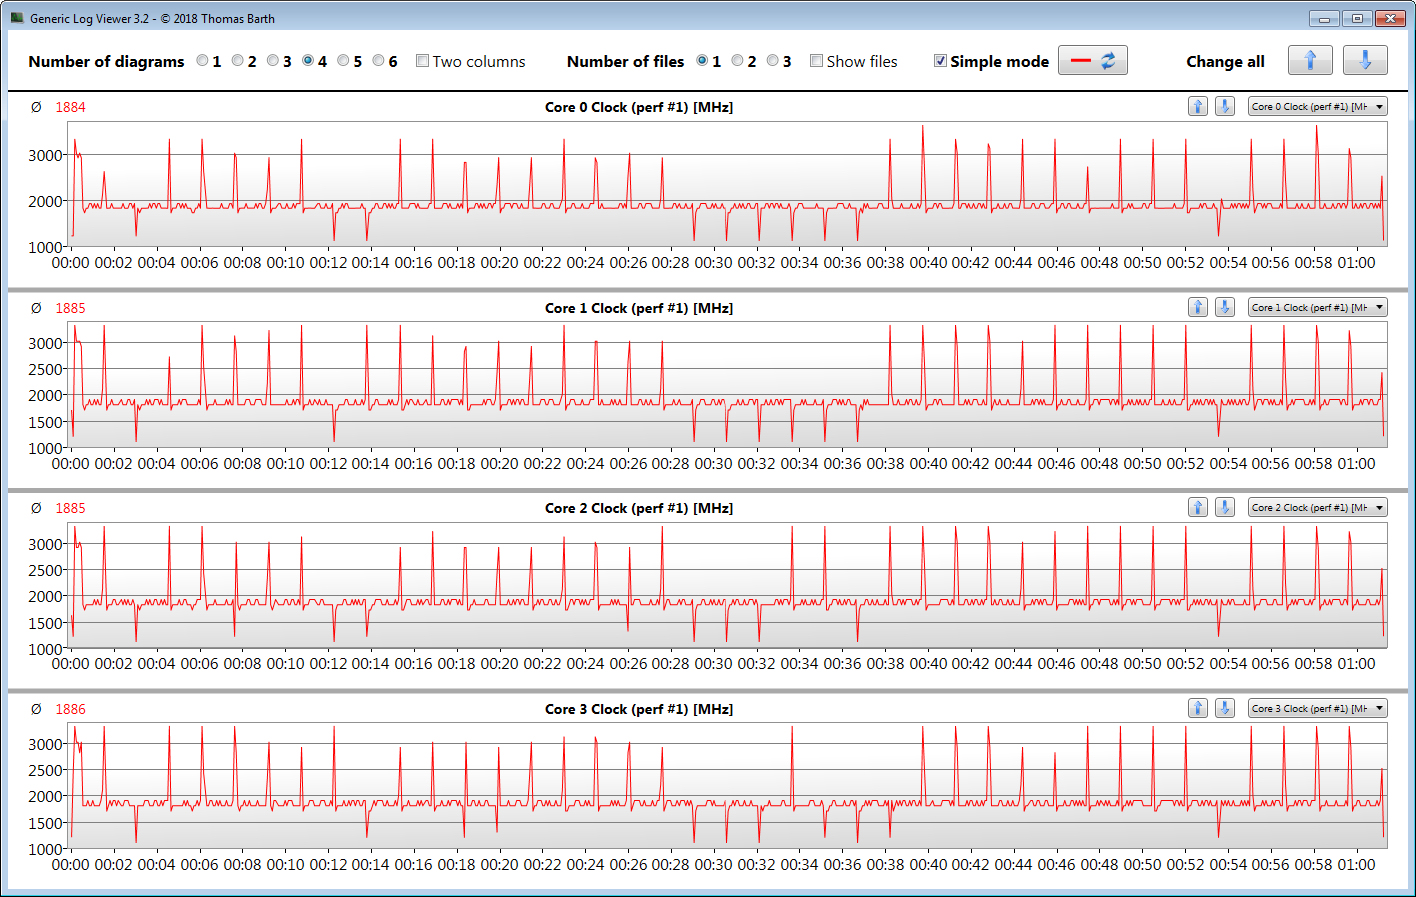
The processor clocks at 3.3 GHz (on mains) and 2.1 - 2.3 GHz (battery) at the start of our stress test, during which we run Prime95 and FurMark for at least one hour. However, the clock rate then slowly drops to one or 1.4 GHz and remains there for the remainder of the test. The GPU clocks at 1500 MHz (both on mains and on battery). The stress test is an extreme scenario that does not occur as such during everyday use. We use the test to find out whether the system remains stable under maximum load.
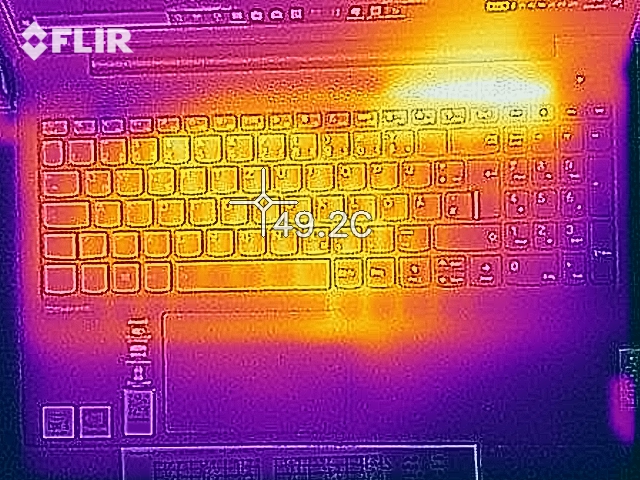
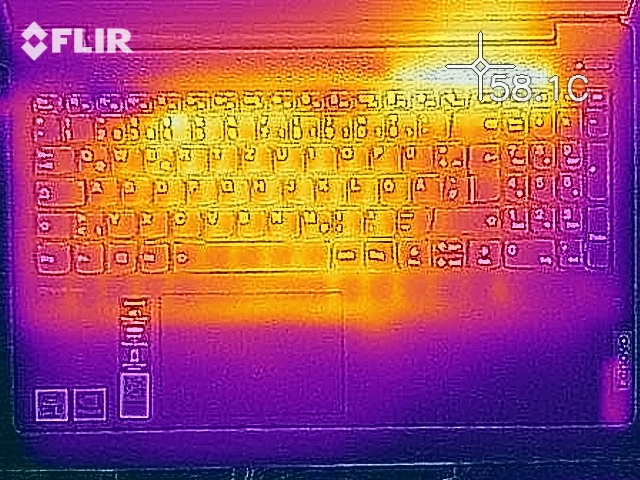
The notebook heats up noticeably, but not too much. We measured a hot spot of just over 50 °C (122 °F) during our stress test. The device heats up a little more during our Witcher 3 test, but temperatures remain perfectly normal during everyday use.
(±) The maximum temperature on the upper side is 43.1 °C / 110 F, compared to the average of 36.8 °C / 98 F, ranging from 21 to 71 °C for the class Multimedia.
(-) The bottom heats up to a maximum of 50.9 °C / 124 F, compared to the average of 39.1 °C / 102 F
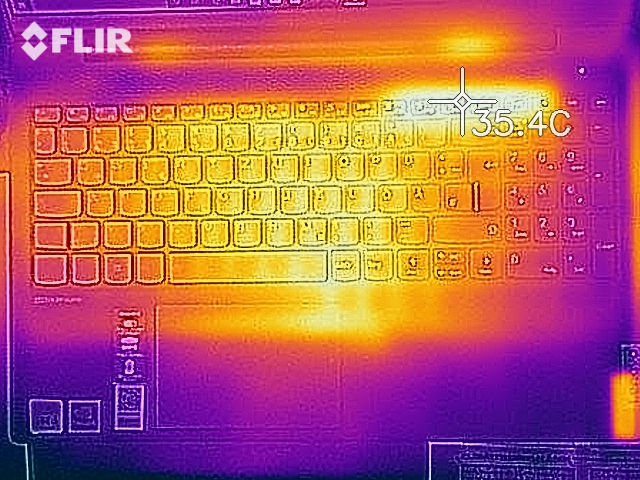
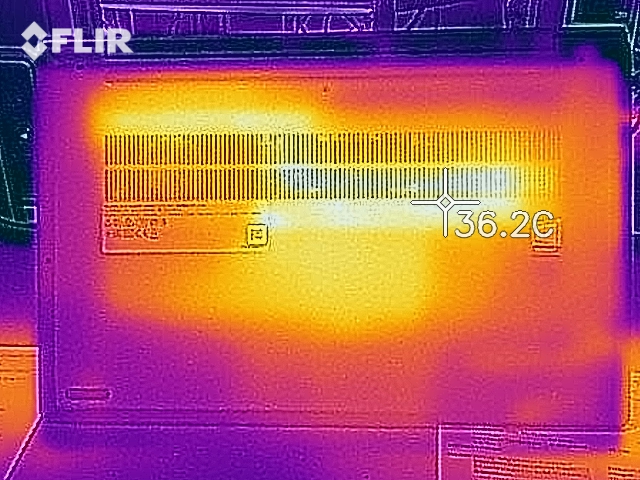
(+) In idle usage, the average temperature for the upper side is 26.8 °C / 80 F, compared to the device average of 31.3 °C / 88 F.
(±) Playing The Witcher 3, the average temperature for the upper side is 37 °C / 99 F, compared to the device average of 31.3 °C / 88 F.
(+) The palmrests and touchpad are cooler than skin temperature with a maximum of 28.7 °C / 83.7 F and are therefore cool to the touch.
(±) The average temperature of the palmrest area of similar devices was 28.7 °C / 83.7 F (0 °C / 0 F).
| Lenovo IdeaPad 5 15IIL05 i5-1035G1, GeForce MX350 | Acer Aspire 5 A515-54G i5-10210U, GeForce MX250 | HP Pavilion 15-cs2019ng i5-8265U, GeForce MX250 | Schenker VIA 15 R5 3500U, Vega 8 | HP Pavilion Gaming 15-ec0002ng R5 3550H, GeForce GTX 1050 Mobile | Lenovo Ideapad S540-15IML i5-10210U, GeForce MX250 | Average NVIDIA GeForce MX350 | Average of class Multimedia | |
|---|---|---|---|---|---|---|---|---|
| Heat | 10% | 6% | 8% | 13% | 11% | 4% | 9% | |
| Maximum Upper Side * (°C) | 43.1 | 41.3 4% | 46 -7% | 44.5 -3% | 41 5% | 42 3% | 44.5 ? -3% | 41.1 ? 5% |
| Maximum Bottom * (°C) | 50.9 | 40 21% | 44.6 12% | 45.2 11% | 39.1 23% | 45 12% | 46.6 ? 8% | 43.6 ? 14% |
| Idle Upper Side * (°C) | 29 | 27.4 6% | 26.6 8% | 26.3 9% | 26 10% | 25 14% | 27.6 ? 5% | 26.9 ? 7% |
| Idle Bottom * (°C) | 31 | 28.6 8% | 27.4 12% | 27 13% | 26.5 15% | 26 16% | 29.4 ? 5% | 27.8 ? 10% |
* ... smaller is better
Speakers
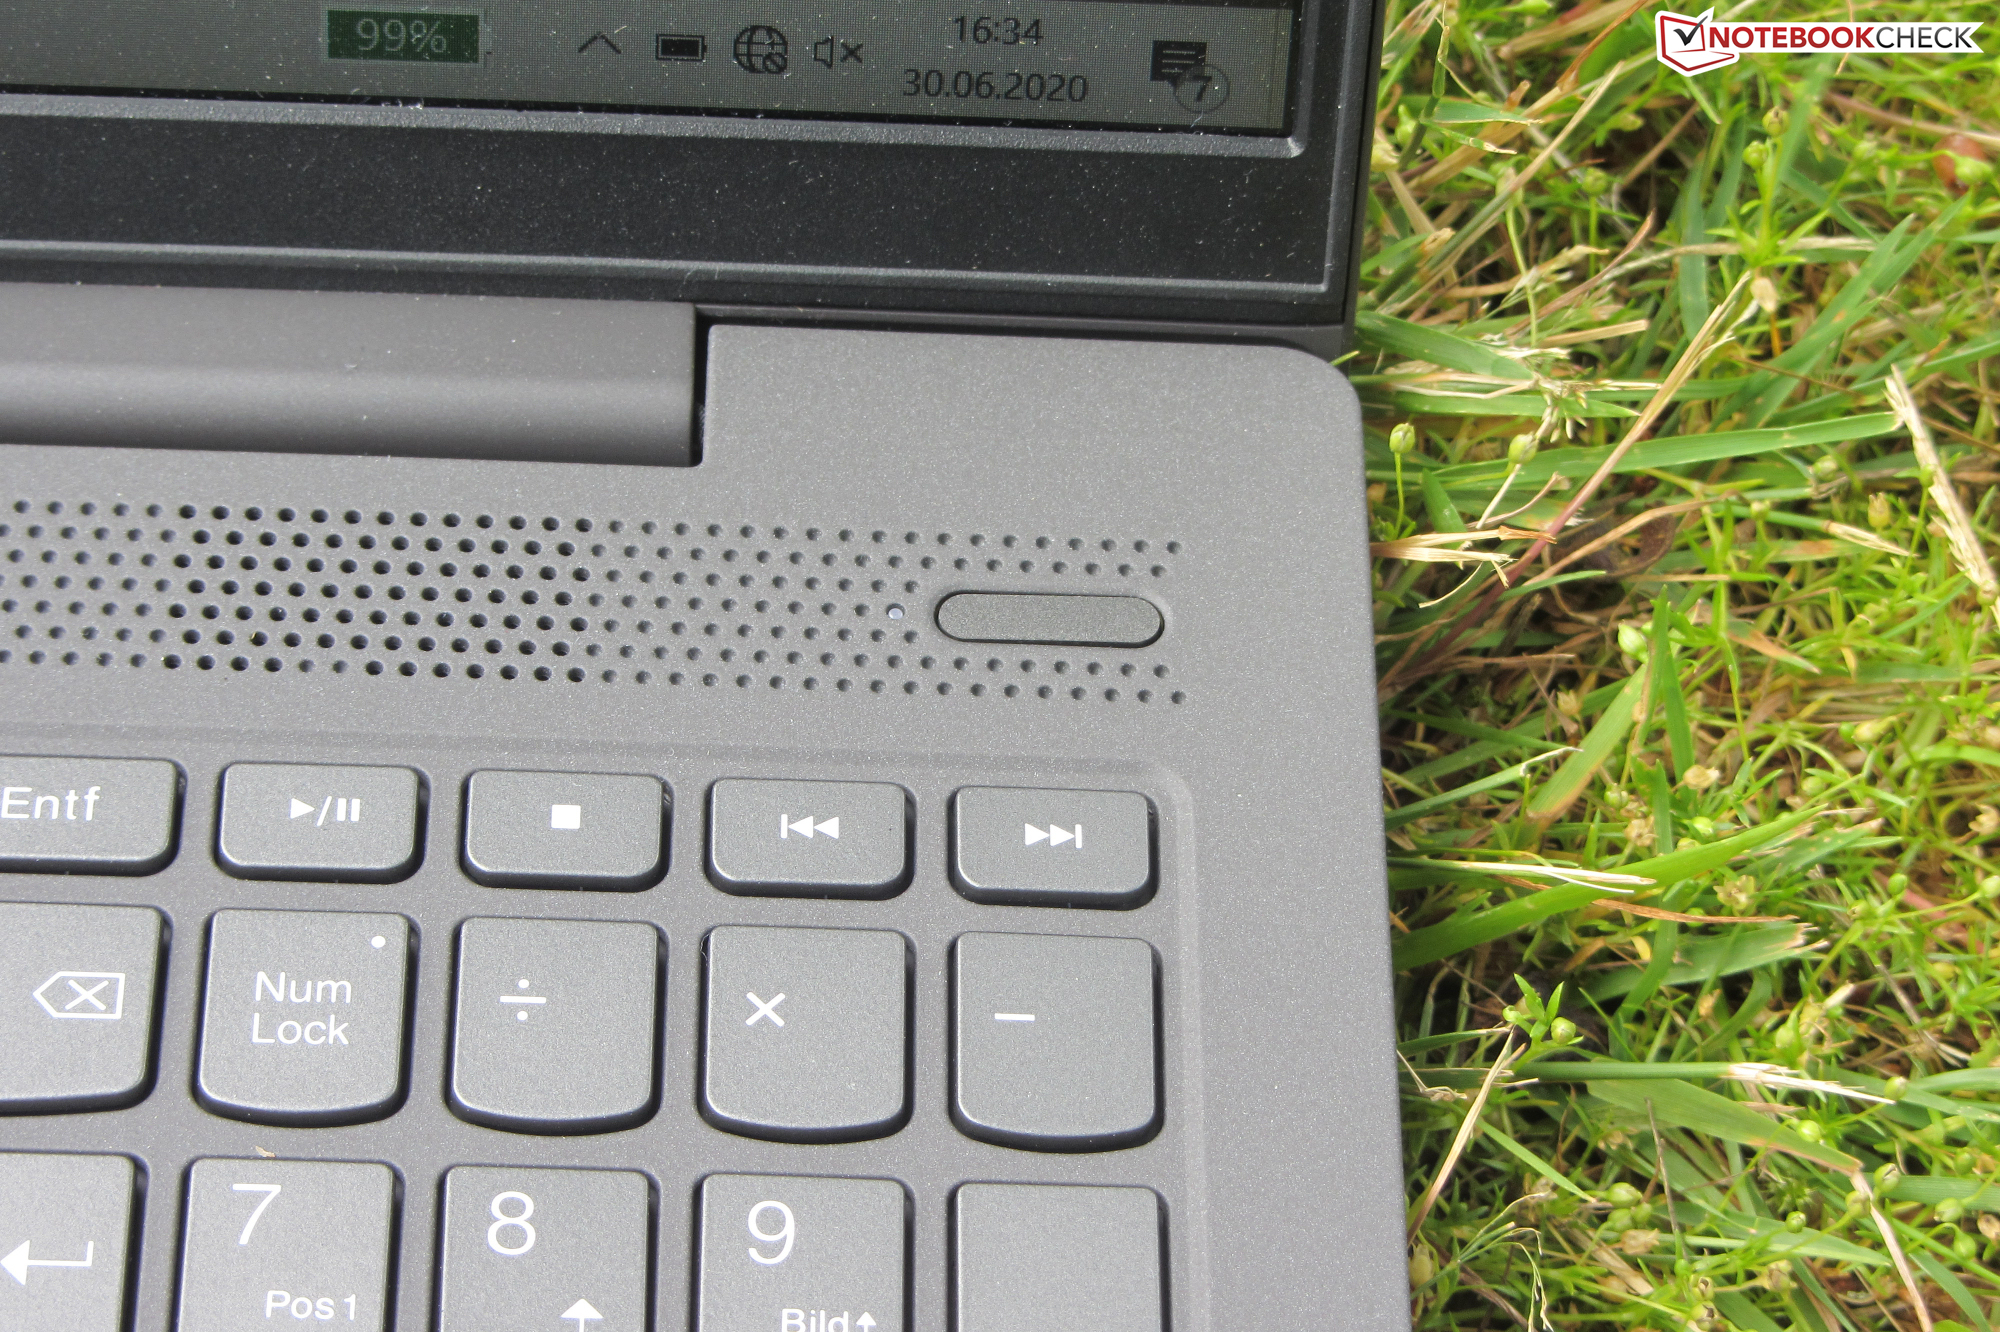
The stereo speakers are positioned above the keyboard, beneath a perforated cover. They produce a decent sound despite the weak bass. The speakers aren't particularly loud either. We would recommend using headphones or external speakers for a better sound.
Lenovo IdeaPad 5 15IIL05 audio analysis
(-) | not very loud speakers (68.6 dB)
Bass 100 - 315 Hz
(-) | nearly no bass - on average 20.9% lower than median
(±) | linearity of bass is average (11.2% delta to prev. frequency)
Mids 400 - 2000 Hz
(+) | balanced mids - only 3.6% away from median
(±) | linearity of mids is average (10% delta to prev. frequency)
Highs 2 - 16 kHz
(+) | balanced highs - only 3.6% away from median
(+) | highs are linear (4.4% delta to prev. frequency)
Overall 100 - 16.000 Hz
(±) | linearity of overall sound is average (21.5% difference to median)
Compared to same class
» 76% of all tested devices in this class were better, 5% similar, 19% worse
» The best had a delta of 5%, average was 17%, worst was 45%
Compared to all devices tested
» 61% of all tested devices were better, 7% similar, 32% worse
» The best had a delta of 4%, average was 23%, worst was 134%
Energy Management - Lenovo IdeaPad 15IIL05 has stamina
Power Consumption
The Lenovo notebook does not have any particularly surprising consumption rates. We measured a maximum consumption of 11.6 Watt while idling and up to 65.3 Watt during our stress test. While gaming (Witcher 3 test), the device requires less power with an average of 59 Watt (57 - 64 Watt). The rated output of the power supply is 65 Watt.
The power supply seems to be a little too weak for the hardware installed in this computer. The battery is drained during the stress test and Witcher 3. According to Lenovo's own platform specifications, the IdeaPad 5 15IIL is also available with a 95-Watt AC adapter. This seems to be the better choice for our test unit. We would therefore recommend choosing a model with a similar output when using a USB power supply.
| Off / Standby | |
| Idle | |
| Load |
|
Key:
min: | |
| Lenovo IdeaPad 5 15IIL05 i5-1035G1, GeForce MX350 | Acer Aspire 5 A515-54G i5-10210U, GeForce MX250 | HP Pavilion 15-cs2019ng i5-8265U, GeForce MX250 | Schenker VIA 15 R5 3500U, Vega 8 | HP Pavilion Gaming 15-ec0002ng R5 3550H, GeForce GTX 1050 Mobile | Lenovo Ideapad S540-15IML i5-10210U, GeForce MX250 | Average NVIDIA GeForce MX350 | Average of class Multimedia | |
|---|---|---|---|---|---|---|---|---|
| Power Consumption | 27% | 15% | 11% | -5% | 10% | 10% | -22% | |
| Idle Minimum * (Watt) | 4.9 | 3.4 31% | 4.9 -0% | 5.7 -16% | 1.9 61% | 5 -2% | 3.97 ? 19% | 5.66 ? -16% |
| Idle Average * (Watt) | 9.1 | 6.4 30% | 7.9 13% | 9.1 -0% | 7.2 21% | 7 23% | 8.26 ? 9% | 10.2 ? -12% |
| Idle Maximum * (Watt) | 11.6 | 9.2 21% | 10.1 13% | 9.6 17% | 9.6 17% | 10 14% | 10.7 ? 8% | 12.5 ? -8% |
| Load Average * (Watt) | 65 | 38 42% | 60 8% | 33.3 49% | 74 -14% | 64 2% | 55.2 ? 15% | 65.2 ? -0% |
| Witcher 3 ultra * (Watt) | 59 | 75 -27% | 44 25% | |||||
| Load Maximum * (Watt) | 65.3 | 59 10% | 38 42% | 63.6 3% | 124 -90% | 67 -3% | 65.8 ? -1% | 113.5 ? -74% |
* ... smaller is better
Battery Life
The Lenovo device reaches a runtime of 11:24 h during our practical Wi-Fi test (browsing the web via a script, energy profile set to balanced). It lasts even longer during our video test (energy profile set to balanced), which it displays for 16:03 h before turning off. This test involves running the short film Big Buck Bunny (H.264 encoding, 1920x1080 pixels) in a loop. Power saving was deactivated and display brightness set to around 150 cd/m² for both of these tests. We also turned off the wireless modules for the video test.
| Lenovo IdeaPad 5 15IIL05 i5-1035G1, GeForce MX350, 70 Wh | Acer Aspire 5 A515-54G i5-10210U, GeForce MX250, 48 Wh | HP Pavilion 15-cs2019ng i5-8265U, GeForce MX250, 41 Wh | Schenker VIA 15 R5 3500U, Vega 8, 91 Wh | HP Pavilion Gaming 15-ec0002ng R5 3550H, GeForce GTX 1050 Mobile, 52.5 Wh | Lenovo Ideapad S540-15IML i5-10210U, GeForce MX250, 70 Wh | Average of class Multimedia | |
|---|---|---|---|---|---|---|---|
| Battery runtime | -22% | -55% | 18% | -26% | -1% | -2% | |
| Reader / Idle (h) | 23.2 | 8 -66% | 30.2 30% | 24.9 ? 7% | |||
| H.264 (h) | 16.1 | 17.1 ? 6% | |||||
| WiFi v1.3 (h) | 11.4 | 8.9 -22% | 5 -56% | 13.4 18% | 8.4 -26% | 12.1 6% | 12.2 ? 7% |
| Load (h) | 2.3 | 1.3 -43% | 1.4 -39% | 1.664 ? -28% |
Pros
Cons
Verdict
Lenovo's multimedia all-rounder now features potent hardware. The combination of a Core i5-1035G1 processor with a GeForce MX350 not only promises more performance for office and internet applications, but can also display most current computer games smoothly.
The Lenovo IdeaPad 5 15IIL05 proves to be a powerful multimedia all-rounder with potential for gaming.
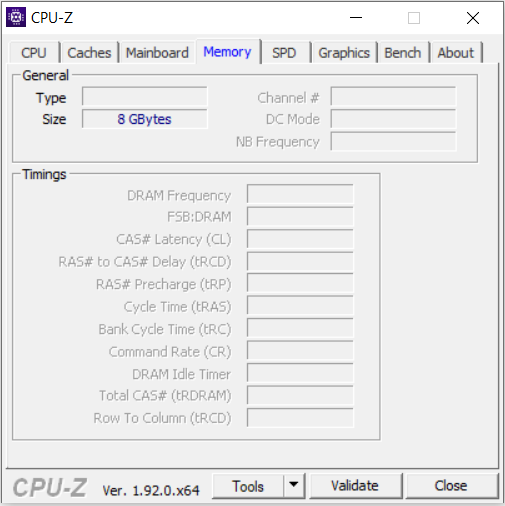
The notebook is equipped with 8 GB of RAM. This cannot be expanded as the chip is soldered on. We would therefore recommend choosing an IdeaPad model with 16 GB of RAM to make sure the device is future-proof. Users can exchange the NVMe SSD for a model with a larger capacity. The device is easy to open for maintenance work.
The IPS Full-HD display offers stable viewing angles, a matte surface and decent colors. The brightness and contrast are within the ideal range. However, color space coverage is a little too low. The backlit keyboard gave a good impression and is suitable for regular typing.
Thanks to the large battery capacity (70Wh), the IdeaPad reaches an ideal battery life and should easily survive a work day without the need for a power supply. The Type-C USB port (USB 3.2 Gen 2, power delivery, DisplayPort via USB-C) means that the device can be recharged using the included AC adapter or any USB charger.
One more thing: According to Lenovo, the IdeaPad 5 series can also be equipped with two other batteries (45 Wh and 57 Wh), so if battery life is an important issue for you, make sure to check which battery is included in the model you're interested in.
Lenovo IdeaPad 5 15IIL05
- 07/06/2020 v7 (old)
Sascha Mölck
Price comparison

