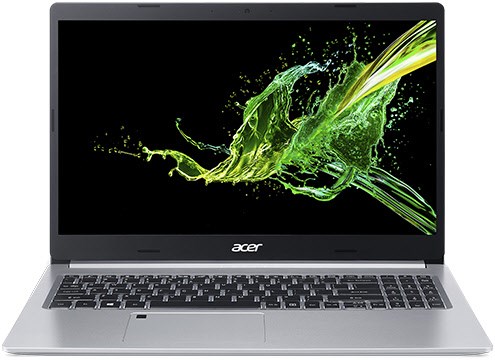
Acer Aspire 5 A515-54G Review: Laptop for Casual Gamers

What exactly is an all-round laptop? As far as we are concerned, this includes cheap devices with a solid system performance, good display, large storage solution and an entry-level graphics card for casual gaming. For years, the Acer Aspire 5 series has been proof of the manufacturer's ability to produce budget laptops with solid components.
Most recently, we reviewed the 8th generation Whiskey Lake i7-8565U-based Aspire 5 A515-52G with the entry-level GeForce MX250 one year ago.
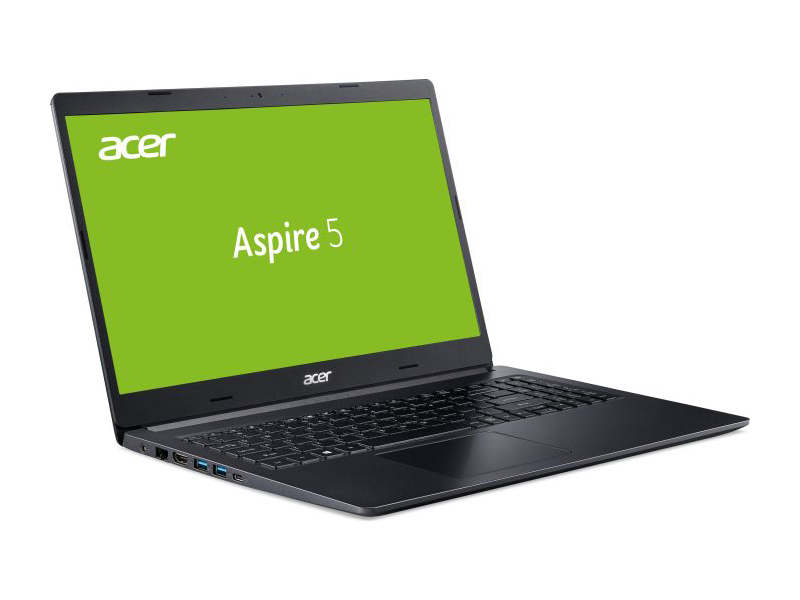
Since then, the manufacturer has not only upgraded to Intel's 10th generation Comet Lake architecture but also redesigned the chassis. Today, we will take a look at Acer's new Aspire 5 A515-54G model, which has been popular and most likely will be again thanks to its customizability both in terms of the price and the hardware. The price ranges from 690 to 1,000 Euros (~$746 to ~$1,081).
Rating | Date | Model | Weight | Height | Size | Resolution | Price |
|---|---|---|---|---|---|---|---|
| 81.5 % v7 (old) | 04 / 2020 | Acer Aspire 5 A515-54G i5-10210U, GeForce MX250 | 1.7 kg | 17.9 mm | 15.60" | 1920x1080 | |
| 81.4 % v7 (old) | 01 / 2020 | Lenovo Ideapad S540-15IML i5-10210U, GeForce MX250 | 1.9 kg | 17 mm | 15.60" | 1920x1080 | |
| 84.6 % v6 (old) | 04 / 2019 | Asus VivoBook 14 F412FJ-EB084T i5-8265U, GeForce MX230 | 1.5 kg | 19 mm | 14.00" | 1920x1080 | |
| 83 % v6 (old) | 04 / 2019 | HP Pavilion 15-cs2019ng i5-8265U, GeForce MX250 | 1.9 kg | 18 mm | 15.60" | 1920x1080 | |
| 79.7 % v6 (old) | 08 / 2019 | Dell Inspiron 15 5000 5585 R7 3700U, Vega 10 | 1.8 kg | 19.5 mm | 15.60" | 1920x1080 |
Chassis & Features
Rigidity is not a strength of the lightweight plastic chassis. The base unit can be twisted by a fair amount and the same holds true for the lid. The hinges hold the latter firmly in place and prevent any teetering. Opening the laptop one-handed is just barely possible. The palm rests and the bottom plate yield under pressure in a few areas.
Regardless, the 15-inch laptop is well-built with even clearances and no protruding excess materials.
Acer has not only equipped its device with a wired networking interface (Gigabit LAN) but also brand-new AX Wi-Fi 6. In our test, the Intel Wi-Fi 6 AX201 achieves good transfer rates of up to 929 MB/s and 837 MB/s for receiving and sending data, respectively.
With these transfer rates, the Acer outperforms most of its competitors that still rely on the older Wi-Fi AC.
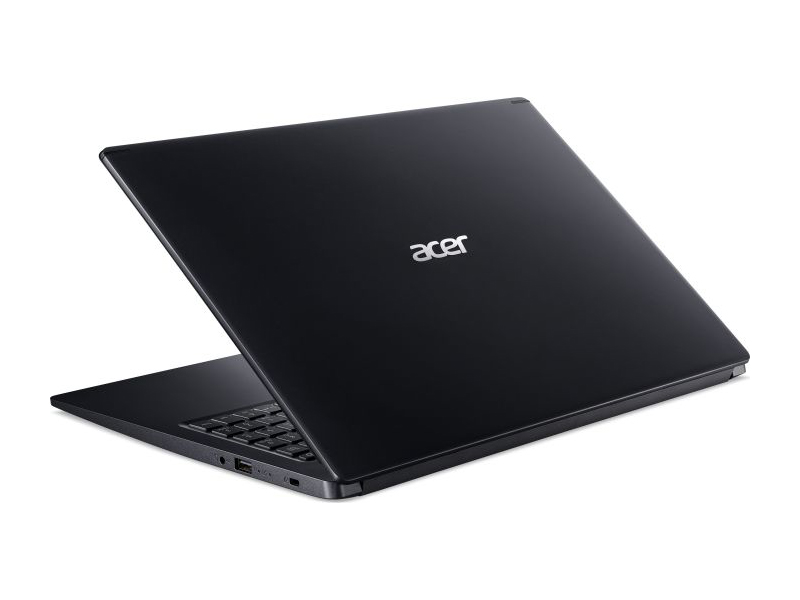
Regrettably, there are not just upgrades, Acer has also downgraded a few things. For example, there is no more integrated card reader or TPM. Meanwhile, the USB Type-C port supports neither charging nor DisplayPort via USB Type-C.
While there is no maintenance hatch on the Acer laptop, the entire bottom plate can be removed. The RAM slot, Wi-Fi module, fan and the M.2 SSD slot are then exposed.
The included HDD mounting frame is a nice extra, since it allows users to install an additional, internal 2.5-inch drive (SATA SSD or HDD).
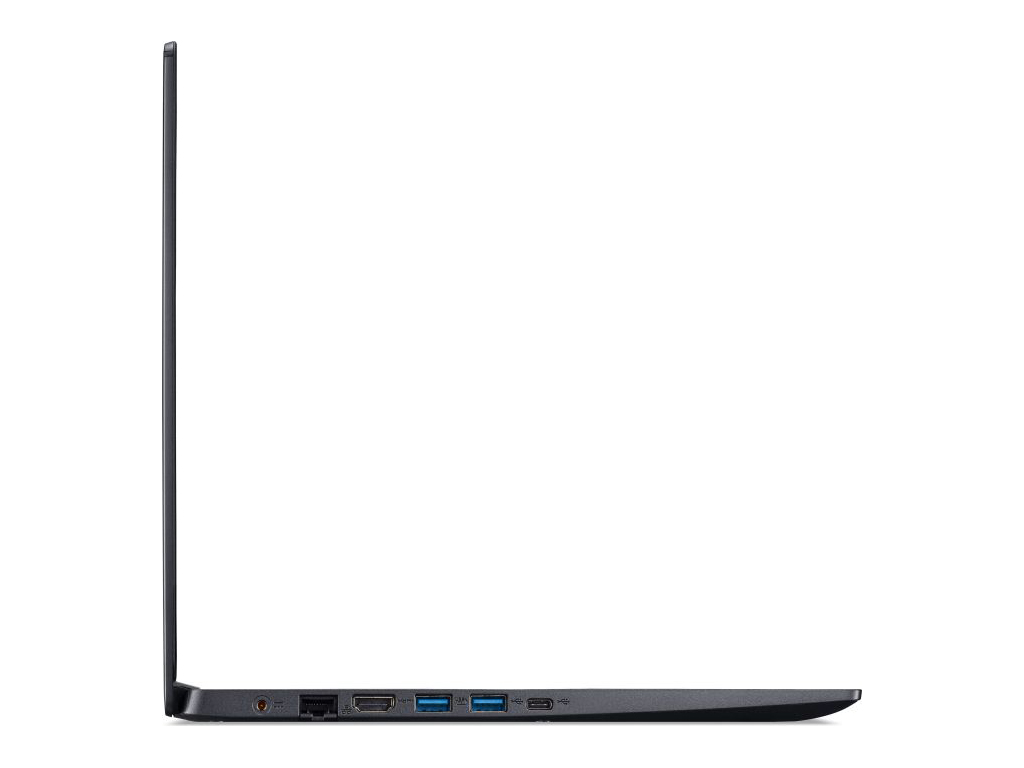
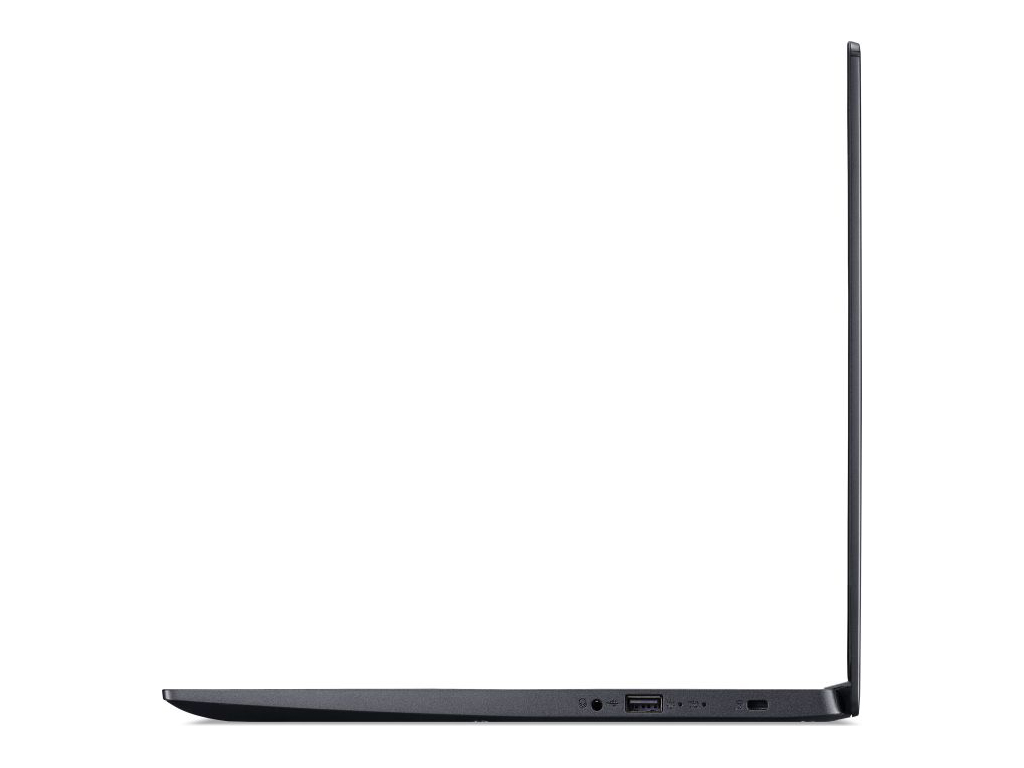
Port Selection


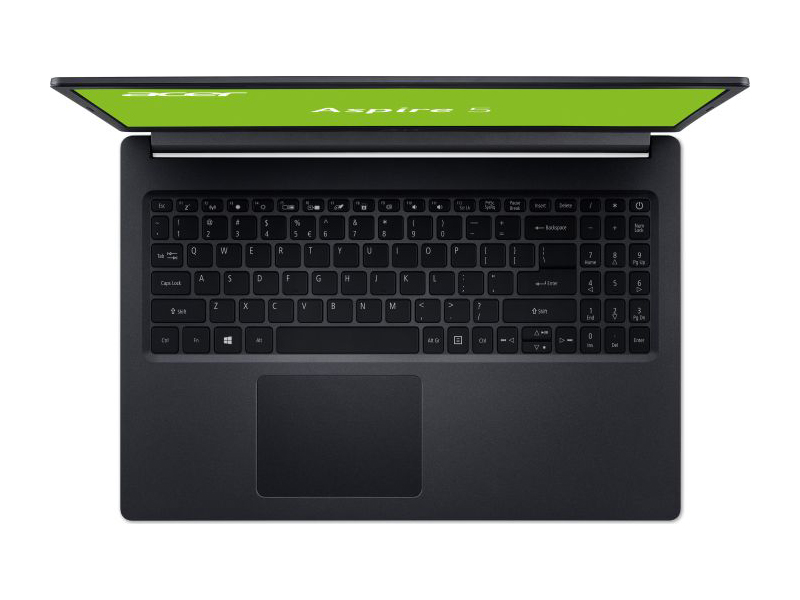
Input Devices
The keyboard keys have a backlight with one brightness level and a fairly indistinct actuation point as well as a somewhat spongy feedback and a smooth surface. While the spacing between the keys is good, the small arrow keys feel cramped. We commend the manufacturer for including a numpad, since it is still preferable for users who work a lot with numbers. Unfortunately, its keys are narrow.
The ClickPad is large at almost 13 cm (~5.1 in) diagonally. The travel is very limited and almost reduced to zero in the upper half. Thus, the feedback of the clicks is not very distinct, even though the acoustic feedback is loud. Lastly, since the key clatter of the keyboard keys is quiet, the Acer laptop is well-suited to noise sensitive environments.
Display
The 15.6-inch LG Display panel offers a native Full HD resolution. The 16:9 screen has a non-reflective surface and its viewing angles are wide, which is typical for IPS.
We did not experience backlight bleeding and the illumination of the display is 86%. The response times are average and neither particularly fast nor particularly slow. However, the brightness is comparatively low and the HP Pavilion 15-cs2019ng does a better job here.
| |||||||||||||||||||||||||
Brightness Distribution: 86 %
Center on Battery: 251 cd/m²
Contrast: 1078:1 (Black: 0.23 cd/m²)
ΔE ColorChecker Calman: 5.05 | ∀{0.5-29.43 Ø4.73}
calibrated: 4.76
ΔE Greyscale Calman: 1.37 | ∀{0.09-98 Ø4.97}
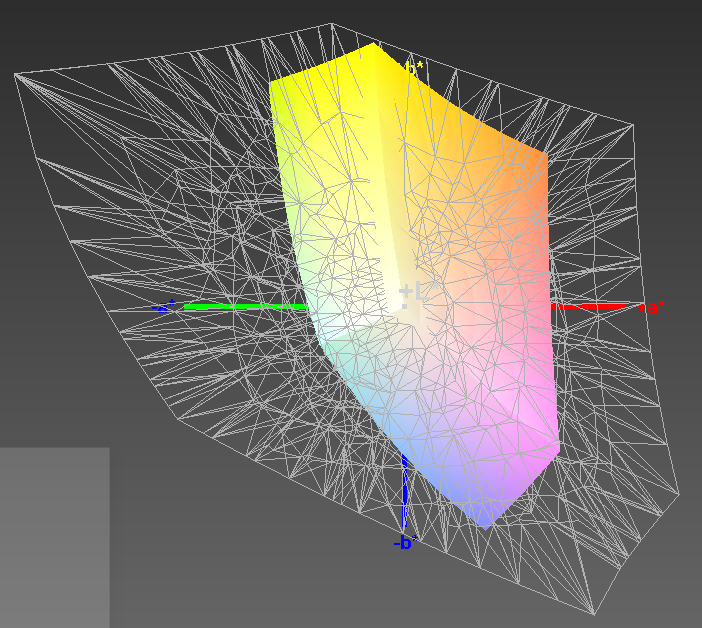
51% sRGB (Argyll 1.6.3 3D)
32% AdobeRGB 1998 (Argyll 1.6.3 3D)
34.9% AdobeRGB 1998 (Argyll 3D)
50.8% sRGB (Argyll 3D)
33.78% Display P3 (Argyll 3D)
Gamma: 2.4
CCT: 6592 K
| Acer Aspire 5 A515-54G LG Display LP156WFC SPD1, IPS, 1920x1080, 15.6" | Lenovo Ideapad S540-15IML BOEhydis NV156FHM-N61 (BOE06FB), IPS, 1920x1080, 15.6" | Asus VivoBook 14 F412FJ-EB084T AU Optronics AUO403D B140HAN04.0, IPS, 1920x1080, 14" | HP Pavilion 15-cs2019ng BOE080D, IPS, 1920x1080, 15.6" | Dell Inspiron 15 5000 5585 LG Philips 156WFC, IPS, 1920x1080, 15.6" | |
|---|---|---|---|---|---|
| Display | 83% | 18% | 86% | 10% | |
| Display P3 Coverage (%) | 33.78 | 66.8 98% | 39.71 18% | 67.2 99% | 37.31 10% |
| sRGB Coverage (%) | 50.8 | 86.5 70% | 59.6 17% | 88.1 73% | 56.2 11% |
| AdobeRGB 1998 Coverage (%) | 34.9 | 63.2 81% | 41.04 18% | 64.4 85% | 38.55 10% |
| Response Times | -39% | -14% | -18% | 6% | |
| Response Time Grey 50% / Grey 80% * (ms) | 36 ? | 49.6 ? -38% | 40 ? -11% | 43 ? -19% | 28.4 ? 21% |
| Response Time Black / White * (ms) | 25 ? | 34.8 ? -39% | 29 ? -16% | 29 ? -16% | 27.2 ? -9% |
| PWM Frequency (Hz) | 202 ? | 208 ? | |||
| Screen | 7% | 14% | 1% | -16% | |
| Brightness middle (cd/m²) | 248 | 299 21% | 267 8% | 320 29% | 253.6 2% |
| Brightness (cd/m²) | 238 | 278 17% | 257 8% | 293 23% | 227 -5% |
| Brightness Distribution (%) | 86 | 87 1% | 91 6% | 86 0% | 84 -2% |
| Black Level * (cd/m²) | 0.23 | 0.25 -9% | 0.2 13% | 0.26 -13% | 0.27 -17% |
| Contrast (:1) | 1078 | 1196 11% | 1335 24% | 1231 14% | 939 -13% |
| Colorchecker dE 2000 * | 5.05 | 4.32 14% | 3.79 25% | 4.5 11% | 6.05 -20% |
| Colorchecker dE 2000 max. * | 14.34 | 9.3 35% | 8.18 43% | 8.81 39% | 14.03 2% |
| Colorchecker dE 2000 calibrated * | 4.76 | 2.58 46% | 4.71 1% | 4.97 -4% | |
| Greyscale dE 2000 * | 1.37 | 4.21 -207% | 1.49 -9% | 4.71 -244% | 3.2 -134% |
| Gamma | 2.4 92% | 2.39 92% | 2.48 89% | 2.45 90% | 2 110% |
| CCT | 6592 99% | 6799 96% | 6659 98% | 7085 92% | 6820 95% |
| Color Space (Percent of AdobeRGB 1998) (%) | 32 | 57 78% | 38 19% | 58 81% | 35.5 11% |
| Color Space (Percent of sRGB) (%) | 51 | 86 69% | 59 16% | 88 73% | 55.6 9% |
| Total Average (Program / Settings) | 17% /
16% | 6% /
11% | 23% /
16% | 0% /
-8% |
* ... smaller is better
Display Response Times
| ↔ Response Time Black to White | ||
|---|---|---|
| 25 ms ... rise ↗ and fall ↘ combined | ↗ 16 ms rise |  |
| ↘ 9 ms fall | ||
| The screen shows relatively slow response rates in our tests and may be too slow for gamers. In comparison, all tested devices range from 0.1 (minimum) to 240 (maximum) ms. » 59 % of all devices are better. This means that the measured response time is worse than the average of all tested devices (19.9 ms). | ||
| ↔ Response Time 50% Grey to 80% Grey | ||
| 36 ms ... rise ↗ and fall ↘ combined | ↗ 19 ms rise | 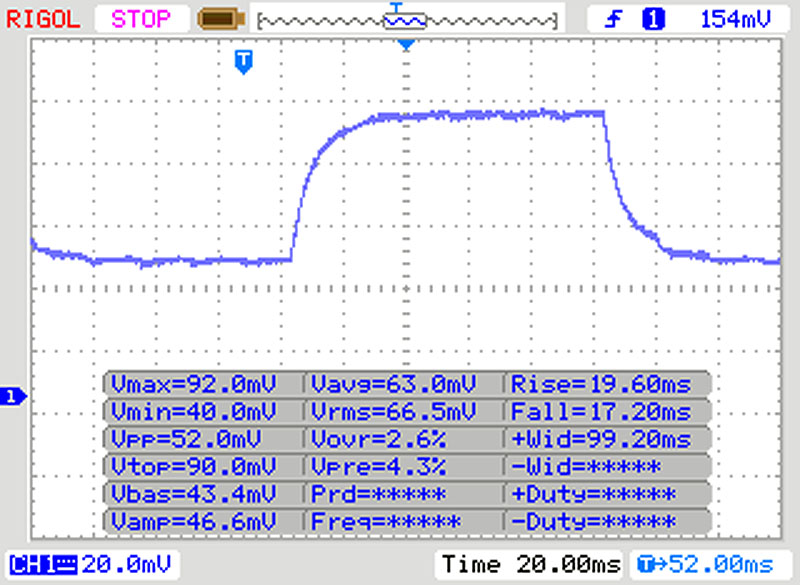 |
| ↘ 17 ms fall | ||
| The screen shows slow response rates in our tests and will be unsatisfactory for gamers. In comparison, all tested devices range from 0.165 (minimum) to 636 (maximum) ms. » 50 % of all devices are better. This means that the measured response time is worse than the average of all tested devices (31.1 ms). | ||
Screen Flickering / PWM (Pulse-Width Modulation)
| Screen flickering / PWM not detected | 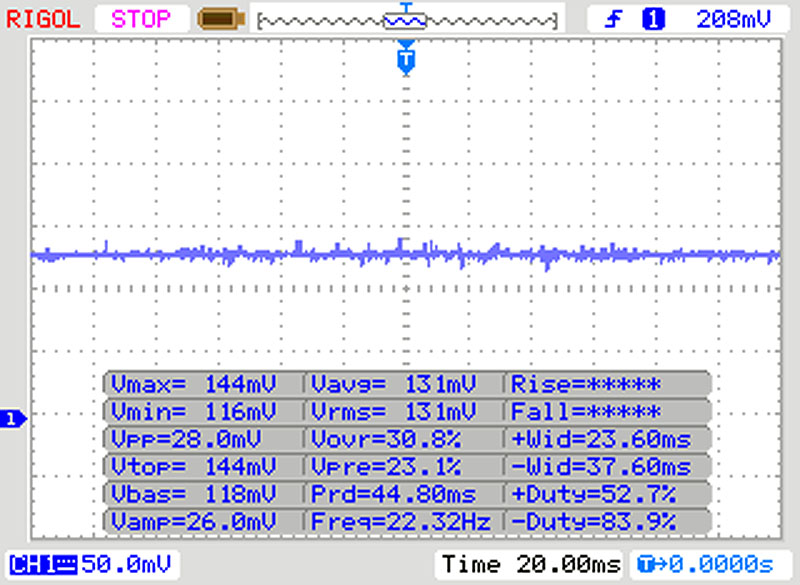 | ||
In comparison: 52 % of all tested devices do not use PWM to dim the display. If PWM was detected, an average of 7798 (minimum: 5 - maximum: 343500) Hz was measured. | |||
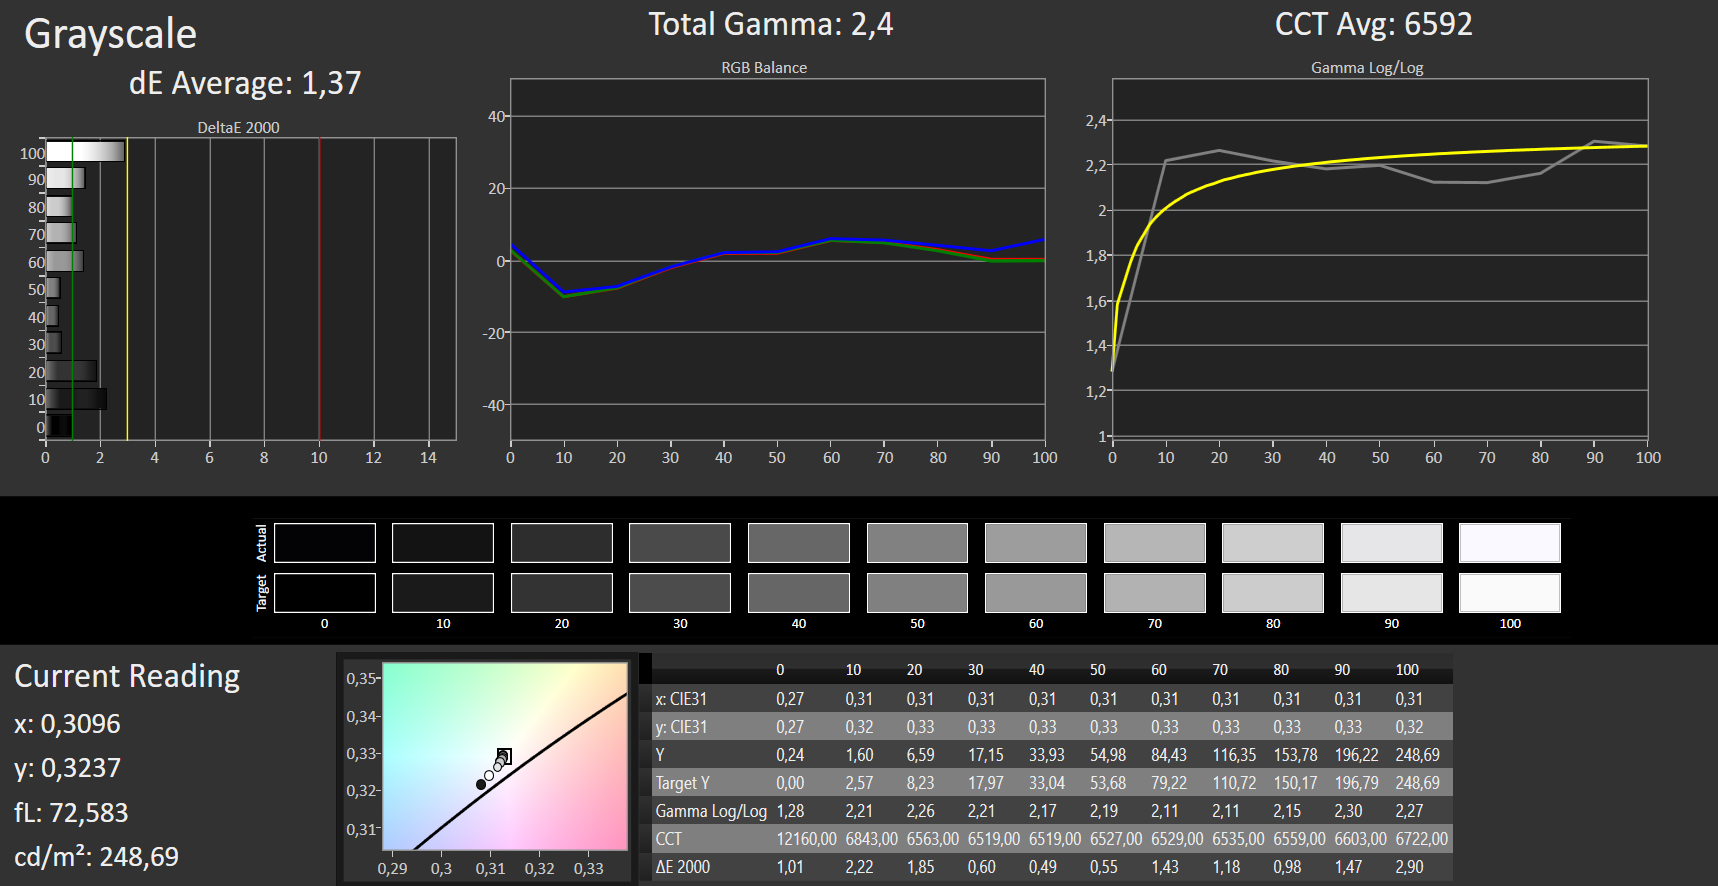
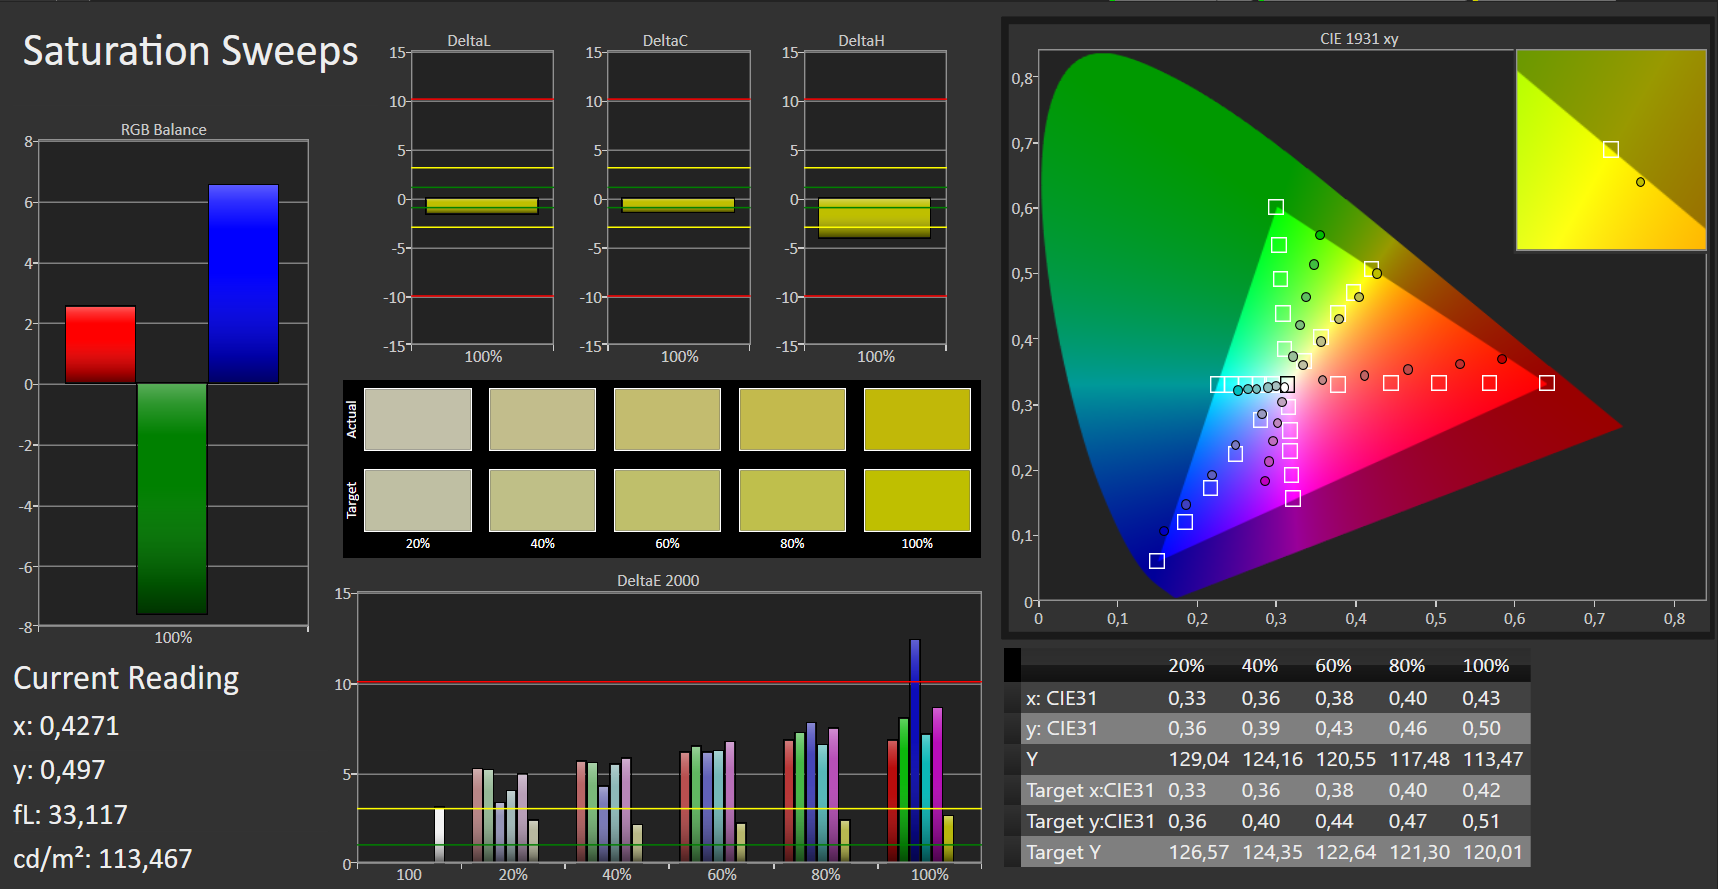
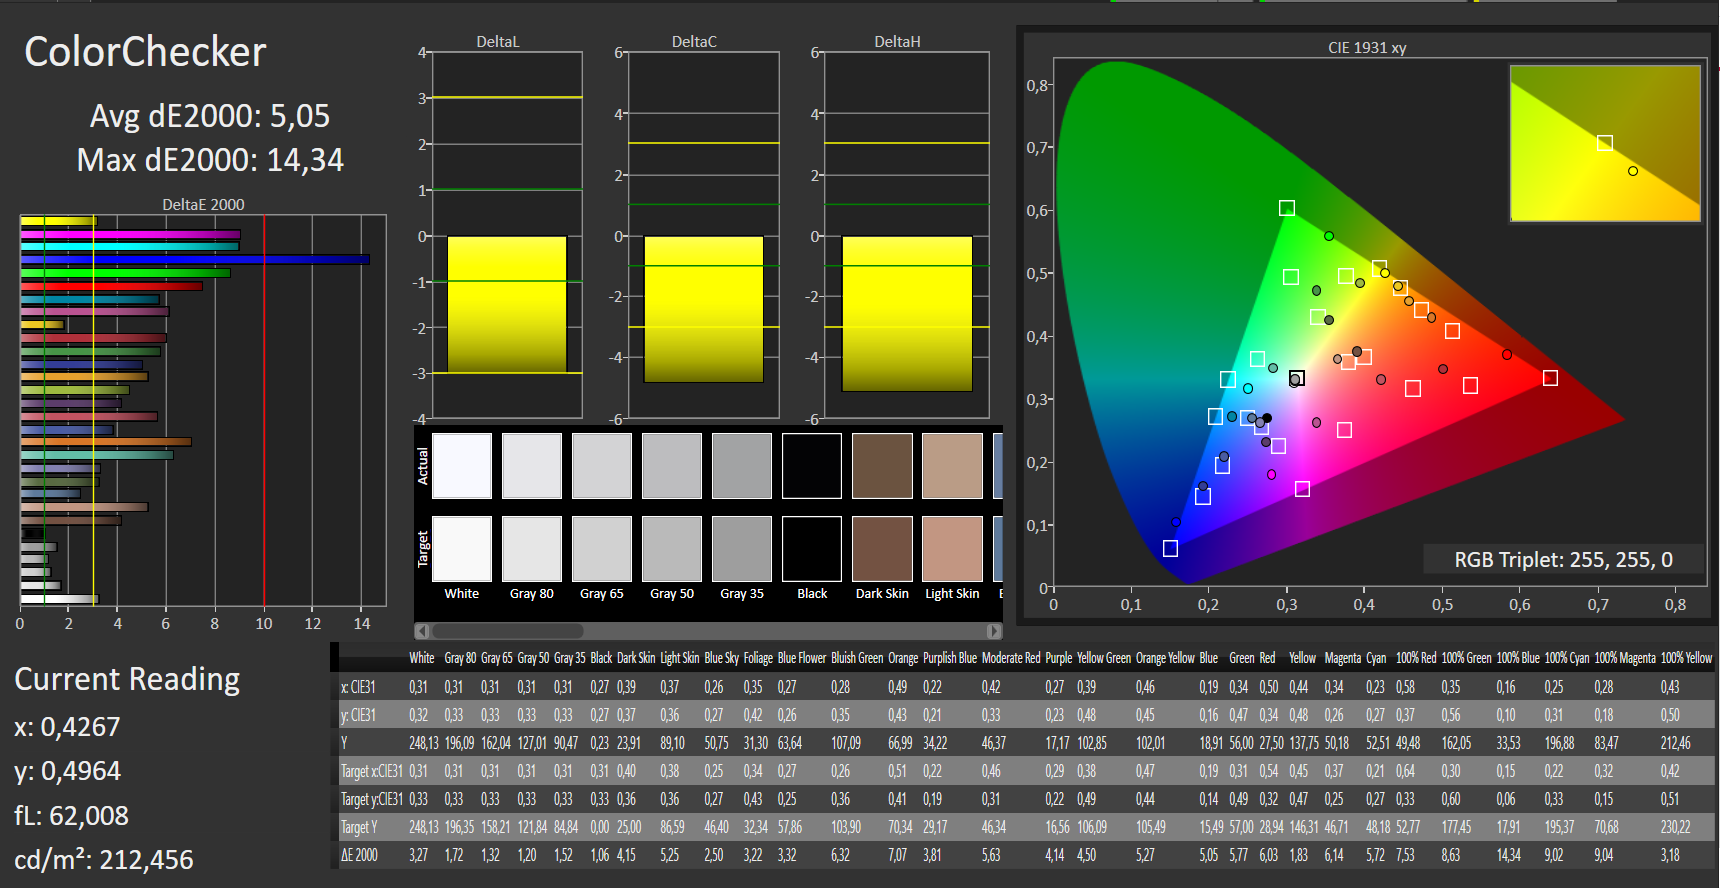
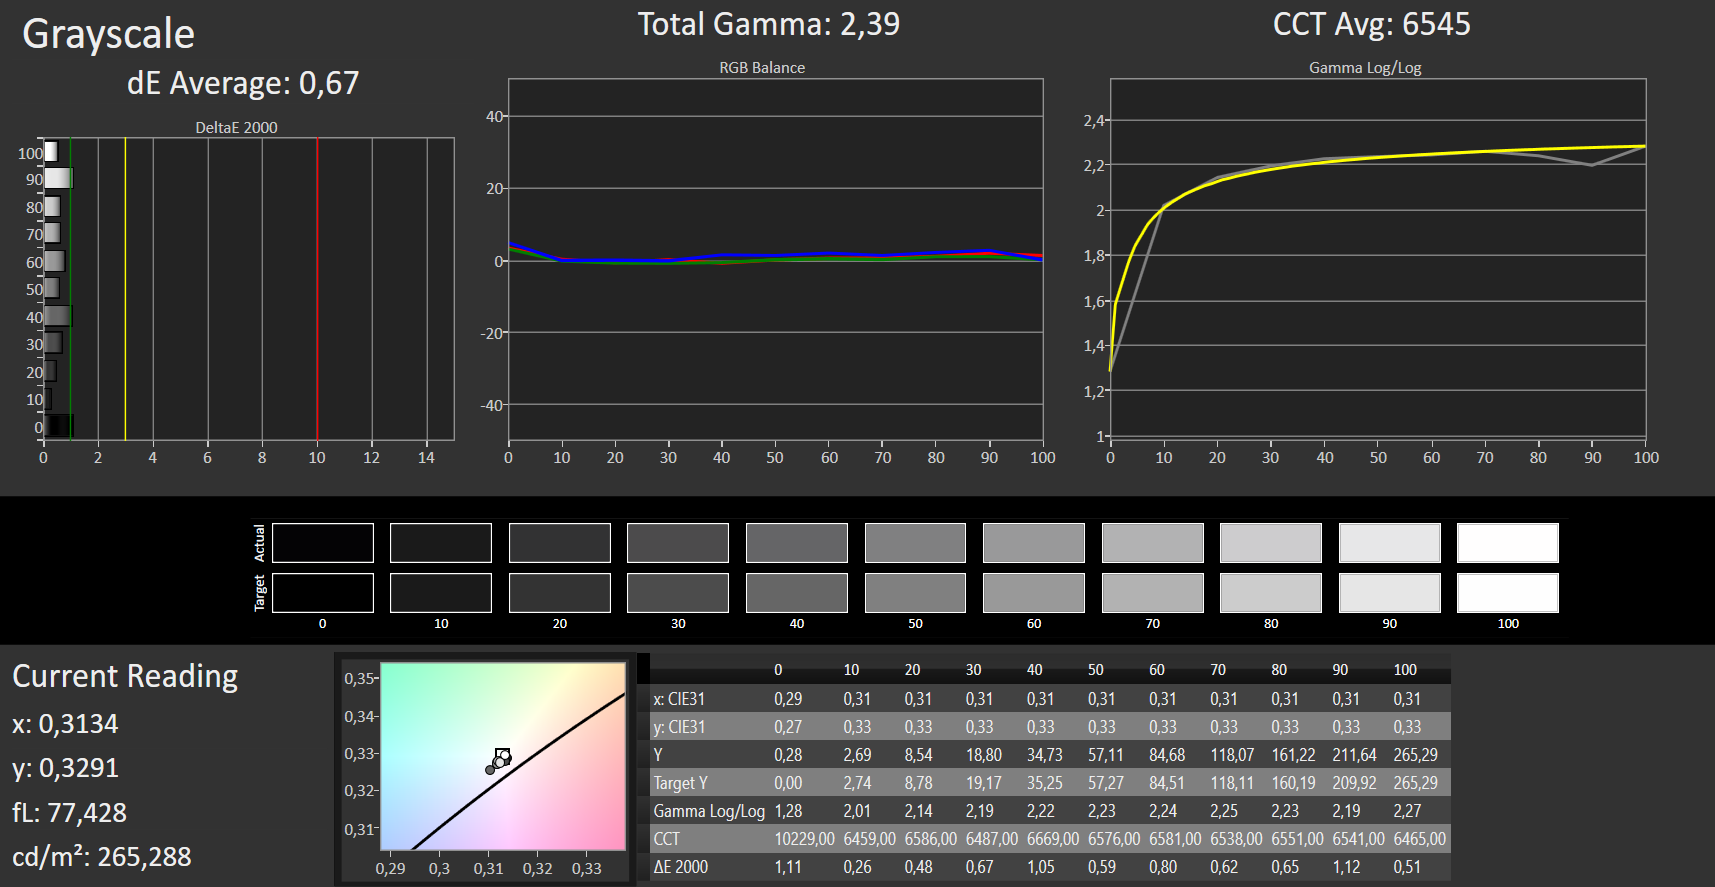


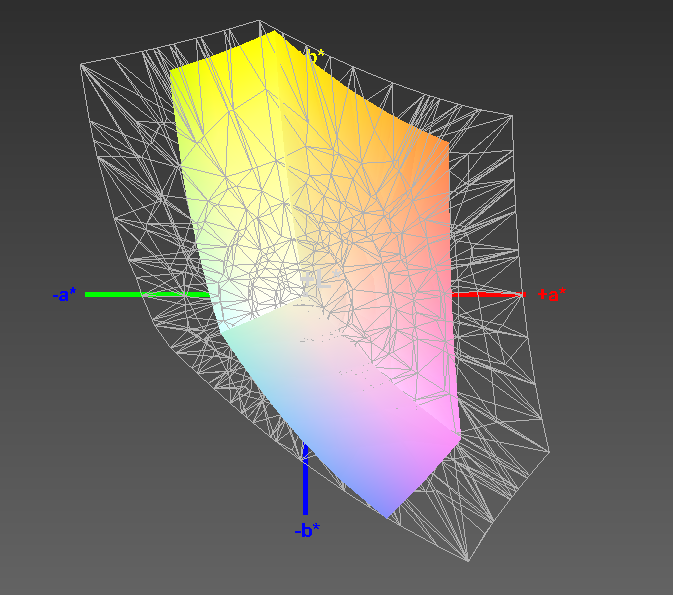
The colors of the panel are not very accurate ex-factory with a DeltaE of more than 3. Even our calibration did not change this. By contrast, the initial grayscale DeltaE is already low at 1.6 with no blue tint.
Colors are not a strength of the display, which at only 51% covers the smallest portion of sRGB compared to its competitors. However, none of its competitors are particularly good at displaying colors and an sRGB coverage of 88% is the best case (HP Pavilion 15-cs2019ng).
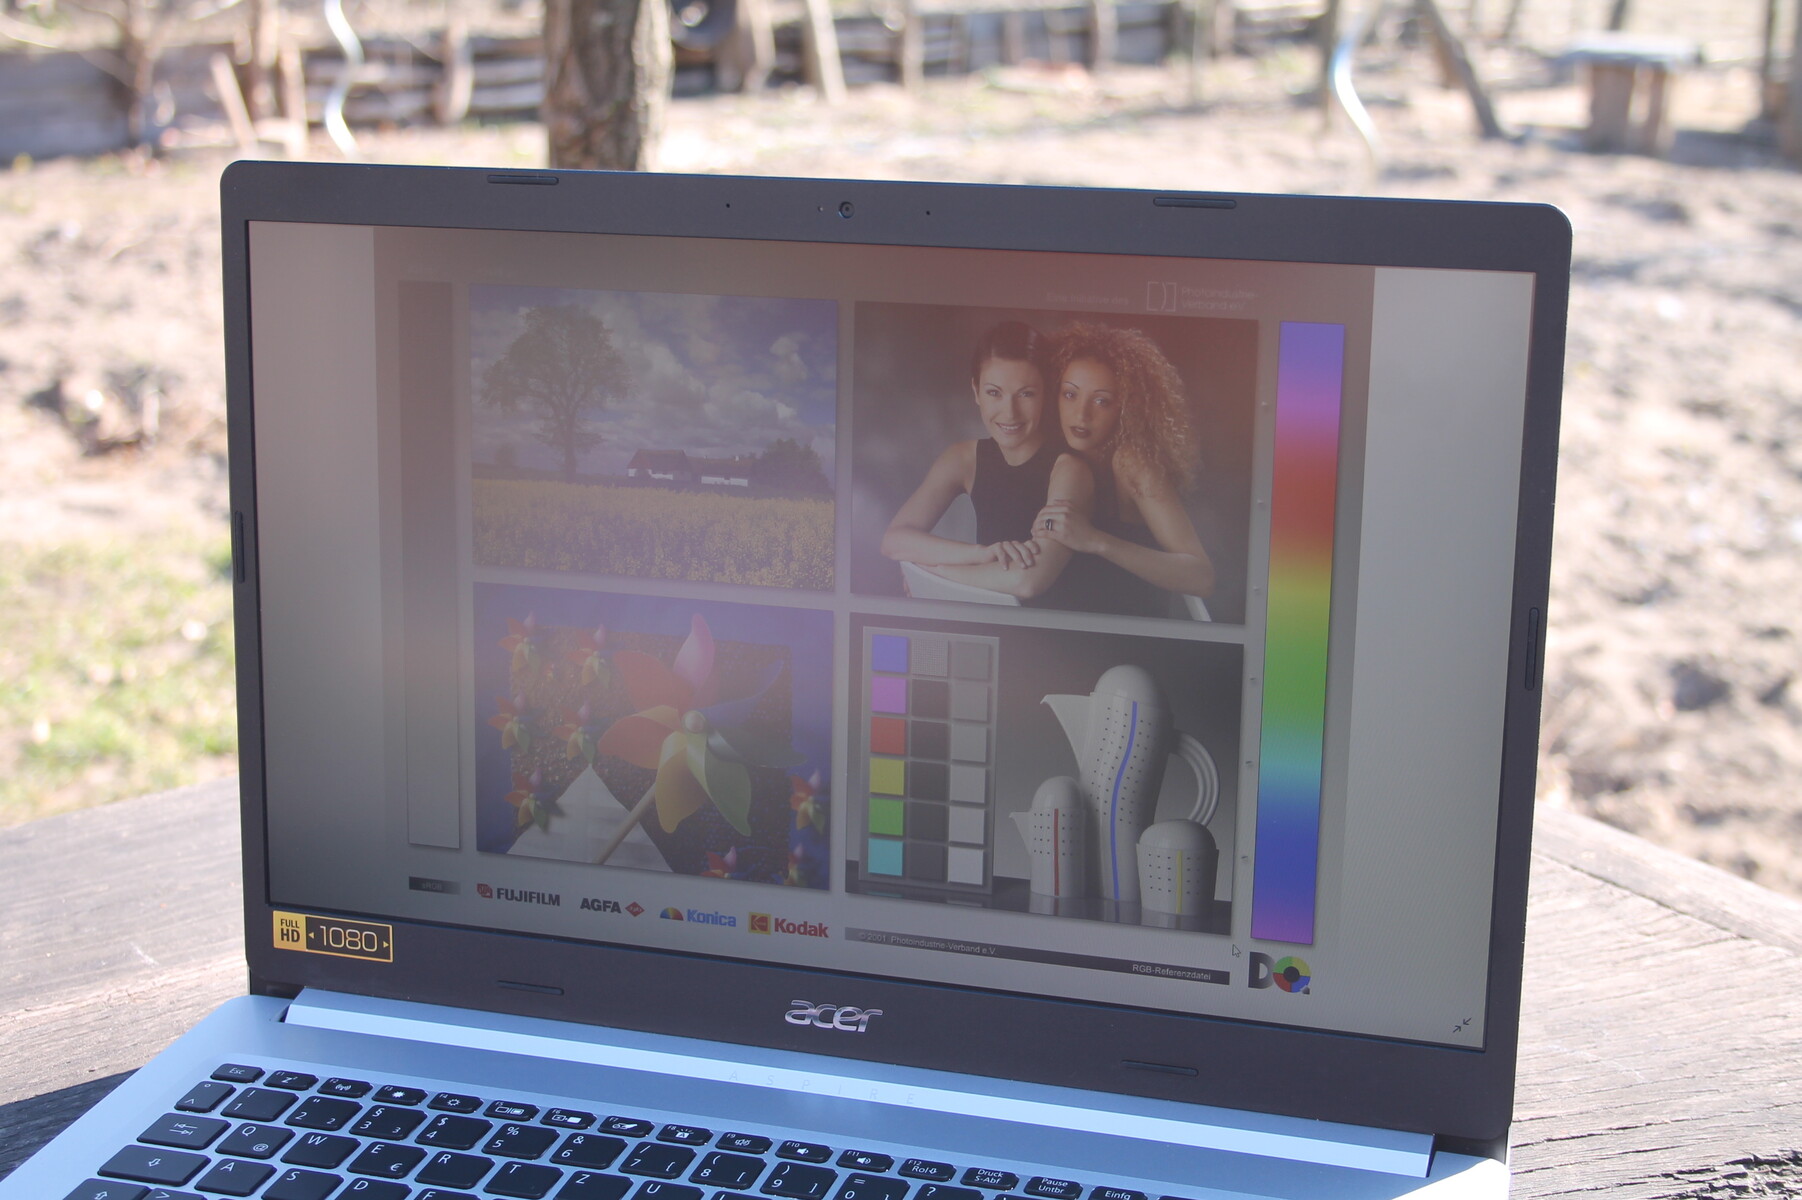
Outdoor use of the panel is limited due to the relatively low brightness. Here, some competitors such as the HP Pavilion 15-cs2019ng in particular with 320 cd/m² in the center of the display achieve better results.

Performance
The base clock of the Intel Core i5-10210U is 4x1.60 GHz with Turbo speeds of up to 4.2 GHz. Acer has soldered 4 GB of RAM onto the mainboard and 4 GB of additional RAM occupy the only available RAM slot. Thus, a maximum of only 20 GB is possible by installing a 16-GB module.
Combined with a 512-GB PCIe SSD and a GeForce MX250 (GDDR5), the laptop is a force to be reckoned with for office, entertainment and casual gaming purposes.
Let us take a closer look at the details.
Processor
The Intel Core i5-10210U can increase its clock speed to up to 4.2 GHz (or up to 3.9 GHz on all 4 cores) via Turbo Boost. Thanks to Hyper-Threading, it can process up to 8 threads simultaneously. As with most smaller laptops with this SoC, it has a 15-watt TDP.
The Turbo Boost analysis shows that the 10210U temporarily manages to run at 4.2 GHz in the single-core test, although it runs at 3.9 GHz most of the time. In battery mode, it reaches a peak single-core clock rate of 1.8 GHz.
The multi-core test shows a different picture and all four cores run at an average clock rate of 2.5 GHz.
By running Cinebench R15 in a loop for 30 minutes, we determine the Turbo Boost sustainability of the SoC and, implicitly, the effectiveness of the cooling solution. Weaker cooling solutions often cause throttling under continuous load, to keep the temperatures in check. In this case, our Aspire 5 A515-54G achieves an initial score of 586 points, after which it throttles and only scores 550 points on average. This translates to a performance deficit of only 6%. The Asus VivoBook 14 F412FJ shows that the performance drop-off can be much more severe.
Thus, the CPU Multi 64 bit numbers should be taken with a grain of salt, since although the Asus VivoBook 14 F412FJ is in the lead nominally, its long-term performance is slower. The Lenovo Ideapad S540-15IML is a strong competitor, since it is able to squeeze more (long-term) performance out of the same 10210U CPU than our Acer (-13%). The Lenovo performs about 7% better in the single-core test.
Note: The Dell Inspiron 5585 tops the chart with a fairly stable 650 to 670 points.
System Performance
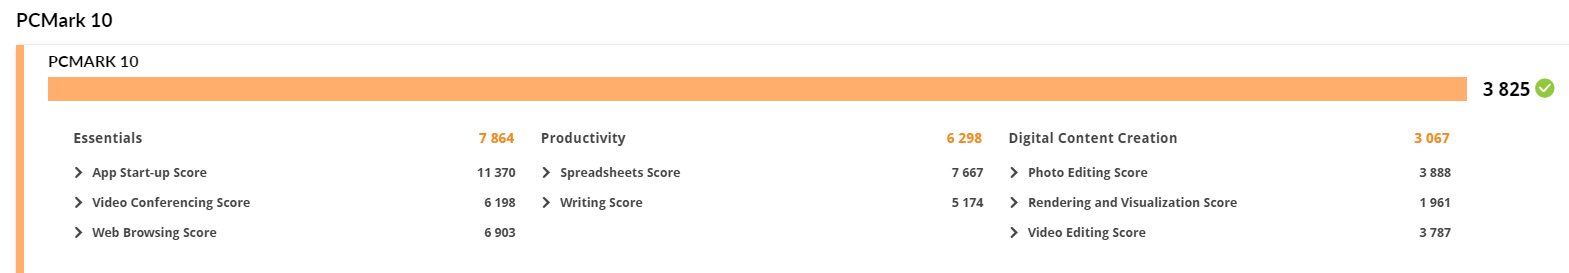
In PCMark 10, the Acer cannot claim the pole position and instead represents the lower end of the spectrum together with the Asus VivoBook 14 F412FJ. The reasons for this are unclear: The SSD is not the slowest and it is faster than the one inside the VivoBook. However, the base performance level of the Core i5-10210U appears to be a contributing factor, since the Lenovo Ideapad S540 beats our test device in all PCMark benchmarks despite being equipped with the same SoC. As mentioned earlier, Lenovo manages to squeeze more performance out of the i5-10210U.
Storage Solution
The Kingston SSD performs well overall and better than most of the competitors' drives in this small comparison. Particularly the Dell Inspiron 15 5000 5585 and the Asus VivoBook 14 F412FJ-EB084T perform worse with their WDC and Kingston SSDs, respectively.
In case the 512 GB SSD does not suffice, an additional 2.5-inch SATA drive can be installed. Acer has included the appropriate mounting frame.
| Acer Aspire 5 A515-54G Kingston RBUSNS8154P3512GJ1 | Lenovo Ideapad S540-15IML Samsung SSD PM981a MZVLB512HBJQ | Asus VivoBook 14 F412FJ-EB084T Kingston RBU-SNS8180DS3512GJ | HP Pavilion 15-cs2019ng Toshiba KBG30ZMV256G | Dell Inspiron 15 5000 5585 WDC PC SN520 SDAPNUW-512G | Average Kingston RBUSNS8154P3512GJ1 | Average of class Multimedia | |
|---|---|---|---|---|---|---|---|
| CrystalDiskMark 5.2 / 6 | 53% | -58% | -3% | -19% | -4% | 137% | |
| Write 4K (MB/s) | 100.4 | 170.7 70% | 55 -45% | 149.3 49% | 105.9 5% | 87.6 ? -13% | 163.8 ? 63% |
| Read 4K (MB/s) | 47.16 | 49.51 5% | 28.79 -39% | 52.7 12% | 36.56 -22% | 40.3 ? -15% | 67.5 ? 43% |
| Write Seq (MB/s) | 993 | 1156 16% | 307.5 -69% | 667 -33% | 1165 17% | 941 ? -5% | 2715 ? 173% |
| Read Seq (MB/s) | 1176 | 1136 -3% | 430 -63% | 818 -30% | 423.2 -64% | 1070 ? -9% | 3120 ? 165% |
| Write 4K Q32T1 (MB/s) | 354.7 | 420.5 19% | 149.5 -58% | 332.1 -6% | 332.1 -6% | 418 ? 18% | 454 ? 28% |
| Read 4K Q32T1 (MB/s) | 473 | 527 11% | 207.2 -56% | 467.1 -1% | 229.3 -52% | 428 ? -10% | 581 ? 23% |
| Write Seq Q32T1 (MB/s) | 1034 | 2984 189% | 389.2 -62% | 985 -5% | 1460 41% | 1035 ? 0% | 4593 ? 344% |
| Read Seq Q32T1 (MB/s) | 1635 | 3550 117% | 497.1 -70% | 1454 -11% | 472.5 -71% | 1629 ? 0% | 5776 ? 253% |
| AS SSD | 67% | -196% | -124% | -19% | -10% | 88% | |
| Seq Read (MB/s) | 1405 | 2642 88% | 487.6 -65% | 1153 -18% | 398.9 -72% | 1398 ? 0% | 4442 ? 216% |
| Seq Write (MB/s) | 953 | 2433 155% | 392.7 -59% | 736 -23% | 884 -7% | 848 ? -11% | 3060 ? 221% |
| 4K Read (MB/s) | 54 | 58 7% | 36.4 -33% | 46.51 -14% | 34.54 -36% | 45.1 ? -16% | 61.2 ? 13% |
| 4K Write (MB/s) | 93 | 145.3 56% | 26.46 -72% | 114.1 23% | 82.1 -12% | 82.2 ? -12% | 185.6 ? 100% |
| 4K-64 Read (MB/s) | 959 | 1431 49% | 325.4 -66% | 618 -36% | 647 -33% | 852 ? -11% | 1085 ? 13% |
| 4K-64 Write (MB/s) | 772 | 1753 127% | 87.2 -89% | 461.4 -40% | 985 28% | 654 ? -15% | 2213 ? 187% |
| Access Time Read * (ms) | 0.051 | 0.072 -41% | 0.432 -747% | 0.421 -725% | 0.072 -41% | 0.04167 ? 18% | 0.05759 ? -13% |
| Access Time Write * (ms) | 0.044 | 0.027 39% | 0.4 -809% | 0.233 -430% | 0.047 -7% | 0.05333 ? -21% | 0.07513 ? -71% |
| Score Read (Points) | 1153 | 1753 52% | 411 -64% | 780 -32% | 721 -37% | 1037 ? -10% | 1590 ? 38% |
| Score Write (Points) | 961 | 2142 123% | 153 -84% | 649 -32% | 1155 20% | 821 ? -15% | 2705 ? 181% |
| Score Total (Points) | 2695 | 4790 78% | 782 -71% | 1822 -32% | 2279 -15% | 2372 ? -12% | 5052 ? 87% |
| Copy ISO MB/s (MB/s) | 862 | 655 ? | 2777 ? | ||||
| Copy Program MB/s (MB/s) | 457 | 262 ? | 852 ? | ||||
| Copy Game MB/s (MB/s) | 902 | 542 ? | 1723 ? | ||||
| Total Average (Program / Settings) | 60% /
61% | -127% /
-138% | -64% /
-73% | -19% /
-19% | -7% /
-7% | 113% /
109% |
* ... smaller is better

GPU Performance
There are 25-watt and 10-watt variants of the GeForce MX250 (Pascal). Acer has installed the GDDR5 solution, which carries the device ID 1D13 and is rated for 25 watts. This is good news, since it means that the memory can run at 3.5 GHz instead of 3.0 GHz.
Since both the HP Pavilion 15 and the Lenovo IdeaPad S540 also have the 25-watt version of the MX250 on board, the 3DMark results are very similar.
The AMD Radeon RX Vega 10 cannot keep up and the MX230 inside the VivoBook falls behind even further.
| 3DMark Fire Strike Score | 3315 points | |
Help | ||
Gaming Performance
Gamers will have to compromise due to the MX250 and current AAA titles cannot be played at high quality settings and Full HD. Often times, the quality in games from 2018 and 2019 will have to be reduced to 720p resolution and low detail settings. Only a few titles such as FIFA 2019 can be played at medium settings and Full HD. Since the situation is even worse for the MX230 and Vega 10, we do not recommend these graphics cards to ambitious casual gamers.
Instead, those with an interest in gaming should stick to our test device, Lenovo's IdeaPad S540-15IML or the HP Pavilion 15-cs2019ng.
Comprehensive information regarding the MX250 can be found in our GPU comparison. Our games list shows which games are playable on which mobile graphics cards.
| The Witcher 3 | |
| 1366x768 Medium Graphics & Postprocessing | |
| Average of class Multimedia (41 - 93, n=4, last 2 years) | |
| Average NVIDIA GeForce MX250 (30 - 40, n=27) | |
| Acer Aspire 5 A515-54G | |
| 1920x1080 High Graphics & Postprocessing (Nvidia HairWorks Off) | |
| Average of class Multimedia (22 - 224, n=13, last 2 years) | |
| Average NVIDIA GeForce MX250 (16.3 - 23.1, n=27) | |
| Acer Aspire 5 A515-54G | |
| 1920x1080 Ultra Graphics & Postprocessing (HBAO+) | |
| Average of class Multimedia (11 - 121, n=13, last 2 years) | |
| Acer Aspire 5 A515-54G | |
| Average NVIDIA GeForce MX250 (9 - 16, n=24) | |
| low | med. | high | ultra | |
|---|---|---|---|---|
| The Witcher 3 (2015) | 31.5 | 18.1 | 14.5 | |
| Dota 2 Reborn (2015) | 108 | 94.4 | 60.8 | 56.9 |
| X-Plane 11.11 (2018) | 58.8 | 33.1 | 43.8 |
Emissions & Energy Management
System Noise
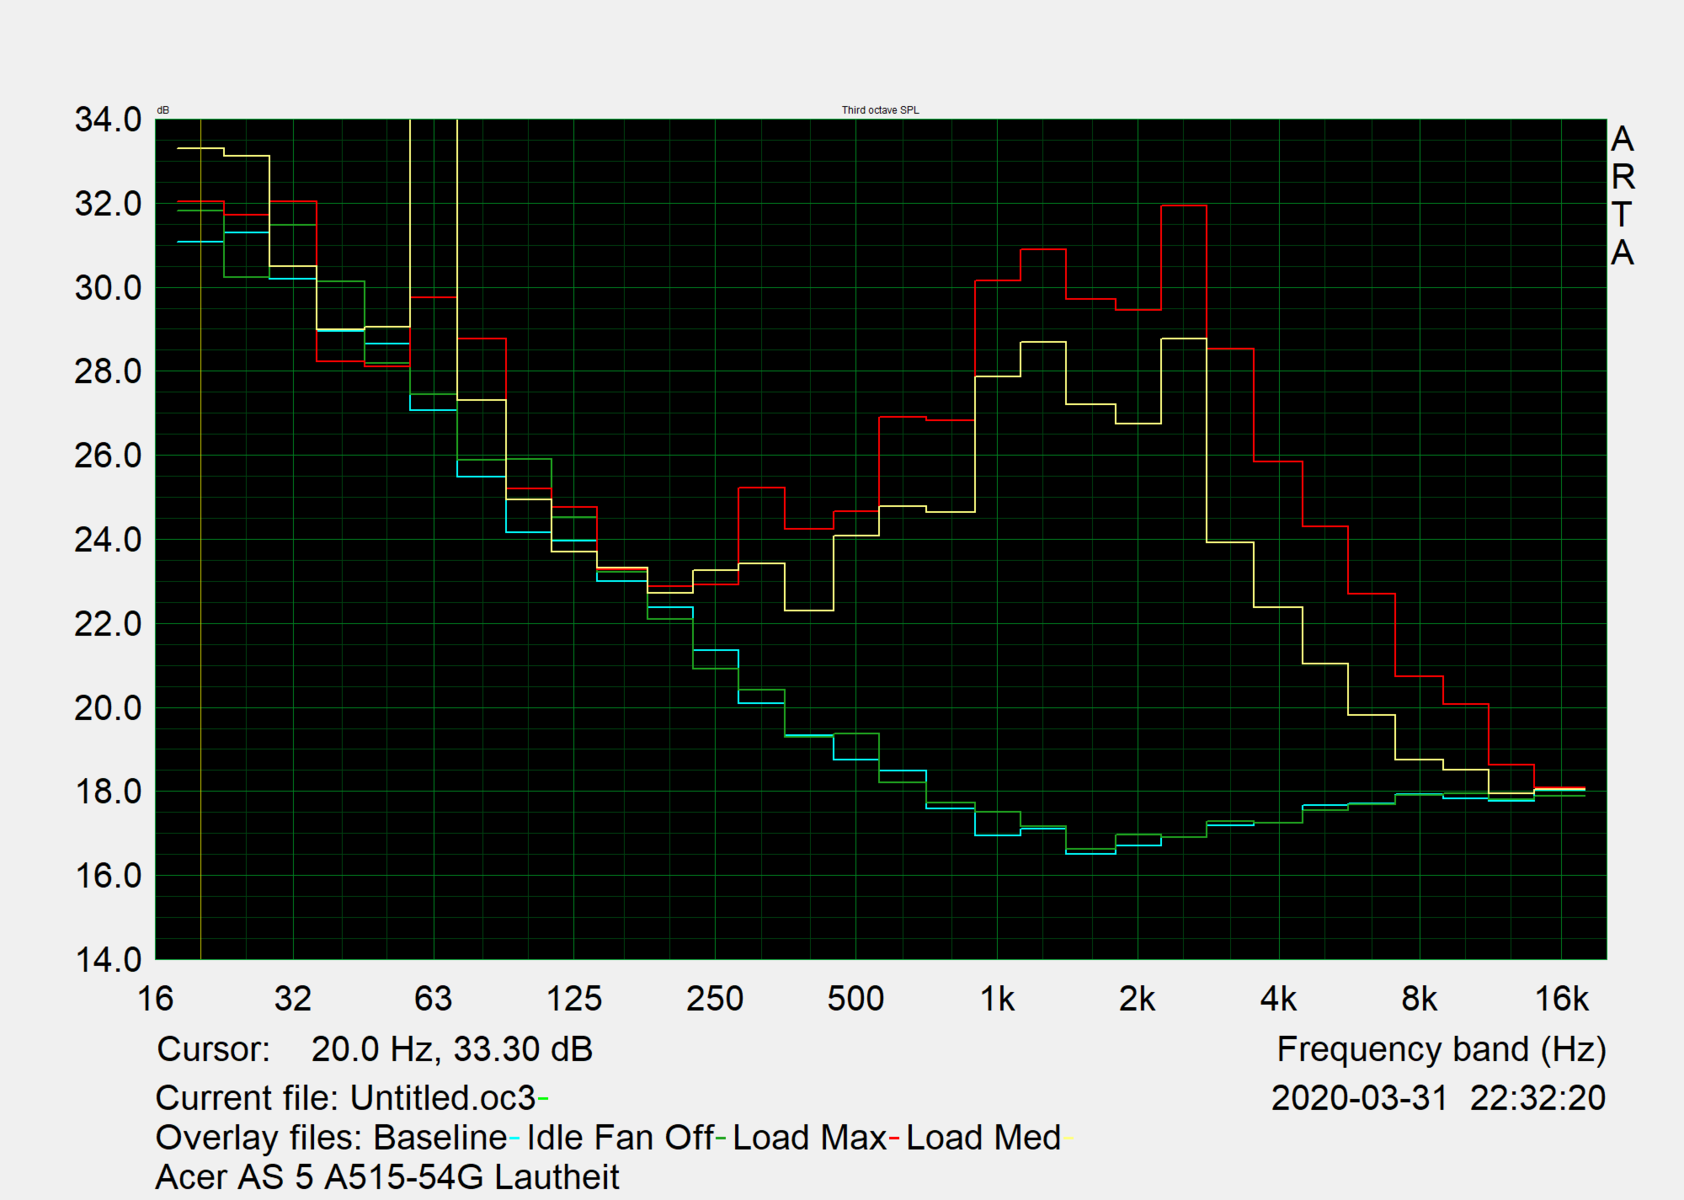
Although the 15-inch laptop can become quite noisy, this is thankfully not an issue while idling. Here, the fan only occasionally starts to spin and the device is silent most of the time. When under low to high loads, the Aspire 5 A515-54G makes a ruckus. Under these conditions, we measured 37 dB(A) to 40 dB(A). However, the Pavilion 15-cs2019ng and the IdeaPad S540 can become even louder.
Noise level
| Idle |
| 29.8 / 29.8 / 29.8 dB(A) |
| Load |
| 37.3 / 40.1 dB(A) |
 | ||
30 dB silent 40 dB(A) audible 50 dB(A) loud |
||
min: | ||
Temperature
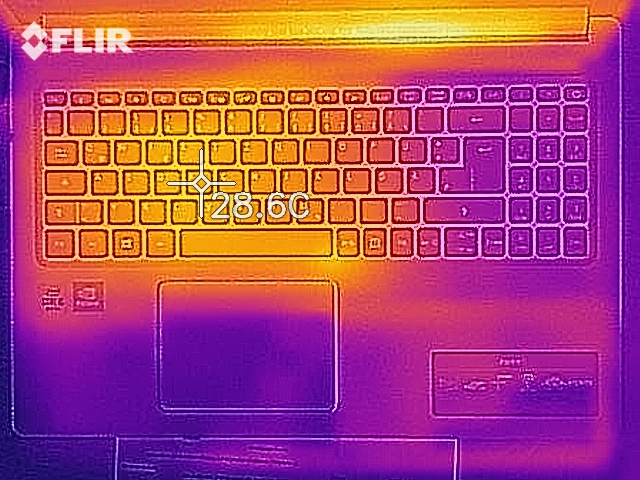
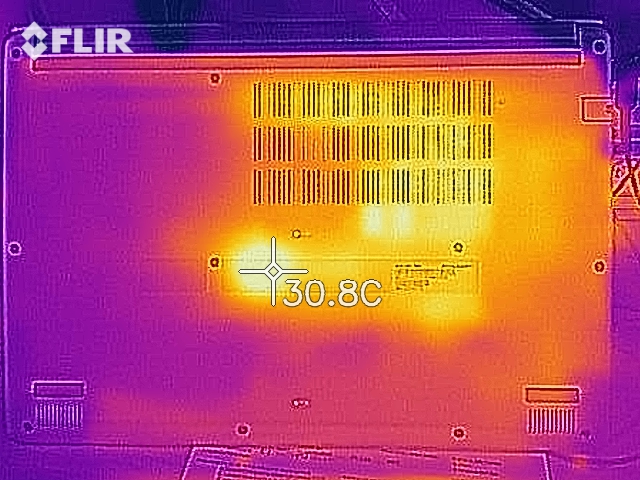
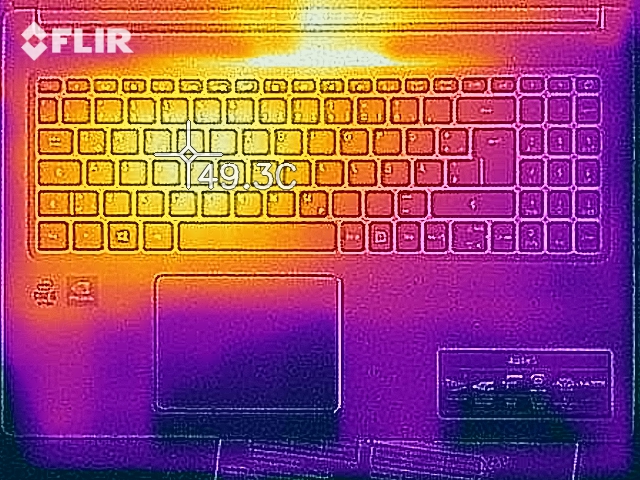
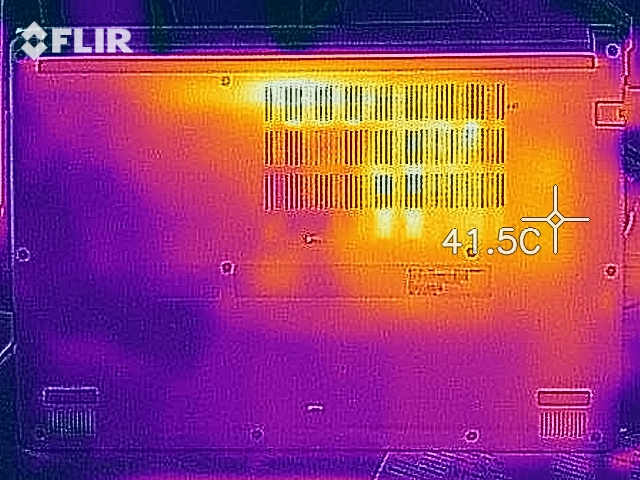
The temperatures are a strength of the Acer laptop, since it only reaches 41 °C (105.8 °F). Meanwhile, the palm rests always remain cool. The same can also be said for its HP and Lenovo competitors.
(±) The maximum temperature on the upper side is 41.3 °C / 106 F, compared to the average of 36.8 °C / 98 F, ranging from 21 to 71 °C for the class Multimedia.
(±) The bottom heats up to a maximum of 40 °C / 104 F, compared to the average of 39.1 °C / 102 F
(+) In idle usage, the average temperature for the upper side is 24.8 °C / 77 F, compared to the device average of 31.3 °C / 88 F.
(+) The palmrests and touchpad are cooler than skin temperature with a maximum of 23.4 °C / 74.1 F and are therefore cool to the touch.
(+) The average temperature of the palmrest area of similar devices was 28.7 °C / 83.7 F (+5.3 °C / 9.6 F).
Speakers
There are two speakers on the bottom of the front edge of the device. They produce a very decent sound, although they lack bass.
Furthermore, the maximum volume level of the speakers is relatively low. We recommend using headphones or external speakers for a better audio experience.
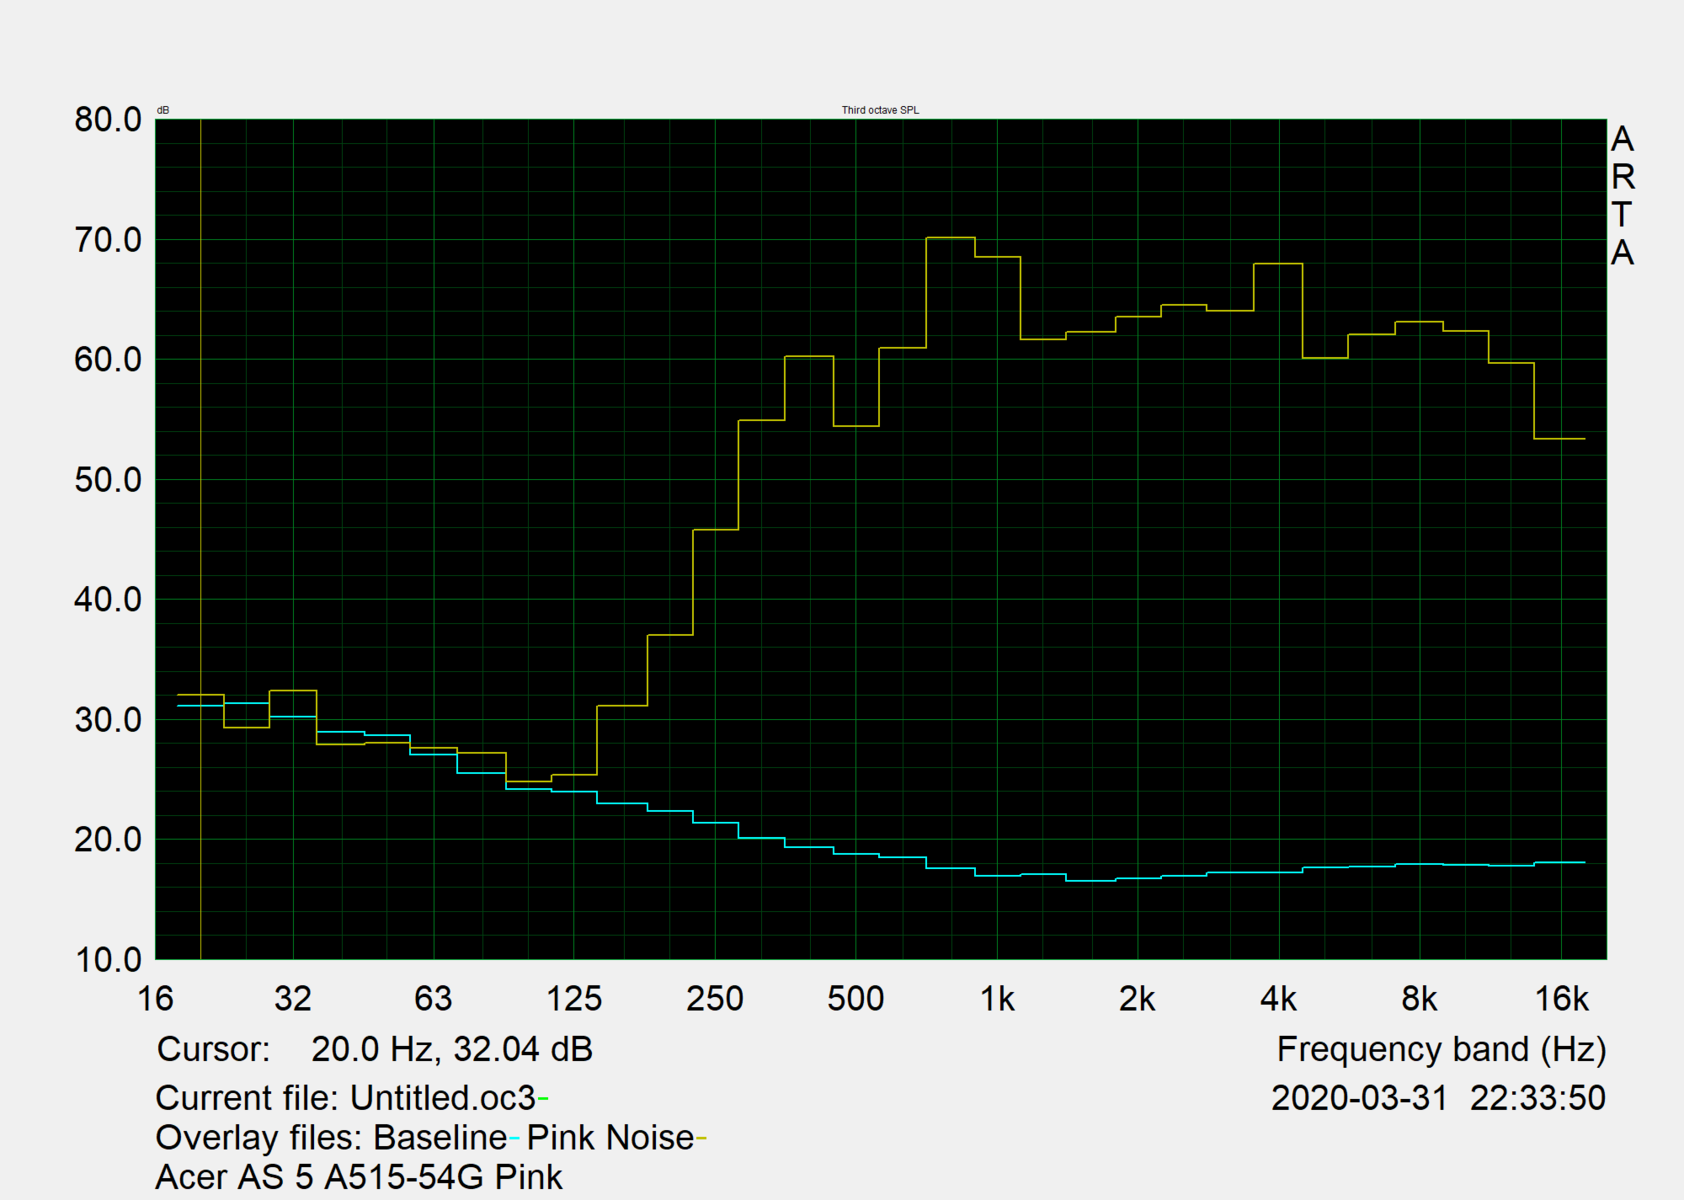
Acer Aspire 5 A515-54G audio analysis
(±) | speaker loudness is average but good (76.6 dB)
Bass 100 - 315 Hz
(-) | nearly no bass - on average 24.5% lower than median
(±) | linearity of bass is average (12.6% delta to prev. frequency)
Mids 400 - 2000 Hz
(+) | balanced mids - only 3.6% away from median
(±) | linearity of mids is average (10.8% delta to prev. frequency)
Highs 2 - 16 kHz
(+) | balanced highs - only 2.7% away from median
(+) | highs are linear (5.6% delta to prev. frequency)
Overall 100 - 16.000 Hz
(±) | linearity of overall sound is average (22.4% difference to median)
Compared to same class
» 80% of all tested devices in this class were better, 4% similar, 16% worse
» The best had a delta of 5%, average was 17%, worst was 45%
Compared to all devices tested
» 65% of all tested devices were better, 6% similar, 29% worse
» The best had a delta of 4%, average was 24%, worst was 134%
Lenovo Ideapad S540-15IML audio analysis
(±) | speaker loudness is average but good (81 dB)
Bass 100 - 315 Hz
(-) | nearly no bass - on average 16.6% lower than median
(±) | linearity of bass is average (13.8% delta to prev. frequency)
Mids 400 - 2000 Hz
(±) | higher mids - on average 5.4% higher than median
(+) | mids are linear (6.5% delta to prev. frequency)
Highs 2 - 16 kHz
(+) | balanced highs - only 1.5% away from median
(+) | highs are linear (4.3% delta to prev. frequency)
Overall 100 - 16.000 Hz
(±) | linearity of overall sound is average (16.7% difference to median)
Compared to same class
» 44% of all tested devices in this class were better, 8% similar, 48% worse
» The best had a delta of 5%, average was 17%, worst was 45%
Compared to all devices tested
» 29% of all tested devices were better, 7% similar, 64% worse
» The best had a delta of 4%, average was 24%, worst was 134%
Energy Consumption
The Aspire A515 does not consume an excessive amount of power. During idle, we measured a maximum power consumption of 9.2 watts. During the stress test, the consumption increases to up to 59 watts. This represents a normal value for the underlying hardware platform. The included power supply is rated for 65 watts.
| Off / Standby | |
| Idle | |
| Load |
|
Key:
min: | |
Battery Life
In our real-world Wi-Fi test, the Aspire achieves a runtime of 8:54 h. During this test, we simulate accessing web pages. We selected the "balanced" profile and set the display brightness to about 150 cd/m² before running the test. Competitors tend to have shorter runtimes with the Lenovo S540 being the exception, although its 12 hours of battery life can be traced back to its thick 70-Wh battery. The latter is partially responsible for the 15-inch device's weight of 1.9 kg, whereas our Acer test device only weighs 1.74 kg.
Pros
Cons
Verdict
Acer's 15.6-inch laptop can be purchased for just under 700 Euros (~$756). The inexpensive device offers decent gaming performance. Additionally, Wi-Fi 6 is supported and the storage can be expanded with a 2.5-inch SATA SSD/HDD. On top of that, the runtime is good at over 8 hours, the weight is low and the display has a matte layer. What more can you ask for?
Due to the low maximum brightness, the visual experience suffers under direct sunlight. The display's inaccurate colors would primarily concerns creative professionals who are not the Aspire 5's target audience. Unfortunately, Acer has cut the card reader that was still present on the last generation of the Aspire 5. The keyboard is acceptable and comes with both a numpad and backlighting. On a 15-inch laptop, a numpad cannot be taken for granted. Unfortunately, the cooling solution does not allow the Comet Lake processor to exhaust its capabilities. The ClickPad's travel is too short, which makes for an overall poor feedback.
While the Acer does not achieve peak Comet Lake performance, there is an SSD upgrade option and Wi-Fi 6.
We see an alternative: Lenovo Ideapad S540-15. It is equipped with an identical 25-watt MX250. However, the Lenovo device offers significantly longer battery life and is able to better take advantage of the Comet Lake SoC, although it costs 100 Euros (~$109) more as well.
By contrast, the HP Pavilion 15 should be disregarded due to its PWM, older processor and lack of maintenance options - it is also more expensive. Overall, there are a lot of good reasons for purchasing the cheaper Aspire 5 A515.
Acer Aspire 5 A515-54G
- 05/14/2020 v7 (old)
Sebastian Jentsch
Price comparison

