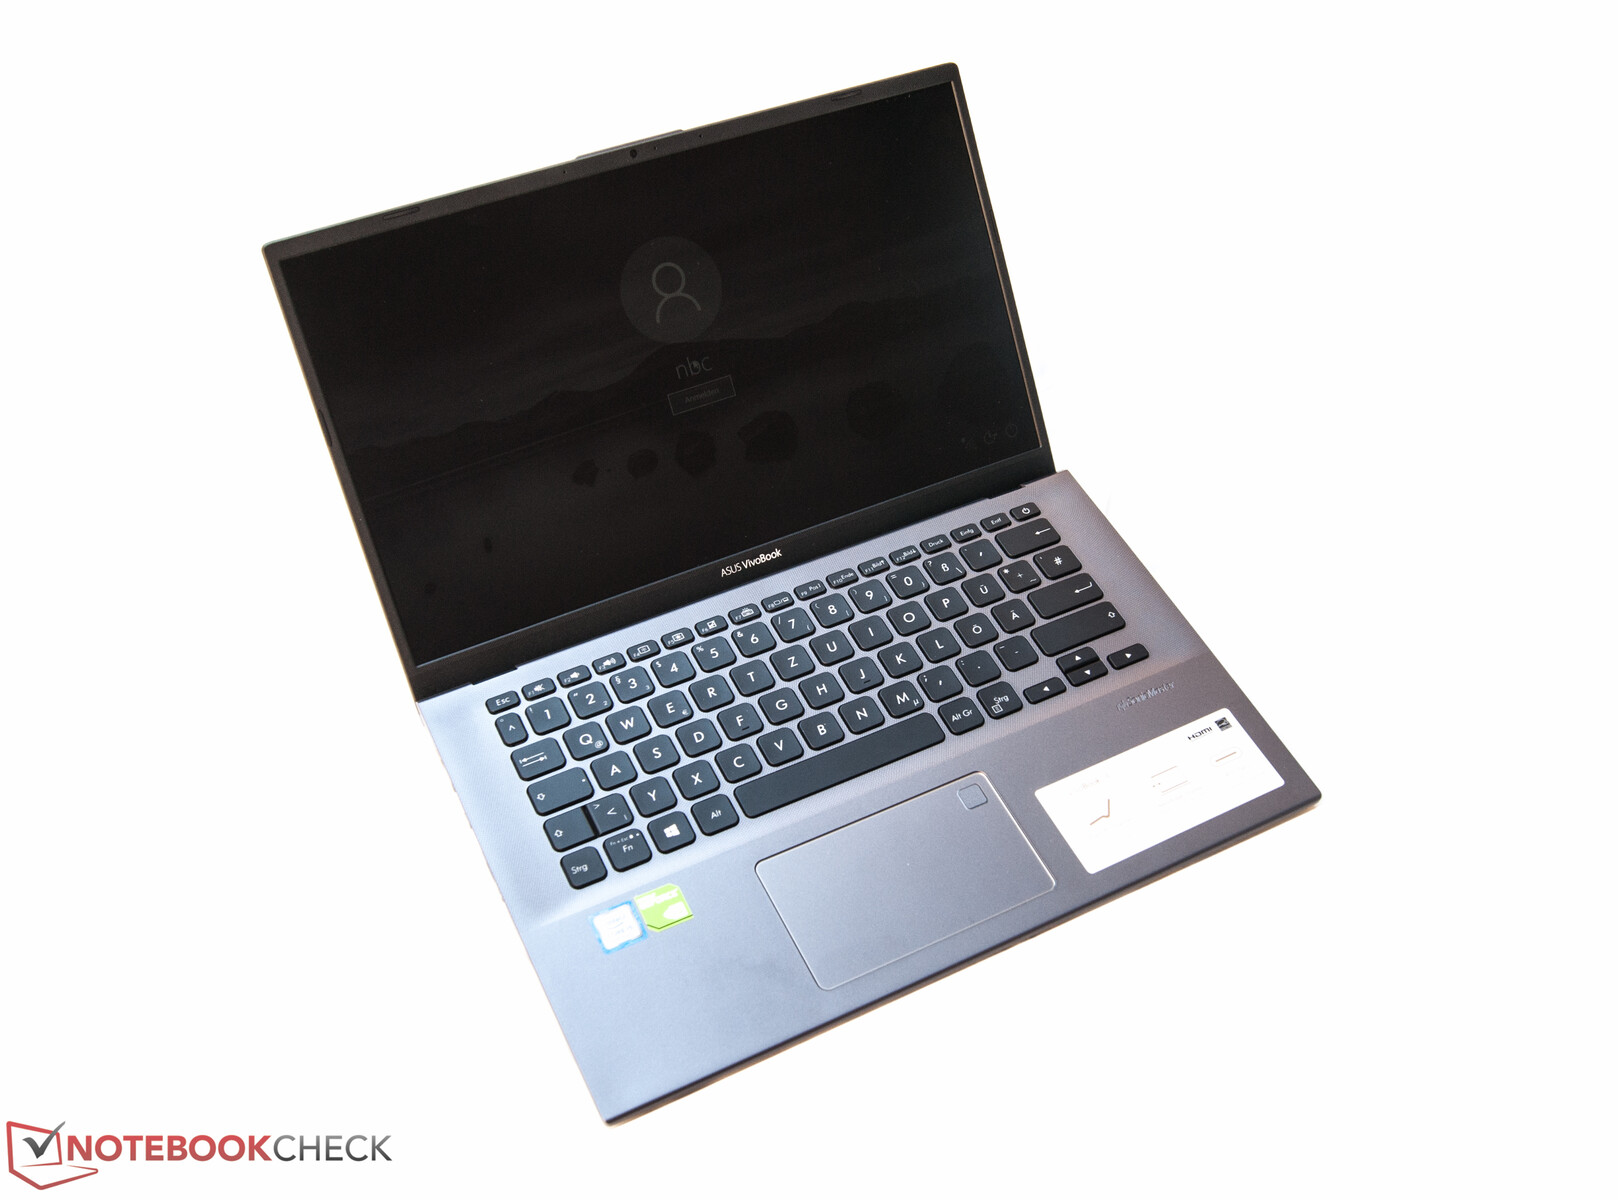
Asus VivoBook 14 (i5-8265U, MX230, FHD) Laptop Review
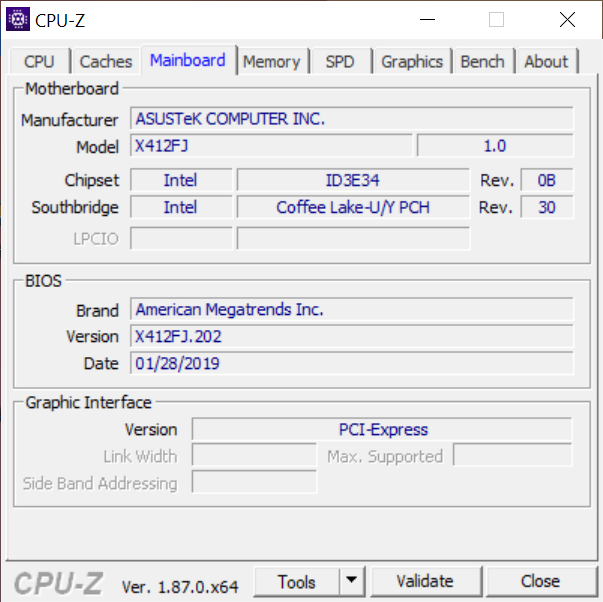
The Asus VivoBook series is expanded with a 14-inch slim ultrabook equipped with a dedicated Nvidia GeForce MX230 graphics unit. Inside we can find an economical Intel Core i5-8265U. Furthermore, our review device comes with 8 GB RAM, 256 GB SSD and a matte Full HD display. The price point for this configuration is around 800 Euros (~$896). The exterior of the Asus laptop is similar to the Asus ZenBook series that we already thoroughly tested (Asus ZenBook 14 UX433FA (i5-8265U, SSD, FHD), Asus ZenBook 14 UX433F (i7-8565U)). Similar components are also to be found inside, which is why the comparison will be drawn again and again over the course of this review.
Whether the new VivoBook is good, we'll find out by comparing it to the competition. The HP ProBook 430 G6 is available for a similar price, but it has no dedicated graphics unit. At this point, the question of whether the dedicated GPU adds value is raised. In addition, we want to compare the new built-in graphics unit with older generation models like the Nvidia GeForce 940MX and MX150.
Case and connectivity
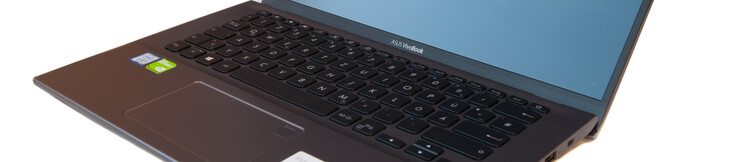
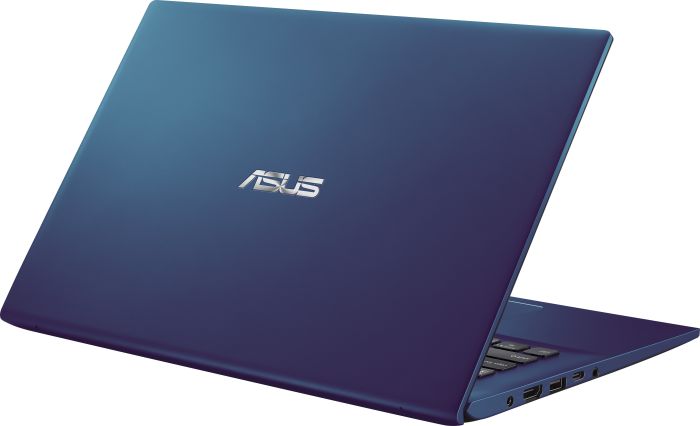
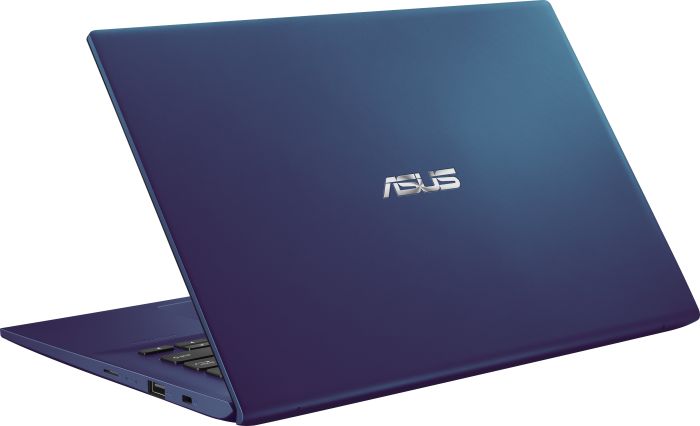
For a price of 800 Euros (~$896), customers get a plastic case with a sandblasted aluminum look. Nevertheless, the dark aluminum finish manages to look classy. The workmanship and feel are satisfactory due to the rounded corners. The only gripe is that the back of the display can be pressed with little effort. When opening the lid, the hinges feel sturdy. The screen does not bounce too much and the keyboard becomes slightly raised, which has a positive effect on the typing experience. In short, the case here can be considered as the plastic equivalent of the metal case found on the ZenBooks.
Thanks to its compact construction and a weight of only 1,460 grams, the Asus VivoBook is a pleasant companion for all occasions.
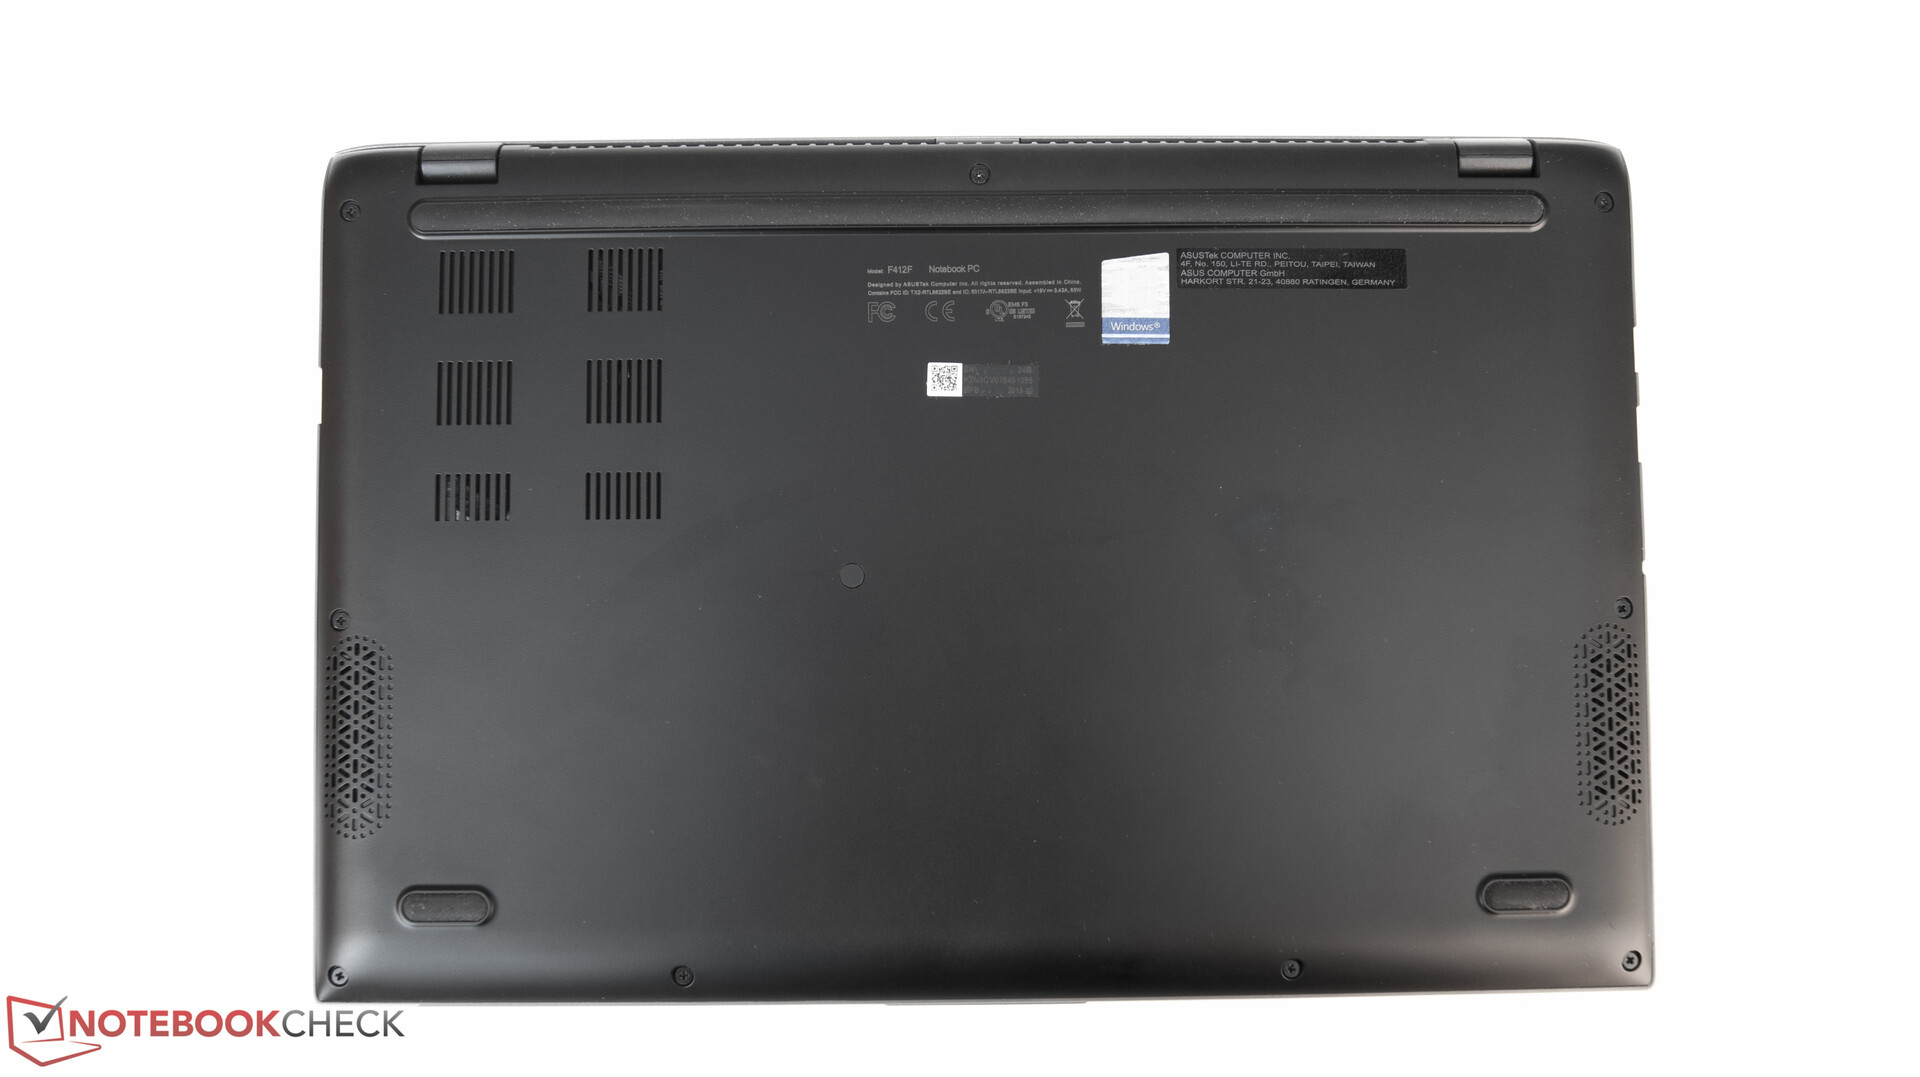
There are no special hatches available for maintenance. In order to be able to take a look at the interior, the whole bottom cover must be removed. The fact that the manufacturer did not intend this for end users is proved by the inclusion of a concealed screw that isn't directly accessible.
The built-in SD card reader shows, as on the ZenBook series, considerable weaknesses. The review device reaches with read speeds of 25 MB/s around a third of the average seen on laptops from the same category.
On the other hand, the Wi-Fi module (Realtek chip RTL8822BE) is fast. According to the datasheet, gross rates of up to 866 Mb/s are reached. The VivoBook 14 attained values of over 600 Mb/s in our practical tests.
Ports configuration


| SD Card Reader | |
| average JPG Copy Test (av. of 3 runs) | |
| Average of class Multimedia (22.3 - 531, n=37, last 2 years) | |
| Dell Latitude 14 5495 (Toshiba Exceria Pro SDXC 64 GB UHS-II) | |
| HP ProBook 430 G6-5TJ89EA (Toshiba Exceria Pro SDXC 64 GB UHS-II) | |
| Asus Zenbook 14 UX433FA-A6018T (Toshiba Exceria Pro M501 microSDXC 64GB) | |
| Asus VivoBook 14 F412FJ-EB084T (Toshiba Exceria Pro M501 microSDXC 64GB) | |
| maximum AS SSD Seq Read Test (1GB) | |
| Dell Latitude 14 5495 (Toshiba Exceria Pro SDXC 64 GB UHS-II) | |
| Average of class Multimedia (37.3 - 1455, n=36, last 2 years) | |
| HP ProBook 430 G6-5TJ89EA (Toshiba Exceria Pro SDXC 64 GB UHS-II) | |
| Asus Zenbook 14 UX433FA-A6018T (Toshiba Exceria Pro M501 microSDXC 64GB) | |
| Asus VivoBook 14 F412FJ-EB084T (Toshiba Exceria Pro M501 microSDXC 64GB) | |
Input devices
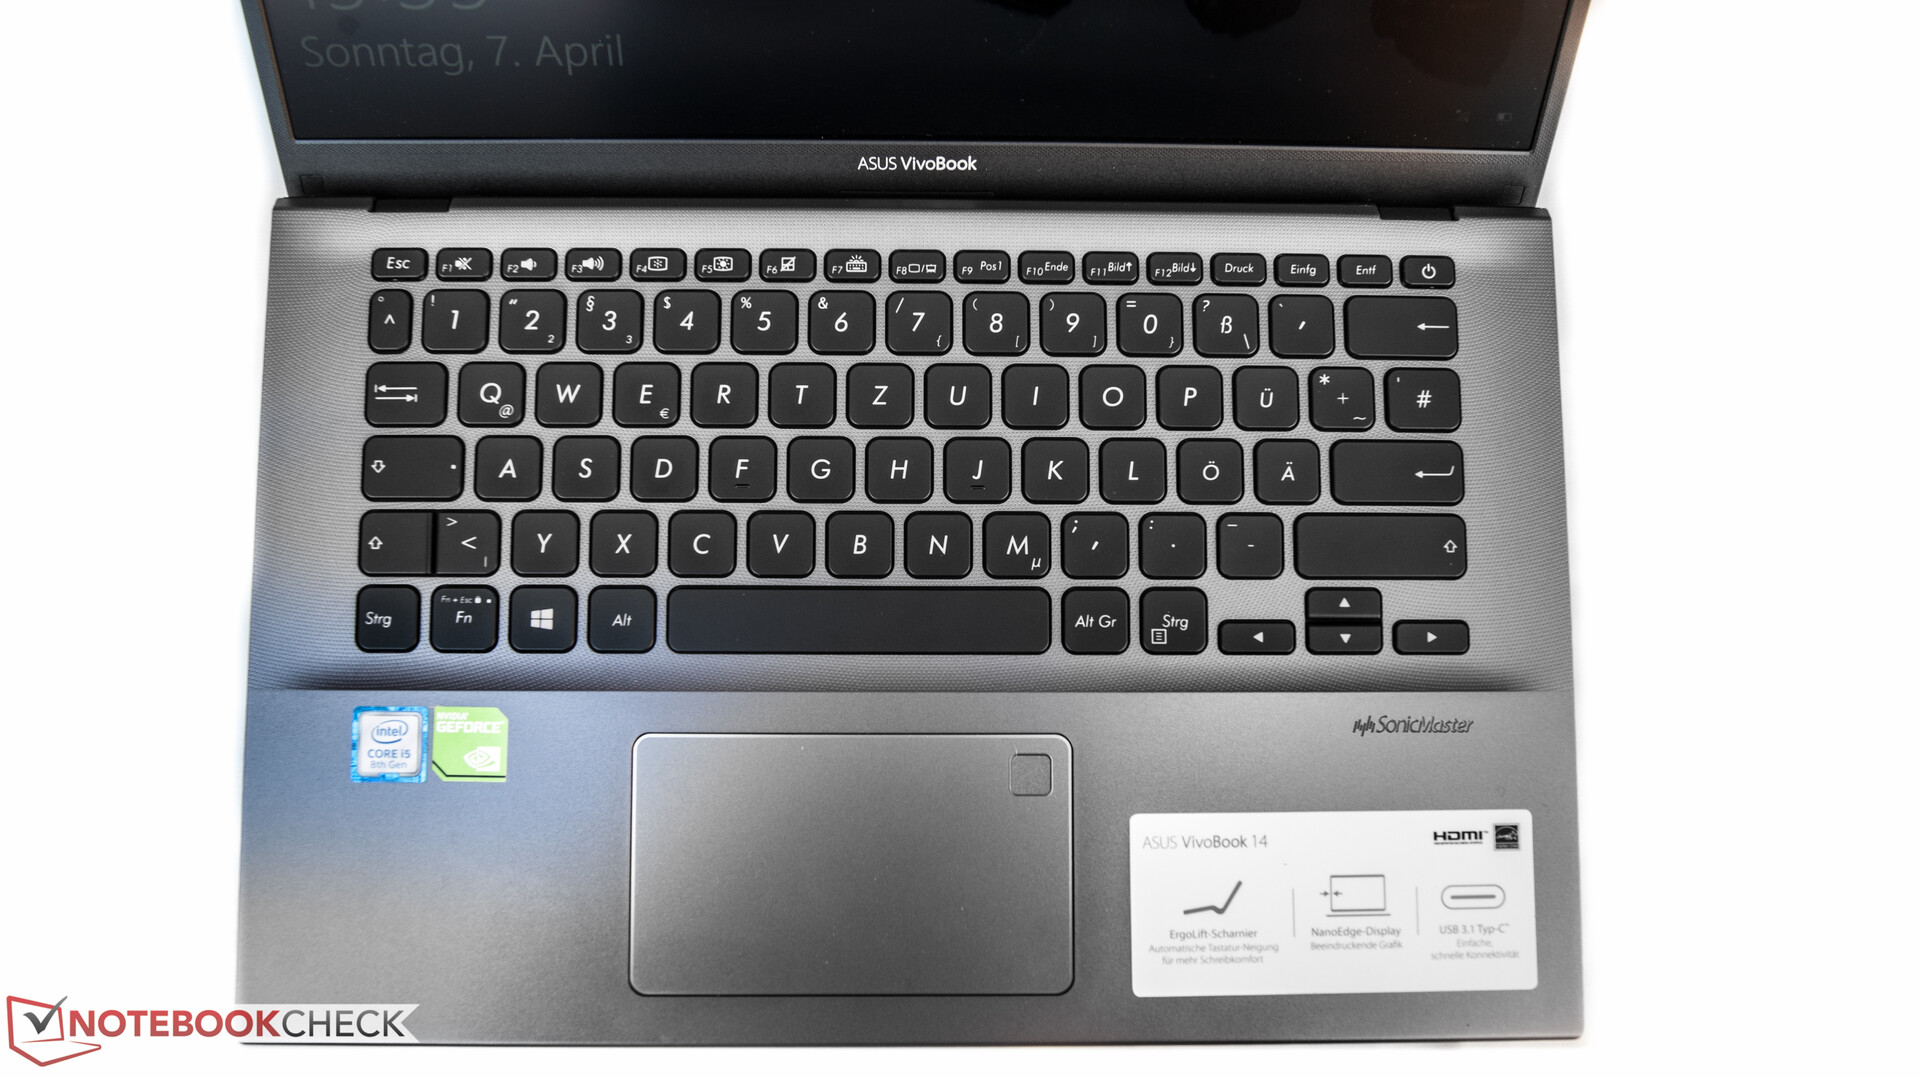
The VivoBook comes with a chiclet keyboard that shows keys with strongly rounded corners. The flat keys are 15 mm wide and are therefore smaller than the ones on the MacBook Pro 13, for example, that has keys that are around 17 mm wide. The pressure point is uniform and precise on all keys. Due to the soft and short hub, fast inputs feel spongy. Nonetheless, the Asus ultrabook is adequate for the occasional writing sessions of everyday life. Furthermore, the keyboard is also backlit and provides three levels of lighting.
The touchpad is with 10.5 x 6.1 cm sufficiently large. The fingerprint scanner is also included in this area, which can be bothersome at times. Gestures and inputs were processed without any issues during our testing time and were even recognized effortlessly in the corner areas. The lower area houses the buttons, which are integrated into the whole touchpad. The clicking experience and the depth of the click vary with the horizontal position.
Overall and despite some minimal flaws, we could reach the base level for a multimedia laptop in everyday use.
Display
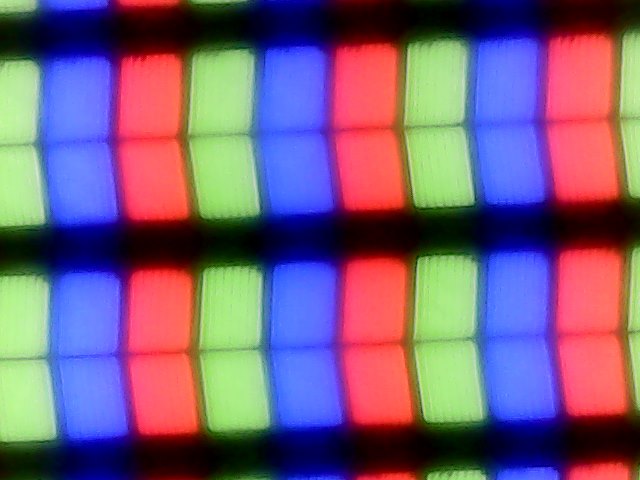
A matte Full HD display with stable viewing angles is expected from the new Asus VivoBook in the 14-inch category. However, the brightness, which reached an average of only 257 cd/m², is out of line. We also found this shortcoming in the VivoBook S series. It's equally unfortunate that our comparison devices perform at a similar level. The Asus ZenBook, for instance, showed an exemplar display in our review. Depending on the chosen configuration, the Asus alternative model comes with a considerably higher price tag than our review device. The ZenBook versions start at 900 Euros (~$1,008) without a dedicated GPU.
| |||||||||||||||||||||||||
Brightness Distribution: 91 %
Center on Battery: 267 cd/m²
Contrast: 1335:1 (Black: 0.2 cd/m²)
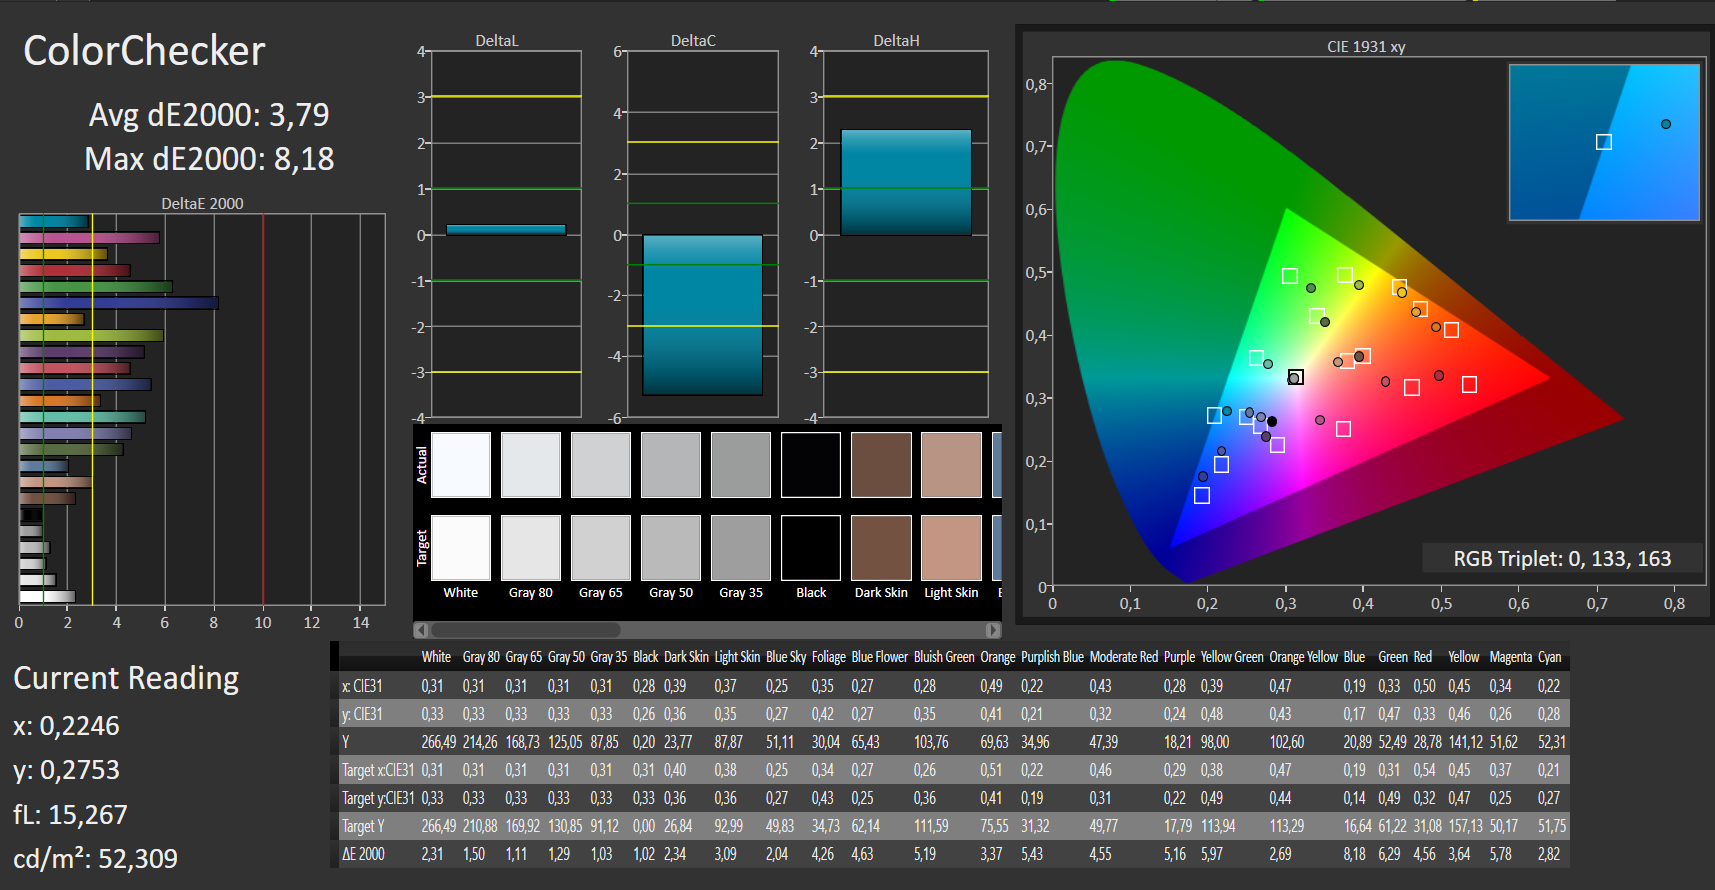
ΔE ColorChecker Calman: 3.79 | ∀{0.5-29.43 Ø4.71}
calibrated: 4.71
ΔE Greyscale Calman: 1.49 | ∀{0.09-98 Ø4.96}
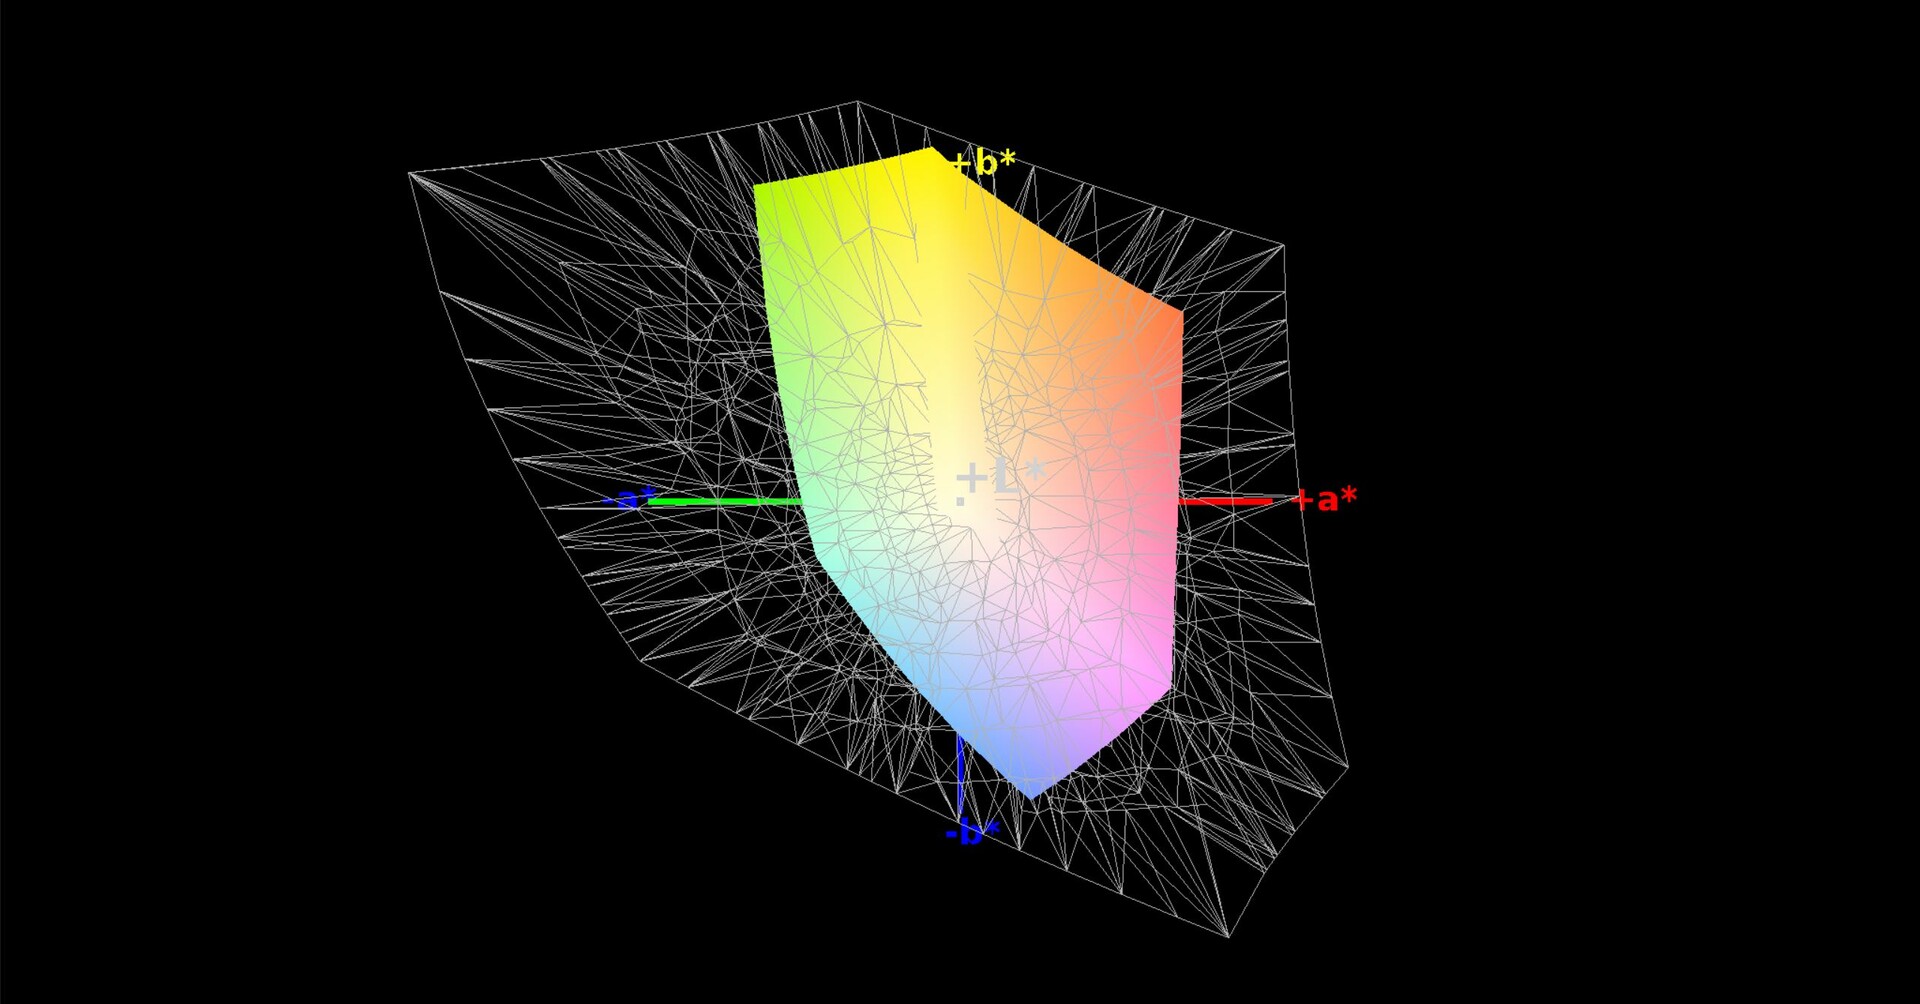
59% sRGB (Argyll 1.6.3 3D)
38% AdobeRGB 1998 (Argyll 1.6.3 3D)
41.04% AdobeRGB 1998 (Argyll 3D)
59.6% sRGB (Argyll 3D)
39.71% Display P3 (Argyll 3D)
Gamma: 2.48
CCT: 6659 K
| Asus VivoBook 14 F412FJ-EB084T AU Optronics AUO403D B140HAN04.0, , 1920x1080, 14" | Asus Zenbook 14 UX433FN-A6023T AU Optronics B140HAN03.2, , 1920x1080, 14" | HP ProBook 430 G6-5TJ89EA CMN1375, , 1920x1080, 13.3" | Dell Latitude 14 5495 CMN14C9, , 1920x1080, 14" | Asus Zenbook 14 UX433FA-A6018T AU Optronics B140HAN03.2, , 1920x1080, 14" | |
|---|---|---|---|---|---|
| Display | 55% | 5% | 3% | 57% | |
| Display P3 Coverage (%) | 39.71 | 64.5 62% | 41.87 5% | 40.94 3% | 63.5 60% |
| sRGB Coverage (%) | 59.6 | 87.9 47% | 62.6 5% | 61.4 3% | 90.9 53% |
| AdobeRGB 1998 Coverage (%) | 41.04 | 64.4 57% | 43.3 6% | 42.32 3% | 64.6 57% |
| Response Times | -9% | -4% | -3% | -1% | |
| Response Time Grey 50% / Grey 80% * (ms) | 40 ? | 44 ? -10% | 40.8 ? -2% | 41 ? -2% | 42 ? -5% |
| Response Time Black / White * (ms) | 29 ? | 31 ? -7% | 30.4 ? -5% | 30 ? -3% | 28 ? 3% |
| PWM Frequency (Hz) | 26040 ? | 25000 ? | |||
| Screen | -32% | -28% | -20% | -34% | |
| Brightness middle (cd/m²) | 267 | 330 24% | 255 -4% | 212 -21% | 321 20% |
| Brightness (cd/m²) | 257 | 285 11% | 238 -7% | 200 -22% | 282 10% |
| Brightness Distribution (%) | 91 | 78 -14% | 88 -3% | 89 -2% | 77 -15% |
| Black Level * (cd/m²) | 0.2 | 0.23 -15% | 0.18 10% | 0.23 -15% | 0.2 -0% |
| Contrast (:1) | 1335 | 1435 7% | 1417 6% | 922 -31% | 1605 20% |
| Colorchecker dE 2000 * | 3.79 | 5.77 -52% | 5.4 -42% | 4.34 -15% | 6.35 -68% |
| Colorchecker dE 2000 max. * | 8.18 | 10.46 -28% | 19.5 -138% | 9.01 -10% | 12.2 -49% |
| Colorchecker dE 2000 calibrated * | 4.71 | 3.18 32% | 4.1 13% | 1.88 60% | |
| Greyscale dE 2000 * | 1.49 | 7.61 -411% | 3.8 -155% | 2.81 -89% | 8.35 -460% |
| Gamma | 2.48 89% | 2.46 89% | 2.41 91% | 2.22 99% | 2.51 88% |
| CCT | 6659 98% | 7485 87% | 7100 92% | 6286 103% | 8227 79% |
| Color Space (Percent of AdobeRGB 1998) (%) | 38 | 57 50% | 39.4 4% | 39 3% | 59 55% |
| Color Space (Percent of sRGB) (%) | 59 | 88 49% | 62.5 6% | 61 3% | 91 54% |
| Total Average (Program / Settings) | 5% /
-12% | -9% /
-19% | -7% /
-13% | 7% /
-13% |
* ... smaller is better
Display Response Times
| ↔ Response Time Black to White | ||
|---|---|---|
| 29 ms ... rise ↗ and fall ↘ combined | ↗ 17 ms rise |  |
| ↘ 12 ms fall | ||
| The screen shows relatively slow response rates in our tests and may be too slow for gamers. In comparison, all tested devices range from 0.1 (minimum) to 240 (maximum) ms. » 77 % of all devices are better. This means that the measured response time is worse than the average of all tested devices (19.8 ms). | ||
| ↔ Response Time 50% Grey to 80% Grey | ||
| 40 ms ... rise ↗ and fall ↘ combined | ↗ 19 ms rise | 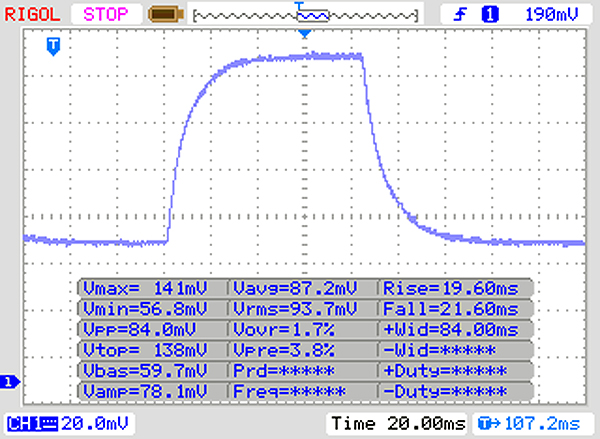 |
| ↘ 21 ms fall | ||
| The screen shows slow response rates in our tests and will be unsatisfactory for gamers. In comparison, all tested devices range from 0.165 (minimum) to 636 (maximum) ms. » 61 % of all devices are better. This means that the measured response time is worse than the average of all tested devices (30.9 ms). | ||
Screen Flickering / PWM (Pulse-Width Modulation)
| Screen flickering / PWM not detected | 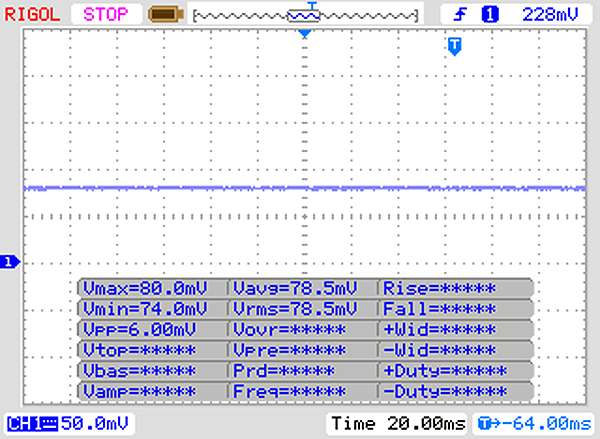 | ||
In comparison: 52 % of all tested devices do not use PWM to dim the display. If PWM was detected, an average of 7741 (minimum: 5 - maximum: 343500) Hz was measured. | |||
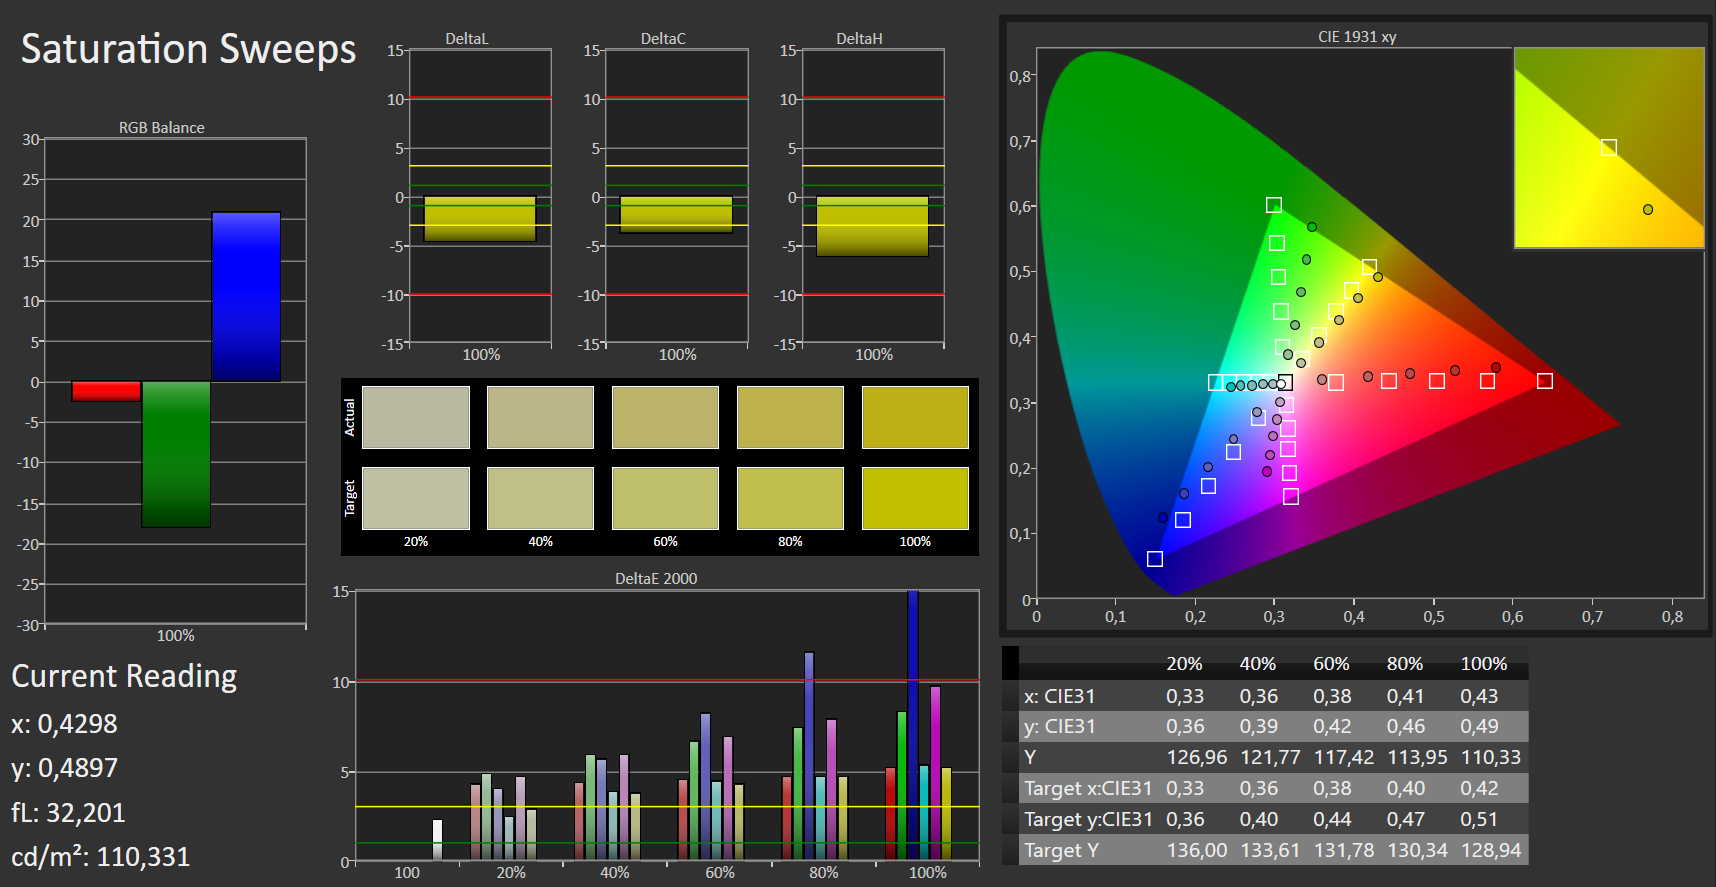
According to our CalMAN test, the reproduction of colors and grayscales is good, as is expected thanks to the IPS panel. The color-space coverage within the "small" sRGB-space falls short for professional use with a value of 59%. The coverage of the AdobeRGB space is 38%.
There is some light screen bleeding on the edges.
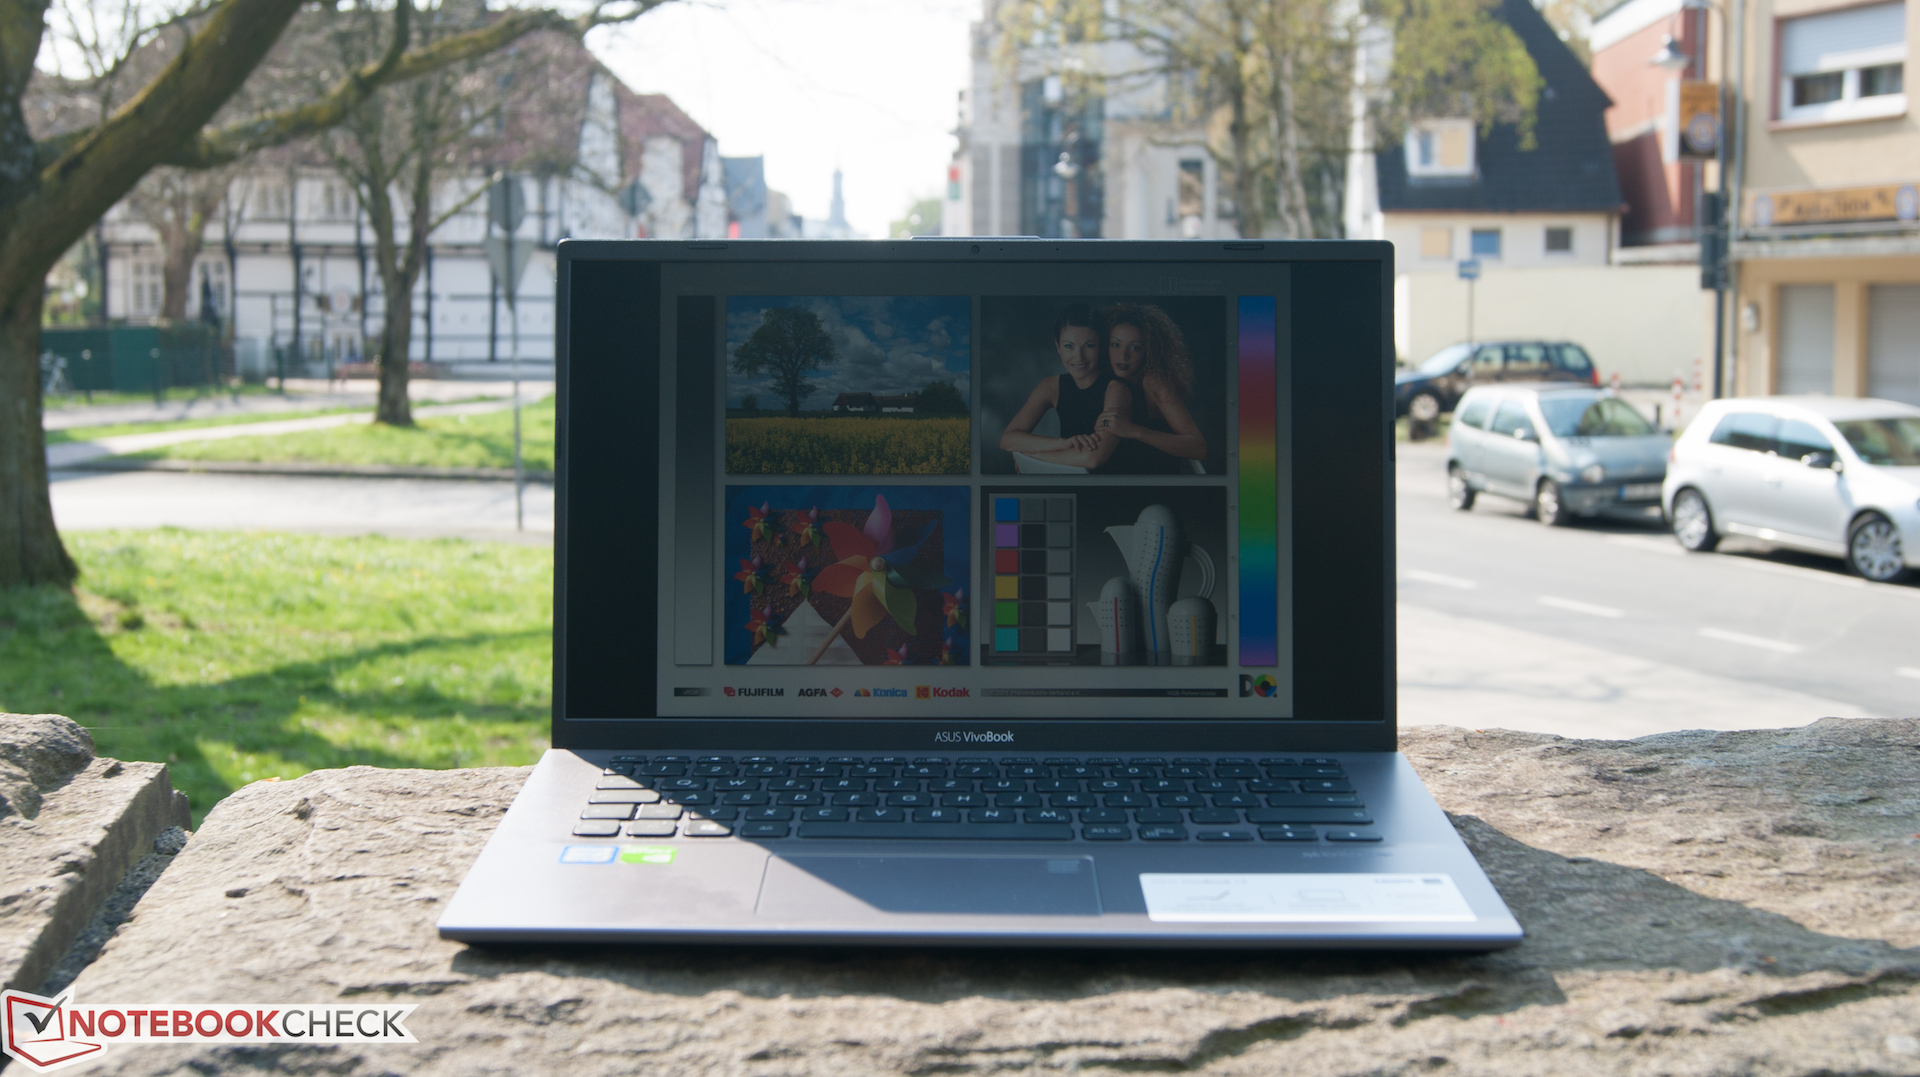
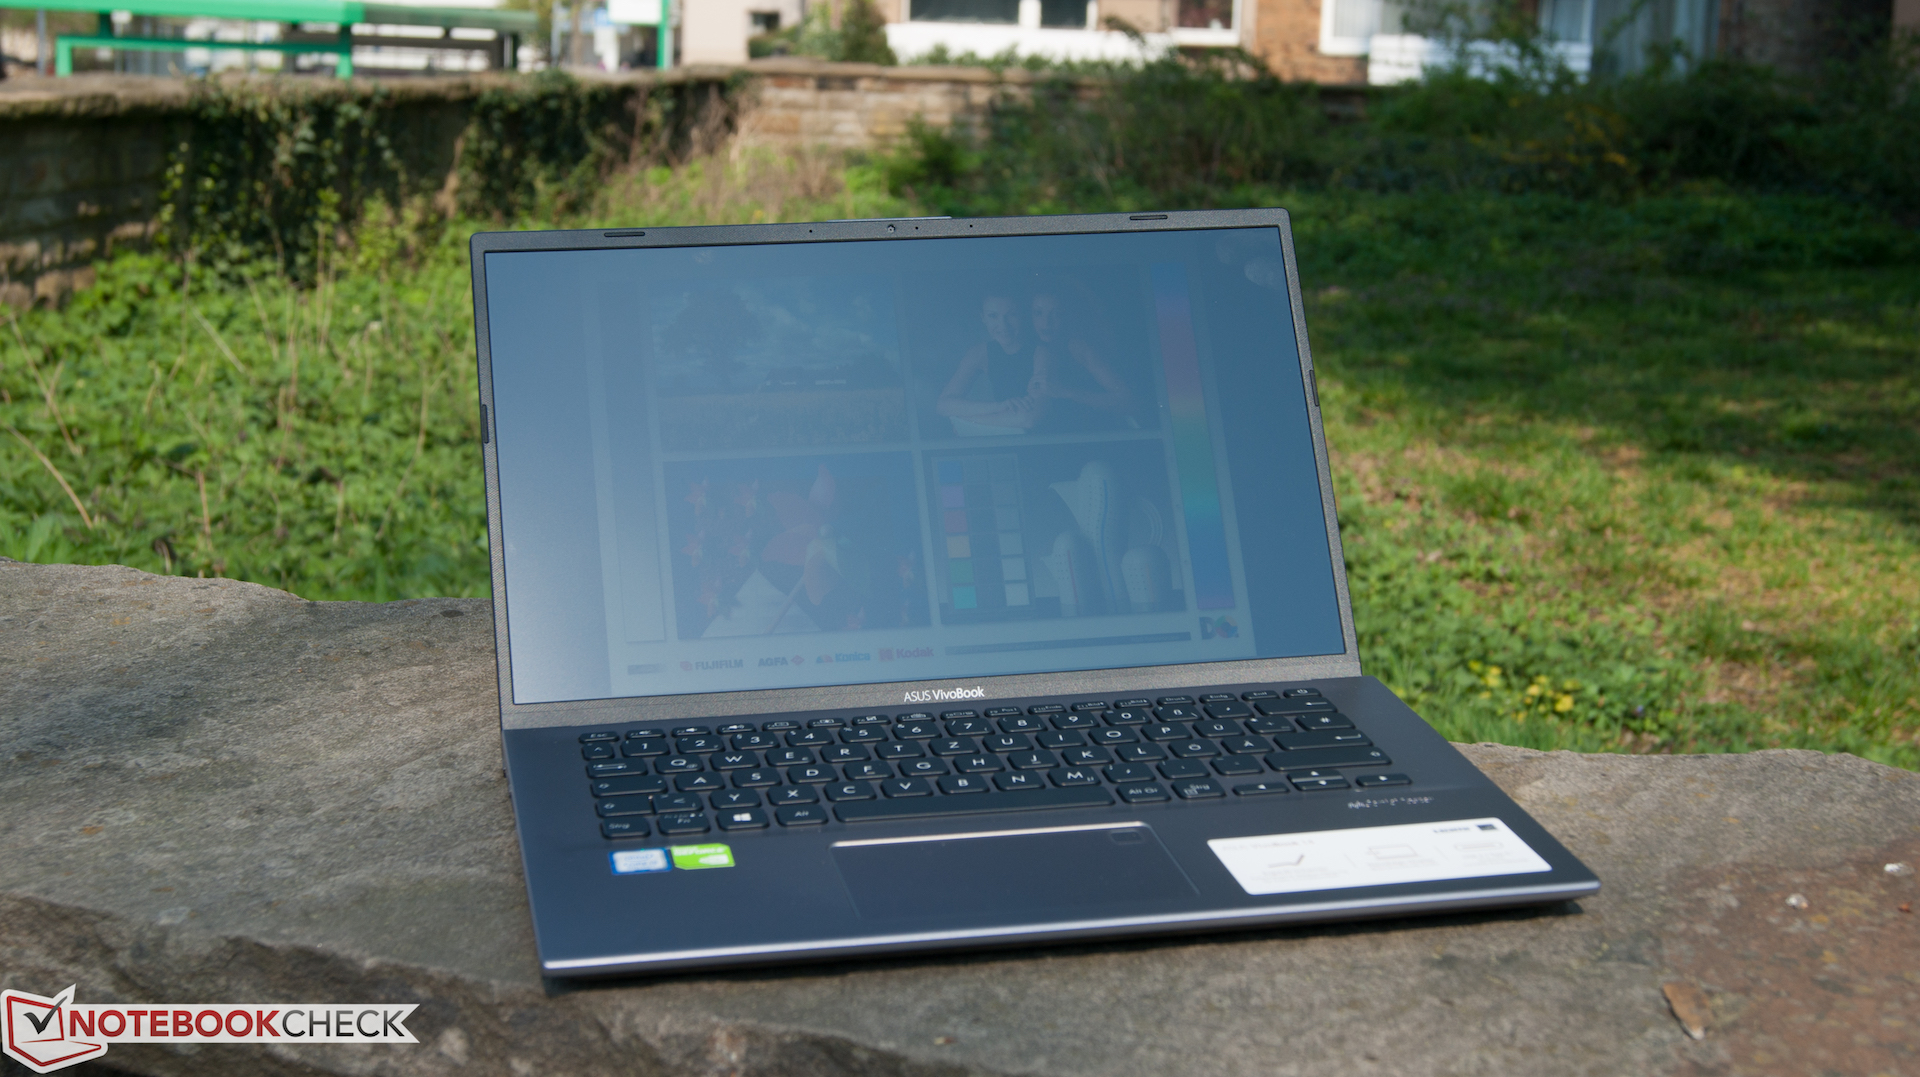
Under weak lighting, the Asus VivoBook is aided by its matte display, so that no reflections hinder the workflow. Things are unfortunately different outdoors: The matte display alone is not able to compensate for indirect or direct sunlight. For outdoor use, shade is recommended.


Performance
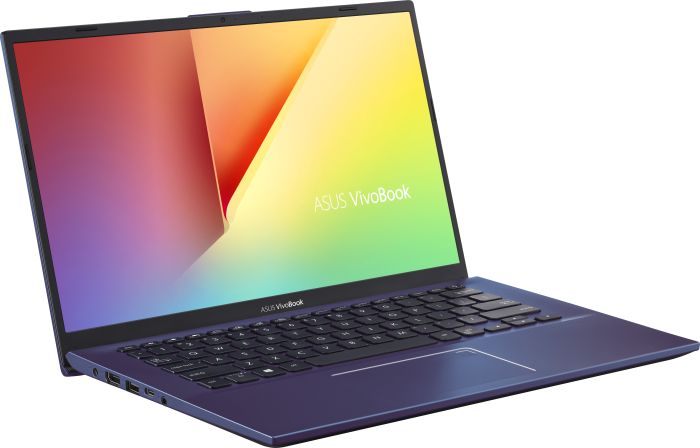
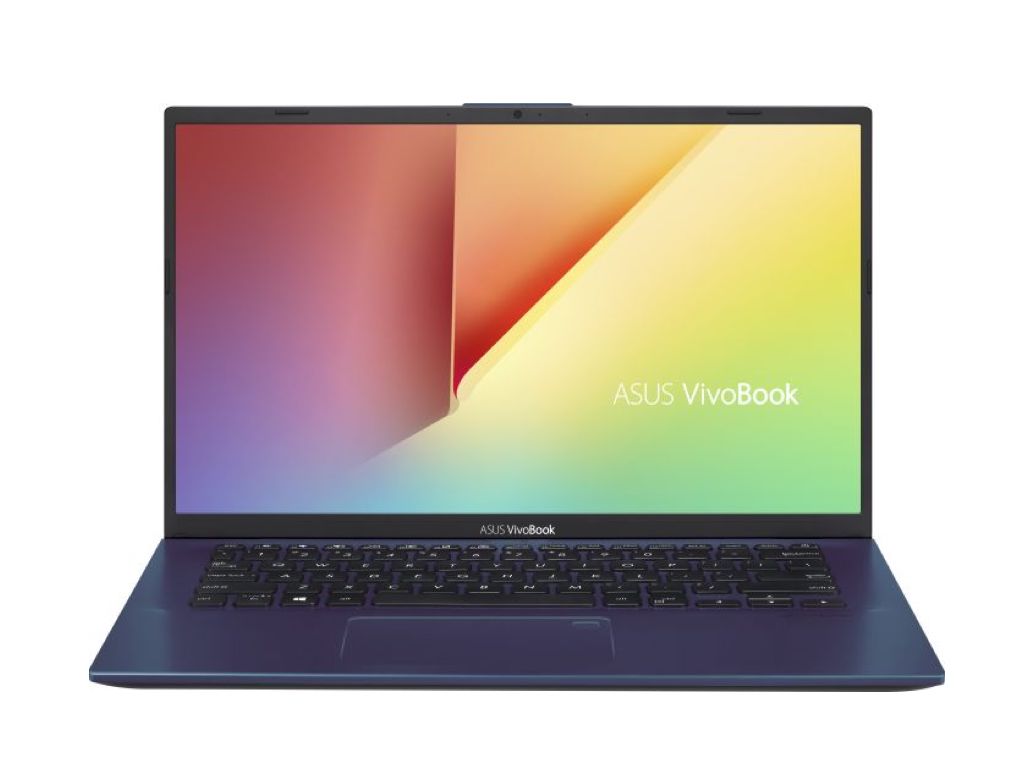
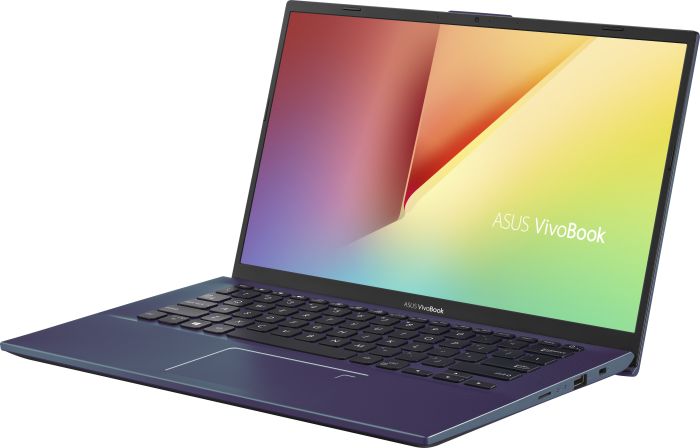
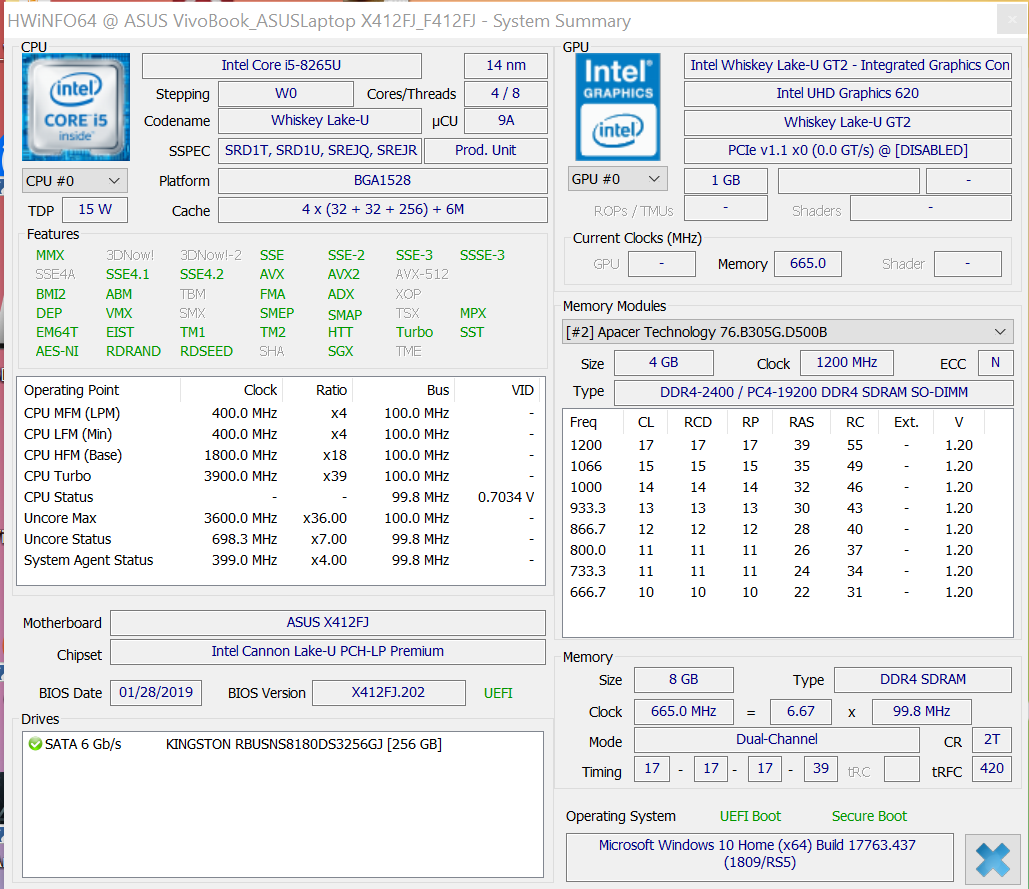
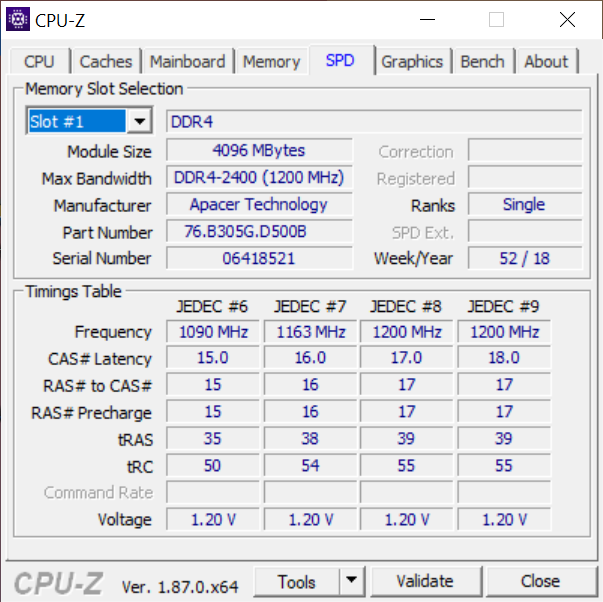
The Asus VivoBook is available in black, blue and silver. At the time of writing, there are no other configurations offered regarding components. There is a 256 GB SSD in all devices. In addition, 8 GB RAM in dual-channel mode is to be found. The centerpiece is the quad-core Intel Core i5-8265U. The recently released dedicated Nvidia GeForce MX230 GPU is considered to be the special feature here. This one still comes with the Pascal architecture. This whole package currently costs 800 Euros (~$896).
Processor
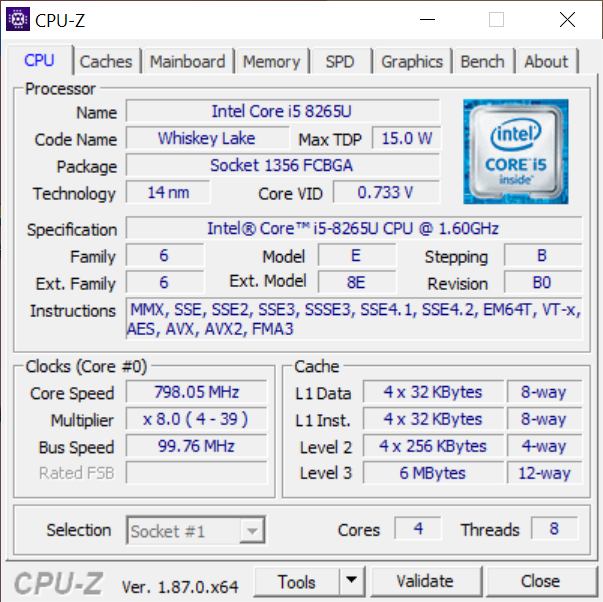
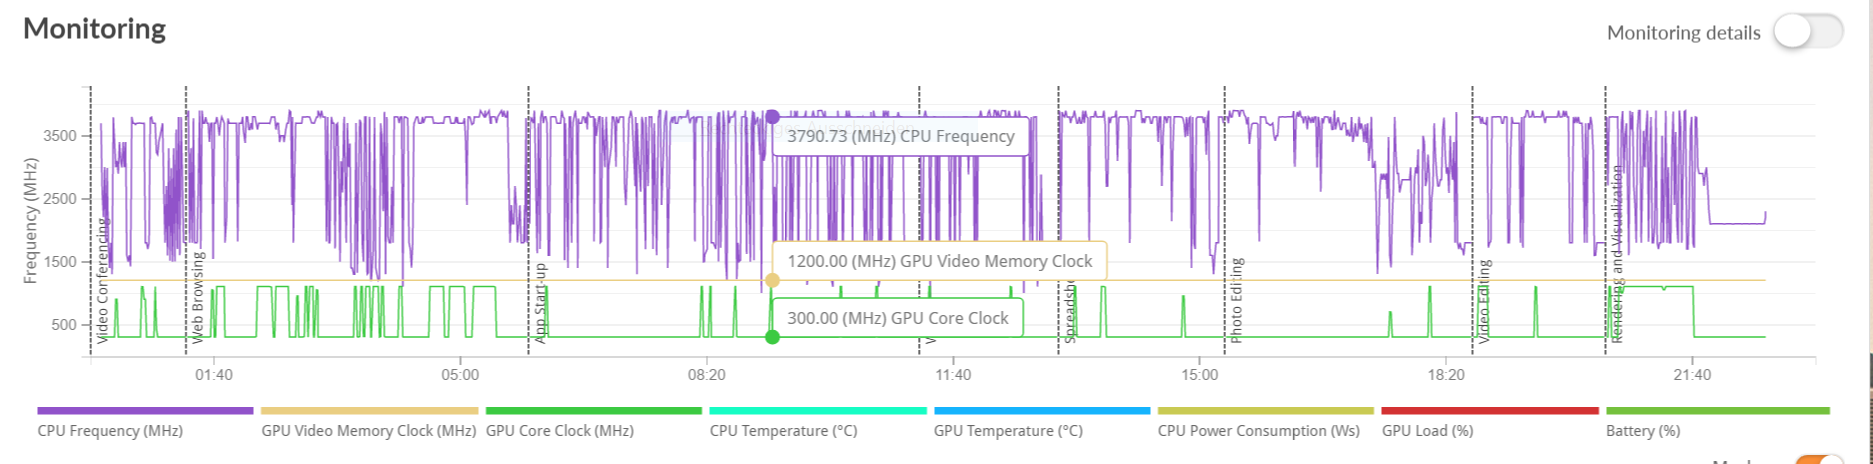
We were already able to examine the CPU in the new VivoBook 14 in our review of the ZenBook series. The Intel Core i5-8265U processor is built using the Whiskey Lake architecture and has a clock speed of up to 3.9 GHz (3.7 GHz with all four cores). According to the datasheet, the energy requirement is rated at 15 Watts. The performance of this CPU is sufficient for standard usage and even offers more power for slightly more-demanding software and games. To determine the potential of this performance reserve, we take a look at the CPU's clock speeds during prolonged load using Cinebench R15.
With a loop of the benchmark, we can see that the results fall by 120 points/20% after just a few runs. The observation of the clock frequencies sheds some light on this. The high clock speeds can only be sustained for a short period. After the second run, the CPU varies between 2.2 and 2.4 GHz, which is why the score is lower. Nonetheless, it performs above its base speed of 1.6 GHz and does not throttle throughout the test.
Our review device achieved 623 points in Cinebench R15. This result corresponds to the expected level of the processor in use. We must make the negative observation that the current VivoBook with the Nvidia GeForce MX230 performed considerably worse than the HP ProBook 430 G6 on the prolonged test (CB15 loop). It should also be noted that the reported maximum score of over 600 points can only be reached after a cold boot. Whether there will be a BIOS fix like with the ZenBook still remains to be seen.
For further comparison with different laptop processors, refer to our CPU benchmarks page.
System Performance
The combination works. Fast storage and modern computing performance are combined in the 14-inch Asus laptop. The results of PCMark 10 are not so positive in all areas. The small setback in the "Digital Content Creation" could probably be attributed to issues with heat development, as seen on the processor section. Overall, the final result is satisfactory.
Storage
A 256 GB SSD is used as storage option. The M.2 drive performed within common values of its design and connection type (SATA 3.2).
| Asus VivoBook 14 F412FJ-EB084T Kingston RBU-SNS8180DS3512GJ | Asus Zenbook 14 UX433FA-A6018T WDC PC SN520 SDAPNUW-256G | HP ProBook 430 G6-5TJ89EA WDC PC SN520 SDAPNUW-256G | Dell Latitude 14 5495 Intel SSDSCKKF256G8 | Average Kingston RBU-SNS8180DS3512GJ | Average of class Multimedia | |
|---|---|---|---|---|---|---|
| CrystalDiskMark 5.2 / 6 | 148% | 160% | 7% | 9% | 539% | |
| Write 4K (MB/s) | 55 | 99.9 82% | 101.8 85% | 48.45 -12% | 59.8 ? 9% | 166.3 ? 202% |
| Read 4K (MB/s) | 28.79 | 40.03 39% | 41.35 44% | 25.11 -13% | 26.9 ? -7% | 68.5 ? 138% |
| Write Seq (MB/s) | 307.5 | 973 216% | 929 202% | 341.2 11% | 380 ? 24% | 2667 ? 767% |
| Read Seq (MB/s) | 430 | 1111 158% | 1388 223% | 521 21% | 427 ? -1% | 3134 ? 629% |
| Write 4K Q32T1 (MB/s) | 149.5 | 424.6 184% | 453.5 203% | 202 35% | 204 ? 36% | 468 ? 213% |
| Read 4K Q32T1 (MB/s) | 207.2 | 255.9 24% | 286.2 38% | 243.5 18% | 204 ? -2% | 587 ? 183% |
| Write Seq Q32T1 (MB/s) | 389.2 | 1300 234% | 1302 235% | 320.8 -18% | 447 ? 15% | 4667 ? 1099% |
| Read Seq Q32T1 (MB/s) | 497.1 | 1723 247% | 1751 252% | 555 12% | 478 ? -4% | 5884 ? 1084% |
| Write 4K Q8T8 (MB/s) | 572 | 247.5 | 284 ? | 1192 ? | ||
| Read 4K Q8T8 (MB/s) | 826 | 253.4 | 301 ? | 1455 ? | ||
| AS SSD | 204% | 157% | 27% | 43% | 698% | |
| Seq Read (MB/s) | 487.6 | 1389 185% | 1373 182% | 507 4% | 487 ? 0% | 4614 ? 846% |
| Seq Write (MB/s) | 392.7 | 795 102% | 726 85% | 286.5 -27% | 372 ? -5% | 3168 ? 707% |
| 4K Read (MB/s) | 36.4 | 37.3 2% | 40.67 12% | 19.76 -46% | 33.7 ? -7% | 62.4 ? 71% |
| 4K Write (MB/s) | 26.46 | 130.8 394% | 119.7 352% | 34.58 31% | 44 ? 66% | 184.6 ? 598% |
| 4K-64 Read (MB/s) | 325.4 | 653 101% | 567 74% | 238.4 -27% | 325 ? 0% | 1133 ? 248% |
| 4K-64 Write (MB/s) | 87.2 | 605 594% | 408.2 368% | 225.2 158% | 264 ? 203% | 2245 ? 2475% |
| Access Time Read * (ms) | 0.432 | 0.114 74% | 0.107 75% | 0.128 70% | 0.27 ? 37% | 0.06262 ? 86% |
| Access Time Write * (ms) | 0.4 | 0.028 93% | 0.03 92% | 0.101 75% | 0.287 ? 28% | 0.07264 ? 82% |
| Score Read (Points) | 411 | 829 102% | 745 81% | 309 -25% | 407 ? -1% | 1656 ? 303% |
| Score Write (Points) | 153 | 815 433% | 600 292% | 288 88% | 345 ? 125% | 2746 ? 1695% |
| Score Total (Points) | 782 | 2048 162% | 1706 118% | 751 -4% | 966 ? 24% | 5190 ? 564% |
| Copy ISO MB/s (MB/s) | 601 | 1117 | 441.3 | 546 ? | 2880 ? | |
| Copy Program MB/s (MB/s) | 246.8 | 376.4 | 152.1 | 106.2 ? | 844 ? | |
| Copy Game MB/s (MB/s) | 549 | 796 | 260 | 151 ? | 1649 ? | |
| Total Average (Program / Settings) | 176% /
180% | 159% /
159% | 17% /
18% | 26% /
28% | 619% /
631% |
* ... smaller is better
Graphics card
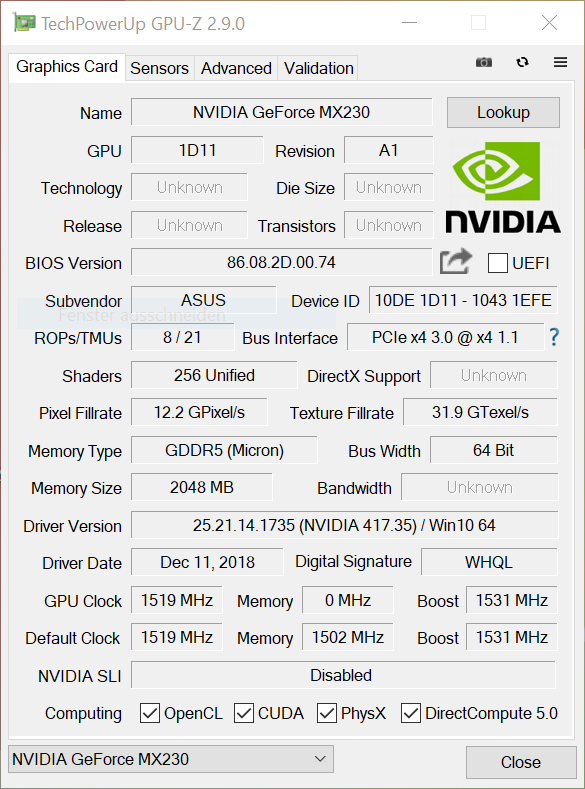
The VivoBook on hand boasts an Nvidia GeForce MX230, which should be able to handle everyday use. The dedicated graphics unit is built using the Pascal architecture from Nvidia and is thus not a descendant of the new Turing architecture, despite the graphics card having been presented at the beginning of 2019. In this configuration, the GPU comes with 2 GB of DDR5 memory. The clock speed is 1519 MHz (1531 MHz after Boost). The GeForce MX230 should perform at a similar level as the GeForce 930MX/940MX. This is also confirmed by the different benchmarks. The GeForce MX230 performs around 10% above the 940MX, but 20-40% below the GeForce MX150.
As soon as the laptop is disconnected from a power source, the graphics unit starts working at about 16% less performance according to 3DMark 11. As a result, the complete performance potential cannot be reached when using the laptop in an unplugged state.
Further comparisons with different graphics units, as well as further reviews, can be found in our mobile GPU benchmarks page.
| 3DMark 11 Performance | 3570 points | |
| 3DMark Ice Storm Standard Score | 61160 points | |
| 3DMark Cloud Gate Standard Score | 10178 points | |
| 3DMark Fire Strike Score | 2202 points | |
| 3DMark Time Spy Score | 797 points | |
Help | ||
Gaming performance
The Nvidia GeForce MX230 is not a typical gaming graphics card. Nevertheless, some games can be enjoyed on the VivoBook. Current games (2019, 2018) are mostly only playable at a lower quality level. Older hits should pose no issues on higher settings. Overall, it can be concluded that the dedicated graphics unit used here is a tad faster than an Nvidia GeForce 940MX.
For more games that can be played with this GPU and their corresponding settings, refer to our separate article: Computer games on laptop graphics cards.
| low | med. | high | ultra | |
|---|---|---|---|---|
| BioShock Infinite (2013) | 151.5 | 82.8 | 70.2 | 27.96 |
| GTA V (2015) | 71.5 | 64.5 | 26.9 | 10.6 |
| Overwatch (2016) | 90 | 78.3 | 35.9 | 16.6 |
| Rocket League (2017) | 152.6 | 77.7 | 72.7 | |
| Playerunknown's Battlegrounds (PUBG) (2017) | 58.5 | 23.8 | 21 | 17.3 |
| Destiny 2 (2017) | 44.9 | 23.9 | 22 | 17.5 |
| Final Fantasy XV Benchmark (2018) | 26 | 11.4 | 7.4 | |
| Kingdom Come: Deliverance (2018) | 31.5 | 13.8 | 11.6 | 7 |
| Monster Hunter World (2018) | 34.1 | 12.9 | 10.9 | 8.3 |
| F1 2018 (2018) | 48 | 23 | 18 | 12 |
| Shadow of the Tomb Raider (2018) | 32 | 10 | 10 () | 7 () |
| FIFA 19 (2018) | 80.5 | 58.6 | 52.6 | 52.2 |
| Forza Horizon 4 (2018) | 46 | 21 | 16 | 12 |
| Assassin´s Creed Odyssey (2018) | 26 | 13 | 10 | 6 |
| Call of Duty Black Ops 4 (2018) | 36.8 | 18.9 | 13.8 | 11.7 |
| Hitman 2 (2018) | 29.3 | 13.4 | 10.7 | 9.9 |
| Battlefield V (2018) | 38.3 | 20.2 | 16 | 12 |
| Farming Simulator 19 (2018) | 122.3 | 48.6 | 23.8 | 17.6 |
| Darksiders III (2018) | 69.3 | 19.8 | 15.9 | 13.4 |
| Just Cause 4 (2018) | 30.9 | 17.4 | 12.7 | 10.9 |
| Apex Legends (2019) | 45.8 | 17.8 | 14.4 | 12.4 |
| Far Cry New Dawn (2019) | 32 | 15 | 13 | 12 |
| Metro Exodus (2019) | 25.9 | 4.8 | 3.3 | 4.5 |
| Anthem (2019) | 22.7 | 12.3 | 11.1 | 9.8 |
| Dirt Rally 2.0 (2019) | 71 | 22.9 | 17.5 | 10.4 |
| The Division 2 (2019) | 43 | 13 | 10 | 6 |
Emissions and energy
Noise emissions
The slim laptop becomes noticeable only under load. But the loudness is still within a moderate range in this case with 38 dB(A). The HP ProBook 430 G6 remains more silent, for example, but it comes without a dedicated graphics unit and requires therefore less cooling.
Noise level
| Idle |
| 30 / 30 / 30 dB(A) |
| Load |
| 33.5 / 38 dB(A) |
 | ||
30 dB silent 40 dB(A) audible 50 dB(A) loud |
||
min: | ||
Temperature
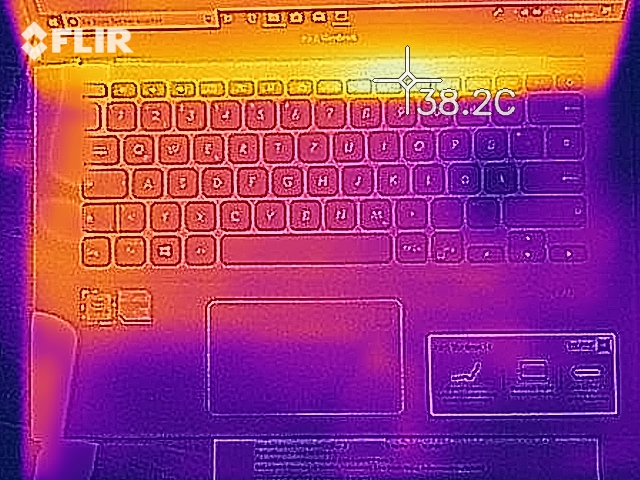
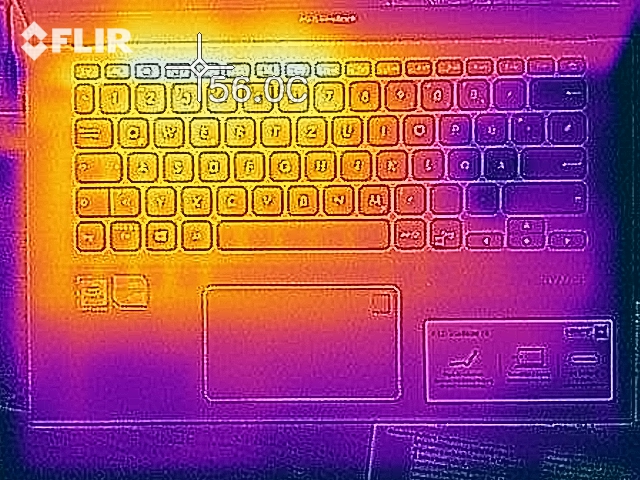
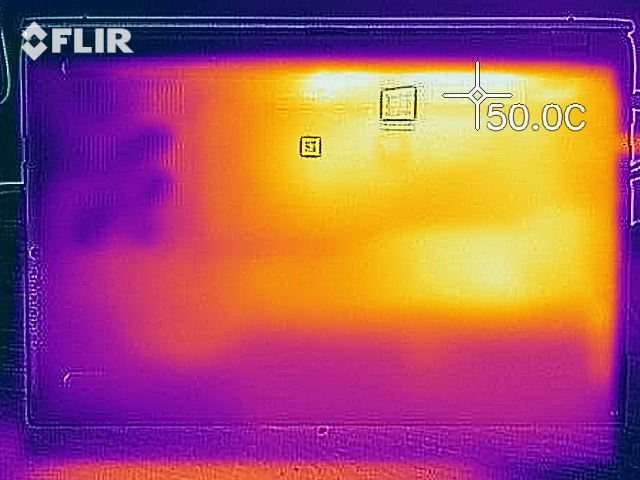
Whether in idle usage or under load, there is always a concern that the Asus laptop will become too hot. The hotspot is, under absolute full load, at 45 °C (113 °F). Something annoying: This maximum is reached on the upper left side of the keyboard. The corresponding power supply gets a bit hot at around 50 °C (122 °F) and should not be covered under pillows or blankets.
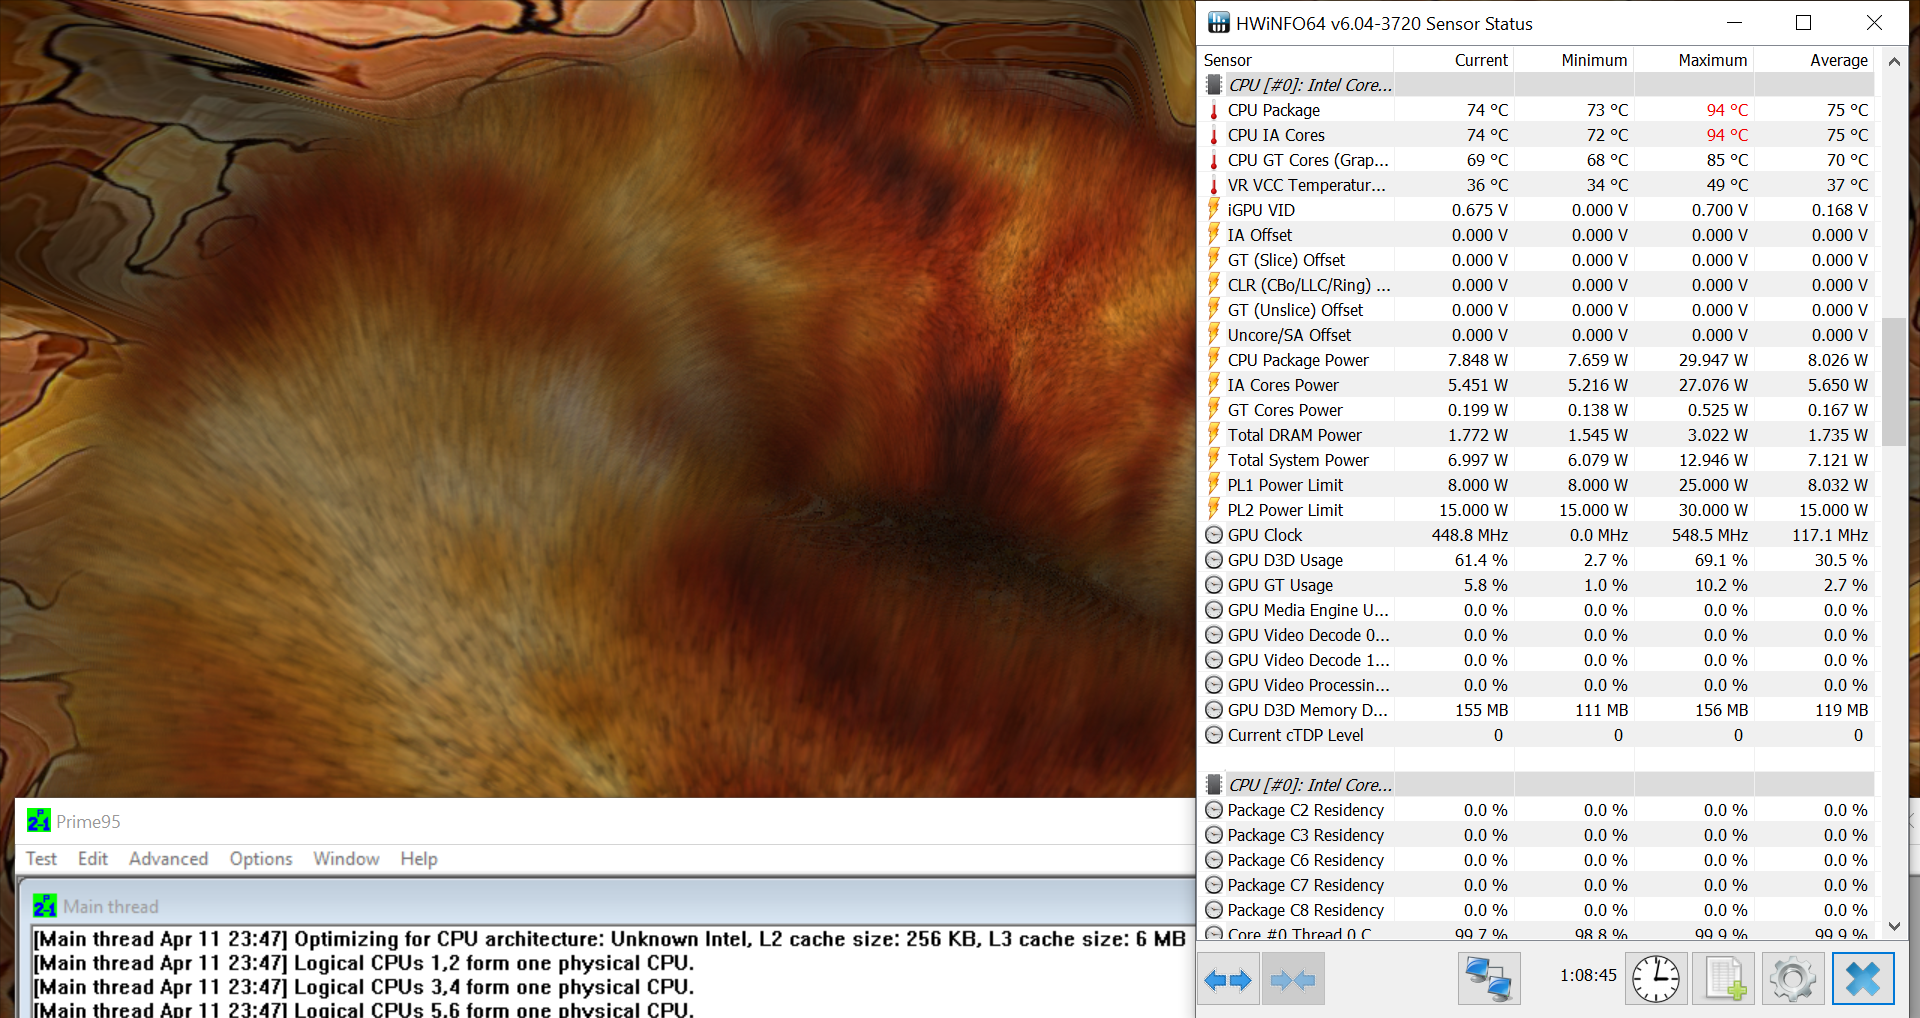
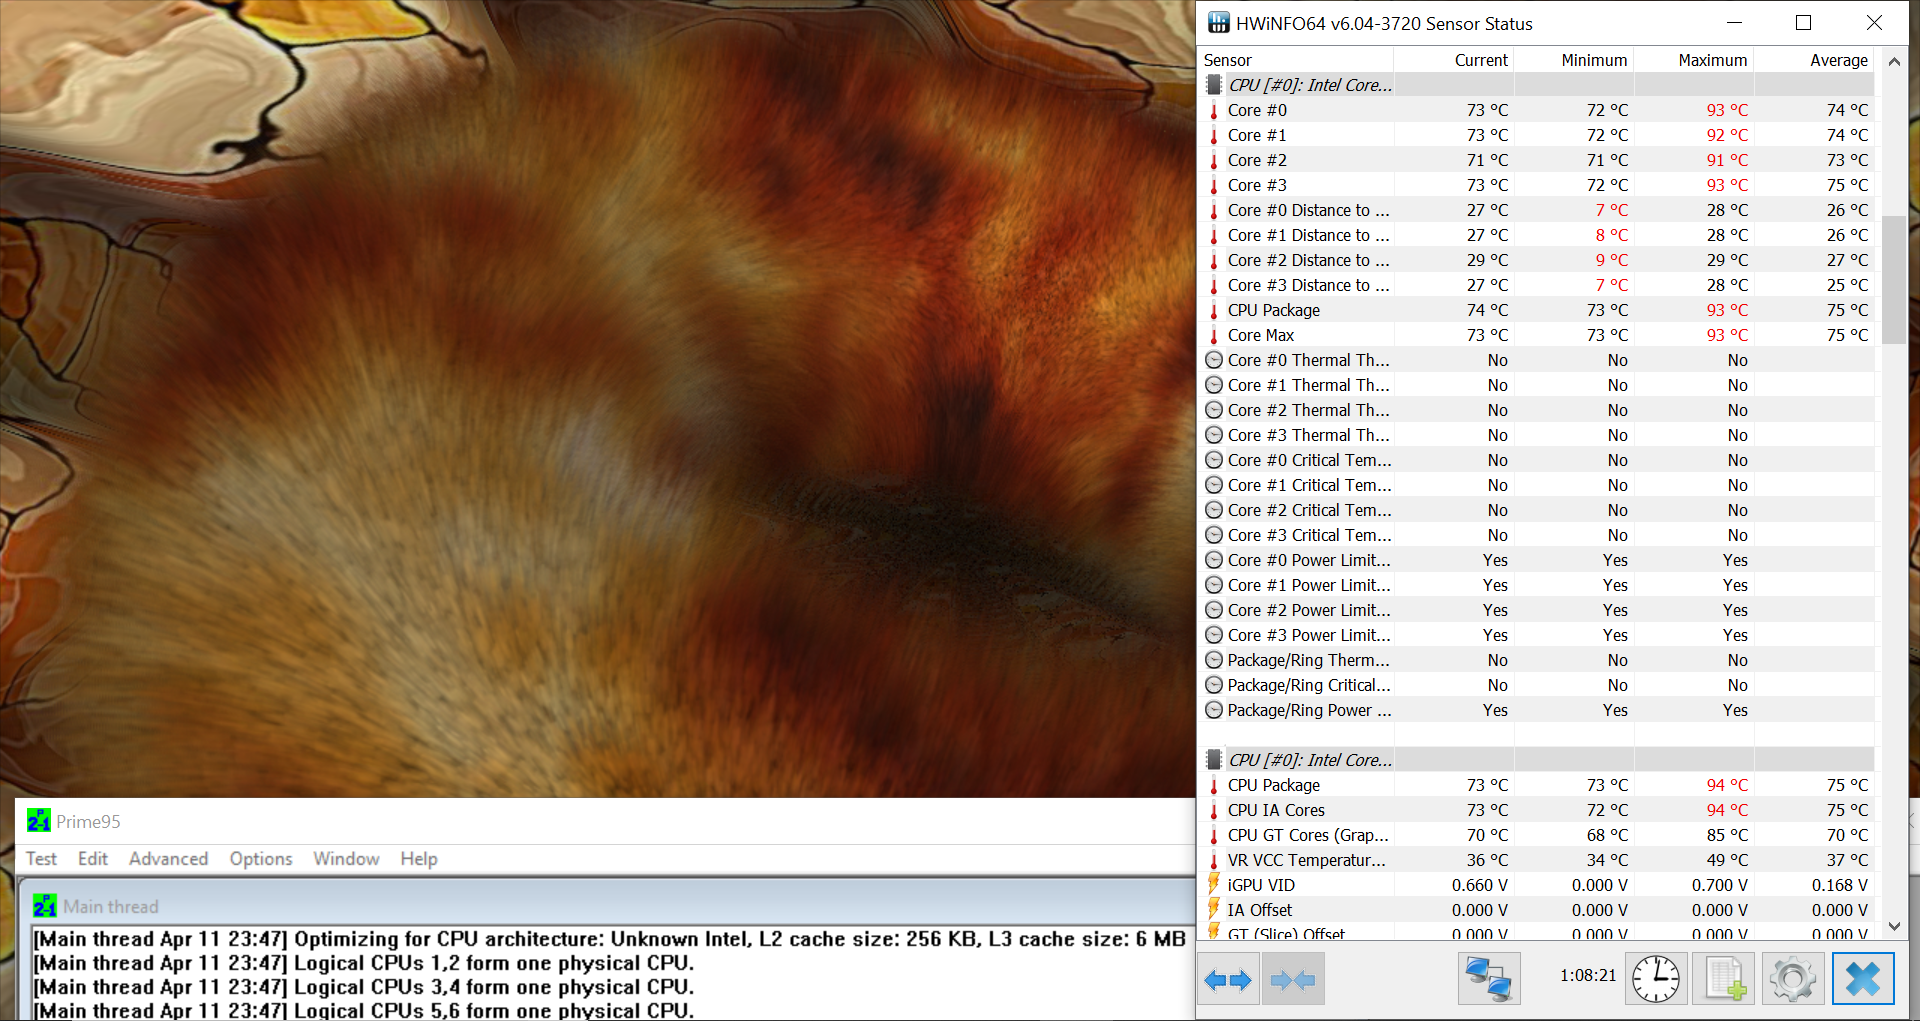
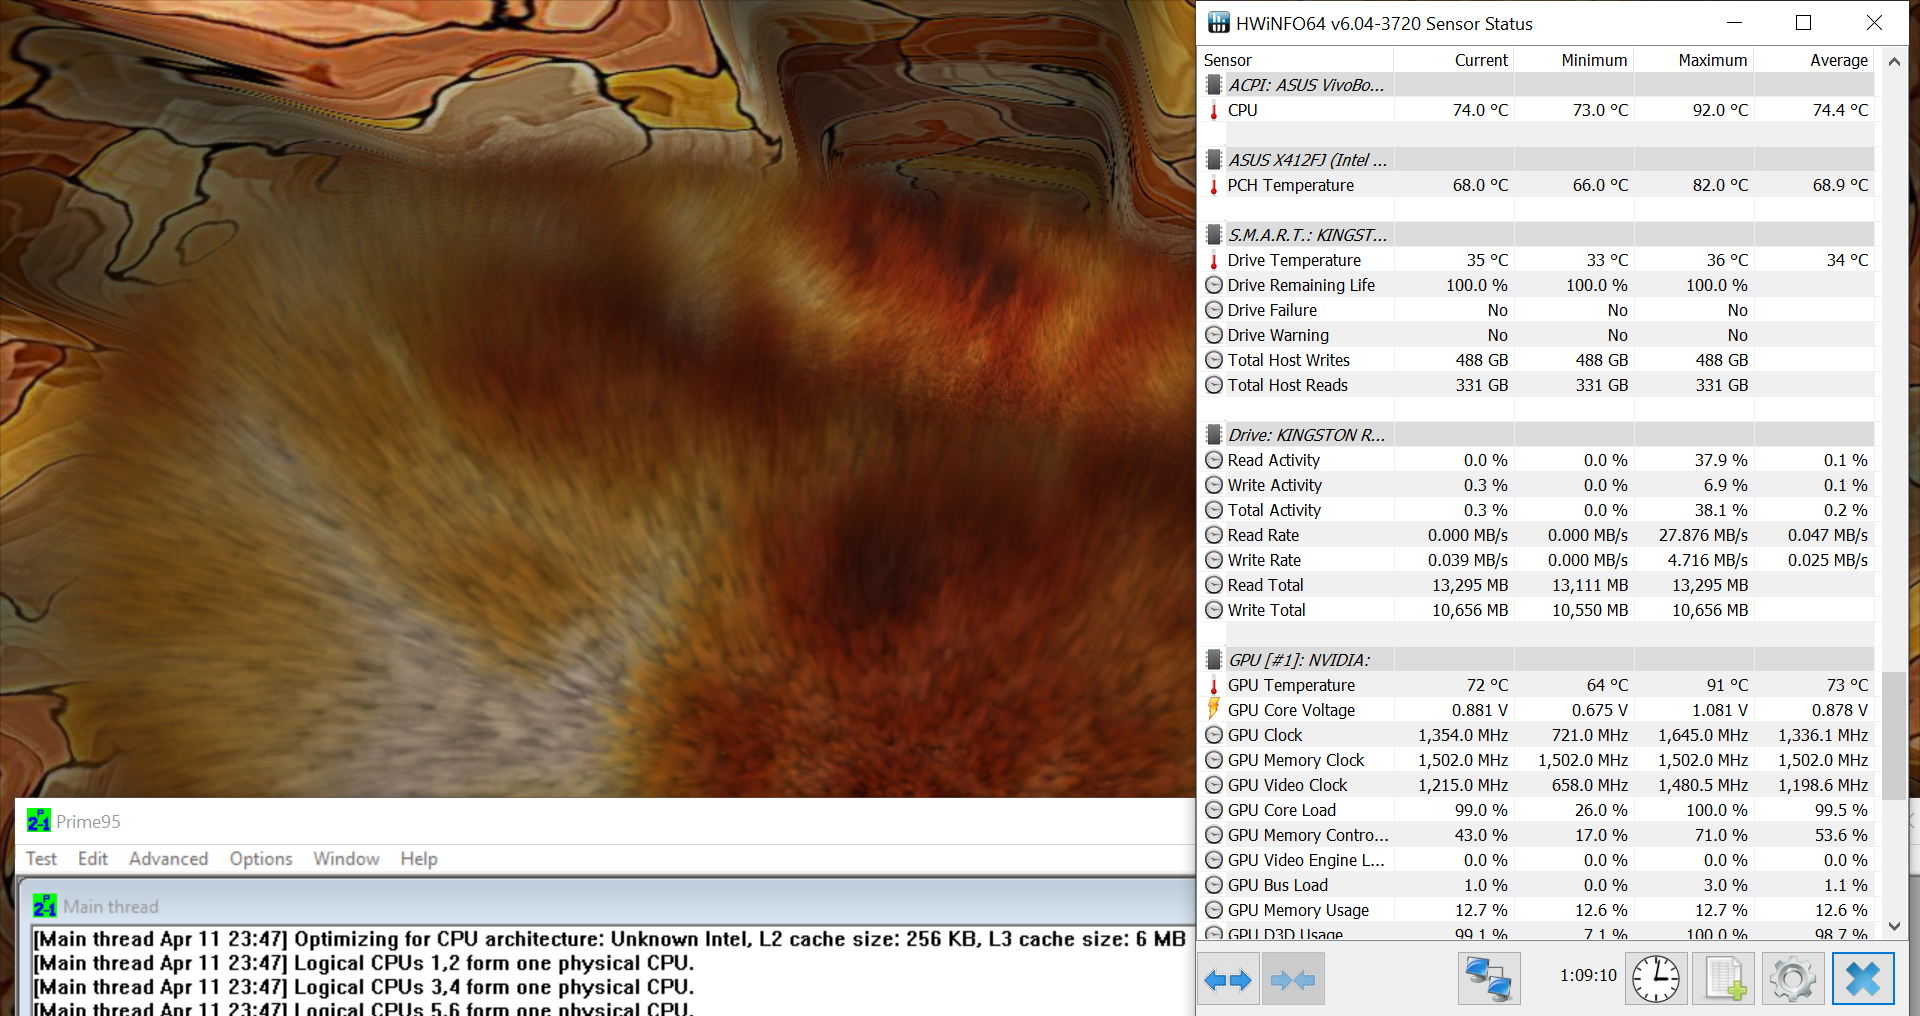
Our stress test is particularly of interest, as it measures the core temperatures and clock speeds on the inside during full load. In order to simulate such a scenario, we use Furmark and Prime95. Already after a few minutes, the CPU must throttle heavily and undercuts its base speed immensely. That is to say, the CPU remains at a frequency of 700 MHz. This is due to the maximum core temperature being reached, which exceeds the 90 °C (194 °F) limit. The CPU can then remain at a level below 75 °C (167 °F) through the decreased clock speeds. Note that the 75 °C (167 °F) threshold was determined too low by the manufacturer. There could probably be a BIOS update from the manufacturer, similar to the one that the Asus ZenBook series received, in order to increase this value. Generally, a scenario posing such degree of load would happen rarely in everyday usage and only in the context of very demanding games.
As soon as we stop the stress test after around an hour, 3530 points is reached in 3DMark 11, which is equivalent to a cold boot.

(-) The maximum temperature on the upper side is 45.4 °C / 114 F, compared to the average of 36.8 °C / 98 F, ranging from 21 to 71 °C for the class Multimedia.
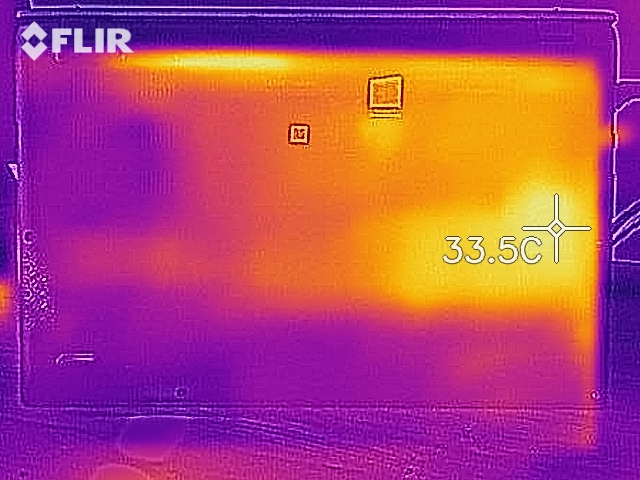
(±) The bottom heats up to a maximum of 44.4 °C / 112 F, compared to the average of 39.2 °C / 103 F
(+) In idle usage, the average temperature for the upper side is 25.2 °C / 77 F, compared to the device average of 31.3 °C / 88 F.
(+) The palmrests and touchpad are cooler than skin temperature with a maximum of 27.9 °C / 82.2 F and are therefore cool to the touch.
(±) The average temperature of the palmrest area of similar devices was 28.7 °C / 83.7 F (+0.8 °C / 1.5 F).
Speakers
The provided stereo speakers are adequate for the occasional YouTube session or video-call. Sound quality is a bit thin for music playback. There's room for improvement when it comes to low tones particularly.
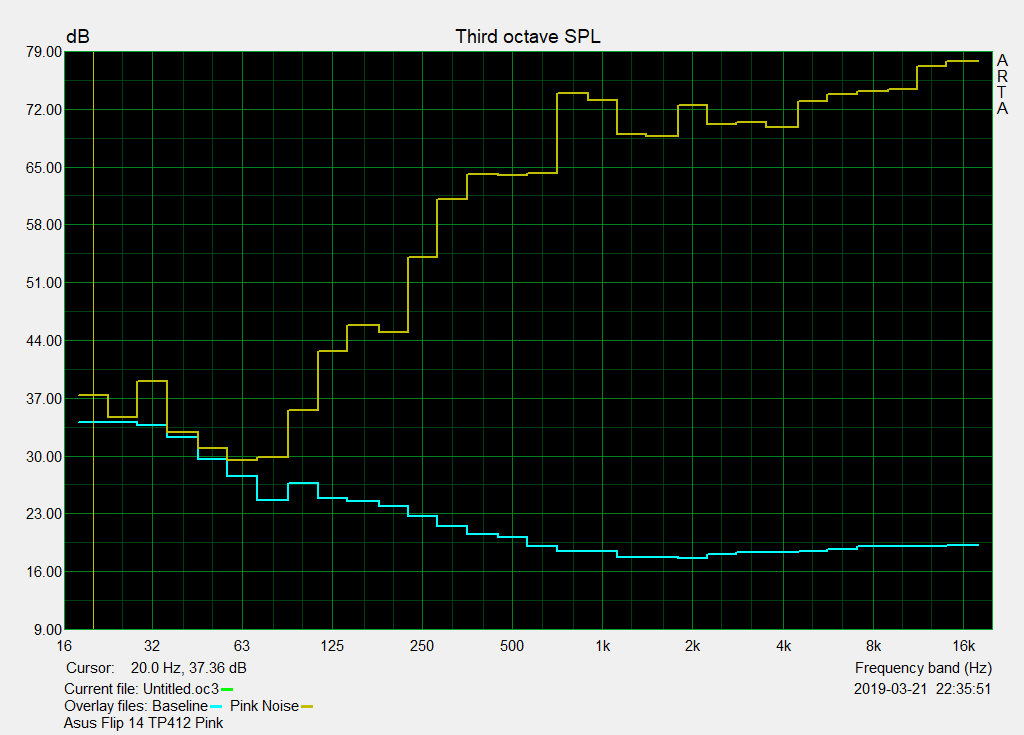
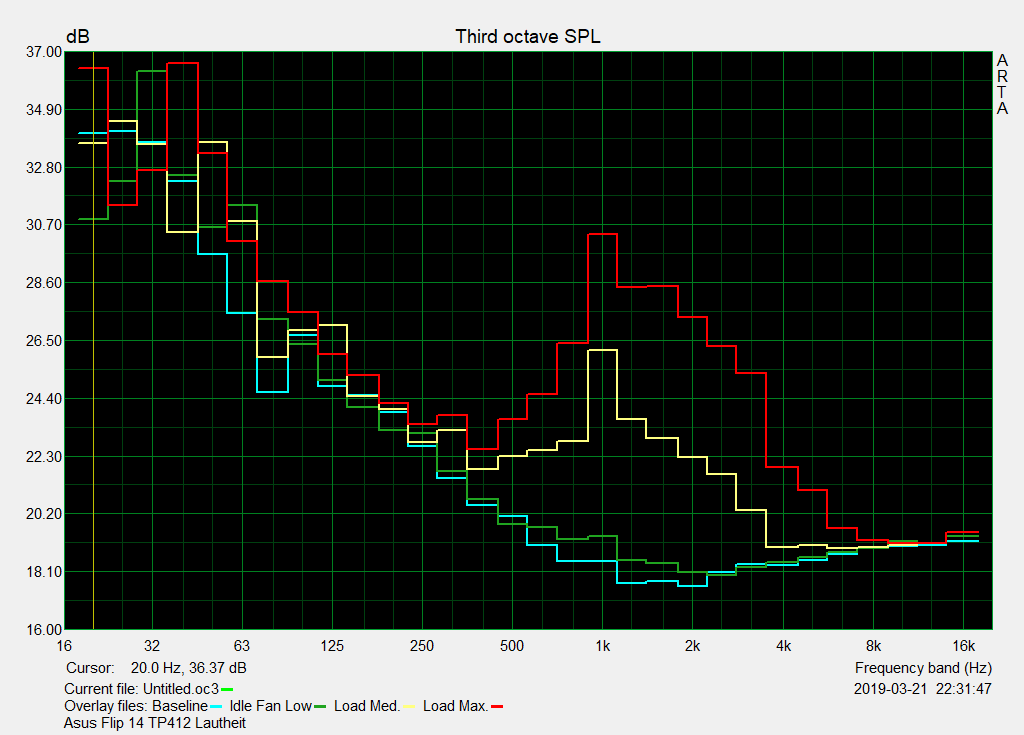
Asus VivoBook 14 F412FJ-EB084T audio analysis
(±) | speaker loudness is average but good (77.8 dB)
Bass 100 - 315 Hz
(-) | nearly no bass - on average 22.4% lower than median
(±) | linearity of bass is average (10.8% delta to prev. frequency)
Mids 400 - 2000 Hz
(+) | balanced mids - only 3.6% away from median
(+) | mids are linear (5.4% delta to prev. frequency)
Highs 2 - 16 kHz
(+) | balanced highs - only 2.5% away from median
(+) | highs are linear (2.3% delta to prev. frequency)
Overall 100 - 16.000 Hz
(±) | linearity of overall sound is average (17.7% difference to median)
Compared to same class
» 51% of all tested devices in this class were better, 7% similar, 42% worse
» The best had a delta of 5%, average was 17%, worst was 45%
Compared to all devices tested
» 35% of all tested devices were better, 8% similar, 56% worse
» The best had a delta of 4%, average was 23%, worst was 134%
Apple MacBook 12 (Early 2016) 1.1 GHz audio analysis
(+) | speakers can play relatively loud (83.6 dB)
Bass 100 - 315 Hz
(±) | reduced bass - on average 11.3% lower than median
(±) | linearity of bass is average (14.2% delta to prev. frequency)
Mids 400 - 2000 Hz
(+) | balanced mids - only 2.4% away from median
(+) | mids are linear (5.5% delta to prev. frequency)
Highs 2 - 16 kHz
(+) | balanced highs - only 2% away from median
(+) | highs are linear (4.5% delta to prev. frequency)
Overall 100 - 16.000 Hz
(+) | overall sound is linear (10.2% difference to median)
Compared to same class
» 7% of all tested devices in this class were better, 2% similar, 90% worse
» The best had a delta of 5%, average was 18%, worst was 53%
Compared to all devices tested
» 5% of all tested devices were better, 1% similar, 94% worse
» The best had a delta of 4%, average was 23%, worst was 134%
Energy consumption
When idle, the Asus VivoBook 14 is not especially power-hungry. It requires between 3.7 and 8.3 Watts for operation. Under full load (stress test), this increases up to 61.6 Watts, which comes really close to the 65-Watt limit of the power supply. Under medium load and while running 3DMark, we observe that the power consumption drops from 43 Watts (maximum) to 31 Watts (average). Clock speeds are already being throttled here.
| Off / Standby | |
| Idle | |
| Load |
|
Key:
min: | |
Battery life
The hardware inside the ZenBook 14 sees an upgrade with the VivoBook 14 through the use of a dedicated graphics card. This extra power has a toll on the battery. But instead of being equipped with a 50 Wh battery like the ZenBook, the VivoBook only comes with a 37 Wh battery. The difference can be seen in our practical Wi-Fi test, which simulates browsing the web. Our review device powers off after 5.5 hours. In comparison, the more-expensive ZenBook and the HP ProBook 430 G6 lasted 9.5 hours.
Pros
Cons
Verdict
In order to meet the daily needs for office, multimedia and gaming, Asus offers with the VivoBook 14 a complete package for 800 Euros (~$896). The Asus laptop looks classy despite it being made solely out of plastic. The case is overall solidly constructed and has a good feel to it. The provided input devices are good enough for the occasional day-to-day office use. Regarding the keyboard, we found that it felt a bit spongy when doing particularly fast inputs. Likewise, the display can't be rated so positively. Even though Asus has provided a display with stable viewing angles, good color accuracy and a matte panel, its low brightness was a thorn in our side.
When it comes to the components, we found the combination to be good. The added value of the Nvidia GeForce MX230 is also noticeable. The sound volume and heat development of our review device remained within acceptable levels too. It's a shame that throttling and an early reduction of the boost speed disrupt the overall experience. There is definitely more potential here.
There is also room for improvement in the battery department. The VivoBook performs overall somewhat below its laptop category. Competitors like the HP ProBook 430 G6 last a lot longer.
Despite some weaknesses, the Asus VivoBook proved to be a solid all-rounder for everyday use.
Before deciding to buy, a look should be taken at competitors like the HP ProBook 430 G6. Furthermore, you can refer to our detailed search function for more information.
Asus VivoBook 14 F412FJ-EB084T
- 04/28/2019 v6 (old)
Nino Ricchizzi
Price comparison
