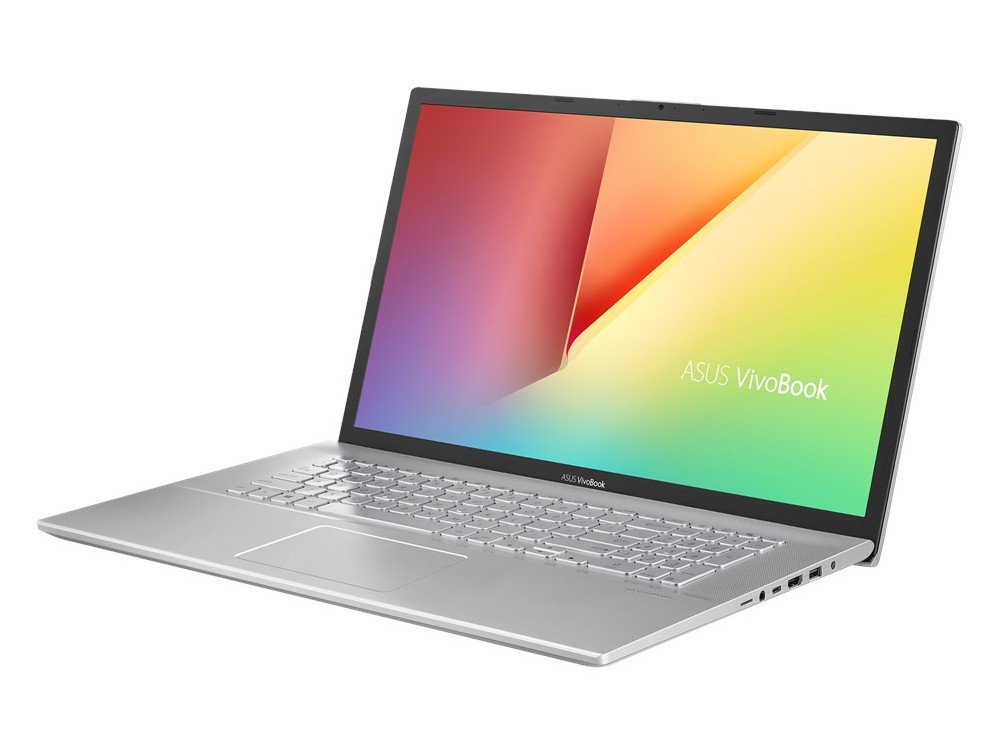
Asus VivoBook 17 S712FA Laptop Review: Low Weight, Low Price
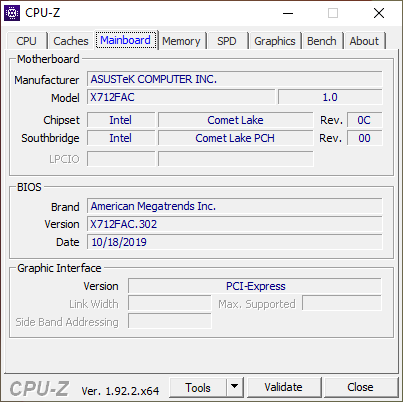
The Asus VivoBook 17 S712FA is the Intel Comet Lake-U version of the AMD Ryzen-powered VivoBook 17 M712DA. Both share the same chassis design and so we recommend checking out our review on the AMD version for all our comments on the case, keyboard, clickpad, and other physical features.
Competitors to the VivoBook 17 include other budget 17.3-inch multimedia laptops like the Dell Inspiron 17, HP Pavilion 17, Lenovo IdeaPad 330-17, or the Acer Aspire ES1. Our specific test unit can be found on Computer Upgrade King for $875 USD.
More Asus reviews:
Rating | Date | Model | Weight | Height | Size | Resolution | Price |
|---|---|---|---|---|---|---|---|
| 76 % v7 (old) | 06 / 2020 | Asus VivoBook 17 S712FA-DS76 i7-10510U, UHD Graphics 620 | 2.3 kg | 21 mm | 17.30" | 1920x1080 | |
| 78.9 % v6 (old) | 05 / 2019 | Dell Inspiron 17 3780 i7-8565U, Radeon 520 | 2.8 kg | 25 mm | 17.30" | 1920x1080 | |
| 81.5 % v7 (old) | 04 / 2020 | Acer Aspire 5 A515-54G i5-10210U, GeForce MX250 | 1.7 kg | 17.9 mm | 15.60" | 1920x1080 | |
| 82 % v6 (old) | 06 / 2019 | Lenovo Ideapad 330S-15ARR-81FB00C7GE R5 2500U, Vega 8 | 1.9 kg | 19.4 mm | 15.60" | 1920x1080 | |
| 75.2 % v7 (old) | 05 / 2020 | HP 17-by2437ng i3-10110U, UHD Graphics 620 | 2.4 kg | 24.5 mm | 17.30" | 1600x900 |
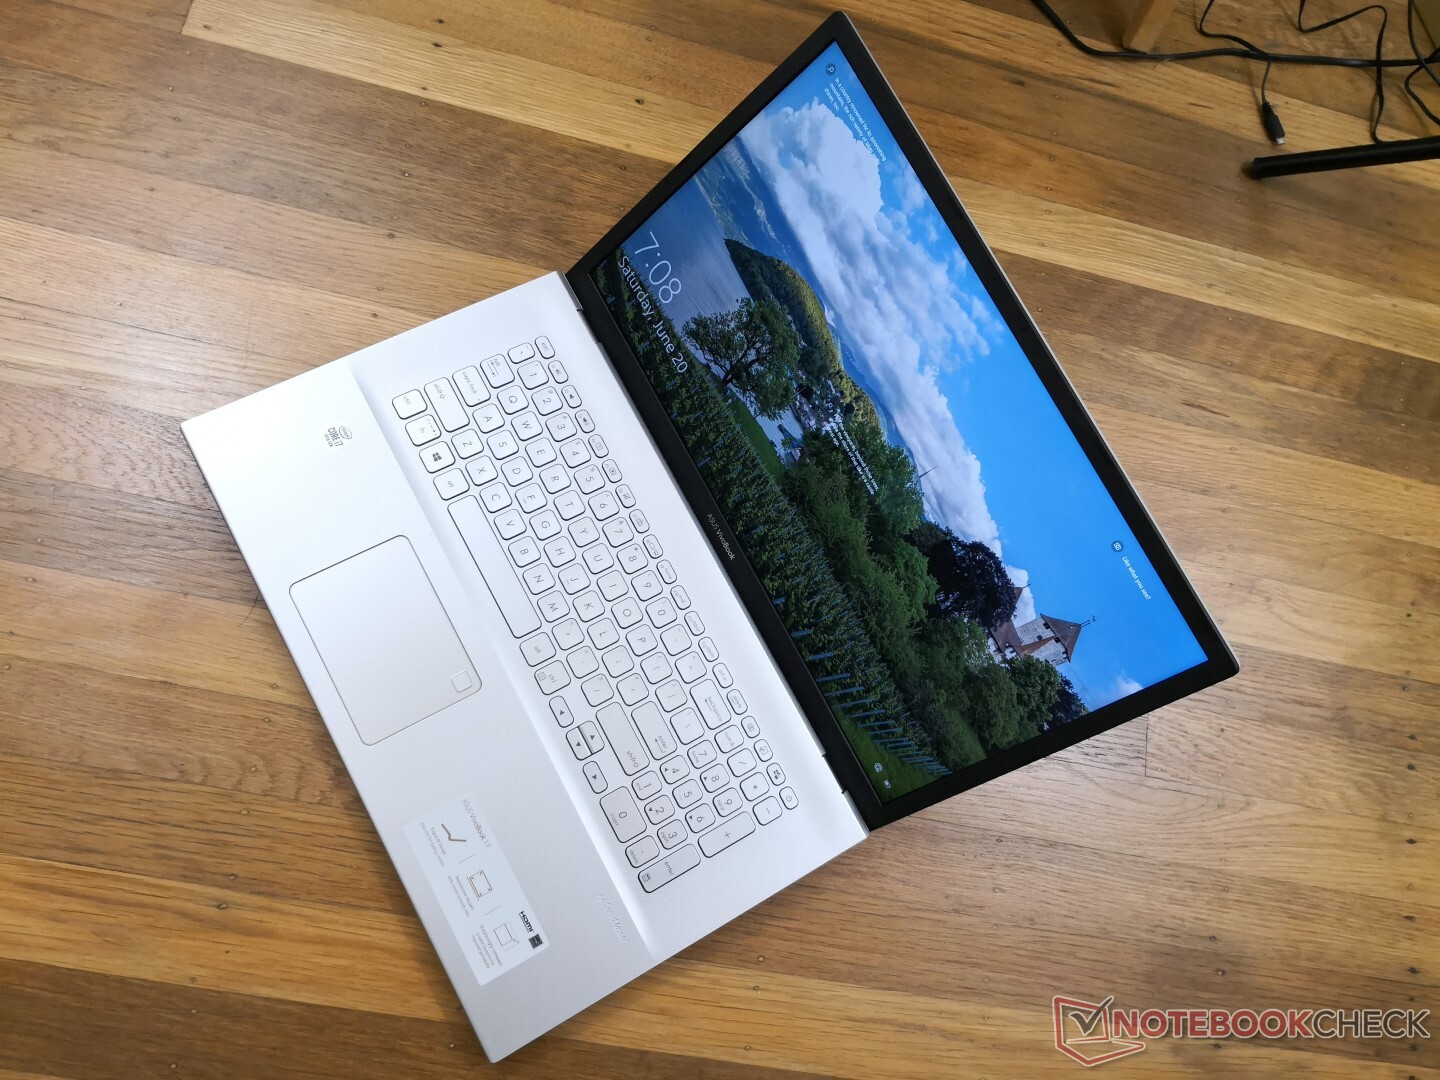
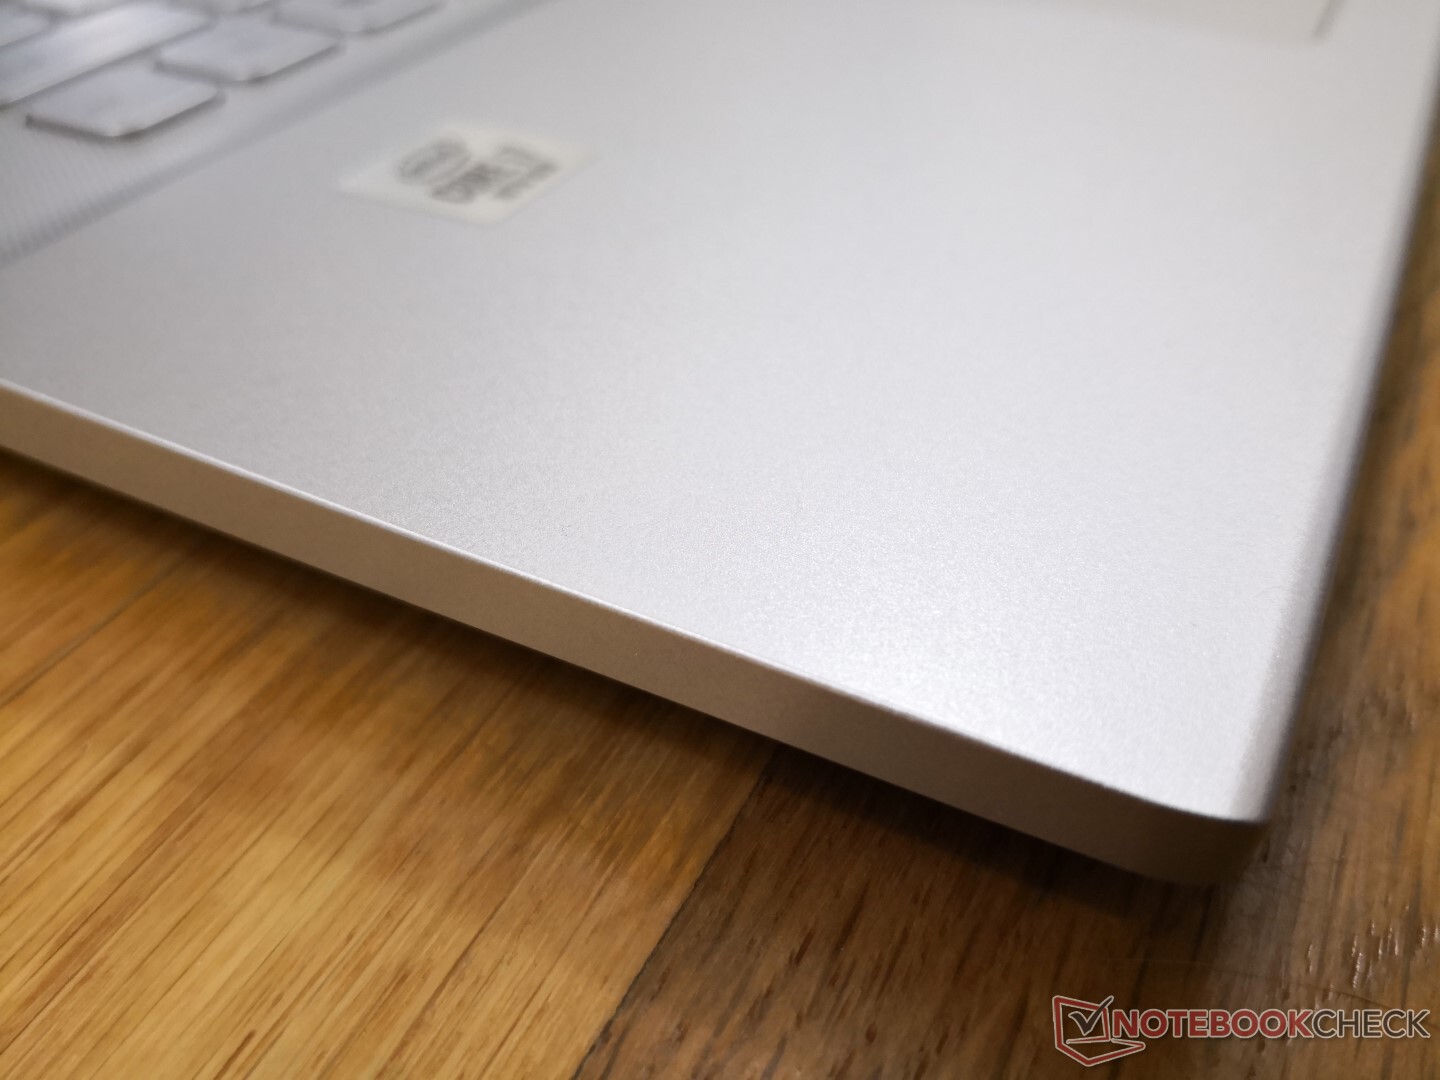
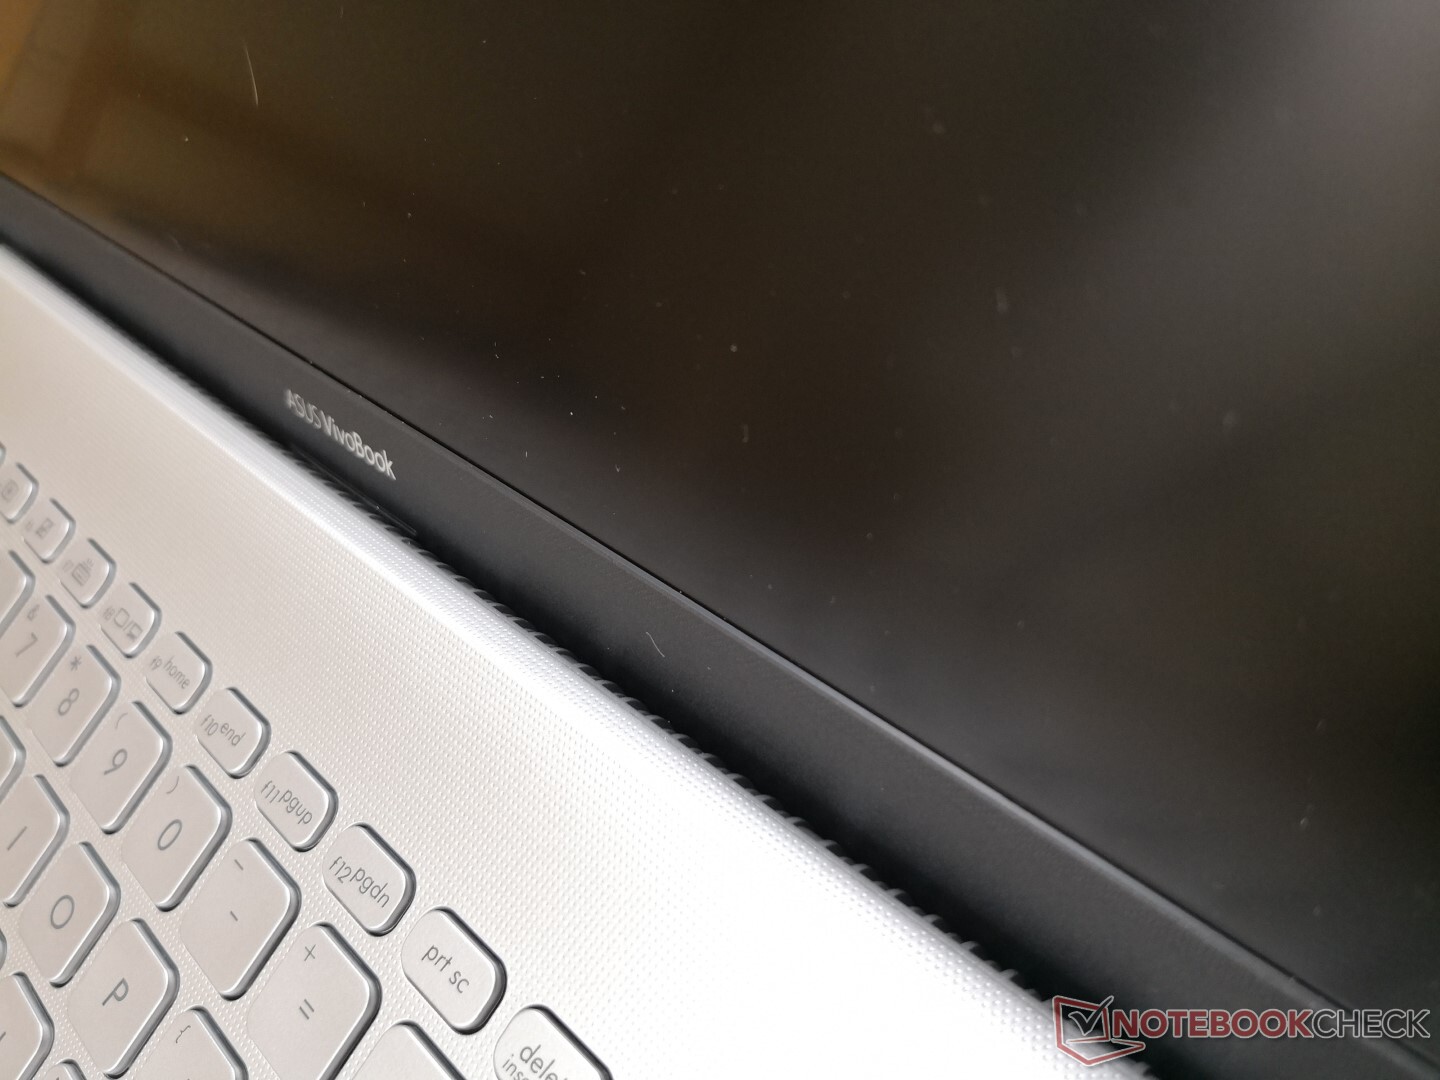
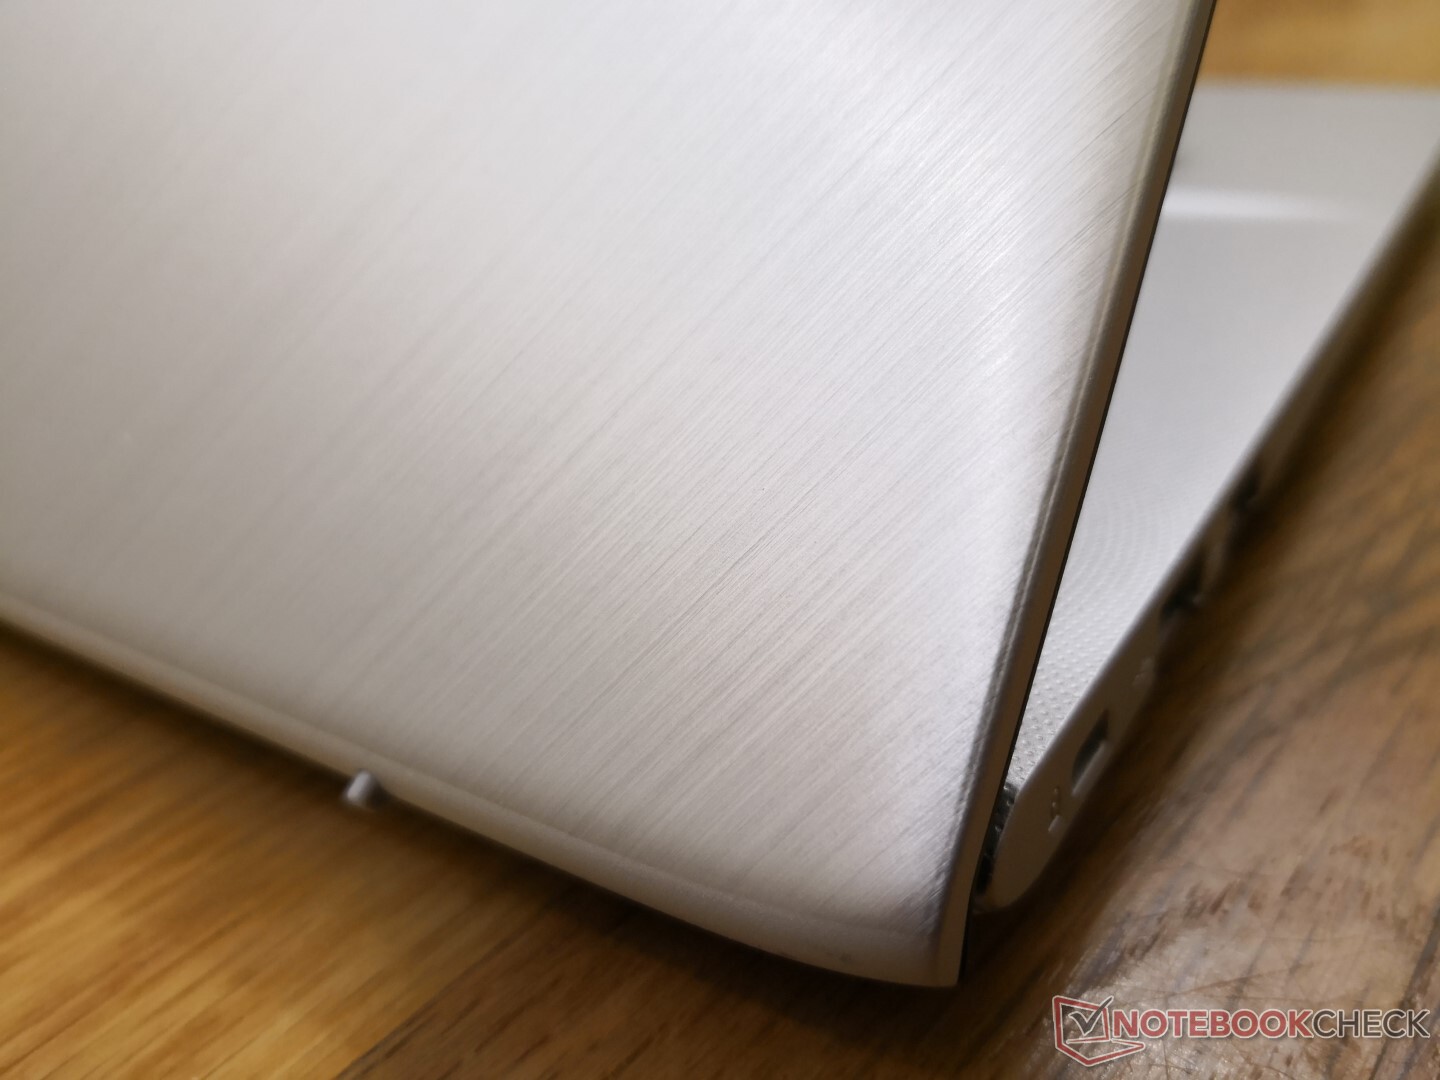
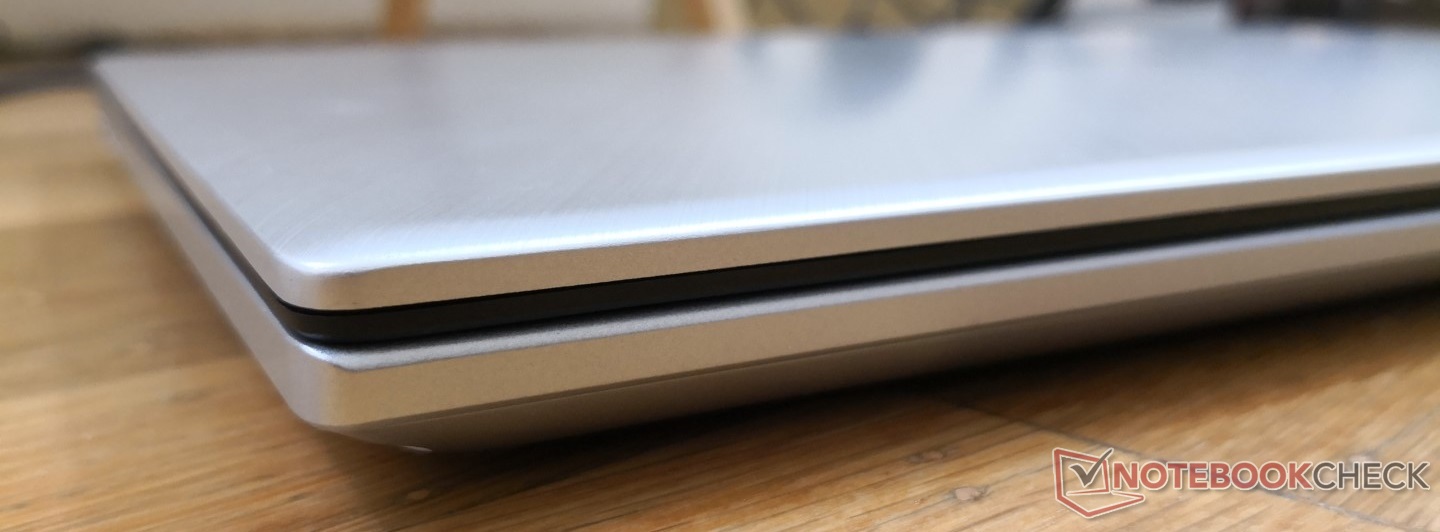
Case
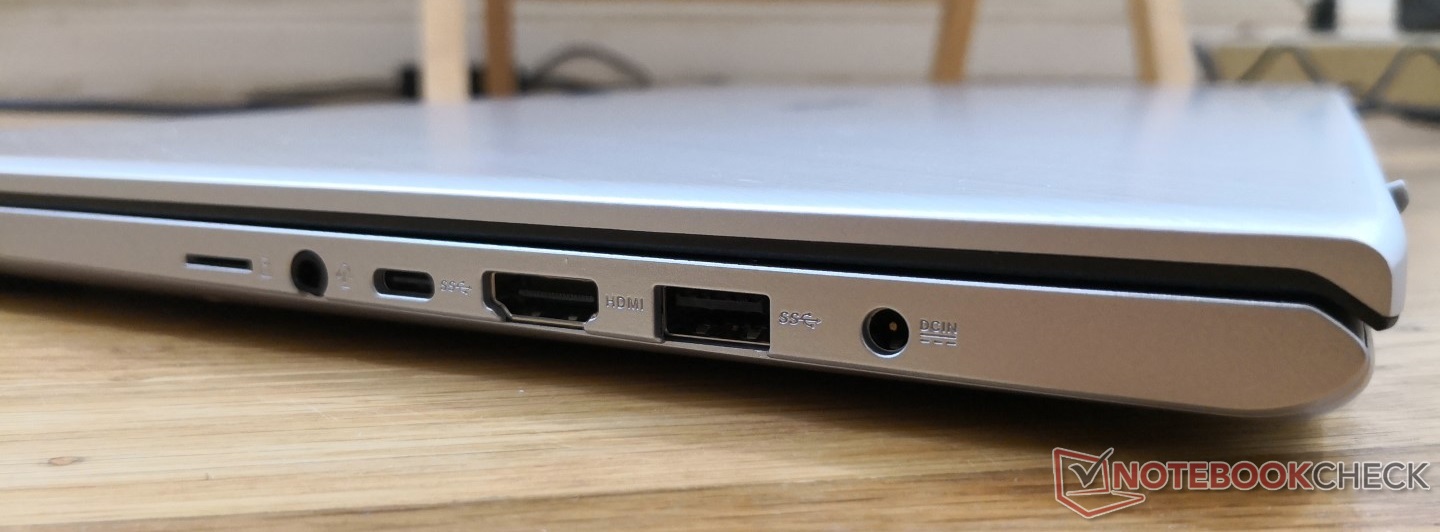
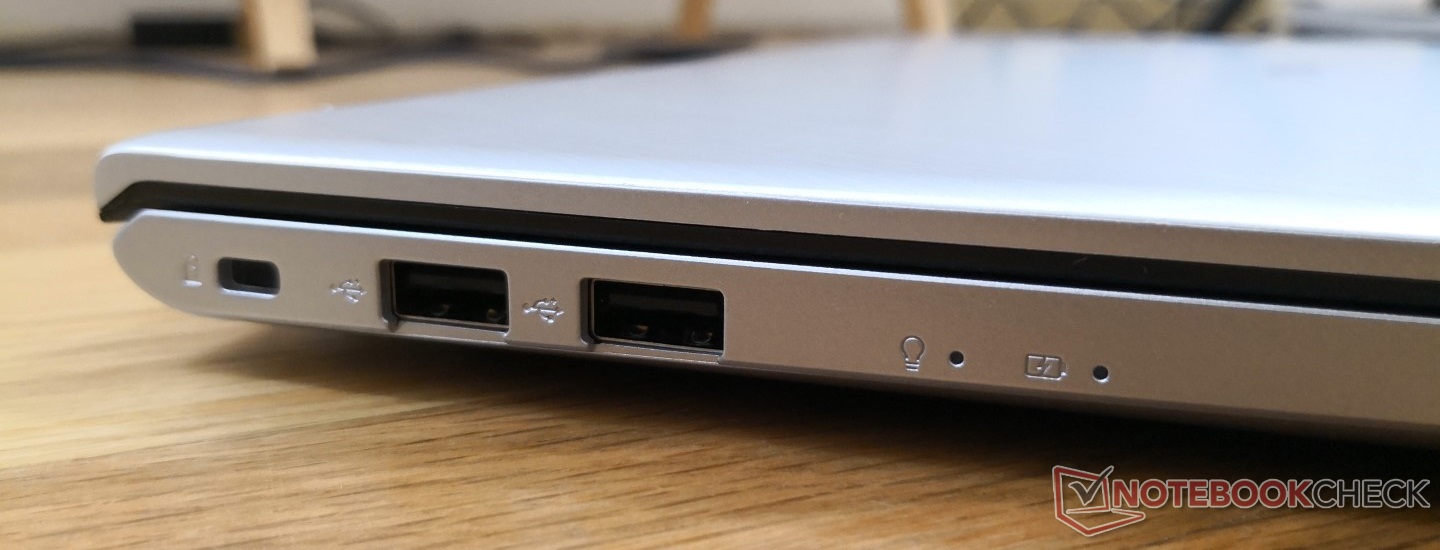
Connectivity
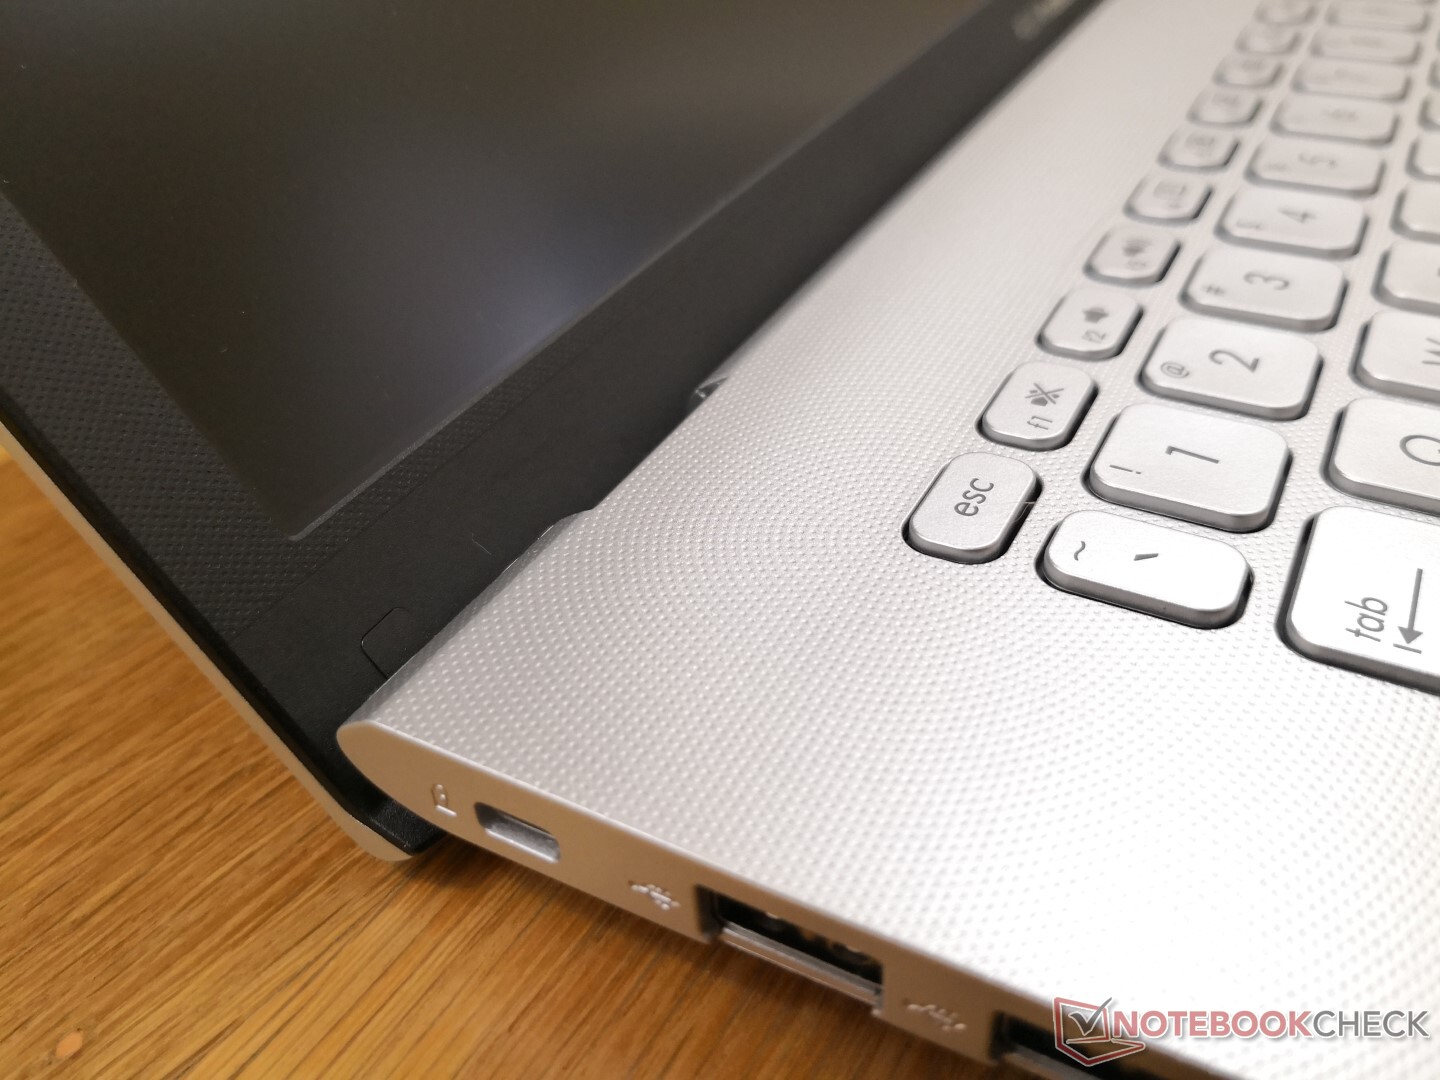
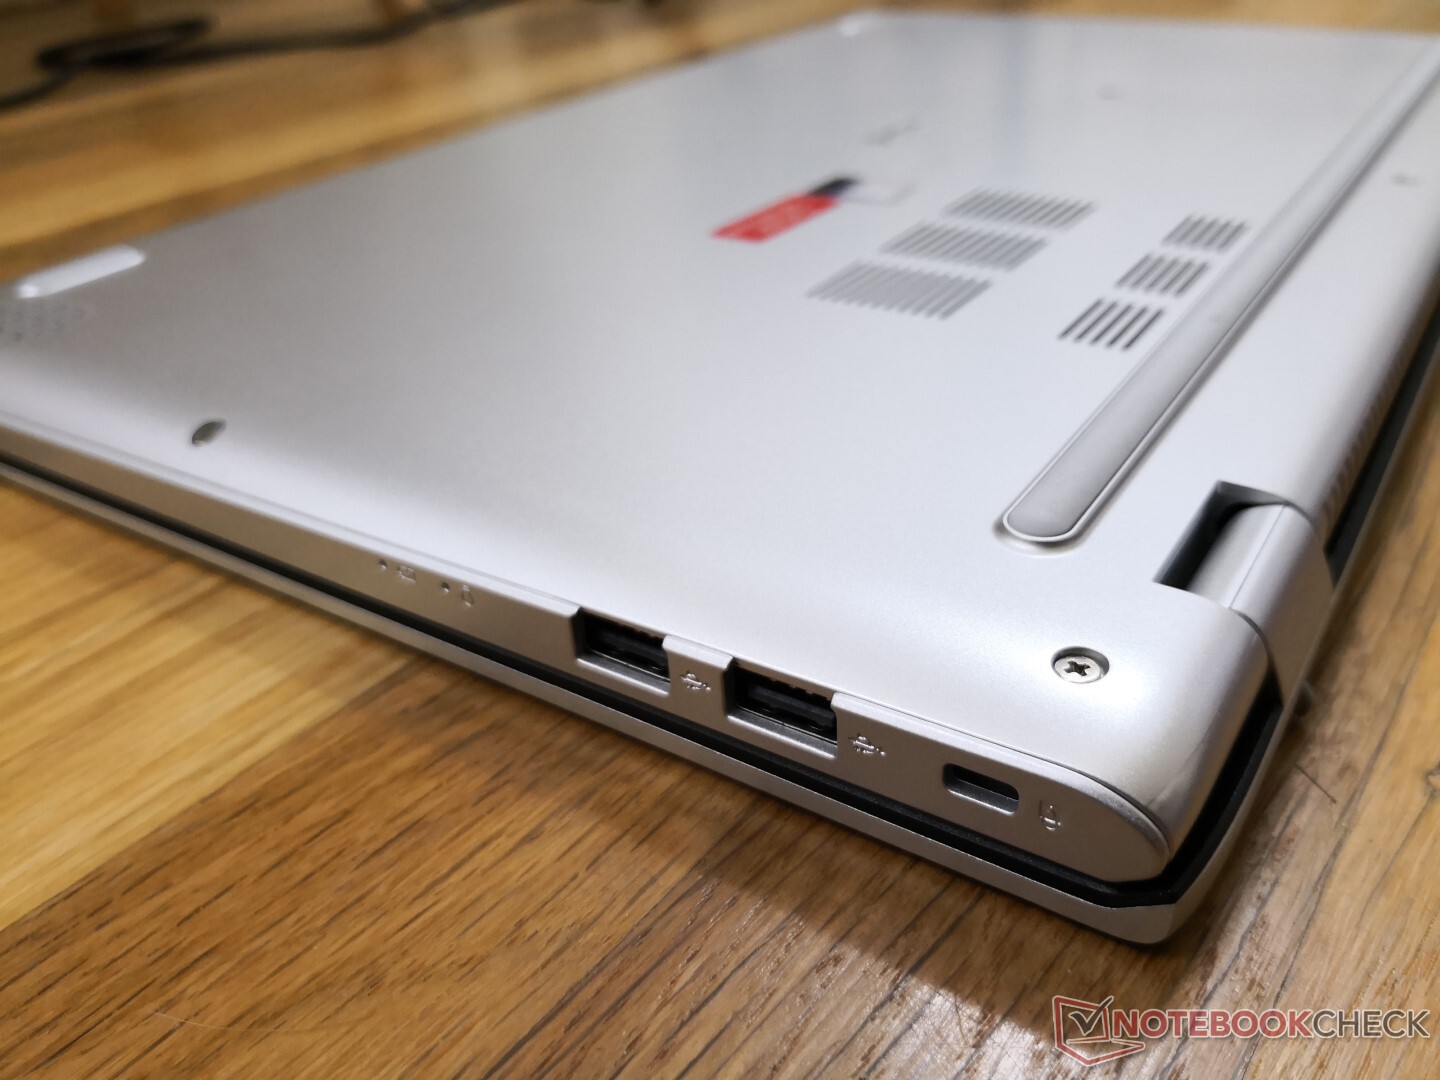
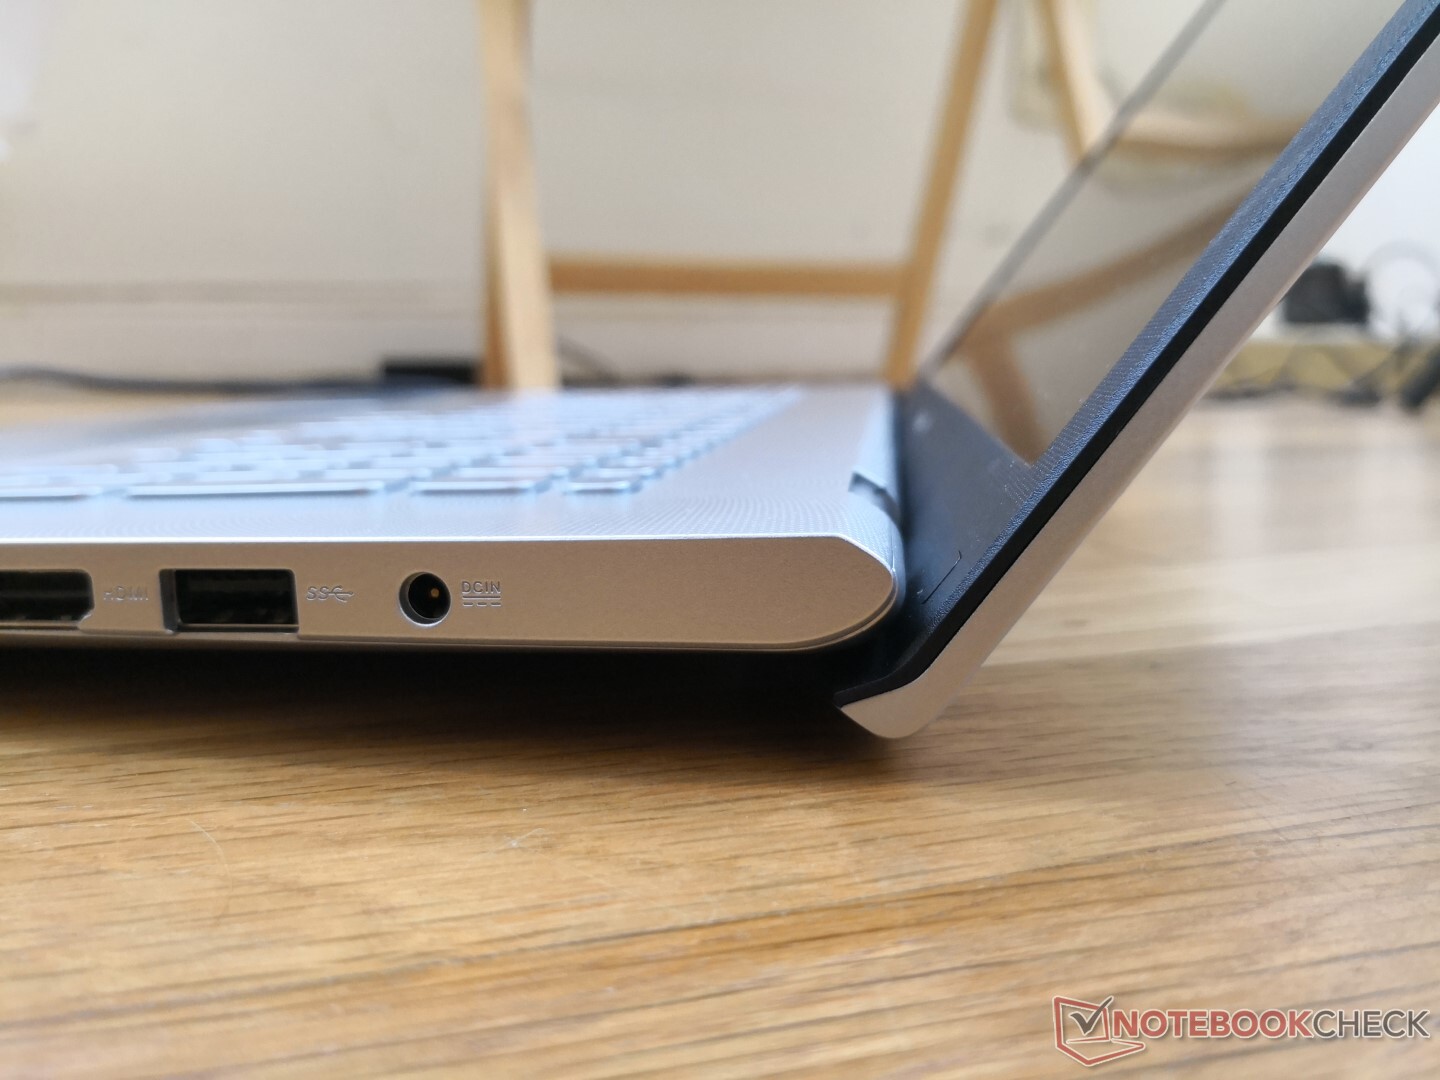
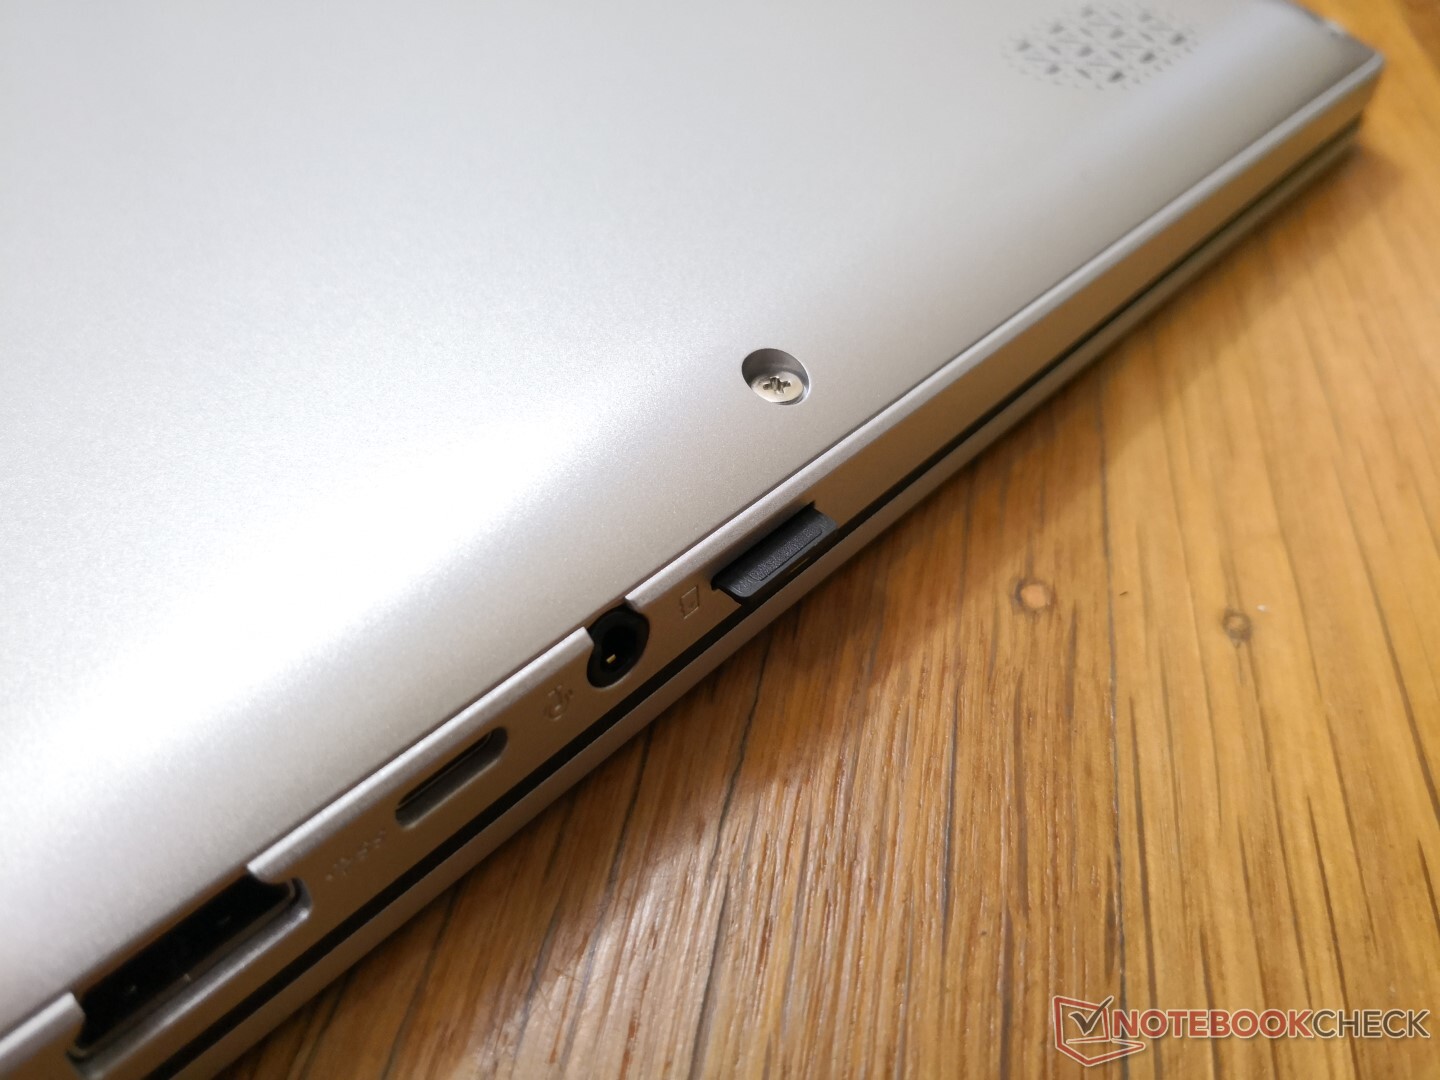
Ports include the expected HDMI with both USB-A and USB-C options not unlike the Lenovo IdeaPad 330S-15. The USB-C port does not support DisplayPort monitors or laptop charging. There is no RJ-45 either which is becoming increasingly common on newer laptops.
SD Card Reader
It's strange to see a MicroSD card reader instead of a full-size one considering the large 17.3-inch form factor. Transfer rates are otherwise respectable for the category and much faster than what we recorded on the Ryzen-powered Asus VivoBook 17 M712DA.
| SD Card Reader | |
| average JPG Copy Test (av. of 3 runs) | |
| Asus VivoBook 17 S712FA-DS76 (Toshiba Exceria Pro M501 microSDXC 64GB) | |
| HP Envy 17t-cg000 (Toshiba Exceria Pro SDXC 64 GB UHS-II) | |
| Lenovo Ideapad 330S-15ARR-81FB00C7GE (Toshiba Exceria Pro SDXC 64 GB UHS-II) | |
| Asus VivoBook 17 M712DA-AU017T (Toshiba Exceria Pro M501 microSDXC 64GB) | |
| HP 17-by2437ng (Toshiba Exceria Pro SDXC 64 GB UHS-II) | |
| Dell Inspiron 17 3780 (Toshiba Exceria Pro SDXC 64 GB UHS-II) | |
| maximum AS SSD Seq Read Test (1GB) | |
| Asus VivoBook 17 S712FA-DS76 (Toshiba Exceria Pro M501 microSDXC 64GB) | |
| HP Envy 17t-cg000 (Toshiba Exceria Pro SDXC 64 GB UHS-II) | |
| Lenovo Ideapad 330S-15ARR-81FB00C7GE (Toshiba Exceria Pro SDXC 64 GB UHS-II) | |
| Asus VivoBook 17 M712DA-AU017T (Toshiba Exceria Pro M501 microSDXC 64GB) | |
| HP 17-by2437ng (Toshiba Exceria Pro SDXC 64 GB UHS-II) | |
| Dell Inspiron 17 3780 (Toshiba Exceria Pro SDXC 64 GB UHS-II) | |
Communication
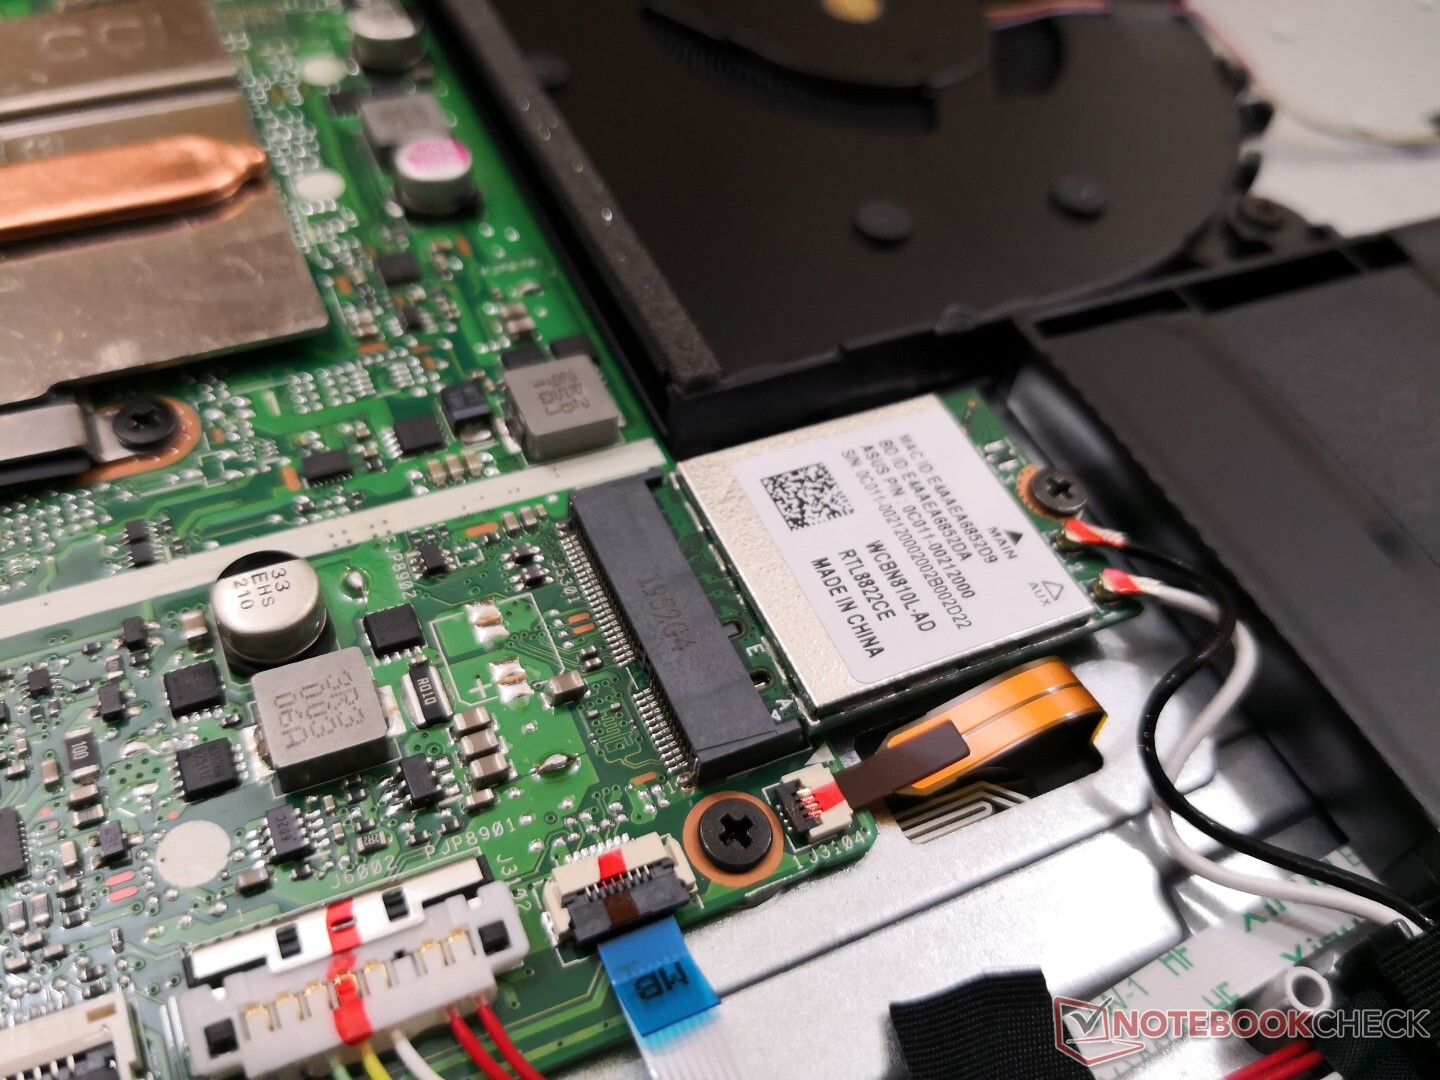
Wi-Fi 802.11ac or Wi-Fi 5 is provided by the Realtek 8822CE. We didn't experience any connectivity issues when paired with our Netgear RAX200 router.
Webcam


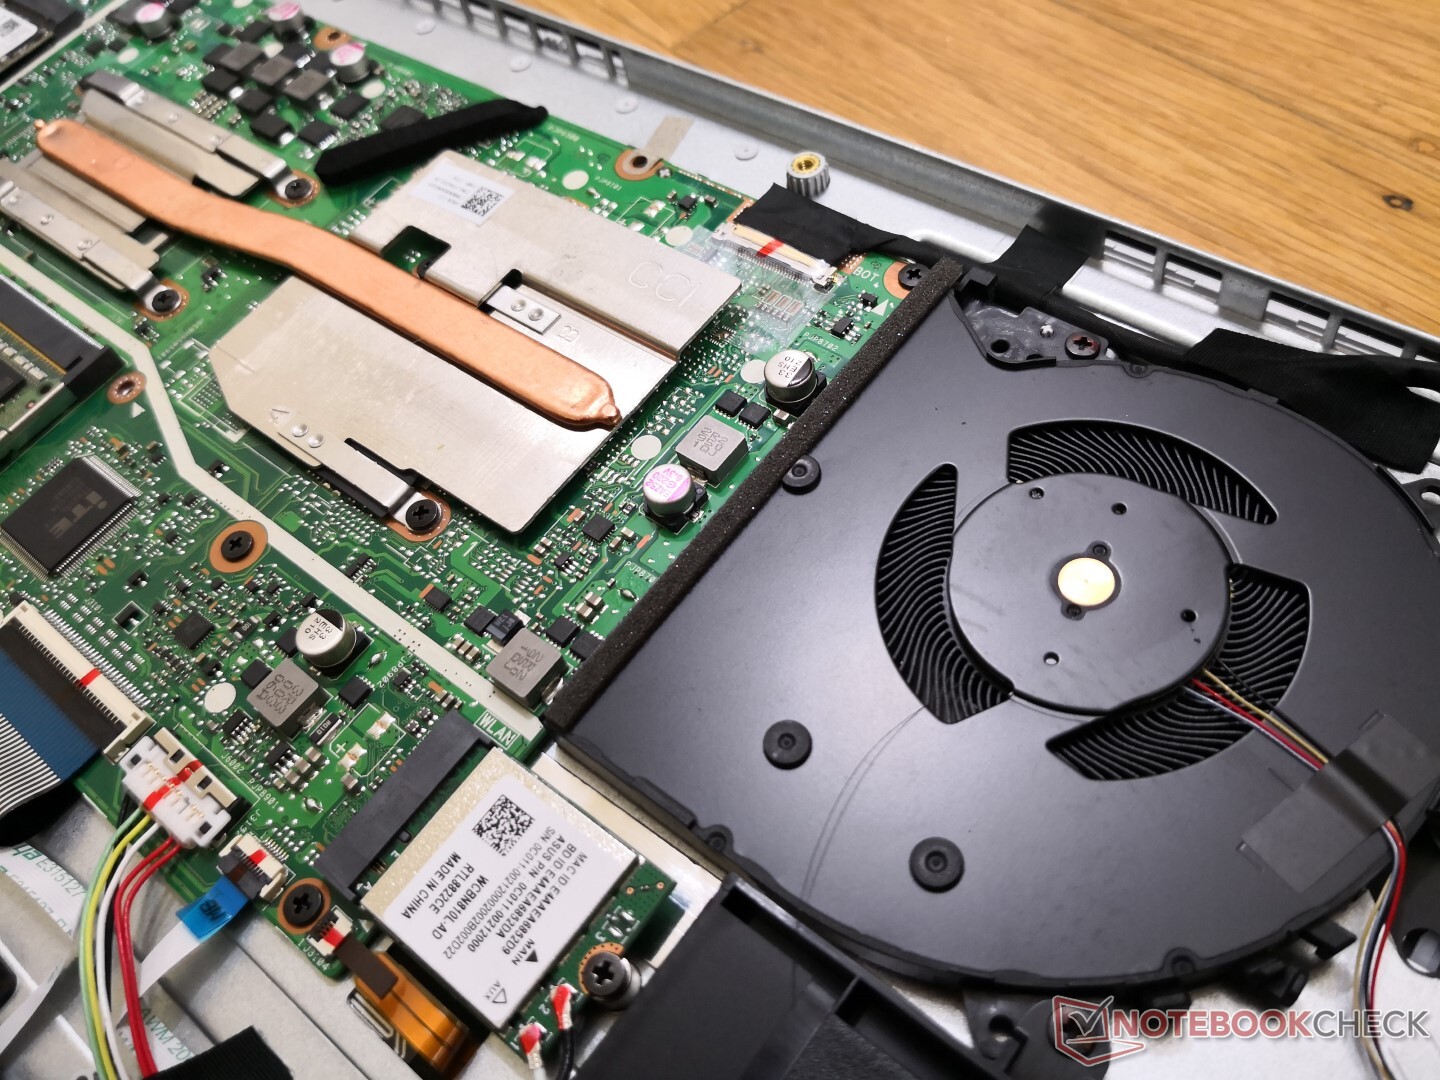
Maintenance
Accessories and Warranty
There are no extras in the box other than the usual paperwork. The one-year limited manufacturer warranty applies with additional options if purchased from CUKUSA.com
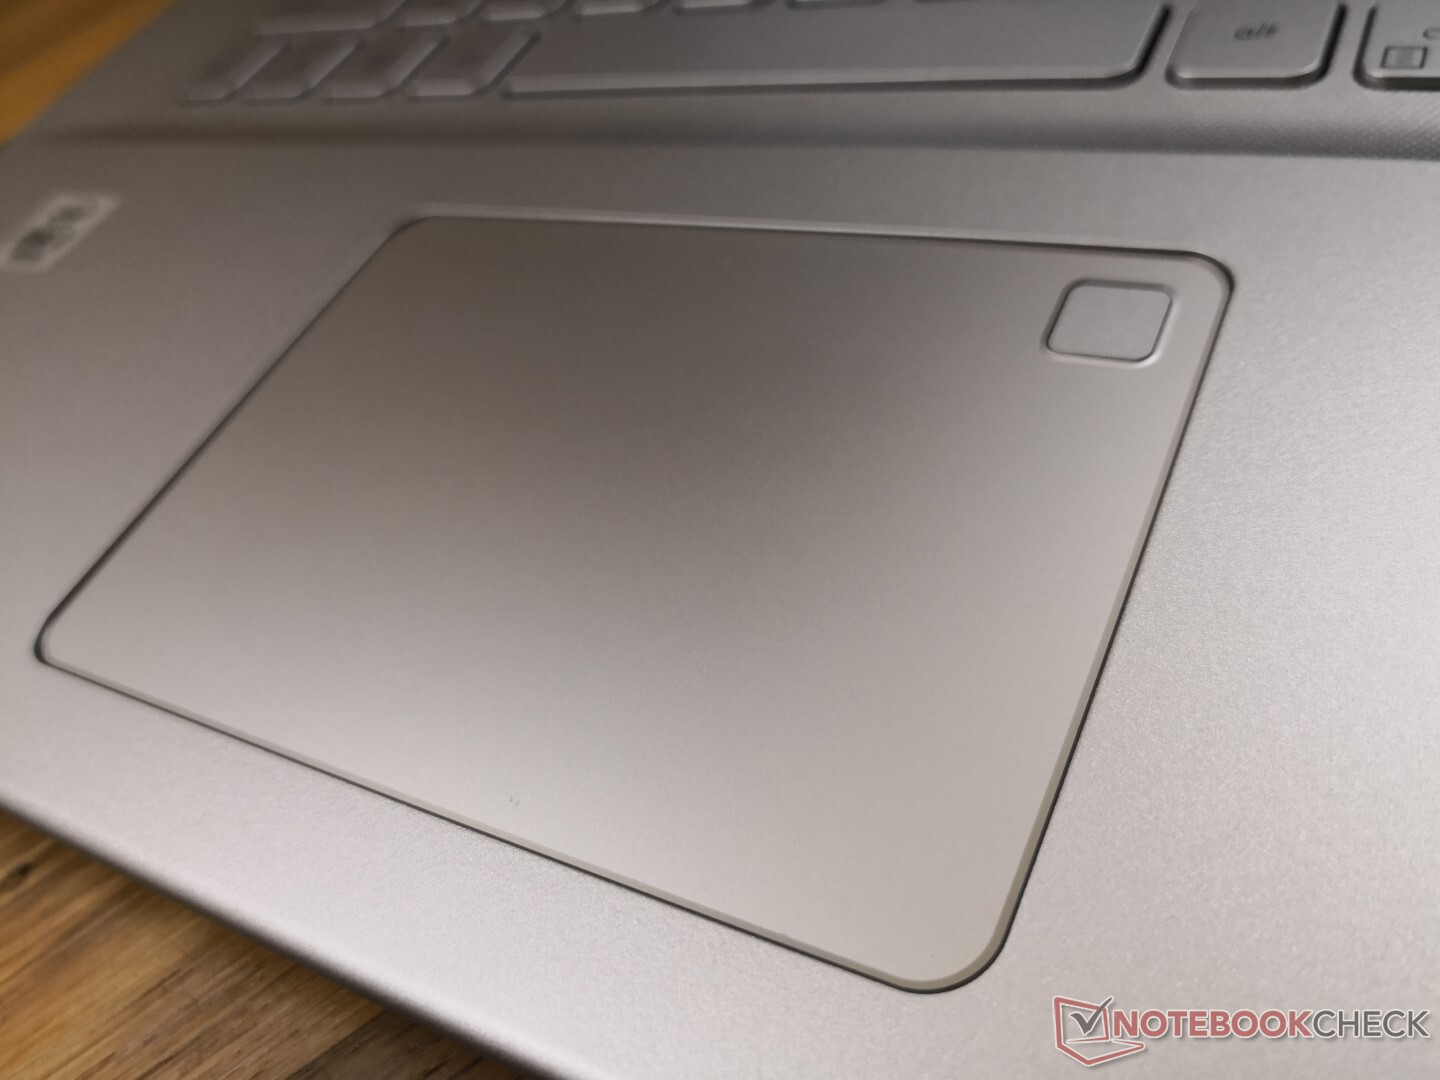
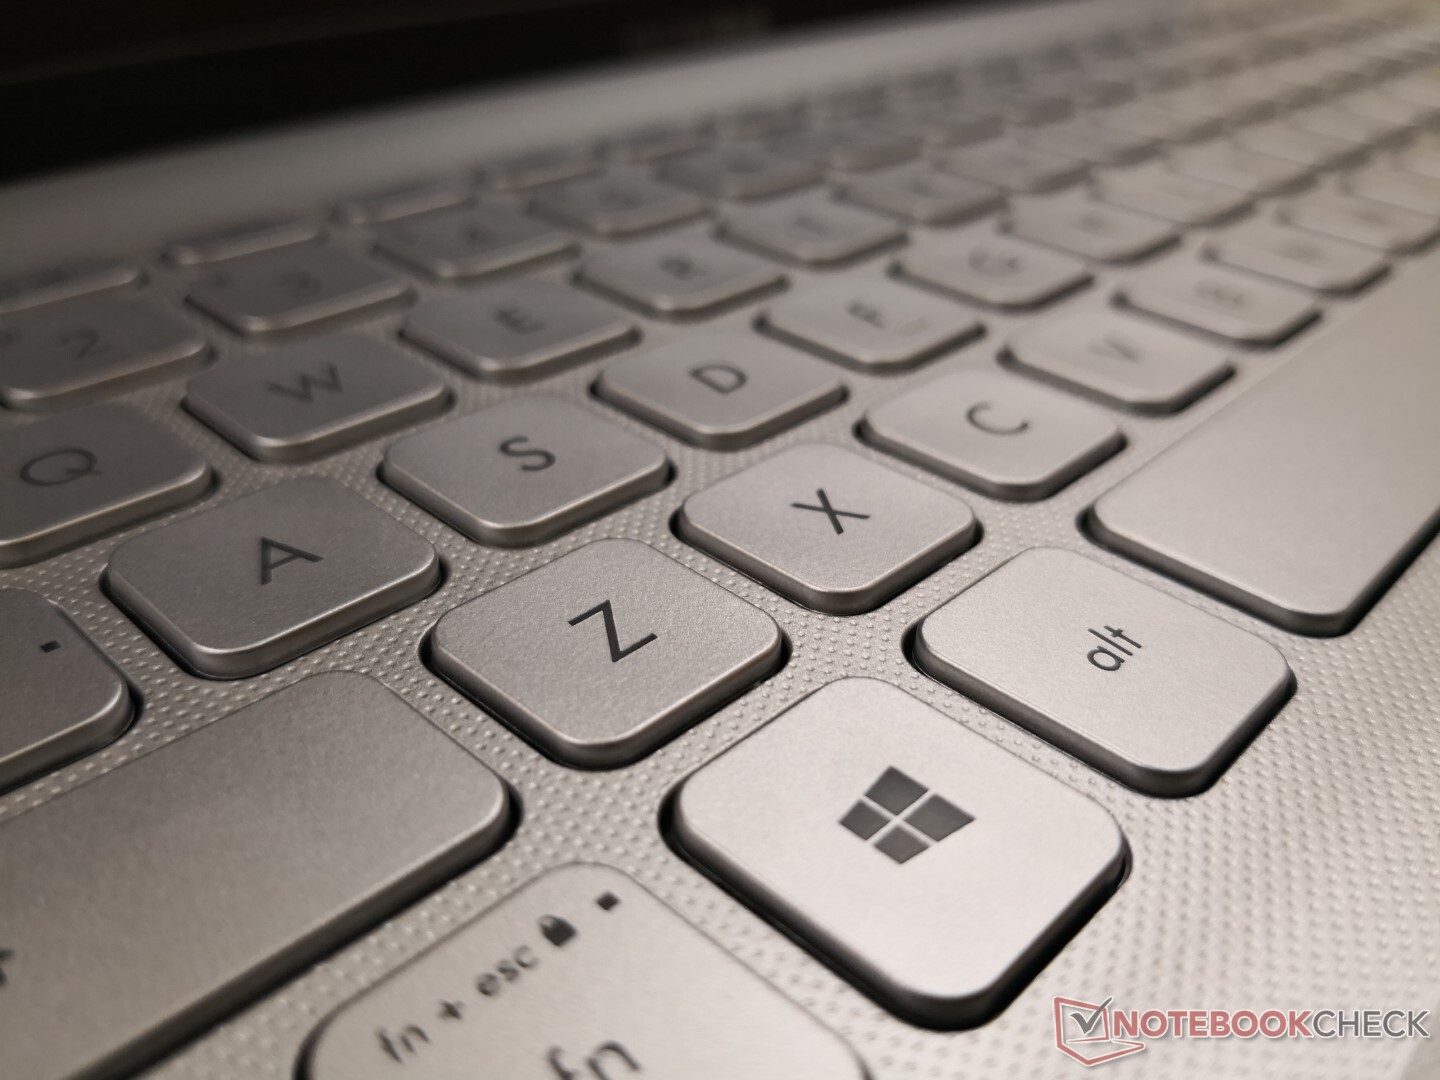
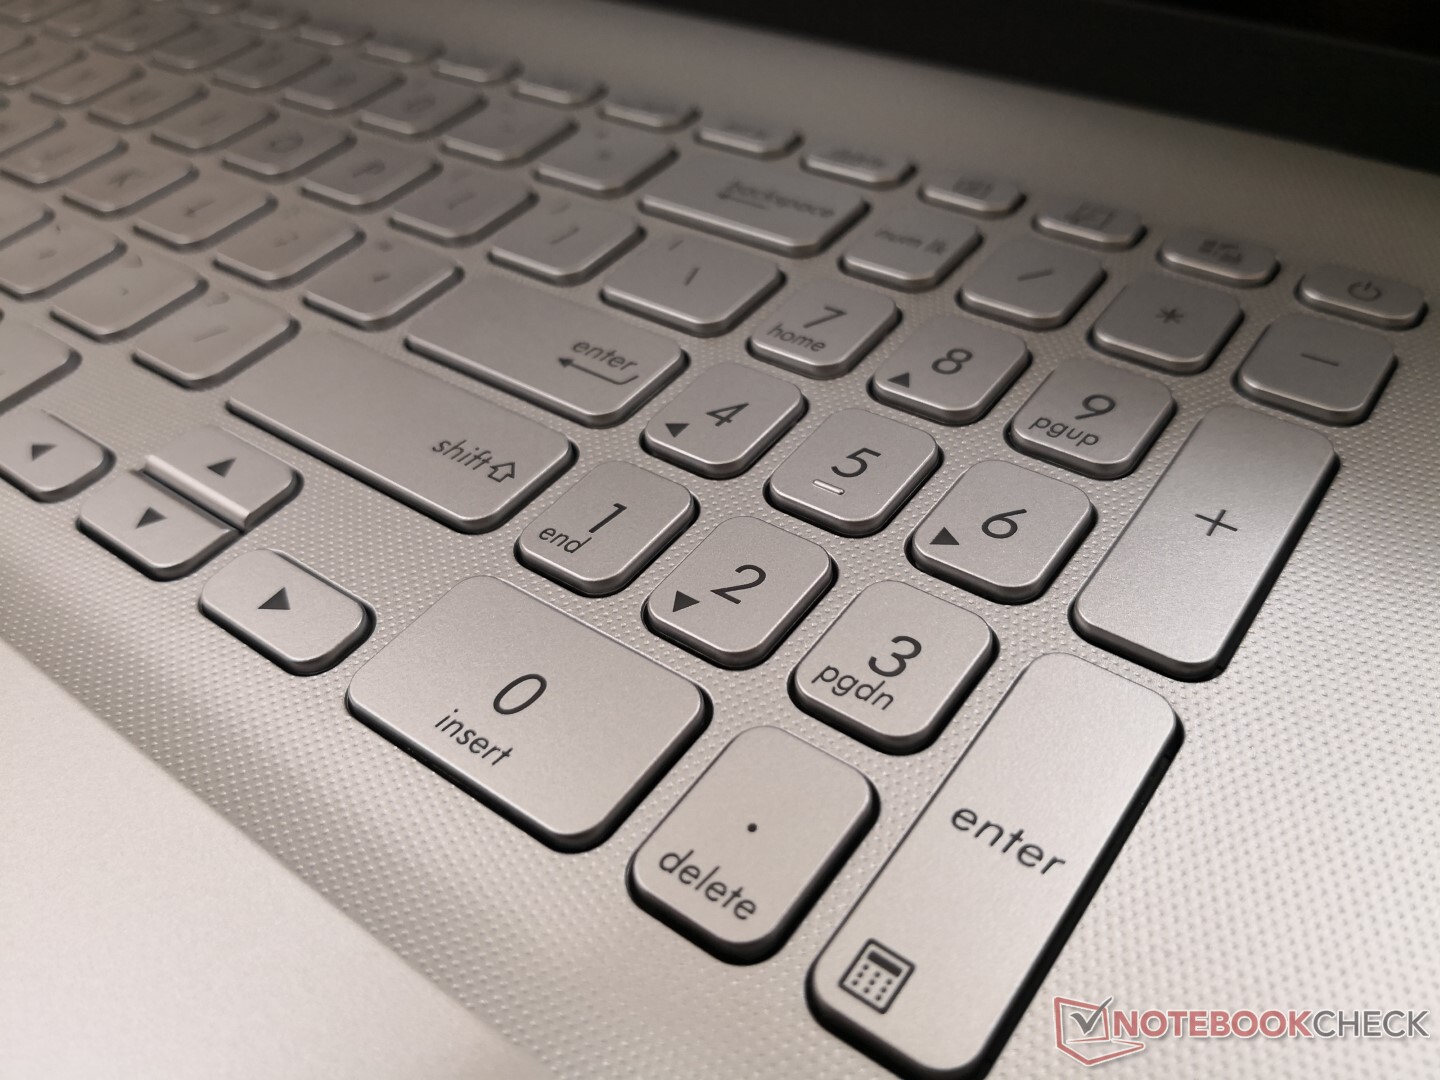
Input Devices
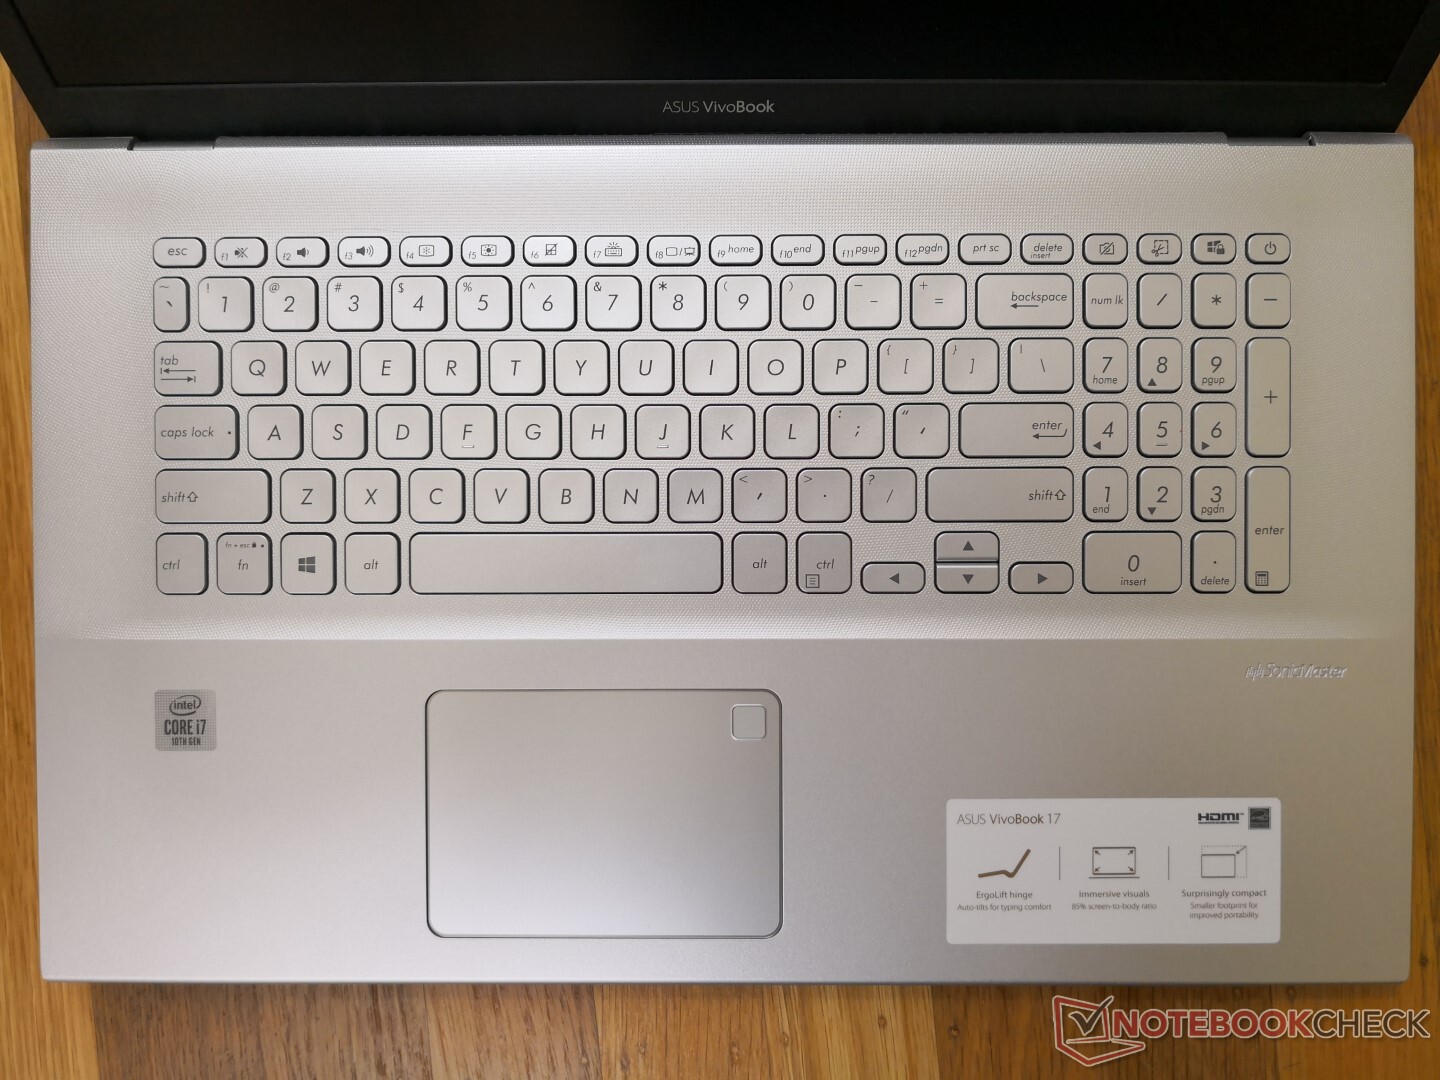
Keyboard and Touchpad
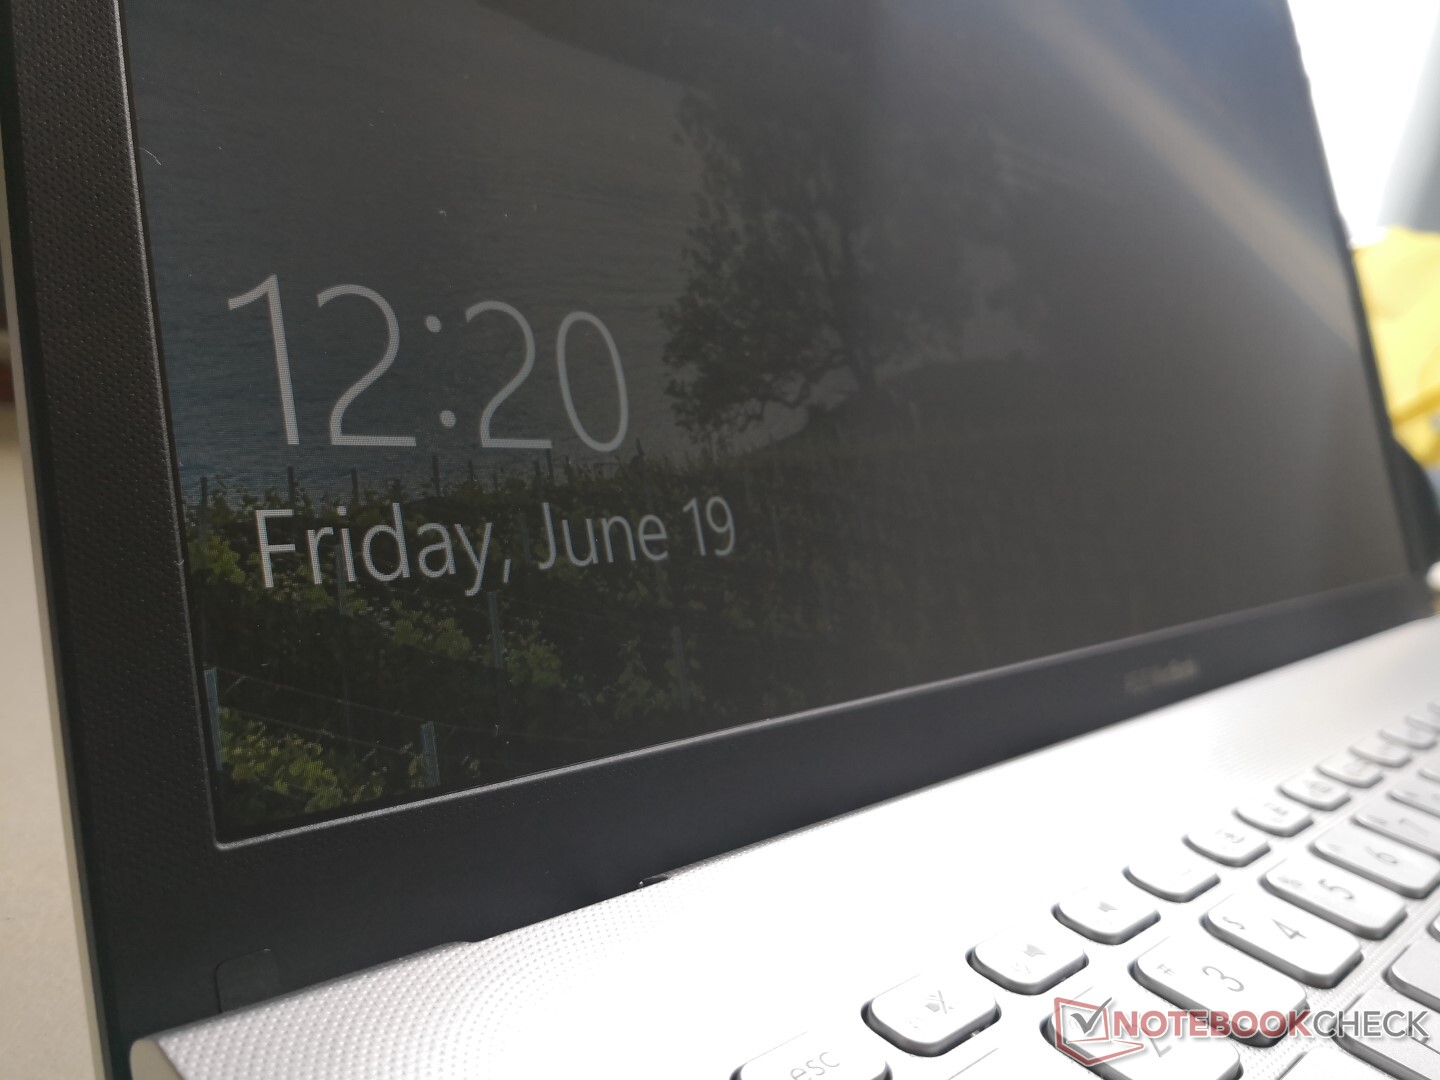
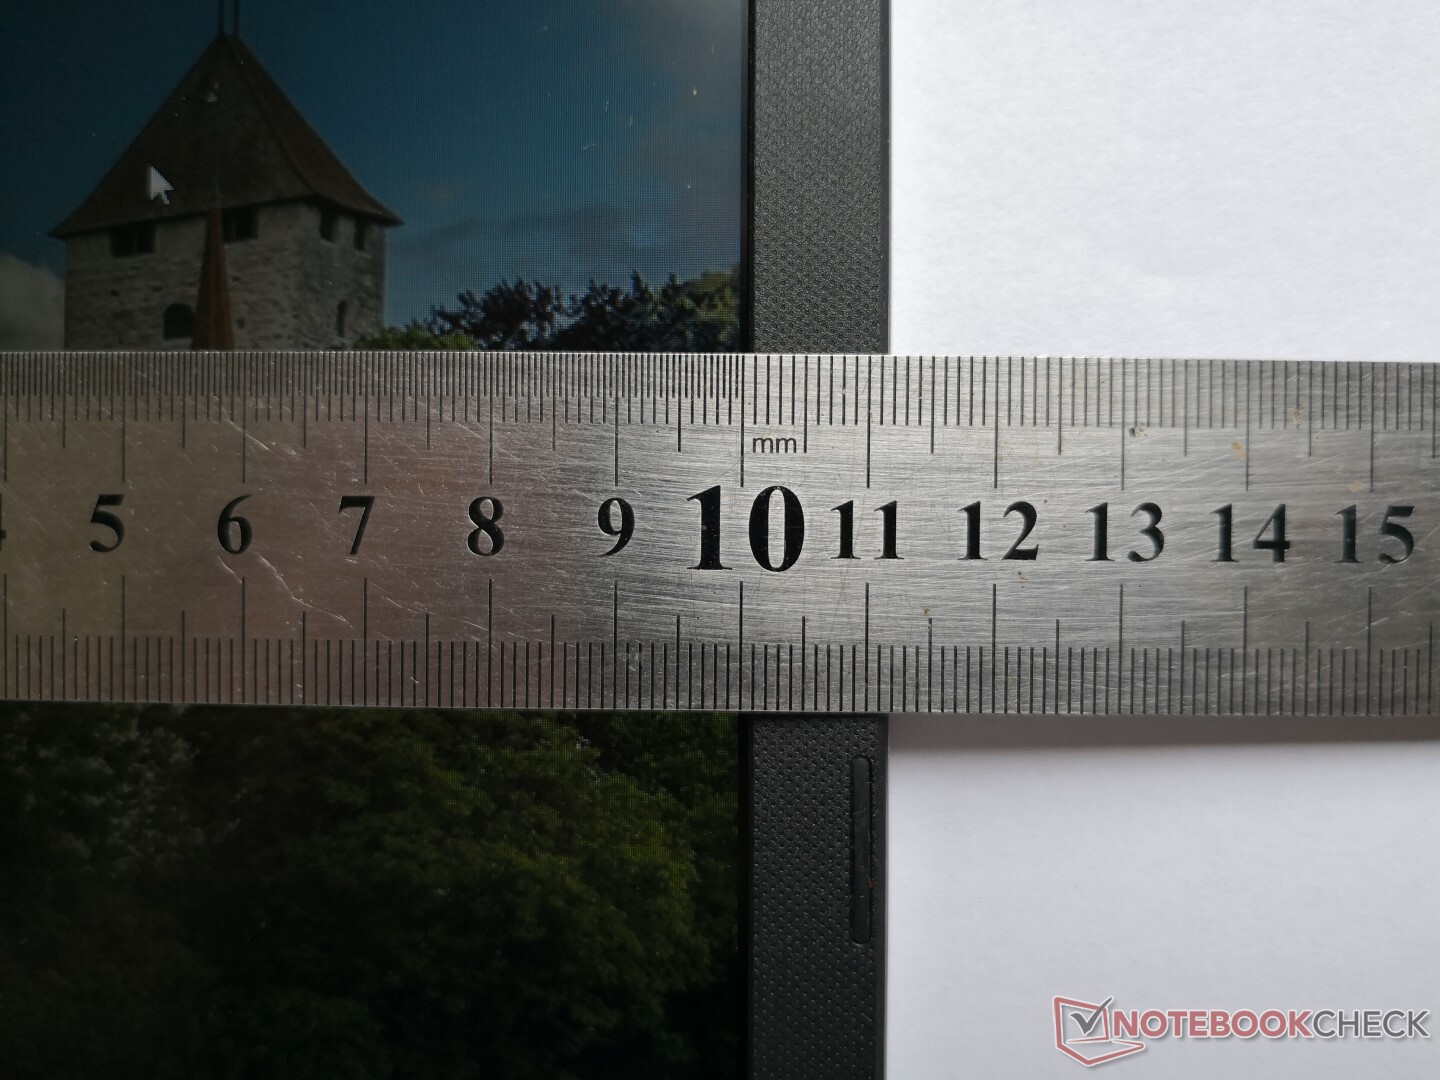
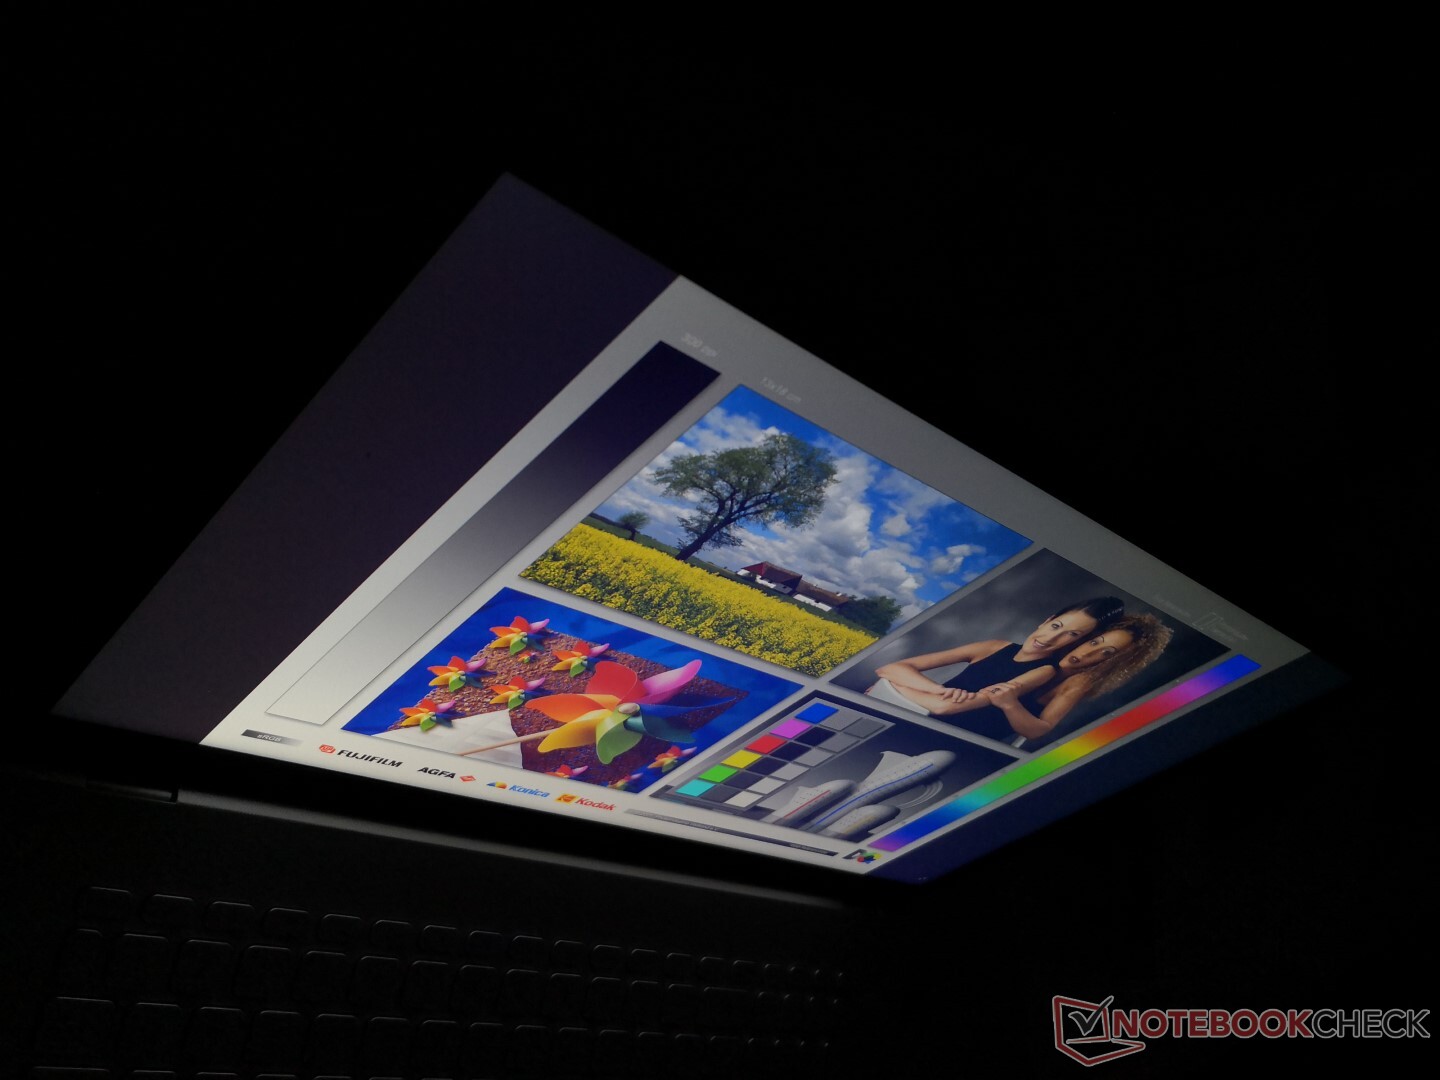
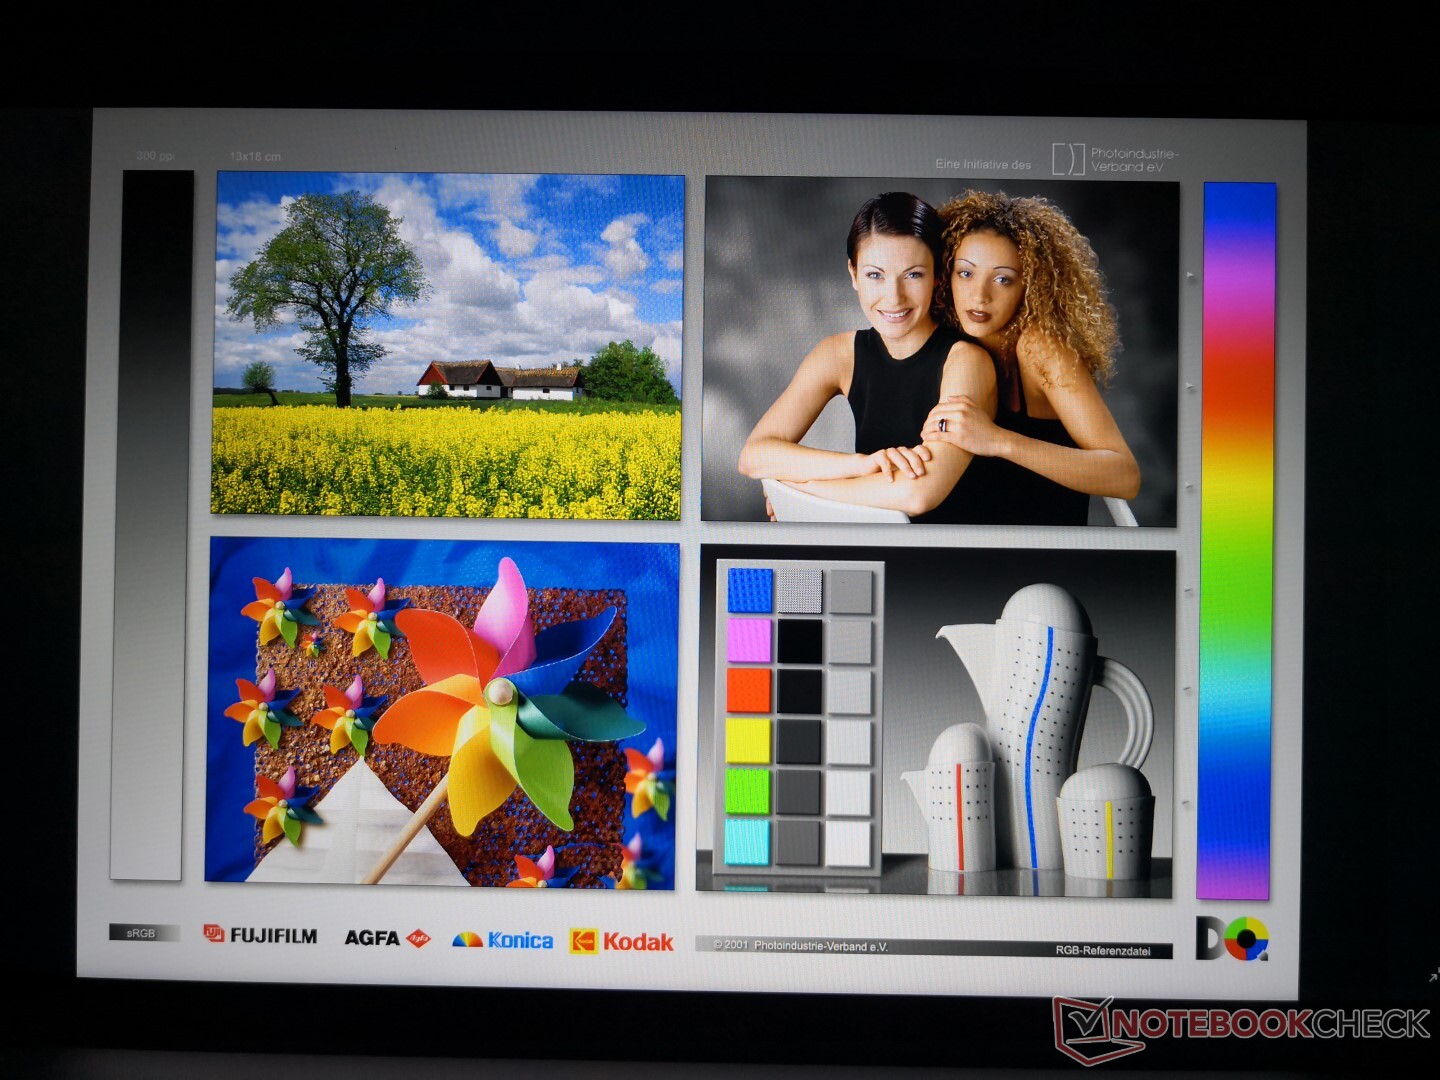
Display
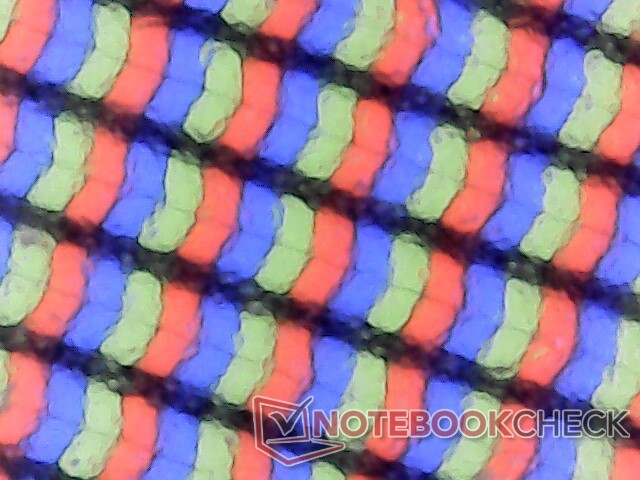
The BOE NV173FHM-N49 IPS panel here can be found on no other laptop in our database, but the NV173FHM series is quite common. This particular panel is characterized by its relatively fast response times at the cost of both limited contrast ratio and gamut. Though content is crisp for a matte panel, colors and pictures don't pop with the same depth or vividness that high-end Ultrabooks have to offer.
| |||||||||||||||||||||||||
Brightness Distribution: 81 %
Center on Battery: 289.5 cd/m²
Contrast: 591:1 (Black: 0.49 cd/m²)
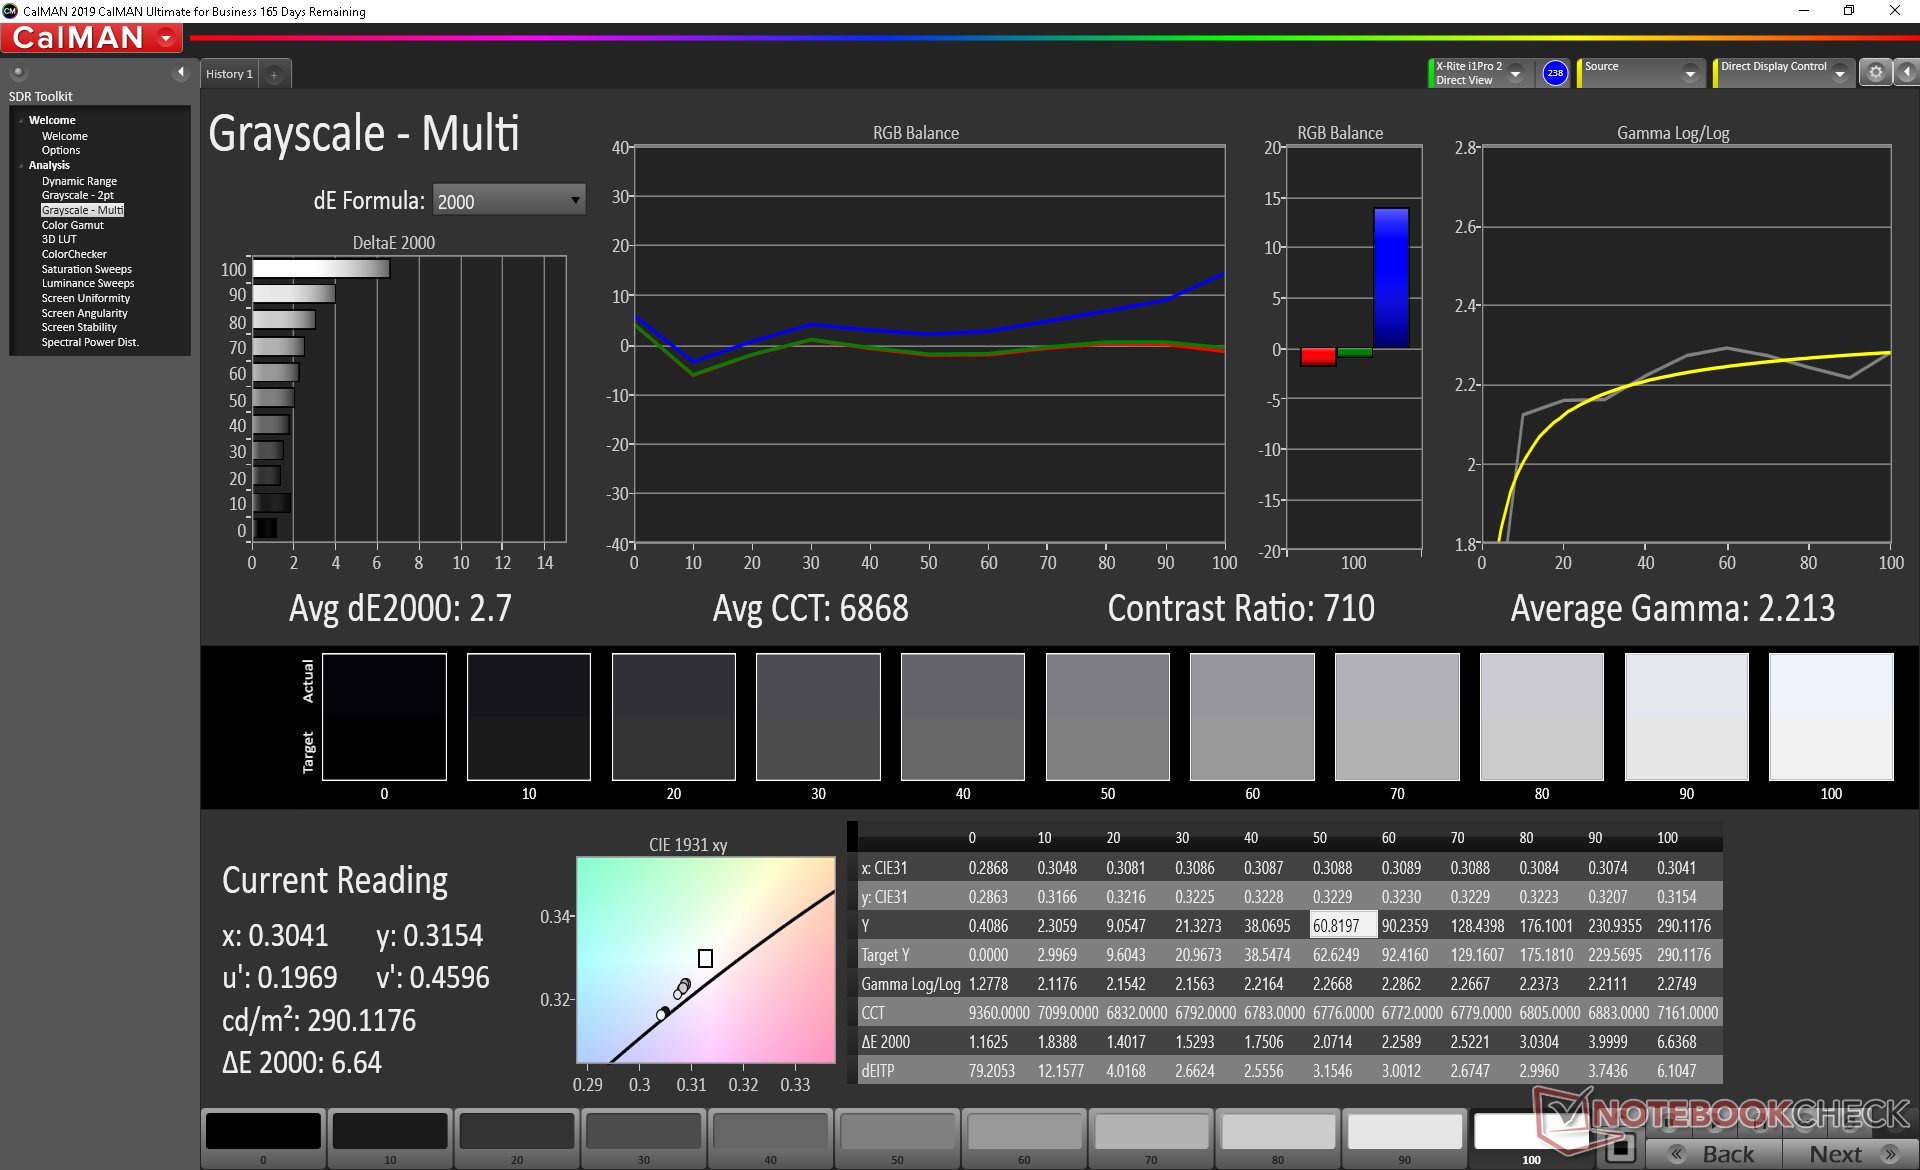
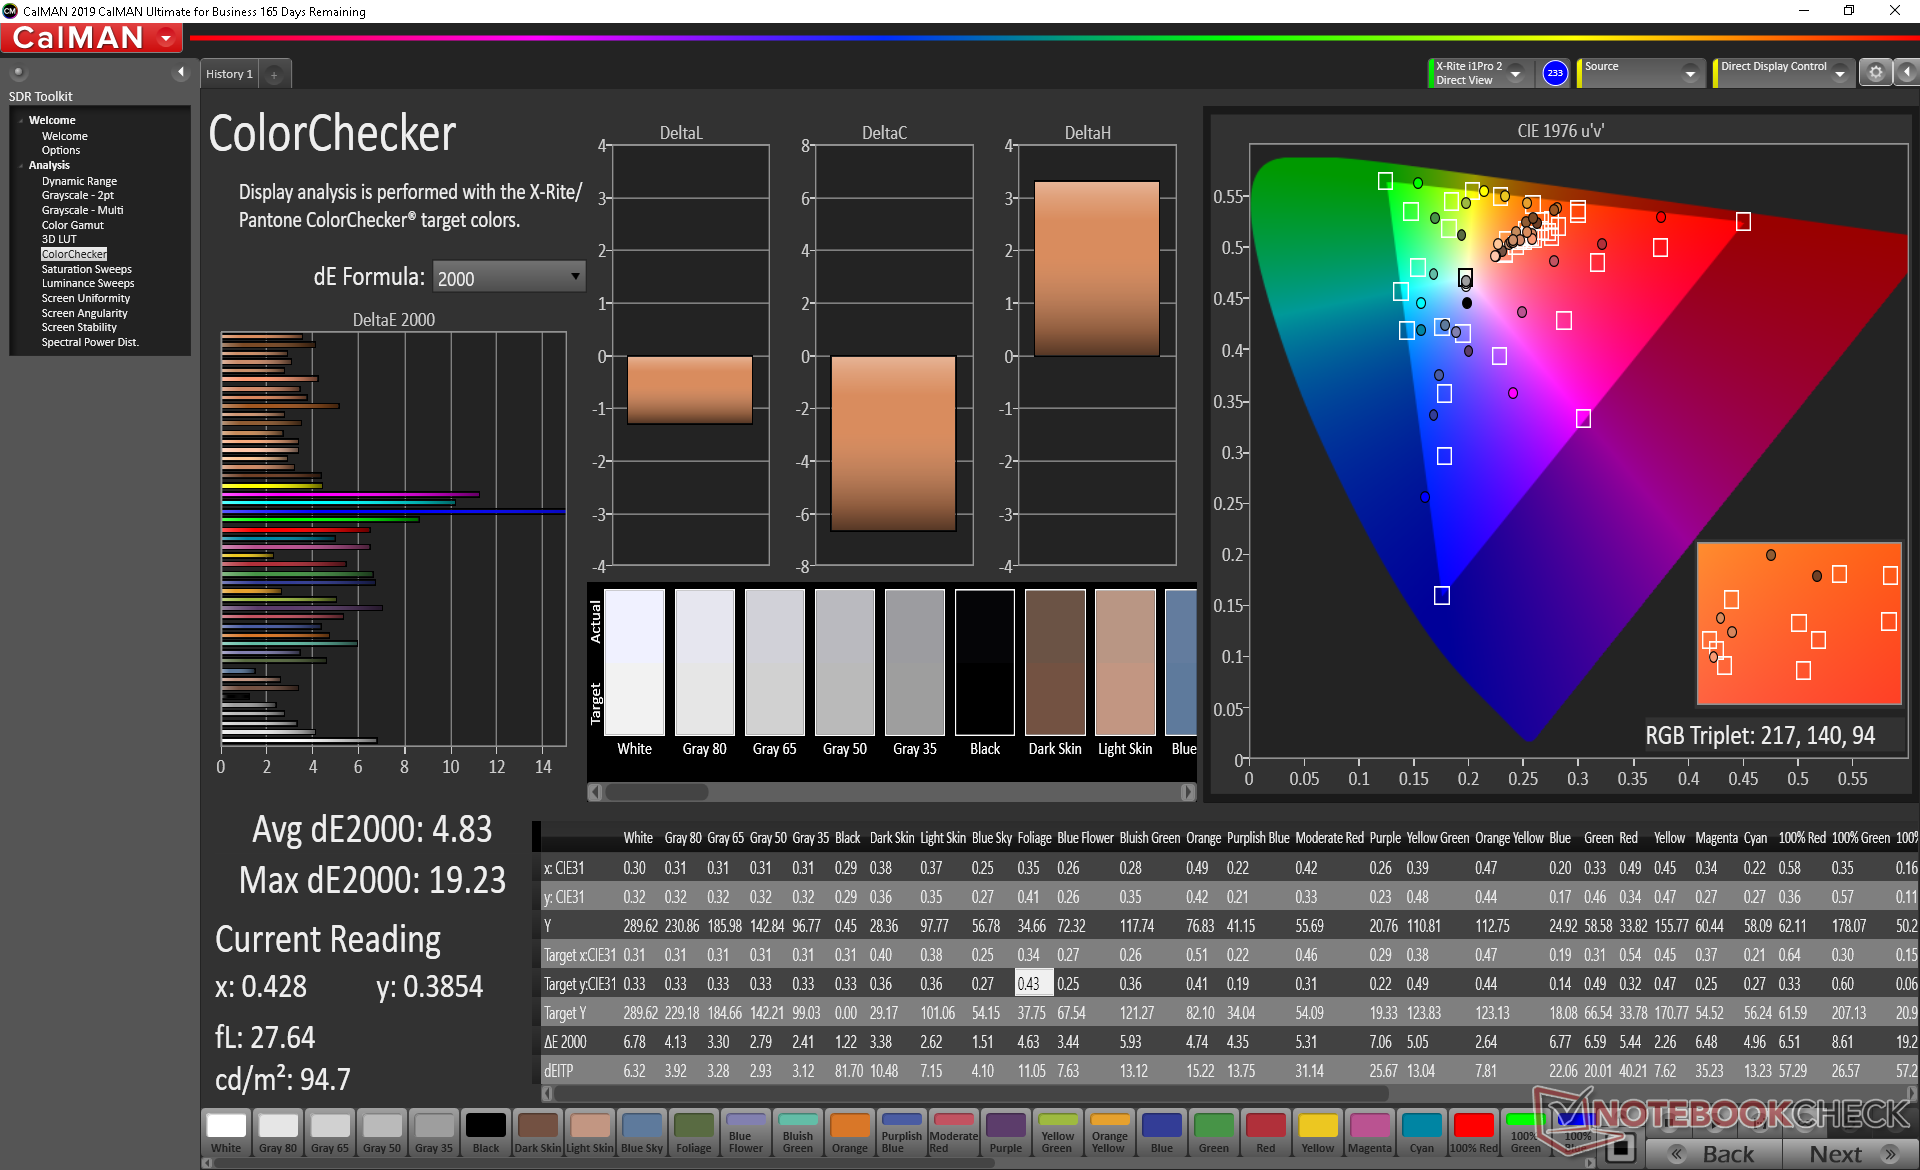
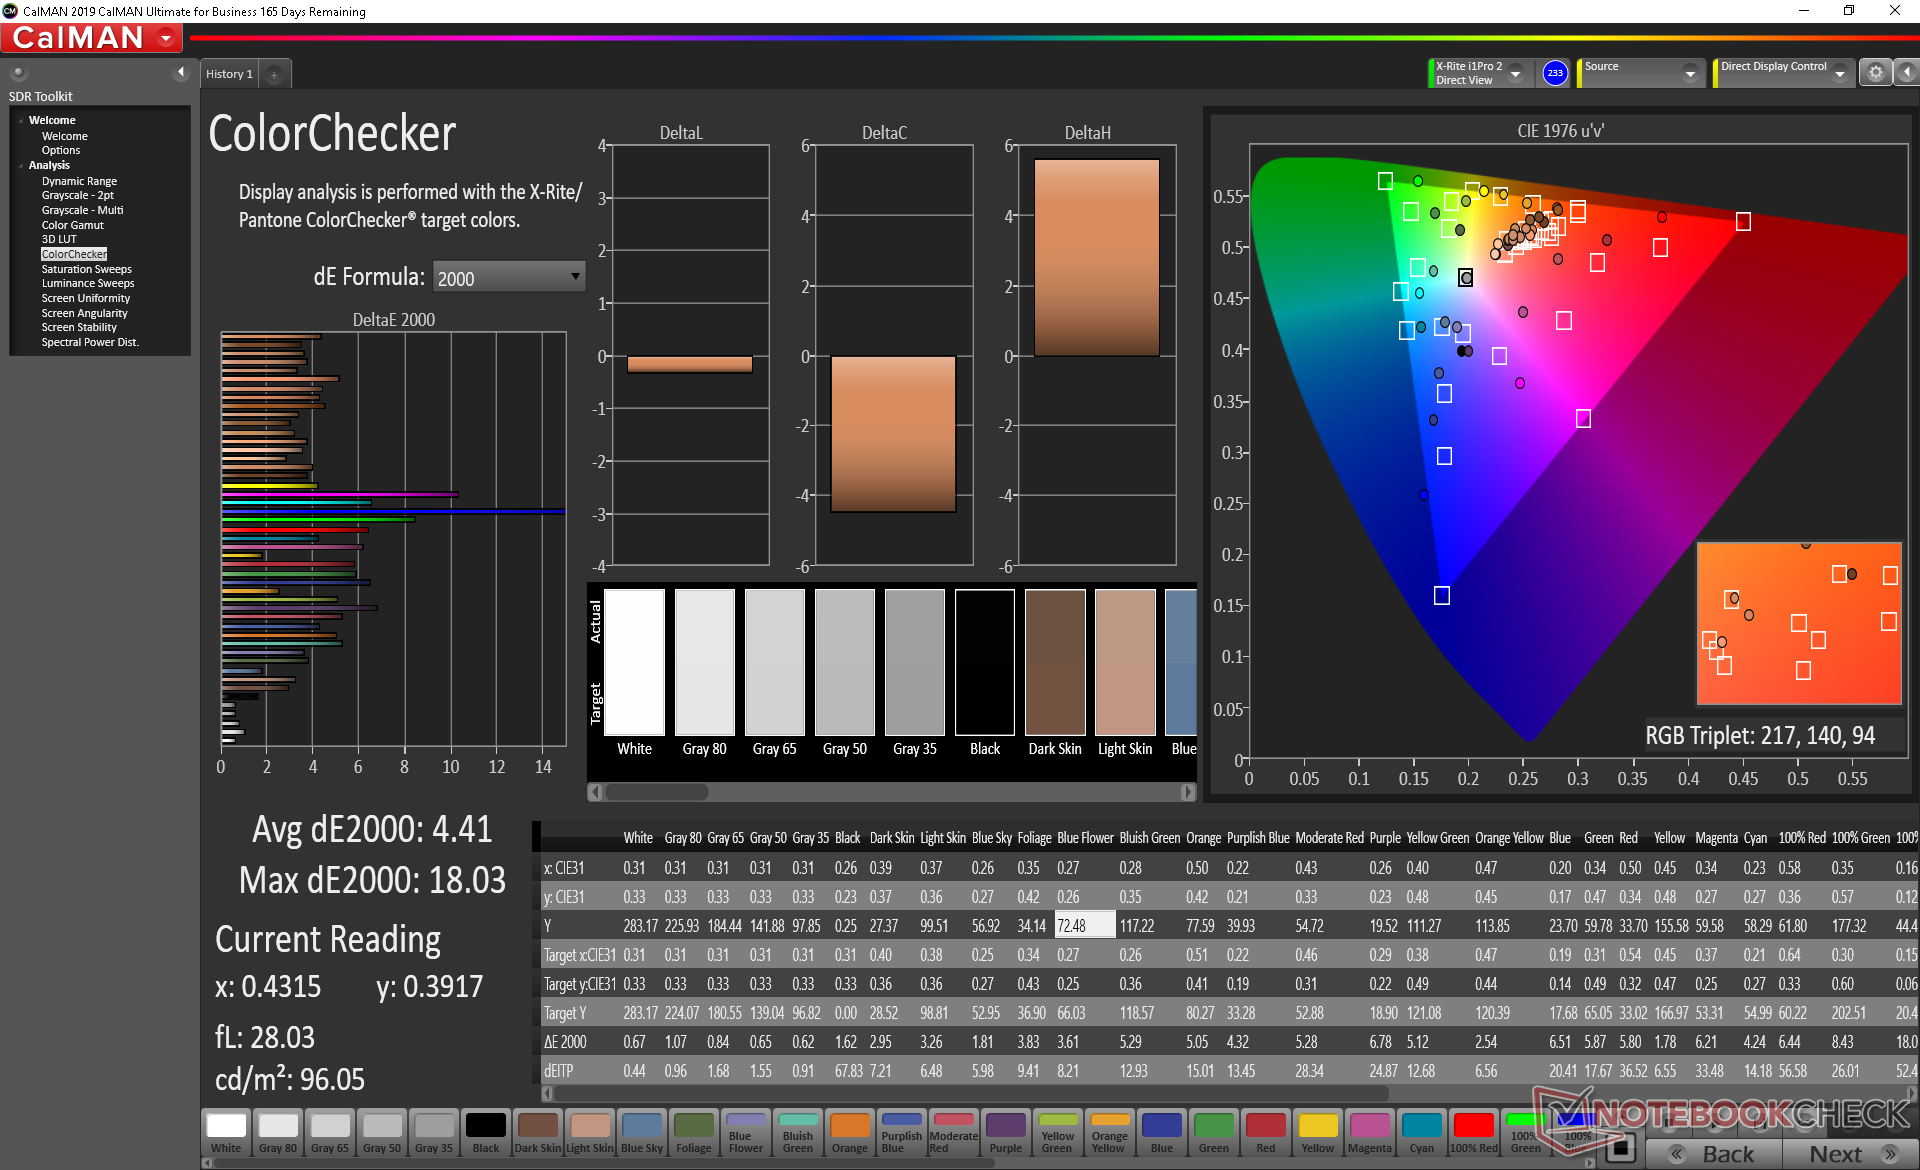
ΔE ColorChecker Calman: 4.83 | ∀{0.5-29.43 Ø4.71}
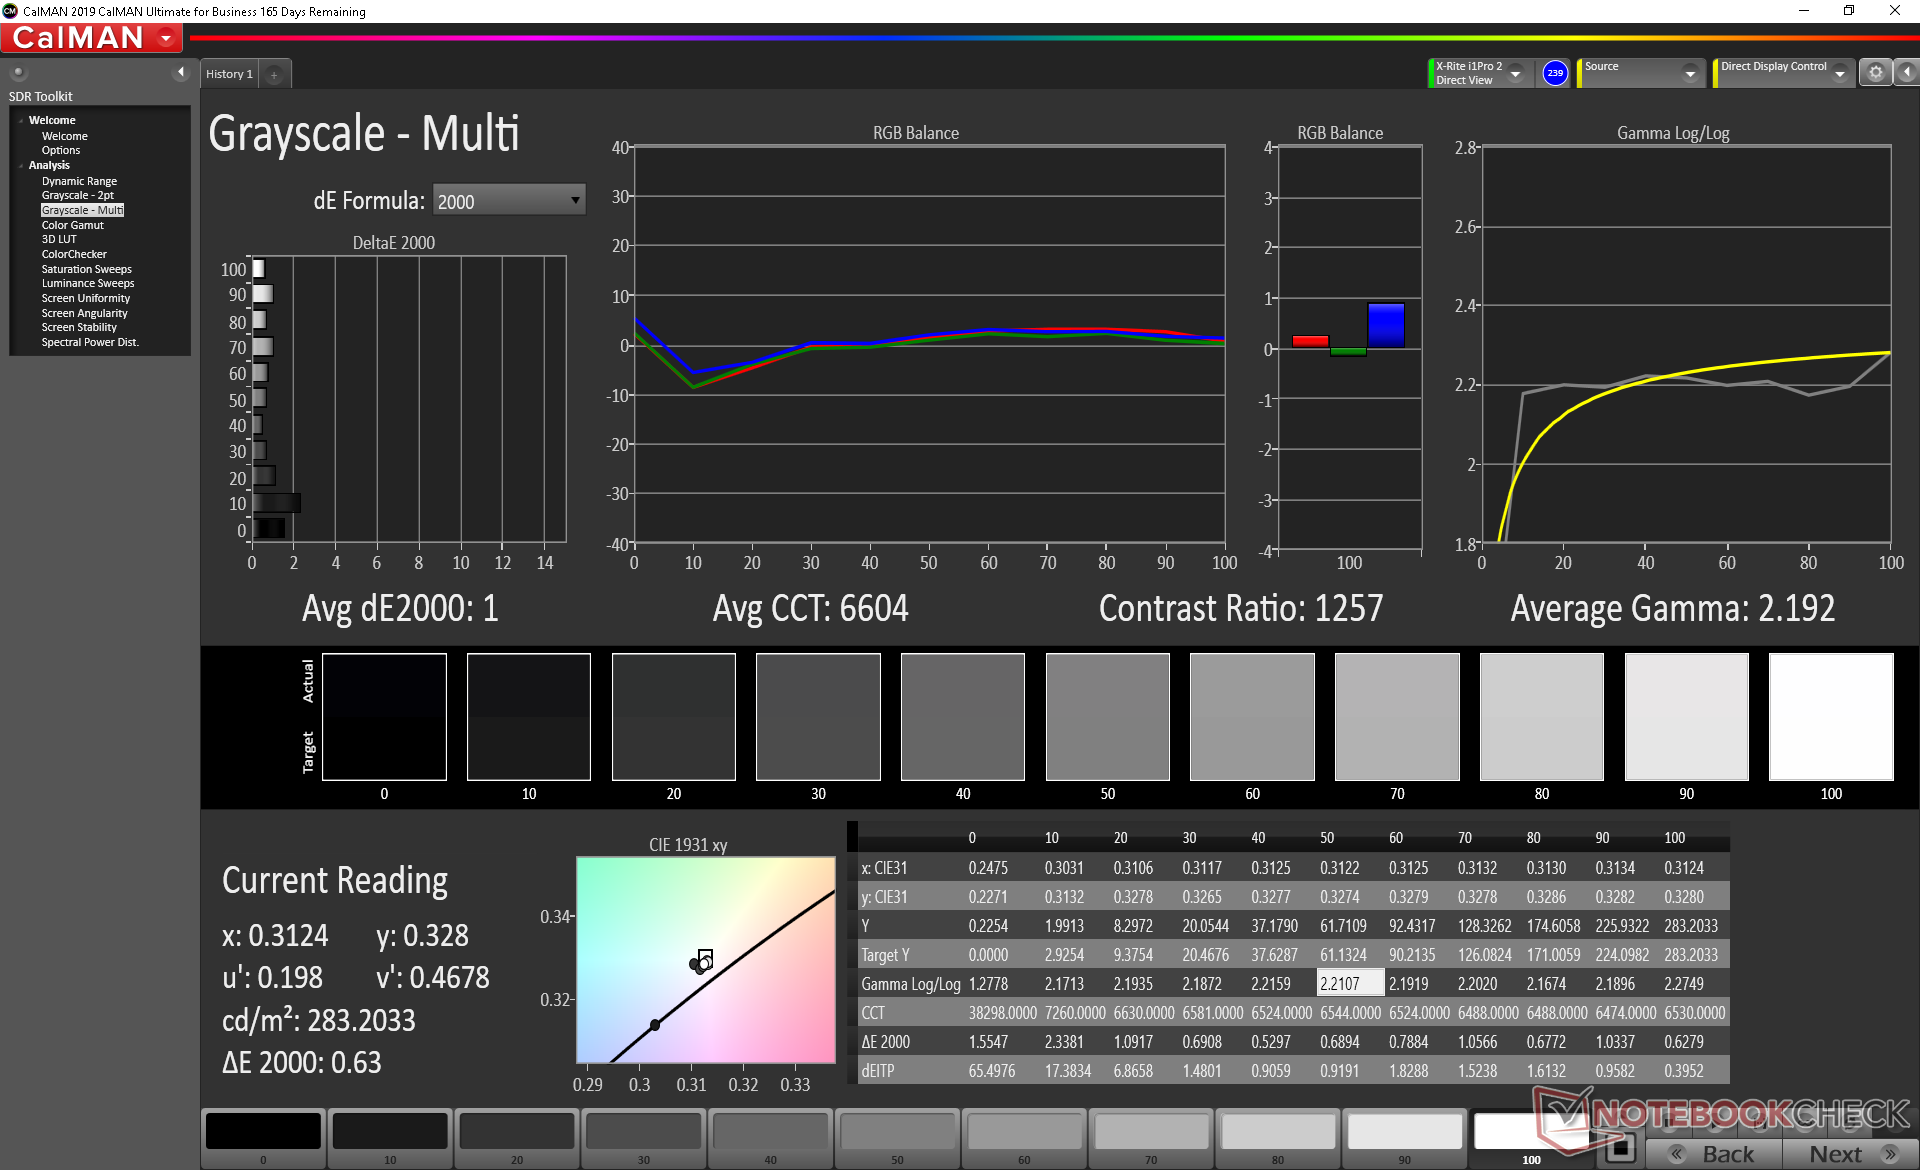
calibrated: 4.41
ΔE Greyscale Calman: 2.7 | ∀{0.09-98 Ø4.96}
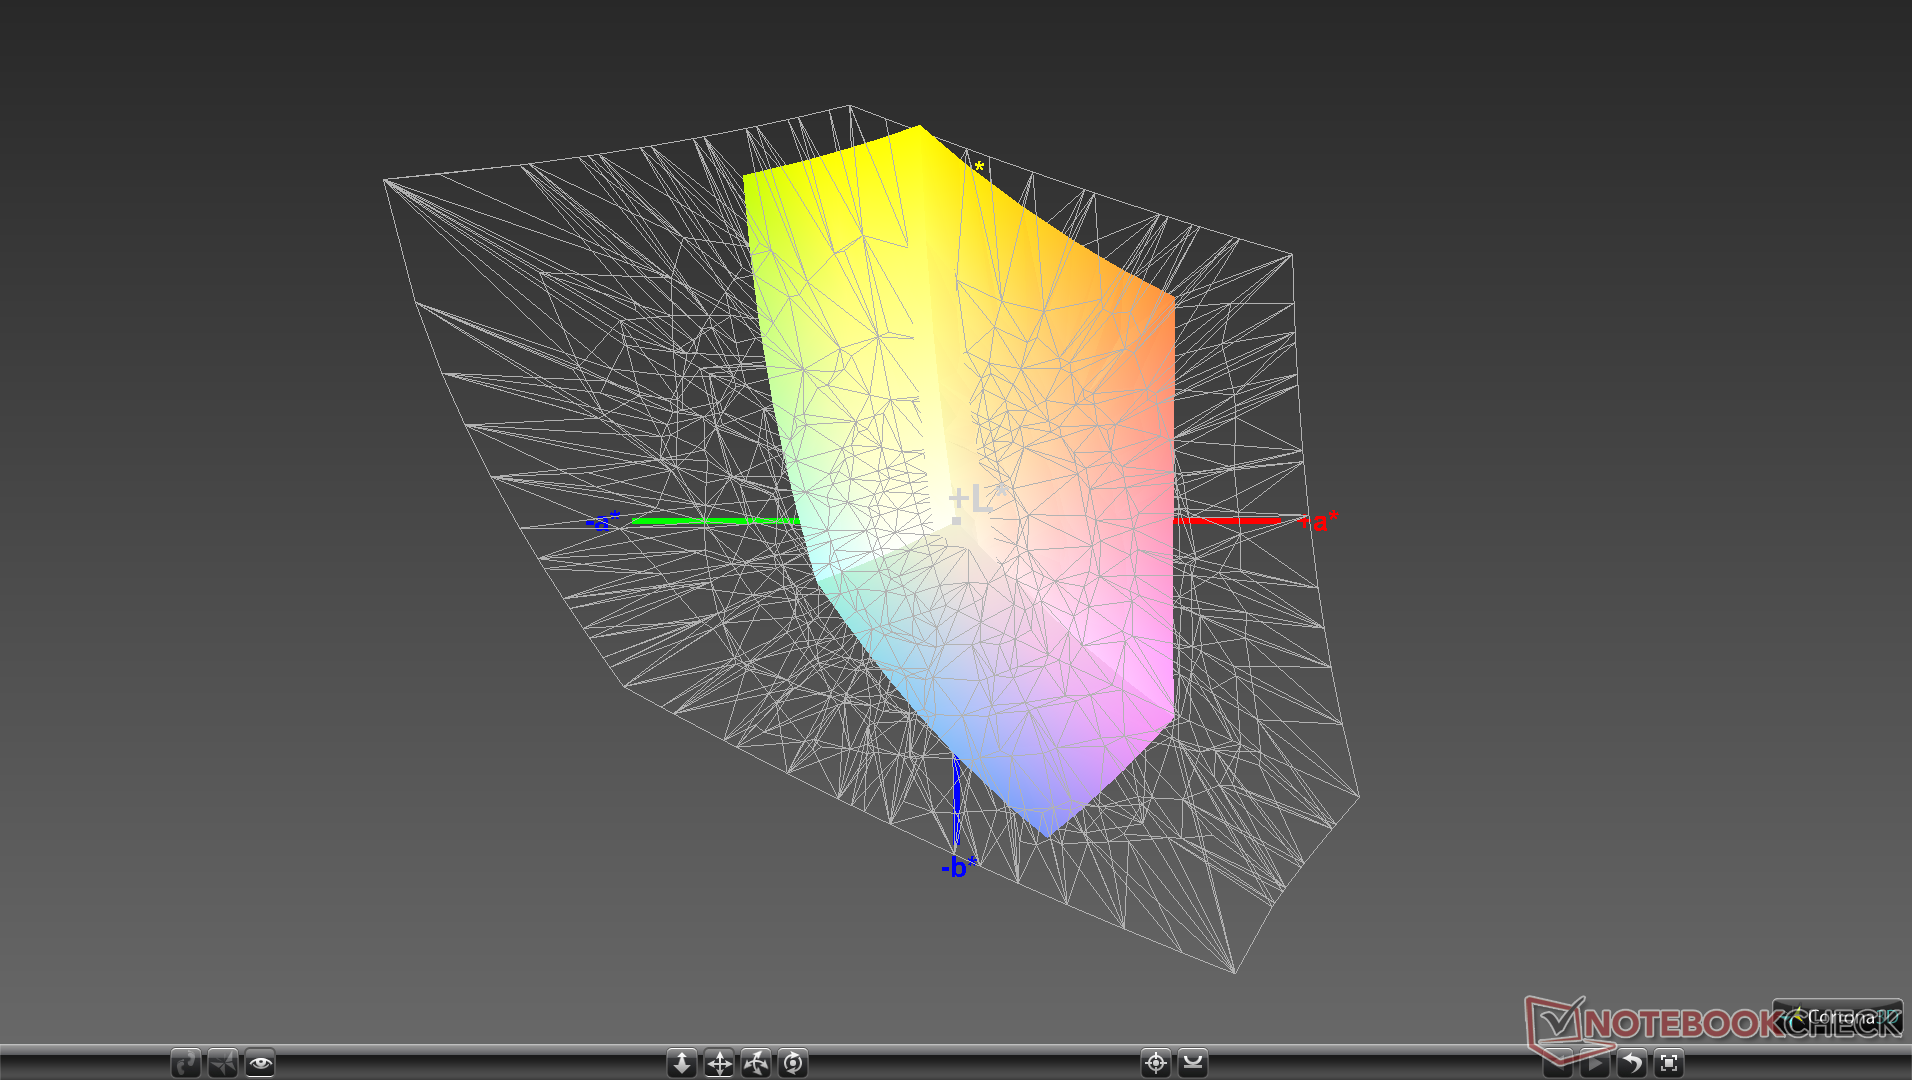
59.2% sRGB (Argyll 1.6.3 3D)
38.1% AdobeRGB 1998 (Argyll 1.6.3 3D)
41.5% AdobeRGB 1998 (Argyll 3D)
59.5% sRGB (Argyll 3D)
40.17% Display P3 (Argyll 3D)
Gamma: 2.21
CCT: 6868 K
| Asus VivoBook 17 S712FA-DS76 BOE NV173FHM-N49, IPS, 17.3", 1920x1080 | HP Envy 17t-cg000 AU Optronics AUO168E, IPS, 17.3", 3840x2160 | Dell Inspiron 17 3780 AU Optronics B173HAN01.3, IPS, 17.3", 1920x1080 | Asus VivoBook 17 M712DA-AU017T BOE084E, IPS, 17.3", 1920x1080 | Acer Aspire ES1-732-P7YA Chi Mei N173FGE-E23, TN LED, 17.3", 1600x900 | Lenovo IdeaPad 330-17IKB 81DM BOE0685, TN LED, 17.3", 1600x900 | |
|---|---|---|---|---|---|---|
| Display | 108% | 55% | 1% | 33% | 35% | |
| Display P3 Coverage (%) | 40.17 | 86.2 115% | 63.7 59% | 40.76 1% | 53.5 33% | 56.9 42% |
| sRGB Coverage (%) | 59.5 | 100 68% | 88.9 49% | 59.7 0% | 80.1 35% | 76.3 28% |
| AdobeRGB 1998 Coverage (%) | 41.5 | 99.8 140% | 64.6 56% | 42.11 1% | 54.9 32% | 55.9 35% |
| Response Times | -132% | -153% | -31% | -93% | -59% | |
| Response Time Grey 50% / Grey 80% * (ms) | 17.2 ? | 45.2 ? -163% | 46 ? -167% | 24 ? -40% | 49 ? -185% | 38.8 ? -126% |
| Response Time Black / White * (ms) | 14.8 ? | 29.6 ? -100% | 35.2 ? -138% | 18 ? -22% | 15 ? -1% | 13.6 ? 8% |
| PWM Frequency (Hz) | 961 | |||||
| Screen | 27% | 29% | 14% | -37% | -43% | |
| Brightness middle (cd/m²) | 289.5 | 383.4 32% | 322.9 12% | 262 -9% | 227 -22% | 210.5 -27% |
| Brightness (cd/m²) | 263 | 382 45% | 322 22% | 234 -11% | 209 -21% | 204 -22% |
| Brightness Distribution (%) | 81 | 86 6% | 84 4% | 84 4% | 80 -1% | 94 16% |
| Black Level * (cd/m²) | 0.49 | 0.34 31% | 0.26 47% | 0.265 46% | 0.15 69% | 0.63 -29% |
| Contrast (:1) | 591 | 1128 91% | 1242 110% | 989 67% | 1513 156% | 334 -43% |
| Colorchecker dE 2000 * | 4.83 | 6.24 -29% | 4.19 13% | 5.13 -6% | 12.93 -168% | 9.48 -96% |
| Colorchecker dE 2000 max. * | 19.23 | 10.18 47% | 7.04 63% | 19.16 -0% | 20.92 -9% | 17.19 11% |
| Colorchecker dE 2000 calibrated * | 4.41 | 3.7 16% | 3.55 20% | 3.96 10% | 4.04 8% | |
| Greyscale dE 2000 * | 2.7 | 6.6 -144% | 4.5 -67% | 1.22 55% | 14.69 -444% | 12 -344% |
| Gamma | 2.21 100% | 2.272 97% | 1.97 112% | 2.42 91% | 2.38 92% | 2.12 104% |
| CCT | 6868 95% | 5973 109% | 7041 92% | 6584 99% | 19863 33% | 13874 47% |
| Color Space (Percent of AdobeRGB 1998) (%) | 38.1 | 88 131% | 57.6 51% | 38 0% | 51 34% | 49.4 30% |
| Color Space (Percent of sRGB) (%) | 59.2 | 100 69% | 88.4 49% | 59 0% | 80 35% | 75.8 28% |
| Total Average (Program / Settings) | 1% /
22% | -23% /
11% | -5% /
6% | -32% /
-30% | -22% /
-30% |
* ... smaller is better
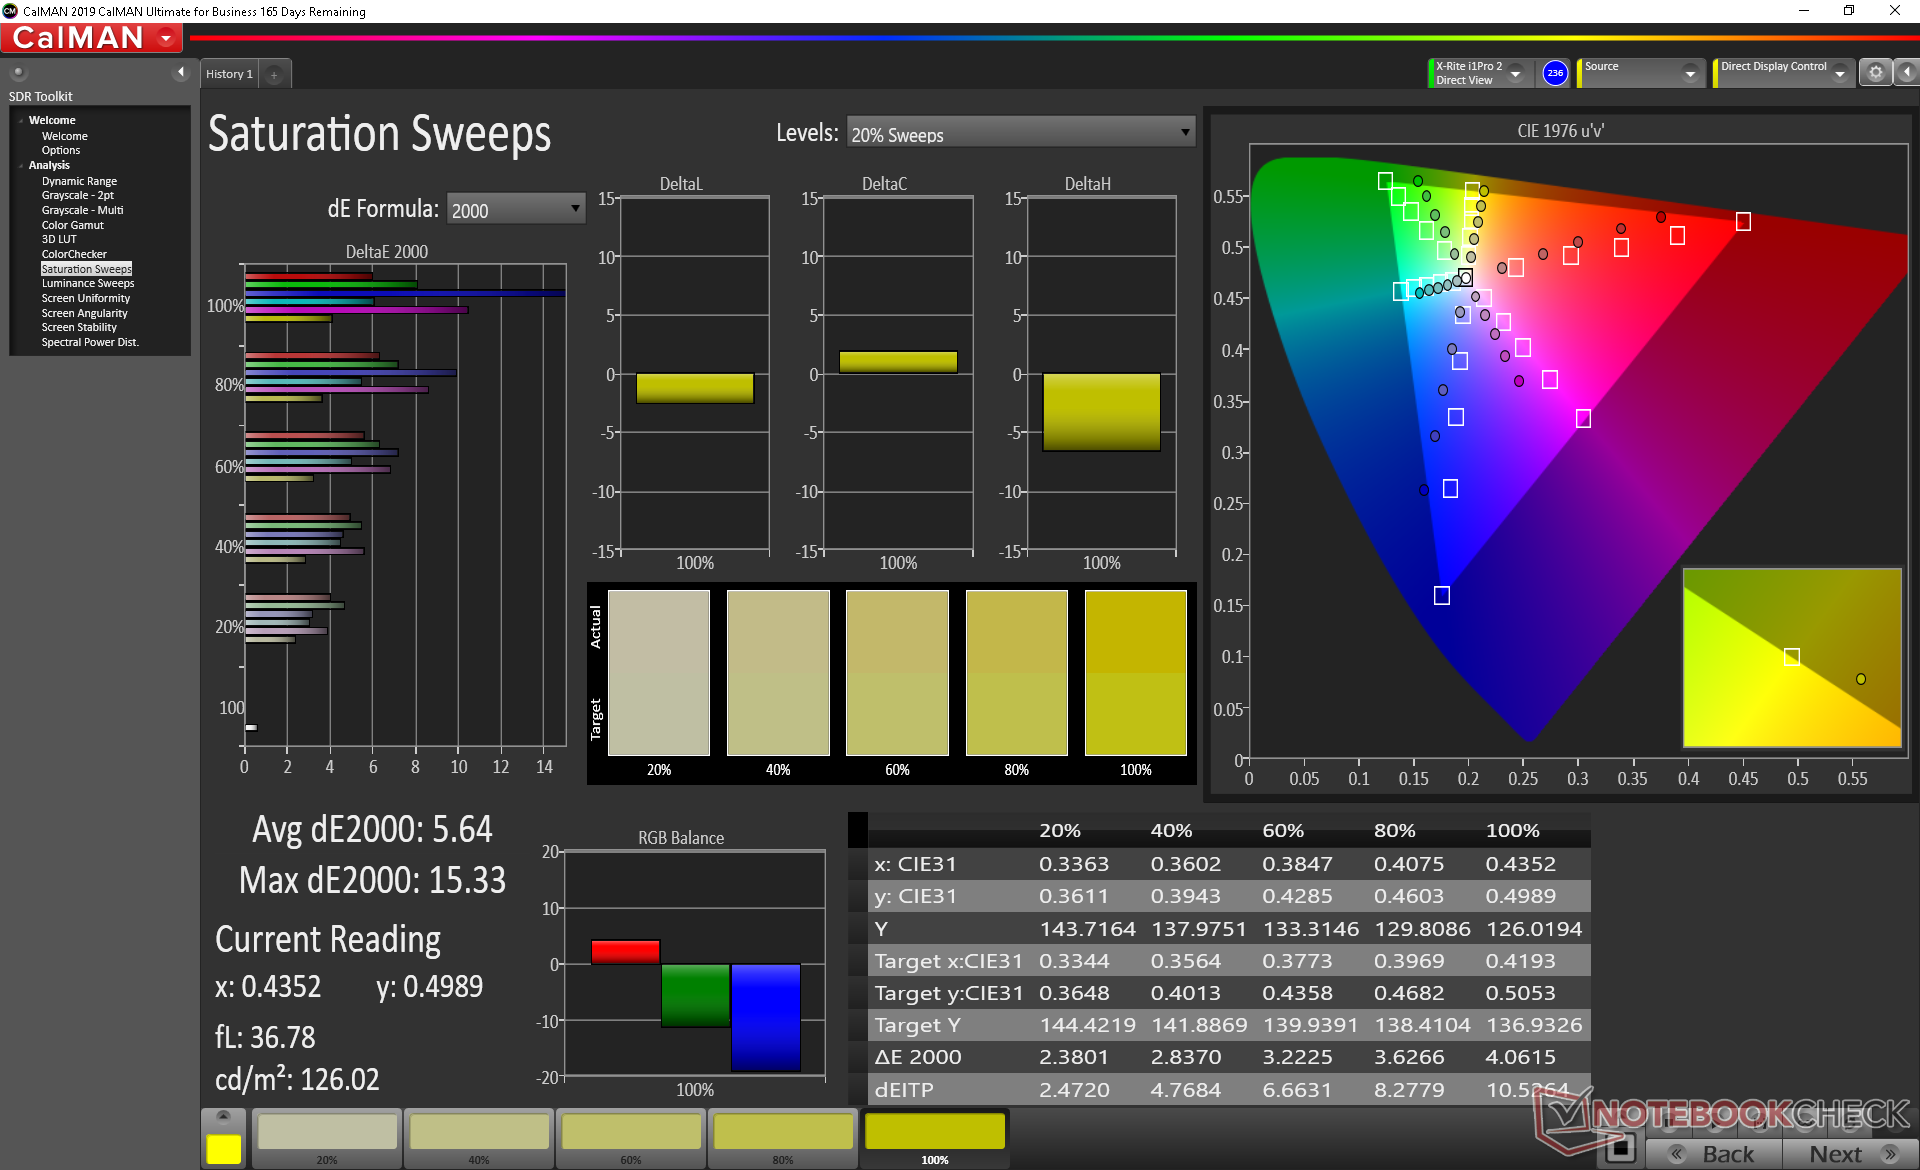
Color space covers just 59 percent of sRGB to be indicative of a budget panel. Most mid-range Ultrabooks cover around 90 percent of sRGB for deeper and potentially more accurate colors.
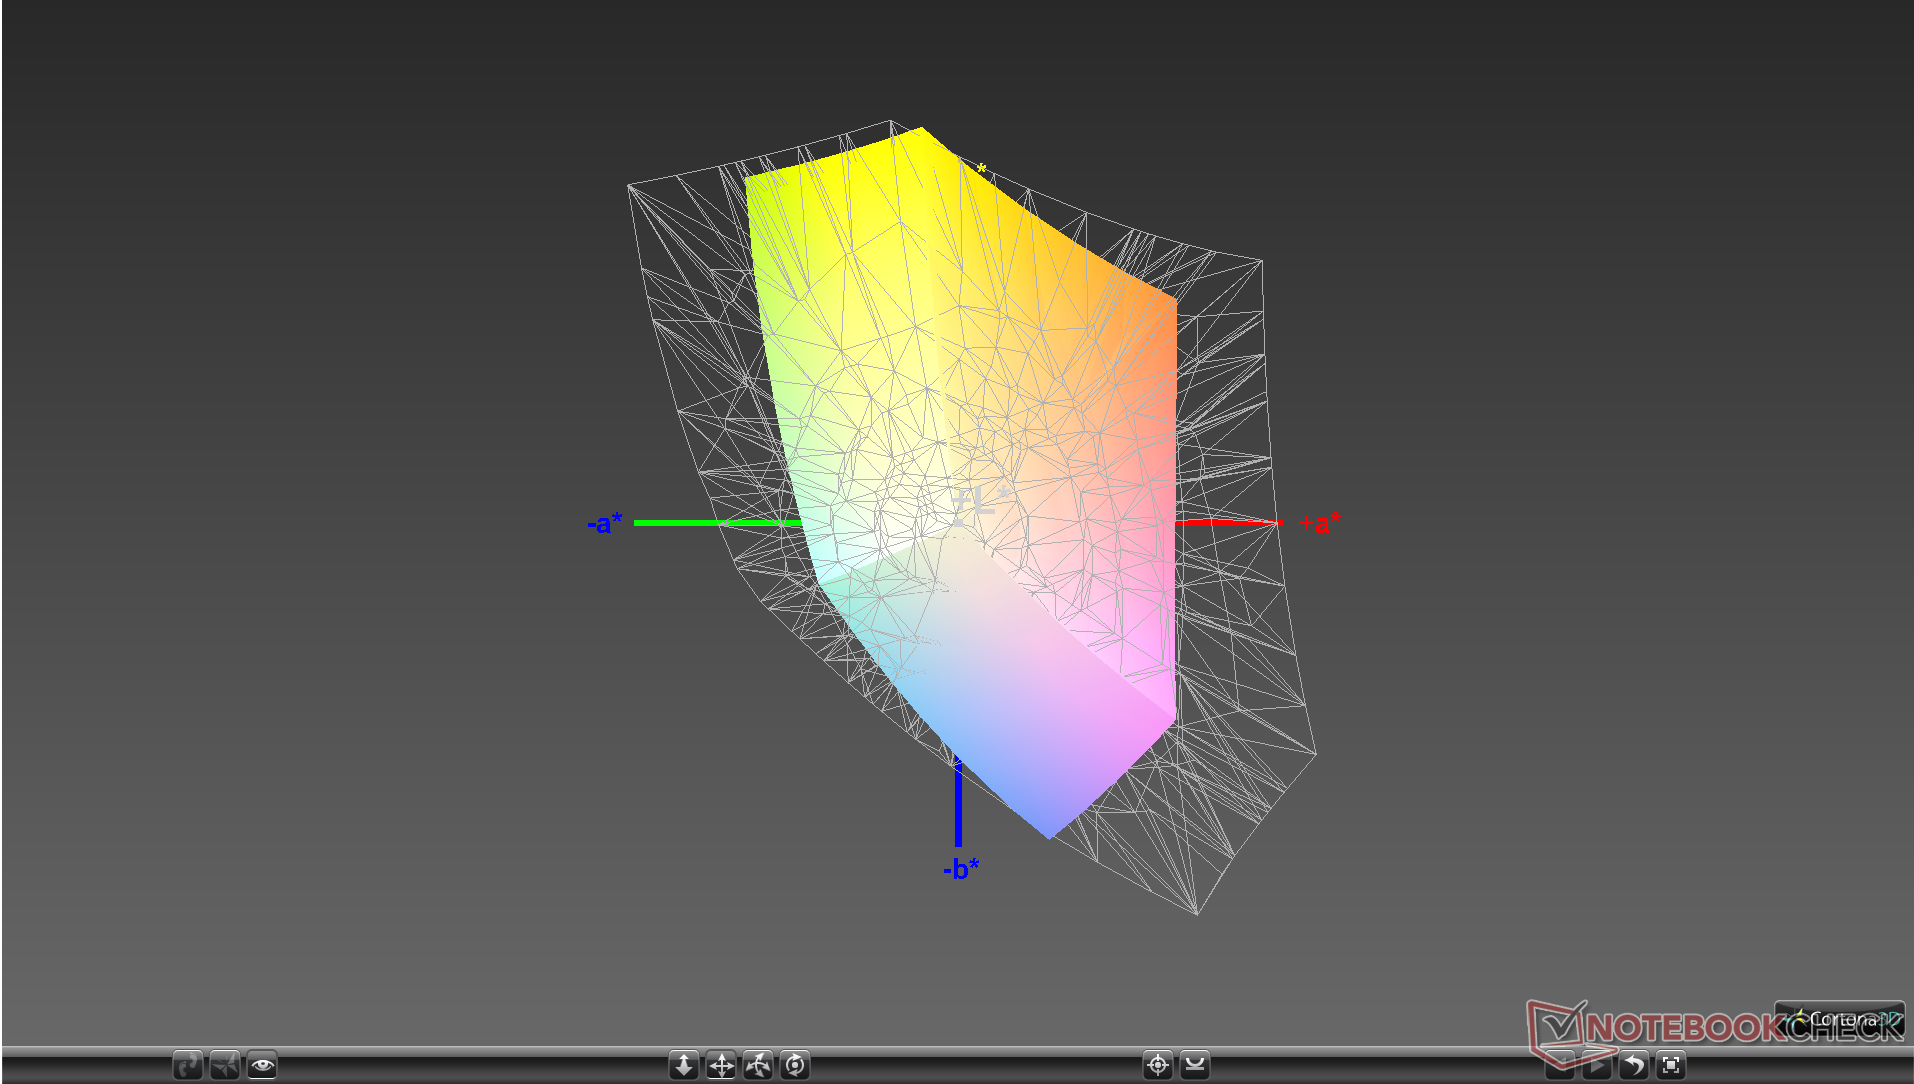
Colors and grayscale are decently calibrated out of the box which is a surprise for a budget laptop. Color temperature is only slightly too cool. Calibrating the panel ourselves addresses this for a final average grayscale DeltaE of just 1.0. However, colors still become increasingly inaccurate the higher the saturation level due to the narrow color space mentioned above. Blue in particular is represented much more inaccurately than other colors.

Display Response Times
| ↔ Response Time Black to White | ||
|---|---|---|
| 14.8 ms ... rise ↗ and fall ↘ combined | ↗ 7.6 ms rise | 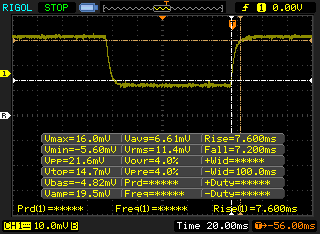 |
| ↘ 7.2 ms fall | ||
| The screen shows good response rates in our tests, but may be too slow for competitive gamers. In comparison, all tested devices range from 0.1 (minimum) to 240 (maximum) ms. » 36 % of all devices are better. This means that the measured response time is better than the average of all tested devices (19.8 ms). | ||
| ↔ Response Time 50% Grey to 80% Grey | ||
| 17.2 ms ... rise ↗ and fall ↘ combined | ↗ 8.8 ms rise | 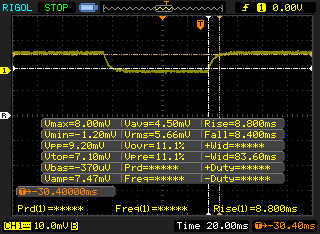 |
| ↘ 8.4 ms fall | ||
| The screen shows good response rates in our tests, but may be too slow for competitive gamers. In comparison, all tested devices range from 0.165 (minimum) to 636 (maximum) ms. » 31 % of all devices are better. This means that the measured response time is better than the average of all tested devices (30.9 ms). | ||
Screen Flickering / PWM (Pulse-Width Modulation)
| Screen flickering / PWM not detected | 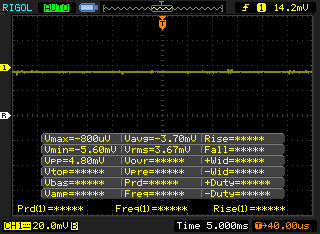 | ||
In comparison: 52 % of all tested devices do not use PWM to dim the display. If PWM was detected, an average of 7741 (minimum: 5 - maximum: 343500) Hz was measured. | |||
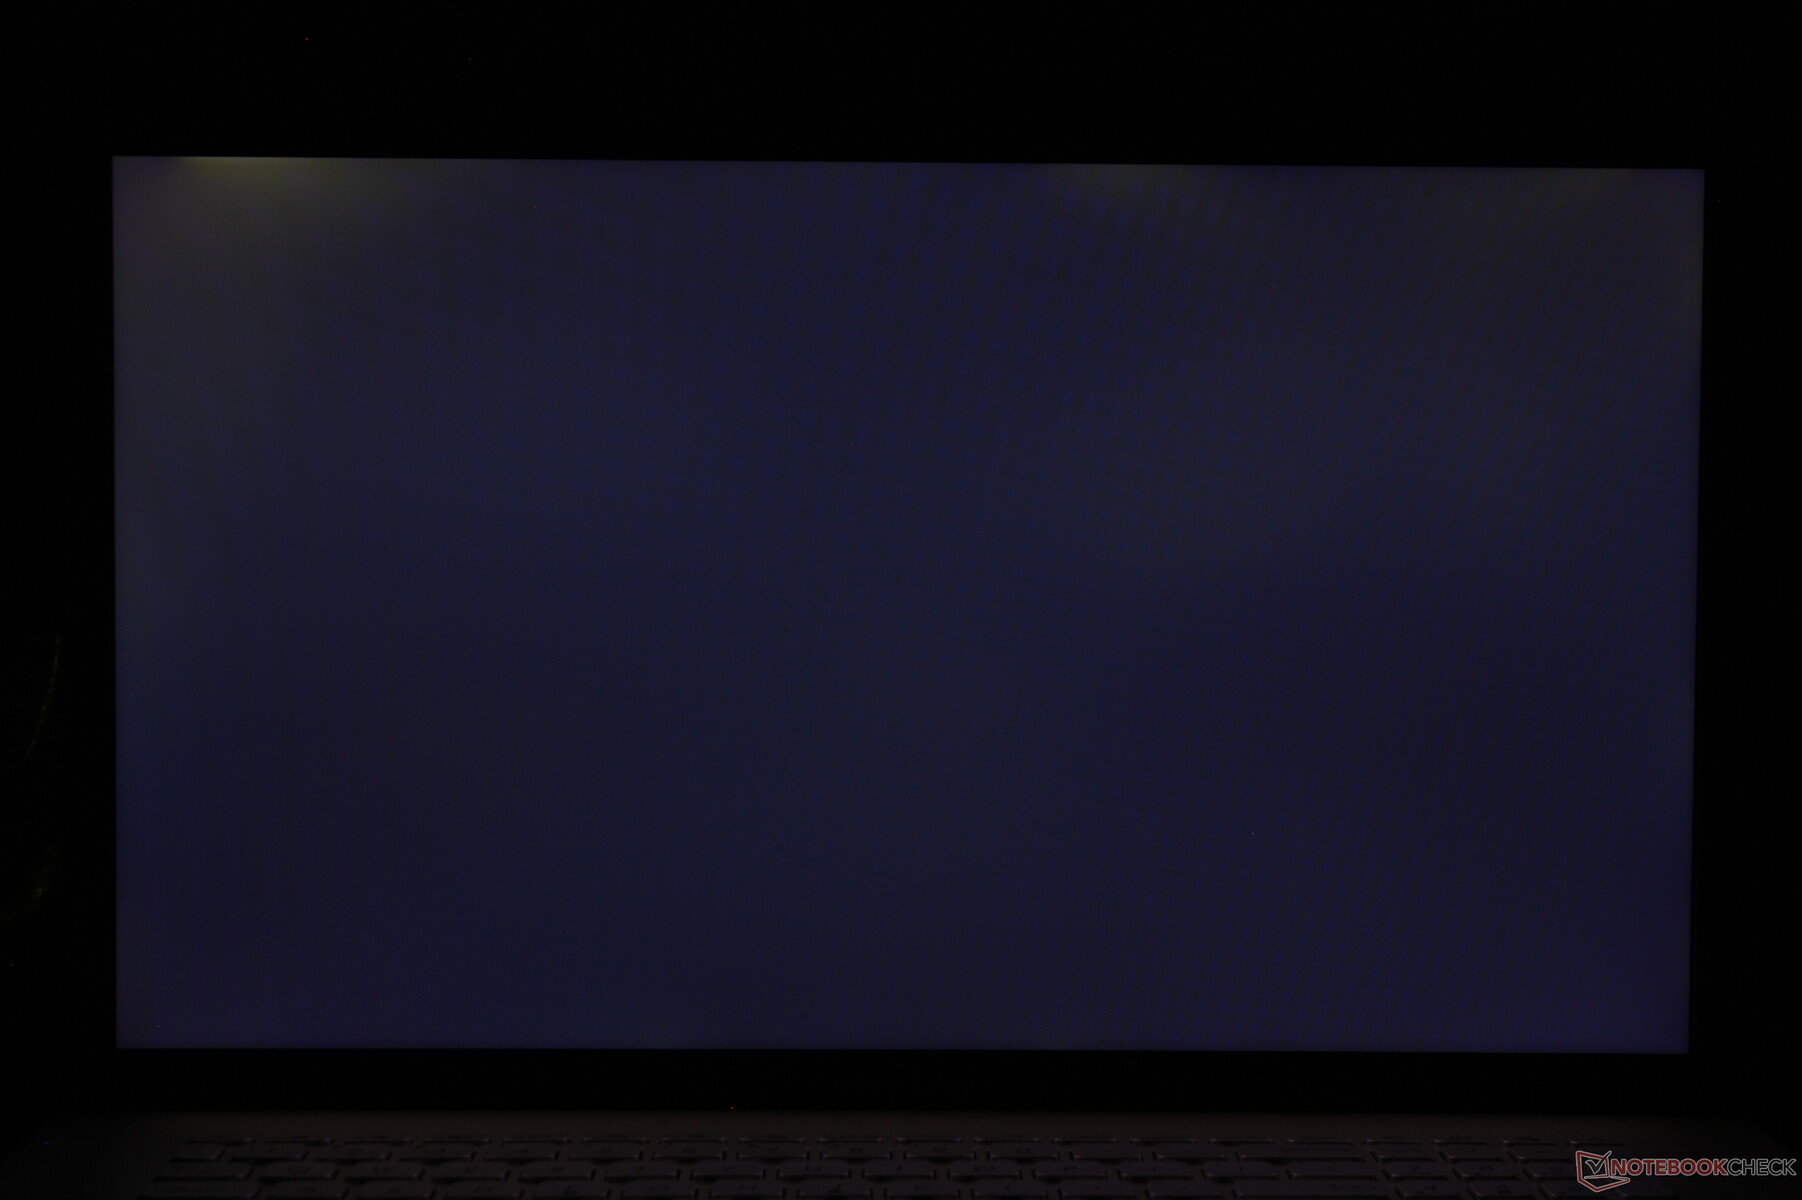
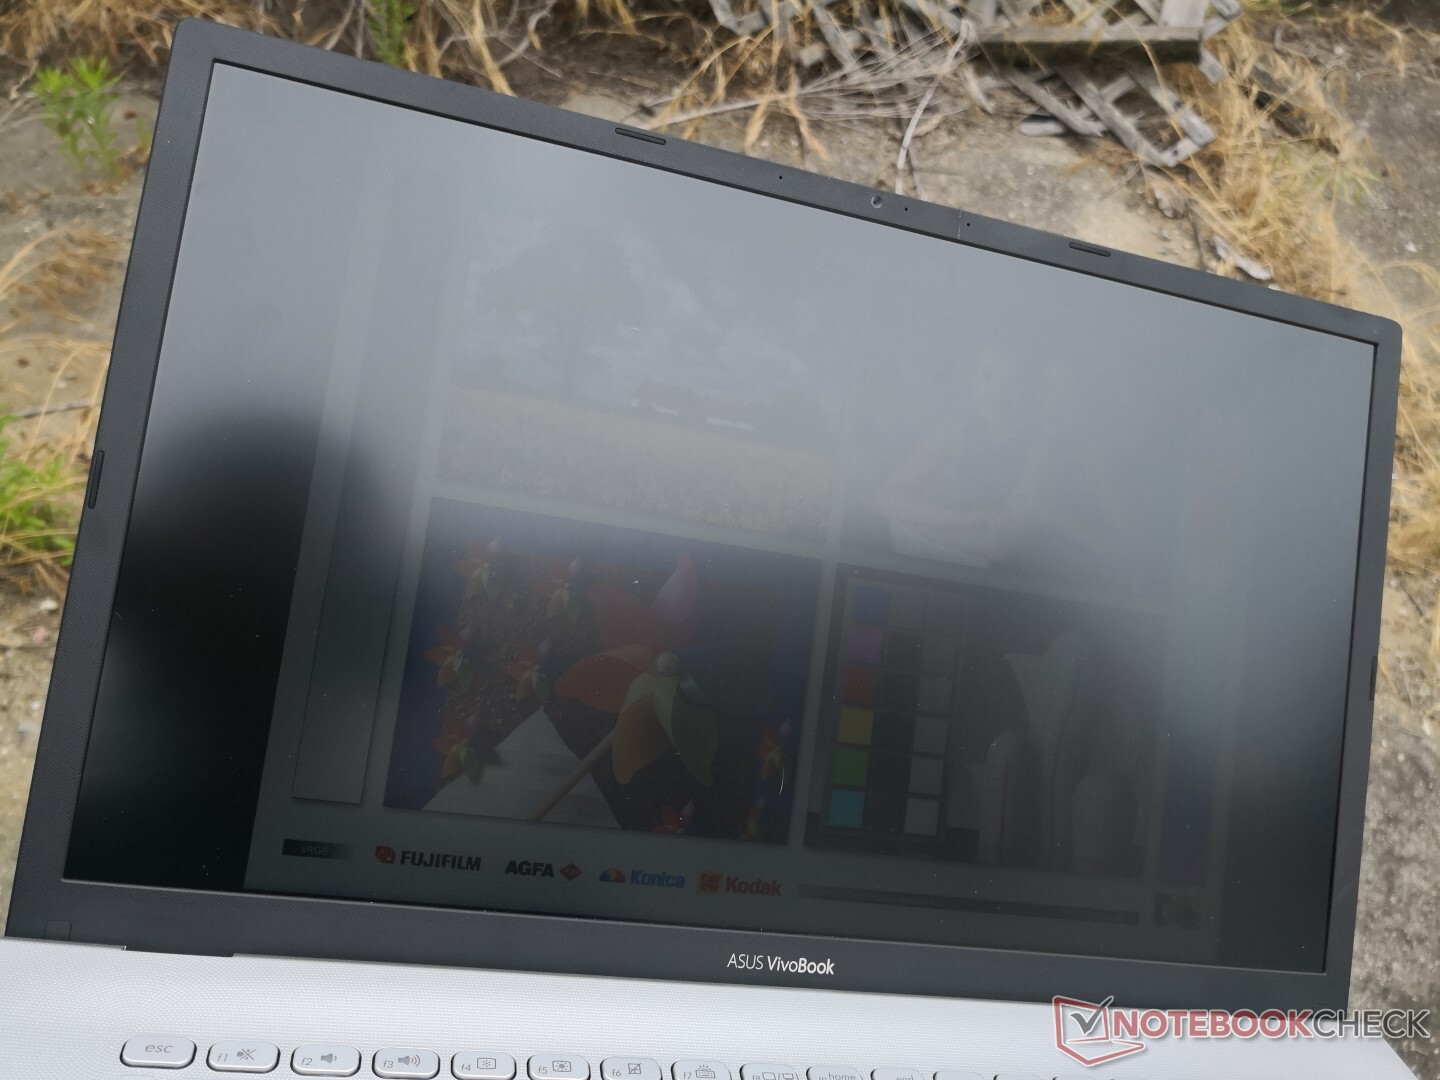
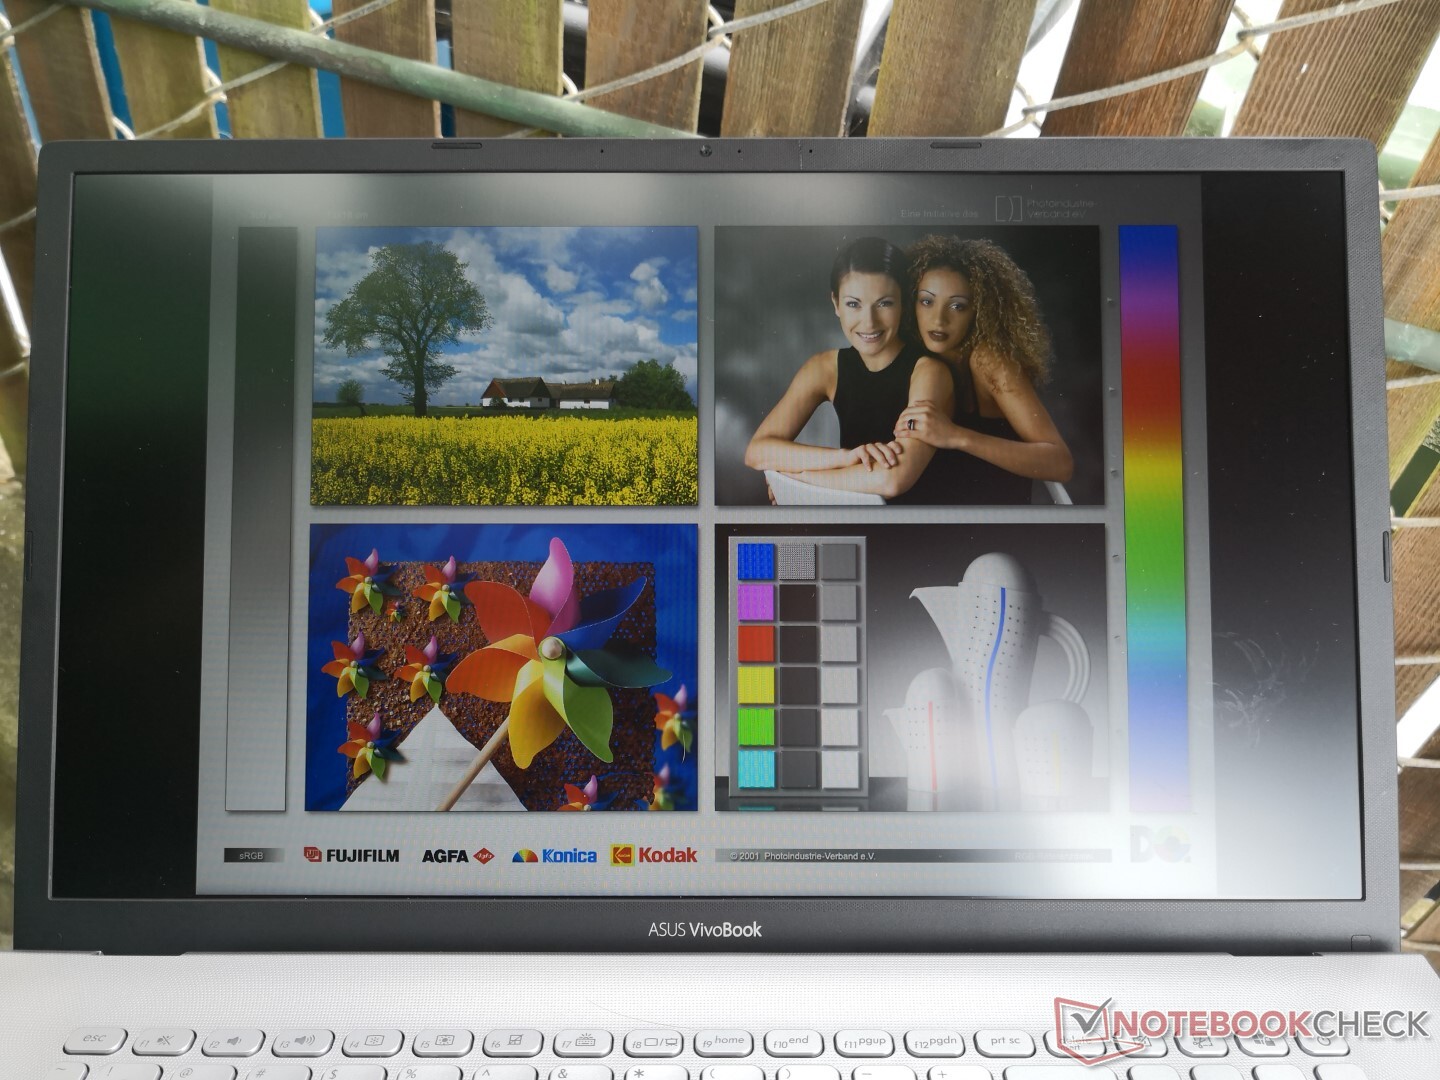
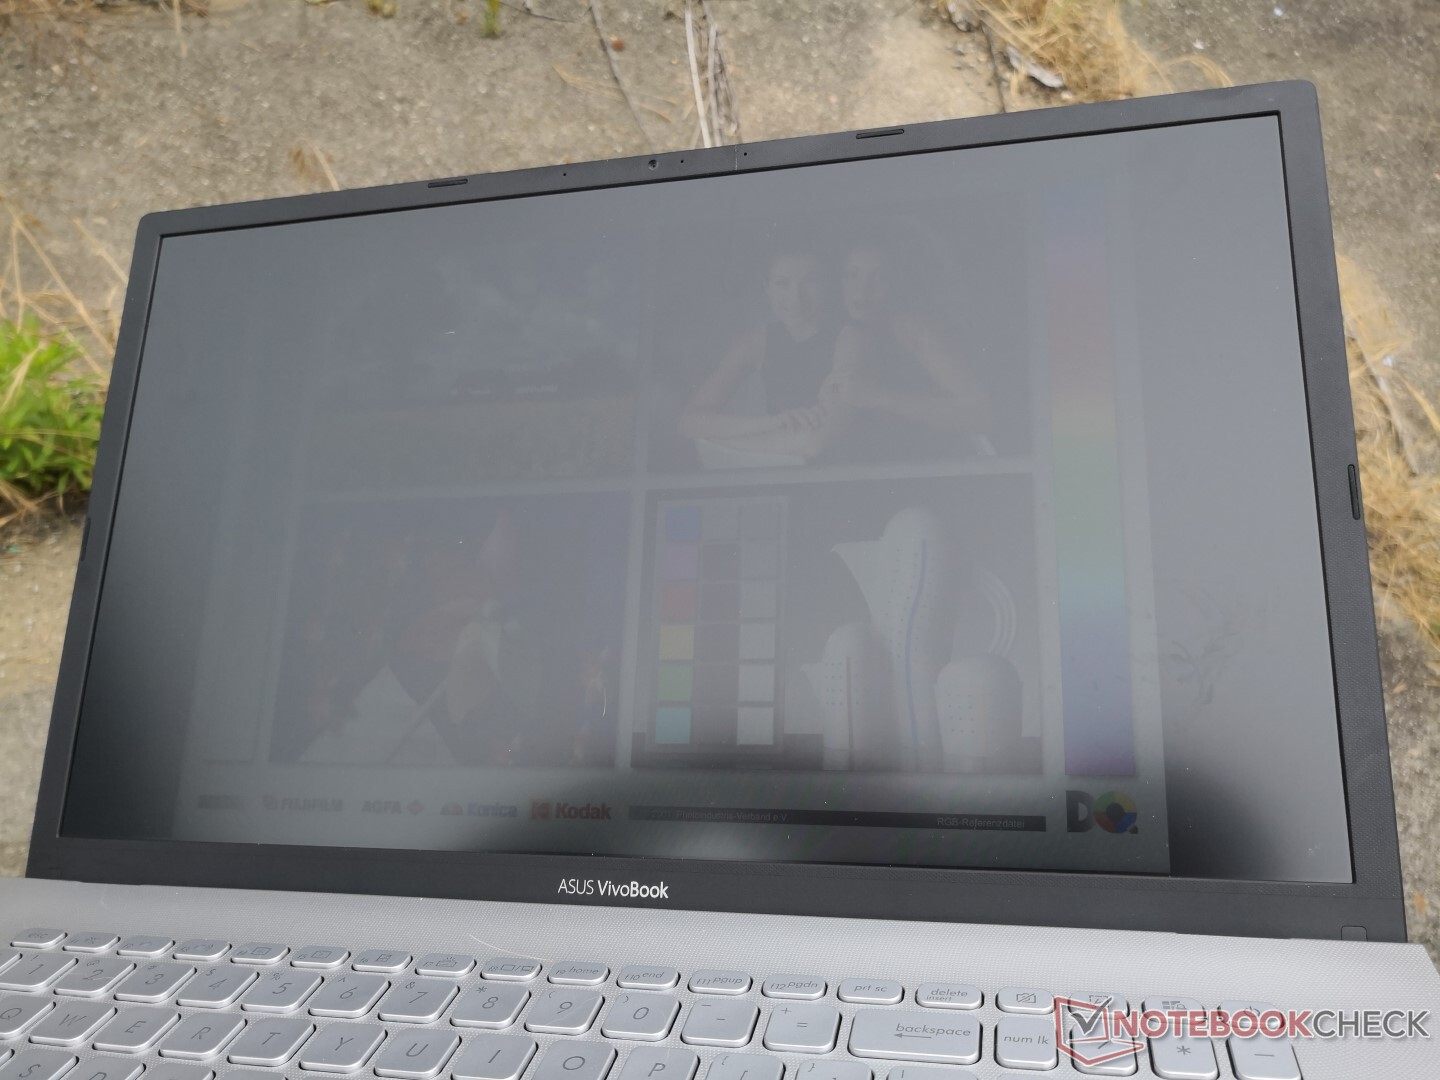
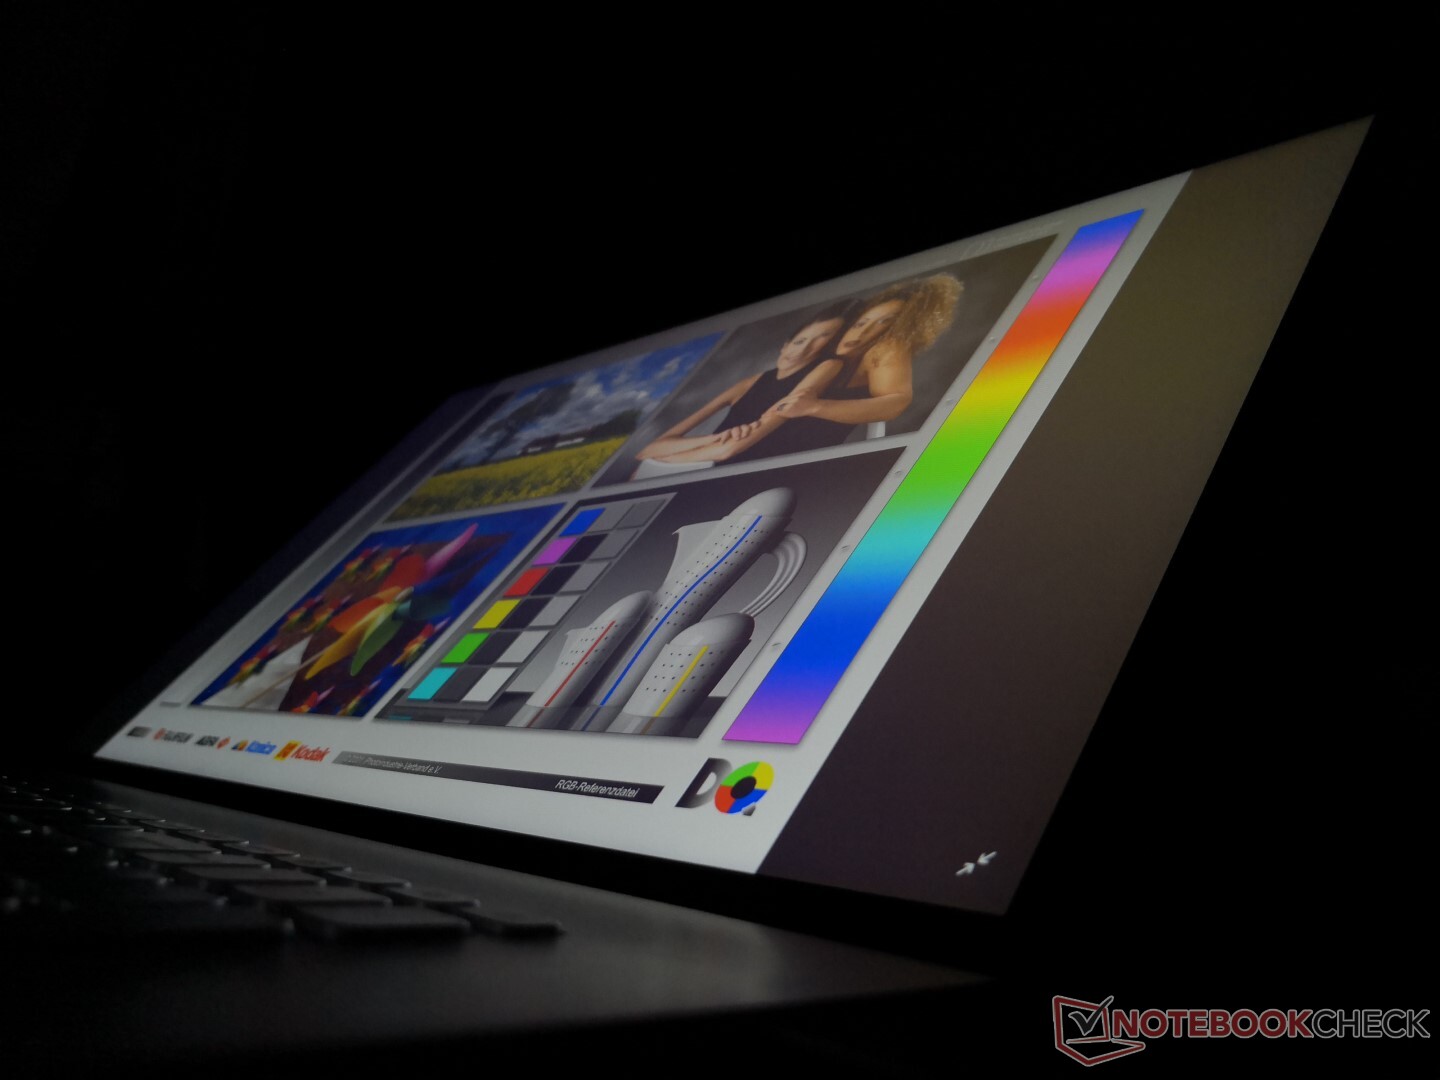
The display is not bright enough to used comfortably in most outdoor conditions. The wide viewing angles help a bit, but glare will be inevitable.
Performance
Asus offers a wide range of U-class processor options for its VivoBook 17 series ranging from the Core i3-7100U up to the Core i7-10510U with some Ryzen SKUs on the side as well. Certain Intel SKUs may include an optional GeForce MX130 GPU for faster graphics performance. There are no Ice Lake options which might be for the best since the GeForce MX GPU can offer roughly the same or better performance than the Iris Plus G7.
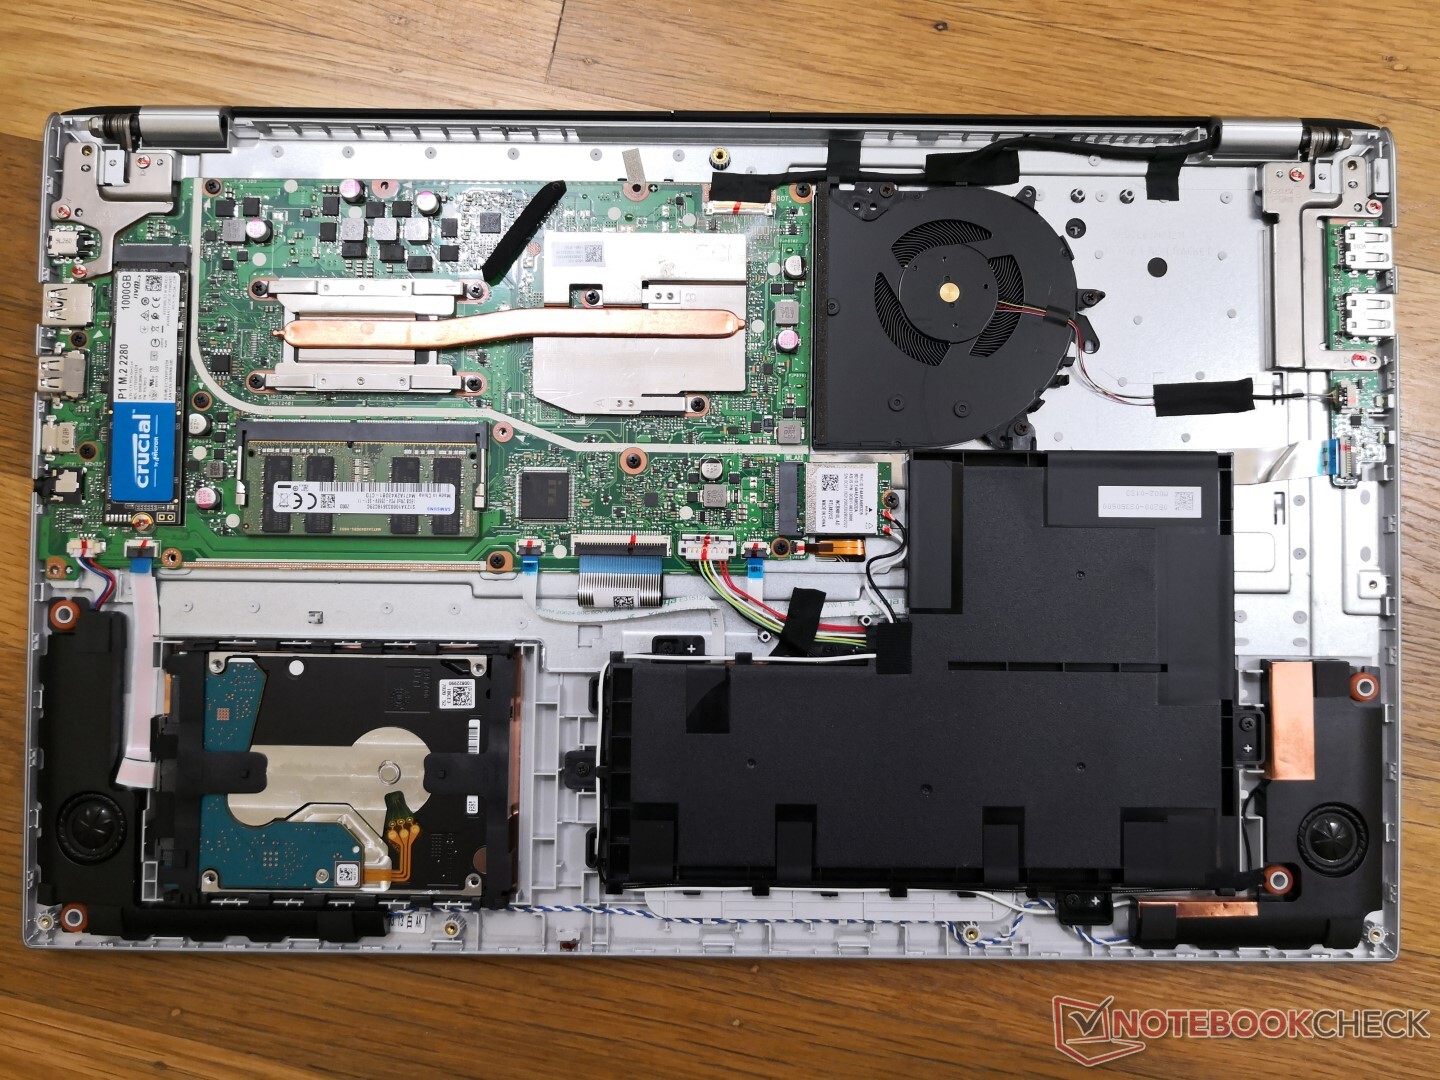
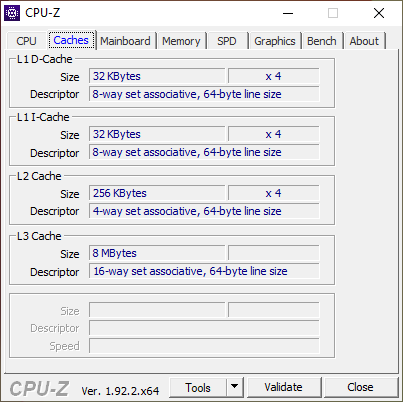
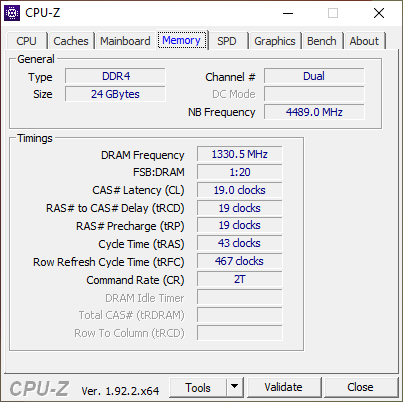
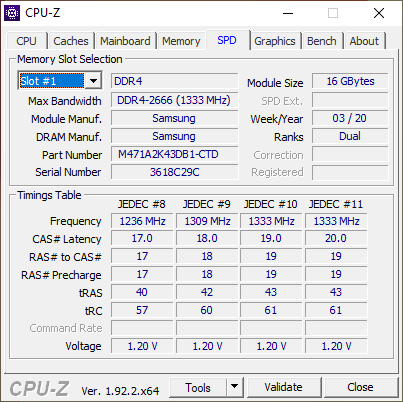
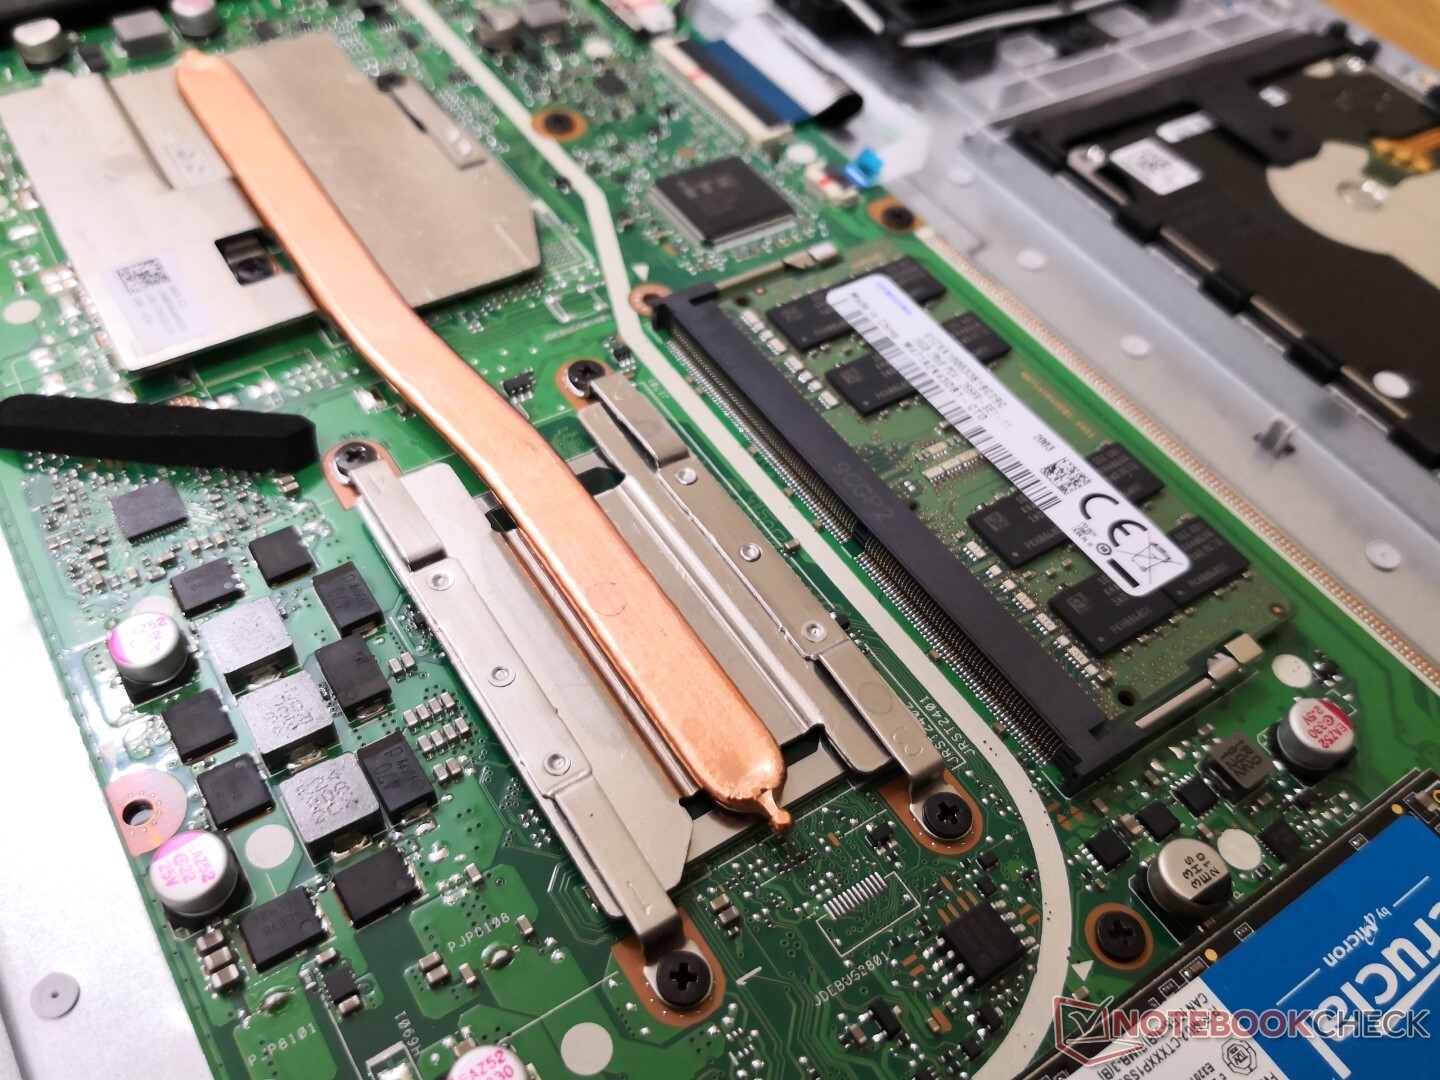
There is 8 GB of soldered RAM with one DDR4 SODIMM slot for expanding up to 24 GB total.
Processor
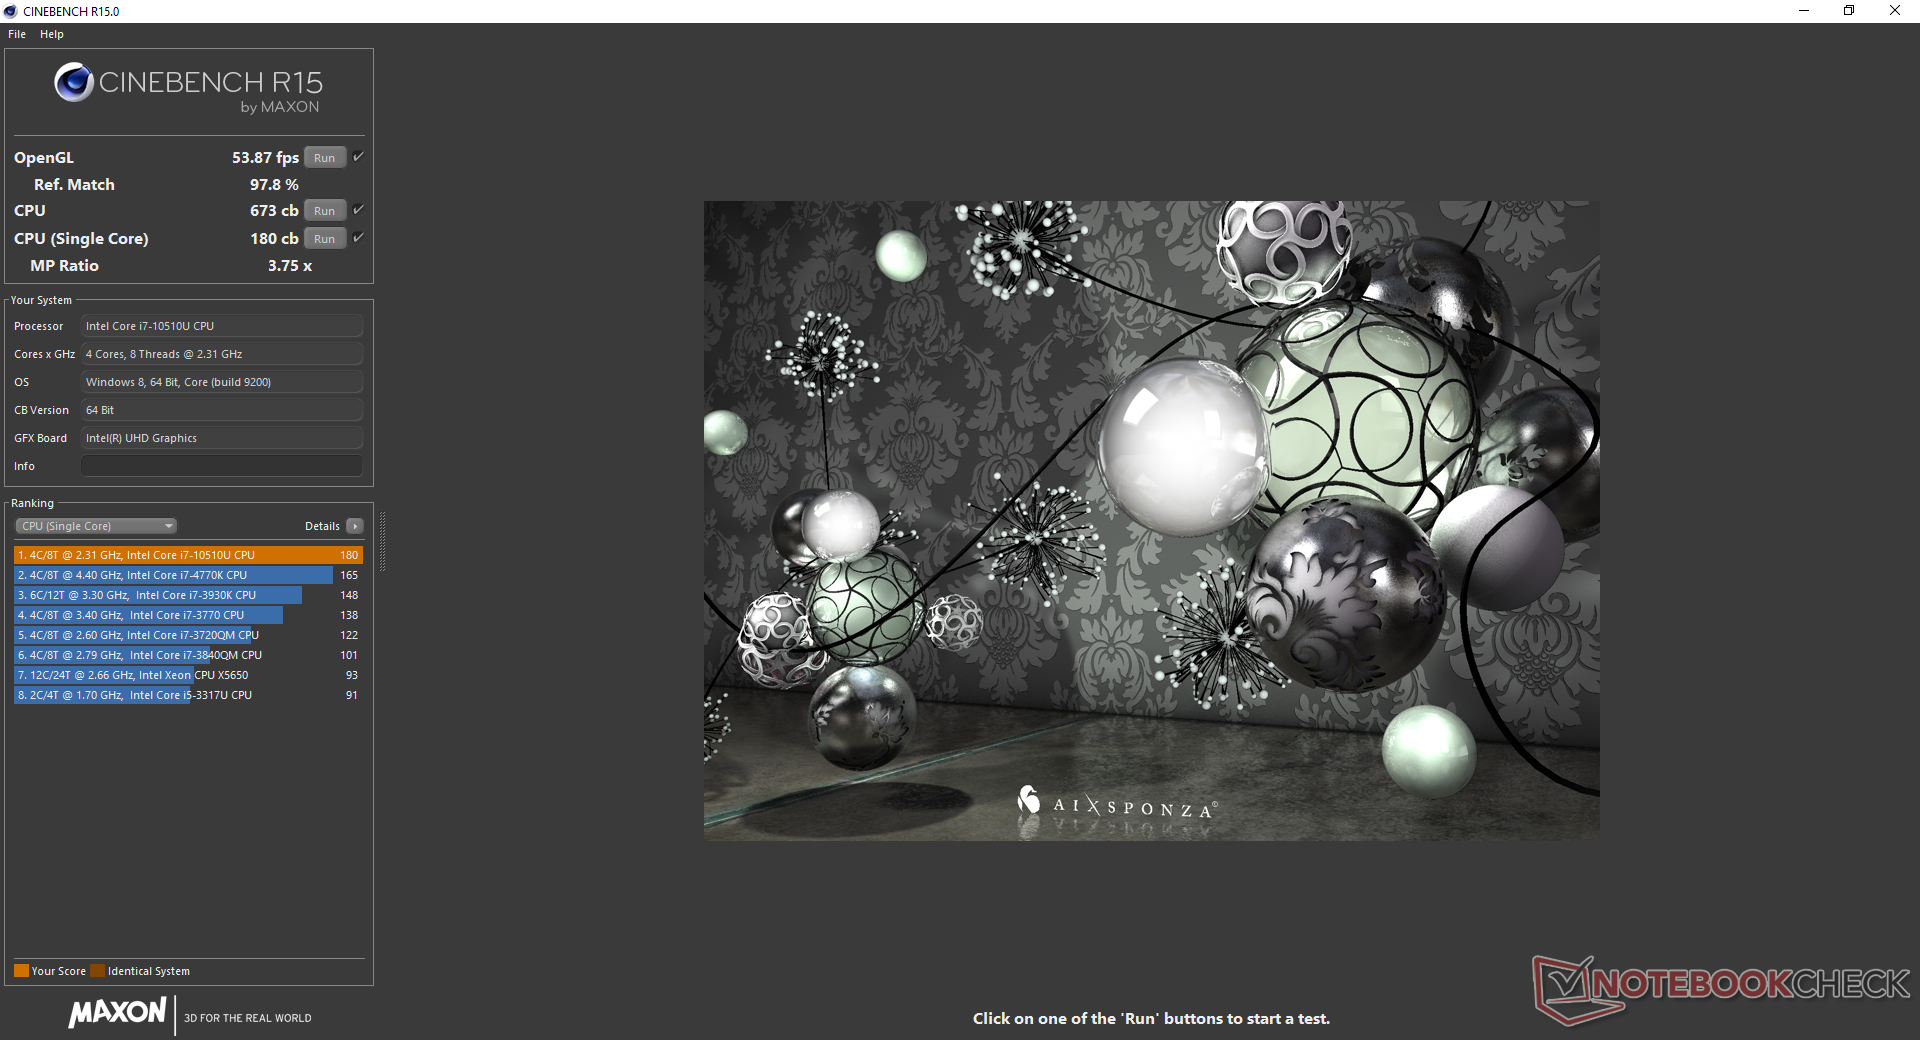
The Core i7-10510U offers just minor performance advantages over the last generation Core i7 Whiskey Lake-U series and even the older Core i7 Kaby Lake-R series. Cheaper alternatives like the Ryzen 5 3500U or Core i5-10210U, for example, are within single-digit percentages of the Core i7-10510U in multi-threaded workloads. Instead, the Core i7 shines in single-threaded workloads where it can outperform the Ryzen 5 3500U by 40 percent.
Performance sustainability is good for a budget laptop. Running CineBench R15 Multi-Thread in a loop results in a dip of only about 6 percent over time.
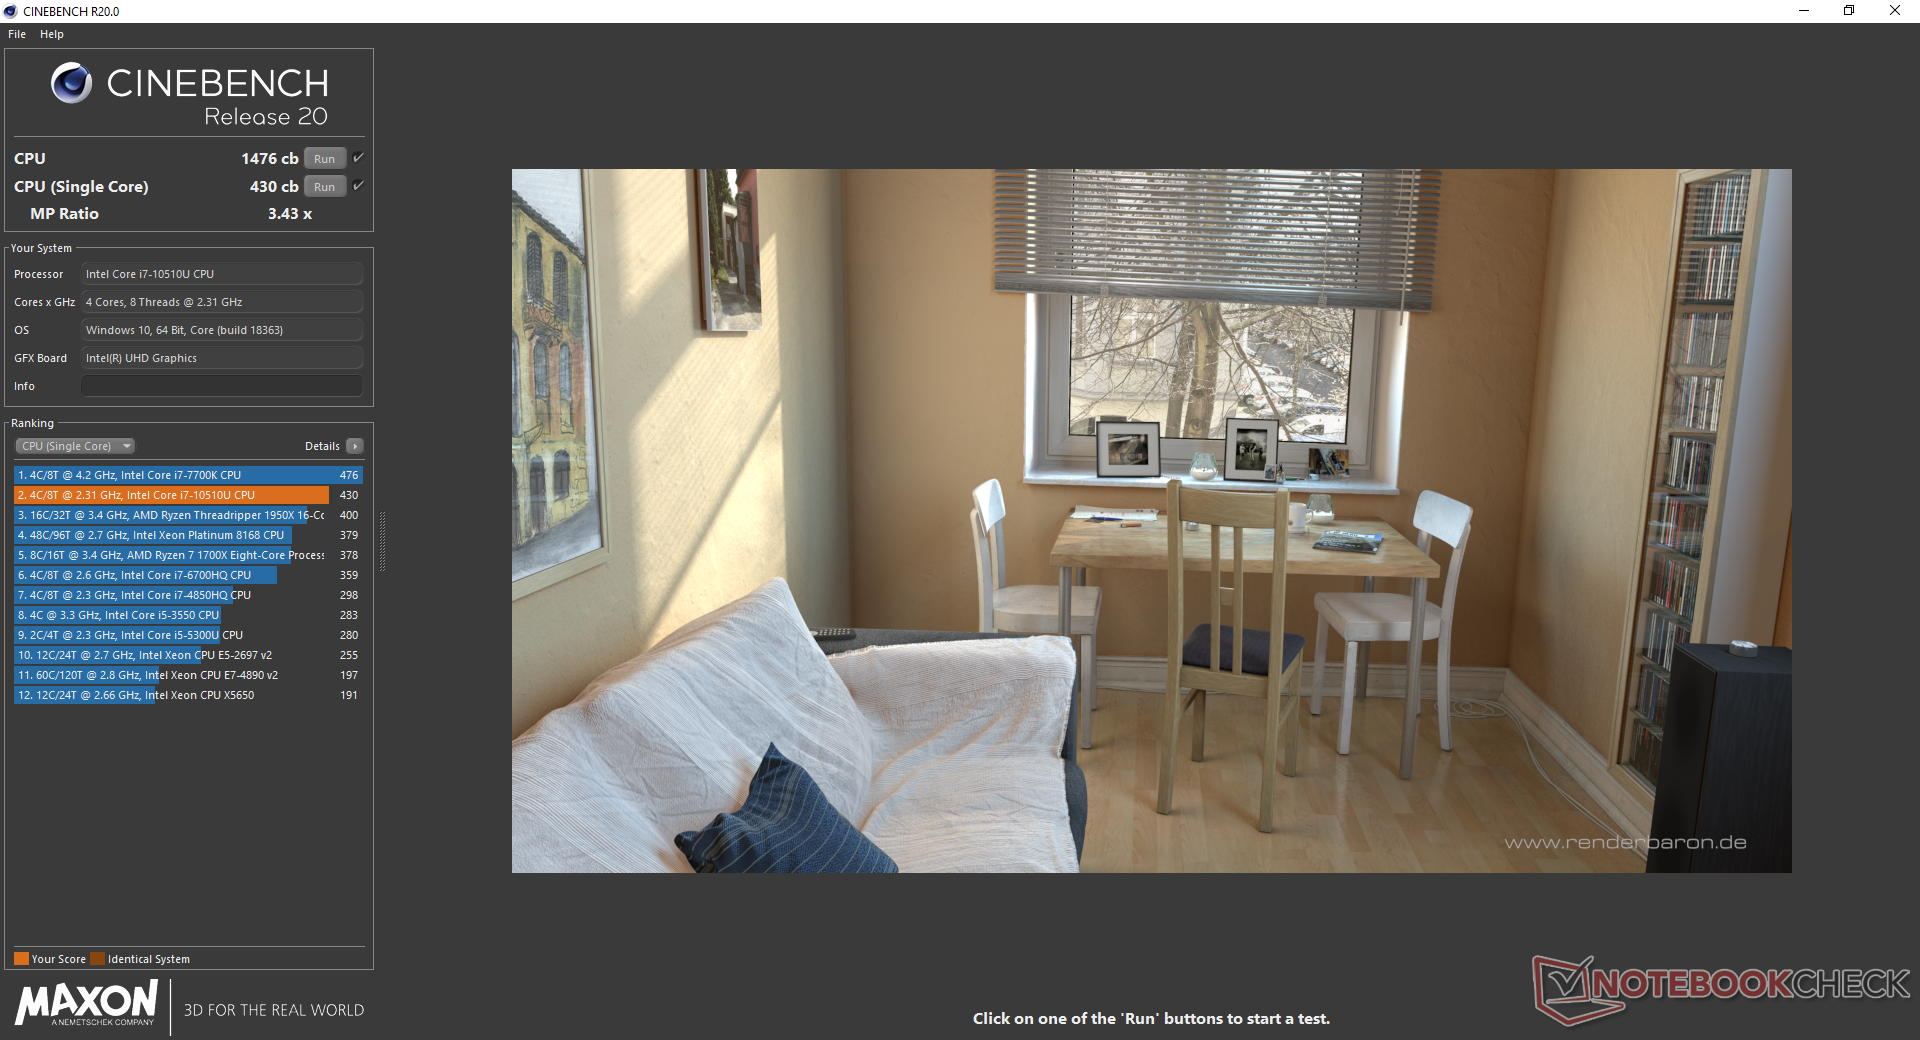
Cinebench R20: CPU (Multi Core) | CPU (Single Core)
Blender: v2.79 BMW27 CPU
7-Zip 18.03: 7z b 4 -mmt1 | 7z b 4
Geekbench 5.5: Single-Core | Multi-Core
HWBOT x265 Benchmark v2.2: 4k Preset
LibreOffice : 20 Documents To PDF
R Benchmark 2.5: Overall mean
| Cinebench R20 / CPU (Multi Core) | |
| MSI Prestige 15 A10SC | |
| Lenovo Yoga S740-14IIL-81RS001DGE | |
| Lenovo Ideapad C340-15IWL-81N5004QGE | |
| Schenker VIA 15 | |
| Asus VivoBook 17 S712FA-DS76 | |
| Microsoft Surface Book 3 15 | |
| Dell Inspiron 15 5000 5585 | |
| Average Intel Core i7-10510U (1015 - 1897, n=38) | |
| Acer Aspire 5 A515-54G | |
| HP Pavilion x360 15-dq0065cl | |
| Cinebench R20 / CPU (Single Core) | |
| MSI Prestige 15 A10SC | |
| Microsoft Surface Book 3 15 | |
| Asus VivoBook 17 S712FA-DS76 | |
| Average Intel Core i7-10510U (362 - 497, n=37) | |
| Lenovo Yoga S740-14IIL-81RS001DGE | |
| Acer Aspire 5 A515-54G | |
| HP Pavilion x360 15-dq0065cl | |
| Lenovo Ideapad C340-15IWL-81N5004QGE | |
| Dell Inspiron 15 5000 5585 | |
| Schenker VIA 15 | |
| Blender / v2.79 BMW27 CPU | |
| Microsoft Surface Book 3 15 | |
| Acer Aspire 5 A515-54G | |
| Average Intel Core i7-10510U (628 - 1051, n=31) | |
| Asus VivoBook 17 S712FA-DS76 | |
| Lenovo Yoga S740-14IIL-81RS001DGE | |
| Schenker VIA 15 | |
| 7-Zip 18.03 / 7z b 4 -mmt1 | |
| Asus VivoBook 17 S712FA-DS76 | |
| Average Intel Core i7-10510U (3747 - 4981, n=31) | |
| Microsoft Surface Book 3 15 | |
| Acer Aspire 5 A515-54G | |
| Lenovo Yoga S740-14IIL-81RS001DGE | |
| Schenker VIA 15 | |
| 7-Zip 18.03 / 7z b 4 | |
| Asus VivoBook 17 S712FA-DS76 | |
| Lenovo Yoga S740-14IIL-81RS001DGE | |
| Microsoft Surface Book 3 15 | |
| Average Intel Core i7-10510U (12196 - 21298, n=31) | |
| Acer Aspire 5 A515-54G | |
| Schenker VIA 15 | |
| Geekbench 5.5 / Single-Core | |
| Microsoft Surface Book 3 15 | |
| Asus VivoBook 17 S712FA-DS76 | |
| Lenovo Yoga S740-14IIL-81RS001DGE | |
| Average Intel Core i7-10510U (977 - 1287, n=31) | |
| Acer Aspire 5 A515-54G | |
| Schenker VIA 15 | |
| Geekbench 5.5 / Multi-Core | |
| Microsoft Surface Book 3 15 | |
| Lenovo Yoga S740-14IIL-81RS001DGE | |
| Asus VivoBook 17 S712FA-DS76 | |
| Acer Aspire 5 A515-54G | |
| Average Intel Core i7-10510U (2474 - 4484, n=31) | |
| Schenker VIA 15 | |
| HWBOT x265 Benchmark v2.2 / 4k Preset | |
| Lenovo Yoga S740-14IIL-81RS001DGE | |
| Asus VivoBook 17 S712FA-DS76 | |
| Average Intel Core i7-10510U (3.41 - 6.04, n=31) | |
| Microsoft Surface Book 3 15 | |
| Acer Aspire 5 A515-54G | |
| Schenker VIA 15 | |
| LibreOffice / 20 Documents To PDF | |
| Microsoft Surface Book 3 15 | |
| Acer Aspire 5 A515-54G | |
| Average Intel Core i7-10510U (50.7 - 77.8, n=27) | |
| Lenovo Yoga S740-14IIL-81RS001DGE | |
| Asus VivoBook 17 S712FA-DS76 | |
| R Benchmark 2.5 / Overall mean | |
| Schenker VIA 15 | |
| Lenovo Yoga S740-14IIL-81RS001DGE | |
| Acer Aspire 5 A515-54G | |
| Microsoft Surface Book 3 15 | |
| Average Intel Core i7-10510U (0.637 - 0.81, n=28) | |
| Asus VivoBook 17 S712FA-DS76 | |
* ... smaller is better
System Performance
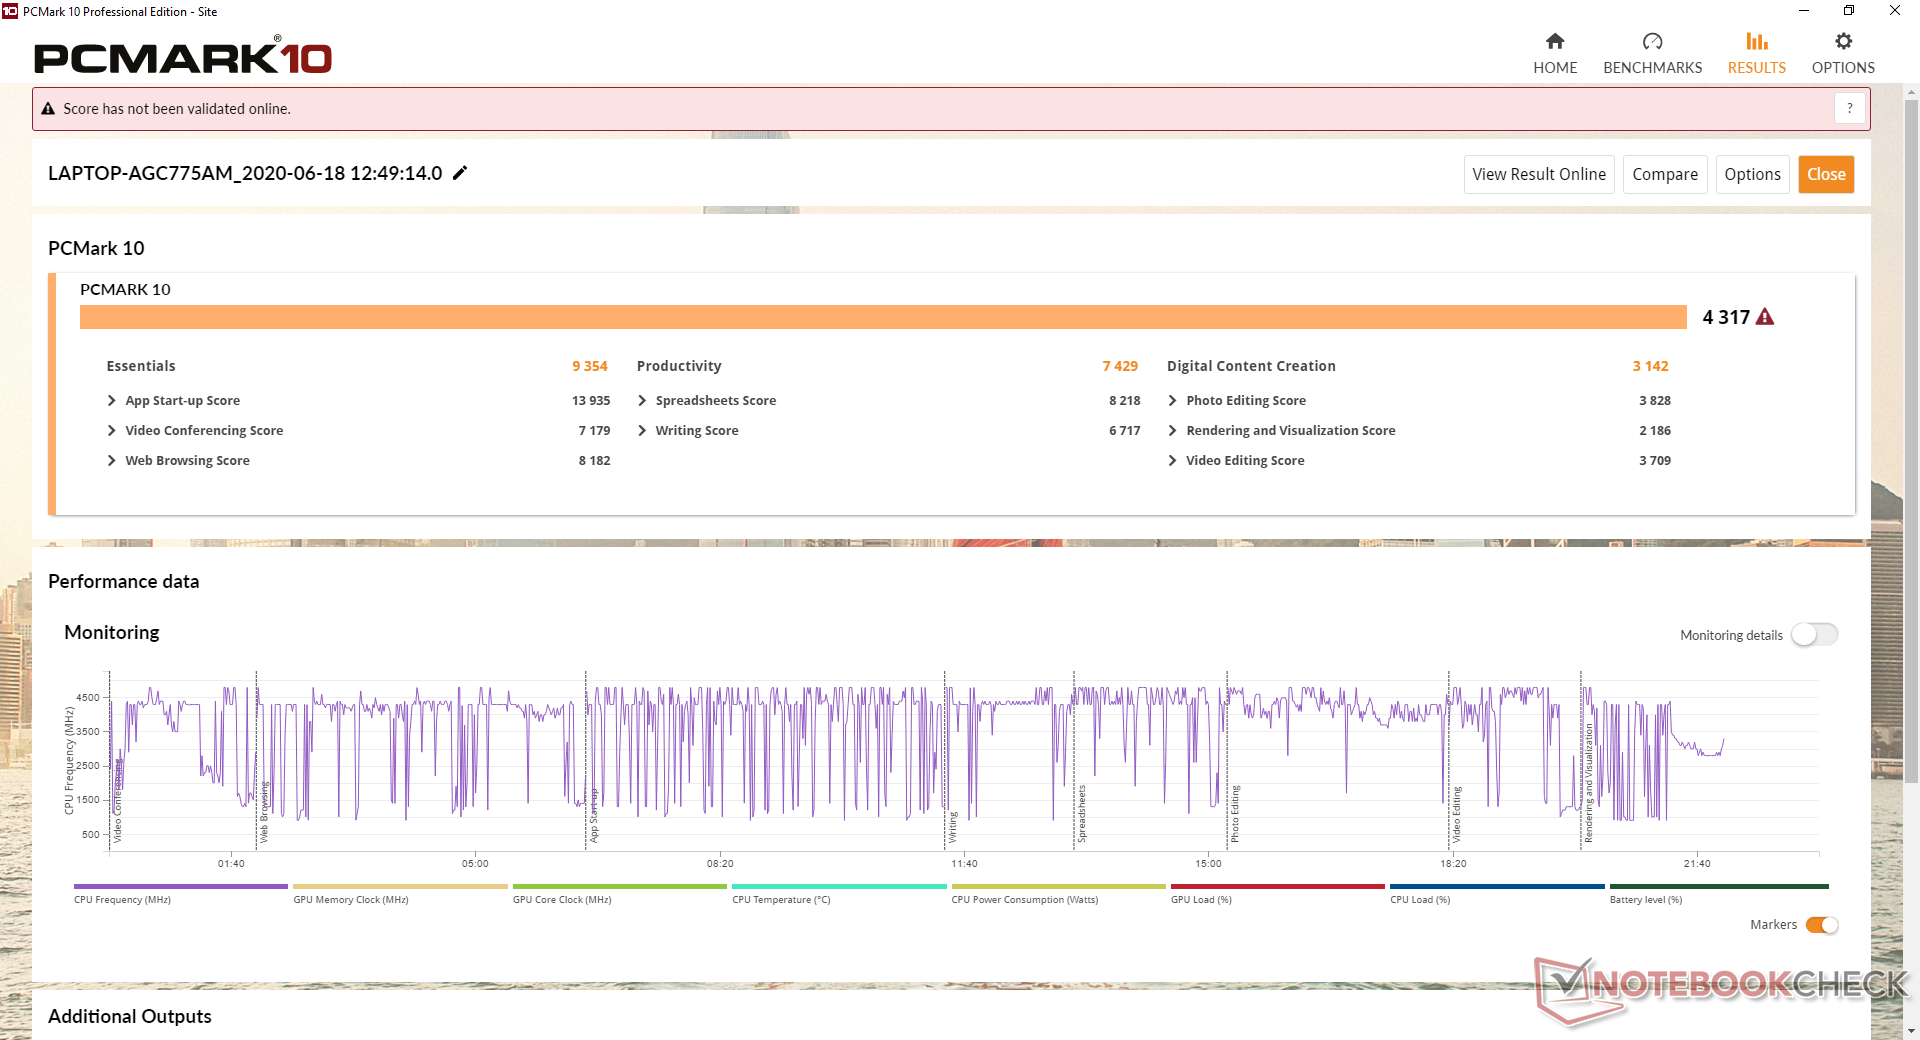
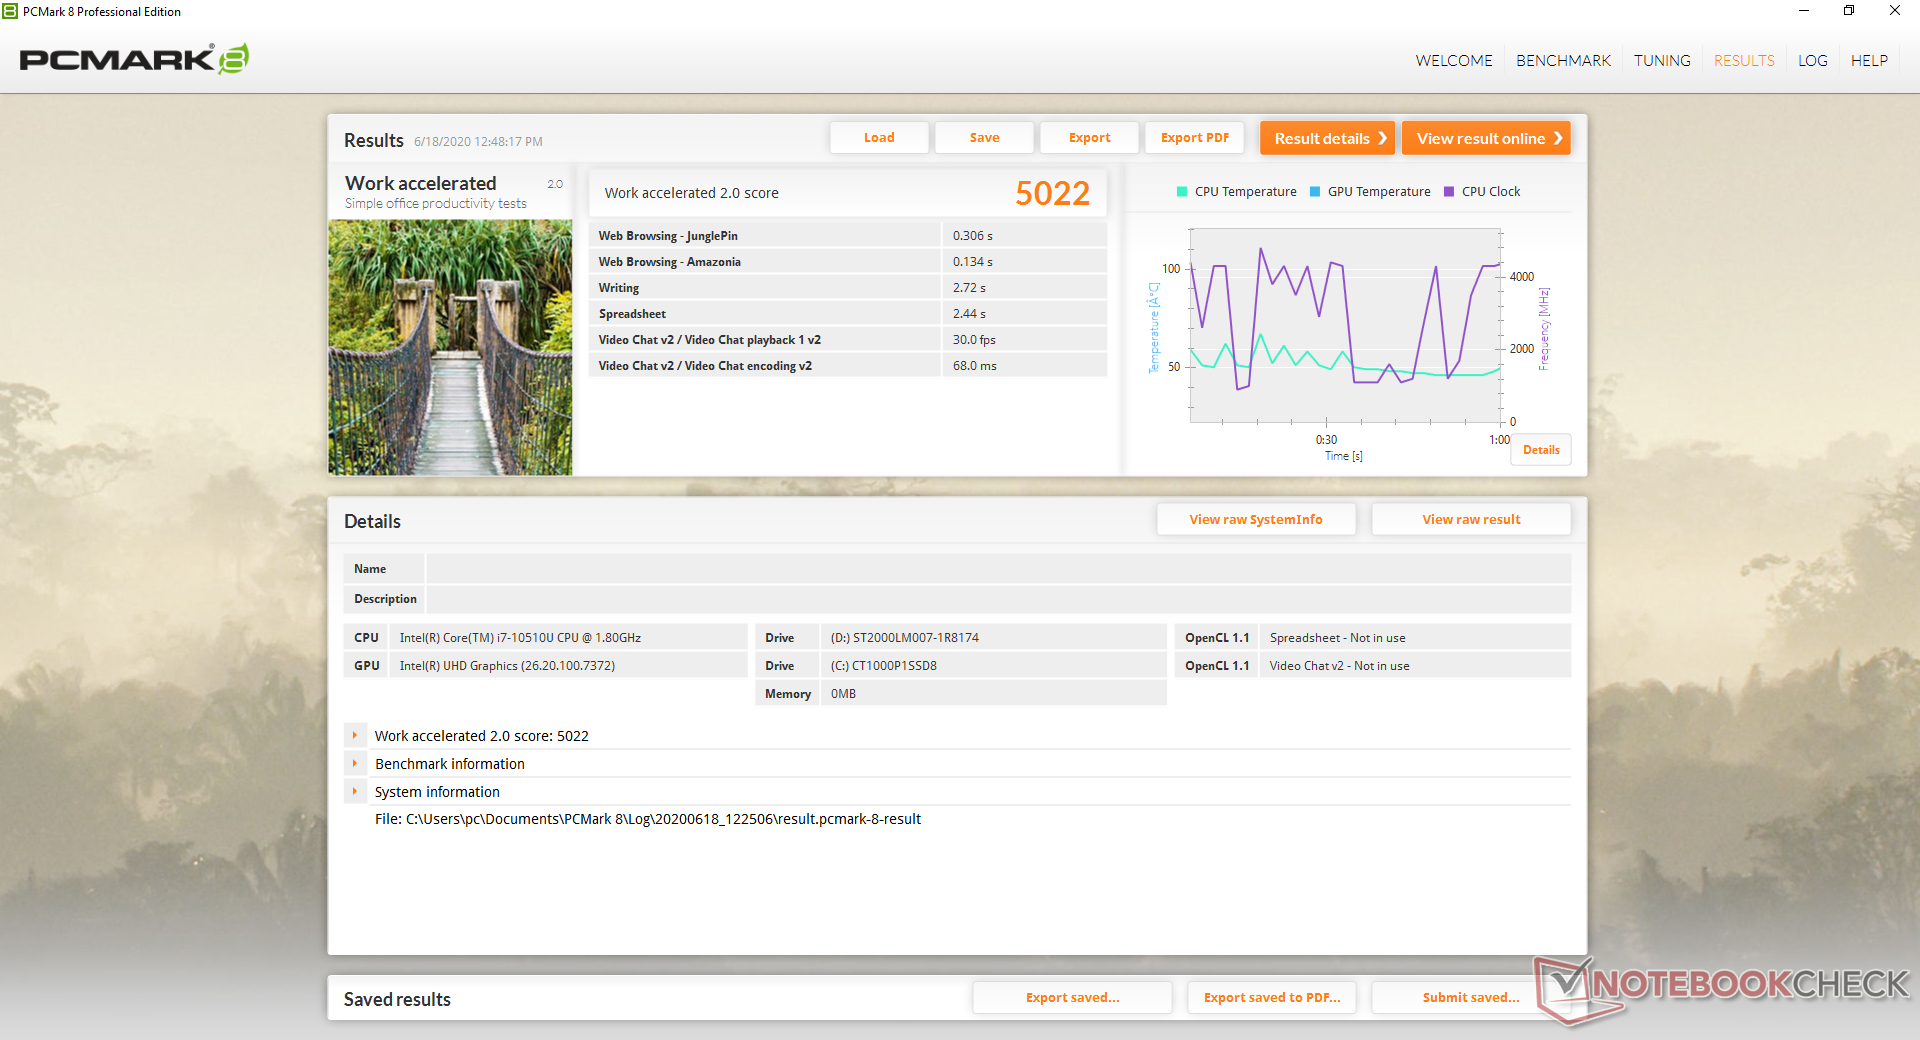
PCMark benchmarks are where we expect them to be relative to other laptops with the same Core i7-10510U processor. We experienced a major software bug during our time with the test unit that we will detail in the Stress Test section below.
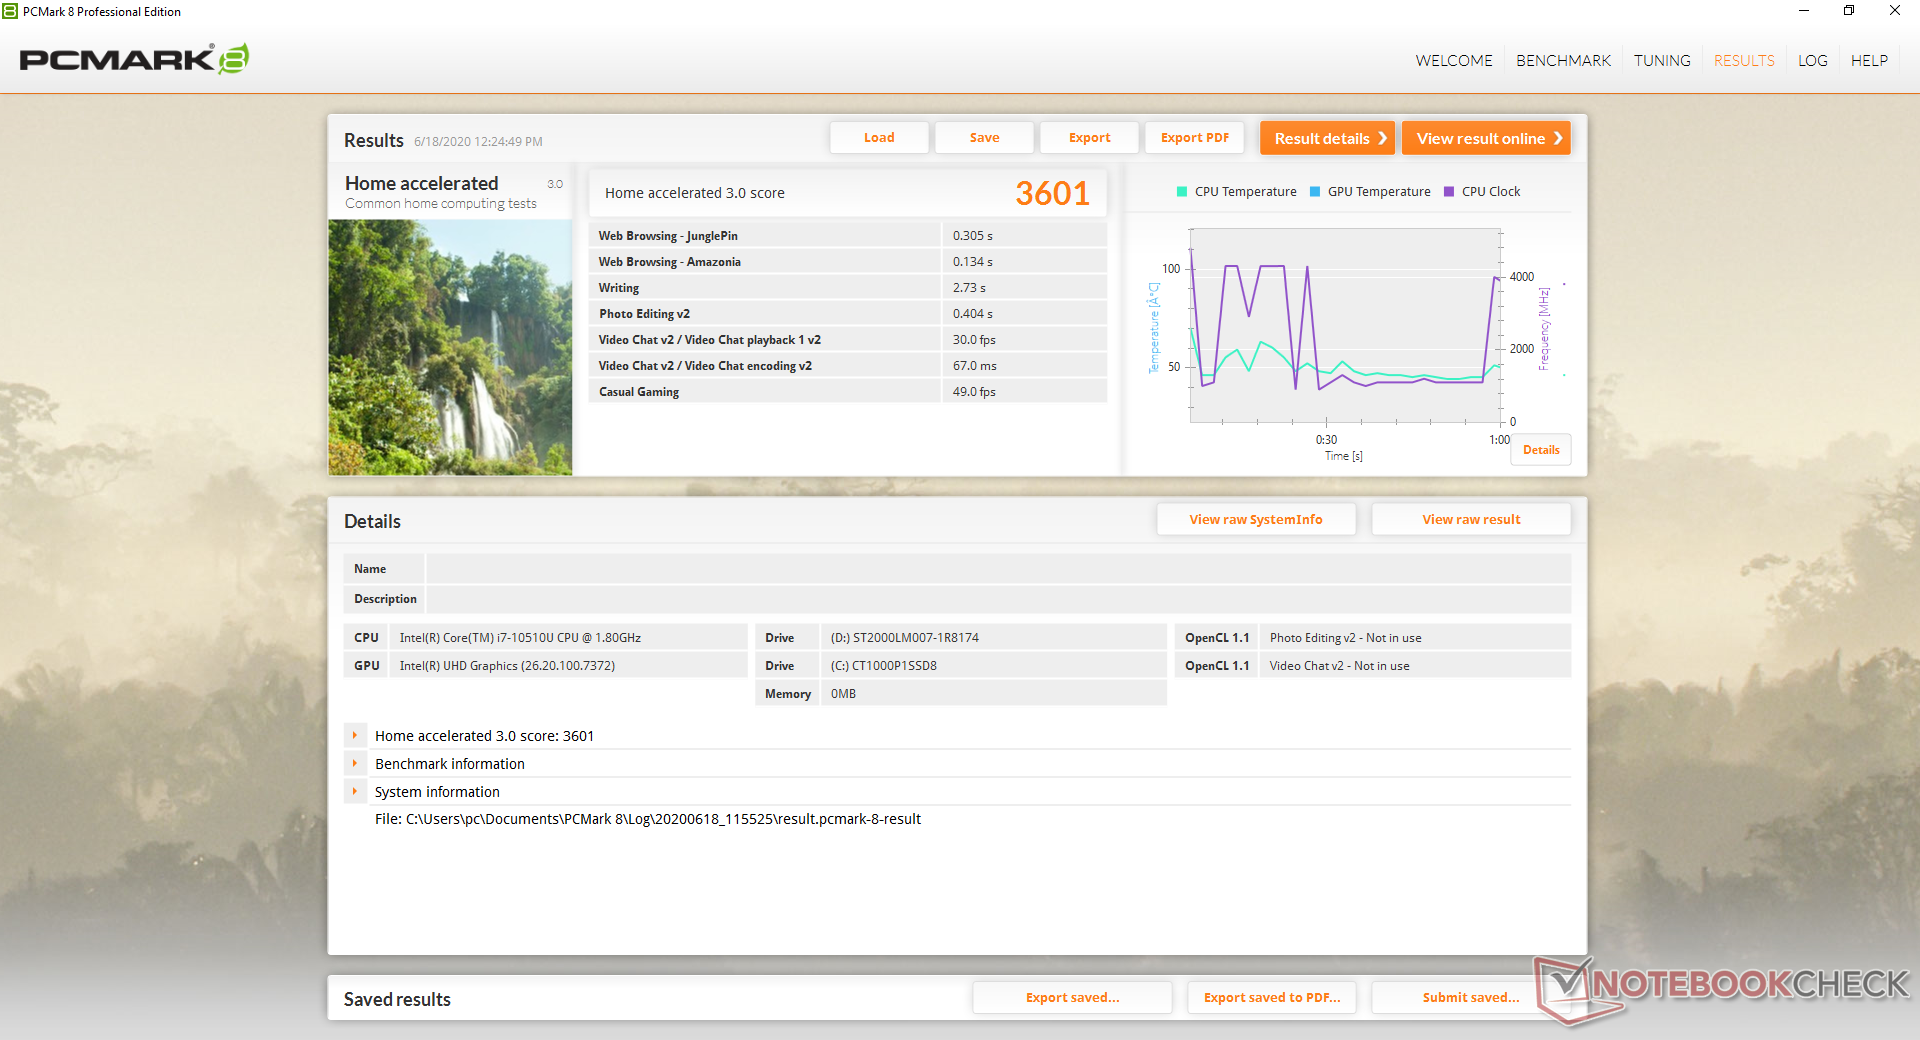
| PCMark 8 Home Score Accelerated v2 | 3601 points | |
| PCMark 8 Work Score Accelerated v2 | 5022 points | |
| PCMark 10 Score | 4317 points | |
Help | ||
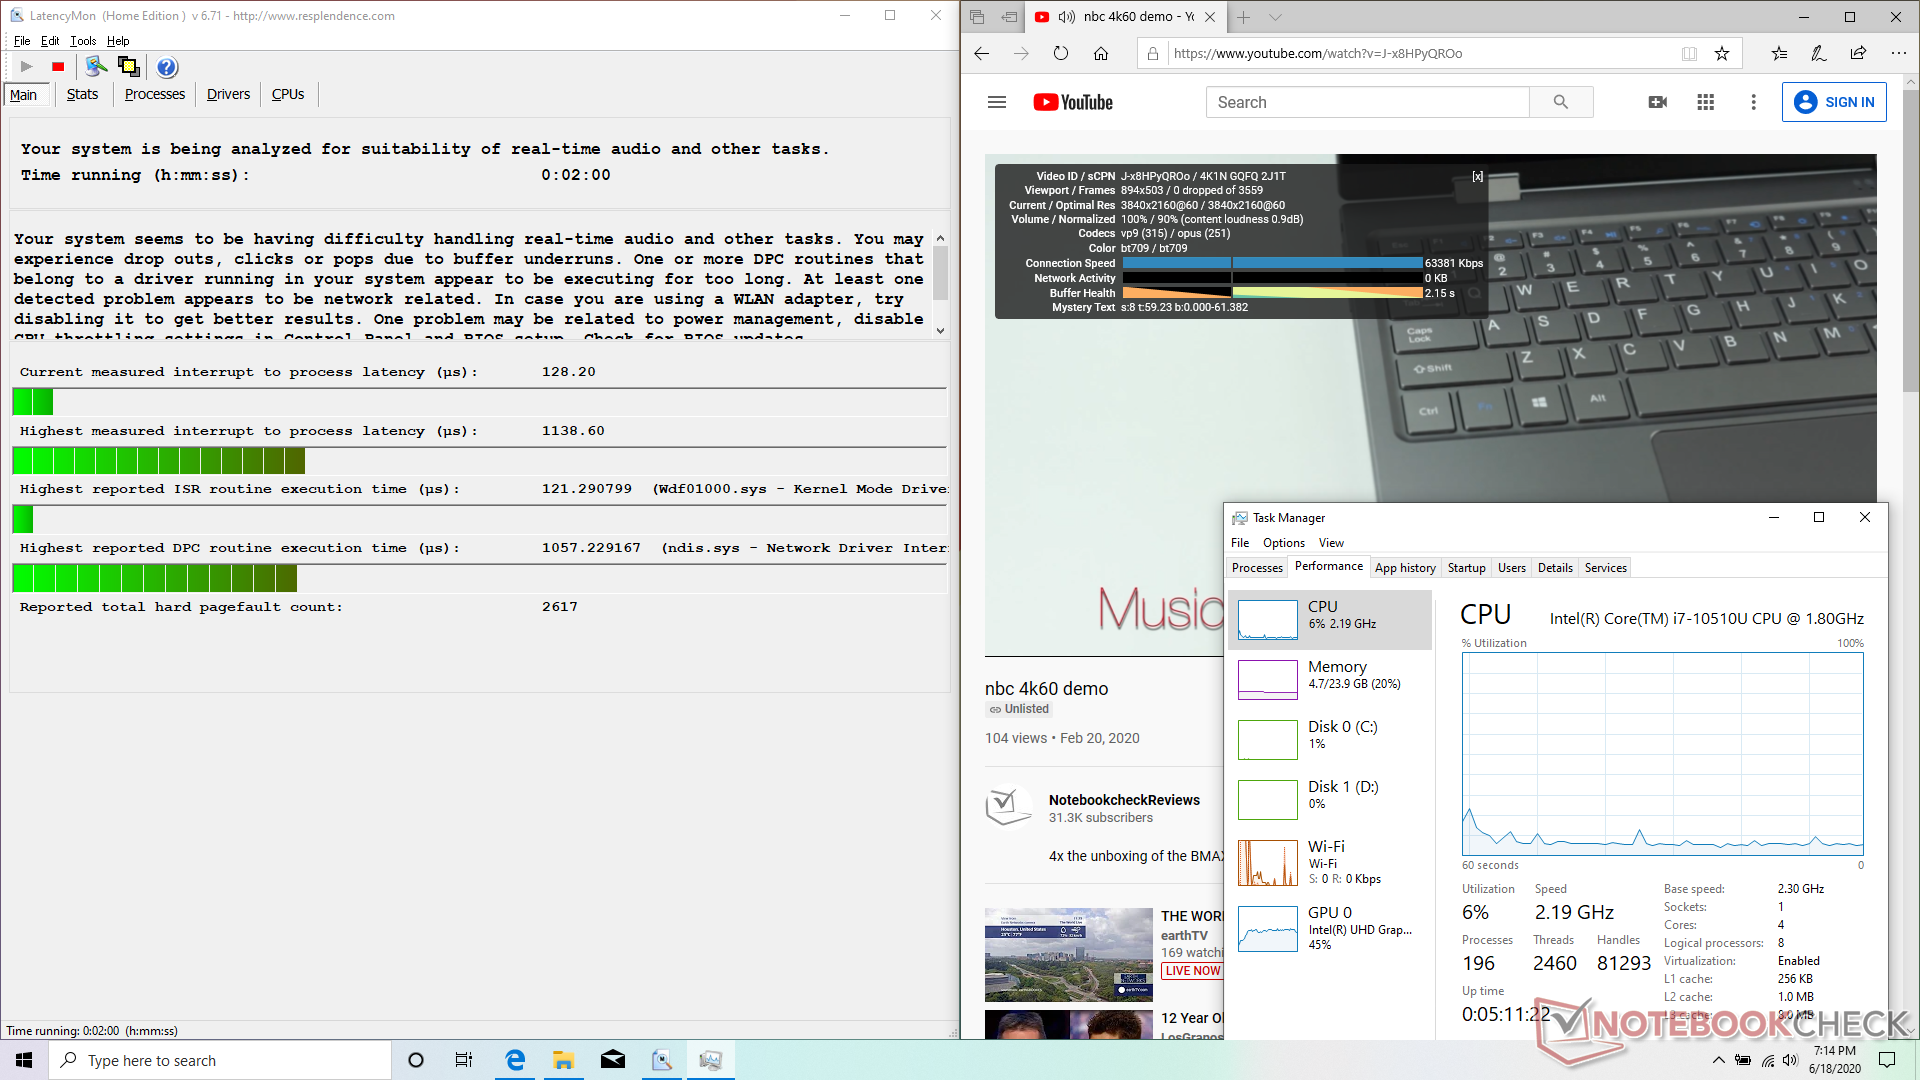
DPC Latency
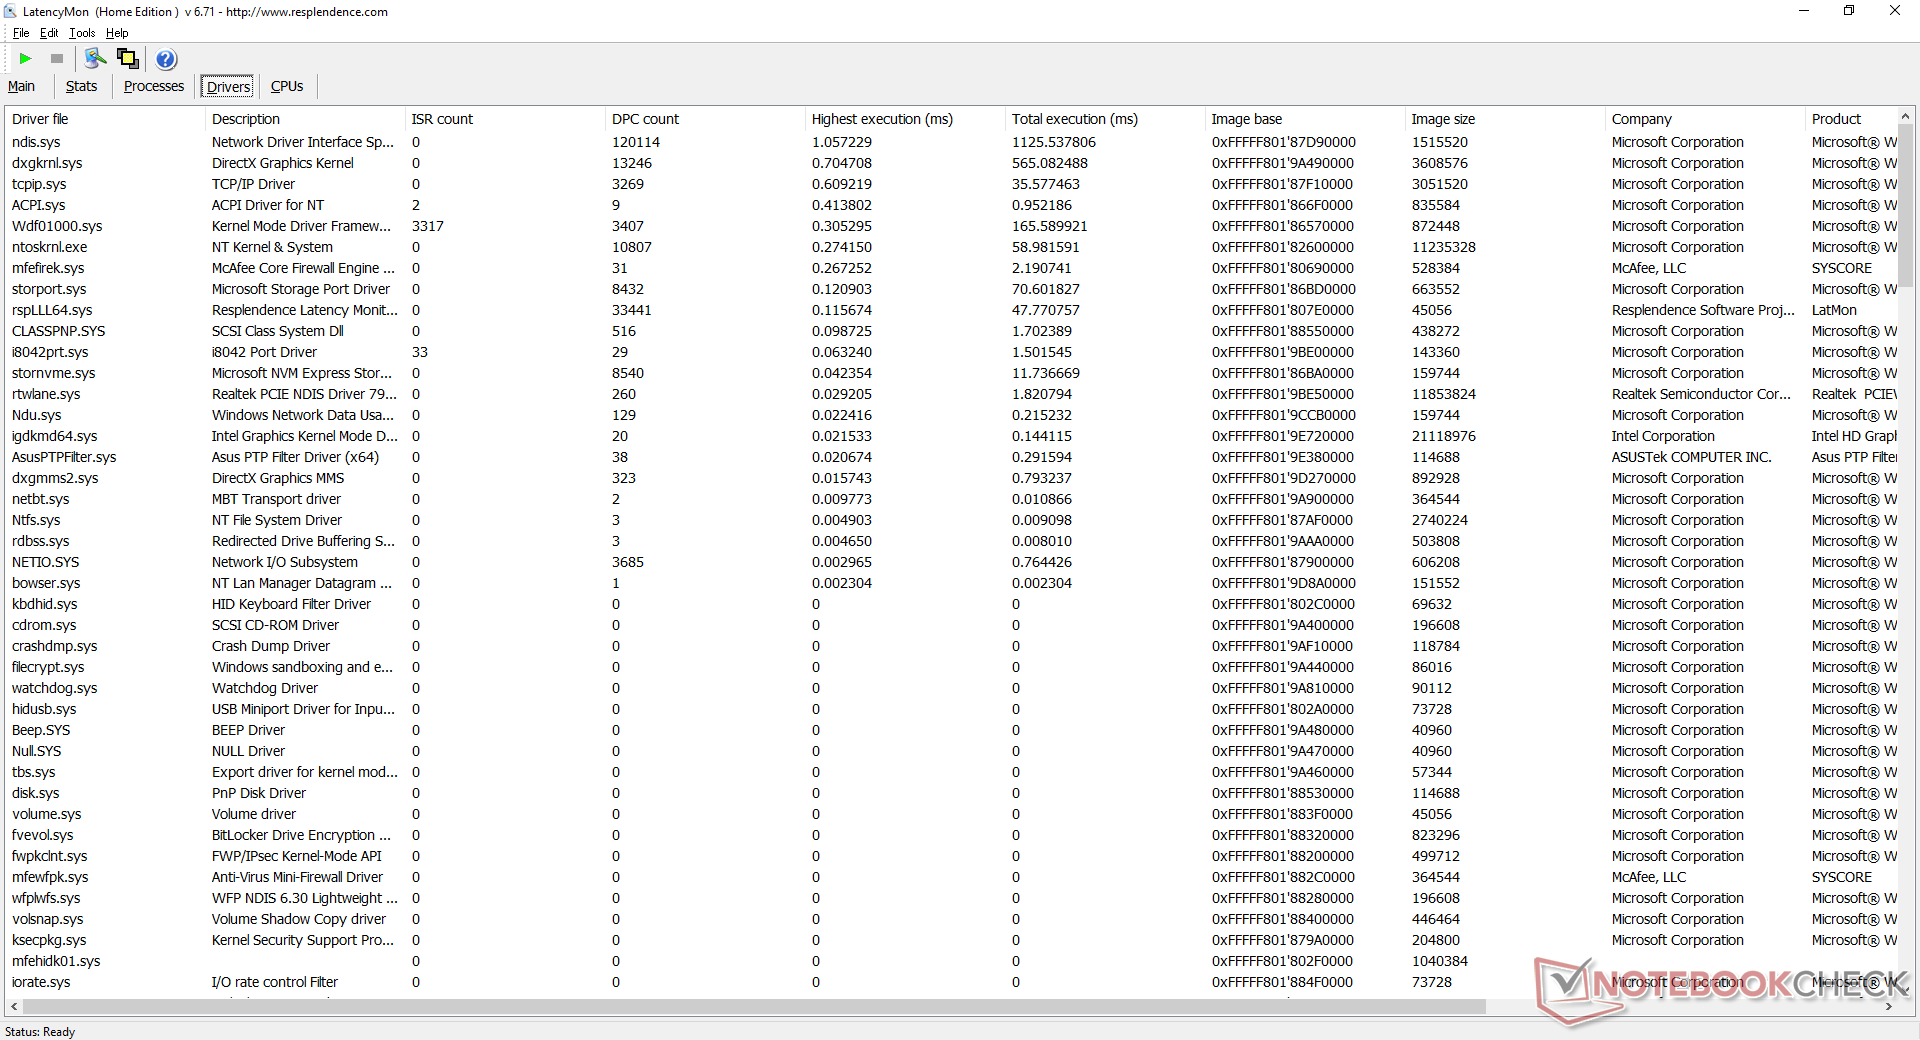
LatencyMon shows minor DPC latency issues when opening multiple tabs on our homepage. 4K UHD video playback on YouTube is otherwise smooth with no dropped frames.
| DPC Latencies / LatencyMon - interrupt to process latency (max), Web, Youtube, Prime95 | |
| Dell XPS 15 9500 Core i7 4K UHD | |
| HP Envy x360 15-dr1679cl | |
| HP Envy 17t-cg000 | |
| Asus VivoBook 17 S712FA-DS76 | |
* ... smaller is better
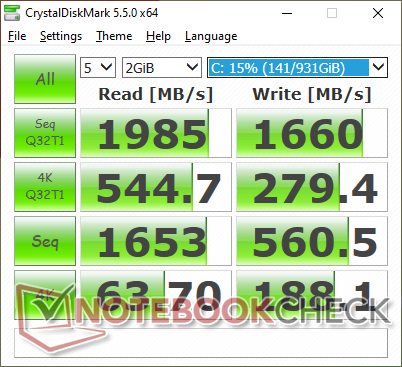
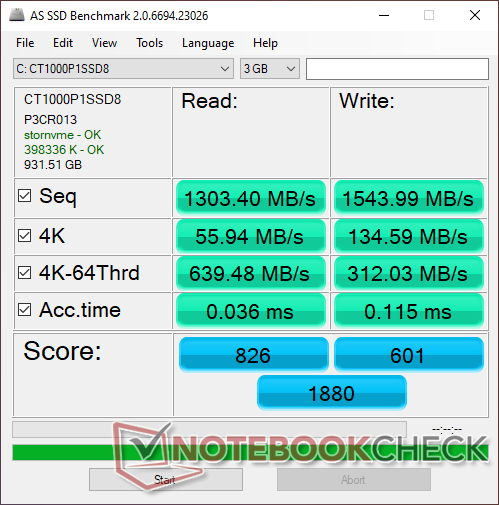
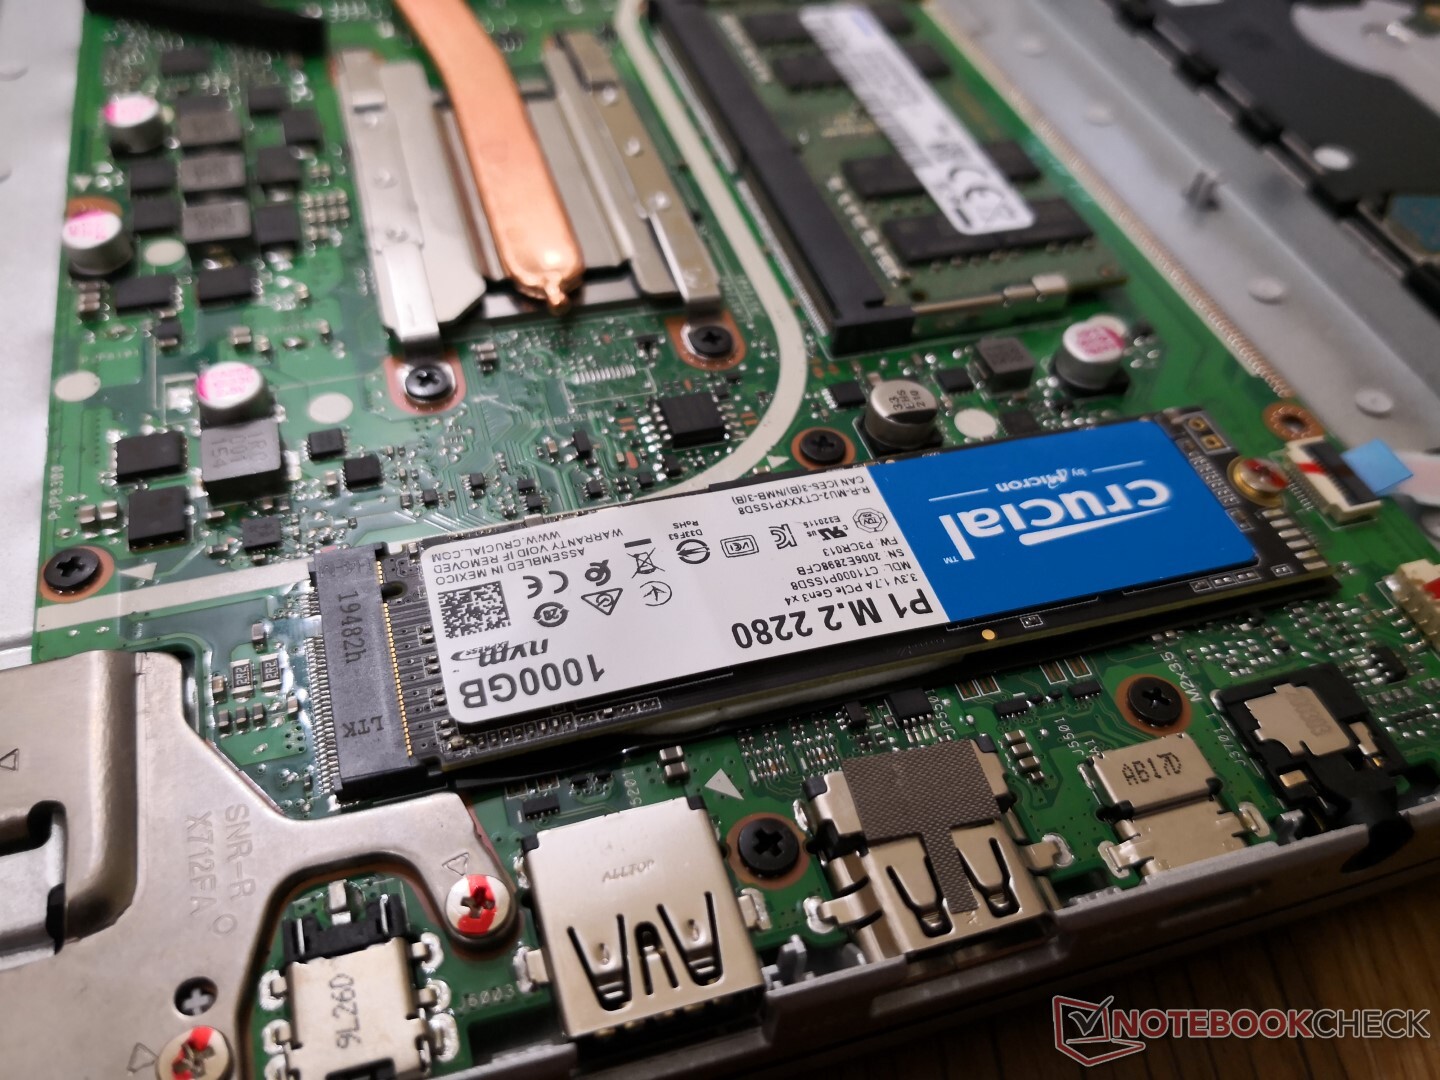
Storage Devices
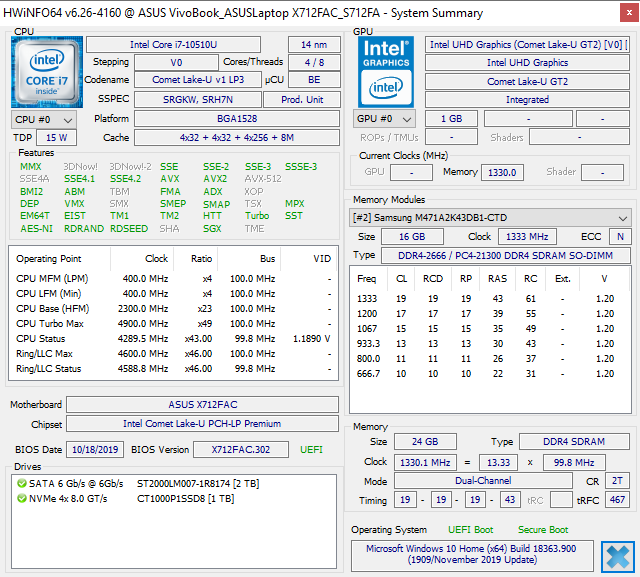
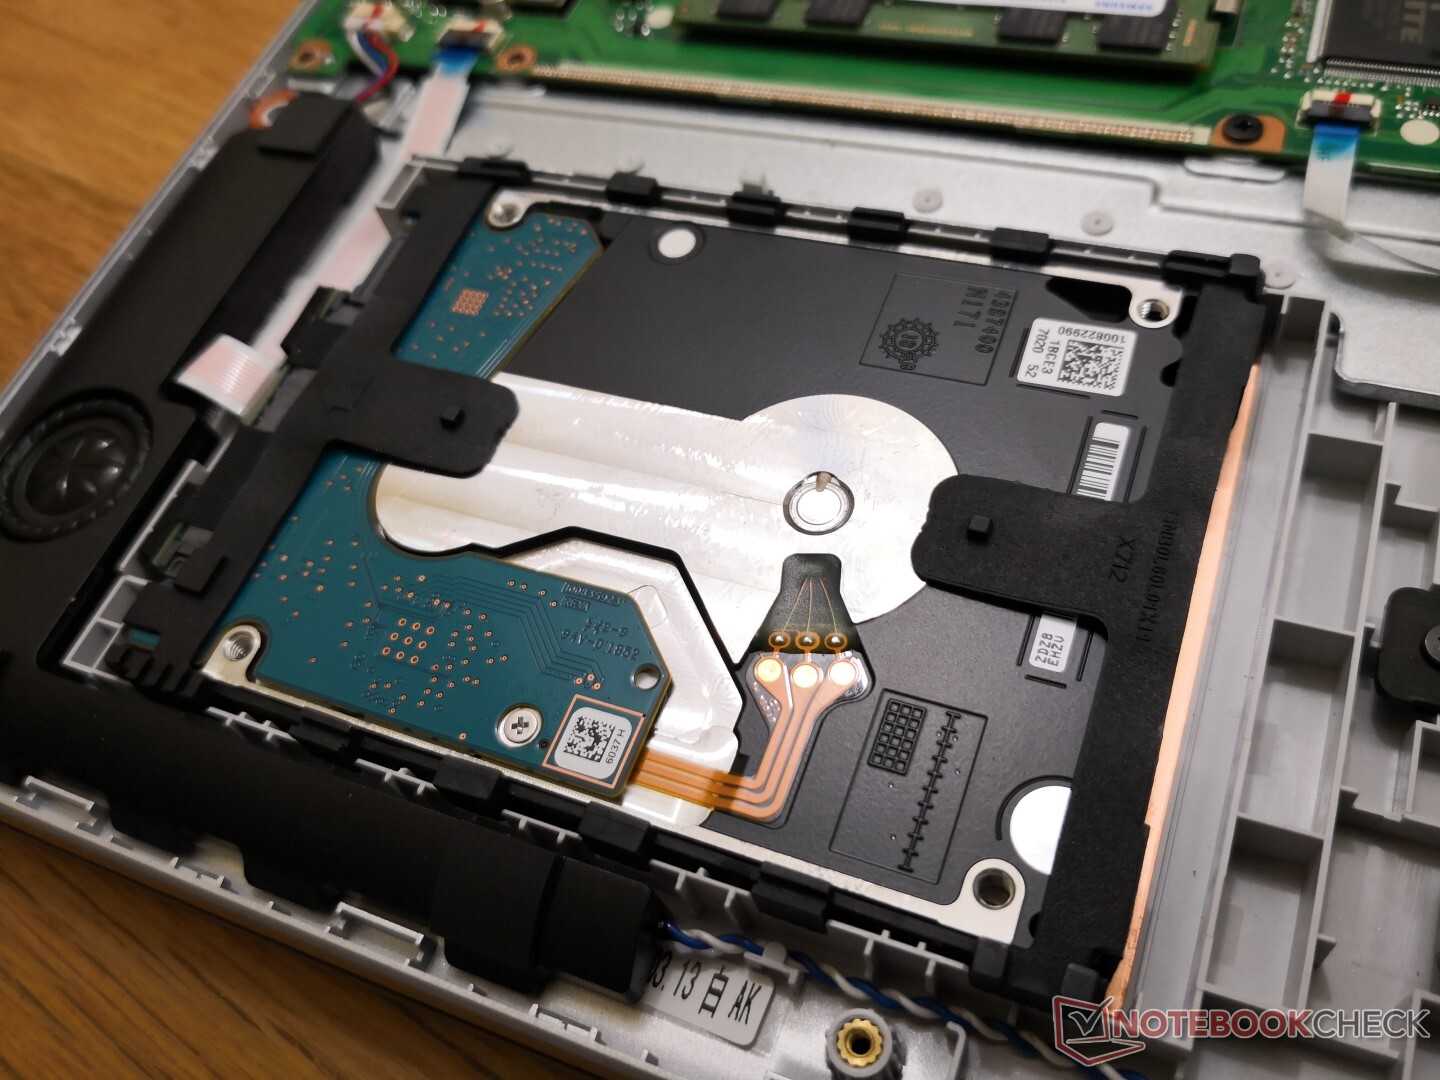
One M.2 2280 slot and a secondary 2.5-inch bay are available. According to HWiNFO, the M.2 slot supports PCIe x4 speeds. Our test unit comes with a 1 TB Crucial P1 SSD CT1000P1SSD8 NVMe SSD and a secondary 2 TB Seagate ST2000LM007 HDD. It's a little overkill since you won't be editing videos or playing many games on this machine, but the wide storage options are welcomed nonetheless.
| Asus VivoBook 17 S712FA-DS76 Crucial P1 SSD CT1000P1SSD8 | Dell Inspiron 17 3780 SK Hynix BC501 NVMe 256 GB | Acer Aspire 5 A515-54G Kingston RBUSNS8154P3512GJ1 | Lenovo Ideapad 330S-15ARR-81FB00C7GE WDC PC SN520 SDAPNUW-256G | Asus VivoBook 17 M712DA-AU017T Intel SSD 660p SSDPEKNW512G8 | HP 17-by2437ng Toshiba KBG30ZMV256G | |
|---|---|---|---|---|---|---|
| AS SSD | -27% | 27% | -37% | 8% | -37% | |
| Seq Read (MB/s) | 1303 | 1061 -19% | 1405 8% | 1530 17% | 1592 22% | 1359 4% |
| Seq Write (MB/s) | 1544 | 491.4 -68% | 953 -38% | 1087 -30% | 900 -42% | 759 -51% |
| 4K Read (MB/s) | 55.9 | 39.13 -30% | 54 -3% | 34.7 -38% | 45.24 -19% | 45.04 -19% |
| 4K Write (MB/s) | 134.6 | 104 -23% | 93 -31% | 79.9 -41% | 104.3 -23% | 105.7 -21% |
| 4K-64 Read (MB/s) | 639 | 505 -21% | 959 50% | 464.7 -27% | 324 -49% | 628 -2% |
| 4K-64 Write (MB/s) | 312 | 314.8 1% | 772 147% | 326.1 5% | 835 168% | 333.8 7% |
| Access Time Read * (ms) | 0.036 | 0.063 -75% | 0.051 -42% | 0.102 -183% | 0.058 -61% | 0.09 -150% |
| Access Time Write * (ms) | 0.115 | 0.034 70% | 0.044 62% | 0.047 59% | 0.047 59% | 0.157 -37% |
| Score Read (Points) | 826 | 650 -21% | 1153 40% | 652 -21% | 528 -36% | 809 -2% |
| Score Write (Points) | 601 | 468 -22% | 961 60% | 515 -14% | 1030 71% | 515 -14% |
| Score Total (Points) | 1880 | 1434 -24% | 2695 43% | 1489 -21% | 1810 -4% | 1722 -8% |
| Copy ISO MB/s (MB/s) | 2218 | 876 -61% | 690 -69% | 448.4 -80% | ||
| Copy Program MB/s (MB/s) | 864 | 653 -24% | 153.9 -82% | 248.3 -71% | ||
| Copy Game MB/s (MB/s) | 1440 | 512 -64% | 339.7 -76% | 416.4 -71% | ||
| CrystalDiskMark 5.2 / 6 | -14% | -8% | -9% | -12% | -21% | |
| Write 4K (MB/s) | 188.1 | 120.3 -36% | 100.4 -47% | 120.4 -36% | 132 -30% | 126.7 -33% |
| Read 4K (MB/s) | 63.7 | 41.81 -34% | 47.16 -26% | 41.23 -35% | 52 -18% | 52.5 -18% |
| Write Seq (MB/s) | 561 | 619 10% | 993 77% | 1293 130% | 973 73% | 669 19% |
| Read Seq (MB/s) | 1653 | 1119 -32% | 1176 -29% | 1289 -22% | 1606 -3% | 881 -47% |
| Write 4K Q32T1 (MB/s) | 279.4 | 492.2 76% | 354.7 27% | 206 -26% | 210.4 -25% | 272.2 -3% |
| Read 4K Q32T1 (MB/s) | 545 | 398.8 -27% | 473 -13% | 275.7 -49% | 312.2 -43% | 483.5 -11% |
| Write Seq Q32T1 (MB/s) | 1660 | 812 -51% | 1034 -38% | 1301 -22% | 982 -41% | 796 -52% |
| Read Seq Q32T1 (MB/s) | 1985 | 1616 -19% | 1635 -18% | 1739 -12% | 1847 -7% | 1503 -24% |
| Total Average (Program / Settings) | -21% /
-22% | 10% /
12% | -23% /
-27% | -2% /
-0% | -29% /
-31% |
* ... smaller is better

Disk Throttling: DiskSpd Read Loop, Queue Depth 8
GPU Performance
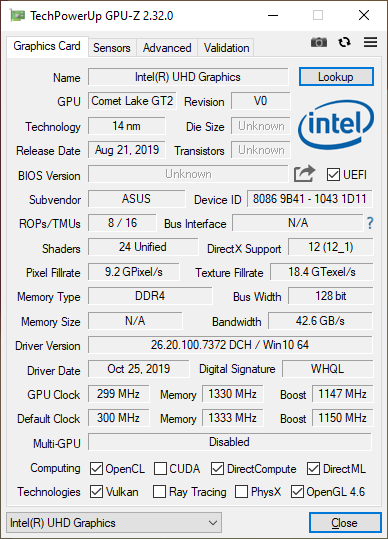
The years-old UHD Graphics 620 is not made for gaming and it's definitely showing its age. For the occasional game of Rocket League or League of Legends, invest in the AMD Radeon RX Vega 10 or the GeForce MX150/250/330 instead.
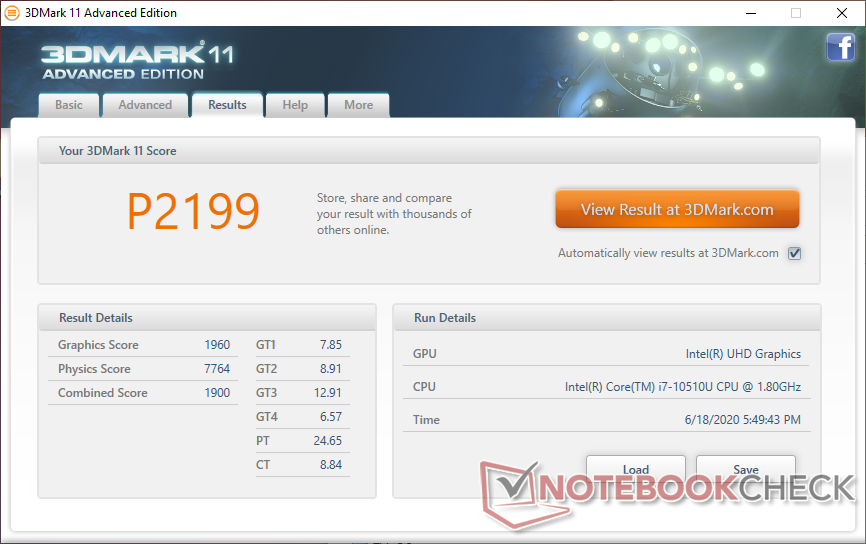
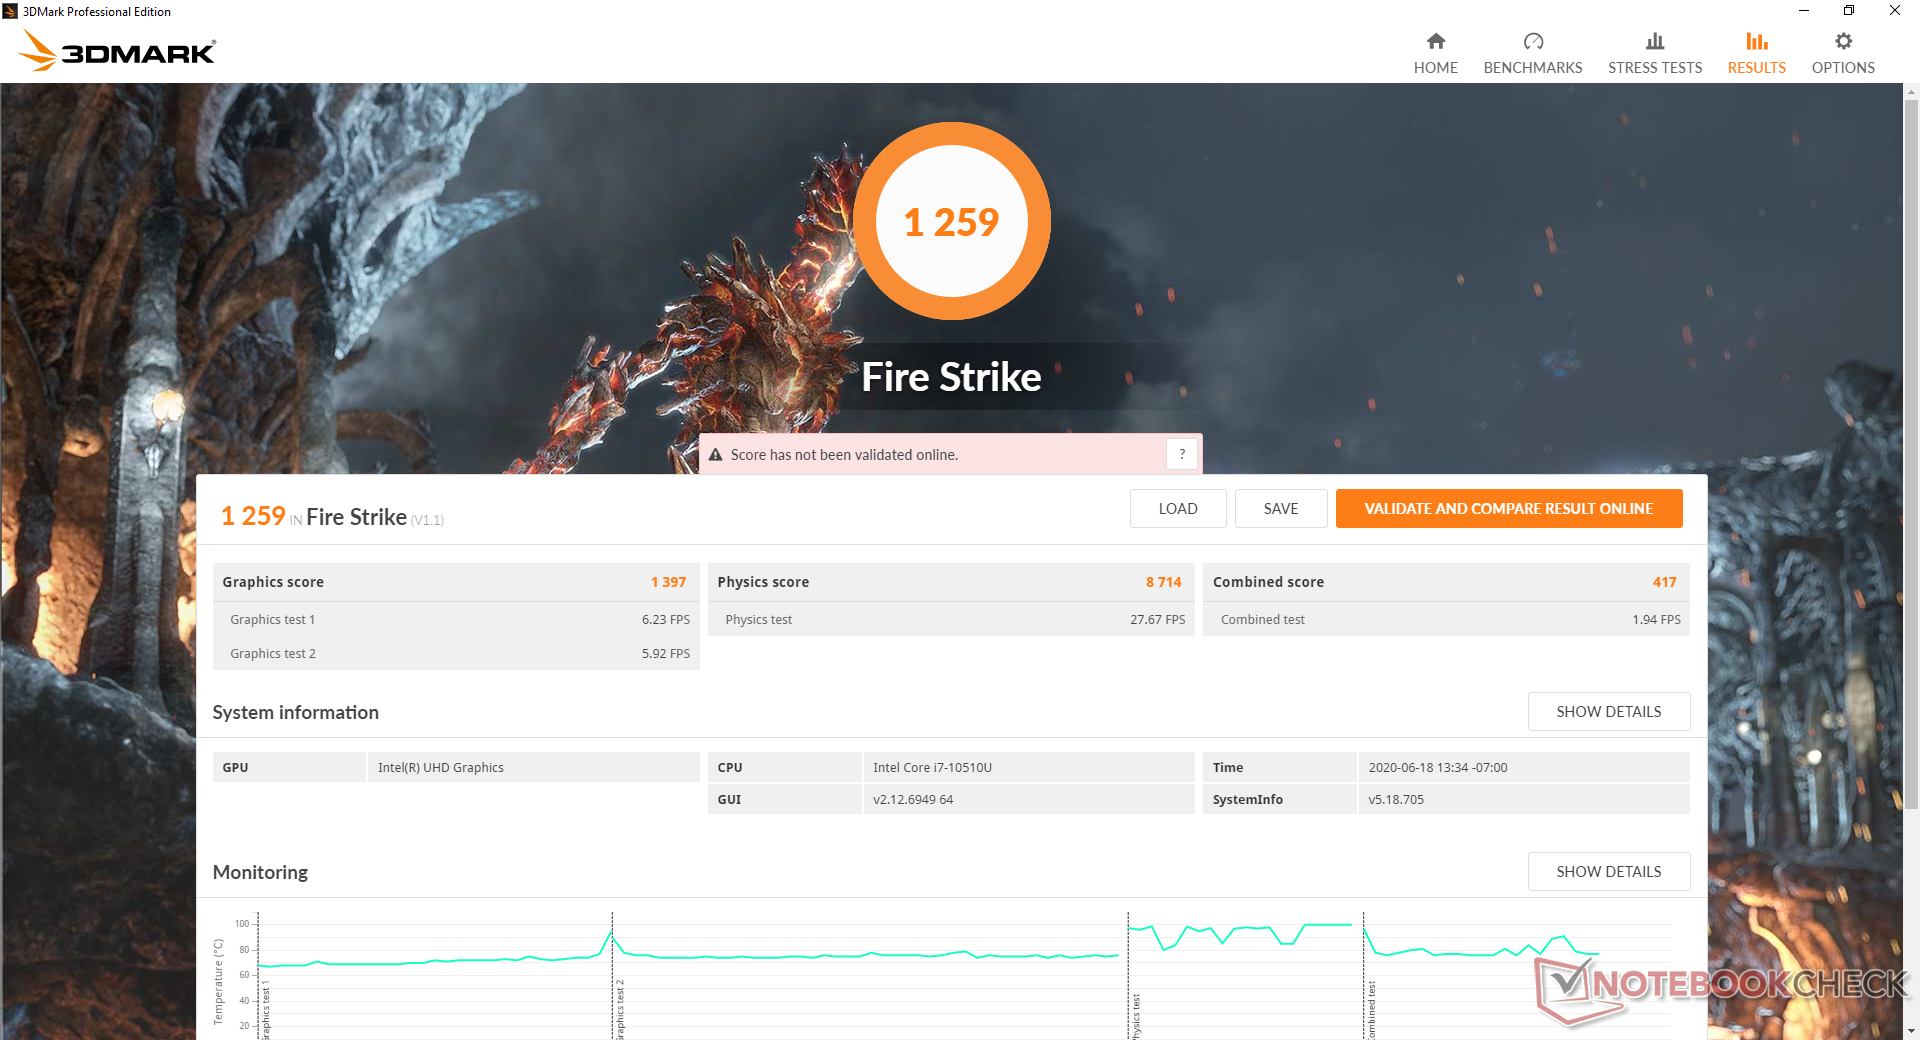
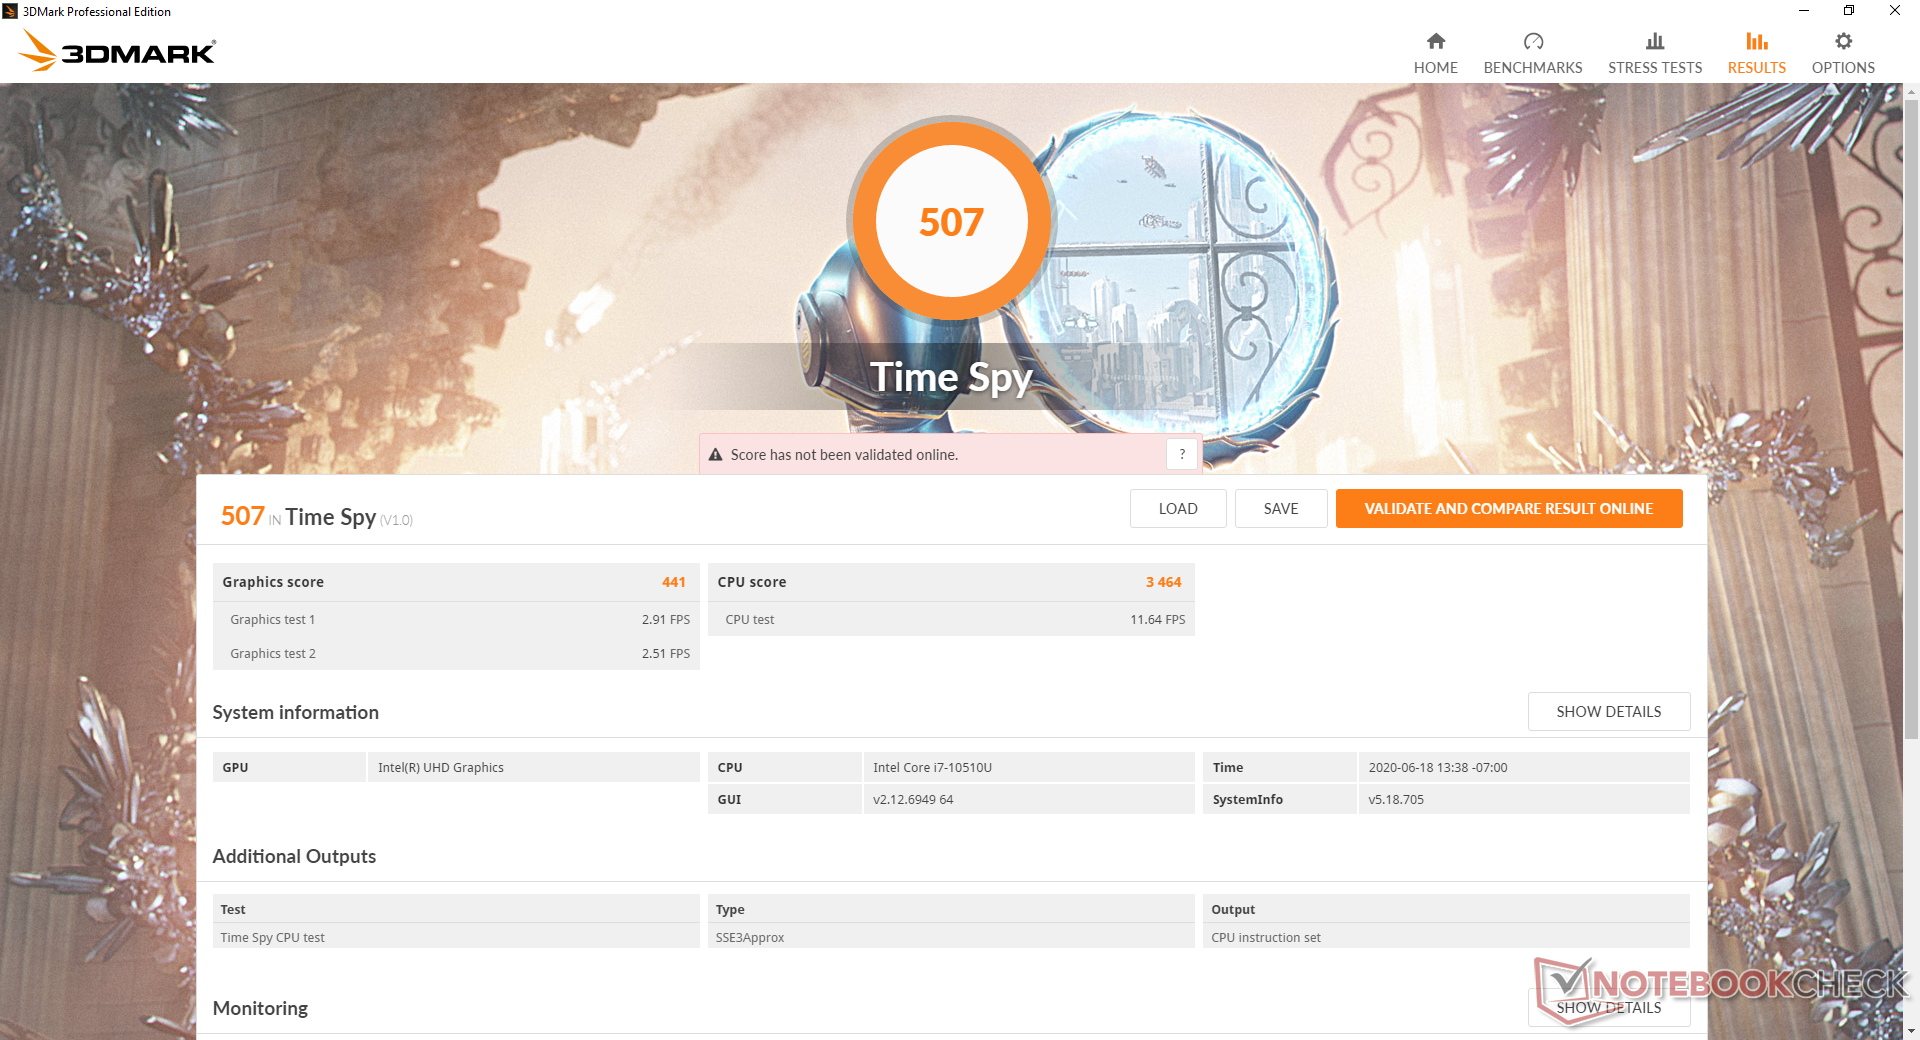
| 3DMark 11 Performance | 2199 points | |
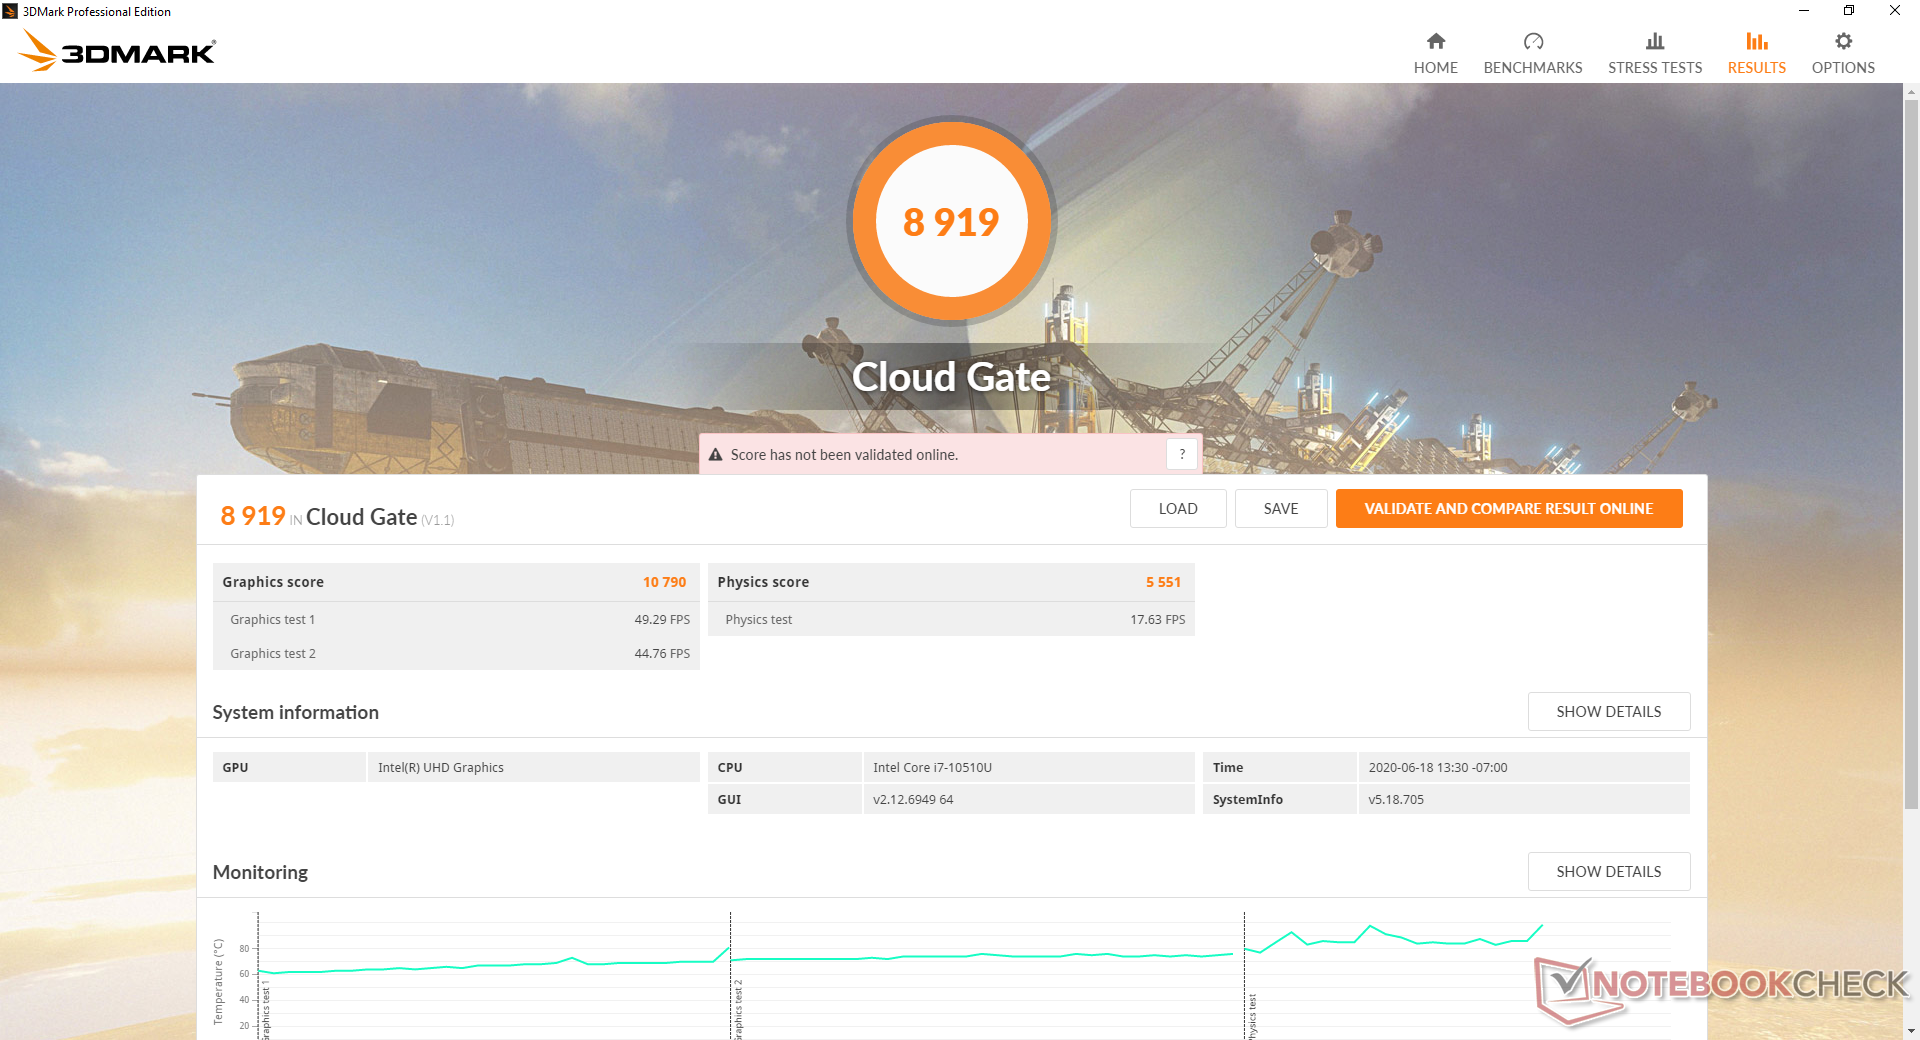
| 3DMark Cloud Gate Standard Score | 8919 points | |
| 3DMark Fire Strike Score | 1259 points | |
| 3DMark Time Spy Score | 507 points | |
Help | ||
| low | med. | high | ultra | |
|---|---|---|---|---|
| Dota 2 Reborn (2015) | 82.2 | 57.1 | 21.8 | 19.6 |
| X-Plane 11.11 (2018) | 17.4 | 11.7 | 11.1 |
Emissions
System Noise
17.3-inch laptops running on low-power Core U-series CPUs with no dedicated graphics should be some of the quietest systems available. Unfortunately, this is not the case for our Asus. The fan is always spinning no matter the load or power setting at 31.4 dB(A) against a background of 28.1 dB(A). It's not loud, but the system is never truly silent, either. If running high loads like gaming, fan noise becomes steady at a loud 44 dB(A).
| Asus VivoBook 17 S712FA-DS76 UHD Graphics 620, i7-10510U, Crucial P1 SSD CT1000P1SSD8 | Dell Inspiron 17 3780 Radeon 520, i7-8565U, SK Hynix BC501 NVMe 256 GB | Asus VivoBook 17 M712DA-AU017T Vega 8, R5 3500U, Intel SSD 660p SSDPEKNW512G8 | HP 17-by2437ng UHD Graphics 620, i3-10110U, Toshiba KBG30ZMV256G | Acer Aspire ES1-732-P7YA HD Graphics 505, Pentium N4200, Toshiba MQ01ABD100 | Lenovo IdeaPad 330-17IKB 81DM GeForce MX150, i5-8550U, WDC Blue WD10SPZX-24Z10T0 | |
|---|---|---|---|---|---|---|
| Noise | -0% | 9% | 7% | 6% | 7% | |
| off / environment * (dB) | 28.1 | 28.1 -0% | 30.3 -8% | 30.1 -7% | 30.2 -7% | 28.6 -2% |
| Idle Minimum * (dB) | 31.4 | 31.7 -1% | 30.3 4% | 31.4 -0% | 31 1% | 29 8% |
| Idle Average * (dB) | 31.4 | 31.8 -1% | 30.3 4% | 31.4 -0% | 31 1% | 29 8% |
| Idle Maximum * (dB) | 31.4 | 31.8 -1% | 30.3 4% | 31.4 -0% | 31 1% | 31.8 -1% |
| Load Average * (dB) | 44 | 38.7 12% | 31.6 28% | 32.6 26% | 35.1 20% | 34.8 21% |
| Load Maximum * (dB) | 44 | 48.5 -10% | 35.7 19% | 33 25% | 35.1 20% | 40.8 7% |
| Witcher 3 ultra * (dB) | 39.9 |
* ... smaller is better
Noise level
| Idle |
| 31.4 / 31.4 / 31.4 dB(A) |
| Load |
| 44 / 44 dB(A) |
 | ||
30 dB silent 40 dB(A) audible 50 dB(A) loud |
||
min: | ||
Temperature
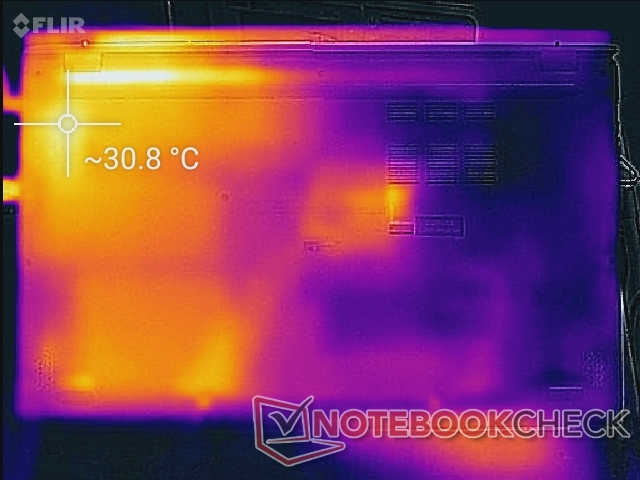
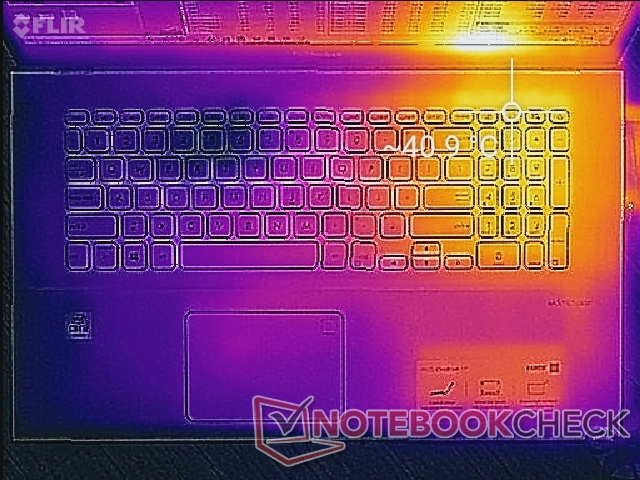
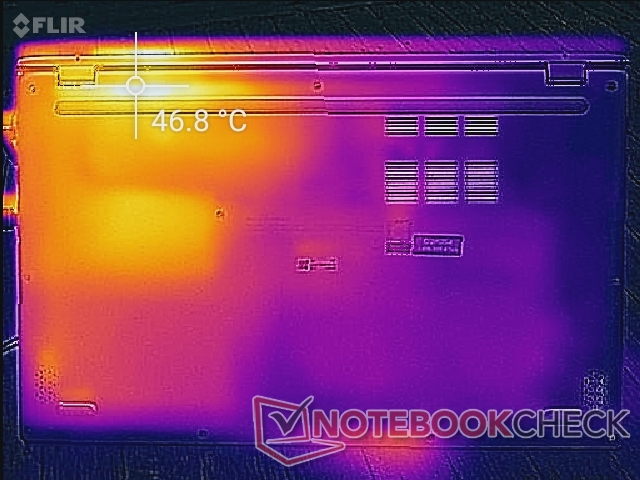
Surface temperatures will always be warmer on the right half than the left due to the positioning of the motherboard inside. When running very high loads for over an hour, hot spots can be as warm as 41 C and 47 C on the top and bottom, respectively. Luckily, the palm rests and QWERTY keys remain relatively cool no matter the workload.
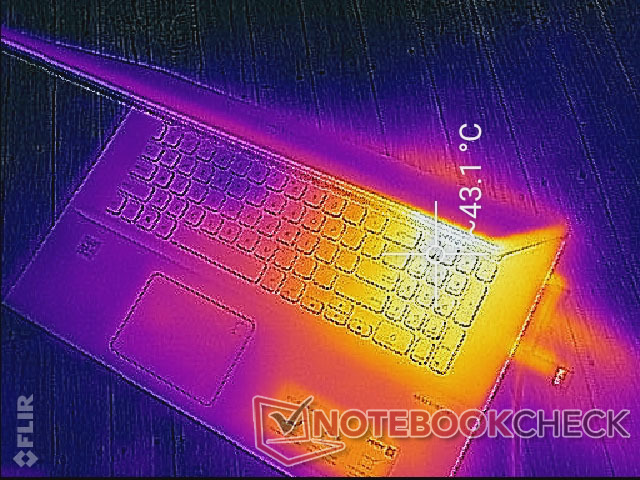
(±) The maximum temperature on the upper side is 41 °C / 106 F, compared to the average of 36.8 °C / 98 F, ranging from 21 to 71 °C for the class Multimedia.
(-) The bottom heats up to a maximum of 47.6 °C / 118 F, compared to the average of 39.1 °C / 102 F
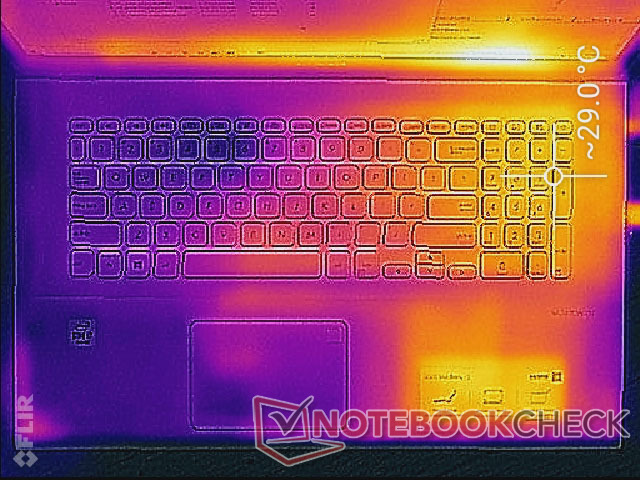
(+) In idle usage, the average temperature for the upper side is 26.8 °C / 80 F, compared to the device average of 31.3 °C / 88 F.
(+) The palmrests and touchpad are cooler than skin temperature with a maximum of 30.6 °C / 87.1 F and are therefore cool to the touch.
(±) The average temperature of the palmrest area of similar devices was 28.7 °C / 83.7 F (-1.9 °C / -3.4 F).
Stress Test
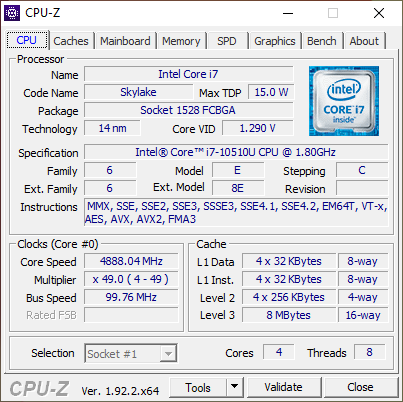
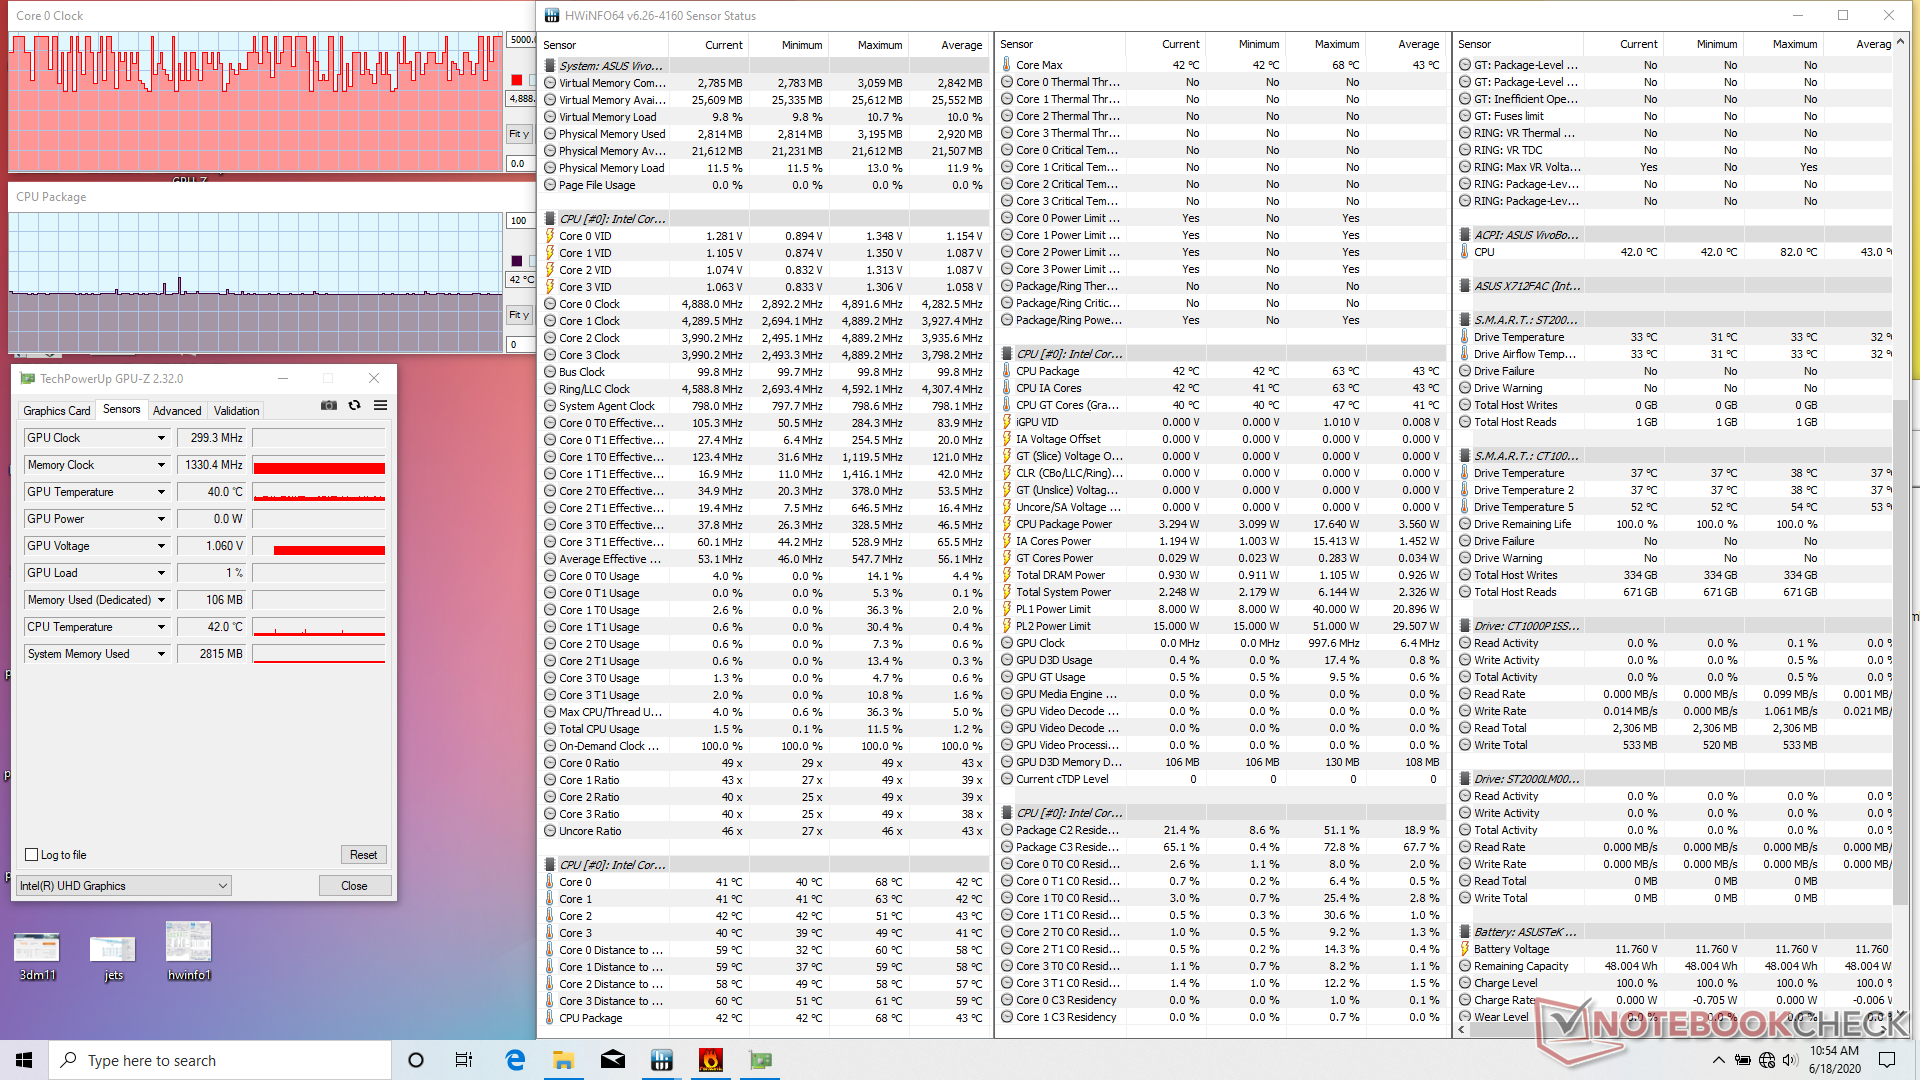
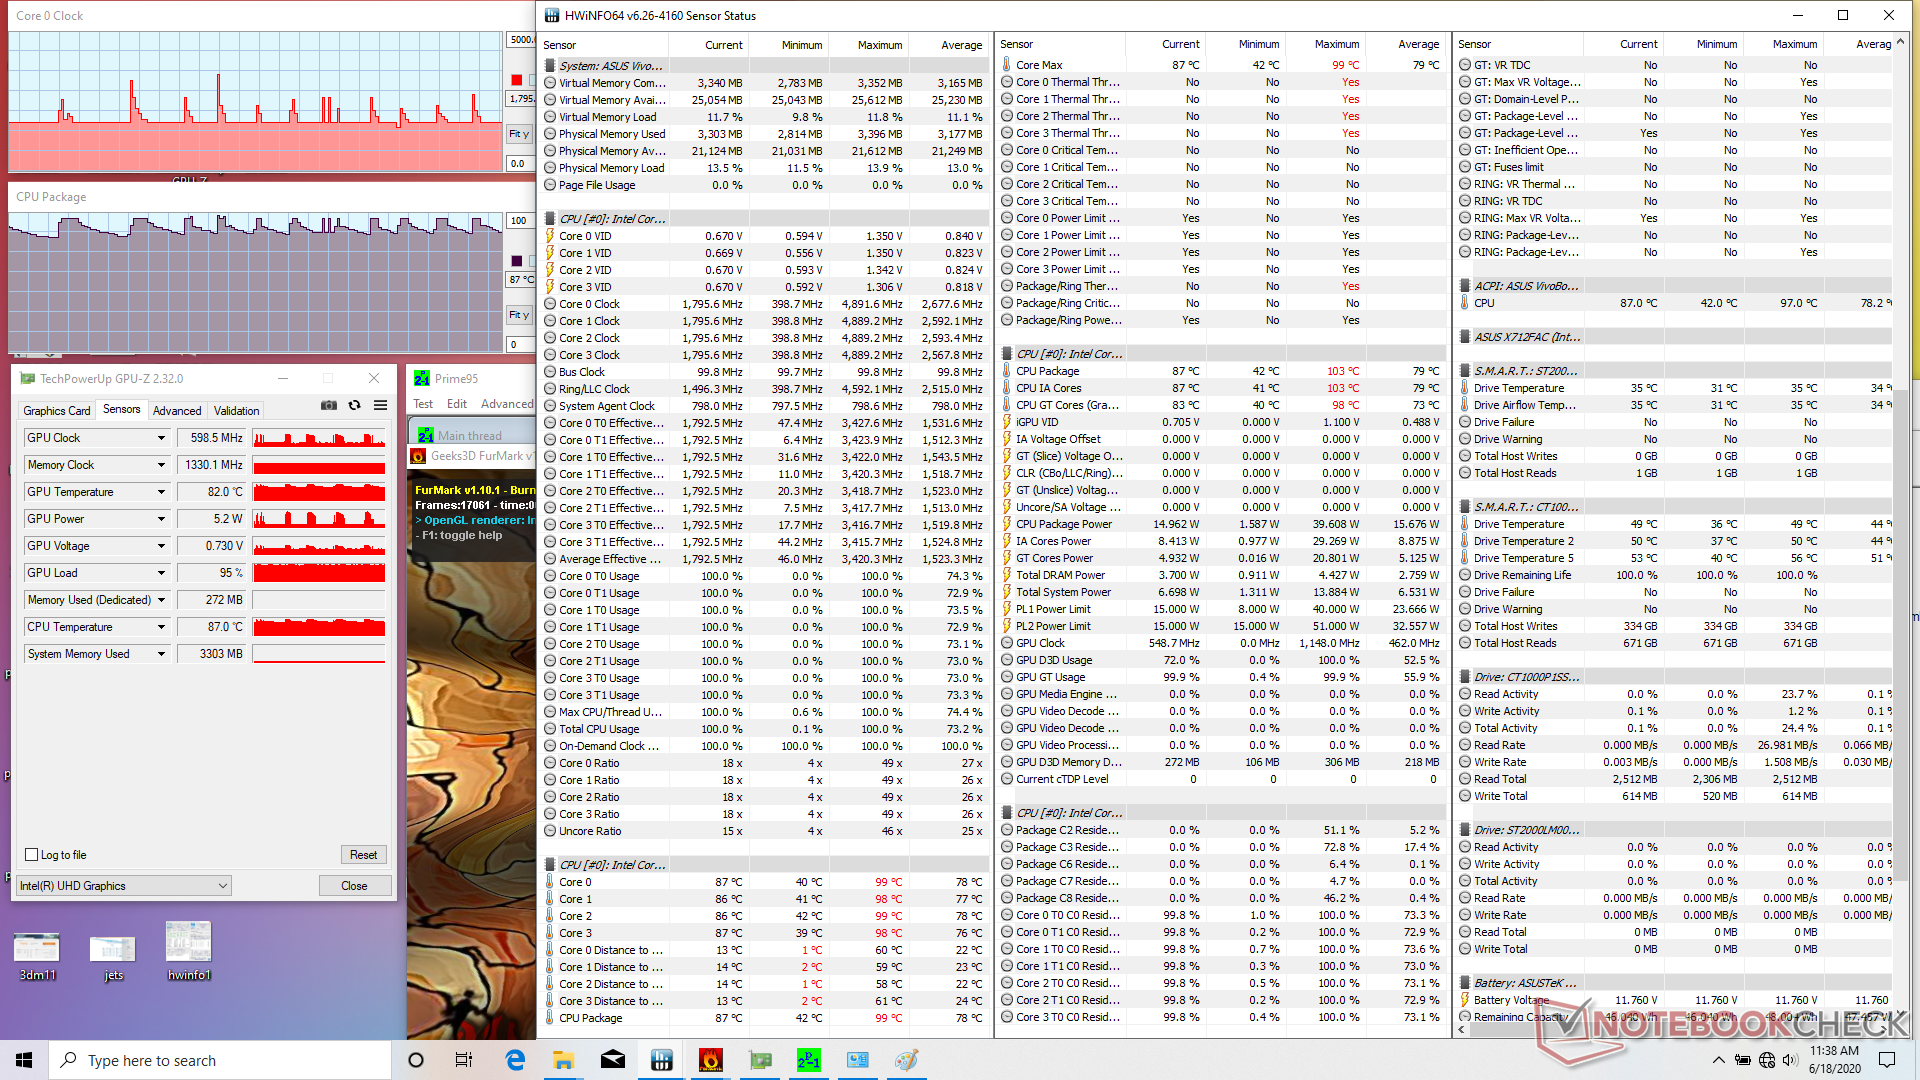
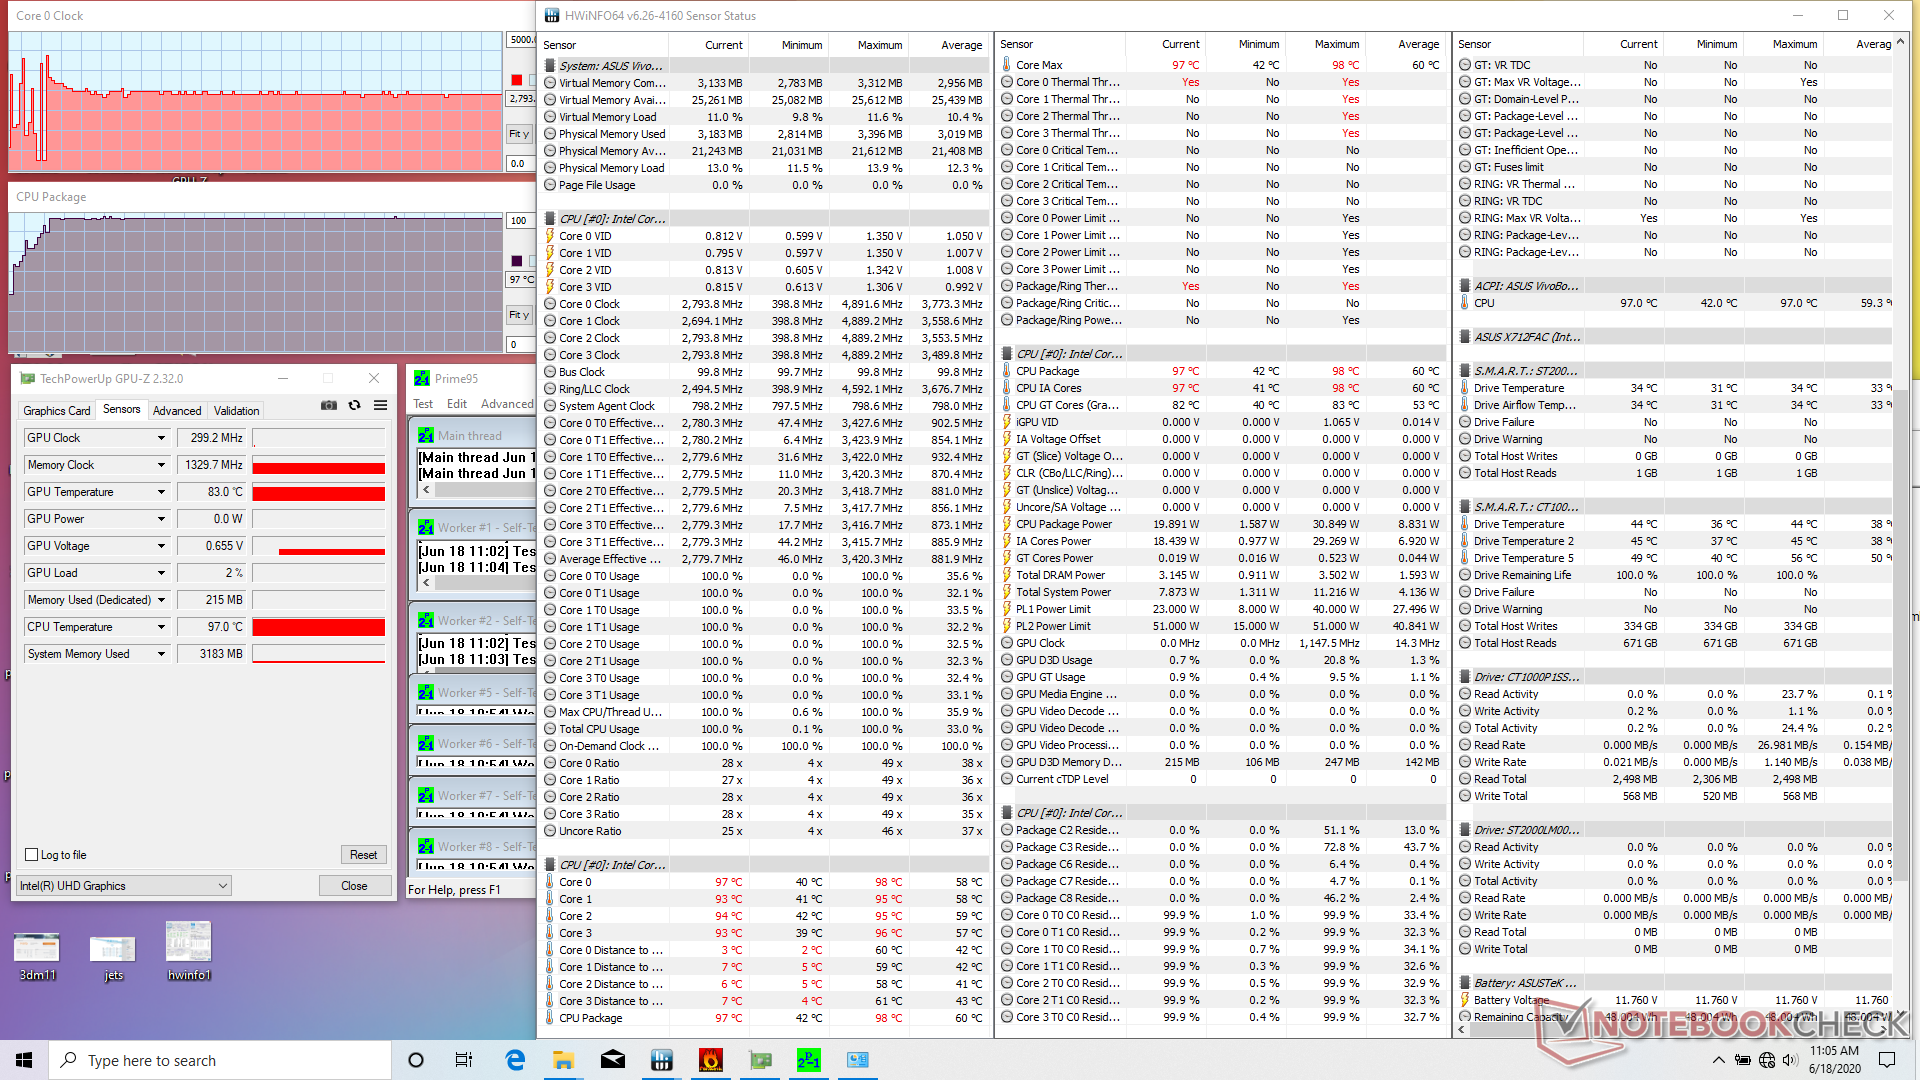
We stress the system with synthetic loads to identify for any potential performance issues. When running Prime95, the CPU can be observed struggling between 400 MHz and 2.8 GHz for the first few seconds which is very odd for any processor. It eventually stabilizes at 2.8 GHz and at a very warm core temperature of 97 C as shown by our screenshot below.
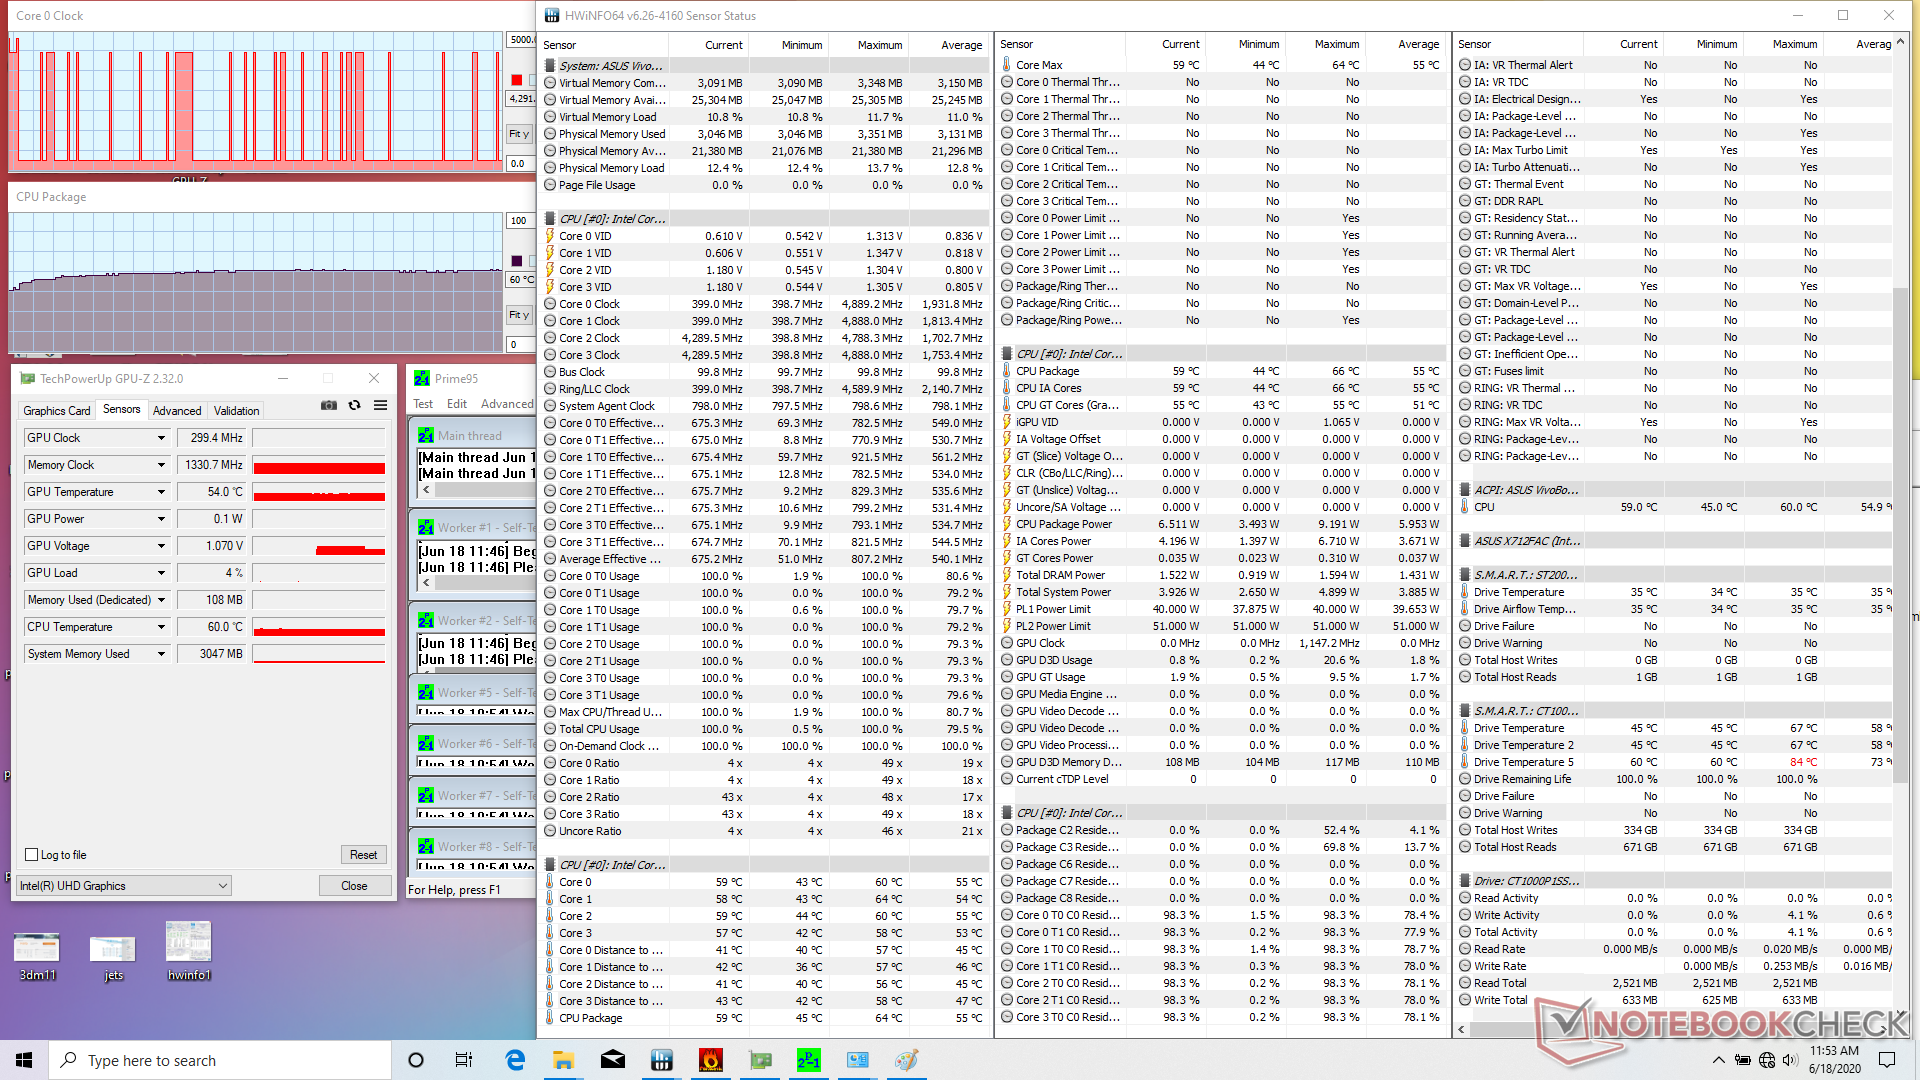
If the power profile is set to High Performance mode, however, clock rates will inexplicably throttle to just 400 MHz with small bursts up to 4.3 GHz. Switching the power profile back to Balanced mode fixes this. This abnormal behavior means users should stick to Balance mode in order to get the most performance out of the laptop until Asus can address the issue.
If running both Prime95 and FurMark simultaneously, CPU and GPU clock rates would cycle between 1.8 GHz to 3.5 GHz and 600 MHz to 1150 MHz, respectively. Fan noise remains constant while core temperatures do not.
Running on battery power will limit performance. A 3DMark 11 run on batteries would return Physics and Graphics scores of 6245 and 1686 points, respectively, compared to 7764 and 1960 points when on mains.
| CPU Clock (GHz) | GPU Clock (MHz) | Average CPU Temperature (°C) | |
| System Idle | -- | -- | 42 |
| Prime95 Stress (Balanced mode) | 2.8 | -- | 97 |
| Prime95 Stress (High Performance mode) | 0.4 - 4.4 | -- | 60 |
| Prime95 + FurMark Stress | 1.8 - 3.5 | 600 - 1150 | 84 - 98 |
Speakers


Energy Management
Power Consumption
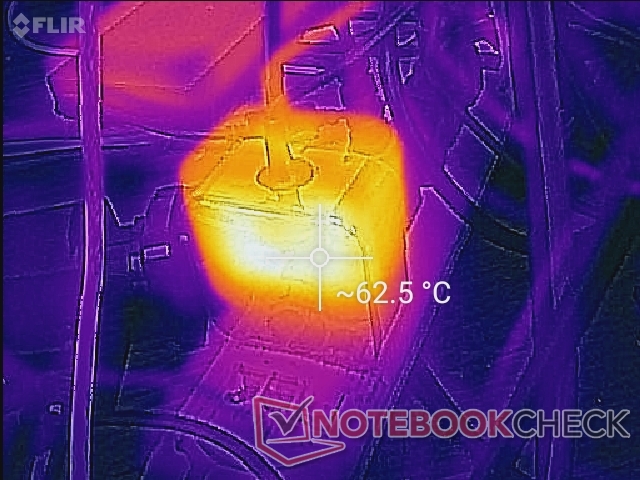
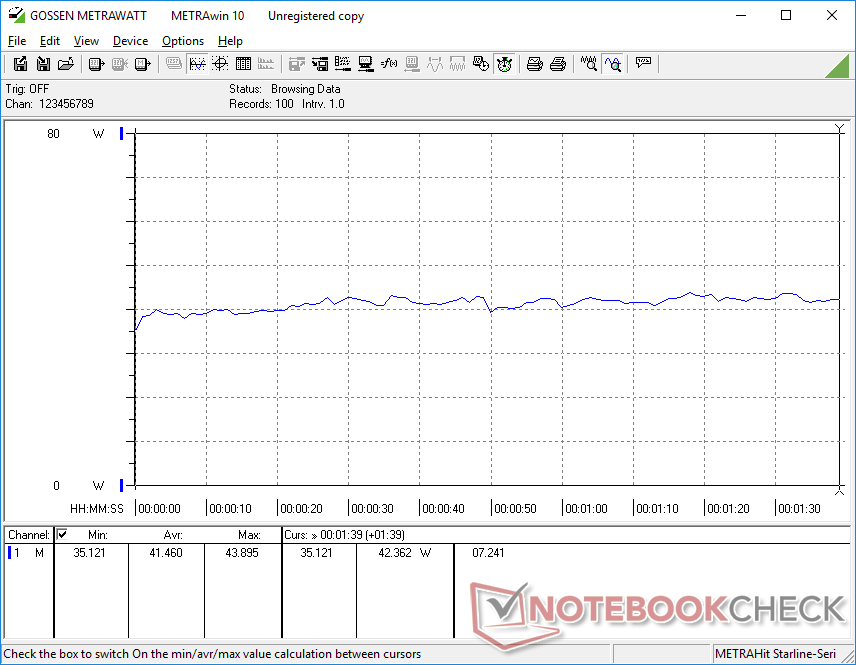
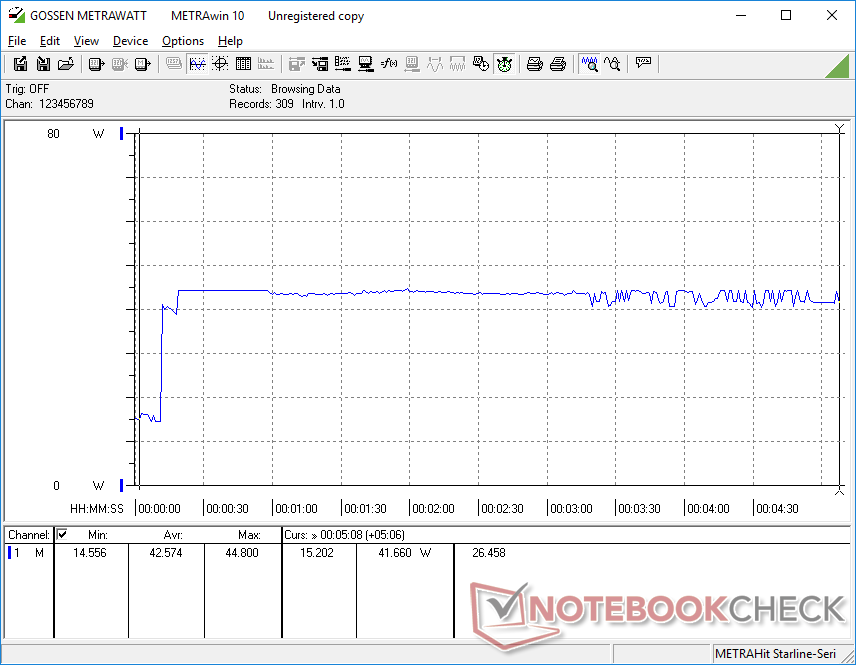
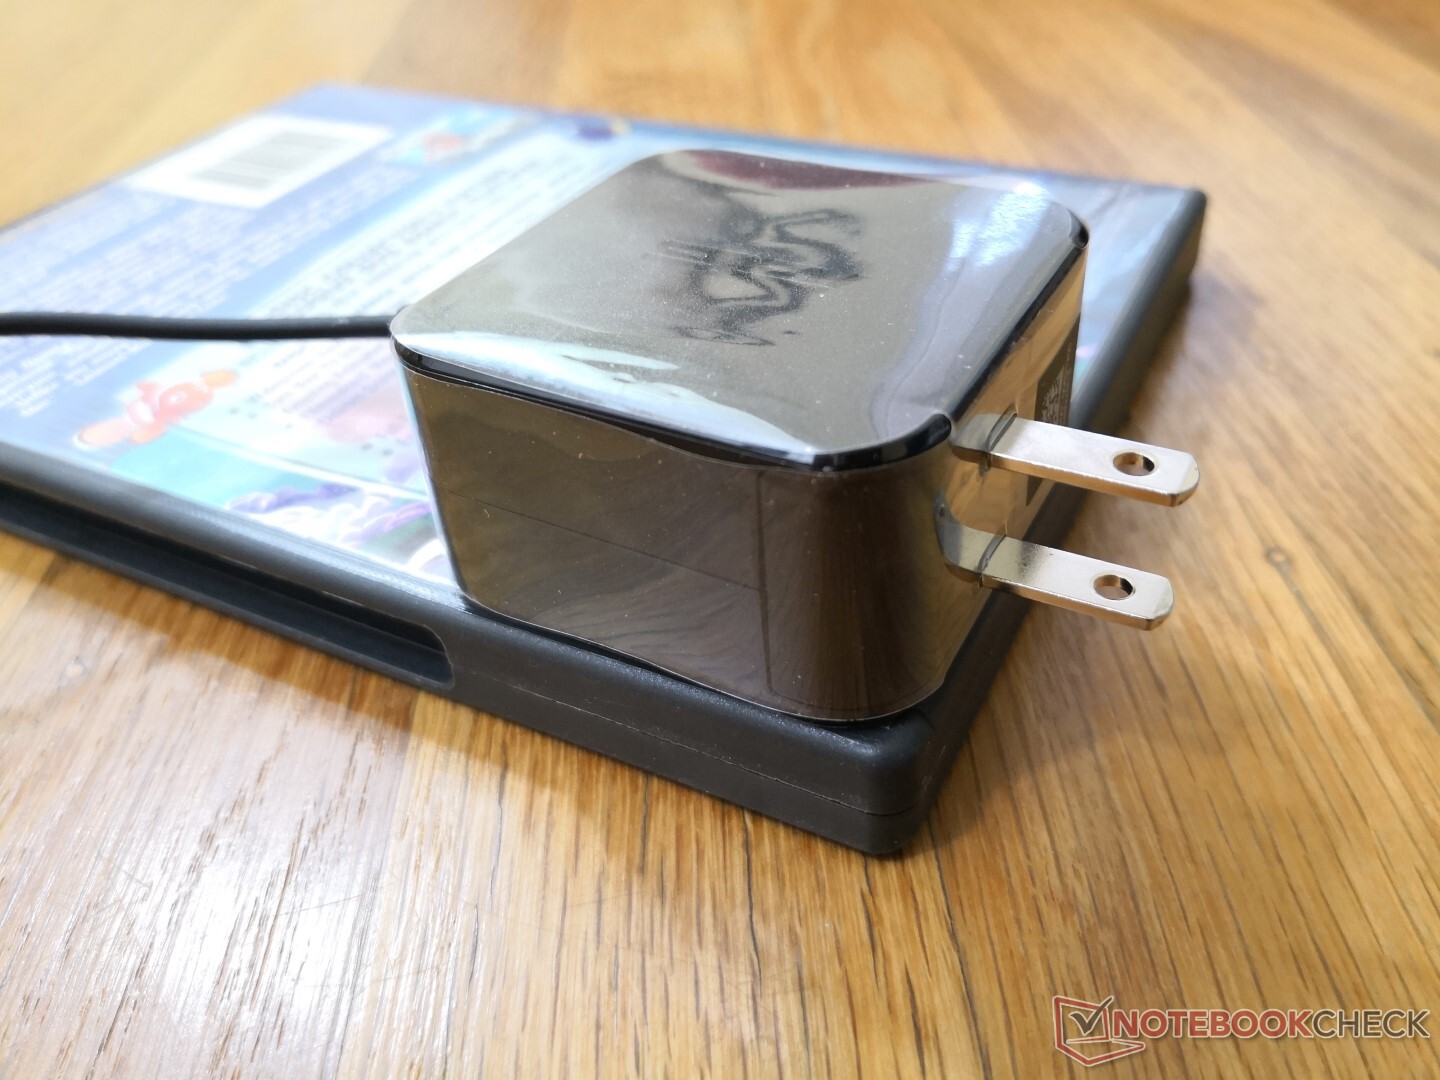
The system consumes between 9 W and 15 W depending on the brightness level when idling on desktop which is more than what we had anticipated. At most, we're able to record a maximum of 44.8 W from the small (~5.3 x 5.3 x 2.8 cm) 45 W AC adapter. Gaming alone will draw around 42 W meaning charging will slow to a crawl if running demanding loads.

| Off / Standby | |
| Idle | |
| Load |
|
Key:
min: | |
| Asus VivoBook 17 S712FA-DS76 i7-10510U, UHD Graphics 620, Crucial P1 SSD CT1000P1SSD8, IPS, 1920x1080, 17.3" | Dell Inspiron 17 3780 i7-8565U, Radeon 520, SK Hynix BC501 NVMe 256 GB, IPS, 1920x1080, 17.3" | Asus VivoBook 17 M712DA-AU017T R5 3500U, Vega 8, Intel SSD 660p SSDPEKNW512G8, IPS, 1920x1080, 17.3" | HP 17-by2437ng i3-10110U, UHD Graphics 620, Toshiba KBG30ZMV256G, TN LED, 1600x900, 17.3" | Acer Aspire ES1-732-P7YA Pentium N4200, HD Graphics 505, Toshiba MQ01ABD100, TN LED, 1600x900, 17.3" | Lenovo IdeaPad 330-17IKB 81DM i5-8550U, GeForce MX150, WDC Blue WD10SPZX-24Z10T0, TN LED, 1600x900, 17.3" | |
|---|---|---|---|---|---|---|
| Power Consumption | 2% | 31% | 34% | 36% | 0% | |
| Idle Minimum * (Watt) | 9.4 | 5 47% | 4.2 55% | 5.7 39% | 6 36% | 4.7 50% |
| Idle Average * (Watt) | 13 | 10.9 16% | 7.9 39% | 8.6 34% | 9.6 26% | 9.2 29% |
| Idle Maximum * (Watt) | 14.3 | 12 16% | 8.4 41% | 9 37% | 10.7 25% | 10.6 26% |
| Load Average * (Watt) | 41.5 | 49.6 -20% | 34 18% | 29.3 29% | 21.2 49% | 56.3 -36% |
| Load Maximum * (Watt) | 44.8 | 66.9 -49% | 43.7 2% | 30.5 32% | 26 42% | 75.3 -68% |
| Witcher 3 ultra * (Watt) | 55 |
* ... smaller is better
Battery Life
Strangely, WLAN runtimes are almost three hours longer than the Ryzen 5 3500U SKU even though power consumption is generally higher. We suspect that background activity involving pre-installed software like McAfee Anti-Virus may have been activated during the Ryzen test. Nonetheless, 6 hours of real-world usage is pretty good considering the small 37 Wh battery.
Charging from empty to full capacity is slow at 2.5 hours compared to 1.5 hours on most other laptops.
| Asus VivoBook 17 S712FA-DS76 i7-10510U, UHD Graphics 620, 37 Wh | Dell Inspiron 17 3780 i7-8565U, Radeon 520, 42 Wh | Asus VivoBook 17 M712DA-AU017T R5 3500U, Vega 8, 37 Wh | HP 17-by2437ng i3-10110U, UHD Graphics 620, 41 Wh | Acer Aspire ES1-732-P7YA Pentium N4200, HD Graphics 505, 37 Wh | Lenovo IdeaPad 330-17IKB 81DM i5-8550U, GeForce MX150, 34 Wh | |
|---|---|---|---|---|---|---|
| Battery runtime | -29% | -44% | -3% | -14% | -34% | |
| WiFi v1.3 (h) | 5.9 | 4.2 -29% | 3.3 -44% | 5.7 -3% | 5.1 -14% | 3.9 -34% |
| Reader / Idle (h) | 9.6 | 8.5 | ||||
| Load (h) | 1.1 | 1.5 |
Pros
Cons
Verdict

Our favorite aspects of the VivoBook 17 are its wide CPU options and easy serviceability. Adding a second storage bay is easier than on most other budget laptops and users have the option for either Intel U-series with GeForce MX graphics or AMD Ryzen. Users on tighter budgets, for example, can save money by purchasing a SKU with a small capacity SSD and then adding more storage on their own down the line. The system is lightweight and relatively sturdy considering its price range and class size as well.
There is a lot that the system can improve. Firmer keyboard keys, firmer clickpad, webcam shutter, full-size SD reader, and quieter fans would improve the user experience. A wider hinge angle with support for USB Type-C charging would also make the system more convenient to travel with. Otherwise, it's a decent no-frills laptop with nothing too outstanding or substandard.
Inexpensive 17.3-inch laptop with easy storage upgrades, wide port options, and a relatively strong chassis for the price. Display quality and keyboard feedback could be better.
Asus VivoBook 17 S712FA-DS76
- 06/21/2020 v7 (old)
Allen Ngo
