2020 HP Envy x360 15 Core i7 Convertible 2-in-1 Review: A Little Too Familiar
It's been two years since we last checked out the 15.6-inch HP Envy x360 15. The series has received both chassis changes and a processor swap to the latest 10th gen Intel Core-U family since then. This review will focus on the differences from the last generation Envy x360 15 and what users can expect out of the latest 2020 model when compared to current alternatives.
There are a wide range of SKUs available ranging from the Core i5-10210U CPU, 256 GB SSD, 8 GB of RAM, and 250-nit 1080p touchscreen for $700 USD to the Core i7-1065G7 with 1 TB SSD, 16 GB of RAM and 4K AMOLED or GeForce MX330 for approximately $1500 USD. Our specific test unit is an entry-level unit with the Core i7-10510U instead of the Core i5 for around $800 USD retail.
Direct competitors include other entry-level to mid-range convertible laptops like the Lenovo Yoga C740-15IML, Dell Inspiron 15 5579, Acer Spin 3, or the Asus VivoBook Flip 15.
More HP reviews:
Rating | Date | Model | Weight | Height | Size | Resolution | Price |
|---|---|---|---|---|---|---|---|
| 80.4 % v7 (old) | 06 / 2020 | HP Envy x360 15-dr1679cl i7-10510U, UHD Graphics 620 | 2.1 kg | 17.2 mm | 15.60" | 1920x1080 | |
| 84.8 % v7 (old) | 01 / 2020 | Lenovo Yoga C740-15IML i7-10510U, UHD Graphics 620 | 1.9 kg | 17.25 mm | 15.60" | 1920x1080 | |
| 81.2 % v6 (old) | 06 / 2018 | Dell Inspiron 15 5579-9672 i5-8250U, UHD Graphics 620 | 2.1 kg | 20.2 mm | 15.60" | 1920x1080 | |
| 86.5 % v7 (old) | 03 / 2020 | Asus ZenBook Flip 15 UX563FD-A1027T i7-10510U, GeForce GTX 1050 Max-Q | 1.9 kg | 19.9 mm | 15.60" | 3840x2160 | |
| 86.8 % v7 (old) | 05 / 2020 | Dell XPS 15 9500 Core i5 i5-10300H, UHD Graphics 630 | 1.8 kg | 18 mm | 15.60" | 1920x1200 |
Case
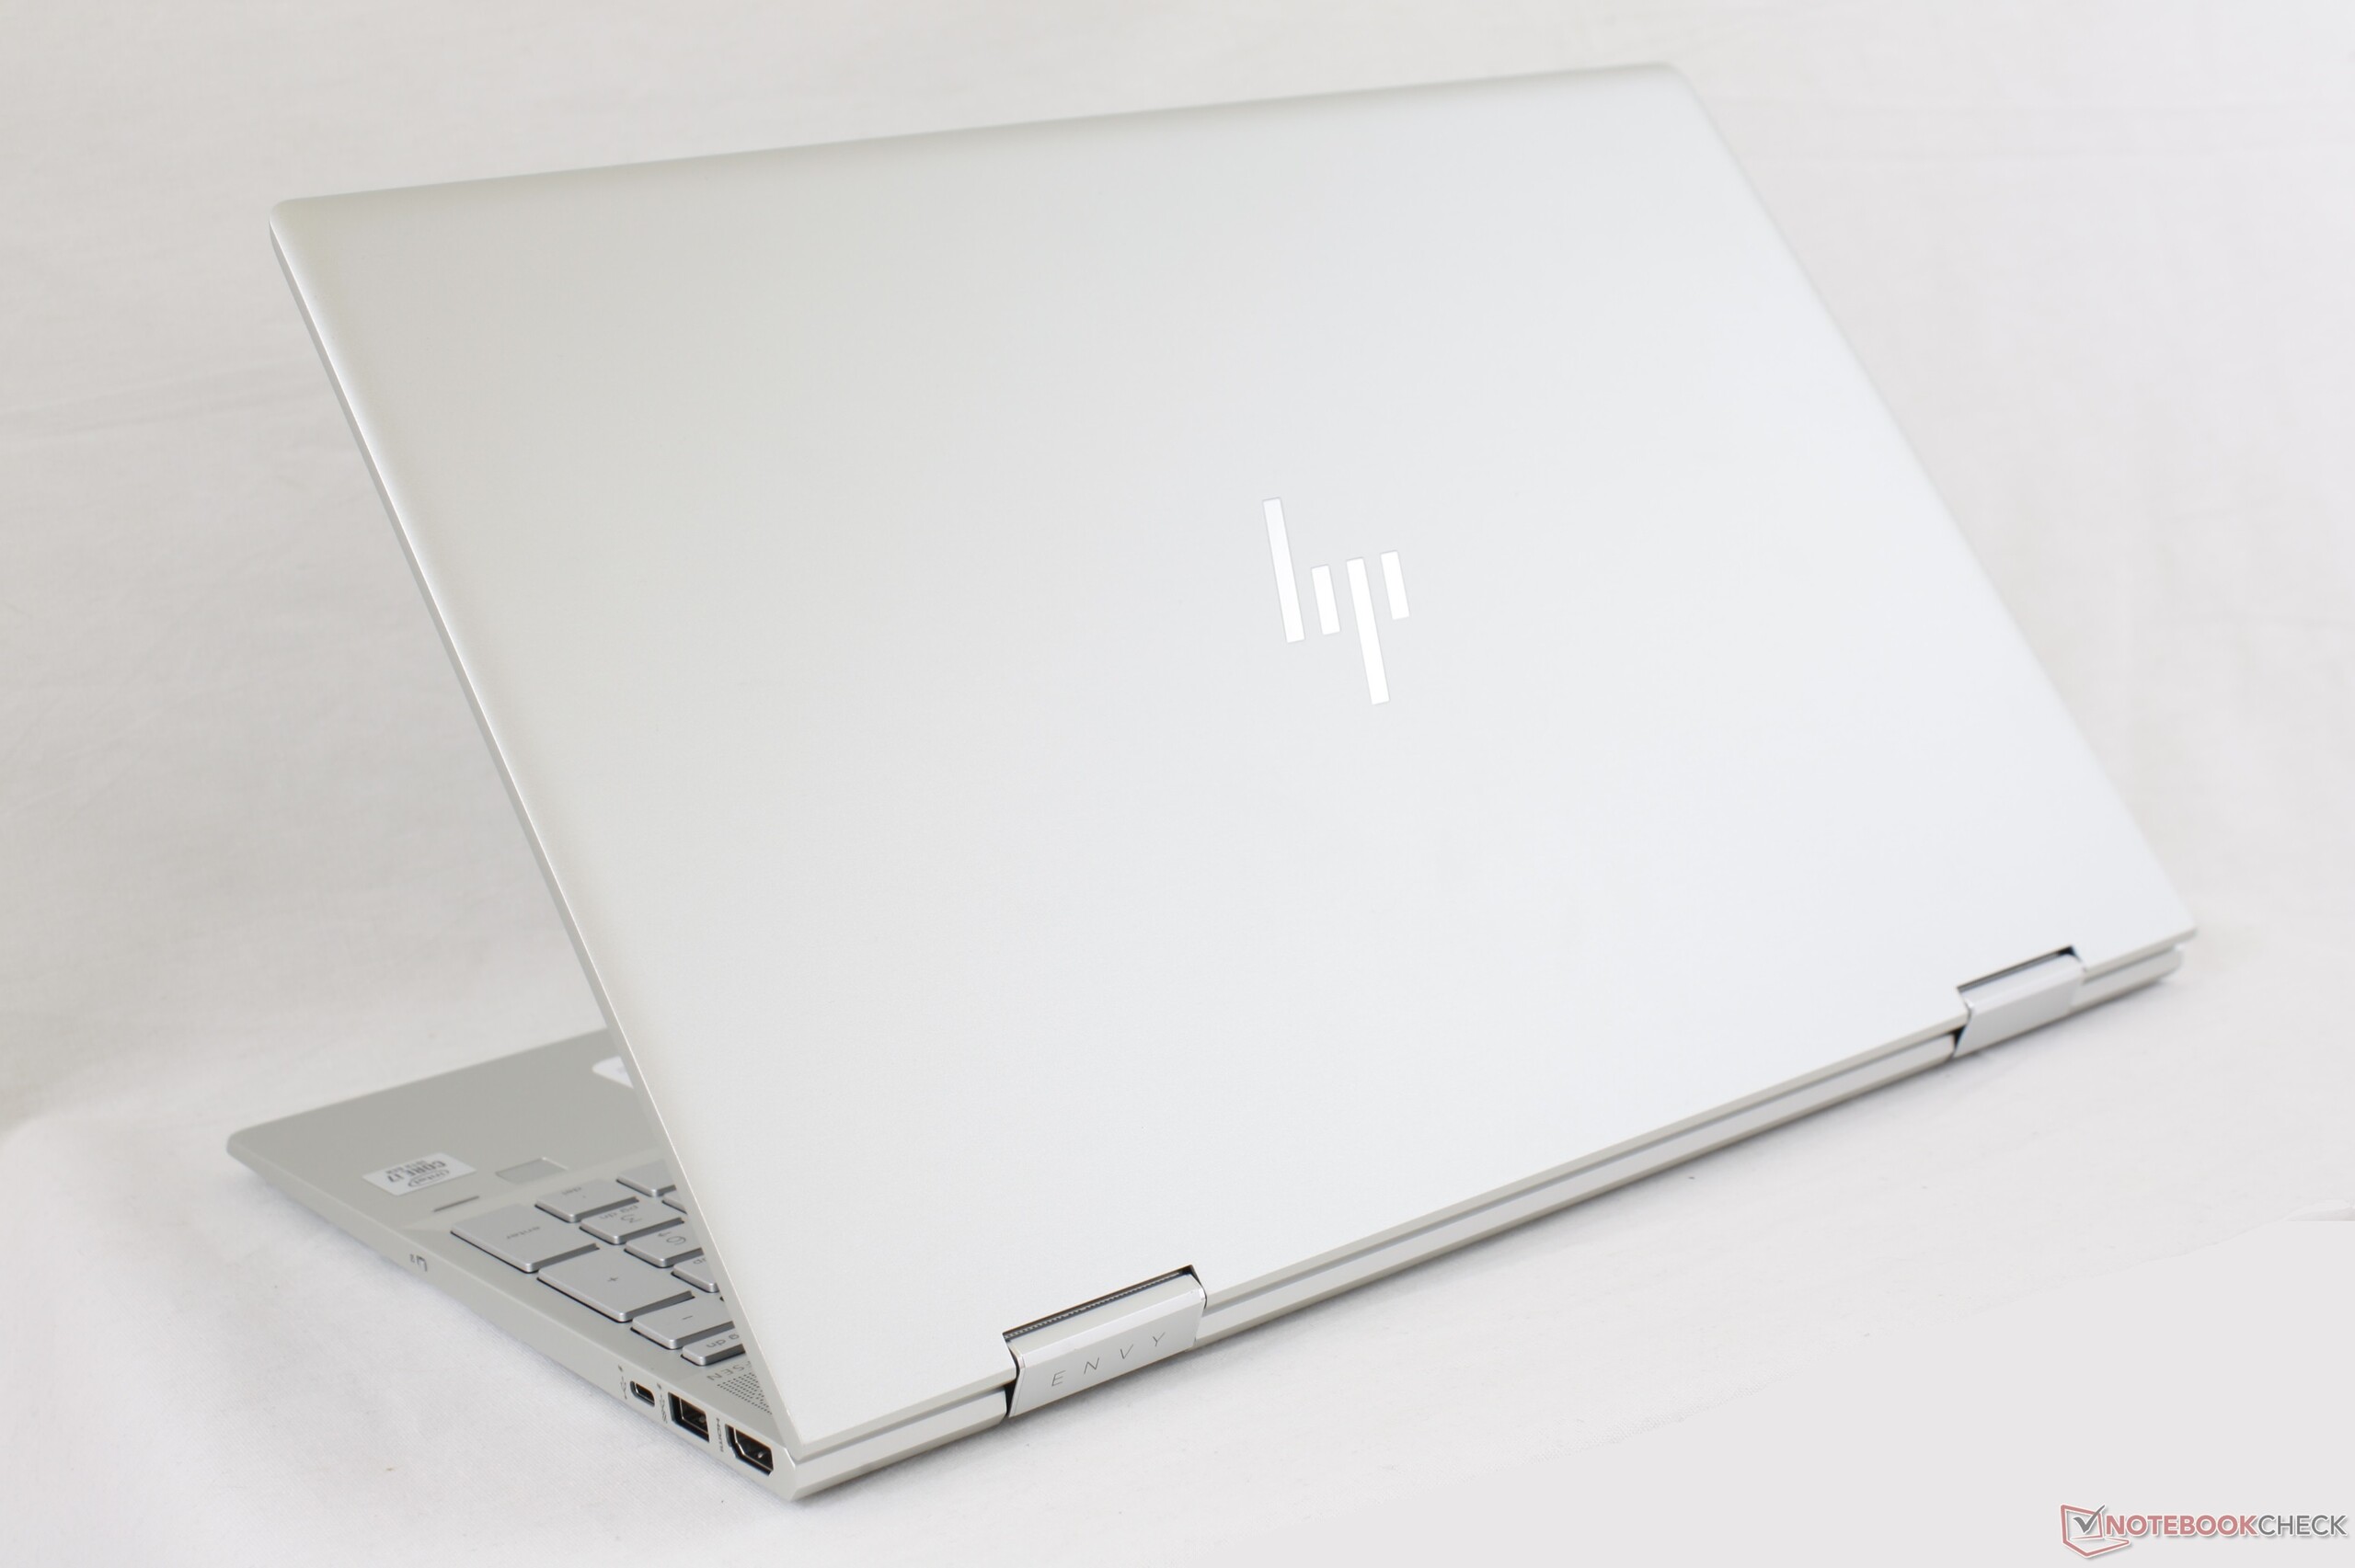
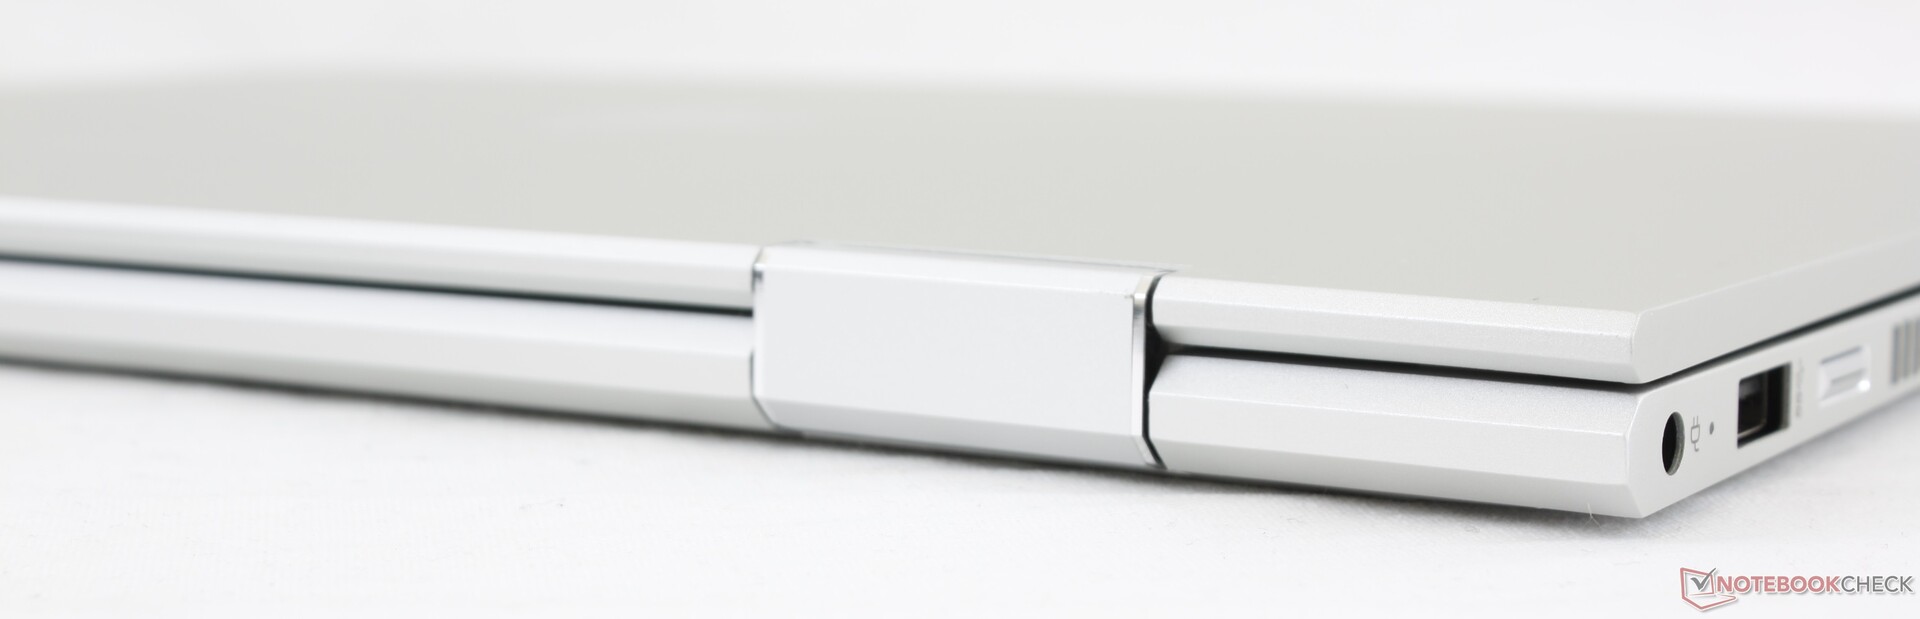
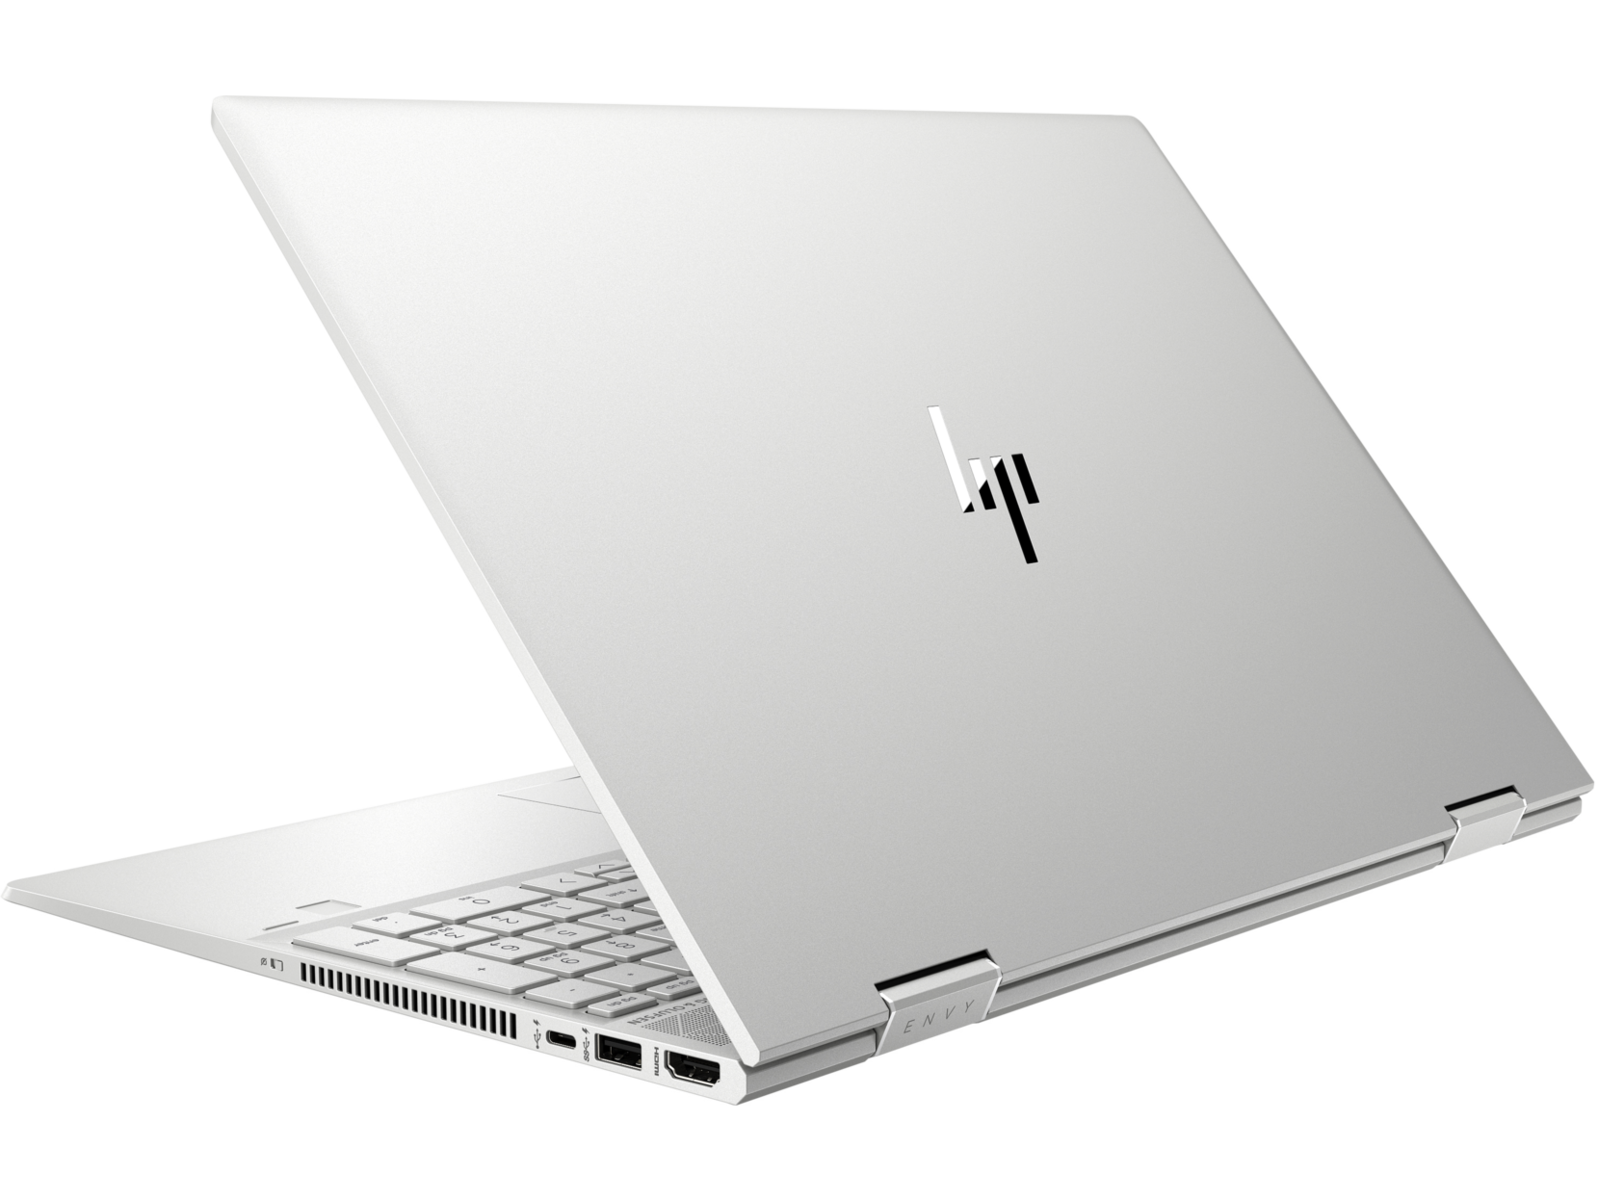
Updates to the chassis design are mostly marginal or superficial. The most notable change is that the front edge is rounder and it no longer meets at a sharp line unlike on the 2018 model. This approach makes the lid much easier to grip and open with a thumb. Accents are also slightly different around the rear and bottom panel. Otherwise, the system still looks and feels the same as before which is good since chassis rigidity has always been a strong point for the Envy x360 15 series. Applying pressure on the palm rests, keyboard center, or outer lid will depress their surfaces just slightly with almost no audible creaking.
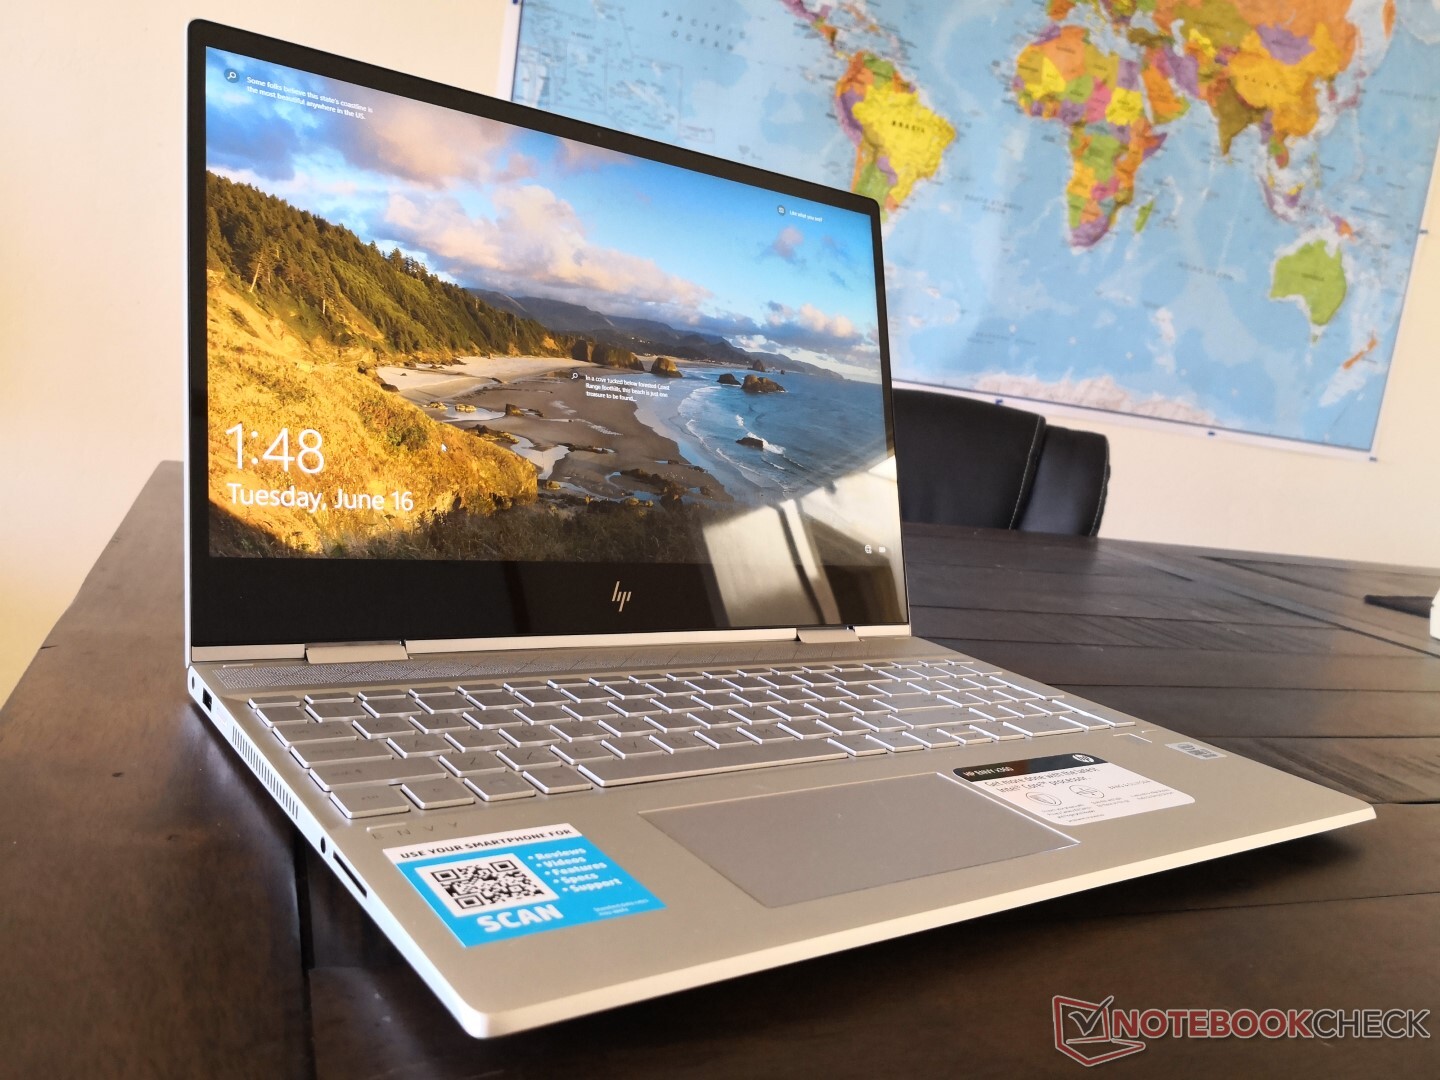

The latest model is ever-so-slightly smaller than the 2018 version in all dimensions while keeping weight roughly the same at about 2.1 kg. Even so, competing systems like the Lenovo Yoga C740-15IML still manage to be even smaller and lighter. The thick bottom bezel is responsible for some of that extra girth and weight on the Envy.
Connectivity
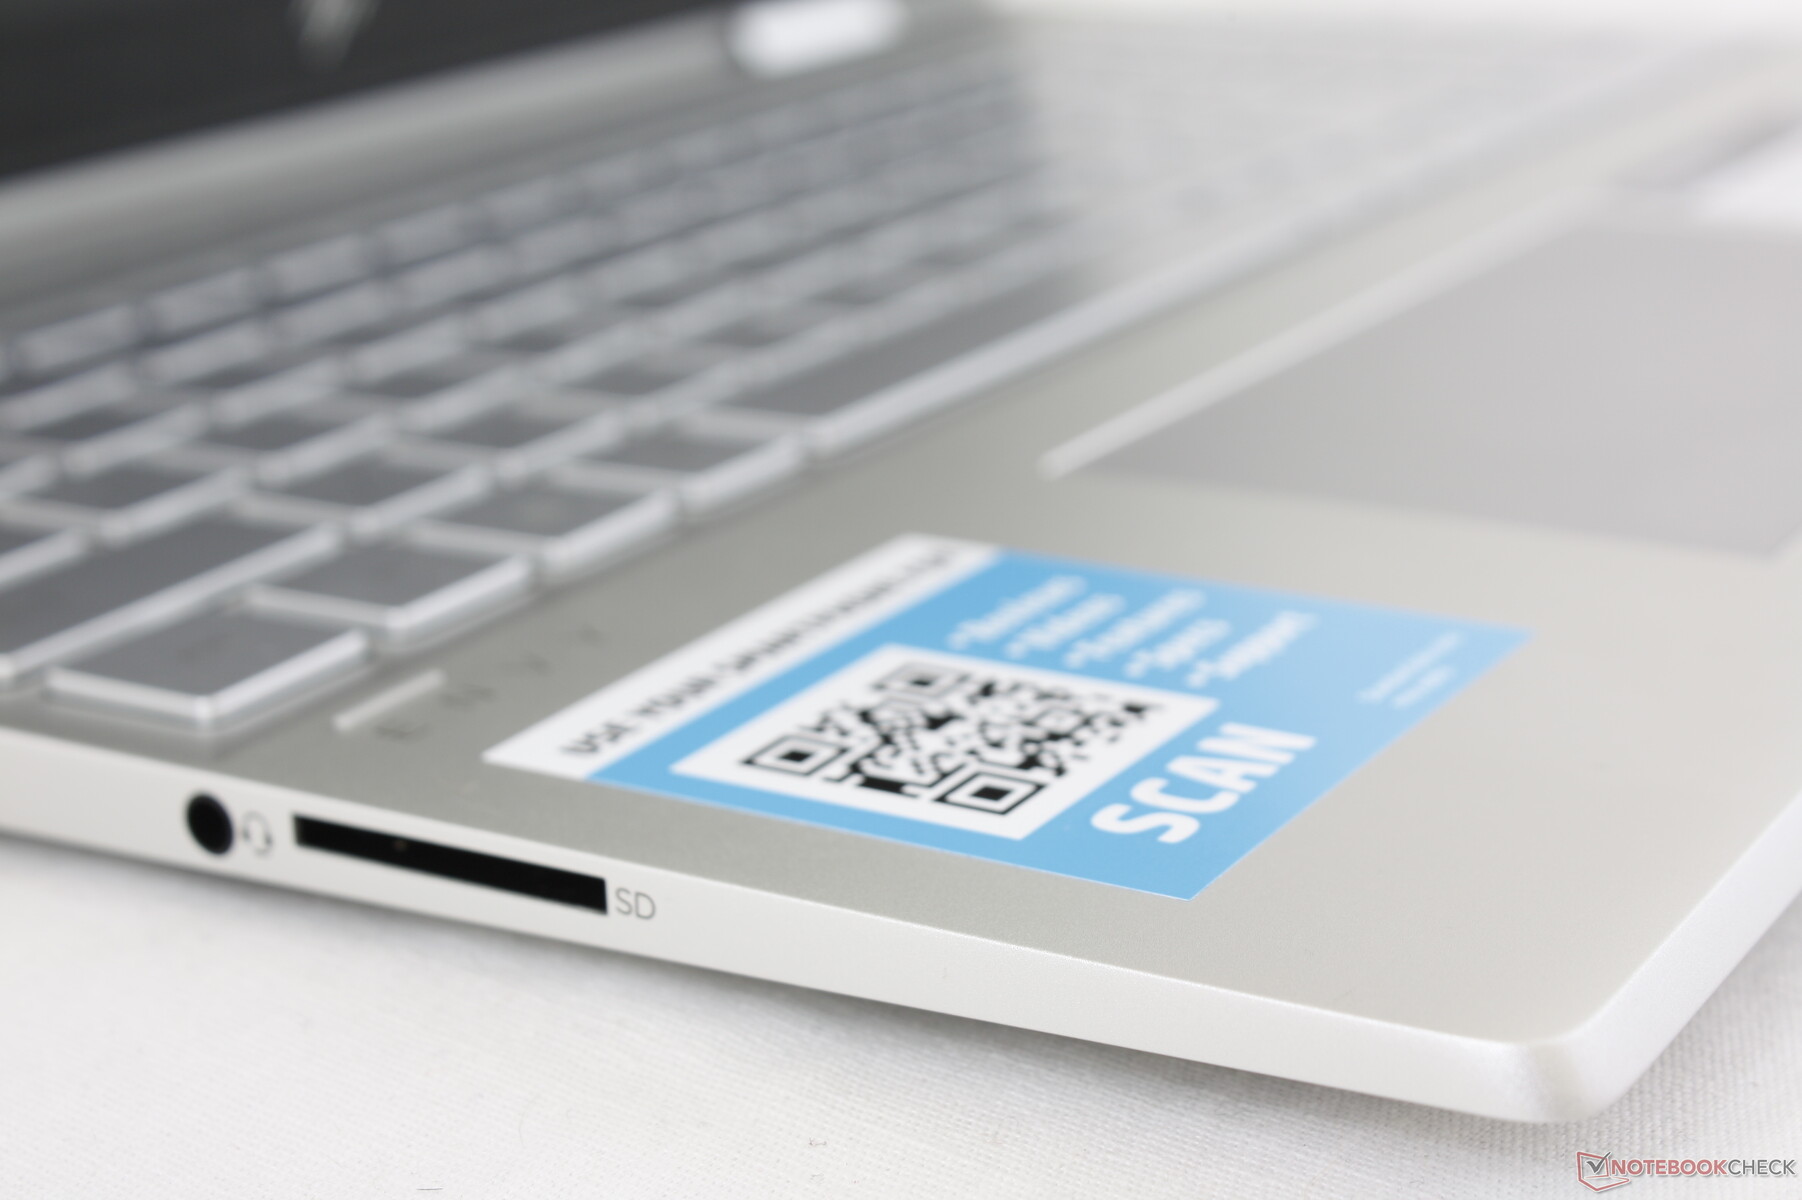
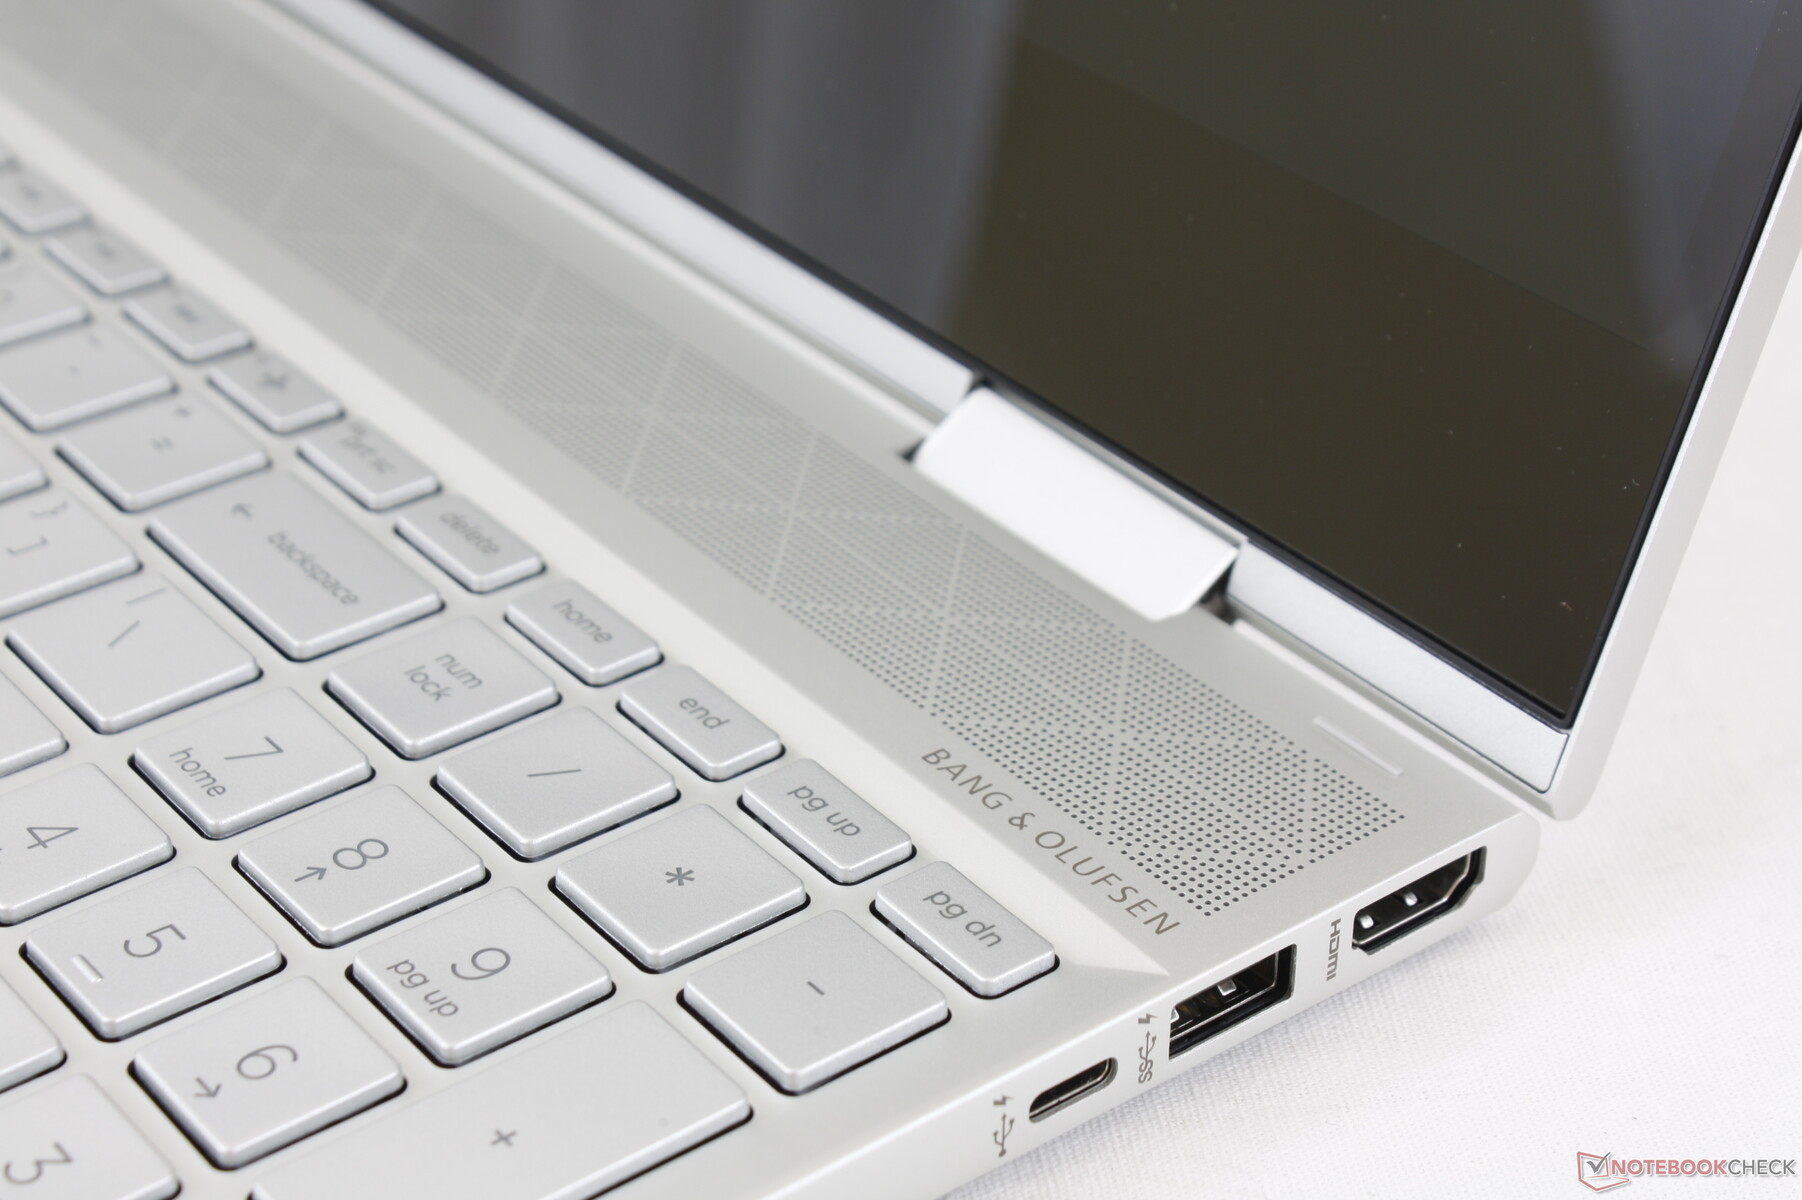
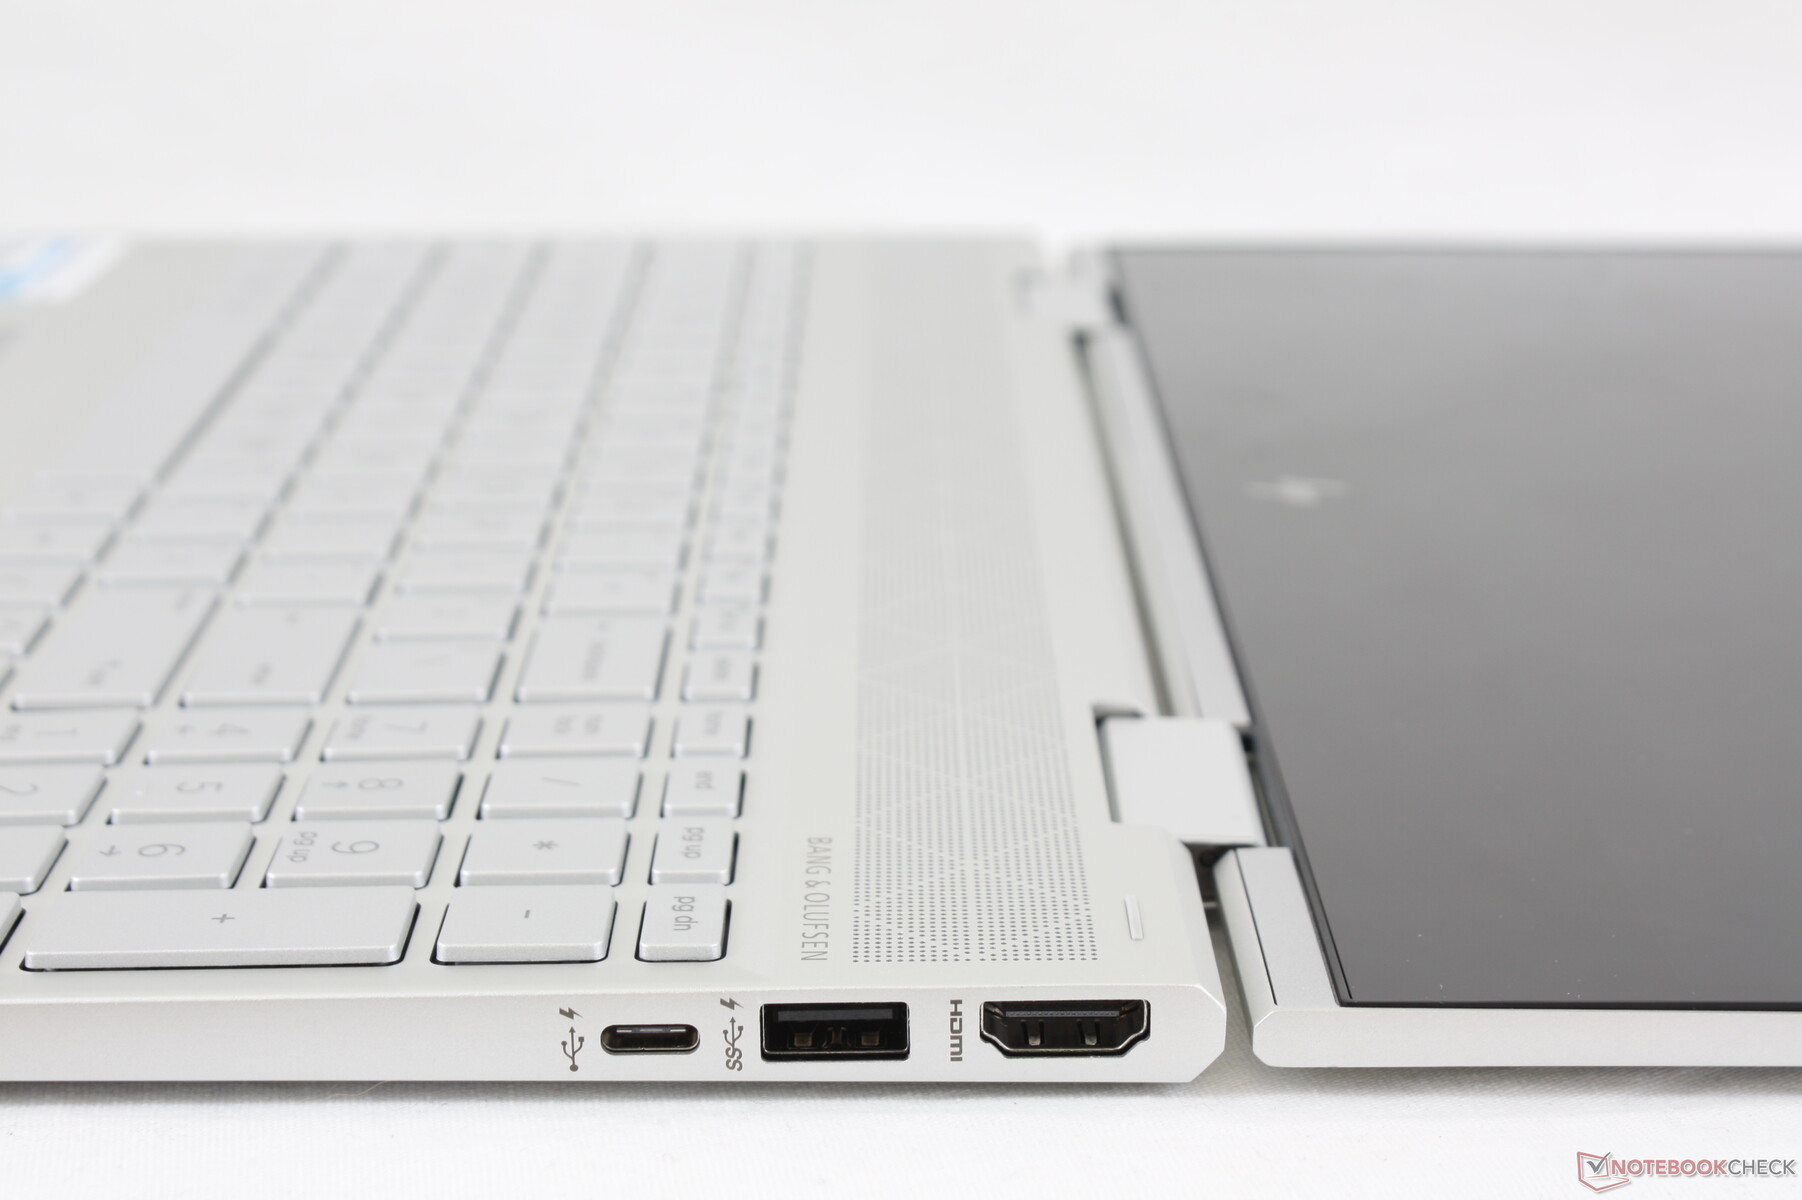
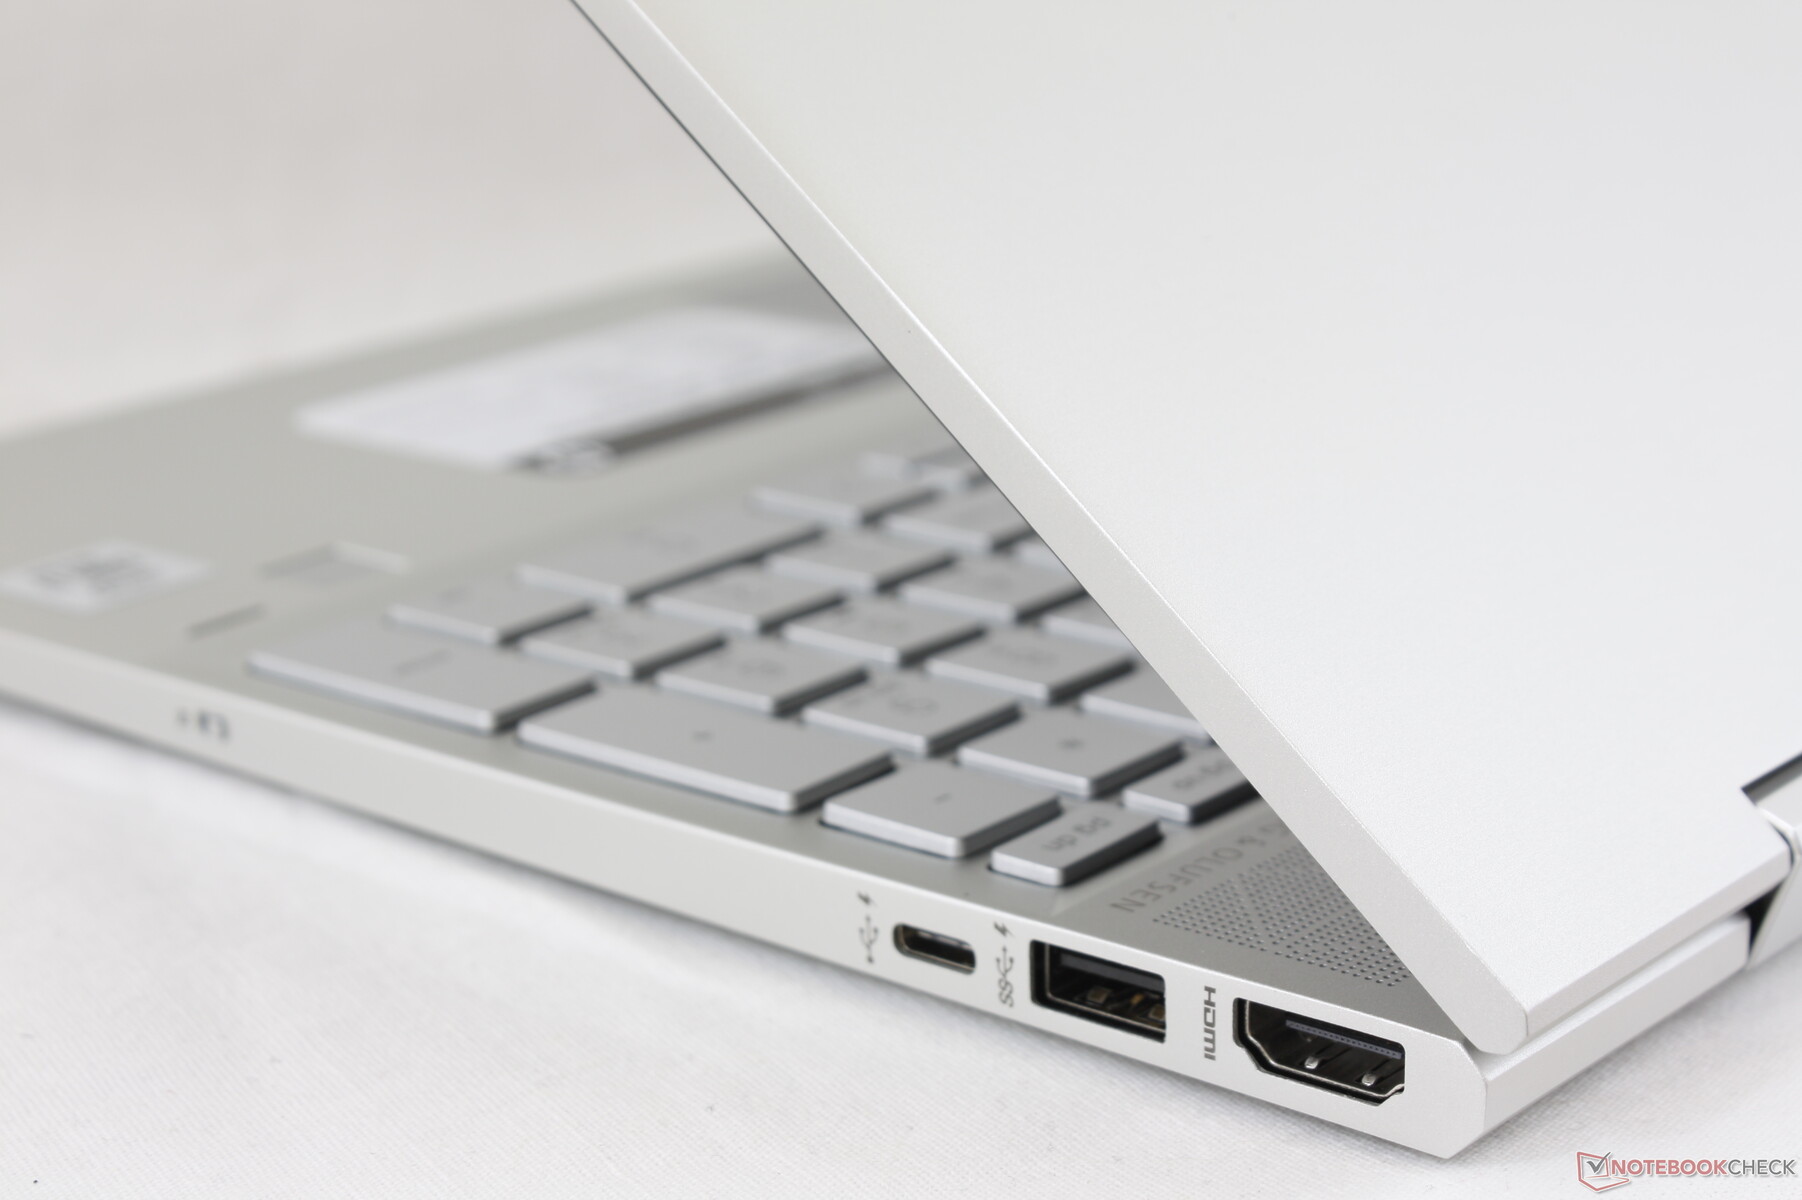
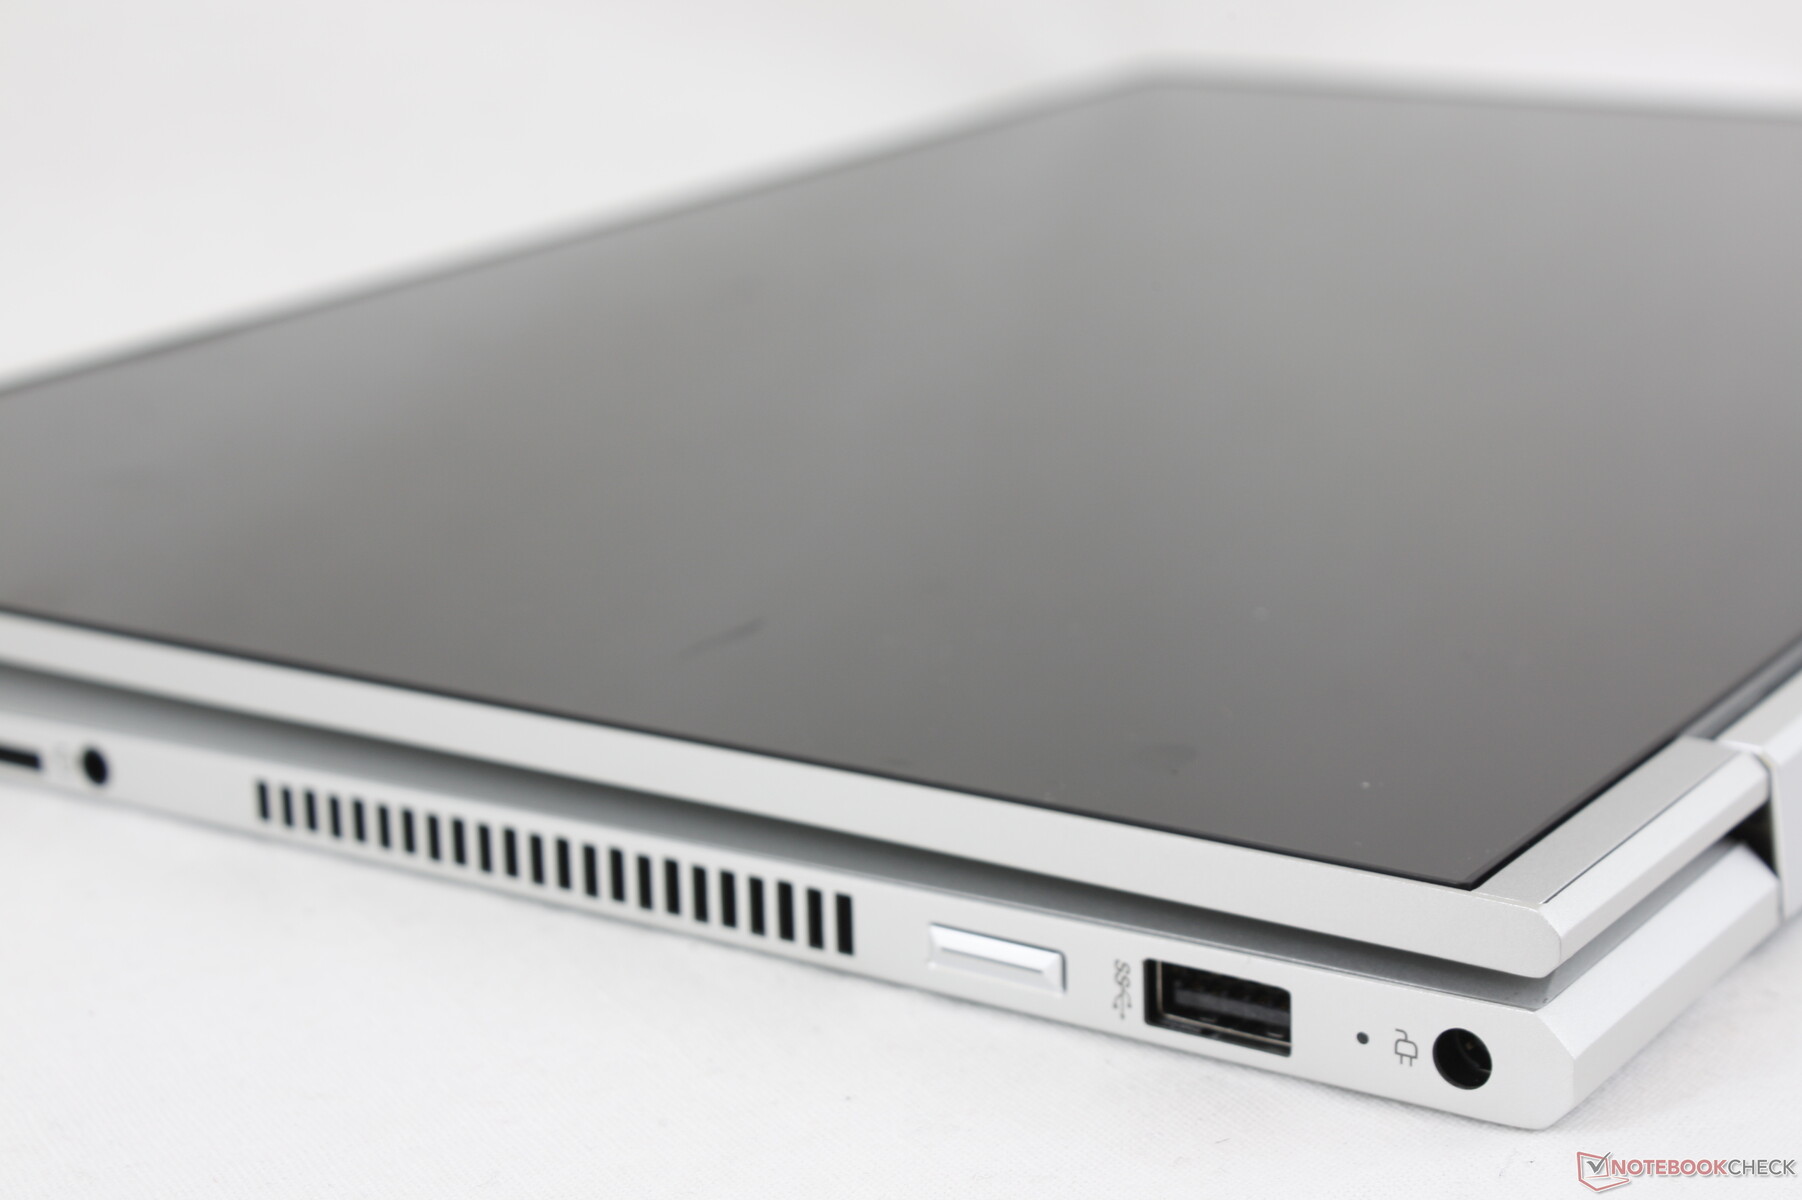
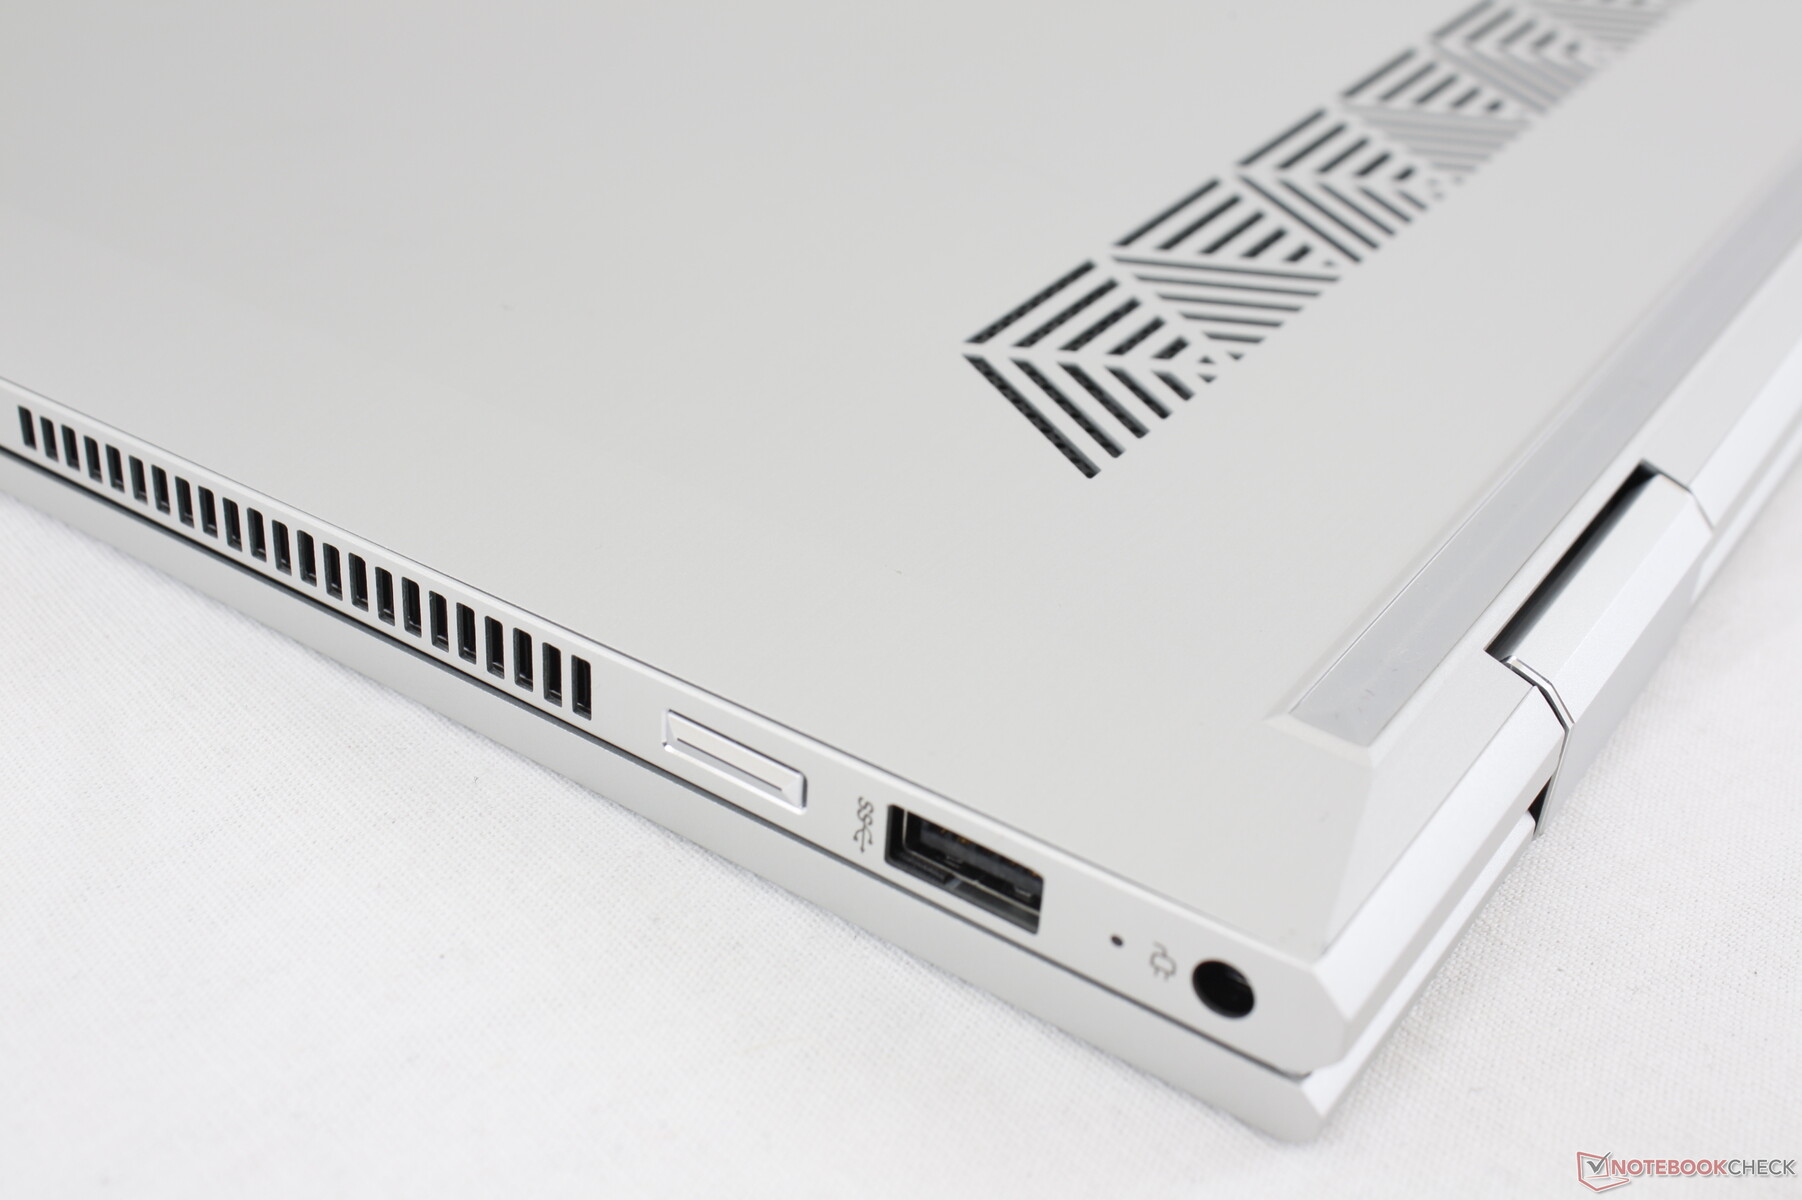
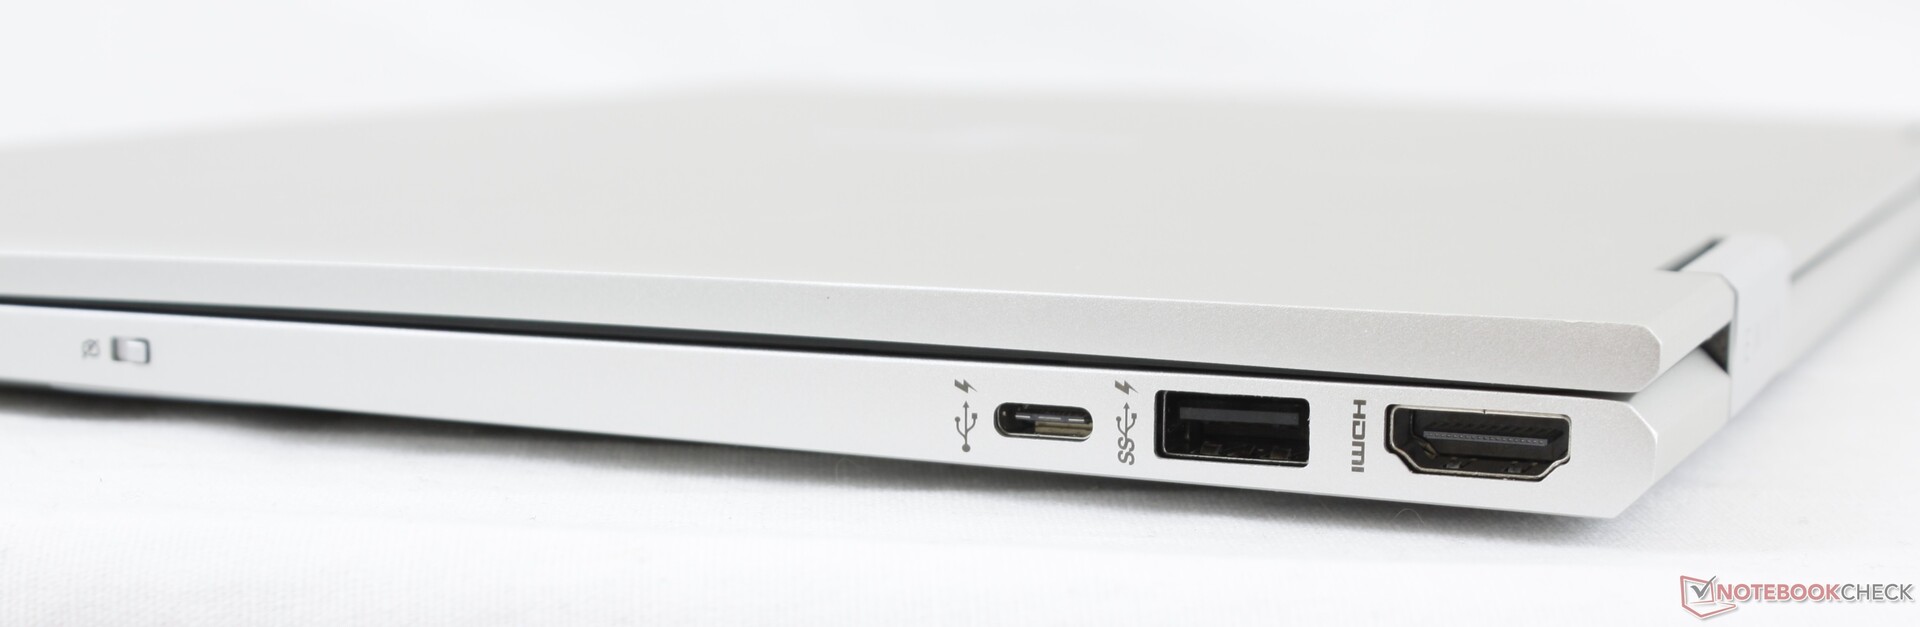
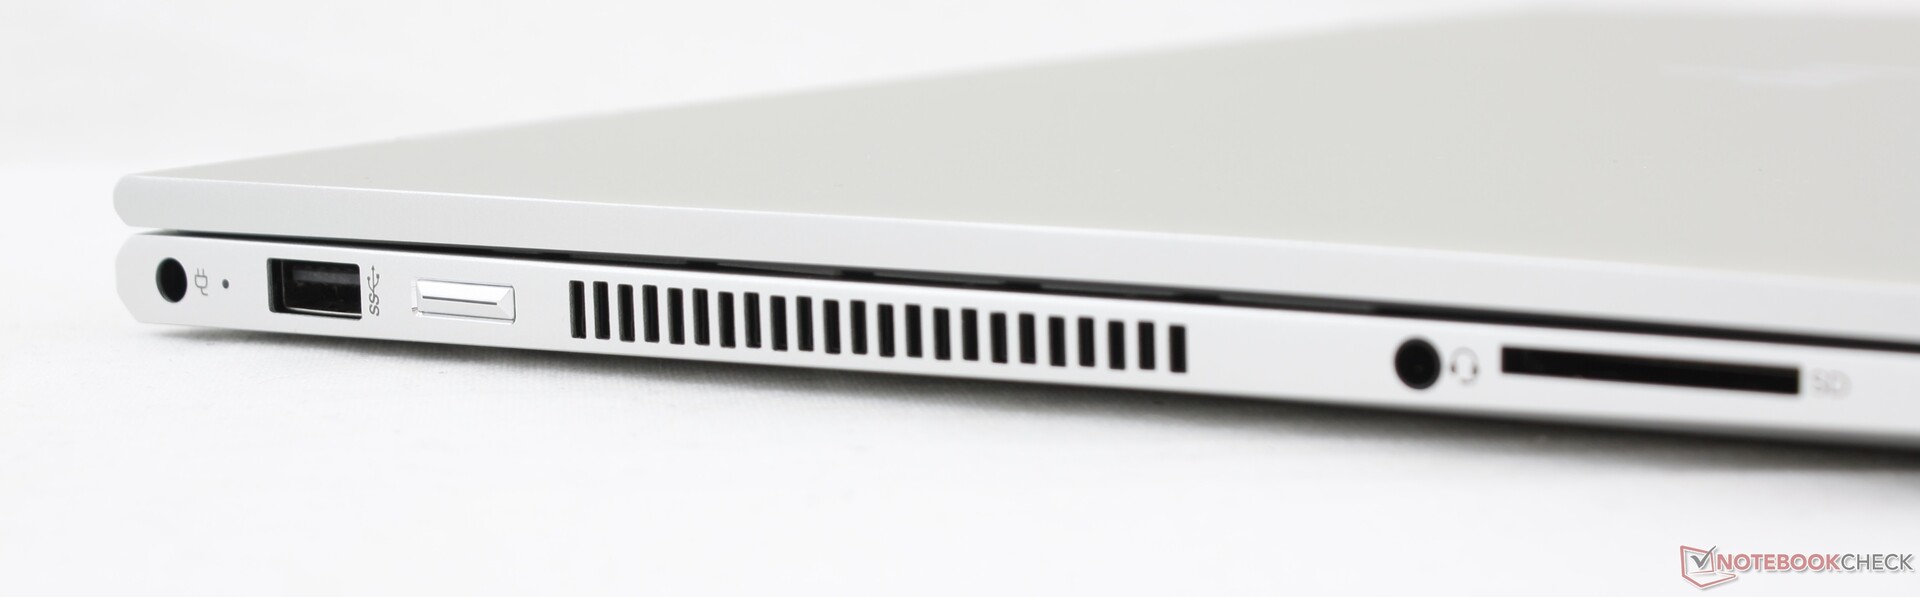
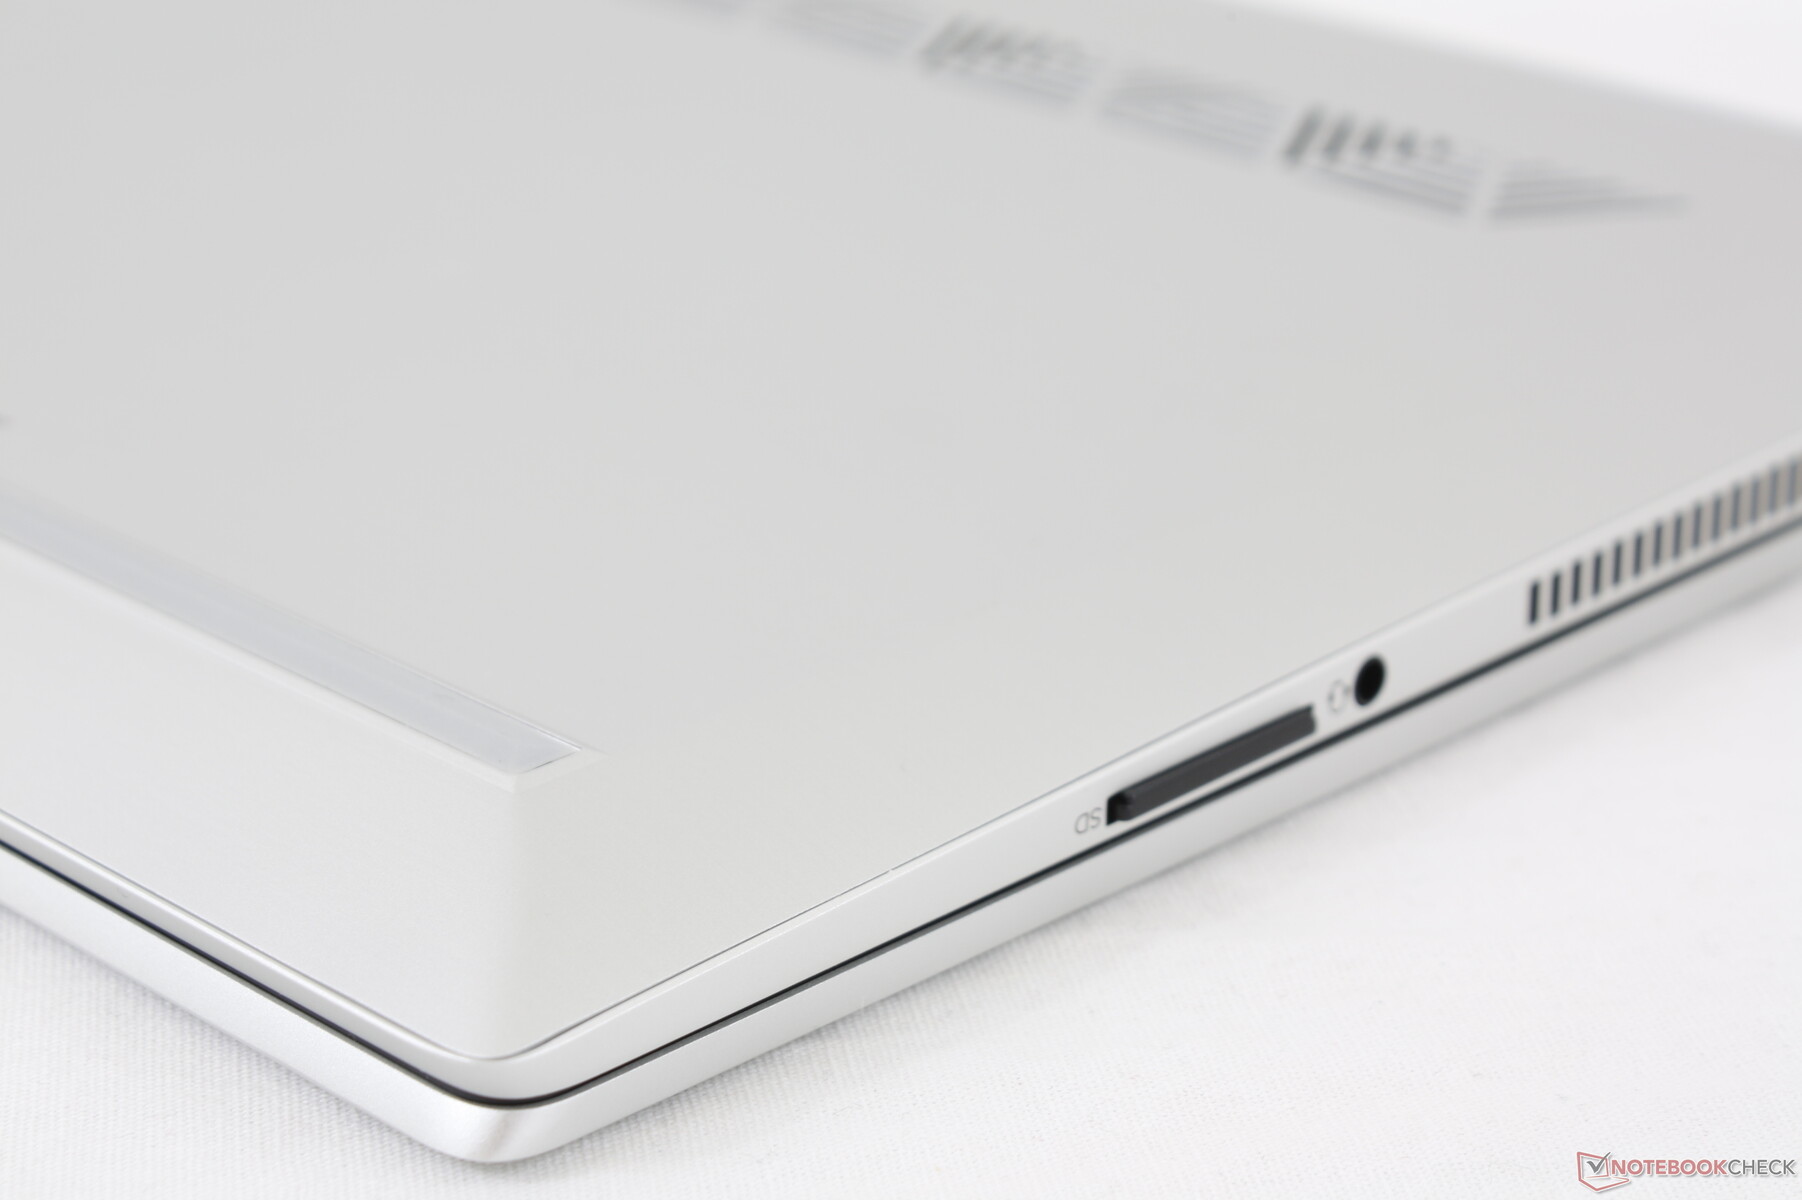
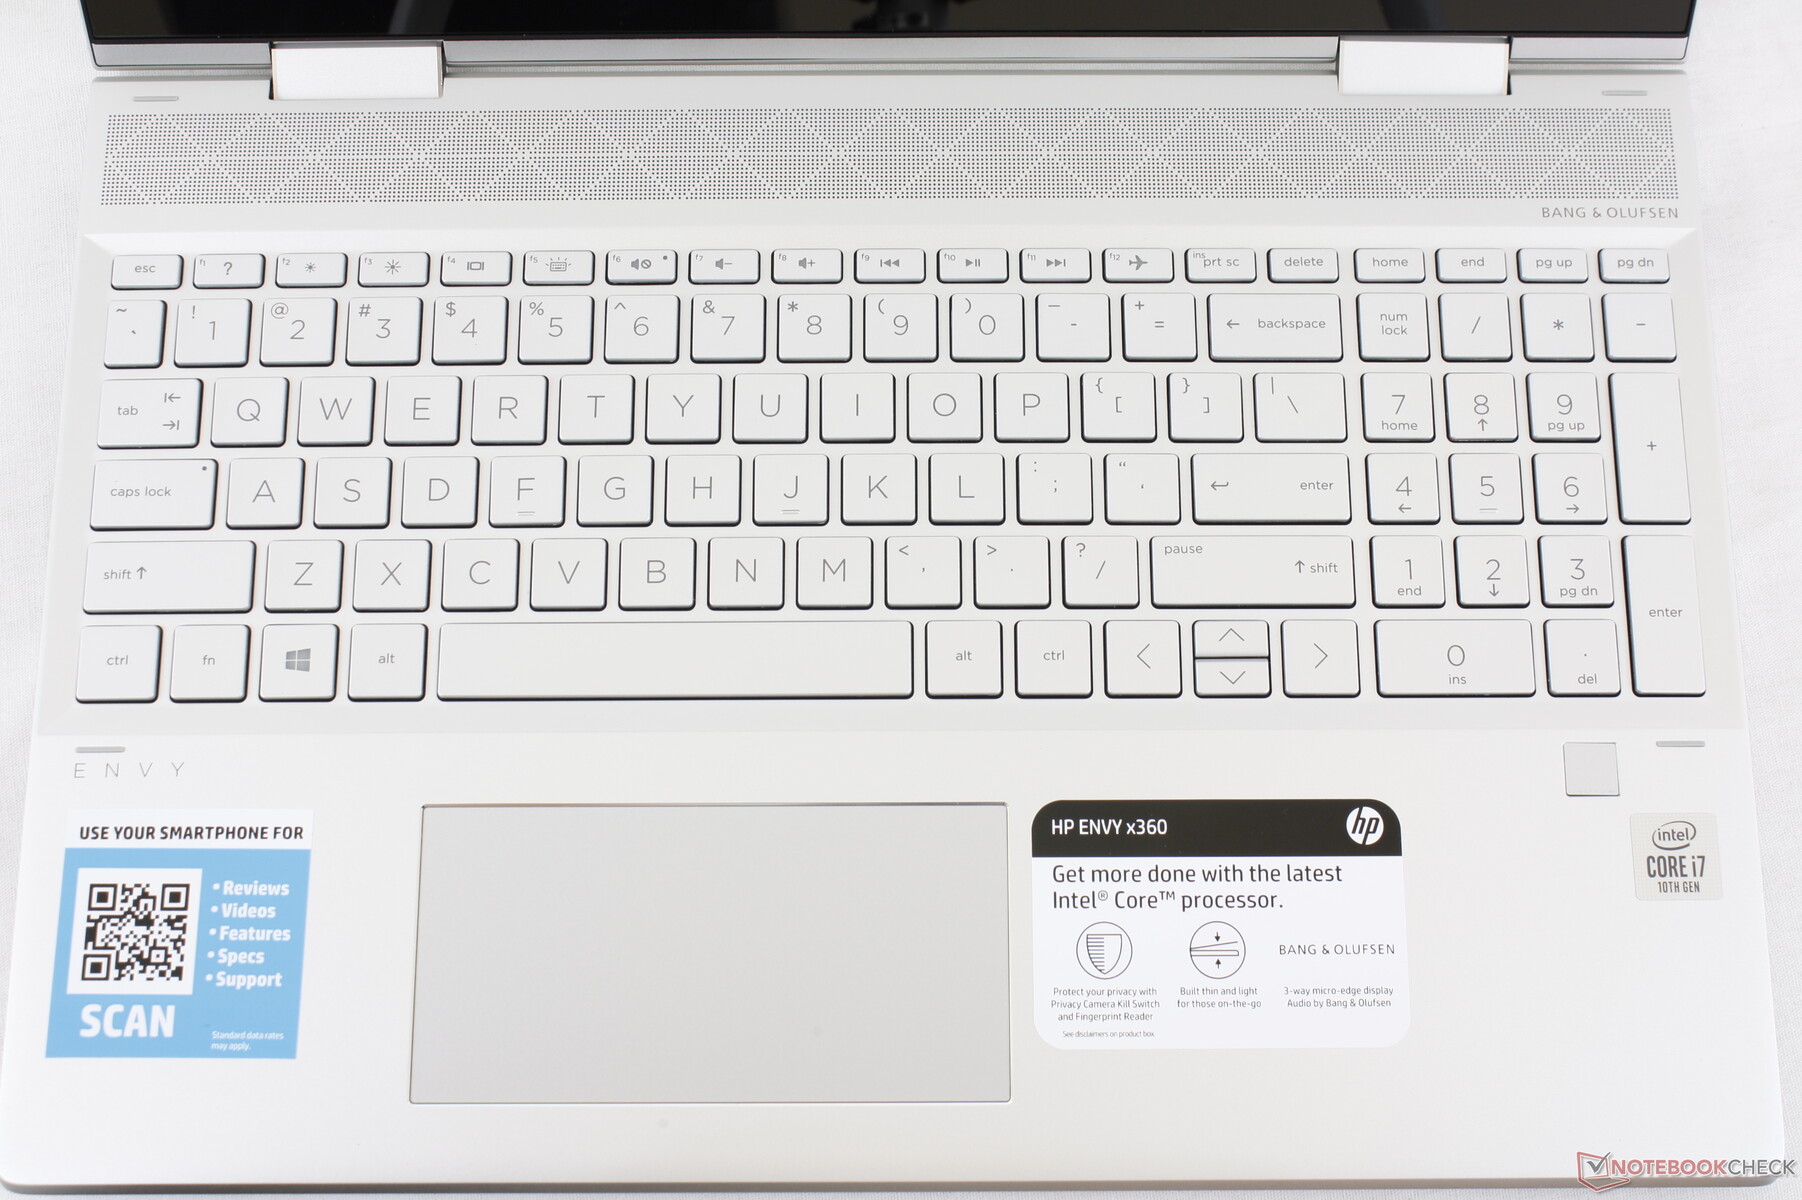
Port options remain identical to the 2018 model albeit rearranged. The volume rocker, however, is now gone in favor of a camera kill switch. Ports are tightly packed together meaning thicker cables or accessories will likely block access to adjacent ports.

SD Card Reader
The spring-loaded SD reader remains the same in terms of performance. Transferring 1 GB of pictures from our UHS-II card to desktop takes about 13 seconds much like on the older Envy x360 15.
| SD Card Reader | |
| average JPG Copy Test (av. of 3 runs) | |
| Dell XPS 15 9500 Core i5 (Toshiba Exceria Pro SDXC 64 GB UHS-II) | |
| HP Envy x360 15-dr1679cl (Toshiba Exceria Pro SDXC 64 GB UHS-II) | |
| HP Envy x360 15-bq102ng (Toshiba Exceria Pro SDXC 64 GB UHS-II) | |
| Dell Inspiron 15 5579-9672 (Toshiba Exceria Pro SDXC 64 GB UHS-II) | |
| maximum AS SSD Seq Read Test (1GB) | |
| Dell XPS 15 9500 Core i5 (Toshiba Exceria Pro SDXC 64 GB UHS-II) | |
| HP Envy x360 15-dr1679cl (Toshiba Exceria Pro SDXC 64 GB UHS-II) | |
| HP Envy x360 15-bq102ng (Toshiba Exceria Pro SDXC 64 GB UHS-II) | |
| Dell Inspiron 15 5579-9672 (Toshiba Exceria Pro SDXC 64 GB UHS-II) | |
Communication
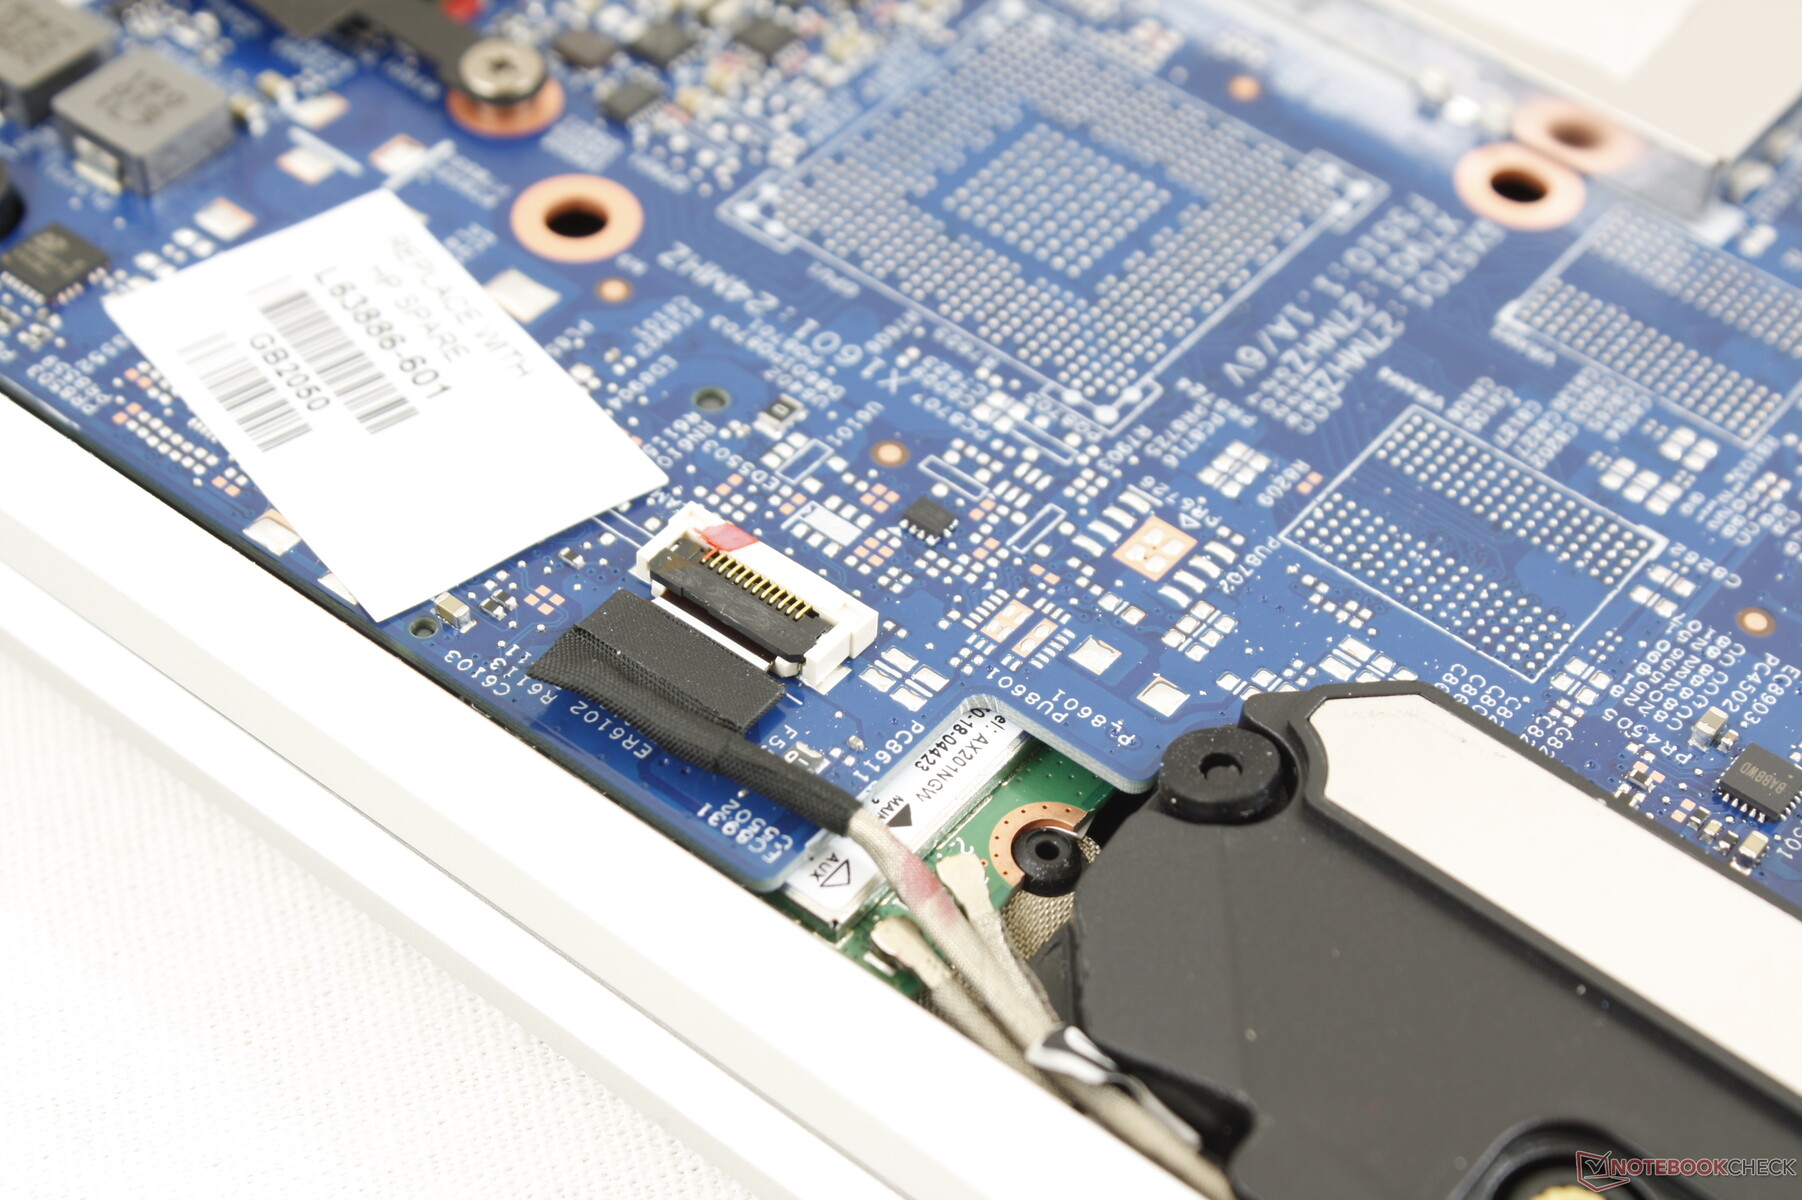
WLAN gets a boost to Wi-Fi 6 to be more in line with the latest Ultrabooks and we didn't experience any issues when connected to our Netgear RAX200 router. The Intel AX201 module is removable if users are willing to open up the system.
Webcam

")
")
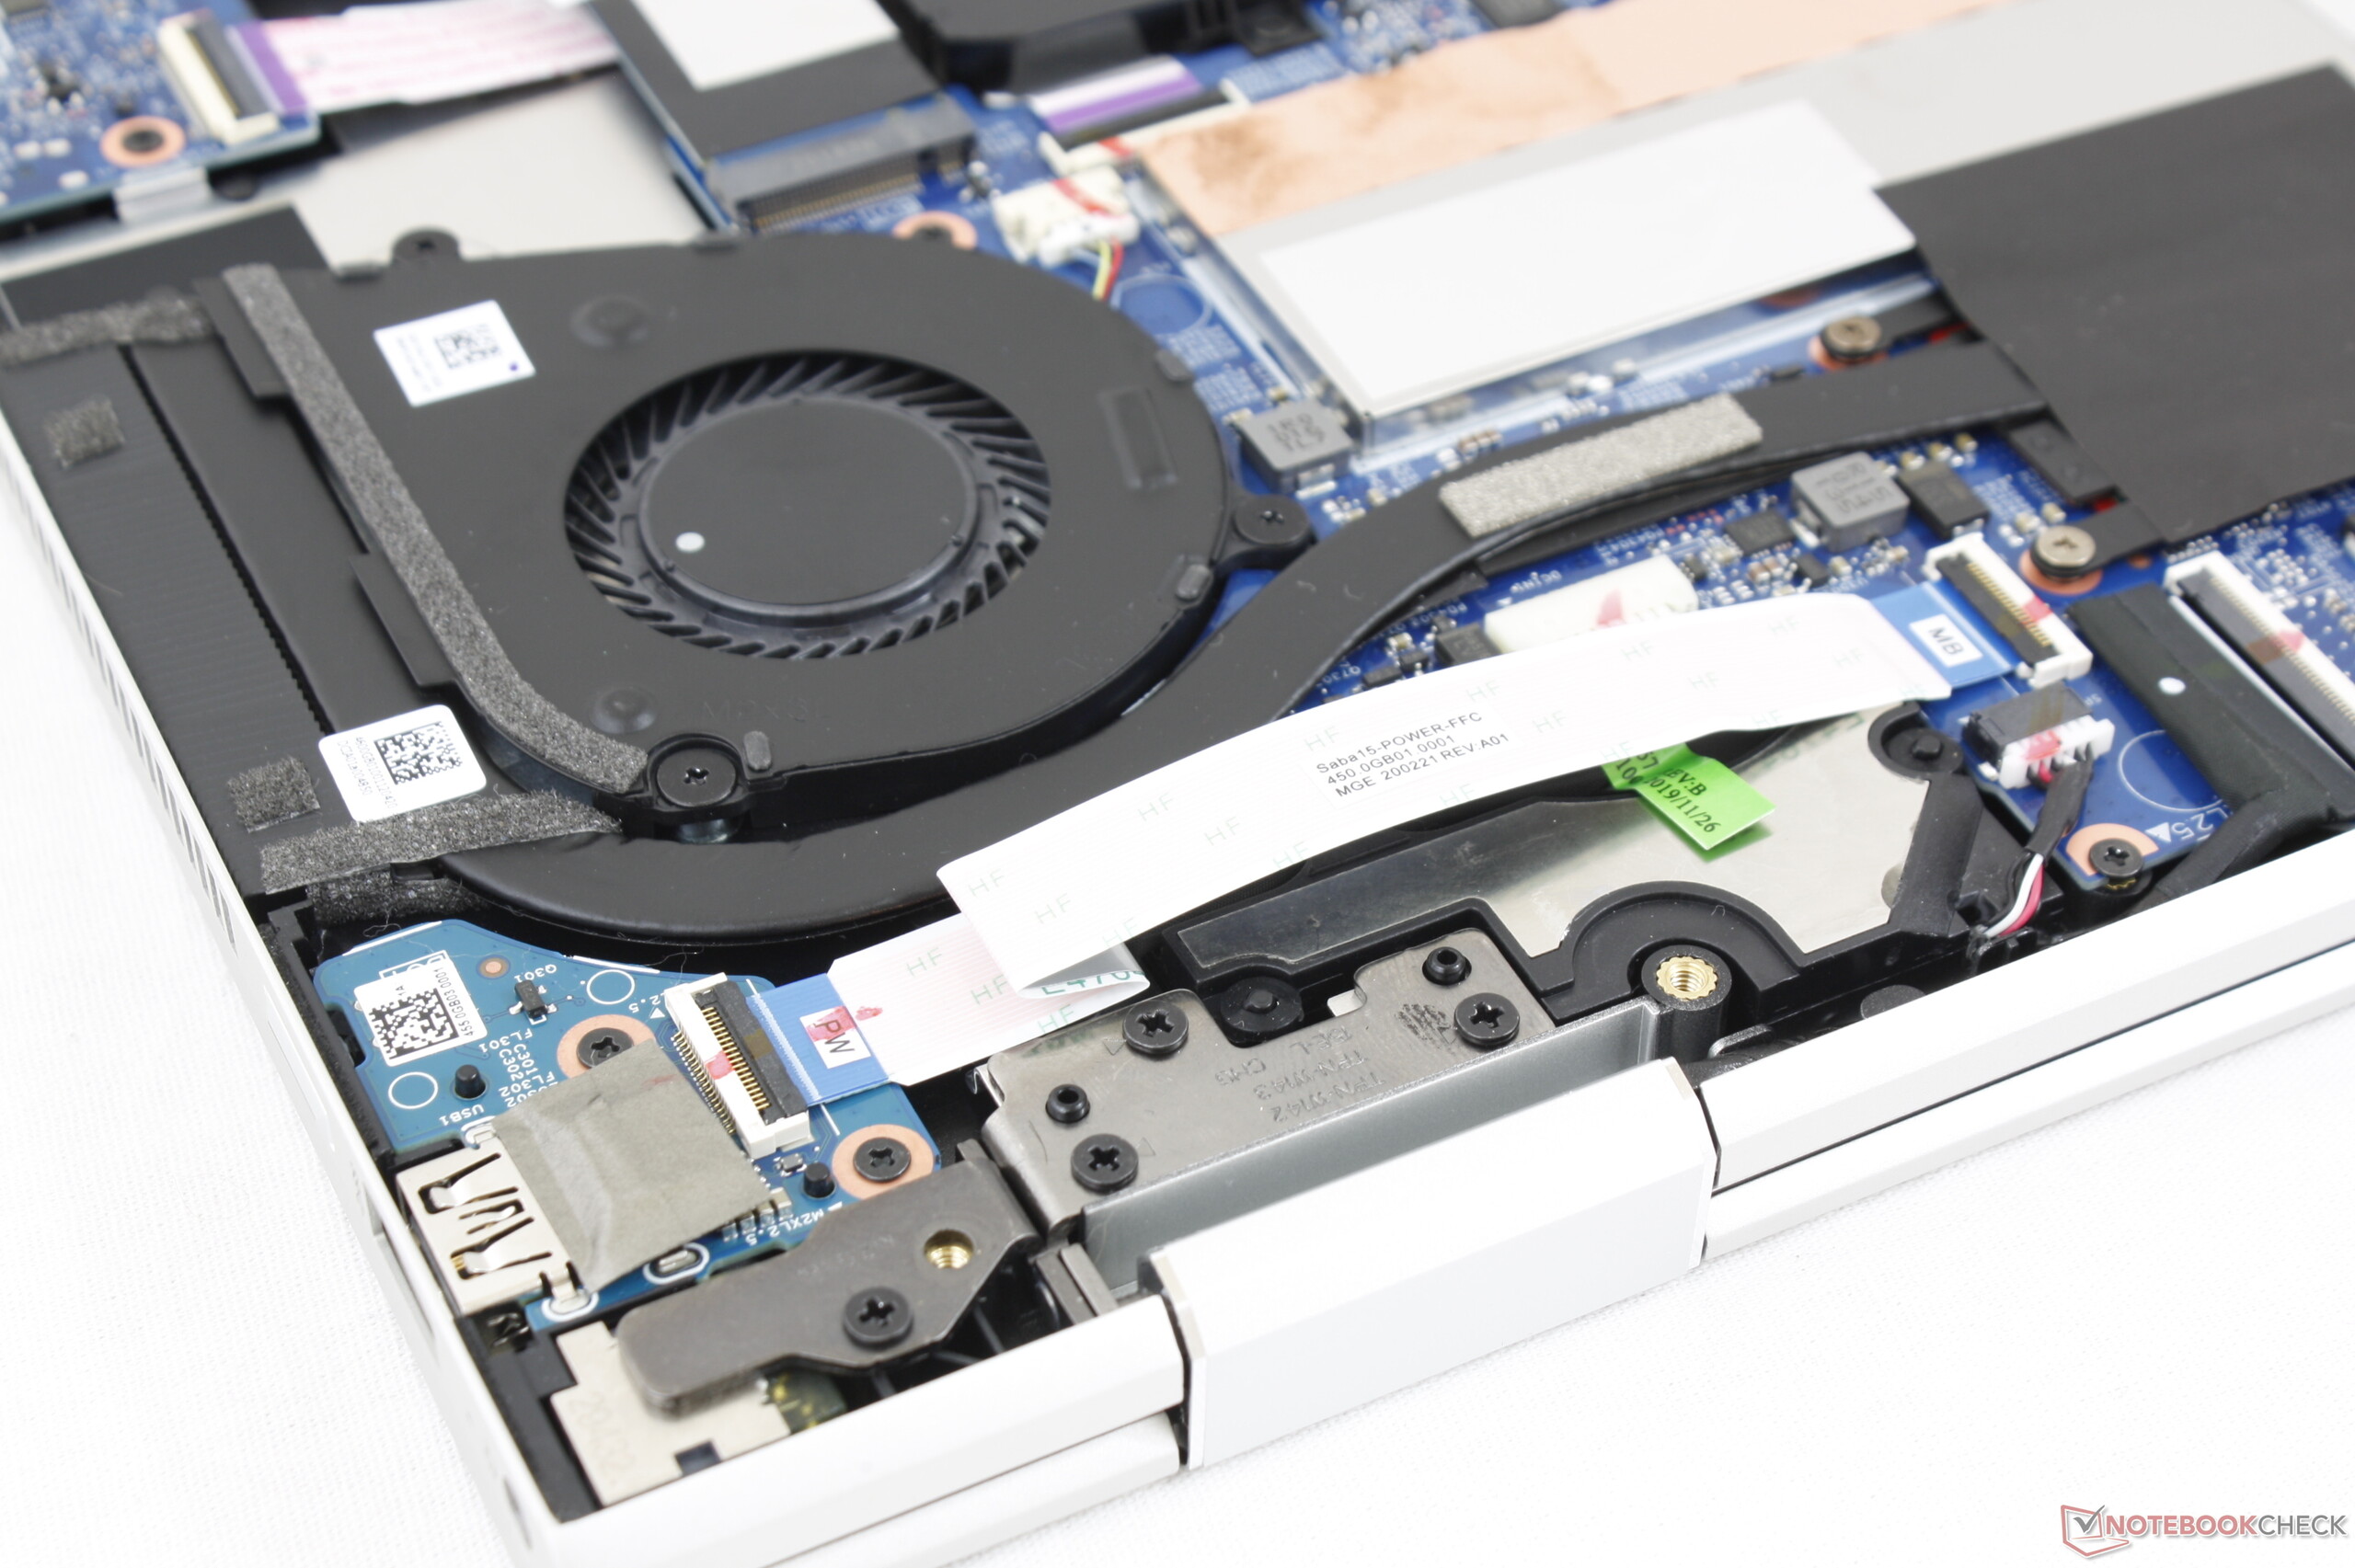
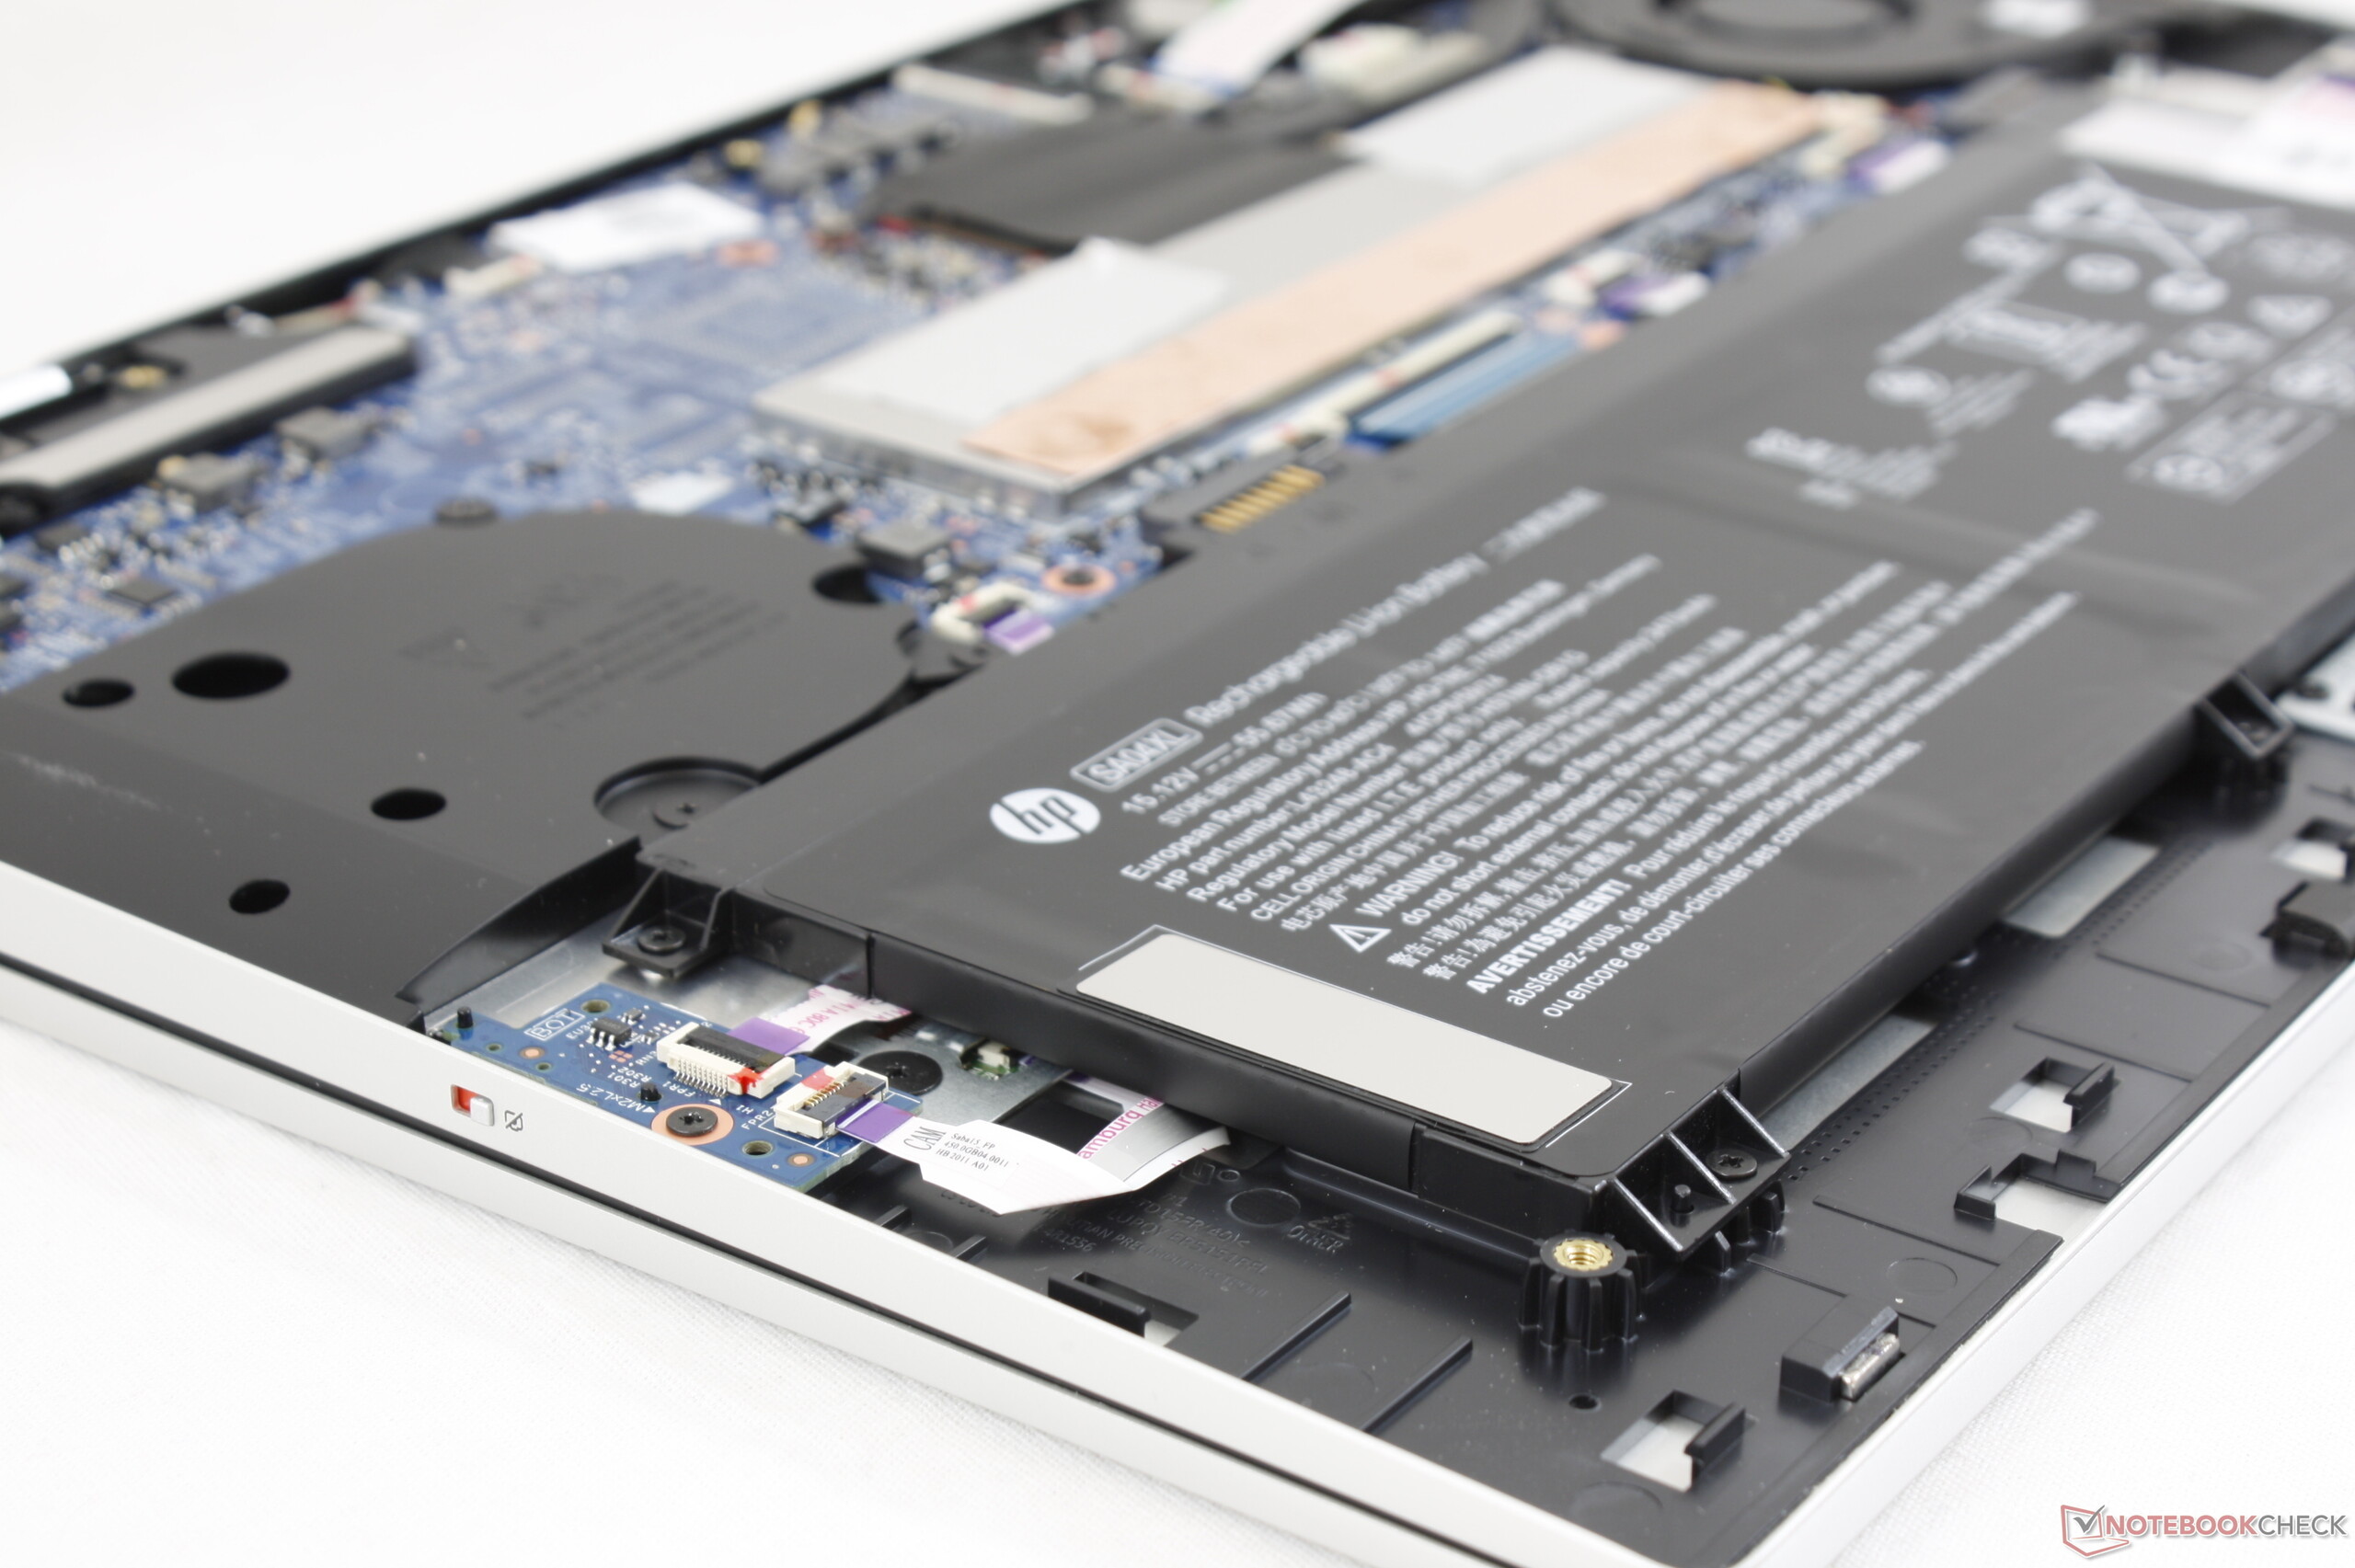
Maintenance
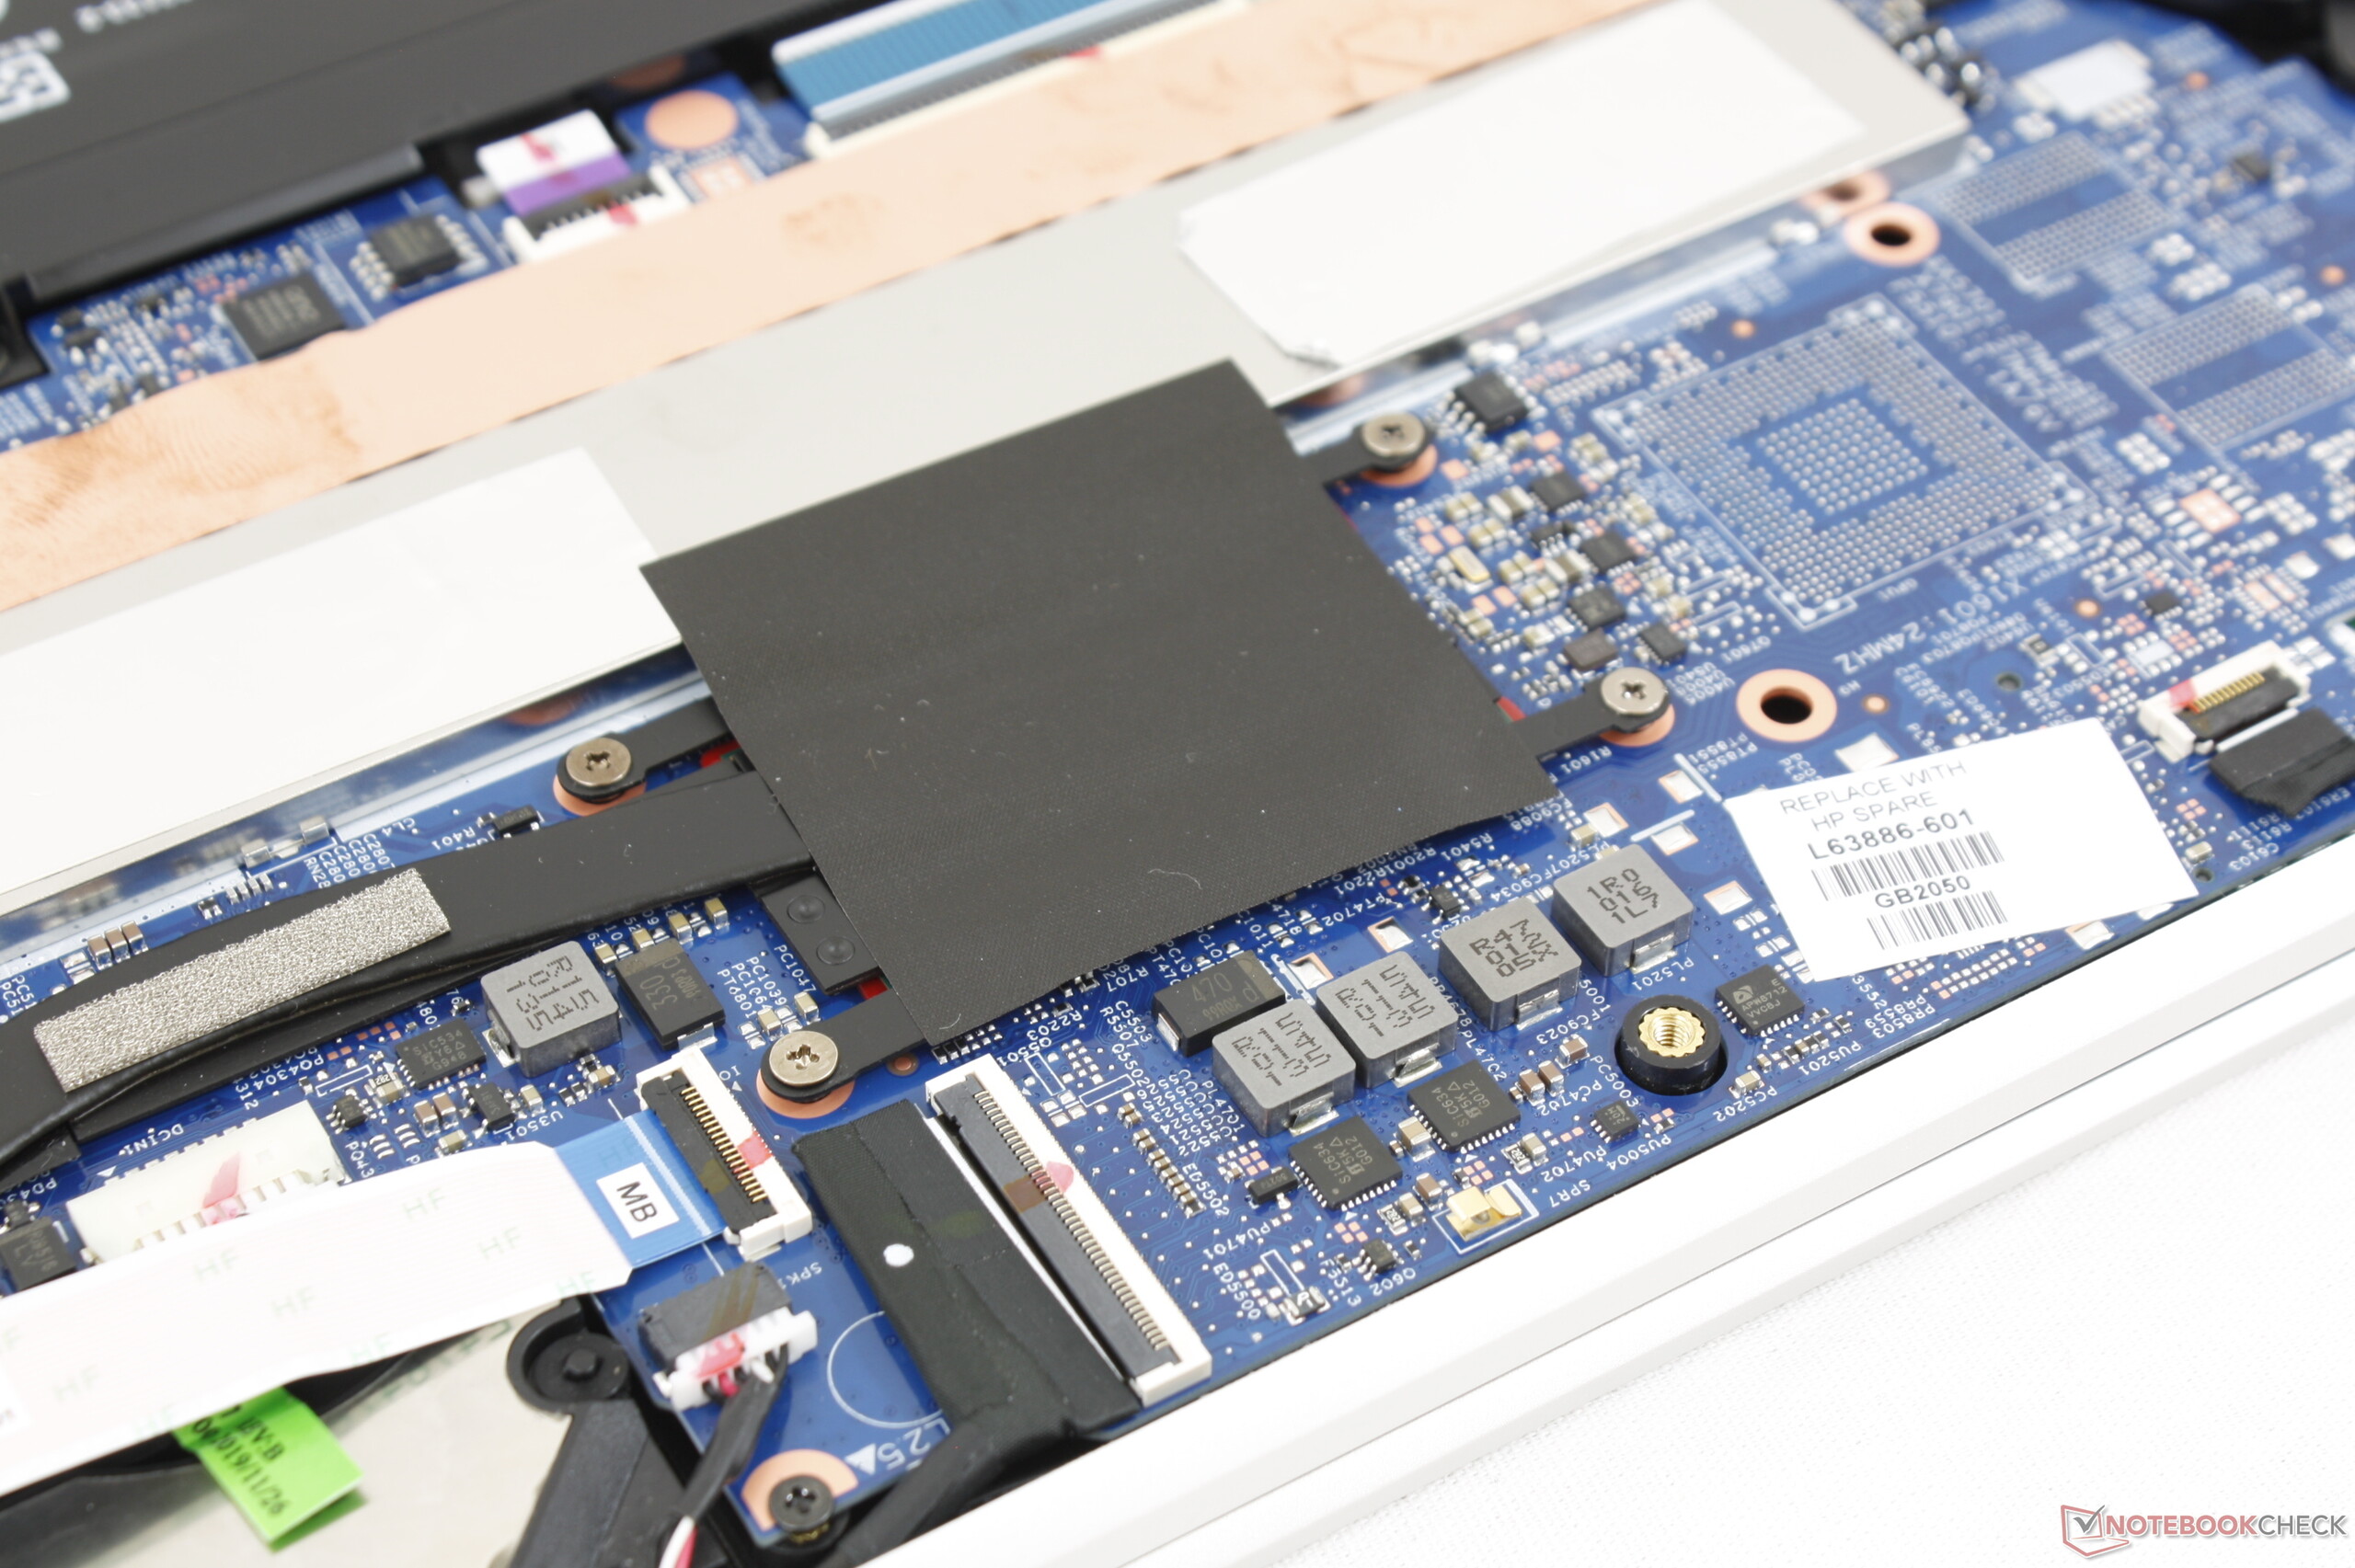
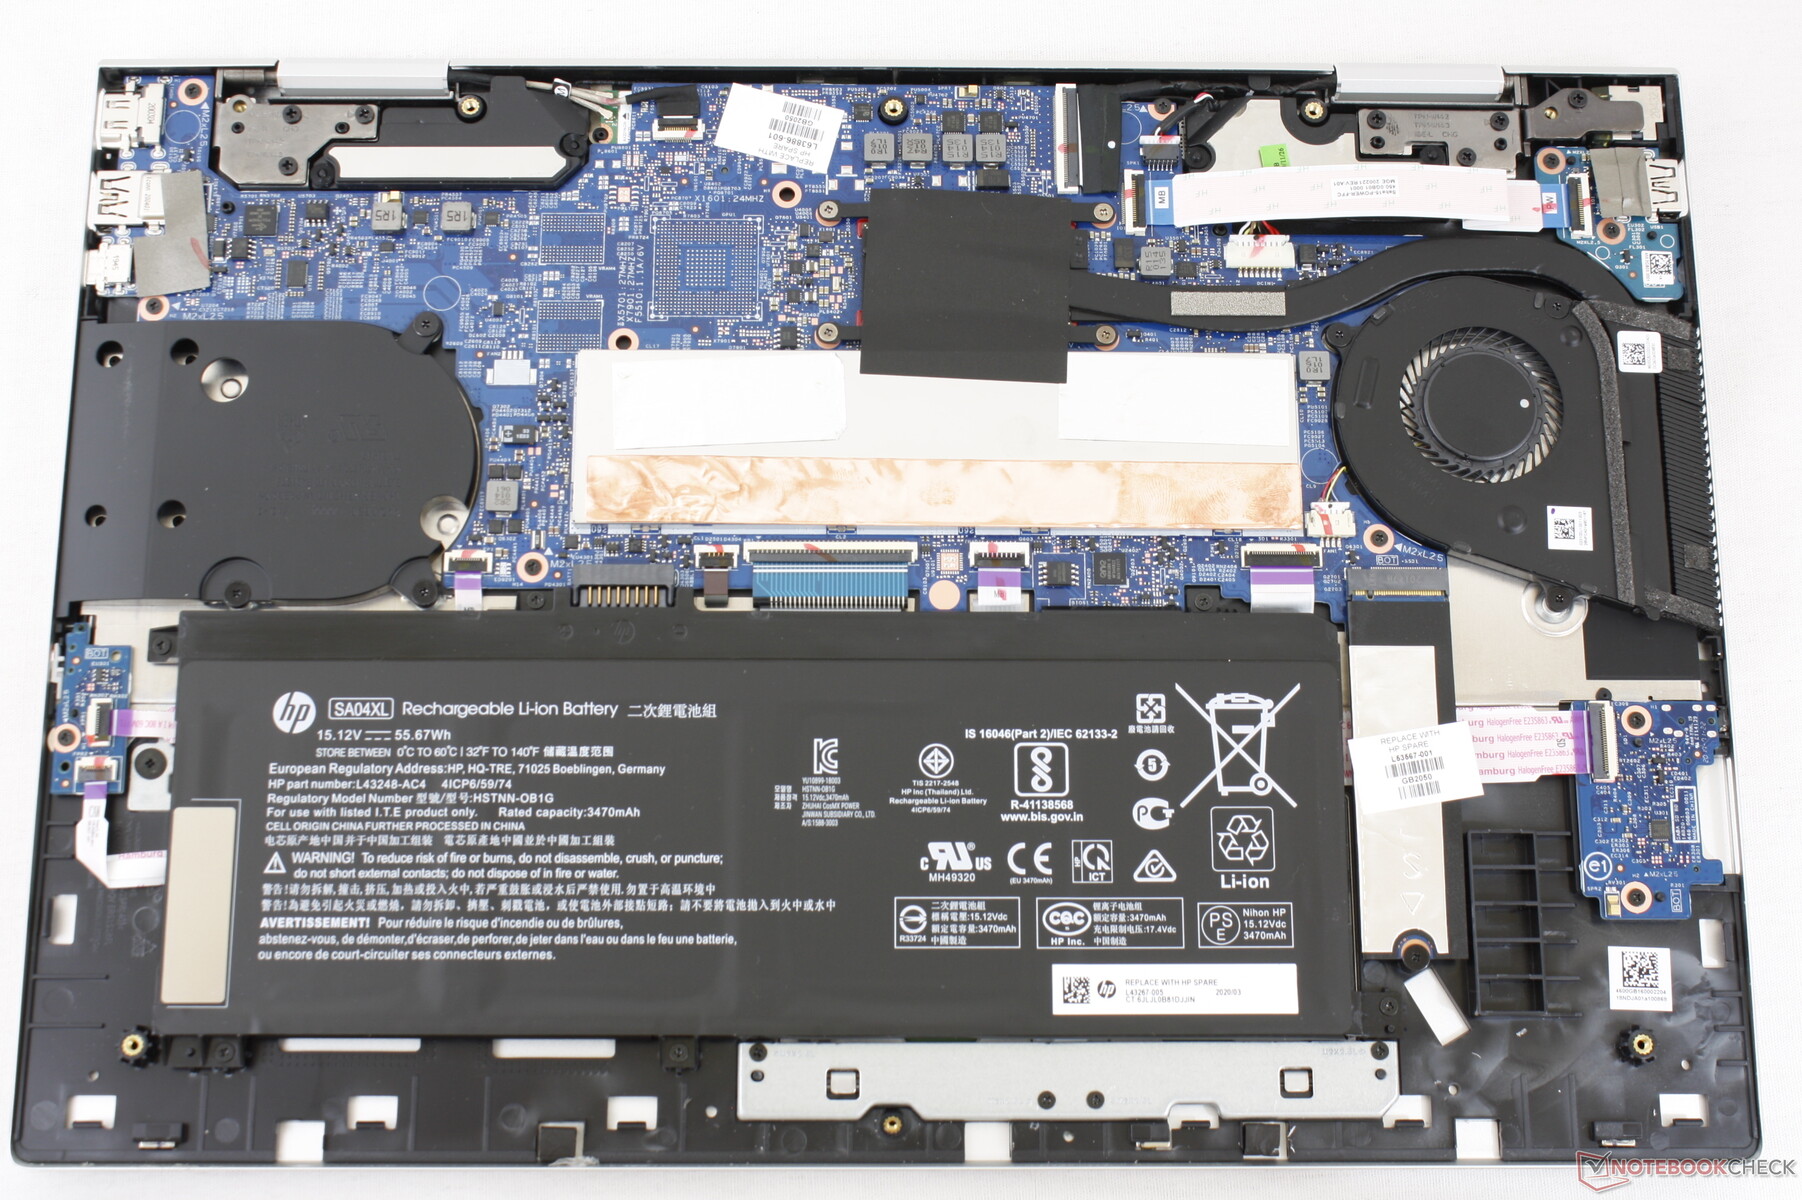
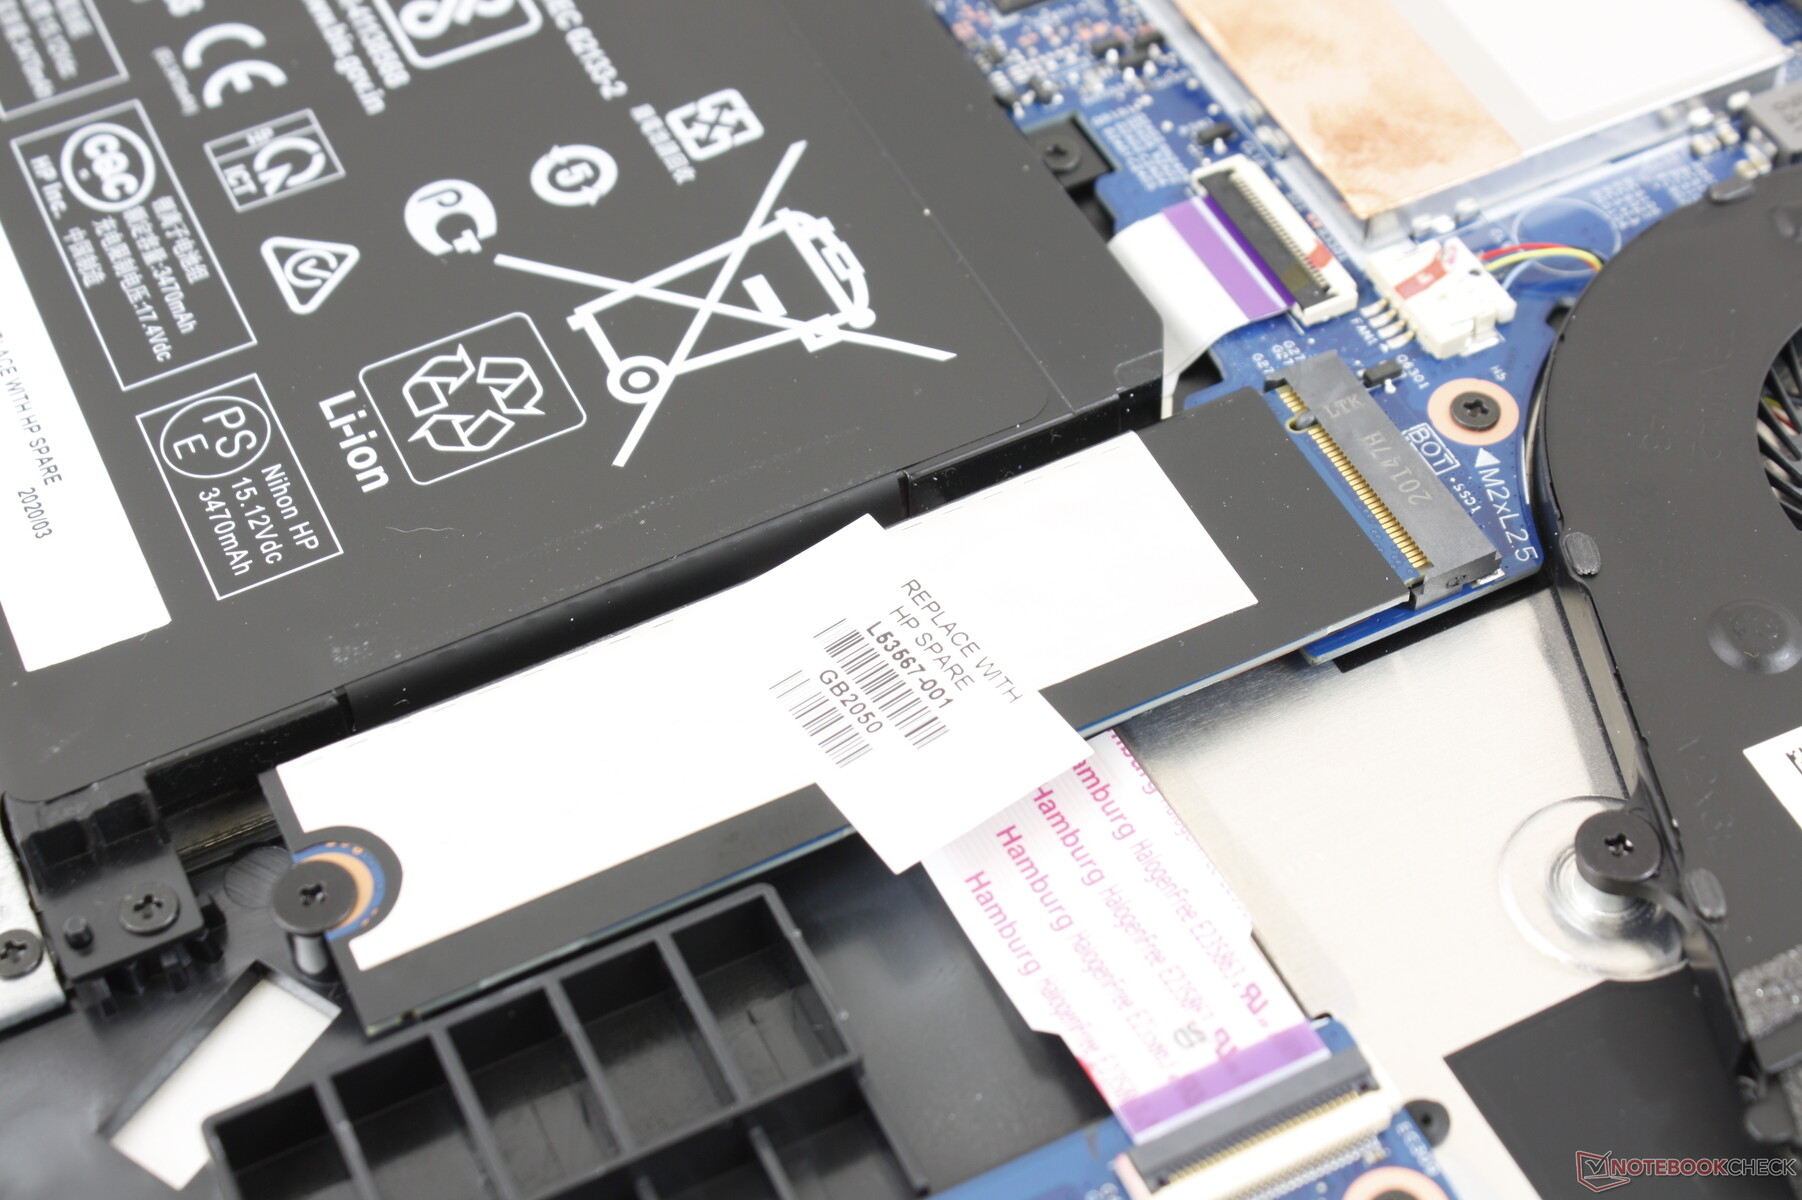
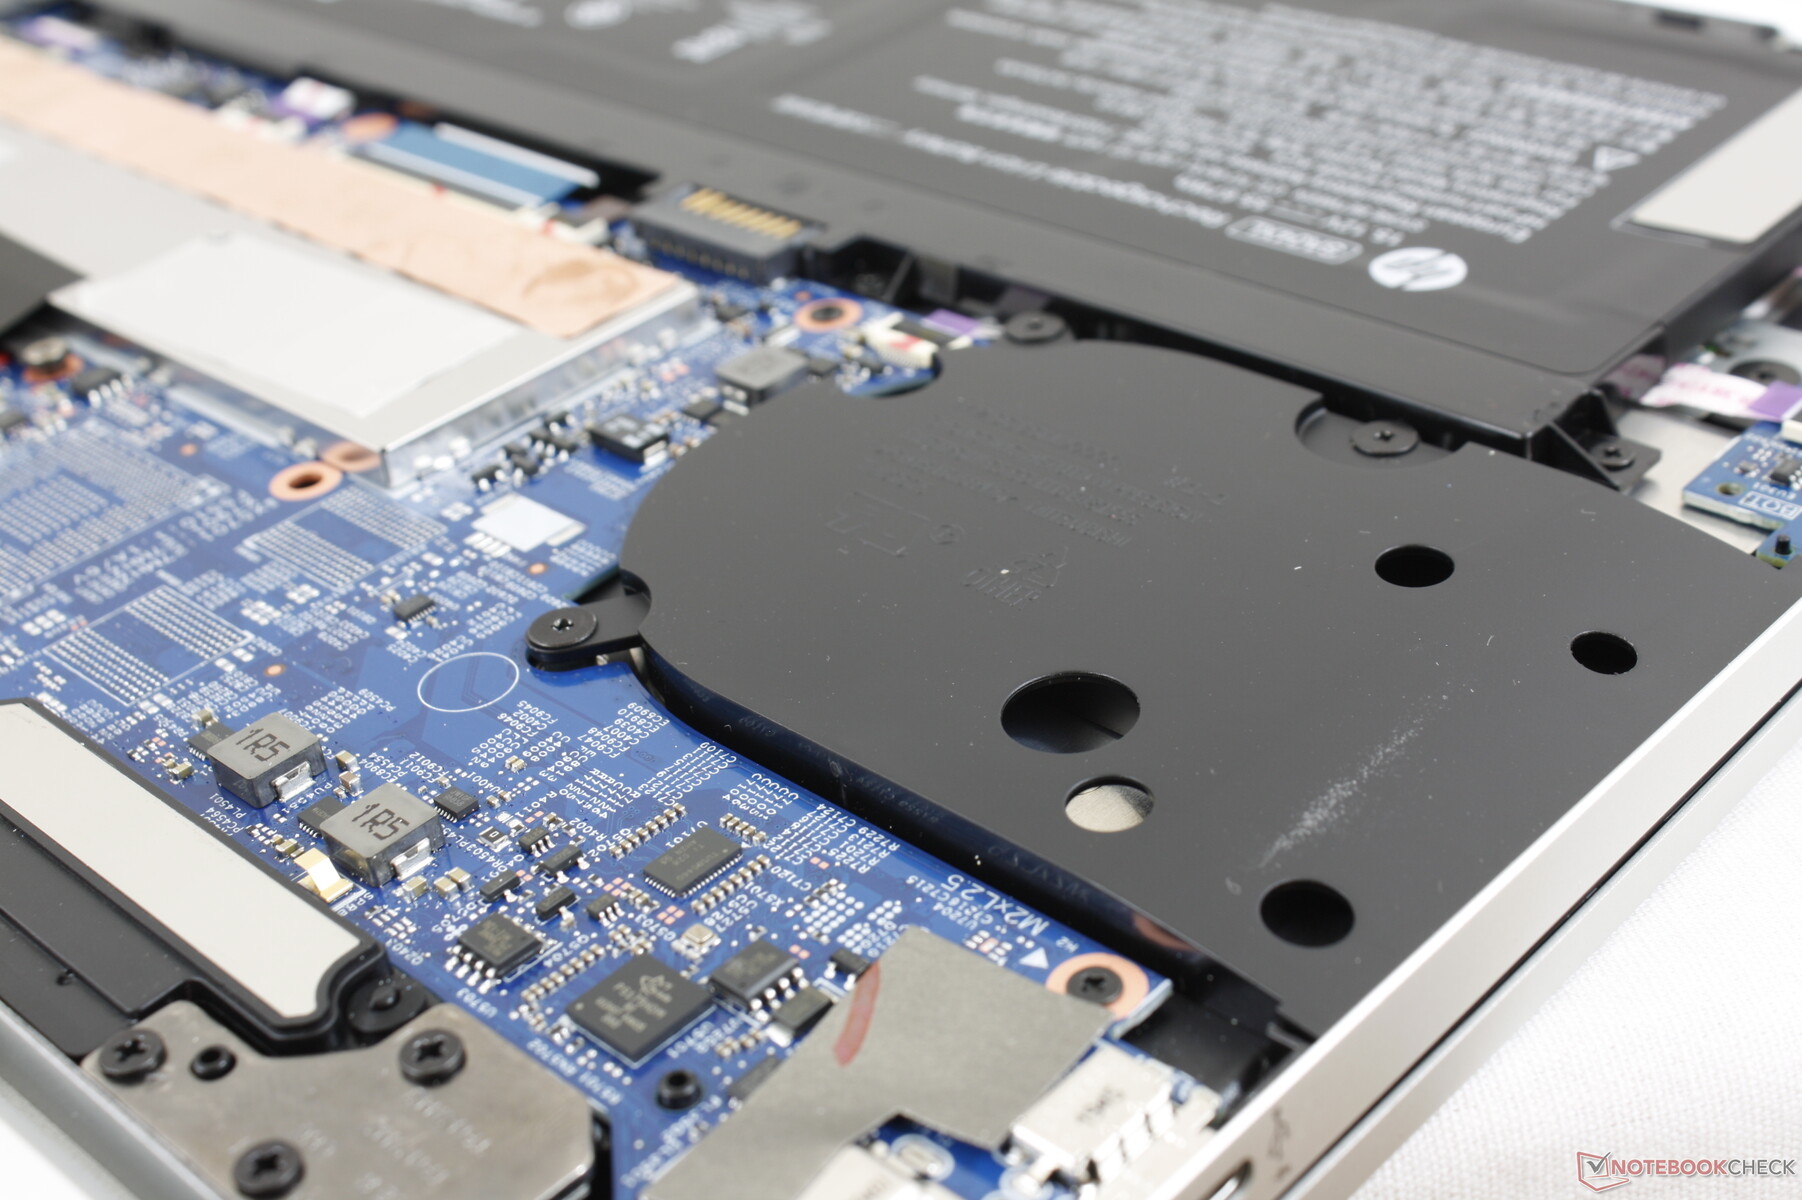
HP has a bad habit of hiding screws underneath rubber footing glued to the bottom of the base. End-user servicing is therefore much more challenging as it is difficult to remove the rubber footing without damaging the case or the feet themselves.
Luckily, HP provides a detailed disassembly manual online if owners are daring enough to add their own RAM or drives. Upgrading RAM or storage on your own isn't encouraged by the manufacturer.
Accessories and Warranty
There are no extras in the box other than the usual paperwork. HP throws in an active pen if purchased directly from their website.
The standard one-year limited warranty applies. Like Lenovo and Dell, HP offers a wide range of extension options if purchased through the manufacturer's site.
Input Devices
Keyboard
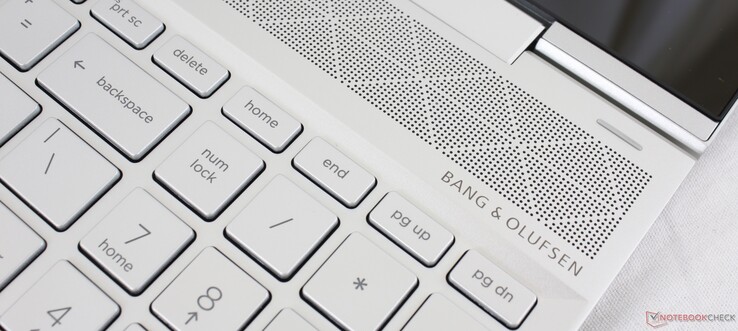
Key feedback and layout are the same as on the 2018 model down to even their secondary functions. This isn't particularly bad as we had no issues typing on the Envy x360 before, but it would have been nice to see some improvements at least. The keys on the pricier Spectre x360 15, for example, still feel firmer and with better feedback than the keys on here. Additionally, there is still no LED indicator for toggling Num lock or hotkey for launching HP Command Center.
Touchpad
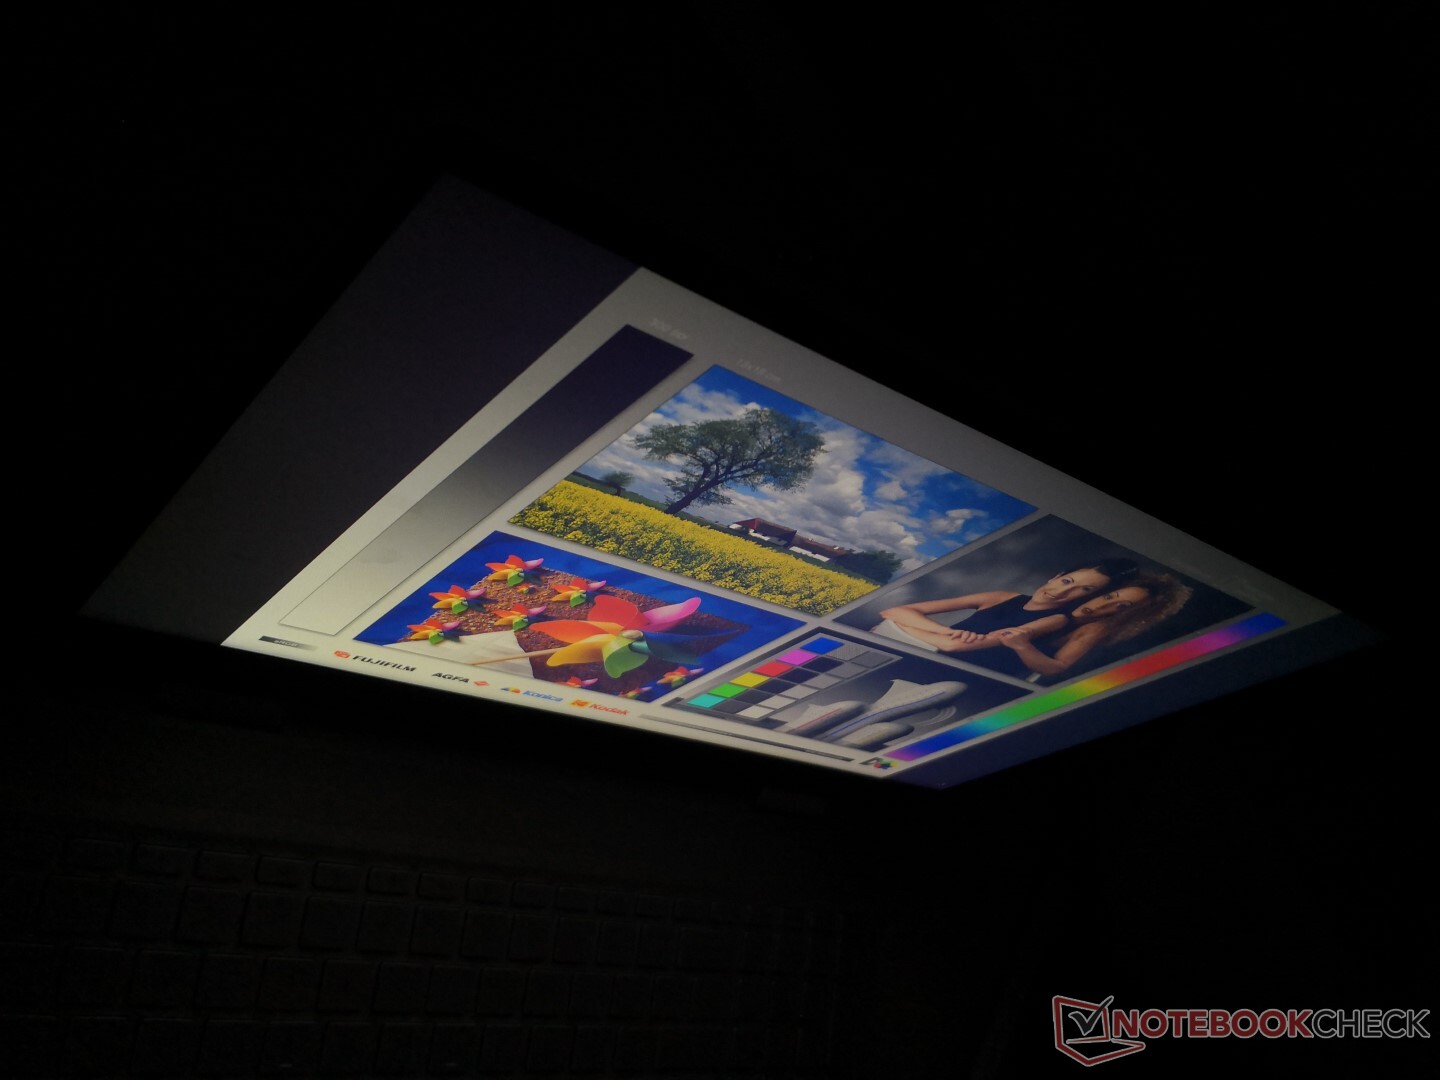
The Precision-enabled clickpad is once again 12 x 6 cm. Its uncommon 2:1 aspect ratio was designed to better match the 16:9 display, but in reality, vertical movements feel much more cramped when compared to most other laptops with squarer clickpads.
The integrated mouse keys have average feedback, shallow travel, and a loud auditory click when pressed. Drag-and-drop actions are also more difficult than usual due to the limited vertical movement. Dedicated mouse keys would have made cursor control much more comfortable here.


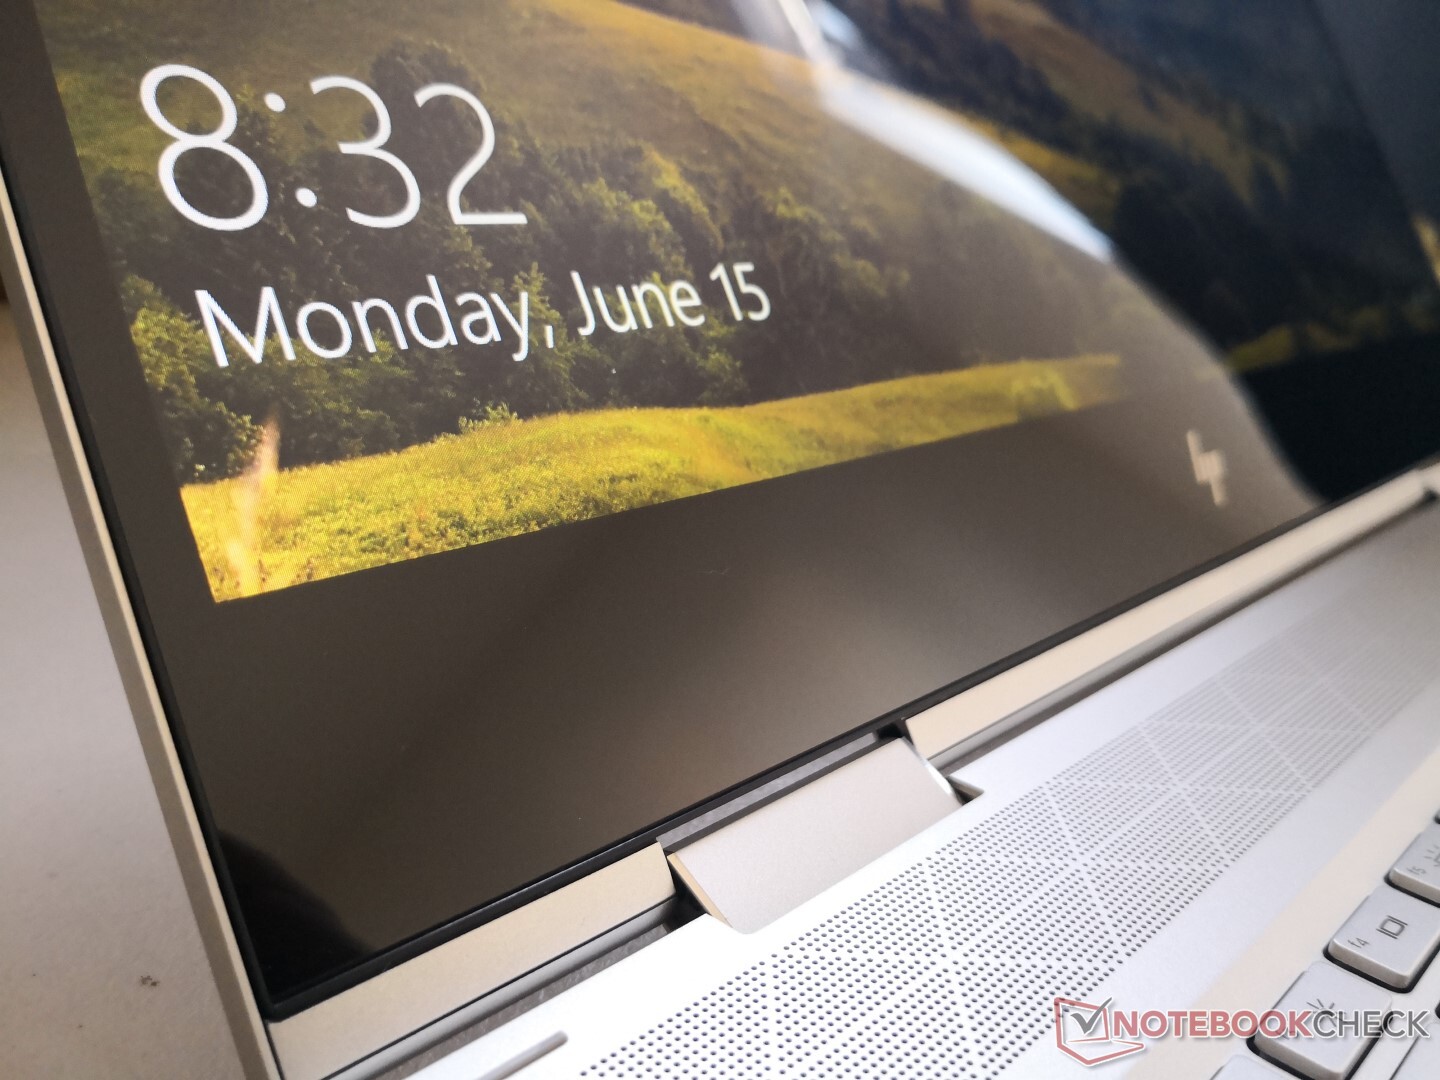
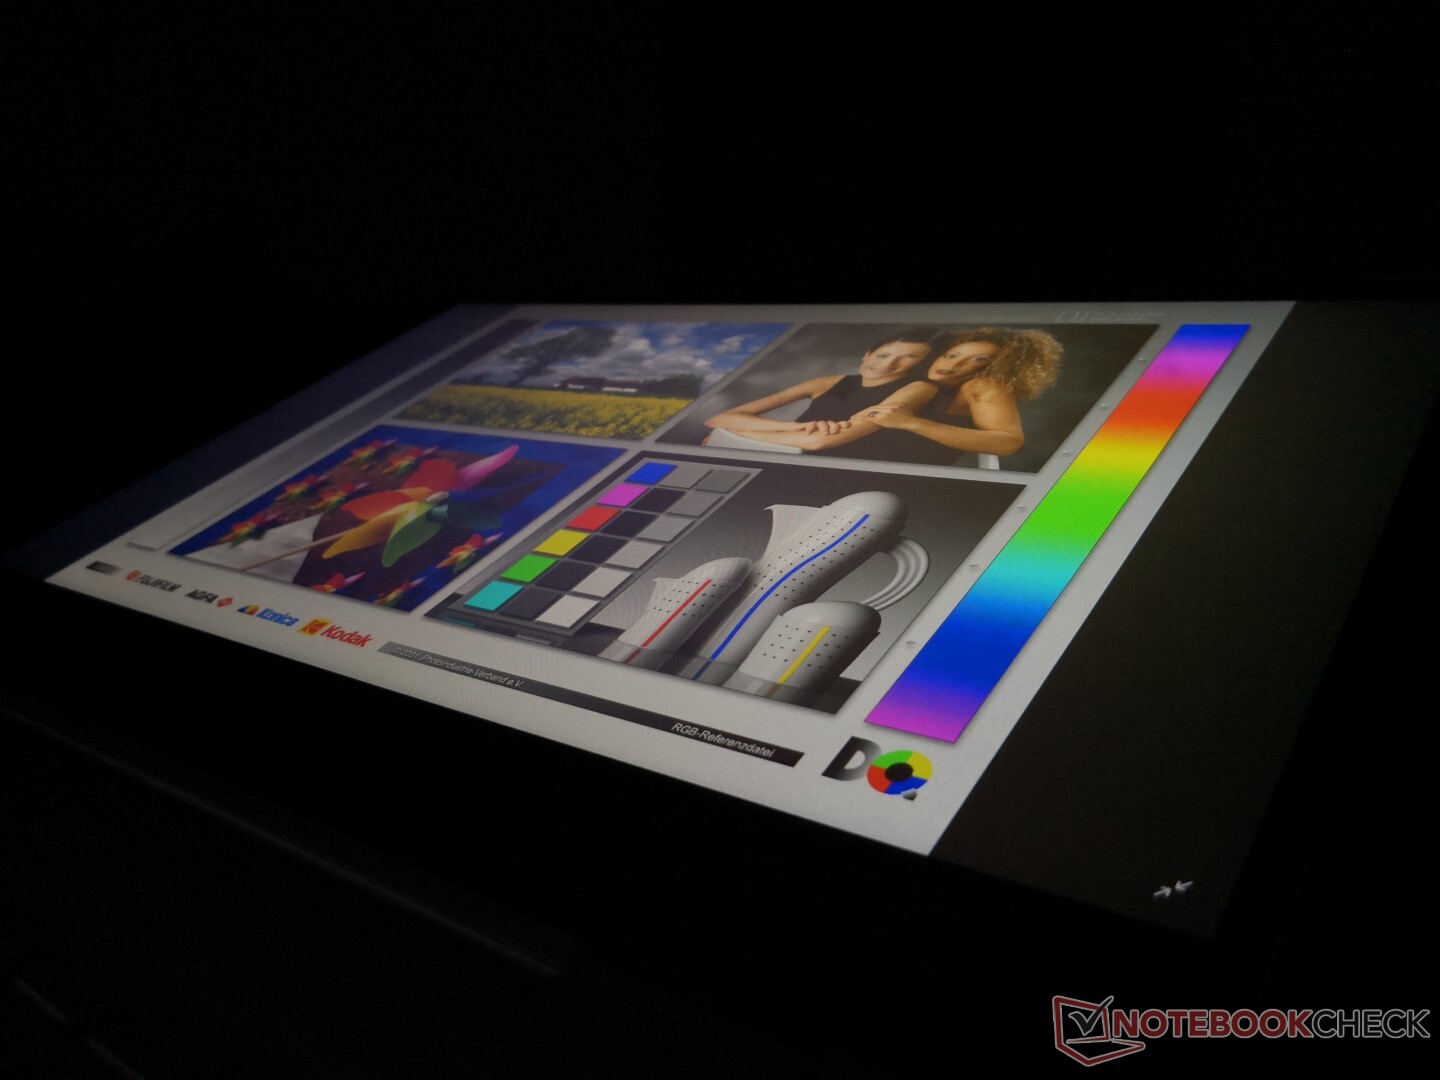
Display
The AU Optronics B156HW02 1080p IPS panel on our unit can also be found on the recent HP Notebook 15s and even the much older Dell Latitude E6540. Characteristics like brightness, response times, colors, and contrast are merely average with nothing to write home about. Display quality is similar to what Lenovo offers on the competing Yoga C740-15IML.
HP offers two other display options: 1080p at 400 nits and 4K UHD AMOLED at 400 nits. Our measurements below reflect only the entry-level 250-nit configuration we have on hand.


| |||||||||||||||||||||||||
Brightness Distribution: 92 %
Center on Battery: 261.2 cd/m²
Contrast: 687:1 (Black: 0.38 cd/m²)
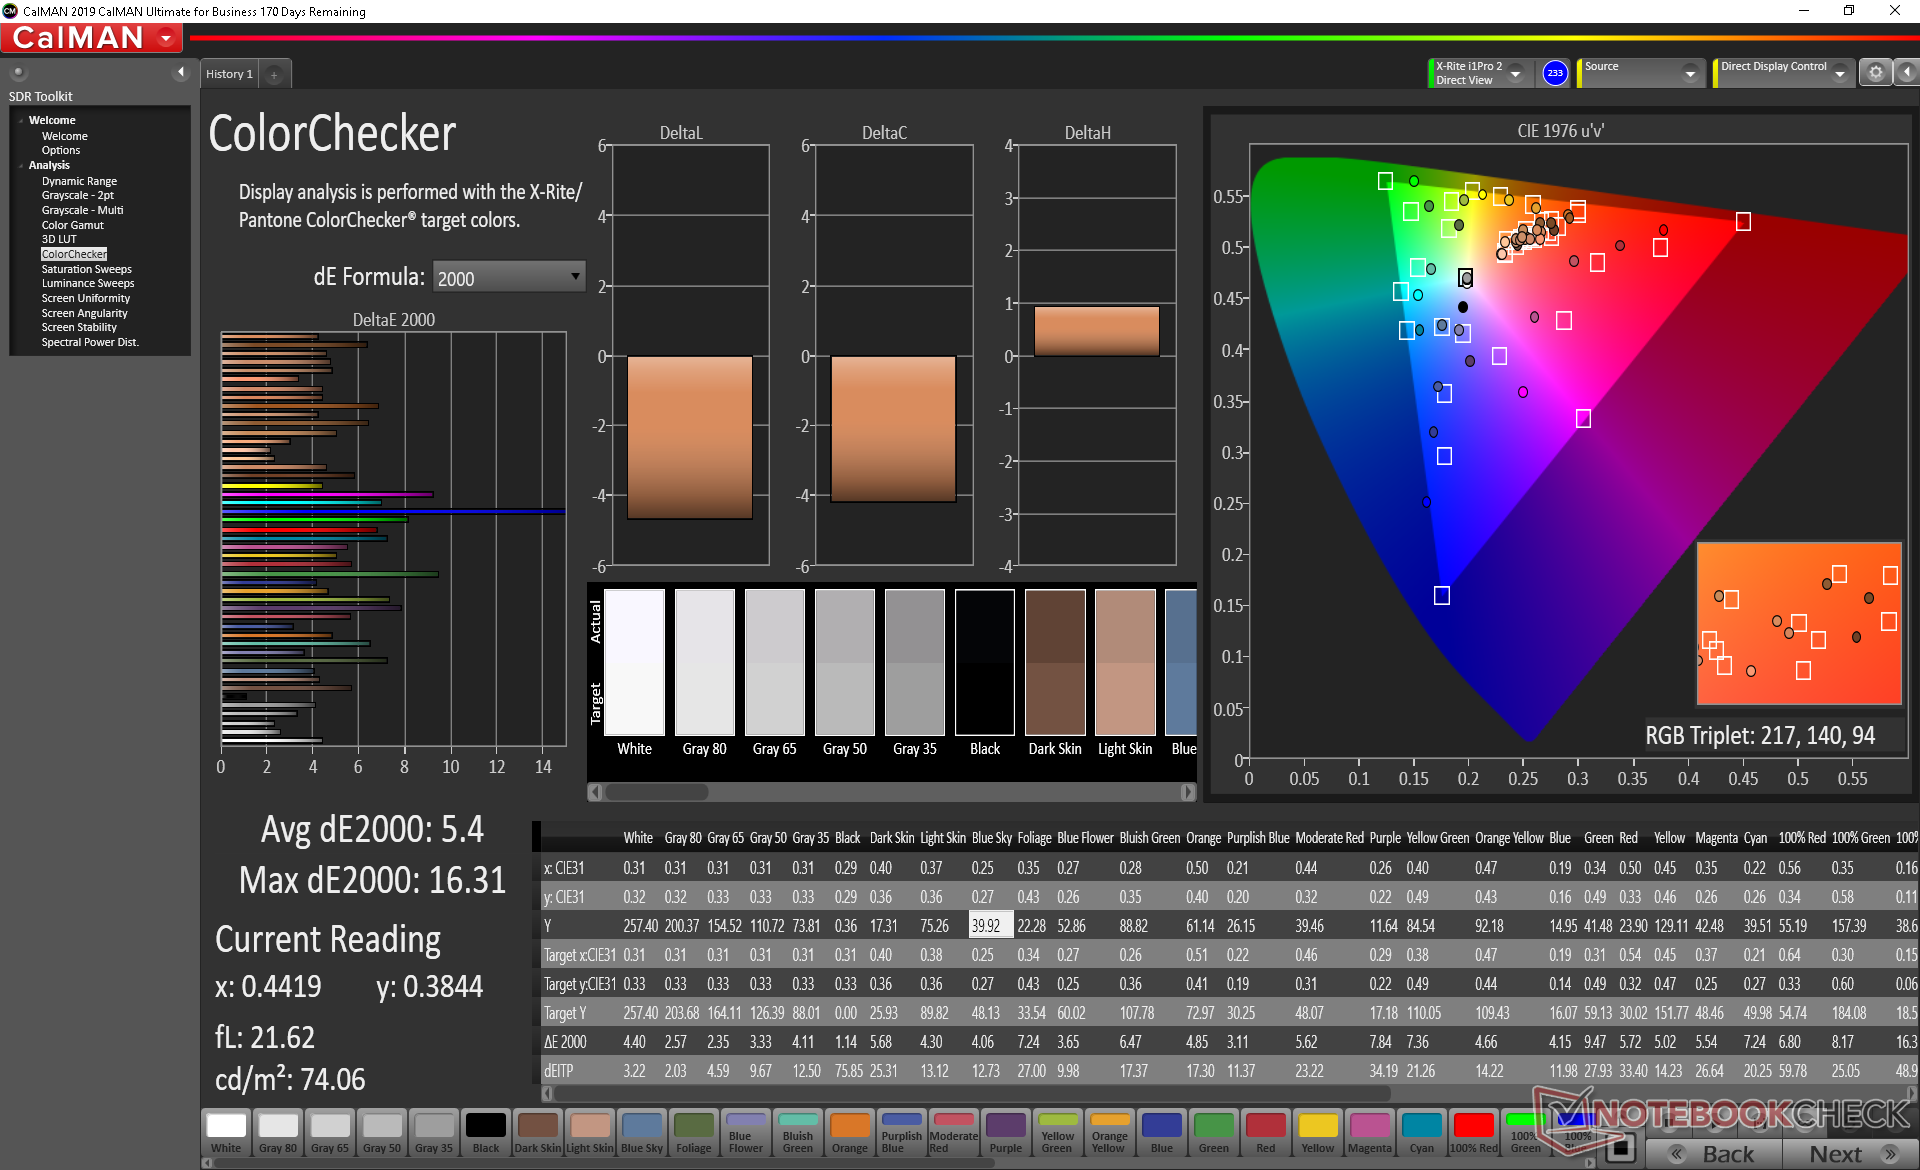
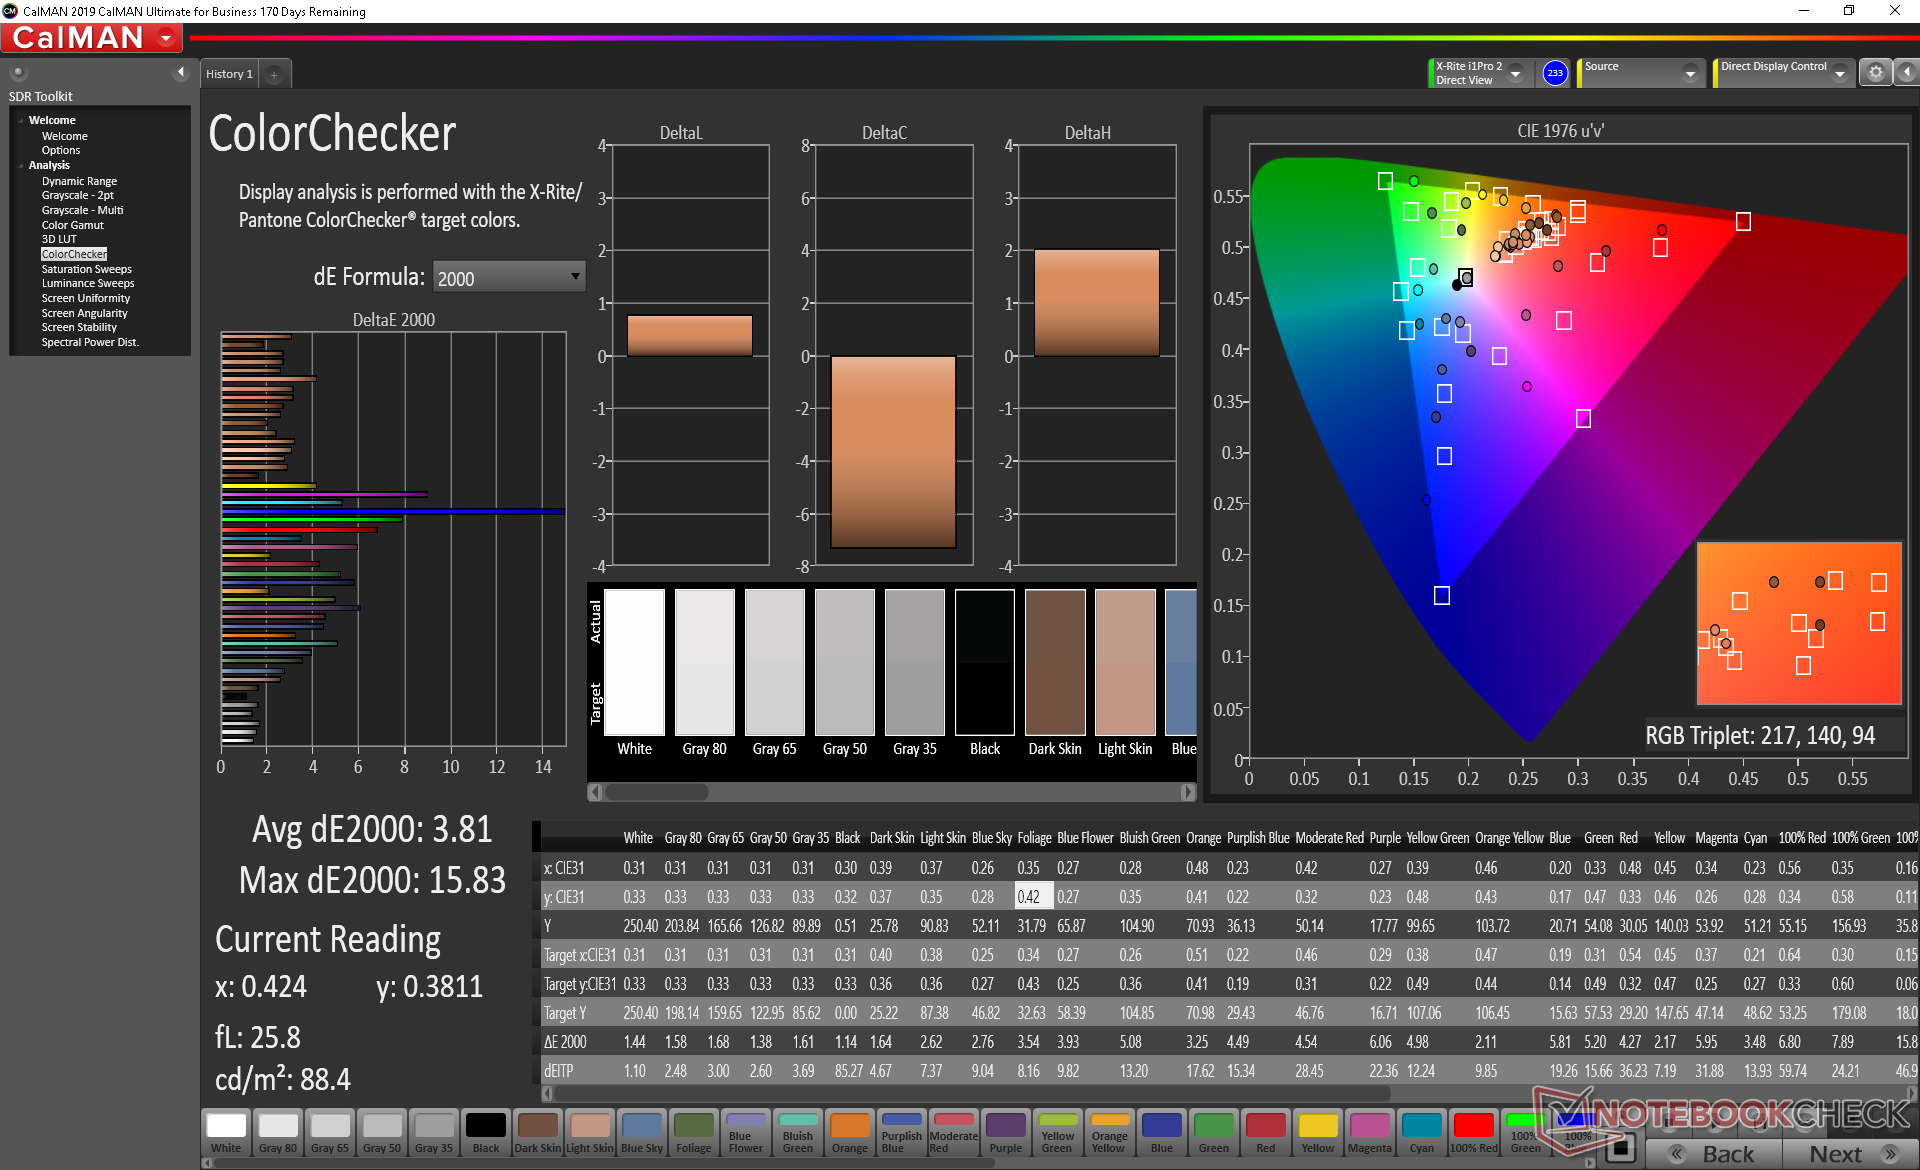
ΔE ColorChecker Calman: 5.4 | ∀{0.5-29.43 Ø4.73}
calibrated: 3.81
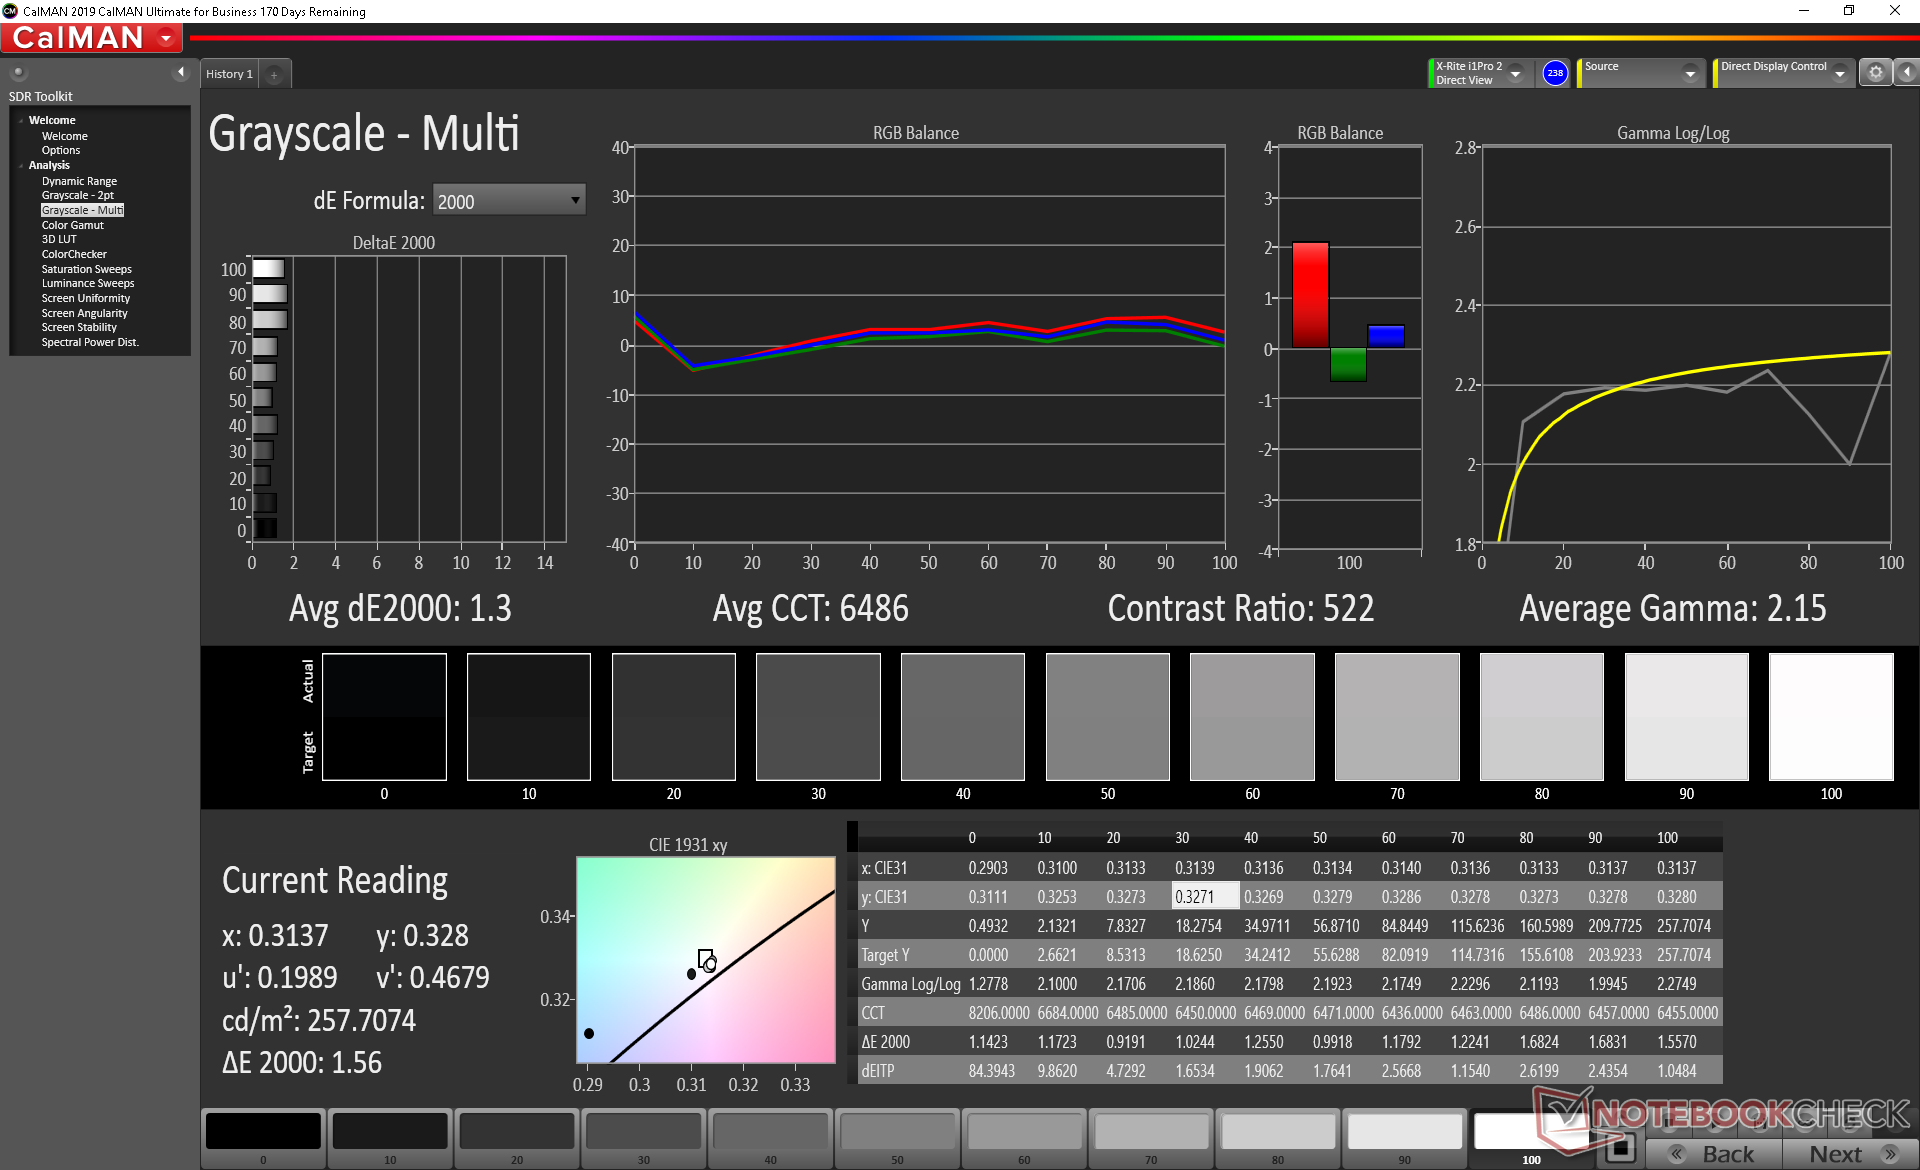
ΔE Greyscale Calman: 4.1 | ∀{0.09-98 Ø4.97}
58.7% sRGB (Argyll 1.6.3 3D)
37.4% AdobeRGB 1998 (Argyll 1.6.3 3D)
40.58% AdobeRGB 1998 (Argyll 3D)
58.8% sRGB (Argyll 3D)
39.28% Display P3 (Argyll 3D)
Gamma: 2.53
CCT: 6611 K
| HP Envy x360 15-dr1679cl AU Optronics B156HW02, IPS, 15.6", 1920x1080 | Lenovo Yoga C740-15IML B156HAN02.5, IPS LED, 15.6", 1920x1080 | Dell Inspiron 15 5579-9672 AUO, B156HW01, IPS, 15.6", 1920x1080 | Asus ZenBook Flip 15 UX563FD-A1027T BOE HF NE156QUM-N64, IPS, 15.6", 3840x2160 | Dell XPS 15 9500 Core i5 Sharp LQ156N1, IPS, 15.6", 1920x1200 | HP Envy x360 15-bq102ng Chi Mei CM15E9, IPS, 15.6", 1920x1080 | |
|---|---|---|---|---|---|---|
| Display | -1% | -6% | 67% | 91% | 5% | |
| Display P3 Coverage (%) | 39.28 | 39.04 -1% | 37 -6% | 66.2 69% | 81.5 107% | 41.36 5% |
| sRGB Coverage (%) | 58.8 | 57.9 -2% | 55.6 -5% | 97.2 65% | 100 70% | 62.2 6% |
| AdobeRGB 1998 Coverage (%) | 40.58 | 40.33 -1% | 38.23 -6% | 68.3 68% | 79.6 96% | 42.74 5% |
| Response Times | -33% | -14% | -50% | -14% | -6% | |
| Response Time Grey 50% / Grey 80% * (ms) | 39.6 ? | 50.8 ? -28% | 41 ? -4% | 60 ? -52% | 42 ? -6% | 40 ? -1% |
| Response Time Black / White * (ms) | 23.6 ? | 32.4 ? -37% | 29 ? -23% | 35 ? -48% | 28.8 ? -22% | 26 ? -10% |
| PWM Frequency (Hz) | 25000 ? | |||||
| Screen | -1% | 16% | 48% | 58% | 32% | |
| Brightness middle (cd/m²) | 261.2 | 286 9% | 251 -4% | 351 34% | 592 127% | 221 -15% |
| Brightness (cd/m²) | 248 | 268 8% | 240 -3% | 335 35% | 565 128% | 207 -17% |
| Brightness Distribution (%) | 92 | 83 -10% | 84 -9% | 87 -5% | 85 -8% | 87 -5% |
| Black Level * (cd/m²) | 0.38 | 0.2 47% | 0.2 47% | 0.31 18% | 0.46 -21% | 0.15 61% |
| Contrast (:1) | 687 | 1430 108% | 1255 83% | 1132 65% | 1287 87% | 1473 114% |
| Colorchecker dE 2000 * | 5.4 | 7.3 -35% | 5.25 3% | 1.74 68% | 3.19 41% | 4.35 19% |
| Colorchecker dE 2000 max. * | 16.31 | 21.7 -33% | 10.04 38% | 2.76 83% | 5.45 67% | 8.98 45% |
| Colorchecker dE 2000 calibrated * | 3.81 | 5.1 -34% | 2.03 47% | |||
| Greyscale dE 2000 * | 4.1 | 7 -71% | 3.28 20% | 2.22 46% | 3.9 5% | 3.09 25% |
| Gamma | 2.53 87% | 2.35 94% | 2.15 102% | 2.35 94% | 2.25 98% | 2.23 99% |
| CCT | 6611 98% | 5847 111% | 6502 100% | 6667 97% | 6522 100% | 6068 107% |
| Color Space (Percent of AdobeRGB 1998) (%) | 37.4 | 36.9 -1% | 35 -6% | 62 66% | 71.6 91% | 56 50% |
| Color Space (Percent of sRGB) (%) | 58.7 | 57.5 -2% | 55 -6% | 97 65% | 100 70% | 86 47% |
| Total Average (Program / Settings) | -12% /
-5% | -1% /
8% | 22% /
38% | 45% /
55% | 10% /
22% |
* ... smaller is better
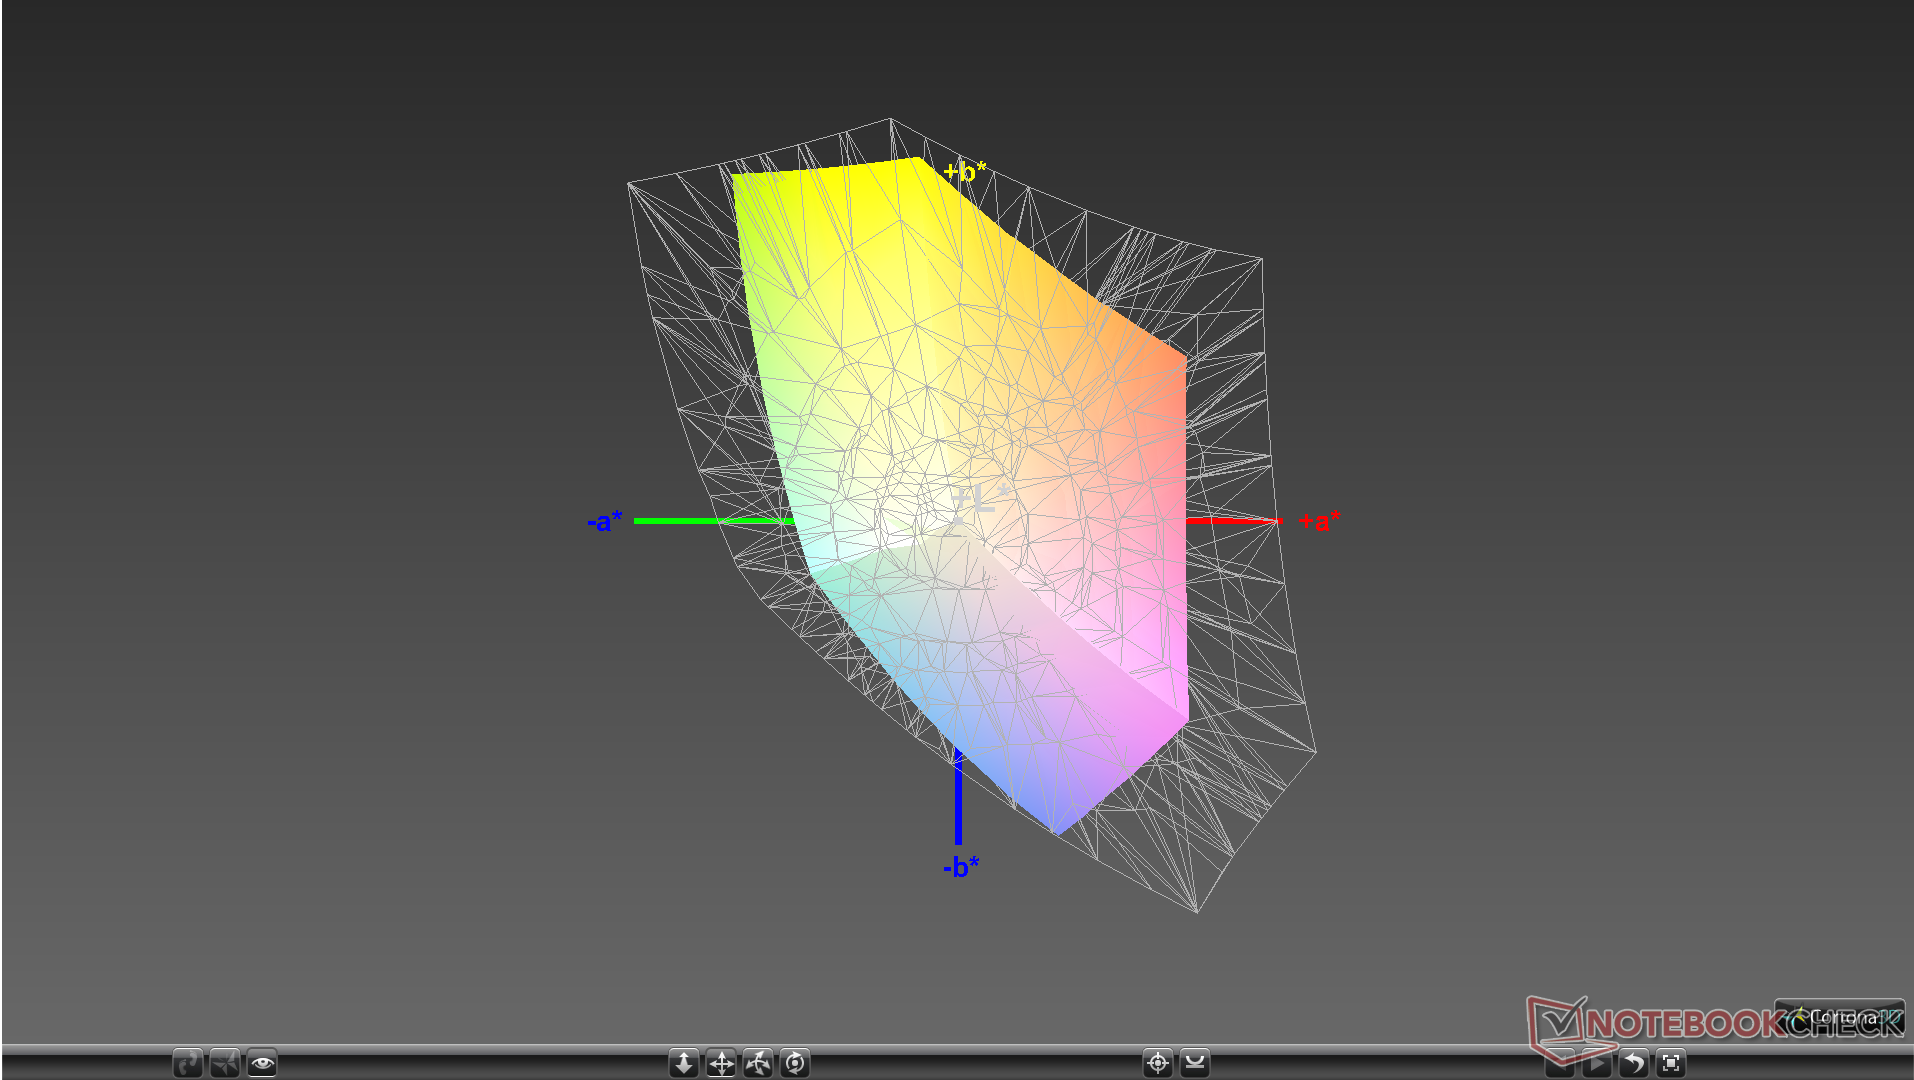
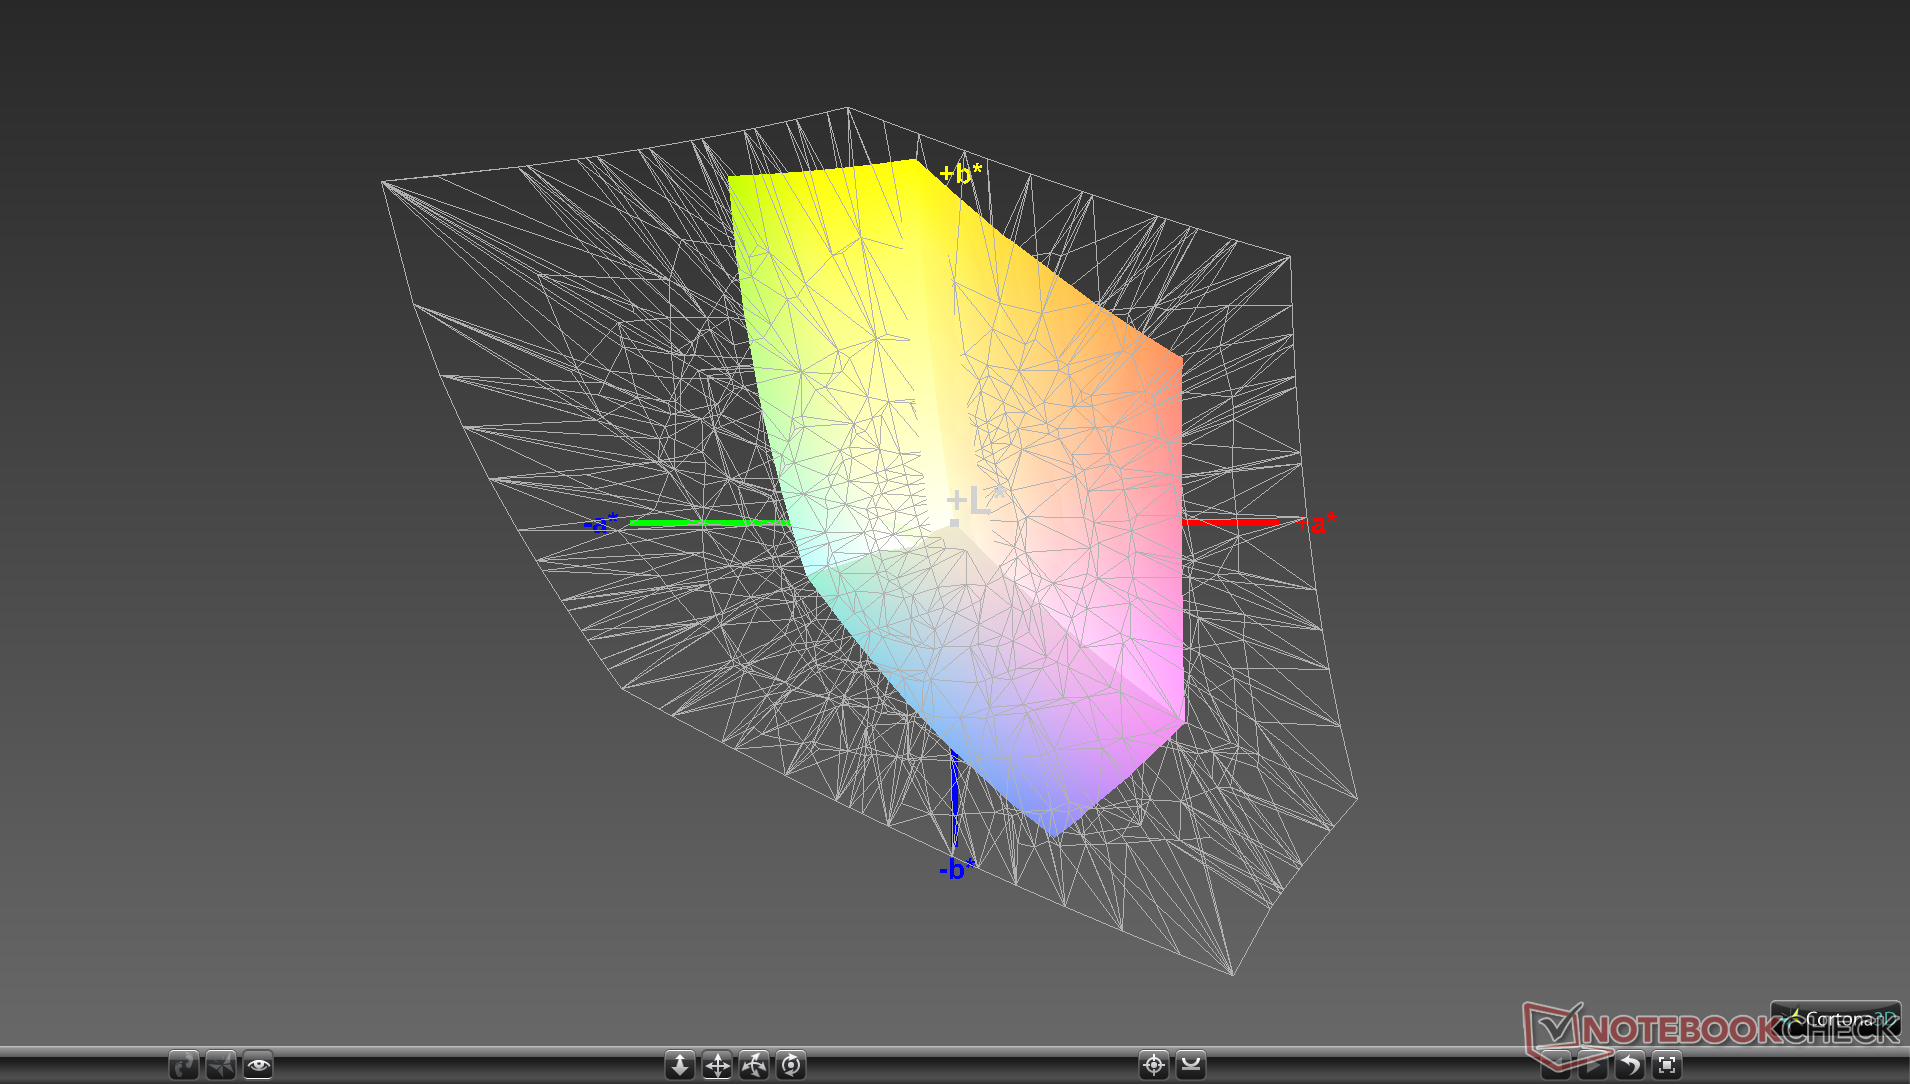
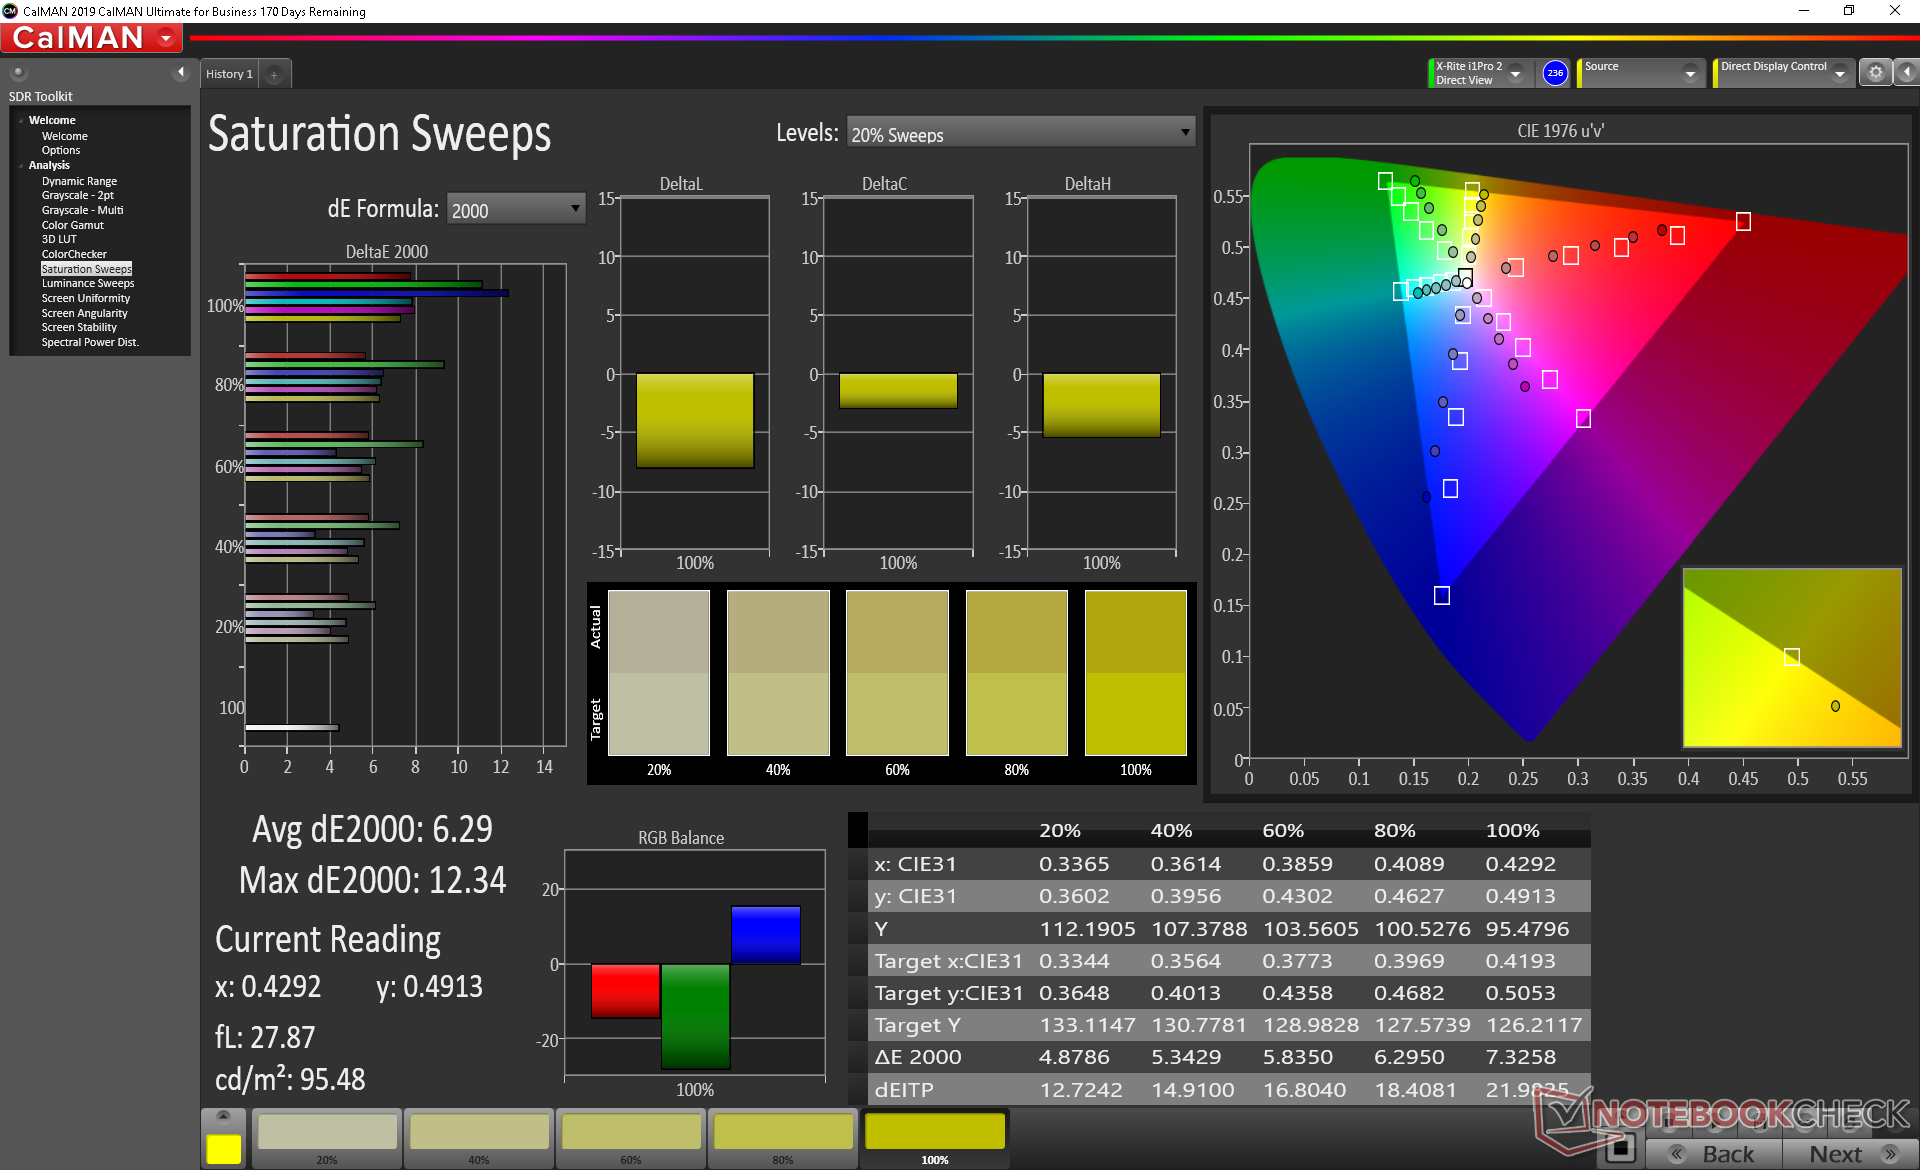
Color space is actually smaller than on the Envy x360 we reviewed over two years ago at just 37 percent and 59 percent of AdobeRGB and sRGB, respectively. We can't speak for the costlier 400-nit option, but the even costlier 4K AMOLED should offer much deeper and more accurate colors than what we have here on the baseline 250-nit configuration.
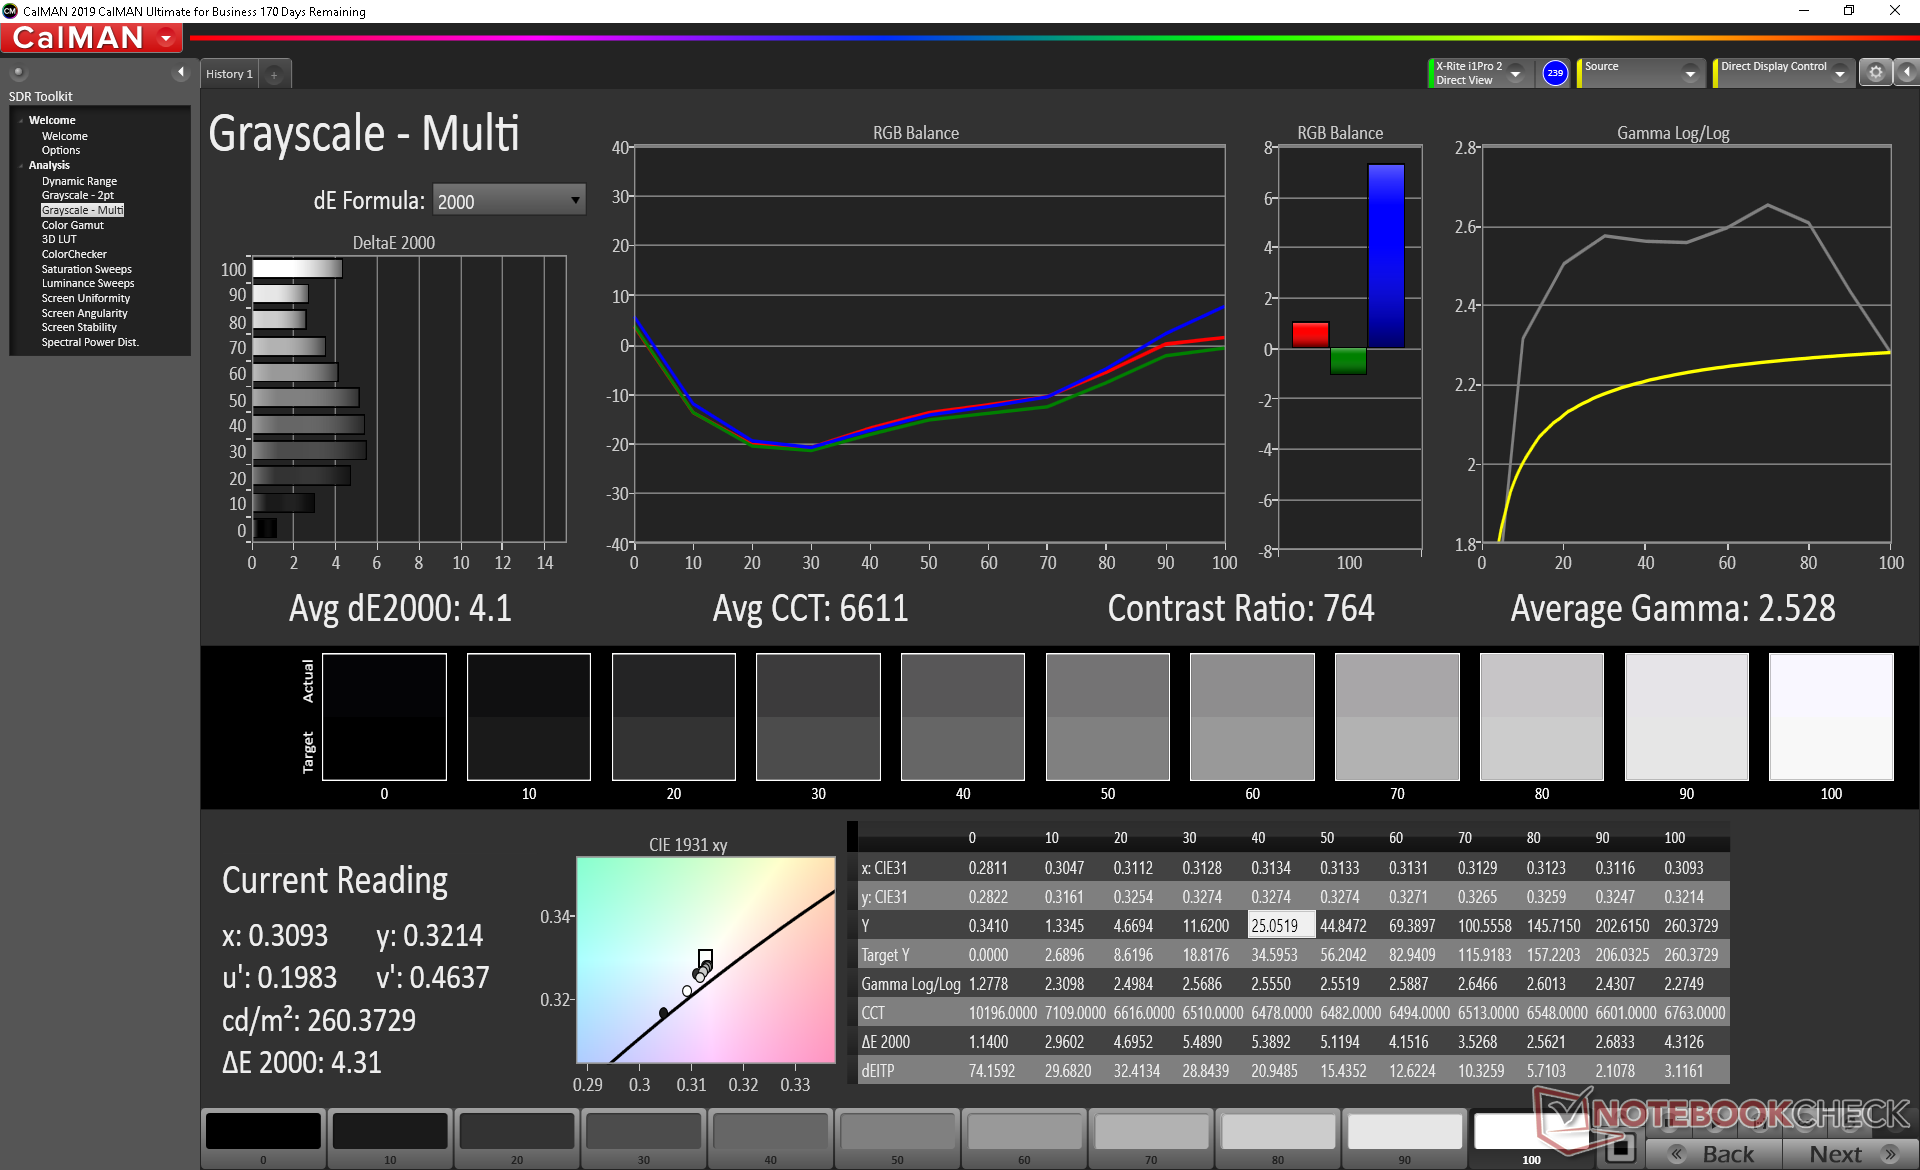
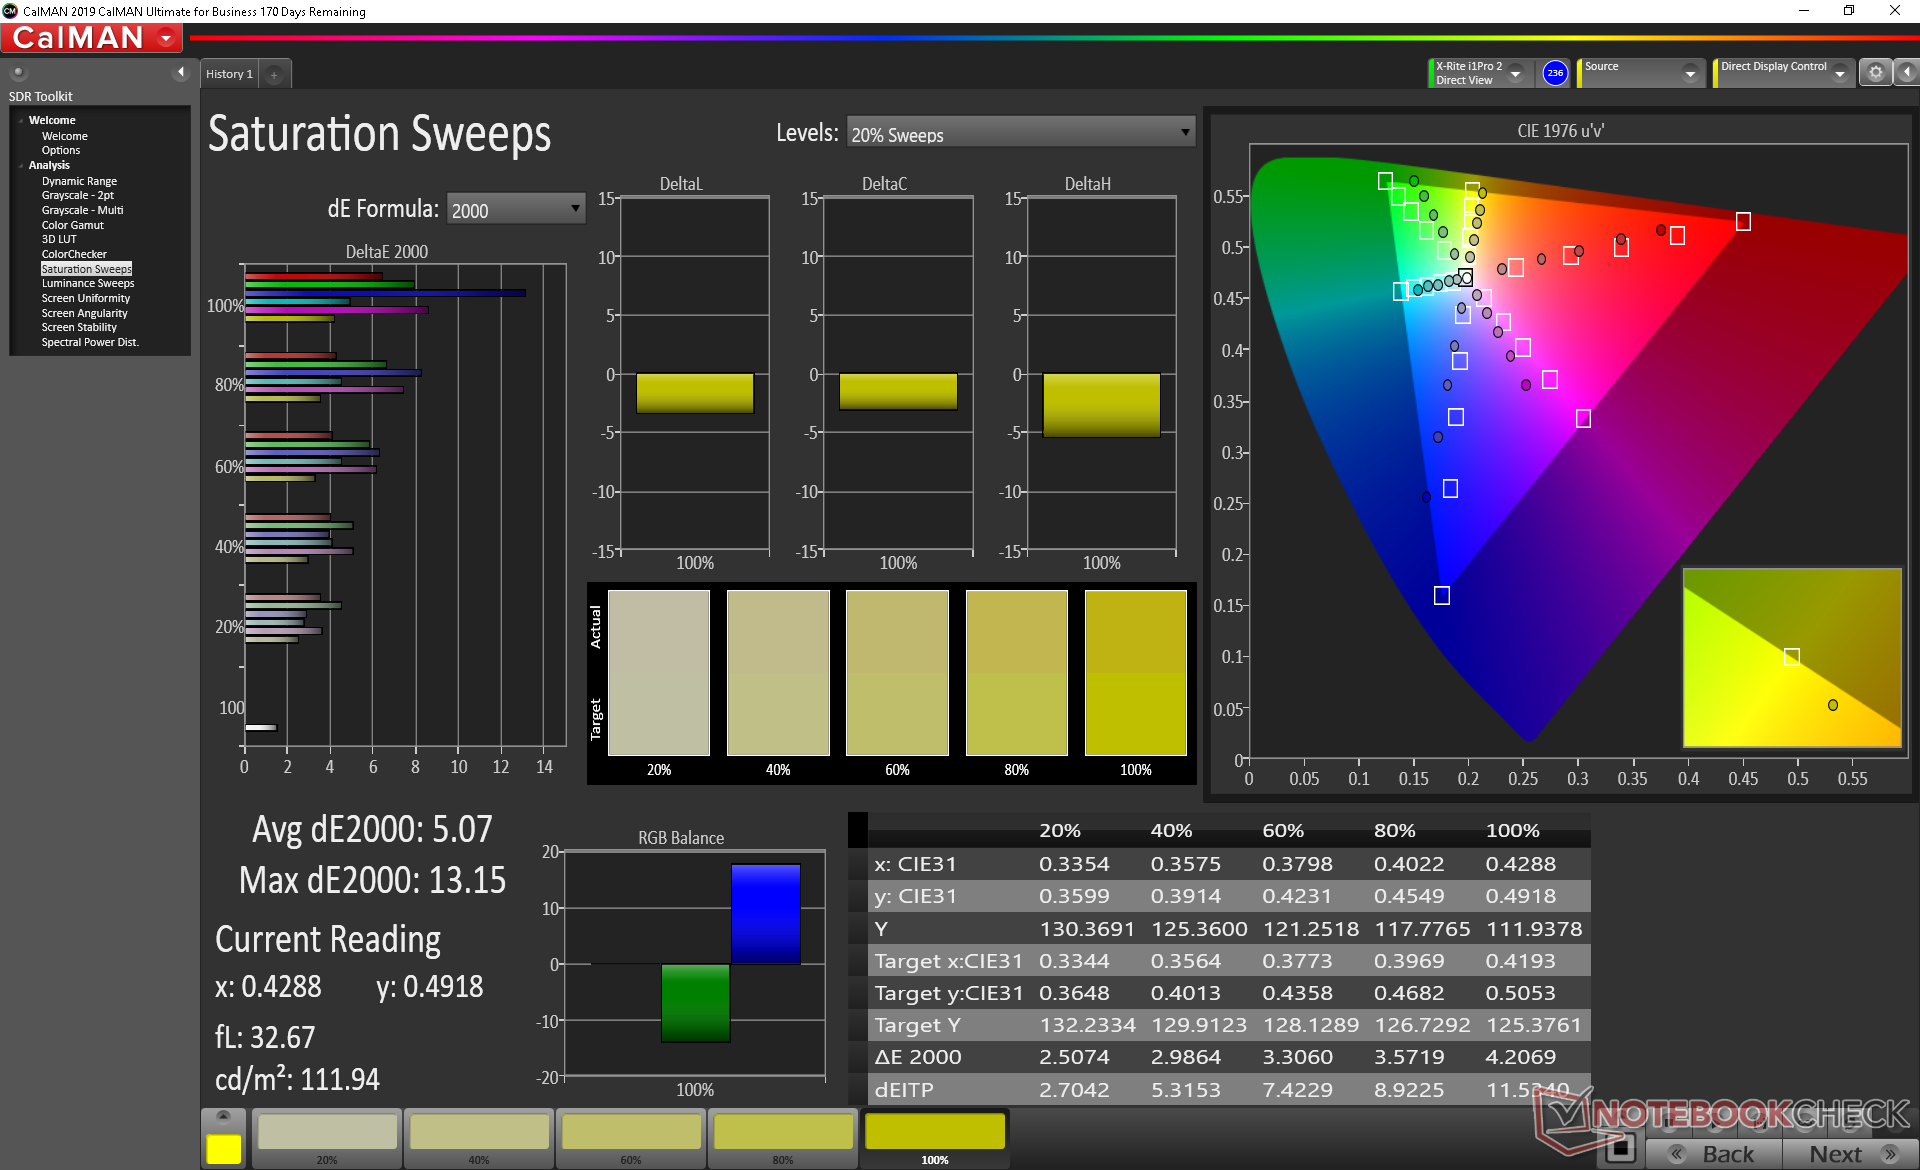
Further measurements with an X-Rite colorimeter reveal poor RGB balance and gamma. Calibrating the panel ourselves would improve both aspects noticeably, but color accuracy remains average at best due to the narrow color space mentioned above. Colors become increasingly inaccurate the higher the saturation level.
Display Response Times
| ↔ Response Time Black to White | ||
|---|---|---|
| 23.6 ms ... rise ↗ and fall ↘ combined | ↗ 12 ms rise | 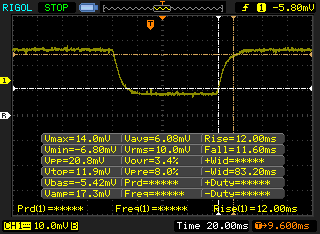 |
| ↘ 11.6 ms fall | ||
| The screen shows good response rates in our tests, but may be too slow for competitive gamers. In comparison, all tested devices range from 0.1 (minimum) to 240 (maximum) ms. » 54 % of all devices are better. This means that the measured response time is worse than the average of all tested devices (19.9 ms). | ||
| ↔ Response Time 50% Grey to 80% Grey | ||
| 39.6 ms ... rise ↗ and fall ↘ combined | ↗ 19.6 ms rise | 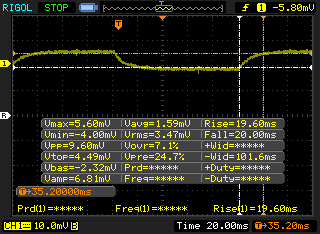 |
| ↘ 20 ms fall | ||
| The screen shows slow response rates in our tests and will be unsatisfactory for gamers. In comparison, all tested devices range from 0.165 (minimum) to 636 (maximum) ms. » 60 % of all devices are better. This means that the measured response time is worse than the average of all tested devices (31.1 ms). | ||
Screen Flickering / PWM (Pulse-Width Modulation)
| Screen flickering / PWM not detected | 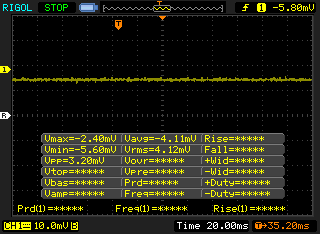 | ||
In comparison: 52 % of all tested devices do not use PWM to dim the display. If PWM was detected, an average of 7798 (minimum: 5 - maximum: 343500) Hz was measured. | |||
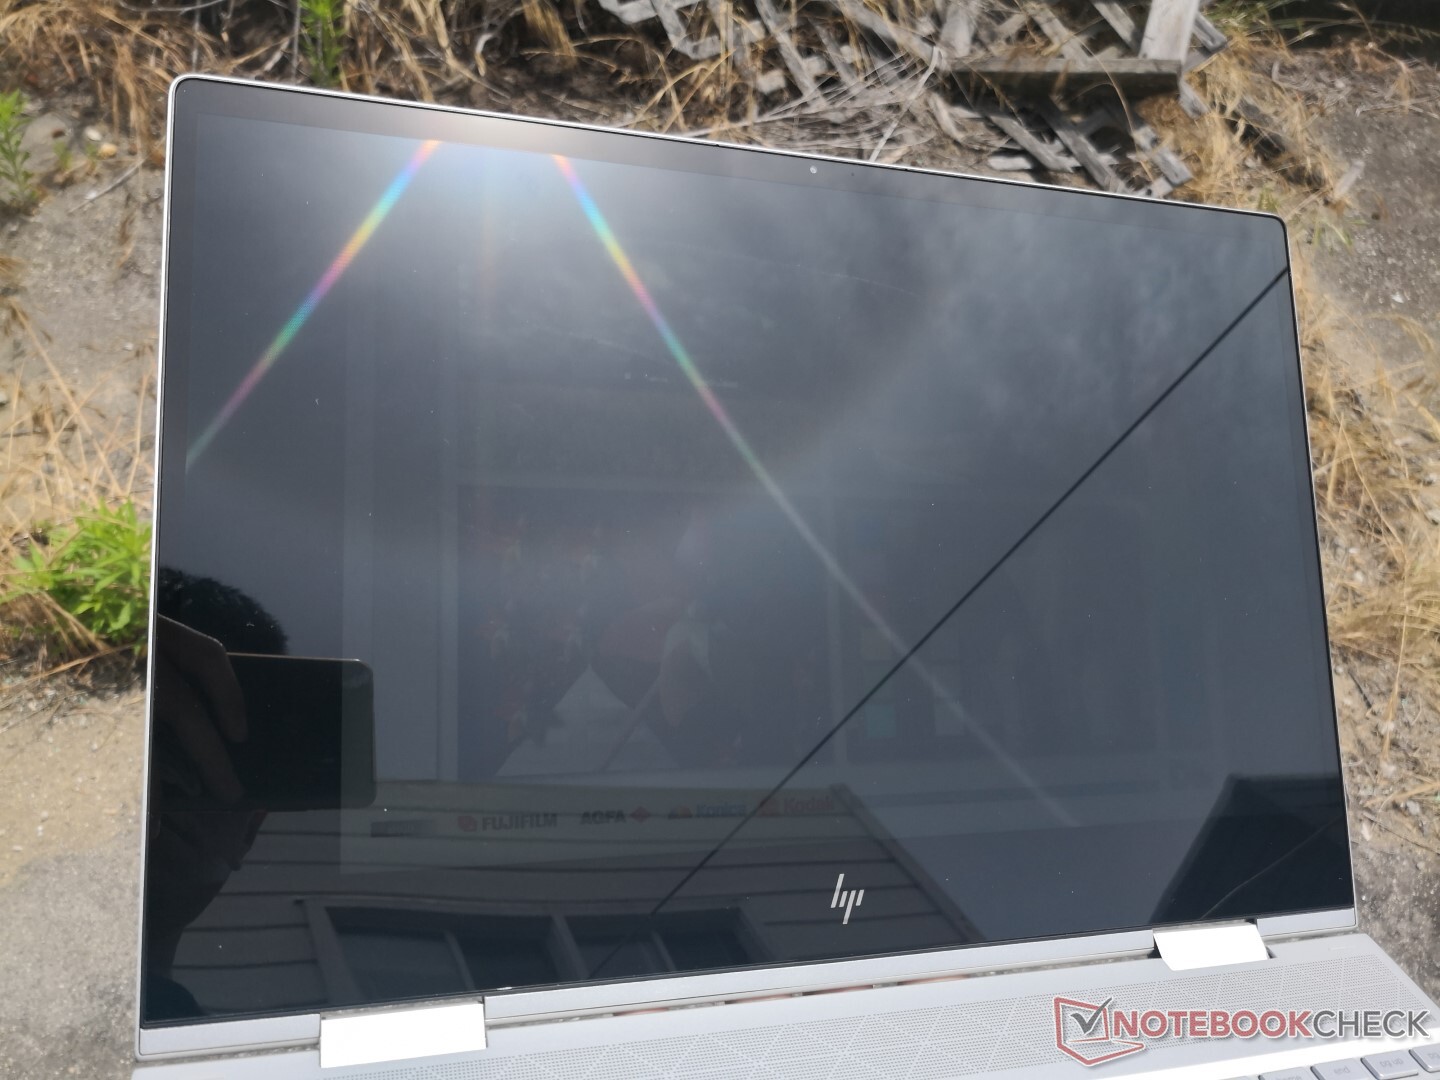
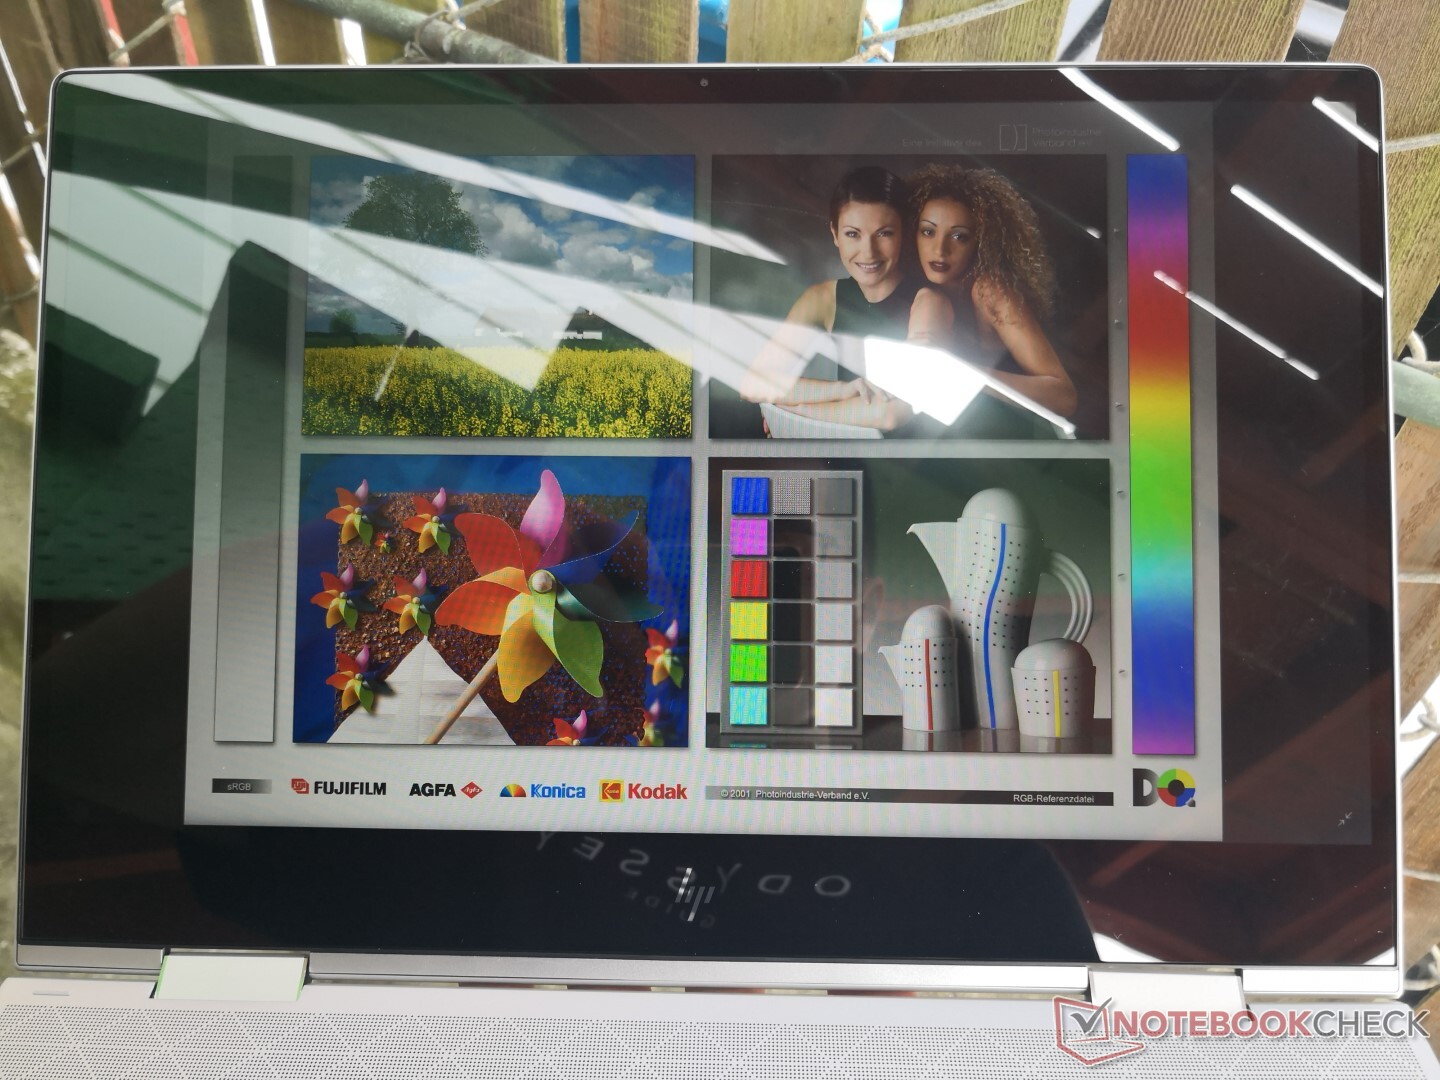
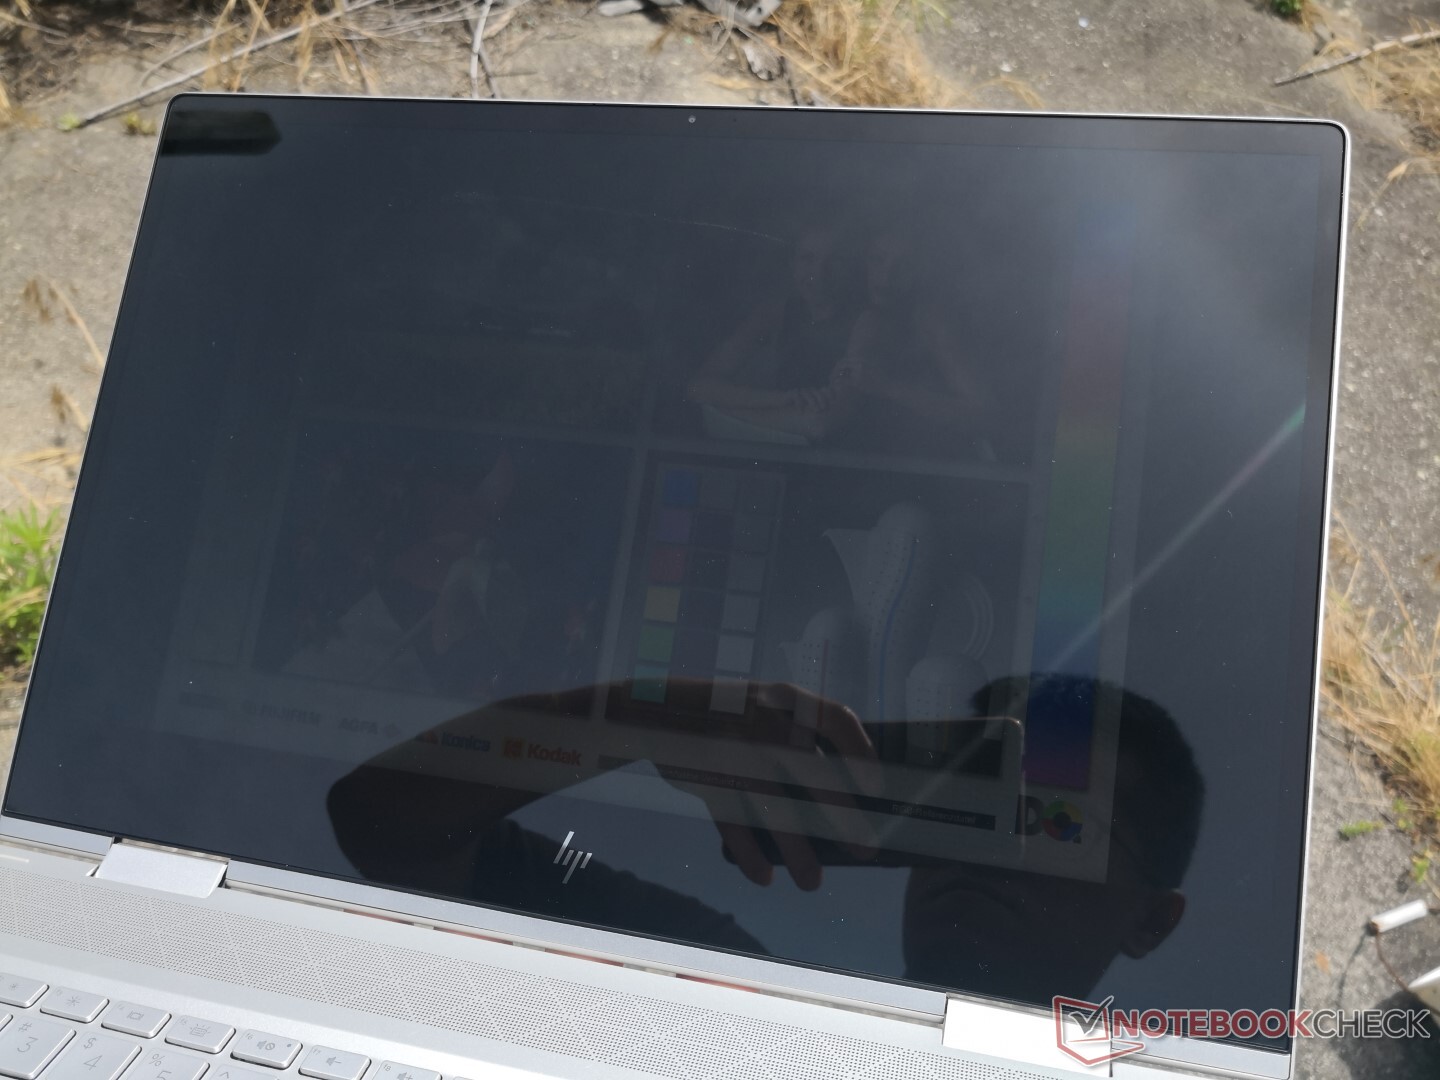
The display is not bright enough to be used outdoors comfortably and the glossy screen only makes matters worse. We recommend the brighter 400-nit panel option if you plan on using the system outdoors frequently. Even then, however, the display will still look relatively dim. HP reserves its super-bright 1000-nit panels for their business-centric EliteBook series only.

Performance
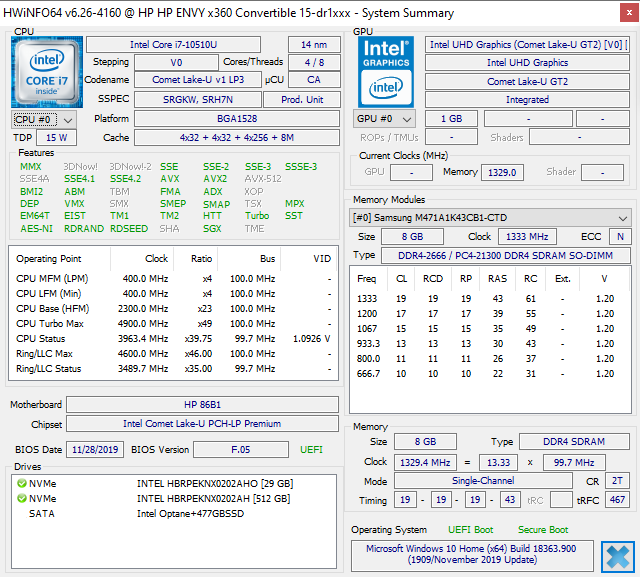
HP offers a wide selection of U-class processors for the Envy x360 15 ranging from the Comet Lake-U Core i5-10210U to the Ice Lake Core i7-1065G7. Ryzen options are also available via the Envy x360 15z series. The discrete GeForce MX330 GPU is available only with Intel CPUs. Strangely, HP will not offer both the GeForce GPU and AMOLED panel simultaneously.
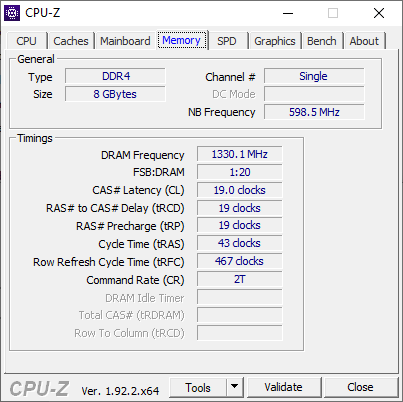
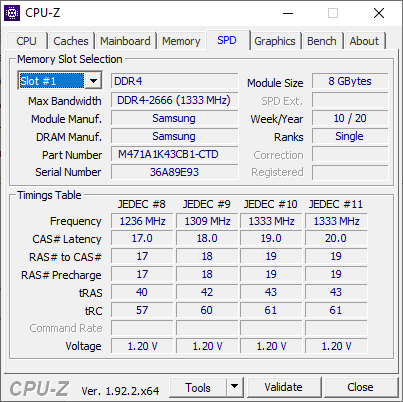
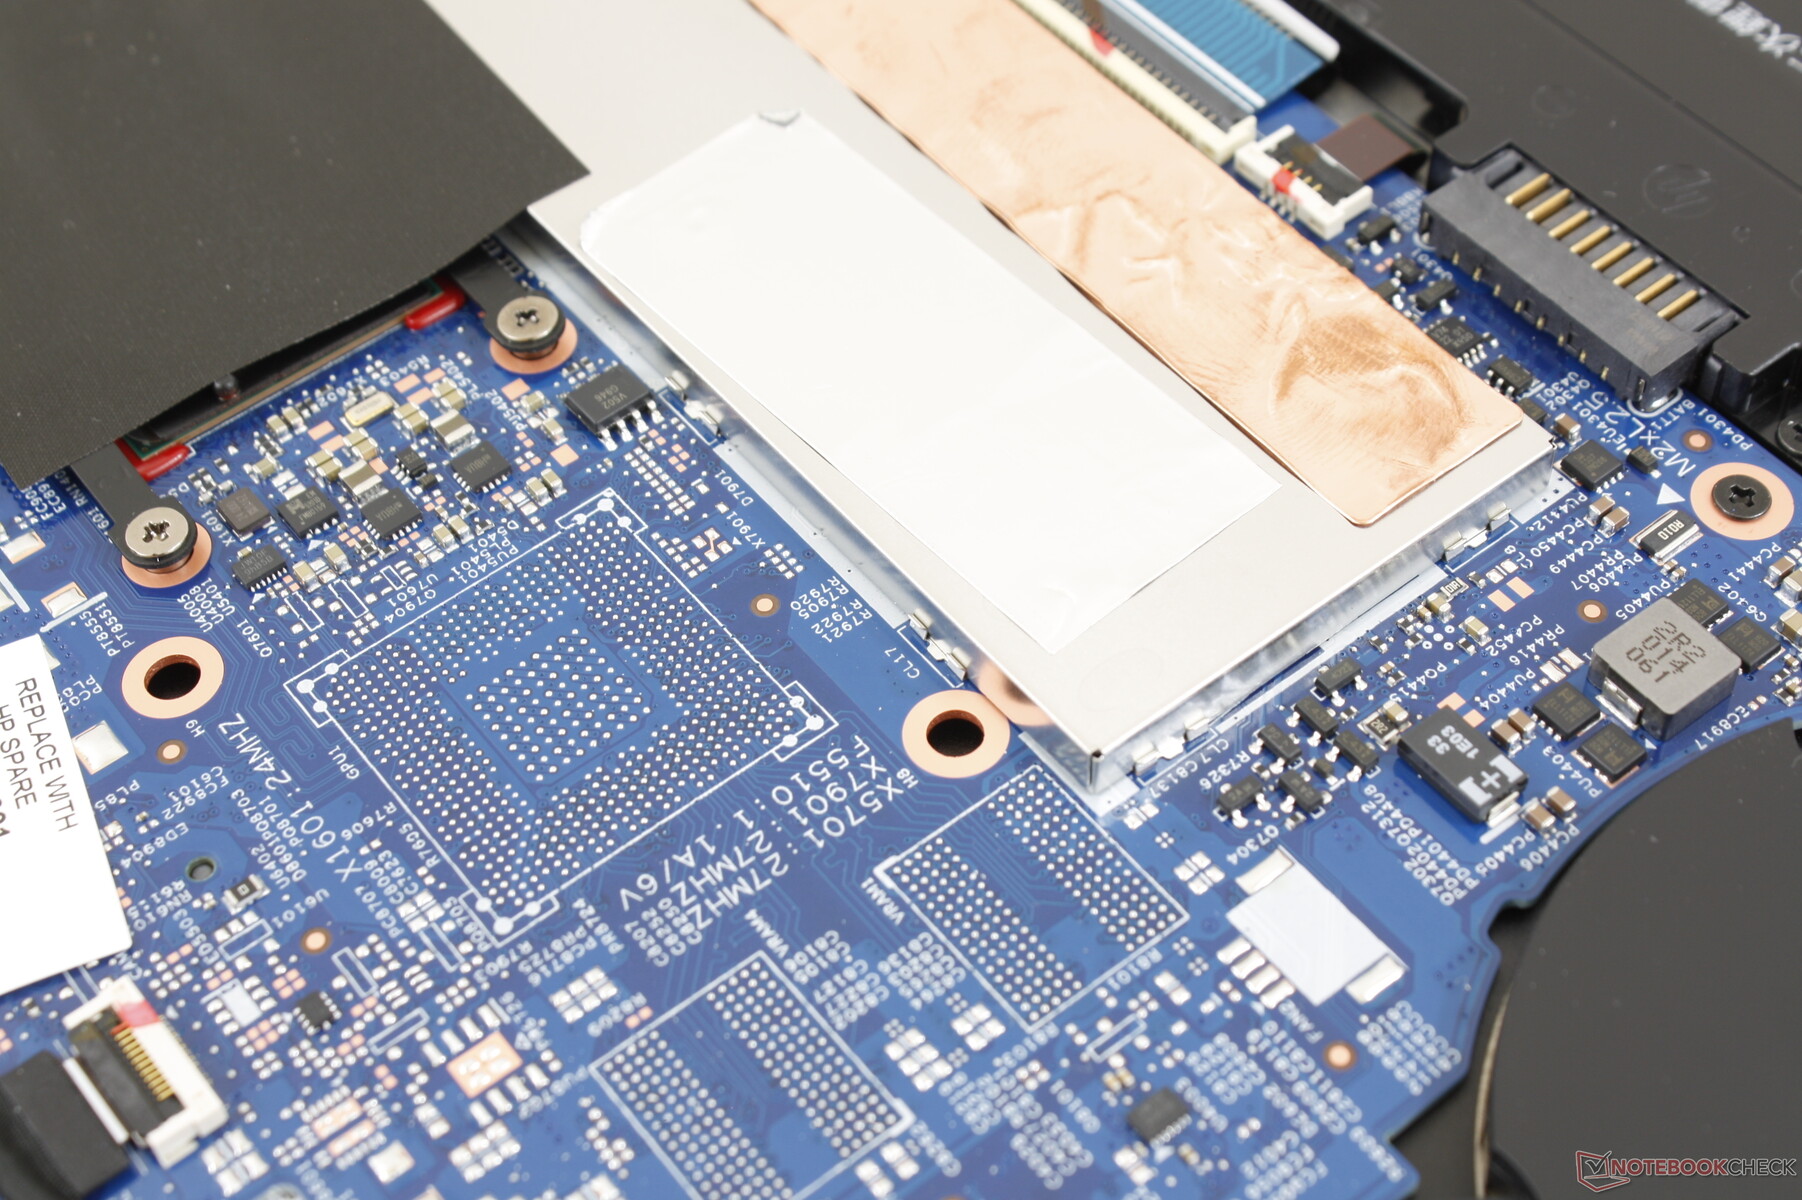
System RAM is configurable up to 16 GB across two SODIMM slots. Our test unit comes with just 8 GB of single-channel RAM.
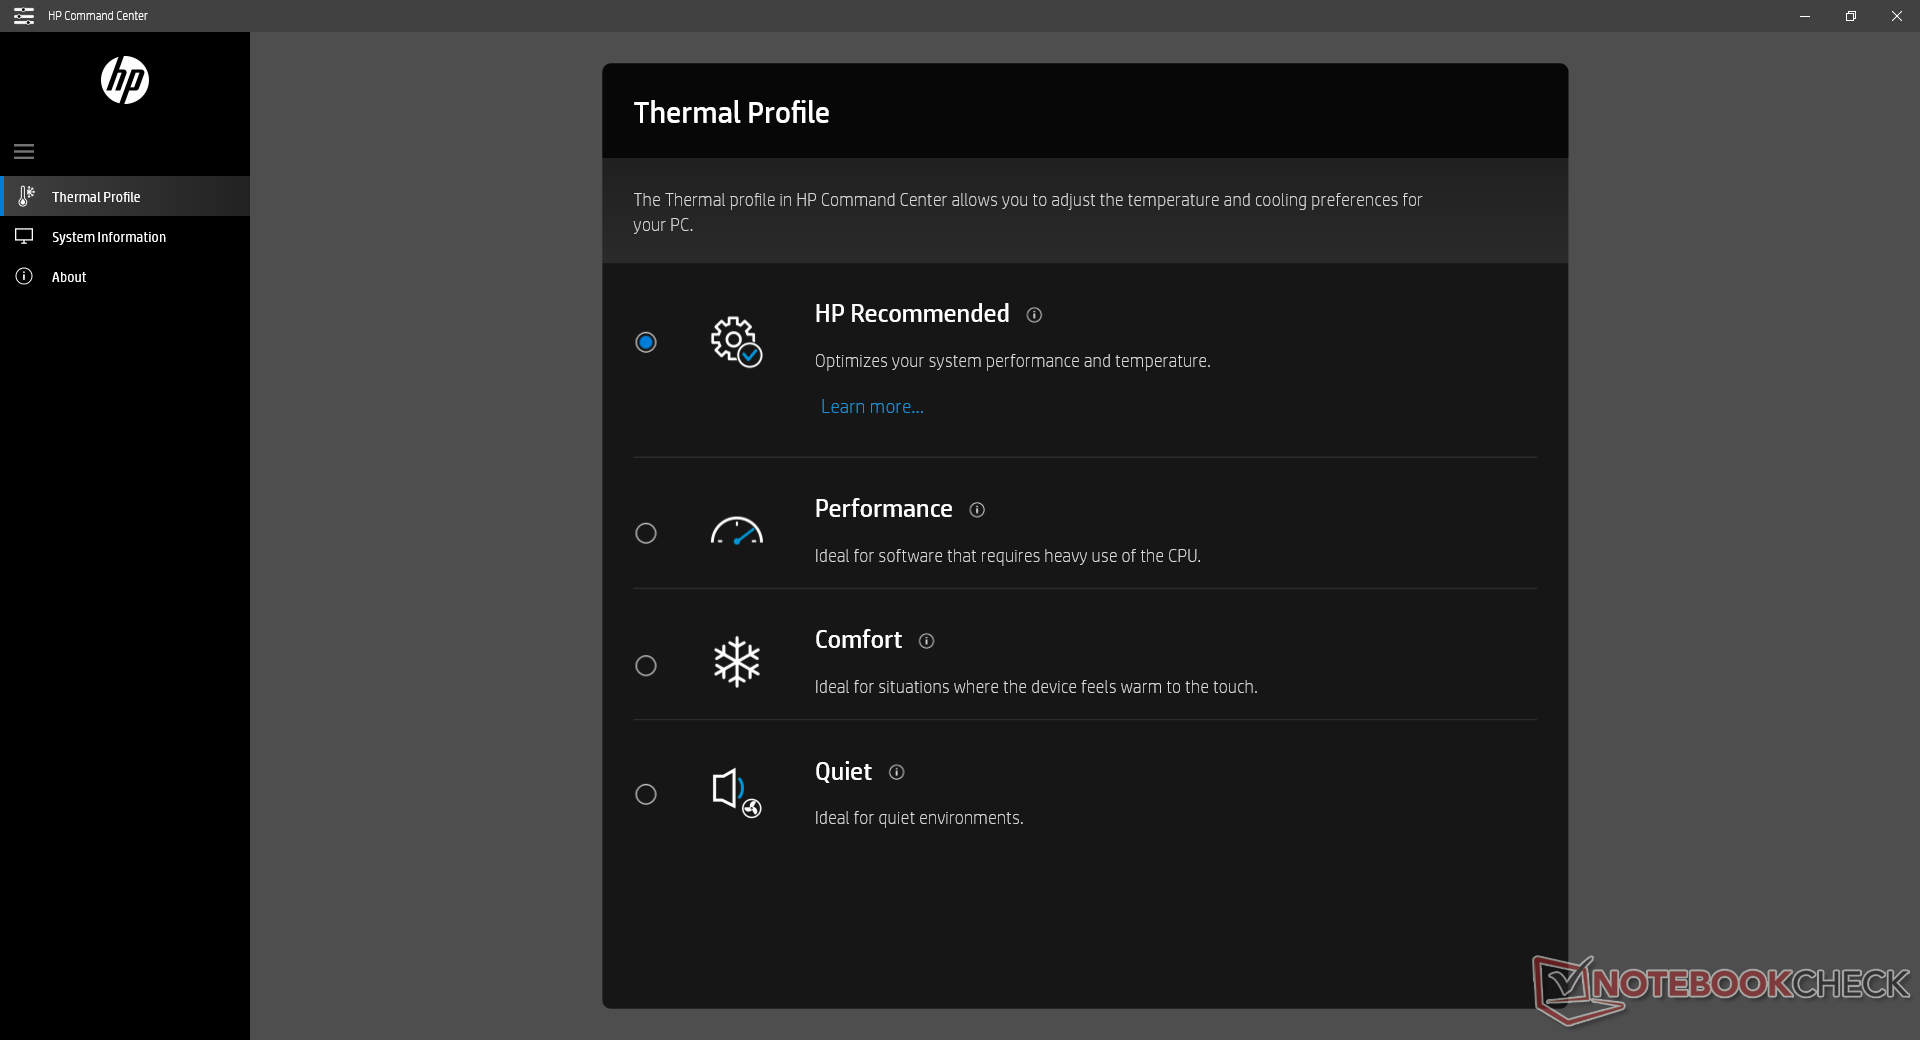
Unless otherwise stated, all benchmarks below were performed on the HP Performance power profile accessible via the pre-installed HP Command Center software.
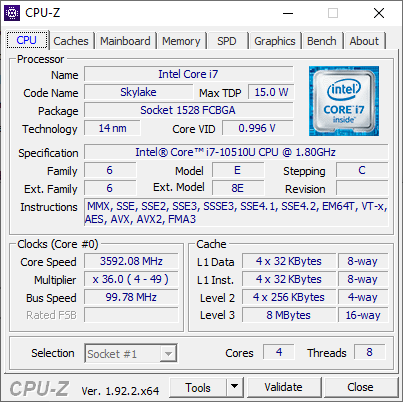
Processor
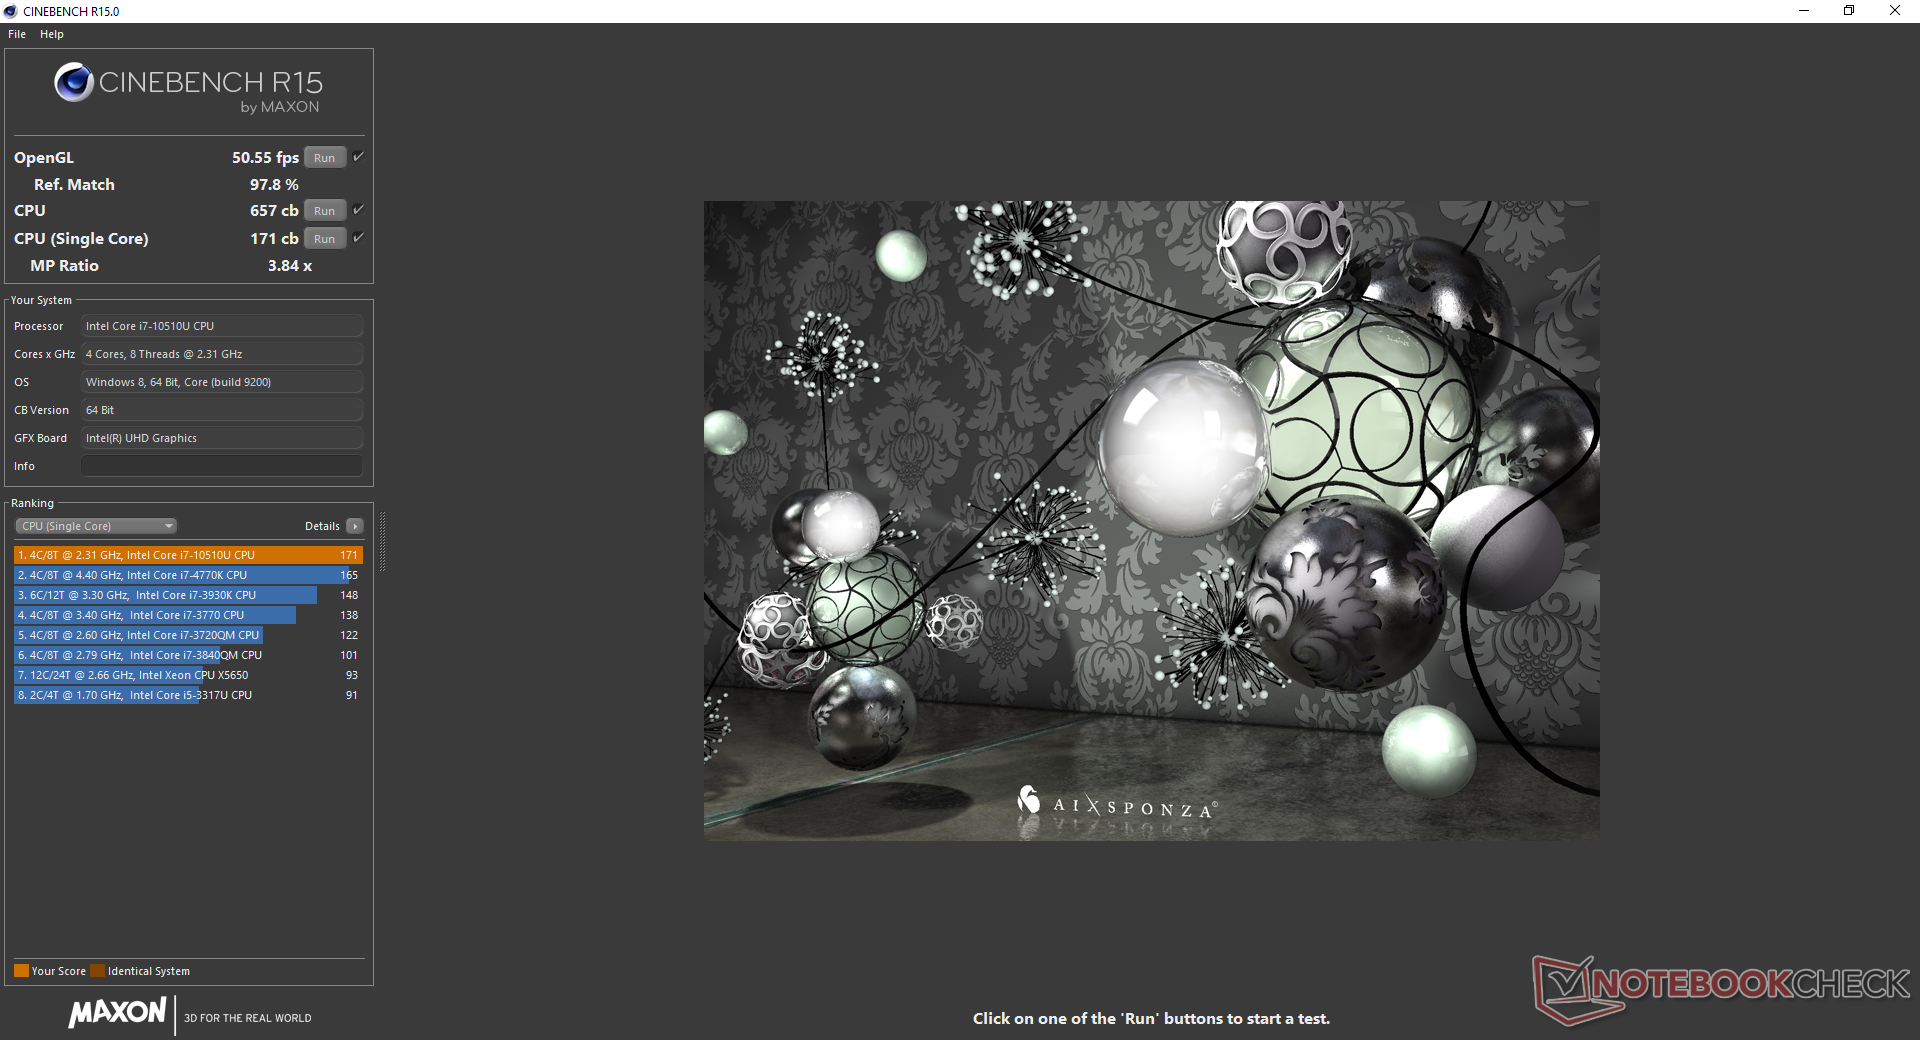
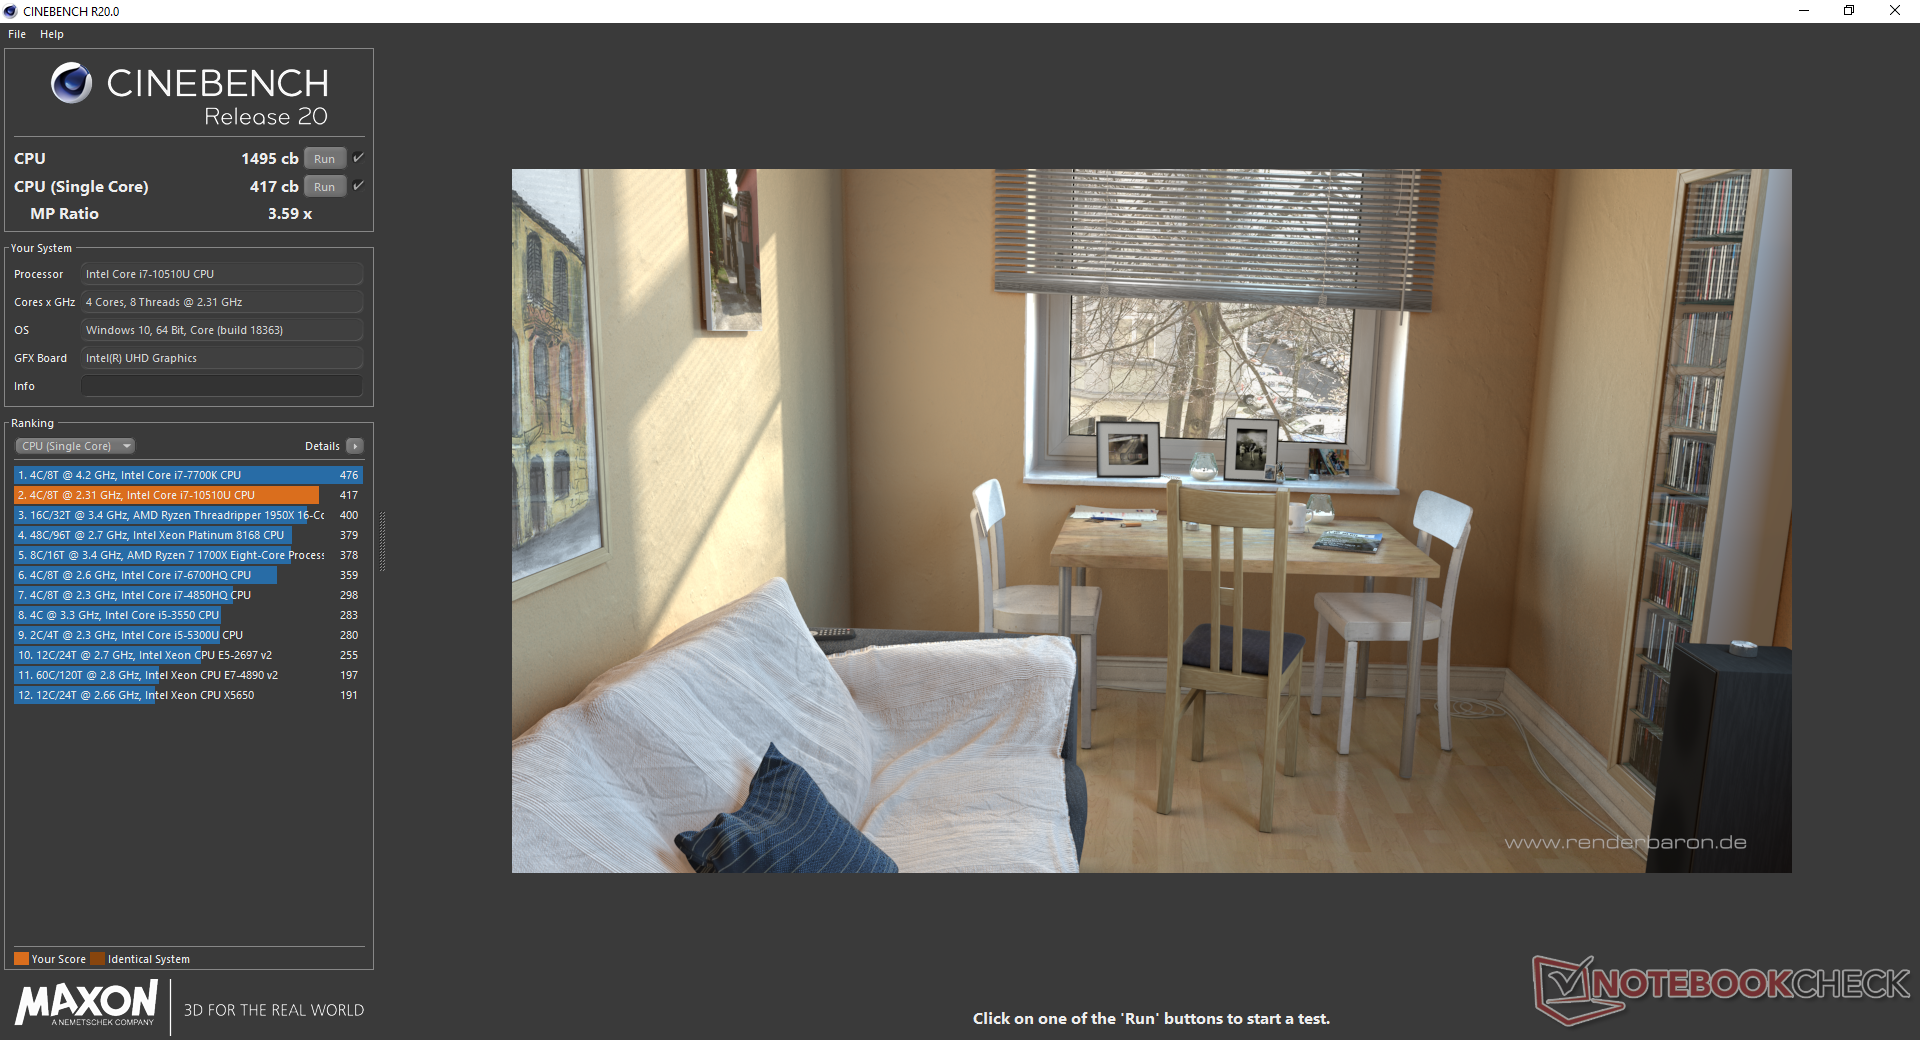
CPU performance is where we expect it to be relative to other laptops with the same Core i7-10510U, if not slightly slower. The Core i7-10510U is generally a disappointing processor since it offers very little performance benefits over the older Core i7-8565U that it is designed to replace. In fact, some laptops with the Core i7-8565U may even run faster such as on the Asus ZenBook 15.
Configuring with the cheaper Core i5-10210U will entail roughly 10 percent slower CPU performance while the more expensive Core i7-1065G7 option is not expected to increase CPU performance at all.
Cinebench R20: CPU (Multi Core) | CPU (Single Core)
Blender: v2.79 BMW27 CPU
7-Zip 18.03: 7z b 4 -mmt1 | 7z b 4
Geekbench 5.5: Single-Core | Multi-Core
HWBOT x265 Benchmark v2.2: 4k Preset
LibreOffice : 20 Documents To PDF
R Benchmark 2.5: Overall mean
| Cinebench R20 / CPU (Multi Core) | |
| MSI Prestige 15 A10SC | |
| Asus ZenBook 15 UX534FT-DB77 | |
| Lenovo Ideapad C340-15IWL-81N5004QGE | |
| Schenker VIA 15 | |
| Microsoft Surface Book 3 15 | |
| Dell Inspiron 15 5000 5585 | |
| HP Envy x360 15-dr1679cl | |
| Average Intel Core i7-10510U (1015 - 1897, n=38) | |
| Acer Aspire 5 A515-54G | |
| Cinebench R20 / CPU (Single Core) | |
| MSI Prestige 15 A10SC | |
| Microsoft Surface Book 3 15 | |
| Asus ZenBook 15 UX534FT-DB77 | |
| Average Intel Core i7-10510U (362 - 497, n=37) | |
| HP Envy x360 15-dr1679cl | |
| Acer Aspire 5 A515-54G | |
| Lenovo Ideapad C340-15IWL-81N5004QGE | |
| Dell Inspiron 15 5000 5585 | |
| Schenker VIA 15 | |
| Blender / v2.79 BMW27 CPU | |
| Microsoft Surface Book 3 15 | |
| Acer Aspire 5 A515-54G | |
| Average Intel Core i7-10510U (628 - 1051, n=31) | |
| HP Envy x360 15-dr1679cl | |
| Schenker VIA 15 | |
| 7-Zip 18.03 / 7z b 4 -mmt1 | |
| HP Envy x360 15-dr1679cl | |
| Average Intel Core i7-10510U (3747 - 4981, n=31) | |
| Microsoft Surface Book 3 15 | |
| Acer Aspire 5 A515-54G | |
| Schenker VIA 15 | |
| 7-Zip 18.03 / 7z b 4 | |
| HP Envy x360 15-dr1679cl | |
| Microsoft Surface Book 3 15 | |
| Average Intel Core i7-10510U (12196 - 21298, n=31) | |
| Acer Aspire 5 A515-54G | |
| Schenker VIA 15 | |
| Geekbench 5.5 / Single-Core | |
| Microsoft Surface Book 3 15 | |
| Average Intel Core i7-10510U (977 - 1287, n=31) | |
| HP Envy x360 15-dr1679cl | |
| Acer Aspire 5 A515-54G | |
| Schenker VIA 15 | |
| Geekbench 5.5 / Multi-Core | |
| Microsoft Surface Book 3 15 | |
| Acer Aspire 5 A515-54G | |
| Average Intel Core i7-10510U (2474 - 4484, n=31) | |
| HP Envy x360 15-dr1679cl | |
| Schenker VIA 15 | |
| HWBOT x265 Benchmark v2.2 / 4k Preset | |
| HP Envy x360 15-dr1679cl | |
| Average Intel Core i7-10510U (3.41 - 6.04, n=31) | |
| Microsoft Surface Book 3 15 | |
| Acer Aspire 5 A515-54G | |
| Schenker VIA 15 | |
| LibreOffice / 20 Documents To PDF | |
| Microsoft Surface Book 3 15 | |
| Acer Aspire 5 A515-54G | |
| HP Envy x360 15-dr1679cl | |
| Average Intel Core i7-10510U (50.7 - 77.8, n=27) | |
| R Benchmark 2.5 / Overall mean | |
| Schenker VIA 15 | |
| Acer Aspire 5 A515-54G | |
| HP Envy x360 15-dr1679cl | |
| Microsoft Surface Book 3 15 | |
| Average Intel Core i7-10510U (0.637 - 0.81, n=28) | |
* ... smaller is better
System Performance
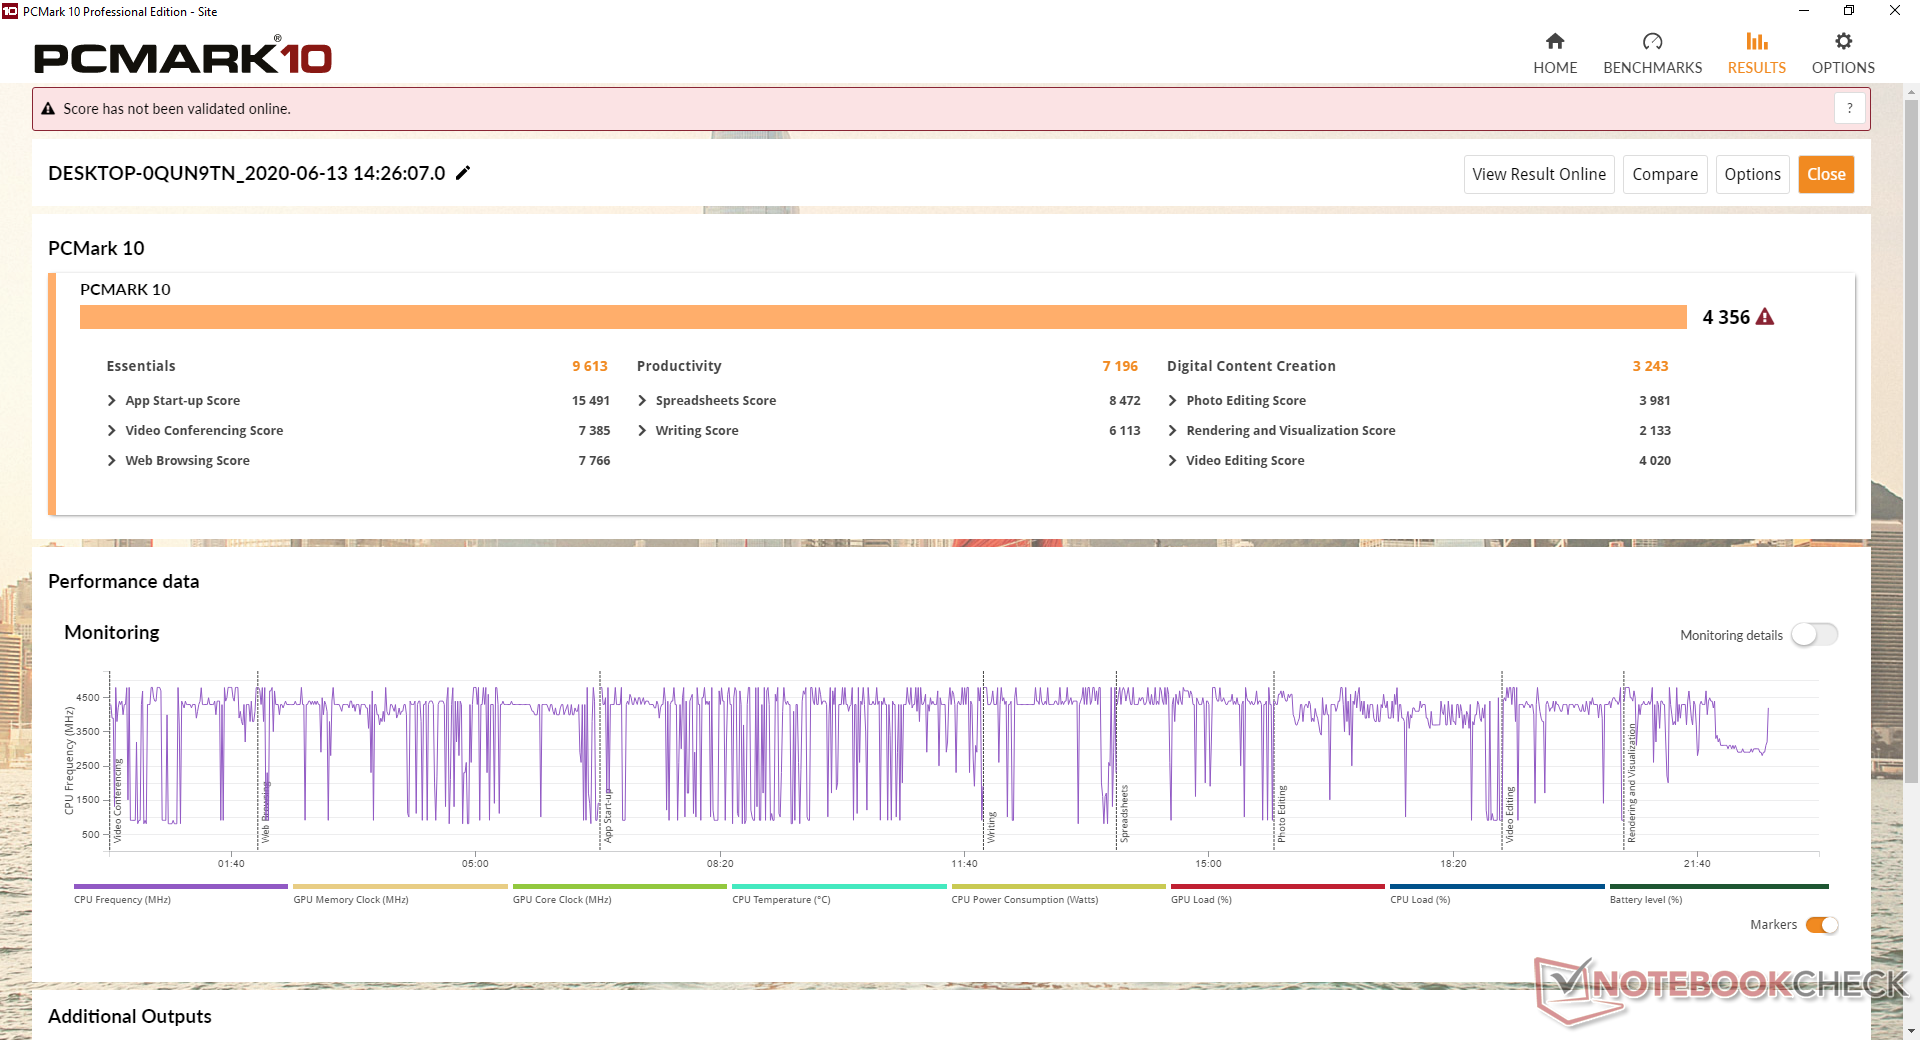
PCMark benchmarks are where we expect them to be relative to other laptops with the same Core i7-10510U CPU. We experienced no software issues during our time with the test unit and we recommend owners become familiar with the HP Command Center software as system performance is tied closely to it.
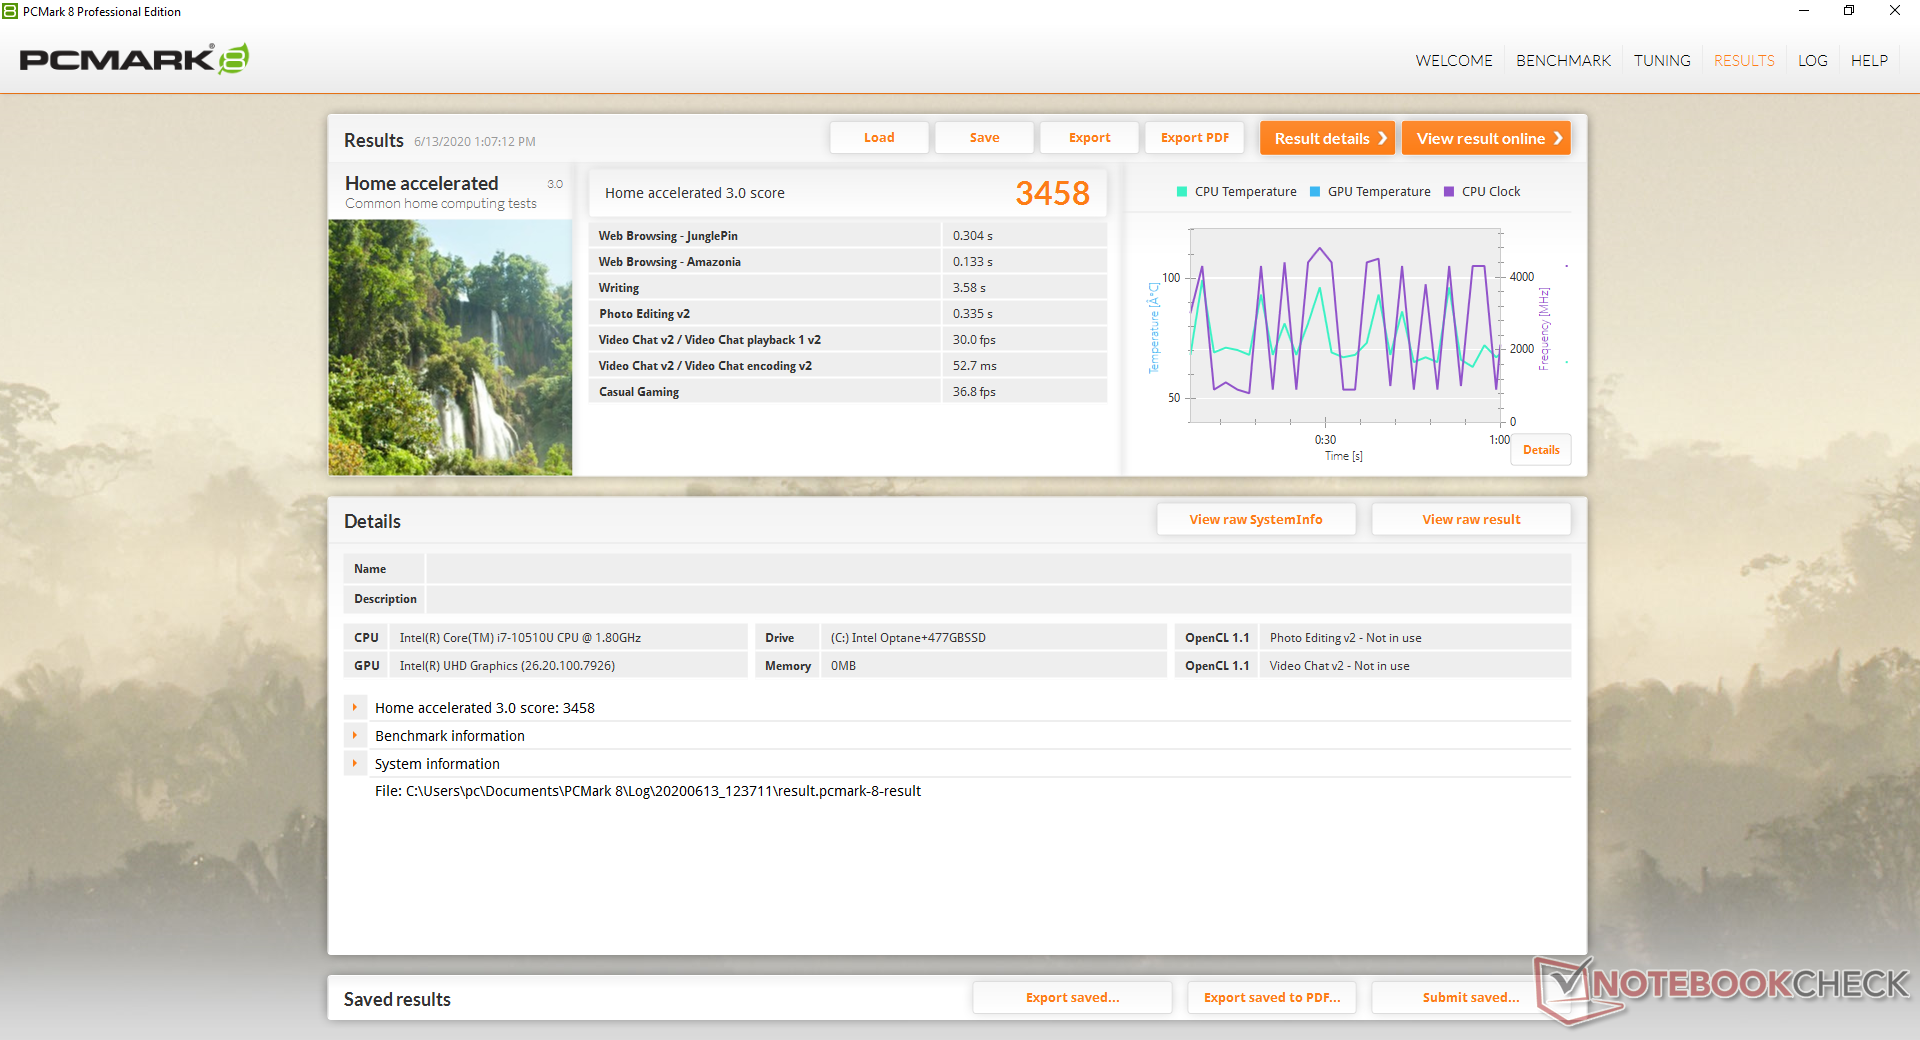
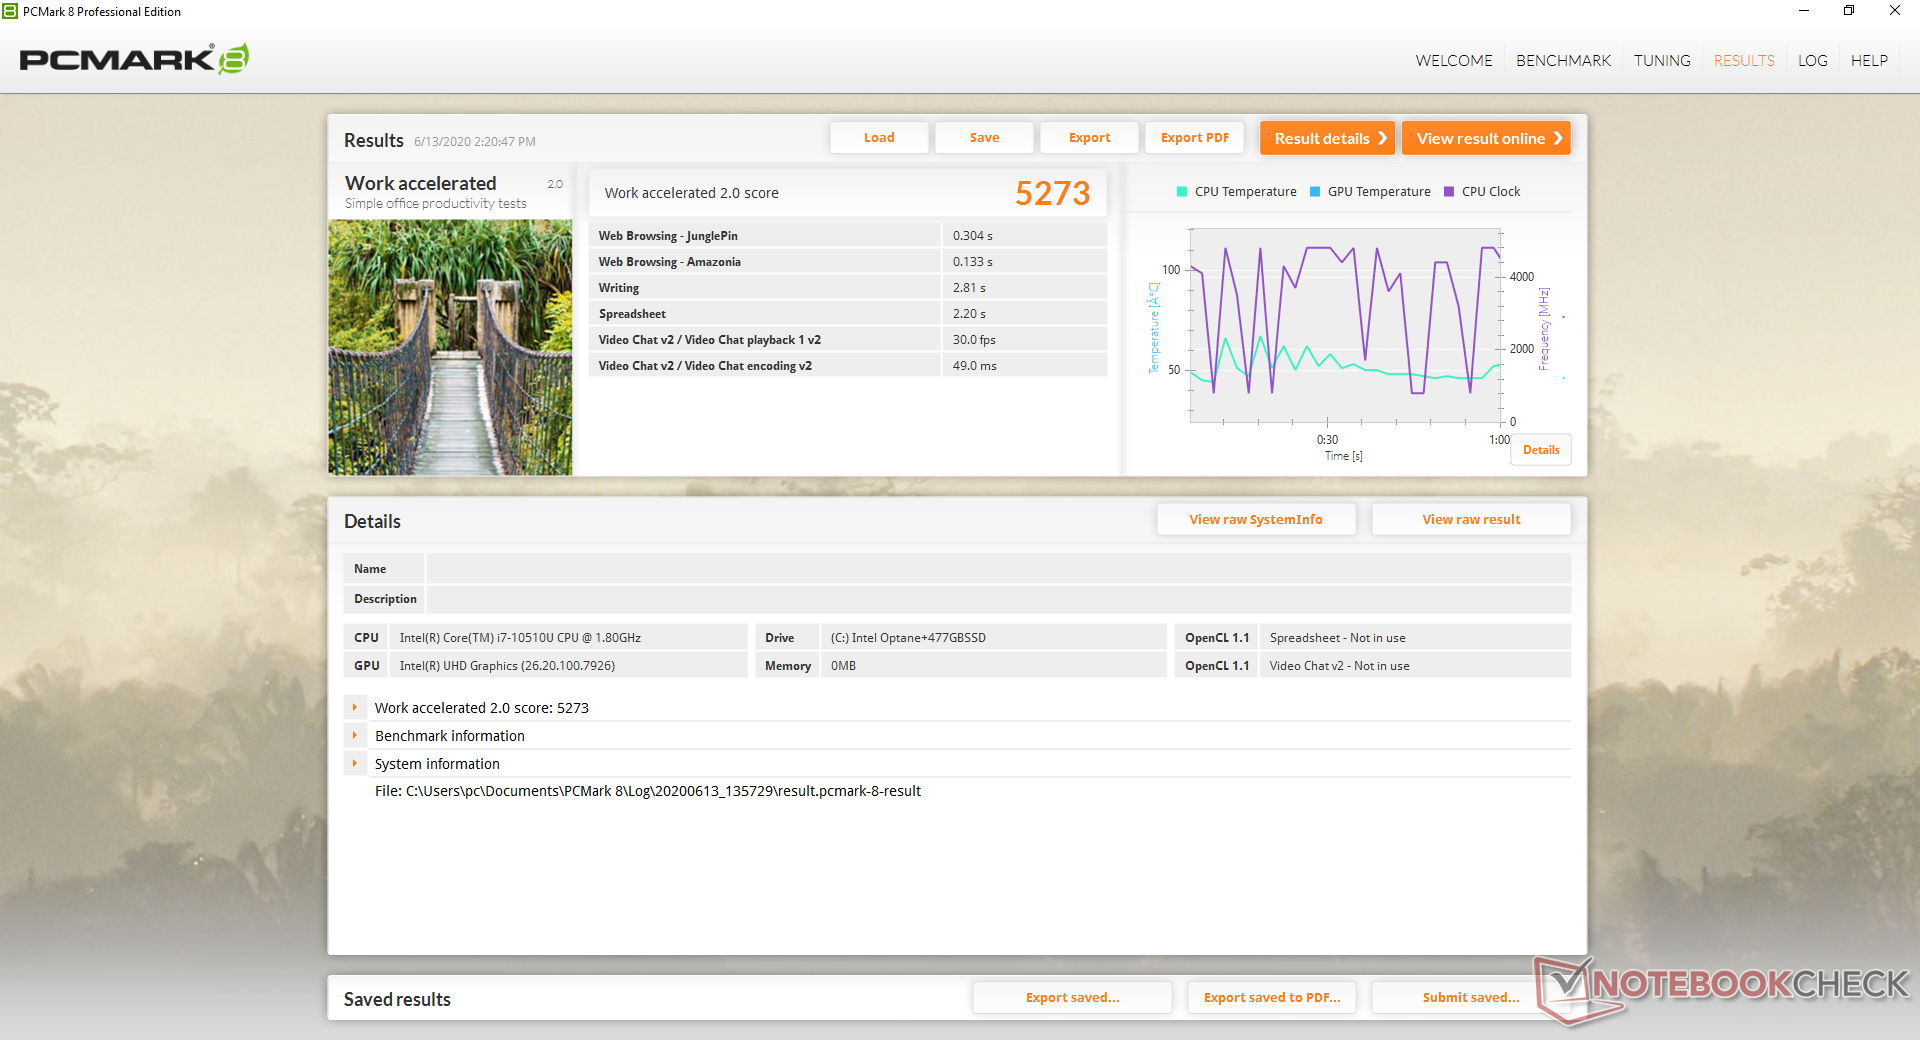
| PCMark 8 Home Score Accelerated v2 | 3458 points | |
| PCMark 8 Work Score Accelerated v2 | 5273 points | |
| PCMark 10 Score | 4356 points | |
Help | ||
DPC Latency
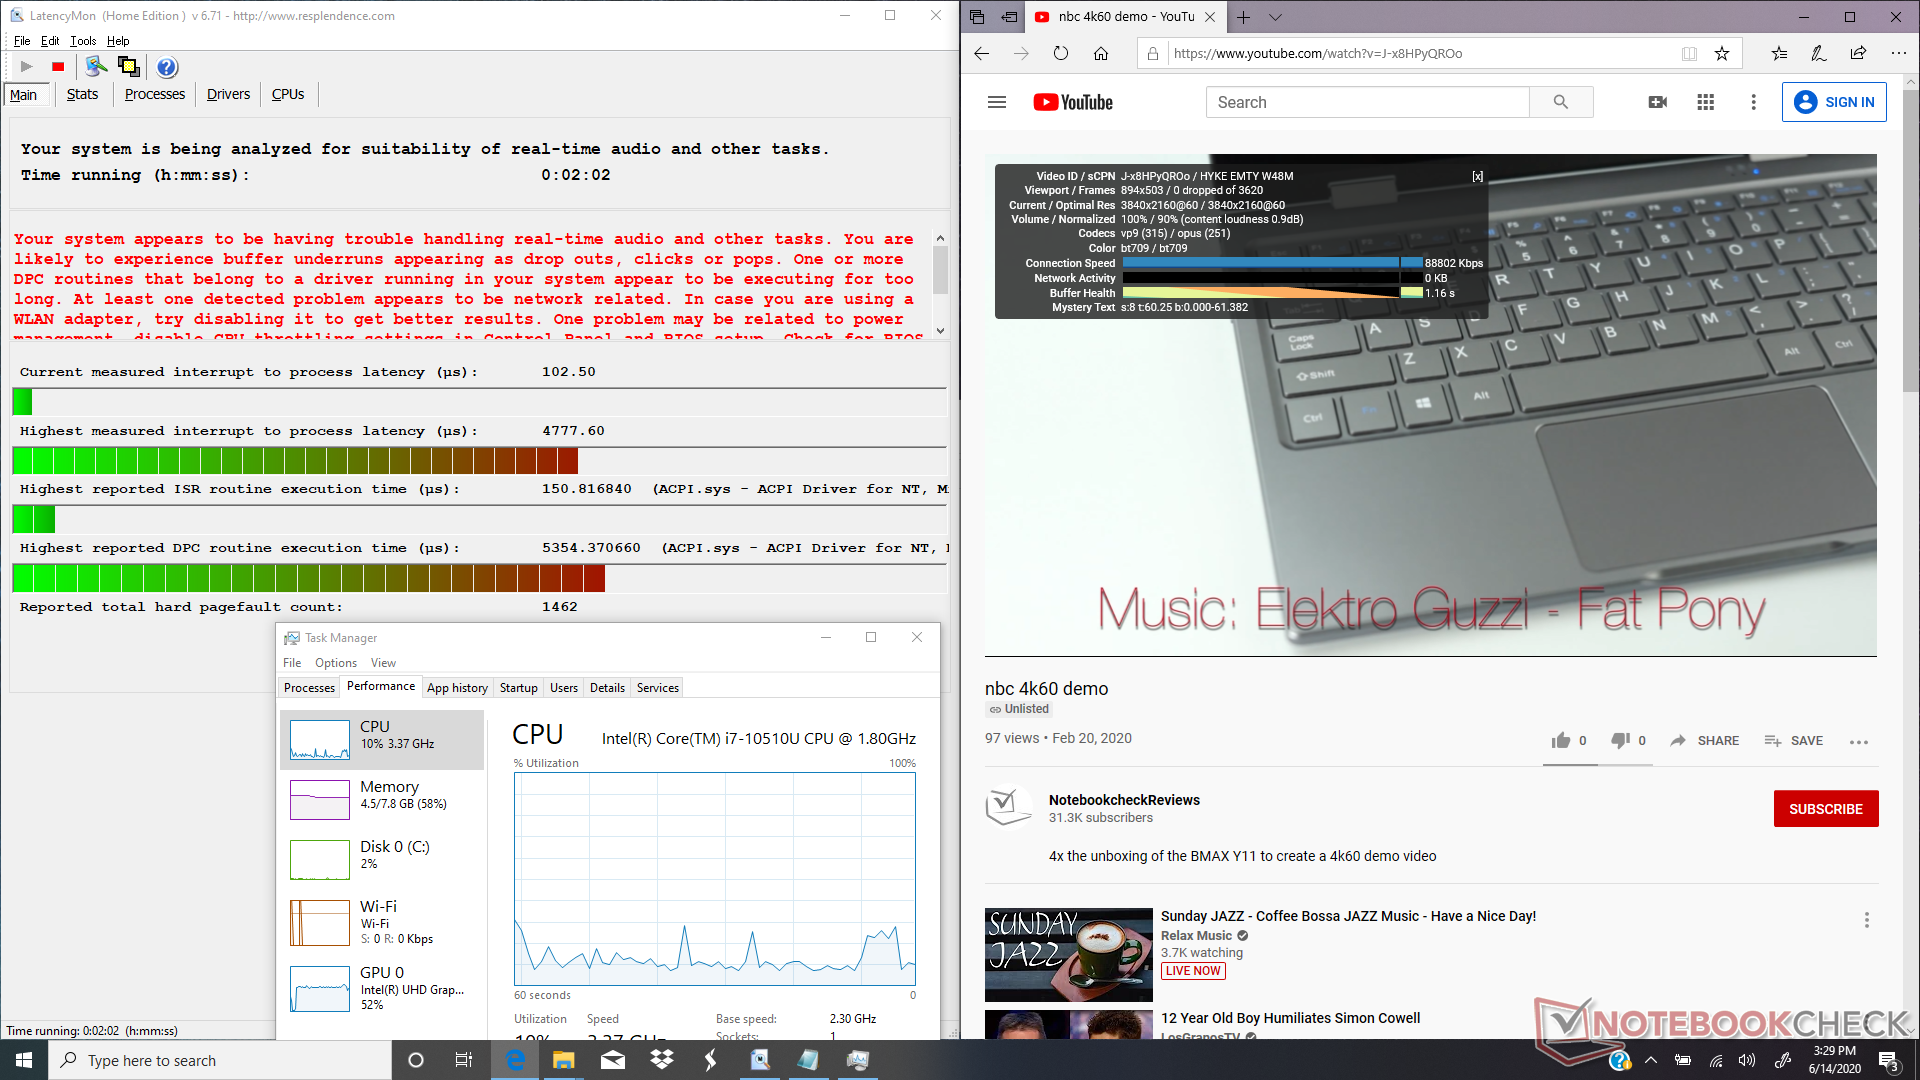
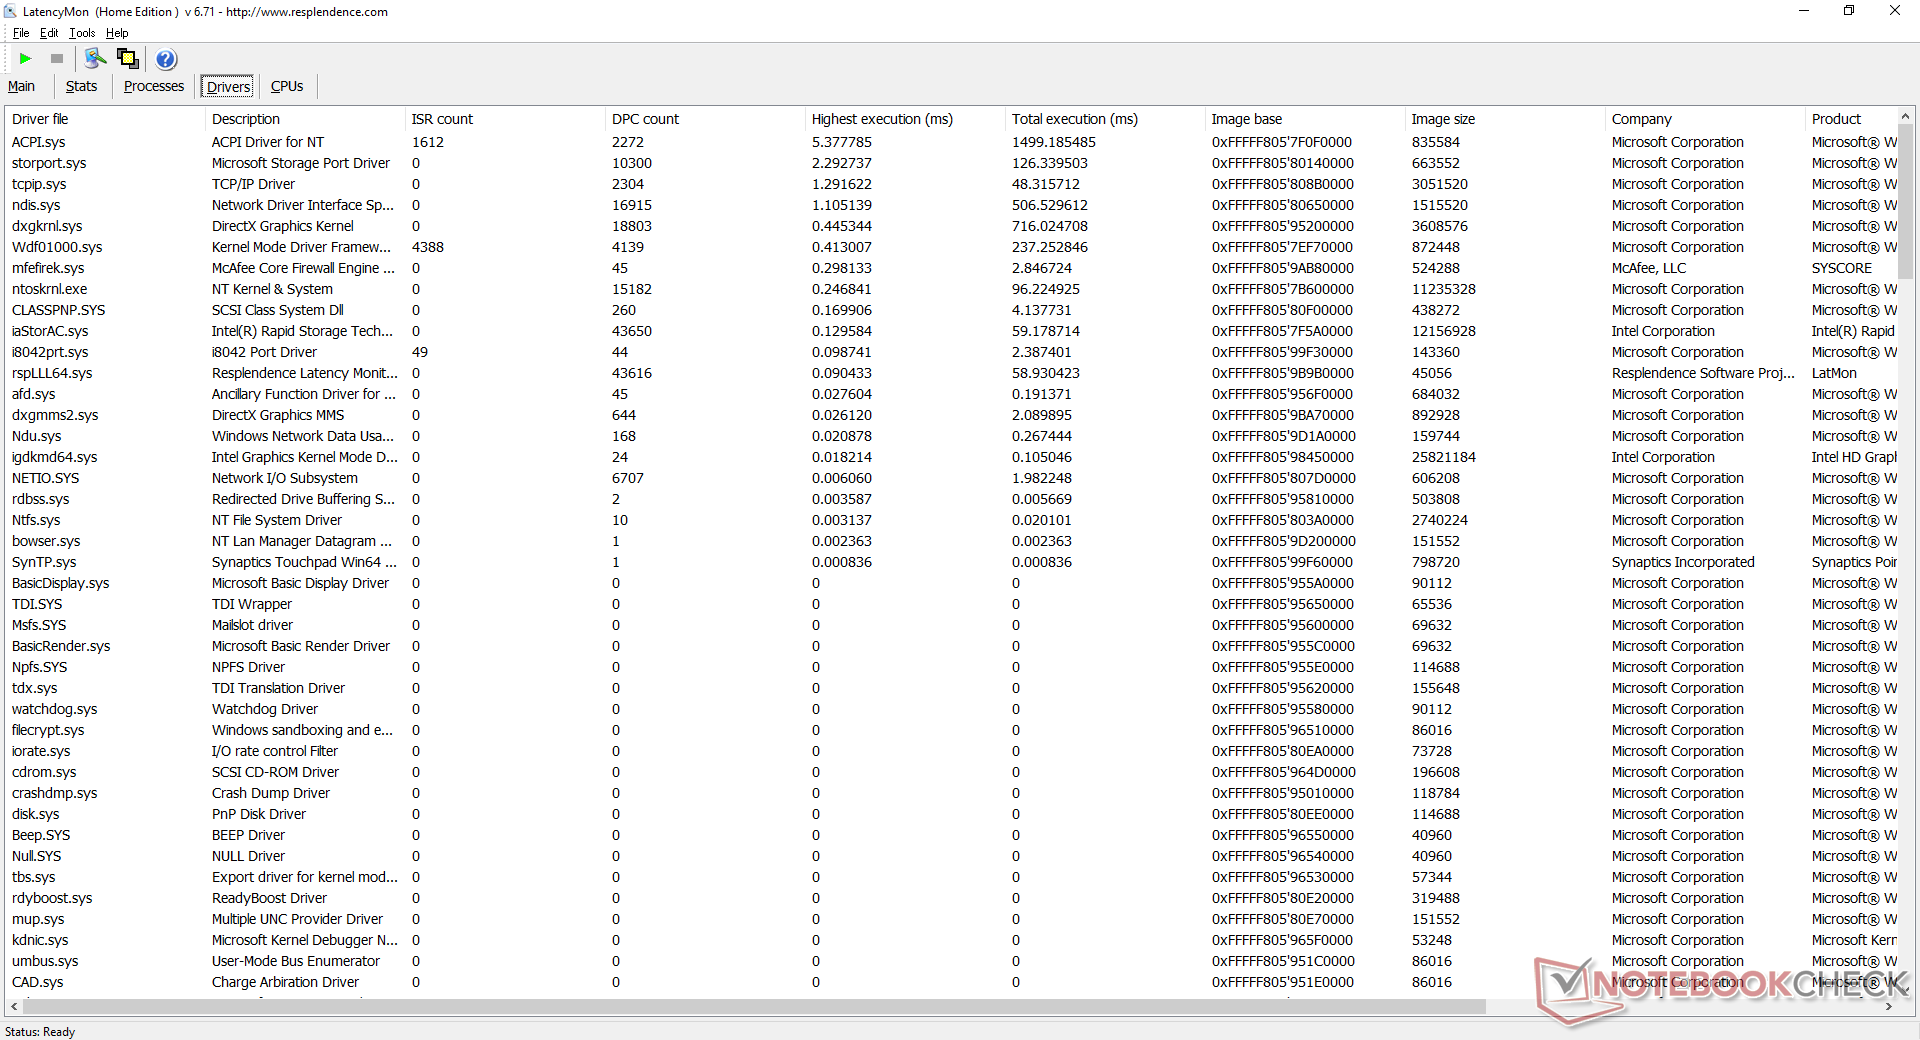
LatencyMon shows DPC latency issues when opening five tabs on our homepage. 4K video playback is otherwise smooth and without any dropped frames.
| DPC Latencies / LatencyMon - interrupt to process latency (max), Web, Youtube, Prime95 | |
| HP Envy x360 15-dr1679cl | |
| HP 470 G7 8VU24EA | |
| Dell XPS 15 9500 Core i5 | |
| Huawei MateBook 13 2020 i5 | |
* ... smaller is better
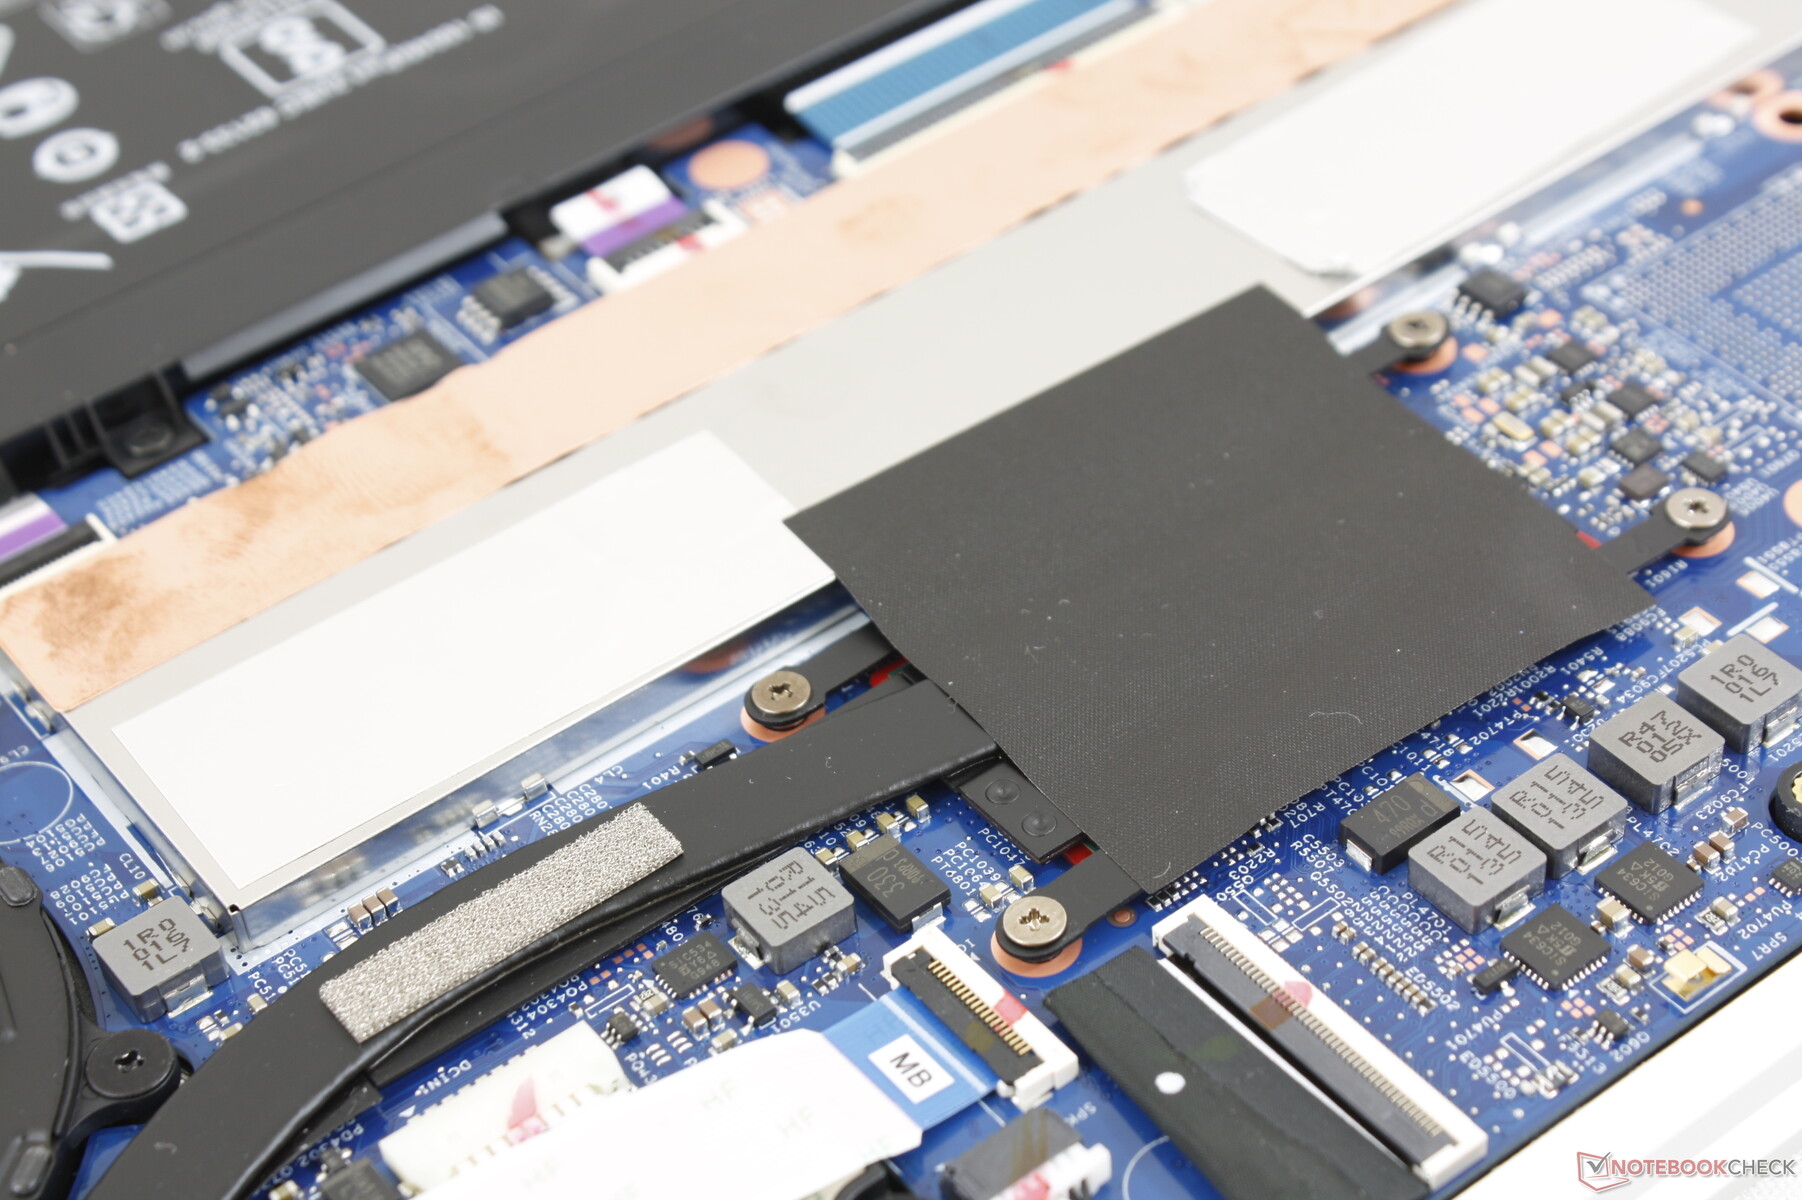
Storage Devices
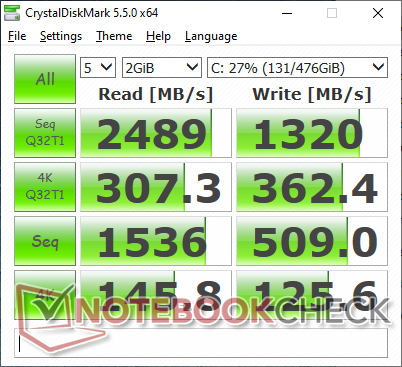
There is only one M.2 2280 slot for storage with no secondary 2.5-inch SATA III slot. While HP offers options with and without Intel Optane, the technology isn't very useful for day-to-day workloads like browsing, video or gaming. The difference becomes tangible if your workloads involve reading and writing massive amounts of small 4K files. Users won't be missing much if they choose to omit the feature.
Interestingly, caching would occur much later in our DiskSpd Read Loop test than most other standard PCIe SSDs.
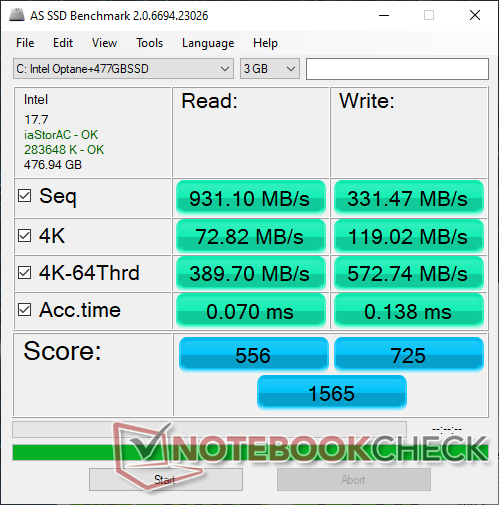
| HP Envy x360 15-dr1679cl Intel Optane Memory H10 with Solid State Storage 32GB + 512GB HBRPEKNX0202A(L/H) | Lenovo Yoga C740-15IML Samsung SSD PM981 MZVLB512HAJQ | Dell Inspiron 15 5579-9672 SK hynix SC311 SATA | Dell XPS 15 9500 Core i5 Toshiba KBG40ZNS256G NVMe | HP Envy x360 15-bq102ng Samsung PM961 MZVLW256HEHP | |
|---|---|---|---|---|---|
| AS SSD | 128% | -43% | 2% | 47% | |
| Seq Read (MB/s) | 931 | 2732 193% | 497.5 -47% | 1423 53% | 2465 165% |
| Seq Write (MB/s) | 331.5 | 1477 346% | 356.2 7% | 766 131% | 1318 298% |
| 4K Read (MB/s) | 72.8 | 57.7 -21% | 23.71 -67% | 42.21 -42% | 42.97 -41% |
| 4K Write (MB/s) | 119 | 136.3 15% | 47.64 -60% | 74.8 -37% | 81.9 -31% |
| 4K-64 Read (MB/s) | 389.7 | 1021 162% | 309.7 -21% | 973 150% | 1025 163% |
| 4K-64 Write (MB/s) | 573 | 1651 188% | 247 -57% | 218.8 -62% | 338.6 -41% |
| Access Time Read * (ms) | 0.07 | 0.062 11% | 0.142 -103% | 0.125 -79% | 0.077 -10% |
| Access Time Write * (ms) | 0.138 | 0.028 80% | 0.075 46% | 0.552 -300% | 0.046 67% |
| Score Read (Points) | 556 | 1352 143% | 383 -31% | 1157 108% | 1314 136% |
| Score Write (Points) | 725 | 1935 167% | 330 -54% | 370 -49% | 552 -24% |
| Score Total (Points) | 1565 | 3929 151% | 910 -42% | 2094 34% | 2488 59% |
| Copy ISO MB/s (MB/s) | 593 | 1972 233% | 301.3 -49% | 1151 94% | 700 18% |
| Copy Program MB/s (MB/s) | 495.5 | 642 30% | 166.4 -66% | 499.4 1% | 167.2 -66% |
| Copy Game MB/s (MB/s) | 566 | 1090 93% | 231.6 -59% | 733 30% | 370.4 -35% |
| CrystalDiskMark 5.2 / 6 | 71% | -56% | 3% | 10% | |
| Write 4K (MB/s) | 125.6 | 142.3 13% | 48.25 -62% | 93.3 -26% | 116 -8% |
| Read 4K (MB/s) | 145.8 | 47.56 -67% | 23.77 -84% | 45.9 -69% | 42.73 -71% |
| Write Seq (MB/s) | 509 | 2185 329% | 444.9 -13% | 1211 138% | 1222 140% |
| Read Seq (MB/s) | 1536 | 2235 46% | 497.5 -68% | 1633 6% | 1608 5% |
| Write 4K Q32T1 (MB/s) | 362.4 | 515 42% | 223.5 -38% | 273.1 -25% | 280.1 -23% |
| Read 4K Q32T1 (MB/s) | 307.3 | 413.4 35% | 171.8 -44% | 356 16% | 333.6 9% |
| Write Seq Q32T1 (MB/s) | 1320 | 2981 126% | 511 -61% | 1198 -9% | 1291 -2% |
| Read Seq Q32T1 (MB/s) | 2489 | 3565 43% | 553 -78% | 2269 -9% | 3183 28% |
| Write 4K Q8T8 (MB/s) | 310.2 | ||||
| Read 4K Q8T8 (MB/s) | 349.5 | ||||
| Total Average (Program / Settings) | 100% /
107% | -50% /
-48% | 3% /
2% | 29% /
33% |
* ... smaller is better

Disk Throttling: DiskSpd Read Loop, Queue Depth 8
GPU Performance
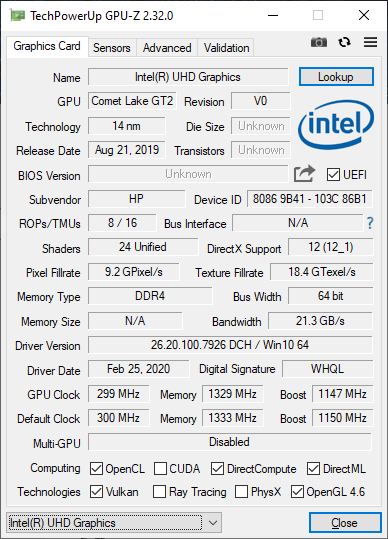
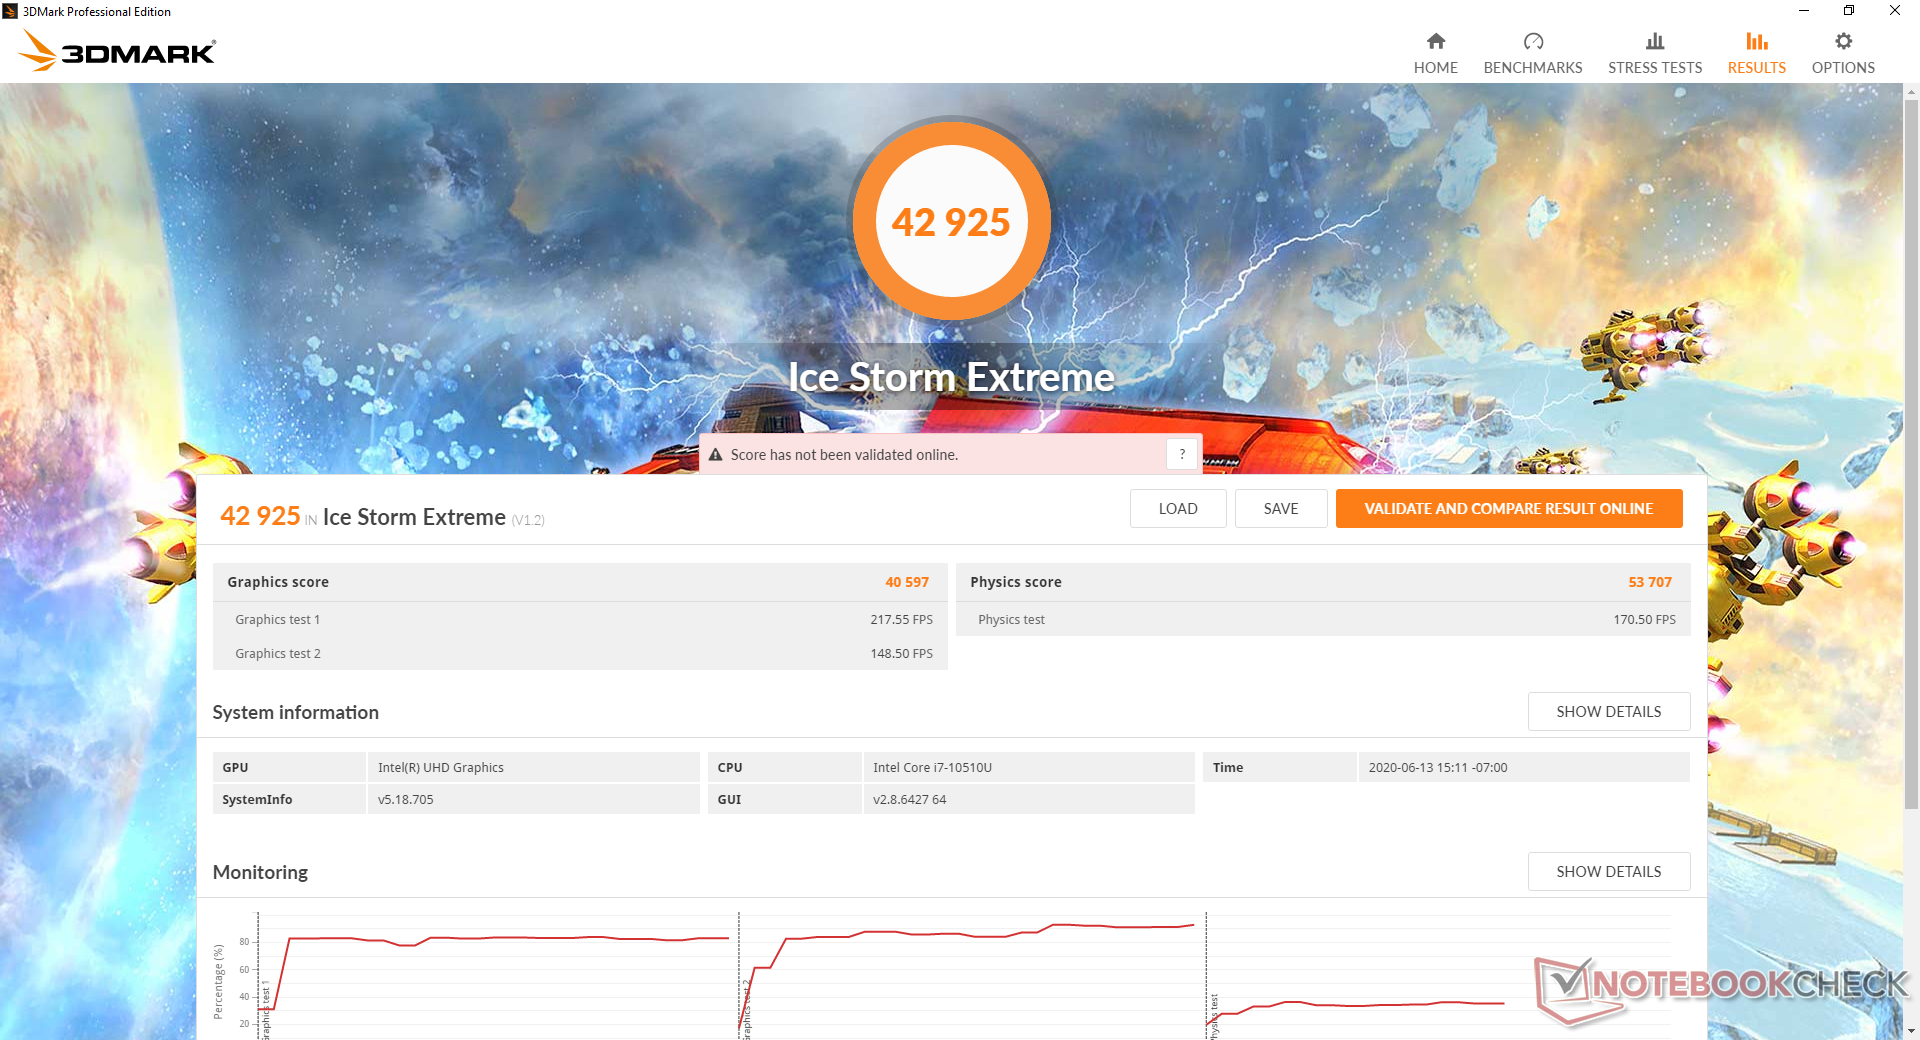
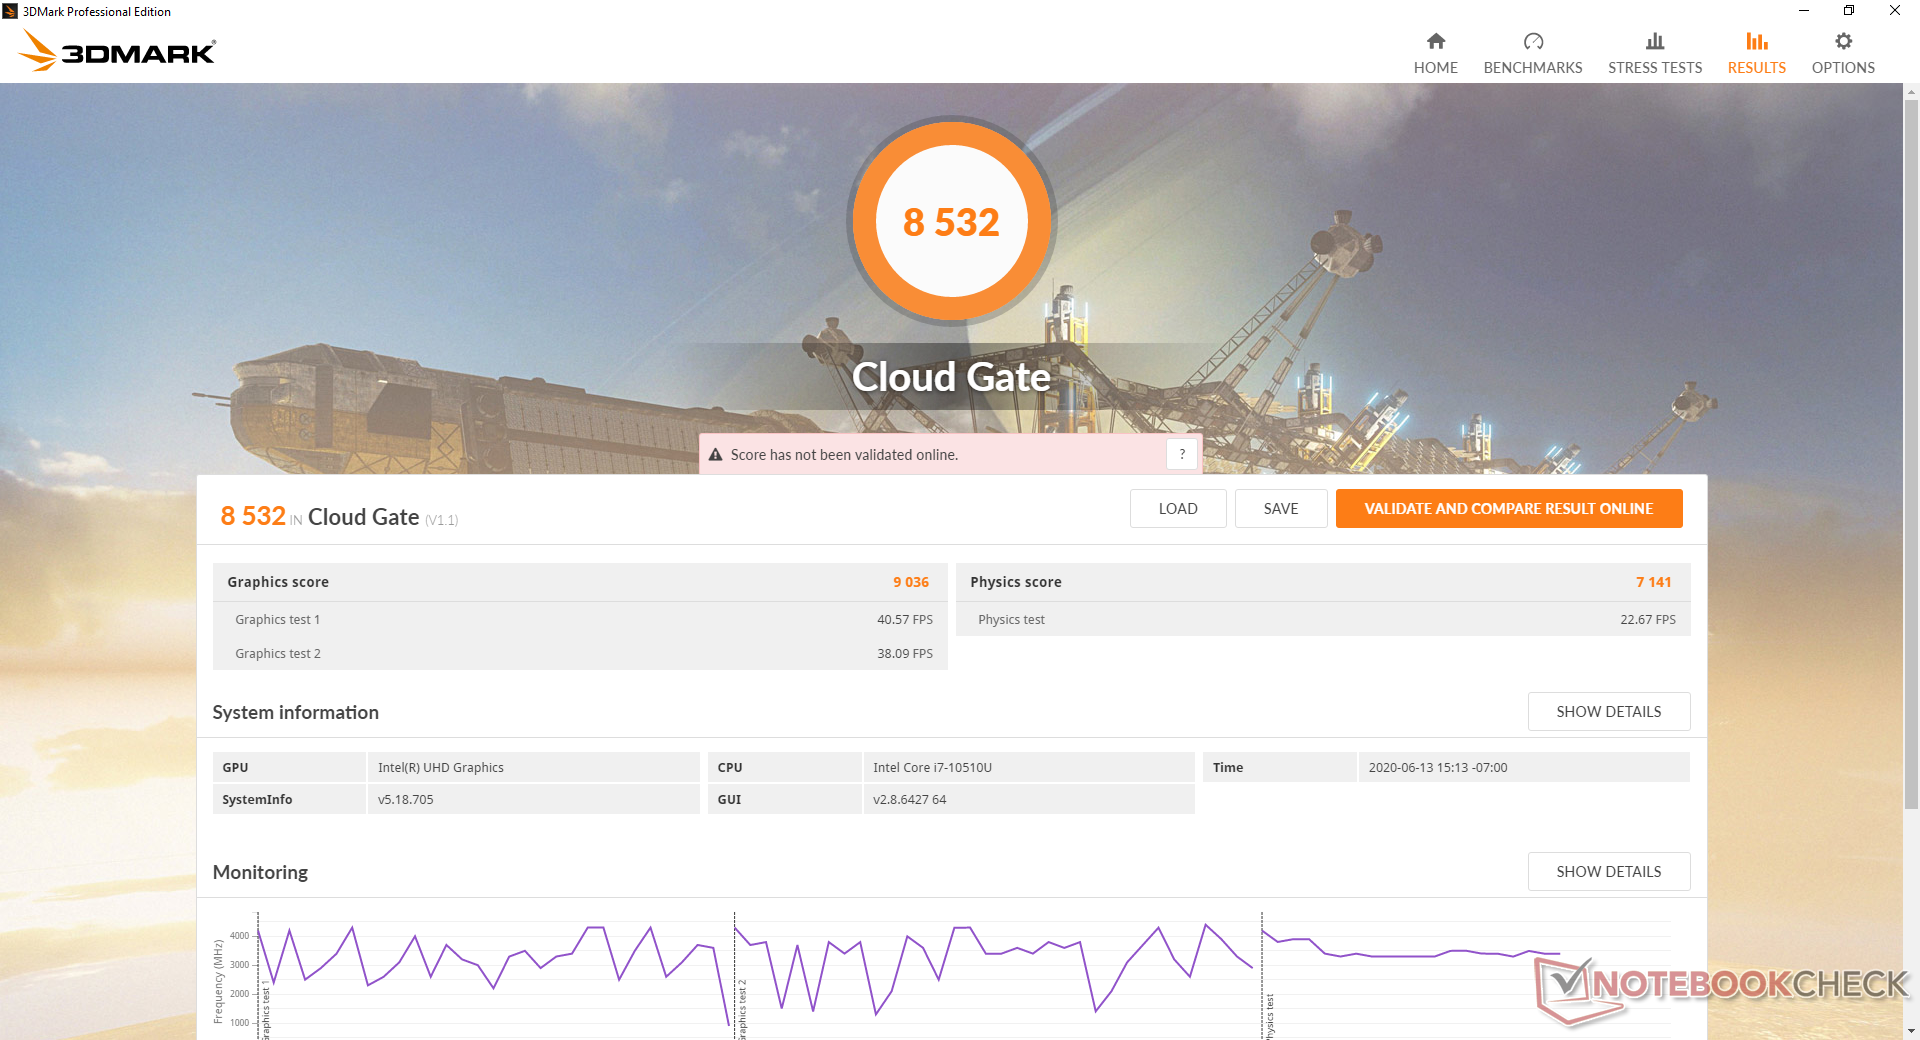
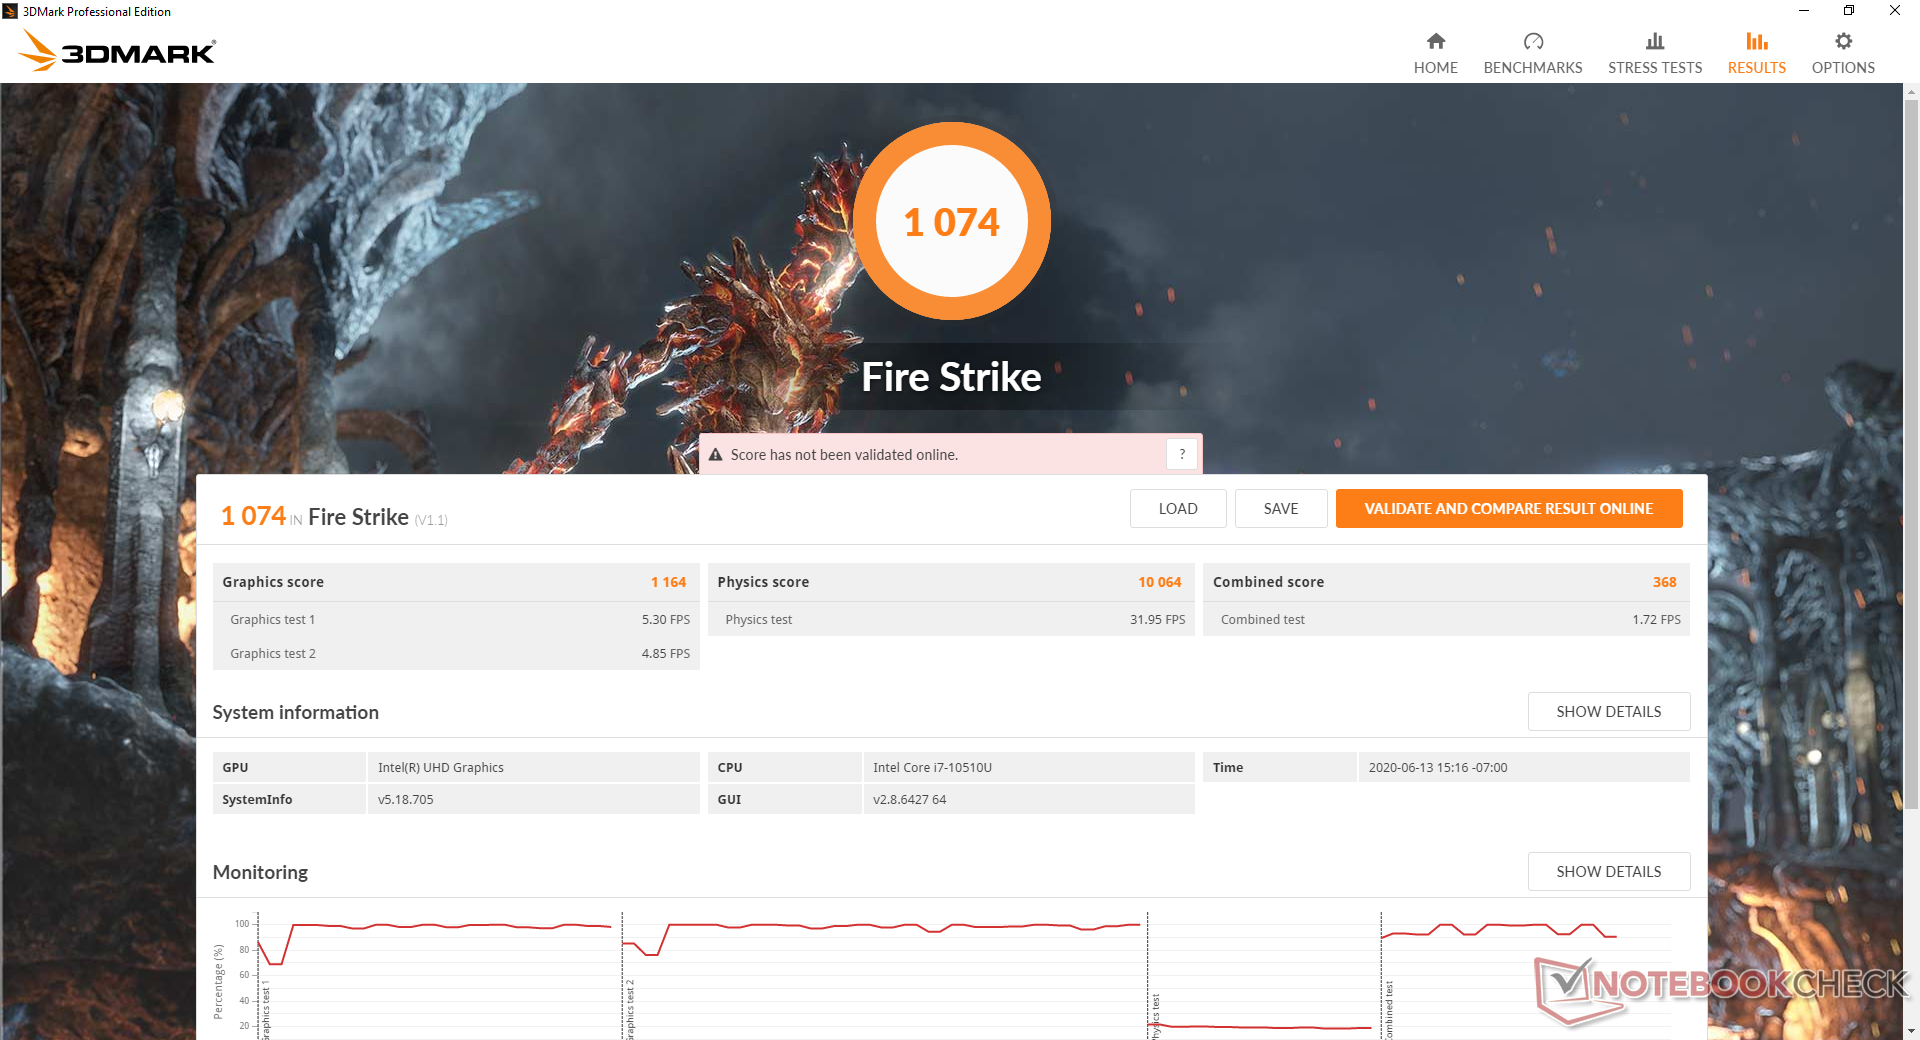
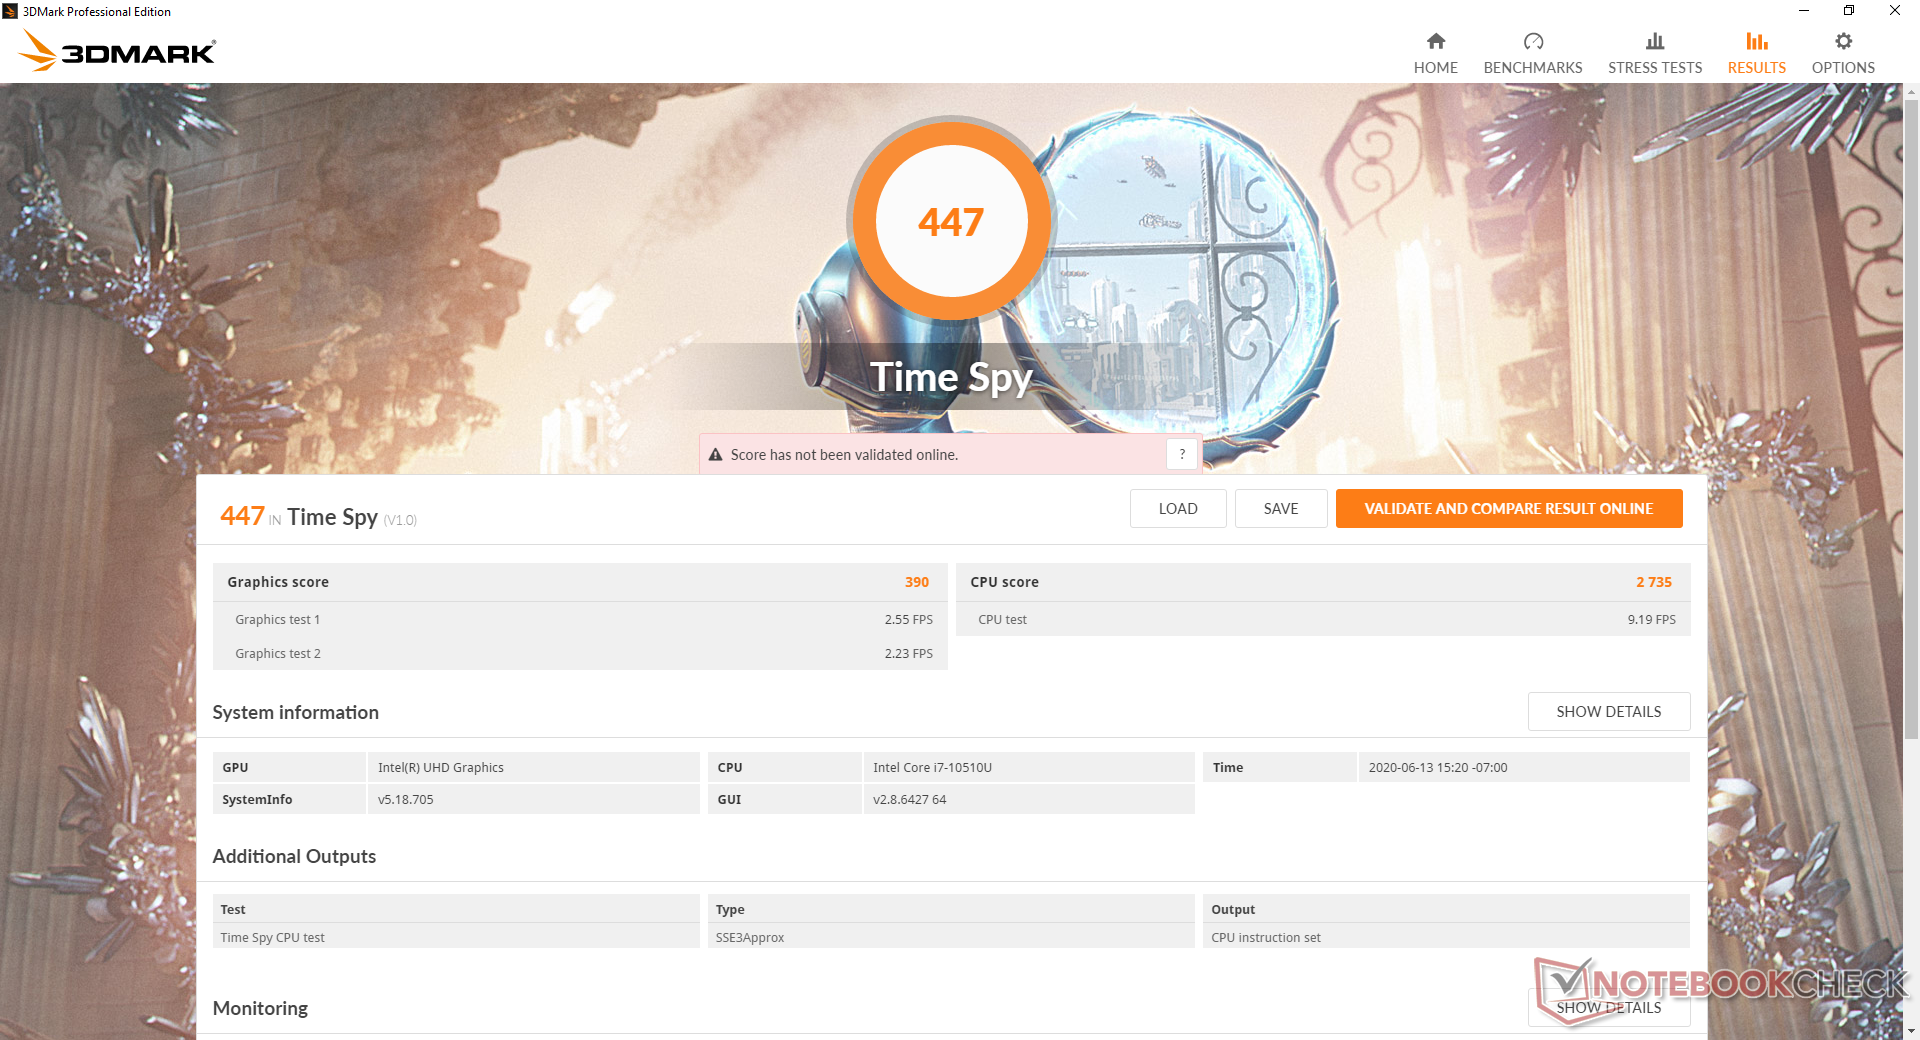
The integrated UHD Graphics 620 is not designed for gaming. Intel has been using this same GPU for years now with no significant updates. Upgrading to the Core i7-1065G7 with Iris Plus G7 graphics will bring roughly double the graphics performance, but most games outside of League of Legends or Rocket League would still be out of the question. Users will need to upgrade to the GeForce MX330 if they intend to play games on the system.
See our dedicated page on the UHD Graphics 620 for more technical information and benchmark comparisons.
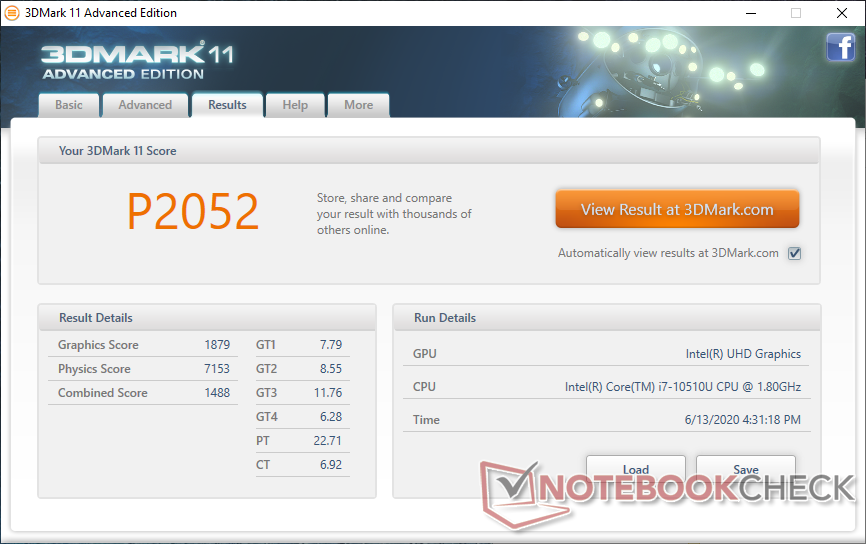
| 3DMark 11 Performance | 2052 points | |
| 3DMark Cloud Gate Standard Score | 8532 points | |
| 3DMark Fire Strike Score | 1074 points | |
| 3DMark Time Spy Score | 447 points | |
Help | ||
| low | med. | high | ultra | |
|---|---|---|---|---|
| The Witcher 3 (2015) | 18.9 | 12.4 | 6.5 | |
| Dota 2 Reborn (2015) | 71.9 | 41.8 | 18.8 | 16.7 |
| X-Plane 11.11 (2018) | 22.6 | 15.2 | 13.6 |
Emissions
System Noise
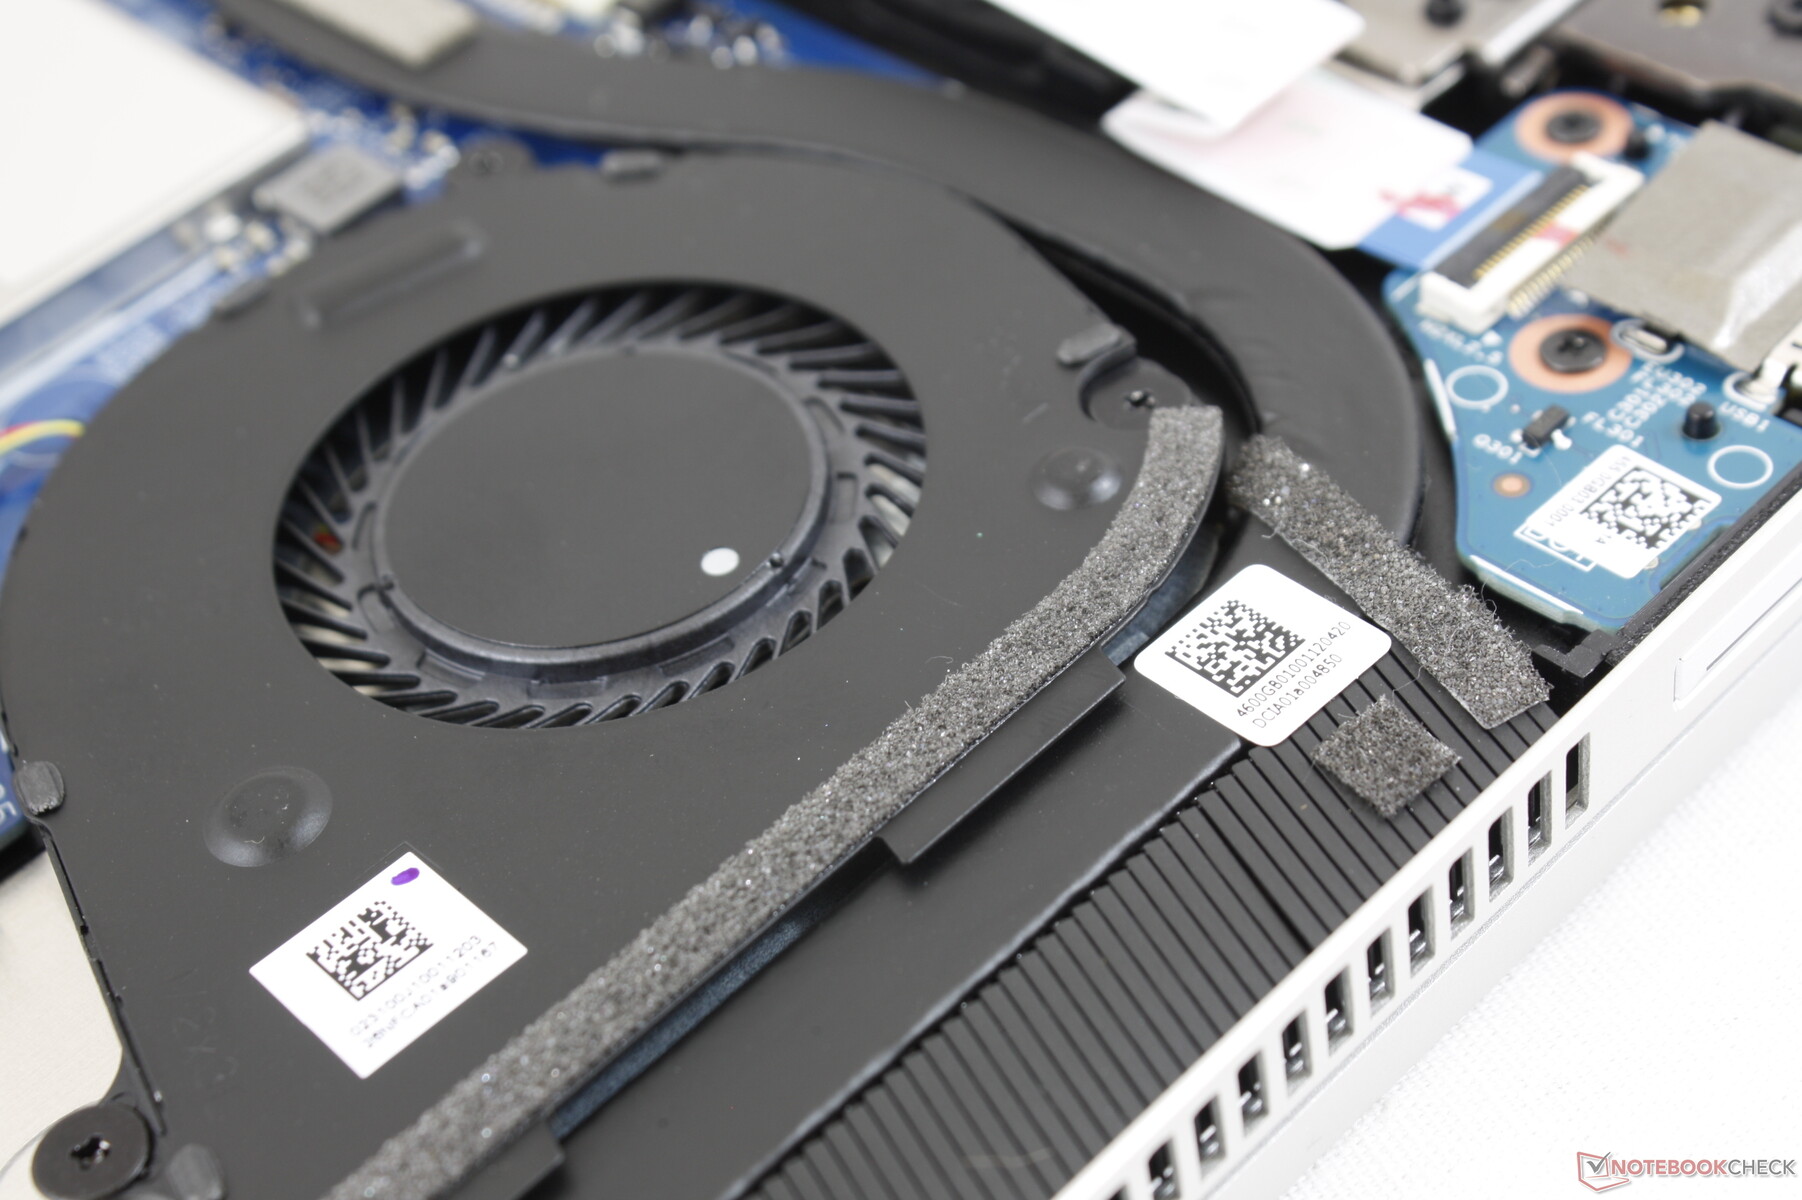
Fan noise is tied closely to the HP Command Center software. When in Quiet mode, fan noise tends to hover around 31.5 dB(A) or under against a silent background of 28 dB(A) when browsing or video streaming. Fan noise can be as high as 36 dB(A) when under high stress on HP Recommended mode or 43 dB(A) when on HP Performance mode to be louder than many other convertible laptops. However, you'll have to really stress the system with games and such to reach these high levels.
Note that fan noise and temperature levels will likely be different on SKUs with the Nvidia GPU as the cooling solution becomes doubled in size.
We can notice no electronic noise or coil whine from our test unit.
| HP Envy x360 15-dr1679cl UHD Graphics 620, i7-10510U, Intel Optane Memory H10 with Solid State Storage 32GB + 512GB HBRPEKNX0202A(L/H) | Lenovo Yoga C740-15IML UHD Graphics 620, i7-10510U, Samsung SSD PM981 MZVLB512HAJQ | Dell Inspiron 15 5579-9672 UHD Graphics 620, i5-8250U, SK hynix SC311 SATA | Asus ZenBook Flip 15 UX563FD-A1027T GeForce GTX 1050 Max-Q, i7-10510U, Samsung SSD PM981 MZVLB1T0HALR | Dell XPS 15 9500 Core i5 UHD Graphics 630, i5-10300H, Toshiba KBG40ZNS256G NVMe | HP Envy x360 15-bq102ng Vega 8, R5 2500U, Samsung PM961 MZVLW256HEHP | |
|---|---|---|---|---|---|---|
| Noise | 5% | 4% | 1% | 7% | -2% | |
| off / environment * (dB) | 28 | 29.3 -5% | 30.4 -9% | 30.3 -8% | 28 -0% | 30.13 -8% |
| Idle Minimum * (dB) | 28 | 29.3 -5% | 30.4 -9% | 30.3 -8% | 28 -0% | 30.13 -8% |
| Idle Average * (dB) | 30.2 | 29.3 3% | 30.4 -1% | 30.3 -0% | 28 7% | 30.13 -0% |
| Idle Maximum * (dB) | 31.5 | 29.6 6% | 31.2 1% | 30.3 4% | 28 11% | 30.13 4% |
| Load Average * (dB) | 35.7 | 32.4 9% | 31.5 12% | 33.7 6% | 28 22% | 38.8 -9% |
| Load Maximum * (dB) | 43.1 | 33.3 23% | 31.5 27% | 38.9 10% | 41.9 3% | 38.8 10% |
| Witcher 3 ultra * (dB) | 37.4 |
* ... smaller is better
Noise level
| Idle |
| 28 / 30.2 / 31.5 dB(A) |
| Load |
| 35.7 / 43.1 dB(A) |
 | ||
30 dB silent 40 dB(A) audible 50 dB(A) loud |
||
min: | ||
Temperature
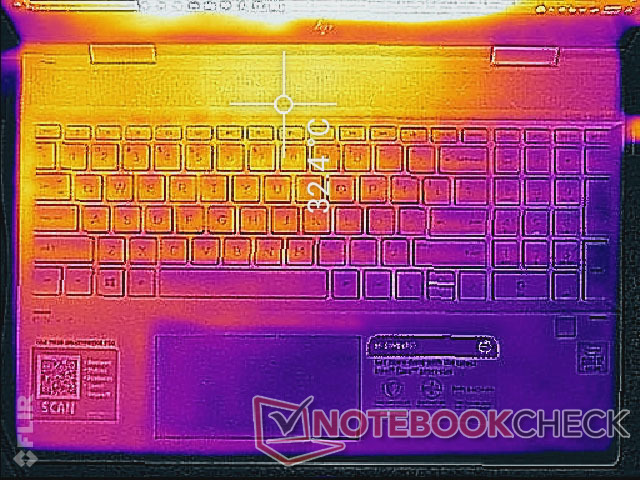
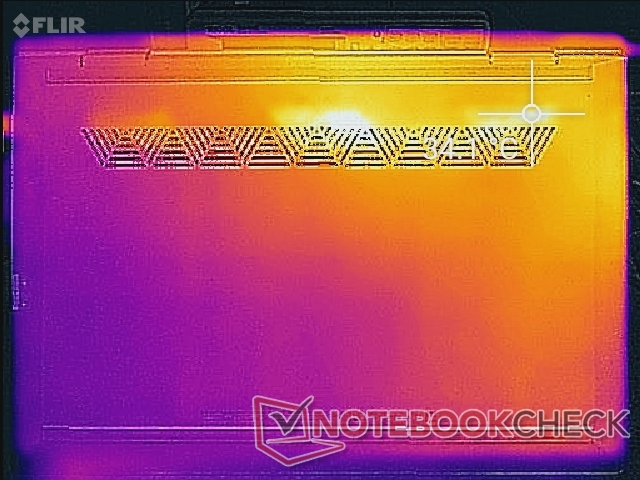
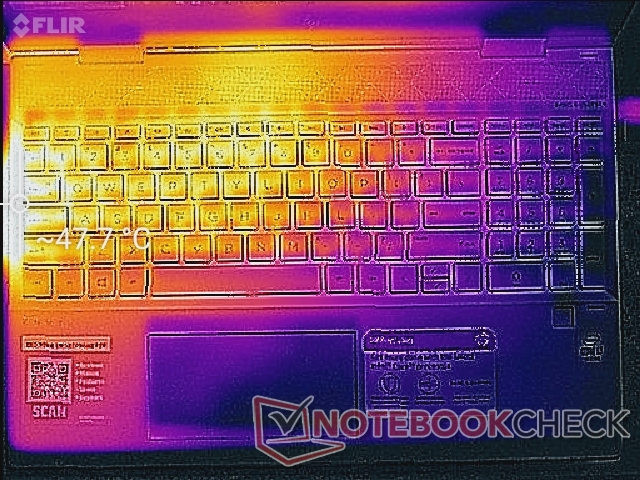
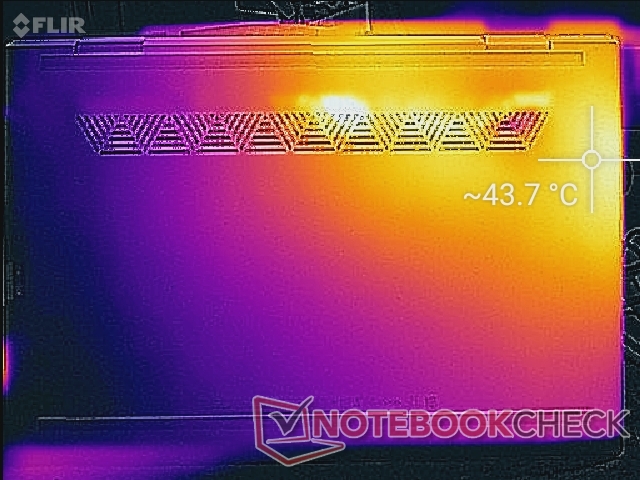
The left side of the laptop will always be warmer than the right likely due to how the processor is positioned inside. When under heavy loads, the hot spots can be as warm as 43 C to 48 C compared to only 31 C on the opposite end of the chassis. The difference, while noticeable on the palms and fingers, shouldn't be an issue if simply browsing the web or watching movies where load is minimal.
The 2018 Envy x360 15 would also reach ~45 C when under extreme processing stress, but its hot spots were closer to the rear of the chassis instead of on the left.

(-) The maximum temperature on the upper side is 47 °C / 117 F, compared to the average of 35.4 °C / 96 F, ranging from 19.6 to 60 °C for the class Convertible.
(±) The bottom heats up to a maximum of 44 °C / 111 F, compared to the average of 36.9 °C / 98 F
(+) In idle usage, the average temperature for the upper side is 30.8 °C / 87 F, compared to the device average of 30.3 °C / 87 F.
(+) The palmrests and touchpad are reaching skin temperature as a maximum (35.2 °C / 95.4 F) and are therefore not hot.
(-) The average temperature of the palmrest area of similar devices was 28 °C / 82.4 F (-7.2 °C / -13 F).
Stress Test
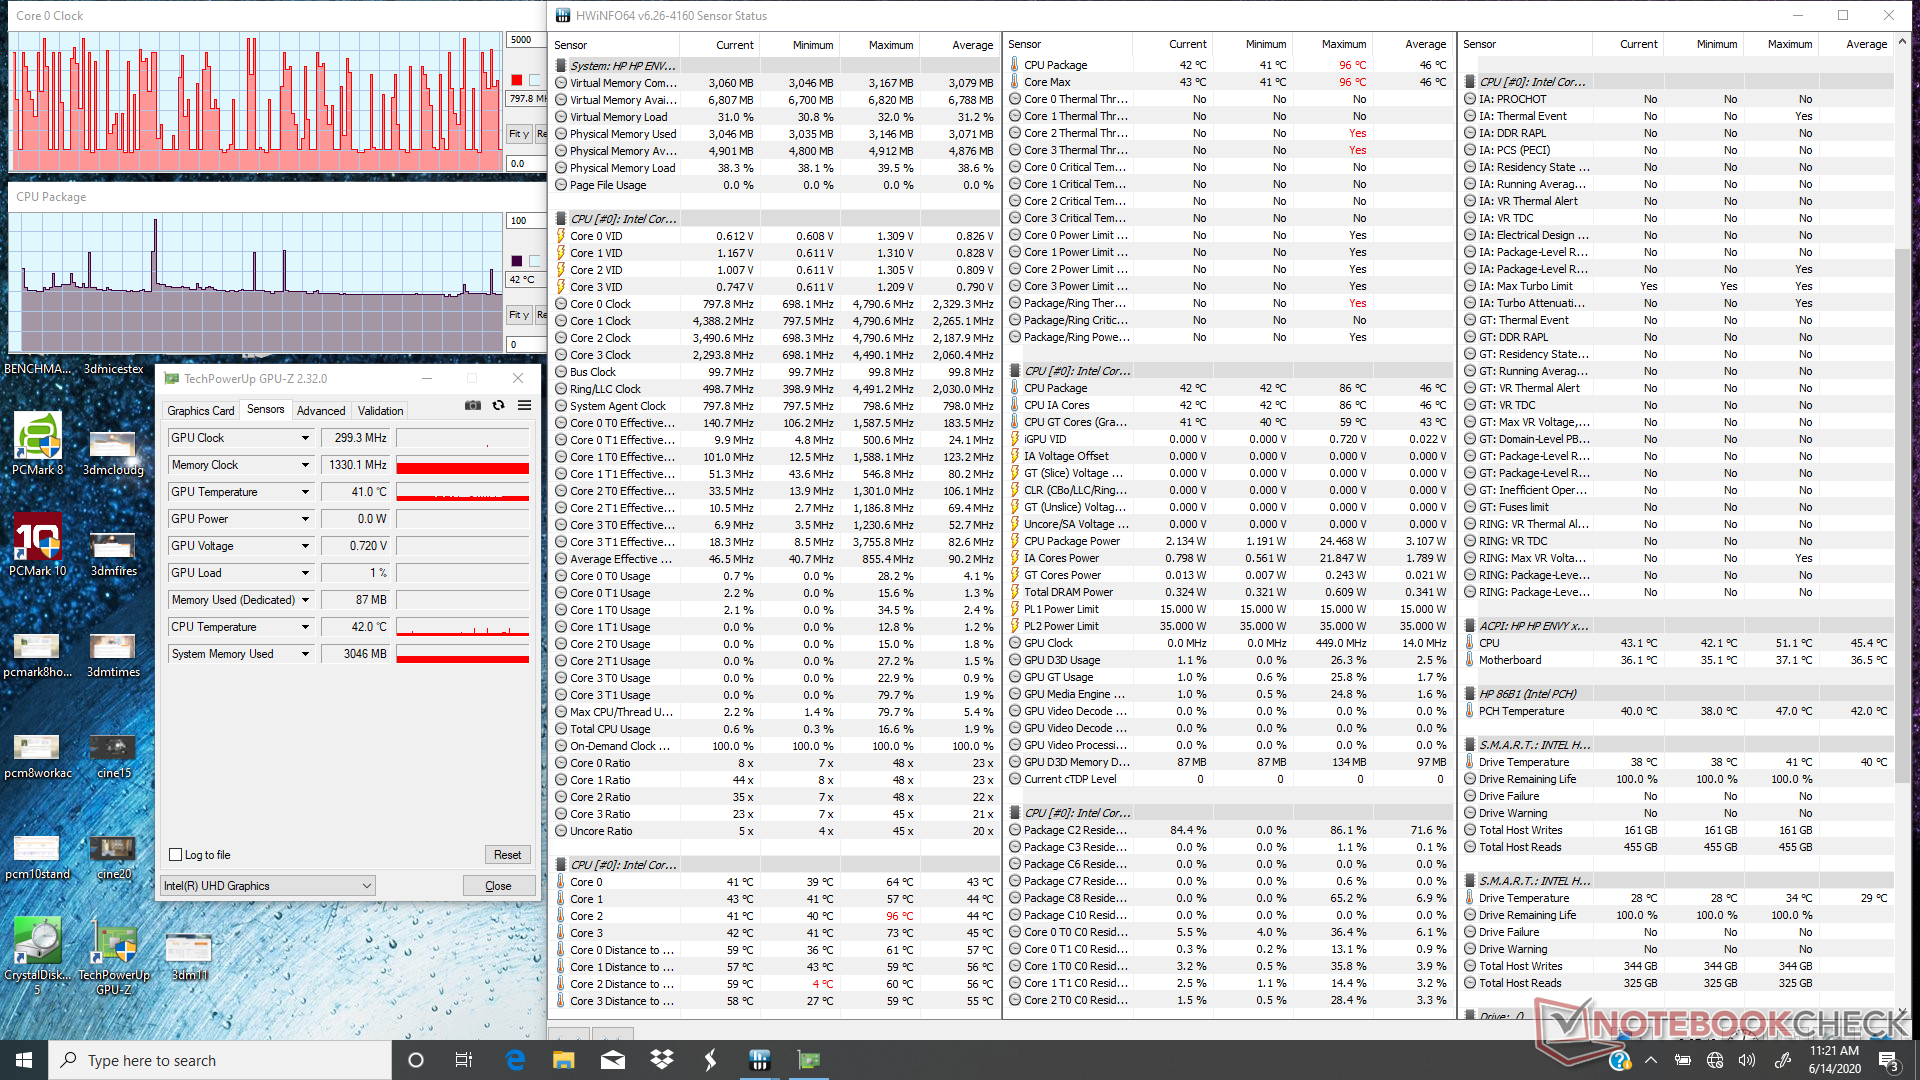
We stress the laptop with synthetic loads to identify for any potential throttling or stability issues. When running Prime95 in HP Performance mode, clock rates would spike to 3.6 GHz for the first few seconds until hitting a core temperature of 96 C. Clock rates would then drop to 3.1 GHz in order to maintain the 96 C core temperature. This is obviously very warm and much warmer than most other Ultrabooks when under similar conditions. If you want to squeeze as much performance out of the processor, however, then the option is at least there. It's interesting to note that processor performance is still average as shown by our CineBench benchmarks above even when on HP Performance mode.
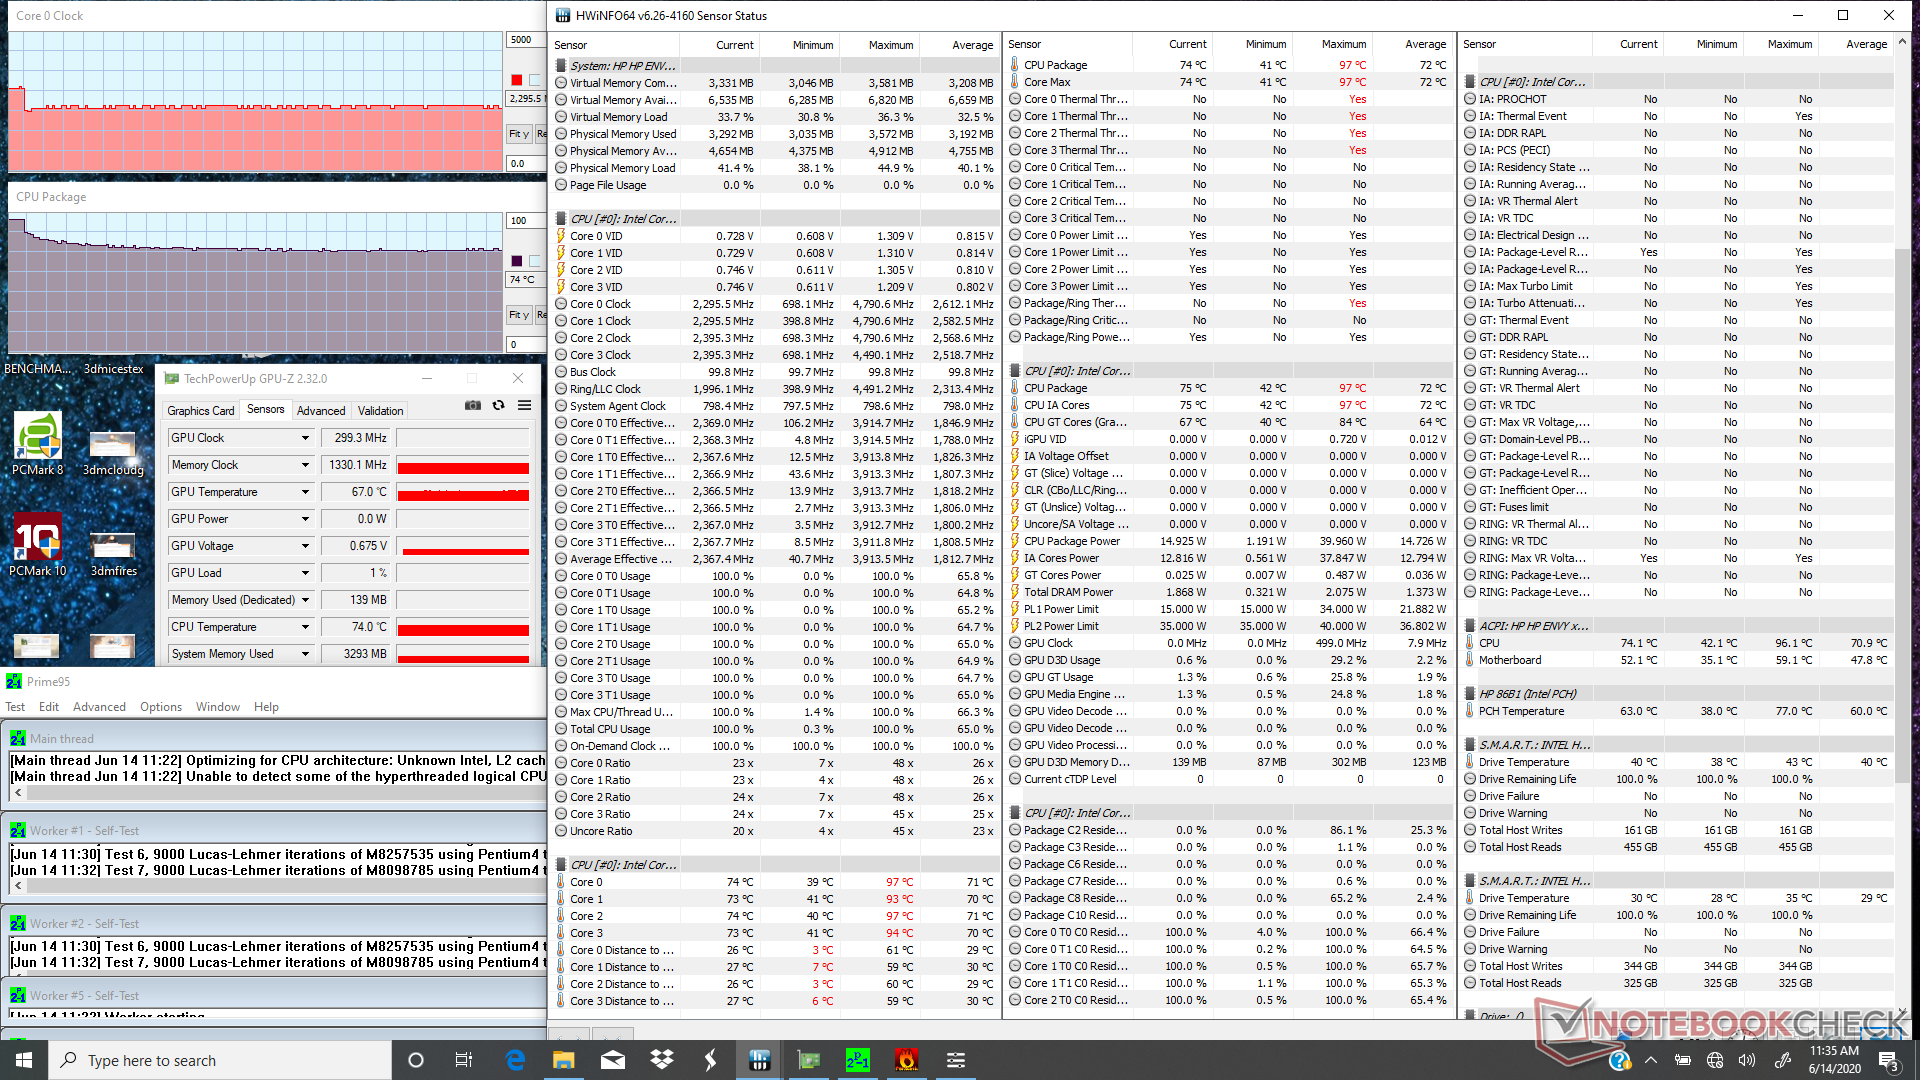
When running Prime95 under the HP Recommended mode, clock rates and temperature would stabilize at only 2.3 GHz and 74 C, respectively.
Running on battery power will limit performance. A 3DMark 11 test on batteries returns Physics and Graphics scores of 5846 and 1684 points, respectively, compared to 7153 and 1879 points when on mains. HP Performance mode is disabled when on battery power.
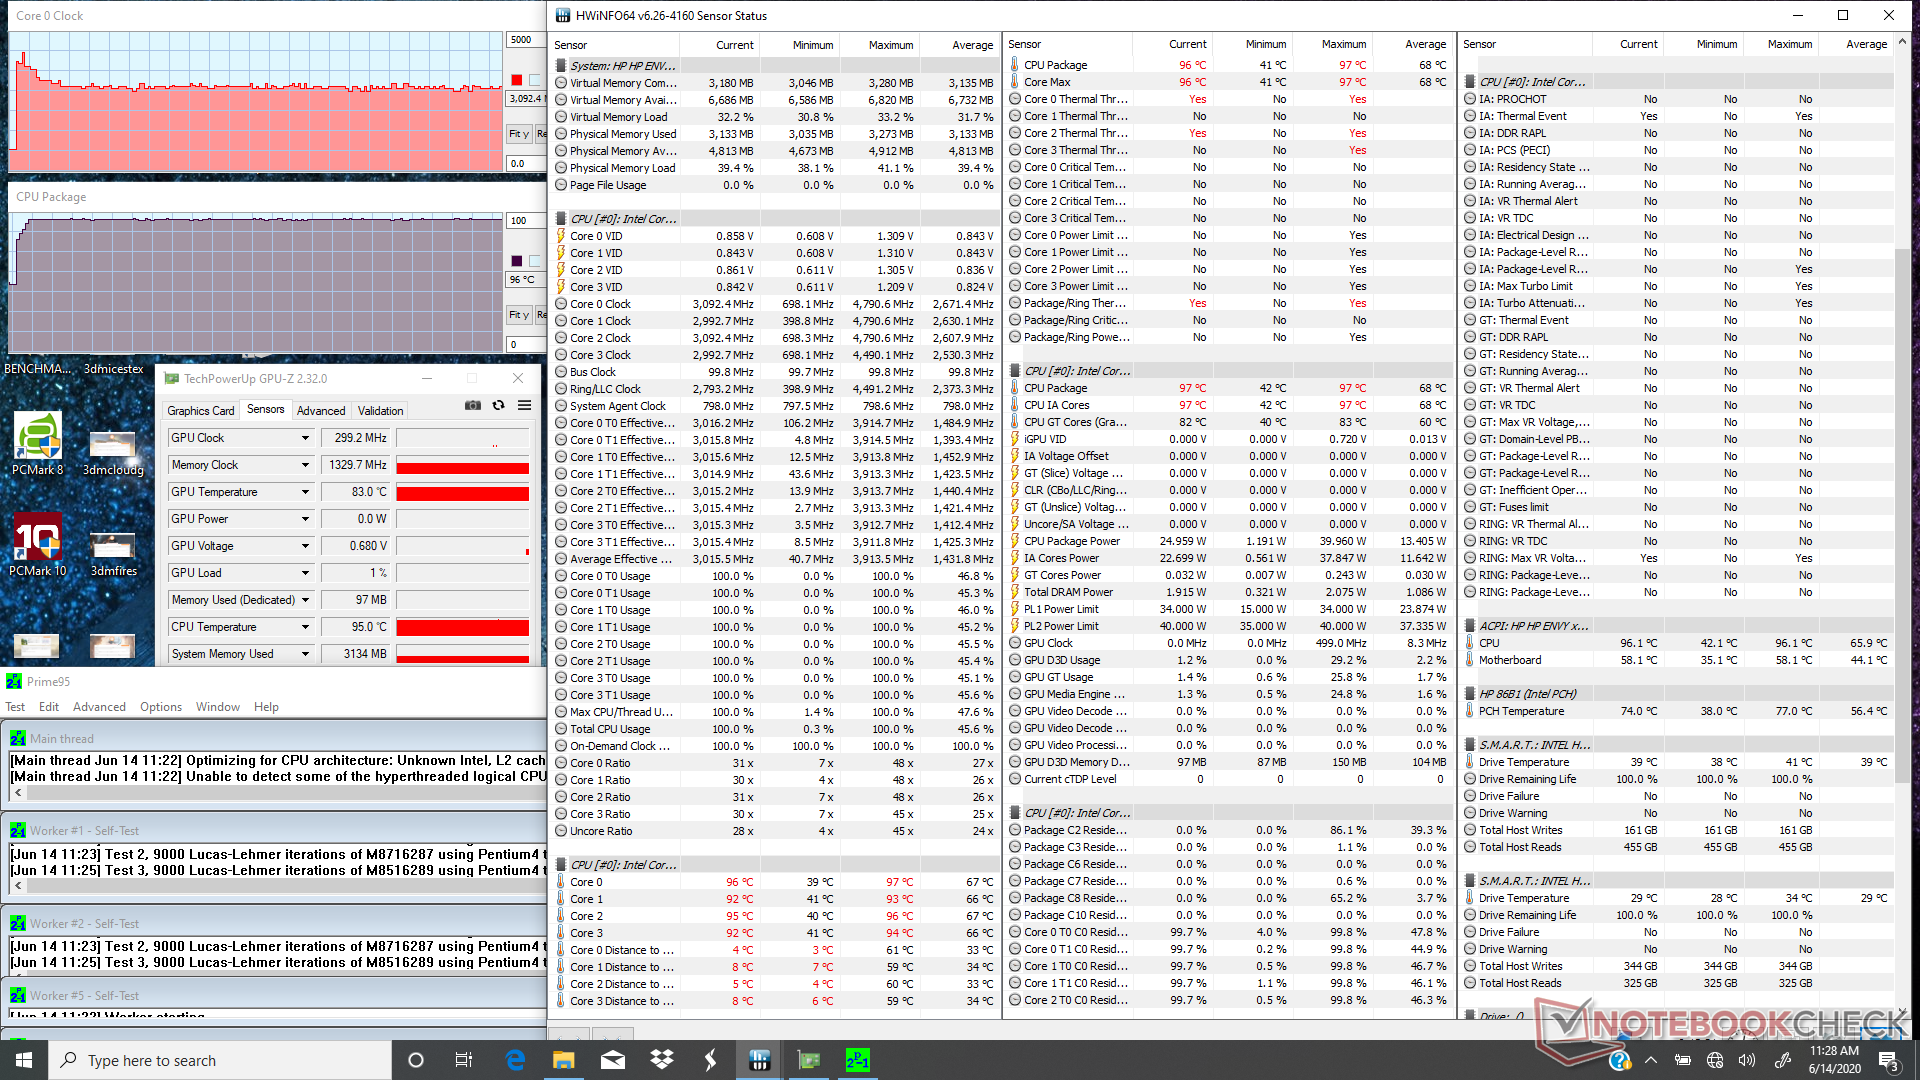
| CPU Clock (GHz) | GPU Clock (MHz) | Average CPU Temperature (°C) | |
| System Idle | -- | -- | 42 |
| Prime95 Stress (HP Recommended mode) | 2.2 - 2.3 | -- | 74 |
| Prime95 Stress (HP Performance mode) | 3.0 - 3.1 | -- | 96 |
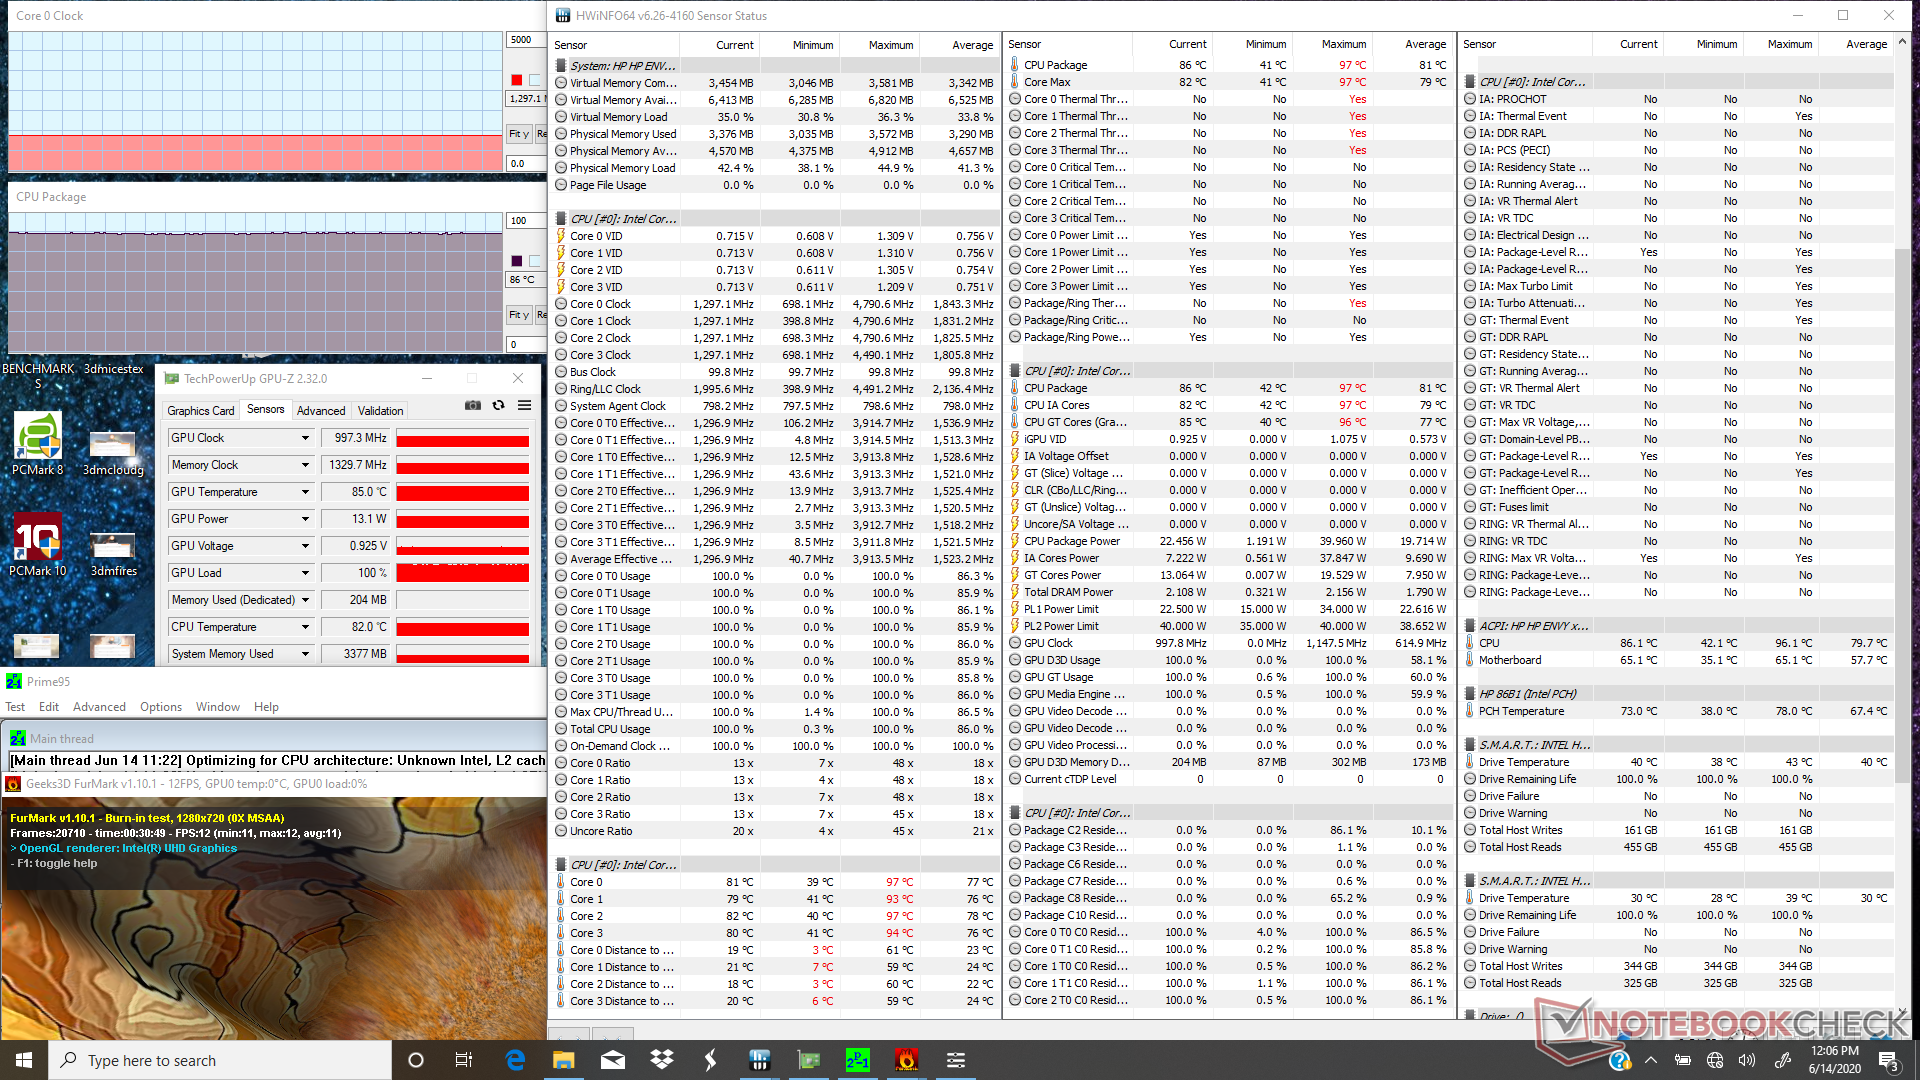
| Prime95 + FurMark Stress | 1.3 | 997 | 86 |
Speakers

Energy Management
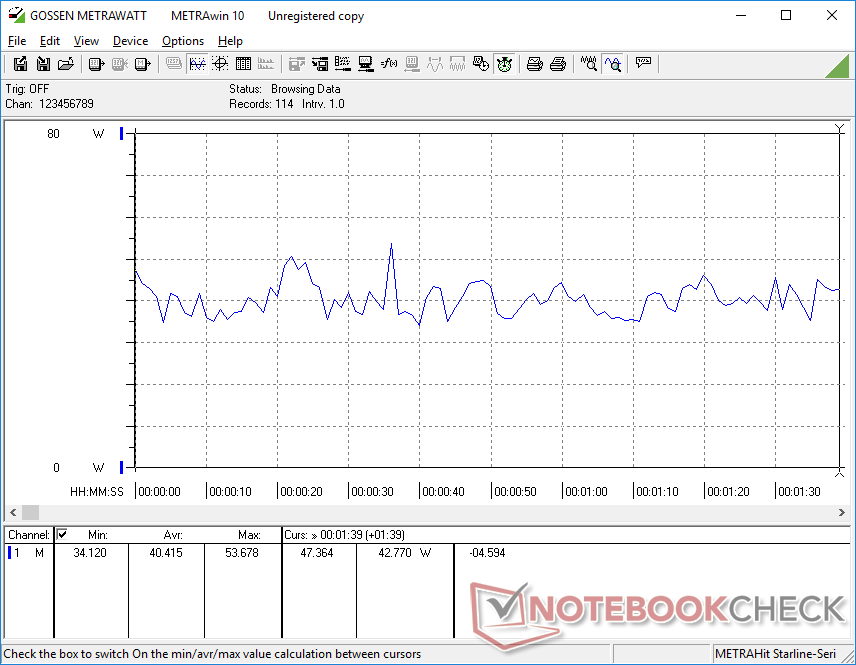
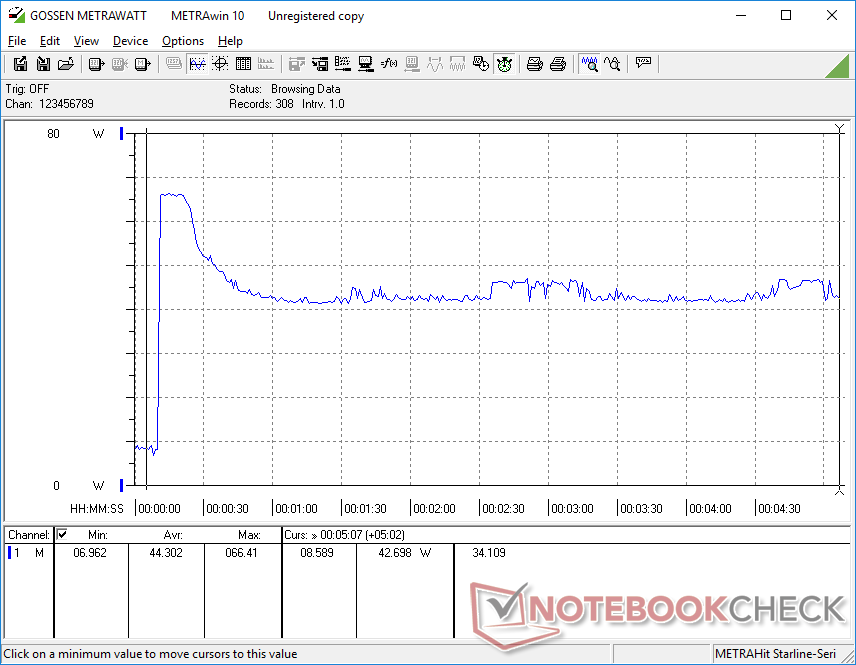
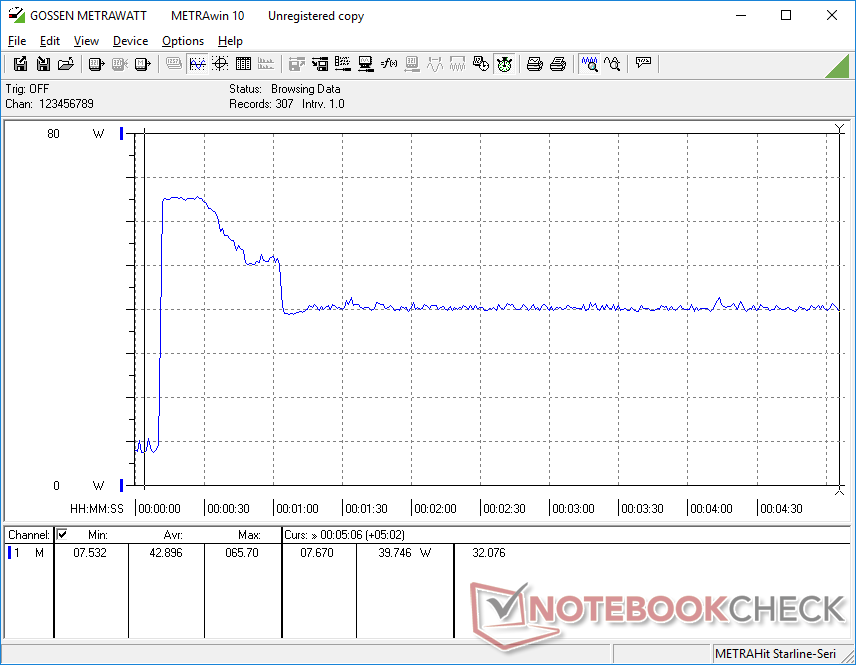
Power Consumption
The system is very power efficient as one would expect from a Core U-series laptop with no dedicated GPU. High loads like gaming will draw about 40 W while idling on desktop will be anywhere between 4 W and 8 W.
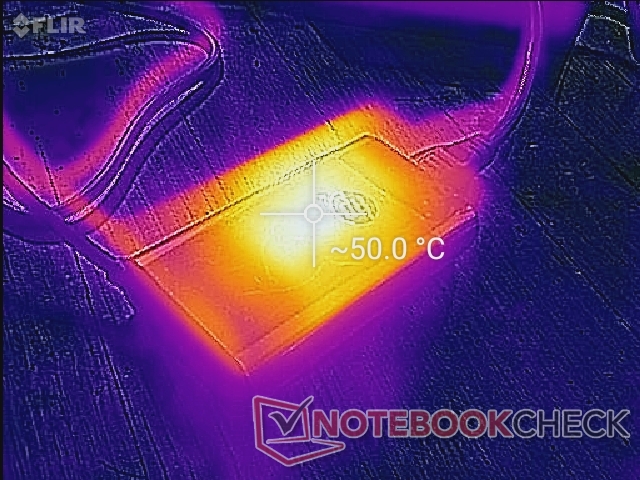
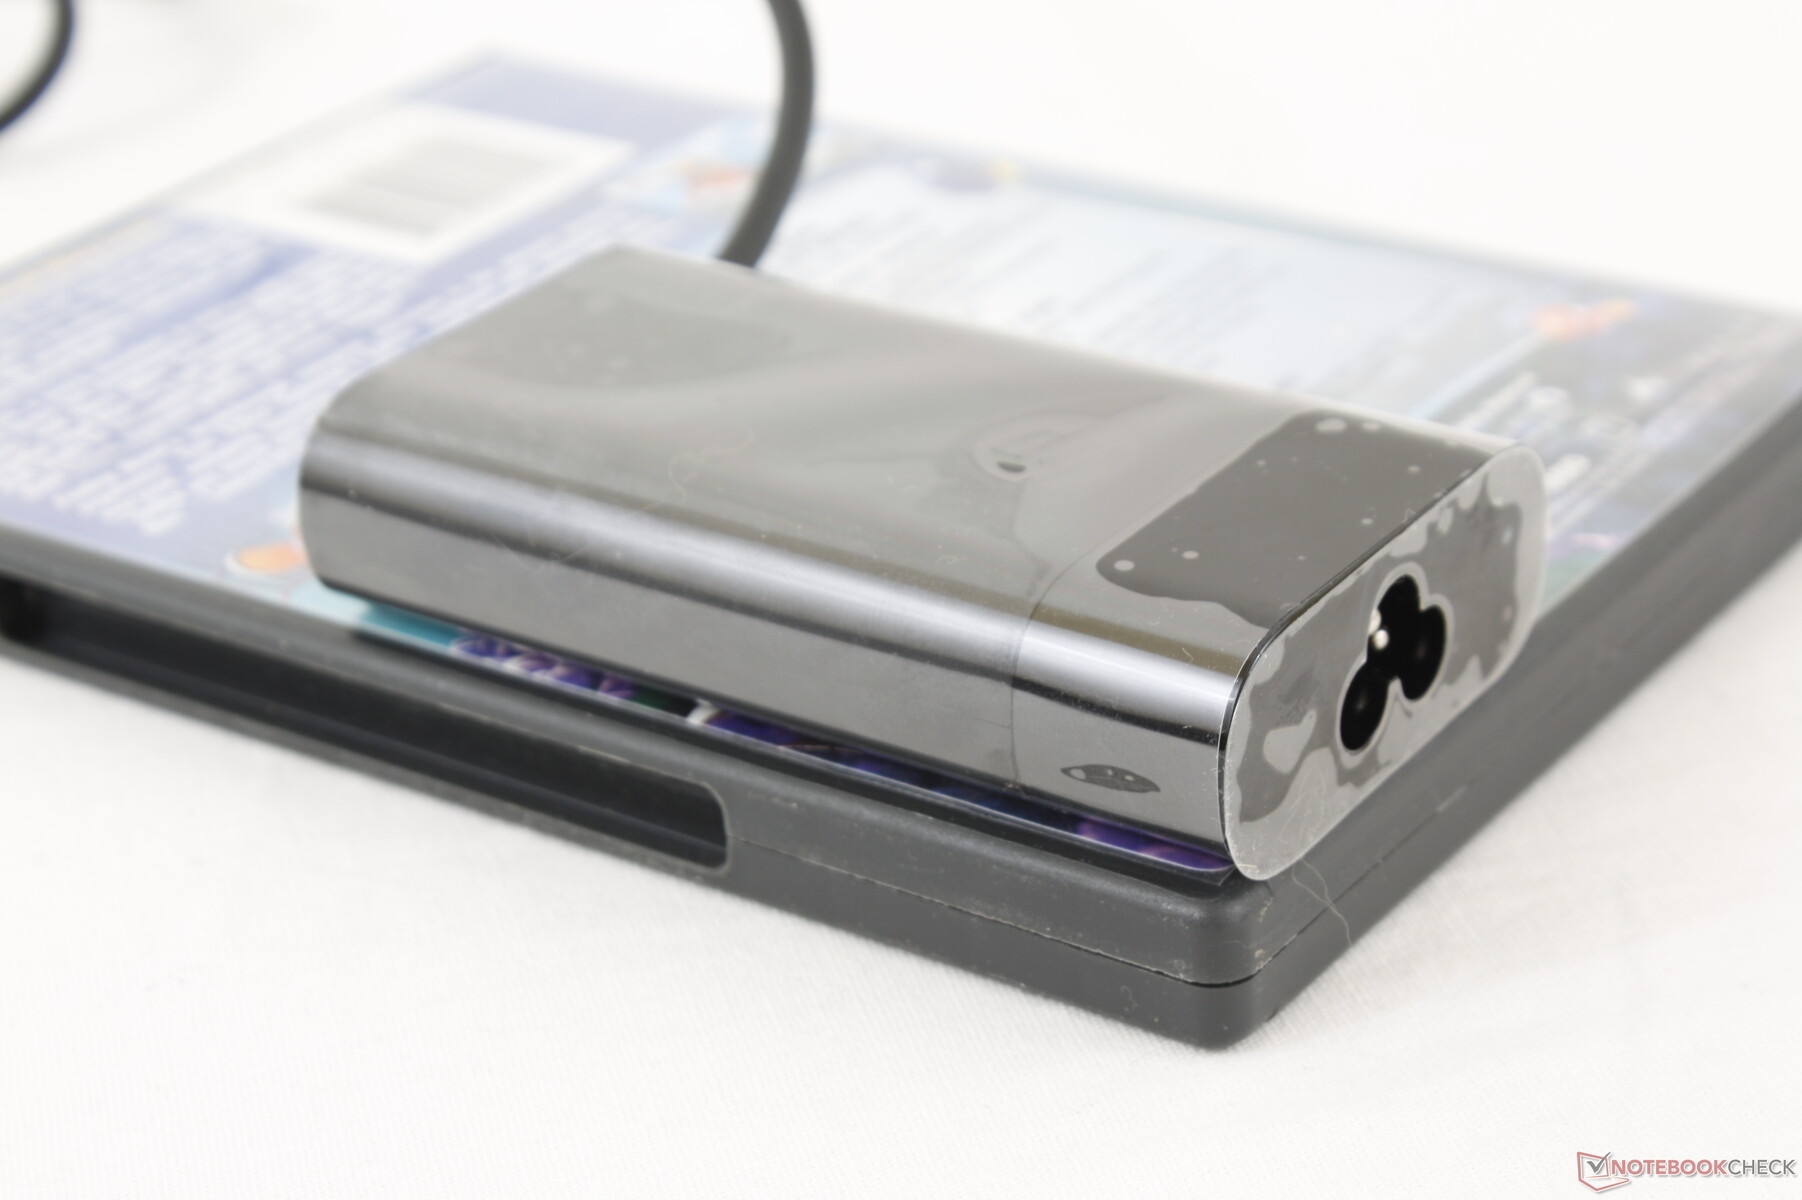
A maximum draw of 65.7 W will occur if running Prime95 and FurMark simultaneously, but this would only last for a few seconds as shown by our graphs below due to thermal limitations. The small (~9.8 x 5.5 x 2 cm) AC adapter is rated for 65 W.
| Off / Standby | |
| Idle | |
| Load |
|
Key:
min: | |
| HP Envy x360 15-dr1679cl i7-10510U, UHD Graphics 620, Intel Optane Memory H10 with Solid State Storage 32GB + 512GB HBRPEKNX0202A(L/H), IPS, 1920x1080, 15.6" | Lenovo Yoga C740-15IML i7-10510U, UHD Graphics 620, Samsung SSD PM981 MZVLB512HAJQ, IPS LED, 1920x1080, 15.6" | Dell Inspiron 15 5579-9672 i5-8250U, UHD Graphics 620, SK hynix SC311 SATA, IPS, 1920x1080, 15.6" | Asus ZenBook Flip 15 UX563FD-A1027T i7-10510U, GeForce GTX 1050 Max-Q, Samsung SSD PM981 MZVLB1T0HALR, IPS, 3840x2160, 15.6" | Dell XPS 15 9500 Core i5 i5-10300H, UHD Graphics 630, Toshiba KBG40ZNS256G NVMe, IPS, 1920x1200, 15.6" | HP Envy x360 15-bq102ng R5 2500U, Vega 8, Samsung PM961 MZVLW256HEHP, IPS, 1920x1080, 15.6" | |
|---|---|---|---|---|---|---|
| Power Consumption | 0% | 13% | -43% | -5% | -1% | |
| Idle Minimum * (Watt) | 4.3 | 2.97 31% | 3.9 9% | 2.3 47% | 2.9 33% | 4.8 -12% |
| Idle Average * (Watt) | 7.2 | 7.2 -0% | 6.6 8% | 10.3 -43% | 7.6 -6% | 7 3% |
| Idle Maximum * (Watt) | 7.5 | 9.9 -32% | 9.3 -24% | 11 -47% | 8 -7% | 9.5 -27% |
| Load Average * (Watt) | 40.4 | 40.8 -1% | 30.2 25% | 77 -91% | 41.7 -3% | 40.8 -1% |
| Load Maximum * (Watt) | 65.7 | 64.7 2% | 33.2 49% | 118 -80% | 94.8 -44% | 44.3 33% |
| Witcher 3 ultra * (Watt) | 68 |
* ... smaller is better
Battery Life
Runtimes are in line with what we recorded on the Asus ZenBook Flip 15 while being about two hours longer than the older Ryzen-powered Envy x360 from 2018. Users can expect over 9 hours of real-world WLAN use.
Charging from empty to full capacity is somewhat slow at 2 to 2.5 hours. The system can also be recharged via USB Type-C.
| HP Envy x360 15-dr1679cl i7-10510U, UHD Graphics 620, 55.67 Wh | Lenovo Yoga C740-15IML i7-10510U, UHD Graphics 620, 60.3 Wh | Dell Inspiron 15 5579-9672 i5-8250U, UHD Graphics 620, 42 Wh | Asus ZenBook Flip 15 UX563FD-A1027T i7-10510U, GeForce GTX 1050 Max-Q, 71 Wh | Dell XPS 15 9500 Core i5 i5-10300H, UHD Graphics 630, 56 Wh | HP Envy x360 15-bq102ng R5 2500U, Vega 8, 55.8 Wh | |
|---|---|---|---|---|---|---|
| Battery runtime | 0% | -33% | -4% | -8% | -23% | |
| Reader / Idle (h) | 25.4 | 11.2 -56% | 19.5 -23% | 26.4 4% | ||
| WiFi v1.3 (h) | 9.2 | 10.4 13% | 7.3 -21% | 9.4 2% | 9.3 1% | 7.1 -23% |
| Load (h) | 2.3 | 2 -13% | 1.8 -22% | 2.5 9% | 1.6 -30% |
Pros
Cons
Verdict
The Envy x360 15 series has been stagnant during these past few years. Despite having changes to the chassis and processors, most of these updates are largely aesthetic and with minimal performance boosts, respectively. You would have to configure with the GeForce MX330 if you want to make the most out of the system as the base Core i7 options with only integrated graphics aren't going to be all that much better than the older Core i7-8565U or Ryzen SKUs.
Additionally, many of the original issues of the 2018 Envy X360 15 remain since HP has yet to address them. The difficult serviceability is still a key drawback as simple procedures like storage or RAM upgrades are more frustrating than they need to be. There is still no hotkey to open HP Command Center which is very strange since system performance is tied so closely to this application. Thus, it's possible to own the laptop without ever even being aware of the software in the first place.
Speaking of HP Command Center, processor performance is average when set to "Performance" mode and below average when set to "Recommended" mode. In other words, CPU performance is only where we expect it to be relative to other laptops when the power profile and fan ceiling are at their highest settings.
The HP convertible is still notable for its excellent build quality and rigidity. It's definitely not very light, but that helps make it feel stronger and longer-lasting than the equivalents from Lenovo, Acer, or Asus.
It's got a low starting price to attract users who just want a solid home laptop for emails and videos. If the GeForce MX330 or AMOLED options aren't attractive, then you can buy an older Envy x360 15 instead of this 2020 version without missing out on all that much.
HP Envy x360 15-dr1679cl
- 06/18/2020 v7 (old)
Allen Ngo
Price comparison
