HP Envy x360 15z (Ryzen 5 2500U, Vega 8, SSD, FHD) Convertible Review
Hewlett Packard’s latest 15.6-inch convertible is powered by an AMD Raven Ridge APU, and we are already familiar with the device itself as we have had a similar model in review just recently. Its competitors are, among others, the Asus VivoBook Flip 15 TP510UA, the Dell Inspiron 15 5578-1777, and the Asus VivoBook Flip 15 TP501UQ.
Given that both Envy notebooks are identical in construction, we will not be going into details in terms of case, connectivity, input devices, and speakers. For anyone interested in these we would kindly like to refer them to our Envy x360 15 review.
| SD Card Reader | |
| average JPG Copy Test (av. of 3 runs) | |
| HP Envy x360 15-bq102ng (Toshiba Exceria Pro SDXC 64 GB UHS-II) | |
| HP Envy x360 15m-bq121dx | |
| Dell Inspiron 15 5578-1777 2-in-1 (Toshiba Exceria Pro SDXC 64 GB UHS-II) | |
| Asus VivoBook Flip TP501UQ-FZ119T (Toshiba Exceria Pro SDXC 64 GB UHS-II) | |
| Asus VivoBook Flip 15 TP510UA-E8073T (Toshiba Exceria Pro SDXC 64 GB UHS-II) | |
| maximum AS SSD Seq Read Test (1GB) | |
| HP Envy x360 15-bq102ng (Toshiba Exceria Pro SDXC 64 GB UHS-II) | |
| HP Envy x360 15m-bq121dx | |
| Dell Inspiron 15 5578-1777 2-in-1 (Toshiba Exceria Pro SDXC 64 GB UHS-II) | |
| Asus VivoBook Flip TP501UQ-FZ119T (Toshiba Exceria Pro SDXC 64 GB UHS-II) | |
| Asus VivoBook Flip 15 TP510UA-E8073T (Toshiba Exceria Pro SDXC 64 GB UHS-II) | |
Maintenance
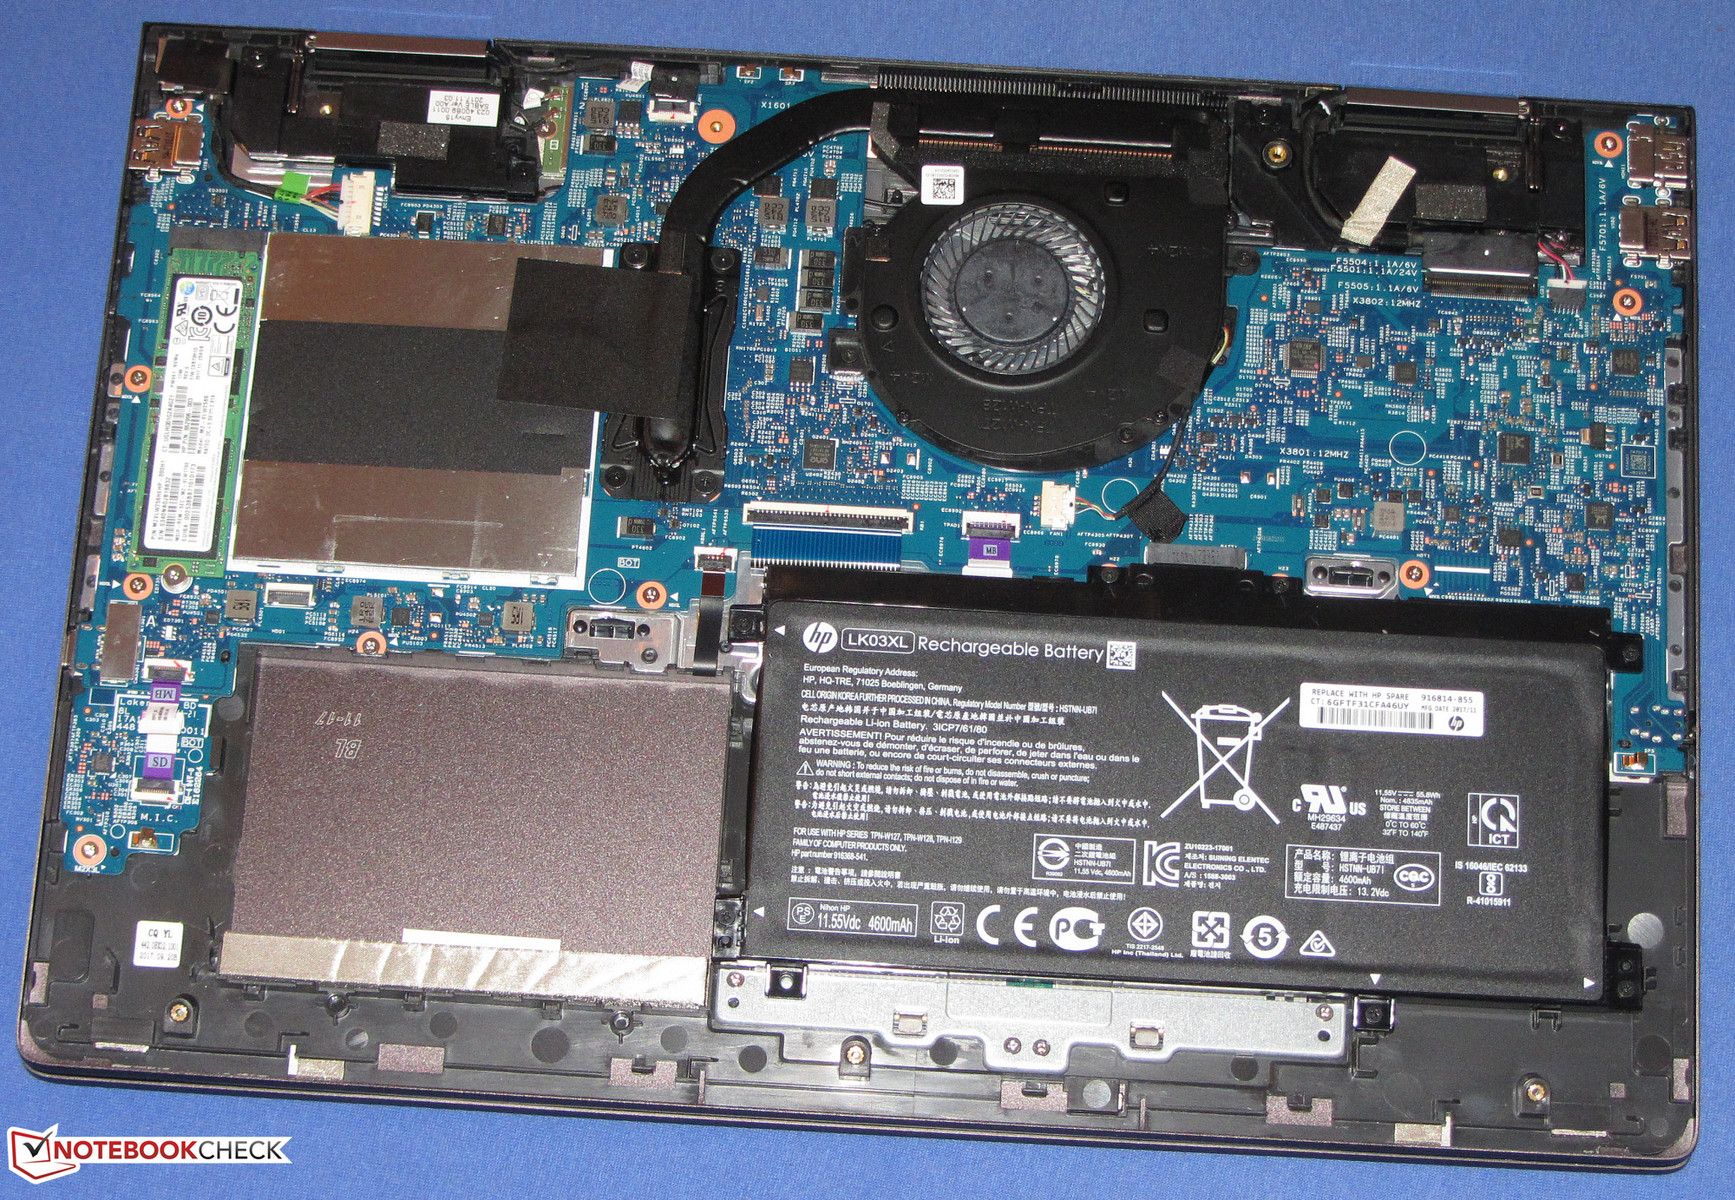
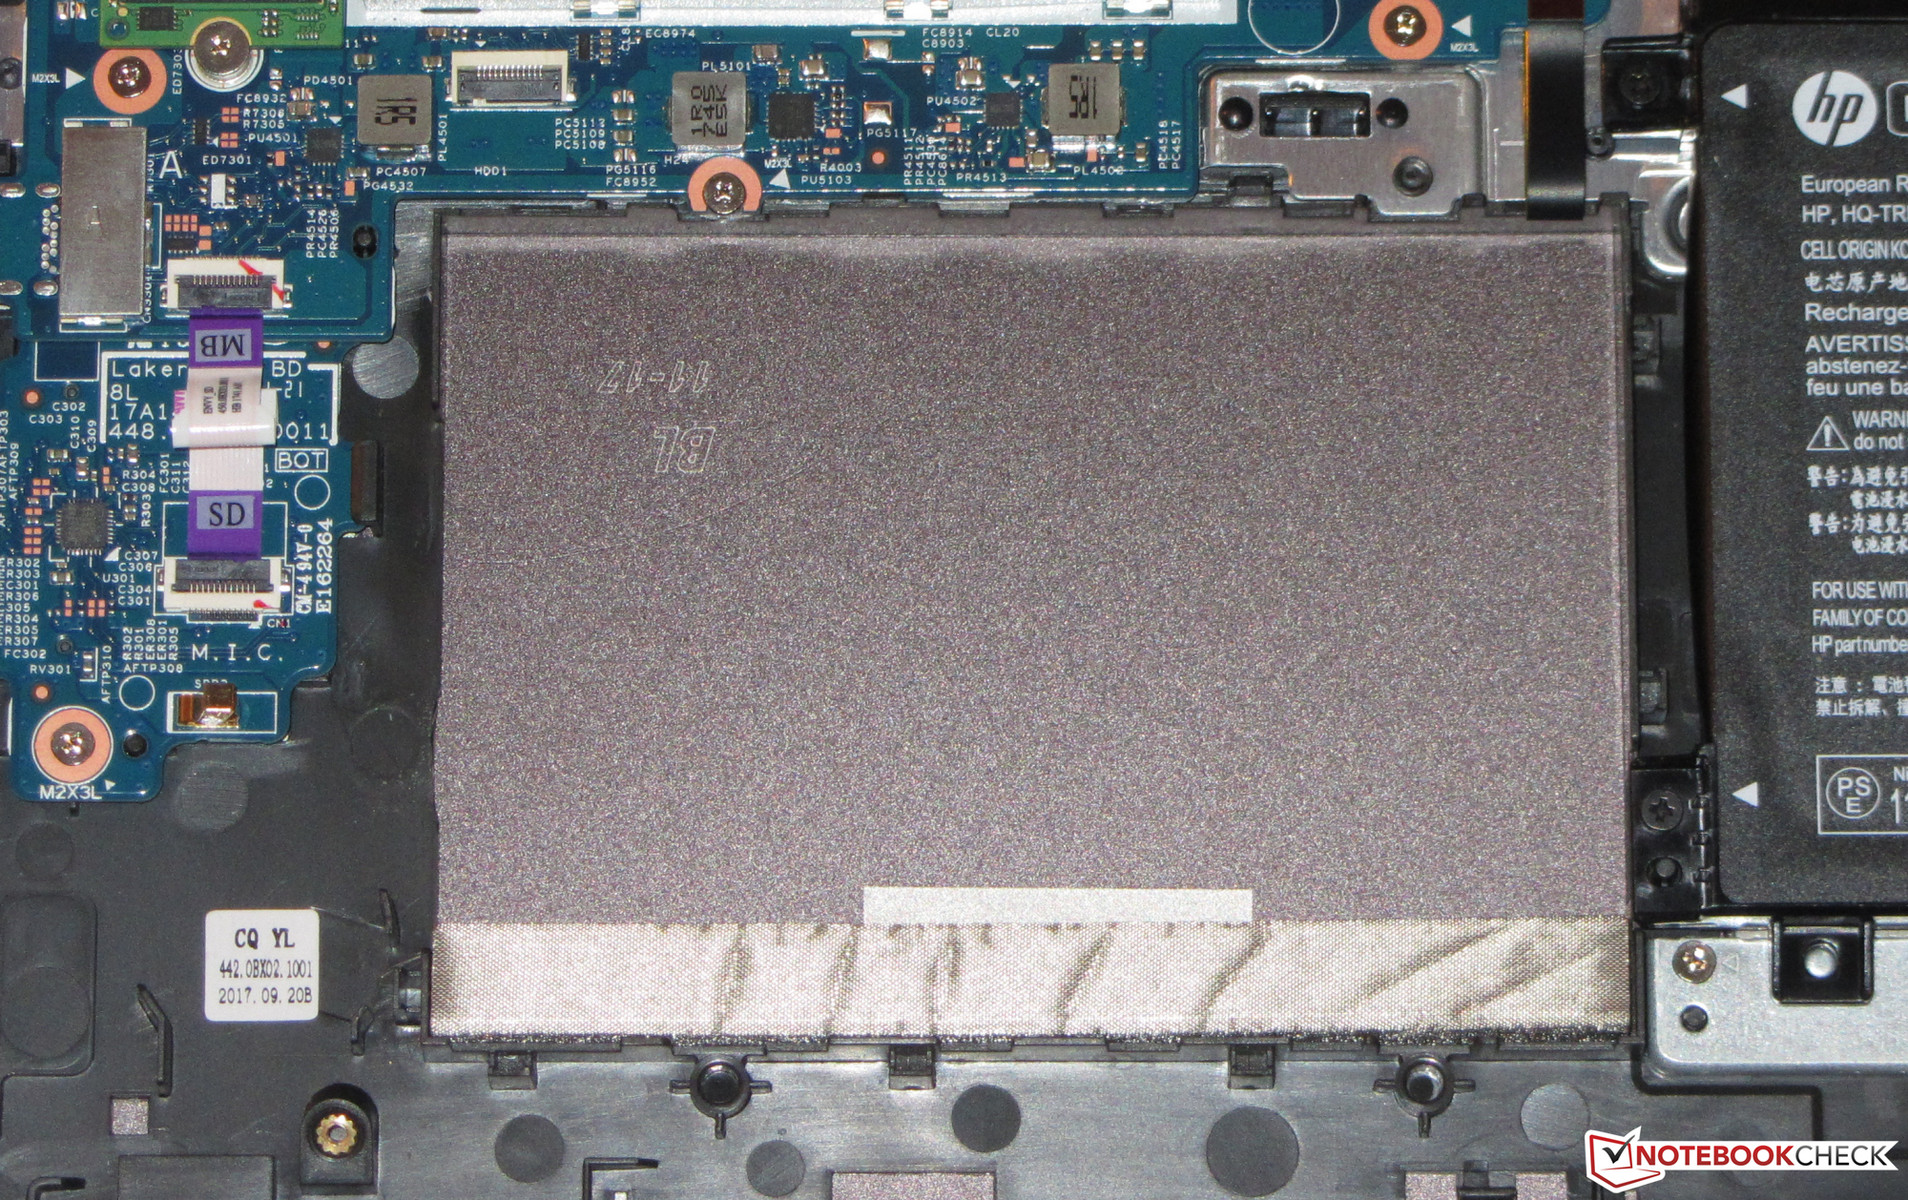
It is not impossible to open and upgrade the Envy per se. However, HP have done everything they could to make it as hard as humanly possible. The device lacks a dedicated maintenance hatch, and in order to get to the internal hardware the case has to be opened. This, in turn, requires removal of all screws at the bottom of the device, including the four hidden ones underneath the rear rubber strip. Afterwards, the base panel can be slowly and carefully popped open with a spudger tool or a spatula. This step requires an extra amount of care and finesse since the base panel seems to be practically glued to the case. Once opened, you have access to the SSD, the fan, the battery, and the RAM slots that are hidden behind an extra shield. In order to get to the Wi-Fi card, the entire motherboard has to be removed.
Running Linux on the Envy
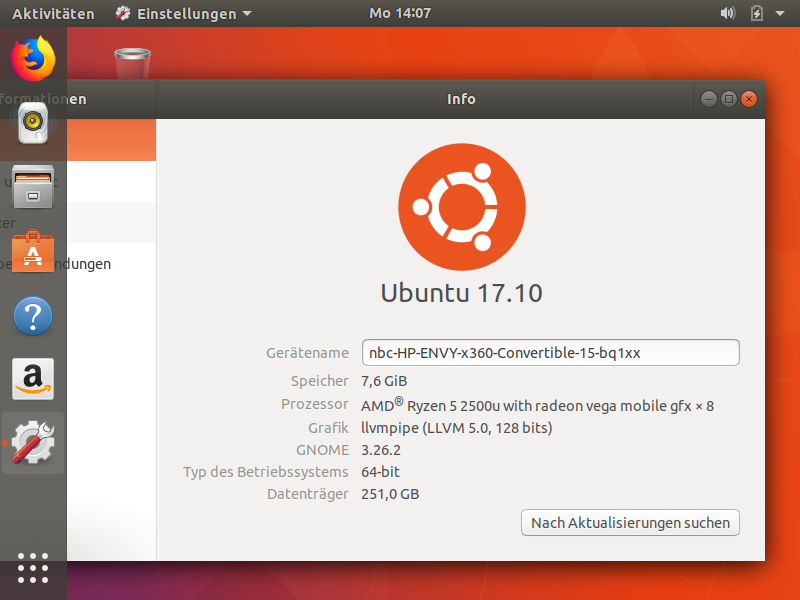
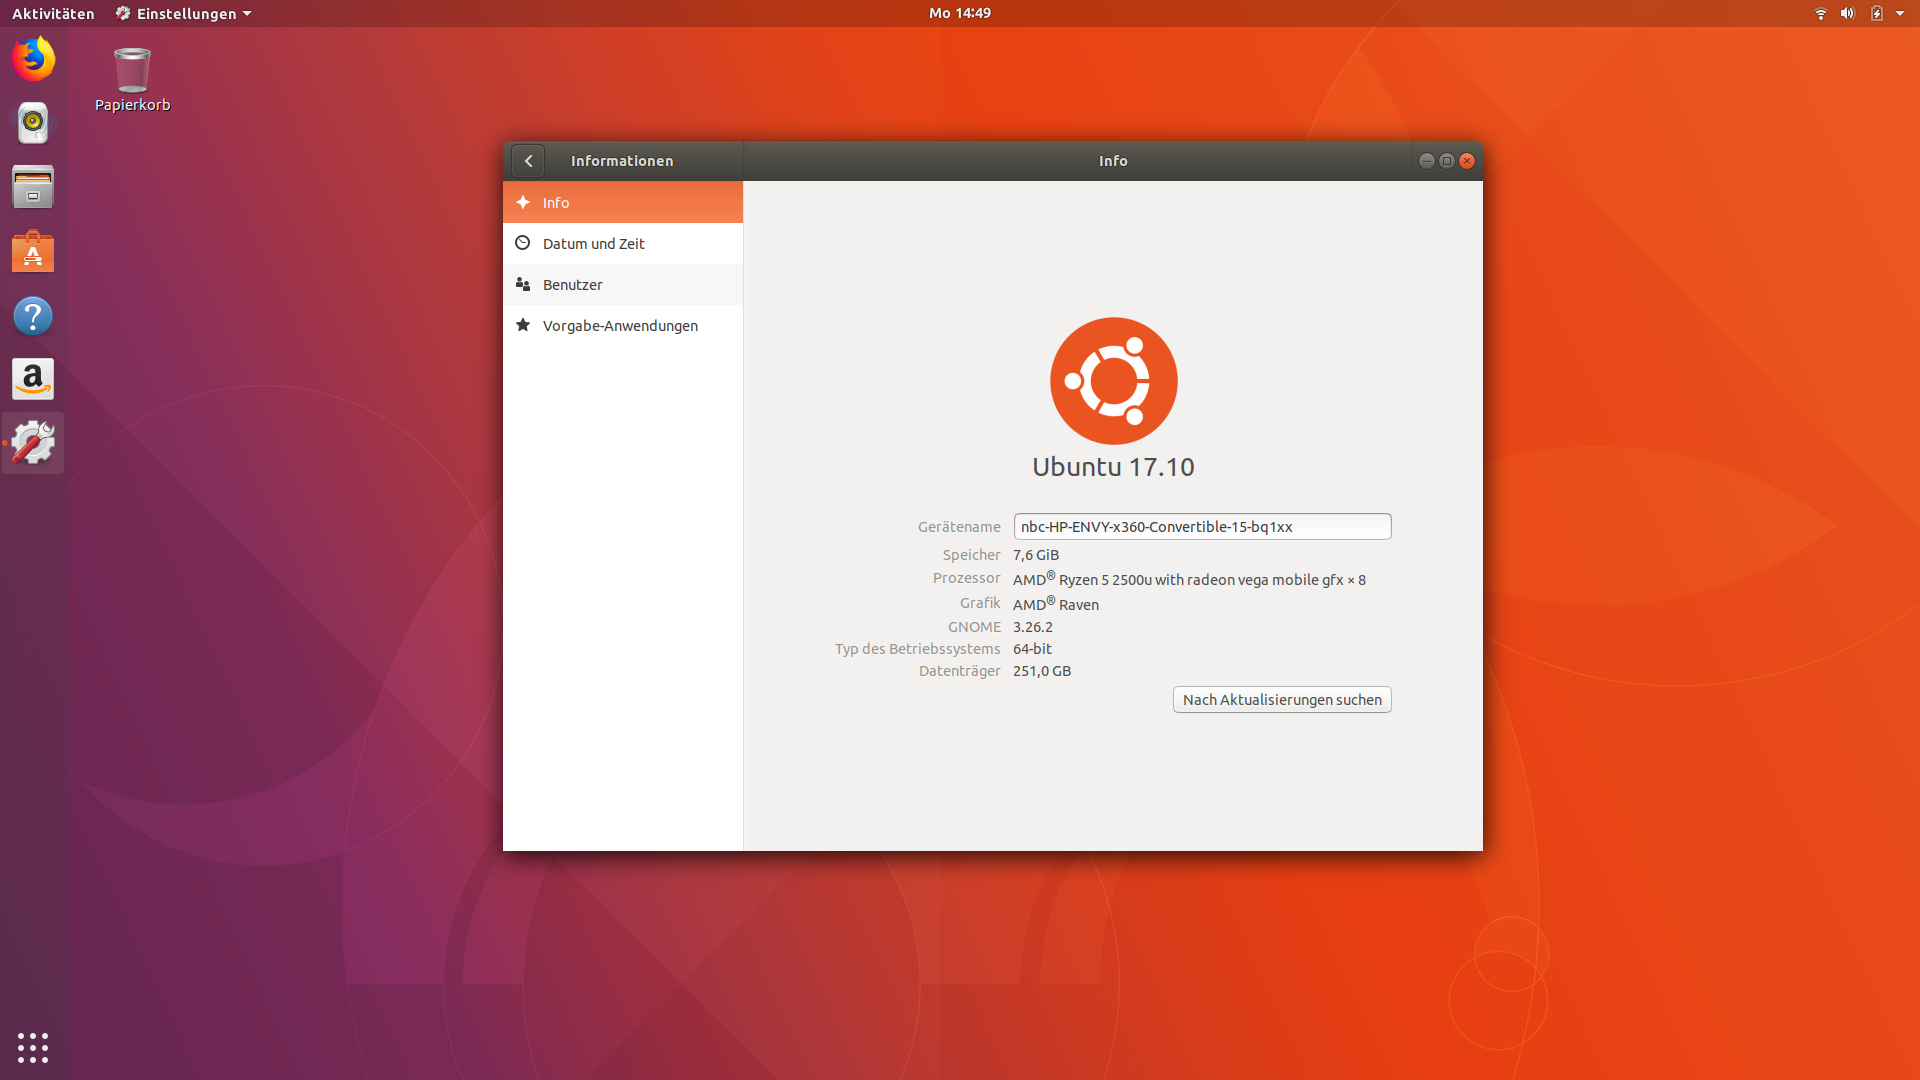
To find out how well Linux and Ryzen get along we have tried installing Ubuntu 17.10.1 on the Envy. Given that the installer image does not contain any GPU drivers, the resolution was fixed at 800 x 600 after first boot. And since Ubuntu also lacked a driver for the Wi-Fi chip we had to connect to the internet via a compatible USB Wi-Fi adapter first. After installing all available Ubuntu updates we went on to download and install AMD’s GPU driver for Linux from AMD’s website. Unfortunately, rebooting the device after installing these drivers did not really solve the issue.
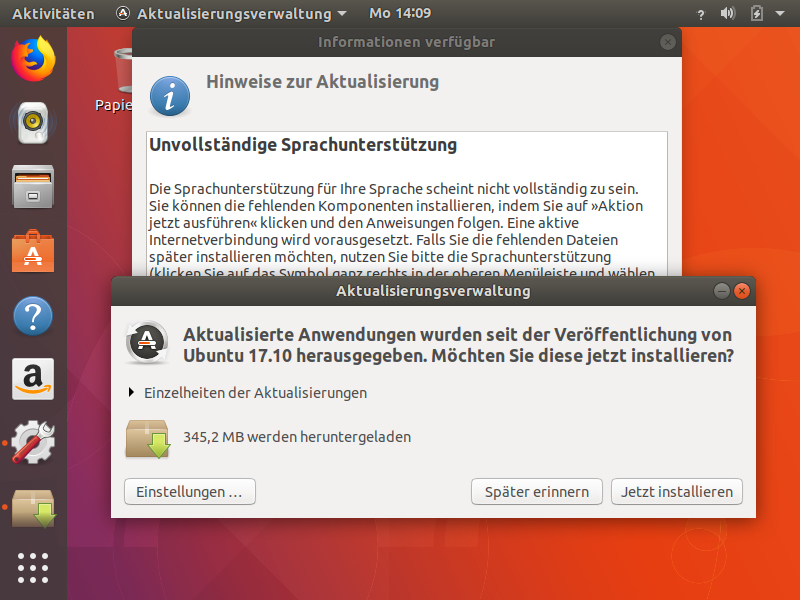
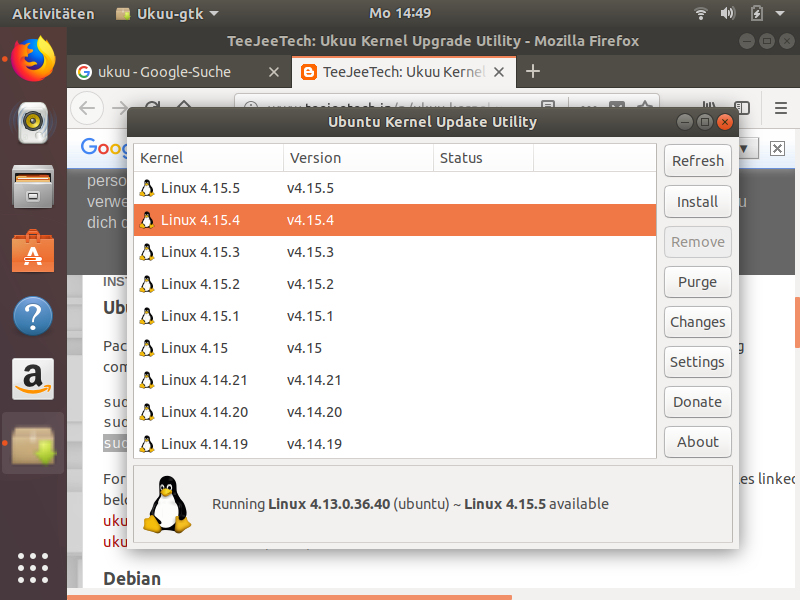
This was not particularly surprising given that the running Kernel (4.13.x.x) lacked support for Ryzen’s Vega GPU. Full support is only available with Linux kernels 4.15 and newer, so we had to install Kernel 4.15.4 via Ubuntu’s Kernel Upgrade Utility (UKUU). Another reboot and the system came up in FHD using the previously installed AMD GPU driver for Vega. Positive side effect: the newer kernel also supported the Envy’s Wi-Fi chip.
Note: the latest available Linux kernel at the time of testing was 4.15.5. However, Ubuntu reproducibly froze during boot with this particular kernel. If newer kernels are available we suggest trying these first - if things deteriorate, you can always boot into recovery mode and try a different kernel.
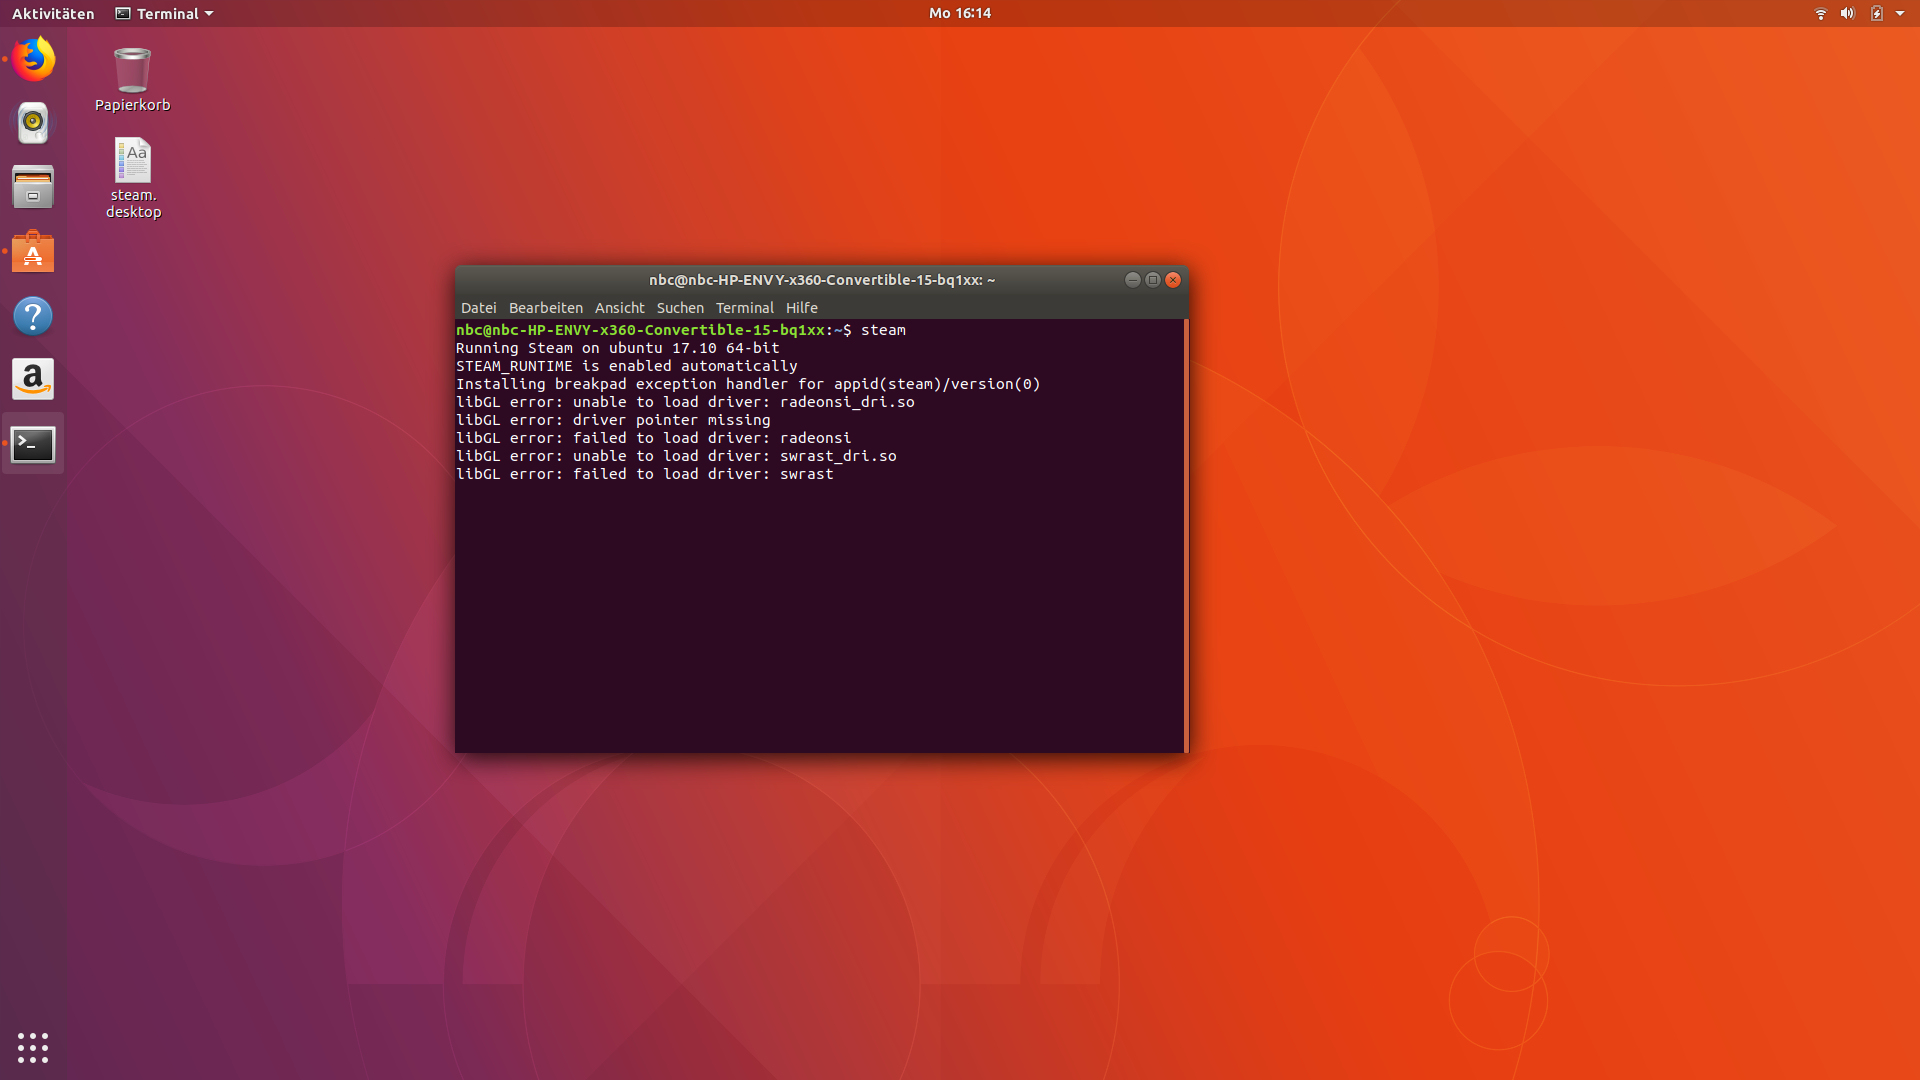
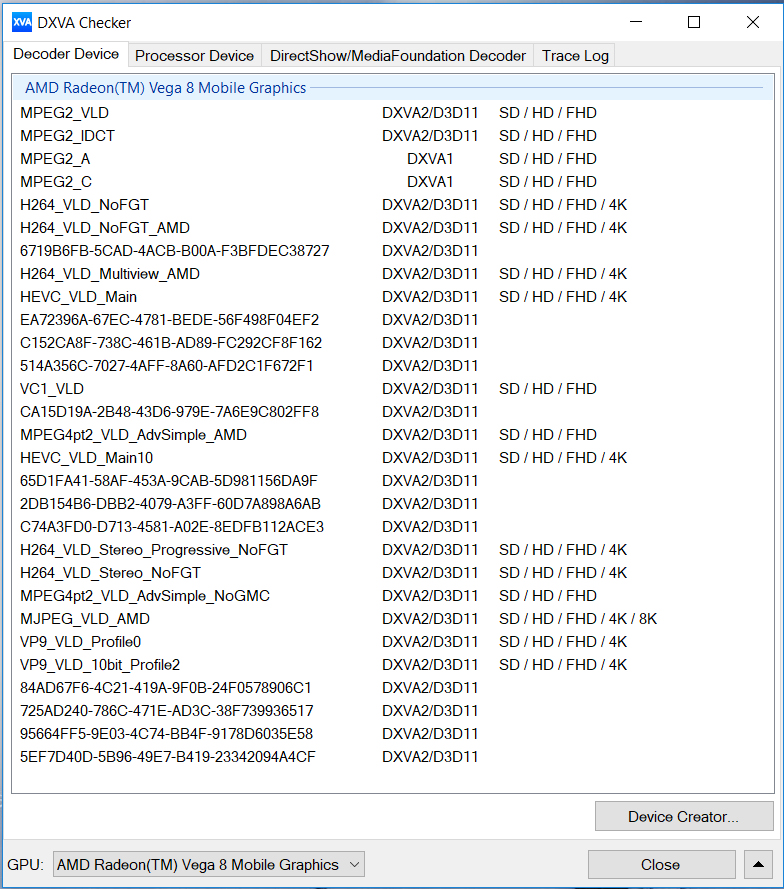
Apart from the touchscreen, the Envy’s hardware was working perfectly fine with the 4.15 Linux kernel. The touchscreen requires a driver that was not available at the time of writing. GPU video acceleration seemed to be working perfectly fine - 4k Videos on YouTube ran buttery smooth. We were unable to play any games though - while Steam installed just fine it crashed at launch. The same happened with X-Plane 11.11: it installed just fine, but crashed reproducibly a second after launch.
Display

The 15.6-inch FHD touchscreen (1920x1080) features a decent contrast ratio (1473:1) but an abysmal maximum brightness of just 207 nits. We expect at least 300 nits from a modern notebook.
Unfortunately, we were able to detect PWM flickering at brightness levels of 30% and below. Fortunately, the frequency was very high (25kHz) and thus harmless. Even the most sensitive users should not suffer from headaches or eye strain because of it.
| |||||||||||||||||||||||||
Brightness Distribution: 87 %
Center on Battery: 222 cd/m²
Contrast: 1473:1 (Black: 0.15 cd/m²)
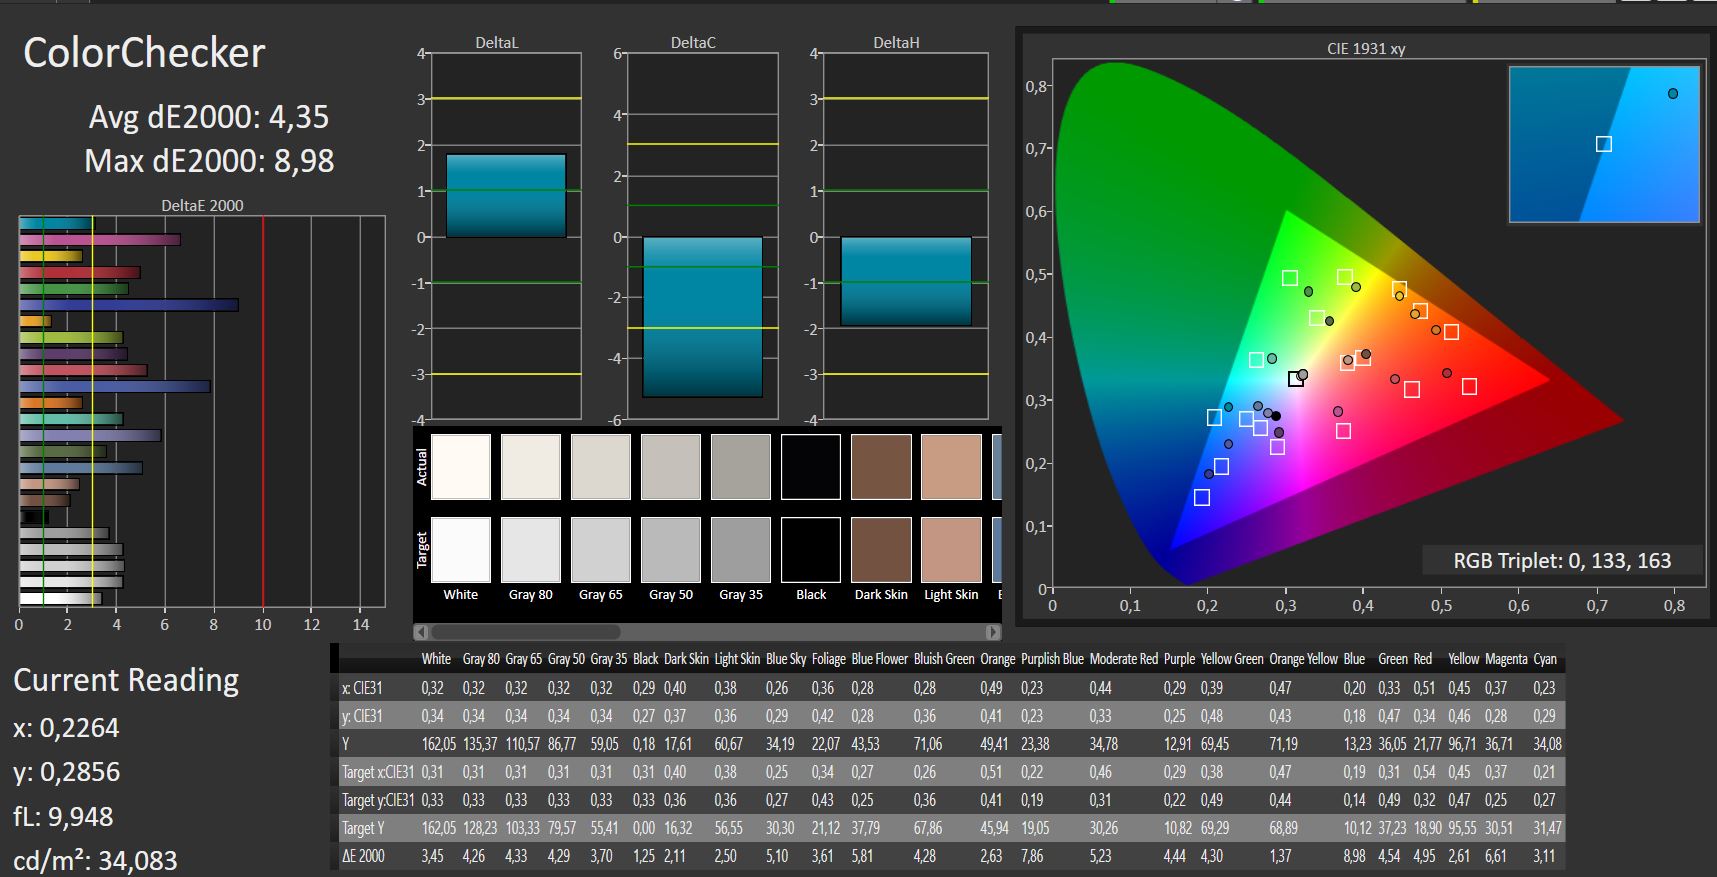
ΔE ColorChecker Calman: 4.35 | ∀{0.5-29.43 Ø4.72}
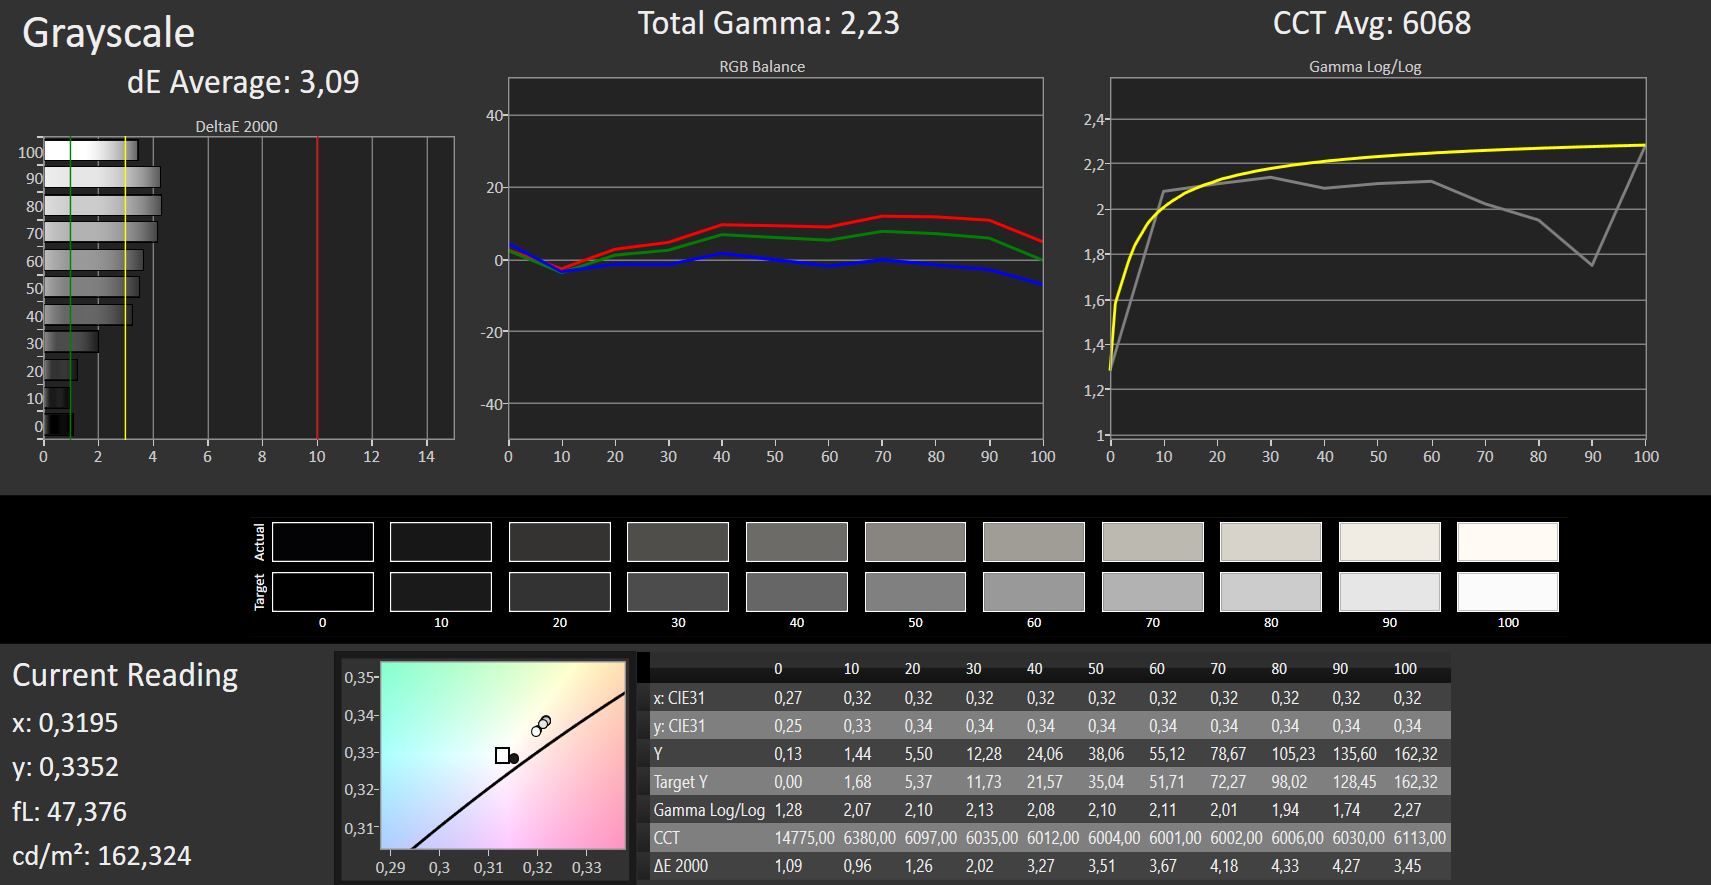
ΔE Greyscale Calman: 3.09 | ∀{0.09-98 Ø4.97}
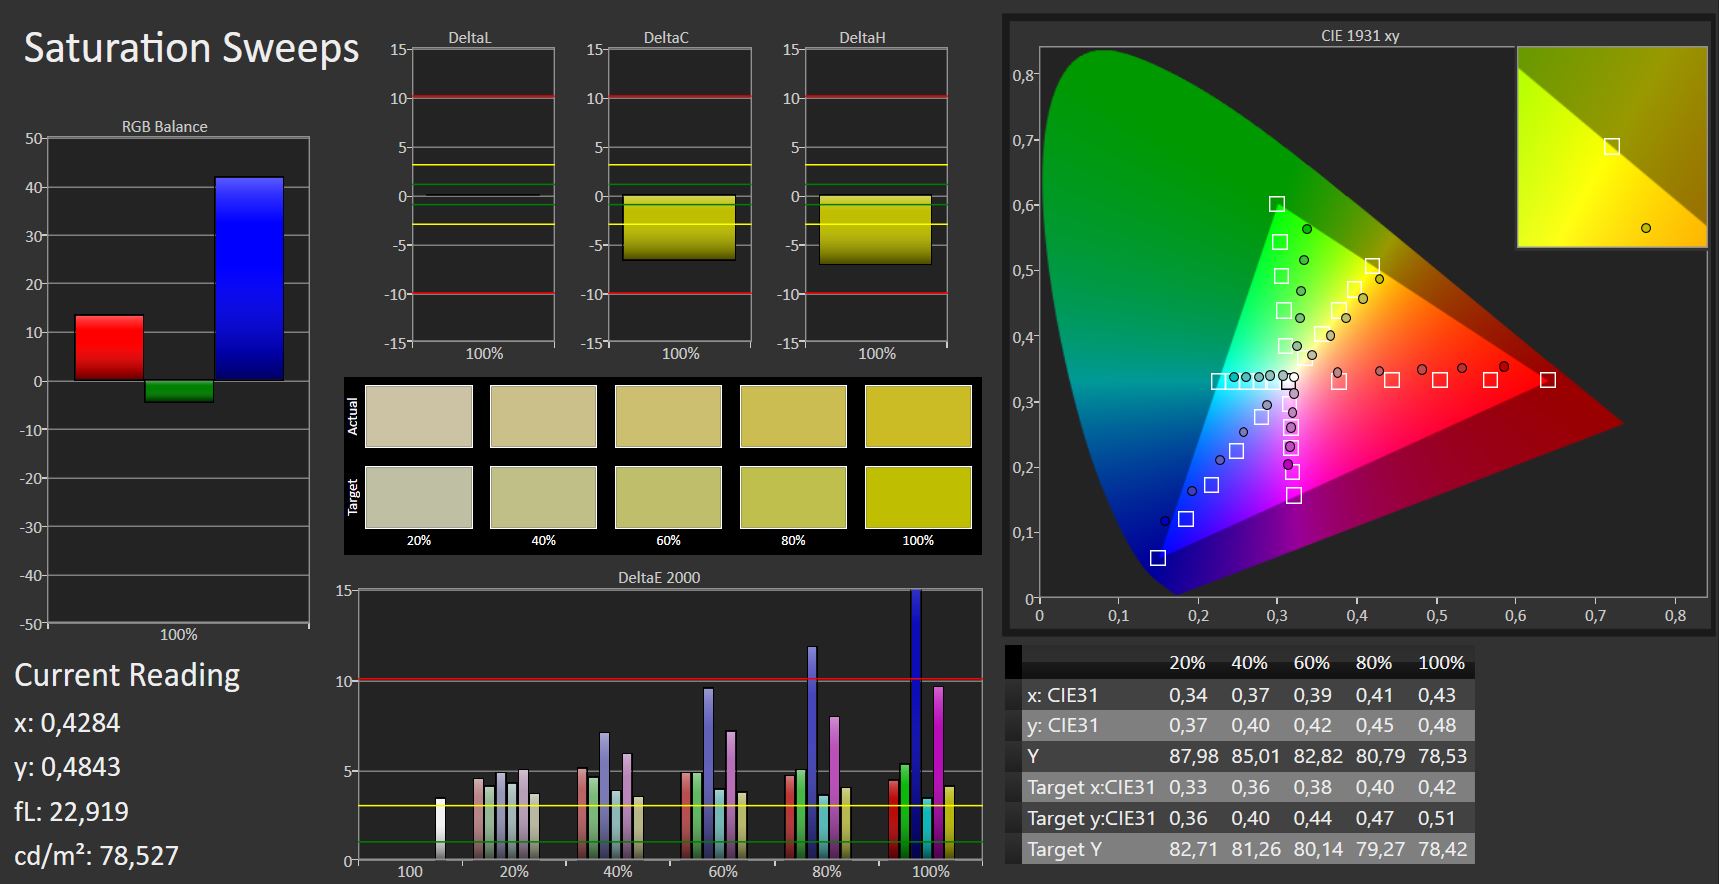
86% sRGB (Argyll 1.6.3 3D)
56% AdobeRGB 1998 (Argyll 1.6.3 3D)
42.74% AdobeRGB 1998 (Argyll 3D)
62.2% sRGB (Argyll 3D)
41.36% Display P3 (Argyll 3D)
Gamma: 2.23
CCT: 6068 K
| HP Envy x360 15-bq102ng IPS, 1920x1080, 15.6" | HP Envy x360 15m-bq121dx IPS, 1920x1080, 15.6" | Asus VivoBook Flip TP501UQ-FZ119T IPS, 1920x1080, 15.6" | Dell Inspiron 15 5578-1777 2-in-1 IPS, 1920x1080, 15.6" | Asus VivoBook Flip 15 TP510UA-E8073T IPS, 1920x1080, 15.6" | |
|---|---|---|---|---|---|
| Display | -4% | 53% | 1% | -5% | |
| Display P3 Coverage (%) | 41.36 | 39.97 -3% | 67.3 63% | 41.74 1% | 39.19 -5% |
| sRGB Coverage (%) | 62.2 | 58.3 -6% | 88.7 43% | 62.8 1% | 58.9 -5% |
| AdobeRGB 1998 Coverage (%) | 42.74 | 41.29 -3% | 64.9 52% | 43.13 1% | 40.49 -5% |
| Response Times | -3% | -26% | -8% | -11% | |
| Response Time Grey 50% / Grey 80% * (ms) | 40 ? | 30.8 ? 23% | 45 ? -13% | 55 ? -38% | 44 ? -10% |
| Response Time Black / White * (ms) | 26 ? | 33.6 ? -29% | 36 ? -38% | 20 ? 23% | 29 ? -12% |
| PWM Frequency (Hz) | 25000 ? | 201.6 ? | 19840 ? | ||
| Screen | -26% | -4% | -18% | -16% | |
| Brightness middle (cd/m²) | 221 | 230.2 4% | 314 42% | 244 10% | 229 4% |
| Brightness (cd/m²) | 207 | 222 7% | 287 39% | 242 17% | 221 7% |
| Brightness Distribution (%) | 87 | 88 1% | 85 -2% | 93 7% | 76 -13% |
| Black Level * (cd/m²) | 0.15 | 0.2 -33% | 0.25 -67% | 0.25 -67% | 0.15 -0% |
| Contrast (:1) | 1473 | 1151 -22% | 1256 -15% | 976 -34% | 1527 4% |
| Colorchecker dE 2000 * | 4.35 | 5.7 -31% | 4.55 -5% | 4.94 -14% | 5.03 -16% |
| Colorchecker dE 2000 max. * | 8.98 | 20.8 -132% | 7.39 18% | 7.3 19% | 8.89 1% |
| Greyscale dE 2000 * | 3.09 | 2.6 16% | 4.95 -60% | 4.93 -60% | 5.56 -80% |
| Gamma | 2.23 99% | 2.2 100% | 2.37 93% | 2.7 81% | 2.64 83% |
| CCT | 6068 107% | 6109 106% | 5803 112% | 7401 88% | 7015 93% |
| Color Space (Percent of AdobeRGB 1998) (%) | 56 | 37.5 -33% | 58 4% | 40 -29% | 37 -34% |
| Color Space (Percent of sRGB) (%) | 86 | 57.9 -33% | 89 3% | 63 -27% | 59 -31% |
| Total Average (Program / Settings) | -11% /
-18% | 8% /
4% | -8% /
-13% | -11% /
-13% |
* ... smaller is better
Screen Flickering / PWM (Pulse-Width Modulation)
| Screen flickering / PWM detected | 25000 Hz | ≤ 30 % brightness setting | 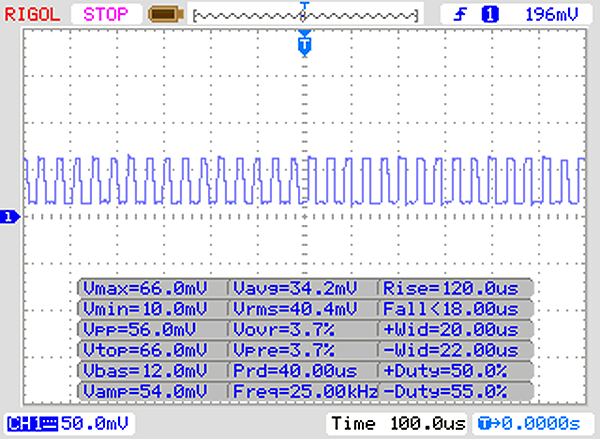 |
The display backlight flickers at 25000 Hz (worst case, e.g., utilizing PWM) Flickering detected at a brightness setting of 30 % and below. There should be no flickering or PWM above this brightness setting. The frequency of 25000 Hz is quite high, so most users sensitive to PWM should not notice any flickering. In comparison: 52 % of all tested devices do not use PWM to dim the display. If PWM was detected, an average of 7750 (minimum: 5 - maximum: 343500) Hz was measured. | |||
Out of the box, CalMAN found a DeltaE 2000 deviation of 4.35 (ideal: less than 3). We found no blue tint on the display.
Display Response Times
| ↔ Response Time Black to White | ||
|---|---|---|
| 26 ms ... rise ↗ and fall ↘ combined | ↗ 14 ms rise | 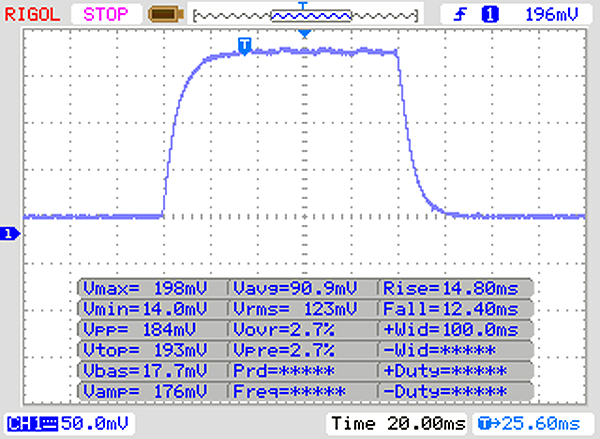 |
| ↘ 12 ms fall | ||
| The screen shows relatively slow response rates in our tests and may be too slow for gamers. In comparison, all tested devices range from 0.1 (minimum) to 240 (maximum) ms. » 63 % of all devices are better. This means that the measured response time is worse than the average of all tested devices (19.8 ms). | ||
| ↔ Response Time 50% Grey to 80% Grey | ||
| 40 ms ... rise ↗ and fall ↘ combined | ↗ 22 ms rise | 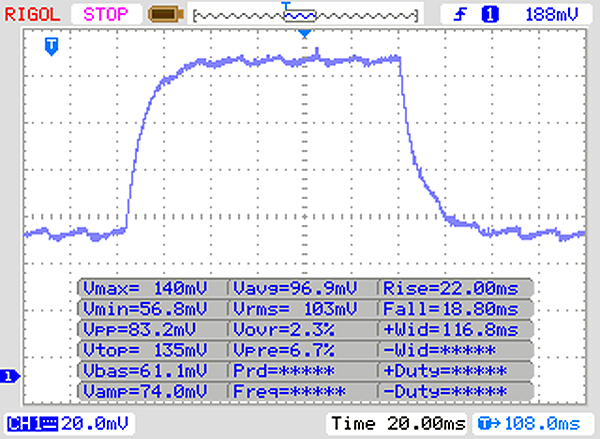 |
| ↘ 18 ms fall | ||
| The screen shows slow response rates in our tests and will be unsatisfactory for gamers. In comparison, all tested devices range from 0.165 (minimum) to 636 (maximum) ms. » 61 % of all devices are better. This means that the measured response time is worse than the average of all tested devices (31 ms). | ||
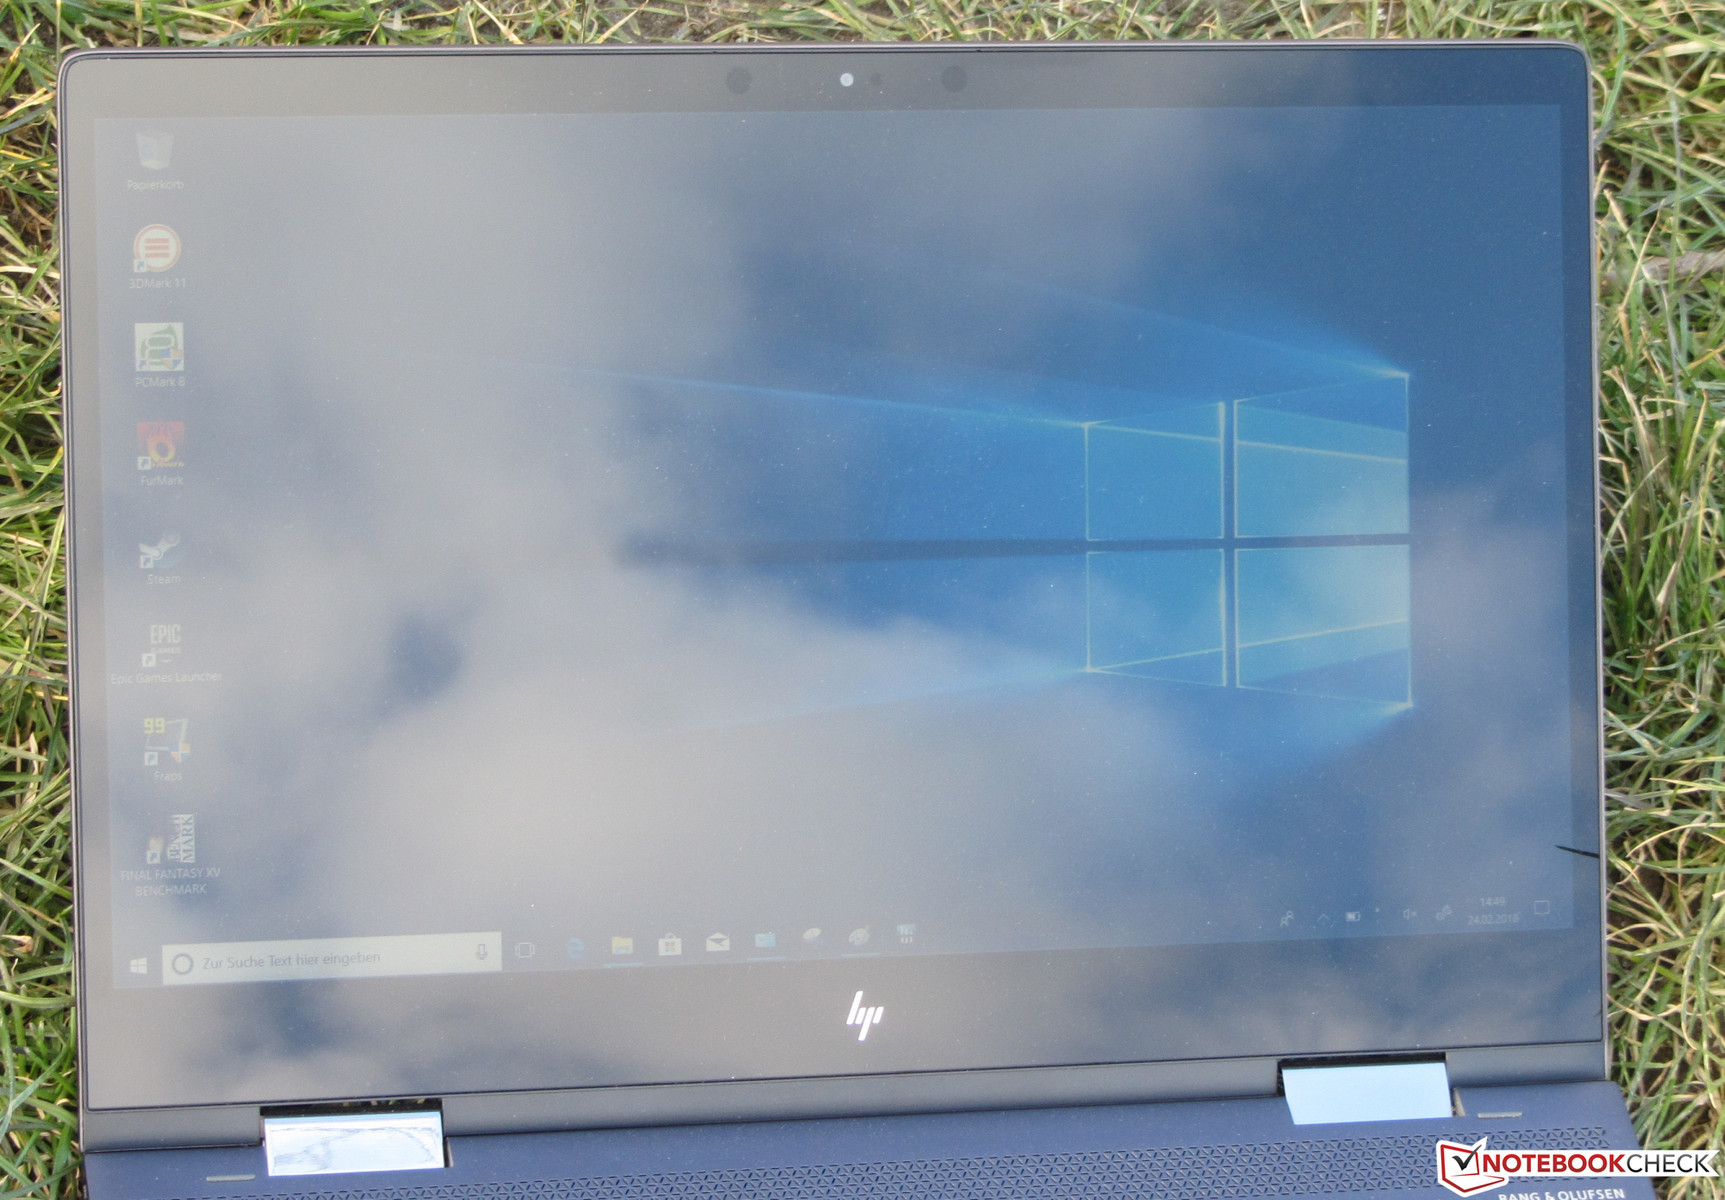
The Envy’s viewing angles were, as expected for an IPS panel, superb. Outdoor usability was severely hampered not only by the low maximum brightness, but also the highly reflective nature of the screen itself. It was thus only usable in the shade.
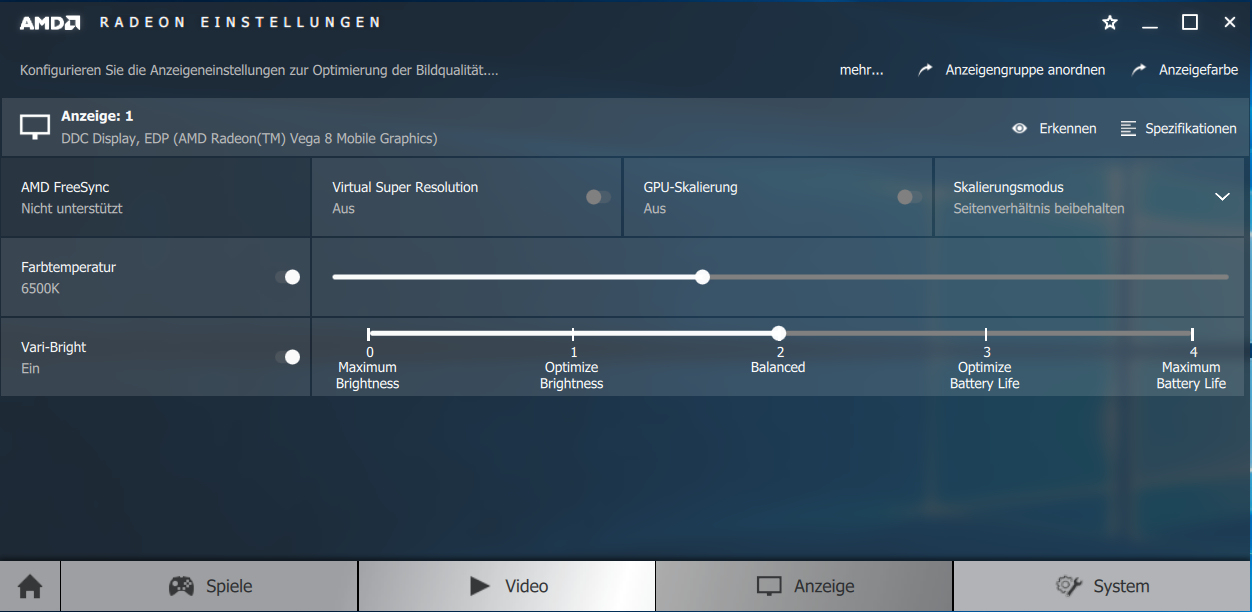
AMD’s Vari Bright technology is supposed to reduce power consumption and improve battery life by dynamically adjusting the panel’s brightness based on the contents displayed on the screen. However, given the Envy’s very low maximum brightness we strongly suggest disabling this feature altogether in order to avoid any further decreases of brightness when running on battery. The Vari Bright feature can be disabled in AMD’s Radeon Settings application.
Performance
The HP Envy x360 15z is a 15.6-inch convertible with enough oomph for the most common usage scenarios, and its integrated GPU is not averse to casual gaming either. At the time of writing, our review unit cost $750 on HP’s website, and the device itself was available in various hardware configurations. In addition, a practically identical model equipped with a choice of Intel CPUs and Nvidia GPUs was also available.
Issues and Crashes
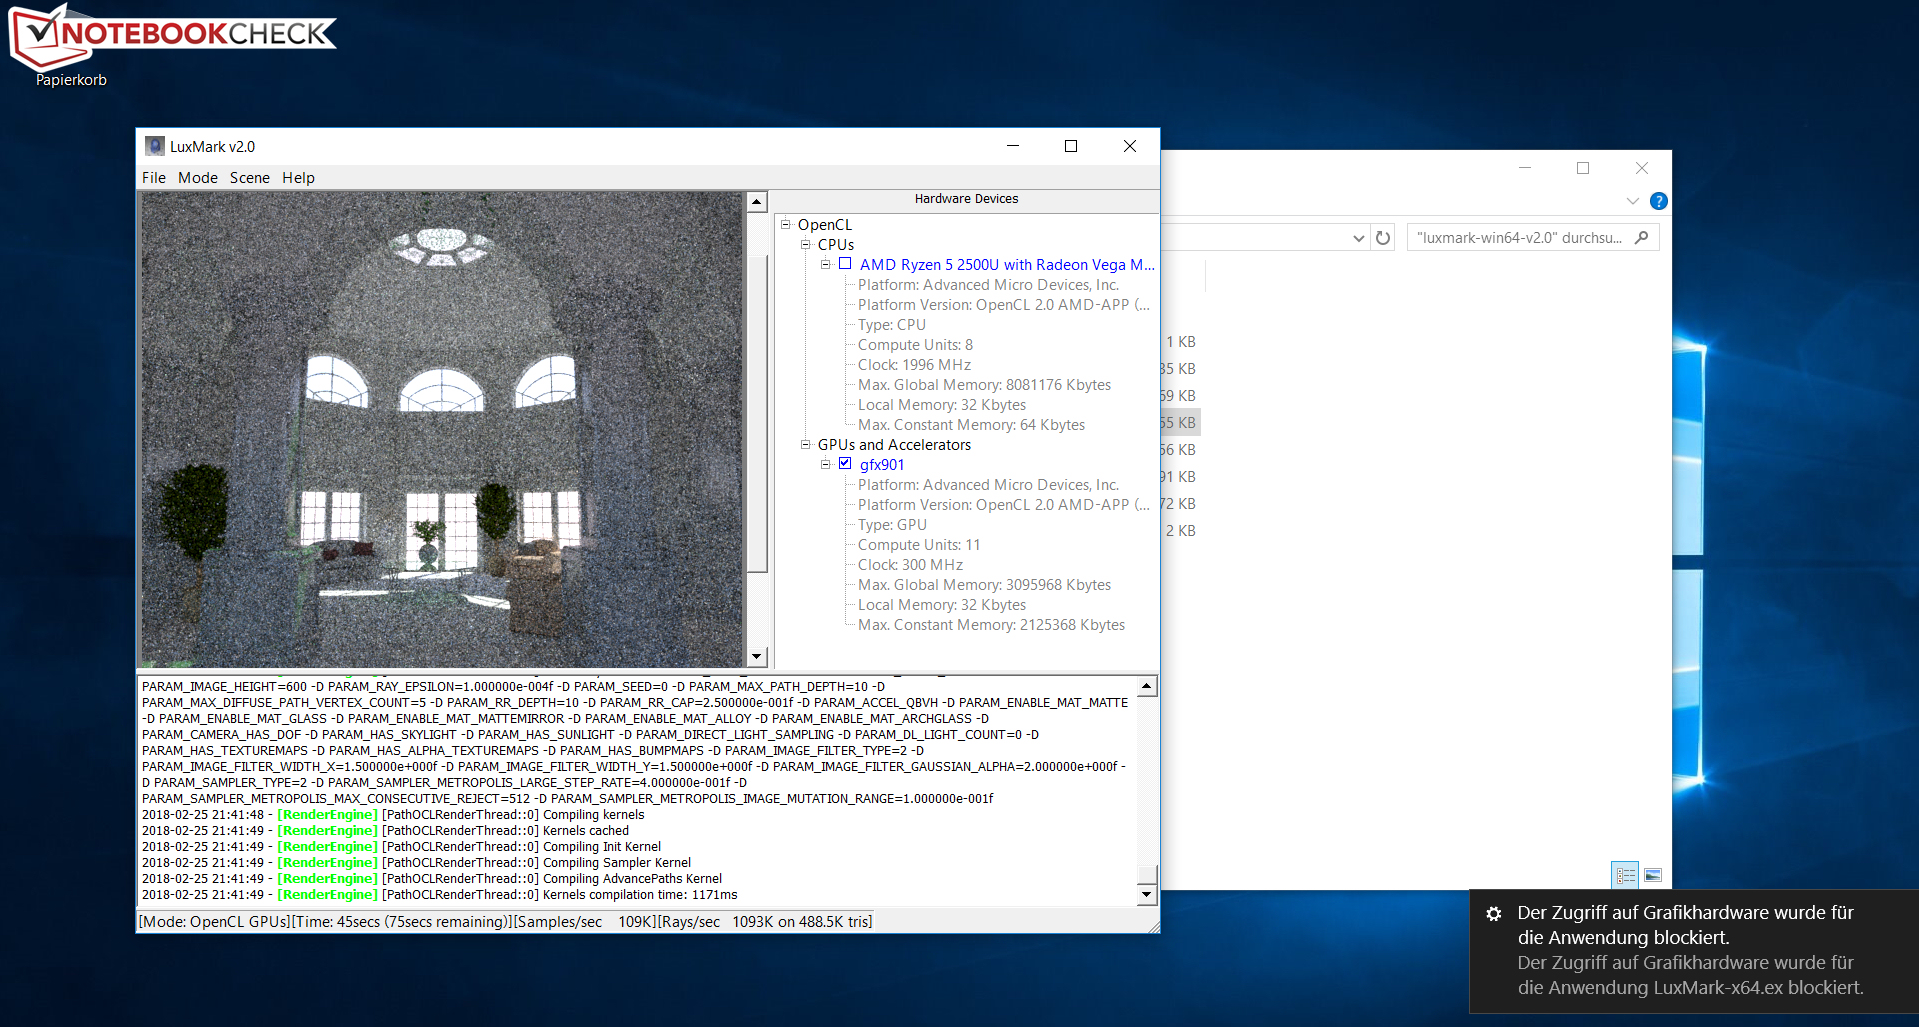
We have already had a US model of the Envy in review in late 2017, and had experienced random crashes when first reviewing the unit. Unfortunately, things have not really changed since, and our review unit suffered from the exact same issue and randomly crashed while running various benchmarks (PC Mark 8 Creative, PC Mark 10, LuxMark). The cause seems to be the same for all these crashes: we get an error message saying that access to the graphics hardware has been denied for the application.
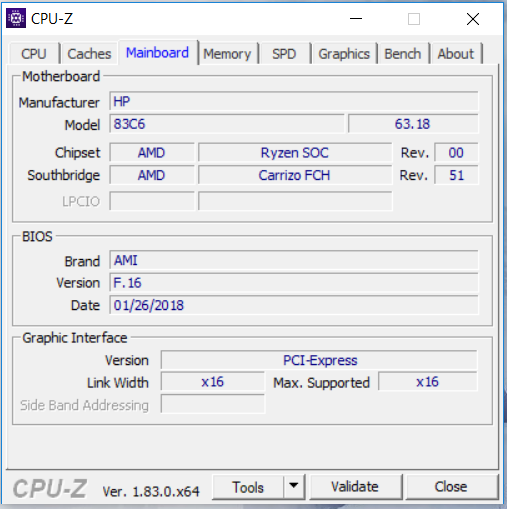
In order to eliminate any preloaded HP software, drivers, or modifications we decided to wipe the SSD completely (which even included all hidden partitions) and reinstall Windows 10 (1709, 1703, and 1607) from scratch via an ISO file downloaded directly from Microsoft’s website. We have also tried every single GPU driver listed on HP’s website and flashed the latest BIOS firmware (dated 1/26/2018) to no avail. The machine kept crashing randomly.
It is worth noting though that the crashes did not occur while running our gaming benchmarks or during normal everyday use. Consequently, they should not be too much of an issue for most users. Nevertheless, HP, Microsoft, and AMD need to address this ASAP.
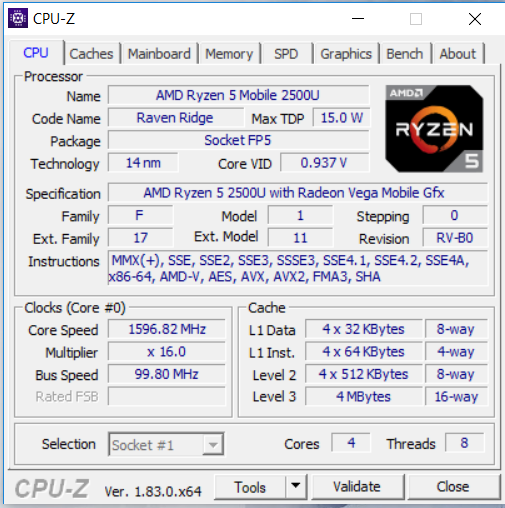
Processor
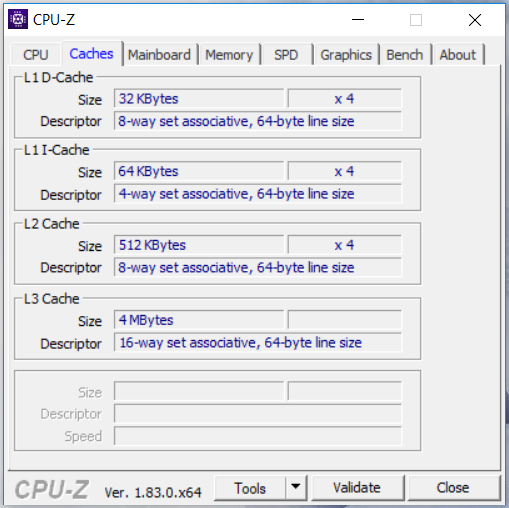
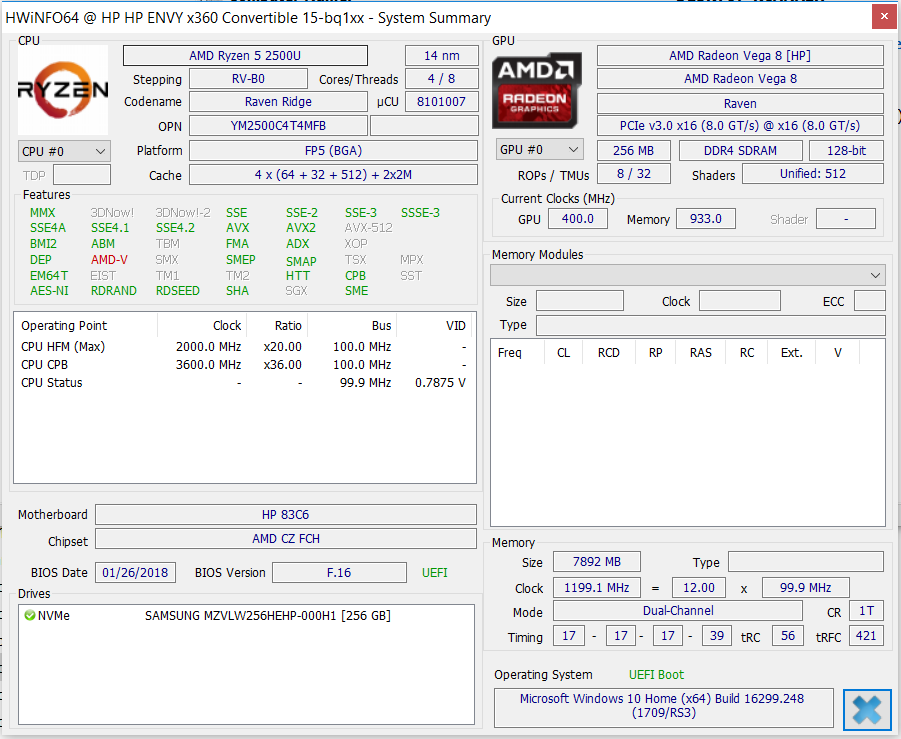
The Envy is equipped with an AMD Raven Ridge based Ryzen 5 2500U APU with four physical cores running at a base frequency of 2 GHz and a turbo boost clock speed of up to 3.6 GHz. The CPU supports SMT with up to two threads per core.
While running our CPU benchmarks on mains, the CPU ran at 2.8-3 GHz and 1.4-3.6 GHz in multi-thread and single-thread benchmarks, respectively. In single-core benchmarks only a single core was running at 3.6 GHz with the other three happily chugging along at 1.4-1.8 GHz. When running on battery, turbo boost was rarely ever applied at all. Frequencies were at 2 GHz (multi-thread) and 1.4-2.4 GHz (single-thread). Accordingly, benchmark results while running on battery were somewhat lower than benchmark results while connected to external power.
We run Cinebench R15 in a loop for at least 30 minutes in order to determine whether or not turbo boost is applied for prolonged sustained loads as well. There was a noticeable drop in performance after the first iteration, but scores remained consistent afterwards. Turbo boost was applied throughout the entire loop.
By and large, the CPU part of AMD’s Ryzen APU was on a par with Intel’s Core i5-8250U processor. We blame the seemingly underdesigned and underpowered cooling system for the fact that the Ryzen 5 2500U was not always able to keep up with the Core i5-8250U due to the lower overall turbo boost speeds.
| Cinebench R11.5 | |
| CPU Multi 64Bit | |
| MSI B350I Pro AC - DDR4-2933 - 2GB GPU | |
| HP Envy x360 15-bq102ng | |
| MSI B350I Pro AC - DDR4-2933 | |
| HP Envy x360 15m-bq121dx | |
| HP 17-bs103ng | |
| Acer Swift 3 SF315-41-R4W1 | |
| HP 15-bs103ng | |
| HP 15-ba077ng | |
| CPU Single 64Bit | |
| MSI B350I Pro AC - DDR4-2933 - 2GB GPU | |
| MSI B350I Pro AC - DDR4-2933 | |
| HP 15-bs103ng | |
| HP 17-bs103ng | |
| HP Envy x360 15-bq102ng | |
| Acer Swift 3 SF315-41-R4W1 | |
| HP Envy x360 15m-bq121dx | |
| HP 15-ba077ng | |
| Geekbench 3 | |
| 32 Bit Multi-Core Score | |
| Asus VivoBook Flip 15 TP510UA-E8073T | |
| HP 17-bs103ng | |
| HP 15-bs103ng | |
| Asus VivoBook S14 S406UA-BV023T | |
| HP Envy x360 15-bq102ng | |
| Acer Swift 3 SF315-41-R4W1 | |
| Asus VivoBook Flip TP501UQ-FZ119T | |
| Dell Inspiron 15 5578-1777 2-in-1 | |
| HP 15-ba077ng | |
| 32 Bit Single-Core Score | |
| HP Envy x360 15-bq102ng | |
| Asus VivoBook S14 S406UA-BV023T | |
| Acer Swift 3 SF315-41-R4W1 | |
| HP 17-bs103ng | |
| Asus VivoBook Flip 15 TP510UA-E8073T | |
| HP 15-bs103ng | |
| Asus VivoBook Flip TP501UQ-FZ119T | |
| Dell Inspiron 15 5578-1777 2-in-1 | |
| HP 15-ba077ng | |
| Geekbench 4.4 | |
| 64 Bit Multi-Core Score | |
| MSI B350I Pro AC - DDR4-2933 - 2GB GPU | |
| Asus VivoBook S14 S406UA-BV023T | |
| HP 17-bs103ng | |
| Asus VivoBook Flip 15 TP510UA-E8073T | |
| HP 15-bs103ng | |
| MSI B350I Pro AC - DDR4-2933 | |
| HP Envy x360 15-bq102ng | |
| Asus VivoBook Flip TP501UQ-FZ119T | |
| 64 Bit Single-Core Score | |
| MSI B350I Pro AC - DDR4-2933 - 2GB GPU | |
| MSI B350I Pro AC - DDR4-2933 | |
| Asus VivoBook S14 S406UA-BV023T | |
| Asus VivoBook Flip 15 TP510UA-E8073T | |
| HP 17-bs103ng | |
| HP 15-bs103ng | |
| Asus VivoBook Flip TP501UQ-FZ119T | |
| HP Envy x360 15-bq102ng | |
| JetStream 1.1 - 1.1 Total | |
| HP 15-bs103ng (Edge 41) | |
| HP 17-bs103ng (Edge 41) | |
| MSI B350I Pro AC - DDR4-2933 - 2GB GPU (Edge 41) | |
| MSI B350I Pro AC - DDR4-2933 (Edge 41) | |
| Asus VivoBook 15 X510UQ-BQ534T (EDGE 40.15063.674.0) | |
| Asus VivoBook Flip 15 TP510UA-E8073T (Edge 41) | |
| Asus VivoBook S14 S406UA-BV023T (Edge 41) | |
| Asus VivoBook Flip TP501UQ-FZ119T (Edge 41) | |
| Dell Inspiron 15 5578-1777 2-in-1 (Edge 38) | |
| Acer Swift 3 SF315-41-R4W1 | |
| HP Envy x360 15m-bq121dx (Edge 40.15063.674.0) | |
| HP Envy x360 15-bq102ng (Edge 41) | |
| HP 15-ba077ng (Edge 38) | |
* ... smaller is better
System Performance
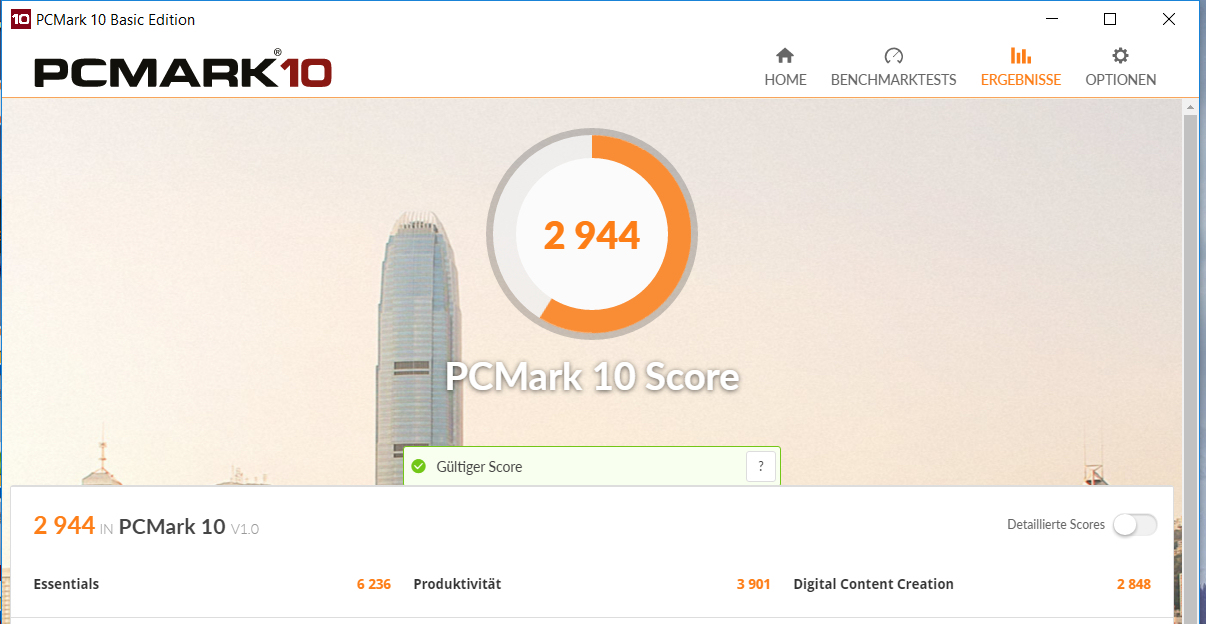
The system was very smooth and responsive. PC Mark benchmark scores were decent, albeit lagging behind Intel’s Core i5-8250U occasionally. We do not consider this to be a major issue, though, as the system was snappy and fast at all times, and never felt any slower than an Intel-based notebook. In addition, our CPU and GPU benchmarks proved that the Envy is indeed very powerful. Further performance improvements are not possible - HP has already done everything they can for optimal performance.
| PCMark 7 Score | 6091 points | |
| PCMark 8 Home Score Accelerated v2 | 3462 points | |
| PCMark 8 Creative Score Accelerated v2 | 3428 points | |
| PCMark 8 Work Score Accelerated v2 | 3800 points | |
| PCMark 10 Score | 2944 points | |
Help | ||
| PCMark 7 | |
| Score | |
| HP Envy x360 15-bq102ng | |
| HP ProBook 470 G5 | |
| HP 15-bs103ng | |
| HP 15-ba077ng | |
| Lightweight | |
| HP ProBook 470 G5 | |
| HP 15-bs103ng | |
| HP Envy x360 15-bq102ng | |
| HP 15-ba077ng | |
| Productivity | |
| HP Envy x360 15-bq102ng | |
| HP ProBook 470 G5 | |
| HP 15-bs103ng | |
| HP 15-ba077ng | |
| Entertainment | |
| HP ProBook 470 G5 | |
| HP 15-bs103ng | |
| HP Envy x360 15-bq102ng | |
| HP 15-ba077ng | |
| Creativity | |
| HP 15-bs103ng | |
| HP ProBook 470 G5 | |
| HP 15-ba077ng | |
| HP Envy x360 15-bq102ng | |
| Computation | |
| HP 15-bs103ng | |
| HP ProBook 470 G5 | |
| HP 15-ba077ng | |
| HP Envy x360 15-bq102ng | |
| System Storage | |
| HP 15-bs103ng | |
| HP ProBook 470 G5 | |
| HP Envy x360 15-bq102ng | |
| HP 15-ba077ng | |
Storage Devices
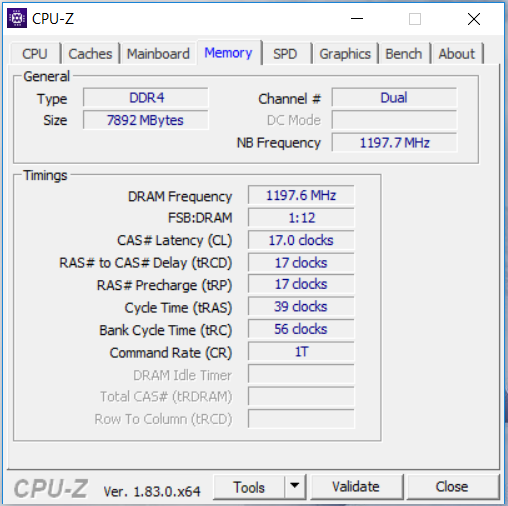
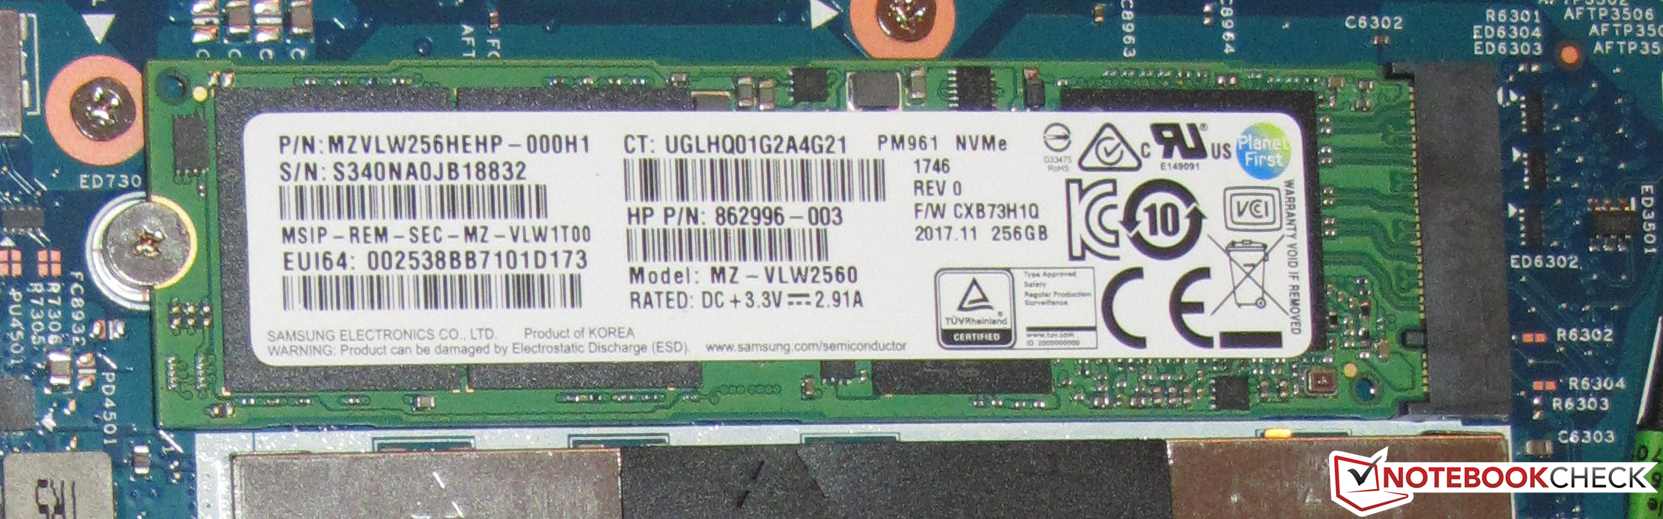
The Envy was equipped with a 256 GB M.2-2280 NVMe SSD made by Samsung, 195 GB of which was available to the user out of the box. The rest was taken up by the Windows installation and the recovery partition. Since they are connected to the rest of the hardware via PCIe 3.0 x4, NVMe SSDs tend to be much faster than SATA III SSDs. As expected, the Envy’s SSD was blazingly fast.
The notebook also features an extra 2.5-inch secondary storage drive bay. Unfortunately, our review unit did not include a mounting frame for the slot or the necessary SATA cable. These have to be purchased separately.

| HP Envy x360 15-bq102ng Samsung PM961 MZVLW256HEHP | Asus VivoBook Flip TP501UQ-FZ119T Micron SSD 1100 (MTFDDAV256TBN) | Dell Inspiron 15 5578-1777 2-in-1 SanDisk X400 256GB, SATA (SD8SB8U-256G) | Asus VivoBook Flip 15 TP510UA-E8073T SanDisk SD8SN8U128G1002 | |
|---|---|---|---|---|
| CrystalDiskMark 3.0 | -46% | -42% | -50% | |
| Read Seq (MB/s) | 1487 | 465.6 -69% | 503 -66% | 458.5 -69% |
| Write Seq (MB/s) | 1241 | 398.7 -68% | 465.3 -63% | 337.2 -73% |
| Read 512 (MB/s) | 923 | 335.6 -64% | 293 -68% | 319.1 -65% |
| Write 512 (MB/s) | 797 | 329.8 -59% | 322.7 -60% | 186 -77% |
| Read 4k (MB/s) | 49.38 | 24.11 -51% | 28.9 -41% | 28.39 -43% |
| Write 4k (MB/s) | 97.3 | 89.8 -8% | 55 -43% | 56.6 -42% |
| Read 4k QD32 (MB/s) | 295 | 161.5 -45% | 314.5 7% | 321.1 9% |
| Write 4k QD32 (MB/s) | 212.5 | 199.2 -6% | 209.2 -2% | 128.5 -40% |
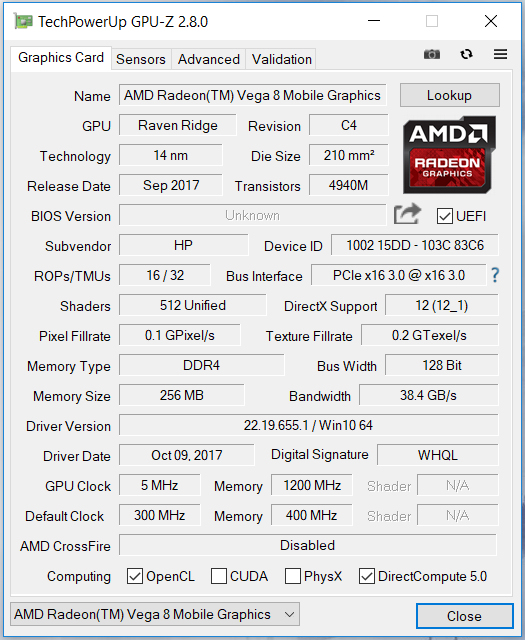
GPU Performance
Graphics are handled by AMD’s Radeon RX Vega 8 GPU. It supports DirectX 12 and runs at clock speeds of up to 1018 MHz. According to AMD’s specifications, a Vega 8 GPU can run at up to 1100 MHz, but our review unit’s GPU failed to achieve these levels. Nevertheless, 3D Mark benchmark scores were at a level expected of this GPU.
By and large, the Vega GPU did much better than Intel’s integrated GPUs, and even outperformed many dedicated GPUs. The Vega 8 performed about as fast as a GeForce 940MX equipped with GDDR5 memory and much faster than a DDR3-equipped model.
| 3DMark Vantage P Result | 11033 points | |
| 3DMark 11 Performance | 3667 points | |
| 3DMark Ice Storm Standard Score | 61382 points | |
| 3DMark Cloud Gate Standard Score | 11201 points | |
| 3DMark Fire Strike Score | 2123 points | |
| 3DMark Fire Strike Extreme Score | 1024 points | |
| 3DMark Time Spy Score | 732 points | |
Help | ||
| 3DMark 06 - 1280x1024 Standard Score AA:0x AF:0x | |
| Acer Aspire E5-575G-549D | |
| Acer Aspire E5-774G-78NA | |
| Geekbench 4.4 - Compute OpenCL Score | |
| Intel Skull Canyon NUC6i7KYK | |
| Lenovo IdeaPad 320-15IKB 80XL01NEGE | |
| HP Envy x360 15-bq102ng | |
| Asus VivoBook Flip TP501UQ-FZ119T | |
| Asus VivoBook Flip 15 TP510UA-E8073T | |
| ComputeMark v2.1 - 1024x600 Normal, Score | |
| Lenovo Yoga 720-15IKB-80X7 | |
| Intel Skull Canyon NUC6i7KYK | |
| HP Envy x360 15m-bq121dx | |
| HP Envy x360 15-bq102ng | |
| Acer Aspire E5-774G-78NA | |
| GFXBench (DX / GLBenchmark) 2.7 | |
| 1920x1080 T-Rex Offscreen | |
| Acer Aspire E5-774G-78NA | |
| HP Envy x360 15-bq102ng | |
| T-Rex Onscreen | |
| HP Envy x360 15-bq102ng | |
| Acer Aspire E5-774G-78NA | |
| GFXBench 3.0 | |
| 1920x1080 1080p Manhattan Offscreen | |
| Acer Aspire E5-774G-78NA | |
| HP Envy x360 15-bq102ng | |
| on screen Manhattan Onscreen OGL | |
| Acer Aspire E5-774G-78NA | |
| HP Envy x360 15-bq102ng | |
| GFXBench 3.1 | |
| 1920x1080 Manhattan ES 3.1 Offscreen | |
| Acer Aspire E5-774G-78NA | |
| HP Envy x360 15-bq102ng | |
| on screen Manhattan ES 3.1 Onscreen | |
| Acer Aspire E5-774G-78NA | |
| HP Envy x360 15-bq102ng | |
| GFXBench | |
| 1920x1080 Car Chase Offscreen | |
| Acer Aspire E5-774G-78NA | |
| HP Envy x360 15-bq102ng | |
| on screen Car Chase Onscreen | |
| HP Envy x360 15-bq102ng | |
| Acer Aspire E5-774G-78NA | |
| Unigine Heaven 2.1 - 1280x1024 high, Tesselation (normal), DirectX11 AA:off AF:1x | |
| Acer Aspire E5-774G-78NA | |
| HP Envy x360 15-bq102ng | |
| Unigine Heaven 3.0 | |
| 1920x1080 OpenGL, Normal Tessellation, High Shaders AA:Off AF:Off | |
| Acer Aspire E5-774G-78NA | |
| HP Envy x360 15-bq102ng | |
| 1920x1080 DX 11, Normal Tessellation, High Shaders AA:Off AF:Off | |
| HP Envy x360 15-bq102ng | |
| Acer Aspire E5-774G-78NA | |
| Unigine Heaven 4.0 | |
| Extreme Preset OpenGL | |
| HP Envy x360 15-bq102ng | |
| Extreme Preset DX11 | |
| Acer Aspire E5-774G-78NA | |
| HP Envy x360 15-bq102ng | |
| Unigine Valley 1.0 | |
| 1920x1080 Extreme HD DirectX AA:x8 | |
| HP Envy x360 15-bq102ng | |
| 1920x1080 Extreme HD Preset OpenGL AA:x8 | |
| HP Envy x360 15-bq102ng | |
Gaming Performance
Many games ran smoothly on the HP Envy provided that resolution and details were lowered to HD (1366x768) and low to medium, respectively. Less demanding games ran at higher resolutions and details while, more demanding games such as “Final Fantasy XV” were not playable at all. By and large, the Envy’s FPS were on a par with notebooks featuring Nvidia’s GDDR5-equipped GeForce 940MX GPU.
| low | med. | high | ultra | |
|---|---|---|---|---|
| World of Warcraft (2005) | 158.3 | 102.2 | 20.5 | |
| Anno 2070 (2011) | 110.9 | 76.5 | 49.1 | 24.8 |
| BioShock Infinite (2013) | 105.7 | 68.3 | 58.5 | 18.4 |
| Risen 3: Titan Lords (2014) | 36.3 | 40.7 | 14.6 | 9.5 |
| Middle-earth: Shadow of Mordor (2014) | 56.2 | 52 | 21.1 | 16.6 |
| Alien: Isolation (2014) | 71.9 | 49.5 | 28.7 | 22.3 |
| Battlefield Hardline (2015) | 58 | 51.9 | 21.4 | 14 |
| Mad Max (2015) | 43.5 | 22.7 | 20.7 | |
| Overwatch (2016) | 84.6 | 67.1 | 31.9 | 16.2 |
| Mirror's Edge Catalyst (2016) | 45.1 | 28.1 | 12.6 | 8.1 |
| Dishonored 2 (2016) | 25 | 20.6 | 11.7 | 9.9 |
| Watch Dogs 2 (2016) | 29.6 | 21.7 | 10.7 | 6.9 |
| Warhammer 40.000: Dawn of War III (2017) | 43.3 | 16.7 | 14.8 | 13.1 |
| Prey (2017) | 56.8 | 20.1 | 16.7 | 14.8 |
| Rocket League (2017) | 107.3 | 44 | 27.9 | |
| FIFA 18 (2017) | 147.2 | 76.4 | 63.3 | 58.3 |
| ELEX (2017) | 33.8 | 15.9 | 12.6 | 9.9 |
| Fortnite (2018) | 75 | 22.7 | 16.7 | 9.1 |
| Final Fantasy XV Benchmark (2018) | 20.1 | 10.3 | 5.1 | |
| Kingdom Come: Deliverance (2018) | 28.2 | 12.4 | 10.1 | 7.3 |
| X-Plane 11.11 (2018) | 24 | 18.3 | 15.6 |
| Prey - 1280x720 Low Preset AF:2x | |
| Lenovo IdeaPad 320-15IKB 80XL01NEGE | |
| HP Envy x360 15m-bq121dx | |
| HP Envy x360 15-bq102ng | |
| HP 17-bs103ng | |
| HP 15-bs103ng | |
| Rocket League - 1920x1080 Quality AA:Medium FX | |
| Lenovo IdeaPad 320-15IKB 80XL01NEGE | |
| HP Envy x360 15-bq102ng | |
| Acer Swift 3 SF315-41-R4W1 | |
| HP 17-bs103ng | |
| HP 15-bs103ng | |
| FIFA 18 - 1920x1080 Ultra Preset AA:4xMS | |
| HP Envy x360 15-bq102ng | |
| Lenovo IdeaPad 320-15IKB 80XL01NEGE | |
| Acer Swift 3 SF315-41-R4W1 | |
| HP 15-bs103ng | |
| Overwatch - 1366x768 Medium (Render Scale 100 %) AA:FX AF:2x | |
| Acer Aspire E5-575G-549D | |
| HP Envy x360 15-bq102ng | |
| HP 17-bs103ng | |
| HP Envy x360 15m-bq121dx | |
| HP 15-bs103ng | |
Emissions & Energy
System Noise
When idle, the Envy’s fans were completely still and the notebook was absolutely silent. Sound pressure levels rose to 38.8 dB(A) during our stress test with both CPU and GPU heavily throttled due to the high combined load. Running Prime95 solo, the notebook was even louder and reached a maximum of 42.1 dB(A). Thus, the Envy is not made for users for whom a low overall noise level is of utmost importance as the fan is very audible even under low to moderate loads.
As with all HP notebooks, the Envy’s BIOS setup includes a “Fan always on” option that will, as the name suggests, keep the fan running at all times regardless of load or temperatures. This setting was disabled on our review unit out of the box.
Noise level
| Idle |
| 30.13 / 30.13 / 30.13 dB(A) |
| Load |
| 38.8 / 38.8 dB(A) |
 | ||
30 dB silent 40 dB(A) audible 50 dB(A) loud |
||
min: | ||
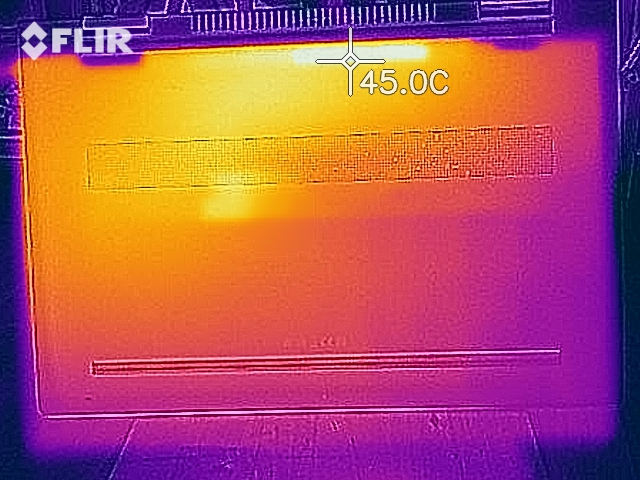
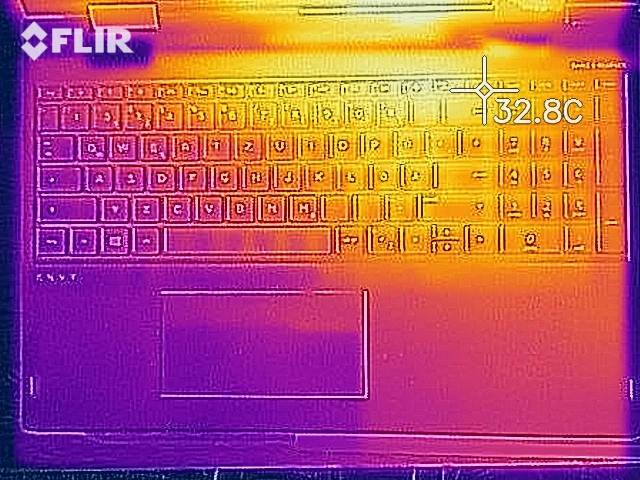
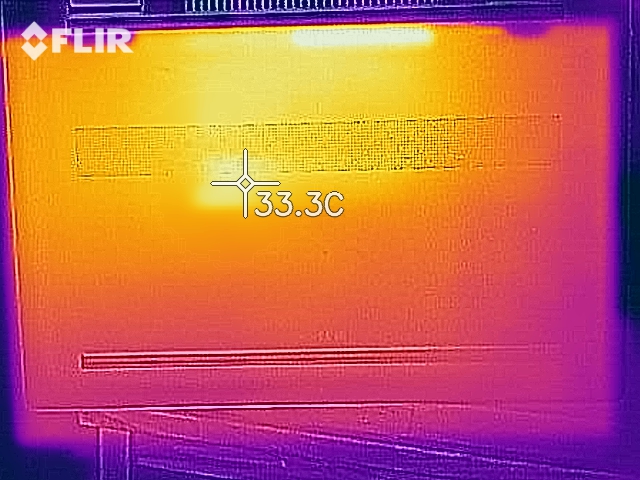
Temperature
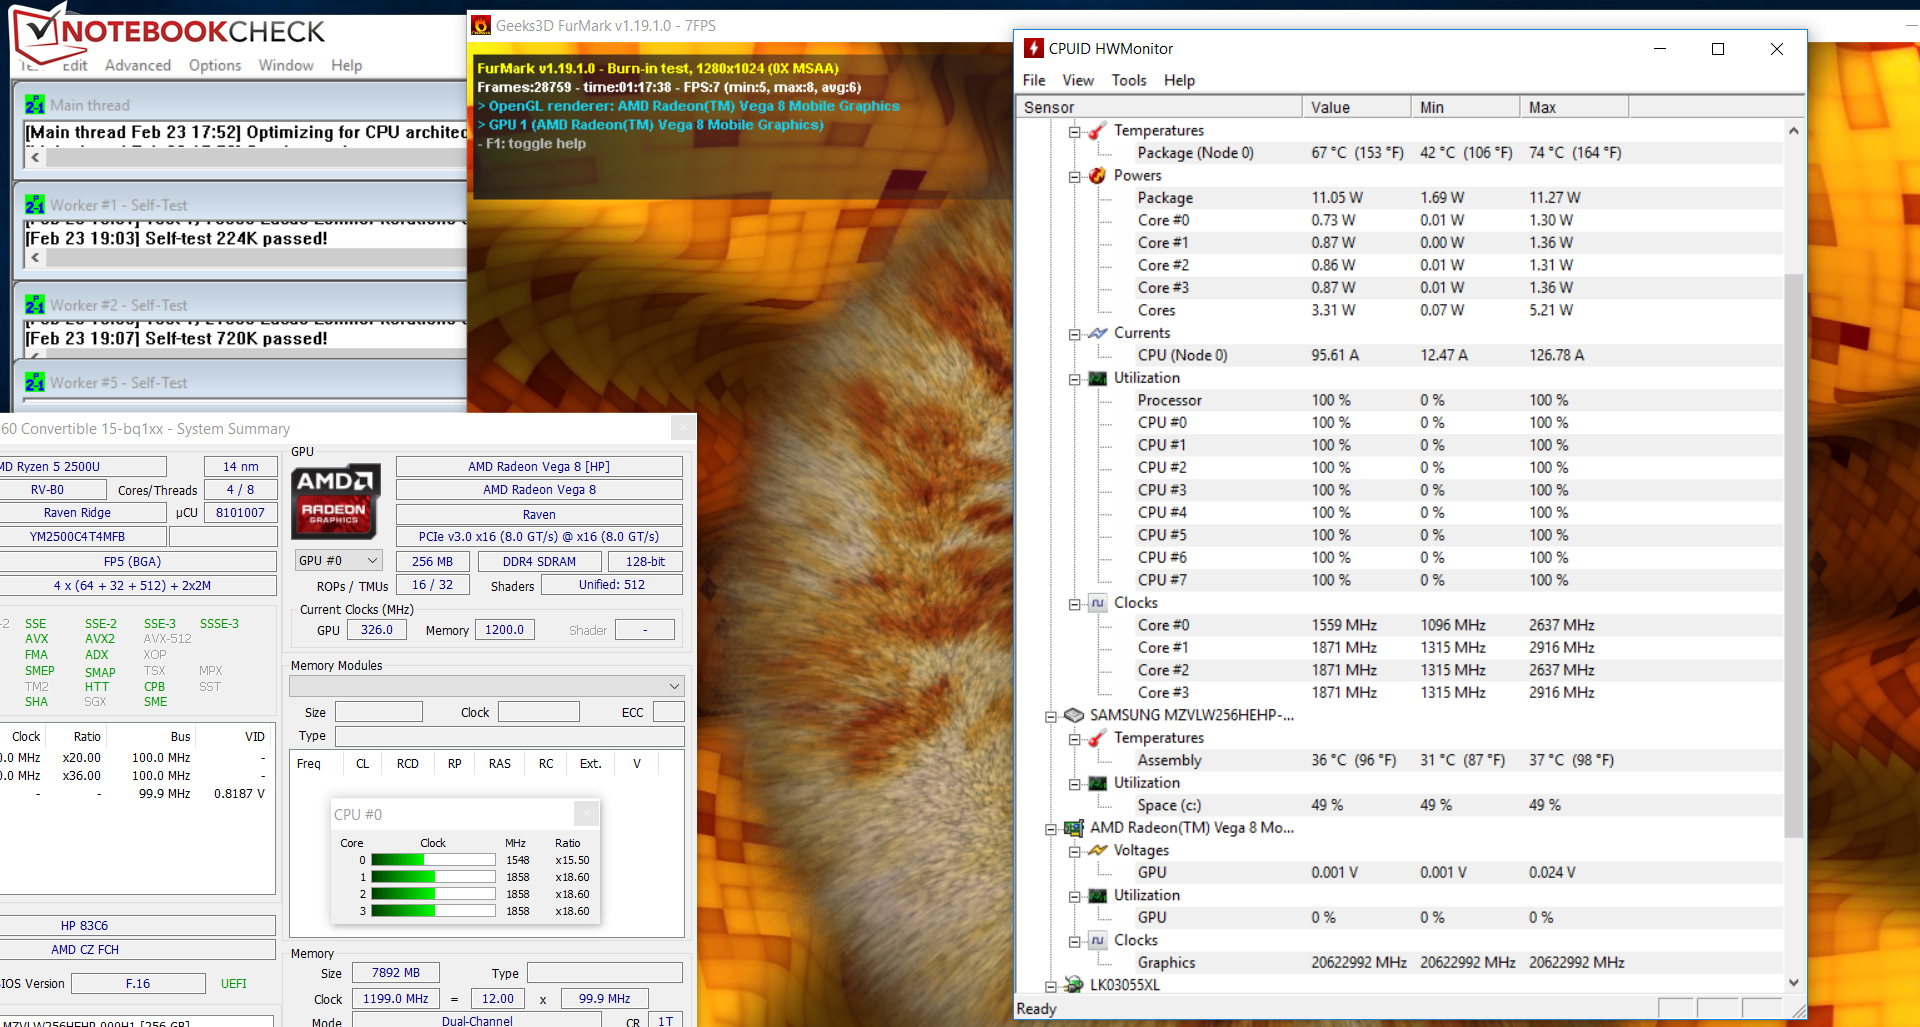
Our stress test (Prime95 and FurMark run simultaneously for at least one hour) was completed identically on both battery and mains. The CPU started out at around 2.2-2.5 GHz and slowly clocked down to 1.6-1.9 GHz while the GPU started out at 400-700 MHz and eventually settled at 300-400 MHz.
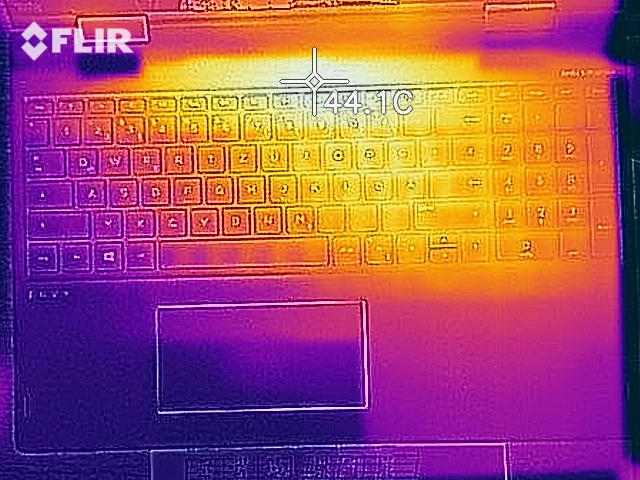
By and large, the notebook stayed comparatively cool. Only when running our stress test did some surface areas cross the 30 °C (~86 °F) threshold.
(+) The maximum temperature on the upper side is 38 °C / 100 F, compared to the average of 35.4 °C / 96 F, ranging from 19.6 to 60 °C for the class Convertible.
(+) The bottom heats up to a maximum of 37.1 °C / 99 F, compared to the average of 36.9 °C / 98 F
(+) In idle usage, the average temperature for the upper side is 27.6 °C / 82 F, compared to the device average of 30.3 °C / 87 F.
(+) The palmrests and touchpad are cooler than skin temperature with a maximum of 27 °C / 80.6 F and are therefore cool to the touch.
(±) The average temperature of the palmrest area of similar devices was 28 °C / 82.4 F (+1 °C / 1.8 F).
Speaker
HP Envy x360 15-bq102ng audio analysis
(-) | not very loud speakers (66.5 dB)
Bass 100 - 315 Hz
(±) | reduced bass - on average 12.7% lower than median
(±) | linearity of bass is average (7.2% delta to prev. frequency)
Mids 400 - 2000 Hz
(+) | balanced mids - only 3.3% away from median
(+) | mids are linear (5% delta to prev. frequency)
Highs 2 - 16 kHz
(+) | balanced highs - only 1.8% away from median
(+) | highs are linear (3.8% delta to prev. frequency)
Overall 100 - 16.000 Hz
(±) | linearity of overall sound is average (17.2% difference to median)
Compared to same class
» 33% of all tested devices in this class were better, 8% similar, 59% worse
» The best had a delta of 6%, average was 20%, worst was 57%
Compared to all devices tested
» 32% of all tested devices were better, 8% similar, 60% worse
» The best had a delta of 4%, average was 23%, worst was 134%
Apple MacBook 12 (Early 2016) 1.1 GHz audio analysis
(+) | speakers can play relatively loud (83.6 dB)
Bass 100 - 315 Hz
(±) | reduced bass - on average 11.3% lower than median
(±) | linearity of bass is average (14.2% delta to prev. frequency)
Mids 400 - 2000 Hz
(+) | balanced mids - only 2.4% away from median
(+) | mids are linear (5.5% delta to prev. frequency)
Highs 2 - 16 kHz
(+) | balanced highs - only 2% away from median
(+) | highs are linear (4.5% delta to prev. frequency)
Overall 100 - 16.000 Hz
(+) | overall sound is linear (10.2% difference to median)
Compared to same class
» 7% of all tested devices in this class were better, 2% similar, 91% worse
» The best had a delta of 5%, average was 18%, worst was 53%
Compared to all devices tested
» 5% of all tested devices were better, 1% similar, 94% worse
» The best had a delta of 4%, average was 23%, worst was 134%
frequency diagram (checkboxes selectable/deselectable!)
Power Consumption
Maximum power consumption when idle was determined to be 9.5 W while our stress test (Prime95 and FurMark run simultaneously for at least one hour) resulted in a power consumption of just 44.3 W due to the heavily throttled CPU and GPU. The power supply is rated at 65 W.
| Off / Standby | |
| Idle | |
| Load |
|
Key:
min: | |
Battery Life
In our real-life Wi-Fi test we simulate the load caused by loading various websites. During this test, the energy profile is set to “Balanced”, display brightness is normalized to 150 nits, and all energy saving features are disabled. With these settings, the Envy ran for 7:06 hours.
Pros
Cons
Verdict

HP’s 15.6-inch convertible is equipped with an AMD Raven Ridge APU and thus offers more than enough performance for most common usage scenarios. The integrated GPU is even fast enough for casual gaming at reduced resolutions and details. More demanding 2017 and 2018 games will be too much for the Envy, though.
HP’s Envy x360 15z is a well-balanced package, were it not for the dark display.
The system was snappy and fast thanks to its NVMe SSD, which can be upgraded after opening the case. The keyboard was decent, and we particularly liked the fact that it was backlit. Battery life was decent as well, but we would have wished for a Thunderbolt 3 port that would have made the Envy x360 15z even more attractive. In addition, the warranty is limited to just 12 months - we expect at least two full years.
The IPS touchscreen had a great contrast ratio and very decent viewing angles. Brightness was too low, though. The touchscreen responds to either fingers or the optional stylus pen (model number 920241-001 according to the manual).
HP Envy x360 15-bq102ng
- 03/02/2018 v6 (old)
Sascha Mölck
Price comparison

