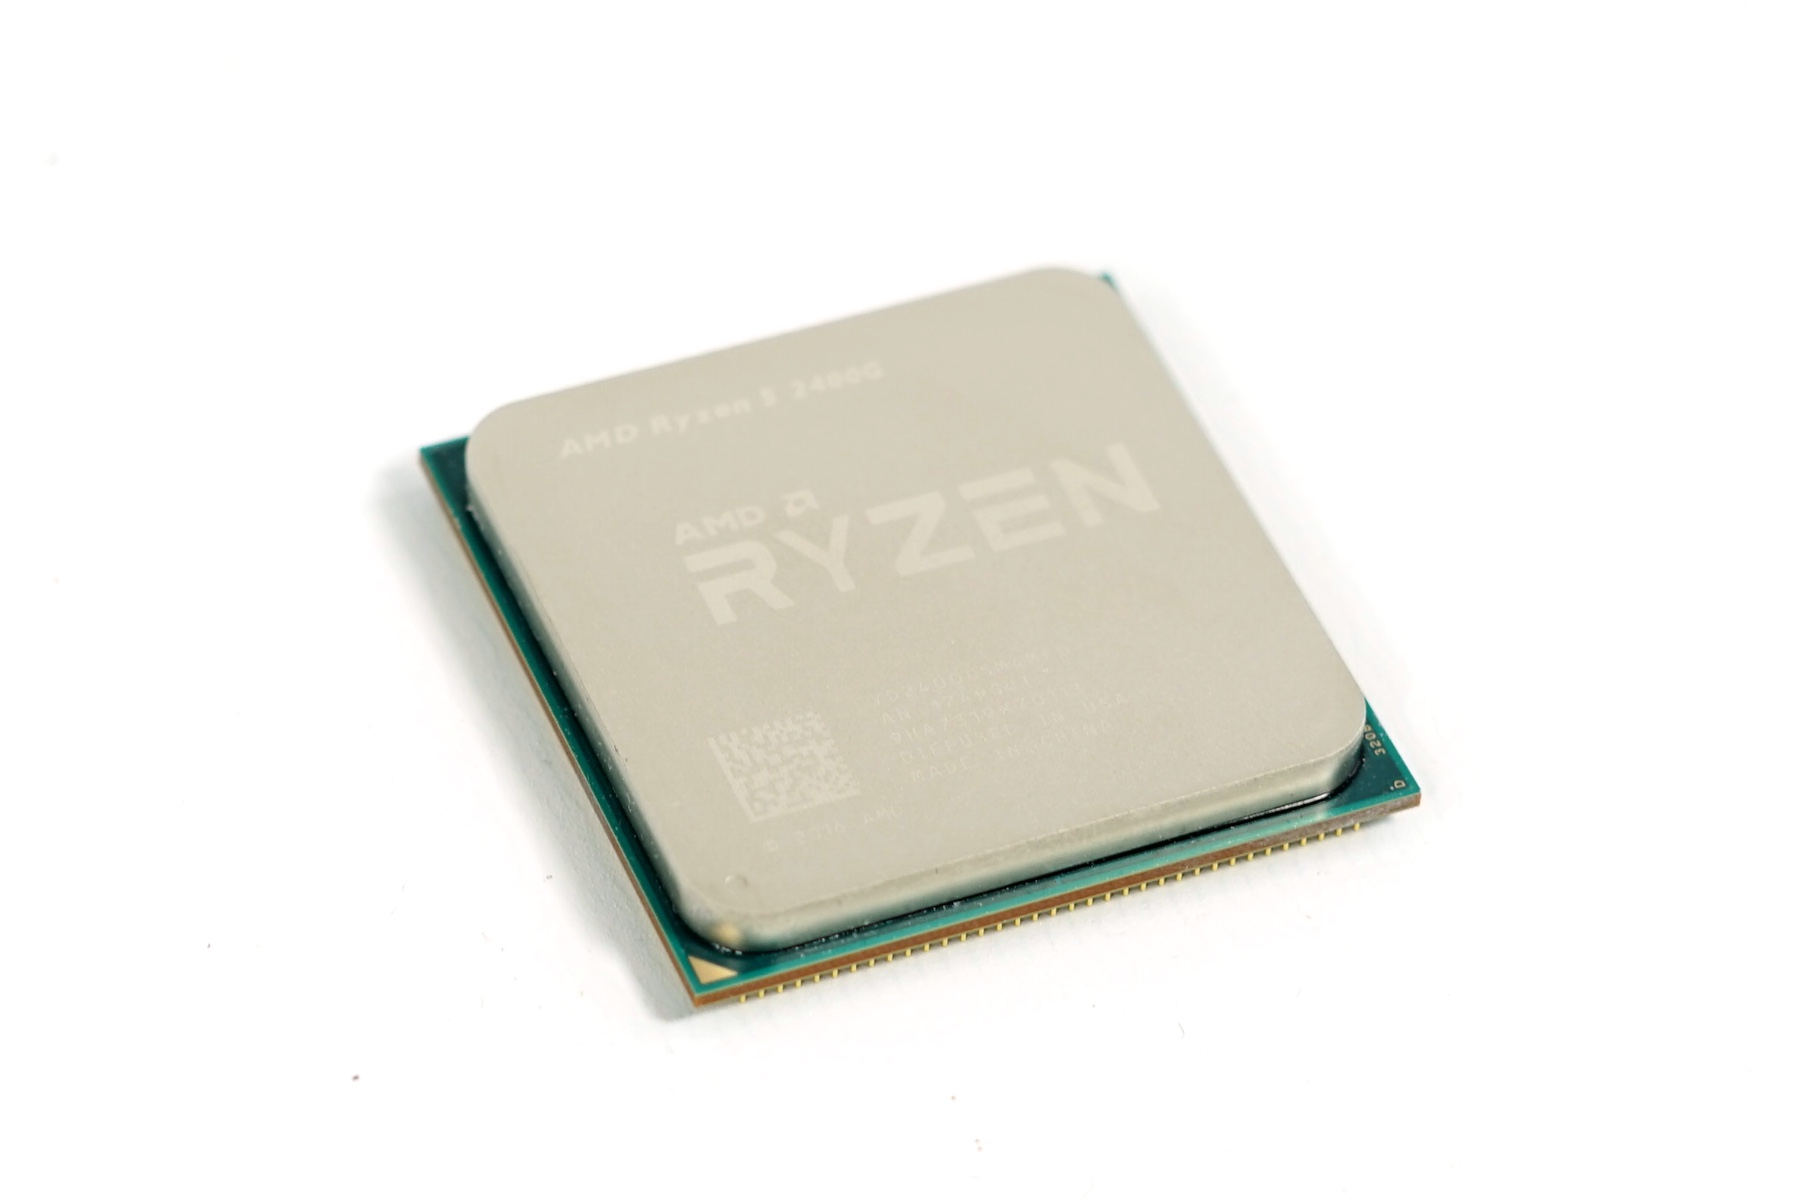
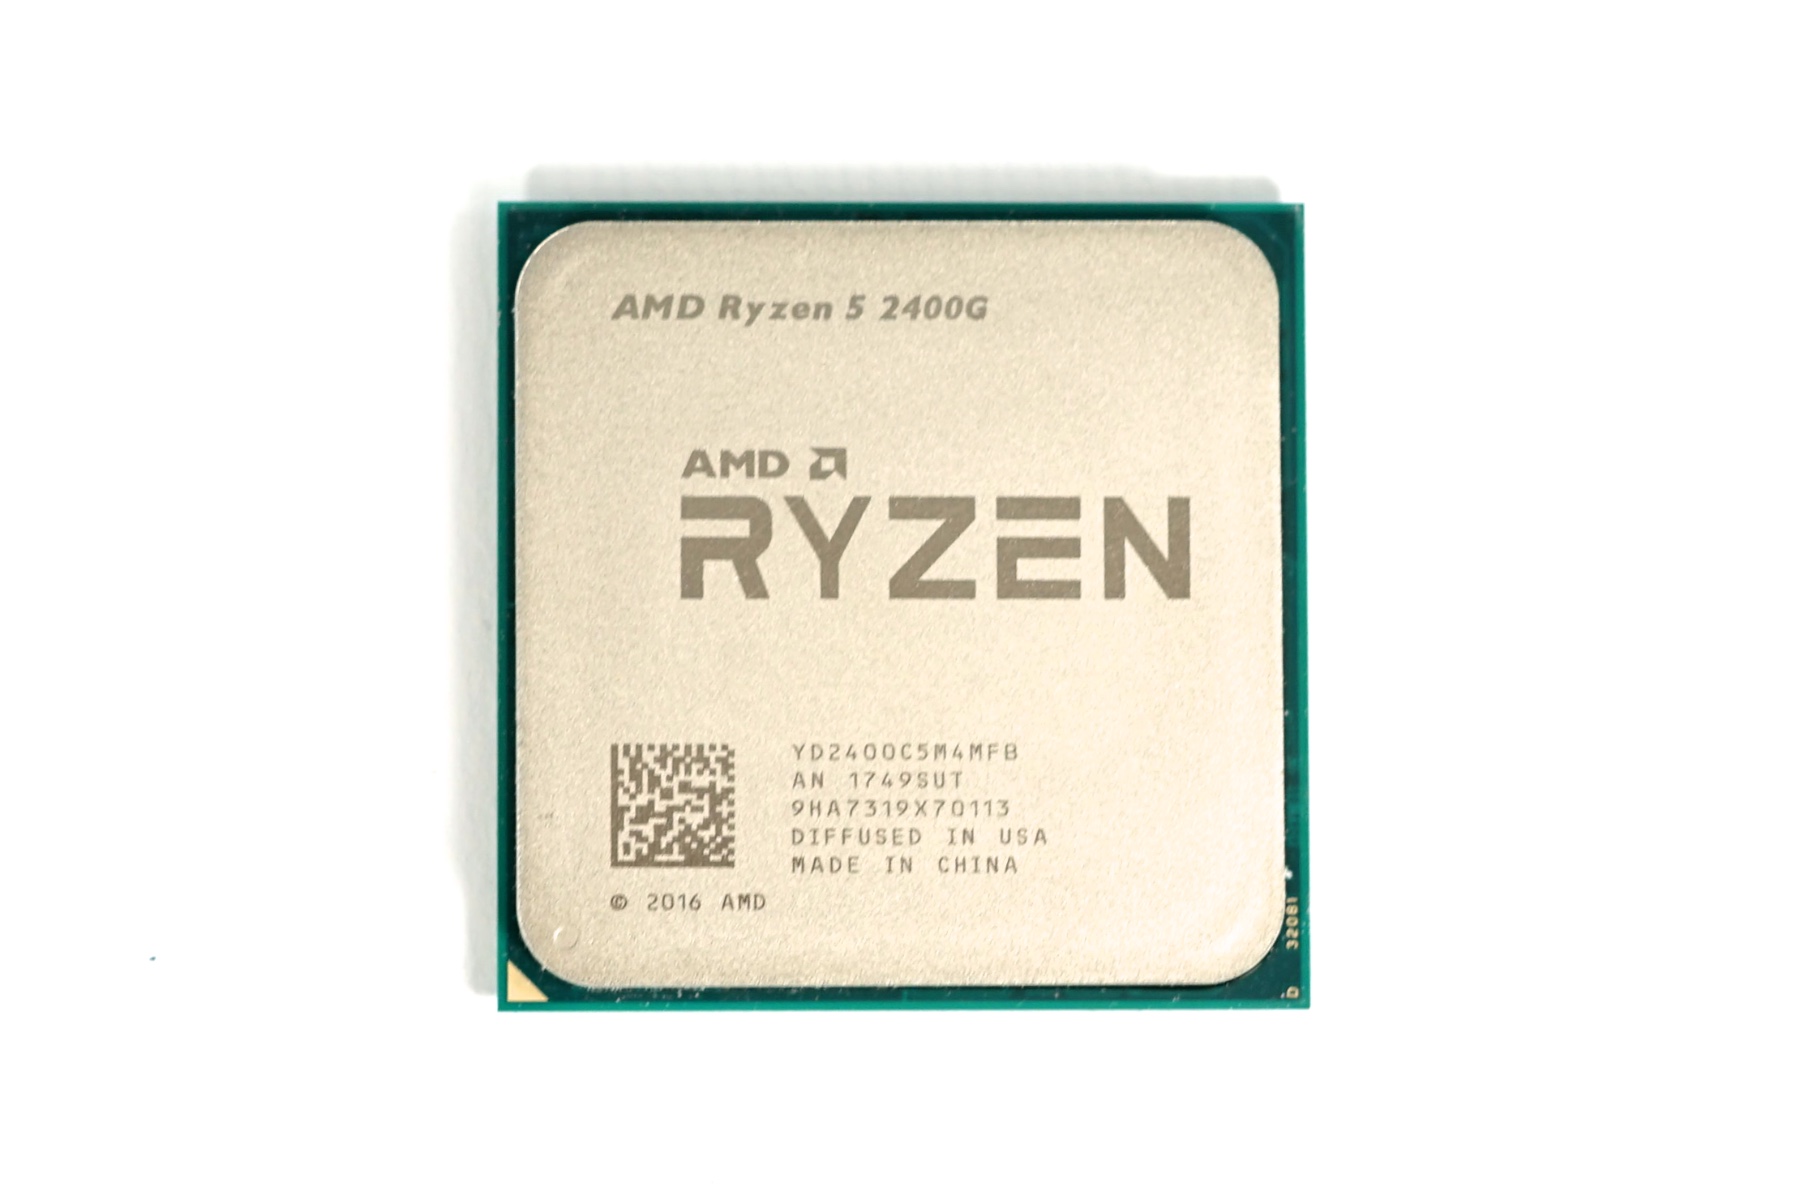
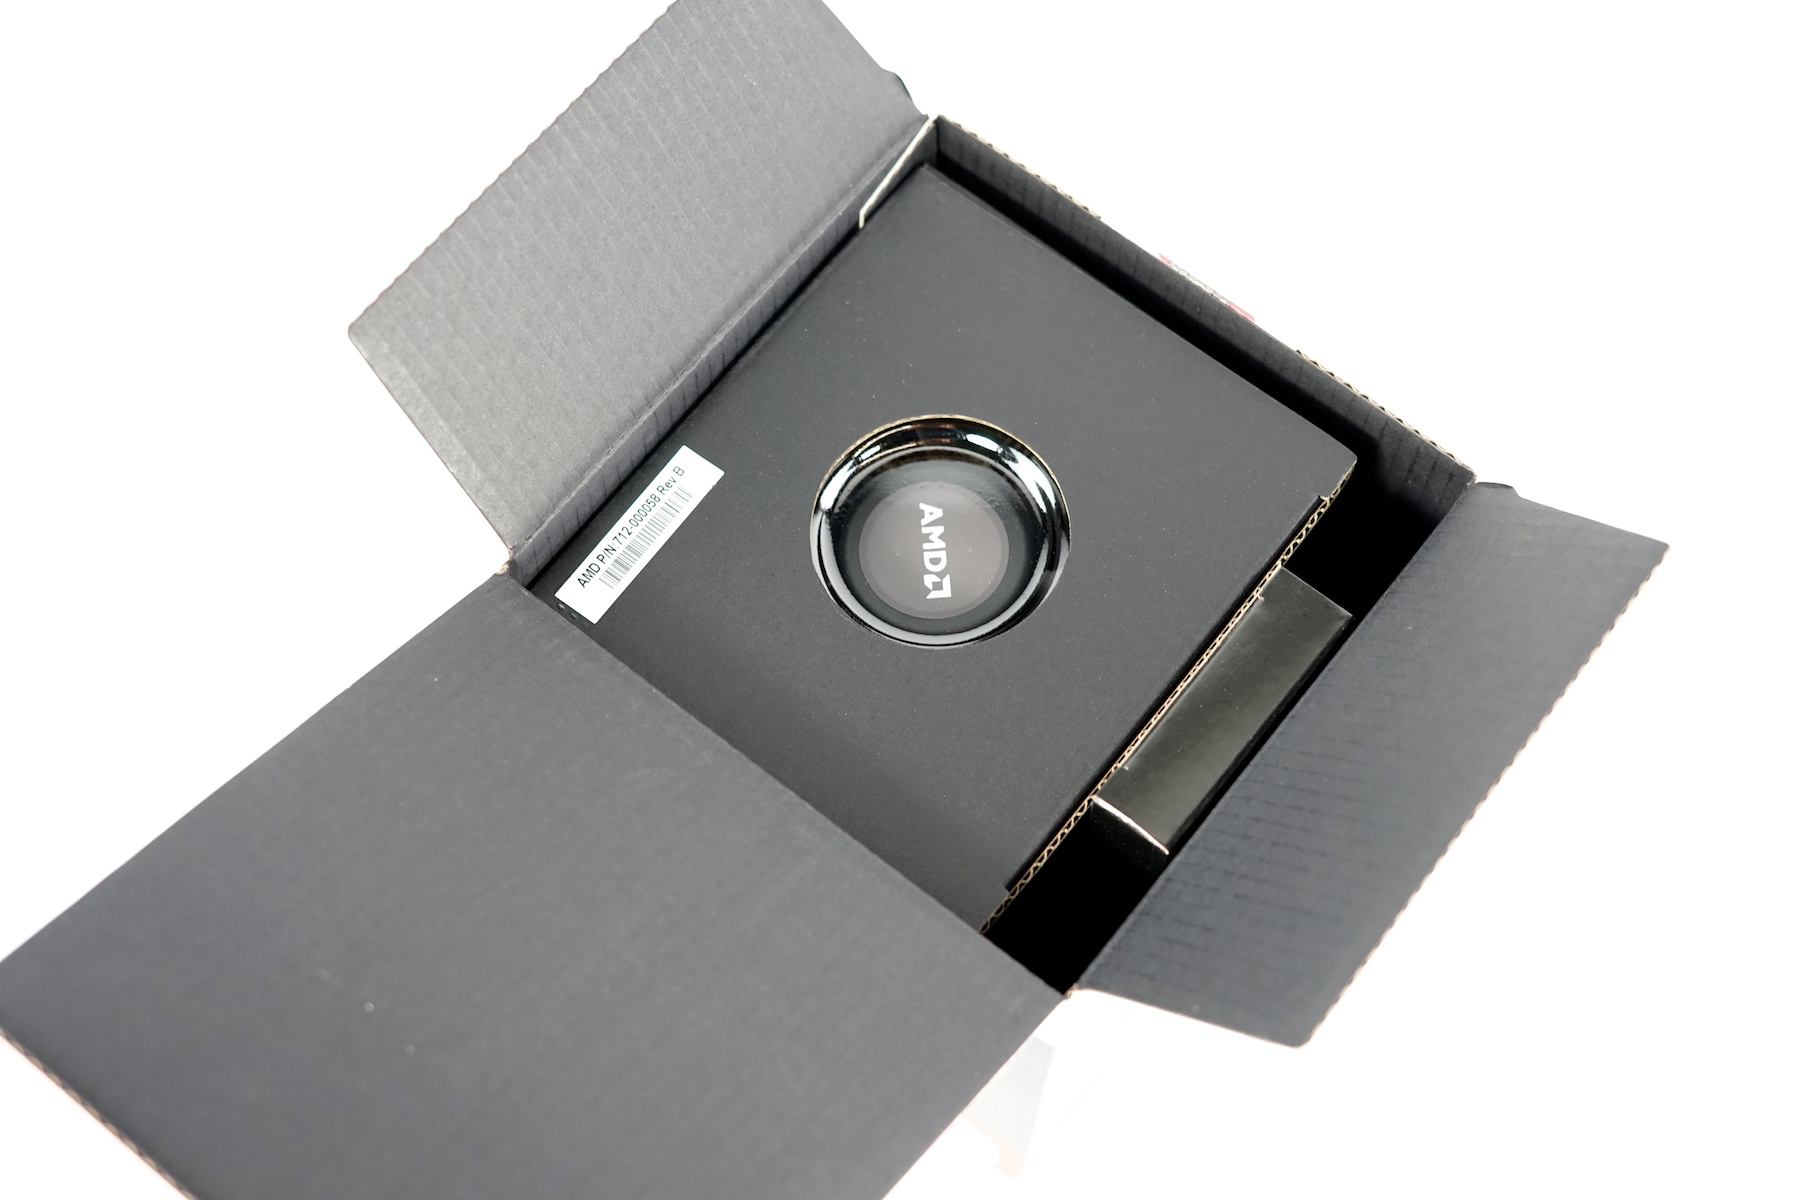
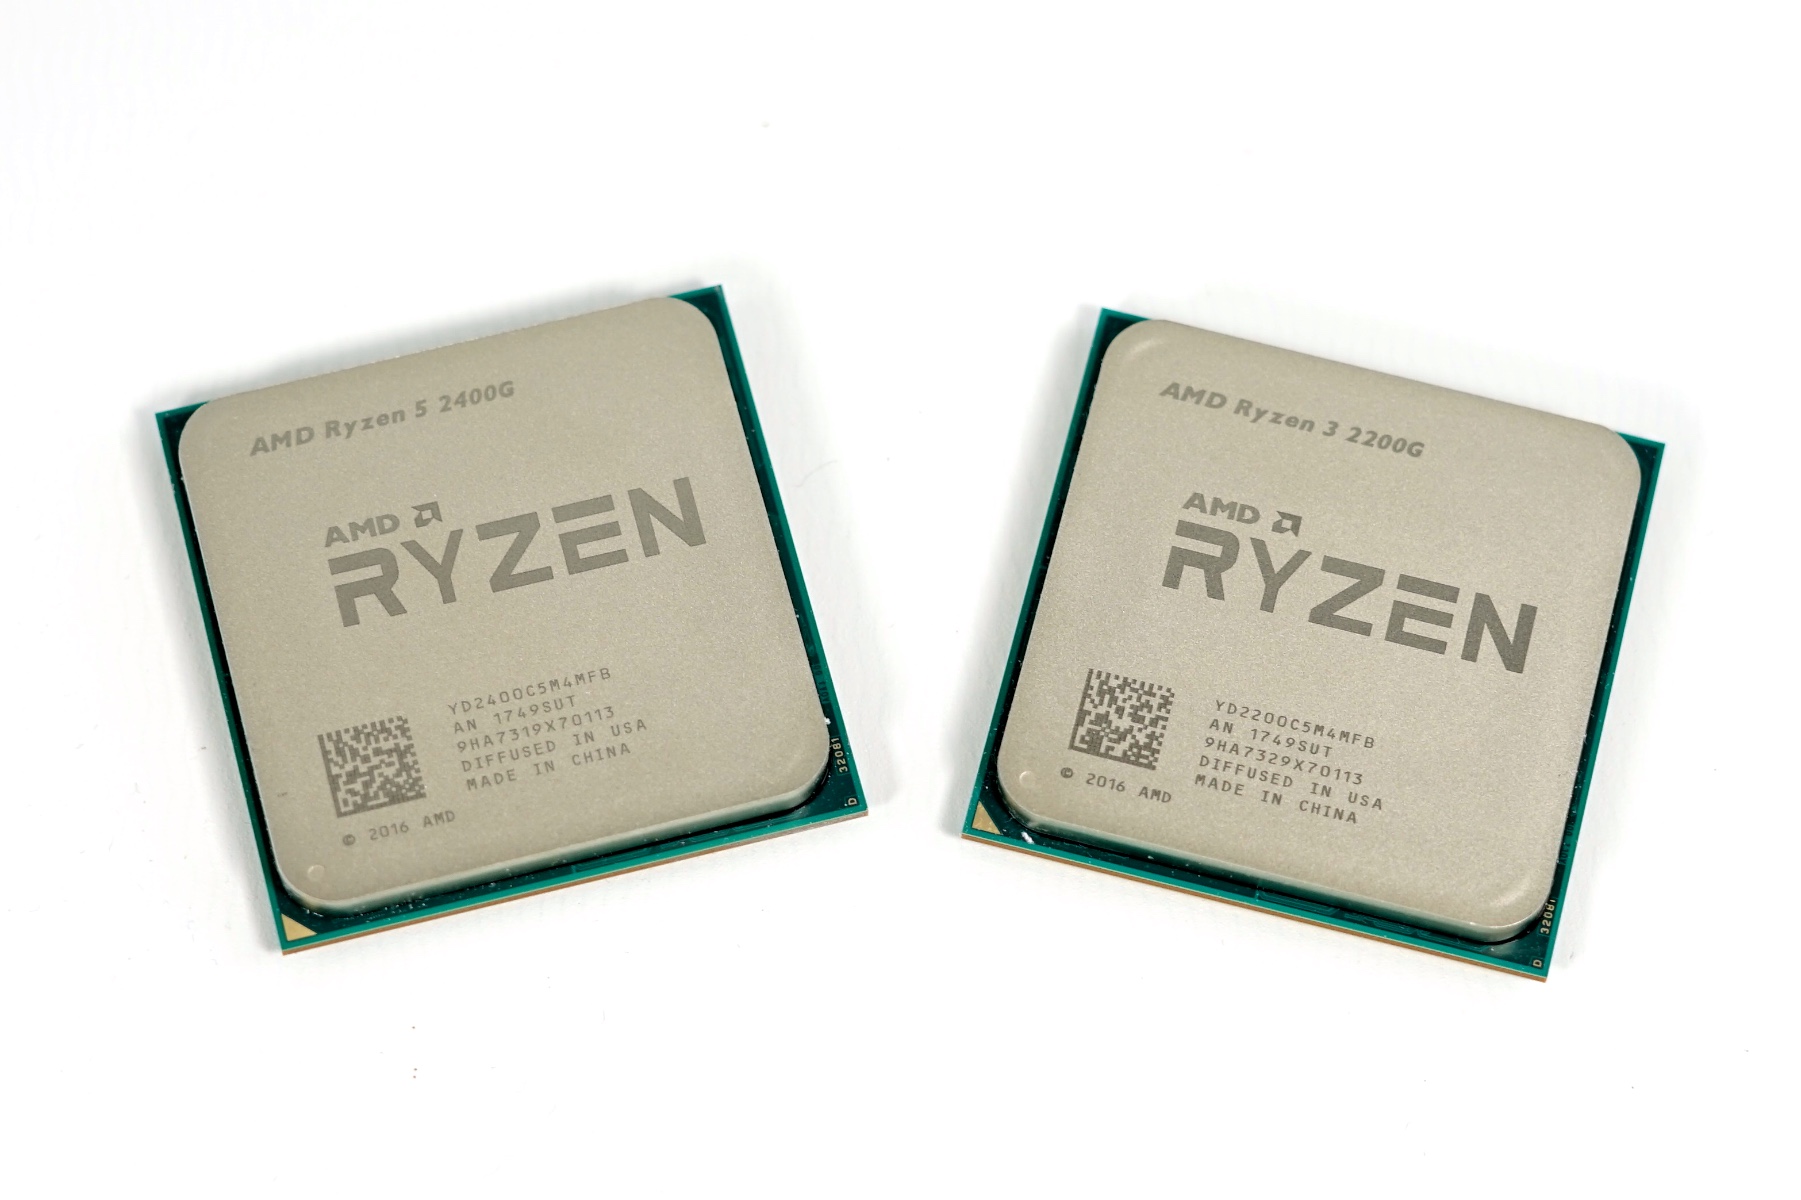
Ryzen 5 2400G and Ryzen 3 2200G in Review
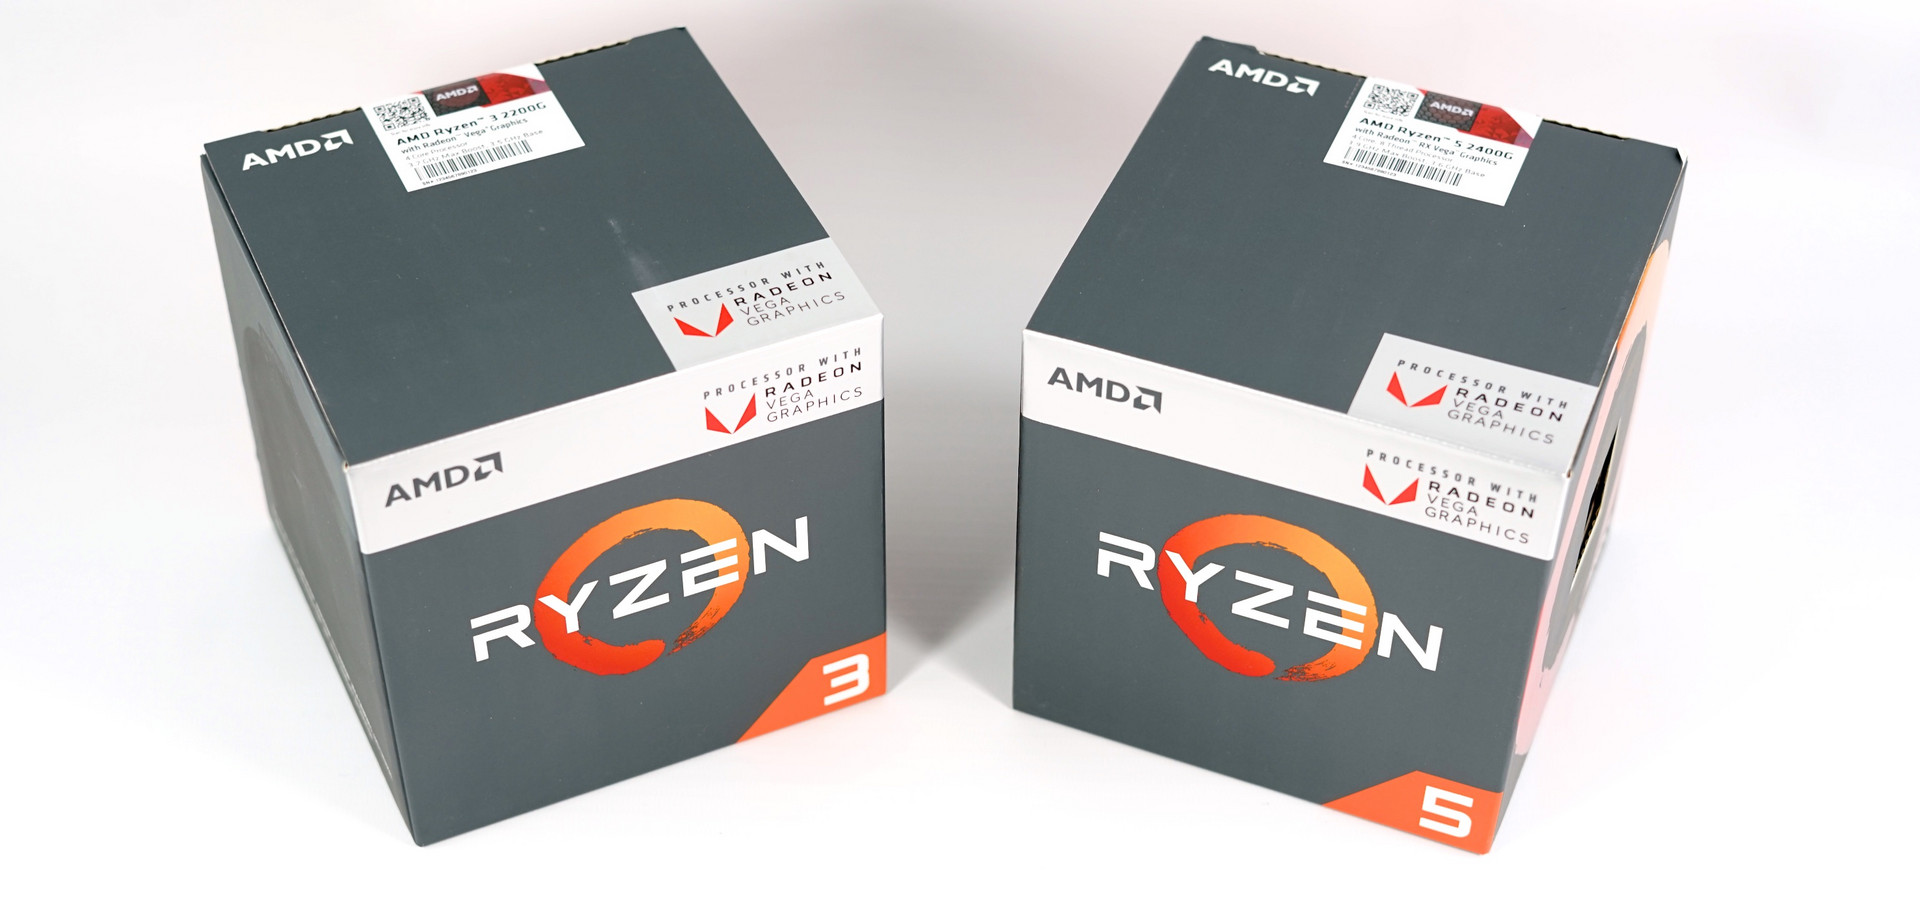
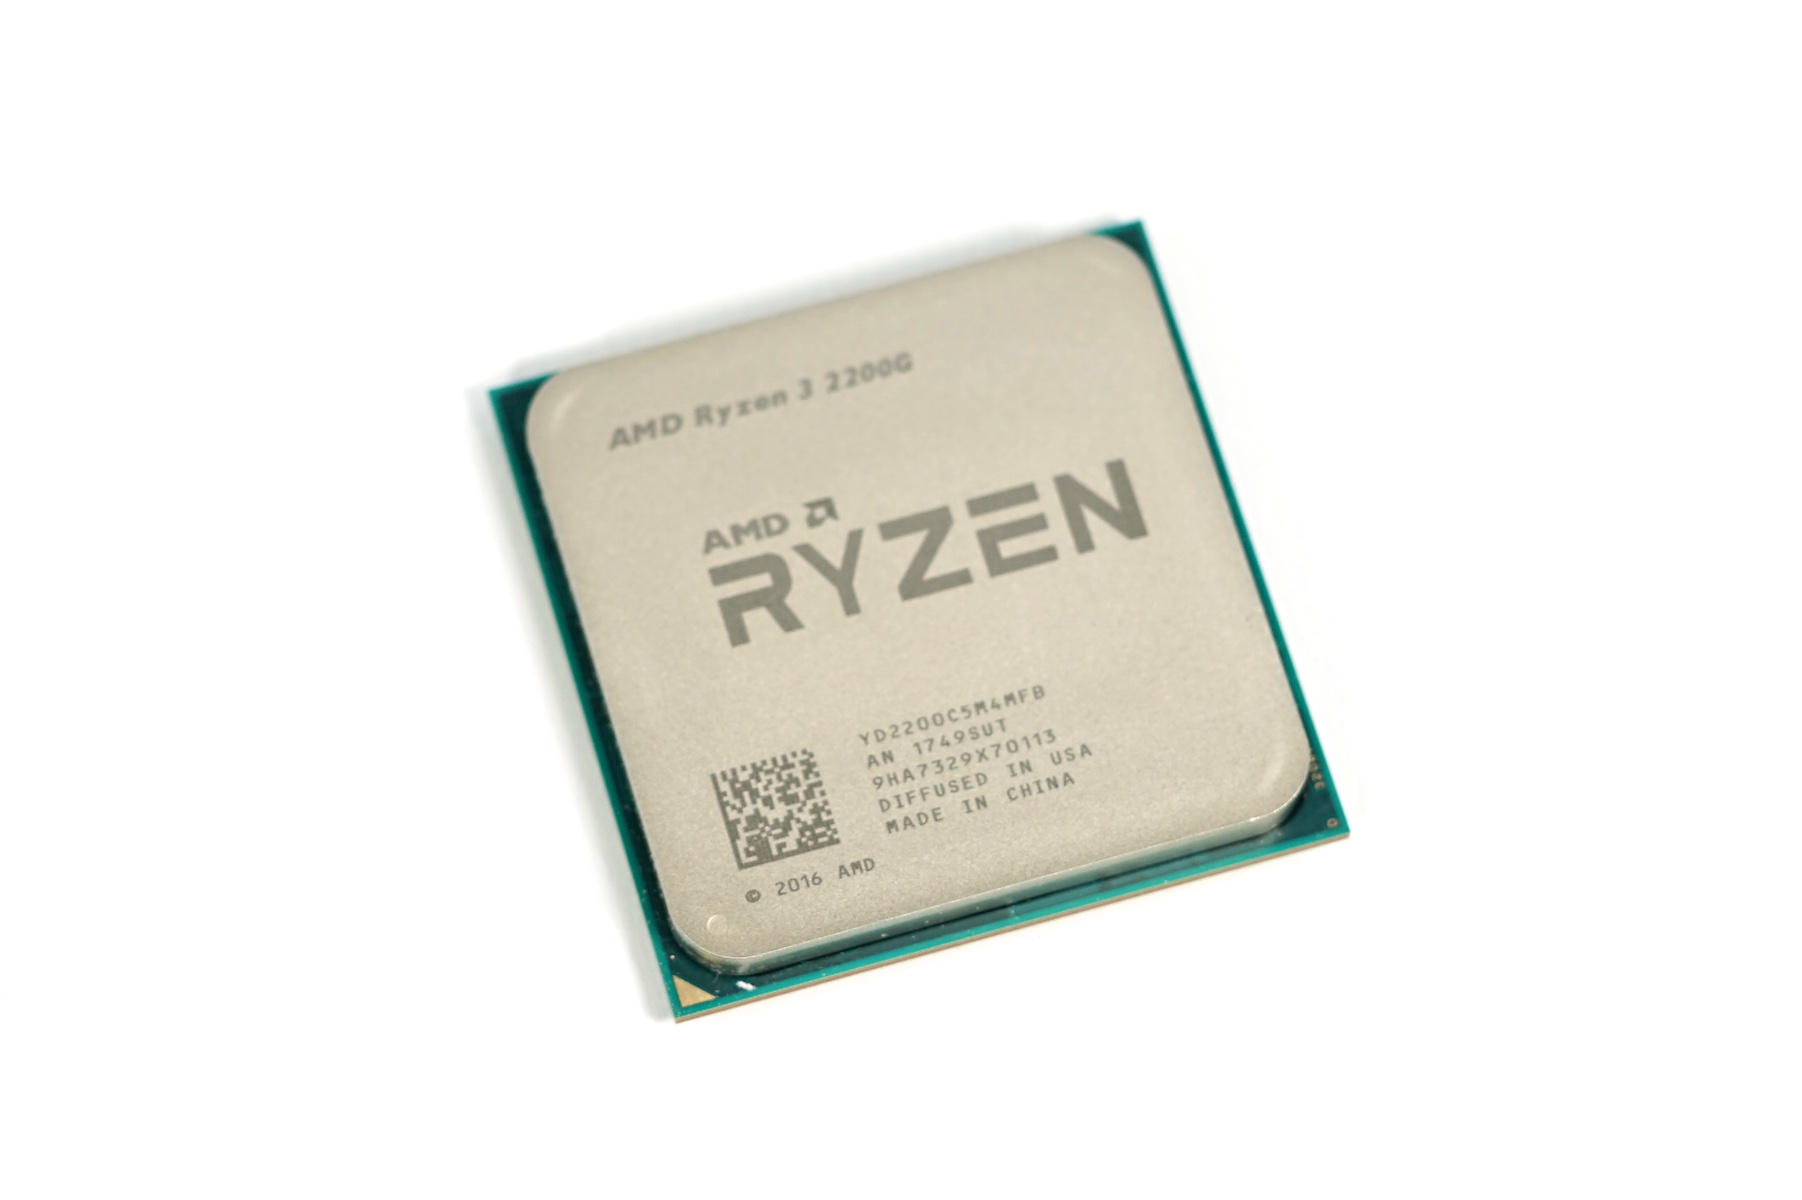
After having introduced the mobile 15-W notebook models in late 2017, AMD has now also announced two 65-W APUs for its AM4 desktop platform. The Ryzen 5 2400G is a fully loaded version of the chip with all 4 cores and SMT enabled, and it is equipped with 11 integrated Vega CUs. The less powerful Ryzen 3 2200G lacks support for SMT and 3 Vega CPUs. It is clocked slightly slower than its bigger brother, but at only $99 it is also significantly cheaper than the $169 Ryzen 5.
Speaking from a strictly technical point of view, these new chips are very similar to their mobile counterparts (e.g. the Ryzen 5 2500U). The APU features a CCX with four cores, 4 MB L3-Cache (compared with 8 MB on the Raven Ridge Ryzen CPUs for desktop computers), a modern integrated Vega GPU, and a DDR4 memory controller with official support up to DDR4-2933. See here for the exact technical specifications of these Raven Ridge APUs.
| Model | Cores | Threads | Clock Speed | GPU | GPU Clock Speed |
|---|---|---|---|---|---|
| Ryzen 5 2400G | 4 | 8 | 3.6 - 3.9 GHz | Vega 11 | 1,250 MHz |
| Ryzen 3 2200G | 4 | 4 | 3.5 - 3.7 GHz | Vega 8 | 1,100 MHz |
| Ryzen 7 2700U | 4 | 8 | 2.2 - 3.8 GHz | Vega 10 | 1,300 MHz |
| Ryzen 5 2500U | 4 | 8 | 2.0 - 3.6 GHz | Vega 8 | 1,100 MHz |
| Ryzen 3 2300U | 4 | 4 | 2.0 - 3.4 GHz | Vega 6 | 1,100 MHz |
| Ryzen 3 2200U | 2 | 4 | 2.5 - 3.4 GHz | Vega 3 | 1,000 MHz |
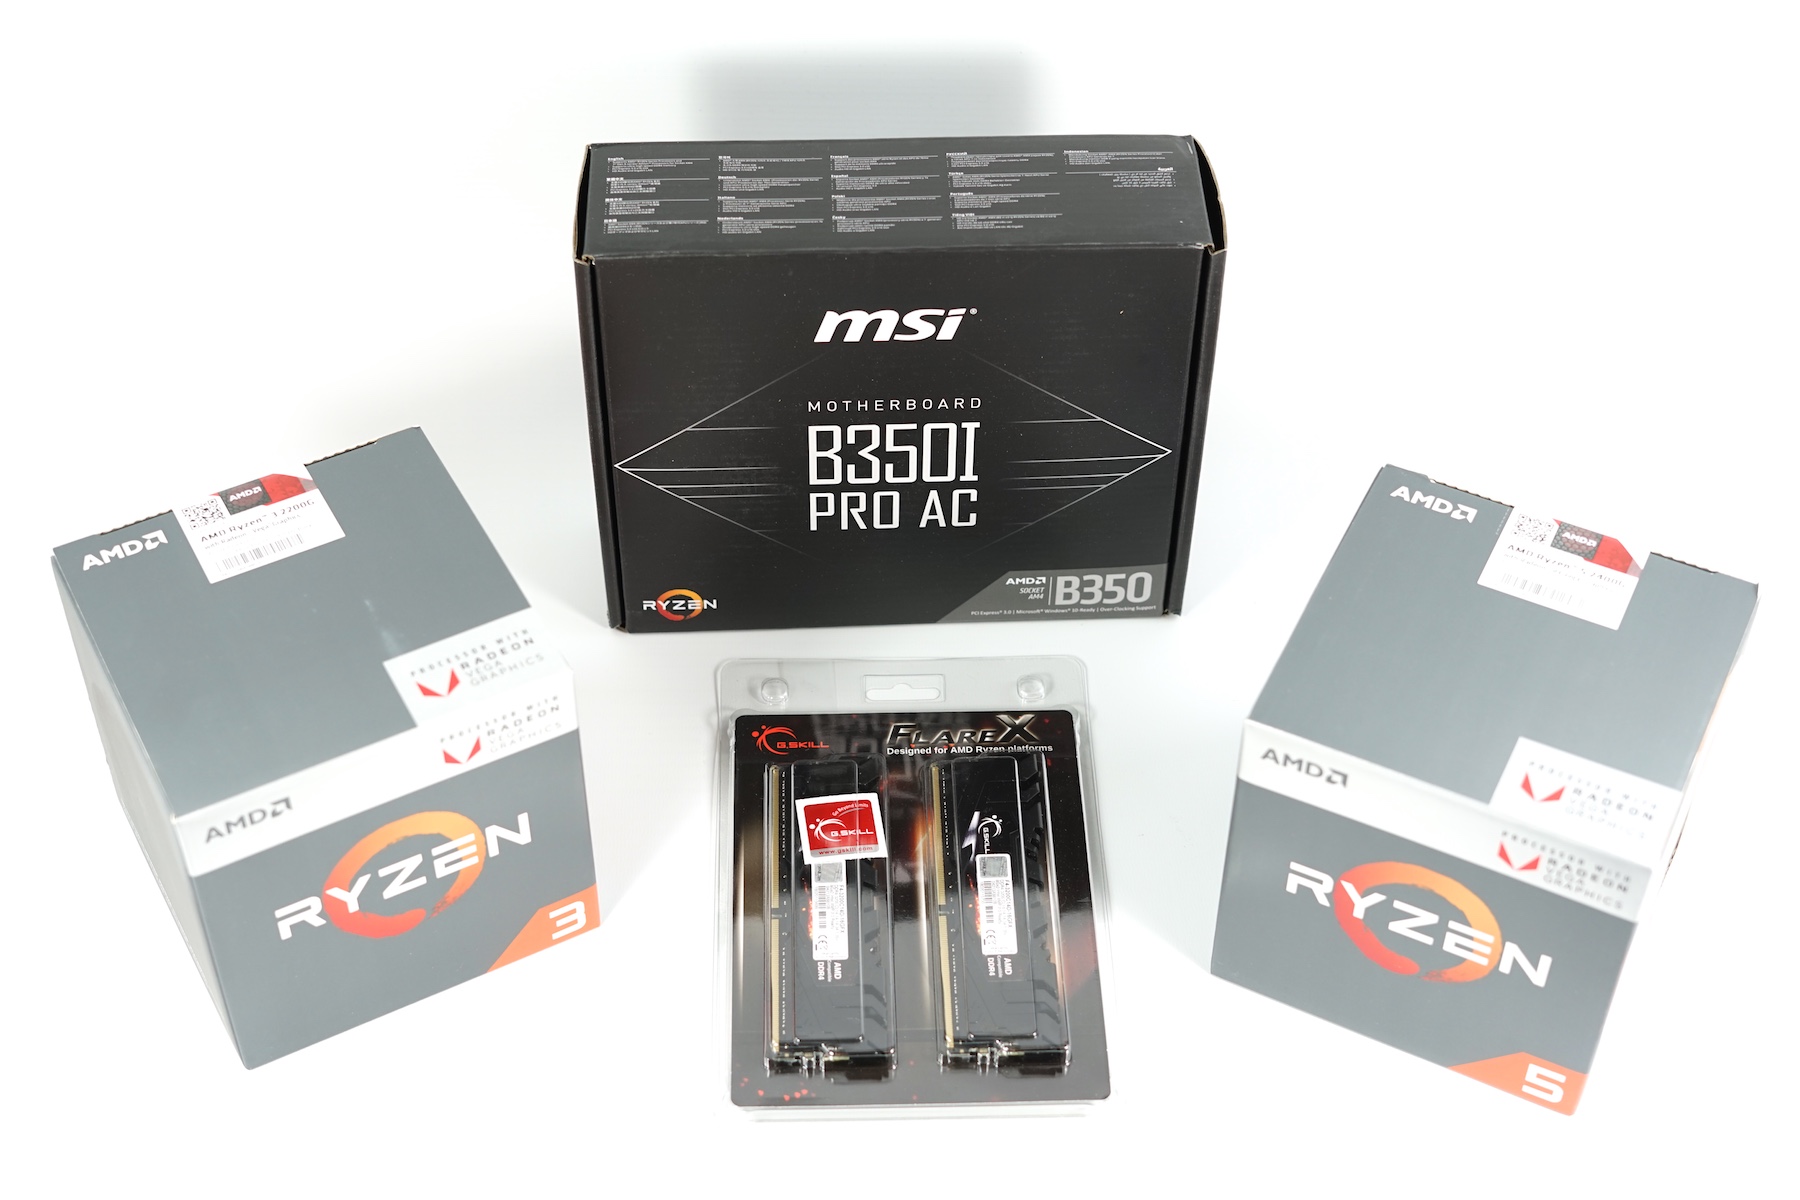
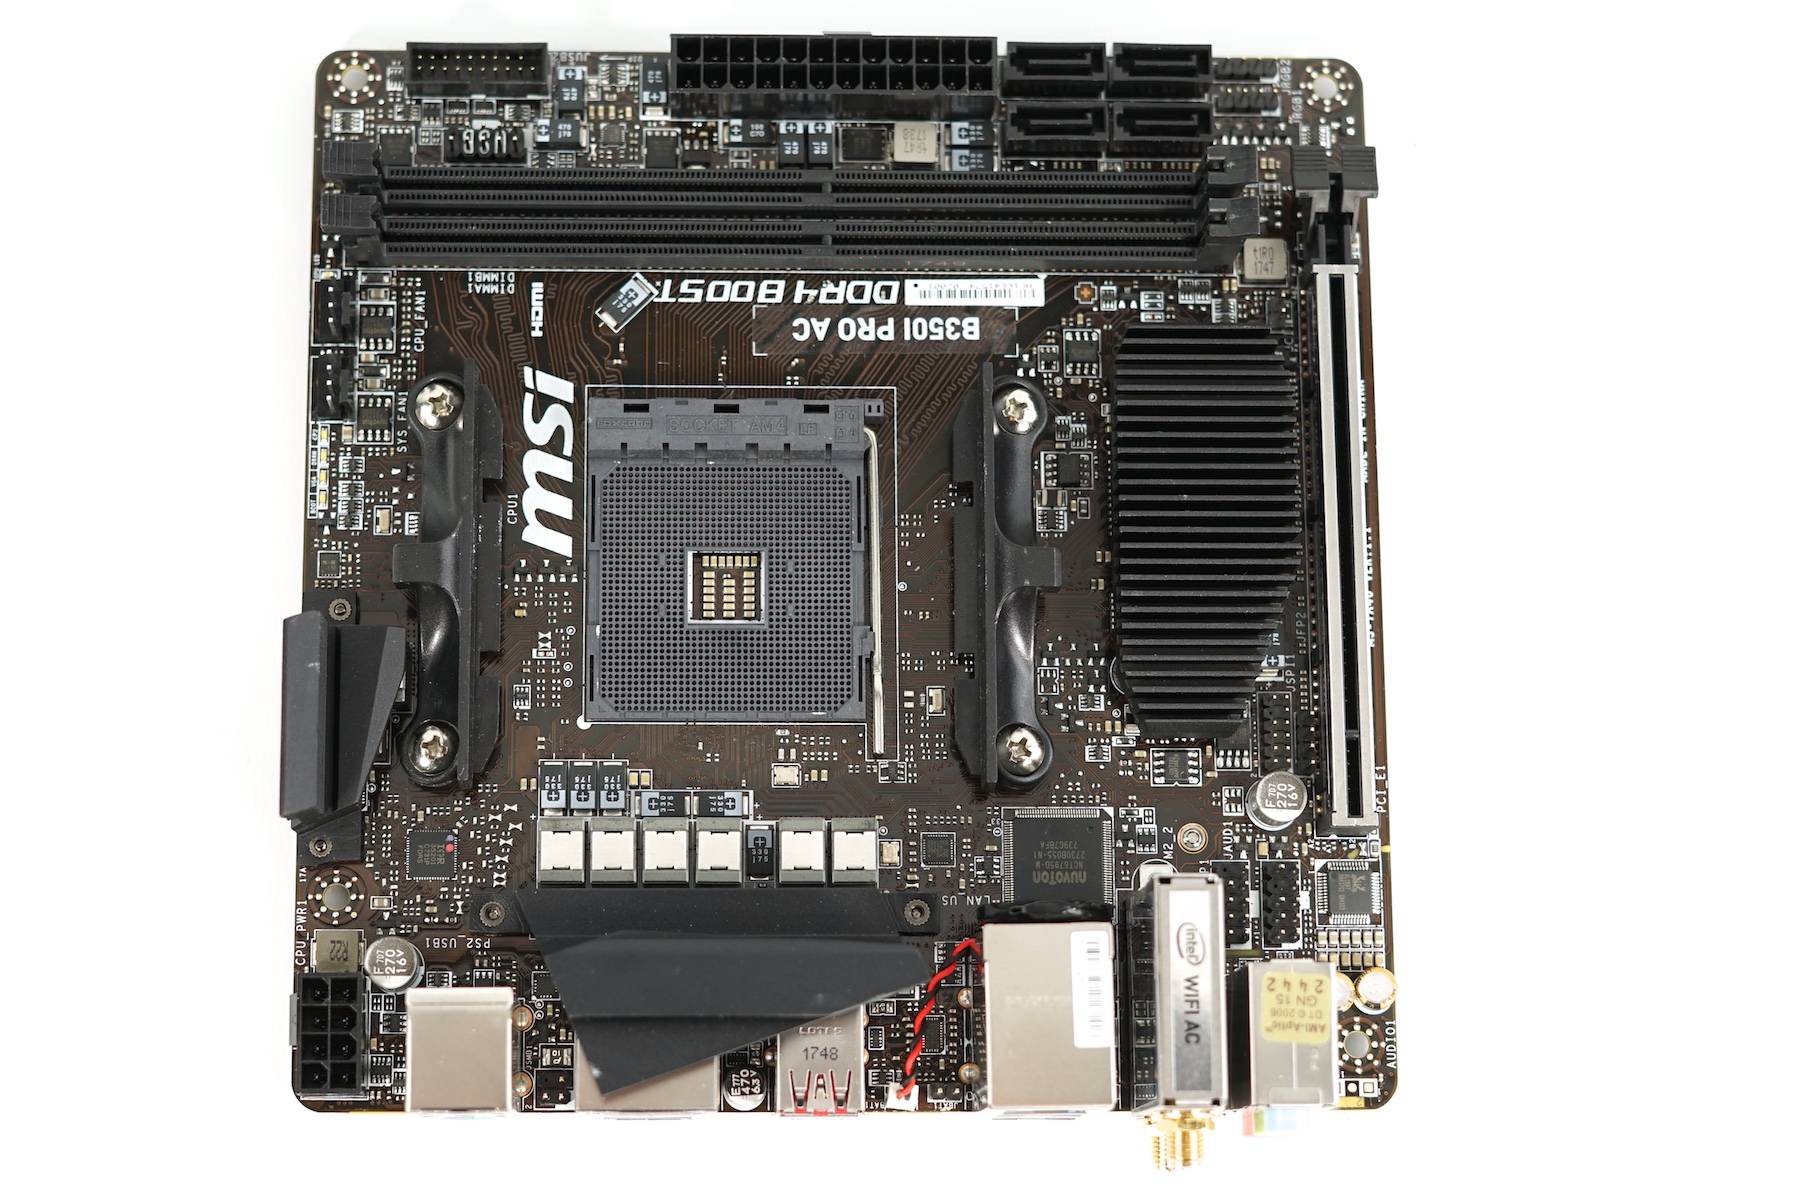
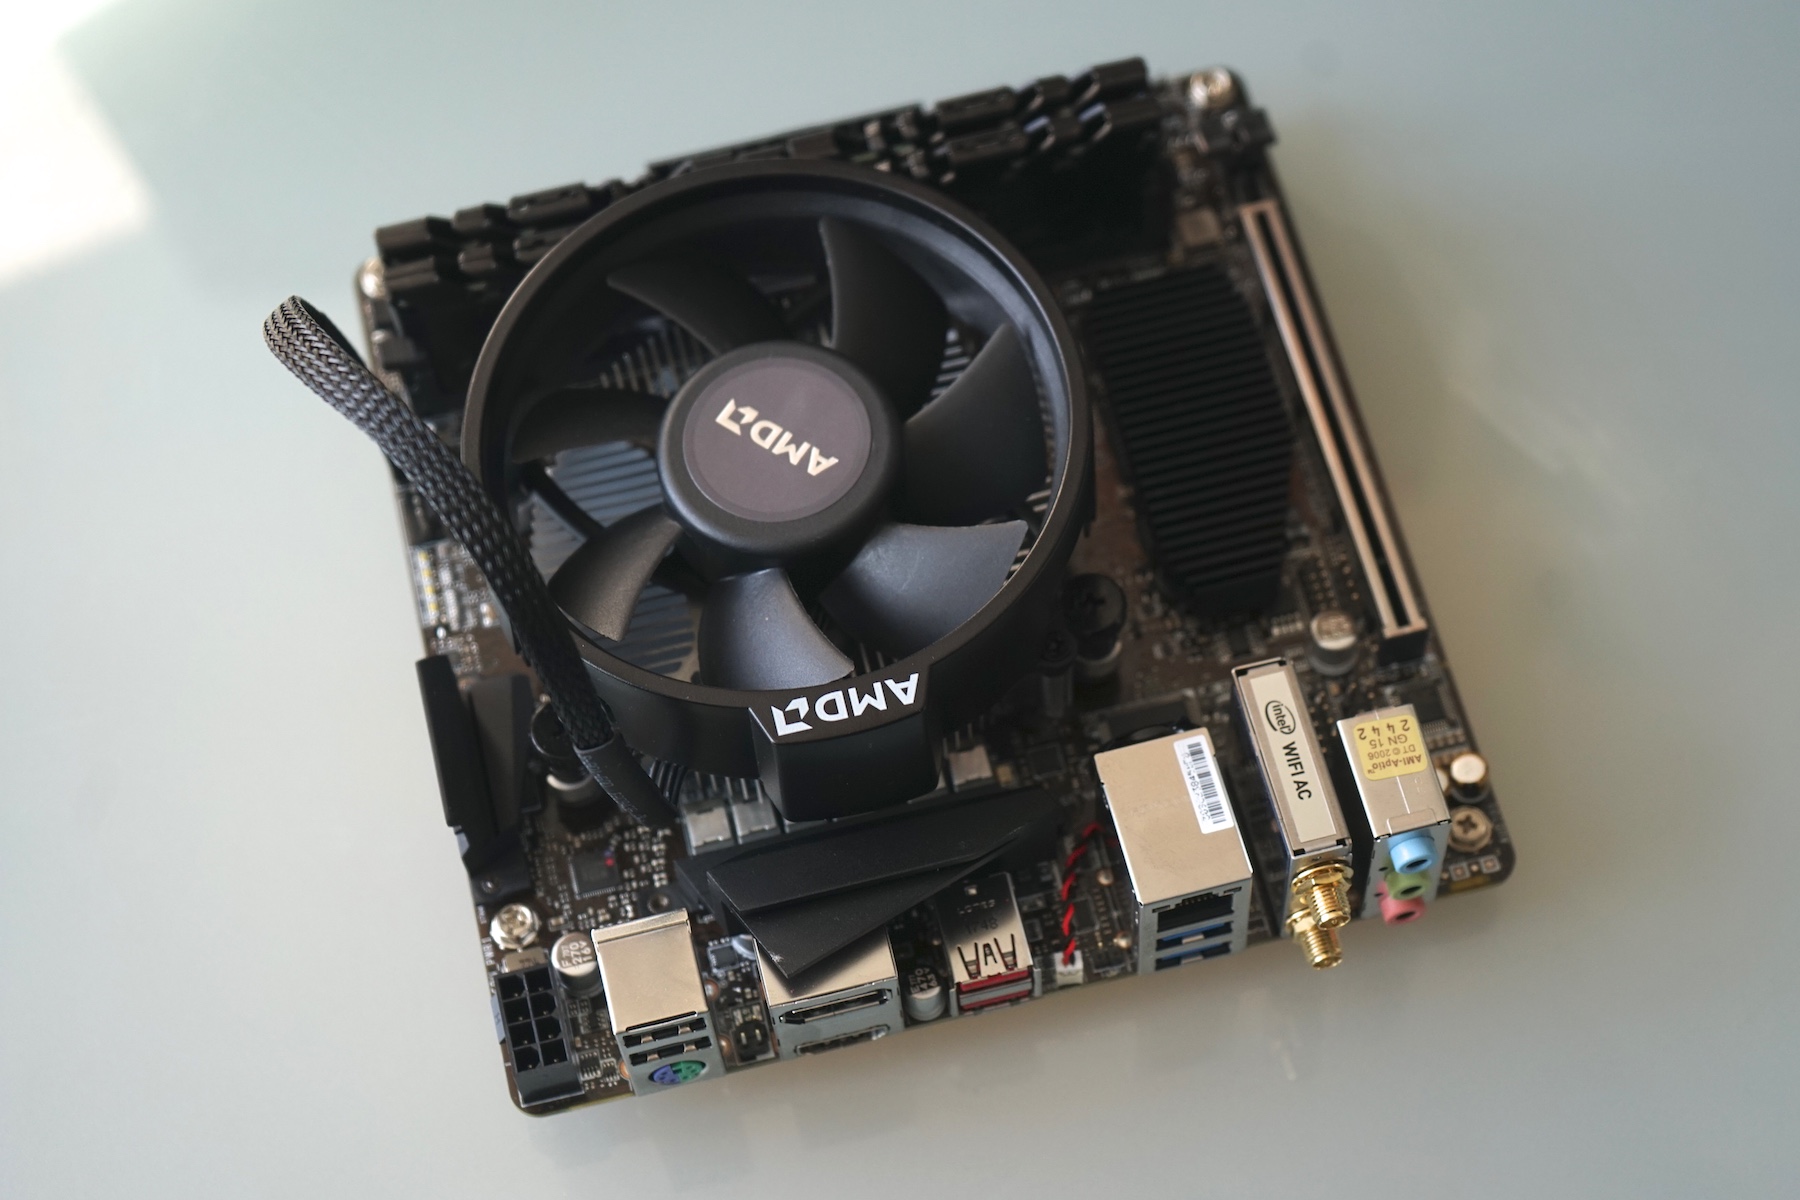
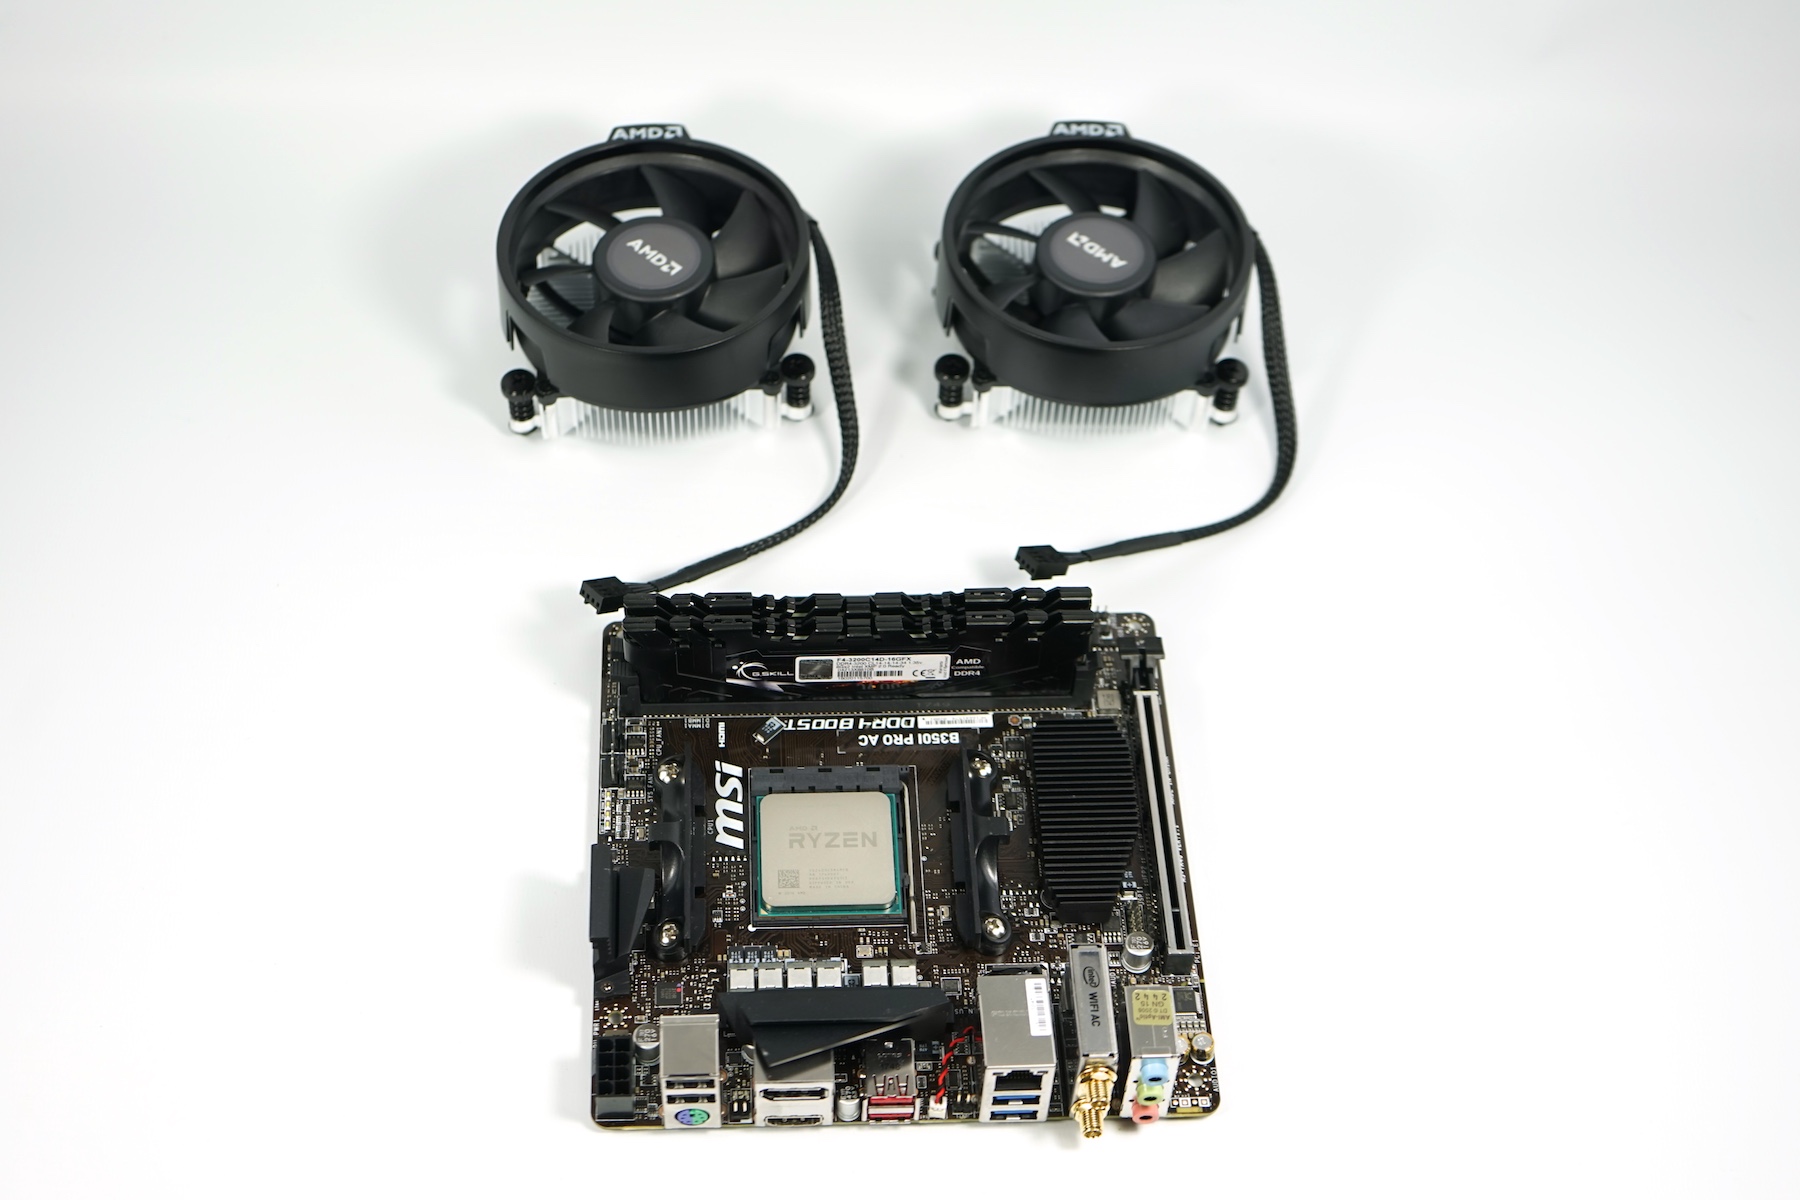
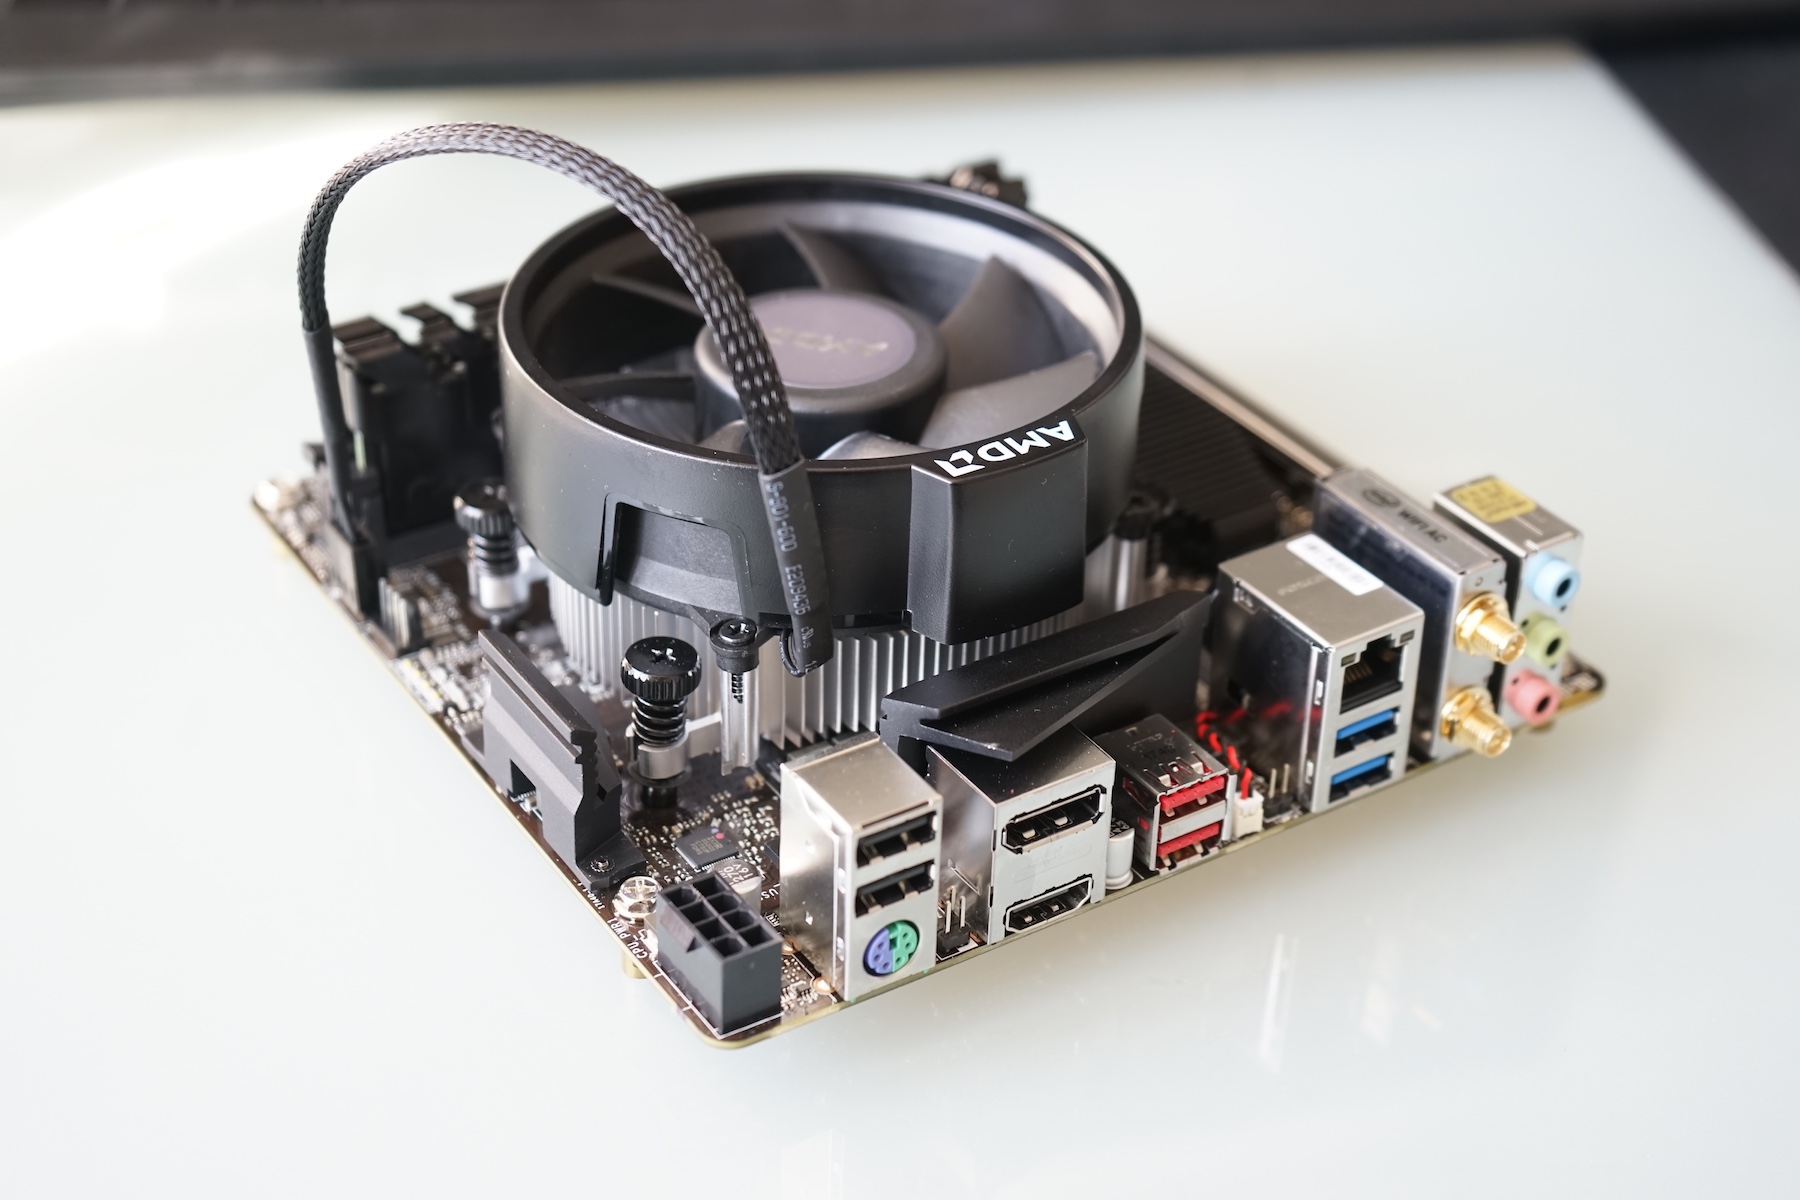
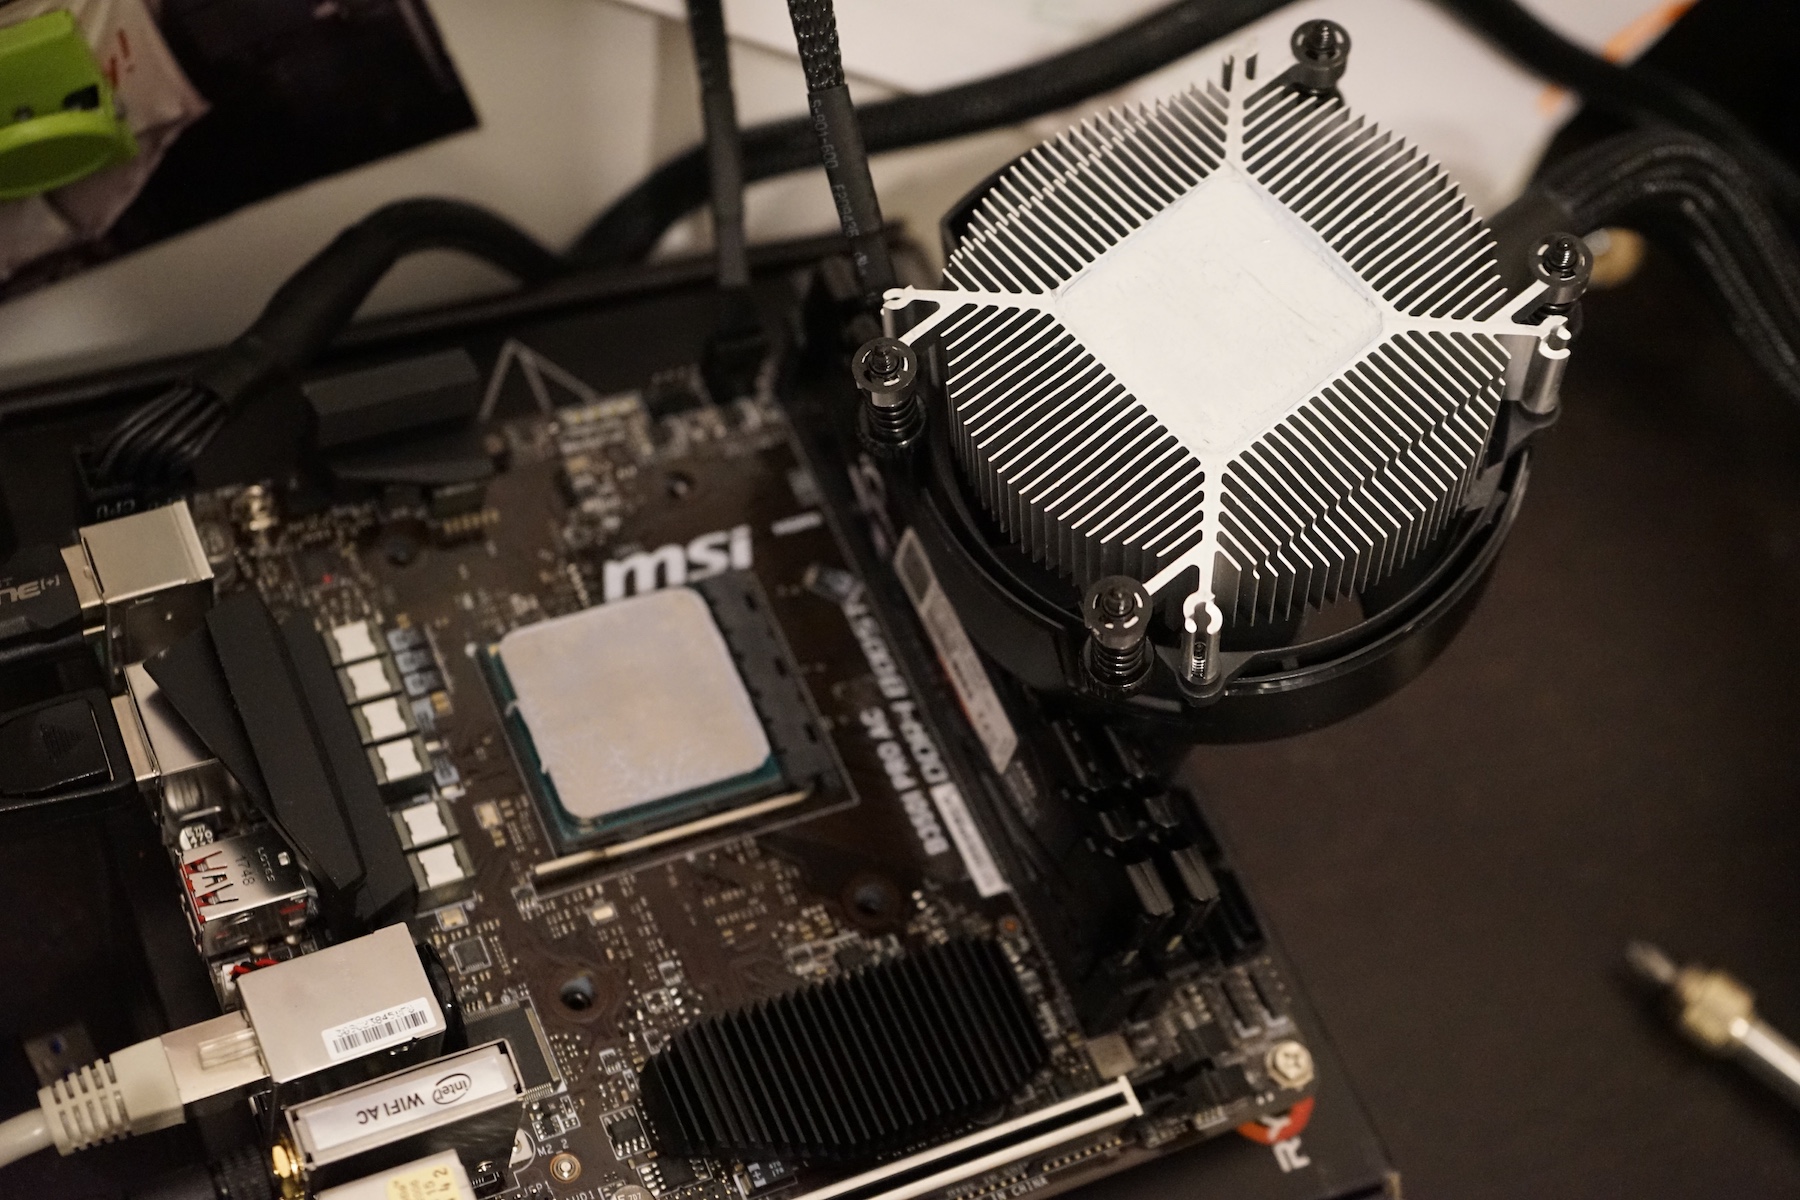
The benchmarks in this review were conducted on the following system:
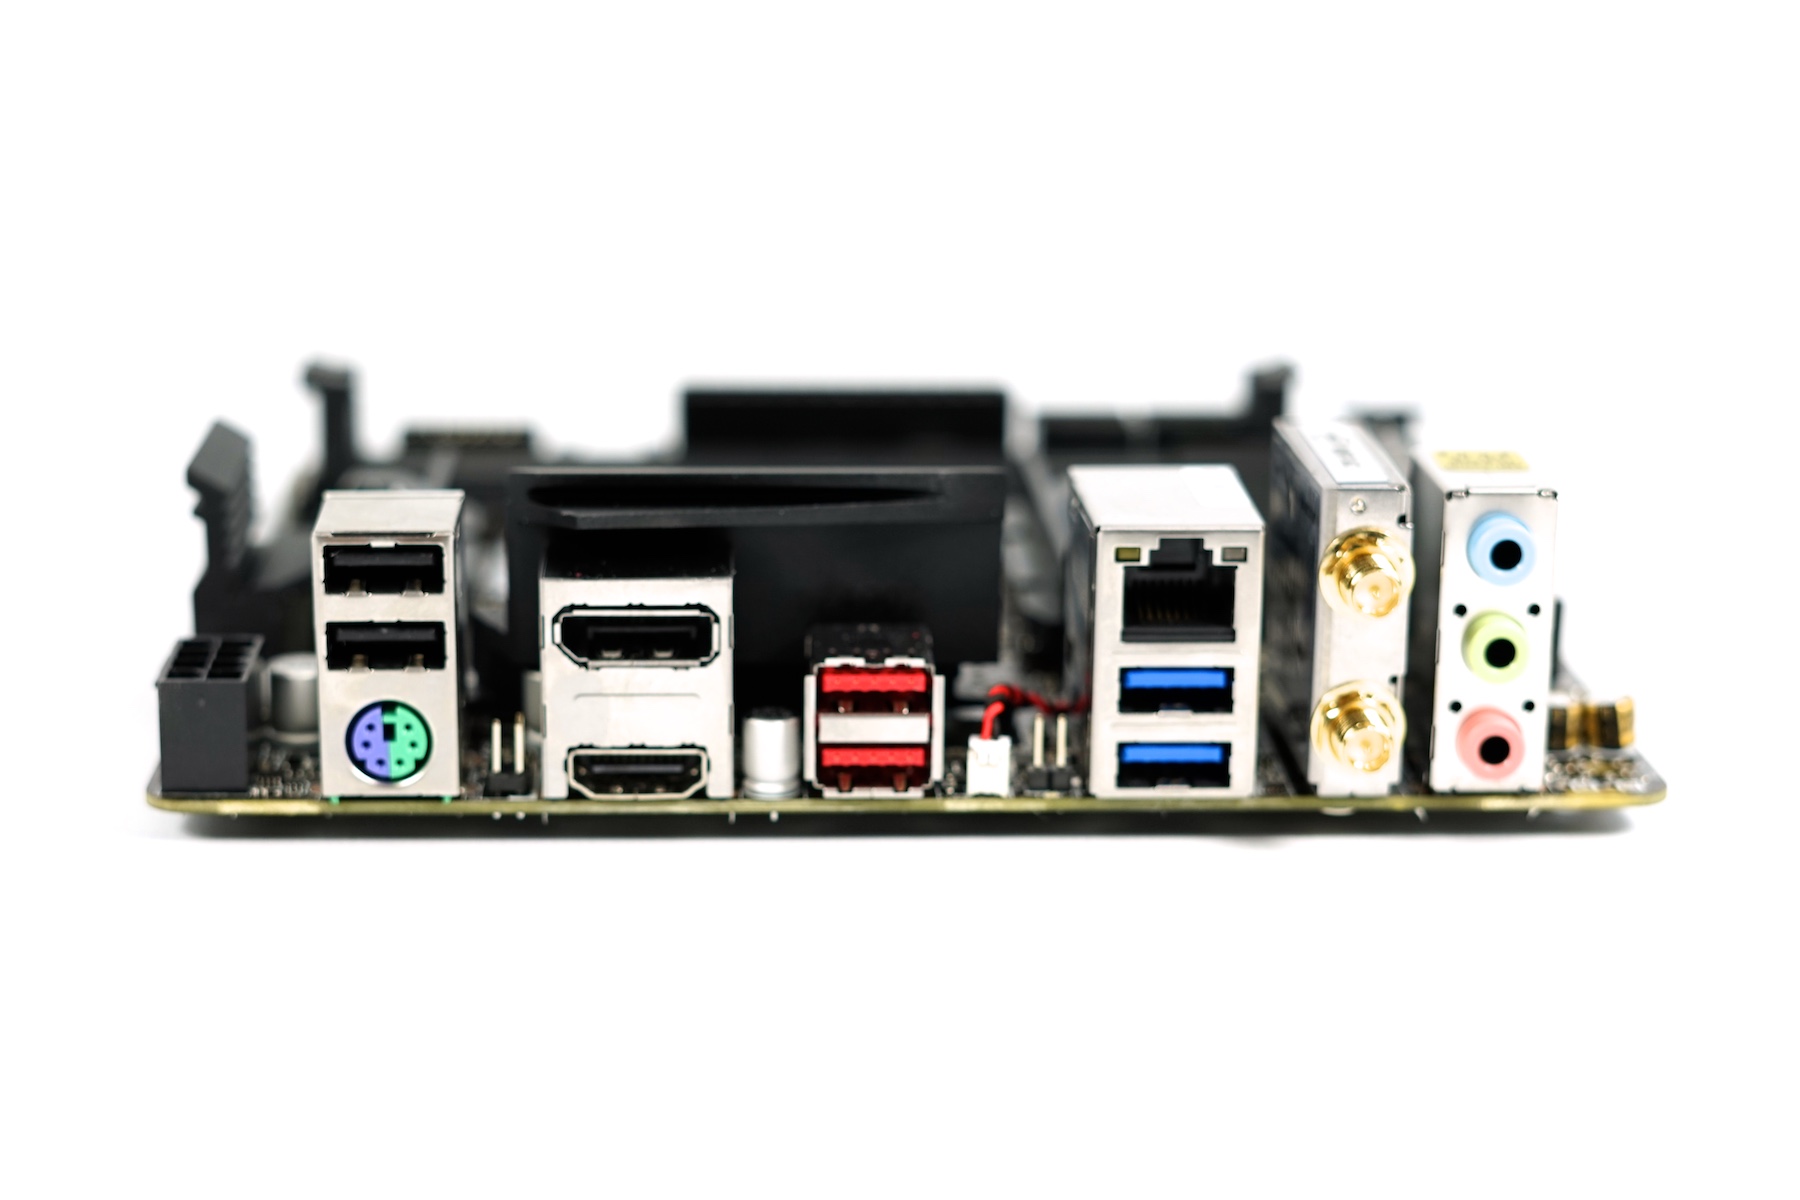
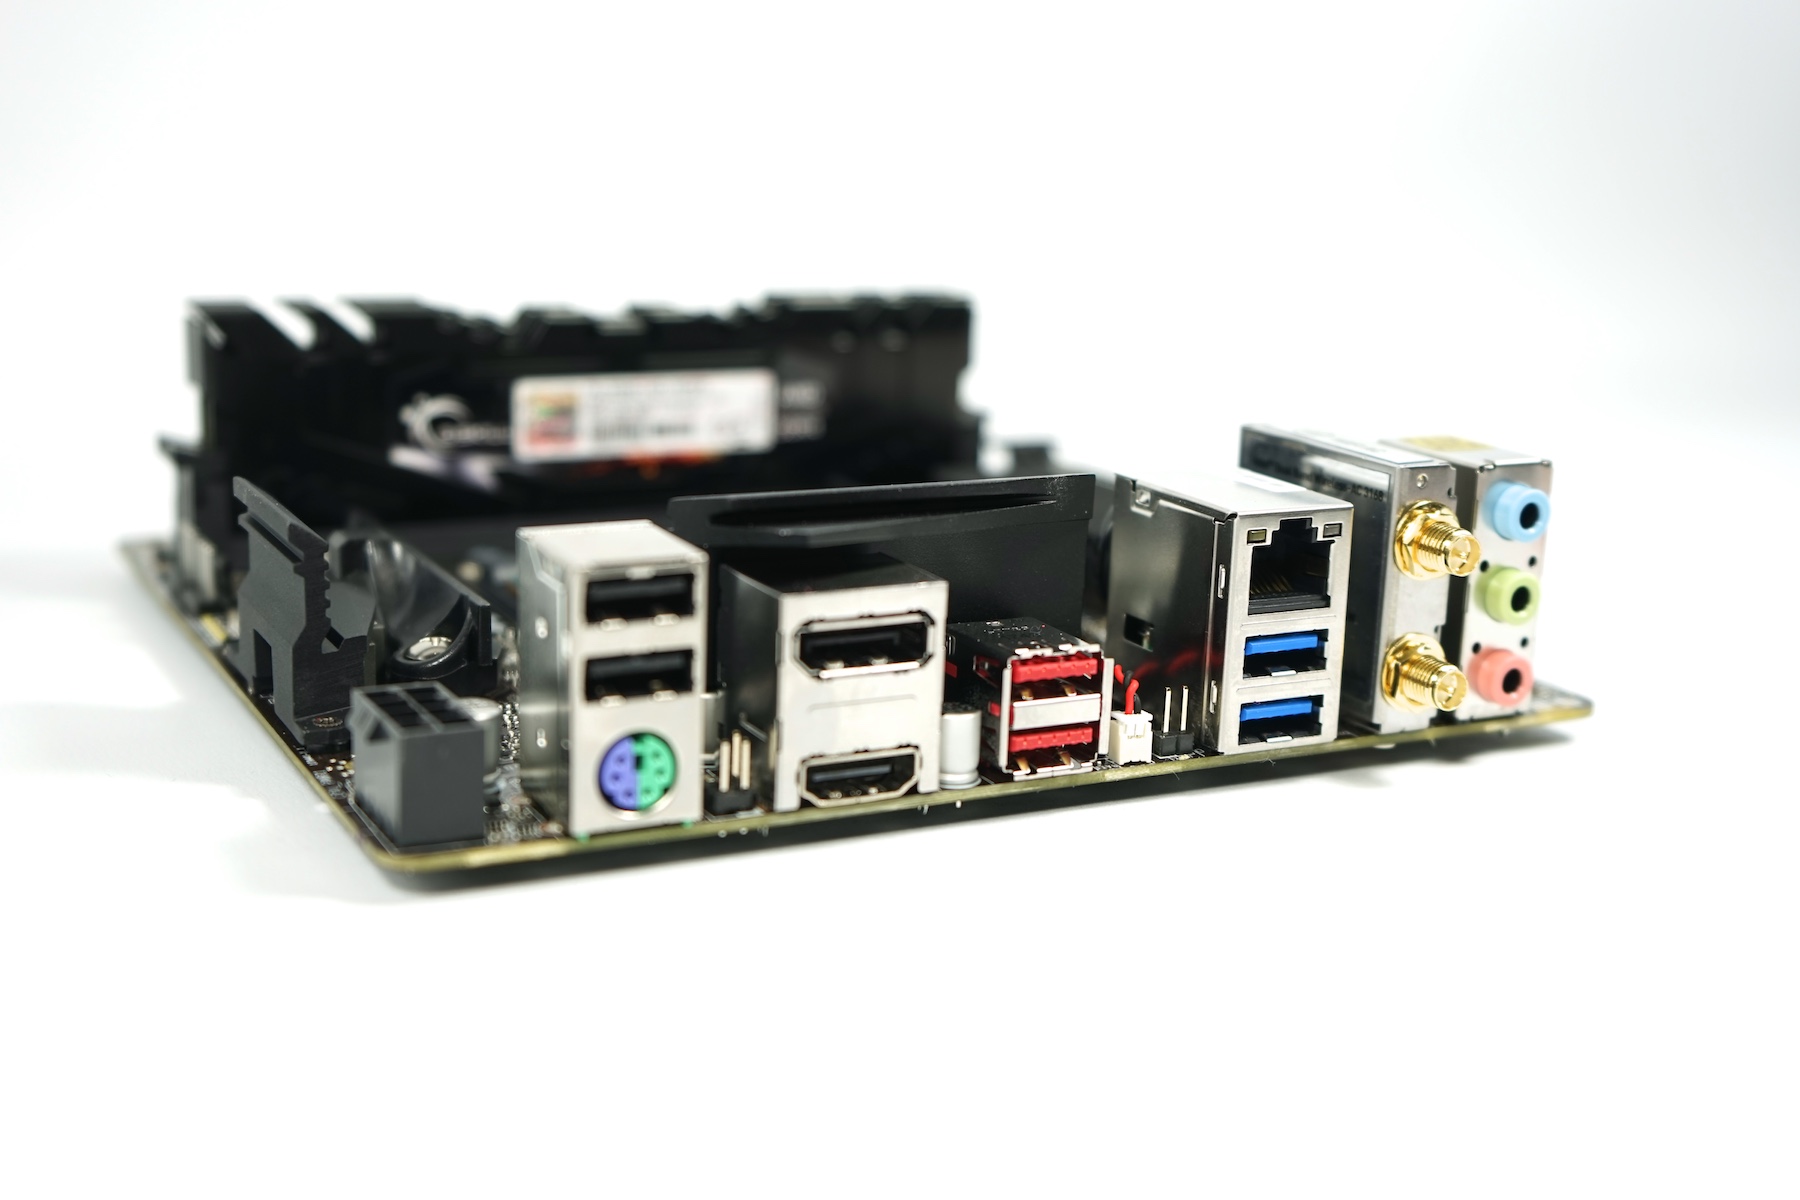
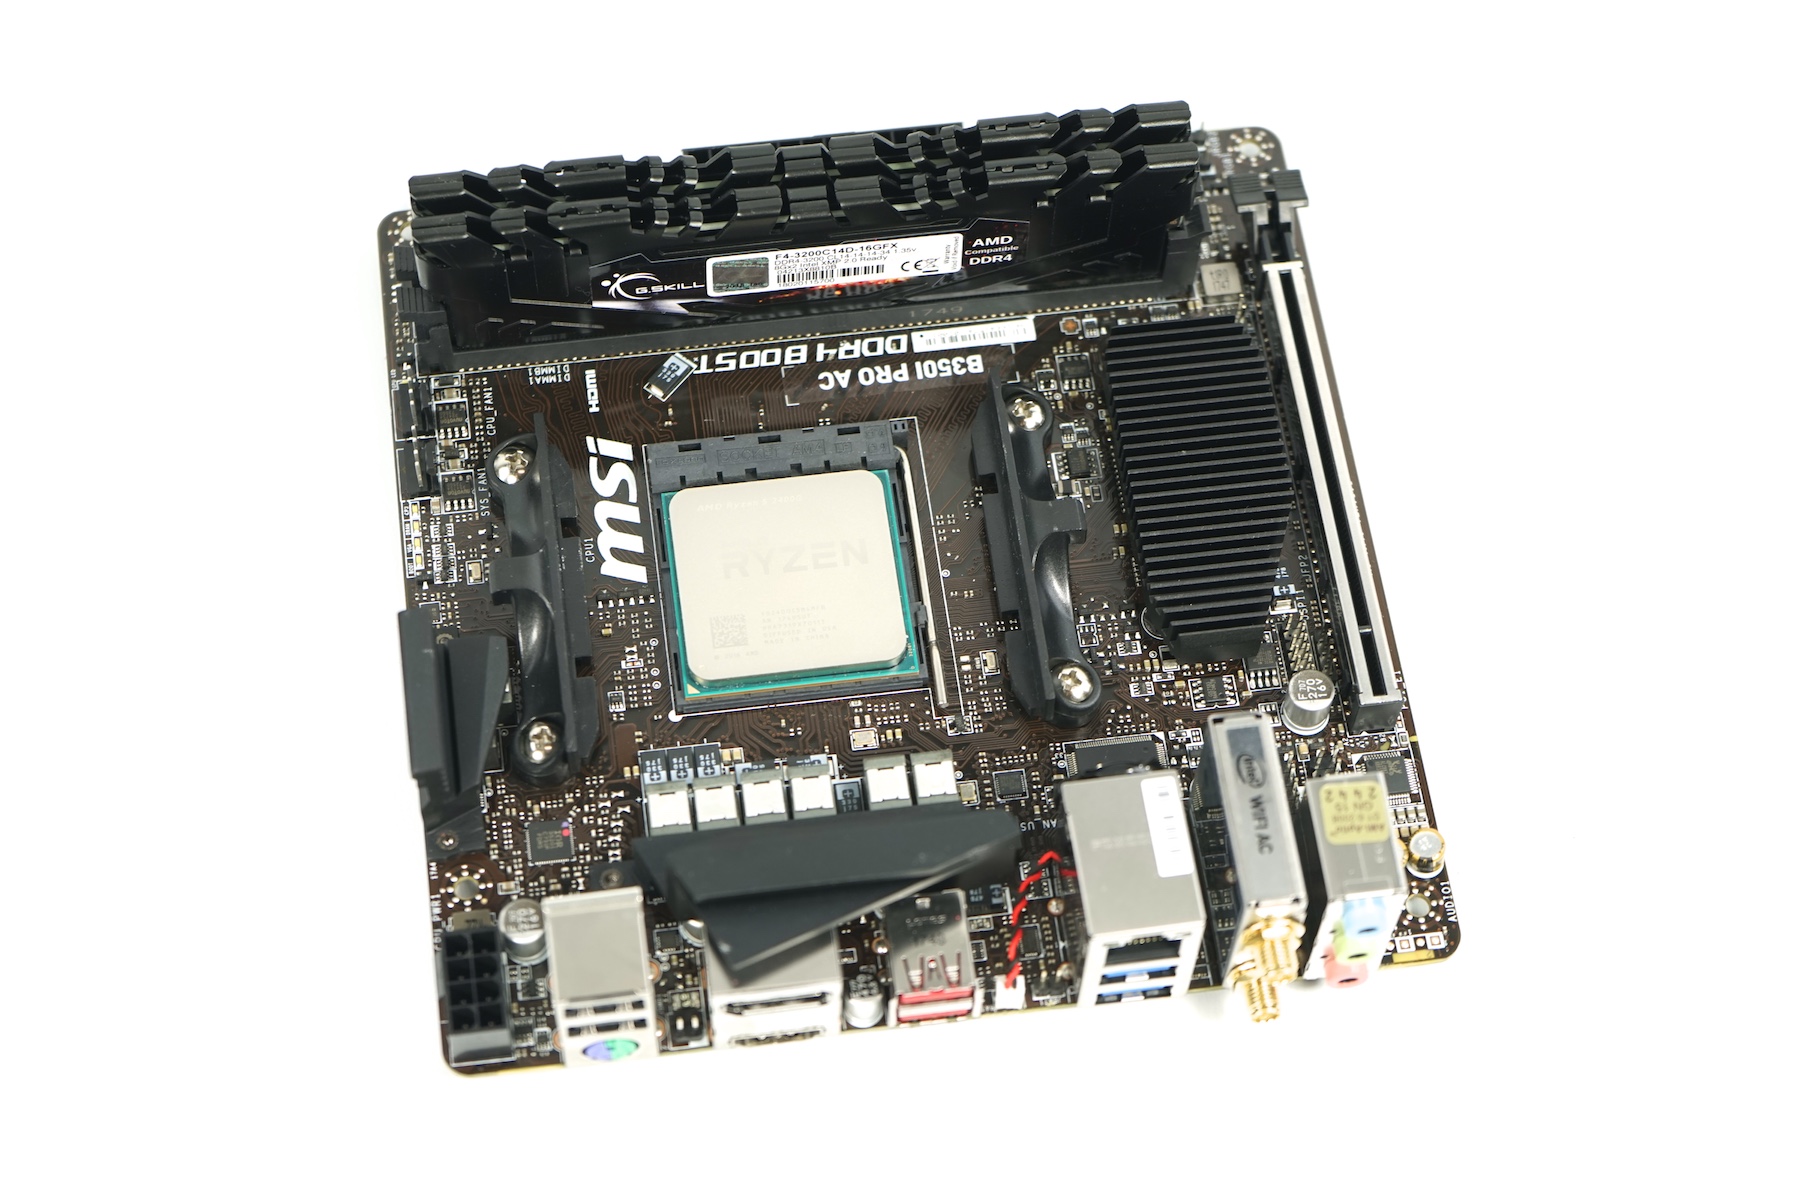
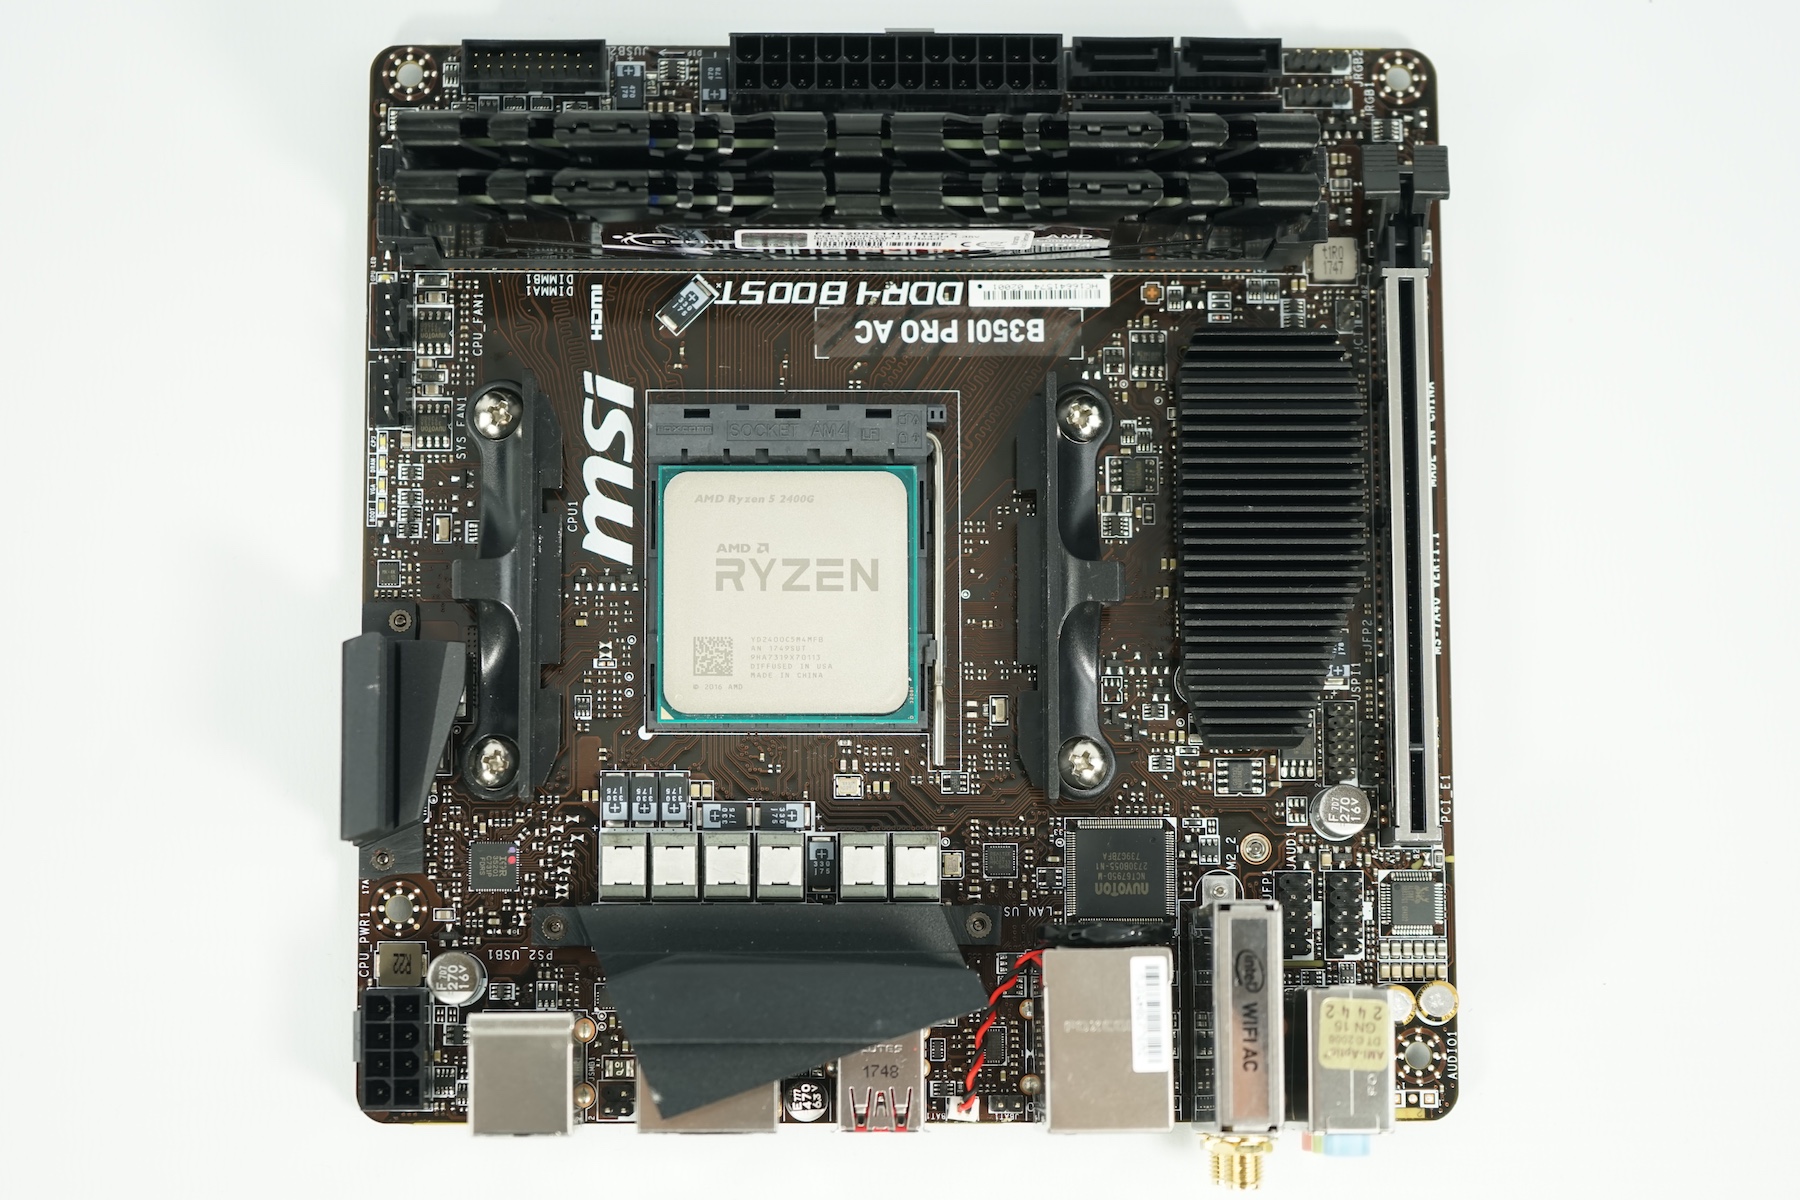
- MSI B350I Pro MicroATX motherboard (BIOS 112PT5, default settings, XMP1 for DDR4-2933)
- Seasonic Focus Platinum Plus 850-W power supply
- G-Skill Flare X DDR4-3200 memory kit (2 x 8 GB) running at DDR4-2933
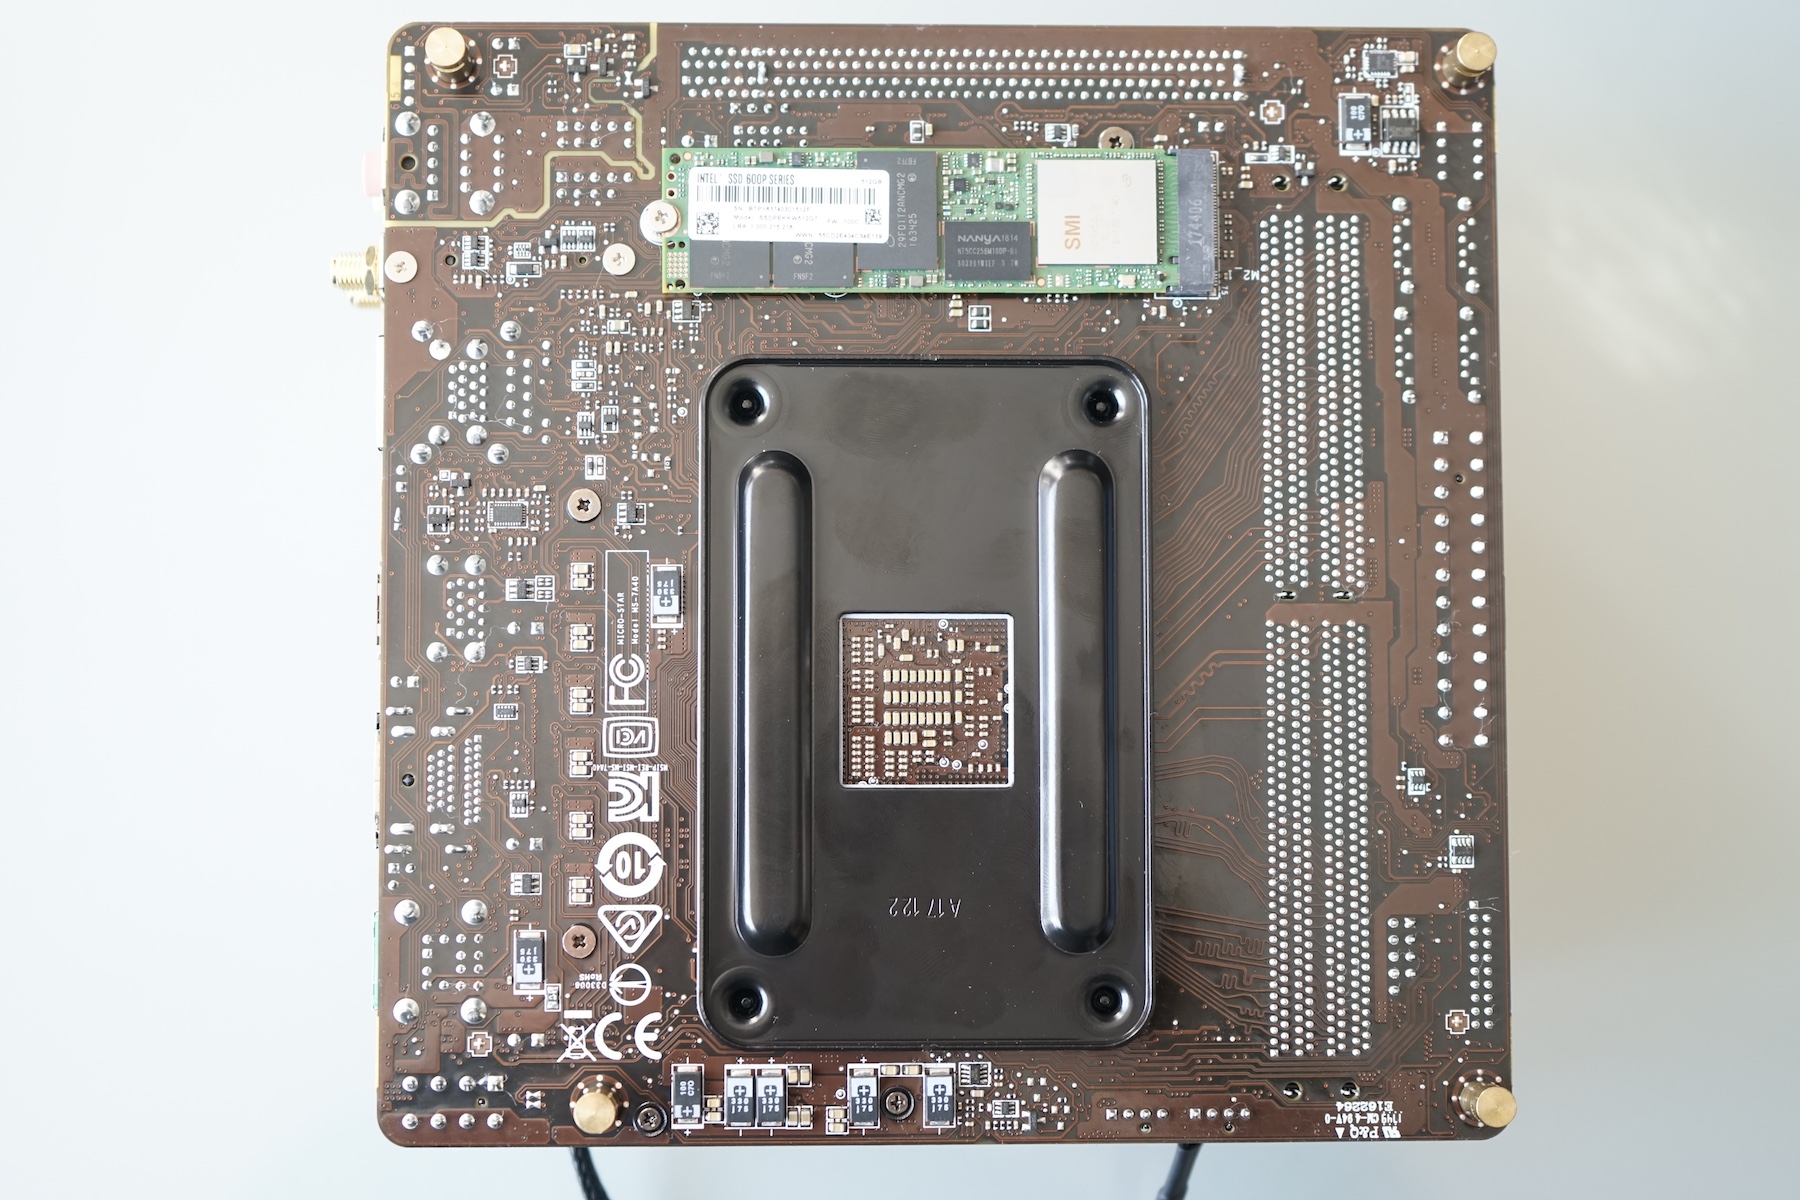
- Intel SSD 600p m.2 512 GB
Motherboard, RAM, and APUs were provided by AMD.
CPU Benchmarks
In the single-core benchmarks, the new Ryzen 5 2400G achieves roughly the same level of performance as a Ryzen 5 1500X (max. 3.7 GHz) or Intel Core i7-7700HQ (mobile, max. 3.8 GHz). It certainly benefits from its higher turbo clock speeds of up to 3.9 GHz. In most benchmarks, the Ryzen 3 2200G immediately follows suit since its lack of SMT is of no disadvantage in these tests. Its 200 MHz lower maximum clock speed sure is, though.
In multi-core benchmarks the tables have turned, and there are major differences between the two APUs. Once again, the Ryzen 5 2400G is about as fast as the Ryzen 5 1500X and slightly faster than a Core i7-7700HQ. In fact, it achieves the same level of performance as the older Core i7-4790K Haswell CPU (desktop, 4 - 4.4 GHz). The slower Ryzen 3 2200G’s performance depends heavily on the particular benchmark’s reliance on SMT support. On average, the slower of the two APUs can easily keep up with a Ryzen 3 1300X or a Core i5-7500 desktop CPU (Kaby Lake quad-core, no Hyperthreading, 3.4 - 3.8 GHz).
| Performance rating - Percent | |
| Intel Core i7-8700K -2! | |
| AMD Ryzen 7 1800X -3! | |
| AMD Ryzen 5 1600 -5! | |
| Intel Core i7-4790K -12! | |
| AMD Ryzen 5 1600 -6! | |
| Intel Core i7-7700HQ -9! | |
| Intel Core i7-4790K -3! | |
| AMD Ryzen 5 1500X -1! | |
| Average Intel Core i7-7820HK -1! | |
| AMD Ryzen 5 2400G | |
| Average Intel Core i7-7700HQ | |
| Intel Core i5-7600K -4! | |
| AMD Ryzen 5 1400 -3! | |
| Intel Core i7-7700HQ -3! | |
| AMD Ryzen 5 2500U -5! | |
| Average Intel Core i5-8250U | |
| Intel Core i5-7500 -3! | |
| AMD Ryzen 3 2200G | |
| AMD Ryzen 5 2500U -6! | |
| AMD Ryzen 3 1300X | |
| AMD Ryzen 3 1200 | |
| Cinebench R15 | |
| CPU Single 64Bit | |
| Intel Core i7-8700K | |
| Intel Core i5-7600K | |
| Intel Core i7-4790K | |
| Average Intel Core i7-7820HK (156 - 185, n=16) | |
| AMD Ryzen 7 1800X | |
| Intel Core i5-7500 | |
| Intel Core i7-7700HQ | |
| AMD Ryzen 5 2400G | |
| AMD Ryzen 5 1500X | |
| Average Intel Core i7-7700HQ (120 - 162, n=110) | |
| AMD Ryzen 3 1300X | |
| AMD Ryzen 3 2200G | |
| AMD Ryzen 5 1600 | |
| AMD Ryzen 5 1600 | |
| Intel Core i7-7700HQ | |
| Average Intel Core i5-8250U (81 - 147, n=97) | |
| AMD Ryzen 5 2500U | |
| AMD Ryzen 5 2500U | |
| AMD Ryzen 3 1200 | |
| AMD Ryzen 5 1400 | |
| CPU Multi 64Bit | |
| AMD Ryzen 7 1800X | |
| Intel Core i7-8700K | |
| AMD Ryzen 5 1600 | |
| AMD Ryzen 5 1600 | |
| AMD Ryzen 5 2400G | |
| Intel Core i7-4790K | |
| AMD Ryzen 5 1500X | |
| Average Intel Core i7-7820HK (689 - 932, n=18) | |
| Intel Core i7-7700HQ | |
| Average Intel Core i7-7700HQ (603 - 747, n=111) | |
| Intel Core i7-7700HQ | |
| AMD Ryzen 5 1400 | |
| Intel Core i5-7600K | |
| AMD Ryzen 5 2500U | |
| Intel Core i5-7500 | |
| AMD Ryzen 3 2200G | |
| AMD Ryzen 5 2500U | |
| Average Intel Core i5-8250U (320 - 730, n=101) | |
| AMD Ryzen 3 1300X | |
| AMD Ryzen 3 1200 | |
| wPrime 2.10 | |
| 32m | |
| AMD Ryzen 3 1200 | |
| AMD Ryzen 3 1300X | |
| AMD Ryzen 3 2200G | |
| Intel Core i7-7700HQ | |
| Average Intel Core i7-7820HK (6.67 - 17.8, n=5) | |
| Intel Core i5-7500 | |
| Average Intel Core i5-8250U (7.39 - 13.8, n=13) | |
| Average Intel Core i7-7700HQ (6.93 - 20.1, n=48) | |
| Intel Core i5-7600K | |
| AMD Ryzen 5 2500U | |
| AMD Ryzen 5 1400 | |
| AMD Ryzen 5 1500X | |
| AMD Ryzen 5 2400G | |
| Intel Core i7-4790K | |
| AMD Ryzen 5 1600 | |
| Intel Core i7-8700K | |
| AMD Ryzen 7 1800X | |
| 1024m | |
| AMD Ryzen 3 1200 | |
| AMD Ryzen 3 1300X | |
| AMD Ryzen 3 2200G | |
| Intel Core i7-7700HQ | |
| Average Intel Core i5-8250U (243 - 402, n=13) | |
| Intel Core i5-7500 | |
| Intel Core i5-7600K | |
| Average Intel Core i7-7700HQ (210 - 379, n=48) | |
| Average Intel Core i7-7820HK (179.4 - 331, n=5) | |
| AMD Ryzen 5 2500U | |
| AMD Ryzen 5 1400 | |
| AMD Ryzen 5 1500X | |
| AMD Ryzen 5 2400G | |
| Intel Core i7-4790K | |
| AMD Ryzen 5 1600 | |
| Intel Core i7-8700K | |
| AMD Ryzen 7 1800X | |
| X264 HD Benchmark 4.0 | |
| Pass 1 | |
| Intel Core i7-8700K | |
| Intel Core i5-7600K | |
| AMD Ryzen 7 1800X | |
| AMD Ryzen 3 2200G | |
| Intel Core i5-7500 | |
| AMD Ryzen 3 1300X | |
| Intel Core i7-4790K | |
| Average Intel Core i7-7820HK (177 - 180.6, n=2) | |
| AMD Ryzen 5 1600 | |
| AMD Ryzen 5 1500X | |
| AMD Ryzen 5 2400G | |
| Intel Core i7-7700HQ | |
| Average Intel Core i7-7700HQ (156.9 - 175, n=22) | |
| AMD Ryzen 3 1200 | |
| AMD Ryzen 5 1400 | |
| Average Intel Core i5-8250U (124.6 - 157.6, n=4) | |
| AMD Ryzen 5 2500U | |
| Pass 2 | |
| AMD Ryzen 7 1800X | |
| Intel Core i7-8700K | |
| AMD Ryzen 5 1600 | |
| Intel Core i7-4790K | |
| AMD Ryzen 5 1500X | |
| AMD Ryzen 5 2400G | |
| Average Intel Core i7-7820HK (46 - 47.8, n=2) | |
| Intel Core i5-7600K | |
| Intel Core i7-7700HQ | |
| Average Intel Core i7-7700HQ (36.6 - 46.5, n=22) | |
| AMD Ryzen 5 1400 | |
| AMD Ryzen 3 2200G | |
| Intel Core i5-7500 | |
| AMD Ryzen 3 1300X | |
| AMD Ryzen 3 1200 | |
| AMD Ryzen 5 2500U | |
| Average Intel Core i5-8250U (29.5 - 37.7, n=4) | |
| WinRAR - Result | |
| Intel Core i7-8700K | |
| Intel Core i7-4790K | |
| Average Intel Core i7-7820HK (5114 - 5155, n=2) | |
| Average Intel Core i7-7700HQ (3763 - 4903, n=12) | |
| AMD Ryzen 7 1800X | |
| Average Intel Core i5-8250U (3632 - 4350, n=2) | |
| Intel Core i7-7700HQ | |
| AMD Ryzen 5 1500X | |
| AMD Ryzen 5 2400G | |
| AMD Ryzen 5 1600 | |
| Intel Core i5-7600K | |
| AMD Ryzen 3 2200G | |
| AMD Ryzen 5 1400 | |
| AMD Ryzen 5 1600 | |
| Intel Core i5-7500 | |
| AMD Ryzen 3 1300X | |
| AMD Ryzen 3 1200 | |
| AMD Ryzen 5 2500U | |
| Geekbench 4.4 | |
| 64 Bit Single-Core Score | |
| Intel Core i7-8700K | |
| Average Intel Core i7-7820HK (4841 - 4952, n=2) | |
| Average Intel Core i7-7700HQ (4415 - 4808, n=9) | |
| Intel Core i7-7700HQ | |
| AMD Ryzen 5 1500X | |
| AMD Ryzen 3 1300X | |
| AMD Ryzen 5 2400G | |
| AMD Ryzen 3 2200G | |
| Average Intel Core i5-8250U (3453 - 4330, n=25) | |
| AMD Ryzen 3 1200 | |
| 64 Bit Multi-Core Score | |
| Intel Core i7-8700K | |
| Average Intel Core i7-7820HK (15838 - 16165, n=2) | |
| AMD Ryzen 5 1500X | |
| Average Intel Core i7-7700HQ (13053 - 15111, n=9) | |
| AMD Ryzen 5 2400G | |
| Intel Core i7-7700HQ | |
| Average Intel Core i5-8250U (11269 - 14228, n=25) | |
| AMD Ryzen 3 1300X | |
| AMD Ryzen 3 2200G | |
| AMD Ryzen 3 1200 | |
| 3DMark 11 - 1280x720 Performance Physics | |
| AMD Ryzen 7 1800X | |
| AMD Ryzen 5 1600 | |
| Intel Core i7-4790K | |
| Average Intel Core i7-7820HK (9542 - 11853, n=15) | |
| Intel Core i7-4790K | |
| AMD Ryzen 5 1500X | |
| Average Intel Core i7-7700HQ (6007 - 9653, n=112) | |
| AMD Ryzen 5 2400G | |
| AMD Ryzen 5 1400 | |
| Intel Core i7-7700HQ | |
| Intel Core i7-7700HQ | |
| AMD Ryzen 3 2200G | |
| AMD Ryzen 3 1300X | |
| AMD Ryzen 5 2500U | |
| Average Intel Core i5-8250U (3233 - 8014, n=96) | |
| Intel Core i5-7500 | |
| AMD Ryzen 5 2500U | |
| AMD Ryzen 3 1200 | |
* ... smaller is better
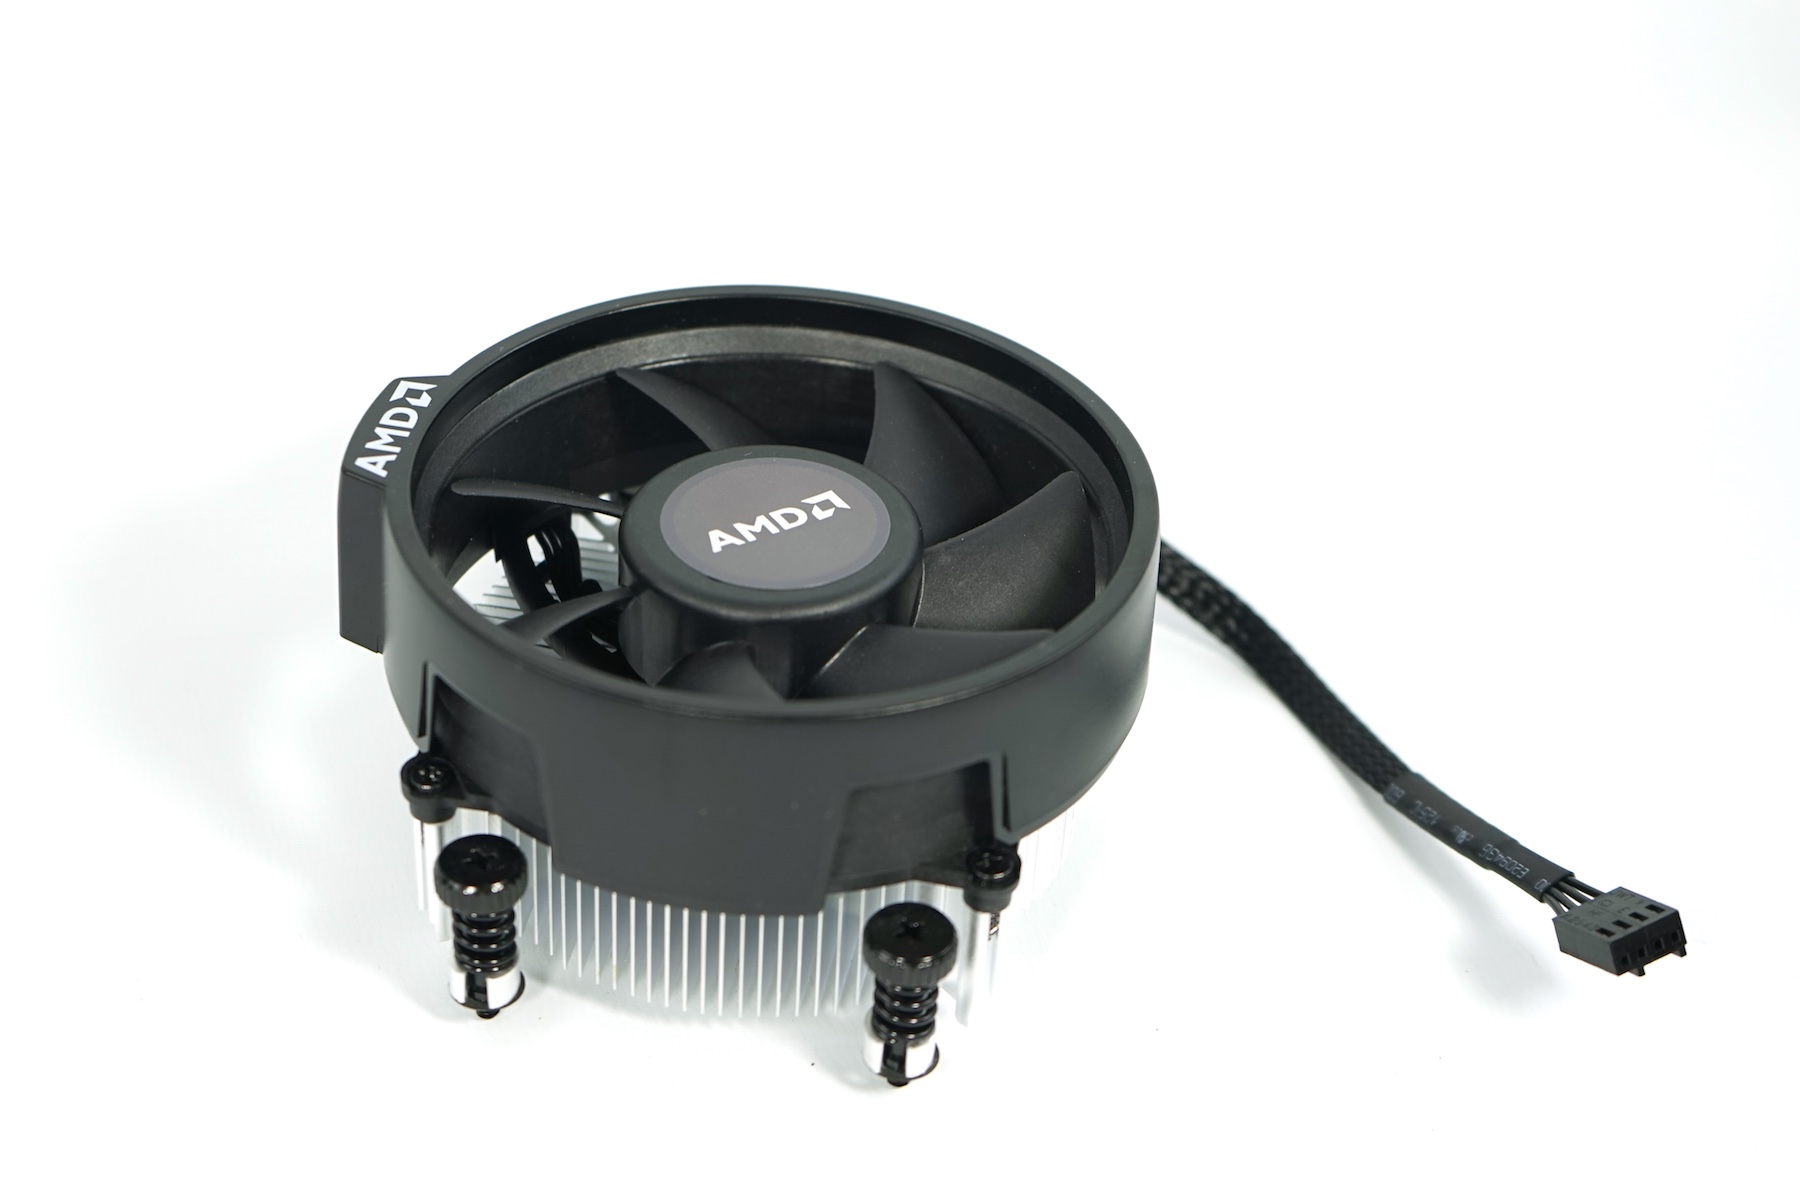
Unlike their mobile counterparts, the desktop APUs do not suffer from throttling at all, not even when using the included Wraith Stealth cooler. Neither of the two Ryzen APUs shows any sort of performance degradation after 20 iterations of our Cinebench R15 benchmark loop.
GPU Benchmarks
As expected of AMD the new APUs steal the show with their integrated Vega GPUs. In 3DMark, the Ryzen 5 2400G’s Vega 11 GPU manages to outperform the older Iris Pro 580 (Intel NUC6i7 Skull Trail). Compared to dedicated graphics cards, the Vega 11 is on a par with a GeForce GTX 1030 / GeForce MX150.
The Ryzen 3 2200G’s Vega 8 GPU is identical to the one featured in the mobile Ryzen 5 and Ryzen 7 APUs. It is, however, much faster thanks to the faster DDR4-2933 memory and the bigger thermal window (aka TDP) at its disposal. The benefits of the faster memory become obvious when looking at the benchmark results of a Vega 11 with DDR4-2400 and a Vega 8 with DDR4-2933: they are virtually identical. Equipped with DDR4-2933, the Vega 8 is about as fast as the MacBook Pro 15’s dedicated Radeon Pro 555 and scores somewhere between a 940MX and a MX150.
Sustained GPU load did not result in reduced performance at all. Neither 3DMark Sky Diver Stress Test nor “The Witcher 3” showed any signs of thermal throttling.
| Performance rating - Percent | |
| AMD Radeon RX 460 (Desktop) -1! | |
| Average NVIDIA GeForce GTX 1050 Mobile | |
| NVIDIA GeForce GTX 1050 Mobile -2! | |
| AMD Radeon Pro 555 -1! | |
| AMD Radeon RX Vega 11 | |
| NVIDIA GeForce GT 1030 (Desktop) | |
| AMD Radeon Pro 450 -1! | |
| Average NVIDIA GeForce MX150 | |
| NVIDIA GeForce MX150 -1! | |
| AMD Radeon RX Vega 8 (Ryzen 2000/3000) -1! | |
| Intel Iris Pro Graphics 580 -4! | |
| AMD Radeon RX Vega 8 (Ryzen 2000/3000) -2! | |
| AMD Radeon RX Vega 8 (Ryzen 2000/3000) -2! | |
| Intel Iris Pro Graphics 580 -2! | |
| Intel Iris Plus Graphics 650 -1! | |
| Average NVIDIA GeForce 940MX | |
| NVIDIA GeForce 940MX -1! | |
| Intel Iris Pro Graphics 5200 -2! | |
| Intel Iris Plus Graphics 640 -1! | |
| Intel UHD Graphics 630 -2! | |
| Average Intel UHD Graphics 630 | |
| Intel Iris Pro Graphics 5200 -3! | |
| Intel UHD Graphics 630 | |
| Intel UHD Graphics 620 -2! | |
Gaming Performance
As expected, gaming performance turned out to be slightly worse than synthetic 3DMark performance. Despite the lack of dedicated video memory both, Vega 8 and Vega 11, did fairly well overall. On average, they achieved the same level of performance as a dedicated mobile GeForce MX150 GPU, and even the slower Vega 8 was always faster than the GeForce 940MX. Accordingly, modern and demanding games will run fine at low details. Less demanding games, such as Rocket League, will run smooth even at high levels of detail.
| Performance rating - Percent | |
| NVIDIA GeForce GTX 1050 Mobile -2! | |
| NVIDIA GeForce GTX 1050 (Desktop) -5! | |
| NVIDIA GeForce MX150 -1! | |
| NVIDIA GeForce GT 1030 (Desktop) | |
| AMD Radeon RX Vega 11 | |
| Average NVIDIA GeForce MX150 | |
| AMD Radeon RX Vega 8 (Ryzen 2000/3000) | |
| NVIDIA GeForce 940MX -1! | |
| Average NVIDIA GeForce 940MX | |
| Average NVIDIA GeForce 940M | |
| Intel Iris Plus Graphics 640 -5! | |
| AMD Radeon RX Vega 8 (Ryzen 2000/3000) -2! | |
| Intel UHD Graphics 630 -5! | |
| Intel Iris Plus Graphics 650 -4! | |
| Average Intel Iris Plus Graphics 650 -4! | |
| Intel UHD Graphics 630 -5! | |
| Rocket League - 1920x1080 High Quality AA:High FX | |
| NVIDIA GeForce GTX 1050 Mobile | |
| NVIDIA GeForce GT 1030 (Desktop) | |
| AMD Radeon RX Vega 11 | |
| Average NVIDIA GeForce MX150 (37.8 - 59.8, n=6) | |
| Intel Iris Plus Graphics 650 | |
| Average Intel Iris Plus Graphics 650 (n=1) | |
| AMD Radeon RX Vega 8 (Ryzen 2000/3000) | |
| AMD Radeon RX Vega 8 (Ryzen 2000/3000) | |
| Intel UHD Graphics 630 | |
| Average NVIDIA GeForce 940MX (20.7 - 32, n=3) | |
| Intel Iris Plus Graphics 640 | |
| Intel UHD Graphics 630 | |
| Average NVIDIA GeForce 940M (n=1) | |
| NVIDIA GeForce 940MX | |
Ryzen 5 2400G
| low | med. | high | ultra | 4K | |
|---|---|---|---|---|---|
| X-Plane 10.25 (2013) | 65.9 | 44.7 | 20.1 | 20 | |
| GTA V (2015) | 102 | 28.7 | 14.3 | ||
| Dota 2 Reborn (2015) | 103.3 | 80.5 | 54.2 | 50.2 | 20.7 |
| World of Warships (2015) | 70 | 52.9 | 15.9 | ||
| Deus Ex Mankind Divided (2016) | 50 | 18.1 | |||
| Rocket League (2017) | 215 | 71 | 47.1 | 15.2 | |
| Team Fortress 2 (2017) | 75.4 | 26.5 | |||
| F1 2017 (2017) | 101 | 45 | 35 | ||
| Middle-earth: Shadow of War (2017) | 48 | 24 | 18 | ||
| Assassin´s Creed Origins (2017) | 41 | 23 | 20 | ||
| Fortnite (2018) | 183 | 86 | 30.8 | ||
| Final Fantasy XV Benchmark (2018) | 31.3 | 16.4 | |||
| Kingdom Come: Deliverance (2018) | 50.6 | 22.3 | 18.7 | 14.1 | |
| X-Plane 11.11 (2018) | 44.8 | 34.6 | 31.8 | 18.1 | |
| Far Cry 5 (2018) | 49 | 23 | 22 | 20 | |
| The Crew 2 (2018) | 58.8 | 28.4 | 24.6 | 17.8 | 5.5 |
| Monster Hunter World (2018) | 43.5 | 19.9 | 18.3 | 13.9 | |
| F1 2018 (2018) | 71 | 38 | 29 | 19 | 10 |
| Shadow of the Tomb Raider (2018) | 49 | 19 | 17 | 14 | 4 |
| FIFA 19 (2018) | 123.6 | 89.3 | 77.6 | 76.6 | 25 |
| Forza Horizon 4 (2018) | 78 | 38 | 35 | 29 | 12 |
| Assassin´s Creed Odyssey (2018) | 37 | 20 | 16 | 11 | 5 |
| Call of Duty Black Ops 4 (2018) | 61.3 | 22.5 | |||
| Hitman 2 (2018) | 35.9 | 0 () | |||
| Fallout 76 (2018) | 44.5 | 24.2 | 22.3 | 21.6 | |
| Battlefield V (2018) | 66.9 | 30.9 | 26.1 | 25.1 | 8.4 |
| The Division 2 (2019) | 62 | 33 | 17 | ||
| Anno 1800 (2019) | 58.5 | 21.3 | 12.9 | ||
| Rage 2 (2019) | 37.5 | 31.9 | 31.1 | ||
| F1 2019 (2019) | 84 | 43 | 30 | ||
| Control (2019) | 41.2 | 12.5 | 7.1 | ||
| Borderlands 3 (2019) | 56.1 | 21.7 | 13.2 | 8.9 |
Ryzen 3 2200G
| low | med. | high | ultra | 4K | |
|---|---|---|---|---|---|
| X-Plane 10.25 (2013) | 63.5 | 41.1 | 19.3 | 18.2 | |
| GTA V (2015) | 51.5 | 25.3 | 12.3 | ||
| Dota 2 Reborn (2015) | 97.2 | 76.3 | 47.8 | 44.8 | |
| World of Warships (2015) | 46 | 37.5 | 13.3 | ||
| Ashes of the Singularity (2016) | 16.3 | ||||
| Overwatch (2016) | 127 | 46.7 | 22.9 | ||
| Deus Ex Mankind Divided (2016) | 42.5 | 15.2 | |||
| Rocket League (2017) | 93 | 45.8 | 32.1 | 14.1 | |
| F1 2017 (2017) | 85 | 36 | 29 | ||
| Middle-earth: Shadow of War (2017) | 46 | 21 | 16 | ||
| Assassin´s Creed Origins (2017) | 38 | 20 | |||
| Star Wars Battlefront 2 (2017) | 70 | 23.1 | 20.2 | ||
| Fortnite (2018) | 198 | 62 | 24.1 | ||
| Final Fantasy XV Benchmark (2018) | 27 | 13.7 | |||
| Kingdom Come: Deliverance (2018) | 36.8 | 18.3 | |||
| Far Cry 5 (2018) | 43 | 20 | 18 | 17 | |
| The Crew 2 (2018) | 56.7 | 24.6 | 22.3 | 15.9 | 5 |
| Monster Hunter World (2018) | 38.7 | 16.2 | 14.7 | 10.7 | |
| F1 2018 (2018) | 64 | 33 | 25 | 16 | 9 |
| Shadow of the Tomb Raider (2018) | 46 | 17 | 15 | 12 | 3 |
| FIFA 19 (2018) | 110.5 | 81.7 | 73.1 | 70.6 | 20.1 |
| Forza Horizon 4 (2018) | 54 | 33 | 30 | 23 | 9 |
| Assassin´s Creed Odyssey (2018) | 34 | 18 | 13 | 9 | 4 |
| Call of Duty Black Ops 4 (2018) | 59.8 | 18.3 | |||
| Hitman 2 (2018) | 32.1 | ||||
| Fallout 76 (2018) | 41.9 | 22.5 | 17.9 | 16.2 | |
| Battlefield V (2018) | 62.1 | 27.5 | 23.7 | 22.5 | 5.6 |
| Farming Simulator 19 (2018) | 120.2 | 53.2 | 30.2 | 14 | |
| Darksiders III (2018) | 79 | 22.4 | 18 | 14.8 | |
| Just Cause 4 (2018) | 30.5 | 18.4 | 14.4 | 10.5 | |
| Apex Legends (2019) | 59.8 | 28.2 | 19.1 | ||
| Far Cry New Dawn (2019) | 37 | 20 | 18 | 16 | |
| Anthem (2019) | 0 game wont start (unsupported gpu) | ||||
| Dirt Rally 2.0 (2019) | 115.8 | 41.2 | 30.6 | 15.3 | |
| The Division 2 (2019) | 51 | 29 | 15 | ||
| Anno 1800 (2019) | 55.4 | 19.4 | 11.6 | ||
| Rage 2 (2019) | 33.1 | 28.5 | 28.4 | ||
| F1 2019 (2019) | 82 | 41 | 26 | ||
| Control (2019) | 35.3 | 10.2 | 6 | ||
| Borderlands 3 (2019) | 49.1 | 18.7 | 11.8 | 7.5 |
Compute Performance
Dedicated video RAM is less important when it comes to general purpose GPU computing. Accordingly, both Vega GPUs performed much better in these benchmarks than in the gaming benchmarks.
Application Performance
Both APUs score reasonably well in PCMark 10, and are roughly on a par with a current model MacBook Pro 15 with dedicated Radeon RX 555 GPU. However, both newcomers suffer somewhat in the older PCMark 8 benchmarks. Interesting side note: both Ryzen APUs offer virtually identical application performance. Thus, the cheaper Ryzen 3 2200G will be the better choice for those looking solely for decent application performance.
Temperatures
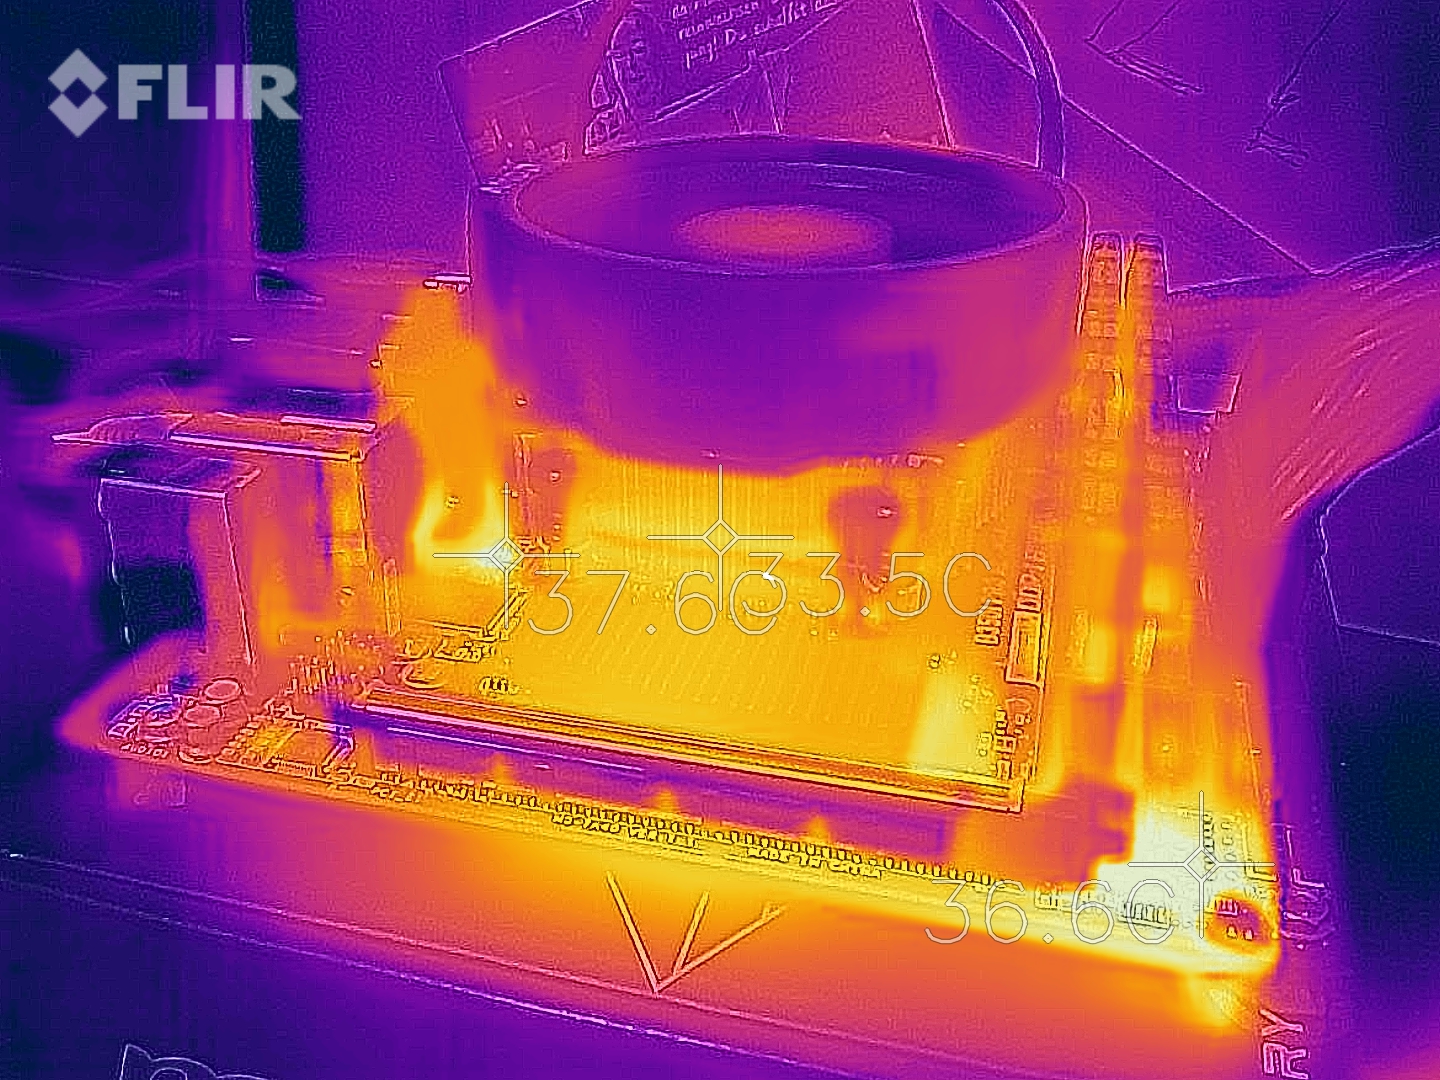
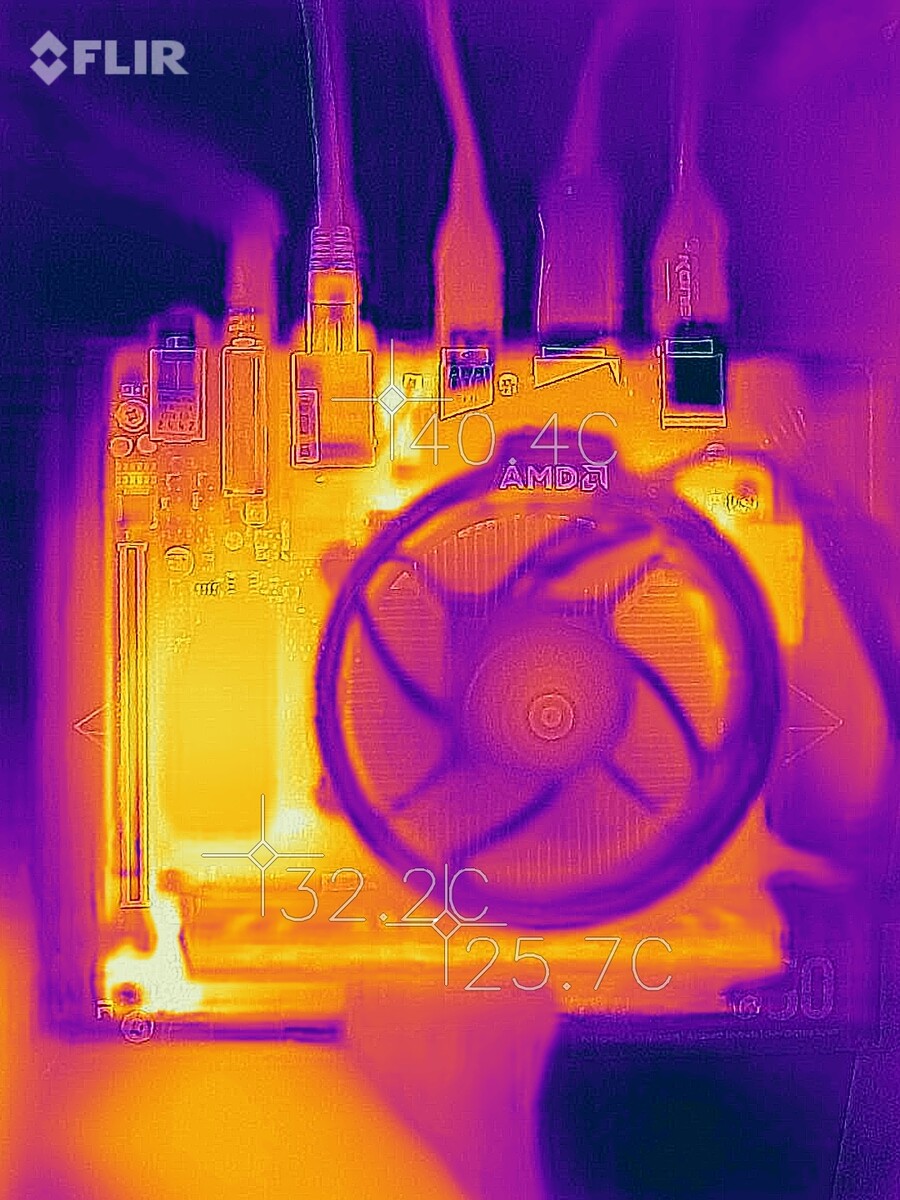
Internal temperatures remained fairly low during our tests. In “The Witcher 3”, the core temperature was at a low 46 °C (~115 °F), and the GPU managed to run at its maximum clock speeds. Compare that to a dedicated GTX 1070 Ti Founders Edition that ran the same game at 82 °C (~180 °F). High CPU load will result in higher temperatures, though. Using the included Wraith Stealth cooler Ryzen 3 and Ryzen 5 heat up to 80 and 84 °C (~176 and ~183 °F), respectively. This does not leave a lot of headroom for overclocking experiments.
System Noise
Out of the box, the included Wraith Stealth cooler is anything but quiet, which became painfully obvious when idle where it remained noticeable and obtrusive at all times. It got slightly louder under load, but managed to keep temperatures under control. The cooler was tested with the included thermal paste. After changing a BIOS setting to control fan speeds via amperage instead of PWM, the fan became much quieter instantly.
Power Consumption
Both Ryzen APUs were very energy efficient when idle: 22.7 W (Ryzen 3) and 23.5 W (Ryzen 5). Only notebooks are even more efficient than that when measured with their displays disabled: between 7 W (Asus GL753V with i7-7700HQ) to 17 W (MacBook Pro 15 2016 with activated Radeon Pro 455). That said, it is also important to note that these notebooks feature power supplies specifically catered to their respective energy consumption profiles.
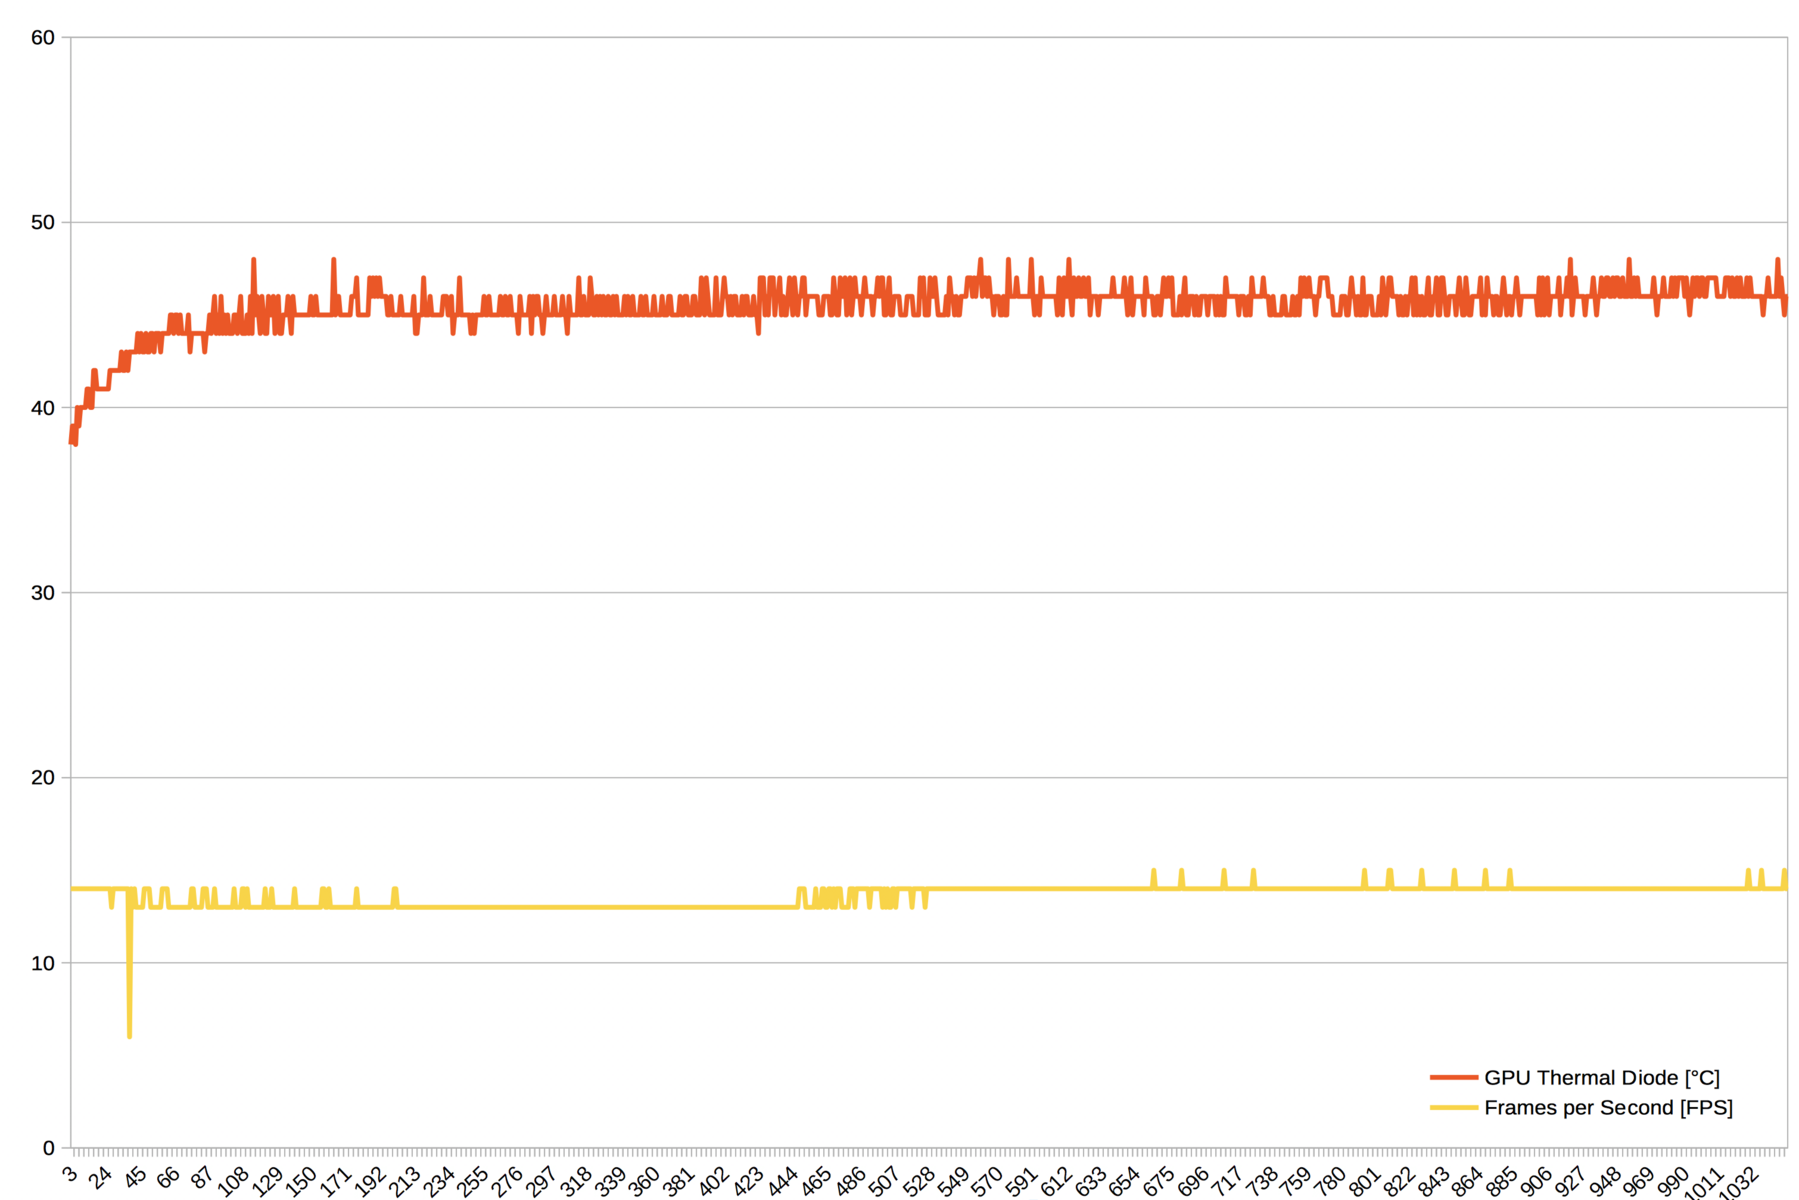
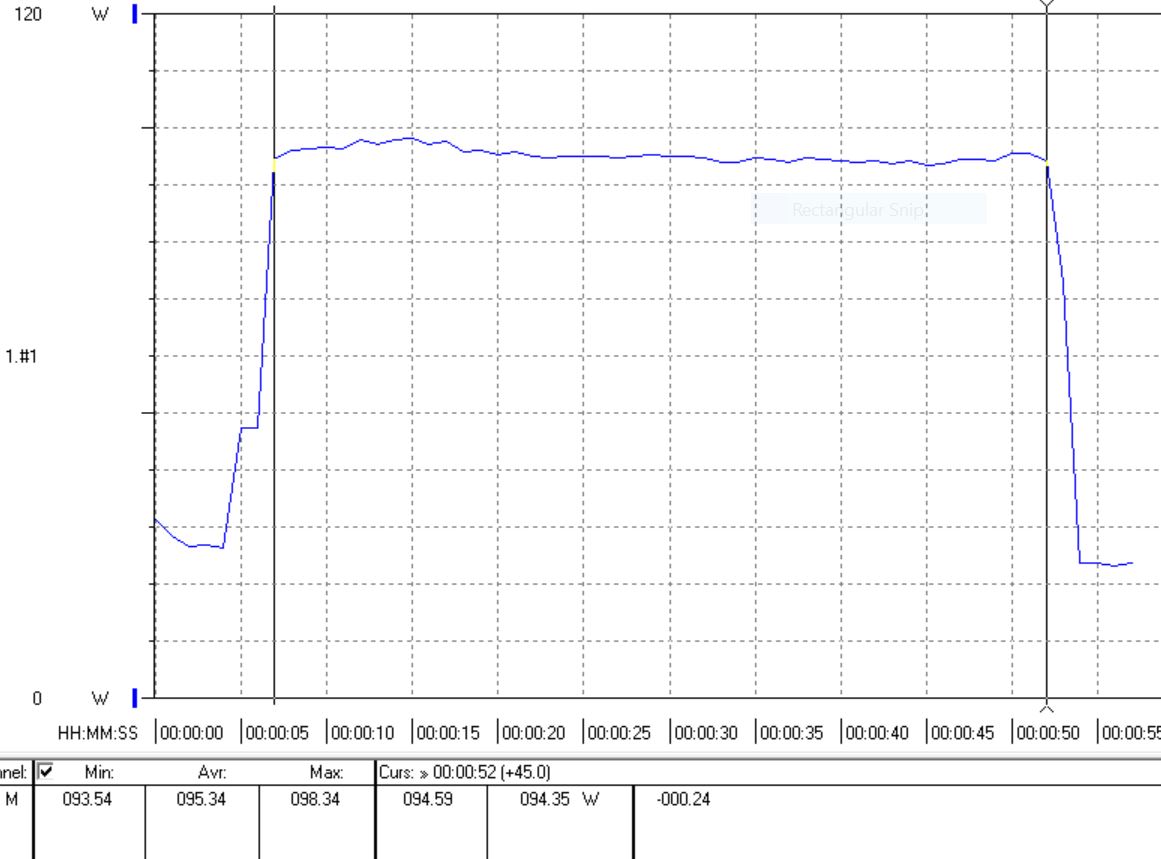
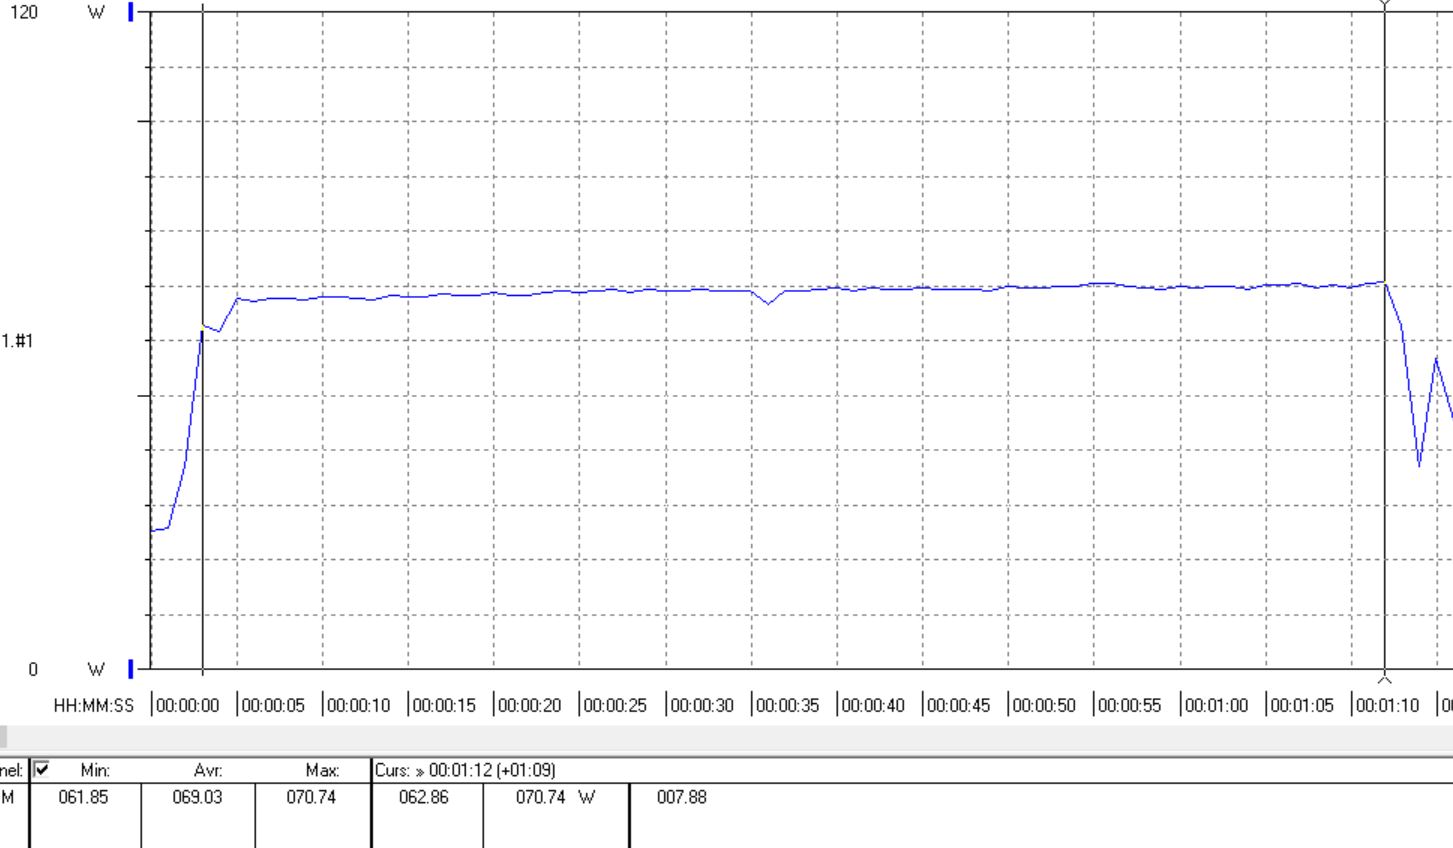
Running “The Witcher 3” the Ryzen 5 starts out at 84 W (˜ 60 W higher than idle) at 14 FPS, but quickly drops to 74.4 W (˜ 51 W higher than idle) at 13 FPS. Thus, the Ryzen 5’s power consumption is on a par with the older A10-7850K processor albeit at a much higher level of performance (13 vs. 6 FPS). Notebooks equipped with a dedicated MX150 GPU usually require between 39 and 53 W of energy, those equipped with a GTX 1050 between 73 and 99 W. A desktop GTX 1050 with a Core i7-4790K desktop CPU will gobble up 155 W of energy. Thus, the APU’s power consumption is very good for a desktop computer. The slower Ryzen 3 2200G APU is even more efficient: 68 W at 12 FPS.
In FurMark, both APUs require an almost identical amount of energy: 79 W for the 2400G vs. 75 W for the 2200G. Both also achieve the same frame rate. Compared to the A10-7850K’s 94 W the results are fairly impressive.
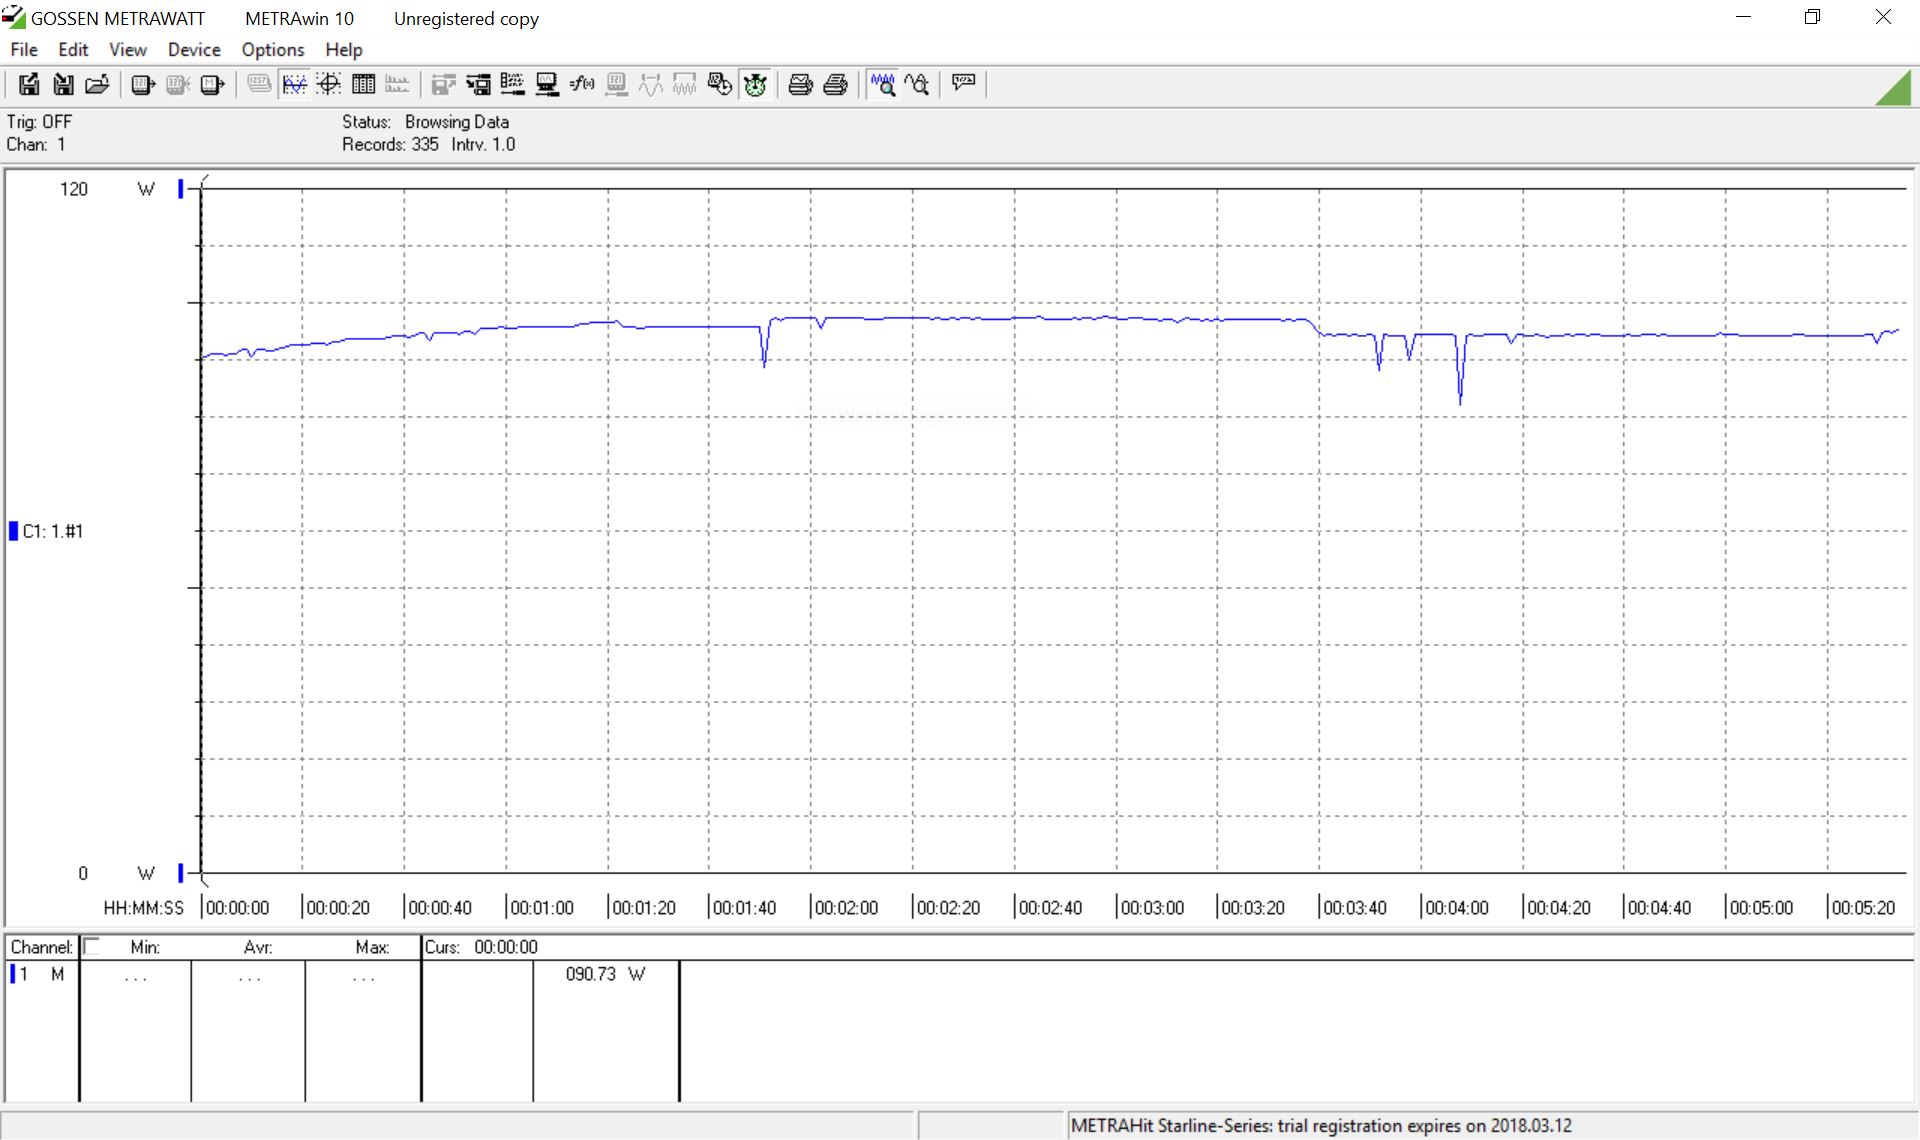
Oddly enough, stressing the CPU results in a much higher power consumption. Running Cinebench R15 yields a power consumption of 95 and 69 W, respectively. Cross-referencing these with the benchmark results the Ryzen 5 2400G ends up being more efficient than the Ryzen 3 as it scores 9 points per W vs. 8.4 for the Ryzen 3.
Maximum CPU load results in a power consumption of 107 and 96 W, respectively. Adding FurMark to the mix further increases this to 114 W on both APUs.
| Power Consumption | |
| Cinebench R15 Multi (external Monitor) | |
| AMD Ryzen 5 1500X (Idle: 51.8 W) | |
| Intel Core i5-7600K (Idle: 43.8 W) | |
| AMD Ryzen 5 2400G (Idle: 23.5 W) | |
| AMD A10-7850K (Idle: 26.4 W) | |
| AMD Ryzen 3 2200G (Idle: 22.7 W) | |
| Intel Core i7-7700HQ (Idle: 13.2 W) | |
| Intel Core i7-8550U (Idle: 6.2 W) | |
| Intel Core i5-8250U (Idle: 6.6 W) | |
| 1920x1080 The Witcher 3 ultra (external Monitor) | |
| AMD Ryzen 5 1500X (90 fps, Idle: 51.8 W) | |
| Intel Core i5-7600K (94 fps, Idle: 43.8 W) | |
| AMD A10-7850K (6.1 fps, Idle: 26.4 W) | |
| AMD Ryzen 5 2400G (13 fps, Idle: 23.5 W) | |
| AMD Ryzen 3 2200G (12 fps, Idle: 22.7 W) | |
| Intel Core i7-7700HQ (13 fps, Idle: 13.2 W) | |
| Intel Core i7-8550U (Idle: 3.8 W) | |
| Intel Core i7-8550U (3.5 fps, Idle: 6.2 W) | |
| Intel Core i5-8250U (3.4 fps, Idle: 6.6 W) | |
* ... smaller is better
Verdict
Just like their mobile counterparts, the Raven Ridge APUs for desktop have managed to impress us as well. Rated at 65 W and equipped with fast DDR4 memory, graphics performance benefits the most when compared to their mobile counterparts. CPU performance is top notch thanks to the fast Zen CPU cores, and GPU performance is at eye-level with dedicated entry-level graphics cards and certainly more than fast enough for casual gaming. Thanks to AM4 compatibility this APU is also well-suited for upgrading an already existing system.
