Ryzen 5 1400 and 1600 Review
For the original German review, see here.
Introduction
We have already reviewed the Ryzen top models 1700, 1700X, and 1800X, and we can now check the mainstream or entry-level segment, respectively. We will not repeat the information about the architecture and refer to our first Ryzen Test – the Ryzen 5 models are based on the Ryzen 7 die, but some cores are deactivated and the cache is adjusted.
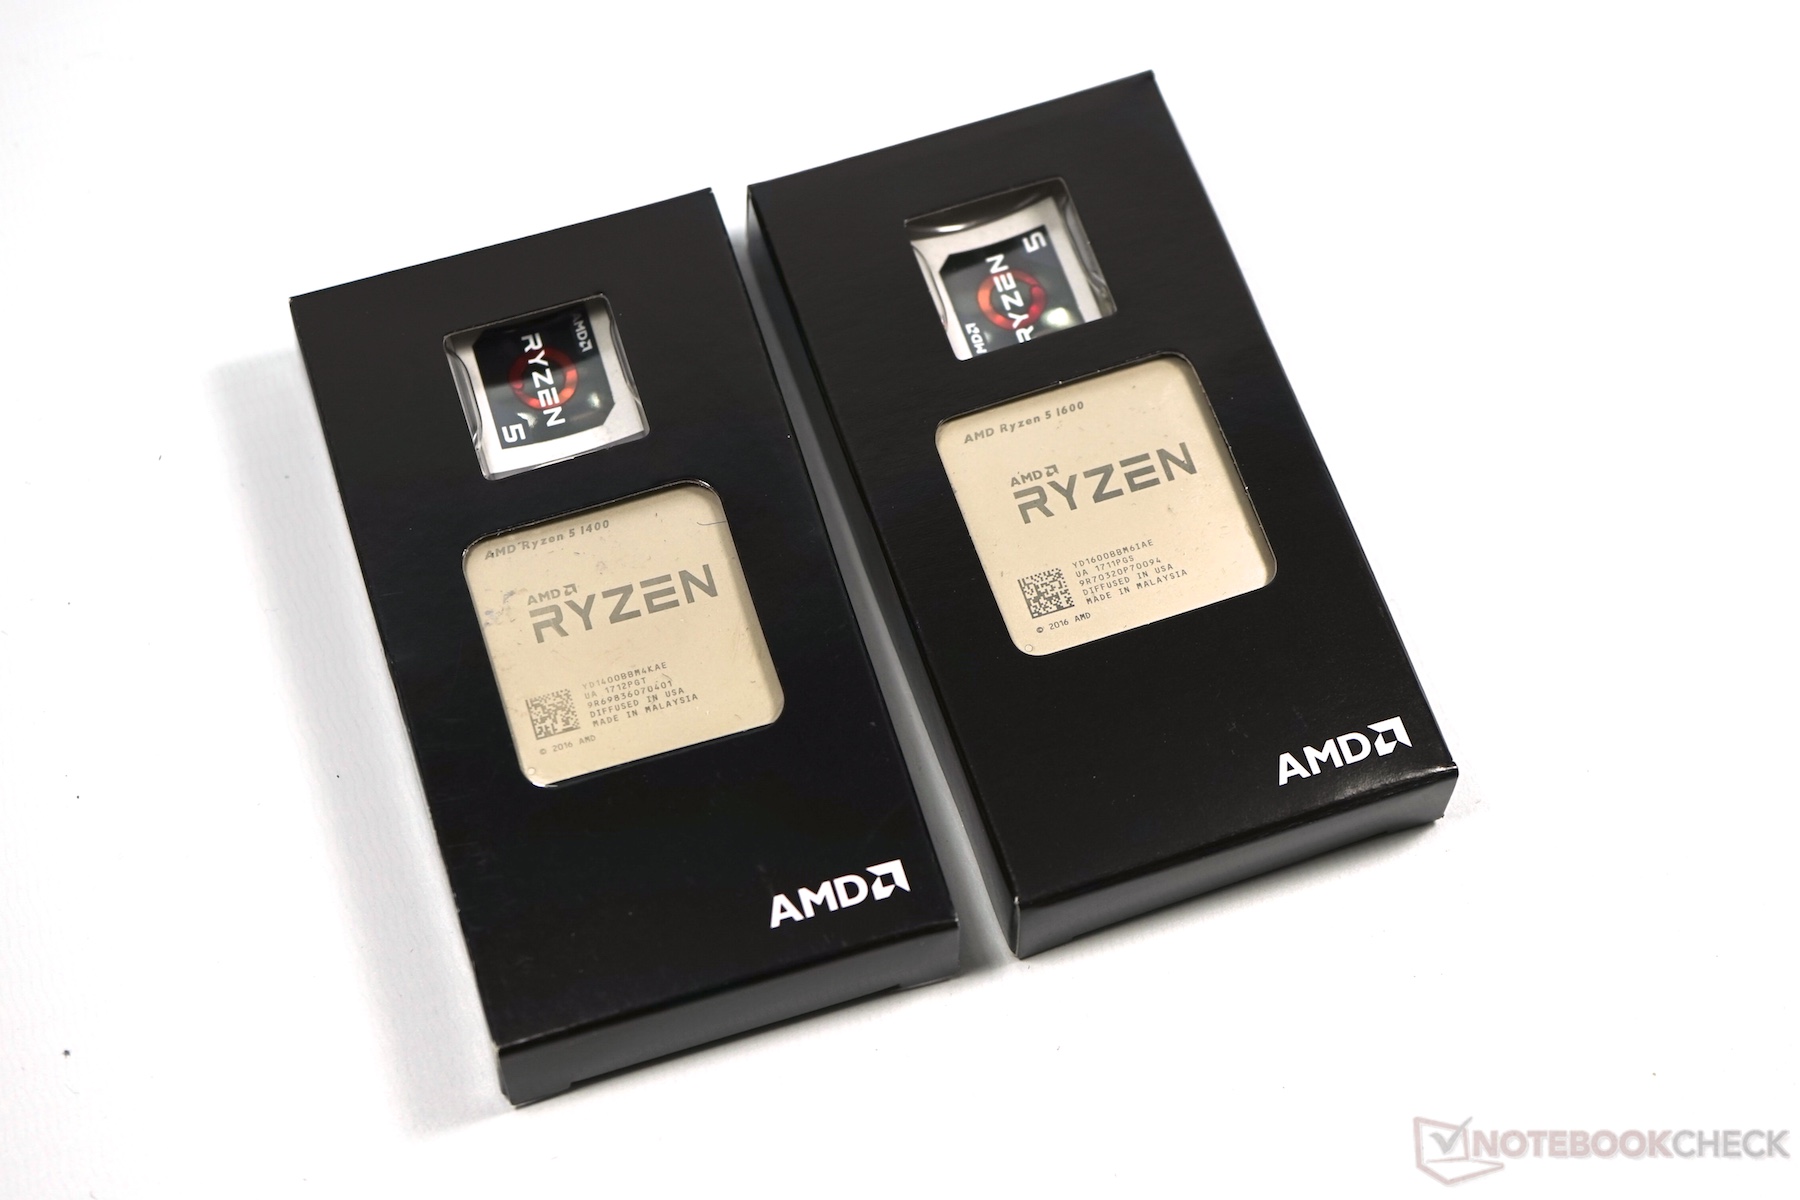

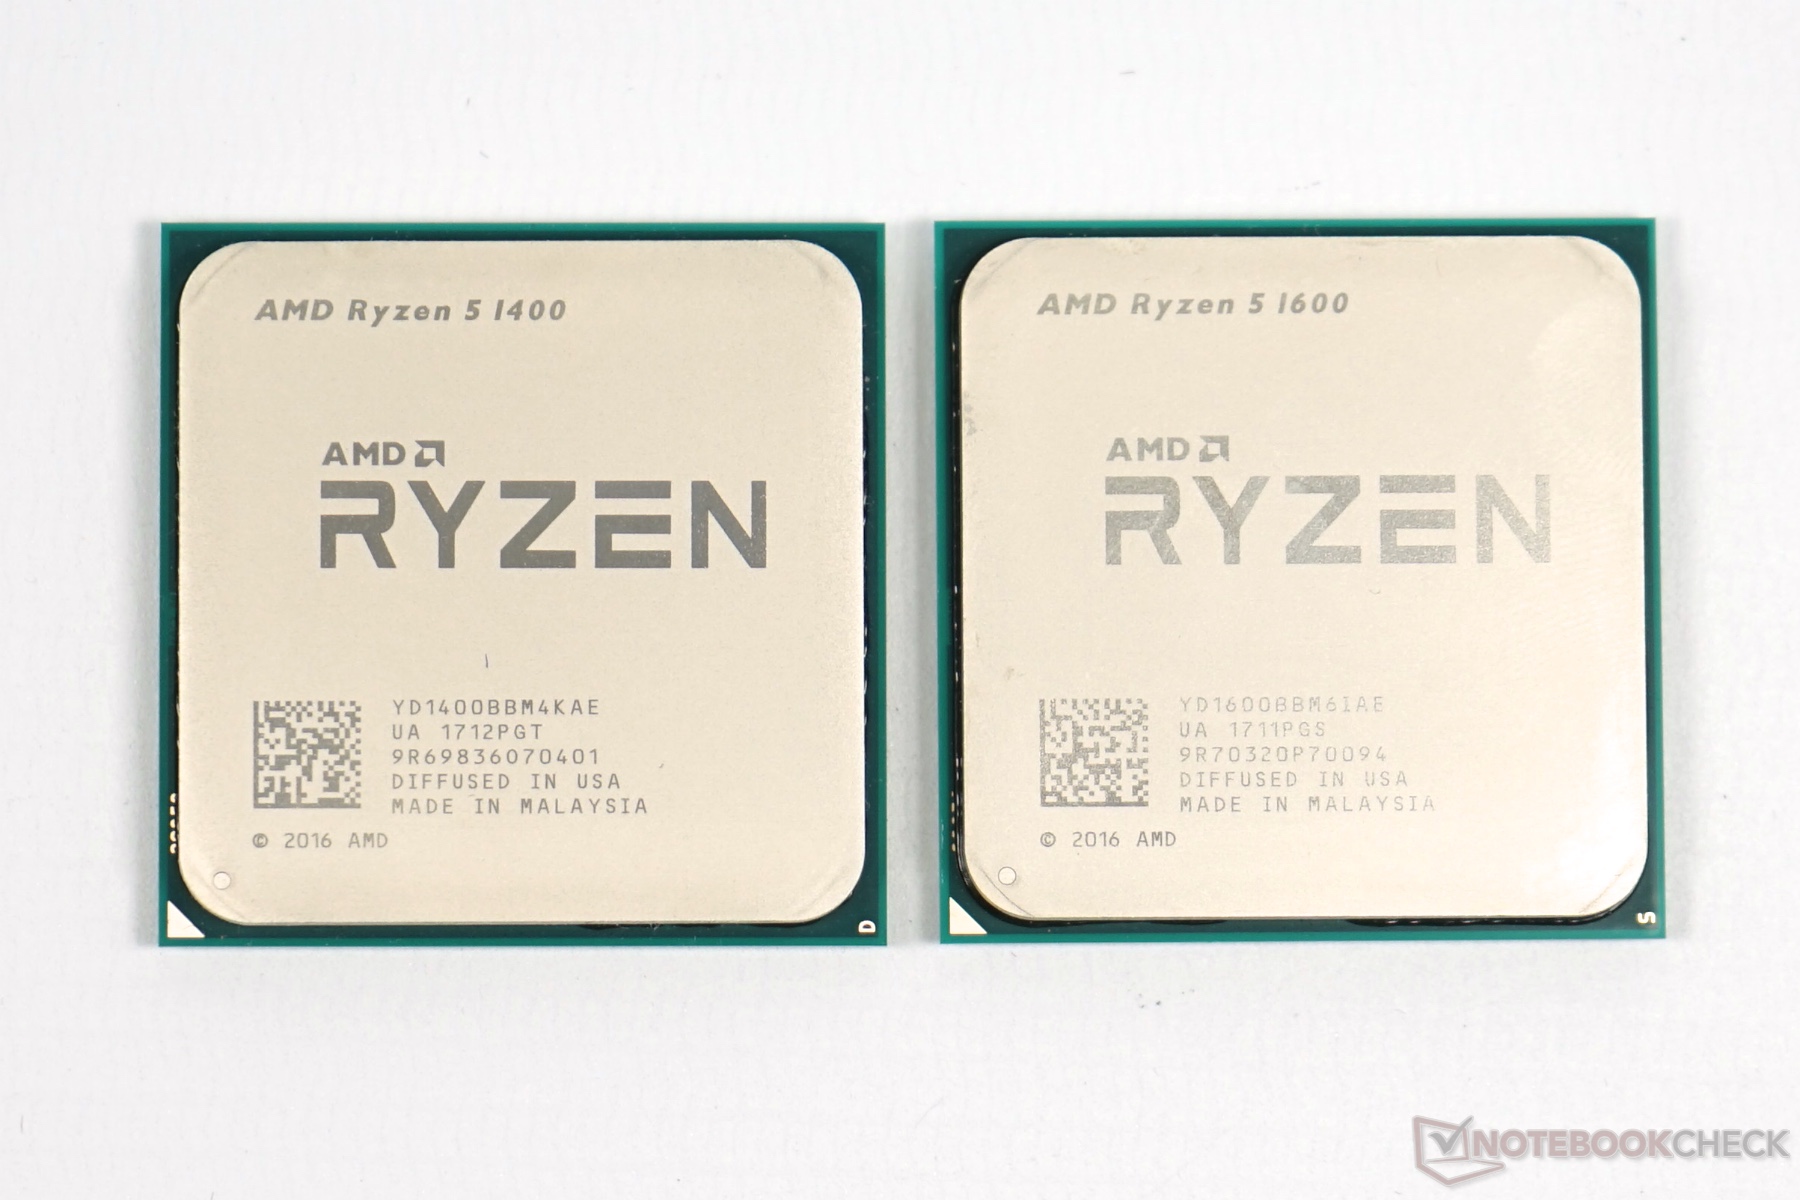
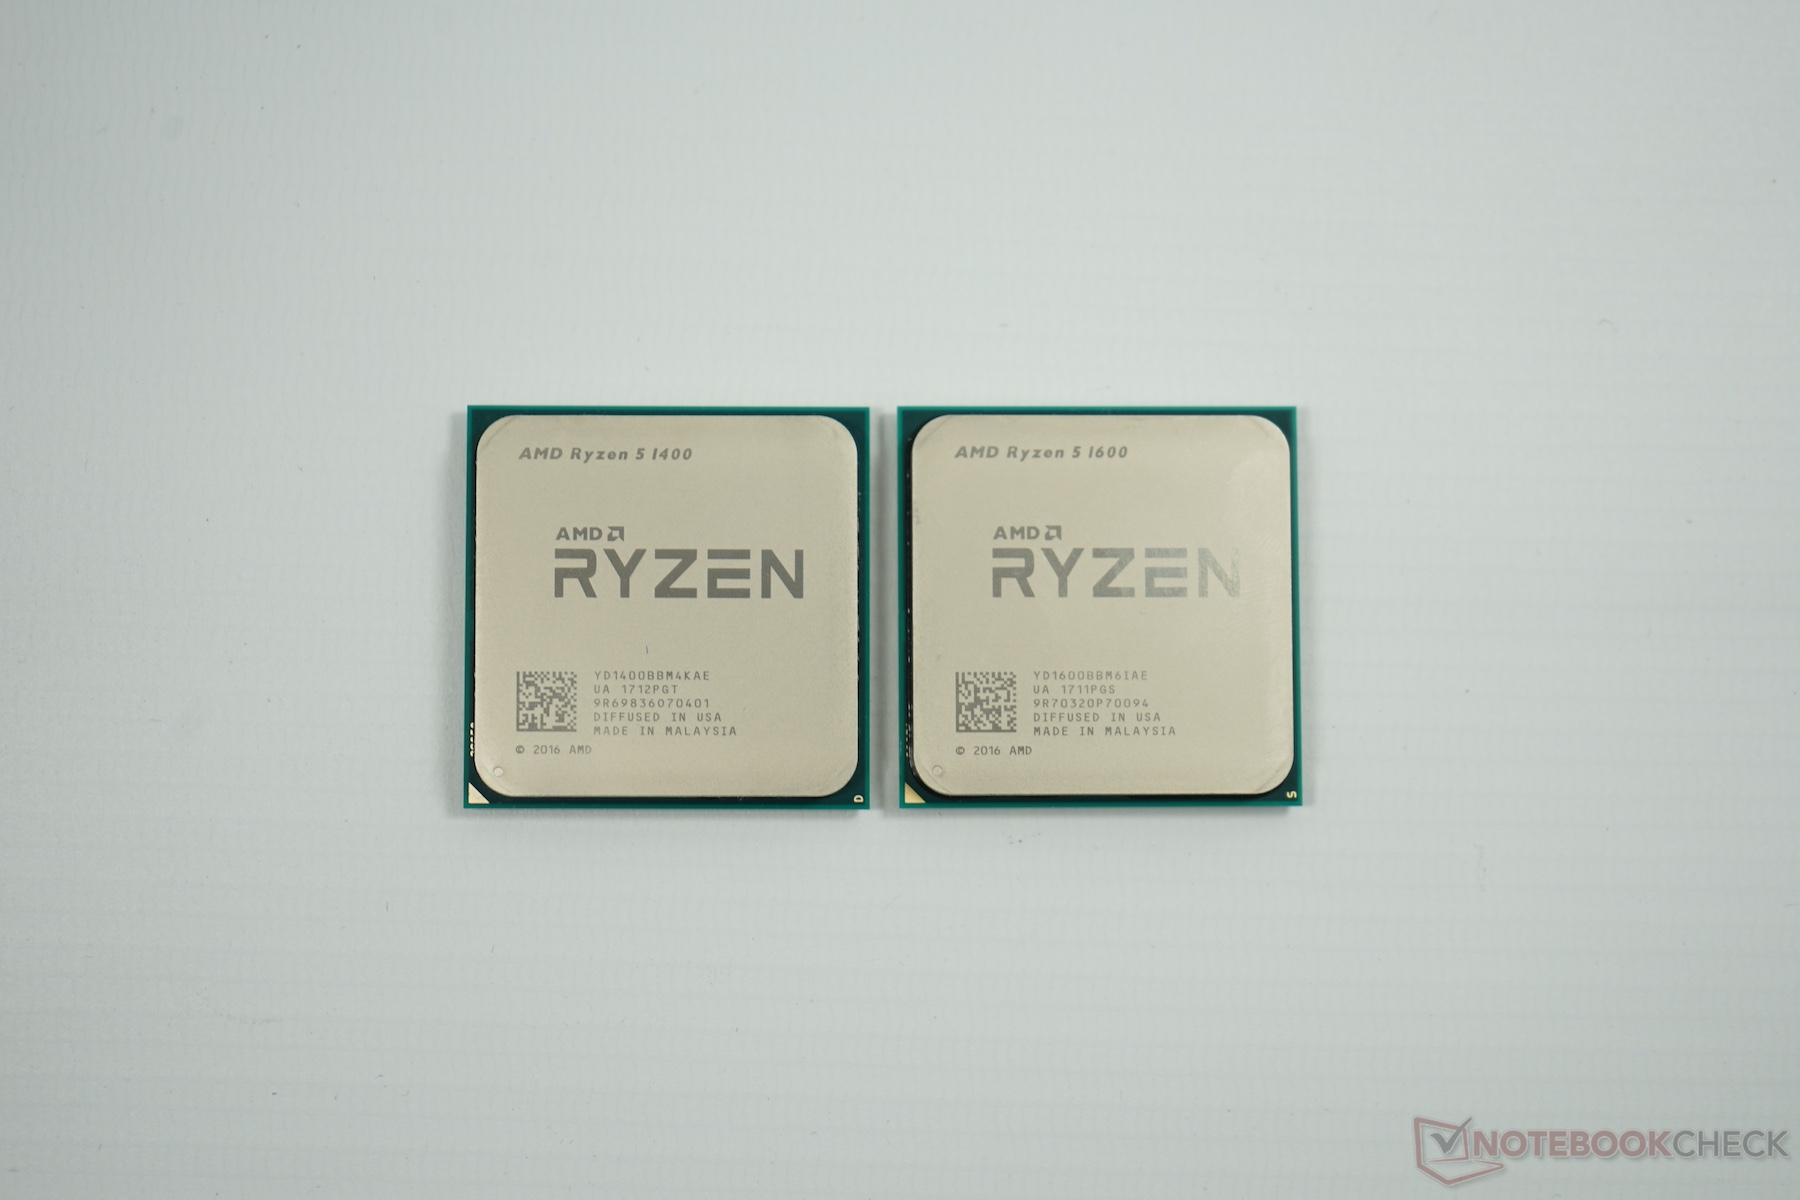
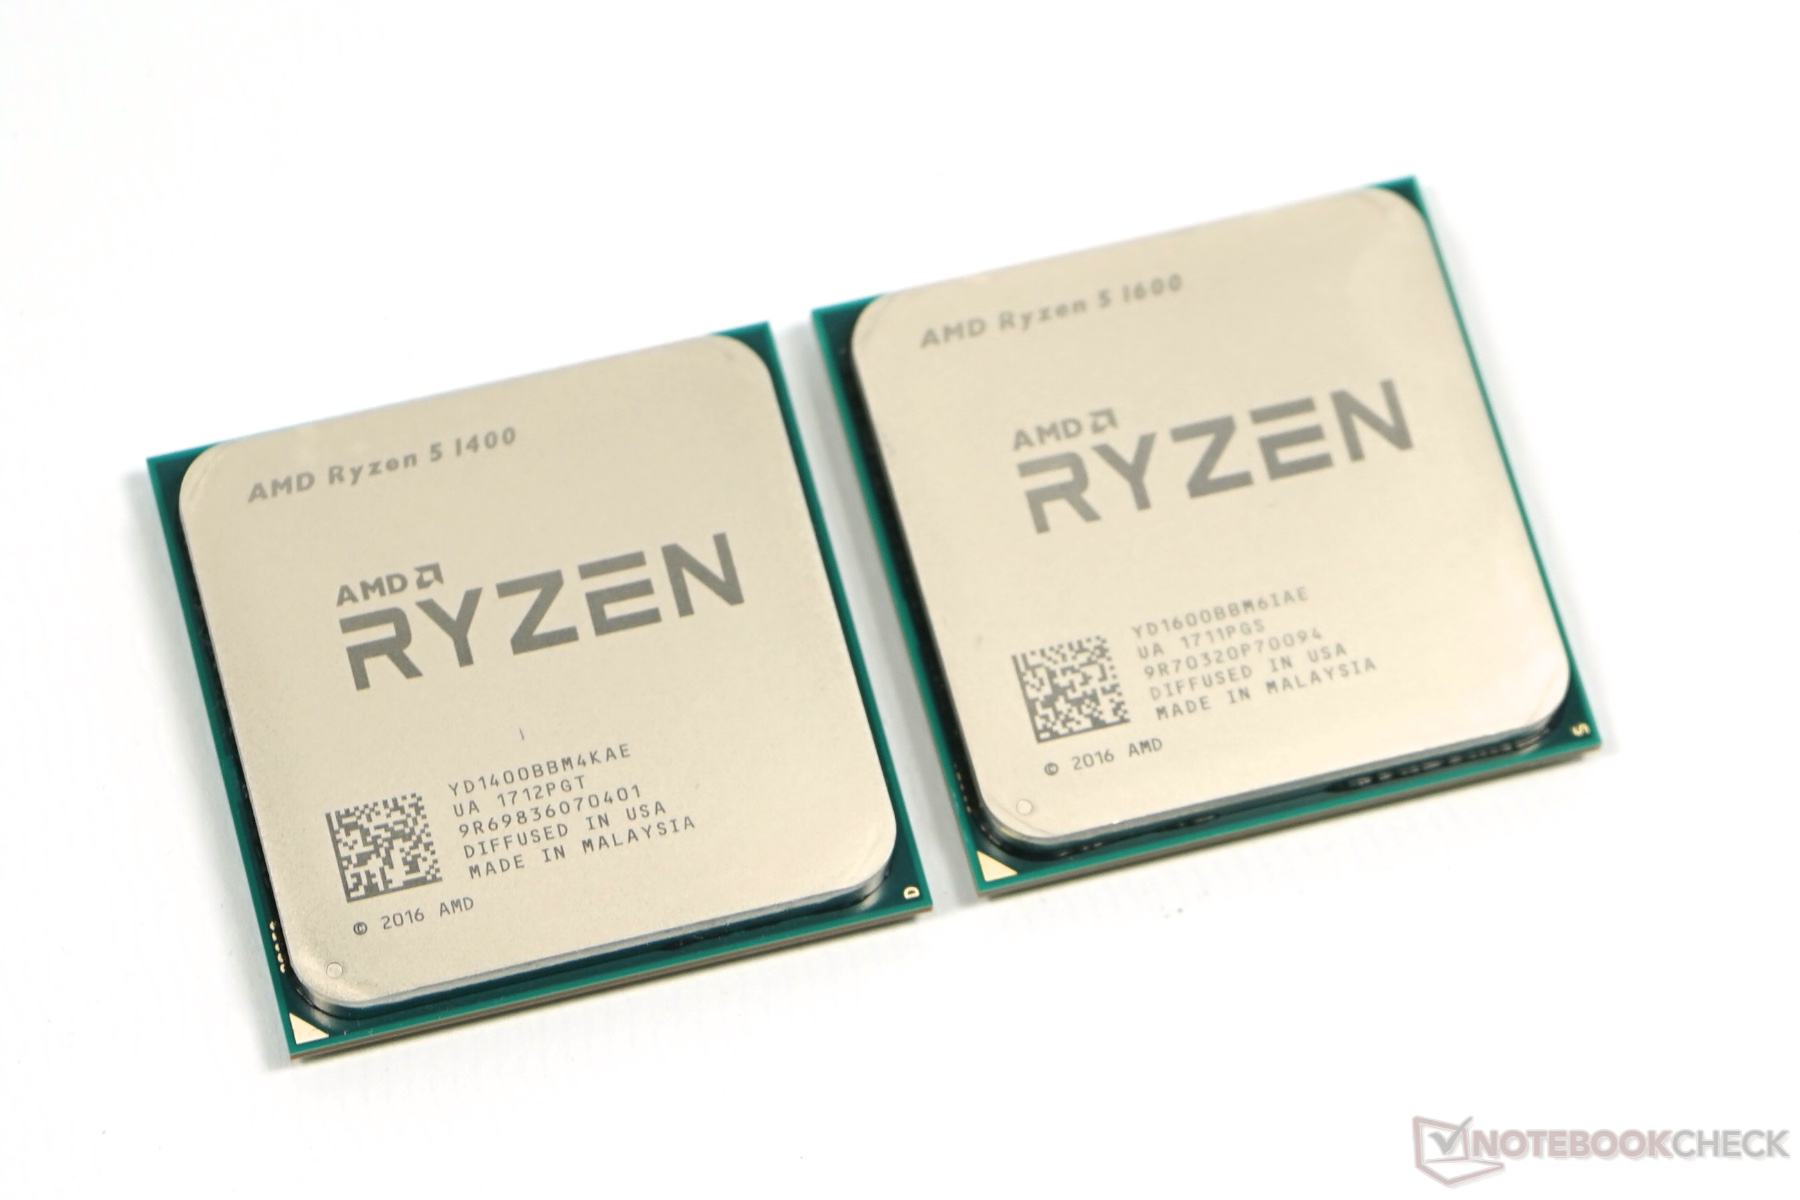
Ryzen 5 1400 and 1600
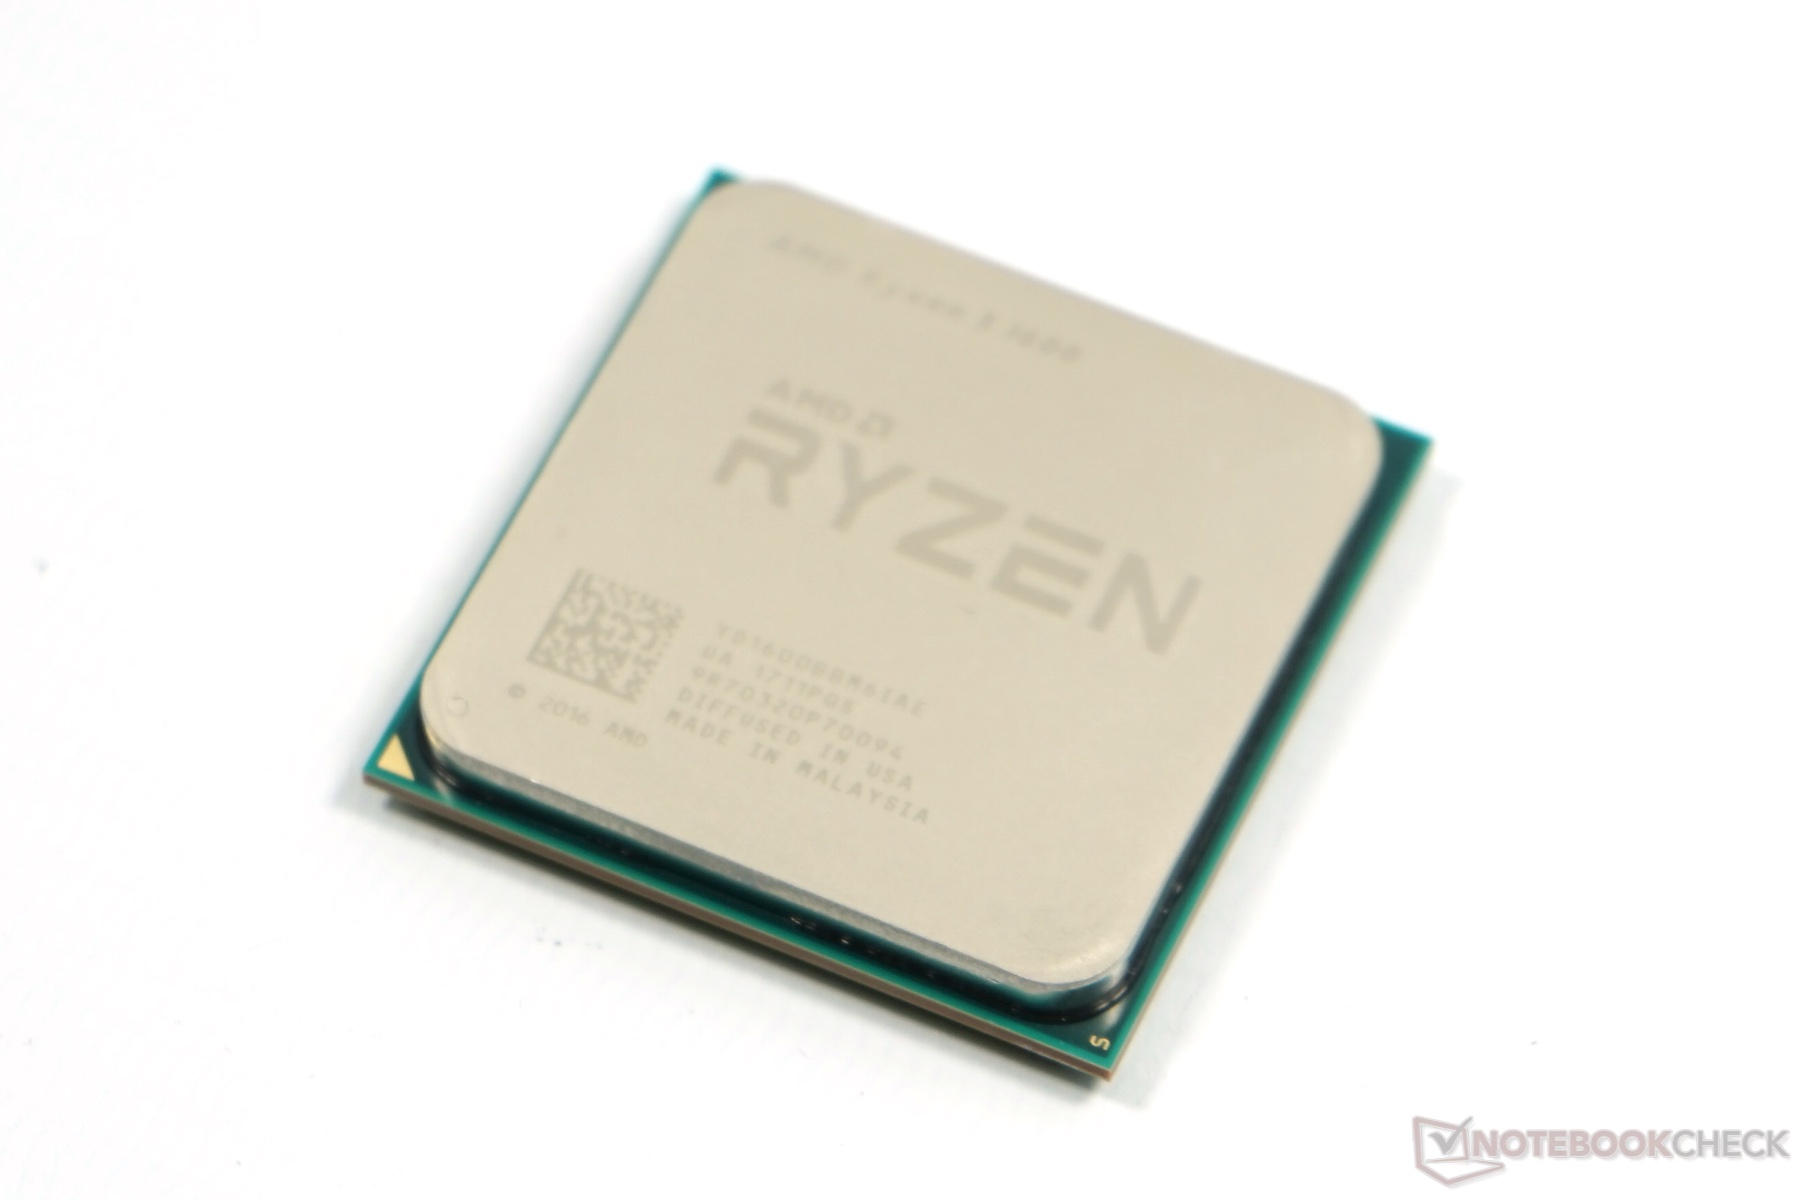
The Ryzen 5 1400 is currently the slowest CPU from the series. It retails for around 170 Euros (~$191) and the four cores reach a maximum Turbo of 3.4 GHz, but the L3-cache has been reduced by half (8 MB) compared to the bigger chips. As with all the other Ryzen CPUs, the smallest chip also supports Simultaneous Multithreading (SMT), so it can execute up to eight threads simultaneously.
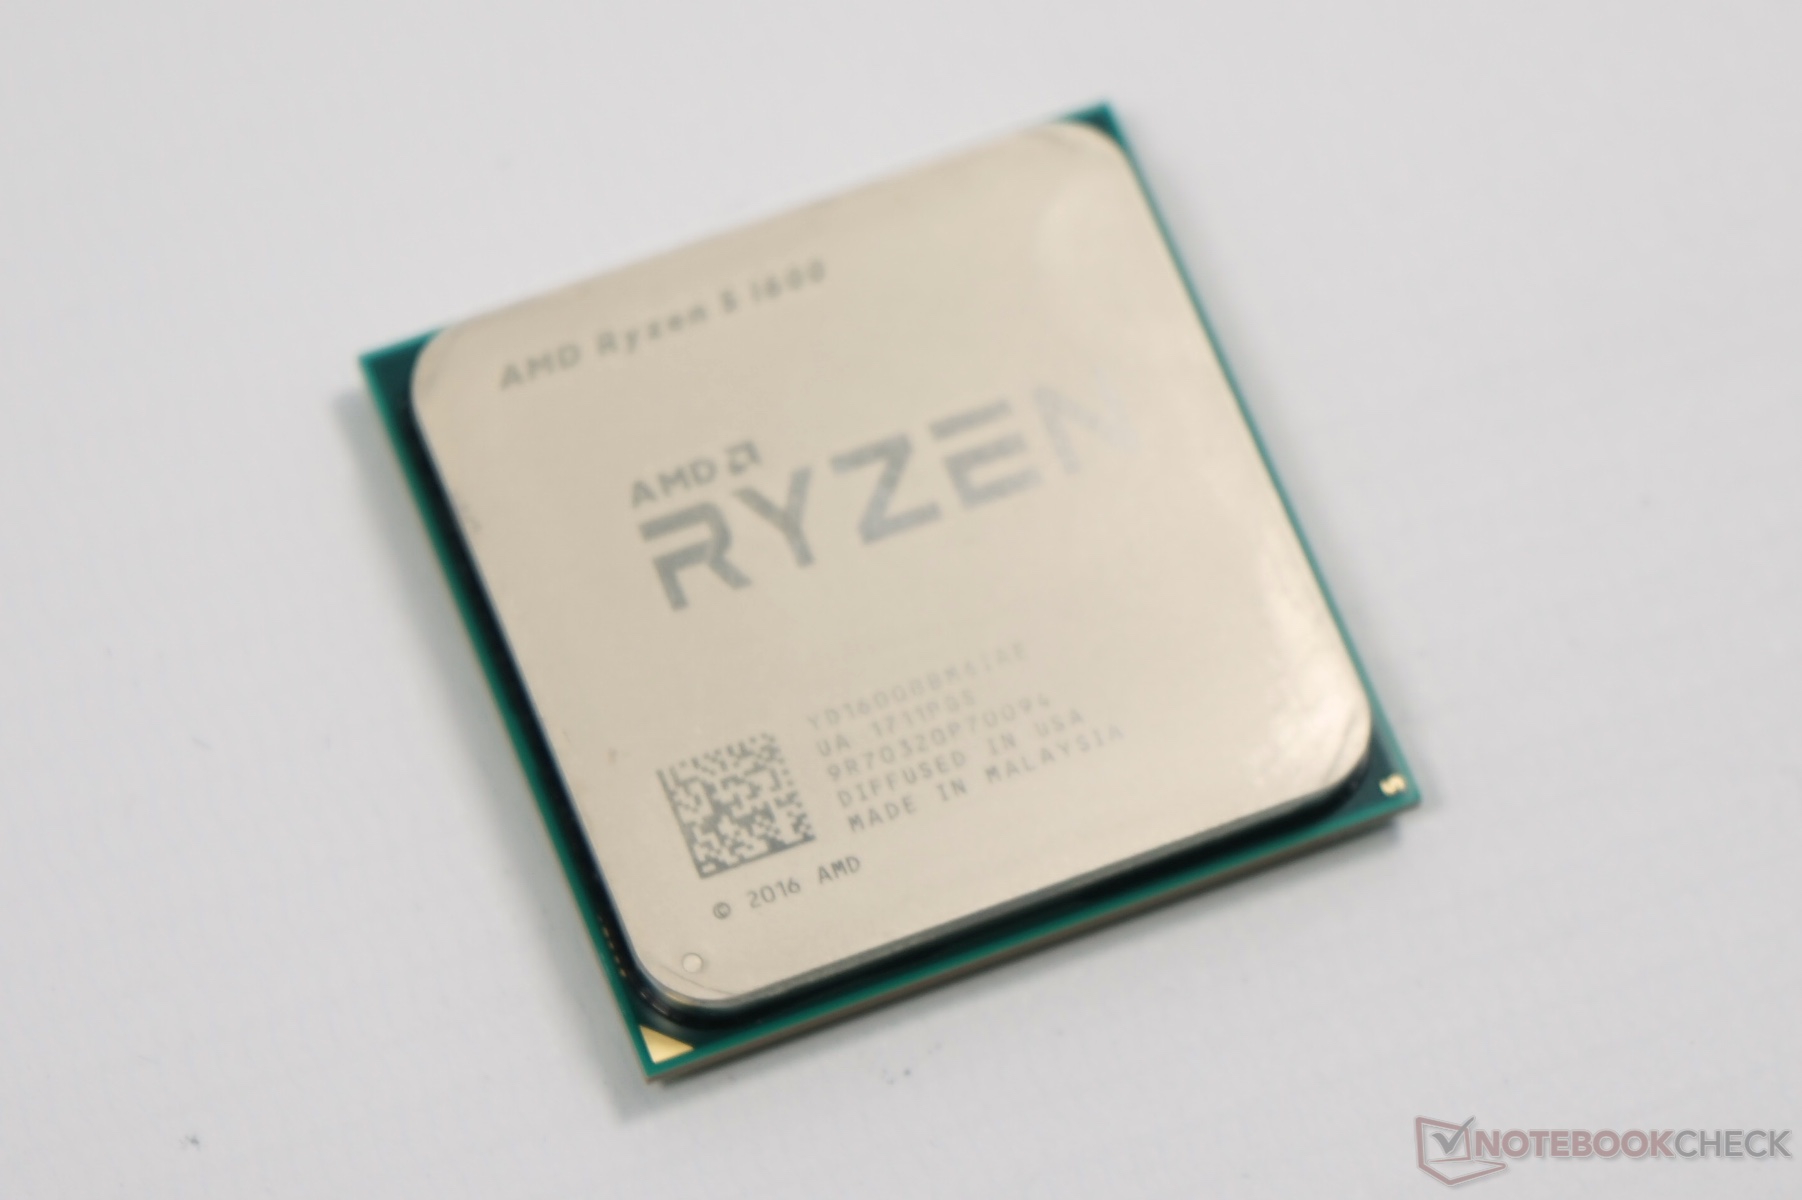
The Ryzen 5 1600 offers two additional cores and twice the L3-cache (16 MB) for around 50 Euros (~$56) extra. Both the base frequency as well as the Turbo are 200 MHz higher compared to the entry-level chip at 3.4 and 3.6 GHz, respectively.
| Model | Cores - Threads | Base frequency | Turbo (1-2 cores) | Turbo (3 and more cores) | XFR overclocking | L3-Cache | TDP | RRP |
| Ryzen R7 1800X | 8-16 | 3.6 GHz | 4.0 GHz | 3.7 GHz | 100 MHz | 16 MB | 95 Watts | 559 Euros |
| Ryzen R7 1700X | 8-16 | 3.4 GHz | 3.8 GHz | 3.5 GHz | 100 MHz | 16 MB | 95 Watts | 439 Euros |
| Ryzen R7 1700 | 8-16 | 3.0 GHz | 3.7 GHz | 3.2 GHz | 50 MHz | 16 MB | 65 Watts | 359 Euros |
| Ryzen R5 1600 | 6-12 | 3.2 GHz | 3.6 GHz | 3.4 GHz | 100 MHz | 16 MB | 65 Watts | 249 Euros |
| Ryzen R5 1400 | 4-8 | 3.2 GHz | 3.4 GHz | 3.2 GHz | 50 MHz | 8 MB | 65 Watts | 189 Euros |
Synthetic Benchmarks
Cinebench R15
Cinebench R15 determines the raw CPU performance, and the tool almost scales linear to the clocks when the architecture and the cache size are identical. It is interesting that the Ryzen 5 1600 is on par with the Ryzen 7 1700 in the single-core test – despite the 100 MHz difference for the Turbo.
The 1400 on the other hand does not really stand a chance against the in-house competition: The Ryzen 5 1600 is already 11% faster, the 1800X 22%. We can also see the almost linear scaling between the clocks and the Cinebench result, so the cache does not have a big effect in this benchmark. The end result is still the same: If you require high single-core performance, you will basically have to get an Intel CPU.
It is not surprising that the situation is more drastic in the multi-core test: The Ryzen 5 1600 is more than 60% faster than the entry-level chip. Looking at the Intel competition, the 1600 sits between the Core i7-7700K and the i7-5960X. However, the Core i7-7700K is already ~100 Euros (~$112) more expensive.
| Cinebench R15 | |
| CPU Single 64Bit | |
| Intel Core i7-7700K | |
| Intel Core i5-7600K | |
| Intel Core i7-6950X | |
| Intel Core i7-6950X | |
| AMD Ryzen 7 1800X | |
| AMD Ryzen 7 1700X | |
| Intel Core i7-7700HQ | |
| AMD Ryzen 5 1600 | |
| AMD Ryzen 7 1700 | |
| Intel Core i7-5960X | |
| AMD Ryzen 5 1400 | |
| Intel Xeon E5-2697 v2 | |
| Intel Xeon E5-2680 v4 | |
| AMD FX-8350 | |
| CPU Multi 64Bit | |
| Intel Core i7-6950X | |
| Intel Xeon E5-2680 v4 | |
| AMD Ryzen 7 1800X | |
| AMD Ryzen 7 1700X | |
| Intel Xeon E5-2697 v2 | |
| AMD Ryzen 7 1700 | |
| Intel Core i7-5960X | |
| AMD Ryzen 5 1600 | |
| Intel Core i7-7700K | |
| Intel Core i7-7700HQ | |
| AMD Ryzen 5 1400 | |
| Intel Core i5-7600K | |
| AMD FX-8350 | |
Truecrypt
Truecrypt is not a completely synthetic benchmark, which determines the encryption performance via different algorithms. The results show significant differences – both the different number of cores as well as the clocks and the size of the cache influence the scores.
The AMD Ryzen 5 1400 is slightly ahead of the Intel Core i5-7600K, but is clearly beaten by the remaining Intel rivals. The i7-7700K is about 40% faster, the Ryzen 5 1600 by even 60%.
| Performance rating - Percent | |
| Intel Core i7-6950X | |
| AMD Ryzen 7 1800X | |
| Intel Xeon E5-2697 v2 | |
| AMD Ryzen 7 1700X | |
| Intel Xeon E5-2680 v4 | |
| Intel Core i7-5960X | |
| AMD Ryzen 5 1600 | |
| AMD Ryzen 5 1600 | |
| Intel Core i7-7700K | |
| AMD Ryzen 5 1400 | |
| Intel Core i5-7600K | |
| TrueCrypt | |
| Serpent Mean 100MB | |
| Intel Core i7-6950X | |
| AMD Ryzen 7 1800X | |
| Intel Xeon E5-2697 v2 | |
| AMD Ryzen 7 1700X | |
| Intel Xeon E5-2680 v4 | |
| Intel Core i7-5960X | |
| AMD Ryzen 5 1600 | |
| AMD Ryzen 5 1600 | |
| Intel Core i7-7700K | |
| AMD Ryzen 5 1400 | |
| Intel Core i5-7600K | |
| Twofish Mean 100MB | |
| Intel Core i7-6950X | |
| Intel Xeon E5-2697 v2 | |
| AMD Ryzen 7 1800X | |
| Intel Xeon E5-2680 v4 | |
| AMD Ryzen 7 1700X | |
| Intel Core i7-5960X | |
| AMD Ryzen 5 1600 | |
| AMD Ryzen 5 1600 | |
| Intel Core i7-7700K | |
| AMD Ryzen 5 1400 | |
| Intel Core i5-7600K | |
| AES Mean 100MB | |
| Intel Core i7-6950X | |
| AMD Ryzen 7 1800X | |
| Intel Xeon E5-2680 v4 | |
| AMD Ryzen 7 1700X | |
| Intel Xeon E5-2697 v2 | |
| Intel Core i7-5960X | |
| AMD Ryzen 5 1600 | |
| Intel Core i7-7700K | |
| AMD Ryzen 5 1600 | |
| AMD Ryzen 5 1400 | |
| Intel Core i5-7600K | |
wPrime
The calculation of square roots supports the picture we have got so far: The difference between the Ryzen 5 1400 and the other models is comparatively big; the Ryzen 5 1600 on the other hand is much faster than the Intel Core i7-7700K. wPrime really benefits from the high number of threads that can be executed at the same time thanks to Simultaneous Multithreading.
| wPrime 2.10 | |
| 1024m | |
| Intel Xeon E5-2697 v2 | |
| Intel Core i5-7600K | |
| AMD Ryzen 5 1400 | |
| Intel Core i7-7700K | |
| Intel Core i7-5960X | |
| AMD Ryzen 7 1700X | |
| AMD Ryzen 7 1800X | |
| Intel Core i7-6950X | |
| 32m | |
| Intel Xeon E5-2697 v2 | |
| Intel Core i5-7600K | |
| AMD Ryzen 5 1400 | |
| Intel Core i7-7700K | |
| Intel Core i7-5960X | |
| AMD Ryzen 7 1700X | |
| AMD Ryzen 7 1800X | |
| Intel Core i7-6950X | |
* ... smaller is better
Other synthetic benchmarks
We have listed the remaining synthetic benchmarks for the sake of completeness. They either support the previous results or do not seem very reliable, which is the case with WinRAR and x264 (Avisynth).
| Geekbench 4.0 | |
| 64 Bit Single-Core Score | |
| Intel Core i7-7700K | |
| Intel Core i5-7600K | |
| AMD Ryzen 7 1800X | |
| AMD Ryzen 7 1700X | |
| Intel Core i7-7700HQ | |
| AMD Ryzen 7 1700 | |
| AMD Ryzen 5 1600 | |
| Intel Core i7-6950X | |
| Intel Core i7-5960X | |
| AMD Ryzen 5 1400 | |
| Intel Xeon E5-2680 v4 | |
| 64 Bit Multi-Core Score | |
| Intel Core i7-6950X | |
| Intel Core i7-5960X | |
| AMD Ryzen 7 1800X | |
| Intel Xeon E5-2680 v4 | |
| AMD Ryzen 7 1700X | |
| AMD Ryzen 7 1700 | |
| AMD Ryzen 5 1600 | |
| Intel Core i7-7700K | |
| Intel Core i5-7600K | |
| Intel Core i7-7700HQ | |
| AMD Ryzen 5 1400 | |
| WinRAR - Result | |
| Intel Core i7-6950X | |
| Intel Xeon E5-2697 v2 | |
| Intel Core i7-5960X | |
| Intel Xeon E5-2680 v4 | |
| Intel Core i7-7700K | |
| AMD Ryzen 7 1800X | |
| AMD Ryzen 7 1700X | |
| AMD Ryzen 5 1600 | |
| Intel Core i5-7600K | |
| AMD Ryzen 5 1400 | |
| X264 HD Benchmark 4.0 | |
| Pass 1 | |
| Intel Core i7-7700K | |
| Intel Core i5-7600K | |
| Intel Core i7-6950X | |
| AMD Ryzen 7 1800X | |
| Intel Core i7-5960X | |
| AMD Ryzen 7 1700X | |
| AMD Ryzen 5 1600 | |
| Intel Xeon E5-2697 v2 | |
| AMD Ryzen 5 1400 | |
| Intel Xeon E5-2680 v4 | |
| Pass 2 | |
| Intel Core i7-6950X | |
| AMD Ryzen 7 1800X | |
| AMD Ryzen 7 1700X | |
| Intel Xeon E5-2697 v2 | |
| Intel Core i7-5960X | |
| Intel Xeon E5-2680 v4 | |
| AMD Ryzen 5 1600 | |
| Intel Core i7-7700K | |
| Intel Core i5-7600K | |
| AMD Ryzen 5 1400 | |
| PCMark 8 | |
| Home Score Accelerated v2 | |
| Intel Core i7-7700K | |
| Intel Core i5-7600K | |
| AMD Ryzen 7 1800X | |
| Intel Core i7-4790K | |
| AMD Ryzen 7 1700X | |
| AMD Ryzen 7 1700 | |
| AMD Ryzen 5 1600 | |
| AMD Ryzen 5 1400 | |
| Intel Core i7-6950X | |
| Intel Core i7-5960X | |
| Intel Core i7-7700HQ | |
| Intel Xeon E5-2697 v2 | |
| Work Score Accelerated v2 | |
| Intel Core i7-7700HQ | |
| Intel Core i7-7700K | |
| Intel Xeon E5-2697 v2 | |
| AMD Ryzen 7 1800X | |
| AMD Ryzen 7 1700X | |
| Intel Core i7-6950X | |
| AMD Ryzen 5 1600 | |
| Intel Core i7-5960X | |
| AMD Ryzen 7 1700 | |
| AMD Ryzen 5 1400 | |
| 3DMark | |
| 1920x1080 Fire Strike Physics | |
| Intel Core i7-6950X | |
| AMD Ryzen 7 1800X | |
| AMD Ryzen 7 1700X | |
| Intel Core i7-5960X | |
| AMD Ryzen 7 1700 | |
| Intel Xeon E5-2697 v2 | |
| Intel Xeon E5-2680 v4 | |
| AMD Ryzen 5 1600 | |
| Intel Core i7-7700K | |
| Intel Core i7-4790K | |
| AMD Ryzen 5 1400 | |
| Intel Core i7-7700HQ | |
| Intel Core i5-7600K | |
| 2560x1440 Time Spy CPU | |
| Intel Core i7-6950X | |
| Intel Xeon E5-2680 v4 | |
| AMD Ryzen 7 1800X | |
| Intel Core i7-5960X | |
| AMD Ryzen 7 1700X | |
| AMD Ryzen 7 1700X | |
| AMD Ryzen 7 1700 | |
| AMD Ryzen 5 1600 | |
| Intel Core i7-7700K | |
| Intel Core i7-4790K | |
| Intel Core i7-7700HQ | |
| Intel Core i5-7600K | |
| AMD Ryzen 5 1400 | |
| 3DMark 11 - 1280x720 Performance Physics | |
| Intel Core i7-6950X | |
| Intel Core i7-5960X | |
| AMD Ryzen 7 1800X | |
| Intel Xeon E5-2697 v2 | |
| AMD Ryzen 7 1700 | |
| Intel Xeon E5-2680 v4 | |
| Intel Core i7-7700K | |
| AMD Ryzen 5 1600 | |
| Intel Core i7-4790K | |
| Intel Core i7-7700HQ | |
| AMD Ryzen 5 1400 | |
| 3DMark 06 - CPU - CPU Score | |
| Intel Core i7-6950X | |
| Intel Core i7-7700K | |
| Intel Core i7-5960X | |
| AMD Ryzen 7 1700 | |
| Intel Xeon E5-2697 v2 | |
| Intel Core i5-7600K | |
| AMD Ryzen 5 1600 | |
| Intel Xeon E5-2680 v4 | |
| Intel Core i7-7700HQ | |
| AMD Ryzen 5 1400 | |
Interim Verdict
The synthetic benchmarks show that AMD's new Zen architecture can basically cover a wide price and performance range and that it scales well. There is a big price advantage over comparable Intel chips, but the single-core performance of the small Ryzen CPUs is rather low compared to Intel CPUs.
However, the synthetic tests also show the comparatively high performance deficit of the Ryzen 5 1400, which is equipped with only four cores.
Gaming Benchmarks
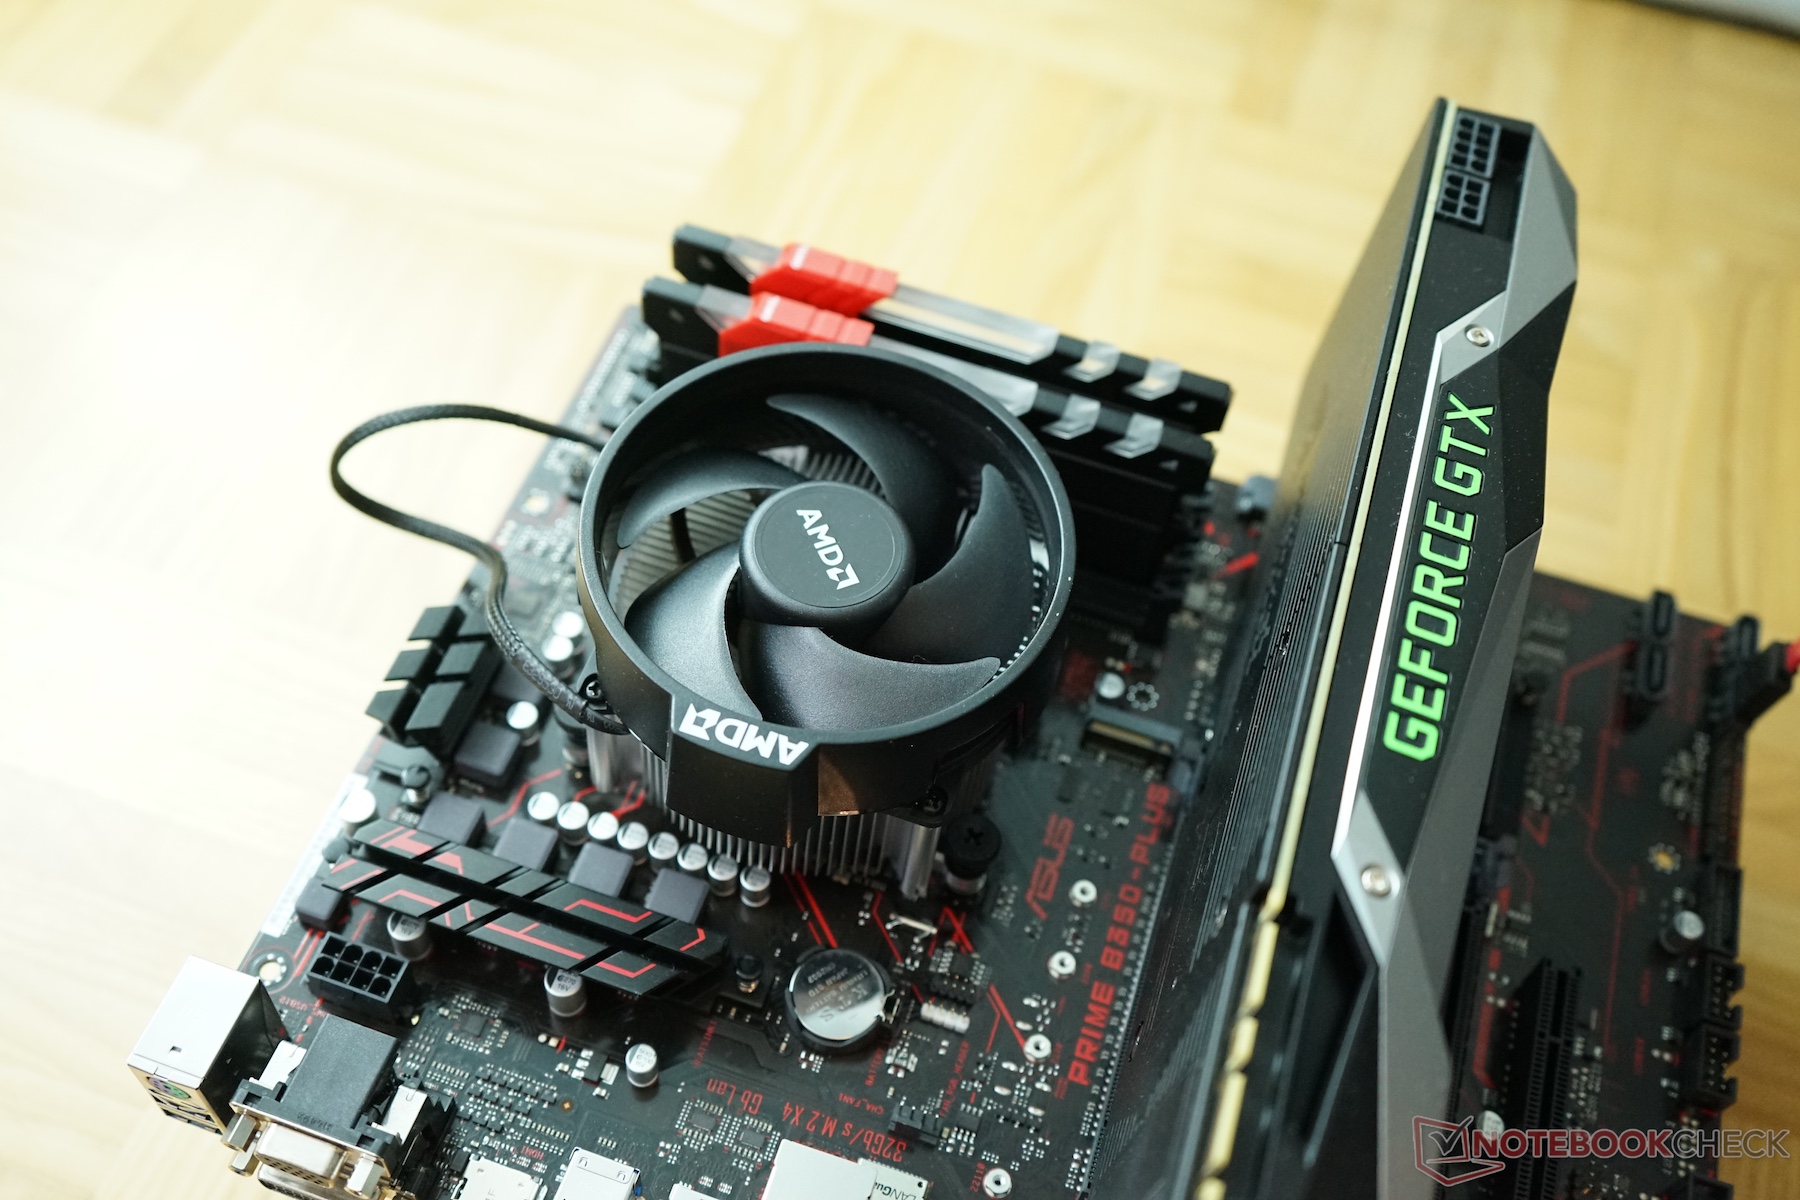
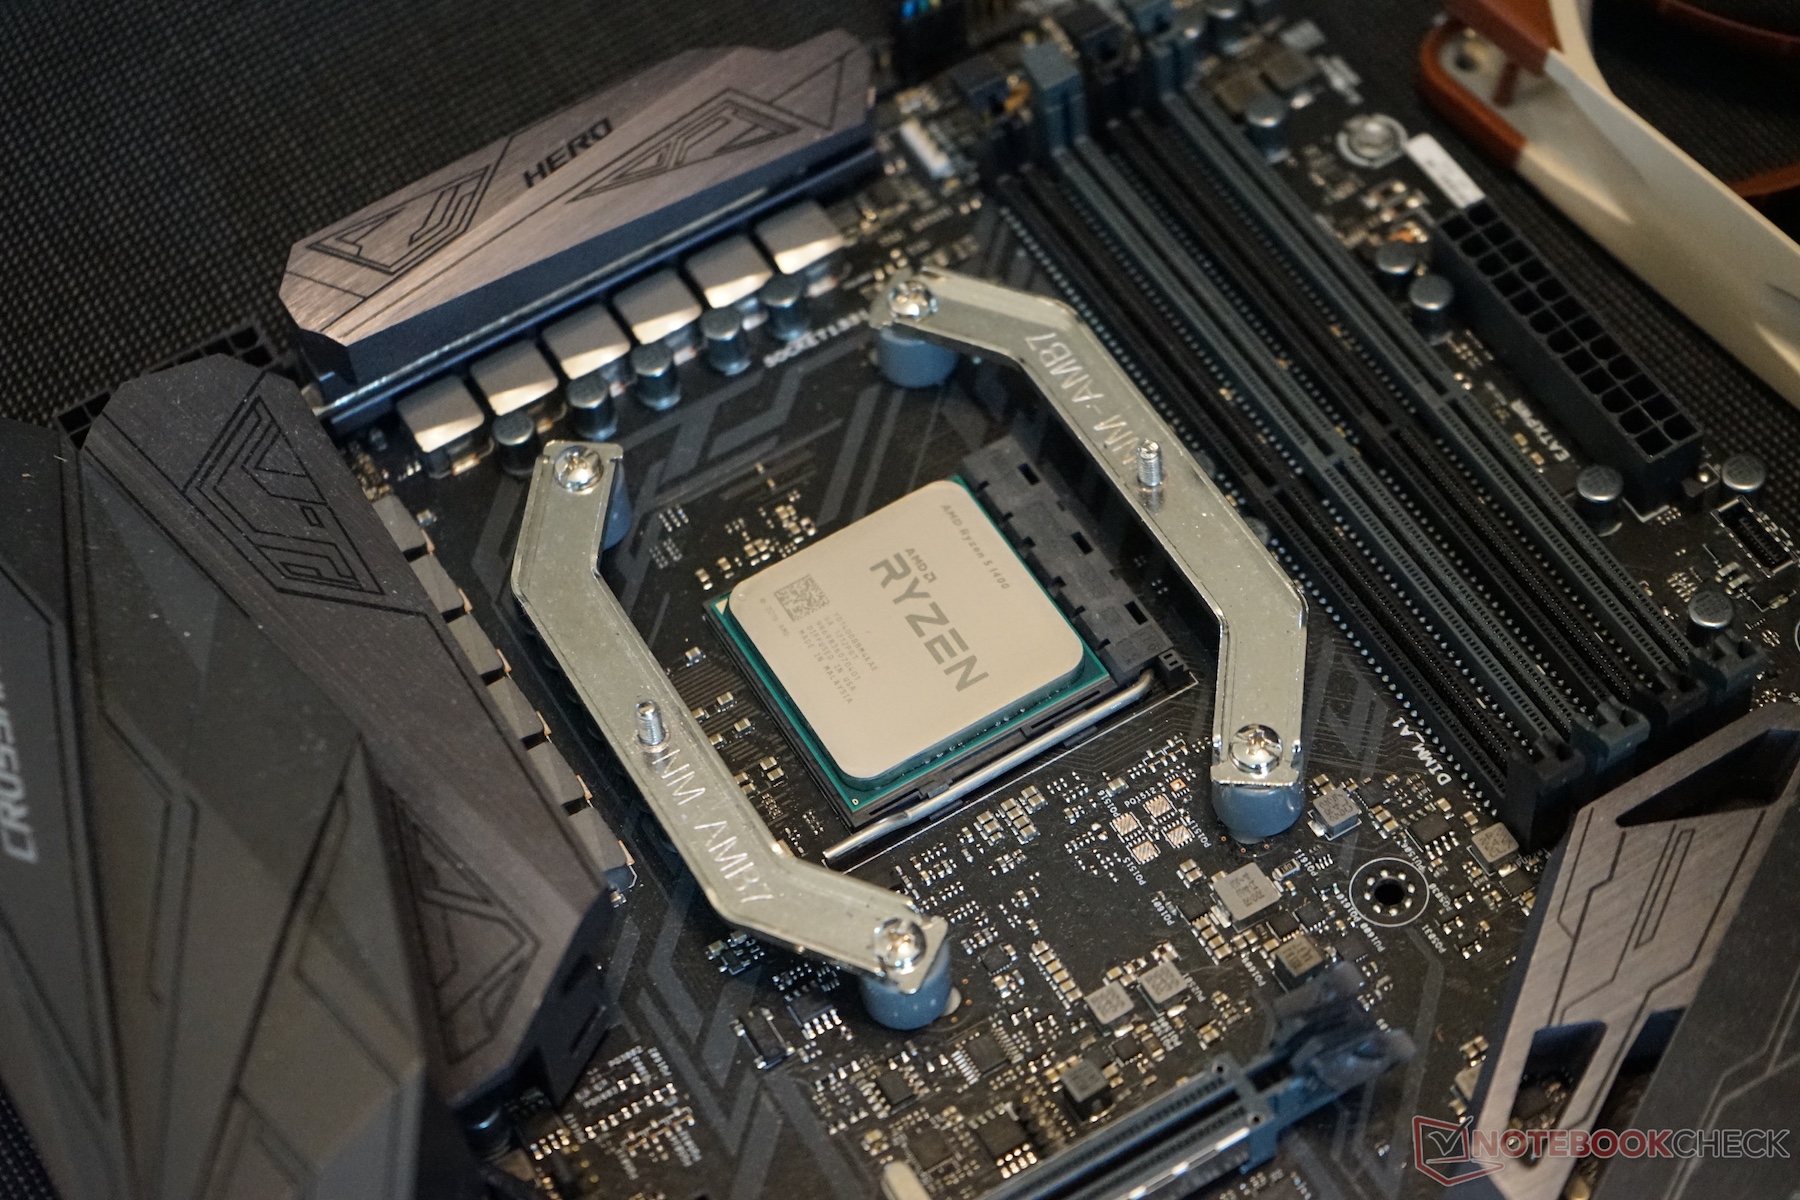
Test System
We want to make sure that the GPU does not limit the results and ensure comparability, so we also test the smaller models with the Nvidia GeForce GTX 1080 Ti. The motherboard for this test is the Asus Prime B350-PLUS in combination with 16 GB of DDR4-3200 RAM.
Some parts of the test suite are once again not very practical – to determine the CPU performance adequately. Owners of a GeForce GTX 1080 Ti will most probably use a more powerful CPU.
Frame rates
In the low resolution and with low settings – the important test environment for the CPU – ranks the slower Ryzen CPUs ahead of the more expensive models in “For Honor”. We cannot completely rule out interferences due to different firmware version, so these results should be handled with care.
We can see a comparatively good scaling of the results in the most important benchmark – “The Witcher 3” in the relevant low resolution (low details). The 1800X is around 30% faster than the Ryzen 5 1400, but the difference compared to the 1600 is much smaller. However, the two Ryzen 5 CPUs do not stand a chance against the more expensive Intel competition. The difference between the 1600 and 1400 is significant at around 10%, but does not reflect the price difference between the two models adequately.
| Farming Simulator 17 - 3840x2160 High Preset AA:2xMS AF:2x | |
| Intel Core i7-6950X | |
| Intel Core i5-7600K | |
| Intel Core i7-4790K | |
| Intel Core i7-7700K | |
| Intel Core i7-5960X | |
| AMD Ryzen 7 1800X | |
| AMD Ryzen 5 1600 | |
| AMD Ryzen 7 1700 | |
| Intel Xeon E5-2680 v4 | |
| AMD Ryzen 5 1400 | |
| The Witcher 3 | |
| 1920x1080 Ultra Graphics & Postprocessing (HBAO+) | |
| Intel Core i7-7700K | |
| Intel Core i7-6950X | |
| Intel Core i7-4790K | |
| AMD Ryzen 7 1700 | |
| AMD Ryzen 7 1800X | |
| AMD Ryzen 5 1400 | |
| AMD Ryzen 5 1600 | |
| Intel Xeon E5-2680 v4 | |
| 1024x768 Low Graphics & Postprocessing | |
| Intel Core i7-4790K | |
| Intel Core i7-6950X | |
| Intel Core i7-7700K | |
| AMD Ryzen 7 1800X | |
| AMD Ryzen 7 1700 | |
| Intel Xeon E5-2680 v4 | |
| AMD Ryzen 5 1600 | |
| AMD Ryzen 5 1400 | |
| For Honor | |
| 3840x2160 High Preset AA:T AF:8x | |
| Intel Xeon E5-2680 v4 | |
| Intel Core i7-7700K | |
| Intel Core i7-6950X | |
| AMD Ryzen 7 1700 | |
| Intel Core i5-7600K | |
| AMD Ryzen 5 1400 | |
| AMD Ryzen 5 1600 | |
| Intel Core i7-4790K | |
| AMD Ryzen 7 1800X | |
| Intel Core i7-5960X | |
| 1280x720 Low Preset | |
| Intel Core i7-7700K | |
| Intel Core i7-4790K | |
| Intel Core i5-7600K | |
| AMD Ryzen 5 1600 | |
| Intel Xeon E5-2680 v4 | |
| AMD Ryzen 5 1400 | |
| AMD Ryzen 7 1800X | |
| Intel Core i7-5960X | |
| AMD Ryzen 7 1700 | |
| Intel Core i7-6950X | |
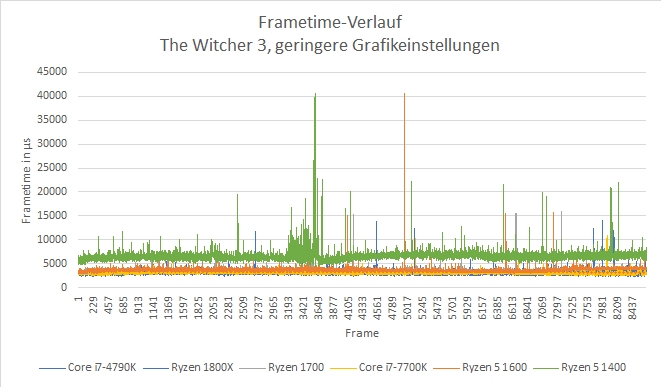
Frame Times
The small Ryzen 5 1400 clearly differs from all the other CPUs in the frame time diagram – the visible difference directly shows the lower frame rate. This CPU also produces big outliers compared to the other models. This can result in stutters in some scenarios and indicates that the processor is hitting its performance limit. The Ryzen 5 1600 has some "outliers" as well, but their intensity is much less distinct.
The statistical analysis of the frame times supports the results. The number of "outliers" is very similar between the Ryzen R7 1700 and the Ryzen R5 1600, but the number is much higher for the Ryzen 5 1400. Around 0.9% of all frames are delivered with a time deviation of at least 50%, and the average frame times – which are increased anyway – even intensify the situation.
| Model | Core i7-4790K | Ryzen R7 1700 | Ryzen R5 1600 | Ryzen R5 1400 |
| Frame times (median, in µs) | 3084 | 3823 | 3840 | 6527 |
| Deviating by at least 20% | 2.711% | 1.129% | 1.104% | 3.771% |
| Deviating by at least 50% | 0.276% | 0.213% | 0.176% | 0.862% |
| Deviating by at least 100% | 0.049% | 0.066% | 0.047% | 0.284% |
| Deviating by at least 300% | 0.005% | 0.053% | 0.020% | 0.046% |
Overclocking
Considering the low price in combination with the free multiplier, the Ryzen 5 1400 seems to be a good candidate for overclocking, and at least our test sample was actually pretty good in this respect. We had no problems to increase the clock to 3.6 GHz without voltage modifications or stability issues. The result was a Cinebench score of 746 points, which is an 8% increase.
We do not want to recommend careless overclocking for inexperienced users at this point, but the risk is comparatively small without voltage increases and you get comparatively high performance benefits.
Verdict
Our verdict for the Ryzen 5 1600 is pretty clear: AMD's hexa-core (also) manages to offer high performance at a very competitive price. The performance of the CPU, which currently retails for around 220 Euros (~$248), is sufficient for complex games as well as all other usage scenarios – in short: Even ambitious users just do not need a more powerful CPU right now.
As with the more powerful Ryzen CPUs, however, we have to mention the lower single-core performance compared to (much more expensive) Intel CPUs. This is getting less important though, so we do not think it is a big deal and it does not really affect our positive impression of the 1600, because the CPU can beat even the expensive i7 models from Intel in the majority of practical scenarios.
The Ryzen 5 1400, however, which is currently around 50 Euros (~$56) less expensive, requires more attention from the user: Four cores and eight threads can still be considered "modern", but they are much less future-proof compared to six cores. The combination of the lower clocks and the smaller cache that results in lower performance figures is not reflected in the price difference, so the price-performance ratio is worse compared to the Ryzen 5 1600. The performance of the smallest Ryzen 5 is still sufficient for occasional gaming sessions and office work, and overclocking can make sense as well.
Test Samples
Most of the test samples for this review were provided by AMD (Ryzen CPUs, Asus motherboard, memory kit, Noctua cooler). Intel provided the Core i7-6950X and i7-5960X, while the X99-E Motherboard was a courtesy of Asus. Noctua provided the NH-U12S cooler for AMD AM4 and the X99 motherboard. We also want to thank the company PCO Computer-Handels-GmbH, which provided Core i7-7700K, 7600K, memory kit, and Gigabyte motherboard (available in the online shop).