Asus ROG Strix GL702ZC (Ryzen 7 1700, Radeon RX 580) Laptop Review
For the original German version, click here.
While demanding gamers can choose processor and graphics card quite freely in the desktop PC range, there are much fewer options for notebooks; at least for AMD fans. We feel that 99.9% of all new high-end laptops come with a quad-core CPU from Intel's Kaby Lake generation (Core i5-7300HQ up to i7-7820HK) and a Pascal GPU from Nvidia (GeForce GTX 1060 up to GTX 1080). While a few exotic devices sported AMD hardware in the past years, most of them disappointed due to driver problems (e.g. Radeon HD 7970M in the Schenker XMG P502) or very weak CPU performance (e.g. A10-4600M in the MSI GX60), which also proved to be a bottleneck in games.
The problems should be solved now, however. While AMD's last processor architecture did not stand a chance against the competition from Intel - especially in terms of power consumption and performance per MHz, the brand new Ryzen generation can finally close the gap to the top thanks to its huge core count and improved energy efficiency. As a result, more notebooks with AMD technology might be launched again. This is sorely needed since Intel and Nvidia can currently freely dictate prices, which often makes powerful devices unnecessarily expensive.
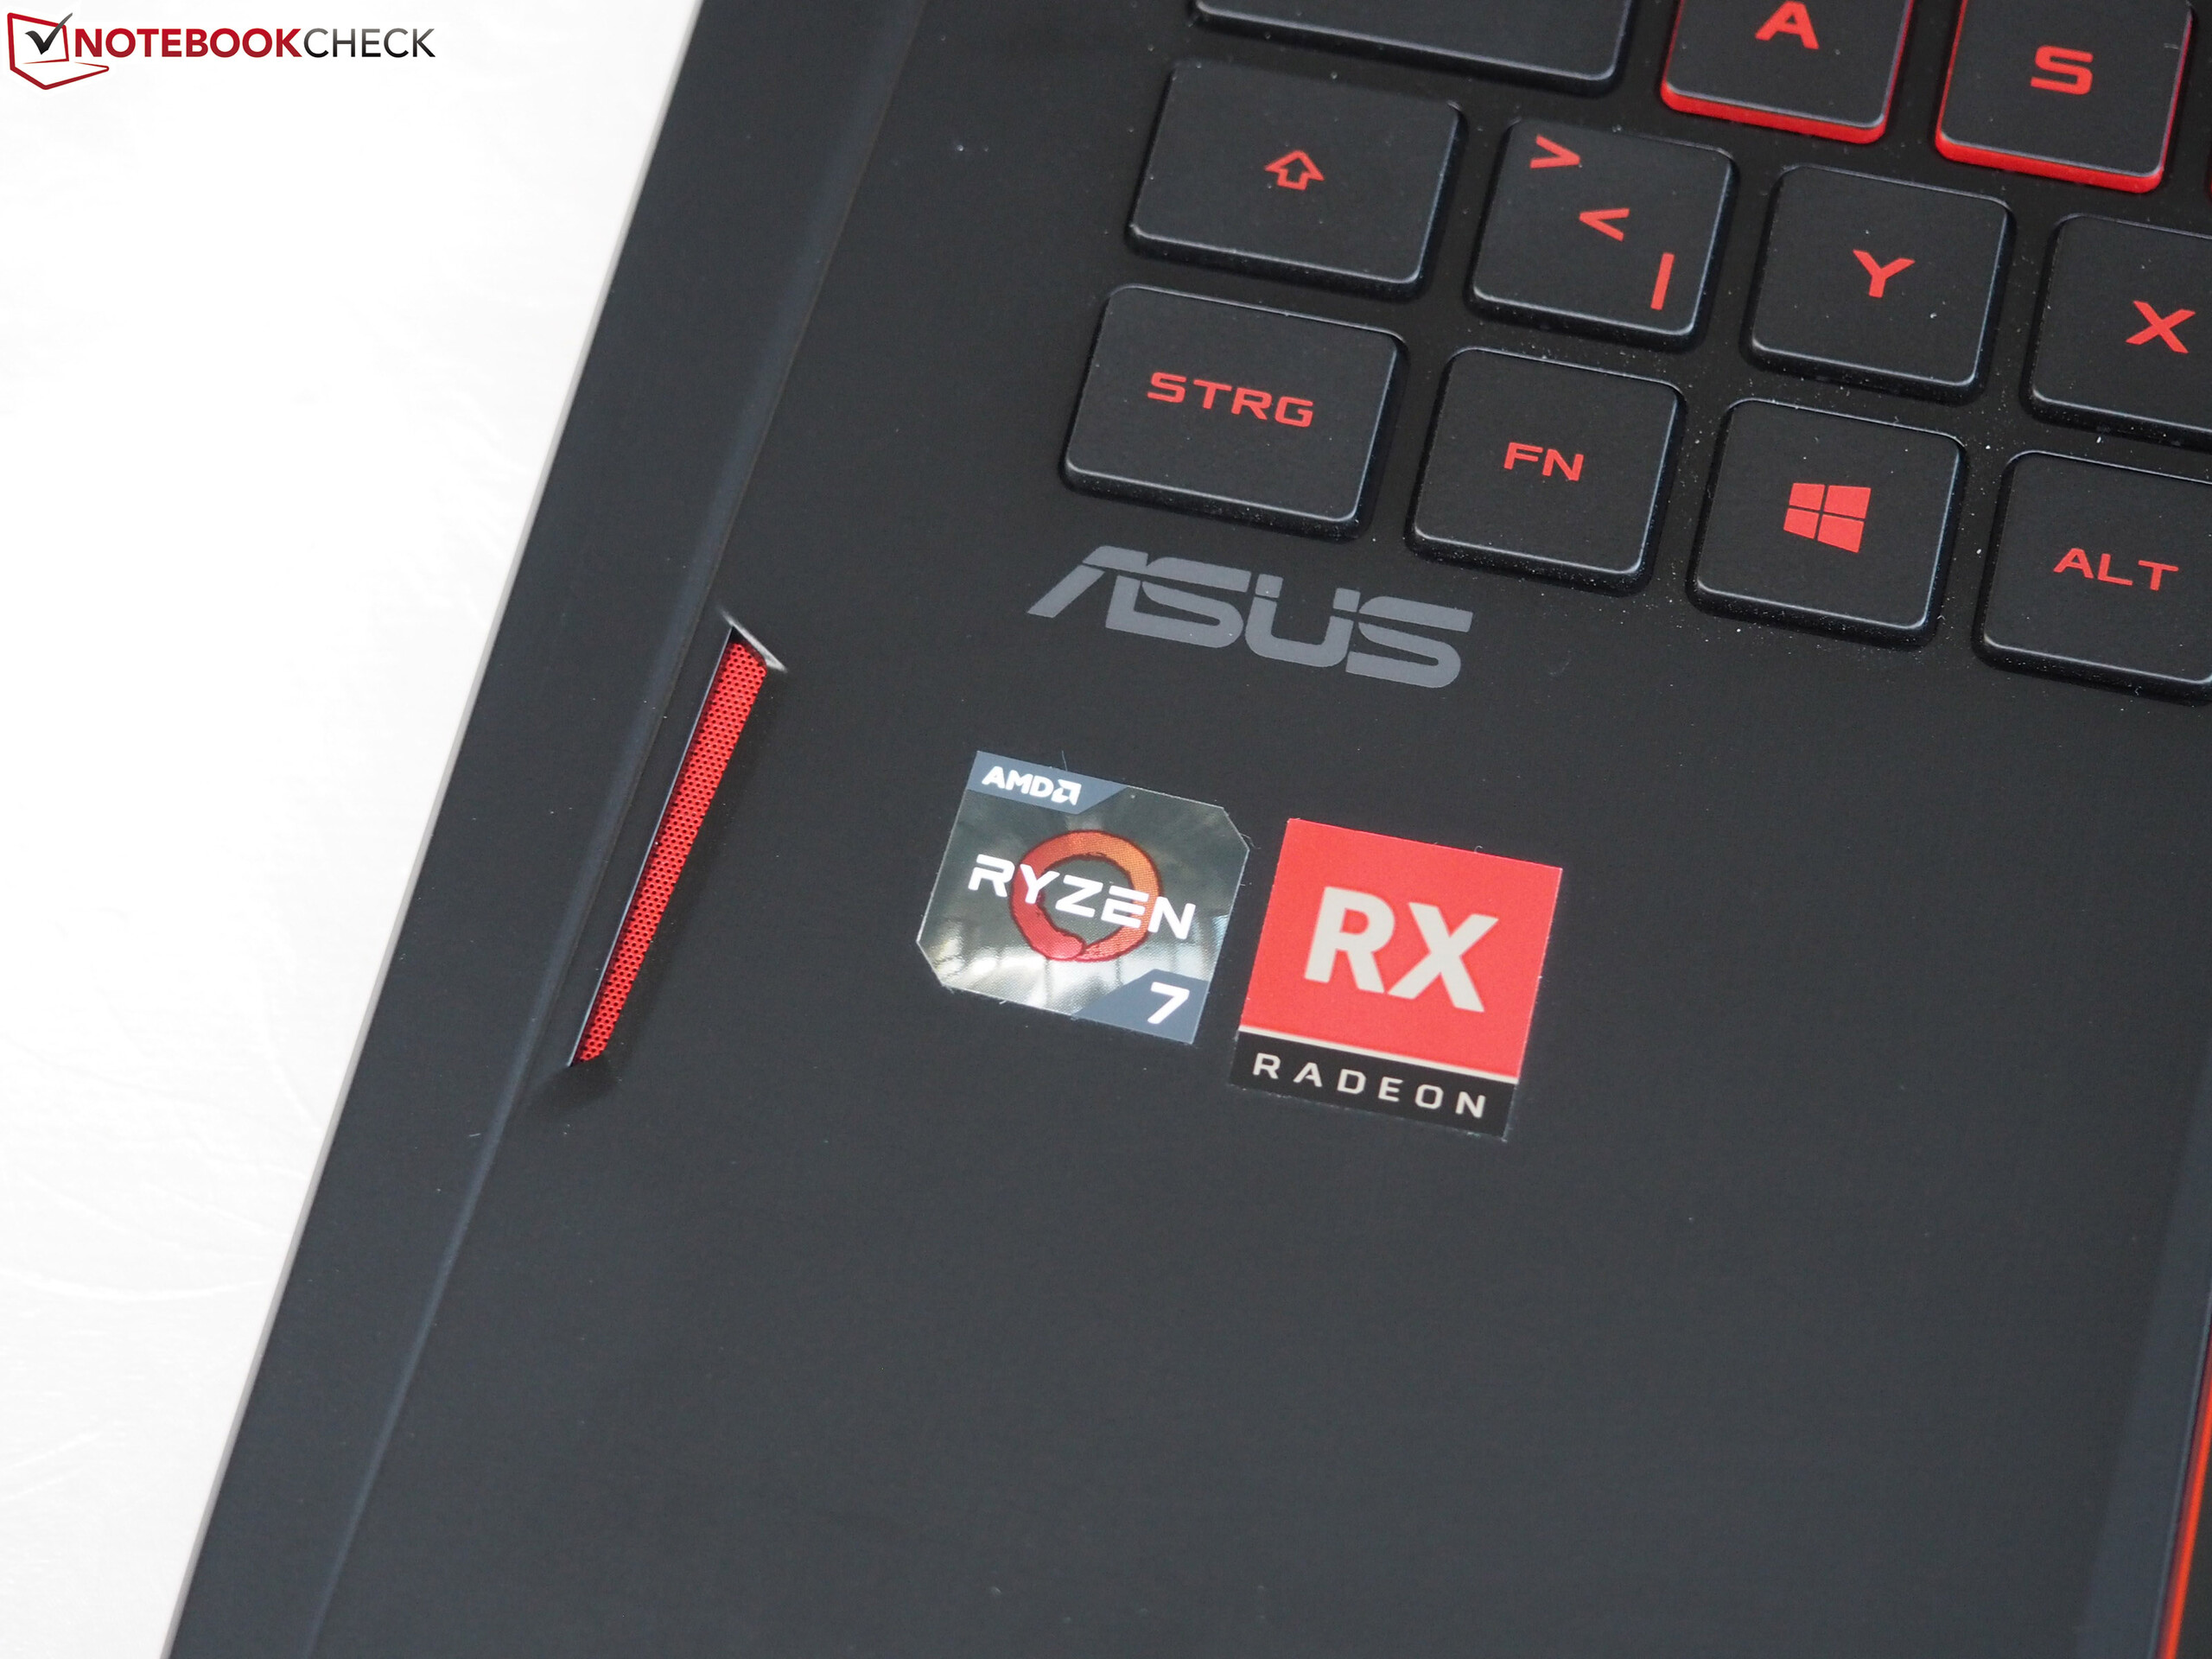
In order to break the market dominance, Asus pioneers with the 17-inch ROG Strix GL702ZC, which uses a Radeon RX 580 with 4 GB of GDDR5 VRAM regardless of the configuration. This graphics card is supposed to compete with the GeForce GTX 1060. According to the geizhals.de price comparison, 10 different models are already available at launch time. While the cheapest variant for 1399 Euros (~$1671) features a 6-core CPU (Ryzen 5 1600), a 1 TB SSHD and 8 GB of DDR4 RAM, the reviewed top model features an 8-core CPU (Ryzen 7 1700), a combination from 256 GB SSD and 1 TB HDD and 16 GB of RAM. Price: a steep 1800 Euros (~$2150).
All models come with a matte Full HD display with FreeSync support. This is the counterpart to Nvidia's G-Sync technology, which is an expensive, closed system. The goal is a smooth image without tearing through synchronizing the frame rate of the graphics card with the frequency of the display. Unfortunately, the display of the test model only supports 60 Hz. According to Asus' homepage 120 Hz panels will be available, too.
Our article basically deals with the question whether the GL702ZC is a good alternative to the established gaming competition in terms of price-performance ratio, and whether the dominance from Intel and Nvidia, respectively, begins to totter. We added the MSI GE72 7RE (i7-7700HQ + GTX 1050 Ti), the Acer Aspire VN7-793 (7700HQ + GTX 1060), the Aorus X7 v7 (i7-7820HK + GTX 1070), and the Schenker XMG U727 (i7-7700K + GTX 1080) to our comparison. These 17-inch devices cover many different CPUs and GPUs.
Review diary
- 09-09-17: article template created, basic specs entered, CPU, GPU, SSD and system benchmarks entered, several photos and screenshots added
- 09-10-17: added many gaming benchmarks
- 09-11-17: display, system noise, temperature, sound, energy, and battery measurements done, added further photos and screenshots
- 09-12-17: added text for case, connectivity, input devices, and display
- 09-13-17: performance text written (processor, system performance, storage device, graphics card & gaming performance)
- 09-14-17: last text parts written (emissions, power management & verdict), final rating is certain
Case
The case only reflects the revolutionary components (first time an 8-core CPU is used) to some extent. With a height of 3.4 cm, the chassis is significantly thicker than the GL702VM's, which we reviewed in late 2016 with Core i7-6700HQ and GeForce GTX 1060. However, the height hardly differs from the GL753VD's (Core i7-7700HQ and GeForce GTX 1050) from early 2017.
The 17-inch laptop is neither especially thick nor thin but complies with the gaming average. We had expected a bulkier chassis in view of the CPU power. The Clevo barebone of the Schenker XMG U727, which also comes with a desktop CPU (with a TDP of 91 Watt instead of 65 Watt, however) measures 4.7 cm for example. The Aorus X7 v7 (2.5 cm) and the Acer V17 Nitro (2.8 cm) are notably thinner.
The weight of the GL702ZC is also quite unspectacular. 3.2 kg is usual for a 17-inch gaming laptop, which is also shown by the MSI GE72 7RE (3.0 kg). Once again, the Schenker notebook takes the lead with a hefty 5.0 kg. None of the mentioned devices is really portable. Those who travel frequently are better off with a slim 13-inch or 15-inch laptop (see our mobile Gaming Top 10).
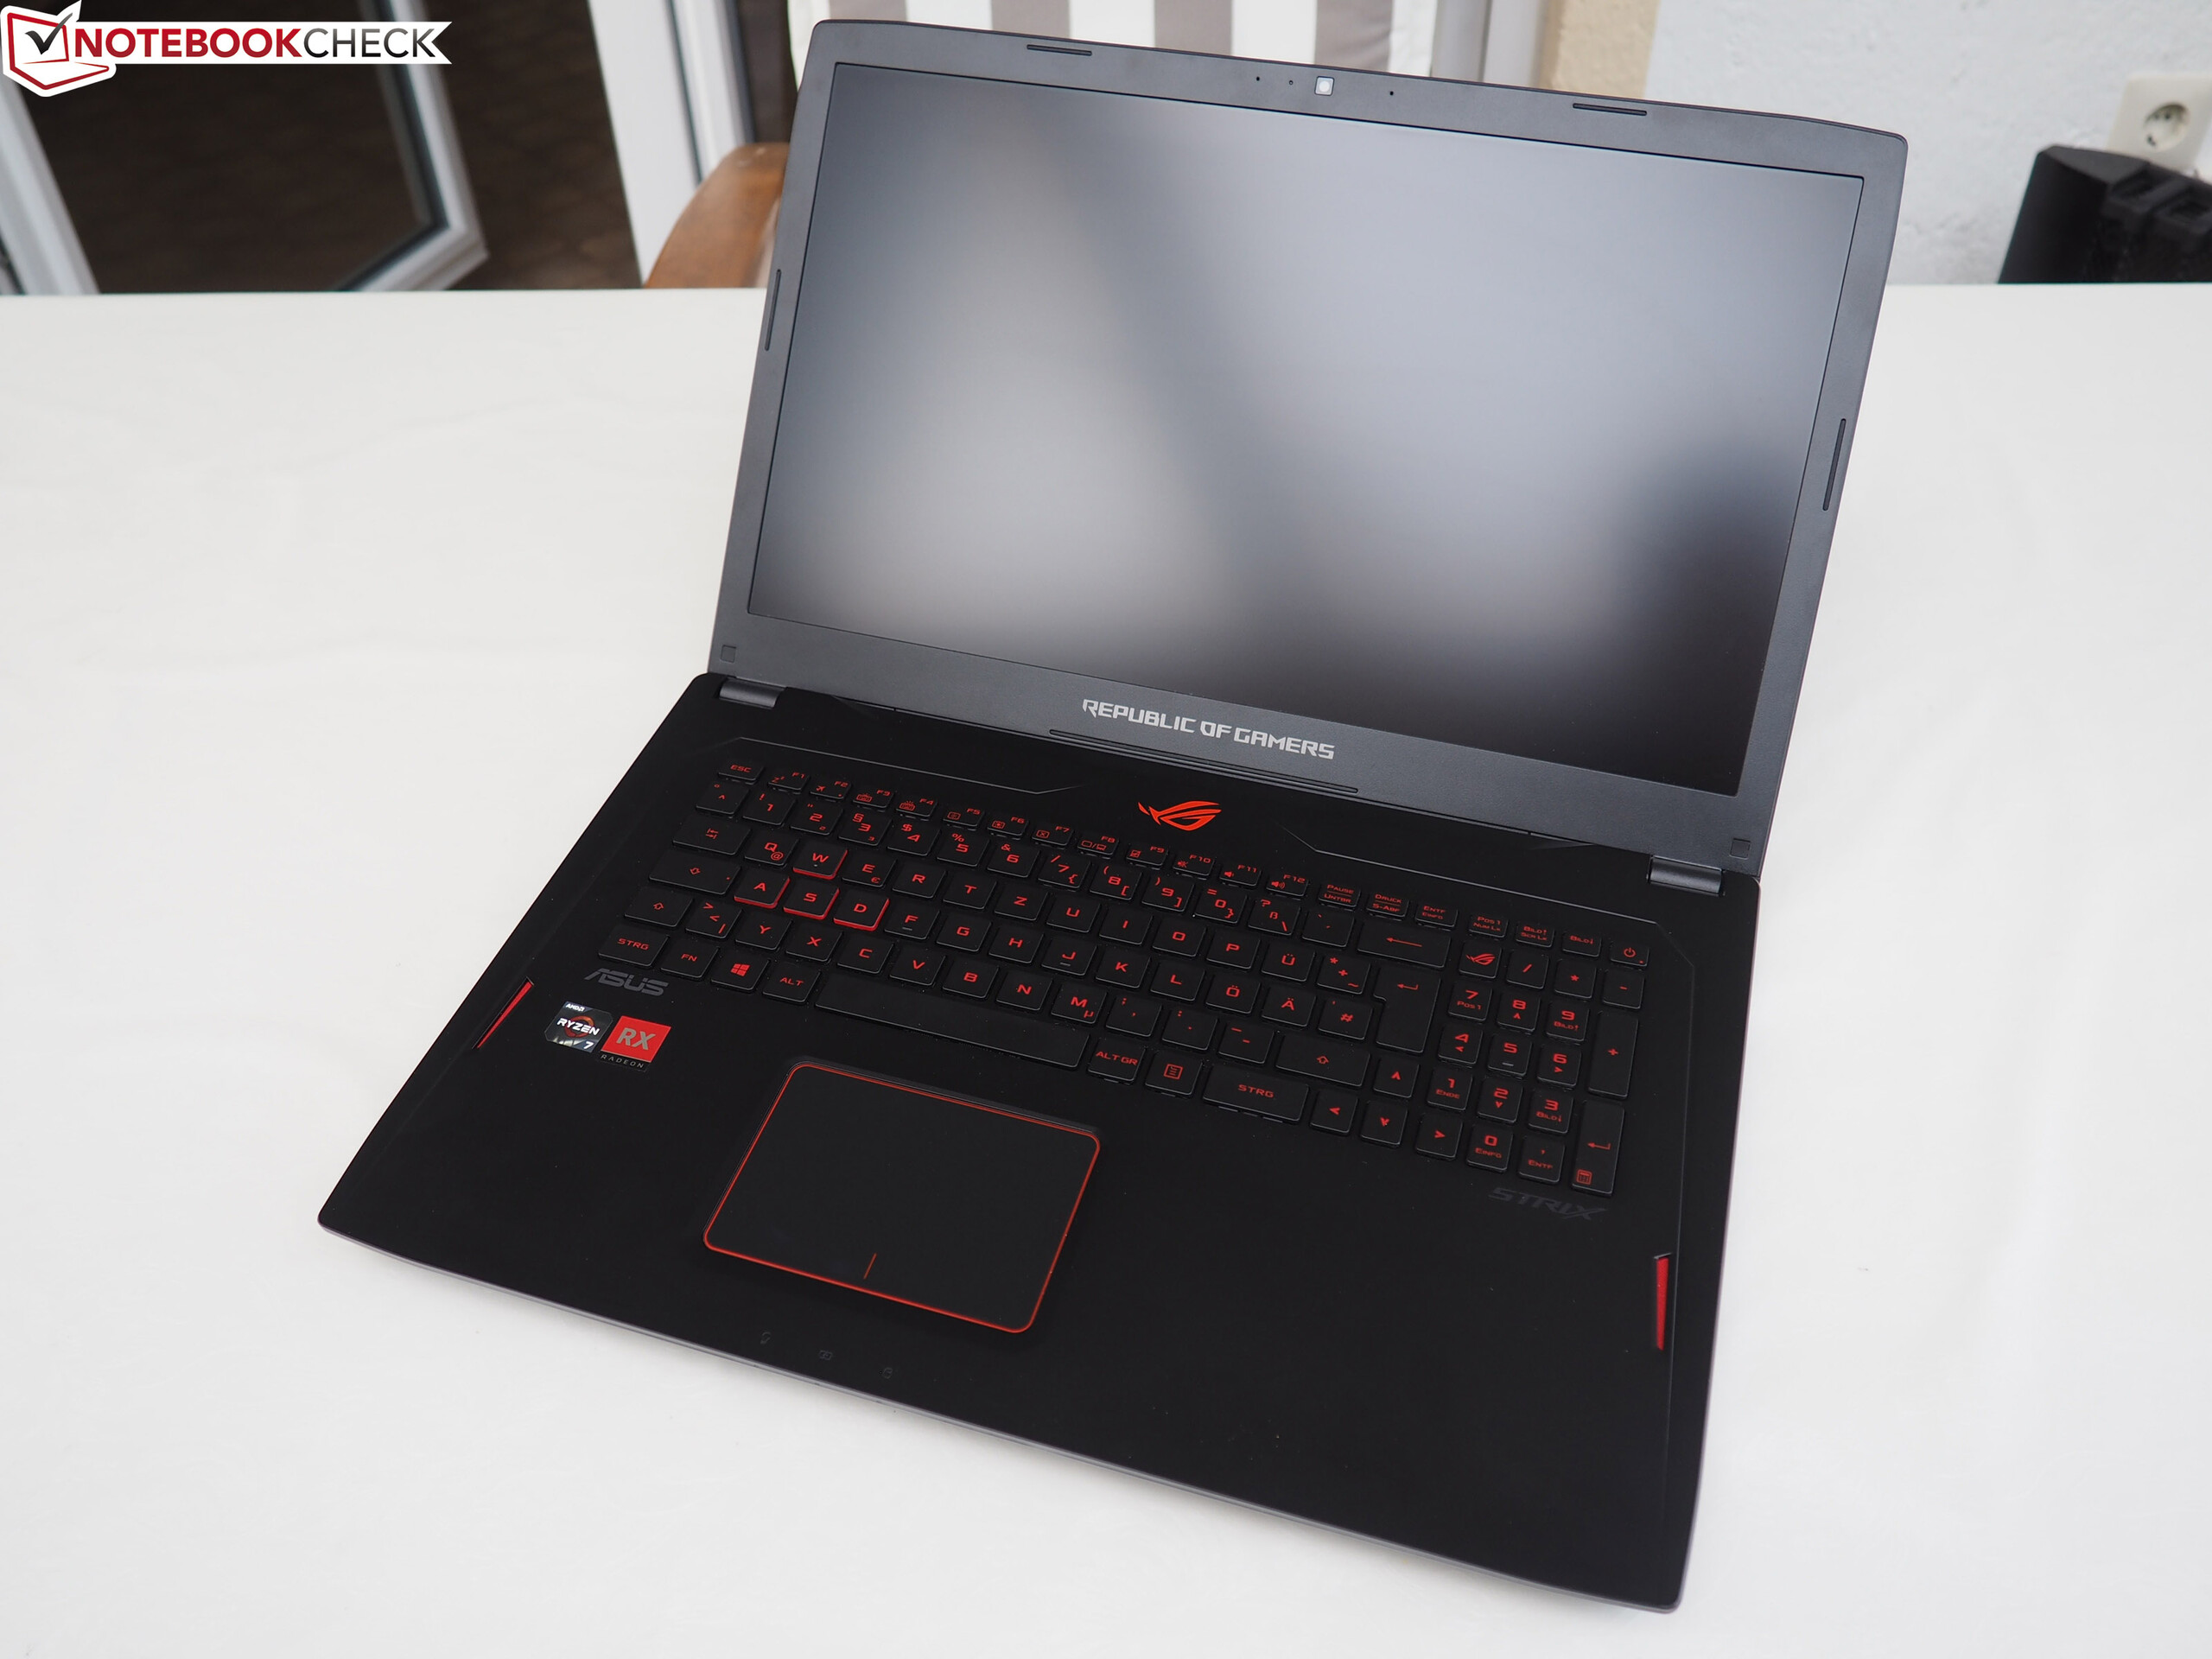
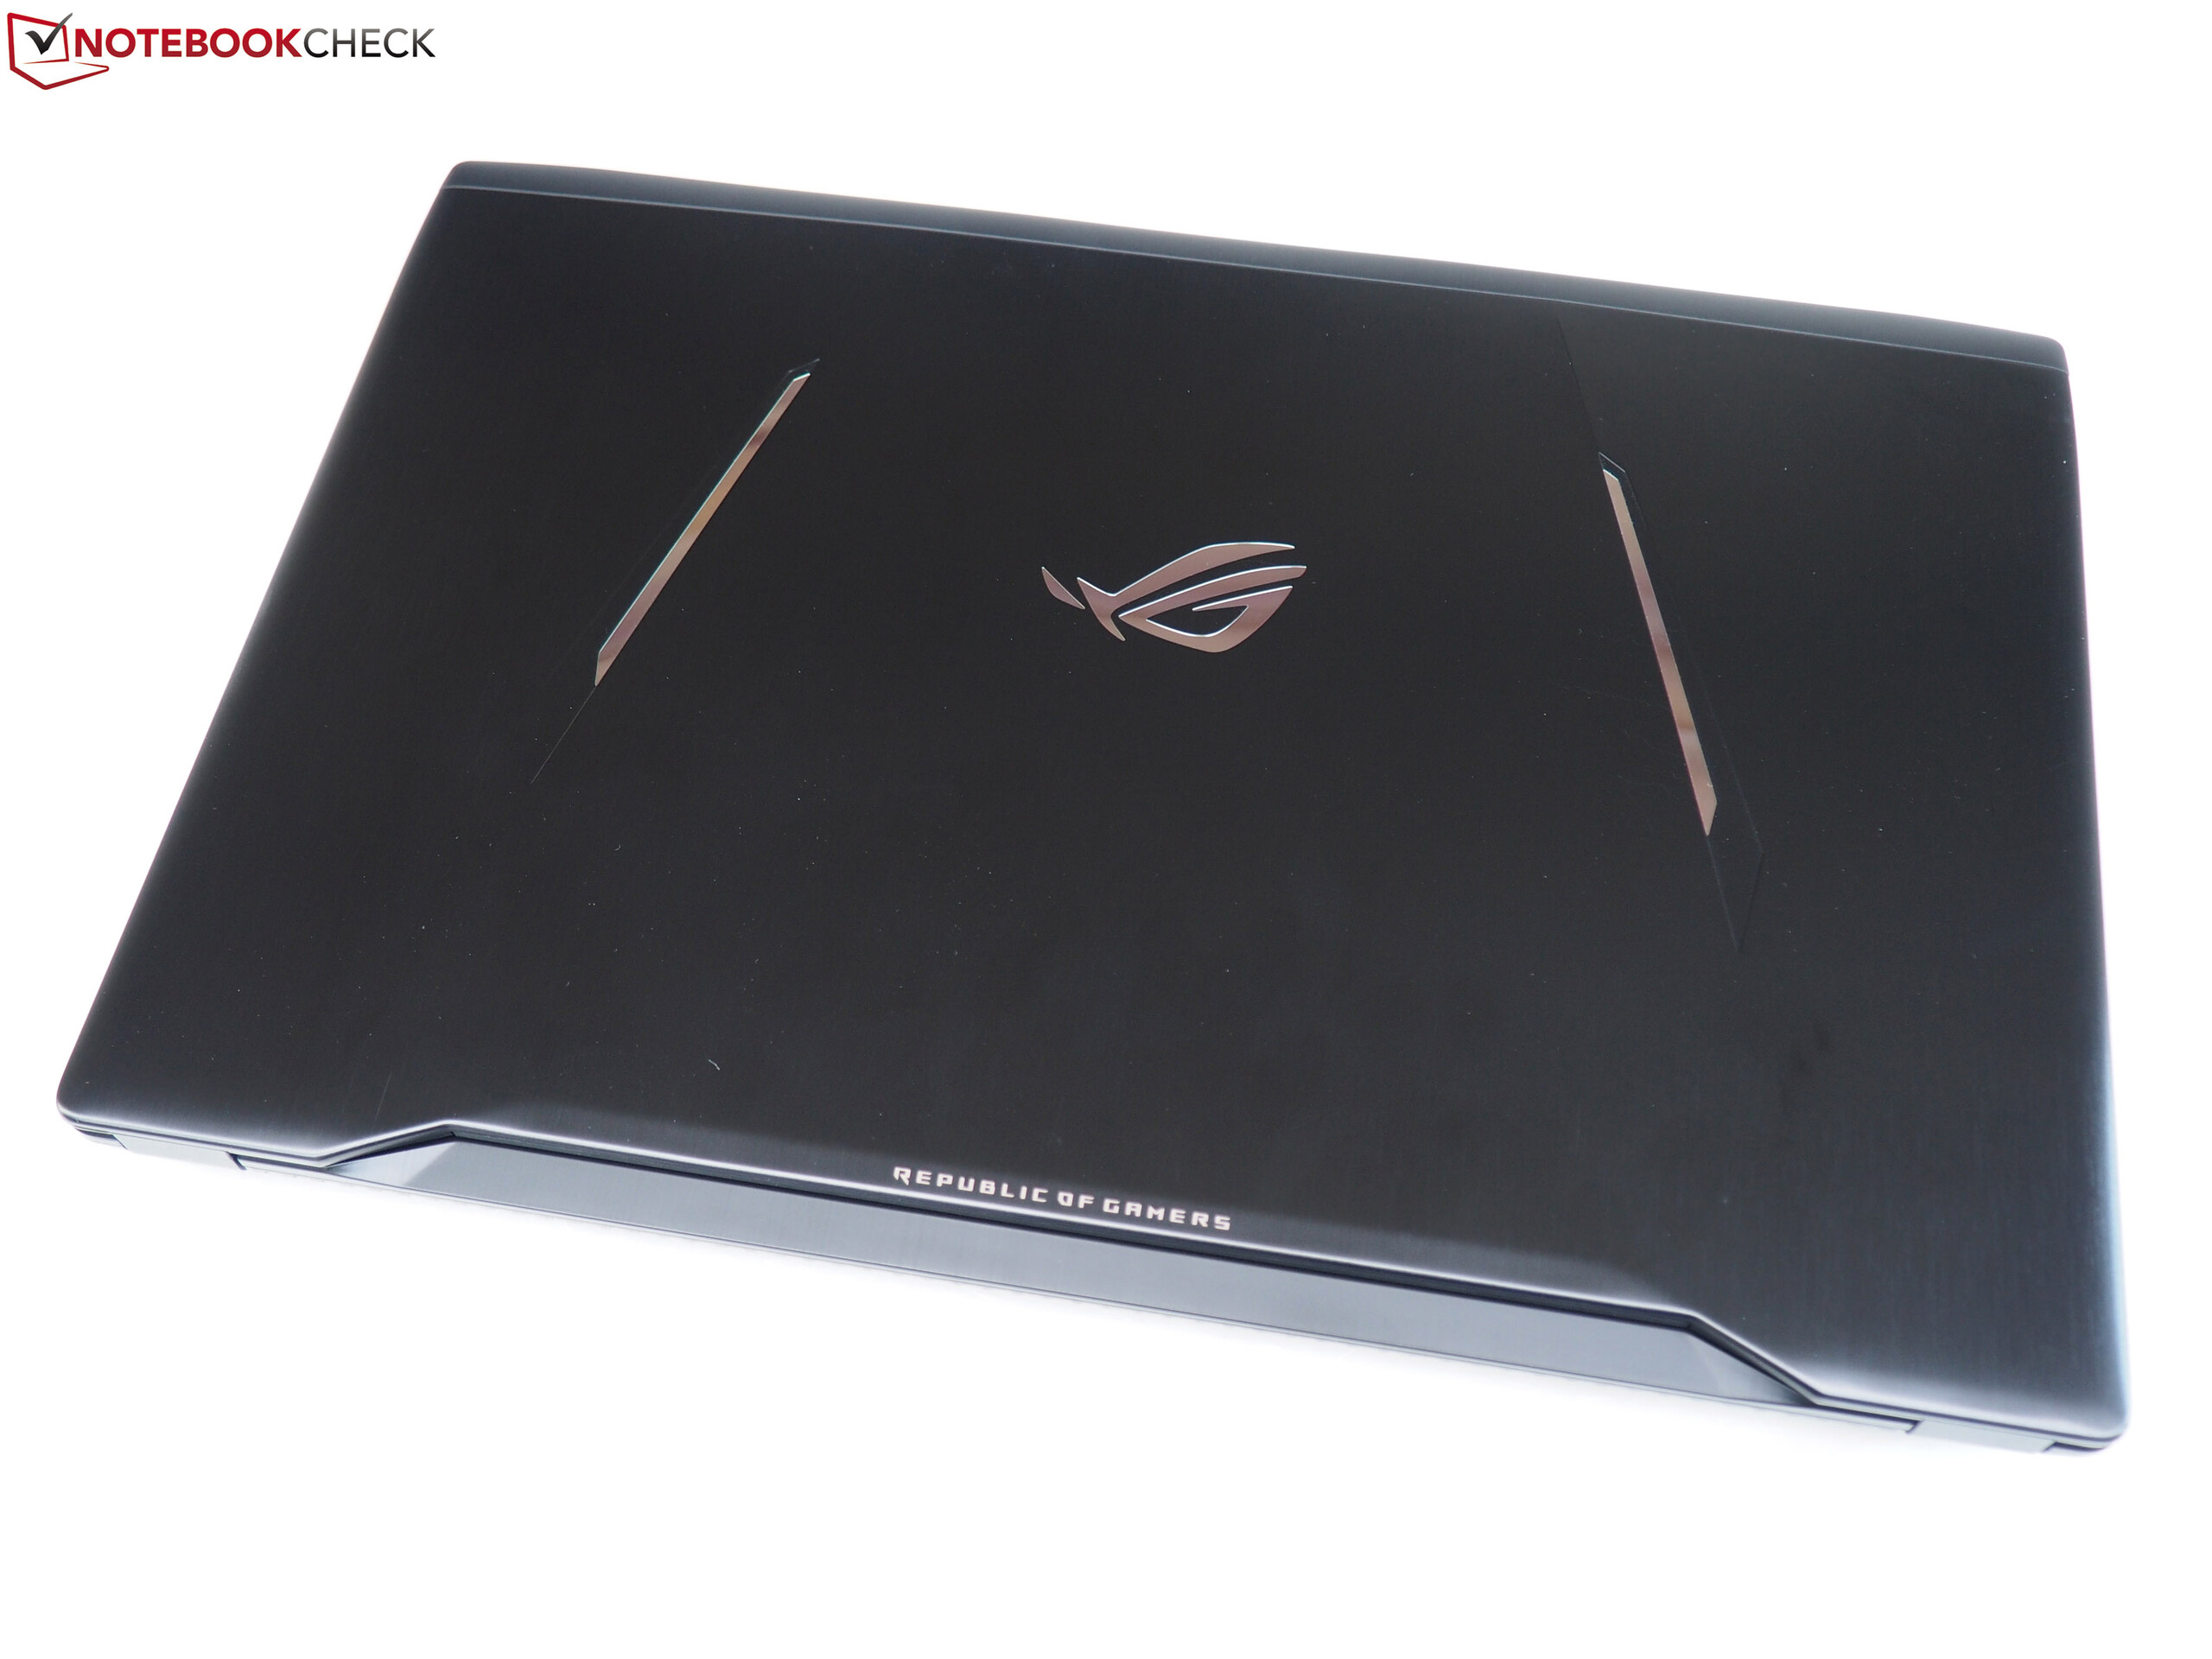
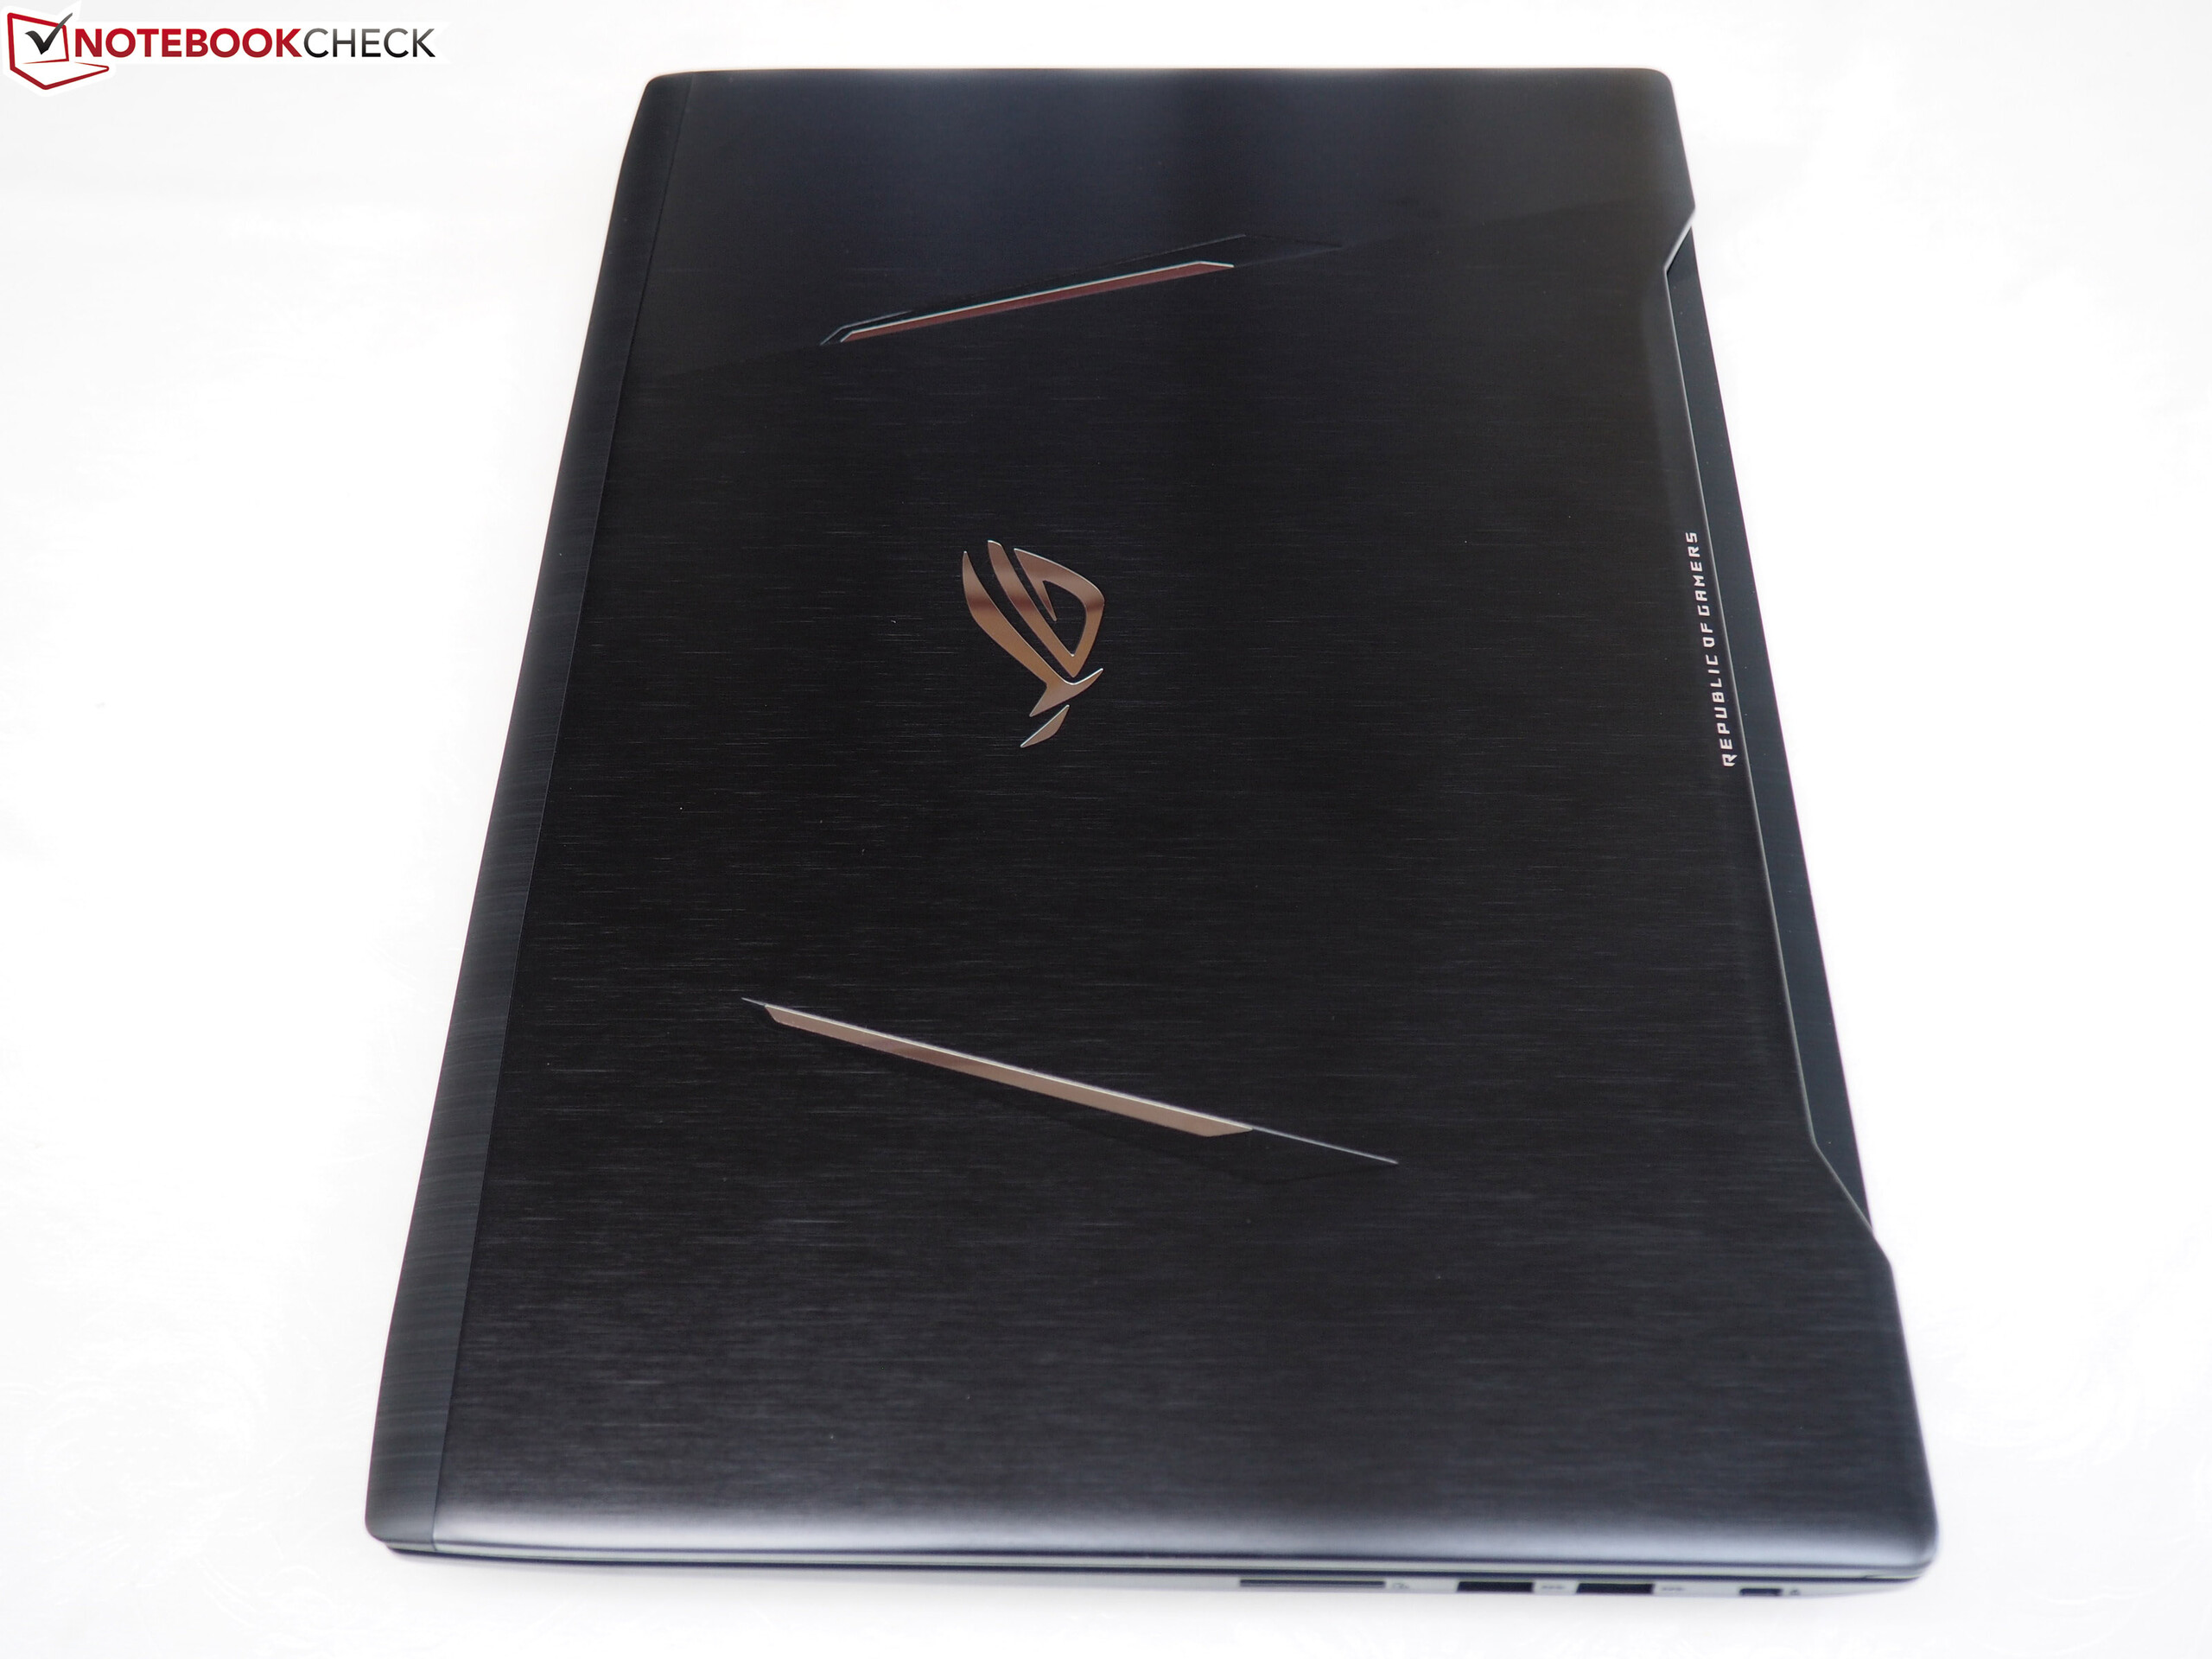
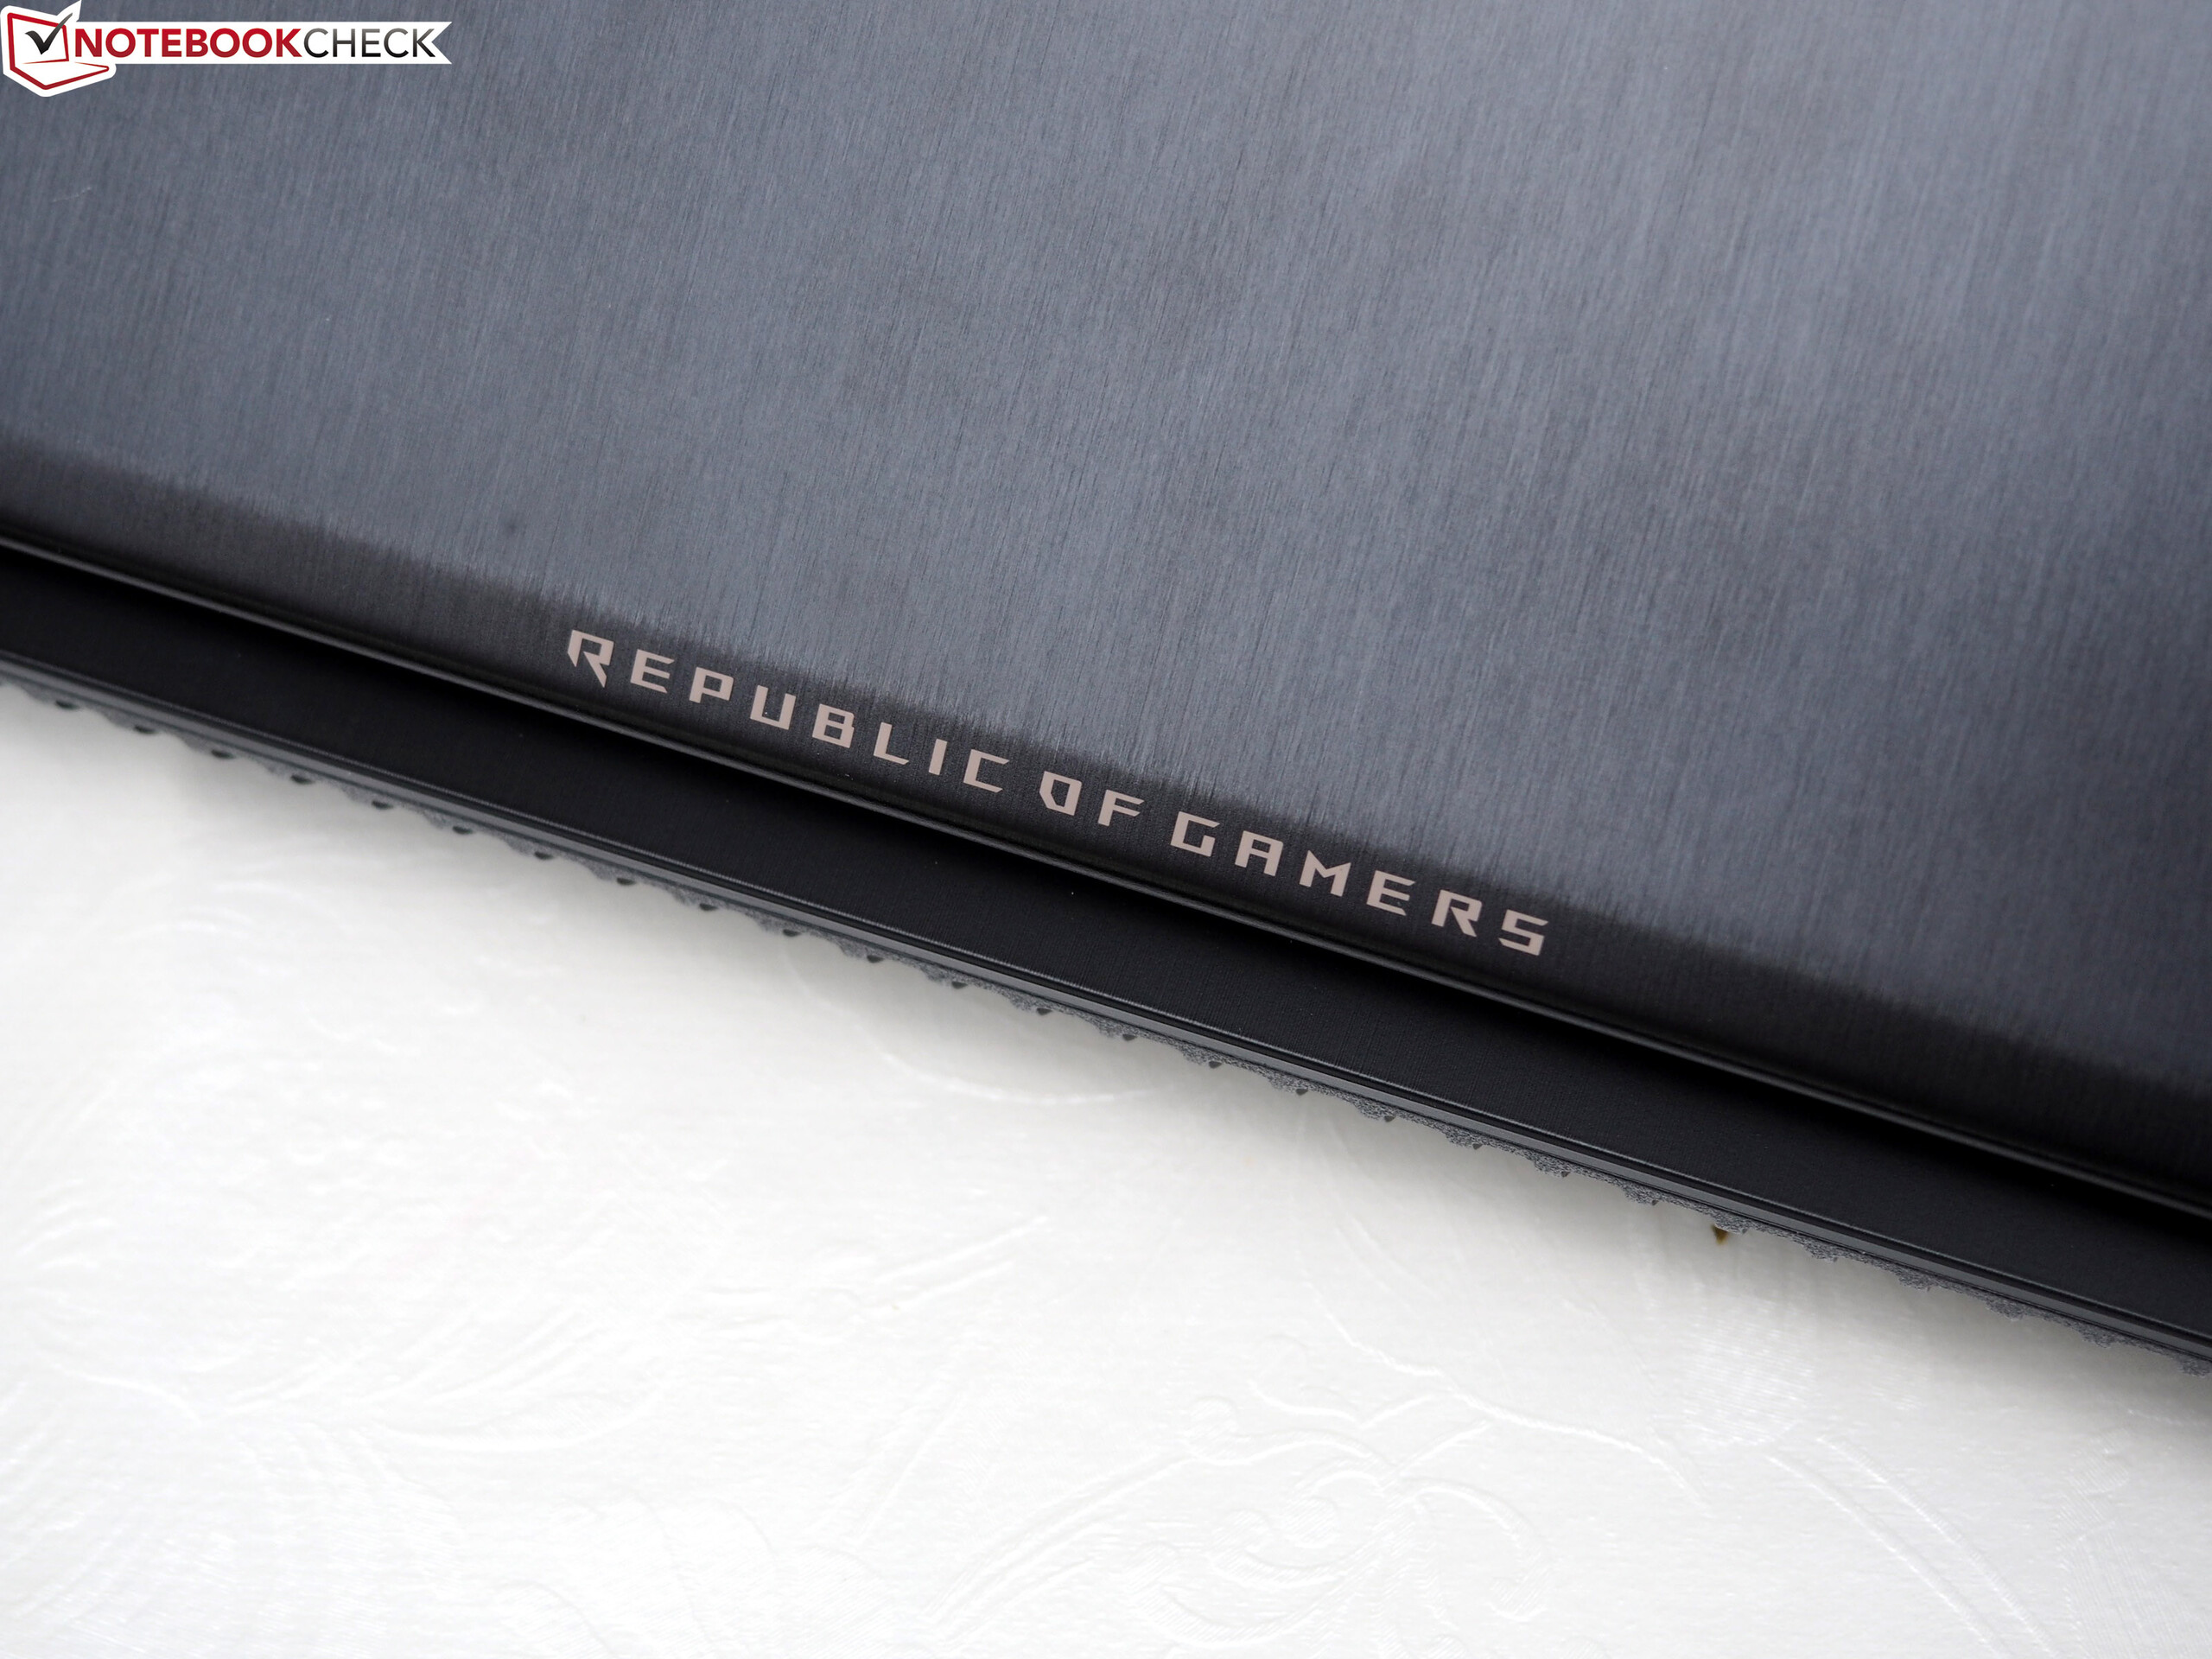
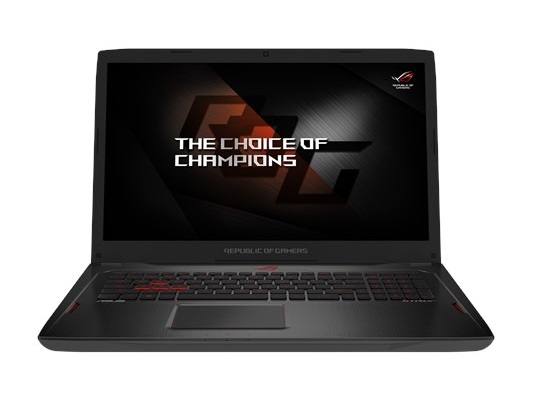
The case quality of the GL702ZC appears to be good. Apart from accurate build quality, the stylish lid made of aluminum is a pro. While the top side of the base unit also looks like brushed metal, Asus used plastic here. By contrast, it becomes apparent at the first glance that the textured underside is made of plastic. Nevertheless, the device is not "nothing but plastic".
The stability is on par with the competition. Although the keyboard warps at the WASD part and the number pad when heavy force is applied, the base unit is quite pressure resistant otherwise. The lid's stability is slightly worse yet still acceptable.
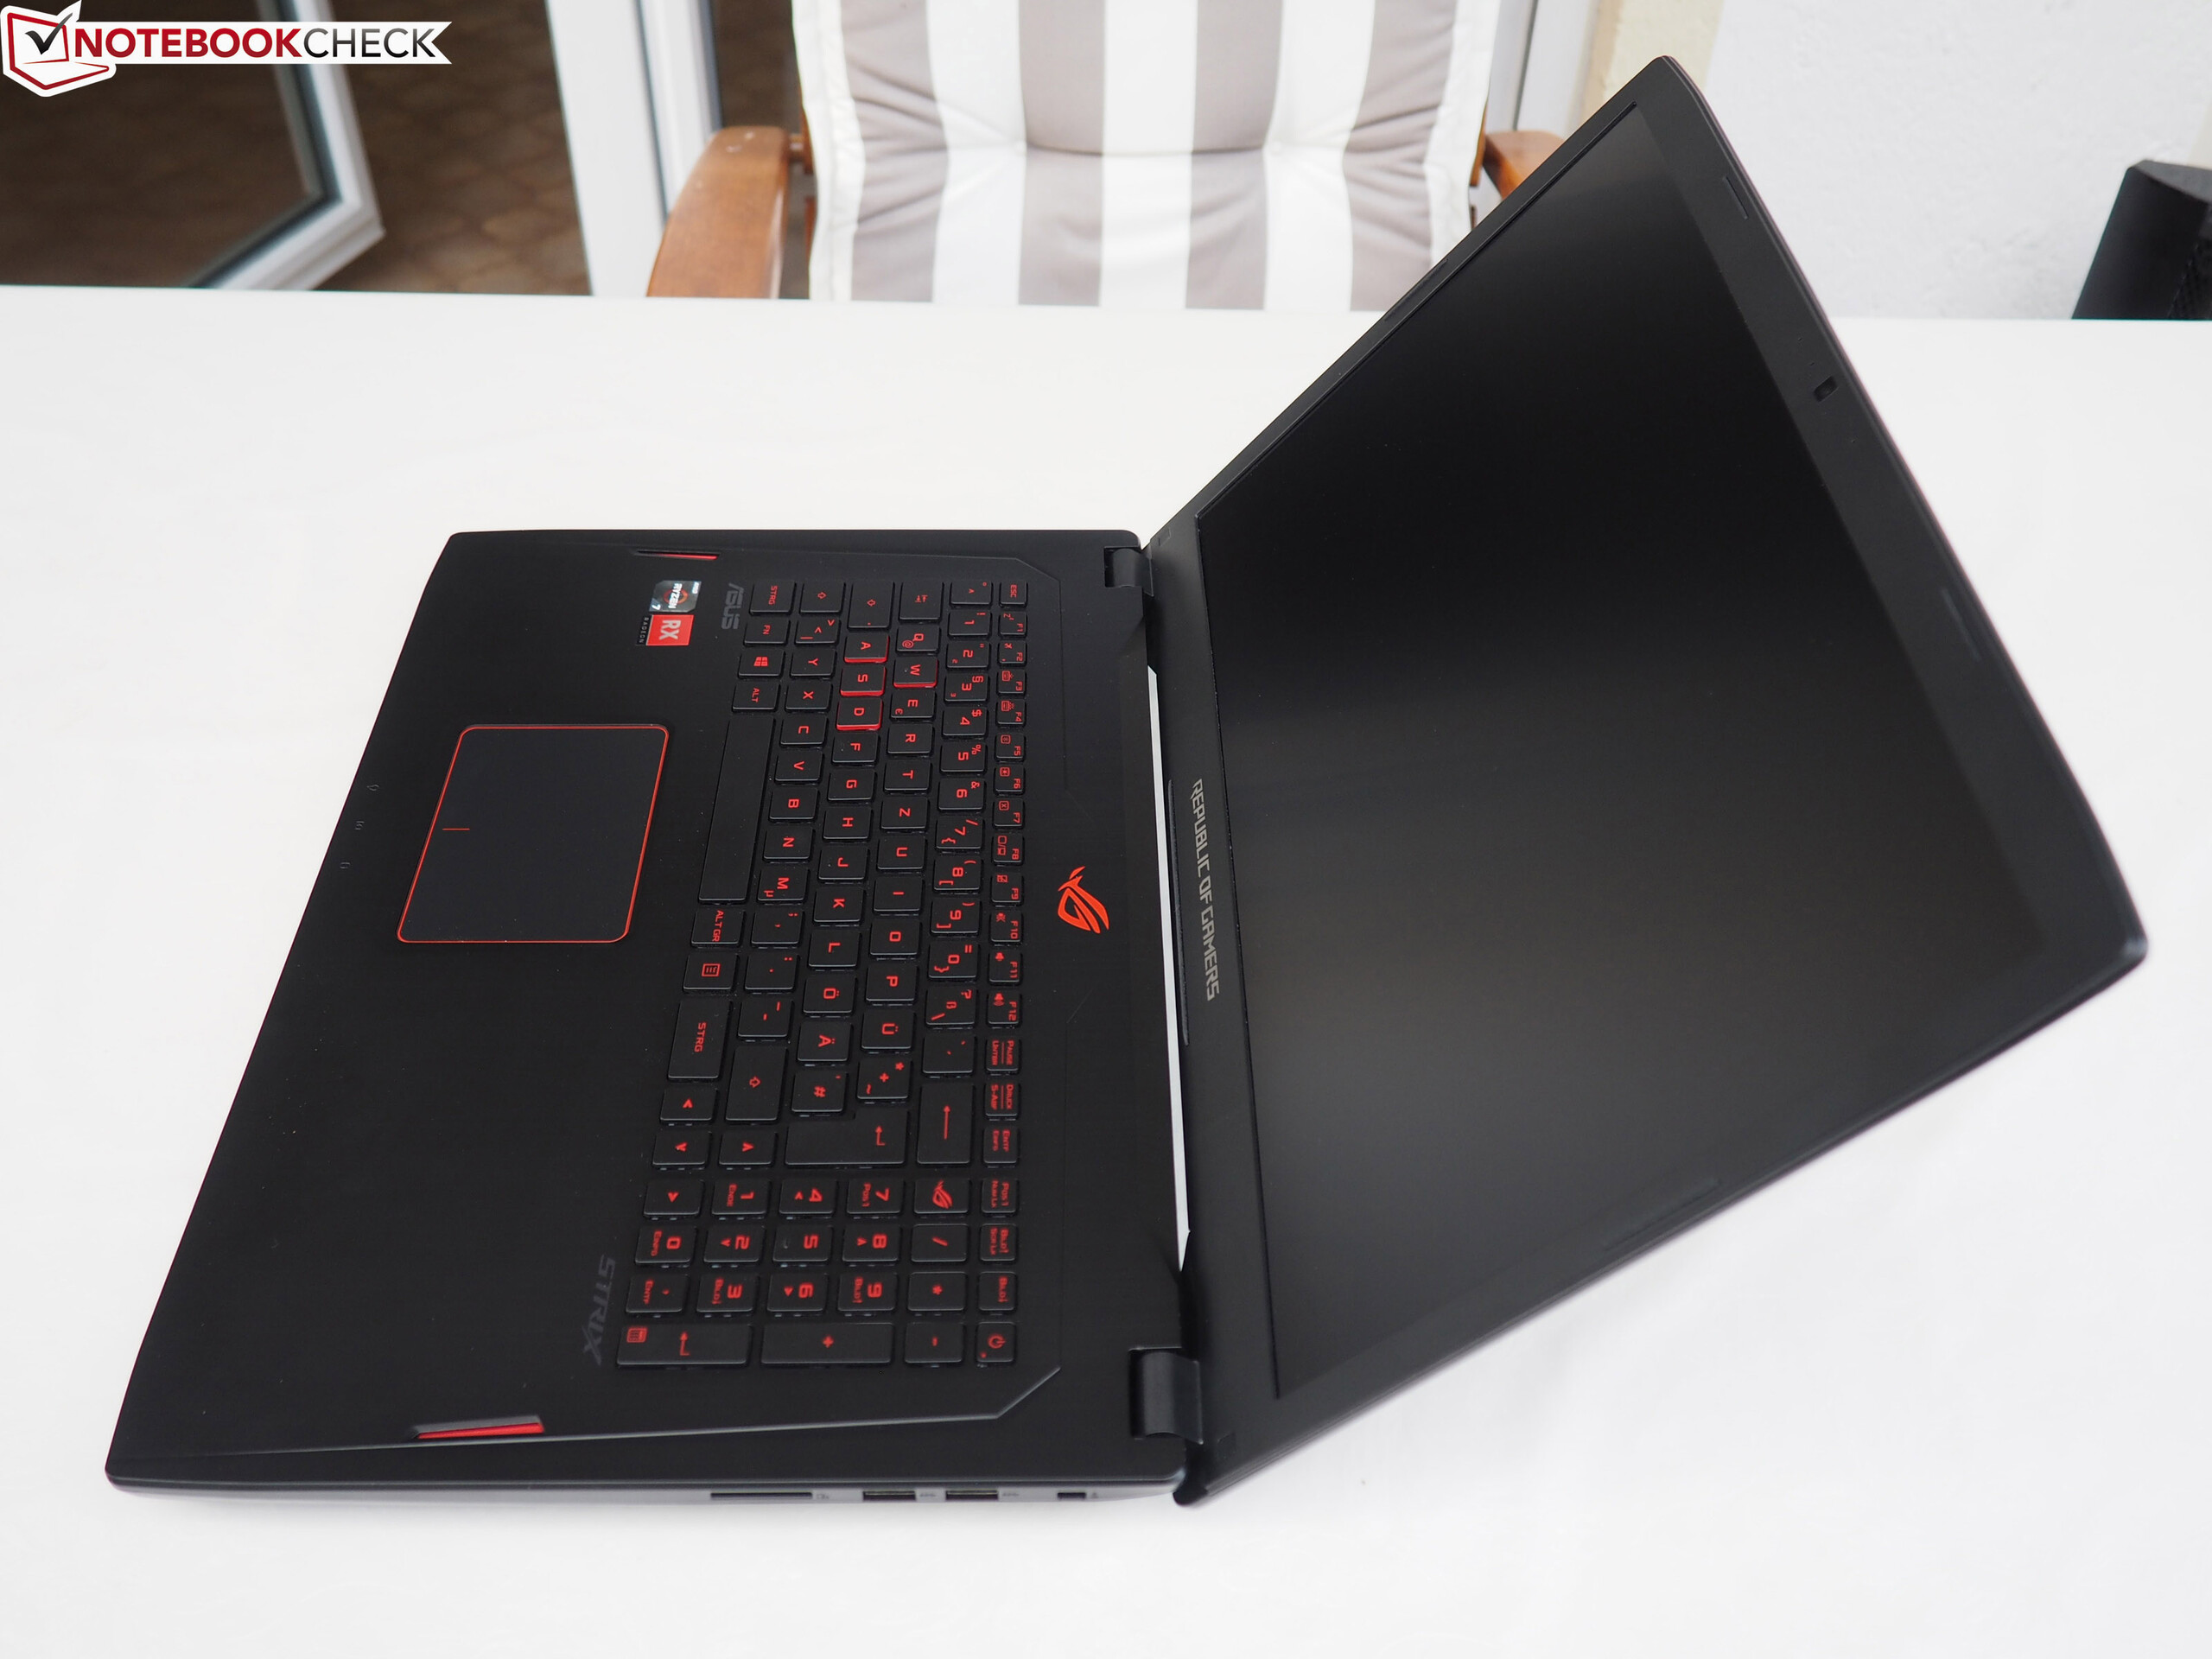
Asus does not risk much in terms of design. Shape and the red accents (touchpad bezel, key labels, logo, etc.) are similar to those of other models of the ROG series. Due to the dark color, dust will be visible. Dirt (fingerprints, etc.) primarily collects on the lid. The hinges allow opening with one hand. Nevertheless, the display does not teeter intensively on vibrating surfaces.


Connectivity
Connectivity
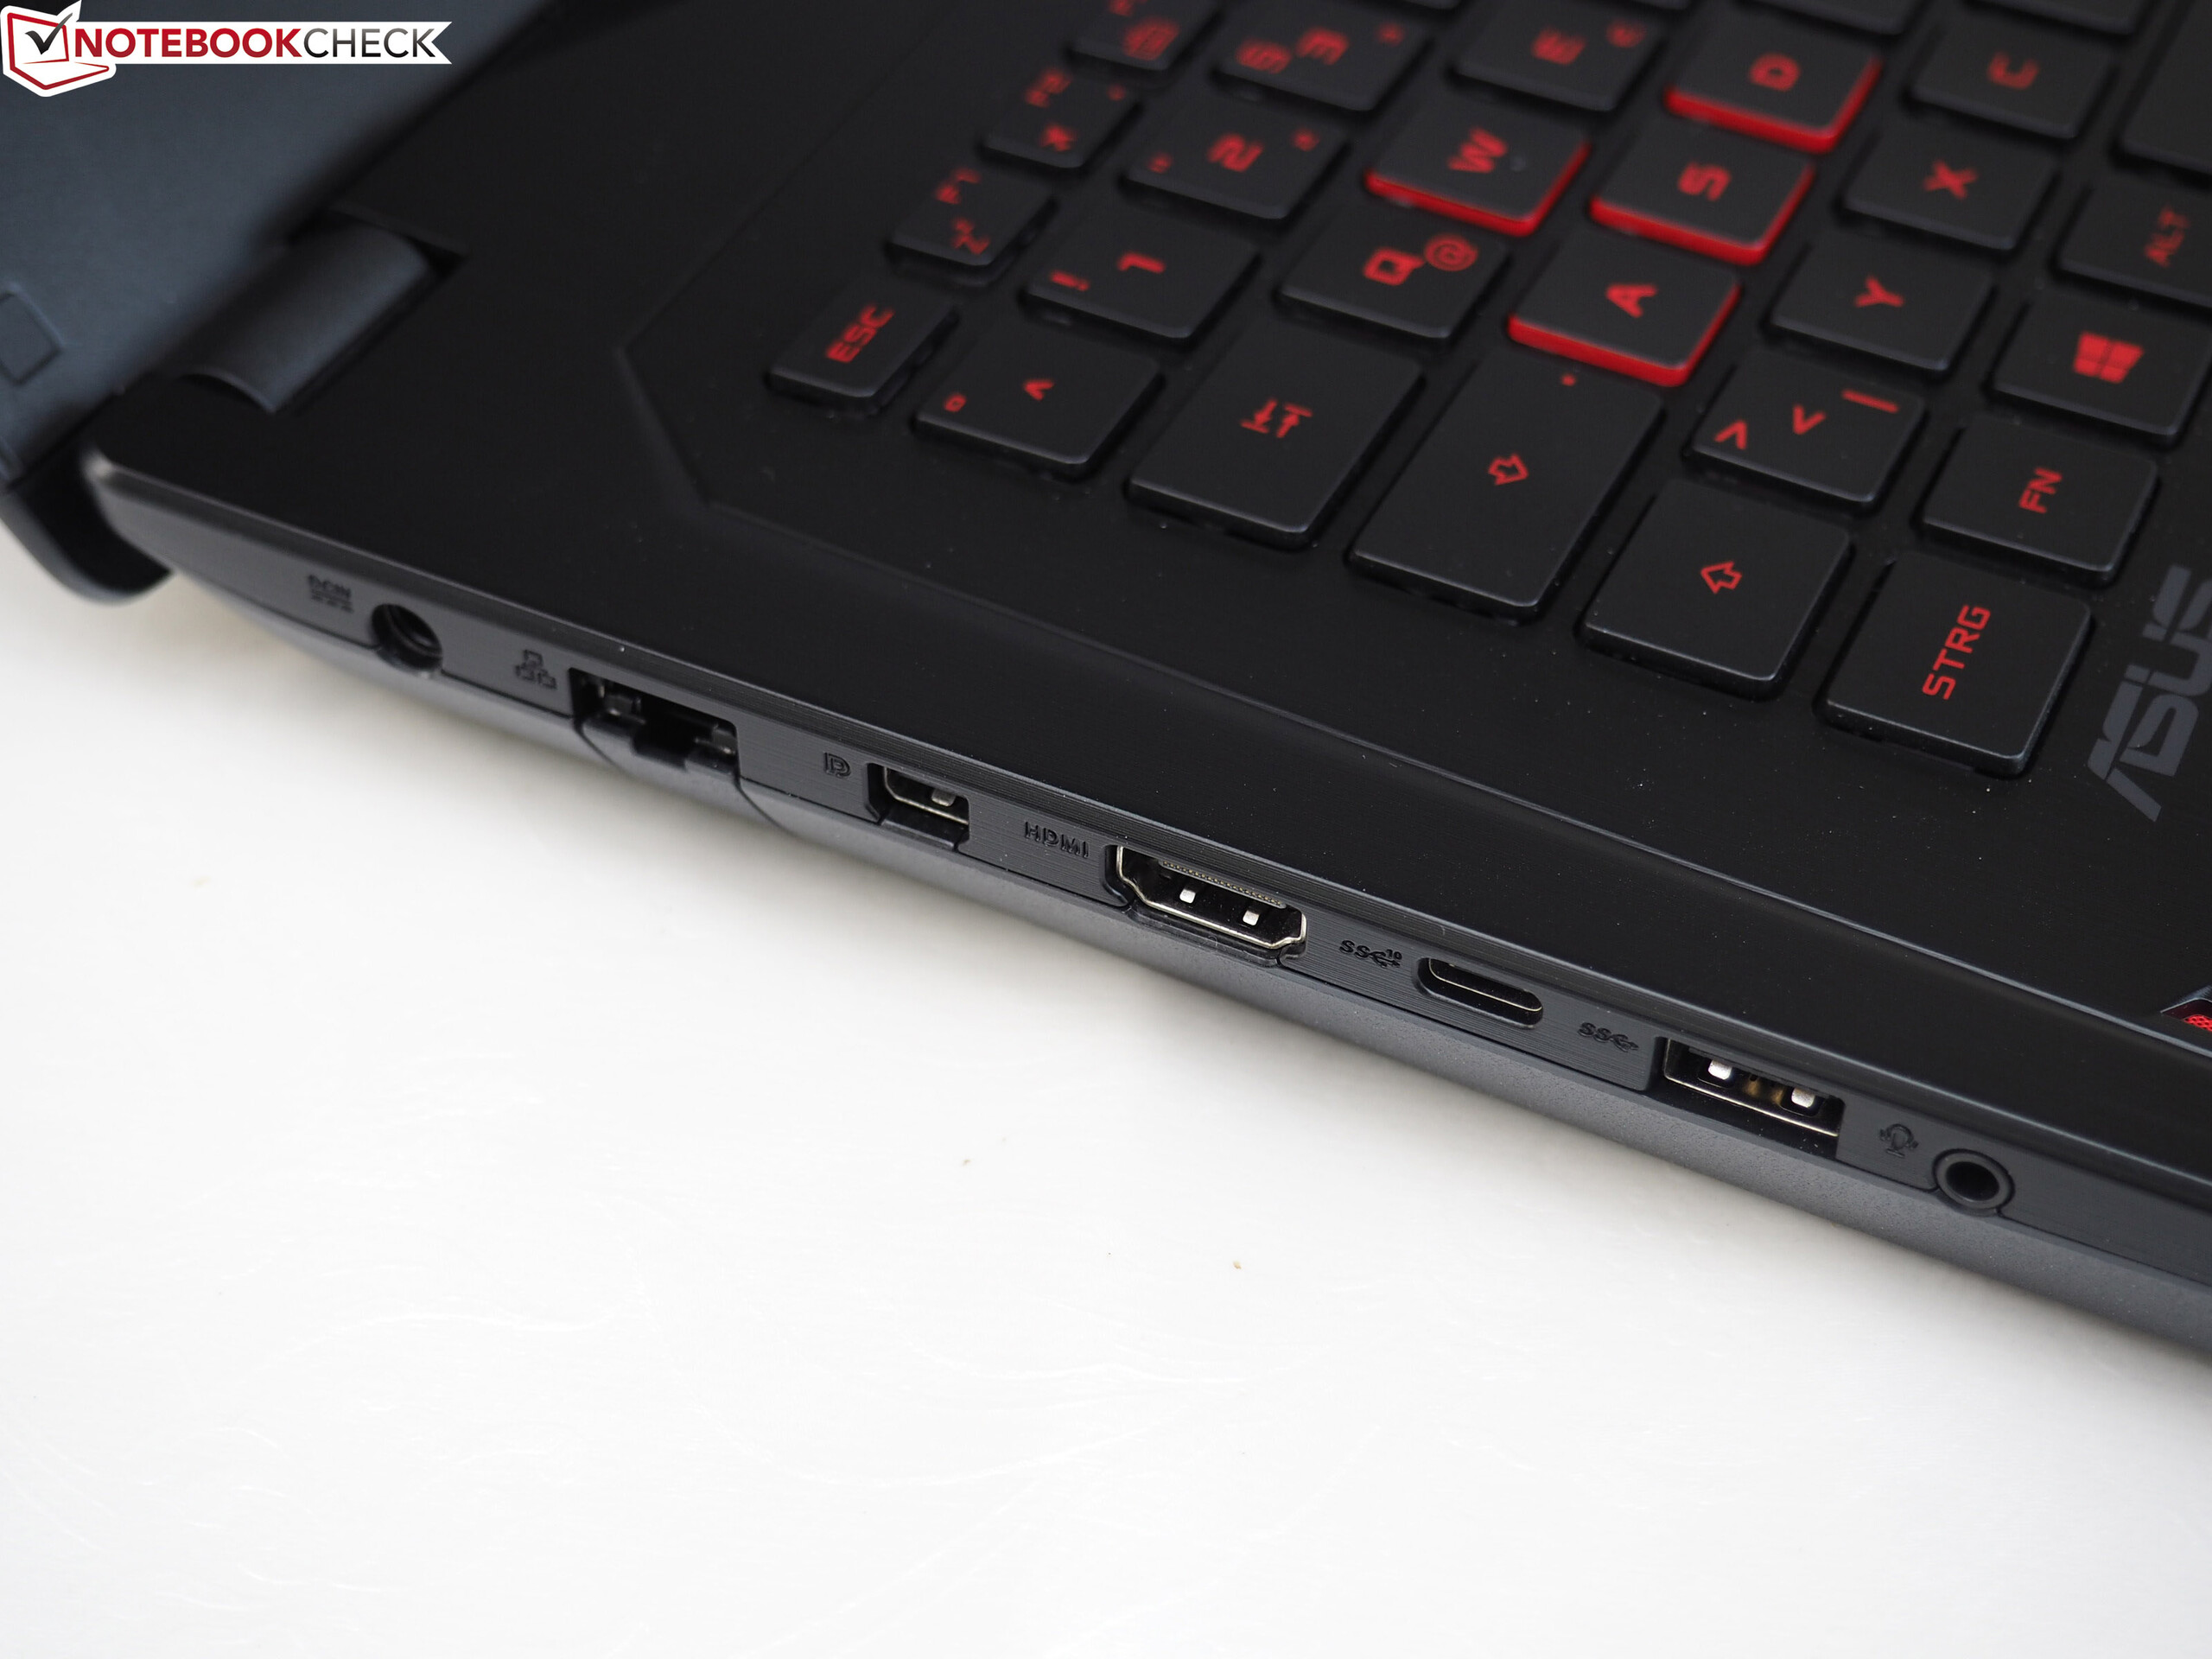
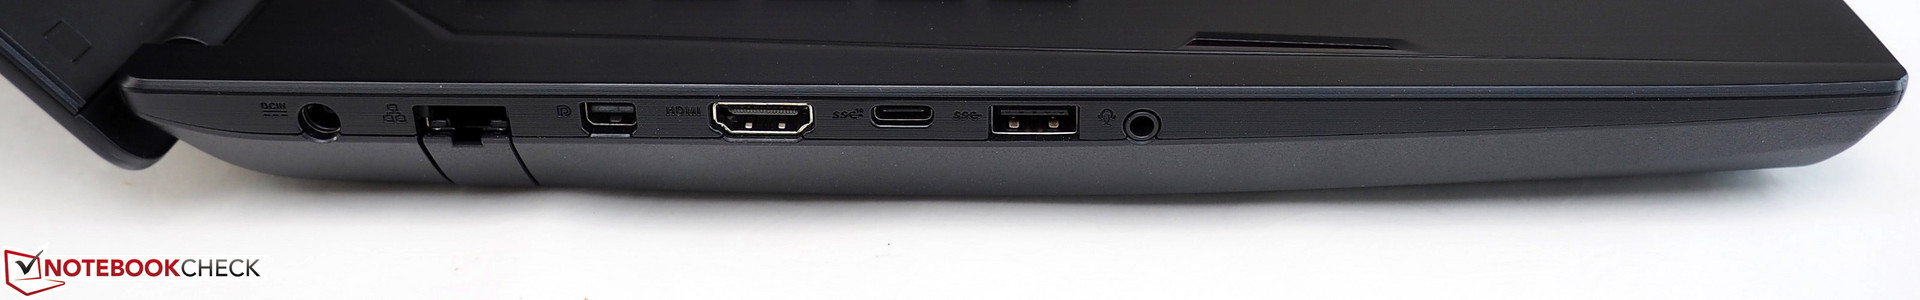
The connectivity leaves room for improvements. Many gamers expect a Thunderbolt-3 port in the price range above 1000 Euros (~$1194), which the GL702ZC unfortunately lacks. The Type-C port on the left side only supports USB 3.1 (at least Gen2 according to Asus).
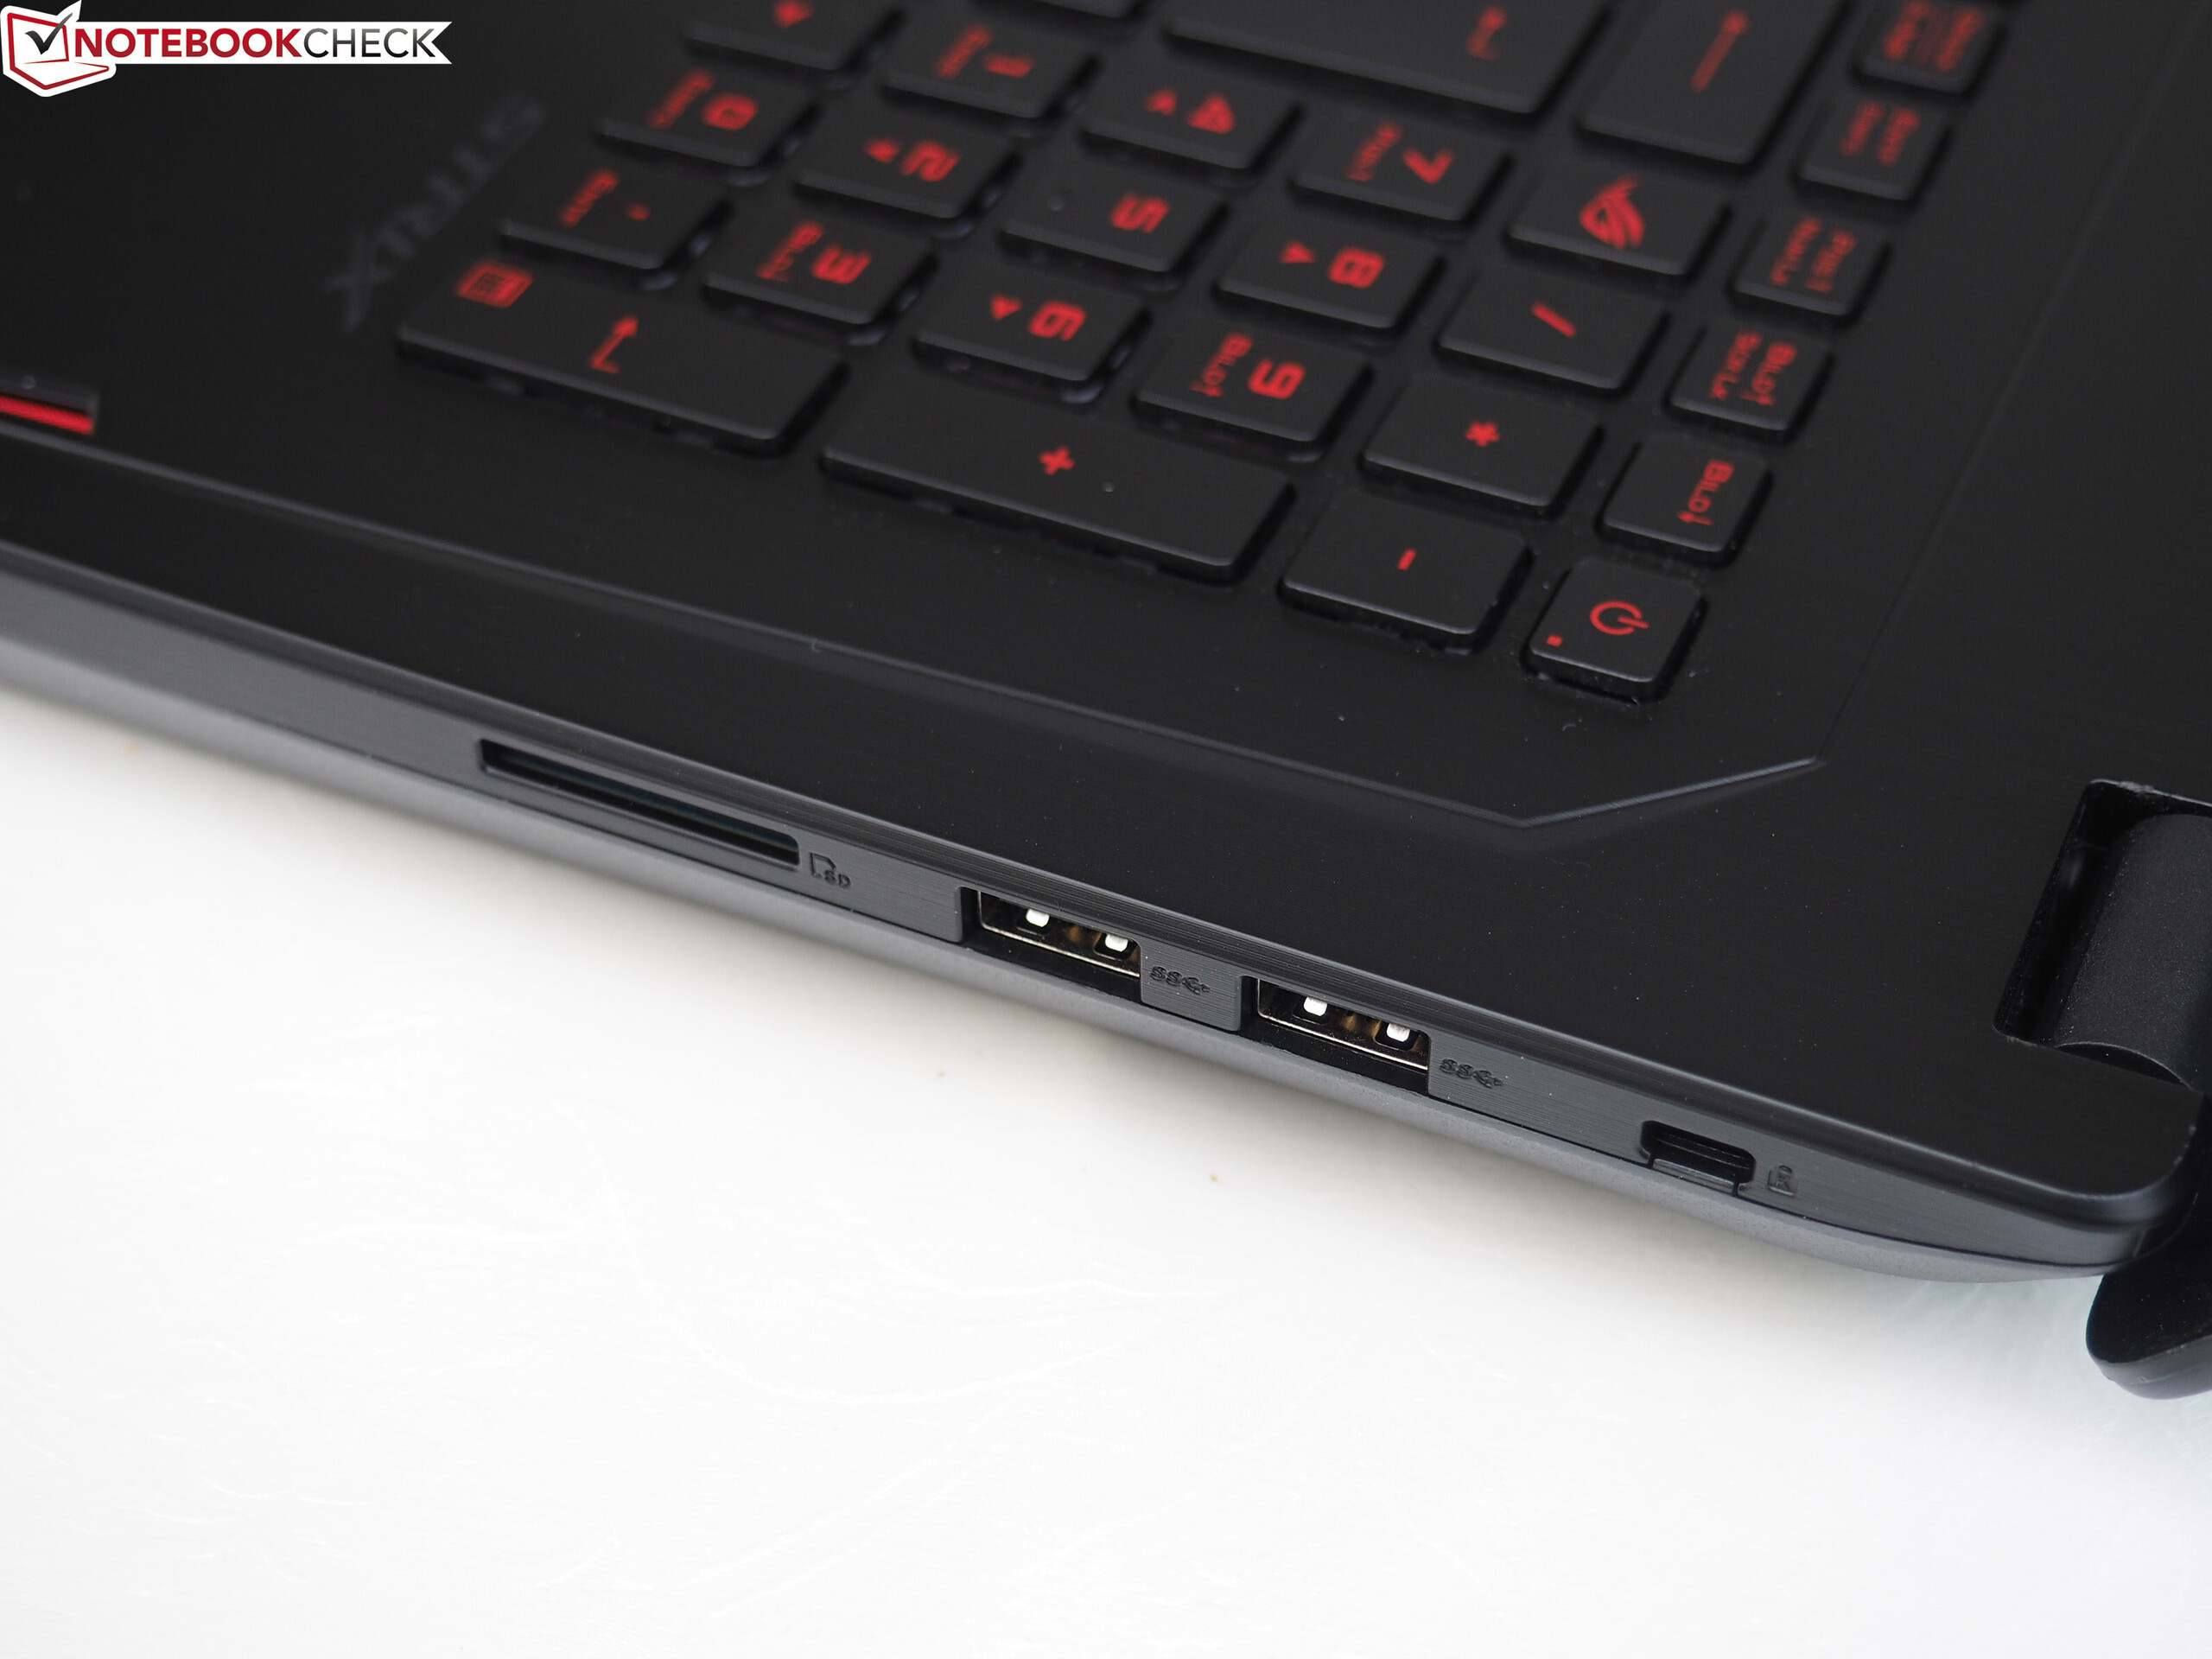
The other interfaces are standard for current notebooks: RJ45, three USB 3.0 Type-A ports, and two digital videos-outs in form of HDMI and mini DisplayPort. The usual card reader and a Kensington lock slot are also available. It is slightly disappointing that Asus uses a combined audio jack for headphones and microphone. Two separate ports might be more convenient for most users and should be obligatory for 1800 Euros (~$2150).
We liked the interface layout. Due to the rear-heavy arrangement, cables will barely or not at all interfere with a mouse.
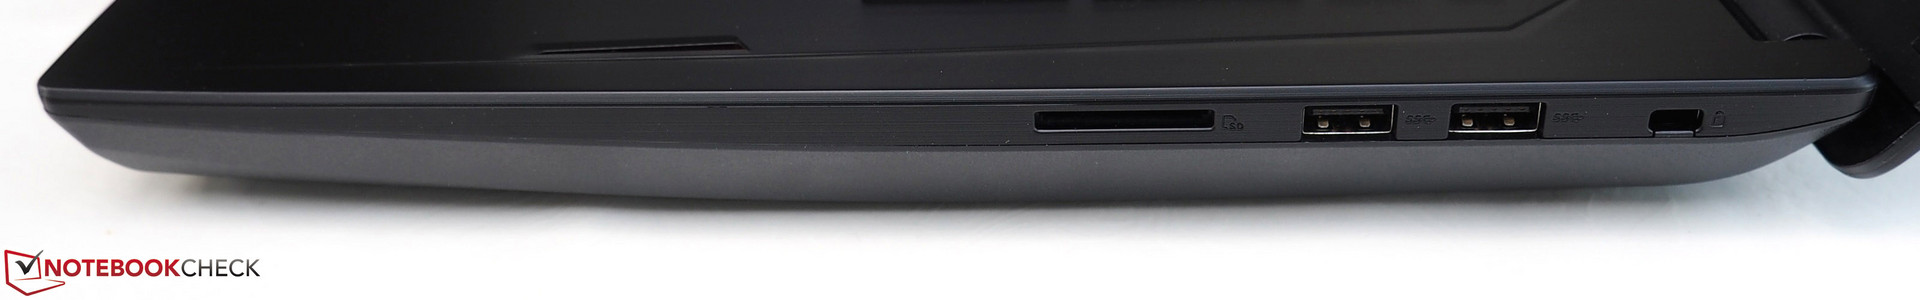
SD-Card Reader
The performance of the SD-card reader is quite unspectacular. The 17-inch laptop ranks mid-range at 90 MB/s (sequential reading) and 76 MB/s (transfer of images). While the Acer V17 Nitro and the MSI GE72 7RE only achieve USB 2.0 speed, the Schenker XMG U727 and the Aorus X7 v7 almost use the full potential of our reference card. It is annoying that inserted SD cards stick out of the slot so much that accidents are likely.
| SD Card Reader | |
| average JPG Copy Test (av. of 3 runs) | |
| Aorus X7 v7 (Toshiba Exceria Pro SDXC 64 GB UHS-II) | |
| Schenker XMG U727 2017 (Toshiba Exceria Pro SDXC 64 GB UHS-II) | |
| Asus GL702ZC-GC104T (Toshiba Exceria Pro SDXC 64 GB UHS-II) | |
| MSI GE72 7RE-046 (Toshiba Exceria Pro SDXC 64 GB UHS-II) | |
| Acer Aspire V17 Nitro BE VN7-793-738J (Toshiba Exceria Pro SDXC 64 GB UHS-II) | |
| maximum AS SSD Seq Read Test (1GB) | |
| Aorus X7 v7 (Toshiba Exceria Pro SDXC 64 GB UHS-II) | |
| Schenker XMG U727 2017 (Toshiba Exceria Pro SDXC 64 GB UHS-II) | |
| Asus GL702ZC-GC104T (Toshiba Exceria Pro SDXC 64 GB UHS-II) | |
| MSI GE72 7RE-046 (Toshiba Exceria Pro SDXC 64 GB UHS-II) | |
| Acer Aspire V17 Nitro BE VN7-793-738J (Toshiba Exceria Pro SDXC 64 GB UHS-II) | |
Communication
Realtek devices are responsible for communication. Gigabit-LAN makes wired connections to the WWW possible. The wireless chip 8822BE supports WLAN 802.11 a/b/g/n/ac and Bluetooth 4.2 and performs well in our range test (1 m distance to the reference router Linksys EA8500) at a rate above 600 Mbit/s. The results vary quite heavily, however.
Accessories
Our test model did not include any accessories beyond the power adapter. The reviewed GL702ZC is powered by a 330 Watt monster (20 x 10 x 4.5 cm), which is only used by real high-end laptops with GeForce GTX 1080 or SLI systems otherwise.
Maintenance
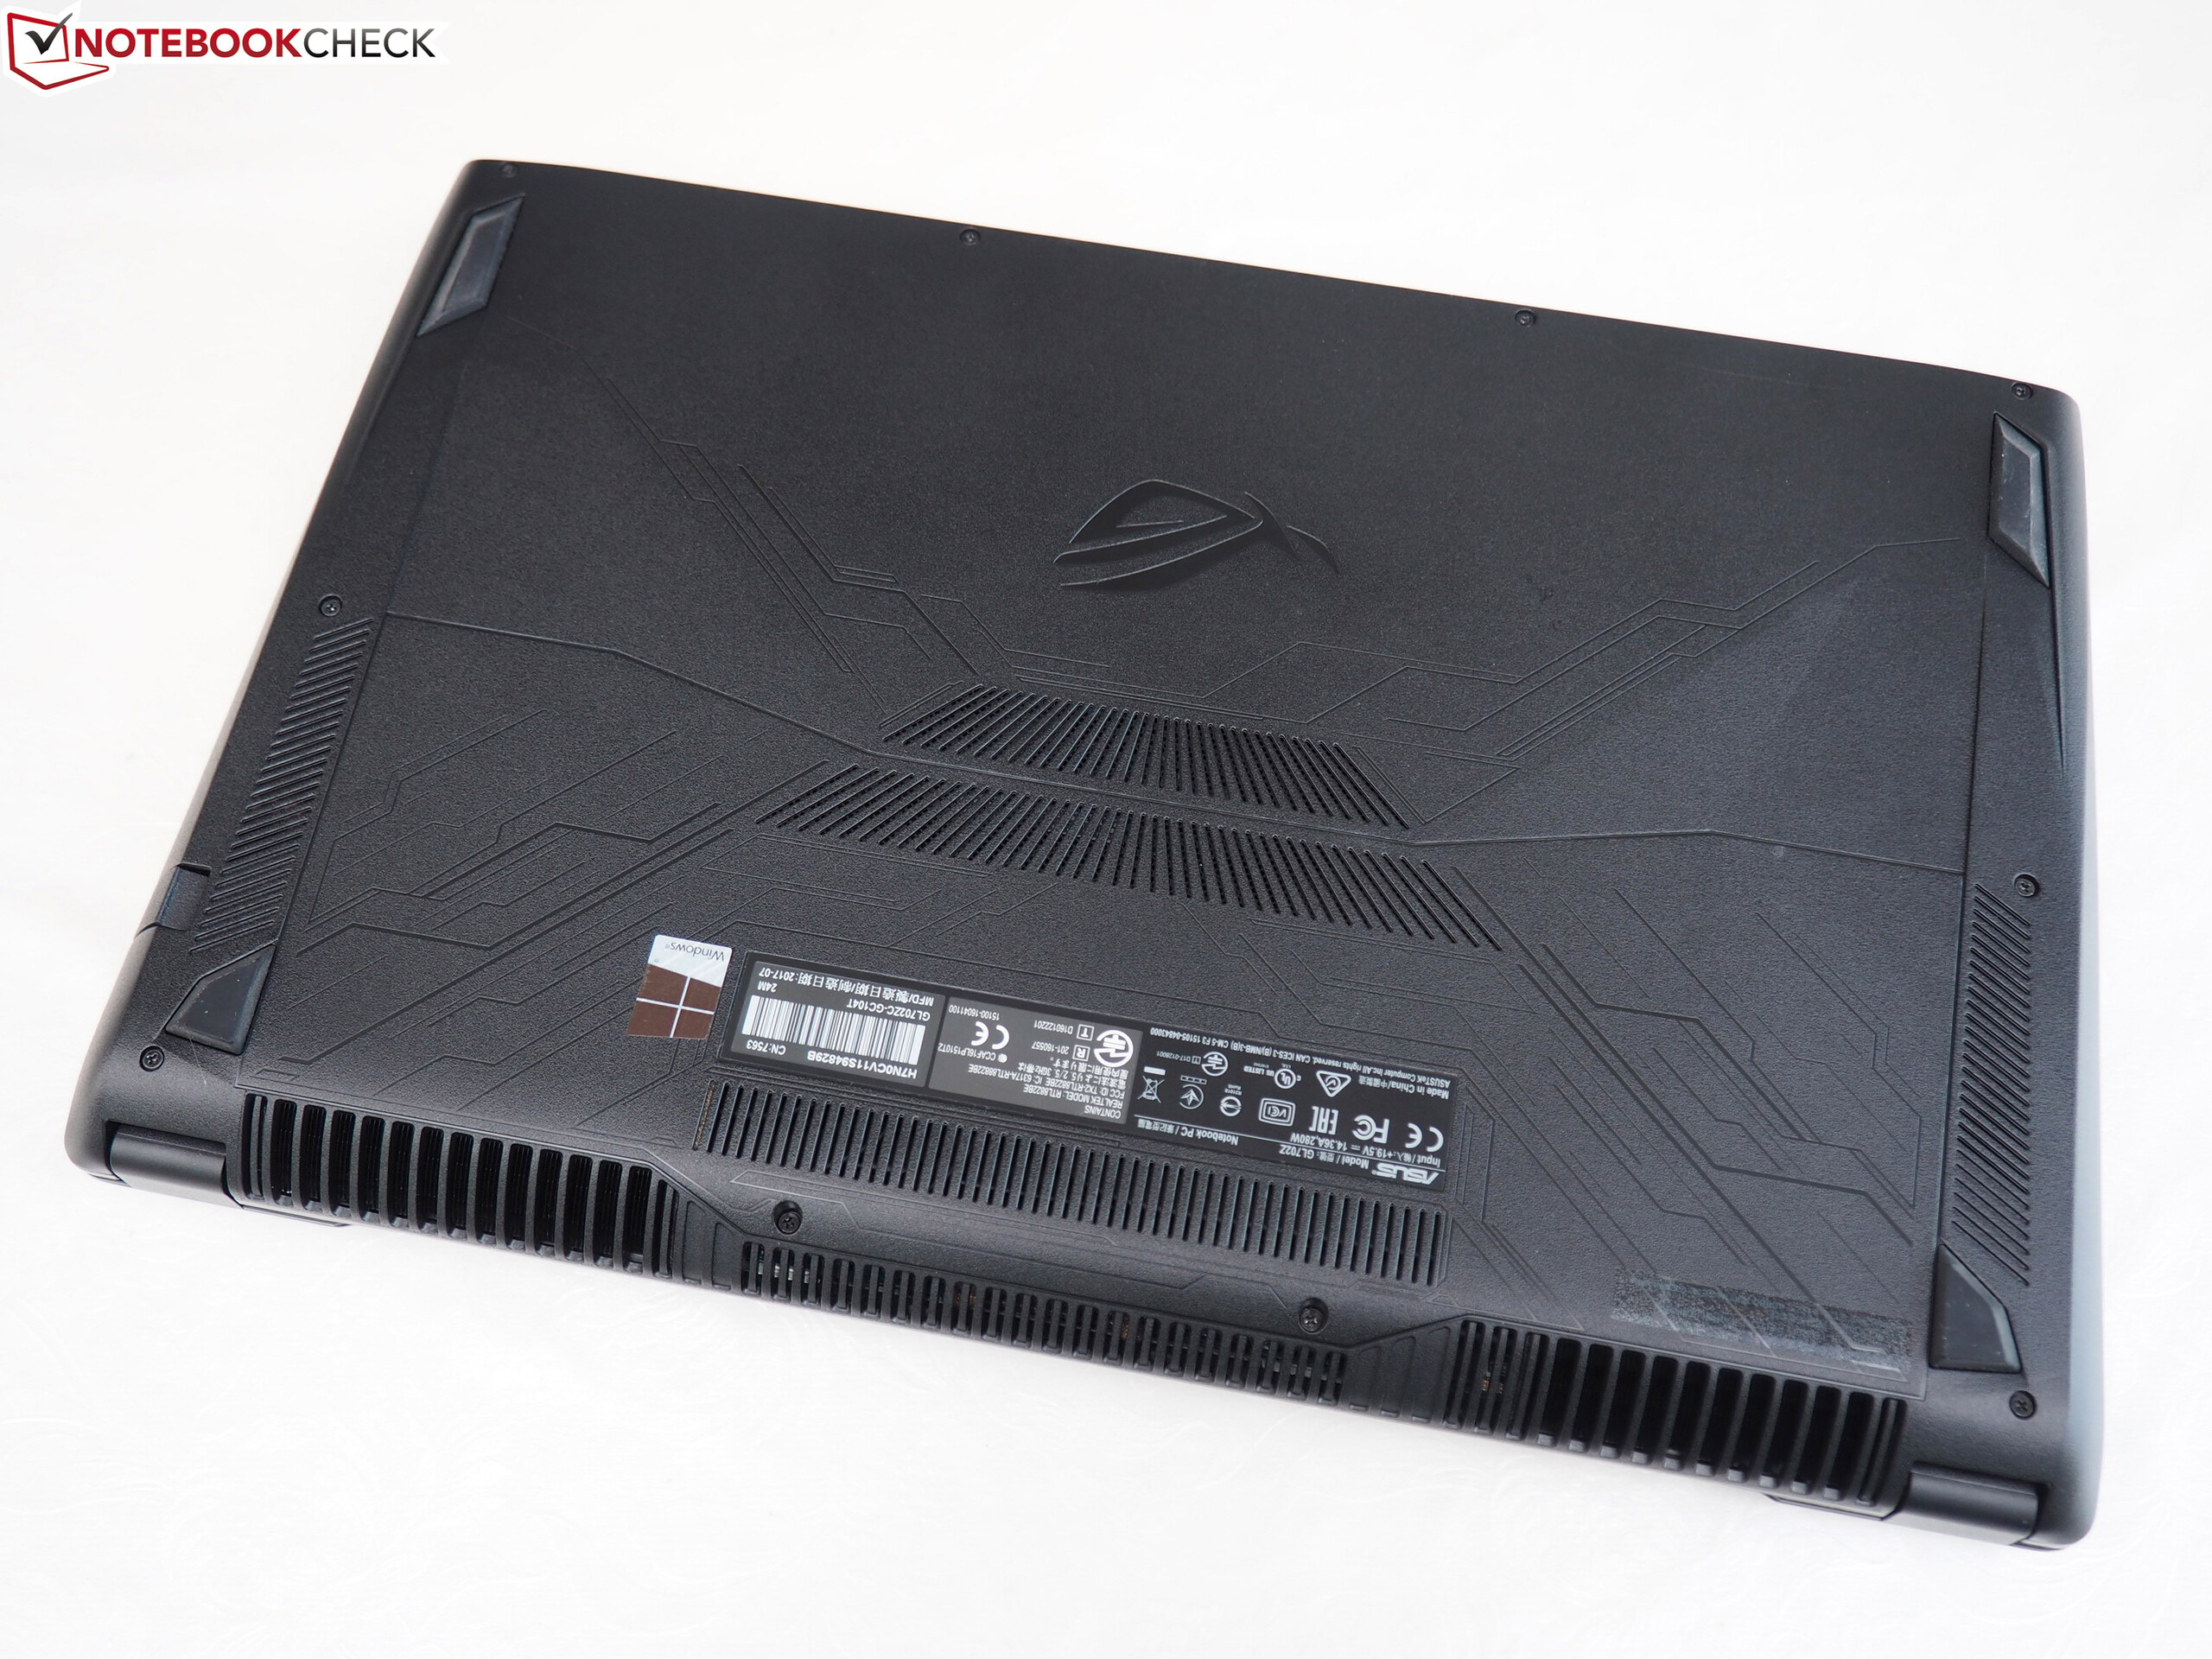
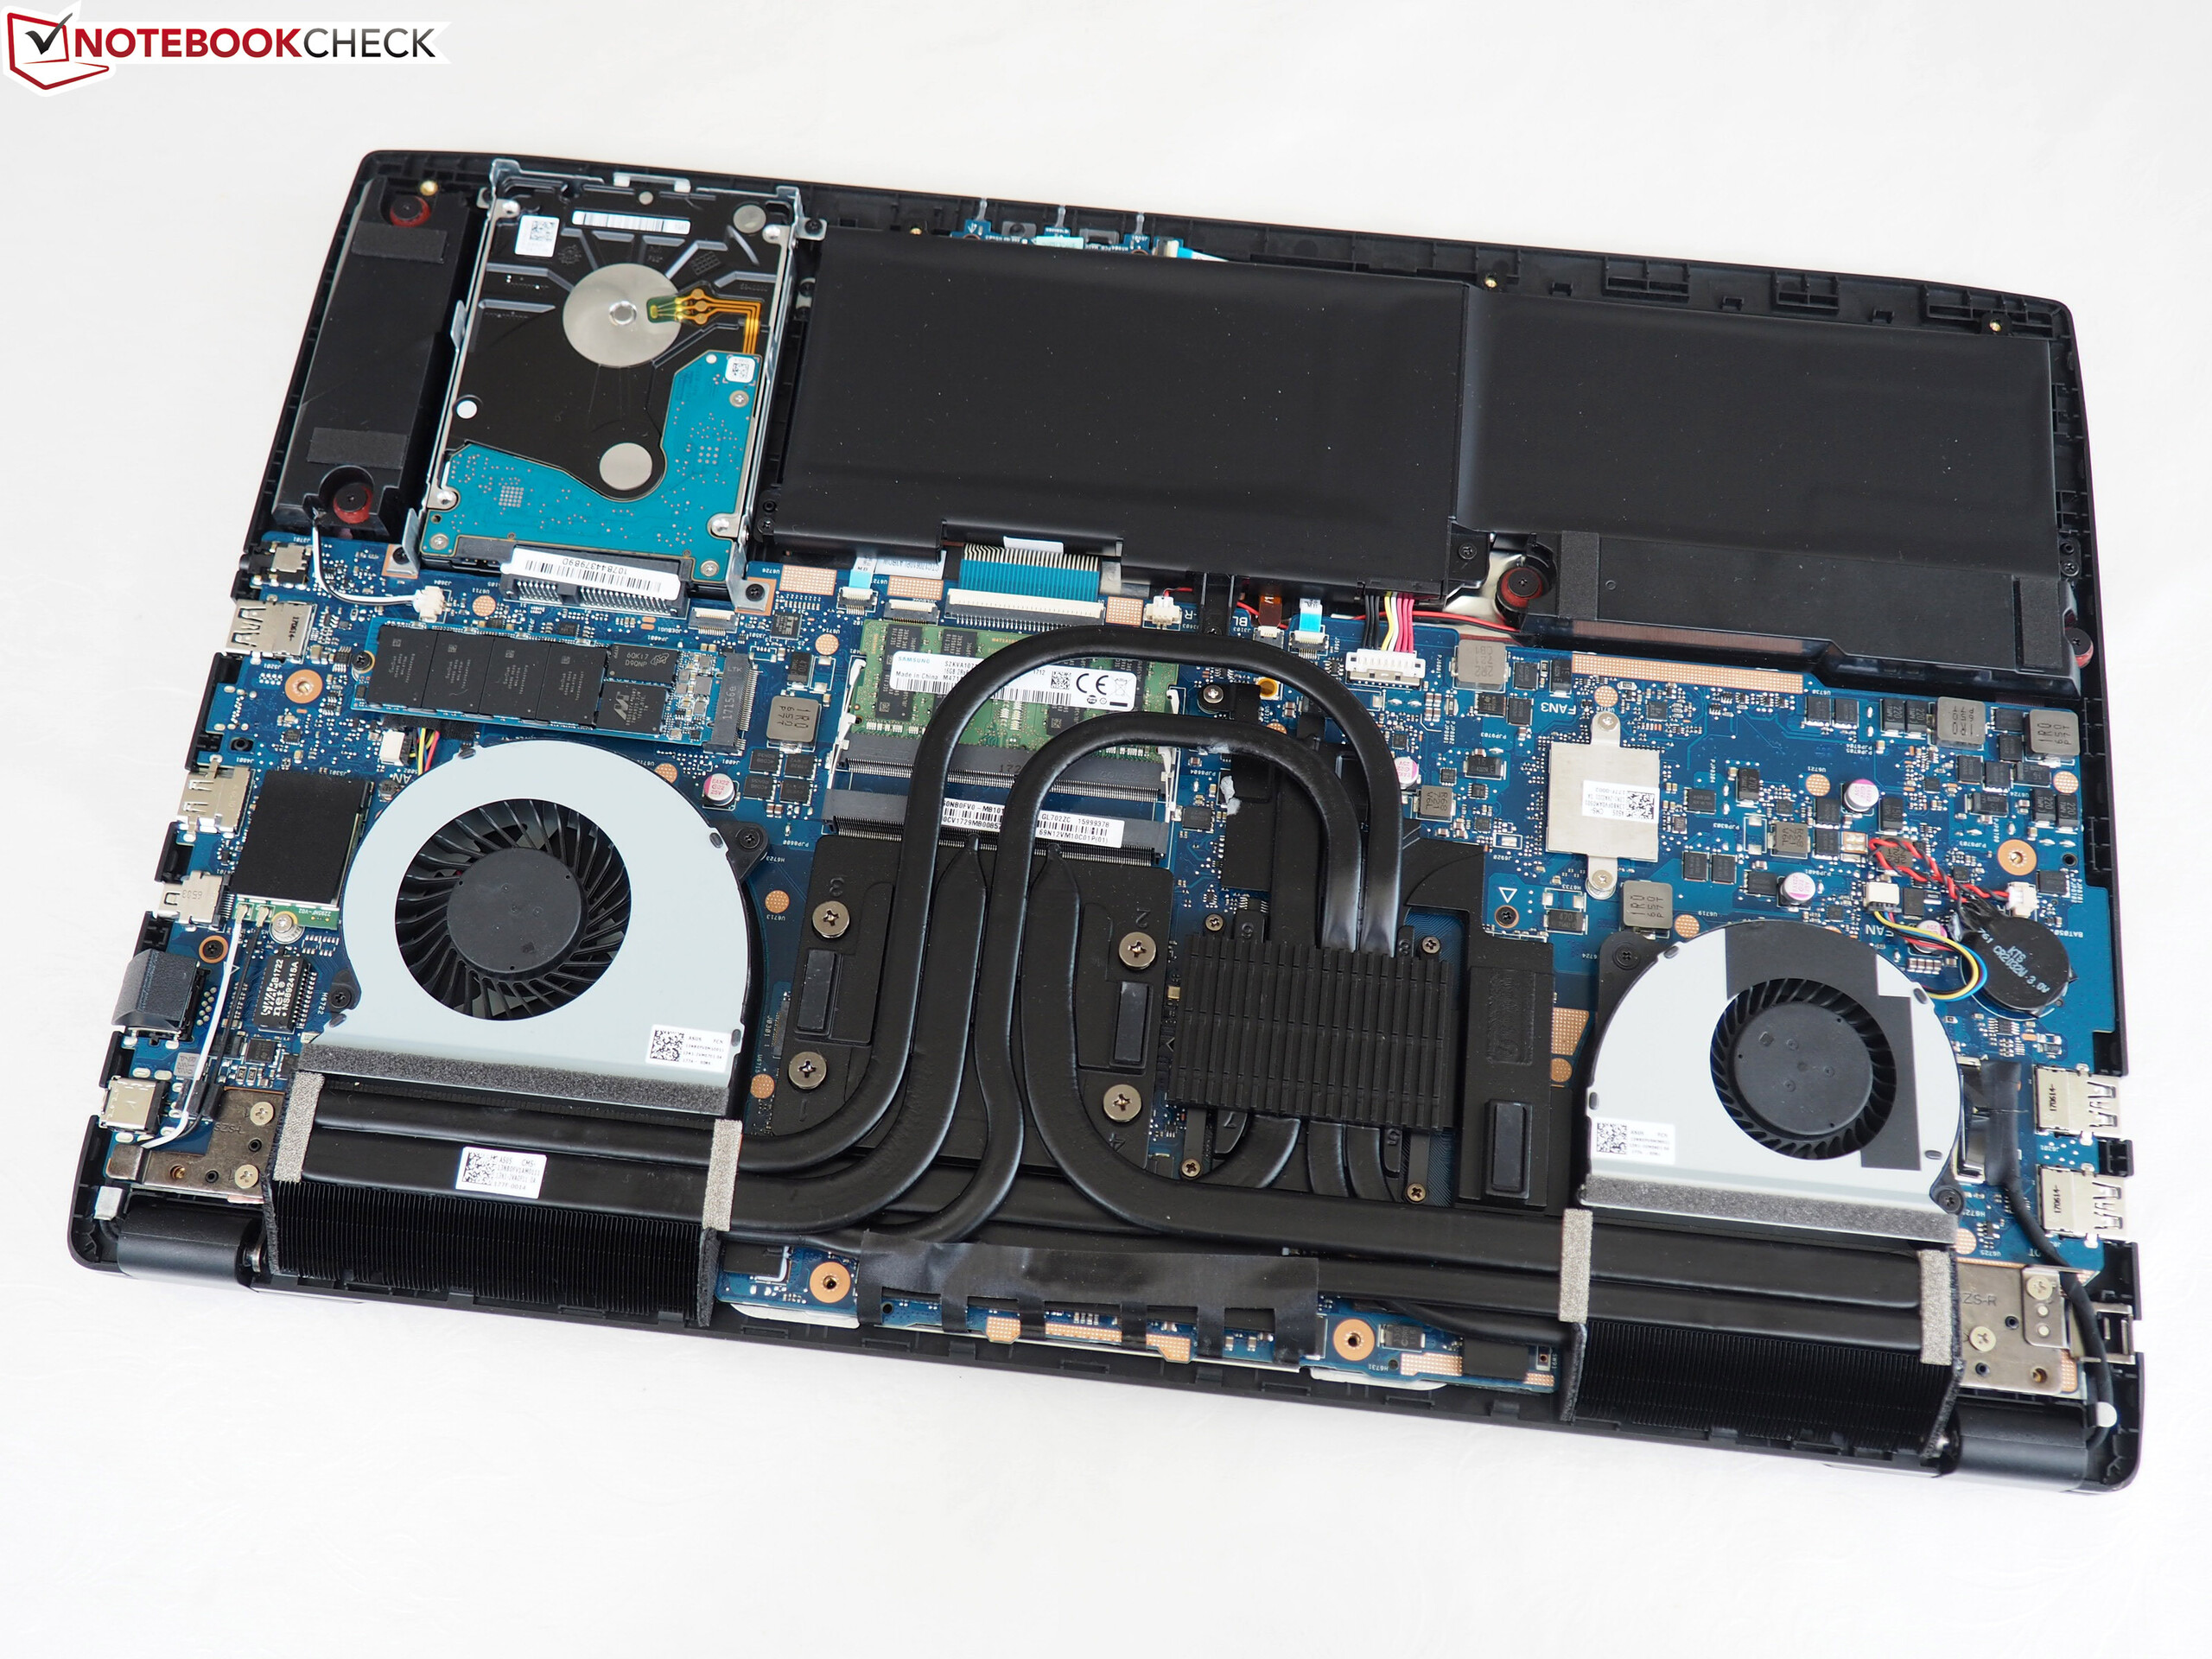
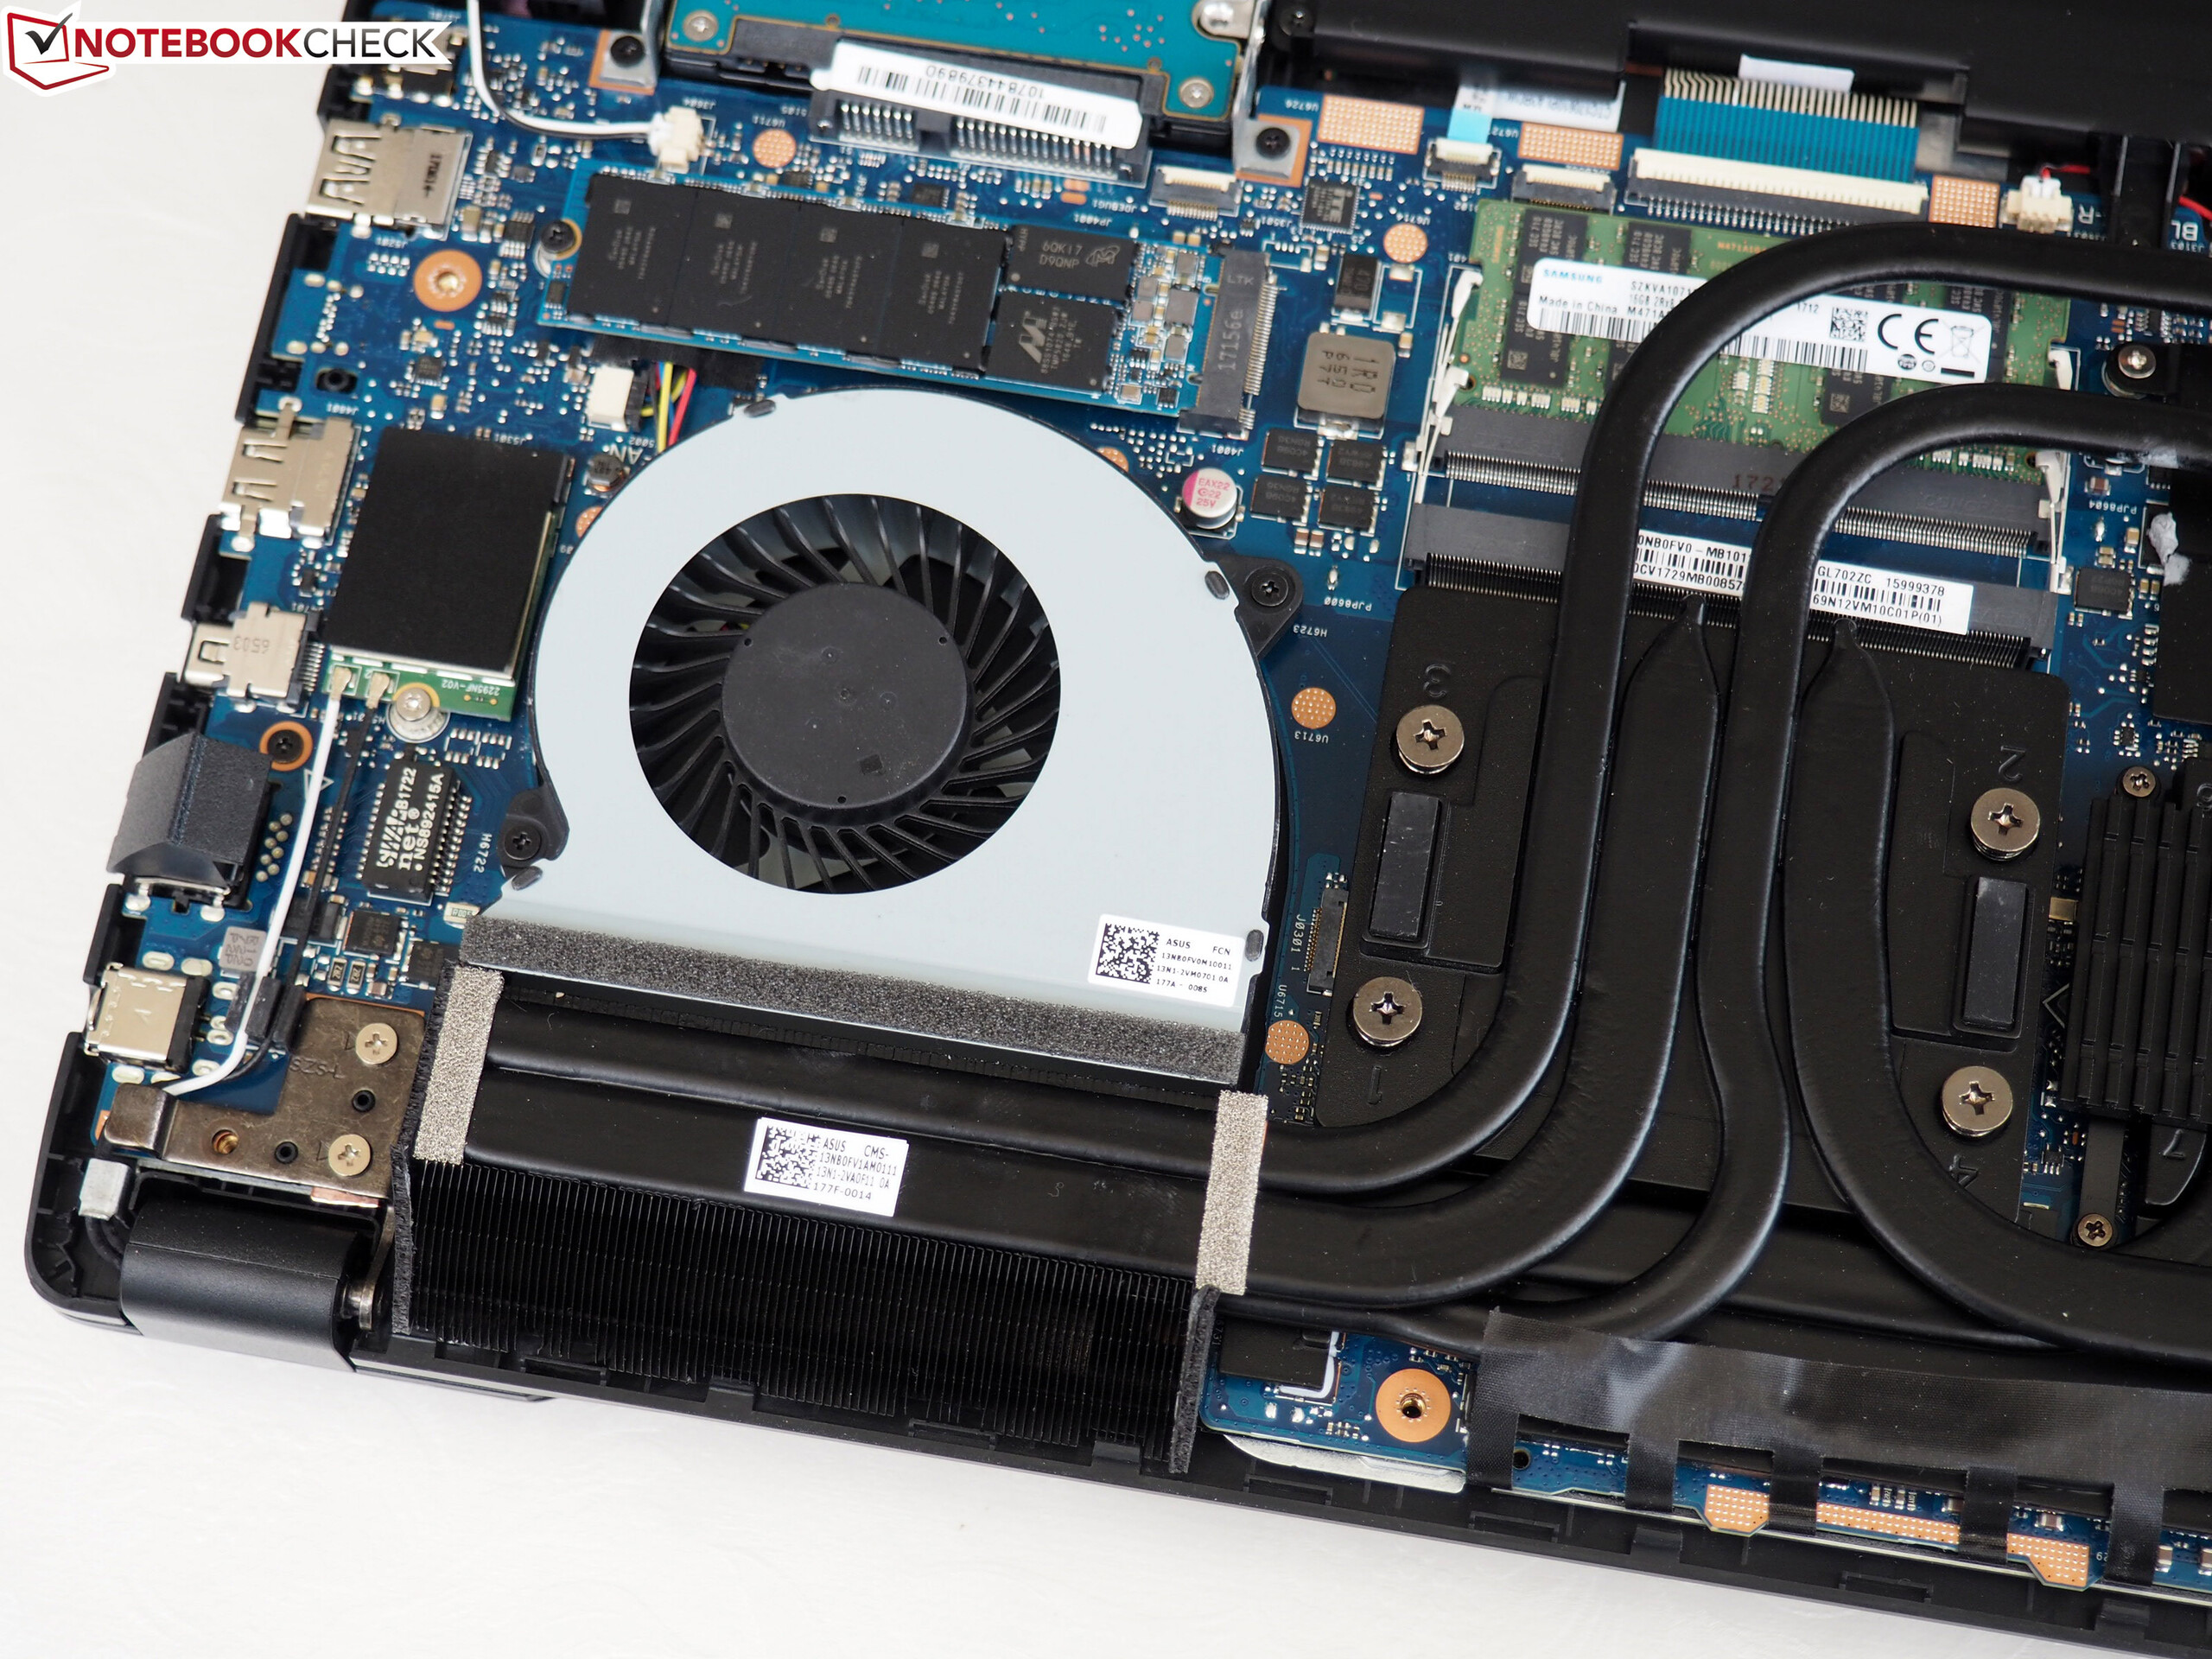
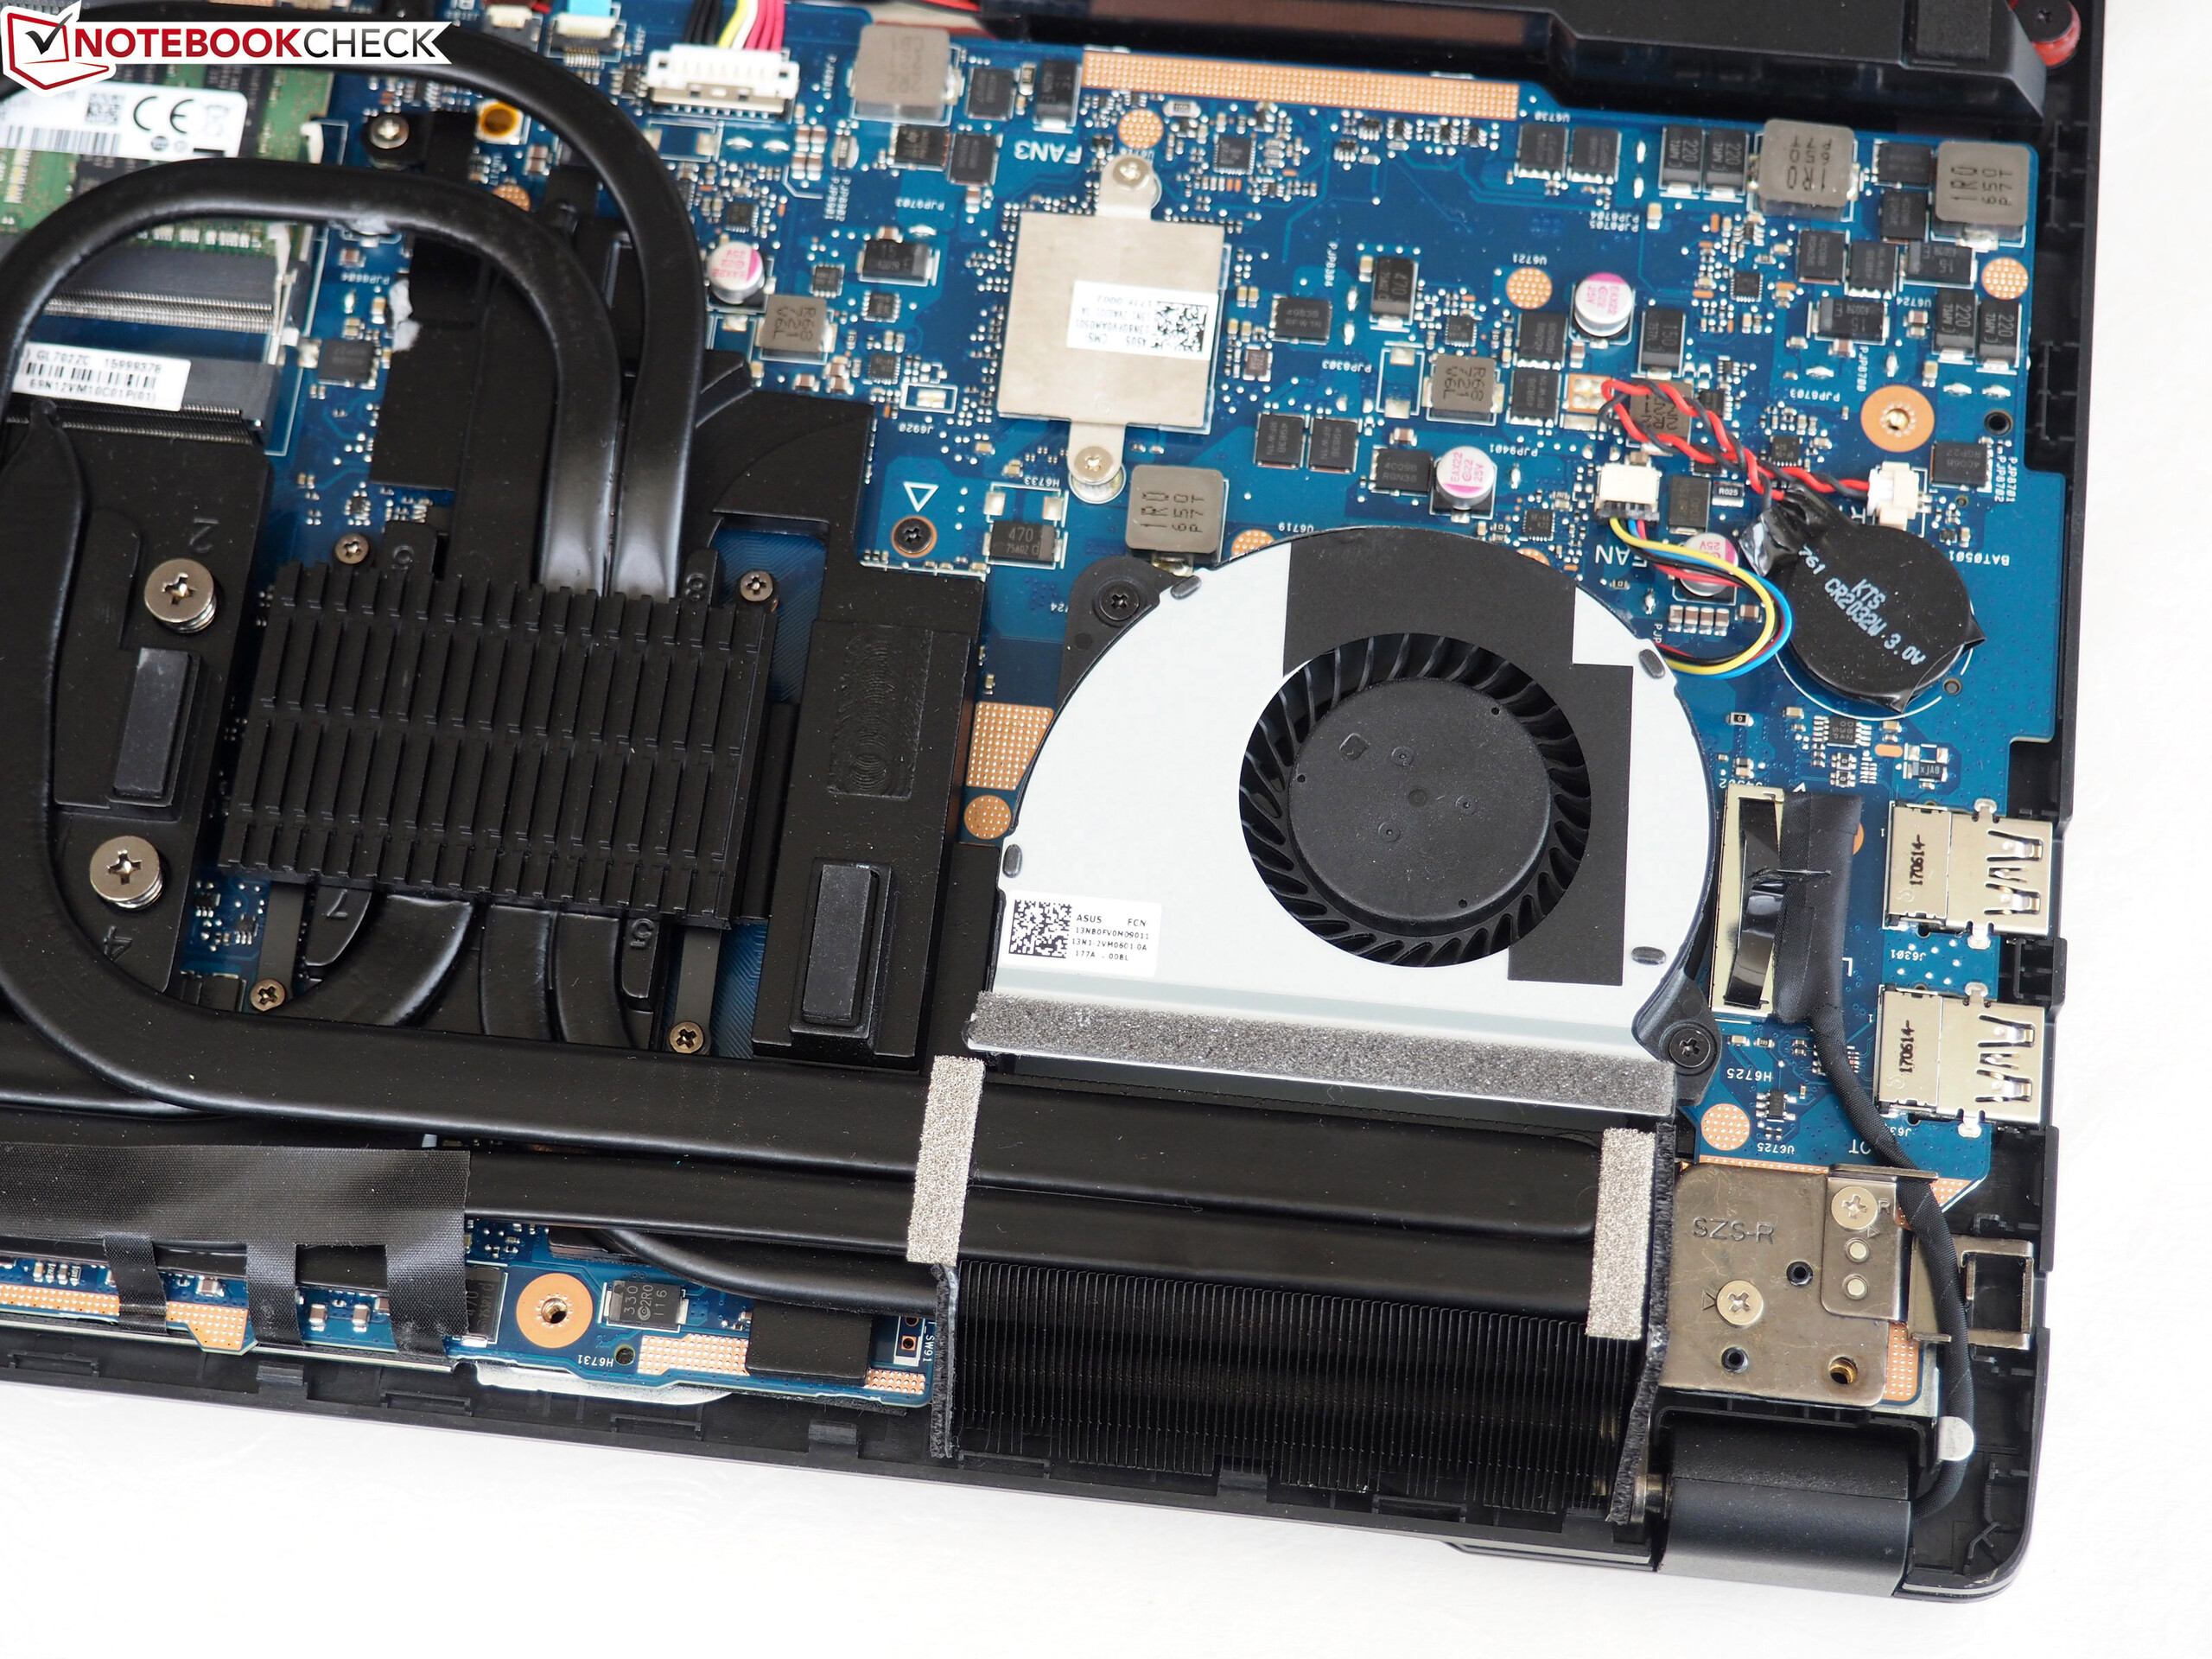
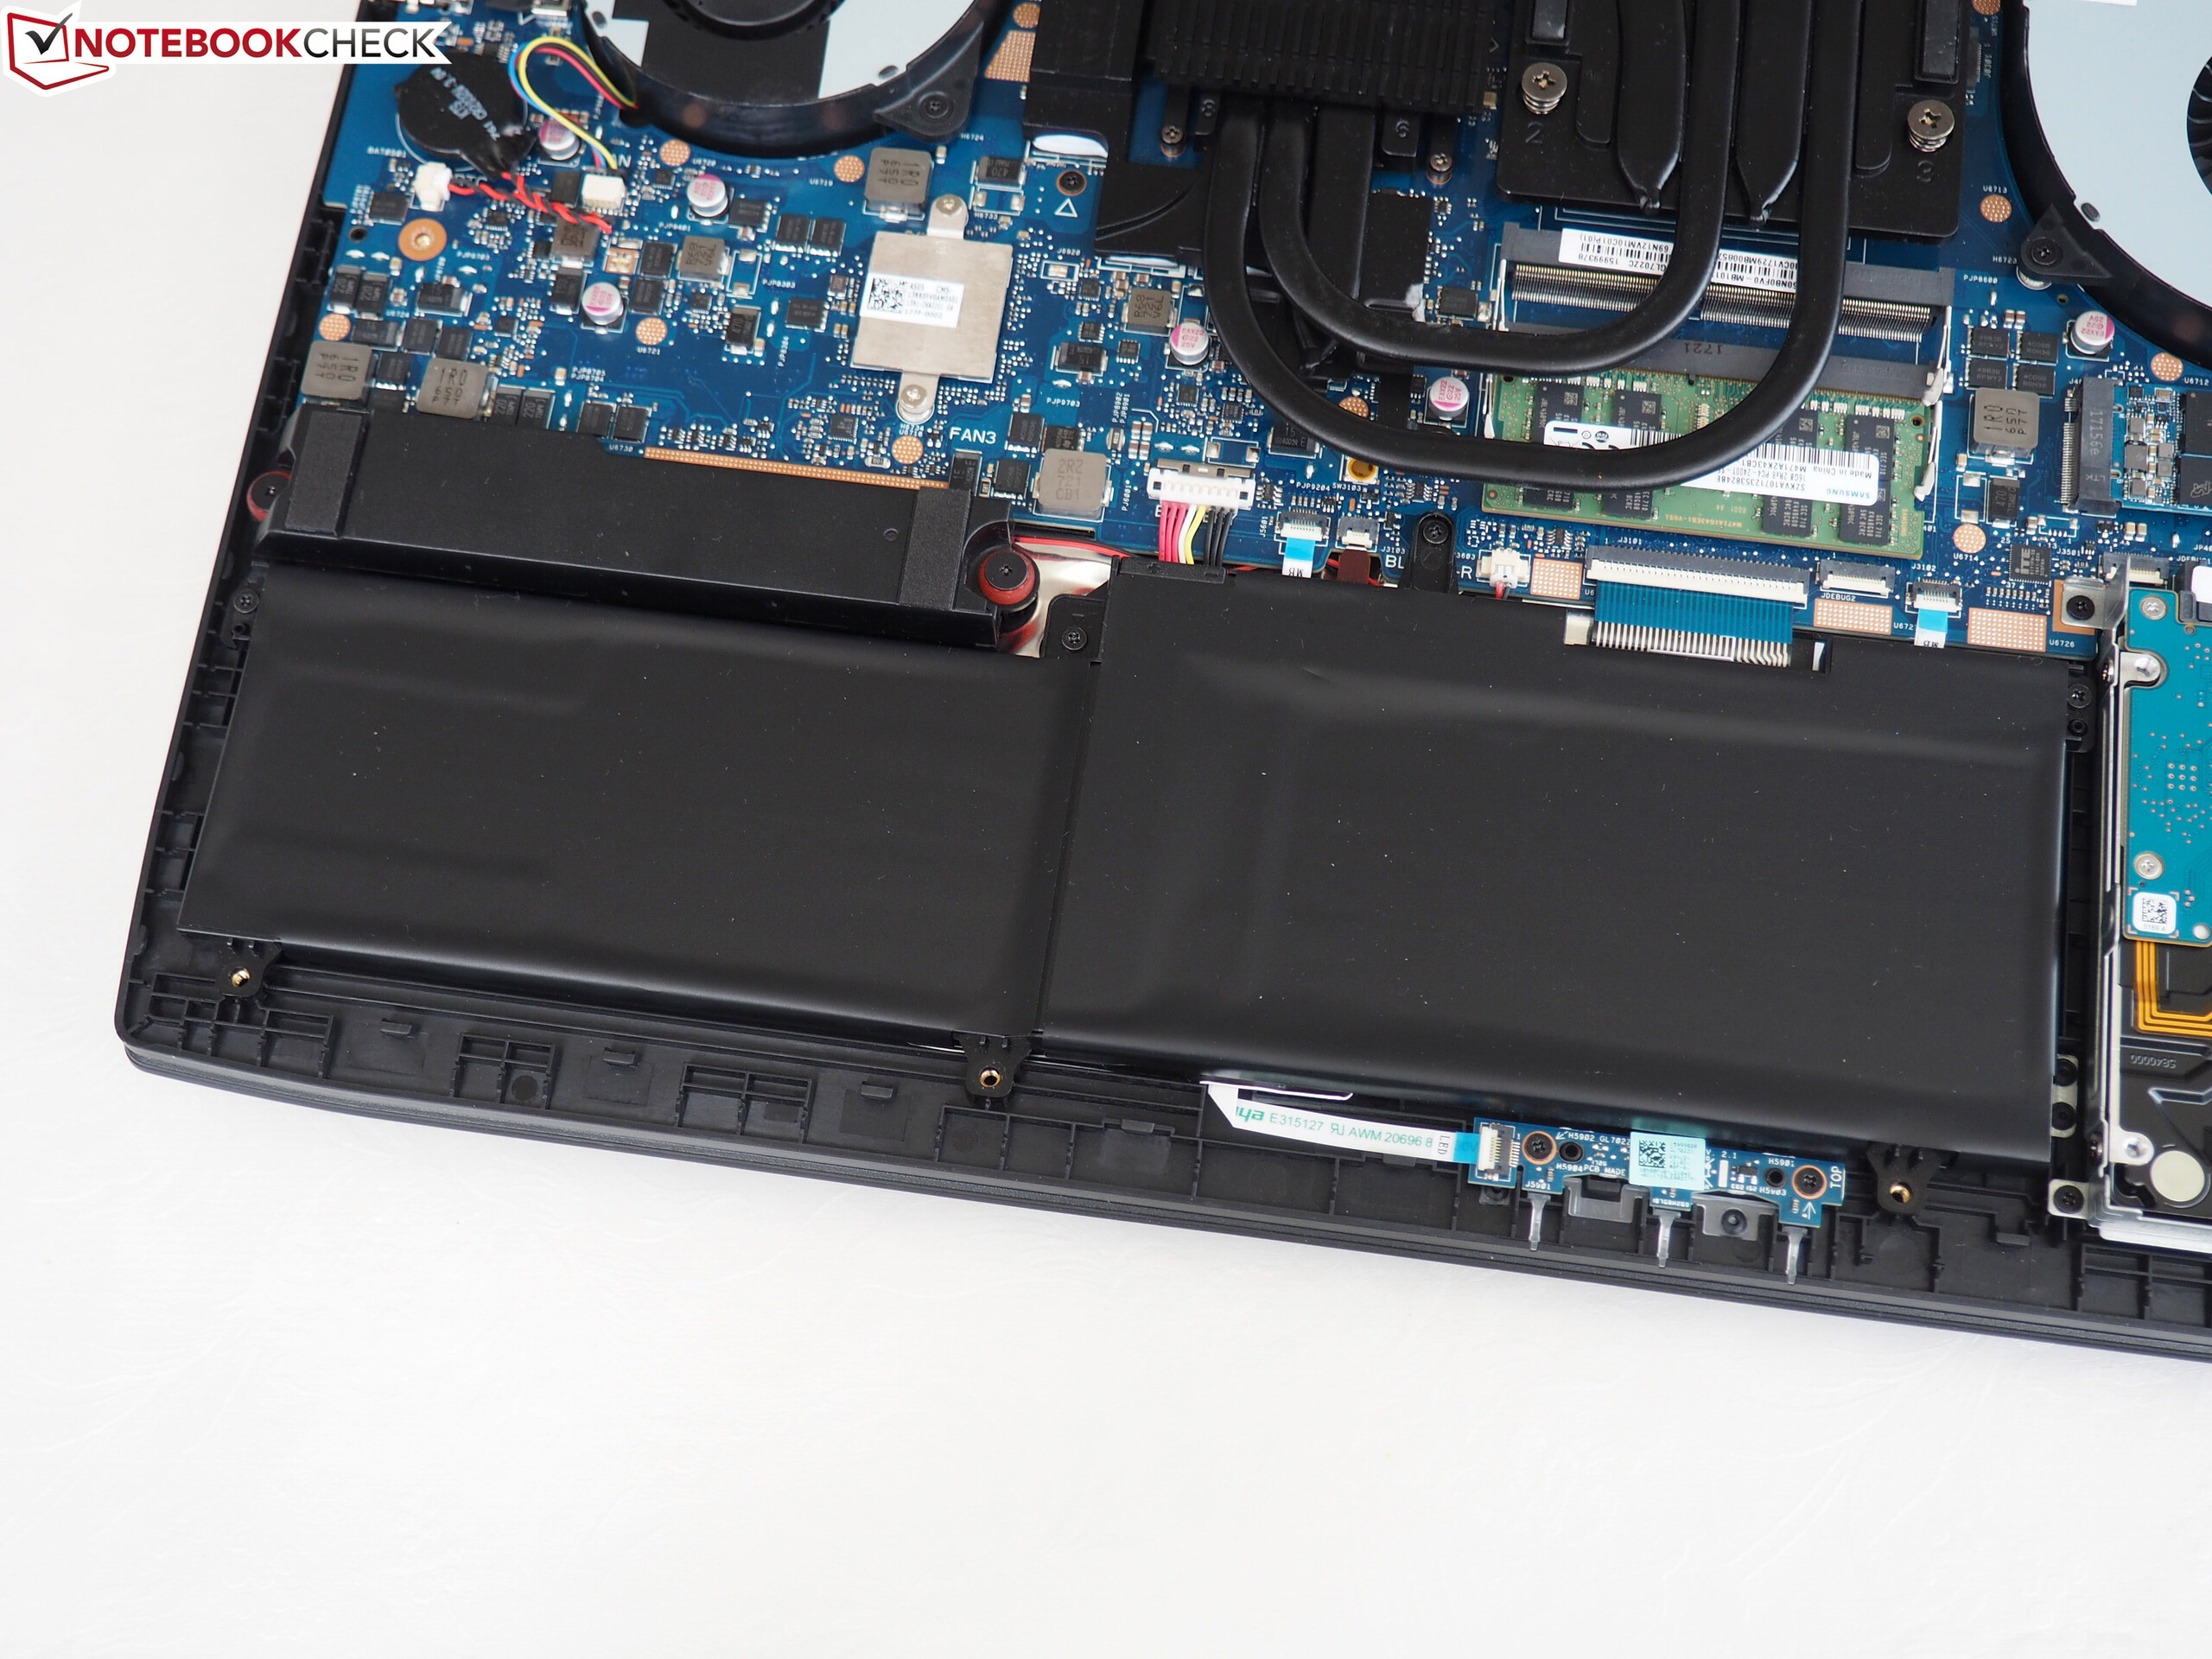
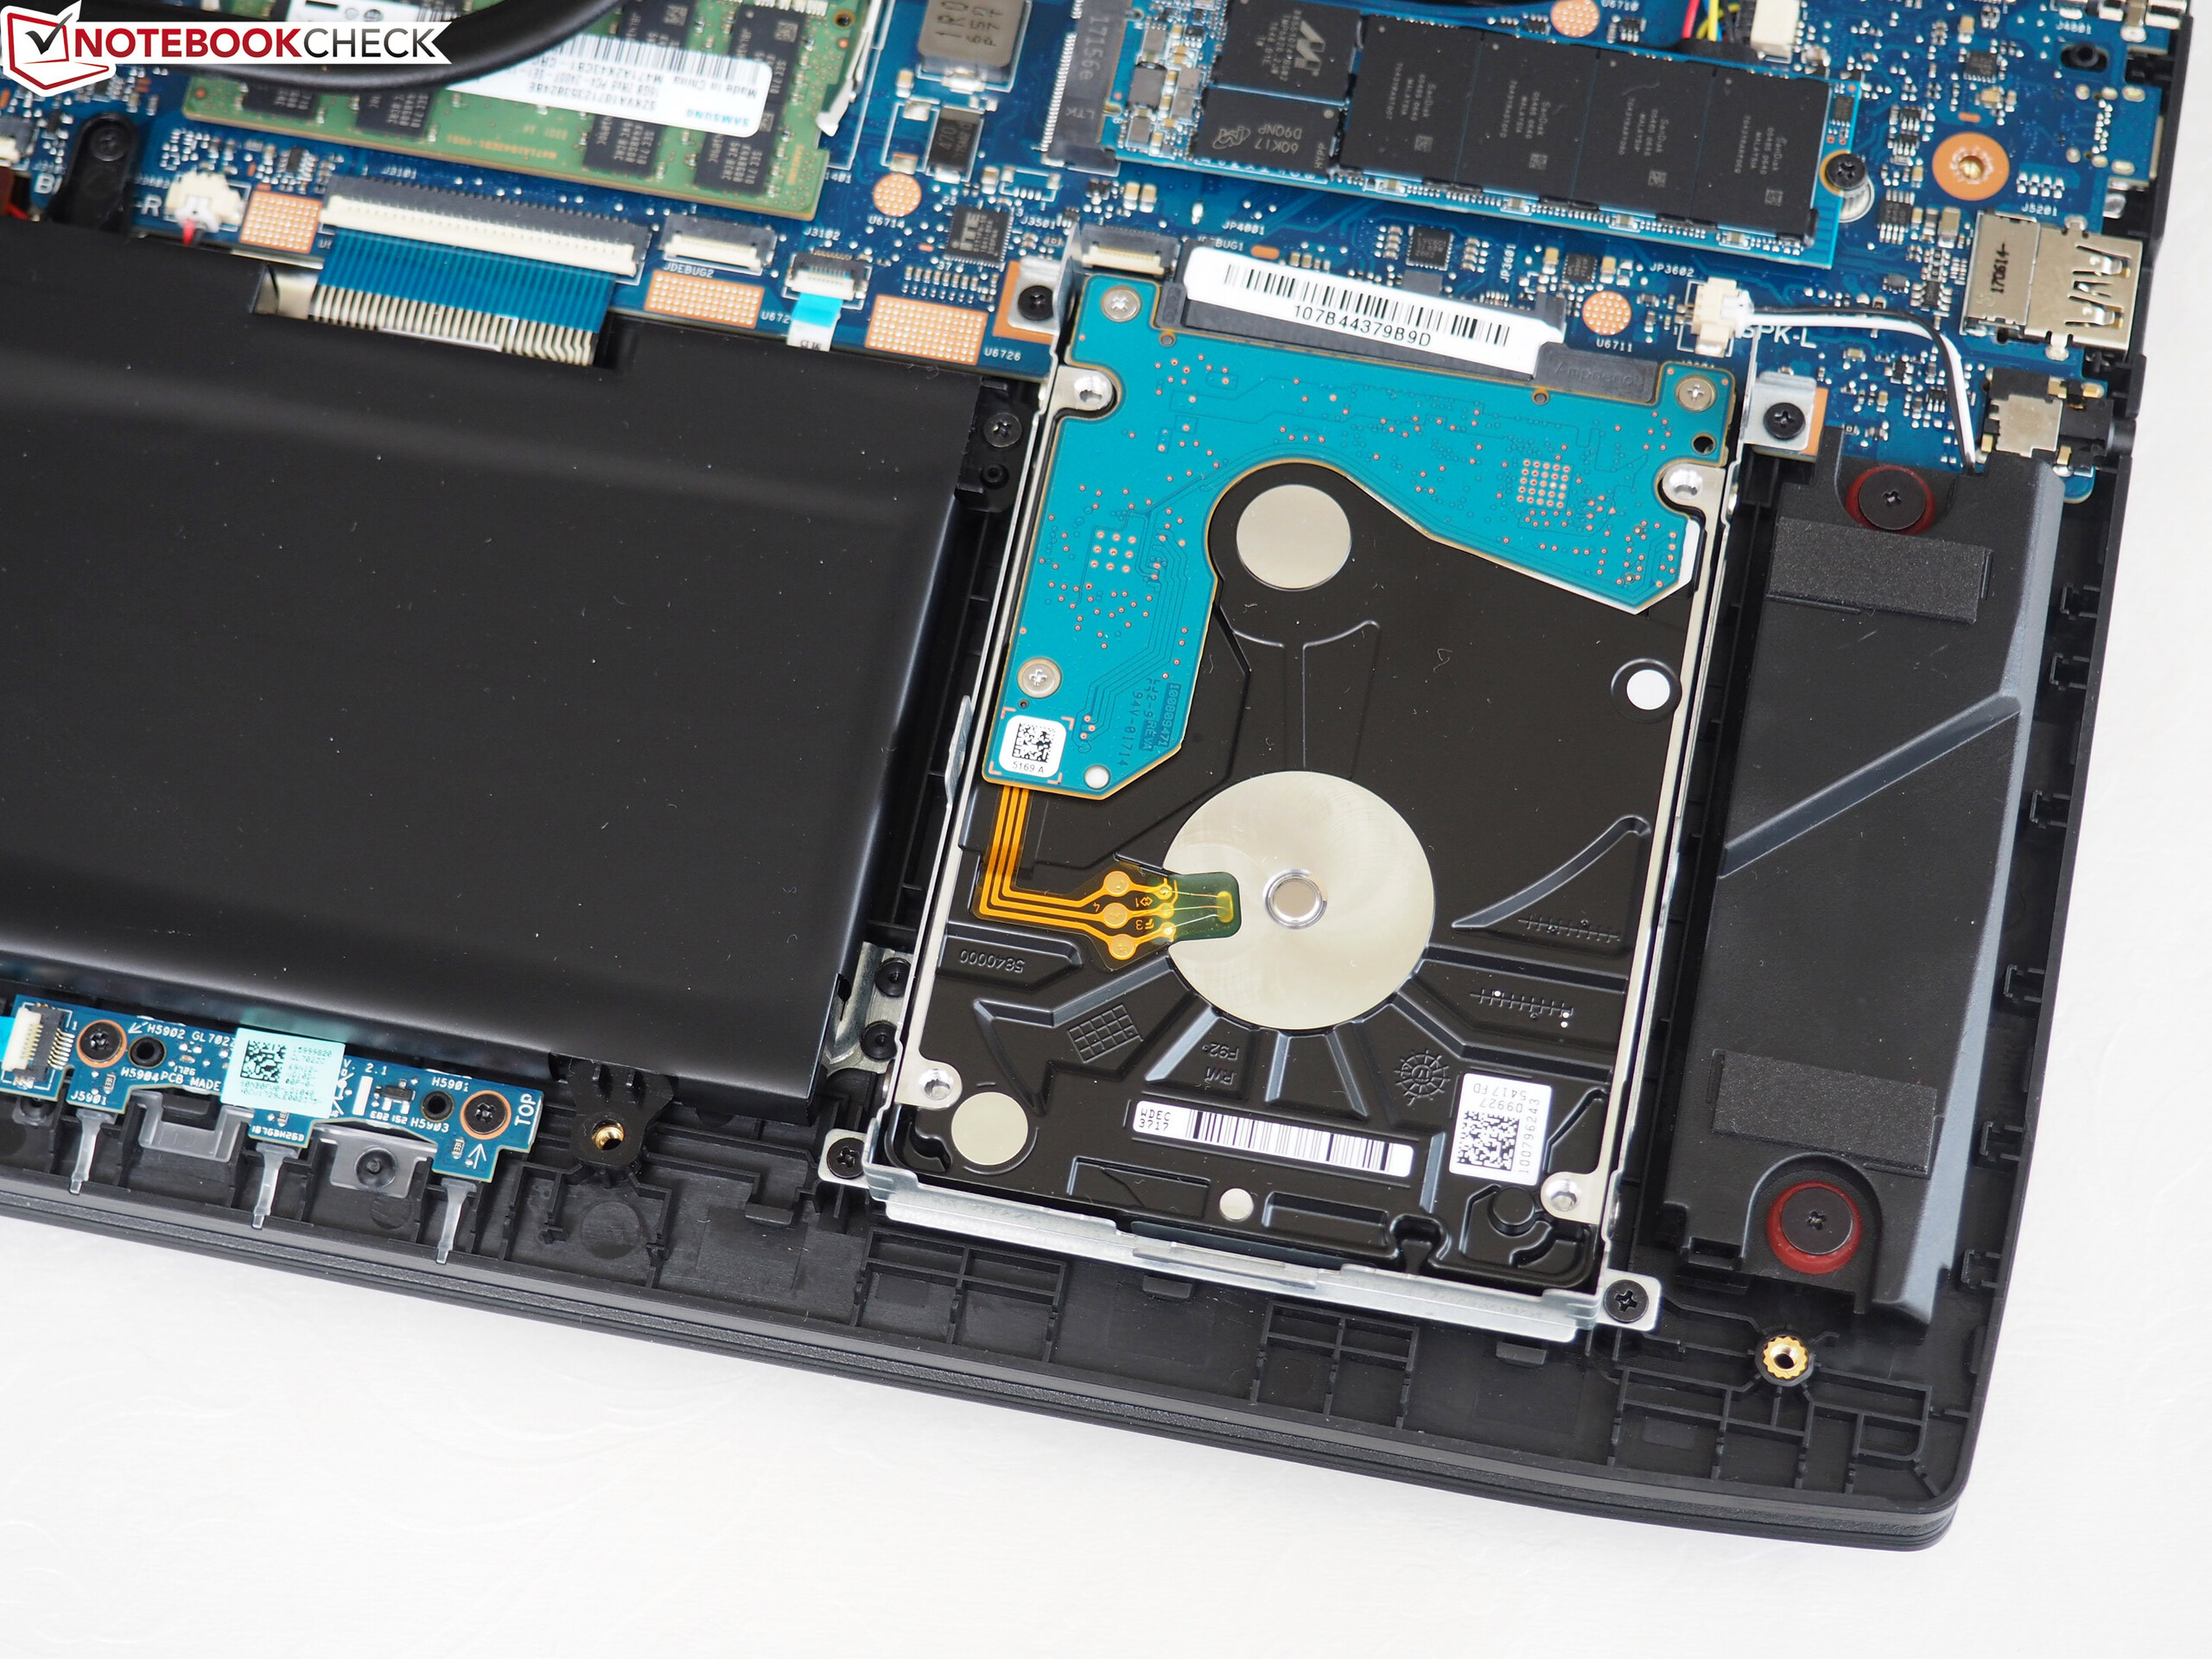
Maintenance is a mixed bag. Due to the lack of a maintenance hatch, it is not very easy to remove the underside. In order to remove the underside, you have to remove 10 screws and many hooks, which requires considerable force and might put laypeople off.
Afterwards, buyers gain access to all inner components from the two RAM slots and the hard drive slots (1x 2.5-inch & 1x M.2 Type 2280) to the cooling system. The latter consists of two fans and several heat-pipes, which are installed quite "artfully" (not to say chaotically). Shape and screwing of the battery are also a bit strange. The laptop earns plus points for having the processor installed on a socket. This means that the processor can be replaced. By contrast, it is not possible to replace the graphics chip (soldered).
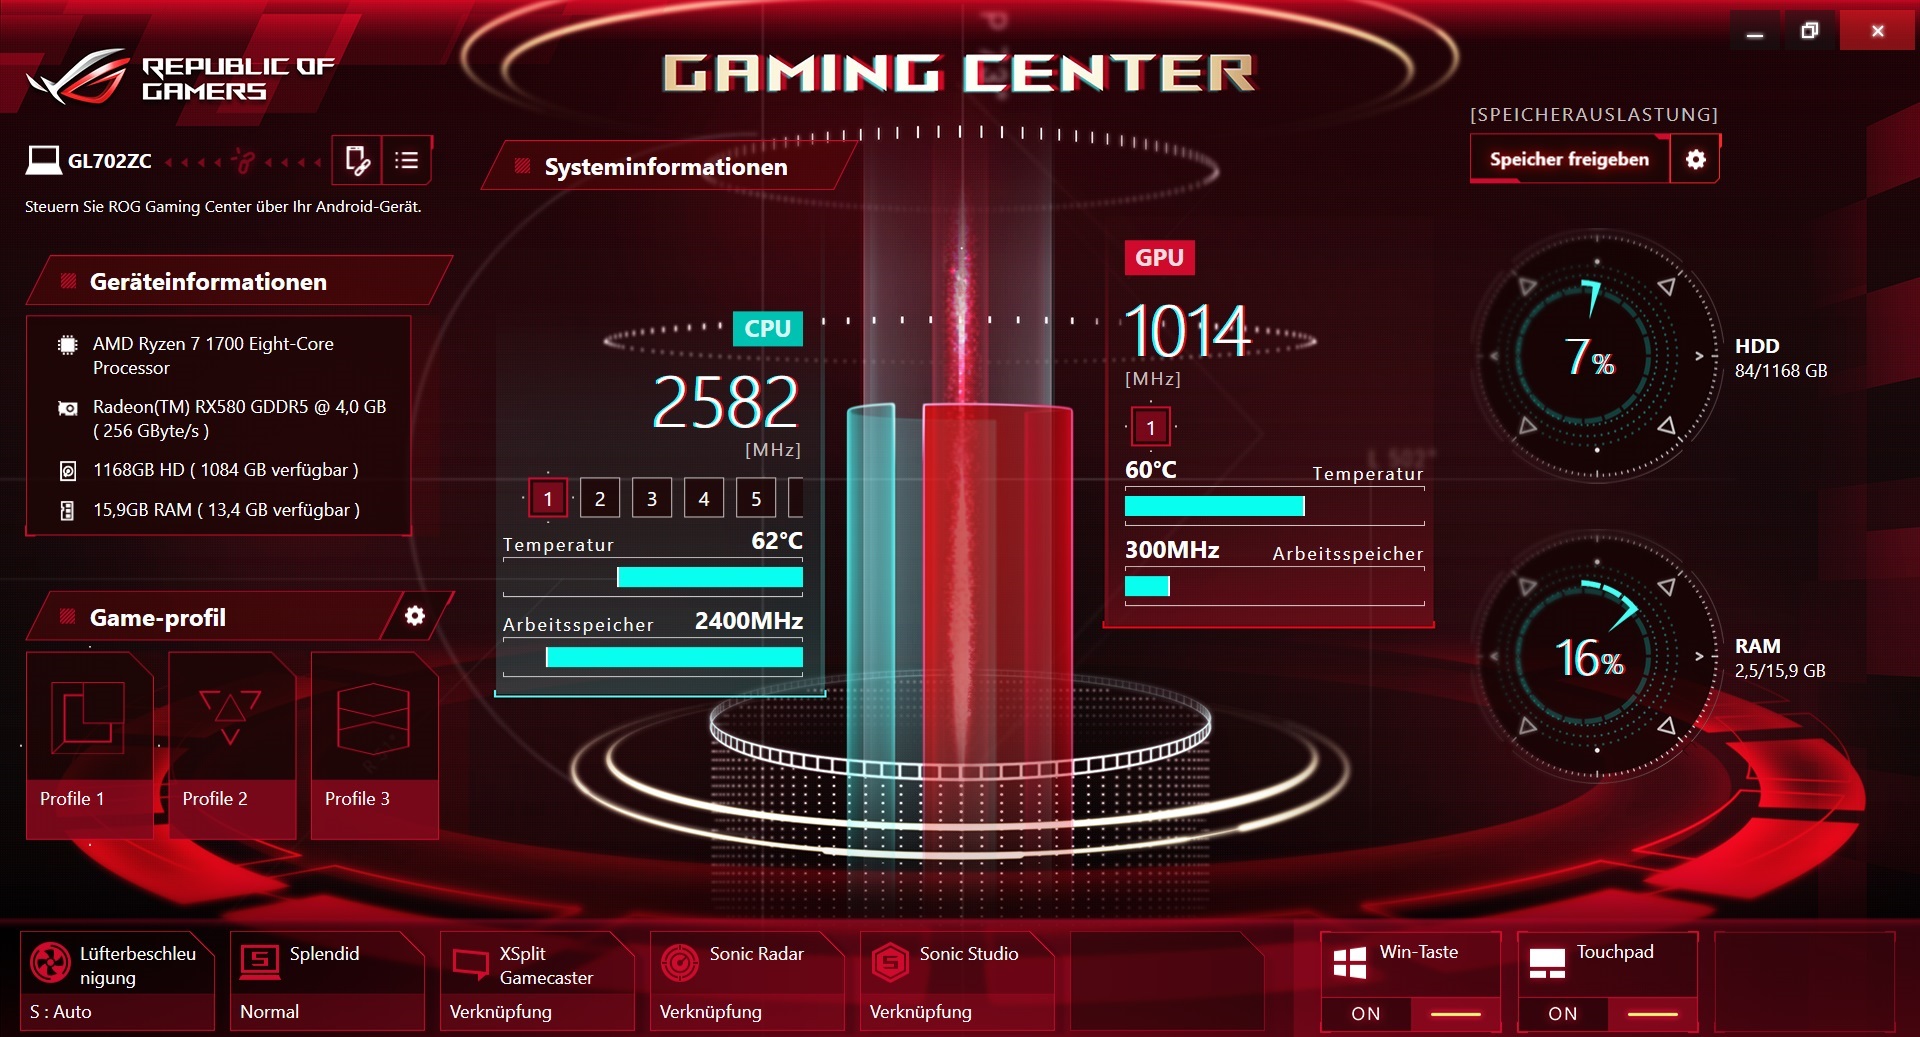
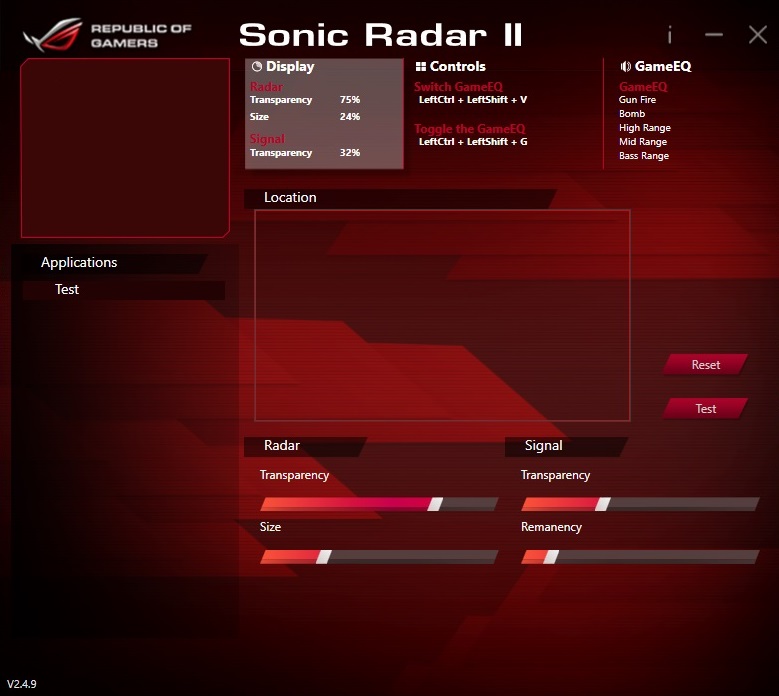
Software
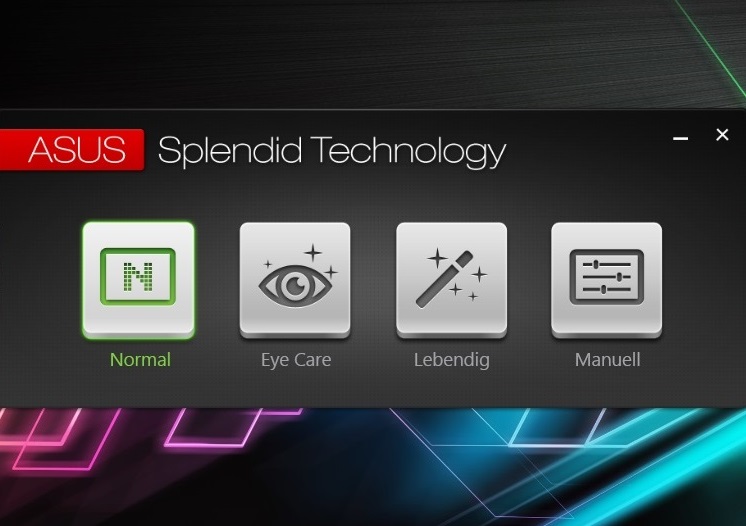
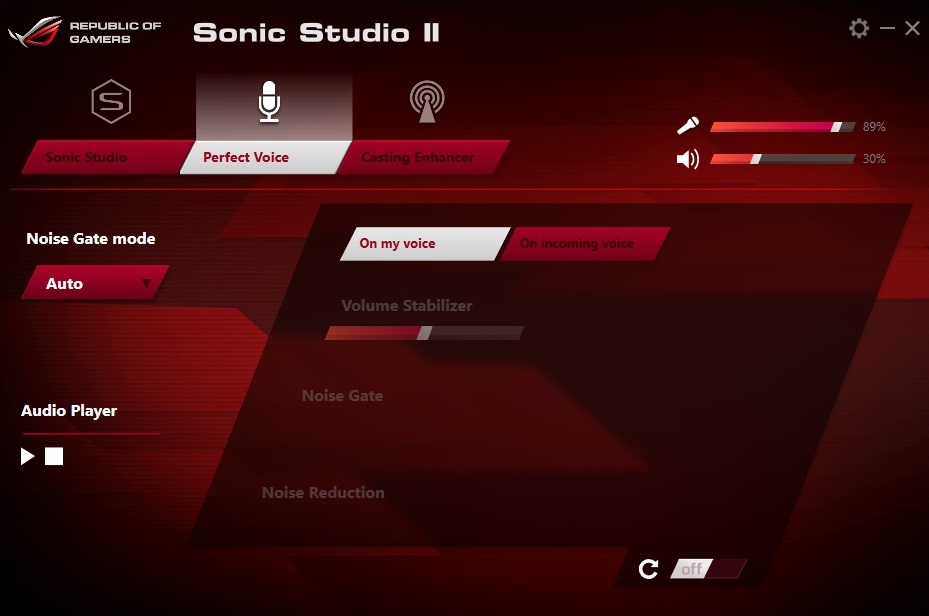
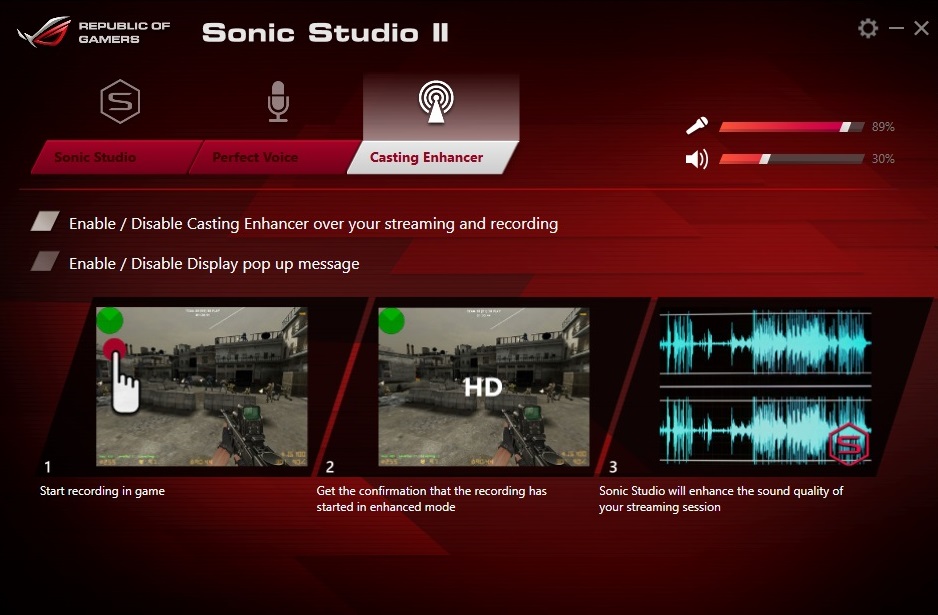
In terms of software, Asus relies on its usual tools. The so-called Gaming Center is the central access point again. It provides many features and much information. It also gives access to many "secondary programs" such as Splendid (image optimization via various tools), Sonic Radar (better location of opponents in games) and Sonic Studio (individual sound adjustment). However, an overclocking option, which is offered by other Asus devices, is missing. Due to the lack of extra tools you have to get along with the default values.
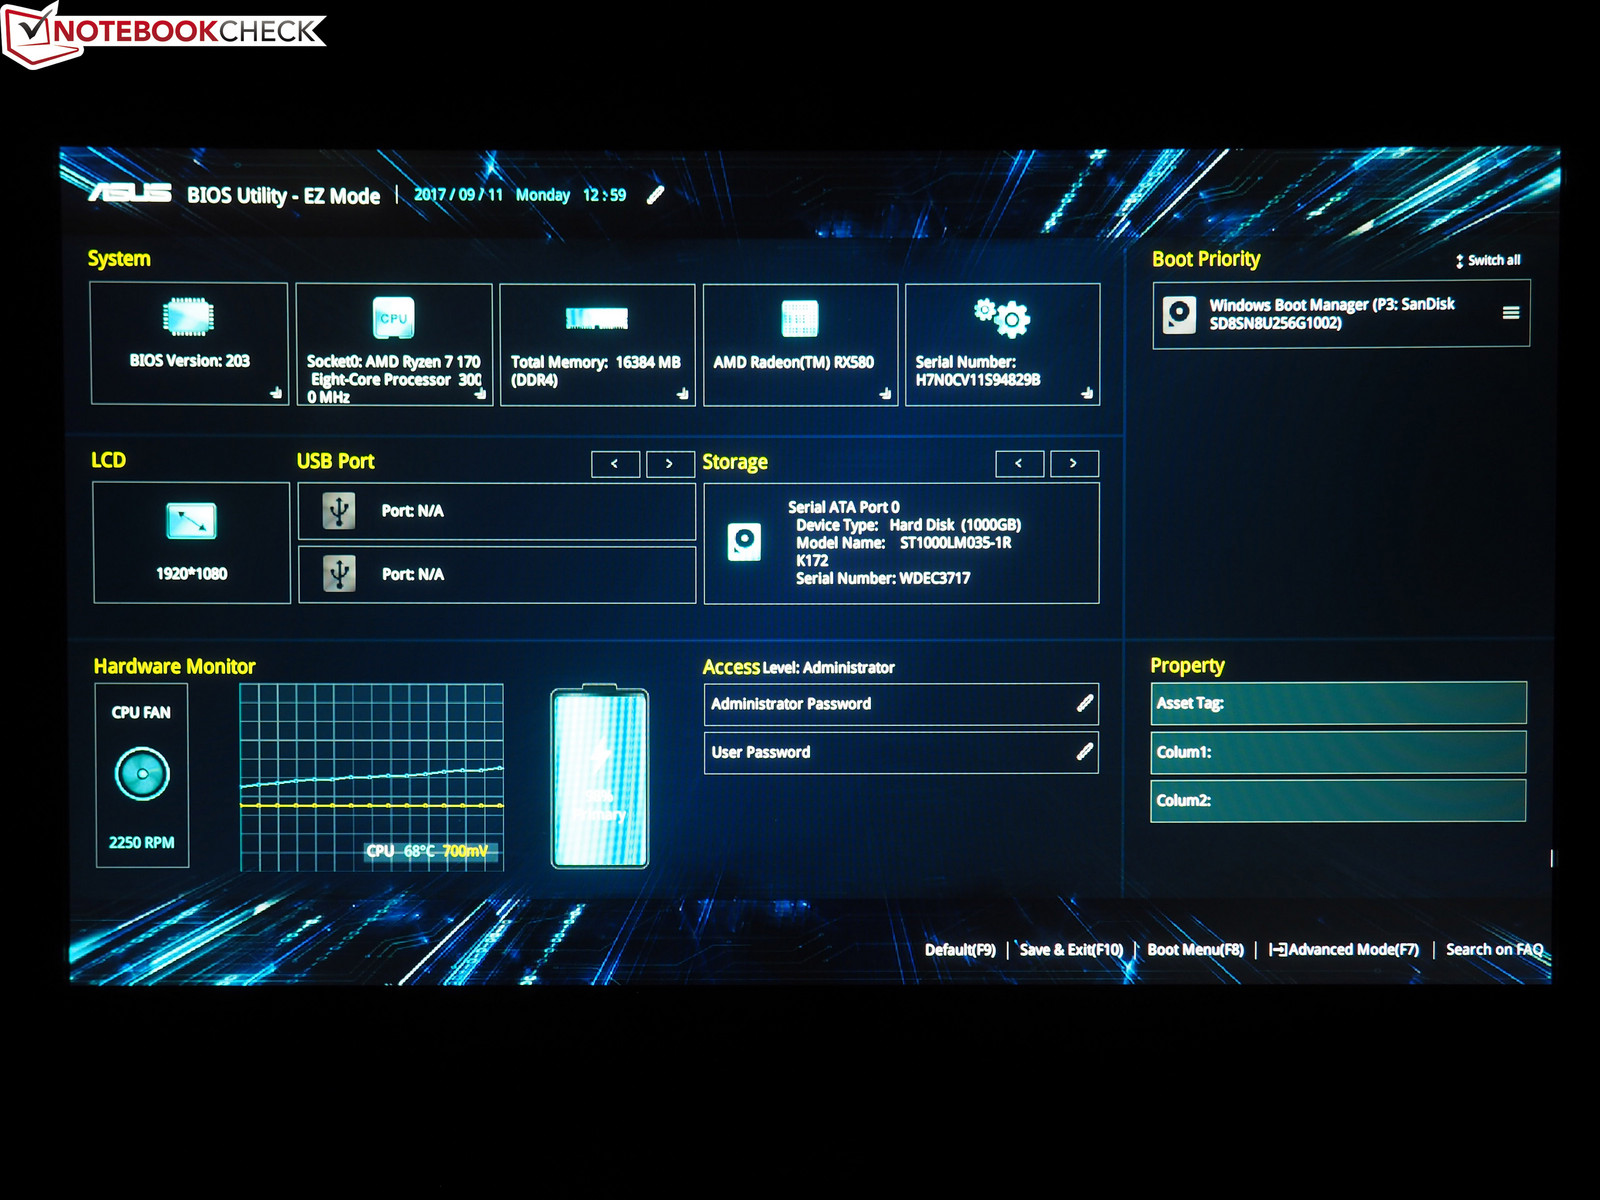
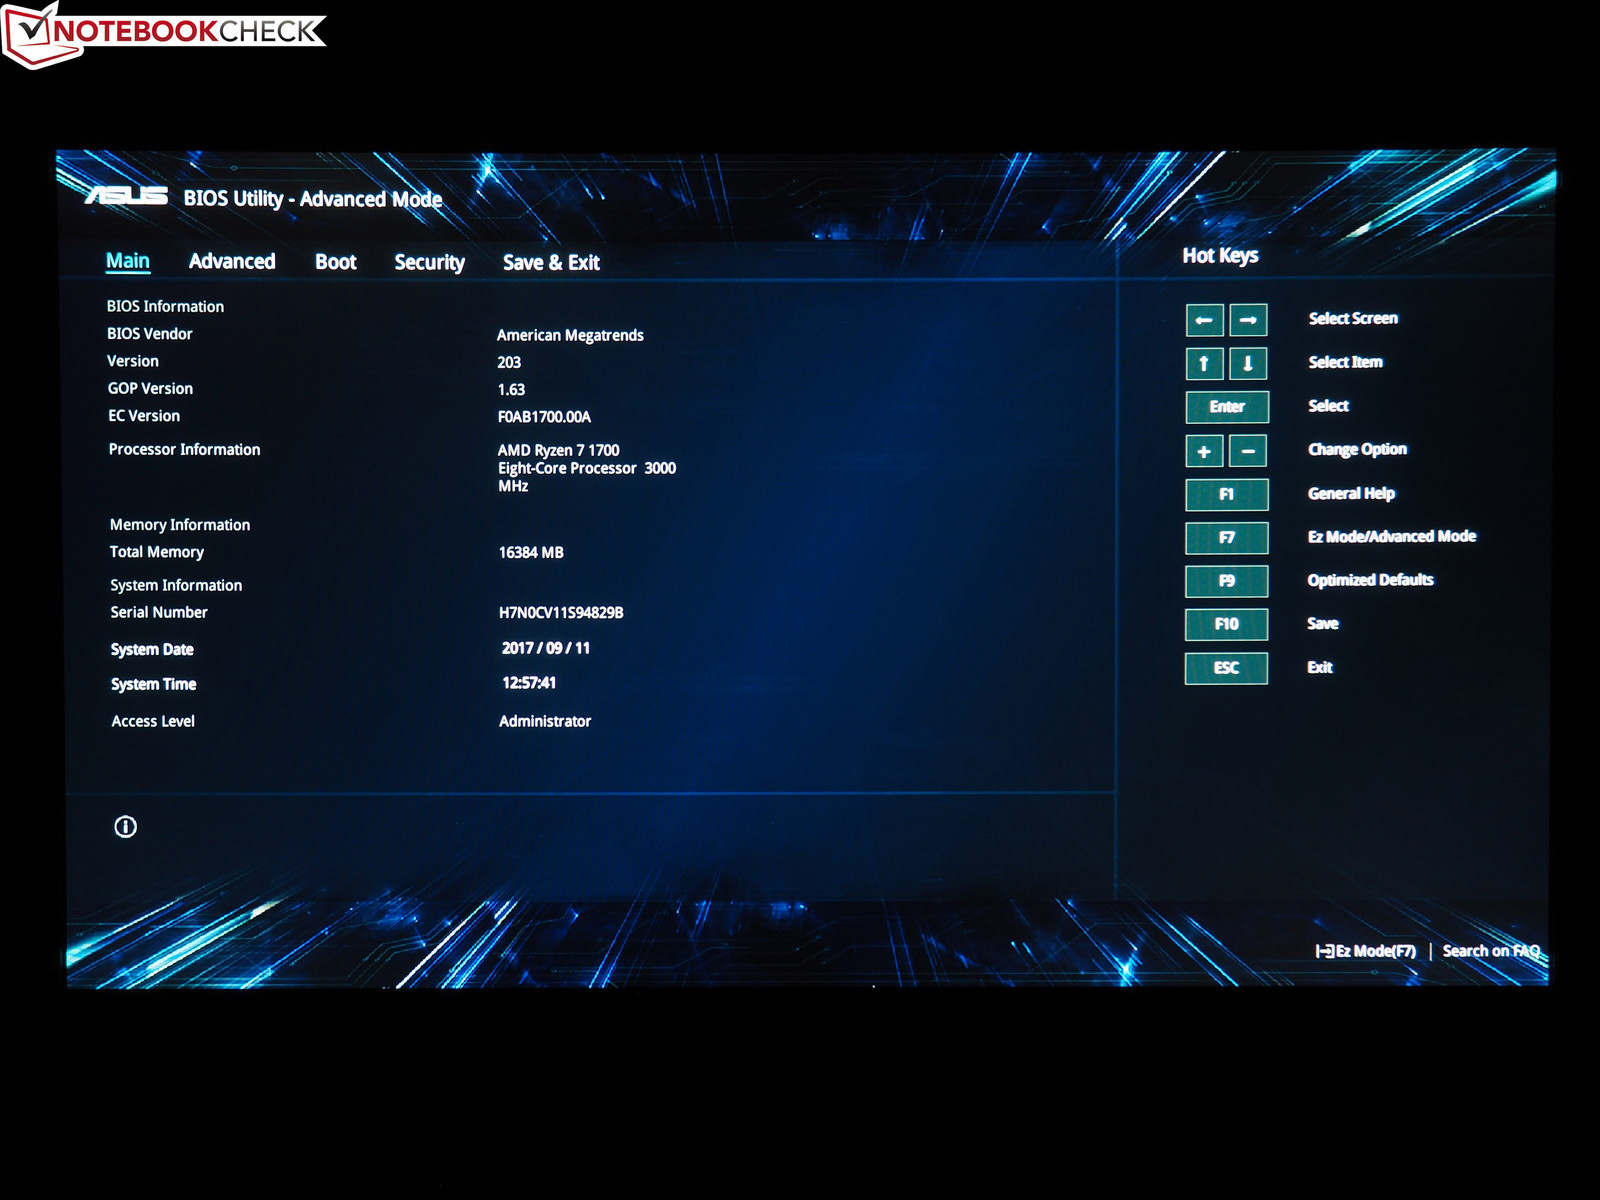
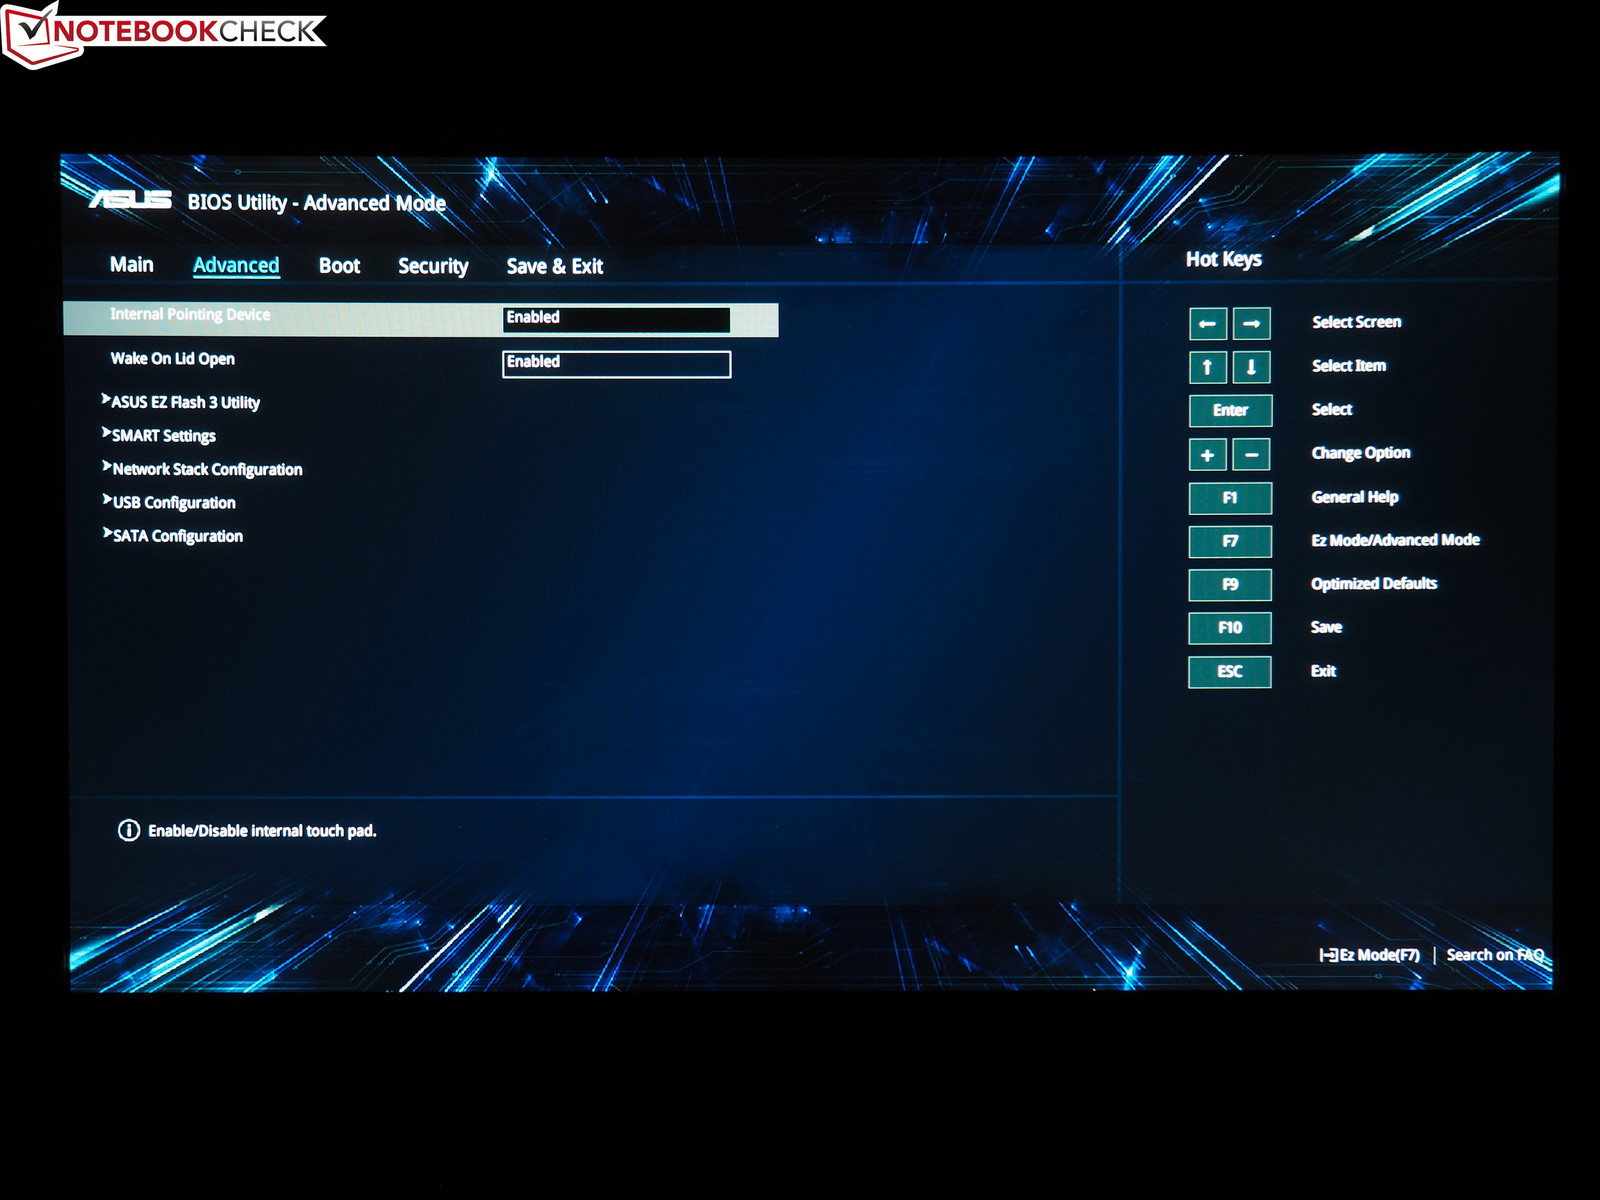
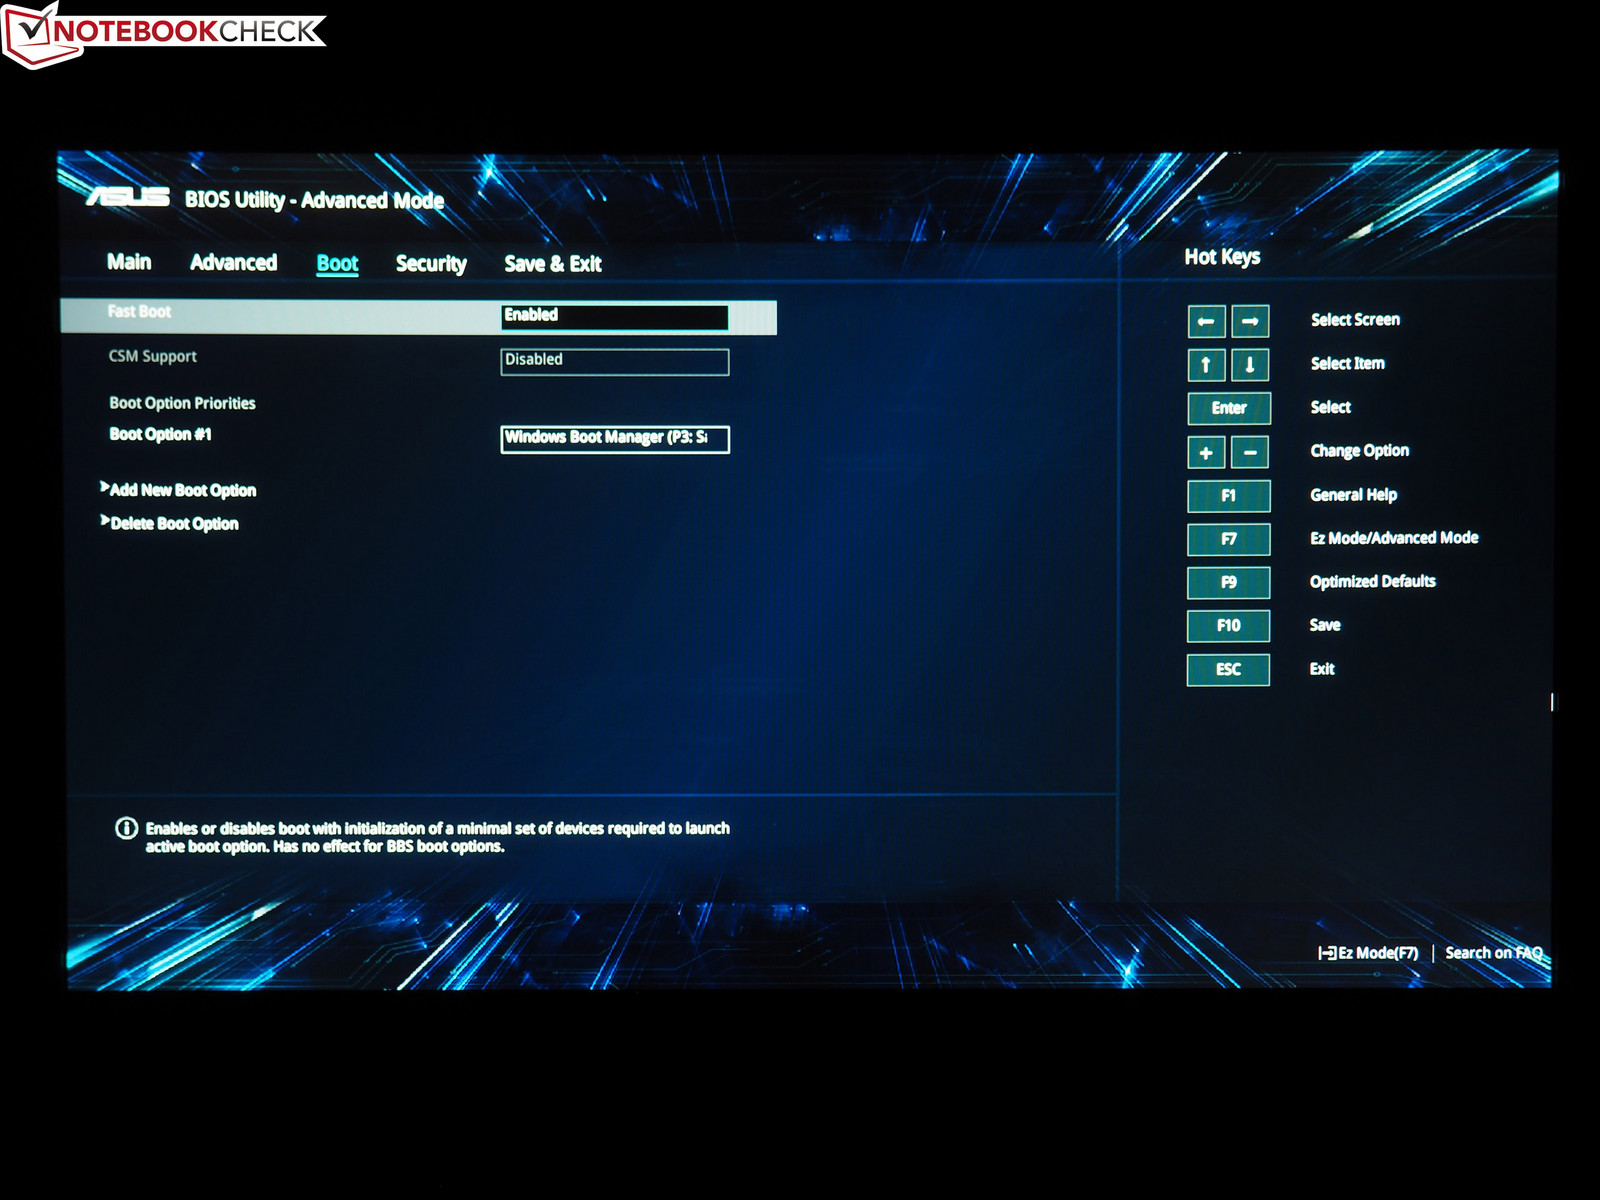
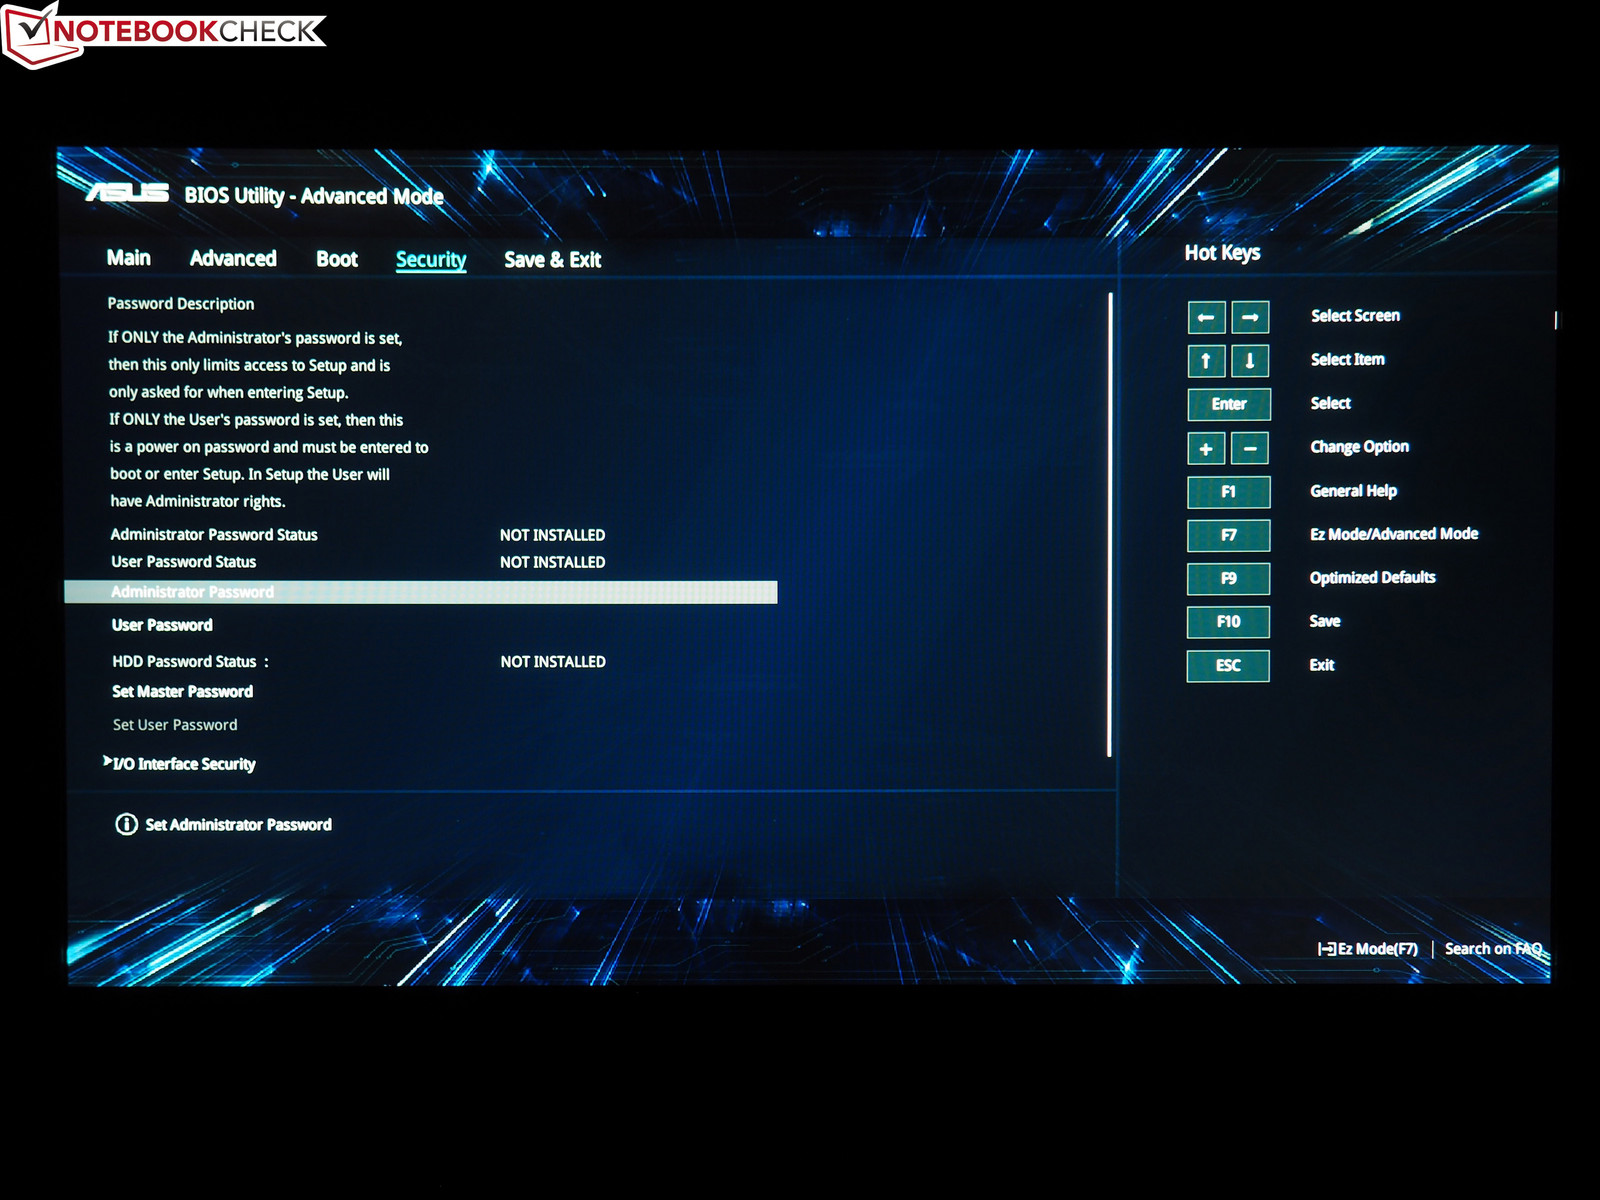
BIOS
As comprehensive the Gaming Center is as meager are the BIOS options. Tuning fans will not even find many options in advanced mode. However, this complaint applies to almost all gaming notebooks.
Warranty
Asus grants a warranty of 24 months on this device. Please see our Guarantees, Return Policies & Warranties FAQ for country-specific information.
Input Devices
Keyboard
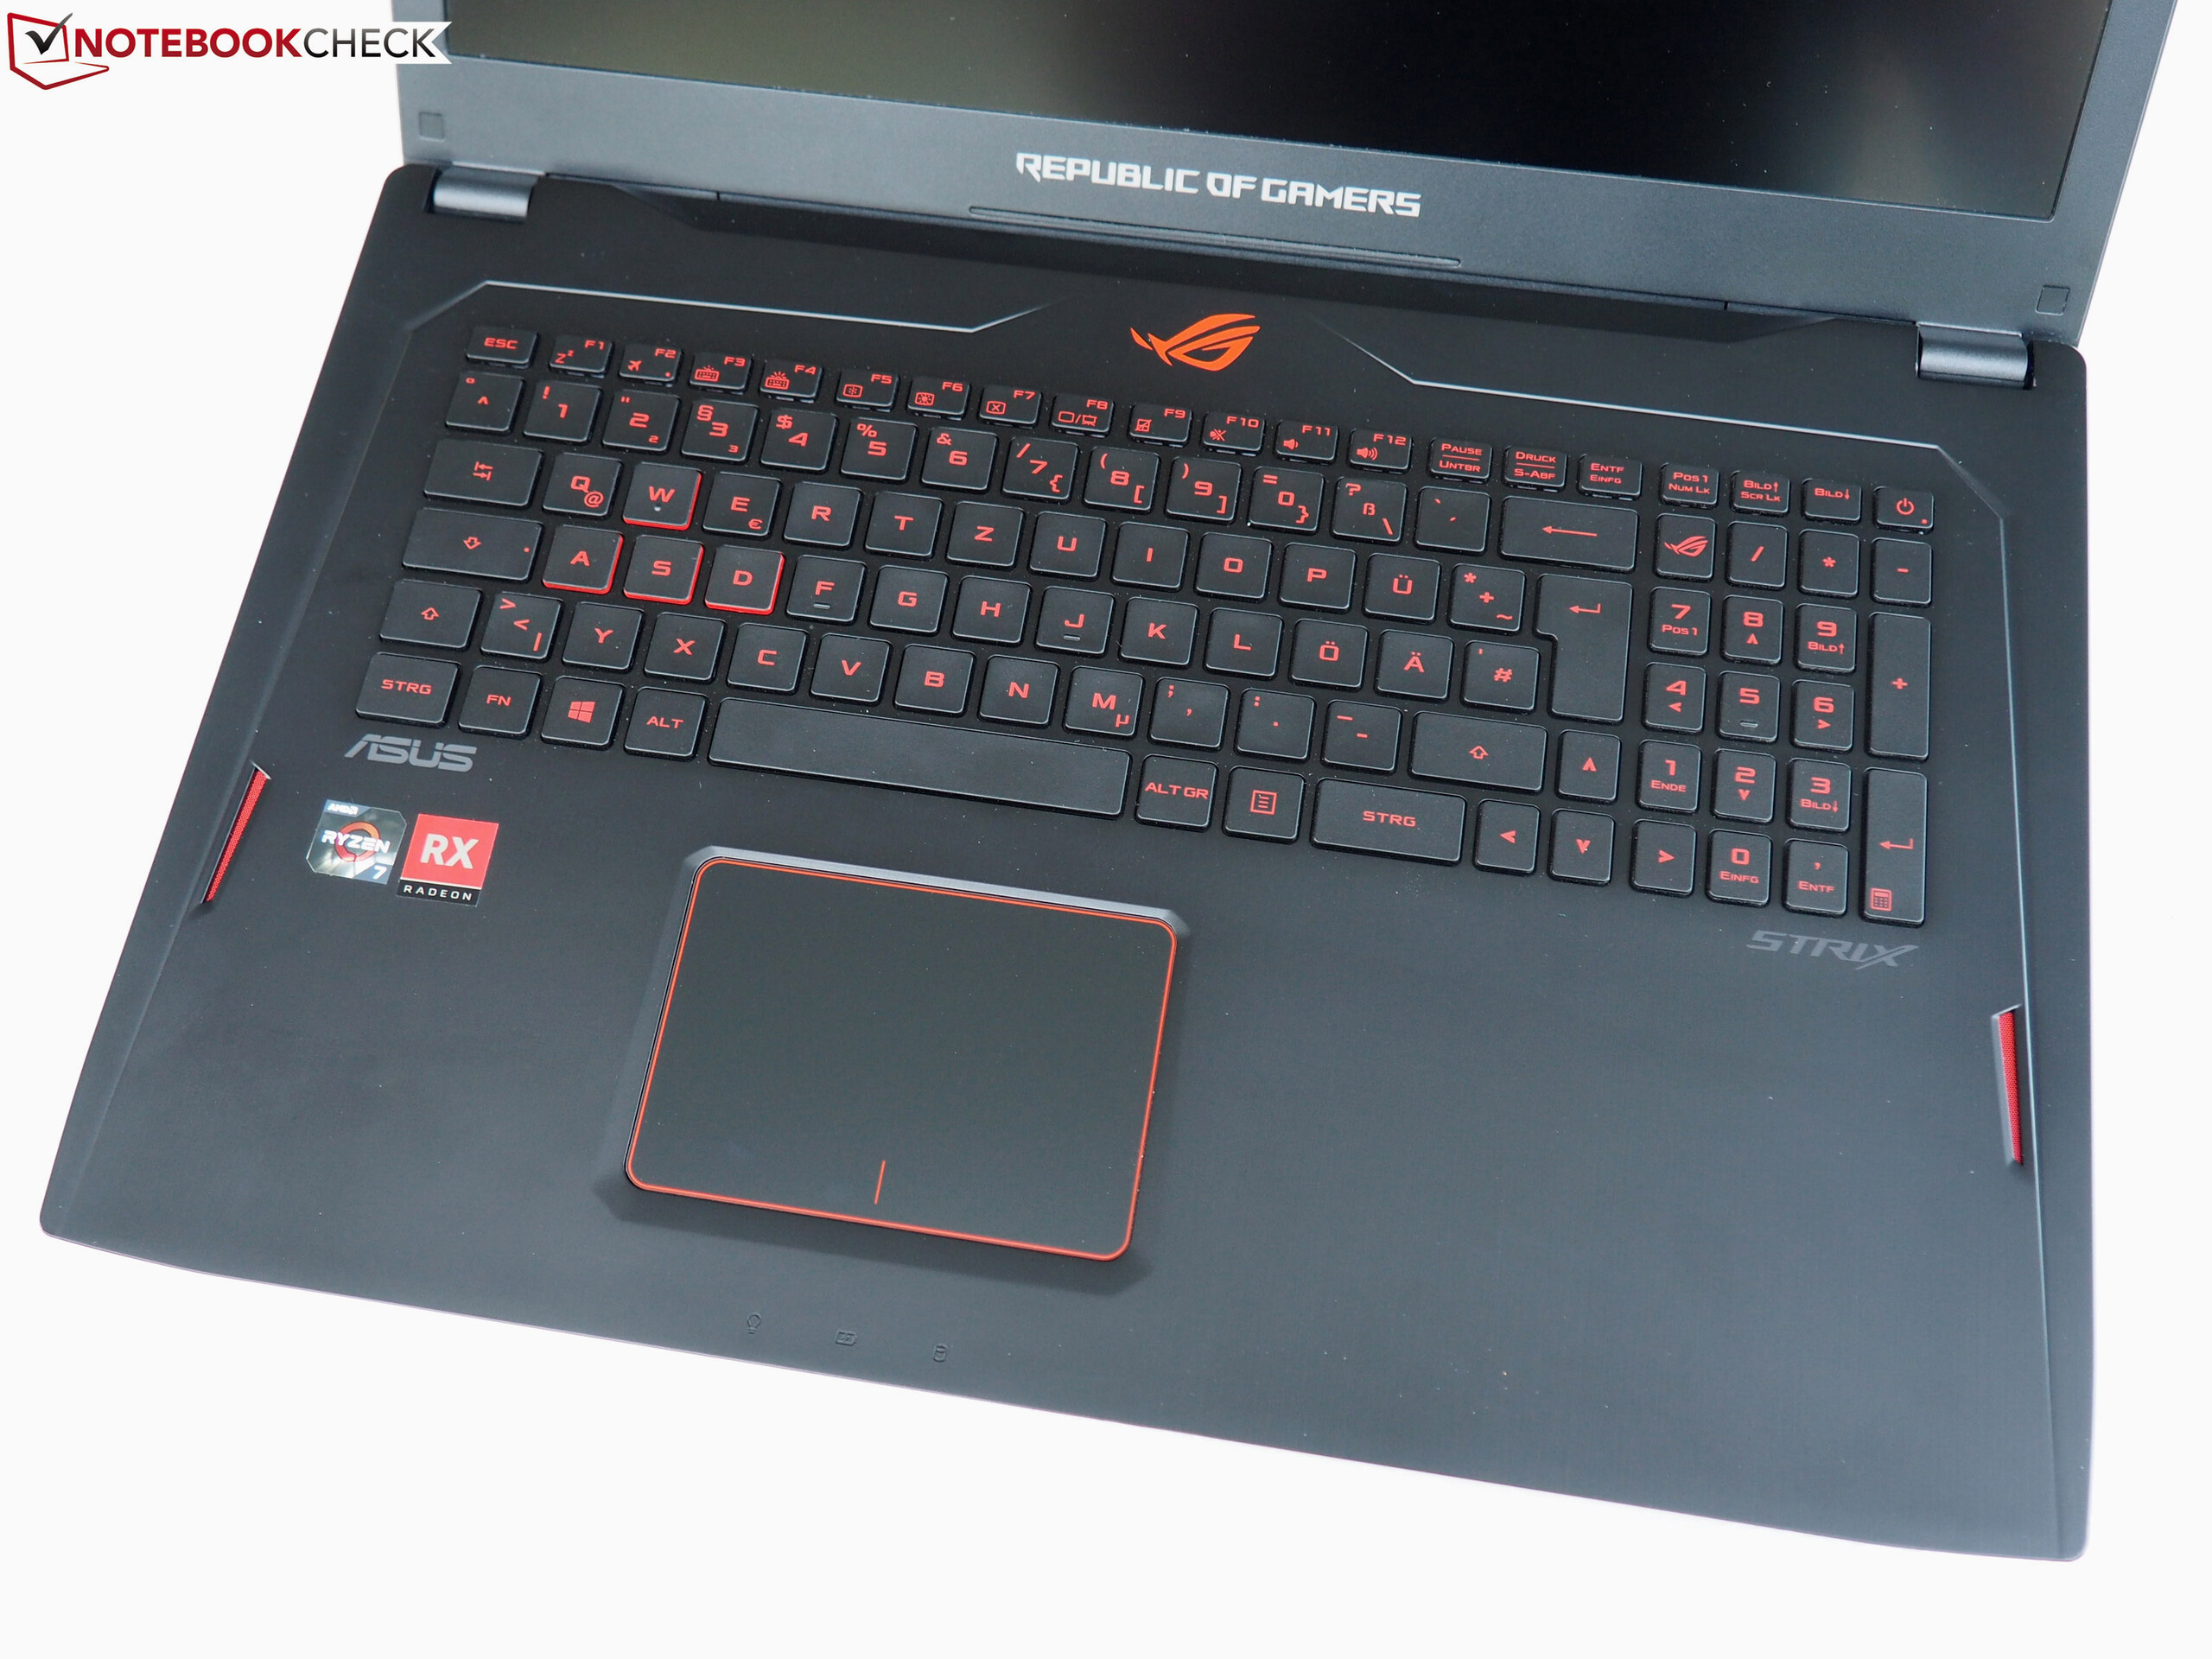
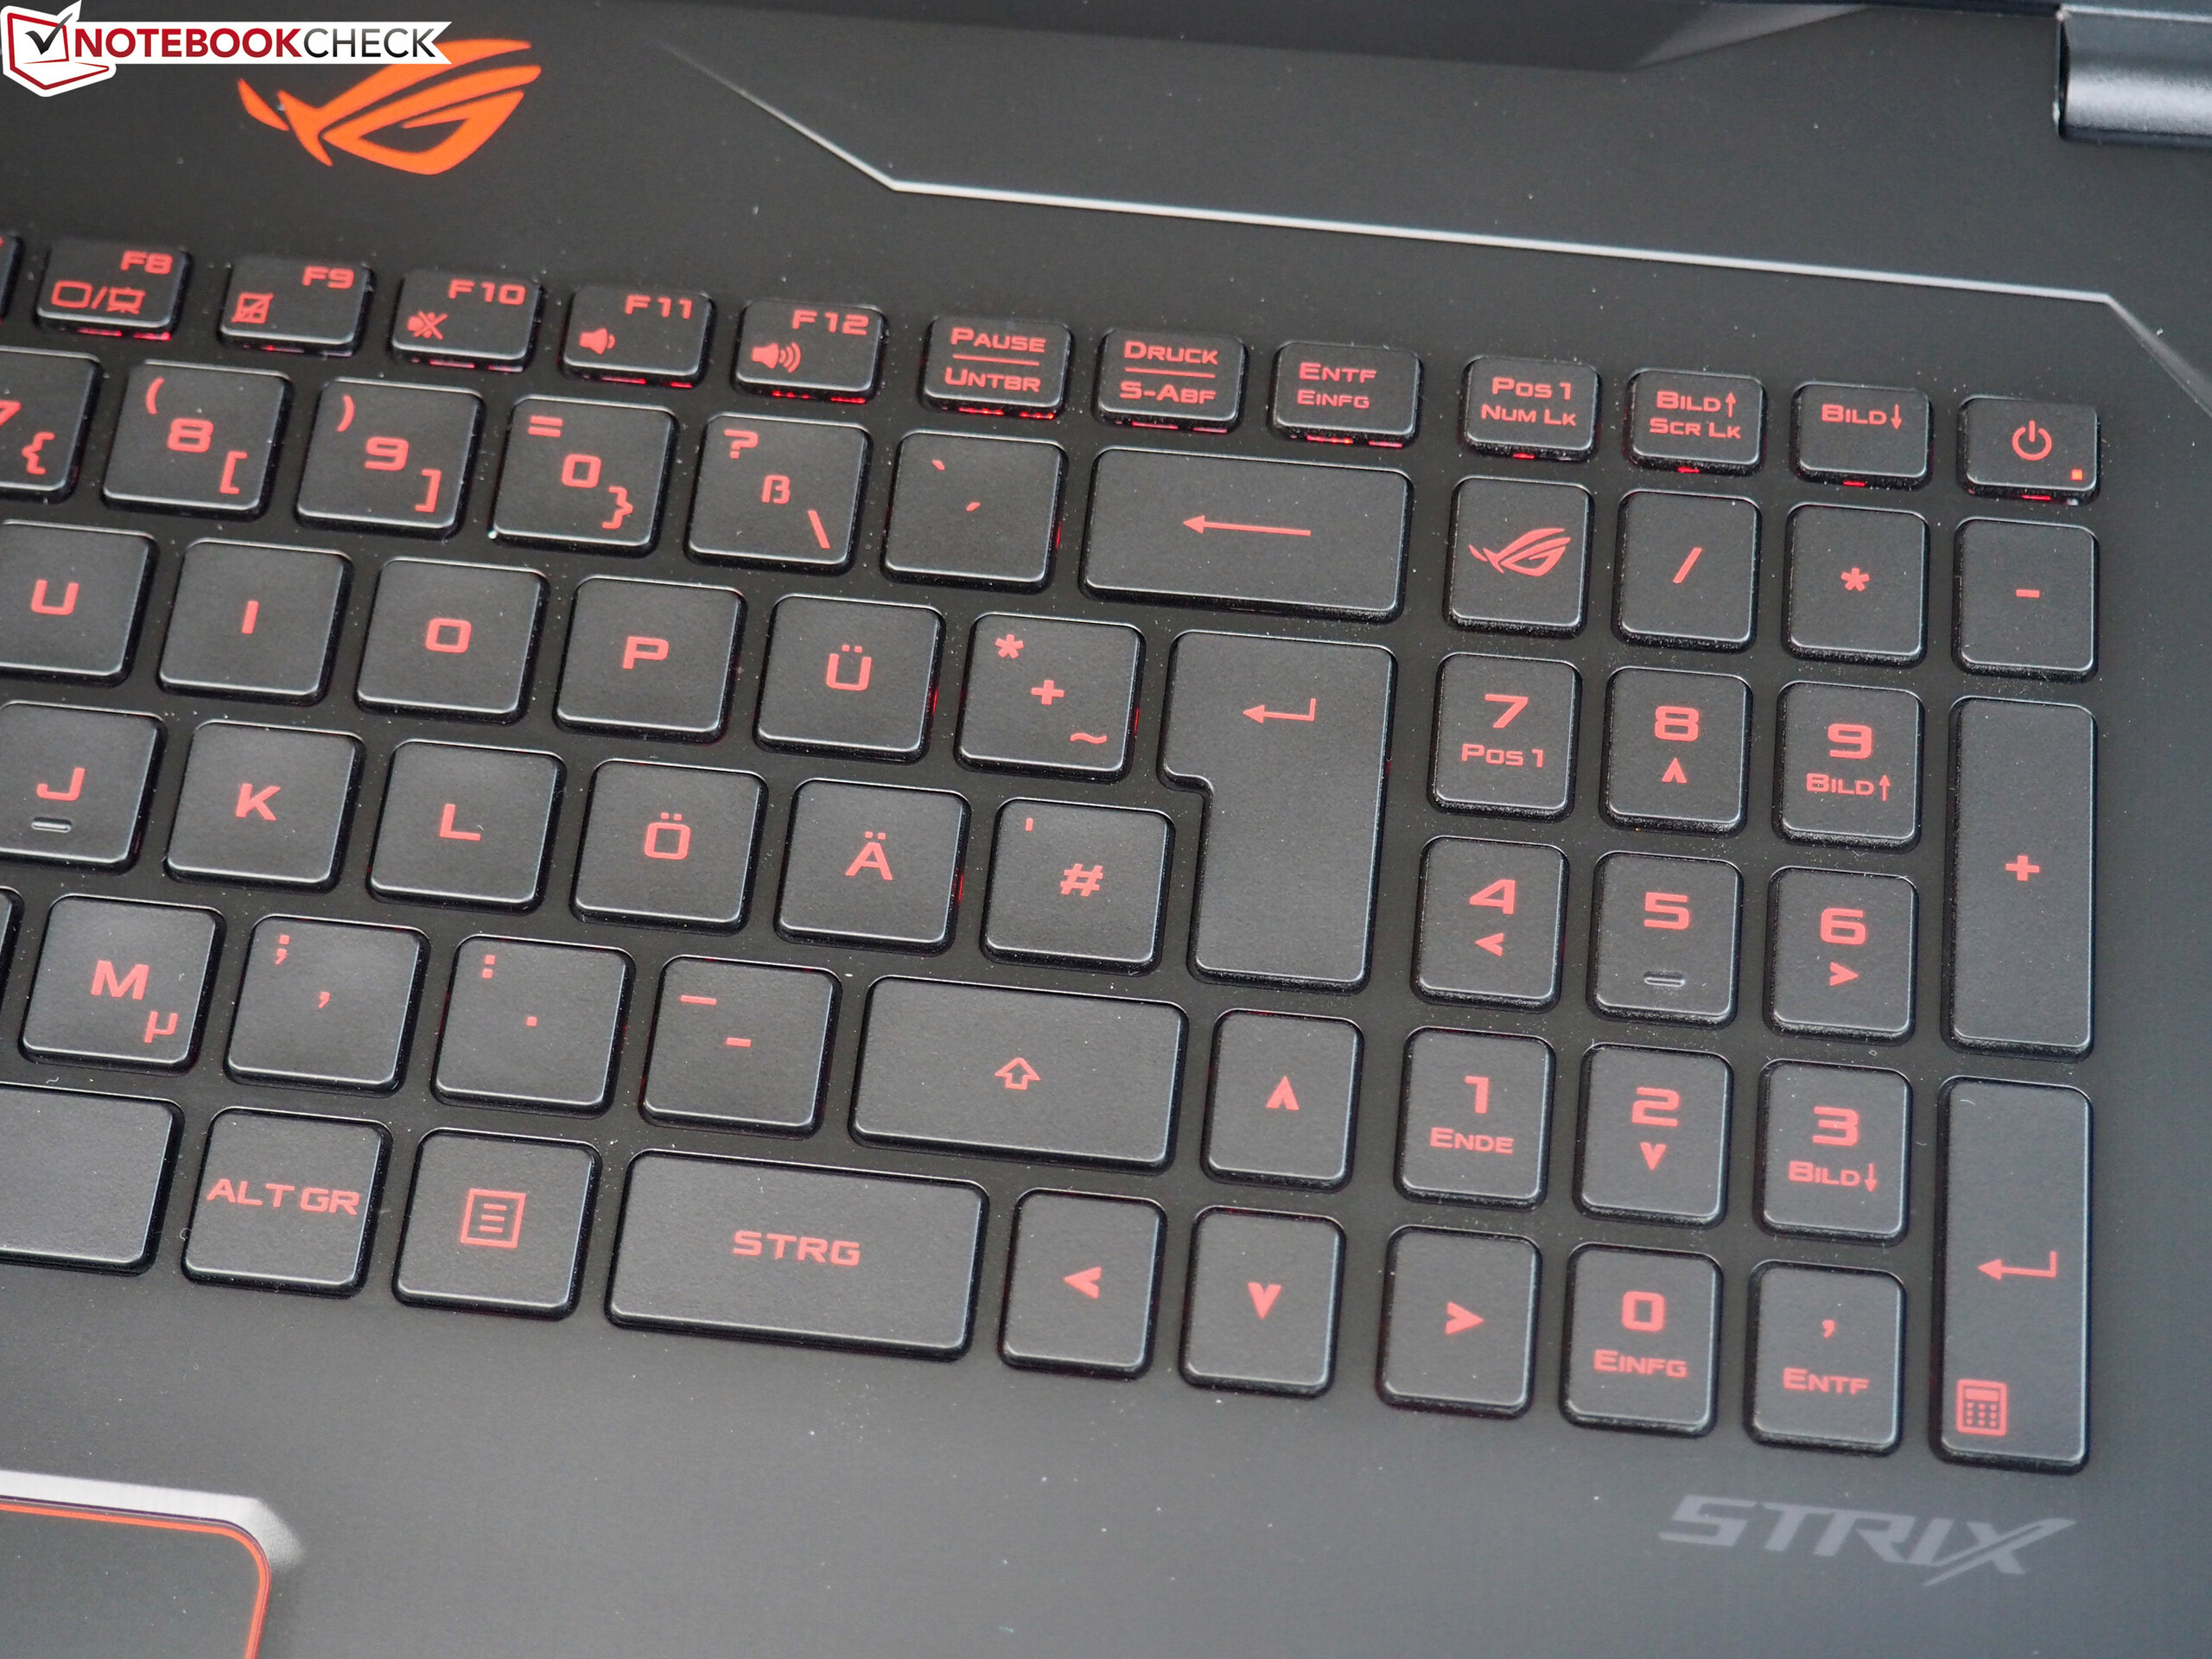
Although the input devices are not poor at all, we had slightly higher expectations. Apart from the fact that the keyboard warps (as mentioned above) under stronger pressure, the typing experience could be better. The author feels that the stroke is slightly too spongy. Competitors offer a crisper feedback. The not fully standard-compliant layout (combined Ins/Del key, power button & Gaming Center key in the number block, etc.) also is a matter of taste.
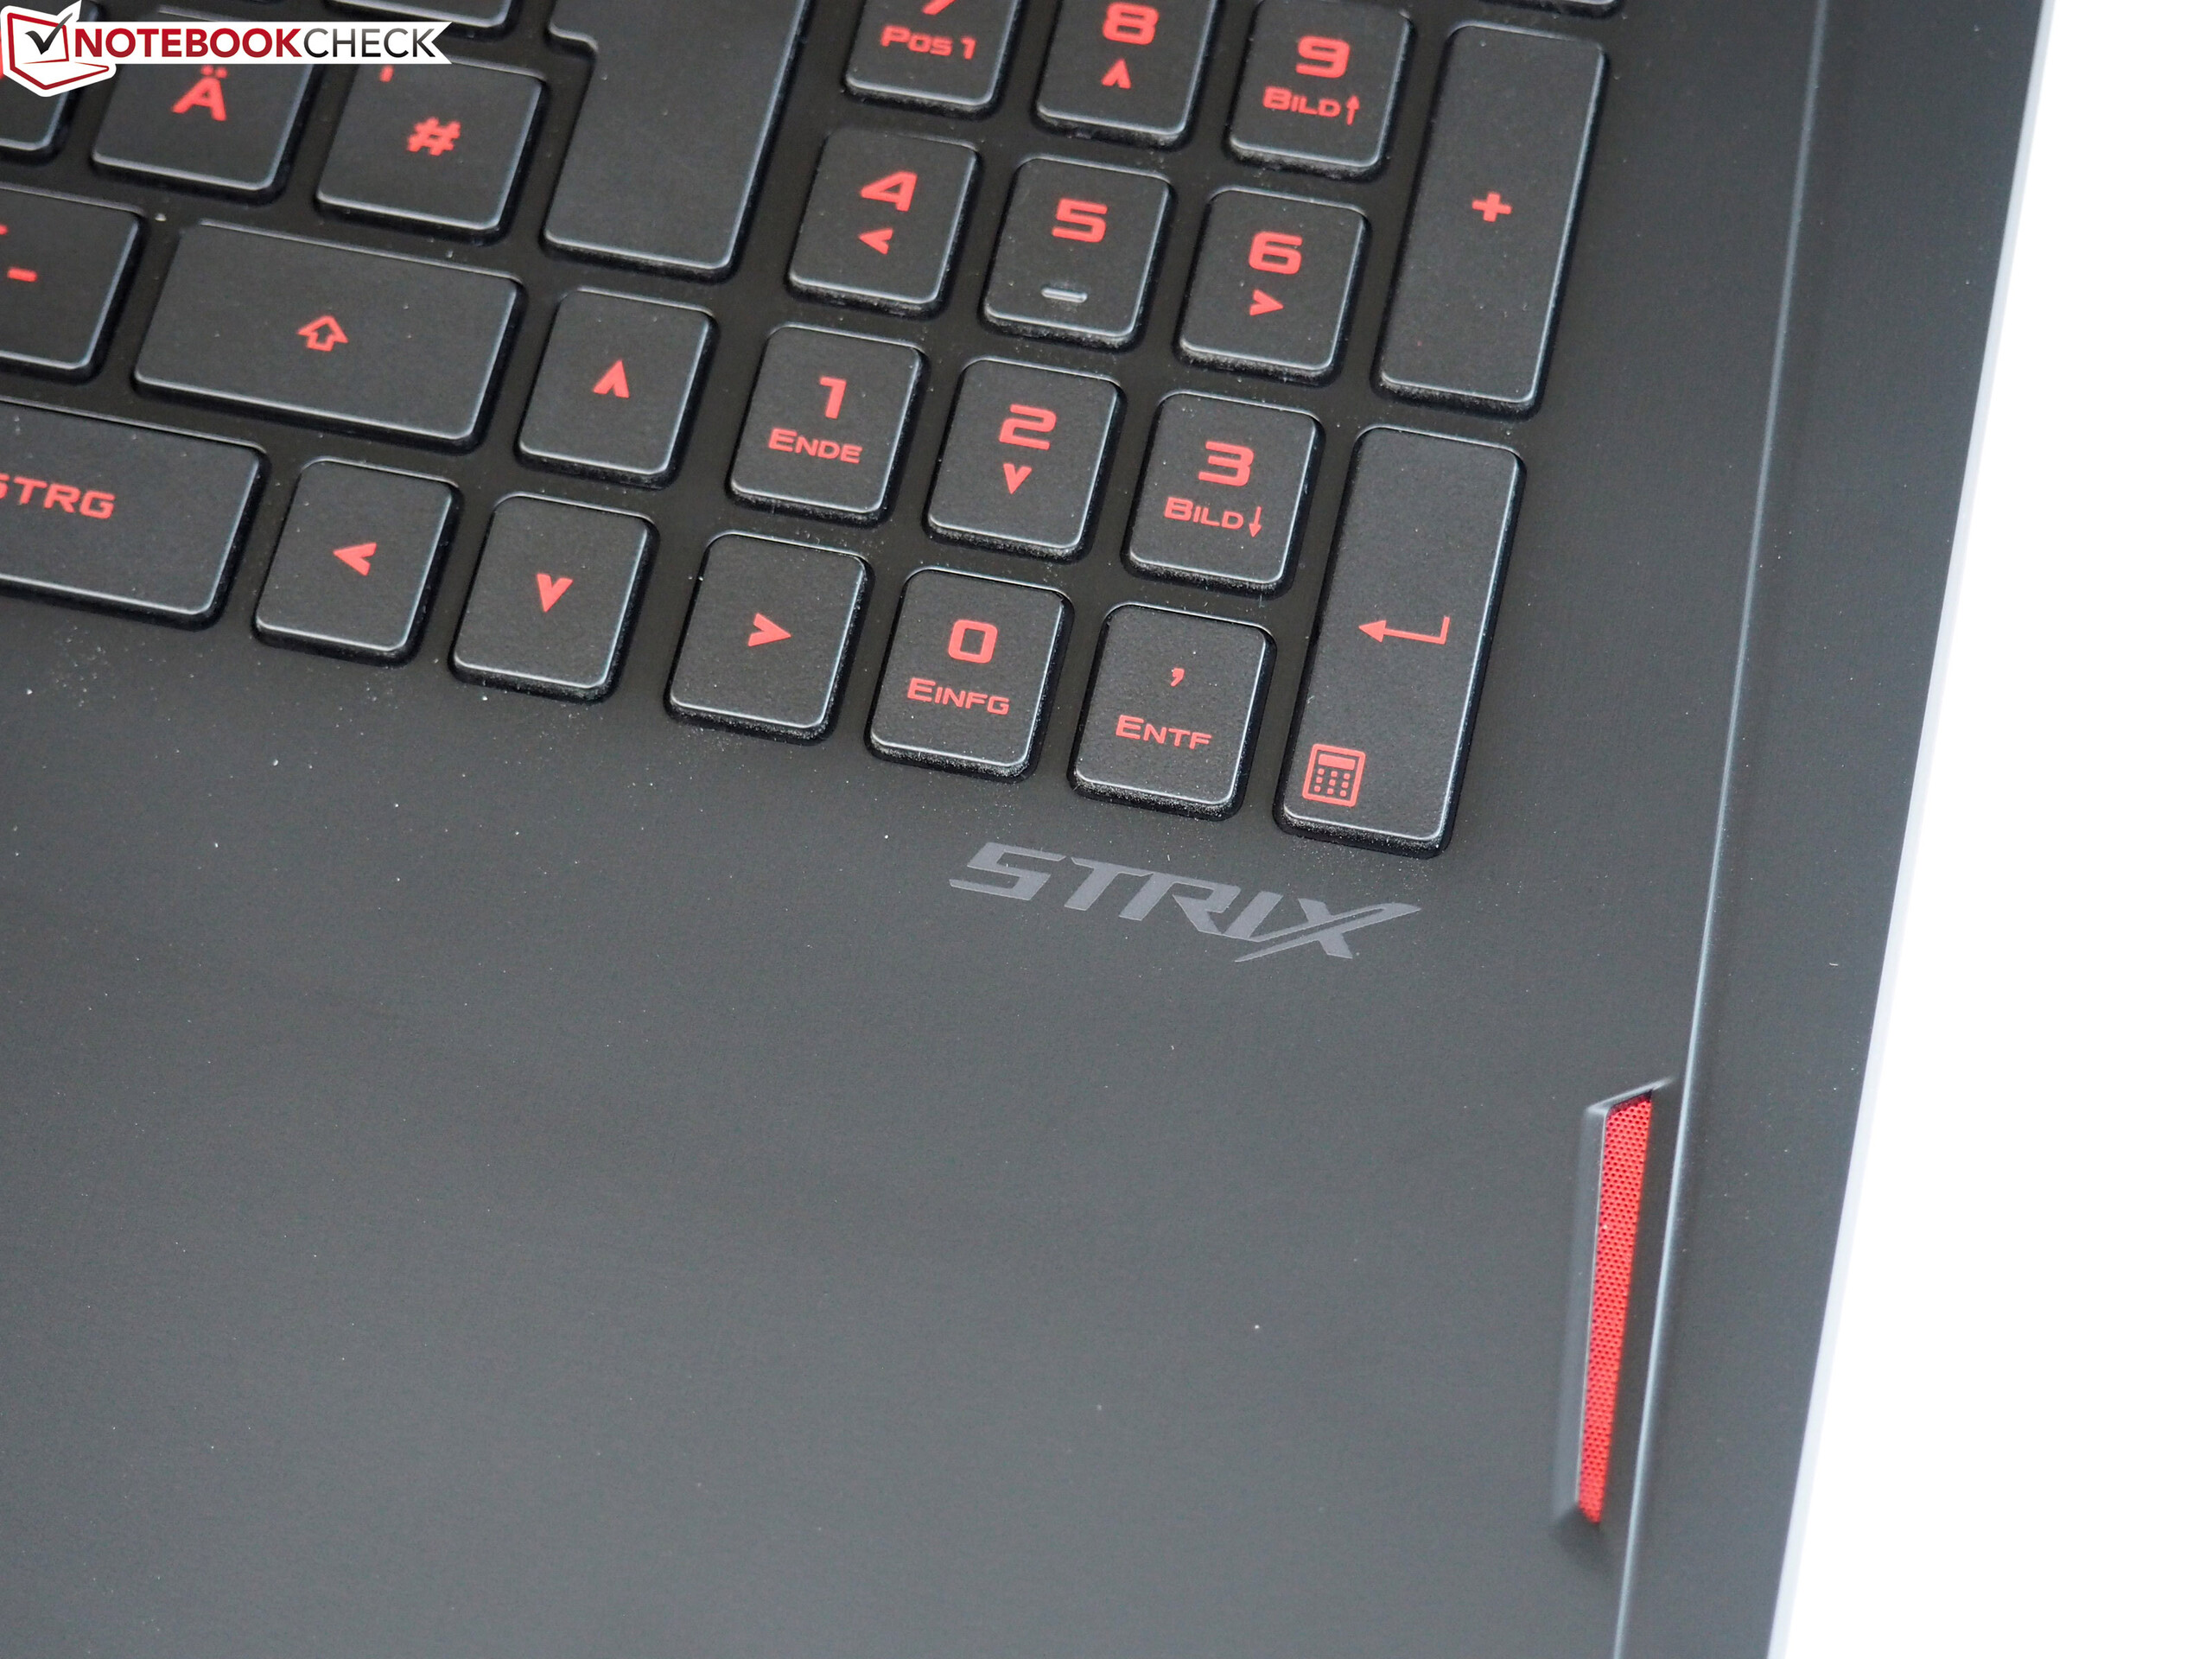
The key size of letters and numbers is standard at 15 x 15 mm. Only the arrow keys and the number block are slightly narrow (width of only 12 mm). Usual comfort features such as volume, display brightness and keyboard light can be controlled via the 0.9 mm high F row.
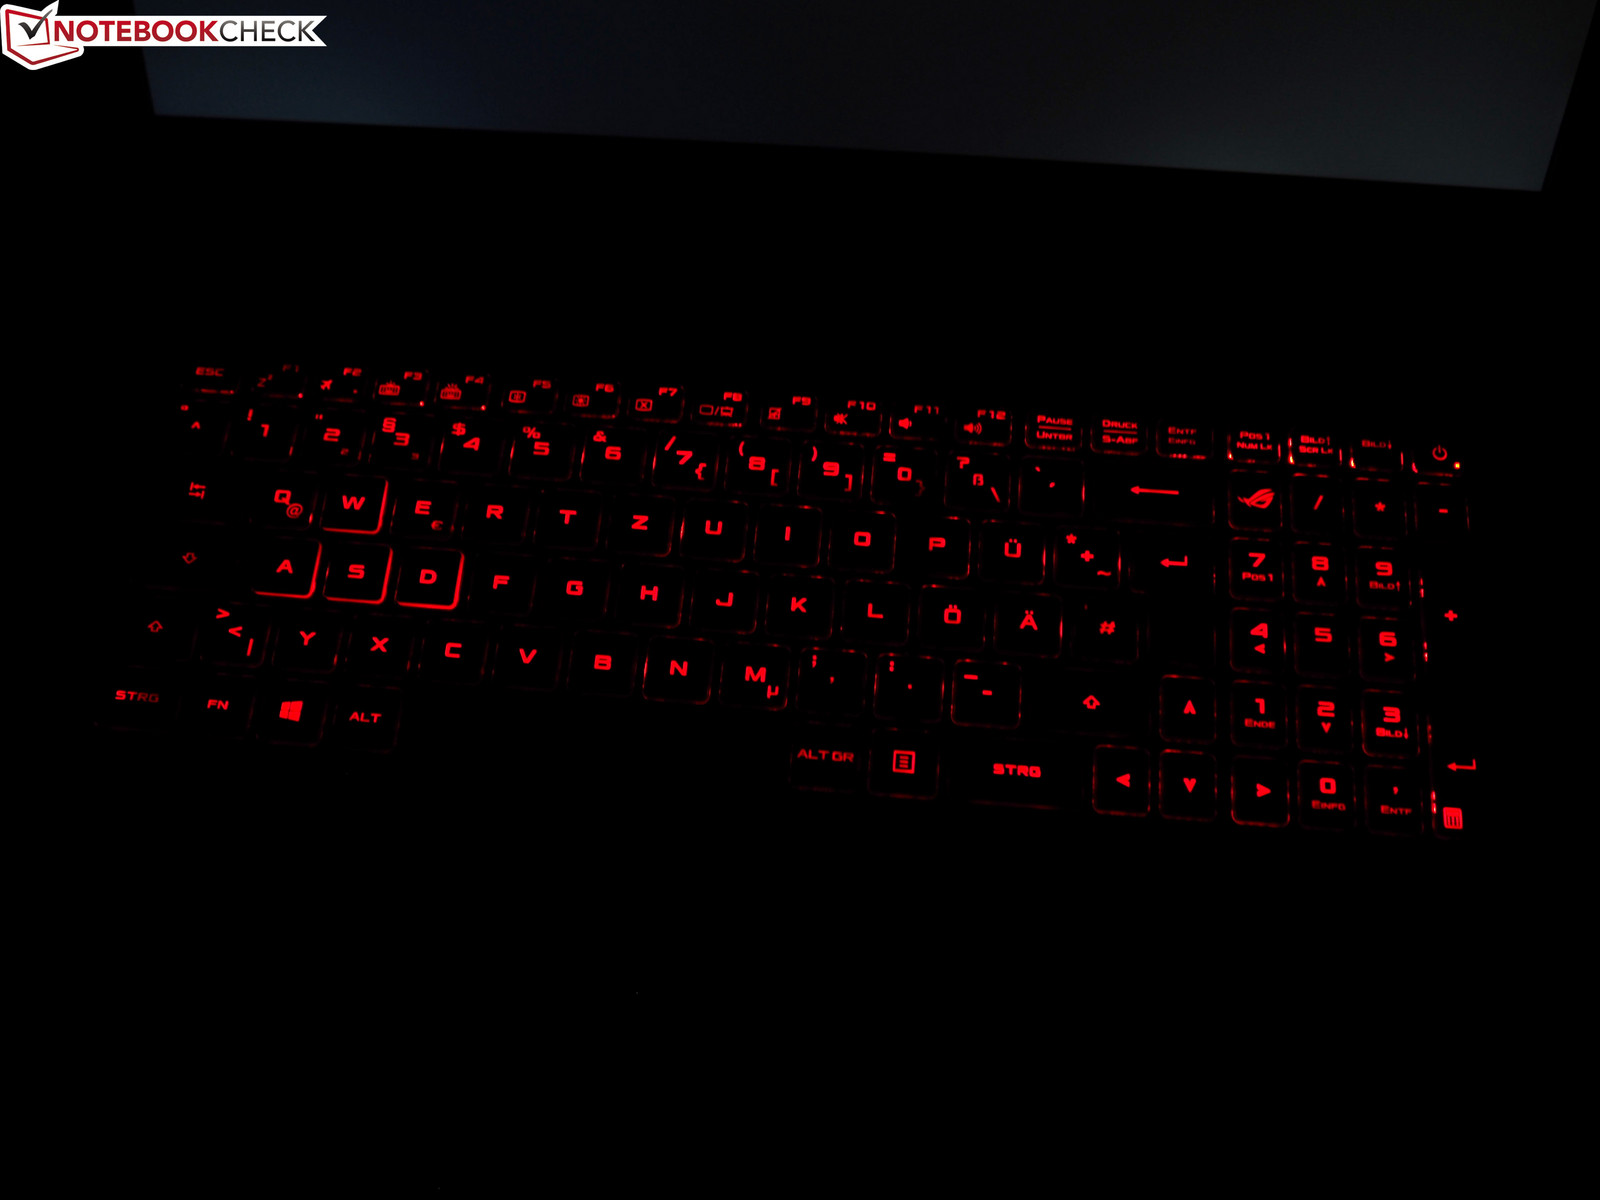
Speaking of the backlight: Asus does not follow the trend and omits an individual RGB key light. The entire keyboard features a multi-level, red key light. Moreover, the GL702ZC lacks macro keys. It is up to you if you consider this features important or not (we tend toward the latter group). Asus should improve the key labels. The legibility suffers from the pale red color - even in daylight. Most manufacturers use white labels for a reason.

Touchpad
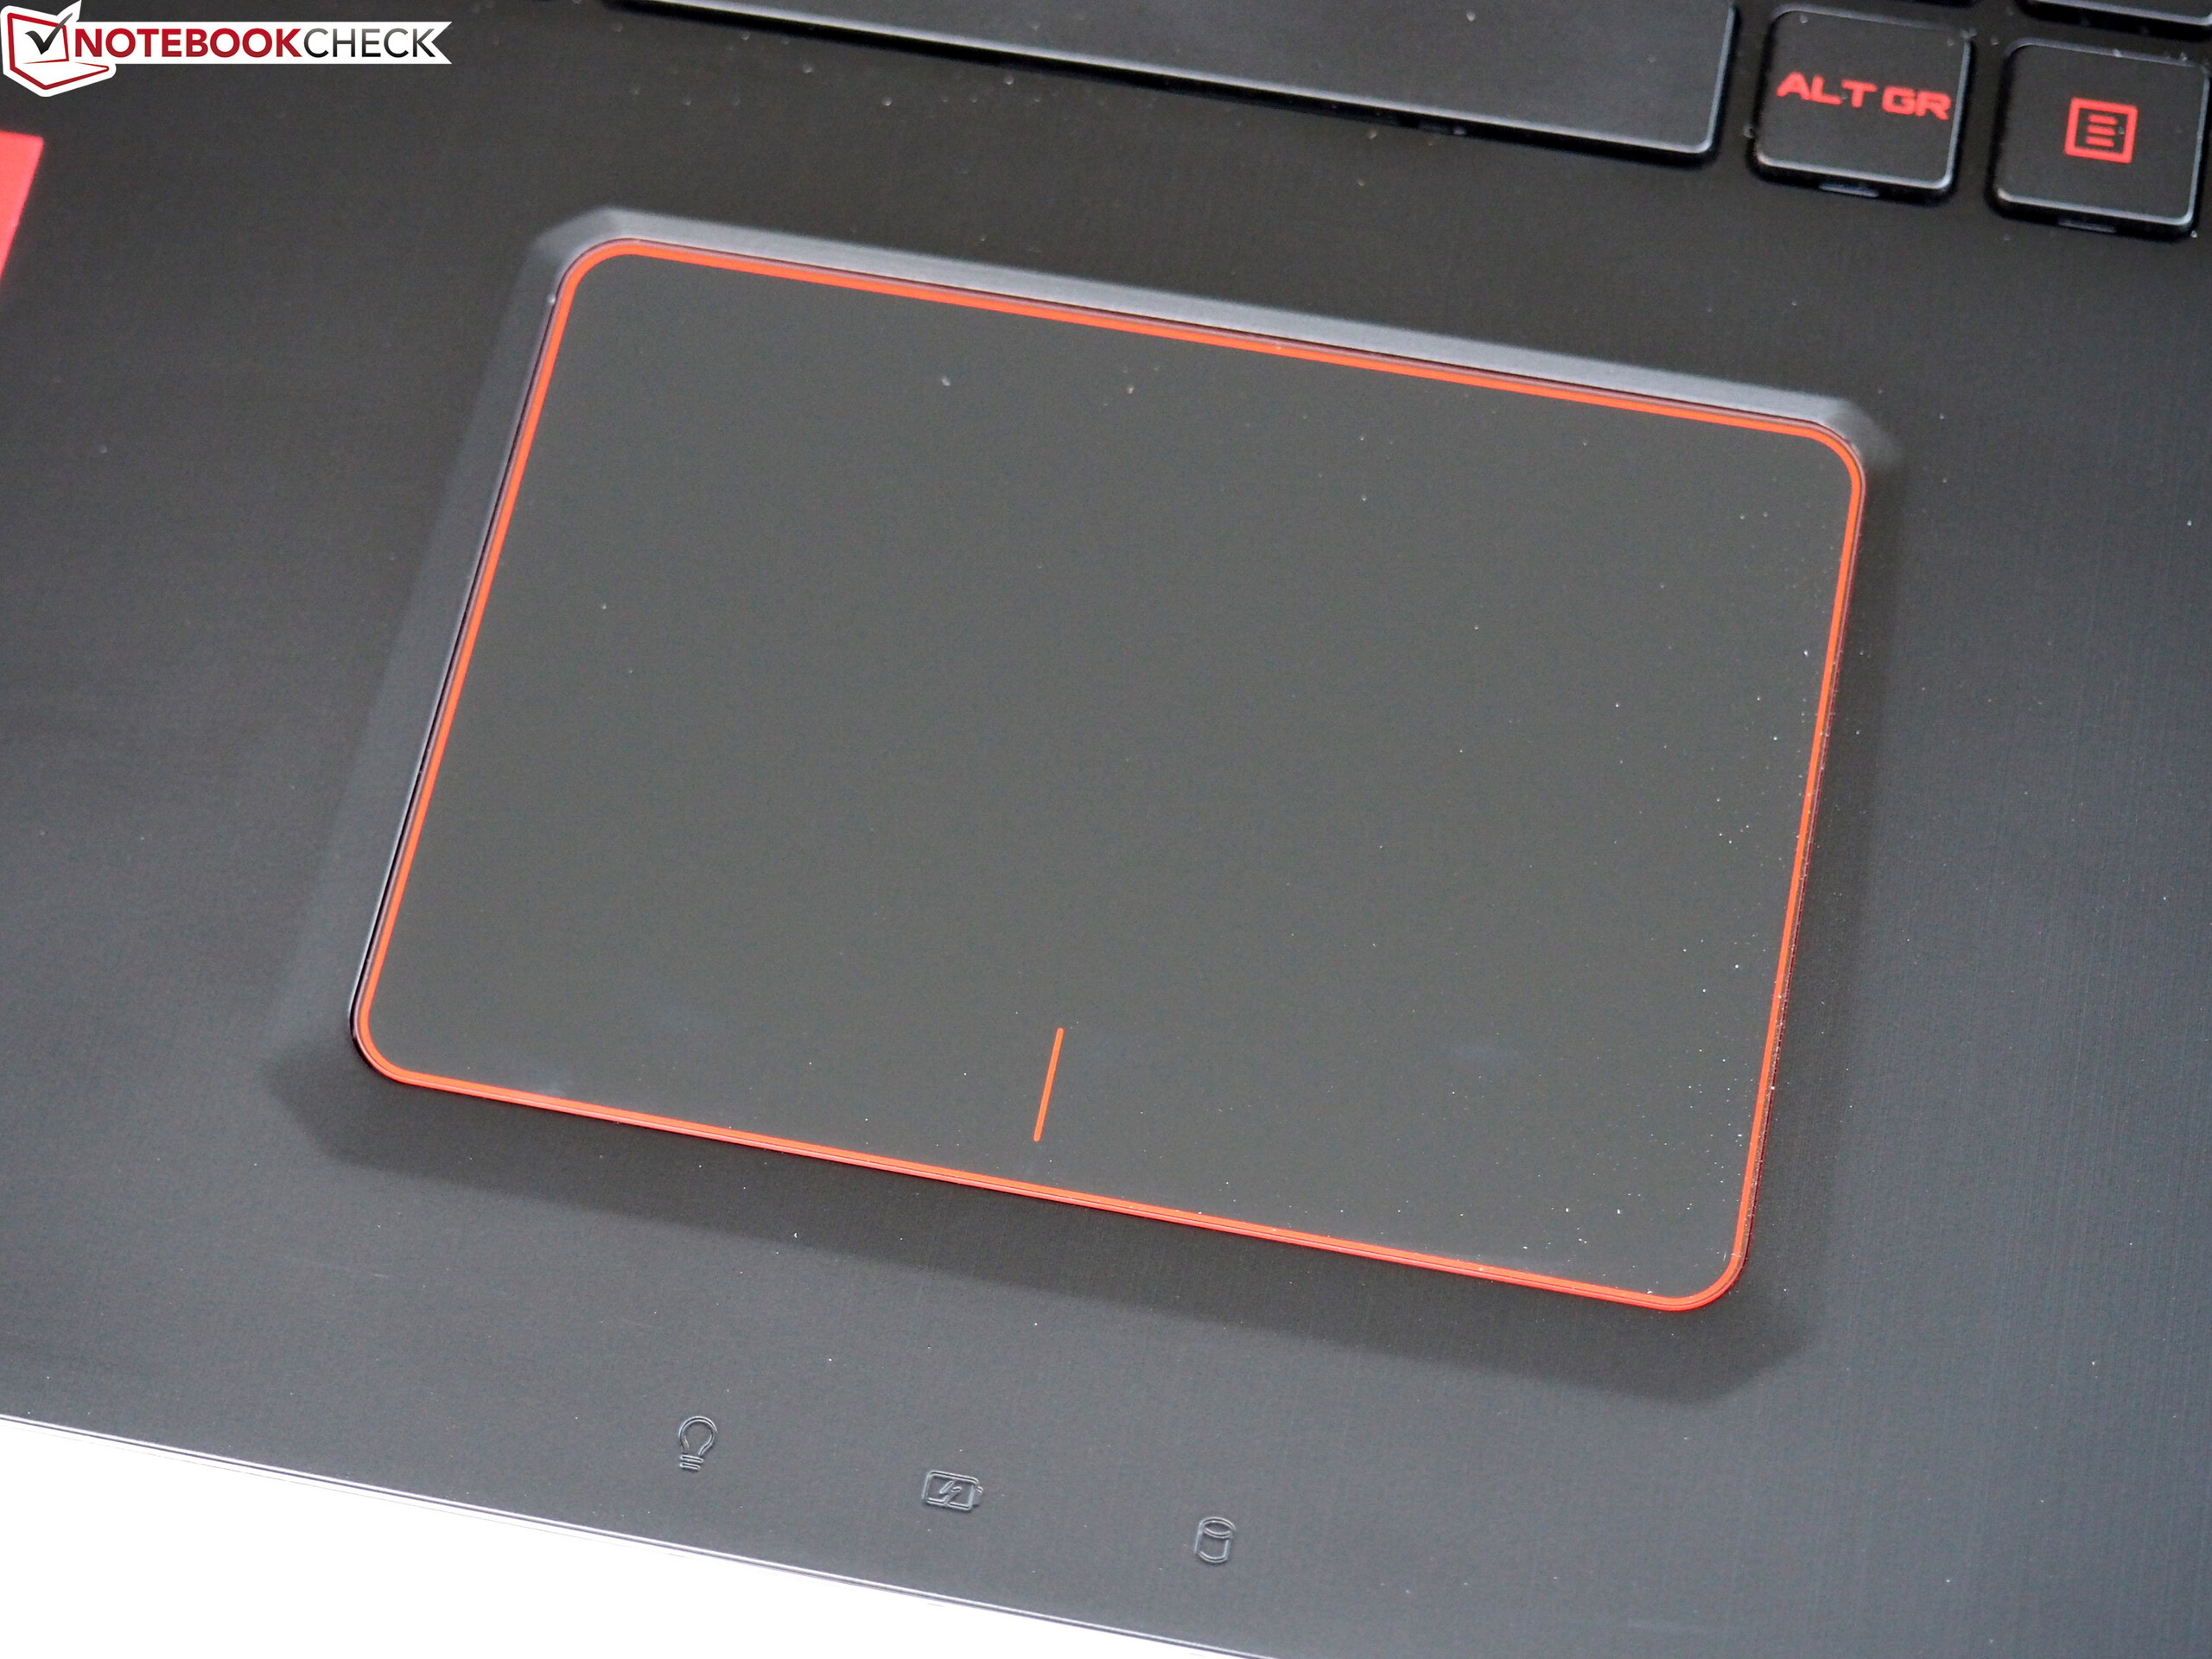
The mouse replacement with a size of 10.3 x 7.2 cm is a ClickPad. Unfortunately, the GL702ZC confirms that touchpads without dedicated mouse buttons do not always works flawlessly. Sometimes left and right clicks lack reliability as the system registers a mouse movement instead of a click and the general precision does not fully reach a (good) conventional touchpad's.
We appreciate the smooth finish, which feels nice to the touch and also allows fast input with slightly wet or greasy fingers. Multi-touch is certainly supported. We could scroll and zoom websites with two-finger gestures without problem in a short test with the Microsoft browser. The 17-inch laptop is not ideal for use in quiet surroundings (libraries, etc.) as the keyboard is loud and clatters.
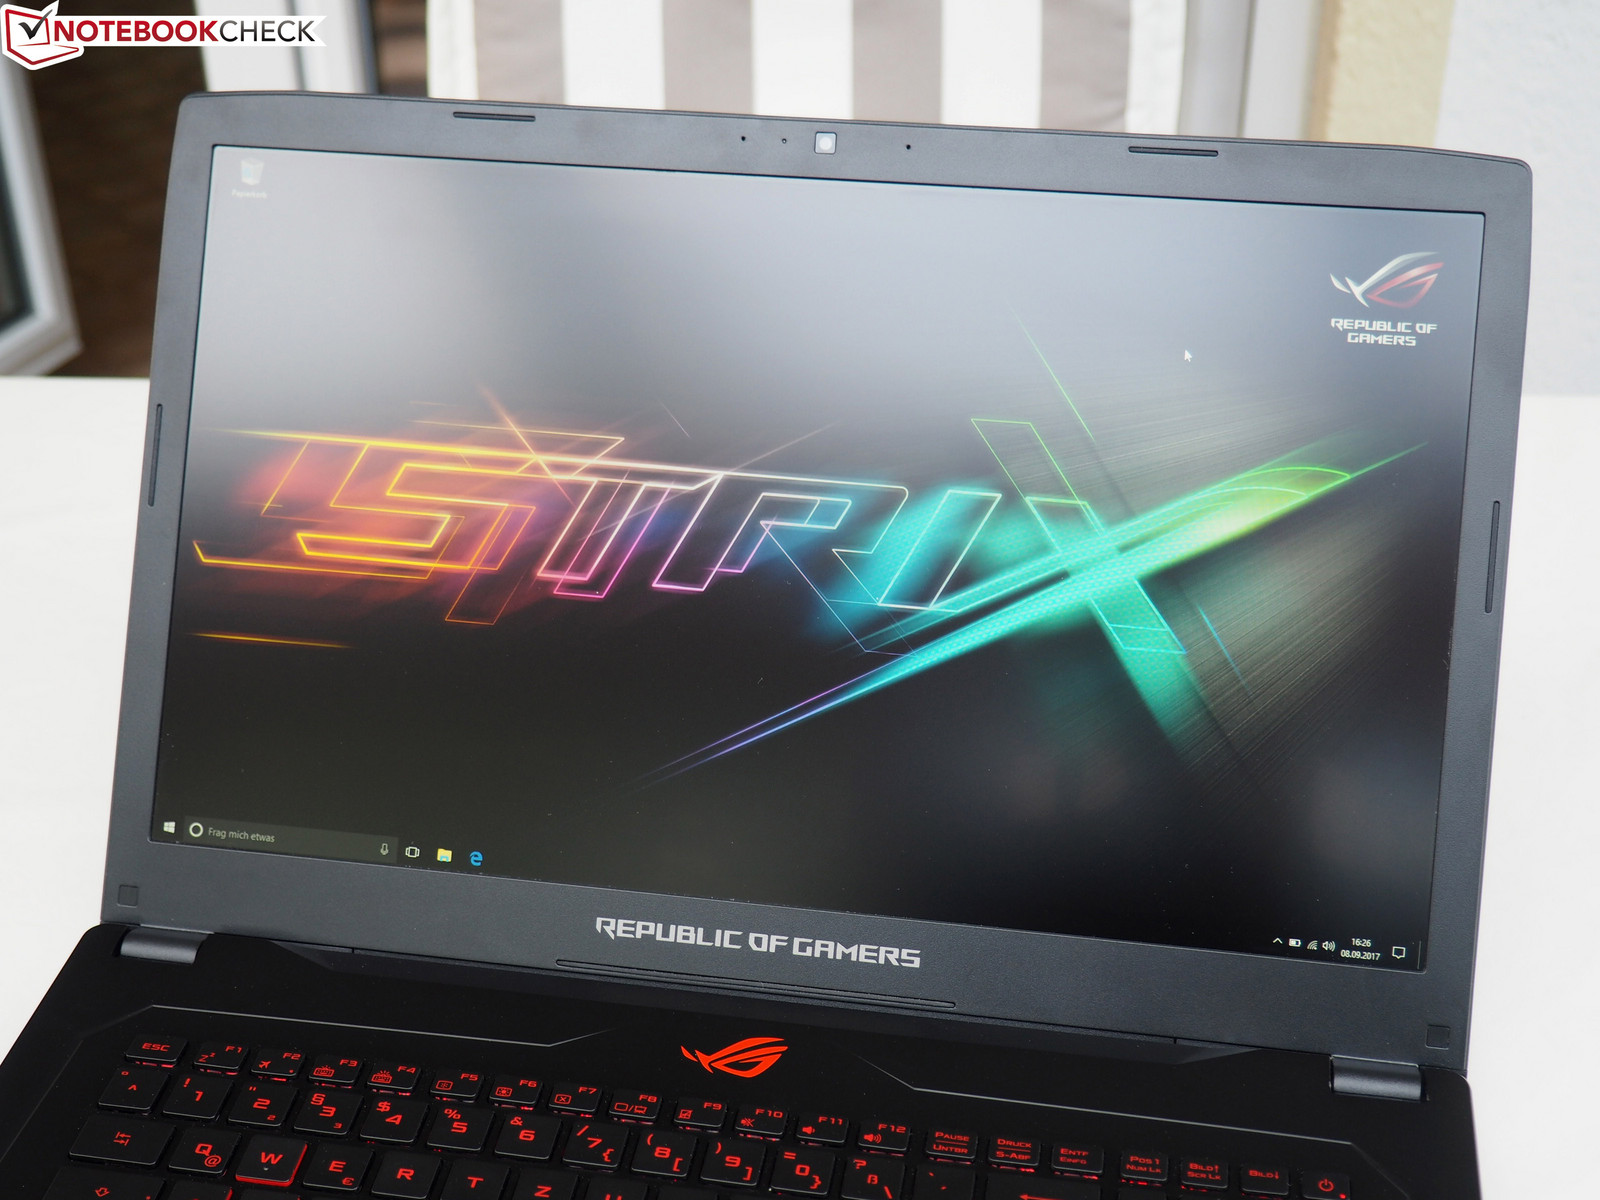
Display

Asus incorporated a Full HD display with 1920x1080 pixels, which is suitable for the performance of the graphics card. Unfortunately, it suffers from screen-bleeding (see photo on the right) at the corners. Apart from this, the 17-inch display LG LP173WF4-SPF5 performs very well.
Thanks to a brightness of 354 cd/m², it is possible to use the laptop outdoors. With this value, the GL702ZC takes the lead in our comparison group. The Schenker XMG U727, the Aorus X7 v7, and the Acer Aspire V17 Nitro follow closely behind.
| |||||||||||||||||||||||||
Brightness Distribution: 89 %
Center on Battery: 379 cd/m²
Contrast: 1223:1 (Black: 0.31 cd/m²)
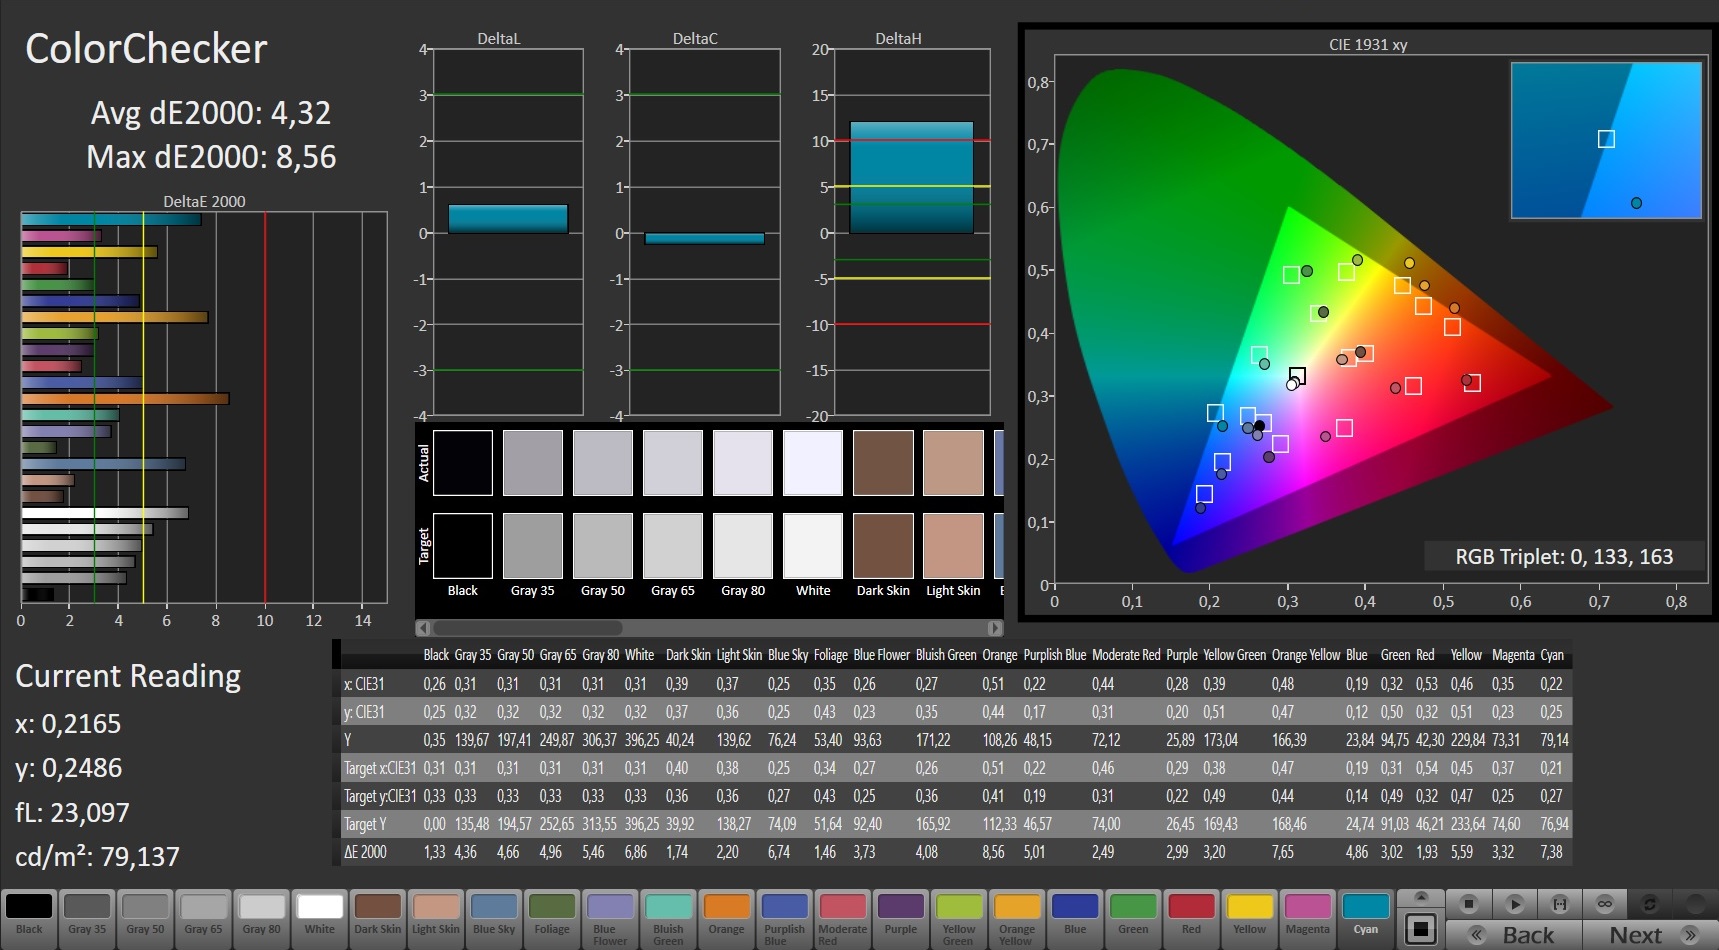
ΔE ColorChecker Calman: 4.32 | ∀{0.5-29.43 Ø4.73}
ΔE Greyscale Calman: 4 | ∀{0.09-98 Ø4.97}
85% sRGB (Argyll 1.6.3 3D)
56% AdobeRGB 1998 (Argyll 1.6.3 3D)
62.5% AdobeRGB 1998 (Argyll 3D)
85.4% sRGB (Argyll 3D)
67.1% Display P3 (Argyll 3D)
Gamma: 2.47
CCT: 6984 K
| Asus GL702ZC-GC104T LG Philips LP173WF4-SPF5 (LGD04E8), 1920x1080, 17.3" | Schenker XMG U727 2017 AU Optronics B173ZAN01.0 (AUO109B), 3840x2160, 17.3" | Aorus X7 v7 AU Optronics B173QTN01.4 (AUO1496), 2560x1440, 17.3" | Acer Aspire V17 Nitro BE VN7-793-738J AU Optronics B173ZAN01.0, 3840x2160, 17.3" | MSI GE72 7RE-046 N173HHE-G32 (CMN1747), 1920x1080, 17.3" | |
|---|---|---|---|---|---|
| Display | 35% | -1% | 33% | 29% | |
| Display P3 Coverage (%) | 67.1 | 86.6 29% | 63 -6% | 85.4 27% | 90.7 35% |
| sRGB Coverage (%) | 85.4 | 99.9 17% | 87.1 2% | 100 17% | 99.9 17% |
| AdobeRGB 1998 Coverage (%) | 62.5 | 99.5 59% | 63.7 2% | 97.8 56% | 85.2 36% |
| Response Times | -18% | 57% | 4% | 46% | |
| Response Time Grey 50% / Grey 80% * (ms) | 39.2 ? | 44 ? -12% | 24 ? 39% | 29 ? 26% | 27 ? 31% |
| Response Time Black / White * (ms) | 22.8 ? | 28 ? -23% | 6 ? 74% | 27 ? -18% | 9 ? 61% |
| PWM Frequency (Hz) | 122000 ? | ||||
| Screen | 16% | -24% | 2% | -13% | |
| Brightness middle (cd/m²) | 379 | 362 -4% | 375 -1% | 380 0% | 253 -33% |
| Brightness (cd/m²) | 354 | 344 -3% | 353 0% | 336 -5% | 230 -35% |
| Brightness Distribution (%) | 89 | 85 -4% | 85 -4% | 81 -9% | 86 -3% |
| Black Level * (cd/m²) | 0.31 | 0.35 -13% | 0.58 -87% | 0.32 -3% | 0.24 23% |
| Contrast (:1) | 1223 | 1034 -15% | 647 -47% | 1188 -3% | 1054 -14% |
| Colorchecker dE 2000 * | 4.32 | 2.46 43% | 6.06 -40% | 5.32 -23% | 5.01 -16% |
| Colorchecker dE 2000 max. * | 8.56 | 4.26 50% | 10.54 -23% | 7.63 11% | 10.4 -21% |
| Greyscale dE 2000 * | 4 | 2.9 27% | 5.68 -42% | 4.9 -23% | 7.26 -82% |
| Gamma | 2.47 89% | 2.31 95% | 2.3 96% | 2.61 84% | 2.09 105% |
| CCT | 6984 93% | 6120 106% | 7998 81% | 6558 99% | 6329 103% |
| Color Space (Percent of AdobeRGB 1998) (%) | 56 | 88 57% | 57 2% | 87.2 56% | 76 36% |
| Color Space (Percent of sRGB) (%) | 85 | 100 18% | 87 2% | 100 18% | 100 18% |
| Total Average (Program / Settings) | 11% /
15% | 11% /
-9% | 13% /
8% | 21% /
4% |
* ... smaller is better
In terms of contrast, only two of the three devices can keep up with our test model (the Aorus falls behind due to its modest black value). 1223:1 ensures a vibrant and nuanced image despite matte surface.
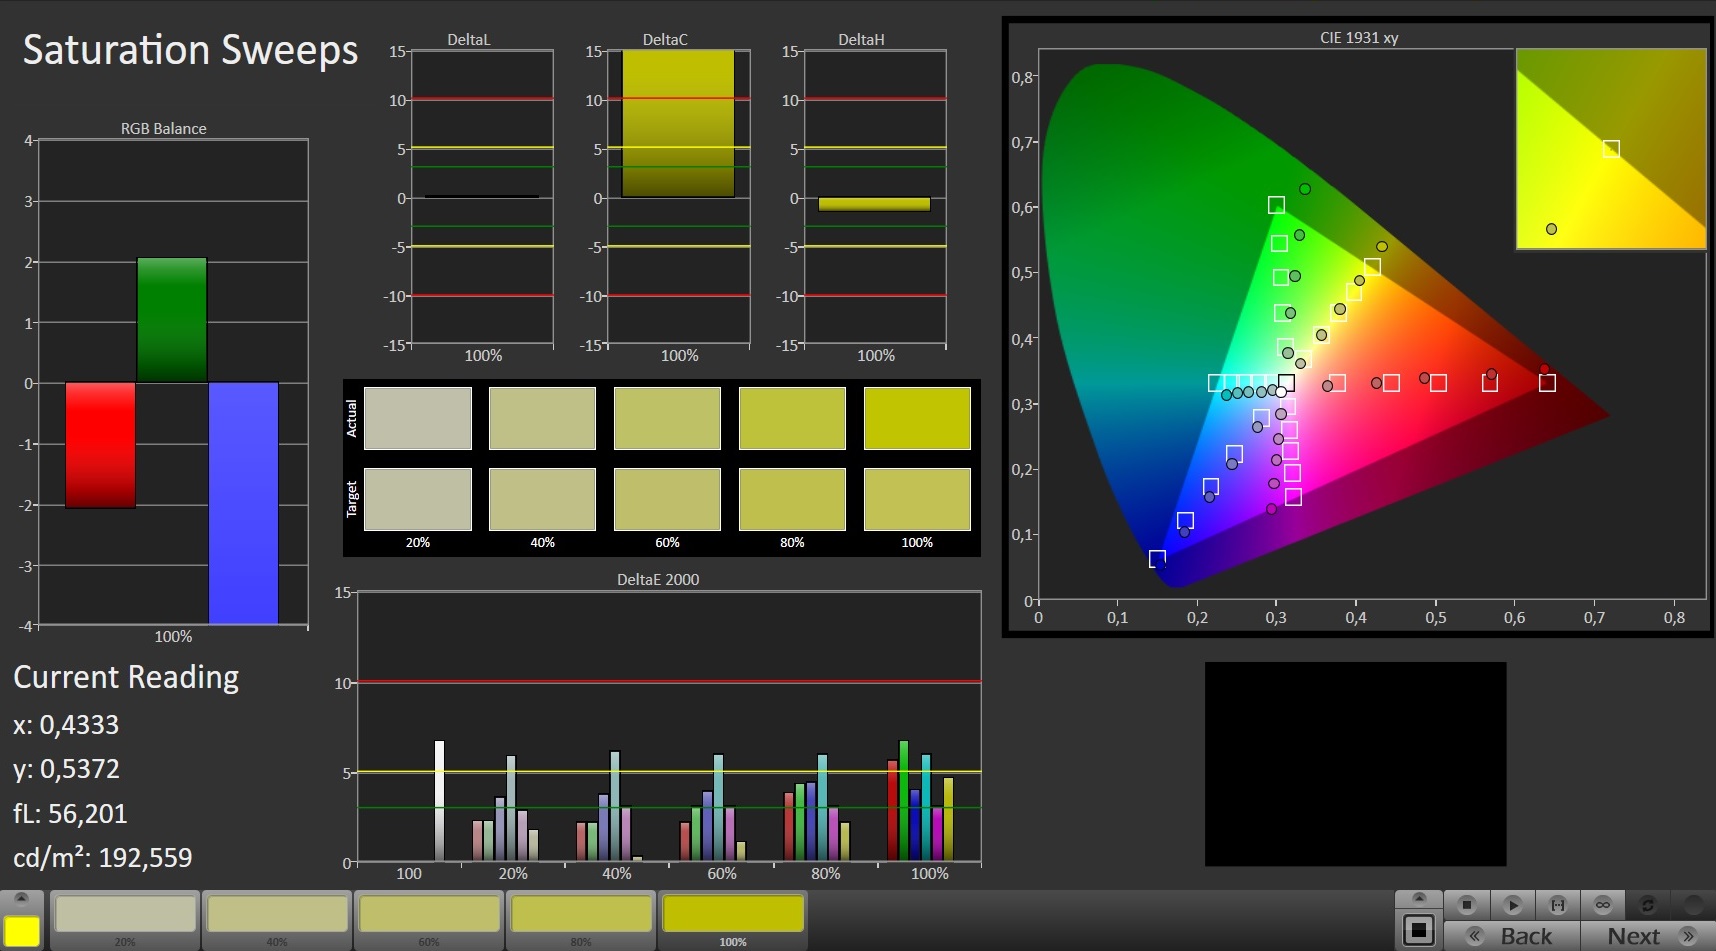
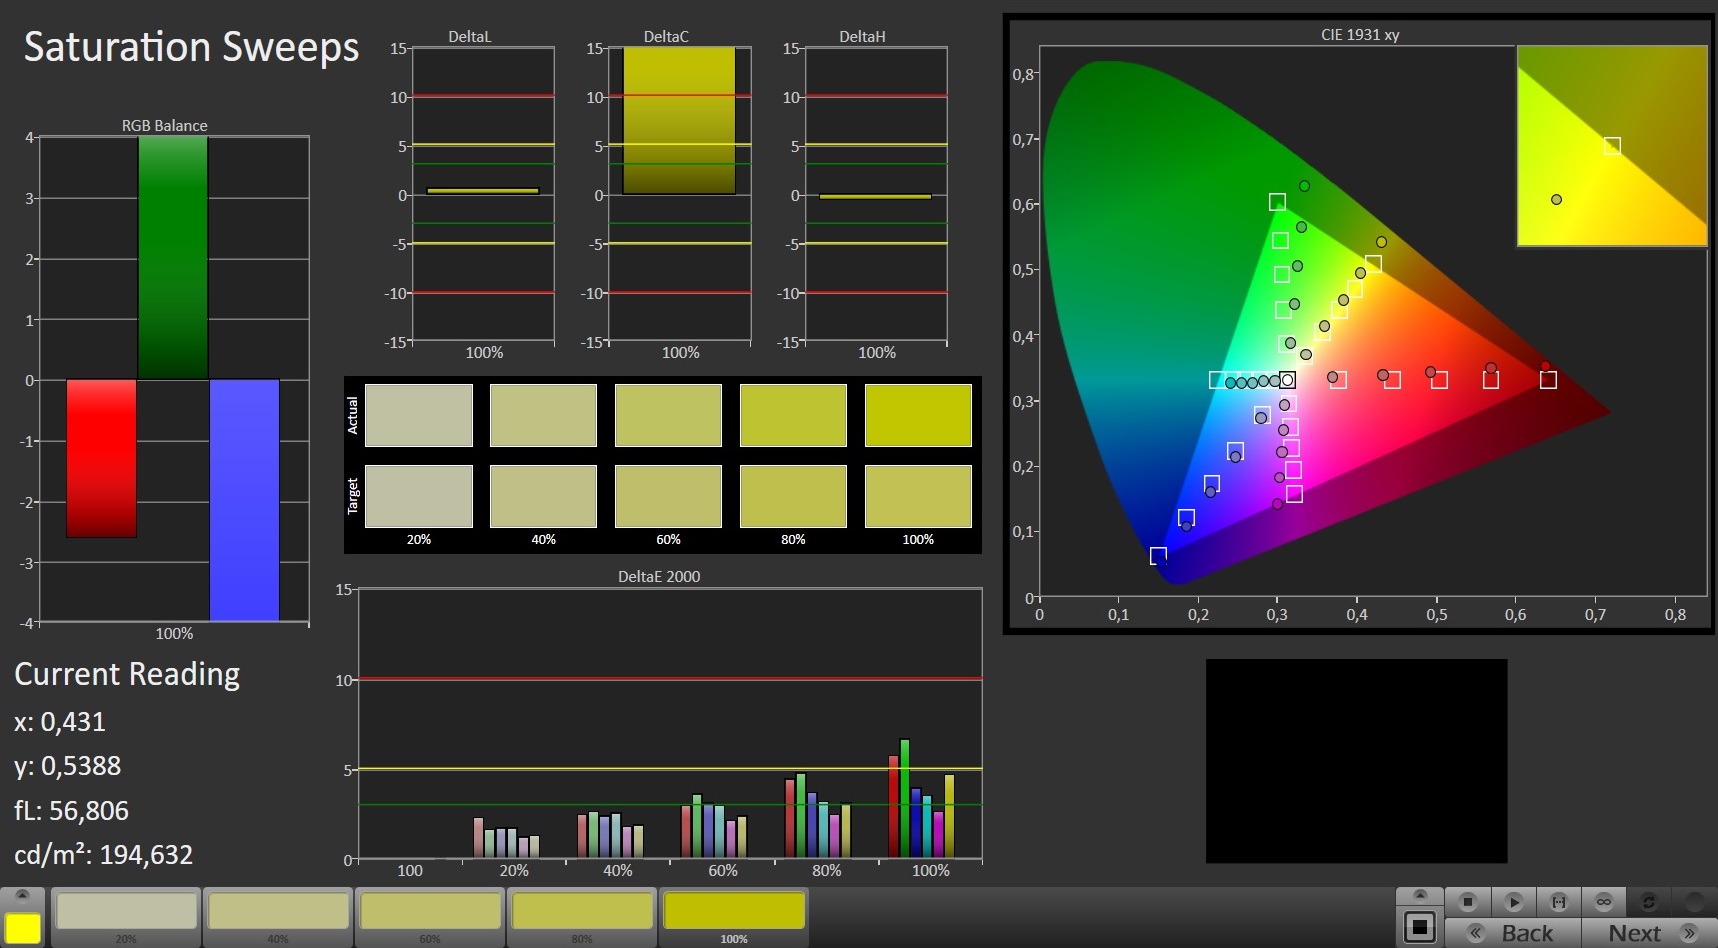
The color accuracy requires optimization. The DeltaE 2000 shifts of about 4 is slightly higher than the ideal value (under 3) in the grayscale and ColorChecker test of the CalMAN tool. Moreover, calibration will remove the slight blue tint.
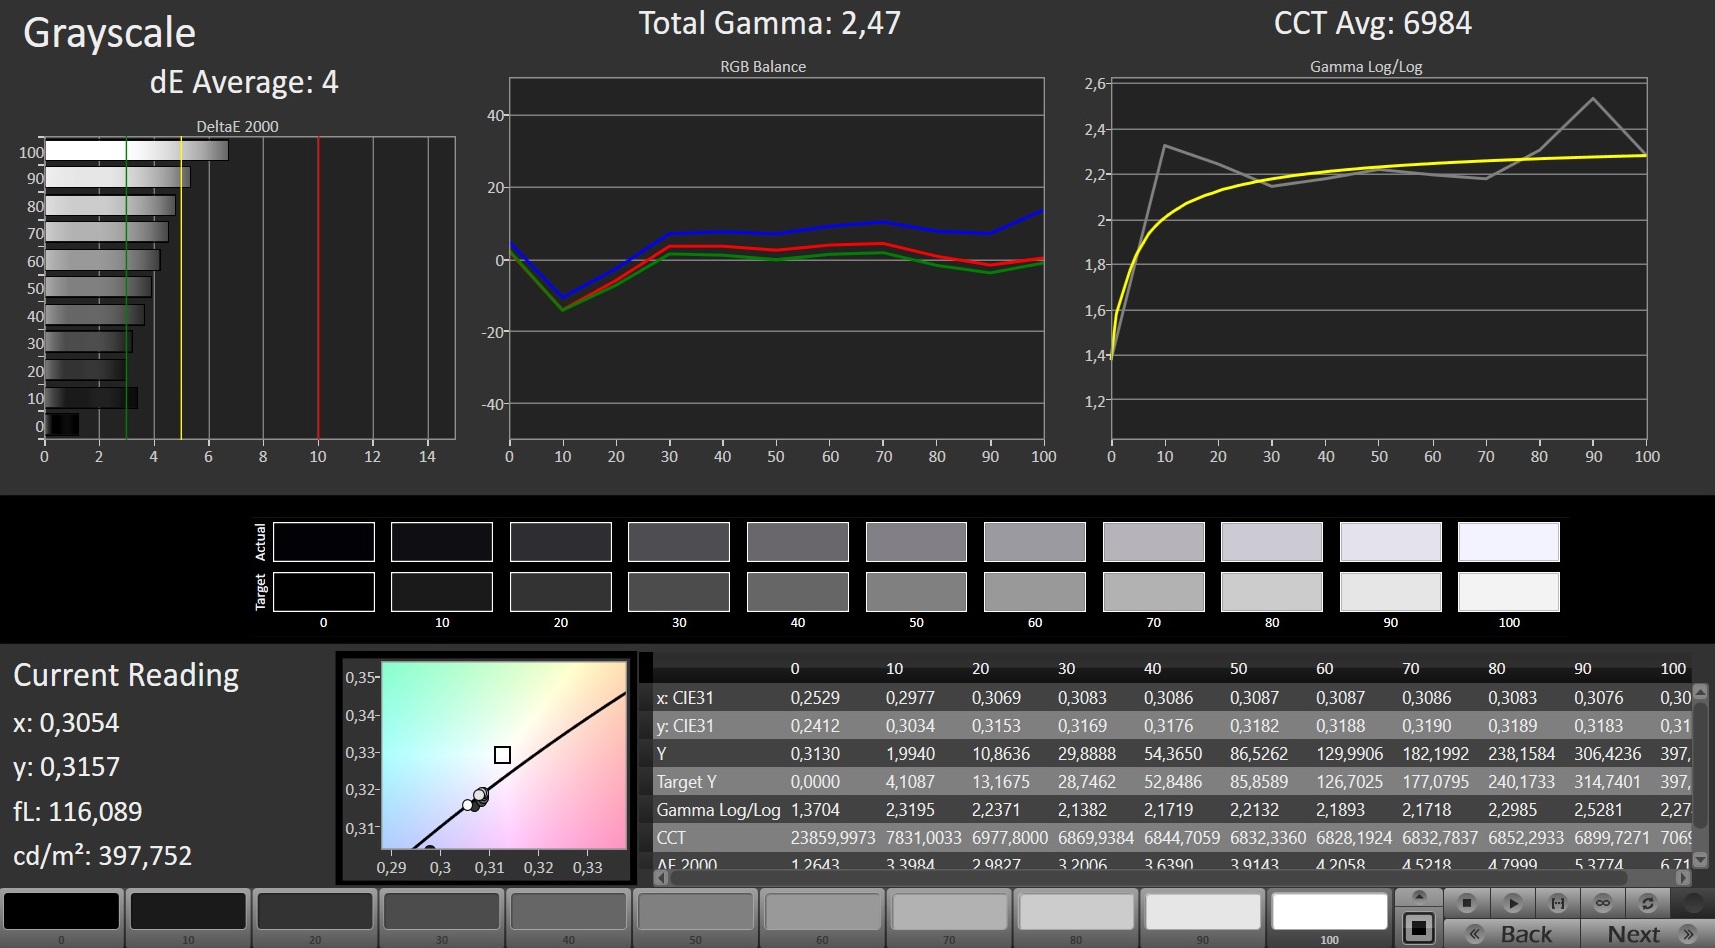
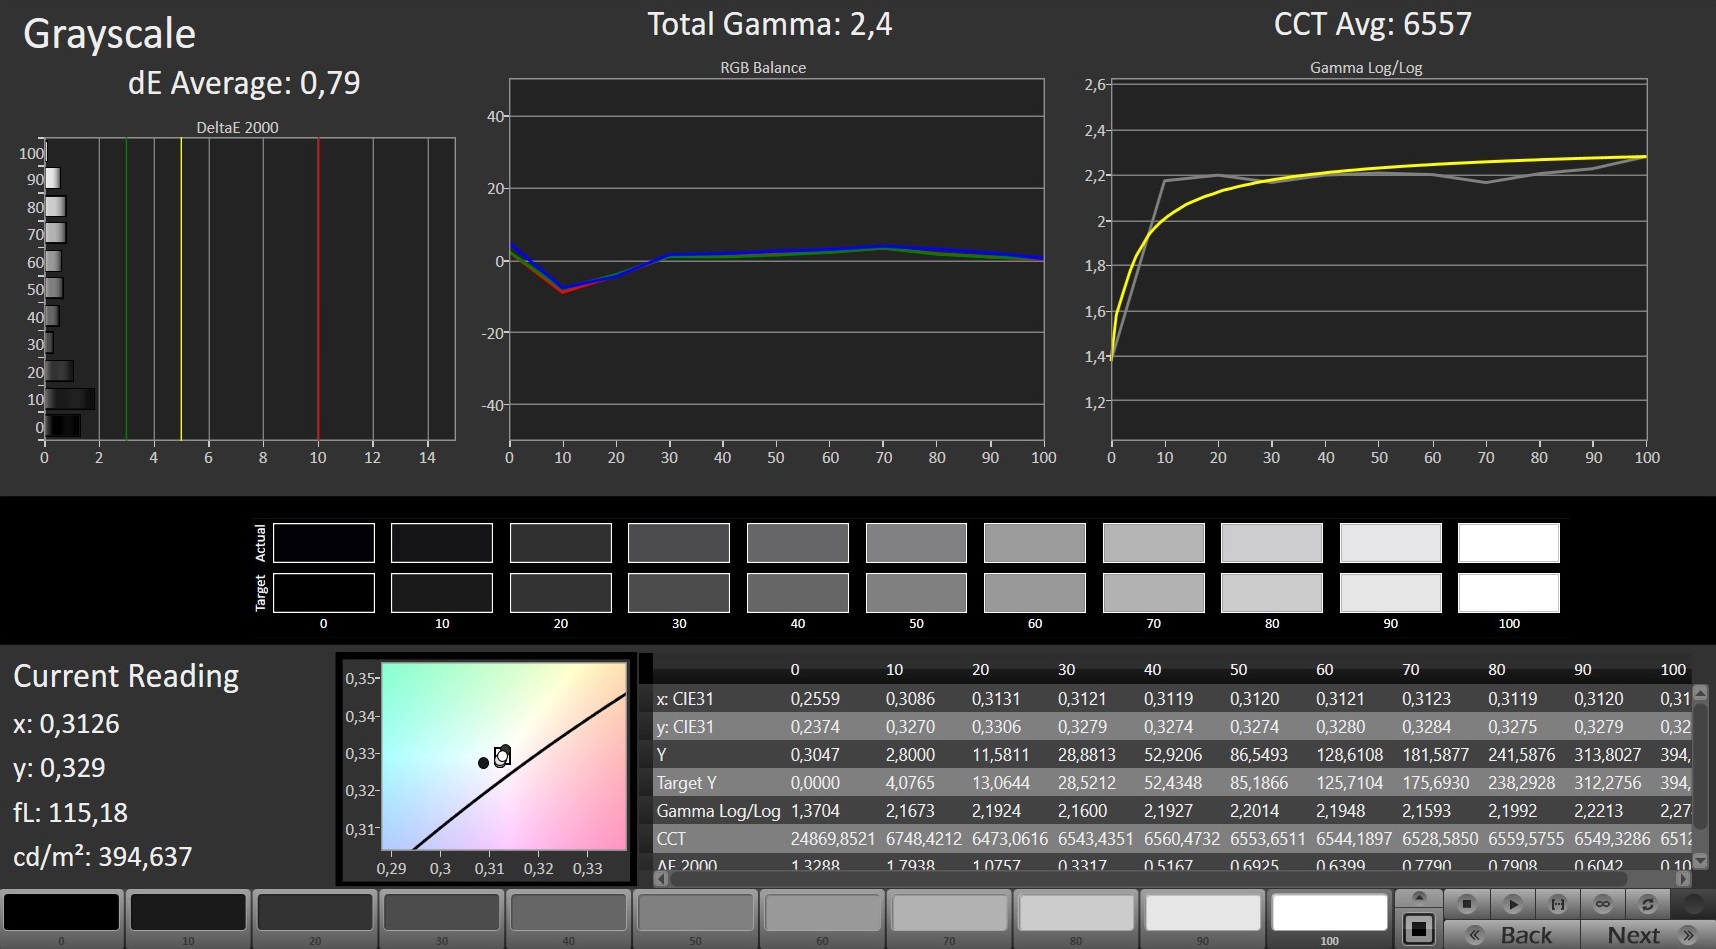
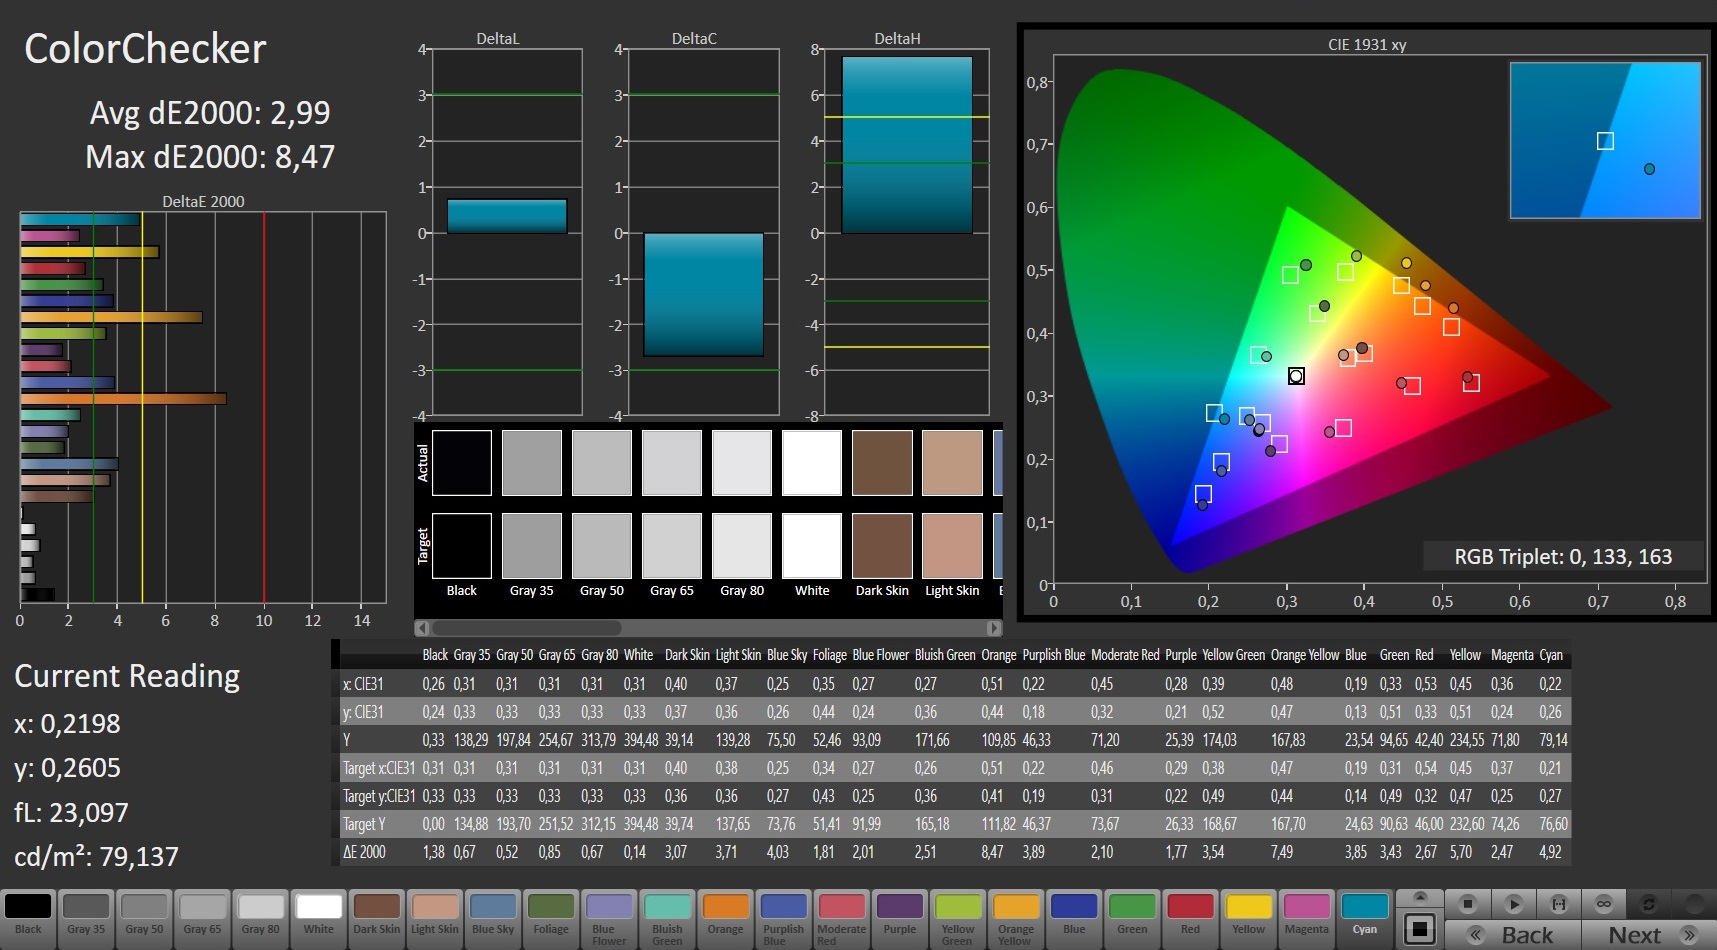
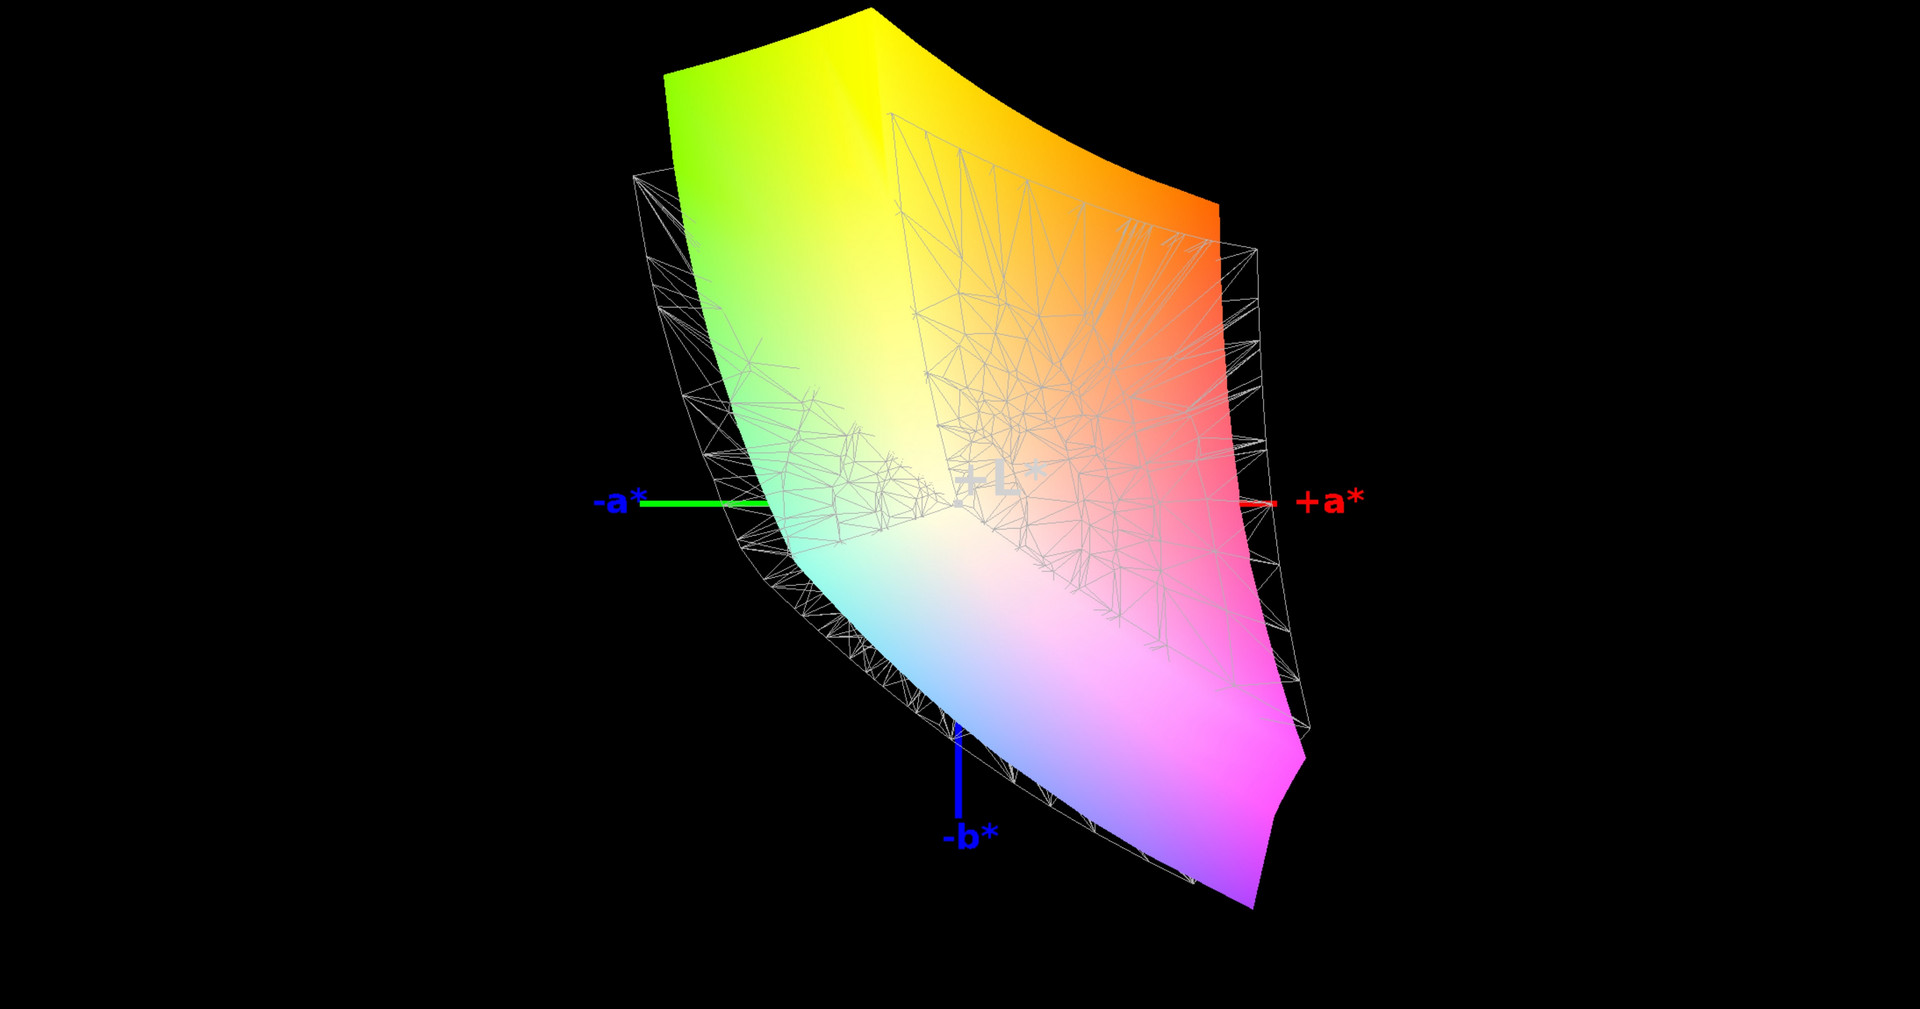
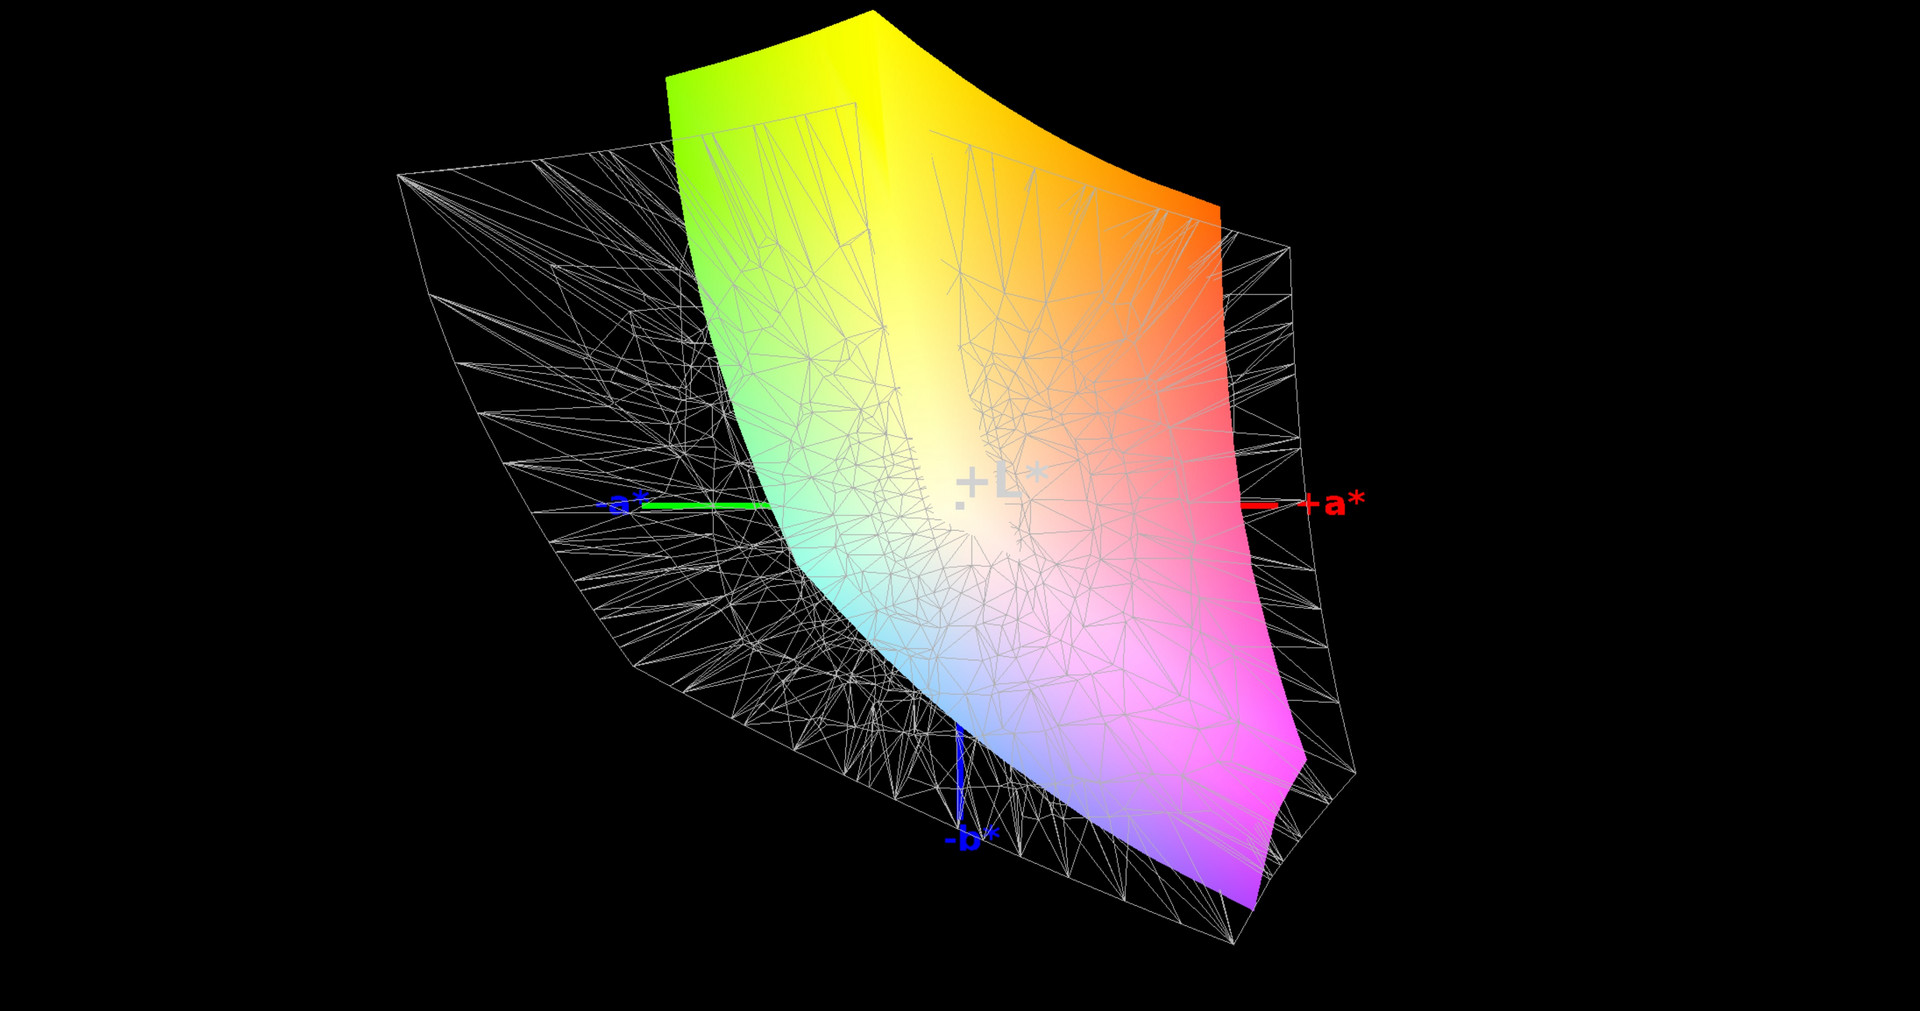
We detected a color space of 85% sRGB and 56% AdobeRGB. This is definitely sufficient for a gaming and multimedia notebook. The viewing angles are quite wide thanks to IPS technology. Images even remain almost unchanged at slightly unfavorable sitting positions. You need to look at the screen from very flat horizontal AND vertical angles in order to face bigger color and brightness shifts.

The response times are also typical for an IPS display. 23 ms black-to-white and 39 ms gray-to-gray are normal. Moreover, we could not detect blurring. Flickering was detected (up to 90% brightness), but this should not even cause problems in sensitive people due to a high frequency. As mentioned in the introduction, the display is FreeSync-capable. We disabled this feature in all our measurements.
Display Response Times
| ↔ Response Time Black to White | ||
|---|---|---|
| 22.8 ms ... rise ↗ and fall ↘ combined | ↗ 11.2 ms rise | 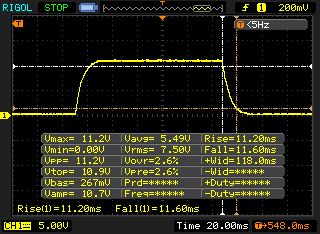 |
| ↘ 11.6 ms fall | ||
| The screen shows good response rates in our tests, but may be too slow for competitive gamers. In comparison, all tested devices range from 0.1 (minimum) to 240 (maximum) ms. » 51 % of all devices are better. This means that the measured response time is worse than the average of all tested devices (19.9 ms). | ||
| ↔ Response Time 50% Grey to 80% Grey | ||
| 39.2 ms ... rise ↗ and fall ↘ combined | ↗ 20.4 ms rise | 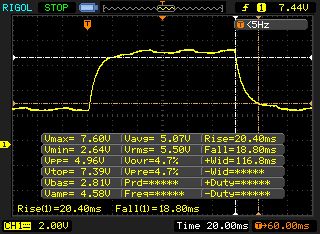 |
| ↘ 18.8 ms fall | ||
| The screen shows slow response rates in our tests and will be unsatisfactory for gamers. In comparison, all tested devices range from 0.165 (minimum) to 636 (maximum) ms. » 60 % of all devices are better. This means that the measured response time is worse than the average of all tested devices (31.1 ms). | ||
Screen Flickering / PWM (Pulse-Width Modulation)
| Screen flickering / PWM detected | 122000 Hz | ≤ 90 % brightness setting | 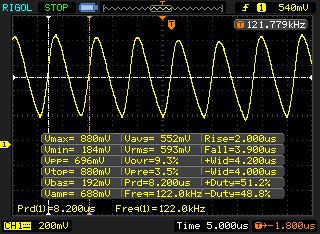 |
The display backlight flickers at 122000 Hz (worst case, e.g., utilizing PWM) Flickering detected at a brightness setting of 90 % and below. There should be no flickering or PWM above this brightness setting. The frequency of 122000 Hz is quite high, so most users sensitive to PWM should not notice any flickering. In comparison: 52 % of all tested devices do not use PWM to dim the display. If PWM was detected, an average of 7794 (minimum: 5 - maximum: 343500) Hz was measured. | |||
Performance
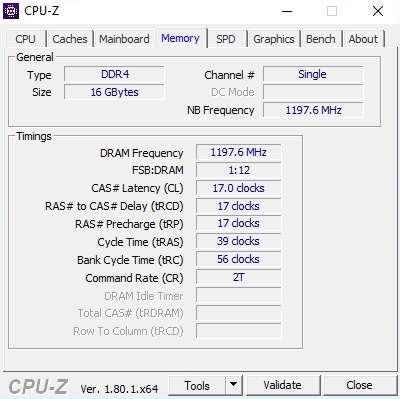
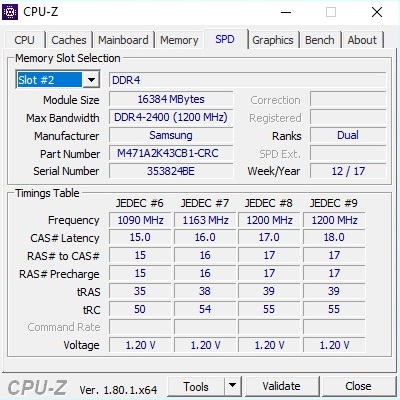
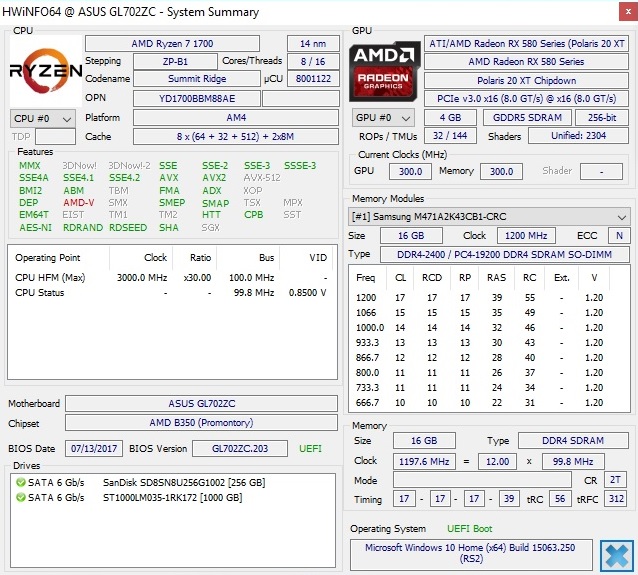
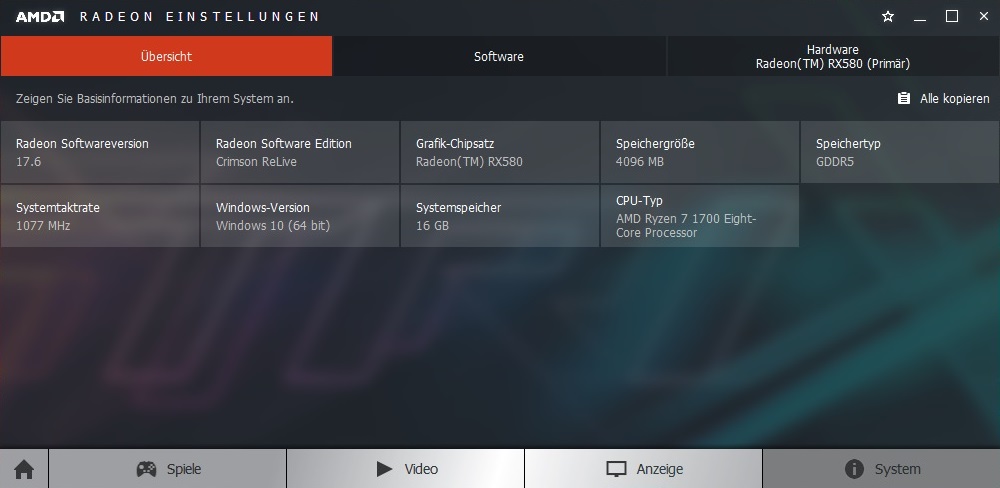
It is not exactly easy to categorize the GL702ZC in a specific performance class. While the Ryzen 7 1700 definitely plays in the top league, the Radeon RX 580 is between mid-range and high-end. The same is true for the used SSD, which lacks PCIe/NVMe technology. There is also room for improvements in terms of RAM, since Asus only used a single 16 GB module in single-channel mode (DDR4-2400 from Samsung).
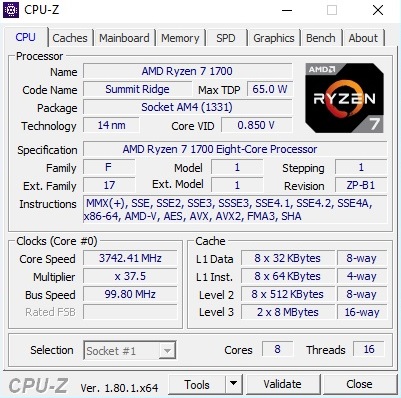
Processor
As AMD does not offer mobile versions of the Ryzen CPUs so far, Asus had no alternative to incorporating a desktop CPU with all its advantages and disadvantages. The reviewed top model uses with the Ryzen 7 1700, an 8-core chip, which can process 16 parallel threads thanks to SMT. This is double the thread count usual Intel CPUs from the notebook and desktop range can handle.
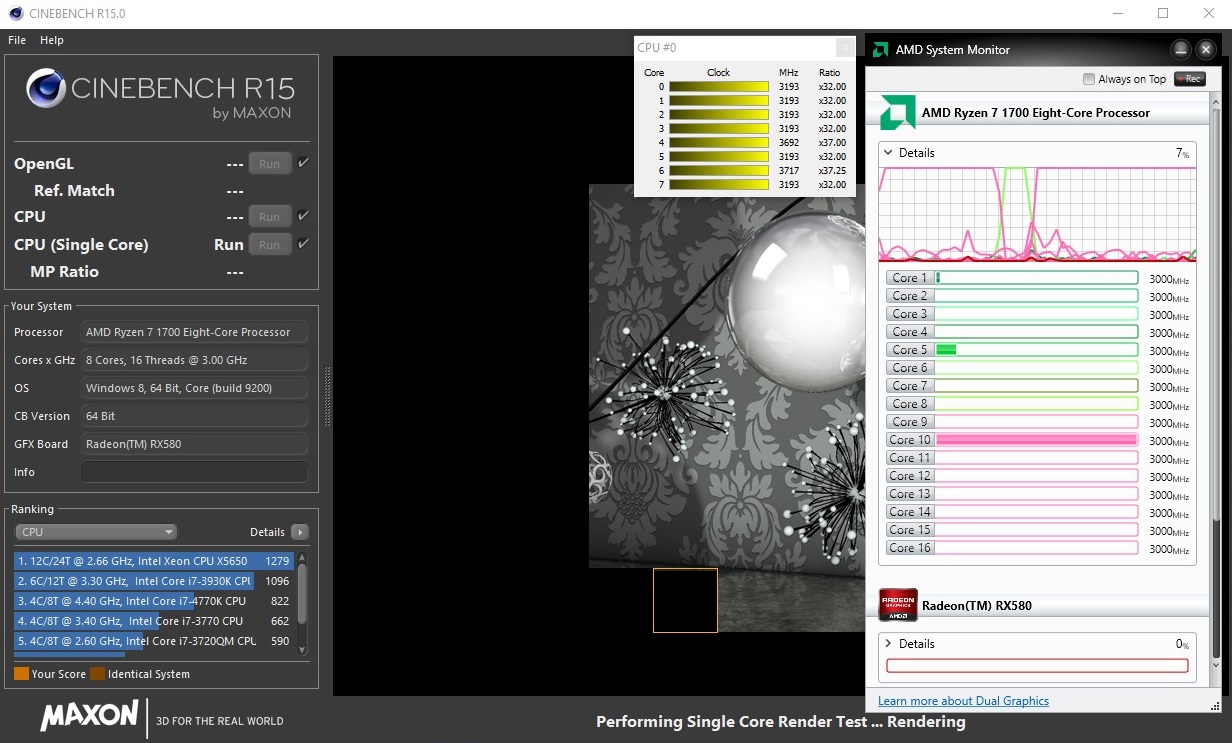
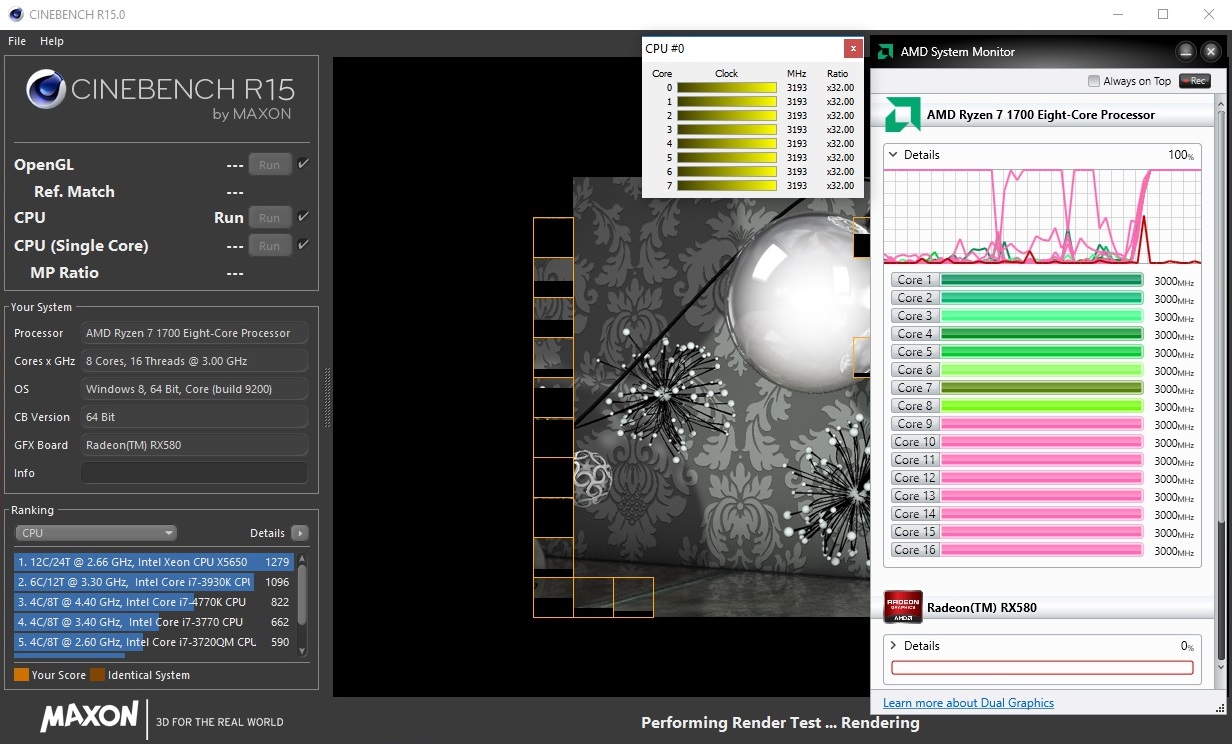
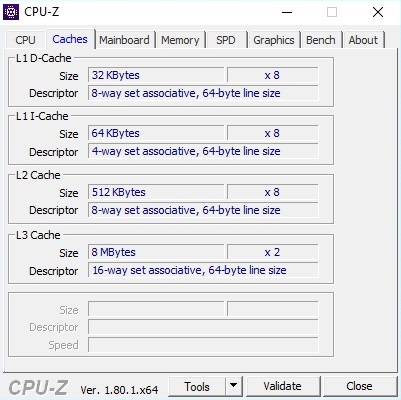
The Ryzen 7 1700 is best comparable with the Core i7-7700 (without K for free multiplier). While the latter only features 8 instead of 16 MB L3 cache, it achieves higher clock rates (3.6 to 4.2 vs. 3.0 to 3.7 GHz). The GL702ZC uses the clock range of the octa-core CPU quite well. A maximum of 3.7 GHz in single-core applications and exactly 3.2 GHz when all cores are used conform to AMD's specification.
| Cinebench R11.5 | |
| CPU Single 64Bit | |
| Schenker XMG U727 2017 | |
| Aorus X7 v7 | |
| MSI GE72 7RE-046 | |
| Asus GL702ZC-GC104T | |
| CPU Multi 64Bit | |
| Asus GL702ZC-GC104T | |
| Schenker XMG U727 2017 | |
| Aorus X7 v7 | |
| MSI GE72 7RE-046 | |
Thanks to its high core count, the Ryzen 7 1700 performs much better than the competitors in the multi-core tests. With 1408 points, it even outperforms the 91 Watt Core i7-7700K in Cinebench R15 by 47% (+49% @Cinebench R11.5). This is the best result of a notebook we have seen so far. As expected, single-core benchmarks are not a strength of the GL702ZC. The Ryzen CPU slightly falls behind the popular notebook CPU Core i7-7700HQ (2.8 to 3.8 GHz, 45 Watt TDP, 6 MB L3 cache) here. Since most modern applications are multi-threaded, this is hardly important.
In practice, the high consumption has a negative impact, which we will explain later. While the GL702ZC gets very loud under load and the cooling system reaches its limits, the CPU can deliver constant performance for a longer period of time. The figure below shows that the Cinebench score is still extremely high after many runs. More benchmarks to the Ryzen 7 1700 can be found in our database.
System Performance
The system performance also didn't give any bad surprises. The GL702ZC ranks relatively mid-range between its competitors in PCMark 8. The Aorus X7 v7 performs slightly better due to its fast PCIe SSD. Subjectively, the operating system reacts exceptionally fast. Apart from booting, also opening games only takes a short time - if they are installed on the SSD.
| PCMark 8 | |
| Home Score Accelerated v2 | |
| Aorus X7 v7 | |
| Schenker XMG U727 2017 | |
| Asus GL702ZC-GC104T | |
| Acer Aspire V17 Nitro BE VN7-793-738J | |
| Work Score Accelerated v2 | |
| Aorus X7 v7 | |
| Asus GL702ZC-GC104T | |
| Schenker XMG U727 2017 | |
| Acer Aspire V17 Nitro BE VN7-793-738J | |
| PCMark 10 - Score | |
| Aorus X7 v7 | |
| Asus GL702ZC-GC104T | |
| PCMark 8 Home Score Accelerated v2 | 4173 points | |
| PCMark 8 Work Score Accelerated v2 | 5110 points | |
| PCMark 10 Score | 5084 points | |
Help | ||
Storage Device
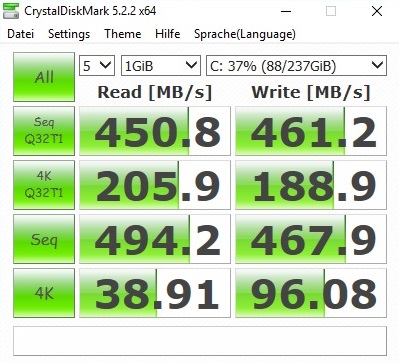
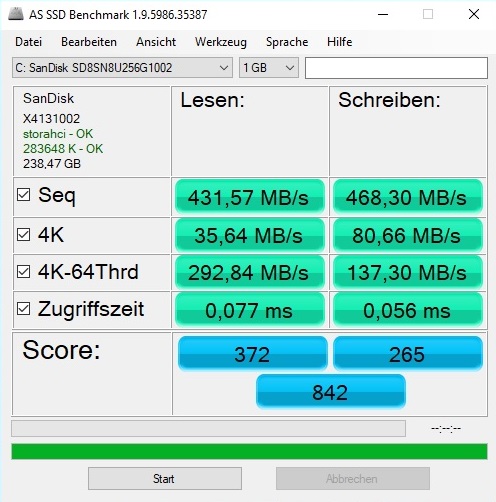
Although most users will not notice a difference between a SATA-III SSD and a PCIe/NVMe model in practice, we still do not quite understand why Asus did not implement the latter technology in the 1800-Euro (~$2150) test model. Alike all of its kind, the 256 GB SanDisk Drive of the GL702ZC limits the sequential rates to about 500 MB/s. Modern SSDs can often exceed 1000 or even 2000 MB/s.
The extreme performance advantage is also apparent in our benchmark table. Other gaming notebooks perform multi-times better in CrystalDiskMark 5.2 than our test model. However, those who do not use applications which require highest possible throughput will also be happy with a SATA-III SSD.
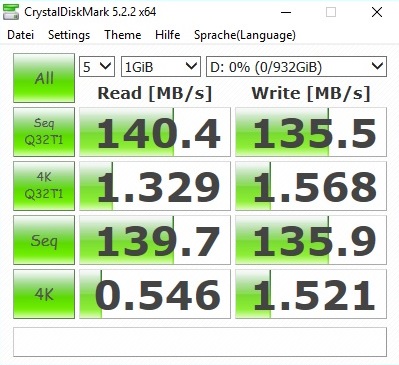
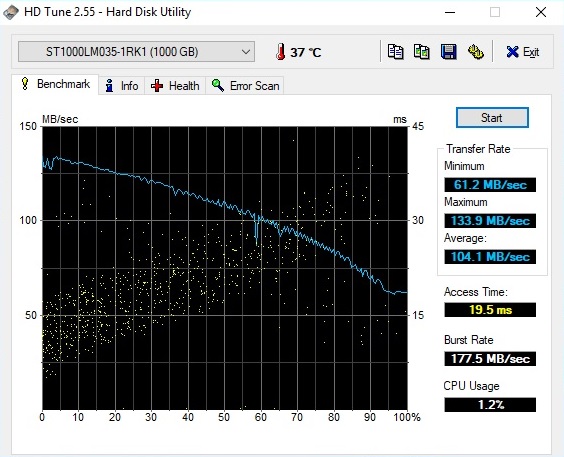
In case the SSD's storage capacity is not sufficient, the laptop features a secondary 1 TB HDD in 2.5-inch format (Seagate ST1000LM035). It works at 5400 RPM and delivers an acceptable performance for an HDD. You should avoid installing games on it however, since loading times will increase dramatically if you do so.
| Asus GL702ZC-GC104T SanDisk SD8SN8U256G1002 | MSI GT75VR 7RF-012 Titan Pro 2x Samsung SM961 MZVPW256HEGL NVMe (RAID 0) | Asus Zephyrus GX501 Samsung SSD SM961 1TB M.2 MZVKW1T0HMLH | Gigabyte P56XT LiteOn CX2-8B256 | Schenker XMG A517 Samsung SSD 960 Evo 500GB m.2 NVMe | HP Omen 15-ce002ng Samsung PM961 MZVLW256HEHP | |
|---|---|---|---|---|---|---|
| CrystalDiskMark 5.2 / 6 | 343% | 196% | 157% | 250% | 202% | |
| Read Seq Q32T1 (MB/s) | 450.8 | 3407 656% | 3445 664% | 2445 442% | 3389 652% | 3431 661% |
| Write Seq Q32T1 (MB/s) | 461.2 | 2944 538% | 1848 301% | 790 71% | 1706 270% | 1246 170% |
| Read 4K Q32T1 (MB/s) | 205.9 | 625 204% | 547 166% | 588 186% | 627 205% | 586 185% |
| Write 4K Q32T1 (MB/s) | 188.9 | 548 190% | 463 145% | 455.5 141% | 591 213% | 486 157% |
| Read Seq (MB/s) | 494.2 | 3377 583% | 954 93% | 1881 281% | 1856 276% | 1419 187% |
| Write Seq (MB/s) | 467.9 | 2612 458% | 1049 124% | 797 70% | 1652 253% | 1266 171% |
| Read 4K (MB/s) | 38.91 | 55.9 44% | 45 16% | 46.69 20% | 49 26% | 47.14 21% |
| Write 4K (MB/s) | 96.1 | 165 72% | 149 55% | 142.5 48% | 196 104% | 156 62% |

Graphics Card
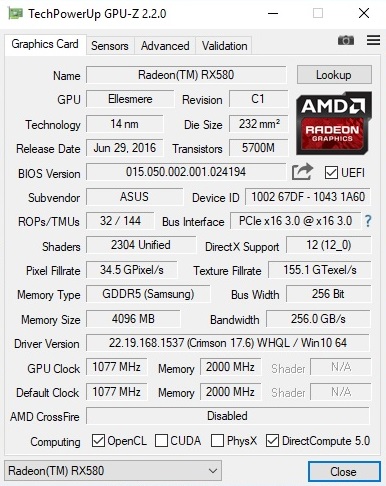
Apart from the processor, we were also excited to test the graphics card. We have tested the Radeon RX 580 the first time and it currently is AMD's most powerful notebook model. One of the biggest complaints is that it has to get along with 4 GB GDDR5 VRAM (256-bit interface). Well, the main competitor from Nvidia, the GeForce GTX 1060, is also available with even weaker 3 GB, but most GTX 1060 laptops use the 6 GB variant.
While several GPUs featured more than enough VRAM before the launch of the current console generation (PS4, Xbox One), you cannot have enough GB nowadays. Many triple A games (e.g. Ghost Recon Wildlands, Watch Dogs 2, Titanfall 2, Rise of the Tomb Raider & Deus Ex Mankind Divided) recommend more than 4 GB for maximum details in Full HD, which is the native resolution of the GL702ZC. However, the frame rate is often also limited by other factors.
It is not necessarily only due to the VRAM if the 6 GB variant of the GeForce GTX 1060 performs more than 10% better than the RX 580. It might also be due to the lack of AMD optimization by gaming developers. Many titles, including Assassin's Creed Syndicate, Watch Dogs 2 and Ghost Recon Wildlands, belong to Nvidia's gaming program "the way it's meant to be played". AMD's counterpart called "Gaming Evolved" can be found significantly less often in the intro videos of games. The gap to the GTX 1060 in several games can also be explained by the still immature driver. According to our experience, AMD always slightly trails behind Nvidia in driver development.
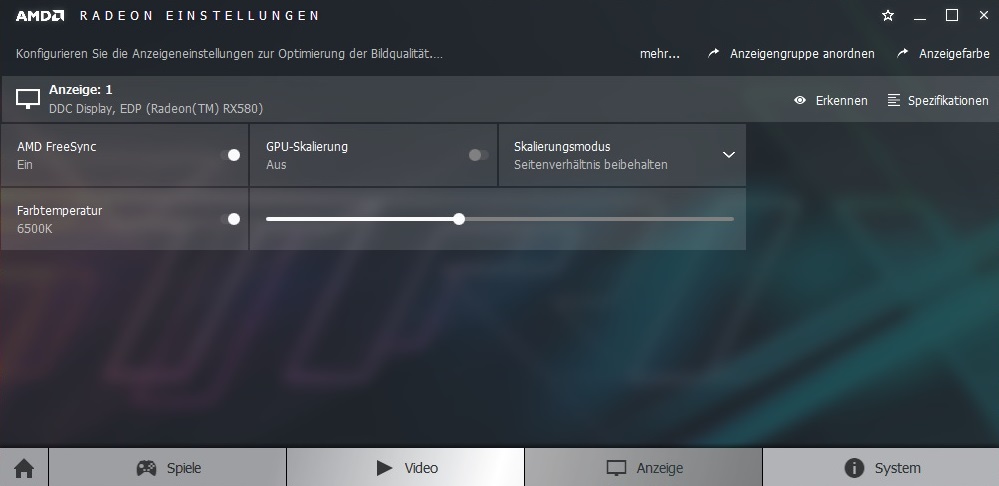
Speaking of the driver: Since the Ryzen 7 1700 does not include a graphics chip, the Radeon RX 580 runs permanently. On the one hand, this has a very negative impact on power consumption, battery life, and emissions in idle mode. On the other hand, AMD's graphics switch called Enduro could never really convince in the past and close up to Nvidia's Optimus technology.
| 3DMark | |
| 2560x1440 Time Spy Graphics | |
| Schenker XMG U727 2017 | |
| Aorus X7 v7 | |
| Acer Aspire V17 Nitro BE VN7-793-738J | |
| Asus GL702ZC-GC104T | |
| 1920x1080 Fire Strike Graphics | |
| Schenker XMG U727 2017 | |
| Aorus X7 v7 | |
| Acer Aspire V17 Nitro BE VN7-793-738J | |
| Asus GL702ZC-GC104T | |
| MSI GE72 7RE-046 | |
| 3DMark 11 - 1280x720 Performance GPU | |
| Schenker XMG U727 2017 | |
| Aorus X7 v7 | |
| Asus GL702ZC-GC104T | |
| Acer Aspire V17 Nitro BE VN7-793-738J | |
| MSI GE72 7RE-046 | |
| Unigine Heaven 4.0 - Extreme Preset DX11 | |
| Schenker XMG U727 2017 | |
| Asus GL702ZC-GC104T | |
| MSI GE72 7RE-046 | |
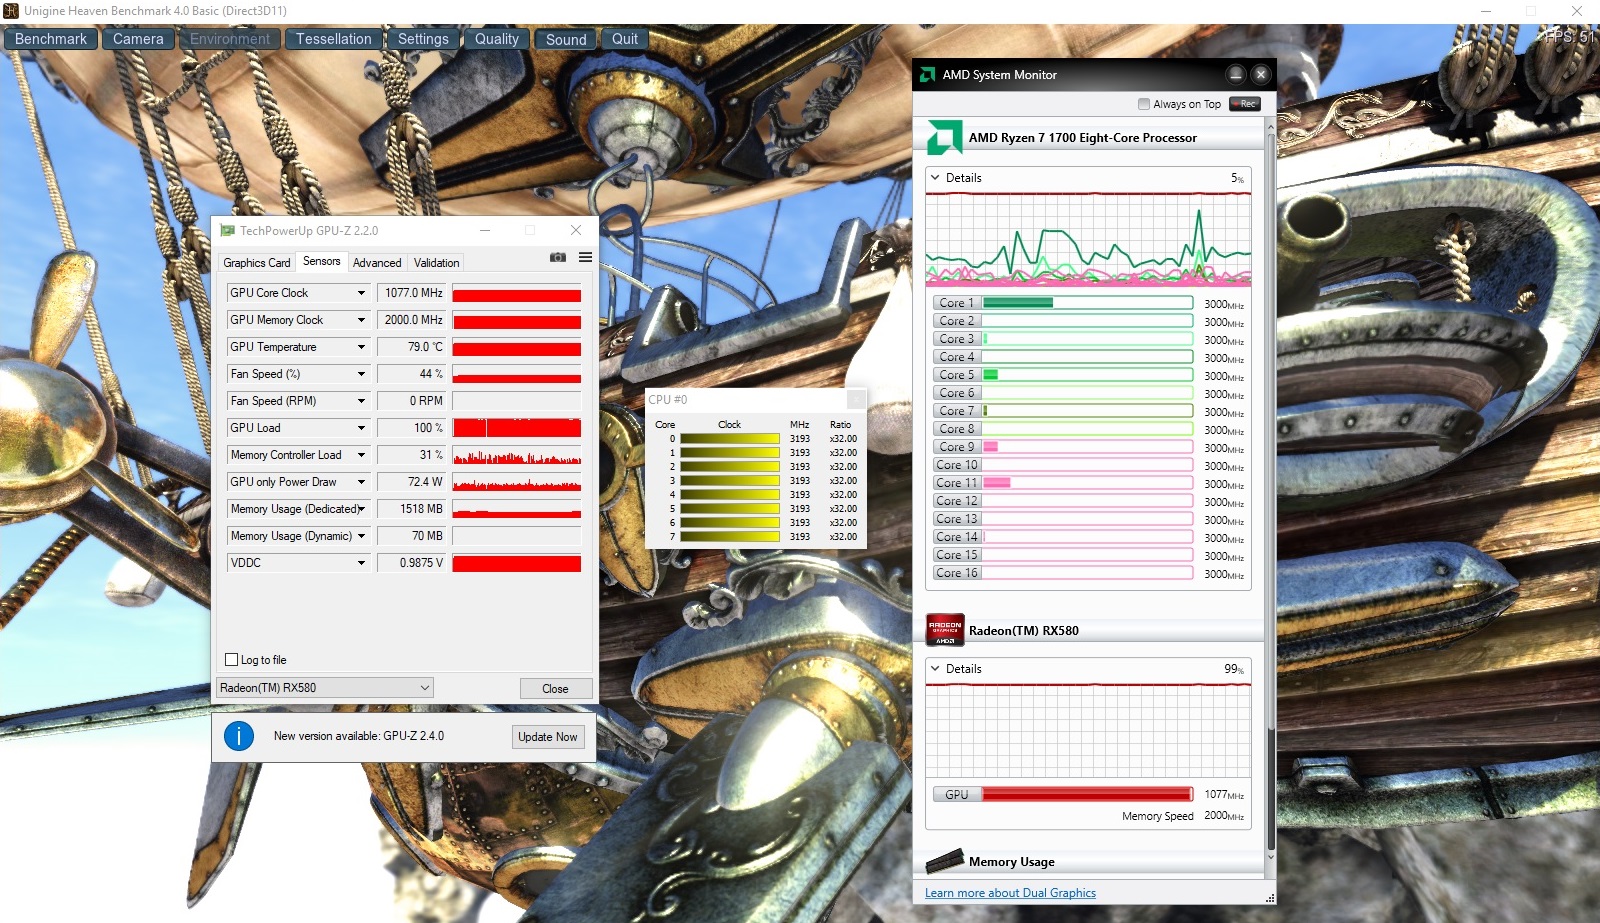
Back to the Radeon RX 580: The DirectX 12 chip performs quite well in our benchmark course. Both the Time Spy test and the Fire Strike test of the current 3DMark rank the RX 580 very close behind the GeForce GTX 1060 with 6 GB VRAM. The GeForce GTX 1050 Ti performs about 30% worse and the GeForce GTX 1070 is about 60% faster.
The graphics driver caused hardly any anomalies in our tests. We only faced the problem that several games (Ark Survival Evolved, Rocket League, Dirt 4 & Titanfall 2) did not run at 3840x2160 pixels on our external display. Far Cry Primal and Watch Dogs 2 refused to run on the internal display with resolutions under 1920x1080 pixels.
| 3DMark 11 Performance | 13320 points | |
| 3DMark Ice Storm Standard Score | 153102 points | |
| 3DMark Cloud Gate Standard Score | 33582 points | |
| 3DMark Fire Strike Score | 9642 points | |
| 3DMark Time Spy Score | 3696 points | |
Help | ||
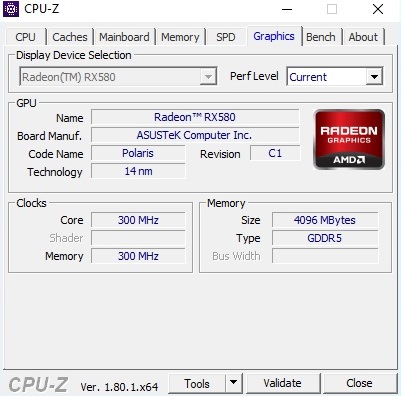
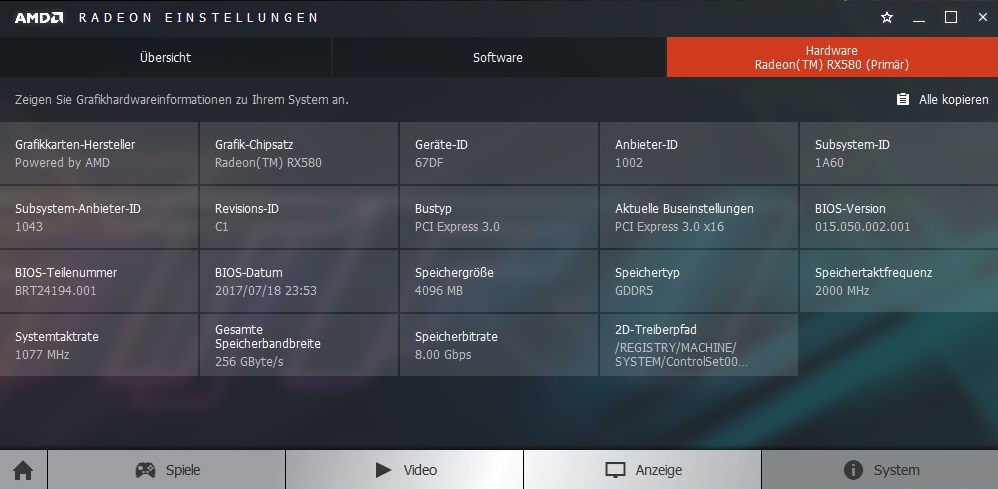
The mobile Radeon RX 580 is based on AMD's Polaris architecture. It has 2304 shader units in common with its desktop counterpart, but the base clock is significantly lower (1077 vs. 1257 MHz). In contrast to the desktop model, we could not detect a boost feature. The Radeon RX 580 never exceeded its standard clock of 1077 MHz in the 3D tests. At least it does not throttle - with the exception of the slightly unrealistic stress test.
The GL702ZC performed flawlessly in our gaming loop with The Witcher 3 (60 minutes @FHD/Ultra). The only complaint is battery use. The performance fell by 75% in The Witcher 3 on battery.
Gaming Performance
We finally reached possibly the most important aspect: gaming performance. The benchmark table below confirms that the Radeon RX 580 has been designed for the Full HD range. Like the GeForce GTX 1060, it allows playing most games at maximum details in 1920x1080 pixels. The GL702ZC is only capable of handling higher resolutions to some extent. The RX 580 will stutter very frequently on UHD displays. The following overview shows how the AMD chip ranks in comparison to competitors (average of Full HD benchmarks).
| Graphics Card | Performance FHD/Ultra & FHD/High |
|---|---|
| Nvidia GeForce GTX 1070 | +45 % |
| Nvidia GeForce GTX 1070 Max-Q | +34 % |
| Nvidia GeForce GTX 1060 | +10 % |
| AMD Radeon RX 580 | reference value |
| Nvidia GeForce GTX 1060 Max-Q | -3 % |
| Nvidia GeForce GTX 1050 Ti | -30 % |
As finally only the level of the GeForce GTX 1060 Max-Q is reached, the GL702ZC appears a bit too expensive from the gamer's point of view - while AMD systems are usually known for their good price-performance ratio. You will also get GTX 1070 laptops for 1800 Euros (~$2150), which feature a significantly better gaming performance (+45%) and are much more future-proof.
| The Witcher 3 | |
| 1920x1080 Ultra Graphics & Postprocessing (HBAO+) | |
| MSI GT62VR-6RE16H21 | |
| MSI GS63VR 7RG | |
| Schenker XMG P507 | |
| Asus GL702ZC-GC104T | |
| HP Omen 15-ce002ng | |
| MSI GE72 7RE-046 | |
| 1920x1080 High Graphics & Postprocessing (Nvidia HairWorks Off) | |
| MSI GT62VR-6RE16H21 | |
| MSI GS63VR 7RG | |
| Asus GL702ZC-GC104T | |
| Schenker XMG P507 | |
| HP Omen 15-ce002ng | |
| MSI GE72 7RE-046 | |
| Batman: Arkham Knight - 1920x1080 High / On (Interactive Smoke & Paper Debris Off) AA:SM AF:8x | |
| MSI GS63VR 7RG | |
| MSI GT62VR-6RE16H21 | |
| Asus GL702ZC-GC104T | |
| Schenker XMG P507 | |
| HP Omen 15-ce002ng | |
| MSI GE72 7RE-046 | |
| Star Wars Battlefront | |
| 1920x1080 Ultra Preset AA:FX | |
| MSI GT62VR-6RE16H21 | |
| MSI GS63VR 7RG | |
| Asus GL702ZC-GC104T | |
| Schenker XMG P507 | |
| HP Omen 15-ce002ng | |
| MSI GE72 7RE-046 | |
| 1920x1080 High Preset AA:FX | |
| MSI GT62VR-6RE16H21 | |
| MSI GS63VR 7RG | |
| Asus GL702ZC-GC104T | |
| Schenker XMG P507 | |
| HP Omen 15-ce002ng | |
| MSI GE72 7RE-046 | |
| Assassin's Creed Syndicate | |
| 1920x1080 Ultra High Preset AA:4x MSAA + FX | |
| MSI GT62VR-6RE16H21 | |
| MSI GS63VR 7RG | |
| Schenker XMG P507 | |
| HP Omen 15-ce002ng | |
| Asus GL702ZC-GC104T | |
| MSI GE72 7RE-046 | |
| 1920x1080 High Preset AA:FX | |
| MSI GS63VR 7RG | |
| Schenker XMG P507 | |
| MSI GT62VR-6RE16H21 | |
| HP Omen 15-ce002ng | |
| MSI GE72 7RE-046 | |
| Asus GL702ZC-GC104T | |
| Rainbow Six Siege | |
| 1920x1080 Ultra Preset AA:T AF:16x | |
| MSI GT62VR-6RE16H21 | |
| MSI GS63VR 7RG | |
| Asus GL702ZC-GC104T | |
| Schenker XMG P507 | |
| HP Omen 15-ce002ng | |
| MSI GE72 7RE-046 | |
| 1920x1080 High Preset AA:T AF:4x | |
| MSI GT62VR-6RE16H21 | |
| MSI GS63VR 7RG | |
| Asus GL702ZC-GC104T | |
| Schenker XMG P507 | |
| HP Omen 15-ce002ng | |
| MSI GE72 7RE-046 | |
| Rise of the Tomb Raider | |
| 1920x1080 Very High Preset AA:FX AF:16x | |
| MSI GT62VR-6RE16H21 | |
| MSI GS63VR 7RG | |
| Schenker XMG P507 | |
| Asus GL702ZC-GC104T | |
| HP Omen 15-ce002ng | |
| MSI GE72 7RE-046 | |
| 1920x1080 High Preset AA:FX AF:4x | |
| MSI GT62VR-6RE16H21 | |
| MSI GS63VR 7RG | |
| Schenker XMG P507 | |
| HP Omen 15-ce002ng | |
| Asus GL702ZC-GC104T | |
| MSI GE72 7RE-046 | |
| Far Cry Primal | |
| 1920x1080 Ultra Preset AA:SM | |
| MSI GT62VR-6RE16H21 | |
| MSI GS63VR 7RG | |
| Schenker XMG P507 | |
| Asus GL702ZC-GC104T | |
| HP Omen 15-ce002ng | |
| MSI GE72 7RE-046 | |
| 1920x1080 High Preset AA:SM | |
| MSI GS63VR 7RG | |
| MSI GT62VR-6RE16H21 | |
| Schenker XMG P507 | |
| HP Omen 15-ce002ng | |
| Asus GL702ZC-GC104T | |
| MSI GE72 7RE-046 | |
| The Division | |
| 1920x1080 Ultra Preset AF:16x | |
| MSI GT62VR-6RE16H21 | |
| MSI GS63VR 7RG | |
| Asus GL702ZC-GC104T | |
| Schenker XMG P507 | |
| HP Omen 15-ce002ng | |
| MSI GE72 7RE-046 | |
| 1920x1080 High Preset AF:8x | |
| MSI GT62VR-6RE16H21 | |
| MSI GS63VR 7RG | |
| Asus GL702ZC-GC104T | |
| Schenker XMG P507 | |
| HP Omen 15-ce002ng | |
| MSI GE72 7RE-046 | |
| Doom | |
| 1920x1080 Ultra Preset AA:SM | |
| MSI GT62VR-6RE16H21 | |
| MSI GS63VR 7RG | |
| Schenker XMG P507 | |
| HP Omen 15-ce002ng | |
| Asus GL702ZC-GC104T | |
| MSI GE72 7RE-046 | |
| 1920x1080 High Preset AA:FX | |
| MSI GT62VR-6RE16H21 | |
| MSI GS63VR 7RG | |
| Schenker XMG P507 | |
| HP Omen 15-ce002ng | |
| MSI GE72 7RE-046 | |
| Asus GL702ZC-GC104T | |
| Mirror's Edge Catalyst | |
| 1920x1080 Ultra Preset AF:16x | |
| MSI GT62VR-6RE16H21 | |
| MSI GS63VR 7RG | |
| Schenker XMG P507 | |
| Asus GL702ZC-GC104T | |
| HP Omen 15-ce002ng | |
| MSI GE72 7RE-046 | |
| 1920x1080 High Preset AF:16x | |
| MSI GT62VR-6RE16H21 | |
| MSI GS63VR 7RG | |
| Schenker XMG P507 | |
| Asus GL702ZC-GC104T | |
| HP Omen 15-ce002ng | |
| MSI GE72 7RE-046 | |
| Deus Ex Mankind Divided | |
| 1920x1080 Ultra Preset AA:2xMS AF:8x | |
| Asus G752VS | |
| MSI GS63VR 7RG | |
| Asus GL702ZC-GC104T | |
| HP Omen 15-ce002ng | |
| MSI GE72 7RE-046 | |
| 1920x1080 High Preset AF:4x | |
| MSI GS63VR 7RG | |
| Asus G752VS | |
| Asus GL702ZC-GC104T | |
| HP Omen 15-ce002ng | |
| MSI GE72 7RE-046 | |
| FIFA 17 | |
| 1920x1080 Ultra Preset AA:4xMS | |
| Asus G752VS | |
| HP Omen 15-ce002ng | |
| Asus GL702ZC-GC104T | |
| MSI GS63VR 7RG | |
| MSI GE72 7RE-046 | |
| 1920x1080 High Preset | |
| Asus G752VS | |
| HP Omen 15-ce002ng | |
| Asus GL702ZC-GC104T | |
| MSI GS63VR 7RG | |
| MSI GE72 7RE-046 | |
| Battlefield 1 | |
| 1920x1080 Ultra Preset AA:T | |
| Asus G752VS | |
| MSI GS63VR 7RG | |
| Asus GL702ZC-GC104T | |
| HP Omen 15-ce002ng | |
| MSI GE72 7RE-046 | |
| 1920x1080 High Preset AA:T | |
| Asus G752VS | |
| MSI GS63VR 7RG | |
| Asus GL702ZC-GC104T | |
| HP Omen 15-ce002ng | |
| MSI GE72 7RE-046 | |
| Titanfall 2 | |
| 1920x1080 Very High (Insane Texture Quality) / Enabled AA:TS AF:16x | |
| Asus G752VS | |
| MSI GS63VR 7RG | |
| Asus GL702ZC-GC104T | |
| HP Omen 15-ce002ng | |
| MSI GE72 7RE-046 | |
| 1920x1080 High / Enabled AA:TS AF:8x | |
| MSI GS63VR 7RG | |
| Asus G752VS | |
| Asus GL702ZC-GC104T | |
| HP Omen 15-ce002ng | |
| MSI GE72 7RE-046 | |
| Call of Duty Infinite Warfare | |
| 1920x1080 Ultra / On AA:T2X SM | |
| Asus G752VS | |
| MSI GS63VR 7RG | |
| MSI GT62VR | |
| Asus GL702ZC-GC104T | |
| HP Omen 15-ce002ng | |
| MSI GE72 7RE-046 | |
| 1920x1080 High / On AA:FX | |
| Asus G752VS | |
| MSI GS63VR 7RG | |
| MSI GT62VR | |
| HP Omen 15-ce002ng | |
| Asus GL702ZC-GC104T | |
| MSI GE72 7RE-046 | |
| Dishonored 2 | |
| 1920x1080 Ultra Preset AA:TX | |
| MSI GS63VR 7RG | |
| Asus G752VS | |
| MSI GT62VR | |
| HP Omen 15-ce002ng | |
| Asus GL702ZC-GC104T | |
| MSI GE72 7RE-046 | |
| 1920x1080 High Preset AA:TX | |
| MSI GS63VR 7RG | |
| Asus G752VS | |
| HP Omen 15-ce002ng | |
| MSI GT62VR | |
| Asus GL702ZC-GC104T | |
| MSI GE72 7RE-046 | |
| Watch Dogs 2 | |
| 1920x1080 Ultra Preset | |
| Asus G752VS | |
| MSI GS63VR 7RG | |
| MSI GT62VR | |
| HP Omen 15-ce002ng | |
| Asus GL702ZC-GC104T | |
| MSI GE72 7RE-046 | |
| 1920x1080 High Preset | |
| Asus G752VS | |
| MSI GS63VR 7RG | |
| MSI GT62VR | |
| HP Omen 15-ce002ng | |
| Asus GL702ZC-GC104T | |
| MSI GE72 7RE-046 | |
| Resident Evil 7 | |
| 1920x1080 Very High / On AA:FXAA+T | |
| Asus G752VS | |
| MSI GS63VR 7RG | |
| Asus GL702ZC-GC104T | |
| MSI GT62VR | |
| HP Omen 15-ce002ng | |
| MSI GE72 7RE-046 | |
| 1920x1080 High / On AA:FXAA+T | |
| Asus G752VS | |
| MSI GS63VR 7RG | |
| Asus GL702ZC-GC104T | |
| MSI GT62VR | |
| HP Omen 15-ce002ng | |
| MSI GE72 7RE-046 | |
| For Honor | |
| 1920x1080 Extreme Preset AA:T AF:16x | |
| Asus G752VS | |
| MSI GS63VR 7RG | |
| MSI GT62VR | |
| Asus GL702ZC-GC104T | |
| HP Omen 15-ce002ng | |
| MSI GE72 7RE-046 | |
| 1920x1080 High Preset AA:T AF:8x | |
| Asus G752VS | |
| MSI GS63VR 7RG | |
| MSI GT62VR | |
| Asus GL702ZC-GC104T | |
| HP Omen 15-ce002ng | |
| MSI GE72 7RE-046 | |
| Ghost Recon Wildlands | |
| 1920x1080 Ultra Preset AA:T AF:16x | |
| Asus G752VS | |
| MSI GS63VR 7RG | |
| MSI GT62VR | |
| HP Omen 15-ce002ng | |
| Asus GL702ZC-GC104T | |
| MSI GE72 7RE-046 | |
| 1920x1080 High Preset AA:T AF:4x | |
| Asus G752VS | |
| MSI GS63VR 7RG | |
| MSI GT62VR | |
| HP Omen 15-ce002ng | |
| Asus GL702ZC-GC104T | |
| MSI GE72 7RE-046 | |
| Prey | |
| 1920x1080 Very High Preset AA:2TX SM AF:16x | |
| Asus G752VS | |
| MSI GS63VR 7RG | |
| MSI GT62VR | |
| Asus GL702ZC-GC104T | |
| HP Omen 15-ce002ng | |
| 1920x1080 High Preset AA:2TX SM AF:8x | |
| MSI GS63VR 7RG | |
| Asus G752VS | |
| MSI GT62VR | |
| Asus GL702ZC-GC104T | |
| HP Omen 15-ce002ng | |
| Rocket League - 1920x1080 High Quality AA:High FX | |
| Asus G752VS | |
| MSI GS63VR 7RG | |
| MSI GT62VR | |
| Asus GL702ZC-GC104T | |
| MSI GE72 7RE-046 | |
| HP Omen 15-ce002ng | |
| Dirt 4 | |
| 1920x1080 Ultra Preset AA:4xMS AF:16x | |
| Asus G752VS | |
| MSI GS63VR 7RG | |
| MSI GT62VR | |
| Asus GL702ZC-GC104T | |
| HP Omen 15-ce002ng | |
| MSI GE72 7RE-046 | |
| 1920x1080 High Preset AA:2xMS AF:8x | |
| Asus G752VS | |
| MSI GS63VR 7RG | |
| MSI GT62VR | |
| Asus GL702ZC-GC104T | |
| HP Omen 15-ce002ng | |
| MSI GE72 7RE-046 | |
| F1 2017 | |
| 1920x1080 Ultra High Preset AA:T AF:16x | |
| Asus G752VS | |
| MSI GT62VR | |
| Asus GL702ZC-GC104T | |
| MSI GE72 7RE-046 | |
| 1920x1080 High Preset AA:T AF:8x | |
| Asus G752VS | |
| MSI GT62VR | |
| Asus GL702ZC-GC104T | |
| MSI GE72 7RE-046 | |
| Ark Survival Evolved | |
| 1920x1080 Epic Preset (100 % Resolution Scale) | |
| Asus G752VS | |
| MSI GT62VR | |
| Asus GL702ZC-GC104T | |
| 1920x1080 High Preset (100 % Resolution Scale) | |
| Asus G752VS | |
| MSI GT62VR | |
| Asus GL702ZC-GC104T | |
| MSI GE72 7RE-046 | |
Things are slightly different for the variant with Ryzen 5 1600, which is 100 Euros (~$119) cheaper, despite similar frame rates are to be expected. It has a significantly more attractive price-performance ratio, since six cores (12 threads per SMT) should bring sufficient performance for the coming years. Those who are interested in more detailed analysis of various CPUs will find information in our gaming list and GPU database.
| low | med. | high | ultra | 4K | |
|---|---|---|---|---|---|
| The Witcher 3 (2015) | 176 | 129 | 67.4 | 37.4 | 23.8 |
| Batman: Arkham Knight (2015) | 111 | 107 | 84 | 30 | |
| Star Wars Battlefront (2015) | 191 | 183 | 112 | 93.1 | 35.4 |
| Assassin's Creed Syndicate (2015) | 49.7 | 49.3 | 46.5 | 24.4 | 24.1 |
| Rainbow Six Siege (2015) | 199 | 177 | 148 | 121 | 47.4 |
| Rise of the Tomb Raider (2016) | 176 | 121 | 64 | 53 | 22.9 |
| Far Cry Primal (2016) | 85 | 75 | 69 | 55 | 25 |
| The Division (2016) | 135 | 116 | 70.9 | 54.7 | 26.2 |
| Doom (2016) | 73.7 | 72.5 | 68 | 65.9 | 27.1 |
| Mirror's Edge Catalyst (2016) | 102 | 88.9 | 72.6 | 63.3 | 23.3 |
| Deus Ex Mankind Divided (2016) | 70.9 | 67.4 | 56.1 | 30.2 | 18.3 |
| FIFA 17 (2016) | 266 | 261 | 230 | 225 | 112 |
| Battlefield 1 (2016) | 125 | 112 | 87.4 | 75.9 | 32.7 |
| Titanfall 2 (2016) | 144 | 143 | 94.4 | 82.1 | |
| Call of Duty Infinite Warfare (2016) | 102 | 97.4 | 90.5 | 83.3 | 43 |
| Dishonored 2 (2016) | 75.9 | 73.1 | 60.2 | 54.2 | 22.3 |
| Watch Dogs 2 (2016) | 72.4 | 65.6 | 54 | 36.5 | 18.2 |
| Resident Evil 7 (2017) | 348 | 179 | 116 | 99.4 | 30.6 |
| For Honor (2017) | 164 | 100 | 95.7 | 68.2 | 26.7 |
| Ghost Recon Wildlands (2017) | 84 | 61.5 | 57 | 26.7 | 21.3 |
| Prey (2017) | 138 | 127 | 102 | 87.2 | 28.4 |
| Rocket League (2017) | 240 | 228 | 168 | ||
| Dirt 4 (2017) | 220 | 148 | 98.5 | 57.7 | |
| Playerunknown's Battlegrounds (PUBG) (2017) | 110 | 69.1 | 57.1 | 40.5 | 14.3 |
| F1 2017 (2017) | 137 | 104 | 87 | 63 | 27 |
| Ark Survival Evolved (2017) | 87.5 | 41.2 | 29.1 | 20.3 |
Emissions
System Noise
As can be expected, the desktop processor of the GL702ZC causes very high noise emissions. The 17-inch laptop is already loud in idle mode with a noise level of 38 dB (slightly increases to 40 dB occasionally). Although the two fans in the case are sometimes entirely off, so that you can only hear the HDD, or they rotate very quietly, this ideal scenario rarely occurs even in energy-saving mode.
The GL702ZC gets very loud when running demanding 3D applications. While 42 dB on average in 3DMark06 (38 to 50 dB depending on the sequence) is still acceptable, the fans reach up to 57 dB under full load. This is extremely loud and gets annoying very quickly. 54 dB in The Witcher 3 is also high and annoying in the long run without a headset. Despite higher 3D performance and slimmer case, the Aorus X7 v7 remains significantly quieter. The other three competitors are also quieter in 3D mode.
Noise level
| Idle |
| 32 / 38 / 40 dB(A) |
| HDD |
| 33 dB(A) |
| Load |
| 42 / 57 dB(A) |
 | ||
30 dB silent 40 dB(A) audible 50 dB(A) loud |
||
min: | ||
| Asus GL702ZC-GC104T R7 1700, Radeon RX 580 (Laptop) | Schenker XMG U727 2017 i7-7700K, GeForce GTX 1080 Mobile | Aorus X7 v7 i7-7820HK, GeForce GTX 1070 Mobile | Acer Aspire V17 Nitro BE VN7-793-738J i7-7700HQ, GeForce GTX 1060 Mobile | MSI GE72 7RE-046 i7-7700HQ, GeForce GTX 1050 Ti Mobile | |
|---|---|---|---|---|---|
| Noise | 5% | 4% | 12% | 5% | |
| off / environment * (dB) | 31 | 30 3% | 30 3% | 30.8 1% | 30 3% |
| Idle Minimum * (dB) | 32 | 31 3% | 33 -3% | 31.4 2% | 34 -6% |
| Idle Average * (dB) | 38 | 34 11% | 36 5% | 31.4 17% | 35 8% |
| Idle Maximum * (dB) | 40 | 37 7% | 41 -2% | 31.4 22% | 36 10% |
| Load Average * (dB) | 42 | 44 -5% | 41 2% | 38.6 8% | 41 2% |
| Witcher 3 ultra * (dB) | 54 | 51 6% | 45 17% | ||
| Load Maximum * (dB) | 57 | 52 9% | 52 9% | 44.3 22% | 49 14% |
* ... smaller is better
Temperature
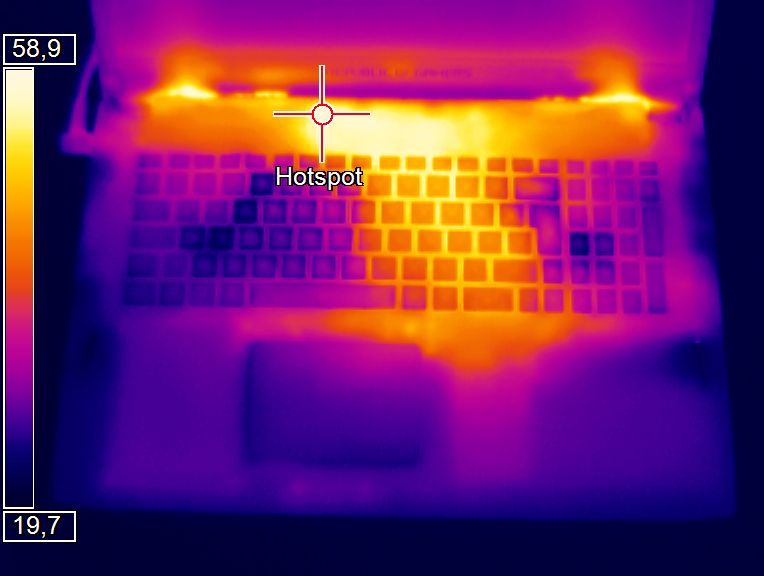
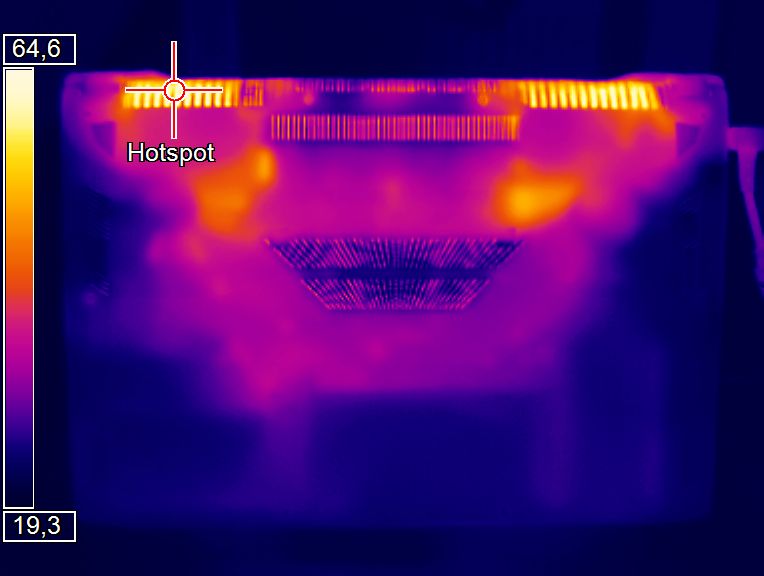
Unlike the system noise, the case temperatures are acceptable. The test model did not even get overly warm after running the stress test with the FurMark and Prime95 tools for one hour. You will hardly notice the maximum of 51 °C (top side) and 54 °C (underside) if the 17-inch device does not sit directly on your lap, since these values have been measured in the rear third of the case. The WASD part and the left palm rest are significantly cooler and remain comfortable even during long gaming sessions (see The Witcher 3 results).
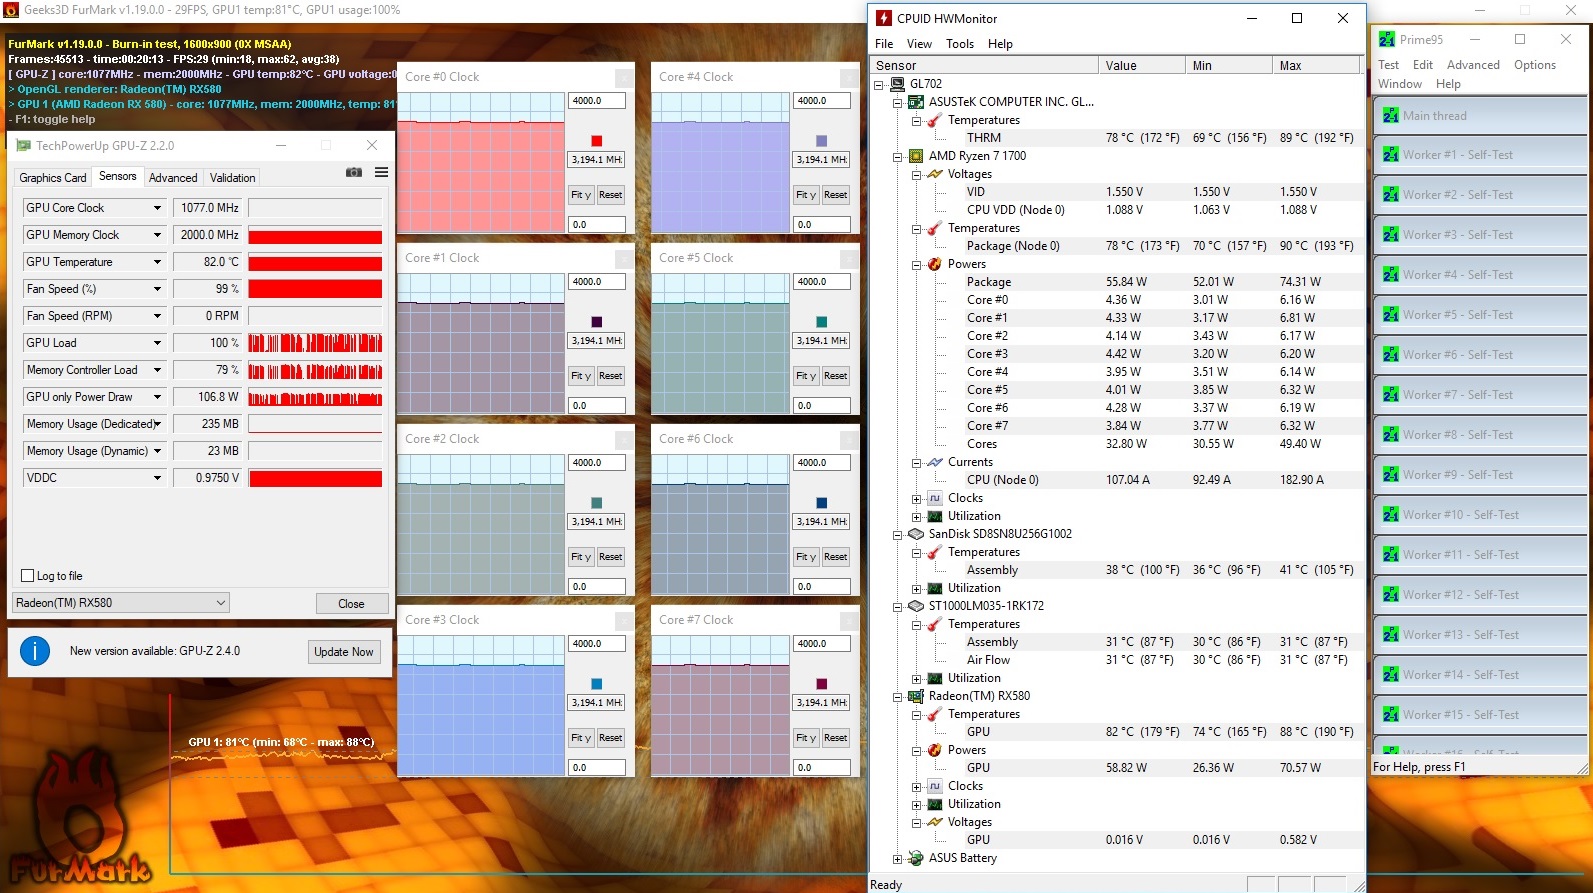
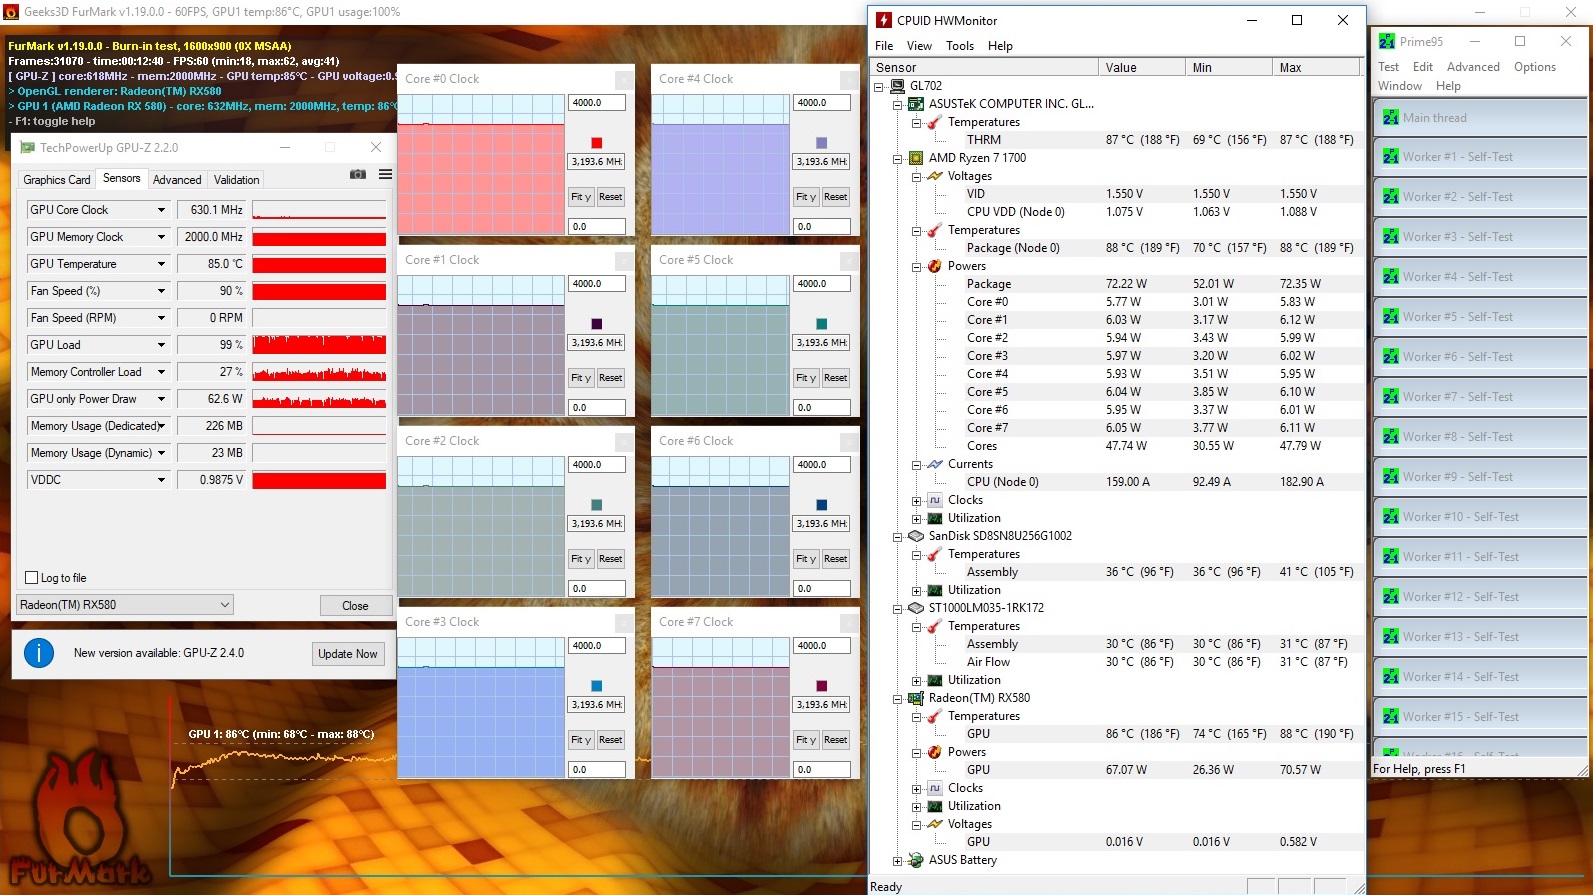
In idle mode, the temperature increase is quite even and pleasingly low at 24 - 35 °C. The temperatures under the hood are not quite that good. During the stress test, the CPU reached up to 90 °C (AMD specifies max-temps of 95 °C) and the GPU hits up to 88 °C. Both values are quite high. The (non-throttling) Ryzen 7 1700 hovers at 78 °C under full load. The average temperature of the Radeon RX 580 (which sometimes throttles to 630 MHz) is 82 °C. As usual, the system remains cooler during gaming. The GPU finishes The Witcher 3 test with a passable 79 °C.
(-) The maximum temperature on the upper side is 51 °C / 124 F, compared to the average of 40.4 °C / 105 F, ranging from 21.2 to 68.8 °C for the class Gaming.
(-) The bottom heats up to a maximum of 54 °C / 129 F, compared to the average of 43.2 °C / 110 F
(+) In idle usage, the average temperature for the upper side is 29.6 °C / 85 F, compared to the device average of 33.9 °C / 93 F.
(-) Playing The Witcher 3, the average temperature for the upper side is 40.2 °C / 104 F, compared to the device average of 33.9 °C / 93 F.
(±) The palmrests and touchpad can get very hot to the touch with a maximum of 39 °C / 102.2 F.
(-) The average temperature of the palmrest area of similar devices was 28.8 °C / 83.8 F (-10.2 °C / -18.4 F).
Speakers
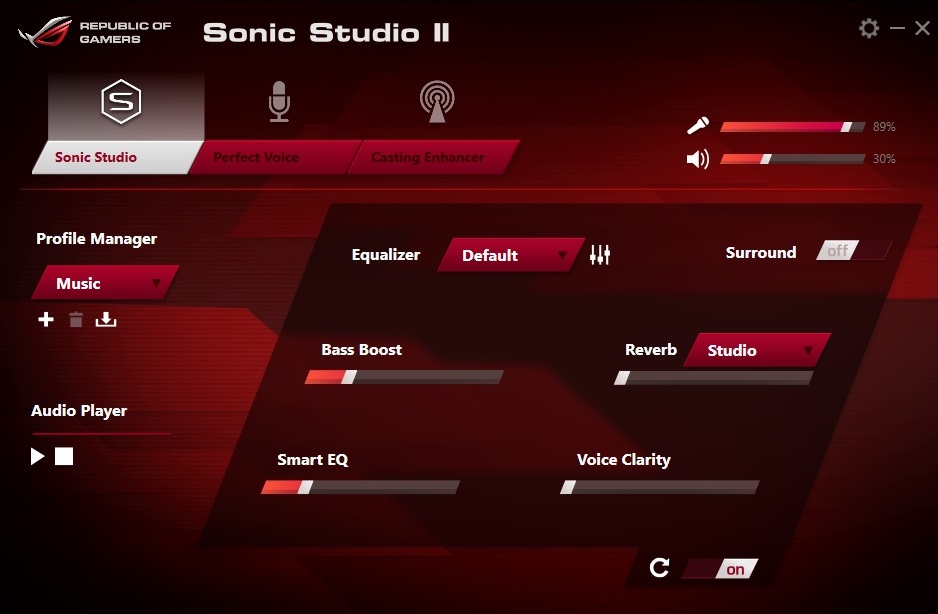
The sound is surprisingly good for a notebook. Asus gave the GL702ZC two speakers, which sit at the left and right edges of the palm rests and are supported by the audio software Sonic Studio II. Buyers will not only find various profiles (Music, Movie, Gaming, etc.) here, but also an equalizer, sound improvement for microphones, and special modes for video streamers.
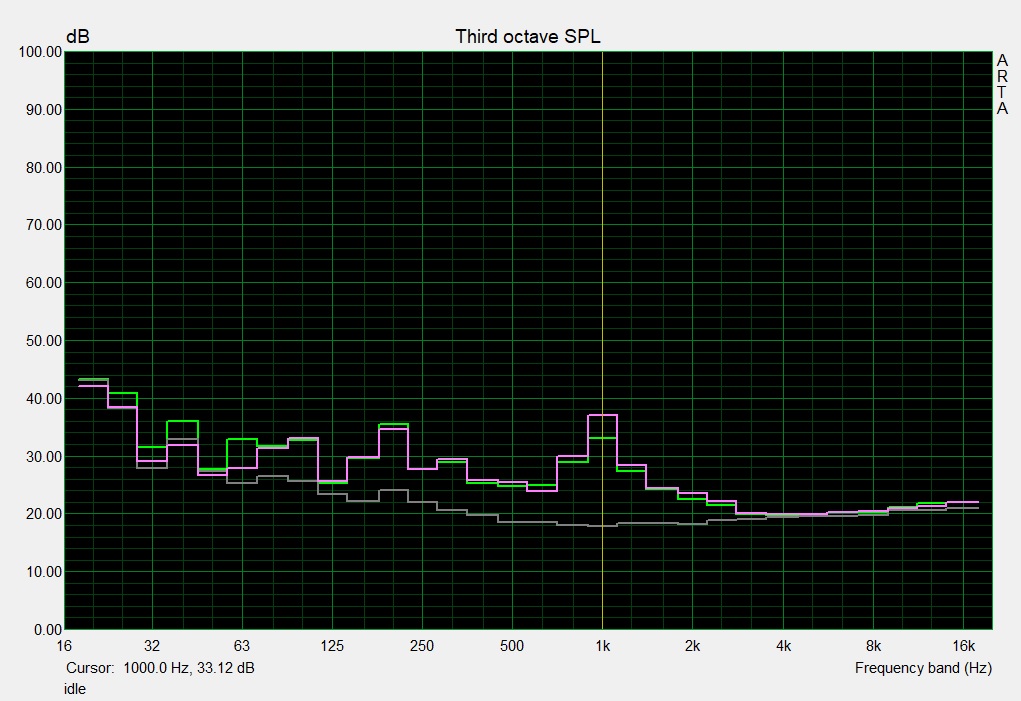
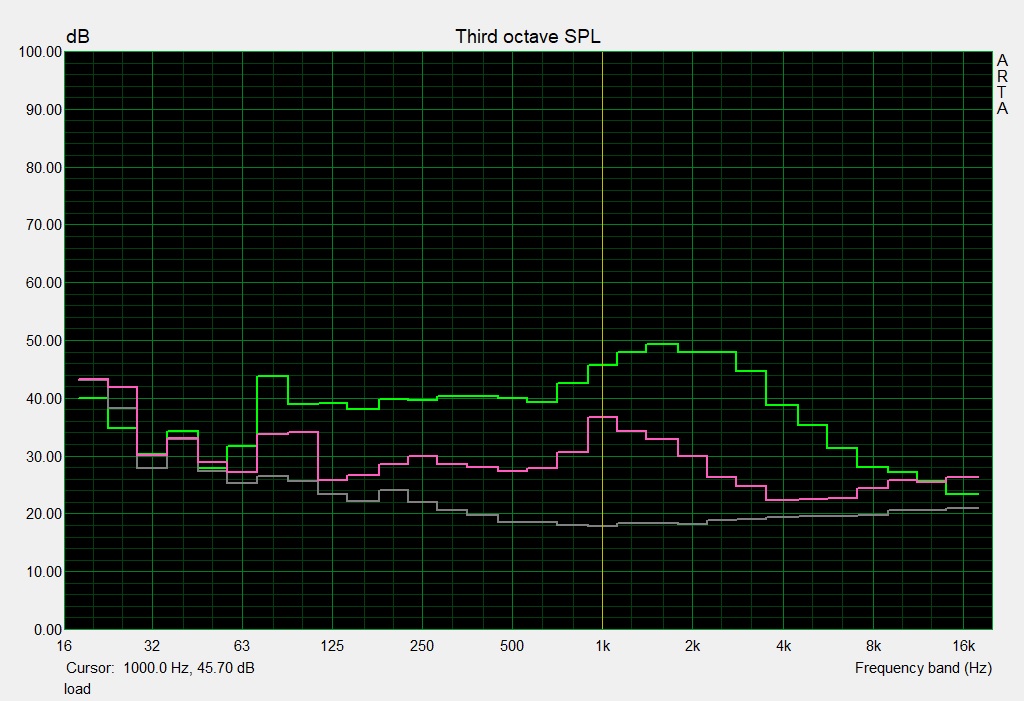
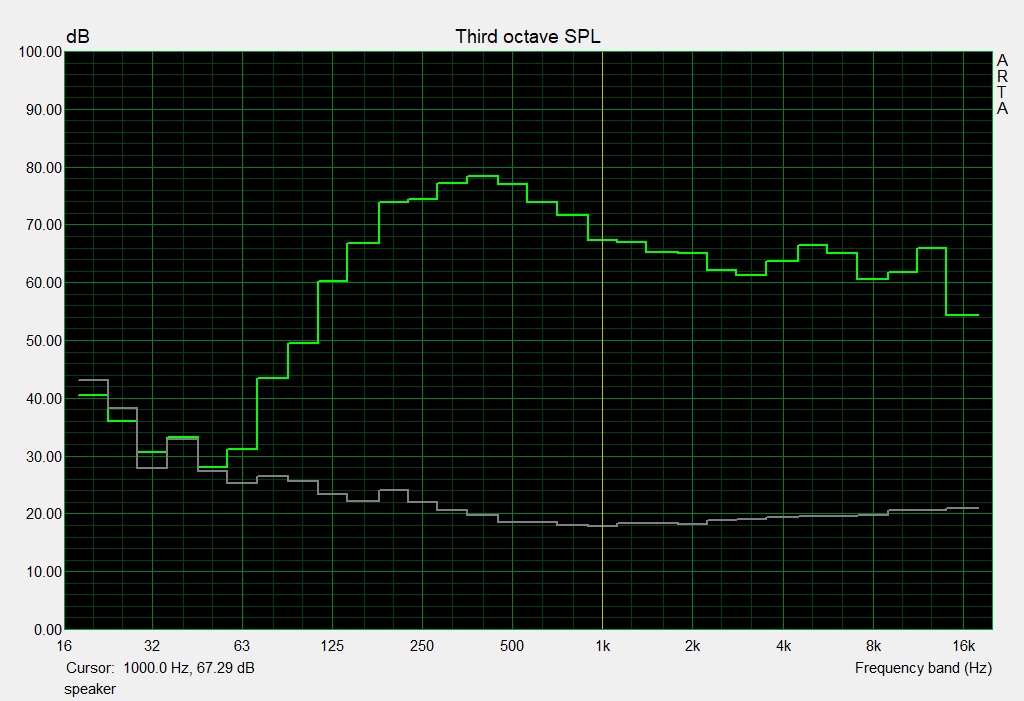
Don't worry: The 17-inch laptop already creates a very nice and balanced sound out-of-the-box without manual tuning. This is confirmed by our audio analysis. The 2.0 system especially has a weak bass, but this is true for most notebooks. The MSI GE72 7RE for example performs slightly worse in terms of bass. To summarize: External speakers or headsets are not necessary for enjoying multimedia. Demanding users will connect better solutions, however.
Asus GL702ZC-GC104T audio analysis
(+) | speakers can play relatively loud (82 dB)
Bass 100 - 315 Hz
(±) | reduced bass - on average 8.4% lower than median
(±) | linearity of bass is average (11.5% delta to prev. frequency)
Mids 400 - 2000 Hz
(+) | balanced mids - only 4.7% away from median
(+) | mids are linear (4.1% delta to prev. frequency)
Highs 2 - 16 kHz
(+) | balanced highs - only 2.9% away from median
(+) | highs are linear (5.2% delta to prev. frequency)
Overall 100 - 16.000 Hz
(+) | overall sound is linear (12.5% difference to median)
Compared to same class
» 15% of all tested devices in this class were better, 3% similar, 81% worse
» The best had a delta of 6%, average was 18%, worst was 132%
Compared to all devices tested
» 11% of all tested devices were better, 2% similar, 87% worse
» The best had a delta of 4%, average was 24%, worst was 134%
MSI GE72 7RE-046 audio analysis
(+) | speakers can play relatively loud (91 dB)
Bass 100 - 315 Hz
(-) | nearly no bass - on average 17.2% lower than median
(±) | linearity of bass is average (9.2% delta to prev. frequency)
Mids 400 - 2000 Hz
(+) | balanced mids - only 3.3% away from median
(+) | mids are linear (4.7% delta to prev. frequency)
Highs 2 - 16 kHz
(+) | balanced highs - only 3.3% away from median
(+) | highs are linear (4% delta to prev. frequency)
Overall 100 - 16.000 Hz
(+) | overall sound is linear (13.7% difference to median)
Compared to same class
» 21% of all tested devices in this class were better, 7% similar, 72% worse
» The best had a delta of 6%, average was 18%, worst was 132%
Compared to all devices tested
» 15% of all tested devices were better, 4% similar, 81% worse
» The best had a delta of 4%, average was 24%, worst was 134%
Frequency diagram in comparison (checkboxes above can be turned on/off!)
Power Management
Power Consumption
That the power adapter is very bulky and heavy for the good, yet not outstanding 3D performance already hints on the 17-inch laptop needing a lot of energy. With 43 to 57 Watt, the GL702ZC even requires more energy than a combination of Core i7-7700K and GeForce GTX 1080. We measured 32 to 51 Watt for such a configuration in the Schenker XMG U727. Hence, AMD's new CPU and GPU architecture is also beaten by Intel and Nvidia in terms of energy efficiency.
The situation is slightly better in 3D mode. The XMG U727 is significantly more power-hungry in all tests here. The Aorus X7 v7 with mobile CPU and GeForce GTX 1070 also requires more energy in a few tests. The Acer V17 Nitro and the MSI GE72 7RE show how efficient gaming notebooks can be nowadays. Nvidia's Optimus technology reduces the idle consumption significantly.
| Off / Standby | |
| Idle | |
| Load |
|
Key:
min: | |
| Asus GL702ZC-GC104T R7 1700, Radeon RX 580 (Laptop) | Schenker XMG U727 2017 i7-7700K, GeForce GTX 1080 Mobile | Aorus X7 v7 i7-7820HK, GeForce GTX 1070 Mobile | Acer Aspire V17 Nitro BE VN7-793-738J i7-7700HQ, GeForce GTX 1060 Mobile | MSI GE72 7RE-046 i7-7700HQ, GeForce GTX 1050 Ti Mobile | |
|---|---|---|---|---|---|
| Power Consumption | -10% | 17% | 52% | 52% | |
| Idle Minimum * (Watt) | 43 | 32 26% | 27 37% | 10.5 76% | 14 67% |
| Idle Average * (Watt) | 50 | 43 14% | 33 34% | 20.5 59% | 20 60% |
| Idle Maximum * (Watt) | 57 | 51 11% | 40 30% | 22 61% | 25 56% |
| Load Average * (Watt) | 125 | 138 -10% | 107 14% | 91 27% | 82 34% |
| Witcher 3 ultra * (Watt) | 180 | 279 -55% | 190 -6% | ||
| Load Maximum * (Watt) | 240 | 350 -46% | 259 -8% | 155 35% | 135 44% |
* ... smaller is better
Battery Life
You should not expect a long battery life from the GL702ZC. The combination of desktop CPU and lack of a graphics switch lets the battery runtimes go through the floor. Even at minimum load and minimum display brightness, the 17-inch laptop has to be recharged after 1.75 hours. Other gaming laptops can only laugh at this. Even the performance bolides Schenker XMG U727 and Aorus X7 v7 last above 3.5 hours in idle mode.
Hence, it is not surprising that the GL702ZC also does not stand a chance against the competition in the other runtime tests. 1.5 hours of Wi-Fi surfing is as disappointing as 1.5 hours of HD video playback (medium brightness in both tests). The 76 Wh battery does not even last one hour in 3D mode.
| Asus GL702ZC-GC104T R7 1700, Radeon RX 580 (Laptop), 76 Wh | Schenker XMG U727 2017 i7-7700K, GeForce GTX 1080 Mobile, 89 Wh | Aorus X7 v7 i7-7820HK, GeForce GTX 1070 Mobile, 94 Wh | Acer Aspire V17 Nitro BE VN7-793-738J i7-7700HQ, GeForce GTX 1060 Mobile, 69 Wh | MSI GE72 7RE-046 i7-7700HQ, GeForce GTX 1050 Ti Mobile, 51.4 Wh | |
|---|---|---|---|---|---|
| Battery runtime | 94% | 90% | 207% | 114% | |
| Reader / Idle (h) | 1.7 | 3.7 118% | 3.7 118% | ||
| H.264 (h) | 1.5 | 2.8 87% | 3.3 120% | ||
| WiFi v1.3 (h) | 1.5 | 2.8 87% | 3 100% | 4.6 207% | 3.1 107% |
| Load (h) | 0.9 | 1.6 78% | 1.4 56% |
Verdict
Pros
Cons
The verdict on the Asus ROG Strix GL702ZC depends on the intended use. Professional users who depend on highest possible CPU performance and/or profit heavily from it will get an almost incomparably fast platform in the 17-incher. The 8-core Ryzen 7 1700 outclasses all Intel-based laptops (even those with desktop CPU) we had under review so far. Hence, the GL702ZC should be very attractive for the mentioned group of buyers.
The situation is different for gamers. The bundle is far less interesting and attractive for them. While the Radeon RX 580 delivers good performance in native resolution of 1920x1080 pixels, gamers are still better off with a combination of Intel CPU and Nvidia GPU since most suitable products work quieter and cost less or are faster at the same price. The verdict is also true for the Ryzen 5 1600 variant with better price-performance ratio to some extent. Input devices and connectivity (no Thunderbolt 3) could also be better.
Otherwise, the GL702ZC did not make big mistakes. Apart from the stylish and precisely manufactured case, we liked the sound of the speakers and the bright and contrast-rich IPS display. Nevertheless, the GL702ZC failed to enter the Gaming Top 10 due to the mentioned weaknesses.
Update 10/18/17: A statement from Asus: "We fine-tuned the BIOS, fan profiles and worked closely with AMD to optimize performance and power consumption of the GL702ZC. While surface and component temperatures increased slightly, we were able to reduce the fan noise by 5-10 dbA under heavy game load (witcher 3) while at the same time increasing game performance by around 5-10 % (3dmark 2011)."
Asus GL702ZC-GC104T
- 09/14/2017 v6 (old)
Florian Glaser
