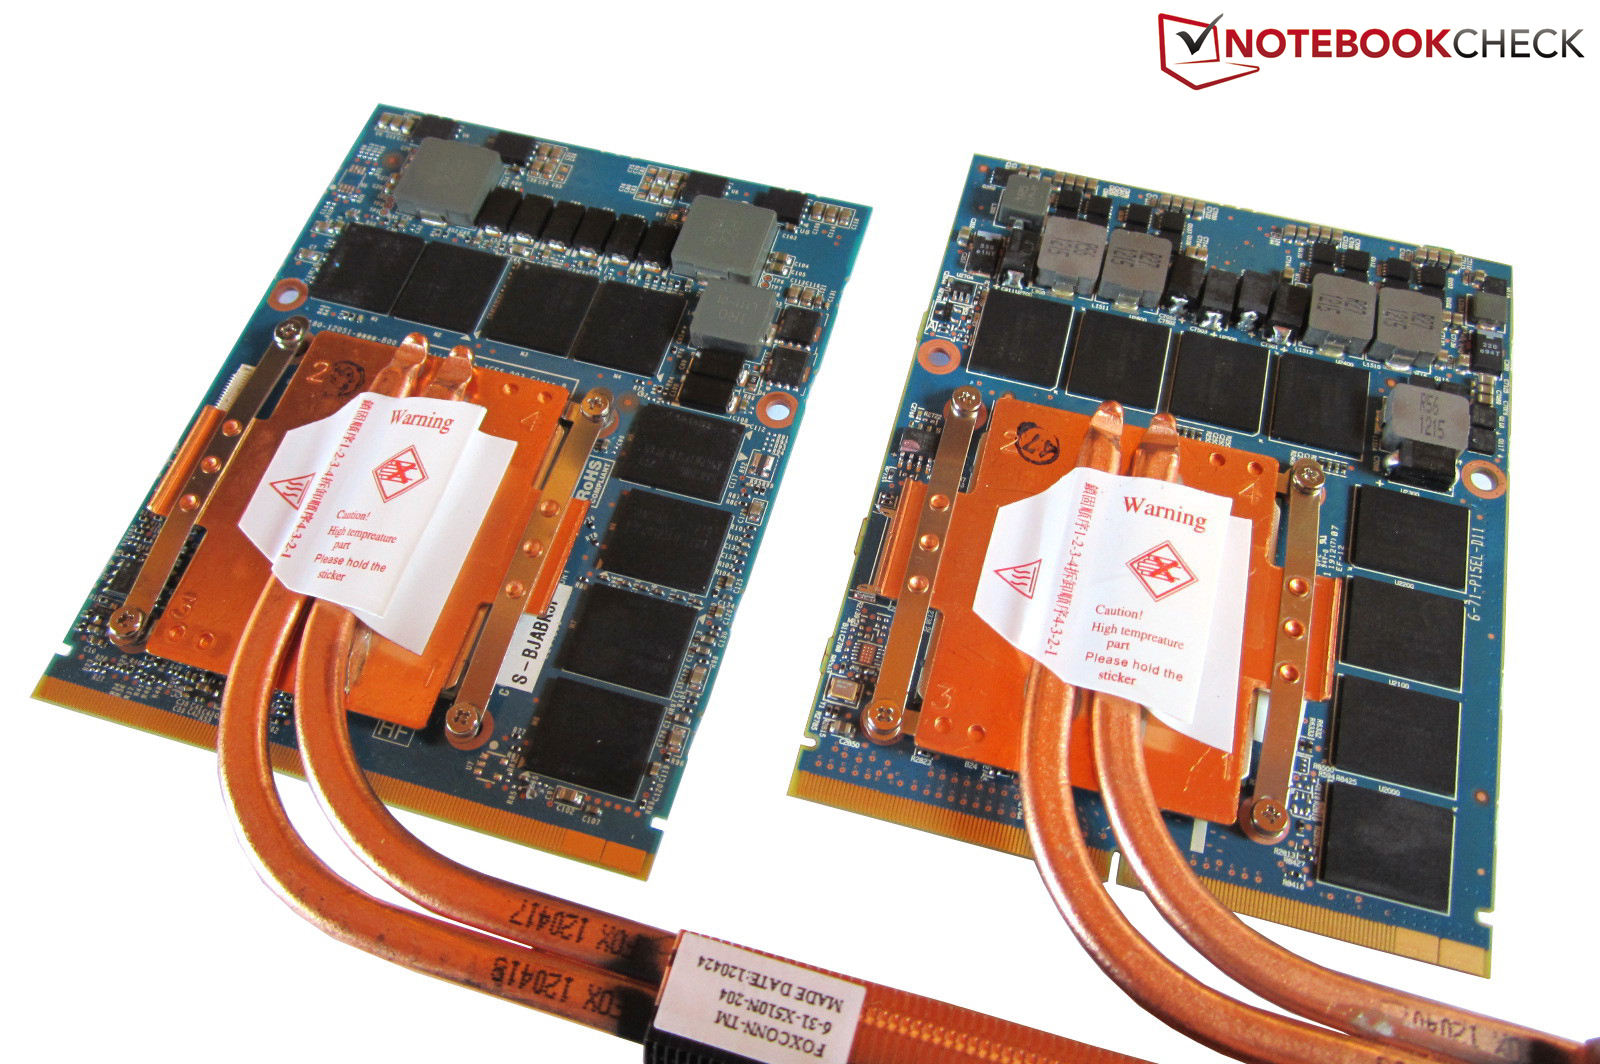
Review GeForce GTX 680M vs. Radeon HD 7970M
Slowly but surely the two most important manufacturers in graphics technology have finally made available their latest GPUs built under a 28 nm lithography for the notebook market. After the launch of the “fastest mobile high-end GPU” Radeon HD 7970M, Nvidia quickly lashed back with the GeForce GTX 680M in an attempt to take back the mobile graphics crown.
Nvidia, however, is by no means modest. The GTX 680M is claimed to be the most efficient, most advanced and fastest notebook GPU and up to 30% faster than the HD 7970M. Of course, claims like these should be taken with a grain of salt; we have seen from past experiences that such marketing information is not entirely true. With much thanks to Schenker Notebooks (mysn.de) for their mobile powerhouses, we can finally compare these powerful graphics cards directly. The question remains: who will come out on top?
Test system
German vendor Schenker has kindly sent us the XMG P702 PRO, a 17-inch gaming notebook based on Clevo's P170EM barebone once again. Similar to its smaller brother, the XMG P502 PRO, The P702 has already been tested in our labs with a GeForce GTX 675M. The unit is still based on Intel's Ivy Bridge HM77 chipset and includes a Core i7-3720QM (2.6-3.6 GHz) with 8 GByte DDR3 RAM (2x 4096 MByte @ 1600 MHz).
We updated Windows 7 Home Premium 64-Bit to its latest updates (as of June 2012) and installed a 128 GByte solid-state drive from Samsung (SSD 830). Because of the small capacity, we had to install some of the benchmarks on the secondary 1000 GByte HDD (Samsung Spinpoint M8). All benchmarks were run on the integrated FullHD display.
By nature, GPU drivers are a more difficult issue. While the GTX 680M performed slightly faster with the 302.72 beta driver than with Clevo's pre-installed driver, we experienced freezes in several games (especially when changing settings in-game or even during launch). As a result, we ran most benchmarks twice and entered the higher values in the tables. In contrast, the HD 7970M worked fine for the most part with the older Clevo 8.951.6.0 driver.
Test Configuration:
- 17.3“ FullHD non glare display
- Windows 7 Home Premium 64 Bit
- Intel HM77 chipset
- Intel Core i7-3720QM
- 8 GByte DDR3-RAM (1600 MHz)
- Nvidia GeForce GTX 680M (4096 MB GDDR5)
- AMD Radeon HD 7970M (2048 MB GDDR5)
- Samsung SSD 830 Series MZMPC128HBFU (128 GB)
- Samsung Spinpoint M8 HN-M101MBB (1000 GB)
- from 1149 Euro (depends on the configuration)
Technology
GeForce GTX 680M
The specs of the GeForce GTX 680M are a monster. Essentially a notebook model of the desktop GTX 670 (GK104 chip), the 680M houses 1344 CUDA cores, 32 ROPs, 112 TMUs, and a 4096 MByte GDDR5 video RAM connected via a 256-Bit bus. The GeForce GTX 660M (GK107), which is also based on the modern 28 nm Kepler architecture, “only” features 384 Shaders, 8 ROPs, 32 TMUs, and 2048 MByte GDDR5 VRAM with a 128-Bit interface.
Compared to the desktop GTX 670, however, Nvidia have significantly decreased the clock rates of the 680M. Instead of 915 MHz for the chip and 3004 MHz for the memory, the mobile GTX 680M is only clocked at 720 MHz and 1800 MHz, respectively. Subsequently, the bandwidth has fallen from 192.2 GB/s to 115.2 GB/s, the pixel fill rate from 29.3 to 23.0 GPix/s and the texture fill rate from 102.5 GTex/s to 80.6 GTex/s. Fortunately, the bus type (PCI-E 3.0) and DirectX 11.1 API are identical between the two models.
Similar to the GTX 580M (aka. GTX 675M) of which the 680M succeeds, the TDP is rated at 100 Watt. However, it is worth noting that the GTX 680M lacks a unique feature of the new desktop Kepler generation - the automatic core overclocking called GPU Boost.
| Model | GTX 660M (Notebook) | GTX 675M (Notebook) | GTX 680M (Notebook) | GTX 670 (Desktop) | GTX 680 (Desktop) |
|---|---|---|---|---|---|
| Codename | N13E-GE | N13E-GS1 | N13E-GTX | ||
| Chip | GK107 | GF114 | GK104 | GK104 | GK104 |
| Architecture | Kepler | Fermi | Kepler | Kepler | Kepler |
| Lithography | 28 nm | 40 nm | 28 nm | 28 nm | 28 nm |
| Die size | ? | 332 mm² | ? | 294 mm² | 294 mm² |
| Transistors | ? | 1.95 billions | ? | 3.54 billions | 3.54 billions |
| Shader units | 384 | 384 | 1344 | 1344 | 1536 |
| ROPs | 16 | 32 | 32 | 32 | 32 |
| TMUs | 32 | 64 | 112 | 112 | 128 |
| Core clock | 835 MHz | 620 MHz | 720 MHz | 915 MHz | 1006 MHz |
| Boost | 950 MHz | - | - | 980 MHz | 1058 MHz |
| Memory clock | 2000 MHz | 1500 MHz | 1800 MHz | 3004 MHz | 3004 MHz |
| Memory bandwidth | 64.0 GB/s | 96.0 GB/s | 115.2 GB/s | 192.2 GB/s | 192.2 GB/s |
| Memory capacity | 2048 MB | 2048 MB | 4096 MB | 2048 MB | 2048 MB |
| Memory interface | 128 Bit | 256 Bit | 256 Bit | 256 Bit | 256 Bit |
| Memory type | GDDR5 | GDDR5 | GDDR5 | GDDR5 | GDDR5 |
| Texture fill rate | 30.4 GTex/s | 39.7 GTex/s | 80.6 GTex/s | 102.5 GTex/s | 128.8 GTex/s |
| Pixel fill rate | 13.4 GPix/s | 19.8 GPix/s | 23.0 GPix/s | 29.3 GPix/s | 32.2 GPix/s |
| DirectX | 11.1 | 11.0 | 11.1 | 11.1 | 11.1 |
| Bus type | PCI-E 3.0 | PCI-E 2.0 | PCI-E 3.0 | PCI-E 3.0 | PCI-E 3.0 |
| TDP | 75 Watt | 100 Watt | 100 Watt | 170 Watt | 195 Watt |
Radeon HD 7970M
Unlike what the name would otherwise suggest, the Radeon HD 7970M in fact does not resemble its namesake HD 7970, but is instead more closely related to the Radeon HD 7870. The 7870 and 7970M each feature 1280 shaders, 32 ROPs, 80 TMUs, and 2.8 billion transistors. The die size of the 28 nm mobile chip is 212 mm² and the interface of the 2048 MByte GDDR5-VRAM is 256-Bit wide with a Memory throughput of 153.6 GB/s.
Unfortunately, AMD has also modified the core clock rate just like what Nvidia have done to the 680M, although not as severely. While the memory clocks at 1200 MHz, the core clock has been decreased from 1000 MHz to 850 MHz. As expected, the GCN-architecture (Graphics Core Next) supports all modern features and DirectX 11.1. Its rated energy consumption of 100 Watt TDP also matches that of the GTX 680M’s.
In comparison to the old HD 6990M, the core performance of the 7970M has been significantly improved. The 40nm DirectX-11.0-GPU features only 1.7 billion transistors, a core clock of 715 MHz and a memory clock of 900 MHz with a bandwidth of 115.2 GB/s.
| Model | HD 6990M (Notebook) | HD 7970M (Notebook) | HD 7870 (Desktop) | HD 7950 (Desktop) | HD 7970 (Desktop) |
|---|---|---|---|---|---|
| Codename | Blackcomb XTX | Wimbledon XT | Pitcairn XT | Tahiti Pro | Tahiti XT |
| Architecture | Terascale 2 | GCN | GCN | GCN | GCN |
| Lithography | 40 nm | 28 nm | 28 nm | 28 nm | 28 nm |
| Die size | 255 mm² | 212 mm² | 212 mm² | 365 mm² | 365 mm² |
| Transistors | 1.7 Milliarden | 2.8 Milliarden | 2.8 Milliarden | 4.31 Milliarden | 4.31 Milliarden |
| Shader units | 1120 | 1280 | 1280 | 1792 | 2048 |
| ROPs | 32 | 32 | 32 | 32 | 32 |
| TMUs | 56 | 80 | 80 | 112 | 128 |
| Core clock | 715 MHz | 850 MHz | 1000 MHz | 800 MHz | 925 MHz |
| Memory clock | 900 MHz | 1200 MHz | 1200 MHz | 1250 MHz MHz | 1375 MHz |
| Memory bandwidth | 115.2 GB/s | 153.6 GB/s | 153.6 GB/s | 240.0 GB/s | 264.0 GB/s |
| Memory capacity | 2048 MB | 2048 MB | 2048 MB | 3072 MB | 3072 MB |
| Memory interface | 256 Bit | 256 Bit | 256 Bit | 384 Bit | 384 Bit |
| Memory type | GDDR5 | GDDR5 | GDDR5 | GDDR5 | GDDR5 |
| Texture fill rate | 40.0 GTex/s | ? | 80.0 GTex/s | 89.6 GTex/s | 118.4 GTex/s |
| Pixel fill rate | 22.9 GPix/s | ? | 32.0 GPix/s | 25.6 GPix/s | 29.6 GPix/s |
| DirectX | 11.0 | 11.1 | 11.1 | 11.1 | 11.1 |
| Bus type | PCI-E 2.0 | PCI-E 3.0 | PCI-E 3.0 | PCI-E 3.0 | PCI-E 3.0 |
| TDP | 100 Watt | 100 Watt | 175 Watt | 200 Watt | 210 Watt |
Features
Let's take a look at the accompanying features where Nvidia traditionally has a leading role in:
• Dual-GPU: Since at least 2004, it has been possible to use two dedicated high-end graphics cards in parallel. Based on our experiences, AMD's CrossFire technology cannot come close to Nvidia's SLI solution in terms of performance gain partly due to continuing driver issues.
• Multi-Monitor: Although Nvidia have somewhat caught up in this category, AMD continue to offer the better multi-monitor support. In theory, the HD 7970M can handle up to six instead of four displays. However, there are usually not enough video-out interfaces available in a notebook, if ever. Usually two or three displays are the maximum.*
• 3D: When it comes to 3D, AMD do not stand a chance against its competitor. Nvidia's advanced 3D Vision technology scores higher points due to its simpler configuration, higher reliability and more supported games. In contrast, HD3D depends more on third-party hardware and software for support.*
• GPU switching: Dynamic graphics switching is no longer uncommon in the high-end range. While Nvidia's Optimus technology works more or less flawlessly and features many settings and optical indicators, AMD's version (Enduro) still appears ineffectual. Unfortunately, Enduro is still quite unreliable and not as transparent as its Nvidia counterpart. About 50 percent of the games tested launch incorrectly with the integrated GPU (HD Graphics 4000) instead of the dGPU. Furthermore, Enduro has a negative impact on the performance as can be seen in our review of the Alienware M17x R4.
• Physics: GPU-based physics acceleration is definitely dominated by Nvidia. Thanks to PhysX, enhanced physics effects can be enabled on several titles at the cost of frame rates and other performance features. However, we firmly believe that PhysX technology should have little or no impact on a buyer’s decision.
• Audio controller: Whoever wants to connect a TV or an external sound system via HDMI with 7.1-Surround Sound will be happy with the GTX 680M and the HD 7970M. Nvidia list the supported audio formats Dolby TrueHD and DTS-HD on its homepage while AMD can confirm AC-3 and AAC support as well.
• Video decoder: An accelerator for HD videos is also available. Among others, the manufacturers mention the following compatible formats: H.264, VC-1, MPEG-1, MPEG-2 (SD/HD), MCV (Blu-ray 3D), MPEG-4 Part 2 (DivX/Xvid), WMV9, and Adobe Flash.
* sometimes restricted or not possible at all in notebooks equipped with Optimus or Enduro.
Performance
Synthetic Benchmarks
Let's start with the synthetic graphics benchmarks. Depending on the test, the race between the 680M and 7970M can be very tight.
In the DirectX 10-based 3DMark Vantage (1280 x 1024), both high-end models achieve a score of almost 21000 points. In comparison, the HD 6990M and the GTX 675M only achieve about half at 13000-14000 points each. The 3DMark 11 benchmark, which (unsurprisingly) tests DirectX 11 capabilities, is much more demanding. The HD 7970M was able to achieve about 5600 points at 1280 x 720 pixels compared to the ~3200 points from the HD 6990M. The GTX 680M GPU score of 6000 points is even slightly better. For reference, the GTX 675M scored ~3300 points in the same test.
In contrast, we ran the popular Unigine Heaven Benchmark at 1280 x 1024 pixels, high details and with the usual tessellation settings. Both GPUs achieve about 74 fps. Our table, however, reveals that the HD 7970M can perform better. The Alienware M17x R4 is 8 % faster (80 fps) without the graphics switching technology from AMD. The difference is especially big in 3DMark 03 - 46000 points with Enduro and 95000 points without Enduro.
The problem is not limited to specific GPU benchmarks as it can also be experienced during games. The performance loss often amounts to double digit frame losses such as in Modern Warfare 3, StarCraft 2 and Fifa 12. It is very annoying to say the least that AMD has unnecessarily reduced performance with the inclusion of Enduro. We would appreciate if Clevo could follow the example of Alienware and implement an optional Non-Enduro model in the P150EM and P170EM.
| Unigine Heaven 2.1 - 1280x1024 high, Tesselation (normal), DirectX11 AA:off AF:1x (sort by value) | |
| GTX 680M (Schenker XMG P702) | |
| HD 7970M (Schenker XMG P702) | |
| HD 7970M (Alienware M17x R4) | |
| GTX 675M (Schenker XMG P702) | |
| HD 6990M (Schenker XMG P701) | |
| 3DMark 11 - 1280x720 Performance GPU (sort by value) | |
| GTX 680M (Schenker XMG P702) | |
| HD 7970M (Schenker XMG P702) | |
| HD 7970M (Alienware M17x R4) | |
| GTX 675M (Schenker XMG P702) | |
| HD 6990M (Schenker XMG P701) | |
| 3DMark Vantage - 1280x1024 P GPU no PhysX (sort by value) | |
| GTX 680M (Schenker XMG P702) | |
| HD 7970M (Schenker XMG P702) | |
| HD 7970M (Alienware M17x R4) | |
| GTX 675M (Schenker XMG P702) | |
| HD 6990M (Schenker XMG P701) | |
| 3DMark 06 - 1280x1024 Standard Score AA:0x AF:0x (sort by value) | |
| GTX 680M (Schenker XMG P702) | |
| HD 7970M (Schenker XMG P702) | |
| HD 7970M (Alienware M17x R4) | |
| GTX 675M (Schenker XMG P702) | |
| HD 6990M (Schenker XMG P701) | |
| 3DMark 05 - 1024x768 Standard AA:0x AF:0x (sort by value) | |
| GTX 680M (Schenker XMG P702) | |
| HD 7970M (Schenker XMG P702) | |
| HD 7970M (Alienware M17x R4) | |
| GTX 675M (Schenker XMG P702) | |
| HD 6990M (Schenker XMG P701) | |
| 3DMark 03 - 1024x768 Standard AA:0x AF:0x (sort by value) | |
| GTX 680M (Schenker XMG P702) | |
| HD 7970M (Schenker XMG P702) | |
| HD 7970M (Alienware M17x R4) | |
| GTX 675M (Schenker XMG P702) | |
| HD 6990M (Schenker XMG P701) | |
CAD Benchmarks
If CAD performance is of utmost importance, then the Radeon HD 7970M takes the cake. The AMD model is almost 200 percent faster than the GTX 680M in SPECviewperf 11. While the Nvidia GPU can still keep up with the AMD model in Catia and Maya, it is considerably outperformed by the Radeon GPU in Tcvis and Siemens NX (-90 %). Meanwhile, the HD 7970M is between 60 to 160 percent faster in Ensight, Lightwave, Pro/Engineer and SolidWorks. It’s no secret that Nvidia is focusing less on non-gaming computational power with the Kepler series compared to the previous Fermi design, and our CAD results below really exemplify the outcome.
Gaming Benchmarks
The two newcomers are, of course, excellent in games. Apart from exceptions like Metro 2033, all modern games can be enjoyed in maximum settings. Games like Battlefield 3 can be enjoyed at >30 FPS with a 1920 x 1080 pixel resolution and ultra settings active. Even Crysis 2 is well playable at ultra details, high-res textures and with the DirectX 11 patch.
Summarizing all gaming benchmarks, the old generation (HD 6990M & GTX 580M/675M) is roughly 30 percent slower on average. Without Enduro, the HD 7970M is marginally faster than the GTX 680M. With Enduro, the AMD model is slightly outperformed.
However, several results suggest that the GTX 680M could do better as well. We were somewhat surprised that several Nvidia-favored games actually ran more smoothly on the HD 7970M. This might be the fault of the driver version. Nonetheless, we will update as necessary and possibly do a follow-up test with an MSI barebones notebook soon.
| Max Payne 3 - 1920x1080 Very High, DX11 AA:Very High FX AF:8x (sort by value) | |
| GTX 680M (Schenker XMG P702) | |
| HD 7970M (Schenker XMG P702) | |
| HD 6990M (Schenker XMG P501) | |
| Dirt Showdown - 1920x1080 Ultra Preset AA:4xMS (sort by value) | |
| GTX 680M (Schenker XMG P702) | |
| HD 7970M (Schenker XMG P702) | |
| HD 7970M (Alienware M17x R4) | |
| HD 6990M (Schenker XMG P501) | |
| Risen 2: Dark Waters - 1920x1080 Ultra / on AA:on AF:8x (sort by value) | |
| GTX 680M (Schenker XMG P702) | |
| HD 7970M (Schenker XMG P702) | |
| HD 7970M (Alienware M17x R4) | |
| HD 6990M (Schenker XMG P501) | |
| Alan Wake - 1920x1080 High Preset AA:4x AF:8x (sort by value) | |
| GTX 680M (Schenker XMG P702) | |
| HD 7970M (Schenker XMG P702) | |
| HD 7970M (Alienware M17x R4) | |
| GTX 675M (Schenker XMG P702) | |
| HD 6990M (Schenker XMG P501) | |
| Anno 2070 - 1920x1080 Very High Preset AA:on AF:4x (sort by value) | |
| GTX 680M (Schenker XMG P702) | |
| HD 7970M (Schenker XMG P702) | |
| HD 7970M (Alienware M17x R4) | |
| GTX 675M (Schenker XMG P702) | |
| HD 6990M (Schenker XMG P501) | |
| The Elder Scrolls V: Skyrim - 1920x1080 Ultra Preset AA:8x AF:16x (sort by value) | |
| GTX 680M (Schenker XMG P702) | |
| HD 7970M (Schenker XMG P702) | |
| HD 7970M (Alienware M17x R4) | |
| GTX 675M (Schenker XMG P702) | |
| HD 6990M (Schenker XMG P501) | |
| CoD: Modern Warfare 3 - 1920x1080 Extra, all on, Image Quality: Native AA:4x (sort by value) | |
| GTX 680M (Schenker XMG P702) | |
| HD 7970M (Schenker XMG P702) | |
| HD 7970M (Alienware M17x R4) | |
| GTX 675M (Schenker XMG P702) | |
| HD 6990M (Schenker XMG P501) | |
| Battlefield 3 - 1920x1080 ultra AA:4x MS AF:16x (sort by value) | |
| GTX 680M (Schenker XMG P702) | |
| HD 7970M (Schenker XMG P702) | |
| HD 7970M (Alienware M17x R4) | |
| GTX 675M (Schenker XMG P702) | |
| HD 6990M (Schenker XMG P501) | |
| Batman: Arkham City - 1920x1080 Extreme Preset DX11 AA:4x MS (sort by value) | |
| GTX 680M (Schenker XMG P702) | |
| HD 7970M (Schenker XMG P702) | |
| HD 7970M (Alienware M17x R4) | |
| GTX 675M (Schenker XMG P702) | |
| Fifa 12 - 1920x1080 high AA:4x (sort by value) | |
| GTX 680M (Schenker XMG P702) | |
| HD 7970M (Schenker XMG P702) | |
| HD 7970M (Alienware M17x R4) | |
| GTX 675M (Schenker XMG P702) | |
| HD 6990M (Schenker XMG P701) | |
| F1 2011 - 1920x1080 Ultra Preset DX11 AA:4xMS (sort by value) | |
| GTX 680M (Schenker XMG P702) | |
| HD 7970M (Alienware M17x R4) | |
| GTX 675M (Schenker XMG P702) | |
| HD 6990M (Schenker XMG P701) | |
| Deus Ex Human Revolution - 1920x1080 DX11, Soft Shadows, SSAO High, DOF: High, Post Processing, Tessellation AA:ML AF:16x (sort by value) | |
| GTX 680M (Schenker XMG P702) | |
| HD 7970M (Schenker XMG P702) | |
| HD 7970M (Alienware M17x R4) | |
| GTX 675M (Schenker XMG P702) | |
| HD 6990M (Schenker XMG P701) | |
| Crysis 2 | |
| 1920x1080 Ultra DX11 High Res Textures (sort by value) | |
| GTX 680M (Schenker XMG P702) | |
| HD 7970M (Schenker XMG P702) | |
| HD 6990M (Schenker XMG P701) | |
| 1920x1080 Extreme (sort by value) | |
| GTX 680M (Schenker XMG P702) | |
| HD 7970M (Schenker XMG P702) | |
| HD 7970M (Alienware M17x R4) | |
| GTX 675M (Schenker XMG P702) | |
| HD 6990M (Schenker XMG P701) | |
| StarCraft 2 - 1920x1080 ultra (sort by value) | |
| GTX 680M (Schenker XMG P702) | |
| HD 7970M (Schenker XMG P702) | |
| HD 7970M (Alienware M17x R4) | |
| GTX 675M (Schenker XMG P702) | |
| HD 6990M (Schenker XMG P701) | |
| Metro 2033 - 1920x1080 Very High DX11 AA:A AF:4x (sort by value) | |
| GTX 680M (Schenker XMG P702) | |
| HD 7970M (Schenker XMG P702) | |
| HD 7970M (Alienware M17x R4) | |
| GTX 675M (Schenker XMG P702) | |
| HD 6990M (Schenker XMG P701) | |
Emissions
System Noise
While idle there is hardly any difference between the two GPUs in terms of system noise. The noise of the XMG P702 PRO ranges from slightly audible 33 dB(A) to a more audible 35 dB(A). However, the two models are quite different under load. The HD 7970M with 47 dB(A) is slightly louder than the GTX 680M in Battlefield 3. Regardless, both GPUs reach an uncomfortable noise level. Recorded measurements were taken after 60 minutes of gaming.
The AMD GPU is also slightly louder during 3DMark 06 at 46 dB(A) versus 45 dB(A) of the 680M on average. The noise increases to 53 dB (GTX 680M) and 54 dB (HD 7970M) under full loud – a deafening noise.
GTX 680M
Noise level
| Idle |
| 33.4 / 33.7 / 34.6 dB(A) |
| Load |
| 45.1 / 52.7 dB(A) |
 | ||
30 dB silent 40 dB(A) audible 50 dB(A) loud |
||
min: | ||
HD 7970M
Noise level
| Idle |
| 33.3 / 33.8 / 34.2 dB(A) |
| Load |
| 46.2 / 54.2 dB(A) |
|
| ||
30 dB silent 40 dB(A) audible 50 dB(A) loud |
||
min: | ||
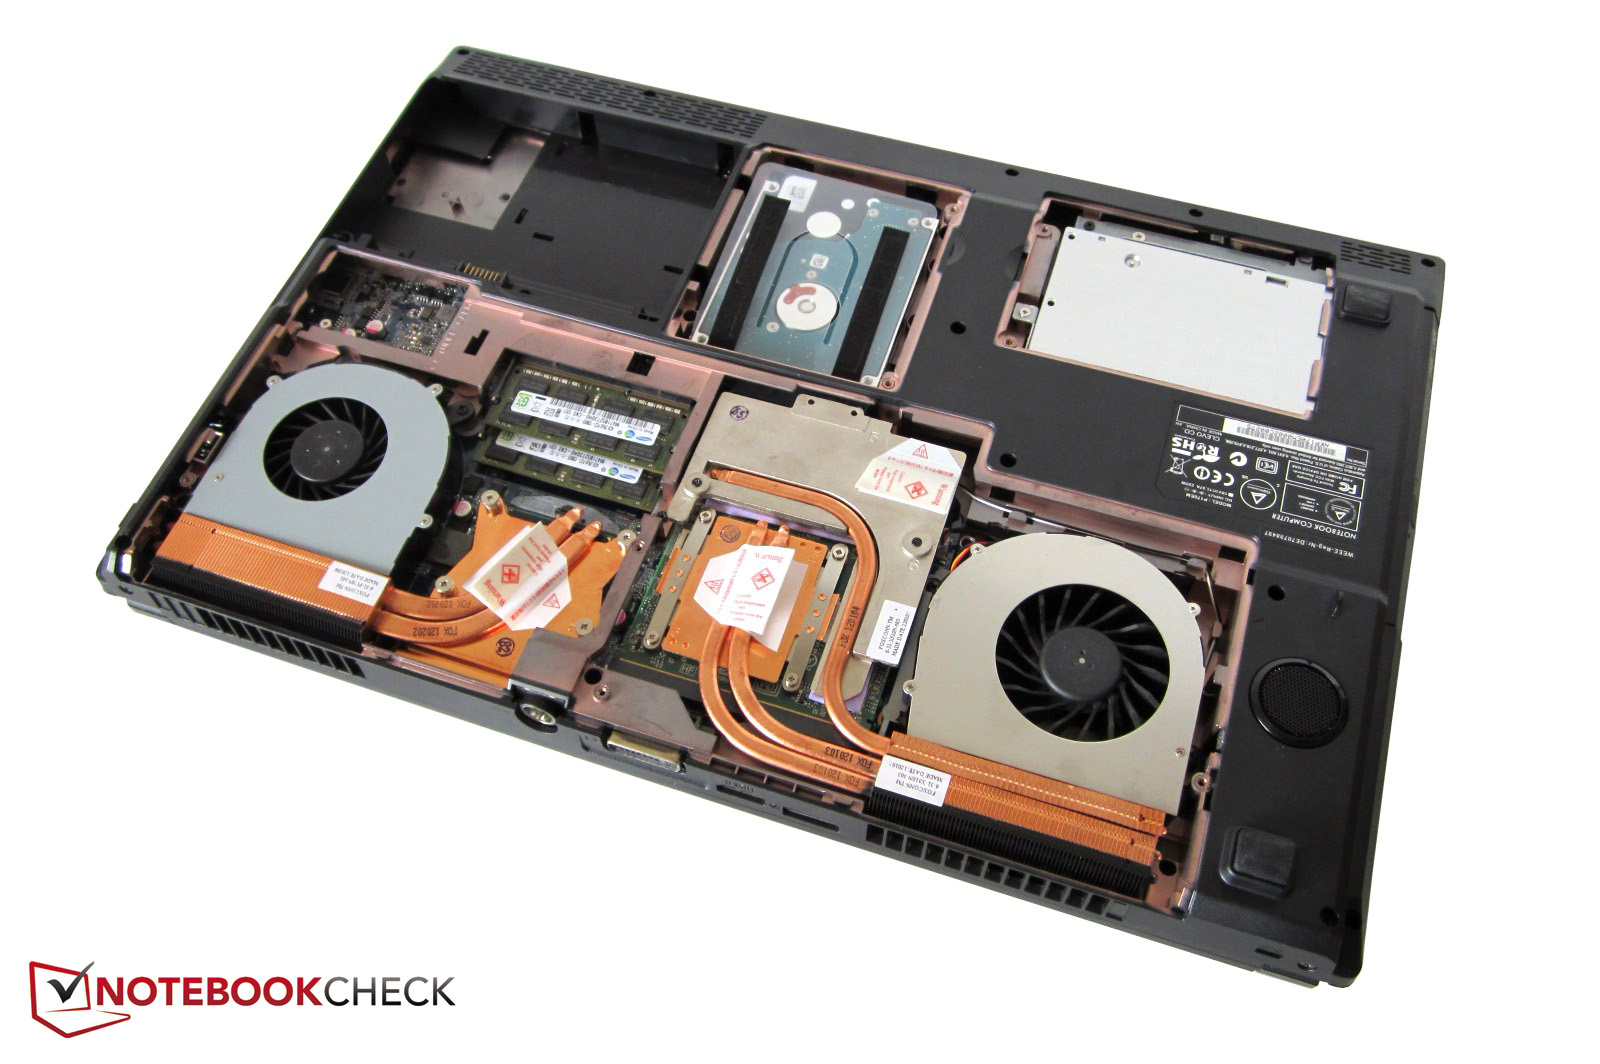
Temperature
Nvidia takes a clearer win in terms of temperature. While the HD 7970M reaches about 83 °C in Battlefield 3 and a maximum of 95°C in the stress test (Furmark + Prime), the 680M runs cooler at 70 °C and 85 °C, respectively.
Furthermore, the AMD GPU generally appears to drive the notebook to its limits. When under full load, the CPU often operates at its base clock rate (2.6 GHz @ Core i7-3720QM) while the CPU in the Nvidia notebook model can always use its Turbo Boost (3 GHz or more). Even worse: According to HWiNFO (GPU-Z 0.6.2 does not record correctly), the core of the HD 7970M sometimes throttles from 850 to 580 MHz. However, we did not experience any throttling during games.
Since the fans work slightly more intensively with the 7970M equipped, the surfaces of the notebook stay cooler with the Radeon GPU. Instead of 34 and 29 °C (full load / idle), the GTX 680M reaches higher averages of 35 and 31 °C.
GTX 680M
(±) The maximum temperature on the upper side is 42.2 °C / 108 F, compared to the average of 36.9 °C / 98 F, ranging from 24.7 to 57 °C for the class .
(-) The bottom heats up to a maximum of 45.2 °C / 113 F, compared to the average of 38.5 °C / 101 F
(+) In idle usage, the average temperature for the upper side is 30.5 °C / 87 F, compared to the device average of 31.9 °C / 89 F.
(+) The palmrests and touchpad are cooler than skin temperature with a maximum of 30.7 °C / 87.3 F and are therefore cool to the touch.
(±) The average temperature of the palmrest area of similar devices was 29.6 °C / 85.3 F (-1.1 °C / -2 F).
HD 7970M
(+) The maximum temperature on the upper side is 38.3 °C / 101 F, compared to the average of 36.9 °C / 98 F, ranging from 24.7 to 57 °C for the class .
(-) The bottom heats up to a maximum of 45.9 °C / 115 F, compared to the average of 38.5 °C / 101 F
(+) In idle usage, the average temperature for the upper side is 29.4 °C / 85 F, compared to the device average of 31.9 °C / 89 F.
(+) The palmrests and touchpad are cooler than skin temperature with a maximum of 29.8 °C / 85.6 F and are therefore cool to the touch.
(±) The average temperature of the palmrest area of similar devices was 29.6 °C / 85.3 F (-0.2 °C / -0.3 F).
Energy Efficiency
Power consumption
Those who have read up on the new GPU generations these past few weeks already know that Kepler is more energy efficient than the competing GCN architecture. The same is true for the mobile range.
In our tests, the energy consumptions are 99-109 Watt (GTX 680M) vs. 106-131 Watt (HD 7970M) in 3DMark 06. The Nvidia model also works more economically in Battlefield 3 (126 vs. 143 Watt). Meanwhile, the maximum power draw amounts to 183 versus 200 Watt. While the notebook is idle with the dedicated graphics card inactive, the power consumption of both models become more identical at the 16-27 Watt range.
As our reviews indicate, the GTX 675M (P702 PRO) and HD 6990M (P701 PRO) have significantly worse performance-to-Watt ratio.
Please note that the mentioned results refer to the whole system and not the individual GPUs.
GTX 680M
| Off / Standby | |
| Idle | |
| Load |
|
Key:
min: | |
HD 7970M
| Off / Standby | |
| Idle | |
| Load |
|
Key:
min: | |
Battery Life
As the screenshots on the right depict, the energy saving mechanisms are quite different on battery. Despite heavy load, the GTX 680M clocks down to 135 MHz (core) and 324 MHz (memory) during the BatteryEater Classic test. The HD 7970M idles higher at 450 and 1200 MHz, respectively, which will reduce battery life accordingly. From our tests, the Nvidia-equipped notebook achieves 100 minutes compared to the paltry 56 minutes of the AMD model. Just the opposite is true when connected to an outlet: The clock rate of the GTX 680M is surprisingly high at low loads compared to the AMD card. We suspect that this could be a bug and may be patched at a later date.
GTX 680M
HD 7970M
Price
Nvidia are asking for much more money for the GTX 680M than are AMD for the HD 7970M. An almost 300 Euro ($380 USD) surcharge (see configurator) can be pretty pretty steep and seems excessive given that the Radeon GPU can perform equally as fast in most games, if not faster. The price differences for the HD 6970M / HD 6990M compared to the GTX 485M / GTX 580M were similarly large in the past.
In an attempt to avoid losing potential buyers, we believe that Nvidia should decrease the price by about 200 Euro (~$250 USD). From a price-performance perspective, the HD 7970M is significantly more appealing, at least for now.
Verdict
It’s a fact that Nvidia have produced the overall better GPU with the GeForce GTX 680M. Its waste heat and energy consumption are both lower compared to the Radeon HD 7970M, leading to quieter system noise and longer battery life.
The manufacturer with the green logo continues to take the lead in supported features. In particular, PhysX and 3D Vision currently do not have any serious competition. Furthermore, AMD’s graphics switching technology is almost abysmal. Poor detection rate, few configuration options, and noticeable performance losses are just a few of the annoying problems. Nvidia’s Optimus definitely deserves praise for its much friendlier interface and better functionality.
On the bright side, the Radeon HD 7970M is not too far behind the 680M in gaming performance. In fact, both are about on par in games and the GTX 680M is even significantly slower in professional applications. However, the biggest advantage of the HD 7970M is its more reasonable price. Hardly any other high-end notebook GPU model can achieve better FPS-per-dollar ratio than this Tahiti core.
If AMD can improve upon the still-young Enduro technology, then we would recommend the 7970M without hesitation. But for now, the 680M offers the most balanced, reliable, and most versatile performance of the two.
