NVIDIA GeForce GTX 680M

NVIDIA GeForce GTX 680M


The NVIDIA GeForce GTX 680M is a high-end DirectX 11.1-compatible graphics card for laptops and was announced during Computex 2012. It was the fastest GPU available for notebooks at the time of announcement and has a 28nm GK104 core based on the Kepler architecture. Compared to the desktop GeForce GTX 670, the GTX 680M also features 1344 CUDA cores, but the mobile counterpart operates at reduced core and memory clock speeds (720/1800MHz vs 915-980/3004MHz).

Architecture

The Kepler architecture is the successor to the Fermi architecture that first appeared in laptops with the GeForce 400M series. The GK104 Kepler core offers eight shader blocks, called SMX, that are clocked at the same speed as the central core. In the GTX 680M, 7 blocks are active leading to the 1344 CUDA cores. Although more shader cores are available in the Kepler architecture as compared to the Fermi design, the Kepler shaders are still expected to be up to twice as power efficient. However, due to the missing hot clock of the shader domain, two shaders of a Kepler chip are of similar speed to one shader of a Fermi chip (as the latter is clocked twice as fast). PCIe 3.0 is now supported by the mobile Kepler series and an optional Turbo mode can automatically overclock the Nvidia card by a theoretical 15 percent if the laptop cooling system allows it. The implementation of this boost mode is done in the BIOS, but it is ultimately dependent upon the manufacturer of the laptop.

Performance

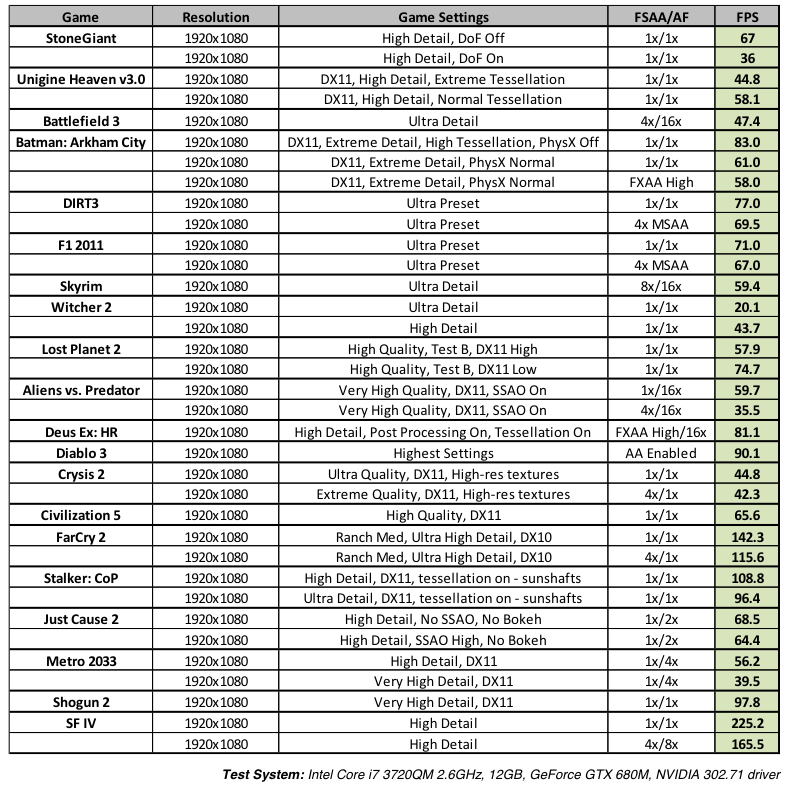
The graphics performance of the GeForce GTX 680M is on average above the Radeon HD 7970M, thus making the Nvidia card the fastest mobile graphics card as of summer 2012. The GPU has enough power to run demanding games of 2012 fluently with Full HD resolution and maxed out graphical settings. Only the extremely demanding title The Witcher 2 will not run fluently in ultra settings. Battlefield 3, Skyrim, and Crysis 2, for example, are playable at the highest detail settings.

Features

The improved feature set now includes support for up to 4 active displays. Furthermore, high resolution monitors of up to 3840x2160 pixels can now be connected using DisplayPort 1.2 or HDMI 1.4a if available. HD-Audio codecs, such as Dolby TrueHD and DTS-HD, can be transmitted via bitstream mode through the HDMI port. However, as most laptops will feature Optimus, the integrated GPU will likely have direct control over the display ports and may limit the feature set available by the Nvidia Kepler cards.

The 5th generation PureVideo HD video processor (VP5) is also integrated in the GK104 core and offers hardware decoding of HD videos. Common codecs such as MPEG-1/2, MPEG-4 ASP, H.264 and VC1/WMV9 are fully supported up to 4K resolutions while VC1 and MPEG-4 are supported up to 1080p. Two streams can be decoded in parallel for features such as Picture-in-Picture. Another novelty is the inclusion of a dedicated video encoding engine similar to Intel QuickSync that can be accessed by the NVENC API.

The power consumption of the GeForce GTX 680M should be similar to the GTX 580M and therefore best suited for large notebooks (17-inches or greater) and desktop replacements.

ManufacturerNVIDIA
GeForce GTX 600M Series

GeForce GTX 680M SLI

2688 cores @ 720 MHz256 Bit @ 1800 MHz

GeForce GTX 680MX

1536 cores @ 720 MHz256 Bit @ 2500 MHz

GeForce GTX 675M SLI

768 cores @ 620 MHz256 Bit @ 1500 MHz

GeForce GTX 670MX SLI

1920 cores @ 600 MHz192 Bit @ 1400 MHz
GeForce GTX 680M 1344 cores @ 720 MHz256 Bit @ 1800 MHz

GeForce GTX 675MX

960 cores @ 600 MHz256 Bit @ 900 MHz

GeForce GTX 675M

384 cores @ 620 MHz256 Bit @ 1500 MHz

GeForce GTX 670MX

960 cores @ 600 MHz192 Bit @ 700 MHz

GeForce GTX 670M

336 cores @ 598 MHz192 Bit @ 1500 MHz

GeForce GTX 660M

384 cores @ 835 MHz128 Bit @ 2000 MHz
CodenameN13E-GTX
ArchitectureKepler
Pipelines1344 - unified
Core Speed *720 MHz
Shader Speed *720 MHz
Memory Speed *1800 MHz
Memory Bus Width256 Bit
Memory TypeGDDR5
Max. Amount of Memory4096 MB
Shared Memoryno
DirectXDirectX 11, Shader 5.0
Current Consumption100 Watt
Transistors3540 Million
technology28 nm
FeaturesOptimus, SLI, PhysX, Verde Drivers, CUDA, 3D Vision, 3DTV Play
Notebook Sizelarge
Date of Announcement04.06.2012
Link to Manufacturer Pagehttp://www.nvidia.com/page/home.html
* The specified clock rates are only guidelines for the manufacturer and can be altered by them.

Benchmarks

3DMark (2013) - Ice Storm Standard Graphics 1280x720
0% 100%
min: 77067     avg: 110472.5 (39%)     max: 143878 Points
3DMark (2013) - Cloud Gate Standard Graphics 1280x720
0% 100%
min: 26851     avg: 27684 (59%)     max: 28517 Points
3DMark (2013) - Fire Strike Standard Graphics 1920x1080
0% 100%
min: 3952     avg: 4049 (59%)     max: 4146 Points
3DMark 11 - Performance 1280x720
0% 100%
min: 5804     avg: 6158.5 (48%)     max: 7218 points
3DMark 11 - Performance GPU 1280x720
0% 100%
min: 5647     avg: 6073.8 (43%)     max: 7214 points
...
GeForce GTX 480 -17%
GeForce GTX 570 -17%
GeForce GTX 580 0%
GeForce GTX 680M
Radeon HD 7870 2%
Radeon HD 7970 28%
GeForce GTX 660 Ti 39%
...
0%
100%
3DMark Vantage - P Result no PhysX 1280x1024
0% 100%
min: 19575     avg: 21163.8 (58%)     max: 21952 Points
3DMark Vantage - P GPU no PhysX 1280x1024
0% 100%
min: 18266     avg: 20575.1 (47%)     max: 21489 Points
3DMark 06
0% 100%
min: 18529     avg: 22478.5 (76%)     max: 25378 Points
3DMark 05 - Standard 1024x768
0% 100%
min: 26556     avg: 29052 (79%)     max: 32763 Points
3DMark 03 - Standard 1024x768
0% 100%
min: 55426     avg: 68272 (45%)     max: 72750 Points
Unigine Heaven 2.1 - high, Tesselation (normal), DirectX11 1280x1024
0% 100%
min: 71.6     avg: 73.9 (49%)     max: 77.6 fps
PCMark Vantage - Gaming Score 1024x768
0% 100%
min: 17770     avg: 18425.3 (70%)     max: 19295 Points
SPECviewperf 11 - Catia 1920x1080
0% 100%
min: 6.77     avg: 6.8 (10%)     max: 6.77 fps
SPECviewperf 11 - Ensight 1920x1080
0% 100%
min: 22.73     avg: 22.7 (38%)     max: 22.73 fps
SPECviewperf 11 - Lightwave 1920x1080
0% 100%
min: 17.39     avg: 17.4 (22%)     max: 17.39 fps
SPECviewperf 11 - Maya 1920x1080
0% 100%
min: 13.47     avg: 13.5 (12%)     max: 13.47 fps
SPECviewperf 11 - Pro/ENGINEER 1920x1080
0% 100%
min: 1.37     avg: 1.4 (8%)     max: 1.37 fps
SPECviewperf 11 - SolidWorks 1920x1080
0% 100%
min: 10.92     avg: 10.9 (17%)     max: 10.92 fps
SPECviewperf 11 - Tcvis 1920x1080
0% 100%
min: 0.9     avg: 0.9 (2%)     max: 0.9 fps
SPECviewperf 11 - Siemens NX 1920x1080
0% 100%
min: 2.1     avg: 2.1 (3%)     max: 2.1 fps
Cinebench R11.5 - OpenGL 64Bit
0% 100%
min: 40.34     avg: 45.2 (51%)     max: 50.89 Points
Cinebench R10 - Shading 32Bit
0% 100%
min: 6669     avg: 8520 (79%)     max: 10045 Points
Windows 7 Experience Index - Graphics
0% 100%
min: 6.9     avg: 7.2 (91%)     max: 7.7 points
Windows 7 Experience Index - Gaming graphics
0% 100%
min: 6.9     avg: 7.2 (91%)     max: 7.7 points
- Range of benchmark values for this graphics card
- Average benchmark values for this graphics card

Game Benchmarks

The following benchmarks stem from our benchmarks of review laptops. The performance depends on the used graphics memory, clock rate, processor, system settings, drivers, and operating systems. So the results don't have to be representative for all laptops with this GPU. For detailled information on the benchmark results, click on the fps number.

GRID 2
GRID 2 (2013)
low:
143.7  fps      Compare
med.:
110.7  fps      Compare
high:
102.2  fps      Compare
ultra:
48.2  fps      Compare
» With all tested laptops playable in detail settings ultra.
Metro: Last Light
low:
102.3  fps      Compare
med.:
87.8  fps      Compare
high:
54.5  fps      Compare
ultra:
30.5  fps      Compare
» With all tested laptops playable in detail settings high.
BioShock Infinite
low:
184.4  fps      Compare
med.:
126 140.4 ~ 133 fps      Compare
high:
111 122.5 ~ 117 fps      Compare
ultra:
45 46.6 ~ 46 fps      Compare
» With all tested laptops playable in detail settings ultra.
StarCraft II: Heart of the Swarm
low:
264.4  fps      Compare
med.:
91 114.9 ~ 103 fps      Compare
high:
79 101.4 ~ 90 fps      Compare
ultra:
53.8 67 ~ 60 fps      Compare
» With all tested laptops playable in detail settings ultra.
SimCity
SimCity (2013)
low:
77.3  fps      Compare
med.:
56.9  fps      Compare
high:
48.3  fps      Compare
ultra:
32.1  fps      Compare
» With all tested laptops playable in detail settings high.
Tomb Raider
Tomb Raider (2013)
low:
283.8  fps      Compare
med.:
160.1 179 ~ 170 fps      Compare
high:
98 119 ~ 109 fps      Compare
ultra:
32.2 47 ~ 40 fps      Compare
» With most tested laptops playable in detail settings ultra.
Crysis 3
Crysis 3 (2013)
low:
84.1  fps      Compare
med.:
69.8  fps      Compare
high:
51.4  fps      Compare
ultra:
21.8  fps      Compare
» With all tested laptops playable in detail settings high.
Dead Space 3
Dead Space 3 (2013)
low:
287  fps      Compare
med.:
220.4  fps      Compare
high:
182.8  fps      Compare
ultra:
111.1  fps      Compare
» With all tested laptops playable in detail settings ultra.
Far Cry 3
Far Cry 3 (2012)
low:
78.7  fps      Compare
med.:
69.4  fps      Compare