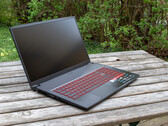
MSI GF75 Thin 8RD (i7-8750H, GTX 1050Ti Max-Q) Laptop Review
"Make it thin and light." This is probably what the engineers at MSI heard when being given the task of creating the MSI GF75 8RD. And the result is: thin and light. But how does the flyweight gamer fare under full load? After all, the MSI GF75 is not made for office work. It is directed at the gaming community. Can the thin MSI keep up with the high demands of gaming or might this design have taken its toll on the laptop's abilities?
Intel Core i7-8750H, NVIDIA GeForce GTX 1050 Ti Max-Q, 17.3", 2.2 kg