Notebook reviews with Intel Iris Plus Graphics G7 (Ice Lake 64 EU) graphics card
Asus VivoBook 17 (F712JA) review: Affordable 17-inch laptop with passive cooling
The Asus VivoBook is an affordable multimedia laptop with a sharp 17-inch display, semi-passive cooling of the CPU, and good speakers. But is this sufficient to stand up to the competitors? Our test evaluates the performance, volume, battery live, keyboard, and quality of the laptop.
Intel Core i7-1065G7, Iris Plus Graphics G7 (Ice Lake 64 EU), 17.3", 2.2 kgInfinix INBook X2 laptop review: The thinner and lighter INBook X1 Pro
The InBook X2 is 20 percent lighter and 13 percent smaller than last year's InBook X1 Pro and with additional QoL updates such as a keyboard backlight and brighter display. There are some downgrades nonetheless that users ought to be aware of.
Intel Core i7-1065G7, Iris Plus Graphics G7 (Ice Lake 64 EU), 14", 1.2 kgInfinix INBook X1 Pro Laptop Review: Surprisingly Solid All Around
After dabbling in budget Android smartphones for years, Infinix is now ready for its leap of faith into the laptop world. Its debut INBook X1 Pro retails for only $700 USD or less and it's already looking like a much stronger contender than initially anticipated.
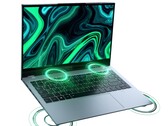
Intel Core i7-1065G7, Iris Plus Graphics G7 (Ice Lake 64 EU), 14", 1.5 kgAsus Zenbook S UX393JA Laptop Review: The Microsoft Surface Alternative
The ZenBook S series is moving away from the standard 16:9 aspect ratio to the more office-friendly 3:2. Results are impressive and definitely worth a look if you were considering a Surface, XPS, or MateBook in the near future.
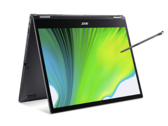
Intel Core i7-1065G7, Iris Plus Graphics G7 (Ice Lake 64 EU), 13.9", 1.4 kgAcer Spin 5 SP513 Laptop Review: Sensibly Optimized and Balanced 13-Inch Convertible
With the new Acer Spin 5 SP513, the manufacturer optimizes the 13.5-inch model of the versatile convertible. With Intel Ice Lake, the hardware has improved considerably and there are additional improvements. So has Acer created a convincing overall package here, or are there still some old or even new weaknesses? In addition, the Intel convertible also has to compete with a new AMD heavyweight.
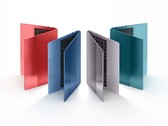
Intel Core i7-1065G7, Iris Plus Graphics G7 (Ice Lake 64 EU), 13.5", 1.2 kgLG Gram 17 17Z90N-V.AA77G: Intel Core i7-1065G7, 17.00", 1.4 kg
Review » LG Gram 17 17Z90N Review: A light and mobile 17-inch laptop with a 16:10 display
Asus ZenBook 13 UX325JA: Intel Core i7-1065G7, 13.30", 1.1 kg
Review » Asus ZenBook 13 UX325JA in Review: 1100-gram Subnotebook with Excellent Battery Life
LG Gram 15Z90N: Intel Core i5-1035G7, 15.60", 1.1 kg
Review » The LG Gram 15 Laptop Review: Featherlight 15-inch laptop with a great display
HP 15s-fq1440ng: Intel Core i7-1065G7, 15.60", 1.6 kg
Review » Office laptop HP 15s-fq1440ng in the test: hardware deceives - potential wasted
Apple MacBook Pro 13 2020 2GHz i5 10th-Gen: Intel Core i5-1038NG7, 13.30", 1.4 kg
Review » MacBook Pro 13 2020 in Review: Apple's subnotebook only gets the mandatory update
LG Gram 14Z90N: Intel Core i7-1065G7, 14.00", 1 kg
Review » LG Gram 14Z90N Laptop Review: Lightweight at the Cost of Performance
Dell XPS 13 9300 4K UHD: Intel Core i7-1065G7, 13.40", 1.2 kg
Review » Dell XPS 13 9300 4K UHD Laptop Review: 16:10 is the New 16:9
Apple MacBook Air 2020 i5: Intel Core i5-1030NG7, 13.30", 1.3 kg
Review » Apple MacBook Air 2020 Core i5 Review – The best MacBook you can get? – No
Dell XPS 13 9300 Core i7-1065G7: Intel Core i7-1065G7, 13.40", 1.2 kg
Review » Dell XPS 13 9300 Core i7 Laptop Review: New Chassis Design is More Exciting than the New CPU
Lenovo Ideapad S340-15IIL: Intel Core i7-1065G7, 15.60", 1.8 kg
Review » Lenovo IdeaPad S340-15 Laptop Review: Cheap Core i7 Ice Lake Comes with a Performance Cost
Microsoft Surface Laptop 3 13 Core i5-1035G7: Intel Core i5-1035G7, 13.50", 1.3 kg
Review » Sayonara, Alcantara: Microsoft Surface Laptop 3 13.5-inch Core i5 Review
Microsoft Surface Pro 7: Intel Core i7-1065G7, 12.30", 0.8 kg
Review » Microsoft Surface Pro 7 Review: An i7 Upgrade with Extra GPU Performance
Acer Swift 3 SF313-52-71Y7: Intel Core i7-1065G7, 13.50", 1.2 kg
Review » Fully Loaded Acer Swift 3 SF313 with Ice Lake Processor in Review
Microsoft Surface Laptop 3 15 i7-1065G7: Intel Core i7-1065G7, 15.00", 1.5 kg
Review » Microsoft Surface Laptop 3 15-inch Core i7 Review: Better with Ice Lake
HP Spectre x360 13-aw0013dx: Intel Core i7-1065G7, 13.30", 1.2 kg
Review » HP Spectre x360 13-aw0013dx Convertible Review: Powered by Intel Ice Lake
Lenovo Yoga C940-14IIL 81Q9: Intel Core i7-1065G7, 14.00", 1.4 kg
Review » Lenovo Yoga C940-14IIL Review: The 14-inch Consumer Convertible to Beat
Razer Blade Stealth i7-1065G7 Iris Plus: Intel Core i7-1065G7, 13.30", 1.4 kg
Review » Razer Blade Stealth i7-1065G7 Iris Plus Laptop Review: The Cheaper GeForce MX150 is Faster
Lenovo Yoga C940-14IIL: Intel Core i7-1065G7, 14.00", 1.4 kg
Review » Lenovo Yoga C940-14IIL Laptop Review: Premium Ice Lake convertible is a strong competitor for the Dell XPS 13
Dell XPS 13 7390 2-in-1 Core i7: Intel Core i7-1065G7, 13.40", 1.3 kg
Review » Dell XPS 13 7390 2-in-1 Core i7-1065G7 Review: Faster Than Any XPS 13 Before It
HP 15s-fq1440ng: Intel Core i7-1065G7, 15.60", 1.6 kg
External Review » HP 15s-fq1440ng
Infinix INBook X2: Intel Core i7-1065G7, 14.00", 1.2 kg
External Review » Infinix INBook X2
LG Gram 14Z90N: Intel Core i7-1065G7, 14.00", 1 kg
External Review » LG Gram 14Z90N
Lenovo IdeaPad Flex 5 14IIL05-81X100FASP: Intel Core i7-1065G7, 14.00", 1.5 kg
External Review » Lenovo IdeaPad Flex 5 14IIL05-81X100FASP
Infinix INBook X1 Pro: Intel Core i7-1065G7, 14.00", 1.5 kg
External Review » Infinix INBook X1 Pro
Asus F415JA-EK398: Intel Core i7-1065G7, 14.00", 1.6 kg
External Review » Asus F415JA-EK398
HP Envy x360 15m-ed0023dx: Intel Core i7-1065G7, 15.60", 1.9 kg
External Review » HP Envy x360 15m-ed0023dx
LG Gram 17Z90N-V.AP75A8: Intel Core i7-1065G7, 17.00", 1.4 kg
External Review » LG Gram 17Z90N-V.AP75A8
HP 14s-dq1021ns : Intel Core i7-1065G7, 14.00", 1.5 kg
External Review » HP 14s-dq1021ns
HP 15s-fq1086ns: Intel Core i7-1065G7, 15.60", 1.7 kg
External Review » HP 15s-fq1086ns
HP 15s-fq1152ns: Intel Core i7-1065G7, 15.60", 1.7 kg
External Review » HP 15s-fq1152ns
HP 15s-fq1087ns: Intel Core i7-1065G7, 15.60", 1.7 kg
External Review » HP 15s-fq1087ns
HP 15s-fq1151ns: Intel Core i7-1065G7, 15.60", 1.7 kg
External Review » HP 15s-fq1151ns
Acer Spin 5 SP513-54N-77UH: Intel Core i7-1065G7, 13.50", 1.2 kg
External Review » Acer Spin 5 SP513-54N-77UH
HP Envy x360 15-ed0019ur: Intel Core i7-1065G7, 15.60", 1.9 kg
External Review » HP Envy x360 15-ed0019ur
LG Gram 14Z90N-V-AP52B: Intel Core i5-1035G7, 14.00", 1 kg
External Review » LG Gram 14Z90N-V-AP52B
Dell Inspiron 14 5401-PXC2V: Intel Core i7-1065G7, 14.00", 1.4 kg
External Review » Dell Inspiron 14 5401-PXC2V
Acer Swift 3 SF313-52-78W6: Intel Core i7-1065G7, 13.50", 1.2 kg
External Review » Acer Swift 3 SF313-52-78W6
Acer Spin 5 SP513-54N-74V2: Intel Core i7-1065G7, 13.50", 1.2 kg
External Review » Acer Spin 5 SP513-54N-74V2
HP Envy 13-ba0006na: Intel Core i7-1065G7, 13.30", 1.3 kg
External Review » HP Envy 13-ba0006na
Asus ZenBook Flip 13 UX363JA-XB71T: Intel Core i7-1065G7, 13.30", 1.3 kg
External Review » Asus ZenBook Flip 13 UX363JA-XB71T
LG Gram 14Z90N-V-AR53B: Intel Core i5-1035G7, 14.00", 1 kg
External Review » LG Gram 14Z90N-V-AR53B
Acer Swift 3 SF314-57-735H: Intel Core i7-1065G7, 14.00", 1.1 kg
External Review » Acer Swift 3 SF314-57-735H
Acer Swift 3 Pro SF313-52-70L2: Intel Core i7-1065G7, 13.50"
External Review » Acer Swift 3 Pro SF313-52-70L2
HP 15s-fq1168ns: Intel Core i7-1065G7, 15.60", 1.7 kg
External Review » HP 15s-fq1168ns
Acer Swift 3 SF314-57-77MU: Intel Core i7-1065G7, 14.00", 1.2 kg
External Review » Acer Swift 3 SF314-57-77MU
LG Gram 15Z90N-V-AA78B: Intel Core i7-1065G7, 15.60", 1.1 kg
External Review » LG Gram 15Z90N-V-AA78B
LG Gram 17 17Z90N-V.AA55D: unknown, 17.00", 1.4 kg
External Review » LG Gram 17 17Z90N-V.AA55D
Lenovo Yoga C940-14IIL-81Q9000NMH: Intel Core i7-1065G7, 14.00", 1.4 kg
External Review » Lenovo Yoga C940-14IIL-81Q9000NMH
HP 15s-fq1090ns: Intel Core i7-1065G7, 15.60", 1.7 kg
External Review » HP 15s-fq1090ns
Asus ZenBook 14 UX425JA-BM040R: Intel Core i7-1065G7, 14.00", 1.2 kg
External Review » Asus ZenBook 14 UX425JA-BM040R
HP Envy 13-ba0002nt: Intel Core i7-1065G7, 13.30", 1.3 kg
External Review » HP Envy 13-ba0002nt
HP Envy 13-ba0047tu: Intel Core i7-1065G7, 13.30", 1.3 kg
External Review » HP Envy 13-ba0047tu
LG Gram 17 17Z90N-V.AA55G: Intel Core i5-1035G7, 17.30", 1.4 kg
External Review » LG Gram 17 17Z90N-V.AA55G
LG Gram 17 17Z90N-V.AA77G: Intel Core i7-1065G7, 17.00", 1.4 kg
External Review » LG Gram 17 17Z90N-V.AA77G
Samsung Galaxy Book Flex 13.3-930QCG-K01SE: Intel Core i7-1065G7, 13.30", 1.2 kg
External Review » Samsung Galaxy Book Flex 13.3-930QCG-K01SE
LG Gram 14Z90N-V.AR53Y: Intel Core i5-1035G7, 14.00", 1 kg
External Review » LG Gram 14Z90N-V.AR53Y
Asus ZenBook 13 UX325JA: Intel Core i7-1065G7, 13.30", 1.1 kg
External Review » Asus ZenBook 13 UX325JA
LG Gram 15Z90N-V: Intel Core i5-1035G7, 15.60", 1.1 kg
External Review » LG Gram 15Z90N-V
Asus ZenBook 14 UX425JA-HM046T: Intel Core i7-1065G7, 14.00", 1.1 kg
External Review » Asus ZenBook 14 UX425JA-HM046T
Acer Swift 3 SF314-57-730G: Intel Core i7-1065G7, 14.00", 1.2 kg
External Review » Acer Swift 3 SF314-57-730G
Acer Spin 5 SP513-54N-79EY: Intel Core i7-1065G7, 13.50", 1.2 kg
External Review » Acer Spin 5 SP513-54N-79EY
HP Spectre x360 13-aw0031ng: Intel Core i7-1065G7, 13.30", 1.3 kg
External Review » HP Spectre x360 13-aw0031ng
Acer Spin 5 SP513-54N-70GZ: Intel Core i7-1065G7, 13.50", 1.2 kg
External Review » Acer Spin 5 SP513-54N-70GZ
Acer Swift 5 SF514-54T-700D: Intel Core i7-1065G7, 14.00", 1 kg
External Review » Acer Swift 5 SF514-54T-700D
HP Pavilion 15-cs3019nr: Intel Core i7-1065G7, 15.60", 1.9 kg
External Review » HP Pavilion 15-cs3019nr
HP Spectre x360 13-aw0013dx: Intel Core i7-1065G7, 13.30", 1.2 kg
External Review » HP Spectre x360 13-aw0013dx
Acer Swift 3 SF313-52-740Y: Intel Core i7-1065G7, 13.50", 1.2 kg
External Review » Acer Swift 3 SF313-52-740Y
HP 15s-fq1112ns: Intel Core i7-1065G7, 15.60", 1.7 kg
External Review » HP 15s-fq1112ns
HP 15s-fq1092ns: Intel Core i7-1065G7, 15.60", 1.7 kg
External Review » HP 15s-fq1092ns
Dell XPS 13 9300 4K UHD: Intel Core i7-1065G7, 13.40", 1.2 kg
External Review » Dell XPS 13 9300 4K UHD
HP 14s-dq1014ns: Intel Core i7-1065G7, 14.00", 1.5 kg
External Review » HP 14s-dq1014ns
HP Spectre x360 13-aw0361no: Intel Core i7-1065G7, 13.30", 1.3 kg
External Review » HP Spectre x360 13-aw0361no
Samsung Galaxy Book Flex 15 NP950QCG-K01CA: Intel Core i7-1065G7, 15.60", 1.5 kg
External Review » Samsung Galaxy Book Flex 15 NP950QCG-K01CA
Apple MacBook Pro 13 2020 2GHz i5 10th-Gen: Intel Core i5-1038NG7, 13.30", 1.4 kg
External Review » Apple MacBook Pro 13 2020 2GHz i5 10th-Gen
Apple MacBook Pro 13 2020 2.3GHz i7 10th-Gen: Intel Core i7-1068G7, 13.30", 1.4 kg
External Review » Apple MacBook Pro 13 2020 2.3GHz i7 10th-Gen
LG Gram 17Z90N-V.AA77G: Intel Core i7-1065G7, 17.30", 1.4 kg
External Review » LG Gram 17Z90N-V.AA77G
HP Spectre x360 13-aw0205tu: Intel Core i7-1065G7, 13.30", 1.3 kg
External Review » HP Spectre x360 13-aw0205tu
Acer Swift 3 SF314-57-710U: Intel Core i7-1065G7, 14.00", 1.2 kg
External Review » Acer Swift 3 SF314-57-710U
HP Spectre x360 13-aw0362no: Intel Core i7-1065G7, 13.30", 1.3 kg
External Review » HP Spectre x360 13-aw0362no
Apple MacBook Air 2020 i7: Intel Core i7-1060NG7, 13.30", 1.3 kg
External Review » Apple MacBook Air 2020 i7
Dell XPS 13 9300 Core i7-1065G7: Intel Core i7-1065G7, 13.40", 1.2 kg
External Review » Dell XPS 13 9300 Core i7-1065G7
HP Envy 13-aq1195nr: Intel Core i7-1065G7, 13.30", 1.2 kg
External Review » HP Envy 13-aq1195nr
LG Gram 17 Z90N-R.AAS9U1: Intel Core i7-1065G7, 17.00", 1.4 kg
External Review » LG Gram 17 Z90N-R.AAS9U1
HP Spectre x360 13-aw0053na: Intel Core i7-1065G7, 13.30", 1.3 kg
External Review » HP Spectre x360 13-aw0053na
Apple MacBook Air 2020 i5: Intel Core i5-1030NG7, 13.30", 1.3 kg
External Review » Apple MacBook Air 2020 i5
HP 15s-fq1043ns: Intel Core i7-1065G7, 15.60", 1.7 kg
External Review » HP 15s-fq1043ns
HP Spectre x360 13-aw0106nc: Intel Core i7-1065G7, 13.30", 1.3 kg
External Review » HP Spectre x360 13-aw0106nc
HP Spectre x360 13-aw0272no: Intel Core i7-1065G7, 13.30", 1.3 kg
External Review » HP Spectre x360 13-aw0272no
Microsoft Surface Pro 7: Intel Core i7-1065G7, 12.30", 0.8 kg
External Review » Microsoft Surface Pro 7
Acer Spin 5 SP513-54N-79EY: Intel Core i7-1065G7, 13.30", 1.2 kg
External Review » Acer Spin 5 SP513-54N-79EY
Acer Swift 5 SF514-54T-76PY: Intel Core i7-1065G7, 14.00", 1 kg
External Review » Acer Swift 5 SF514-54T-76PY
Microsoft Surface Laptop 3 13 Core i5-1035G7: Intel Core i5-1035G7, 13.50", 1.3 kg
External Review » Microsoft Surface Laptop 3 13 Core i5-1035G7
HP 15s-fq1023ns: Intel Core i7-1065G7, 15.60", 1.7 kg
External Review » HP 15s-fq1023ns
Dell XPS 13 9300 (2020): Intel Core i7-1065G7, 13.40", 1.2 kg
External Review » Dell XPS 13 9300 (2020)
Lenovo Yoga C940-14IIL-81Q90022GE: Intel Core i7-1065G7, 14.00", 1.4 kg
External Review » Lenovo Yoga C940-14IIL-81Q90022GE
Acer Swift 3 SF313-52-71Y7: Intel Core i7-1065G7, 13.50", 1.2 kg
External Review » Acer Swift 3 SF313-52-71Y7
HP Spectre X360 13-aw0016no: Intel Core i7-1065G7, 13.30", 1.3 kg
External Review » HP Spectre X360 13-aw0016no
Lenovo Yoga C940-14IIL 81Q9: Intel Core i7-1065G7, 14.00", 1.4 kg
External Review » Lenovo Yoga C940-14IIL 81Q9
HP Pavilion 15-cs3012ns: Intel Core i7-1065G7, 15.60", 1.9 kg
External Review » HP Pavilion 15-cs3012ns
HP Spectre x360 13-aw0000ns: Intel Core i7-1065G7, 13.30", 1.3 kg
External Review » HP Spectre x360 13-aw0000ns
HP Spectre x360 13-aw0002tu: Intel Core i7-1065G7, 13.30", 1.3 kg
External Review » HP Spectre x360 13-aw0002tu
Microsoft Surface Laptop 3 15 i7-1065G7: Intel Core i7-1065G7, 15.00", 1.5 kg
External Review » Microsoft Surface Laptop 3 15 i7-1065G7
Lenovo Yoga C940-14IIL-81Q9004GMH: Intel Core i7-1065G7, 14.00", 1.4 kg
External Review » Lenovo Yoga C940-14IIL-81Q9004GMH
Microsoft Surface Laptop 3 15, i7-1065G7: Intel Core i7-1065G7, 15.00", 1.5 kg
External Review » Microsoft Surface Laptop 3 15, i7-1065G7
Dell Inspiron 15 3593, i7-1065G7: Intel Core i7-1065G7, 15.60", 2 kg
External Review » Dell Inspiron 15 3593, i7-1065G7
Microsoft Surface Laptop 3 13 i5 1035G7: Intel Core i5-1035G7, 13.50", 1.3 kg
External Review » Microsoft Surface Laptop 3 13, i5-1035G7
Dell XPS 13 7390 2-in-1 Core i7: Intel Core i7-1065G7, 13.40", 1.3 kg
External Review » Dell XPS 13 7390 2-in-1 Core i7
Razer Blade Stealth i7-1065G7 Iris Plus: Intel Core i7-1065G7, 13.30", 1.4 kg
External Review » Razer Blade Stealth i7-1065G7 Iris Plus
HP Spectre x360 13-aw0013dx: Intel Core i7-1065G7, 13.30", 1.3 kg
External Review » HP Spectre x360 13-aw0013dx
Microsoft Surface Laptop 3 13, Core i7-1065G7: Intel Core i7-1065G7, 13.50", 1.3 kg
External Review » Microsoft Surface Laptop 3 13, Core i7-1065G7
Microsoft Surface Pro 7, Core i7-1065G7: Intel Core i7-1065G7, 12.30", 0.8 kg
External Review » Microsoft Surface Pro 7, Core i7-1065G7
Lenovo Yoga C940-14IIL: Intel Core i7-1065G7, 14.00", 1.4 kg
External Review » Lenovo Yoga C940-14IIL
Razer Blade Stealth 13, Core i7-1065G7: Intel Core i7-1065G7, 13.30", 1.4 kg
External Review » Razer Blade Stealth 13, Core i7-1065G7
Dell XPS 13 7390 (2-in-1): Intel Core i7-1065G7, 13.40", 1.3 kg
External Review » Dell XPS 13 7390 (2-in-1)
Asus VivoBook 17 F712JA-AU708W: Intel Core i7-1065G7, 17.30", 2.2 kg
» Asus VivoBook 17 (F712JA) test: Affordable 17-inch laptop with semi-passive cooling
Infinix INBook X2: Intel Core i7-1065G7, 14.00", 1.2 kg
» Infinix InBook X2 adds features not found on the InBook X1 Pro, but performance hasn't changed
Asus Zenbook S UX393JA: Intel Core i7-1065G7, 13.90", 1.4 kg
» Uh oh, now laptops are beginning to drop the 3.5 mm audio jack
LG Gram 17 17Z90N-V.AA77G: Intel Core i7-1065G7, 17.00", 1.4 kg
» The LG Gram 17 is able to run almost silently
» The LG Gram 17 is able to run almost silently
Asus ZenBook 13 UX325JA: Intel Core i7-1065G7, 13.30", 1.1 kg
» The lightweight, compact Asus Zenbook UX325JA also comes with a bright display
LG Gram 15Z90N: Intel Core i5-1035G7, 15.60", 1.1 kg
» LG Gram 15 Laptop is ultralight and ultraportable
HP 15s-fq1440ng: Intel Core i7-1065G7, 15.60", 1.6 kg
» Two-class society at HP - no recommendation for the HP 15s-fq1440ng
Apple MacBook Pro 13 2020 2GHz i5 10th-Gen: Intel Core i5-1038NG7, 13.30", 1.4 kg
» The new MacBook Pro 13 is pretty boring, but still very good
» Apple MacBook Pro 13 2020 has arrived: Ice Lake only improves GPU performance, would AMD's Ryzen be the better choice?
LG Gram 14Z90N: Intel Core i7-1065G7, 14.00", 1 kg
» LG Gram 14 costs $1600 USD, somehow manages to be one of the slowest Core i7 Ice Lake laptops you can buy
Dell XPS 13 9300 4K UHD: Intel Core i7-1065G7, 13.40", 1.2 kg
» Dell XPS 13 9300 FHD version is brighter than the 4K UHD version and other interesting differences
Apple MacBook Air 2020 i5: Intel Core i5-1030NG7, 13.30", 1.3 kg
» MacBook Air 2020: Why does Apple sabotage the Air?
» The new 2020 MacBook Air Core i5 has arrived: Faster CPU, but still way too loud
» Apple MacBook Air 2020: Retina Display still uses PWM
Dell XPS 13 9300 Core i7-1065G7: Intel Core i7-1065G7, 13.40", 1.2 kg
» The XPS 13 9300 display can be 20 percent brighter than what Dell is letting on, but you'll need a few clicks to enable it
Lenovo Ideapad S340-15IIL: Intel Core i7-1065G7, 15.60", 1.8 kg
» $700 Core i7-1065G7 vs. $1400 Core i7-1065G7: What's the difference?
Acer Swift 3 SF313-52-71Y7: Intel Core i7-1065G7, 13.50", 1.2 kg
» The Acer Swift 3 is so much more than just a visual upgrade
Microsoft Surface Laptop 3 13 Core i5-1035G7: Intel Core i5-1035G7, 13.50", 1.3 kg
» Microsoft is discounting its Surface Laptop 3 13.5-inch with Core i5 CPU, 8 GB RAM and 128 GB to $800