Dell XPS 13 9300 4K UHD Laptop Review: 16:10 is the New 16:9
Much like how Dell accelerated the adoption of narrow-bezel laptops with the 2015 XPS 13 and XPS 15, Dell now wants to accelerate the adoption of 16:10 laptops with the 2020 XPS 13 9300 and inevitable 2020 XPS 15. We've already reviewed the FHD+ (1920 x 1200) versions of the XPS 13 9300, so this review will focus on the 4K UHD+ (3840 x 2400) configuration which represents the highest option currently available.
For more information on the chassis and its features, we recommend checking out our existing reviews on the FHD XPS 13 below as this page will focus on the 4K display and any battery life or performance differences between it and the FHD SKUs. Direct competitors include other high-end Wiindows subnotebooks like the Microsoft Surface Laptop 3 13, Asus ZenBook 13, Lenovo IdeaPad S940, HP Spectre 13, or the Huawei MateBook X Pro. None, however, come with 16:10 displays.
Rating | Date | Model | Weight | Height | Size | Resolution | Price |
|---|---|---|---|---|---|---|---|
| 88 % v7 (old) | 05 / 2020 | Dell XPS 13 9300 4K UHD i7-1065G7, Iris Plus Graphics G7 (Ice Lake 64 EU) | 1.2 kg | 14.8 mm | 13.40" | 3840x2400 | |
| 86.3 % v7 (old) | 10 / 2019 | Dell XPS 13 7390 2-in-1 Core i7 i7-1065G7, Iris Plus Graphics G7 (Ice Lake 64 EU) | 1.3 kg | 13 mm | 13.40" | 1920x1200 | |
| 85.9 % v7 (old) | 11 / 2019 | Dell XPS 13 7390 Core i7-10710U i7-10710U, UHD Graphics 620 | 1.2 kg | 11.6 mm | 13.30" | 3840x2160 | |
| 90.6 % v7 (old) | 02 / 2020 | Apple MacBook Pro 13 2019 2TB3 i5-8257U, Iris Plus Graphics 645 | 1.4 kg | 14.9 mm | 13.30" | 2560x1600 | |
| 83.9 % v7 (old) | 12 / 2019 | Microsoft Surface Laptop 3 15 i7-1065G7 i7-1065G7, Iris Plus Graphics G7 (Ice Lake 64 EU) | 1.5 kg | 14.7 mm | 15.00" | 2496x1664 | |
| 83.7 % v7 (old) | 11 / 2019 | Razer Blade Stealth 13, Core i7-1065G7 i7-1065G7, GeForce GTX 1650 Max-Q | 1.5 kg | 15.3 mm | 13.30" | 3840x2160 |
Case
SD Card Reader
| SD Card Reader | |
| average JPG Copy Test (av. of 3 runs) | |
| Dell XPS 13 9300 4K UHD (Toshiba Exceria Pro M501 64 GB UHS-II) | |
| Dell XPS 13 7390 Core i7-10710U (Toshiba Exceria Pro M501 64 GB UHS-II) | |
| HP Spectre x360 13-aw0013dx (Toshiba Exceria Pro M501 microSDXC 64GB) | |
| Dell XPS 13 7390 2-in-1 Core i7 (Toshiba Exceria Pro M501 64 GB UHS-II) | |
| Asus ZenBook Duo UX481FL (Toshiba Exceria Pro M501 microSDXC 64GB) | |
| maximum AS SSD Seq Read Test (1GB) | |
| Dell XPS 13 9300 4K UHD (Toshiba Exceria Pro M501 64 GB UHS-II) | |
| Dell XPS 13 7390 Core i7-10710U (Toshiba Exceria Pro M501 64 GB UHS-II) | |
| Dell XPS 13 7390 2-in-1 Core i7 (Toshiba Exceria Pro M501 64 GB UHS-II) | |
| HP Spectre x360 13-aw0013dx (Toshiba Exceria Pro M501 microSDXC 64GB) | |
| Asus ZenBook Duo UX481FL (Toshiba Exceria Pro M501 microSDXC 64GB) | |
Communication
All SKUs come with the Killer Wi-Fi 6 AX1650 for Wi-Fi 6 connectivity and Bluetooth 5.0. We experienced no issues when connected to our Netgear RAX200 router.
| Networking | |
| iperf3 transmit AX12 | |
| Asus ZenBook Duo UX481FL | |
| MSI GP65 10SFK-047US | |
| Gigabyte Aero 17 HDR XB | |
| Dell XPS 13 9300 4K UHD | |
| iperf3 receive AX12 | |
| Gigabyte Aero 17 HDR XB | |
| Dell XPS 13 9300 4K UHD | |
| Asus ZenBook Duo UX481FL | |
| MSI GP65 10SFK-047US | |
Webcam

, i7-1065G7, Intel SSDPEMKF512G8 NVMe SSD")
, i7-1065G7, Intel SSDPEMKF512G8 NVMe SSD")
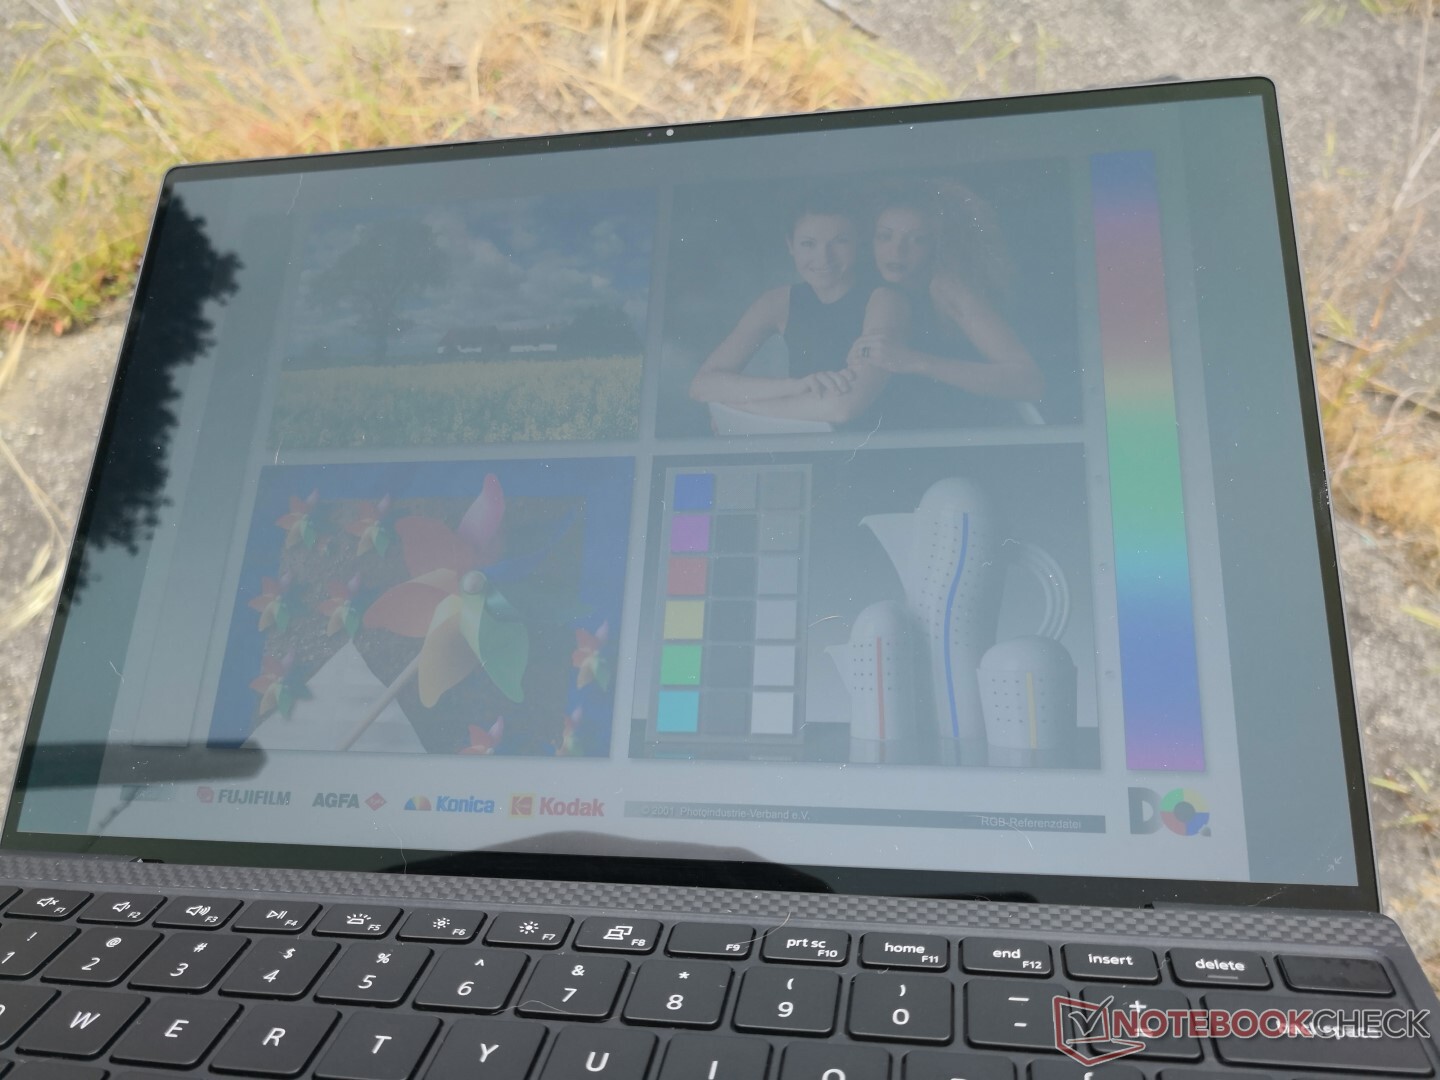
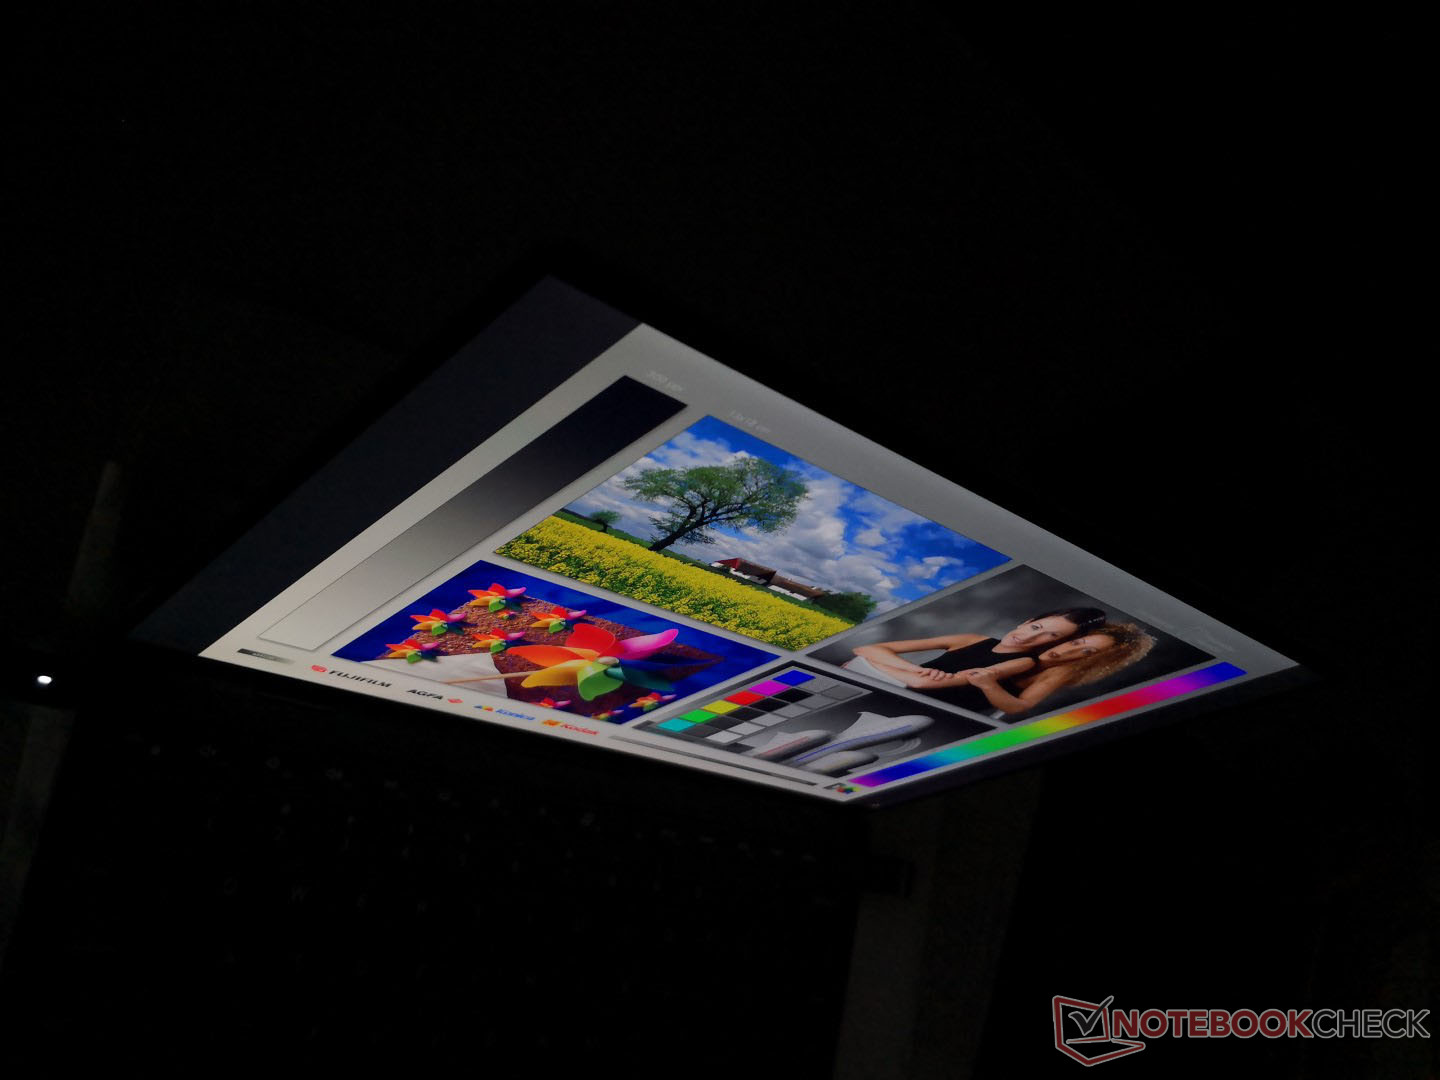
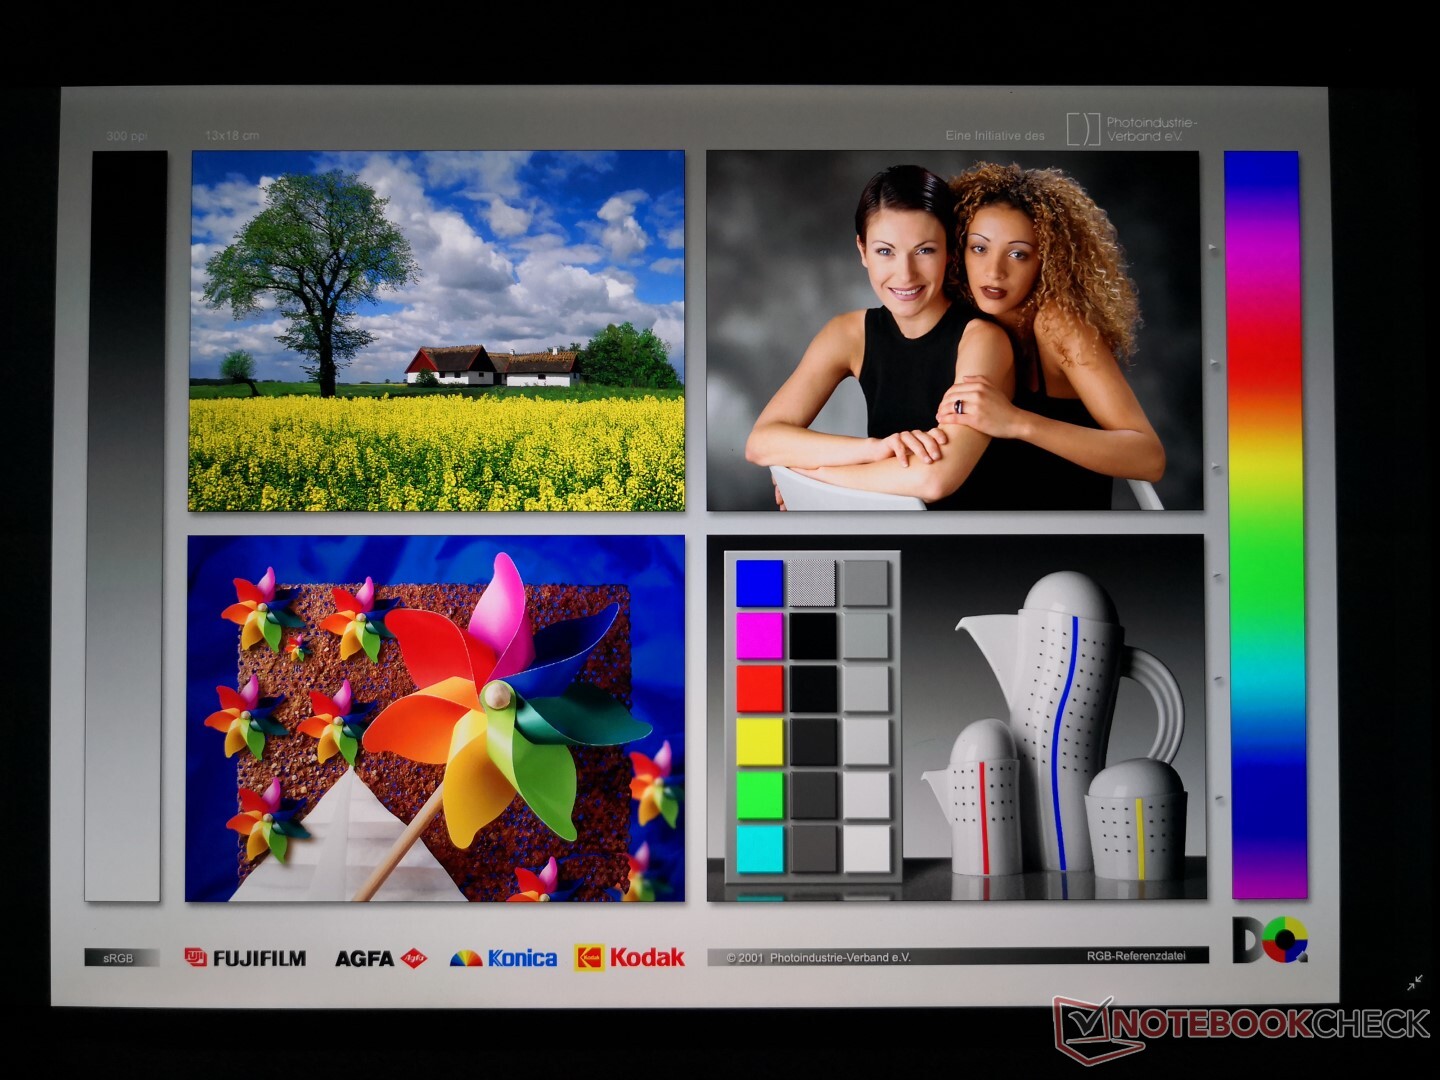
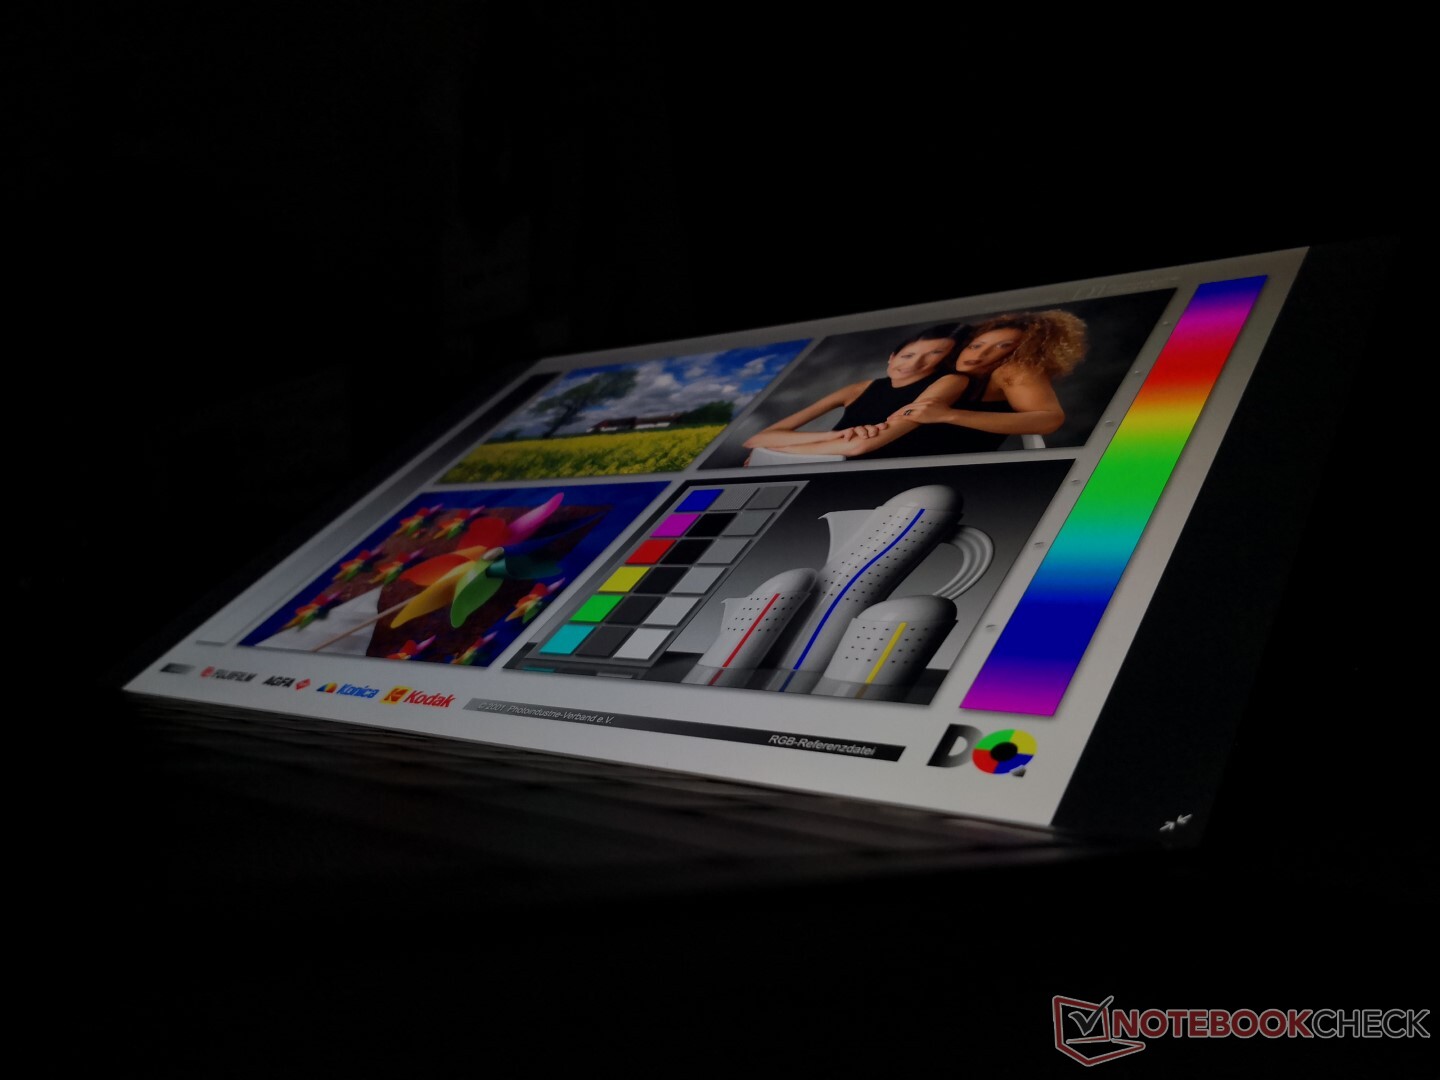
Display
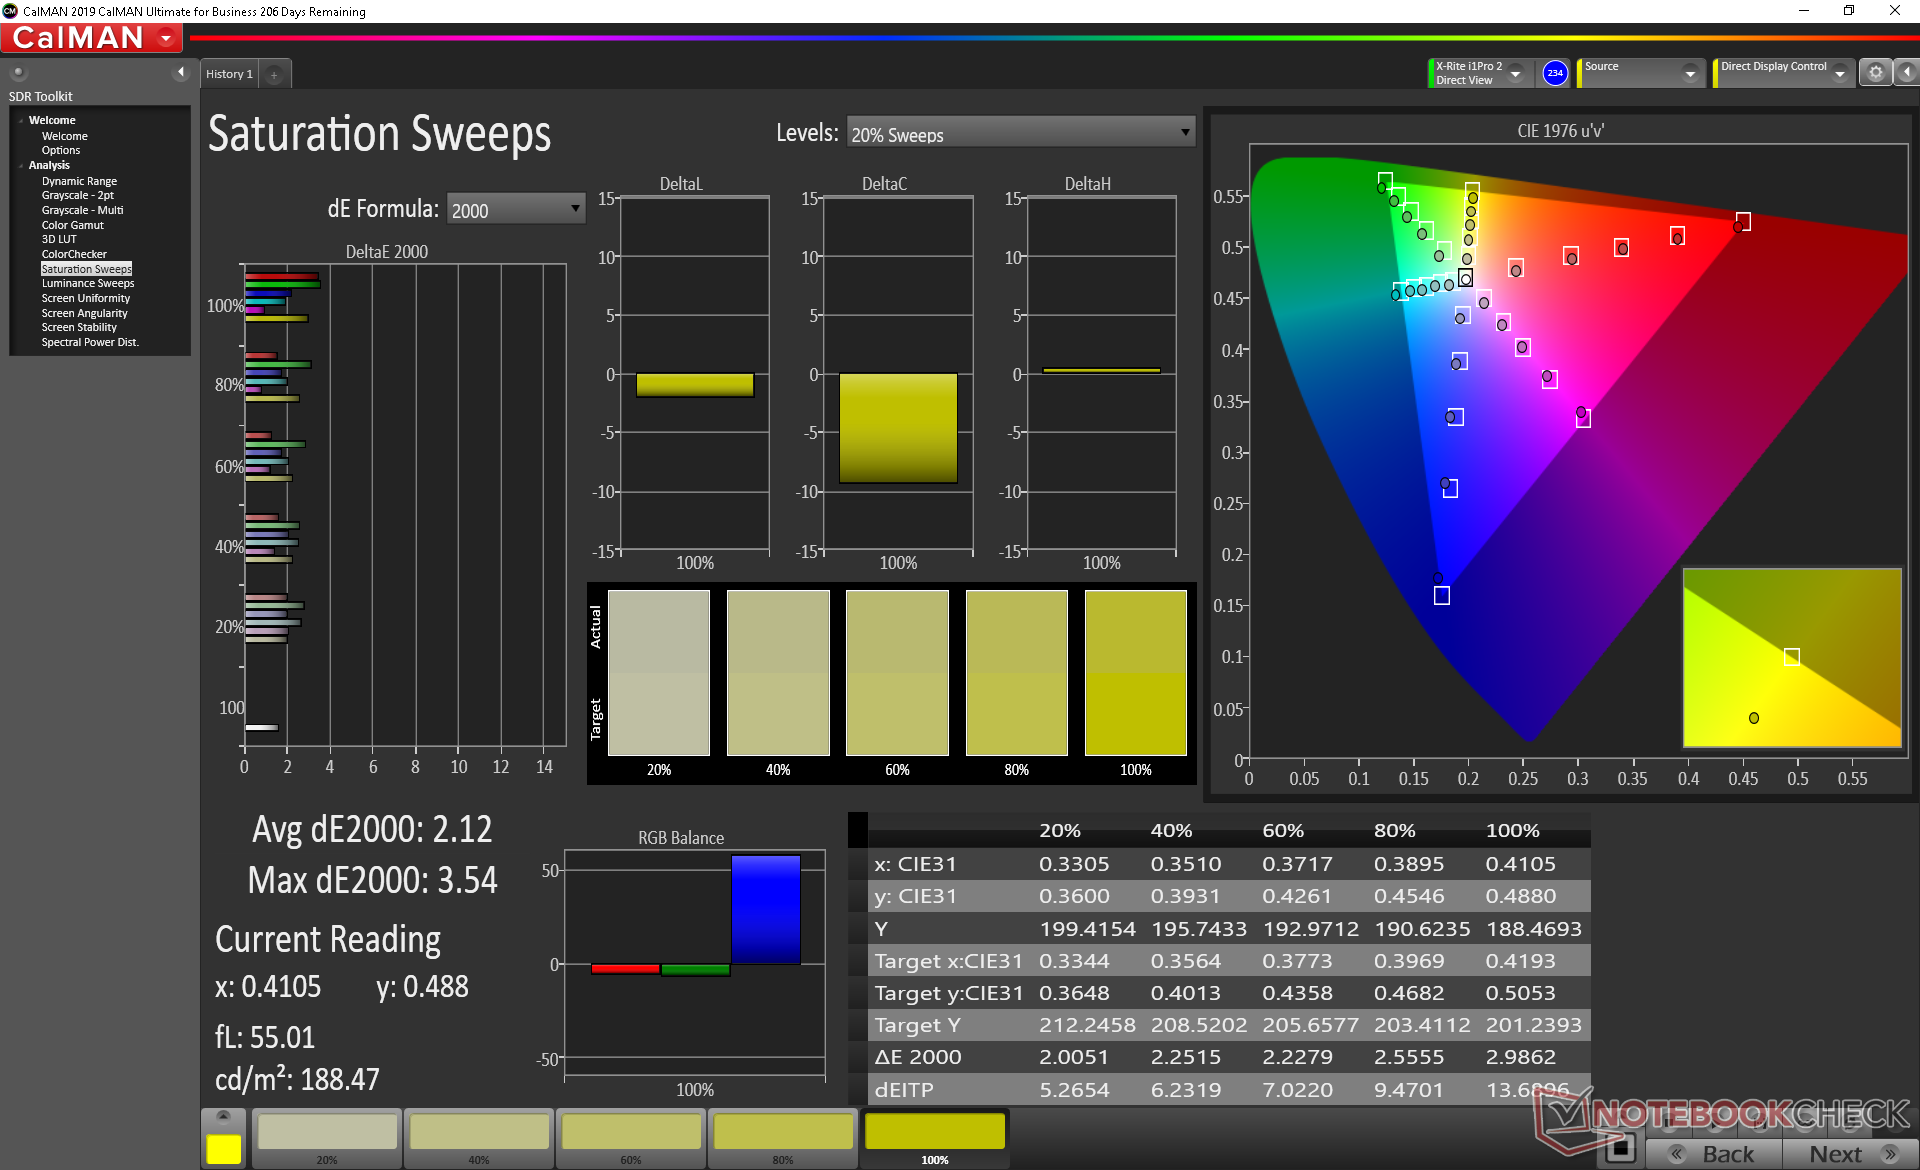
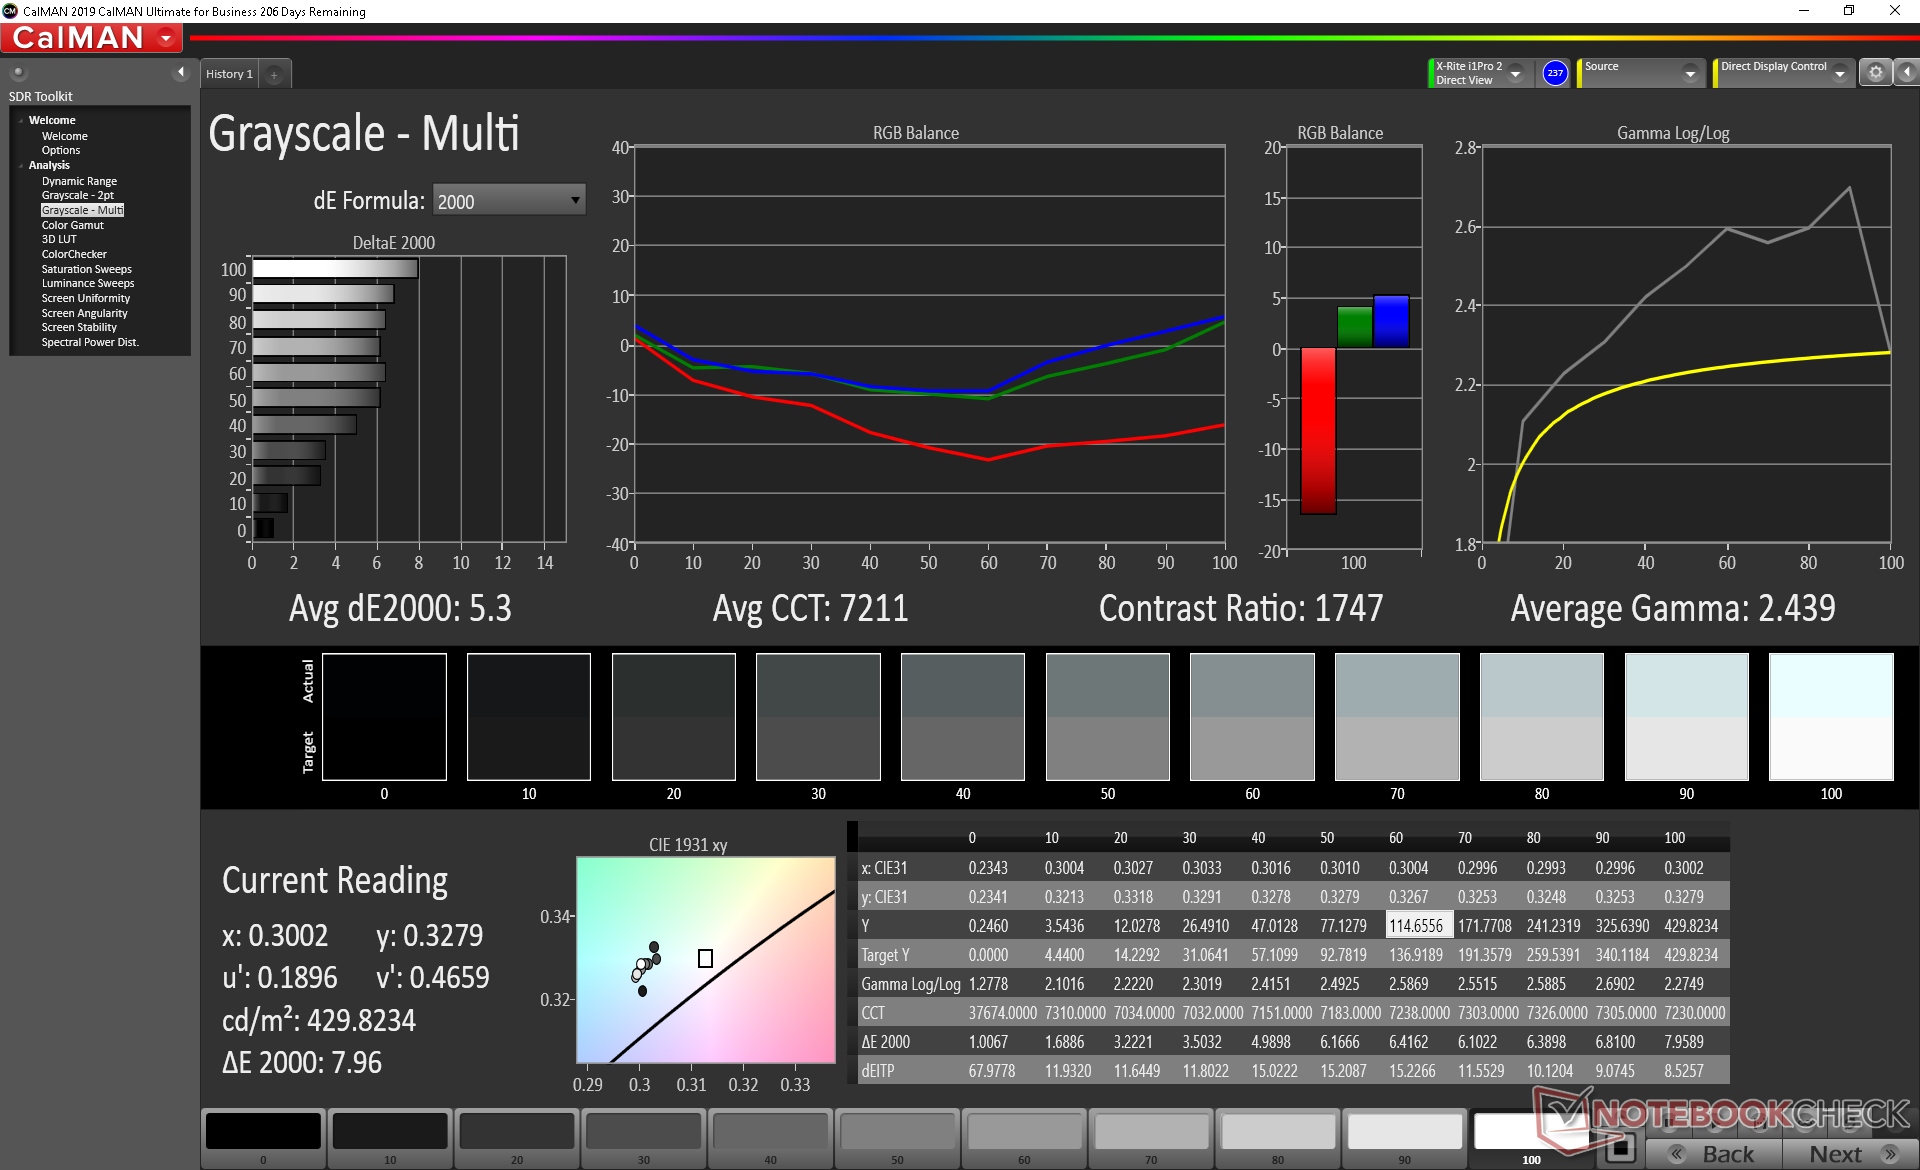
Whereas the FHD configuration carries the panel name Sharp LQ134N1, our 4K UHD panel is called the Sharp LQ134R1. Dell advertises a brightness of 500 nits and a contrast ratio of 1500:1 and our independent measurements can certainly confirm the latter at 1479:1. Unfortunately, we're only able to record a brightness of 414 nits even when set to the maximum brightness setting with both adaptive brightness turned off and Intel Display Power Savings disabled. The 4K UHD panel is dimmer than on both our FHD test units where we were able to measure 600 nits each.
Nonetheless, there are a couple of noteworthy advantages over the FHD panel other than resolution. Firstly, the 4K panel does not suffer from pulse-width modulation at any brightness level which suggests that Dell is using a different LED backlight for its 4K SKUs. The fact that there is a brightness difference between the FHD and 4K SKUs supports our speculation. Secondly, black-white and gray-gray response times are a bit faster on the 4K panel meaning ghosting is not as severe. The opposite is usually true between FHD and 4K panels and so this is an unexpected advantage.


| |||||||||||||||||||||||||
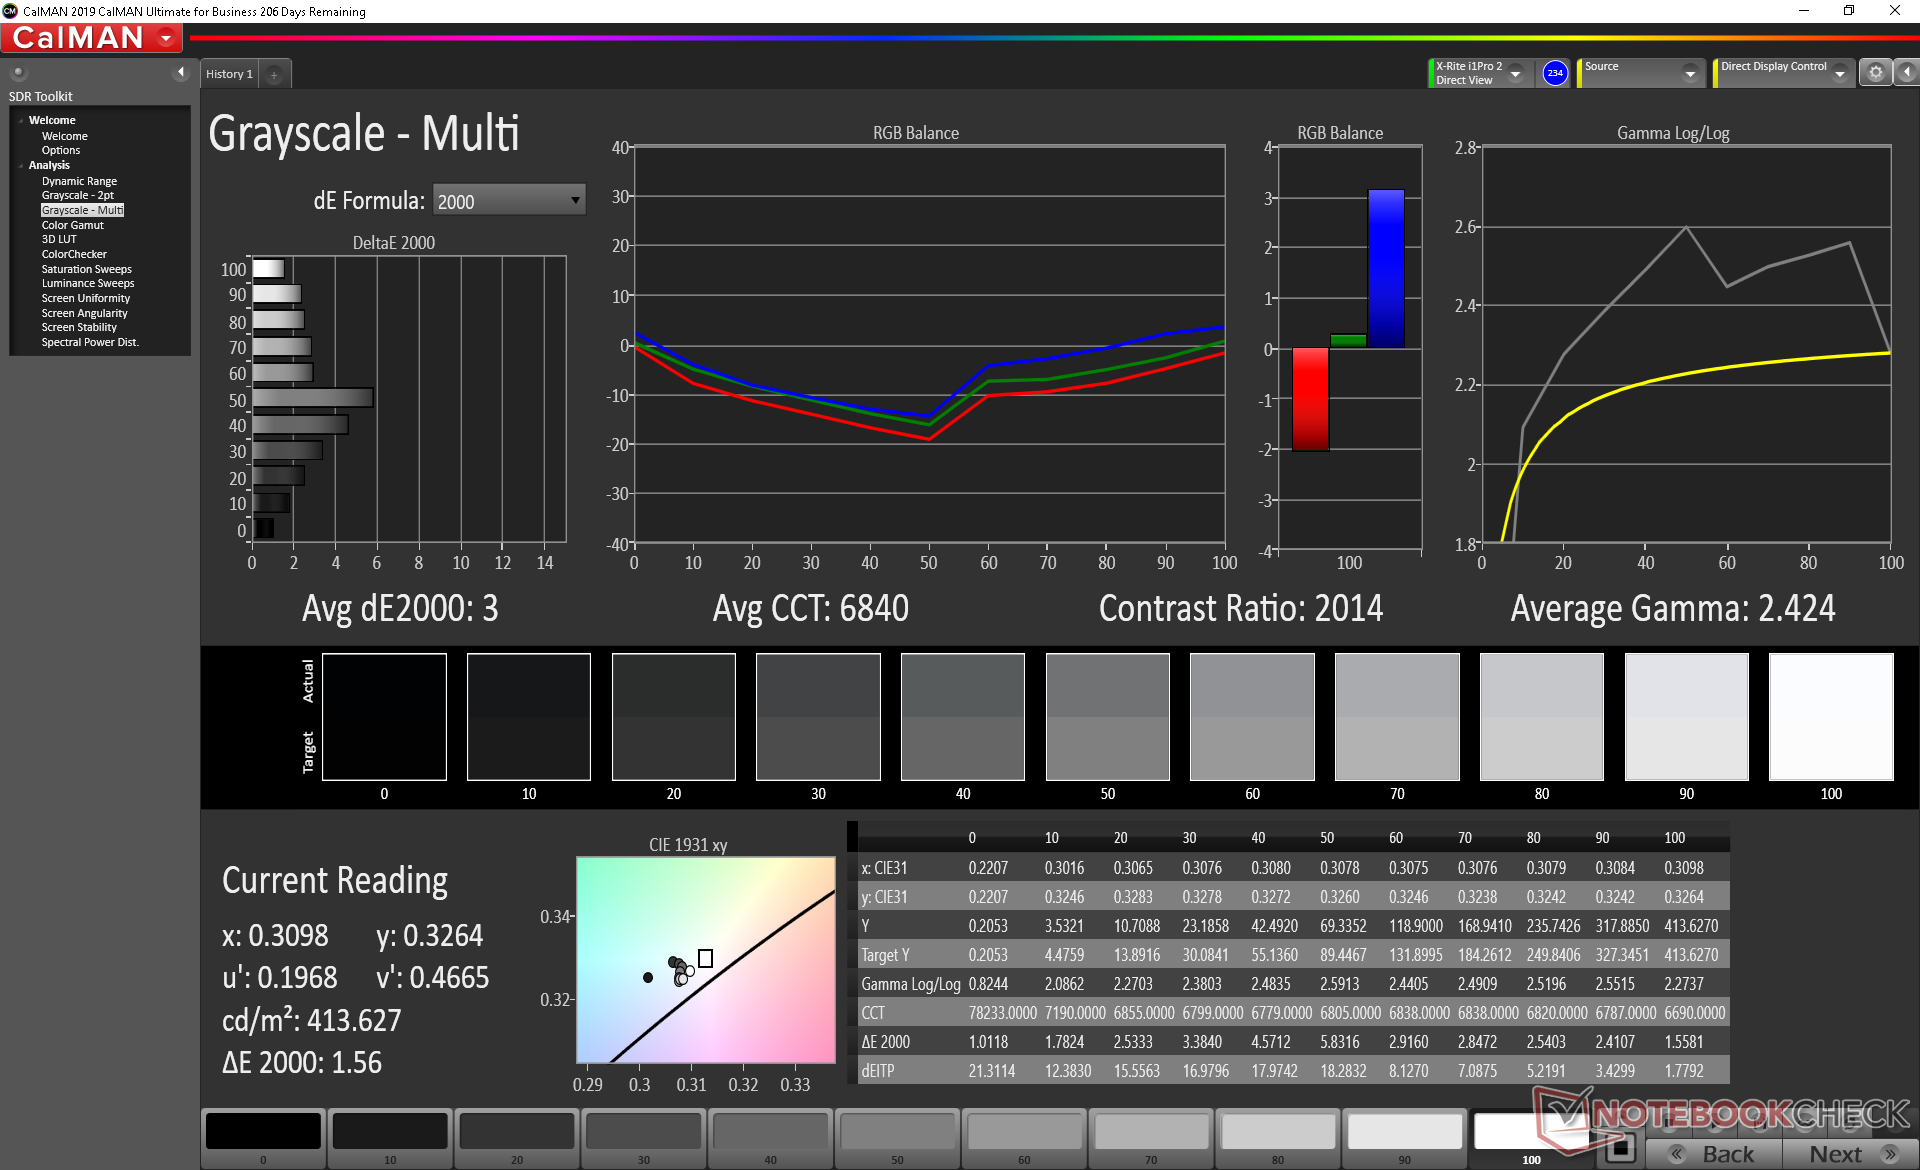
Brightness Distribution: 94 %
Center on Battery: 414 cd/m²
Contrast: 1479:1 (Black: 0.28 cd/m²)
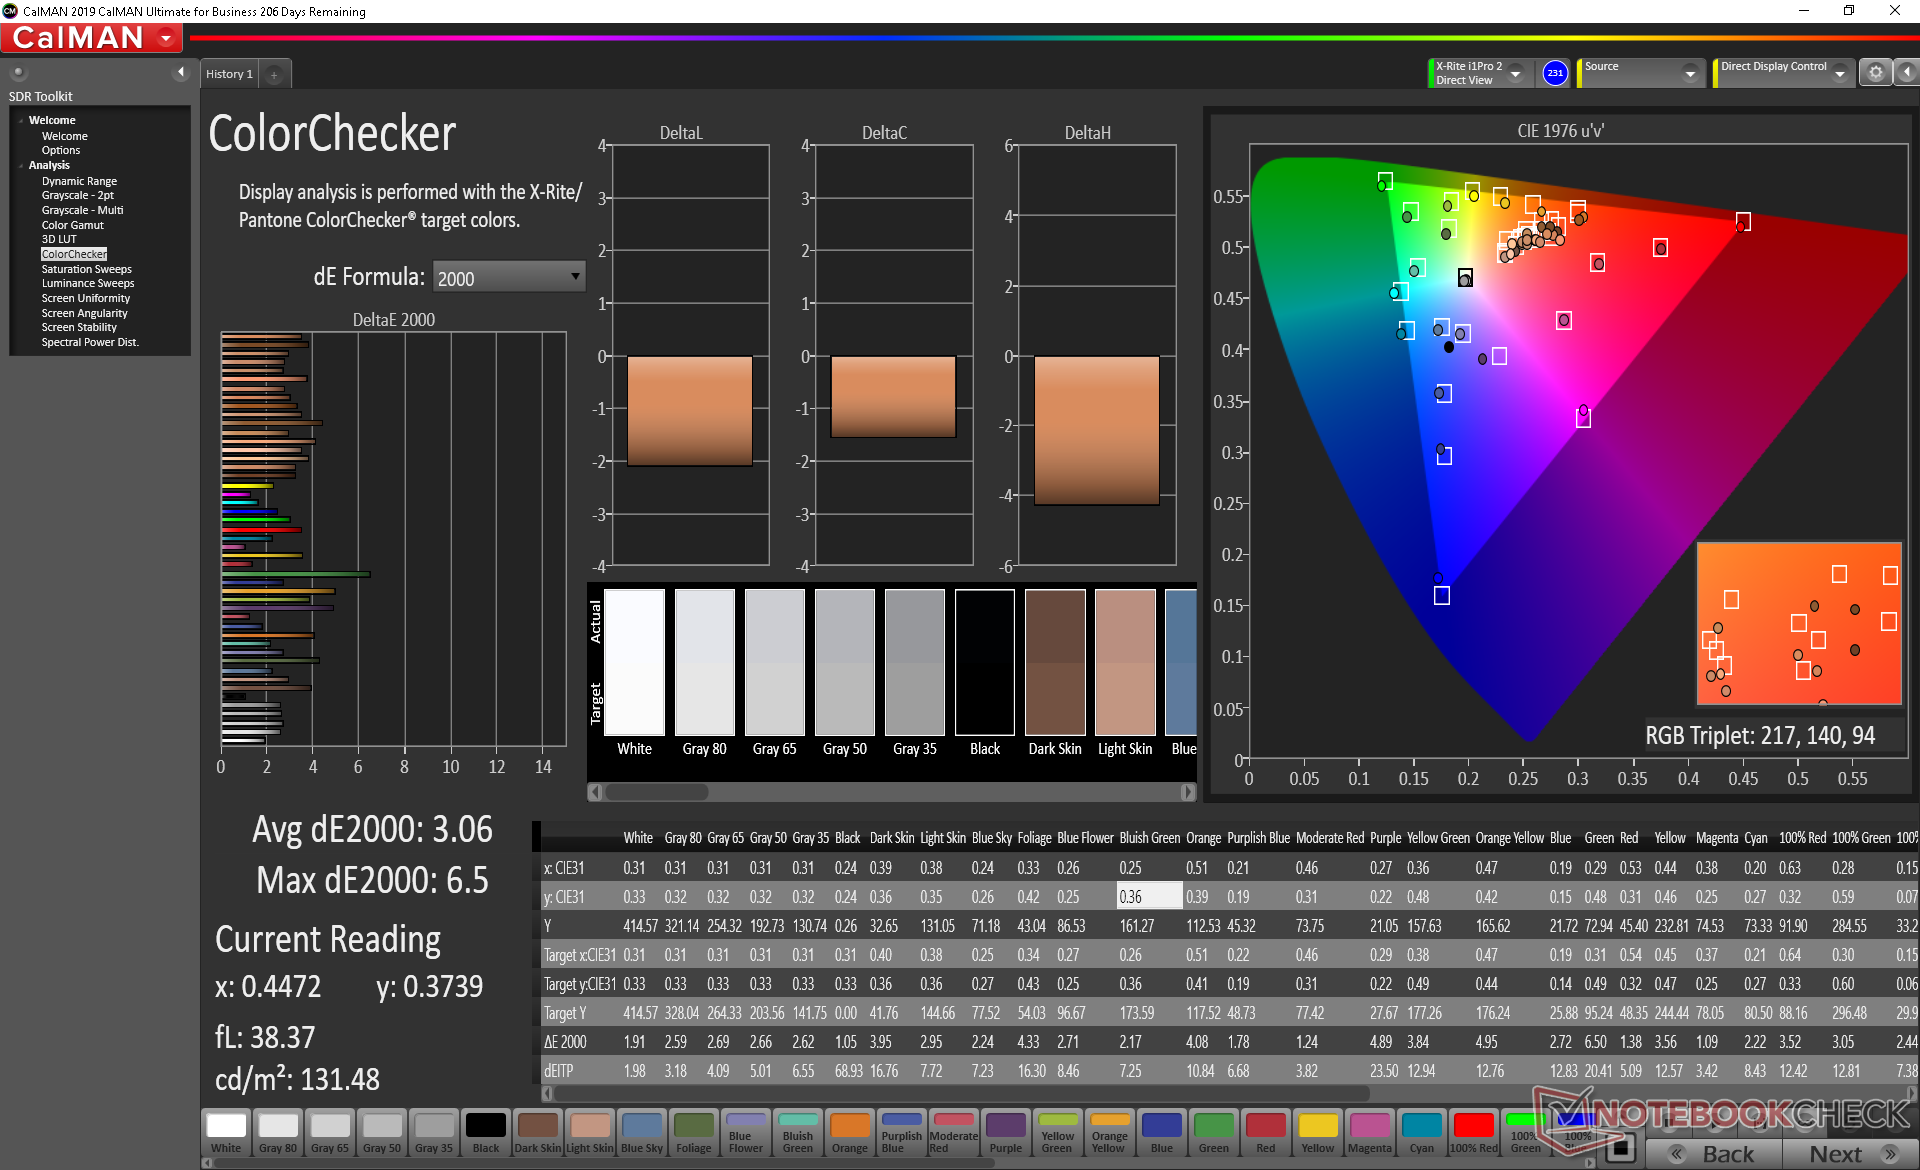
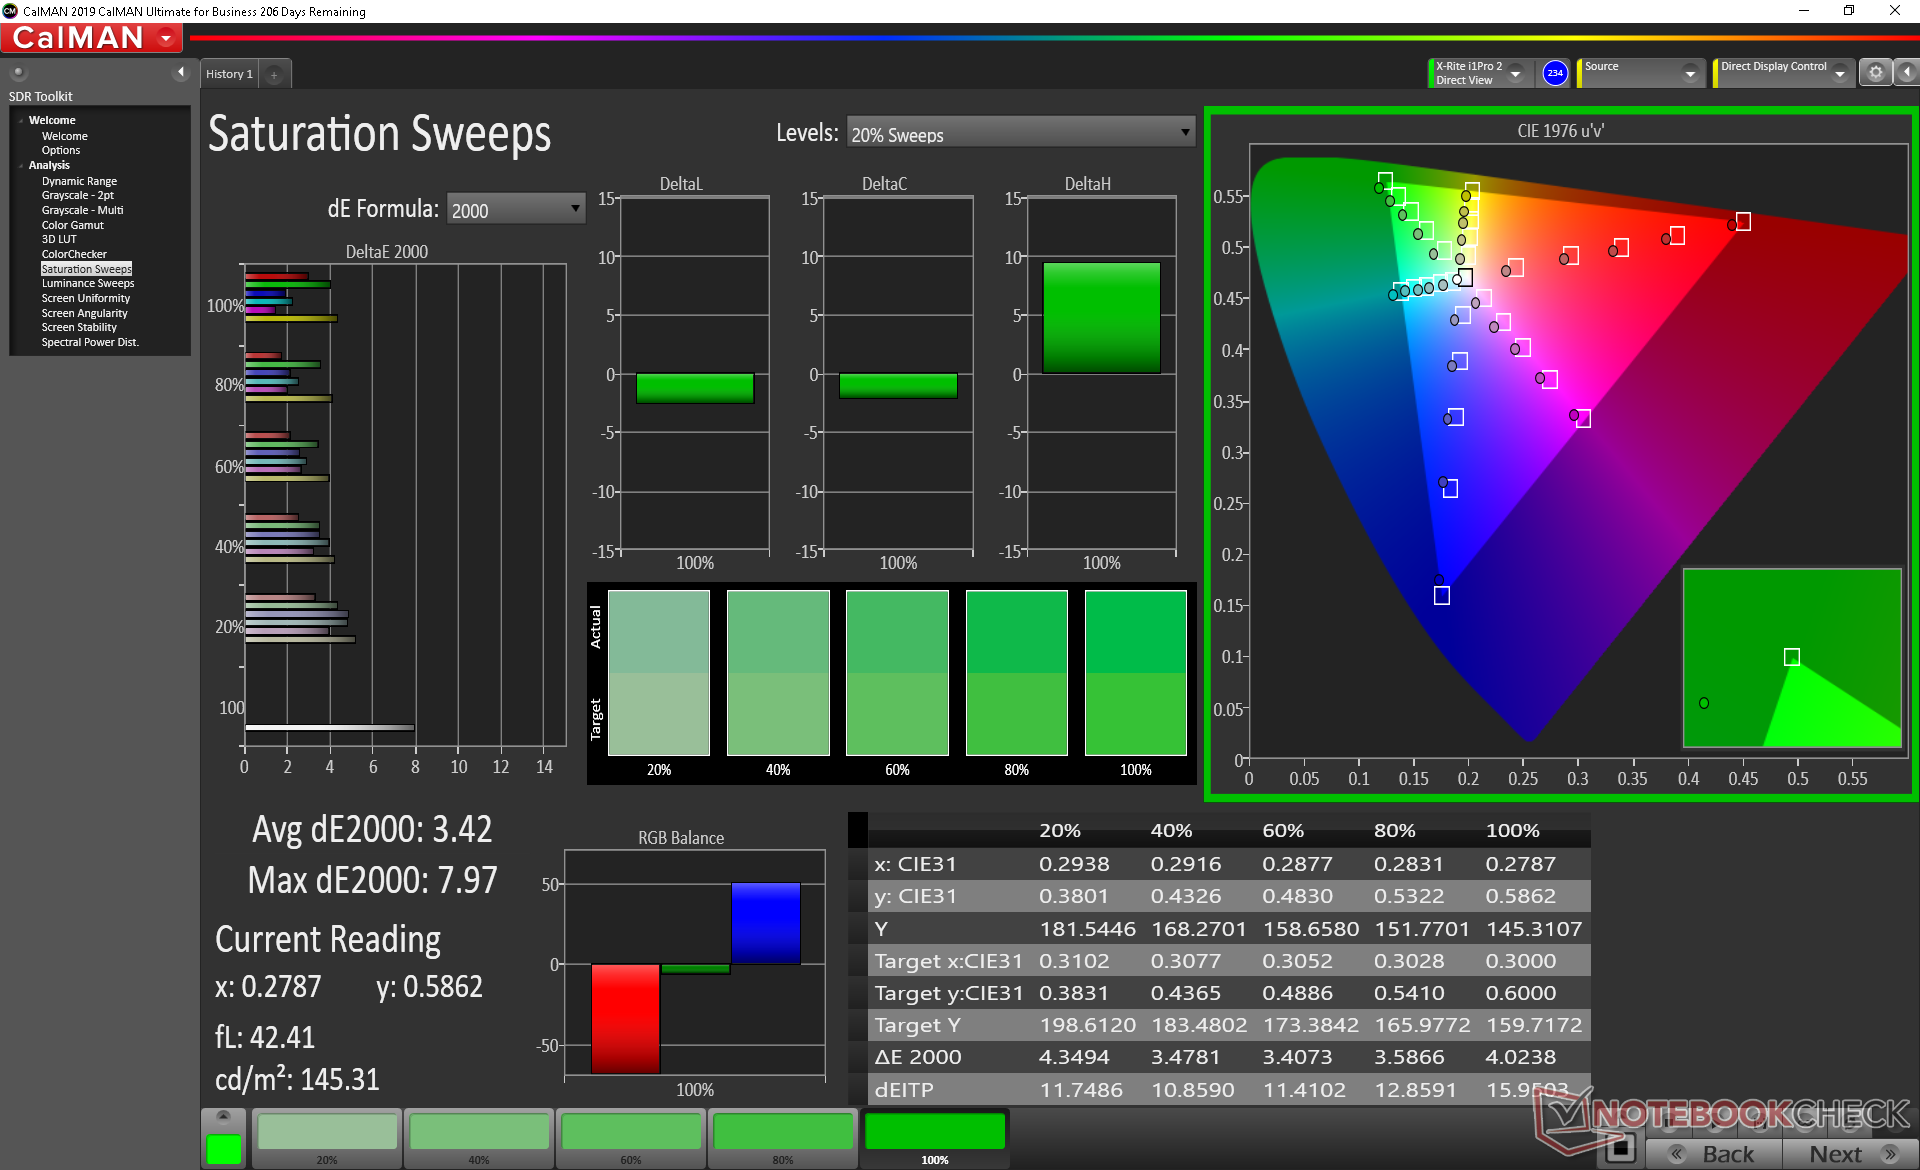
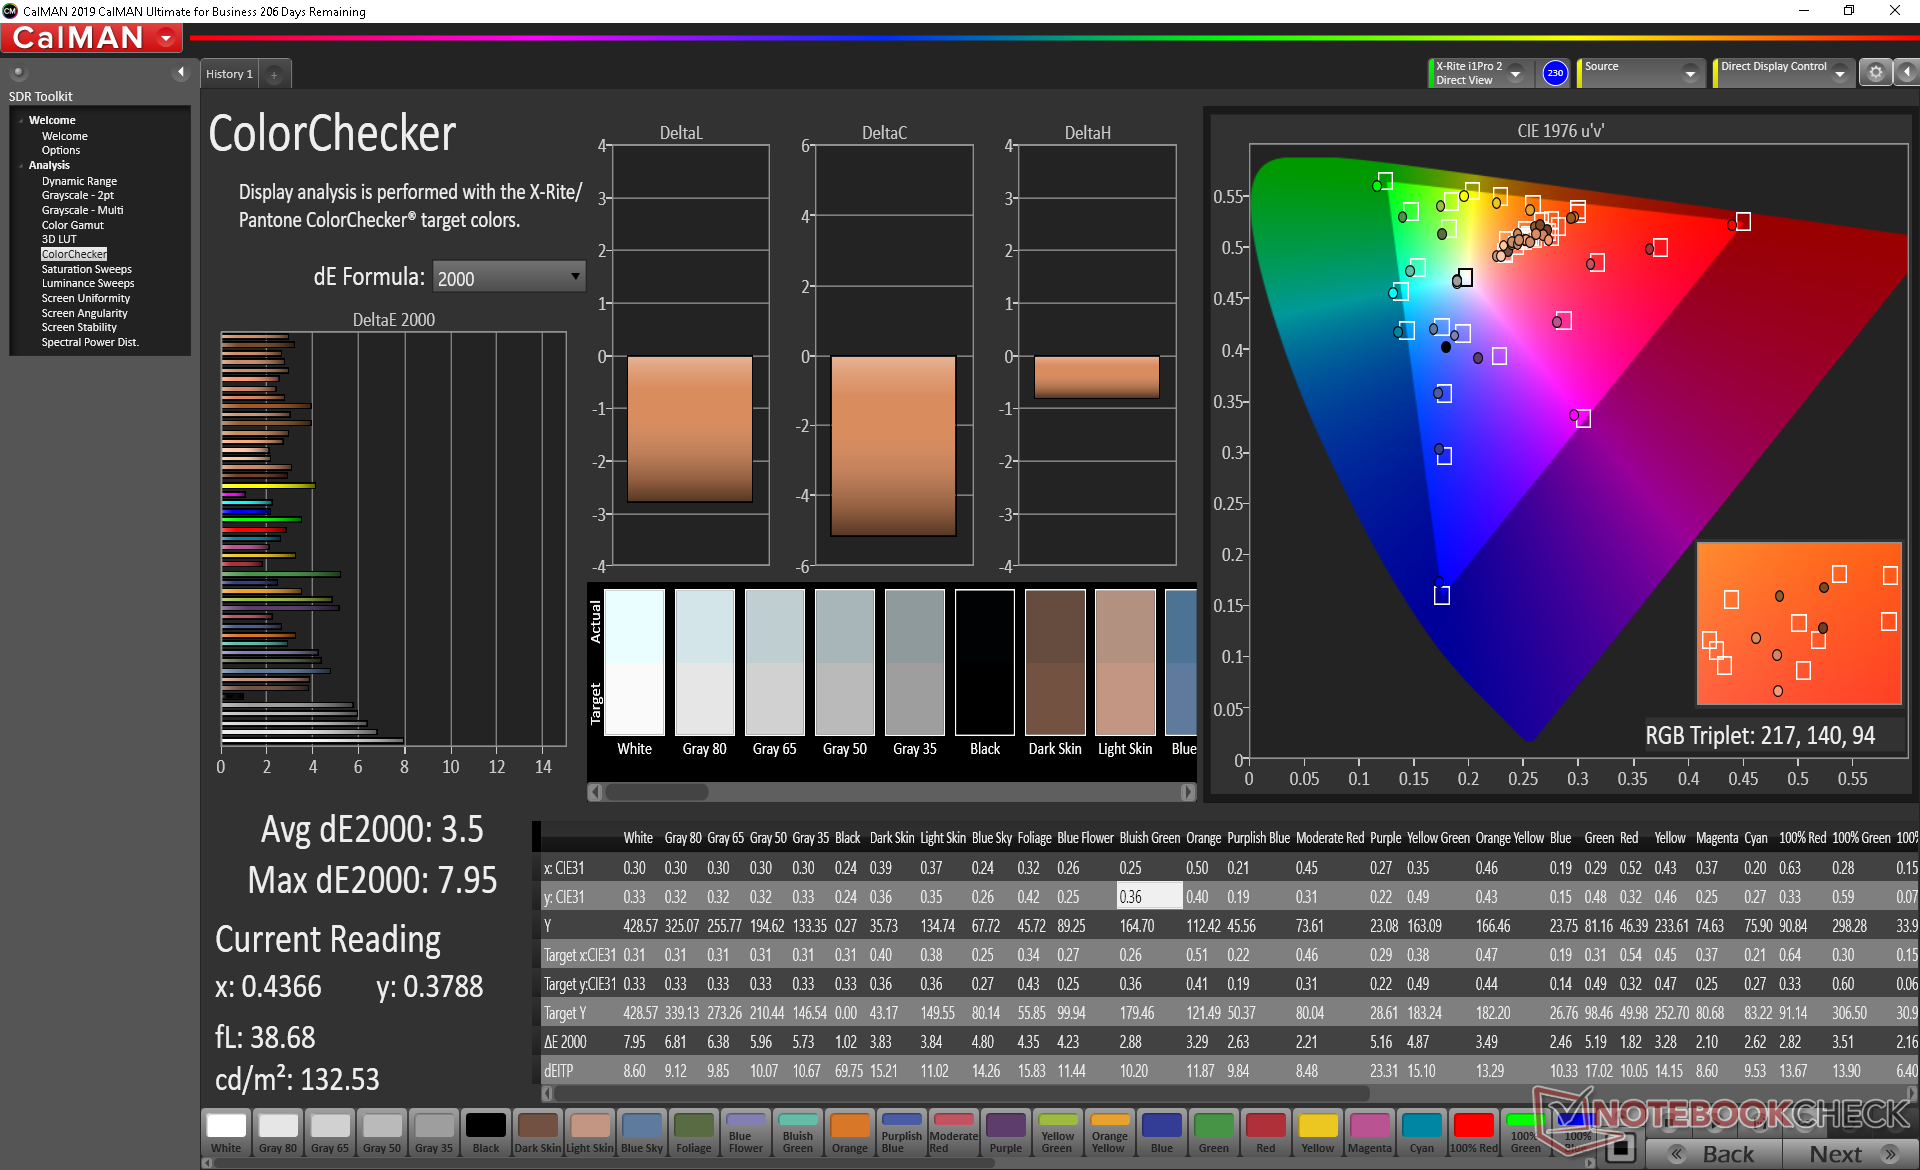
ΔE ColorChecker Calman: 3.06 | ∀{0.5-29.43 Ø4.75}
calibrated: 3.5
ΔE Greyscale Calman: 3 | ∀{0.09-98 Ø5}
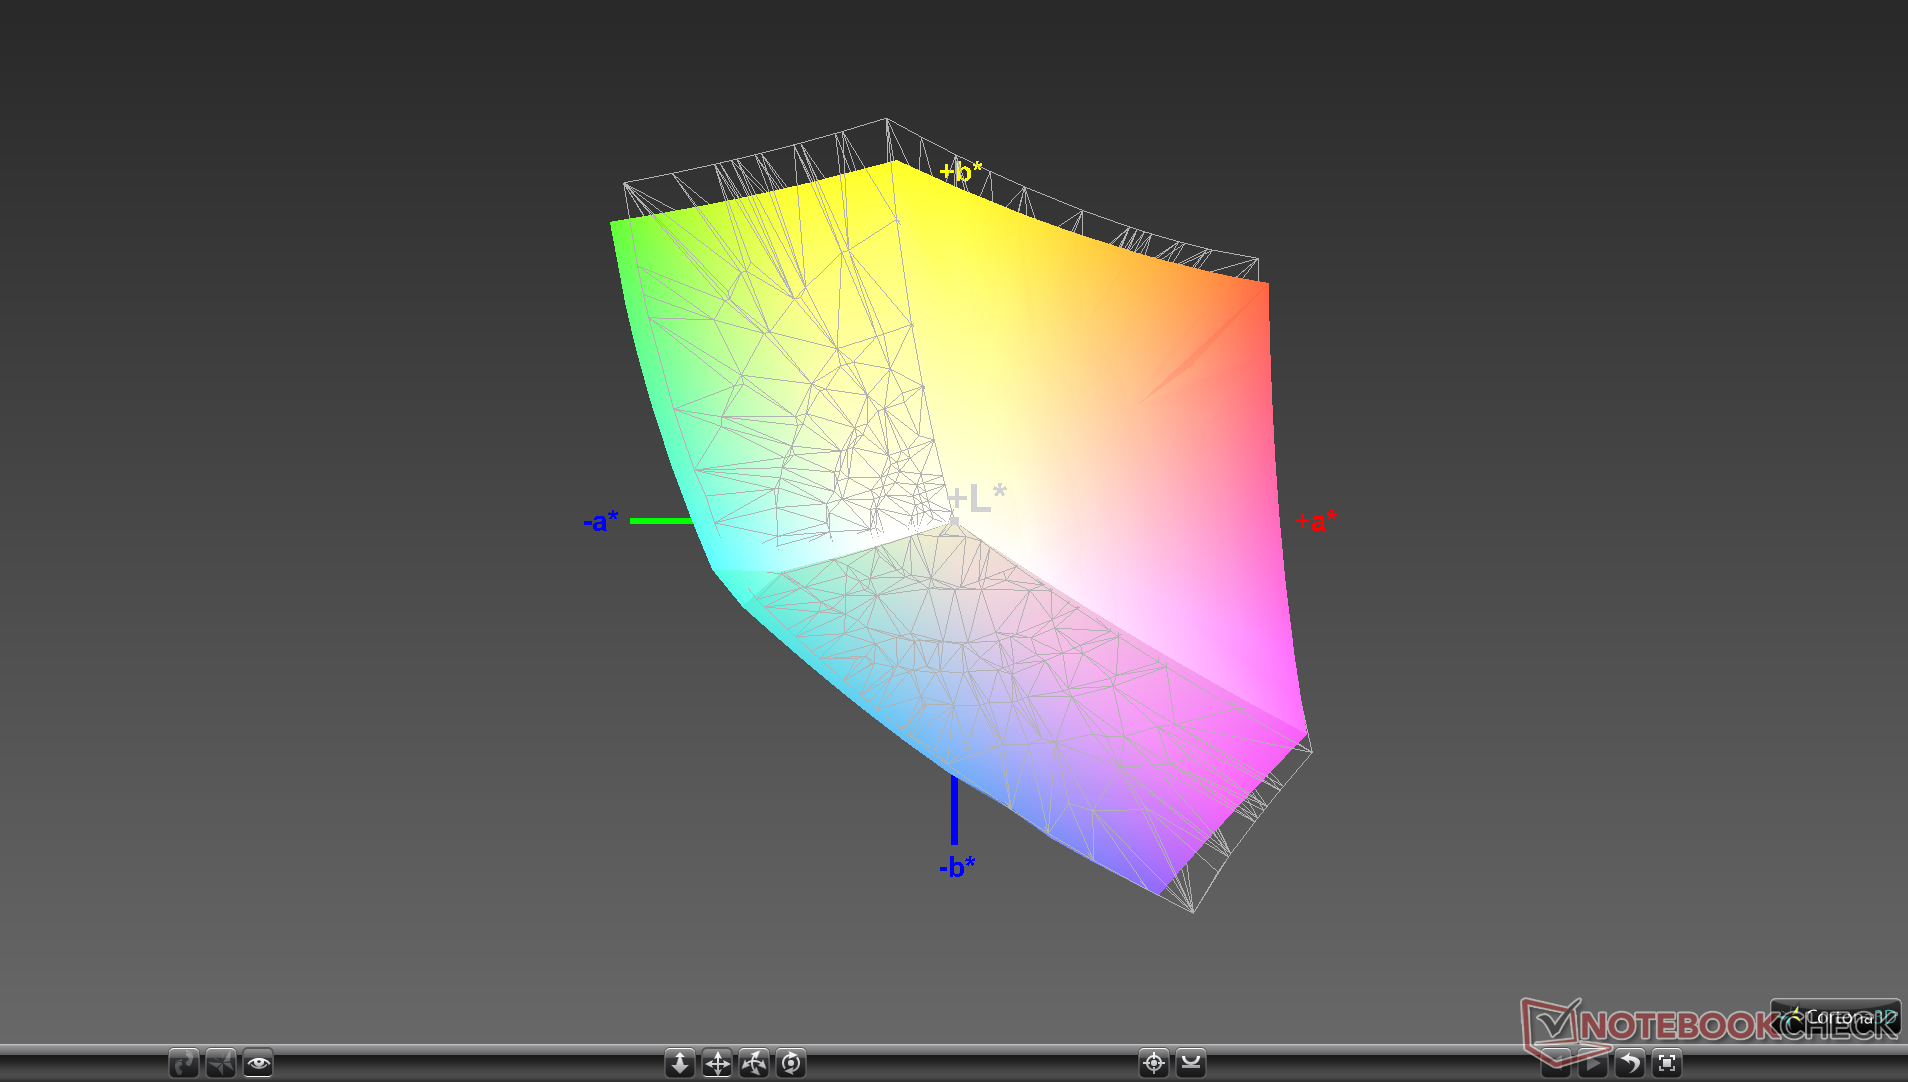
91.4% sRGB (Argyll 1.6.3 3D)
61.1% AdobeRGB 1998 (Argyll 1.6.3 3D)
66.6% AdobeRGB 1998 (Argyll 3D)
91.4% sRGB (Argyll 3D)
64.5% Display P3 (Argyll 3D)
Gamma: 2.42
CCT: 6840 K
| Dell XPS 13 9300 4K UHD Sharp LQ134R1, IPS, 13.4", 3840x2400 | Dell XPS 13 9300 Core i7-1065G7 Sharp LQ134N1, IPS, 13.4", 1920x1200 | Dell XPS 13 7390 2-in-1 Core i7 Sharp LQ134N1, IPS, 13.4", 1920x1200 | Dell XPS 13 7390 Core i7-10710U AU Optronics B133ZAN, Dell P/N: 90NTH, IPS, 13.3", 3840x2160 | Apple MacBook Pro 13 2019 2TB3 APPA03D, IPS, 13.3", 2560x1600 | Microsoft Surface Laptop 3 13 Core i5-1035G7 Sharp LQ135P1JX51, IPS, 13.5", 2256x1504 | |
|---|---|---|---|---|---|---|
| Display | 4% | 8% | -1% | 29% | 4% | |
| Display P3 Coverage (%) | 64.5 | 66.3 3% | 69.9 8% | 63.4 -2% | 96.1 49% | 65.7 2% |
| sRGB Coverage (%) | 91.4 | 97.3 6% | 99.2 9% | 93.7 3% | 99.4 9% | 98.6 8% |
| AdobeRGB 1998 Coverage (%) | 66.6 | 68.5 3% | 71.5 7% | 64.3 -3% | 85.6 29% | 67.8 2% |
| Response Times | -25% | -14% | -28% | -30% | -53% | |
| Response Time Grey 50% / Grey 80% * (ms) | 41.6 ? | 50 ? -20% | 47.6 ? -14% | 51.6 ? -24% | 50.4 ? -21% | 59.2 ? -42% |
| Response Time Black / White * (ms) | 25.6 ? | 33.2 ? -30% | 29.2 ? -14% | 33.6 ? -31% | 35.2 ? -38% | 41.6 ? -63% |
| PWM Frequency (Hz) | 2500 ? | 2500 ? | 116300 ? | 21740 ? | ||
| Screen | 1% | 16% | -29% | 29% | 21% | |
| Brightness middle (cd/m²) | 414 | 607.6 47% | 549.8 33% | 408.2 -1% | 603 46% | 403.4 -3% |
| Brightness (cd/m²) | 401 | 595 48% | 520 30% | 399 0% | 577 44% | 397 -1% |
| Brightness Distribution (%) | 94 | 96 2% | 86 -9% | 89 -5% | 92 -2% | 89 -5% |
| Black Level * (cd/m²) | 0.28 | 0.4 -43% | 0.39 -39% | 0.39 -39% | 0.35 -25% | 0.34 -21% |
| Contrast (:1) | 1479 | 1519 3% | 1410 -5% | 1047 -29% | 1723 16% | 1186 -20% |
| Colorchecker dE 2000 * | 3.06 | 3.23 -6% | 2.12 31% | 4.6 -50% | 1.7 44% | 0.94 69% |
| Colorchecker dE 2000 max. * | 6.5 | 8.67 -33% | 3.66 44% | 11.84 -82% | 3.1 52% | 2.92 55% |
| Colorchecker dE 2000 calibrated * | 3.5 | 1.01 71% | 1.37 61% | 2.03 42% | 0.7 80% | 0.99 72% |
| Greyscale dE 2000 * | 3 | 5.5 -83% | 2.6 13% | 7.5 -150% | 2.1 30% | 0.9 70% |
| Gamma | 2.42 91% | 2.12 104% | 2.3 96% | 2.12 104% | 2.18 101% | 2.13 103% |
| CCT | 6840 95% | 6413 101% | 6884 94% | 7966 82% | 6843 95% | 6620 98% |
| Color Space (Percent of AdobeRGB 1998) (%) | 61.1 | 63 3% | 65.4 7% | 59.5 -3% | 76.7 26% | 62.3 2% |
| Color Space (Percent of sRGB) (%) | 91.4 | 97.5 7% | 99.7 9% | 93.5 2% | 99.4 9% | 98.7 8% |
| Total Average (Program / Settings) | -7% /
-1% | 3% /
11% | -19% /
-23% | 9% /
22% | -9% /
8% |
* ... smaller is better
Color space is not any wider than the FHD option despite the denser PPI. We're able to measure ~91 percent sRGB coverage or 61 percent AdobeRGB to be on par with other flagship subnotebooks. Some larger 4K UHD laptops like the XPS 15 or ZenBook Pro series are able to cover AdobeRGB almost completely for deeper colors.

Measurements with an X-Rite colorimeter reveal accurate colors and grayscale although the latter could certainly be a little better. RGB balance and gamma have room for improvement according to our measurements and, strangely, attempting to calibrate the 4K panel ourselves would throw off the color temperature for a slightly worse picture overall. Results are opposite to what we observed on the FHD XPS 9300 where picture would noticeably improve after calibration.
All XPS 13 9300 SKUs integrate Eyesafe technology which means their displays have been pre-calibrated to reduce blue light emissions without impacting the profile or accuracy of the colors. Dell is the first to integrate such a feature onto a consumer laptop.
Display Response Times
| ↔ Response Time Black to White | ||
|---|---|---|
| 25.6 ms ... rise ↗ and fall ↘ combined | ↗ 15.6 ms rise | 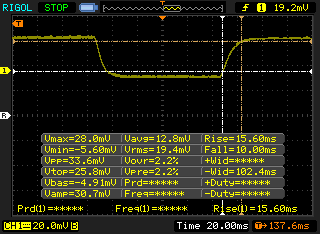 |
| ↘ 10 ms fall | ||
| The screen shows relatively slow response rates in our tests and may be too slow for gamers. In comparison, all tested devices range from 0.1 (minimum) to 240 (maximum) ms. » 61 % of all devices are better. This means that the measured response time is worse than the average of all tested devices (20.1 ms). | ||
| ↔ Response Time 50% Grey to 80% Grey | ||
| 41.6 ms ... rise ↗ and fall ↘ combined | ↗ 23.2 ms rise | 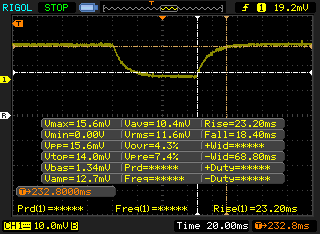 |
| ↘ 18.4 ms fall | ||
| The screen shows slow response rates in our tests and will be unsatisfactory for gamers. In comparison, all tested devices range from 0.165 (minimum) to 636 (maximum) ms. » 66 % of all devices are better. This means that the measured response time is worse than the average of all tested devices (31.4 ms). | ||
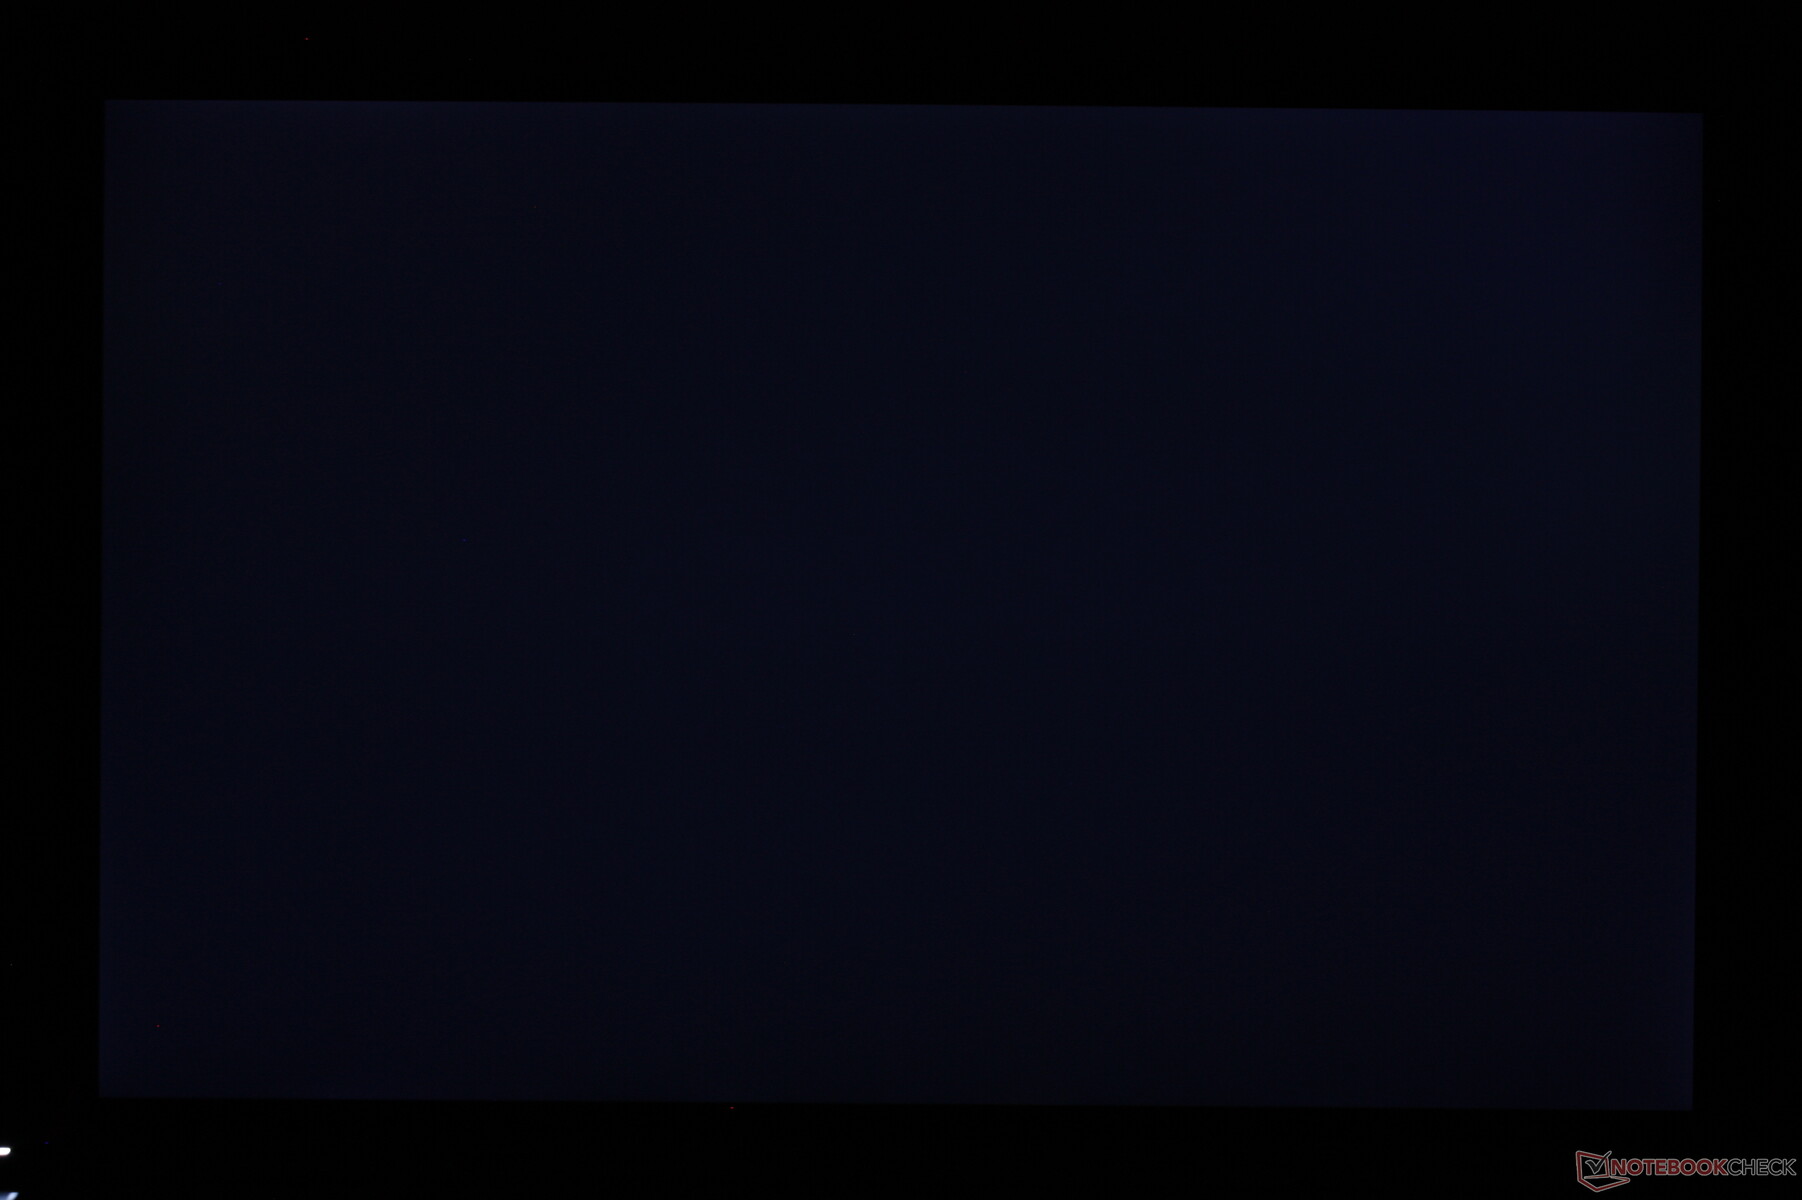
Screen Flickering / PWM (Pulse-Width Modulation)
| Screen flickering / PWM not detected | 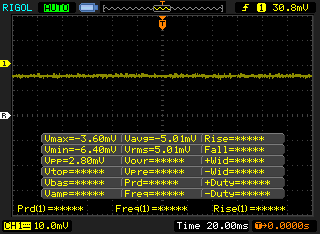 | ||
In comparison: 53 % of all tested devices do not use PWM to dim the display. If PWM was detected, an average of 7996 (minimum: 5 - maximum: 343500) Hz was measured. | |||
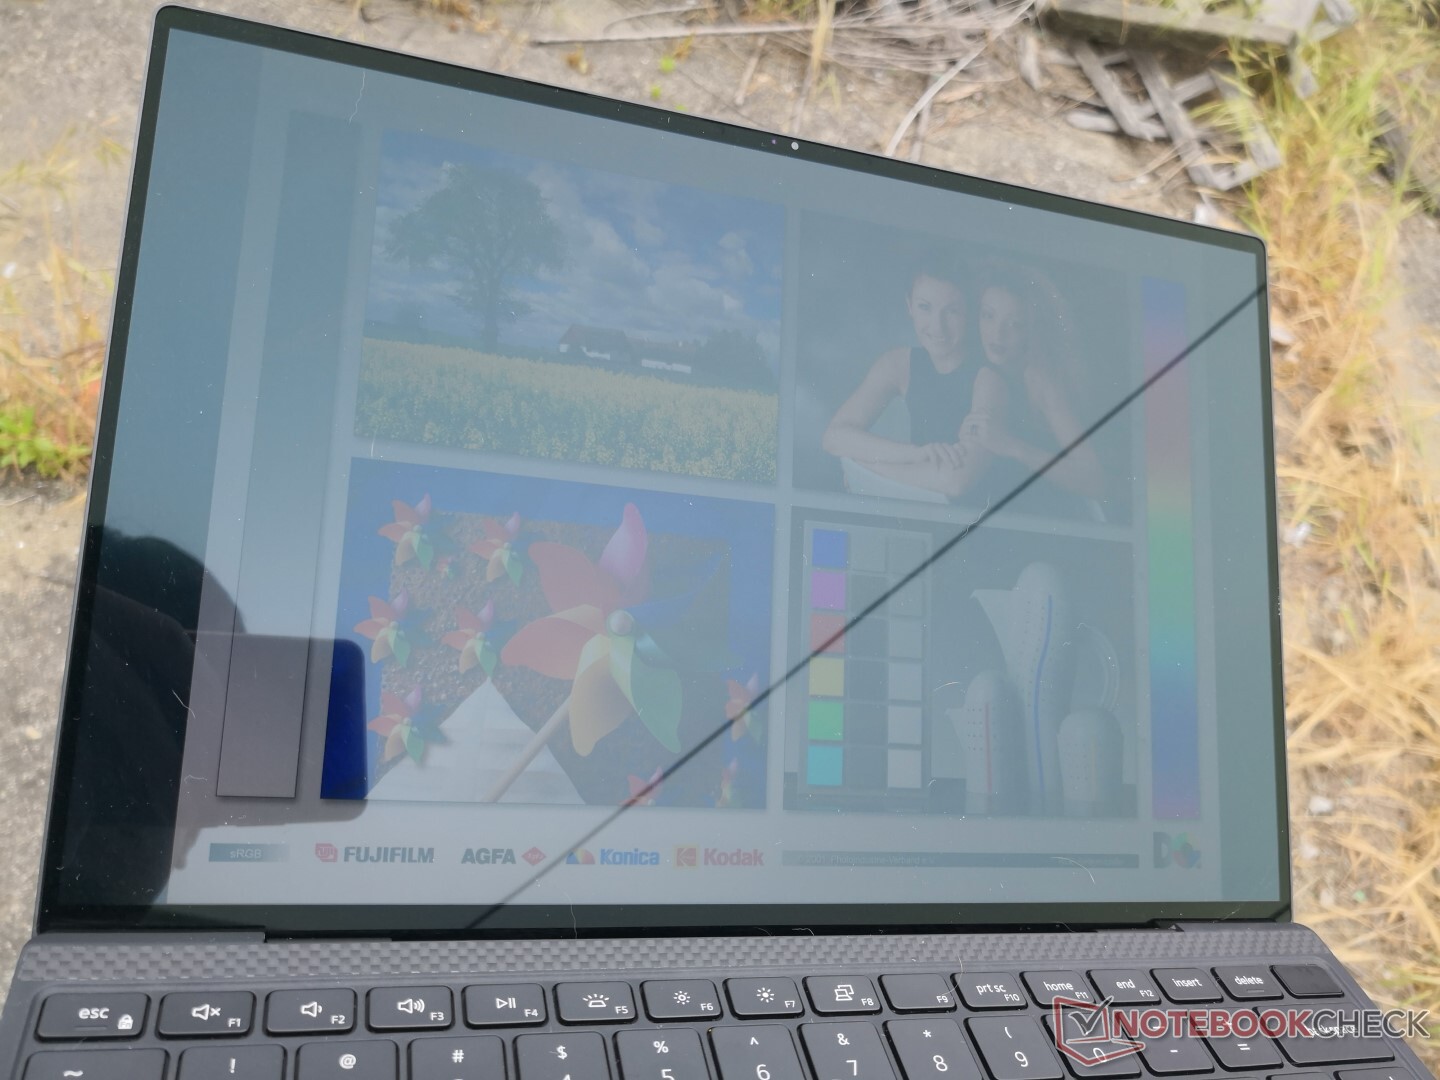
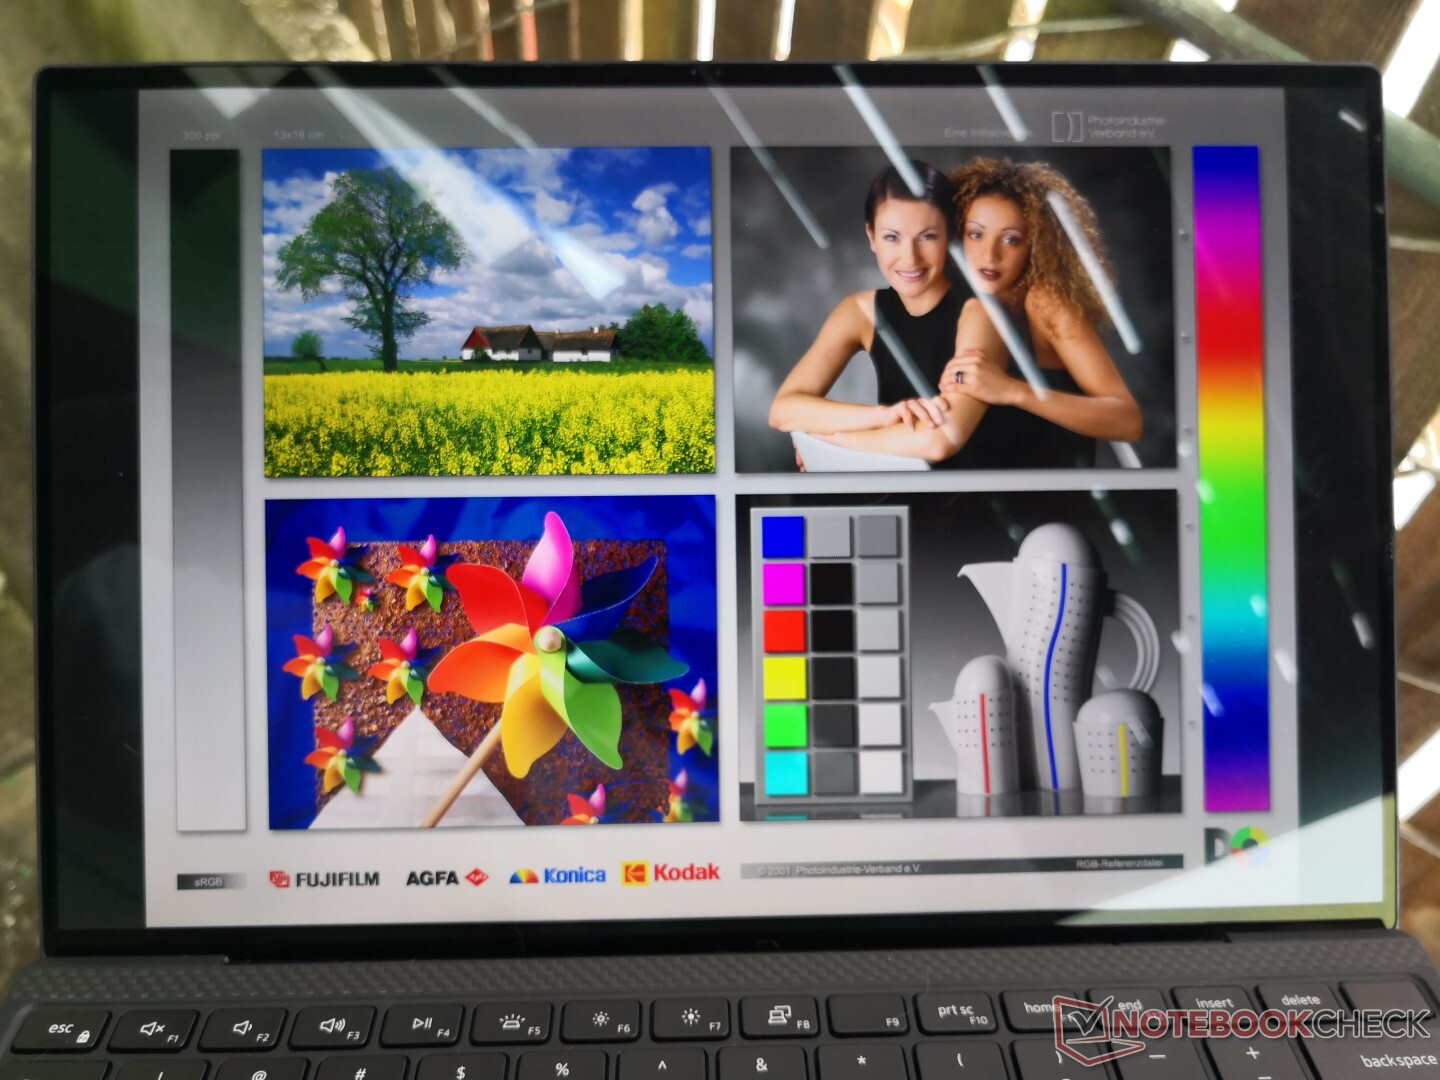
Outdoor visibility is good when under shade even though some glare will always be present. We recommend disabling the Intel Display Power Saver setting or else maximum brightness will automatically drop to 358 nits instead of the maximum of 414 nits. Viewing angles are otherwise excellent with very small changes in contrast and colors if viewing from extreme angles. Apparent brightness, however, will dip as expected.
Performance
Processor
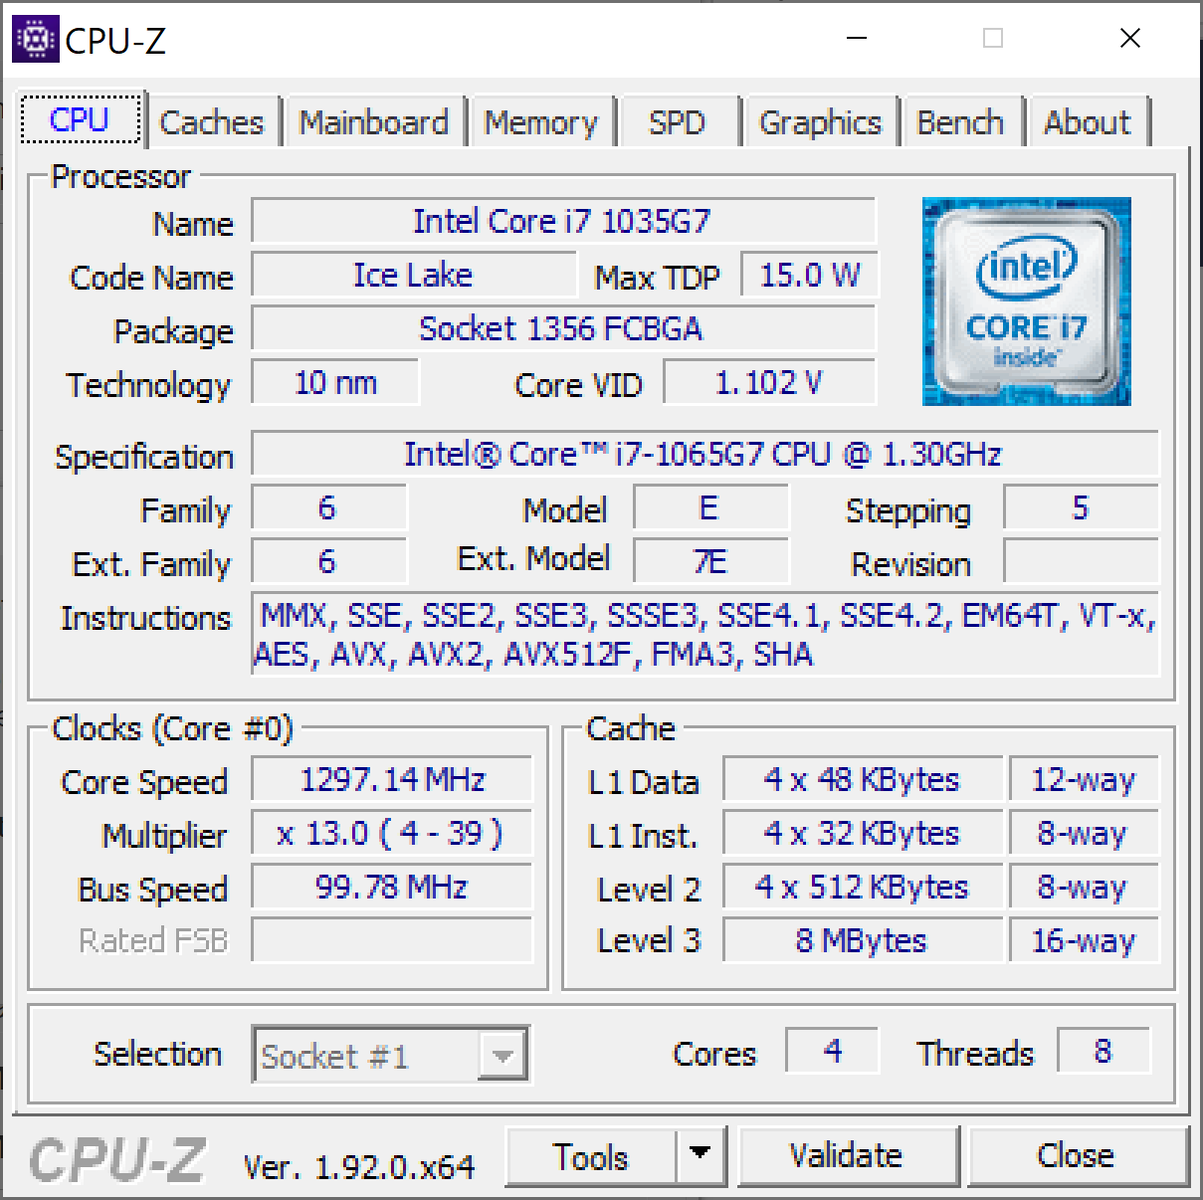
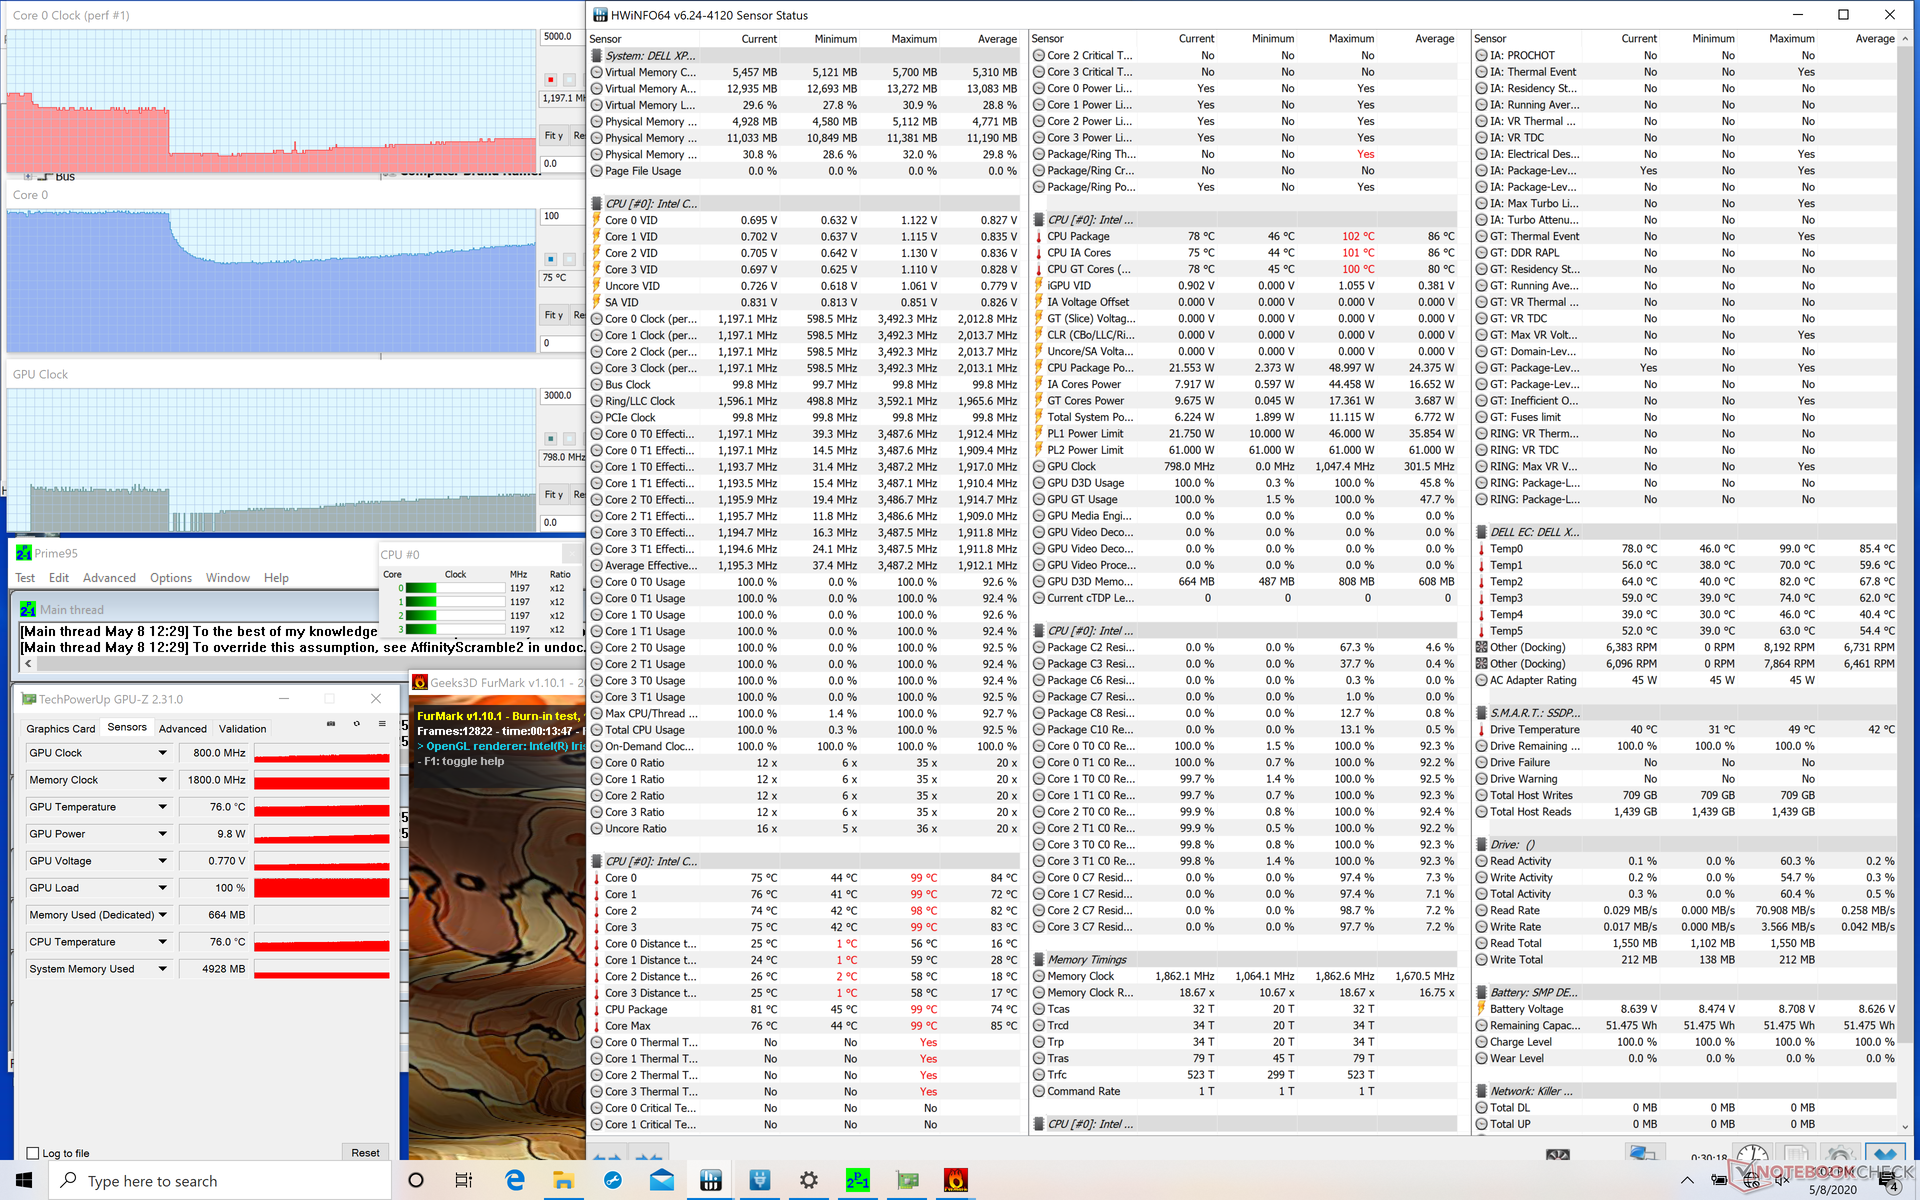
The Ice Lake-U CPU starts out strong before plateauing in performance if subjected to extreme stress for long periods. When running CineBench R15 Multi-Thread in a loop, for example, scores would dip by about 25 percent after the first loop. In real-world scenarios, this means that the XPS 13 9300 can be very fast at launching applications or multi-tasking between windows where short bursts in clock rates are helpful, but extended stress like video editing would be merely average. In fact, raw CPU performance is only about 10 percent faster than the lesser Core i5-1035G1 option after accounting for any performance throttling. Note that all benchmarks below were performed on Dell's Ultra Performance mode.
Interestingly, CPU clock rates would dip sooner on our 4K UHD test unit than on our FHD test unit even though both are equipped with the same Core i7 CPU. We suspect that differences in ambient temperature or starting conditions may be responsible.
See our dedicated page on the Core i7-1065G7 for more technical information and benchmark comparisons.
Cinebench R15: CPU Single 64Bit | CPU Multi 64Bit
Blender: v2.79 BMW27 CPU
7-Zip 18.03: 7z b 4 -mmt1 | 7z b 4
Geekbench 5.5: Single-Core | Multi-Core
HWBOT x265 Benchmark v2.2: 4k Preset
LibreOffice : 20 Documents To PDF
R Benchmark 2.5: Overall mean
| Blender / v2.79 BMW27 CPU | |
| Dell XPS 13 7390 2-in-1 Core i3 | |
| Average Intel Core i7-1065G7 (675 - 1650, n=23) | |
| Acer Aspire 5 A515-54G | |
| Asus ZenBook Duo UX481FL | |
| Dell XPS 13 9300 i5 FHD | |
| Huawei MateBook D 14-53010TVS | |
| Huawei MateBook D 14-53010TVS | |
| Dell XPS 13 9300 4K UHD | |
| Dell XPS 13 7390 Core i7-10710U | |
| 7-Zip 18.03 / 7z b 4 -mmt1 | |
| Asus ZenBook Duo UX481FL | |
| Dell XPS 13 9300 4K UHD | |
| Dell XPS 13 7390 Core i7-10710U | |
| Average Intel Core i7-1065G7 (3289 - 4589, n=24) | |
| Acer Aspire 5 A515-54G | |
| Dell XPS 13 9300 i5 FHD | |
| Dell XPS 13 7390 2-in-1 Core i3 | |
| Huawei MateBook D 14-53010TVS | |
| Huawei MateBook D 14-53010TVS | |
| Geekbench 5.5 / Single-Core | |
| Dell XPS 13 9300 4K UHD | |
| Average Intel Core i7-1065G7 (948 - 1348, n=18) | |
| Asus ZenBook Duo UX481FL | |
| Dell XPS 13 9300 i5 FHD | |
| Acer Aspire 5 A515-54G | |
| Huawei MateBook D 14-53010TVS | |
| Huawei MateBook D 14-53010TVS | |
| Geekbench 5.5 / Multi-Core | |
| Dell XPS 13 9300 4K UHD | |
| Dell XPS 13 9300 i5 FHD | |
| Average Intel Core i7-1065G7 (2464 - 4855, n=18) | |
| Asus ZenBook Duo UX481FL | |
| Acer Aspire 5 A515-54G | |
| Huawei MateBook D 14-53010TVS | |
| Huawei MateBook D 14-53010TVS | |
| HWBOT x265 Benchmark v2.2 / 4k Preset | |
| Dell XPS 13 9300 4K UHD | |
| Dell XPS 13 7390 Core i7-10710U | |
| Asus ZenBook Duo UX481FL | |
| Average Intel Core i7-1065G7 (2.2 - 6.38, n=22) | |
| Acer Aspire 5 A515-54G | |
| Dell XPS 13 9300 i5 FHD | |
| Huawei MateBook D 14-53010TVS | |
| Huawei MateBook D 14-53010TVS | |
| Dell XPS 13 7390 2-in-1 Core i3 | |
| LibreOffice / 20 Documents To PDF | |
| Dell XPS 13 9300 4K UHD | |
| Asus ZenBook Duo UX481FL | |
| Acer Aspire 5 A515-54G | |
| Average Intel Core i7-1065G7 (46.9 - 85.3, n=19) | |
| R Benchmark 2.5 / Overall mean | |
| Asus ZenBook Duo UX481FL | |
| Huawei MateBook D 14-53010TVS | |
| Huawei MateBook D 14-53010TVS | |
| Dell XPS 13 9300 i5 FHD | |
| Acer Aspire 5 A515-54G | |
| Average Intel Core i7-1065G7 (0.661 - 0.798, n=18) | |
| Dell XPS 13 9300 4K UHD | |
* ... smaller is better
System Performance
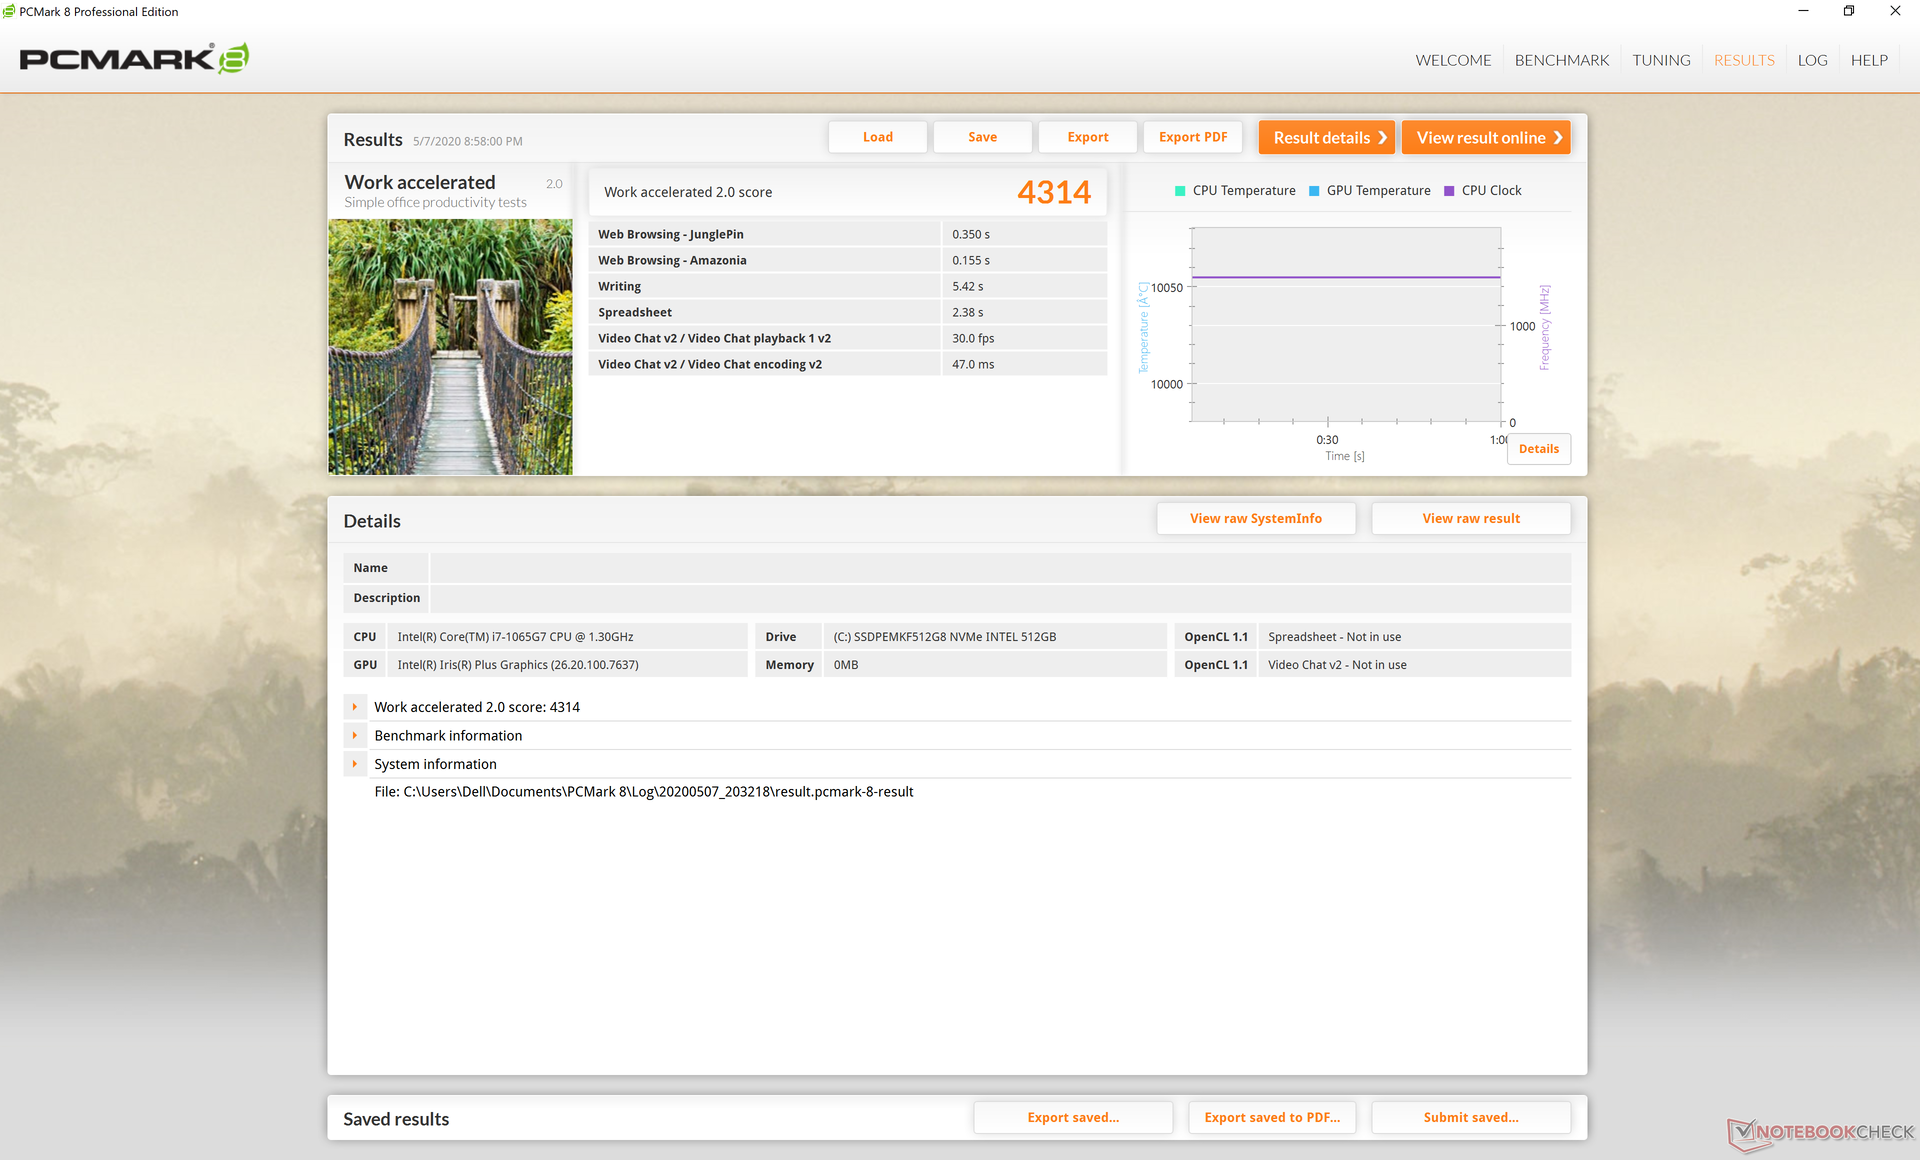
PCMark 10 benchmarks are consistently higher than the average Core i7-8565U laptop with integrated UHD Graphics 620 only. We recommend that users become familiar with the pre-installed Dell Power Manager and Update software as they directly impact performance and are independent of the default Windows Power Profile menu.
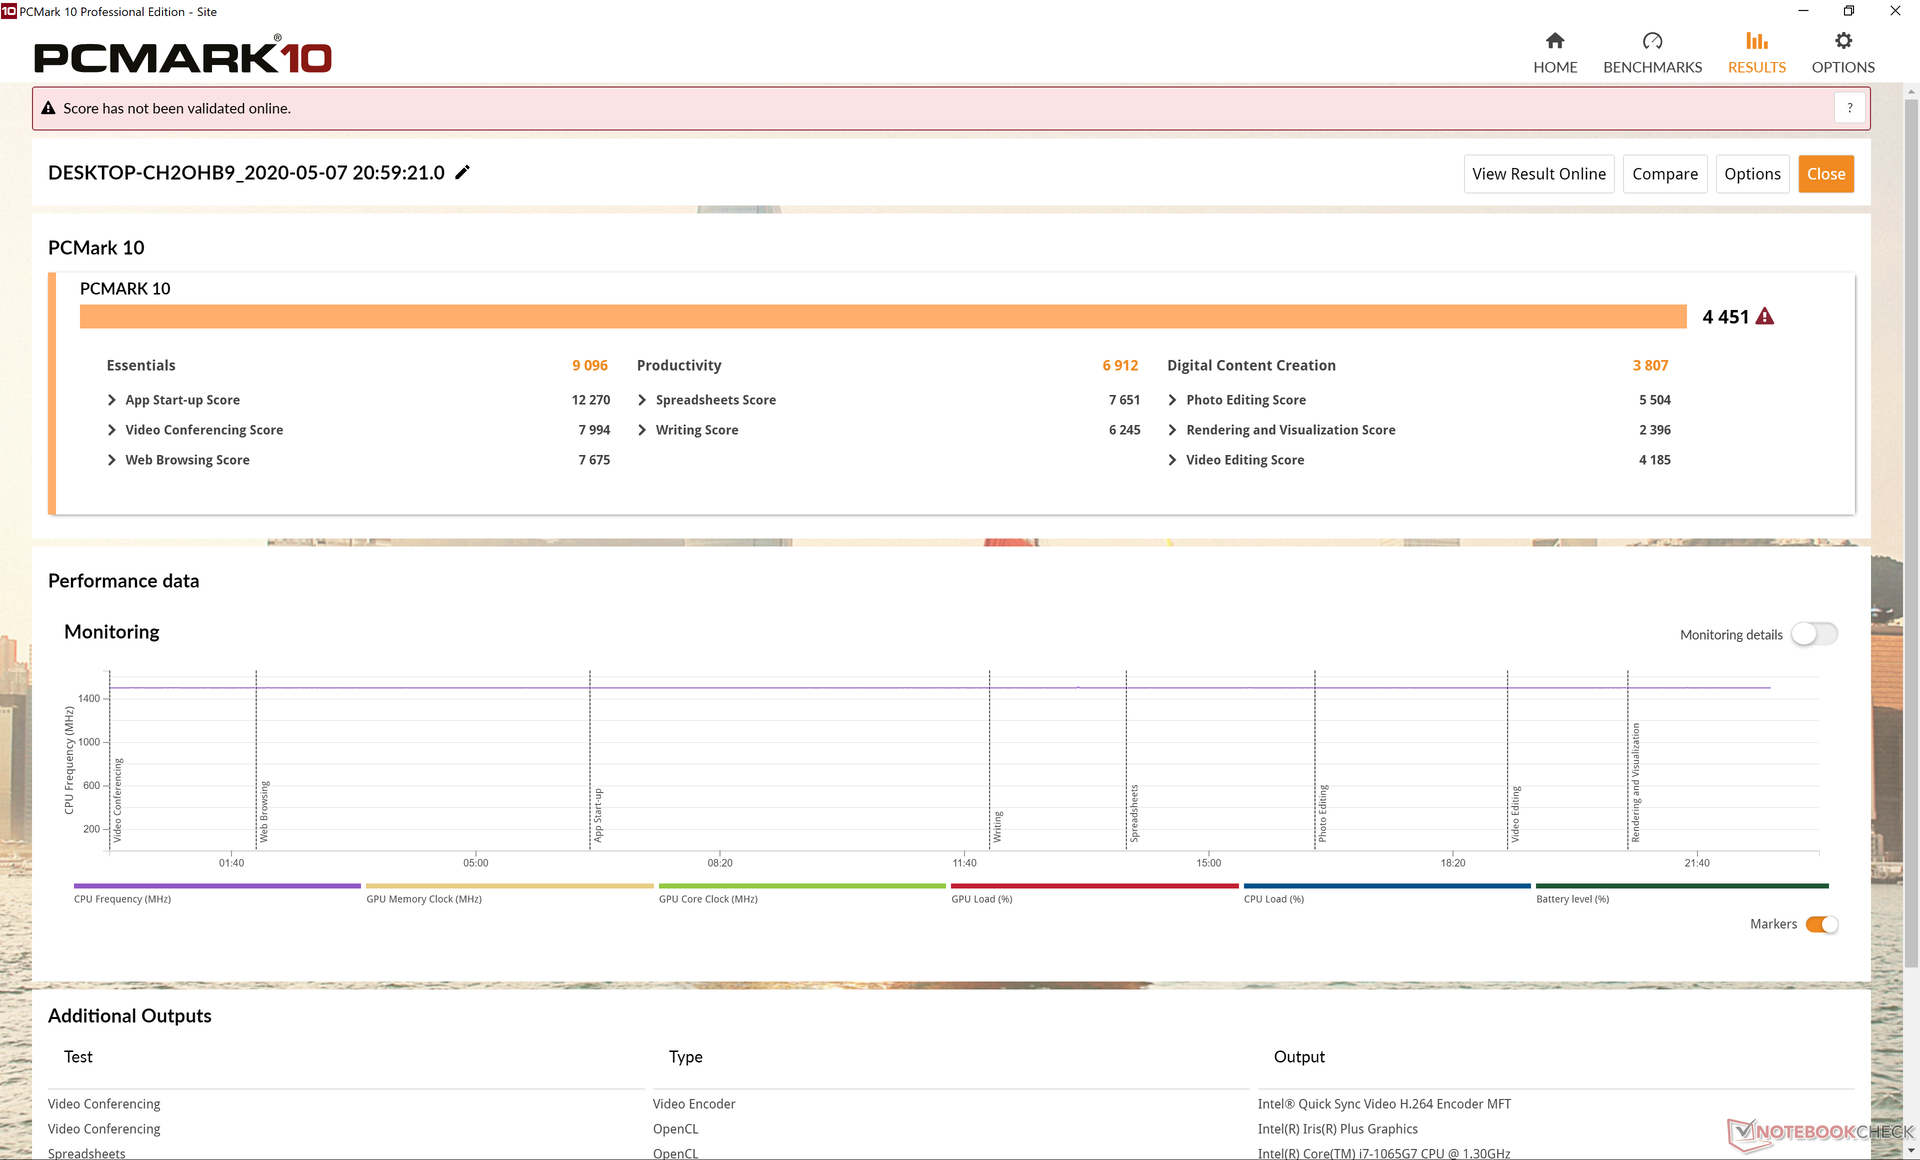
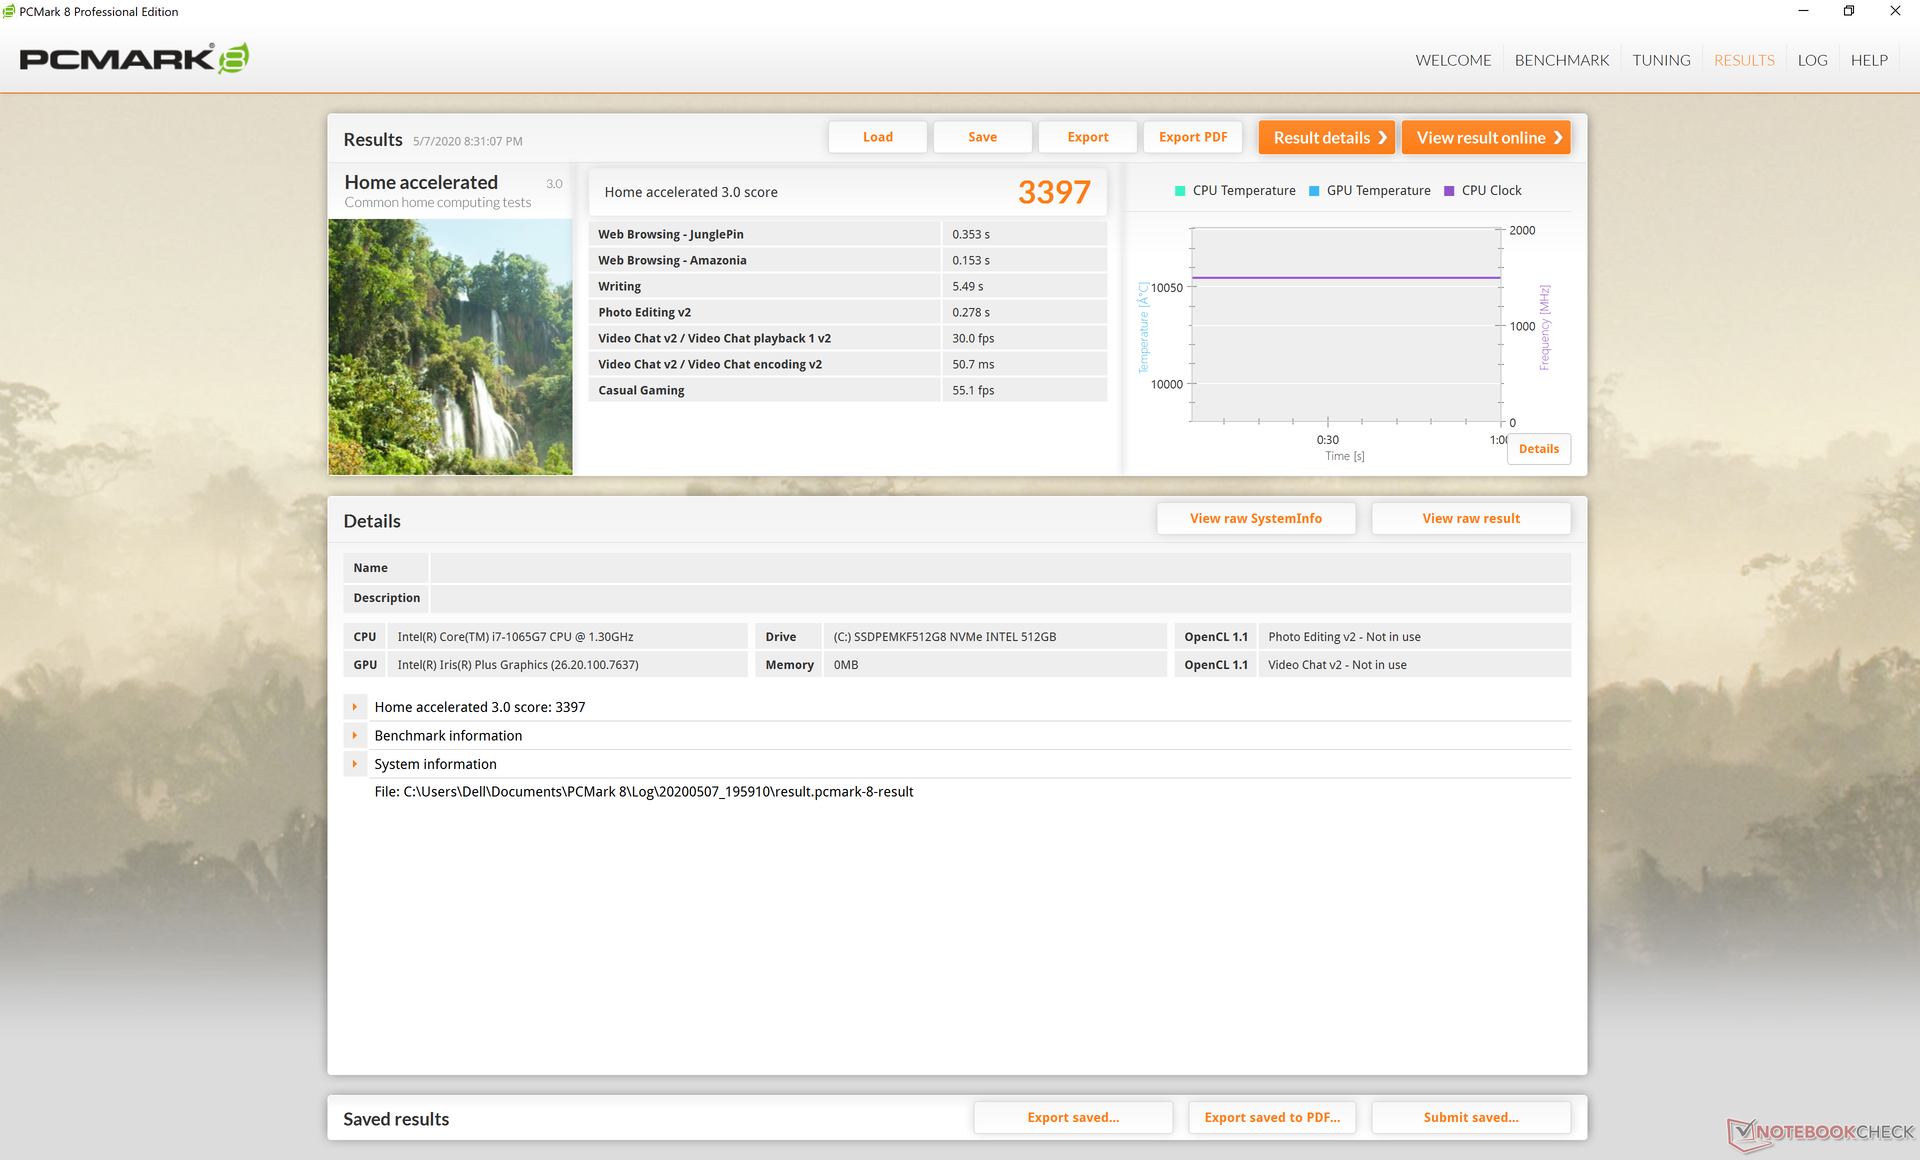
| PCMark 8 Home Score Accelerated v2 | 3397 points | |
| PCMark 8 Work Score Accelerated v2 | 4314 points | |
| PCMark 10 Score | 4451 points | |
Help | ||
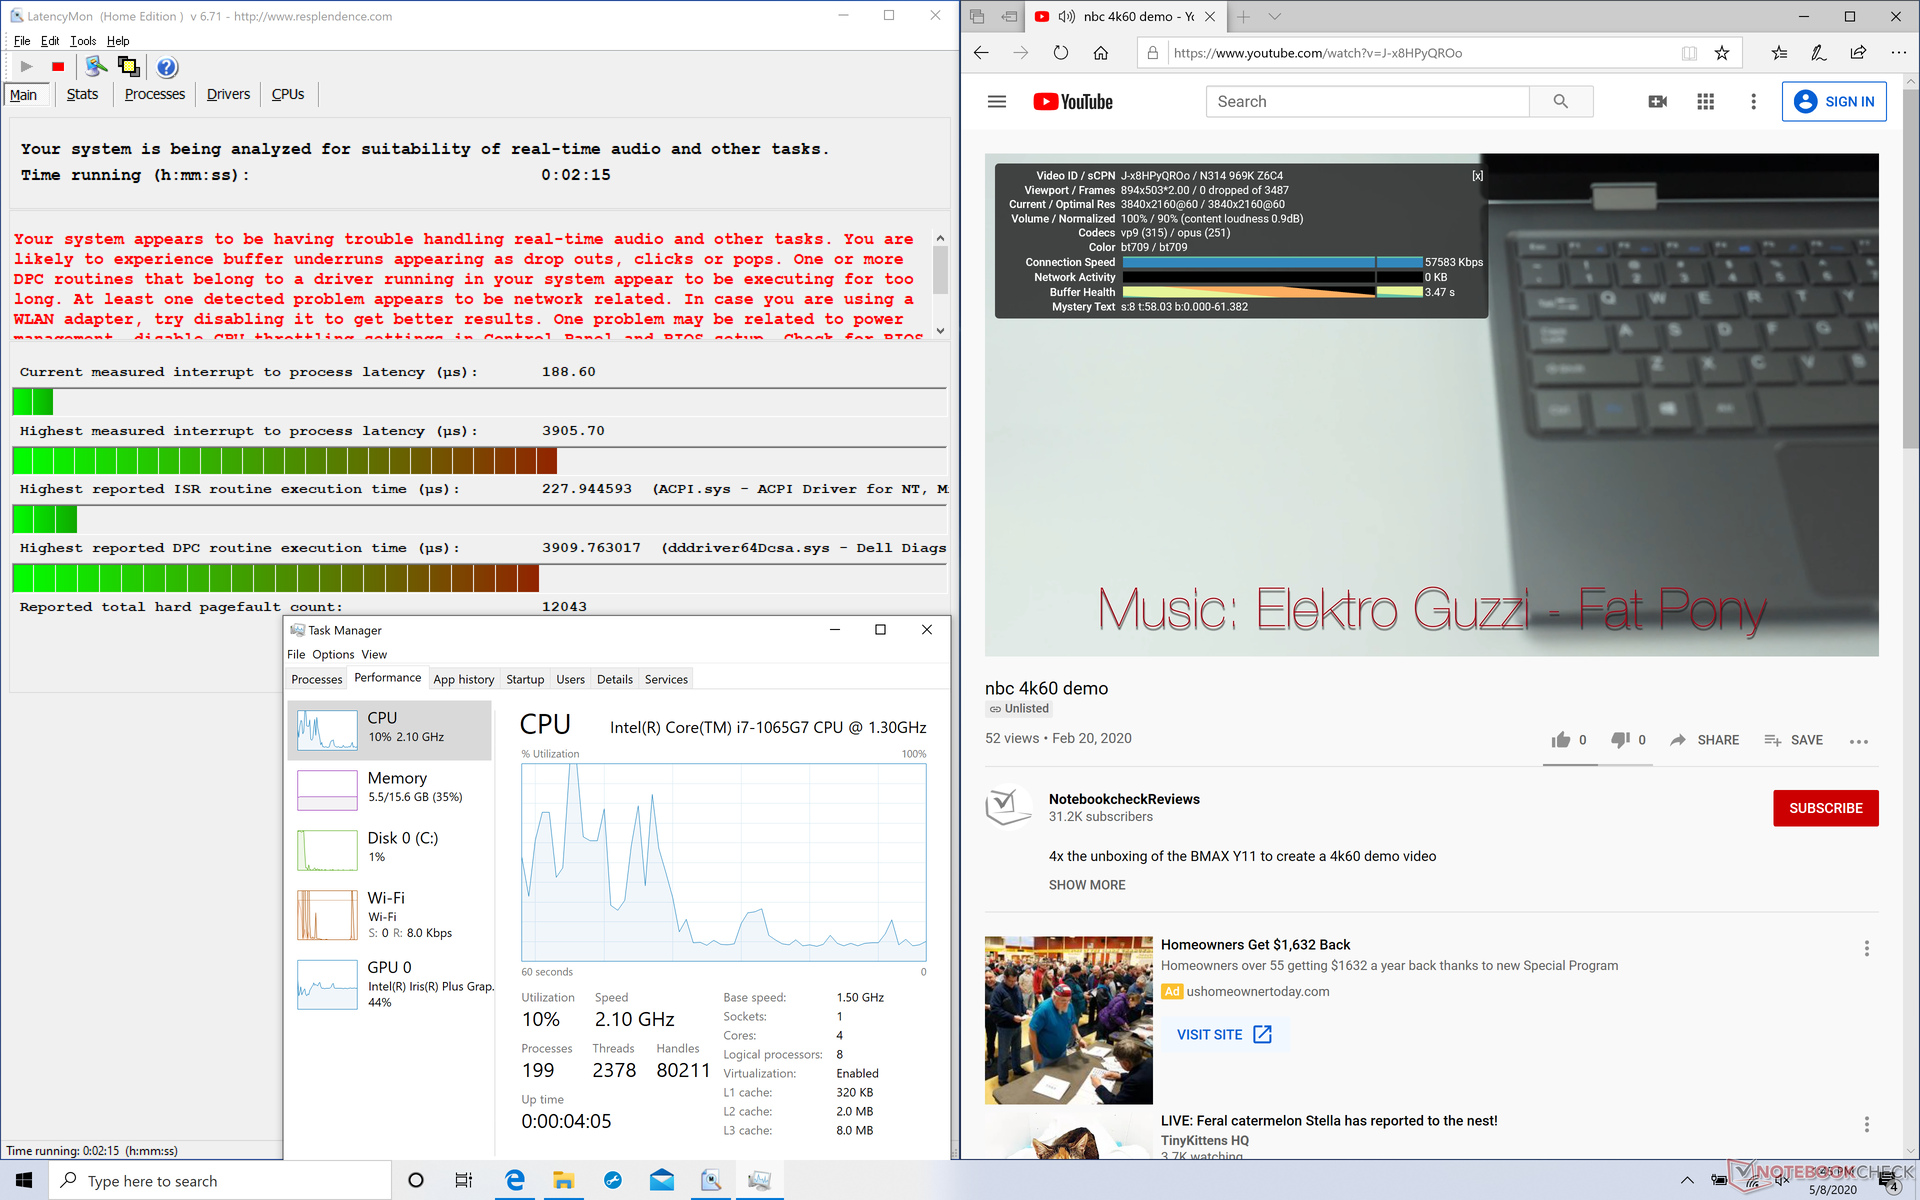
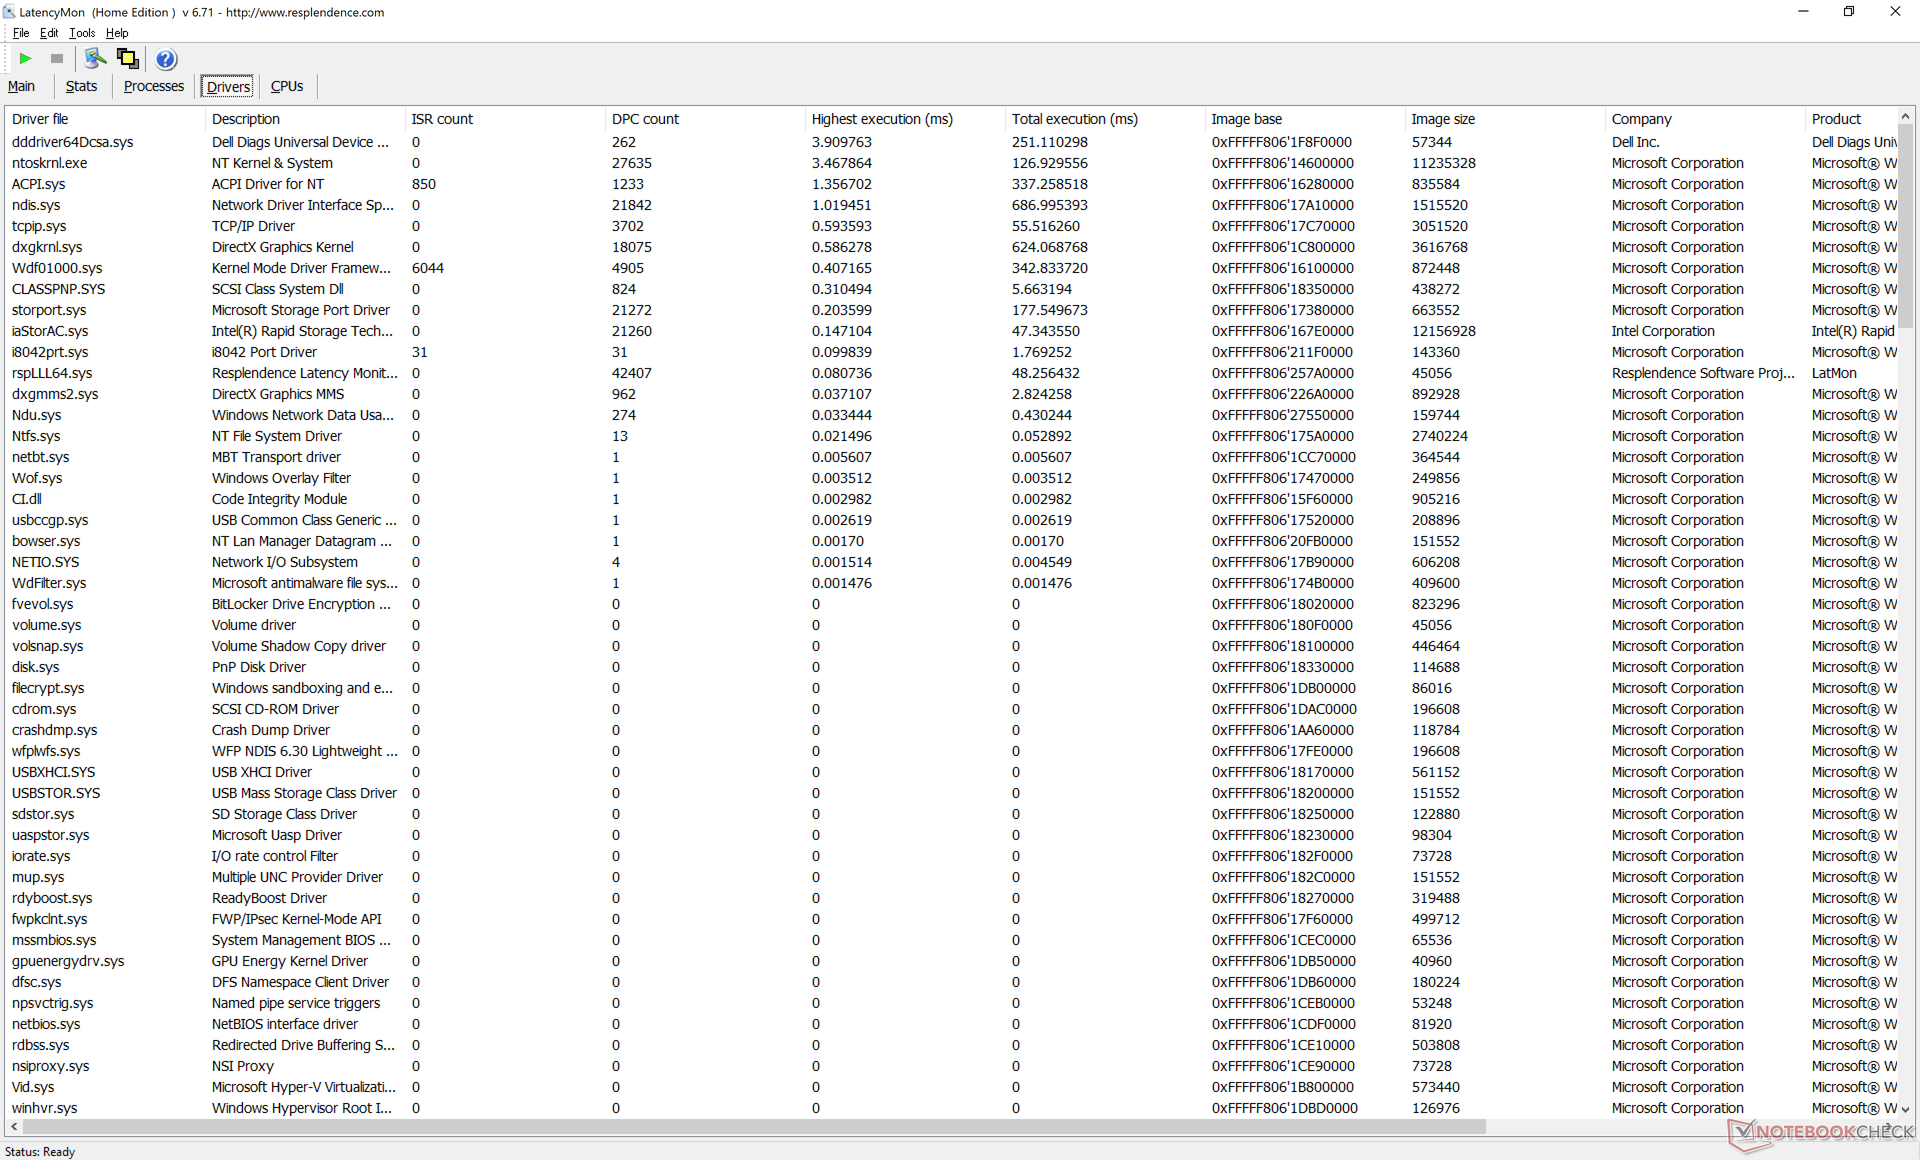
DPC Latency
LatencyMon shows DPC latency issues when opening multiple browser tabs. 4K video playback on YouTube remains smooth with no dropped frames.
| DPC Latencies / LatencyMon - interrupt to process latency (max), Web, Youtube, Prime95 | |
| Dell XPS 13 9300 4K UHD | |
* ... smaller is better
Storage Devices
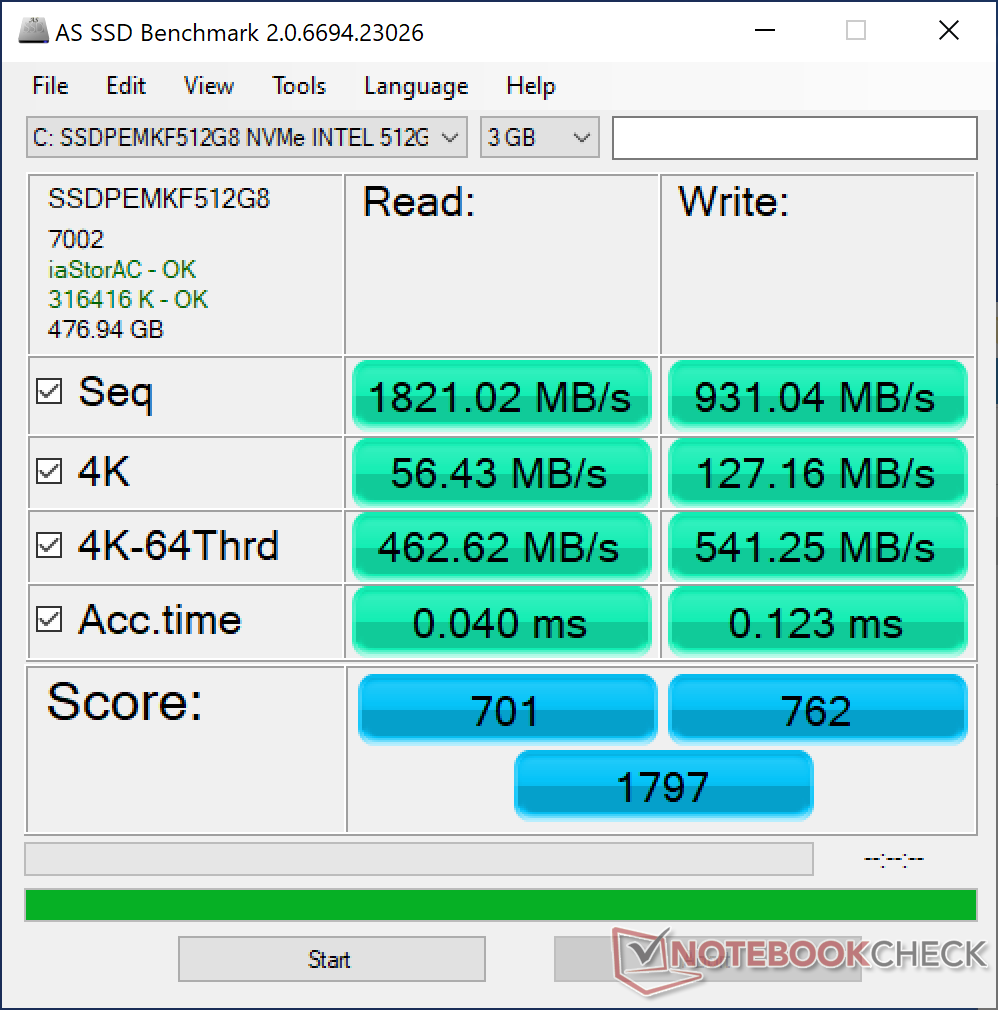
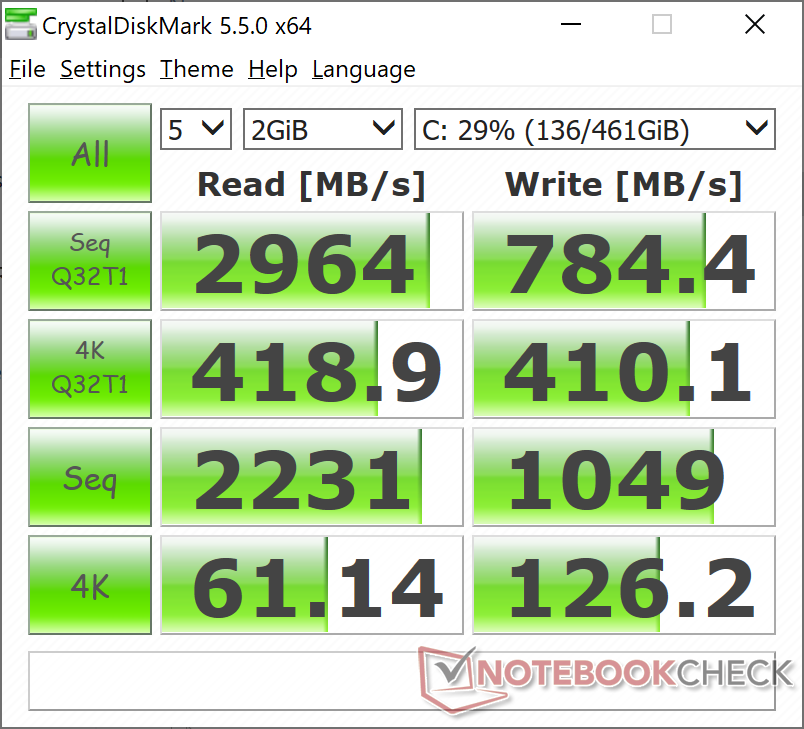
Our test unit comes with the same 512 GB Intel SSDPEMKF512G8 NVMe SSD as found on our last XPS 13 9300 test unit. However, we wouldn't be surprised to see Toshiba or SK Hynix drives much like 2what we discovered on the XPS 13 7390 2-in-1 or 7390 clamshell. More benchmarks can be found on our table of SSDs and HDDs here.
| Dell XPS 13 9300 4K UHD Intel SSDPEMKF512G8 NVMe SSD | Dell XPS 13 9300 Core i7-1065G7 Intel SSDPEMKF512G8 NVMe SSD | Dell XPS 13 7390 2-in-1 Core i7 Toshiba BG4 KBG40ZPZ512G | Dell XPS 13 7390 Core i7-10710U SK Hynix PC601 NVMe 512 GB | Apple MacBook Pro 13 2019 2TB3 Apple SSD AP0256 | |
|---|---|---|---|---|---|
| AS SSD | 1% | -21% | 22% | -77% | |
| Seq Read (MB/s) | 1821 | 1956 7% | 1801 -1% | 1804 -1% | 974 -47% |
| Seq Write (MB/s) | 931 | 1227 32% | 1125 21% | 1000 7% | 1340 44% |
| 4K Read (MB/s) | 56.4 | 63 12% | 39.7 -30% | 45.1 -20% | 11.35 -80% |
| 4K Write (MB/s) | 127.2 | 156.6 23% | 67 -47% | 115 -10% | 15.95 -87% |
| 4K-64 Read (MB/s) | 462.6 | 475.6 3% | 1253 171% | 893 93% | 643 39% |
| 4K-64 Write (MB/s) | 541 | 539 0% | 209 -61% | 732 35% | 163 -70% |
| Access Time Read * (ms) | 0.04 | 0.042 -5% | 0.069 -73% | 0.044 -10% | 0.316 -690% |
| Access Time Write * (ms) | 0.123 | 0.105 15% | 0.625 -408% | 0.095 23% | 0.258 -110% |
| Score Read (Points) | 701 | 734 5% | 1472 110% | 1119 60% | 752 7% |
| Score Write (Points) | 762 | 818 7% | 388 -49% | 947 24% | 313 -59% |
| Score Total (Points) | 1797 | 1915 7% | 2583 44% | 2608 45% | 1465 -18% |
| Copy ISO MB/s (MB/s) | 1068 | 1022 -4% | 1293 21% | 1515 42% | 1404 31% |
| Copy Program MB/s (MB/s) | 446.4 | 302.8 -32% | 560 25% | 535 20% | 406.9 -9% |
| Copy Game MB/s (MB/s) | 1163 | 491.4 -58% | 927 -20% | 1211 4% | 850 -27% |
| CrystalDiskMark 5.2 / 6 | 20% | 1% | 27% | ||
| Write 4K (MB/s) | 126.2 | 186.8 48% | 106.7 -15% | 134 6% | |
| Read 4K (MB/s) | 61.1 | 71.4 17% | 49.94 -18% | 42.91 -30% | |
| Write Seq (MB/s) | 1049 | 1203 15% | 1223 17% | 1841 76% | |
| Read Seq (MB/s) | 2231 | 2600 17% | 1801 -19% | 1707 -23% | |
| Write 4K Q32T1 (MB/s) | 410.1 | 514 25% | 325.3 -21% | 394.7 -4% | |
| Read 4K Q32T1 (MB/s) | 418.9 | 570 36% | 551 32% | 398.5 -5% | |
| Write Seq Q32T1 (MB/s) | 784 | 786 0% | 1224 56% | 2250 187% | |
| Read Seq Q32T1 (MB/s) | 2964 | 2947 -1% | 2350 -21% | 3265 10% | |
| Total Average (Program / Settings) | 11% /
8% | -10% /
-13% | 25% /
24% | -77% /
-77% |
* ... smaller is better

Disk Throttling: DiskSpd Read Loop, Queue Depth 8
GPU Performance
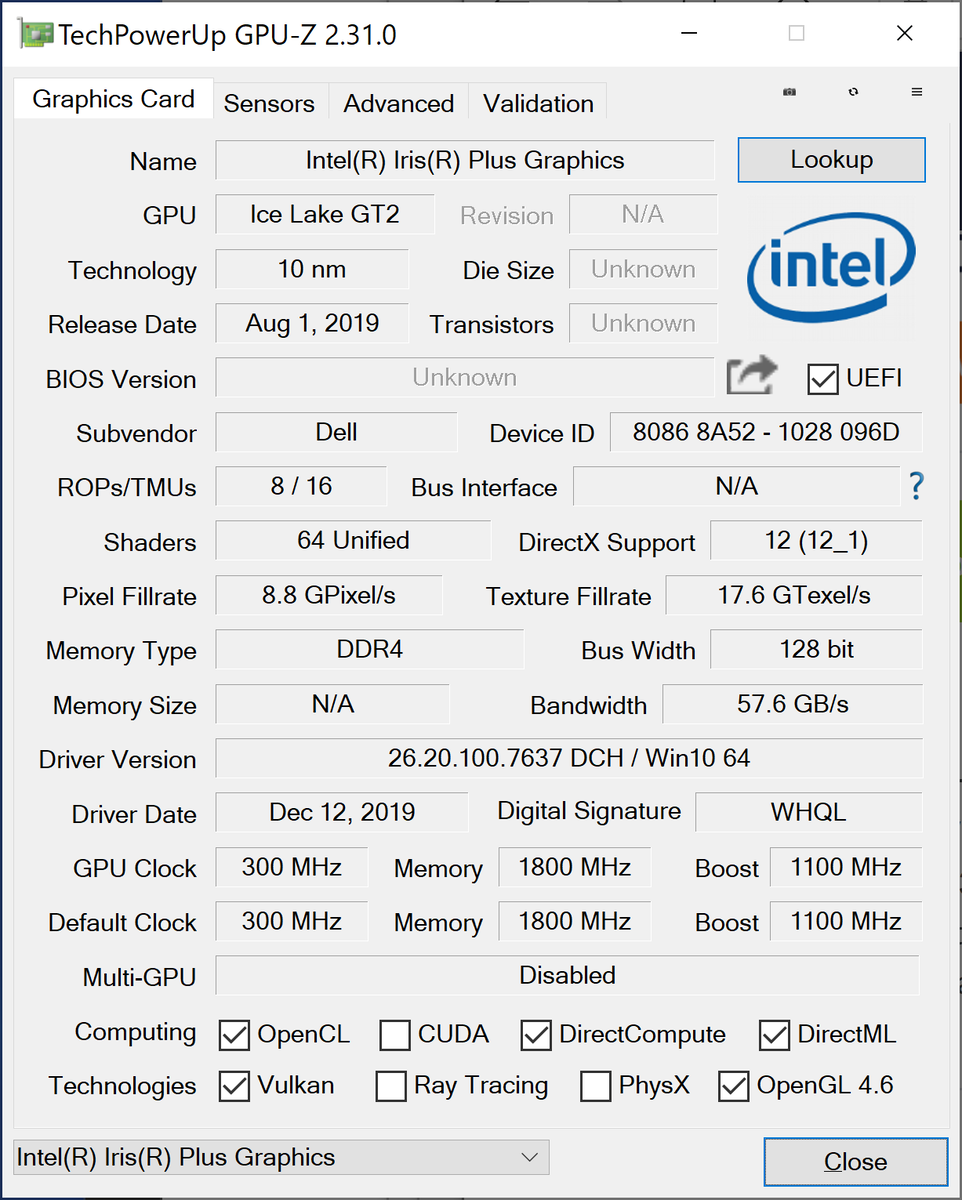
The integrated Iris Plus Graphics G7 performs where we expect it to be relative to other laptops with the same GPU. Users upgrading from the less expensive Core i5-1035G1 SKU will see a 60 percent boost in graphics performance while users upgrading from an older UHD Graphics 620 laptop like the XPS 13 7390 will see an even larger performance boost of 80 to 110 percent. Keep in mind that the major difference between the Core i5-1035G1 and Core i7-1065G7 relates to their integrated GPUs rather than their raw CPU horsepower.
See our dedicated page on the Iris Plus Graphics G7 for more technical information and benchmarks.
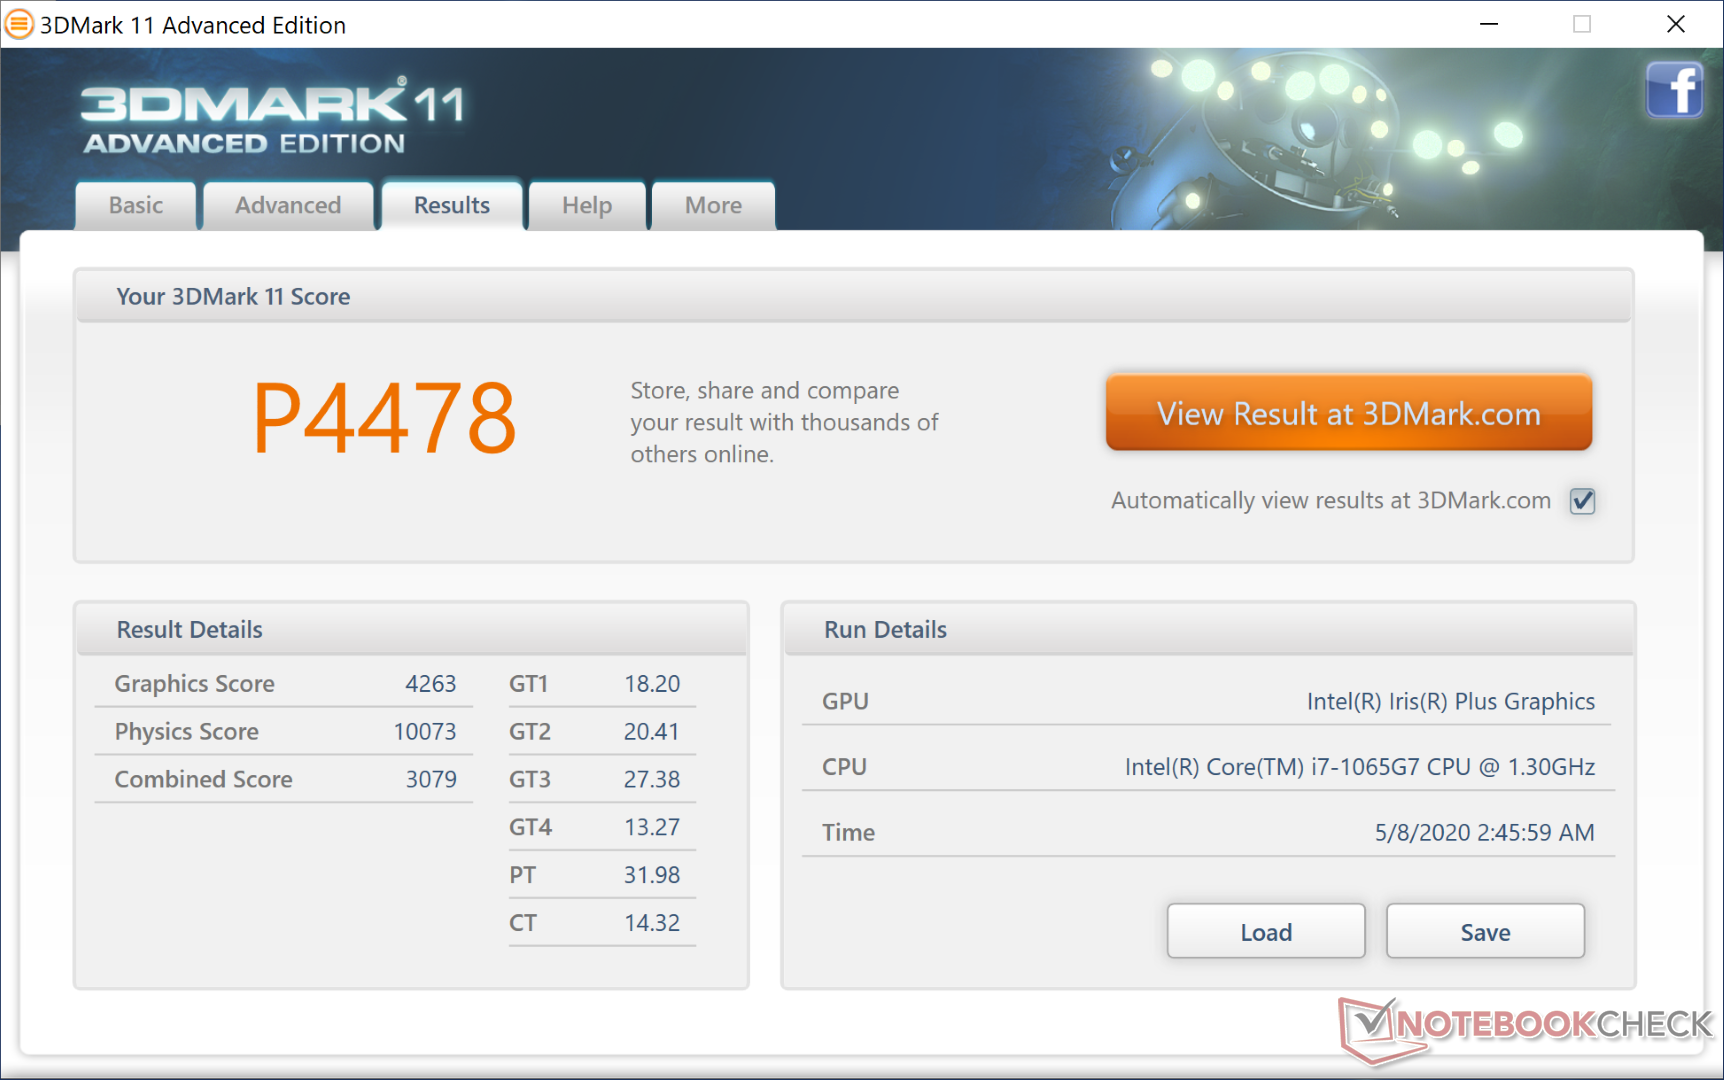
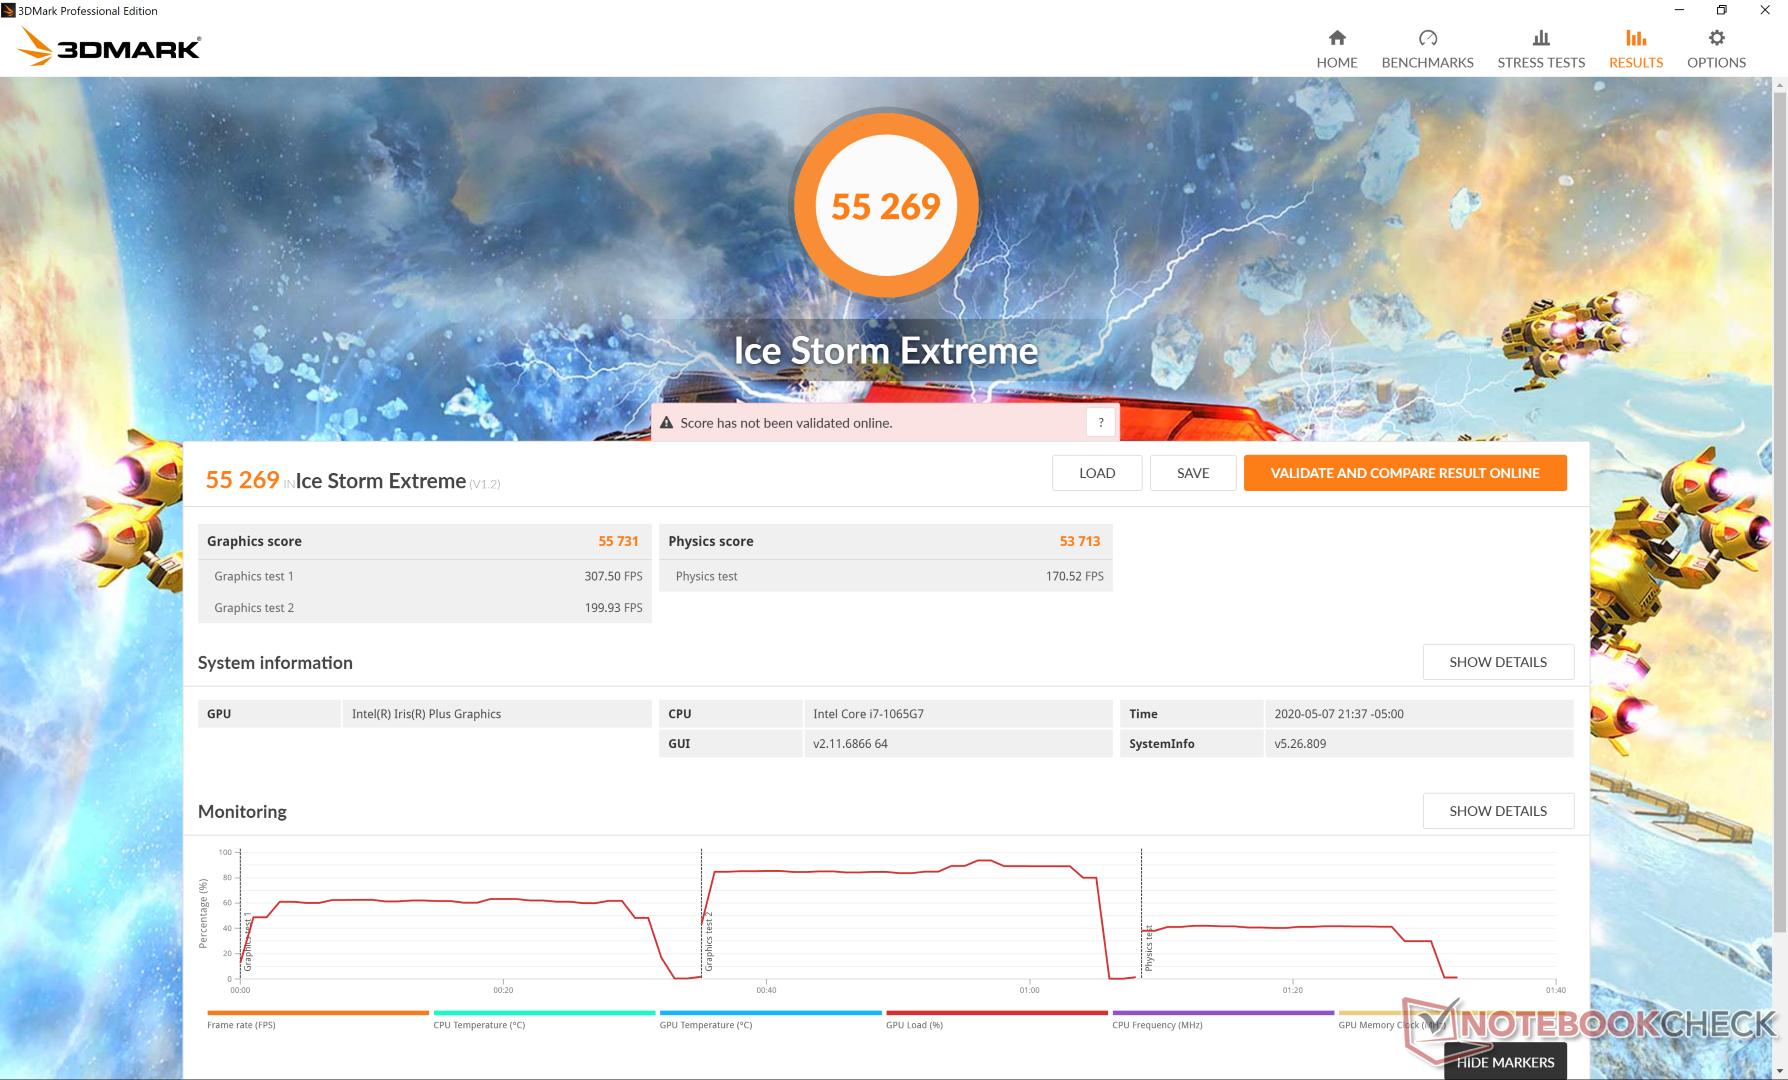
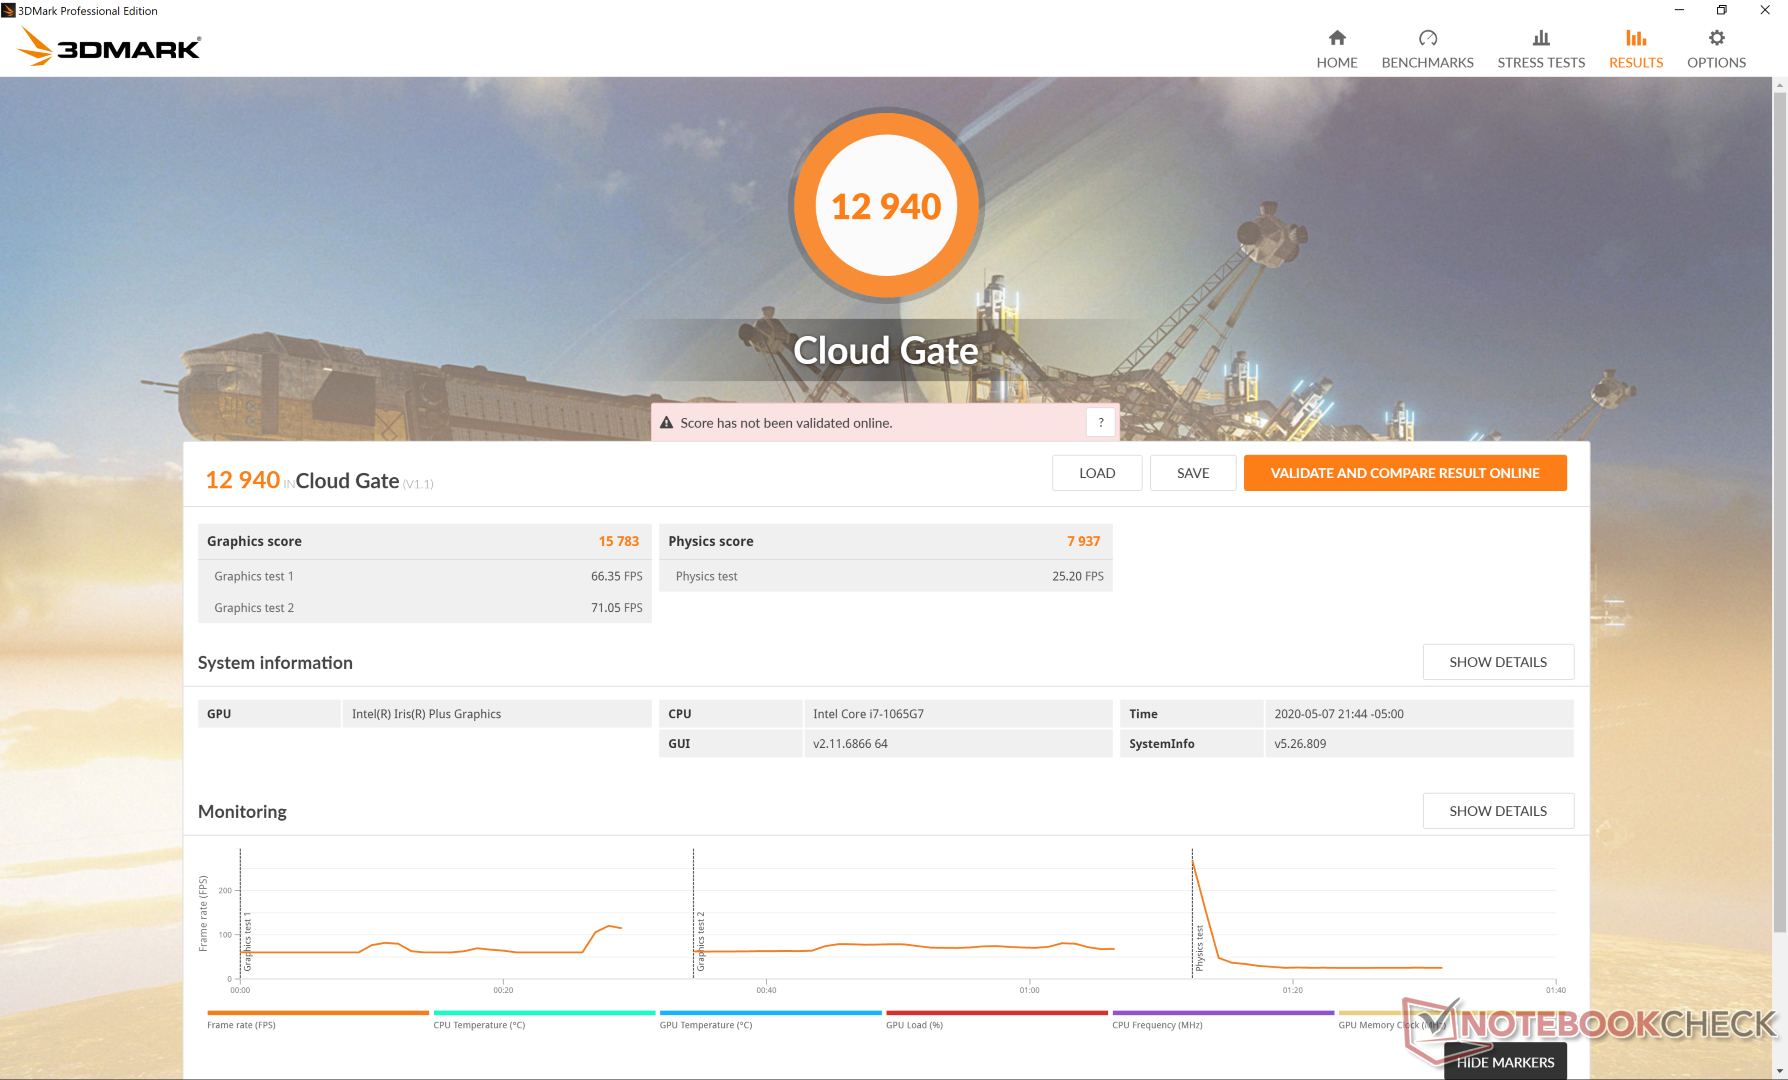
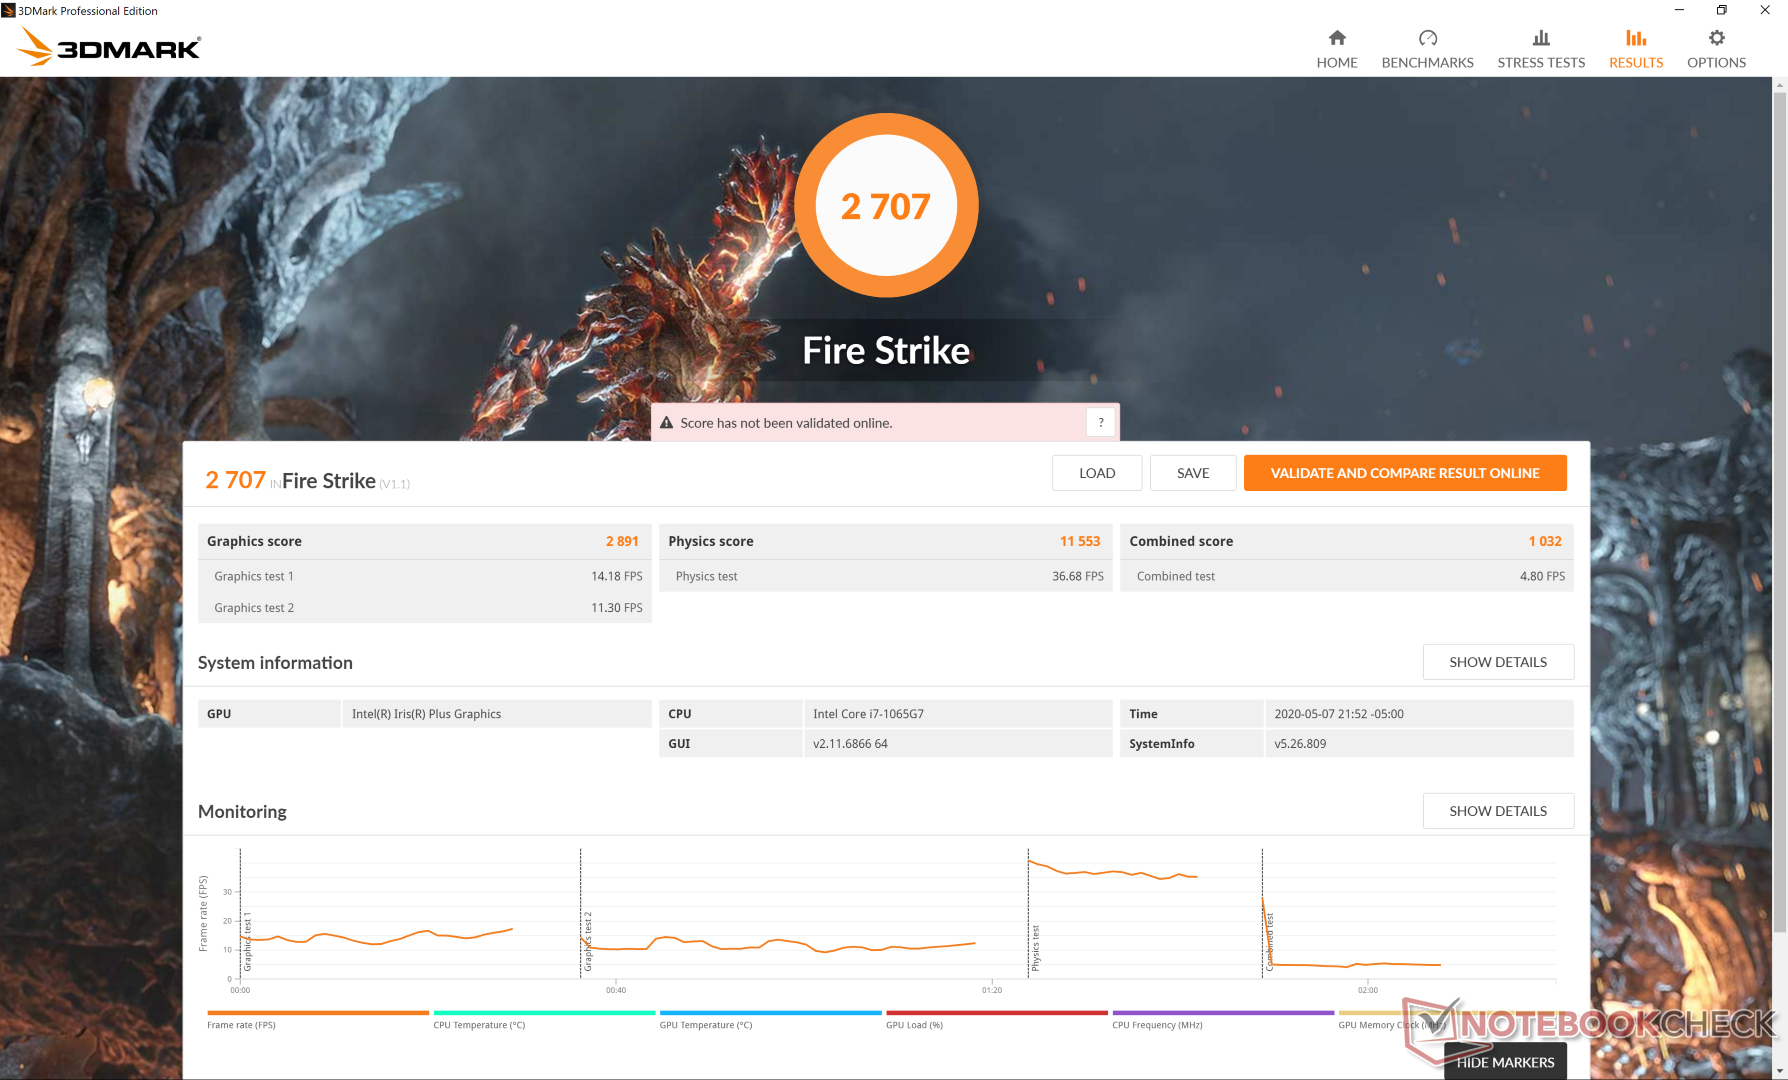
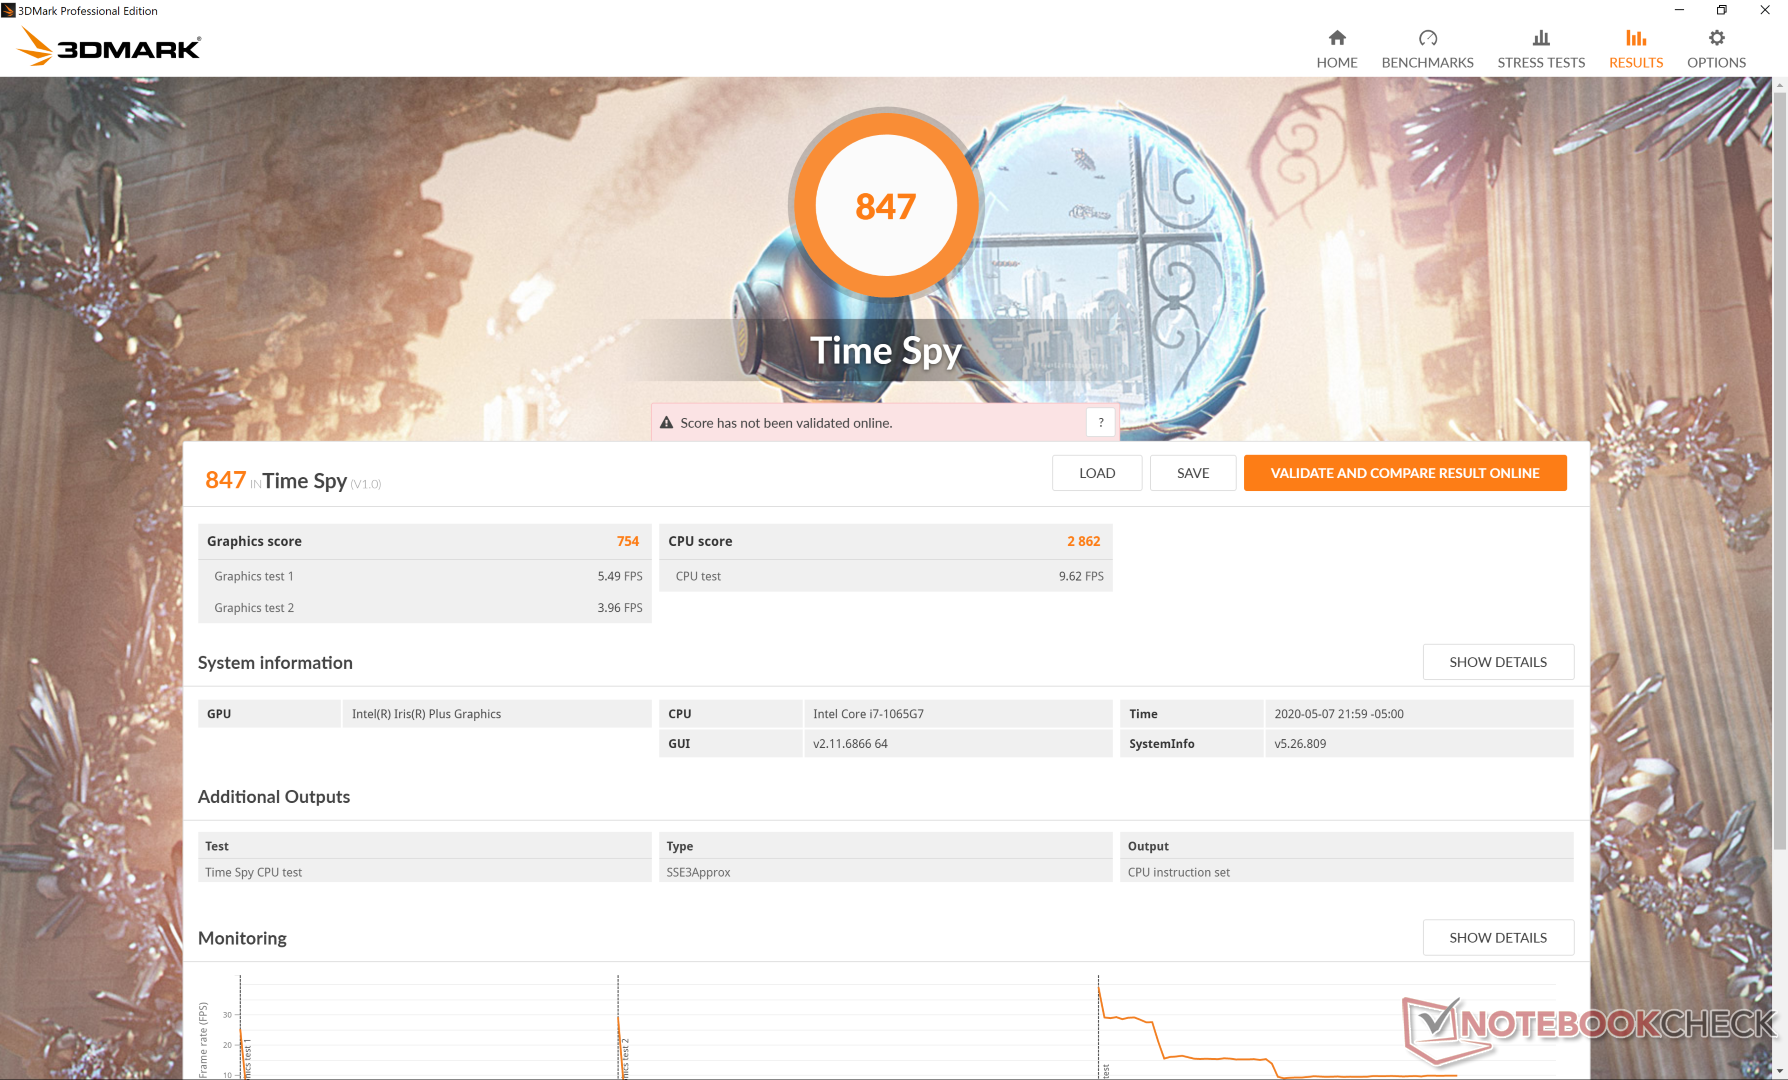
| 3DMark 11 Performance | 4478 points | |
| 3DMark Cloud Gate Standard Score | 12940 points | |
| 3DMark Fire Strike Score | 2707 points | |
| 3DMark Time Spy Score | 847 points | |
Help | ||
| low | med. | high | ultra | |
|---|---|---|---|---|
| Dota 2 Reborn (2015) | 80.2 | 48.6 | 30.1 | 27.6 |
| X-Plane 11.11 (2018) | 27.6 | 15.2 | 17.3 |
Emissions
System Noise
The system is almost always silent during low loads like browsing, video streaming, or emailing. When running 3DMark 06, fan noise doesn't pick up until about halfway through the initial 90-second benchmark scene. Fan noise only becomes noticeable when running these high loads for long periods. For a high-end Ultrabook with no dedicated GPU, this is nothing out of the ordinary.
We can notice no electronic noise or coil whine from our test unit.
| Dell XPS 13 9300 4K UHD Iris Plus Graphics G7 (Ice Lake 64 EU), i7-1065G7, Intel SSDPEMKF512G8 NVMe SSD | Dell XPS 13 9300 Core i7-1065G7 Iris Plus Graphics G7 (Ice Lake 64 EU), i7-1065G7, Intel SSDPEMKF512G8 NVMe SSD | Dell XPS 13 7390 2-in-1 Core i7 Iris Plus Graphics G7 (Ice Lake 64 EU), i7-1065G7, Toshiba BG4 KBG40ZPZ512G | Dell XPS 13 7390 Core i7-10710U UHD Graphics 620, i7-10710U, SK Hynix PC601 NVMe 512 GB | Apple MacBook Pro 13 2019 2TB3 Iris Plus Graphics 645, i5-8257U, Apple SSD AP0256 | Microsoft Surface Laptop 3 13 Core i5-1035G7 Iris Plus Graphics G7 (Ice Lake 64 EU), i5-1035G7, SK hynix BC501 HFM256GDGTNG | |
|---|---|---|---|---|---|---|
| Noise | 2% | 0% | -1% | 0% | 3% | |
| off / environment * (dB) | 29 | 28.3 2% | 28.1 3% | 28 3% | 29.5 -2% | 28.5 2% |
| Idle Minimum * (dB) | 29 | 28.3 2% | 28.1 3% | 28 3% | 29.5 -2% | 28.5 2% |
| Idle Average * (dB) | 29 | 28.3 2% | 28.1 3% | 28 3% | 29.5 -2% | 28.5 2% |
| Idle Maximum * (dB) | 29 | 28.3 2% | 28.1 3% | 28 3% | 29.5 -2% | 28.5 2% |
| Load Average * (dB) | 33.5 | 32.5 3% | 31.7 5% | 33.7 -1% | 31.1 7% | 28.5 15% |
| Witcher 3 ultra * (dB) | 40.5 | 39.3 3% | 43.4 -7% | 40.4 -0% | ||
| Load Maximum * (dB) | 40.5 | 39.3 3% | 43.4 -7% | 46.5 -15% | 39.3 3% | 40.4 -0% |
* ... smaller is better
Noise level
| Idle |
| 29 / 29 / 29 dB(A) |
| Load |
| 33.5 / 40.5 dB(A) |
 | ||
30 dB silent 40 dB(A) audible 50 dB(A) loud |
||
min: | ||
Temperature
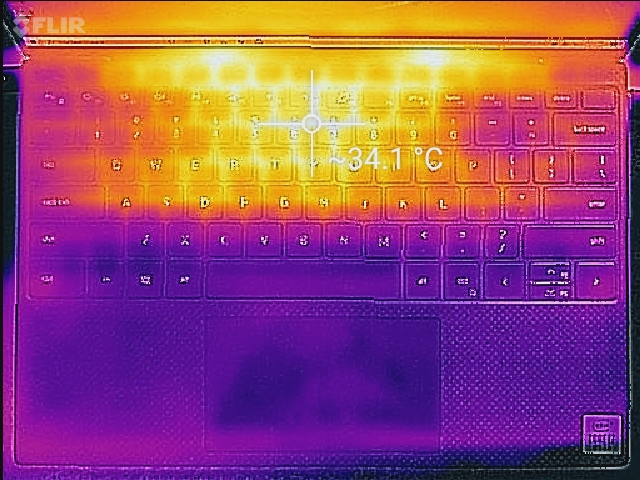
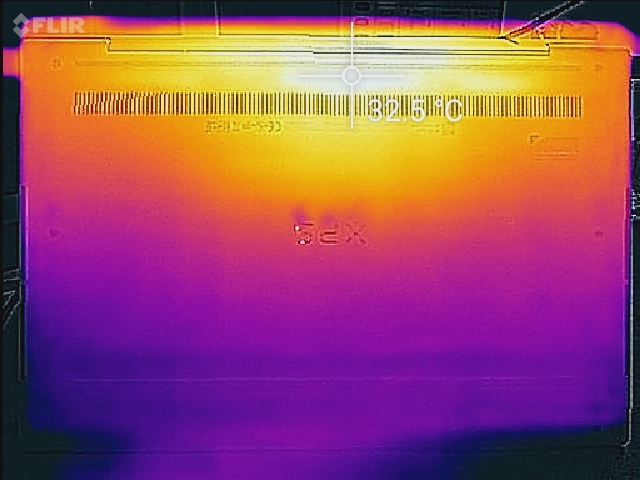
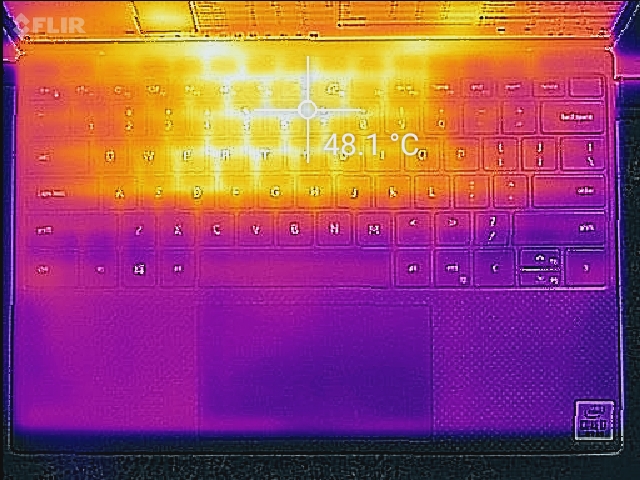
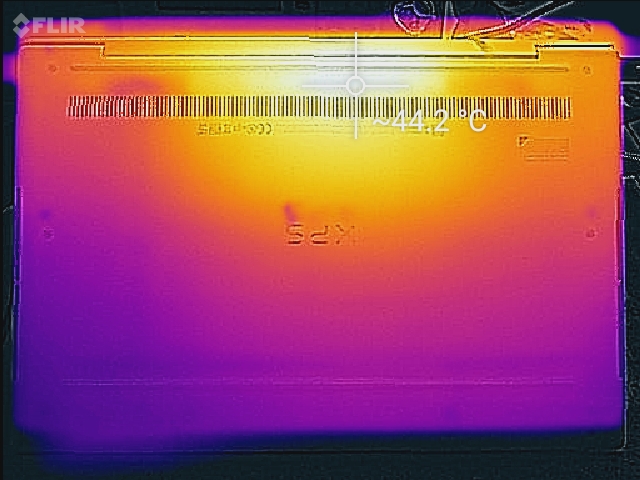
Surface temperature development is largely symmetric with hot spots near the center of the keyboard and bottom rear of the chassis. At worst, we're able to record a hot spot of almost 49 C on the keyboard whereas the HP Spectre x360 13 with the same CPU is able to push the hot spot further back and away from the keyboard keys. The front half of the chassis never becomes uncomfortably warm since the battery occupies most of this space.
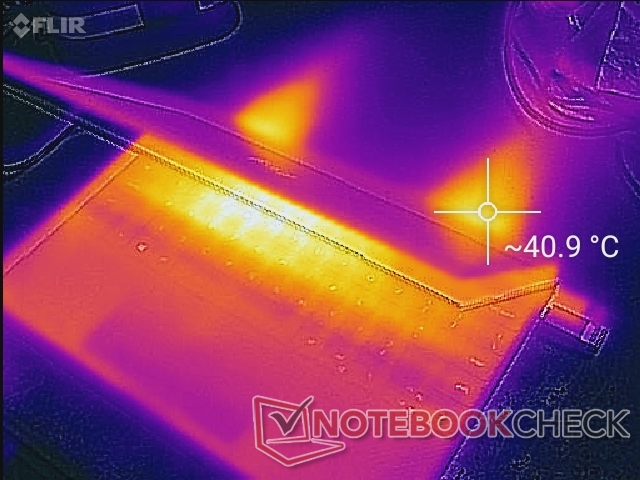
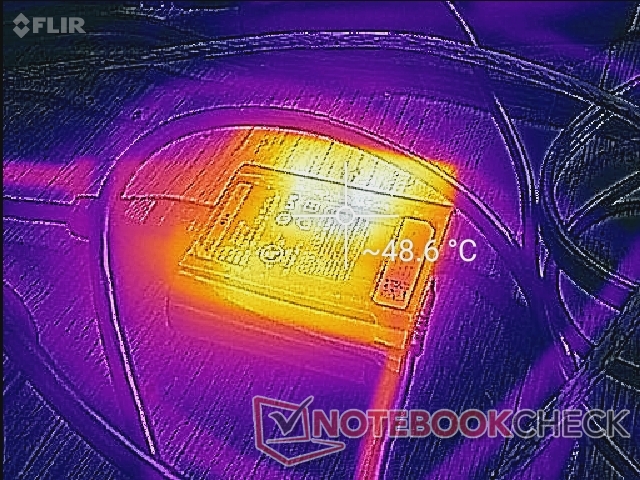
(-) The maximum temperature on the upper side is 48.4 °C / 119 F, compared to the average of 35.9 °C / 97 F, ranging from 21.4 to 59 °C for the class Subnotebook.
(±) The bottom heats up to a maximum of 44.4 °C / 112 F, compared to the average of 39.2 °C / 103 F
(+) In idle usage, the average temperature for the upper side is 27.3 °C / 81 F, compared to the device average of 30.8 °C / 87 F.
(+) The palmrests and touchpad are reaching skin temperature as a maximum (32 °C / 89.6 F) and are therefore not hot.
(-) The average temperature of the palmrest area of similar devices was 28.2 °C / 82.8 F (-3.8 °C / -6.8 F).
Stress Test
We stress the laptop with synthetic loads on Ultra Performance mode to identify for any potential throttling or stability issues. When running Prime95, the CPU can be observed boosting to 3.5 GHz for the first few 18 seconds or so before clock rates fall and stabilize at around 2.8 GHz. Core temperature would also stabilize at a very toasty 99 C.
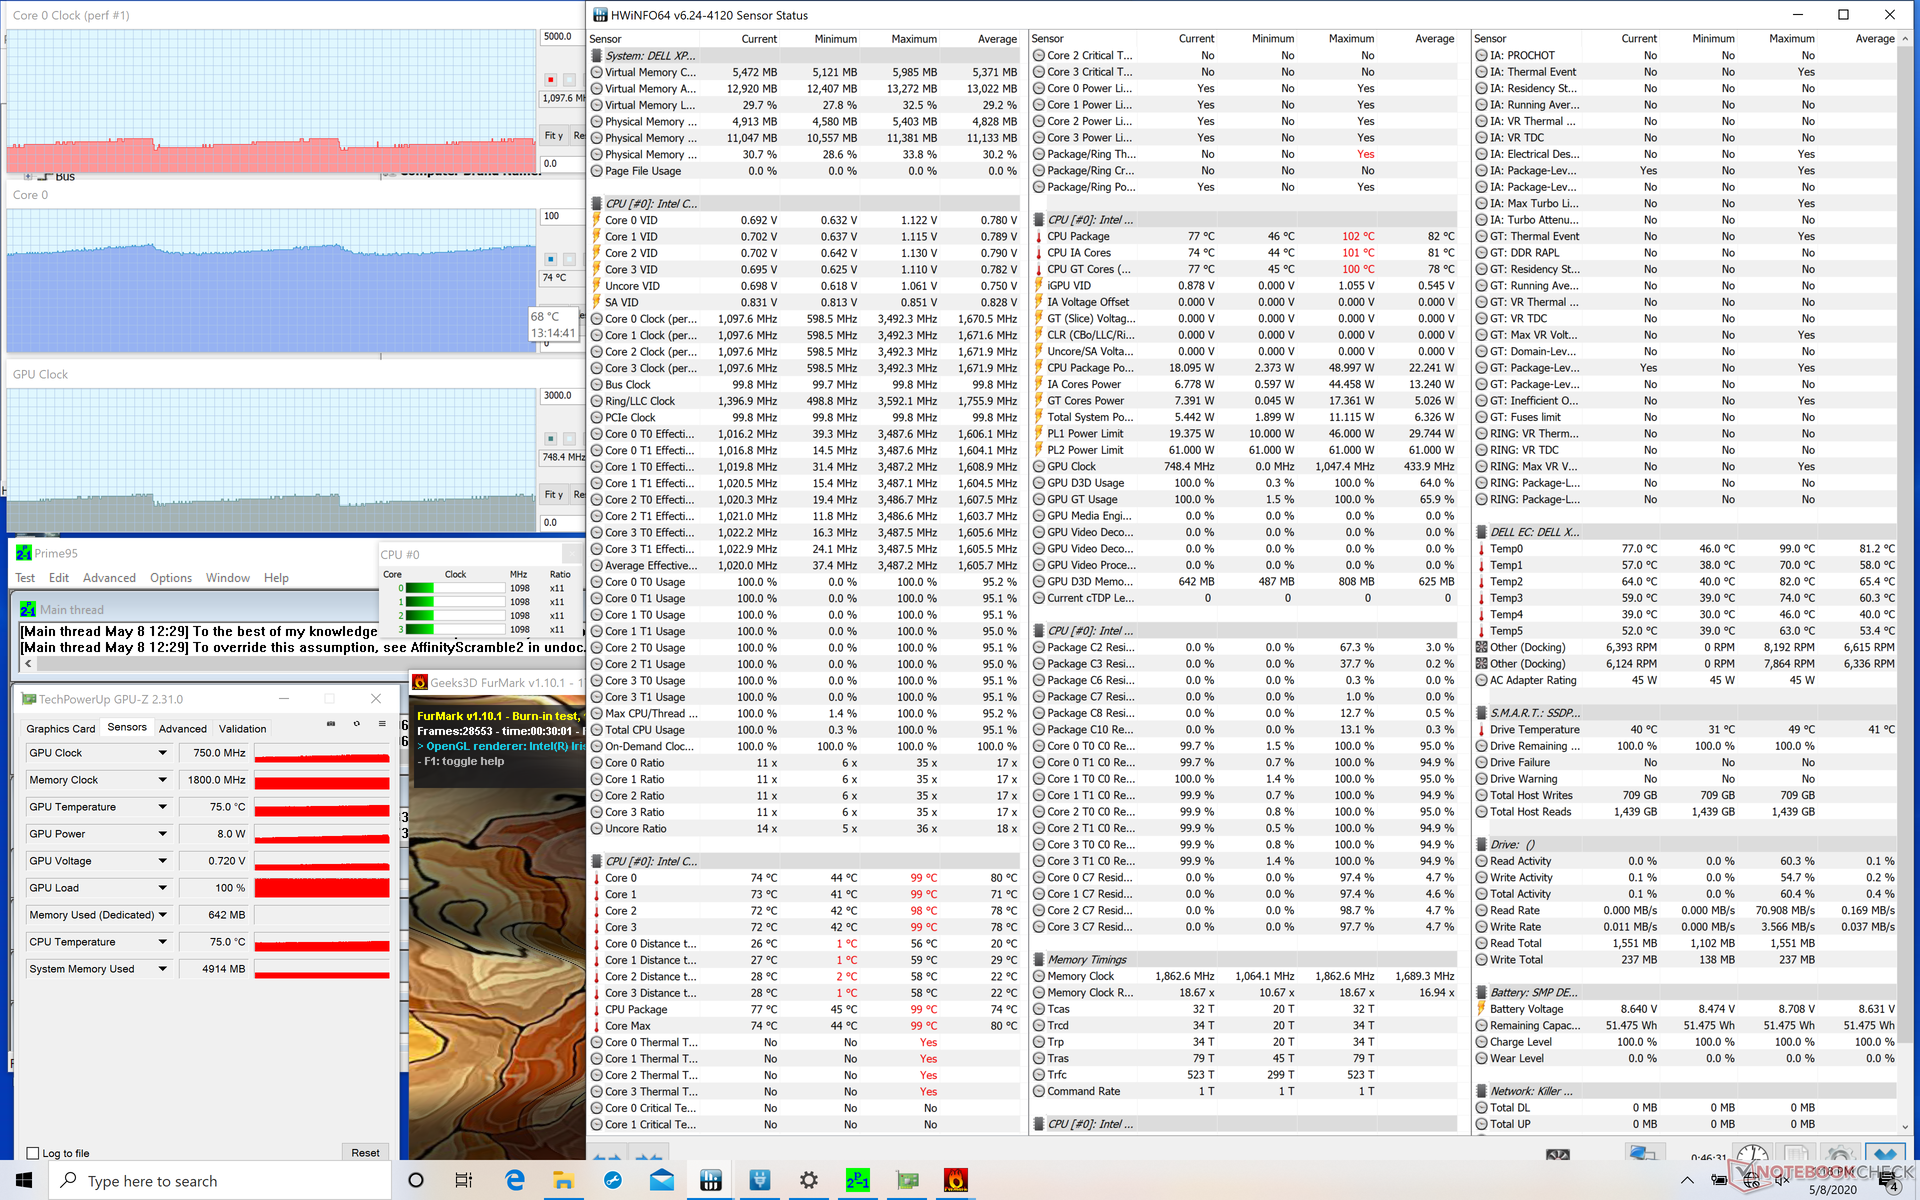
If running both Prime95 and FurMark simultaneously, CPU clock rates would stabilize at 2.2 GHz for the first few minutes before falling and cycling between 0.8 GHz and 1.2 GHz. Core temperature and GPU clock rate would also cycle between 70 C to 75 C and 650 MHz to 900 MHz, respectively.
Running on battery power will limit performance even if on Dell's Ultra Performance mode. A 3DMark 11 test on batteries returns Physics and Graphics scores of 7975 and 3766 points, respectively, compared to 10073 and 4263 points when on mains.
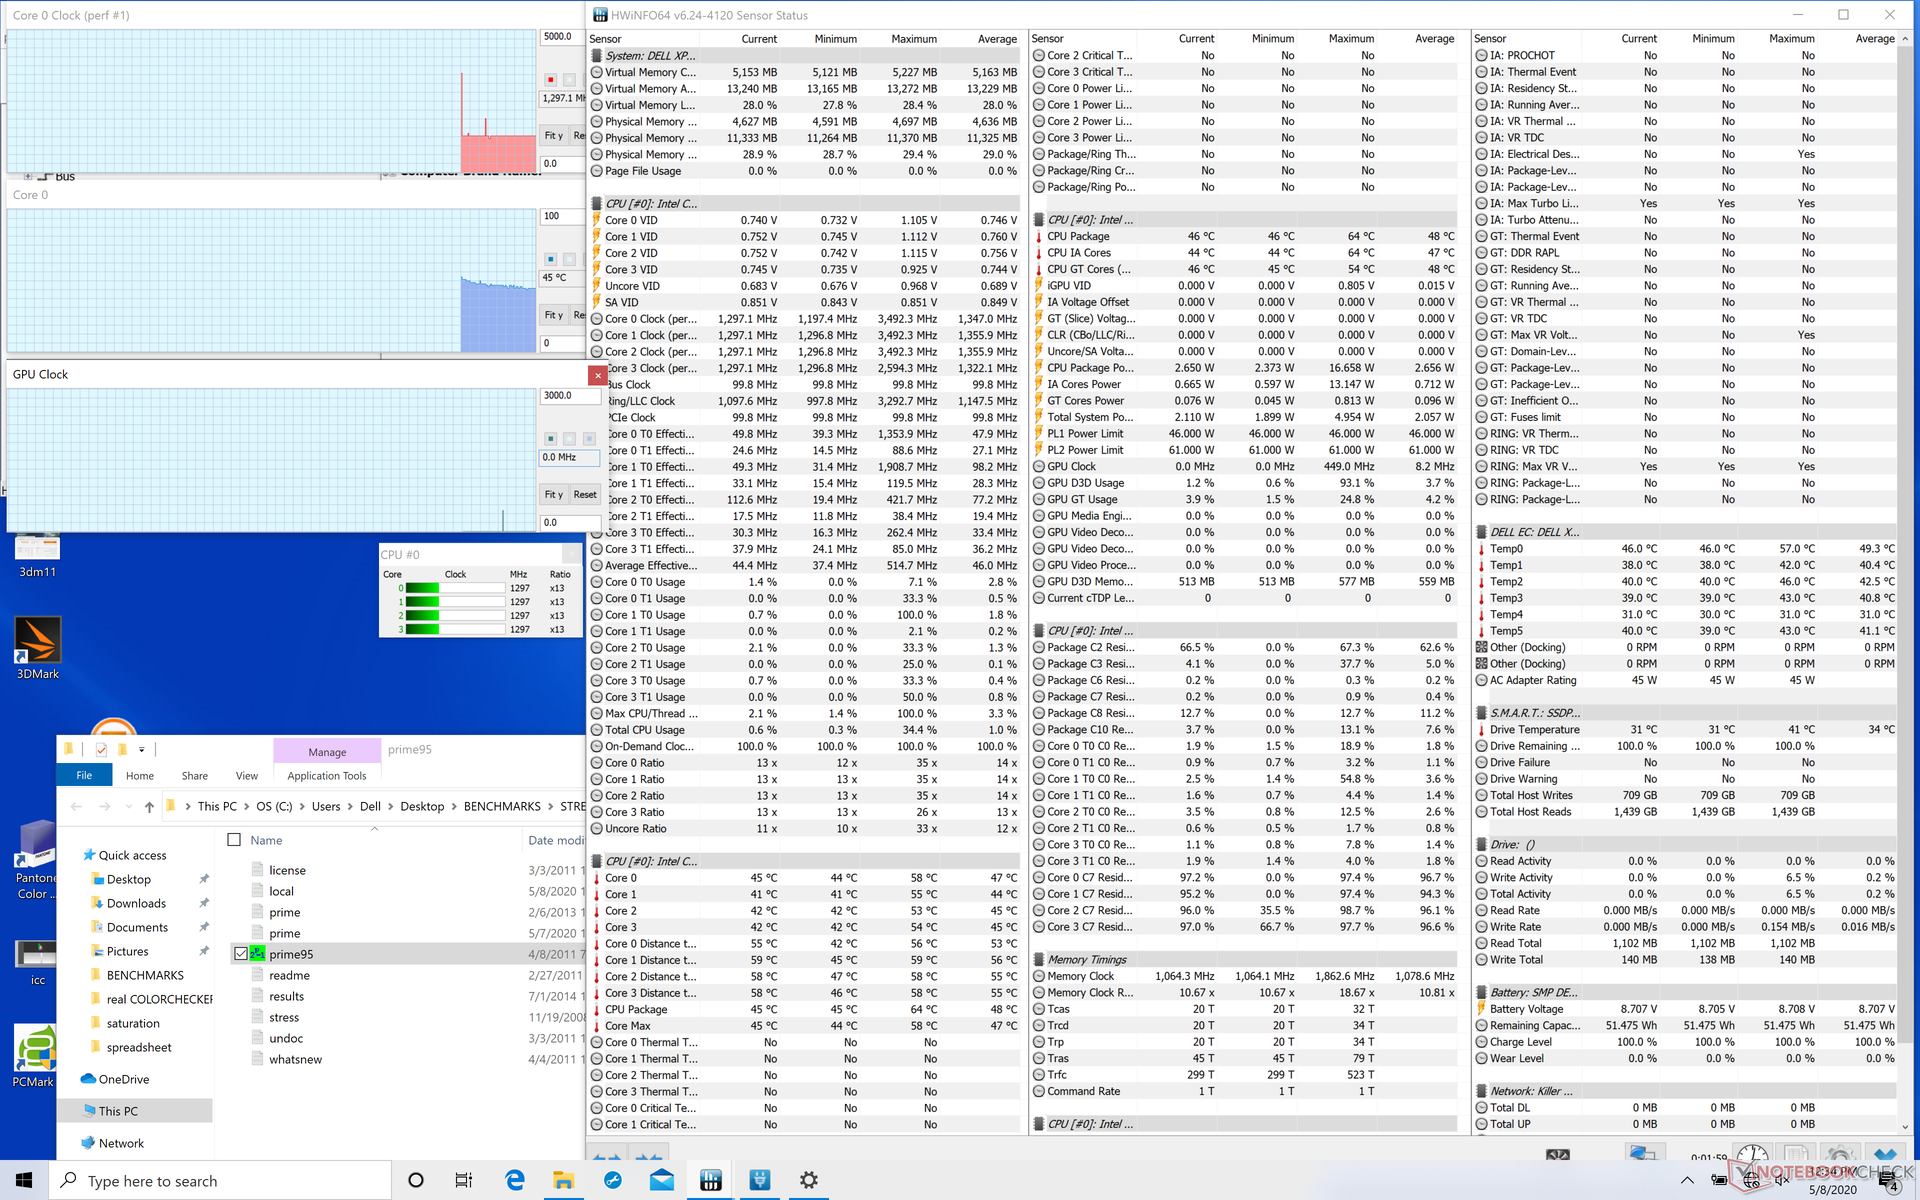
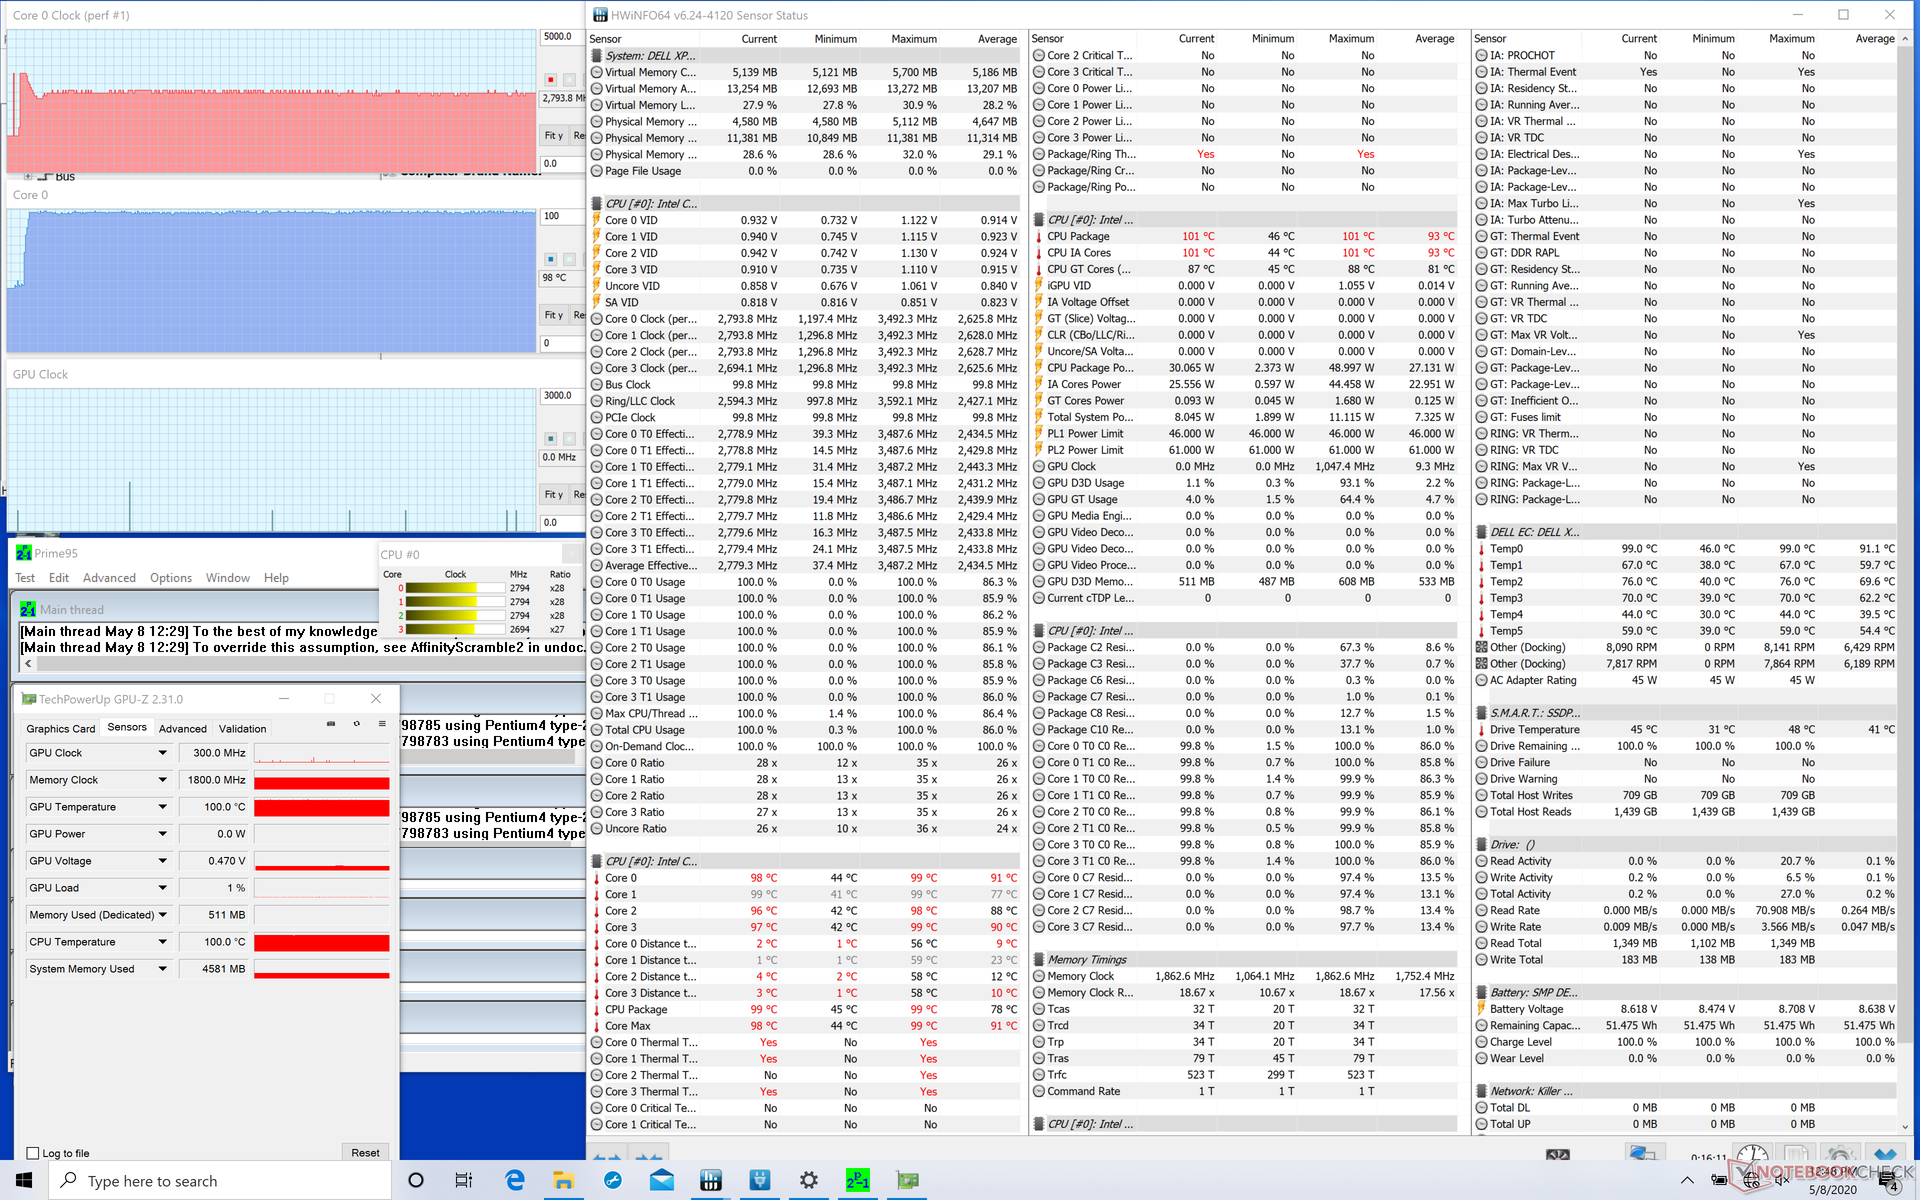
| CPU Clock (GHz) | GPU Clock (MHz) | Average CPU Temperature (°C) | |
| System Idle | -- | -- | 44 |
| Prime95 Stress | 2.8 | -- | 99 |
| Prime95 + FurMark Stress | 0.8 - 1.2 | 650 - 900 | 70 - 75 |
Energy Management
Power Consumption
Idling on desktop consumes between 5 W to 10 W depending on the brightness level and power profile compared to 4 W to 8 W on the FHD configuration. The difference between the minimum and maximum brightness settings is about 2 W.
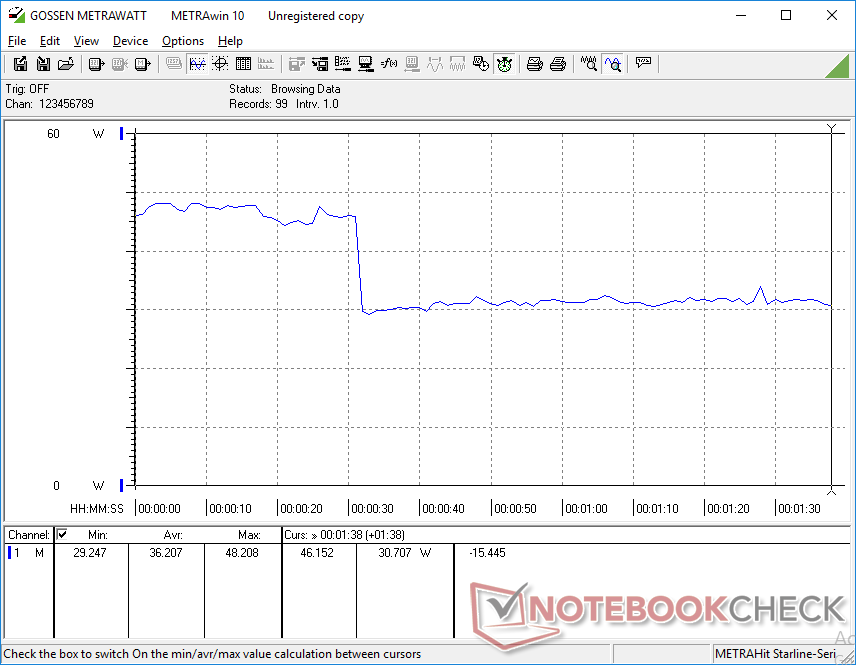
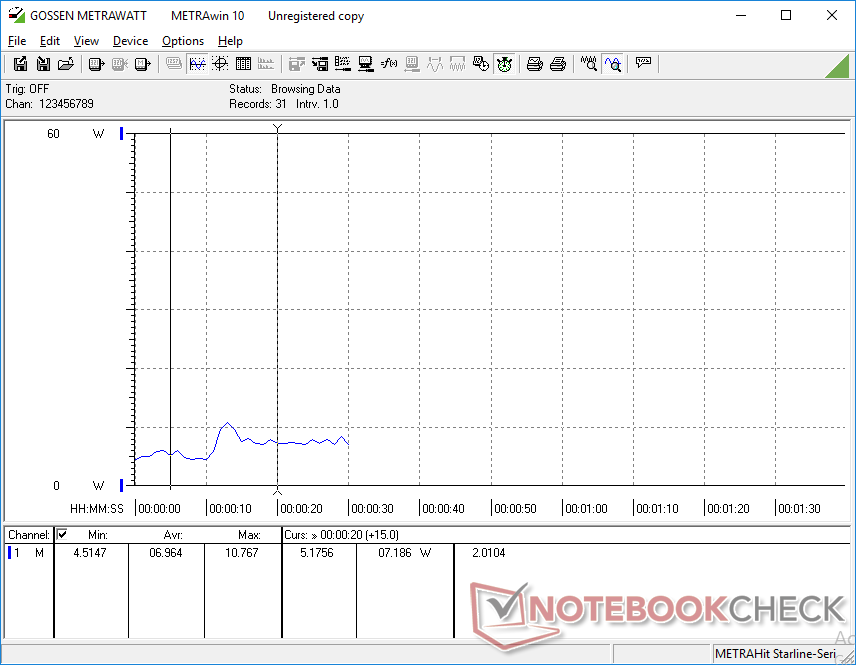
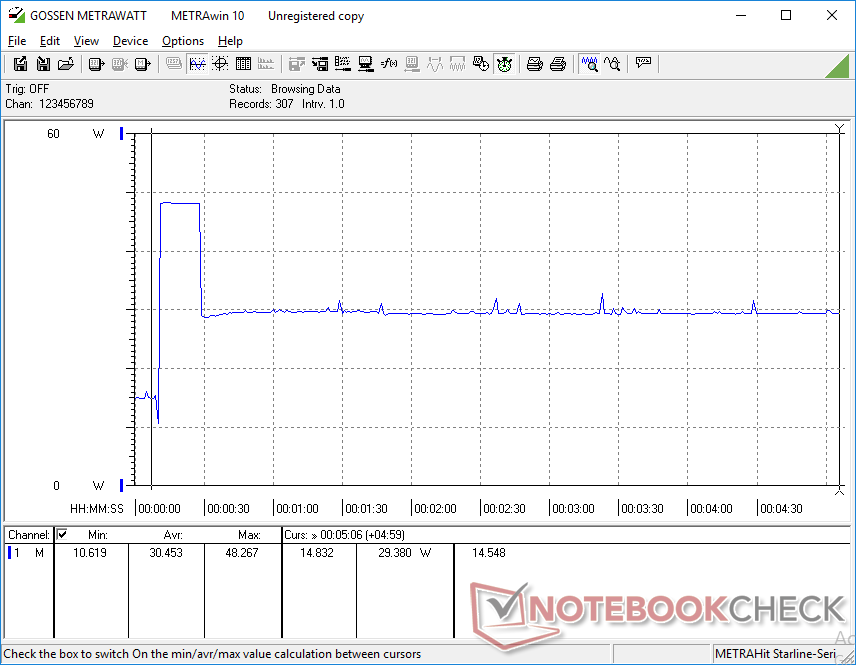
Things get more interesting when running the first benchmark scene of 3DMark 06. If on the Dell Optimized power profile, average power consumption is only about 36 W because consumption drops after about 30 seconds into the 3DMark test as shown by our screenshots below. If on the Dell Ultra Performance profile, however, consumption remains steady throughout the 90-second benchmark scene for a higher average of 46 W.
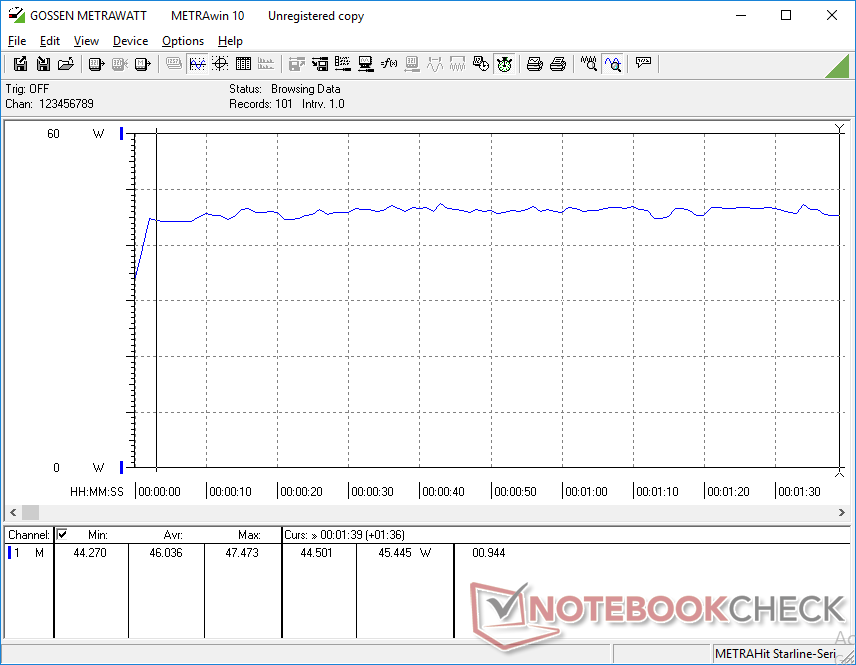
If running Prime95, consumption spikes to 48.3 W for only about 18 seconds before falling and stabilizing at 29.4 W. This behavior mimics our Prime95 stress test observations above where clock rates would spike to 3.5 GHz during the start of the test only to fall and stabilize at 2.8 GHz thereafter. Note that the small (6 x 5.5 x 2.2 cm) AC adapter is rated for a maximum output of 45 W only.
| Off / Standby | |
| Idle | |
| Load |
|
Key:
min: | |
| Dell XPS 13 9300 4K UHD i7-1065G7, Iris Plus Graphics G7 (Ice Lake 64 EU), Intel SSDPEMKF512G8 NVMe SSD, IPS, 3840x2400, 13.4" | Dell XPS 13 9300 Core i7-1065G7 i7-1065G7, Iris Plus Graphics G7 (Ice Lake 64 EU), Intel SSDPEMKF512G8 NVMe SSD, IPS, 1920x1200, 13.4" | Dell XPS 13 7390 2-in-1 Core i7 i7-1065G7, Iris Plus Graphics G7 (Ice Lake 64 EU), Toshiba BG4 KBG40ZPZ512G, IPS, 1920x1200, 13.4" | Dell XPS 13 7390 Core i7-10710U i7-10710U, UHD Graphics 620, SK Hynix PC601 NVMe 512 GB, IPS, 3840x2160, 13.3" | Apple MacBook Pro 13 2019 2TB3 i5-8257U, Iris Plus Graphics 645, Apple SSD AP0256, IPS, 2560x1600, 13.3" | Microsoft Surface Laptop 3 13 Core i5-1035G7 i5-1035G7, Iris Plus Graphics G7 (Ice Lake 64 EU), SK hynix BC501 HFM256GDGTNG, IPS, 2256x1504, 13.5" | |
|---|---|---|---|---|---|---|
| Power Consumption | 16% | 20% | 4% | 13% | 4% | |
| Idle Minimum * (Watt) | 5.3 | 4.2 21% | 2.6 51% | 4.7 11% | 2.1 60% | 4.4 17% |
| Idle Average * (Watt) | 7.8 | 6.9 12% | 5.3 32% | 8.3 -6% | 6.9 12% | 7.5 4% |
| Idle Maximum * (Watt) | 9.8 | 7.5 23% | 7 29% | 9 8% | 7.8 20% | 7.8 20% |
| Load Average * (Watt) | 46 | 33.3 28% | 43.1 6% | 42 9% | 42 9% | 41.9 9% |
| Witcher 3 ultra * (Watt) | 43 | 37.1 14% | 43.1 -0% | 40.8 5% | ||
| Load Maximum * (Watt) | 48.3 | 48.4 -0% | 49 -1% | 49 -1% | 64.5 -34% | 63.9 -32% |
* ... smaller is better
Battery Life
When set to Balanced mode at 150 nit brightness, we're able to record a WLAN runtiime of almost 11.5 hours to be about 90 minutes shorter than the FHD configuration. Even so, battery life should be long enough to more than satisfy satisfy most day-to-day and office users.
Recharging from empty to full capacity is slower than usual at just over 2 hours compared to 1.5 hours on most other Ultrabooks. The USB Type-C charger can be used to charge other devices as well including smartphones and tablets.
| Dell XPS 13 9300 4K UHD i7-1065G7, Iris Plus Graphics G7 (Ice Lake 64 EU), 52 Wh | Dell XPS 13 9300 Core i7-1065G7 i7-1065G7, Iris Plus Graphics G7 (Ice Lake 64 EU), 52 Wh | Dell XPS 13 7390 2-in-1 Core i7 i7-1065G7, Iris Plus Graphics G7 (Ice Lake 64 EU), 51 Wh | Dell XPS 13 7390 Core i7-10710U i7-10710U, UHD Graphics 620, 52 Wh | Apple MacBook Pro 13 2019 2TB3 i5-8257U, Iris Plus Graphics 645, 58.2 Wh | Microsoft Surface Laptop 3 13 Core i5-1035G7 i5-1035G7, Iris Plus Graphics G7 (Ice Lake 64 EU), 45 Wh | |
|---|---|---|---|---|---|---|
| Battery runtime | 11% | -21% | -26% | 14% | -27% | |
| WiFi v1.3 (h) | 11.4 | 12.7 11% | 9 -21% | 8.4 -26% | 13 14% | 8.3 -27% |
| Reader / Idle (h) | 34.4 | |||||
| Load (h) | 1.9 |
Pros
Cons
Verdict

The Dell XPS 13 9300 is unique in that it's currently one of the only (if not the only) Windows subnotebook clamshell with a 16:10 4K UHD touchscreen. If you're considering the 4K UHD option over the base FHD option, then there are some advantages and disadvantages to keep in mind.
First, the advantages: Aside from the denser resolution and crisper screen, the 4K option offers faster black-white and gray-gray response times than the FHD option for less noticeable ghosting. Pulse-width modulation is completely absent whereas the phenomenon is present on the FHD models. Contrast and color space are essentially identical to the FHD panel as well meaning users won't lose out on either if opting for the higher resolution display.
The main drawback to the 4K option is that it's not as bright as the FHD option. It's not enough to make a difference if working indoors, but every extra nit of brightness will be helpful if you plan on using the laptop outdoors frequently. Battery life is also a bit shorter by one to two hours, but that's merely a dent to the already long runtimes of the XPS 13.
4K offers some unexpected advantages including faster response times and no pulse-width modulation when compared to the FHD version. If you like to work on-the-go, however, then the FHD version may be the better buy simply because it is 50 percent brighter than the 4K option.
Dell XPS 13 9300 4K UHD
- 05/15/2020 v7 (old)
Allen Ngo
Price comparison
