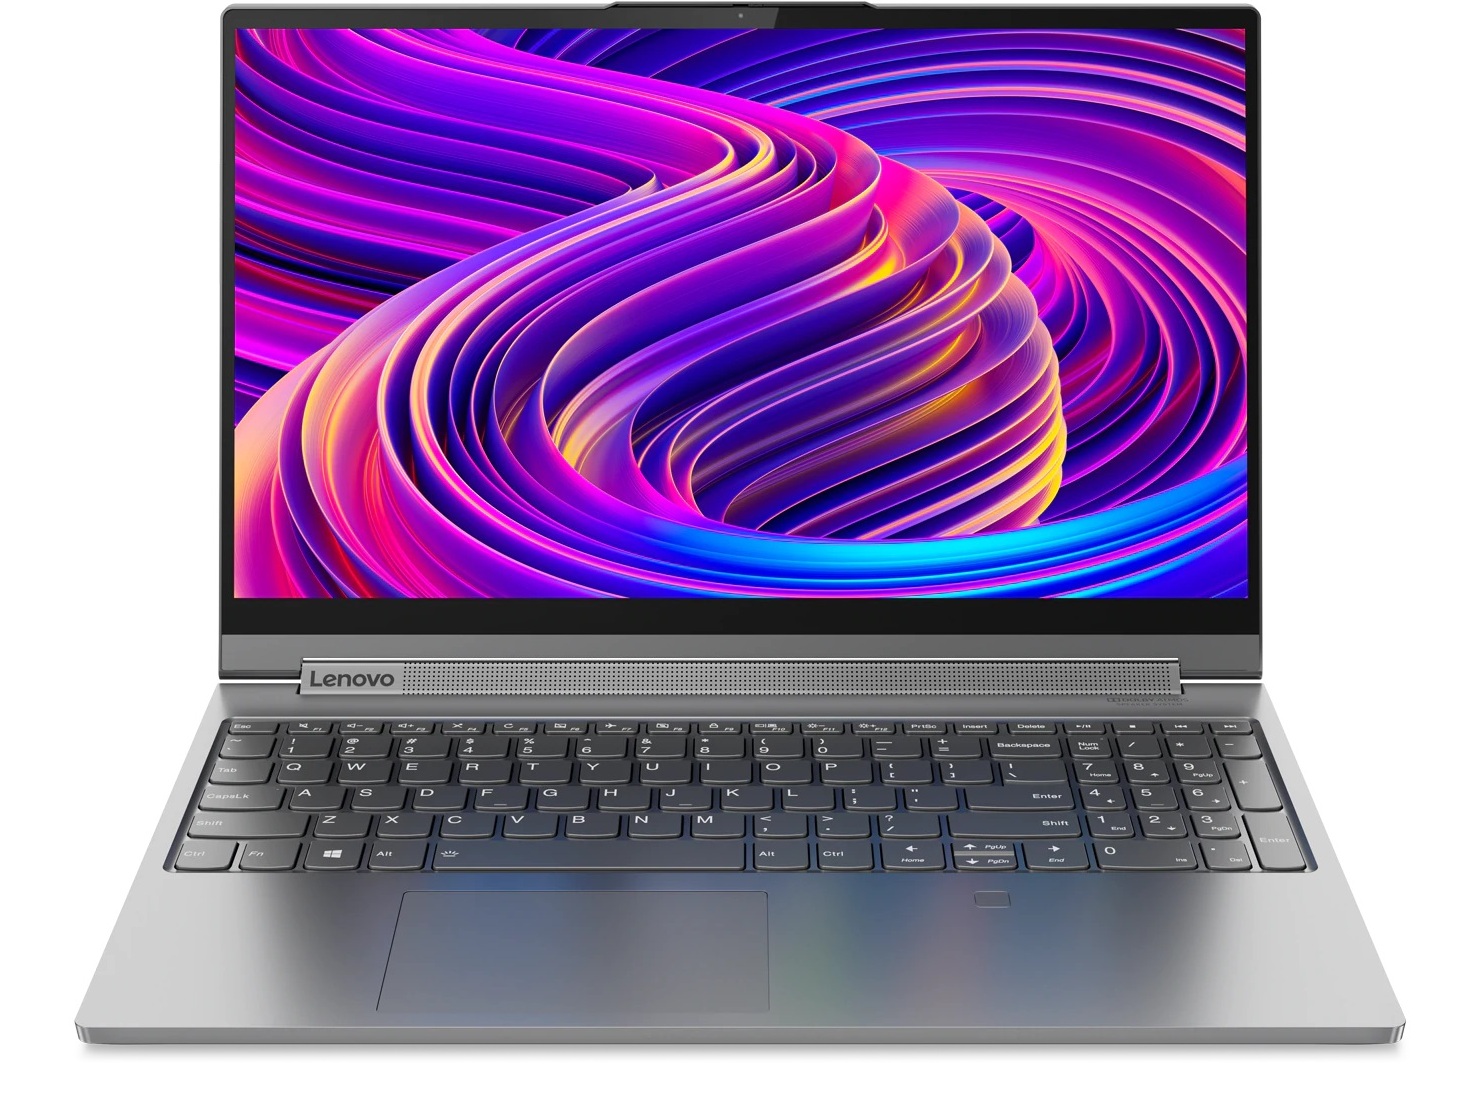
Lenovo Yoga C940-15IRH Convertible Review: The XPS 15 2-in-1 Dell Should Have Made
The Yoga C900 series is home to Lenovo's premier convertible Ultrabooks. Last year's 13.9-inch Yoga C930 was popular enough that it spawned two successors instead of just one: the 14-inch Yoga C940-14 and the larger 15.6-inch Yoga C940-15. We had already checked out the Yoga C940-14 back in October and so this review will focus on the Yoga C940-15. Nonetheless, we recommend checking out our review on the Yoga C940-14 as this 15.6-inch variant shares the same materials and overall design language as its smaller 14-inch sibling.
The Yoga C940-15 is very different internally when compared to the Yoga C940-14 despite their similar appearances. Instead of an Ice Lake-U CPU, the 15.6-inch model comes with Coffee Lake-H and a GeForce Max-Q GPU for much faster performance. Direct competitors in this space include other 15.6-inch performance multimedia laptops like the Asus ZenBook Pro 15, Dell XPS 15 9570/7590, XPS 15 9575, Gigabyte Aero 15, HP Spectre x360 15, and the Microsoft Surface Book.
More Lenovo reviews:
Rating | Date | Model | Weight | Height | Size | Resolution | Price |
|---|---|---|---|---|---|---|---|
| 86 % v7 (old) | 12 / 2019 | Lenovo Yoga C940-15IRH i7-9750H, GeForce GTX 1650 Max-Q | 2 kg | 19.7 mm | 15.60" | 1920x1080 | |
| 87.8 % v7 (old) | 08 / 2019 | Dell XPS 15 7590 9980HK GTX 1650 i9-9980HK, GeForce GTX 1650 Mobile | 2 kg | 17 mm | 15.60" | 3840x2160 | |
| 83.1 % v7 (old) | 09 / 2019 | Asus ZenBook 15 UX534FT-DB77 i7-8565U, GeForce GTX 1650 Max-Q | 1.7 kg | 18.9 mm | 15.60" | 1920x1080 | |
| 83.9 % v7 (old) | 08 / 2019 | HP Gaming Pavilion 15-dk0009ng i7-9750H, GeForce GTX 1660 Ti Max-Q | 2.4 kg | 23.4 mm | 15.60" | 1920x1080 | |
| 85.2 % v7 (old) | 11 / 2019 | MSI Prestige 15 A10SC i7-10710U, GeForce GTX 1650 Max-Q | 1.7 kg | 16 mm | 15.60" | 3840x2160 |
Case
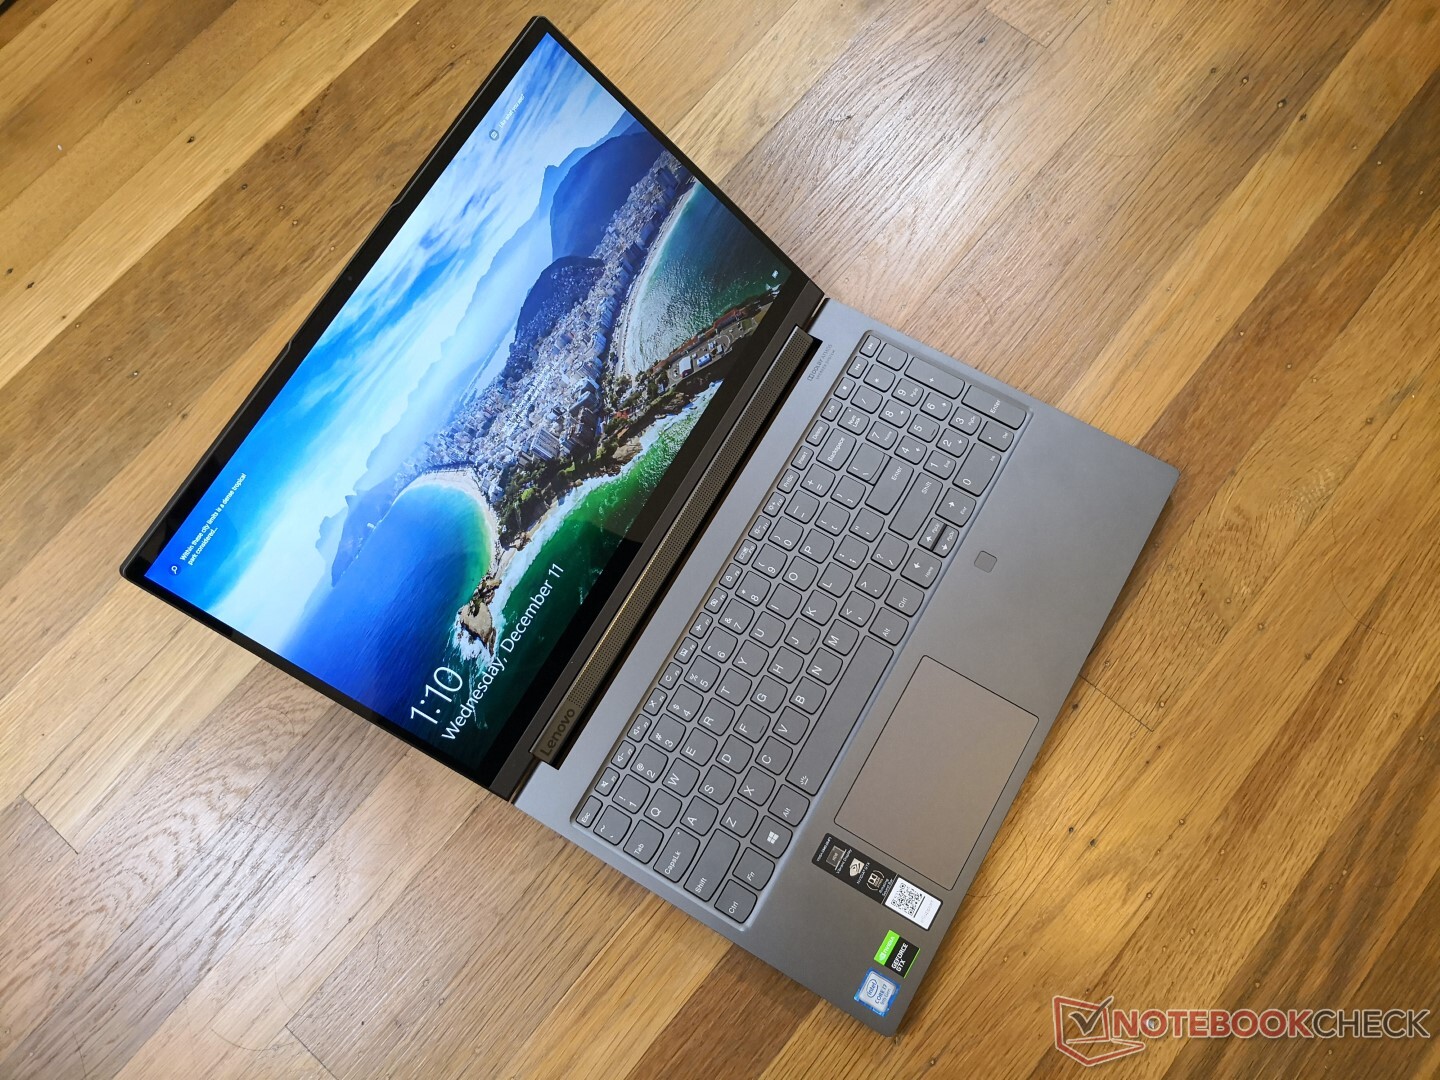
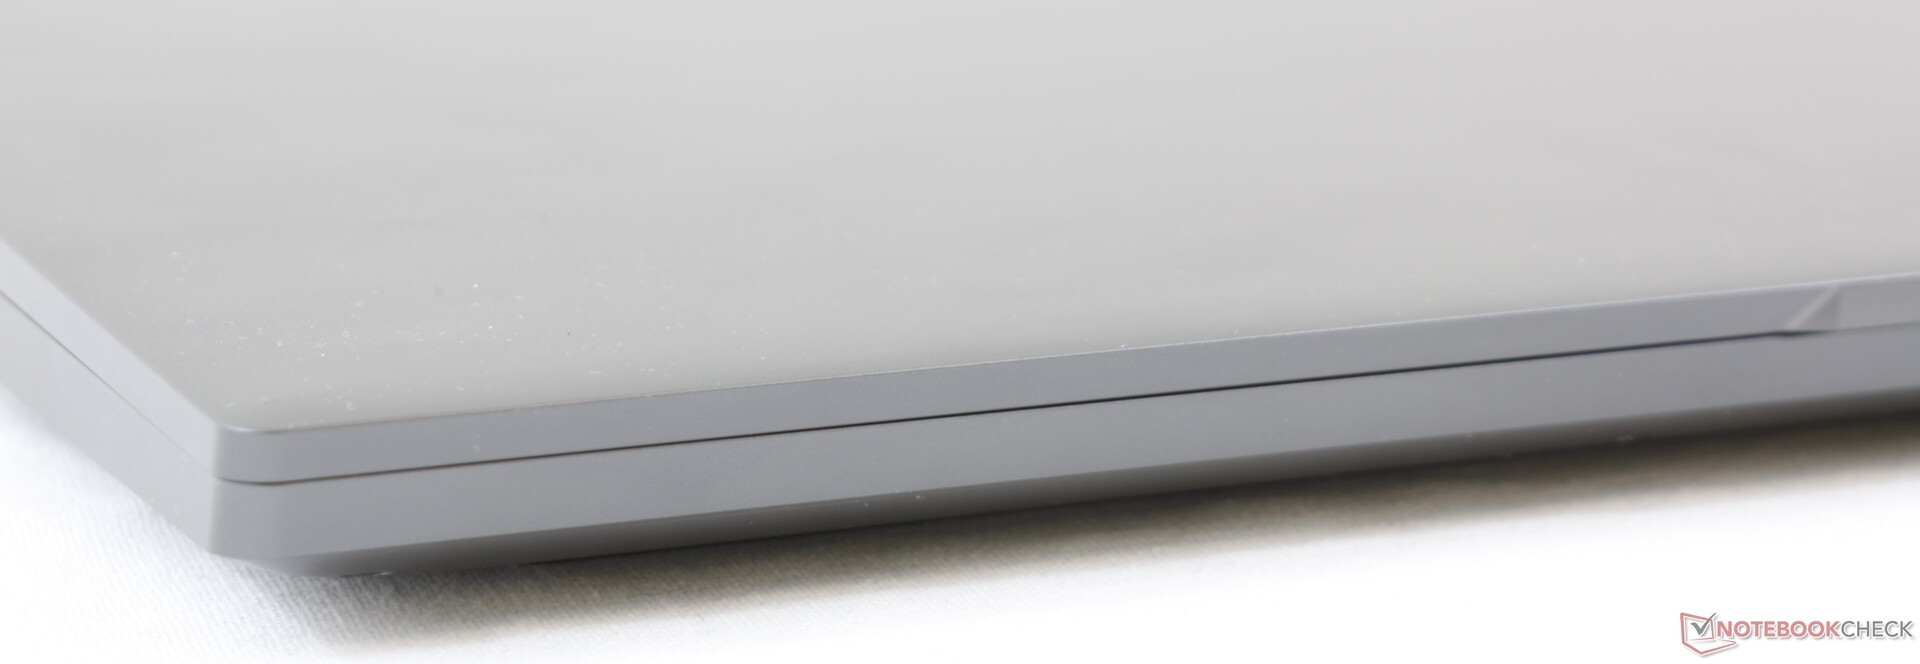
Lenovo has translated the 14-inch Yoga C940 chassis perfectly for a 15.6-inch form factor. Surfaces do not feel any weaker or more flexible despite the expanded volume for a solid first impression. Attempting to twist the base or lid results in just minor flexing to be in line with the competing XPS 15 or ZenBook 15. Rigidity is a step above the lesser Yoga 730 or 500 series where materials feel thinner, cheaper, and more prone to warping.
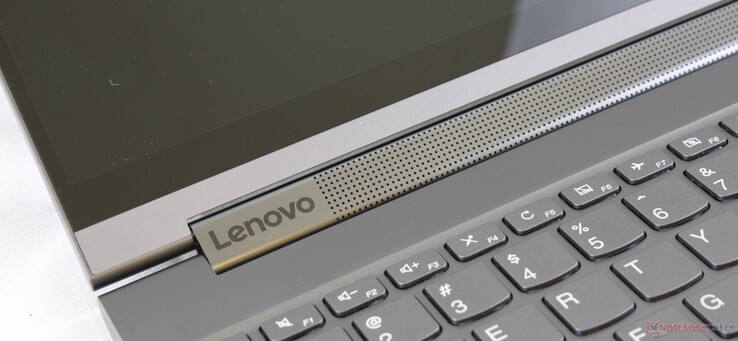
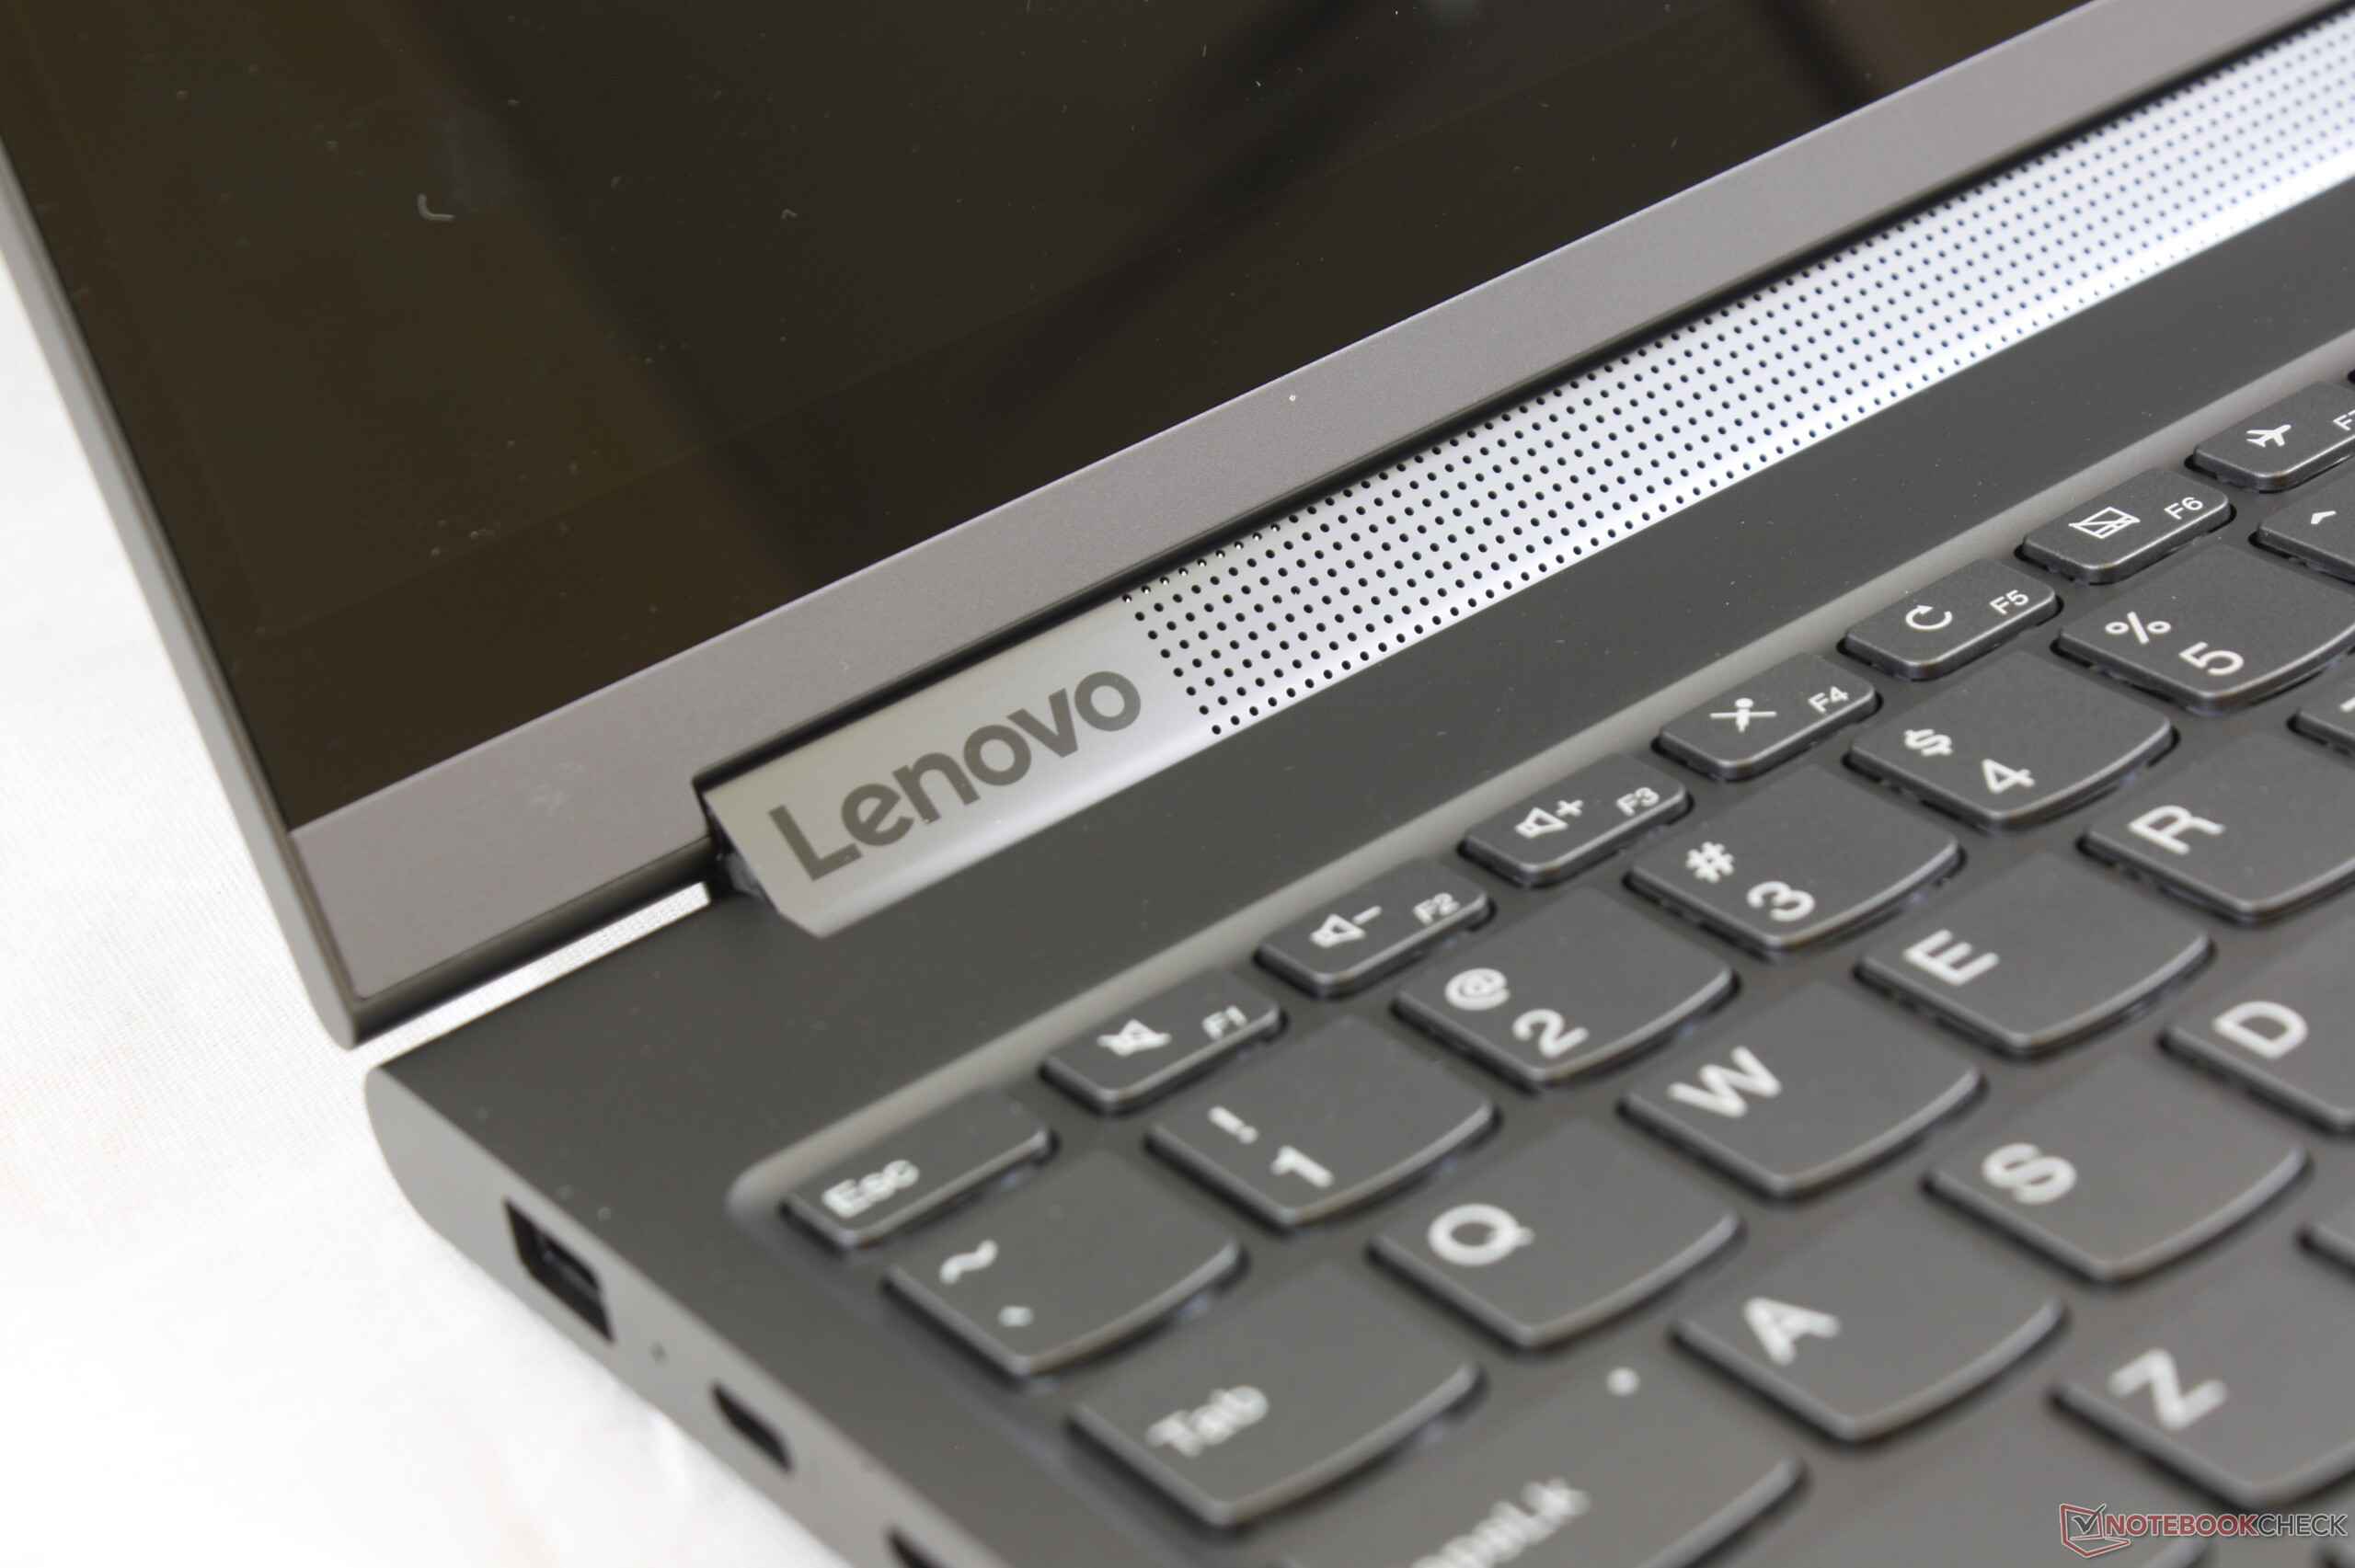
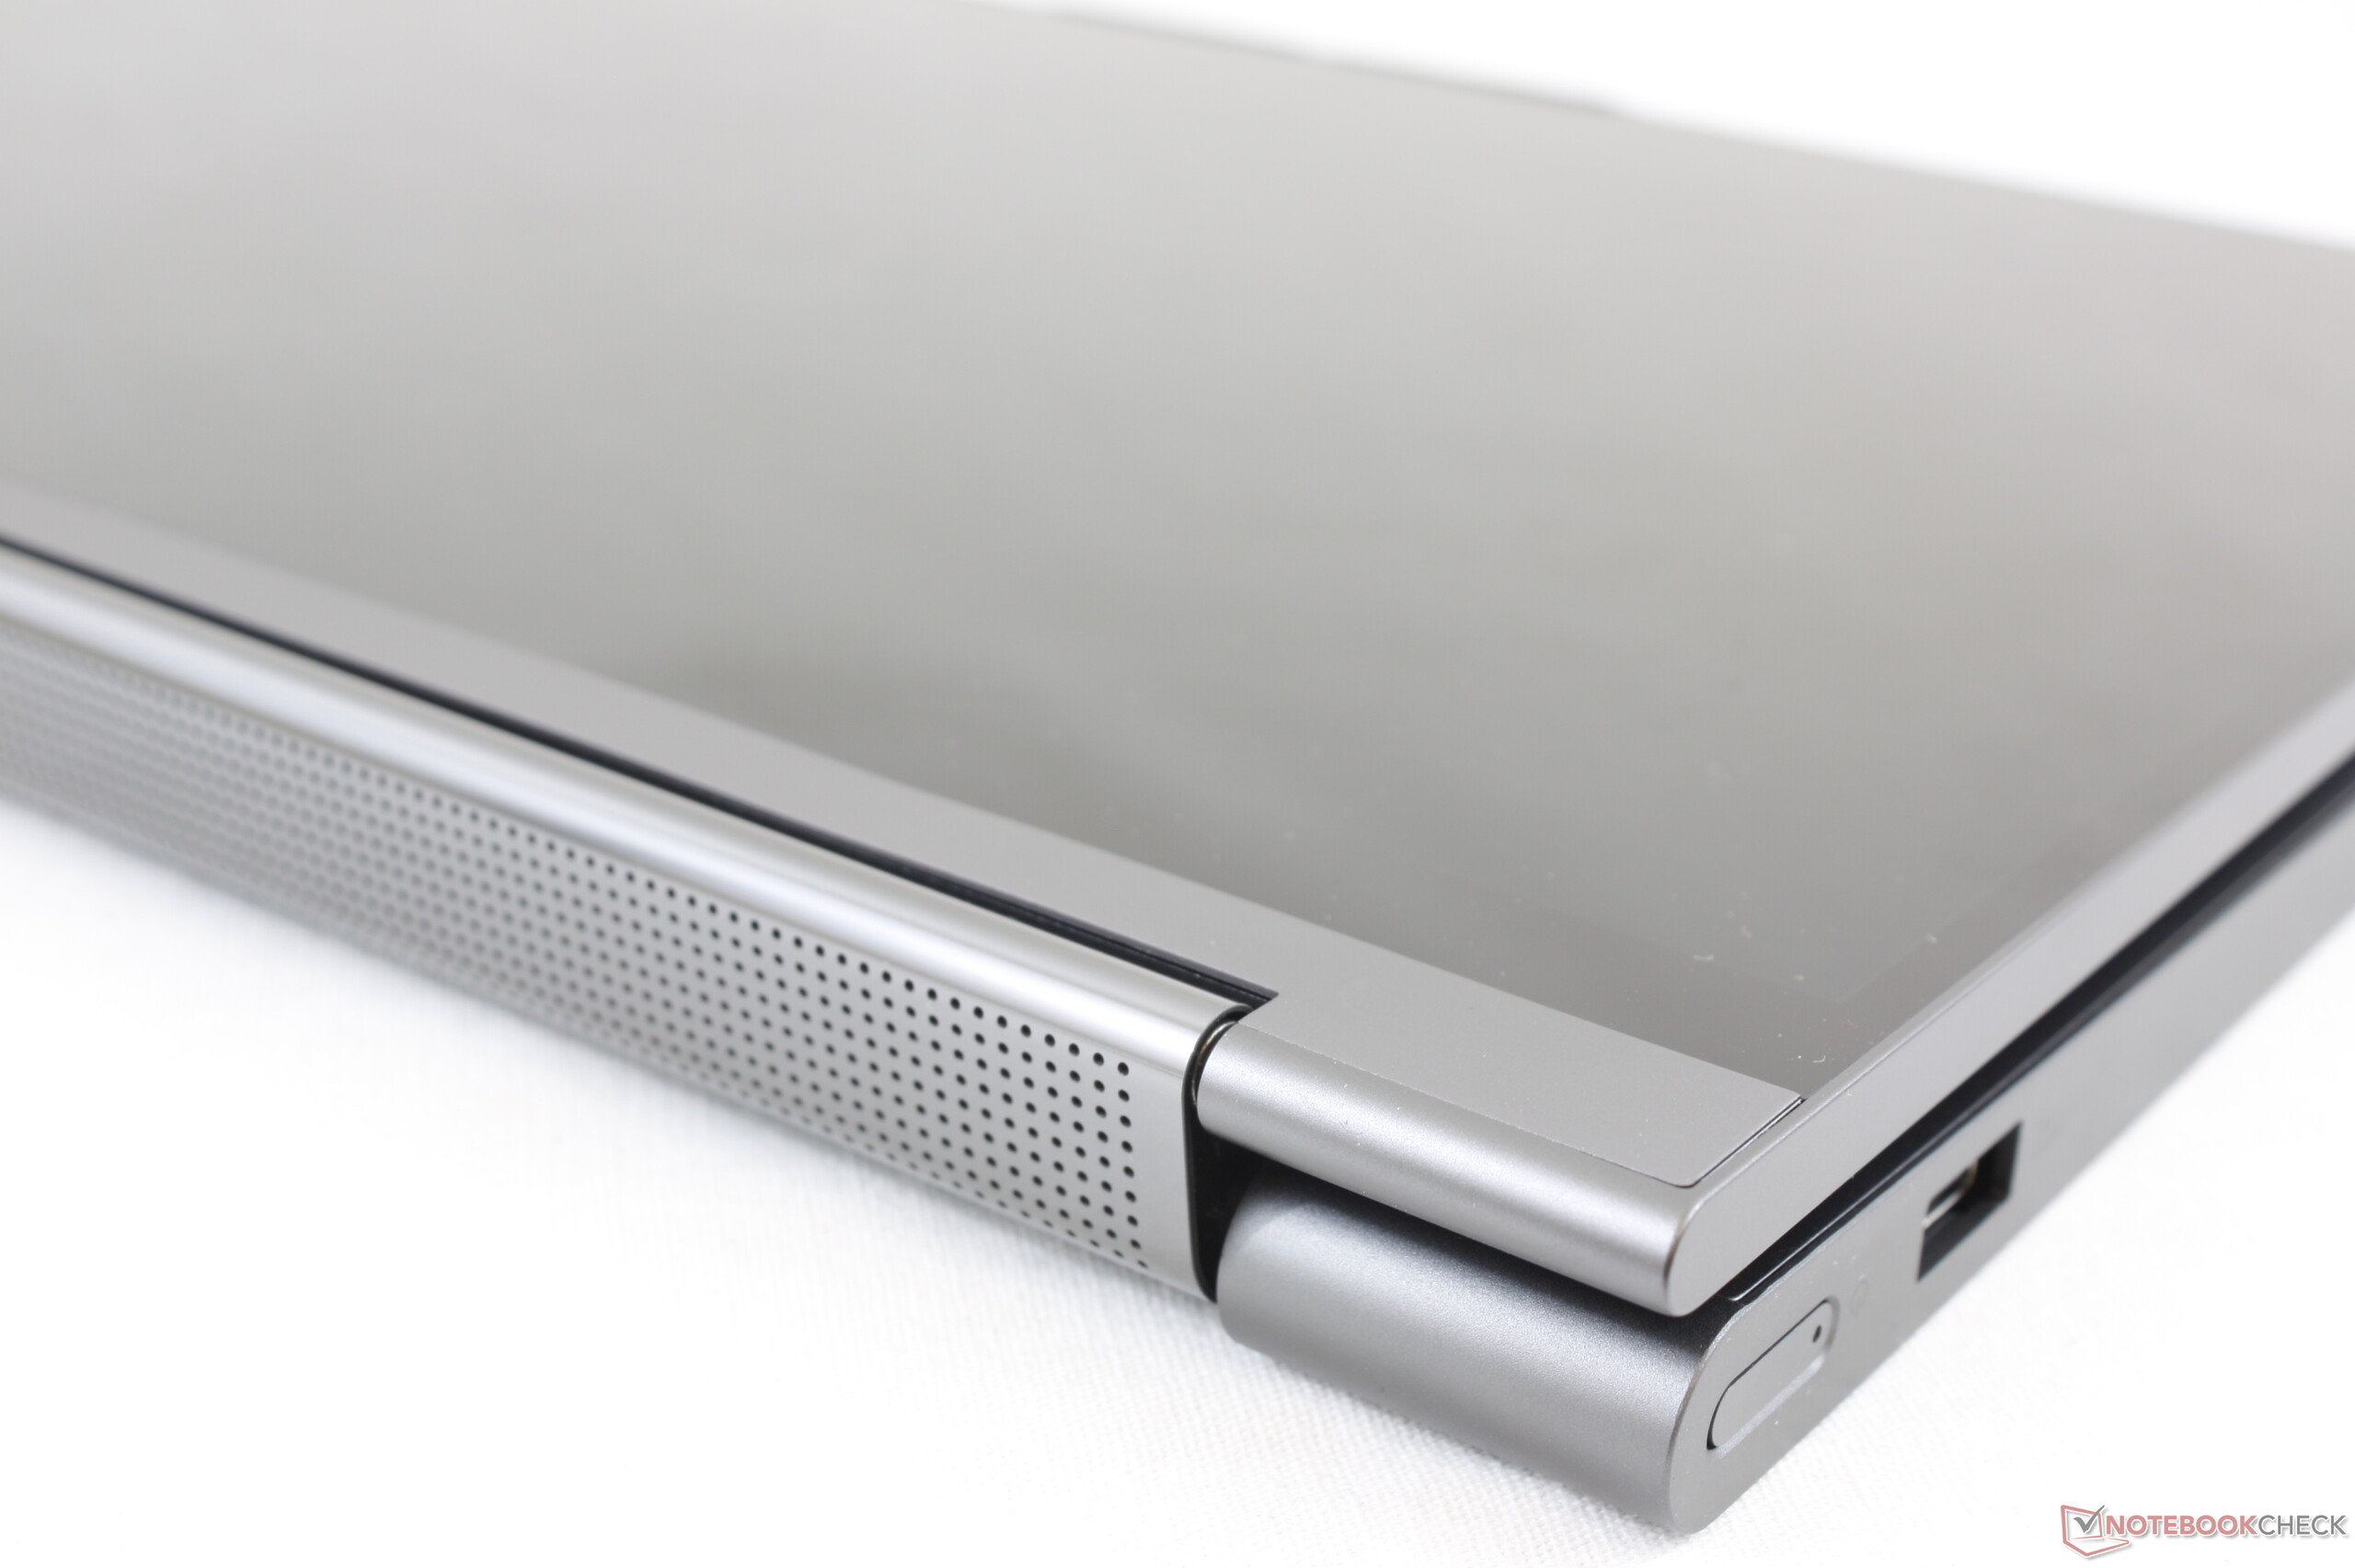
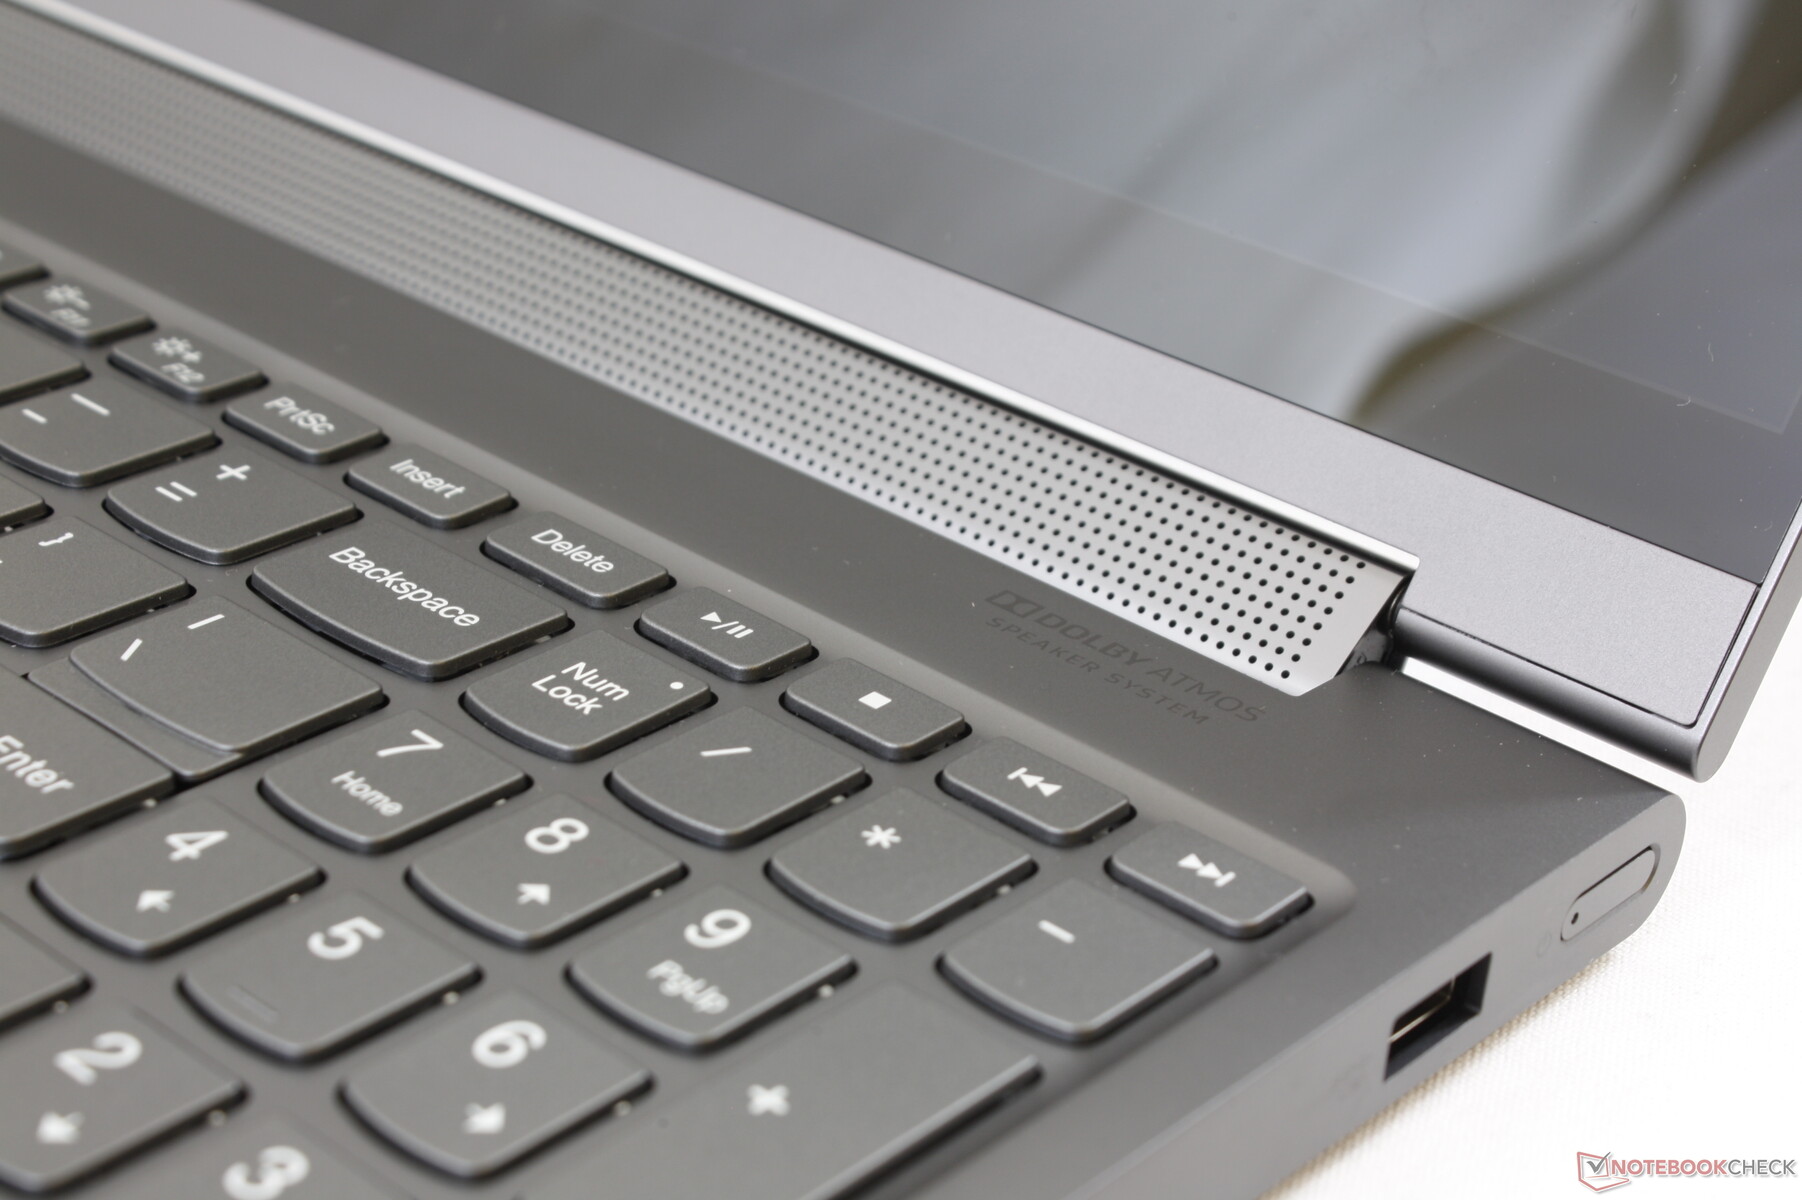
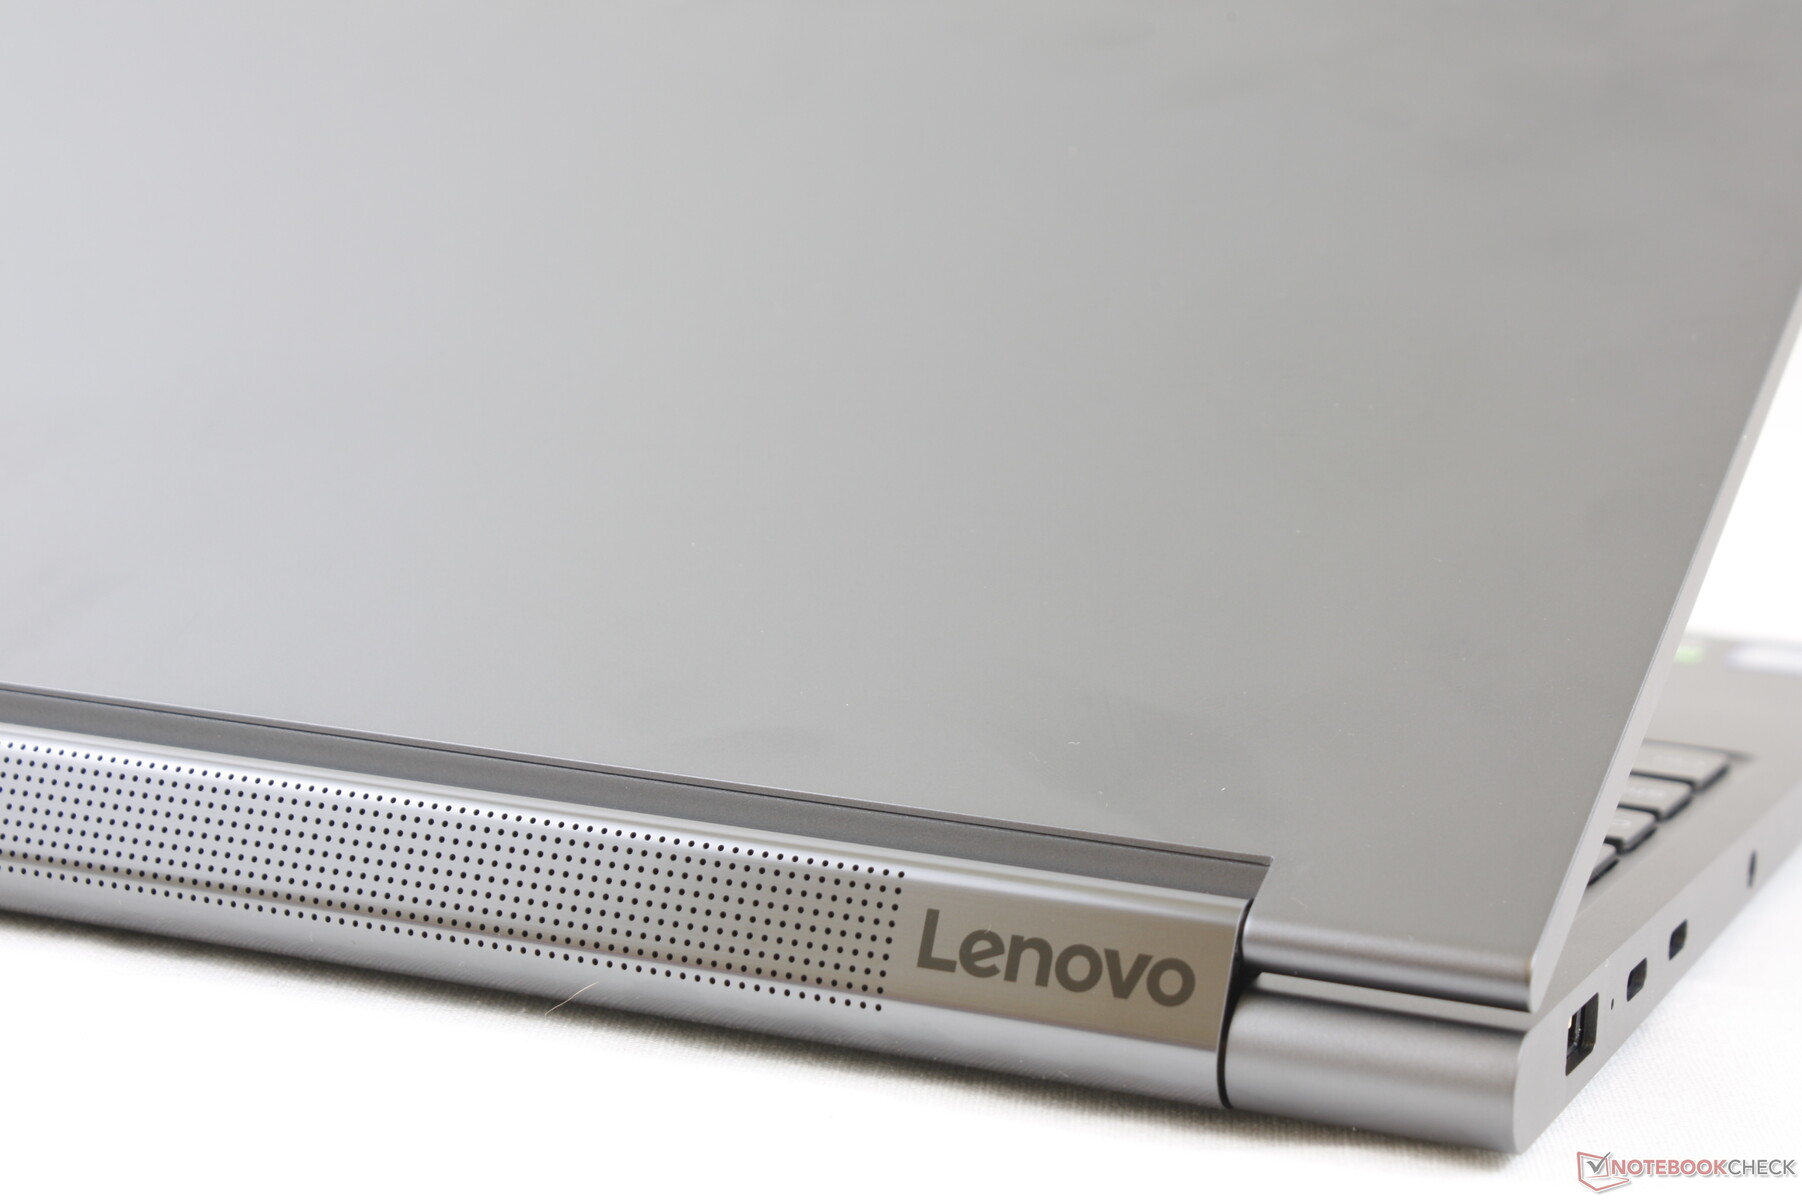
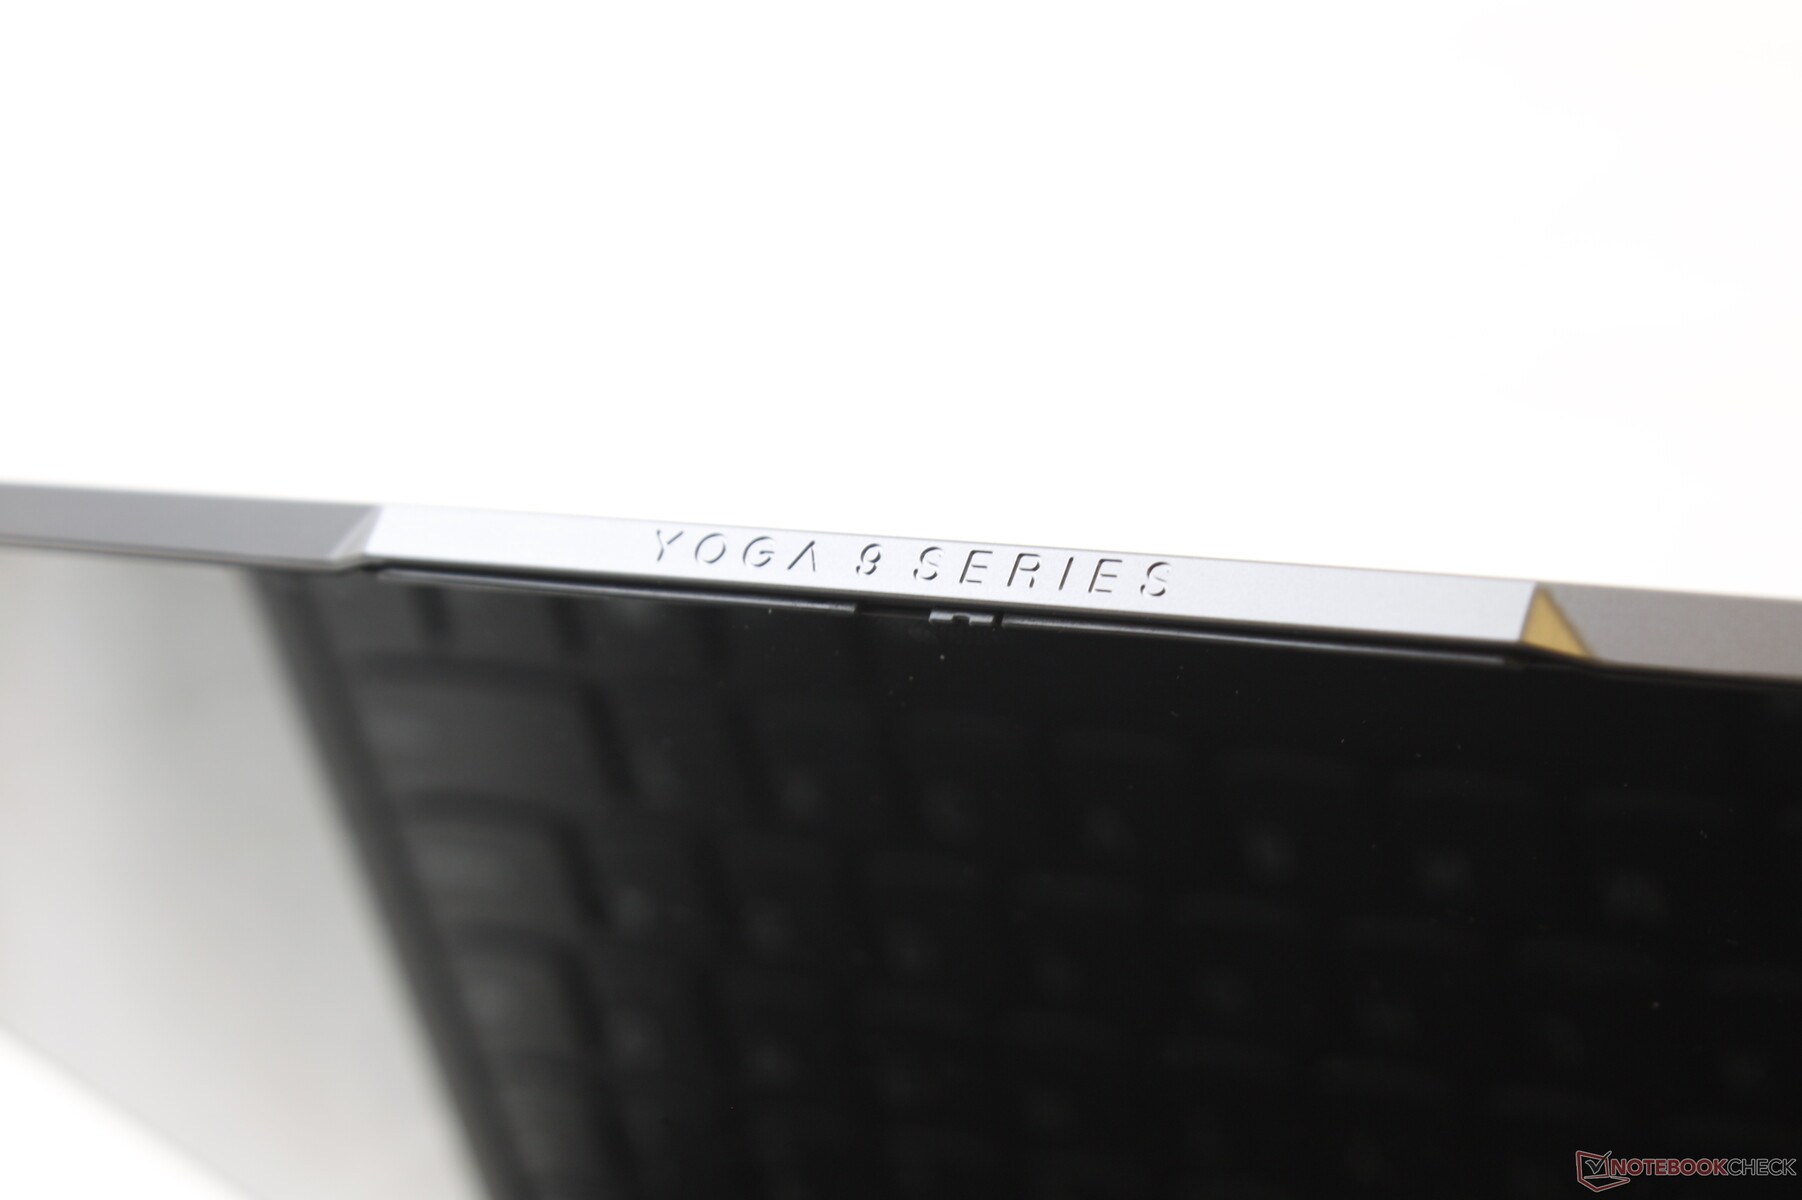
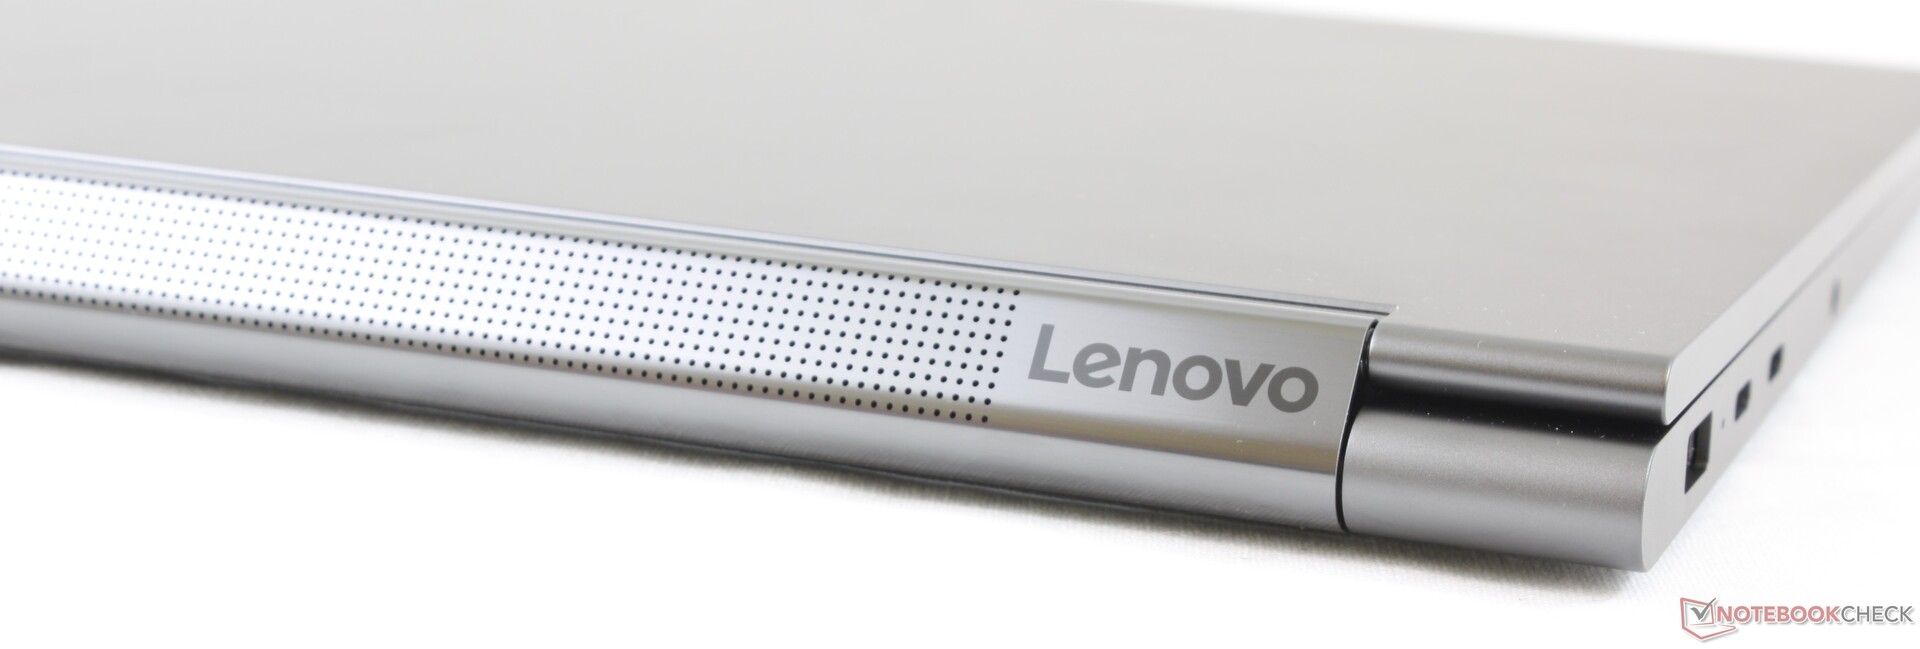
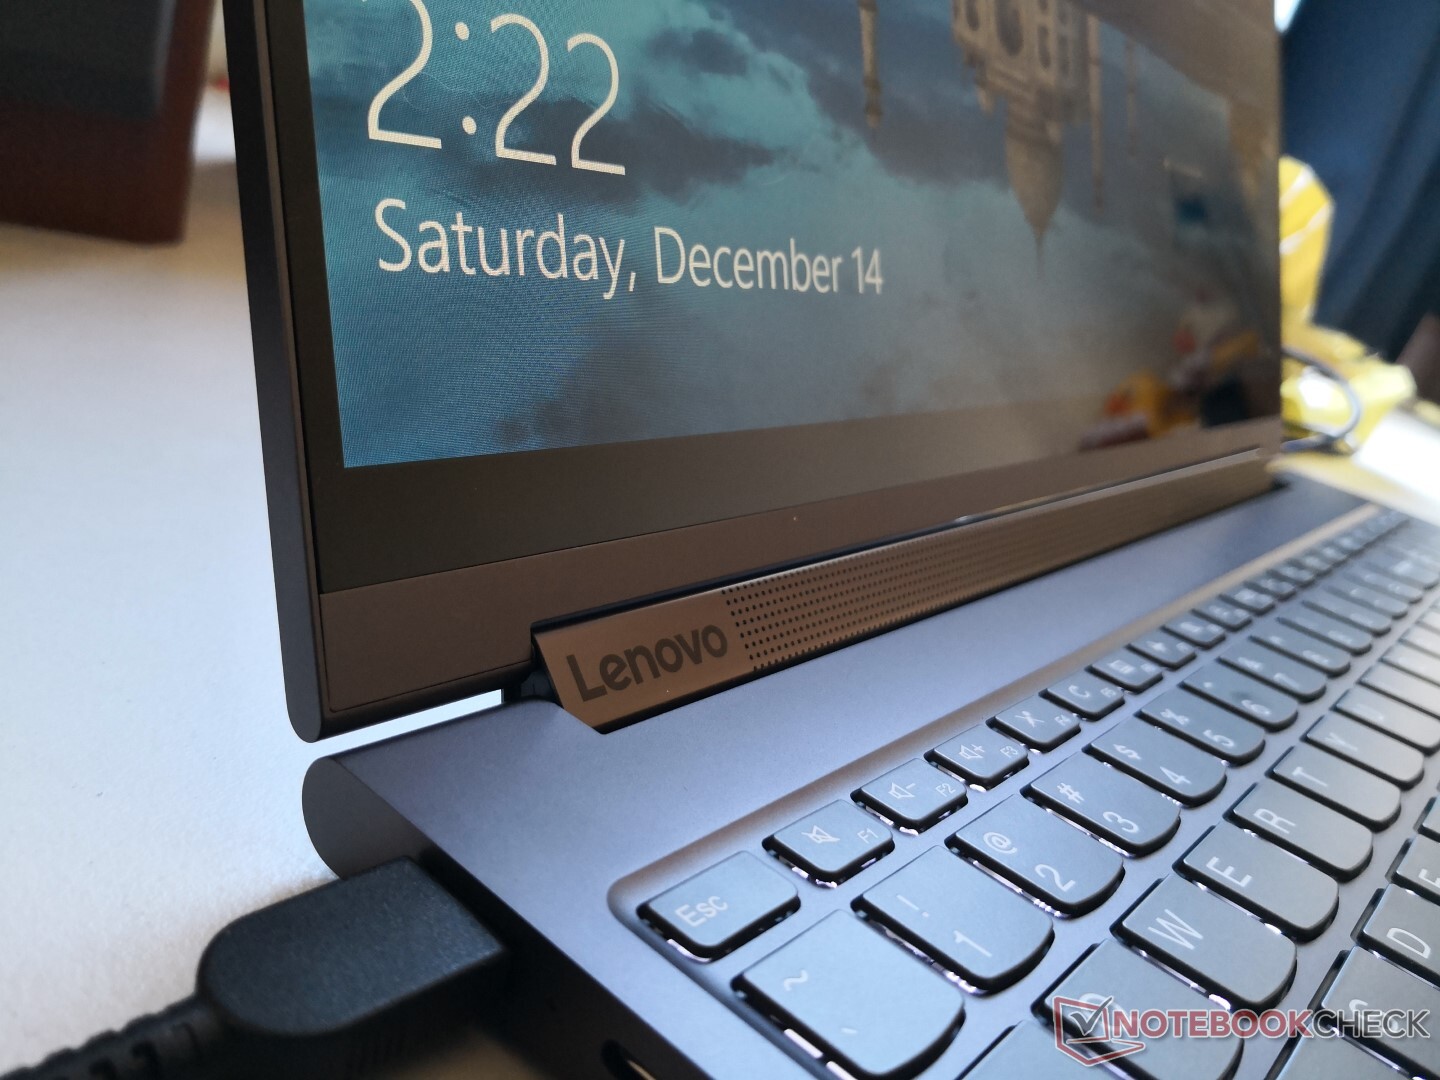
Much like last year's Yoga C930, the C940 continues the tradition of a notched bezel and a hinge with integrated speakers. The former provides an easier grip for opening the lid while the latter allows for stronger audio. However, we suspect Lenovo will eventually drop the characteristic notch as webcams have become smaller as exemplified by the latest XPS 13 and HP Spectre 13 designs.
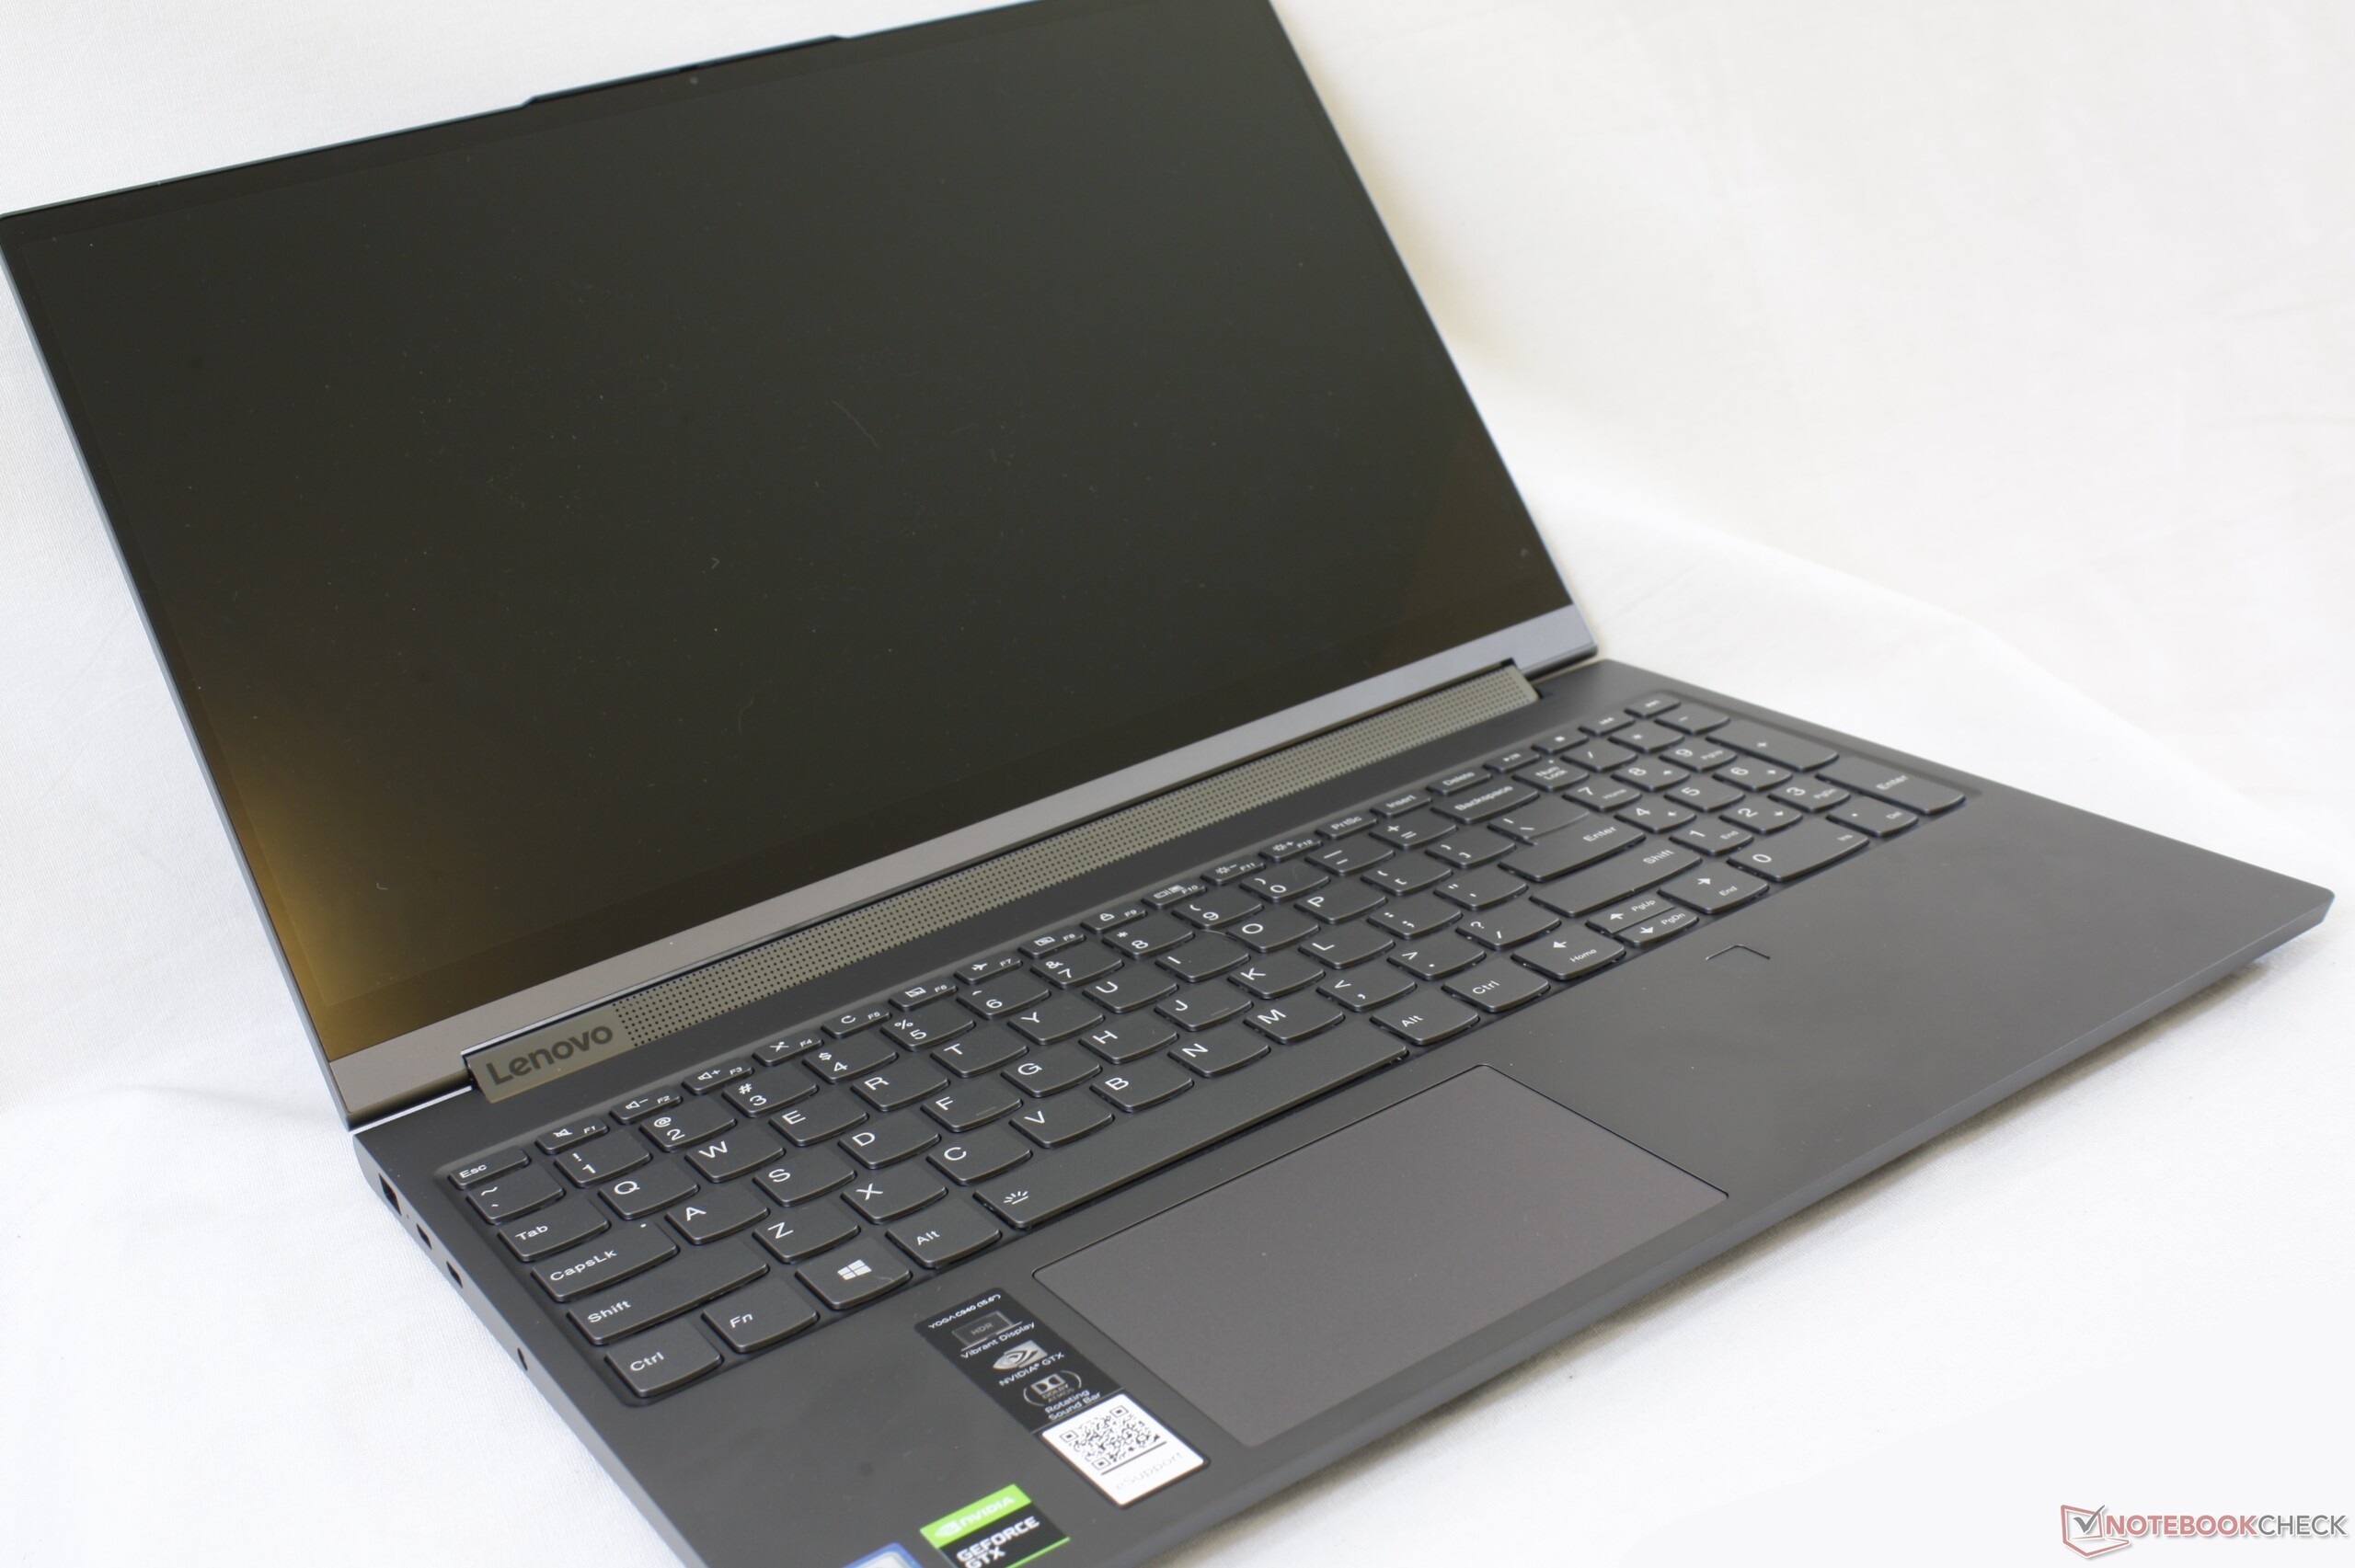
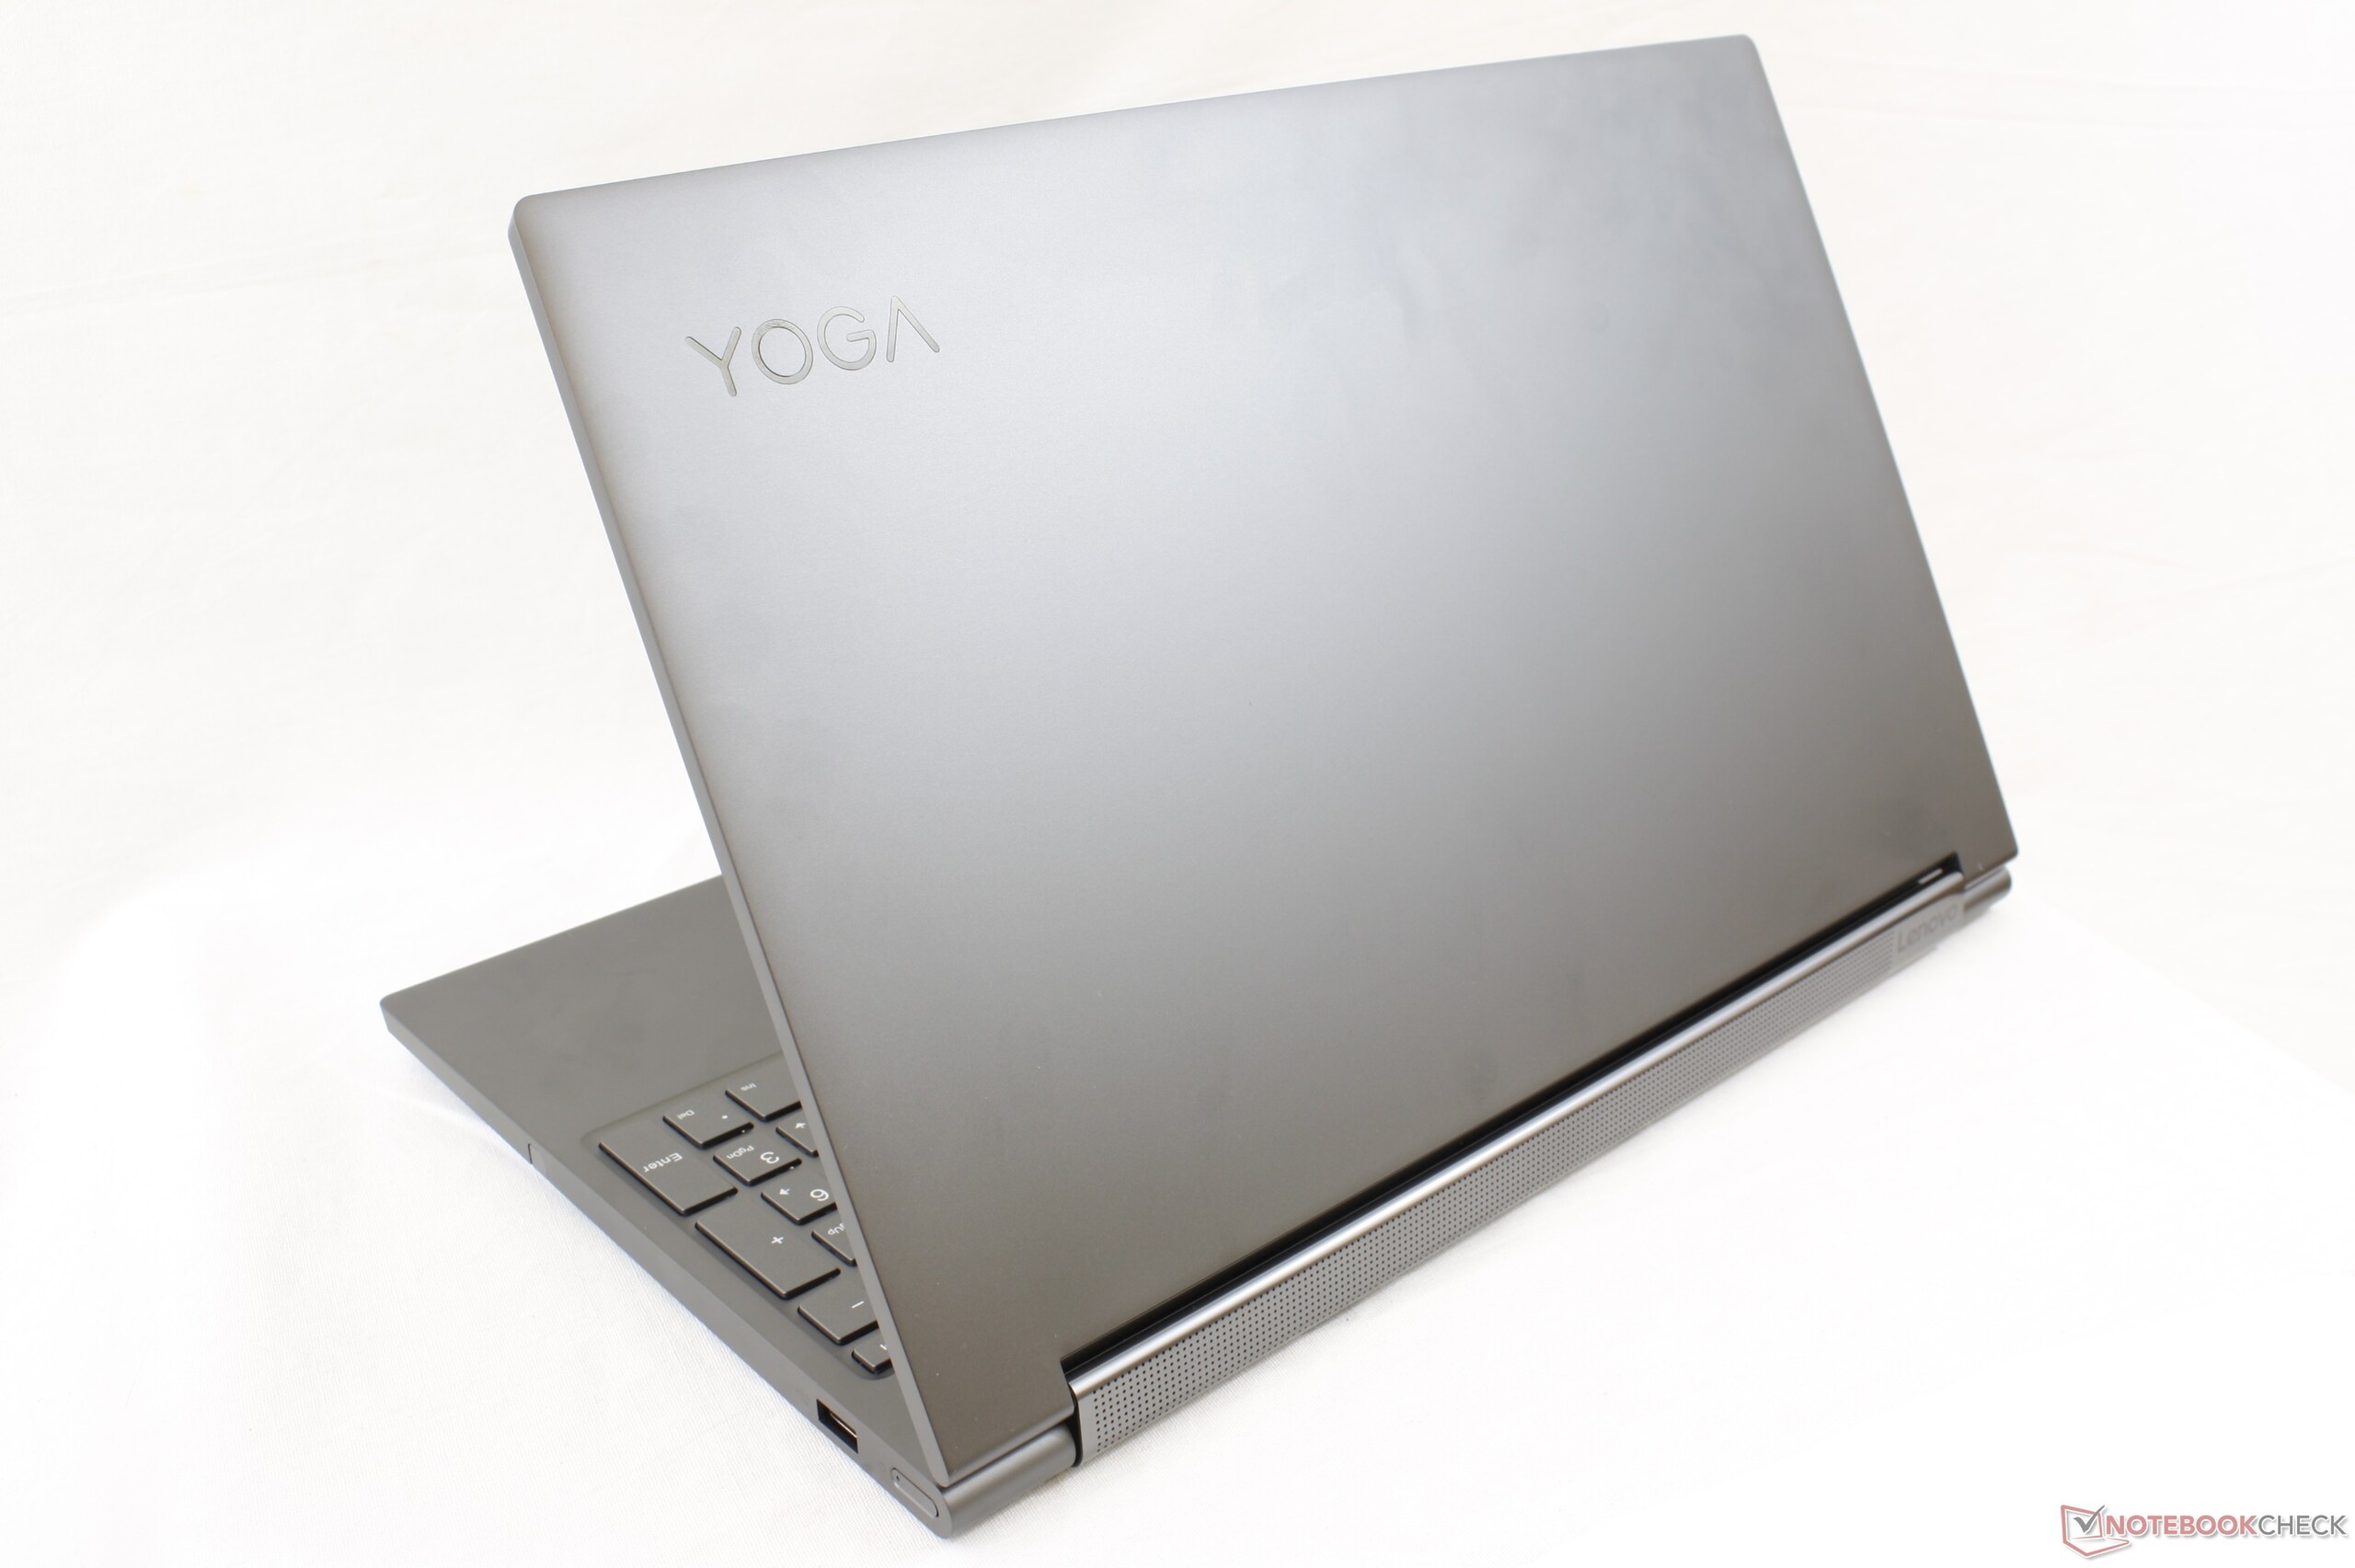
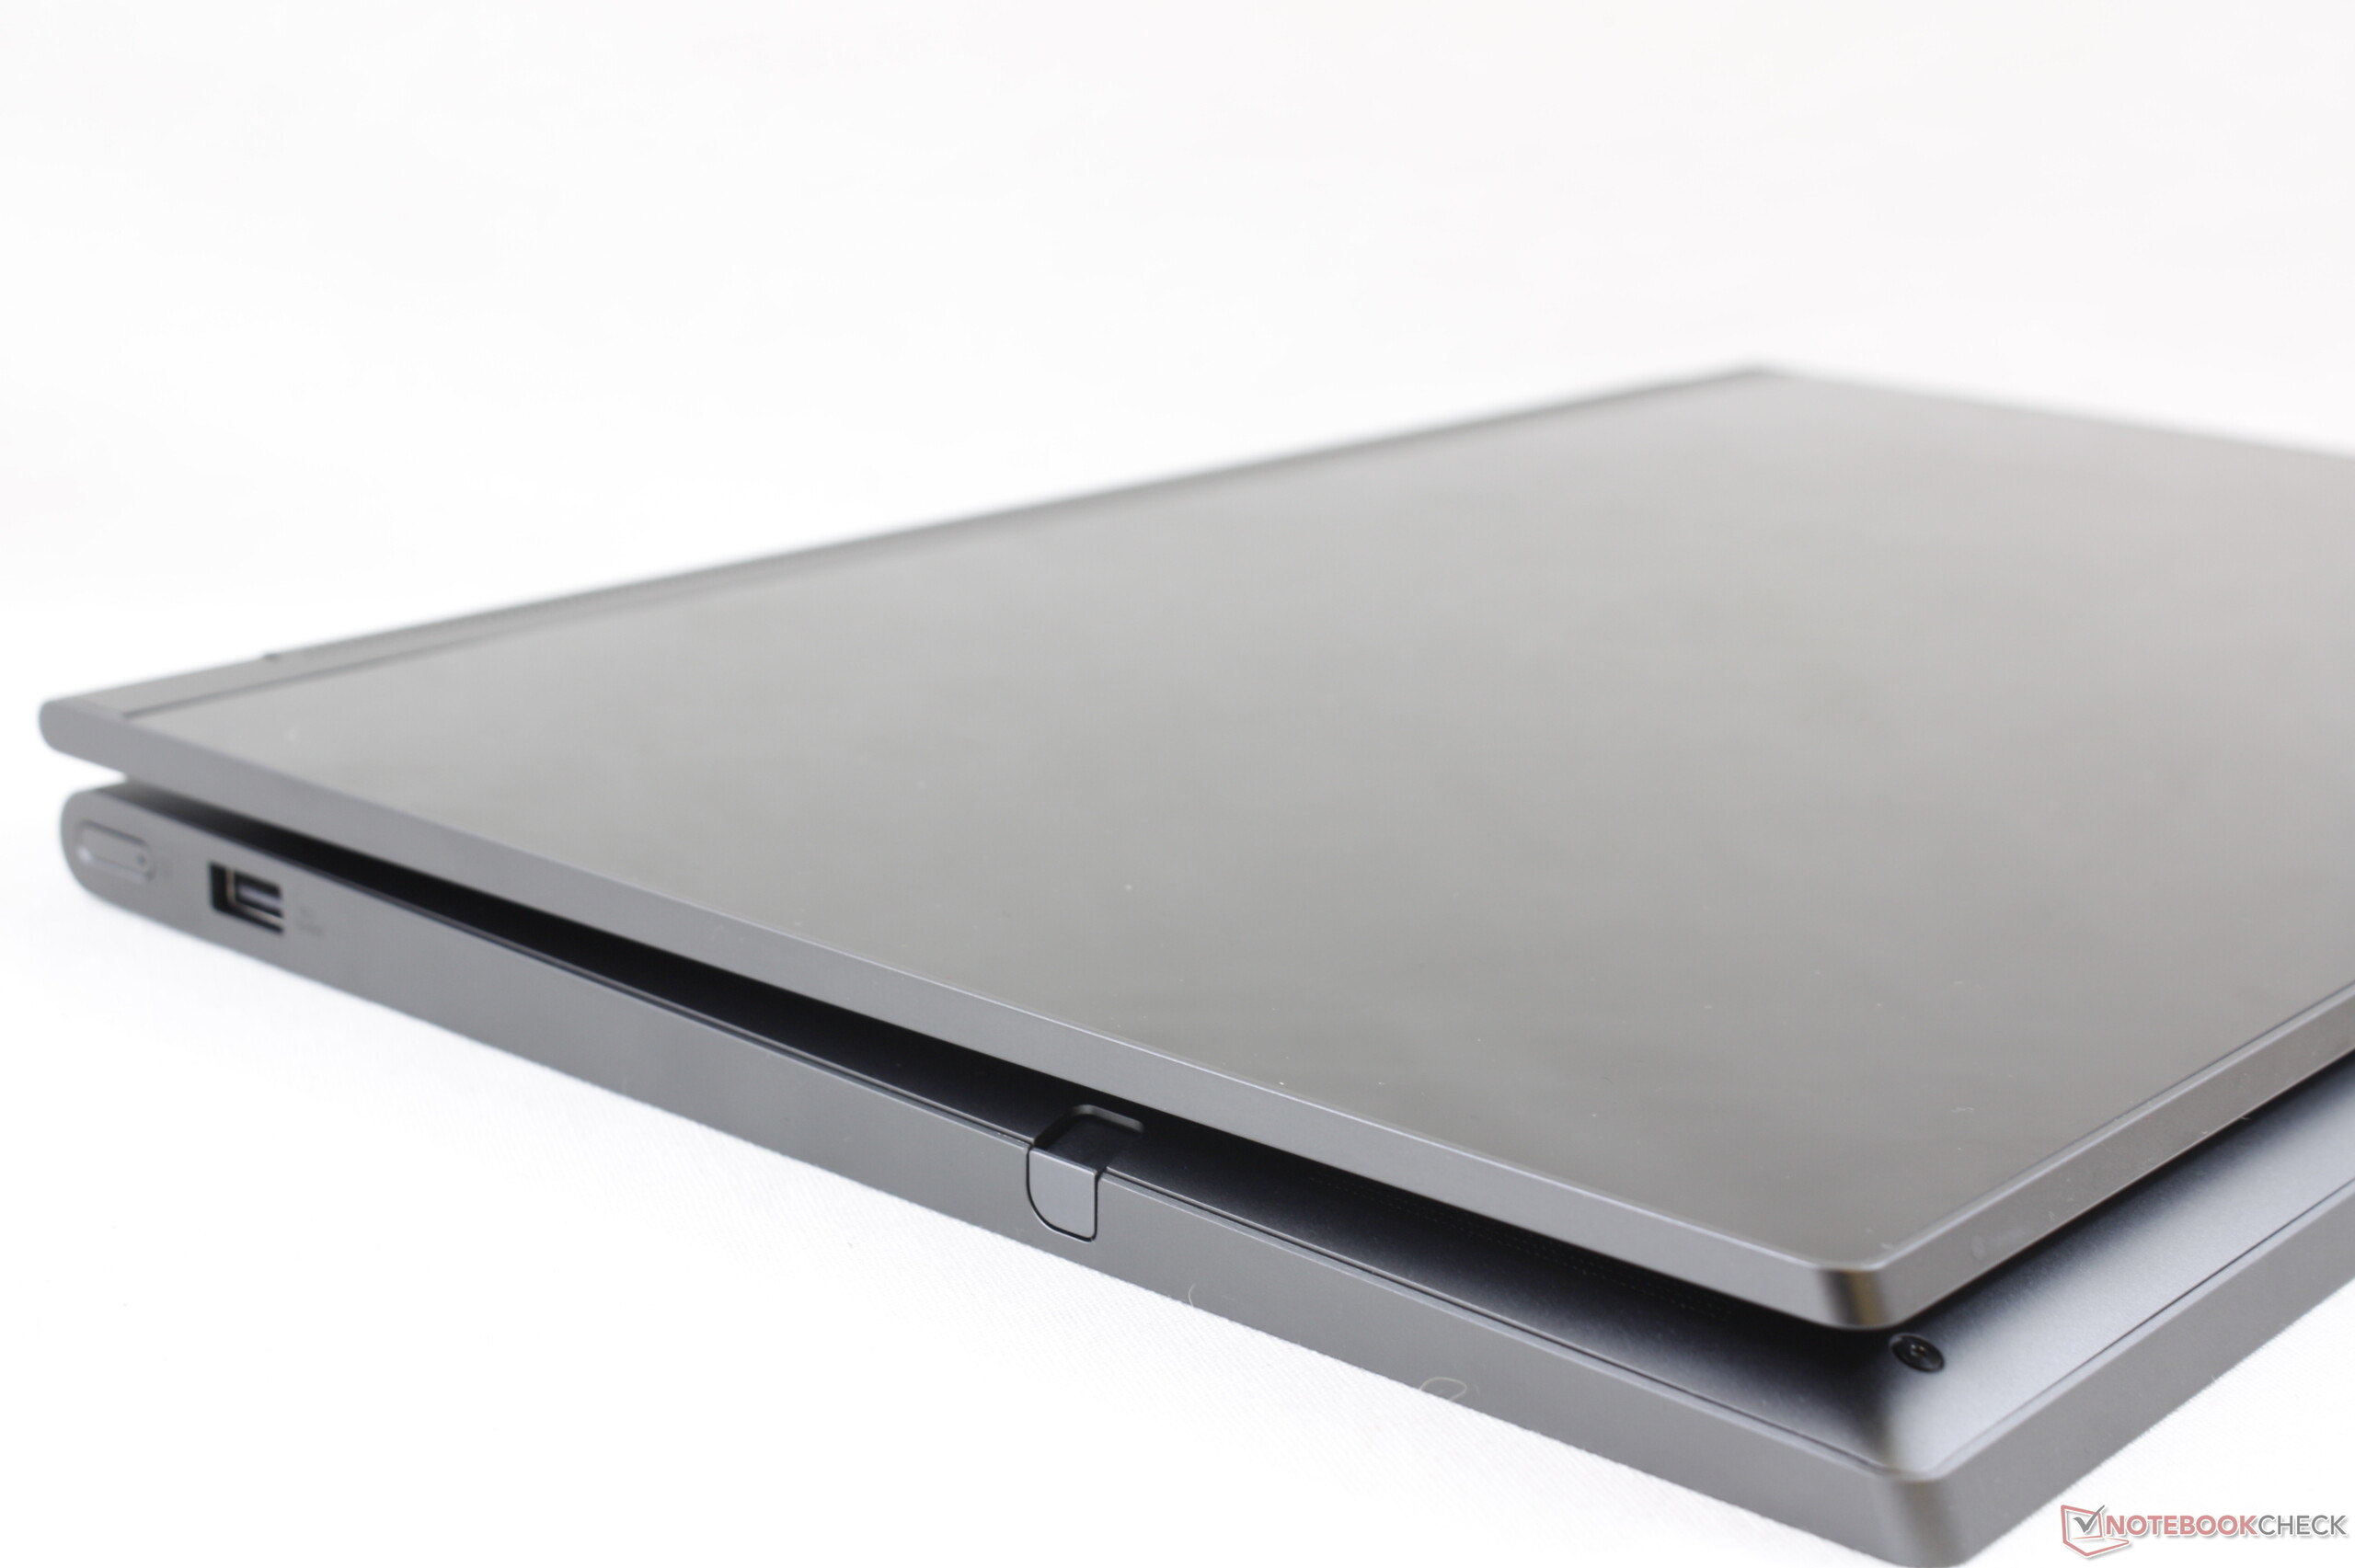
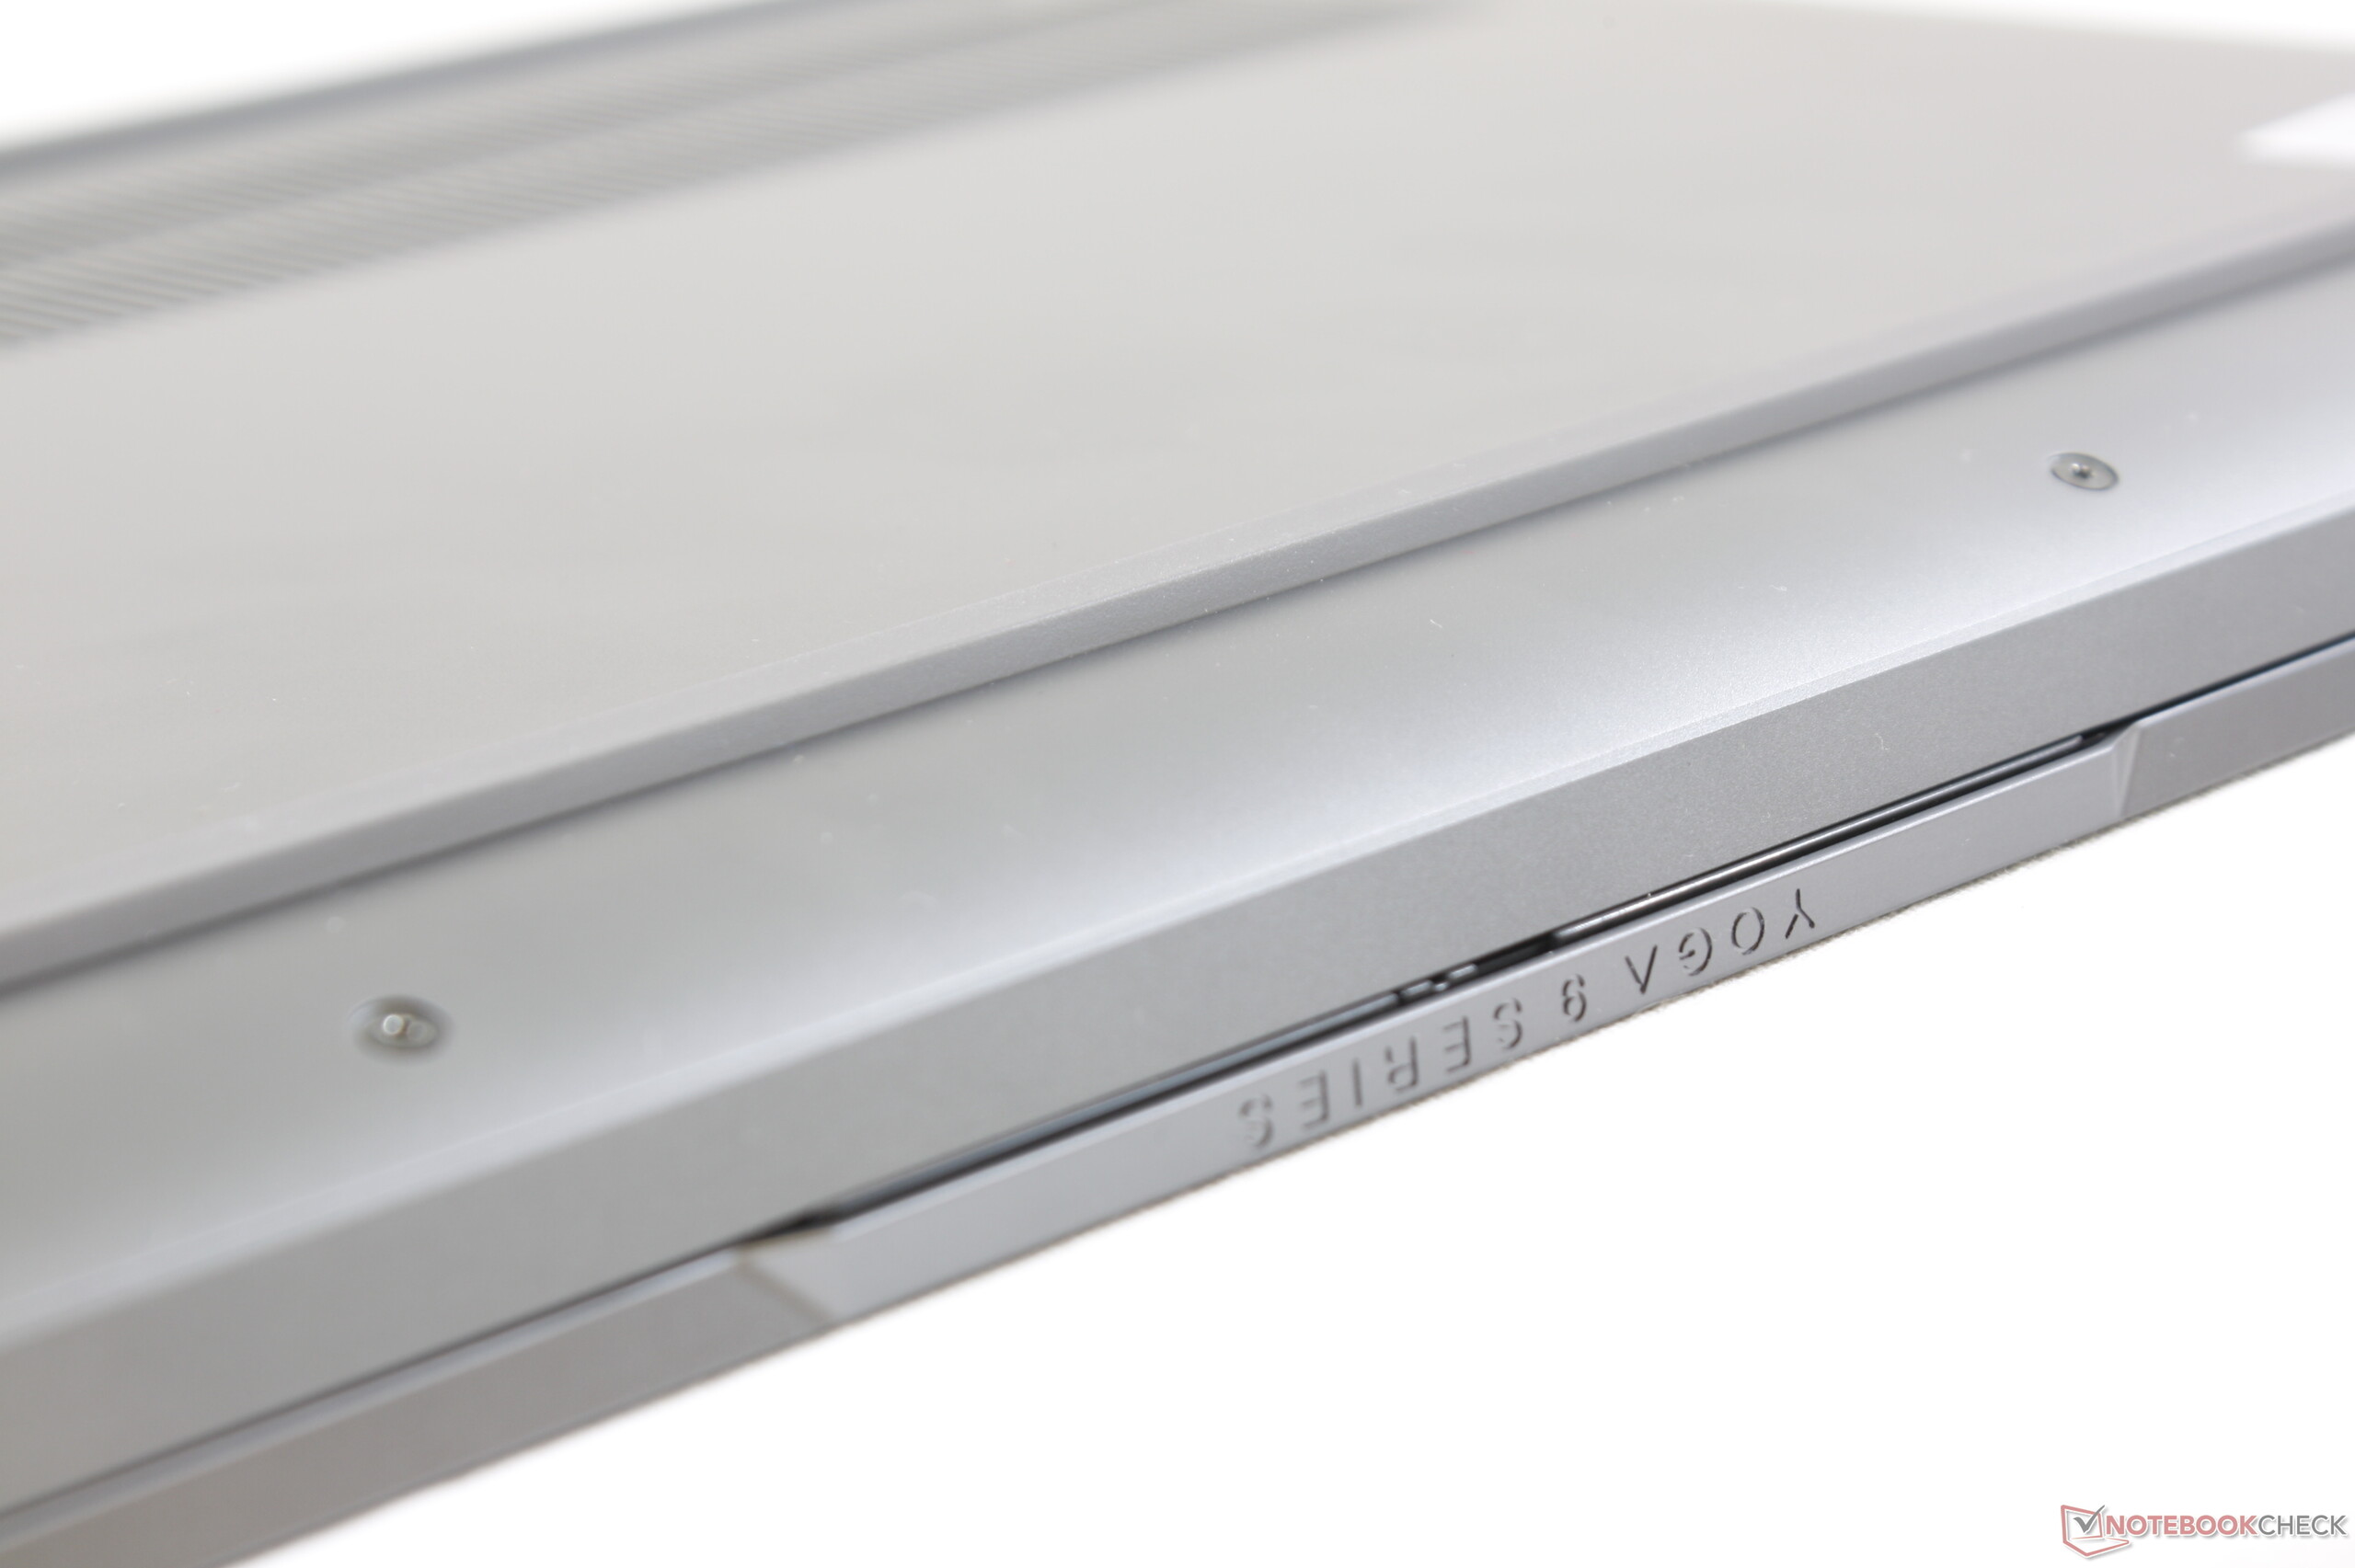
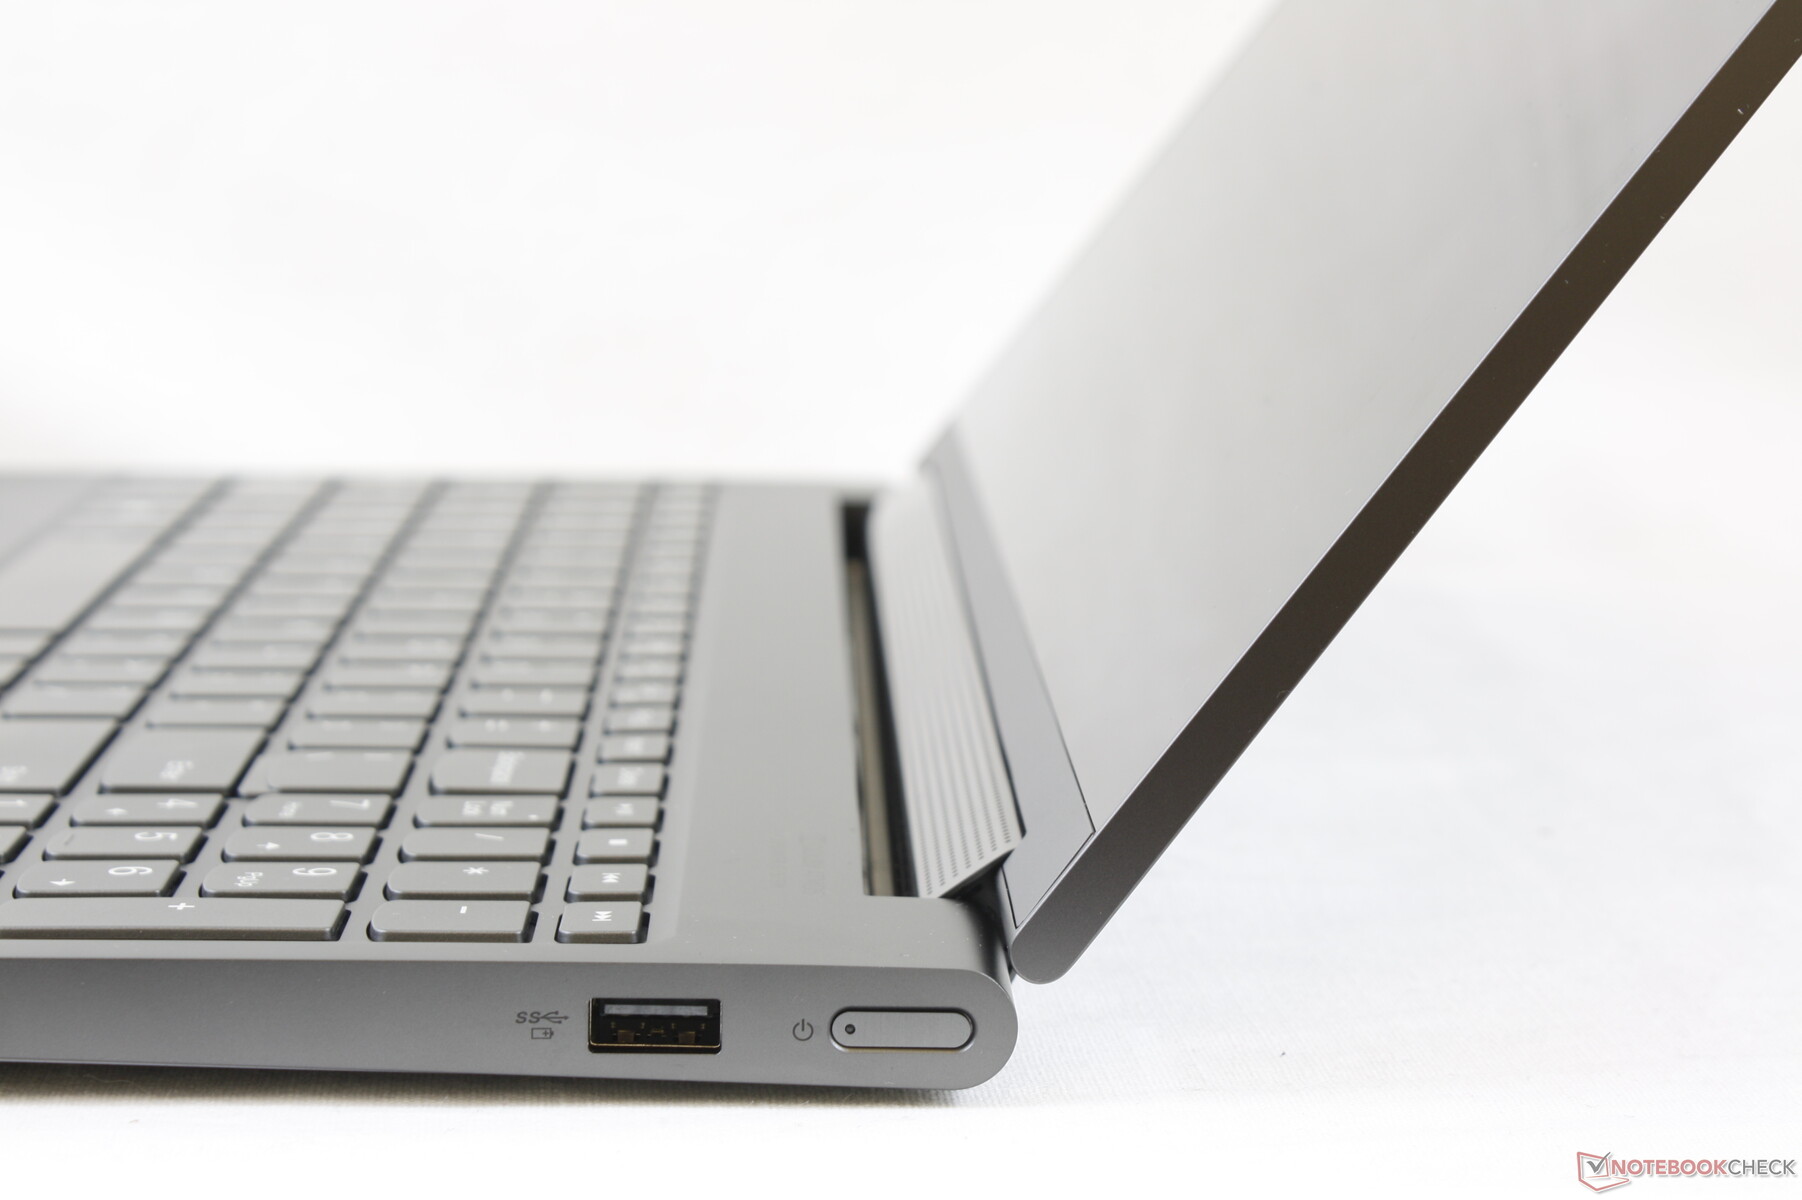
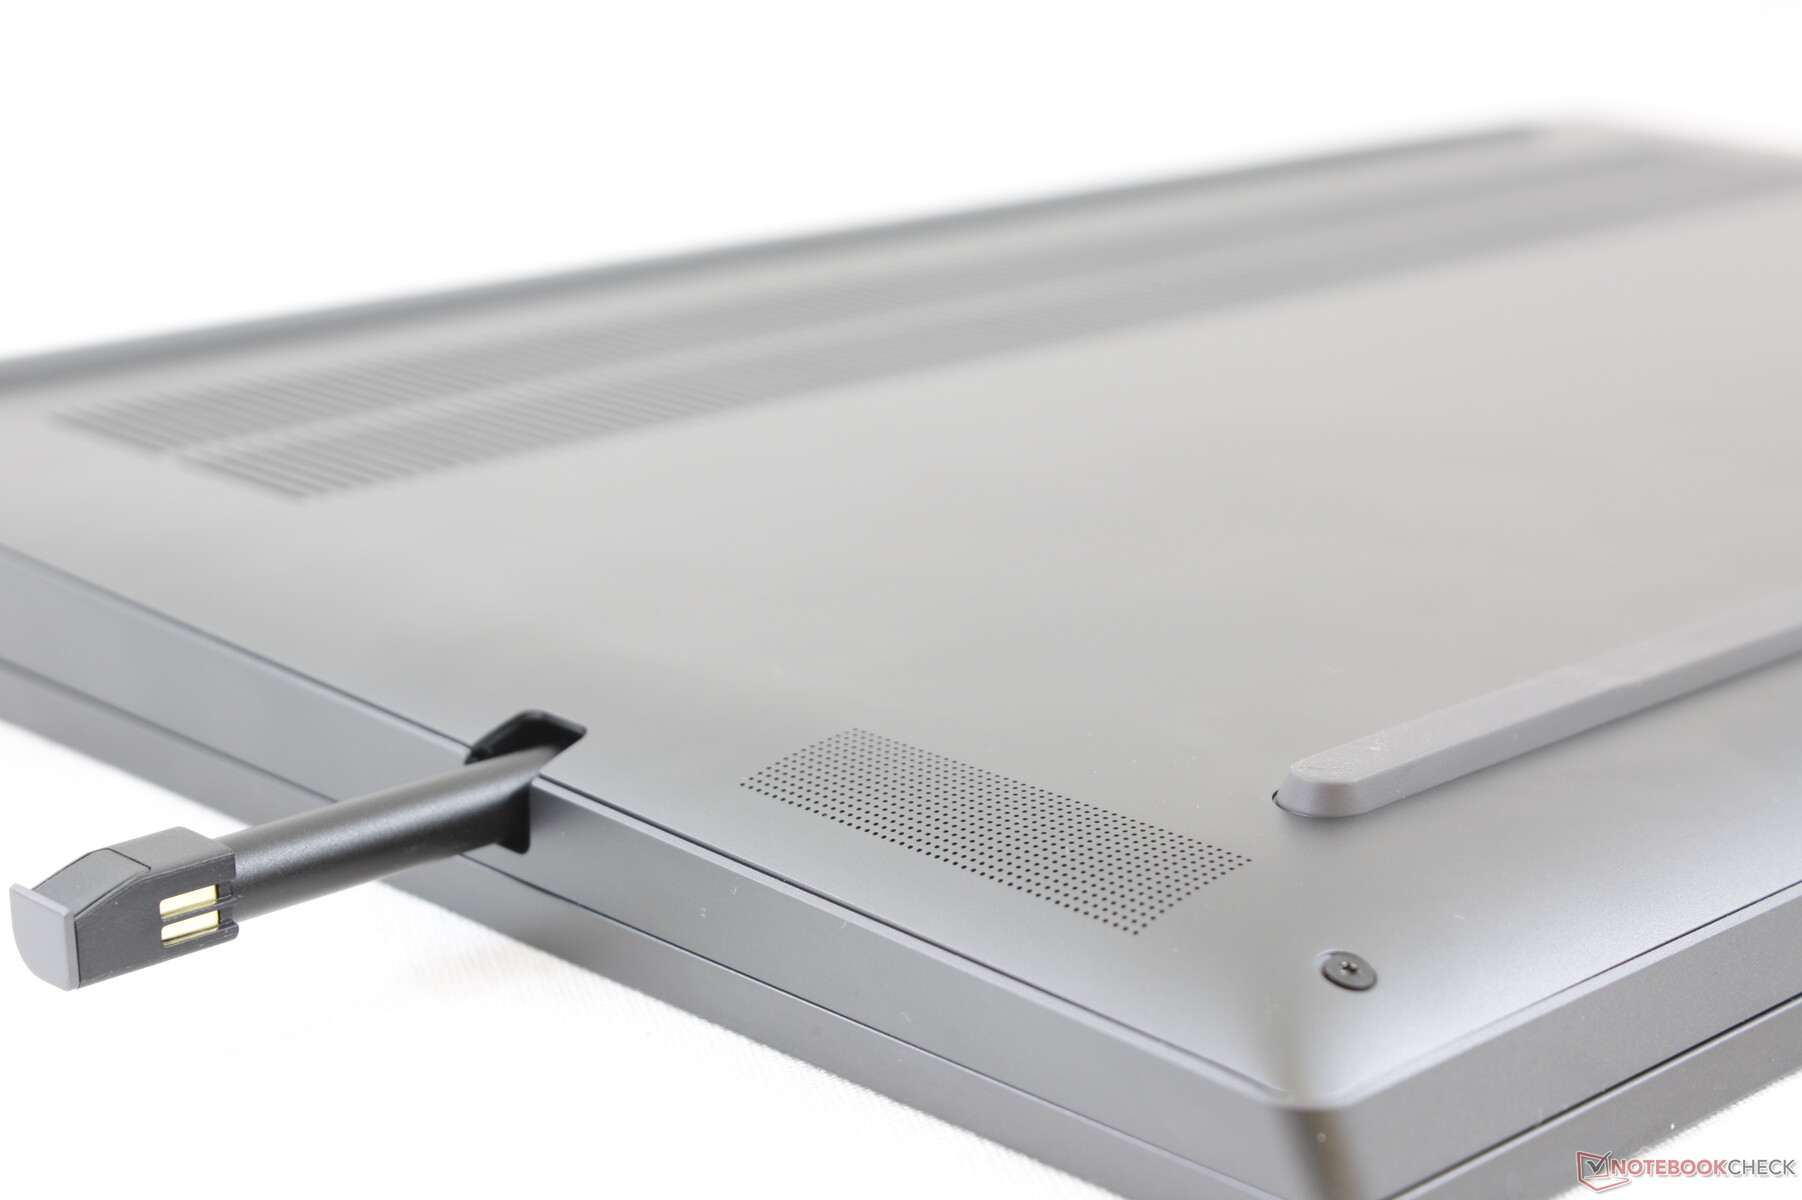
The Lenovo is thicker than the Dell XPS 15 by almost 3 mm while maintaining roughly the same footprint and weight. In return, users get stronger speakers, the added versatility of 360-degree hinges, and an integrated active stylus slot. Traditional clamshell Ultrabooks with ULV CPUs like the Asus ZenBook 15 or Lenovo's own IdeaPad S940 are noticeably lighter and smaller. For a convertible, however, 2 kg feels quite heavy especially if you intend to use the stylus often.
Connectivity
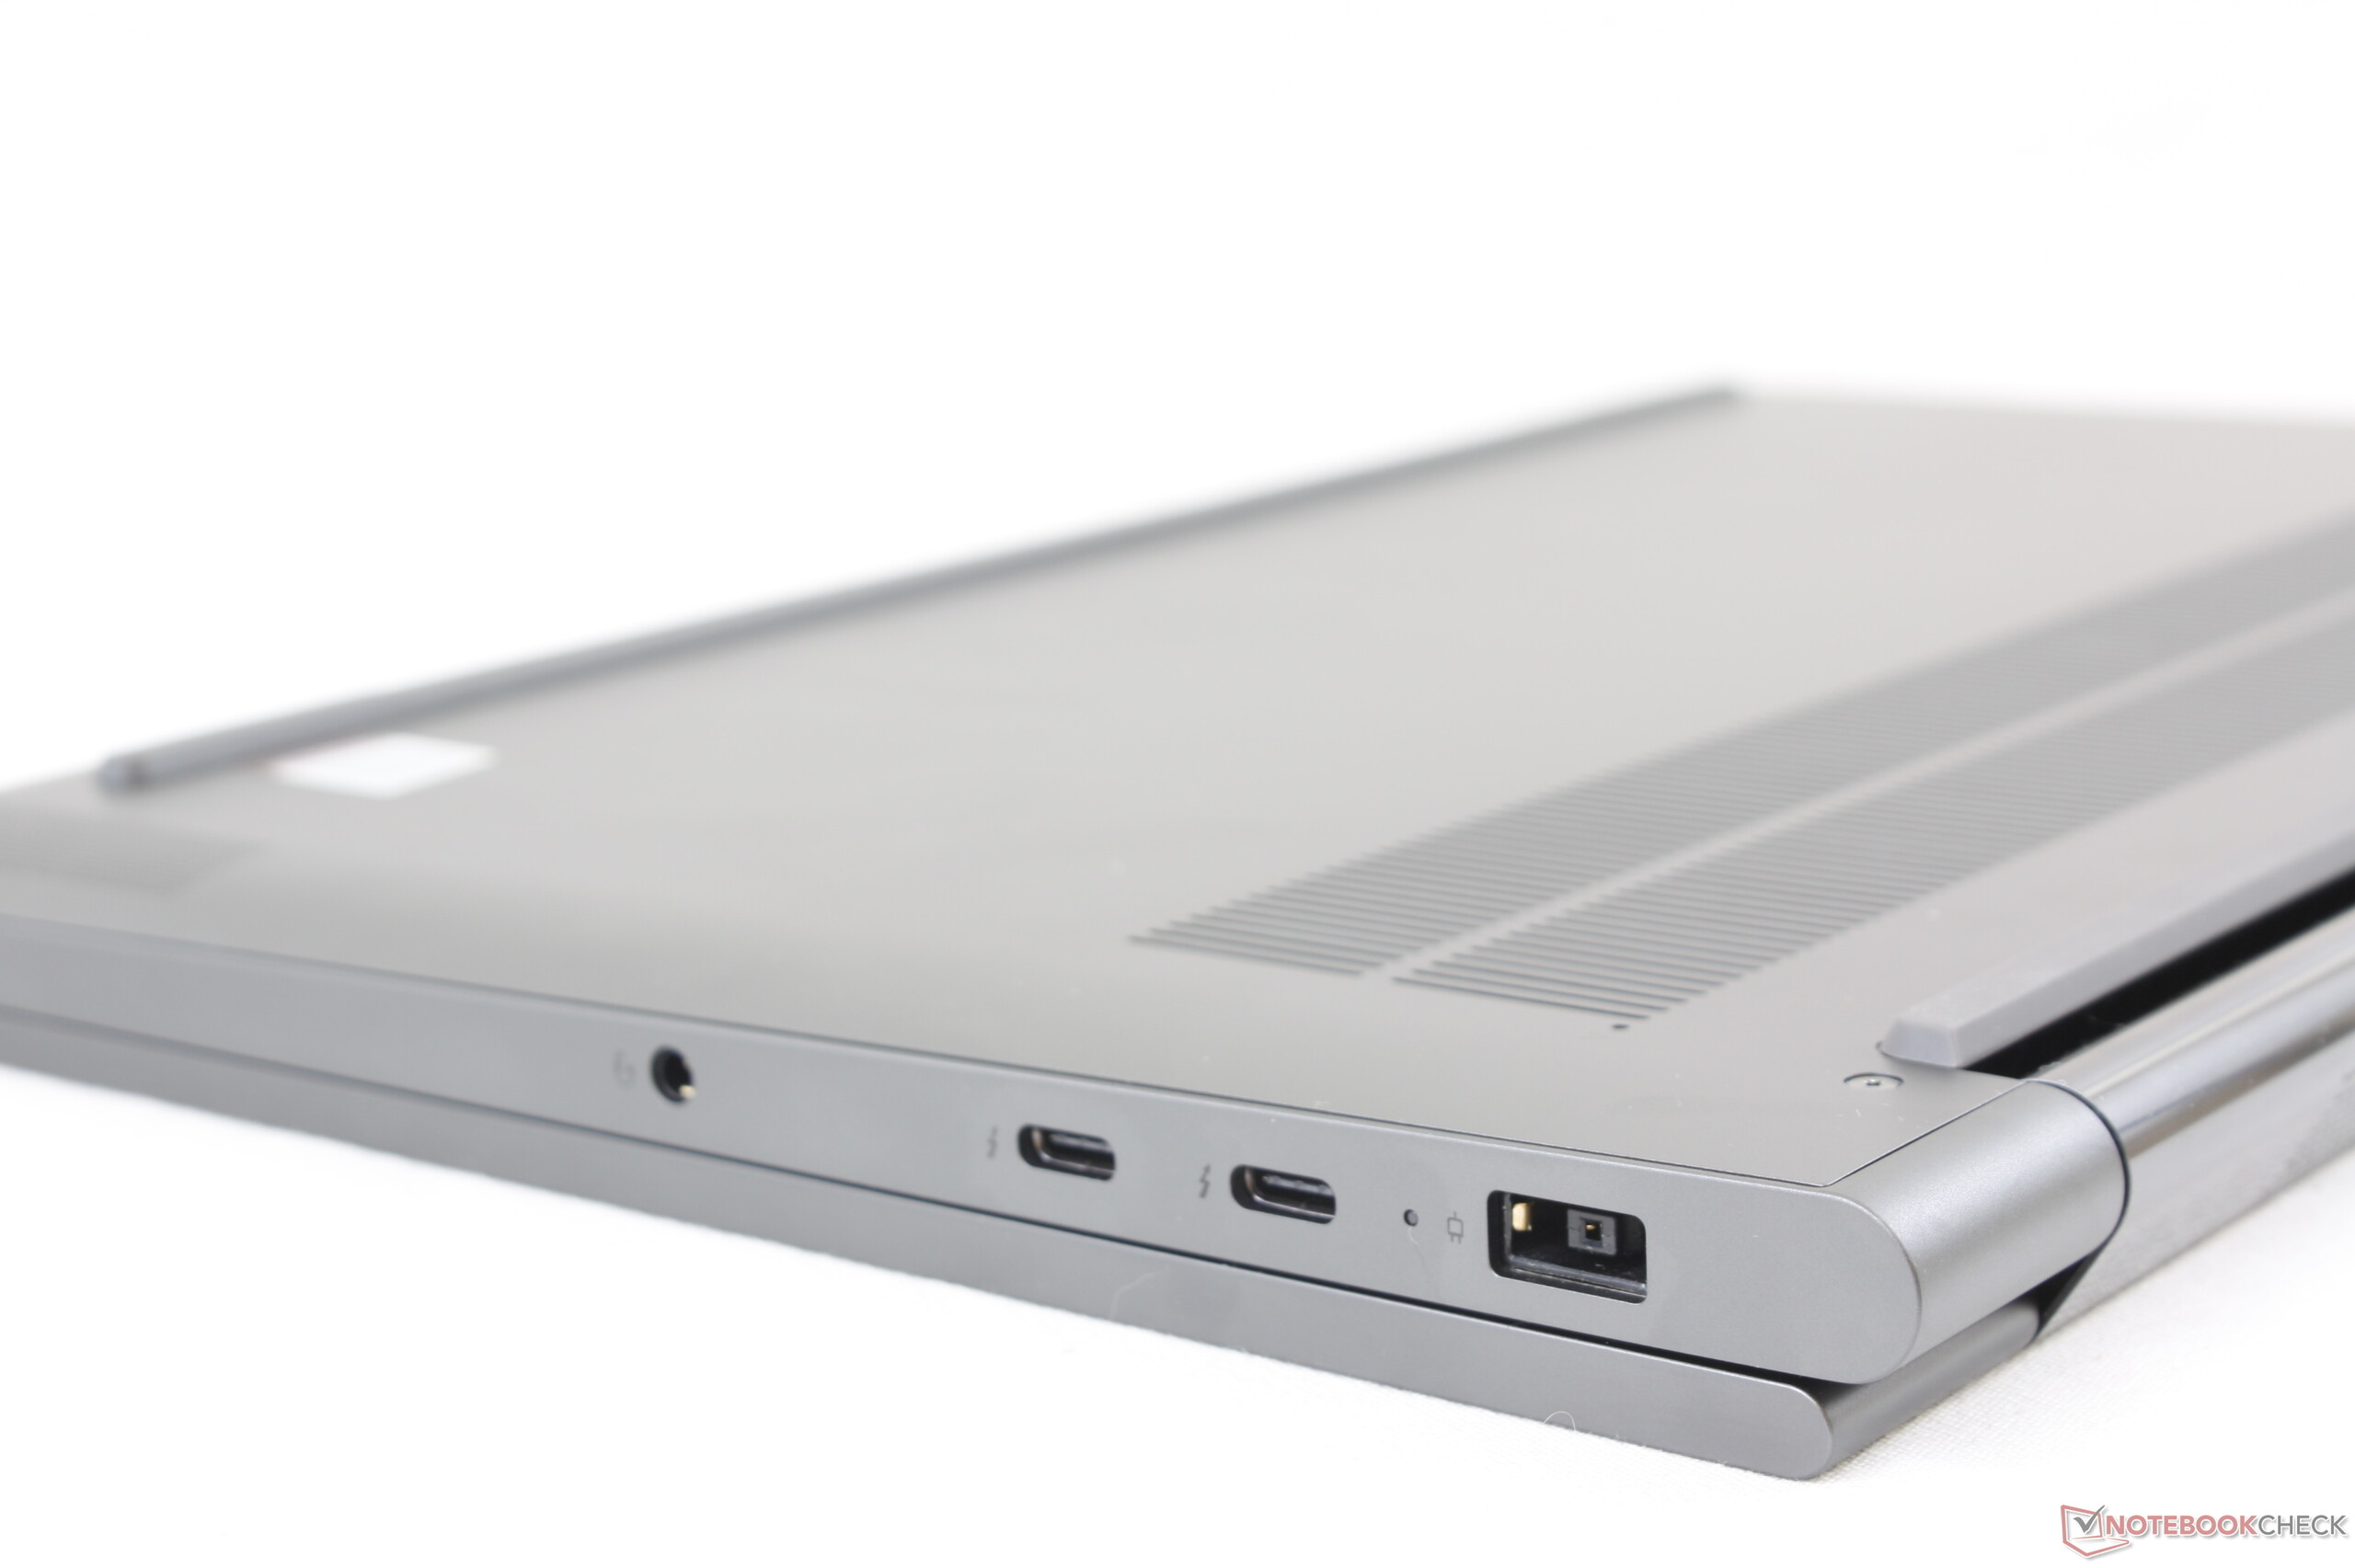
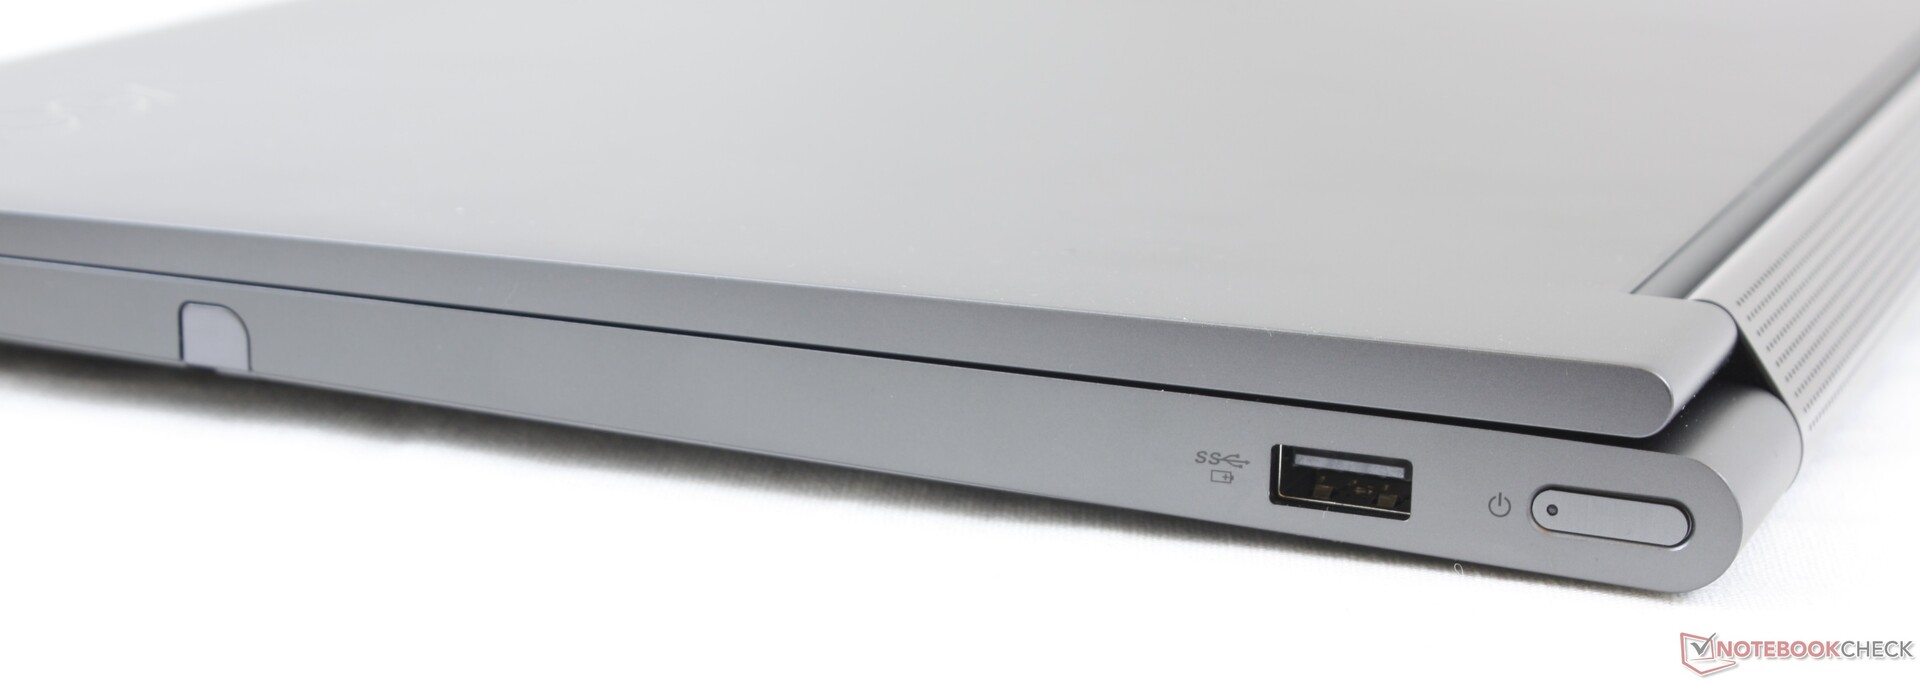
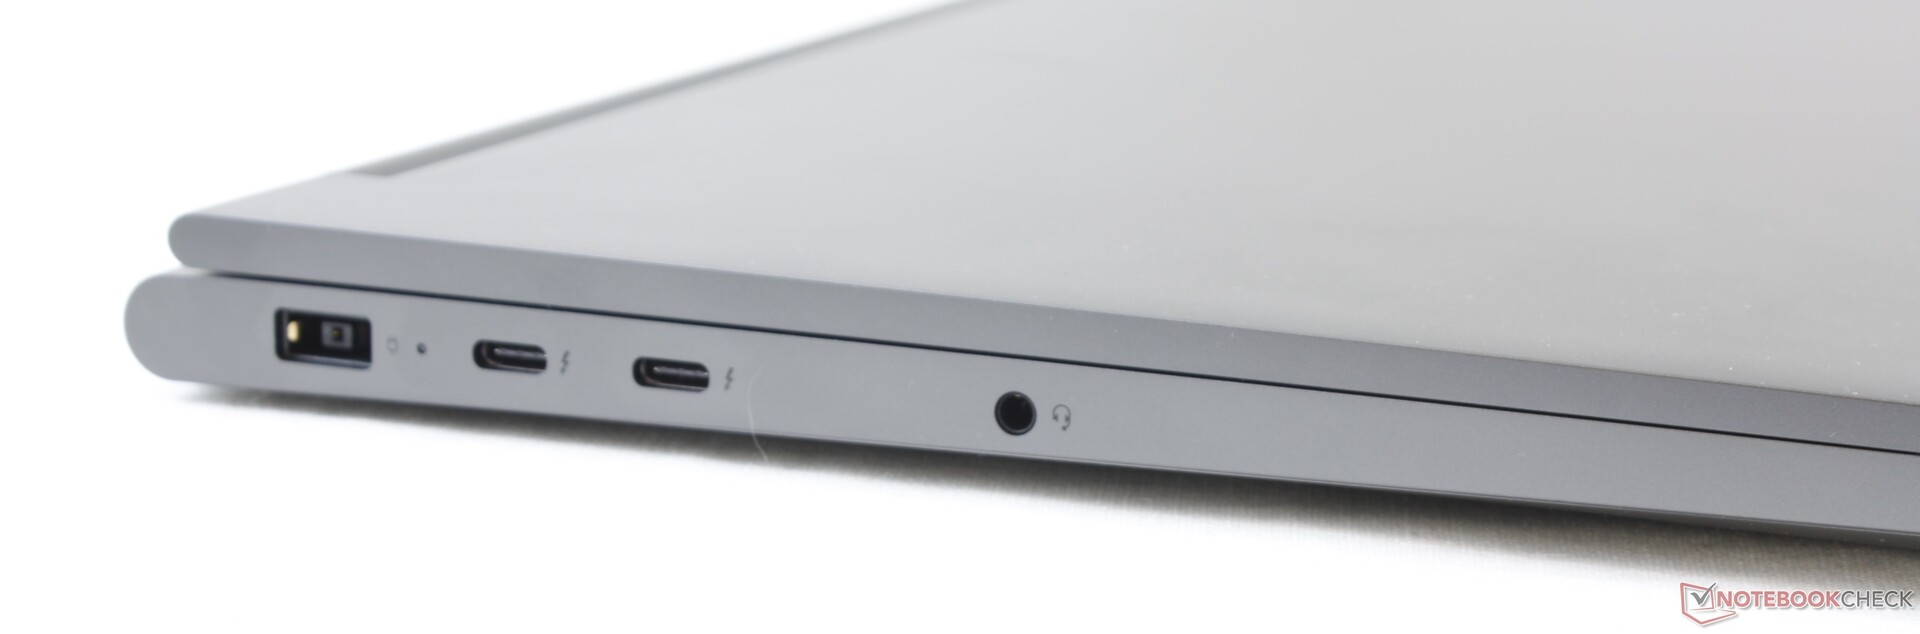
All ports from the 14-inch Yoga C940 are here with an added USB Type-A port along the right edge. We would have liked an SD card reader since both the XPS 15 and ZenBook 15 include one. You'll have to exploit the dual Thunderbolt 3 ports to make the most of the system since port options are fairly limited for a 15.6-inch form factor.
Communication
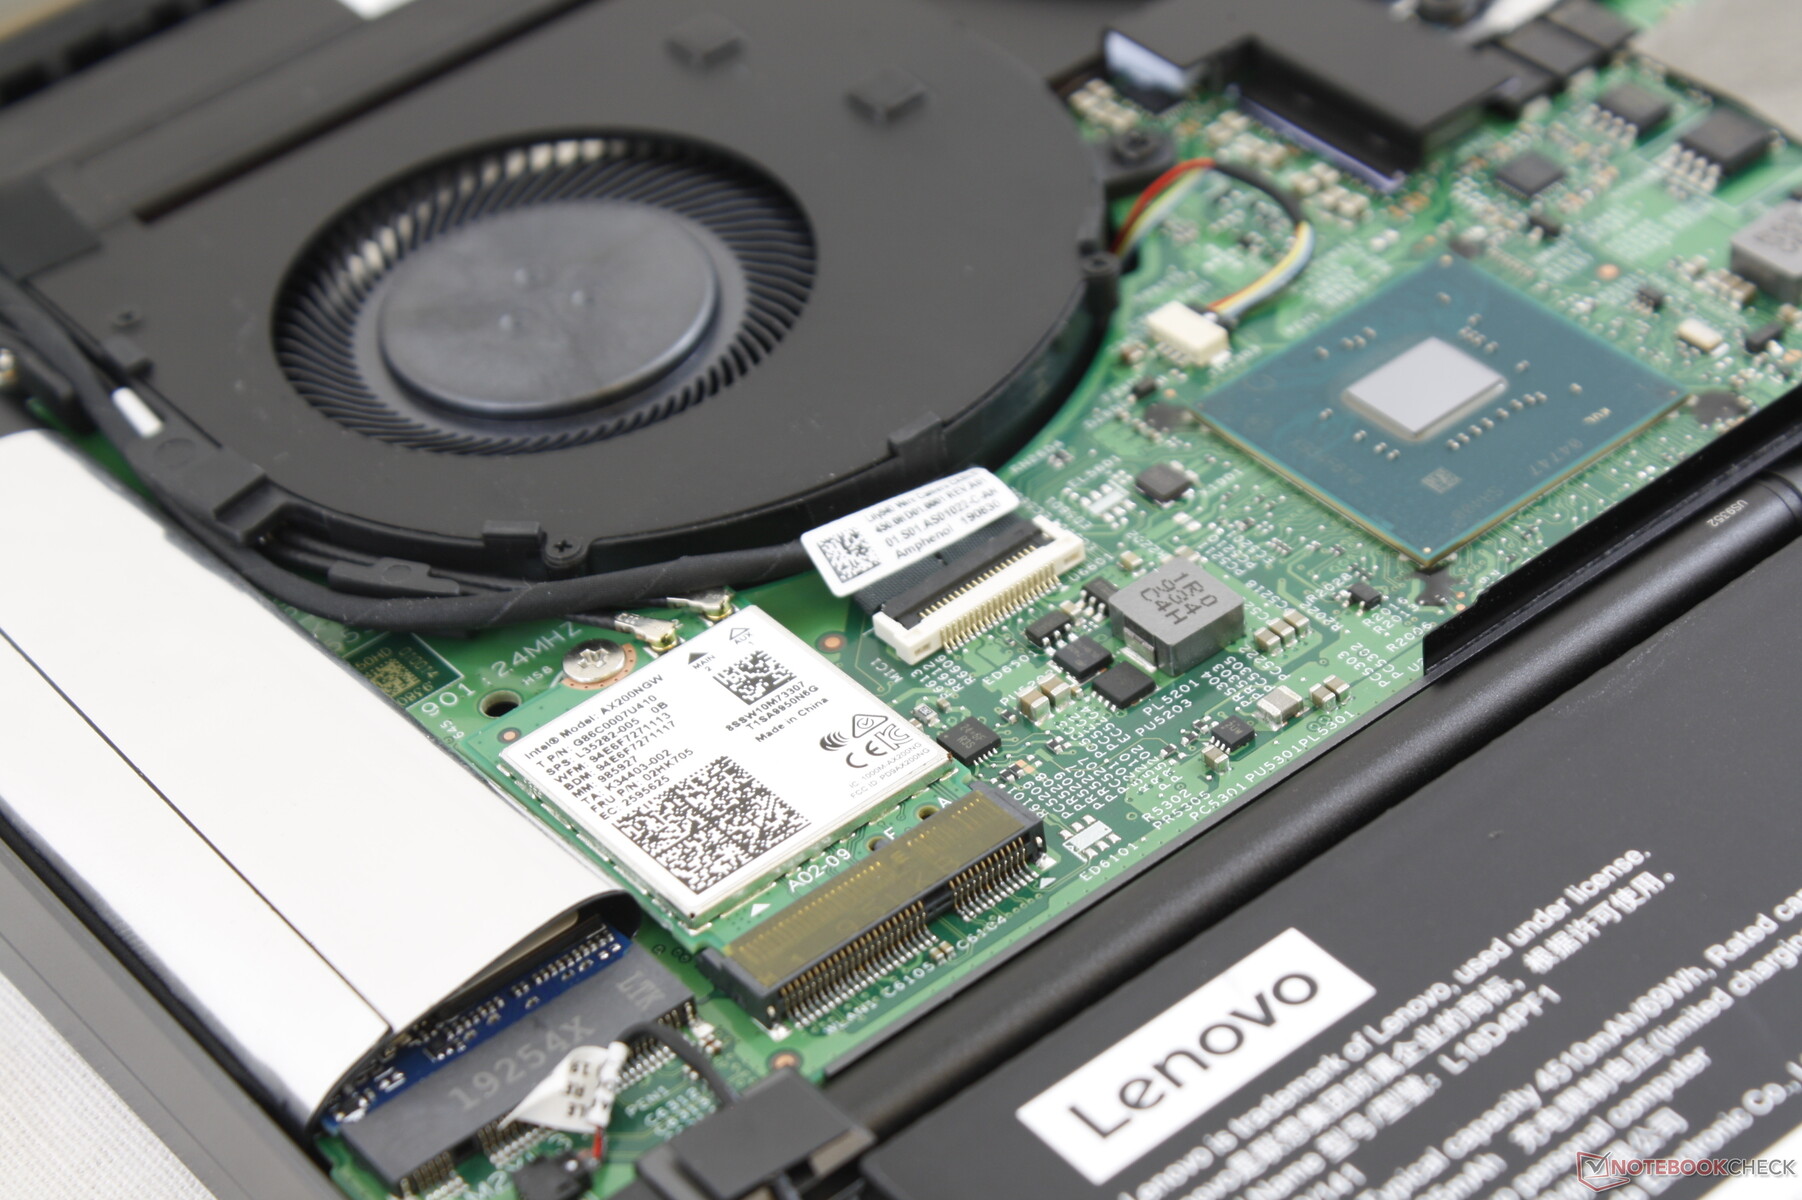
The Intel AX200 comes standard for Bluetooth 5 and 802.11ax/Wi-Fi 6 connectivity. Transfer rates can reach over two times the typical 802.11ac standard should you have a Wi-Fi 6 router.
| Networking | |
| iperf3 transmit AX12 | |
| MSI Prestige 15 A10SC | |
| Dell XPS 15 7590 9980HK GTX 1650 | |
| Asus ZenBook 15 UX534FT-DB77 | |
| iperf3 receive AX12 | |
| MSI Prestige 15 A10SC | |
| Asus ZenBook 15 UX534FT-DB77 | |
| Dell XPS 15 7590 9980HK GTX 1650 | |
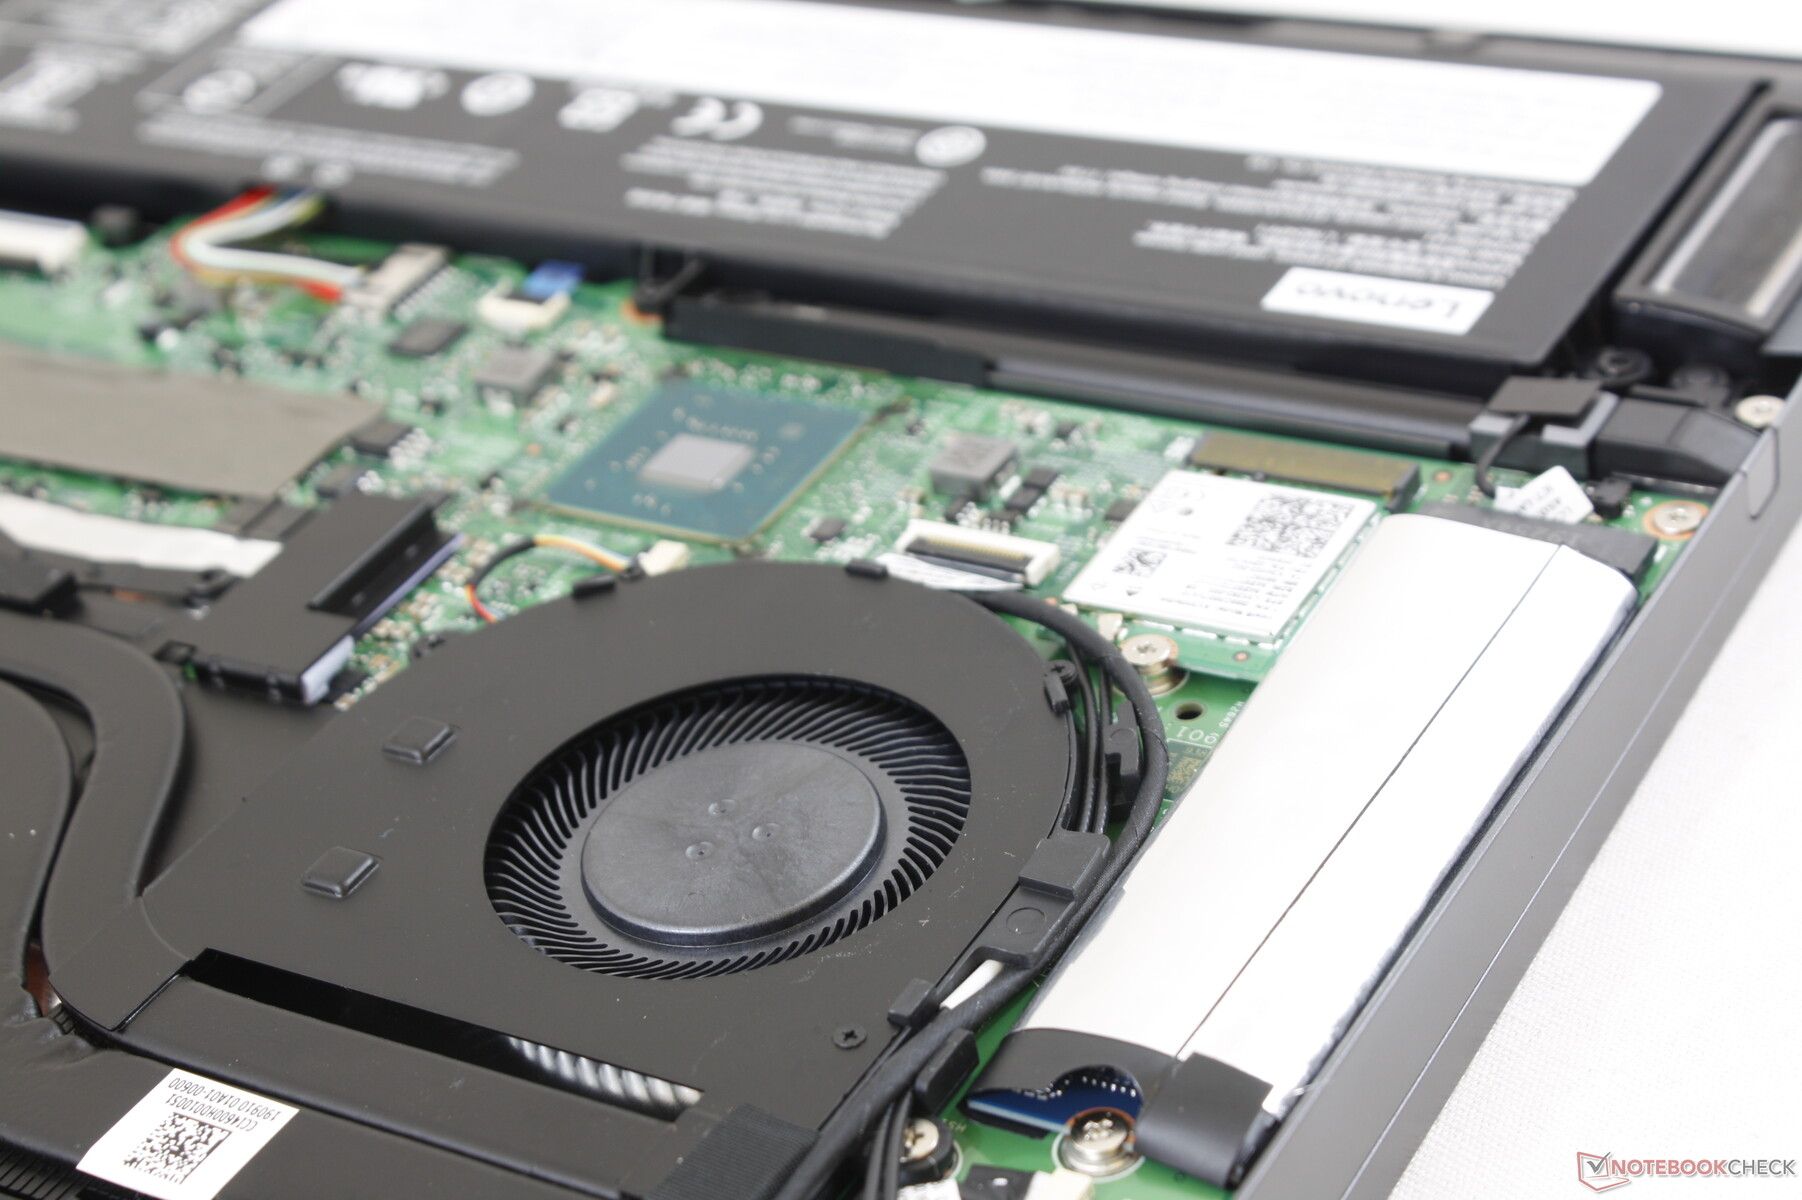
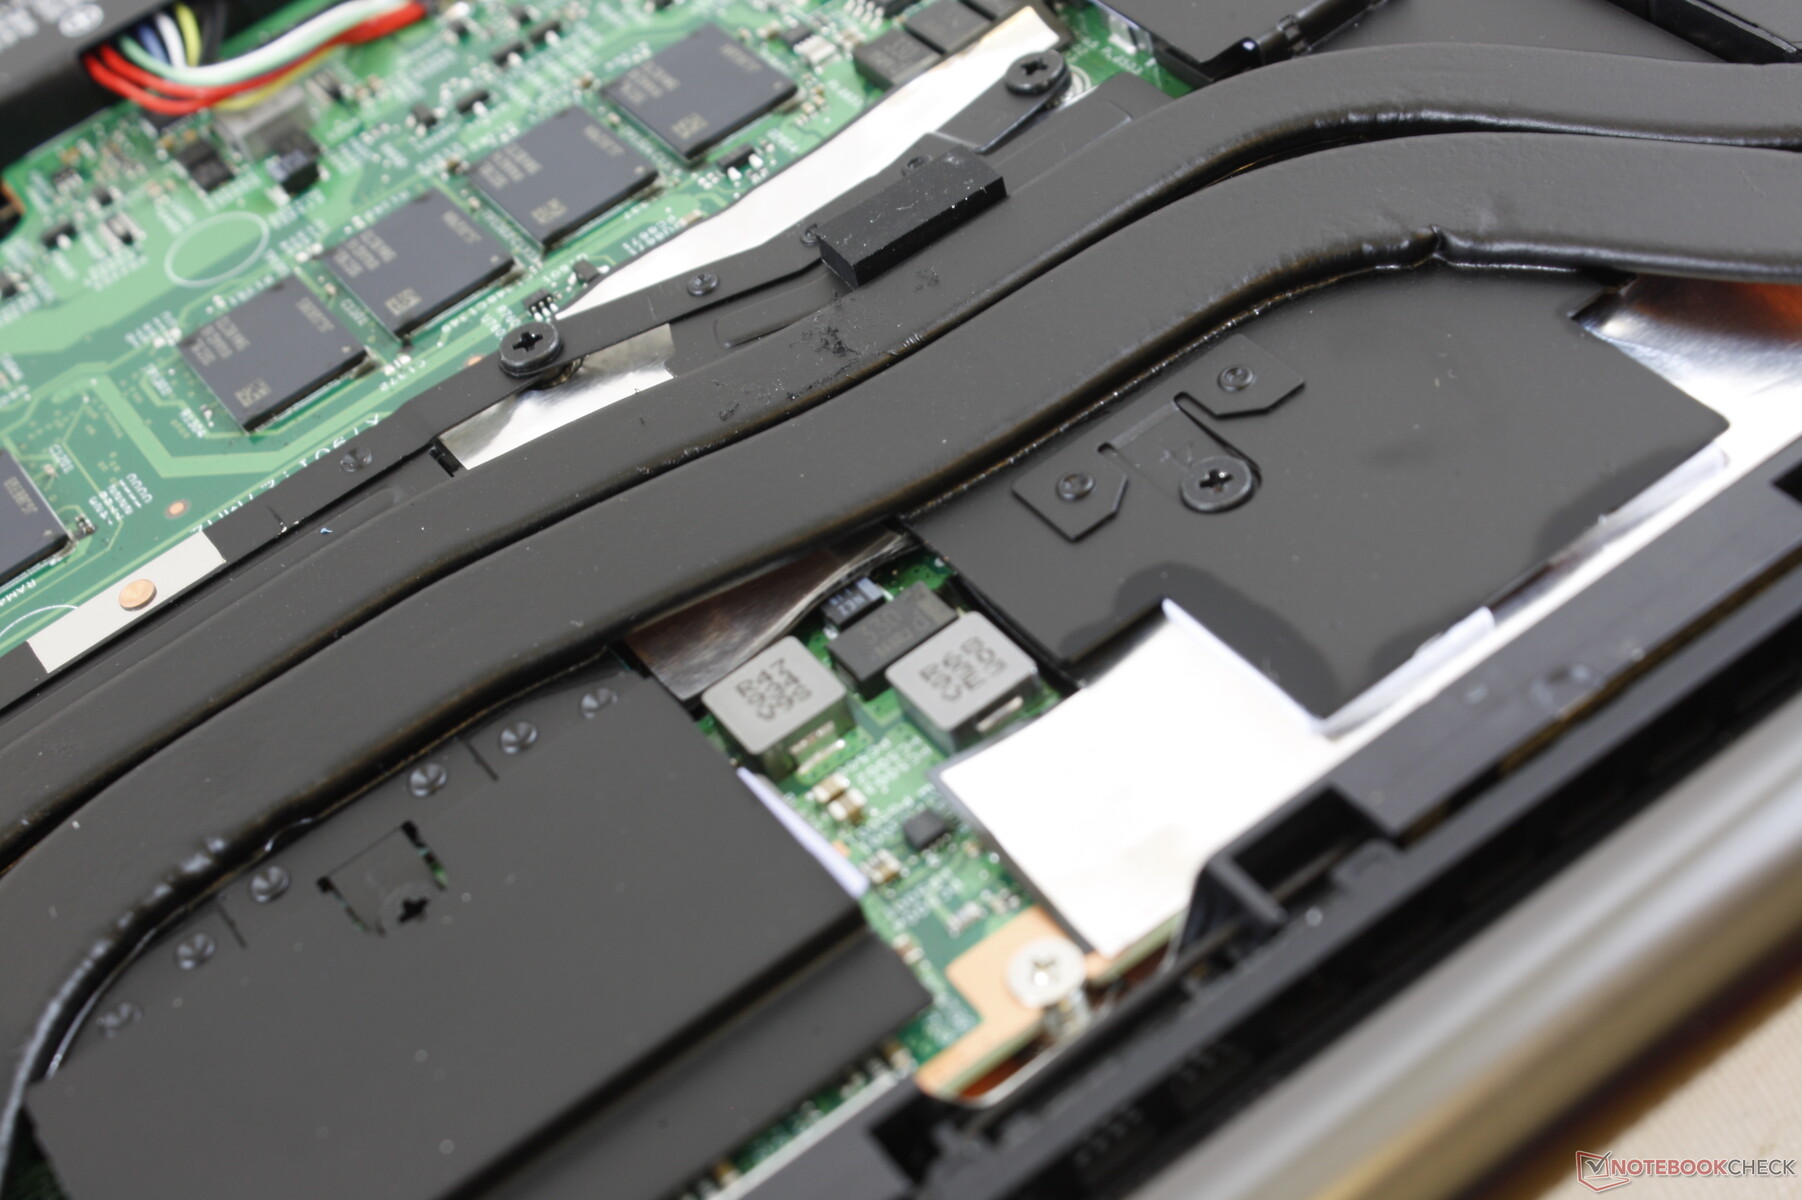
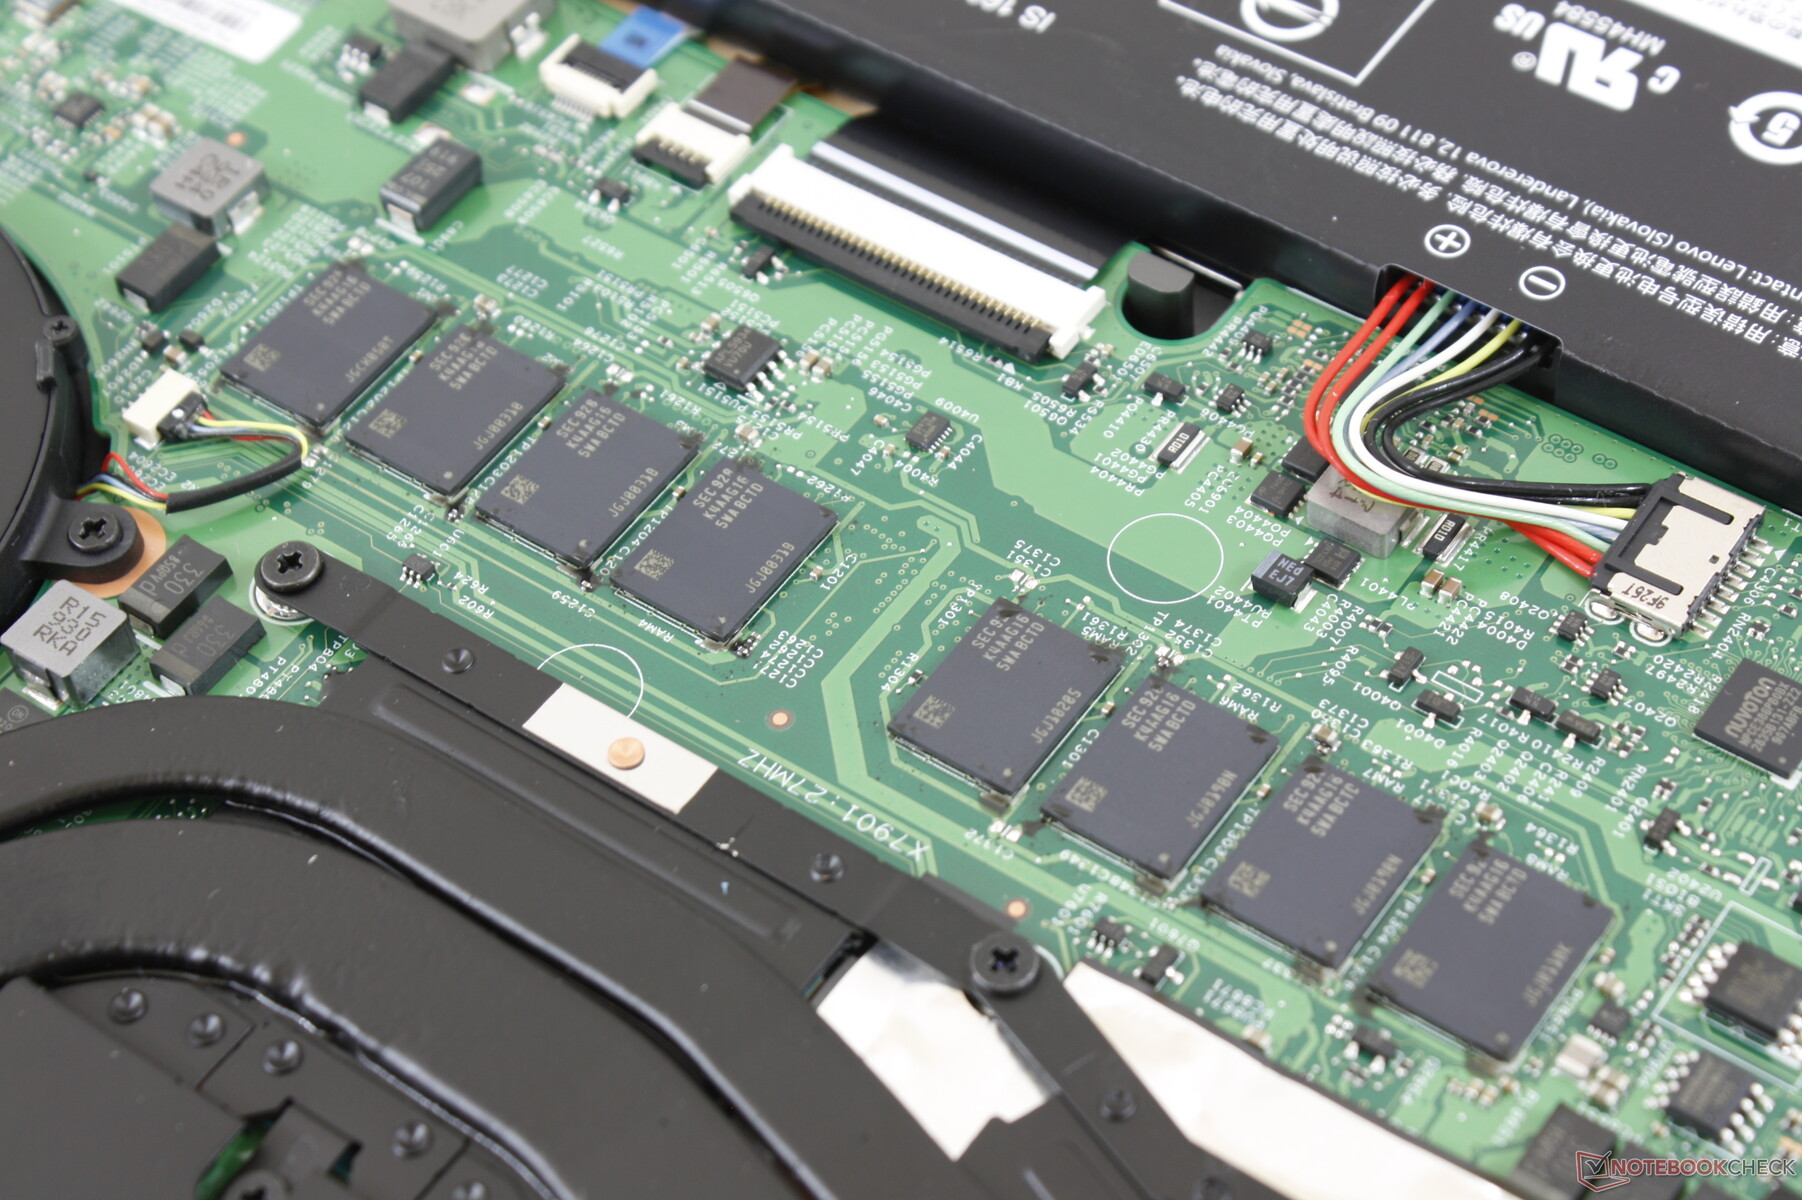
Maintenance
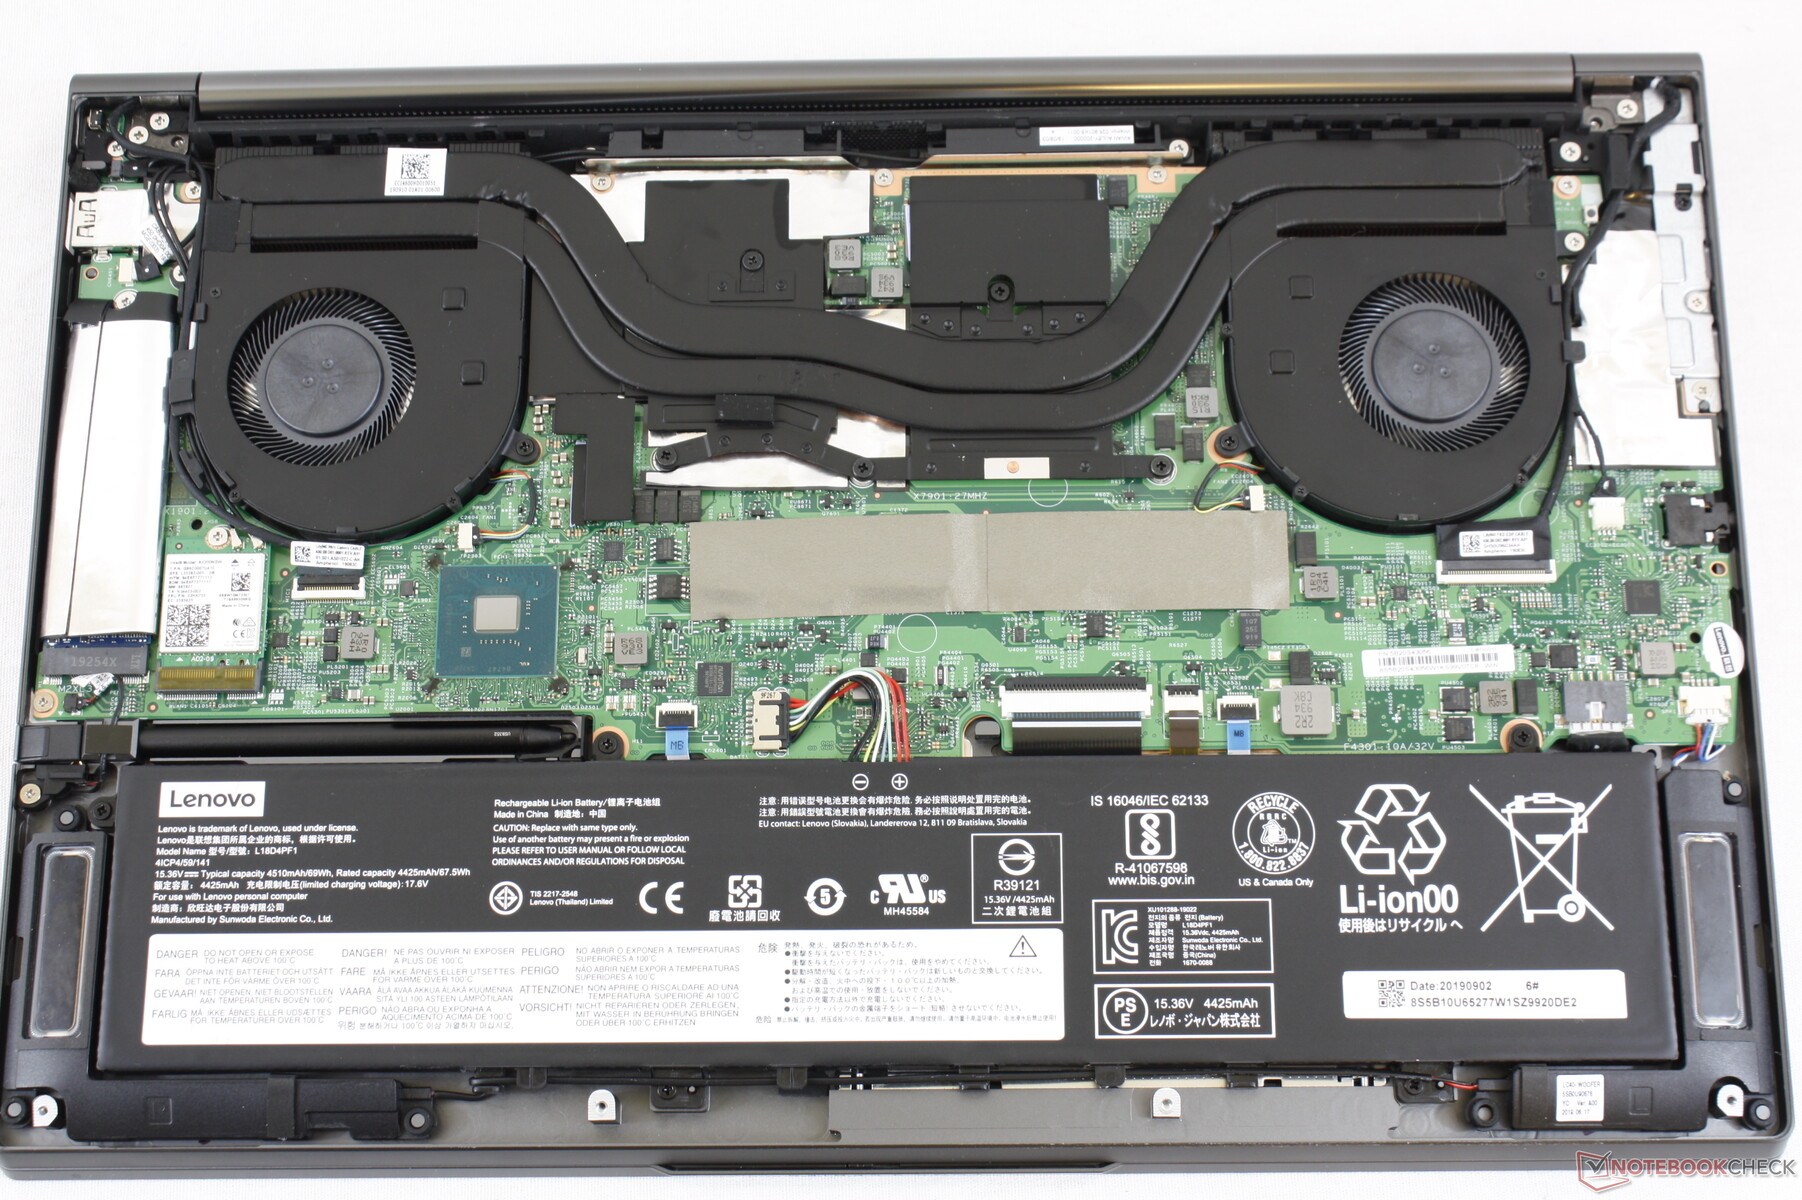
A T5 Torx screw is required to pry open the bottom panel. Once inside, users will be able to service the M.2 SSD, WLAN module, and battery. System RAM is soldered.
Accessories and Warranty
There are no included extras in the box aside from the active stylus housed in the laptop itself. A USB Type-C to HDMI adapter would have been appreciated since the system integrates no HDMI ports.
The standard one-year limited warranty applies. Protection can be extended up to four years for an additional $100 USD with on-site coverage options.
Input Devices
Keyboard
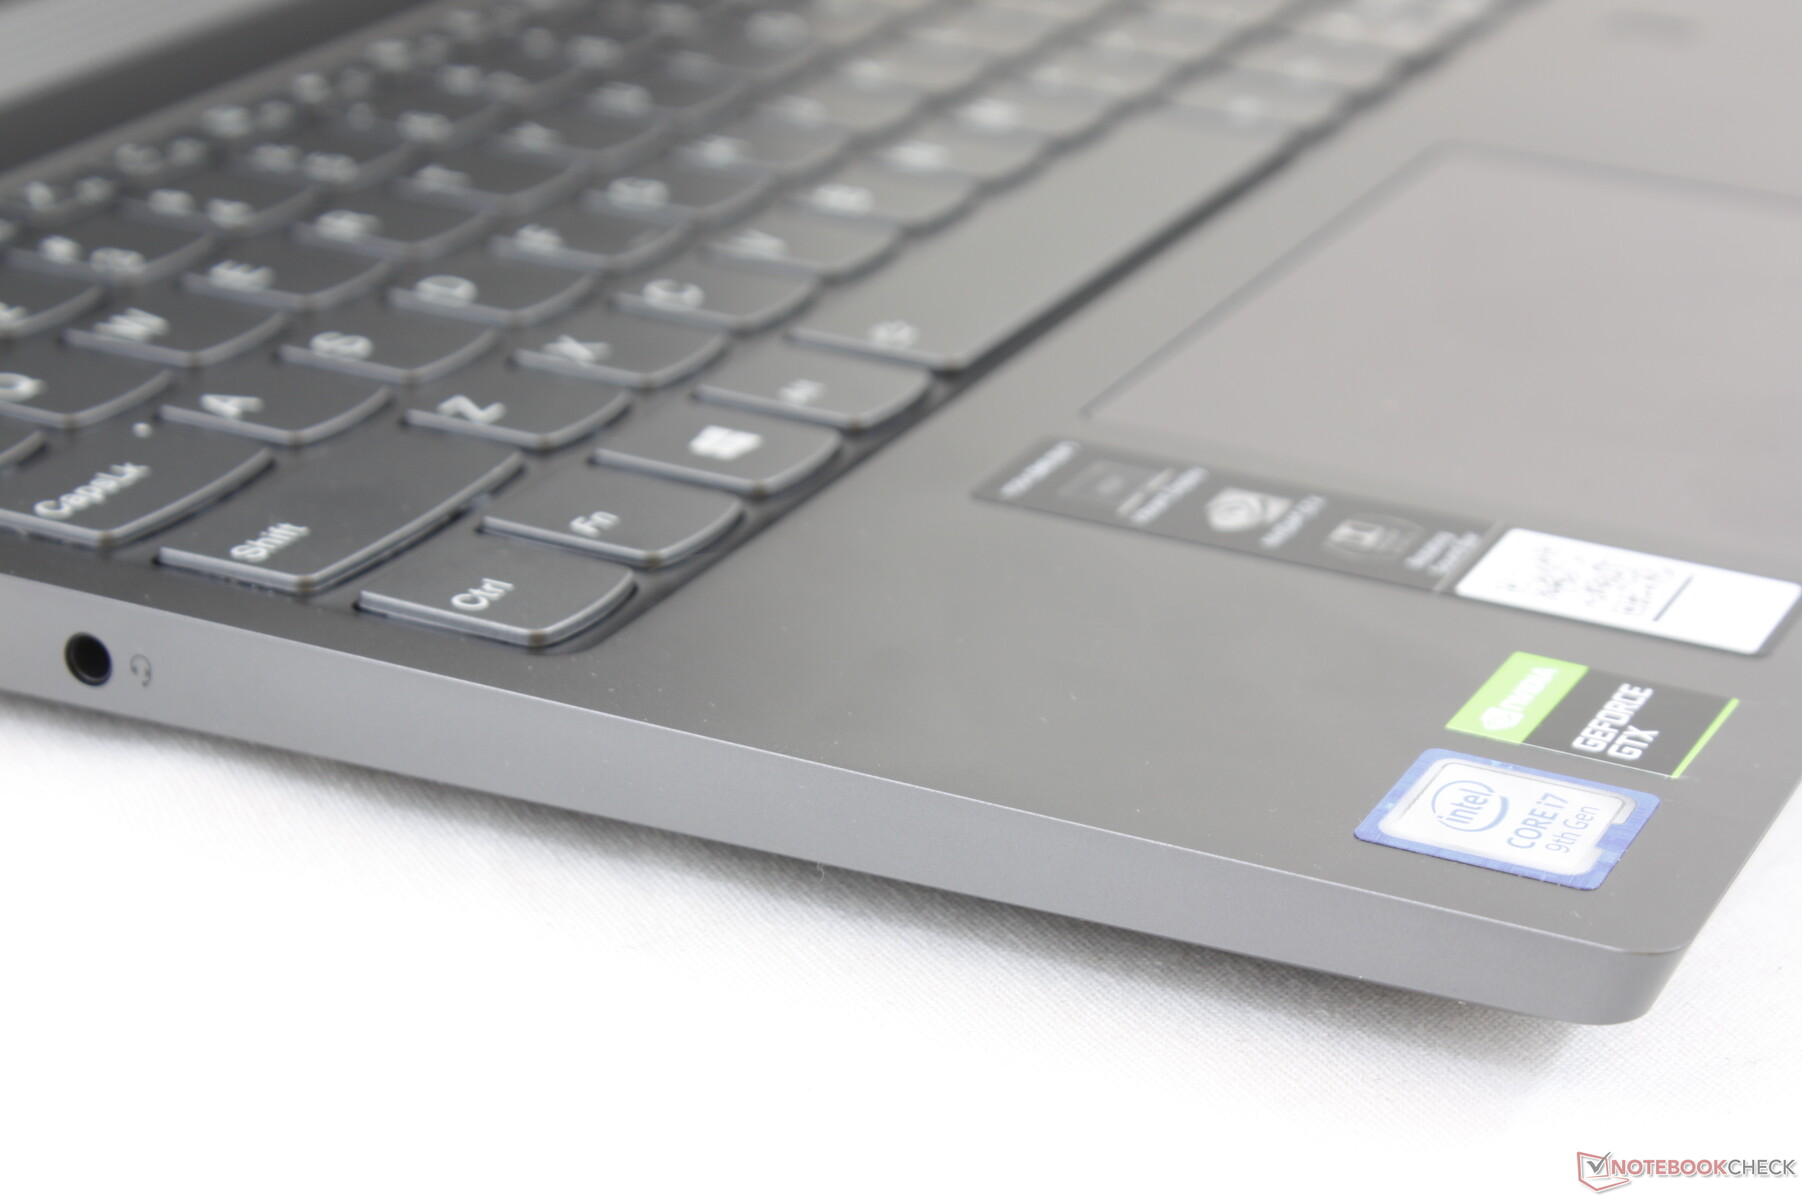
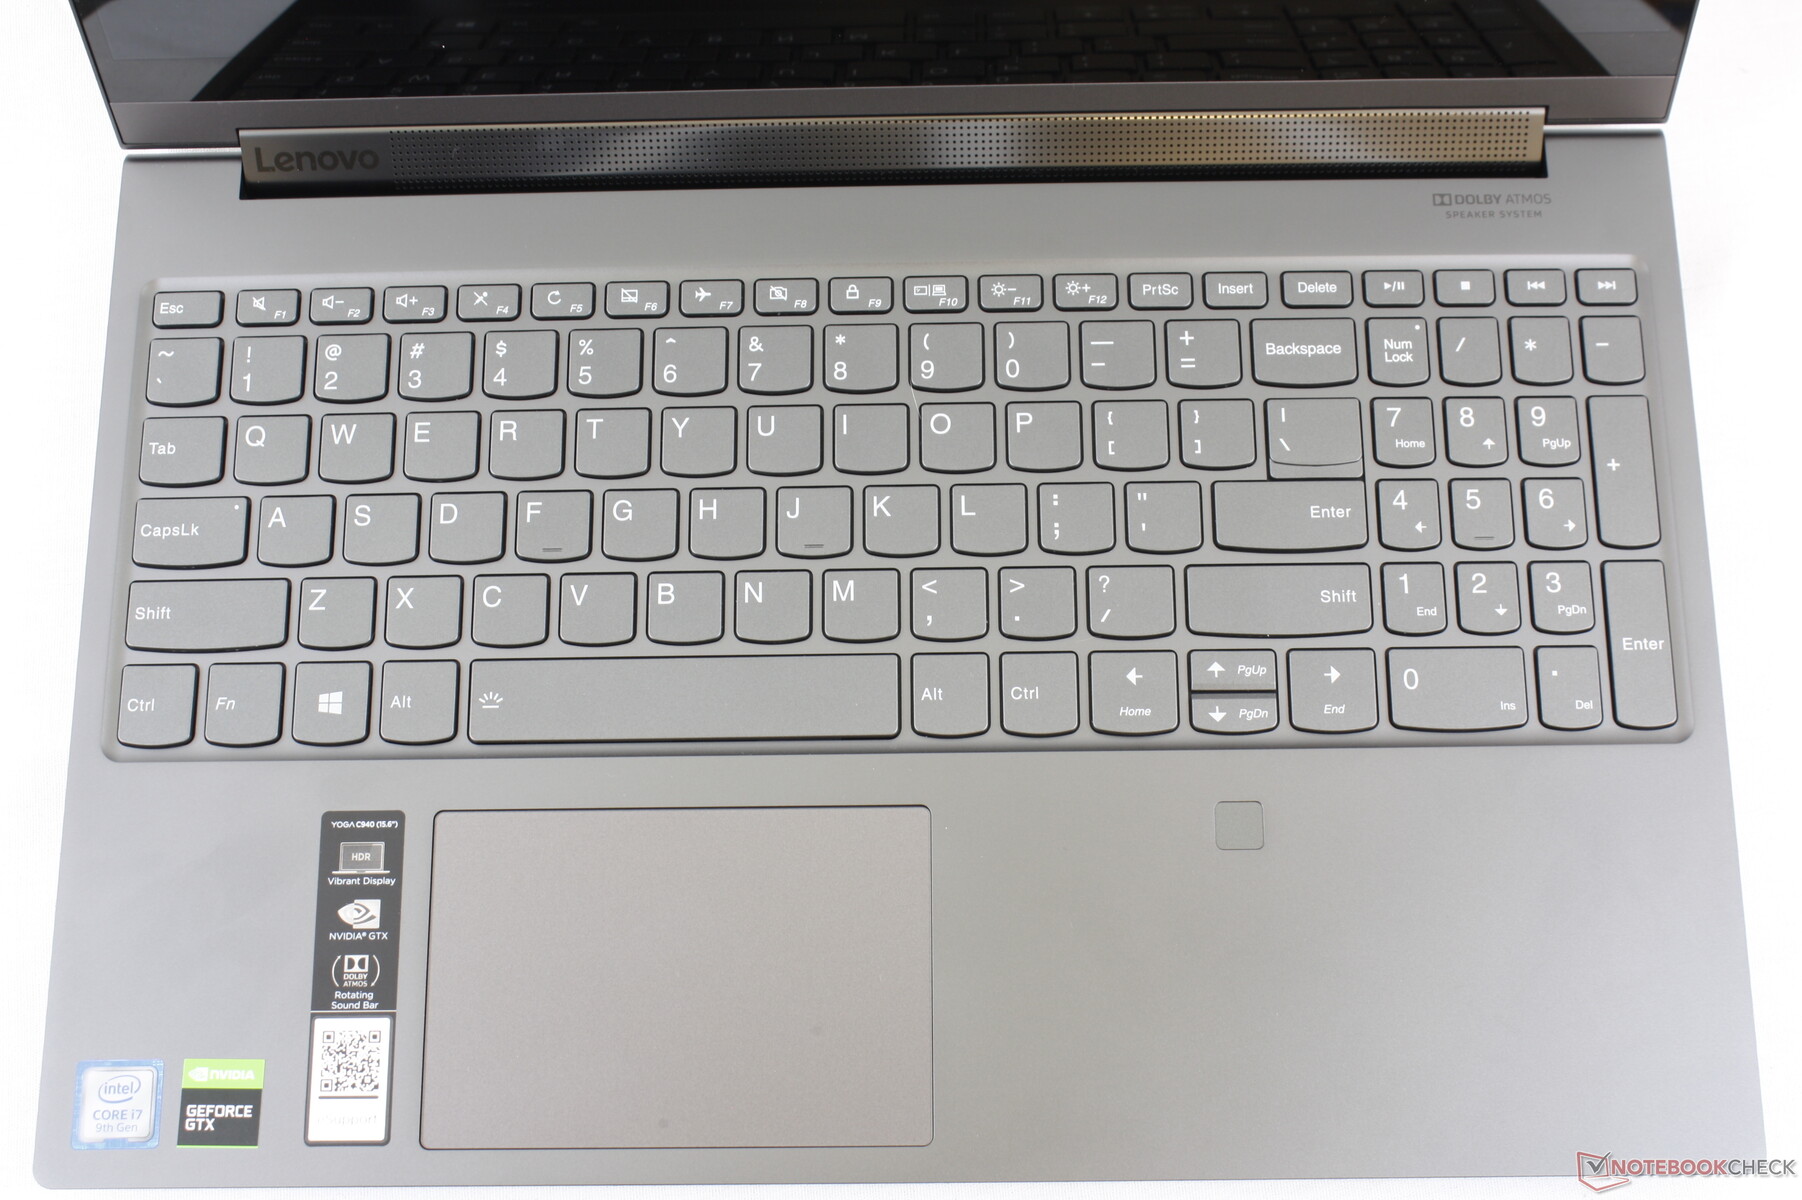
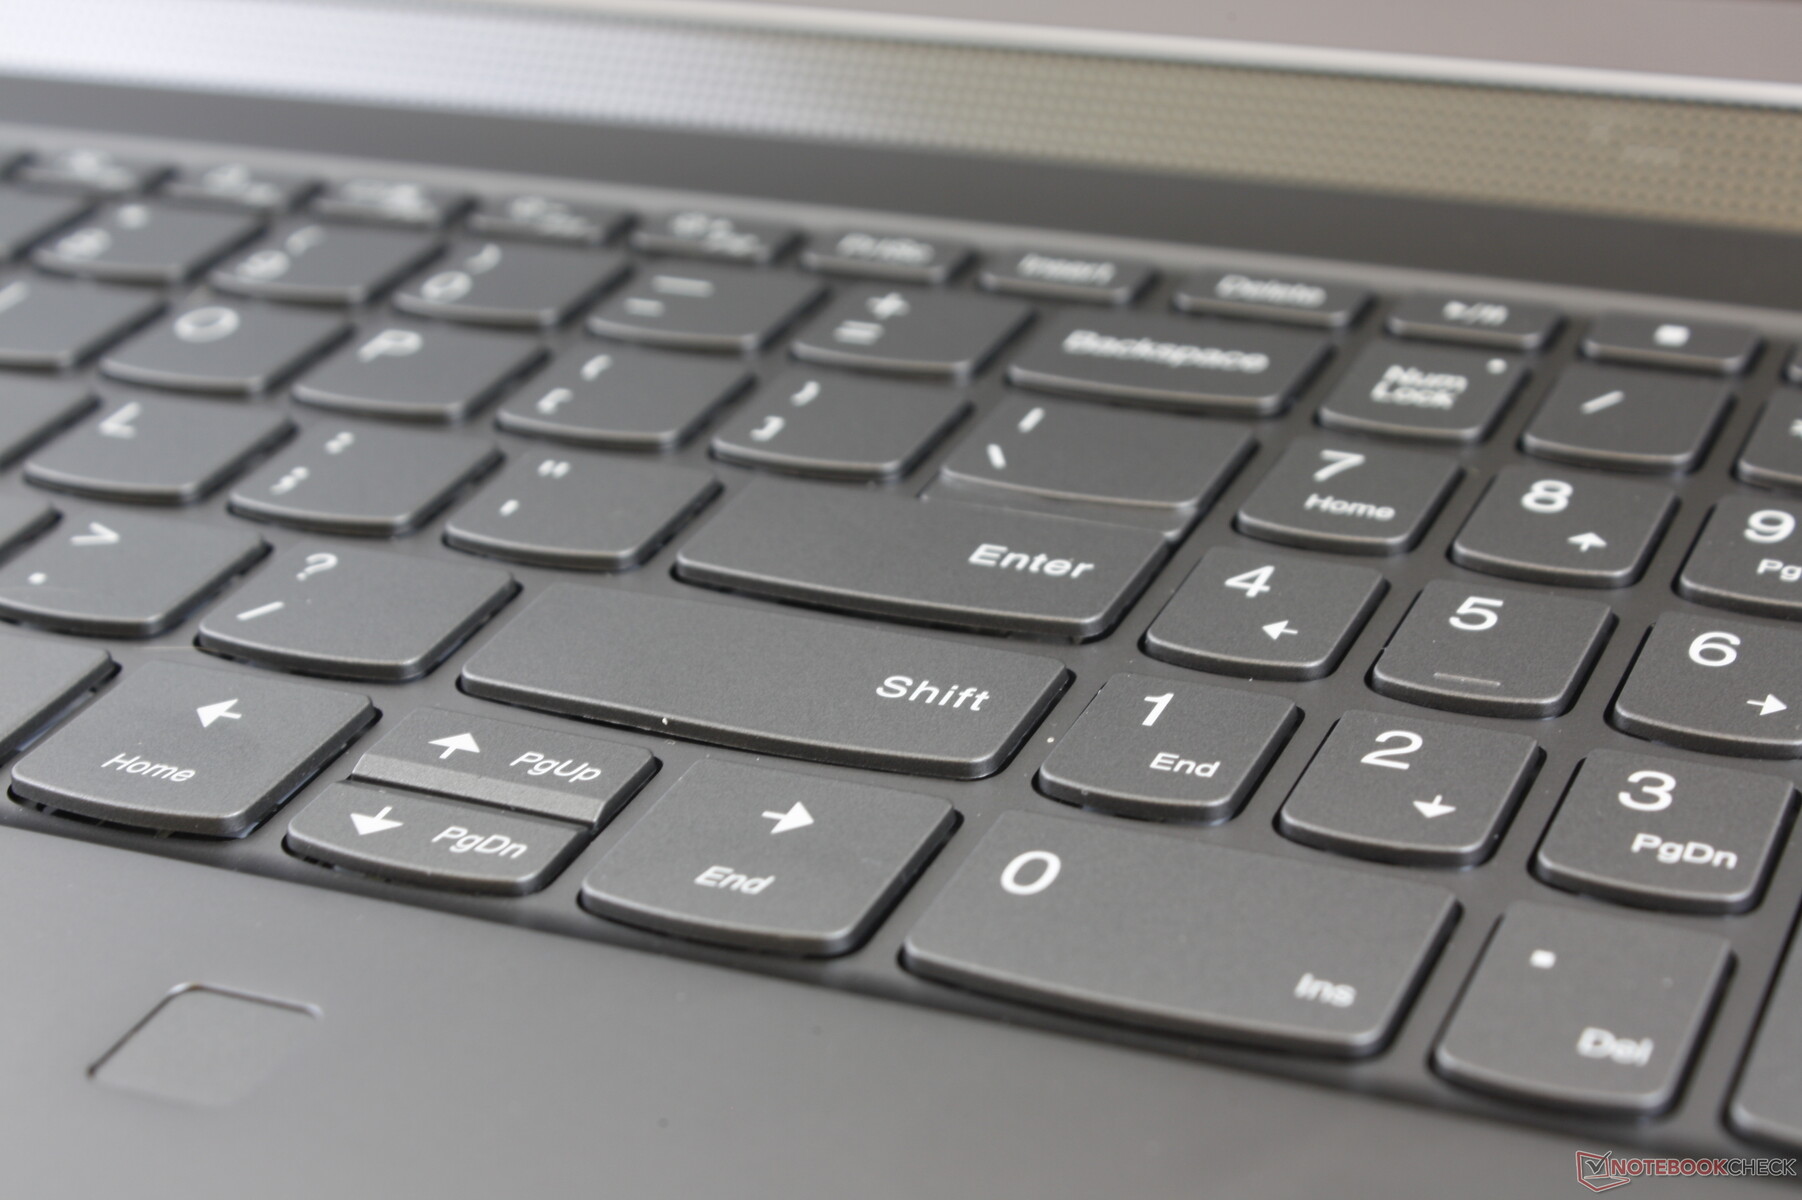
Key feedback and size are the same as they are on the 14-inch Yoga C940 but with an integrated NumPad to make use of the roomier 15.6-inch screen size. Unfortunately, the NumPad keys are narrower than the main QWERTY keys and so they do not feel as firm. The keyboards on most ThinkPads like the T590 or X1 Carbon feel more robust with deeper key travel than what the Yoga C940 has to offer. The keys on the competing Spectre x360 15 are firmer and more satisfying to type on as well.
A two-level white keyboard backlight is included. All key labels are illuminated unlike some keys on the Gigabyte Aero series.
Touchpad
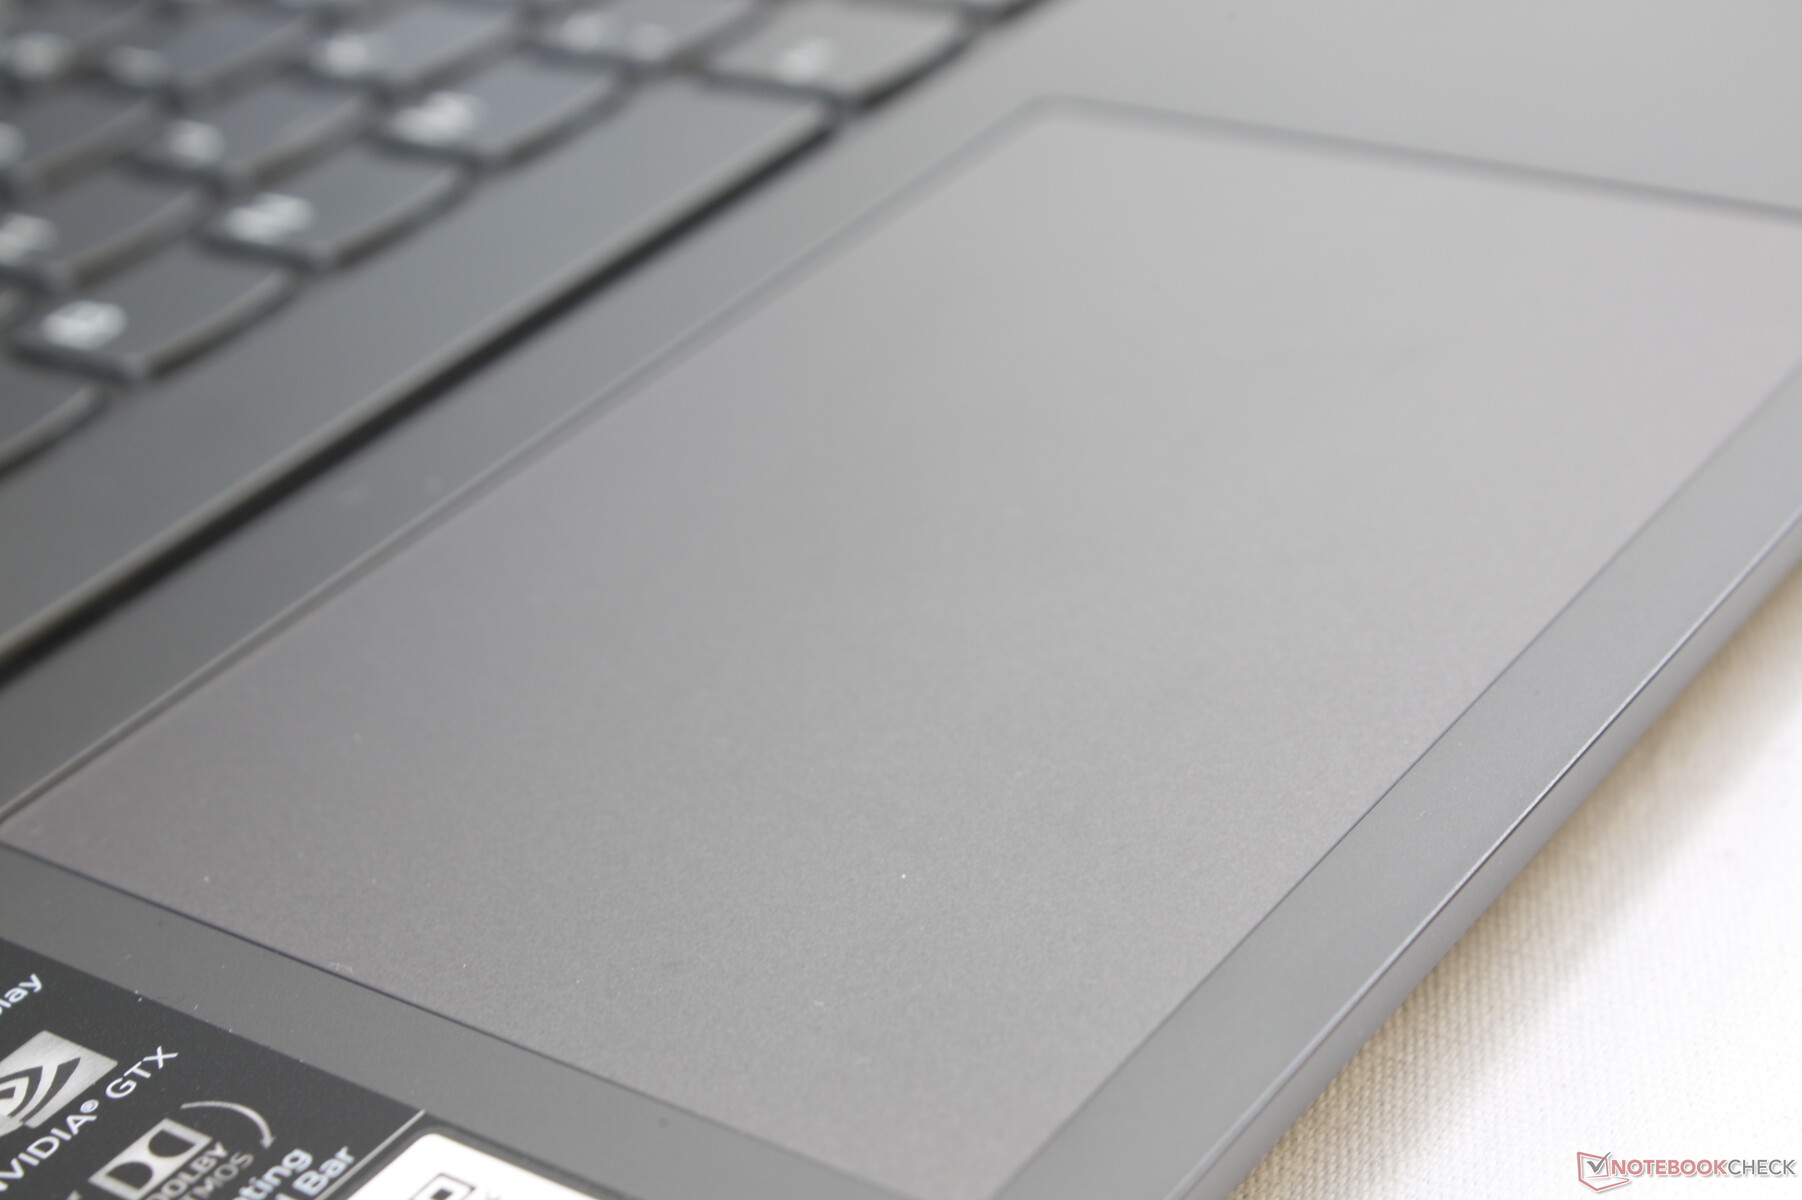
The clickpad (10.5 x 7 cm) is slightly smaller than the one on the XPS 15 (10.5 x 8.5 cm). It's also the same size as the clickpad on the smaller 14-inch Yoga C940 and so it's a bit disappointing that Lenovo chose not to utilize the extra space available for a larger surface area. The smooth glide and spongy feedback are also exactly as they are on the smaller 14-inch Yoga C940 for better or worse.

Display
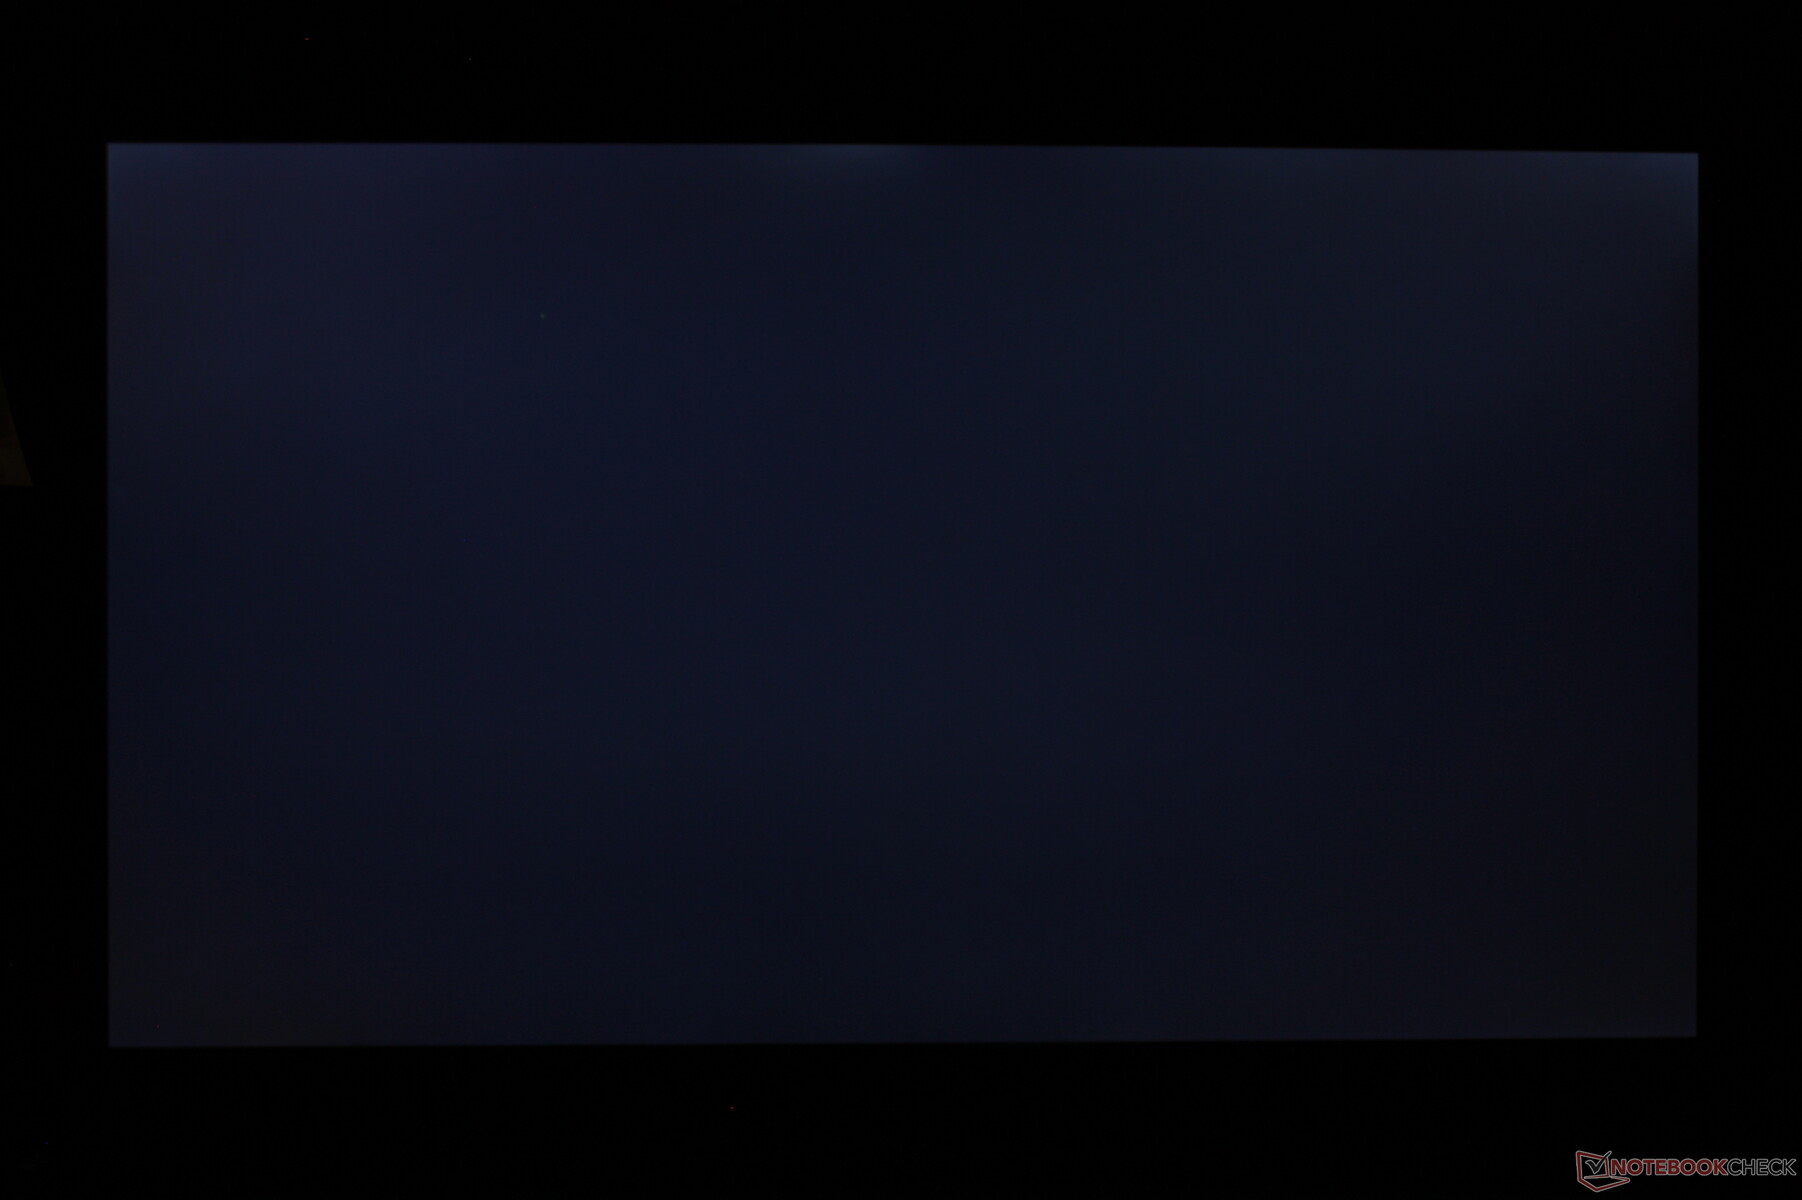
Our unit comes with a 1080p IPS touchscreen which, despite being the base option, is able to offer most features of a pricier panel. The backlight in particular is brighter than most Ultrabooks as our independent measurements can confirm Lenovo's advertisement claim of 500 nits even though uniformity could have been better. Contrast is also better than expected at nearly 1900:1 for better video playback. While the LG Philips LP156WFC panel series can be found on many other 15.6-inch laptops like the Asus VivoBook S15 or Lenovo ThinkPad T590, this specific LP156WFC-SPU1 panel on our Lenovo is the first in our database.
The main drawbacks of the display are the slow black-to-black and gray-to-gray response times. Whereas most desktop monitors offer 5 ms or 8 ms response times, the panel here is at 21 ms for more noticeable ghosting. This isn't an issue if merely word processing or video streaming, but the blurring becomes apparent when playing fast-paced games like Rocket League or most first-person shooters.

| |||||||||||||||||||||||||
Brightness Distribution: 82 %
Center on Battery: 484.8 cd/m²
Contrast: 1865:1 (Black: 0.26 cd/m²)
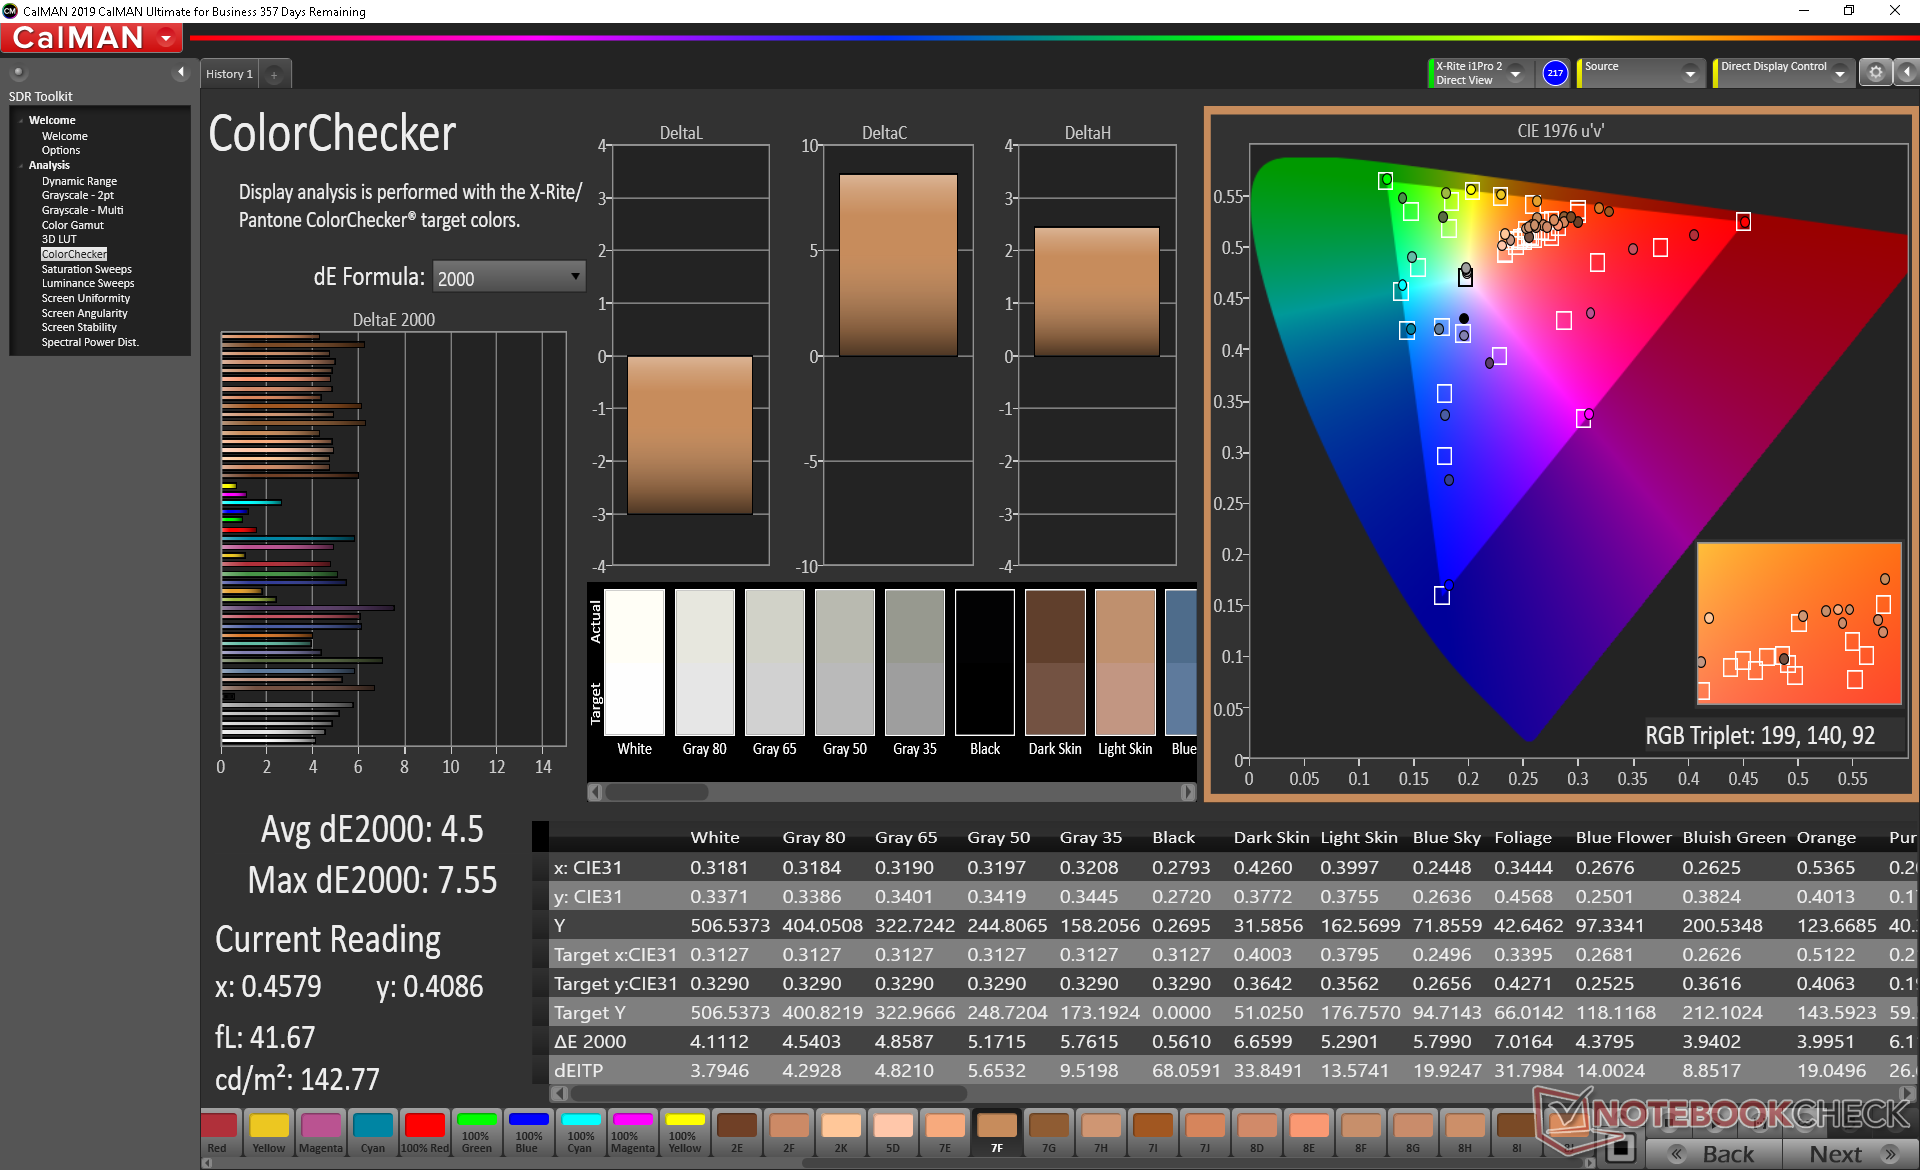
ΔE ColorChecker Calman: 4.5 | ∀{0.5-29.43 Ø4.73}
calibrated: 1.19
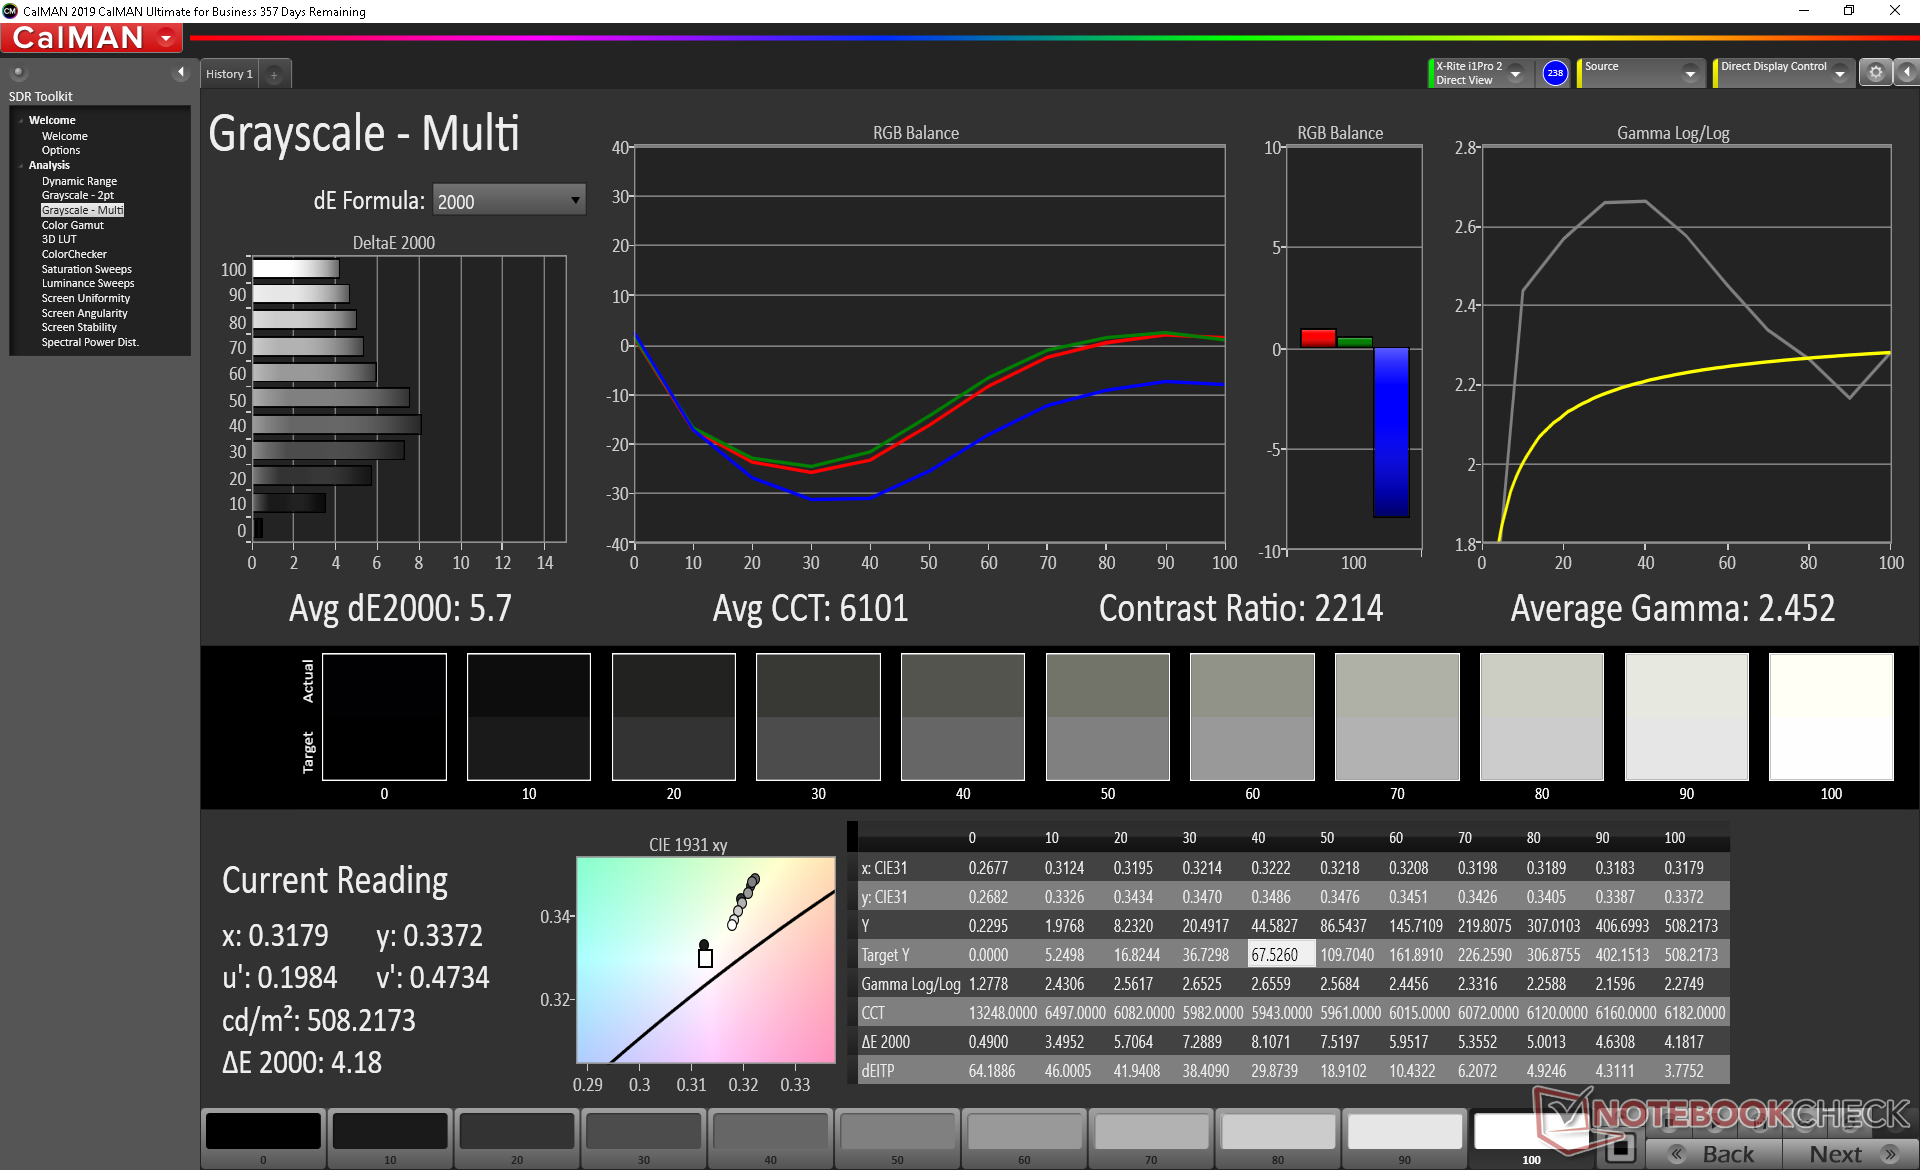
ΔE Greyscale Calman: 5.7 | ∀{0.09-98 Ø4.97}
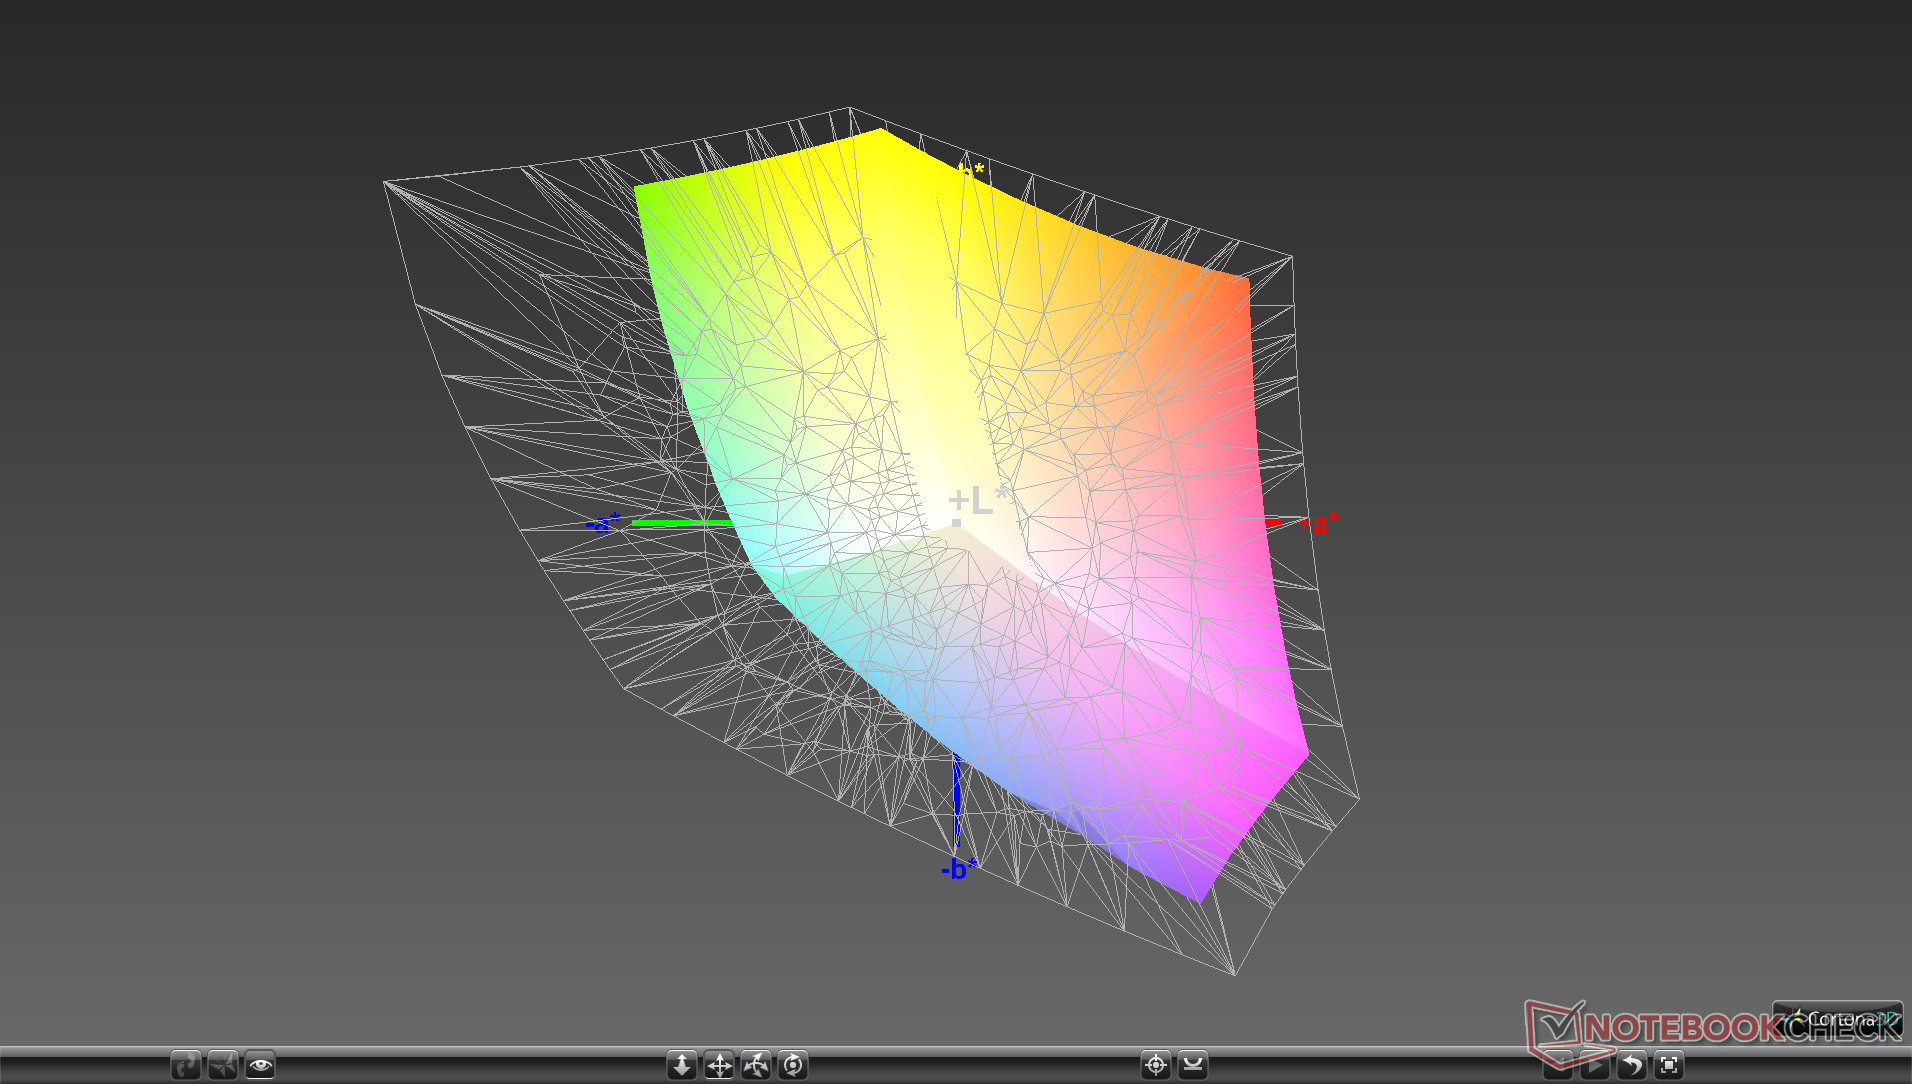
92.8% sRGB (Argyll 1.6.3 3D)
58.7% AdobeRGB 1998 (Argyll 1.6.3 3D)
63.6% AdobeRGB 1998 (Argyll 3D)
92.7% sRGB (Argyll 3D)
61.5% Display P3 (Argyll 3D)
Gamma: 2.45
CCT: 6101 K
| Lenovo Yoga C940-15IRH LG Philips LP156WFC-SPU1, IPS, 15.6", 1920x1080 | Dell XPS 15 7590 9980HK GTX 1650 Samsung 156WR04, SDCA029, OLED, 15.6", 3840x2160 | Asus ZenBook 15 UX534FT-DB77 BOE NV156FHM-N63, IPS, 15.6", 1920x1080 | Lenovo Ideapad 720S-15IKB 81AC001AGE Chi Mei CMN15E8 / N156HCE-EN1 CMN, IPS, 15.6", 1920x1080 | HP Gaming Pavilion 15-dk0009ng LG Philips LGD05FE, IPS, 15.6", 1920x1080 | MSI GP65 Leopard 9SE-225US LG Philips LGD0625, IPS, 15.6", 1920x1080 | HP Spectre x360 15-df0126ng AU Optronics AUO30EB, IPS, 15.6", 3840x2160 | |
|---|---|---|---|---|---|---|---|
| Display | 31% | 1% | 0% | 3% | 4% | 7% | |
| Display P3 Coverage (%) | 61.5 | 88.1 43% | 66.6 8% | 63.6 3% | 64.2 4% | 64.8 5% | 68.1 11% |
| sRGB Coverage (%) | 92.7 | 99.6 7% | 87.7 -5% | 89.4 -4% | 95.1 3% | 96.2 4% | 94.2 2% |
| AdobeRGB 1998 Coverage (%) | 63.6 | 91.8 44% | 64.1 1% | 64.3 1% | 65.8 3% | 66.3 4% | 68.4 8% |
| Response Times | 94% | 12% | 31% | 69% | 76% | -2% | |
| Response Time Grey 50% / Grey 80% * (ms) | 48.4 ? | 2.3 ? 95% | 41.2 ? 15% | 34 ? 30% | 16.4 ? 66% | 9.6 ? 80% | 57 ? -18% |
| Response Time Black / White * (ms) | 36.4 ? | 2.4 ? 93% | 33.2 ? 9% | 25 ? 31% | 10.4 ? 71% | 10.4 ? 71% | 31 ? 15% |
| PWM Frequency (Hz) | 59.5 ? | 25000 ? | |||||
| Screen | -1% | -36% | -12% | 5% | 2% | -16% | |
| Brightness middle (cd/m²) | 484.8 | 421.2 -13% | 312.6 -36% | 332 -32% | 345 -29% | 348.3 -28% | 330 -32% |
| Brightness (cd/m²) | 463 | 417 -10% | 290 -37% | 301 -35% | 324 -30% | 327 -29% | 310 -33% |
| Brightness Distribution (%) | 82 | 94 15% | 85 4% | 83 1% | 86 5% | 85 4% | 87 6% |
| Black Level * (cd/m²) | 0.26 | 0.31 -19% | 0.29 -12% | 0.42 -62% | 0.4 -54% | 0.37 -42% | |
| Contrast (:1) | 1865 | 1008 -46% | 1145 -39% | 821 -56% | 871 -53% | 892 -52% | |
| Colorchecker dE 2000 * | 4.5 | 6.06 -35% | 5.78 -28% | 3.73 17% | 1.3 71% | 1.6 64% | 4.03 10% |
| Colorchecker dE 2000 max. * | 7.55 | 11.89 -57% | 8.86 -17% | 6.6 13% | 2.8 63% | 5.07 33% | 6.74 11% |
| Colorchecker dE 2000 calibrated * | 1.19 | 3.78 -218% | 2 -68% | 1.1 8% | 1 16% | 1.96 -65% | |
| Greyscale dE 2000 * | 5.7 | 2.8 51% | 5.4 5% | 3.96 31% | 1.2 79% | 2.3 60% | 4.49 21% |
| Gamma | 2.45 90% | 2.15 102% | 2.21 100% | 2.4 92% | 2.31 95% | 2.203 100% | 2.57 86% |
| CCT | 6101 107% | 6235 104% | 7864 83% | 6921 94% | 6476 100% | 6707 97% | 6744 96% |
| Color Space (Percent of AdobeRGB 1998) (%) | 58.7 | 81 38% | 57.1 -3% | 58 -1% | 60.5 3% | 61 4% | 61 4% |
| Color Space (Percent of sRGB) (%) | 92.8 | 99.6 7% | 87.4 -6% | 89 -4% | 94.9 2% | 96 3% | 94 1% |
| Total Average (Program / Settings) | 41% /
21% | -8% /
-23% | 6% /
-4% | 26% /
13% | 27% /
12% | -4% /
-10% |
* ... smaller is better
Color space covers approximately 93 percent and 59 percent of the sRGB and AdobeRGB standards, respectively, to be indicative of a mid-range IPS panel. While a 4K UHD IPS option is available for the Yoga C940-15, we're unsure of the exact panel or how its colors compare to our FHD SKU. It's too bad that Lenovo does not offer any OLED options for the Yoga C940-15 in the U.S. unlike on the XPS 15, Razer Blade 15, Gigabyte Aero 15, or Alienware m15.
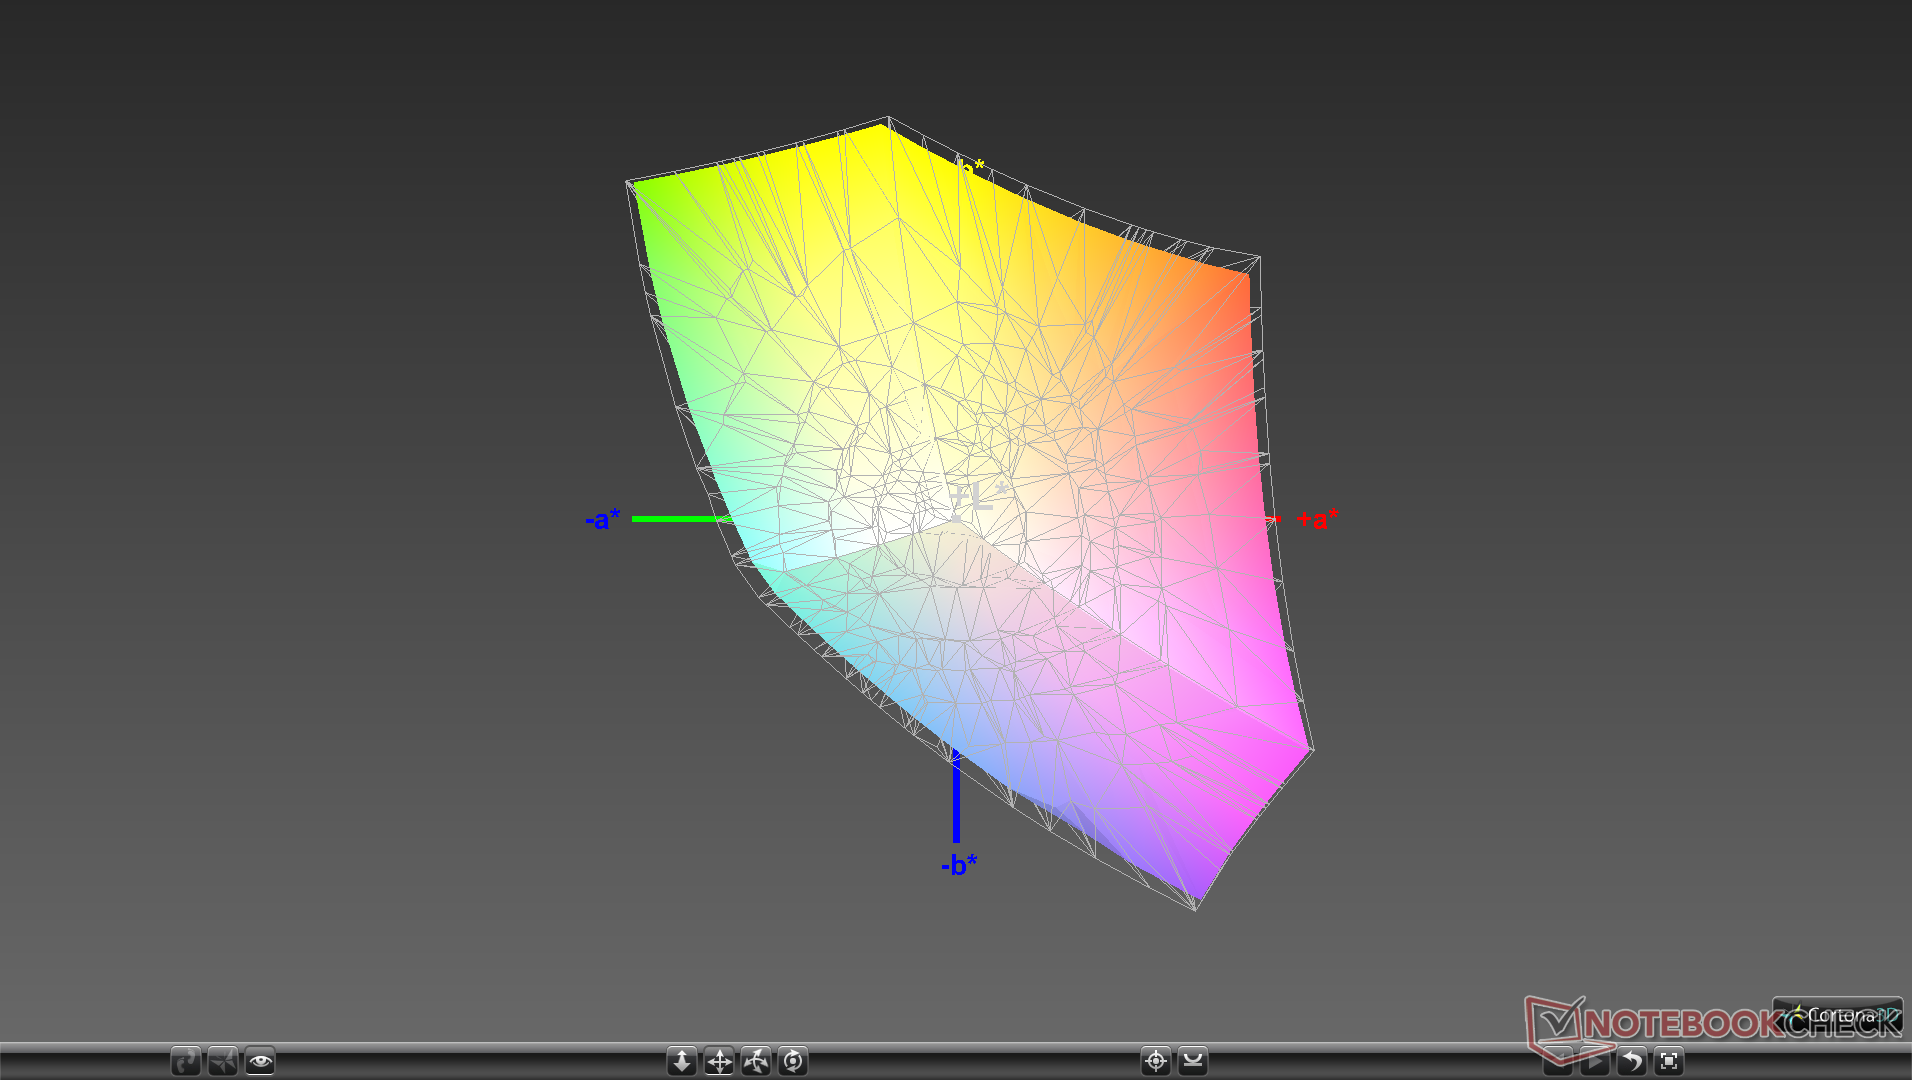
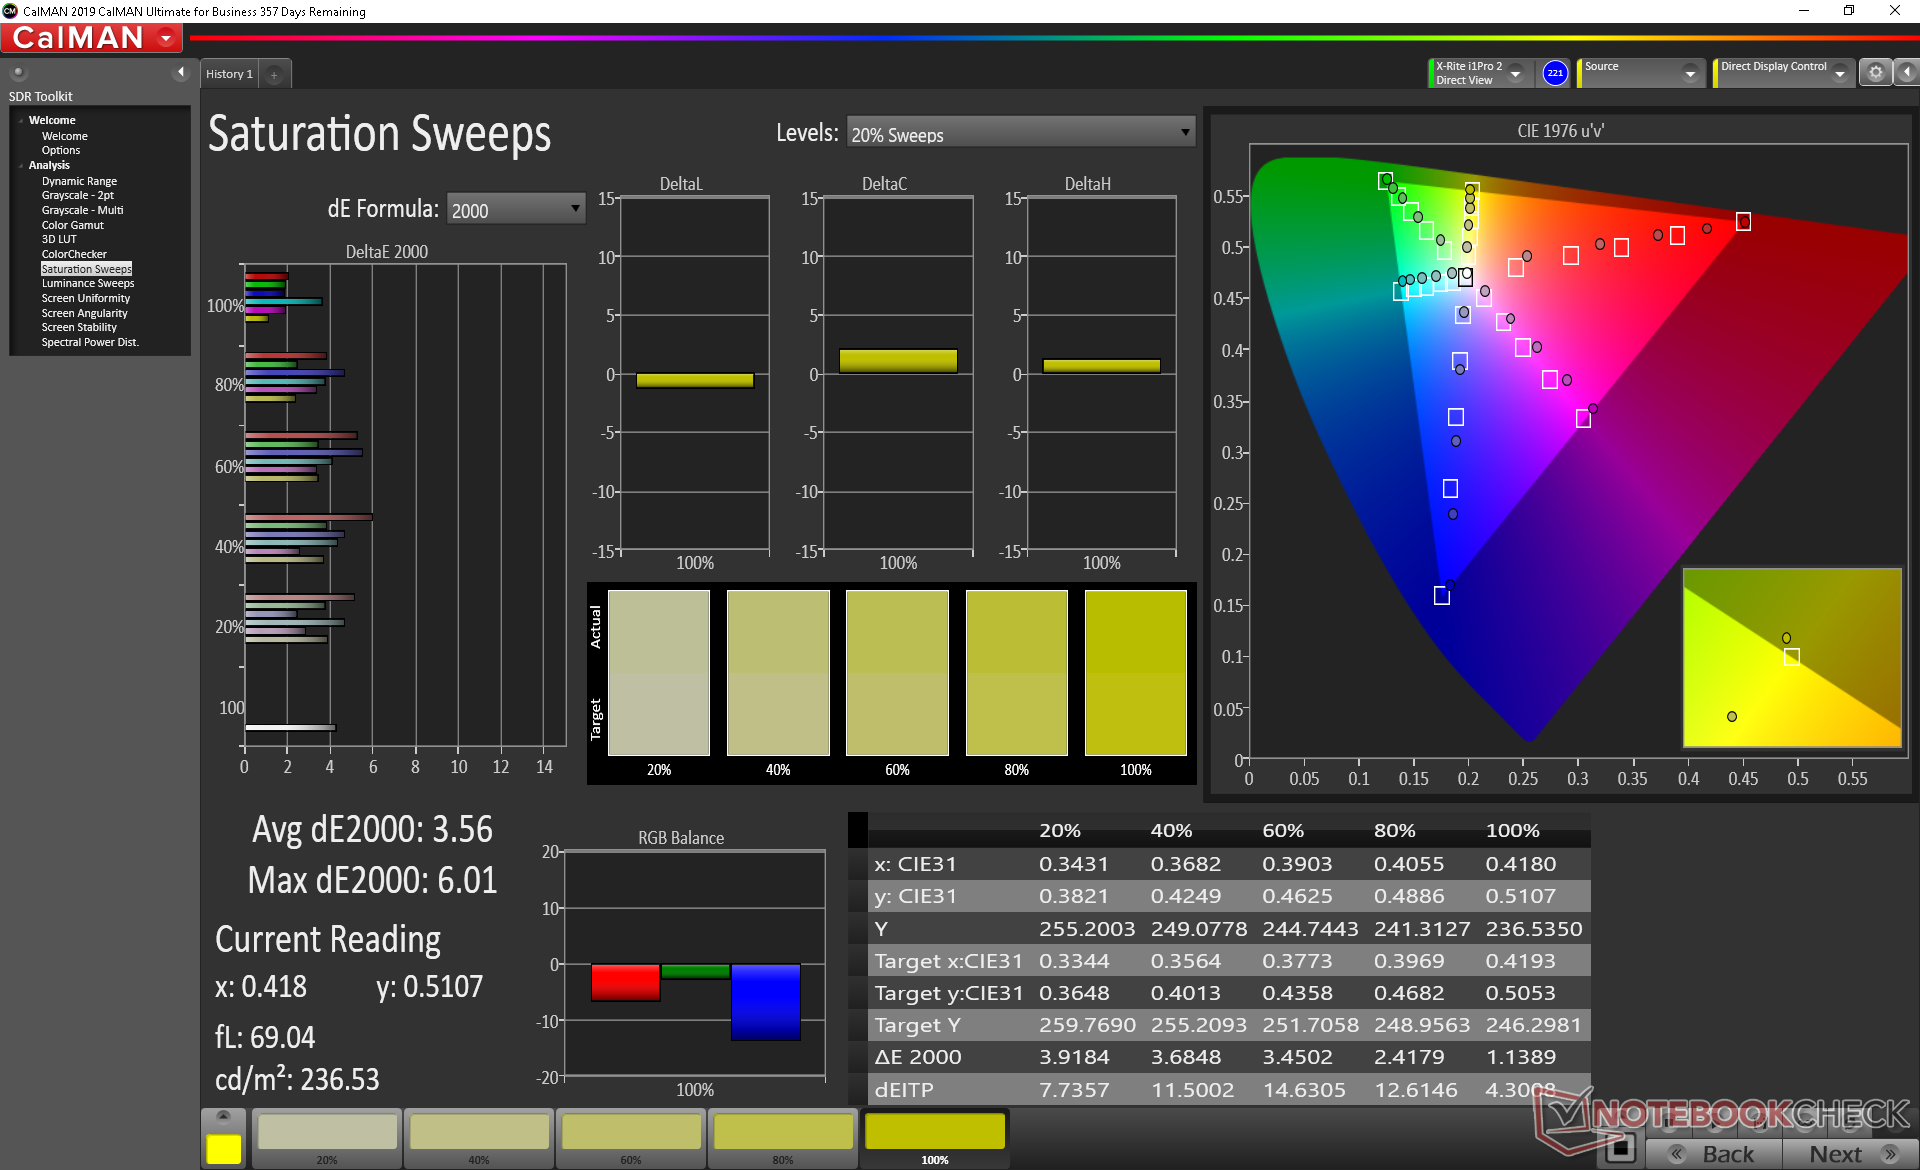
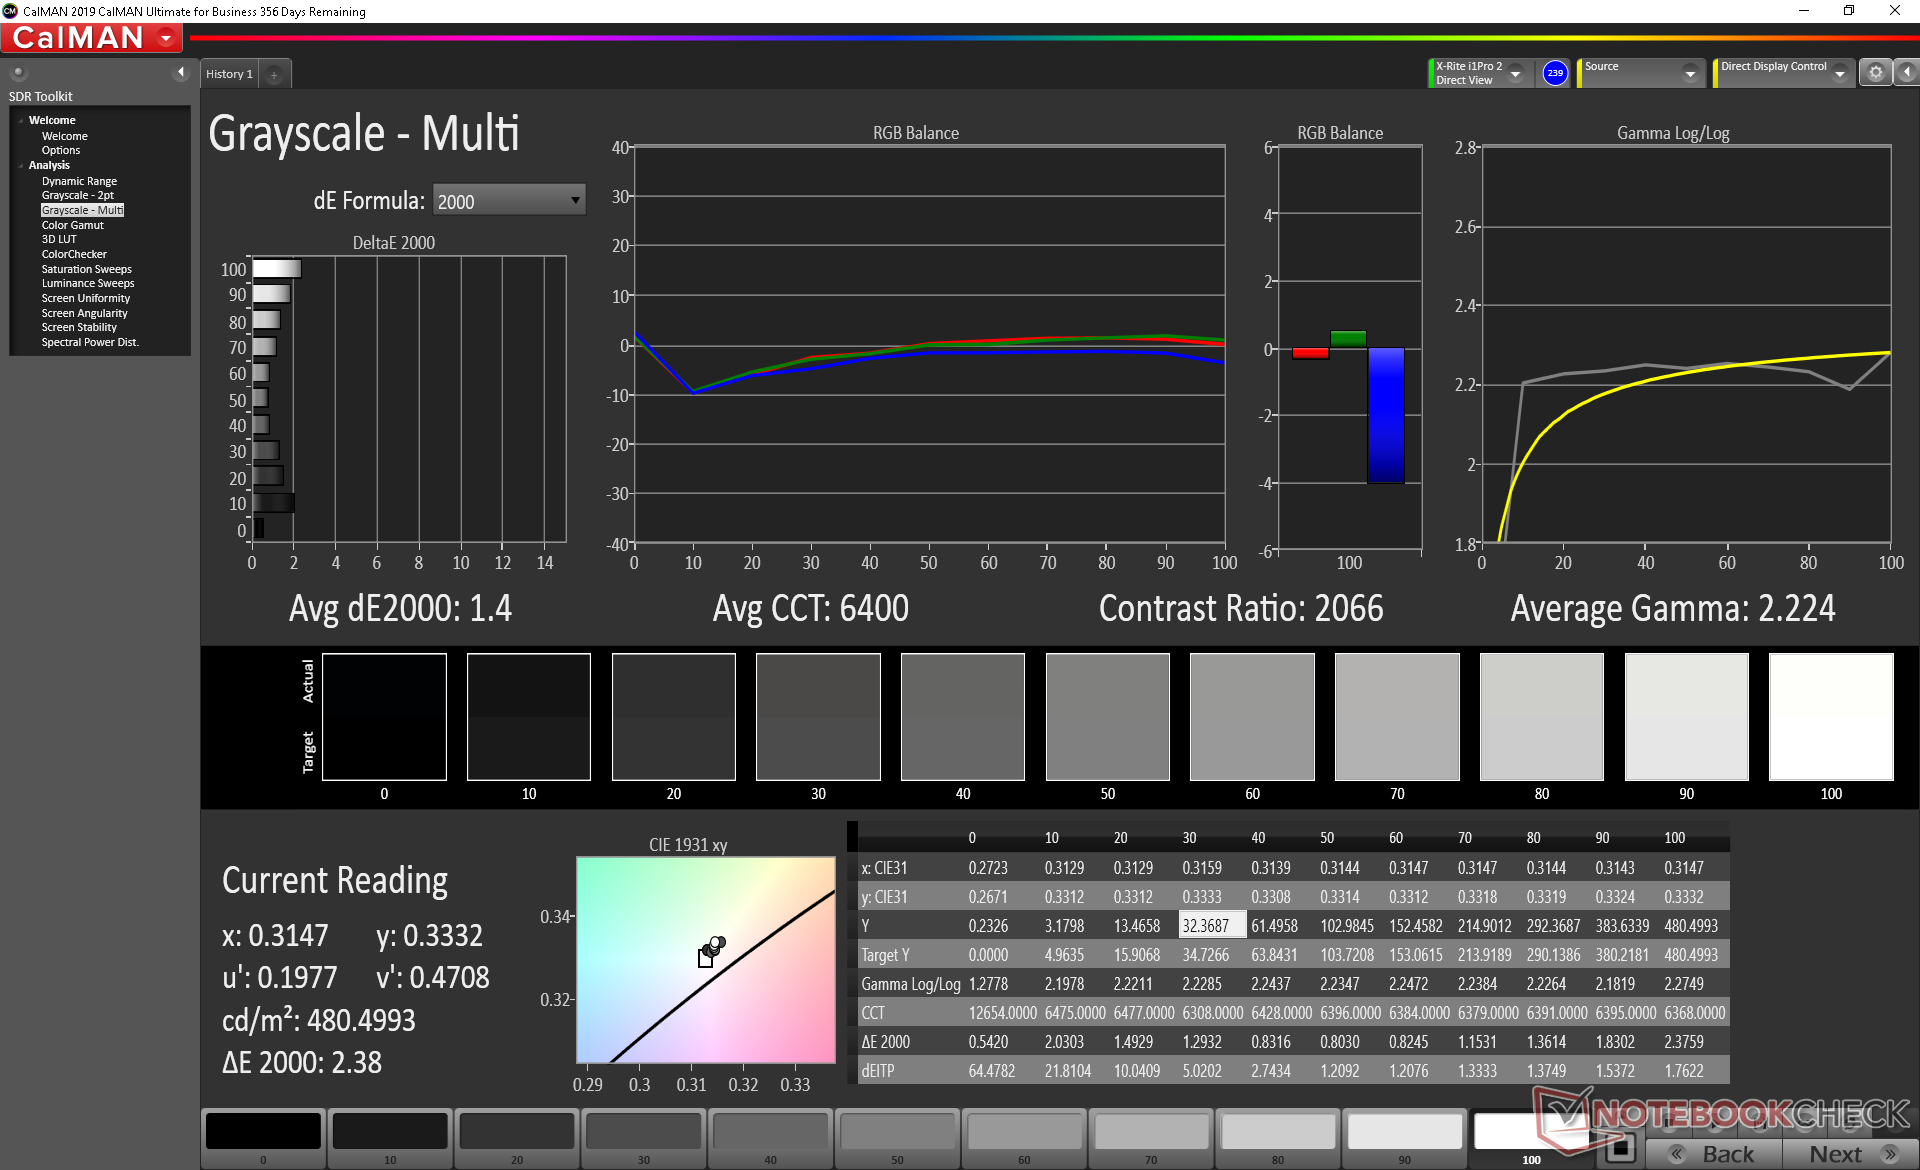
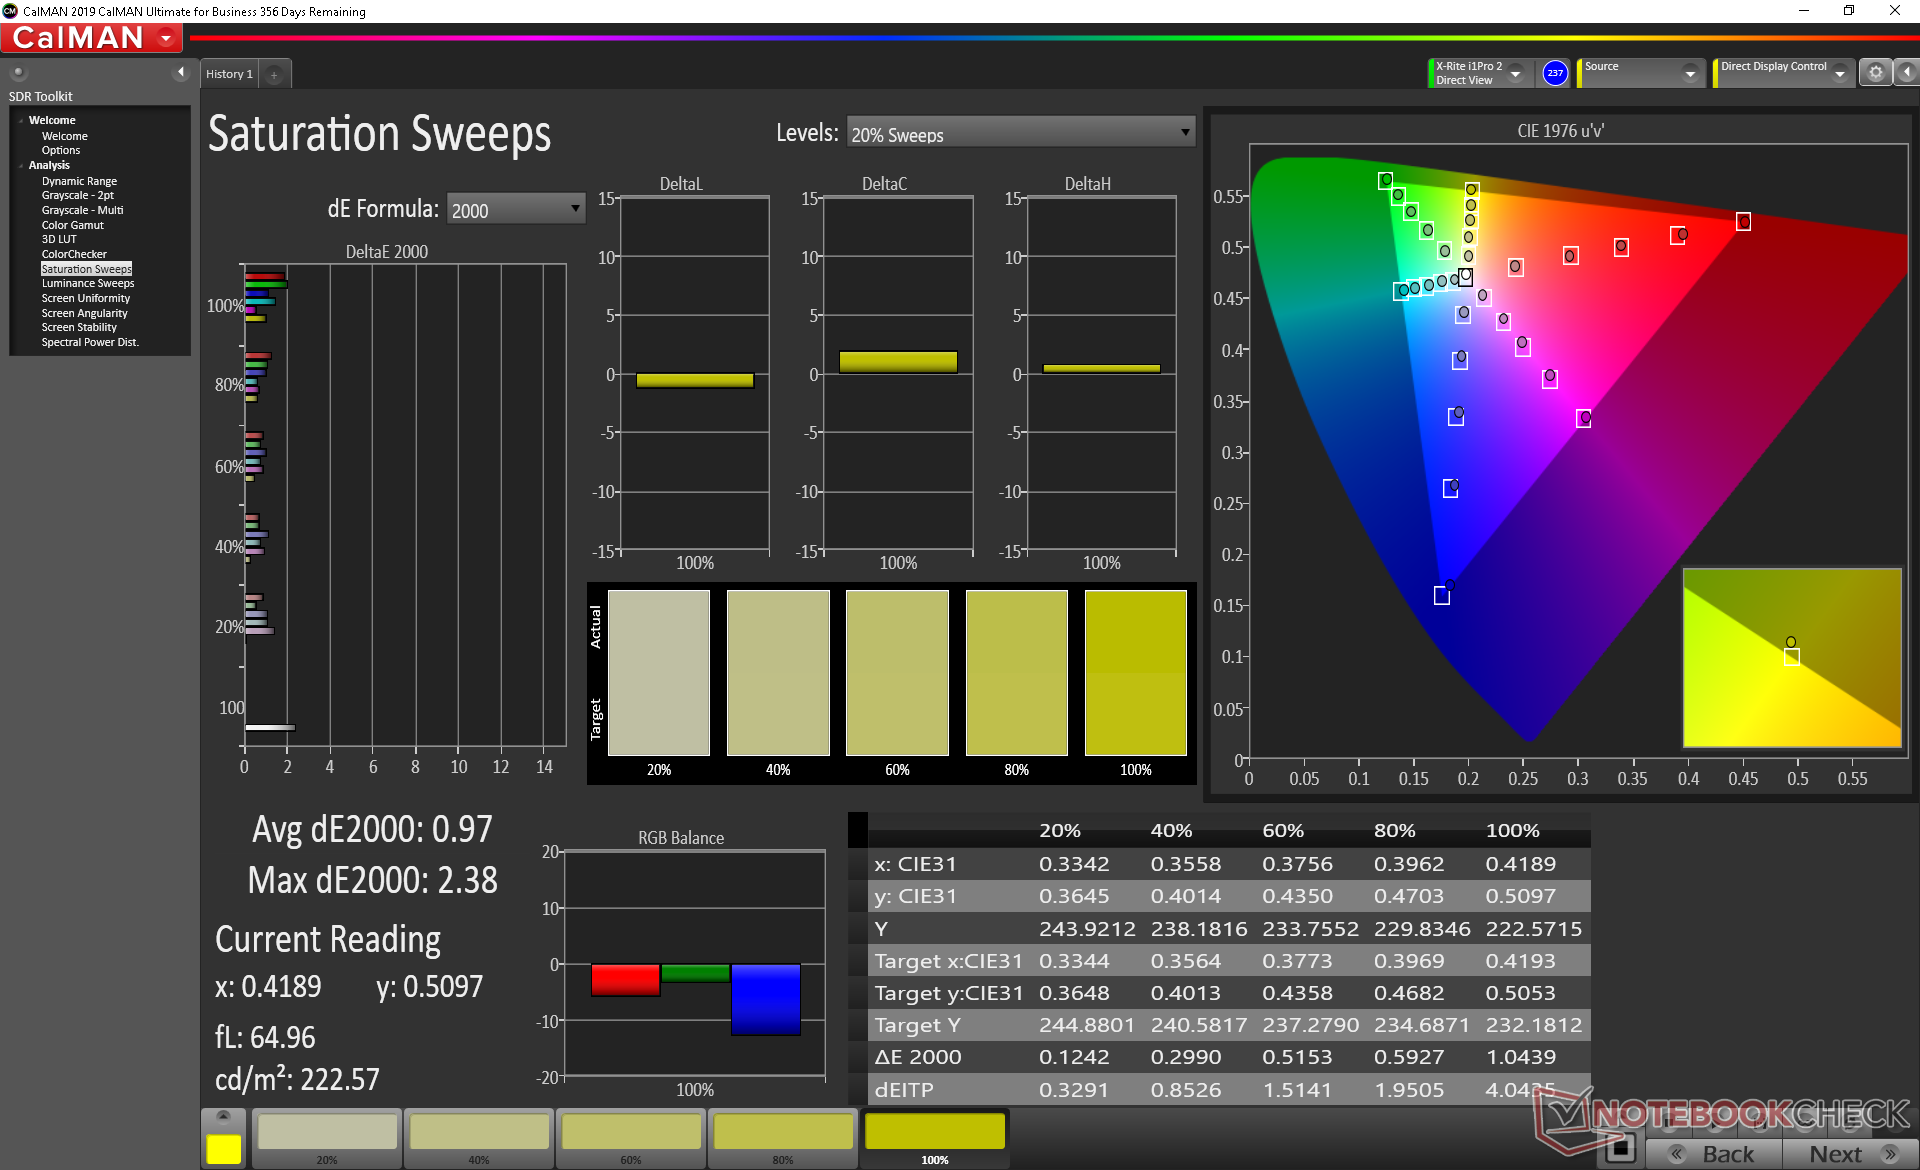
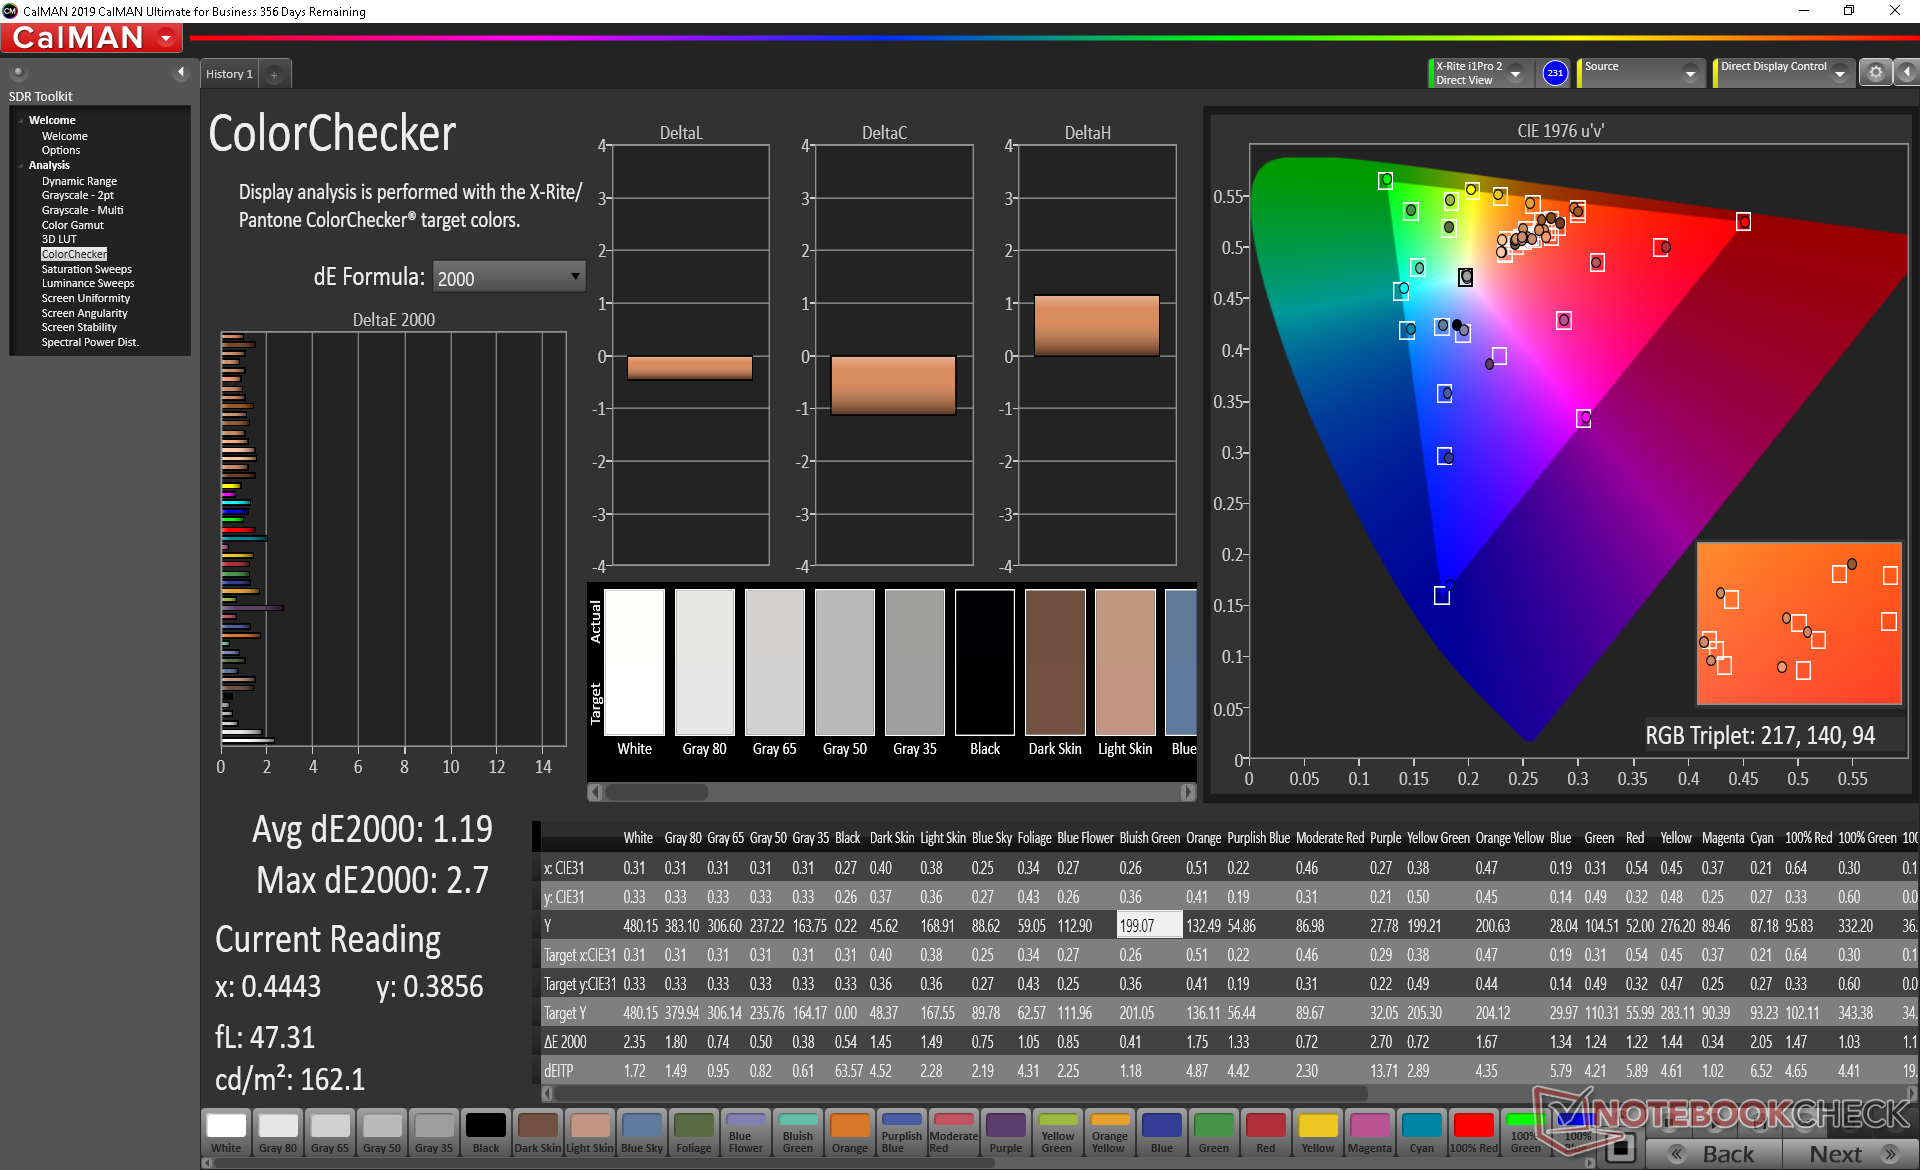
Further measurements with an X-Rite colorimeter reveal an inaccurate display with poor RGB balance and an overly warm color temperature. Once we calibrated the panel ourselves, average grayscale and color DeltaE values improved dramatically from 5.7 to 1.4 and 3.56 to 0.97, respectively. We recommend an end-user calibration or applying our calibrated ICM profile above to get the most out of the display.
Display Response Times
| ↔ Response Time Black to White | ||
|---|---|---|
| 36.4 ms ... rise ↗ and fall ↘ combined | ↗ 21.2 ms rise | 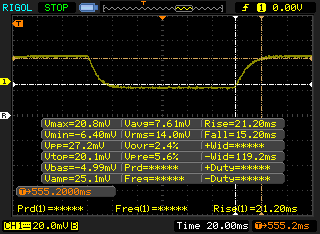 |
| ↘ 15.2 ms fall | ||
| The screen shows slow response rates in our tests and will be unsatisfactory for gamers. In comparison, all tested devices range from 0.1 (minimum) to 240 (maximum) ms. » 95 % of all devices are better. This means that the measured response time is worse than the average of all tested devices (19.9 ms). | ||
| ↔ Response Time 50% Grey to 80% Grey | ||
| 48.4 ms ... rise ↗ and fall ↘ combined | ↗ 24.4 ms rise | 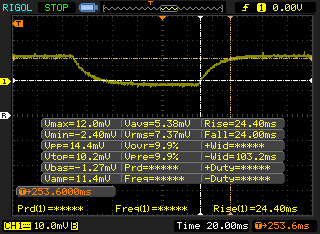 |
| ↘ 24 ms fall | ||
| The screen shows slow response rates in our tests and will be unsatisfactory for gamers. In comparison, all tested devices range from 0.165 (minimum) to 636 (maximum) ms. » 84 % of all devices are better. This means that the measured response time is worse than the average of all tested devices (31.1 ms). | ||
Screen Flickering / PWM (Pulse-Width Modulation)
| Screen flickering / PWM not detected | 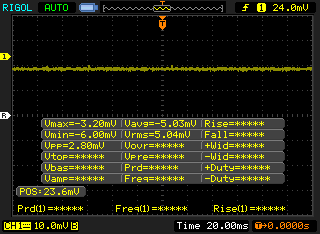 | ||
In comparison: 52 % of all tested devices do not use PWM to dim the display. If PWM was detected, an average of 7798 (minimum: 5 - maximum: 343500) Hz was measured. | |||
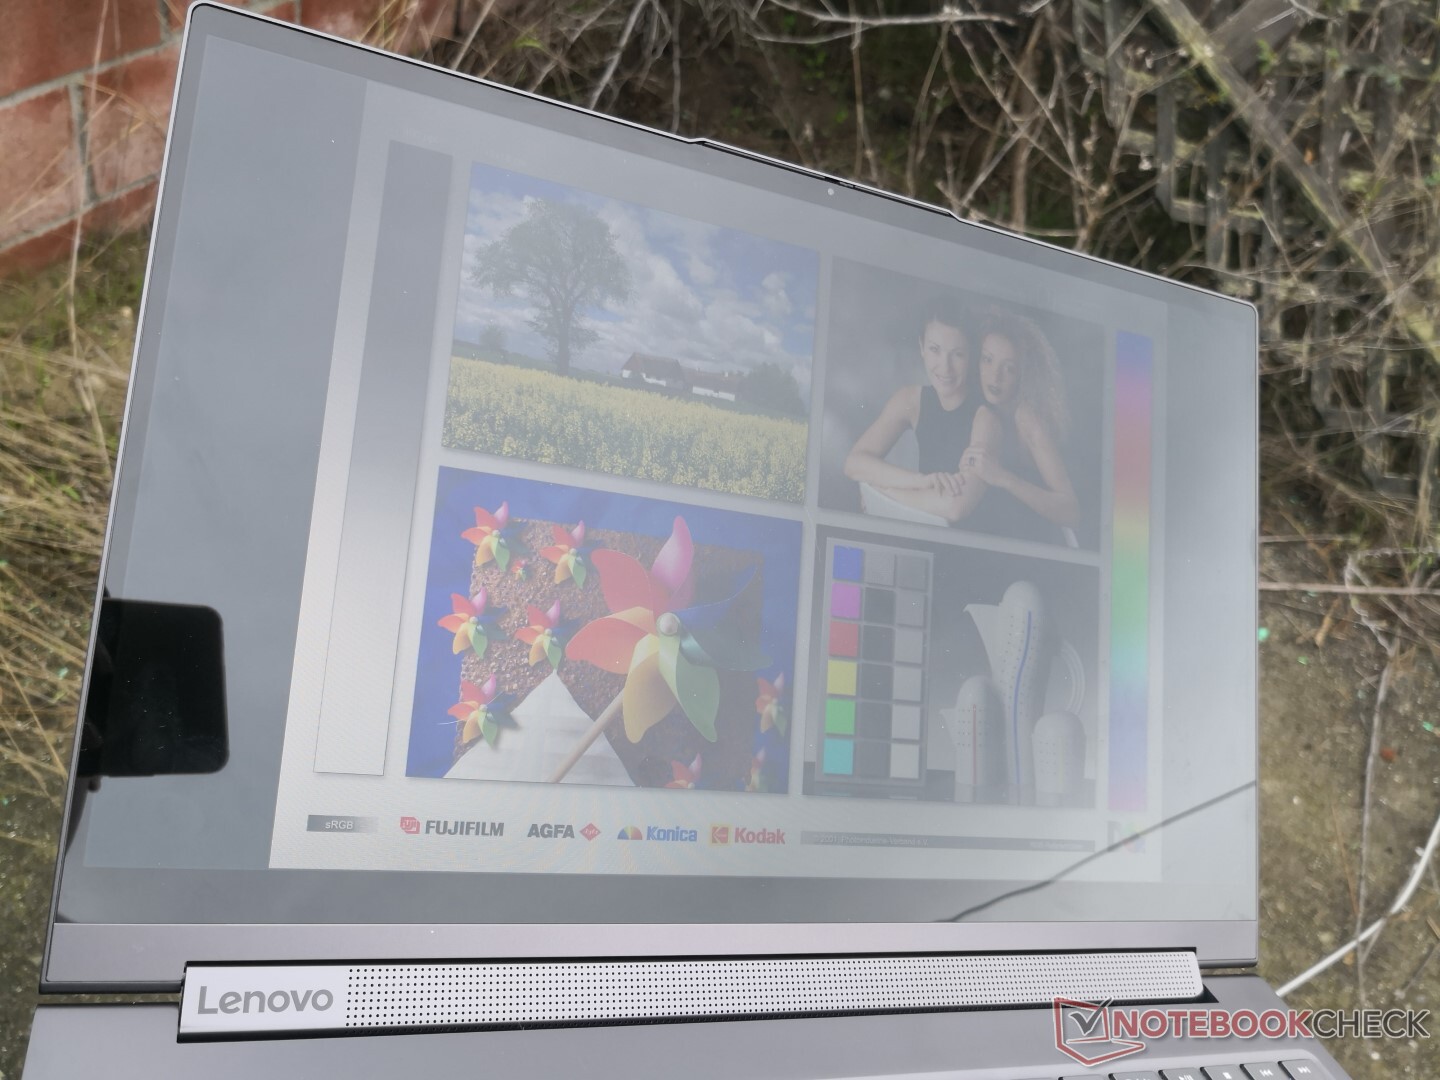
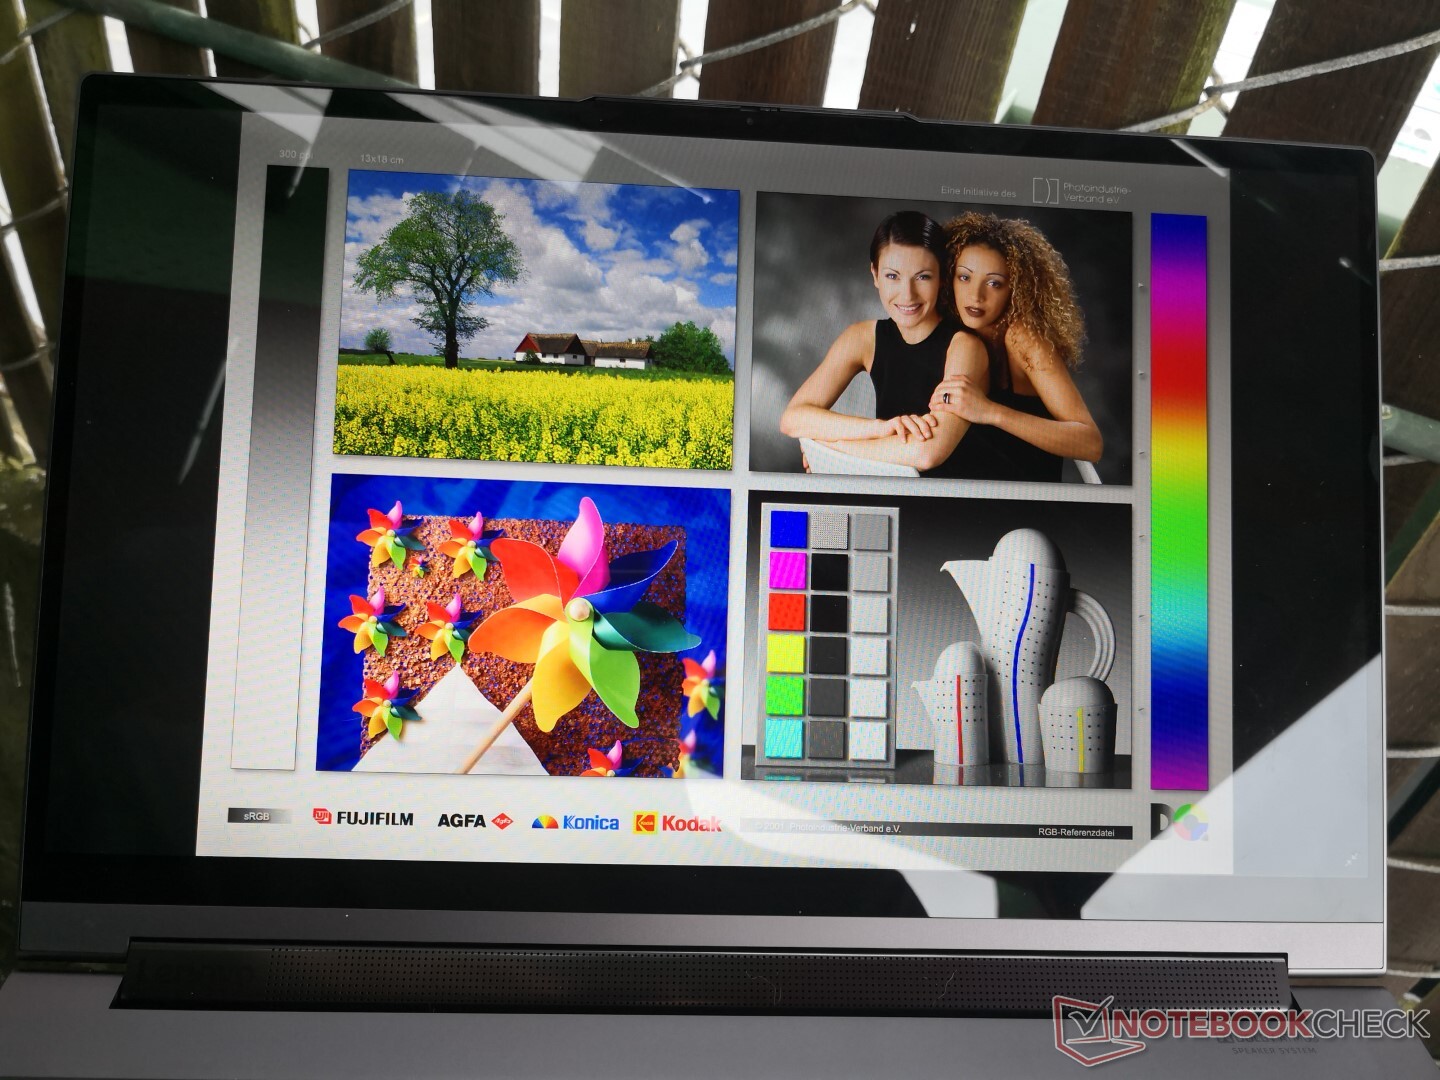
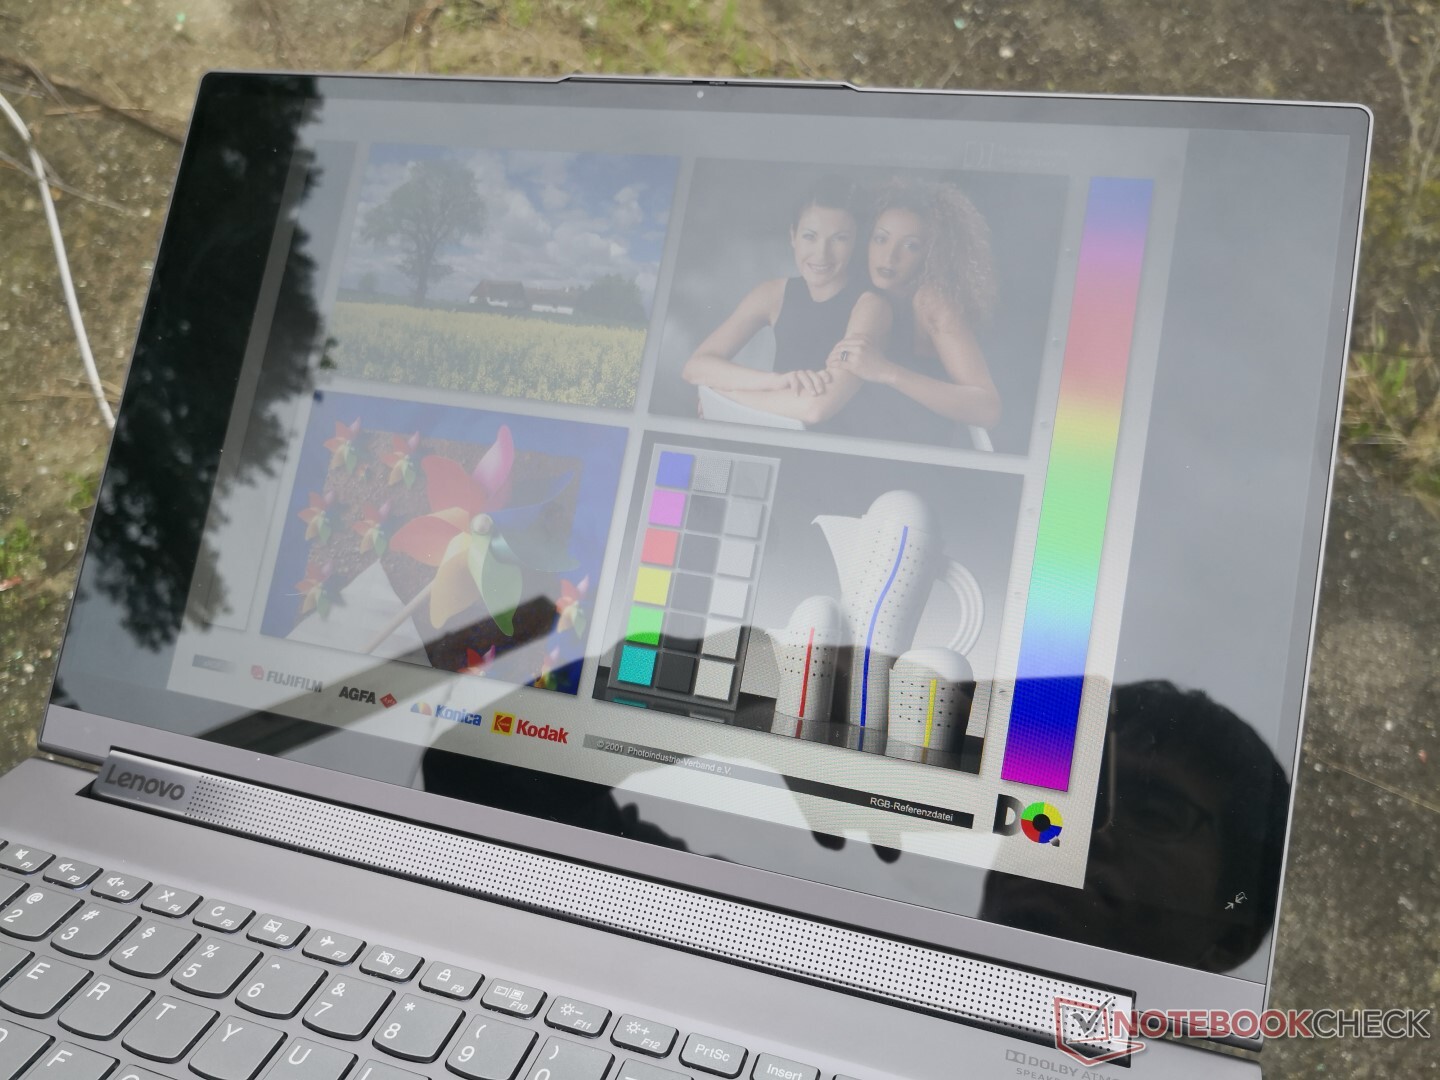
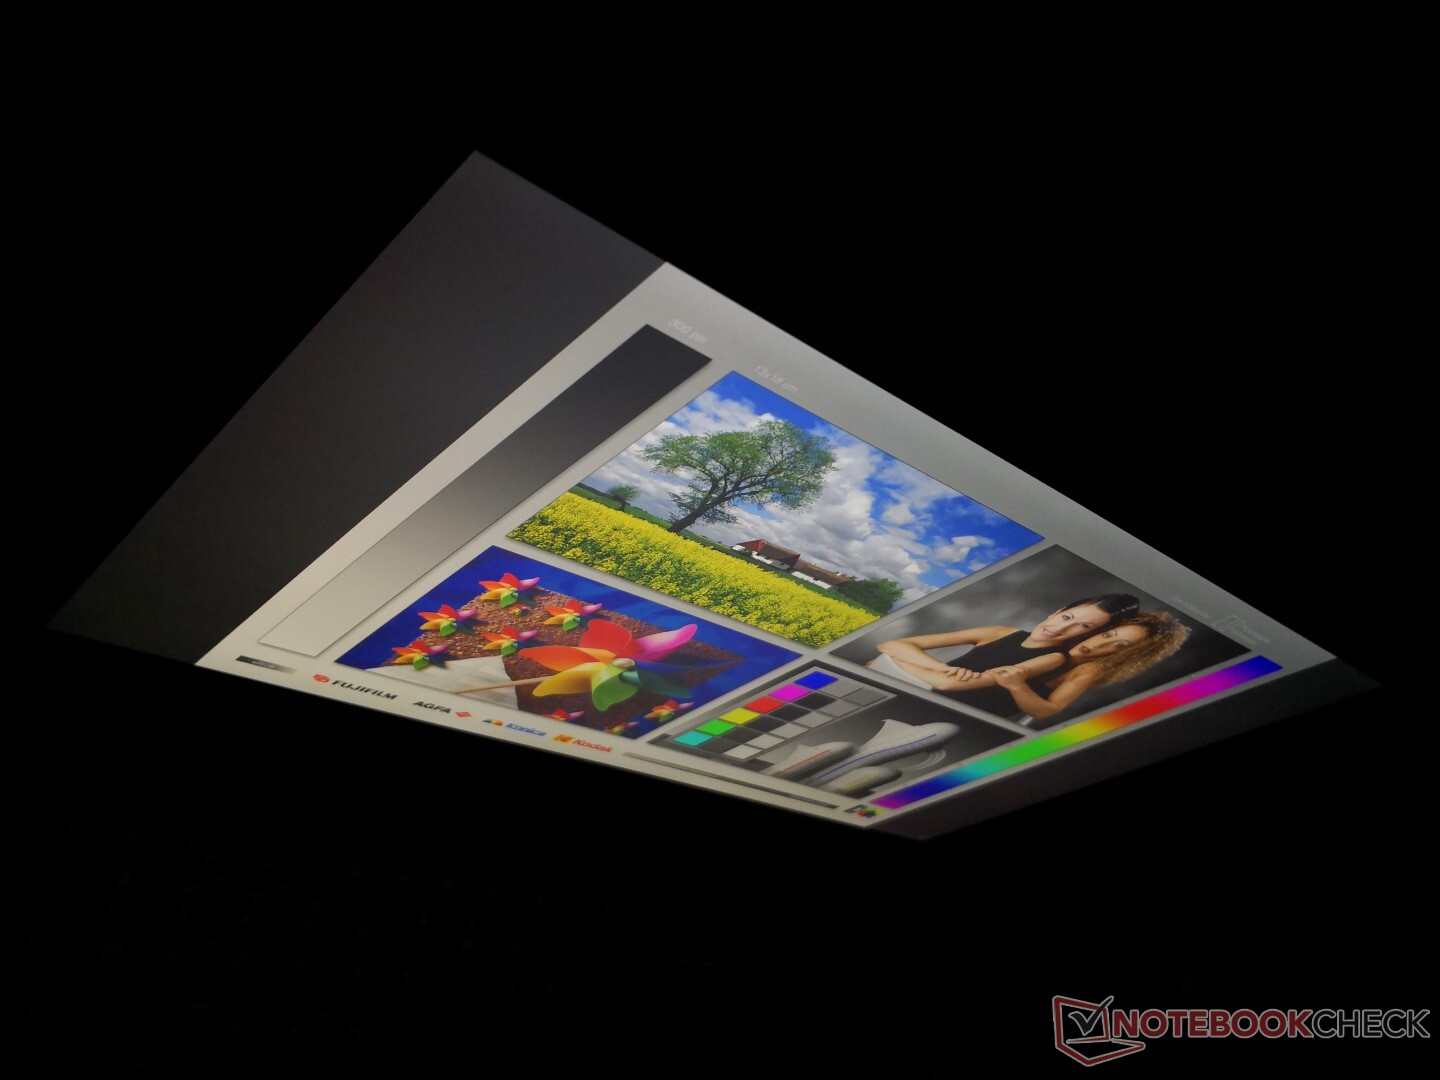
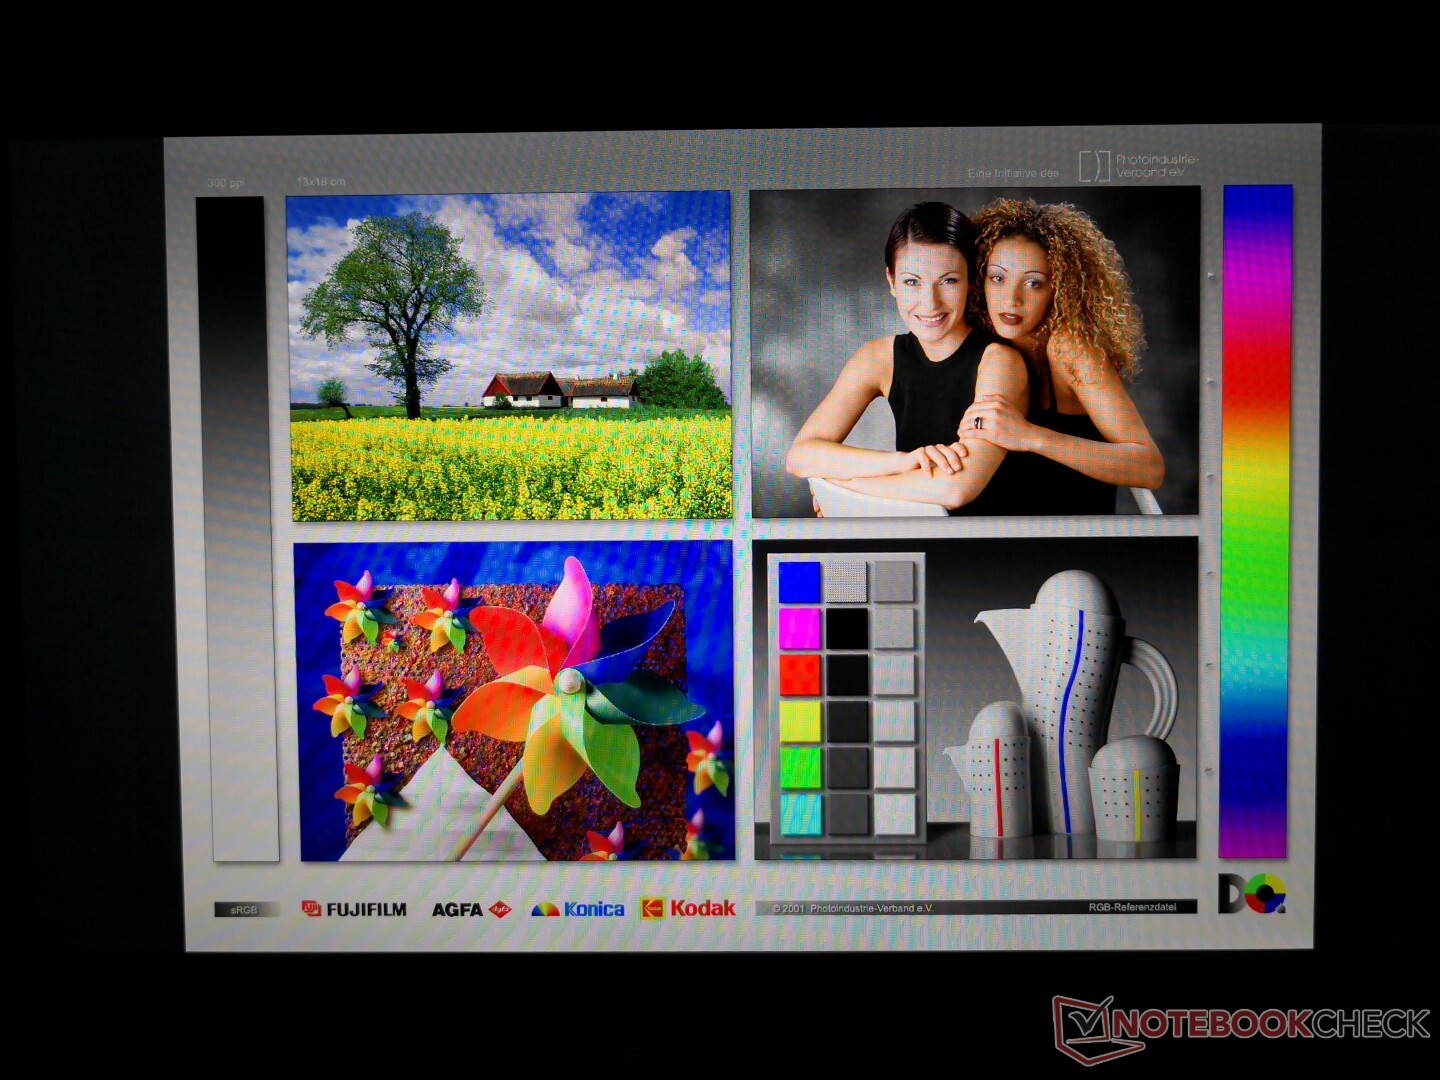
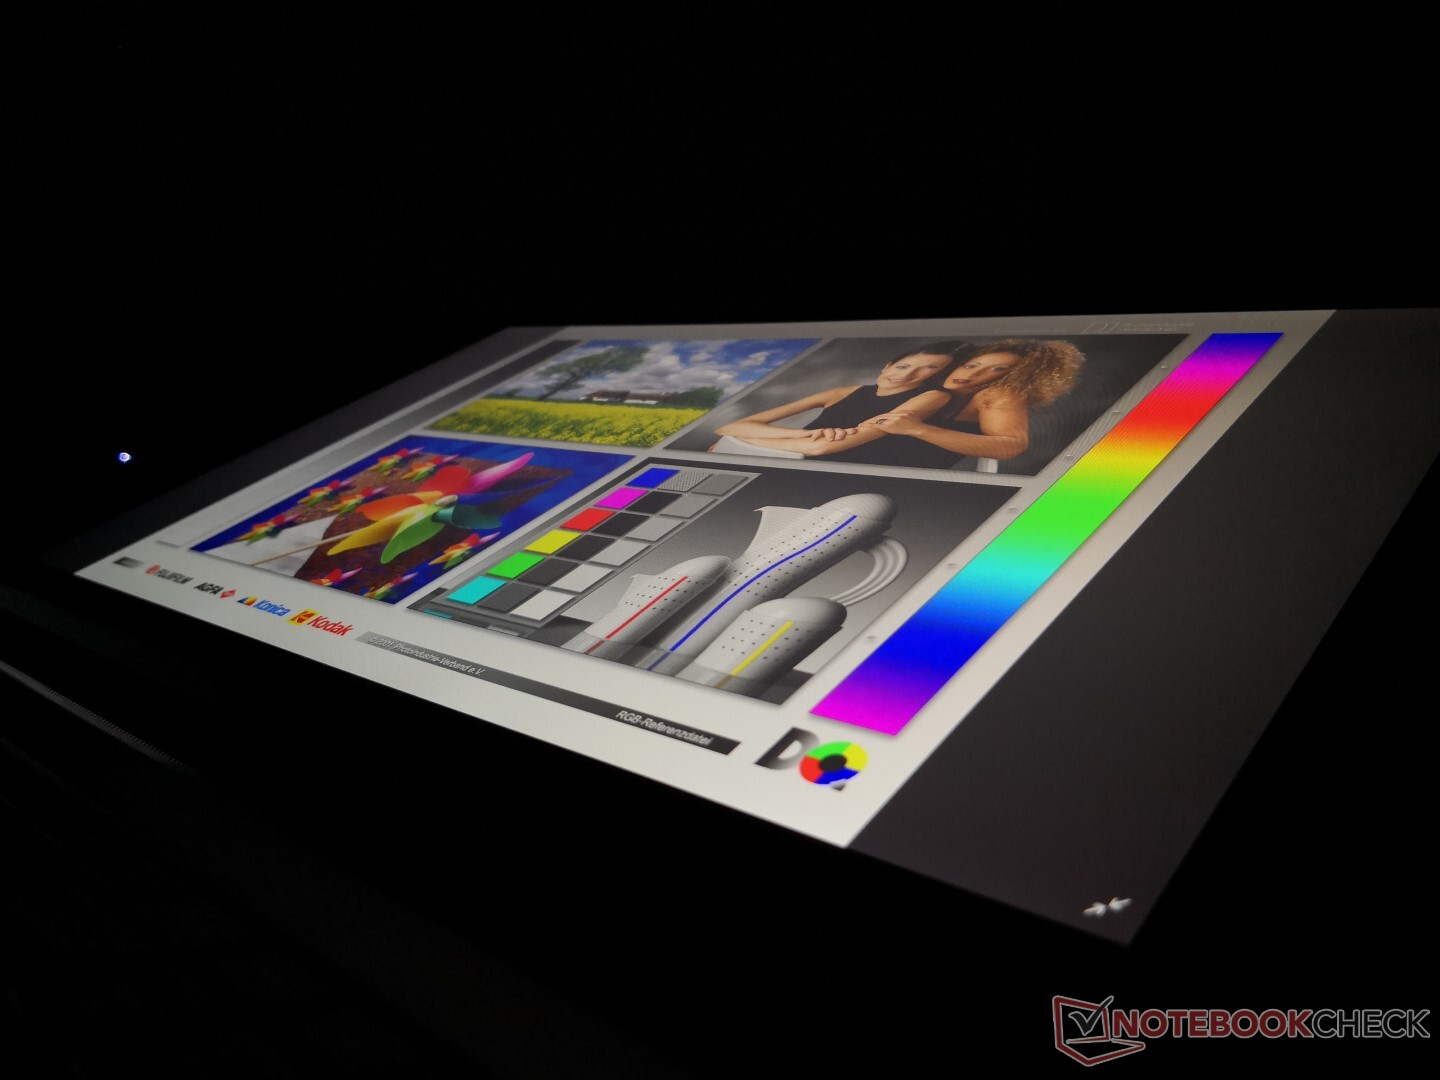
Since the display is brighter than on both the XPS 15 and Spectre x360 15, the Yoga C940-15 is easier to see when outdoors. However, 500 nits is not nearly enough to to completely overpower ambient glare. Certain HP EliteBooks like the 1040 series offer 1000-nit options for better outdoor visibility. Viewing angles are otherwise stable enough for both landscape and portrait orientations. Keep in mind that the sides of the screen will appear dimmer when in portrait mode which is typical on many large IPS panels.
Performance
Currently, the Yoga C940-15 comes in two CPU options (i7-9750H or i9-9880H), two RAM options (12 GB or 16 GB DDR4), two display options (FHD IPS or 4K UHD IPS), and just one GPU. The fact that there are no Core U options shows that Lenovo is targeting performance users who want to do more than just web browsing, video streaming, or emailing. Keep in mind that the system ships with a GTX 1650 Max-Q GPU despite Lenovo failing to mention the term "Max-Q" anywhere on the official product page.
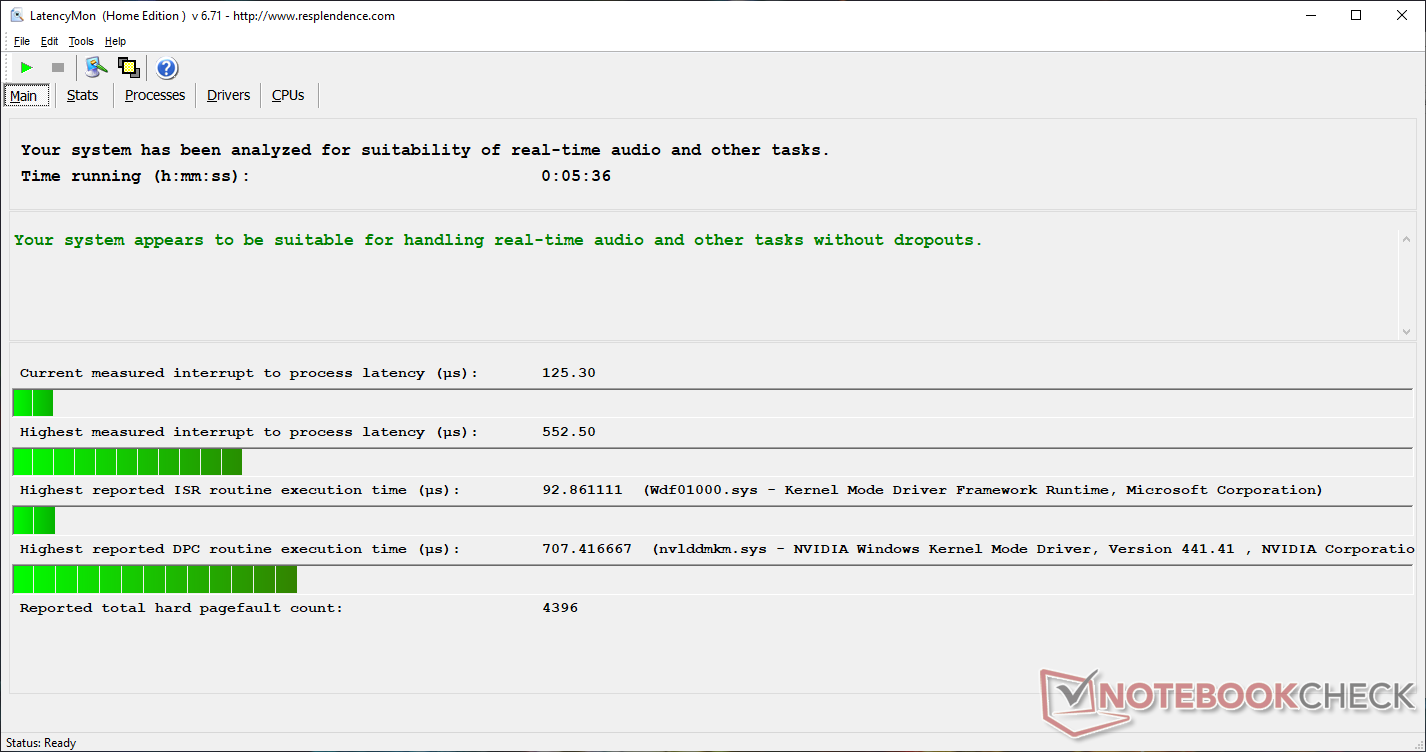
LatencyMon shows no DPC latency issues even when wireless is enabled.
Processor
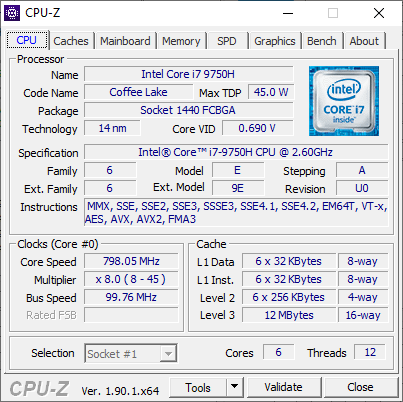
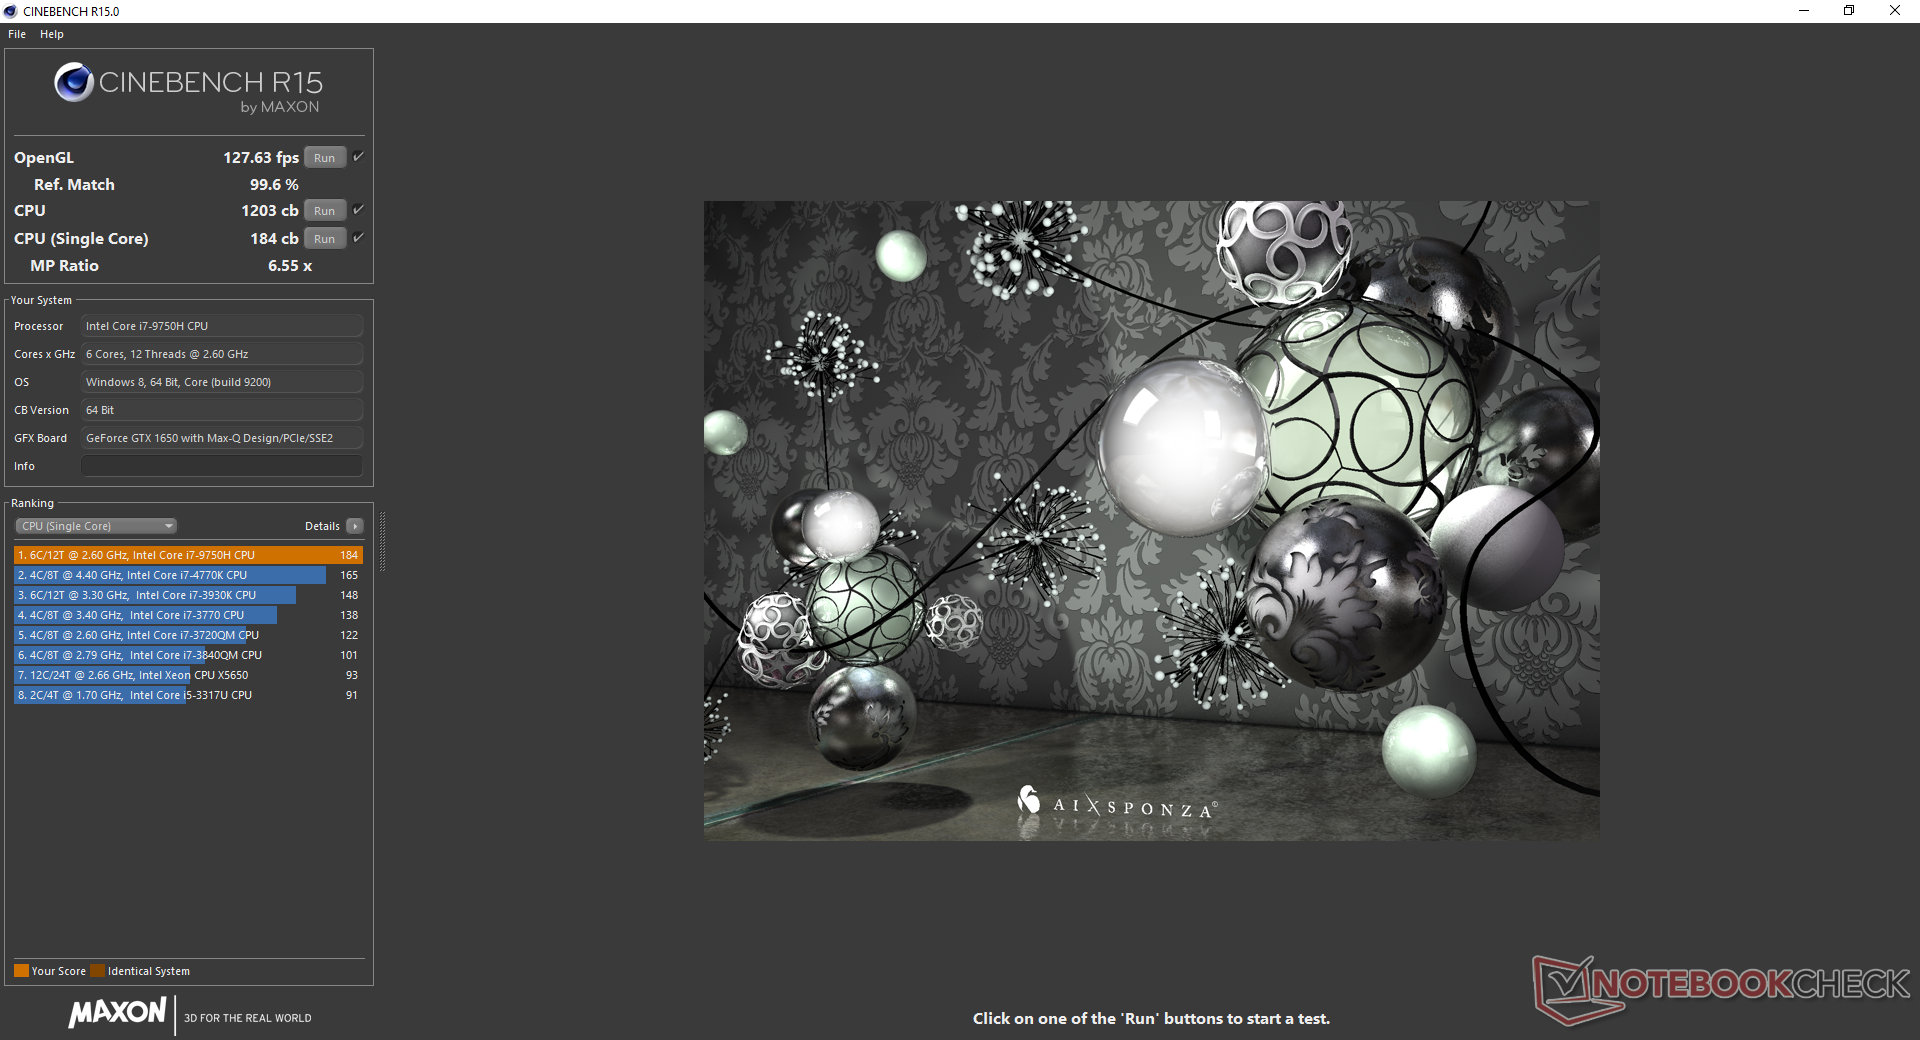
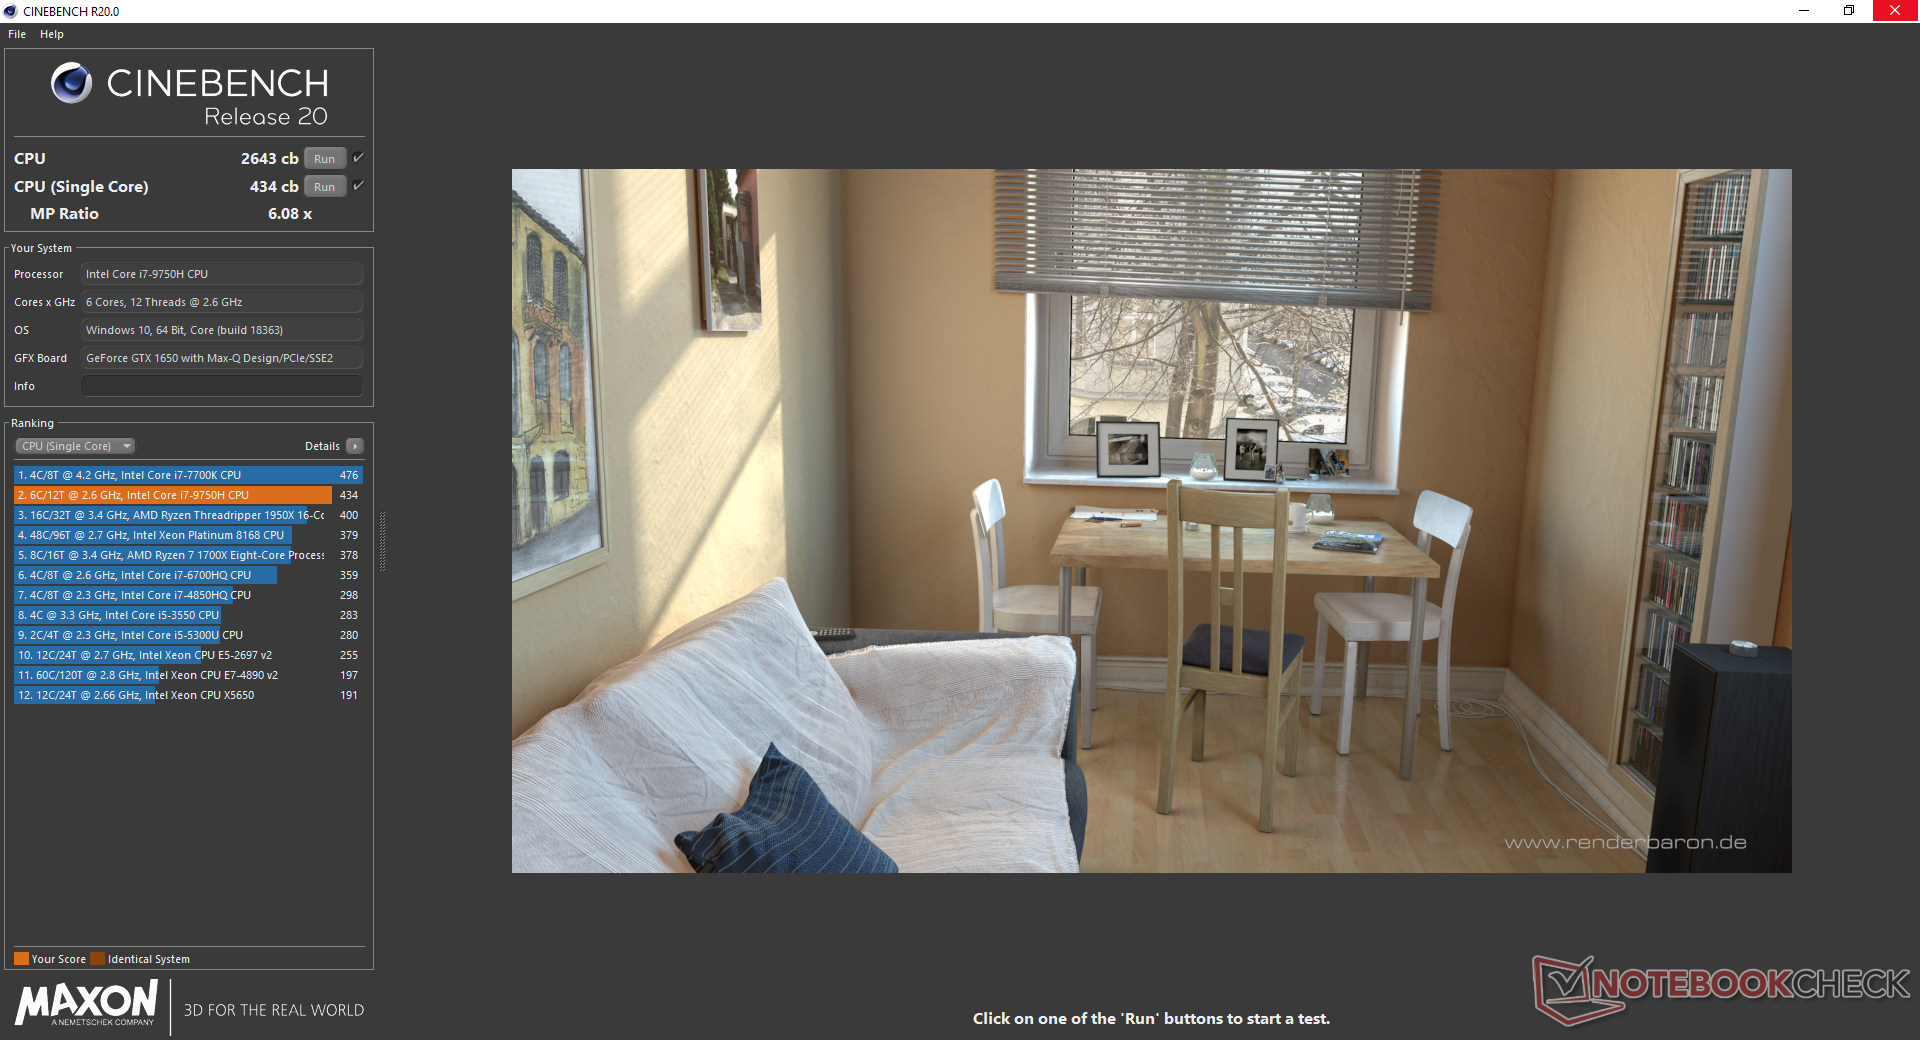
The Core i7-9750H is performing within 2 percent of the average i7-9750H in our database taken from over 60 other laptops. Users can expect just 10 percent faster performance than last year's Core i7-8750H or just 10 percent slower than the disappointing Core i9-8950HK. Running CineBench R15 Multi-Thread in a loop results in respectable performance sustainability with a dip of just 10 percent over time. Opting for the higher-end SKU with the octa-core Core i9-9880H can bring up to 40 percent faster multi-thread performance assuming that the Yoga chassis can sustain the high clock rates.
See our dedicated page on the Core i7-9750H for more technical information and benchmark comparisons.
System Performance
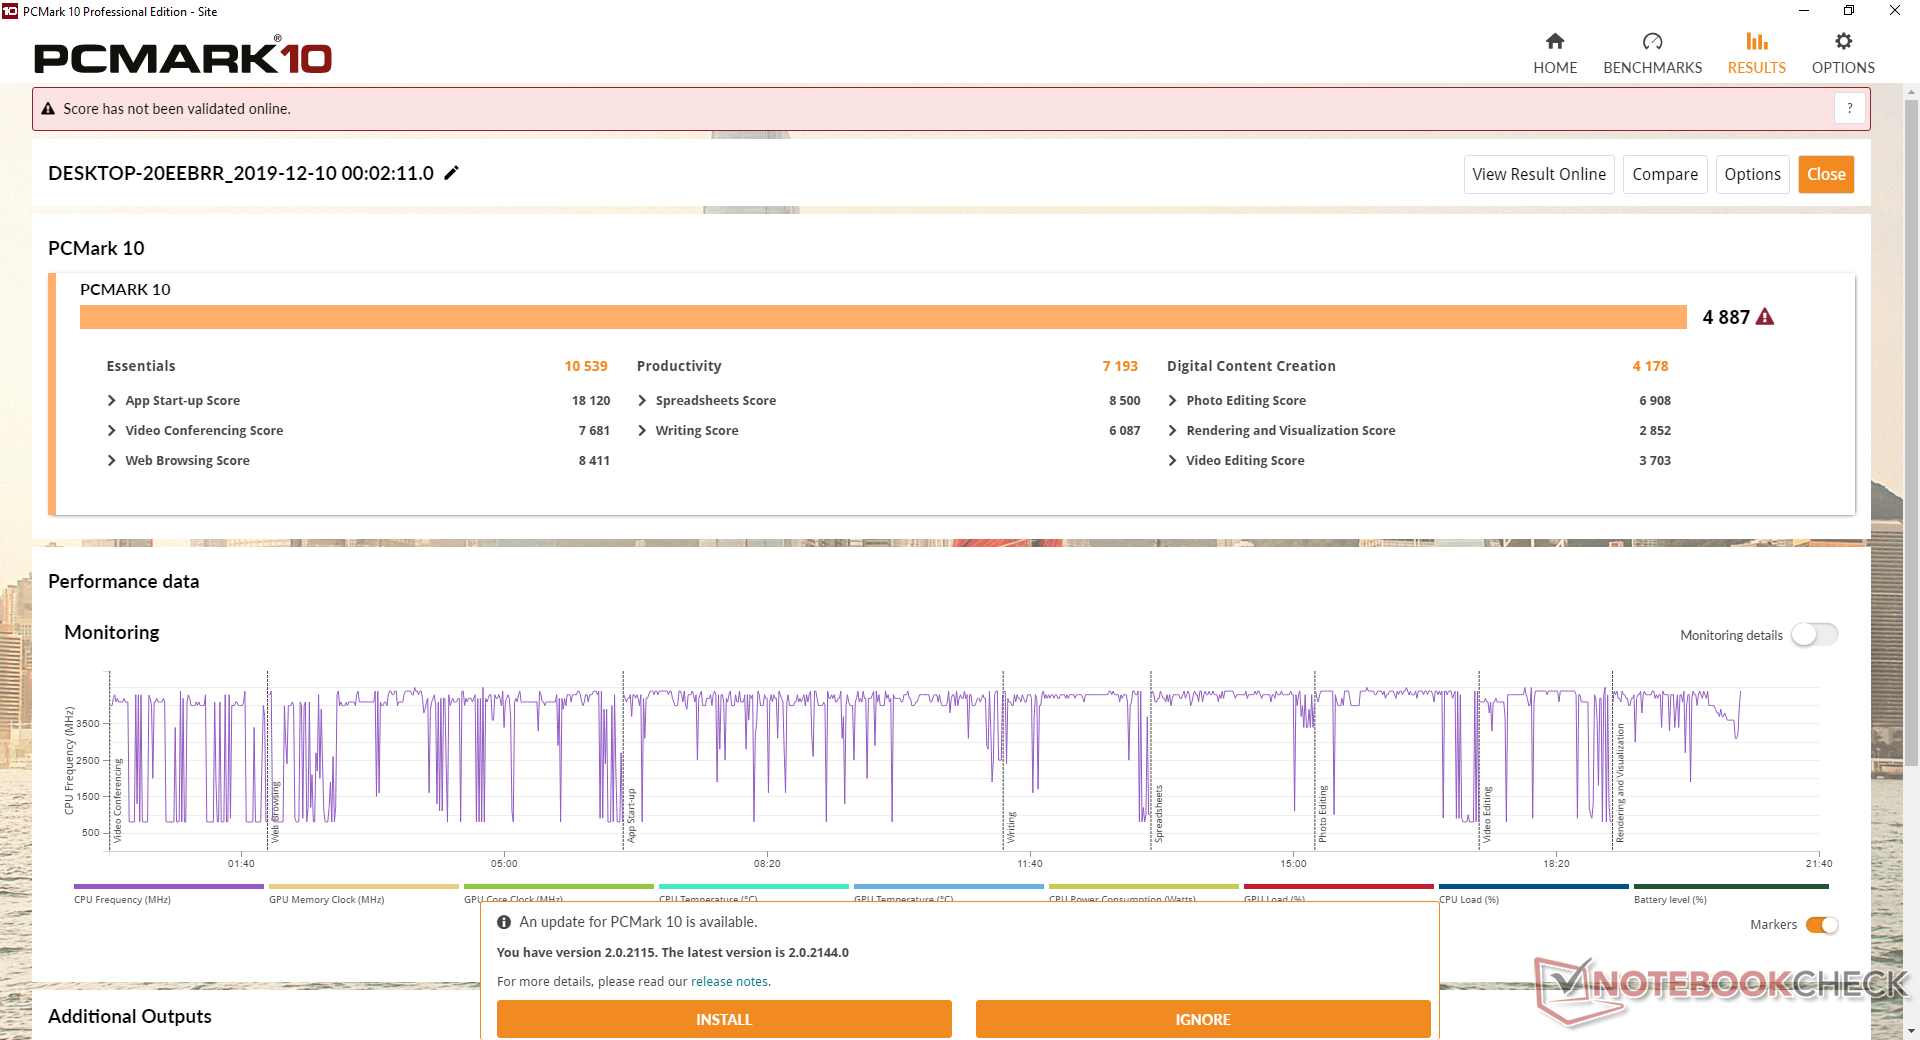
PCMark scores are generally comparable to the Asus ZenBook 15. The Lenovo uses a slower SSD while the latter has the slower ULV Core U CPU to compensate. We experienced no software or hardware issues during our time the test unit. Strangely, the Power button became inconsistent after resetting Windows as the system would wake and resume uncontrollably.
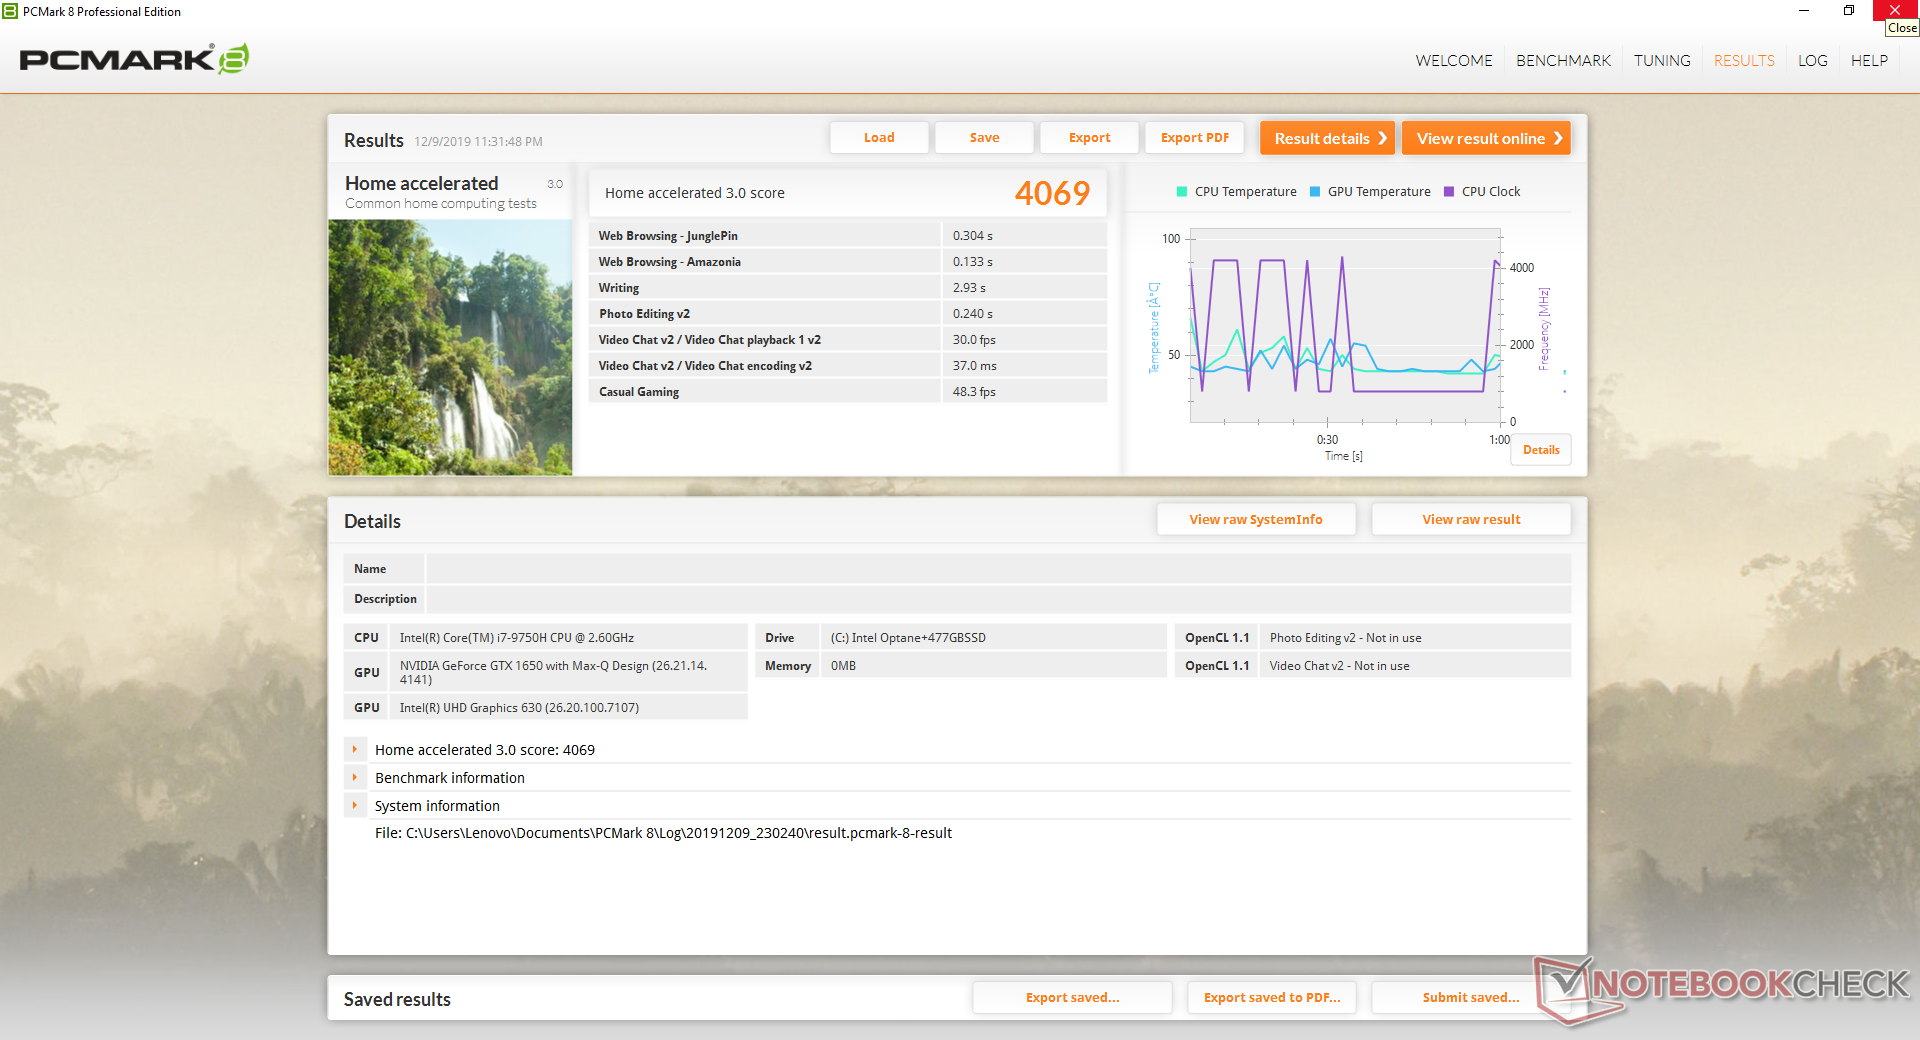
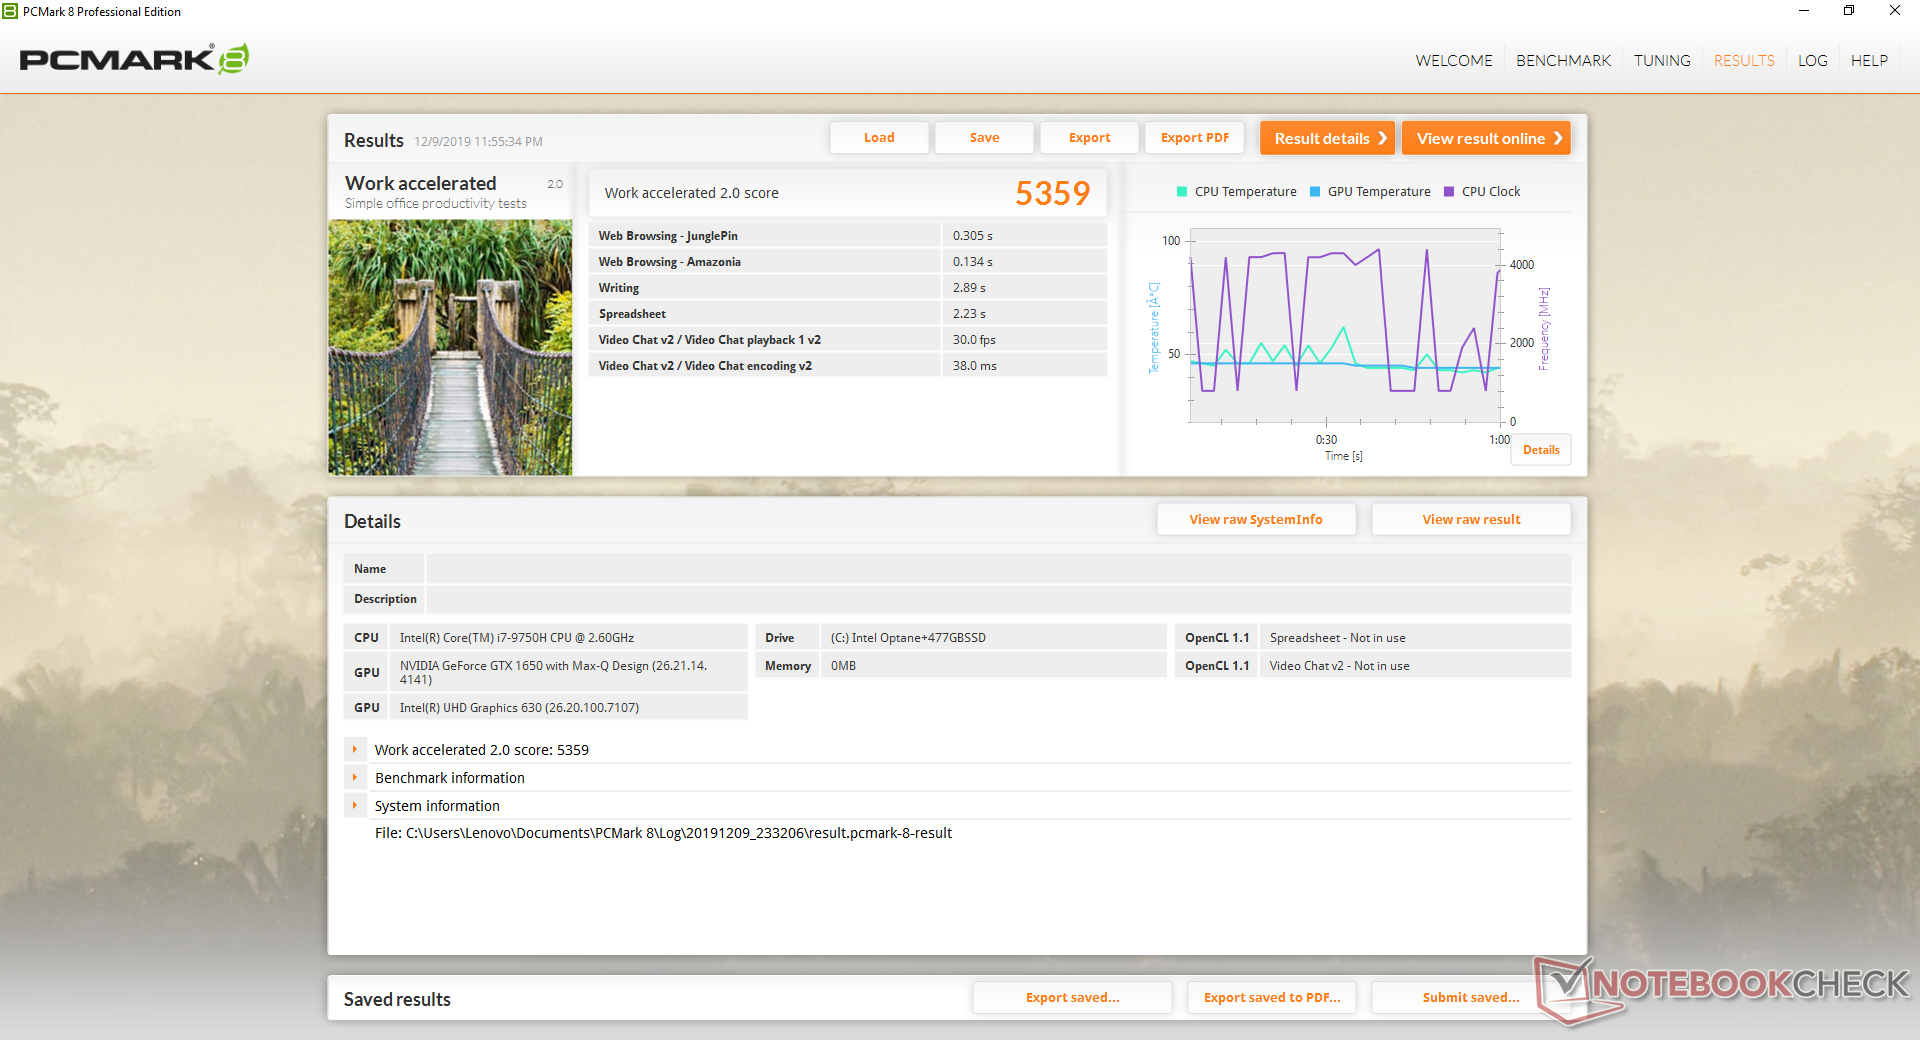
| PCMark 8 Home Score Accelerated v2 | 4069 points | |
| PCMark 8 Work Score Accelerated v2 | 5359 points | |
| PCMark 10 Score | 4887 points | |
Help | ||
Storage Devices
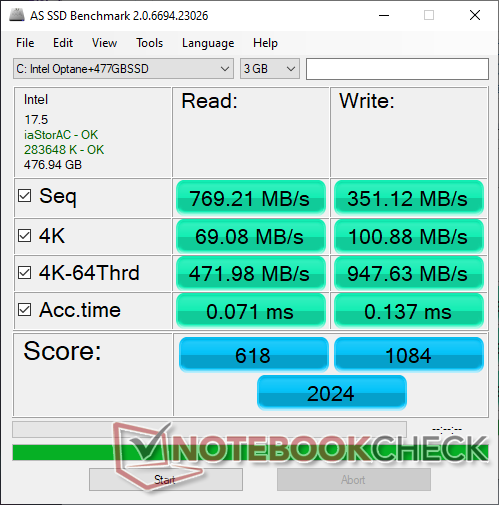
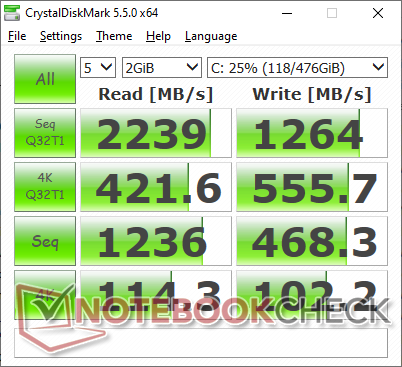
Just one storage bay is available (M.2 2280 PCIe x4) compared to two on some XPS 15 SKUs and most 15.6-inch gaming laptops. Our particular test unit comes with a 512 GB Intel HBRPEKNX0202AL SSD that integrates Intel H10 Optane. Performance is slower than a "proper" dedicated NVMe SSD like the Samsung PM981 since Optane is positioned to be in between SATA and NVMe. Even so, a budget NVMe SSD like the Toshiba KBG30ZMT512G is still able to offer much faster sequential write rates according to AS SSD and CDM benchmarks. You would be better off configuring with a basic entry-level NVMe SSD since Optane technology is still rather pricey per GB.
See our table of HDDs and SSDs for more benchmark comparisons.
| Lenovo Yoga C940-15IRH Intel Optane Memory H10 with Solid State Storage 32GB + 512GB HBRPEKNX0202A(L/H) | Dell XPS 15 7590 9980HK GTX 1650 Toshiba XG6 KXG60ZNV1T02 | Asus ZenBook 15 UX534FT-DB77 Samsung SSD PM981 MZVLB1T0HALR | Lenovo Ideapad 720S-15IKB 81AC001AGE Samsung SSD PM981 MZVLB512HAJQ | HP Gaming Pavilion 15-dk0009ng Samsung SSD PM981 MZVLB256HAHQ | MSI GP65 Leopard 9SE-225US Toshiba KBG30ZMT512G | |
|---|---|---|---|---|---|---|
| AS SSD | 99% | 75% | 139% | 27% | -17% | |
| Seq Read (MB/s) | 769 | 1723 124% | 1887 145% | 2469 221% | 2088 172% | 1307 70% |
| Seq Write (MB/s) | 351.1 | 1386 295% | 1432 308% | 1991 467% | 1347 284% | 730 108% |
| 4K Read (MB/s) | 69.1 | 43.25 -37% | 52.3 -24% | 54.3 -21% | 36.14 -48% | 27.58 -60% |
| 4K Write (MB/s) | 100.9 | 98.3 -3% | 146 45% | 99.8 -1% | 96.5 -4% | 80.3 -20% |
| 4K-64 Read (MB/s) | 472 | 1078 128% | 969 105% | 1823 286% | 565 20% | 878 86% |
| 4K-64 Write (MB/s) | 948 | 1456 54% | 1375 45% | 1282 35% | 588 -38% | 246.8 -74% |
| Access Time Read * (ms) | 0.071 | 0.05 30% | 0.034 52% | 0.042 41% | 0.093 -31% | 0.231 -225% |
| Access Time Write * (ms) | 0.137 | 0.039 72% | 0.075 45% | 0.039 72% | 0.038 72% | 0.223 -63% |
| Score Read (Points) | 618 | 1294 109% | 1210 96% | 2125 244% | 810 31% | 1036 68% |
| Score Write (Points) | 1084 | 1693 56% | 1664 54% | 1581 46% | 819 -24% | 400 -63% |
| Score Total (Points) | 2024 | 3638 80% | 3483 72% | 4771 136% | 2014 0% | 1940 -4% |
| Copy ISO MB/s (MB/s) | 839 | 3182 279% | 1375 64% | 1043 24% | 993 18% | |
| Copy Program MB/s (MB/s) | 455.8 | 984 116% | 468 3% | 371.7 -18% | 309.5 -32% | |
| Copy Game MB/s (MB/s) | 969 | 1824 88% | 1287 33% | 399.9 -59% | 582 -40% | |
| CrystalDiskMark 5.2 / 6 | 50% | 63% | 59% | 14% | -26% | |
| Write 4K (MB/s) | 102.2 | 104.3 2% | 141.6 39% | 139.3 36% | 100 -2% | 99.3 -3% |
| Read 4K (MB/s) | 114.3 | 45.23 -60% | 45.28 -60% | 46.78 -59% | 31.39 -73% | 46.96 -59% |
| Write Seq (MB/s) | 468.3 | 1729 269% | 1975 322% | 2125 354% | 1308 179% | |
| Read Seq (MB/s) | 1236 | 1861 51% | 2272 84% | 2354 90% | 1083 -12% | |
| Write 4K Q32T1 (MB/s) | 556 | 509 -8% | 458.6 -18% | 298.4 -46% | 362.9 -35% | 240.1 -57% |
| Read 4K Q32T1 (MB/s) | 421.6 | 388.5 -8% | 391.4 -7% | 355.8 -16% | 425.7 1% | 581 38% |
| Write Seq Q32T1 (MB/s) | 1264 | 2813 123% | 2393 89% | 2128 68% | 1411 12% | 686 -46% |
| Read Seq Q32T1 (MB/s) | 2239 | 2906 30% | 3464 55% | 3324 48% | 3240 45% | 1581 -29% |
| Write 4K Q8T8 (MB/s) | 268.1 | |||||
| Read 4K Q8T8 (MB/s) | 977 | |||||
| Total Average (Program / Settings) | 75% /
81% | 69% /
70% | 99% /
105% | 21% /
23% | -22% /
-19% |
* ... smaller is better

GPU Performance
The GTX 1650 Max-Q is only about 7 to 15 percent slower than our desktop GTX 1650 reference or about 10 to 30 percent faster than the mobile GTX 1050 Ti. Thus, the Yoga C940-15 is wholly capable of playing the latest games even though it is not technically a gaming laptop. Had Lenovo offered a GTX 1660 Ti Max-Q option, gaming performance would have been up to 50 percent faster. Be sure to enable DX12 if available since Nvidia Turing GPUs are optimized for Microsoft's latest API.
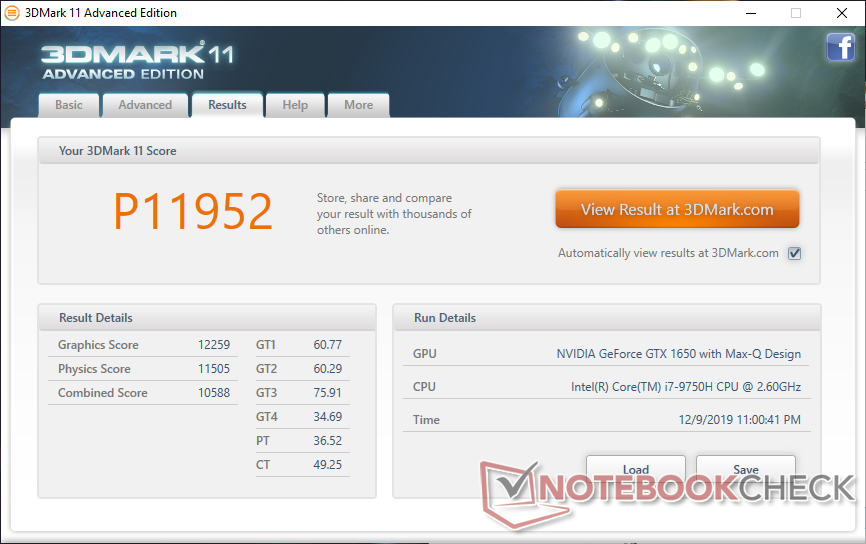
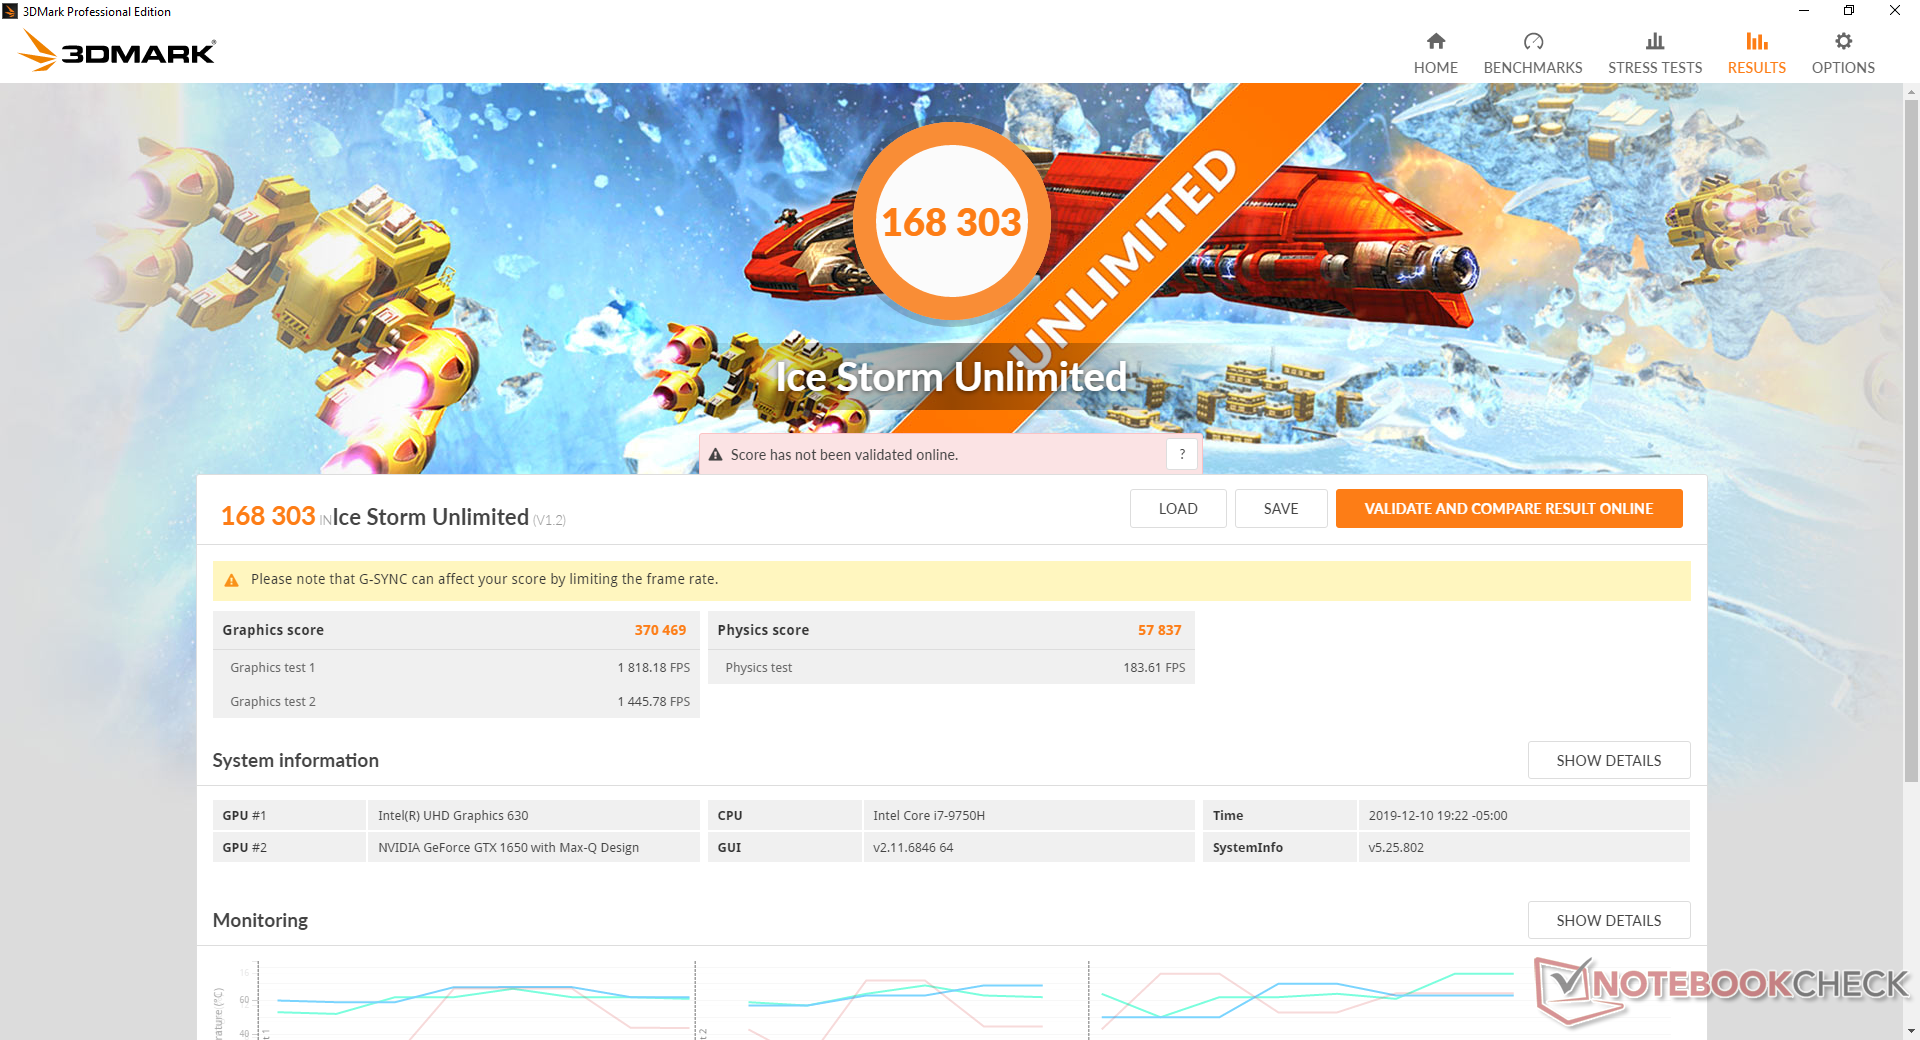
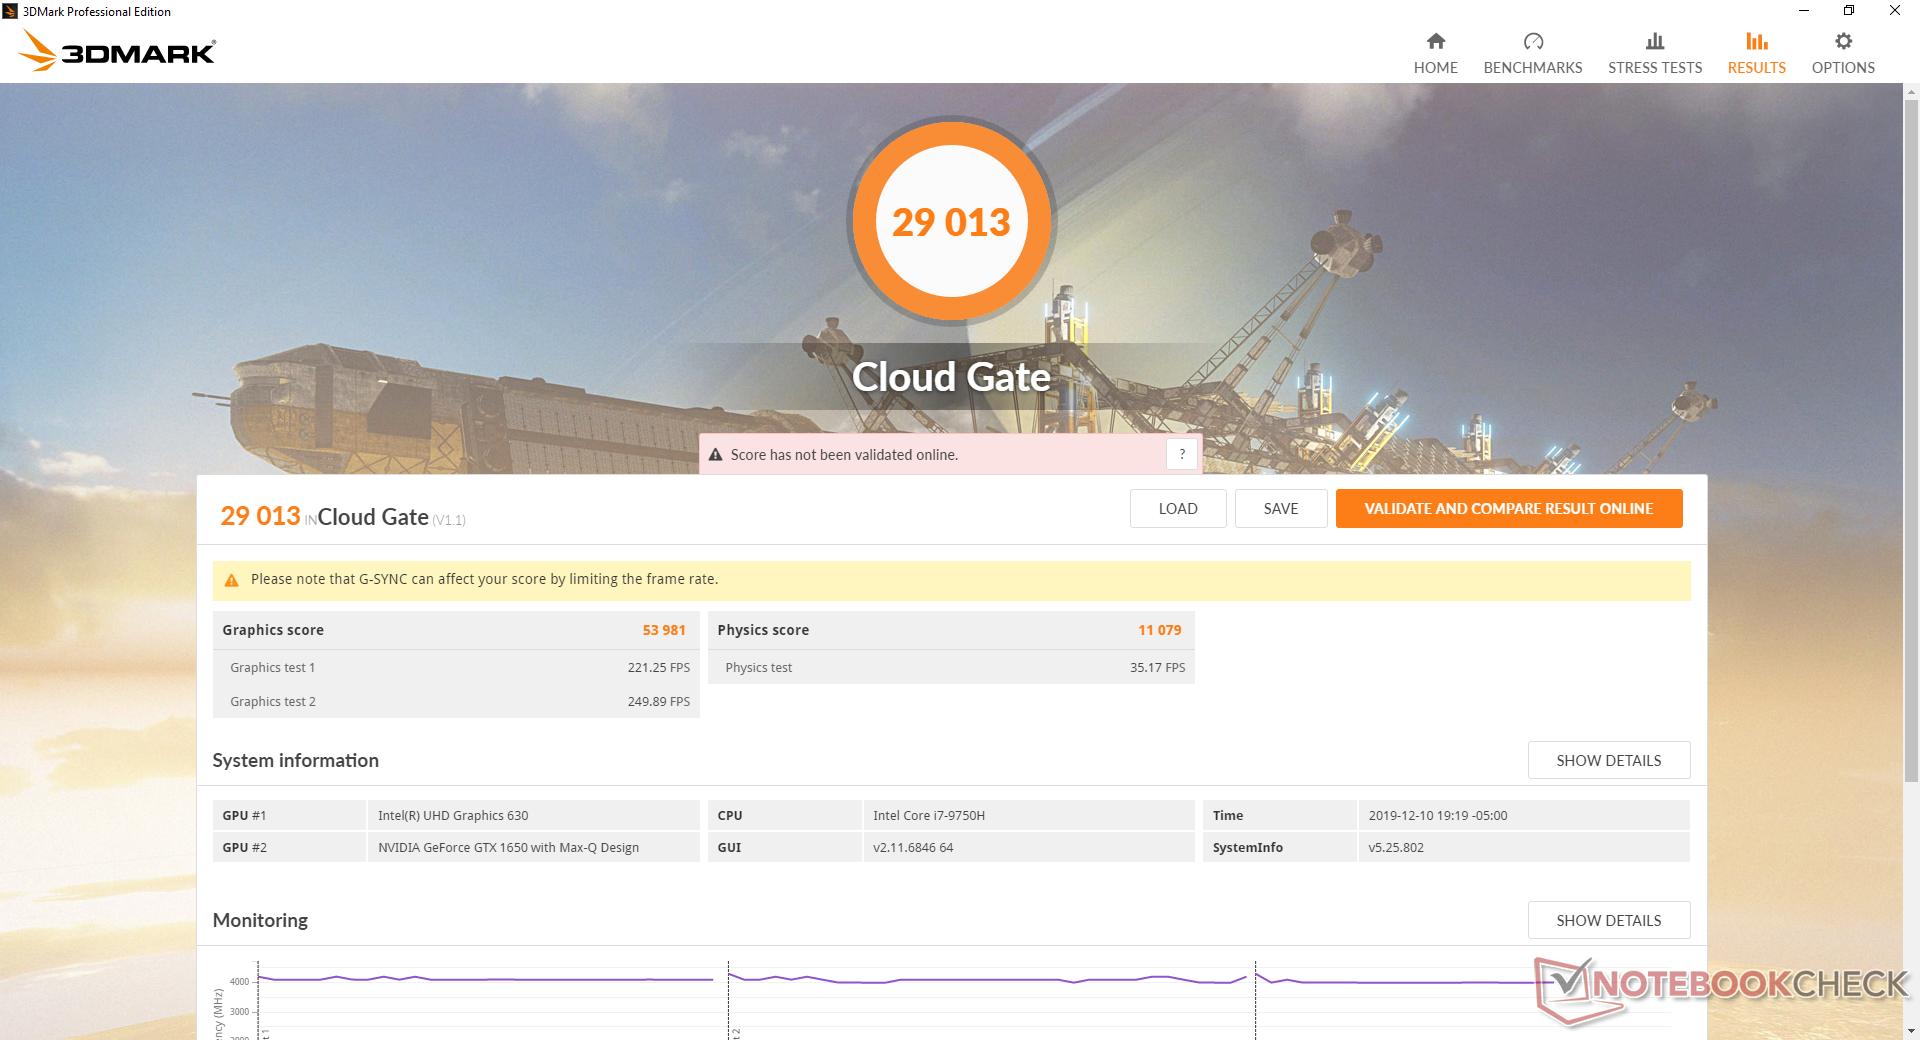
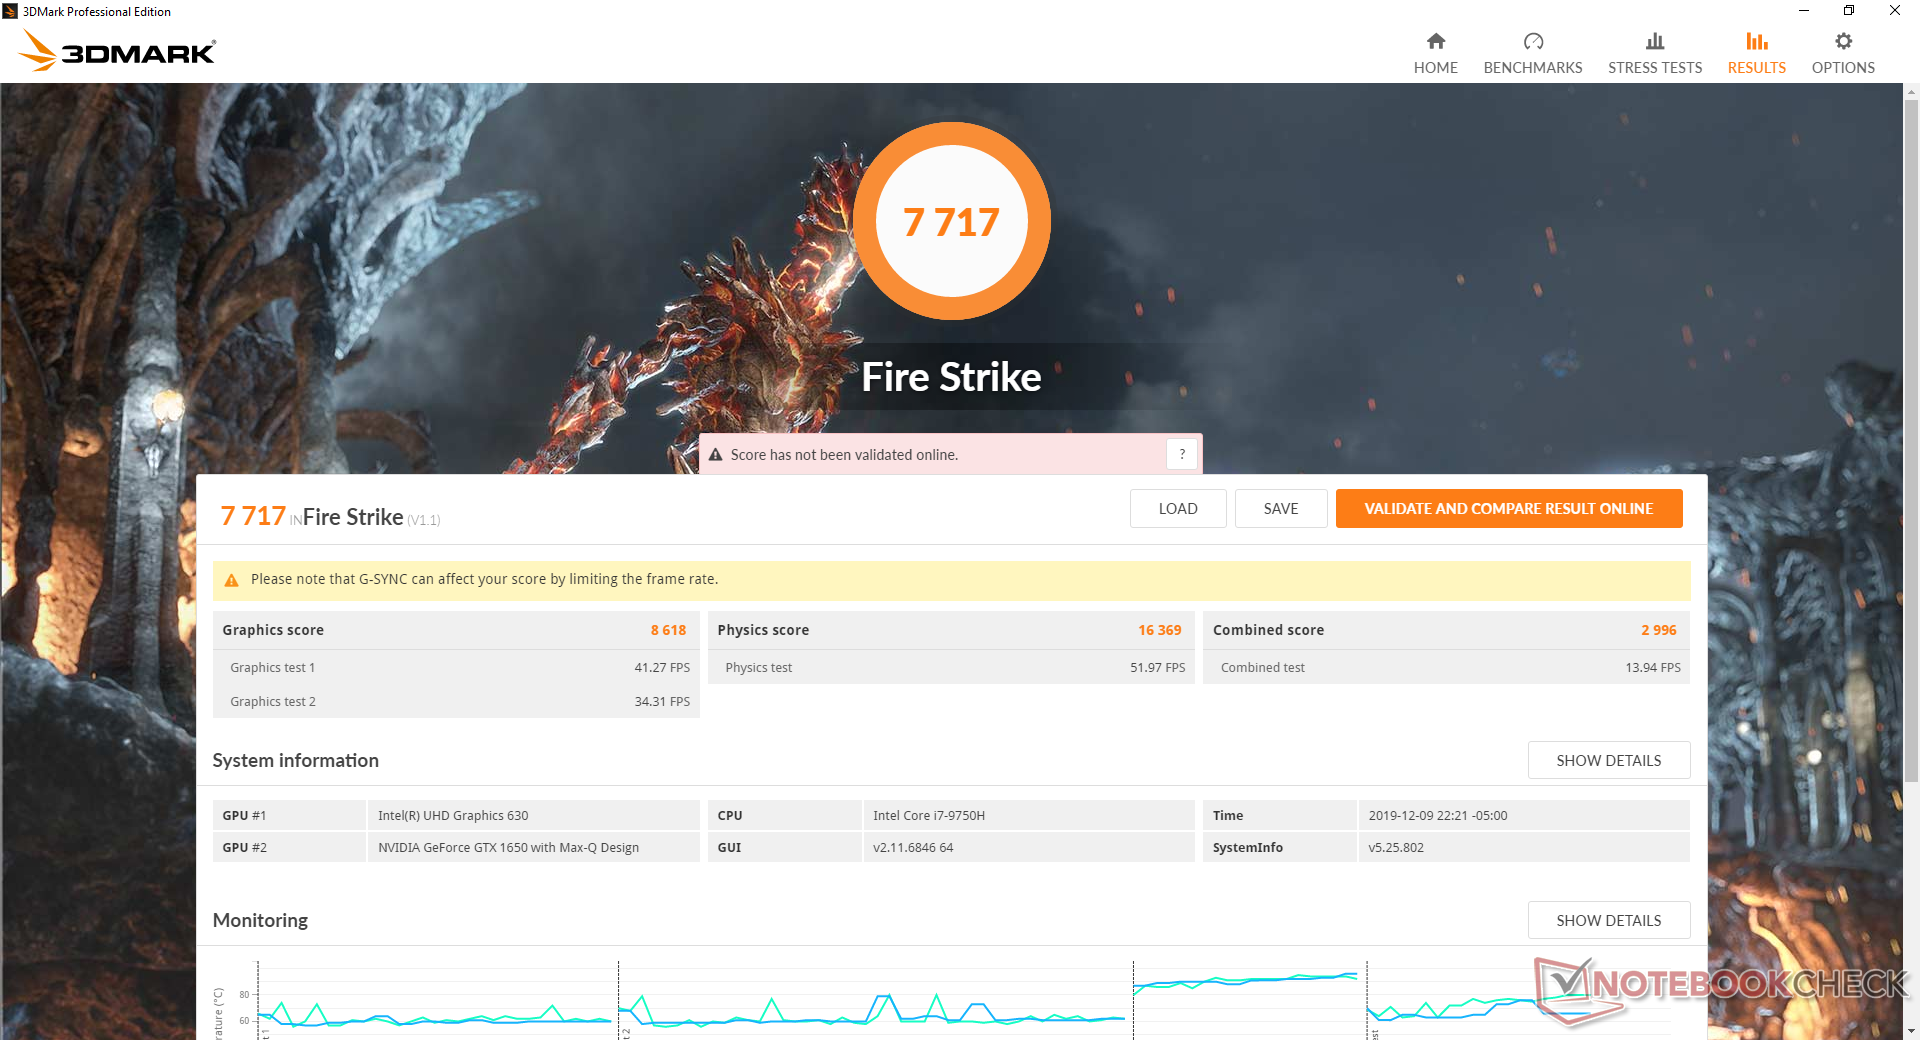
| 3DMark 11 Performance | 11952 points | |
| 3DMark Cloud Gate Standard Score | 29013 points | |
| 3DMark Fire Strike Score | 7717 points | |
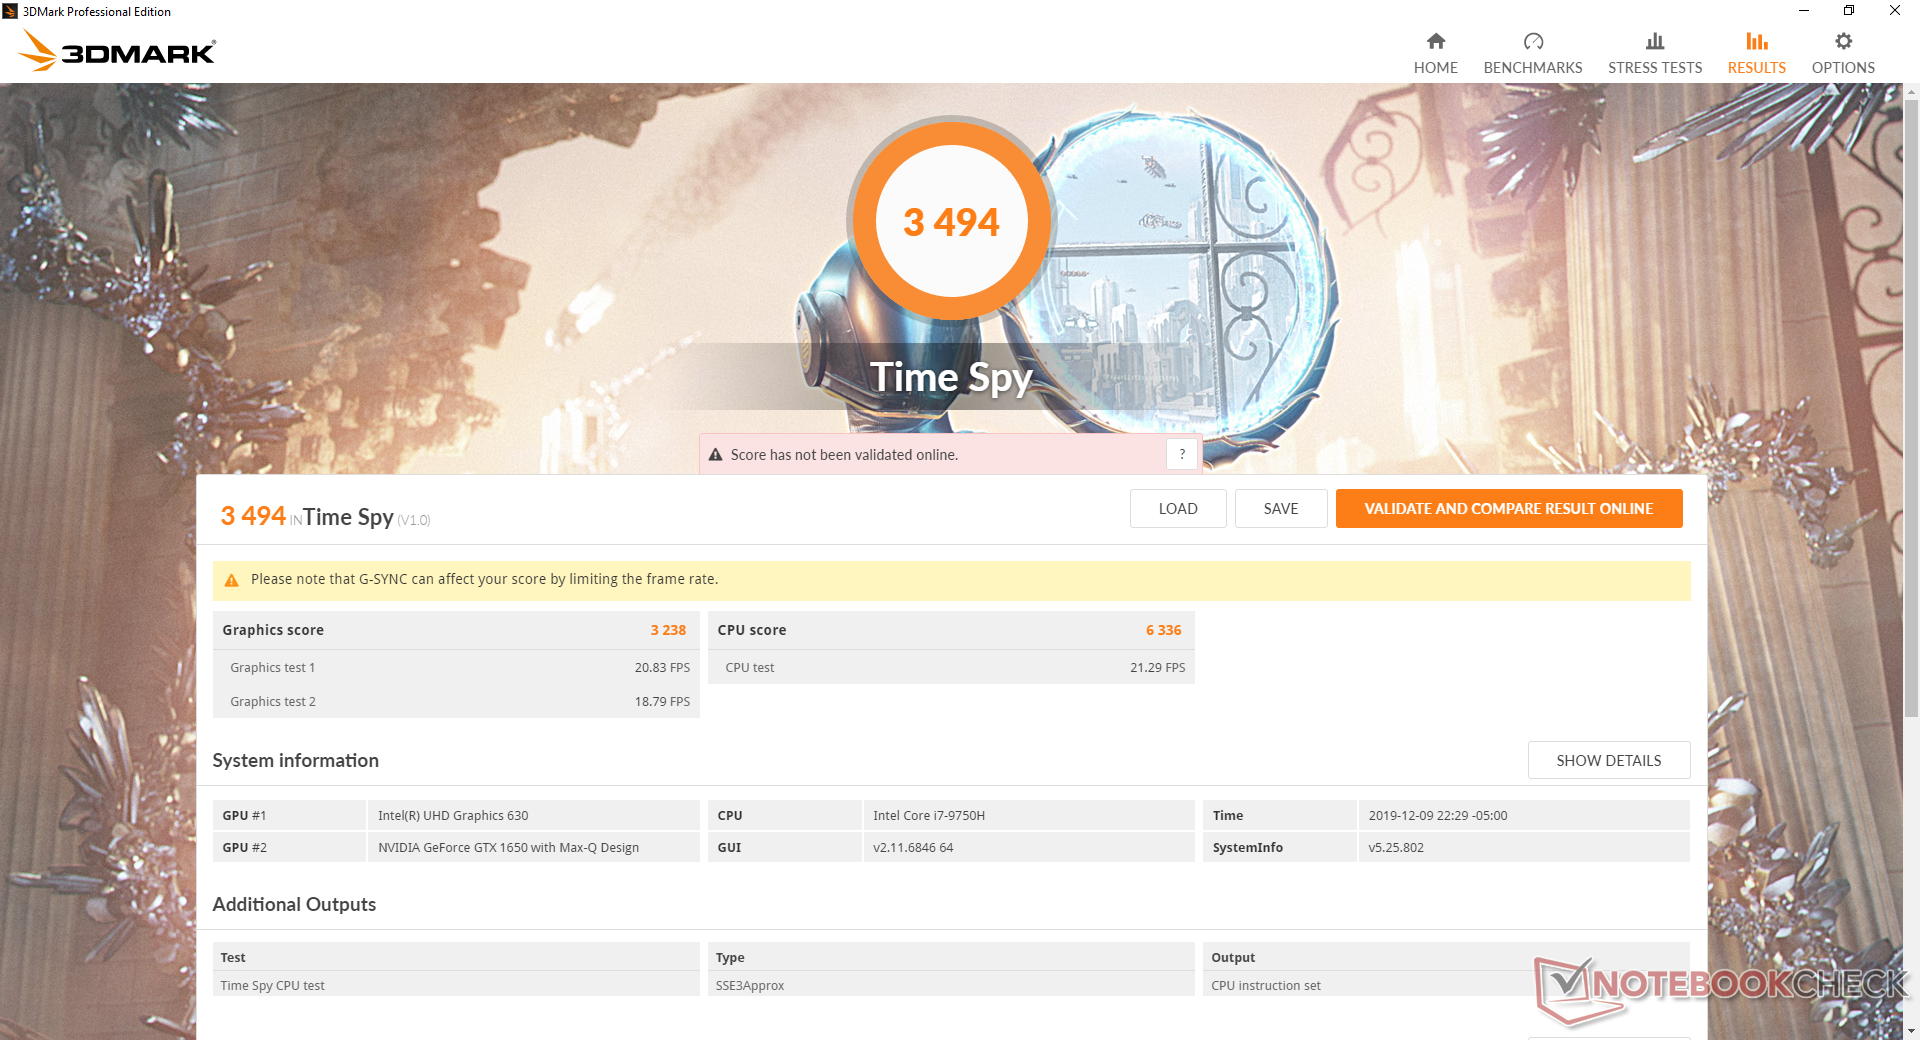
| 3DMark Time Spy Score | 3494 points | |
Help | ||
Gaming Performance
The GTX 1650 Max-Q may be one of the slowest GTX Turing GPUs available, but it's still able to punch above its weight class to be on par with the popular GTX 1060. Even the latest demanding titles can run smoothly at 1080p with most settings set to High or Maximum. We recommend engaging v-sync since frame rates tend to hover between 30 and 60 FPS.
It's interesting to note that the MSI Prestige 15 with a 15 W hexa-core CPU and same GTX 1650 Max-Q GPU performs about 20 percent slower in Shadow of the Tomb Raider. It's likely that most games will still run better on a 9th gen quad-core Core H laptop than a 10th gen hexa-core Core U laptop when given the same GPU.
See our dedicated page on the GeForce GTX 1650 Max-Q for more technical information and benchmark comparisons.
| low | med. | high | ultra | |
|---|---|---|---|---|
| BioShock Infinite (2013) | 317.2 | 231.2 | 215.2 | 84.3 |
| The Witcher 3 (2015) | 196 | 119.8 | 65.1 | 36.5 |
| Rocket League (2017) | 247.2 | 222.4 | 145.6 | |
| Shadow of the Tomb Raider (2018) | 105 | 58 | 51 | 45 |
Emissions
System Noise
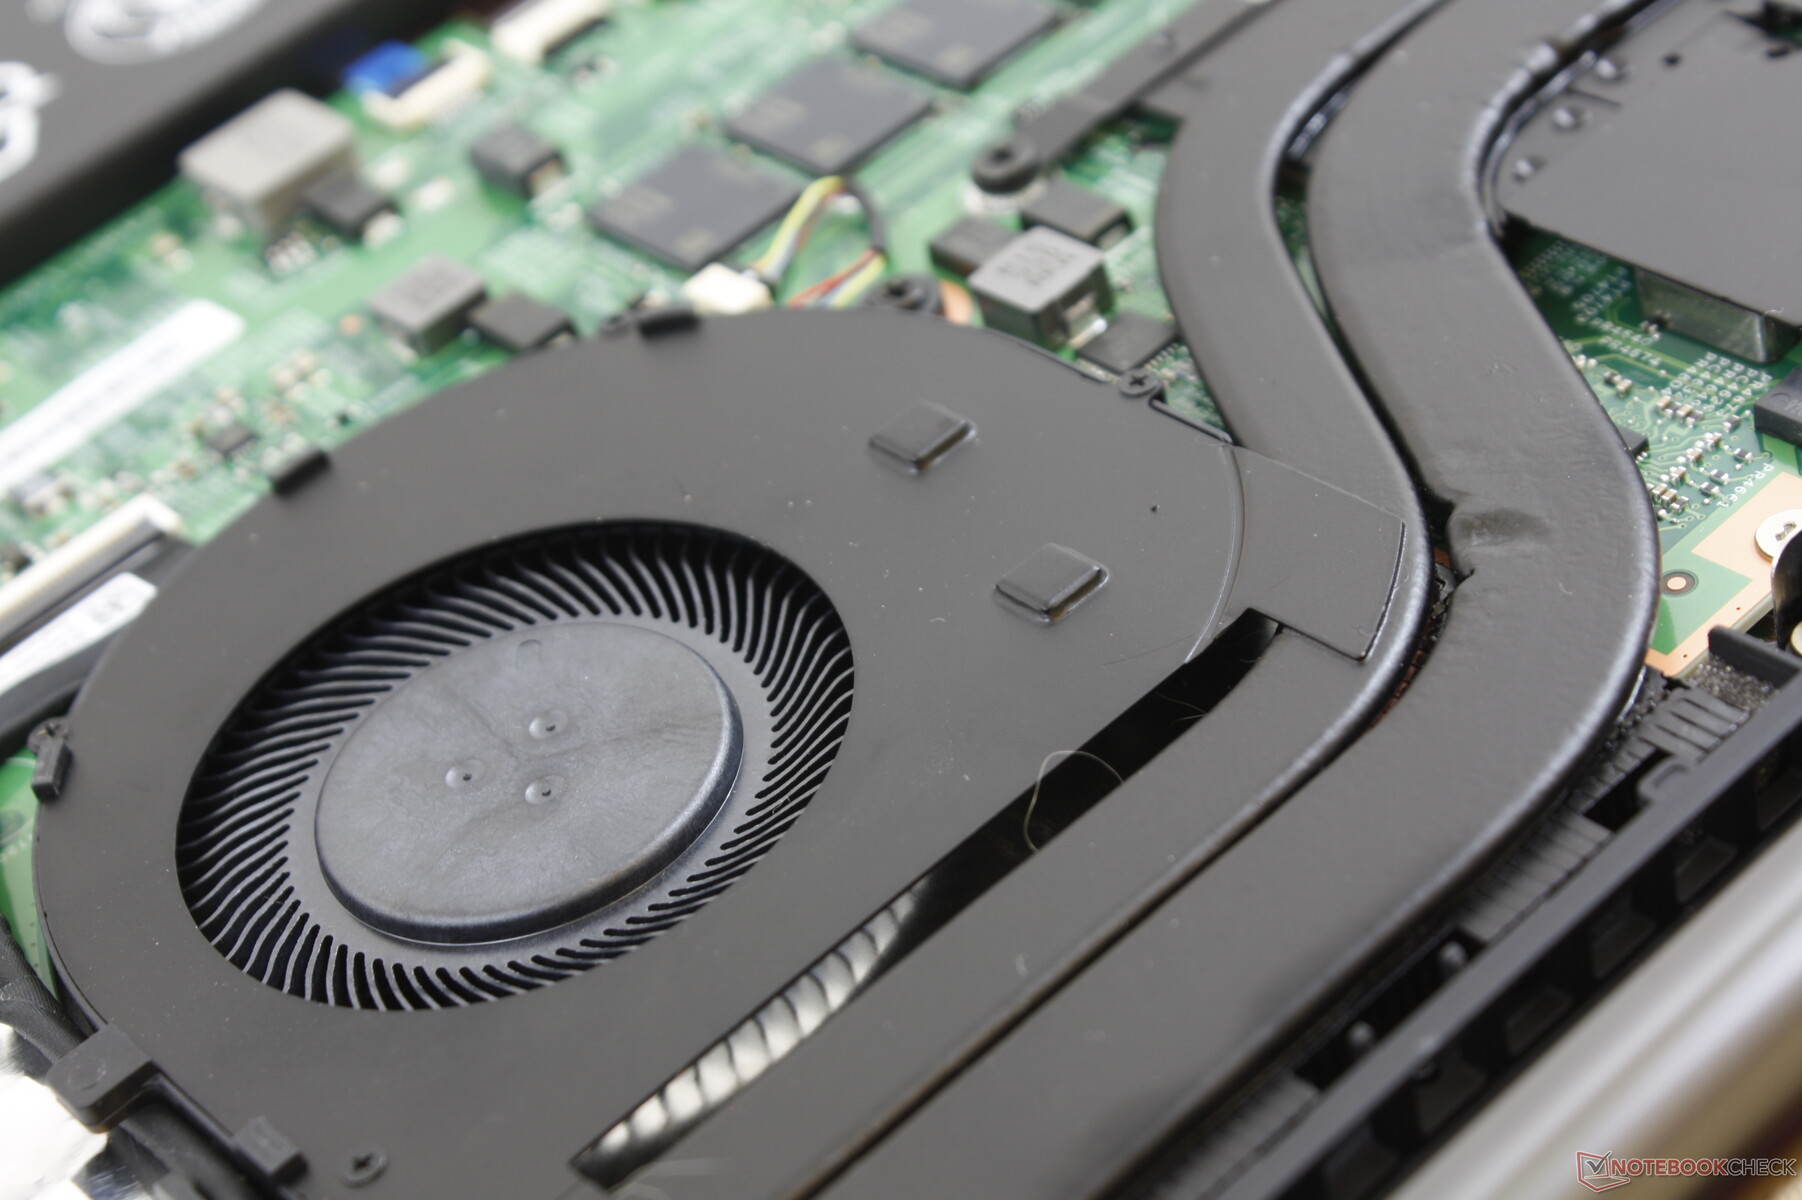
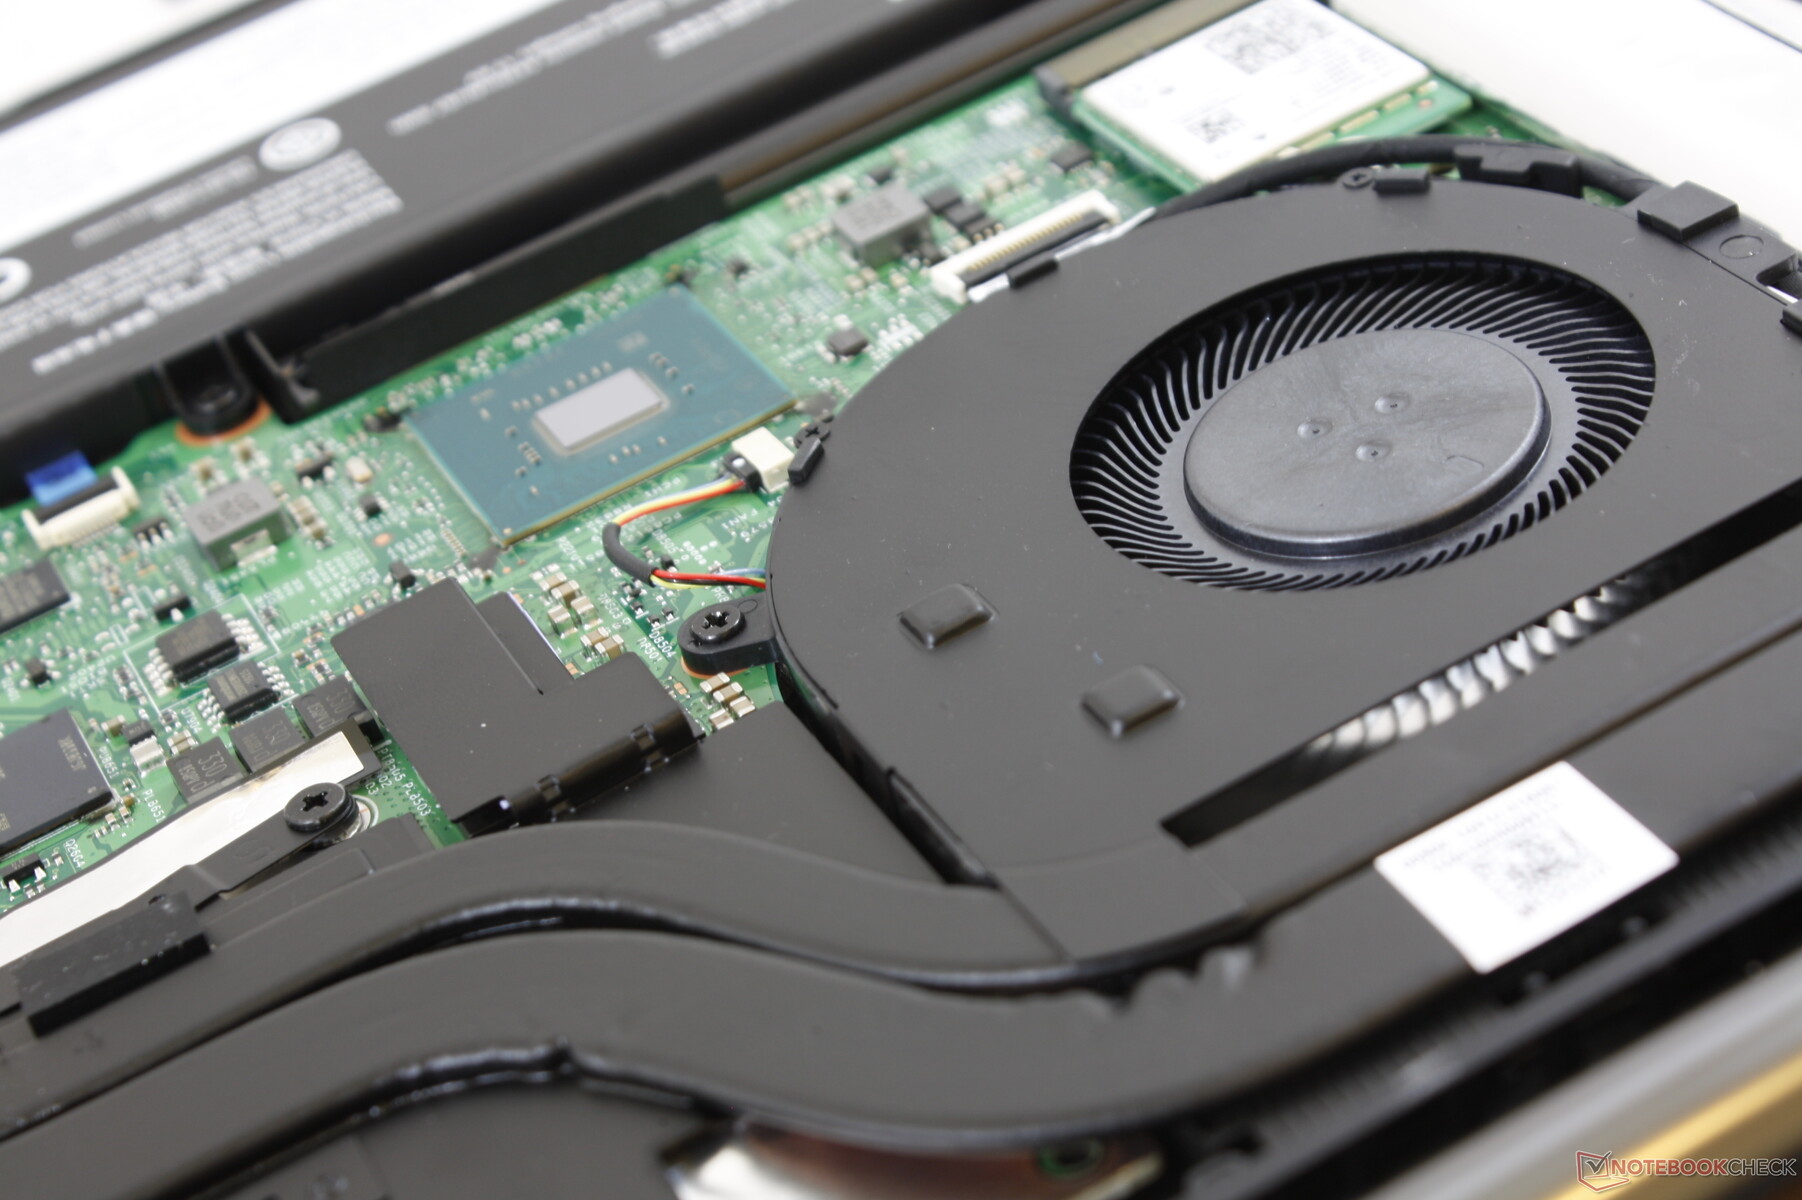
The cooling solution consists of twin fans and two heat pipes arranged symmetrically. The fans will idle during low loads like video streaming or pulse up to 30.9 dB(A) at worst to be essentially inaudible. During higher loads like gaming, however, fan noise will stabilize at their maximum of 45 dB(A) to be louder than most Ultrabooks and convertibles. In general, fan noise sits between an Ultrabook and a proper gaming laptop with RTX graphics when subjected to high processing loads.
We're able to notice slight coil whine or electronic noise from our test unit when placing an ear on the keyboard keys.
| Lenovo Yoga C940-15IRH GeForce GTX 1650 Max-Q, i7-9750H, Intel Optane Memory H10 with Solid State Storage 32GB + 512GB HBRPEKNX0202A(L/H) | Dell XPS 15 7590 9980HK GTX 1650 GeForce GTX 1650 Mobile, i9-9980HK, Toshiba XG6 KXG60ZNV1T02 | Asus ZenBook 15 UX534FT-DB77 GeForce GTX 1650 Max-Q, i7-8565U, Samsung SSD PM981 MZVLB1T0HALR | Lenovo Ideapad 720S-15IKB 81AC001AGE GeForce GTX 1050 Ti Max-Q, i7-7700HQ, Samsung SSD PM981 MZVLB512HAJQ | HP Gaming Pavilion 15-dk0009ng GeForce GTX 1660 Ti Max-Q, i7-9750H, Samsung SSD PM981 MZVLB256HAHQ | MSI GP65 Leopard 9SE-225US GeForce RTX 2060 Mobile, i7-9750H, Toshiba KBG30ZMT512G | |
|---|---|---|---|---|---|---|
| Noise | -1% | 7% | 0% | 8% | -0% | |
| off / environment * (dB) | 28.7 | 28.2 2% | 28.4 1% | 30.3 -6% | 28.2 2% | 28.2 2% |
| Idle Minimum * (dB) | 28.7 | 28.2 2% | 28.4 1% | 30.3 -6% | 29.3 -2% | 29.5 -3% |
| Idle Average * (dB) | 28.8 | 28.2 2% | 28.4 1% | 30.3 -5% | 29.3 -2% | 29.6 -3% |
| Idle Maximum * (dB) | 28.8 | 30.4 -6% | 28.4 1% | 30.3 -5% | 29.3 -2% | 29.6 -3% |
| Load Average * (dB) | 45 | 43.8 3% | 33.9 25% | 39.3 13% | 32.3 28% | 33 27% |
| Witcher 3 ultra * (dB) | 44.7 | 47.2 -6% | 39.8 11% | 34 24% | 47.2 -6% | |
| Load Maximum * (dB) | 44.7 | 47.2 -6% | 40.2 10% | 39.6 11% | 41.2 8% | 52 -16% |
* ... smaller is better
Noise level
| Idle |
| 28.7 / 28.8 / 28.8 dB(A) |
| Load |
| 45 / 44.7 dB(A) |
 | ||
30 dB silent 40 dB(A) audible 50 dB(A) loud |
||
min: | ||
Temperature
Surface temperatures are generally flat on both sides of the laptop during low processing loads. When gaming, the center of the laptop can become as warm as 38 C to 42 C to be cooler than what we observed on the XPS 15 or HP Spectre x360 15 where hot spots can reach over 50 C each. The edges and corners never become uncomfortably warm to hold when in tablet mode.
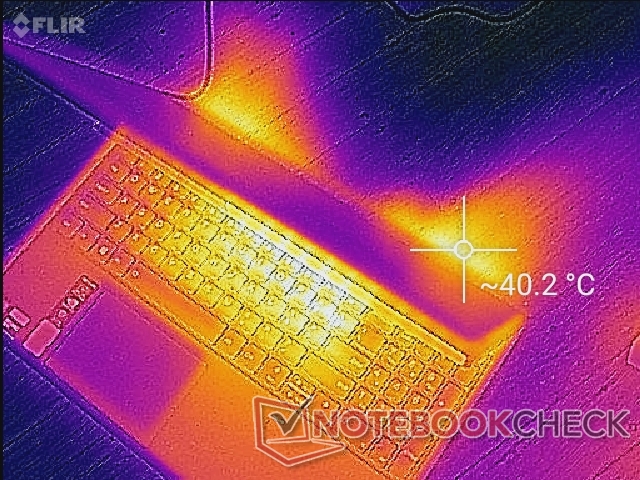

(-) The maximum temperature on the upper side is 46.2 °C / 115 F, compared to the average of 36.8 °C / 98 F, ranging from 21 to 71 °C for the class Multimedia.
(±) The bottom heats up to a maximum of 45 °C / 113 F, compared to the average of 39.1 °C / 102 F
(+) In idle usage, the average temperature for the upper side is 23.9 °C / 75 F, compared to the device average of 31.3 °C / 88 F.
(±) Playing The Witcher 3, the average temperature for the upper side is 32 °C / 90 F, compared to the device average of 31.3 °C / 88 F.
(+) The palmrests and touchpad are cooler than skin temperature with a maximum of 31 °C / 87.8 F and are therefore cool to the touch.
(-) The average temperature of the palmrest area of similar devices was 28.7 °C / 83.7 F (-2.3 °C / -4.1 F).


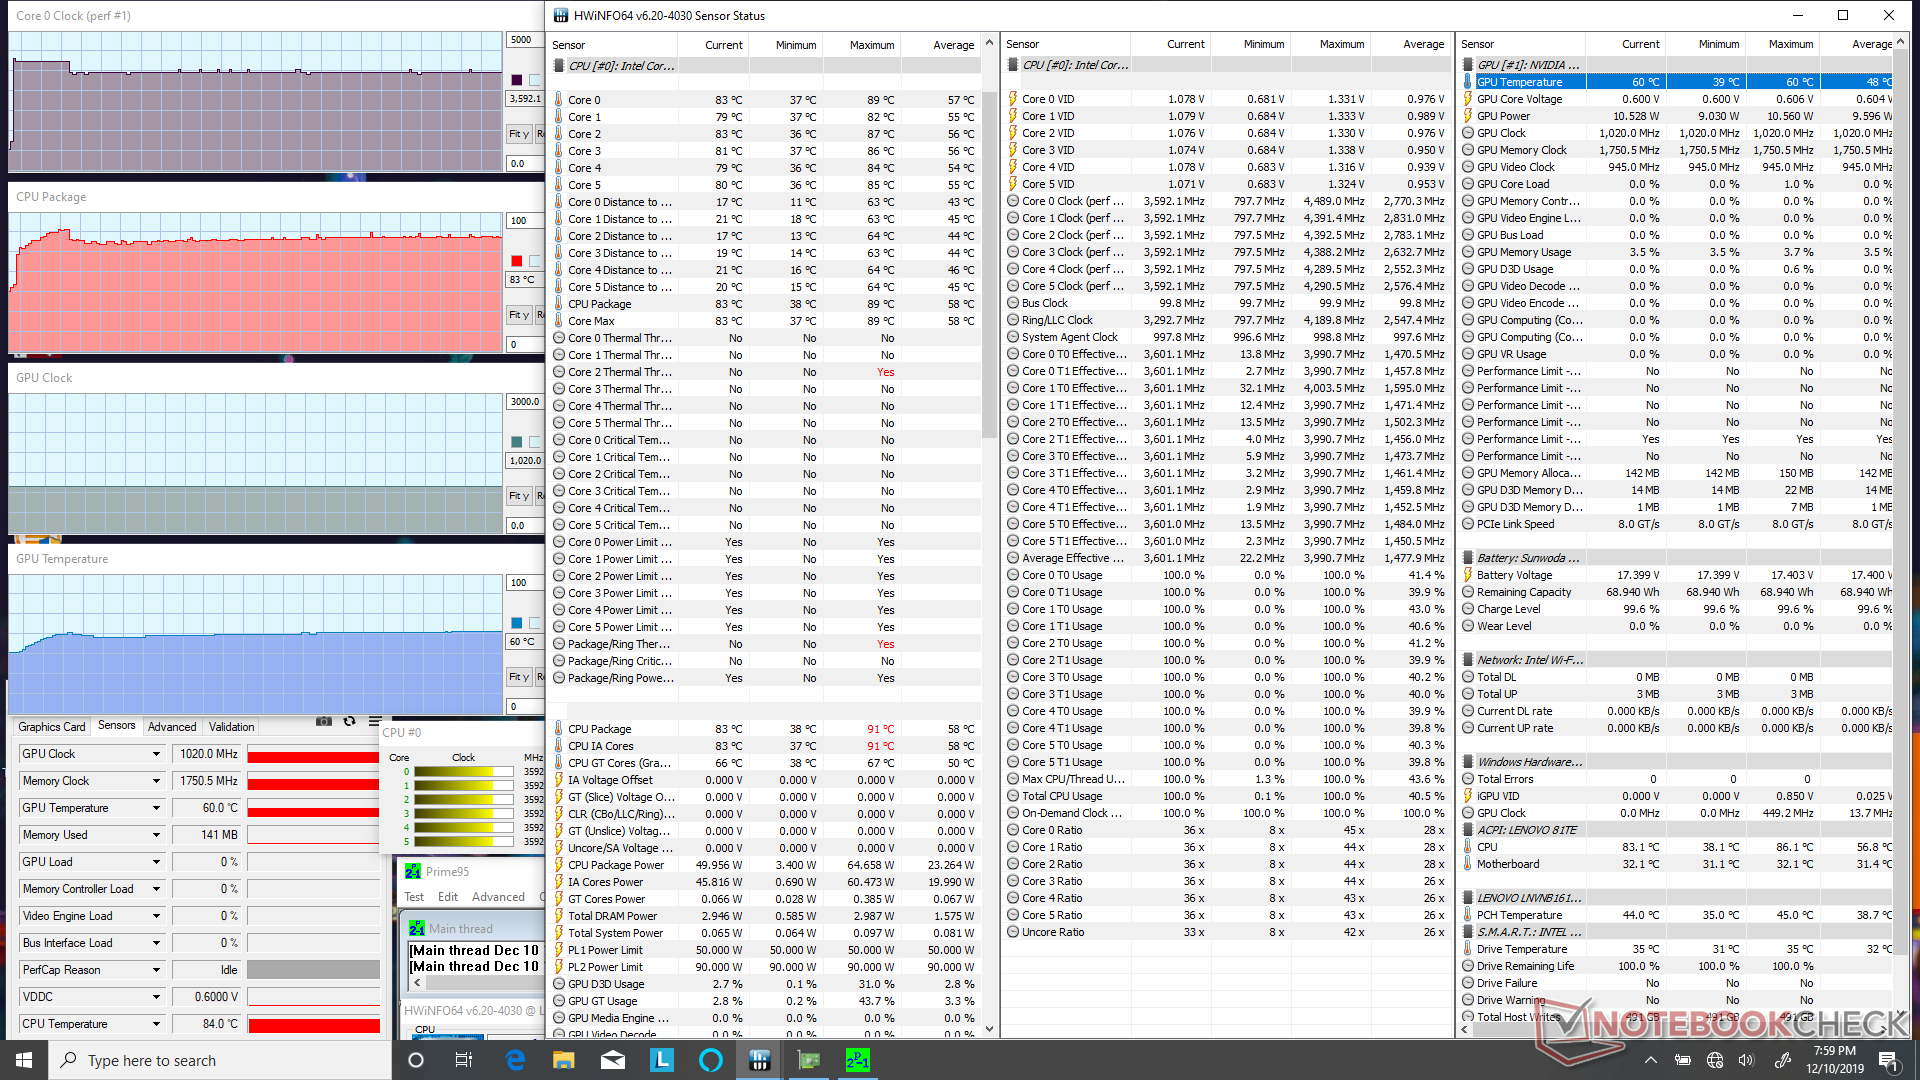
Stress Test
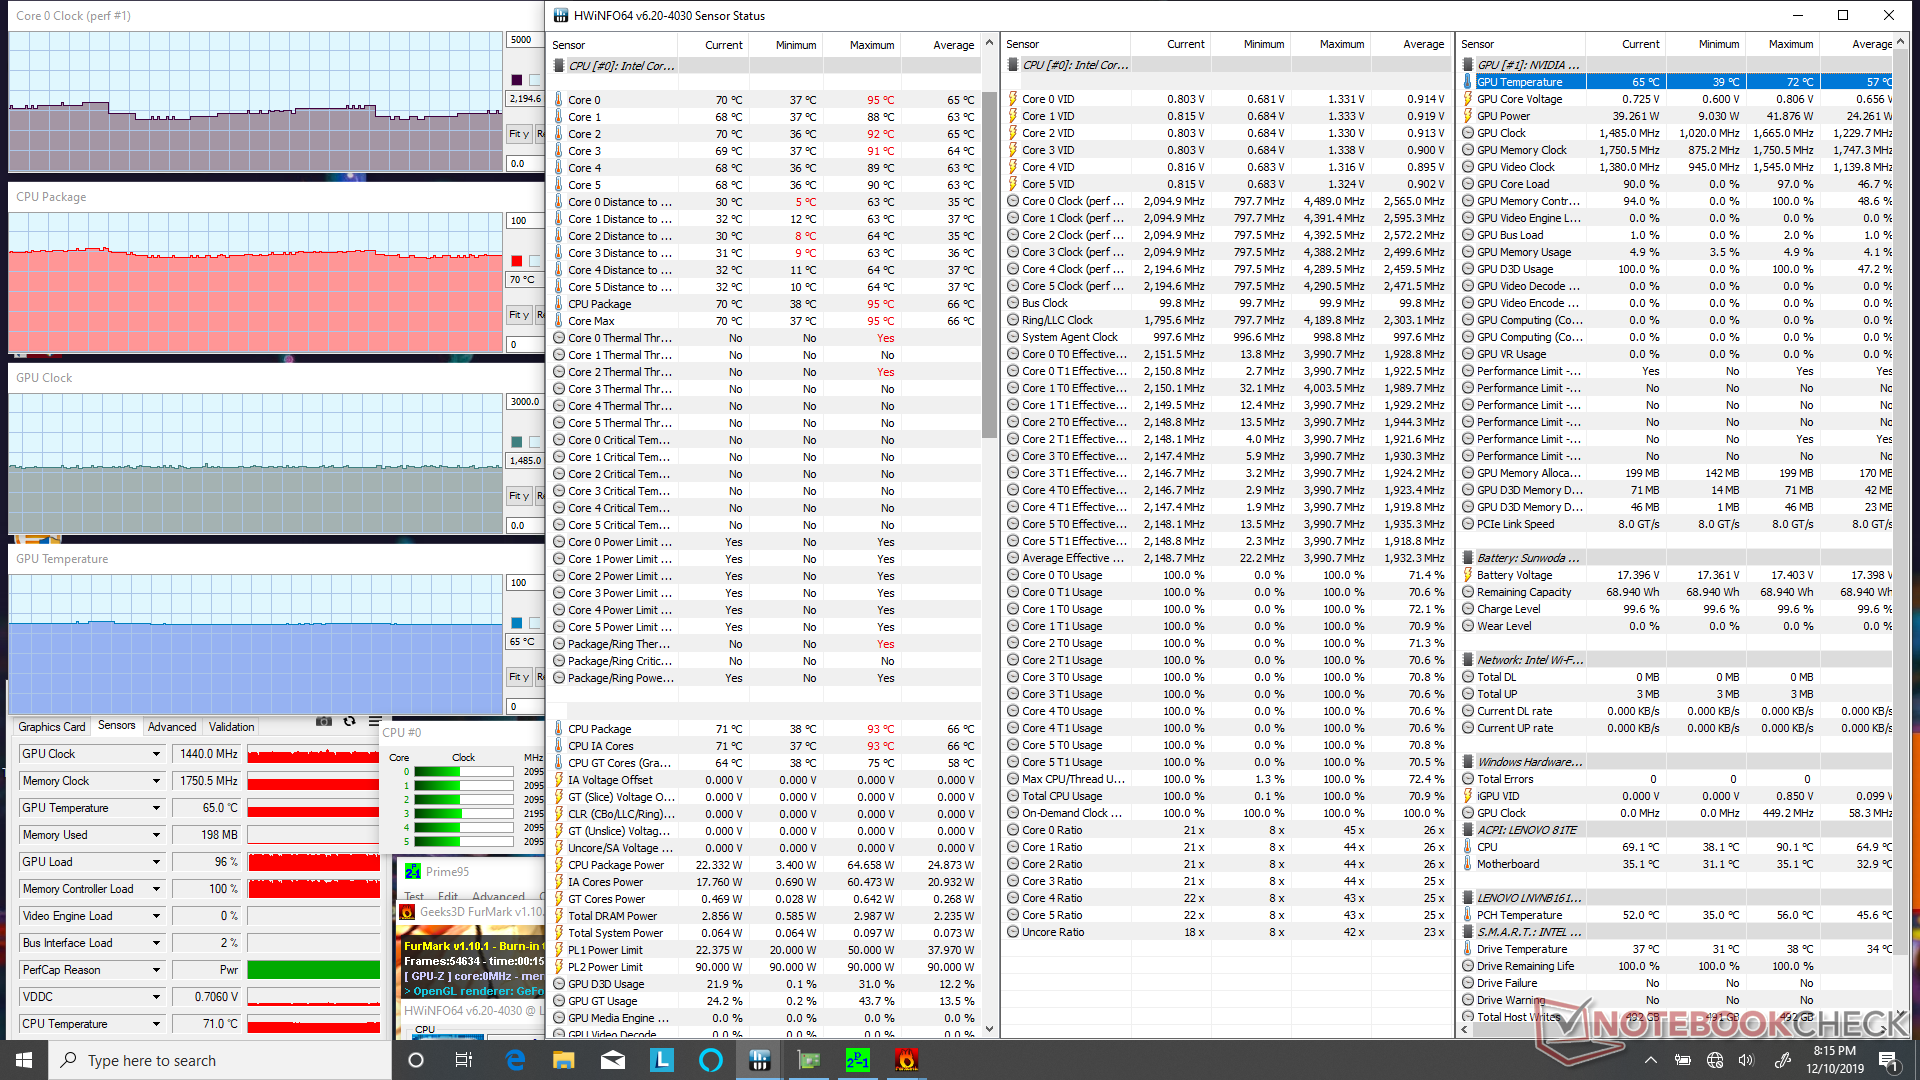
We stress the laptop with synthetic loads to identify for any potential throttling or stability issues. When running Prime95, the CPU can be observed boosting up to 4 GHz for about 30 seconds until hitting a core temperature of 89 C. Thereafter, clock rates drop and stabilize at the 3.5 to 3.6 GHz range in order to maintain a cooler core temperature of 83 C. Running both Prime95 and FurMark will cause CPU clock rates and temperature to drop and cycle between 1.9 to 2.4 GHz and 69 C to 74 C, respectively.
Running Witcher 3 is more representative of stressful real-world loads. Here, the CPU and GPU stabilize at relatively cool temperatures of 72 C and 67 C, respectively, compared to 92 C and 79 C on the ZenBook 15. Temperature results are not all that different from what we discovered on the HP Pavilion Gaming 15 with the more powerful GTX 1660 Ti Max-Q.
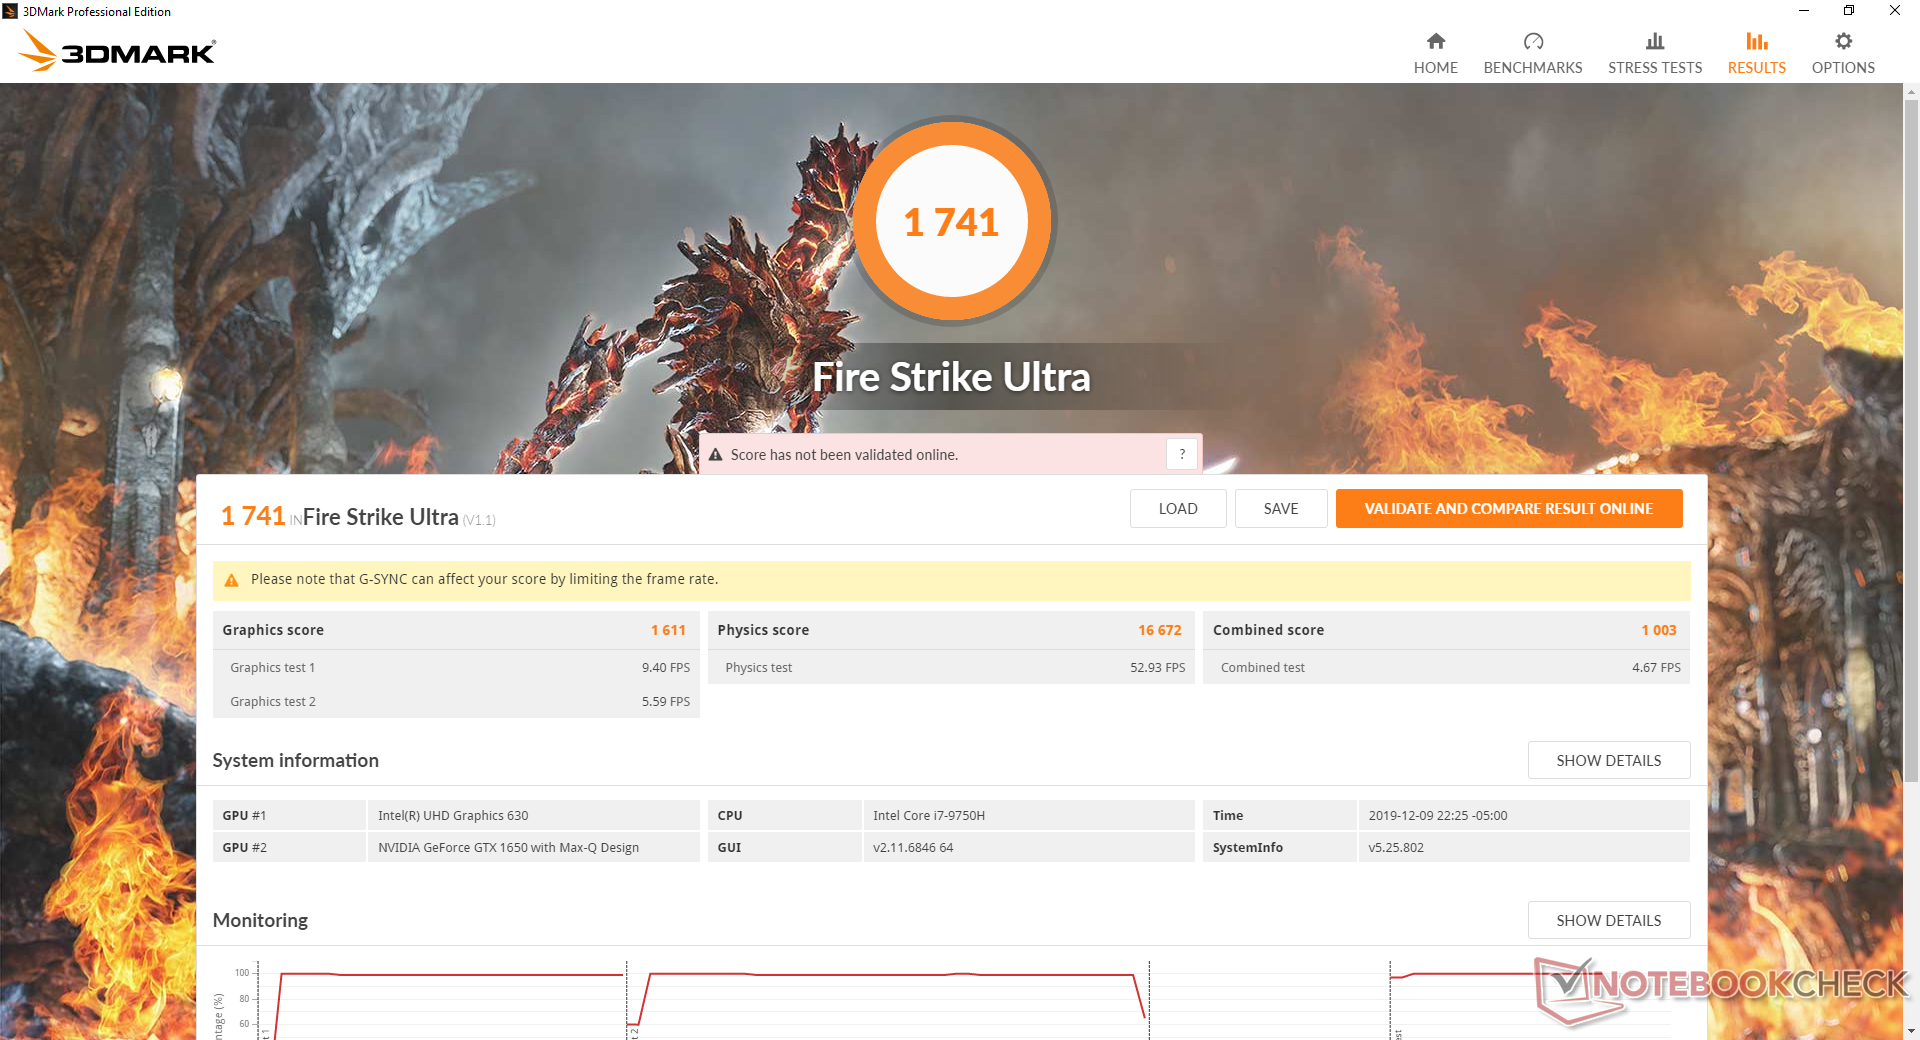
Running on battery power will limit performance. A Fire Strike run on batteries returns Physics and Graphics scores of 10757 and 7876 points, respectively, compared to 16369 and 8618 points when on mains.
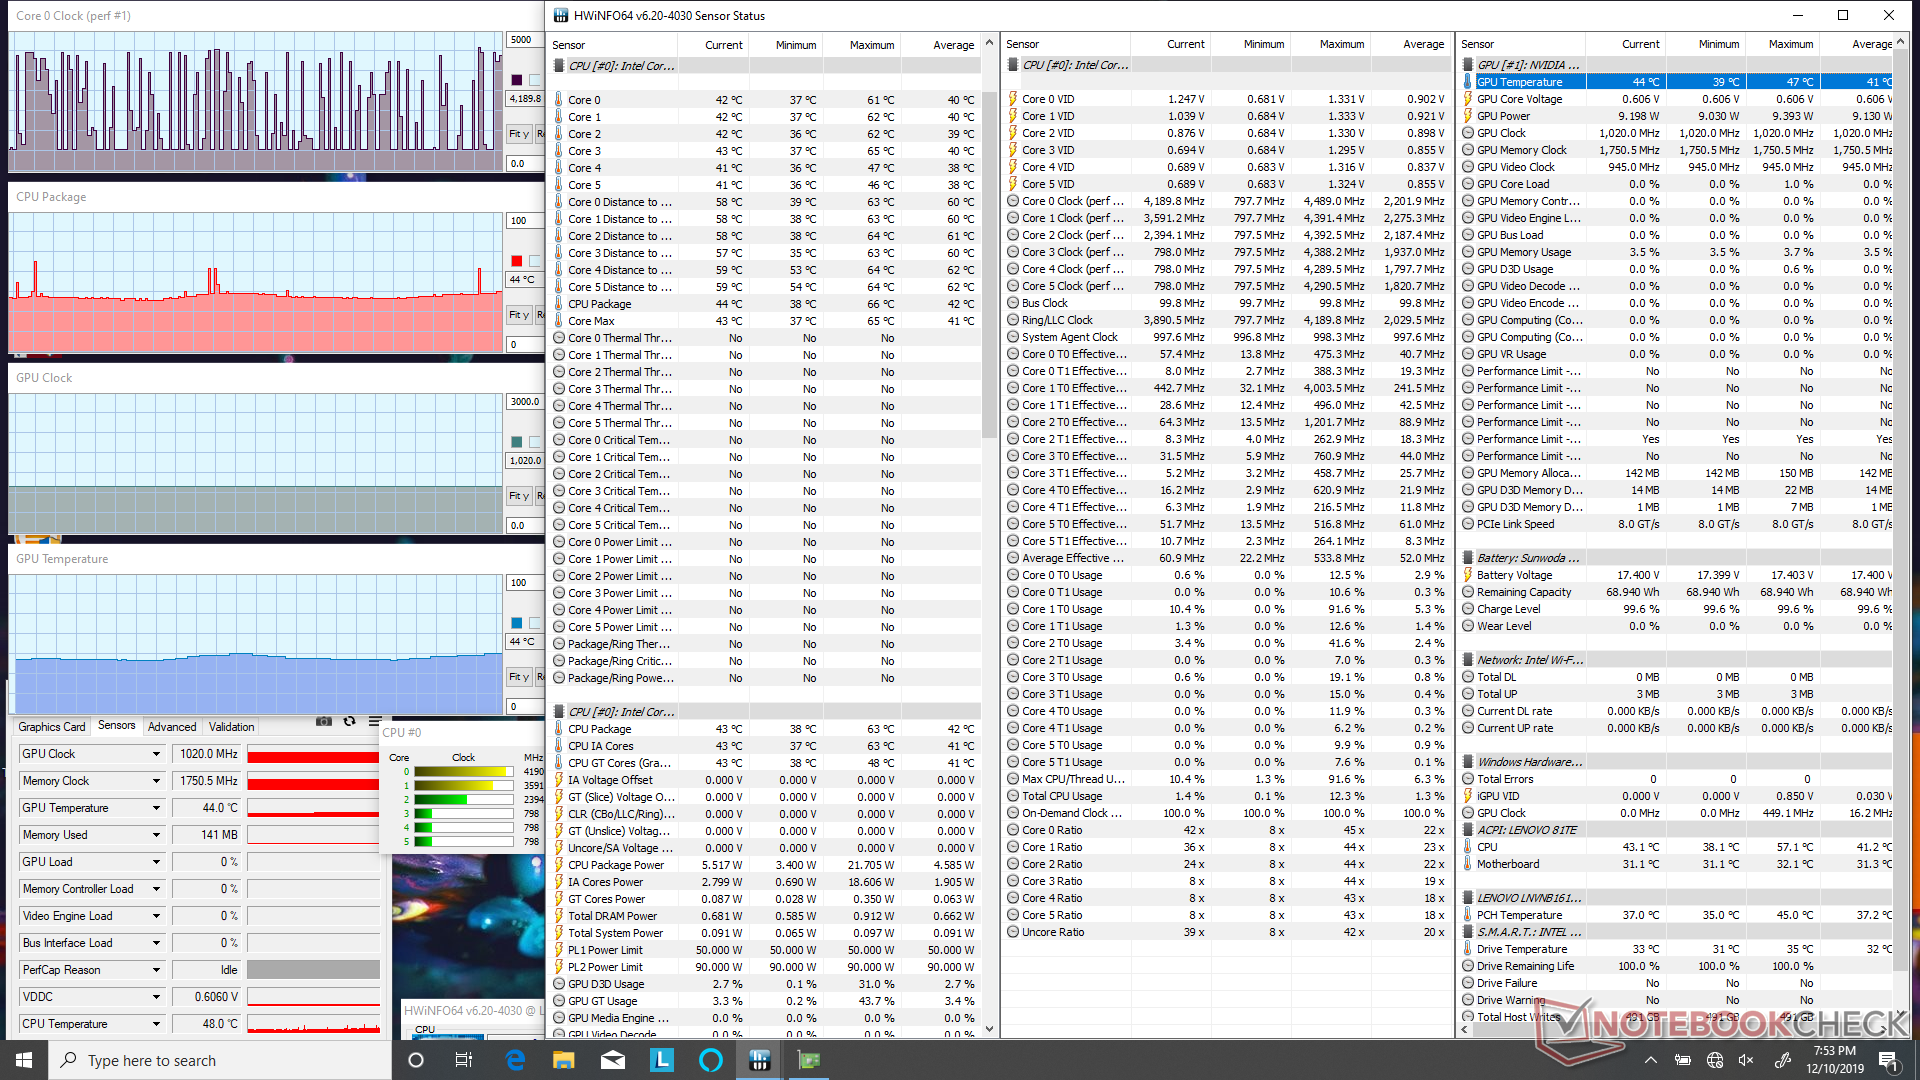
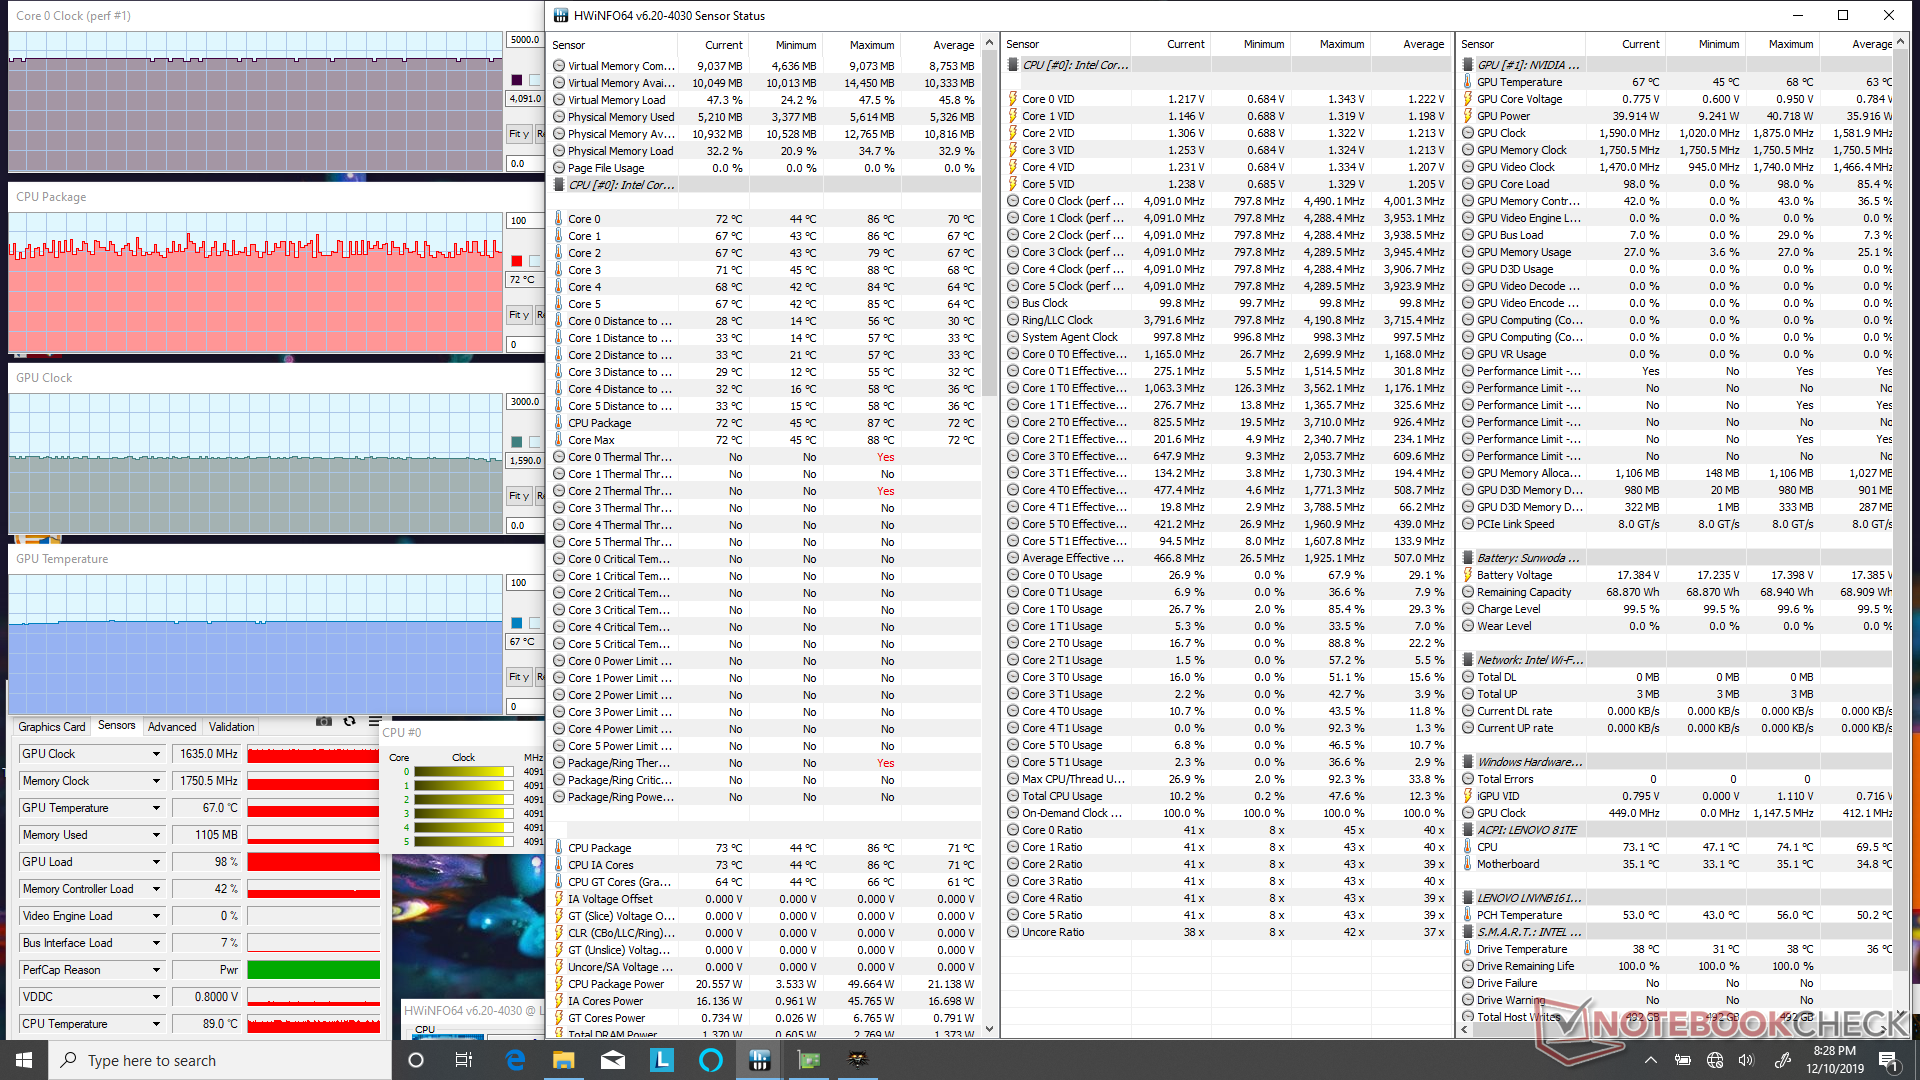
| CPU Clock (GHz) | GPU Clock (MHz) | Average CPU Temperature (°C) | Average GPU Temperature (°C) | |
| System Idle | -- | -- | 44 | 44 |
| Prime95 Stress | 3.6 | -- | 83 | -- |
| Prime95 + FurMark Stress | 1.9 - 2.4 | 1440 | 69 - 74 | 65 |
| Witcher 3 Stress | 4.1 | 1635 | ~72 | 67 |
Speakers
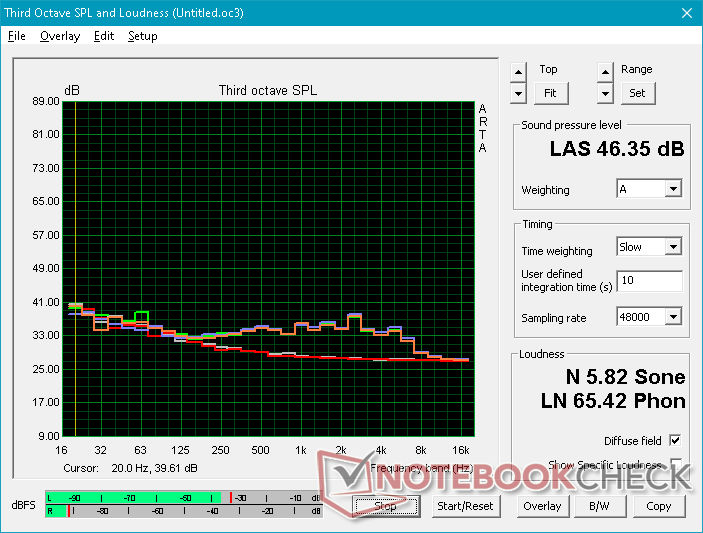
Audio quality is better than expected ever since Lenovo ditched the watchband hinge a few years ago in favor of the current iteration. Unlike on other laptops, Yoga C930 and C940 models integrate two additional speakers inside the hinge for a total of four 2 W speakers. The outcome is louder audio and a roll-off that begins at around 250 Hz compared to ~600 Hz on cheaper laptops like the Walmart Motile. Higher volume settings introduce only minimal surface vibrations and no static.


Lenovo Yoga C940-15IRH audio analysis
(+) | speakers can play relatively loud (85.3 dB)
Bass 100 - 315 Hz
(±) | reduced bass - on average 9.8% lower than median
(±) | linearity of bass is average (14% delta to prev. frequency)
Mids 400 - 2000 Hz
(±) | higher mids - on average 6.5% higher than median
(+) | mids are linear (5.1% delta to prev. frequency)
Highs 2 - 16 kHz
(+) | balanced highs - only 3.4% away from median
(±) | linearity of highs is average (8.5% delta to prev. frequency)
Overall 100 - 16.000 Hz
(±) | linearity of overall sound is average (17.8% difference to median)
Compared to same class
» 52% of all tested devices in this class were better, 7% similar, 41% worse
» The best had a delta of 5%, average was 17%, worst was 45%
Compared to all devices tested
» 36% of all tested devices were better, 8% similar, 56% worse
» The best had a delta of 4%, average was 24%, worst was 134%
Apple MacBook 12 (Early 2016) 1.1 GHz audio analysis
(+) | speakers can play relatively loud (83.6 dB)
Bass 100 - 315 Hz
(±) | reduced bass - on average 11.3% lower than median
(±) | linearity of bass is average (14.2% delta to prev. frequency)
Mids 400 - 2000 Hz
(+) | balanced mids - only 2.4% away from median
(+) | mids are linear (5.5% delta to prev. frequency)
Highs 2 - 16 kHz
(+) | balanced highs - only 2% away from median
(+) | highs are linear (4.5% delta to prev. frequency)
Overall 100 - 16.000 Hz
(+) | overall sound is linear (10.2% difference to median)
Compared to same class
» 7% of all tested devices in this class were better, 2% similar, 91% worse
» The best had a delta of 5%, average was 18%, worst was 53%
Compared to all devices tested
» 5% of all tested devices were better, 1% similar, 94% worse
» The best had a delta of 4%, average was 24%, worst was 134%
Energy Management
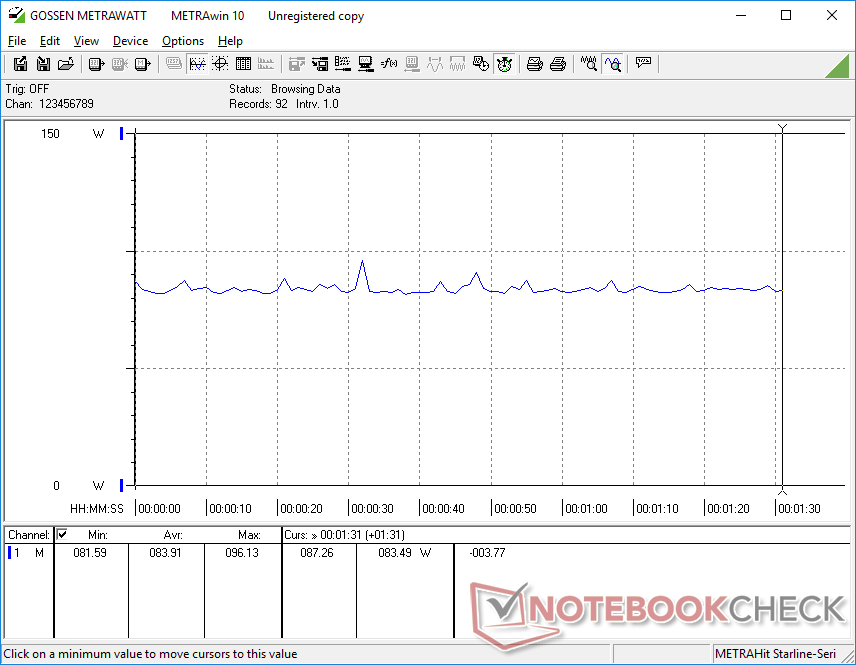
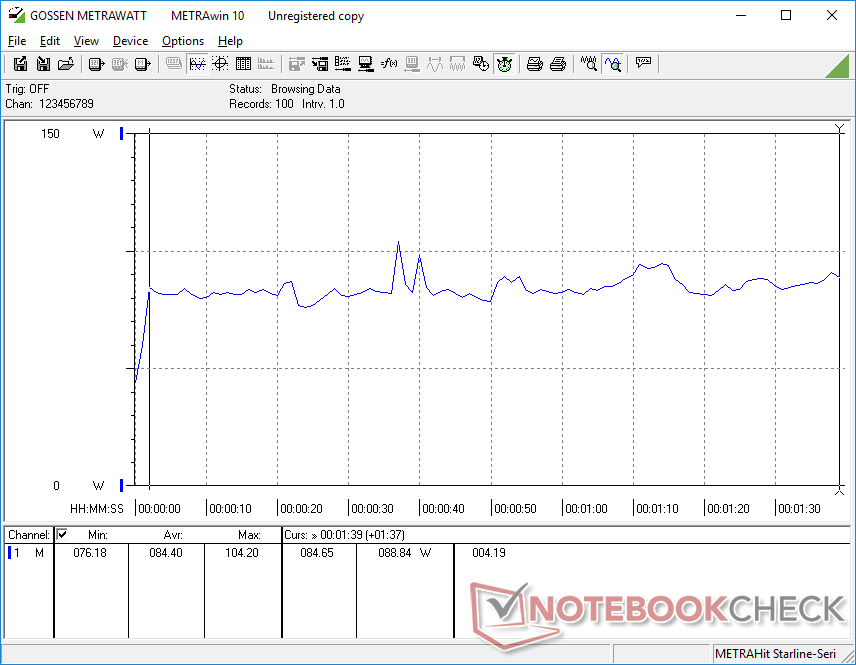
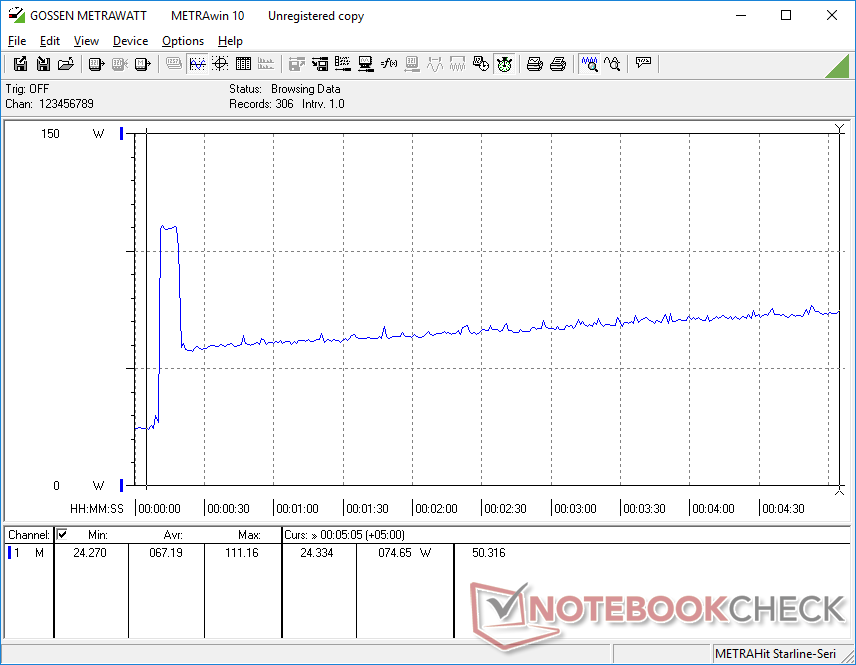
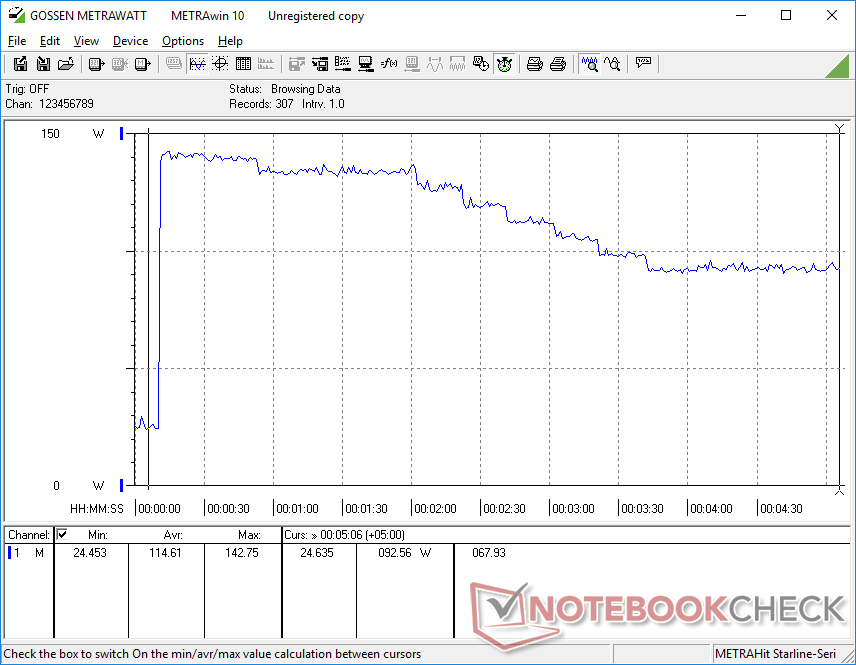
Power Consumption
Idling on desktop demands between 5 W and 25 W depending on the power profile and GPU setting. This upper range is higher than many competitors likely due in part to the brighter display of the Lenovo when set to maximum. We're able to record an average consumption of 84 C when running Witcher 3 compared to 121 W on the HP Pavilion Gaming 15 equipped with the more powerful GTX 1660 Ti Max-Q GPU. The performance-per-Watt is nearly the same between the GTX 1650 Max-Q and GTX 1660 Ti Max-Q as the latter offers roughly 50 percent faster performance alongside a 45 percent increase in power consumption. Note that power consumption when gaming is nearly identical to the GTX 1050 Ti even though the GTX 1650 Max-Q can be up to 30 percent faster.
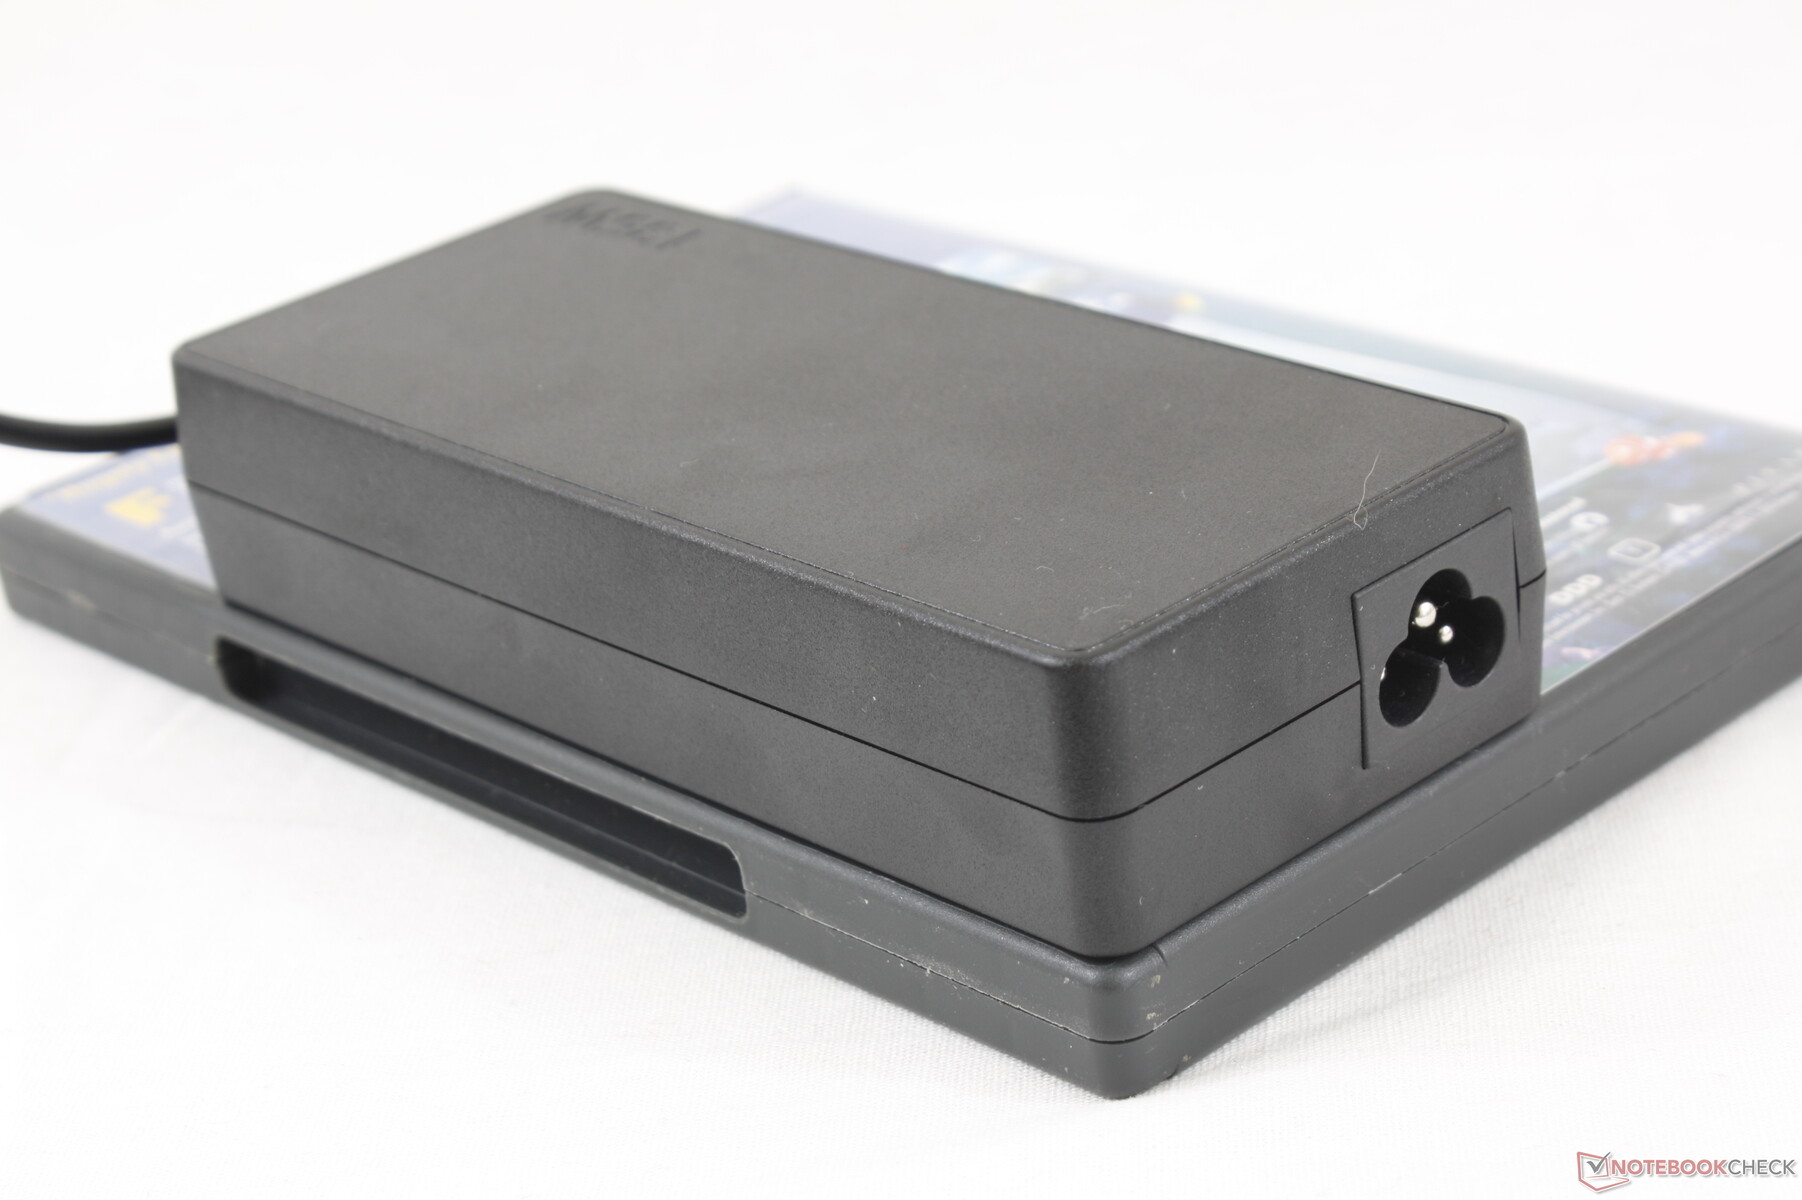
Running both Prime95 and FurMark simultaneously will draw a maximum of 143 W from the medium-sized (~14.4 x 6.3 x 3.1 cm) 135 W AC adapter. This high of a consumption is only temporary as it eventually falls and stabilizes at a lower rate over time as shown by our graphs below.
| Off / Standby | |
| Idle | |
| Load |
|
Key:
min: | |
| Lenovo Yoga C940-15IRH i7-9750H, GeForce GTX 1650 Max-Q, Intel Optane Memory H10 with Solid State Storage 32GB + 512GB HBRPEKNX0202A(L/H), IPS, 1920x1080, 15.6" | Dell XPS 15 7590 9980HK GTX 1650 i9-9980HK, GeForce GTX 1650 Mobile, Toshiba XG6 KXG60ZNV1T02, OLED, 3840x2160, 15.6" | Asus ZenBook 15 UX534FT-DB77 i7-8565U, GeForce GTX 1650 Max-Q, Samsung SSD PM981 MZVLB1T0HALR, IPS, 1920x1080, 15.6" | HP Gaming Pavilion 15-dk0009ng i7-9750H, GeForce GTX 1660 Ti Max-Q, Samsung SSD PM981 MZVLB256HAHQ, IPS, 1920x1080, 15.6" | MSI GP65 Leopard 9SE-225US i7-9750H, GeForce RTX 2060 Mobile, Toshiba KBG30ZMT512G, IPS, 1920x1080, 15.6" | HP Pavilion Gaming 15-cx0003ng i7-8750H, GeForce GTX 1050 Ti Mobile, Intel Optane 16 GB MEMPEK1J016GAH + HGST HTS721010A9E630 1 TB HDD, IPS, 1920x1080, 15.6" | |
|---|---|---|---|---|---|---|
| Power Consumption | -4% | 7% | -11% | -61% | 9% | |
| Idle Minimum * (Watt) | 5.2 | 6.2 -19% | 5 4% | 6.8 -31% | 13.6 -162% | 5.5 -6% |
| Idle Average * (Watt) | 10.7 | 9.6 10% | 13.2 -23% | 10.7 -0% | 17.9 -67% | 8.5 21% |
| Idle Maximum * (Watt) | 24.3 | 21.2 13% | 24 1% | 12.5 49% | 20.6 15% | 11.9 51% |
| Load Average * (Watt) | 84.4 | 104.3 -24% | 70 17% | 87.2 -3% | 96 -14% | 94 -11% |
| Witcher 3 ultra * (Watt) | 83.9 | 91.7 -9% | 63.3 25% | 121 -44% | 154.6 -84% | 86 -3% |
| Load Maximum * (Watt) | 142.8 | 135.3 5% | 114 20% | 191.4 -34% | 218.6 -53% | 144 -1% |
* ... smaller is better
Battery Life
The 69 Wh battery may be smaller than the 97 Wh battery of the XPS 15, but runtimes don't disappoint. We're able squeeze just over 9.5 hours of real-world WLAN use when set to the Balanced profile with the integrated GPU active. Charging, however, is on the slower side at almost 3 hours compared to just half that on most other laptops.
We attempted to recharge the system via USB Type-C with a 130 W Dell AC adapter but the system would not charge. For what it's worth, Lenovo advertises USB Type-C Power Delivery compatibility to suggest that USB Type-C charging should work.
| Lenovo Yoga C940-15IRH i7-9750H, GeForce GTX 1650 Max-Q, 69 Wh | Dell XPS 15 7590 9980HK GTX 1650 i9-9980HK, GeForce GTX 1650 Mobile, 97 Wh | Asus ZenBook 15 UX534FT-DB77 i7-8565U, GeForce GTX 1650 Max-Q, 71 Wh | Lenovo Ideapad 720S-15IKB 81AC001AGE i7-7700HQ, GeForce GTX 1050 Ti Max-Q, 79 Wh | HP Gaming Pavilion 15-dk0009ng i7-9750H, GeForce GTX 1660 Ti Max-Q, 52.5 Wh | MSI GP65 Leopard 9SE-225US i7-9750H, GeForce RTX 2060 Mobile, 51 Wh | Dell XPS 15 9575 i7-8705G i7-8705G, Vega M GL / 870, 75 Wh | |
|---|---|---|---|---|---|---|---|
| Battery runtime | 65% | 65% | 32% | -24% | -39% | -19% | |
| Reader / Idle (h) | 18.2 | 15.2 -16% | 21.5 18% | 22.6 24% | 8.7 -52% | 6 -67% | 11.2 -38% |
| WiFi v1.3 (h) | 9.7 | 7.8 -20% | 8.4 -13% | 9.8 1% | 4.8 -51% | 3.9 -60% | 7 -28% |
| Load (h) | 1 | 3.3 230% | 2.9 190% | 1.7 70% | 1.3 30% | 1.1 10% | 1.1 10% |
| Witcher 3 ultra (h) | 1 |
Pros
Cons
Verdict
When Dell announced the XPS 15 2-in-1, users were expecting a standard XPS 15 clamshell but with 360-degree hinges. What we got instead was a completely different chassis with an unproven CPU/GPU series that may have turned off the core XPS 15 fan base. The Lenovo Yoga C940-15 is actually closer to what most users had imagined the XPS 15 2-in-1 to be: a touchscreen convertible with a traditional chiclet keyboard, traditional Intel Core H CPU, GeForce GTX GPU, easily serviceable storage, and a more secure pen garage instead of a finicky magnetic one.
Having a gaming-capable GTX GPU in a 15.6-inch convertible form factor has its drawbacks. Namely, tablet mode is best used sparingly or in short bursts due to the sheer weight and size of the unit. Even so, the Yoga C940 is still lighter, brighter, smaller, and more powerful than the competing 2019 HP Spectre x360 15 to make it the overall better option in this particular category. The XPS 15 9575 2-in-1 is ever-so-slightly smaller, but it falls short in most other aspects including performance, battery life, brightness, and audio. We're hopeful that future iterations will improve upon the heavy weight and soft keyboard keys and clickpad.
The Lenovo Yoga C940-15 offers very high performance per volume for a 15.6-inch convertible. While not particularly light or cheap at around $1500 retail, it's the superior option when compared to the XPS 15 2-in-1 or current HP Spectre x360 15.
Lenovo Yoga C940-15IRH
- 12/15/2019 v7 (old)
Allen Ngo
