Corsair One i160 Gaming PC Review: A 12 litre machine with a Core i9-9900K and RTX 2080 Ti
")


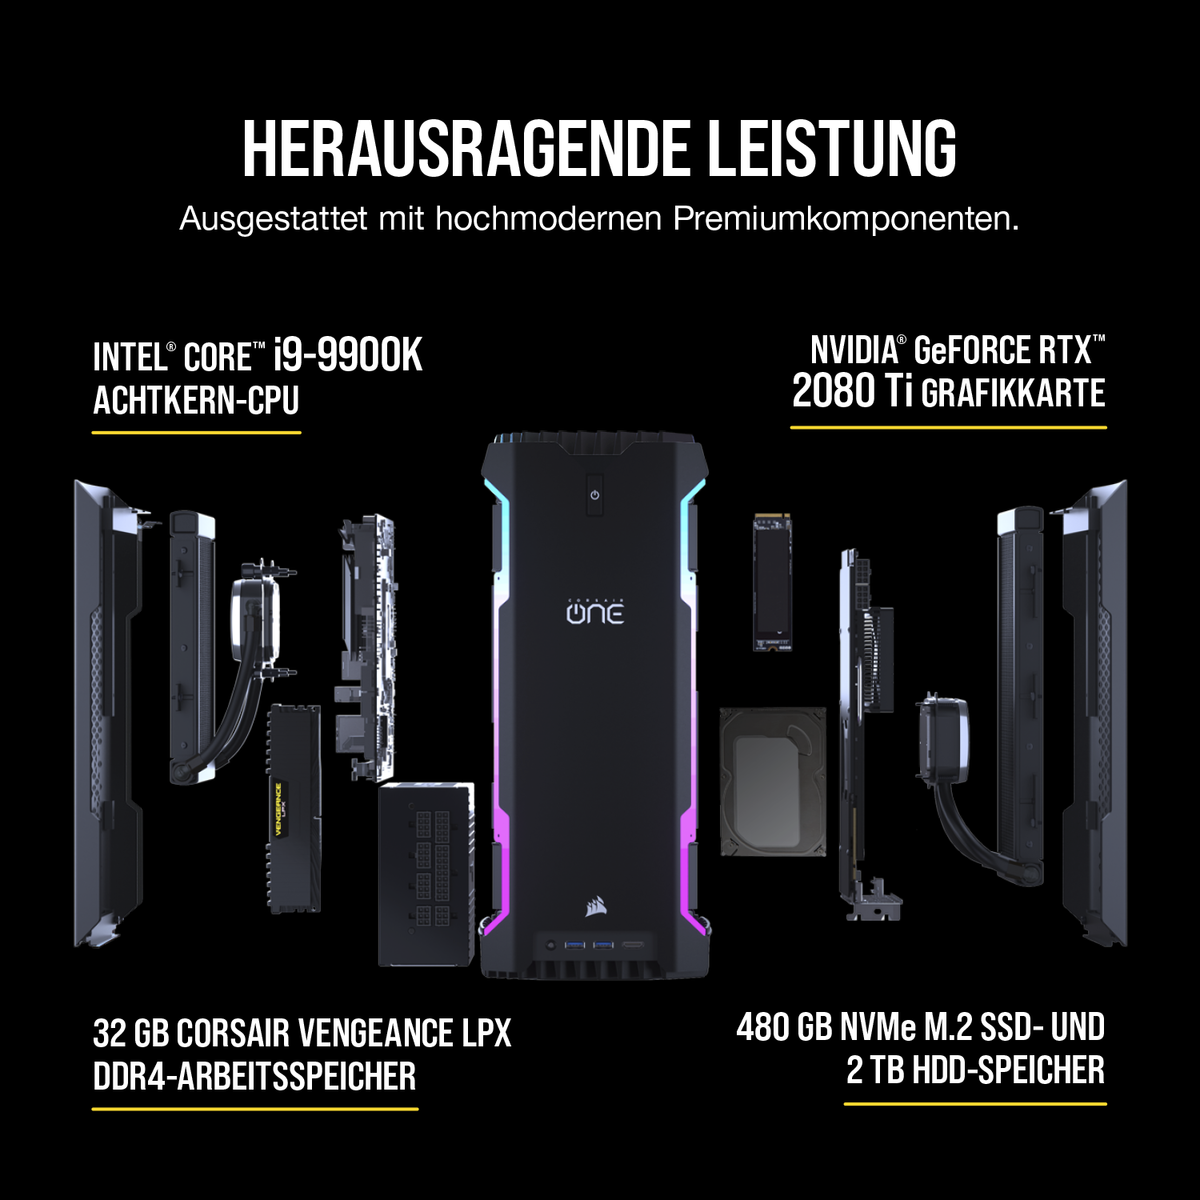
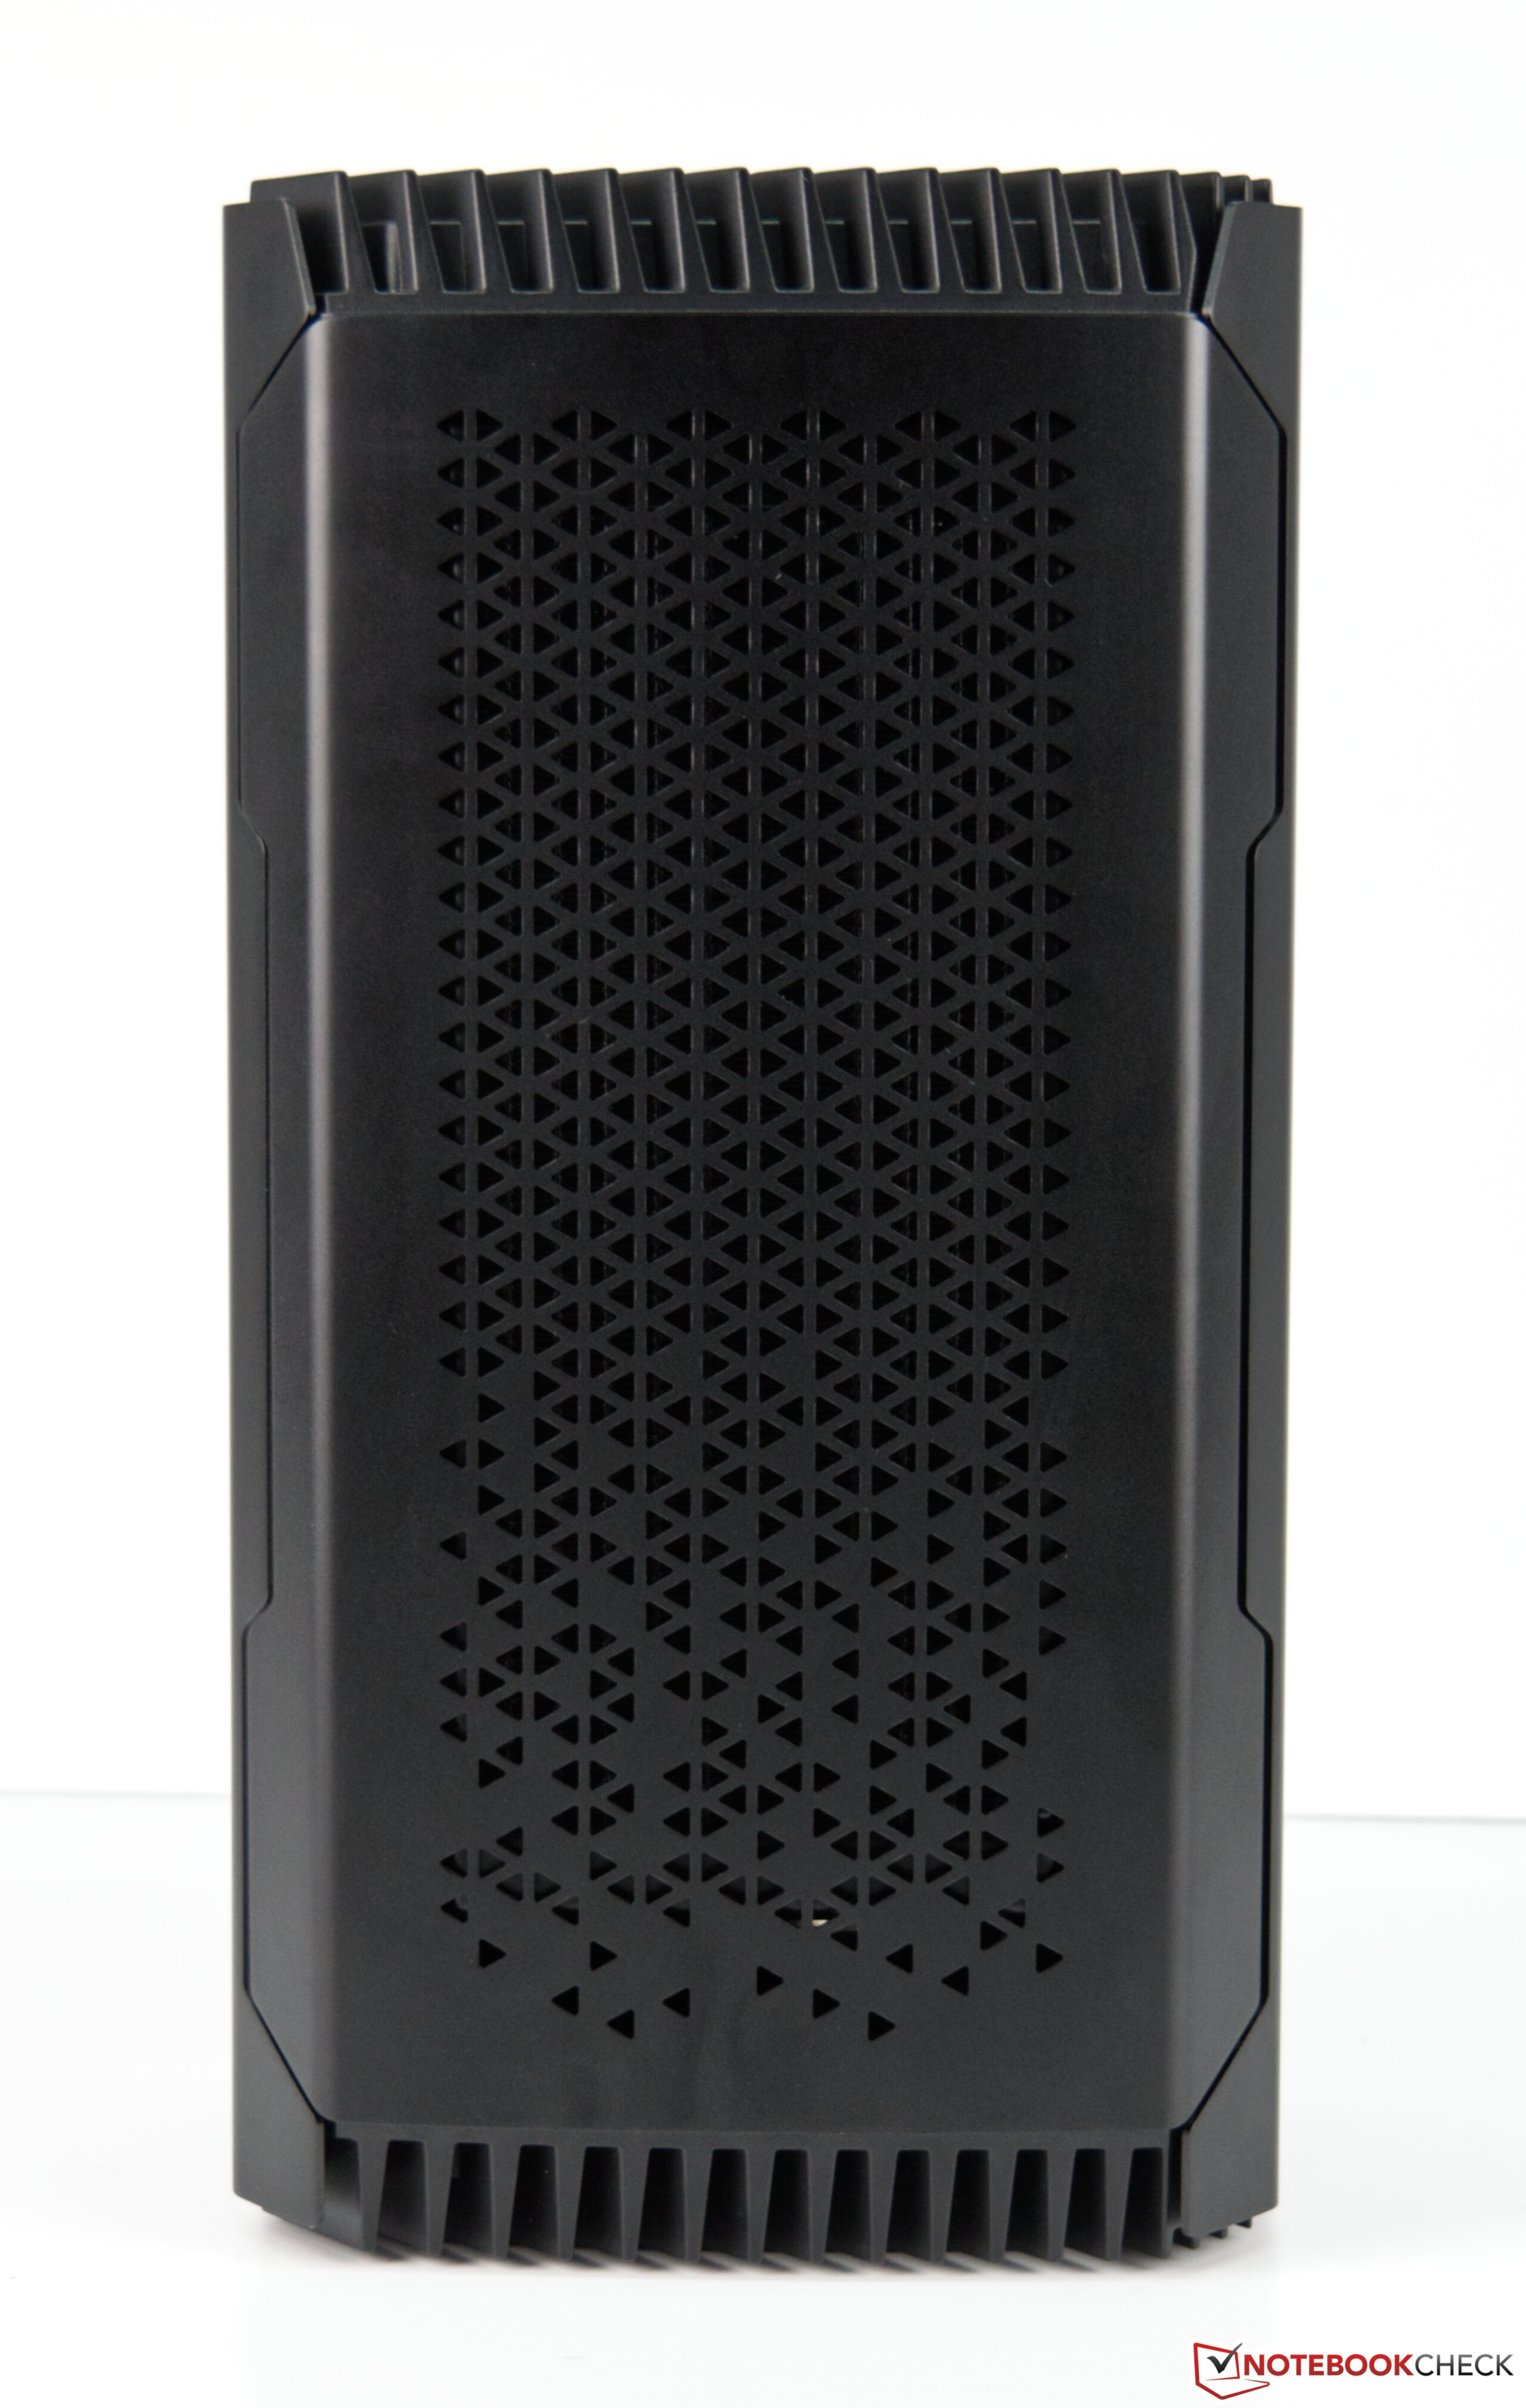
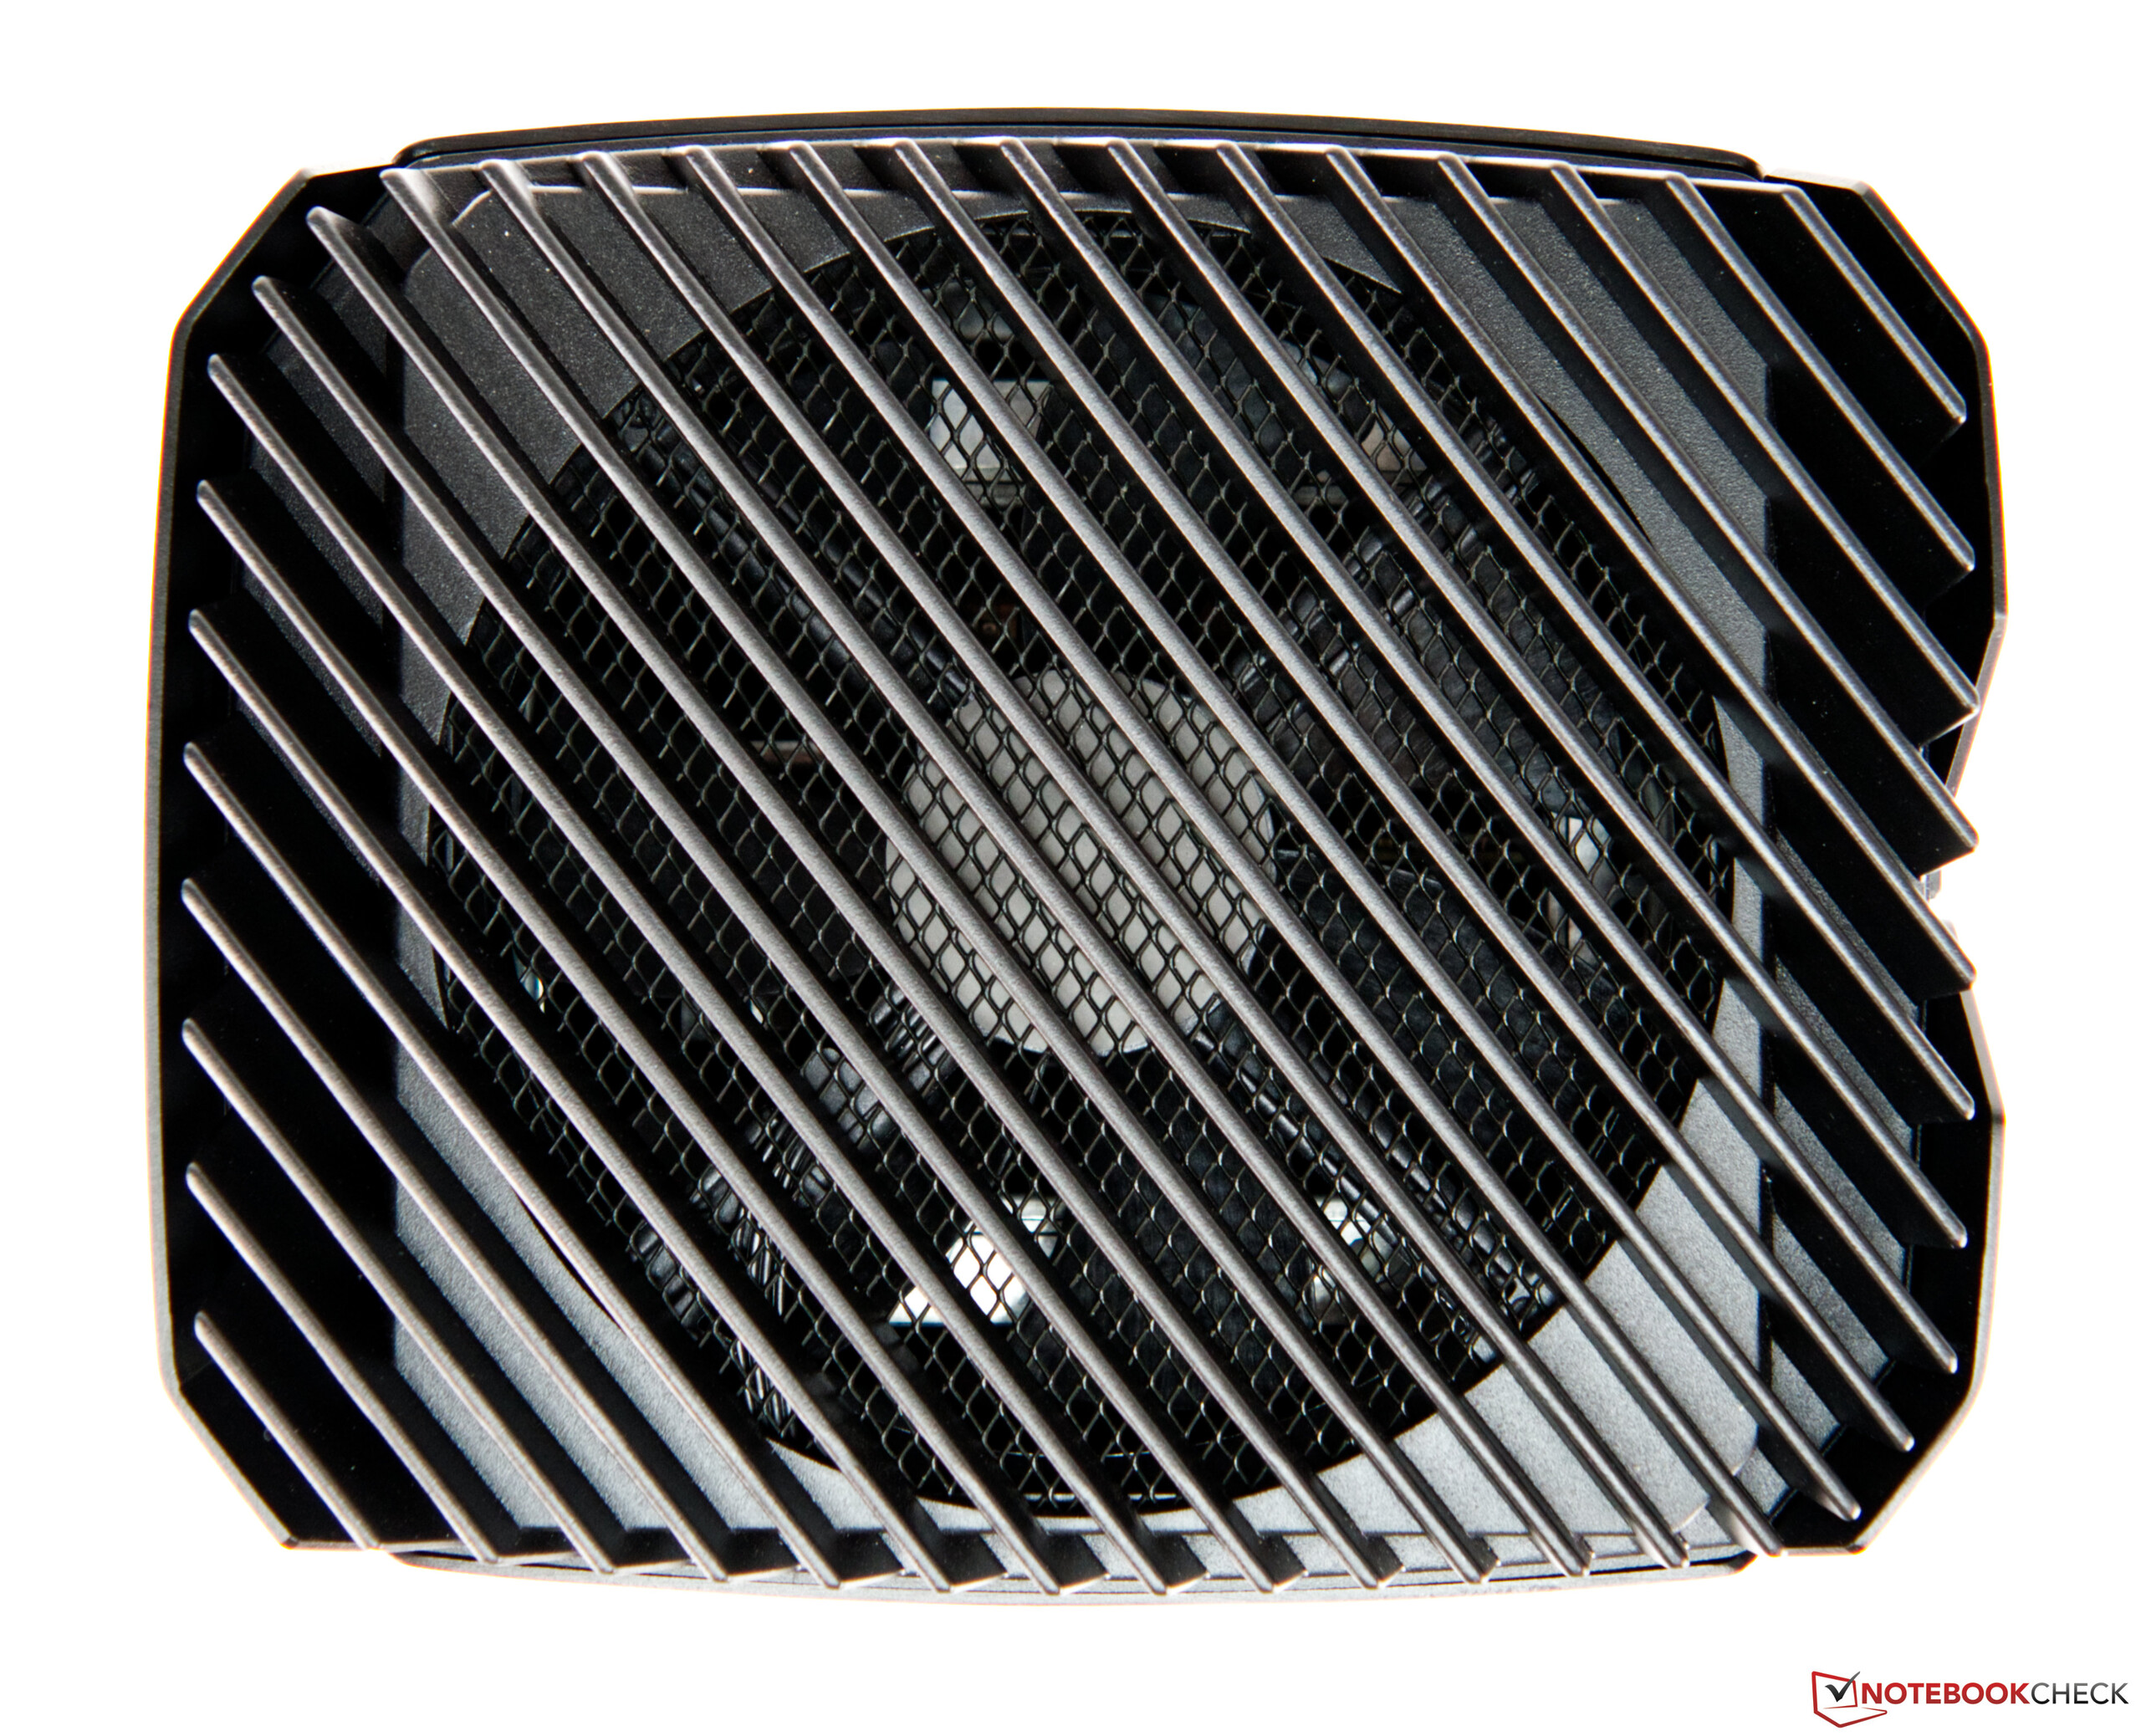
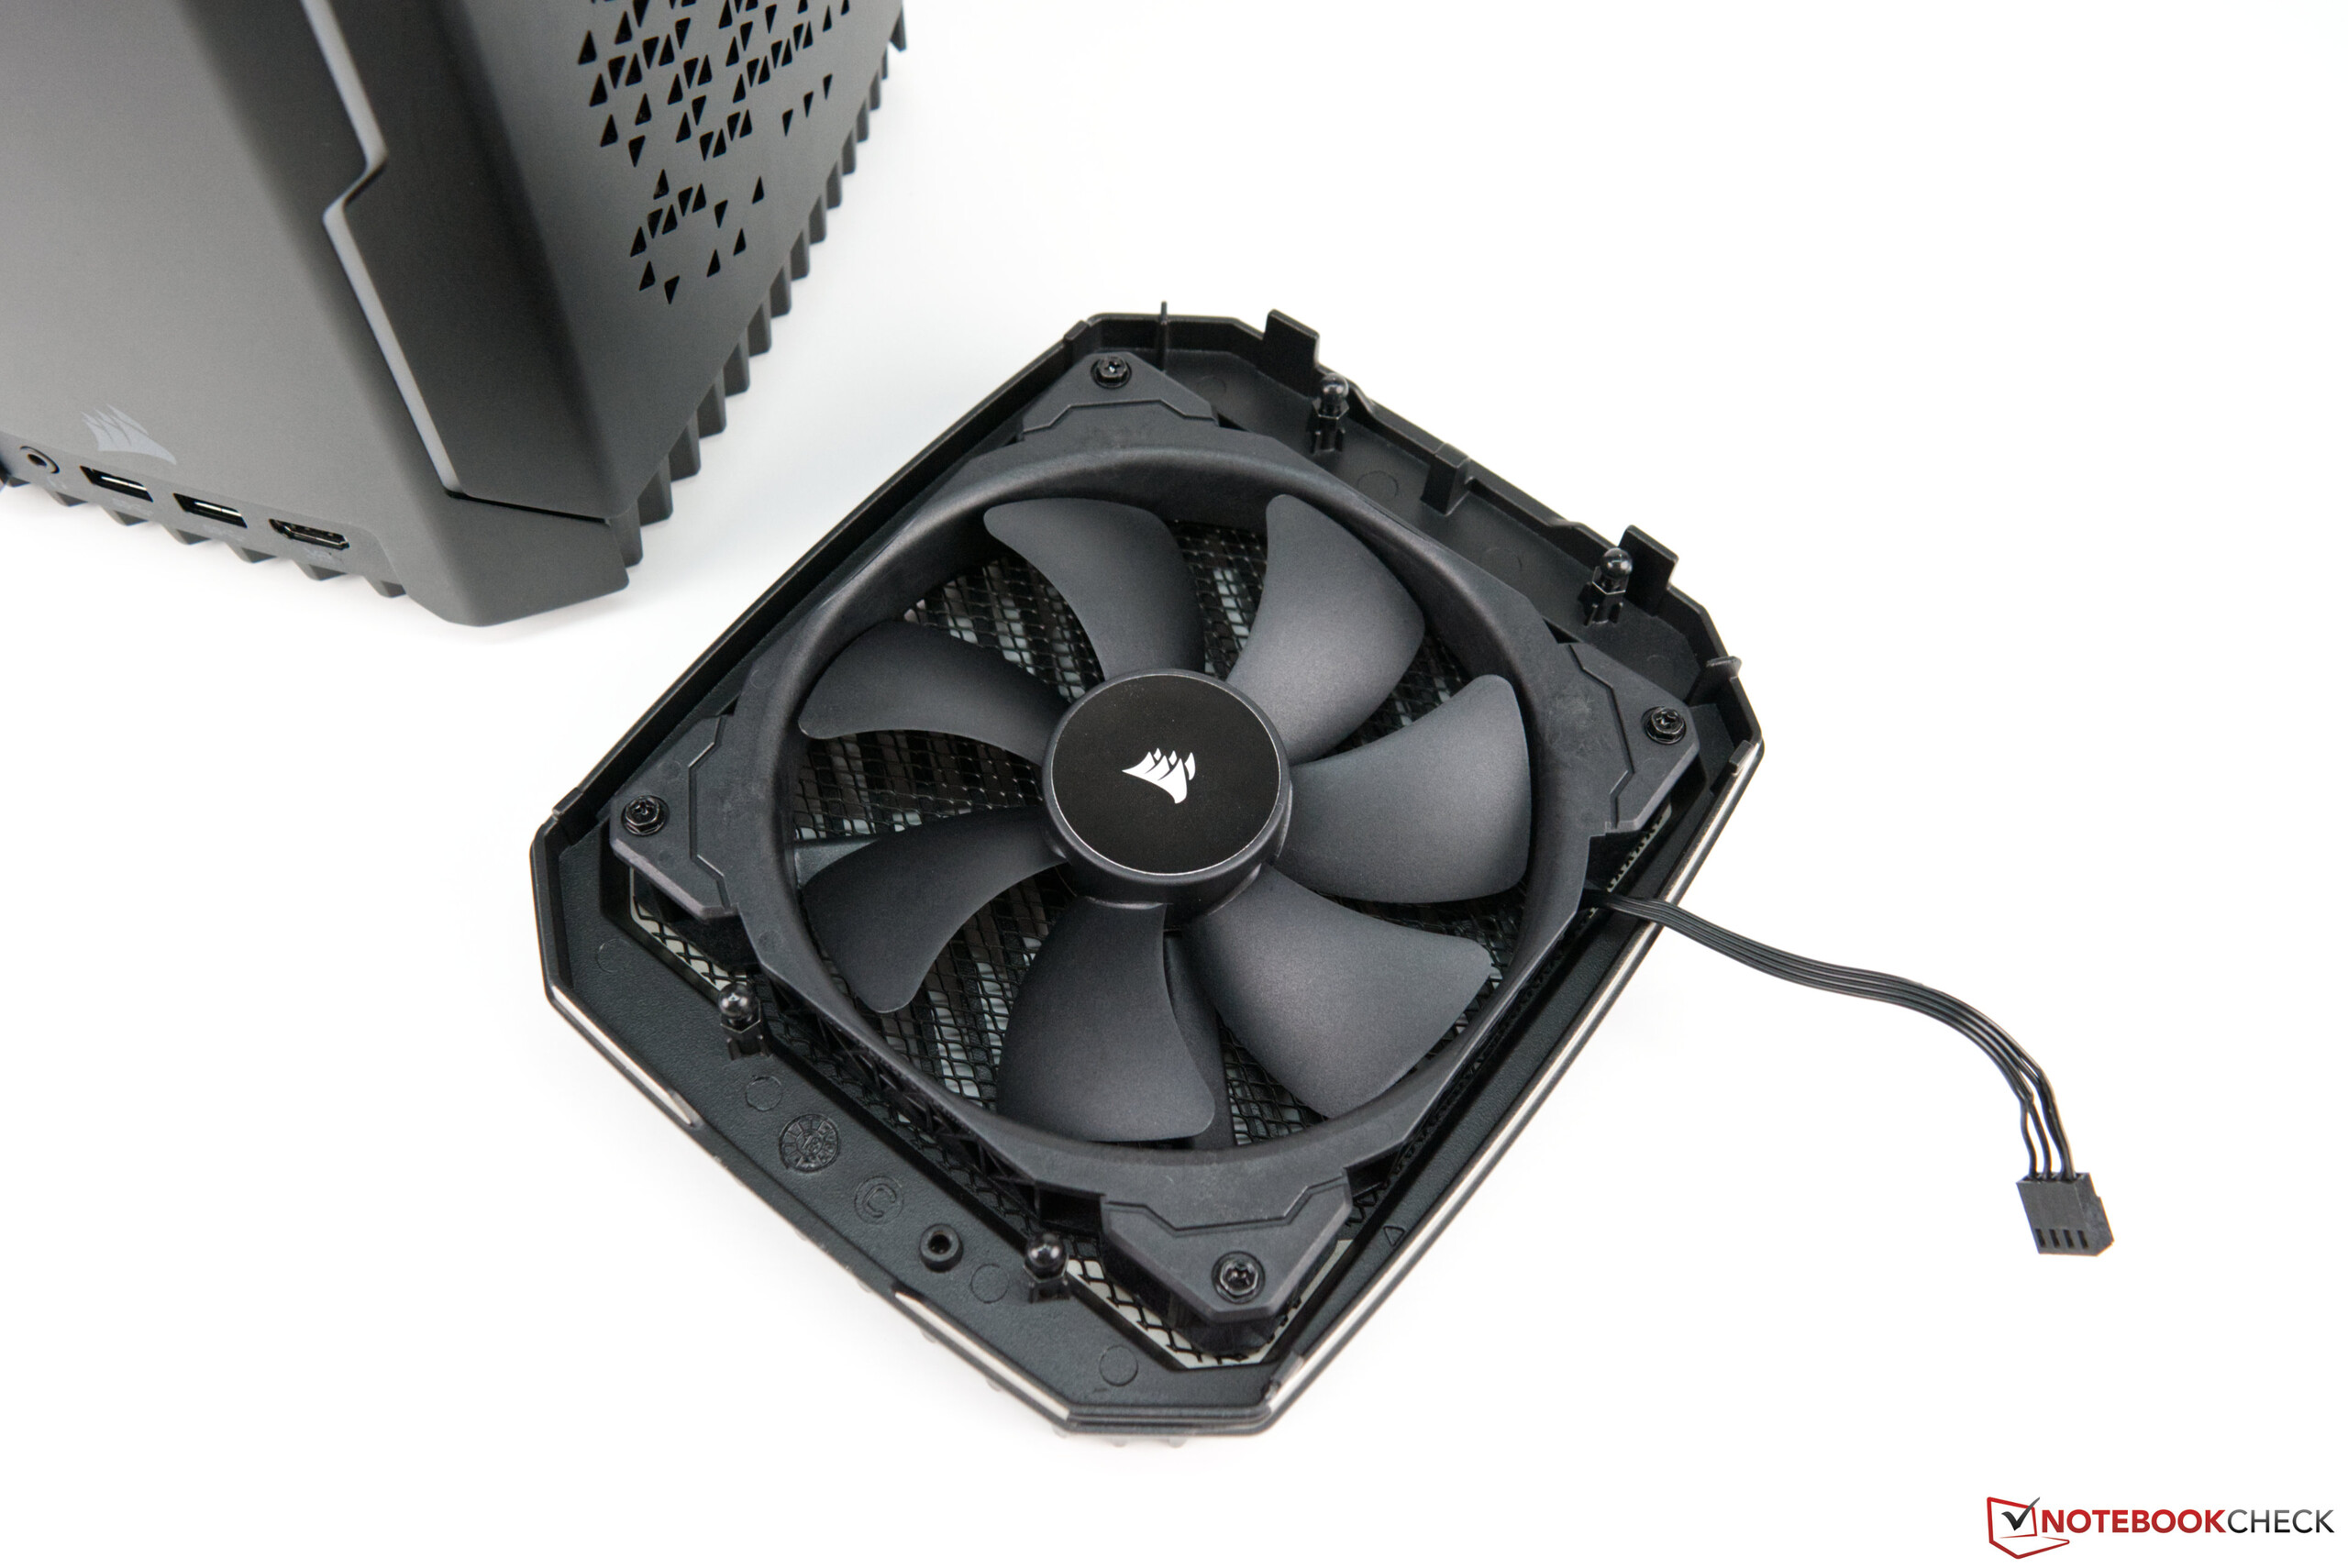
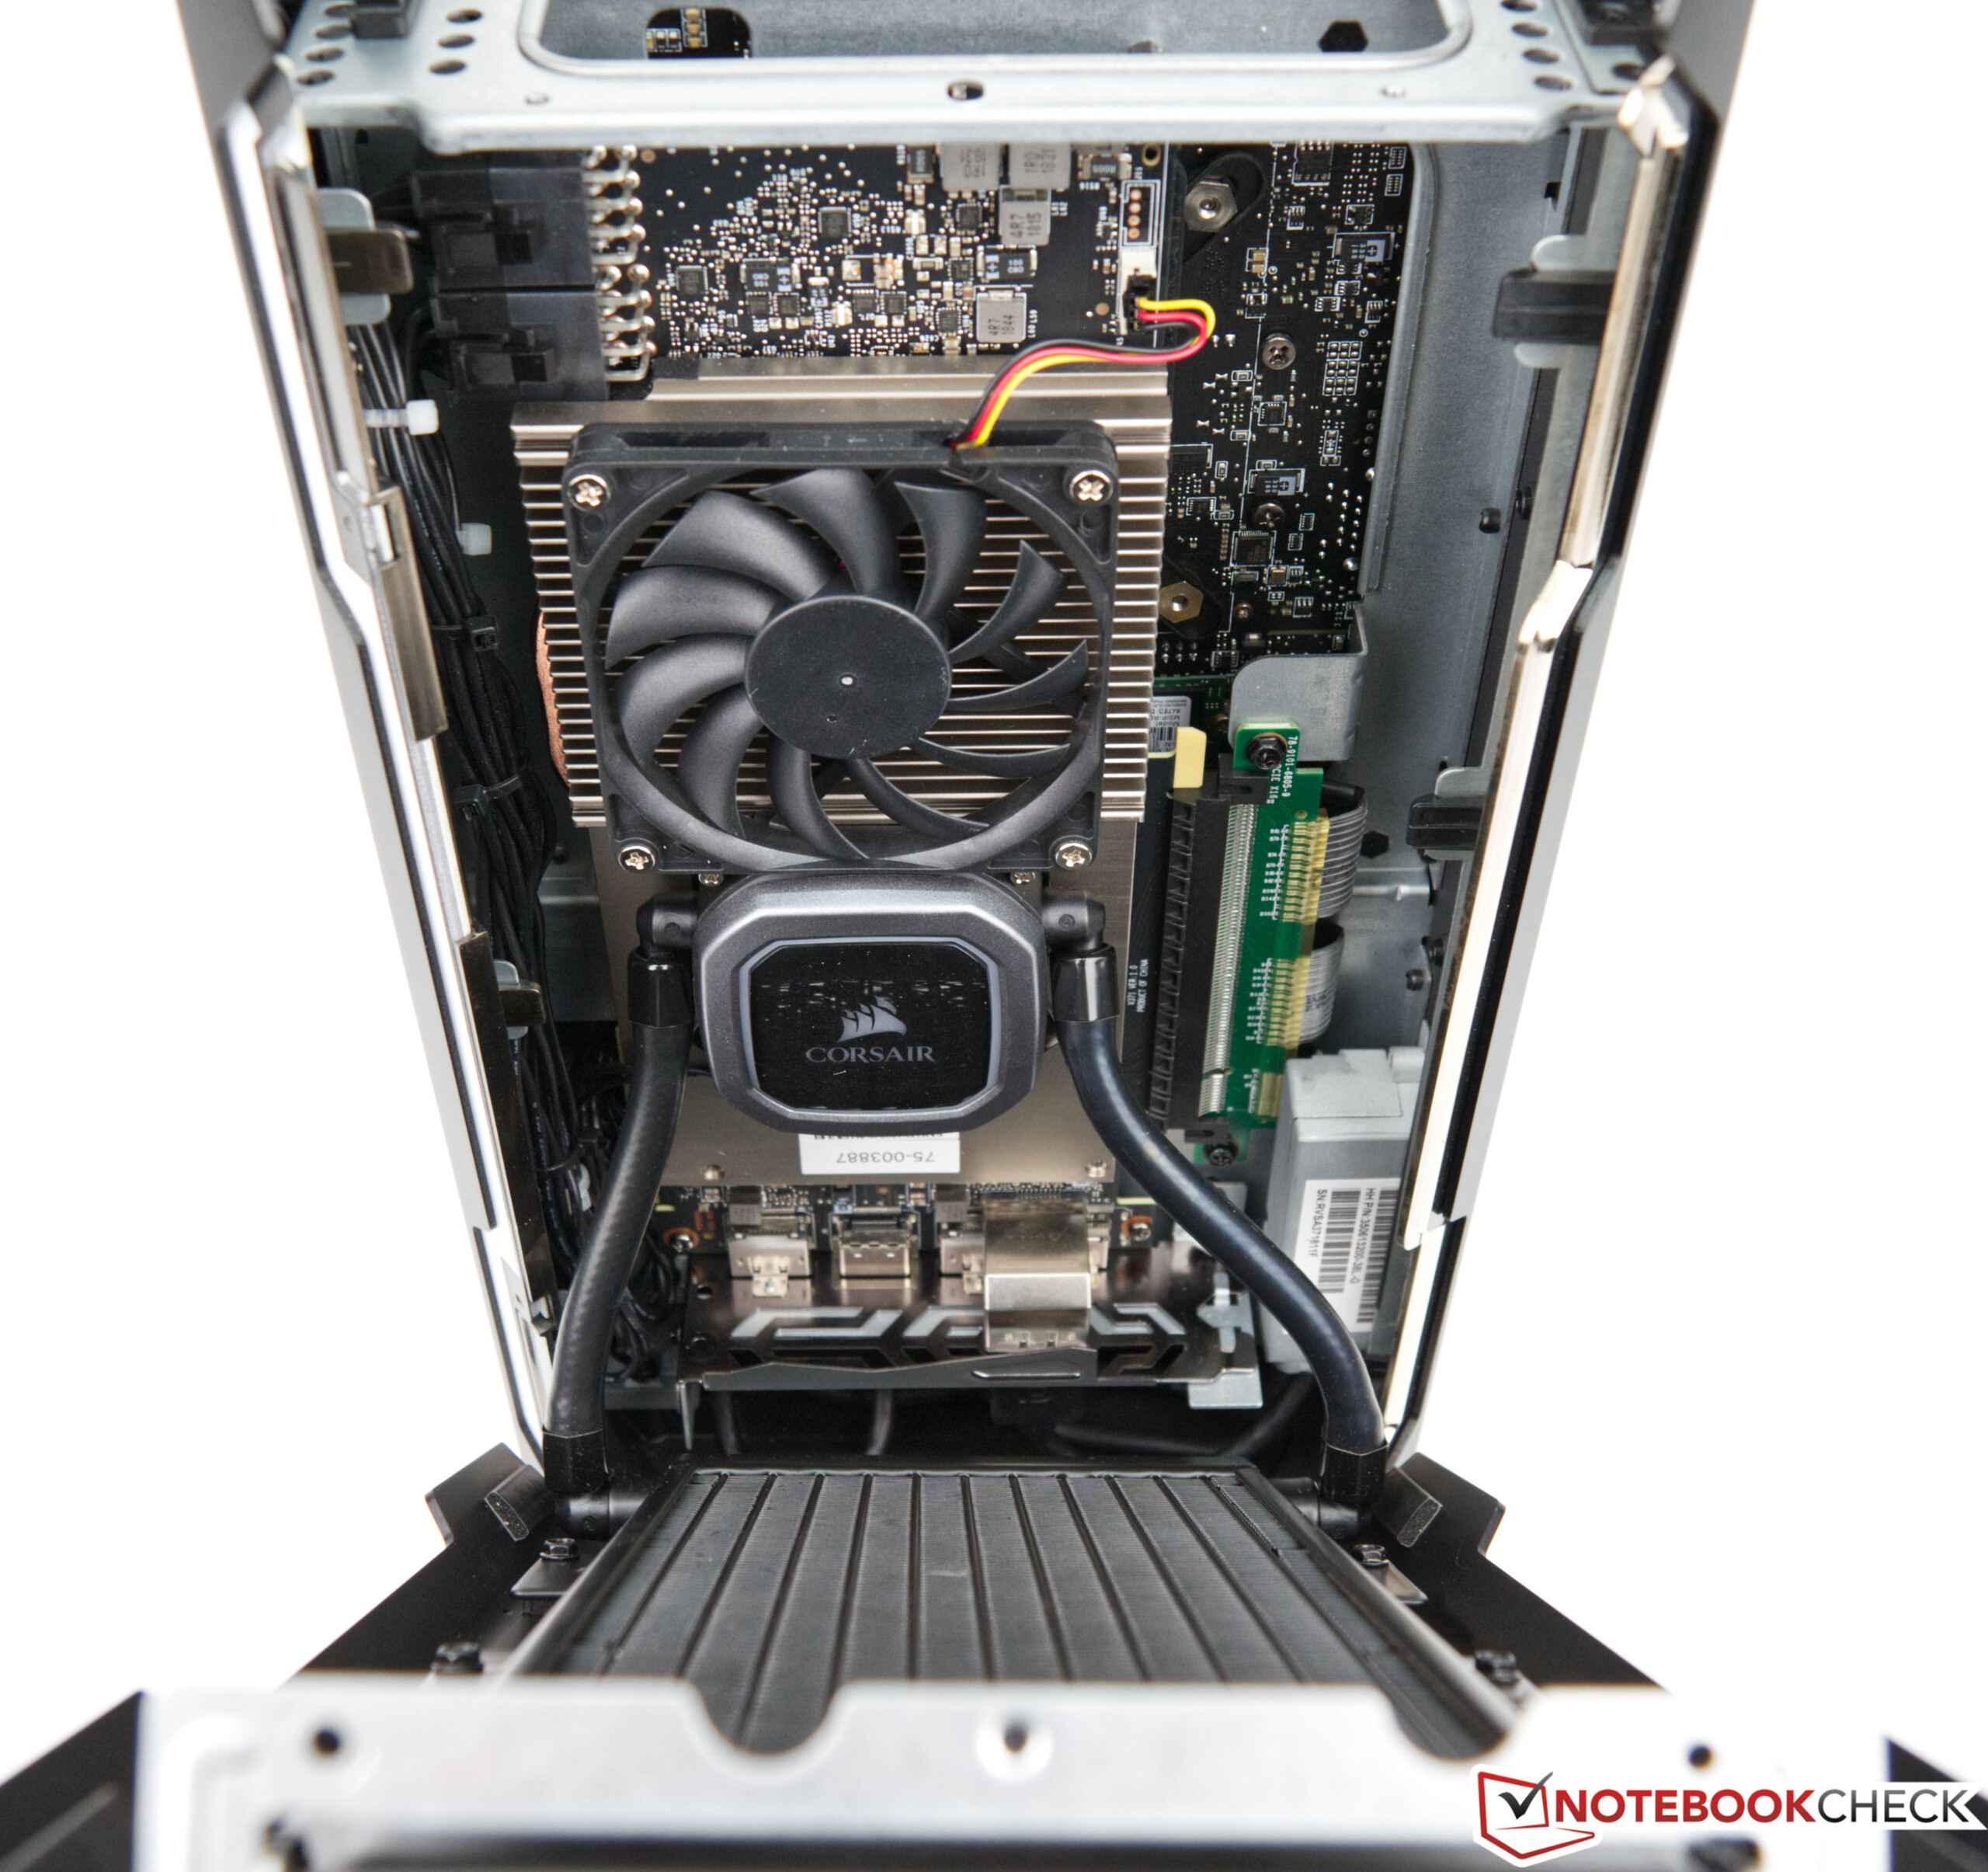
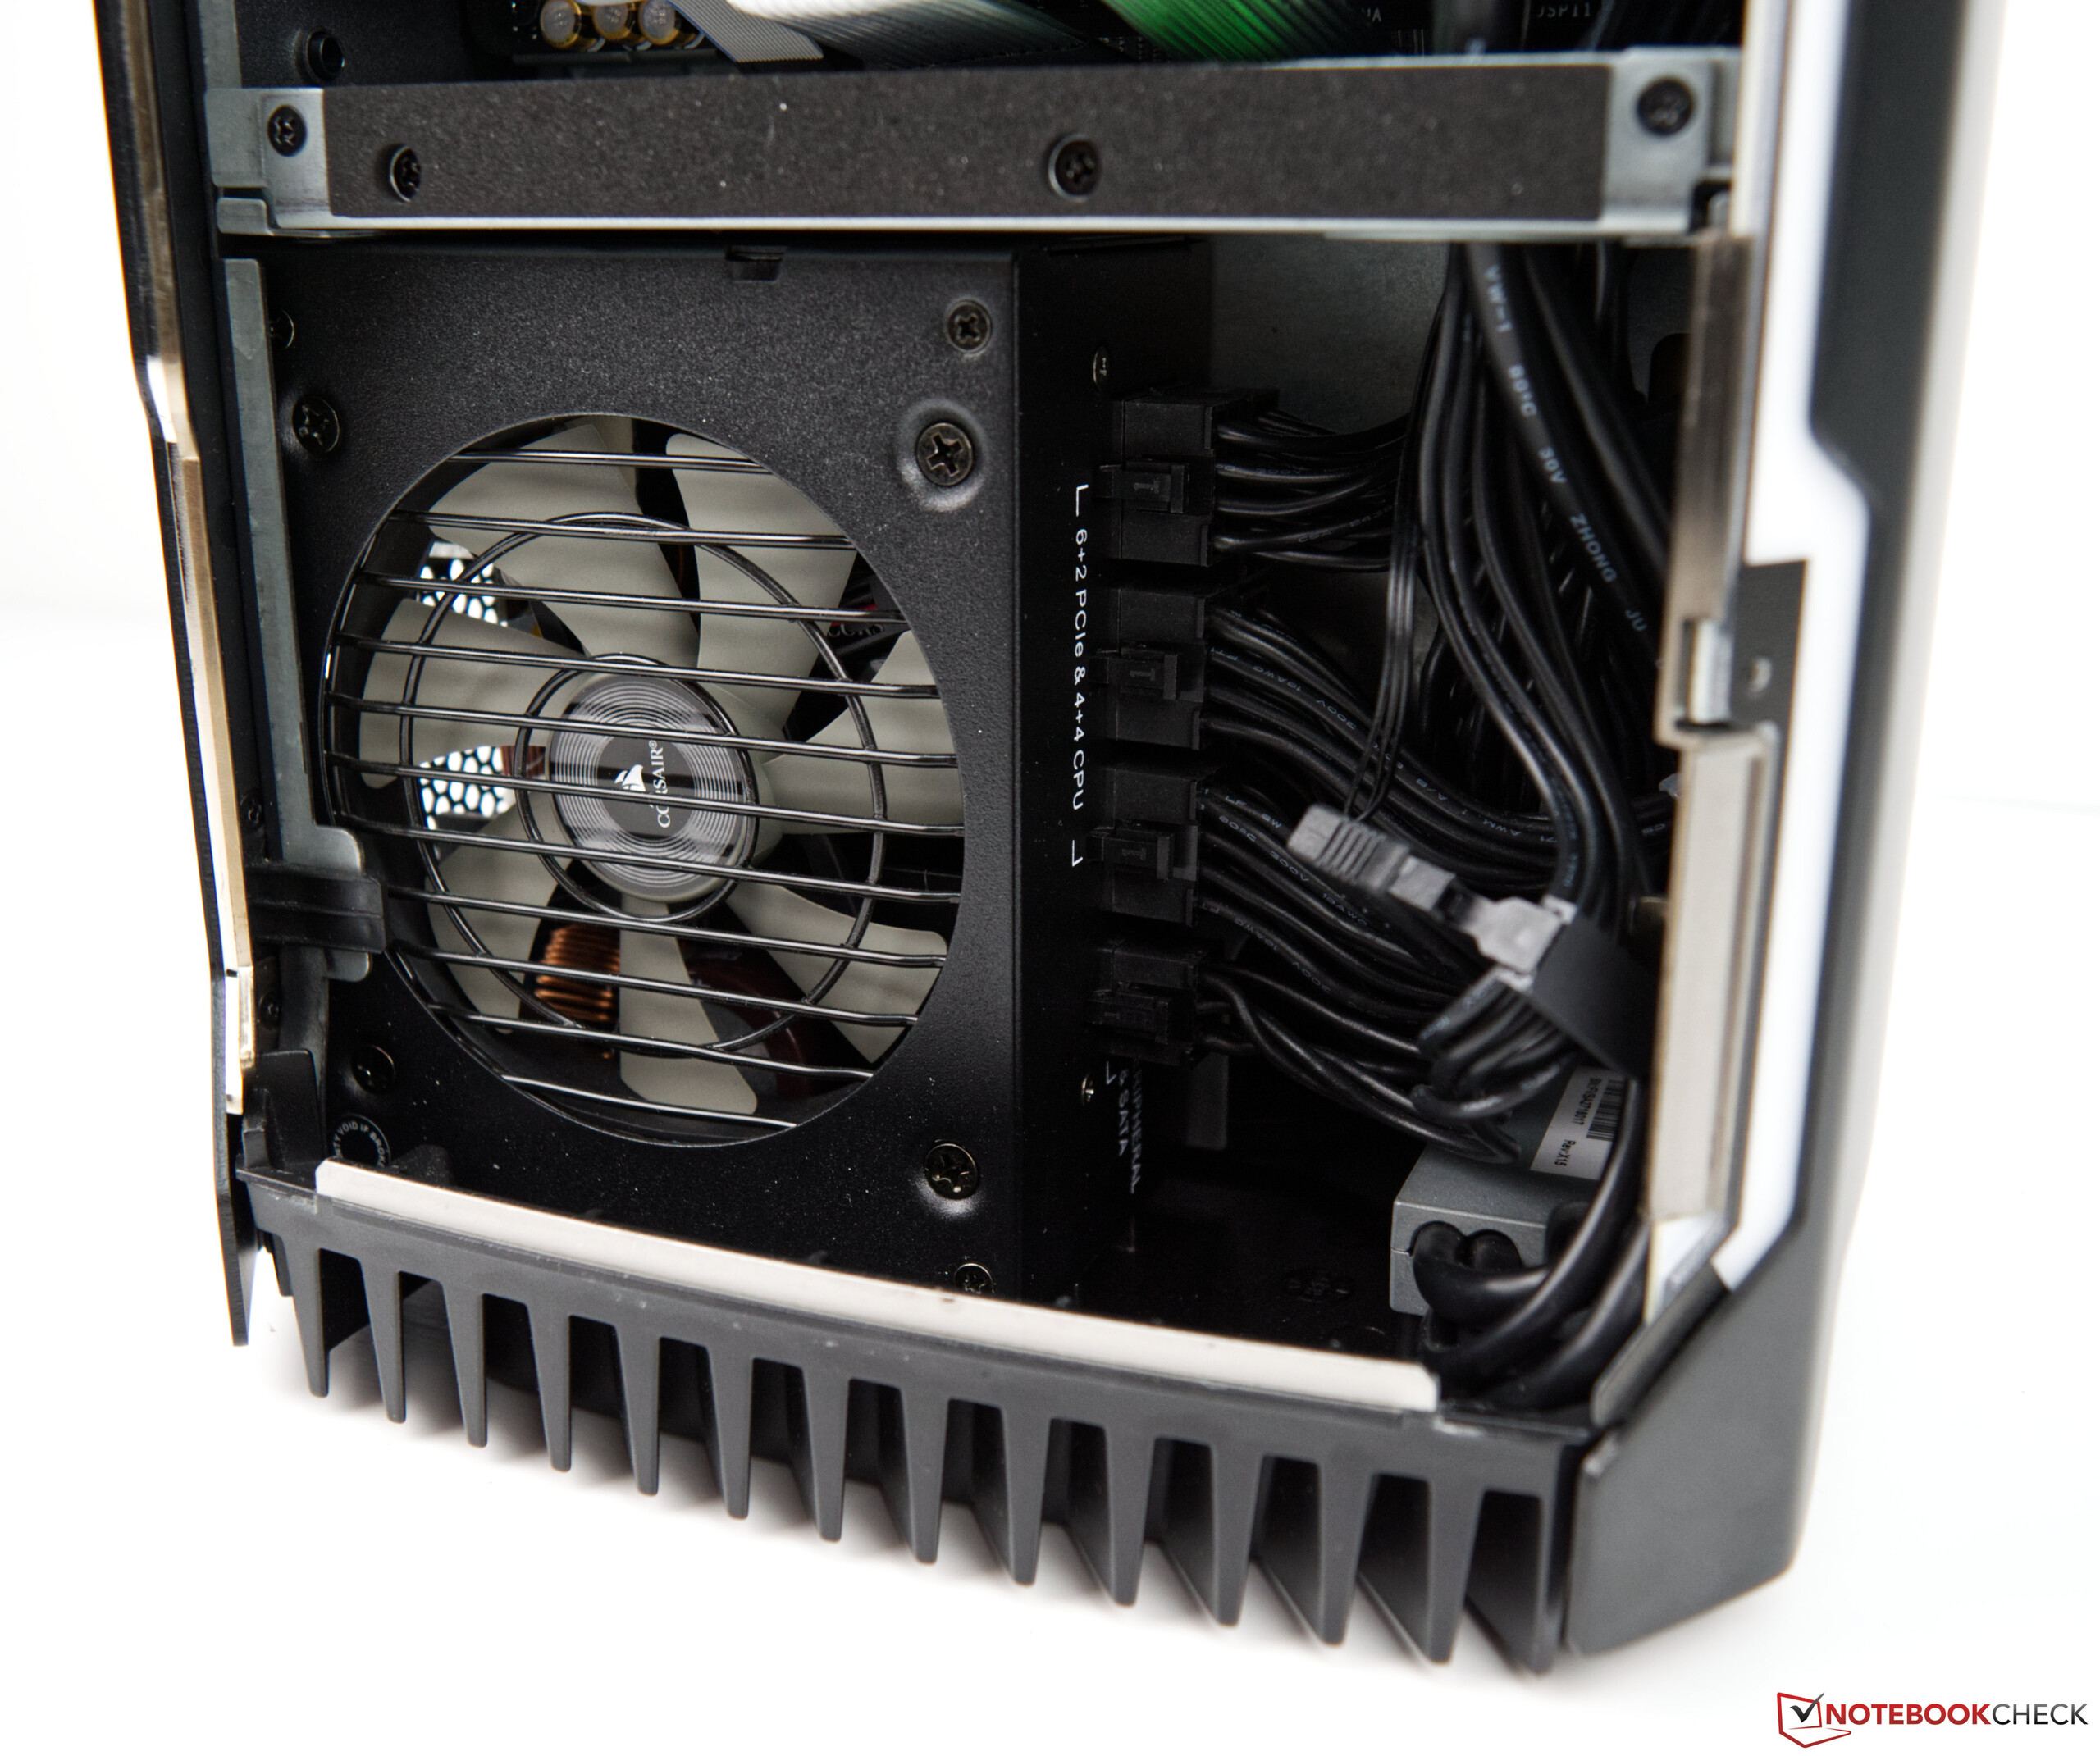
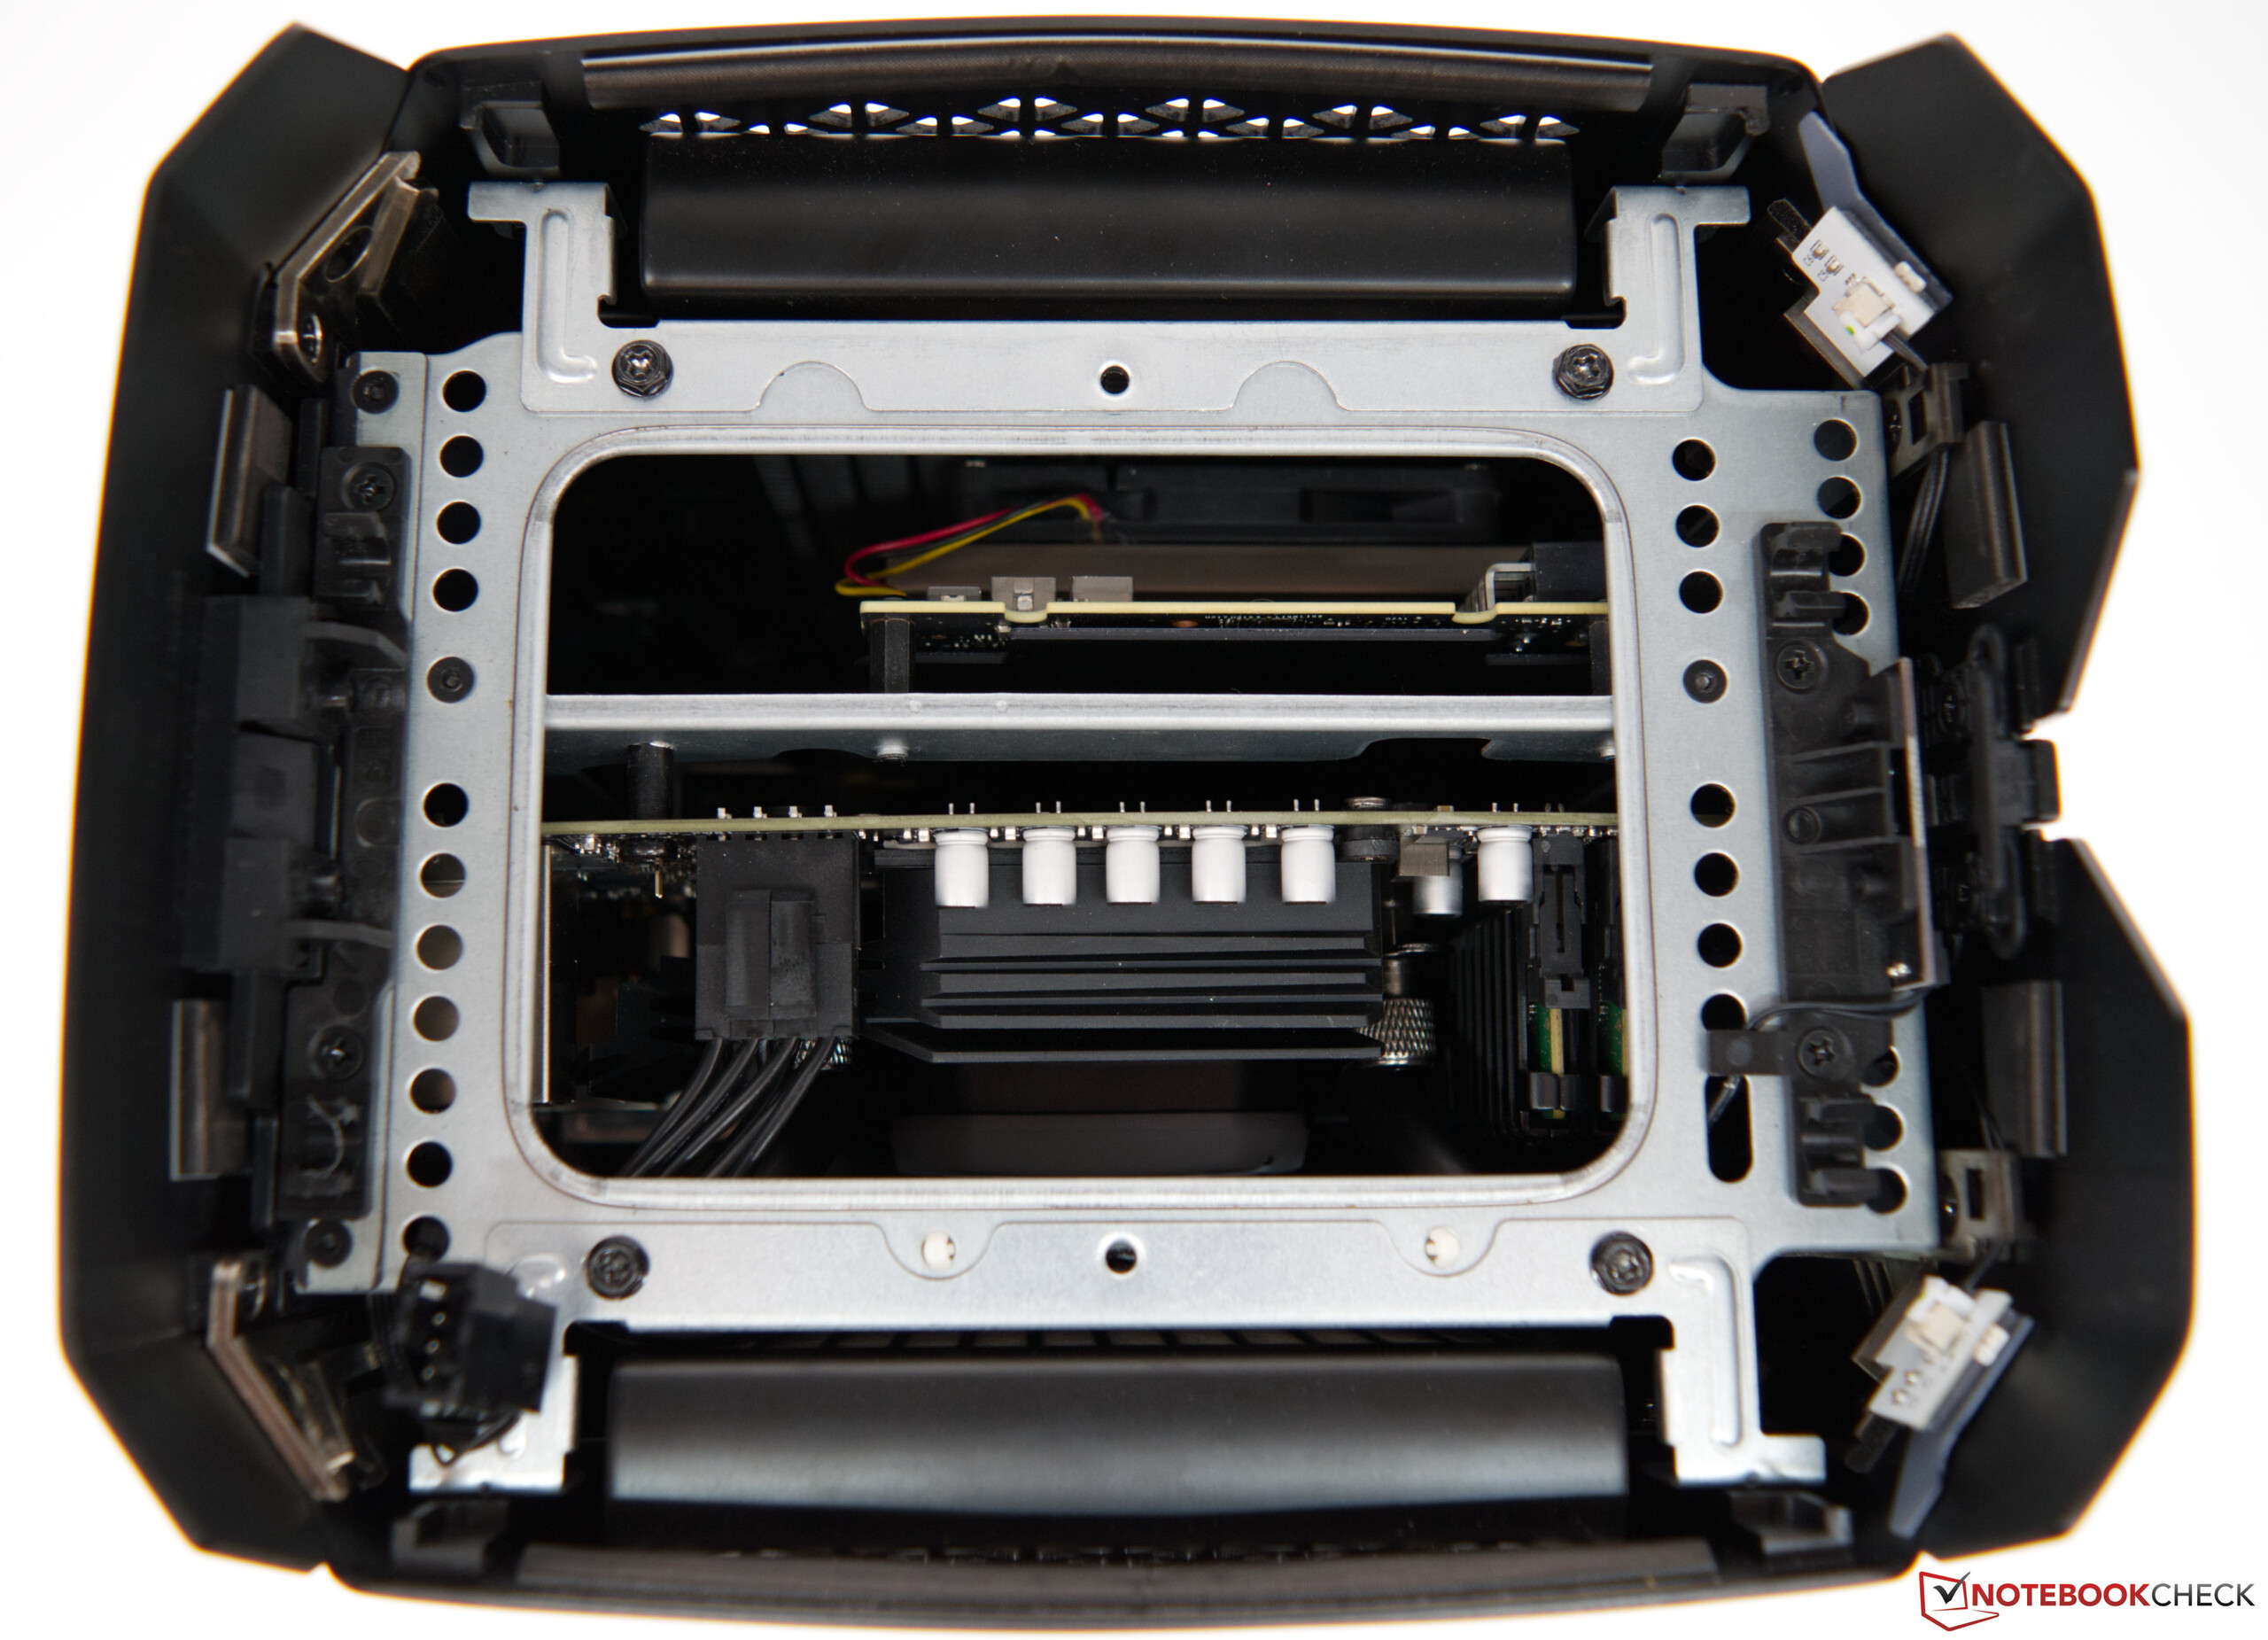
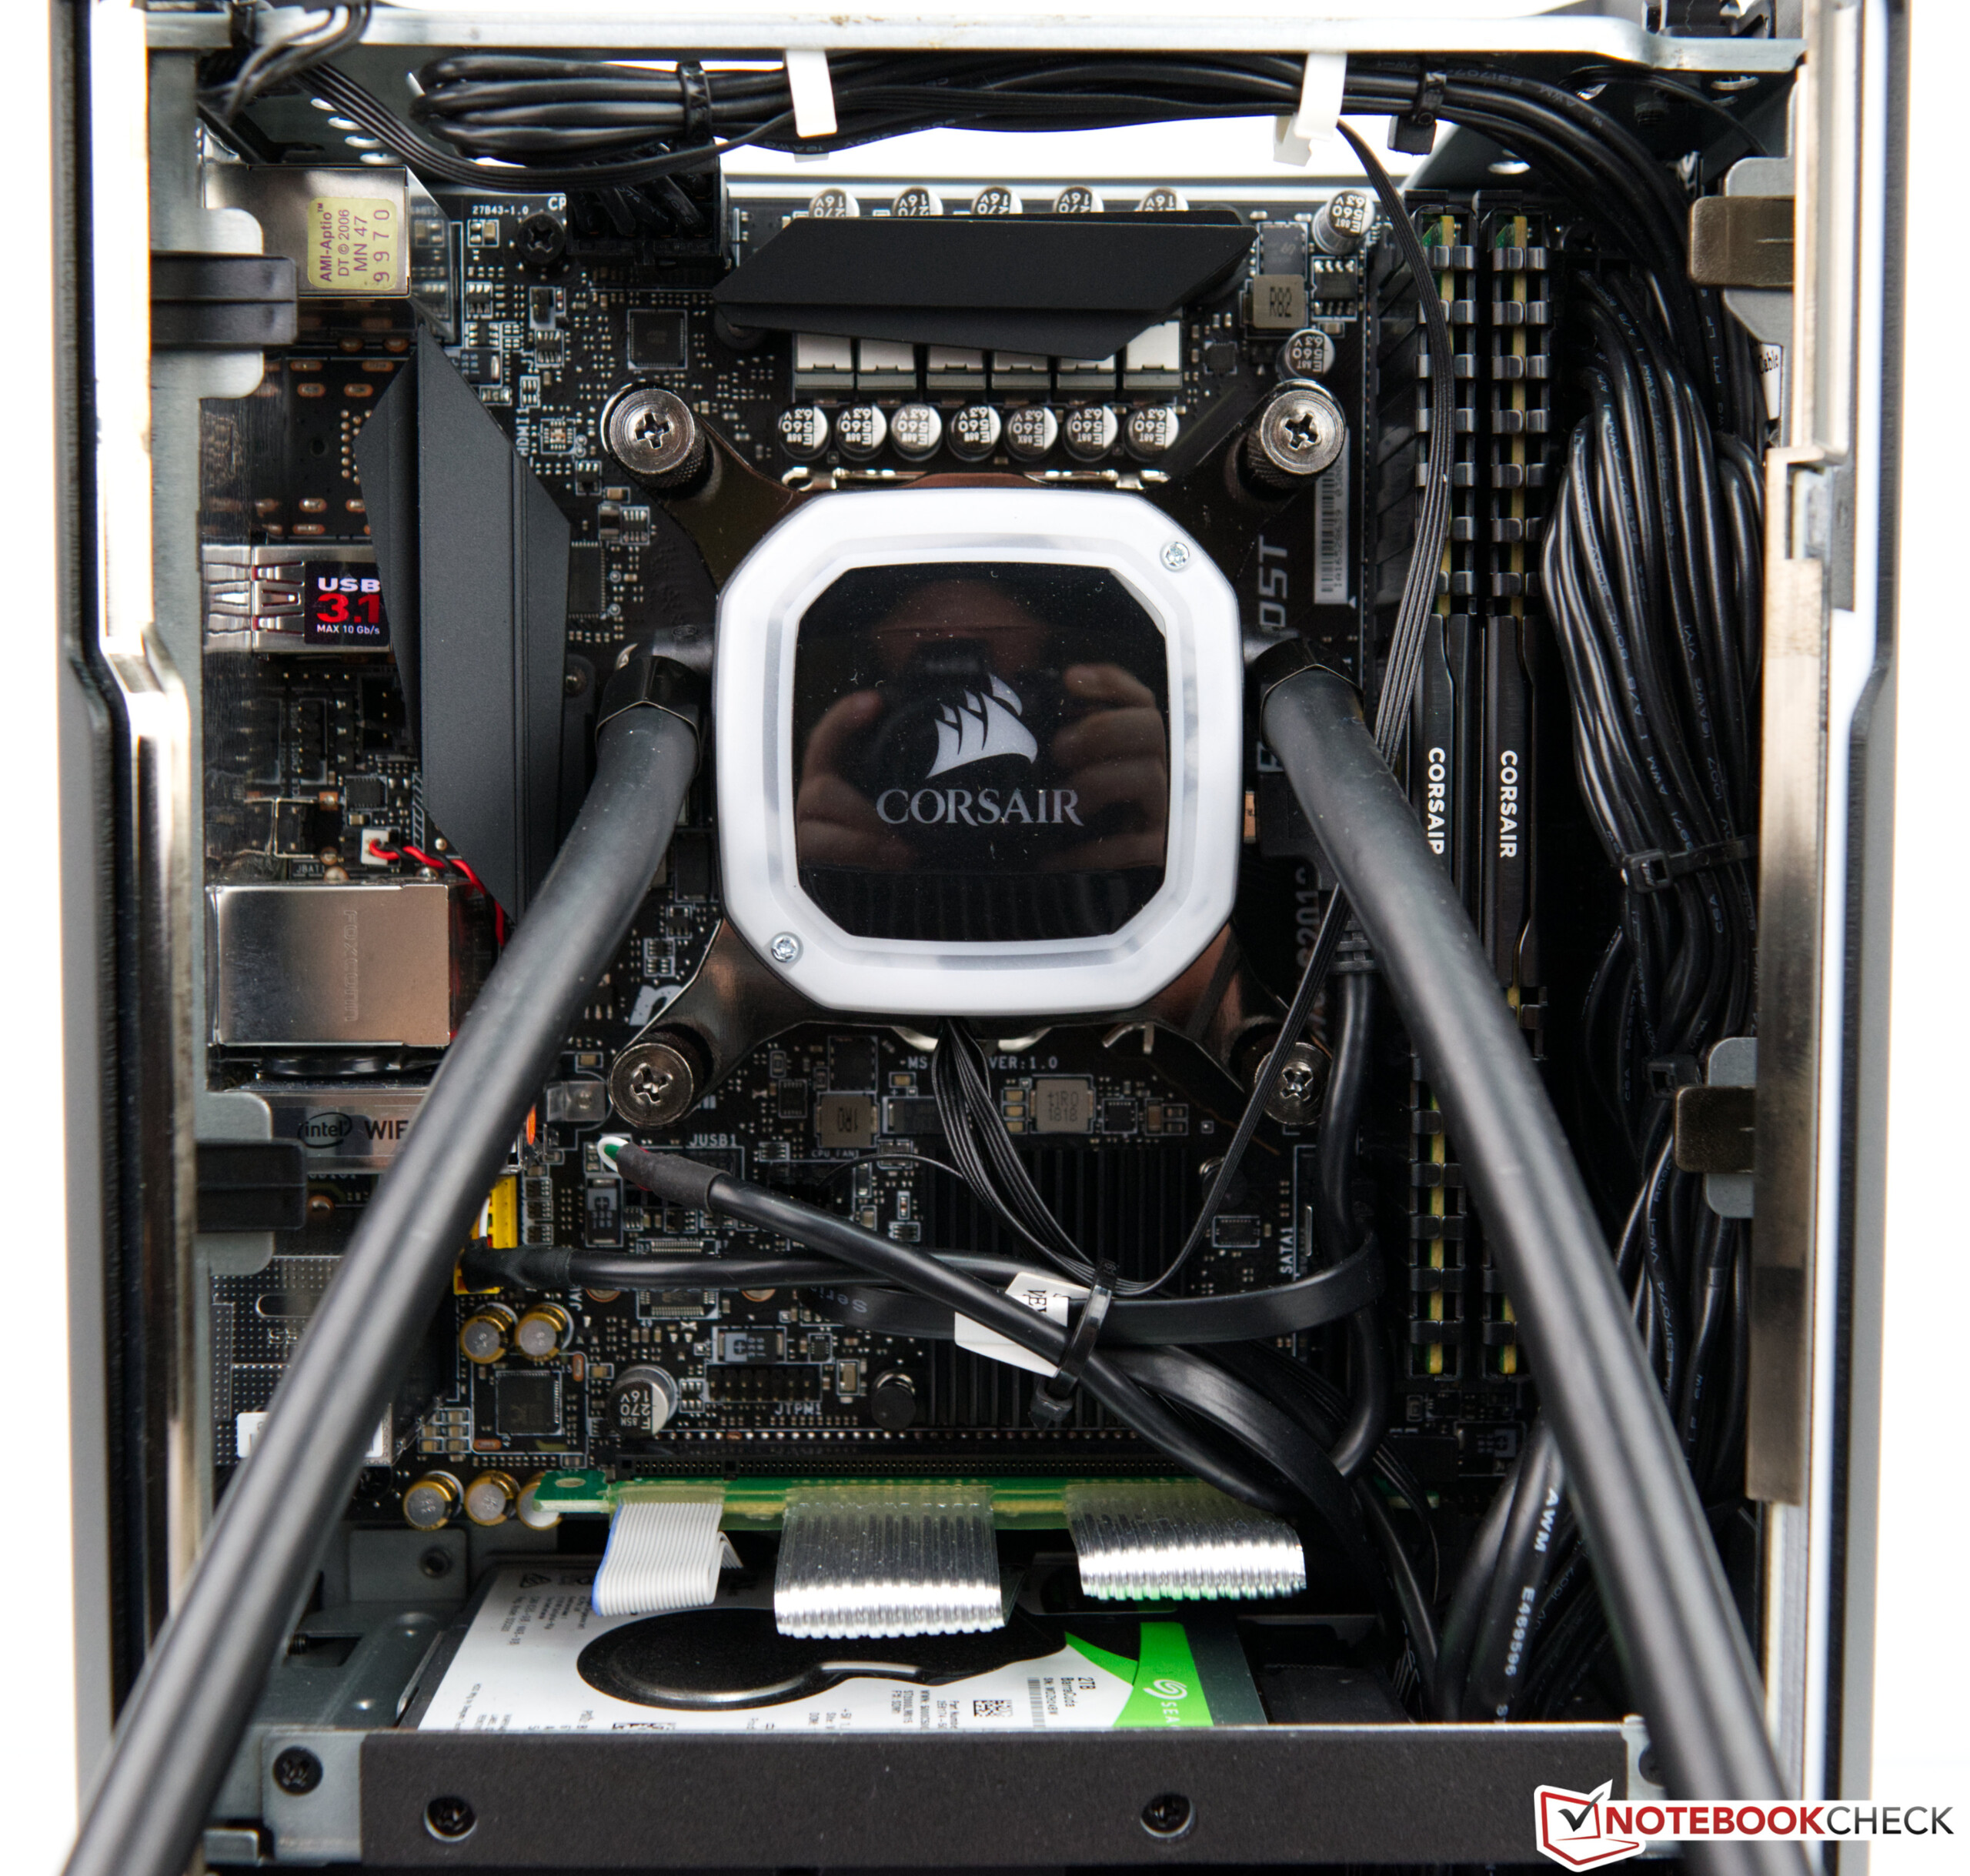
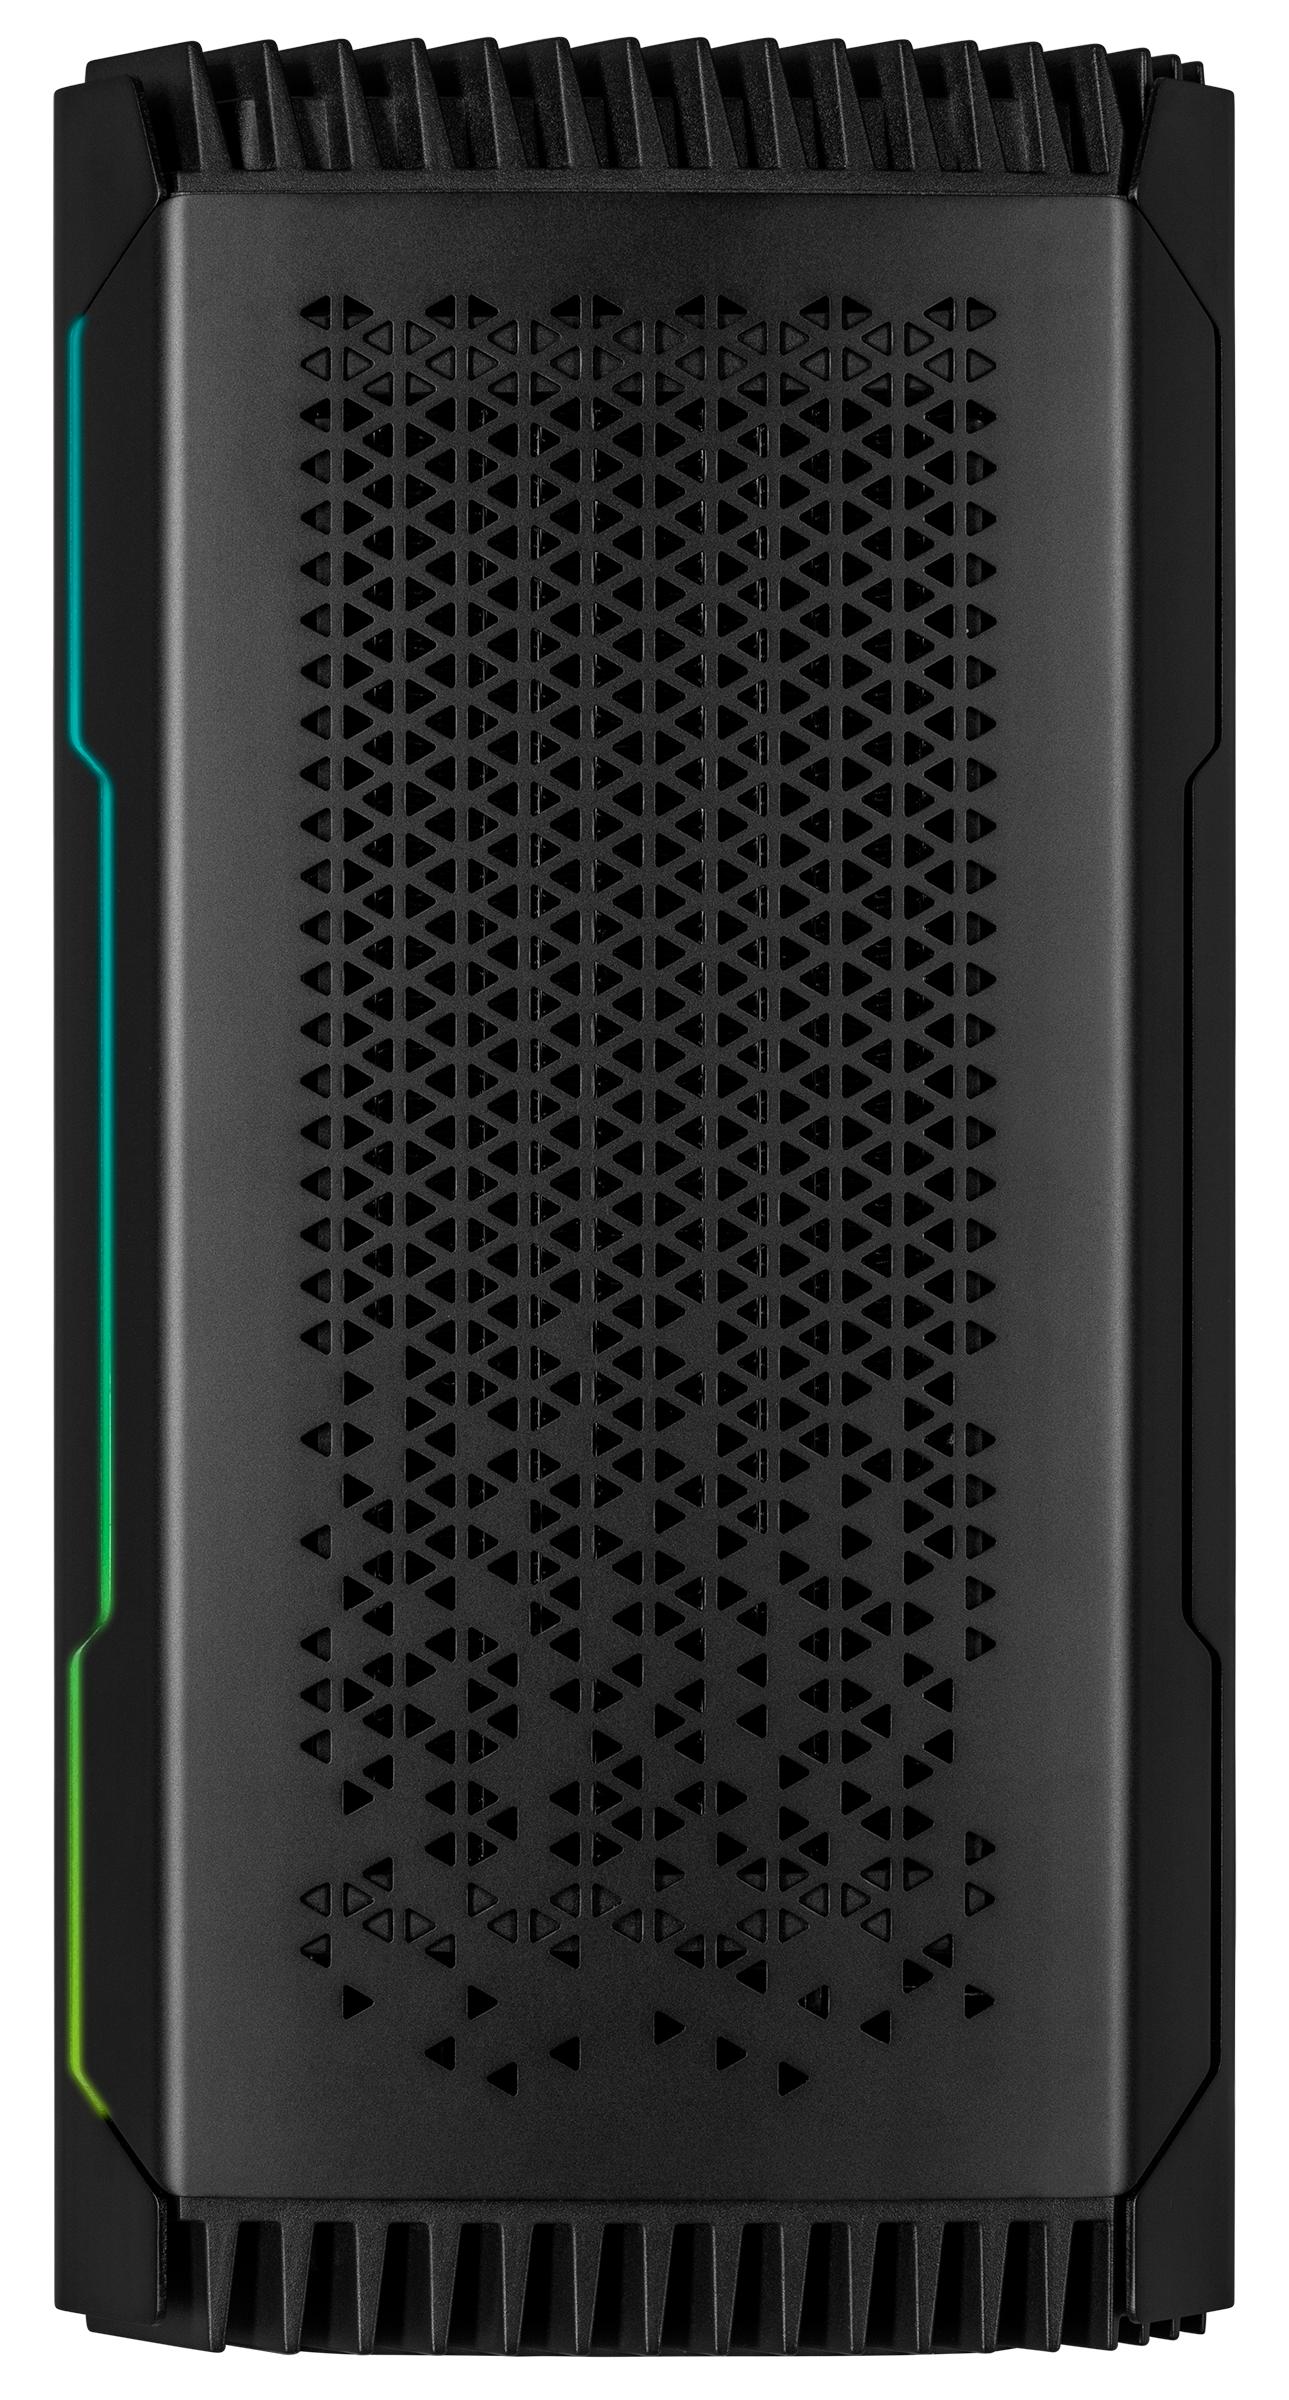
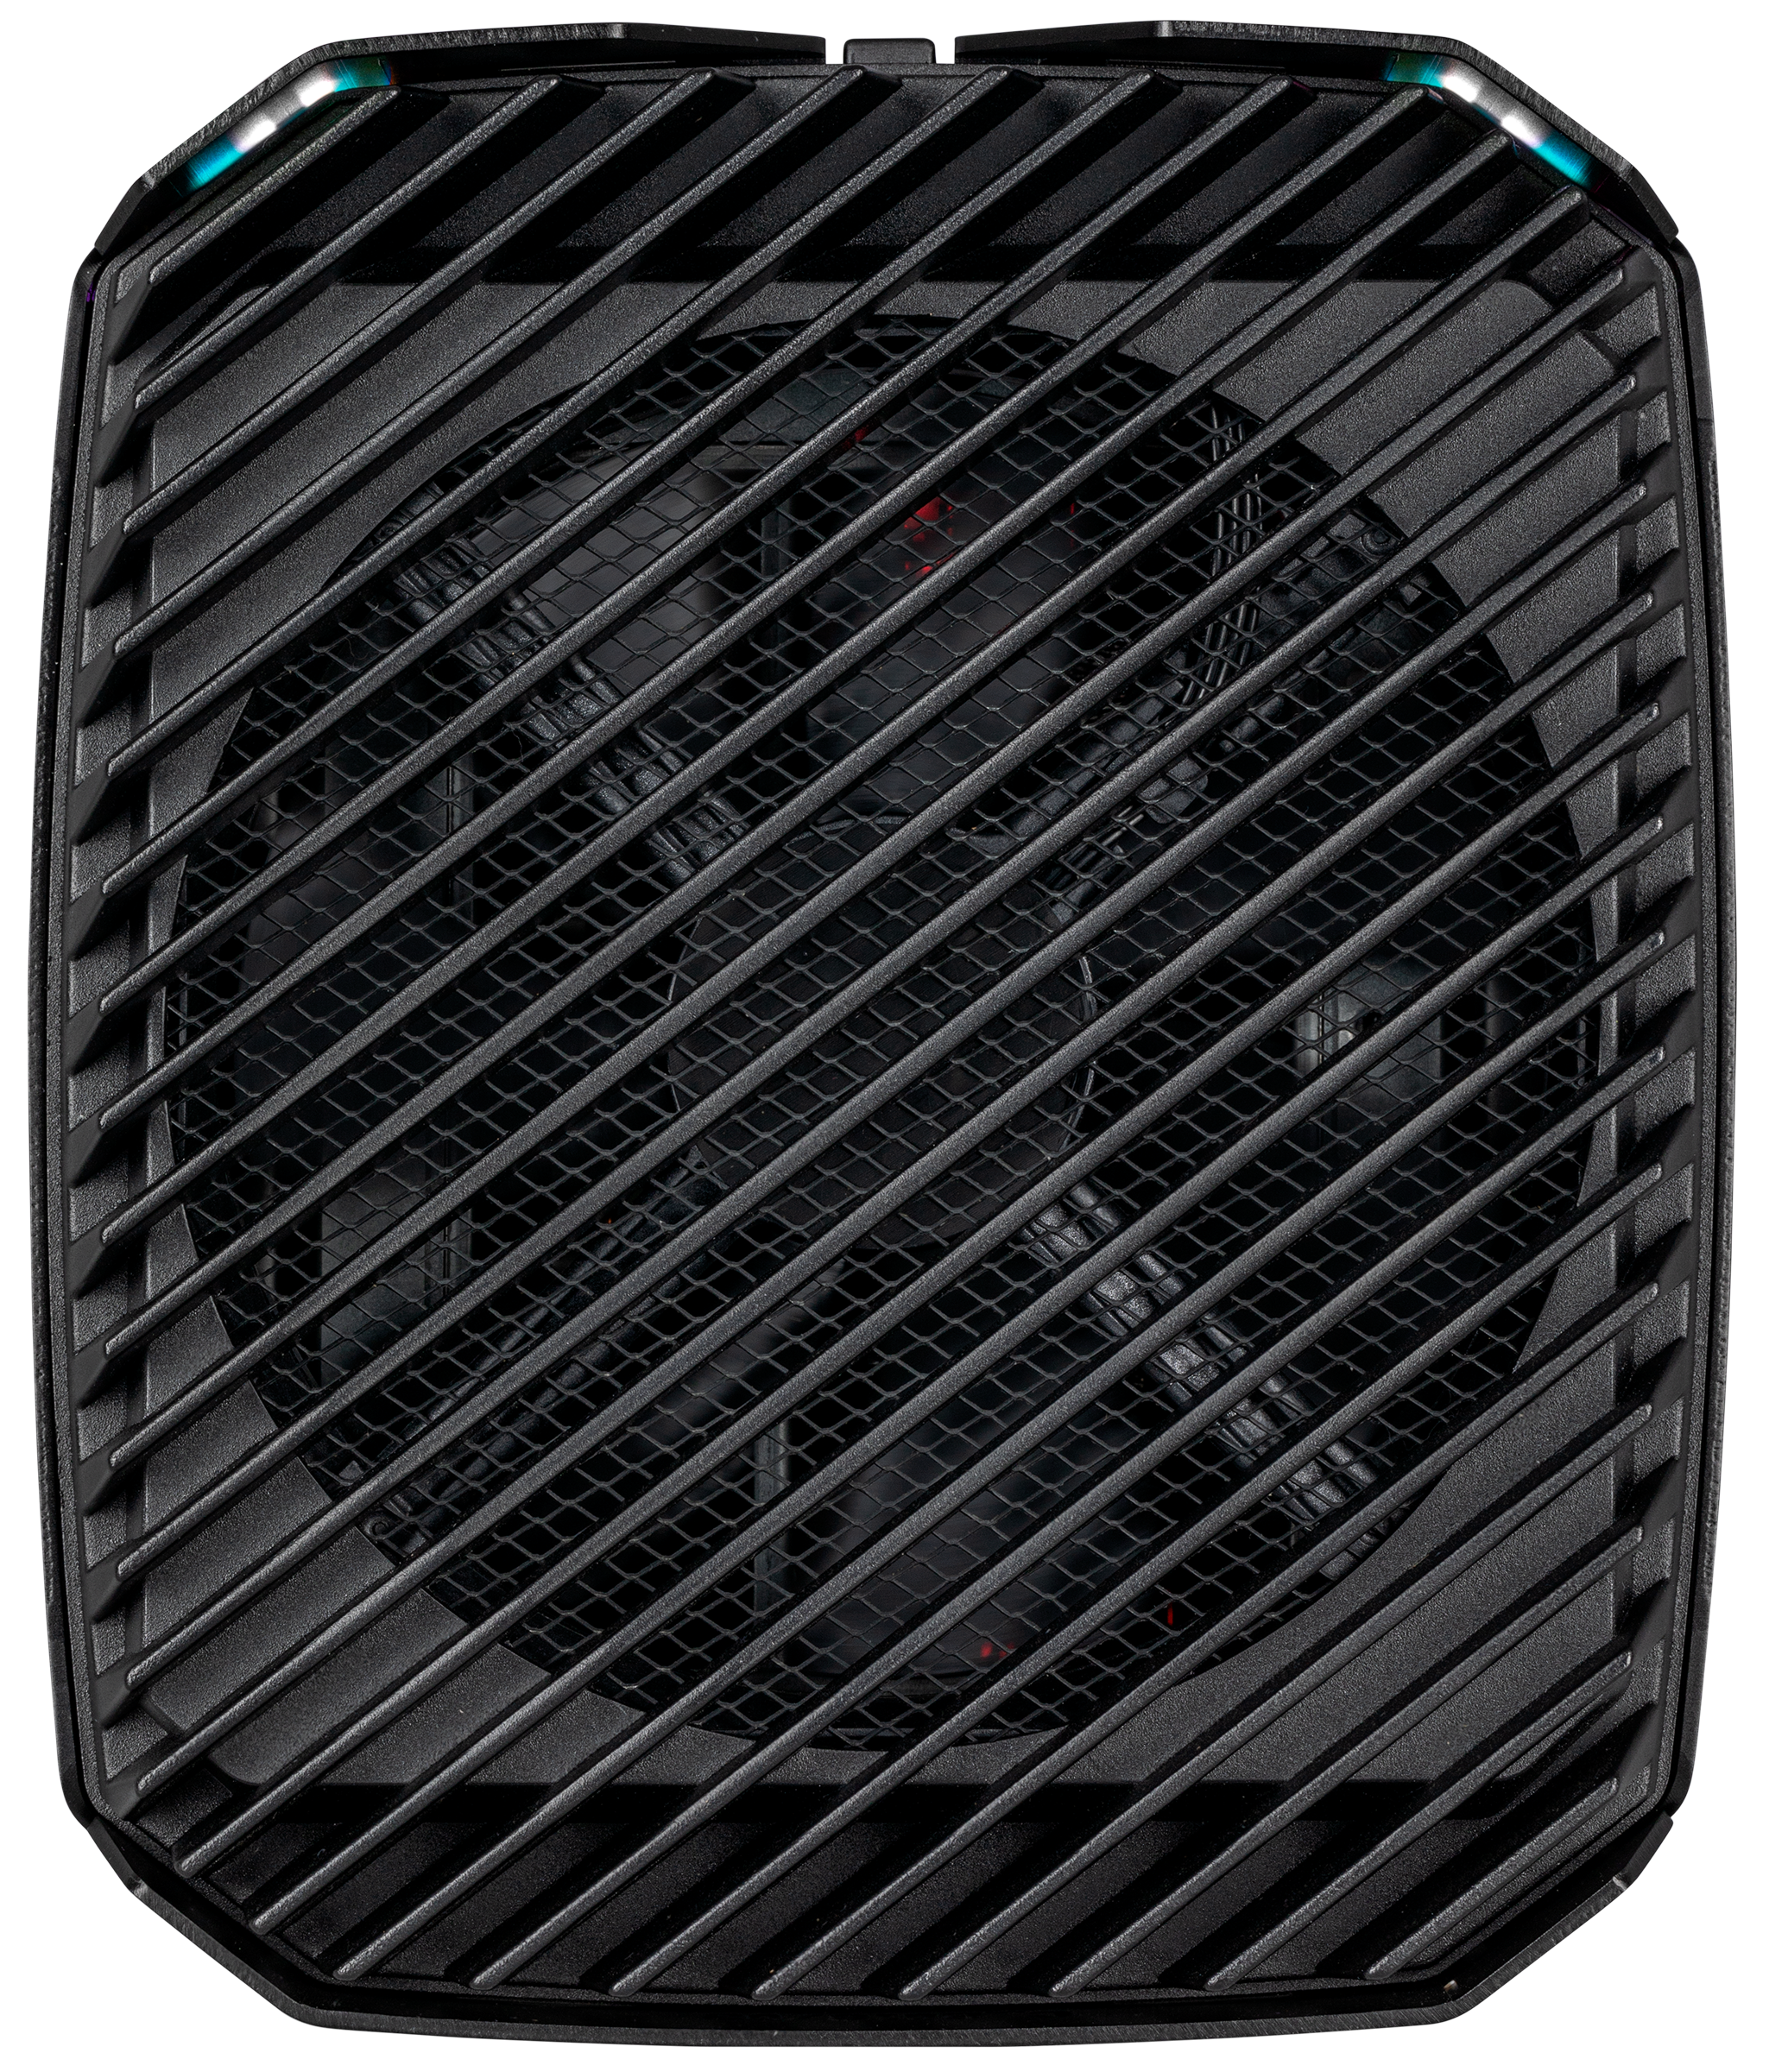
If you are looking for a state-of-the-art gaming PC and do not want to compromise on performance, then an Intel CPU and NVIDIA GPU is a good place to start, with both OEMs currently offering some of the most powerful gaming hardware that money can buy. Clearly, Corsair thought the same, with it cramming a Core i9-9900K and GeForce RTX 2080 Ti into a 12-litre chassis. The company has been able to do so thanks to a custom all-in-one (AIO) cooler, which comprises of two radiators and a 140 mm fan that sits at the top of the case. The fan draws air through two sides of the device, effectively turning the chassis into a chimney to cool the two radiators. The concept works, although our tests will reveal if there are any flaws in its design.
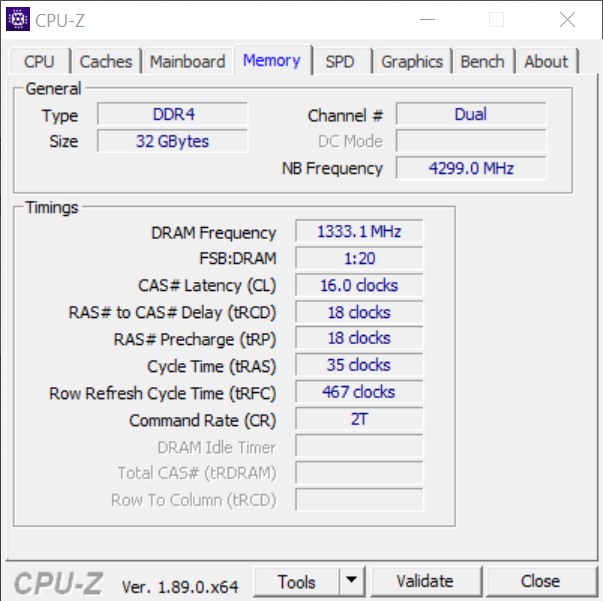
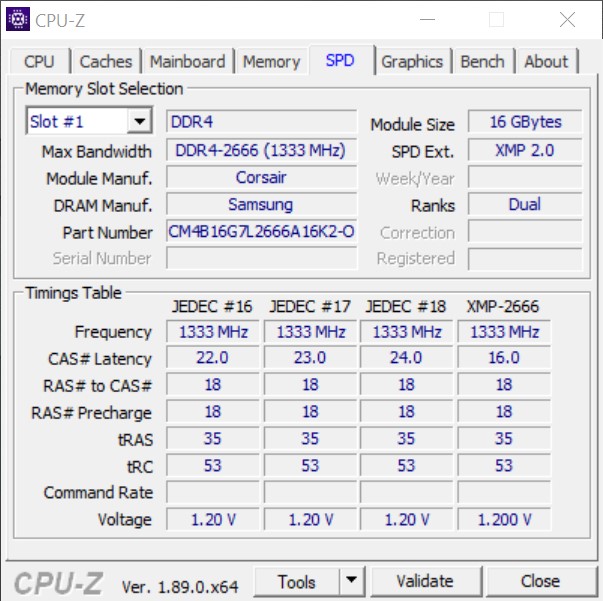
A gaming PC needs more than a powerful CPU and GPU though, with Corsair including 32 GB of DDR4-2666 RAM and 2.5 TB of storage. Disappointingly, it is 2.5 TB of combined storage, as Corsair has paired a 512 GB M.2 2280 SSD with a 2 TB 2.5-inch HDD, the latter of which we did not expect to see in a device that retails for almost US$3,399.99.
The One i160 can be ordered directly from Corsair, which preinstalls all components, including the CPU and GPU. The company does not sell the case or patented cooling solution separately though, so you must buy the One i160 if you want either of these.
If your budget does not stretch to nearly US$3,500, then Corsair also sells the One i140, which retails for US$2,799.99. The One i40 comes with a Core i7-9700K, GeForce RTX 2080, 32 GB of RAM, a 480 GB SSD and a 2 TB HDD. The company sells the One i165 too, which has double the SSD storage and a Windows 10 Pro licence for US$100 more than the One i160. The One i140 and i160 come with Windows 10 Home licenses, for reference.
Case
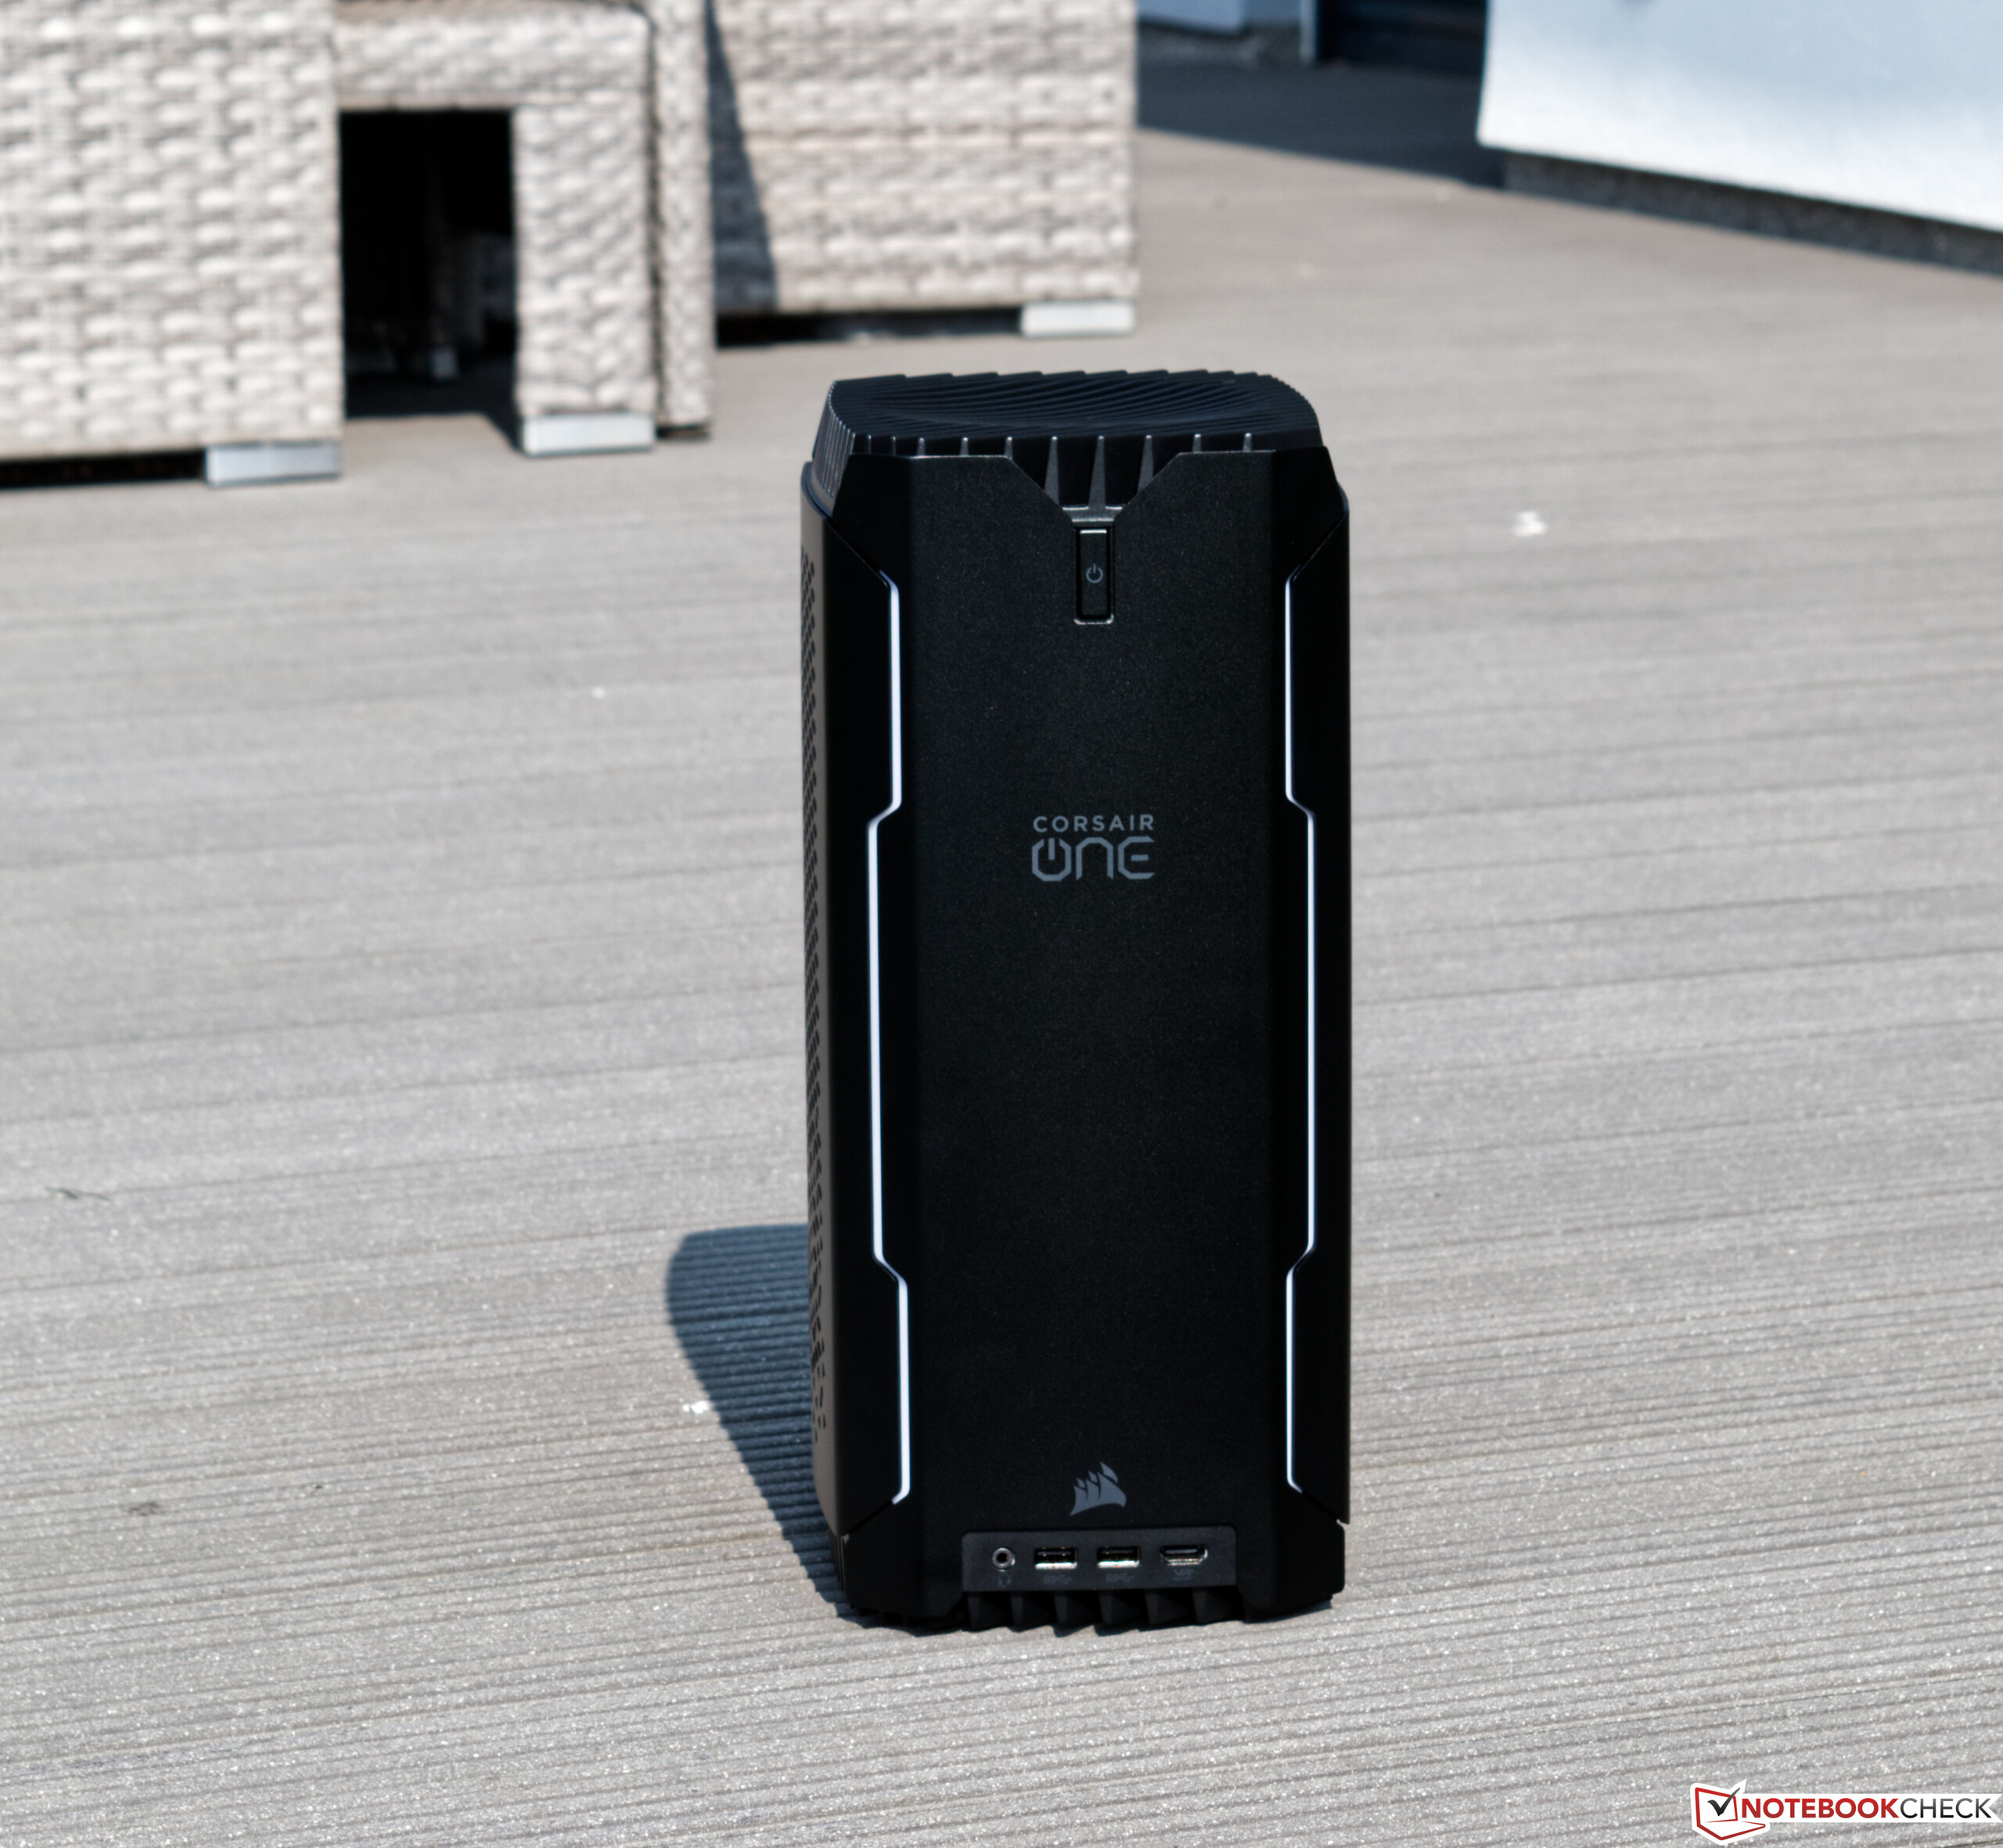
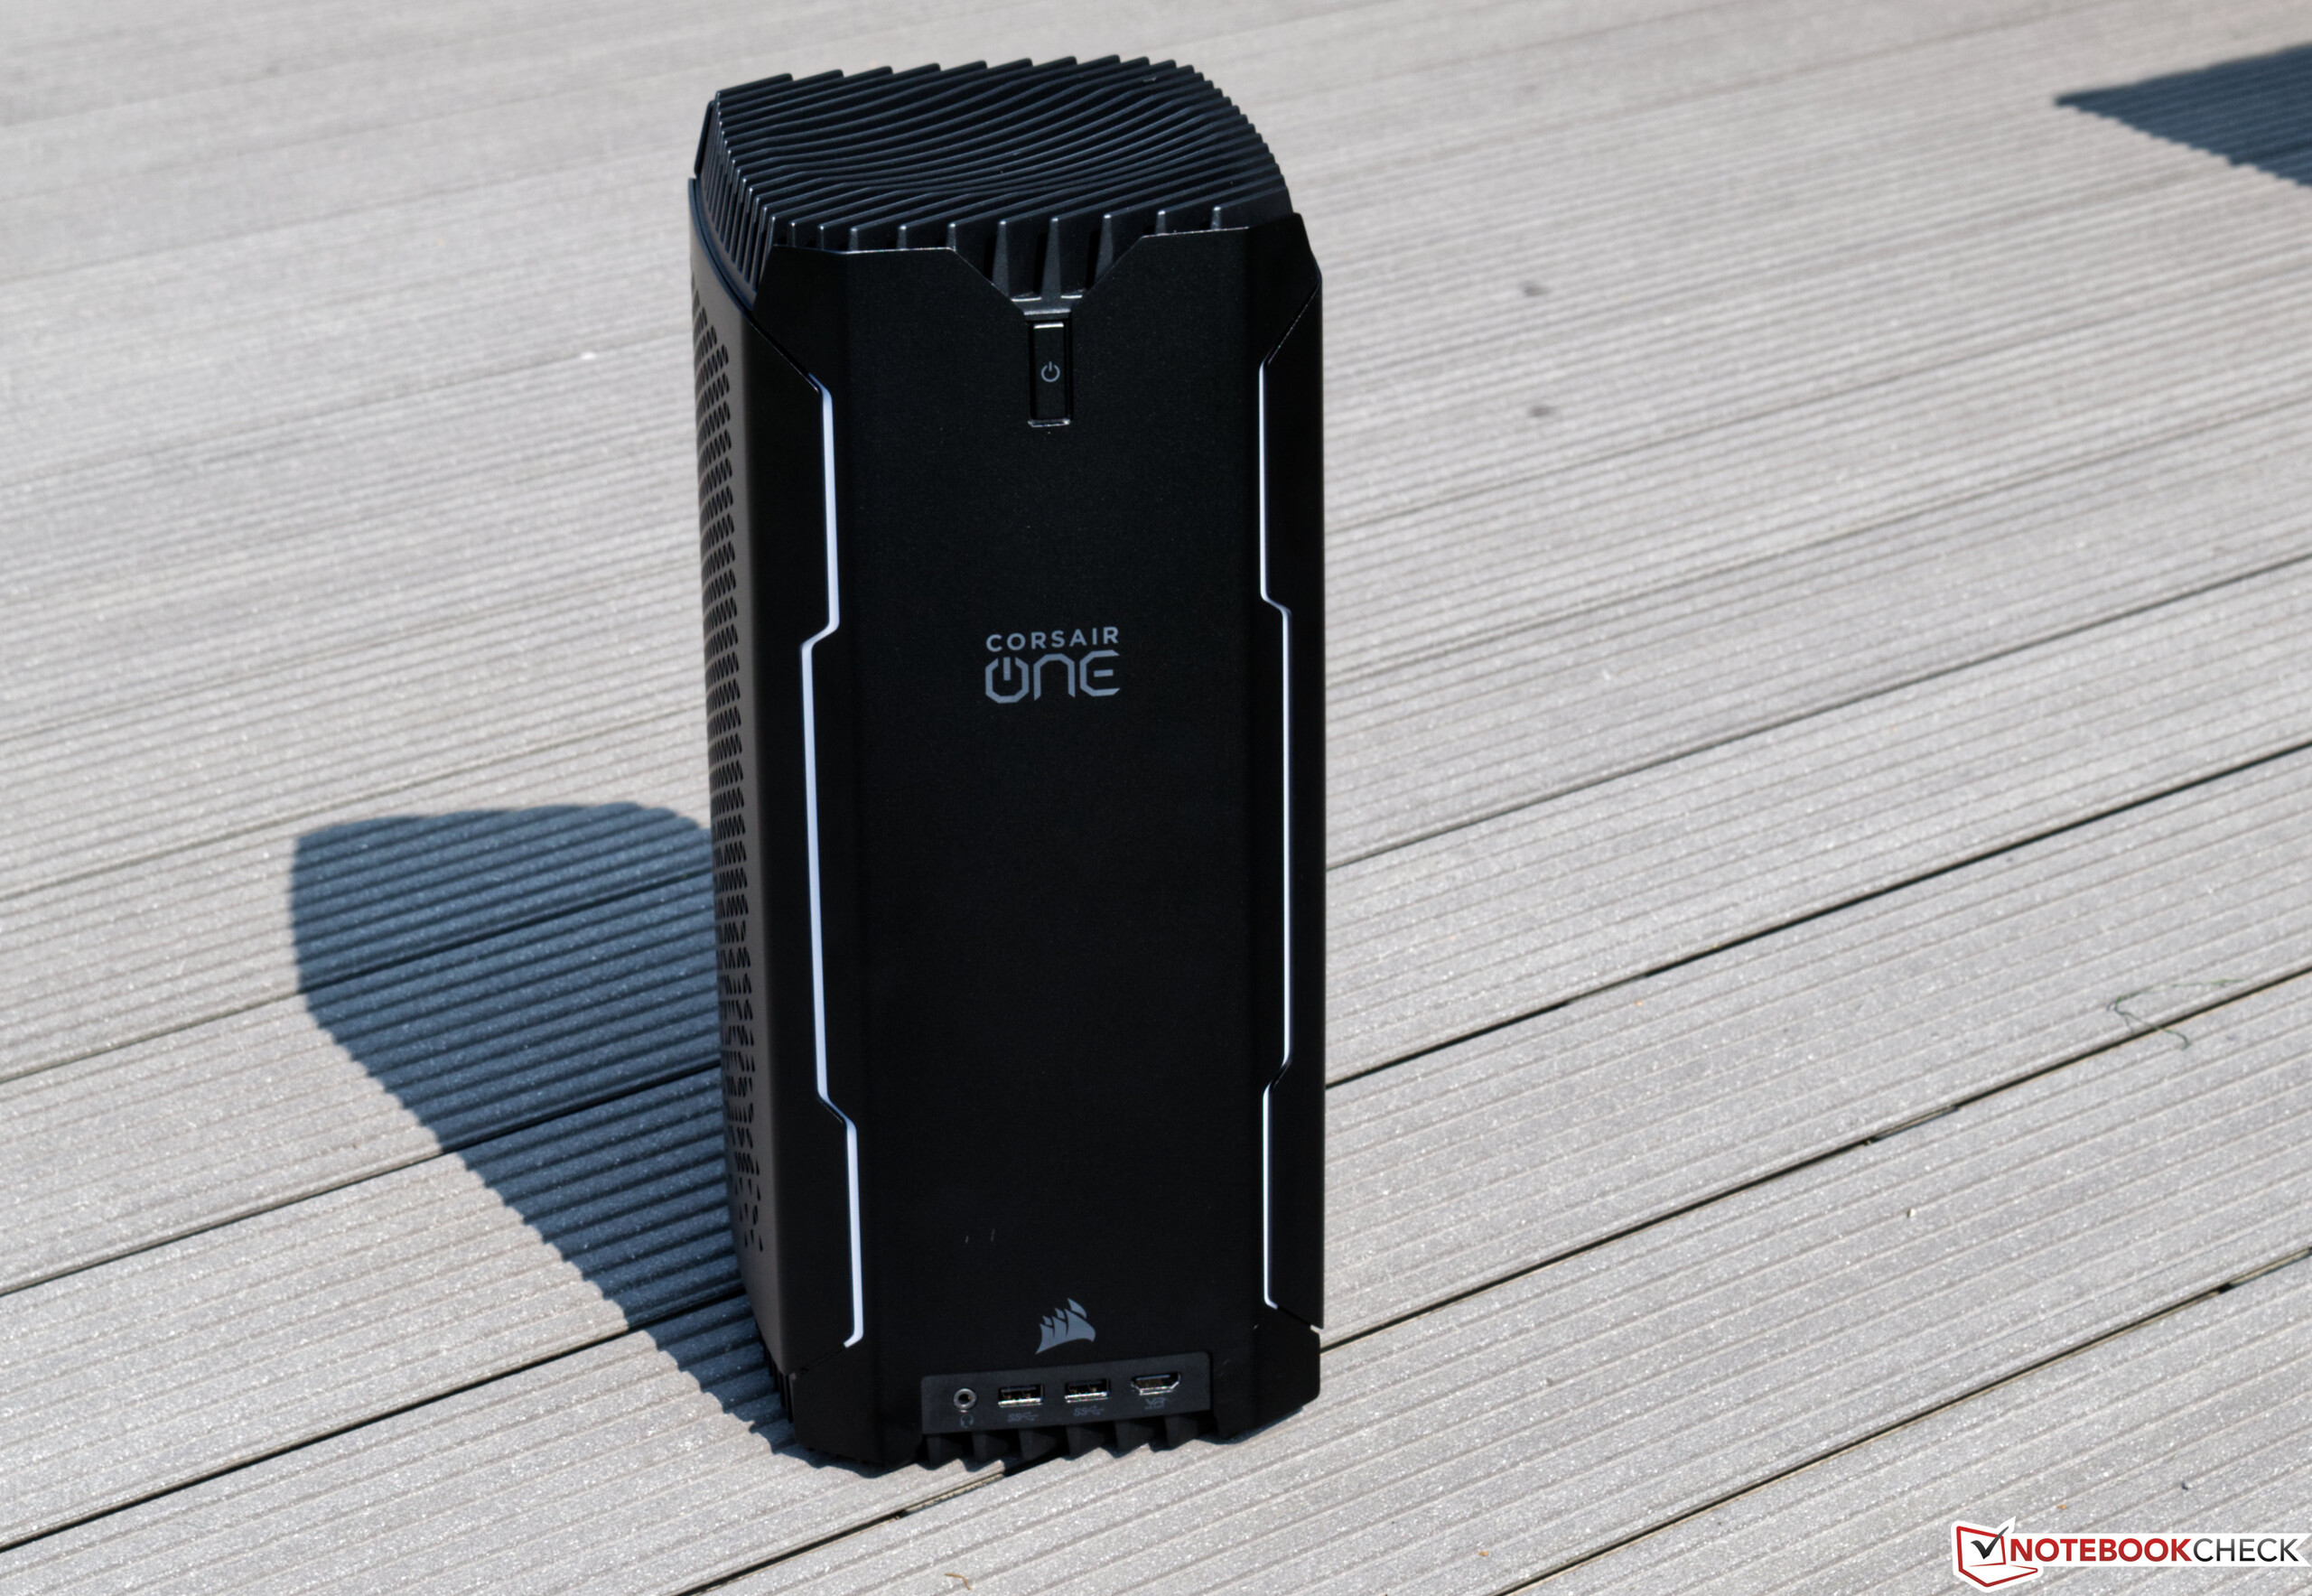
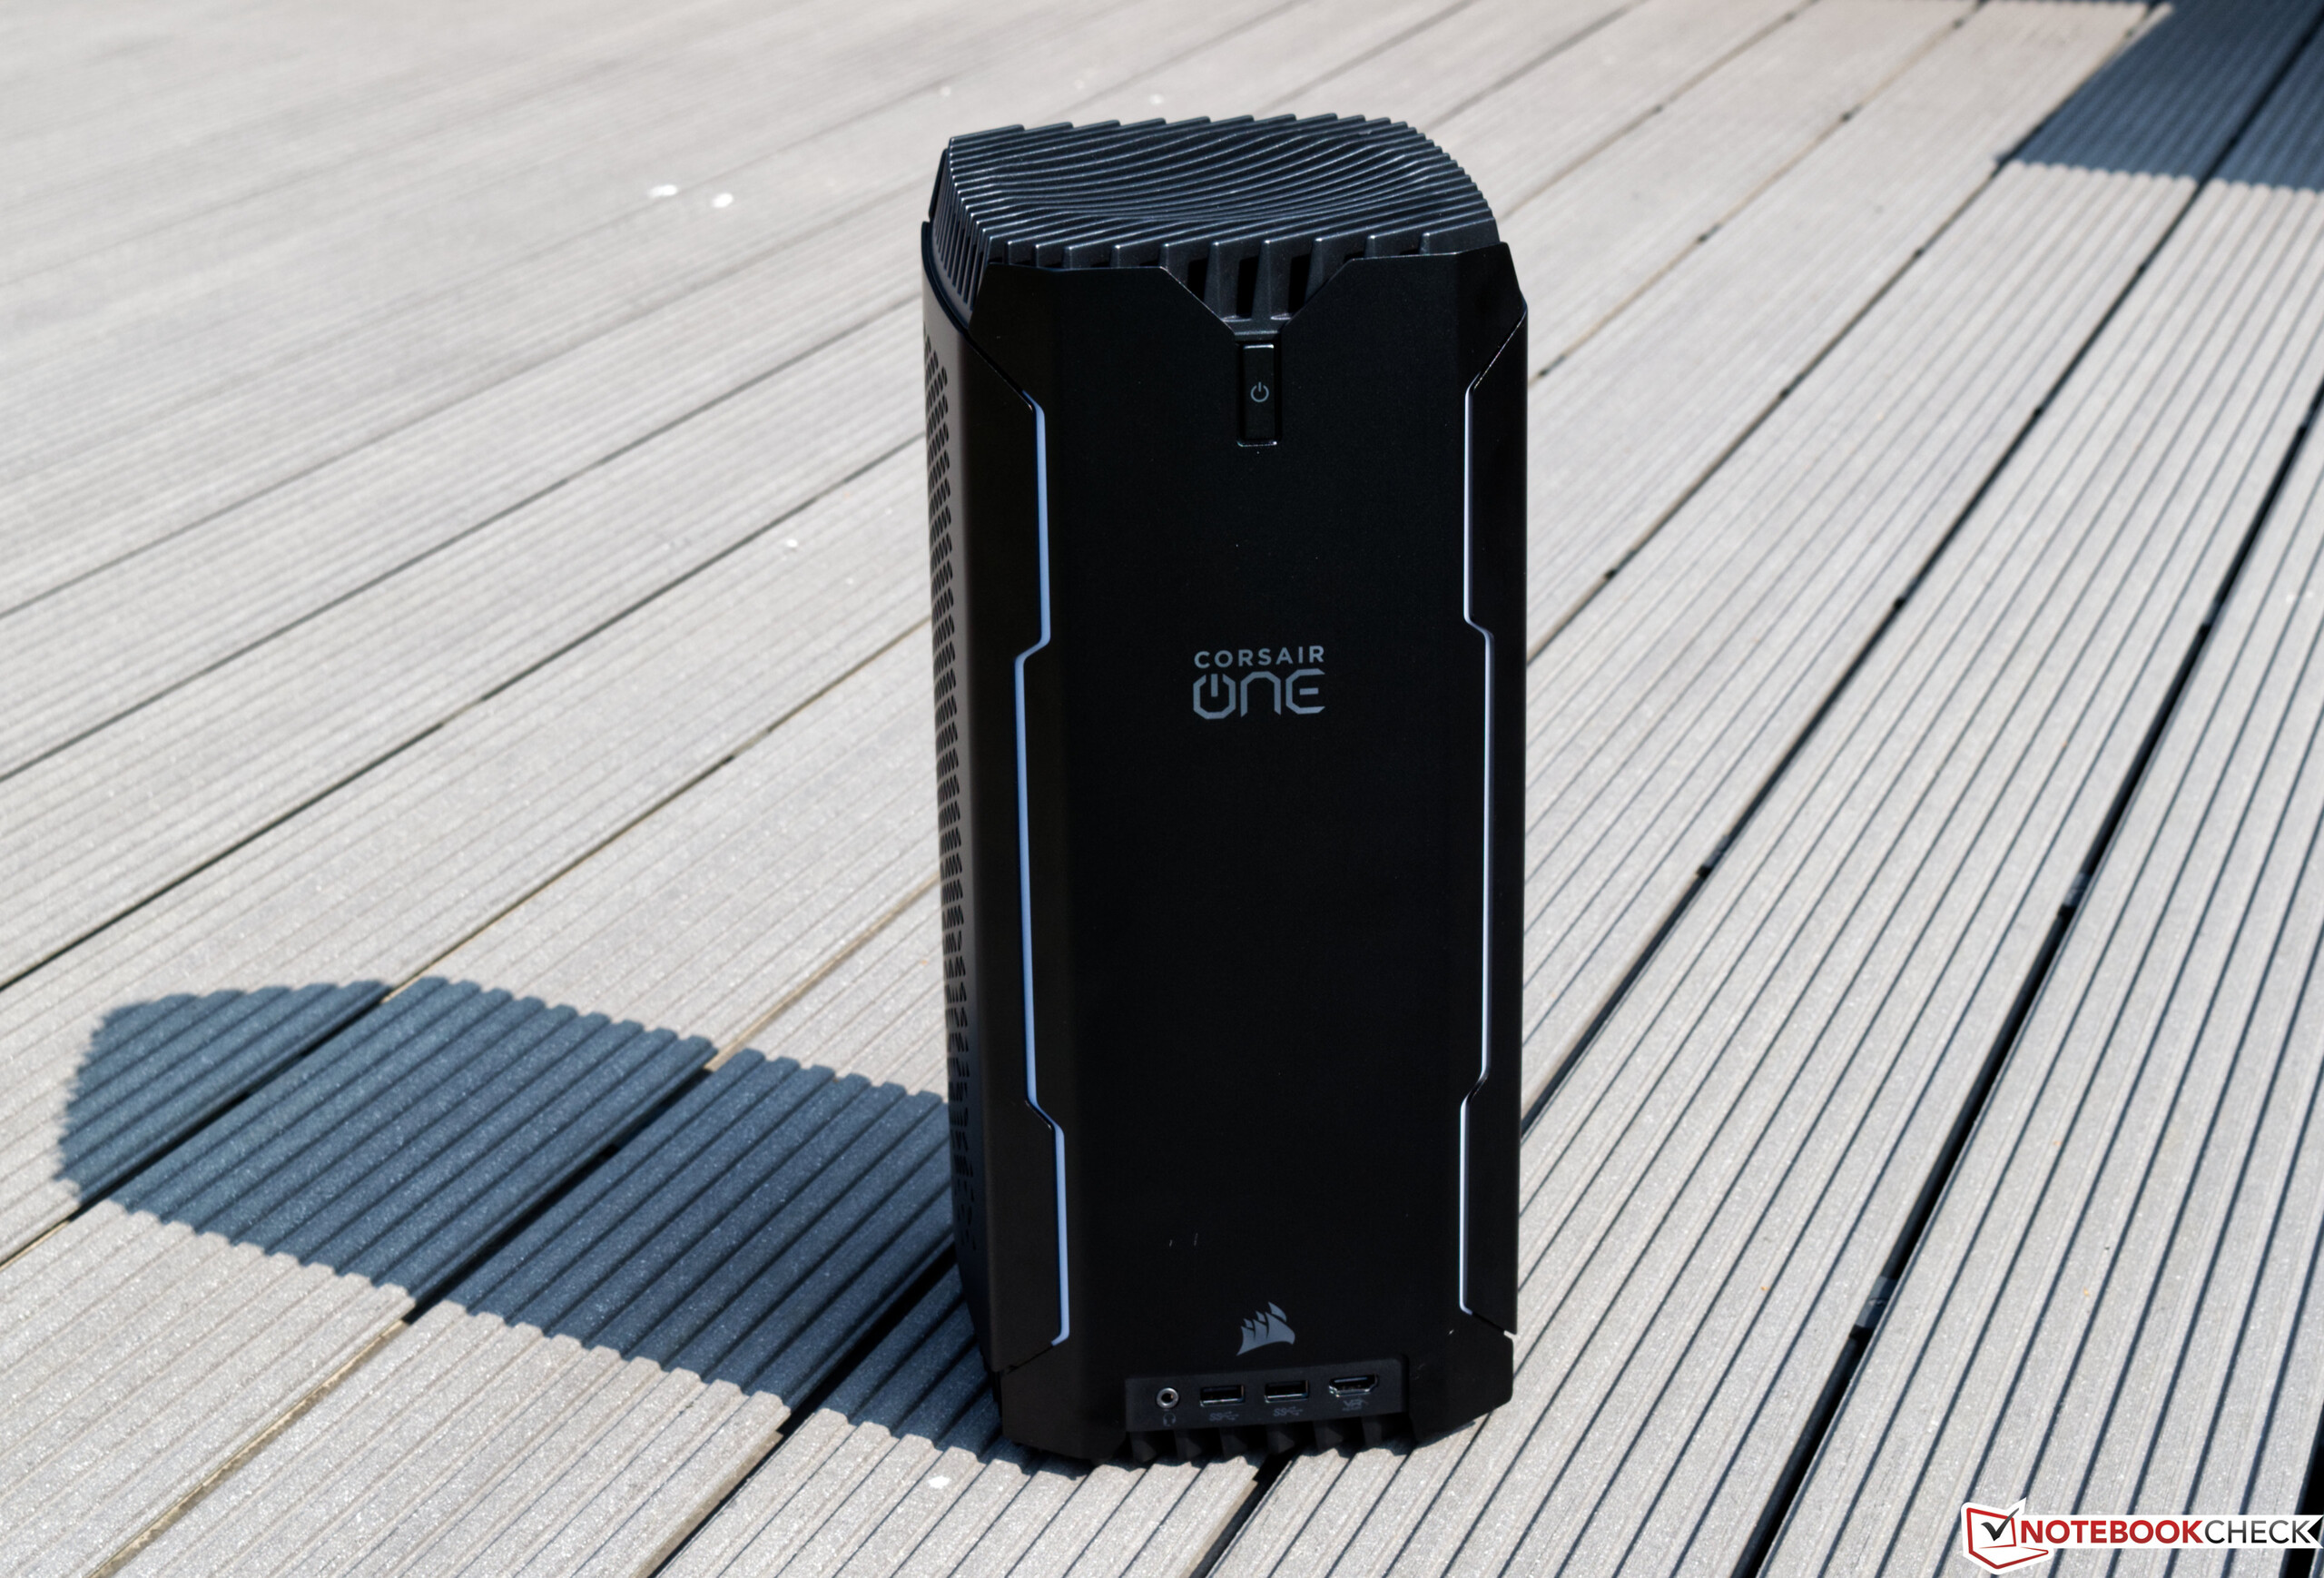
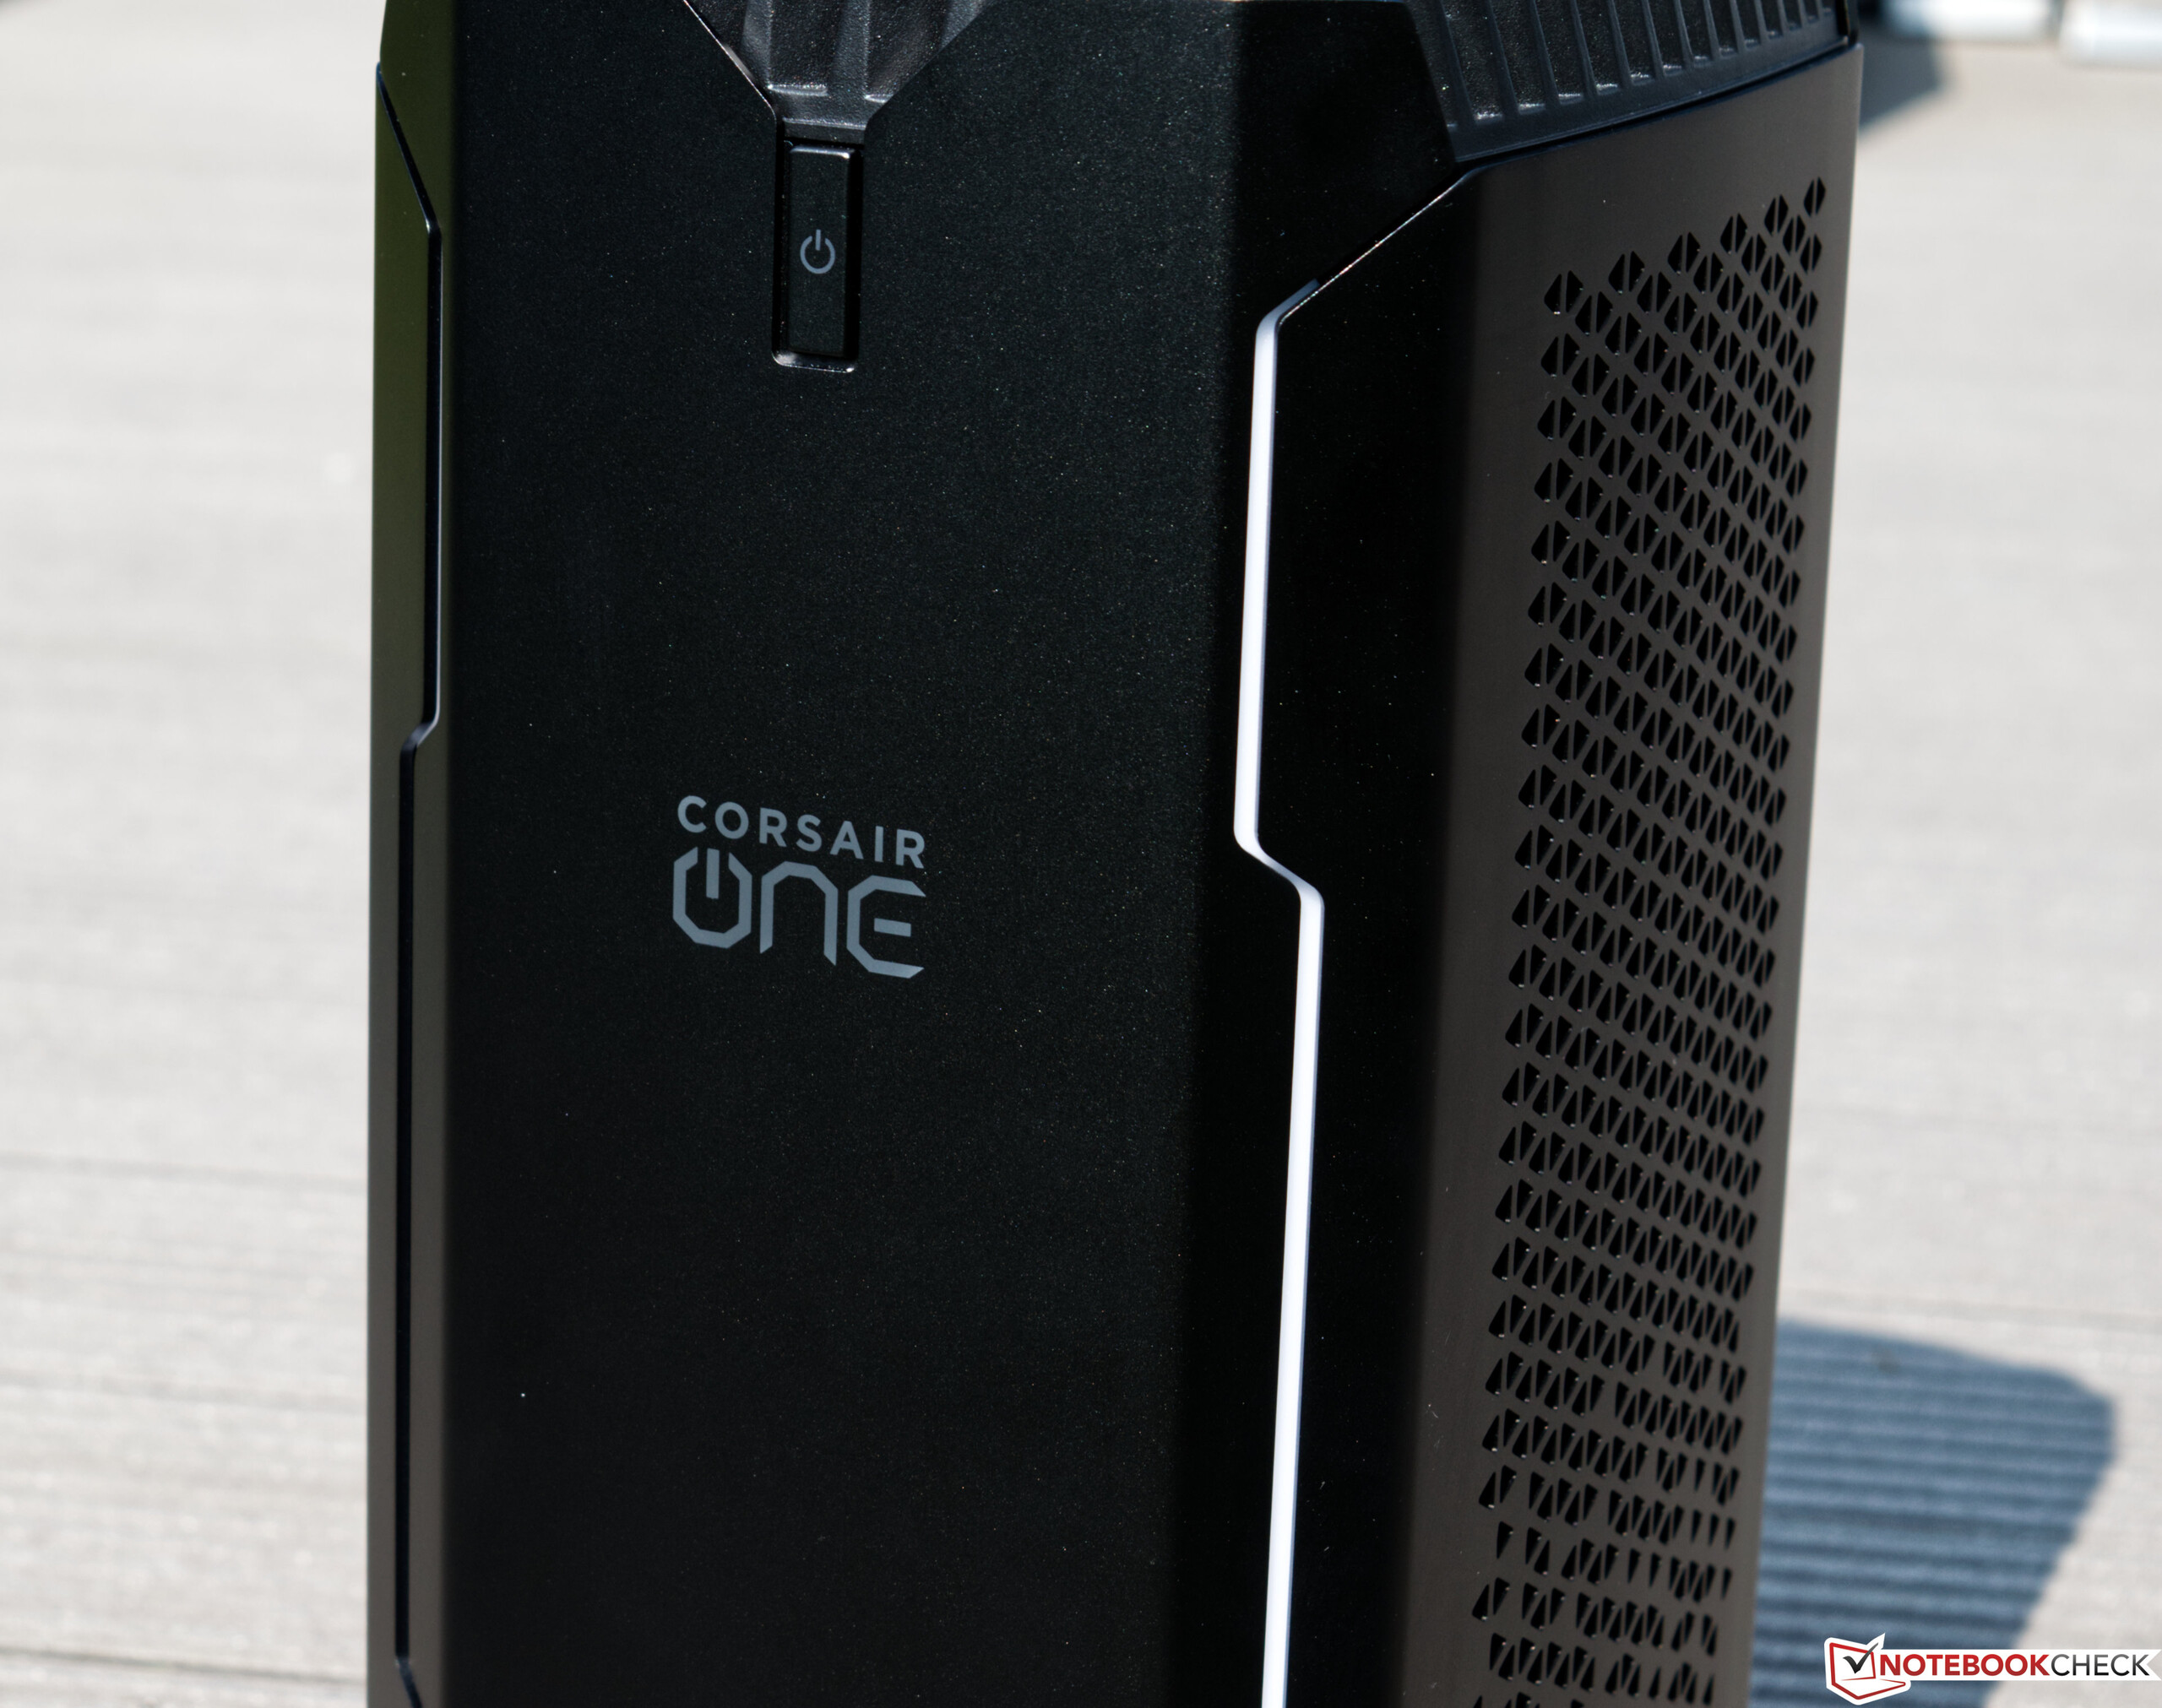
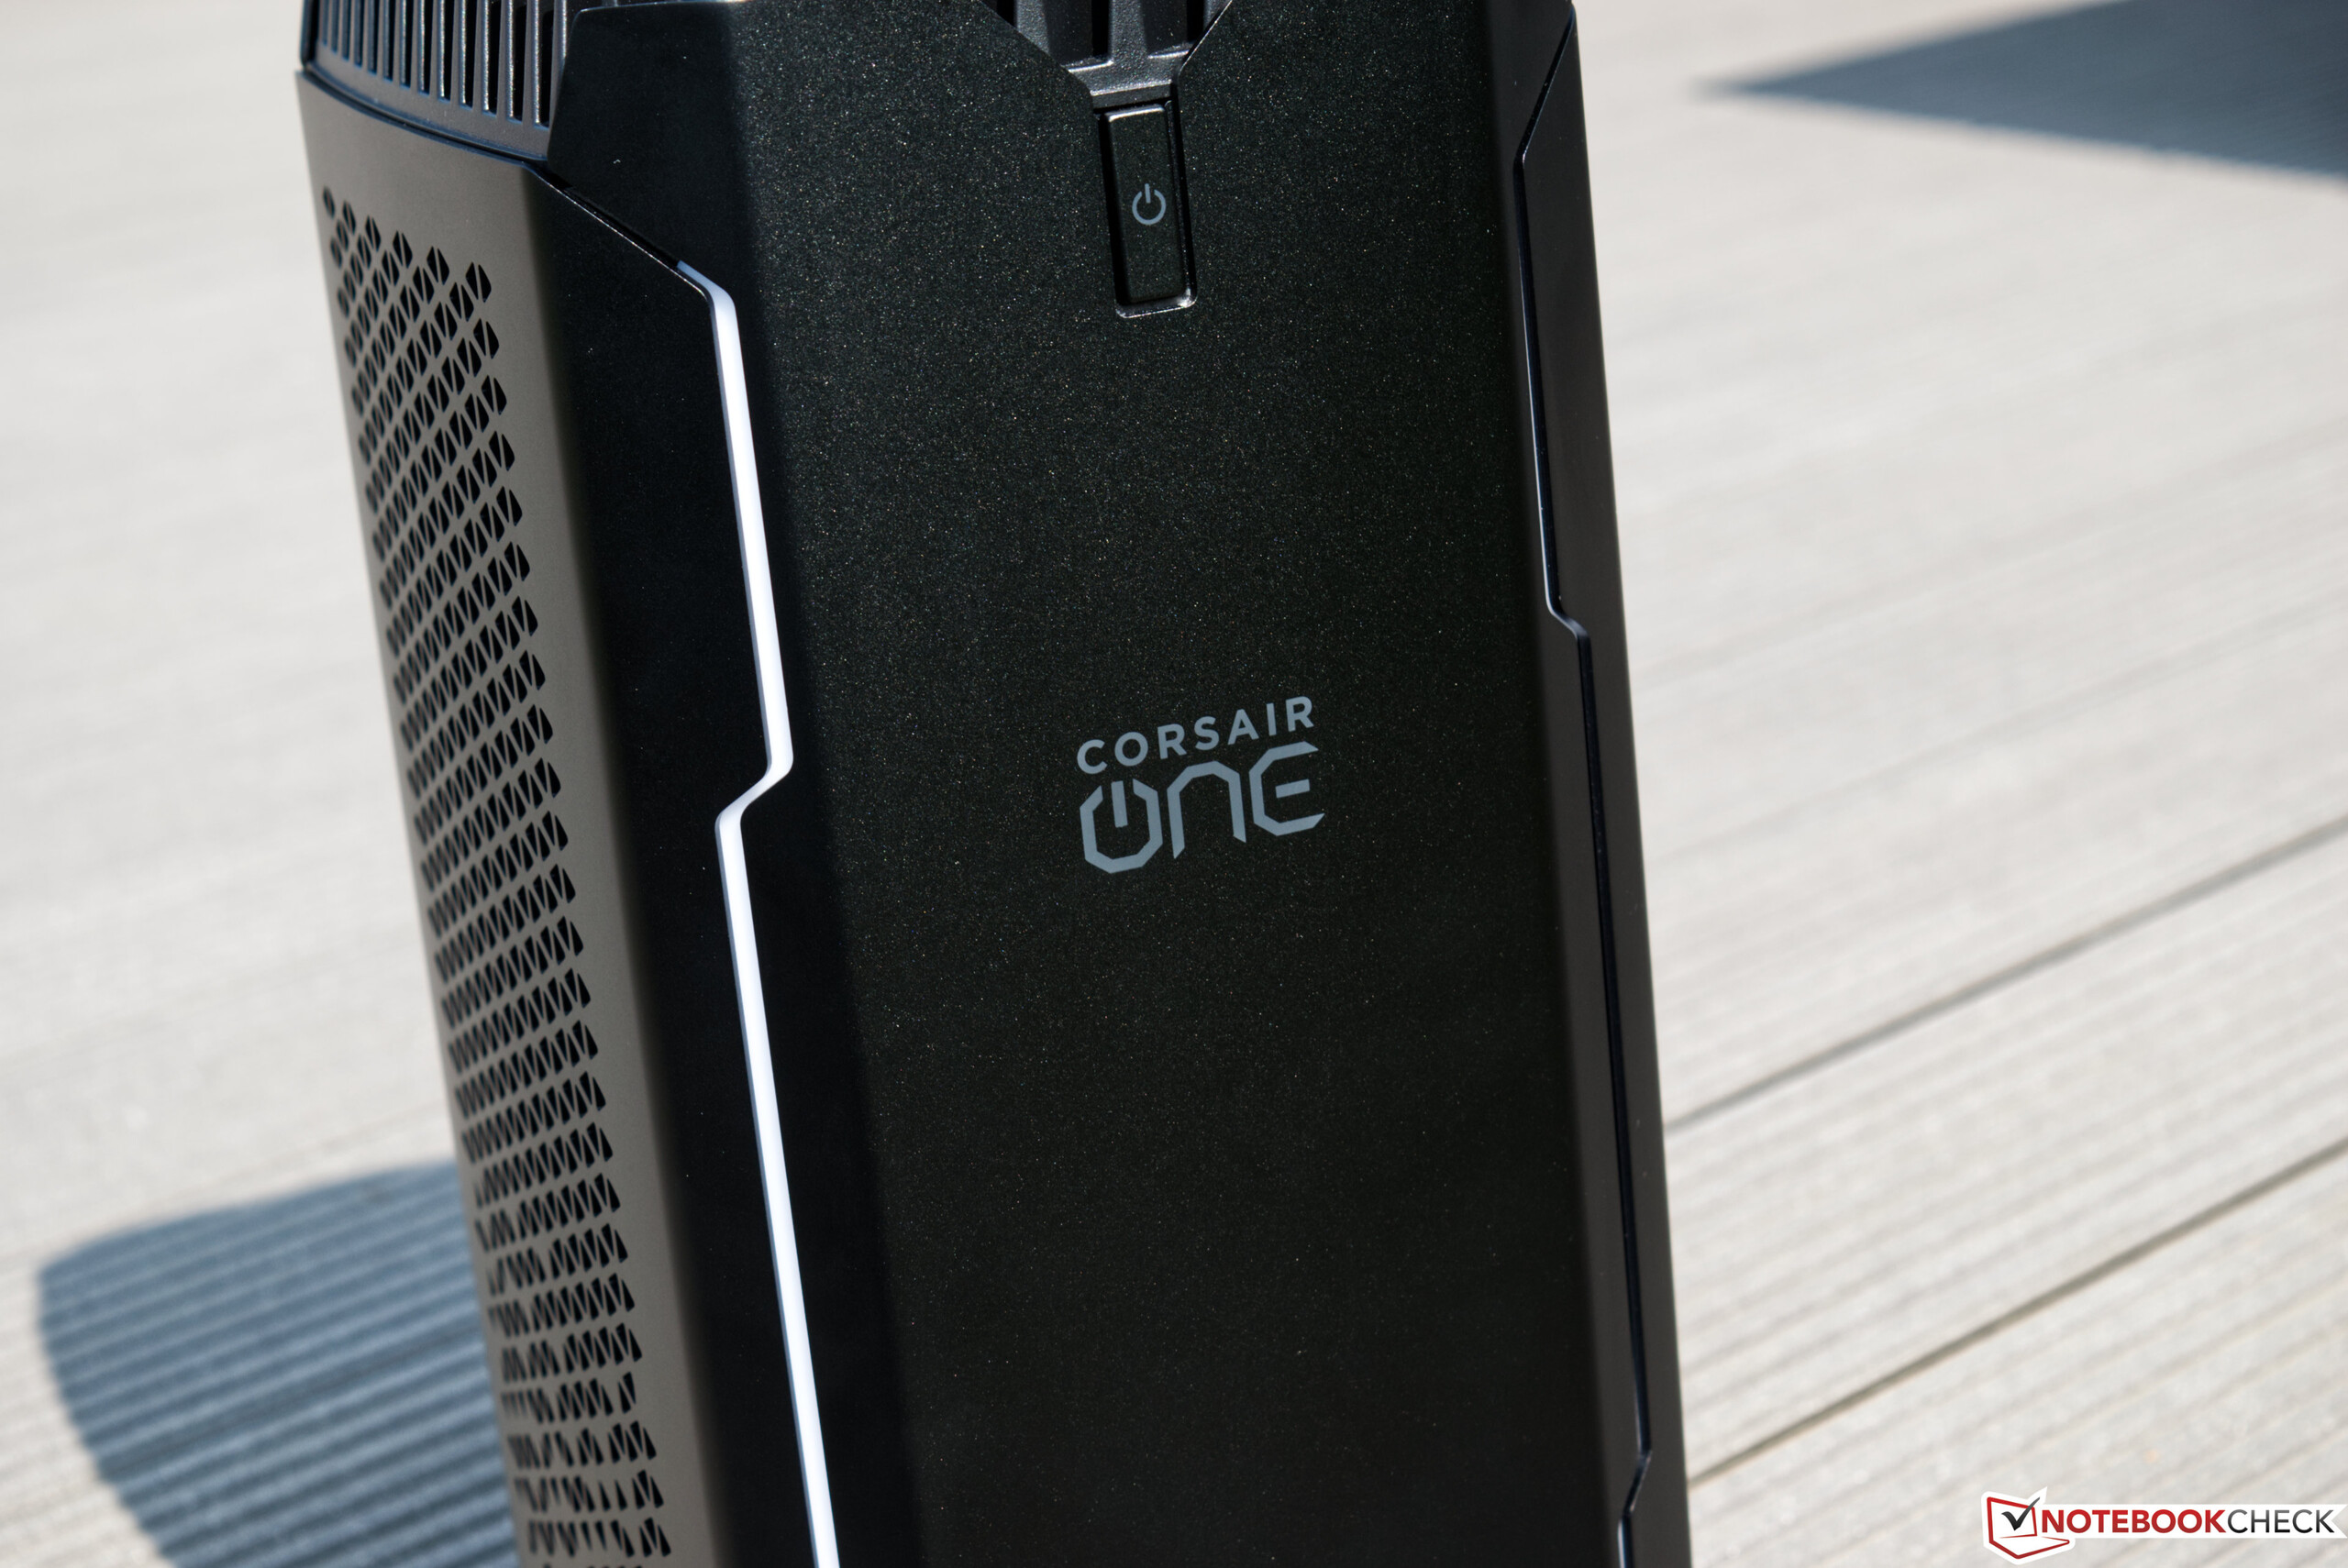
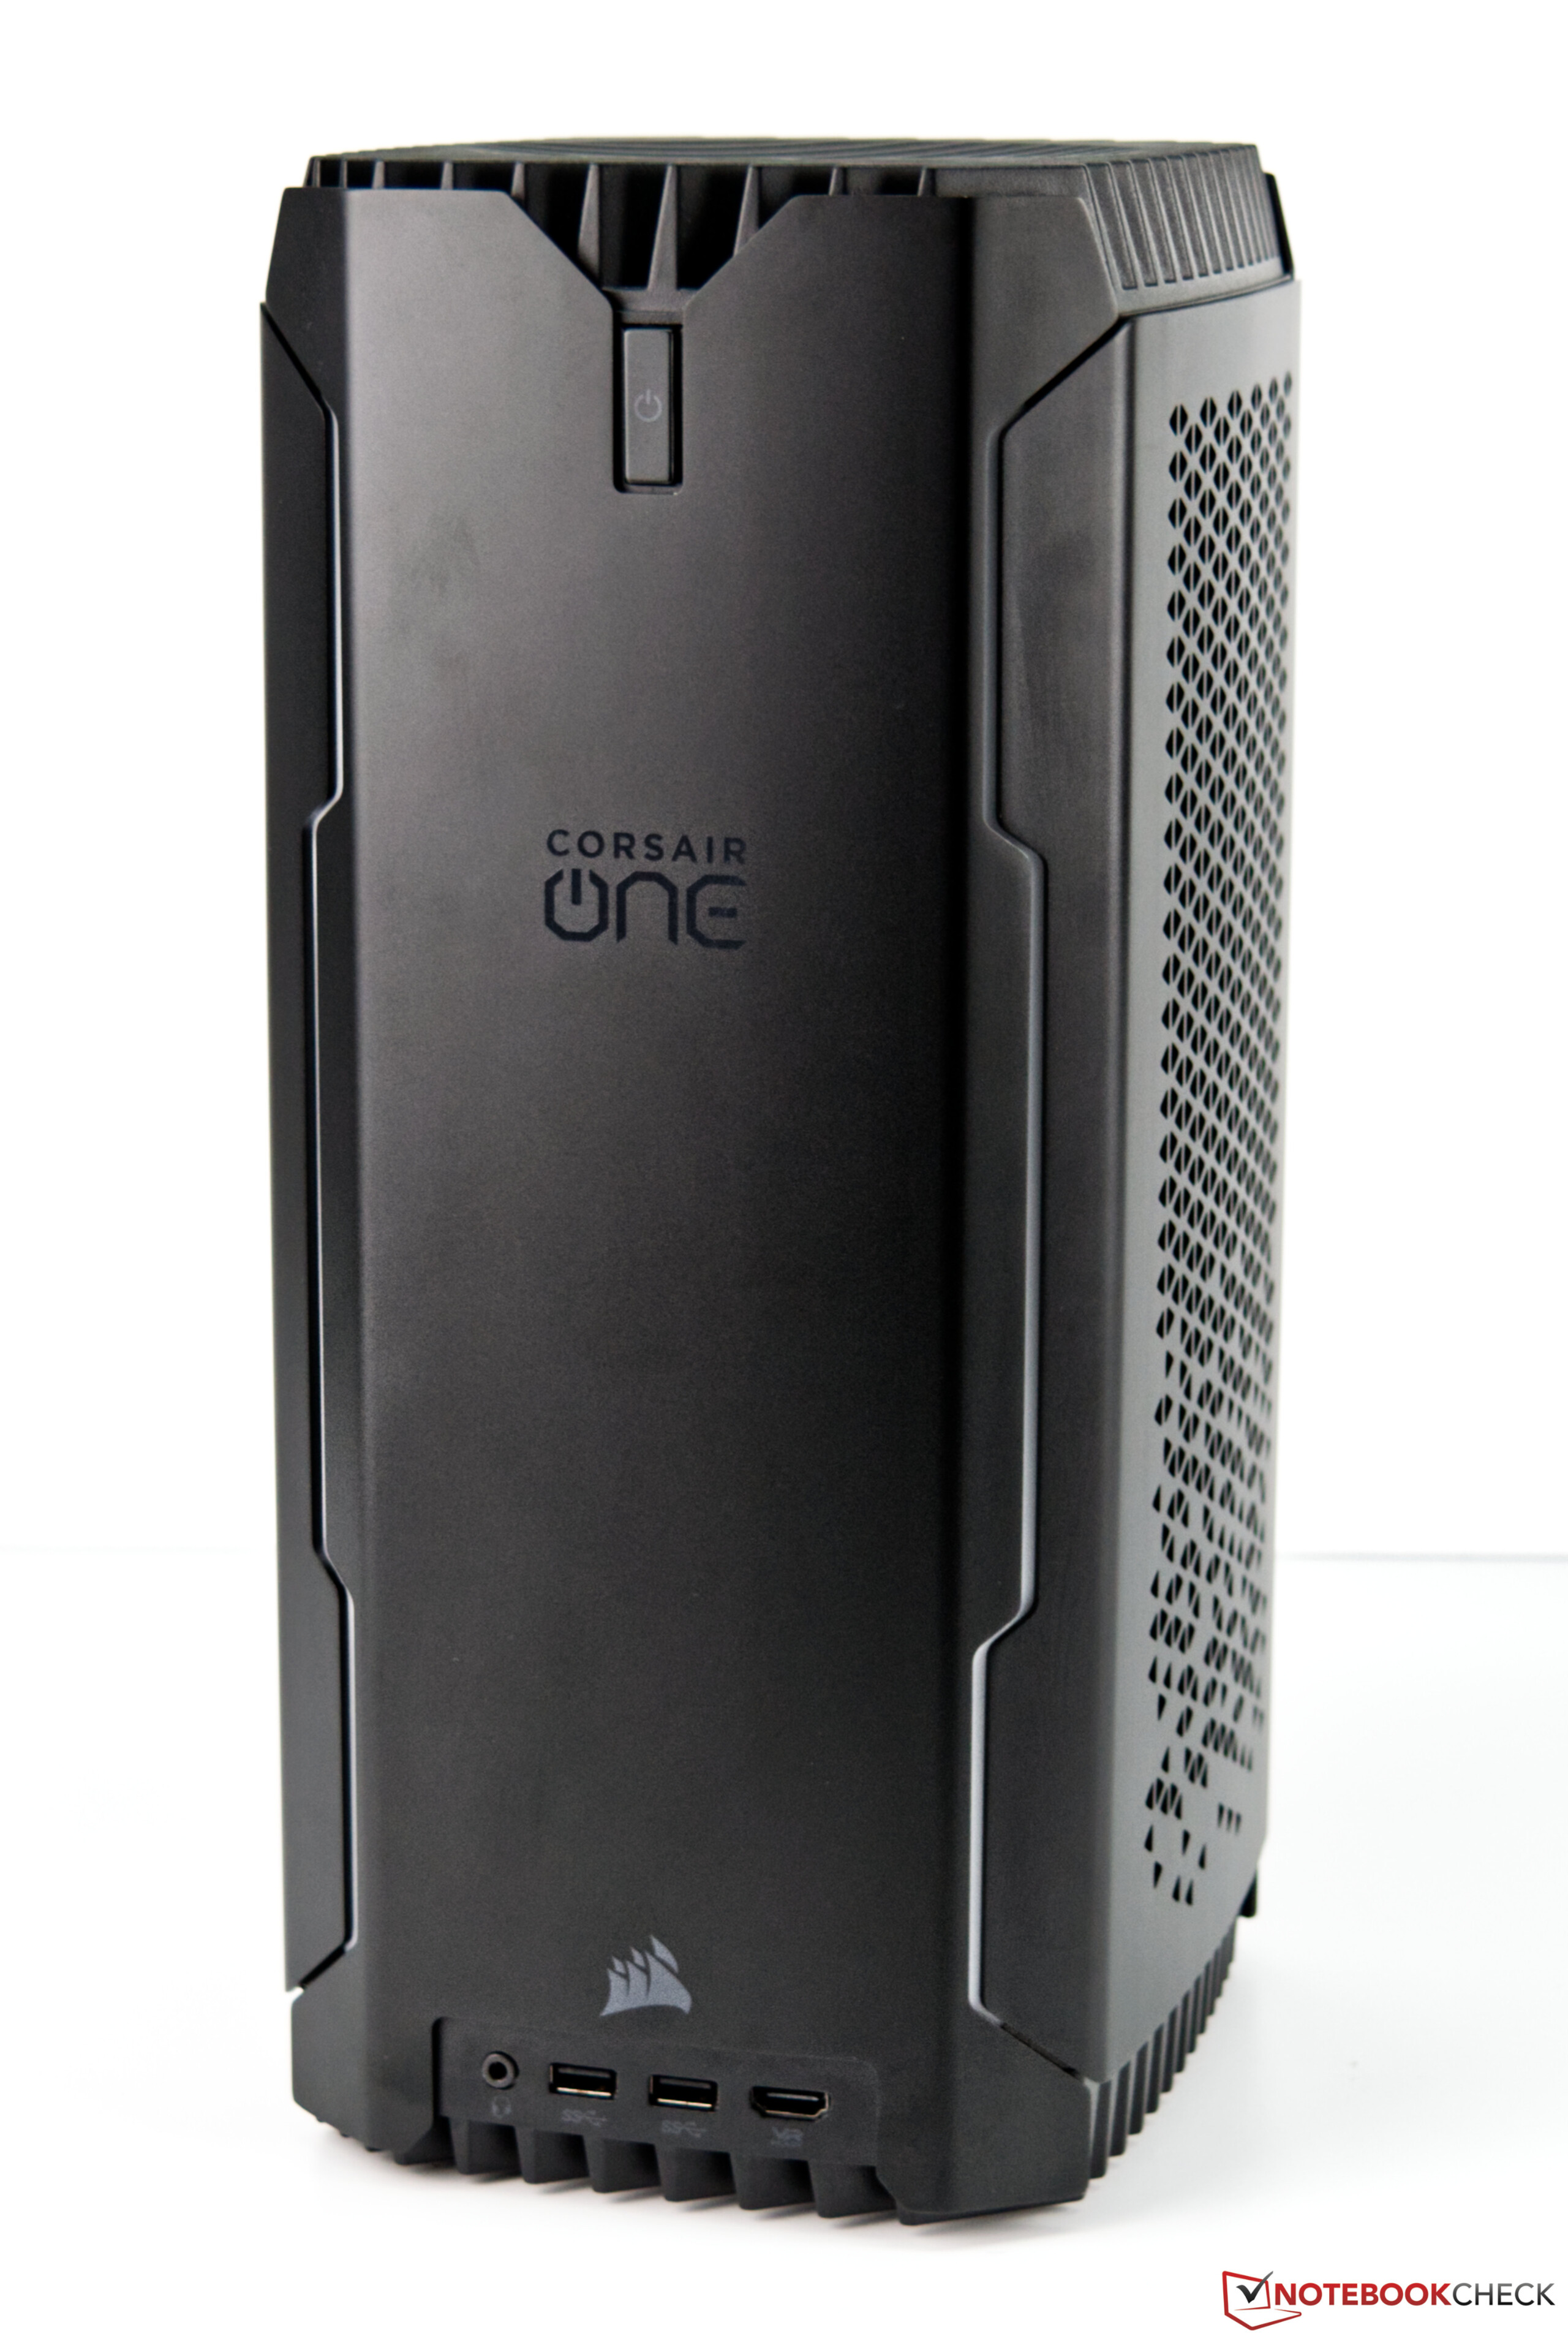
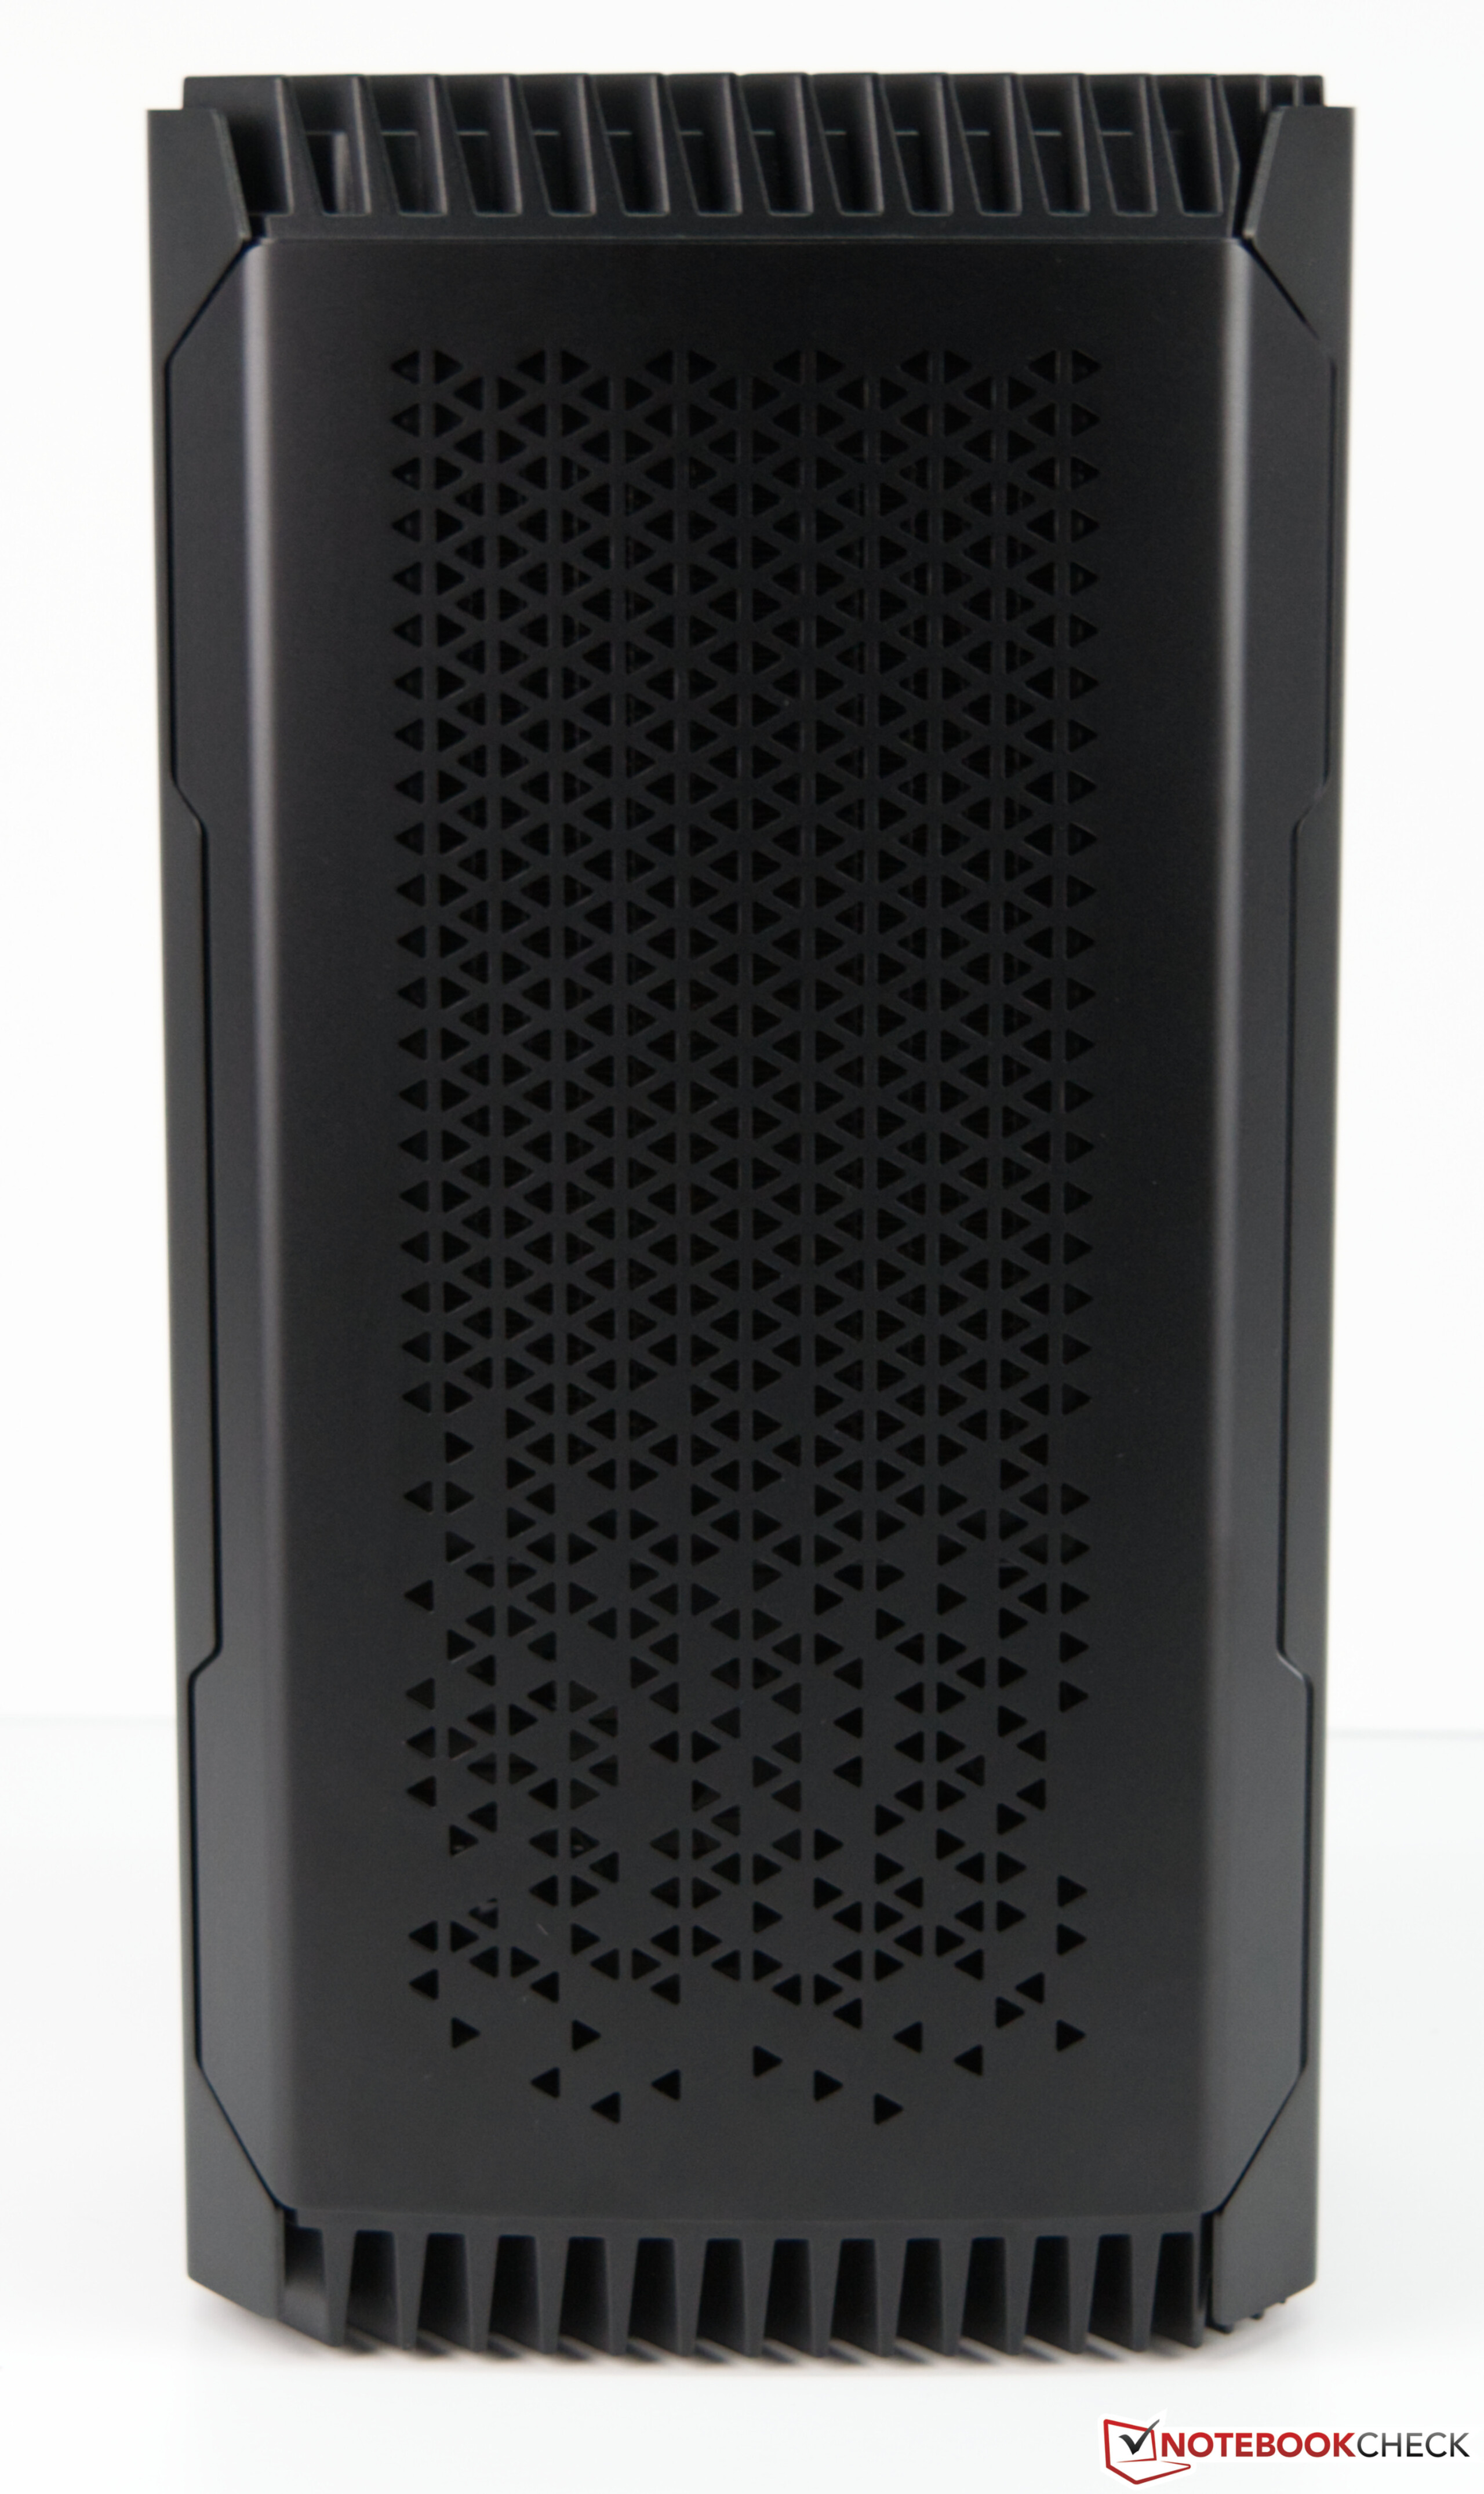
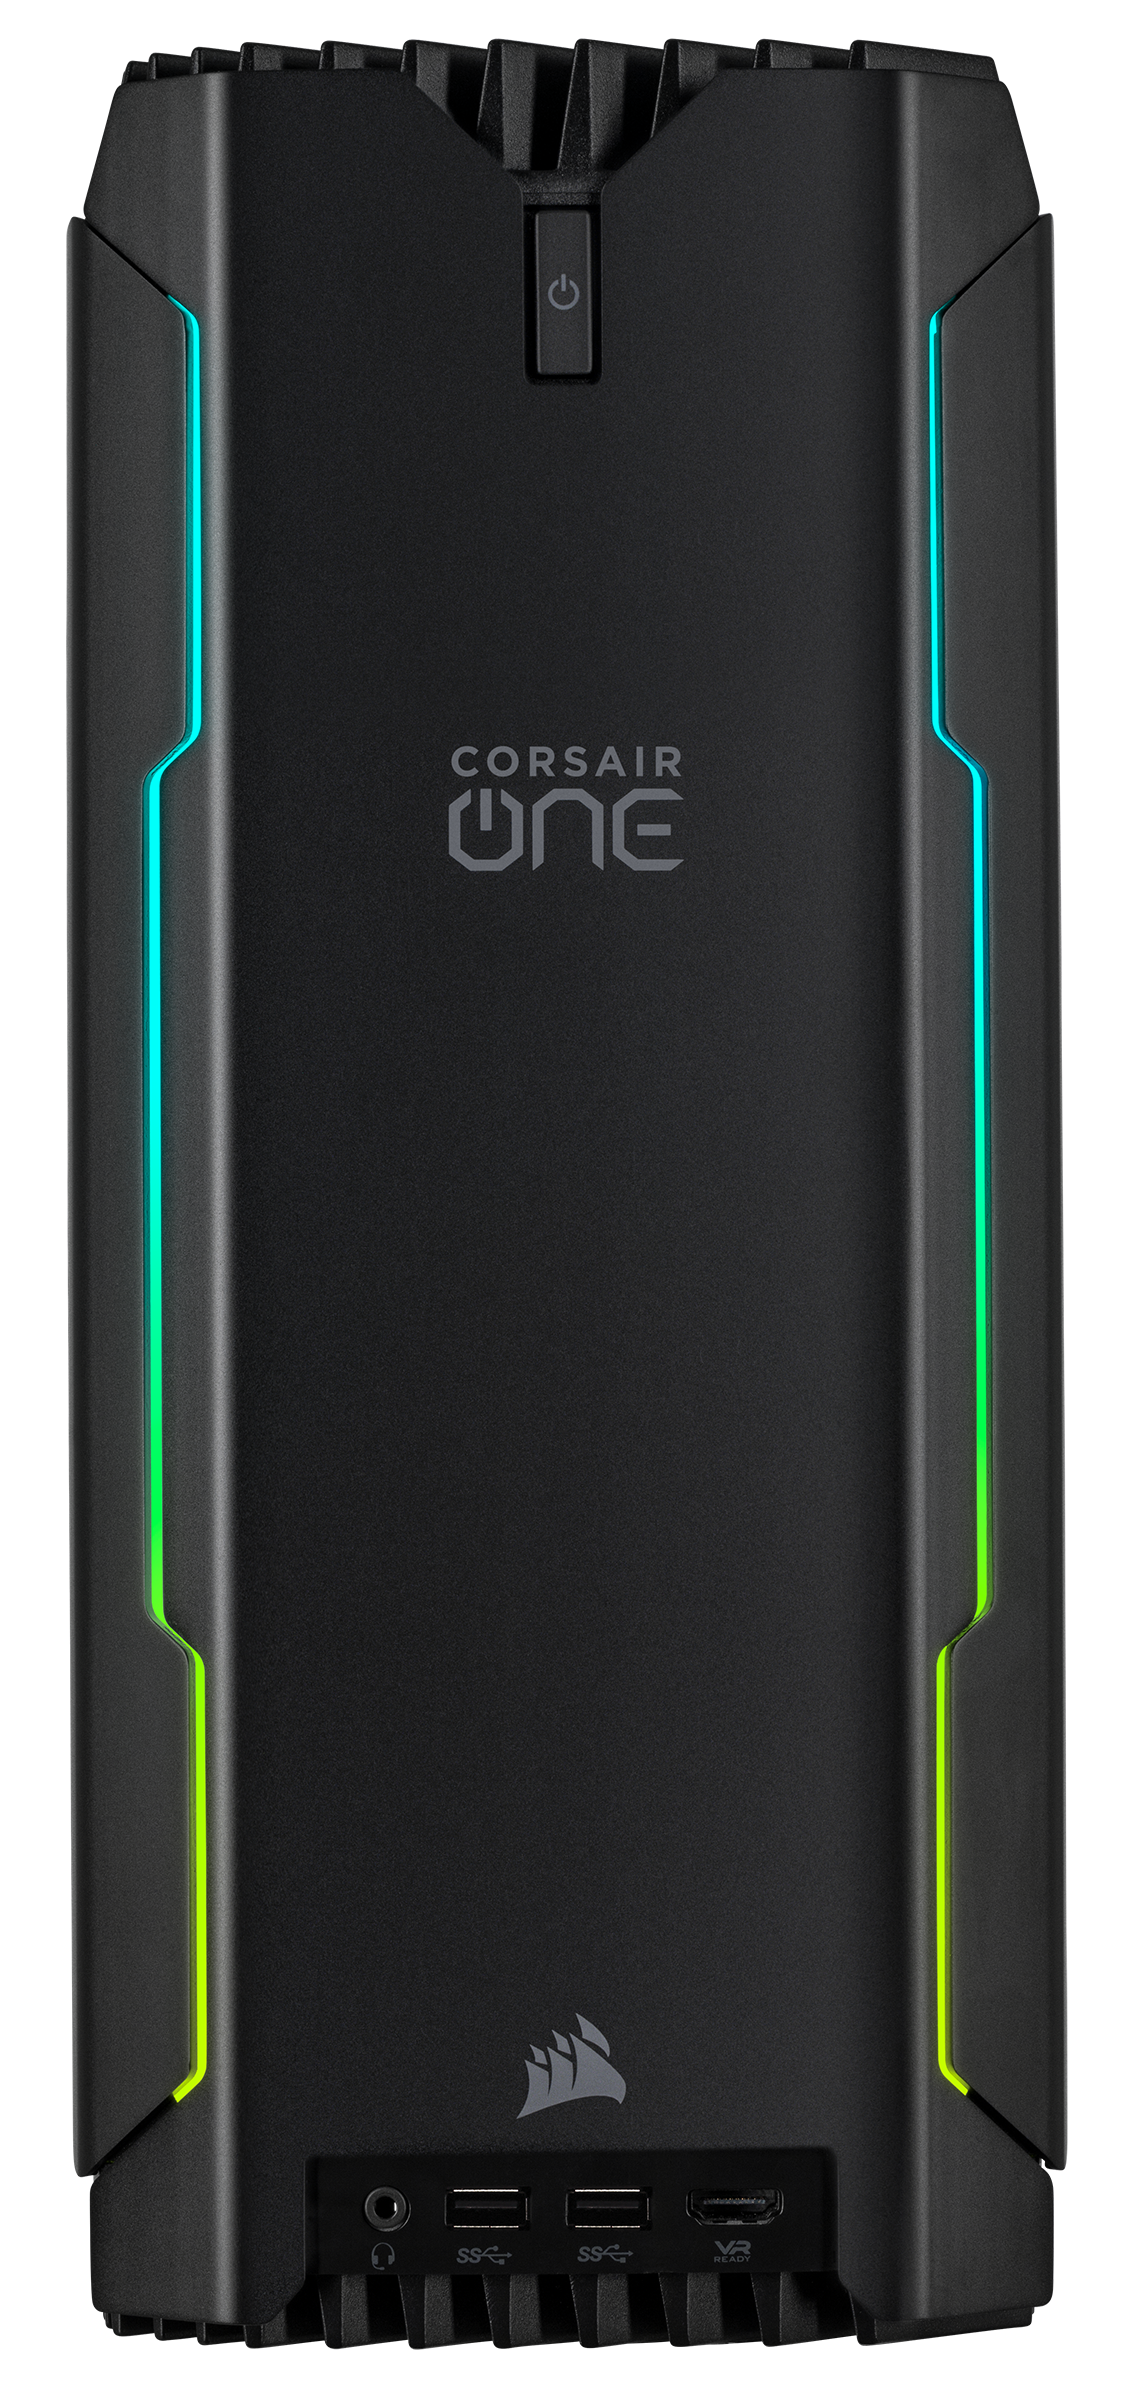
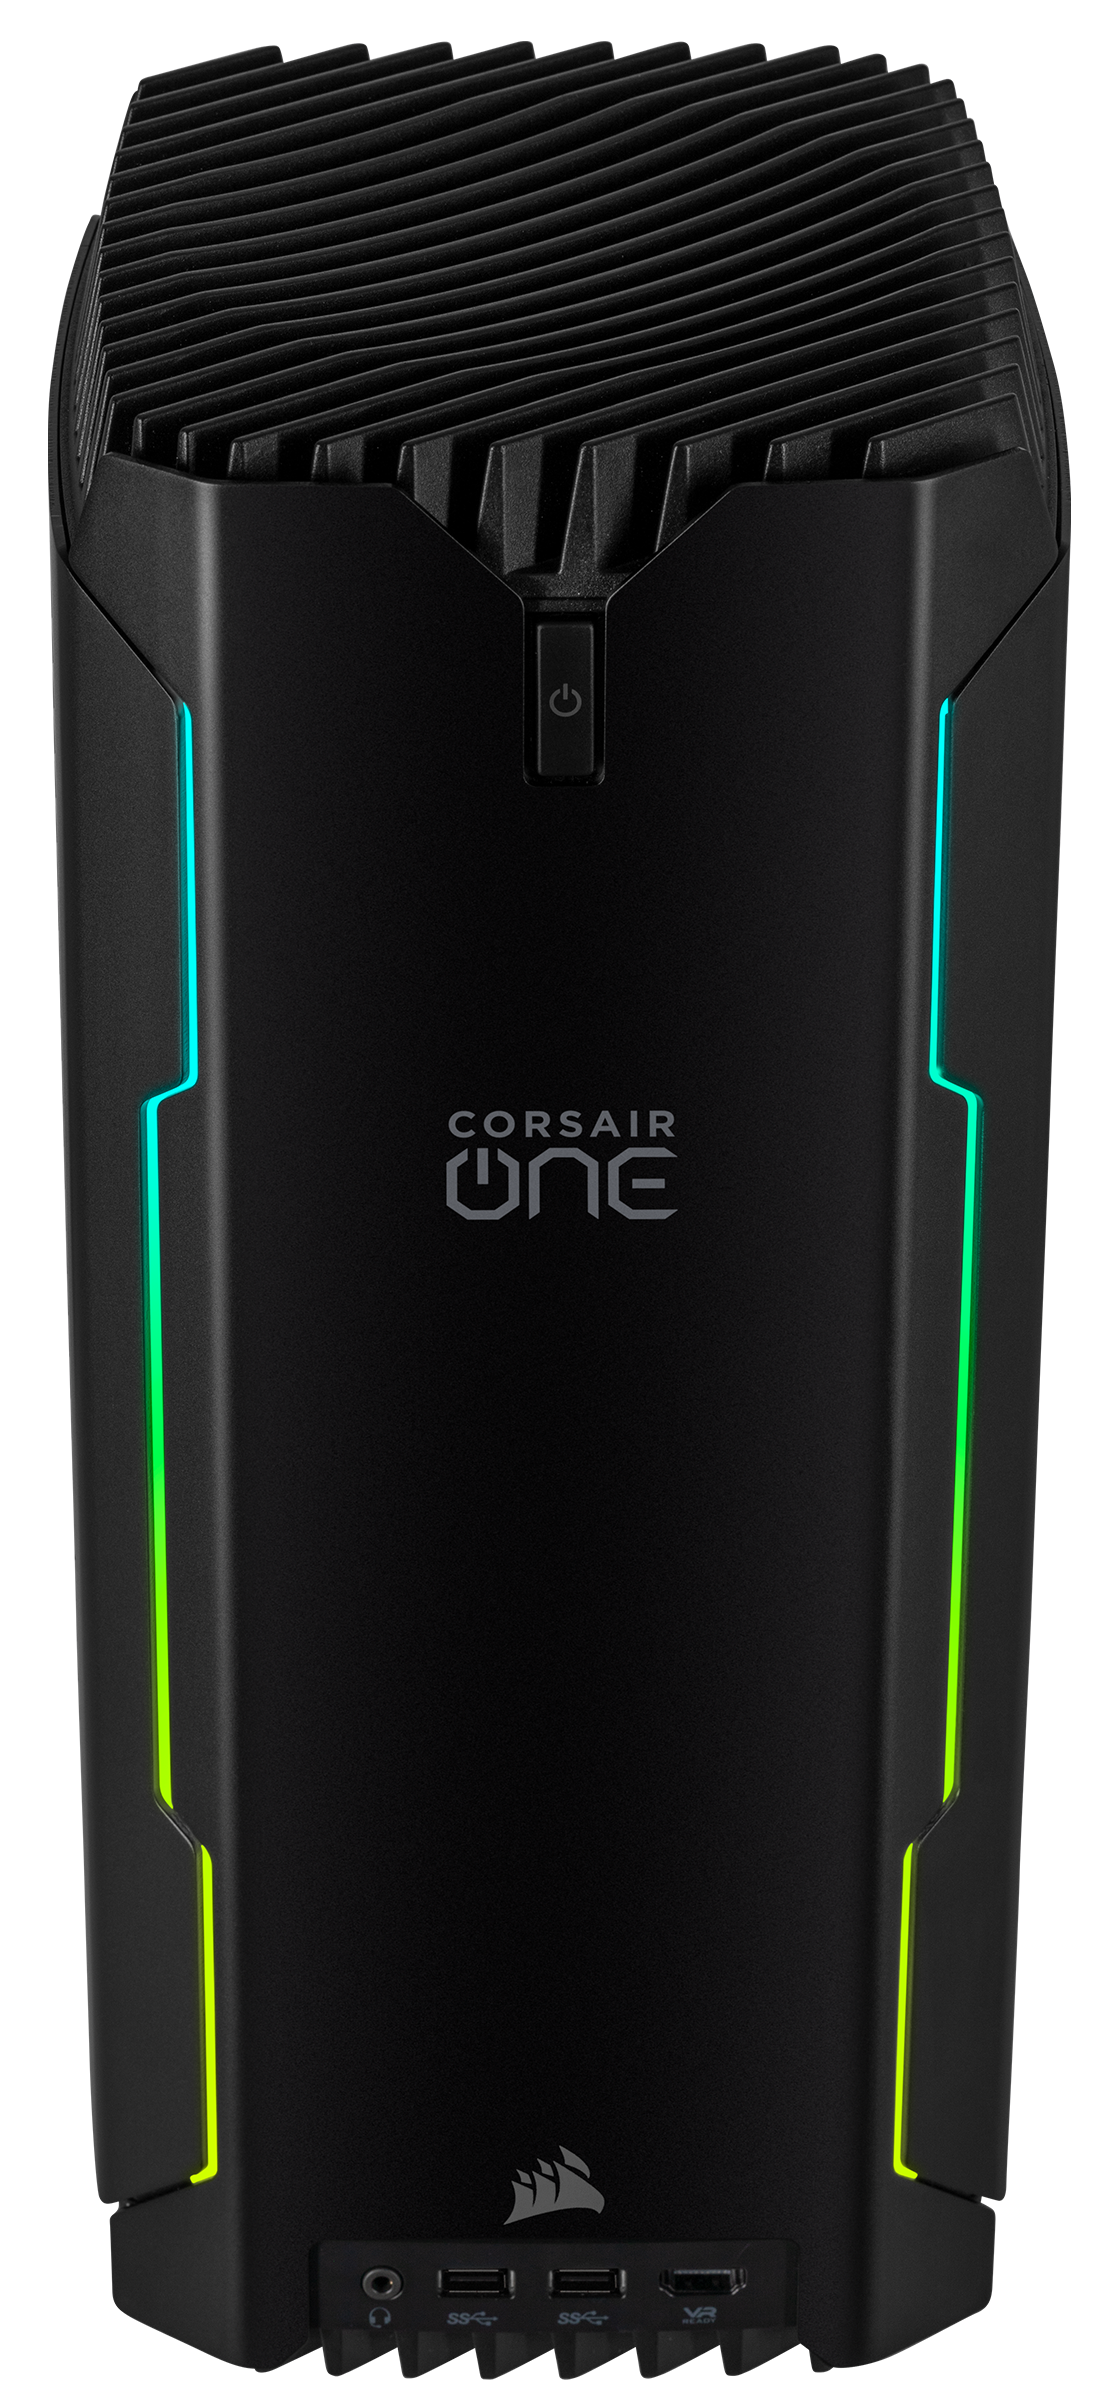
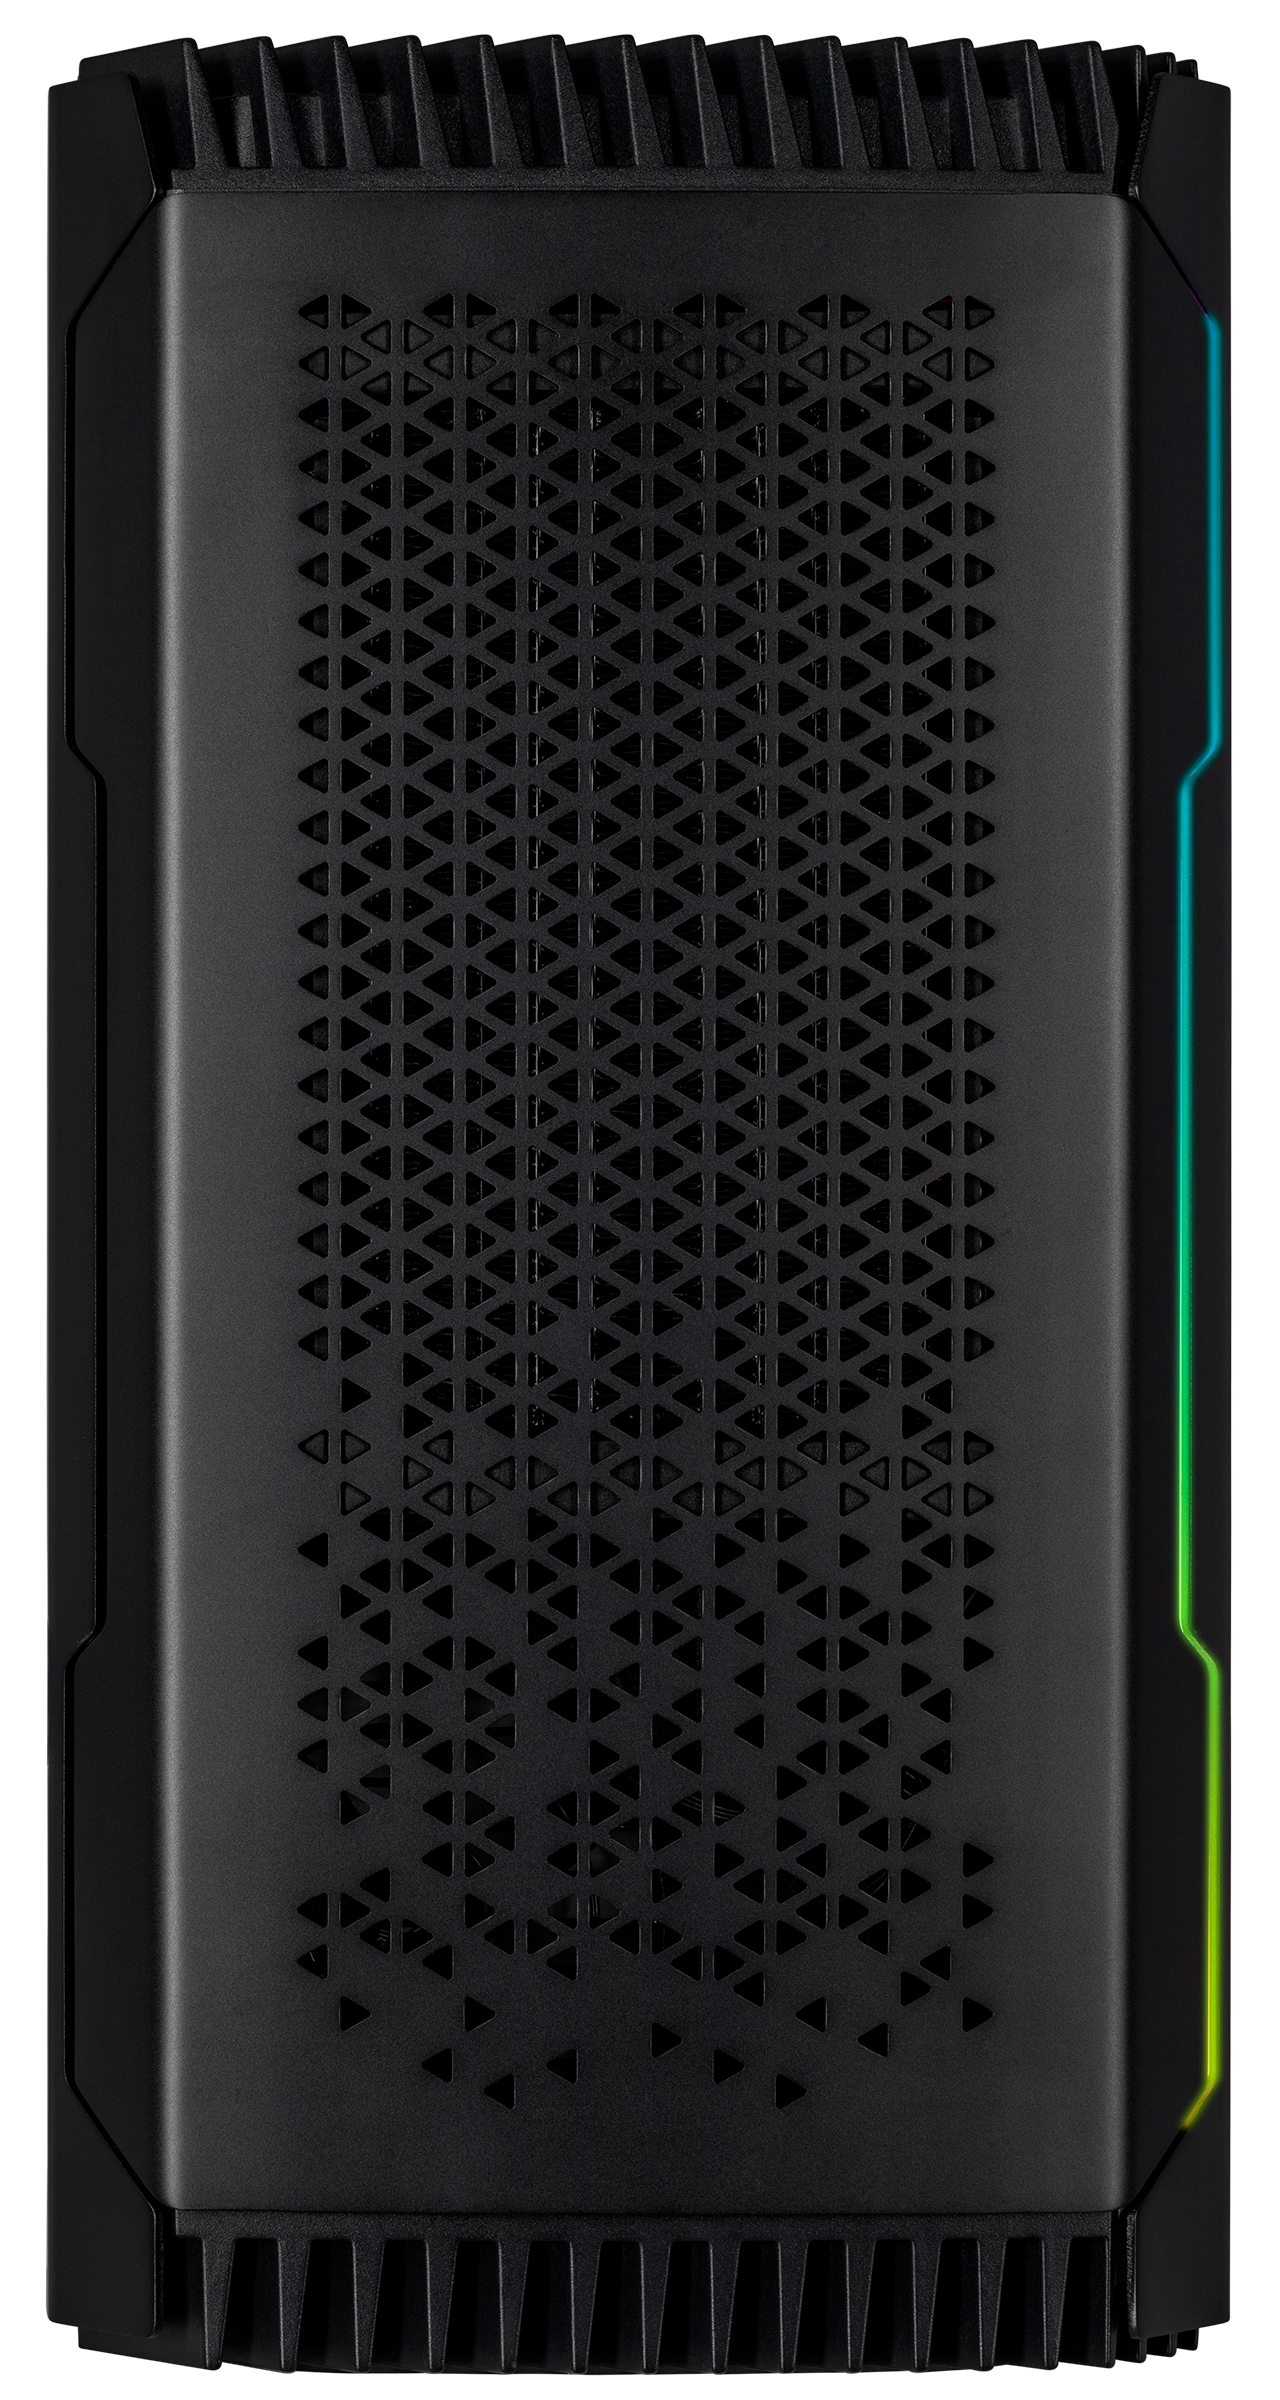
As mentioned earlier, the One i160 has a 12-litre case, which Corsair has built mostly using aluminium. Our review unit looks and feels premium, with its understated black finish juxtaposed with two long RGB strips down the front panel. Corsair preinstalls its in-house iCUE software for customising the RGB lighting to your preferences.
The One i160 weighs almost 7.5 kg, which you may not have expected considering how compact it is. However, this heft adds to the premium feel in our opinion. Incidentally, Corsair has maximised heat dissipation too.


Connectivity
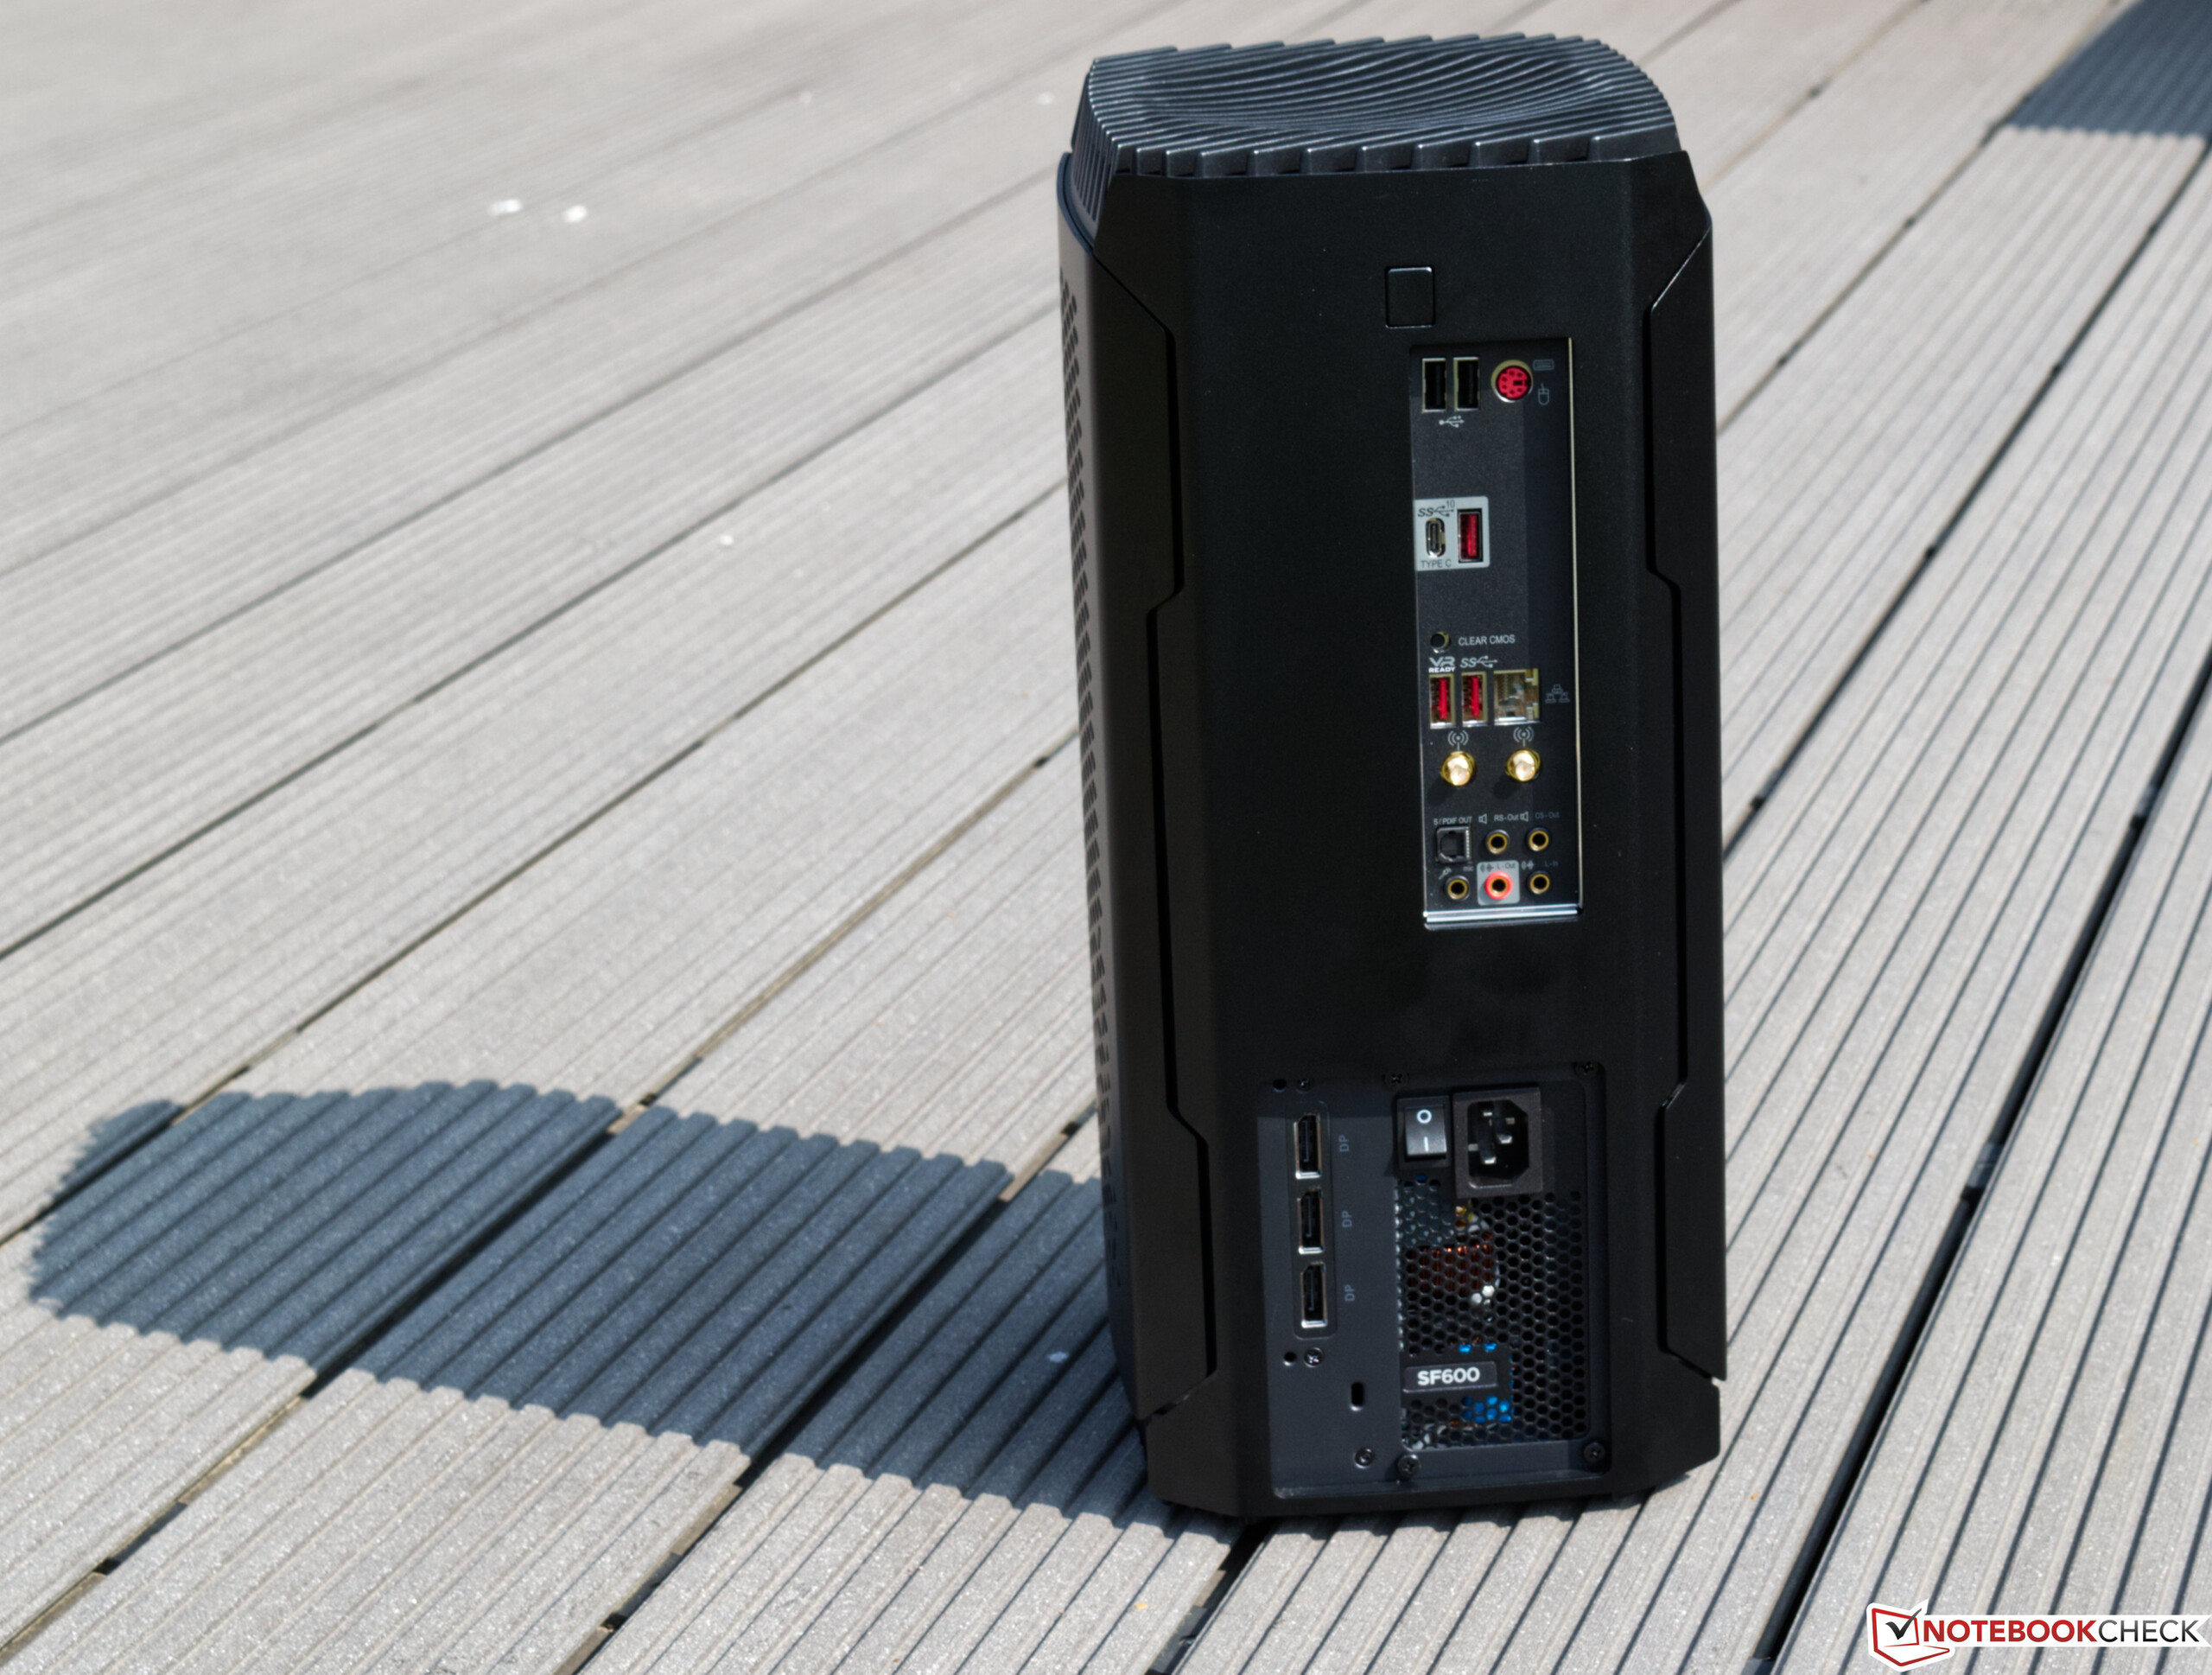
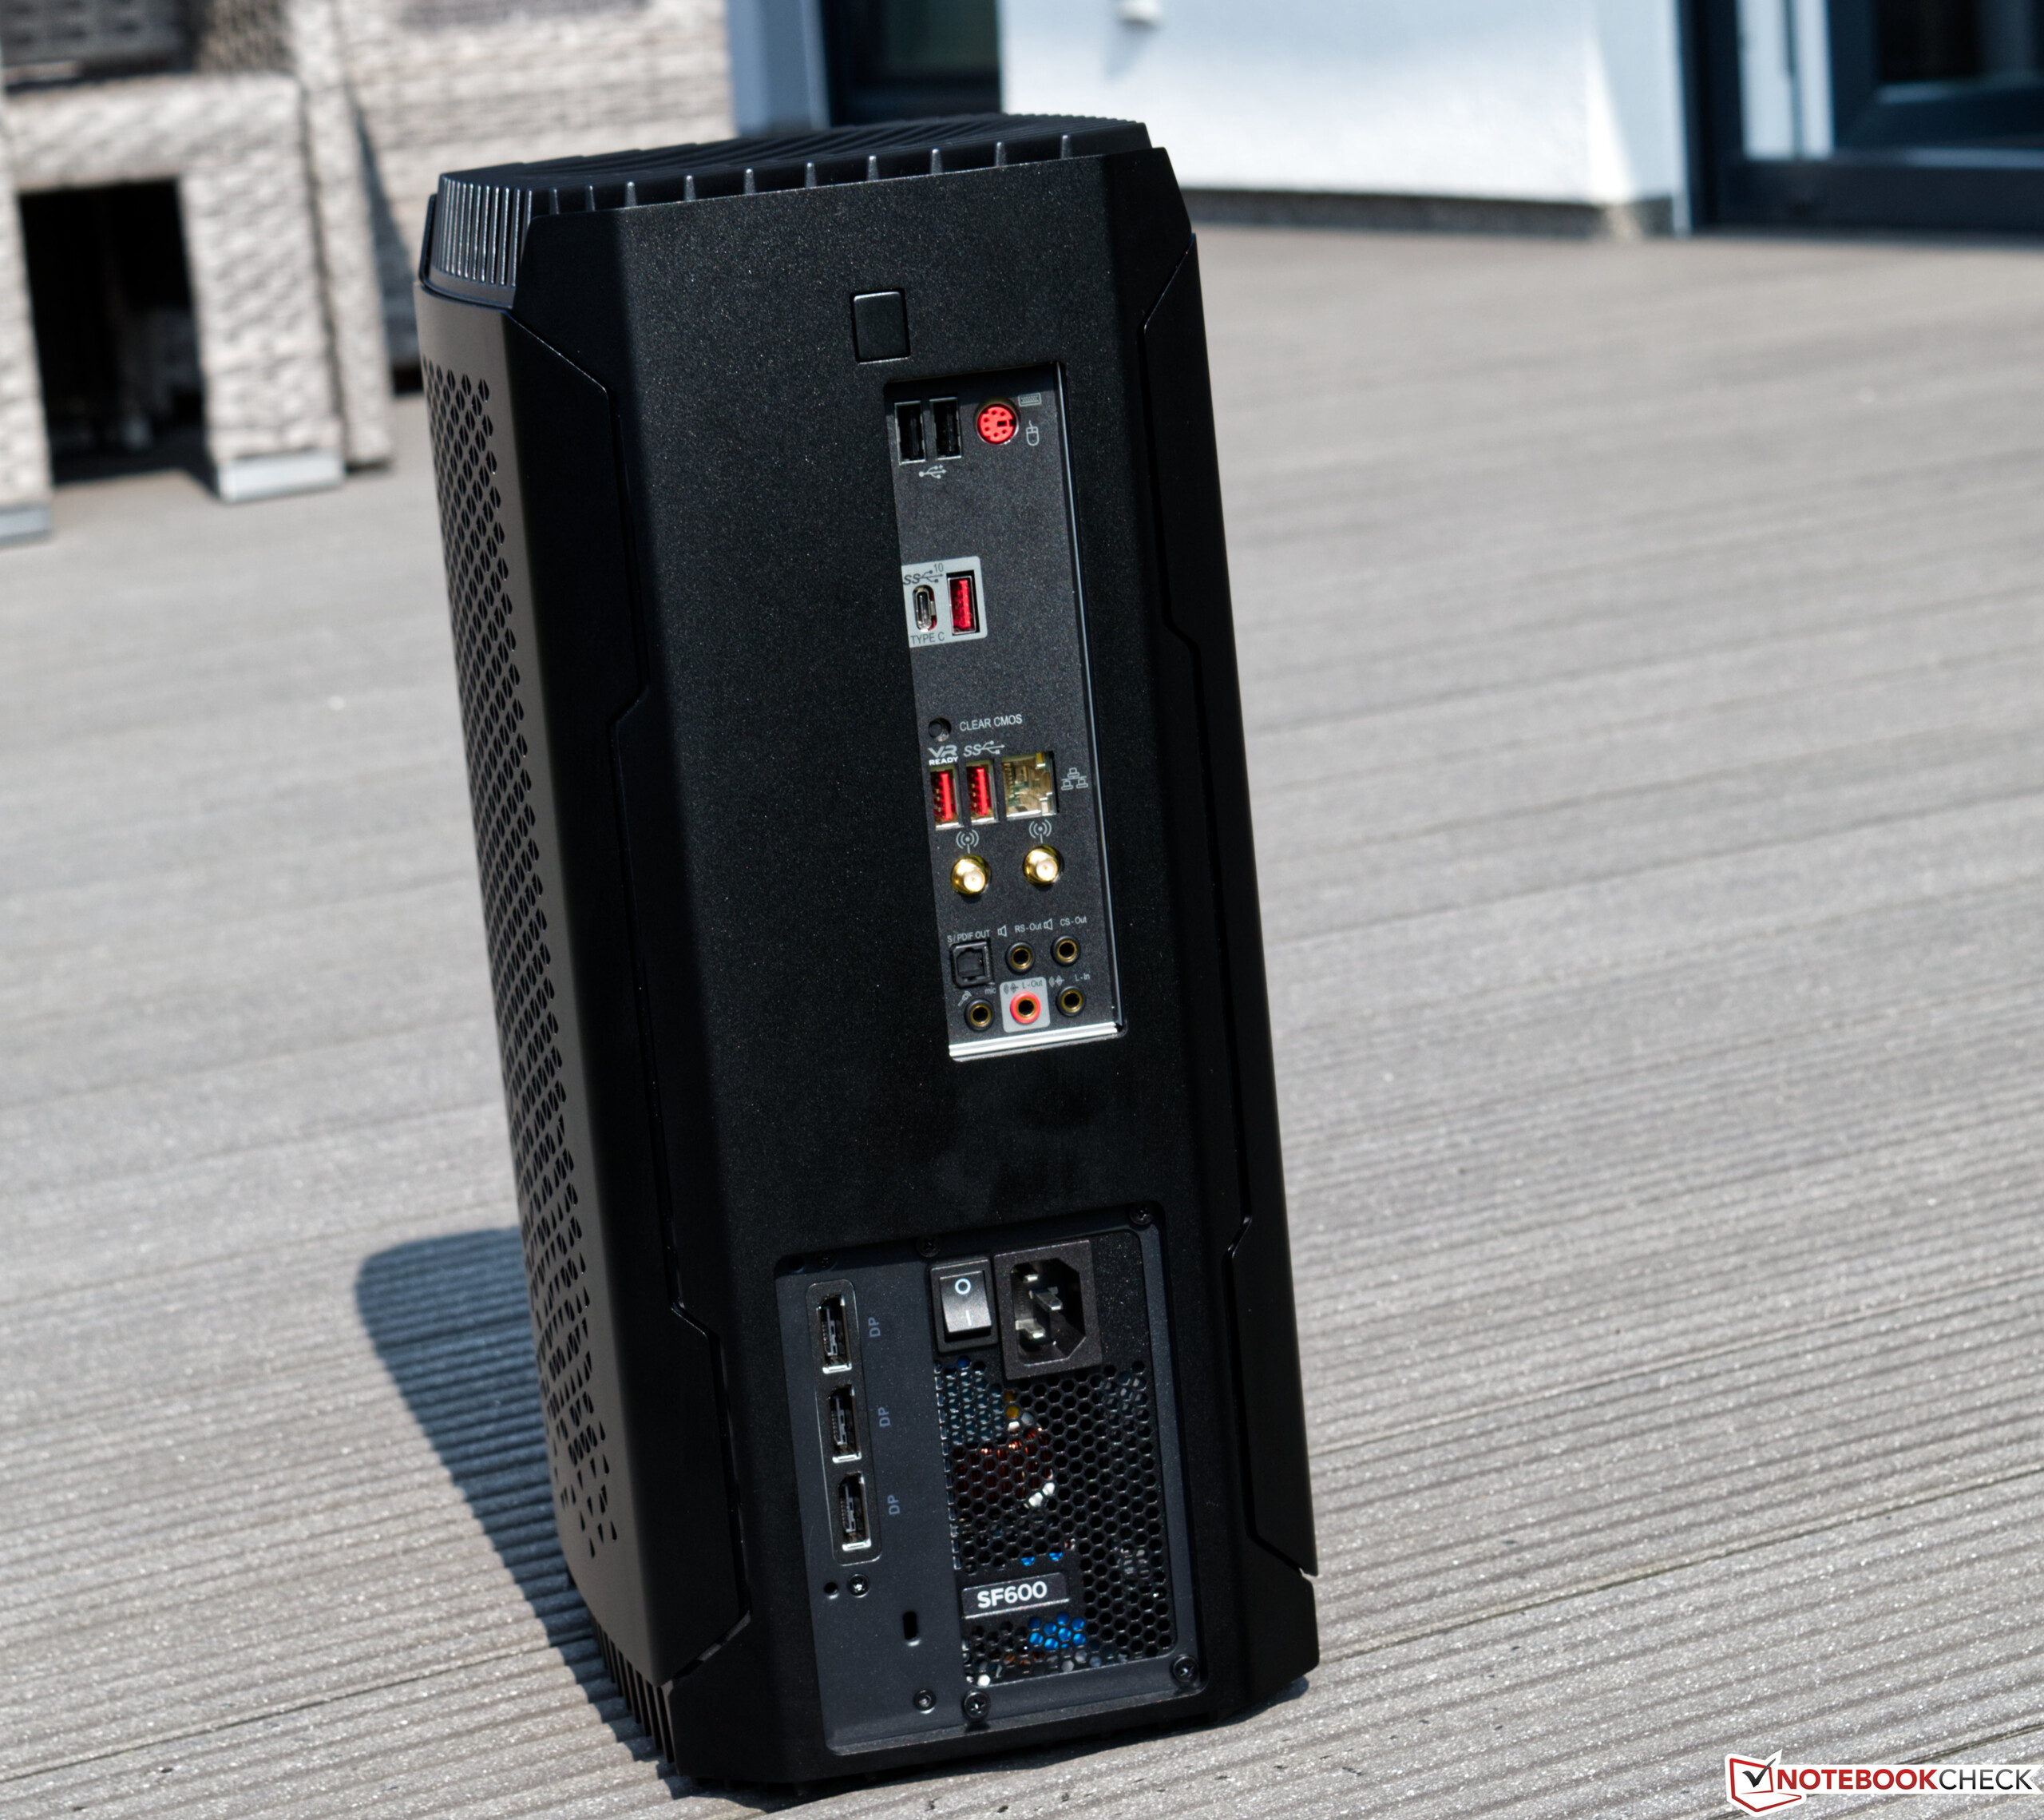
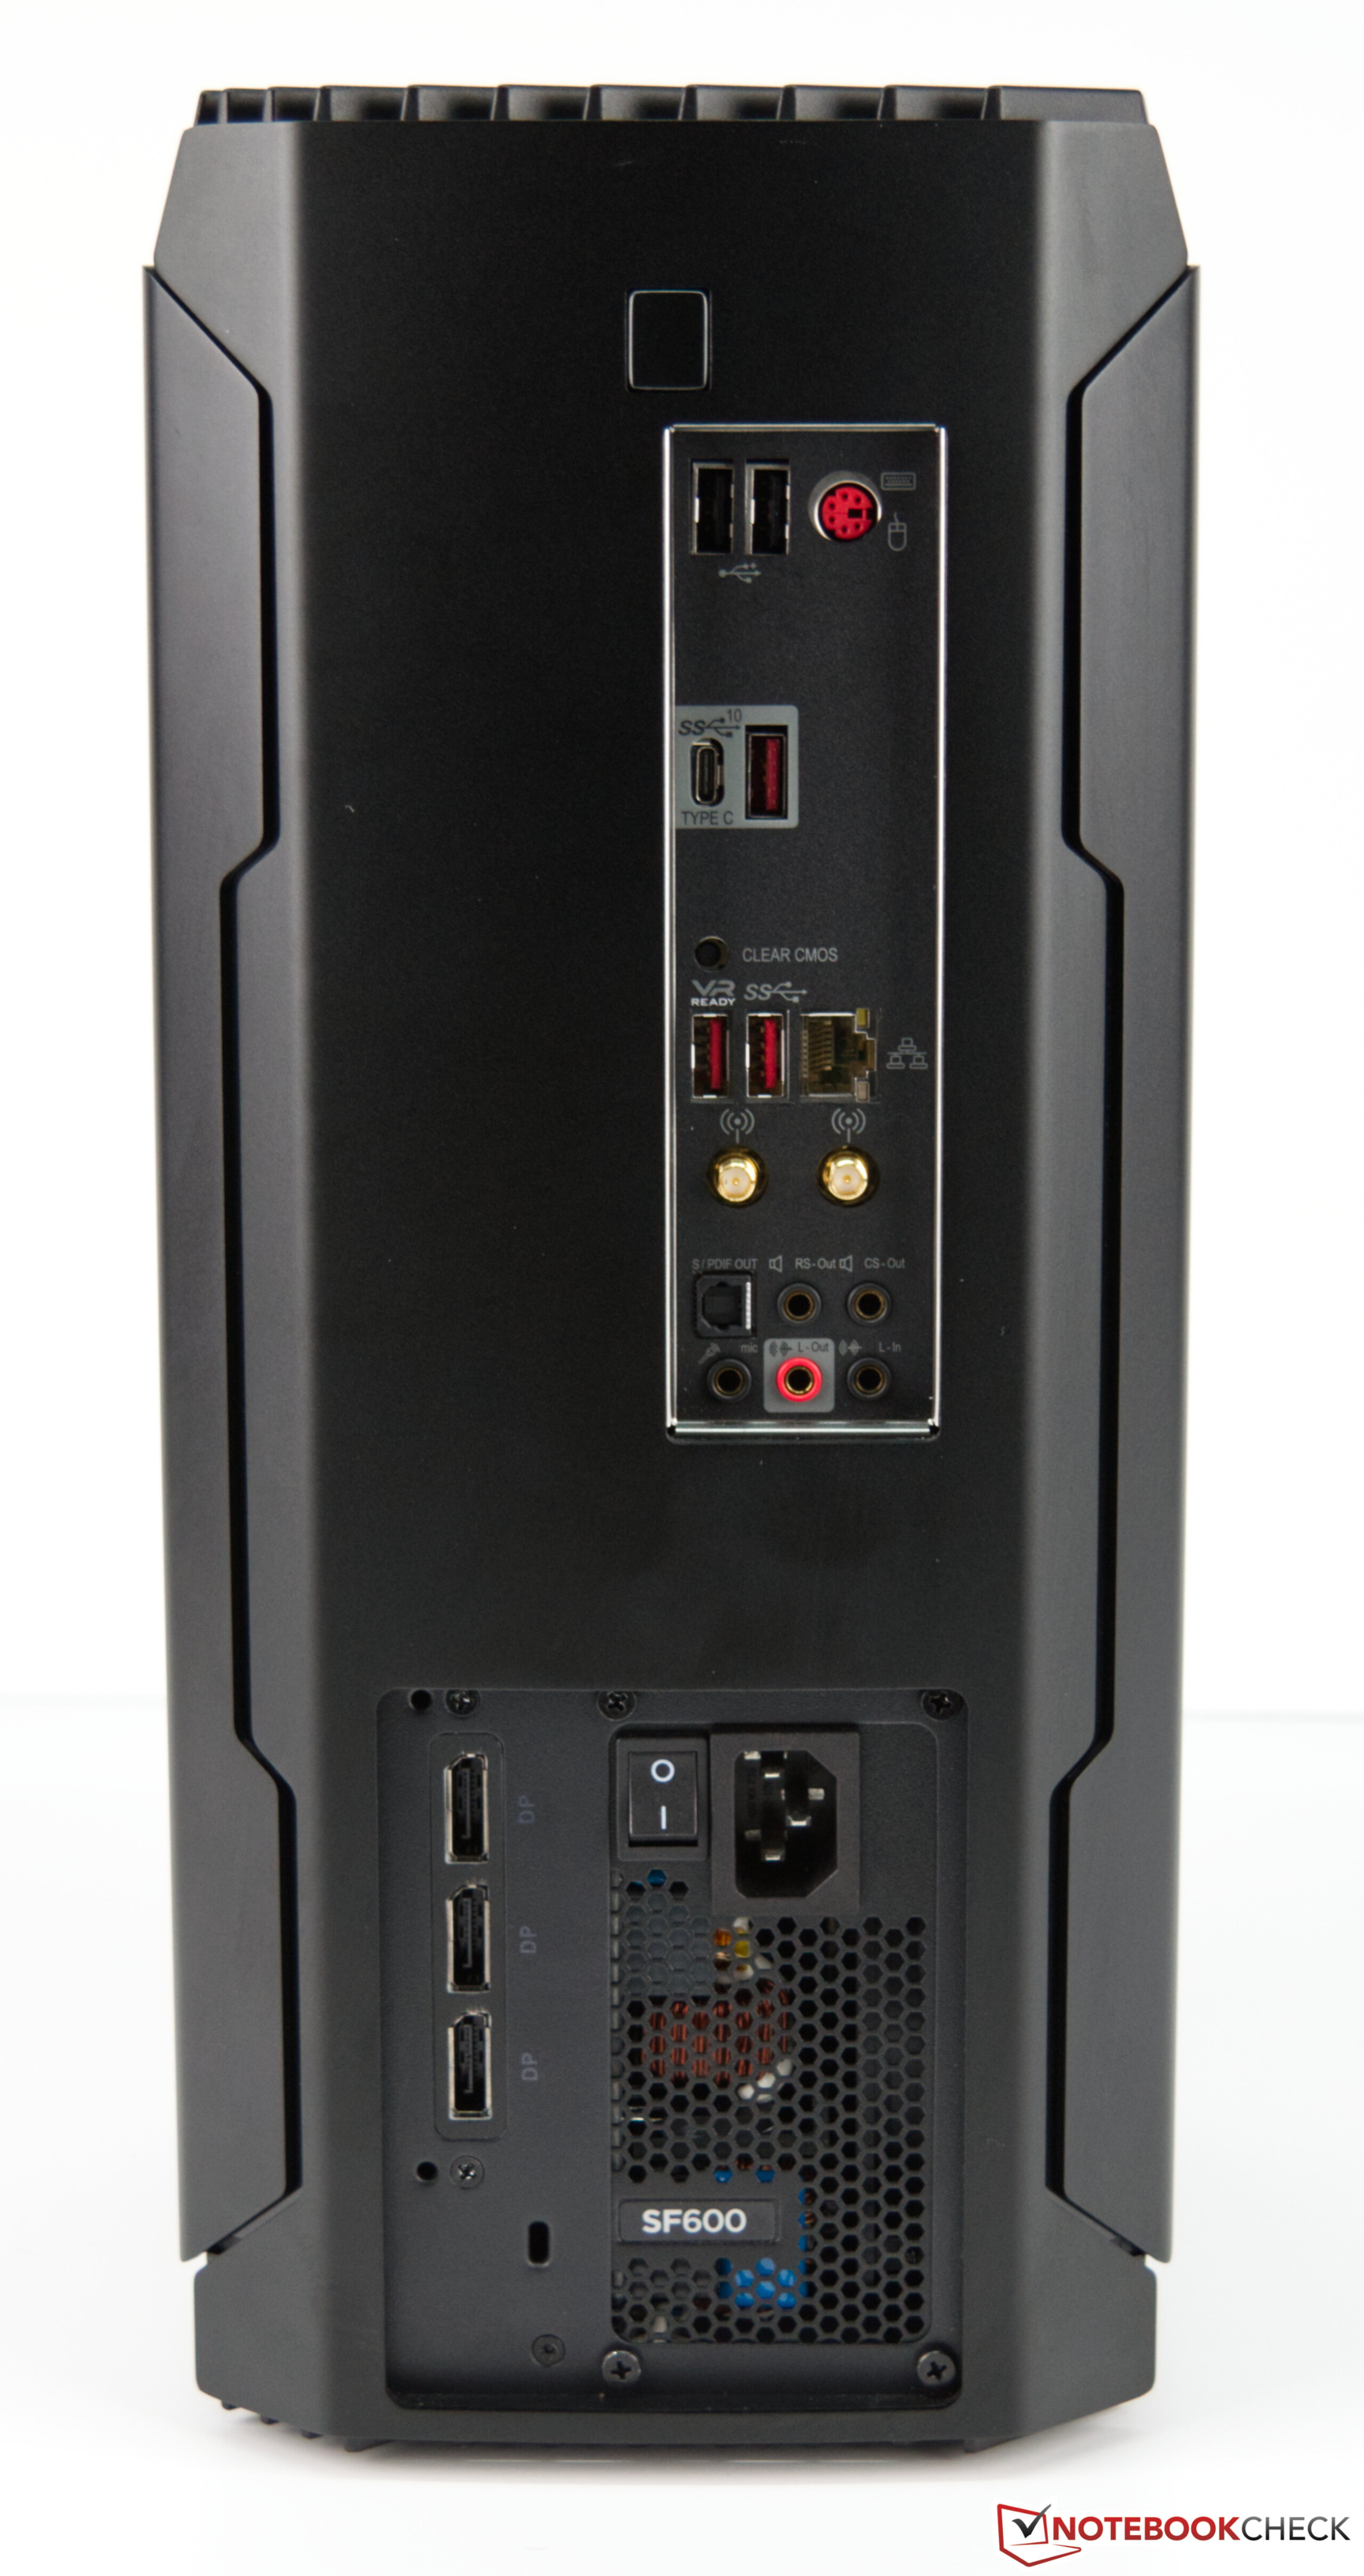
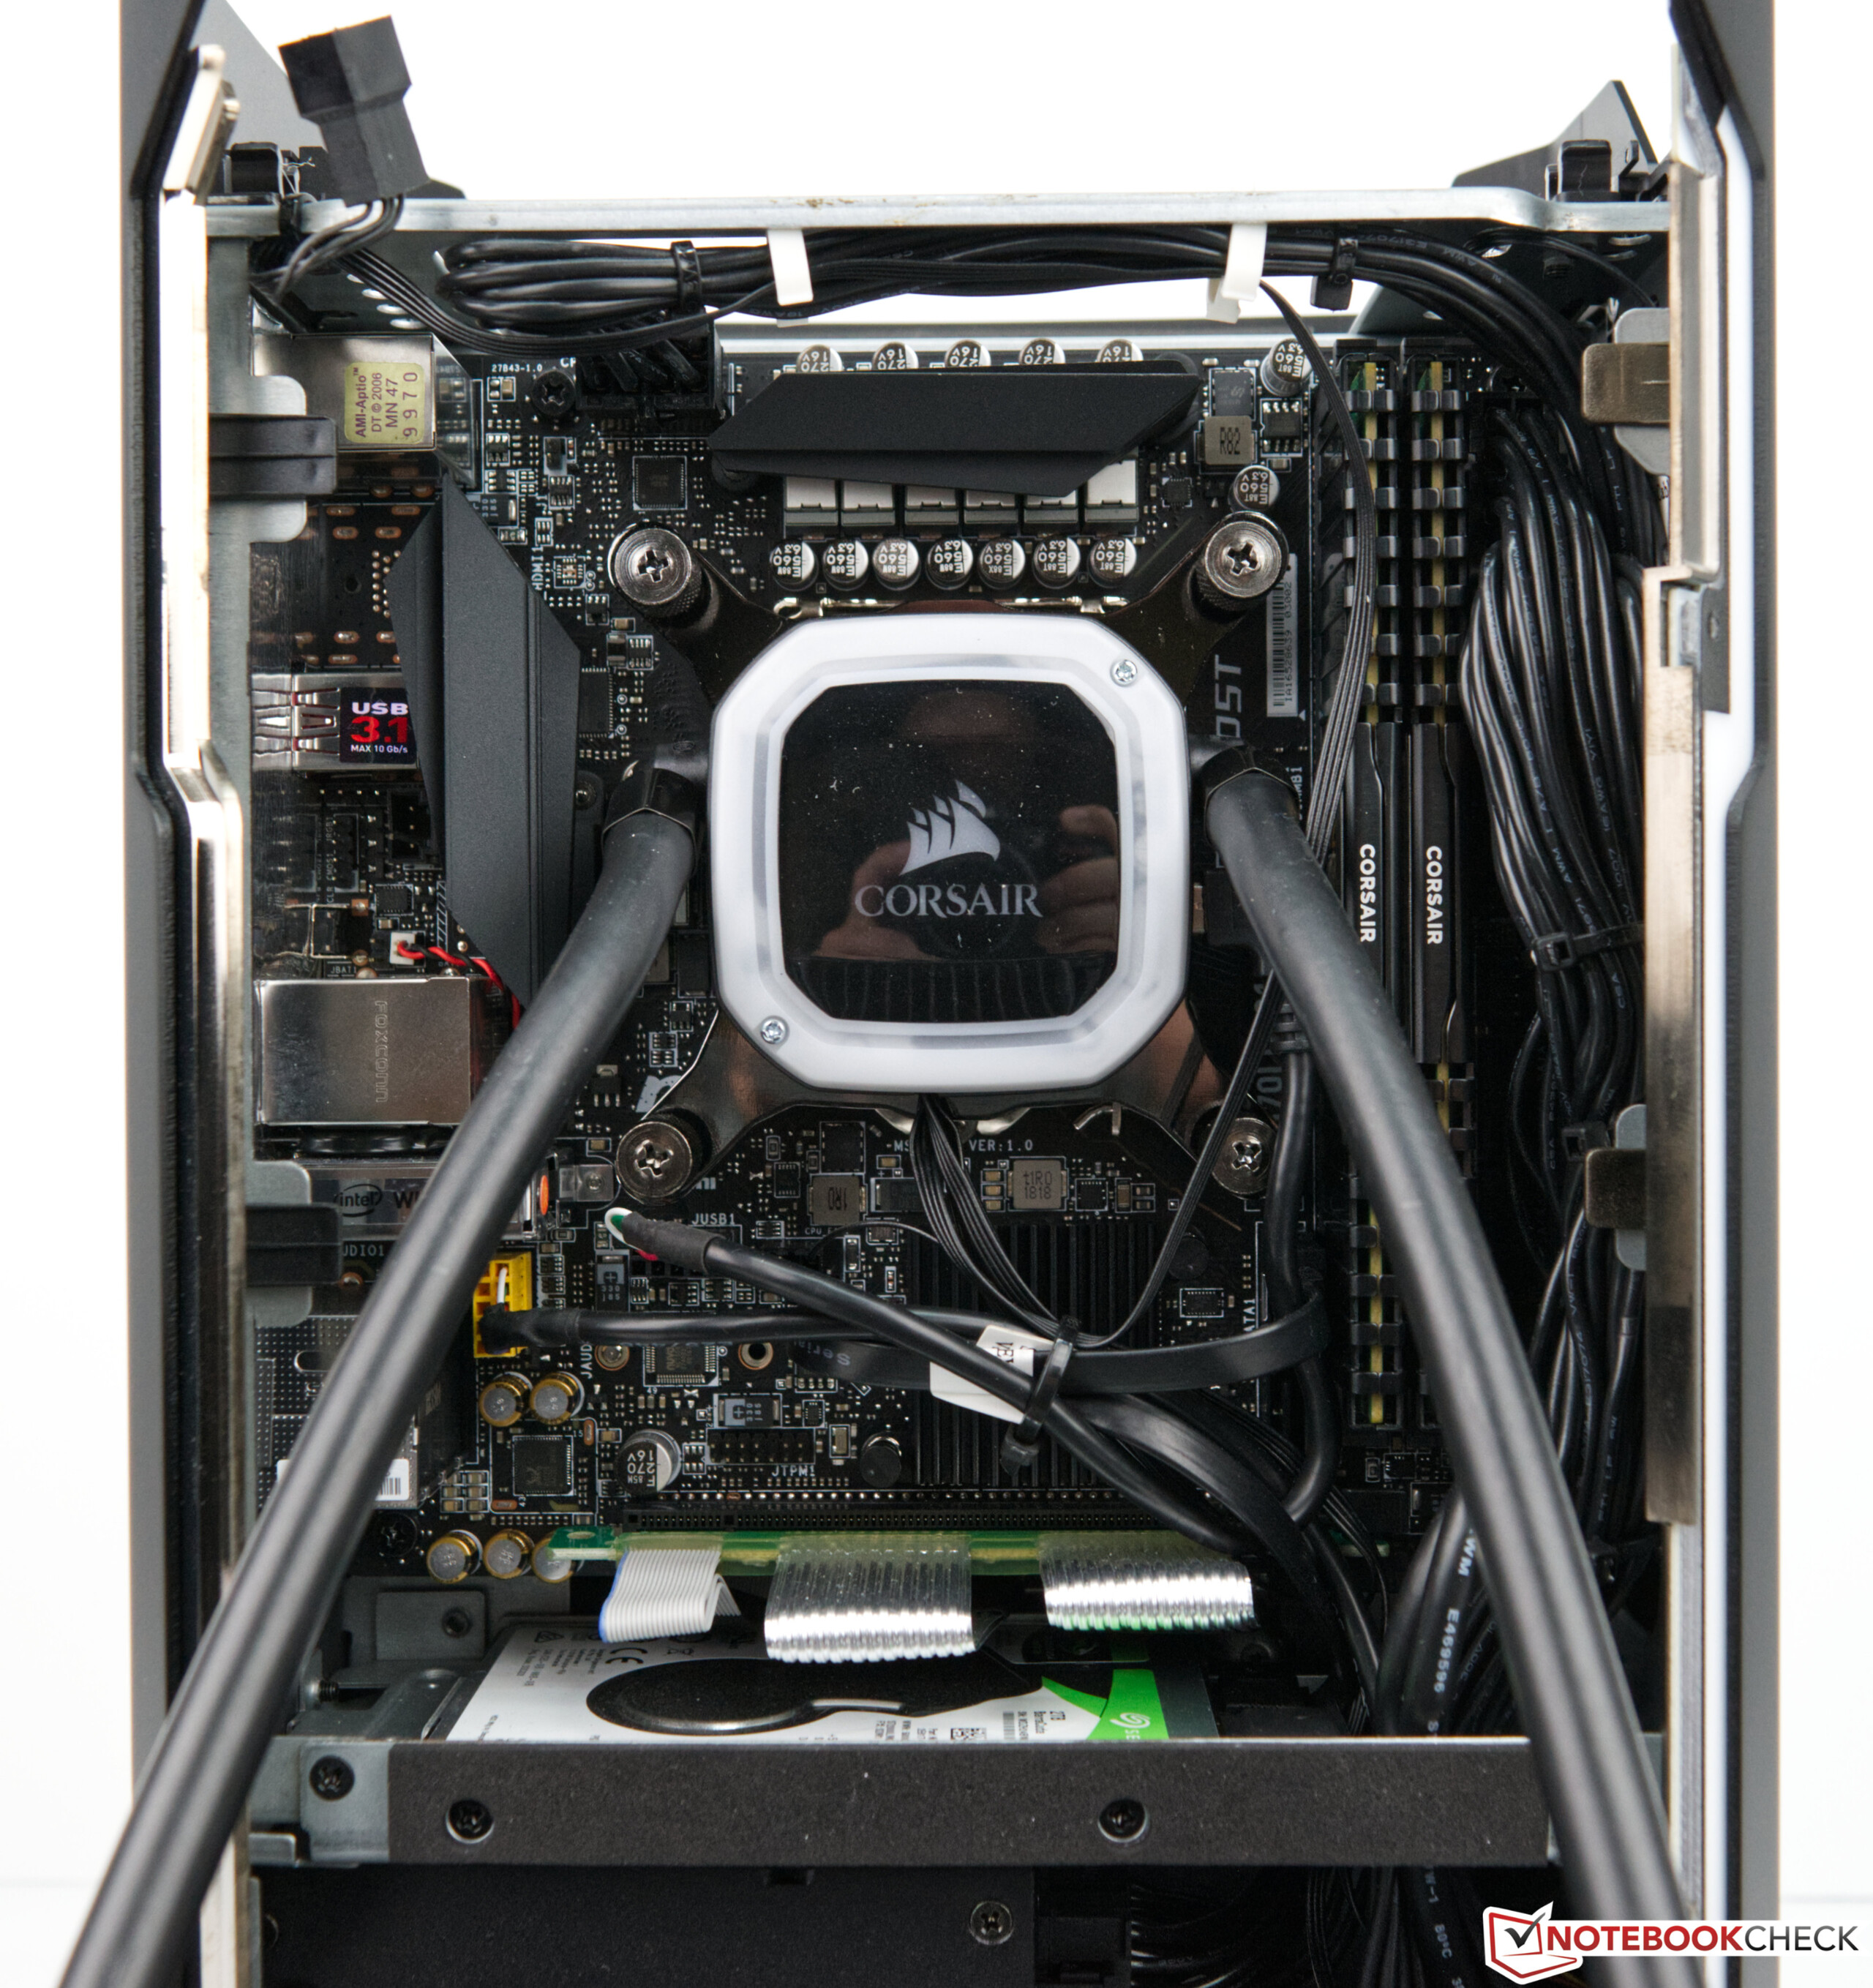
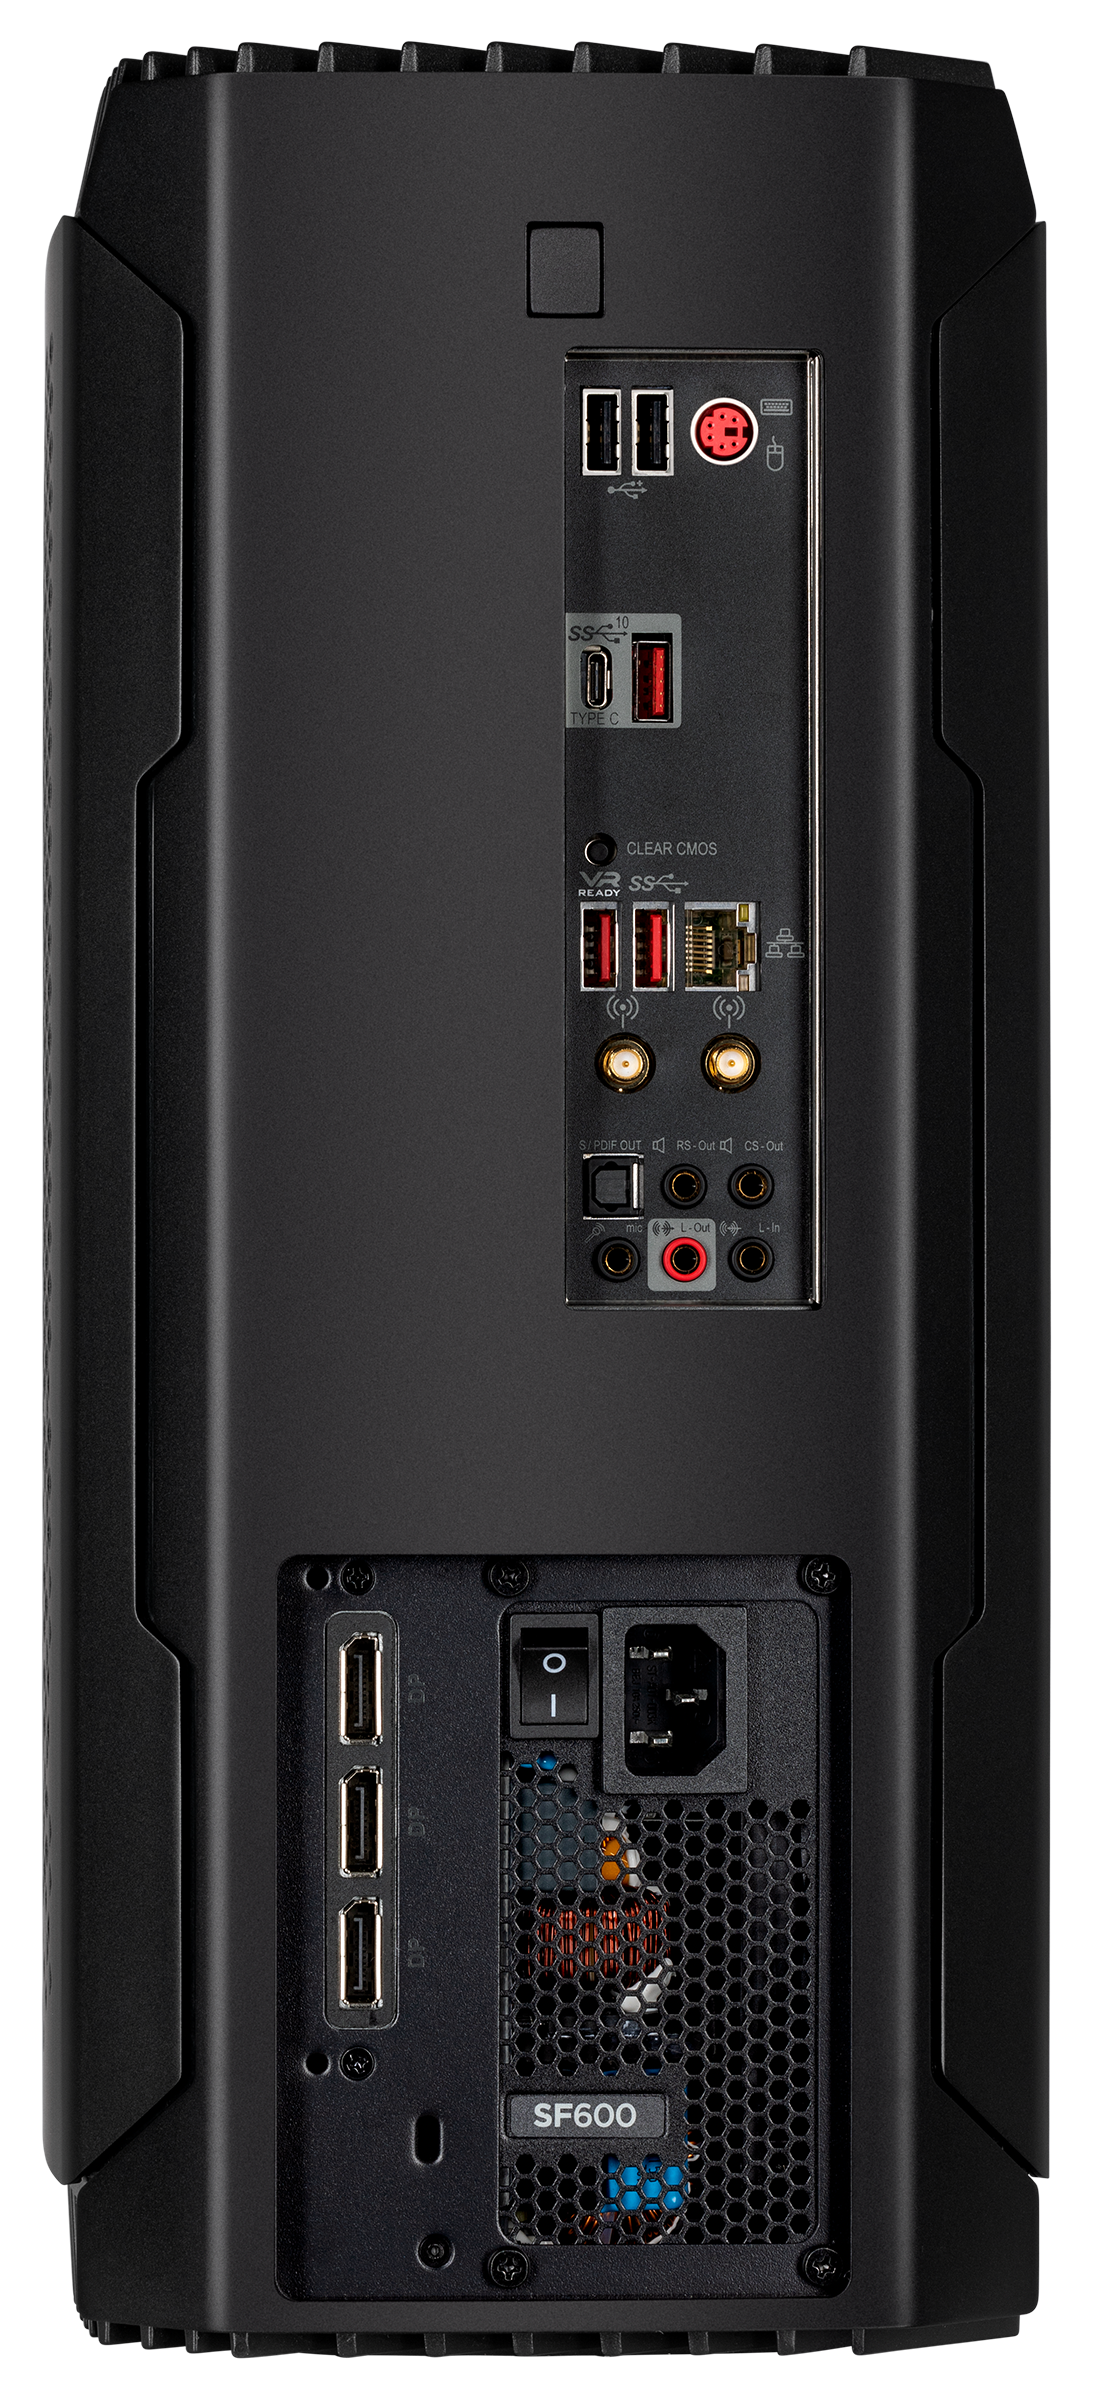
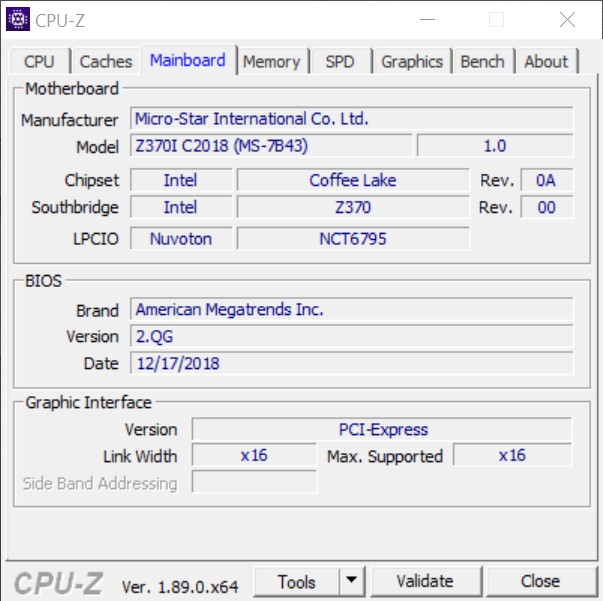
Corsair has equipped the One i160 with an MSI Z370I Gaming Pro Carbon AC motherboard, which comes stocked with ports. These are complemented by the ports integrated on the back of the GeForce RTX 2080 Ti, which can power up to three 4K displays simultaneously. Most of the ports are on the back of the One i160, but Corsair has included two USB Type-A ports, a headphone jack and an HDMI 2.0b port on the front for added convenience.
The One i160 has a Gigabit Ethernet connection and integrates an Intel Dual-Band Wireless AC-8265 module too for up to IEEE 802.11ac Wi-Fi. The latter also supports Bluetooth 4.2 for connecting peripherals.


Security
If you intend on frequently taking your One i160 to LAN parties but were worried about preventing it from being stolen, then rest assured as Corsair has you covered. The company has incorporated a Kensington lock slot for securing the device when you are away from it, minimising the chances of it going missing. There is a Trusted Platform Module 2.0 (TPM 2.0) on board too, but this a requirement by Microsoft for all devices sold with Windows 10 preinstalled. Corsair does not include any other hardware security features like a fingerprint scanner, for example.
Maintenance
If the performance of the One i160 is not enough or should you need more storage, then fear not as the device can be opened easily and upgraded. Firstly, you must remove the 140 mm fan at the top of the case, which can be done without using tools. Next, you must remove two screws from the two side panels, although please be advised that both panels have heat exchangers attached to them, so you cannot put aside the side panels without disconnecting the whole AIO. However, you can change the RAM and HDD without any additional disassembly. Unfortunately, you must remove the motherboard or the GPU to access the SSD, as it sits on the back of the former and is otherwise inaccessible.
Warranty
The One i160 comes with a 24-month limited manufacturer's warranty. Please see our Guarantees, Return Policies & Warranties FAQ for country-specific information.
Software
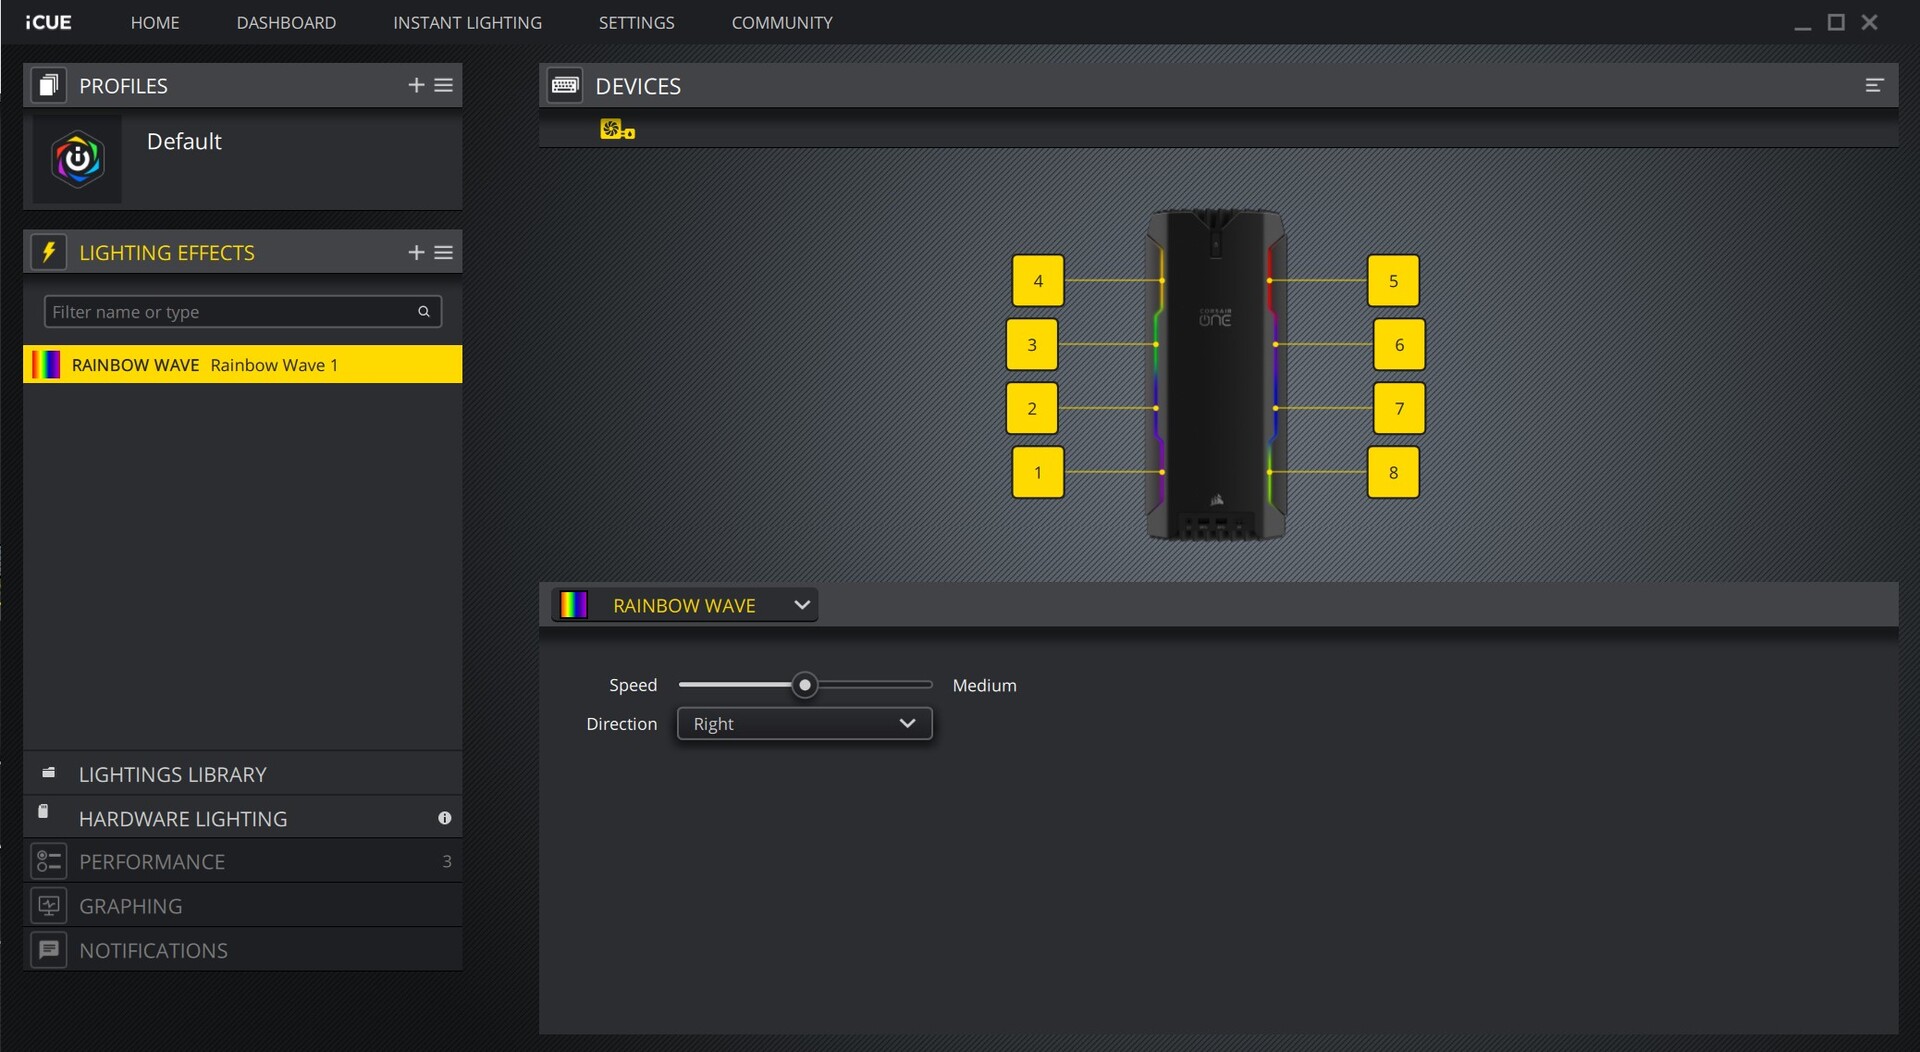
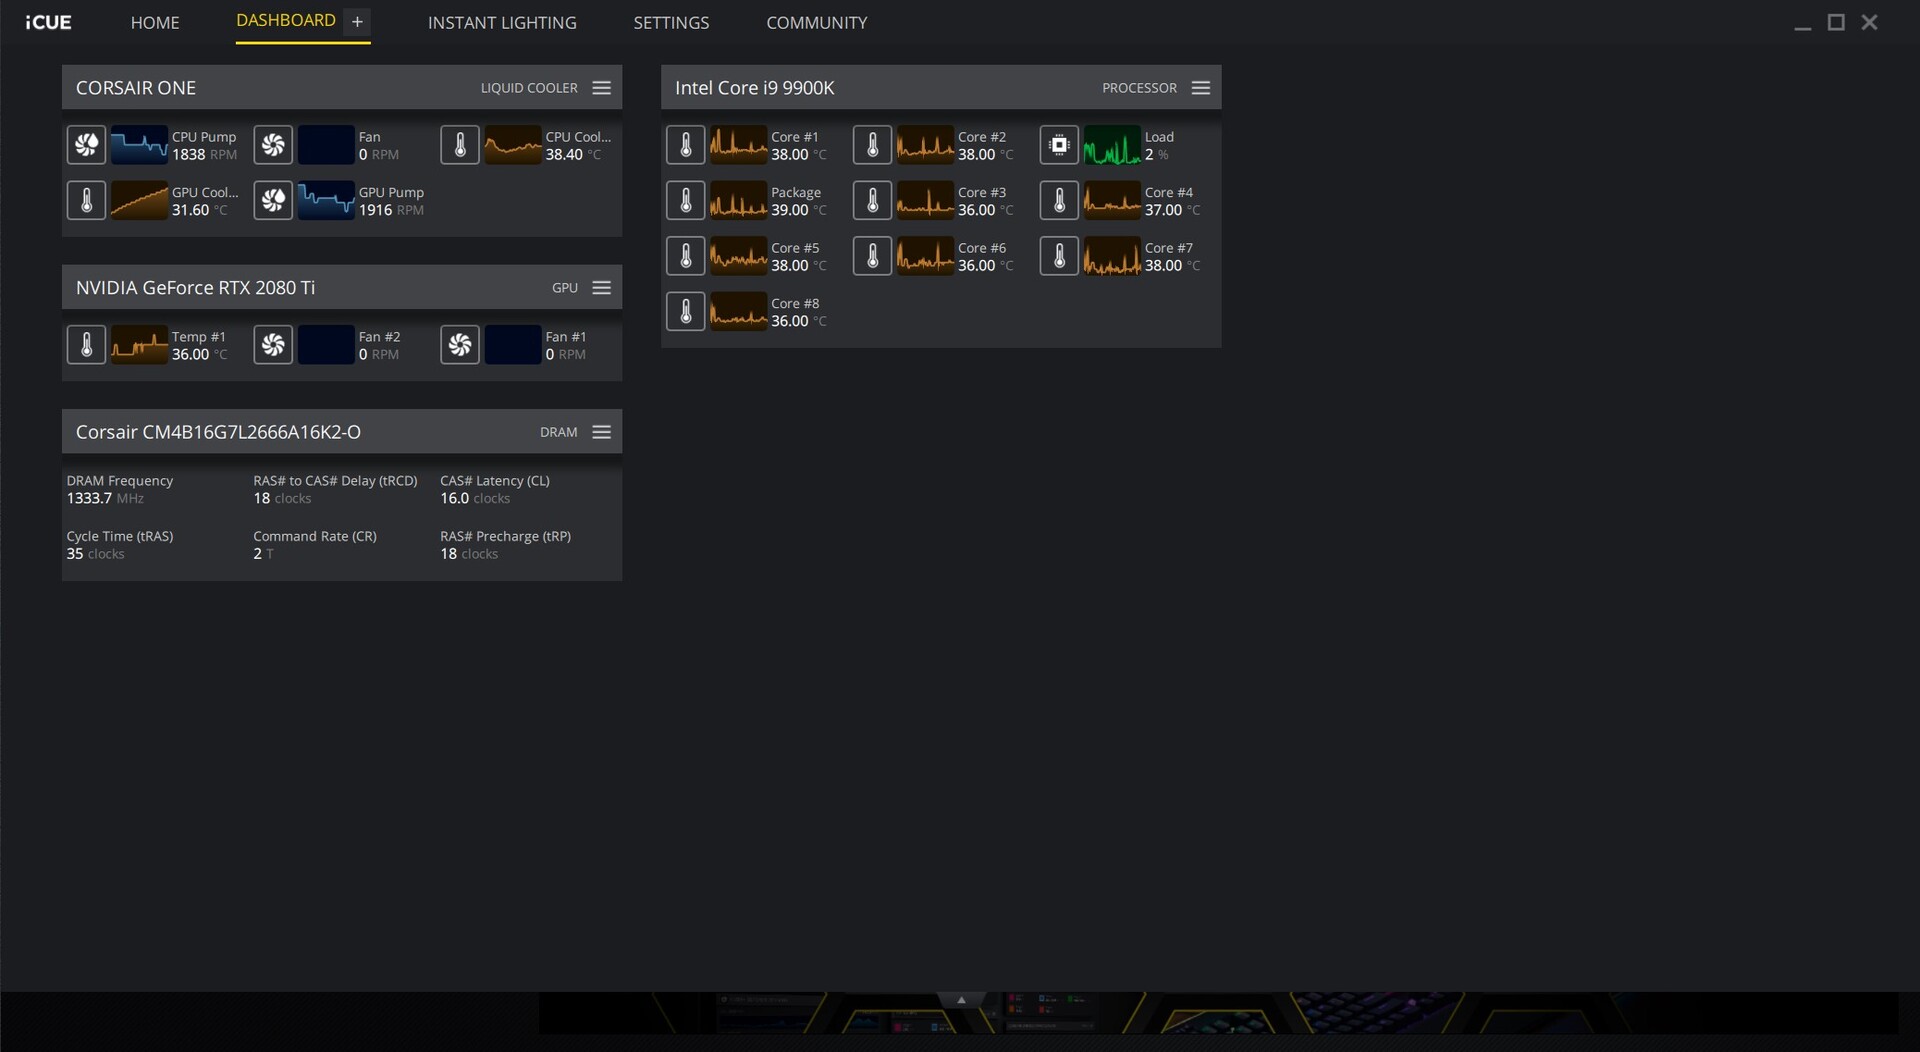
As mentioned earlier, Corsair preinstalls its in-house iCUE software, which not only allows you to change the RGB lighting but also monitor system information. We have included screenshots of the program below, which contains tutorials and a community section too.


Performance
The One i160 combines two of the most powerful gaming components into one system: Intel's top gaming CPU and NVIDIA’s flagship desktop GPU, which deliver exceptional frame rates even at 4K. The One i140 is a great alternative for those who only want to game in 1080p though.
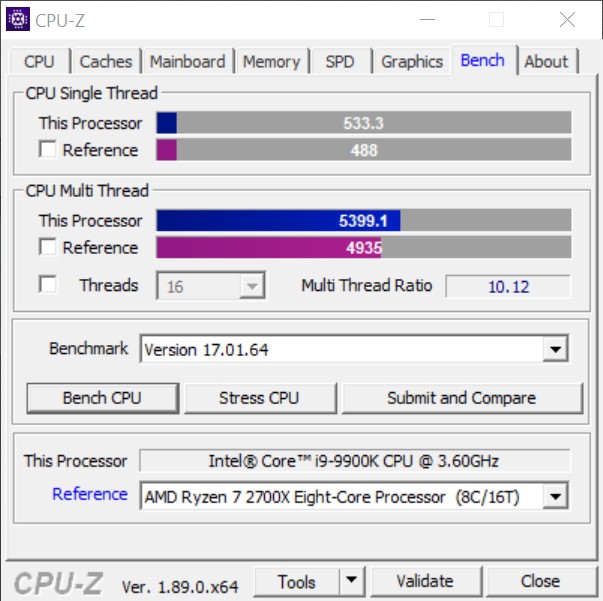
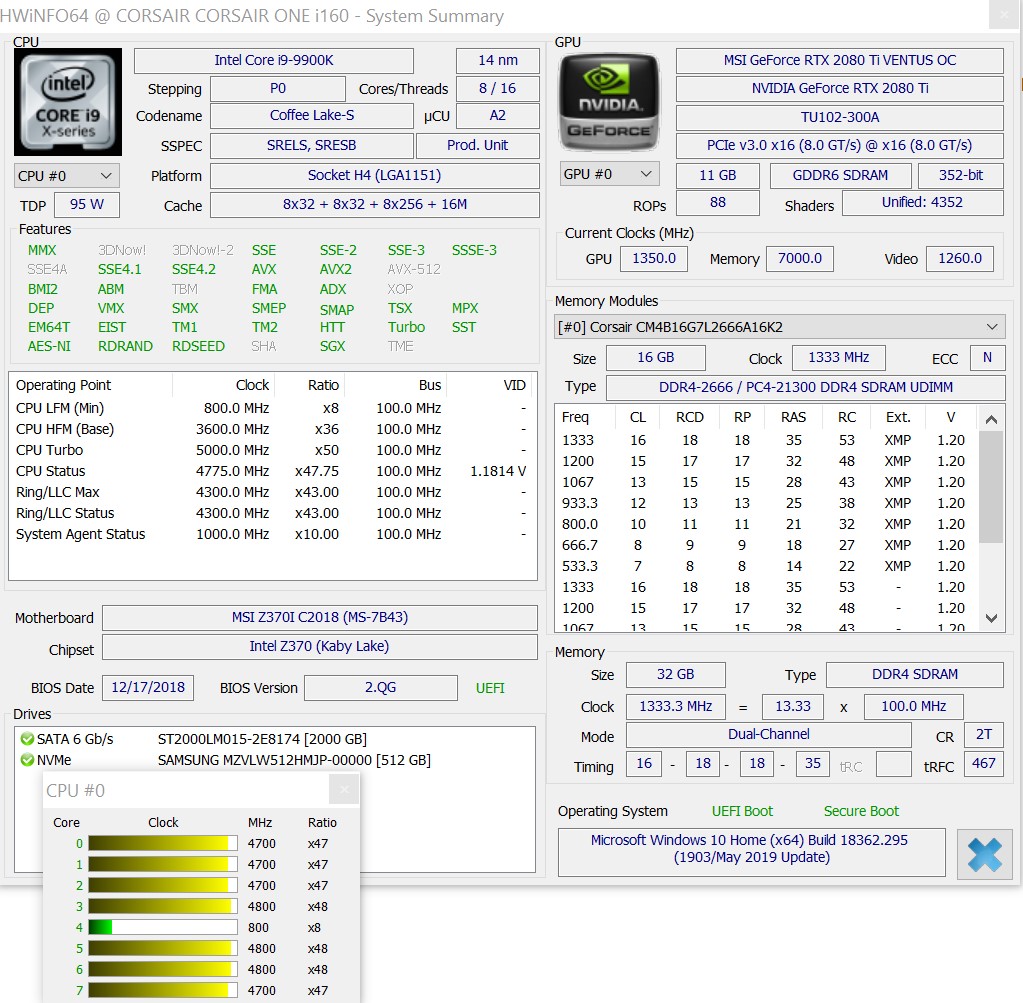
Processor
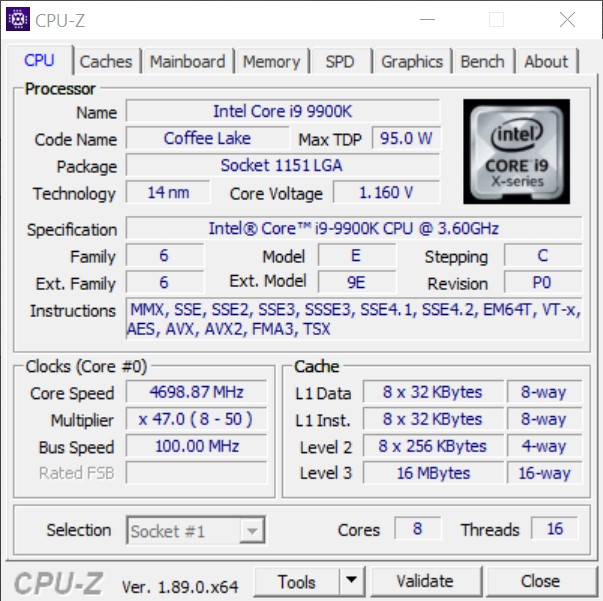
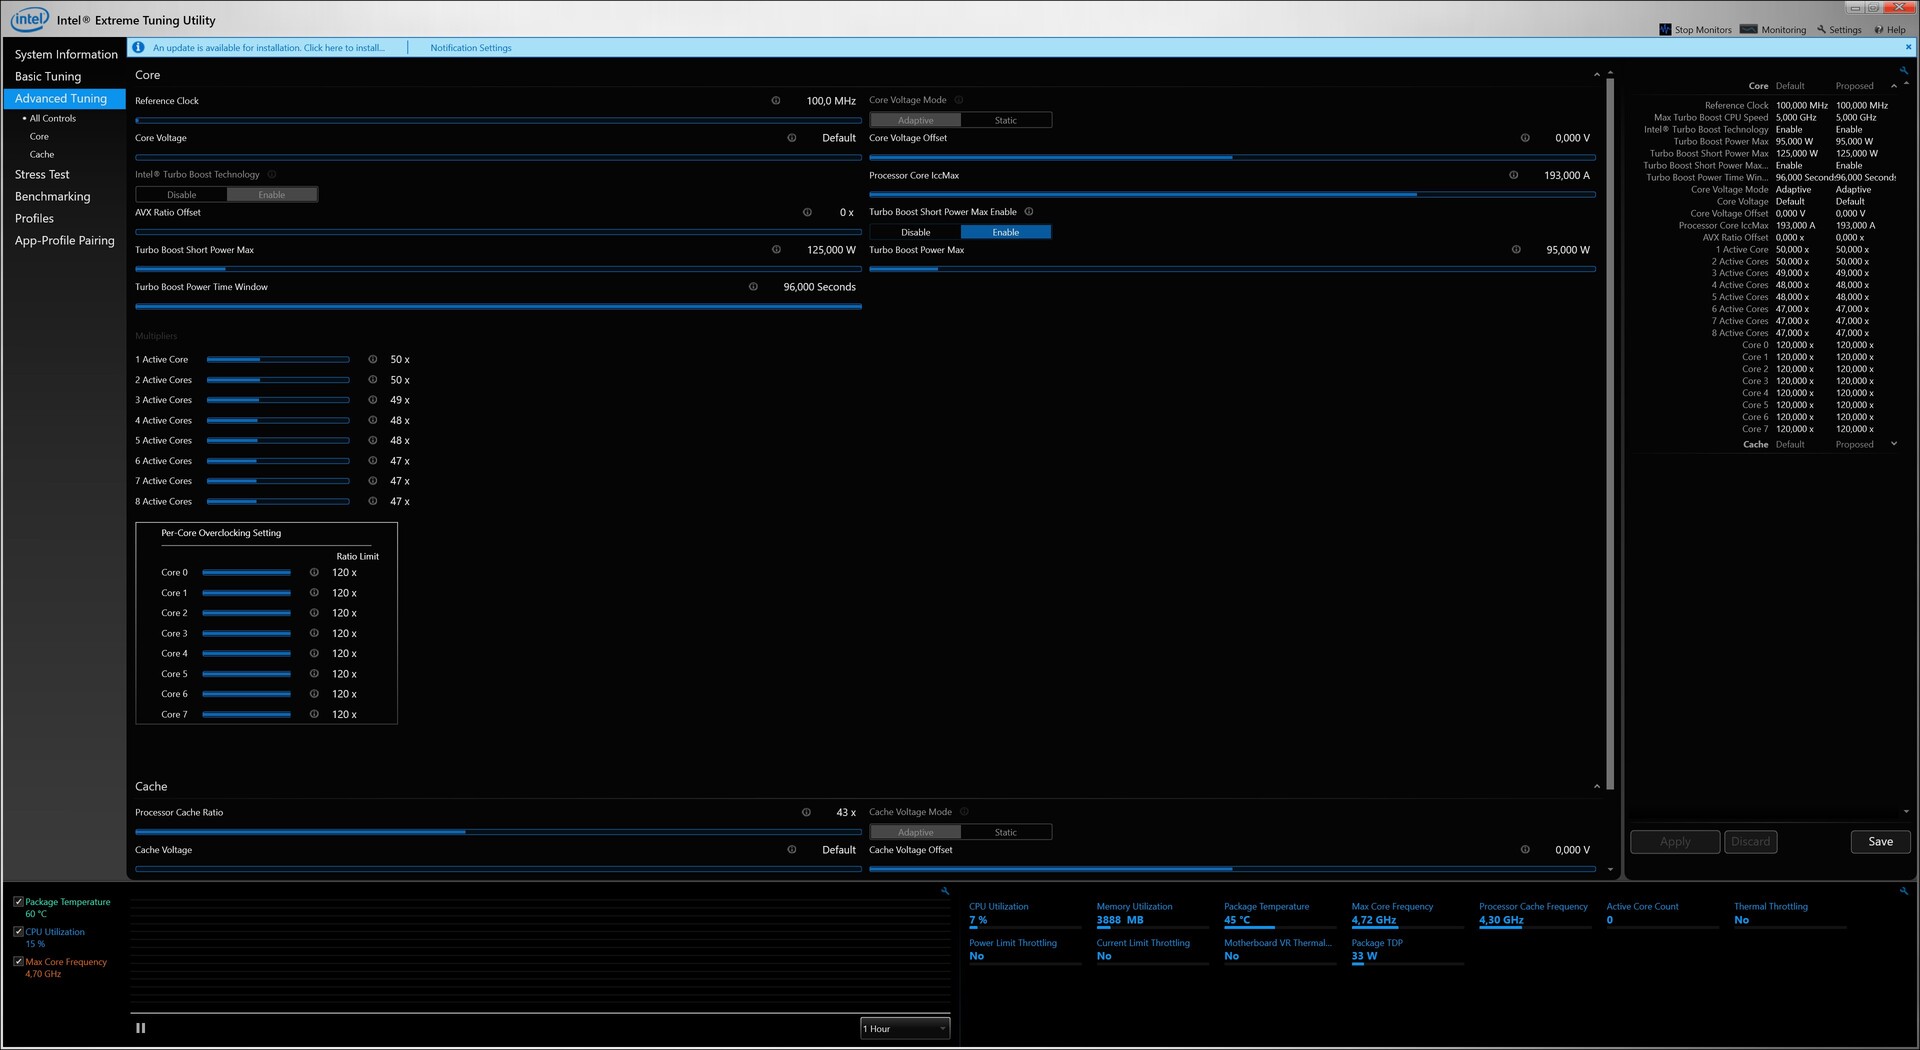
The Core i9-9900K is currently Intel’s flagship desktop CPU, which has eight physical processing cores and supports Hyper-Threading, meaning that it can execute two threads per core simultaneously. Intel stipulates that the Core i9-9900K has a 95 W thermal design power (TDP), although it can reach up to 125 W at peak clock speeds. The Core i9-9900K is overclockable too, although we would advise against doing so in the One i160 because of cooling constraints.
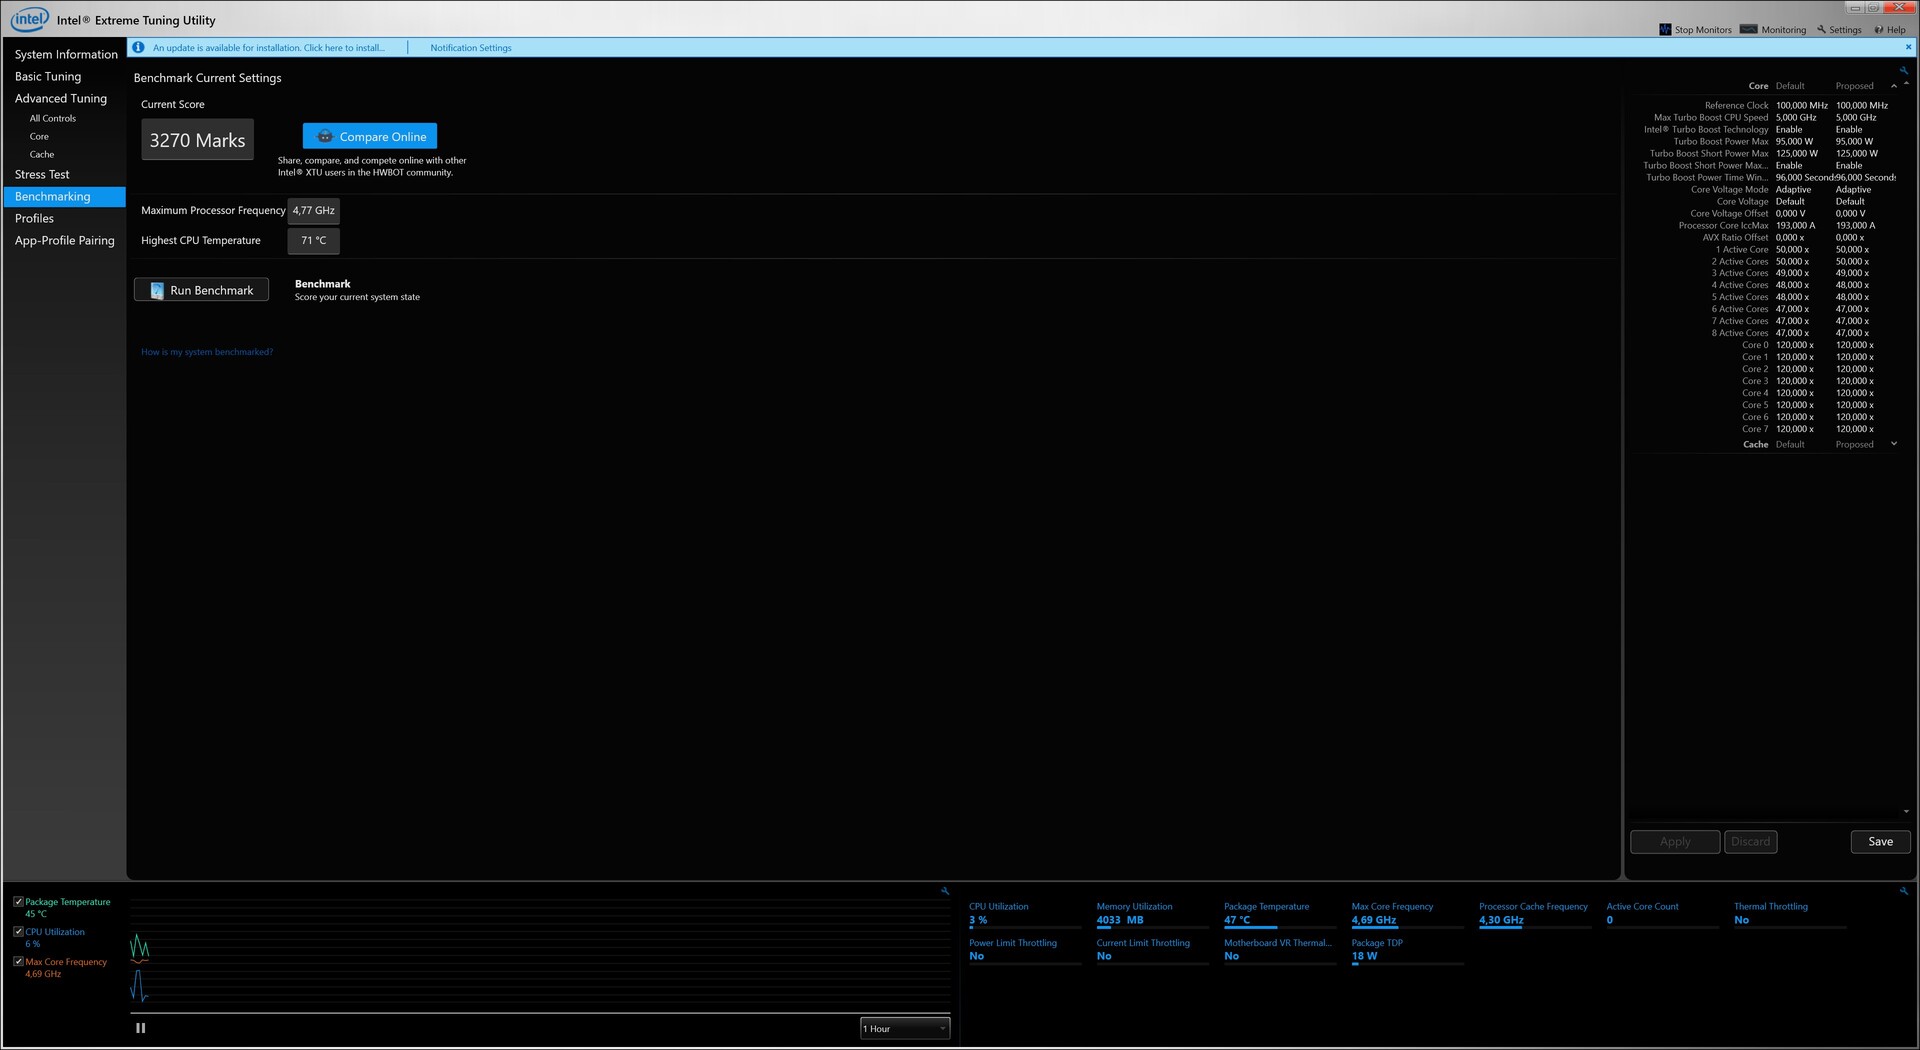
Our review unit can still achieve good results in synthetic benchmarks even at stock settings. However, the Core i9-9900K falls short of the Ryzen 7 3700X, with the performance deficit largely being down to cooling. The Core i9-9900K would perform better in a larger case, but it is still good enough for all modern triple-A games. By and large, the One i160 shows that it is possible to keep a Core i9-9900K in check even in a small chassis.
| Performance rating - Percent | |
| AMD Ryzen 9 3900X | |
| AMD Ryzen Threadripper 2950X | |
| AMD Ryzen Threadripper 1950X | |
| AMD Ryzen 7 3700X | |
| Intel Core i9-9900K | |
| AMD Ryzen 7 2700X -3! | |
| Intel Core i7-9700K | |
| AMD Ryzen 5 2600X -3! | |
| Intel Core i7-8700K -4! | |
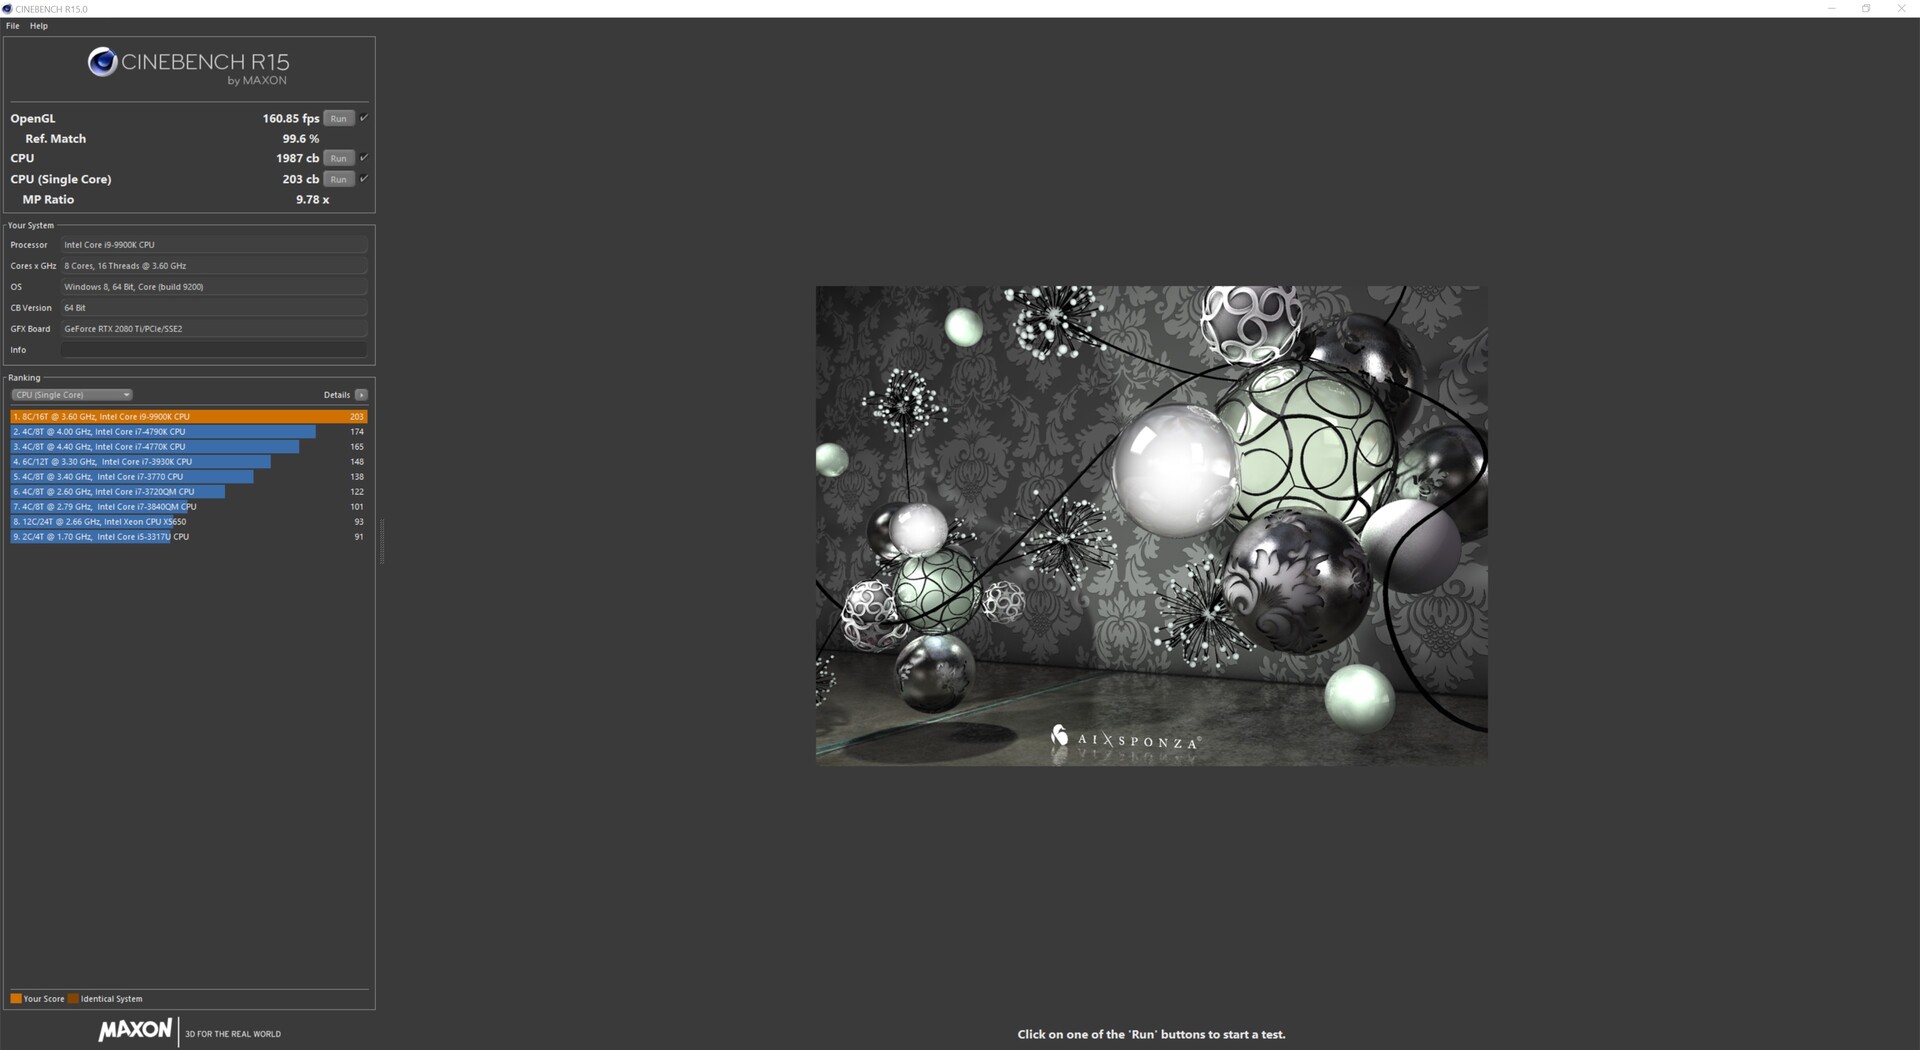
| Cinebench R15 | |
| CPU Single 64Bit | |
| AMD Ryzen 9 3900X | |
| Intel Core i7-9700K | |
| AMD Ryzen 7 3700X | |
| Intel Core i9-9900K | |
| Intel Core i7-8700K | |
| AMD Ryzen 7 2700X | |
| AMD Ryzen Threadripper 2950X | |
| AMD Ryzen 5 2600X | |
| AMD Ryzen Threadripper 1950X | |
| CPU Multi 64Bit | |
| AMD Ryzen Threadripper 2950X | |
| AMD Ryzen 9 3900X | |
| AMD Ryzen Threadripper 1950X | |
| AMD Ryzen 7 3700X | |
| Intel Core i9-9900K | |
| AMD Ryzen 7 2700X | |
| Intel Core i7-9700K | |
| Intel Core i7-8700K | |
| AMD Ryzen 5 2600X | |
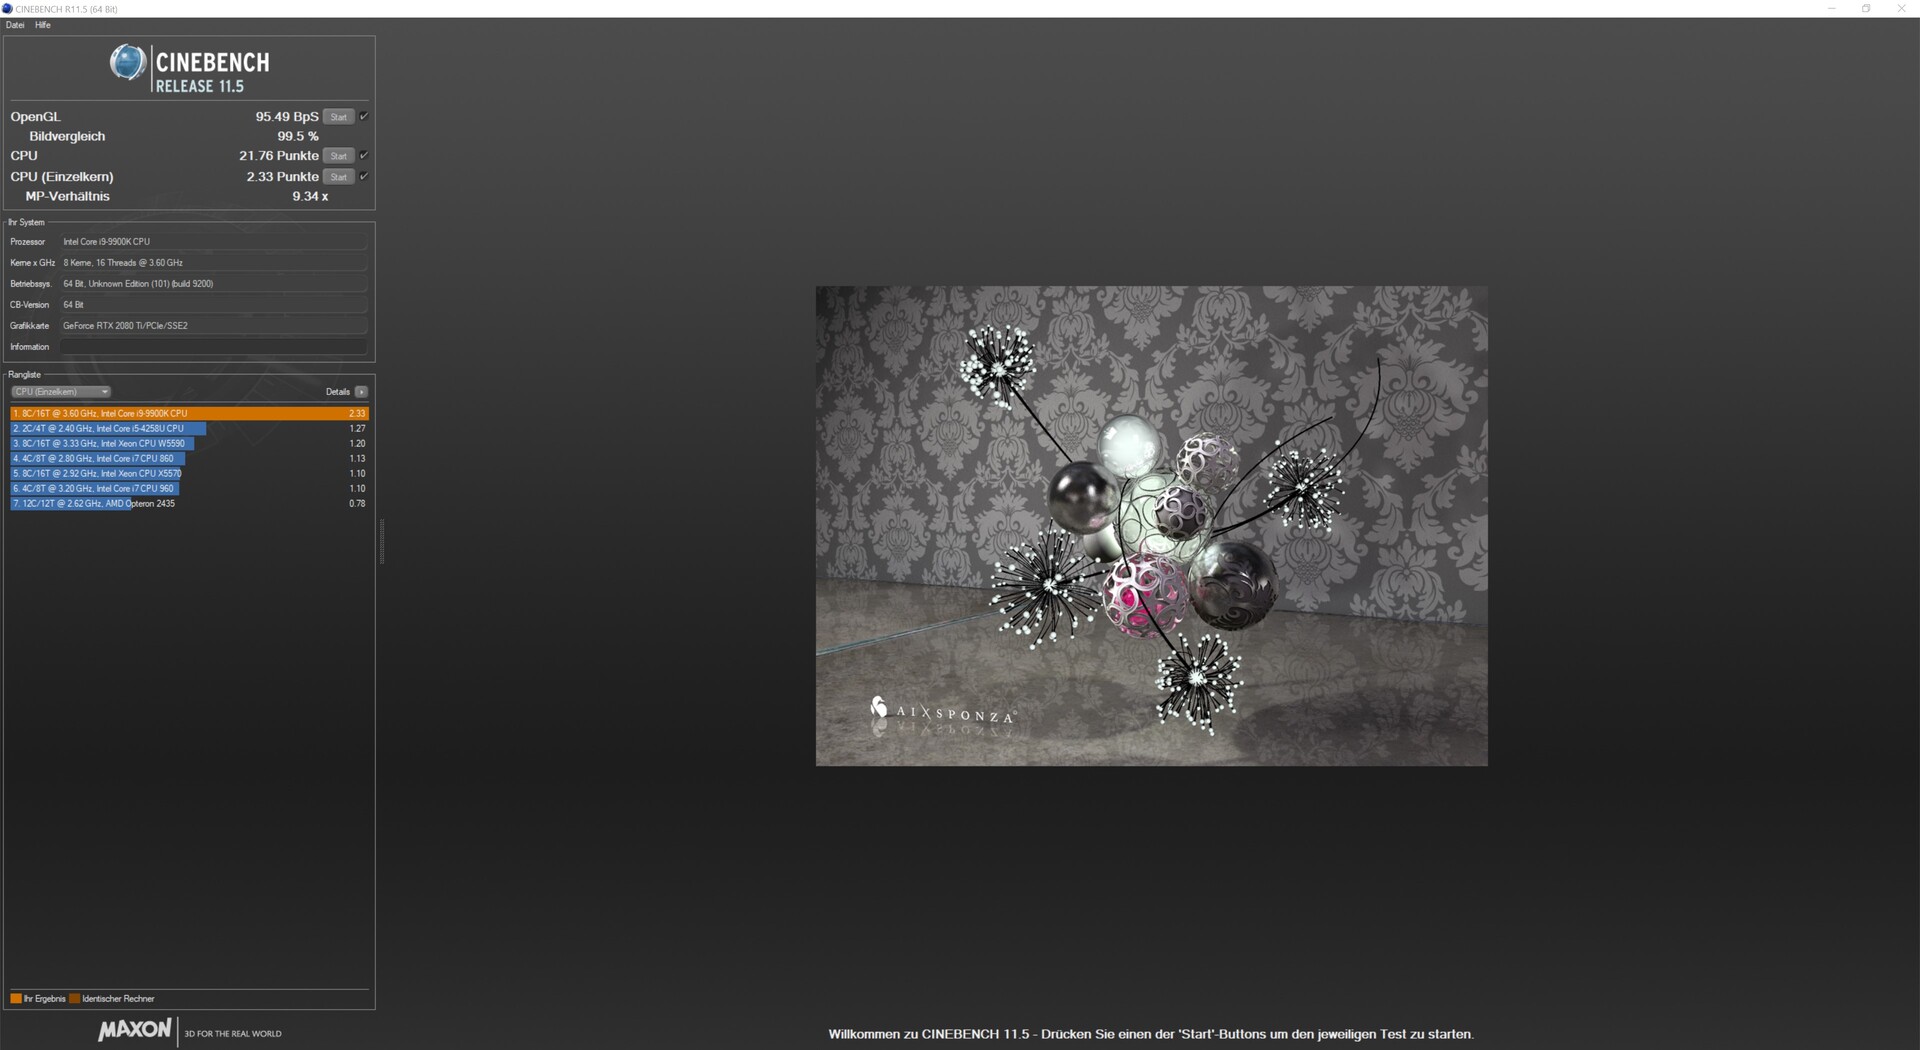
| Cinebench R11.5 | |
| CPU Multi 64Bit | |
| AMD Ryzen 9 3900X | |
| AMD Ryzen Threadripper 2950X | |
| AMD Ryzen 7 3700X | |
| AMD Ryzen Threadripper 1950X | |
| Intel Core i9-9900K | |
| AMD Ryzen 7 2700X | |
| Intel Core i7-9700K | |
| Intel Core i7-8700K | |
| AMD Ryzen 5 2600X | |
| CPU Single 64Bit | |
| Intel Core i7-9700K | |
| AMD Ryzen 9 3900X | |
| Intel Core i9-9900K | |
| AMD Ryzen 7 3700X | |
| Intel Core i7-8700K | |
| AMD Ryzen 7 2700X | |
| AMD Ryzen Threadripper 2950X | |
| AMD Ryzen 5 2600X | |
| AMD Ryzen Threadripper 1950X | |
| Blender - v2.79 BMW27 CPU | |
| AMD Ryzen 5 2600X | |
| Intel Core i7-9700K | |
| AMD Ryzen 7 2700X | |
| Intel Core i9-9900K | |
| AMD Ryzen 7 3700X | |
| AMD Ryzen Threadripper 1950X | |
| AMD Ryzen 9 3900X | |
| AMD Ryzen Threadripper 2950X | |
| wPrime 2.10 | |
| 32m | |
| AMD Ryzen 5 2600X | |
| Intel Core i7-9700K | |
| AMD Ryzen Threadripper 2950X | |
| Intel Core i7-8700K | |
| AMD Ryzen 7 3700X | |
| AMD Ryzen 7 2700X | |
| AMD Ryzen Threadripper 1950X | |
| Intel Core i9-9900K | |
| AMD Ryzen 9 3900X | |
| 1024m | |
| AMD Ryzen 5 2600X | |
| Intel Core i7-9700K | |
| Intel Core i7-8700K | |
| AMD Ryzen 7 2700X | |
| Intel Core i9-9900K | |
| AMD Ryzen 7 3700X | |
| AMD Ryzen 9 3900X | |
| AMD Ryzen Threadripper 1950X | |
| AMD Ryzen Threadripper 2950X | |
| HWBOT x265 Benchmark v2.2 - 4k Preset | |
| AMD Ryzen 9 3900X | |
| AMD Ryzen Threadripper 2950X | |
| AMD Ryzen Threadripper 1950X | |
| Intel Core i9-9900K | |
| AMD Ryzen 7 3700X | |
| Intel Core i7-9700K | |
| X264 HD Benchmark 4.0 | |
| Pass 1 | |
| Intel Core i7-9700K | |
| AMD Ryzen 7 3700X | |
| AMD Ryzen 9 3900X | |
| Intel Core i9-9900K | |
| Intel Core i7-8700K | |
| AMD Ryzen 7 2700X | |
| AMD Ryzen 5 2600X | |
| AMD Ryzen Threadripper 2950X | |
| AMD Ryzen Threadripper 1950X | |
| Pass 2 | |
| AMD Ryzen 9 3900X | |
| AMD Ryzen Threadripper 2950X | |
| AMD Ryzen Threadripper 1950X | |
| Intel Core i9-9900K | |
| AMD Ryzen 7 3700X | |
| AMD Ryzen 7 2700X | |
| Intel Core i7-9700K | |
| Intel Core i7-8700K | |
| AMD Ryzen 5 2600X | |
| WinRAR - Result | |
| Intel Core i9-9900K | |
| AMD Ryzen 9 3900X | |
| AMD Ryzen 7 3700X | |
| Intel Core i7-9700K | |
| Intel Core i7-8700K | |
| AMD Ryzen 7 2700X | |
| AMD Ryzen 5 2600X | |
| AMD Ryzen Threadripper 2950X | |
| AMD Ryzen Threadripper 1950X | |
| TrueCrypt | |
| AES Mean 100MB | |
| AMD Ryzen Threadripper 2950X | |
| AMD Ryzen Threadripper 1950X | |
| Intel Core i9-9900K | |
| AMD Ryzen 7 3700X | |
| AMD Ryzen 9 3900X | |
| AMD Ryzen 7 2700X | |
| Intel Core i7-9700K | |
| Intel Core i7-8700K | |
| AMD Ryzen 5 2600X | |
| Twofish Mean 100MB | |
| AMD Ryzen Threadripper 1950X | |
| AMD Ryzen Threadripper 2950X | |
| AMD Ryzen 9 3900X | |
| AMD Ryzen 7 3700X | |
| Intel Core i9-9900K | |
| AMD Ryzen 7 2700X | |
| Intel Core i7-8700K | |
| Intel Core i7-9700K | |
| AMD Ryzen 5 2600X | |
| Serpent Mean 100MB | |
| AMD Ryzen Threadripper 1950X | |
| AMD Ryzen Threadripper 2950X | |
| AMD Ryzen 9 3900X | |
| AMD Ryzen 7 3700X | |
| Intel Core i9-9900K | |
| AMD Ryzen 7 2700X | |
| Intel Core i7-8700K | |
| AMD Ryzen 5 2600X | |
| Intel Core i7-9700K | |
| Geekbench 4.4 | |
| 64 Bit Single-Core Score | |
| Intel Core i7-9700K | |
| Intel Core i9-9900K | |
| Intel Core i7-8700K | |
| AMD Ryzen 9 3900X | |
| AMD Ryzen 7 3700X | |
| AMD Ryzen 7 2700X | |
| AMD Ryzen Threadripper 2950X | |
| AMD Ryzen 5 2600X | |
| AMD Ryzen Threadripper 1950X | |
| 64 Bit Multi-Core Score | |
| AMD Ryzen 9 3900X | |
| AMD Ryzen Threadripper 2950X | |
| AMD Ryzen 7 3700X | |
| Intel Core i9-9900K | |
| Intel Core i7-9700K | |
| AMD Ryzen Threadripper 1950X | |
| AMD Ryzen 7 2700X | |
| Intel Core i7-8700K | |
| AMD Ryzen 5 2600X | |
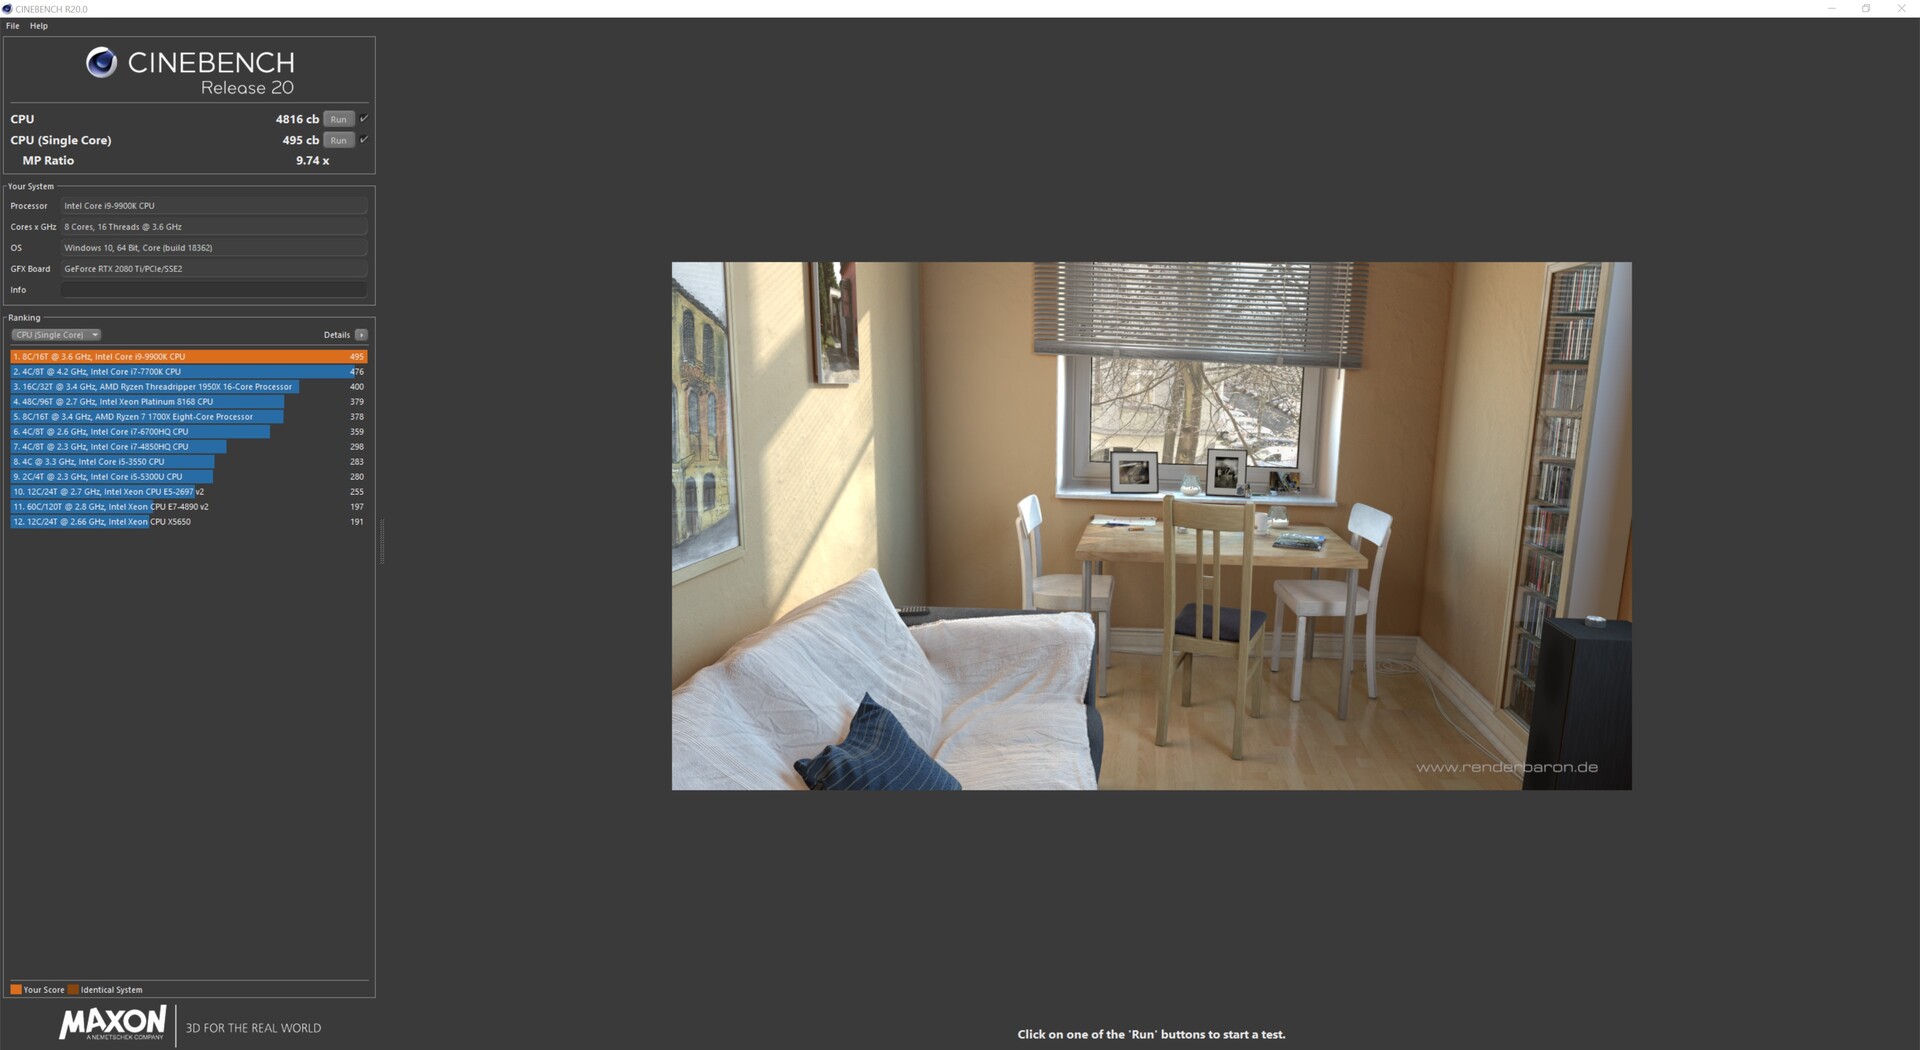
| Cinebench R20 | |
| CPU (Single Core) | |
| AMD Ryzen 9 3900X | |
| AMD Ryzen 7 3700X | |
| Intel Core i9-9900K | |
| Intel Core i7-9700K | |
| AMD Ryzen Threadripper 2950X | |
| AMD Ryzen Threadripper 1950X | |
| CPU (Multi Core) | |
| AMD Ryzen Threadripper 2950X | |
| AMD Ryzen 9 3900X | |
| AMD Ryzen Threadripper 1950X | |
| Intel Core i9-9900K | |
| AMD Ryzen 7 3700X | |
| Intel Core i7-9700K | |
* ... smaller is better
Cinebench R15 Multi Loop
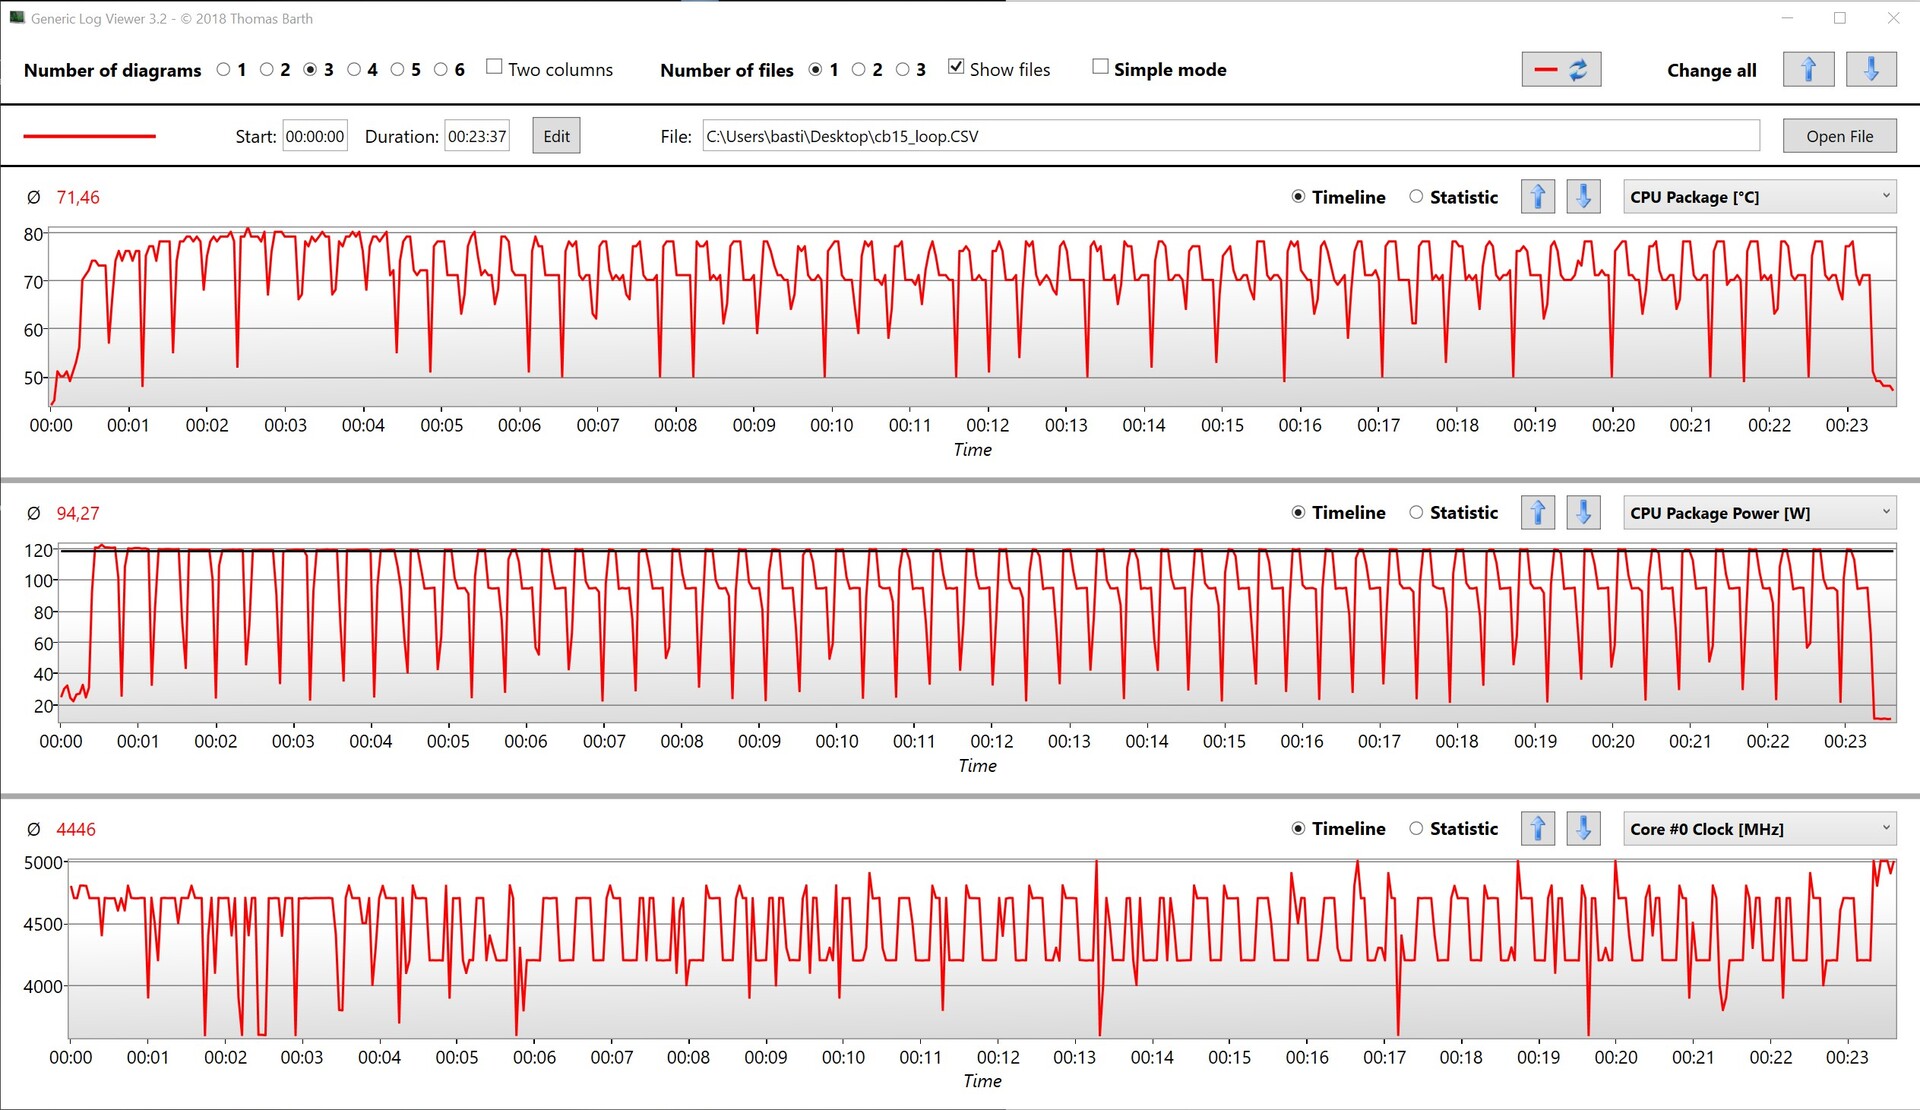
We also subjected our review unit to a looped Cinebench R15 Multi 64Bit benchmark to see how it maintained its CPU performance under prolonged load. As we suspected, the Core i9-9900K can only partially exploit its turbo clock speeds in such a small chassis, with CB R15 Multi 64Bit scores steadily dropping from a high of 1,919 points in the second pass-through to a low of 1,864 points in the seventh. However, the system then rallied to 1,886 points before slumping to 1,812 points. Benchmark scores fluctuated thereafter between 1,804 and 1,847 points, with the system stabilising at around 1,840 points by the end of the benchmark loop. Overall, the One i160 generally scores around 100 points lower than our Core i9-9900K-powered testbench.
The Core i9-9900K performed as expected during our CB R15 Multi 64Bit tests. The CPU even occasionally reached 5.0 GHz, at which it consumed 125 W. However, generally it drew around 95 W during our CB R15 Multi 64Bit loop, with it dropping from 125 W after the ninth benchmark loop.
System Performance
Our review unit performed well during our tests, although its fast NVMe SSD makes a big difference here. The conventional HDD proved to be a bottleneck during our gaming tests as games loaded slower than if they had been saved to an NVMe SSD. We would recommend replacing the 512 GB SSD with a larger drive and removing the HDD altogether if you plan to install many games, as the existing 2 TB HDD artificially holds the system back.
| PCMark 10 | |
| Score | |
| AMD Ryzen 7 2700X | |
| AMD Ryzen Threadripper 2950X | |
| AMD Ryzen 5 2600X | |
| Intel Core i9-9900K | |
| AMD Ryzen 9 3900X | |
| AMD Ryzen 7 3700X | |
| Intel Core i7-9700K | |
| Intel Core i7-8700K | |
| Essentials | |
| AMD Ryzen 9 3900X | |
| AMD Ryzen 7 3700X | |
| Intel Core i9-9900K | |
| Intel Core i7-9700K | |
| Intel Core i7-8700K | |
| AMD Ryzen 7 2700X | |
| AMD Ryzen 5 2600X | |
| AMD Ryzen Threadripper 2950X | |
| Productivity | |
| AMD Ryzen 7 3700X | |
| AMD Ryzen 9 3900X | |
| Intel Core i7-9700K | |
| AMD Ryzen 7 2700X | |
| Intel Core i9-9900K | |
| AMD Ryzen 5 2600X | |
| Intel Core i7-8700K | |
| AMD Ryzen Threadripper 2950X | |
| Digital Content Creation | |
| Intel Core i9-9900K | |
| AMD Ryzen 9 3900X | |
| AMD Ryzen 7 3700X | |
| Intel Core i7-9700K | |
| Intel Core i7-8700K | |
| AMD Ryzen Threadripper 2950X | |
| AMD Ryzen 7 2700X | |
| AMD Ryzen 5 2600X | |
| PCMark 8 | |
| Home Score Accelerated v2 | |
| Intel Core i9-9900K | |
| AMD Ryzen 9 3900X | |
| Intel Core i7-9700K | |
| AMD Ryzen 7 3700X | |
| Intel Core i7-8700K | |
| AMD Ryzen 7 2700X | |
| AMD Ryzen 5 2600X | |
| AMD Ryzen Threadripper 2950X | |
| Work Score Accelerated v2 | |
| Intel Core i9-9900K | |
| AMD Ryzen 7 3700X | |
| AMD Ryzen 9 3900X | |
| Intel Core i7-9700K | |
| AMD Ryzen 7 2700X | |
| Intel Core i7-8700K | |
| AMD Ryzen 5 2600X | |
| AMD Ryzen Threadripper 2950X | |
| SPECviewperf 13 | |
| Solidworks (sw-04) | |
| AMD Ryzen 7 2700X | |
| Intel Core i9-9900K | |
| AMD Ryzen 9 3900X | |
| AMD Ryzen 7 3700X | |
| Intel Core i7-9700K | |
| Siemens NX (snx-03) | |
| AMD Ryzen 7 2700X | |
| Intel Core i7-9700K | |
| AMD Ryzen 7 3700X | |
| AMD Ryzen 9 3900X | |
| Intel Core i9-9900K | |
| Showcase (showcase-02) | |
| AMD Ryzen 7 2700X | |
| Intel Core i9-9900K | |
| Intel Core i7-9700K | |
| AMD Ryzen 9 3900X | |
| AMD Ryzen 7 3700X | |
| Medical (medical-02) | |
| AMD Ryzen 7 2700X | |
| Intel Core i9-9900K | |
| AMD Ryzen 7 3700X | |
| AMD Ryzen 9 3900X | |
| Intel Core i7-9700K | |
| Maya (maya-05) | |
| Intel Core i9-9900K | |
| AMD Ryzen 7 2700X | |
| AMD Ryzen 7 3700X | |
| AMD Ryzen 9 3900X | |
| Intel Core i7-9700K | |
| Energy (energy-02) | |
| AMD Ryzen 7 2700X | |
| Intel Core i9-9900K | |
| AMD Ryzen 9 3900X | |
| AMD Ryzen 7 3700X | |
| Intel Core i7-9700K | |
| Creo (creo-02) | |
| AMD Ryzen 7 2700X | |
| Intel Core i9-9900K | |
| AMD Ryzen 7 3700X | |
| AMD Ryzen 9 3900X | |
| Intel Core i7-9700K | |
| Catia (catia-05) | |
| AMD Ryzen 7 2700X | |
| AMD Ryzen 9 3900X | |
| AMD Ryzen 7 3700X | |
| Intel Core i7-9700K | |
| Intel Core i9-9900K | |
| 3ds Max (3dsmax-06) | |
| AMD Ryzen 7 2700X | |
| Intel Core i9-9900K | |
| AMD Ryzen 7 3700X | |
| AMD Ryzen 9 3900X | |
| Intel Core i7-9700K | |
| LuxMark v2.0 64Bit | |
| Room GPUs-only | |
| AMD Ryzen 7 2700X | |
| Intel Core i9-9900K | |
| Sala GPUs-only | |
| AMD Ryzen 7 2700X | |
| Intel Core i9-9900K | |
| ComputeMark v2.1 | |
| 1024x600 Normal, Score | |
| Intel Core i9-9900K | |
| AMD Ryzen 7 2700X | |
| 1024x600 Normal, Fluid 3DTex | |
| AMD Ryzen 7 2700X | |
| Intel Core i9-9900K | |
| 1024x600 Normal, Fluid 2DTexArr | |
| AMD Ryzen 7 2700X | |
| Intel Core i9-9900K | |
| 1024x600 Normal, Mandel Vector | |
| Intel Core i9-9900K | |
| AMD Ryzen 7 2700X | |
| 1024x600 Normal, Mandel Scalar | |
| Intel Core i9-9900K | |
| AMD Ryzen 7 2700X | |
| 1024x600 Normal, QJuliaRayTrace | |
| Intel Core i9-9900K | |
| AMD Ryzen 7 2700X | |
| PCMark 8 Home Score Accelerated v2 | 5418 points | |
| PCMark 8 Creative Score Accelerated v2 | 10550 points | |
| PCMark 8 Work Score Accelerated v2 | 5296 points | |
| PCMark 10 Score | 7329 points | |
Help | ||
Storage Devices
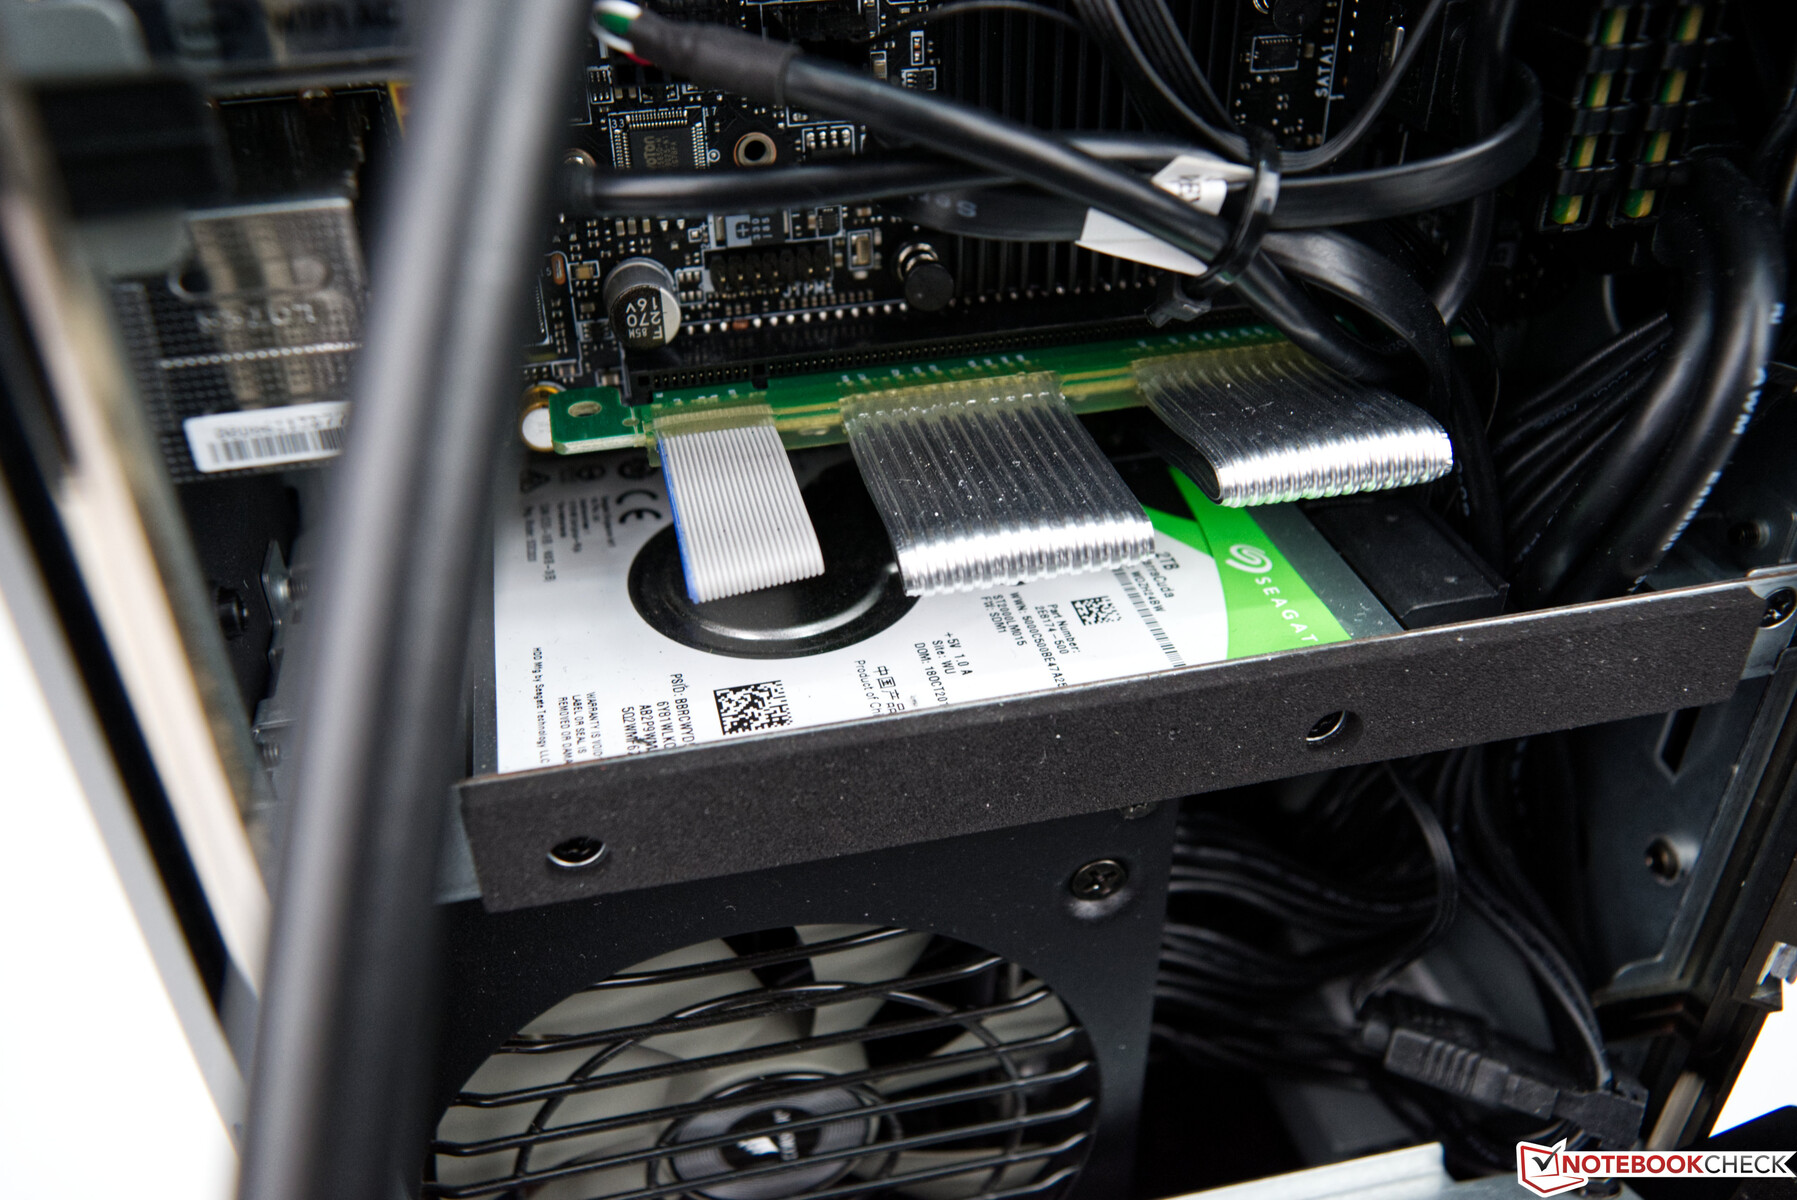
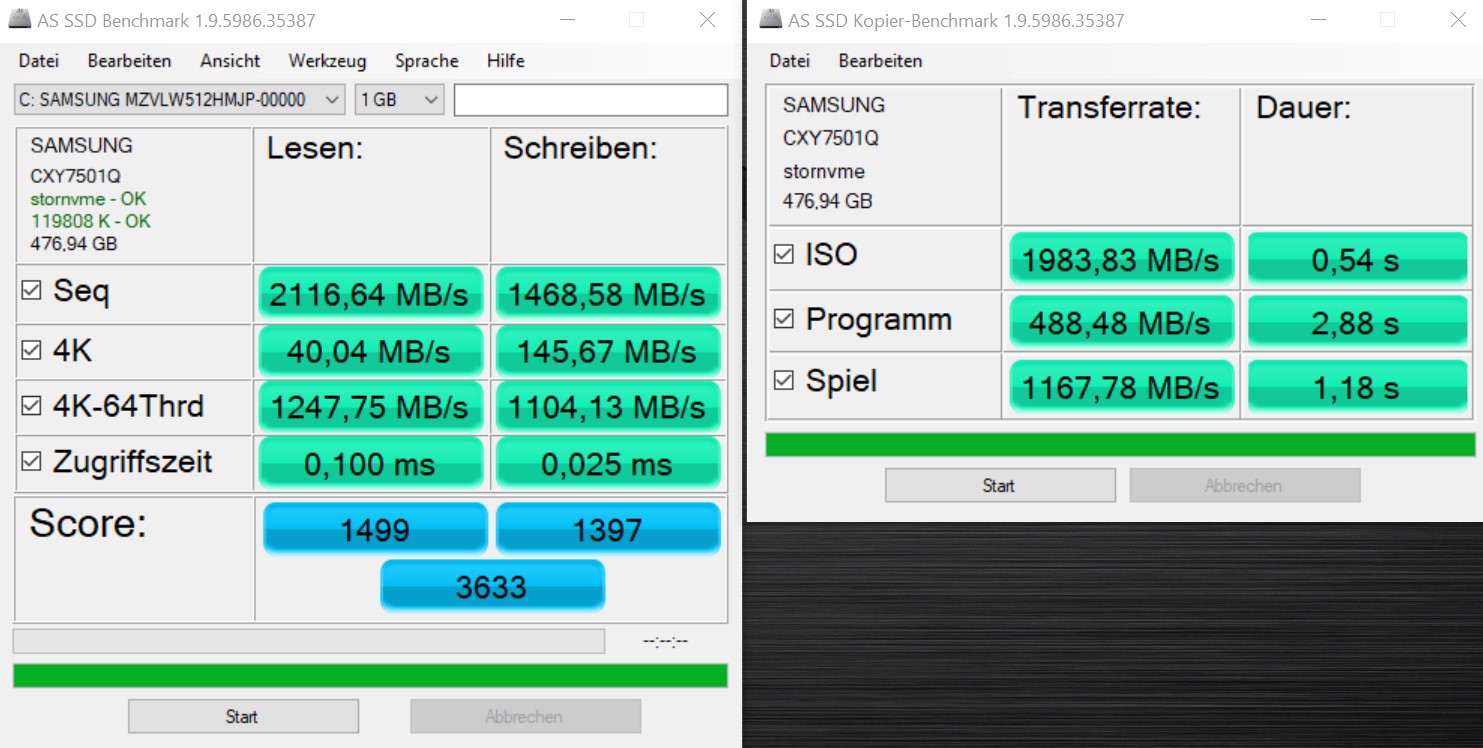
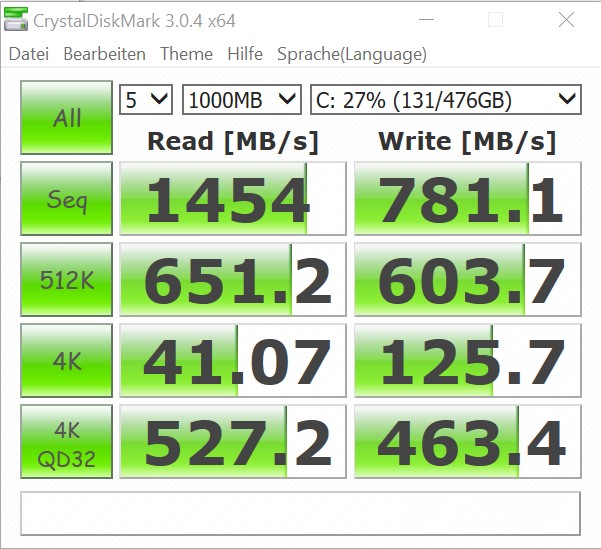
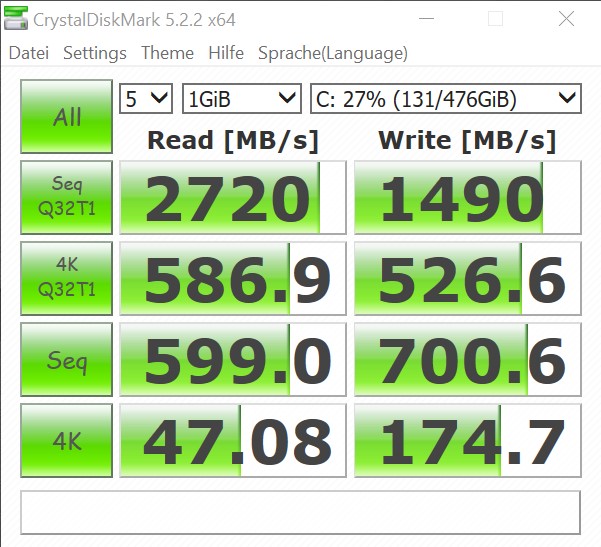
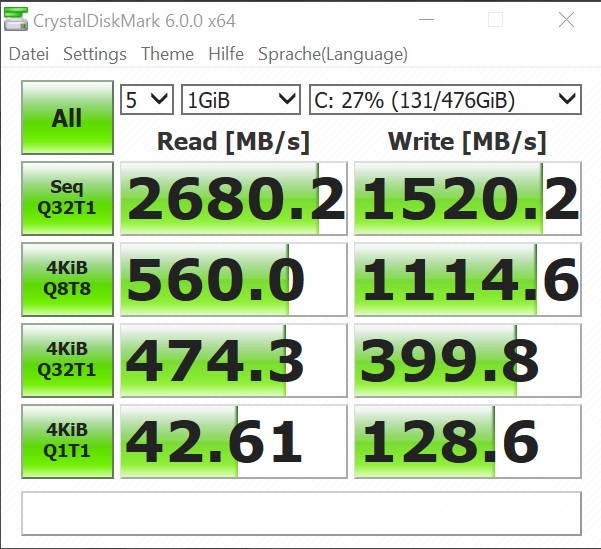
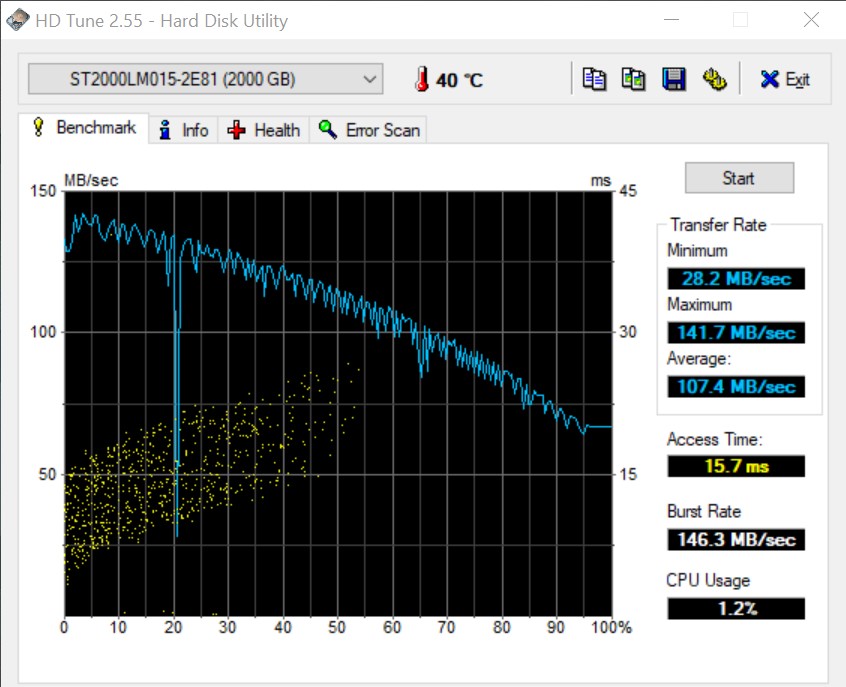
As already mentioned, Corsair equips the One i160 with a fast SSD and a much slower conventional HDD. The former is a 512 GB Samsung PM961, which is now a few generations old itself, with the latter being a Seagate 2 TB HDD.
The PM961 still performed well in synthetic benchmarks, although we would have expected something newer like the PM981 in a US$3,400 system. Likewise, while the 2 TB Seagate is fast by HDD standards, its 107 MB/s average transfer speeds are awfully slow compared to those achieved by the PM961 system drive.
While you cannot add a third drive, you can switch the preinstalled ones out for larger capacity or faster alternatives. In short, we would recommend equipping the system with a 1 TB or larger SSD if possible, as it will deliver a better gaming experience than the 2 TB HDD can.

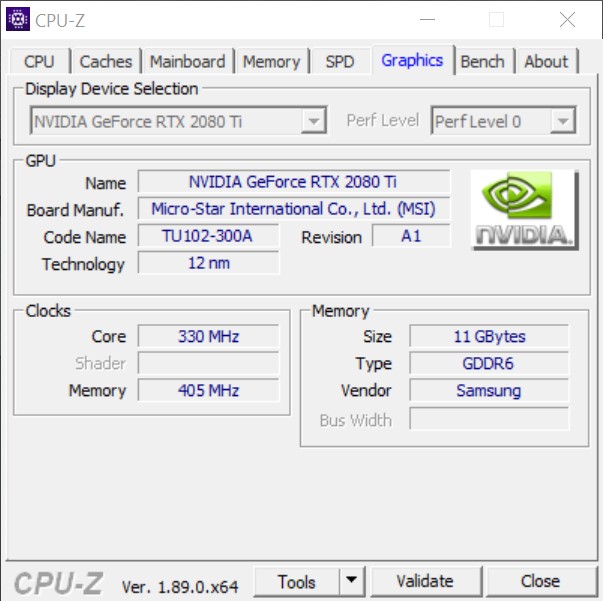
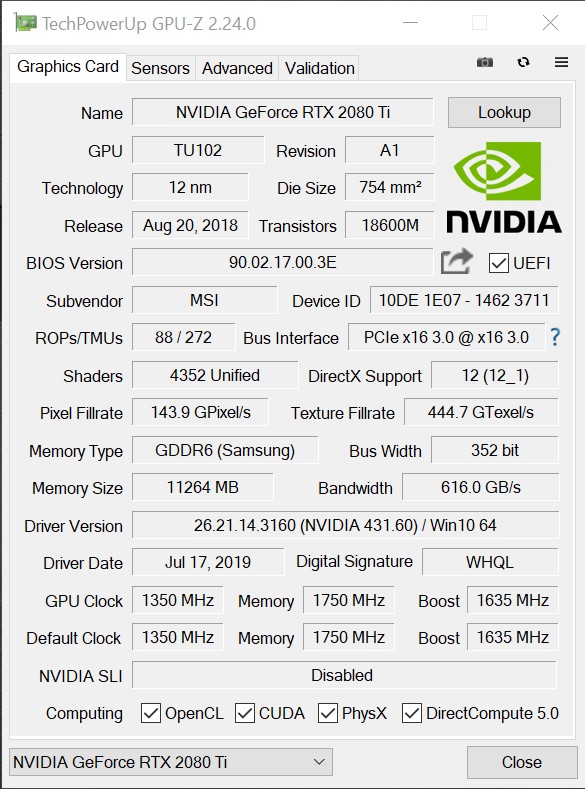
Graphics Card

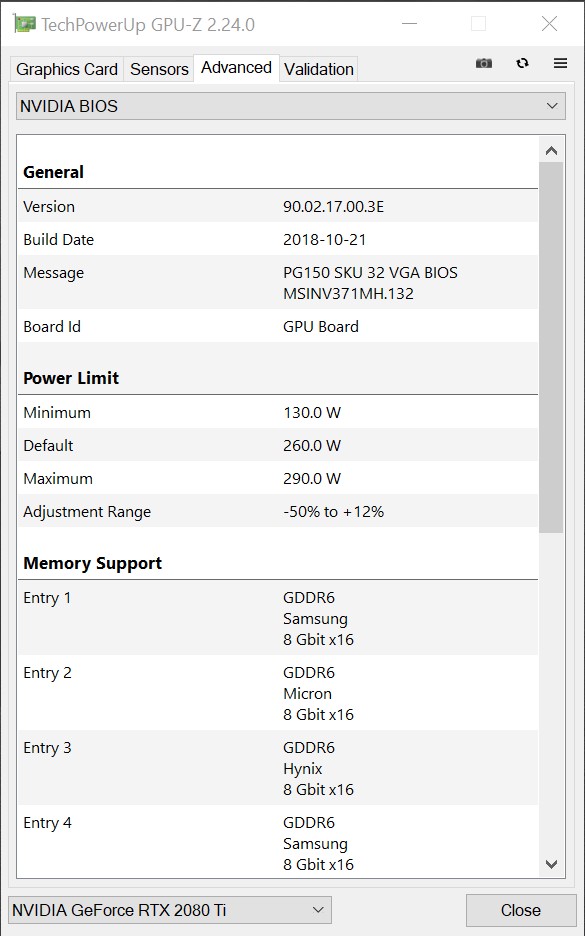
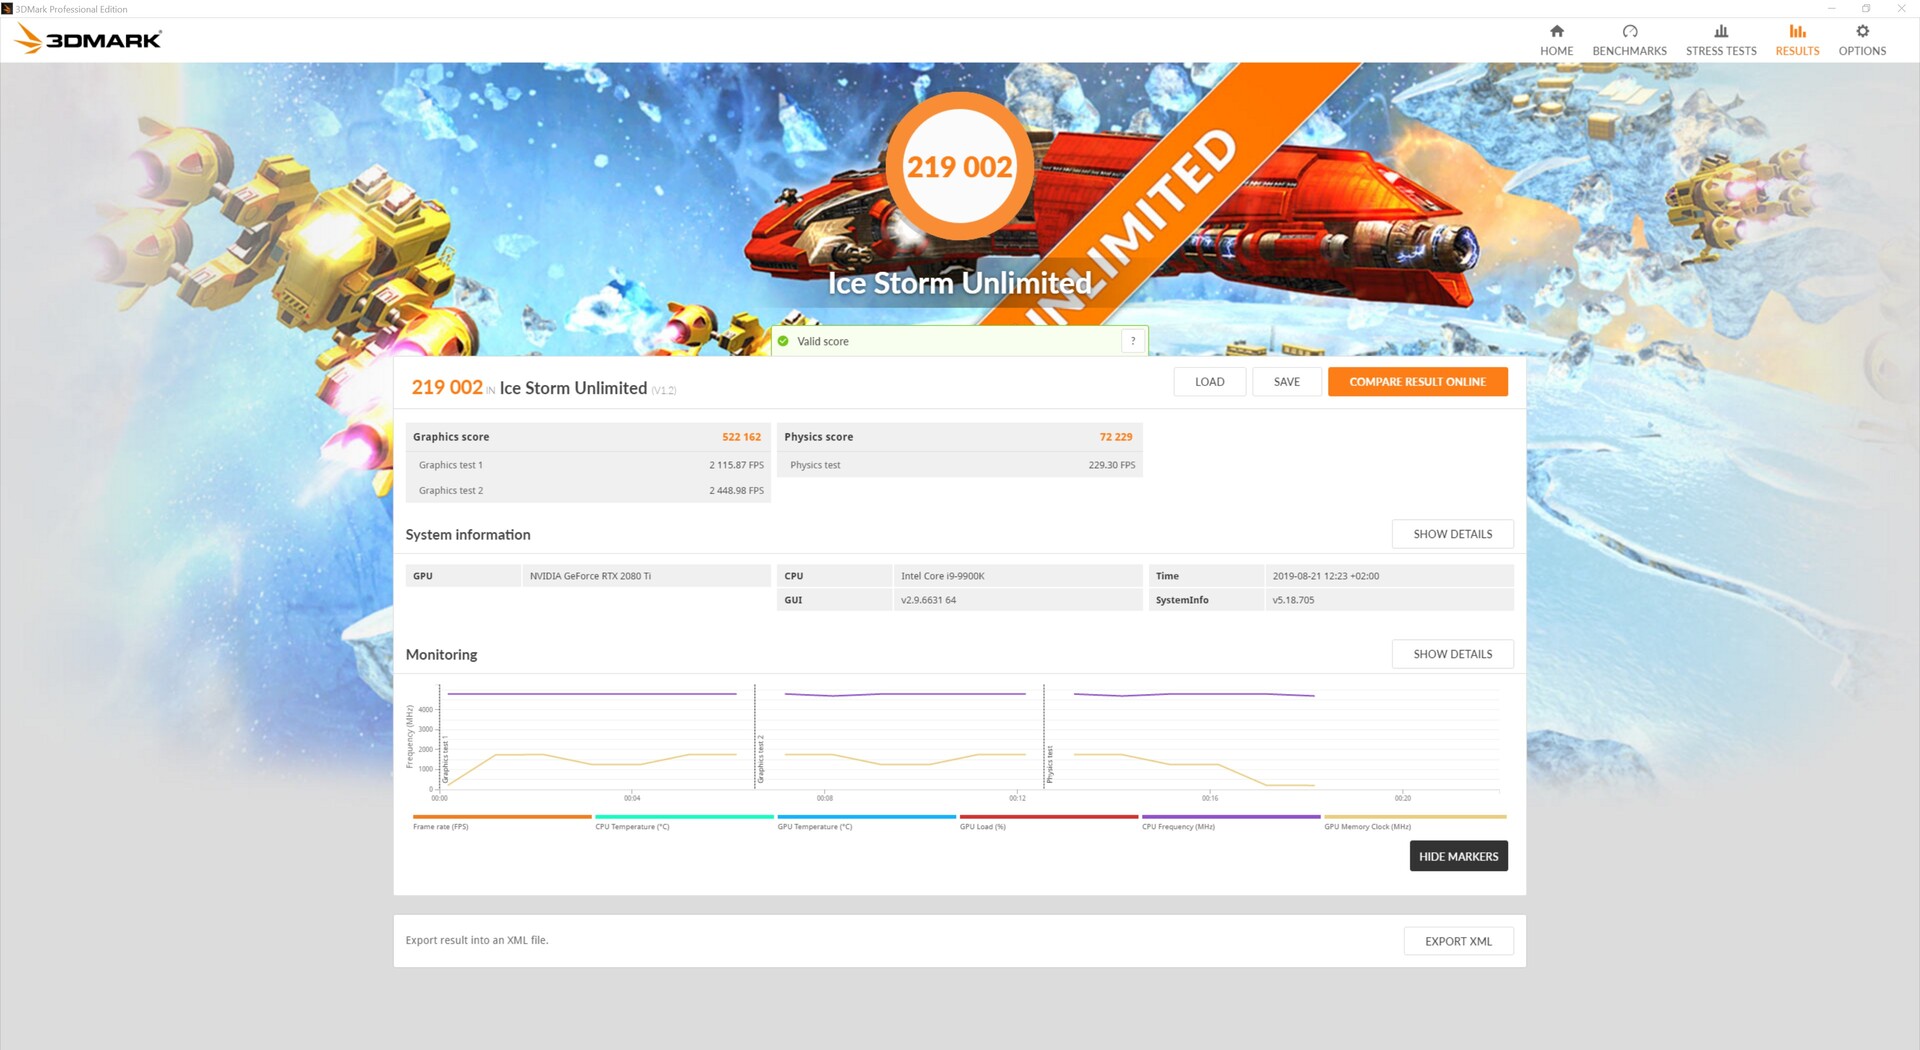
Corsair not only equips the One i160 with a powerful CPU but also the best gaming GPU currently on the market. Specifically, the One i160 comes with an MSI GeForce RTX 2080 Ti VENTUS OC, although Corsair has modified the GPU to fit it within such a compact case. It has also incorporated its patented AIO.
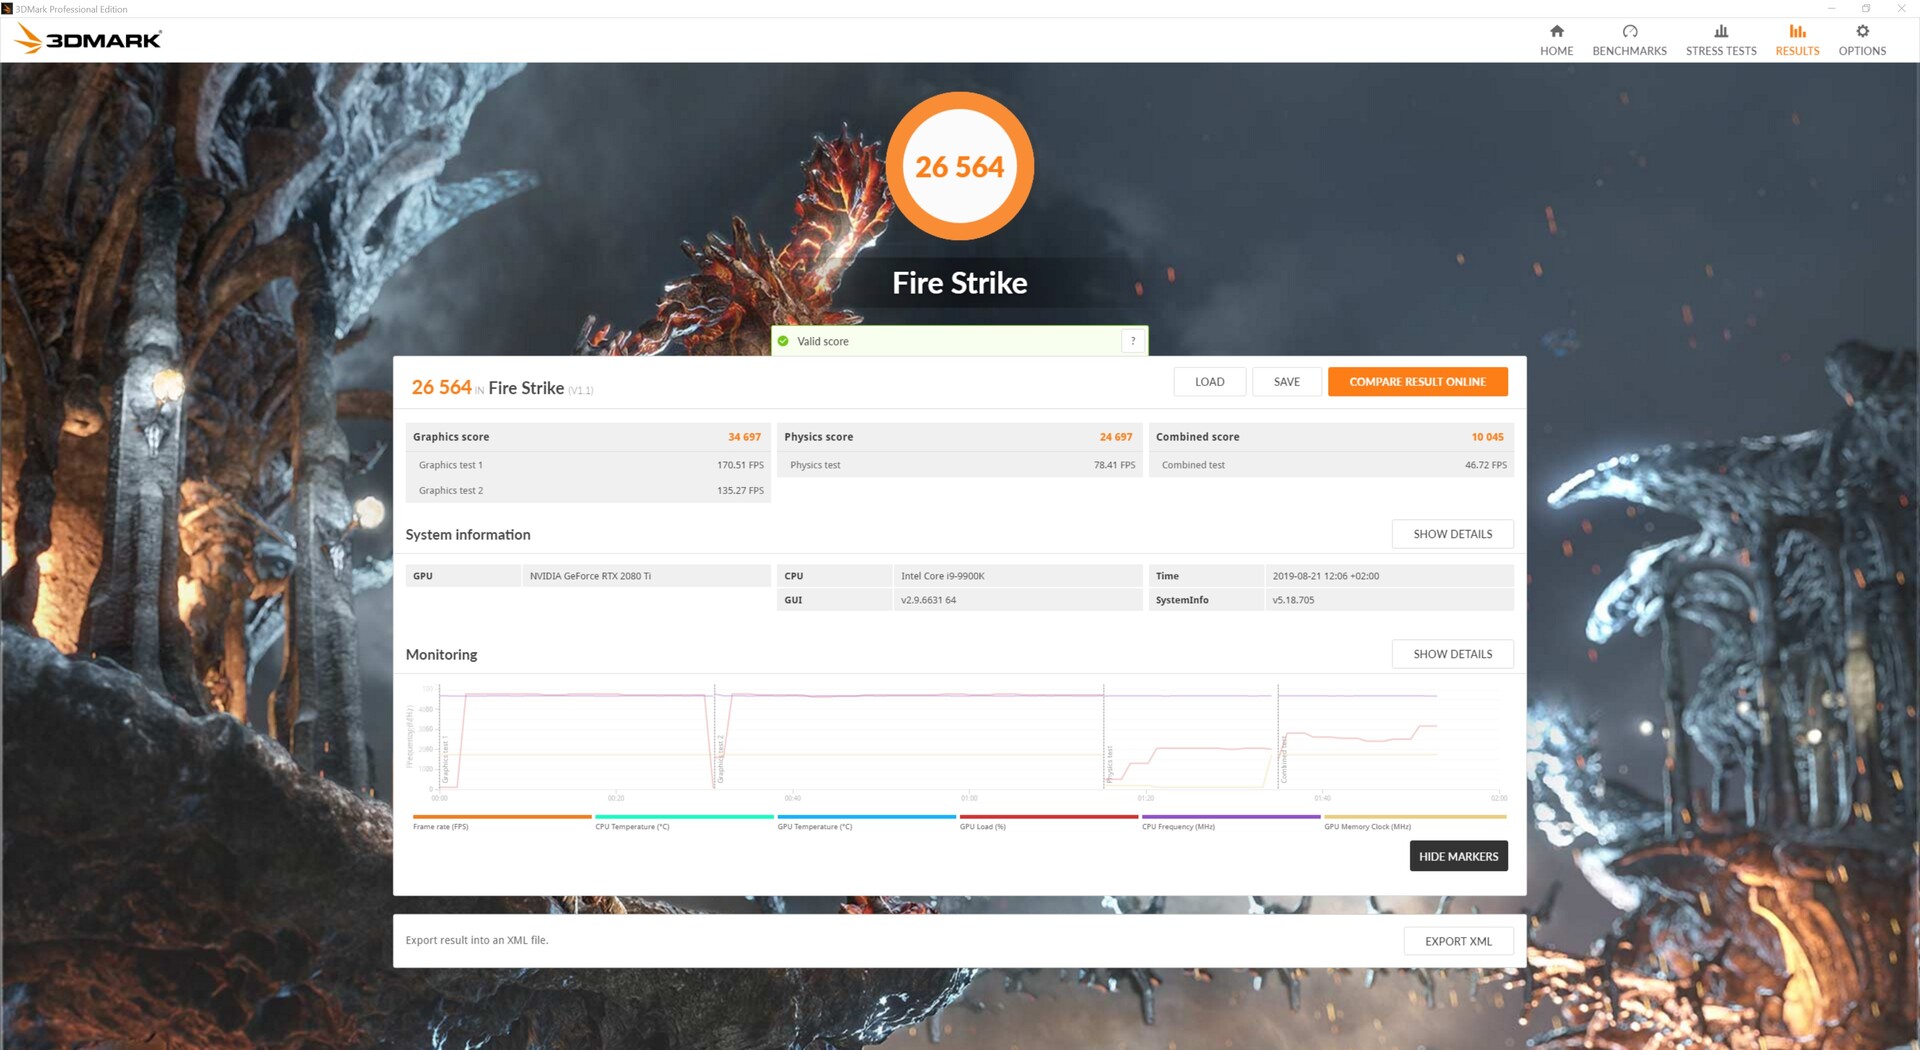
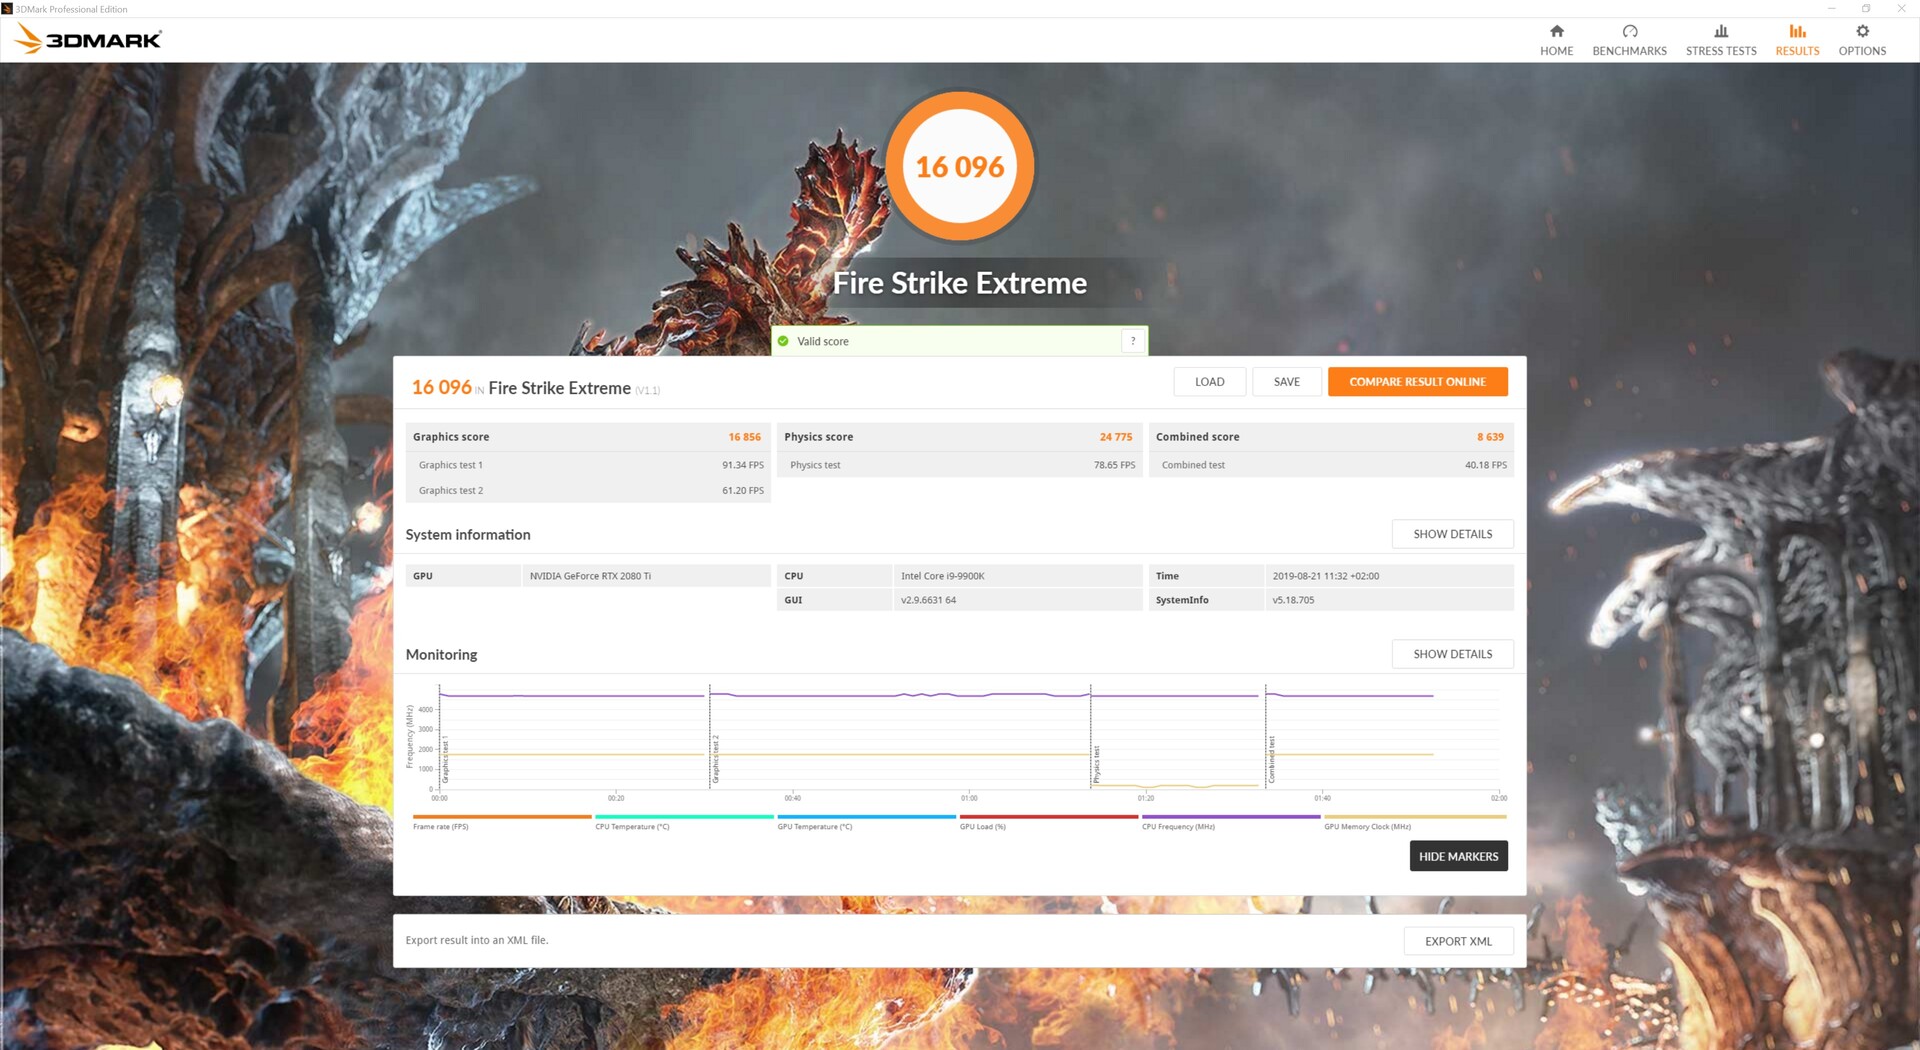
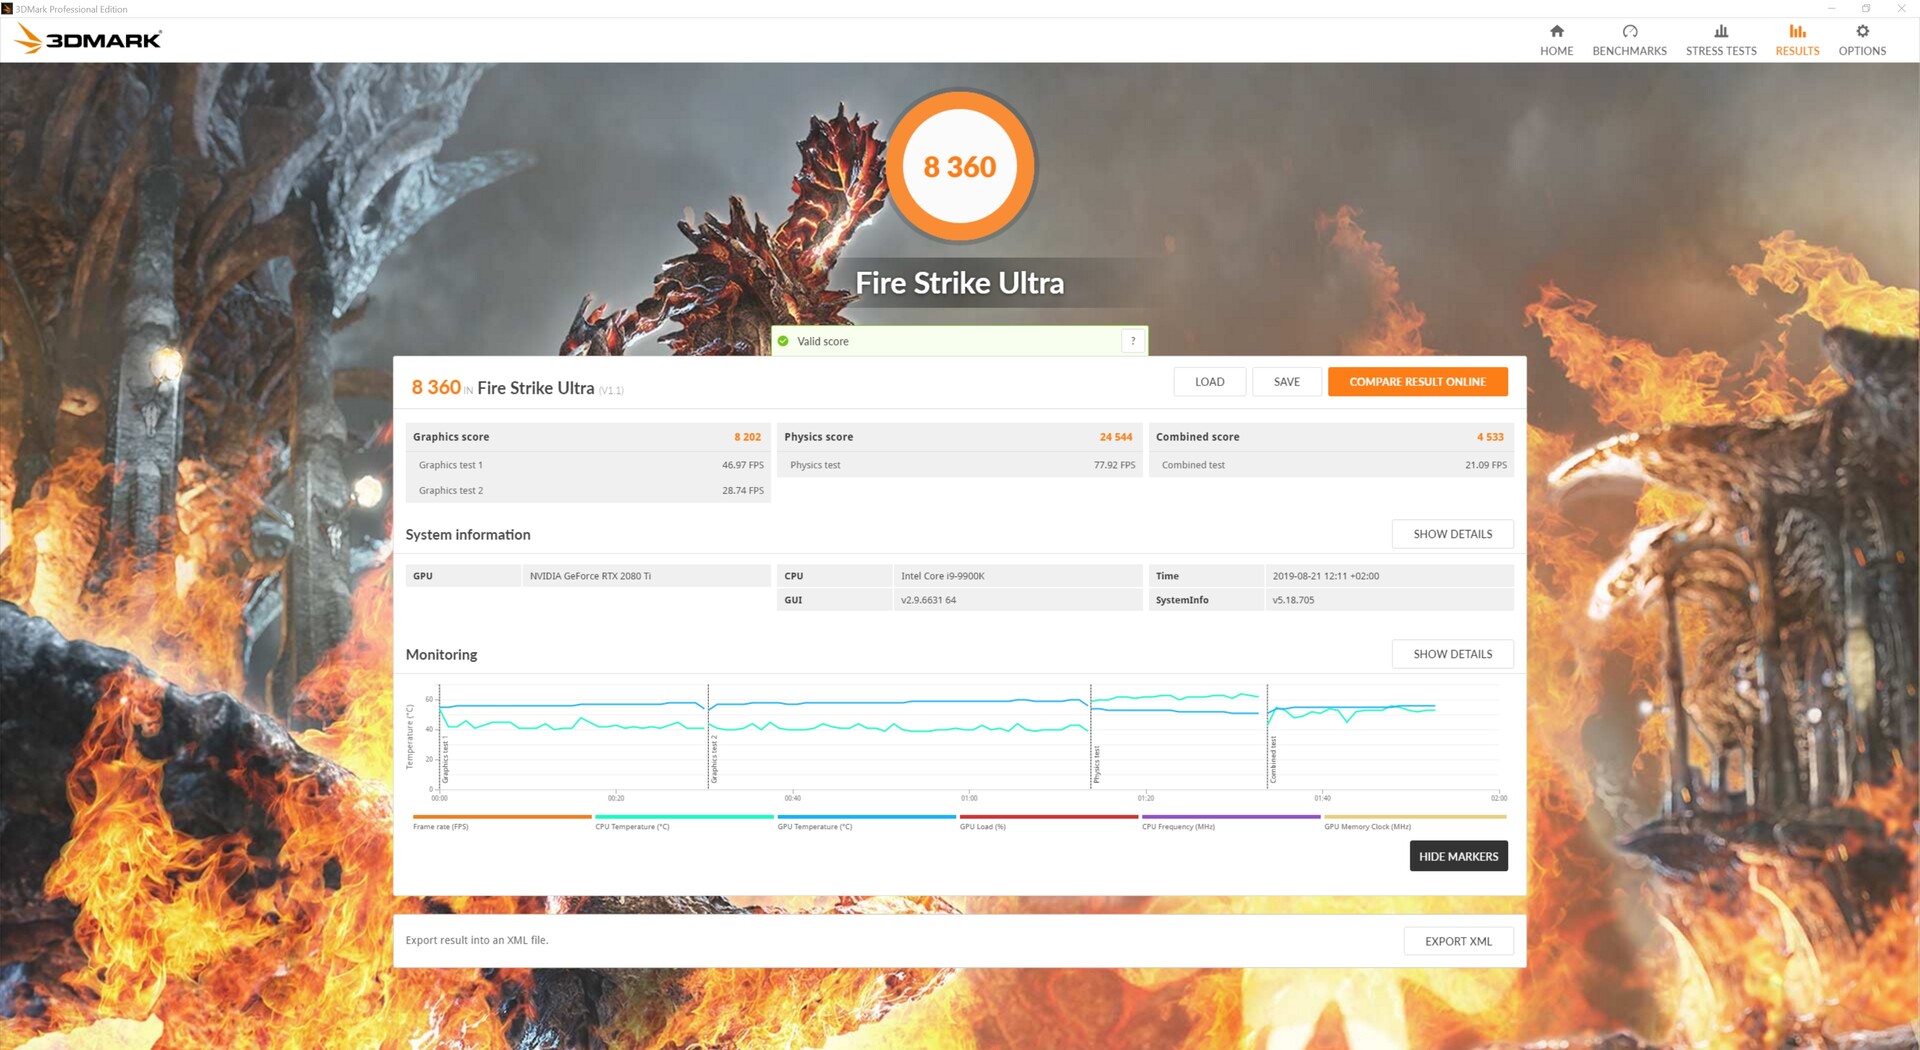
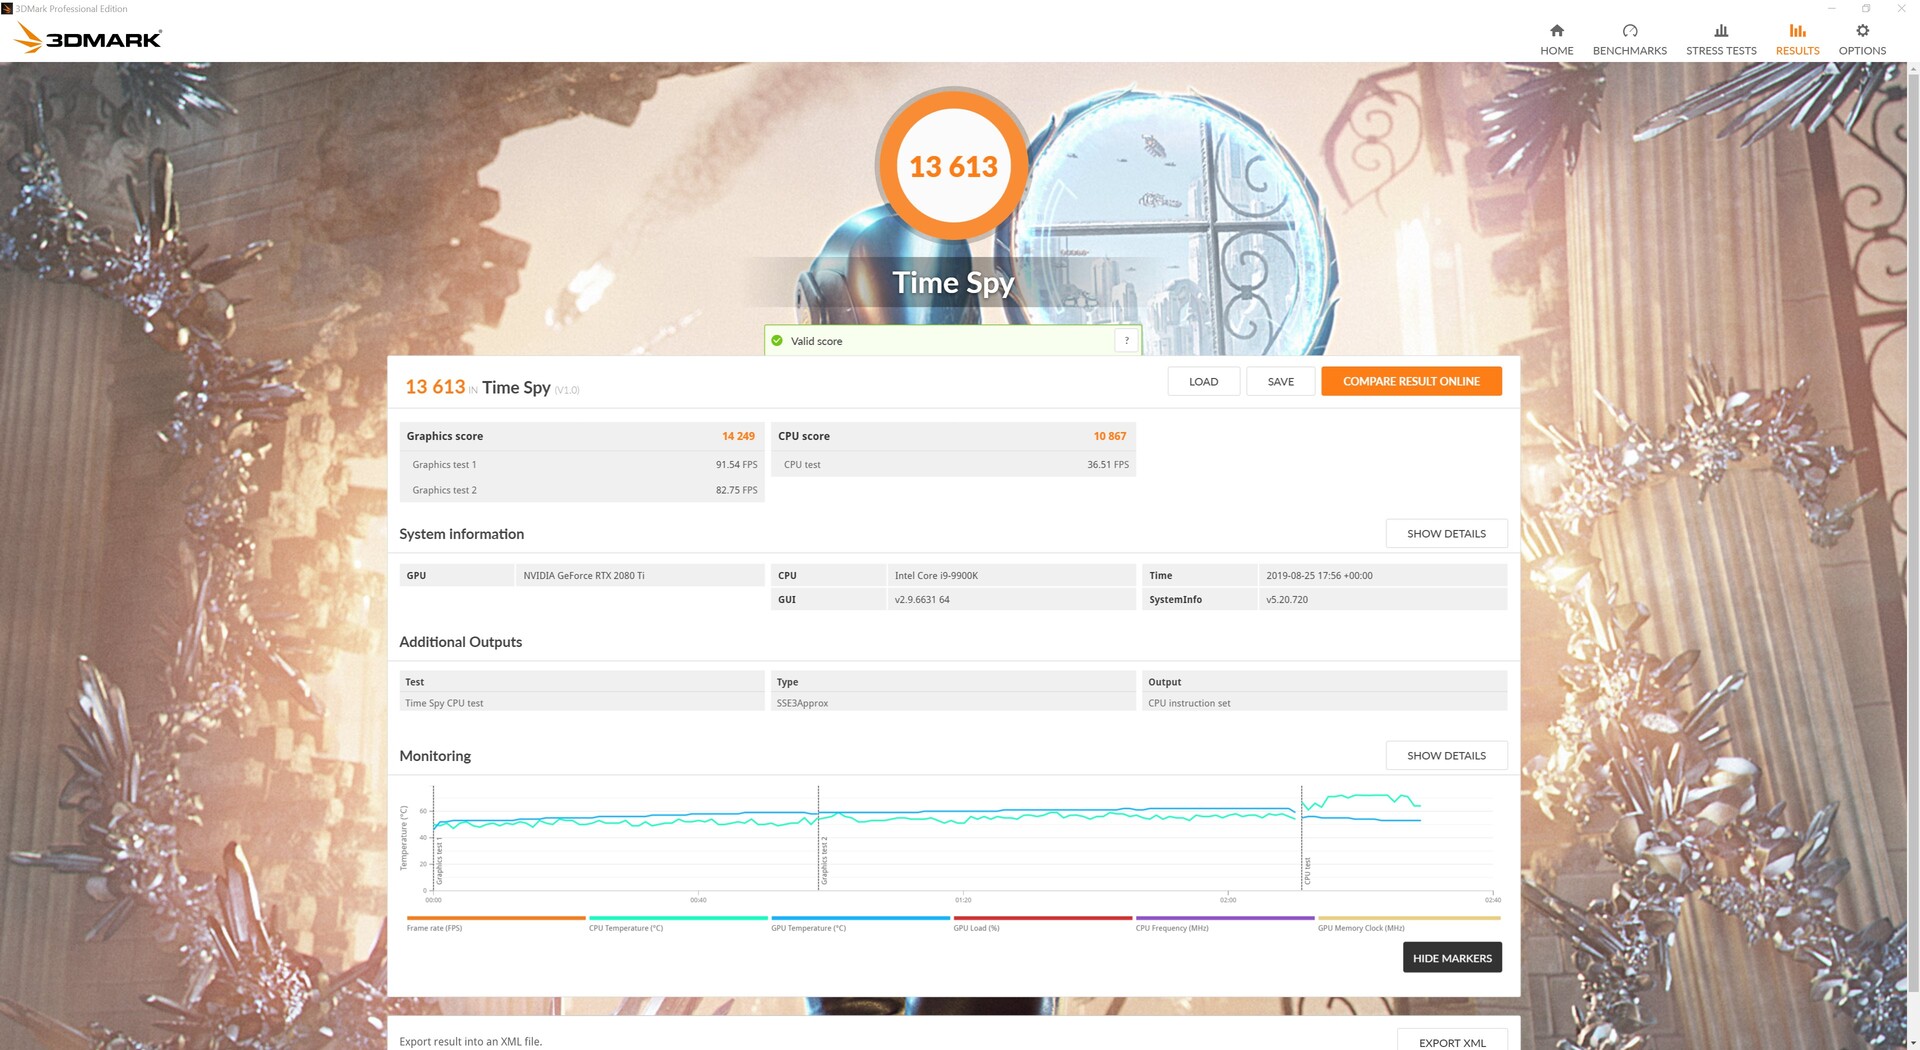
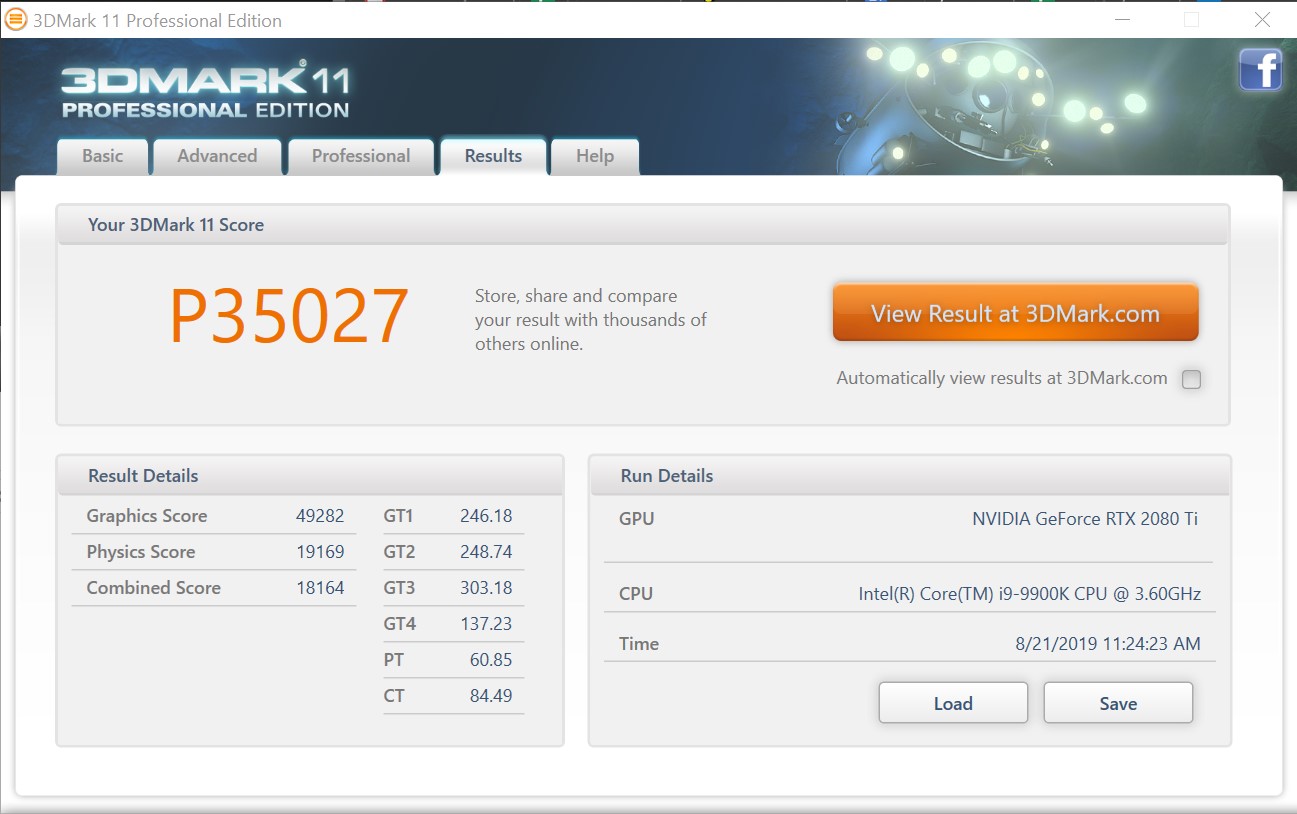
The Core i9-9900K and GeForce RTX 2080 Ti perform exceptionally well in synthetic benchmarks, only falling short to our NVIDIA TITAN RTX test system in some tests. We paired the latter with an AMD Ryzen 7 2700X, which holds the GPU back somewhat, and this allows the One i160 to triumph in 3DMark 11.

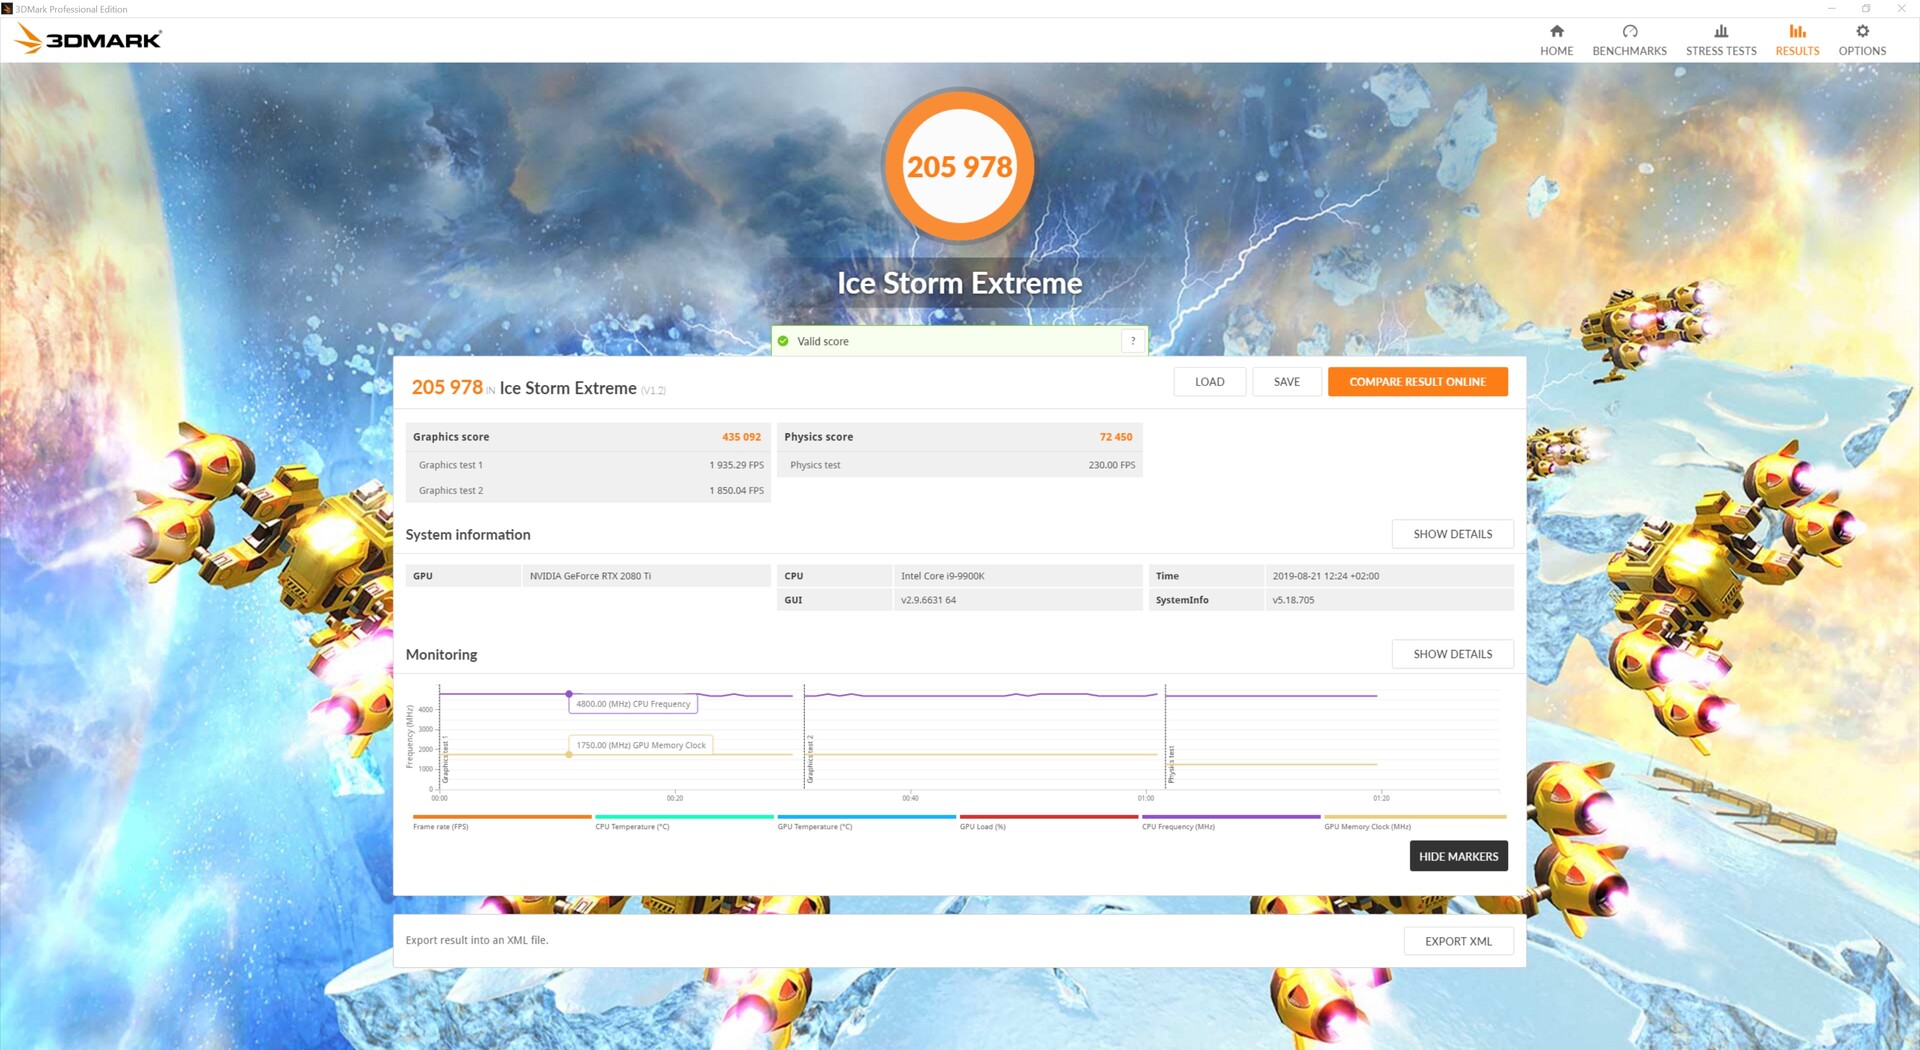
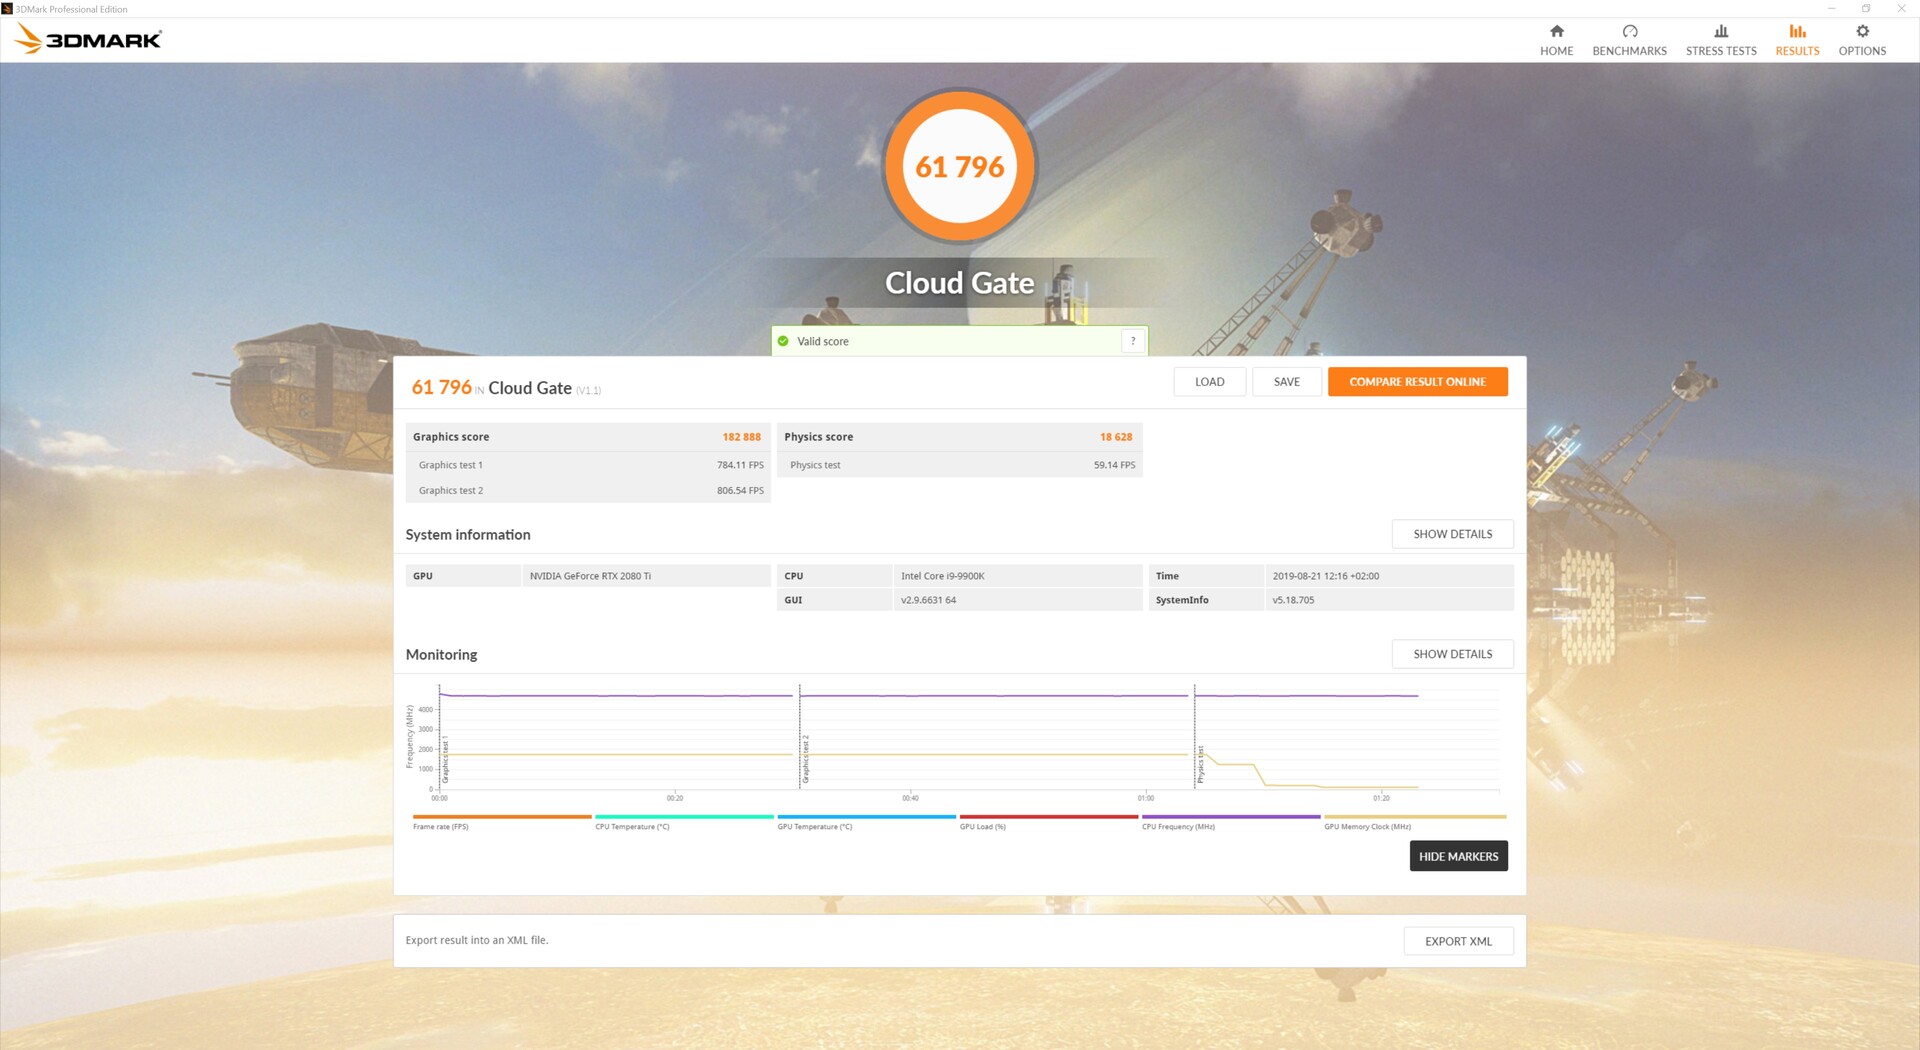
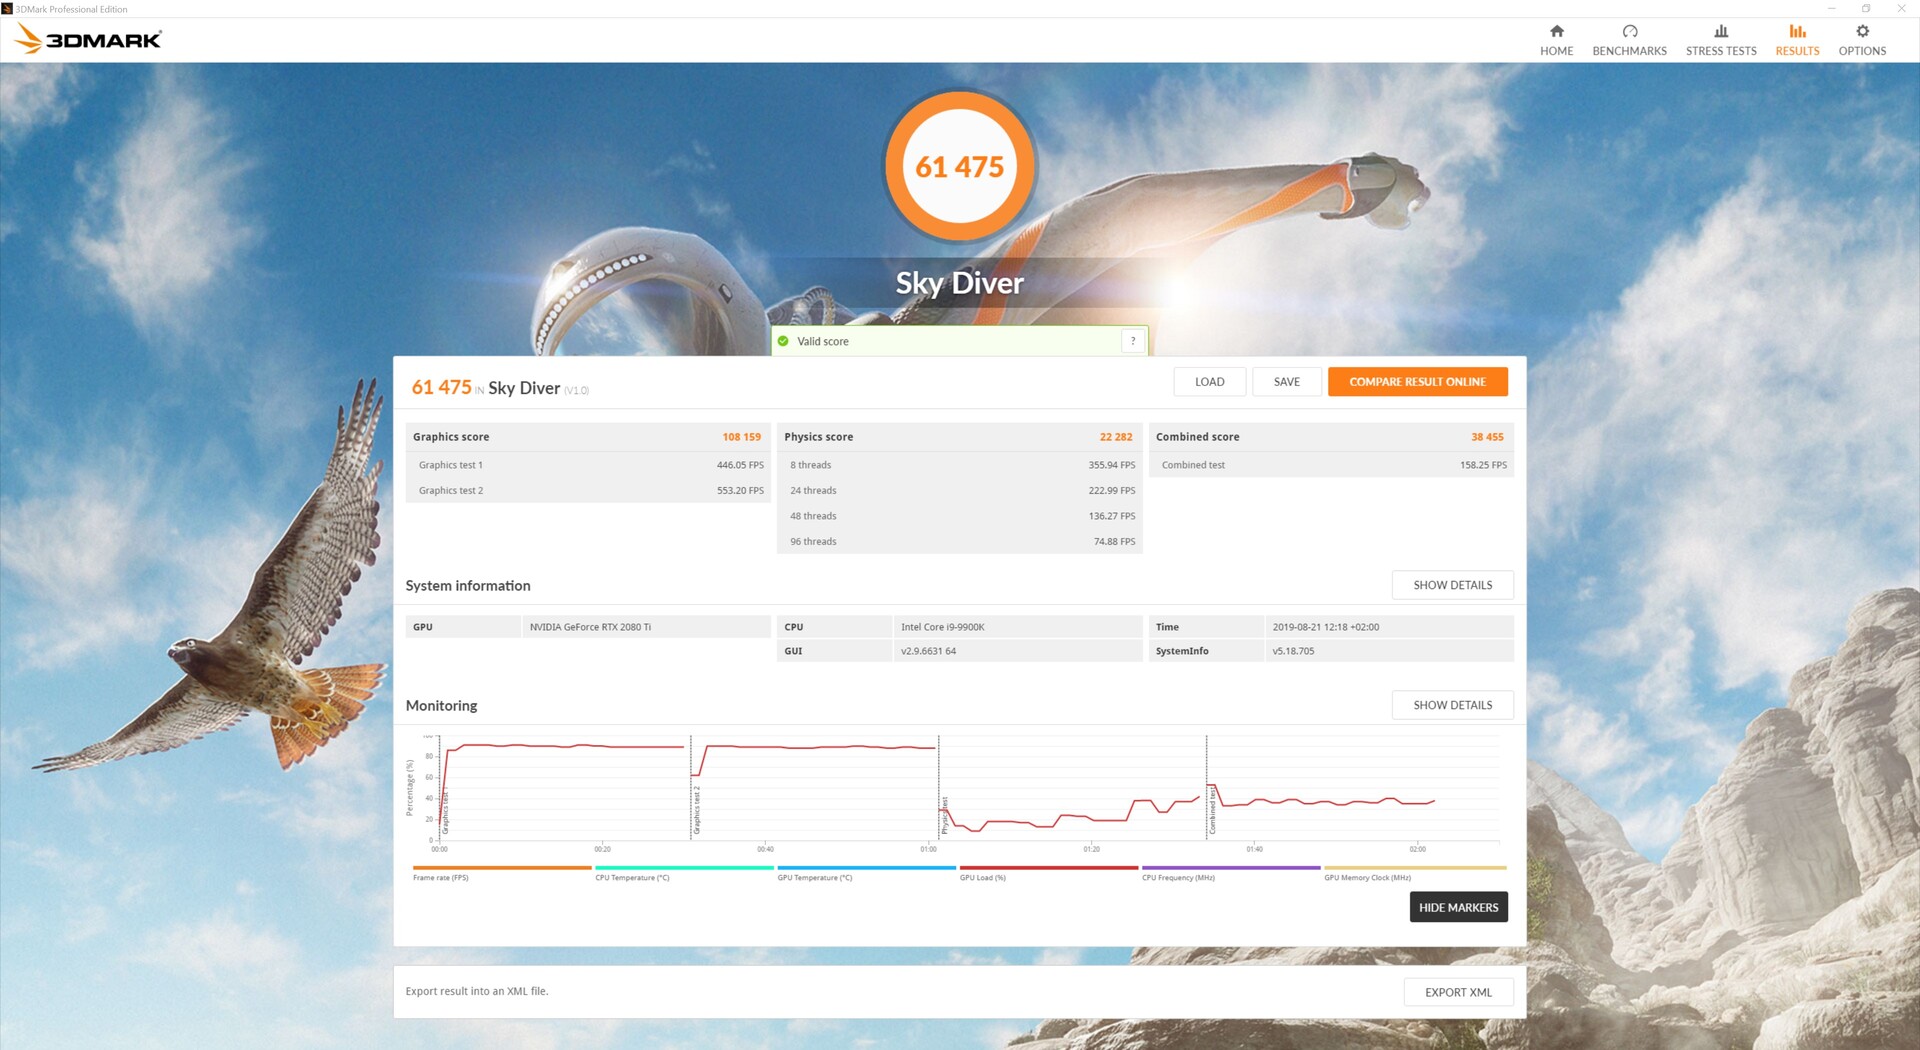
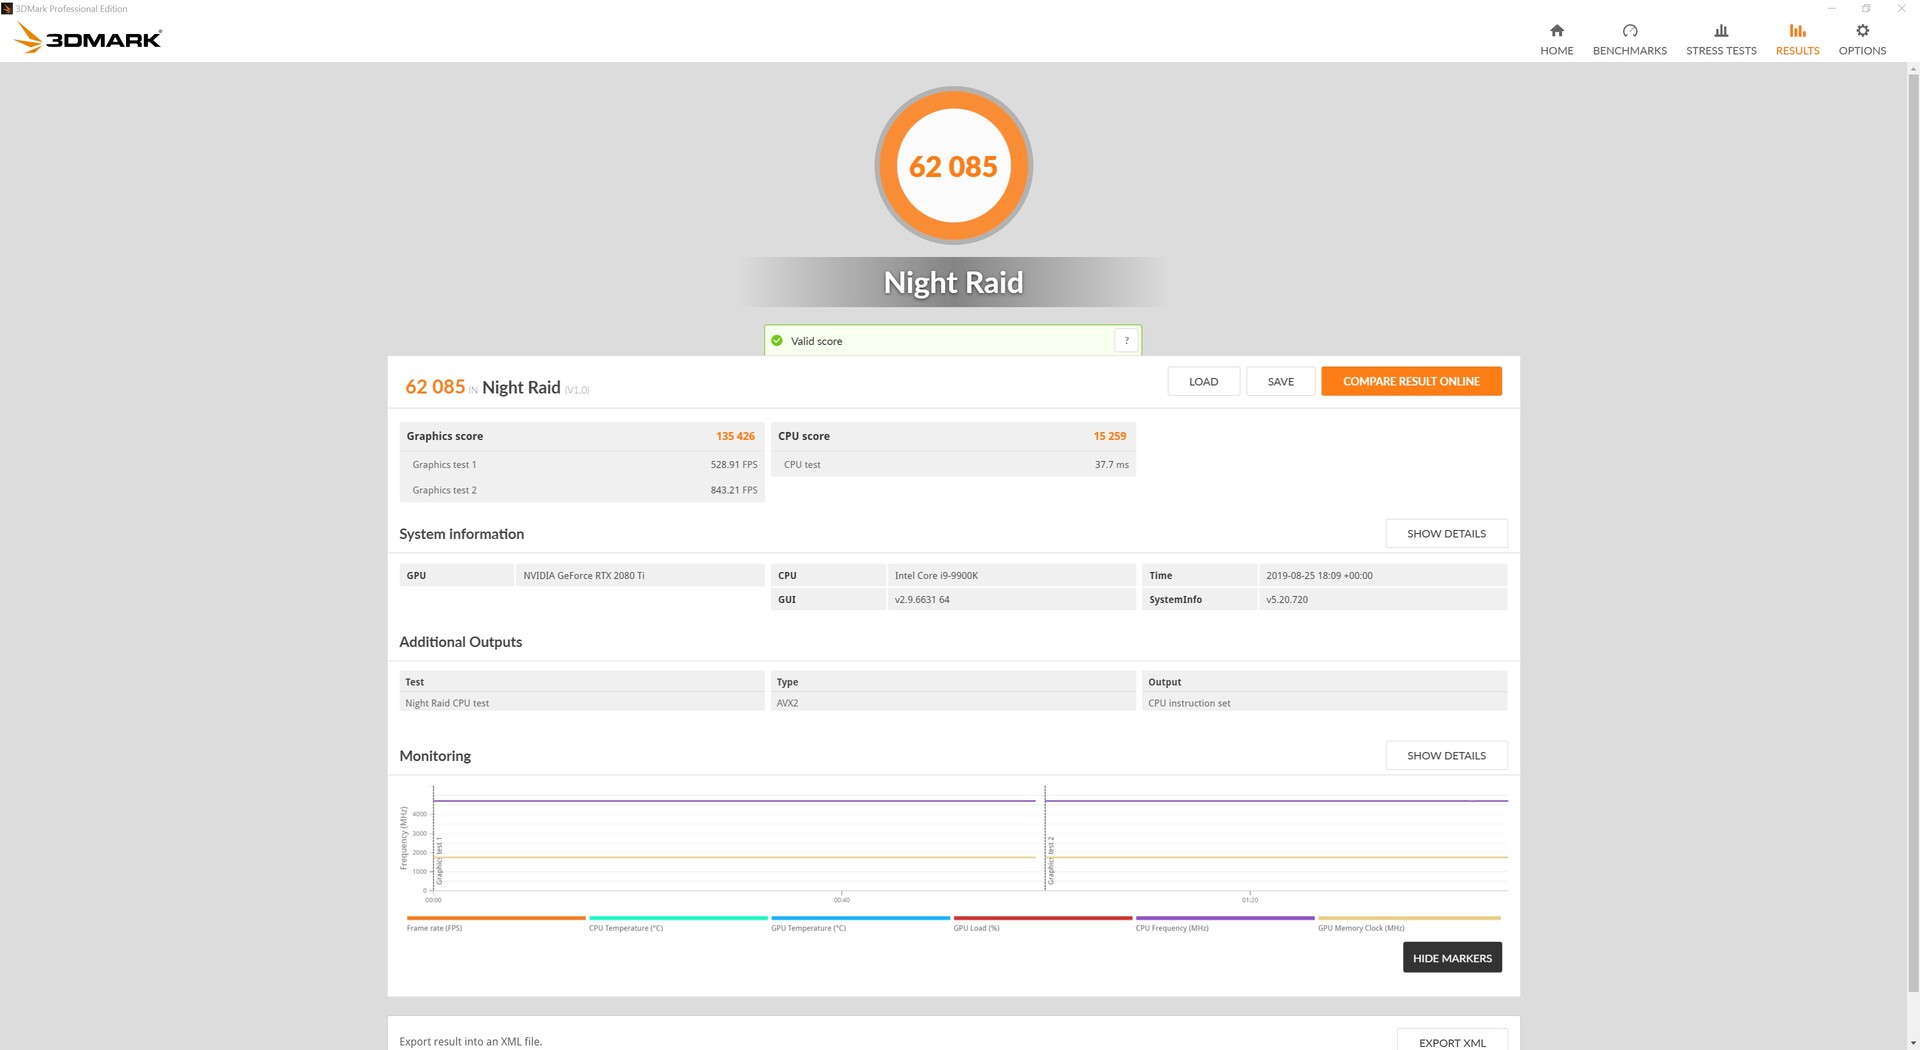
| 3DMark 05 Standard | 42923 points | |
| 3DMark 06 Standard Score | 47106 points | |
| 3DMark Vantage P Result | 85226 points | |
| 3DMark 11 Performance | 35027 points | |
| 3DMark Ice Storm Standard Score | 211517 points | |
| 3DMark Cloud Gate Standard Score | 61796 points | |
| 3DMark Fire Strike Score | 26564 points | |
| 3DMark Fire Strike Extreme Score | 16096 points | |
| 3DMark Time Spy Score | 13613 points | |
Help | ||
Gaming Performance


The One i160 is powerful enough to play all modern triple-A games smoothly in 4K at maximum graphics, although some titles like Anno 1800 and Metro Exodus average below 60 FPS. The TITAN RTX would outperform the GeForce RTX 2080 Ti here but for its weaker CPU, although the difference between the two in games like Call of Duty Black Ops 4 is only 1 FPS at 4K and maximum graphics.
We also subjected our review unit to a prolonged gaming test to assess its performance under sustained load. We used The Witcher 3 for this, which we set at 1080p, ultra-graphics and left running for an hour. We did not move the character during this time and measured any changes in FPS. The system dropped around 5 FPS by the end of the test but still ran at around 131 FPS, so you should not notice any throttling when gaming.
| Call of Duty Black Ops 4 | |
| 1920x1080 Very High / On | |
| Corsair One i160 | |
| Nvidia Titan RTX | |
| MSI RTX 2080 Gaming X Trio | |
| AMD Radeon RX Vega 64 | |
| Nvidia GeForce RTX 2070 Super | |
| MSI RTX 2070 Gaming Z 8G | |
| AMD Radeon VII | |
| Nvidia GeForce RTX 2060 Super | |
| AMD Radeon RX 5700 XT | |
| MSI RTX 2060 Gaming Z 6G | |
| AMD Radeon RX 5700 | |
| 3840x2160 Very High / On | |
| Corsair One i160 | |
| Nvidia Titan RTX | |
| MSI RTX 2080 Gaming X Trio | |
| AMD Radeon RX Vega 64 | |
| AMD Radeon VII | |
| AMD Radeon RX 5700 XT | |
| Nvidia GeForce RTX 2070 Super | |
| AMD Radeon RX 5700 | |
| Nvidia GeForce RTX 2060 Super | |
| MSI RTX 2070 Gaming Z 8G | |
| MSI RTX 2060 Gaming Z 6G | |
| 2560x1440 Very High / On | |
| Corsair One i160 | |
| AMD Radeon RX 5700 XT | |
| MSI RTX 2080 Gaming X Trio | |
| Nvidia GeForce RTX 2070 Super | |
| MSI RTX 2070 Gaming Z 8G | |
| AMD Radeon RX 5700 | |
| Nvidia GeForce RTX 2060 Super | |
| Assassin´s Creed Odyssey | |
| 1920x1080 Ultra High Preset | |
| Corsair One i160 | |
| Nvidia Titan RTX | |
| MSI RTX 2080 Gaming X Trio | |
| MSI RTX 2070 Gaming Z 8G | |
| Nvidia GeForce RTX 2070 Super | |
| AMD Radeon VII | |
| AMD Radeon RX 5700 XT | |
| Nvidia GeForce RTX 2060 Super | |
| AMD Radeon RX 5700 | |
| MSI RTX 2060 Gaming Z 6G | |
| AMD Radeon RX Vega 64 | |
| 3840x2160 Ultra High Preset | |
| Corsair One i160 | |
| Nvidia Titan RTX | |
| AMD Radeon VII | |
| MSI RTX 2080 Gaming X Trio | |
| Nvidia GeForce RTX 2070 Super | |
| MSI RTX 2070 Gaming Z 8G | |
| AMD Radeon RX 5700 XT | |
| Nvidia GeForce RTX 2060 Super | |
| AMD Radeon RX 5700 | |
| AMD Radeon RX Vega 64 | |
| MSI RTX 2060 Gaming Z 6G | |
| 2560x1440 Ultra High Preset | |
| Corsair One i160 | |
| MSI RTX 2080 Gaming X Trio | |
| Nvidia GeForce RTX 2070 Super | |
| MSI RTX 2070 Gaming Z 8G | |
| AMD Radeon RX 5700 XT | |
| Nvidia GeForce RTX 2060 Super | |
| AMD Radeon RX 5700 | |
| FIFA 19 | |
| 1920x1080 Ultra Preset AA:4x MS | |
| Corsair One i160 | |
| AMD Radeon RX Vega 64 | |
| AMD Radeon RX 5700 XT | |
| AMD Radeon RX 5700 | |
| Nvidia GeForce RTX 2070 Super | |
| Nvidia Titan RTX | |
| MSI RTX 2080 Gaming X Trio | |
| AMD Radeon VII | |
| MSI RTX 2070 Gaming Z 8G | |
| Nvidia GeForce RTX 2060 Super | |
| MSI RTX 2060 Gaming Z 6G | |
| 3840x2160 Ultra Preset AA:4x MS | |
| Corsair One i160 | |
| Nvidia Titan RTX | |
| AMD Radeon VII | |
| MSI RTX 2080 Gaming X Trio | |
| AMD Radeon RX 5700 XT | |
| Nvidia GeForce RTX 2060 Super | |
| MSI RTX 2070 Gaming Z 8G | |
| Nvidia GeForce RTX 2070 Super | |
| AMD Radeon RX 5700 | |
| AMD Radeon RX Vega 64 | |
| MSI RTX 2060 Gaming Z 6G | |
| 2560x1440 Ultra Preset AA:4x MS | |
| Corsair One i160 | |
| AMD Radeon RX 5700 XT | |
| AMD Radeon RX 5700 | |
| Nvidia GeForce RTX 2070 Super | |
| MSI RTX 2080 Gaming X Trio | |
| Nvidia GeForce RTX 2060 Super | |
| MSI RTX 2070 Gaming Z 8G | |
| Forza Horizon 4 | |
| 1920x1080 Ultra Preset AA:2xMS | |
| Corsair One i160 | |
| MSI RTX 2080 Gaming X Trio | |
| AMD Radeon RX 5700 XT | |
| Nvidia Titan RTX | |
| AMD Radeon VII | |
| Nvidia GeForce RTX 2070 Super | |
| AMD Radeon RX Vega 64 | |
| AMD Radeon RX 5700 | |
| MSI RTX 2070 Gaming Z 8G | |
| Nvidia GeForce RTX 2060 Super | |
| MSI RTX 2060 Gaming Z 6G | |
| 3840x2160 Ultra Preset AA:2xMS | |
| Corsair One i160 | |
| Nvidia Titan RTX | |
| MSI RTX 2080 Gaming X Trio | |
| AMD Radeon RX 5700 XT | |
| AMD Radeon VII | |
| Nvidia GeForce RTX 2070 Super | |
| AMD Radeon RX 5700 | |
| MSI RTX 2070 Gaming Z 8G | |
| AMD Radeon RX Vega 64 | |
| Nvidia GeForce RTX 2060 Super | |
| MSI RTX 2060 Gaming Z 6G | |
| 2560x1440 Ultra Preset AA:2xMS | |
| Corsair One i160 | |
| AMD Radeon RX 5700 XT | |
| MSI RTX 2080 Gaming X Trio | |
| Nvidia GeForce RTX 2070 Super | |
| AMD Radeon RX 5700 | |
| MSI RTX 2070 Gaming Z 8G | |
| Nvidia GeForce RTX 2060 Super | |
| F1 2018 | |
| 1920x1080 Ultra High Preset AA:T AF:16x | |
| Corsair One i160 | |
| Nvidia Titan RTX | |
| MSI RTX 2080 Gaming X Trio | |
| AMD Radeon VII | |
| Nvidia GeForce RTX 2070 Super | |
| MSI RTX 2070 Gaming Z 8G | |
| Nvidia GeForce RTX 2060 Super | |
| MSI RTX 2060 Gaming Z 6G | |
| AMD Radeon RX Vega 64 | |
| 3840x2160 Ultra High Preset AA:T AF:16x | |
| Nvidia Titan RTX | |
| Corsair One i160 | |
| MSI RTX 2080 Gaming X Trio | |
| AMD Radeon VII | |
| Nvidia GeForce RTX 2070 Super | |
| MSI RTX 2070 Gaming Z 8G | |
| Nvidia GeForce RTX 2060 Super | |
| MSI RTX 2060 Gaming Z 6G | |
| AMD Radeon RX Vega 64 | |
| 2560x1440 Ultra High Preset AA:T AF:16x | |
| Corsair One i160 | |
| MSI RTX 2080 Gaming X Trio | |
| Nvidia GeForce RTX 2070 Super | |
| MSI RTX 2070 Gaming Z 8G | |
| Nvidia GeForce RTX 2060 Super | |
| Monster Hunter World | |
| 1920x1080 Highest Preset (Image Quality High) | |
| Corsair One i160 | |
| Nvidia Titan RTX | |
| MSI RTX 2080 Gaming X Trio | |
| Nvidia GeForce RTX 2070 Super | |
| MSI RTX 2070 Gaming Z 8G | |
| AMD Radeon VII | |
| Nvidia GeForce RTX 2060 Super | |
| AMD Radeon RX 5700 XT | |
| MSI RTX 2060 Gaming Z 6G | |
| AMD Radeon RX Vega 64 | |
| AMD Radeon RX 5700 | |
| 3840x2160 Highest Preset (Image Quality High) | |
| Nvidia Titan RTX | |
| Corsair One i160 | |
| MSI RTX 2080 Gaming X Trio | |
| Nvidia GeForce RTX 2070 Super | |
| AMD Radeon VII | |
| MSI RTX 2070 Gaming Z 8G | |
| AMD Radeon RX 5700 XT | |
| AMD Radeon RX Vega 64 | |
| Nvidia GeForce RTX 2060 Super | |
| AMD Radeon RX 5700 | |
| MSI RTX 2060 Gaming Z 6G | |
| 2560x1440 Highest Preset (Image Quality High) | |
| Corsair One i160 | |
| MSI RTX 2080 Gaming X Trio | |
| Nvidia GeForce RTX 2070 Super | |
| MSI RTX 2070 Gaming Z 8G | |
| AMD Radeon RX 5700 XT | |
| Nvidia GeForce RTX 2060 Super | |
| AMD Radeon RX 5700 | |
| Far Cry 5 | |
| 1920x1080 Ultra Preset AA:T | |
| Corsair One i160 | |
| MSI RTX 2080 Gaming X Trio | |
| Nvidia Titan RTX | |
| MSI RTX 2070 Gaming Z 8G | |
| AMD Radeon RX Vega 64 | |
| Nvidia GeForce RTX 2060 Super | |
| Nvidia GeForce RTX 2070 Super | |
| AMD Radeon RX 5700 XT | |
| MSI RTX 2060 Gaming Z 6G | |
| AMD Radeon VII | |
| AMD Radeon RX 5700 | |
| 3840x2160 Ultra Preset AA:T | |
| Corsair One i160 | |
| Nvidia Titan RTX | |
| MSI RTX 2080 Gaming X Trio | |
| AMD Radeon VII | |
| Nvidia GeForce RTX 2070 Super | |
| AMD Radeon RX 5700 XT | |
| MSI RTX 2070 Gaming Z 8G | |
| Nvidia GeForce RTX 2060 Super | |
| AMD Radeon RX 5700 | |
| AMD Radeon RX Vega 64 | |
| MSI RTX 2060 Gaming Z 6G | |
| 2560x1440 Ultra Preset AA:T | |
| Corsair One i160 | |
| MSI RTX 2080 Gaming X Trio | |
| Nvidia GeForce RTX 2070 Super | |
| AMD Radeon RX 5700 XT | |
| MSI RTX 2070 Gaming Z 8G | |
| Nvidia GeForce RTX 2060 Super | |
| AMD Radeon RX 5700 | |
| The Crew 2 | |
| 1920x1080 Ultra Preset | |
| Nvidia Titan RTX | |
| MSI RTX 2060 Gaming Z 6G | |
| MSI RTX 2070 Gaming Z 8G | |
| MSI RTX 2080 Gaming X Trio | |
| AMD Radeon VII | |
| Nvidia GeForce RTX 2060 Super | |
| Nvidia GeForce RTX 2070 Super | |
| AMD Radeon RX 5700 | |
| AMD Radeon RX 5700 XT | |
| Corsair One i160 | |
| 3840x2160 Ultra Preset | |
| Nvidia Titan RTX | |
| MSI RTX 2080 Gaming X Trio | |
| Corsair One i160 | |
| Nvidia GeForce RTX 2070 Super | |
| AMD Radeon RX 5700 XT | |
| MSI RTX 2070 Gaming Z 8G | |
| AMD Radeon VII | |
| AMD Radeon RX 5700 | |
| Nvidia GeForce RTX 2060 Super | |
| MSI RTX 2060 Gaming Z 6G | |
| 2560x1440 Ultra Preset | |
| MSI RTX 2070 Gaming Z 8G | |
| MSI RTX 2080 Gaming X Trio | |
| Nvidia GeForce RTX 2070 Super | |
| AMD Radeon RX 5700 | |
| AMD Radeon RX 5700 XT | |
| Corsair One i160 | |
| Nvidia GeForce RTX 2060 Super | |
| Assassin´s Creed Origins | |
| 1920x1080 Ultra High Preset | |
| Corsair One i160 | |
| Nvidia Titan RTX | |
| MSI RTX 2080 Gaming X Trio | |
| MSI RTX 2070 Gaming Z 8G | |
| Nvidia GeForce RTX 2070 Super | |
| Nvidia GeForce RTX 2060 Super | |
| MSI RTX 2060 Gaming Z 6G | |
| AMD Radeon RX Vega 64 | |
| AMD Radeon VII | |
| AMD Radeon RX 5700 | |
| AMD Radeon RX 5700 XT | |
| 3840x2160 Ultra High Preset | |
| Nvidia Titan RTX | |
| Corsair One i160 | |
| MSI RTX 2080 Gaming X Trio | |
| AMD Radeon VII | |
| Nvidia GeForce RTX 2070 Super | |
| MSI RTX 2070 Gaming Z 8G | |
| Nvidia GeForce RTX 2060 Super | |
| MSI RTX 2060 Gaming Z 6G | |
| AMD Radeon RX 5700 XT | |
| AMD Radeon RX 5700 | |
| AMD Radeon RX Vega 64 | |
| 2560x1440 Ultra High Preset | |
| Corsair One i160 | |
| MSI RTX 2080 Gaming X Trio | |
| Nvidia GeForce RTX 2070 Super | |
| MSI RTX 2070 Gaming Z 8G | |
| Nvidia GeForce RTX 2060 Super | |
| AMD Radeon RX 5700 XT | |
| AMD Radeon RX 5700 | |
| Kingdom Come: Deliverance | |
| 1920x1080 Ultra High Preset | |
| Corsair One i160 | |
| Nvidia Titan RTX | |
| MSI RTX 2080 Gaming X Trio | |
| Nvidia GeForce RTX 2070 Super | |
| MSI RTX 2070 Gaming Z 8G | |
| Nvidia GeForce RTX 2060 Super | |
| AMD Radeon RX 5700 XT | |
| AMD Radeon RX Vega 64 | |
| AMD Radeon VII | |
| MSI RTX 2060 Gaming Z 6G | |
| AMD Radeon RX 5700 | |
| 3840x2160 Ultra High Preset | |
| Corsair One i160 | |
| Nvidia Titan RTX | |
| MSI RTX 2080 Gaming X Trio | |
| AMD Radeon RX Vega 64 | |
| Nvidia GeForce RTX 2070 Super | |
| AMD Radeon VII | |
| MSI RTX 2070 Gaming Z 8G | |
| Nvidia GeForce RTX 2060 Super | |
| AMD Radeon RX 5700 XT | |
| AMD Radeon RX 5700 | |
| MSI RTX 2060 Gaming Z 6G | |
| 2560x1440 Ultra High Preset | |
| Corsair One i160 | |
| MSI RTX 2080 Gaming X Trio | |
| Nvidia GeForce RTX 2070 Super | |
| AMD Radeon RX 5700 XT | |
| Nvidia GeForce RTX 2060 Super | |
| MSI RTX 2070 Gaming Z 8G | |
| AMD Radeon RX 5700 | |
| Destiny 2 | |
| 1920x1080 Highest Preset AA:SM AF:16x | |
| Corsair One i160 | |
| Nvidia Titan RTX | |
| MSI RTX 2070 Gaming Z 8G | |
| MSI RTX 2080 Gaming X Trio | |
| Nvidia GeForce RTX 2060 Super | |
| Nvidia GeForce RTX 2070 Super | |
| AMD Radeon RX 5700 XT | |
| AMD Radeon RX 5700 | |
| AMD Radeon VII | |
| MSI RTX 2060 Gaming Z 6G | |
| 3840x2160 Highest Preset AA:SM AF:16x | |
| Nvidia Titan RTX | |
| Corsair One i160 | |
| MSI RTX 2080 Gaming X Trio | |
| Nvidia GeForce RTX 2070 Super | |
| MSI RTX 2070 Gaming Z 8G | |
| AMD Radeon RX 5700 XT | |
| Nvidia GeForce RTX 2060 Super | |
| AMD Radeon VII | |
| MSI RTX 2060 Gaming Z 6G | |
| AMD Radeon RX 5700 | |
| 2560x1440 Highest Preset AA:SM AF:16x | |
| Corsair One i160 | |
| MSI RTX 2080 Gaming X Trio | |
| Nvidia GeForce RTX 2070 Super | |
| MSI RTX 2070 Gaming Z 8G | |
| AMD Radeon RX 5700 XT | |
| Nvidia GeForce RTX 2060 Super | |
| AMD Radeon RX 5700 | |
| Far Cry Primal | |
| 1920x1080 Ultra Preset AA:SM | |
| Corsair One i160 | |
| AMD Radeon RX Vega 64 | |
| MSI RTX 2070 Gaming Z 8G | |
| AMD Radeon VII | |
| MSI RTX 2060 Gaming Z 6G | |
| AMD Radeon RX 5700 | |
| MSI RTX 2080 Gaming X Trio | |
| Nvidia GeForce RTX 2060 Super | |
| Nvidia GeForce RTX 2070 Super | |
| AMD Radeon RX 5700 XT | |
| Nvidia Titan RTX | |
| 3840x2160 High Preset AA:SM | |
| Corsair One i160 | |
| Nvidia Titan RTX | |
| MSI RTX 2080 Gaming X Trio | |
| AMD Radeon VII | |
| Nvidia GeForce RTX 2070 Super | |
| MSI RTX 2070 Gaming Z 8G | |
| AMD Radeon RX 5700 XT | |
| Nvidia GeForce RTX 2060 Super | |
| AMD Radeon RX 5700 | |
| MSI RTX 2060 Gaming Z 6G | |
| AMD Radeon RX Vega 64 | |
| The Witcher 3 | |
| 1920x1080 Ultra Graphics & Postprocessing (HBAO+) | |
| Corsair One i160 | |
| Nvidia Titan RTX | |
| MSI RTX 2080 Gaming X Trio | |
| Nvidia GeForce RTX 2070 Super | |
| AMD Radeon RX 5700 XT | |
| MSI RTX 2070 Gaming Z 8G | |
| AMD Radeon RX 5700 | |
| Nvidia GeForce RTX 2060 Super | |
| AMD Radeon RX Vega 64 | |
| AMD Radeon VII | |
| MSI RTX 2060 Gaming Z 6G | |
| 3840x2160 High Graphics & Postprocessing (Nvidia HairWorks Off) | |
| Nvidia Titan RTX | |
| Corsair One i160 | |
| MSI RTX 2080 Gaming X Trio | |
| Nvidia GeForce RTX 2070 Super | |
| MSI RTX 2070 Gaming Z 8G | |
| Nvidia GeForce RTX 2060 Super | |
| AMD Radeon VII | |
| AMD Radeon RX 5700 XT | |
| MSI RTX 2060 Gaming Z 6G | |
| AMD Radeon RX Vega 64 | |
| AMD Radeon RX 5700 | |
| Watch Dogs 2 | |
| 1920x1080 Ultra Preset | |
| Corsair One i160 | |
| Nvidia Titan RTX | |
| MSI RTX 2080 Gaming X Trio | |
| Nvidia GeForce RTX 2070 Super | |
| MSI RTX 2070 Gaming Z 8G | |
| Nvidia GeForce RTX 2060 Super | |
| AMD Radeon RX Vega 64 | |
| MSI RTX 2060 Gaming Z 6G | |
| AMD Radeon VII | |
| 3840x2160 High Preset | |
| Nvidia Titan RTX | |
| Corsair One i160 | |
| MSI RTX 2080 Gaming X Trio | |
| Nvidia GeForce RTX 2070 Super | |
| MSI RTX 2070 Gaming Z 8G | |
| Nvidia GeForce RTX 2060 Super | |
| AMD Radeon VII | |
| MSI RTX 2060 Gaming Z 6G | |
| AMD Radeon RX Vega 64 | |
| Battlefield 1 | |
| 1920x1080 Ultra Preset AA:T | |
| Corsair One i160 | |
| Nvidia Titan RTX | |
| Nvidia GeForce RTX 2070 Super | |
| MSI RTX 2080 Gaming X Trio | |
| AMD Radeon RX Vega 64 | |
| Nvidia GeForce RTX 2060 Super | |
| MSI RTX 2070 Gaming Z 8G | |
| AMD Radeon VII | |
| MSI RTX 2060 Gaming Z 6G | |
| 3840x2160 High Preset AA:T | |
| Corsair One i160 | |
| Nvidia Titan RTX | |
| MSI RTX 2080 Gaming X Trio | |
| AMD Radeon VII | |
| Nvidia GeForce RTX 2070 Super | |
| MSI RTX 2070 Gaming Z 8G | |
| Nvidia GeForce RTX 2060 Super | |
| AMD Radeon RX Vega 64 | |
| MSI RTX 2060 Gaming Z 6G | |
| The Division | |
| 1920x1080 Ultra Preset AF:16x | |
| Nvidia Titan RTX | |
| Corsair One i160 | |
| MSI RTX 2080 Gaming X Trio | |
| AMD Radeon RX 5700 XT | |
| AMD Radeon RX 5700 | |
| Nvidia GeForce RTX 2070 Super | |
| MSI RTX 2070 Gaming Z 8G | |
| Nvidia GeForce RTX 2060 Super | |
| AMD Radeon RX Vega 64 | |
| MSI RTX 2060 Gaming Z 6G | |
| AMD Radeon VII | |
| 3840x2160 High Preset AF:8x | |
| Corsair One i160 | |
| Nvidia Titan RTX | |
| MSI RTX 2080 Gaming X Trio | |
| AMD Radeon RX 5700 XT | |
| Nvidia GeForce RTX 2070 Super | |
| AMD Radeon VII | |
| MSI RTX 2070 Gaming Z 8G | |
| AMD Radeon RX 5700 | |
| Nvidia GeForce RTX 2060 Super | |
| AMD Radeon RX Vega 64 | |
| MSI RTX 2060 Gaming Z 6G | |
| For Honor | |
| 1920x1080 Extreme Preset AA:T AF:16x | |
| Nvidia Titan RTX | |
| Corsair One i160 | |
| MSI RTX 2080 Gaming X Trio | |
| AMD Radeon RX 5700 XT | |
| Nvidia GeForce RTX 2070 Super | |
| AMD Radeon RX 5700 | |
| MSI RTX 2070 Gaming Z 8G | |
| Nvidia GeForce RTX 2060 Super | |
| AMD Radeon RX Vega 64 | |
| MSI RTX 2060 Gaming Z 6G | |
| AMD Radeon VII | |
| 3840x2160 High Preset AA:T AF:8x | |
| Nvidia Titan RTX | |
| Corsair One i160 | |
| MSI RTX 2080 Gaming X Trio | |
| Nvidia GeForce RTX 2070 Super | |
| AMD Radeon VII | |
| AMD Radeon RX 5700 XT | |
| MSI RTX 2070 Gaming Z 8G | |
| Nvidia GeForce RTX 2060 Super | |
| AMD Radeon RX 5700 | |
| MSI RTX 2060 Gaming Z 6G | |
| AMD Radeon RX Vega 64 | |
| Ghost Recon Wildlands | |
| 1920x1080 Ultra Preset AA:T AF:16x | |
| Corsair One i160 | |
| Nvidia Titan RTX | |
| MSI RTX 2080 Gaming X Trio | |
| Nvidia GeForce RTX 2070 Super | |
| AMD Radeon RX 5700 XT | |
| MSI RTX 2070 Gaming Z 8G | |
| Nvidia GeForce RTX 2060 Super | |
| AMD Radeon RX 5700 | |
| MSI RTX 2060 Gaming Z 6G | |
| AMD Radeon RX Vega 64 | |
| AMD Radeon VII | |
| 3840x2160 Ultra Preset AA:T AF:16x | |
| Nvidia Titan RTX | |
| Corsair One i160 | |
| MSI RTX 2080 Gaming X Trio | |
| Nvidia GeForce RTX 2070 Super | |
| AMD Radeon RX 5700 XT | |
| MSI RTX 2070 Gaming Z 8G | |
| AMD Radeon RX 5700 | |
| Nvidia GeForce RTX 2060 Super | |
| Doom | |
| 1920x1080 Ultra Preset AA:SM | |
| Corsair One i160 | |
| Nvidia Titan RTX | |
| Nvidia GeForce RTX 2060 Super | |
| MSI RTX 2080 Gaming X Trio | |
| MSI RTX 2070 Gaming Z 8G | |
| MSI RTX 2060 Gaming Z 6G | |
| Nvidia GeForce RTX 2070 Super | |
| 3840x2160 High Preset AA:FX | |
| Corsair One i160 | |
| Nvidia Titan RTX | |
| MSI RTX 2080 Gaming X Trio | |
| Nvidia GeForce RTX 2070 Super | |
| MSI RTX 2070 Gaming Z 8G | |
| Nvidia GeForce RTX 2060 Super | |
| MSI RTX 2060 Gaming Z 6G | |
| GTA V | |
| 1920x1080 Highest AA:4xMSAA + FX AF:16x | |
| Nvidia Titan RTX | |
| MSI RTX 2080 Gaming X Trio | |
| AMD Radeon VII | |
| MSI RTX 2070 Gaming Z 8G | |
| Corsair One i160 | |
| MSI RTX 2060 Gaming Z 6G | |
| Nvidia GeForce RTX 2060 Super | |
| Nvidia GeForce RTX 2070 Super | |
| AMD Radeon RX 5700 | |
| AMD Radeon RX 5700 XT | |
| 3840x2160 High/On (Advanced Graphics Off) AA:FX AF:8x | |
| Corsair One i160 | |
| Nvidia Titan RTX | |
| Nvidia GeForce RTX 2070 Super | |
| AMD Radeon RX 5700 XT | |
| MSI RTX 2080 Gaming X Trio | |
| Nvidia GeForce RTX 2060 Super | |
| AMD Radeon RX 5700 | |
| AMD Radeon VII | |
| MSI RTX 2070 Gaming Z 8G | |
| MSI RTX 2060 Gaming Z 6G | |
| Battlefield 4 - 3840x2160 High Preset | |
| Nvidia Titan RTX | |
| Corsair One i160 | |
| MSI RTX 2080 Gaming X Trio | |
| Nvidia GeForce RTX 2070 Super | |
| MSI RTX 2070 Gaming Z 8G | |
| AMD Radeon RX Vega 64 | |
| AMD Radeon VII | |
| Nvidia GeForce RTX 2060 Super | |
| MSI RTX 2060 Gaming Z 6G | |
| Farming Simulator 19 | |
| 1920x1080 Very High Preset | |
| Corsair One i160 | |
| Nvidia Titan RTX | |
| MSI RTX 2080 Gaming X Trio | |
| MSI RTX 2060 Gaming Z 6G | |
| Nvidia GeForce RTX 2070 Super | |
| MSI RTX 2070 Gaming Z 8G | |
| Nvidia GeForce RTX 2060 Super | |
| AMD Radeon RX 5700 XT | |
| AMD Radeon VII | |
| AMD Radeon RX Vega 64 | |
| AMD Radeon RX 5700 | |
| 3840x2160 Very High Preset | |
| Nvidia Titan RTX | |
| Corsair One i160 | |
| MSI RTX 2080 Gaming X Trio | |
| Nvidia GeForce RTX 2070 Super | |
| MSI RTX 2070 Gaming Z 8G | |
| Nvidia GeForce RTX 2060 Super | |
| MSI RTX 2060 Gaming Z 6G | |
| AMD Radeon RX 5700 XT | |
| AMD Radeon VII | |
| AMD Radeon RX 5700 | |
| AMD Radeon RX Vega 64 | |
| 2560x1440 Very High Preset | |
| Corsair One i160 | |
| MSI RTX 2080 Gaming X Trio | |
| MSI RTX 2070 Gaming Z 8G | |
| Nvidia GeForce RTX 2070 Super | |
| Nvidia GeForce RTX 2060 Super | |
| AMD Radeon RX 5700 XT | |
| AMD Radeon RX 5700 | |
| Just Cause 4 | |
| 1920x1080 Very High / On AA:SM AF:16x | |
| Nvidia Titan RTX | |
| Corsair One i160 | |
| MSI RTX 2080 Gaming X Trio | |
| Nvidia GeForce RTX 2070 Super | |
| AMD Radeon RX 5700 XT | |
| MSI RTX 2070 Gaming Z 8G | |
| Nvidia GeForce RTX 2060 Super | |
| AMD Radeon VII | |
| MSI RTX 2060 Gaming Z 6G | |
| AMD Radeon RX Vega 64 | |
| AMD Radeon RX 5700 | |
| 3840x2160 Very High / On AA:SM AF:16x | |
| Nvidia Titan RTX | |
| Corsair One i160 | |
| MSI RTX 2080 Gaming X Trio | |
| Nvidia GeForce RTX 2070 Super | |
| AMD Radeon VII | |
| AMD Radeon RX 5700 XT | |
| MSI RTX 2070 Gaming Z 8G | |
| Nvidia GeForce RTX 2060 Super | |
| AMD Radeon RX 5700 | |
| MSI RTX 2060 Gaming Z 6G | |
| AMD Radeon RX Vega 64 | |
| 2560x1440 Very High / On AA:SM AF:16x | |
| Corsair One i160 | |
| MSI RTX 2080 Gaming X Trio | |
| Nvidia GeForce RTX 2070 Super | |
| AMD Radeon RX 5700 XT | |
| MSI RTX 2070 Gaming Z 8G | |
| Nvidia GeForce RTX 2060 Super | |
| AMD Radeon RX 5700 | |
| Apex Legends | |
| 1920x1080 Maximum Settings AA:TS AF:16x | |
| MSI RTX 2070 Gaming Z 8G | |
| MSI RTX 2080 Gaming X Trio | |
| Nvidia Titan RTX 24 GB | |
| Nvidia GeForce RTX 2060 Super | |
| Nvidia GeForce RTX 2070 Super | |
| AMD Radeon RX 5700 XT | |
| Corsair One i160 | |
| AMD Radeon RX 5700 | |
| MSI RTX 2060 Gaming Z 6G | |
| AMD Radeon RX Vega 64 | |
| 3840x2160 Maximum Settings AA:TS AF:16x | |
| Nvidia Titan RTX 24 GB | |
| Corsair One i160 | |
| MSI RTX 2080 Gaming X Trio | |
| MSI RTX 2070 Gaming Z 8G | |
| Nvidia GeForce RTX 2070 Super | |
| AMD Radeon RX 5700 XT | |
| Nvidia GeForce RTX 2060 Super | |
| AMD Radeon RX 5700 | |
| AMD Radeon RX Vega 64 | |
| MSI RTX 2060 Gaming Z 6G | |
| 2560x1440 Maximum Settings AA:TS AF:16x | |
| Corsair One i160 | |
| Nvidia Titan RTX 24 GB | |
| MSI RTX 2070 Gaming Z 8G | |
| MSI RTX 2080 Gaming X Trio | |
| Nvidia GeForce RTX 2070 Super | |
| AMD Radeon RX 5700 XT | |
| Nvidia GeForce RTX 2060 Super | |
| AMD Radeon RX 5700 | |
| MSI RTX 2060 Gaming Z 6G | |
| AMD Radeon RX Vega 64 | |
| Far Cry New Dawn | |
| 1920x1080 Ultra Preset | |
| Corsair One i160 | |
| MSI RTX 2080 Gaming X Trio | |
| MSI RTX 2070 Gaming Z 8G | |
| MSI RTX 2060 Gaming Z 6G | |
| Nvidia GeForce RTX 2070 Super | |
| AMD Radeon RX Vega 64 | |
| Nvidia GeForce RTX 2060 Super | |
| AMD Radeon VII | |
| AMD Radeon RX 5700 | |
| AMD Radeon RX 5700 XT | |
| Nvidia Titan RTX 24 GB | |
| 3840x2160 Ultra Preset | |
| Corsair One i160 | |
| Nvidia Titan RTX 24 GB | |
| MSI RTX 2080 Gaming X Trio | |
| AMD Radeon VII | |
| Nvidia GeForce RTX 2070 Super | |
| AMD Radeon RX 5700 XT | |
| MSI RTX 2070 Gaming Z 8G | |
| AMD Radeon RX 5700 | |
| Nvidia GeForce RTX 2060 Super | |
| AMD Radeon RX Vega 64 | |
| MSI RTX 2060 Gaming Z 6G | |
| 2560x1440 Ultra Preset | |
| Corsair One i160 | |
| MSI RTX 2080 Gaming X Trio | |
| Nvidia GeForce RTX 2070 Super | |
| AMD Radeon VII | |
| MSI RTX 2070 Gaming Z 8G | |
| AMD Radeon RX 5700 XT | |
| AMD Radeon RX Vega 64 | |
| Nvidia GeForce RTX 2060 Super | |
| AMD Radeon RX 5700 | |
| MSI RTX 2060 Gaming Z 6G | |
| Nvidia Titan RTX 24 GB | |
| Metro Exodus | |
| 1920x1080 Ultra Quality AF:16x | |
| Corsair One i160 | |
| MSI RTX 2080 Gaming X Trio | |
| Nvidia Titan RTX 24 GB | |
| Nvidia GeForce RTX 2070 Super | |
| AMD Radeon VII | |
| AMD Radeon RX 5700 XT | |
| MSI RTX 2070 Gaming Z 8G | |
| Nvidia GeForce RTX 2060 Super | |
| AMD Radeon RX 5700 | |
| AMD Radeon RX Vega 64 | |
| MSI RTX 2060 Gaming Z 6G | |
| 3840x2160 Ultra Quality AF:16x | |
| Nvidia Titan RTX 24 GB | |
| Corsair One i160 | |
| AMD Radeon RX Vega 64 | |
| MSI RTX 2080 Gaming X Trio | |
| AMD Radeon VII | |
| Nvidia GeForce RTX 2070 Super | |
| MSI RTX 2070 Gaming Z 8G | |
| Nvidia GeForce RTX 2060 Super | |
| AMD Radeon RX 5700 XT | |
| AMD Radeon RX 5700 | |
| MSI RTX 2060 Gaming Z 6G | |
| 2560x1440 Ultra Quality AF:16x | |
| Corsair One i160 | |
| Nvidia Titan RTX 24 GB | |
| MSI RTX 2080 Gaming X Trio | |
| AMD Radeon VII | |
| AMD Radeon RX 5700 XT | |
| Nvidia GeForce RTX 2070 Super | |
| MSI RTX 2070 Gaming Z 8G | |
| AMD Radeon RX 5700 | |
| Nvidia GeForce RTX 2060 Super | |
| AMD Radeon RX Vega 64 | |
| MSI RTX 2060 Gaming Z 6G | |
| Anthem | |
| 1920x1080 Ultra Preset | |
| Corsair One i160 | |
| MSI RTX 2080 Gaming X Trio | |
| AMD Radeon RX Vega 64 | |
| Nvidia GeForce RTX 2070 Super | |
| Nvidia Titan RTX 24 GB | |
| MSI RTX 2070 Gaming Z 8G | |
| AMD Radeon VII | |
| Nvidia GeForce RTX 2060 Super | |
| MSI RTX 2060 Gaming Z 6G | |
| AMD Radeon RX 5700 XT | |
| AMD Radeon RX 5700 | |
| 2560x1440 Ultra Preset | |
| Corsair One i160 | |
| Nvidia Titan RTX 24 GB | |
| MSI RTX 2080 Gaming X Trio | |
| AMD Radeon RX 5700 XT | |
| AMD Radeon VII | |
| Nvidia GeForce RTX 2070 Super | |
| MSI RTX 2070 Gaming Z 8G | |
| AMD Radeon RX 5700 | |
| AMD Radeon RX Vega 64 | |
| Nvidia GeForce RTX 2060 Super | |
| MSI RTX 2060 Gaming Z 6G | |
| Dirt Rally 2.0 | |
| 1920x1080 Ultra Preset AA:T AF:16x | |
| Corsair One i160 | |
| Nvidia Titan RTX 24 GB | |
| AMD Radeon RX 5700 XT | |
| Nvidia GeForce RTX 2070 Super | |
| MSI RTX 2080 Gaming X Trio | |
| AMD Radeon VII | |
| AMD Radeon RX 5700 | |
| MSI RTX 2070 Gaming Z 8G | |
| Nvidia GeForce RTX 2060 Super | |
| AMD Radeon RX Vega 64 | |
| MSI RTX 2060 Gaming Z 6G | |
| 3840x2160 Ultra Preset AA:T AF:16x | |
| Corsair One i160 | |
| Nvidia Titan RTX 24 GB | |
| MSI RTX 2080 Gaming X Trio | |
| Nvidia GeForce RTX 2070 Super | |
| AMD Radeon VII | |
| AMD Radeon RX 5700 XT | |
| MSI RTX 2070 Gaming Z 8G | |
| AMD Radeon RX 5700 | |
| Nvidia GeForce RTX 2060 Super | |
| AMD Radeon RX Vega 64 | |
| MSI RTX 2060 Gaming Z 6G | |
| 2560x1440 Ultra Preset AA:T AF:16x | |
| Corsair One i160 | |
| Nvidia Titan RTX 24 GB | |
| Nvidia GeForce RTX 2070 Super | |
| AMD Radeon RX 5700 XT | |
| MSI RTX 2080 Gaming X Trio | |
| AMD Radeon VII | |
| AMD Radeon RX 5700 | |
| MSI RTX 2070 Gaming Z 8G | |
| Nvidia GeForce RTX 2060 Super | |
| AMD Radeon RX Vega 64 | |
| MSI RTX 2060 Gaming Z 6G | |
| Anno 1800 | |
| 3840x2160 Ultra Graphics Quality (DX11) | |
| Corsair One i160 | |
| Nvidia Titan RTX 24 GB | |
| MSI RTX 2080 Gaming X Trio | |
| Nvidia GeForce RTX 2070 Super | |
| MSI RTX 2070 Gaming Z 8G | |
| AMD Radeon RX 5700 XT | |
| Nvidia GeForce RTX 2060 Super | |
| AMD Radeon RX 5700 | |
| MSI RTX 2060 Gaming Z 6G | |
| AMD Radeon RX Vega 64 | |
| 1920x1080 Ultra Graphics Quality (DX11) | |
| Corsair One i160 | |
| MSI RTX 2080 Gaming X Trio | |
| Nvidia GeForce RTX 2070 Super | |
| AMD Radeon RX 5700 XT | |
| MSI RTX 2070 Gaming Z 8G | |
| MSI RTX 2060 Gaming Z 6G | |
| Nvidia GeForce RTX 2060 Super | |
| AMD Radeon RX 5700 | |
| Nvidia Titan RTX 24 GB | |
| AMD Radeon RX Vega 64 | |
| 2560x1440 Ultra Graphics Quality (DX11) | |
| Corsair One i160 | |
| MSI RTX 2080 Gaming X Trio | |
| Nvidia GeForce RTX 2070 Super | |
| AMD Radeon RX 5700 XT | |
| MSI RTX 2070 Gaming Z 8G | |
| Nvidia GeForce RTX 2060 Super | |
| AMD Radeon RX 5700 | |
| MSI RTX 2060 Gaming Z 6G | |
| Nvidia Titan RTX 24 GB | |
| AMD Radeon RX Vega 64 | |
| Rage 2 | |
| 3840x2160 Ultra Preset (Resolution Scale Off) | |
| Corsair One i160 | |
| Nvidia Titan RTX 24 GB | |
| MSI RTX 2080 Gaming X Trio | |
| Nvidia GeForce RTX 2070 Super | |
| MSI RTX 2070 Gaming Z 8G | |
| AMD Radeon RX 5700 XT | |
| Nvidia GeForce RTX 2060 Super | |
| AMD Radeon RX Vega 64 | |
| AMD Radeon RX 5700 | |
| MSI RTX 2060 Gaming Z 6G | |
| 1920x1080 Ultra Preset (Resolution Scale Off) | |
| Corsair One i160 | |
| Nvidia Titan RTX 24 GB | |
| MSI RTX 2080 Gaming X Trio | |
| Nvidia GeForce RTX 2070 Super | |
| MSI RTX 2070 Gaming Z 8G | |
| AMD Radeon RX Vega 64 | |
| Nvidia GeForce RTX 2060 Super | |
| AMD Radeon RX 5700 XT | |
| MSI RTX 2060 Gaming Z 6G | |
| 2560x1440 Ultra Preset (Resolution Scale Off) | |
| Corsair One i160 | |
| Nvidia Titan RTX 24 GB | |
| MSI RTX 2080 Gaming X Trio | |
| Nvidia GeForce RTX 2070 Super | |
| MSI RTX 2070 Gaming Z 8G | |
| AMD Radeon RX Vega 64 | |
| Nvidia GeForce RTX 2060 Super | |
| AMD Radeon RX 5700 XT | |
| AMD Radeon RX 5700 | |
| MSI RTX 2060 Gaming Z 6G | |
| F1 2019 | |
| 3840x2160 Ultra High Preset AA:T AF:16x | |
| Nvidia Titan RTX 24 GB | |
| Corsair One i160 | |
| Nvidia GeForce RTX 2070 Super | |
| AMD Radeon RX 5700 XT | |
| AMD Radeon RX 5700 | |
| Nvidia GeForce RTX 2060 Super | |
| AMD Radeon RX Vega 64 | |
| 1920x1080 Ultra High Preset AA:T AF:16x | |
| Corsair One i160 | |
| AMD Radeon RX 5700 XT | |
| Nvidia GeForce RTX 2070 Super | |
| Nvidia Titan RTX 24 GB | |
| AMD Radeon RX Vega 64 | |
| AMD Radeon RX 5700 | |
| Nvidia GeForce RTX 2060 Super | |
| 2560x1440 Ultra High Preset AA:T AF:16x | |
| Corsair One i160 | |
| Nvidia Titan RTX 24 GB | |
| Nvidia GeForce RTX 2070 Super | |
| AMD Radeon RX 5700 XT | |
| AMD Radeon RX 5700 | |
| Nvidia GeForce RTX 2060 Super | |
| AMD Radeon RX Vega 64 | |
The Witcher 3: Framerates – ultra preset
| low | med. | high | ultra | QHD | 4K | |
|---|---|---|---|---|---|---|
| BioShock Infinite (2013) | 443.2 | 419.1 | 385.6 | 259.5 | ||
| Battlefield 4 (2013) | 200 | 200 | 200 | 200 | 155 | |
| GTA V (2015) | 182 | 175 | 168 | 106 | 145 | |
| The Witcher 3 (2015) | 415 | 349 | 248 | 131 | 98 | |
| Dota 2 Reborn (2015) | 167.6 | 152.9 | 149 | 142.7 | 139.3 | |
| Rainbow Six Siege (2015) | 425.1 | 360.4 | 343.5 | 327 | 187.4 | |
| Rise of the Tomb Raider (2016) | 346 | 239 | 222 | 201 | 97 | |
| Far Cry Primal (2016) | 149 | 135 | 124 | 114 | 92 | |
| The Division (2016) | 354.3 | 285.1 | 196.9 | 155.2 | 93.1 | |
| Doom (2016) | 187 | 173 | 164 | 156 | 144 | |
| Overwatch (2016) | 300 | 300 | 300 | 299 | 198 | |
| Deus Ex Mankind Divided (2016) | 186.6 | 173.6 | 151.6 | 106.5 | 70.2 | |
| Battlefield 1 (2016) | 200 | 200 | 200 | 199 | 118 | |
| Dishonored 2 (2016) | 120 | 120 | 120 | 119 | 105 | |
| Watch Dogs 2 (2016) | 176 | 170 | 144 | 113 | 70 | |
| For Honor (2017) | 378.4 | 280.1 | 267.3 | 212.2 | 97 | |
| Ghost Recon Wildlands (2017) | 191.8 | 156 | 150 | 90.9 | 67.5 | |
| Rocket League (2017) | 250 | 250 | 248 | 209 | ||
| Dirt 4 (2017) | 459 | 328 | 278 | 196 | 127 | |
| Playerunknown's Battlegrounds (PUBG) (2017) | 228 | 211 | 203 | 201 | 89 | |
| Destiny 2 (2017) | 204 | 203 | 202 | 202 | 167 | 93 |
| Assassin´s Creed Origins (2017) | 147 | 135 | 130 | 109 | 96 | 65 |
| Call of Duty WWII (2017) | 320 | 313 | 227 | 205 | 178 | 115 |
| Fortnite (2018) | 412 | 313 | 245 | 235 | 160 | 81 |
| Final Fantasy XV Benchmark (2018) | 210 | 168 | 124 | 57.7 | ||
| Kingdom Come: Deliverance (2018) | 198 | 171 | 141 | 97 | 84 | 50.3 |
| X-Plane 11.11 (2018) | 136 | 122 | 99 | 79 | ||
| Far Cry 5 (2018) | 166 | 148 | 141 | 131 | 123 | 78 |
| The Crew 2 (2018) | 60 | 60 | 60 | 60 | 60 | 60 |
| Monster Hunter World (2018) | 188 | 182 | 179 | 150 | 99 | 47.9 |
| F1 2018 (2018) | 295 | 259 | 191 | 166 | 152 | 99 |
| Shadow of the Tomb Raider (2018) | 167 | 150 | 149 | 142 | 112 | 61 |
| FIFA 19 (2018) | 358 | 333 | 312 | 310 | 306 | 302 |
| Forza Horizon 4 (2018) | 223 | 189 | 184 | 153 | 131 | 98 |
| Assassin´s Creed Odyssey (2018) | 139 | 129 | 111 | 83 | 72 | 53 |
| Call of Duty Black Ops 4 (2018) | 281 | 246 | 238 | 203 | 172 | 89 |
| Hitman 2 (2018) | 110 | 106 | 98 | 93 | 92 | 69 |
| Battlefield V (2018) | 196 | 193 | 190 | 190 | 159 | 99 |
| Farming Simulator 19 (2018) | 269 | 204 | 175 | 158 | 159 | 110 |
| Darksiders III (2018) | 256 | 170 | 158 | 151 | 133 | 73 |
| Just Cause 4 (2018) | 237 | 199 | 158 | 149 | 112 | 65 |
| Apex Legends (2019) | 144 | 144 | 144 | 144 | 144 | 112 |
| Far Cry New Dawn (2019) | 142 | 123 | 119 | 108 | 104 | 79 |
| Metro Exodus (2019) | 174.9 | 147.8 | 118.5 | 98.6 | 77.9 | 50.5 |
| Anthem (2019) | 134 | 132 | 129 | 125 | 115 | 71 |
| Dirt Rally 2.0 (2019) | 306 | 244 | 239 | 192 | 153 | 96 |
| The Division 2 (2019) | 223 | 196 | 162 | 133 | 100 | 56 |
| Anno 1800 (2019) | 123 | 117 | 92 | 51.7 | 49.2 | 46.1 |
| Rage 2 (2019) | 319 | 197 | 169 | 164 | 112 | 57.8 |
| F1 2019 (2019) | 283 | 256 | 198 | 176 | 143 | 97 |
Emissions
Fan Noise
The One i160 runs quietly when idling, although its 140 mm fan becomes audible under sustained load. However, the device has three fans in total, including the ones in the GPU and SFX 600 W power supply. Hence, you will hear the One i160 whirring away when gaming.
We did not find any of the three fans particularly disturbing during our tests though. We did not notice any electrical interference like coil whine when gaming either.
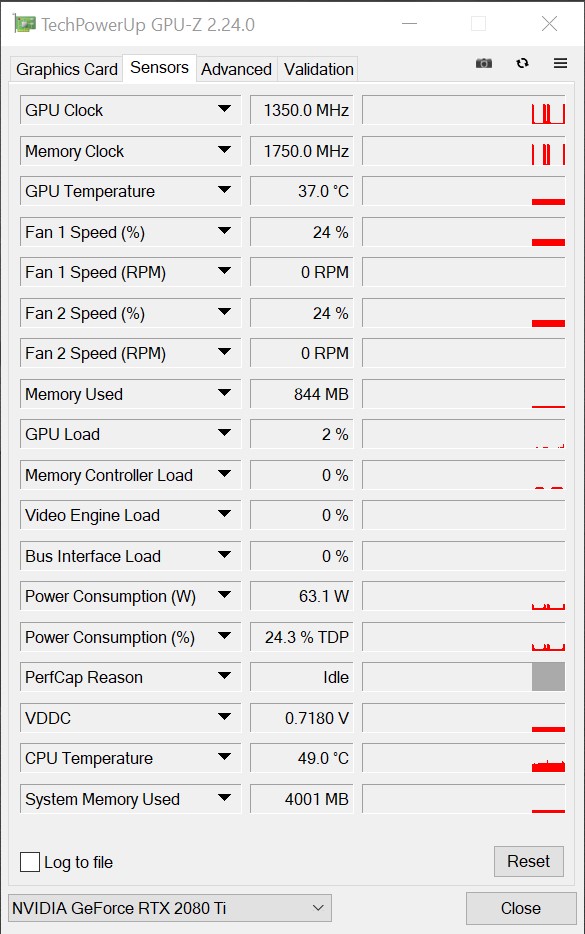
Temperature & Power Consumption
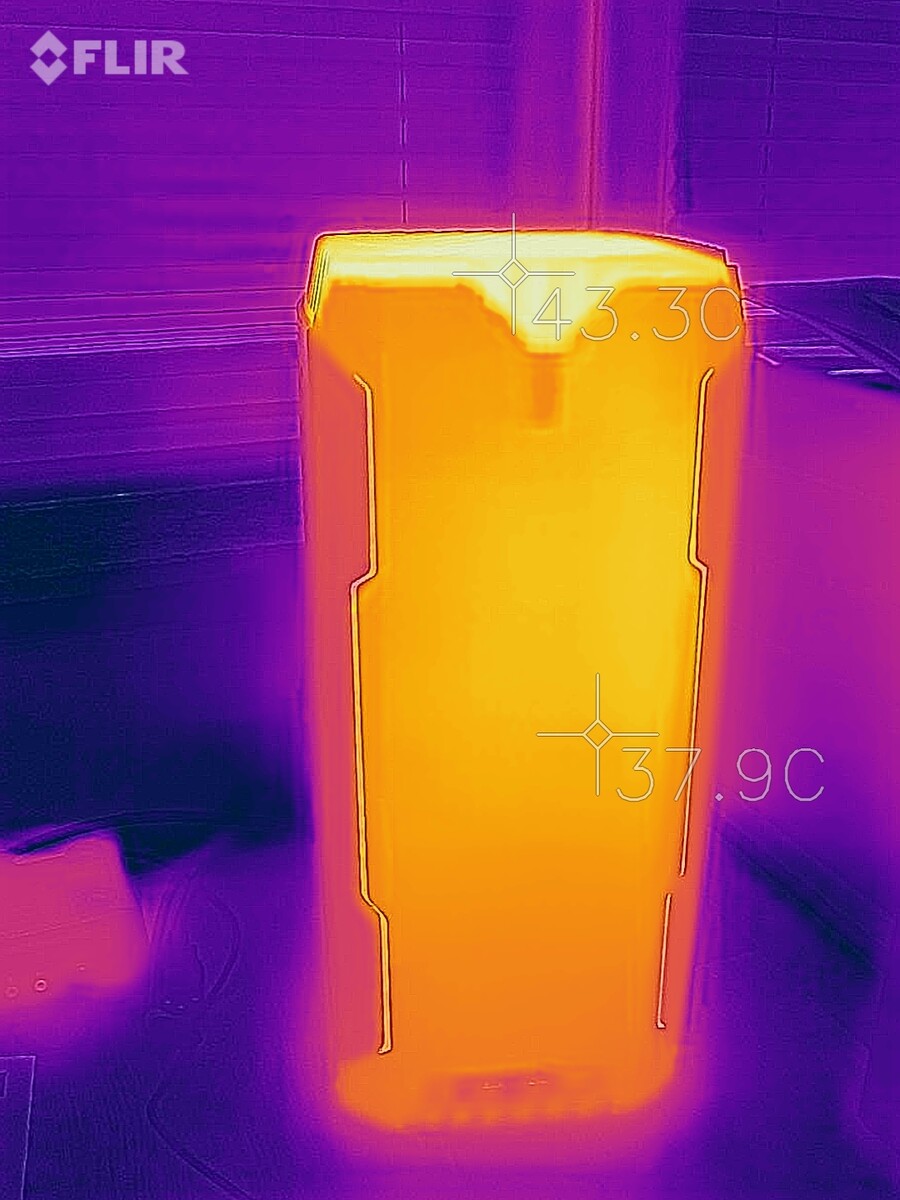
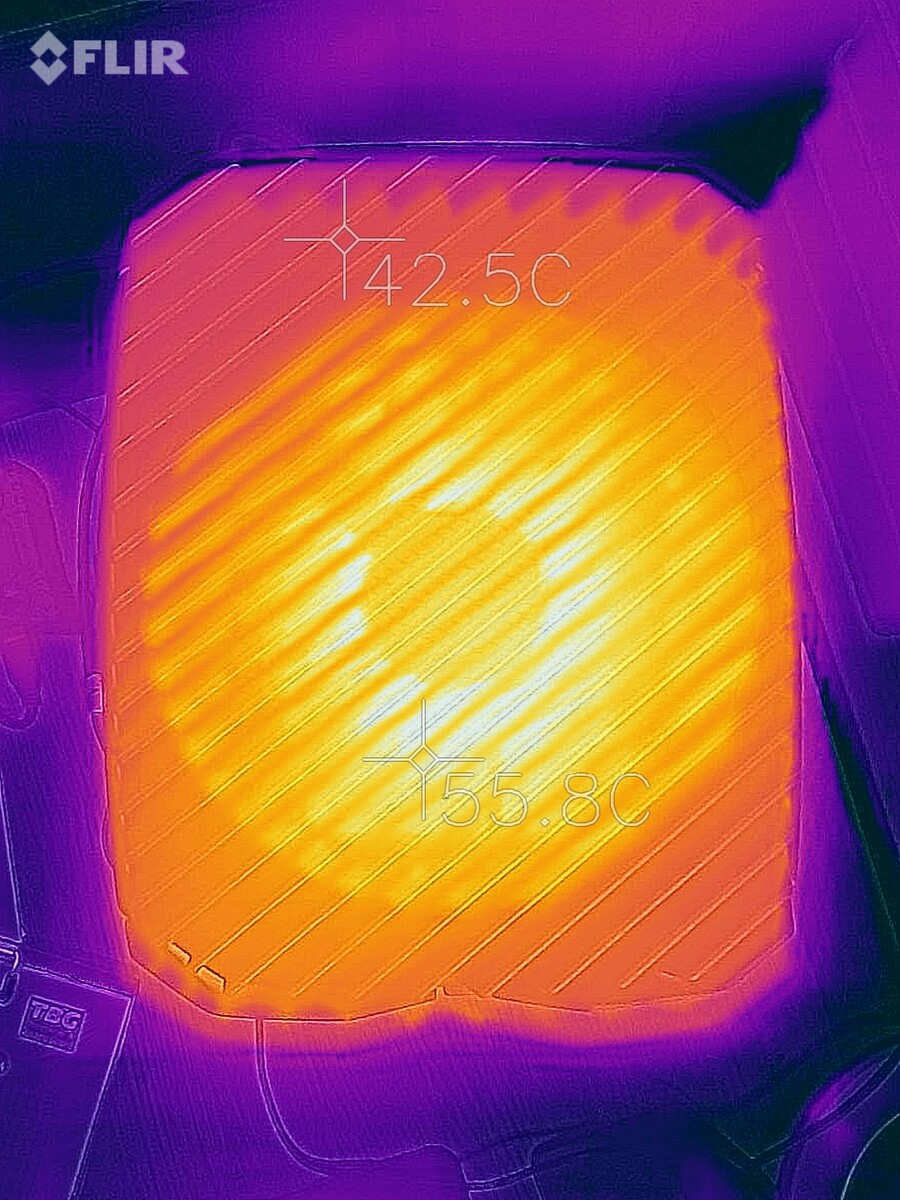
While the aluminium case also dissipates excess heat, surface temperatures peaked at only 38 °C on the front of the device during our test and were only 5 °C hotter at the 140 mm fan. Expectedly, the sides of the device remained much cooler, as these areas draw in cool air rather than exhaust waste heat.
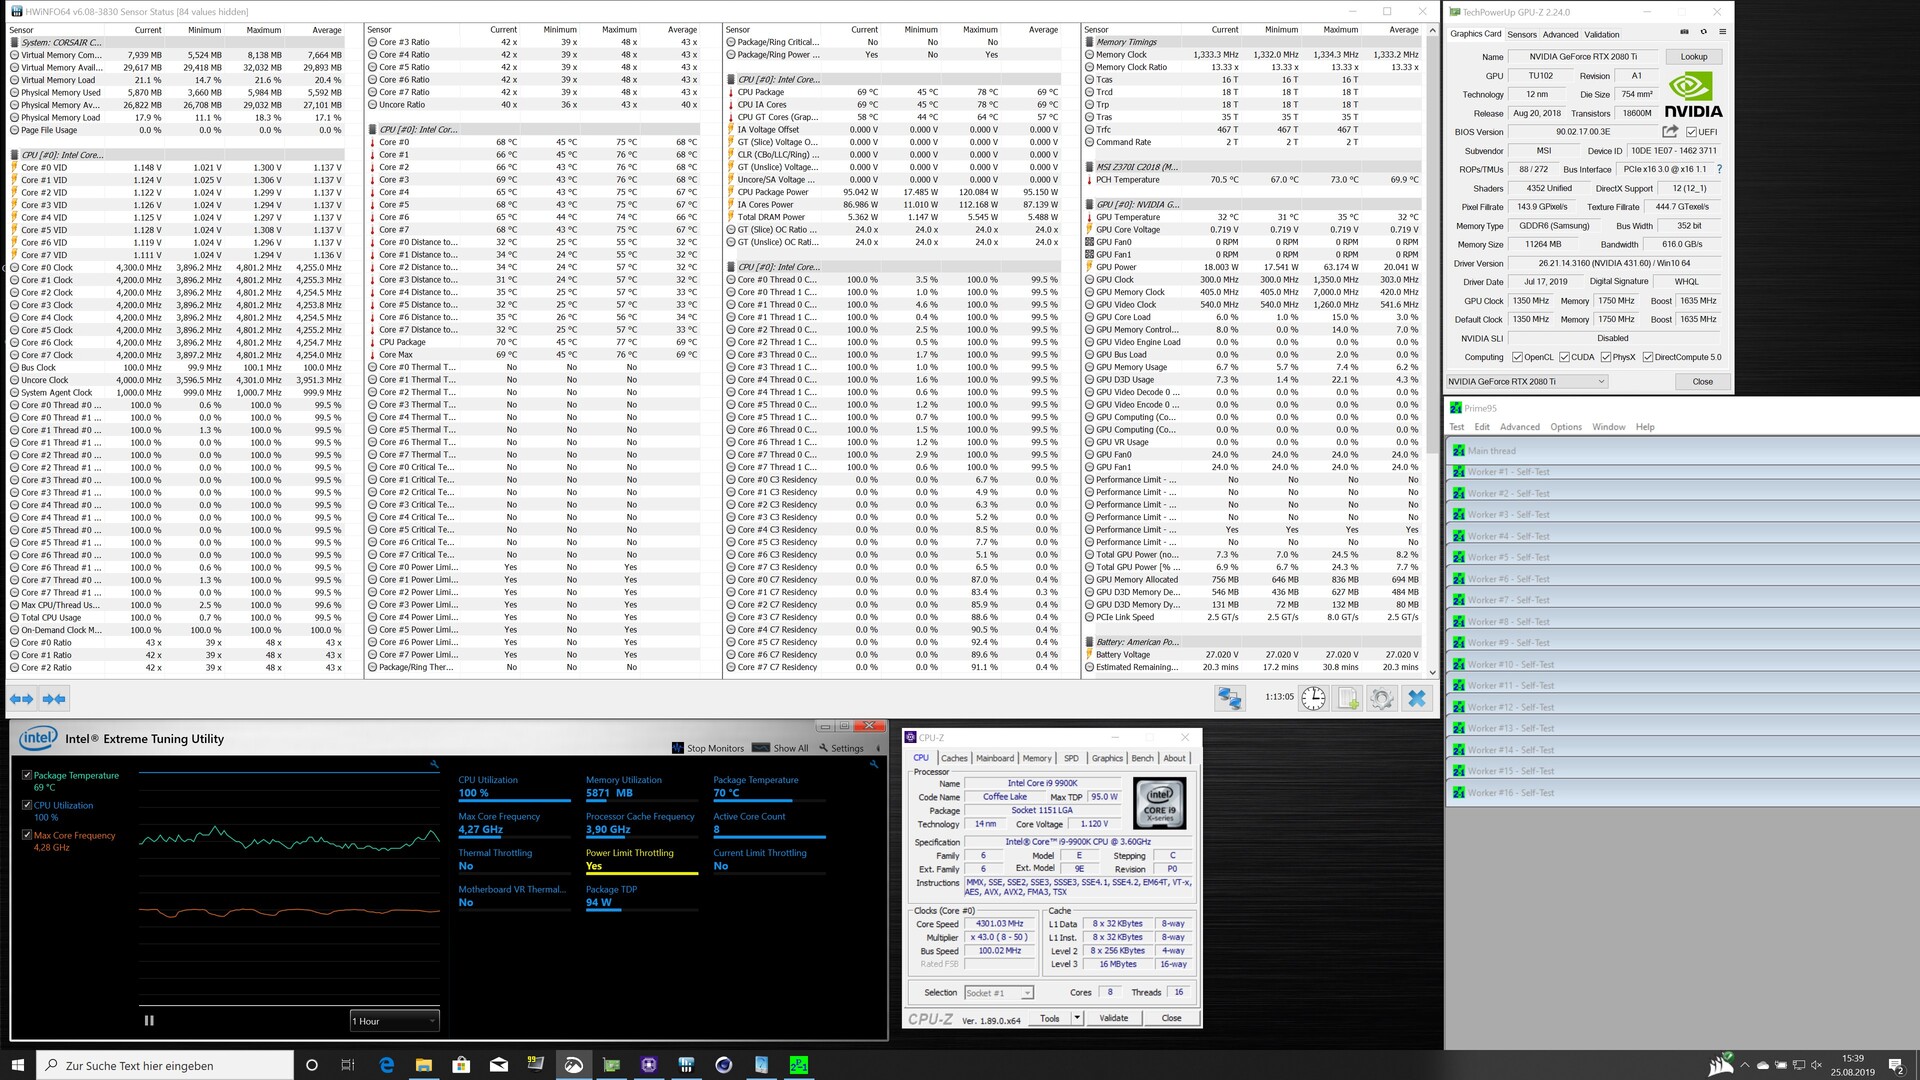
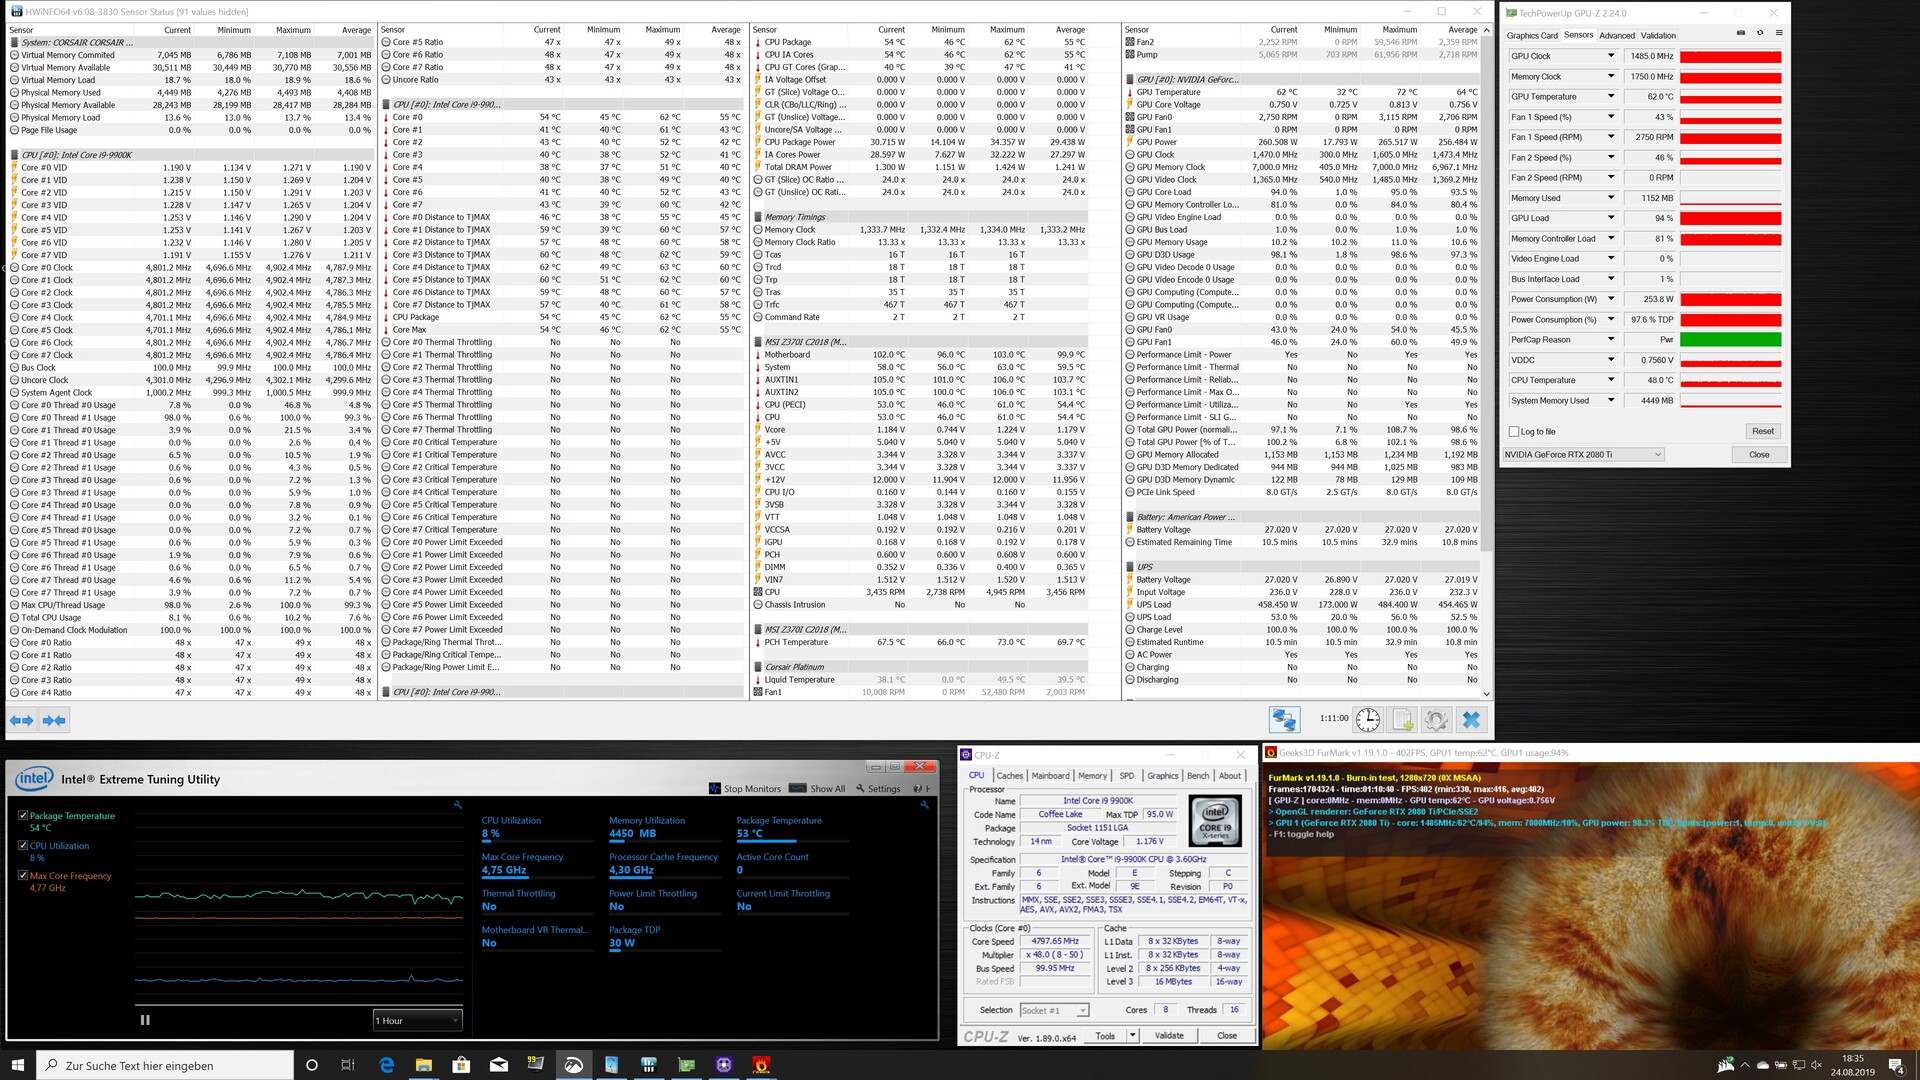
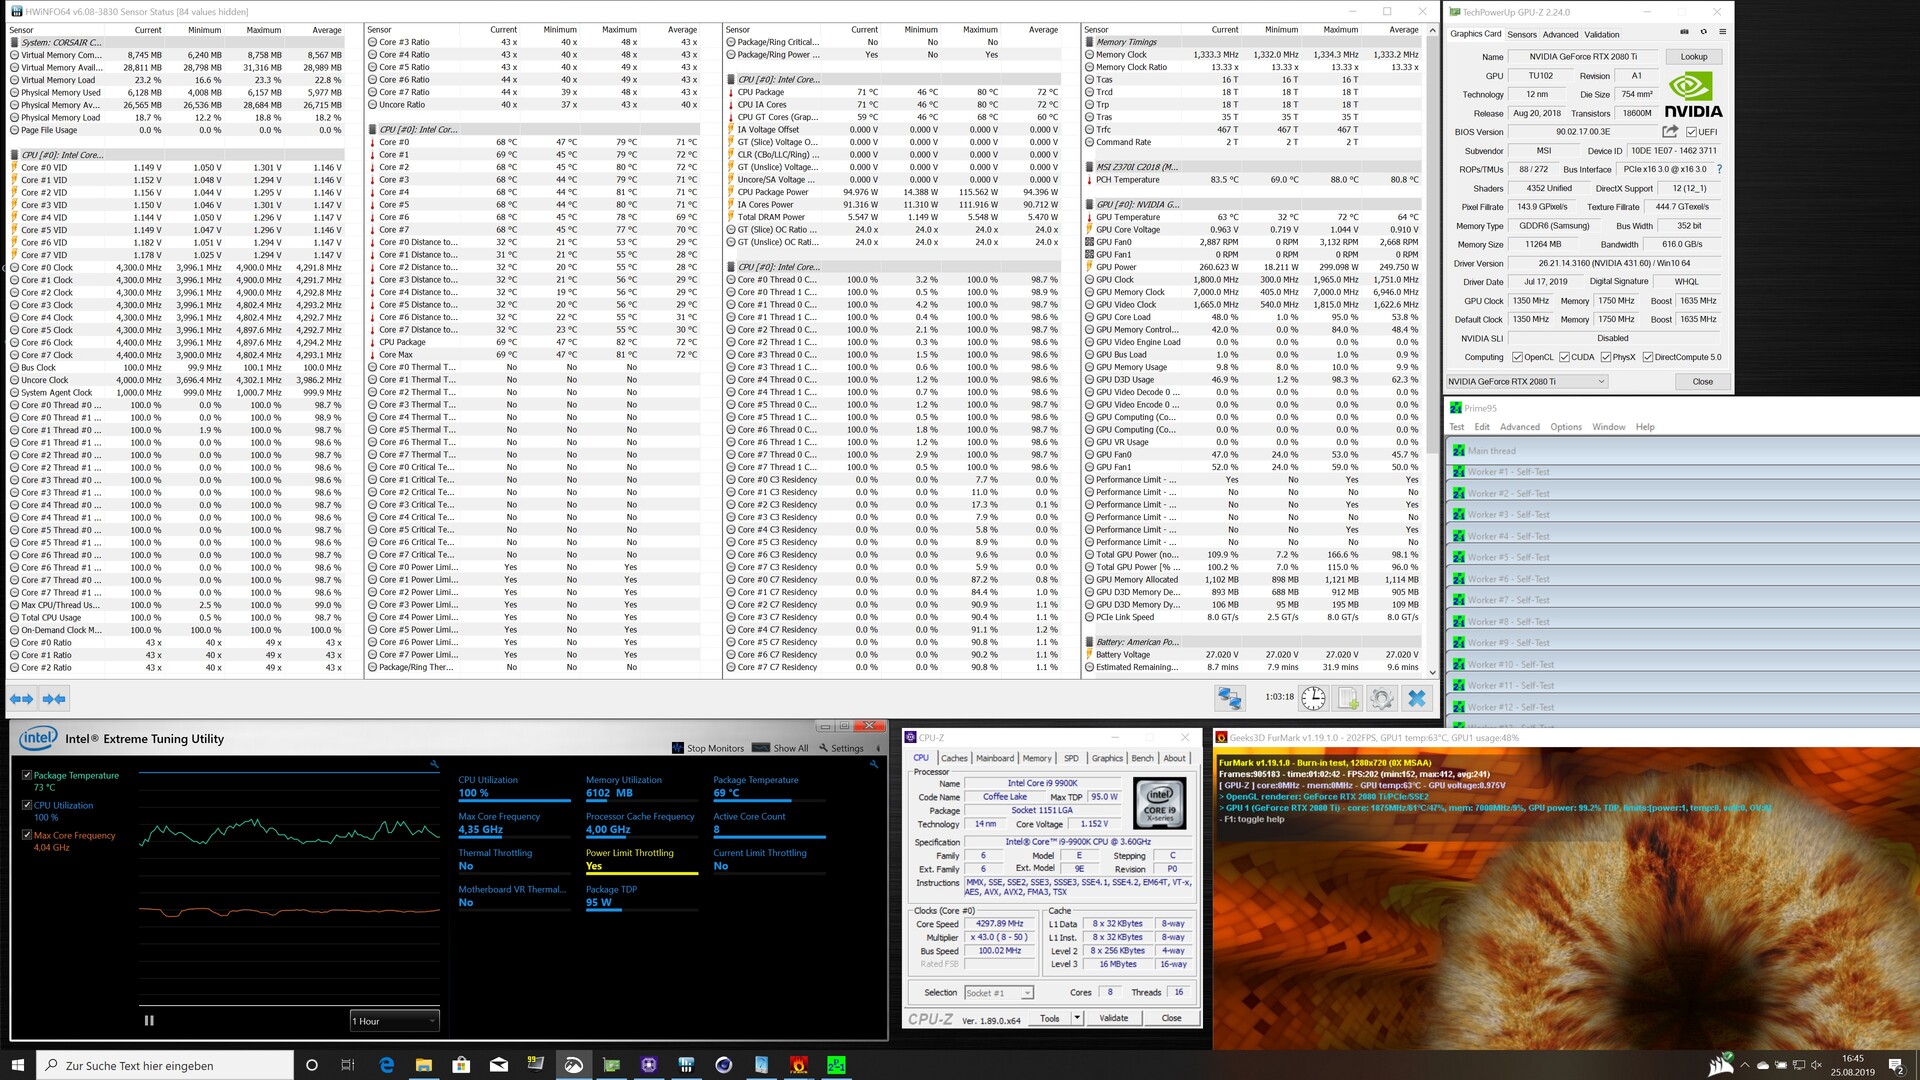
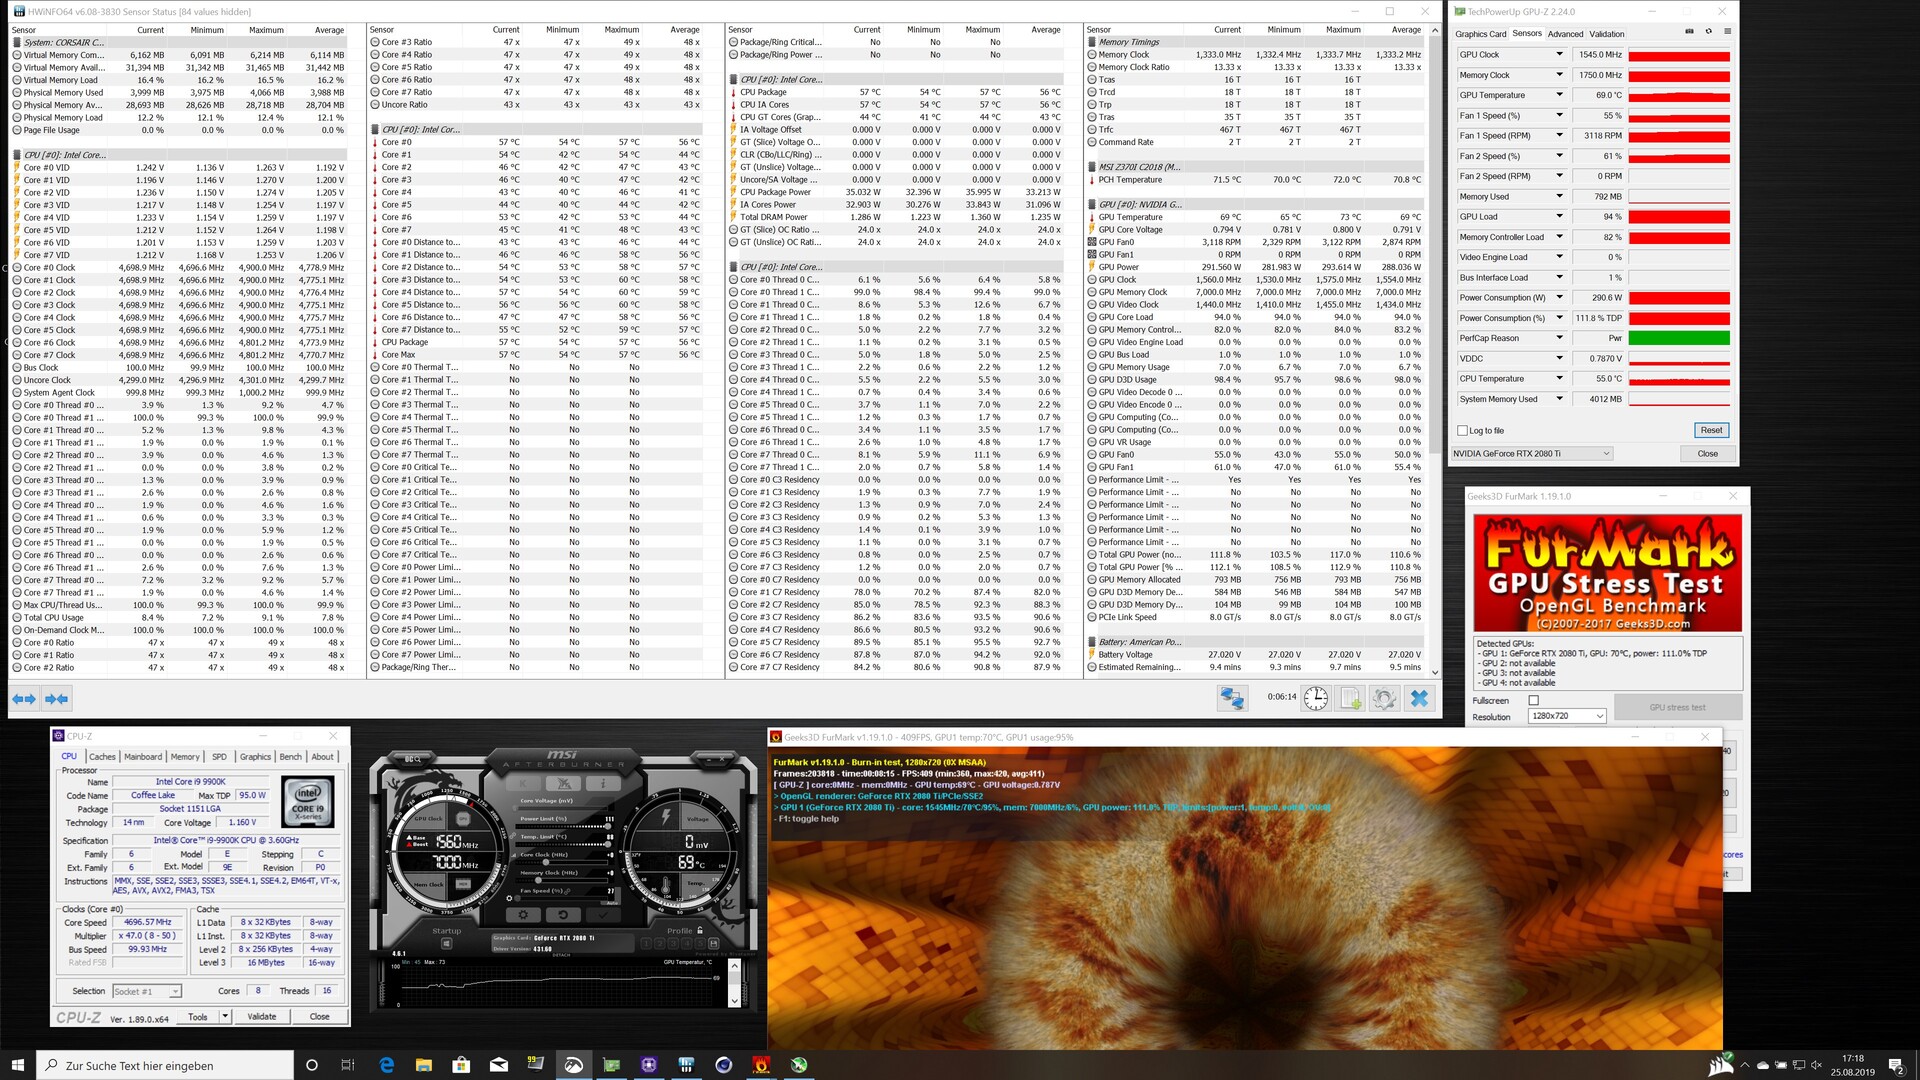
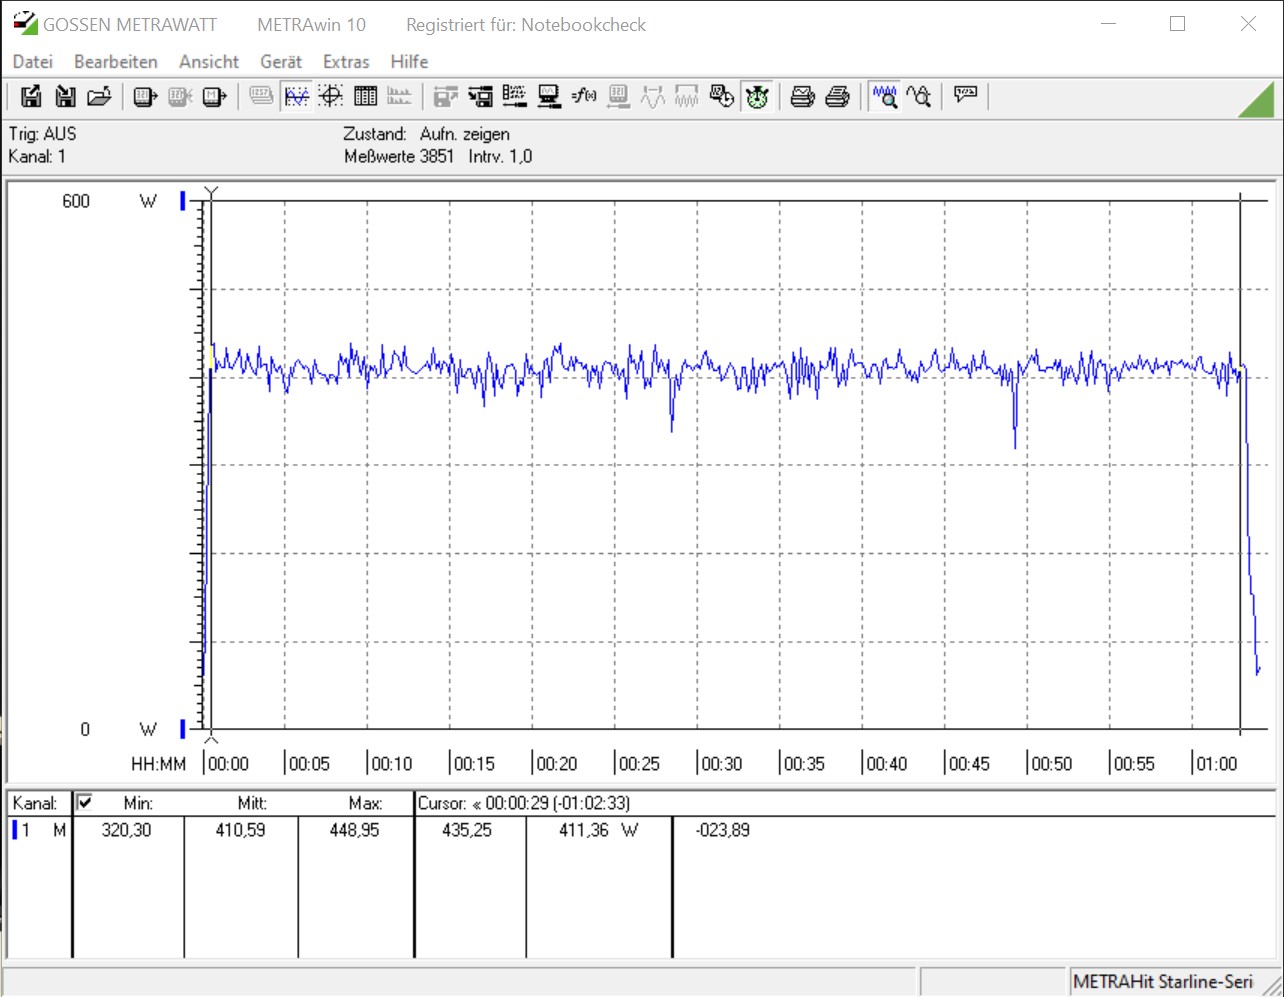
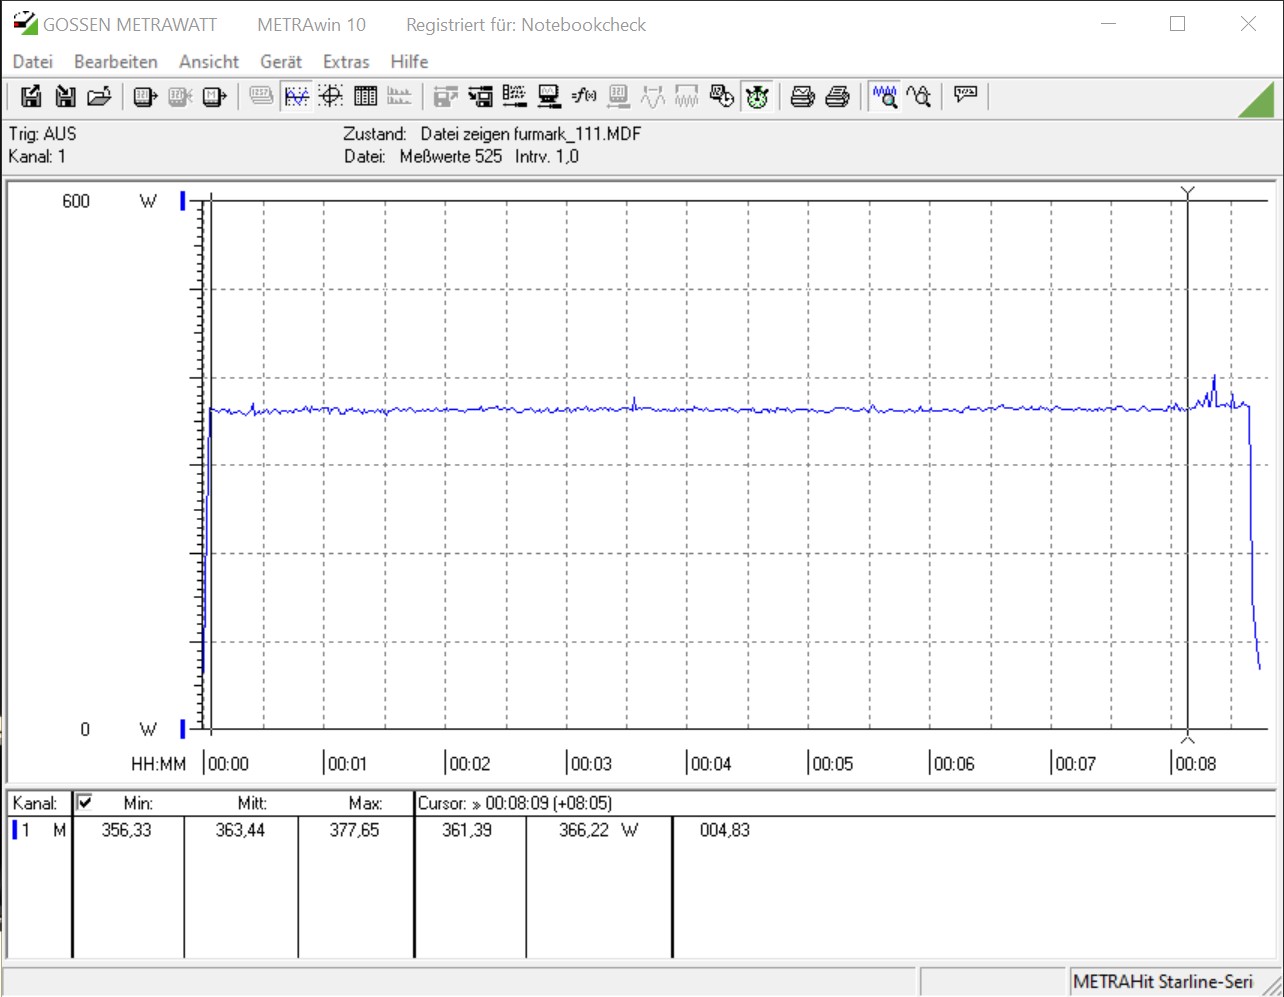
We also subjected our review unit to a combined FurMark and Prime95 stress test to push the system to its limits. We left the stress test running for an hour, during which CPU core temperatures reached 80 °C, which is around 20 °C below its critical operating temperature. Better still, GPU core temperatures peaked at only 72 °C, so you should not experience any GPU throttling during prolonged gaming sessions. Likewise, the CPU continually operated at around 4.3 GHz during our stress test, so it should not throttle either. It could maintain higher clock speeds with better ventilation and more power, but that should not have much of an effect when gaming.
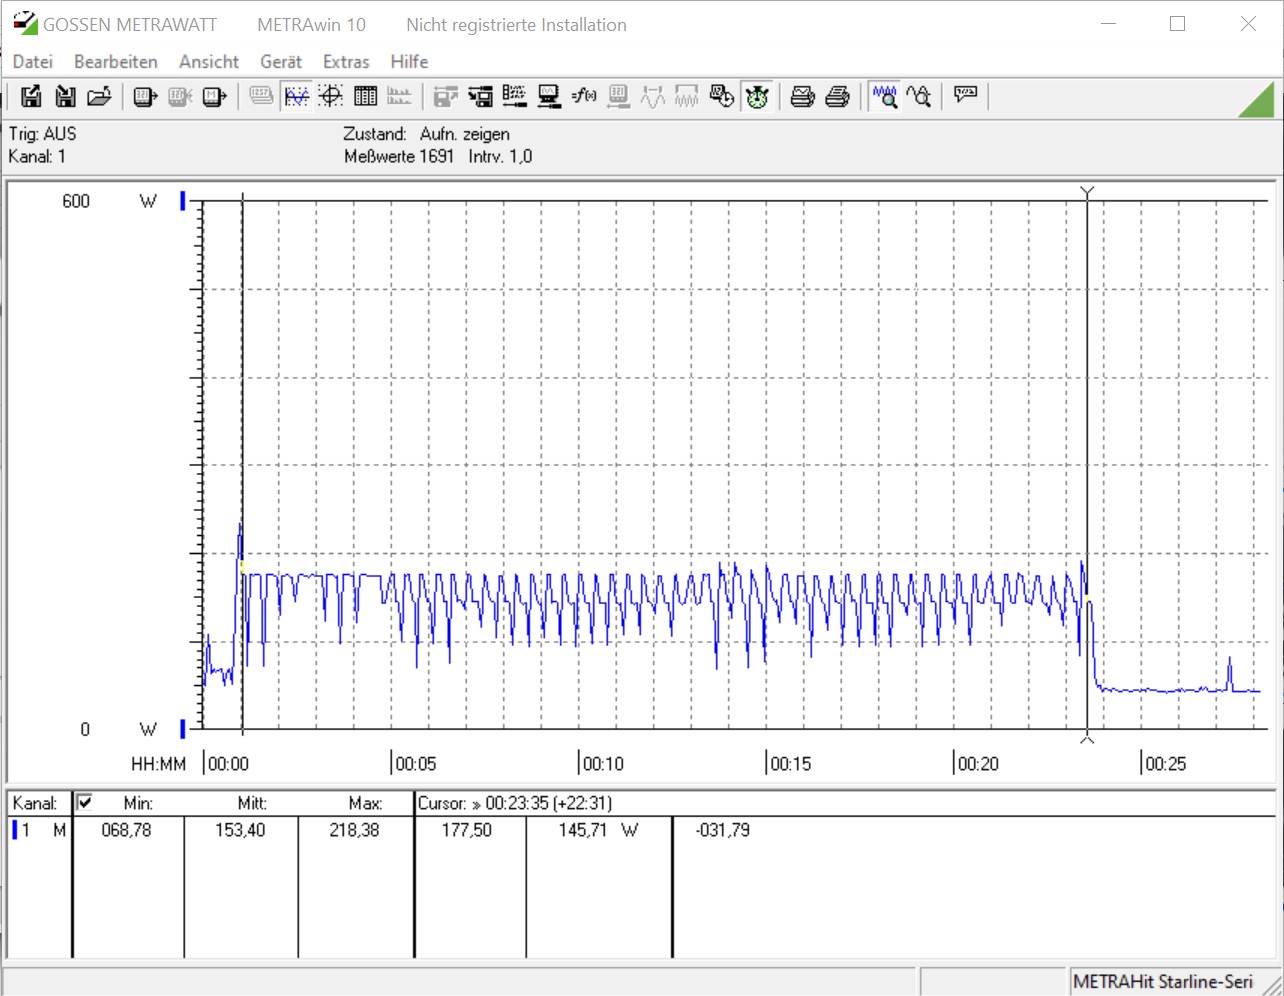
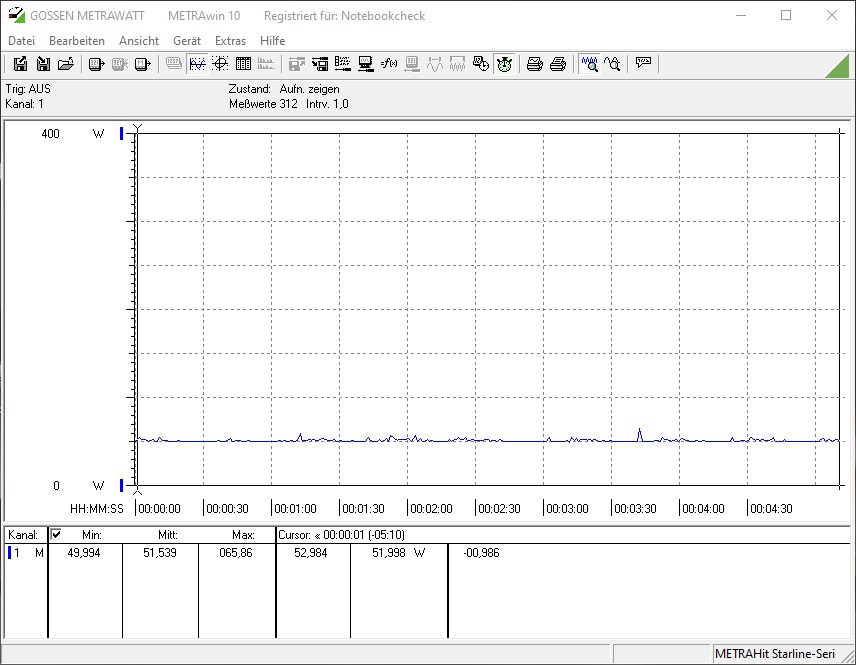
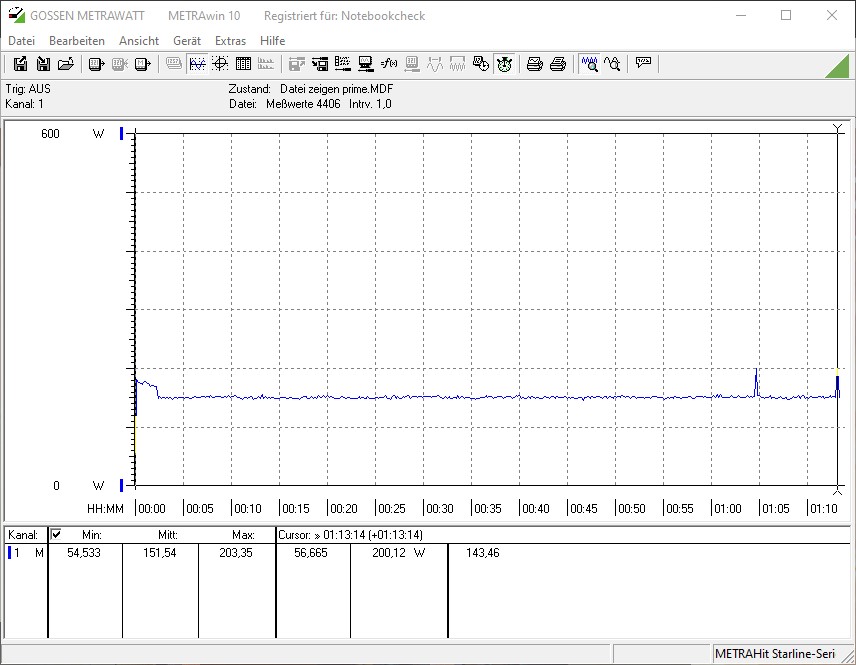
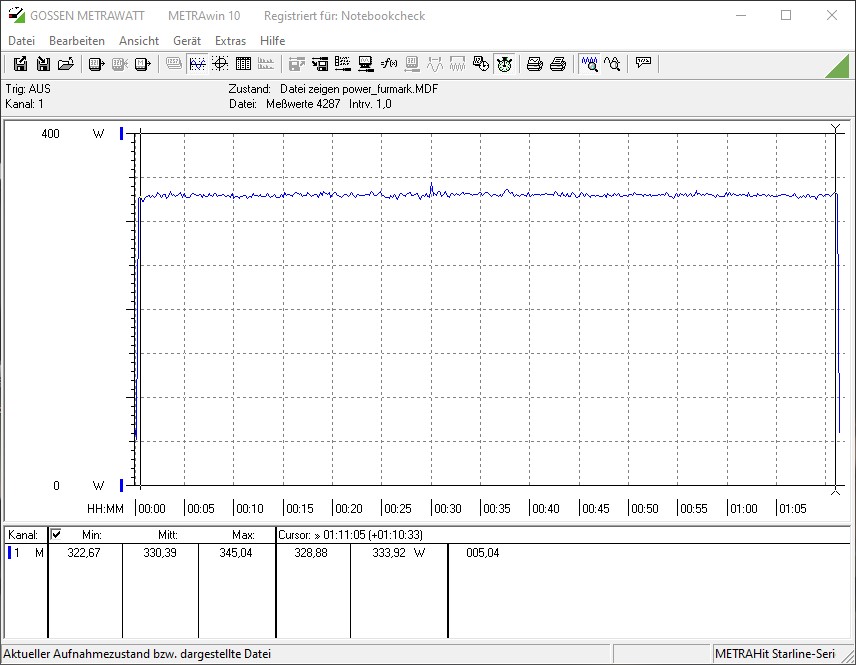
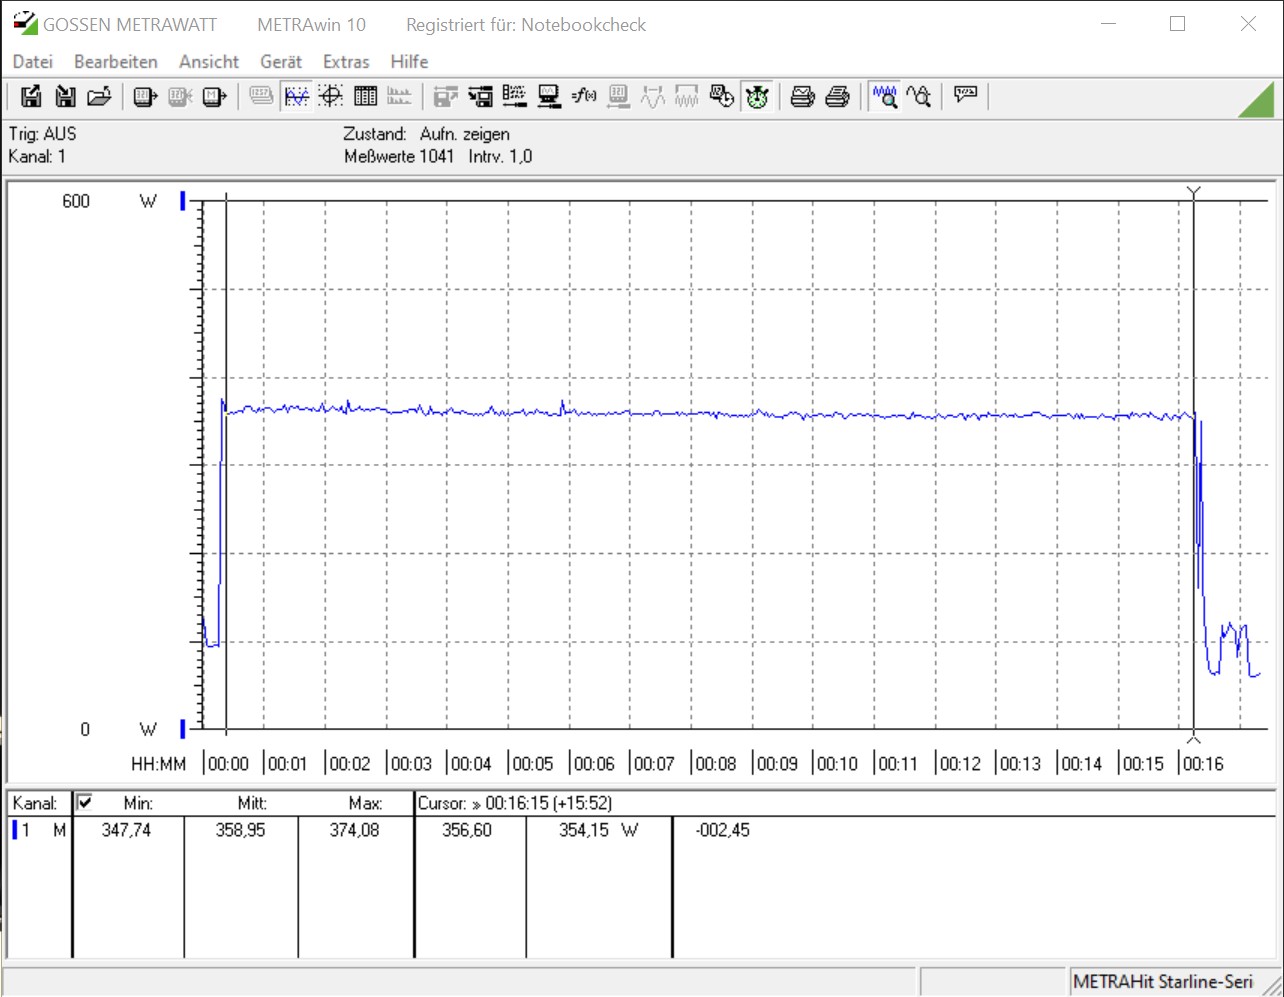
We measure power consumption at idle at around 51.5 W, which is exceptionally low. This rises to 359 W when gaming, but it is still considerably lower than the 437 W that our comparable AMD Ryzen 7 2700X and NVIDIA TITAN RTX test system consumed while also playing The Witcher 3.
* ... smaller is better
Pros
Cons
Verdict

The Corsair One i160 is a premium gaming PC that delivers fantastic performance thanks to its powerful hardware and effective cooling. Our main gripe with the machine is the inclusion of an HDD, which occasionally slows the system down. However, this is only a blemish on the One i160’s part.
In short, the One i160 is the perfect compact gaming PC. Its fast CPU and GPU combine to deliver exceptional performance, although one should expect as much after spending almost US$3,500. Corsair includes a two-year warranty as well, but it could have been longer in our opinion at this price.
Overall, the One i160 is best suited for someone who either loves the compact design or does not want to build a PC for whatever reason. The machine is upgradable too, but it should be future-proofed for several years to come.
The Corsair One i160 strikes an excellent balance between being a small form-factor PC and a gaming monster. Its innovative cooling is effective, if a little loud, but the Corsair One i160 will not disappoint.
Price comparison

