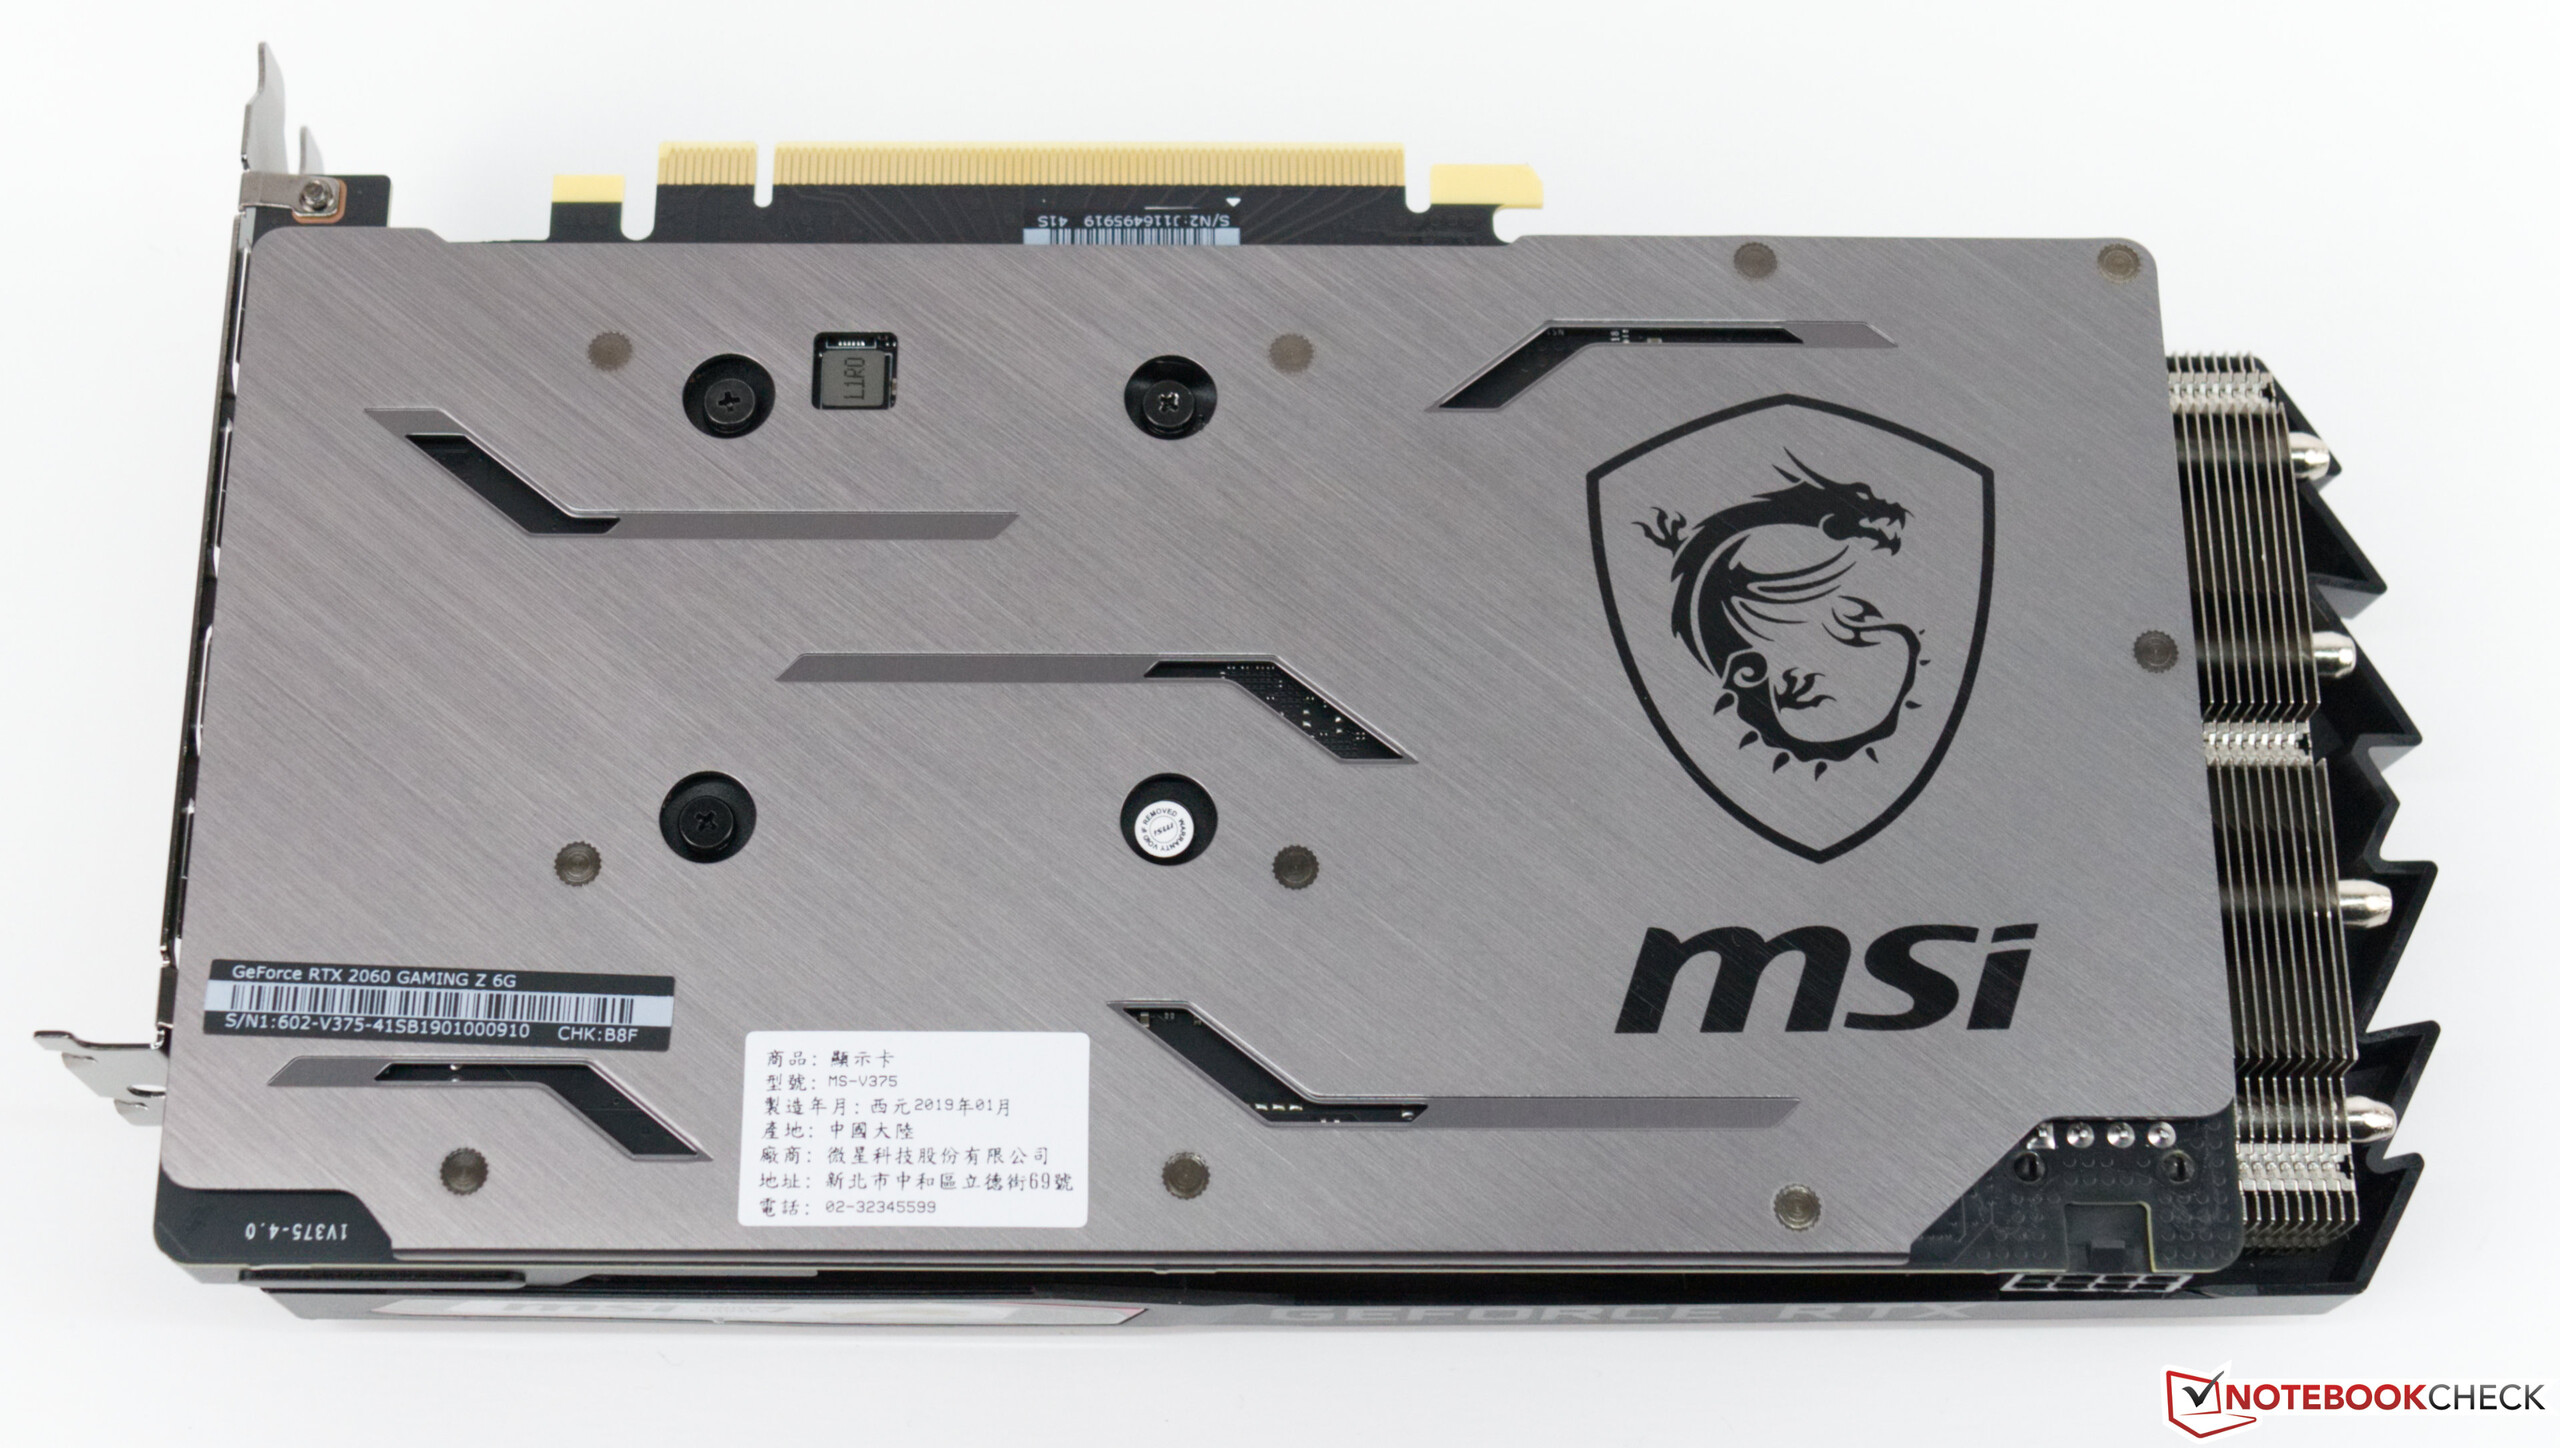
MSI RTX 2060 Gaming Z 6G Desktop Graphics Card Review
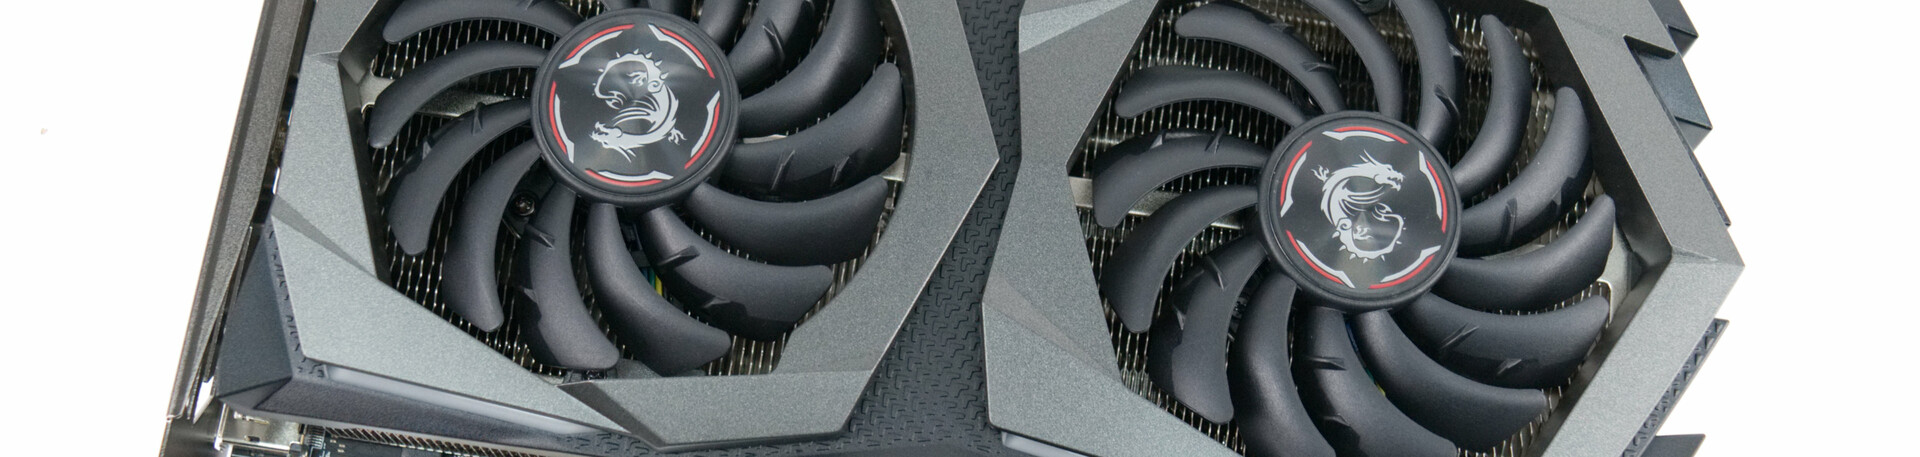
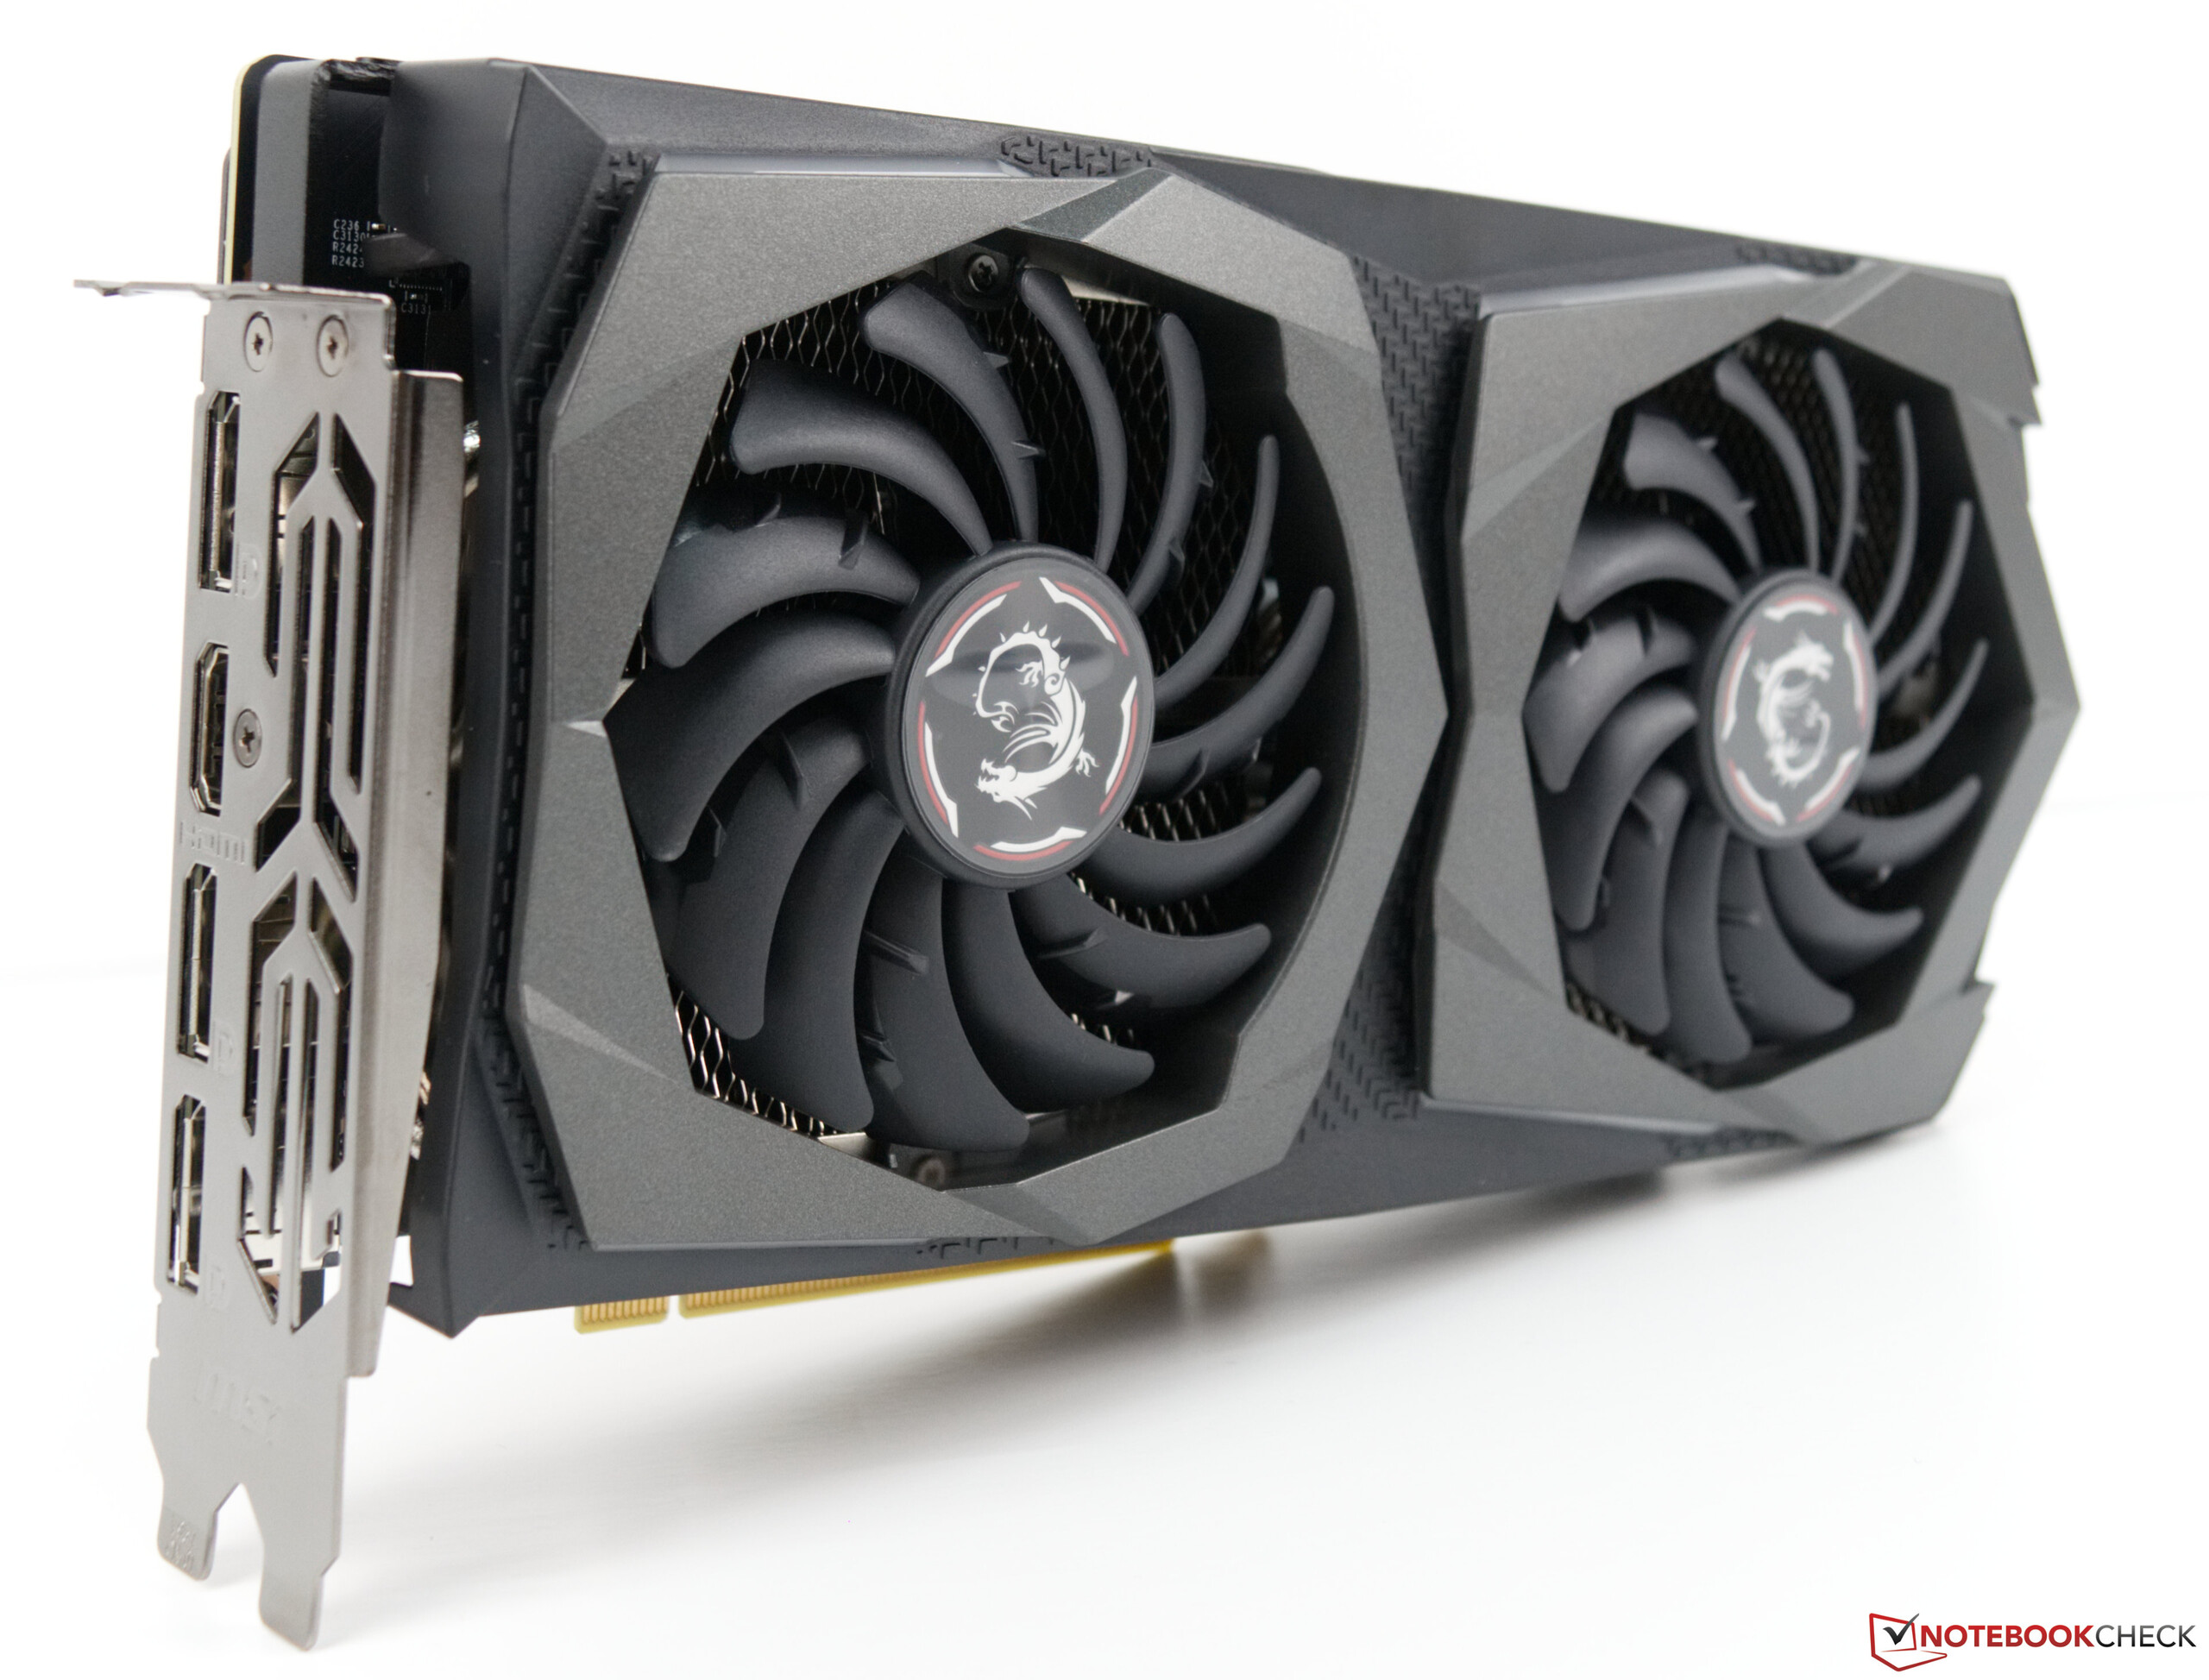
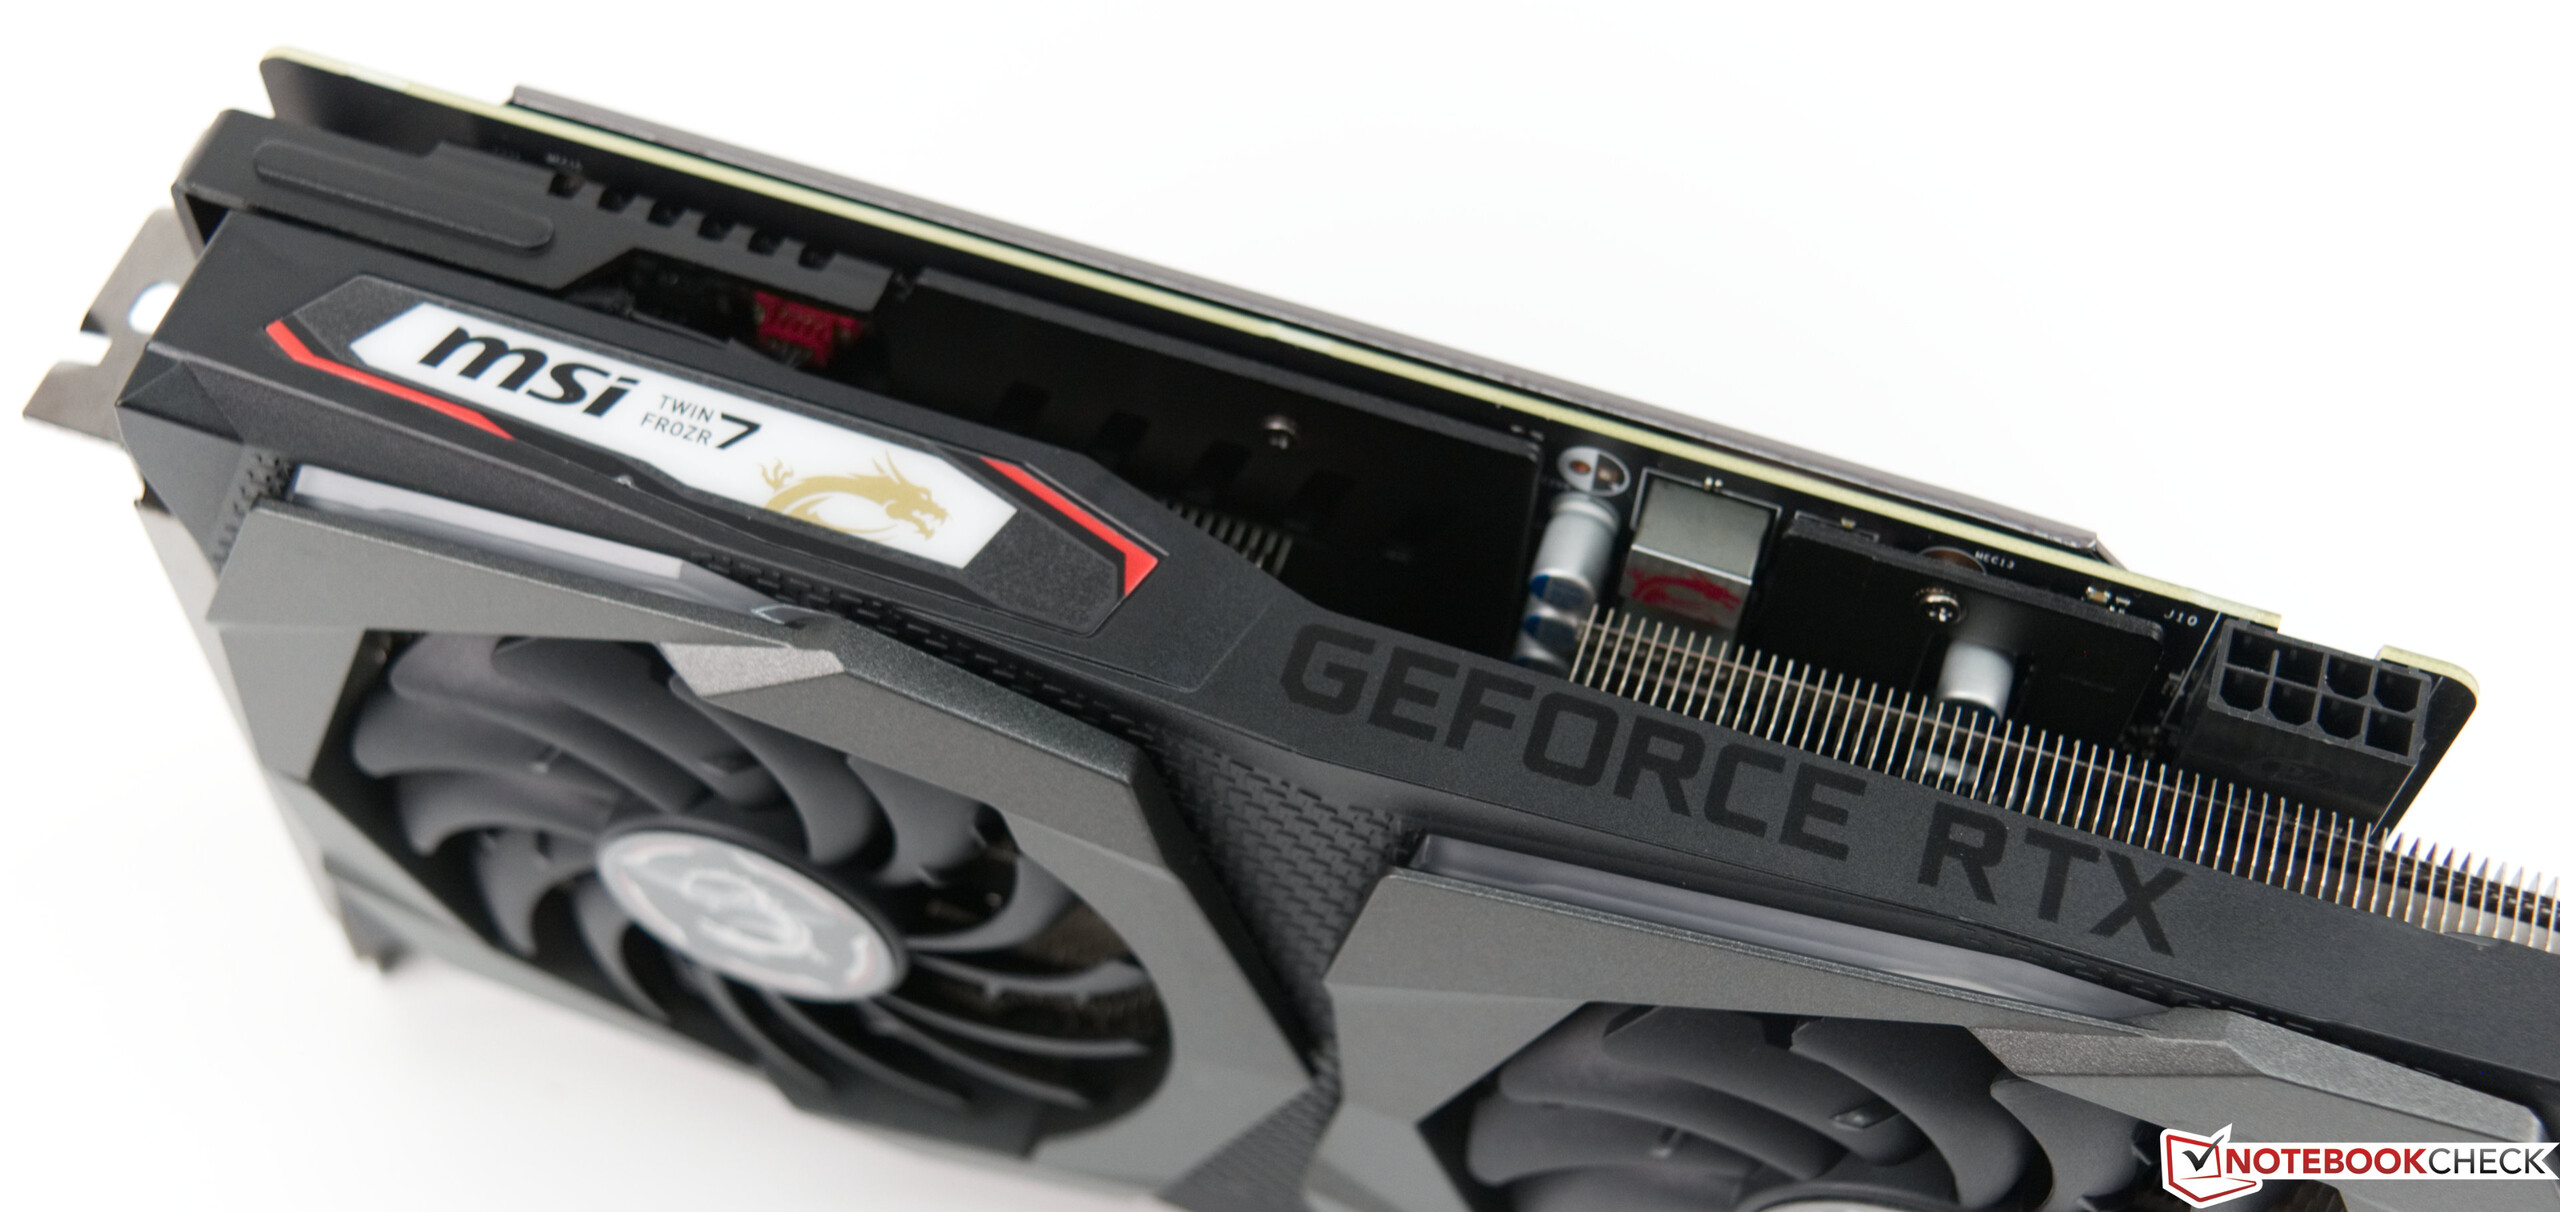
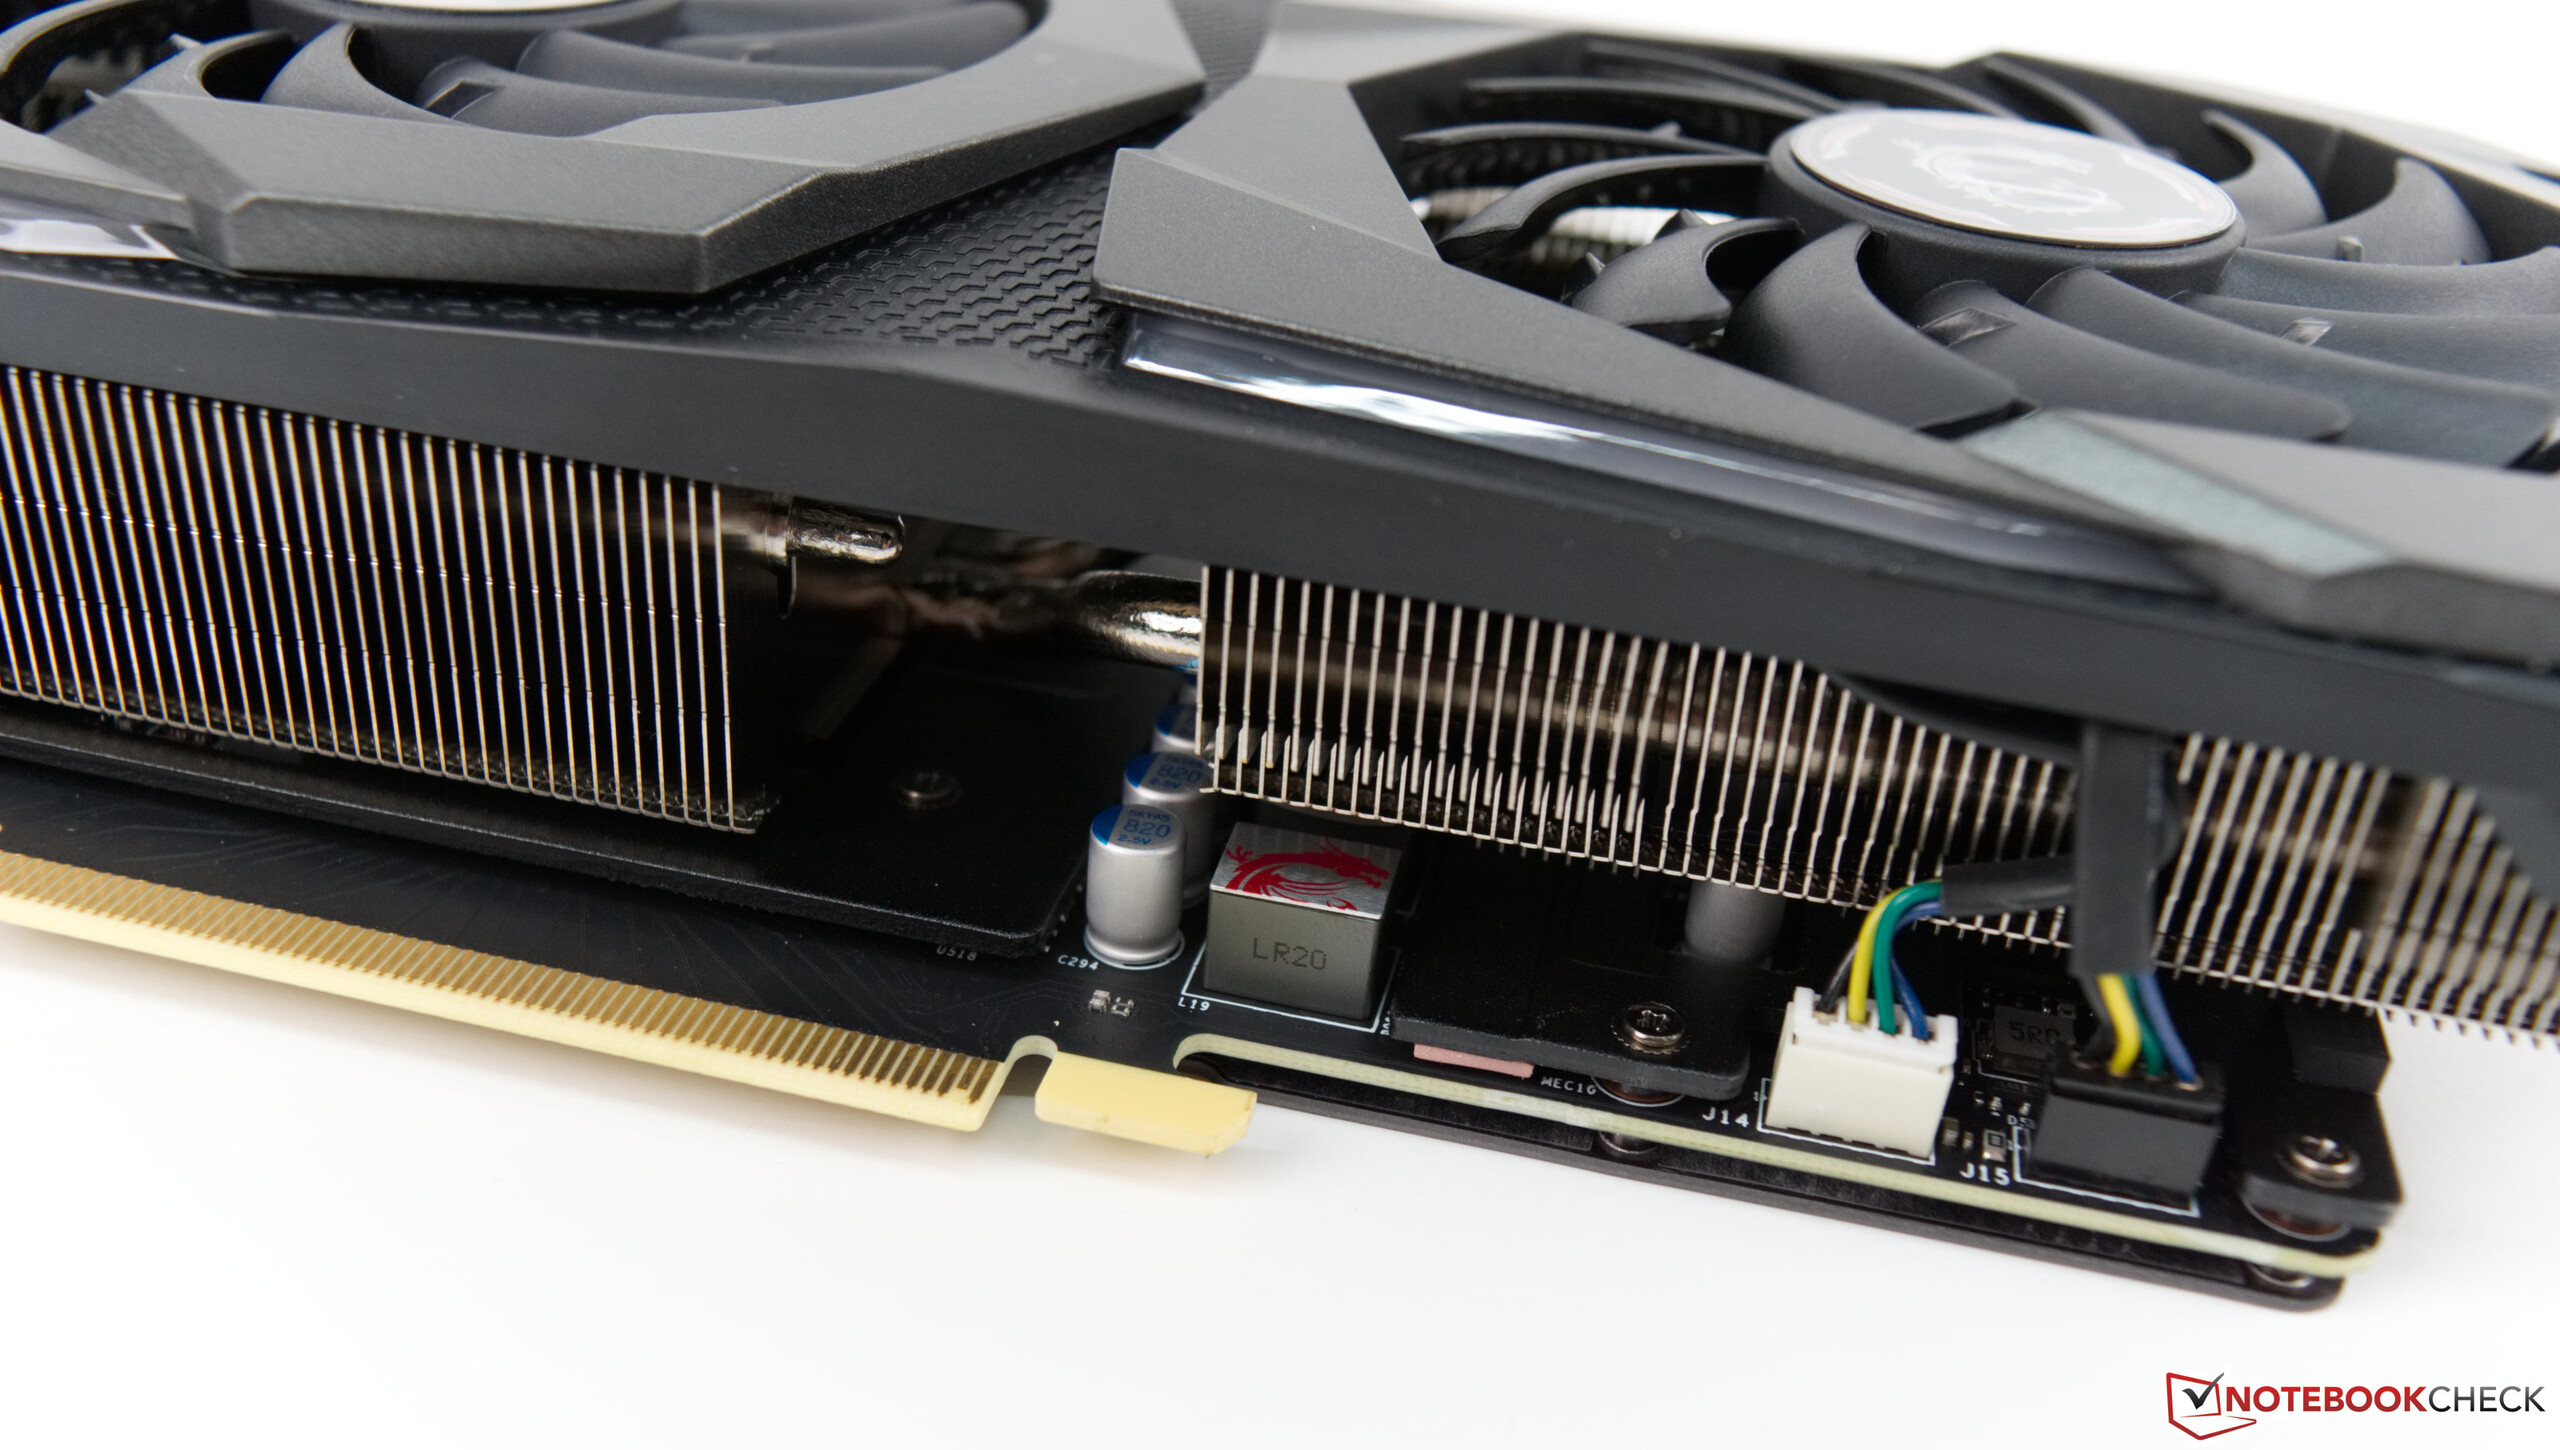
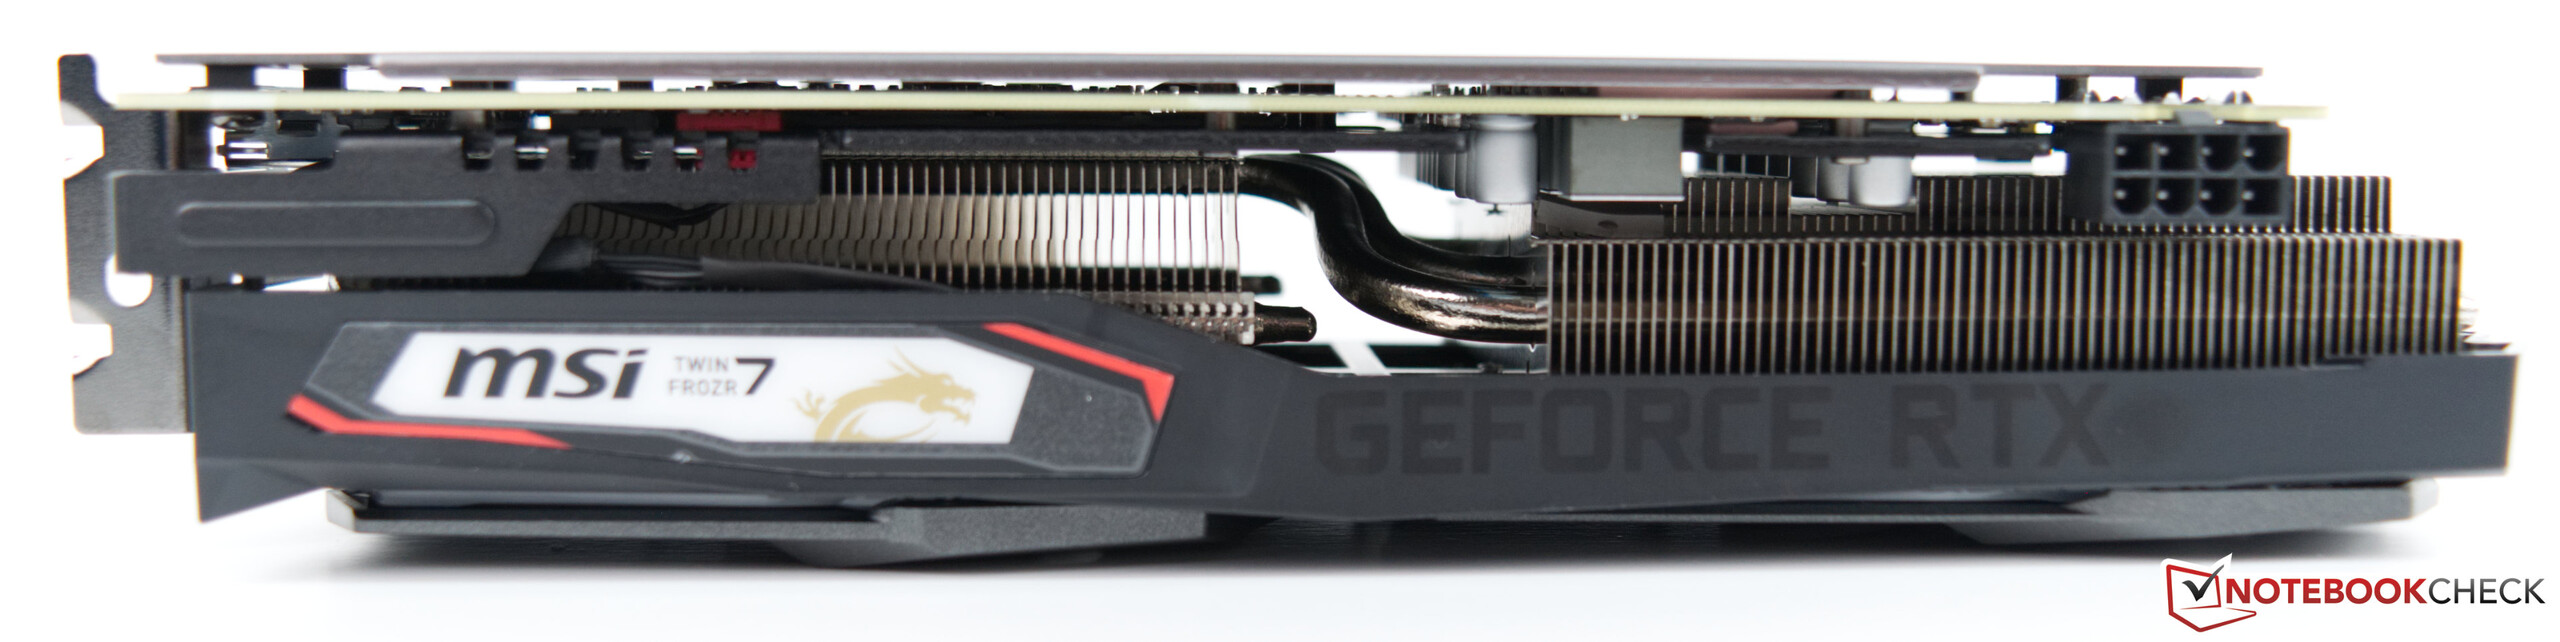
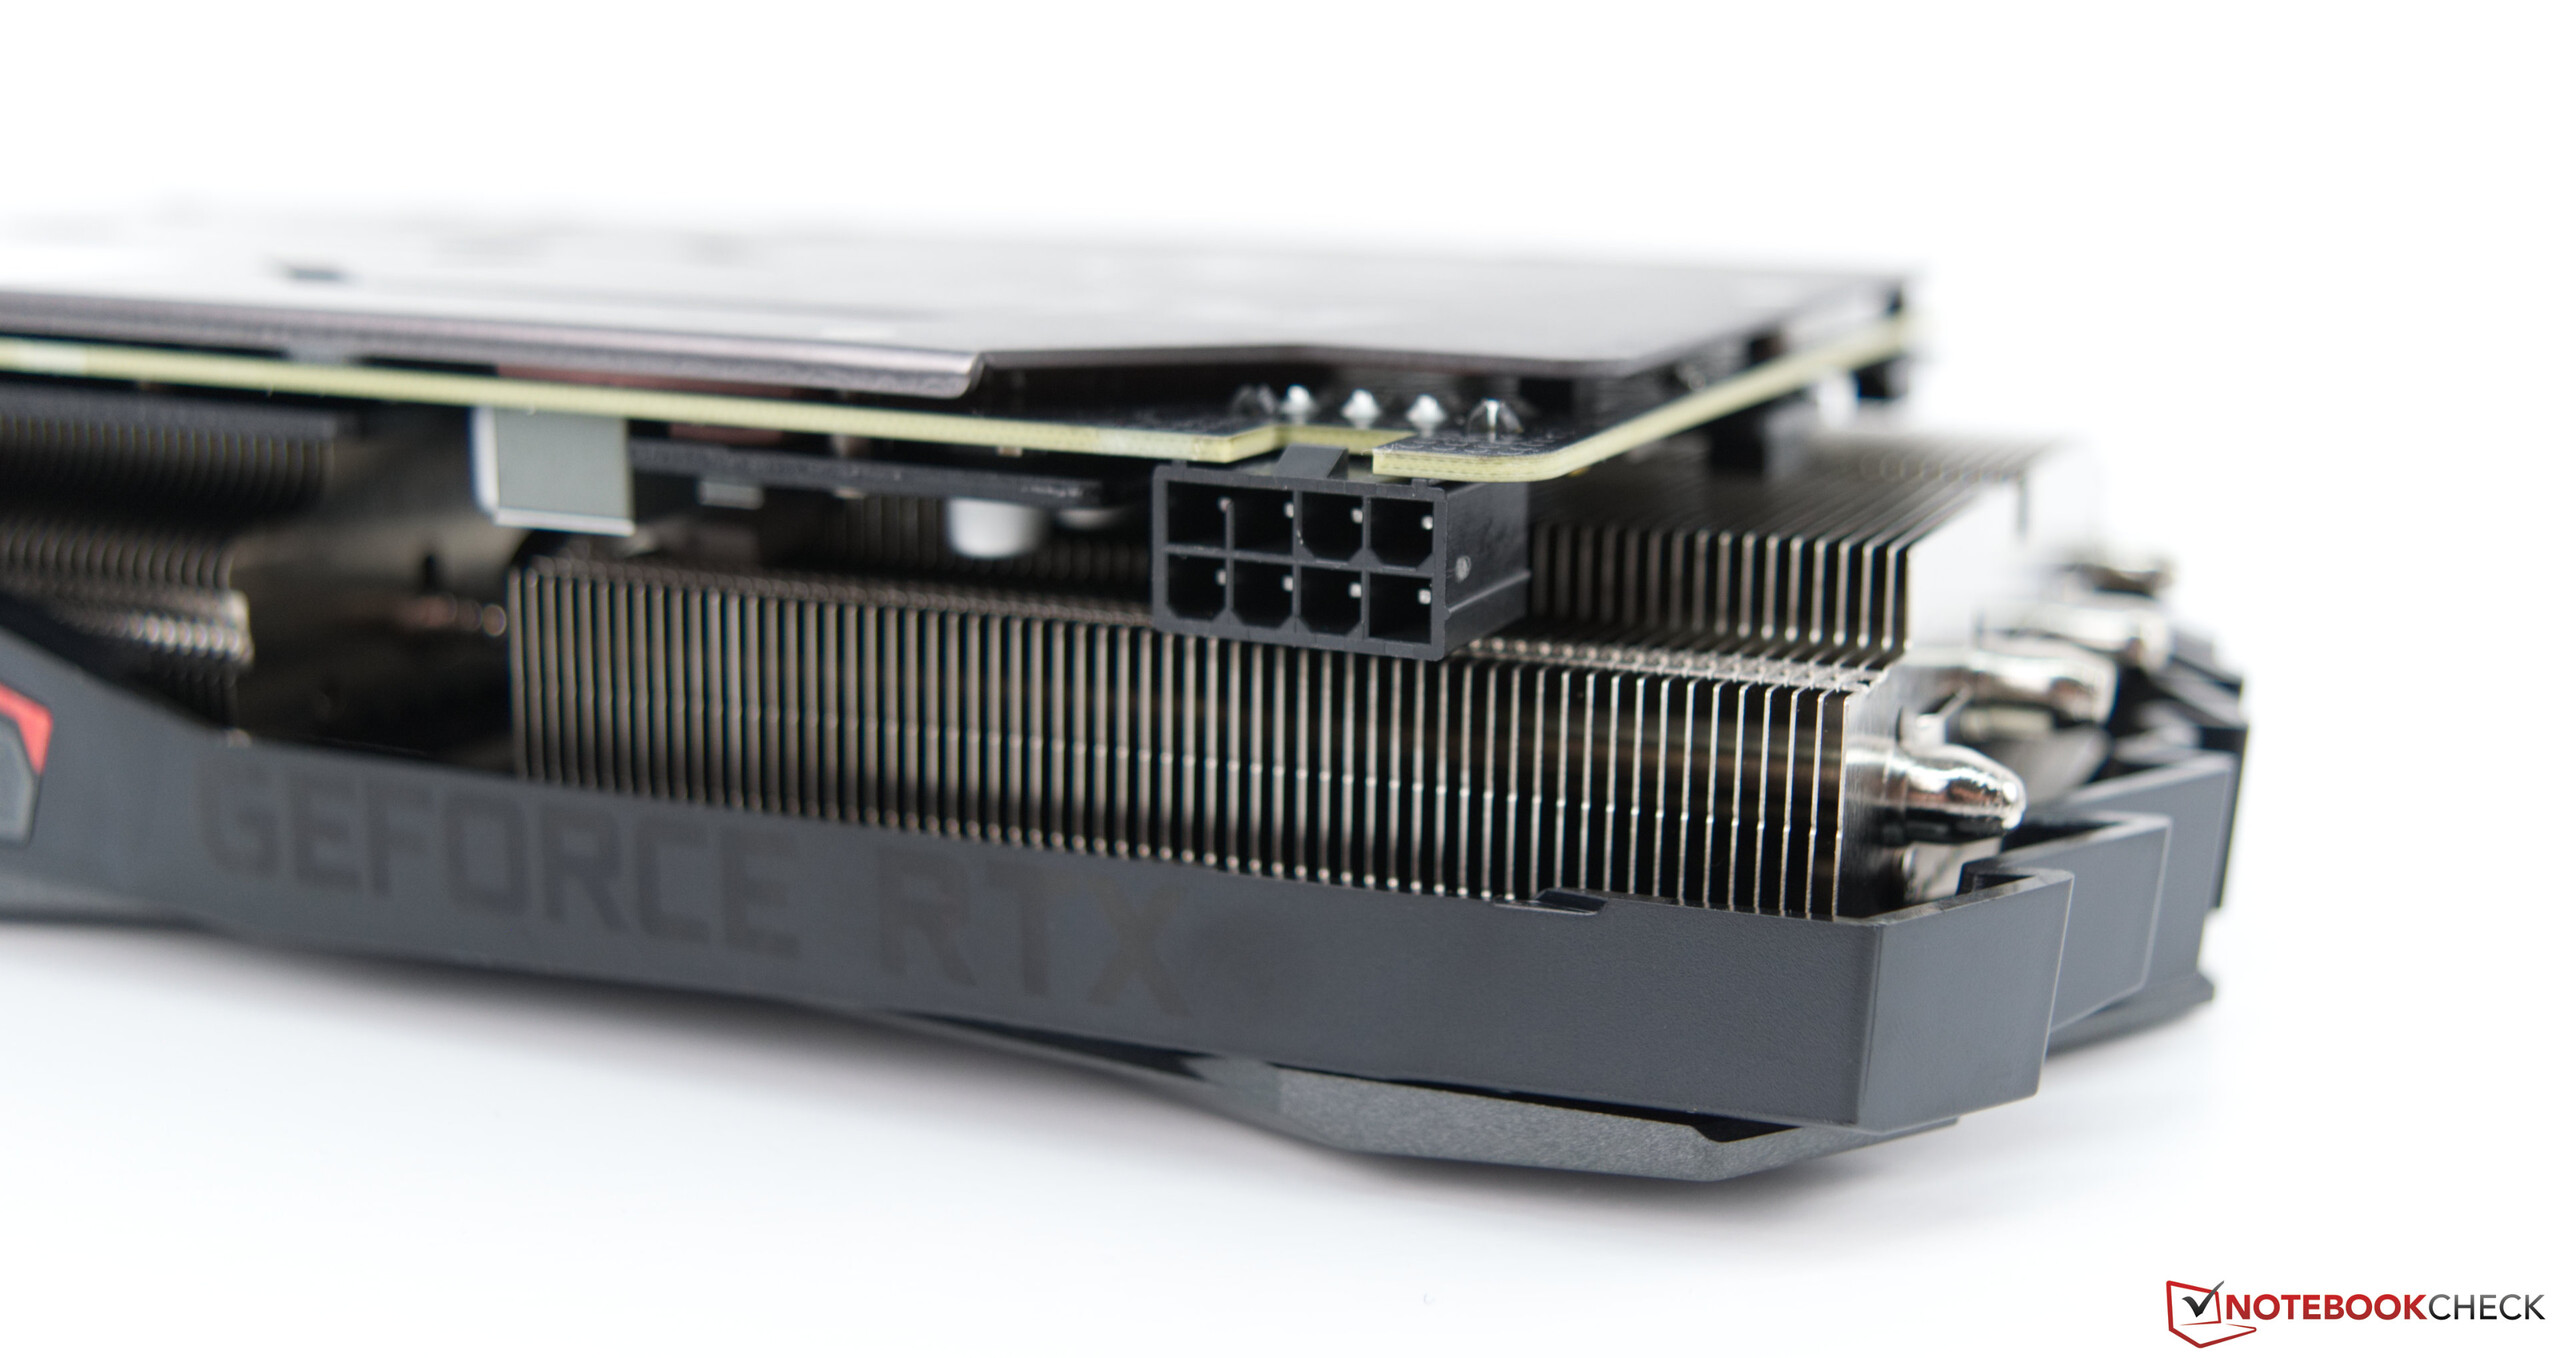
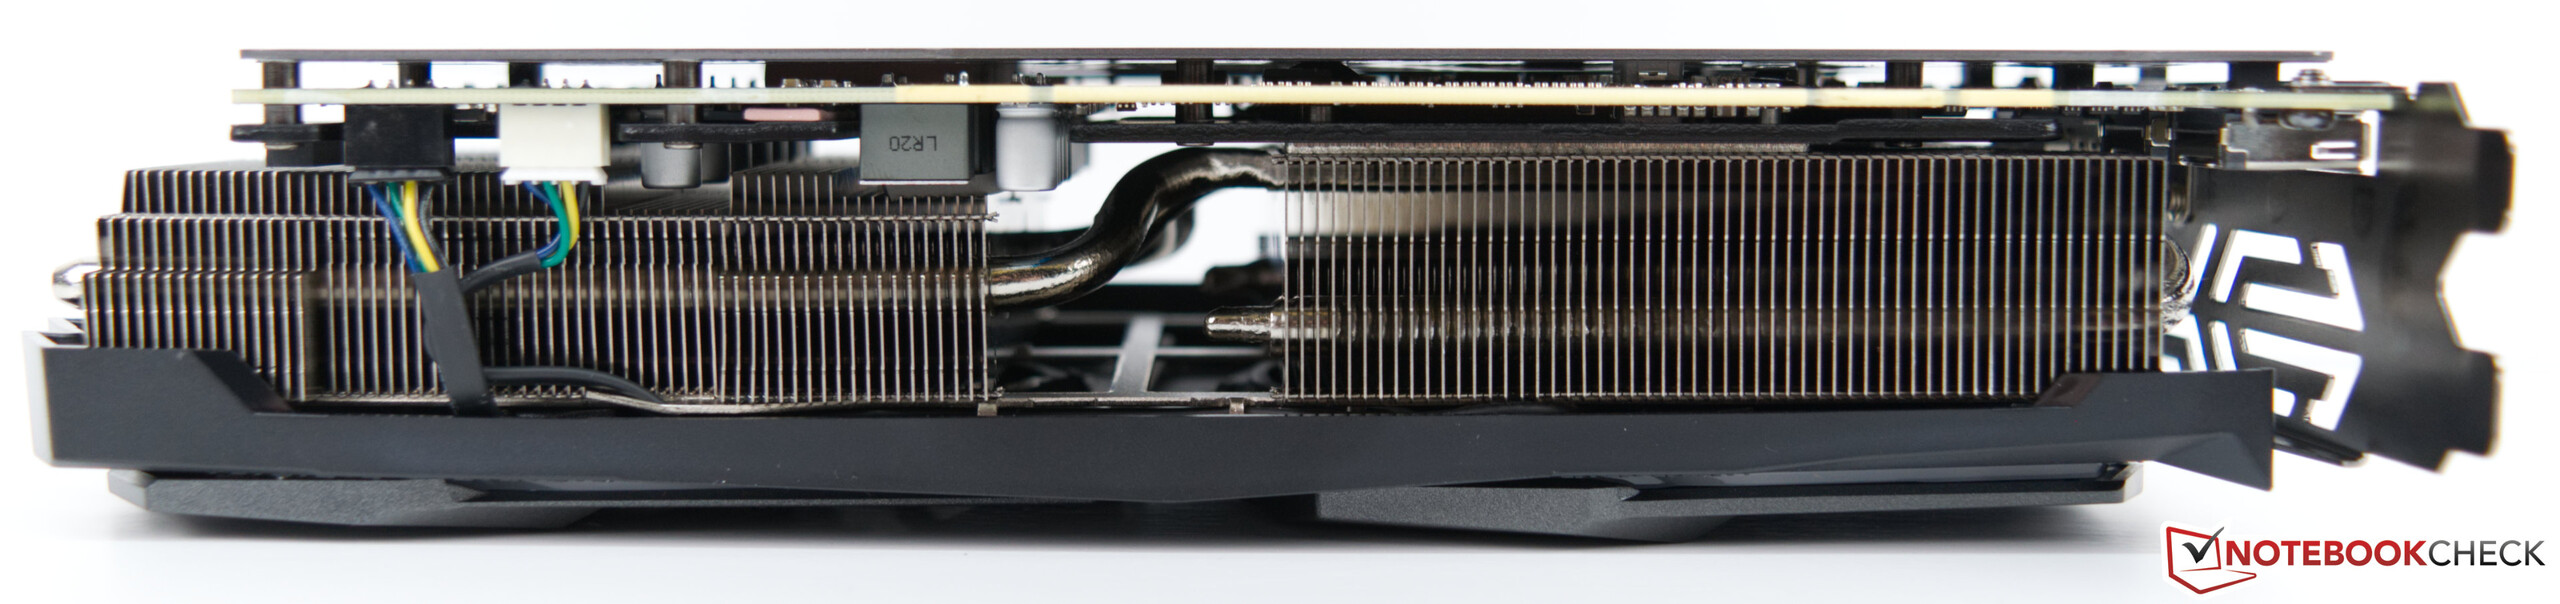
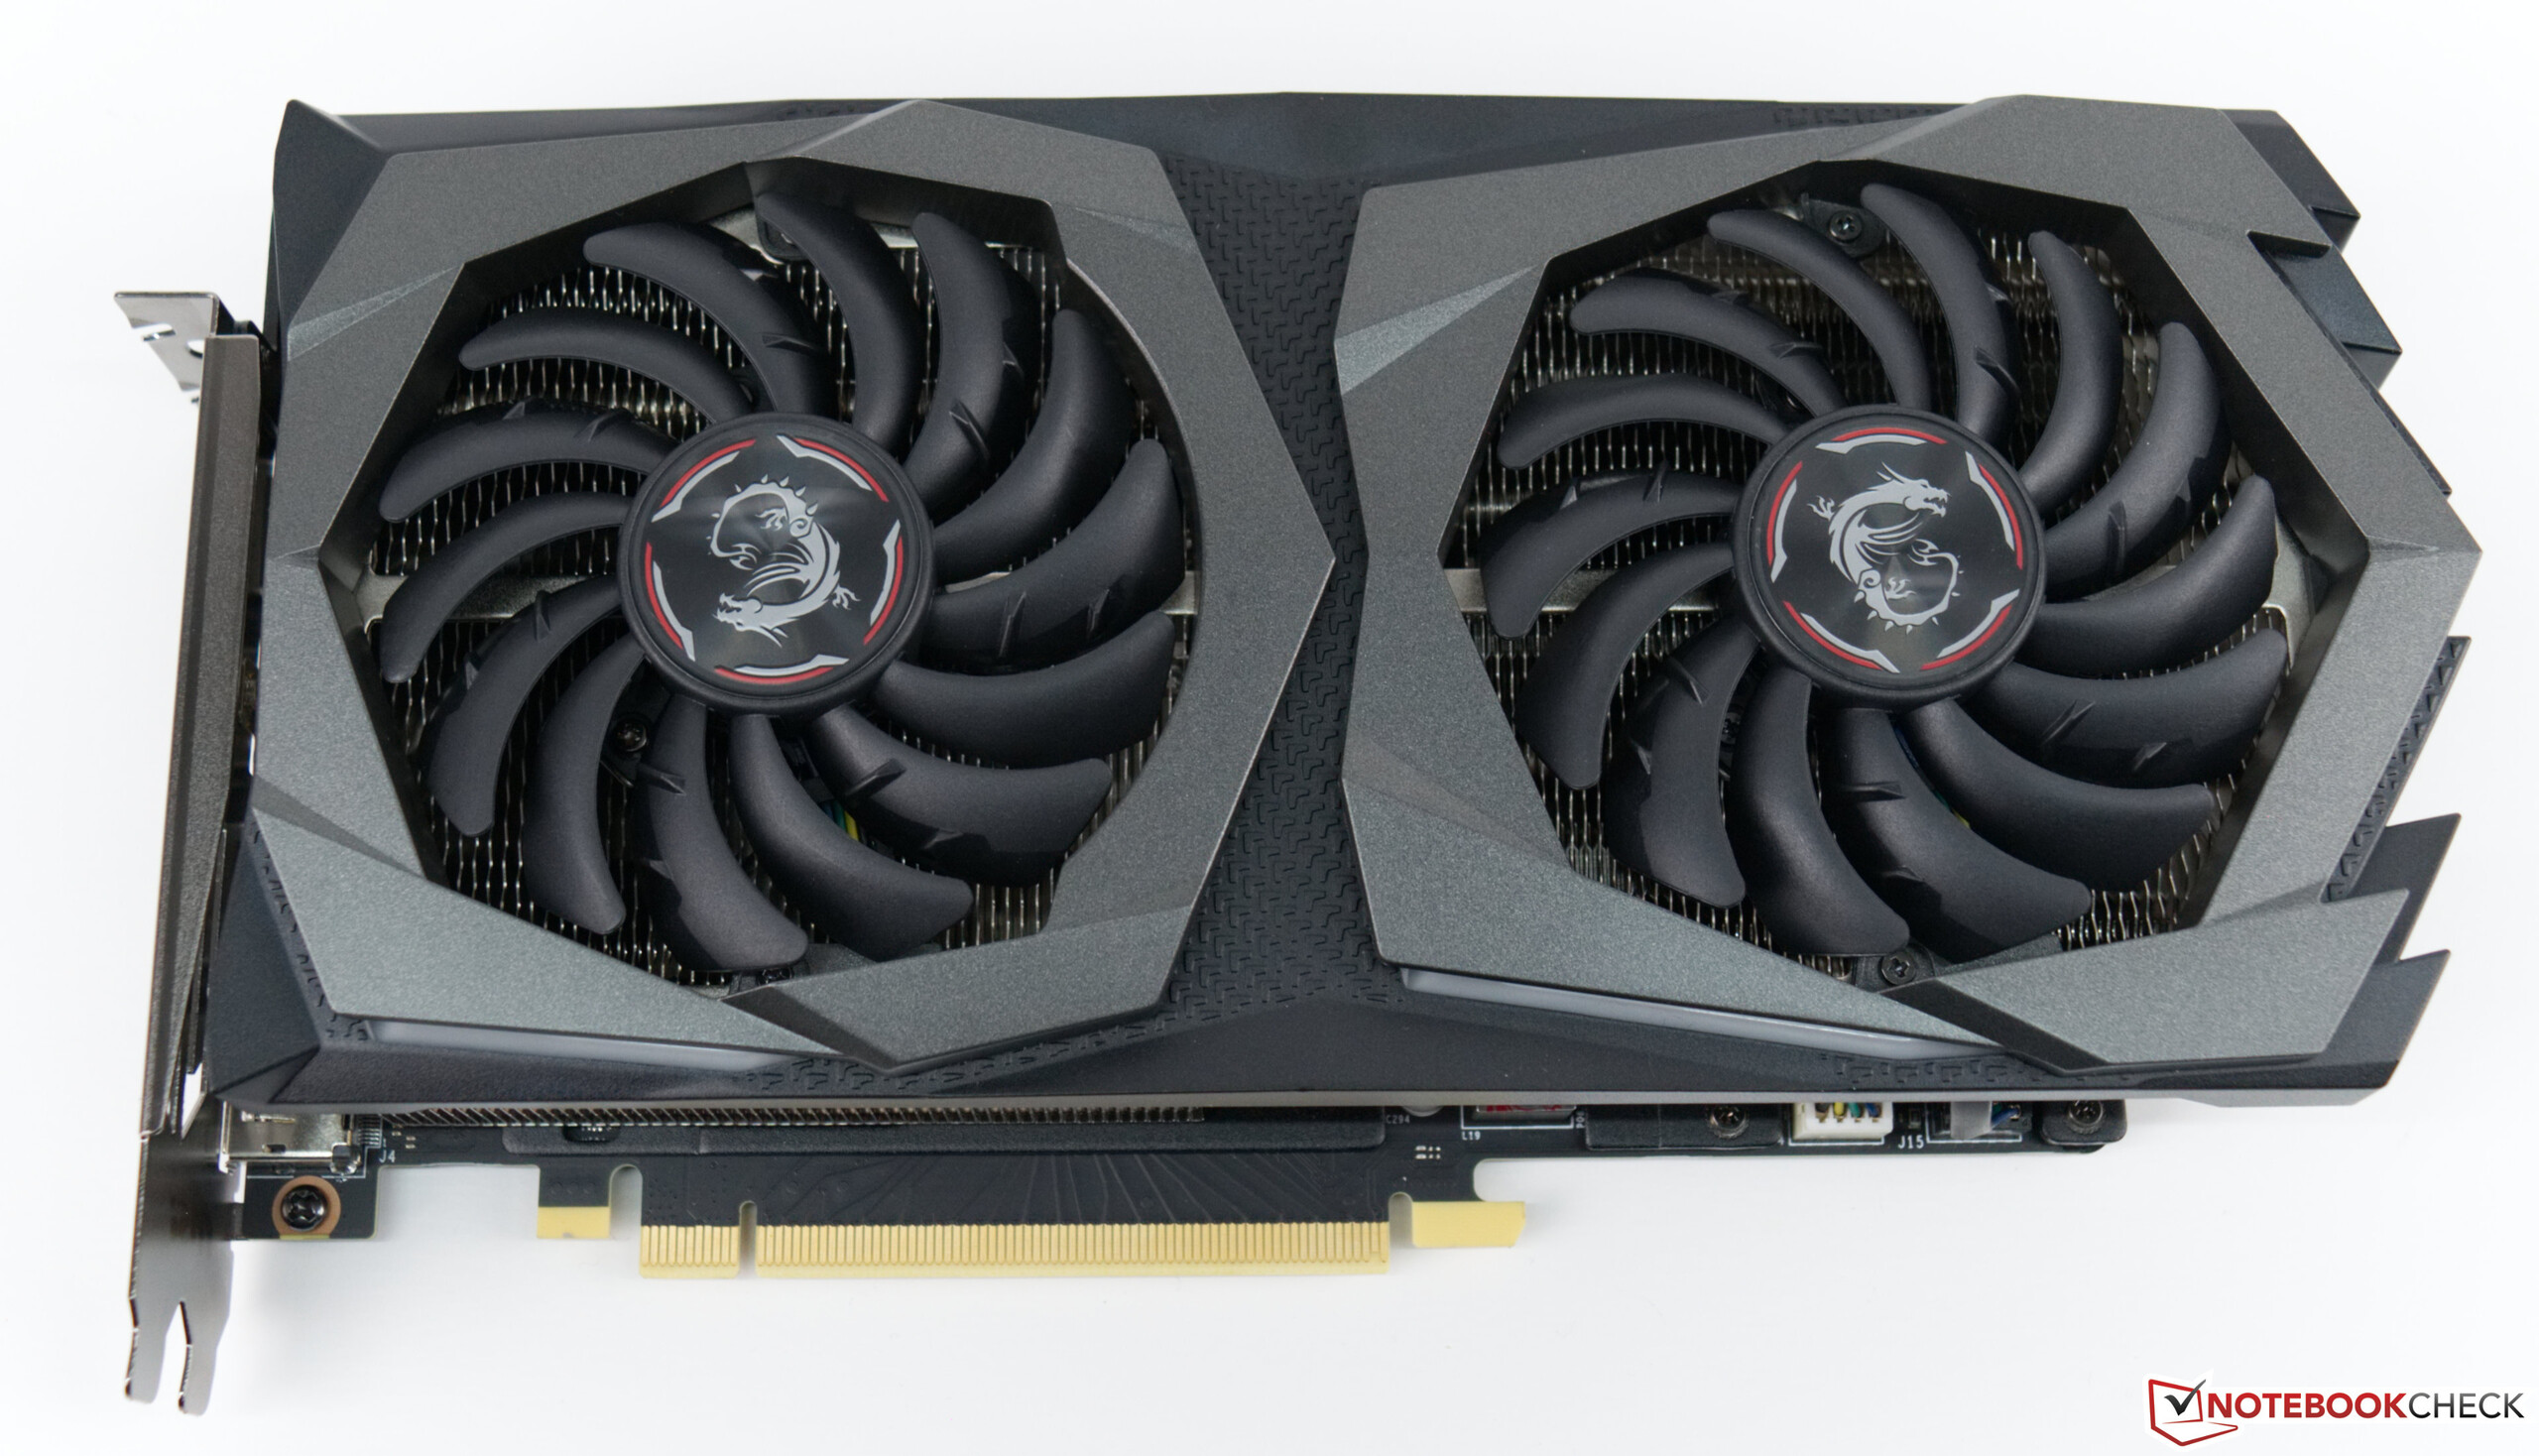
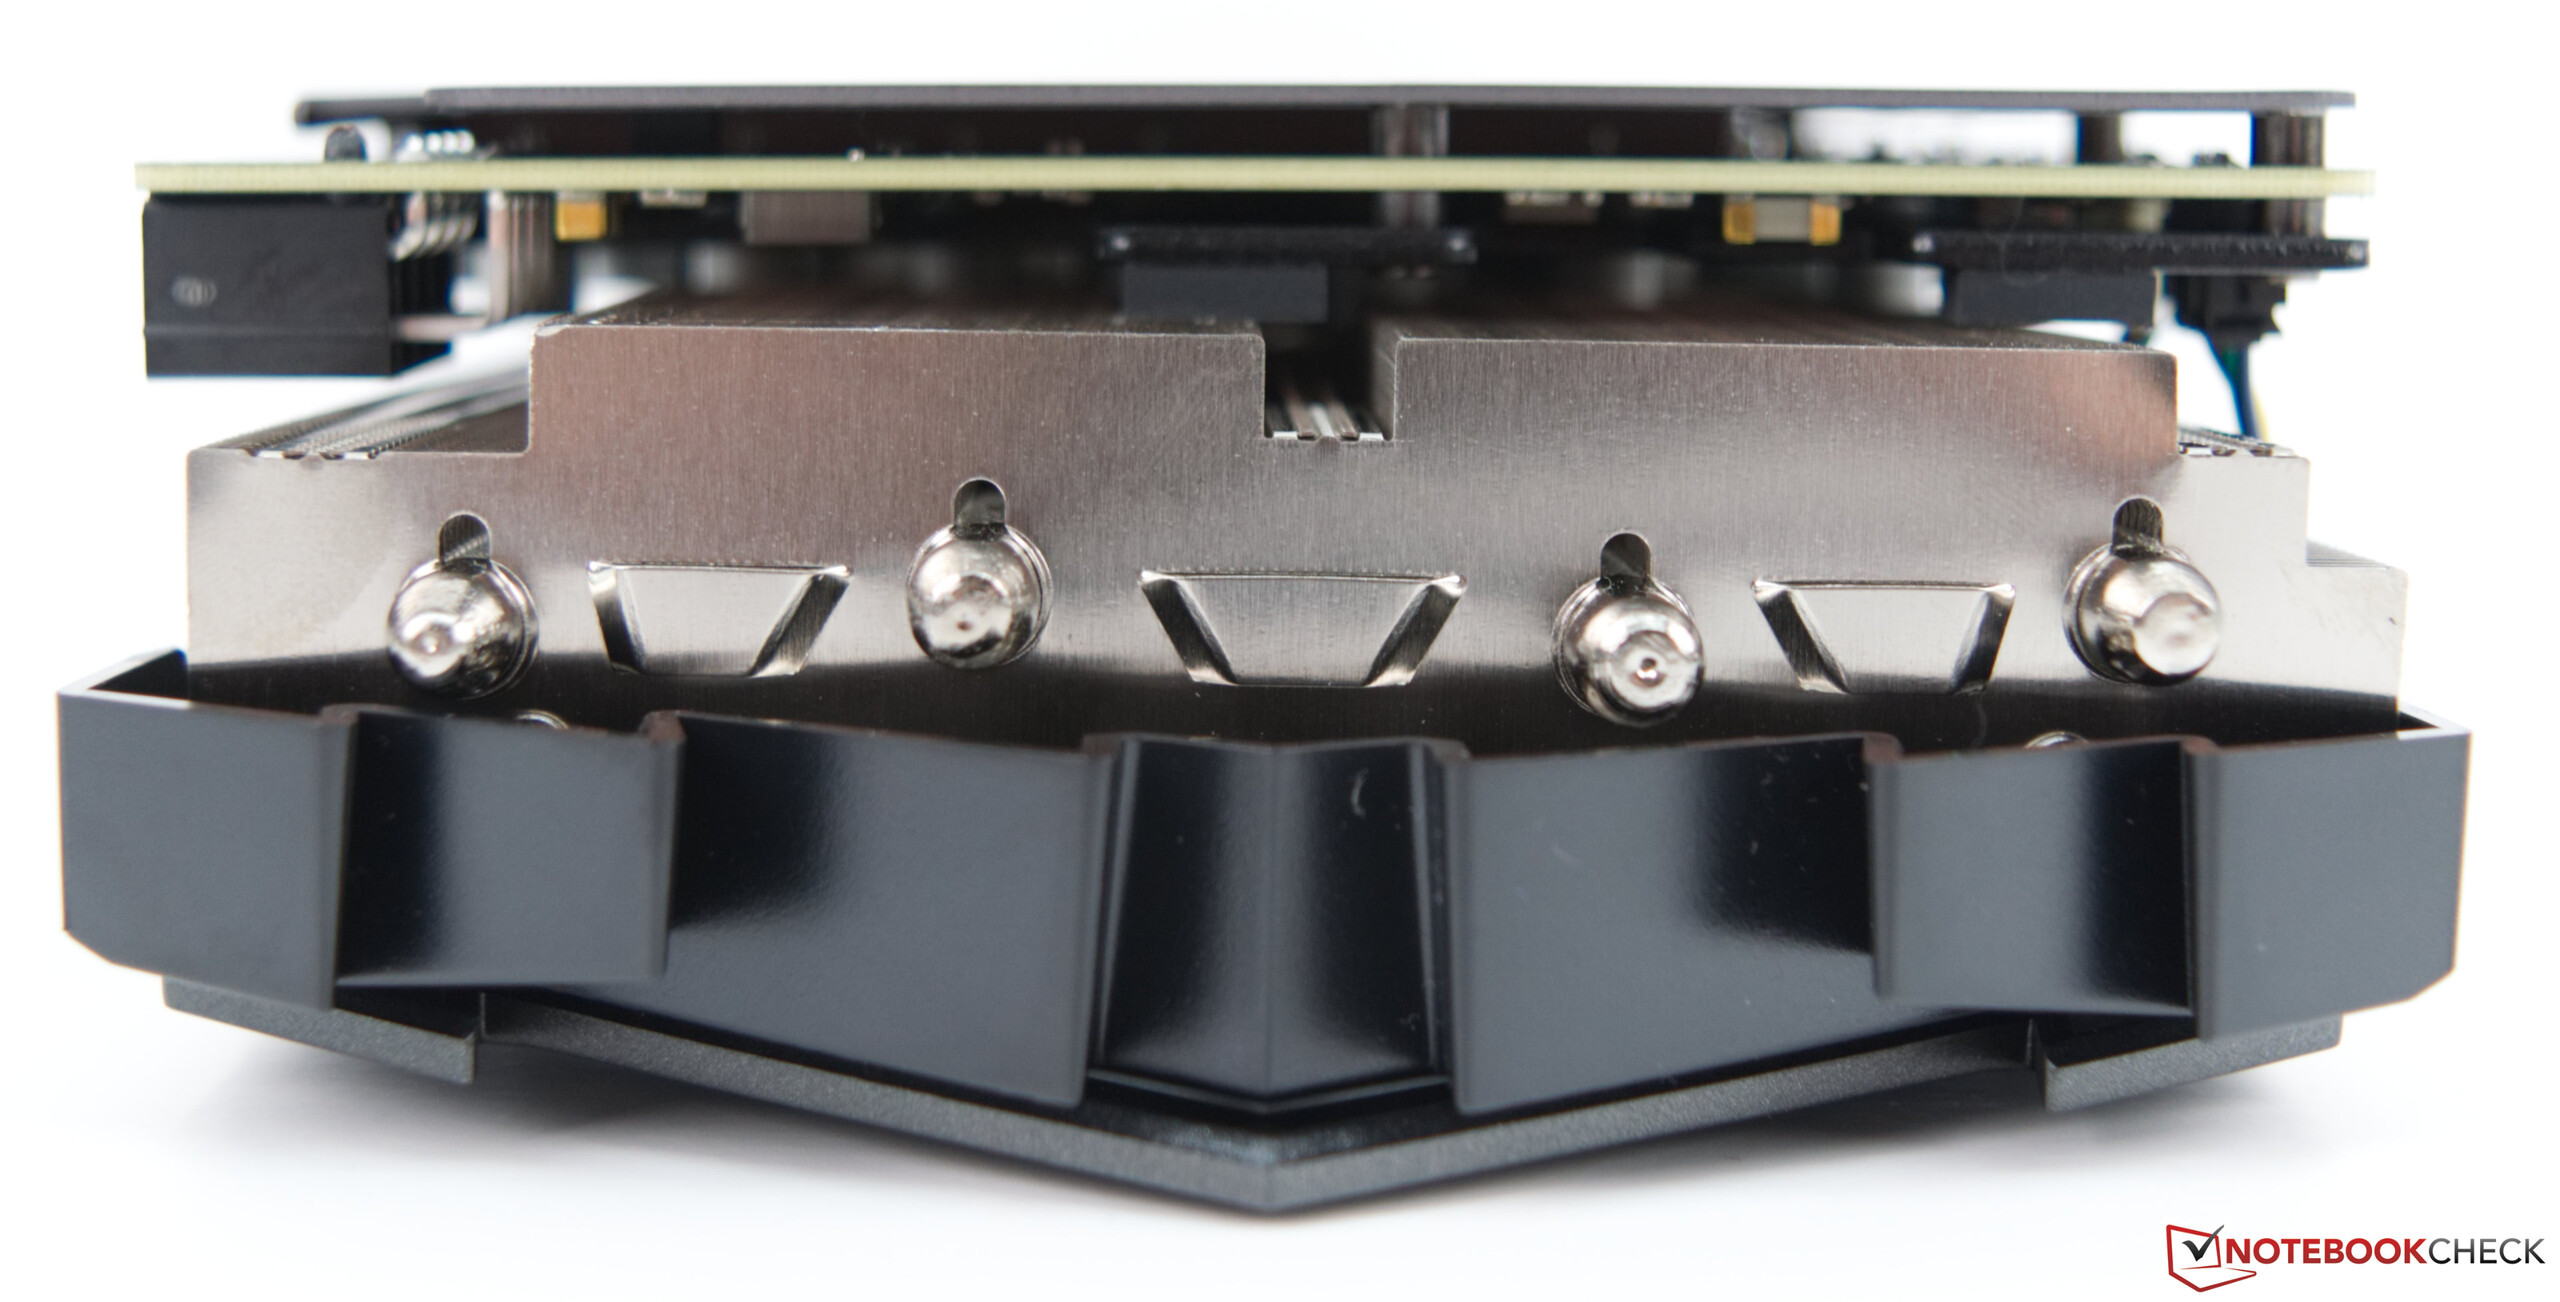
The GeForce RTX 2060 serves as a low-priced alternative to the expensive RTX GPUs. The sample video card that we received from MSI sports a non-reference design. Because Nvidia has stepped up its game when it comes to its reference-grade GPUs, the board partners also have to come up with new features such as improved energy management and RGB lighting to win buyers over. Our review sample from MSI is known as the RTX 2060 Gaming Z 6G, and it looks more massive than the reference model because of its large coolers. All in all, this GPU requires 2.5 slots. Users cannot hook up two GPUs at the same time, because the RTX 2060 cards do not support the NVLink technology. Users will need an RTX 2080 or higher to enable SLI.
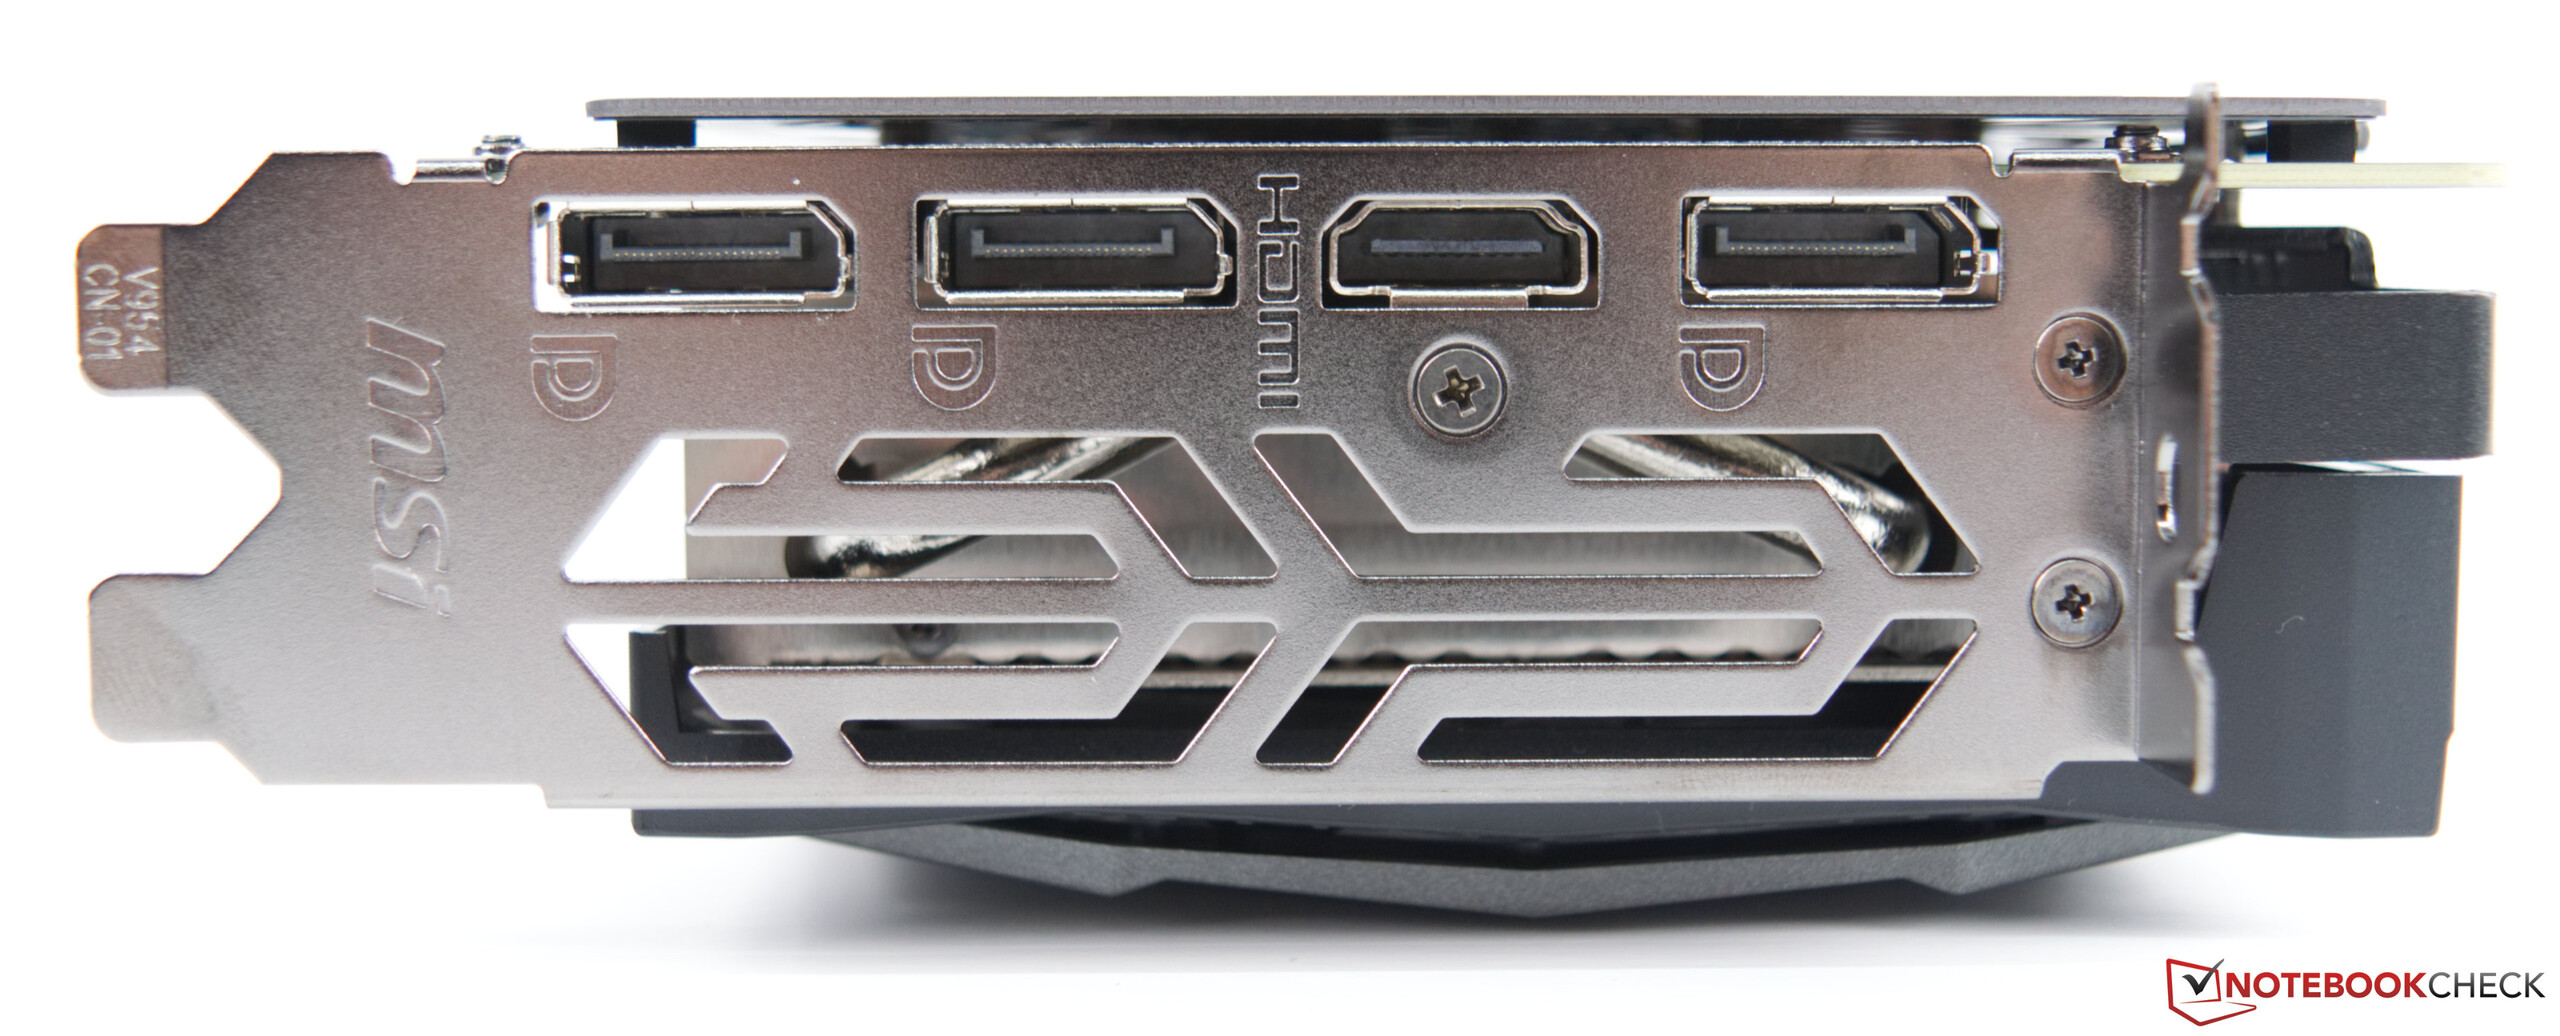
In terms of connectivity, the MSI RTX 2060 Gaming Z 6G offers three DisplayPort 1.4 connectors as well as an HDMI 2.0b port. The GPU requires an 8-pin power connector.
GPU Specifications in Overview
| Spezifikationen | MSI RTX 2060 | RTX 2060 | RTX 2080 Ti | RTX 2080 | RTX 2070 | GTX 1060 |
| Chip | TU106 | TU106 | TU102 | TU104 | TU106 | GP106 |
| Manufacturing Process | 12 nm | 12 nm | 12 nm | 12 nm | 12 nm | 16 nm |
| Shader | 1.920 | 1.920 | 4.352 | 2.944 | 2.304 | 1.280 |
| Texture Units | 120 | 120 | 272 | 184 | 144 | 80 |
| Tensor Cores | 240 | 240 | 544 | 368 | 288 | - |
| RT Cores | 30 | 30 | 68 | 46 | 36 | - |
| GPU Base Clock | 1.365 MHz | 1.365 MHz | 1.350 MHz | 1.515 MHz | 1.410 MHz | 1.506 MHz |
| GPU Boost Clock | 1.830 MHz | 1.680 MHz | 1.545 MHz | 1.710 MHz | 1.620 MHz | 1.709 MHz |
| Memory Bus | 192 Bit | 192 Bit | 352 Bit | 256 Bit | 256 Bit | 192 Bit |
| Memory Bandwidth | 336 GB/s | 336 GB/s | 616 GB/s | 448 GB/s | 448 GB/s | 192.2 GB/s |
| Memory Size | 6 GB GDDR6 | 6 GB GDDR6 | 11 GB GDDR6 | 8 GB GDDR6 | 8 GB GDDR6 | 6 GB GDDR5 |
| Power (Watt) | 190 W | 160 W | 250 W | 250 W | 215 W | 175 W |
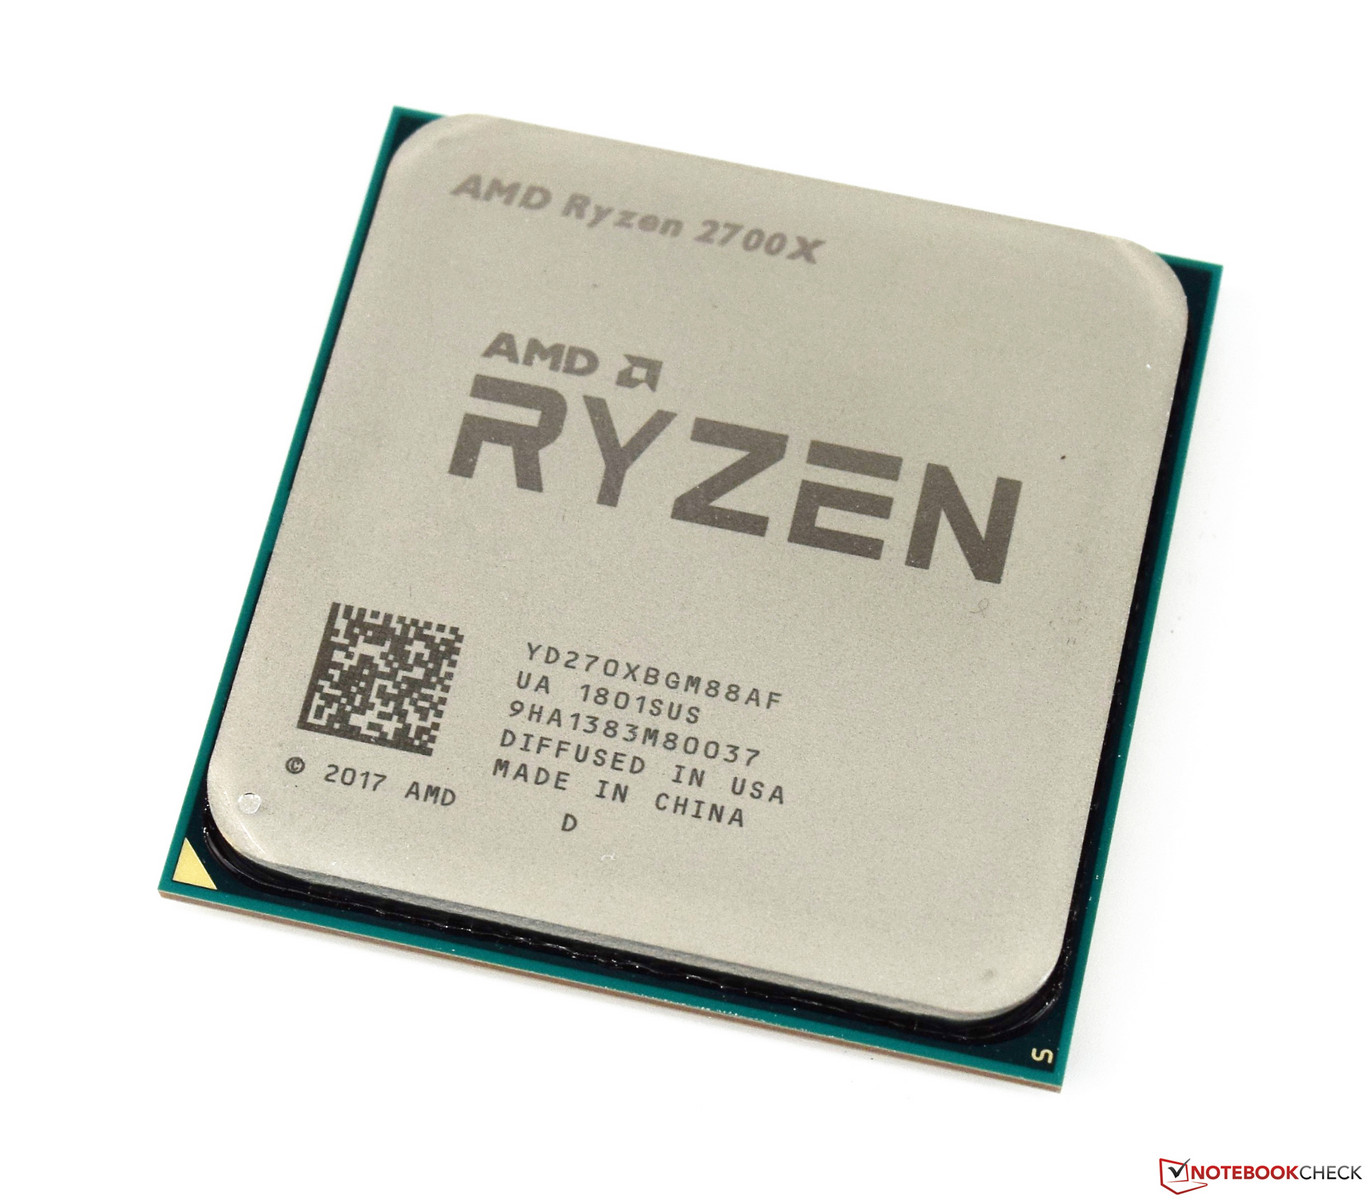
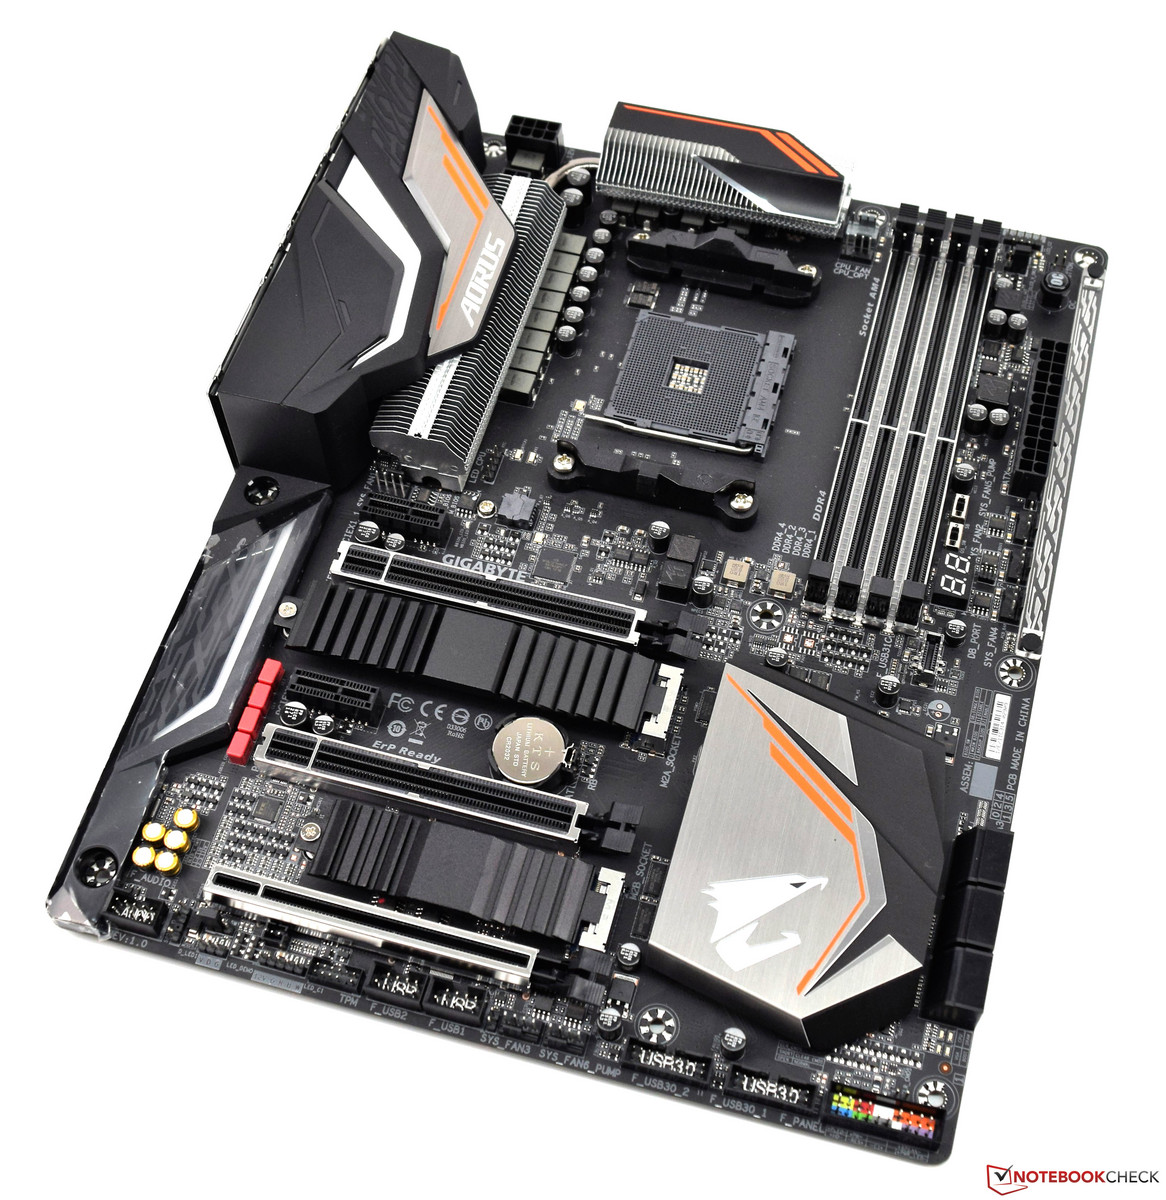
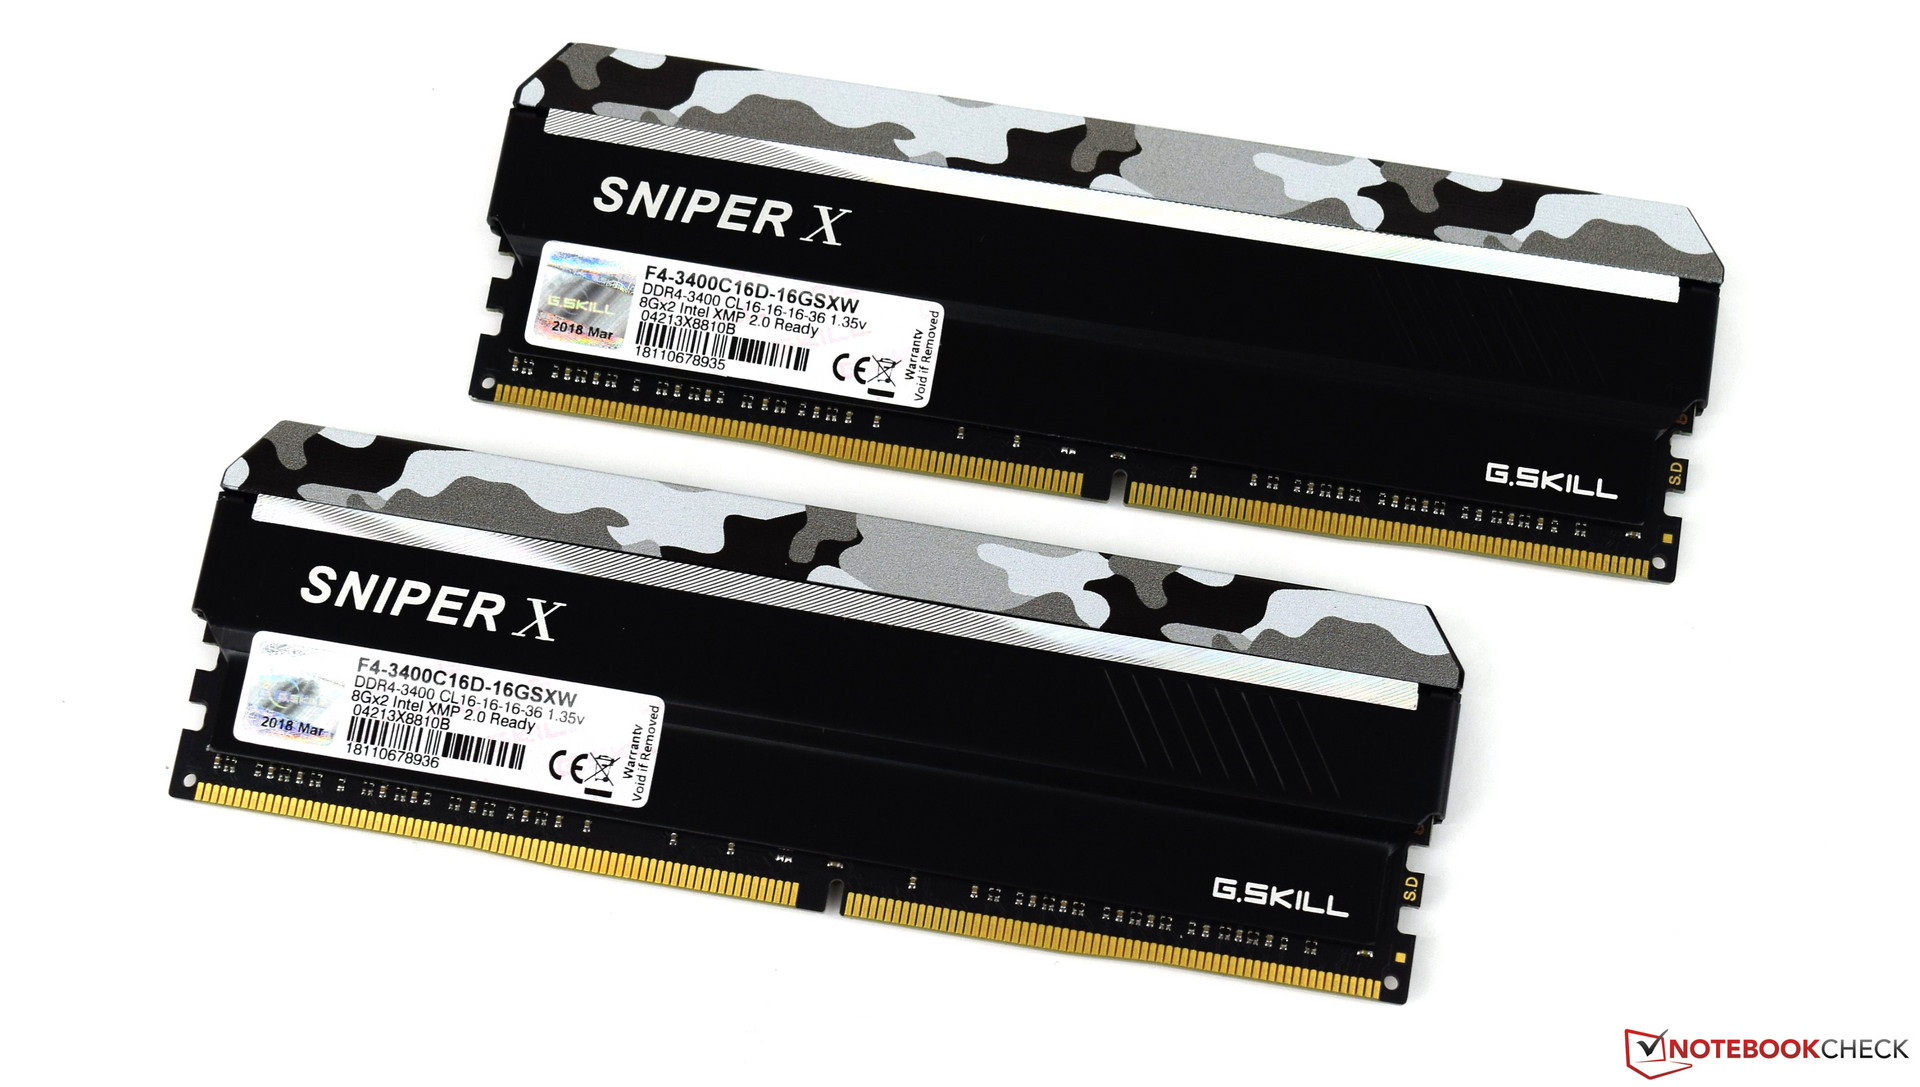
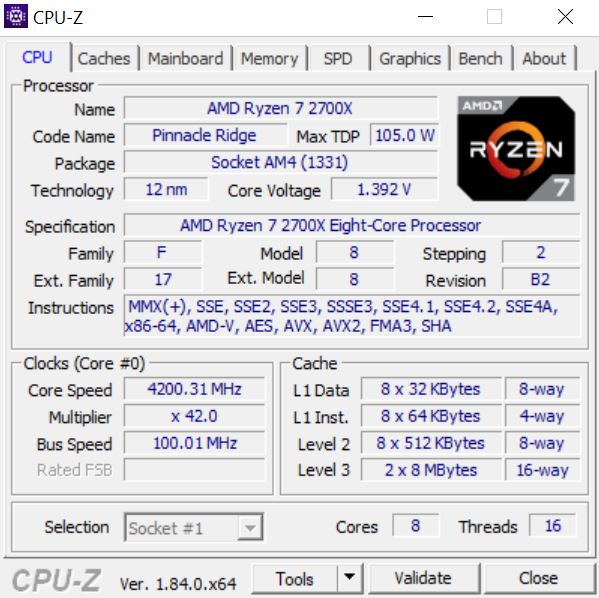
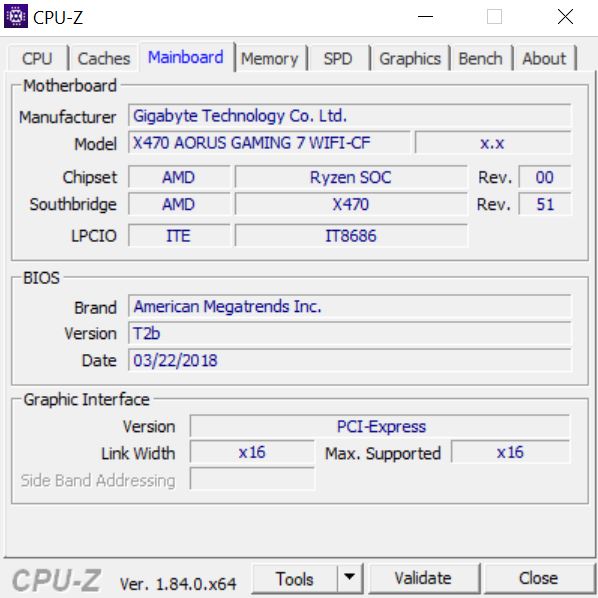
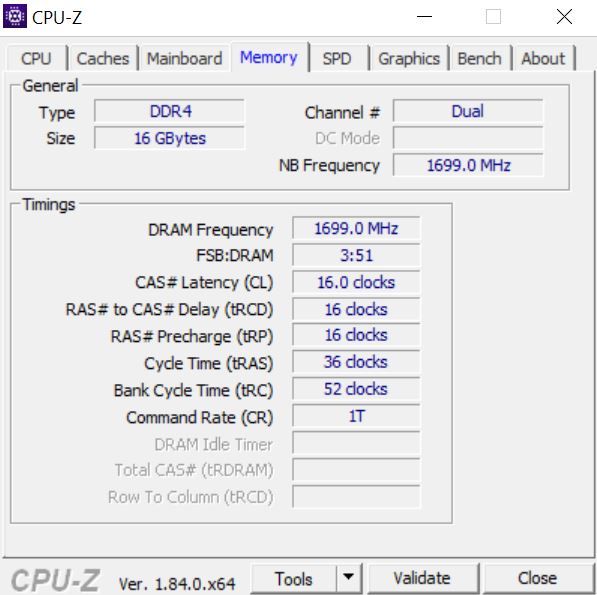
The Test Bench - Based on the Ryzen 7 2700X
Our test bench is based on a current AMD platform. The Gigabyte X470 Aorus Gaming 7 Wi-Fi serves as the motherboard. The CPU, which is known as the AMD Ryzen 7 2700X, offers a lot of performance. The system is cooled by an all-in-one water cooler from Be Quiet (Silent Loop 280mm). The 16 GB of 3400 MHz RAM comes from G-Skill. The Acer Predator XB321HK does not represent a bottleneck, thanks to its 4K resolution. We are very grateful to AMD for providing us with the above-mentioned system.
| Case | Corsair Carbide Air 540 ATX Cube |
| CPU | AMD RYZEN 7 2700X |
| CPU Cooler | Be Quiet Silent Loop 280mm |
| RAM | G-Skill Sniper X 16 GB DDR4 3.400 MHz |
| Motherboard | Gigabyte X470 Aorus Gaming 7 WiFi |
| Monitor | Acer Predator XB321HK 4K |
| SSD | ADATA SP900 M.2 SSD |
| HDD | 2 TB Western Digital (for gaming) |
| Operating System | Microsoft Windows 10 Professional 64-Bit (Version 1809) |
| Drivers | Nvidia 418.91 |


The Core Clocks of the MSI RTX 2060 Gaming Z 6G
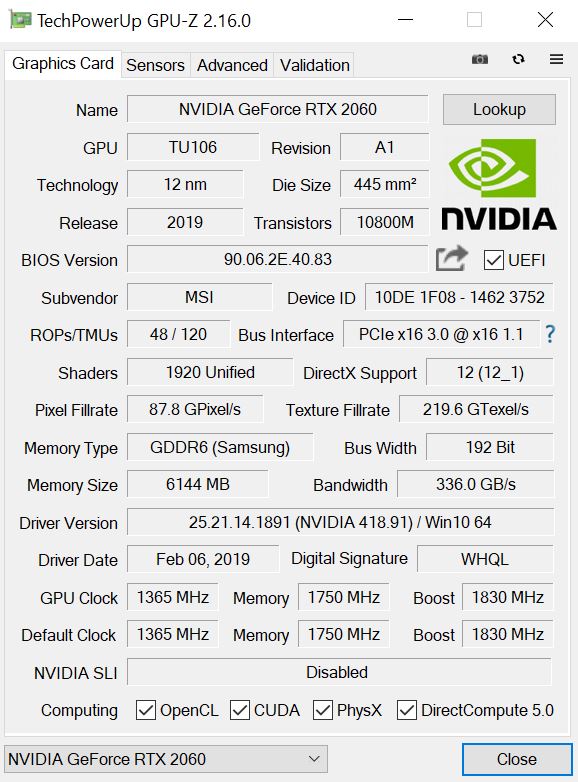
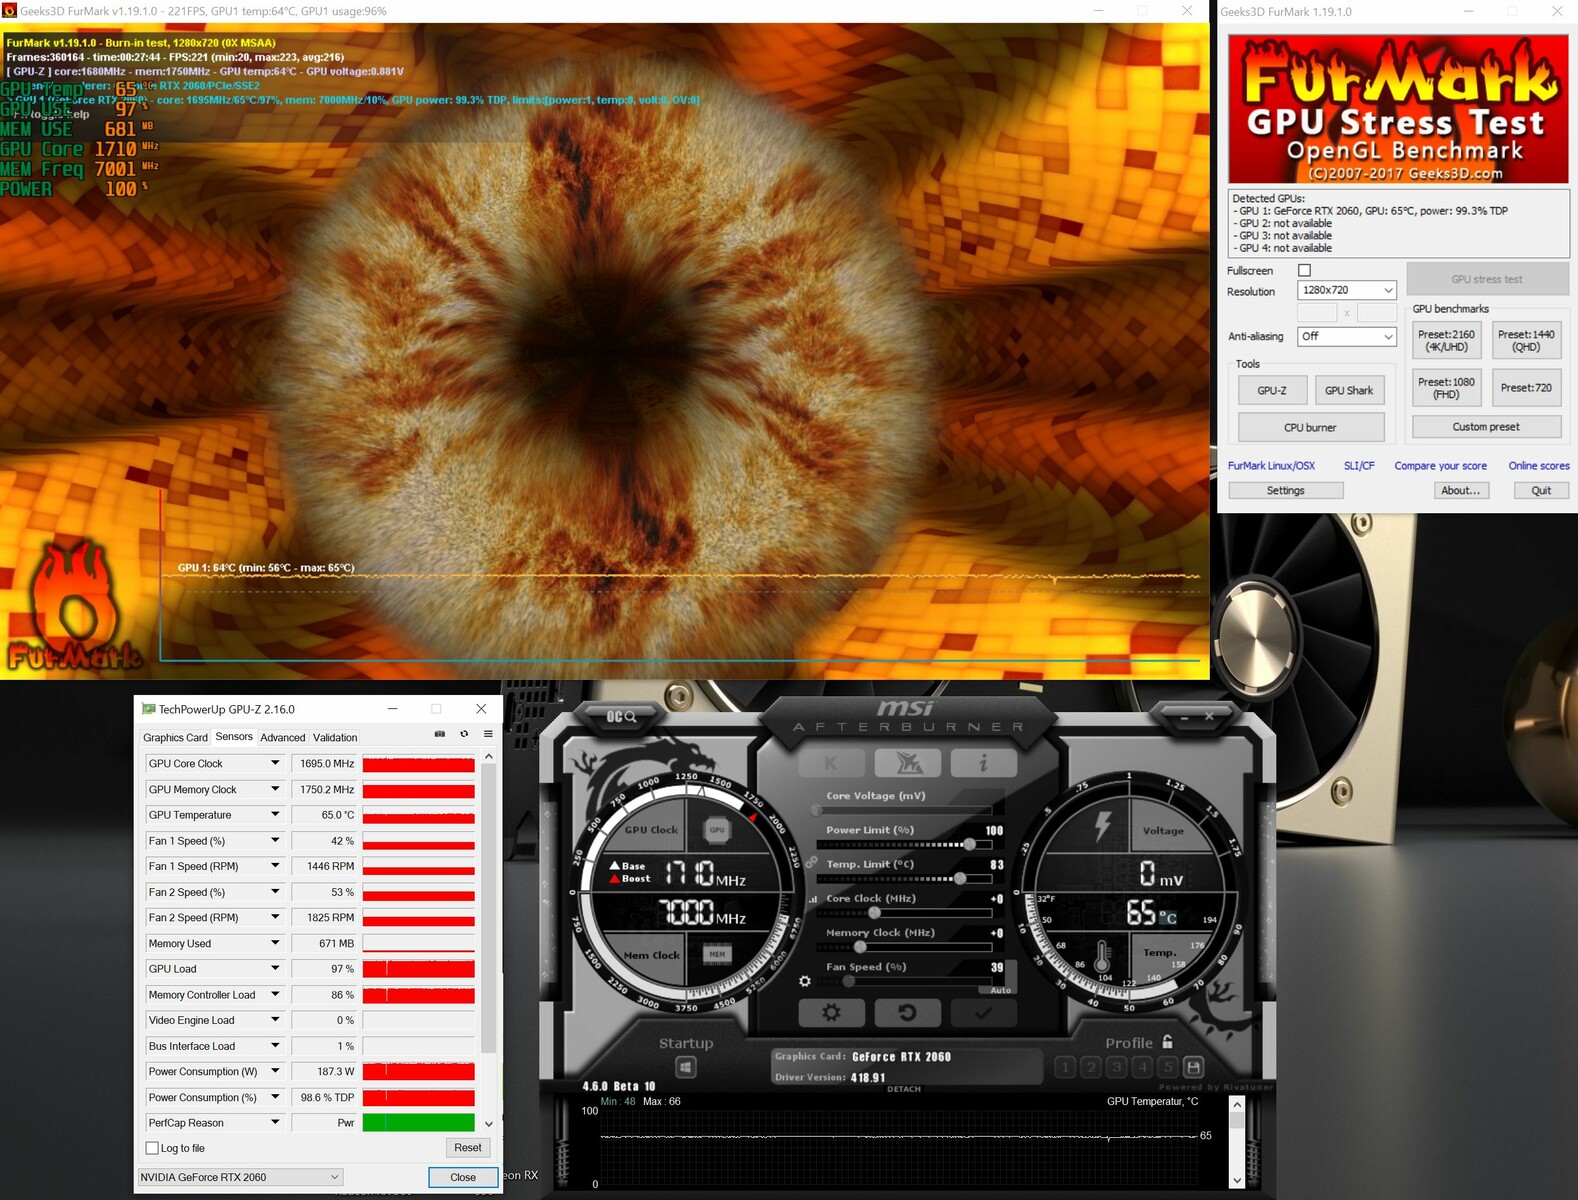
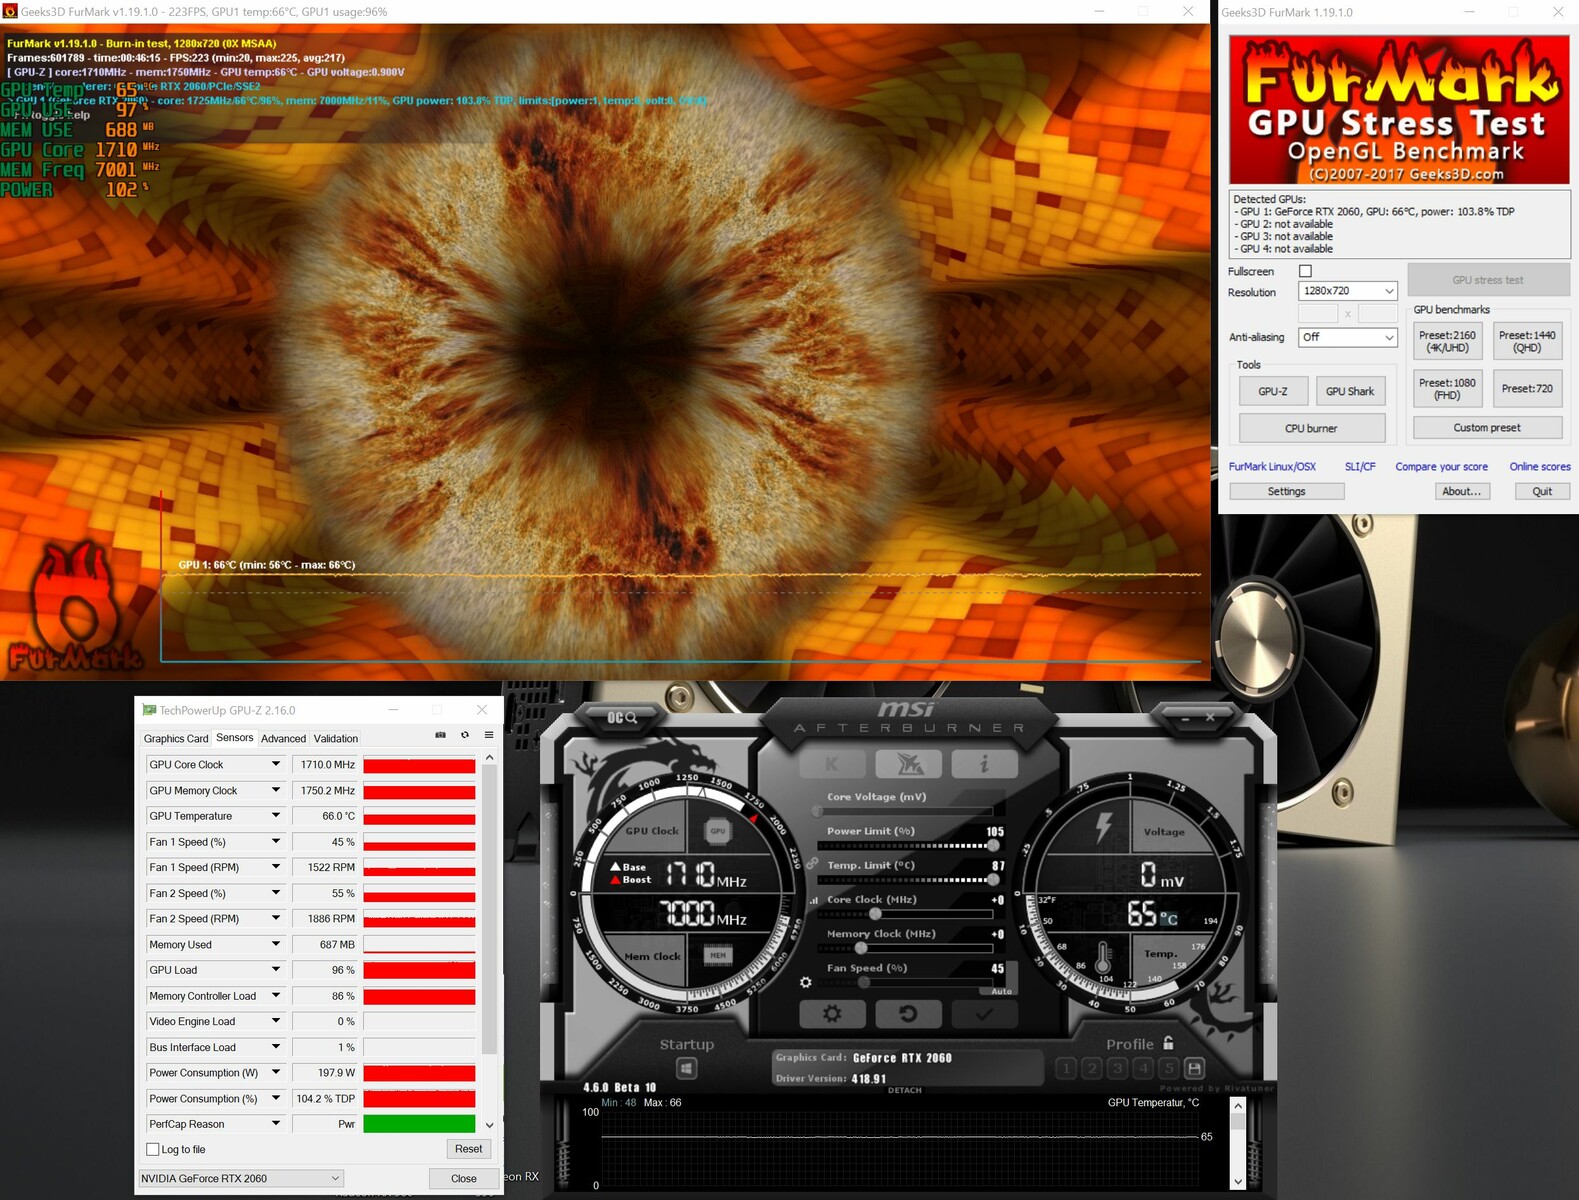
MSI’s GPU offers the same base core clock as Nvidia’s reference model. Both graphics cards have a base clock of 1365 MHz. However, when it comes to the boost clock, there is some difference. The MSI RTX 2060 Gaming Z 6G comes with a higher boost clock of 1830 MHz, whereas the reference model has a boost clock of 1680 MHz. The VRAM of both GPUs is clocked at 1750 MHz, which is why they have the same memory bandwidth of 336 GB/s. The amount of VRAM is quite disappointing, because 6 GB is not very future-proof.
One disadvantage of a higher boost clock is a higher TDP. According to Nvidia, the RTX 2060 has a TDP of 160 watts. However, our sample card draws about 30 watts more under load.
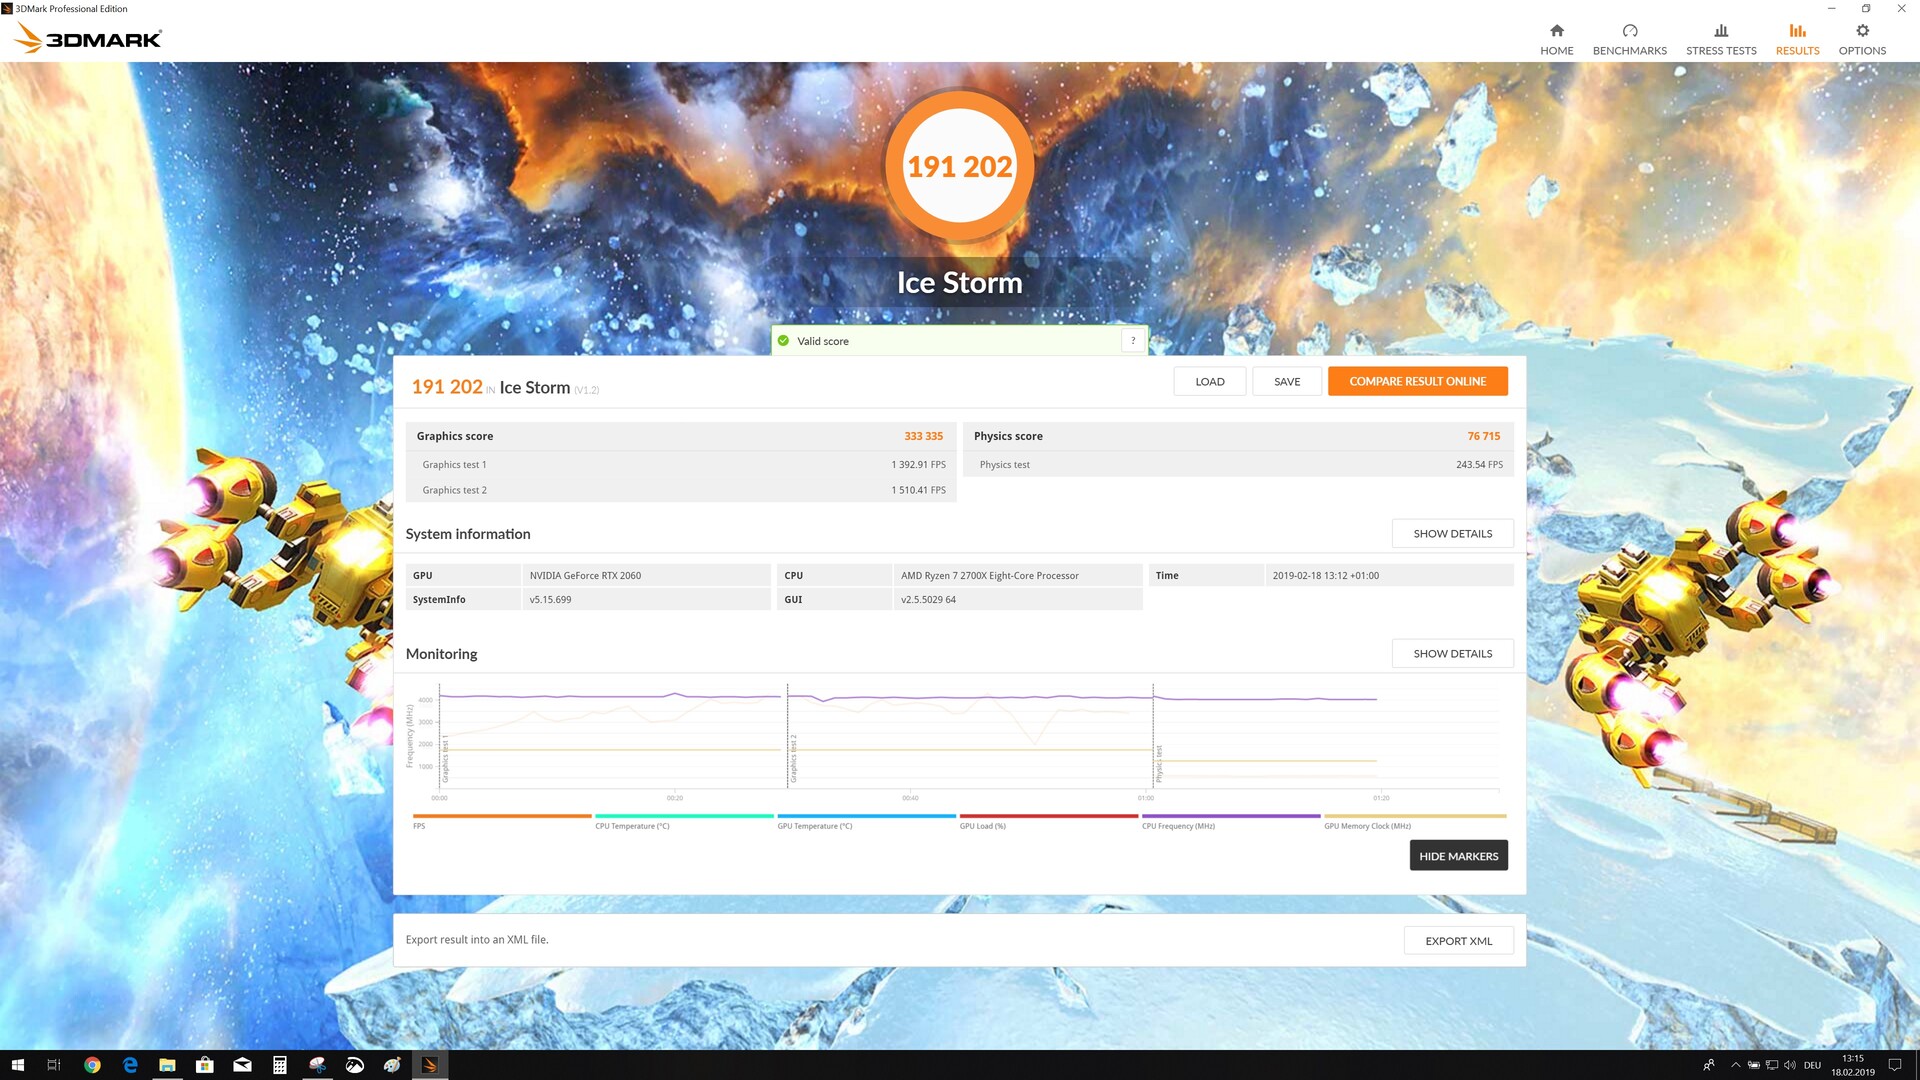
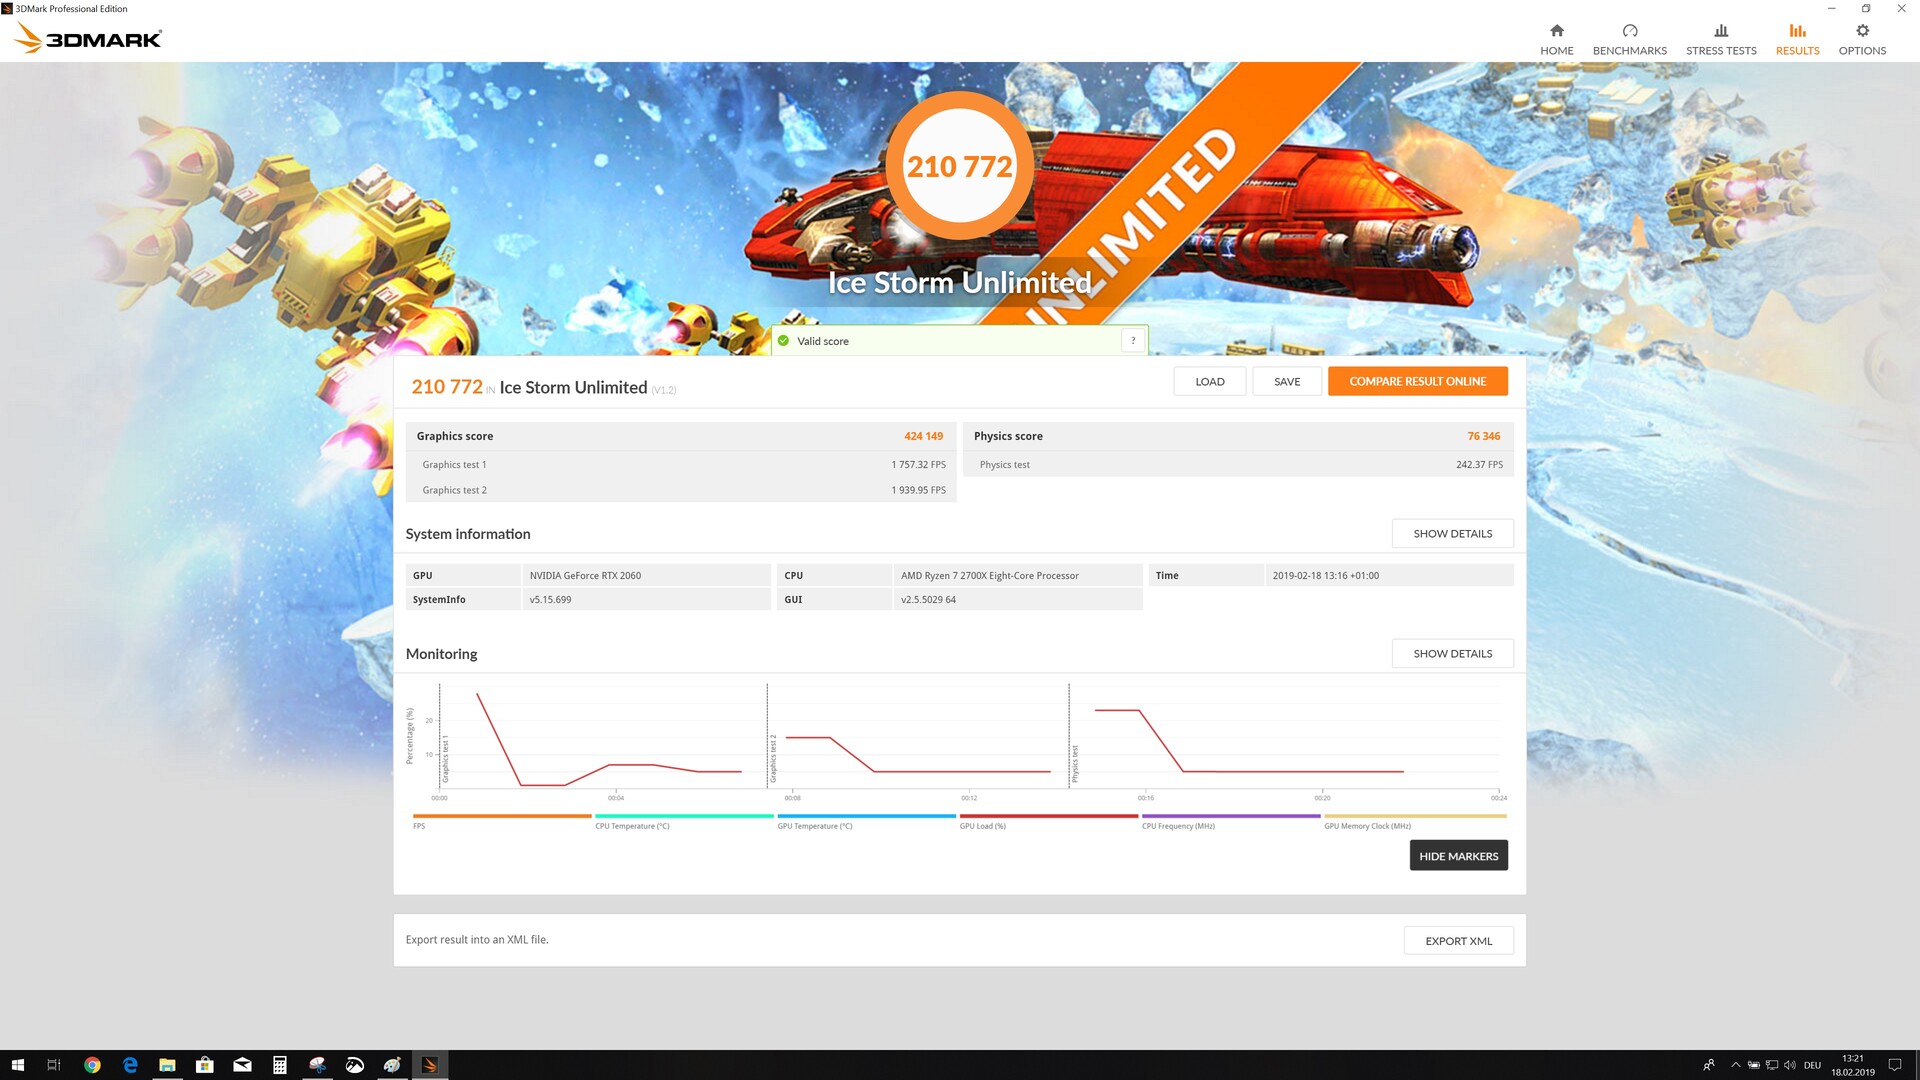
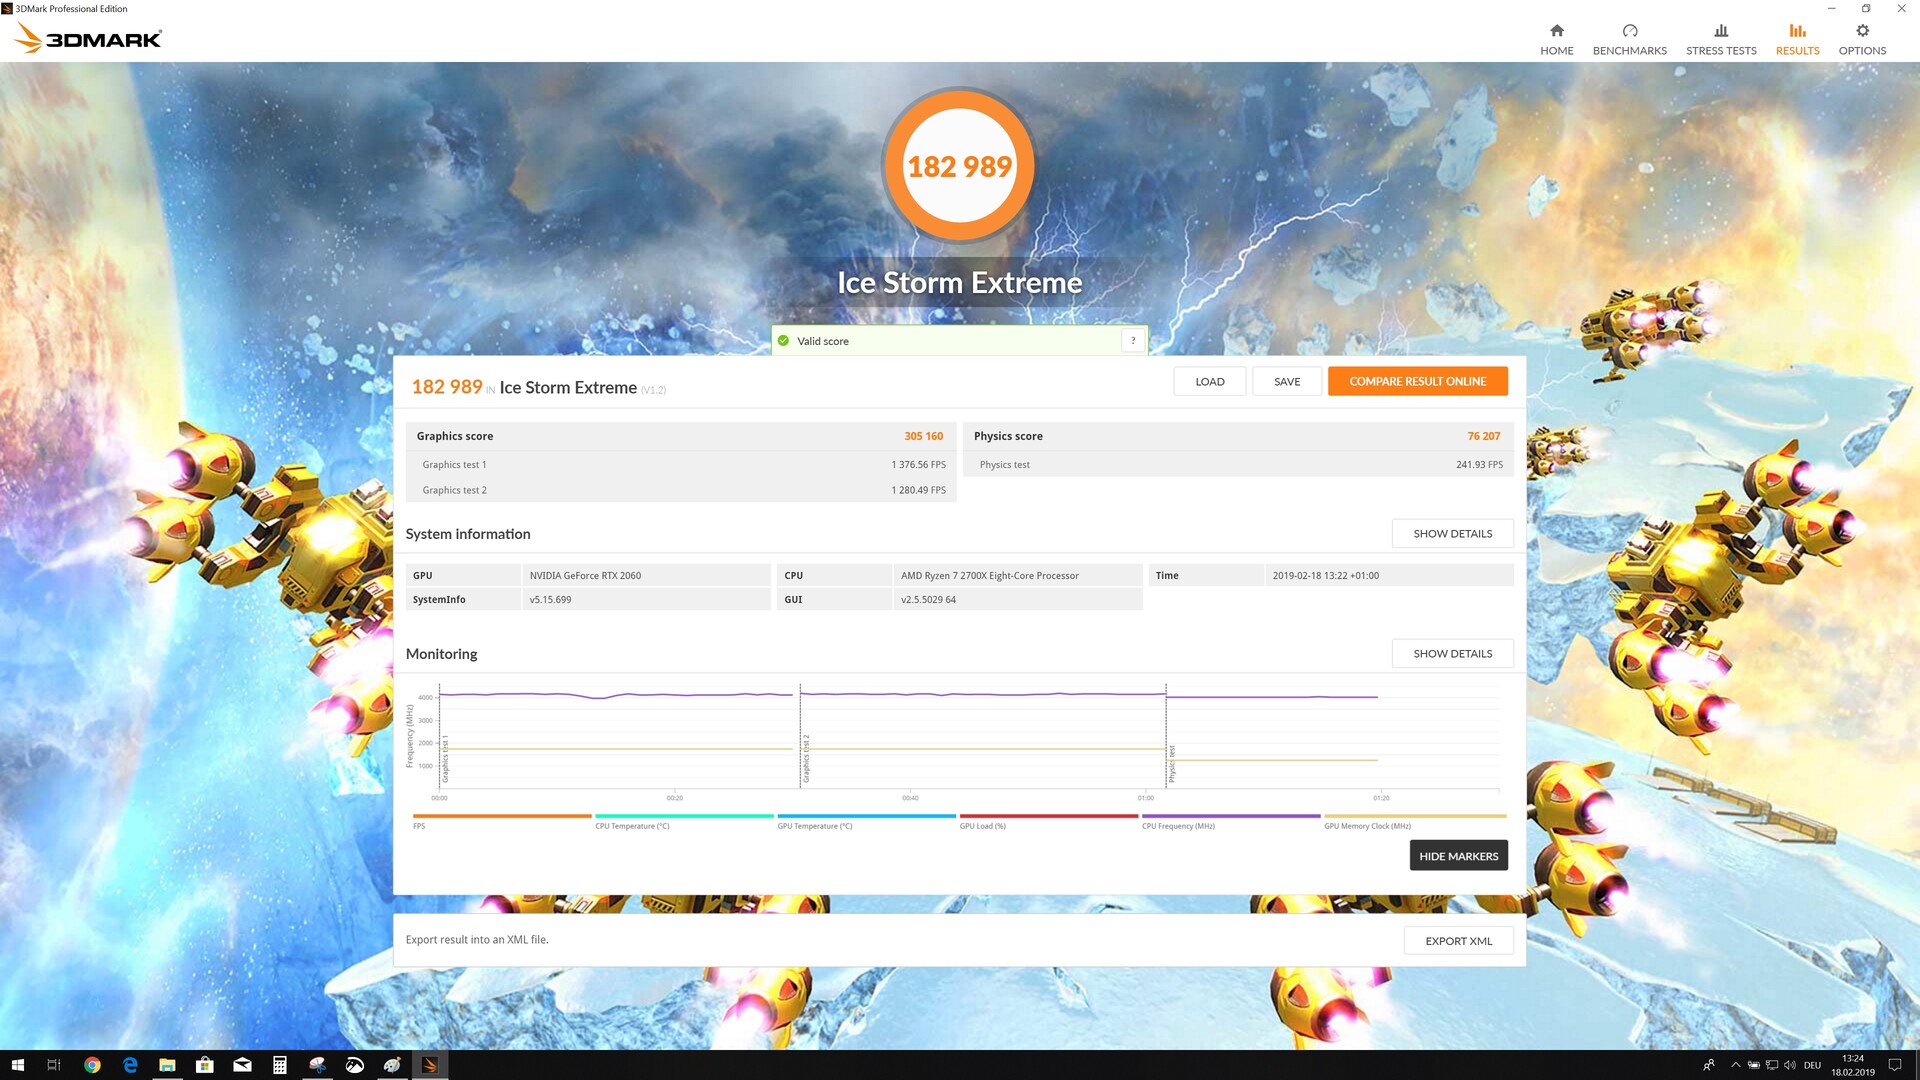
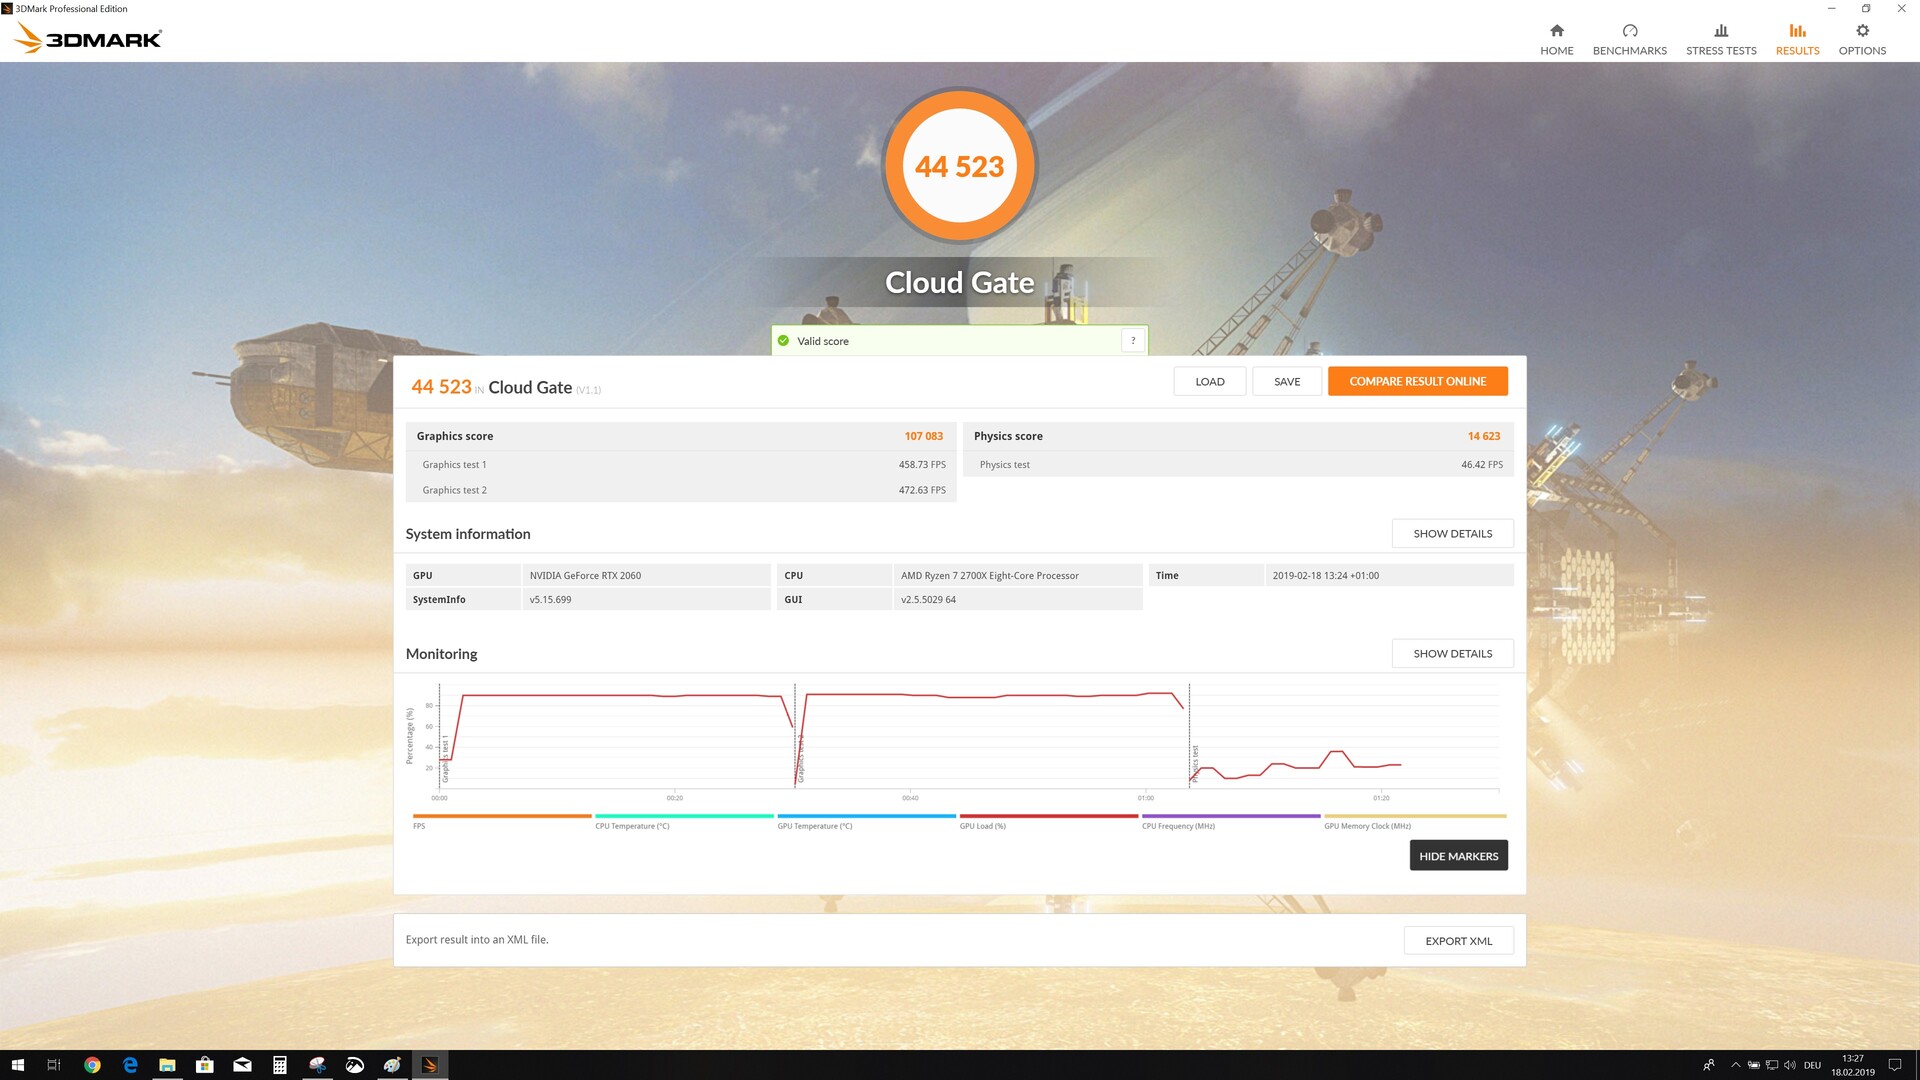
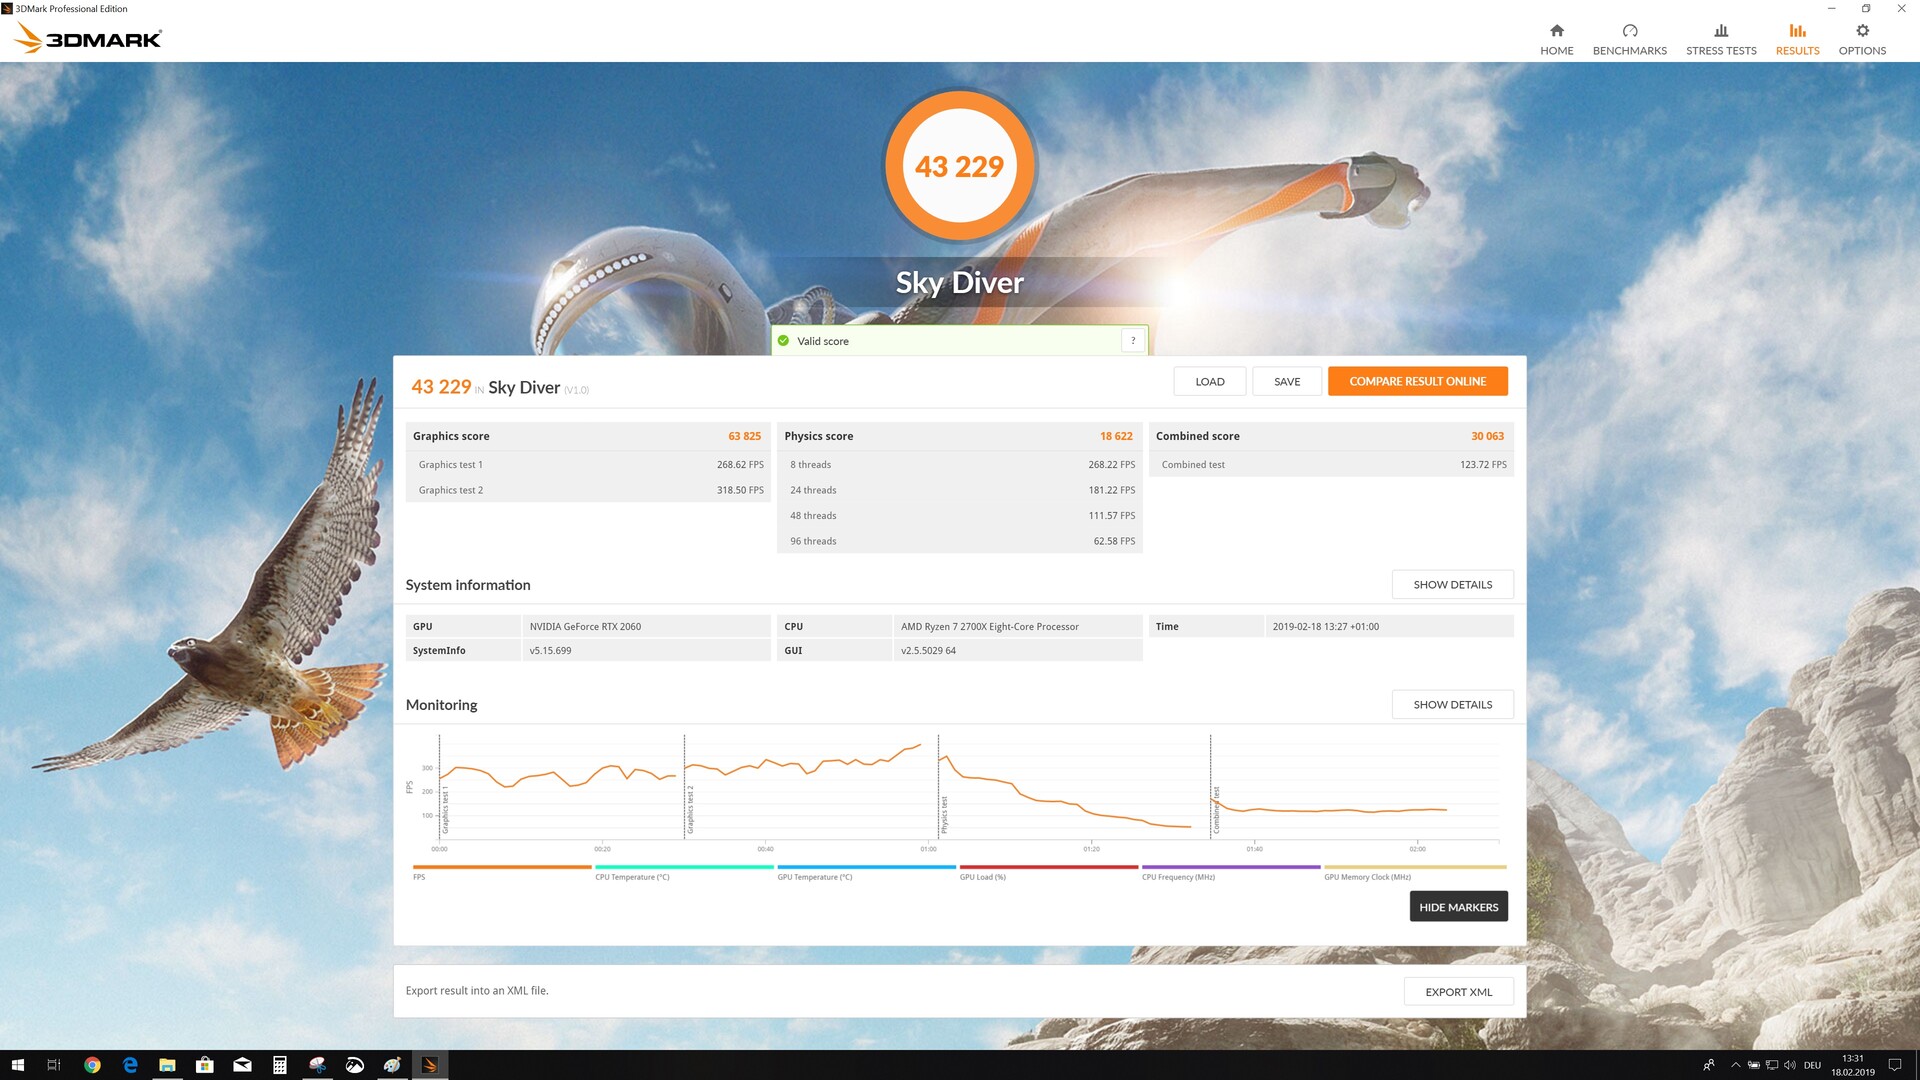
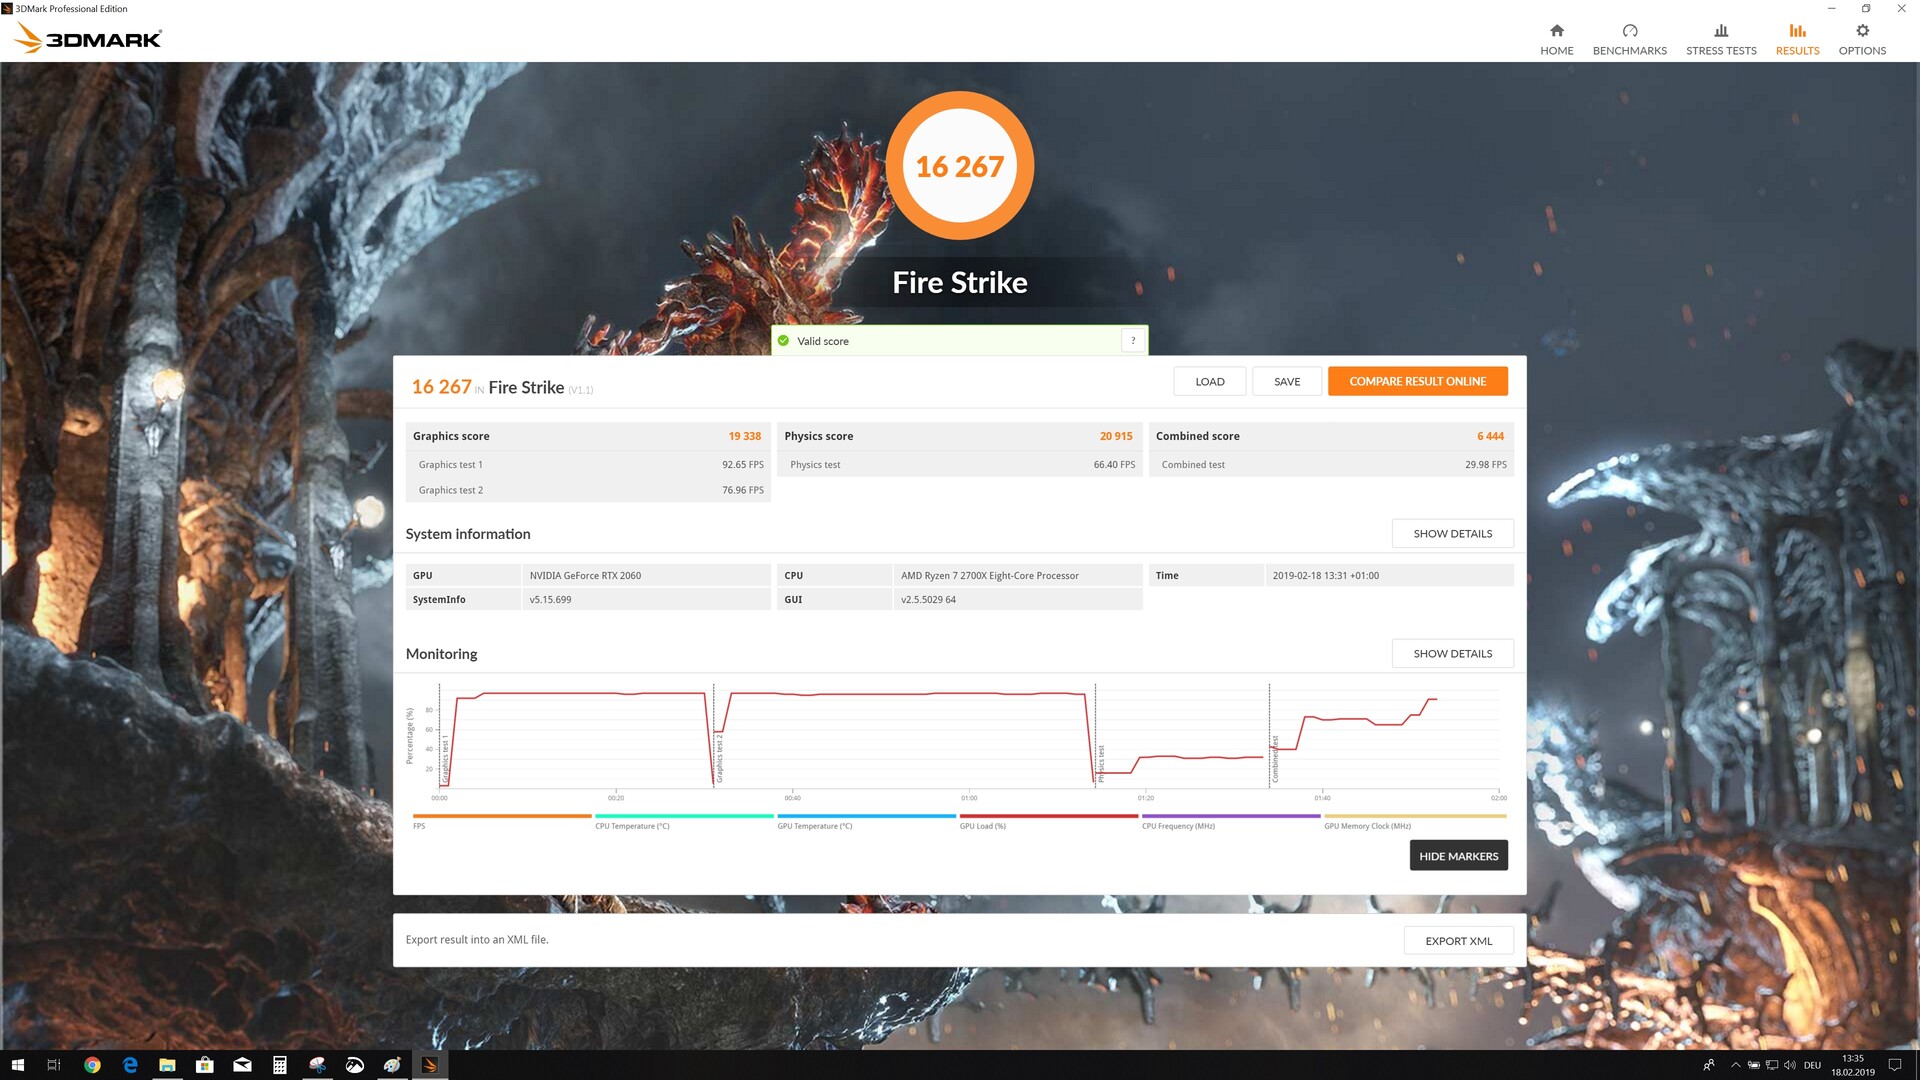
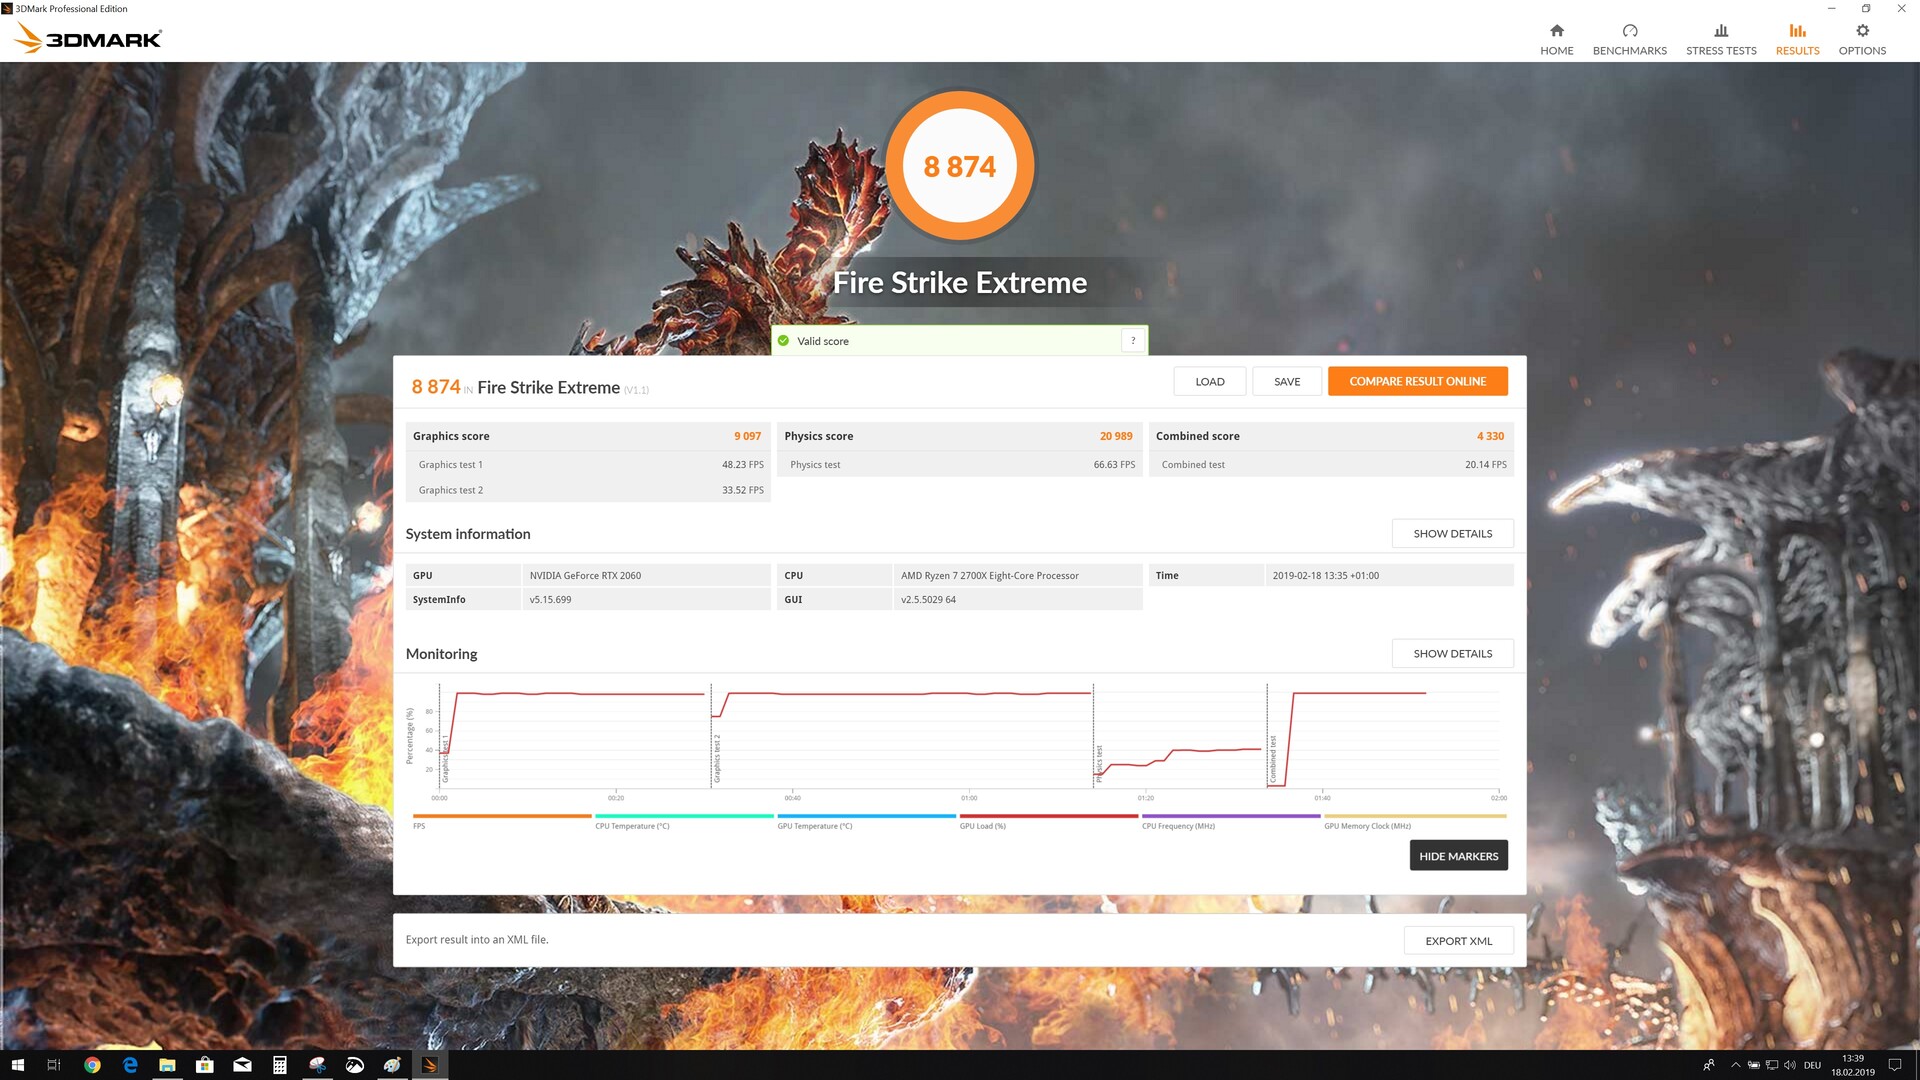
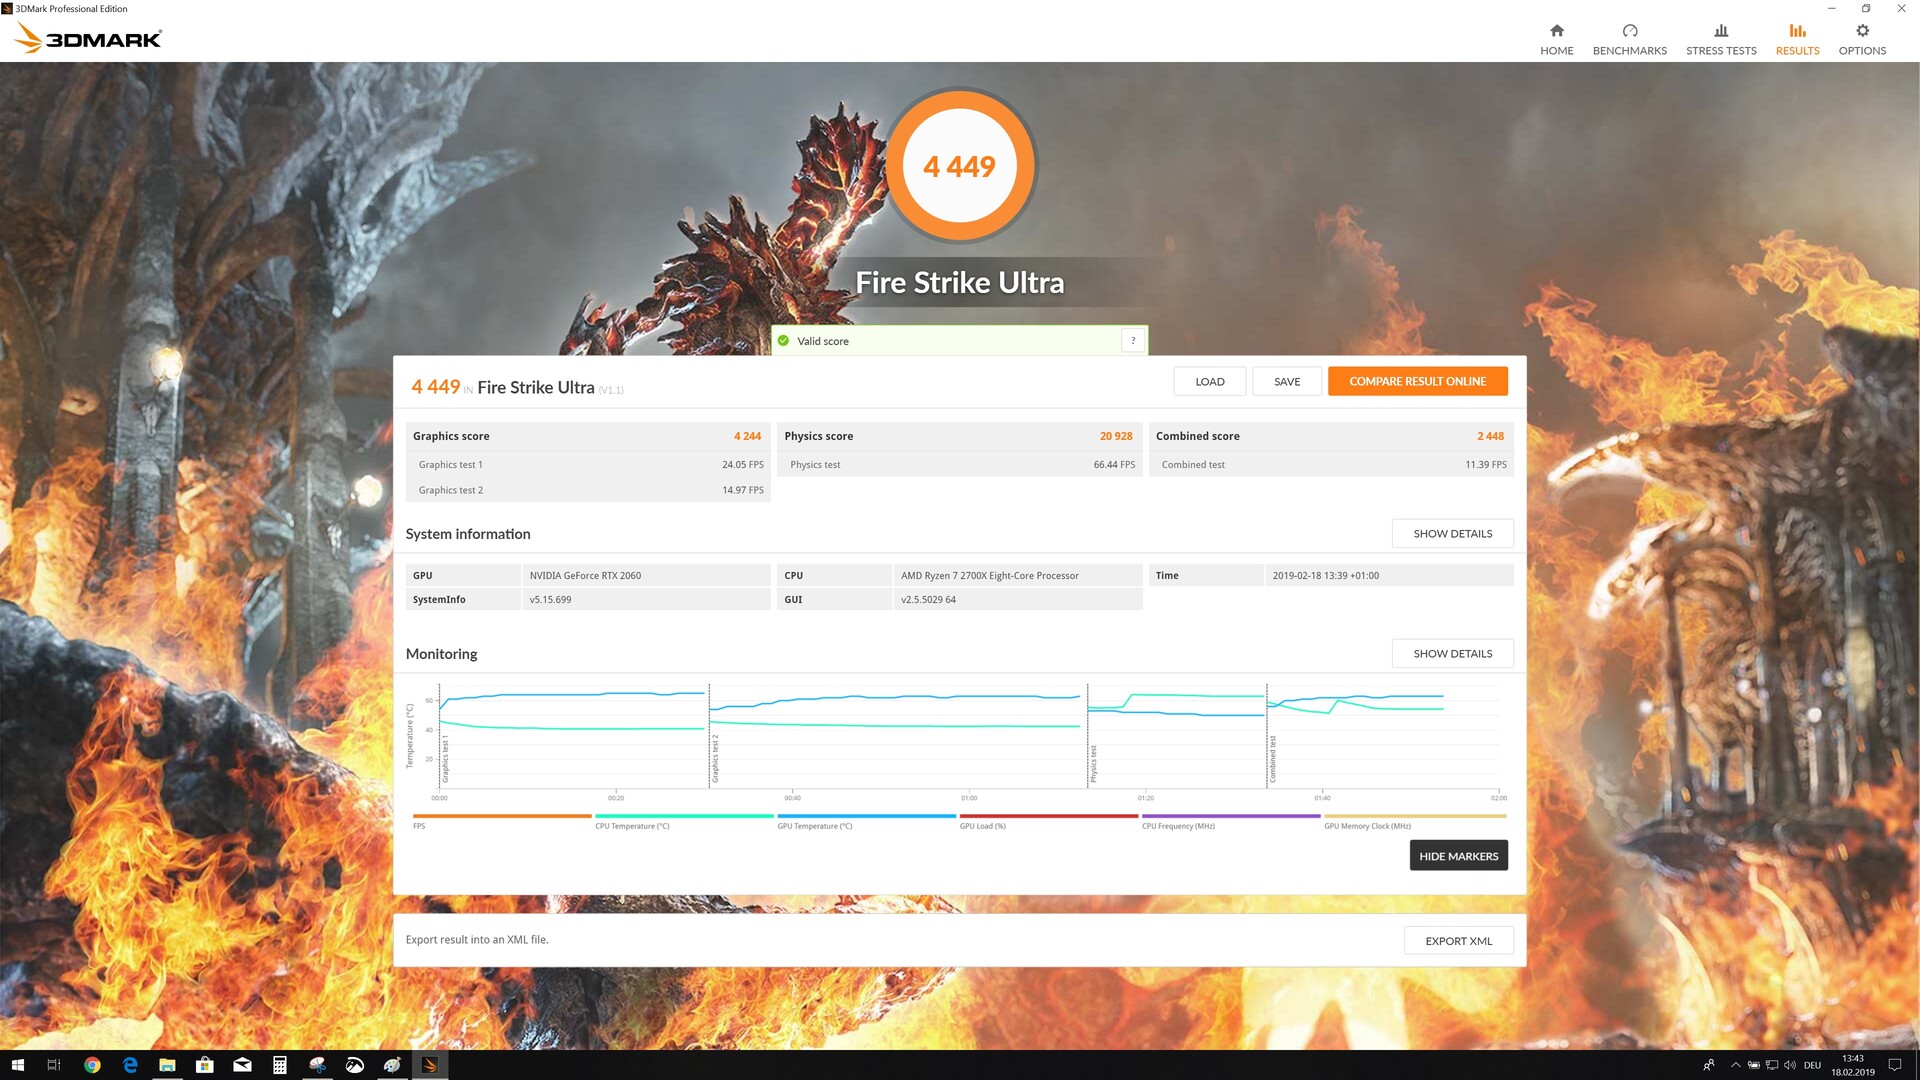
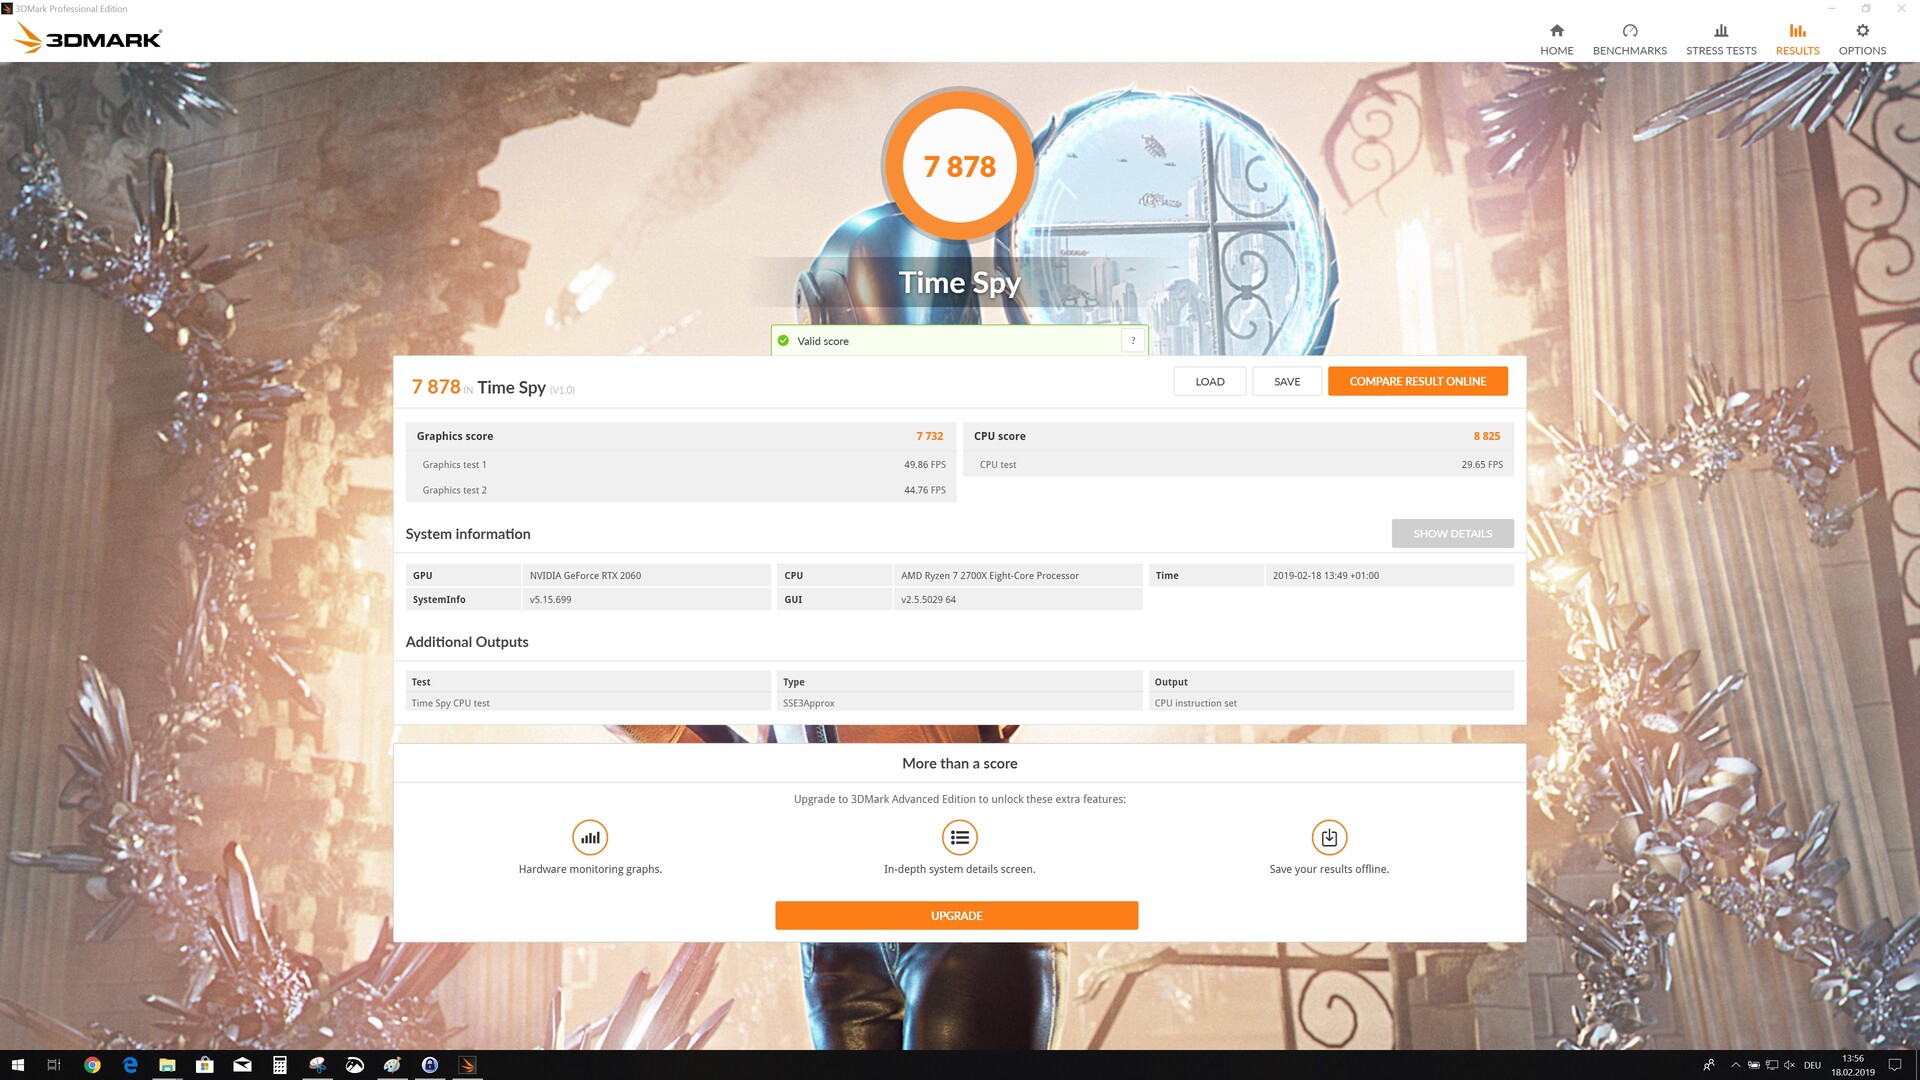
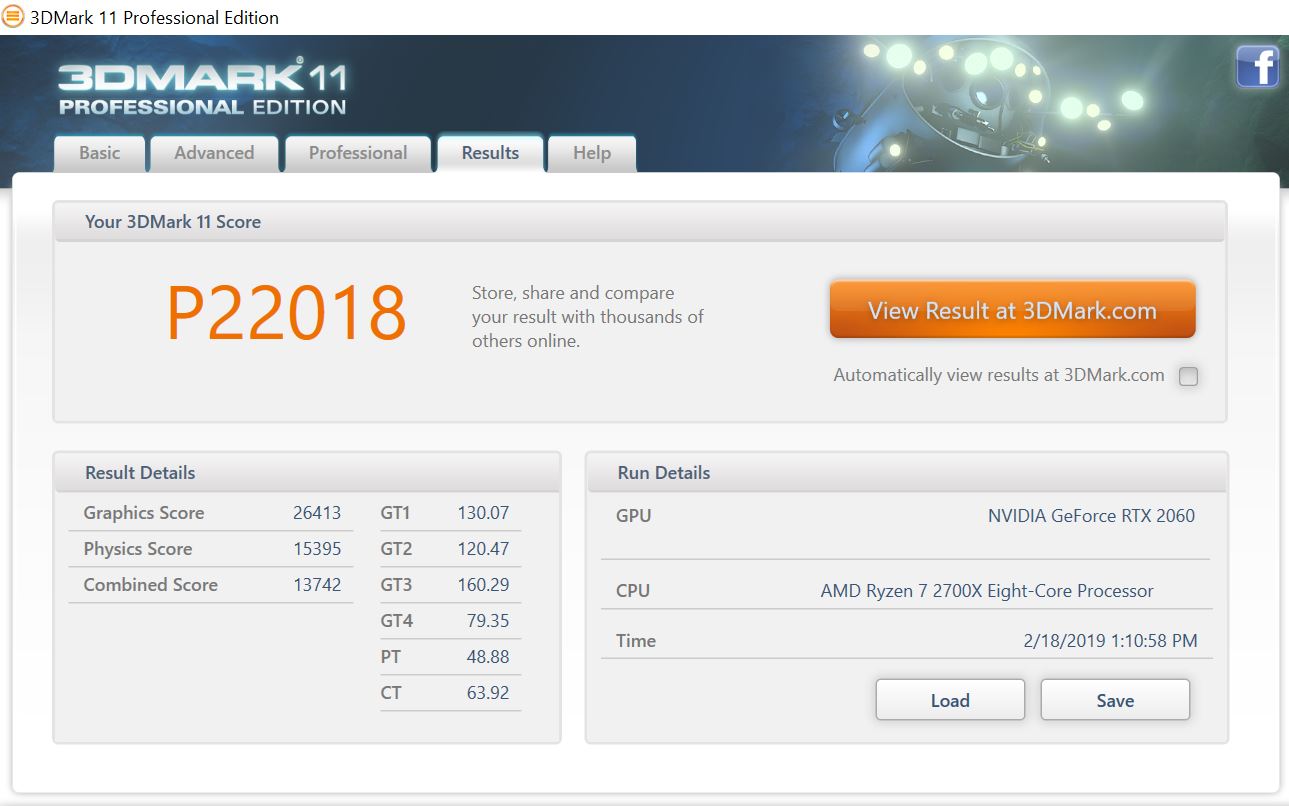
Synthetic Benchmarks
In the synthetic benchmarks, the MSI RTX 2060 Gaming Z 6G is performing as well as the GeForce GTX 1070 Founders Edition. All in all, it does quite well when compared to the Pascal-based competitors. The RTX 2060 is only definitively beaten by the GTX 1080. When compared to AMD GPUs, the RTX 2060 is roughly on the same level as the Radeon Vega 56. Unfortunately, we did not have a chance to review this AMD GPU, which is why it cannot be found in our data base.
| 3DMark 11 - 1280x720 Performance GPU | |
| Nvidia Titan RTX | |
| Nvidia GeForce GTX 1080 Ti Founders Edition | |
| MSI RTX 2080 Gaming X Trio | |
| AMD Radeon VII | |
| MSI Gaming X GeForce GTX 1080 Desktop PC | |
| Asus ROG Strix RTX 2070 OC | |
| MSI RTX 2070 Gaming Z 8G | |
| Nvidia GeForce GTX 1080 Founders Edition | |
| AMD Radeon RX Vega 64 | |
| NVIDIA Titan X Pascal | |
| MSI RTX 2060 Gaming Z 6G | |
| Nvidia GeForce GTX 1070 Founders Edition | |
| XFX AMD Radeon RX 590 OC+ 8 GB | |
| Asus ROG Strix RX 580 8 GB | |
| Unigine Heaven 4.0 - Extreme Preset DX11 | |
| Nvidia Titan RTX | |
| Nvidia GeForce GTX 1080 Ti Founders Edition | |
| MSI RTX 2080 Gaming X Trio | |
| MSI RTX 2070 Gaming Z 8G | |
| Asus ROG Strix RTX 2070 OC | |
| MSI Gaming X GeForce GTX 1080 Desktop PC | |
| AMD Radeon VII | |
| Nvidia GeForce GTX 1080 Founders Edition | |
| MSI RTX 2060 Gaming Z 6G | |
| Nvidia GeForce GTX 1070 Founders Edition | |
| Desktop PC | |
| XFX AMD Radeon RX 590 OC+ 8 GB | |
| Asus ROG Strix RX 580 8 GB | |
| Unigine Valley 1.0 - 1920x1080 Extreme HD DirectX AA:x8 | |
| Nvidia GeForce GTX 1080 Ti Founders Edition | |
| Nvidia Titan RTX | |
| MSI RTX 2080 Gaming X Trio | |
| Asus ROG Strix RTX 2070 OC | |
| MSI RTX 2070 Gaming Z 8G | |
| MSI Gaming X GeForce GTX 1080 Desktop PC | |
| AMD Radeon VII | |
| Nvidia GeForce GTX 1080 Founders Edition | |
| Nvidia GeForce GTX 1070 Founders Edition | |
| MSI RTX 2060 Gaming Z 6G | |
| XFX AMD Radeon RX 590 OC+ 8 GB | |
| Asus ROG Strix RX 580 8 GB | |
Gaming Benchmarks - RTX 2060 with 6 GB of GDDR6 VRAM
When compared to competitors from AMD (RX Vega 64), the MSI RTX 2060 Gaming Z 6G is thoroughly beaten in the synthetic benchmarks. However, in gaming benchmarks, the RTX 2060 Gaming Z 6G often outperforms the AMD Radeon RX Vega 64. The RTX 2060 Gaming Z 6G can run all current tiles in 1080p and 1440p. In "Metro Exodus", the average frame rate falls below 60 FPS on ultra settings at 1080p. If you decide to enable Ray tracing, then you will get even lower frame rates.
Those who prefer to game in 4K should get an RTX 2070 or an AMD Radeon VII.
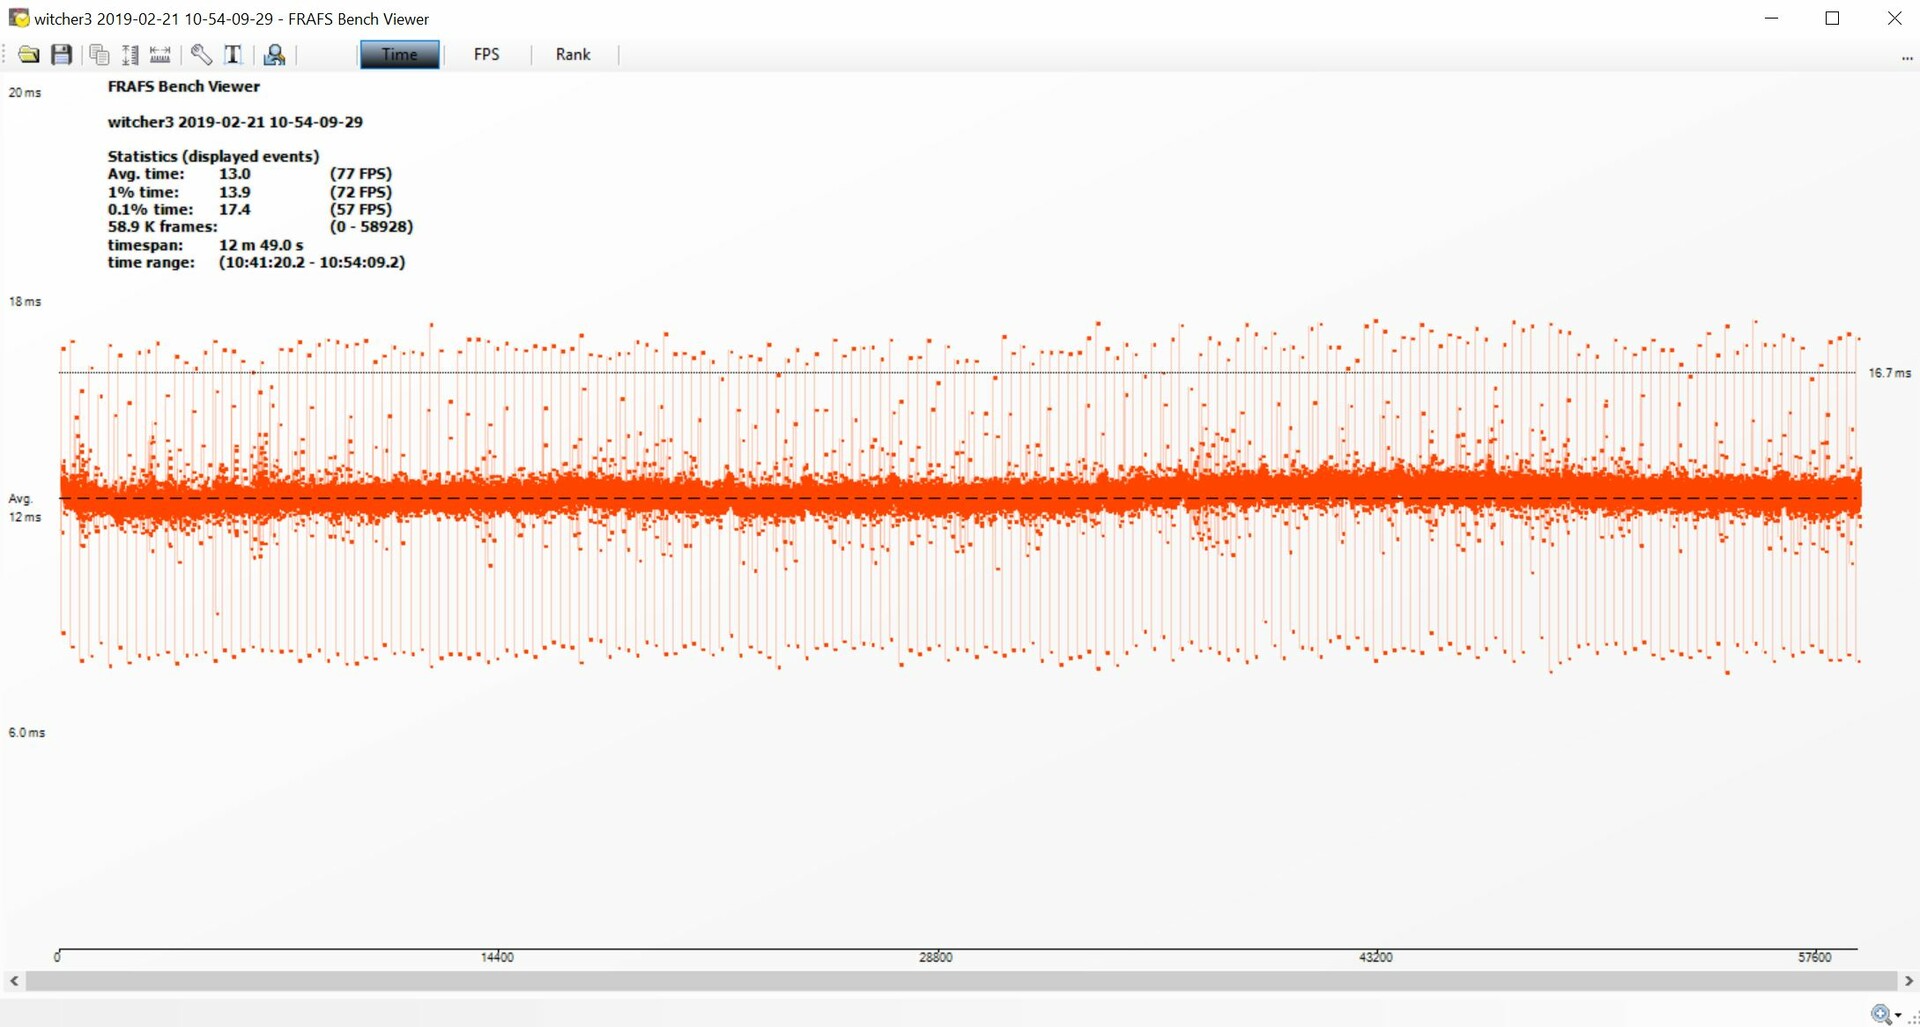
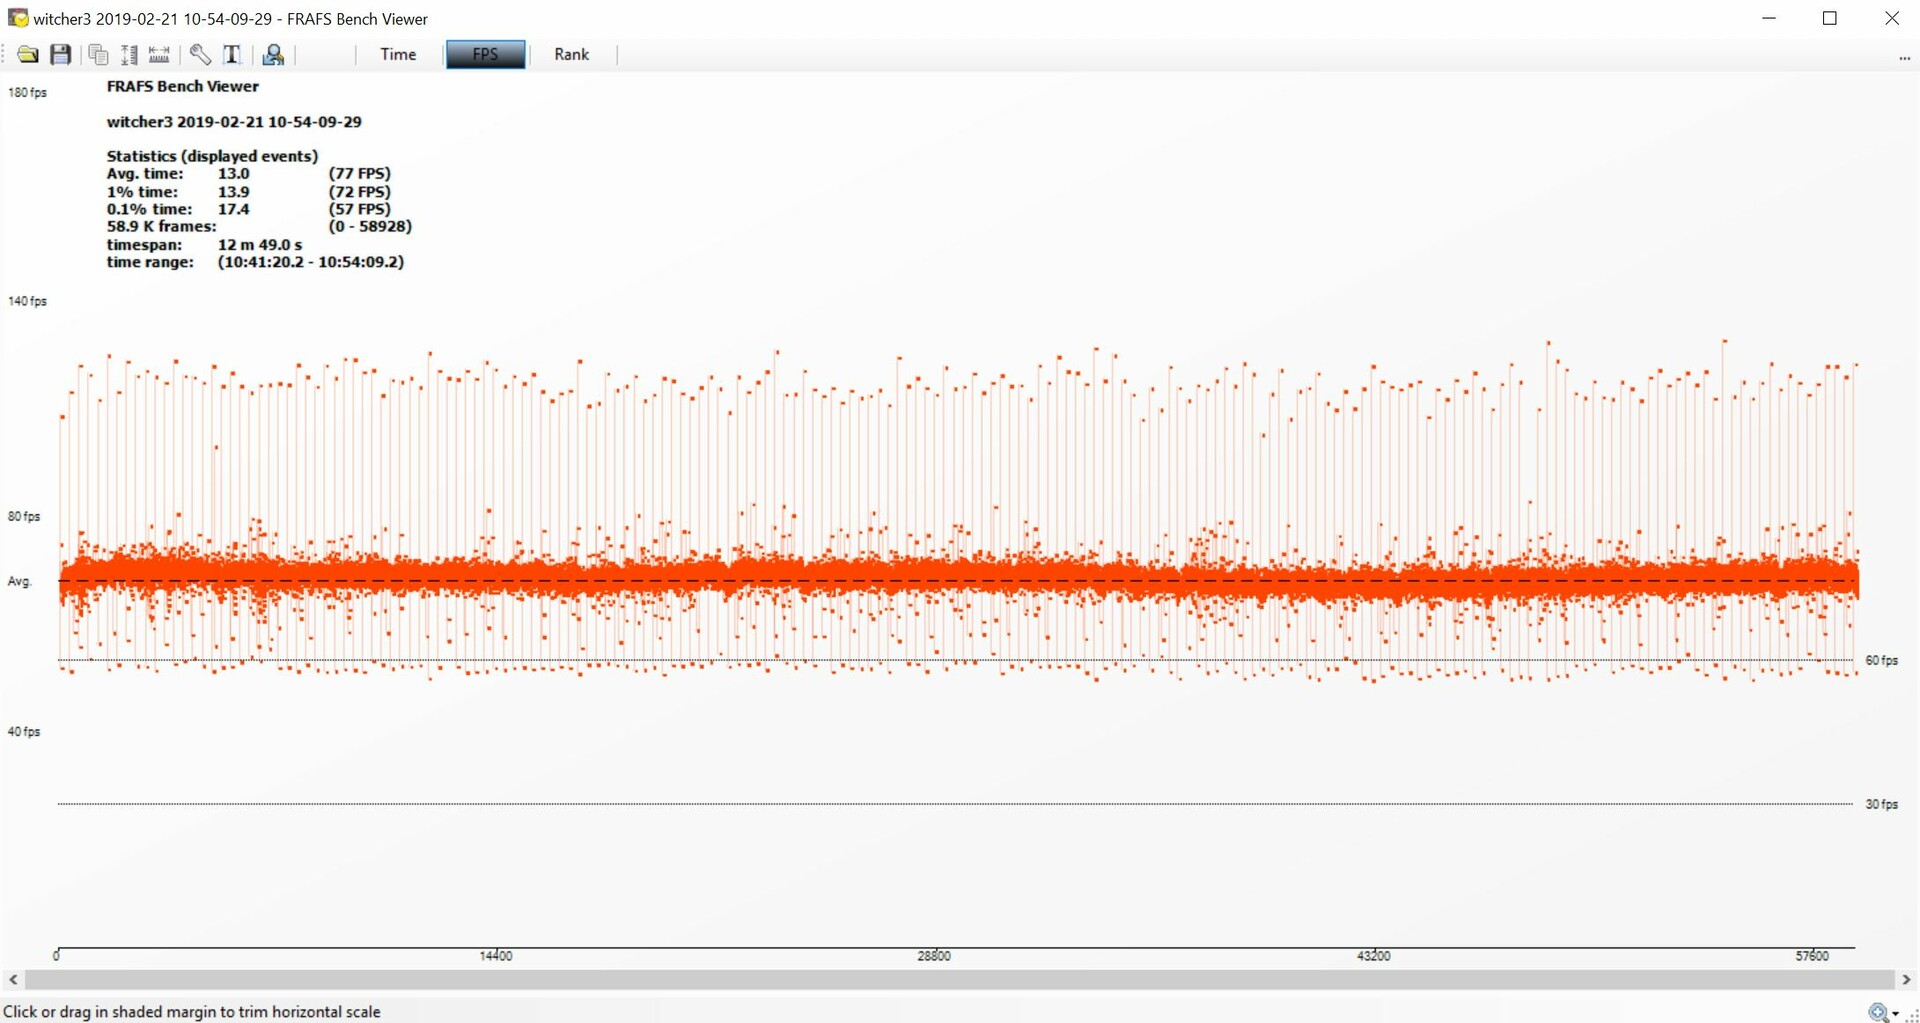
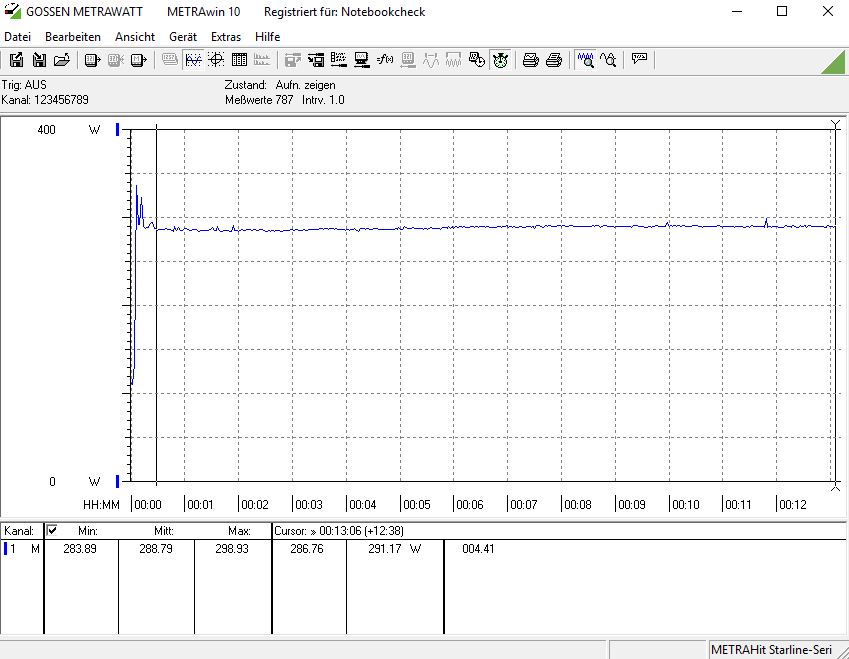
We use the video game known as "The Witcher 3" to examine how well the graphics card performs under load. For this, we record both the frame rate and the frame time. Neither graph contains any unusual fluctuations. This goes to show that the cooling system is doing its job very well.
The Witcher 3 frame time with the ultra preset
| Call of Duty Black Ops 4 | |
| 1920x1080 Very High / On | |
| NVIDIA Titan RTX | |
| NVIDIA GeForce RTX 2080 (Desktop) | |
| AMD Radeon RX Vega 64 | |
| NVIDIA Titan X Pascal | |
| NVIDIA GeForce RTX 2070 (Desktop) | |
| NVIDIA GeForce RTX 2070 (Desktop) | |
| AMD Radeon VII | |
| NVIDIA GeForce RTX 2060 (Desktop) | |
| AMD Radeon RX 590 (Desktop) | |
| NVIDIA GeForce GTX 1060 (Desktop) | |
| 3840x2160 Very High / On | |
| NVIDIA Titan RTX | |
| NVIDIA GeForce RTX 2080 (Desktop) | |
| NVIDIA Titan X Pascal | |
| AMD Radeon RX Vega 64 | |
| AMD Radeon VII | |
| NVIDIA GeForce RTX 2070 (Desktop) | |
| NVIDIA GeForce RTX 2070 (Desktop) | |
| NVIDIA GeForce RTX 2060 (Desktop) | |
| AMD Radeon RX 590 (Desktop) | |
| NVIDIA GeForce GTX 1060 (Desktop) | |
| Assassin´s Creed Odyssey | |
| 1920x1080 Ultra High Preset | |
| NVIDIA Titan RTX | |
| NVIDIA GeForce RTX 2080 (Desktop) | |
| NVIDIA Titan X Pascal | |
| NVIDIA GeForce RTX 2070 (Desktop) | |
| AMD Radeon VII | |
| NVIDIA GeForce RTX 2070 (Desktop) | |
| NVIDIA GeForce RTX 2060 (Desktop) | |
| AMD Radeon RX Vega 64 | |
| AMD Radeon RX 590 (Desktop) | |
| NVIDIA GeForce GTX 1060 (Desktop) | |
| AMD Radeon RX 580 (Desktop) | |
| 3840x2160 Ultra High Preset | |
| NVIDIA Titan RTX | |
| AMD Radeon VII | |
| NVIDIA GeForce RTX 2080 (Desktop) | |
| NVIDIA Titan X Pascal | |
| NVIDIA GeForce RTX 2070 (Desktop) | |
| NVIDIA GeForce RTX 2070 (Desktop) | |
| AMD Radeon RX Vega 64 | |
| NVIDIA GeForce RTX 2060 (Desktop) | |
| AMD Radeon RX 590 (Desktop) | |
| NVIDIA GeForce GTX 1060 (Desktop) | |
| AMD Radeon RX 580 (Desktop) | |
| FIFA 19 | |
| 1920x1080 Ultra Preset AA:4x MS | |
| AMD Radeon RX Vega 64 | |
| AMD Radeon RX 580 (Desktop) | |
| NVIDIA GeForce GTX 1060 (Desktop) | |
| NVIDIA Titan RTX | |
| AMD Radeon RX 590 (Desktop) | |
| NVIDIA GeForce RTX 2080 (Desktop) | |
| AMD Radeon VII | |
| NVIDIA Titan X Pascal | |
| NVIDIA GeForce RTX 2070 (Desktop) | |
| NVIDIA GeForce RTX 2070 (Desktop) | |
| NVIDIA GeForce RTX 2060 (Desktop) | |
| 3840x2160 Ultra Preset AA:4x MS | |
| NVIDIA Titan RTX | |
| AMD Radeon VII | |
| NVIDIA Titan X Pascal | |
| NVIDIA GeForce RTX 2070 (Desktop) | |
| NVIDIA GeForce RTX 2080 (Desktop) | |
| NVIDIA GeForce RTX 2070 (Desktop) | |
| AMD Radeon RX Vega 64 | |
| NVIDIA GeForce RTX 2060 (Desktop) | |
| NVIDIA GeForce GTX 1060 (Desktop) | |
| AMD Radeon RX 580 (Desktop) | |
| AMD Radeon RX 590 (Desktop) | |
| Forza Horizon 4 | |
| 1920x1080 Ultra Preset AA:2xMS | |
| NVIDIA GeForce RTX 2080 (Desktop) | |
| NVIDIA Titan RTX | |
| AMD Radeon VII | |
| AMD Radeon RX Vega 64 | |
| NVIDIA GeForce RTX 2070 (Desktop) | |
| NVIDIA Titan X Pascal | |
| NVIDIA GeForce RTX 2070 (Desktop) | |
| NVIDIA GeForce RTX 2060 (Desktop) | |
| AMD Radeon RX 590 (Desktop) | |
| AMD Radeon RX 580 (Desktop) | |
| NVIDIA GeForce GTX 1060 (Desktop) | |
| 3840x2160 Ultra Preset AA:2xMS | |
| NVIDIA Titan RTX | |
| NVIDIA GeForce RTX 2080 (Desktop) | |
| AMD Radeon VII | |
| NVIDIA Titan X Pascal | |
| NVIDIA GeForce RTX 2070 (Desktop) | |
| AMD Radeon RX Vega 64 | |
| NVIDIA GeForce RTX 2070 (Desktop) | |
| NVIDIA GeForce RTX 2060 (Desktop) | |
| AMD Radeon RX 590 (Desktop) | |
| AMD Radeon RX 580 (Desktop) | |
| NVIDIA GeForce GTX 1060 (Desktop) | |
| F1 2018 | |
| 1920x1080 Ultra High Preset AA:T AF:16x | |
| NVIDIA Titan RTX | |
| NVIDIA GeForce RTX 2080 (Desktop) | |
| AMD Radeon VII | |
| NVIDIA GeForce RTX 2070 (Desktop) | |
| NVIDIA GeForce RTX 2070 (Desktop) | |
| NVIDIA Titan X Pascal | |
| NVIDIA GeForce RTX 2060 (Desktop) | |
| AMD Radeon RX Vega 64 | |
| AMD Radeon RX 590 (Desktop) | |
| AMD Radeon RX 580 (Desktop) | |
| NVIDIA GeForce GTX 1060 (Desktop) | |
| 3840x2160 Ultra High Preset AA:T AF:16x | |
| NVIDIA Titan RTX | |
| NVIDIA GeForce RTX 2080 (Desktop) | |
| NVIDIA Titan X Pascal | |
| AMD Radeon VII | |
| NVIDIA GeForce RTX 2070 (Desktop) | |
| NVIDIA GeForce RTX 2070 (Desktop) | |
| NVIDIA GeForce RTX 2060 (Desktop) | |
| AMD Radeon RX Vega 64 | |
| AMD Radeon RX 590 (Desktop) | |
| NVIDIA GeForce GTX 1060 (Desktop) | |
| Monster Hunter World | |
| 1920x1080 Highest Preset (Image Quality High) | |
| NVIDIA Titan RTX | |
| NVIDIA GeForce RTX 2080 (Desktop) | |
| NVIDIA Titan X Pascal | |
| NVIDIA GeForce RTX 2070 (Desktop) | |
| NVIDIA GeForce RTX 2070 (Desktop) | |
| AMD Radeon VII | |
| NVIDIA GeForce RTX 2060 (Desktop) | |
| AMD Radeon RX Vega 64 | |
| AMD Radeon RX 590 (Desktop) | |
| AMD Radeon RX 580 (Desktop) | |
| NVIDIA GeForce GTX 1060 (Desktop) | |
| 3840x2160 Highest Preset (Image Quality High) | |
| NVIDIA Titan RTX | |
| NVIDIA GeForce RTX 2080 (Desktop) | |
| NVIDIA Titan X Pascal | |
| AMD Radeon VII | |
| NVIDIA GeForce RTX 2070 (Desktop) | |
| NVIDIA GeForce RTX 2070 (Desktop) | |
| AMD Radeon RX Vega 64 | |
| NVIDIA GeForce RTX 2060 (Desktop) | |
| AMD Radeon RX 590 (Desktop) | |
| AMD Radeon RX 580 (Desktop) | |
| NVIDIA GeForce GTX 1060 (Desktop) | |
| Far Cry 5 | |
| 1920x1080 Ultra Preset AA:T | |
| NVIDIA GeForce RTX 2080 (Desktop) | |
| NVIDIA GeForce RTX 2070 (Desktop) | |
| NVIDIA Titan RTX | |
| NVIDIA GeForce RTX 2070 (Desktop) | |
| AMD Radeon RX Vega 64 | |
| NVIDIA GeForce RTX 2060 (Desktop) | |
| AMD Radeon VII | |
| NVIDIA Titan X Pascal | |
| AMD Radeon RX 590 (Desktop) | |
| NVIDIA GeForce GTX 1060 (Desktop) | |
| AMD Radeon RX 580 (Desktop) | |
| 3840x2160 Ultra Preset AA:T | |
| NVIDIA Titan RTX | |
| NVIDIA GeForce RTX 2080 (Desktop) | |
| AMD Radeon VII | |
| NVIDIA Titan X Pascal | |
| NVIDIA GeForce RTX 2070 (Desktop) | |
| NVIDIA GeForce RTX 2070 (Desktop) | |
| AMD Radeon RX Vega 64 | |
| NVIDIA GeForce RTX 2060 (Desktop) | |
| AMD Radeon RX 580 (Desktop) | |
| AMD Radeon RX 590 (Desktop) | |
| NVIDIA GeForce GTX 1060 (Desktop) | |
| The Crew 2 | |
| 1920x1080 Ultra Preset | |
| NVIDIA GeForce GTX 1060 (Desktop) | |
| NVIDIA Titan X Pascal | |
| AMD Radeon RX 580 (Desktop) | |
| NVIDIA GeForce RTX 2070 (Desktop) | |
| AMD Radeon RX 590 (Desktop) | |
| NVIDIA Titan RTX | |
| NVIDIA GeForce RTX 2060 (Desktop) | |
| NVIDIA GeForce RTX 2070 (Desktop) | |
| NVIDIA GeForce RTX 2080 (Desktop) | |
| AMD Radeon VII | |
| 3840x2160 Ultra Preset | |
| NVIDIA Titan RTX | |
| NVIDIA GeForce RTX 2080 (Desktop) | |
| NVIDIA GeForce RTX 2070 (Desktop) | |
| NVIDIA Titan X Pascal | |
| NVIDIA GeForce RTX 2070 (Desktop) | |
| AMD Radeon VII | |
| NVIDIA GeForce RTX 2060 (Desktop) | |
| AMD Radeon RX 580 (Desktop) | |
| AMD Radeon RX 590 (Desktop) | |
| NVIDIA GeForce GTX 1060 (Desktop) | |
| Assassin´s Creed Origins | |
| 1920x1080 Ultra High Preset | |
| NVIDIA Titan RTX | |
| NVIDIA GeForce RTX 2080 (Desktop) | |
| NVIDIA GeForce RTX 2070 (Desktop) | |
| NVIDIA GeForce RTX 2070 (Desktop) | |
| NVIDIA GeForce GTX 1080 Ti (Desktop) | |
| NVIDIA GeForce RTX 2060 (Desktop) | |
| AMD Radeon RX Vega 64 | |
| AMD Radeon VII | |
| NVIDIA GeForce GTX 1060 (Desktop) | |
| AMD Radeon RX 590 (Desktop) | |
| AMD Radeon RX 580 (Desktop) | |
| 3840x2160 Ultra High Preset | |
| NVIDIA Titan RTX | |
| NVIDIA GeForce RTX 2080 (Desktop) | |
| NVIDIA GeForce GTX 1080 Ti (Desktop) | |
| AMD Radeon VII | |
| NVIDIA GeForce RTX 2070 (Desktop) | |
| NVIDIA GeForce RTX 2070 (Desktop) | |
| NVIDIA GeForce RTX 2060 (Desktop) | |
| AMD Radeon RX Vega 64 | |
| AMD Radeon RX 590 (Desktop) | |
| NVIDIA GeForce GTX 1060 (Desktop) | |
| AMD Radeon RX 580 (Desktop) | |
| Kingdom Come: Deliverance | |
| 1920x1080 Ultra High Preset | |
| NVIDIA GeForce RTX 2070 (Desktop) | |
| NVIDIA Titan RTX | |
| NVIDIA GeForce RTX 2080 (Desktop) | |
| NVIDIA GeForce RTX 2070 (Desktop) | |
| NVIDIA GeForce GTX 1080 Ti (Desktop) | |
| AMD Radeon RX Vega 64 | |
| AMD Radeon VII | |
| NVIDIA GeForce RTX 2060 (Desktop) | |
| AMD Radeon RX 590 (Desktop) | |
| NVIDIA GeForce GTX 1060 (Desktop) | |
| AMD Radeon RX 580 (Desktop) | |
| 3840x2160 Ultra High Preset | |
| NVIDIA Titan RTX | |
| NVIDIA GeForce RTX 2080 (Desktop) | |
| AMD Radeon RX Vega 64 | |
| NVIDIA GeForce GTX 1080 Ti (Desktop) | |
| NVIDIA GeForce RTX 2070 (Desktop) | |
| AMD Radeon VII | |
| NVIDIA GeForce RTX 2070 (Desktop) | |
| NVIDIA GeForce RTX 2060 (Desktop) | |
| AMD Radeon RX 590 (Desktop) | |
| AMD Radeon RX 580 (Desktop) | |
| NVIDIA GeForce GTX 1060 (Desktop) | |
| Fortnite | |
| 1920x1080 Epic Preset | |
| NVIDIA GeForce GTX 1080 Ti (Desktop) | |
| NVIDIA GeForce RTX 2070 (Desktop) | |
| NVIDIA GeForce RTX 2080 (Desktop) | |
| NVIDIA GeForce RTX 2060 (Desktop) | |
| NVIDIA GeForce RTX 2070 (Desktop) | |
| NVIDIA Titan RTX | |
| AMD Radeon VII | |
| AMD Radeon RX 590 (Desktop) | |
| NVIDIA GeForce GTX 1060 (Desktop) | |
| AMD Radeon RX 580 (Desktop) | |
| 3840x2160 Epic Preset | |
| NVIDIA Titan RTX | |
| NVIDIA GeForce RTX 2080 (Desktop) | |
| NVIDIA GeForce RTX 2070 (Desktop) | |
| NVIDIA GeForce RTX 2070 (Desktop) | |
| NVIDIA GeForce GTX 1080 Ti (Desktop) | |
| AMD Radeon VII | |
| NVIDIA GeForce RTX 2060 (Desktop) | |
| AMD Radeon RX 590 (Desktop) | |
| NVIDIA GeForce GTX 1060 (Desktop) | |
| AMD Radeon RX 580 (Desktop) | |
| Final Fantasy XV Benchmark | |
| 1920x1080 High Quality | |
| NVIDIA Titan RTX | |
| NVIDIA GeForce RTX 2080 (Desktop) | |
| NVIDIA GeForce GTX 1080 Ti (Desktop) | |
| NVIDIA GeForce RTX 2070 (Desktop) | |
| NVIDIA GeForce RTX 2070 (Desktop) | |
| NVIDIA GeForce RTX 2060 (Desktop) | |
| NVIDIA GeForce GTX 1080 (Desktop) | |
| AMD Radeon RX Vega 64 | |
| AMD Radeon RX Vega 64 | |
| NVIDIA GeForce GTX 1060 (Desktop) | |
| AMD Radeon RX 590 (Desktop) | |
| AMD Radeon RX 580 (Desktop) | |
| 3840x2160 High Quality | |
| NVIDIA Titan RTX | |
| NVIDIA GeForce RTX 2080 (Desktop) | |
| NVIDIA GeForce GTX 1080 Ti (Desktop) | |
| NVIDIA GeForce RTX 2070 (Desktop) | |
| NVIDIA GeForce RTX 2070 (Desktop) | |
| NVIDIA GeForce RTX 2060 (Desktop) | |
| NVIDIA GeForce GTX 1080 (Desktop) | |
| AMD Radeon RX Vega 64 | |
| AMD Radeon RX Vega 64 | |
| AMD Radeon RX 590 (Desktop) | |
| NVIDIA GeForce GTX 1060 (Desktop) | |
| AMD Radeon RX 580 (Desktop) | |
| Destiny 2 | |
| 1920x1080 Highest Preset AA:SM AF:16x | |
| NVIDIA GeForce GTX 1080 Ti (Desktop) | |
| NVIDIA GeForce RTX 2070 (Desktop) | |
| NVIDIA Titan RTX | |
| NVIDIA GeForce RTX 2070 (Desktop) | |
| NVIDIA GeForce RTX 2080 (Desktop) | |
| AMD Radeon VII | |
| NVIDIA GeForce RTX 2060 (Desktop) | |
| NVIDIA GeForce GTX 1060 (Desktop) | |
| 3840x2160 Highest Preset AA:SM AF:16x | |
| NVIDIA Titan RTX | |
| NVIDIA GeForce RTX 2080 (Desktop) | |
| NVIDIA GeForce RTX 2070 (Desktop) | |
| NVIDIA GeForce RTX 2070 (Desktop) | |
| NVIDIA GeForce GTX 1080 Ti (Desktop) | |
| AMD Radeon VII | |
| NVIDIA GeForce RTX 2060 (Desktop) | |
| NVIDIA GeForce GTX 1060 (Desktop) | |
| The Witcher 3 | |
| 1920x1080 Ultra Graphics & Postprocessing (HBAO+) | |
| NVIDIA Titan RTX | |
| NVIDIA GeForce RTX 2080 (Desktop) | |
| NVIDIA GeForce GTX 1080 Ti (Desktop) | |
| NVIDIA GeForce RTX 2070 (Desktop) | |
| NVIDIA GeForce RTX 2070 (Desktop) | |
| NVIDIA GeForce GTX 1080 (Desktop) | |
| AMD Radeon RX Vega 64 | |
| NVIDIA GeForce GTX 1080 (Desktop) | |
| AMD Radeon VII | |
| NVIDIA GeForce RTX 2060 (Desktop) | |
| NVIDIA GeForce GTX 1070 (Desktop) | |
| AMD Radeon RX 590 (Desktop) | |
| AMD Radeon RX 580 (Desktop) | |
| 3840x2160 High Graphics & Postprocessing (Nvidia HairWorks Off) | |
| NVIDIA Titan RTX | |
| NVIDIA GeForce RTX 2080 (Desktop) | |
| NVIDIA GeForce GTX 1080 Ti (Desktop) | |
| NVIDIA GeForce RTX 2070 (Desktop) | |
| NVIDIA GeForce RTX 2070 (Desktop) | |
| NVIDIA GeForce GTX 1080 (Desktop) | |
| NVIDIA GeForce GTX 1080 (Desktop) | |
| AMD Radeon VII | |
| NVIDIA GeForce RTX 2060 (Desktop) | |
| AMD Radeon RX Vega 64 | |
| NVIDIA GeForce GTX 1070 (Desktop) | |
| AMD Radeon RX 590 (Desktop) | |
| AMD Radeon RX 580 (Desktop) | |
| Watch Dogs 2 | |
| 1920x1080 Ultra Preset | |
| NVIDIA Titan RTX | |
| NVIDIA GeForce GTX 1080 Ti (Desktop) | |
| NVIDIA GeForce RTX 2080 (Desktop) | |
| NVIDIA GeForce RTX 2070 (Desktop) | |
| NVIDIA GeForce RTX 2070 (Desktop) | |
| NVIDIA GeForce GTX 1080 (Desktop) | |
| AMD Radeon RX Vega 64 | |
| NVIDIA GeForce RTX 2060 (Desktop) | |
| AMD Radeon VII | |
| AMD Radeon RX 590 (Desktop) | |
| NVIDIA GeForce GTX 1060 (Desktop) | |
| AMD Radeon RX 580 (Desktop) | |
| 3840x2160 High Preset | |
| NVIDIA Titan RTX | |
| NVIDIA GeForce GTX 1080 Ti (Desktop) | |
| NVIDIA GeForce RTX 2080 (Desktop) | |
| NVIDIA GeForce RTX 2070 (Desktop) | |
| NVIDIA GeForce GTX 1080 (Desktop) | |
| NVIDIA GeForce RTX 2070 (Desktop) | |
| AMD Radeon VII | |
| NVIDIA GeForce RTX 2060 (Desktop) | |
| AMD Radeon RX Vega 64 | |
| NVIDIA GeForce GTX 1060 (Desktop) | |
| AMD Radeon RX 590 (Desktop) | |
| AMD Radeon RX 580 (Desktop) | |
| Battlefield 1 | |
| 1920x1080 Ultra Preset AA:T | |
| NVIDIA GeForce GTX 1080 Ti (Desktop) | |
| NVIDIA Titan RTX | |
| NVIDIA GeForce GTX 1080 (Desktop) | |
| NVIDIA GeForce GTX 1080 (Desktop) | |
| NVIDIA GeForce RTX 2080 (Desktop) | |
| AMD Radeon RX Vega 64 | |
| NVIDIA GeForce RTX 2070 (Desktop) | |
| AMD Radeon VII | |
| NVIDIA GeForce RTX 2070 (Desktop) | |
| NVIDIA GeForce RTX 2060 (Desktop) | |
| AMD Radeon RX 590 (Desktop) | |
| NVIDIA GeForce GTX 1060 (Desktop) | |
| 3840x2160 High Preset AA:T | |
| NVIDIA Titan RTX | |
| NVIDIA GeForce RTX 2080 (Desktop) | |
| AMD Radeon VII | |
| NVIDIA GeForce GTX 1080 Ti (Desktop) | |
| NVIDIA GeForce RTX 2070 (Desktop) | |
| NVIDIA GeForce RTX 2070 (Desktop) | |
| NVIDIA GeForce GTX 1080 (Desktop) | |
| NVIDIA GeForce GTX 1080 (Desktop) | |
| AMD Radeon RX Vega 64 | |
| NVIDIA GeForce RTX 2060 (Desktop) | |
| AMD Radeon RX 590 (Desktop) | |
| NVIDIA GeForce GTX 1060 (Desktop) | |
| For Honor | |
| 1920x1080 Extreme Preset AA:T AF:16x | |
| NVIDIA Titan RTX | |
| NVIDIA GeForce GTX 1080 Ti (Desktop) | |
| NVIDIA GeForce RTX 2080 (Desktop) | |
| NVIDIA GeForce RTX 2070 (Desktop) | |
| NVIDIA GeForce RTX 2070 (Desktop) | |
| NVIDIA GeForce GTX 1080 (Desktop) | |
| AMD Radeon RX Vega 64 | |
| NVIDIA GeForce RTX 2060 (Desktop) | |
| AMD Radeon VII | |
| NVIDIA GeForce GTX 1070 (Desktop) | |
| AMD Radeon RX 590 (Desktop) | |
| AMD Radeon RX 580 (Desktop) | |
| NVIDIA GeForce GTX 1060 (Desktop) | |
| 3840x2160 High Preset AA:T AF:8x | |
| NVIDIA Titan RTX | |
| NVIDIA GeForce GTX 1080 Ti (Desktop) | |
| NVIDIA GeForce RTX 2080 (Desktop) | |
| AMD Radeon VII | |
| NVIDIA GeForce RTX 2070 (Desktop) | |
| NVIDIA GeForce GTX 1080 (Desktop) | |
| NVIDIA GeForce RTX 2070 (Desktop) | |
| NVIDIA GeForce RTX 2060 (Desktop) | |
| AMD Radeon RX Vega 64 | |
| NVIDIA GeForce GTX 1070 (Desktop) | |
| AMD Radeon RX 590 (Desktop) | |
| NVIDIA GeForce GTX 1060 (Desktop) | |
| AMD Radeon RX 580 (Desktop) | |
| Ghost Recon Wildlands | |
| 1920x1080 Ultra Preset AA:T AF:16x | |
| NVIDIA Titan RTX | |
| NVIDIA GeForce RTX 2080 (Desktop) | |
| NVIDIA GeForce GTX 1080 Ti (Desktop) | |
| NVIDIA GeForce RTX 2070 (Desktop) | |
| NVIDIA GeForce RTX 2070 (Desktop) | |
| NVIDIA GeForce RTX 2060 (Desktop) | |
| AMD Radeon RX Vega 64 | |
| NVIDIA GeForce GTX 1070 (Desktop) | |
| AMD Radeon VII | |
| AMD Radeon RX 590 (Desktop) | |
| NVIDIA GeForce GTX 1060 (Desktop) | |
| AMD Radeon RX 580 (Desktop) | |
| 3840x2160 Ultra Preset AA:T AF:16x | |
| NVIDIA Titan RTX | |
| NVIDIA GeForce RTX 2080 (Desktop) | |
| NVIDIA GeForce GTX 1080 Ti (Desktop) | |
| NVIDIA GeForce RTX 2070 (Desktop) | |
| GTA V | |
| 1920x1080 Highest AA:4xMSAA + FX AF:16x | |
| NVIDIA Titan RTX | |
| NVIDIA GeForce RTX 2080 (Desktop) | |
| AMD Radeon VII | |
| NVIDIA GeForce RTX 2070 (Desktop) | |
| NVIDIA GeForce RTX 2070 (Desktop) | |
| NVIDIA GeForce RTX 2060 (Desktop) | |
| NVIDIA GeForce GTX 1080 (Desktop) | |
| NVIDIA GeForce GTX 1080 Ti (Desktop) | |
| NVIDIA GeForce GTX 1080 (Desktop) | |
| NVIDIA GeForce GTX 1070 (Desktop) | |
| AMD Radeon RX 590 (Desktop) | |
| 3840x2160 High/On (Advanced Graphics Off) AA:FX AF:8x | |
| NVIDIA Titan RTX | |
| NVIDIA GeForce RTX 2070 (Desktop) | |
| NVIDIA GeForce GTX 1080 Ti (Desktop) | |
| NVIDIA GeForce RTX 2080 (Desktop) | |
| AMD Radeon VII | |
| NVIDIA GeForce RTX 2070 (Desktop) | |
| NVIDIA GeForce GTX 1080 (Desktop) | |
| NVIDIA GeForce GTX 1080 (Desktop) | |
| NVIDIA GeForce RTX 2060 (Desktop) | |
| NVIDIA GeForce GTX 1070 (Desktop) | |
| AMD Radeon RX 590 (Desktop) | |
| Hitman 2 | |
| 1920x1080 Ultra AF:16x | |
| AMD Radeon VII | |
| NVIDIA GeForce RTX 2060 (Desktop) | |
| NVIDIA GeForce RTX 2080 (Desktop) | |
| AMD Radeon RX Vega 64 | |
| NVIDIA GeForce RTX 2070 (Desktop) | |
| NVIDIA Titan RTX | |
| AMD Radeon RX 590 (Desktop) | |
| NVIDIA GeForce GTX 1060 (Desktop) | |
| NVIDIA Titan X Pascal | |
| 3840x2160 Ultra AF:16x | |
| NVIDIA Titan RTX | |
| NVIDIA GeForce RTX 2080 (Desktop) | |
| AMD Radeon VII | |
| NVIDIA Titan X Pascal | |
| AMD Radeon RX Vega 64 | |
| NVIDIA GeForce RTX 2070 (Desktop) | |
| NVIDIA GeForce RTX 2060 (Desktop) | |
| AMD Radeon RX 590 (Desktop) | |
| NVIDIA GeForce GTX 1060 (Desktop) | |
| Battlefield V | |
| 1920x1080 Ultra Preset | |
| NVIDIA Titan RTX | |
| NVIDIA GeForce RTX 2080 (Desktop) | |
| AMD Radeon RX Vega 64 | |
| NVIDIA Titan X Pascal | |
| AMD Radeon VII | |
| NVIDIA GeForce RTX 2070 (Desktop) | |
| NVIDIA GeForce RTX 2060 (Desktop) | |
| AMD Radeon RX 590 (Desktop) | |
| 3840x2160 Ultra Preset | |
| NVIDIA Titan RTX | |
| NVIDIA GeForce RTX 2080 (Desktop) | |
| AMD Radeon VII | |
| NVIDIA Titan X Pascal | |
| NVIDIA GeForce RTX 2070 (Desktop) | |
| AMD Radeon RX Vega 64 | |
| NVIDIA GeForce RTX 2060 (Desktop) | |
| AMD Radeon RX 590 (Desktop) | |
| Farming Simulator 19 | |
| 1920x1080 Very High Preset | |
| NVIDIA Titan RTX | |
| NVIDIA GeForce RTX 2080 (Desktop) | |
| NVIDIA GeForce RTX 2060 (Desktop) | |
| NVIDIA GeForce RTX 2070 (Desktop) | |
| AMD Radeon VII | |
| AMD Radeon RX Vega 64 | |
| NVIDIA Titan X Pascal | |
| AMD Radeon RX 590 (Desktop) | |
| 3840x2160 Very High Preset | |
| NVIDIA Titan RTX | |
| NVIDIA Titan X Pascal | |
| NVIDIA GeForce RTX 2080 (Desktop) | |
| NVIDIA GeForce RTX 2070 (Desktop) | |
| NVIDIA GeForce RTX 2060 (Desktop) | |
| AMD Radeon VII | |
| AMD Radeon RX Vega 64 | |
| AMD Radeon RX 590 (Desktop) | |
| Darksiders III | |
| 1920x1080 Epic | |
| NVIDIA Titan RTX | |
| NVIDIA GeForce RTX 2080 (Desktop) | |
| NVIDIA GeForce RTX 2070 (Desktop) | |
| AMD Radeon VII | |
| NVIDIA GeForce RTX 2060 (Desktop) | |
| NVIDIA Titan X Pascal | |
| AMD Radeon RX Vega 64 | |
| AMD Radeon RX 590 (Desktop) | |
| 3840x2160 Epic | |
| NVIDIA Titan RTX | |
| NVIDIA GeForce RTX 2080 (Desktop) | |
| NVIDIA Titan X Pascal | |
| NVIDIA GeForce RTX 2070 (Desktop) | |
| AMD Radeon VII | |
| AMD Radeon RX Vega 64 | |
| NVIDIA GeForce RTX 2060 (Desktop) | |
| AMD Radeon RX 590 (Desktop) | |
| Just Cause 4 | |
| 1920x1080 Very High / On AA:SM AF:16x | |
| NVIDIA Titan RTX | |
| NVIDIA GeForce RTX 2080 (Desktop) | |
| NVIDIA Titan X Pascal | |
| NVIDIA GeForce RTX 2070 (Desktop) | |
| AMD Radeon VII | |
| NVIDIA GeForce RTX 2060 (Desktop) | |
| AMD Radeon RX Vega 64 | |
| AMD Radeon RX 590 (Desktop) | |
| 3840x2160 Very High / On AA:SM AF:16x | |
| NVIDIA Titan RTX | |
| NVIDIA GeForce RTX 2080 (Desktop) | |
| NVIDIA Titan X Pascal | |
| AMD Radeon VII | |
| NVIDIA GeForce RTX 2070 (Desktop) | |
| NVIDIA GeForce RTX 2060 (Desktop) | |
| AMD Radeon RX Vega 64 | |
| AMD Radeon RX 590 (Desktop) | |
| Apex Legends | |
| 1920x1080 Maximum Settings AA:TS AF:16x | |
| NVIDIA GeForce RTX 2070 (Desktop) | |
| NVIDIA GeForce RTX 2080 (Desktop) | |
| NVIDIA GeForce RTX 2060 (Desktop) | |
| AMD Radeon RX Vega 64 | |
| AMD Radeon RX 590 (Desktop) | |
| 3840x2160 Maximum Settings AA:TS AF:16x | |
| NVIDIA GeForce RTX 2080 (Desktop) | |
| NVIDIA GeForce RTX 2070 (Desktop) | |
| AMD Radeon RX Vega 64 | |
| NVIDIA GeForce RTX 2060 (Desktop) | |
| AMD Radeon RX 590 (Desktop) | |
| Far Cry New Dawn | |
| 1920x1080 Ultra Preset | |
| NVIDIA GeForce RTX 2080 (Desktop) | |
| NVIDIA GeForce RTX 2070 (Desktop) | |
| NVIDIA GeForce RTX 2060 (Desktop) | |
| AMD Radeon RX Vega 64 | |
| AMD Radeon VII | |
| AMD Radeon RX 590 (Desktop) | |
| 3840x2160 Ultra Preset | |
| NVIDIA GeForce RTX 2080 (Desktop) | |
| AMD Radeon VII | |
| NVIDIA GeForce RTX 2070 (Desktop) | |
| AMD Radeon RX Vega 64 | |
| NVIDIA GeForce RTX 2060 (Desktop) | |
| AMD Radeon RX 590 (Desktop) | |
| Metro Exodus | |
| 1920x1080 Ultra Quality AF:16x | |
| NVIDIA GeForce RTX 2080 (Desktop) | |
| AMD Radeon VII | |
| NVIDIA GeForce RTX 2070 (Desktop) | |
| AMD Radeon RX Vega 64 | |
| NVIDIA GeForce RTX 2060 (Desktop) | |
| AMD Radeon RX 590 (Desktop) | |
| 3840x2160 Ultra Quality AF:16x | |
| AMD Radeon RX Vega 64 | |
| NVIDIA GeForce RTX 2080 (Desktop) | |
| AMD Radeon VII | |
| NVIDIA GeForce RTX 2070 (Desktop) | |
| NVIDIA GeForce RTX 2060 (Desktop) | |
| AMD Radeon RX 590 (Desktop) | |
| Anthem - 1920x1080 Ultra Preset | |
| NVIDIA GeForce RTX 2080 (Desktop) | |
| AMD Radeon RX Vega 64 | |
| NVIDIA GeForce RTX 2070 (Desktop) | |
| AMD Radeon VII | |
| NVIDIA GeForce RTX 2060 (Desktop) | |
| AMD Radeon RX 590 (Desktop) | |
| Dirt Rally 2.0 | |
| 1920x1080 Ultra Preset AA:T AF:16x | |
| NVIDIA GeForce RTX 2080 (Desktop) | |
| AMD Radeon VII | |
| NVIDIA GeForce RTX 2070 (Desktop) | |
| AMD Radeon RX Vega 64 | |
| NVIDIA GeForce RTX 2060 (Desktop) | |
| AMD Radeon RX 590 (Desktop) | |
| 3840x2160 Ultra Preset AA:T AF:16x | |
| NVIDIA GeForce RTX 2080 (Desktop) | |
| AMD Radeon VII | |
| NVIDIA GeForce RTX 2070 (Desktop) | |
| AMD Radeon RX Vega 64 | |
| NVIDIA GeForce RTX 2060 (Desktop) | |
| AMD Radeon RX 590 (Desktop) | |
| low | med. | high | ultra | QHD | 4K | |
|---|---|---|---|---|---|---|
| Battlefield 4 (2013) | 199.4 | 199.6 | 199.8 | 163.9 | 55.4 | |
| GTA V (2015) | 174.4 | 166.4 | 148.4 | 100.5 | 66.7 | |
| The Witcher 3 (2015) | 286.7 | 204.5 | 135.7 | 72.7 | 51.3 | |
| Rainbow Six Siege (2015) | 244 | 297 | 238 | 223 | 97 | |
| Rise of the Tomb Raider (2016) | 268 | 189 | 136 | 113 | 47.3 | |
| Far Cry Primal (2016) | 119 | 107 | 97 | 91 | 50 | |
| The Division (2016) | 278 | 218 | 120 | 95 | 49 | |
| Doom (2016) | 164.4 | 149.2 | 141.3 | 139.5 | 78.7 | |
| Overwatch (2016) | 279.9 | 275.2 | 266.8 | 110.2 | 102.2 | |
| Deus Ex Mankind Divided (2016) | 149.9 | 140 | 103.5 | 75.7 | 37.3 | |
| Battlefield 1 (2016) | 179 | 162 | 143 | 133 | 59.8 | |
| Watch Dogs 2 (2016) | 139.2 | 126 | 94.6 | 66 | 38.5 | |
| For Honor (2017) | 265 | 163 | 157 | 122 | 53 | |
| Ghost Recon Wildlands (2017) | 149 | 103 | 97 | 56 | 38 | |
| Rocket League (2017) | 246 | 248 | 221 | 115 | ||
| Dirt 4 (2017) | 312 | 196 | 117 | 68 | ||
| Playerunknown's Battlegrounds (PUBG) (2017) | 189.5 | 166.7 | 158.7 | 121.6 | 44.3 | |
| Destiny 2 (2017) | 137 | 135 | 136 | 103 | 49.7 | |
| Assassin´s Creed Origins (2017) | 113 | 97 | 92 | 78 | 39 | |
| Call of Duty WWII (2017) | 243 | 231 | 155 | 128 | 68 | |
| Fortnite (2018) | 214.4 | 179.2 | 155 | 141 | 38 | |
| Final Fantasy XV Benchmark (2018) | 151.9 | 99.6 | 72.6 | 30.8 | ||
| Kingdom Come: Deliverance (2018) | 128 | 114 | 91 | 70 | 25 | |
| Far Cry 5 (2018) | 117 | 103 | 99 | 94 | 41 | |
| The Crew 2 (2018) | 60 | 60 | 60 | 60 | 35.3 | |
| Monster Hunter World (2018) | 144 | 114 | 109 | 86 | 27.5 | |
| F1 2018 (2018) | 241 | 191 | 154 | 112 | 55 | |
| Shadow of the Tomb Raider (2018) | 133 | 107 | 101 | 90 | 32 | |
| FIFA 19 (2018) | 234.5 | 205.4 | 194 | 186.2 | 151.2 | |
| Forza Horizon 4 (2018) | 178 | 140 | 131 | 105 | 59 | |
| Assassin´s Creed Odyssey (2018) | 108 | 92 | 78 | 56 | 28 | |
| Call of Duty Black Ops 4 (2018) | 223 | 157 | 147 | 133 | 39.7 | |
| Hitman 2 (2018) | 93.4 | 89.7 | 84.3 | 79.9 | 40.7 | |
| Fallout 76 (2018) | 60 | 60 | 60 | 60 | 60 | 50.6 |
| Battlefield V (2018) | 169 | 145 | 129 | 119.1 | 53.1 | |
| Farming Simulator 19 (2018) | 191.1 | 147.9 | 132.7 | 122.4 | 54.9 | |
| Darksiders III (2018) | 226 | 142 | 127 | 110 | 34.9 | |
| Just Cause 4 (2018) | 174 | 128 | 96 | 93 | 37.4 | |
| Apex Legends (2019) | 144 | 144 | 141 | 139 | 98 | 52 |
| Far Cry New Dawn (2019) | 116 | 101 | 97 | 88 | 76 | 42 |
| Metro Exodus (2019) | 127.8 | 85.4 | 63.9 | 52.7 | 41.5 | 26.3 |
| Anthem (2019) | 114 | 103 | 95 | 88 | 66 | 34.6 |
| Dirt Rally 2.0 (2019) | 229.3 | 152.4 | 138.2 | 84.4 | 64.9 | 39.9 |
| The Division 2 (2019) | 178 | 135 | 108 | 85 | 60 | 33 |
| Anno 1800 (2019) | 87 | 87 | 72 | 40.3 | 34 | 19.8 |
| Rage 2 (2019) | 211 | 110 | 98 | 94 | 64 | 29.8 |
Compute Performance
The MSI RTX 2060 Gaming Z 6G can give the competition a run for its money when it comes to compute performance. As expected, the smallest member of the RTX family brings up the rear, behind the RTX 2070 and 2080. When compared to the Pascal-based GPUs, the GeForce RTX 2060 is more or less on the same level as the GeForce GTX 1070.
Emissions of the MSI RTX 2060 Gaming Z 6G

When looking at the emissions of the MSI RTX 2060 Gaming Z 6G, we primarily focus on the energy consumption and thermal performance. We measure energy consumption with both a default and an increased power target (PT). When idle, the system ran without any problems and drew 75 watts on average. During our stress test, which we conduct by running FurMark to really tax the GPU, the average power consumption was 295 watts. The maximum power draw came in at 330 watts. After we raised the PT to 105%, the average power draw amounted to 305 watts. When gaming, we saw an average power consumption of 289 watts, which is an acceptable result in view of the performance. That being said, the system based on the GeForce GTX 1070 had a power draw of 243 watts.
We did not observe any significant fluctuations in the temperature when the power limit was raised by 5%. All in all, the cooling system, which consists of two axial fans, is very good and quiet. Under load, users can only hear a slight hum coming from the two fans. The MSI RTX 2060 Gaming Z 6G stays comparatively cool under load. Here, we measured a maximum temperature of 66 °C (150.8 °F).
When compared to the Founders Edition model from Nvidia, the MSI RTX 2060 Gaming Z 6G has a higher TDP (190 watts).


| Power Consumption - 1920x1080 The Witcher 3 ultra (external Monitor) | |
| AMD Ryzen 7 2700X | |
| AMD Ryzen 7 2700X (Idle: 74.3 W) | |
| AMD Ryzen 7 2700X (Idle: 87.78 W) | |
| Intel Core i7-4790K (88 fps, Idle: 70.3 W) | |
| AMD Ryzen 7 2700X | |
| AMD Ryzen 7 2700X (Idle: 73.3 W) | |
| AMD Ryzen 7 2700X (Idle: 81.39 W) | |
| AMD Ryzen 7 2700X | |
| Intel Core i7-4790K (Idle: 68.3 W) | |
| AMD Ryzen 7 2700X (Idle: 74.66 W) | |
| Intel Core i7-4790K (Idle: 68 W) | |
* ... smaller is better
Overclocking - The power limit gets in the way of overclocking
As we mentioned in the Emissions section, the power target of the MSI RTX 2060 Gaming Z 6G can be increased up to 105%. This causes the maximum TDP to hit 200 watts. When overclocking, we were able to raise the core frequency to 80 – 100 MHz. The 80 MHz overclock provides a much greater degree of system stability. The system was able to complete the 3DMark 11 benchmark with a 100 MHz overclock, but it crashed in Fire Strike.
The VRAM can be easily overclocked. Our system was stable even at an effective clock rate of 8.5 GHz. This is 1500 MHz higher than the default clock rate.
Depending on the application, the overclocking can boost performance by 3 to 7%. However, users cannot eke any more performance out of this GPU without further adjustments to the power target. Having said that, there is still plenty of headroom for overclocking because of the very capable cooling solution.


Pros
Cons
Verdict - Fast, but not future-proof

The MSI RTX 2060 Gaming Z 6G is a modern, Turing-based GPU that supports such features as Ray tracing and DLSS. The somewhat newer Turing-based graphics cards (GTX 1660 and GTX 1660 Ti) do not come with such features. This is what distinguishes the RTX series from the GTX series.
Objectively, the GeForce RTX 2060 offers enough performance for 1080p and 1440p gaming. However, it cannot handle 4K at all. And it is not even the lack of VRAM to blame, the GPU is simply not powerful enough for gaming at such resolutions. Speaking of VRAM, 6 GB is not sufficient even at lower resolutions, especially if you want to game on the highest settings. Nevertheless, "Call of Duty Black Ops 4" - the VRAM-hog that it is - still manages to achieve 133 FPS at 1080p with the RTX 2060 on the highest settings. The picture is quite different in "Metro Exodus". Here, the GPU cannot achieve a stable 60 FPS even at 1080p.
The MSI RTX 2060 Gaming Z 6G tries to woo customers with an increased power target, a proprietary cooling solution and RGB lighting. The chances look good, thanks to great build quality and performance.
But for whom is this graphics card intended? This question is not easy to answer at this particular moment. Those who decide to limit their budget to 400 Euros ($448) will eventually bump into the RTX 2060. The Red team does not have anything to offer in this price range right now. The AMD Radeon VII is significantly more expensive and the AMD Radeon RX 590 is significantly cheaper than our MSI RTX 2060 Gaming Z 6G. This leaves only the used graphics card market to explore where there are quite a few AMD Radeon RX Vega 64 GPUs tumbling around. They perform as well as the GeForce RTX 2060, but they have a much higher power draw, which is not something that some people might be willing to stomach.
The GeForce RTX 2060 serves as the only possible comprise solution at the moment. This should change in the second half of the year when AMD releases a new crop of its GPUs. Currently, those who cannot afford the GeForce RTX 2070 or some of its pricier siblings will not be disappointed if they decide to get a GeForce RTX 2060. Our review sample from MSI is not only quiet, but also cool and it offers additional performance, thanks to its higher TDP, as well.
