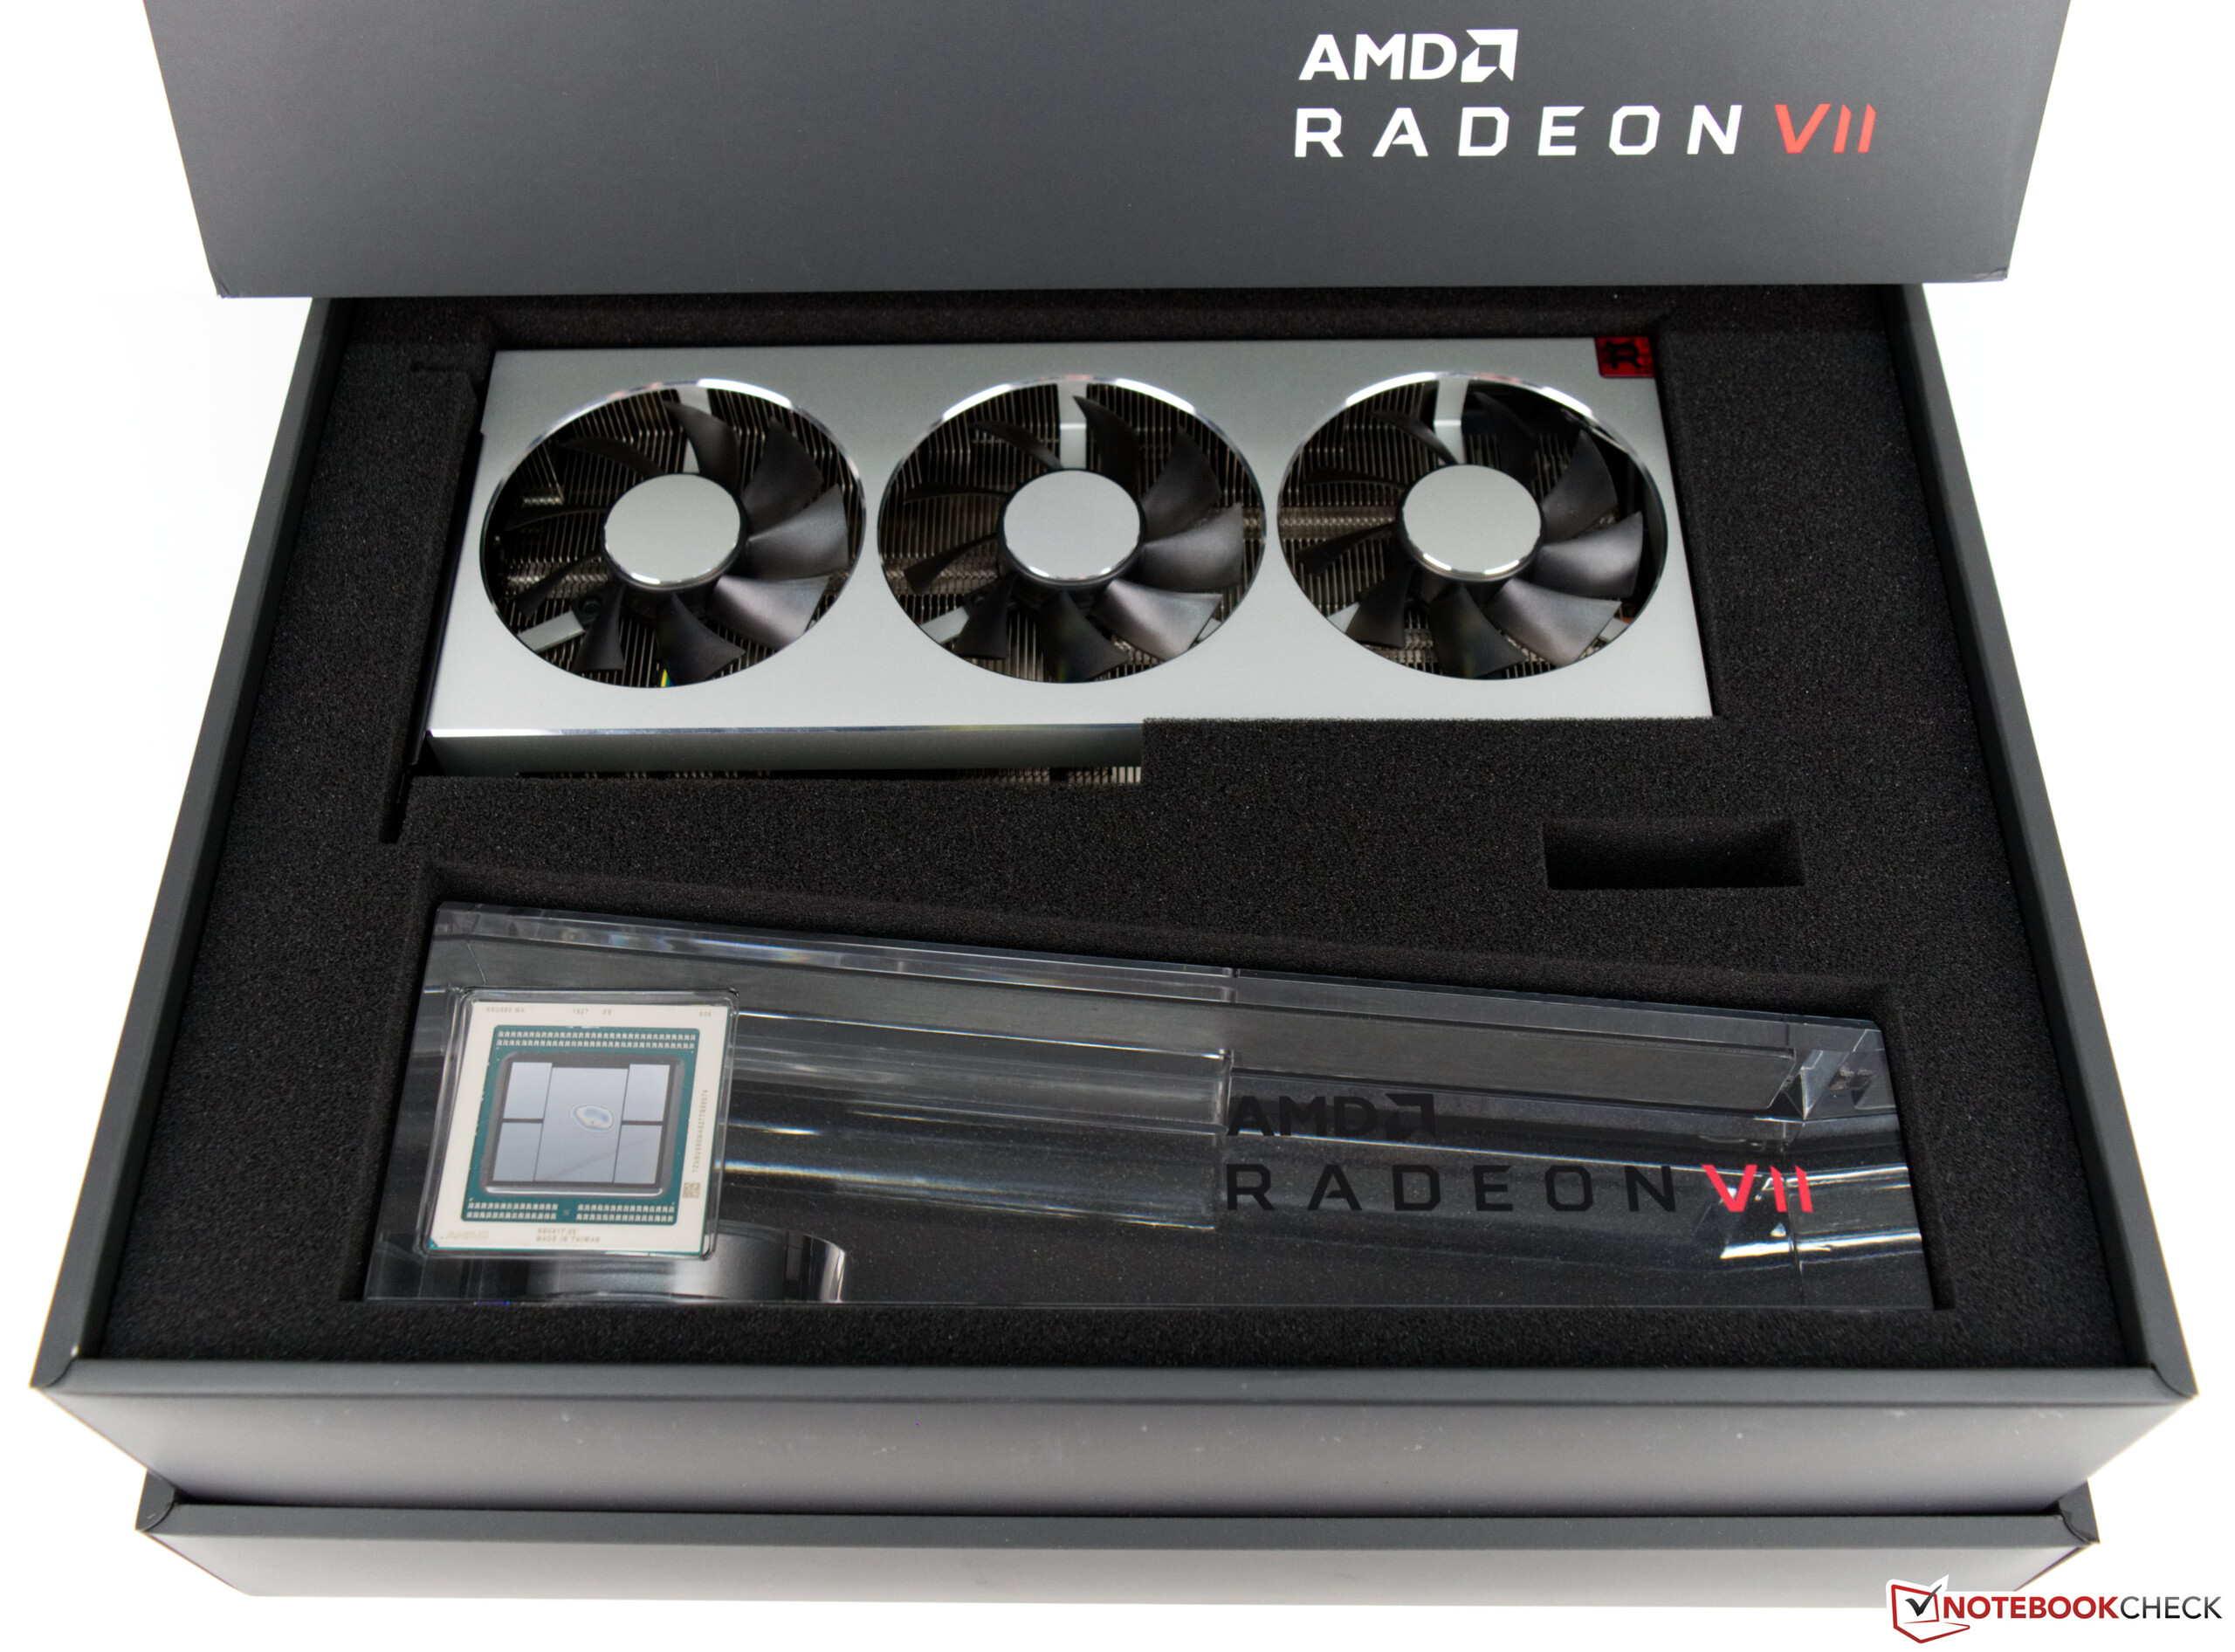
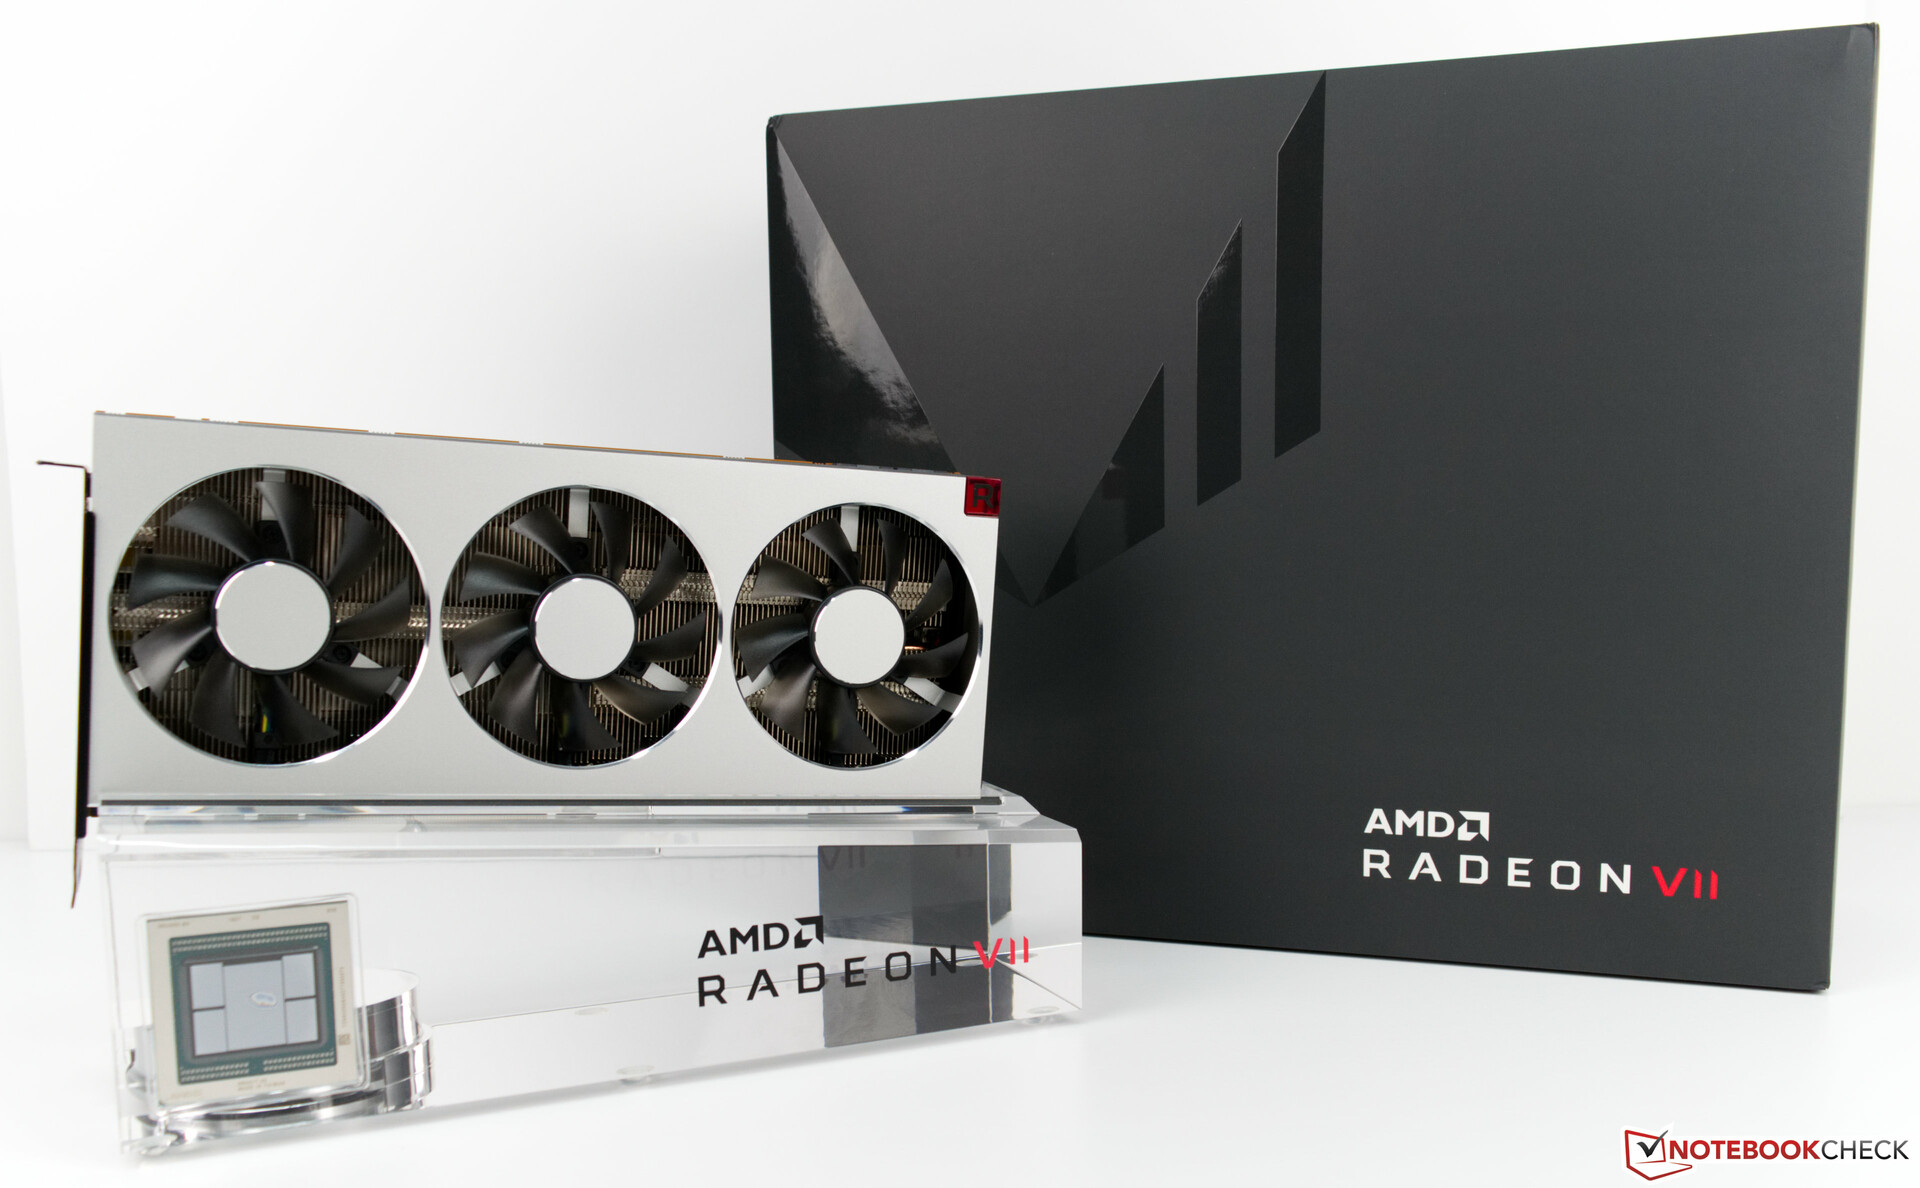
AMD Radeon VII Desktop GPU Review

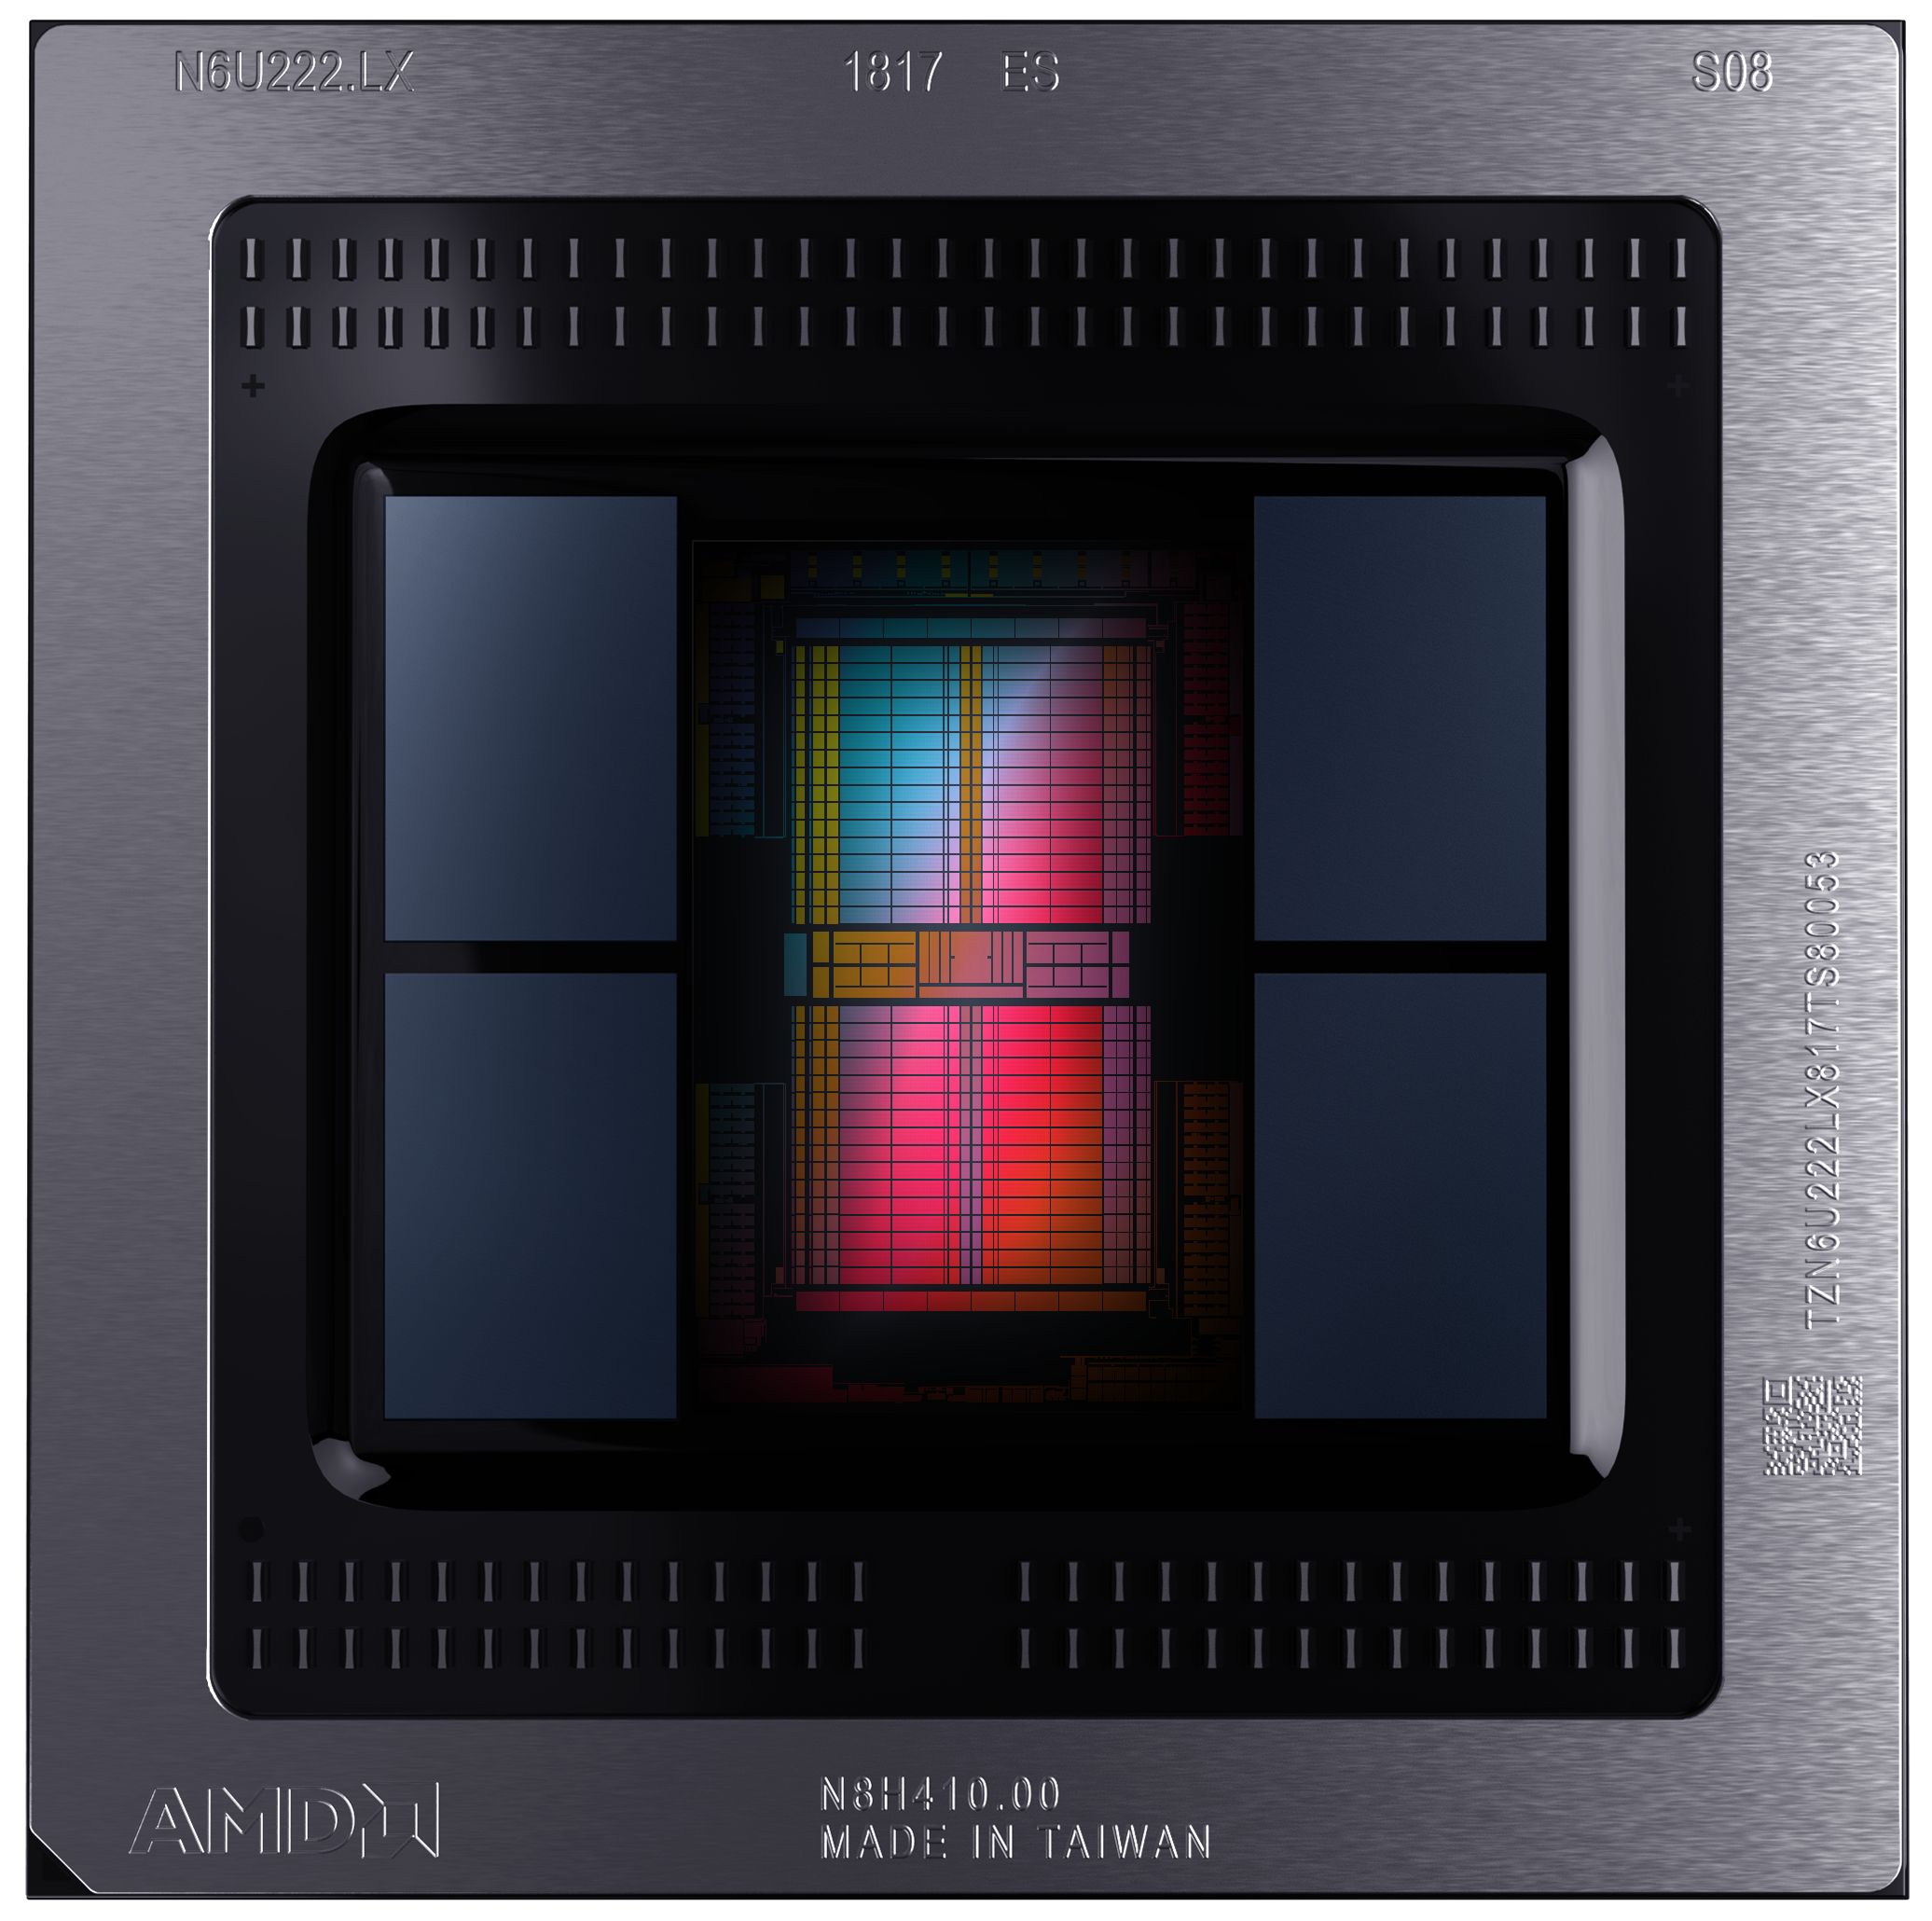
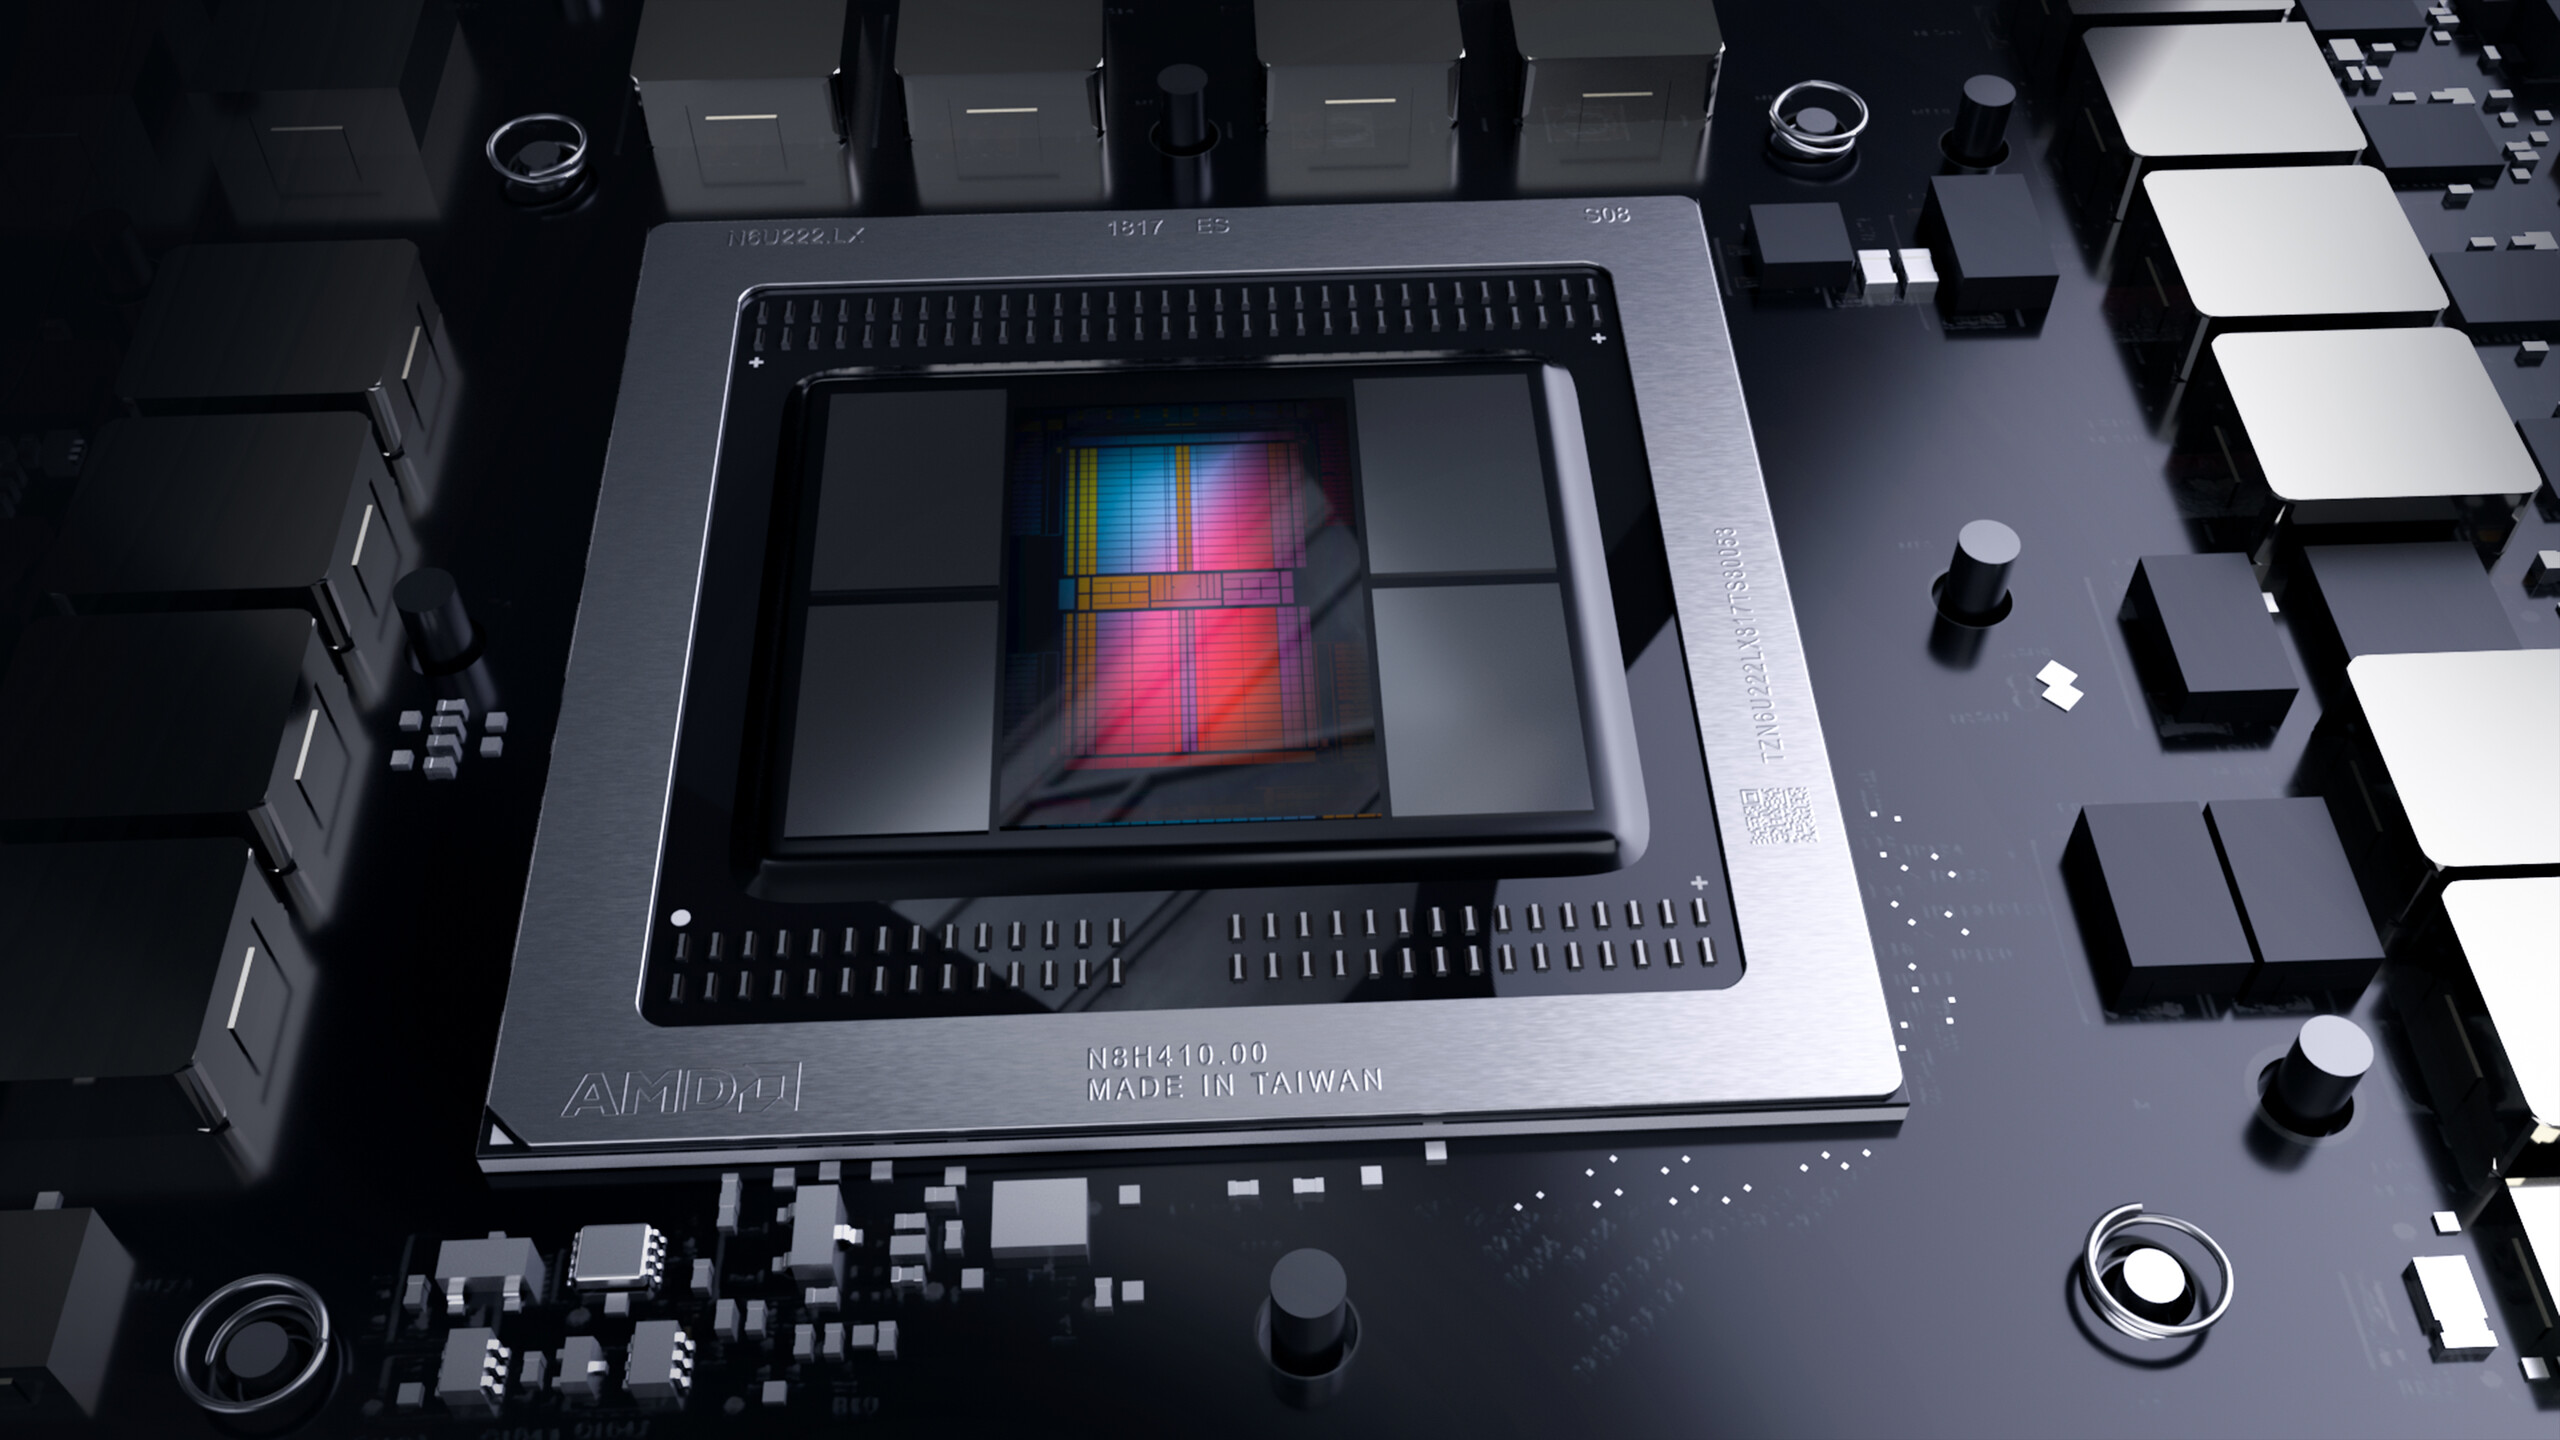
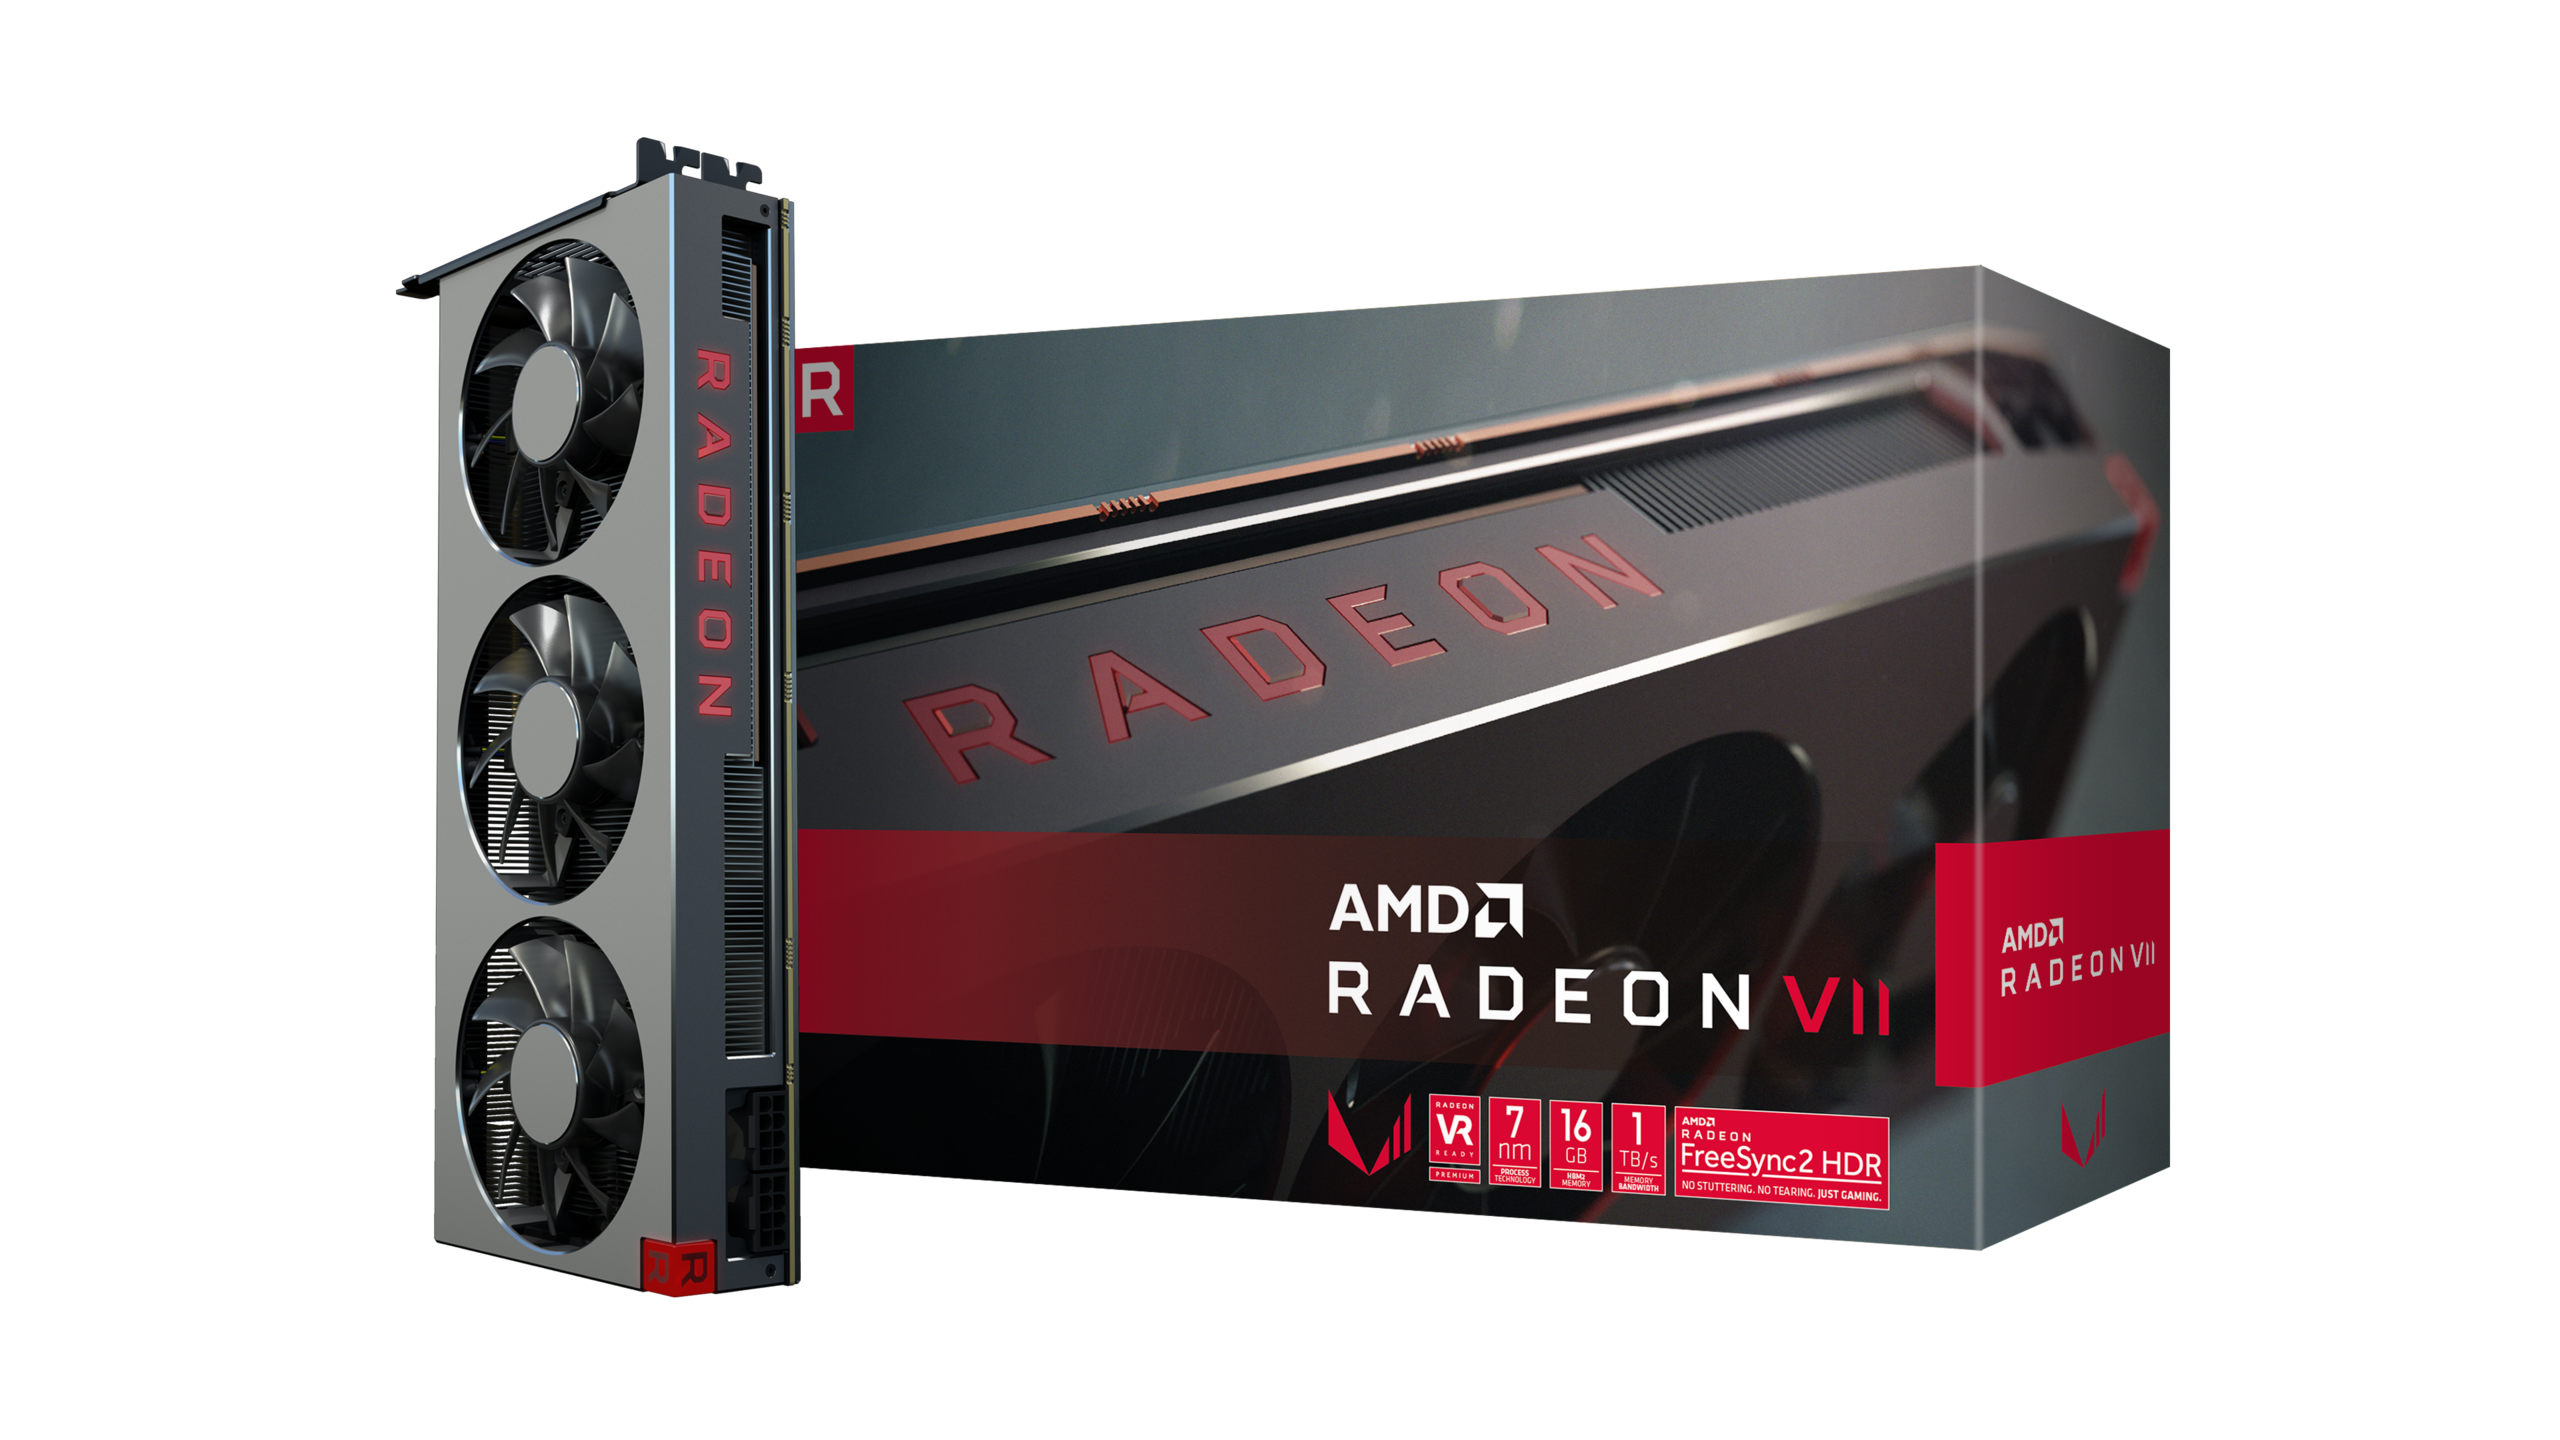
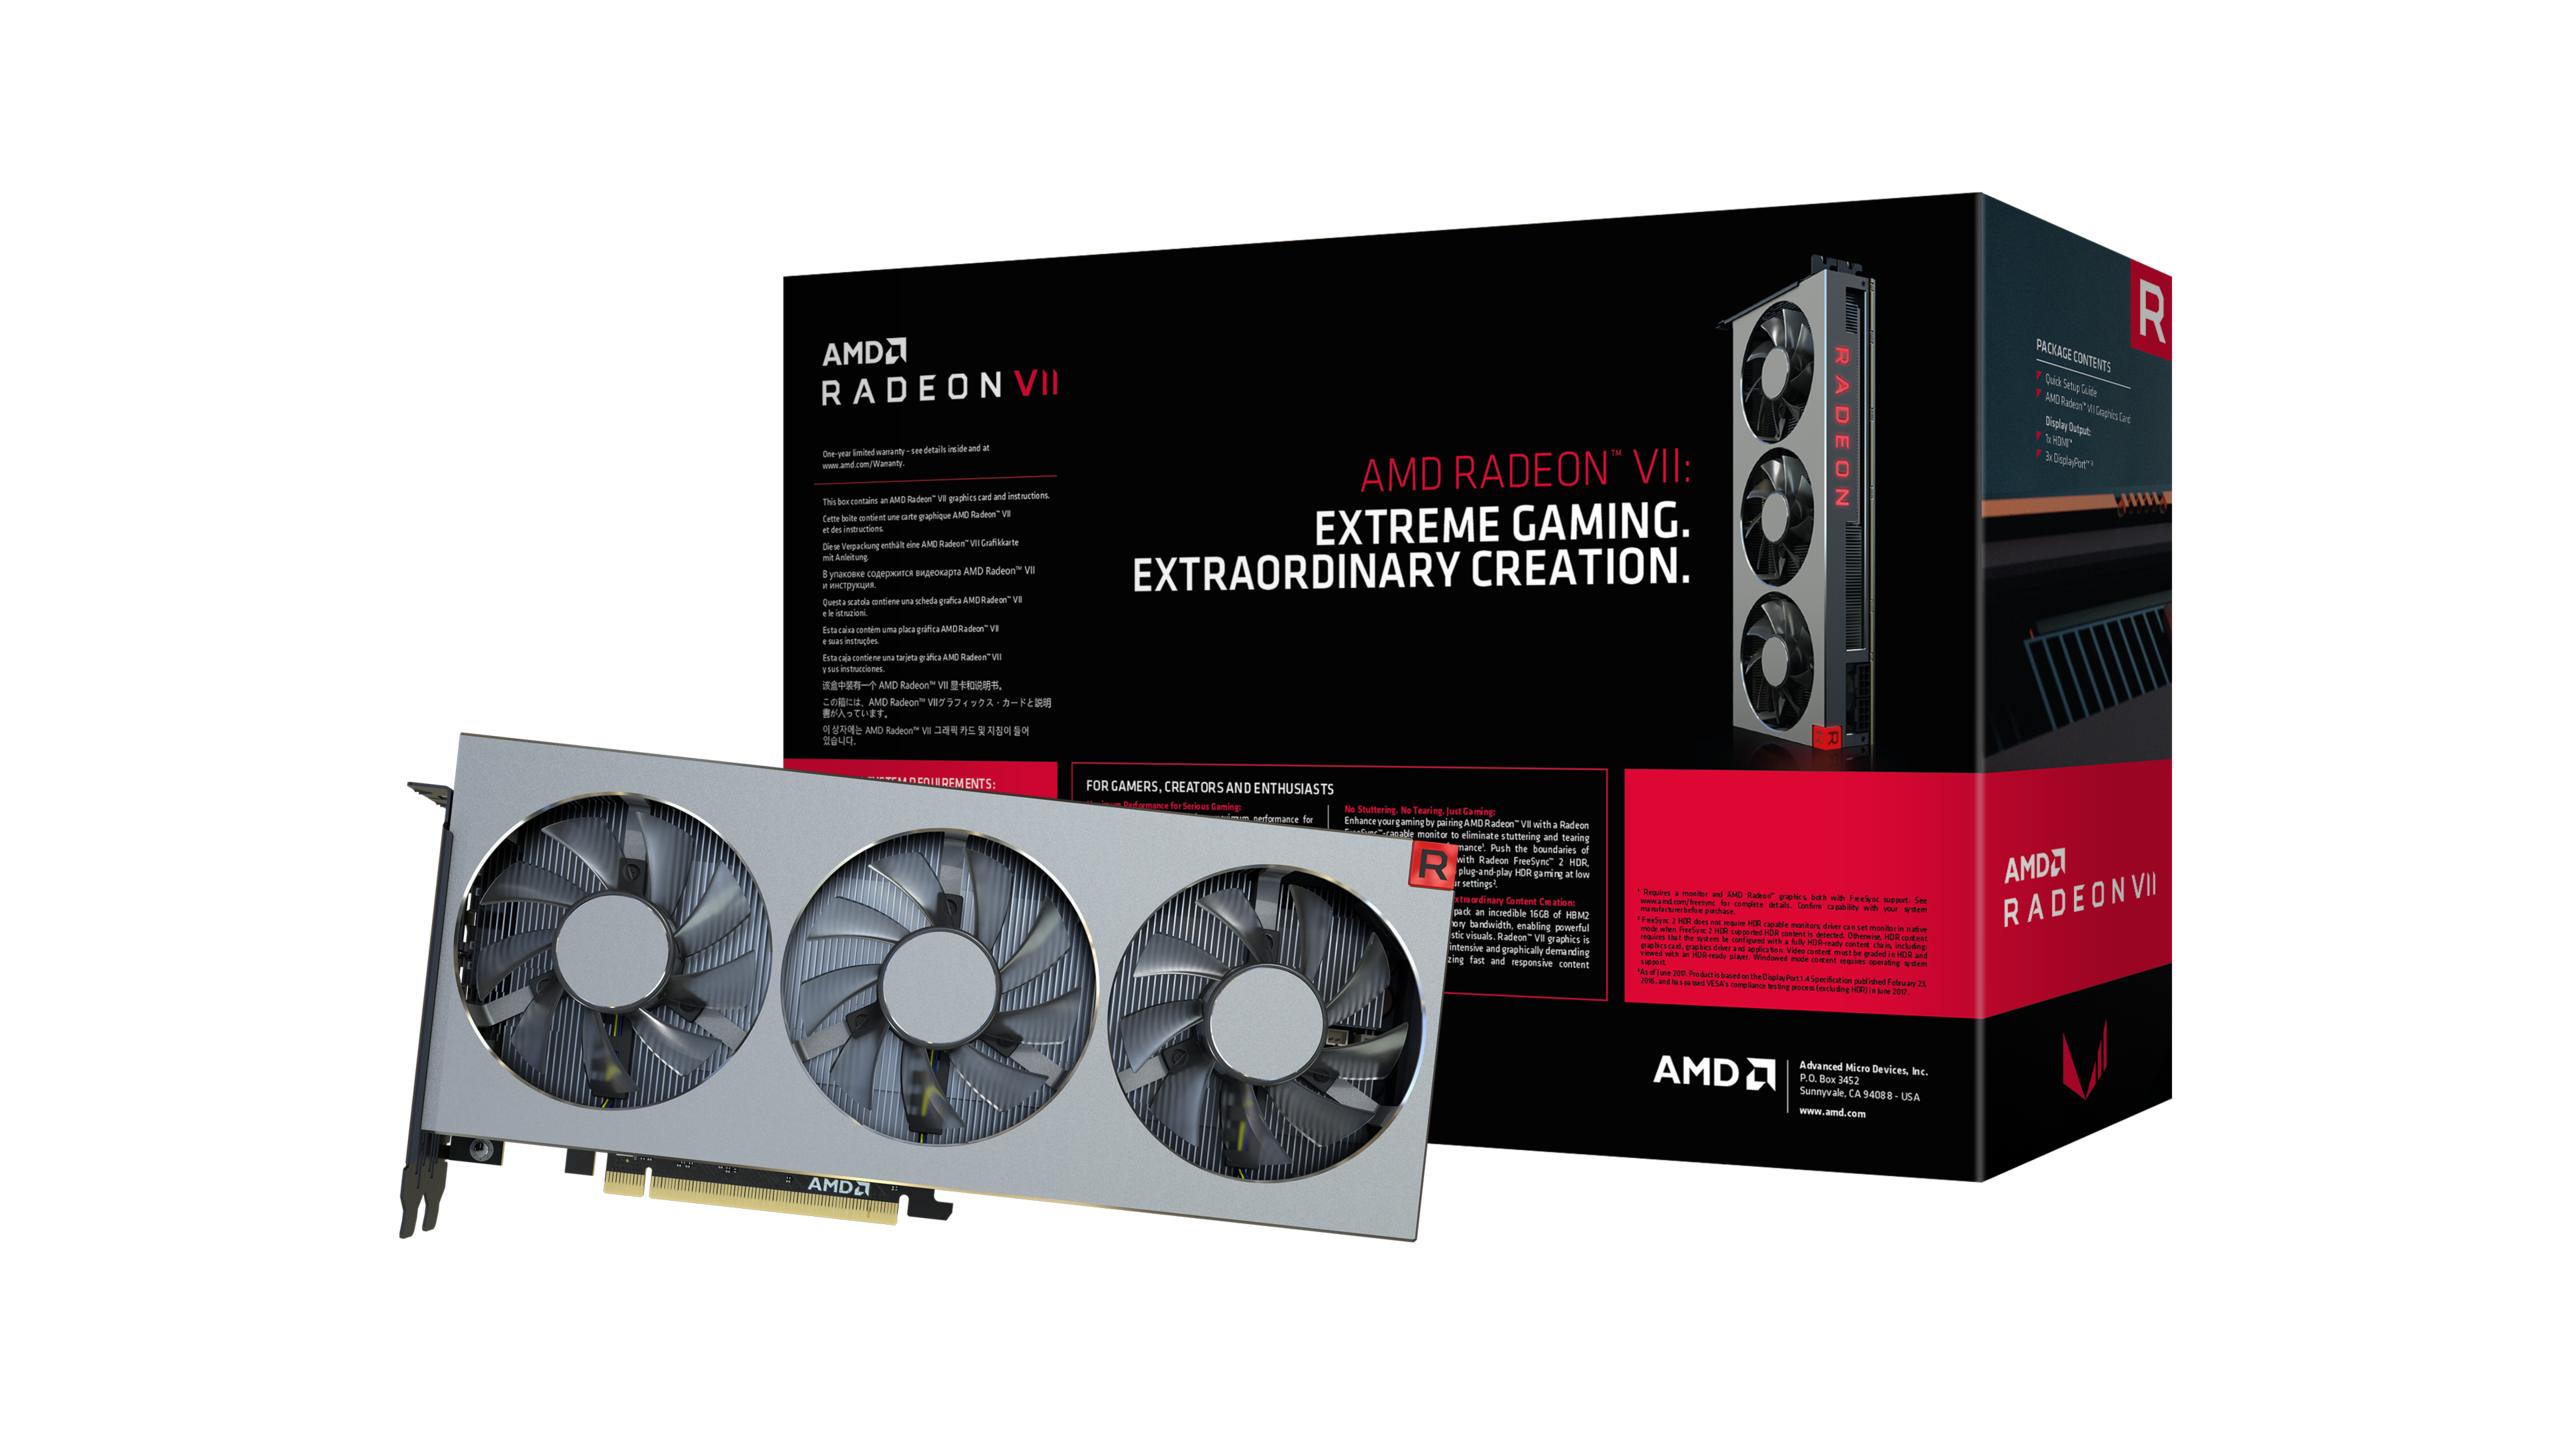
AMD introduced the Radeon VII at CES 2019 and based the GPU on its Vega architecture. The card is also the first to be manufactured on a 7 nm FinFET process and has 16 GB of VRAM, which should futureproof it for years to come. By contrast, the RTX 2080 Ti, which is currently the flagship GPU in the green corner, has only 11 GB of VRAM, so the Radeon VII has the edge in this regard.
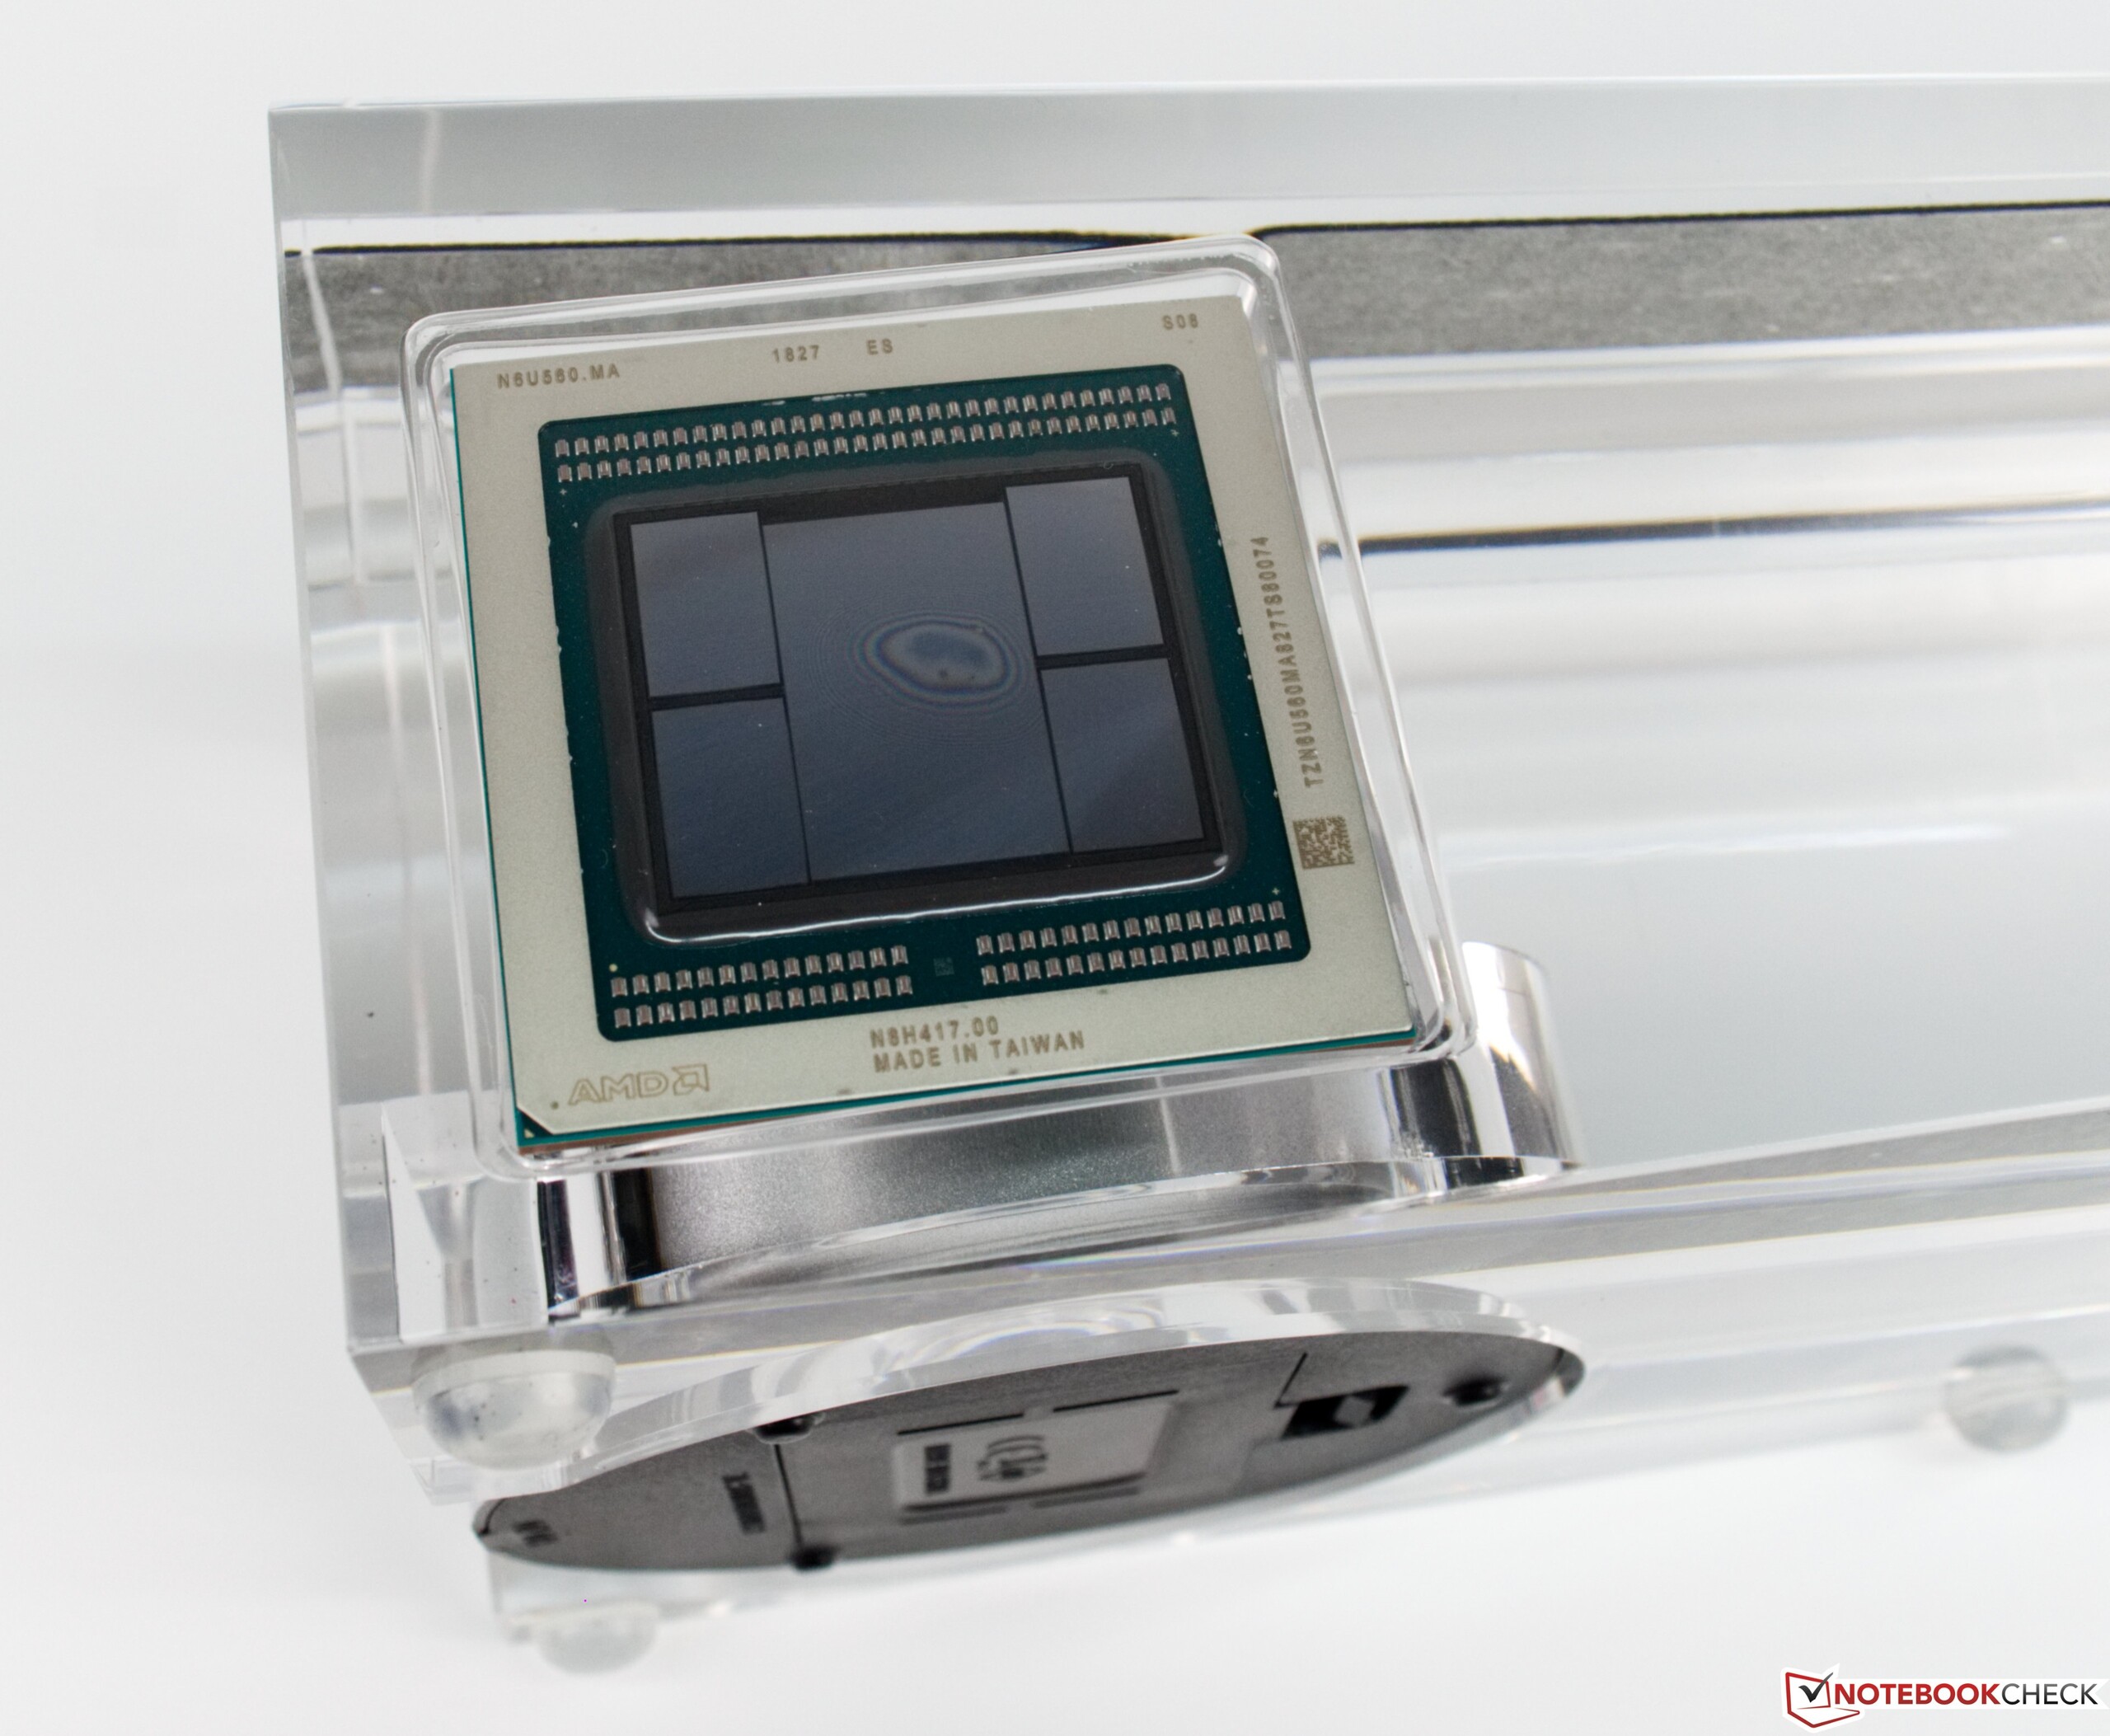
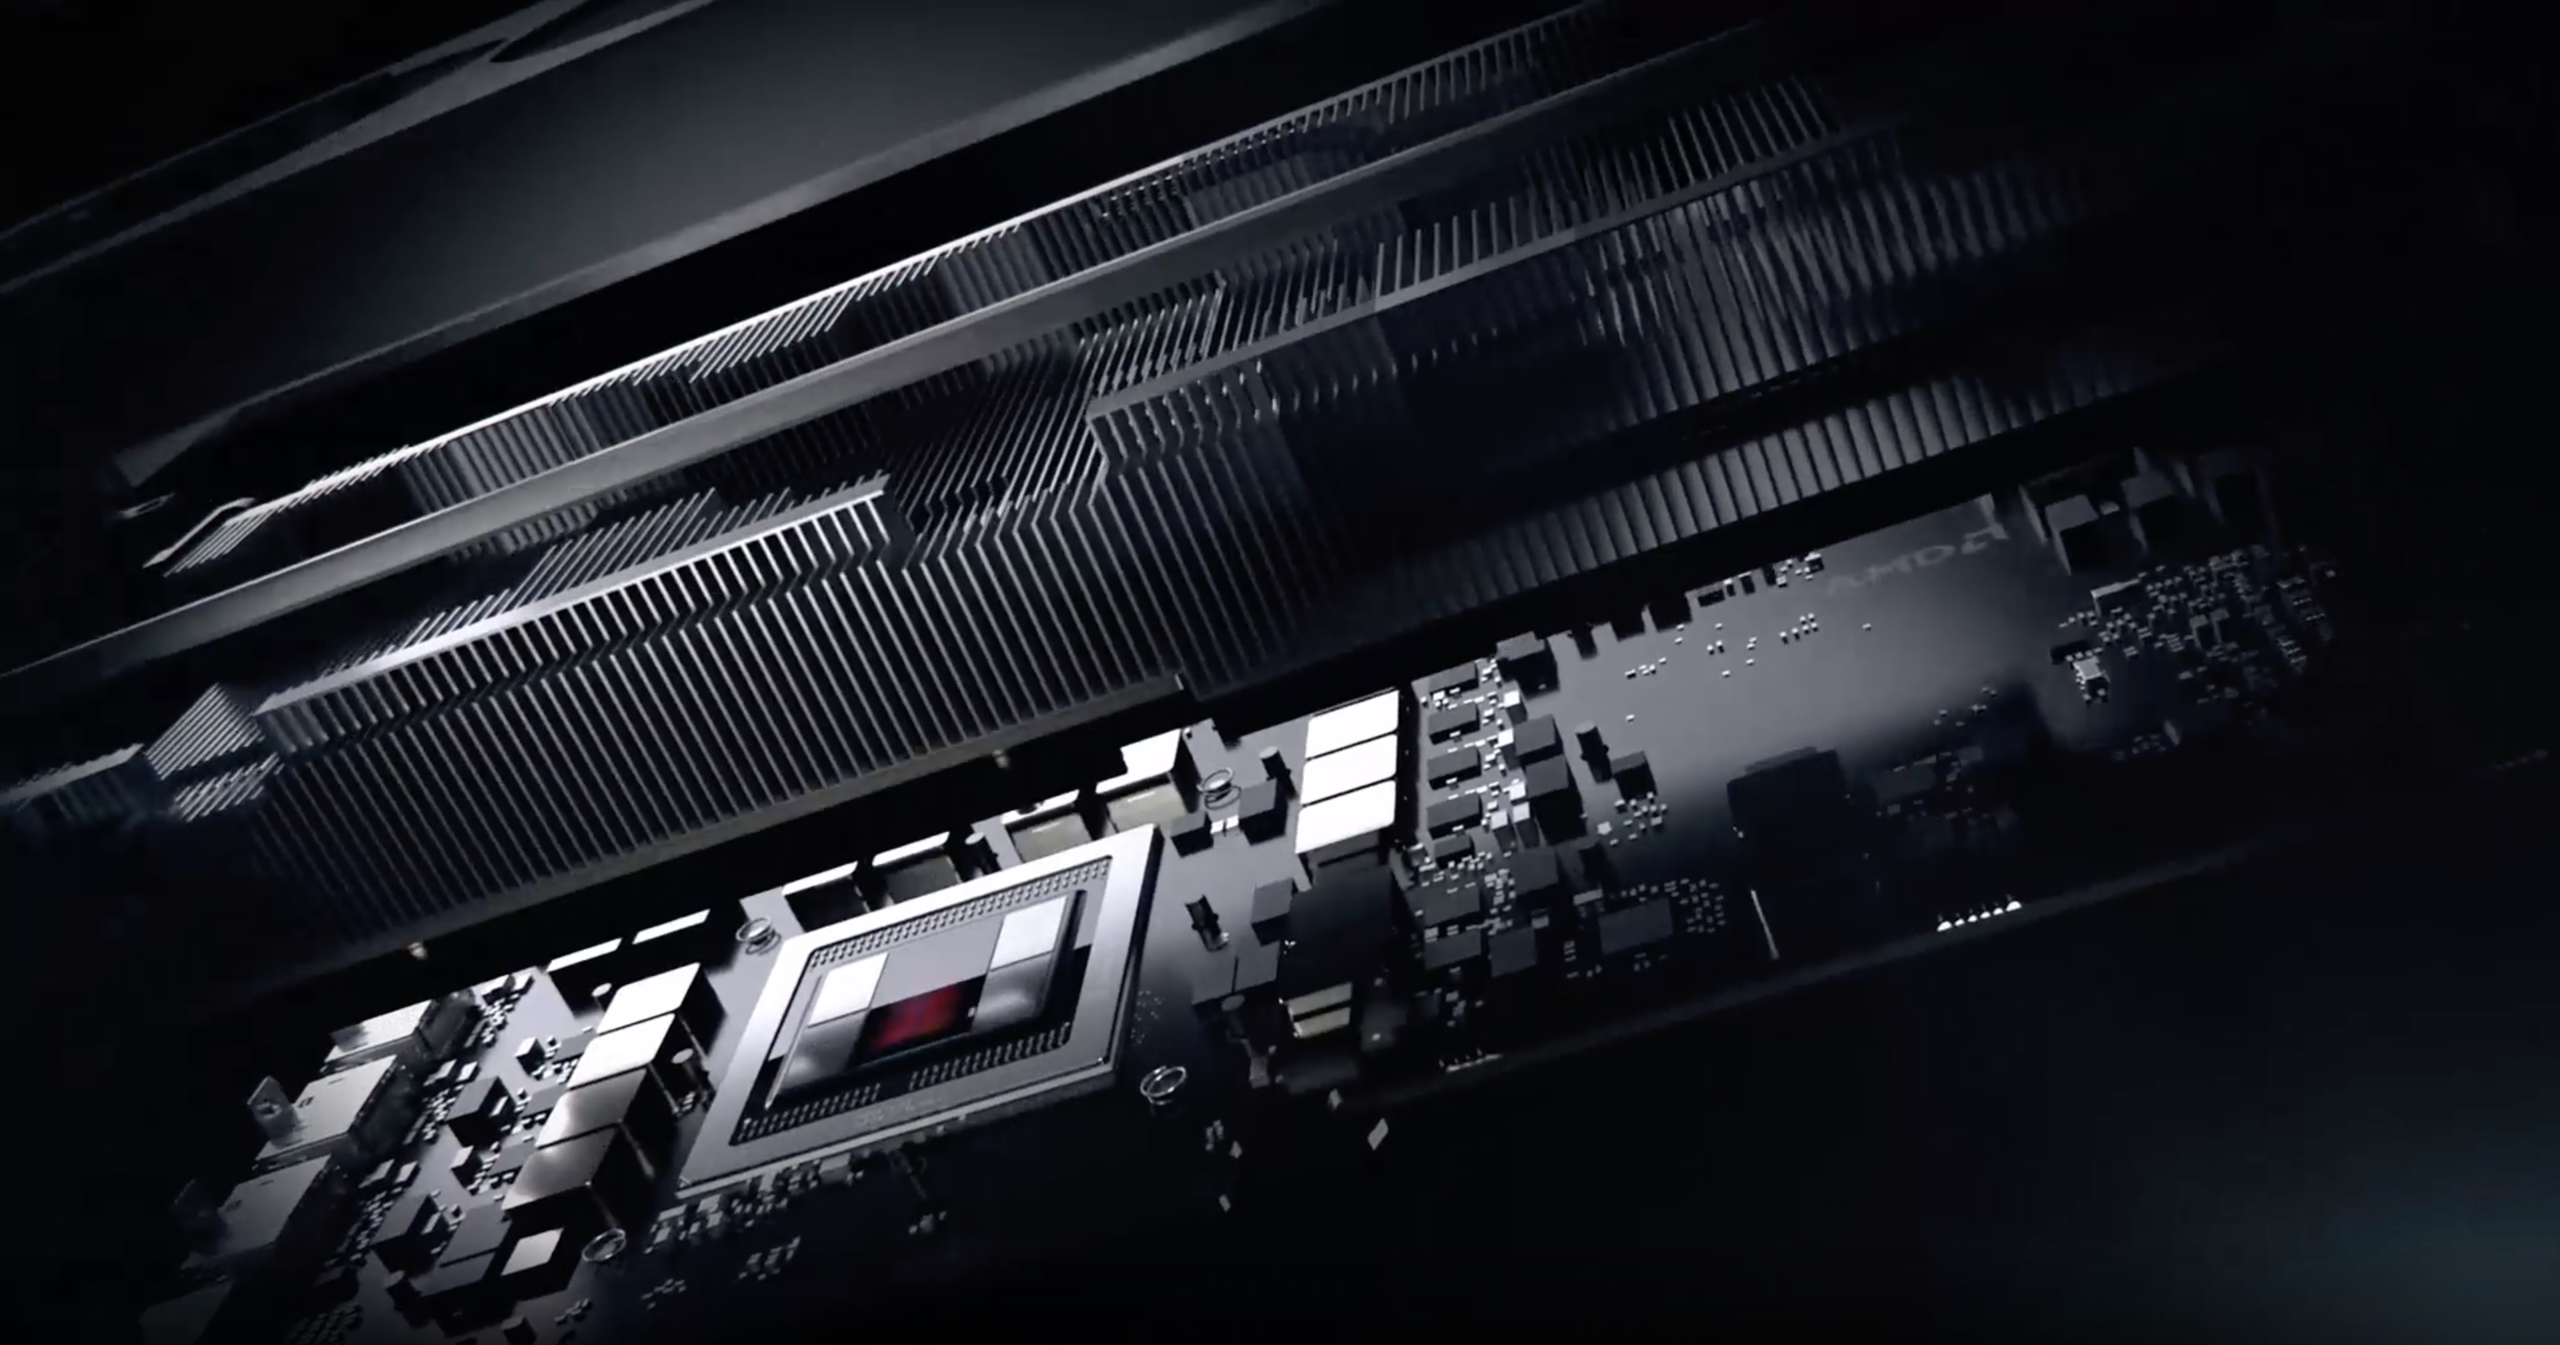
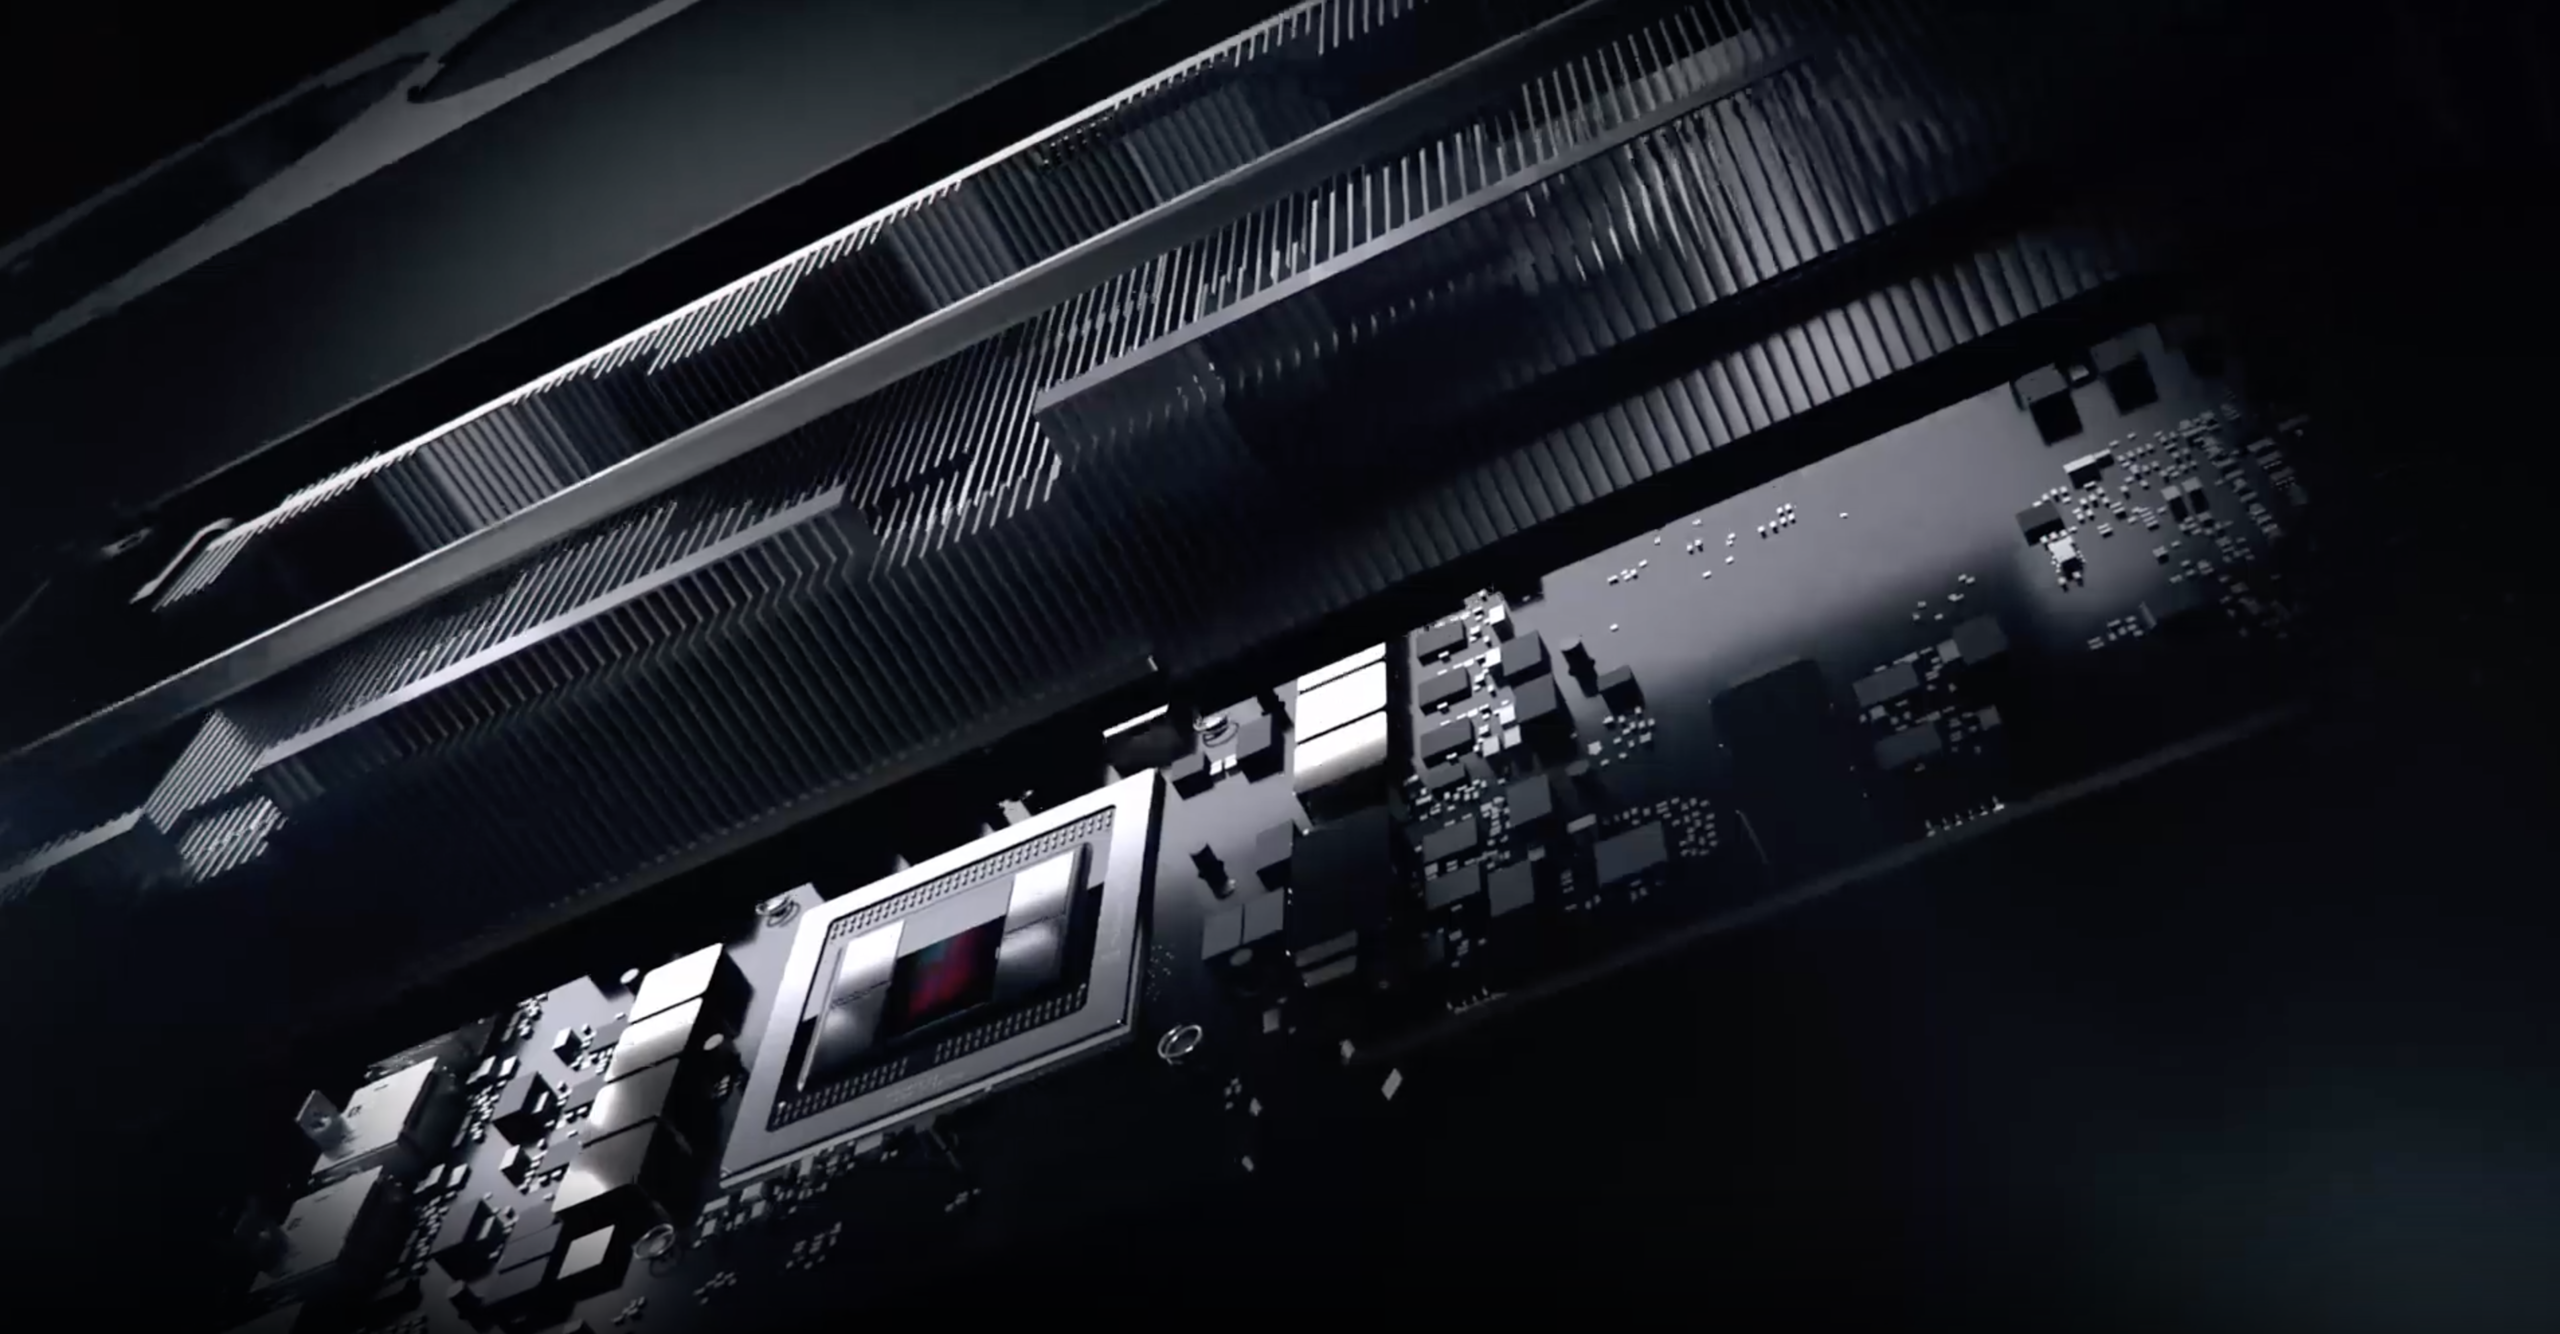
The smaller architecture should also significantly improve performance per watt and help the card run more efficiently. AMD has packed approximately 13.2 billion transistors within 331 mm², along with 3,840 shader units and a 4,096-bit memory interface.
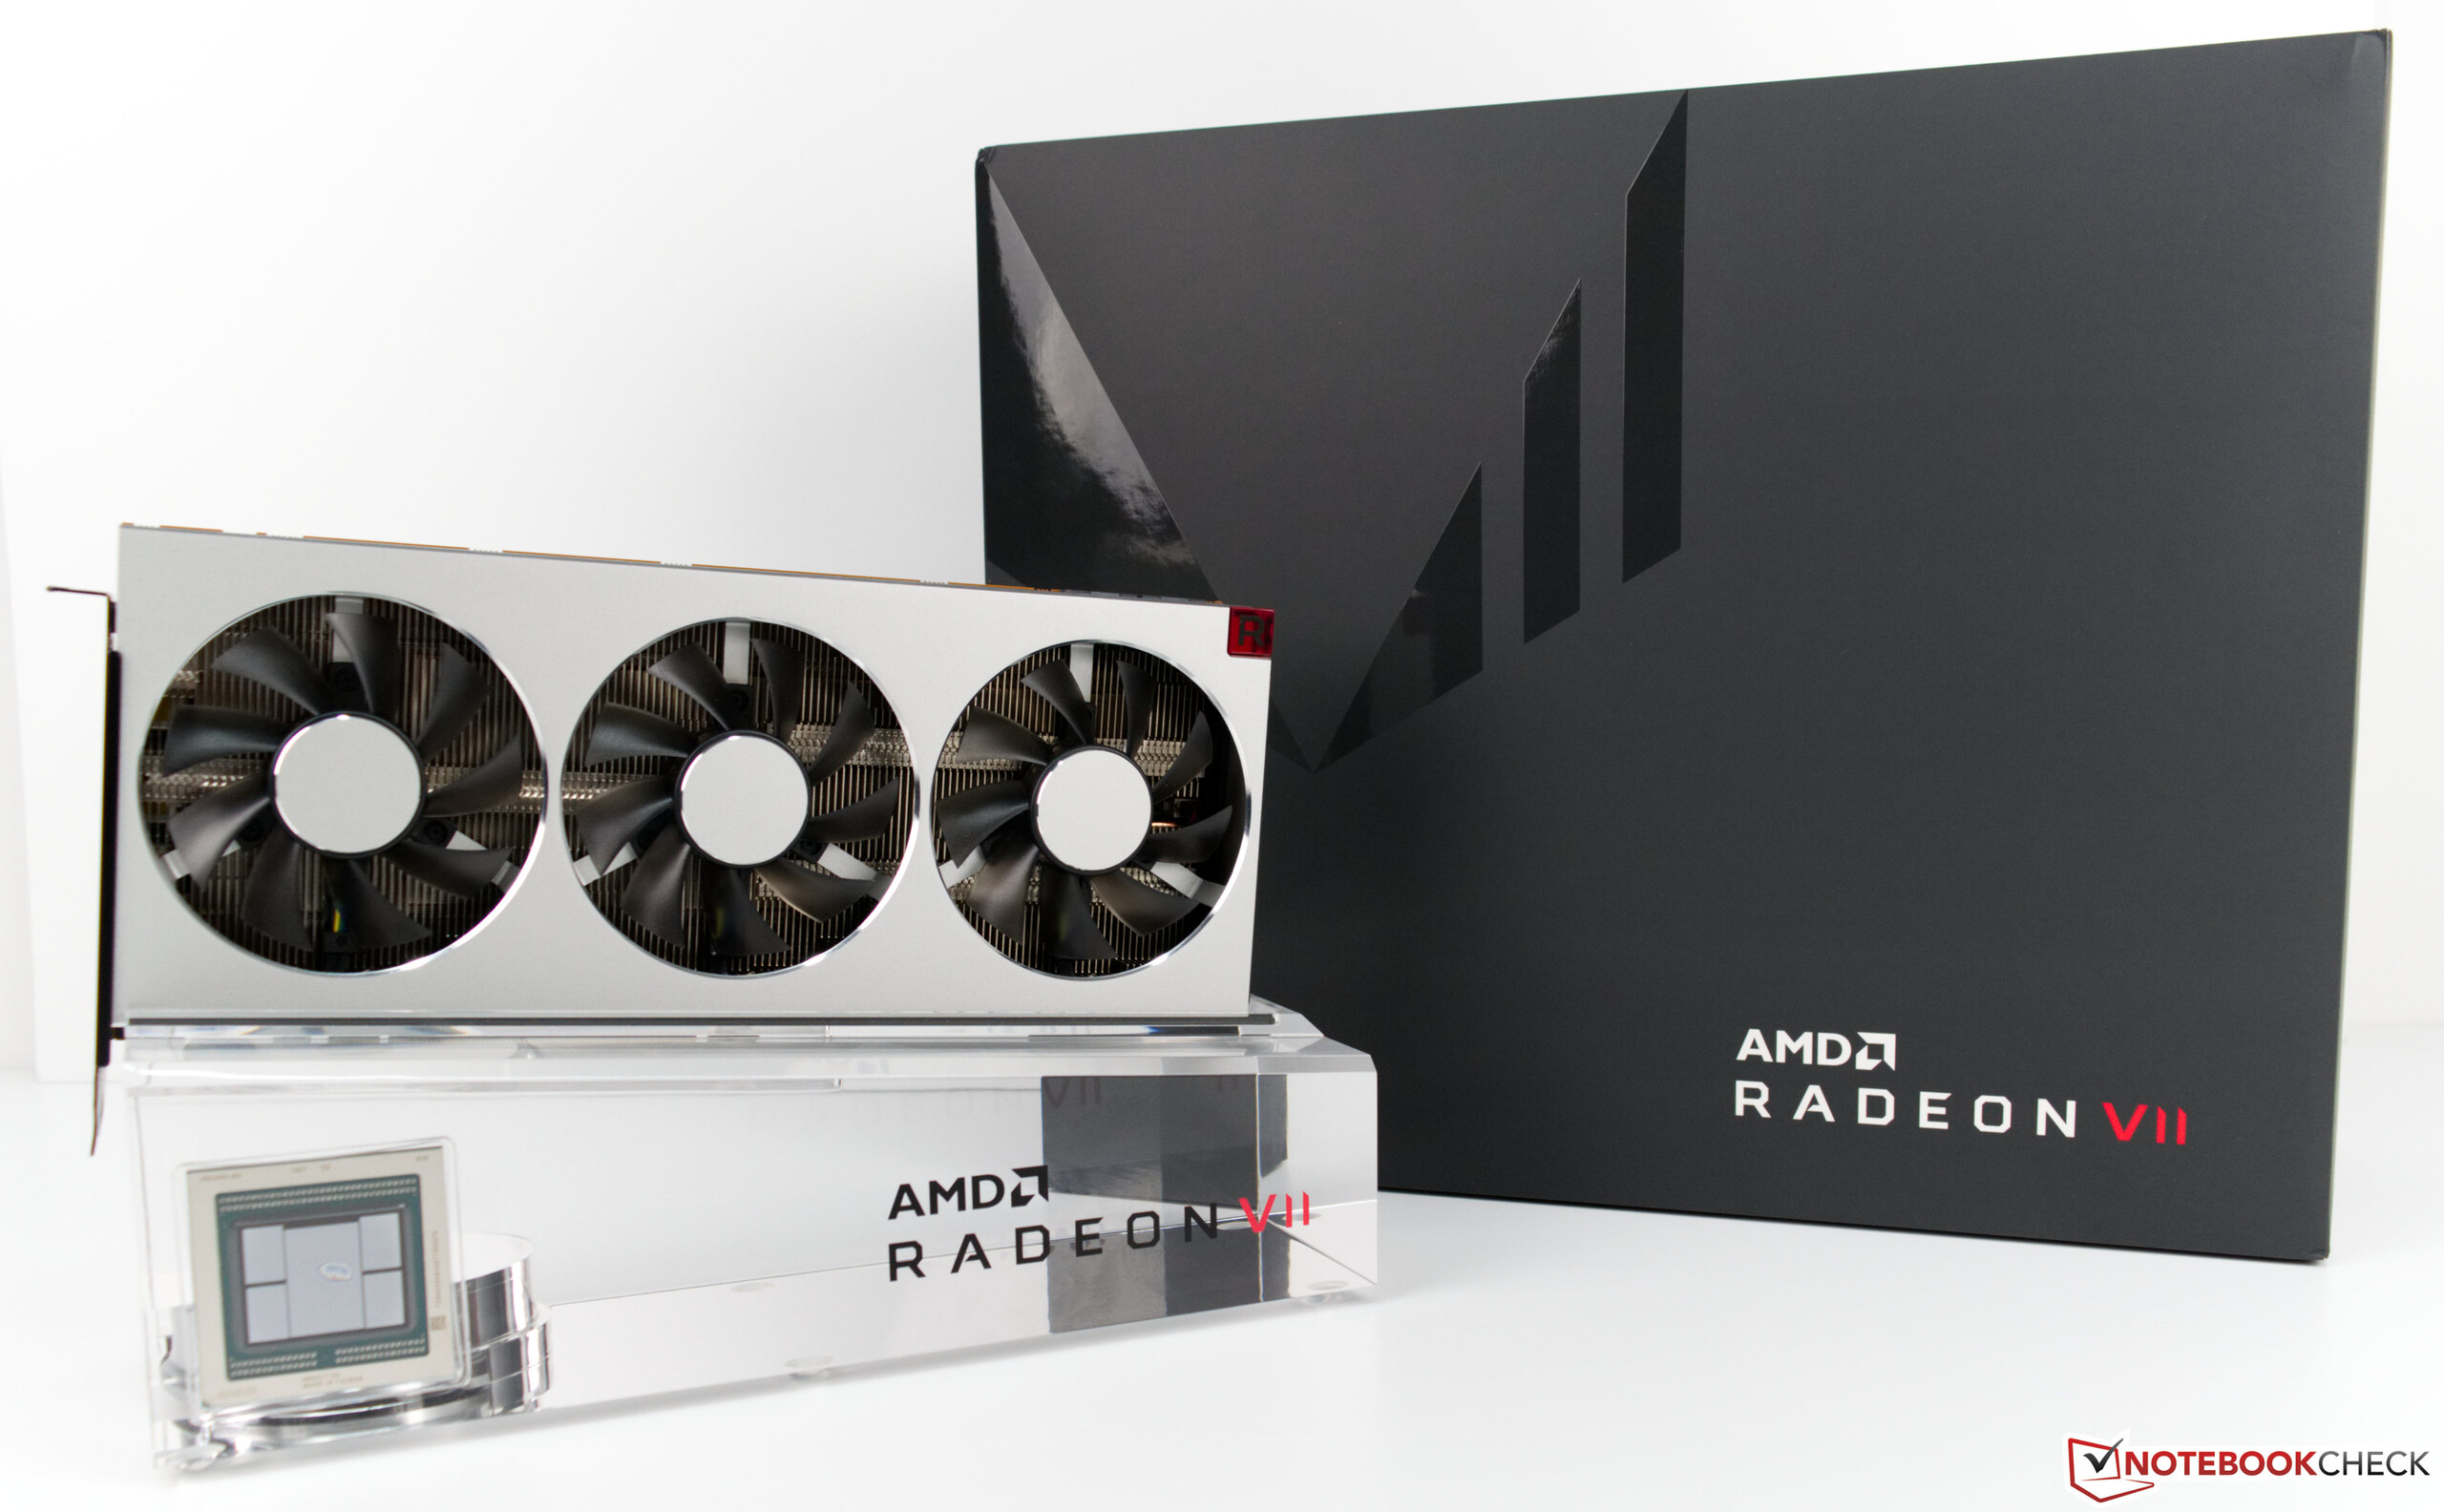
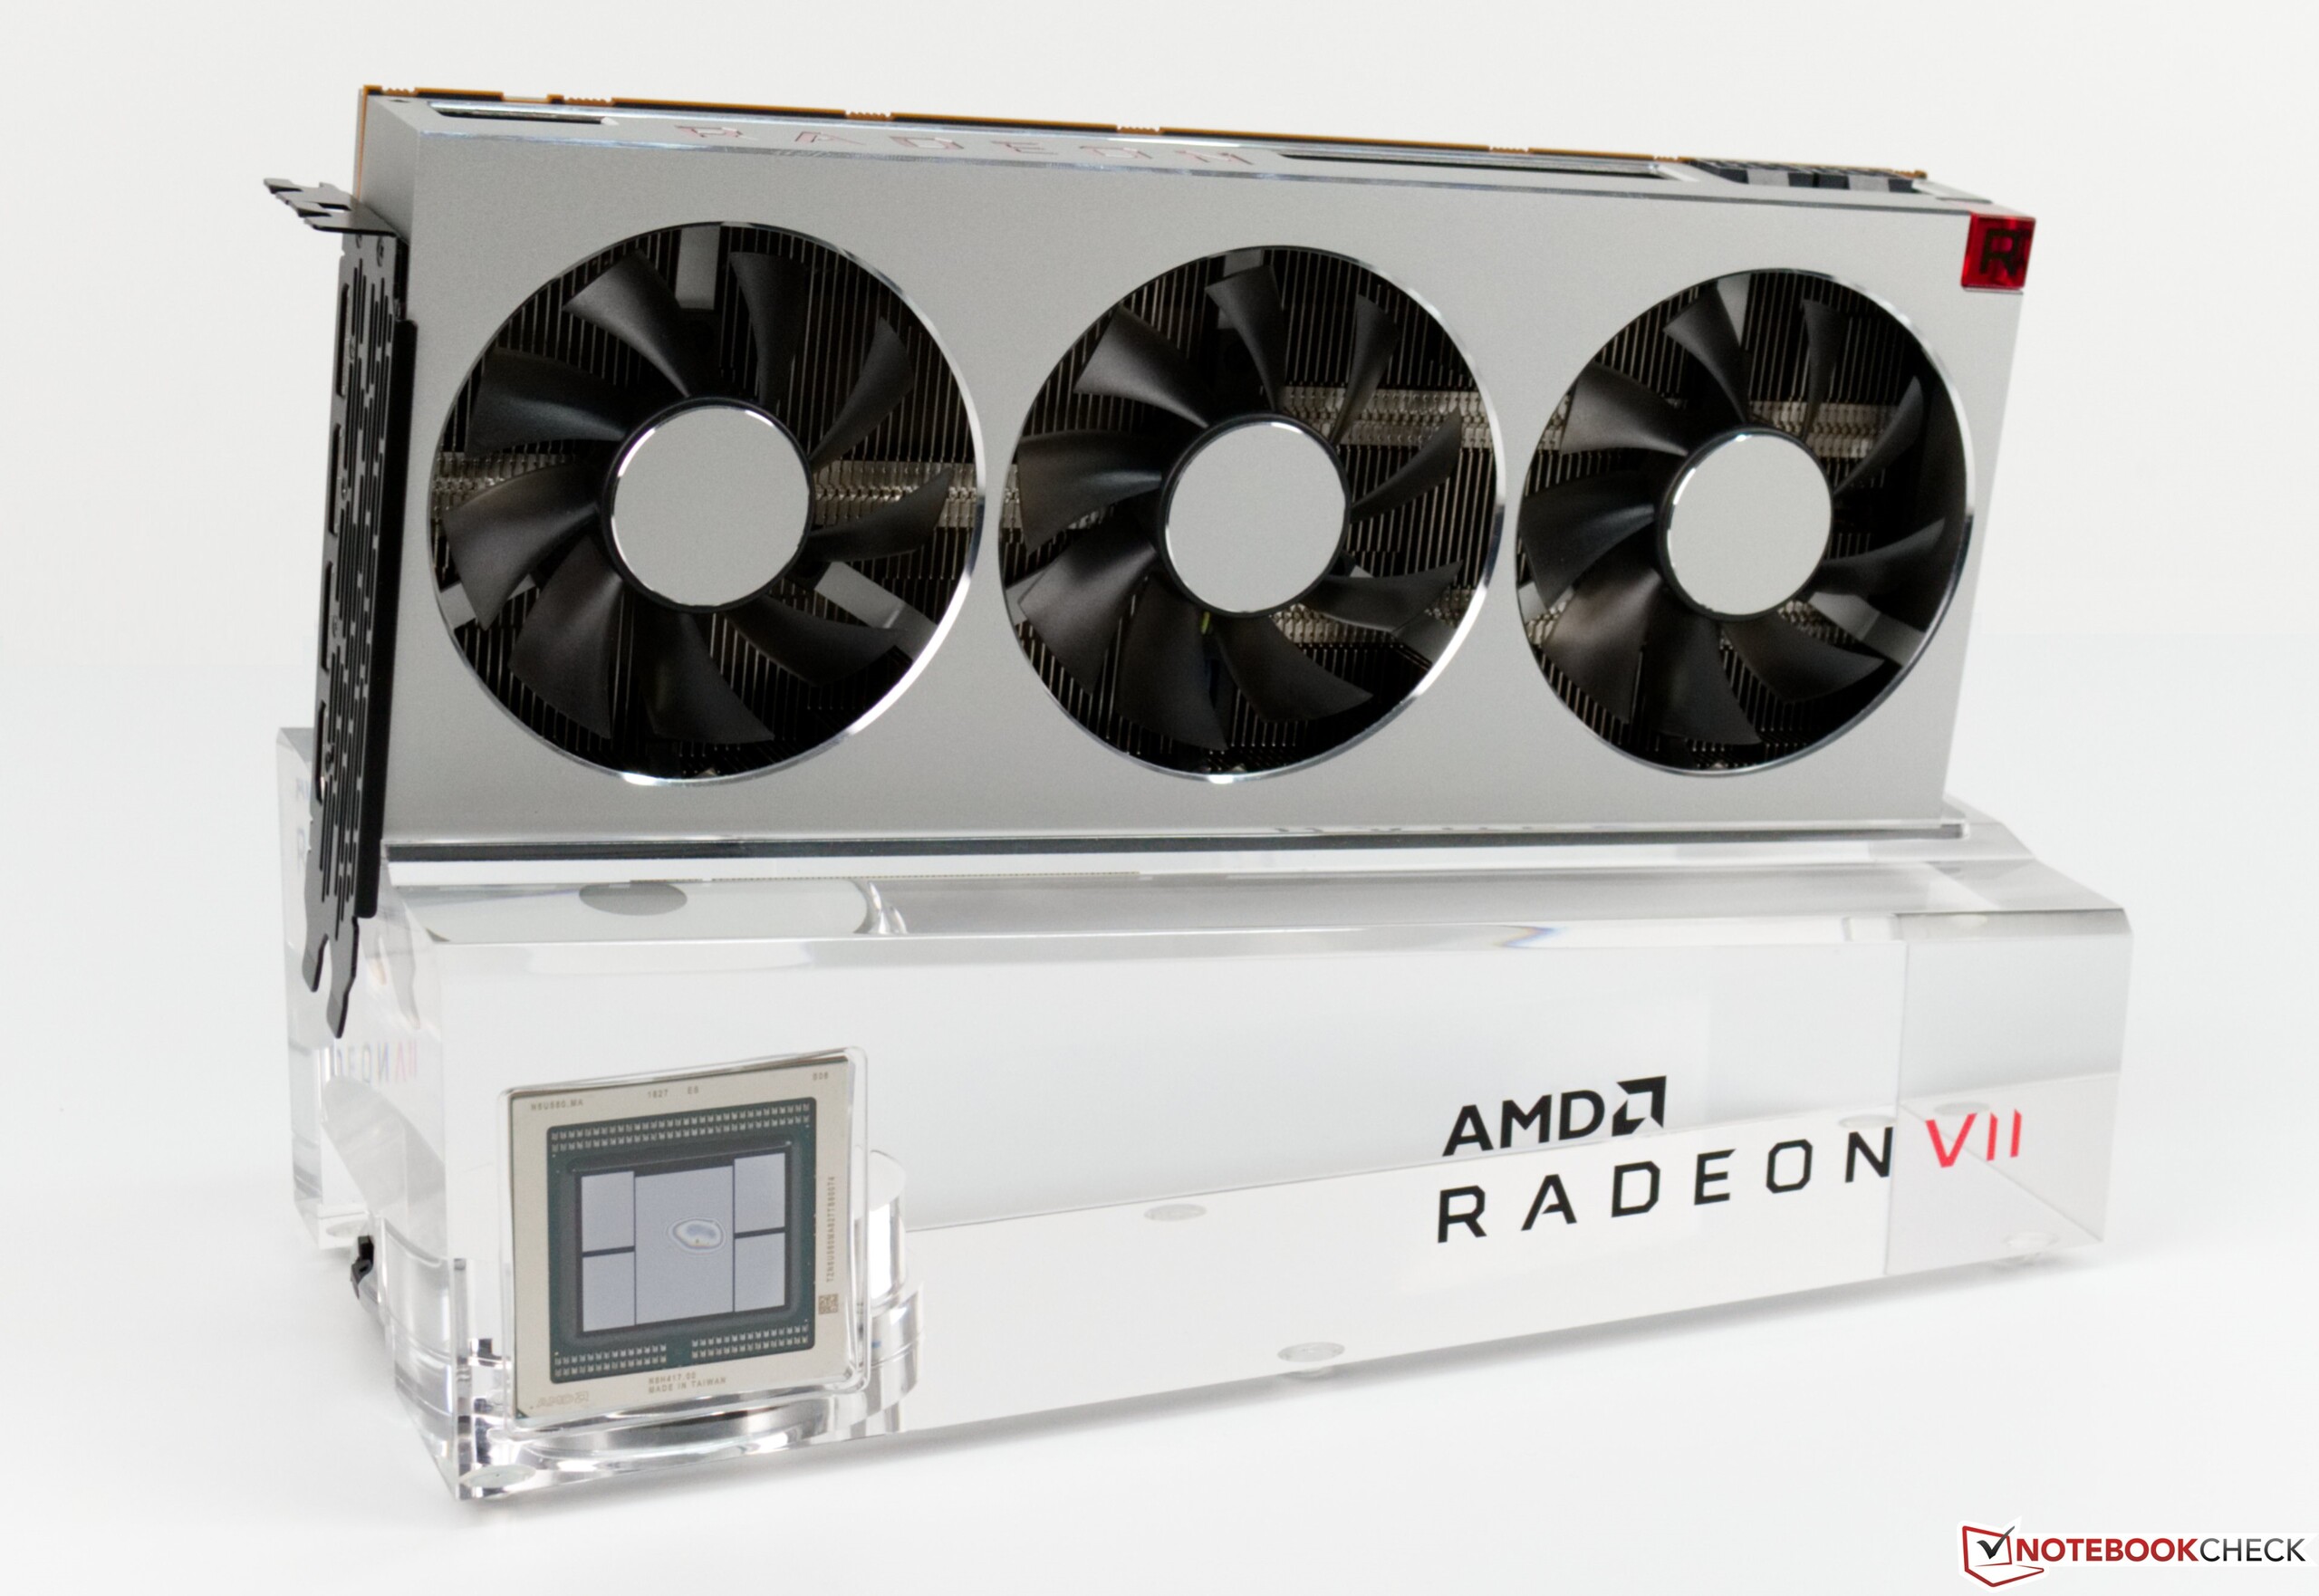
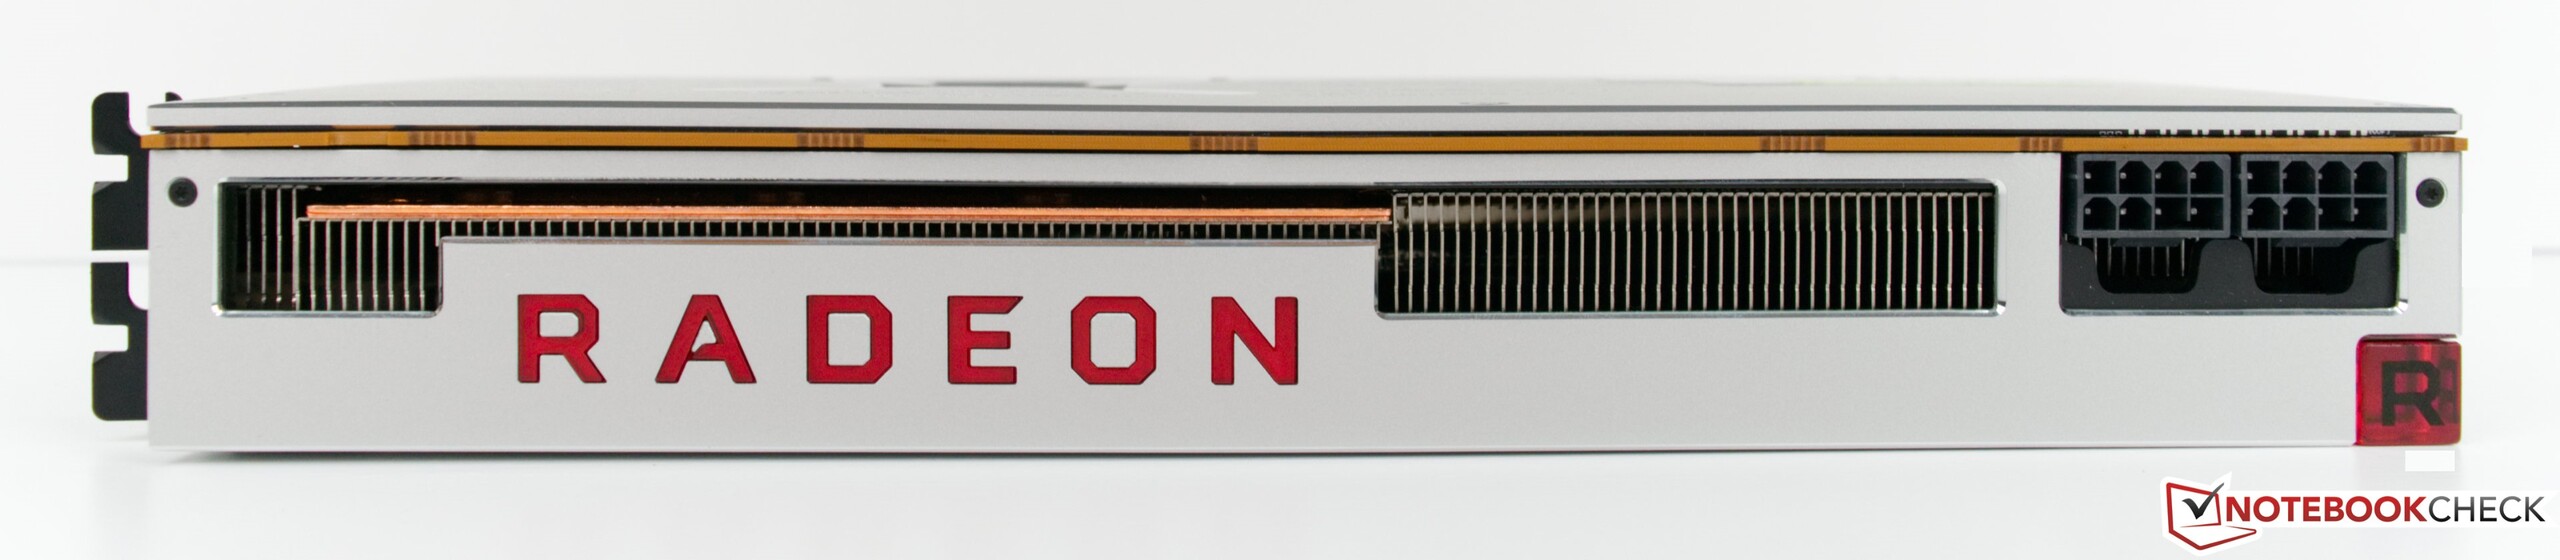
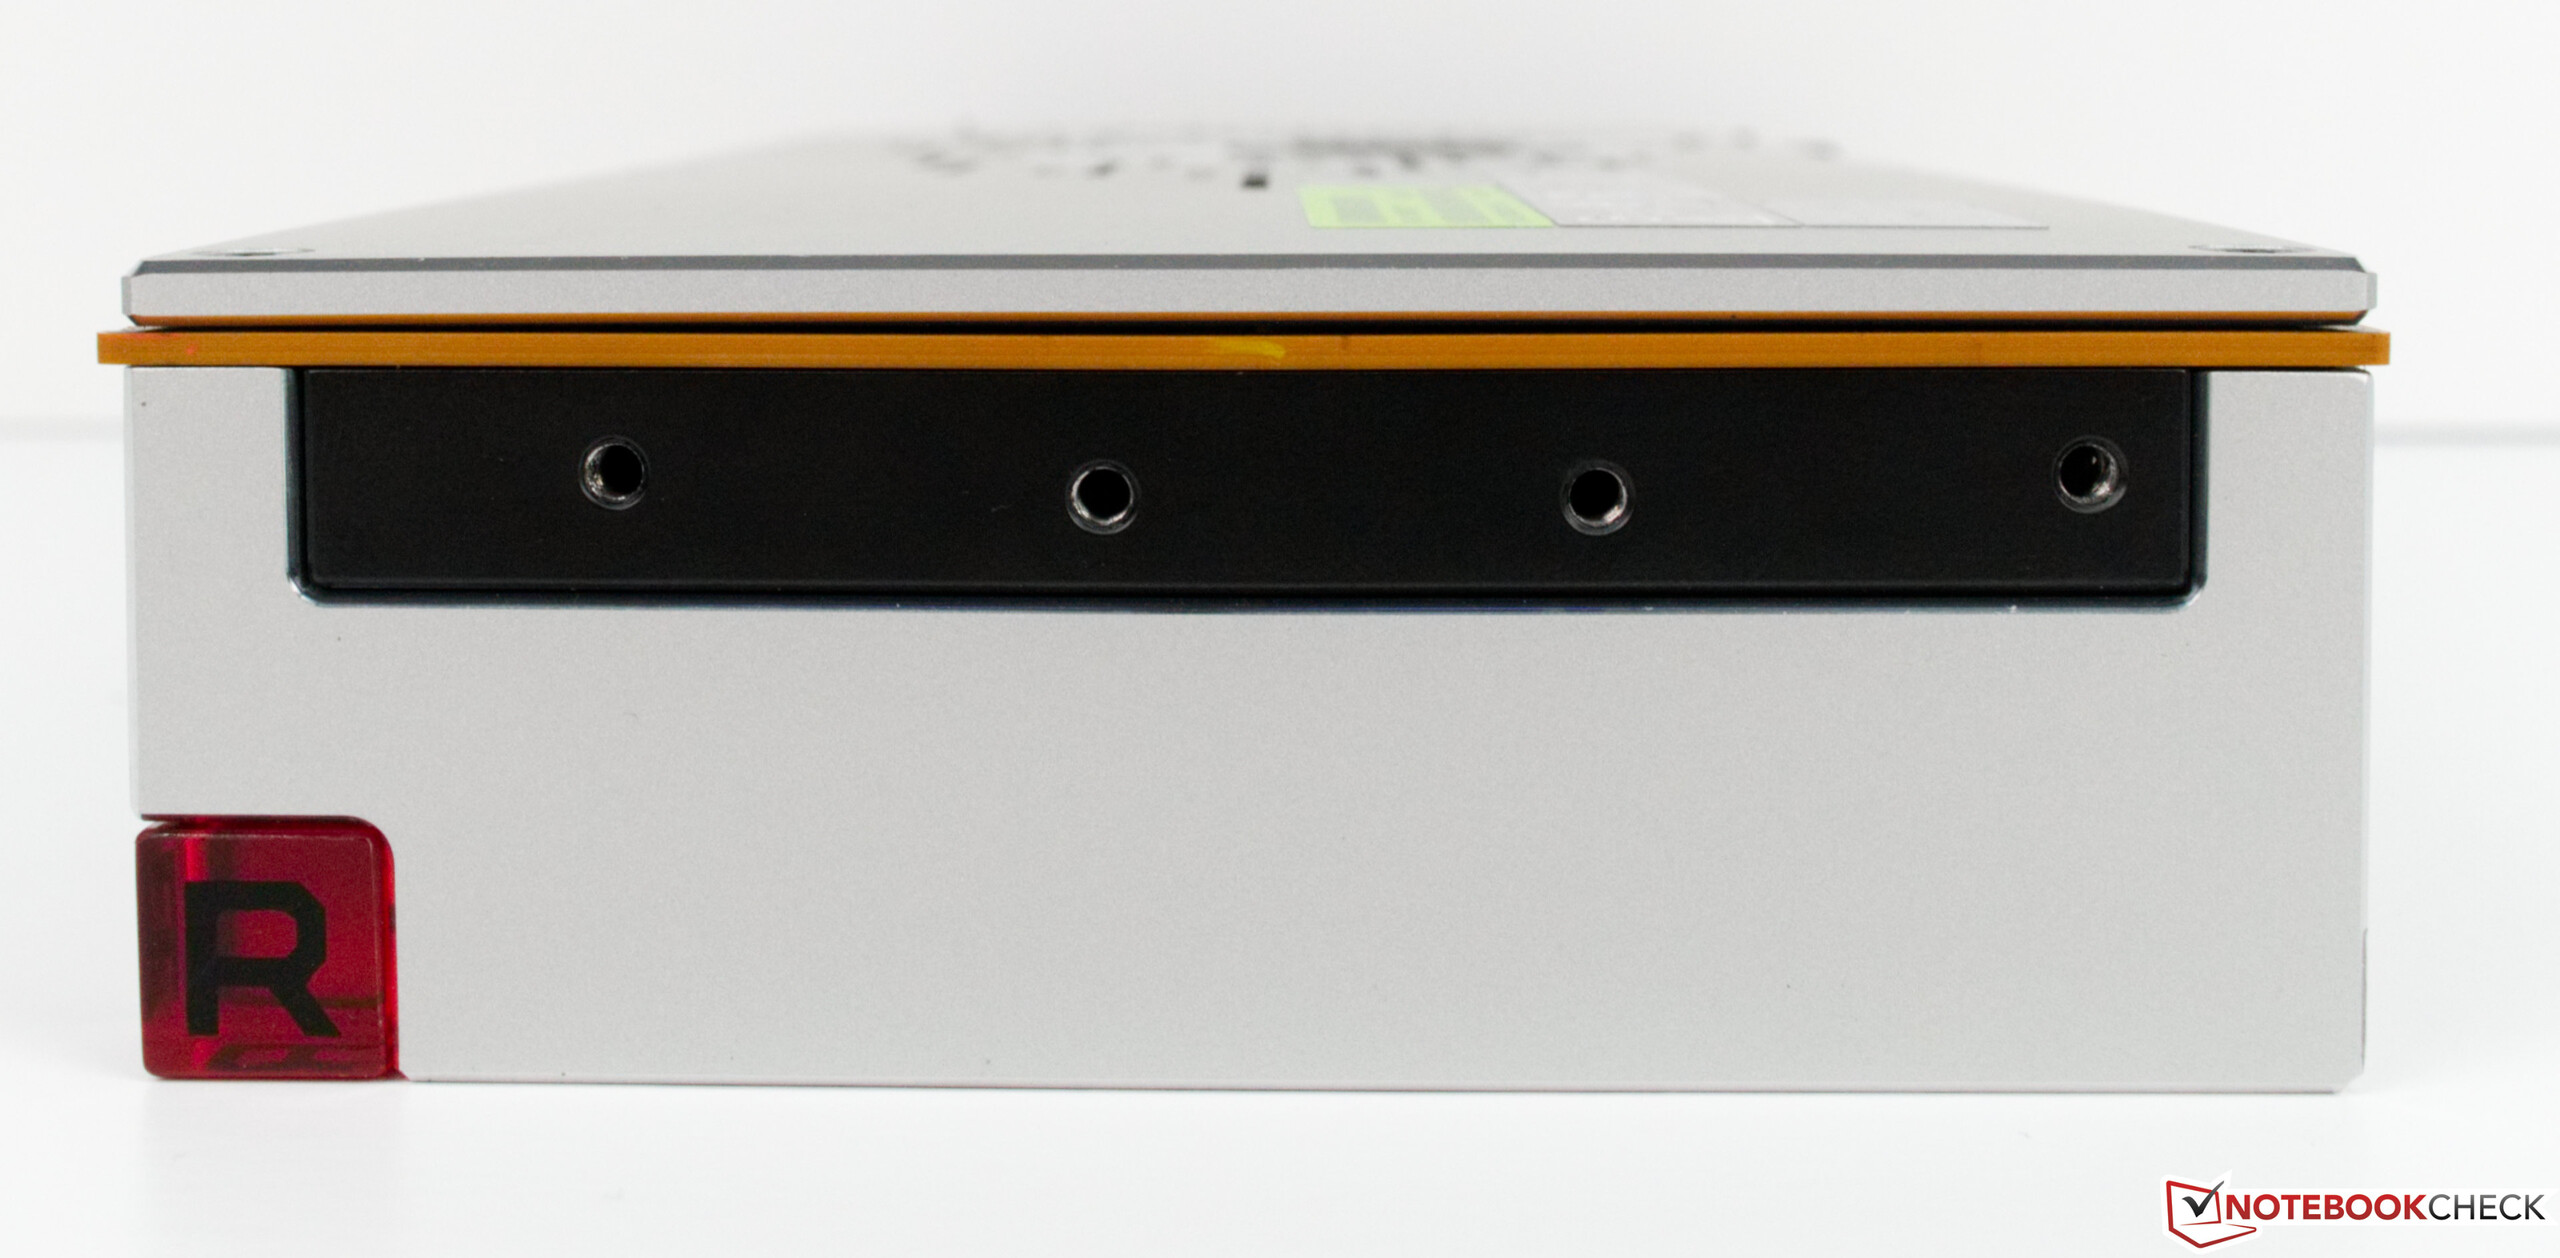
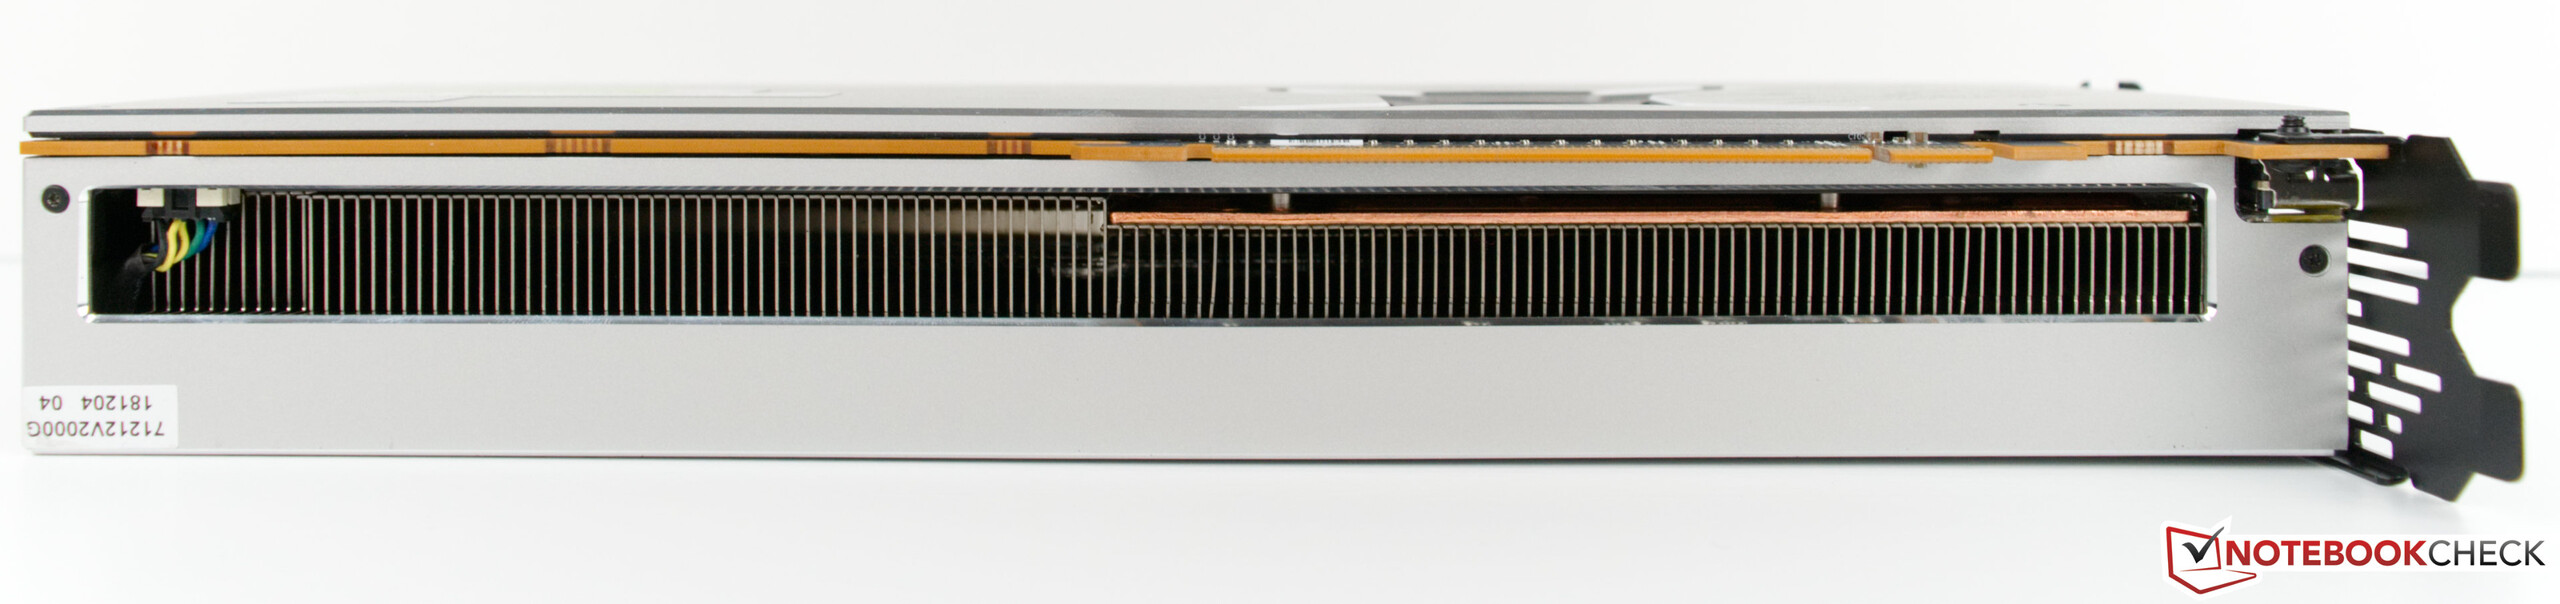
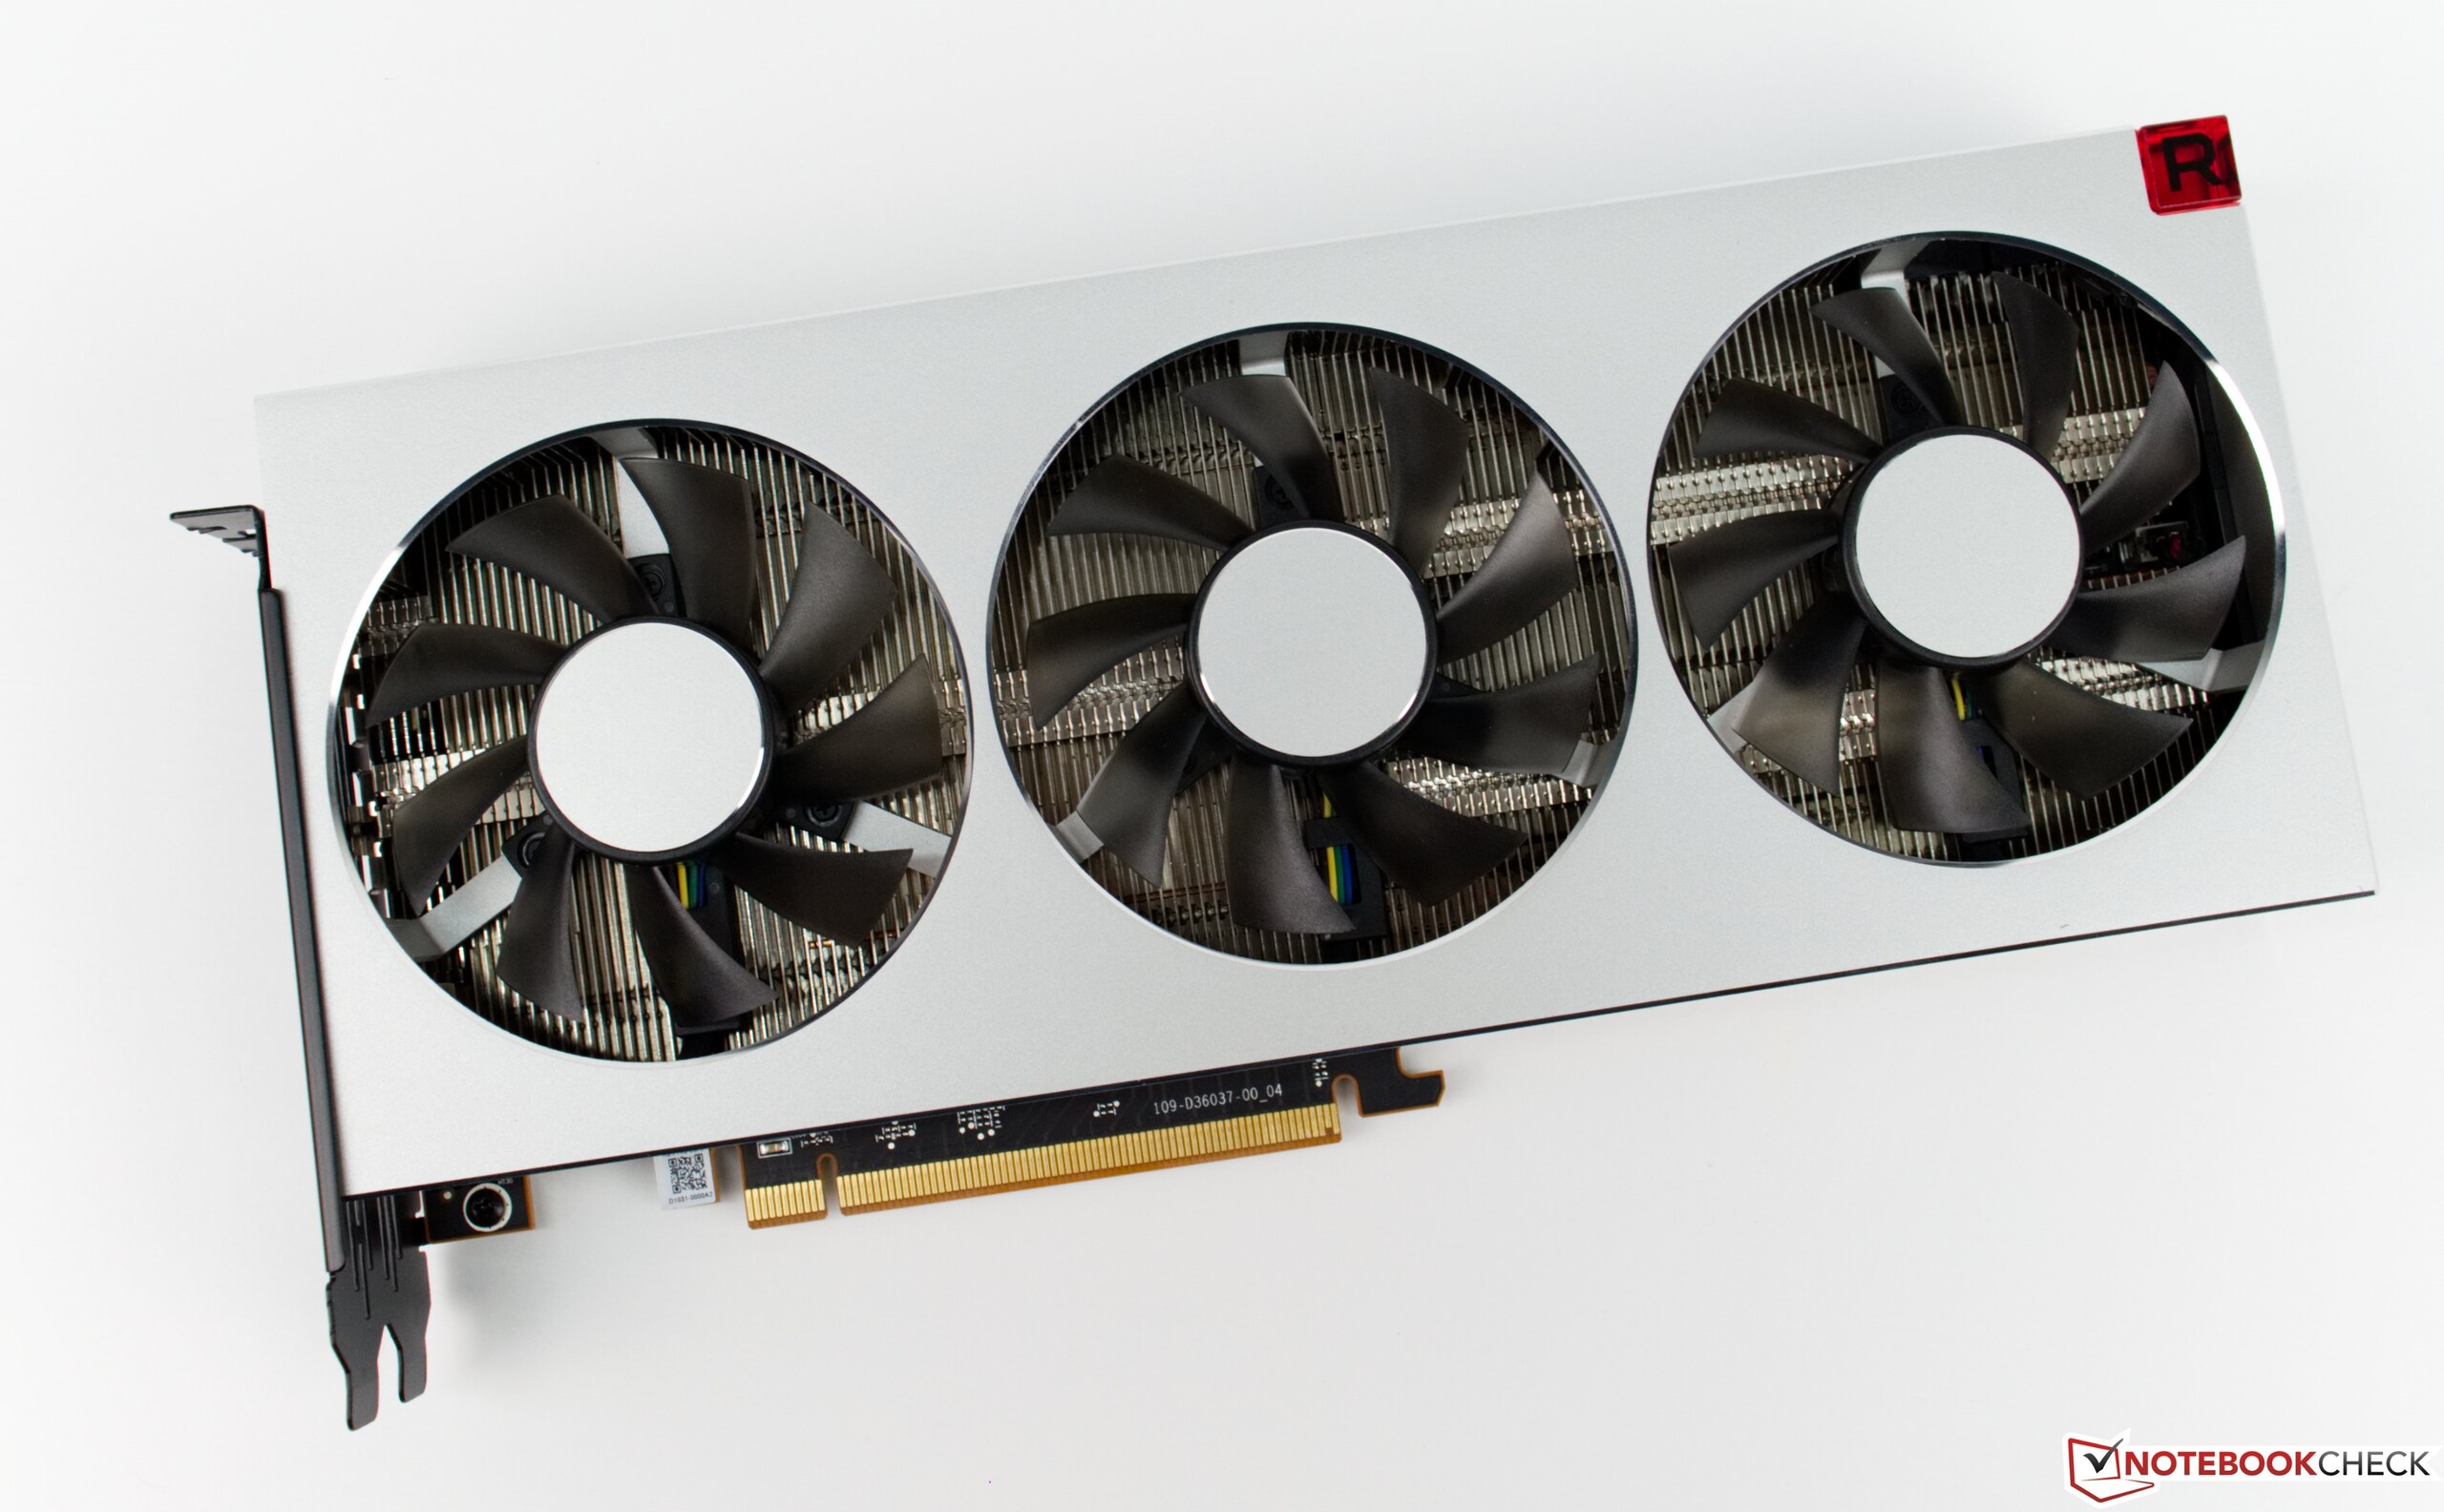
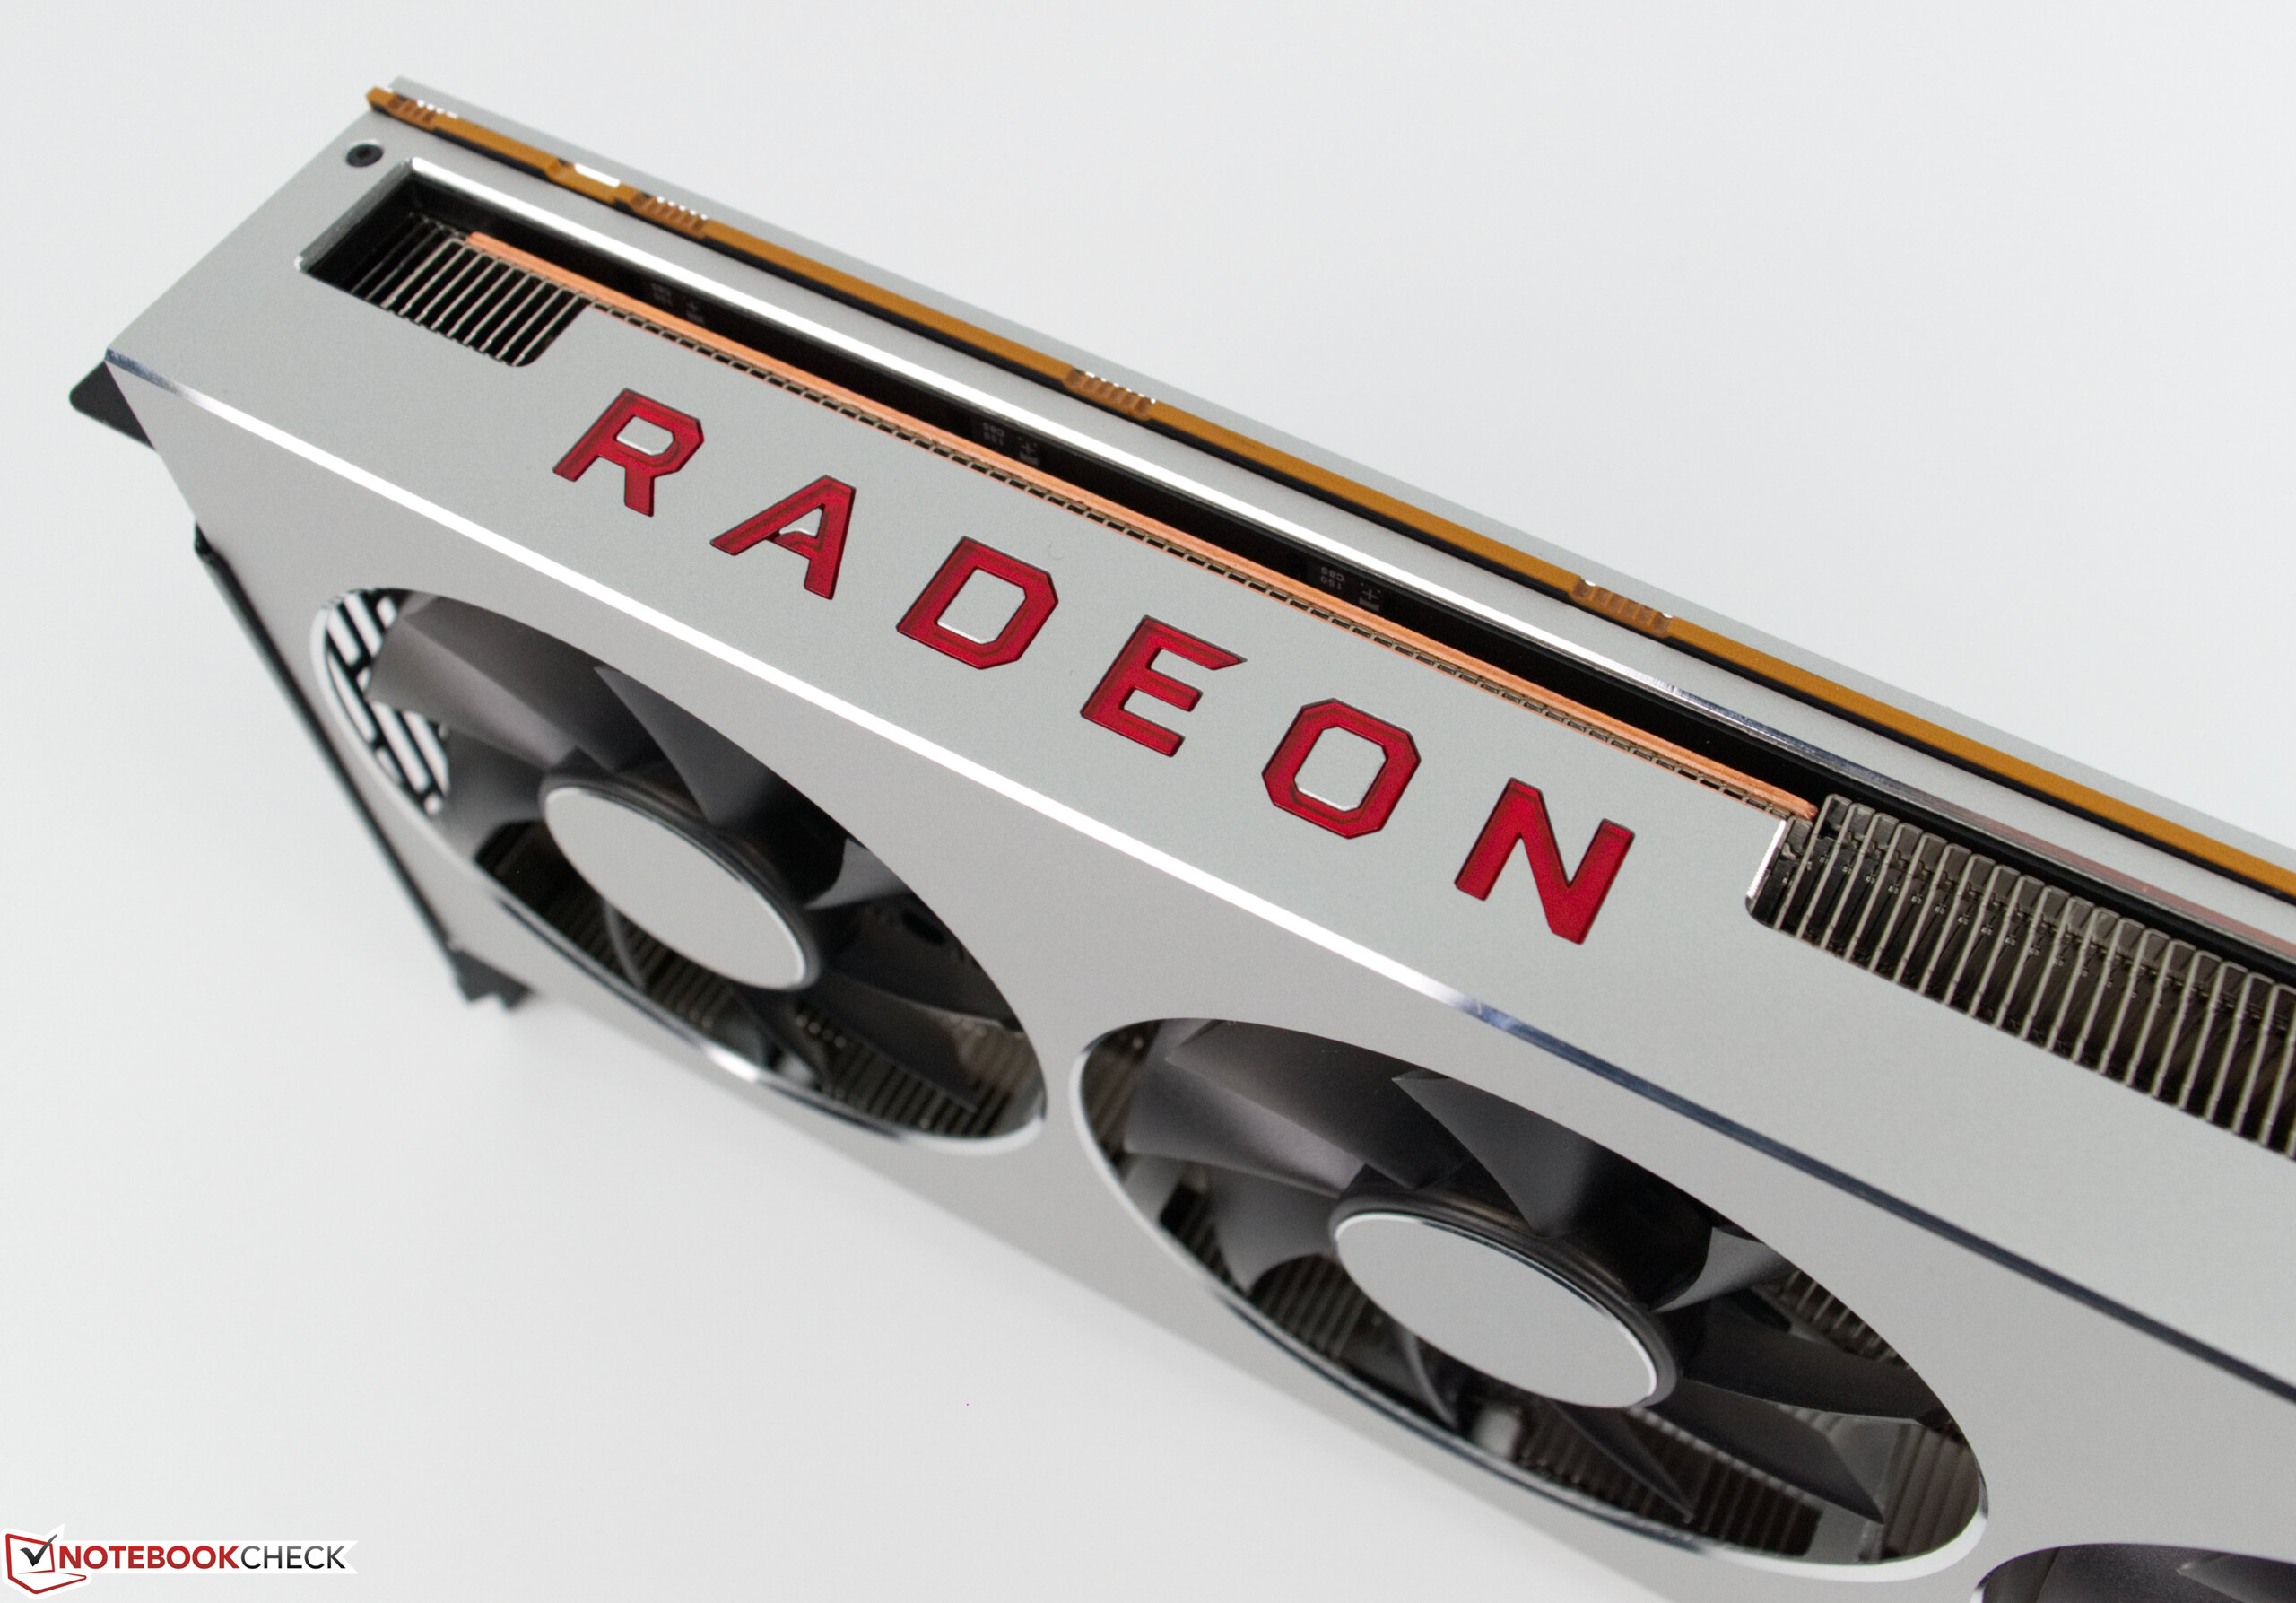
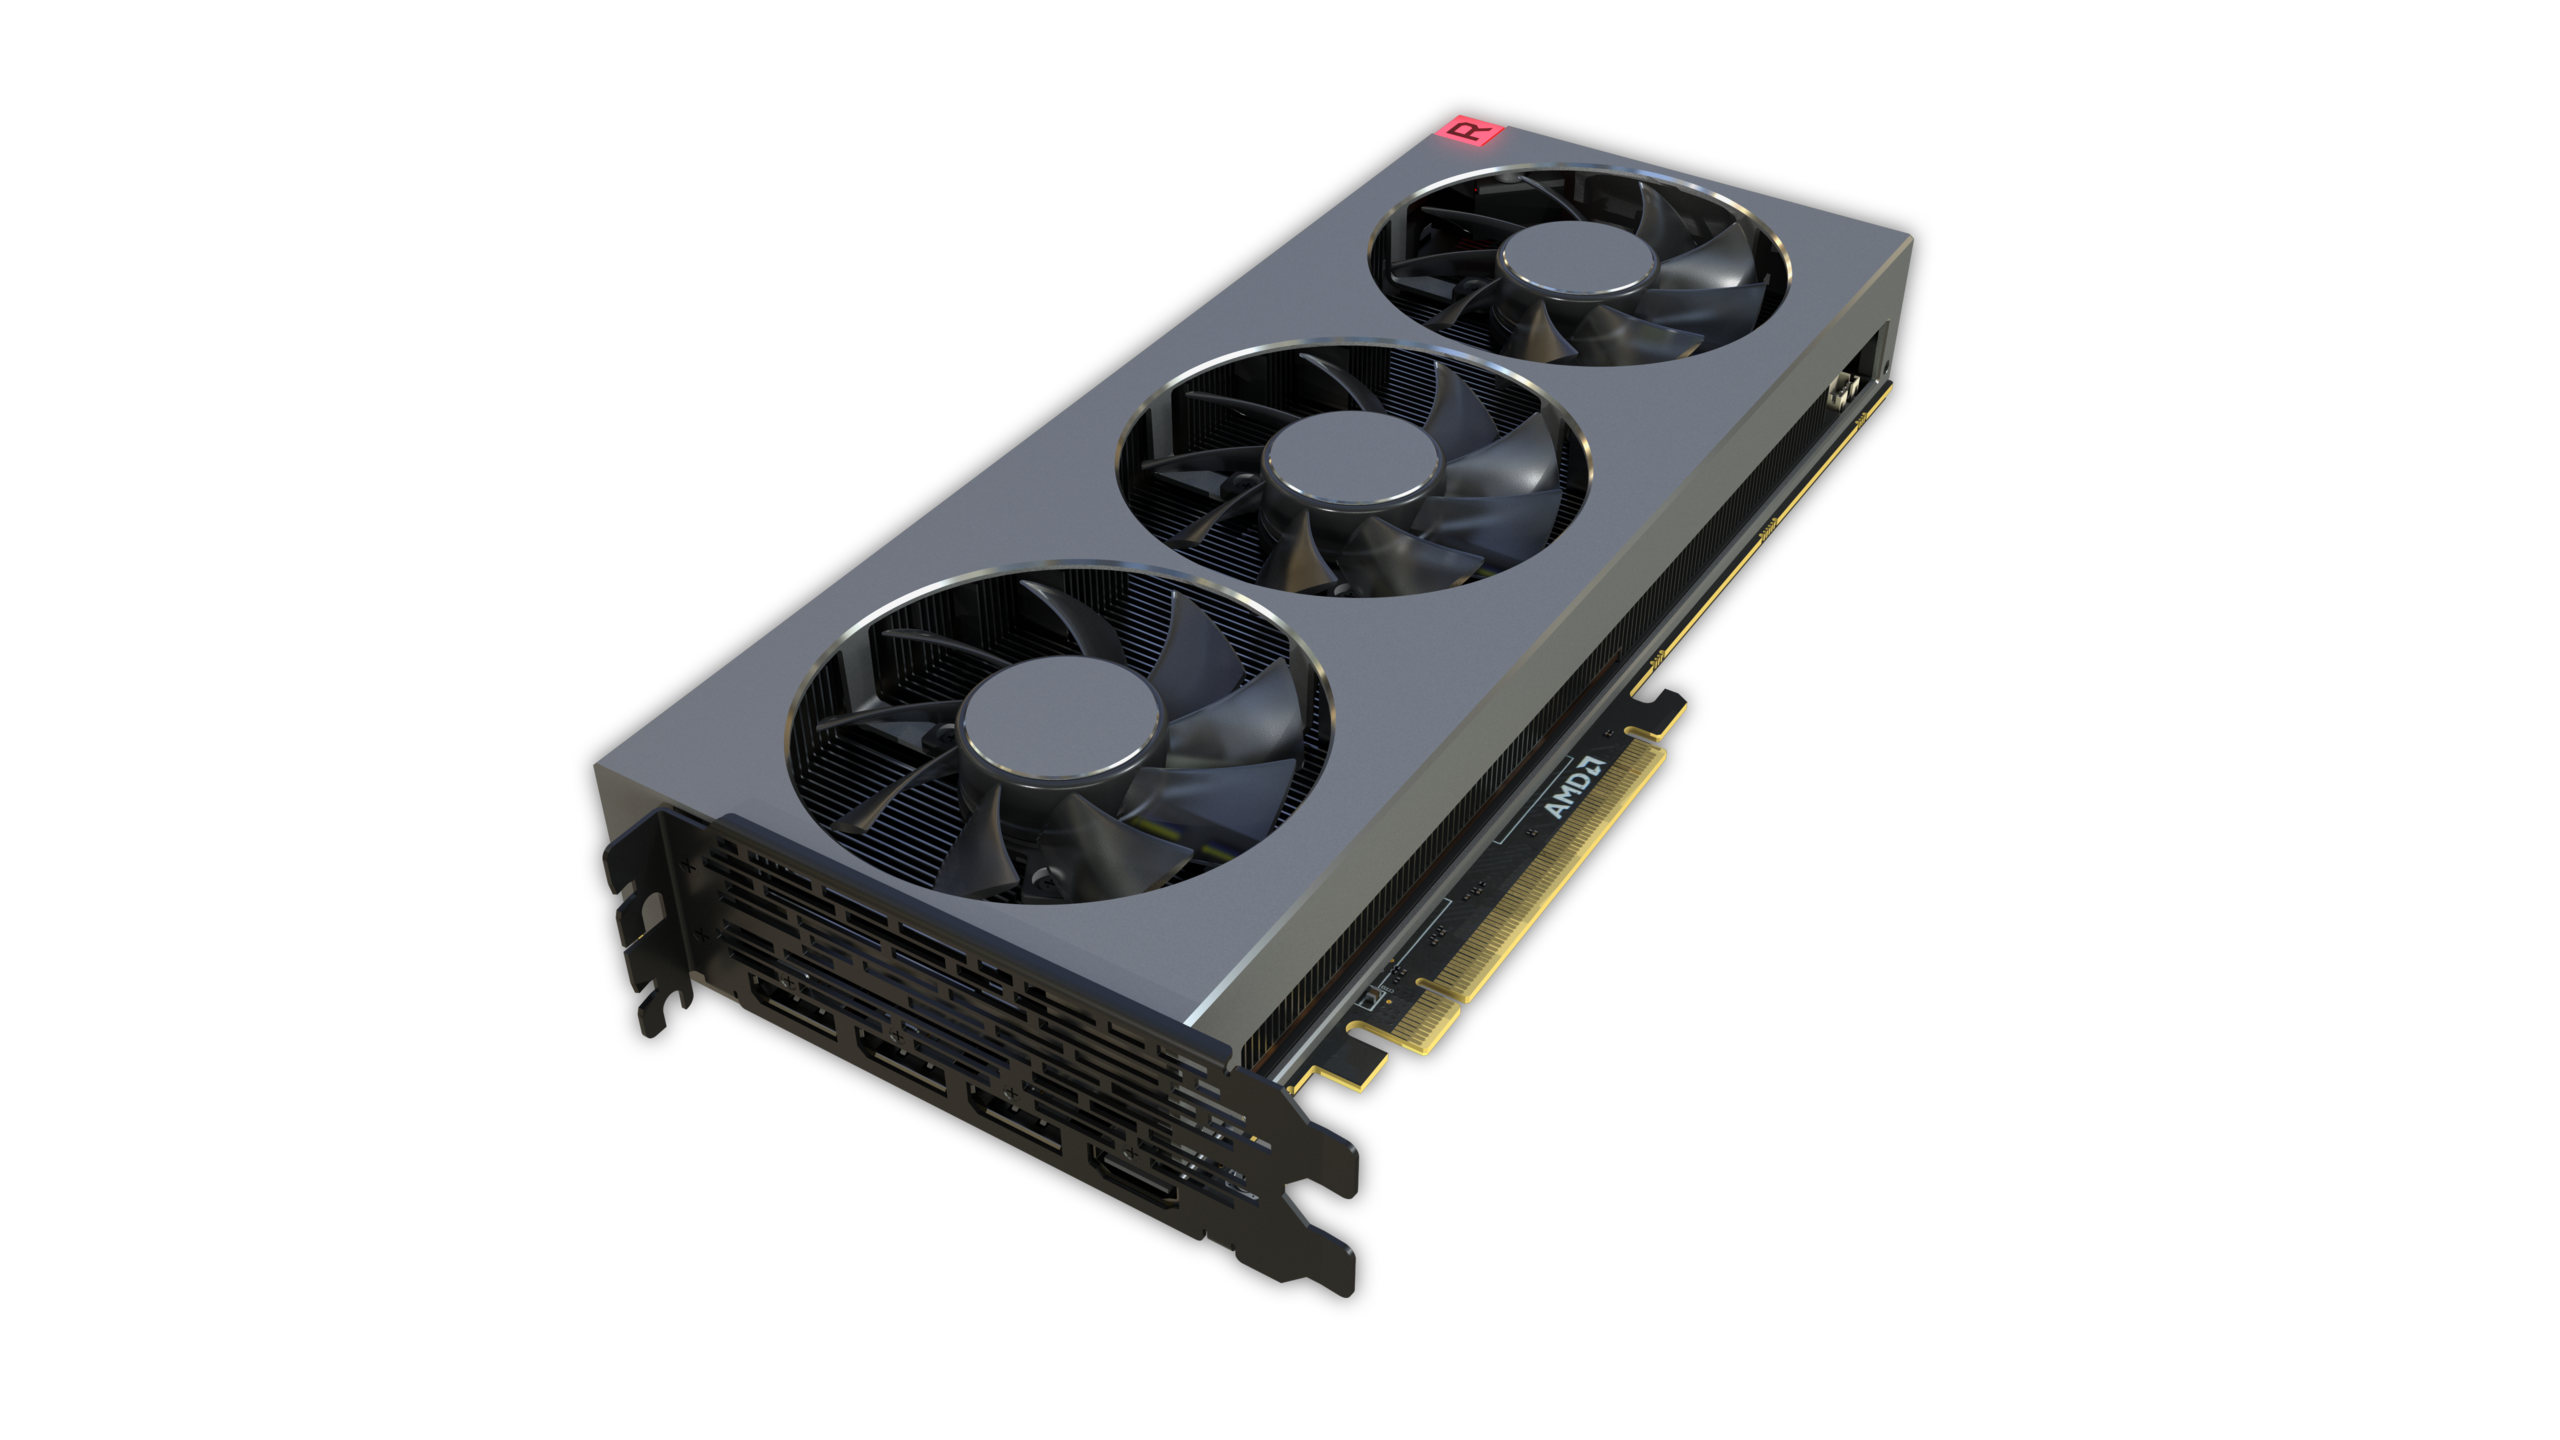
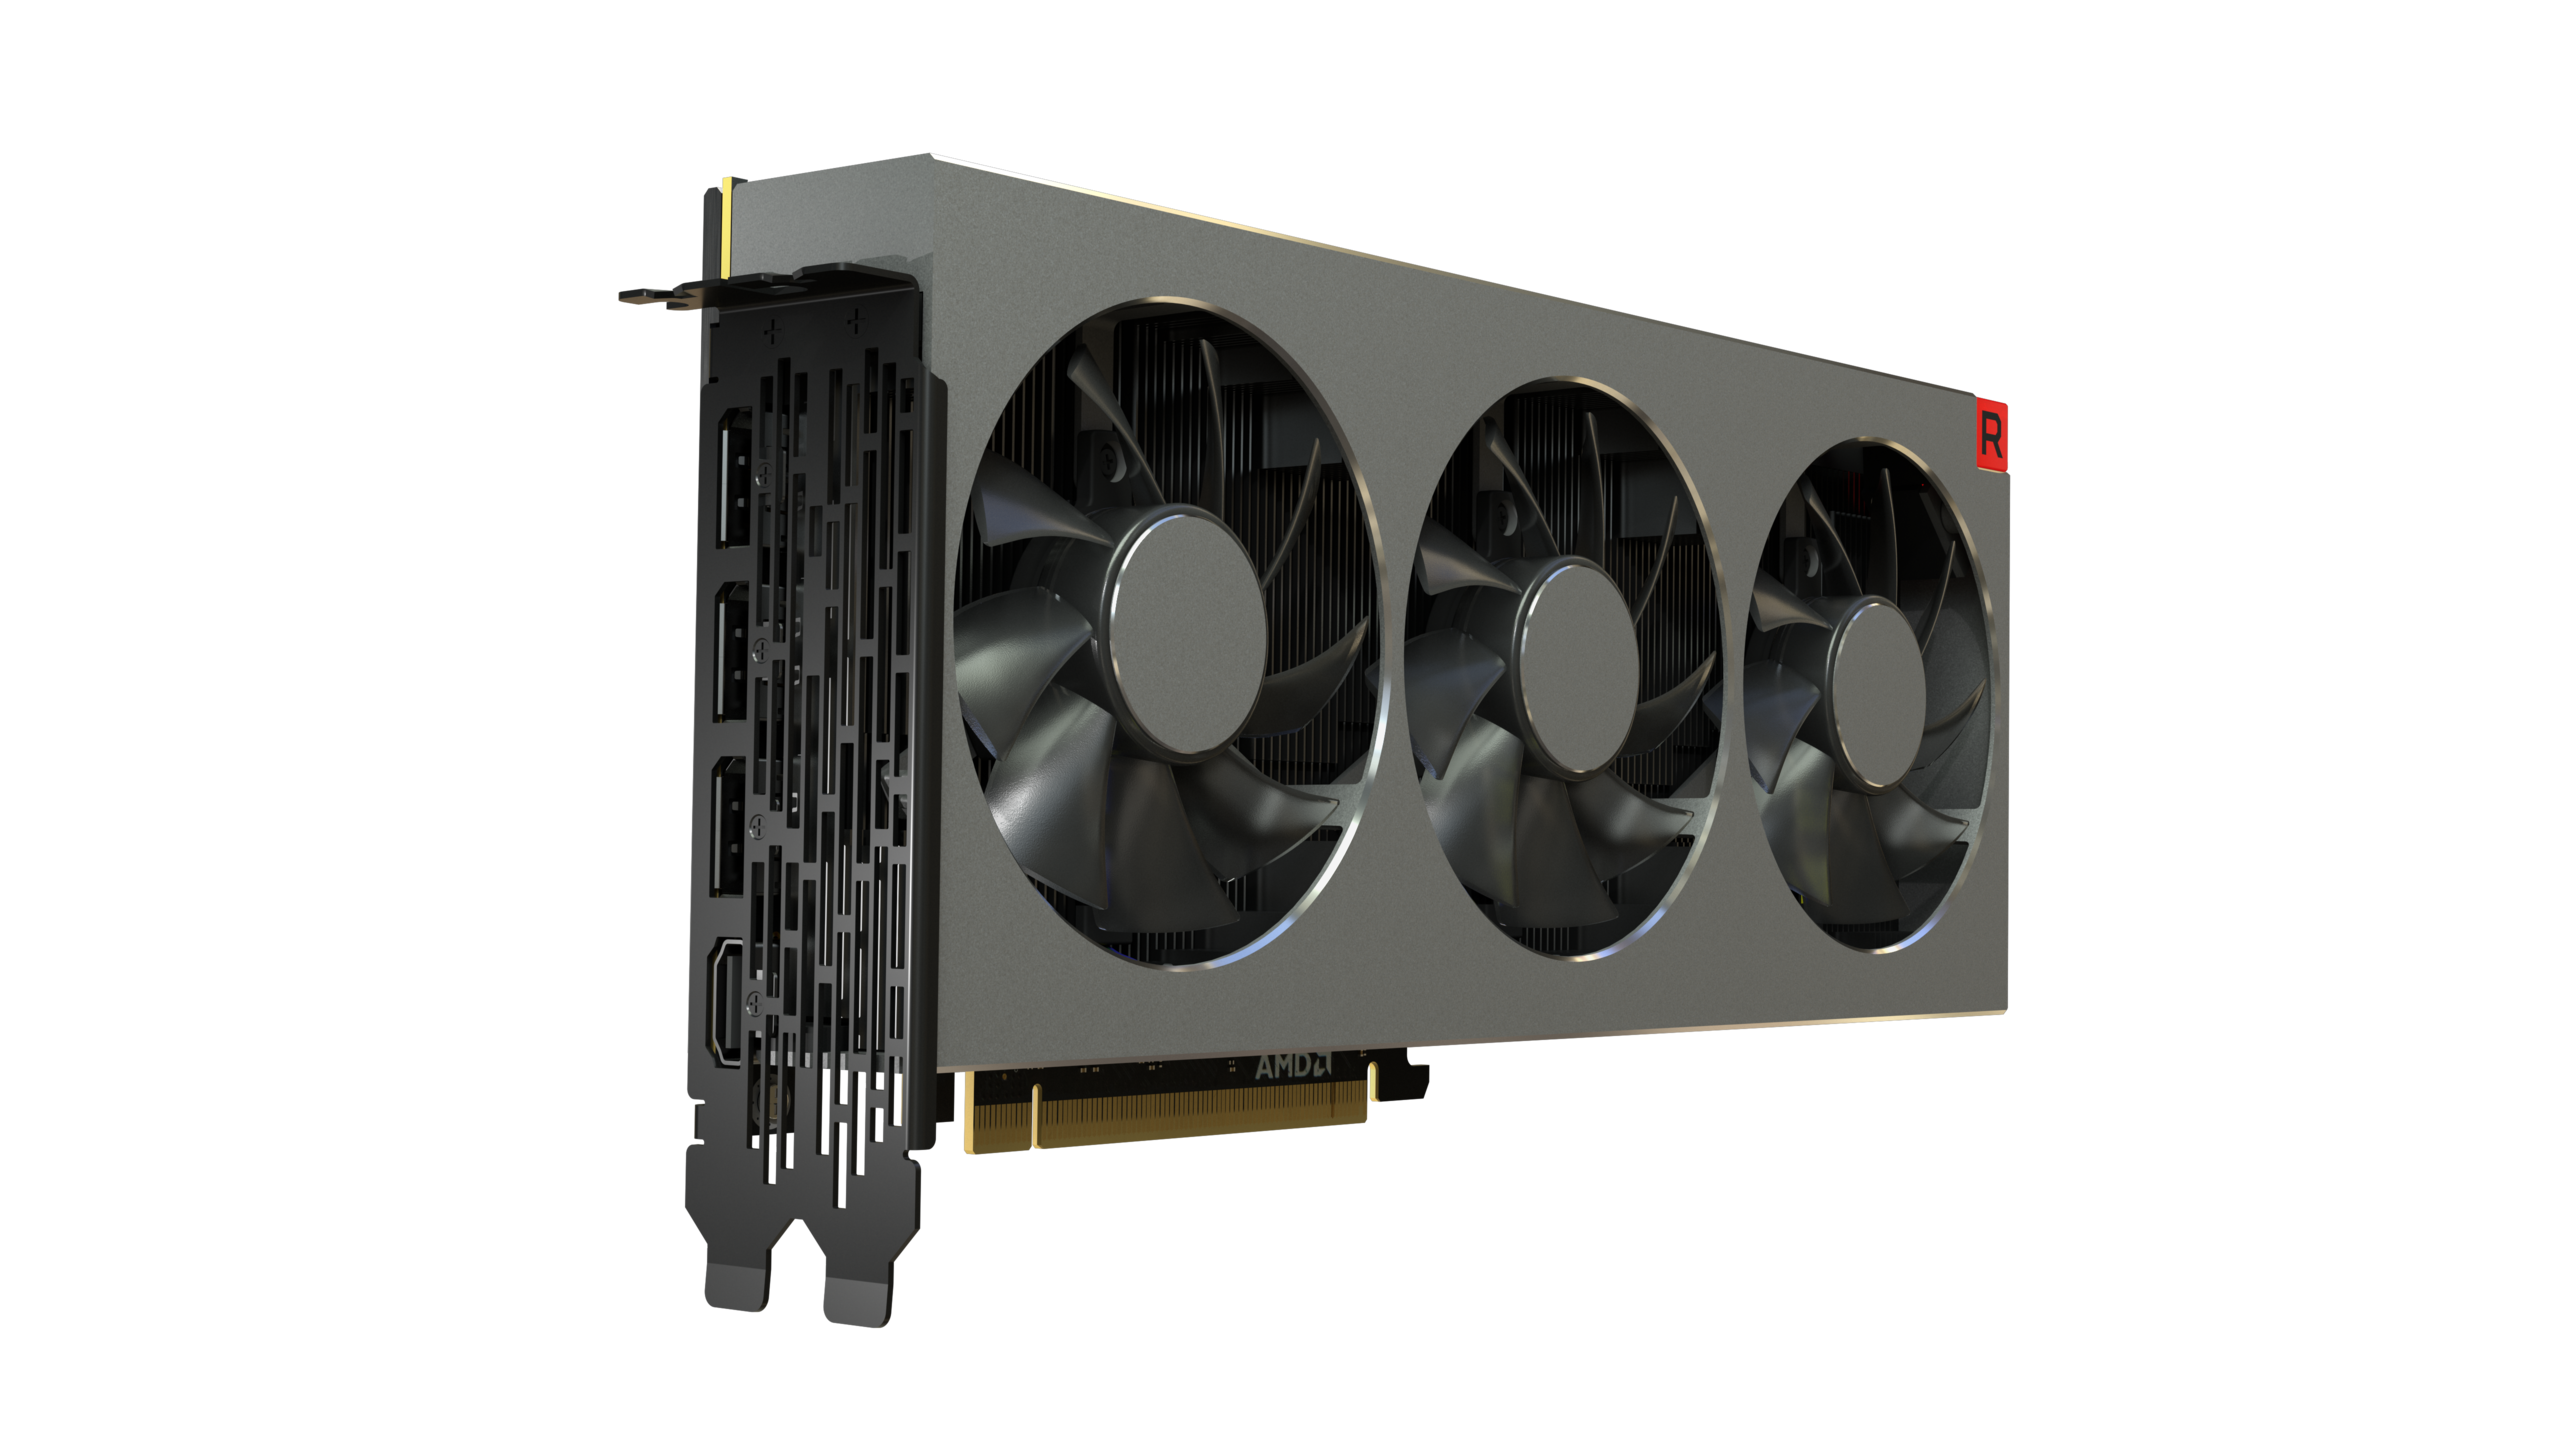
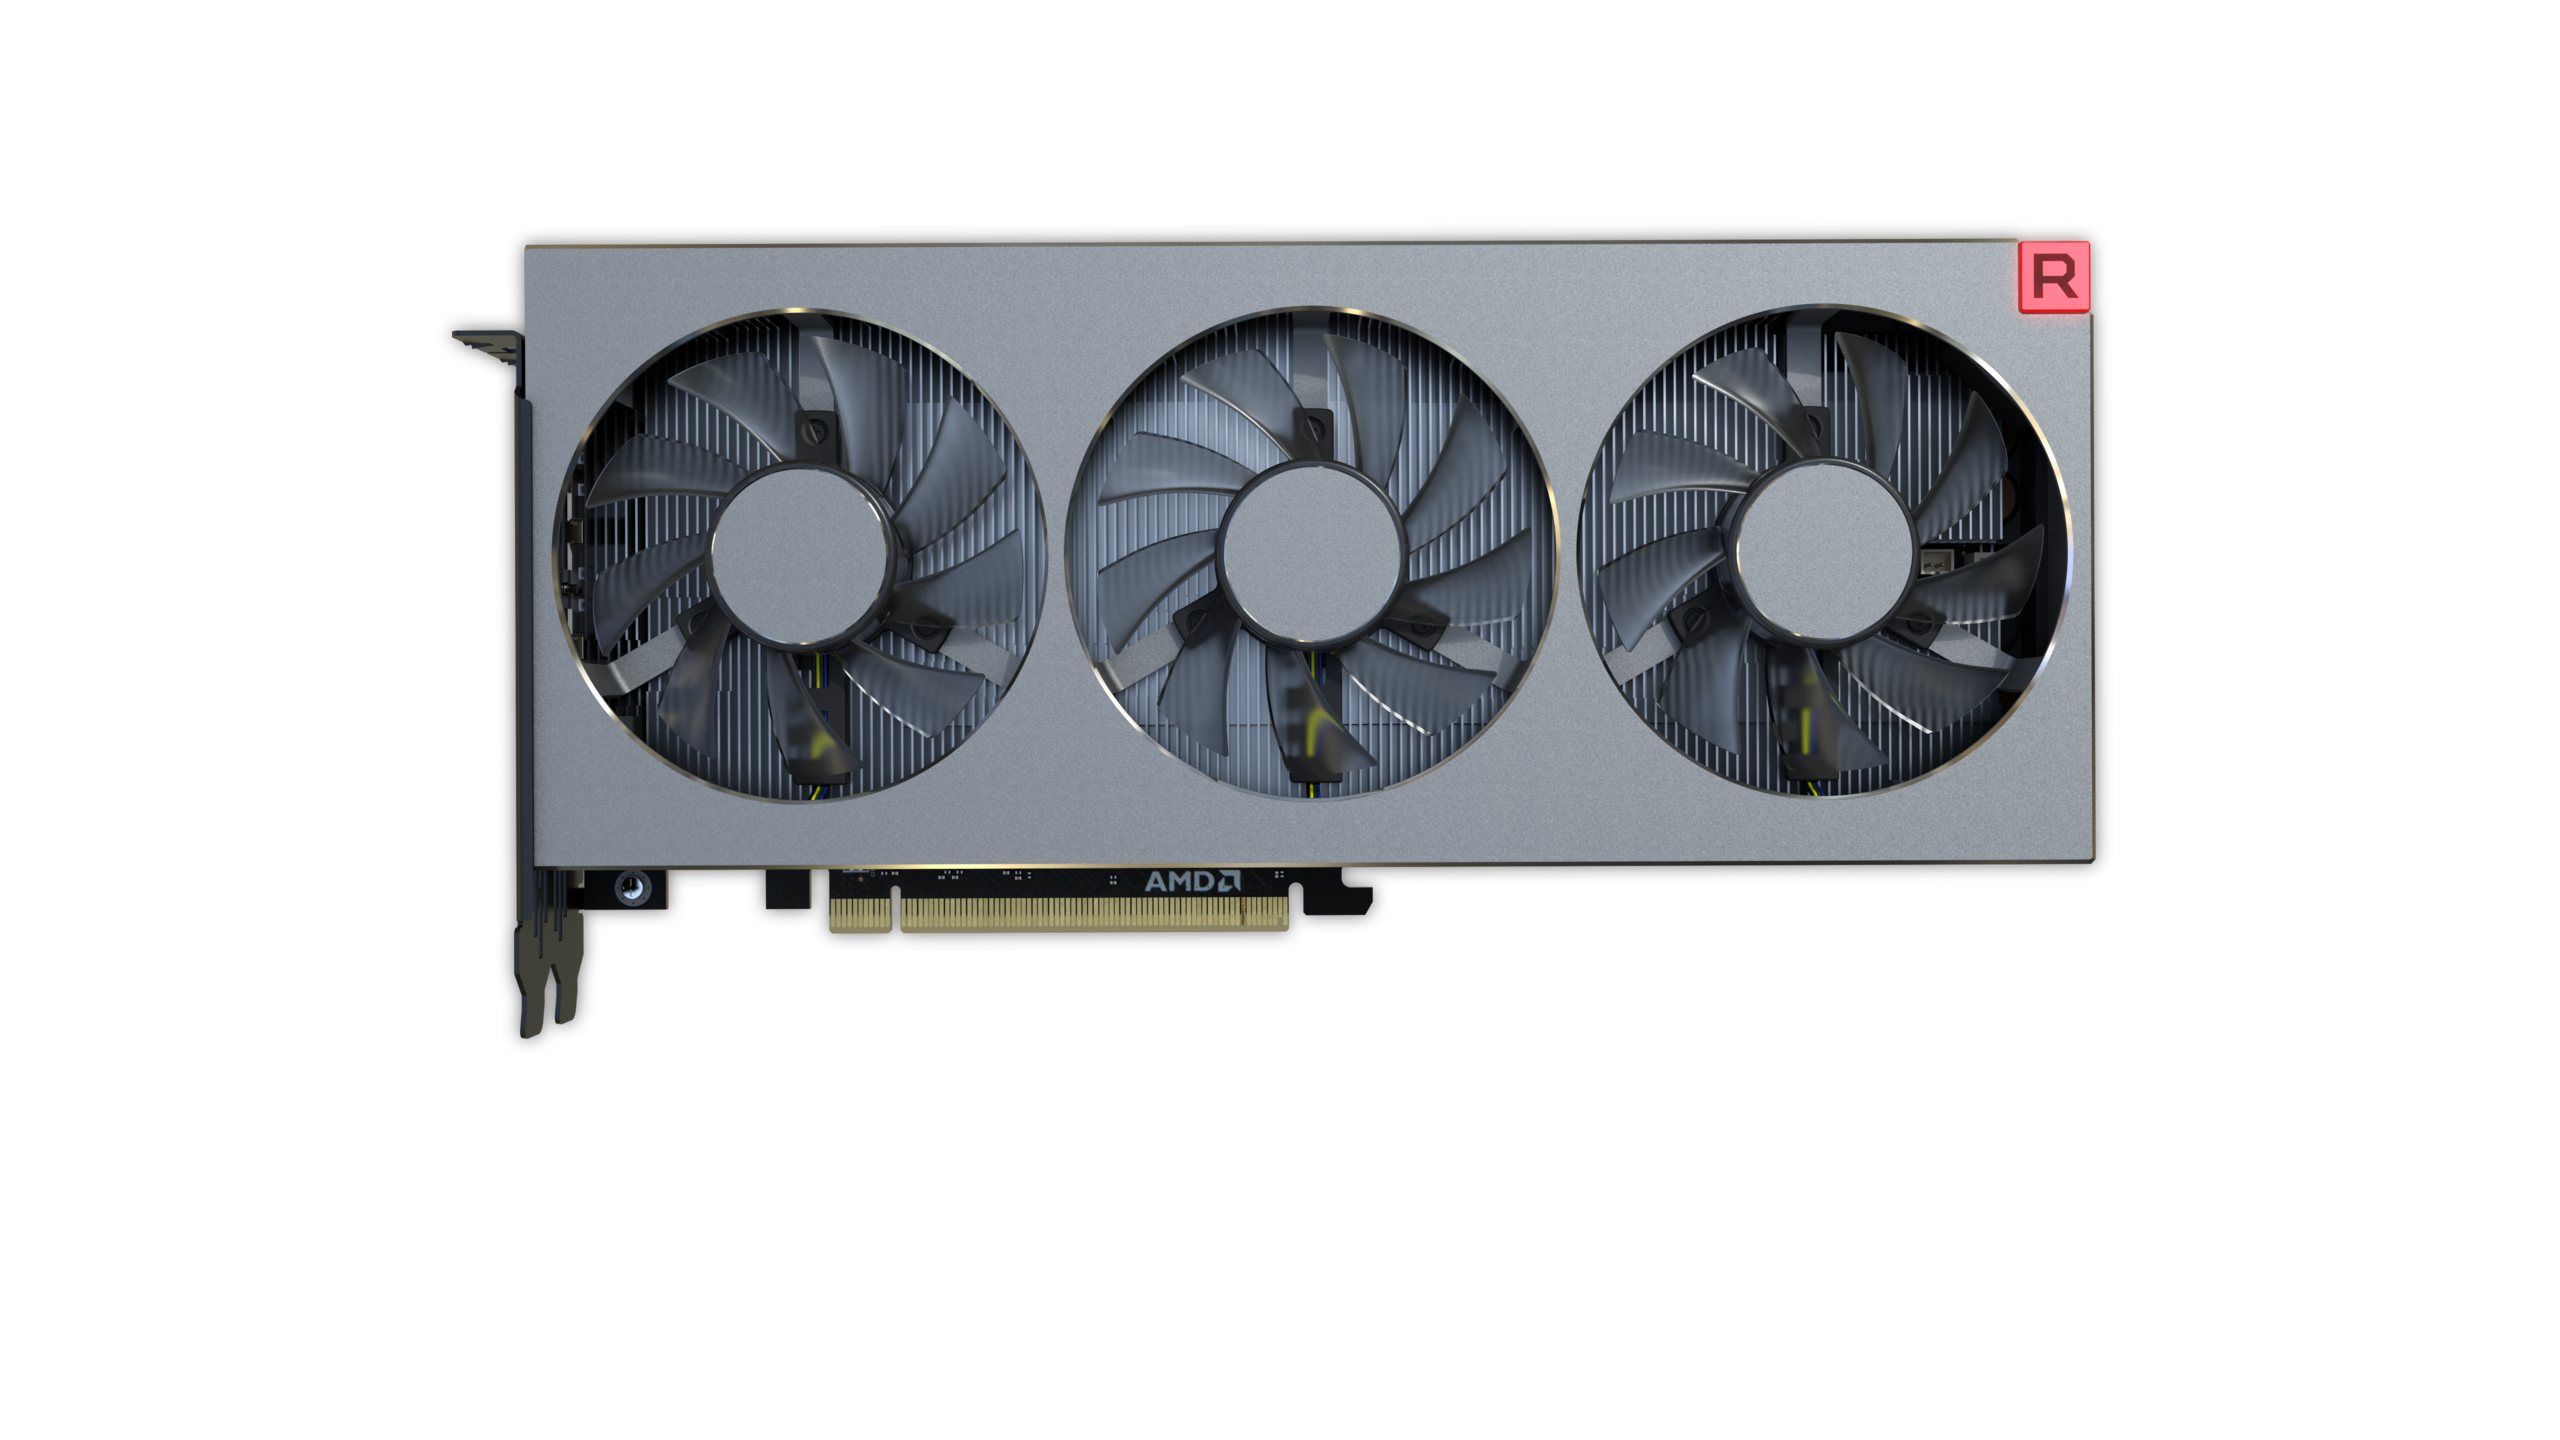
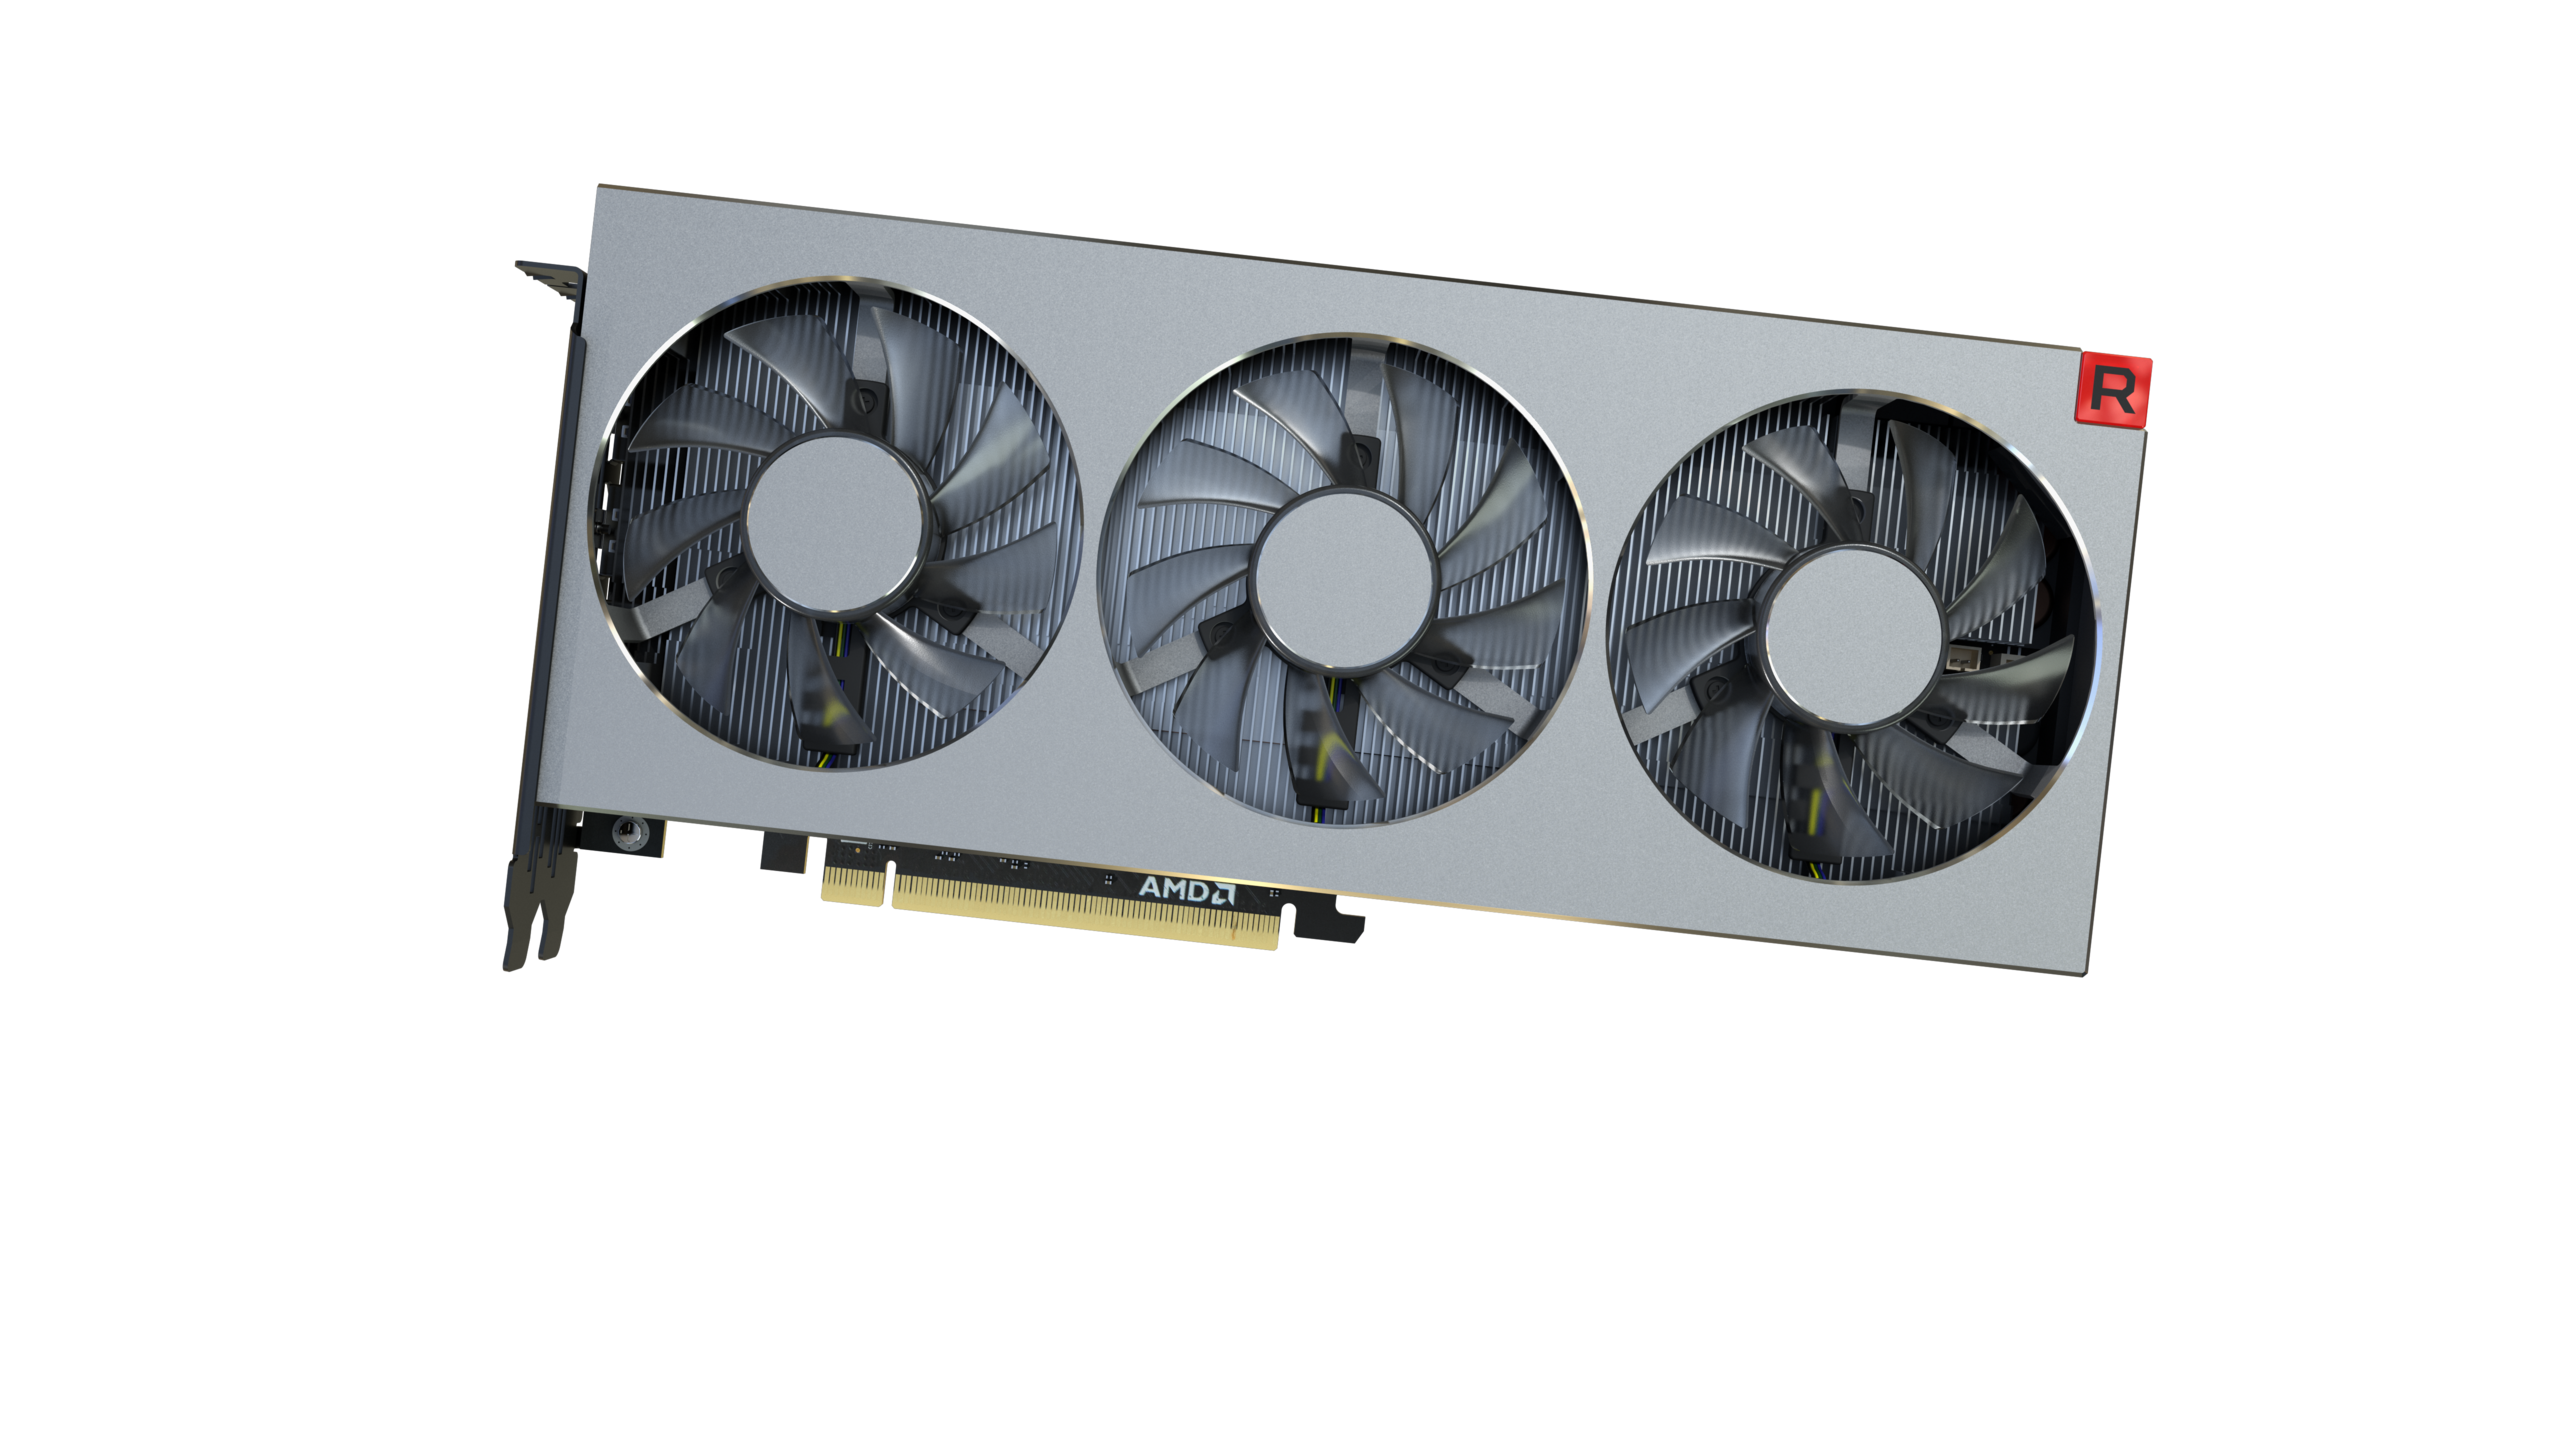
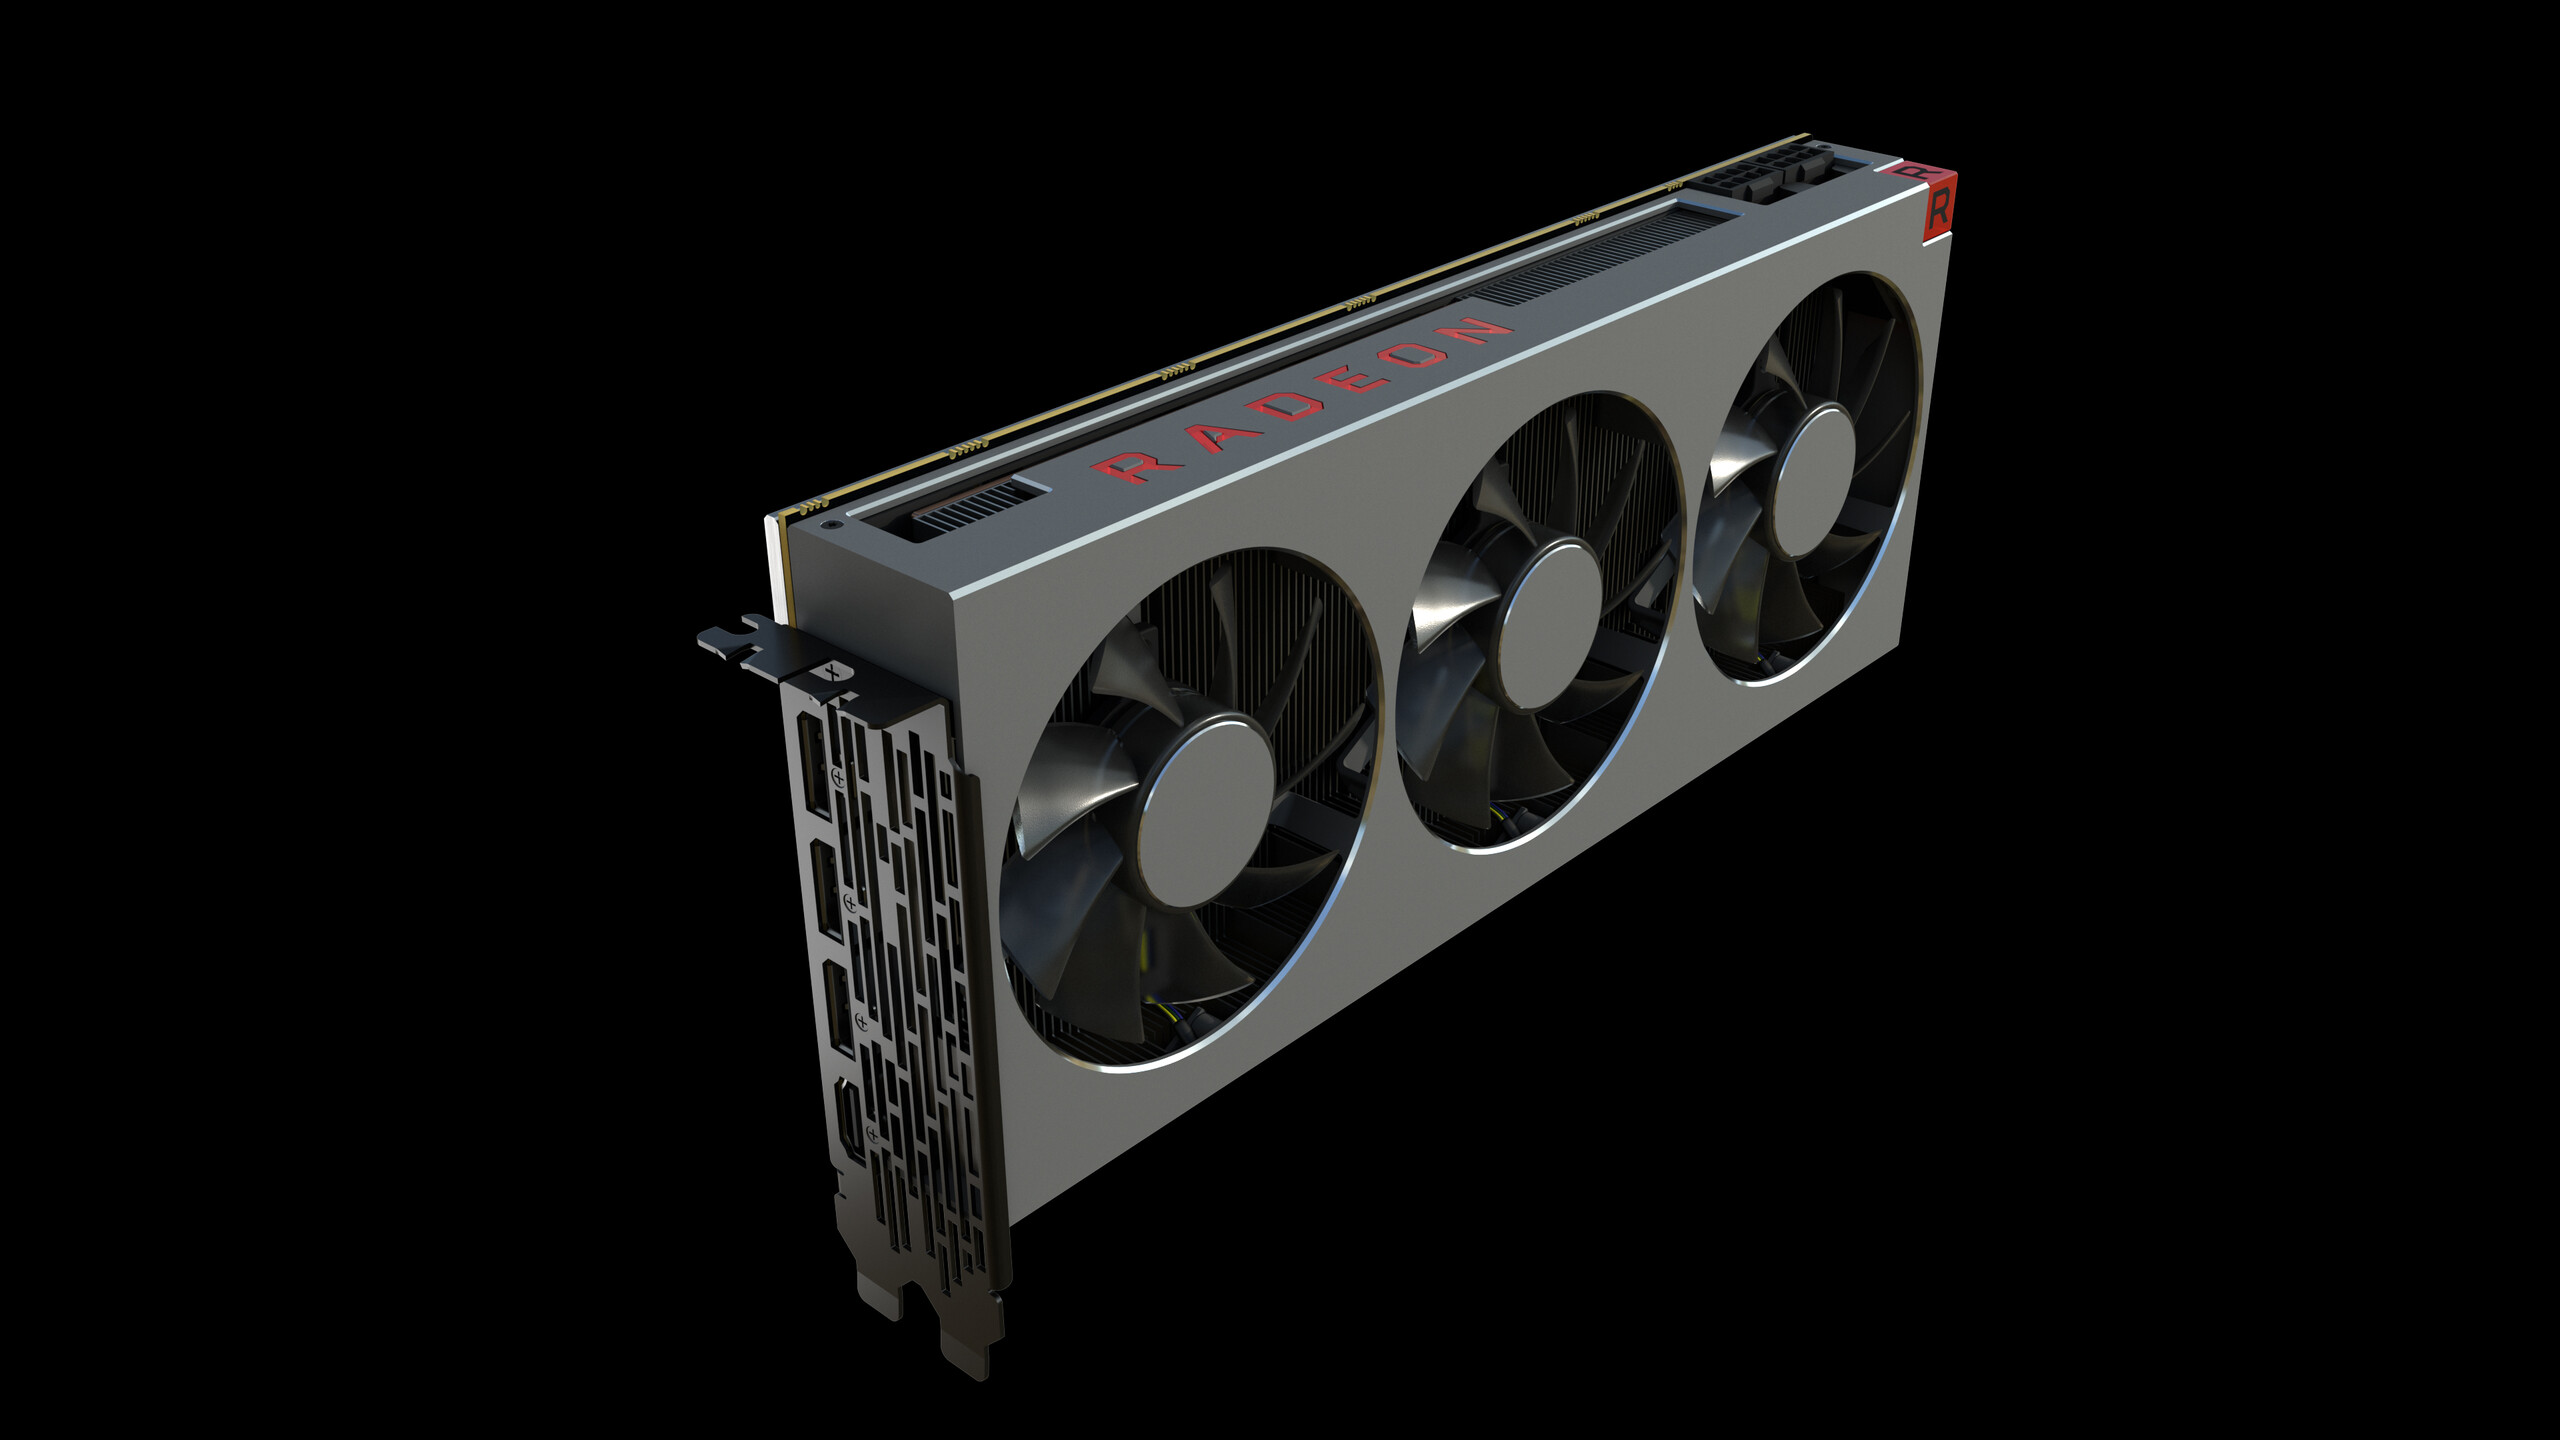
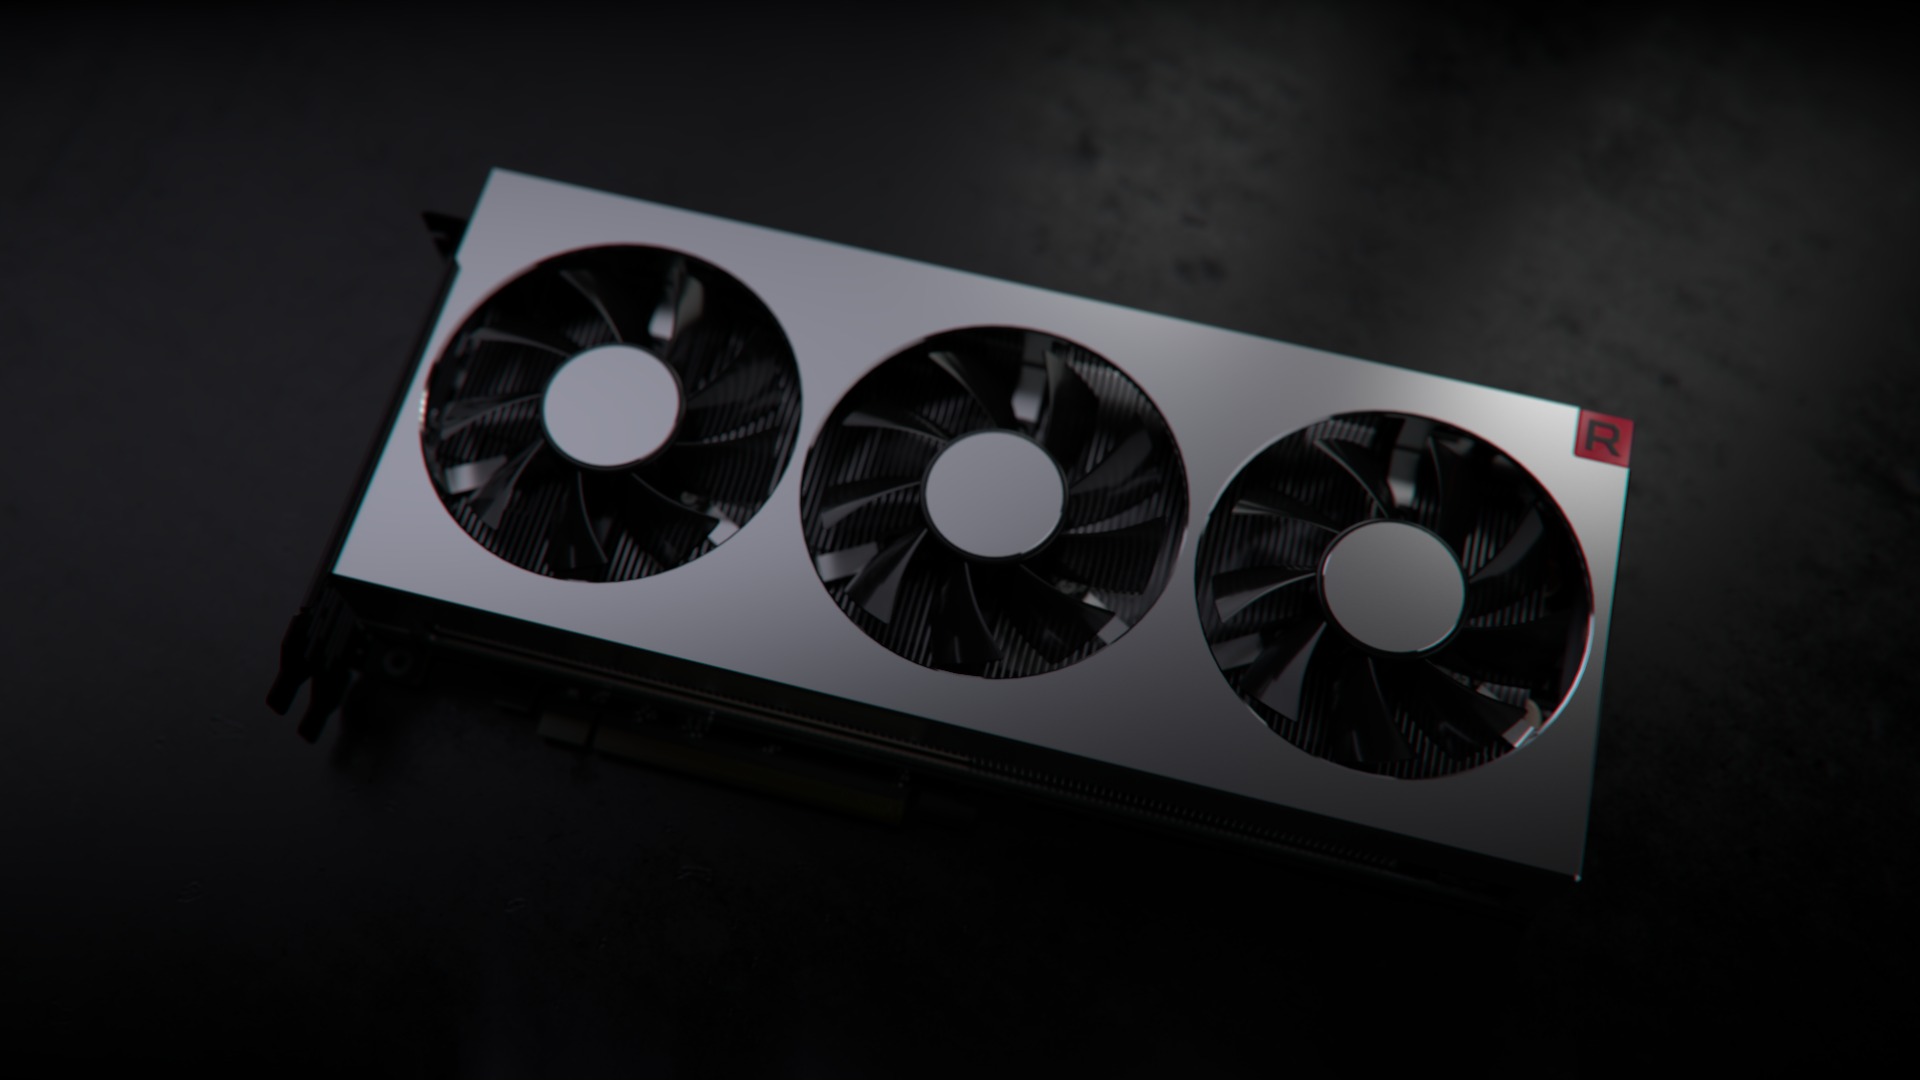
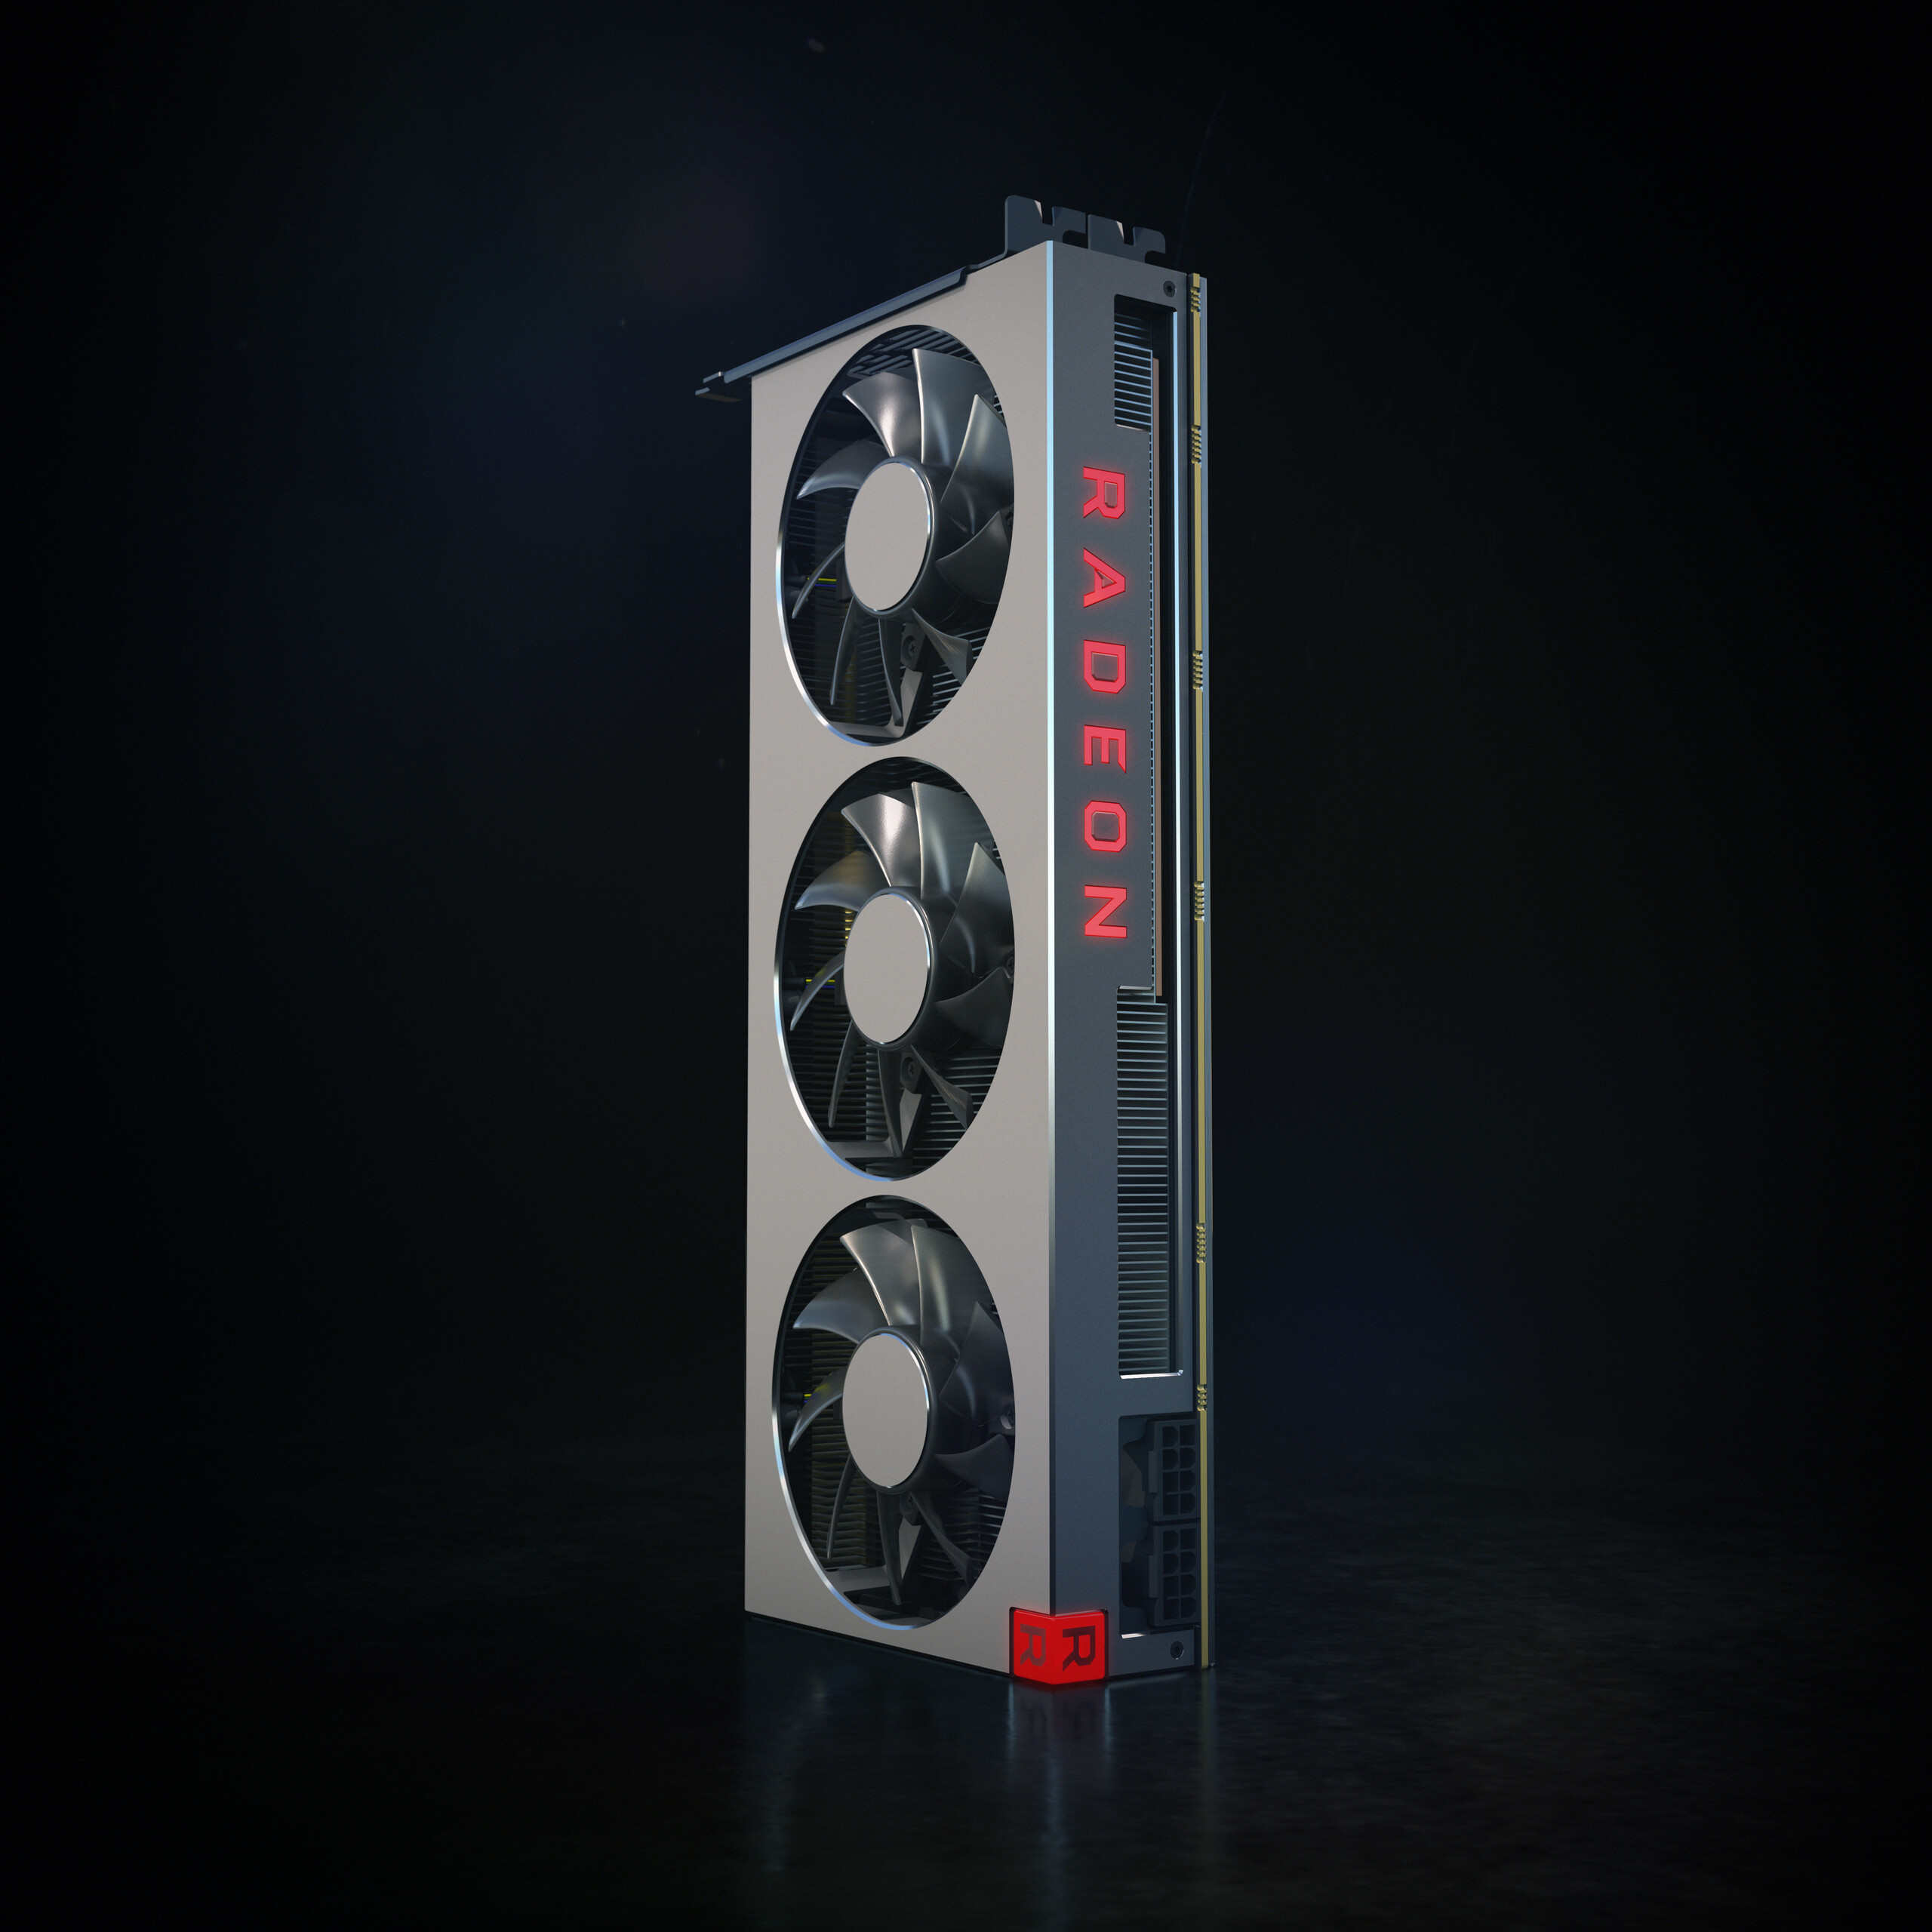
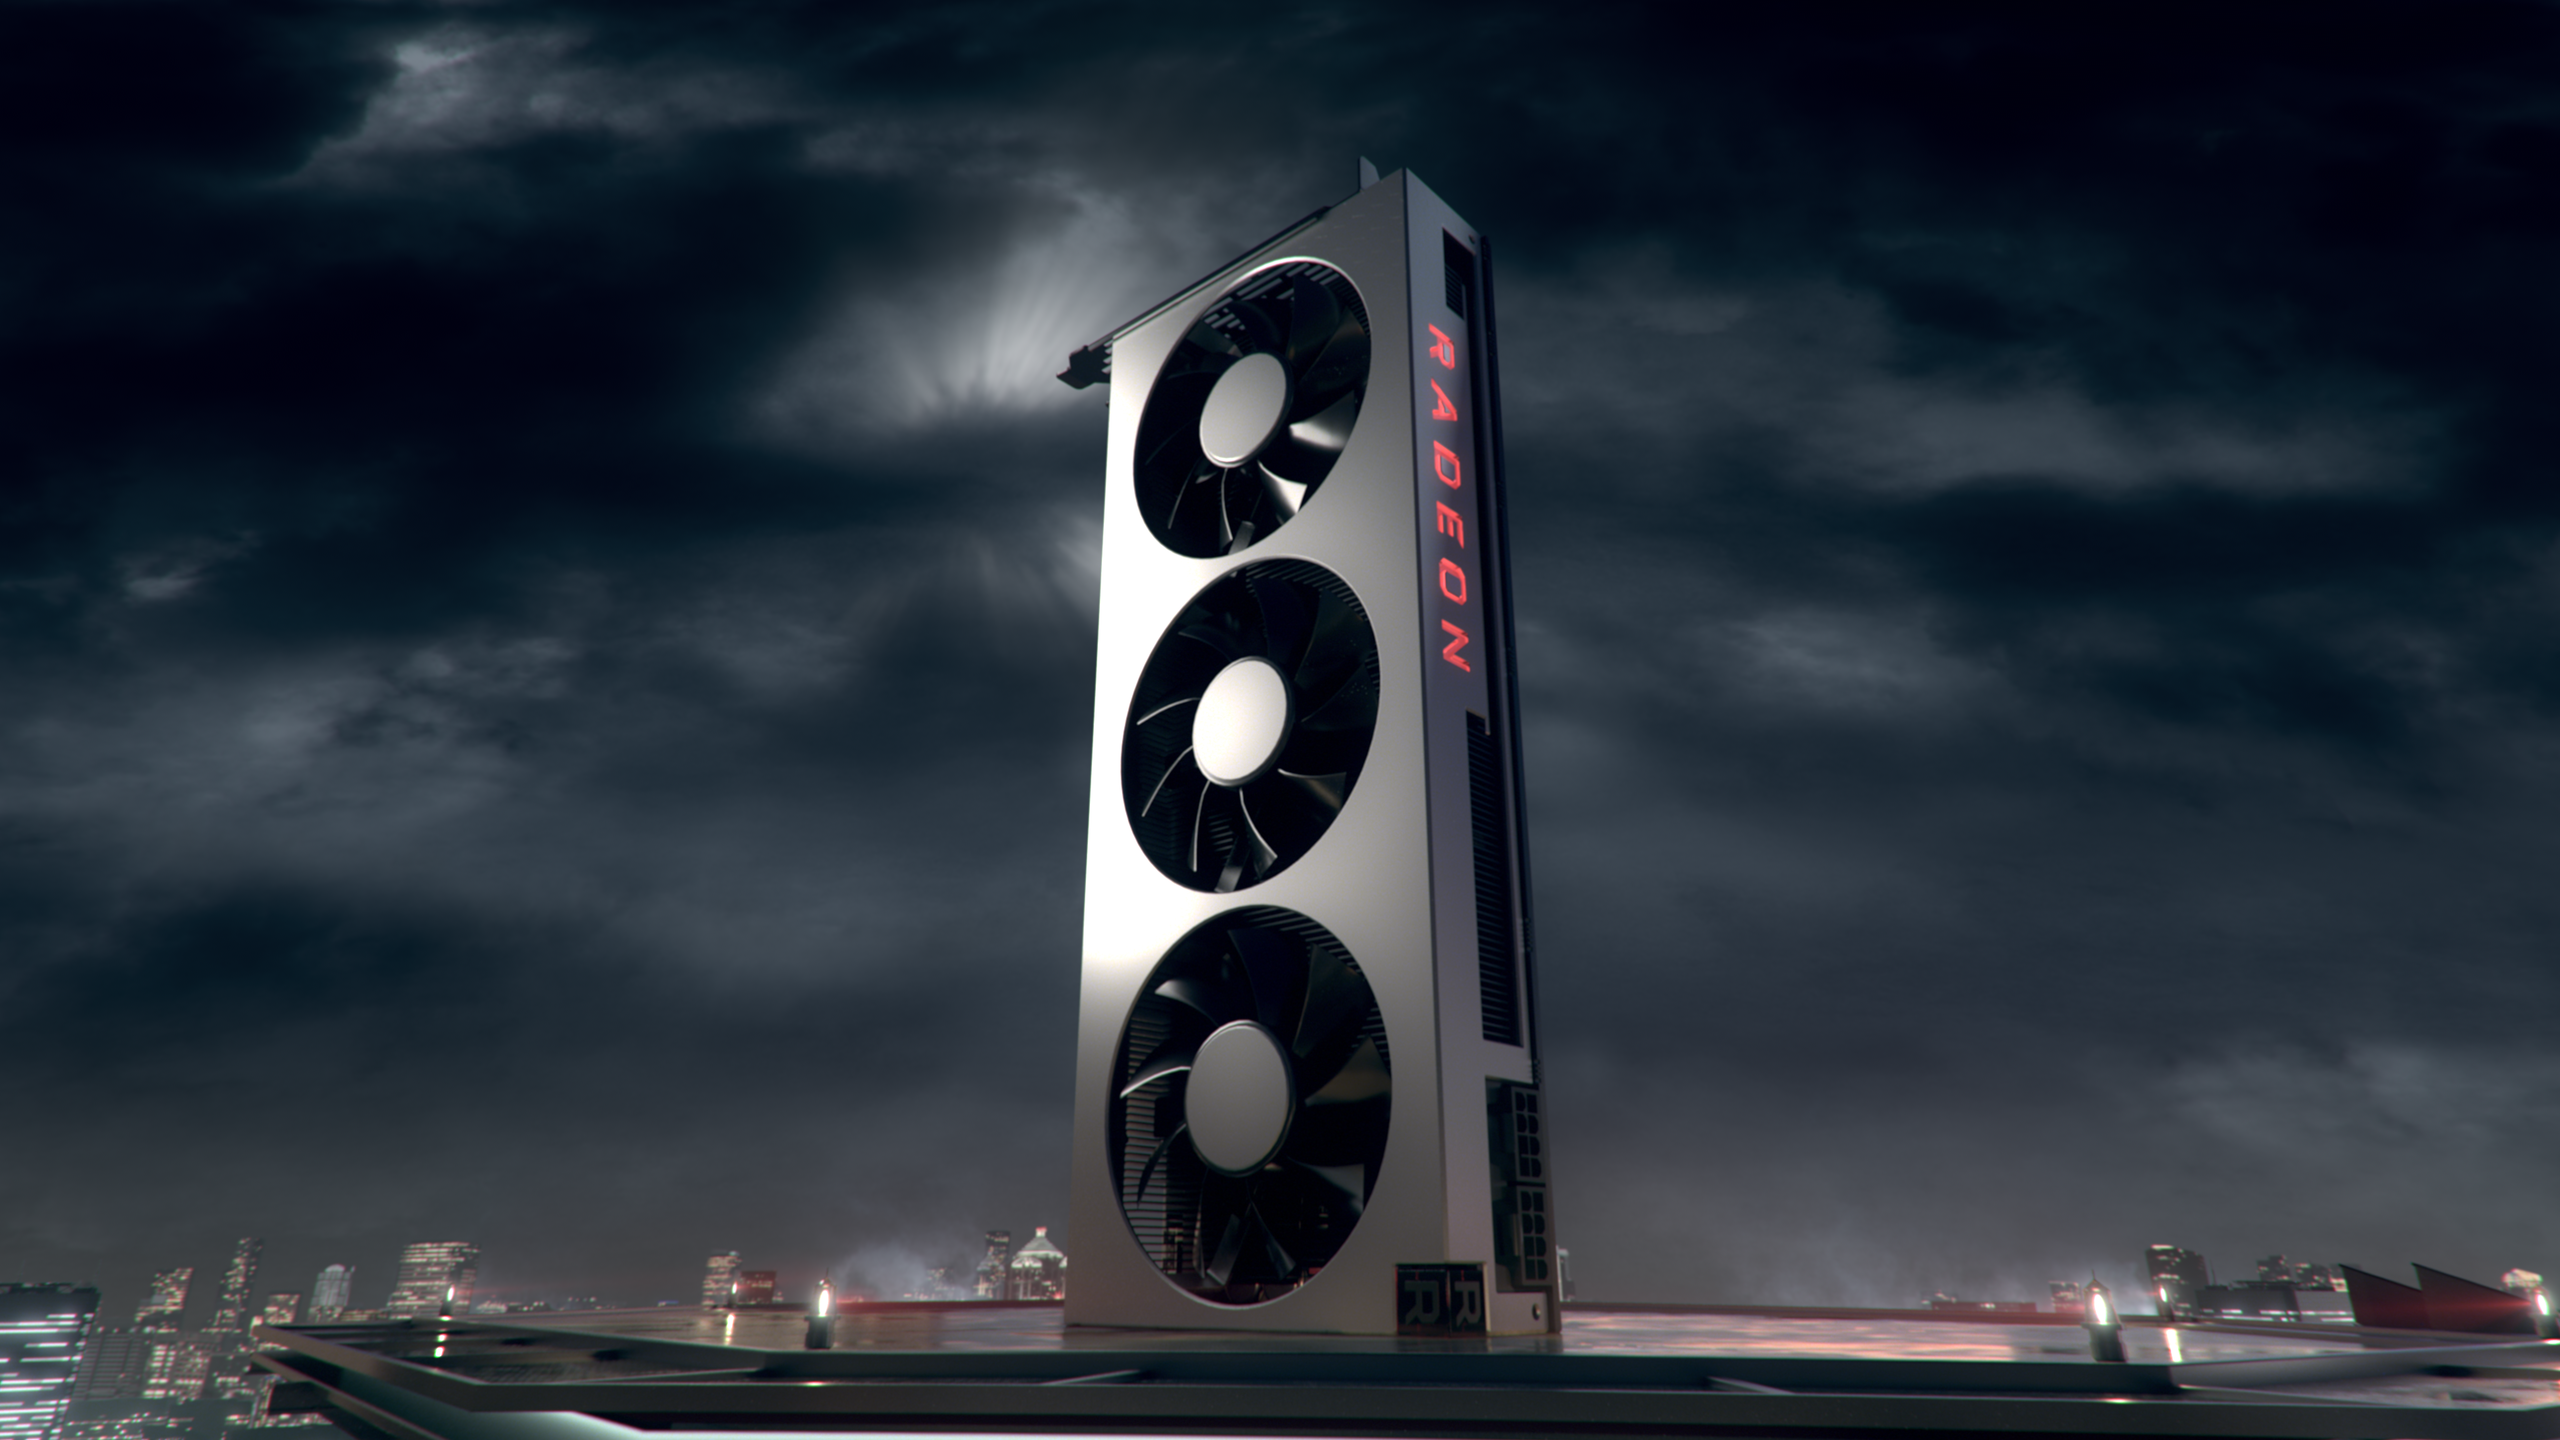
The Radeon VII still consumes around 300 W under load, for which AMD has designed a new cooling system. The GPU has vapour chamber heatpipes and a set of aluminium fins that are cooled by three axial fans. Previously, the company has equipped its reference GPUs with radial fans, but one fan design is not necessarily more effective than the other, and it depends more on how AMD has optimised the three fans to run appropriately under load.
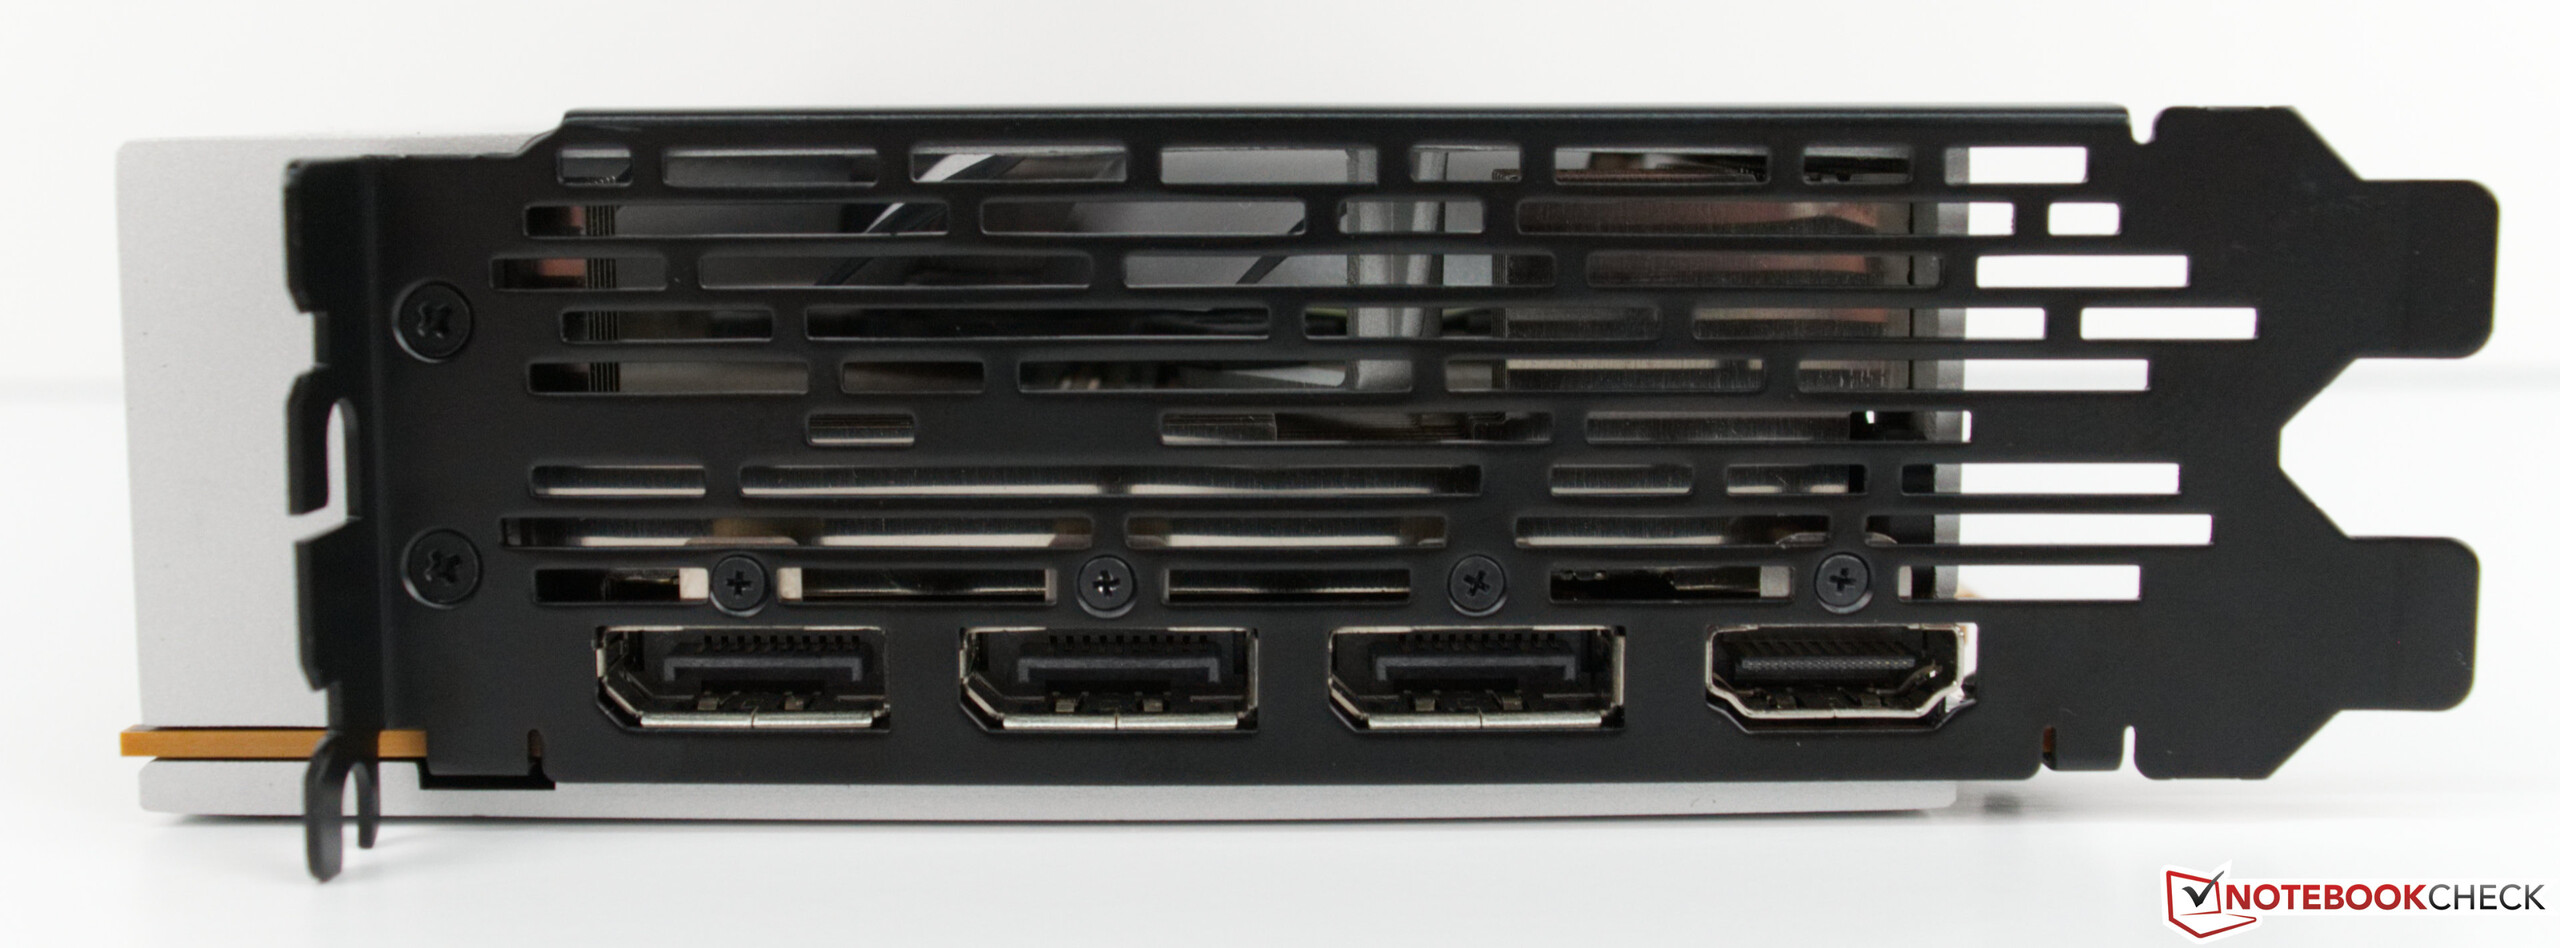
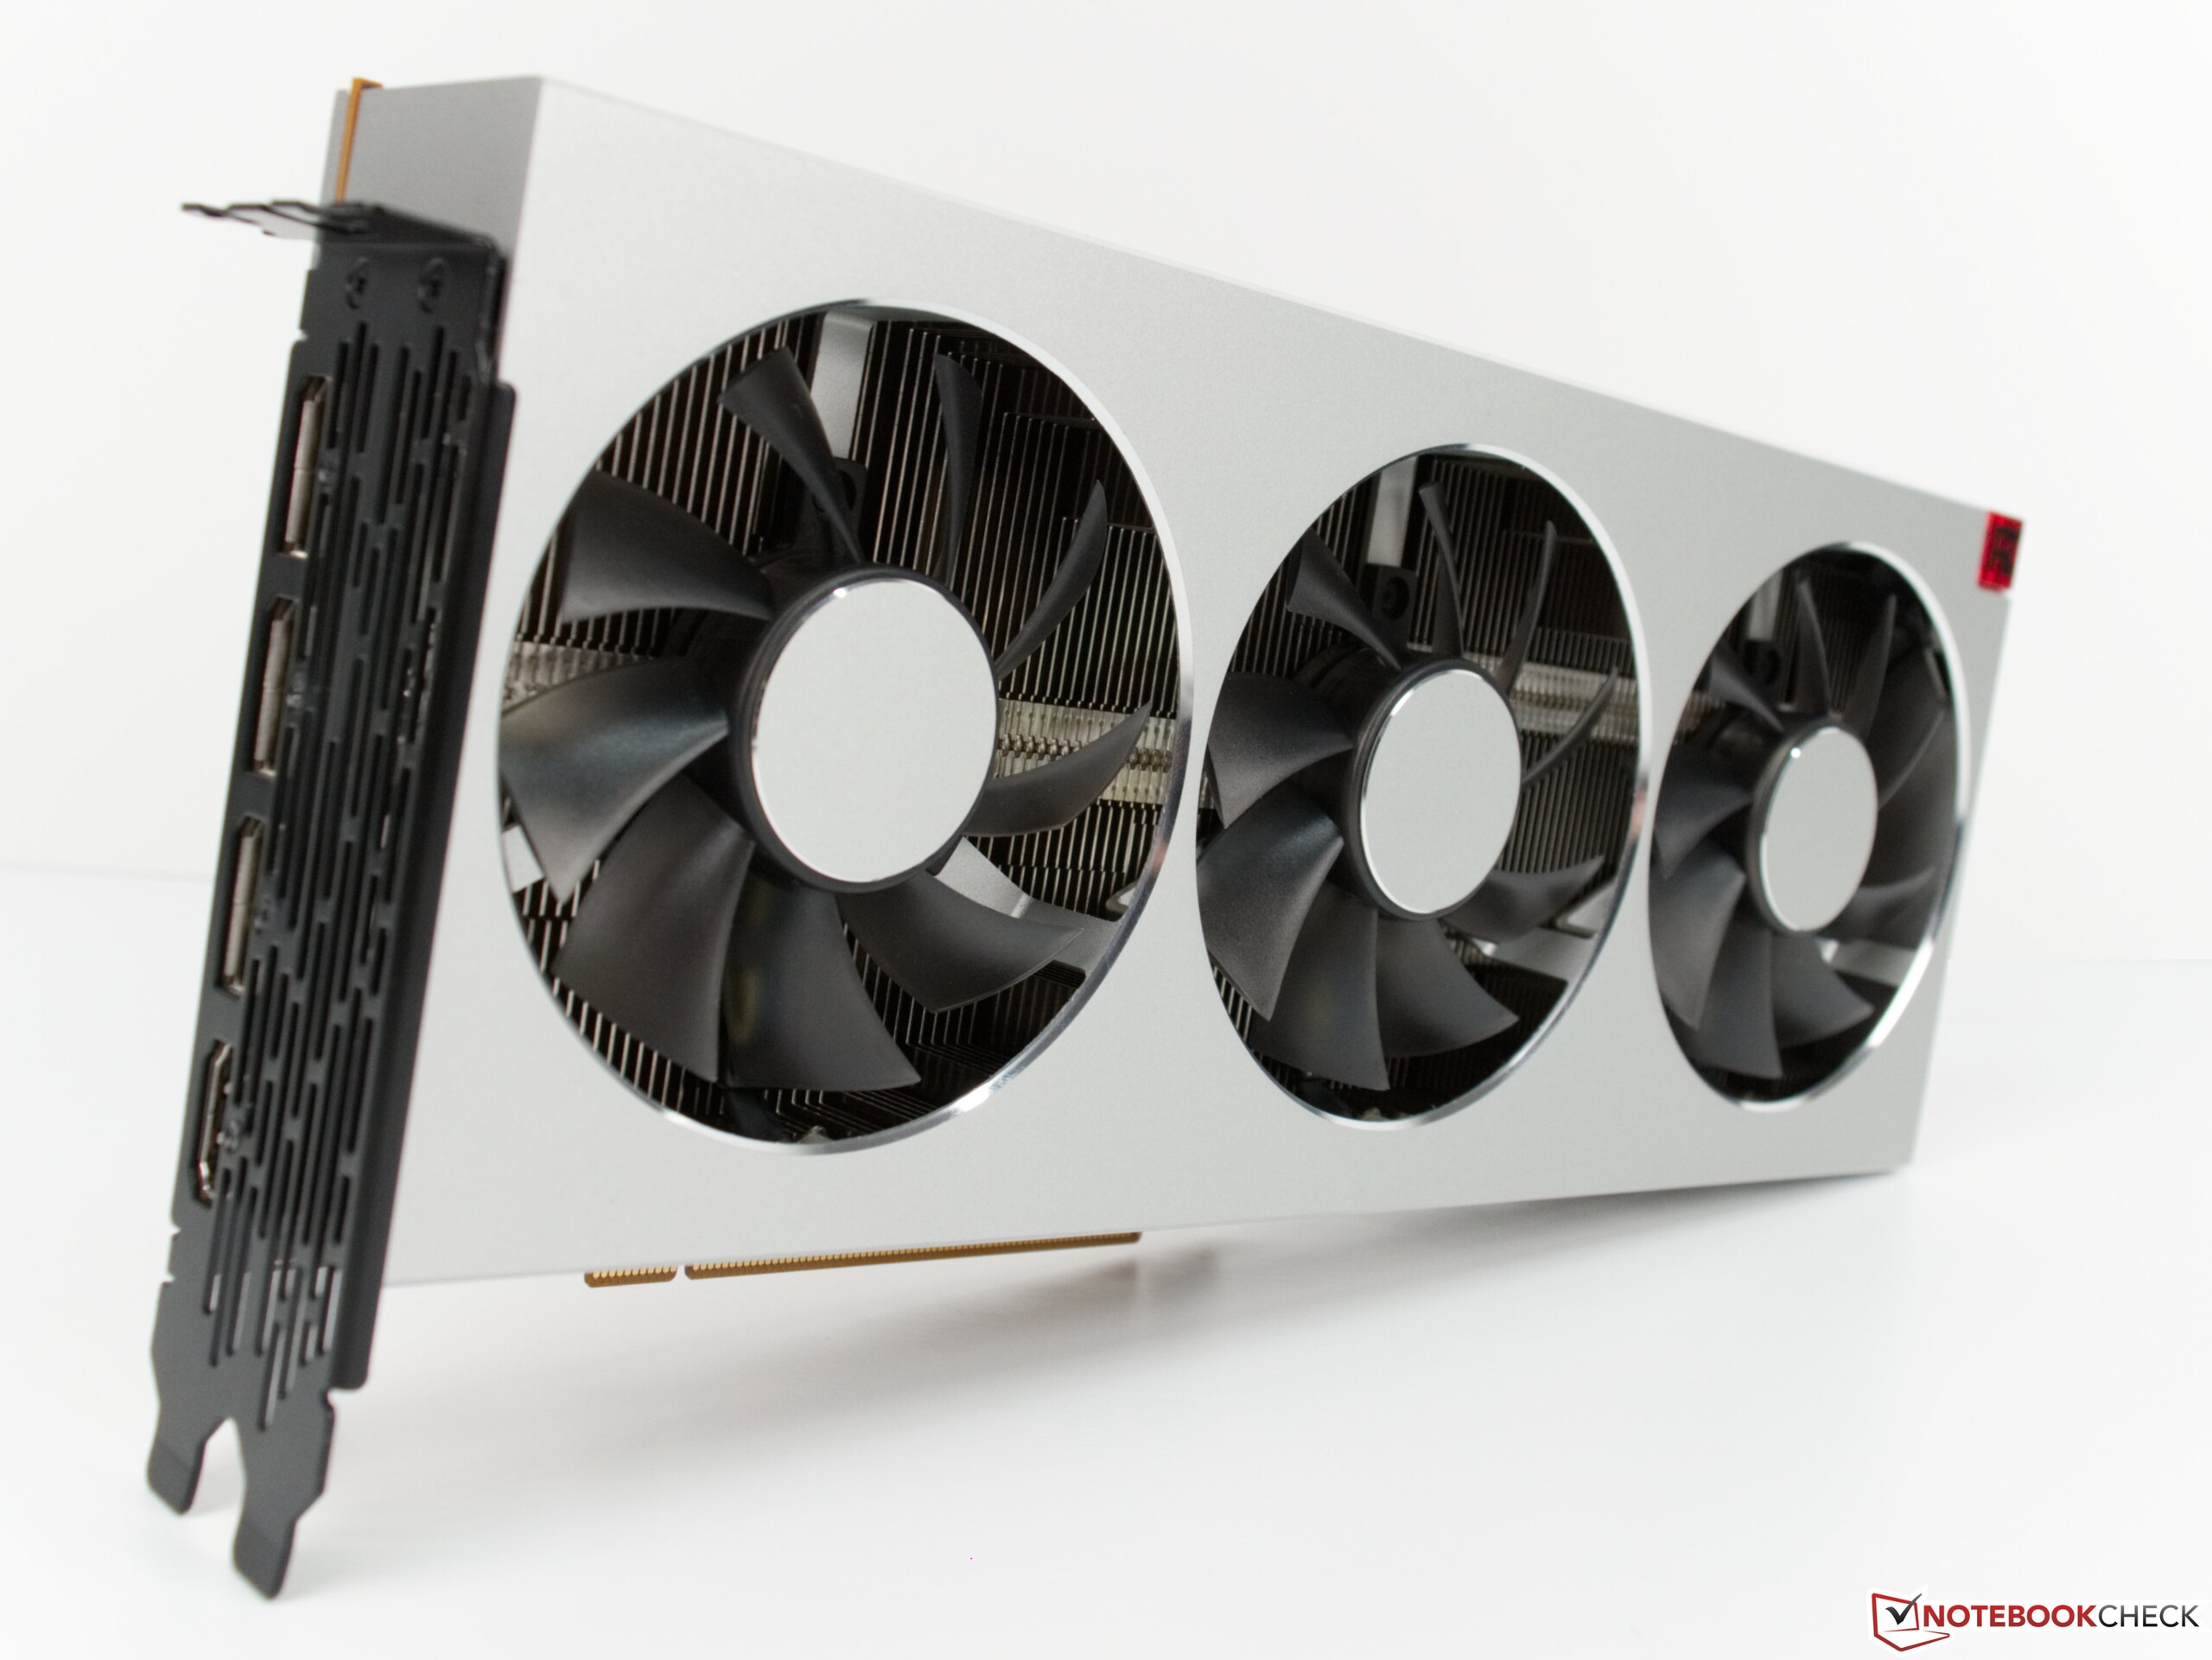
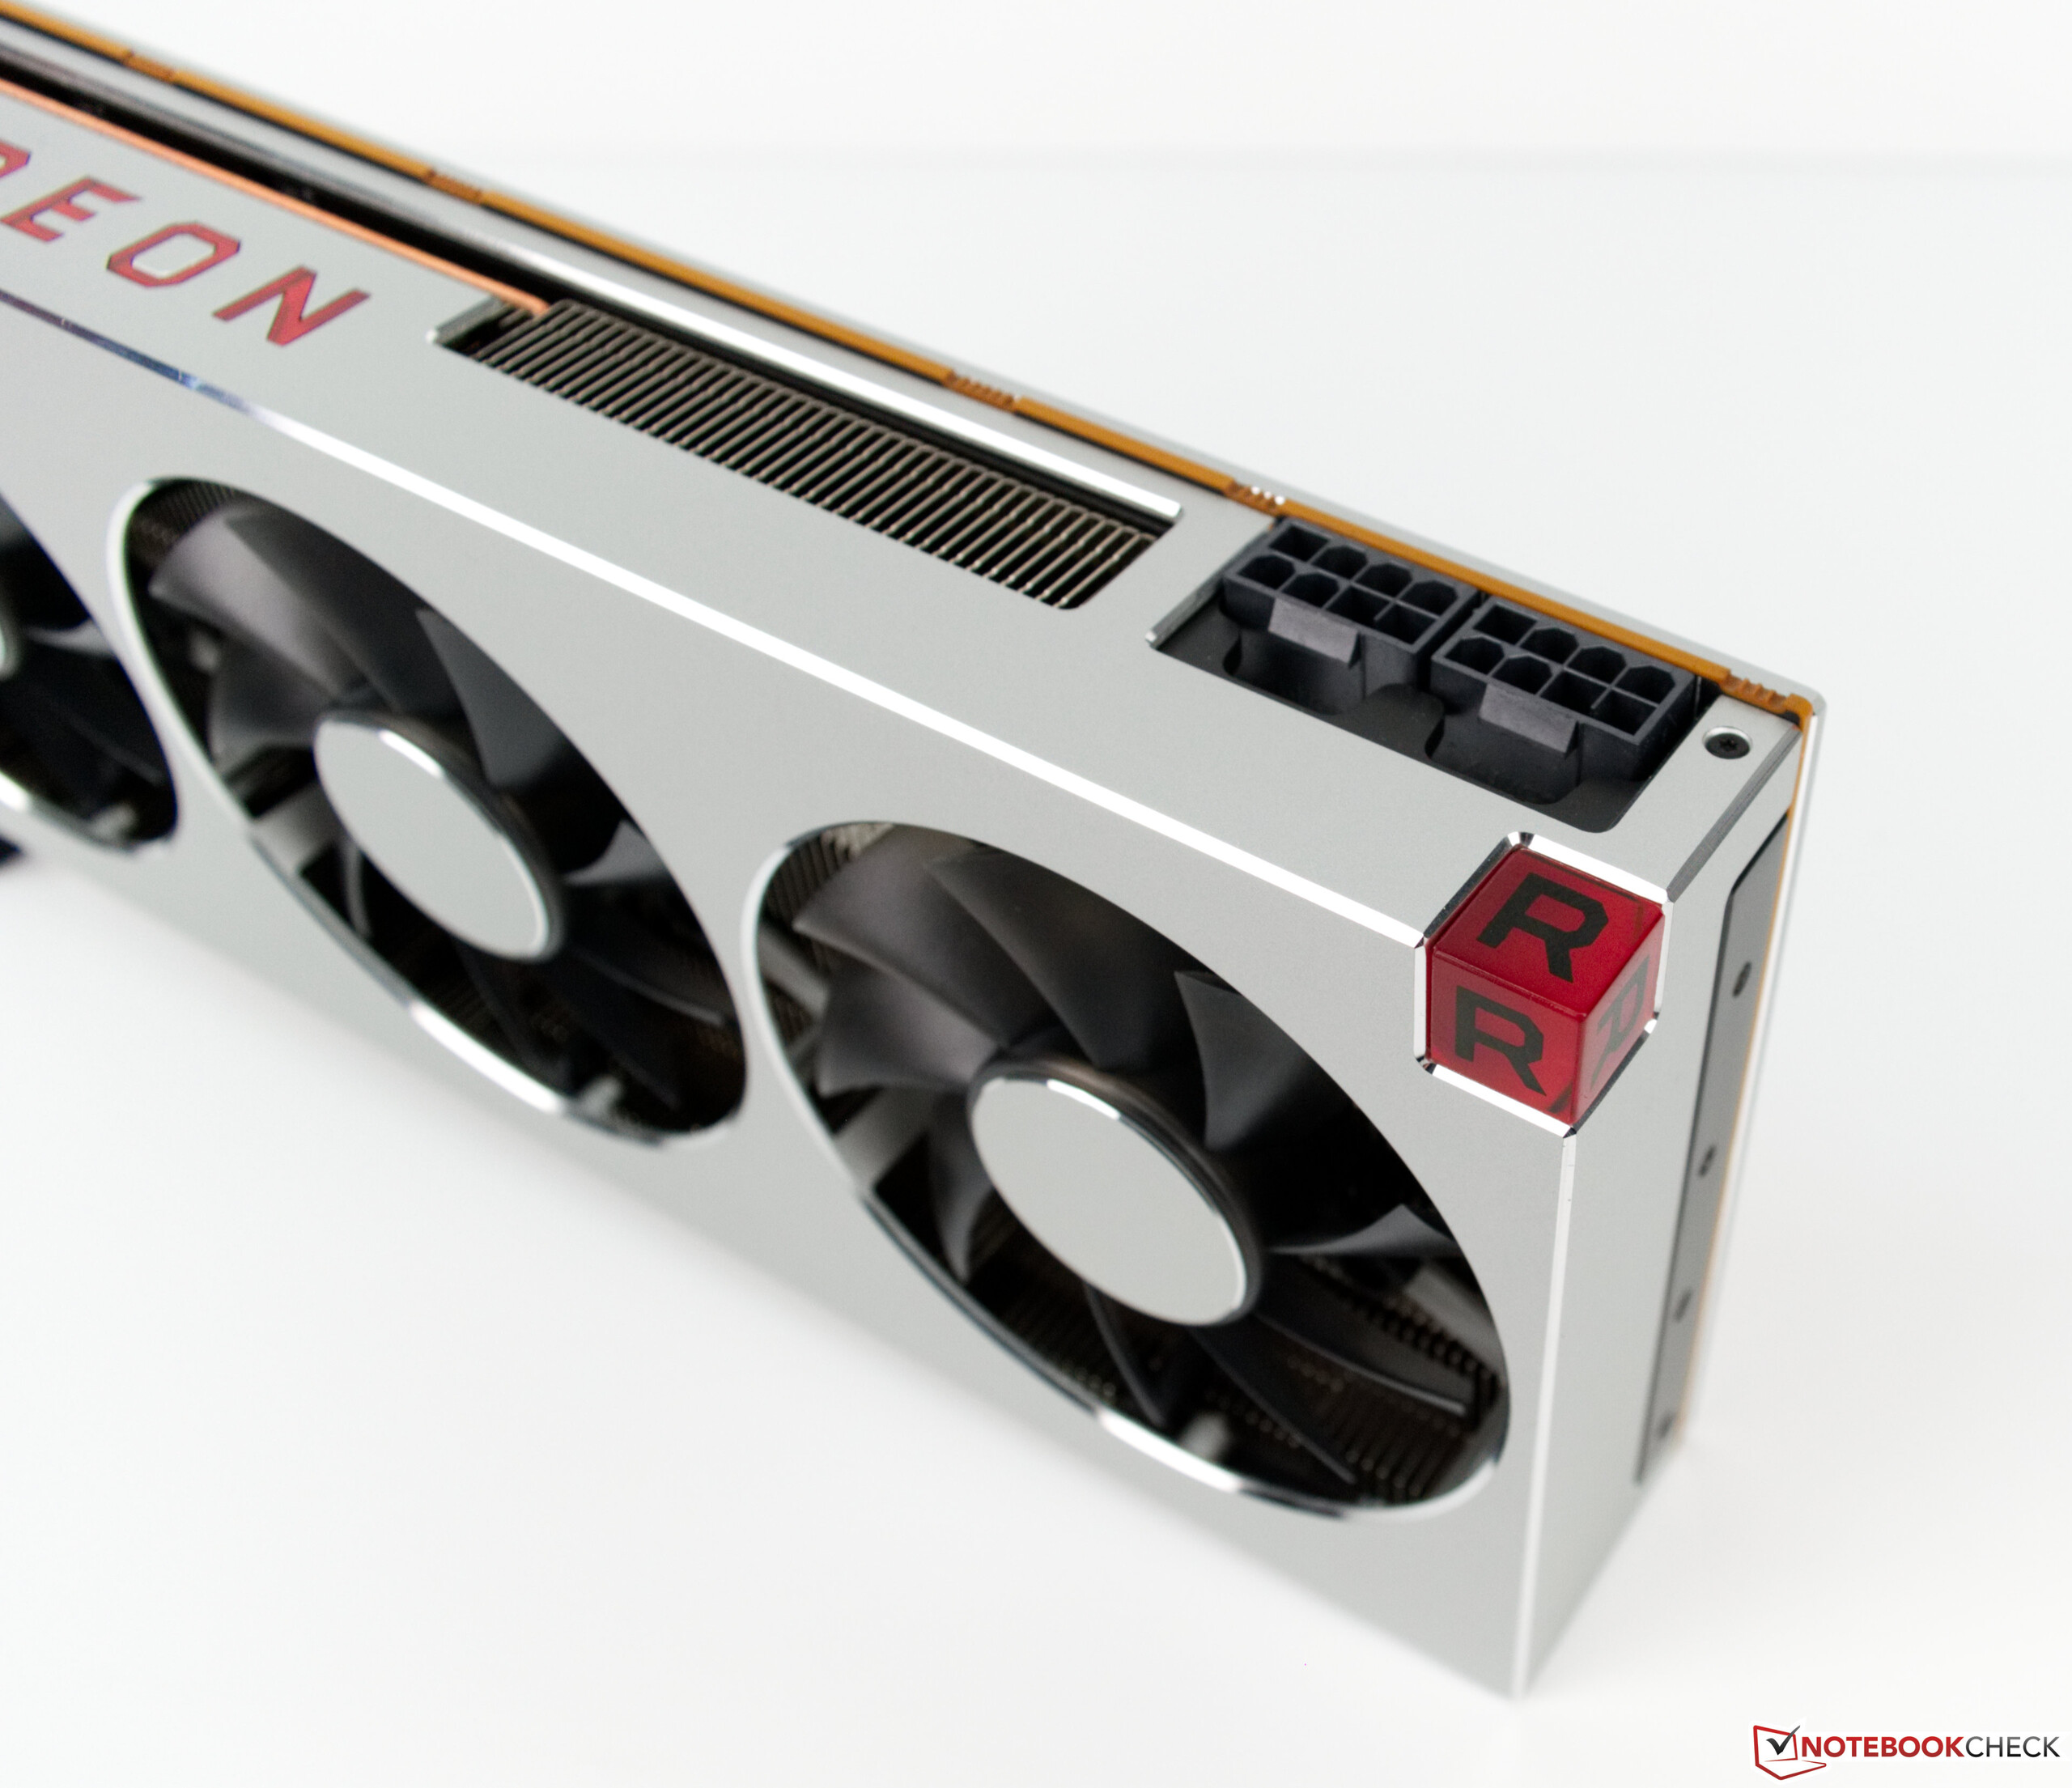
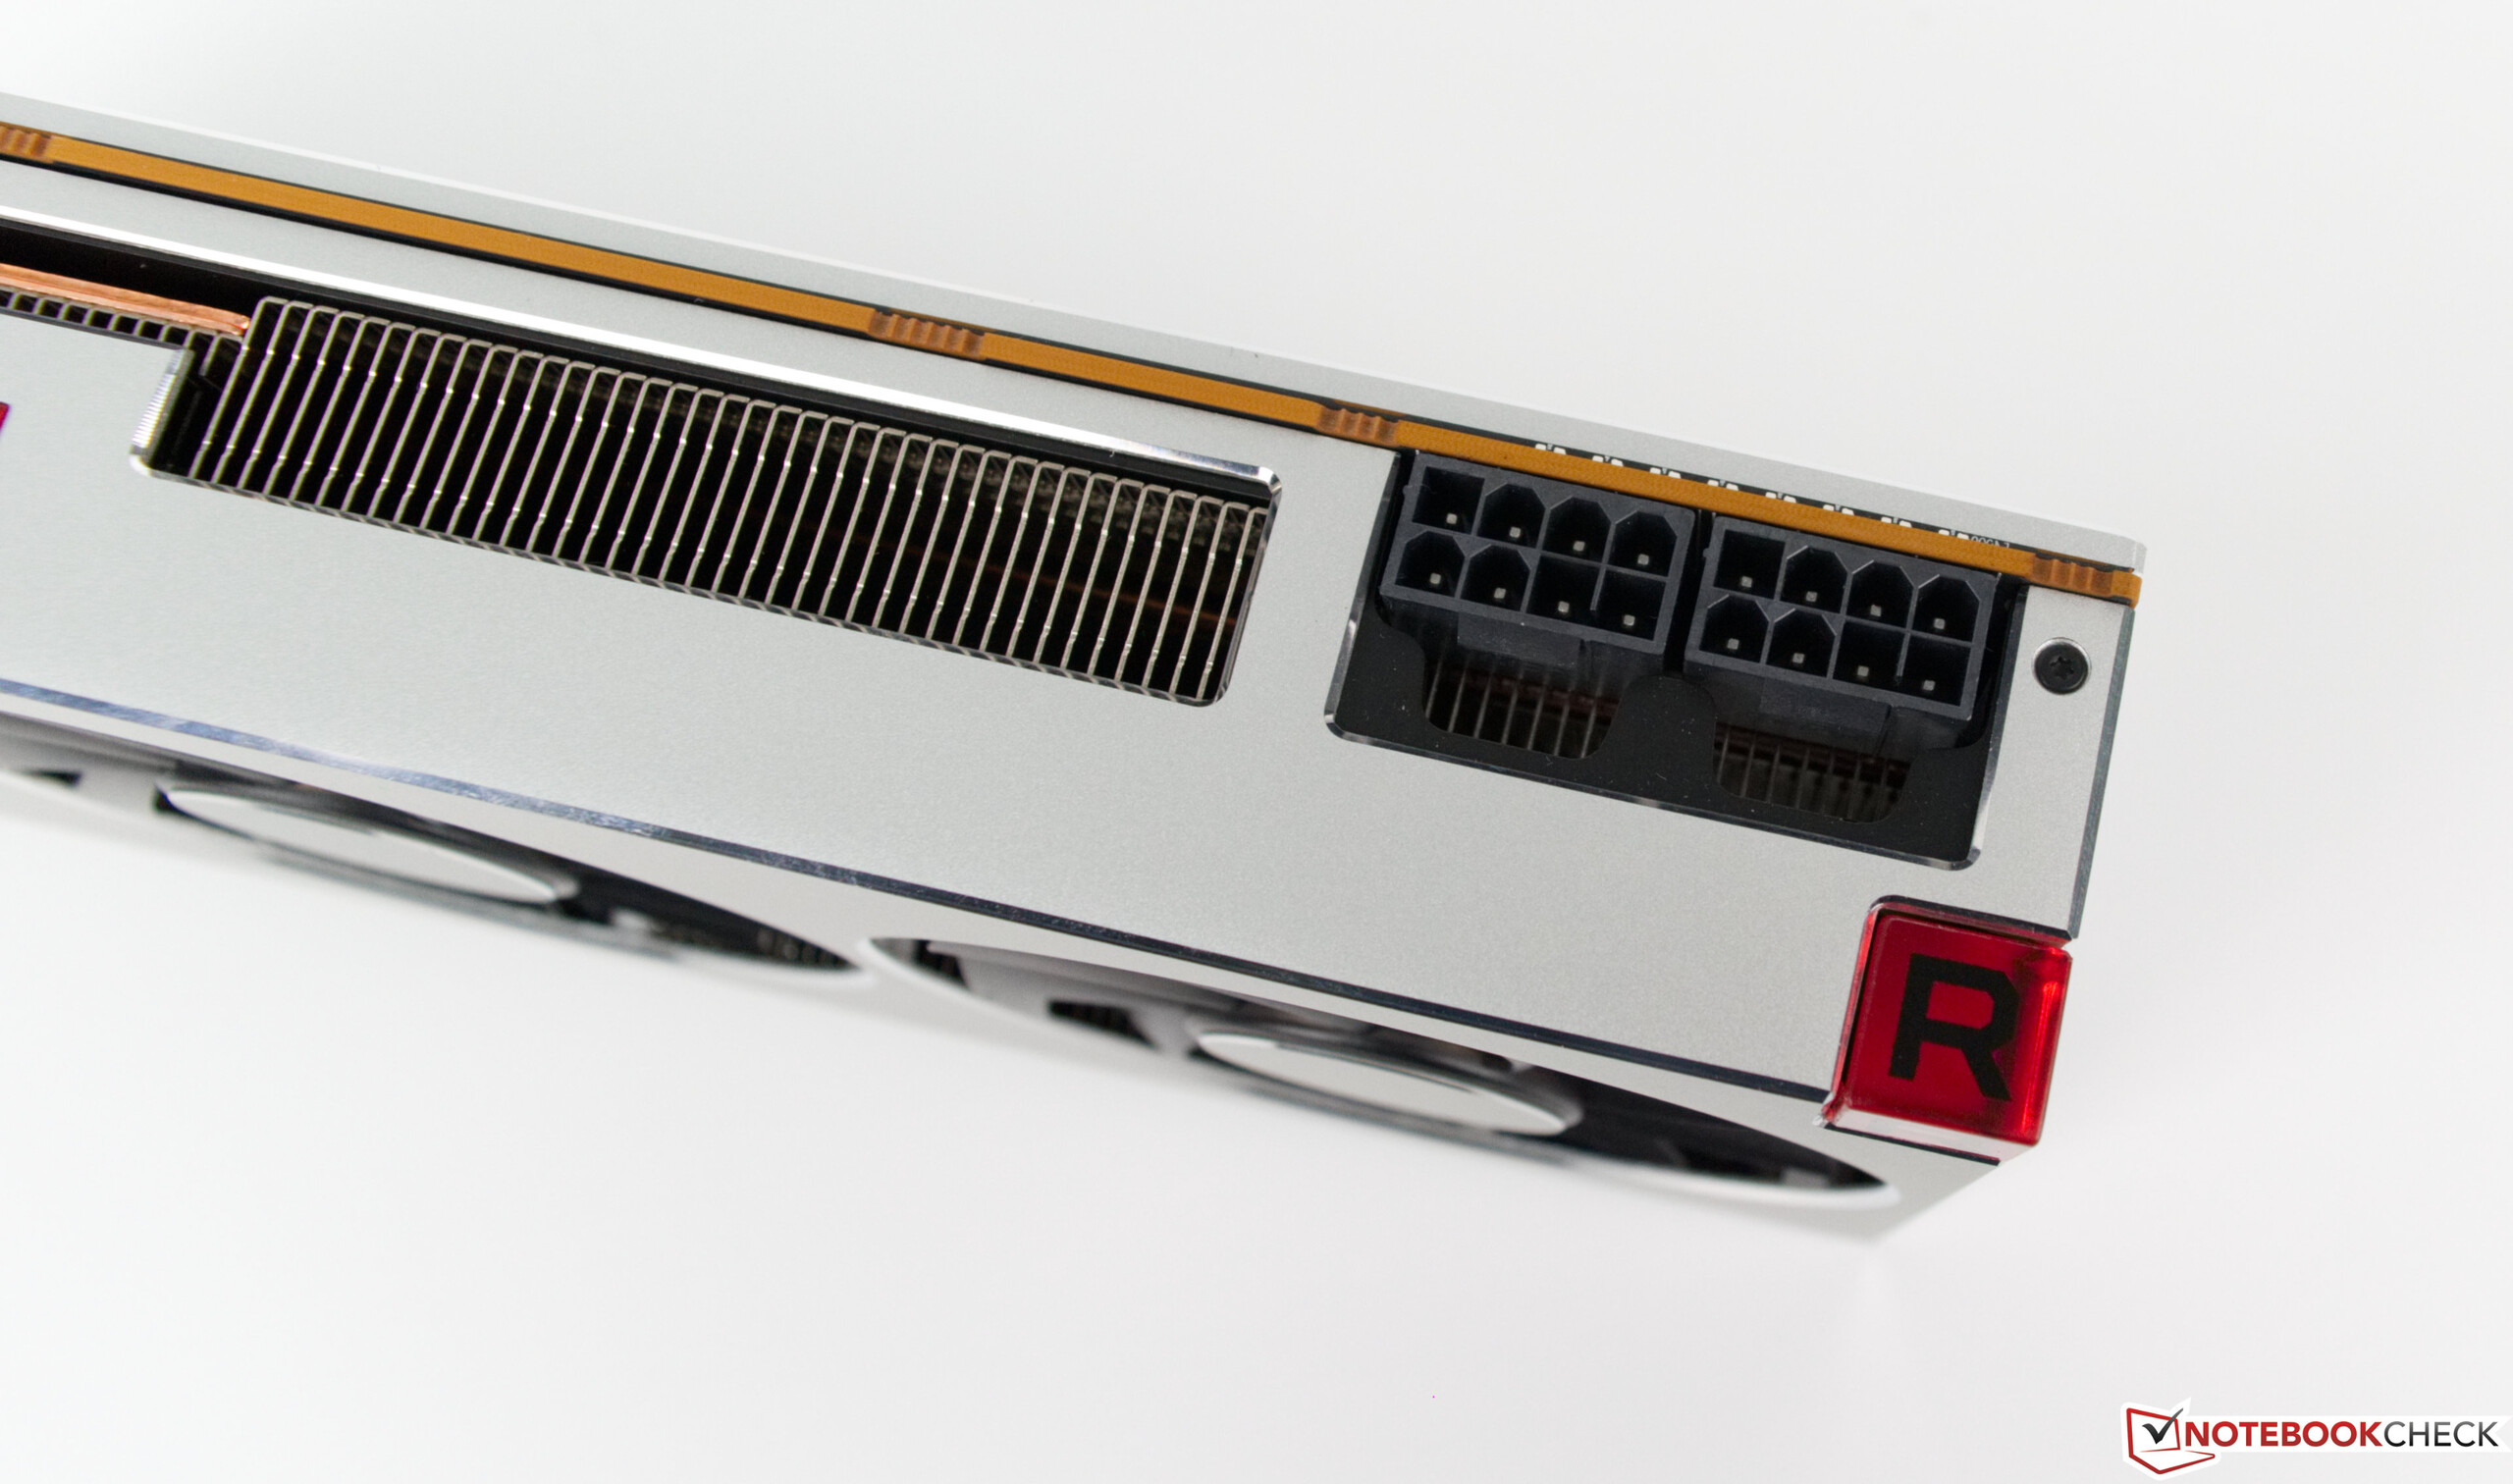
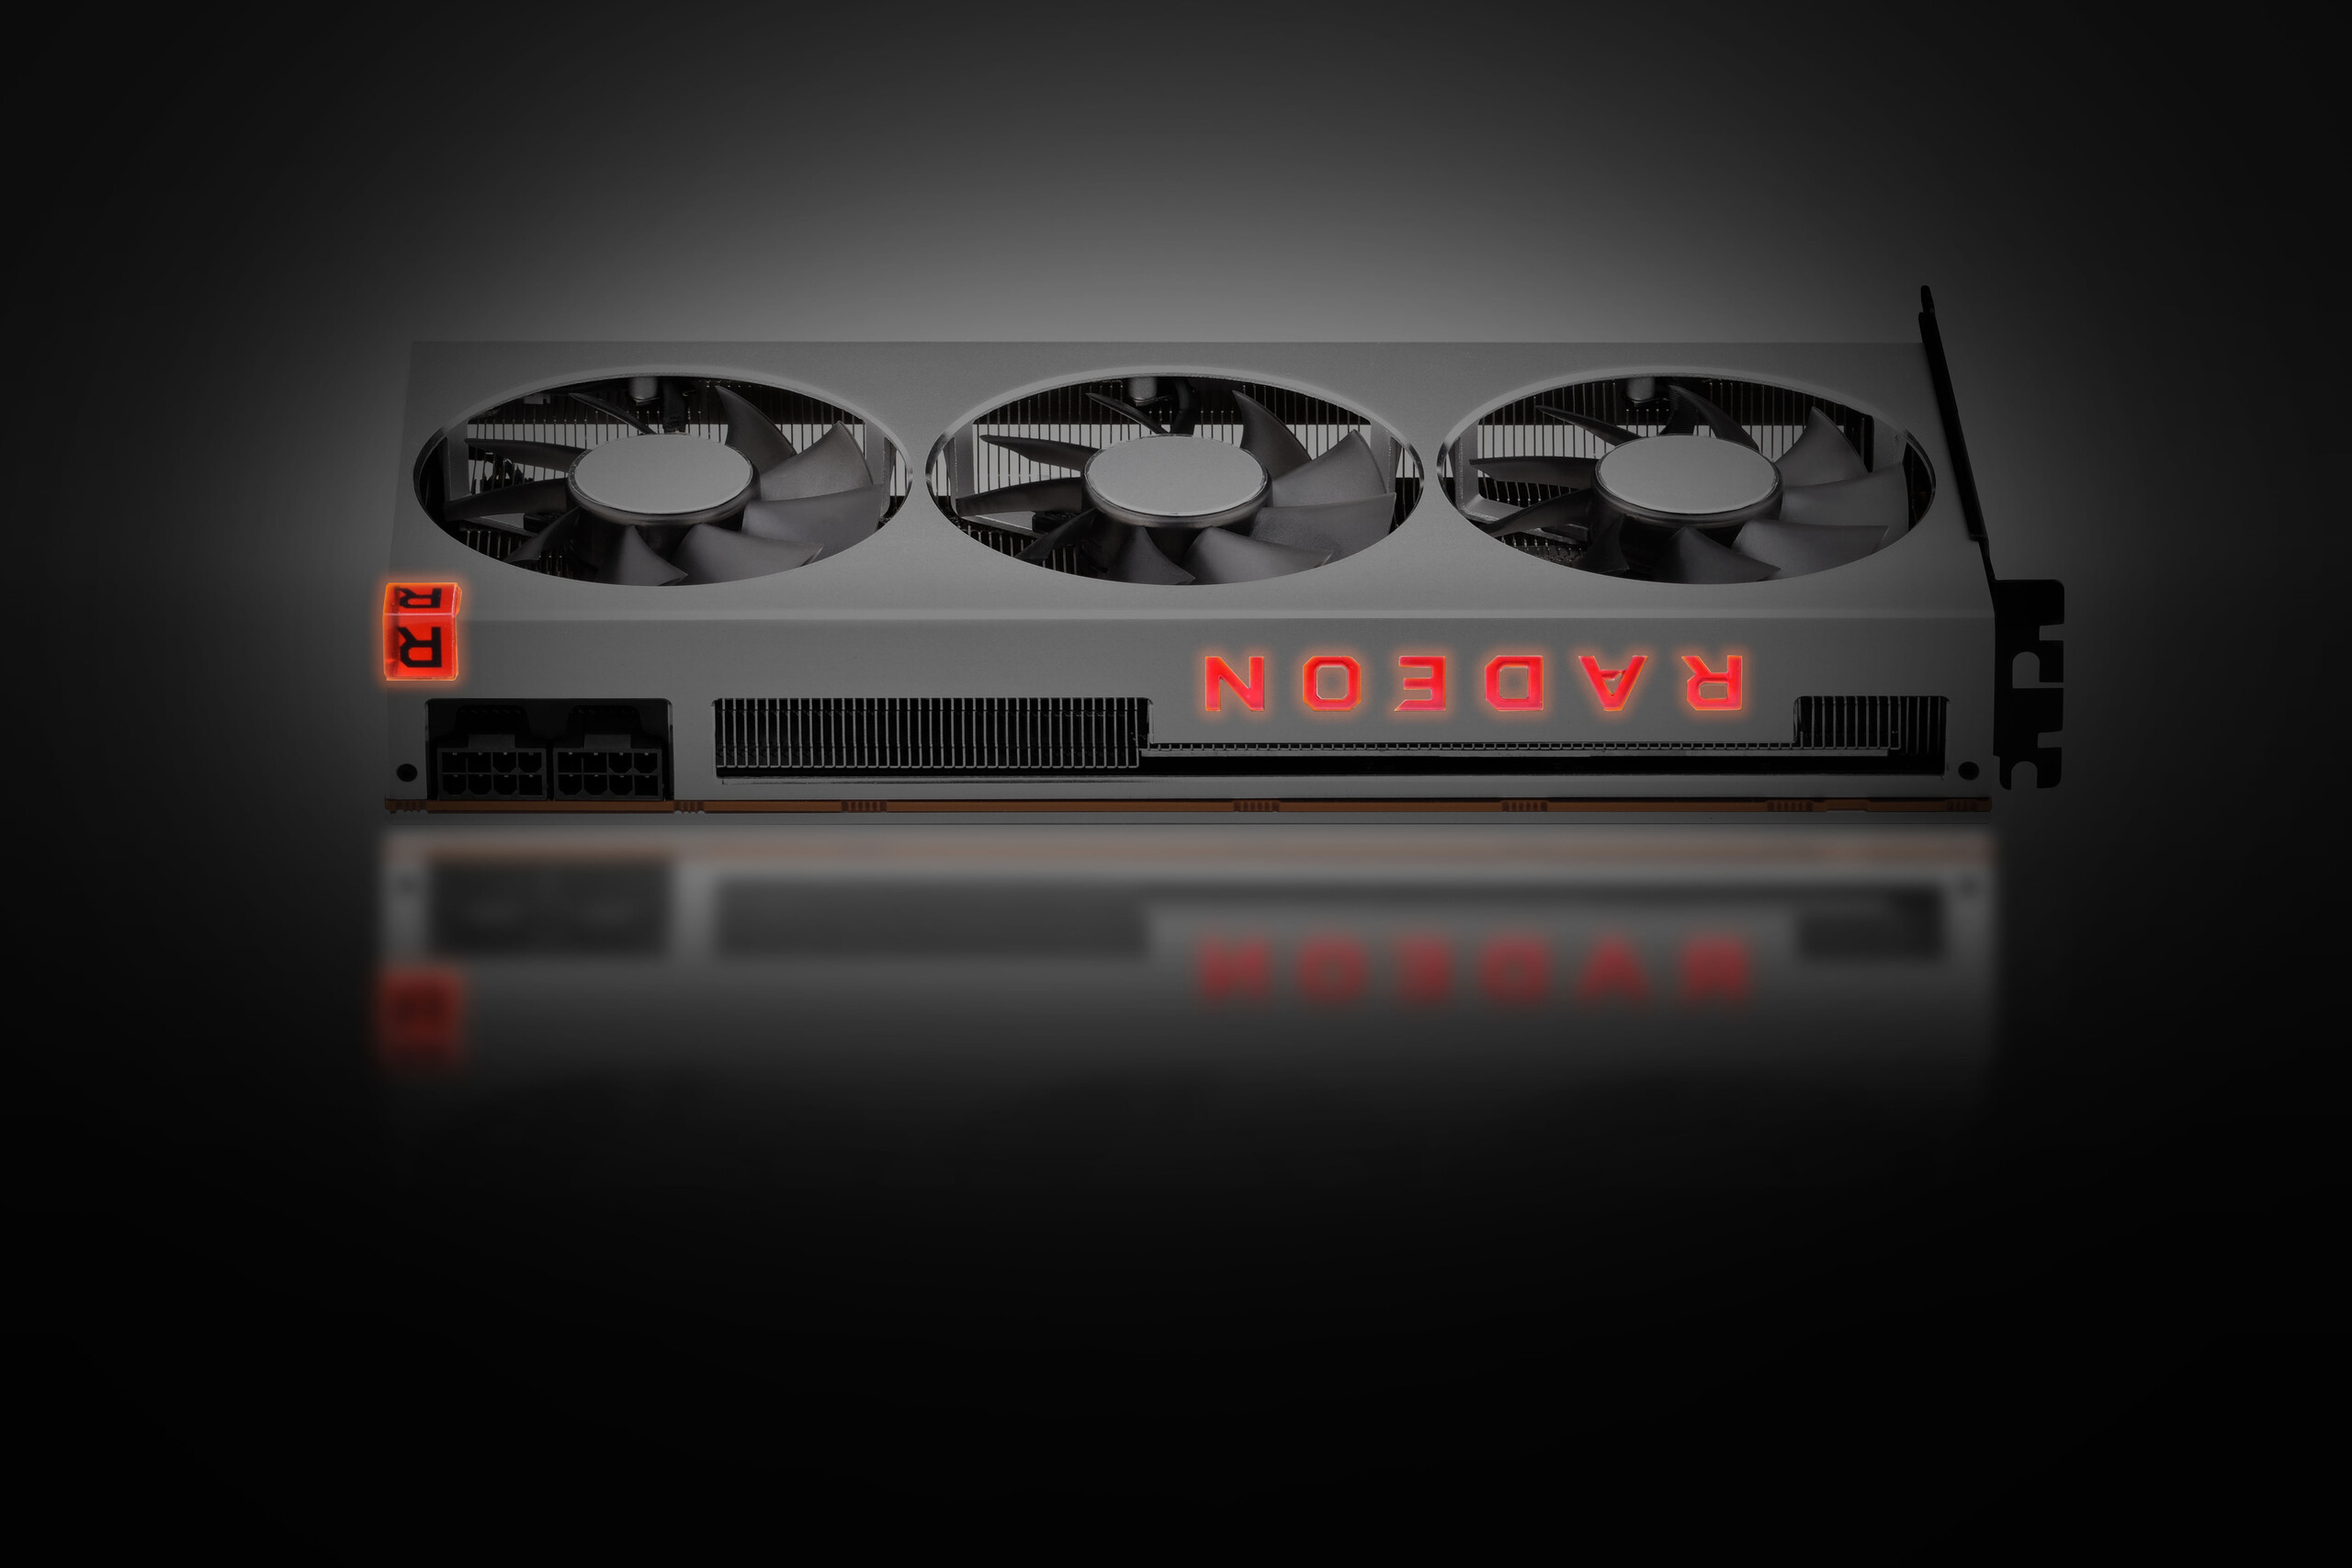
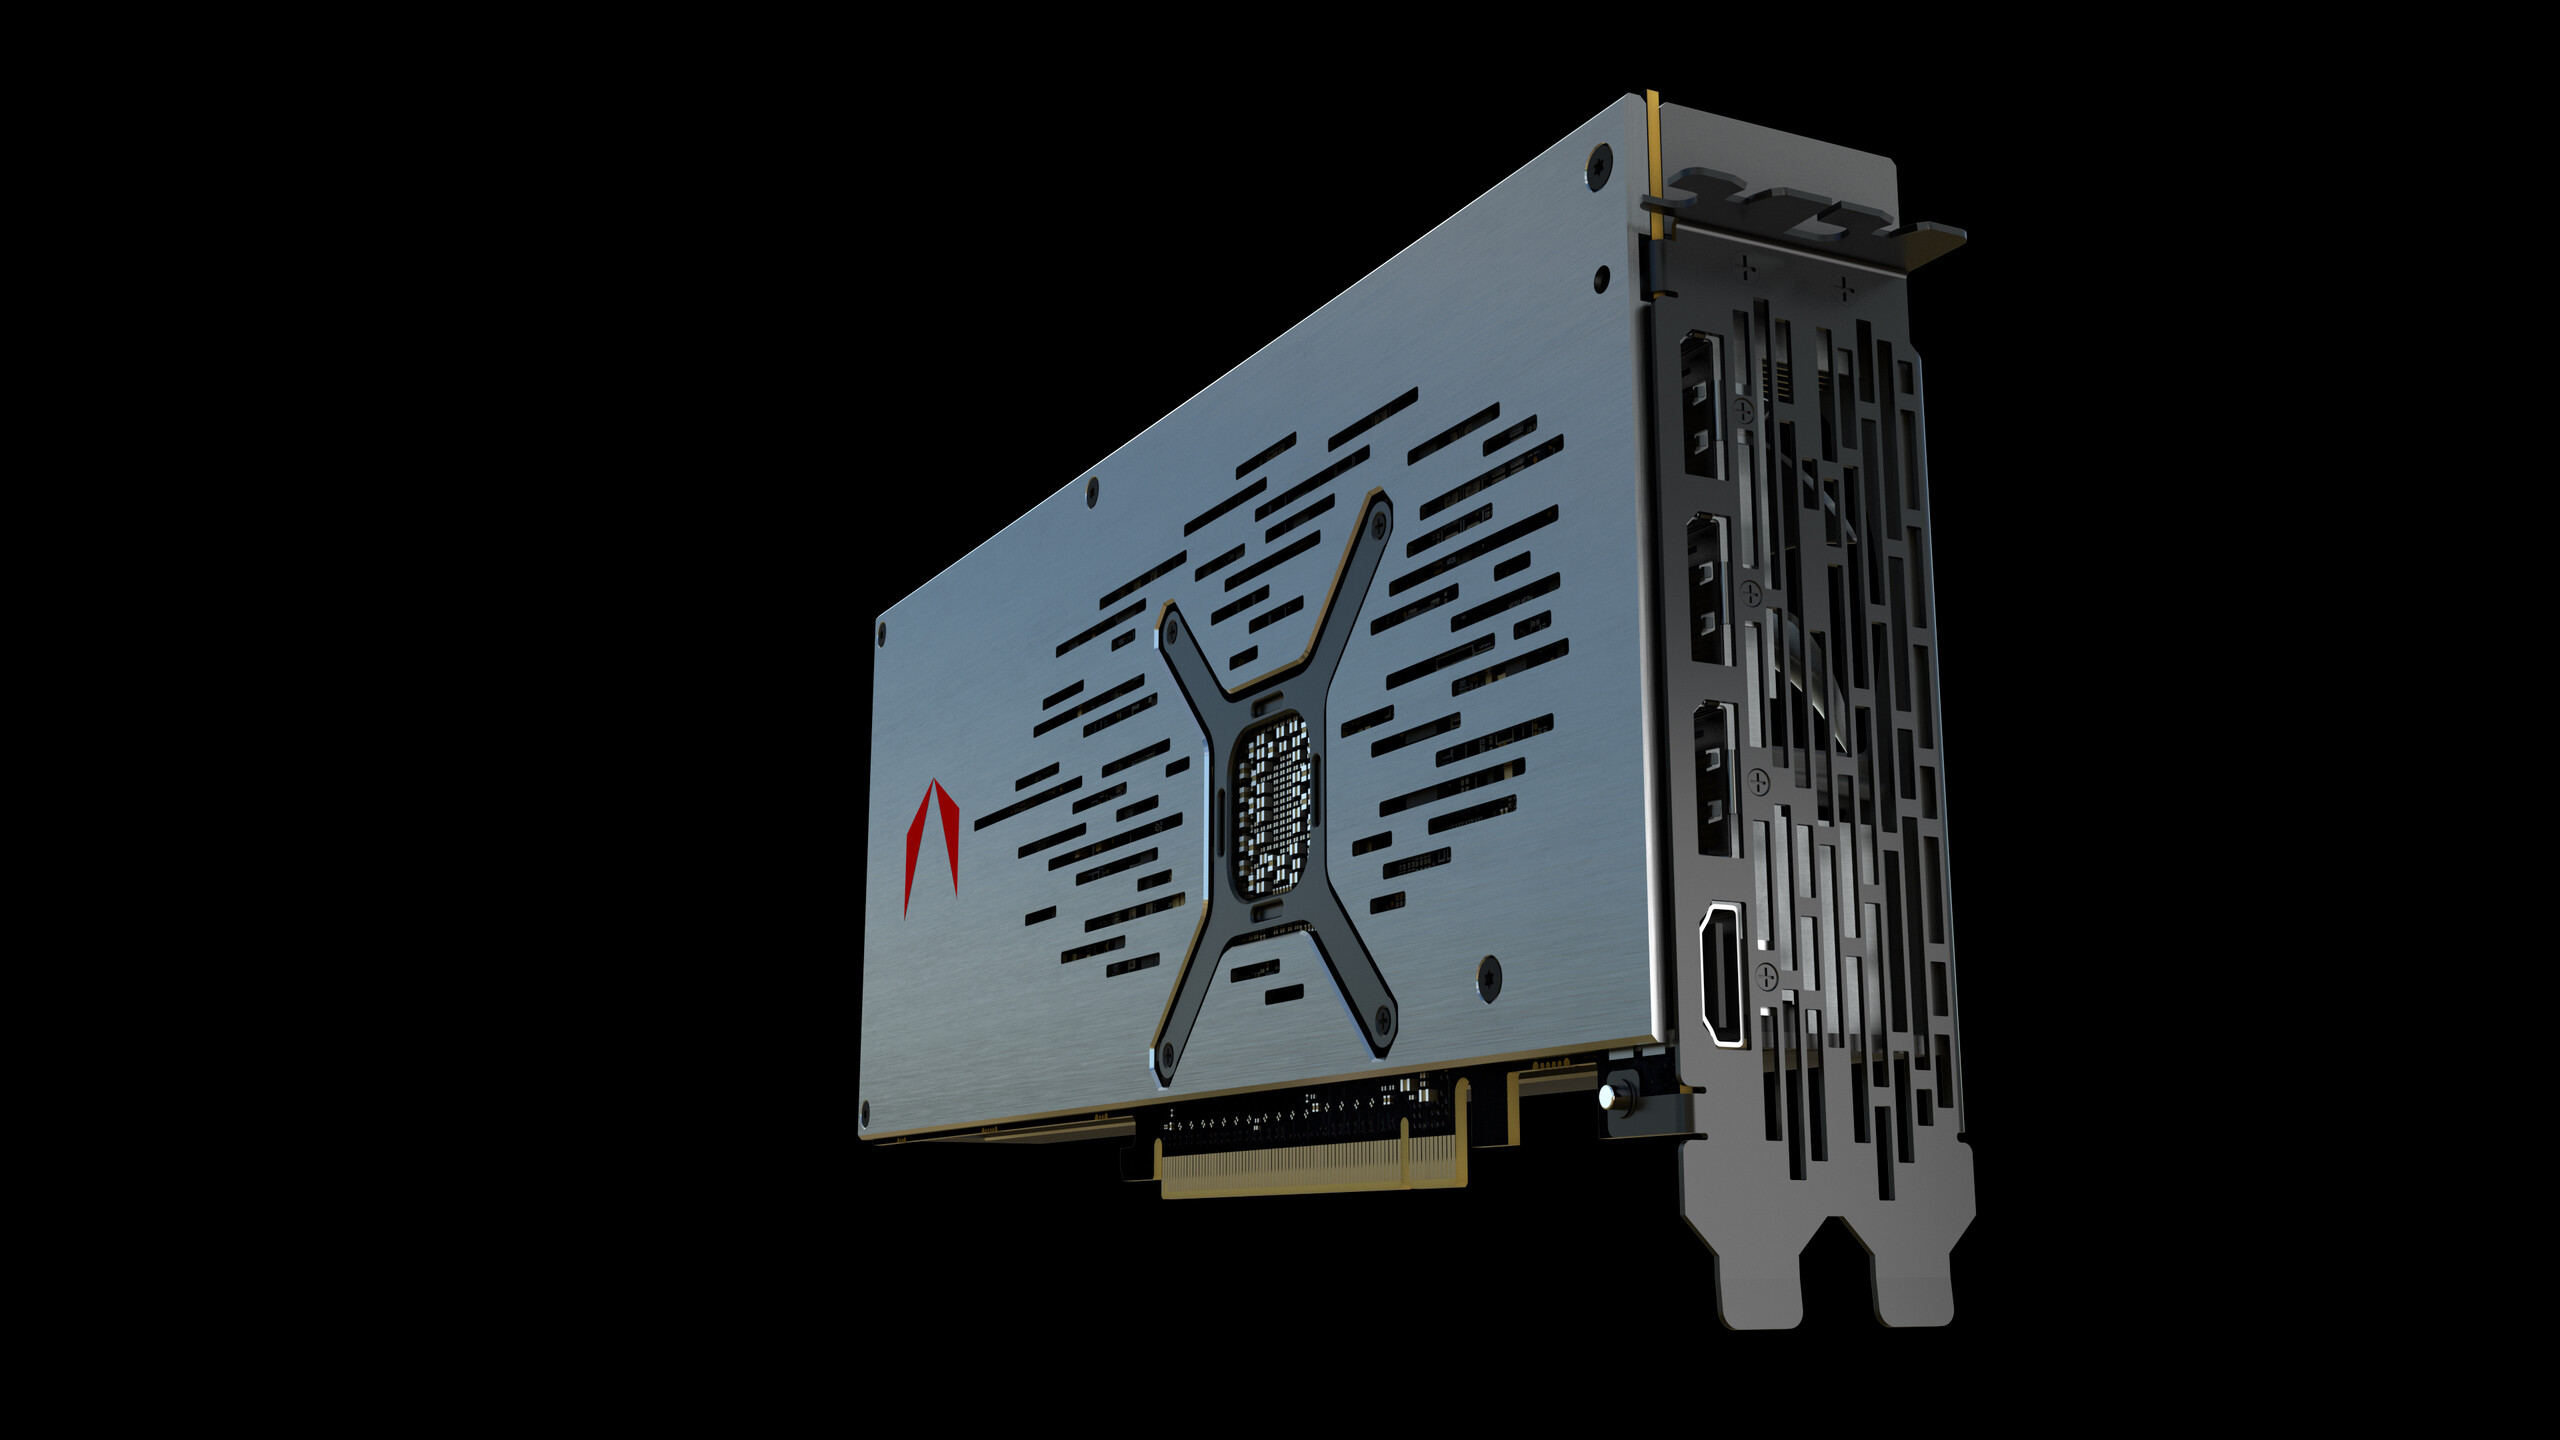
The Radeon VII also has three DisplayPort and one HDMI connections, which are spaced out well. The GPU requires two 8-pin power connectors too.
An overview of GPU specifications
| Specifications | AMD Radeon VII | RX Vega 64 | RTX 2080 Ti | RTX 2080 | RTX 2070 | GTX 1080 Ti |
| Chipset | Vega 20 | Vega 10 | TU102 | TU104 | TU106 | GP102 |
| FinFet process | 7 nm | 14 nm | 12 nm | 12 nm | 12 nm | 16 nm |
| Shader units | 3,840 | 4,096 | 4,352 | 2,944 | 2,304 | 3,584 |
| Texture Units | 240 | 256 | 272 | 184 | 144 | 224 |
| Tensor Cores | - | - | 544 | 368 | 288 | - |
| RT Cores | - | - | 68 | 46 | 36 | - |
| GPU base clock | 1,400 MHz | 1,200 MHz | 1,350 MHz | 1,515 MHz | 1,410 MHz | 1,481 MHz |
| GPU boost clock | 1,750 MHz | 1,536 MHz | 1,545 MHz | 1,710 MHz | 1,620 MHz | 1,582 MHz |
| Memory Bus | 4,096 Bit | 2,048 Bit | 352 Bit | 256 Bit | 256 Bit | 352 Bit |
| Memory Bandwidth | 1,024 GB/s | 483.8 GB/s | 616 GB/s | 448 GB/s | 448 GB/s | 484.4 GB/s |
| Memory Size | 16 GB HBM2 | 8 GB HBM2 | 11 GB GDDR6 | 8 GB GDDR6 | 8 GB GDDR6 | 11 GB GDDR5X |
| Power consumption | 300 W | 295 W | 250 W | 215 W | 175 W | 215 W |
The Test System
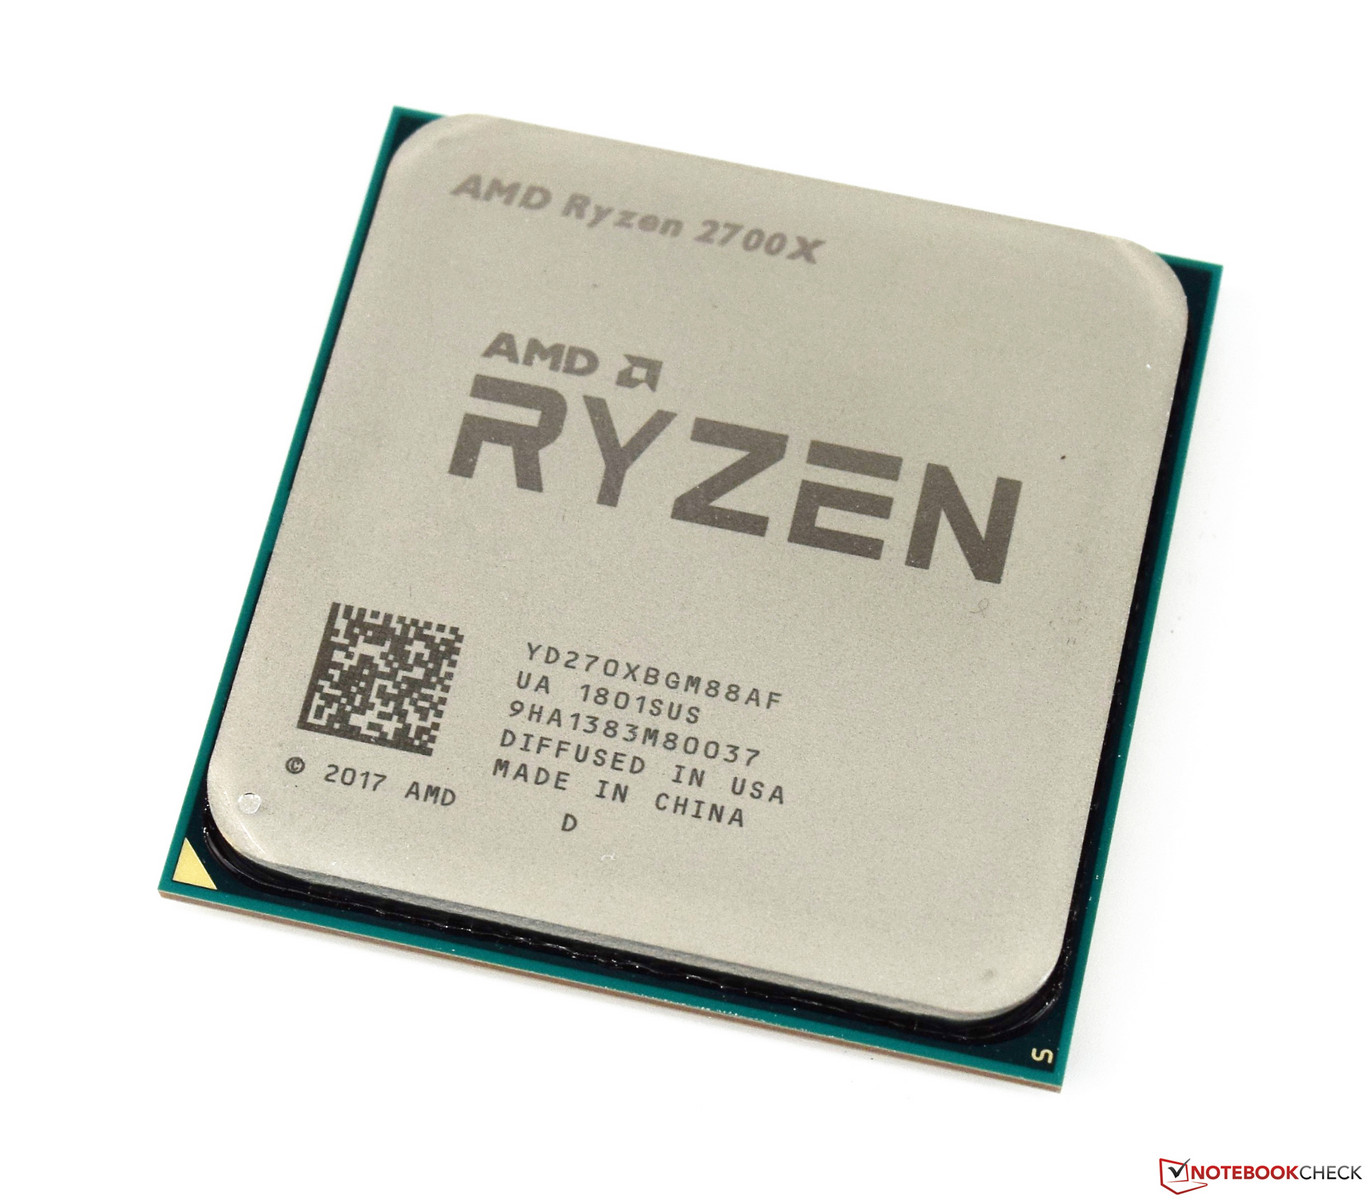
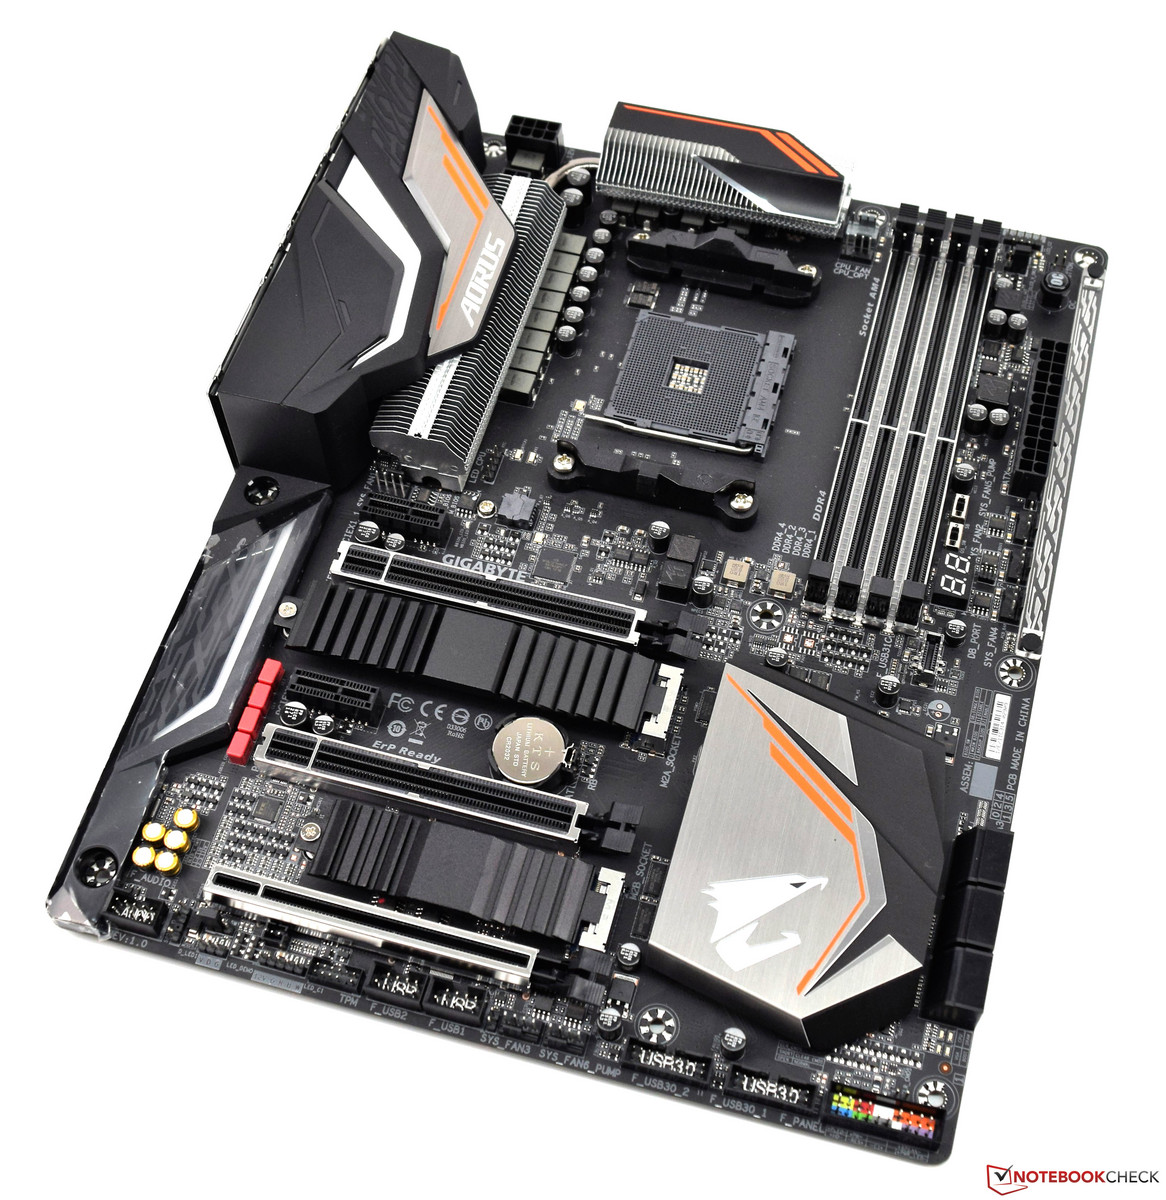
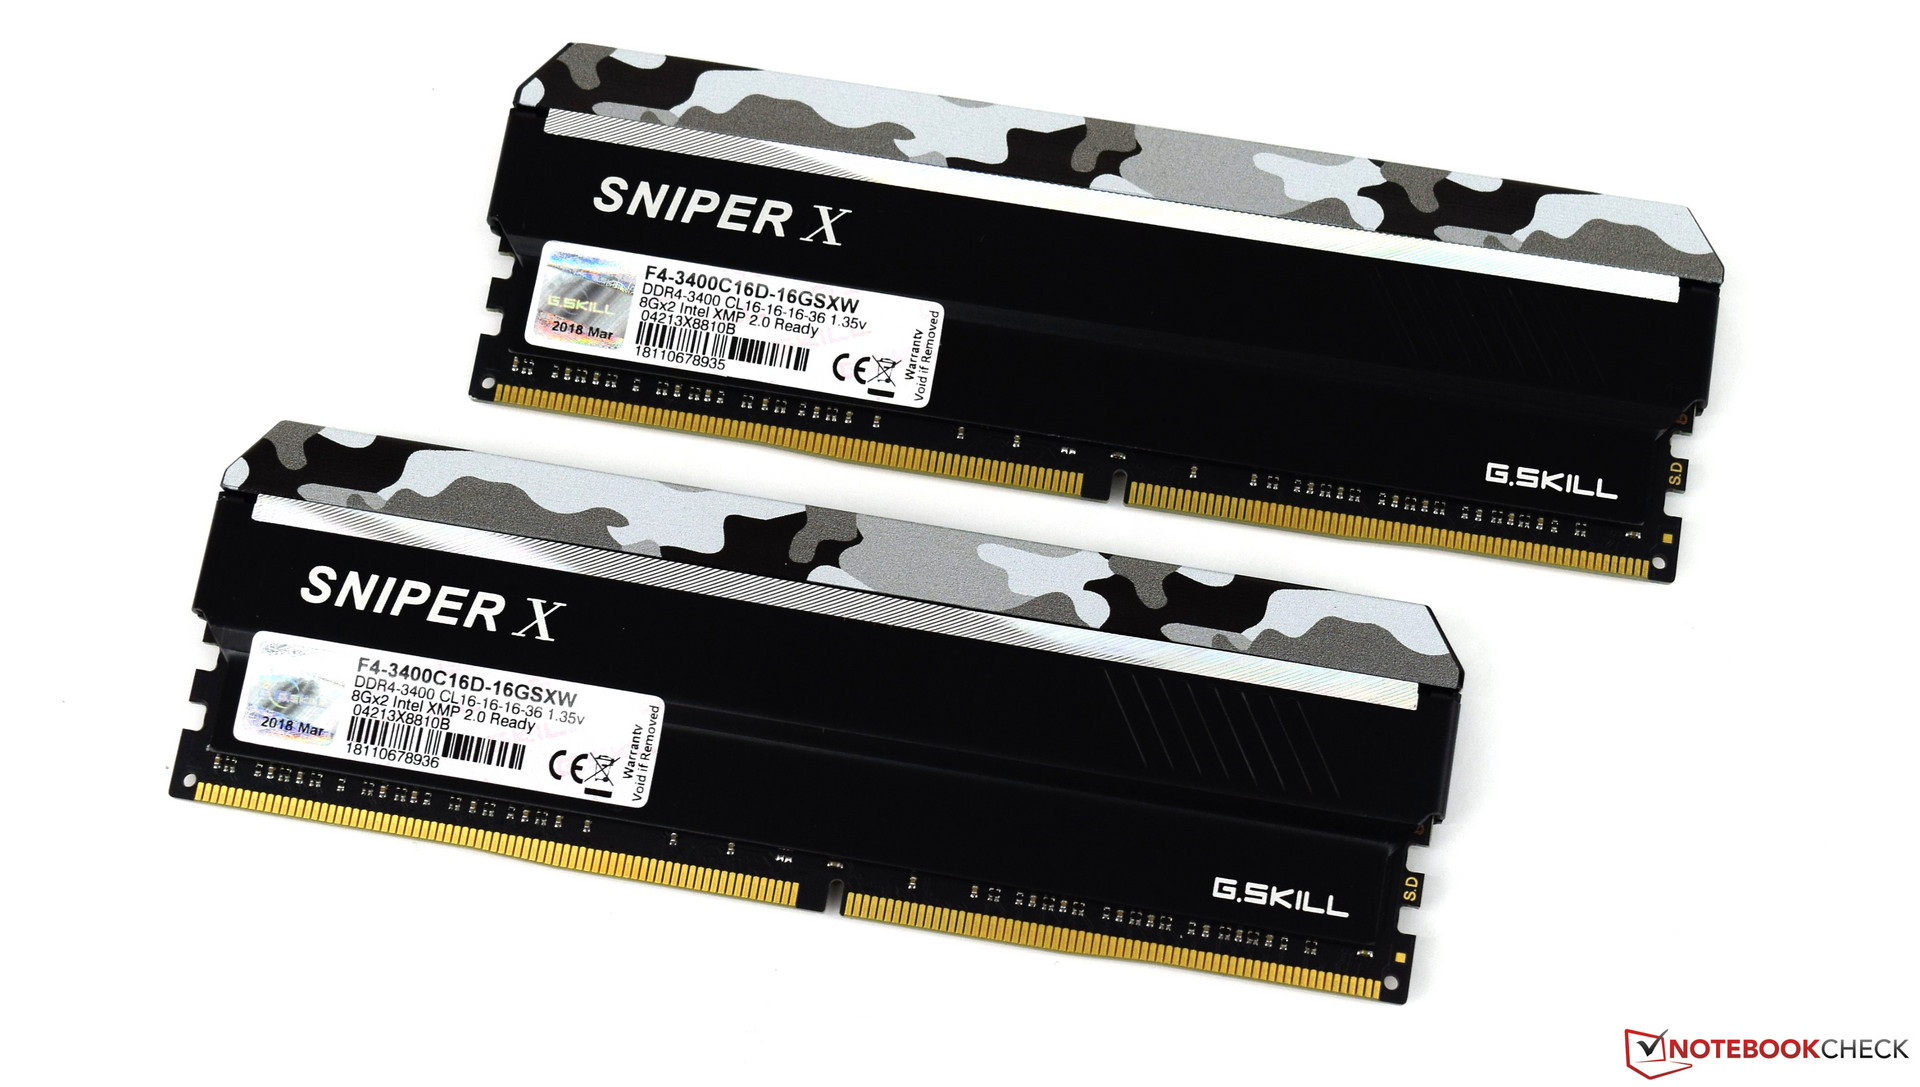
We based our test system on the Gigabyte X470 Aorus Gaming 7 Wi-Fi that we paired with an AMD Ryzen 7 2700X, which offers good CPU performance for the money. We also equipped the system with a Be Quiet Silent Loop 280 mm AIO and 16 GB of G-Skill RAM that clocks at 3,400 MHz. We also used an Acer Predator XB321HK monitor so that we could test games at 4K.
A big thank you to AMD for kindly providing us with our test platform.
| Case | Corsair Carbide Air 540 ATX Cube |
| GPU | AMD Radeon VII |
| CPU | AMD Ryzen 7 2700X |
| CPU cooler | Be Quiet Silent Loop 280 mm |
| RAM | G-Skill Sniper X 16 GB DDR4 3,400 MHz |
| Motherboard | Gigabyte X470 Aorus Gaming 7 WiFi |
| Monitor | Acer Predator XB321HK 4K |
| SSD | ADATA SP900 M.2 SSD |
| HDD | 2 TB Western Digital for installing games |
| OS | Microsoft Windows 10 Professional 64-Bit (Version 1809) |
| Drivers | Adrenalin 19.2.2 |
The Radeon VII is currently AMD’s flagship desktop GPU and has a 1,400 MHz base clock speed that can boost to 1,750 MHz when required. The card also has 60 CUs, 16 GB of HBM2 VRAM, a 4,096 memory bus and a 1,024 GB/s memory bandwidth. The GPU also has a significantly smaller die than its 14 nm predecessors, but AMD has crammed 13.2 billion transistors onto the Radeon VII compared to the 12.5 billion with which it equipped the Radeon RX Vega 64. The former also has 3,840 shader units but does not support raytracing or tensor cores like NVIDIA RTX 20 series GPUs do. It is worth keeping in mind that the Radeon VII is rated to consume 300 W, which is 5 W higher than its predecessor and 50 W more than the RTX 2080 Ti.
The Radeon VII should deliver significantly better performance in games than the Radeon RX Vega 64 and ought to perform on par with the NVIDIA GeForce RTX 2080. In short, you should have no issues with playing modern triple-A games at 4K with the Radeon VII.
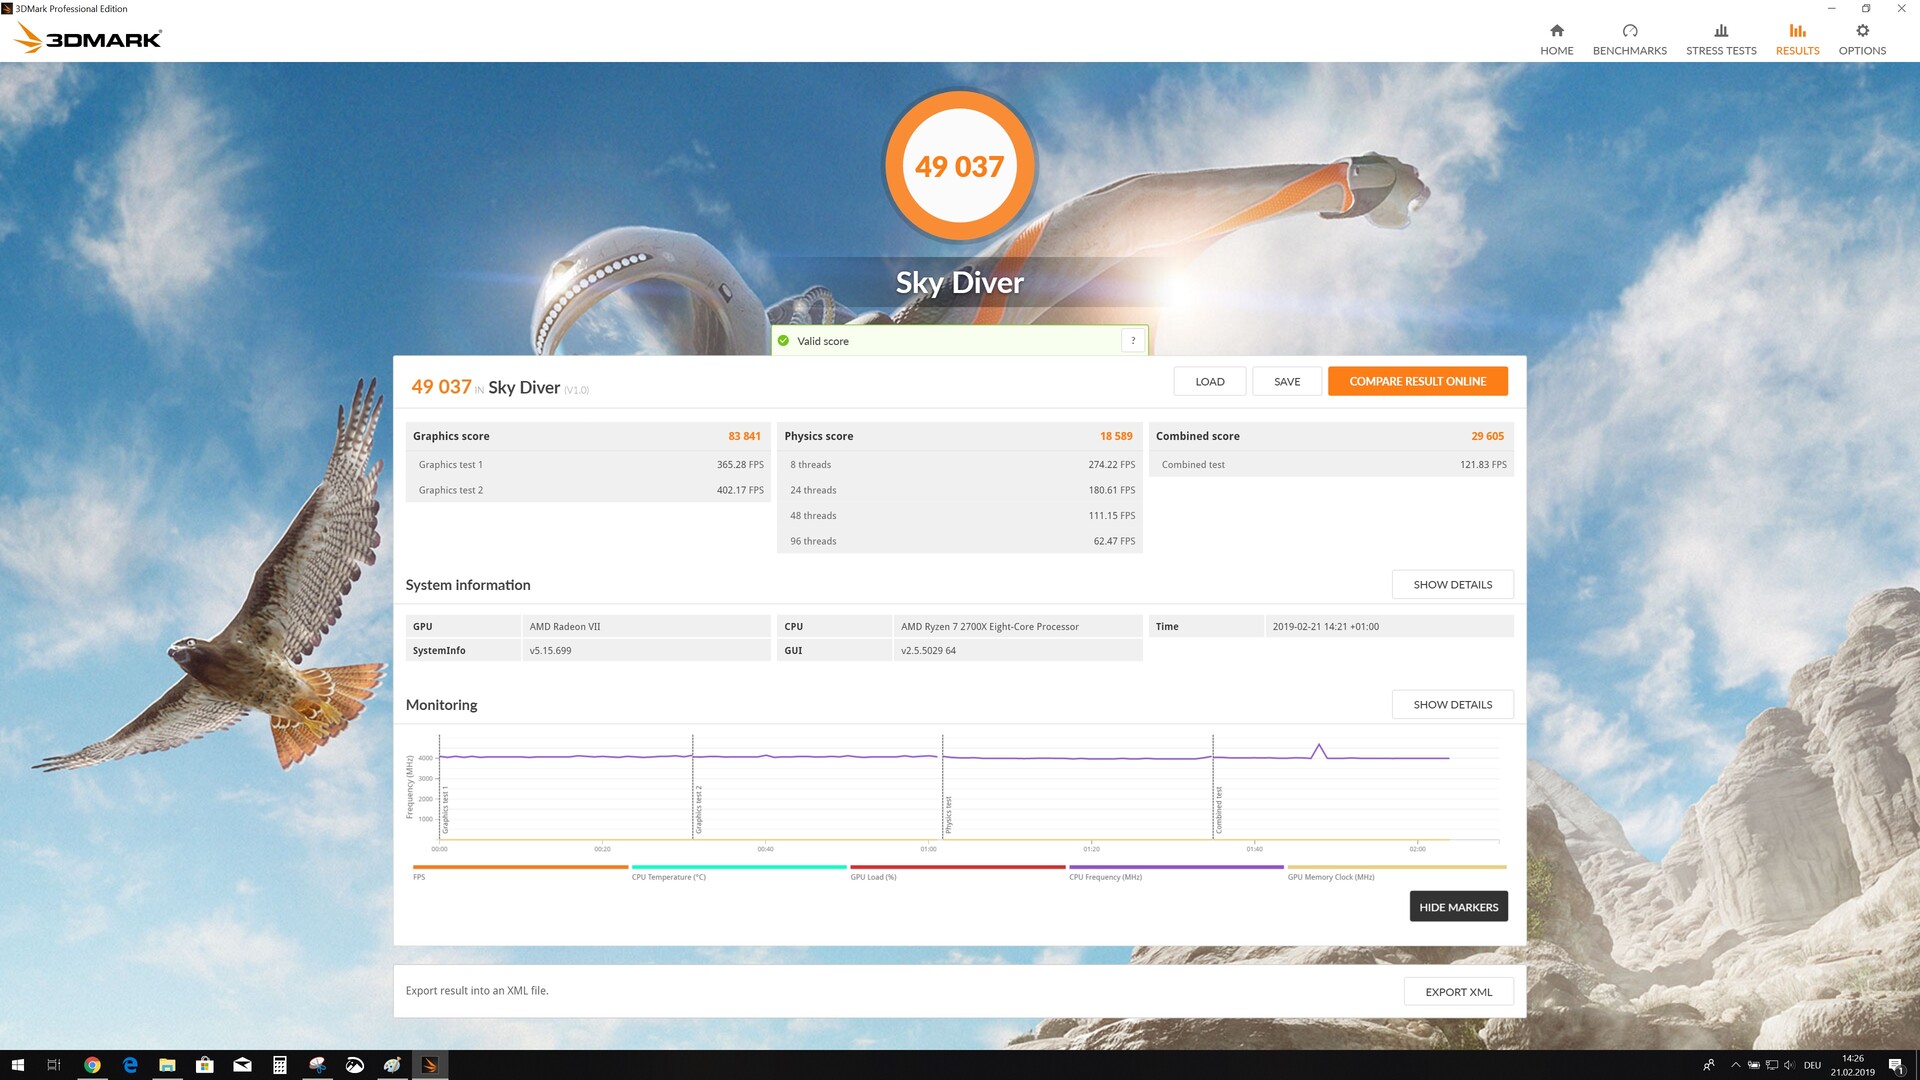
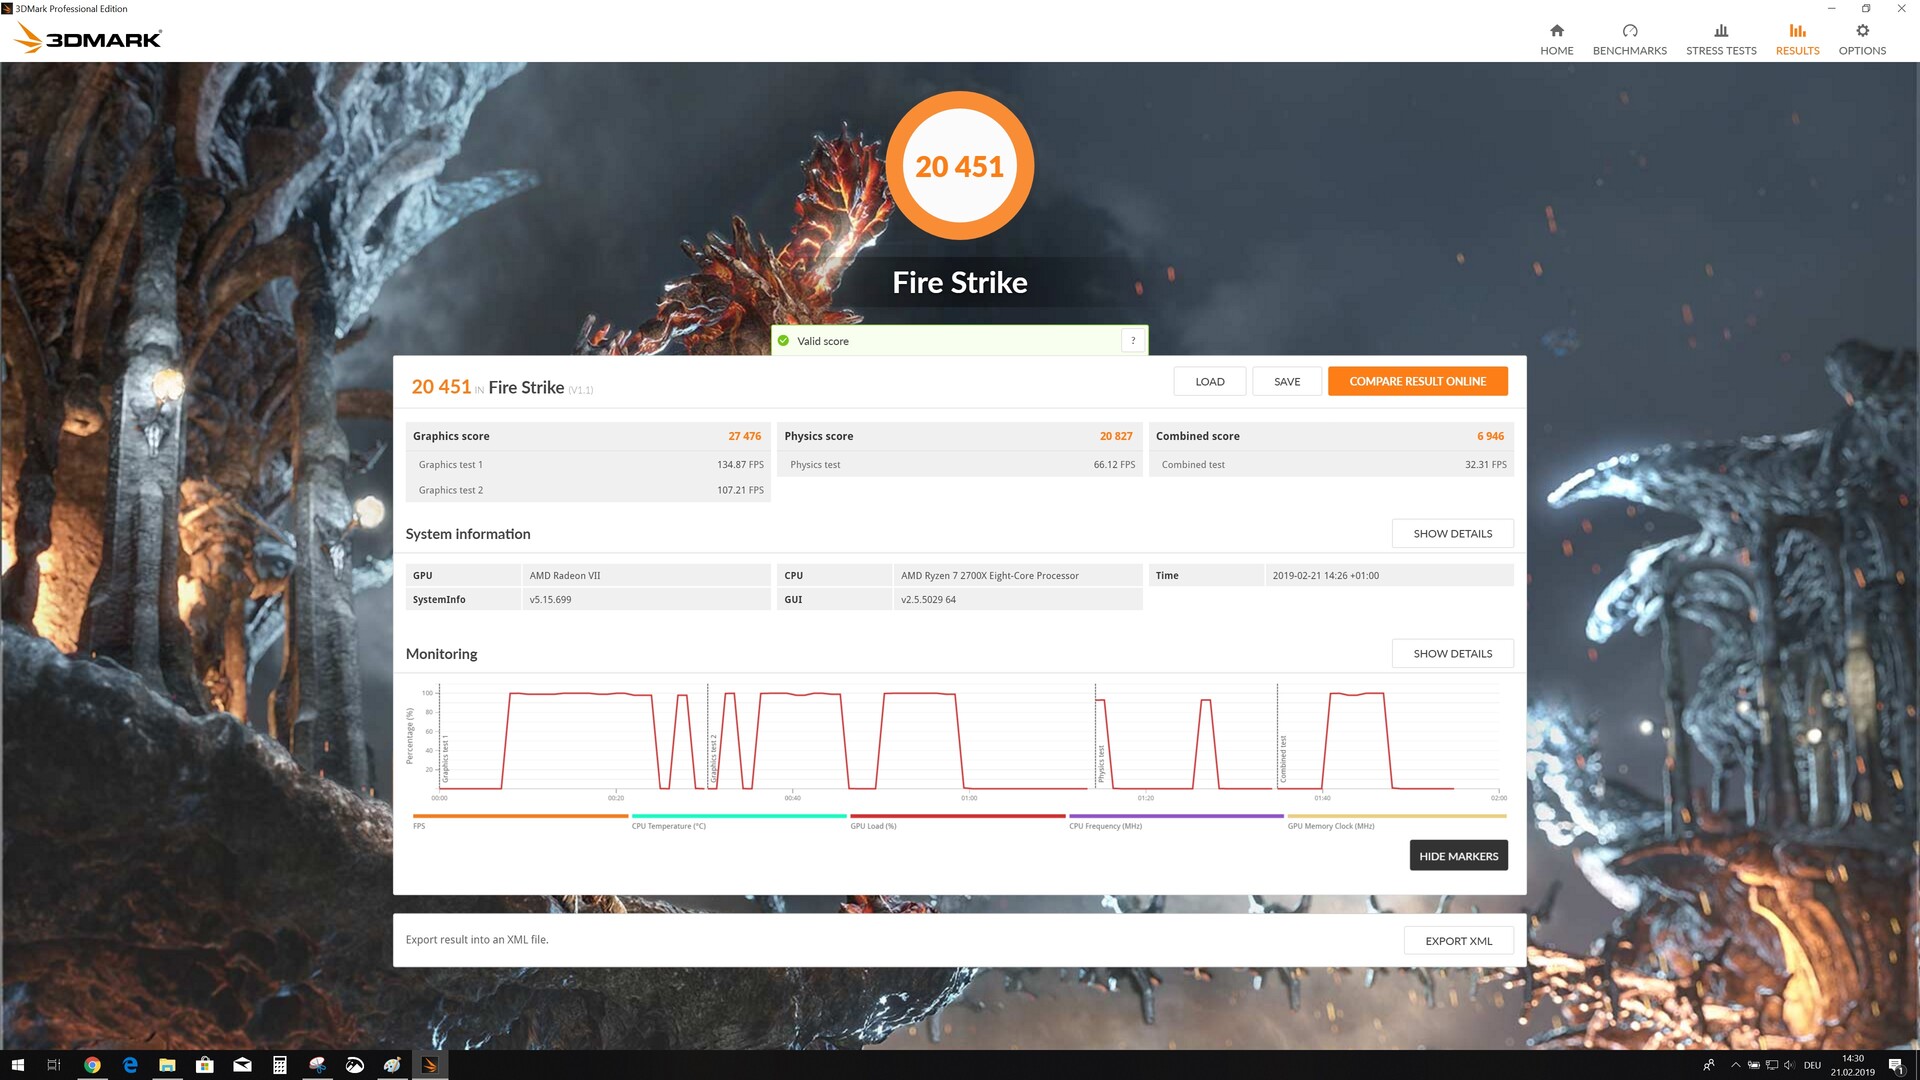
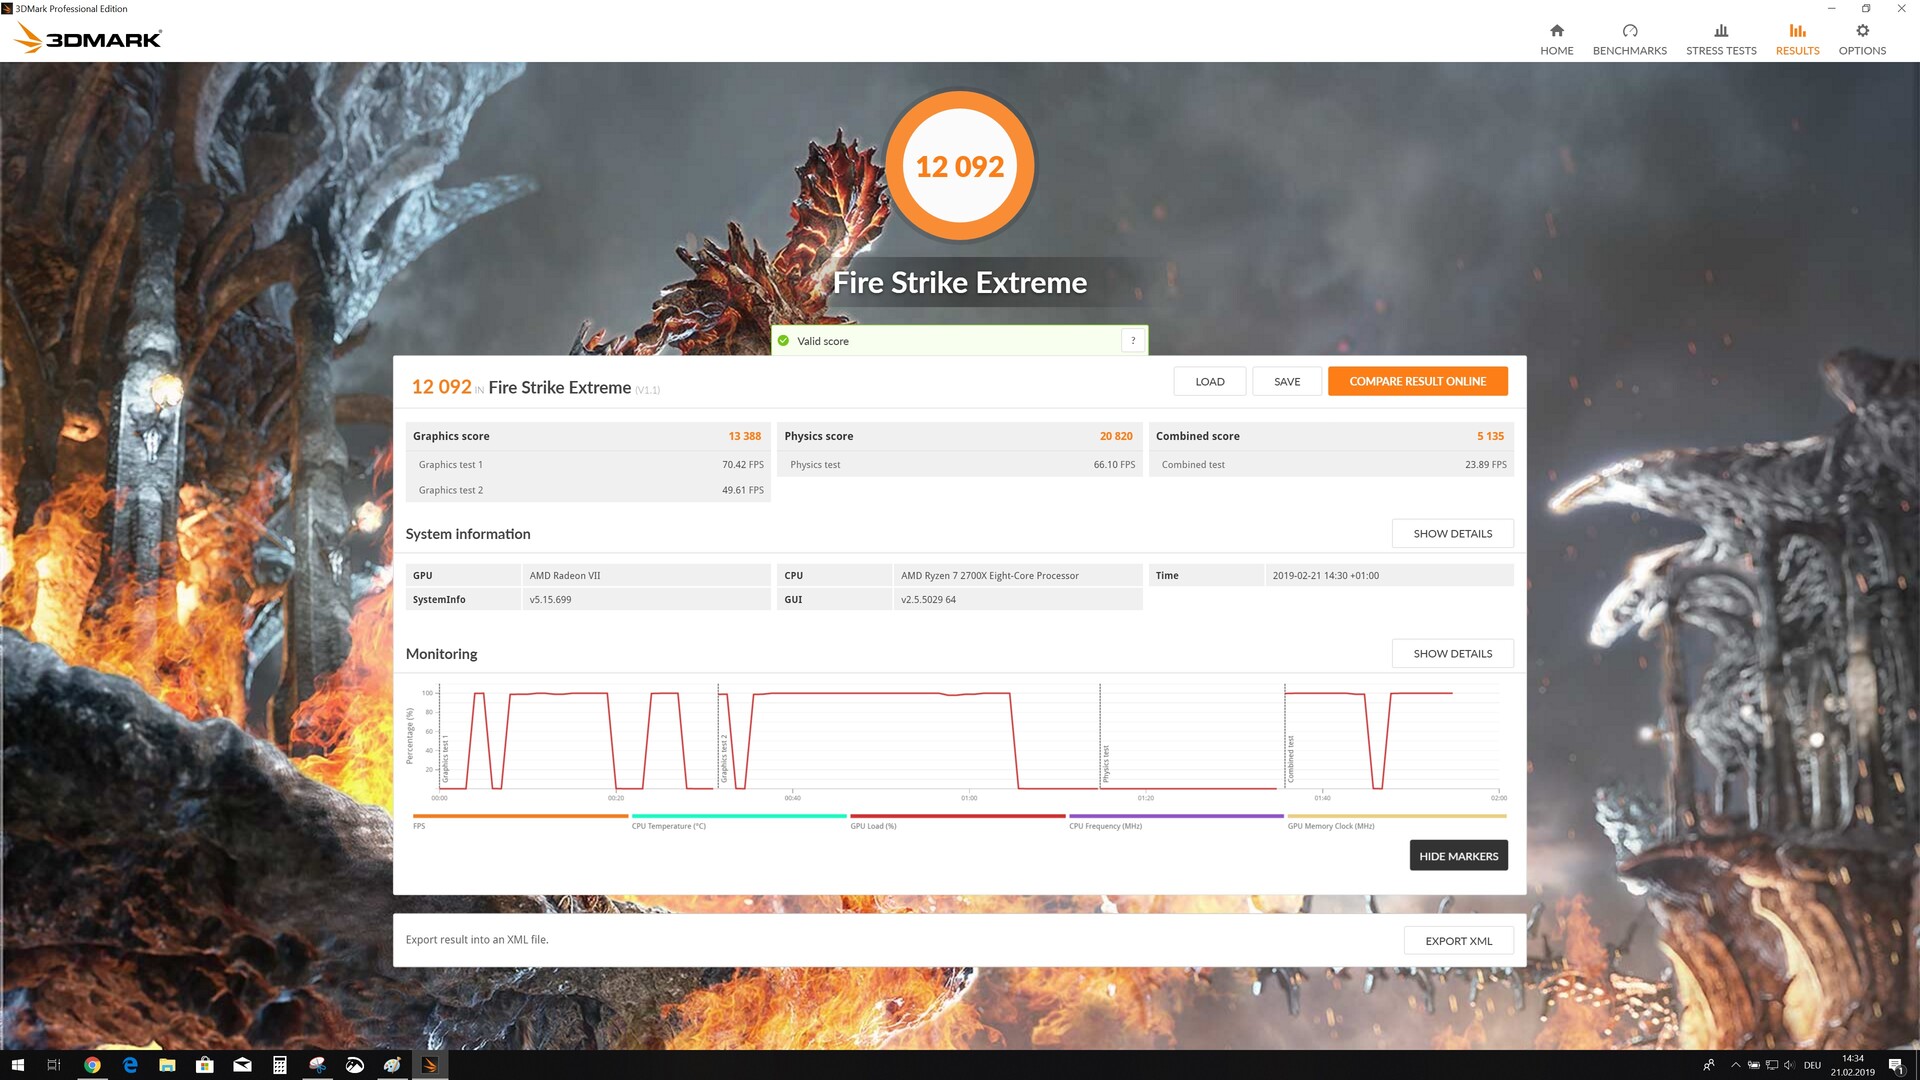
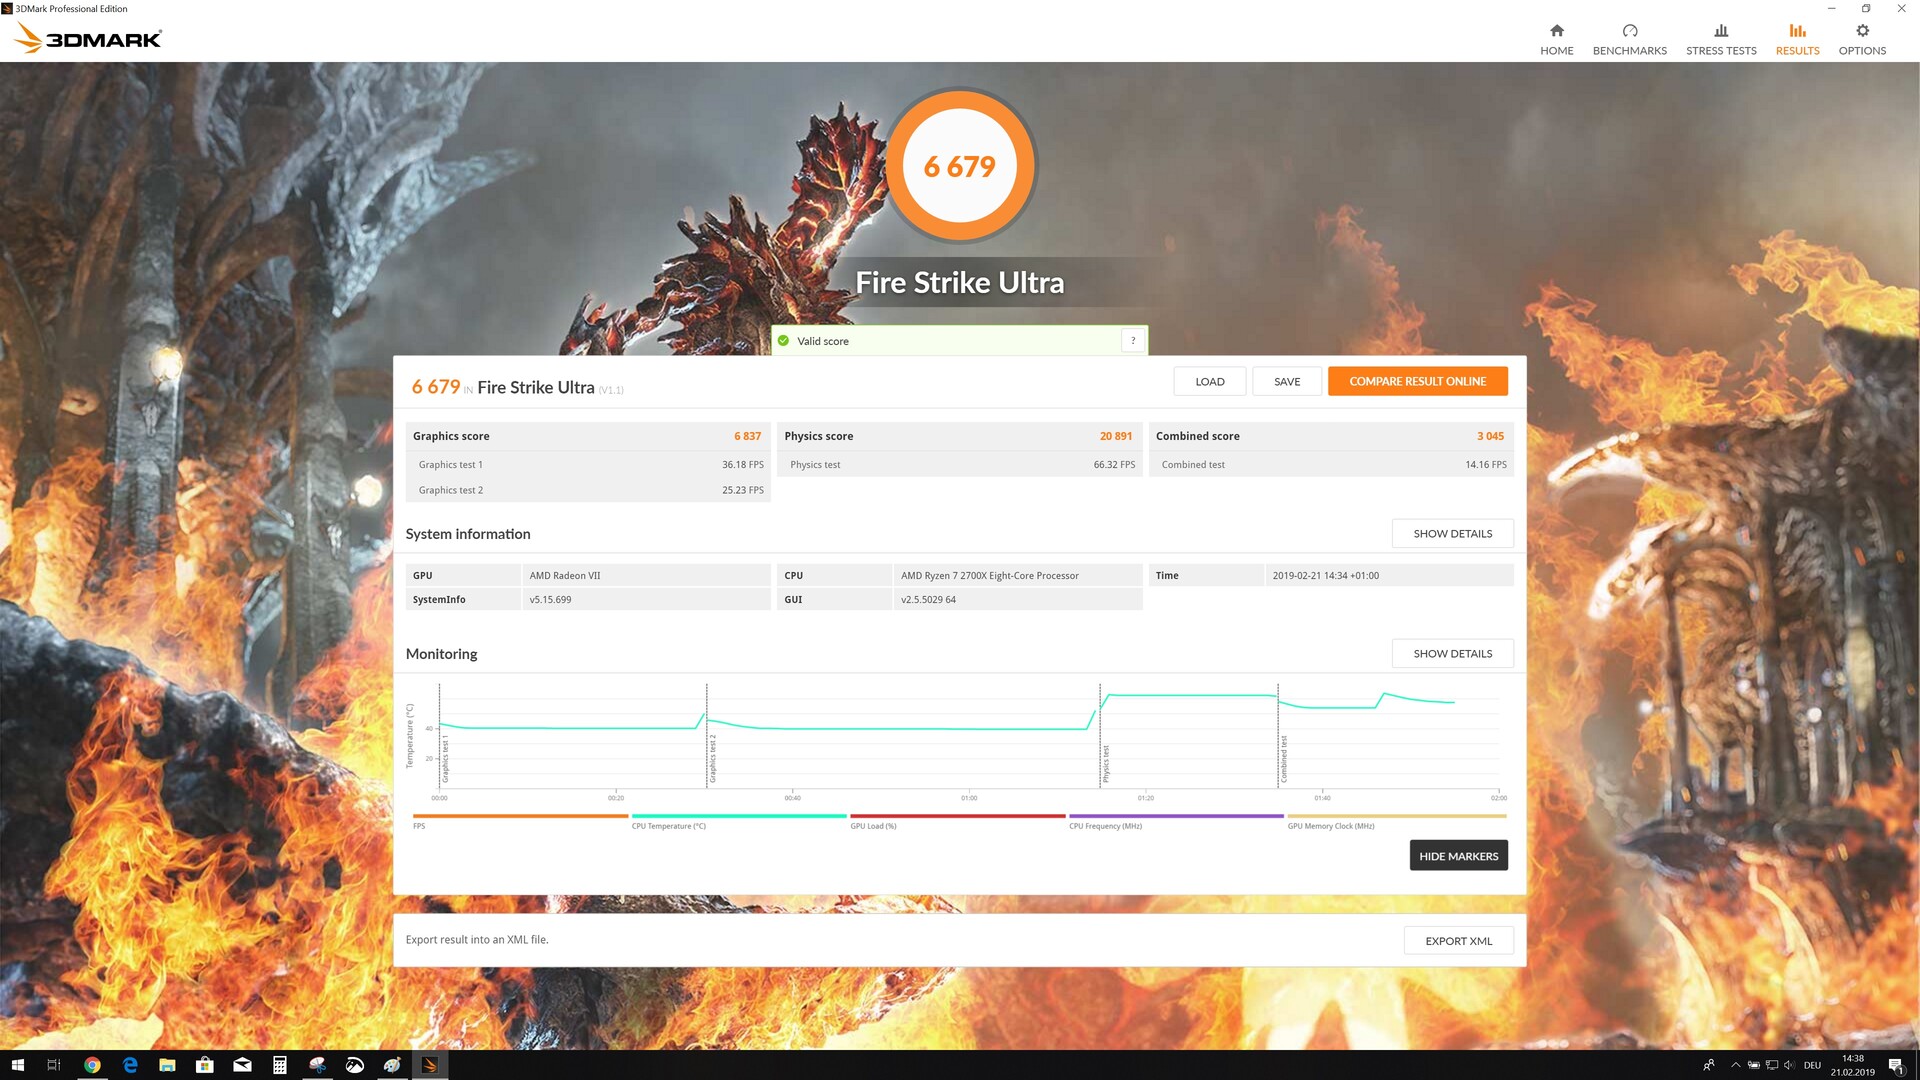
Synthetic Benchmarks
The Radeon VII performed on par with the ASUS ROG Strix RTX 2080 OC in synthetic benchmarks and at least 20% better than the Radeon RX Vega 64. Likewise, the GPU blows away the Radeon RX 590 and the RX 580. Hence, the Radeon VII is currently the fastest graphics card in the red corner, but it is way off the NVIDIA Titan RTX and even falls short of the Titan X Pascal.
| 3DMark 11 - 1280x720 Performance GPU | |
| NVIDIA Titan RTX | |
| NVIDIA GeForce RTX 2080 (Desktop) | |
| NVIDIA GeForce GTX 1080 Ti (Desktop) | |
| AMD Radeon VII | |
| NVIDIA GeForce GTX 1080 (Desktop) | |
| NVIDIA GeForce RTX 2070 (Desktop) | |
| NVIDIA GeForce GTX 1080 (Desktop) | |
| AMD Radeon RX Vega 64 | |
| NVIDIA Titan X Pascal | |
| NVIDIA GeForce GTX 1070 (Desktop) | |
| AMD Radeon RX 590 (Desktop) | |
| AMD Radeon RX 580 (Desktop) | |
| AMD Radeon RX 580 (Desktop) | |
| NVIDIA GeForce GTX 1060 (Desktop) | |
| Unigine Heaven 4.0 | |
| Extreme Preset DX11 | |
| NVIDIA Titan RTX | |
| NVIDIA GeForce RTX 2080 (Desktop) | |
| NVIDIA GeForce RTX 2070 (Desktop) | |
| NVIDIA GeForce GTX 1080 (Desktop) | |
| AMD Radeon VII | |
| NVIDIA GeForce GTX 1080 (Desktop) | |
| NVIDIA GeForce GTX 1070 (Desktop) | |
| NVIDIA GeForce GTX 1060 (Desktop) | |
| AMD Radeon RX 590 (Desktop) | |
| AMD Radeon RX 580 (Desktop) | |
| AMD Radeon RX 580 (Desktop) | |
| Extreme Preset OpenGL | |
| NVIDIA Titan RTX | |
| NVIDIA GeForce RTX 2080 (Desktop) | |
| NVIDIA GeForce RTX 2070 (Desktop) | |
| AMD Radeon VII | |
| AMD Radeon RX 590 (Desktop) | |
| AMD Radeon RX 580 (Desktop) | |
| Unigine Valley 1.0 | |
| 1920x1080 Extreme HD DirectX AA:x8 | |
| NVIDIA Titan RTX | |
| NVIDIA GeForce RTX 2080 (Desktop) | |
| NVIDIA GeForce RTX 2070 (Desktop) | |
| NVIDIA GeForce GTX 1080 (Desktop) | |
| AMD Radeon VII | |
| NVIDIA GeForce GTX 1080 (Desktop) | |
| NVIDIA GeForce GTX 1070 (Desktop) | |
| AMD Radeon RX 580 (Desktop) | |
| AMD Radeon RX 590 (Desktop) | |
| AMD Radeon RX 580 (Desktop) | |
| 1920x1080 Extreme HD Preset OpenGL AA:x8 | |
| NVIDIA Titan RTX | |
| NVIDIA GeForce RTX 2080 (Desktop) | |
| NVIDIA GeForce RTX 2070 (Desktop) | |
| NVIDIA GeForce GTX 1080 (Desktop) | |
| AMD Radeon VII | |
| AMD Radeon RX 590 (Desktop) | |
| 3DMark 03 Standard | 136483 points | |
| 3DMark 05 Standard | 34535 points | |
| 3DMark 06 Standard Score | 35659 points | |
| 3DMark Vantage P Result | 62128 points | |
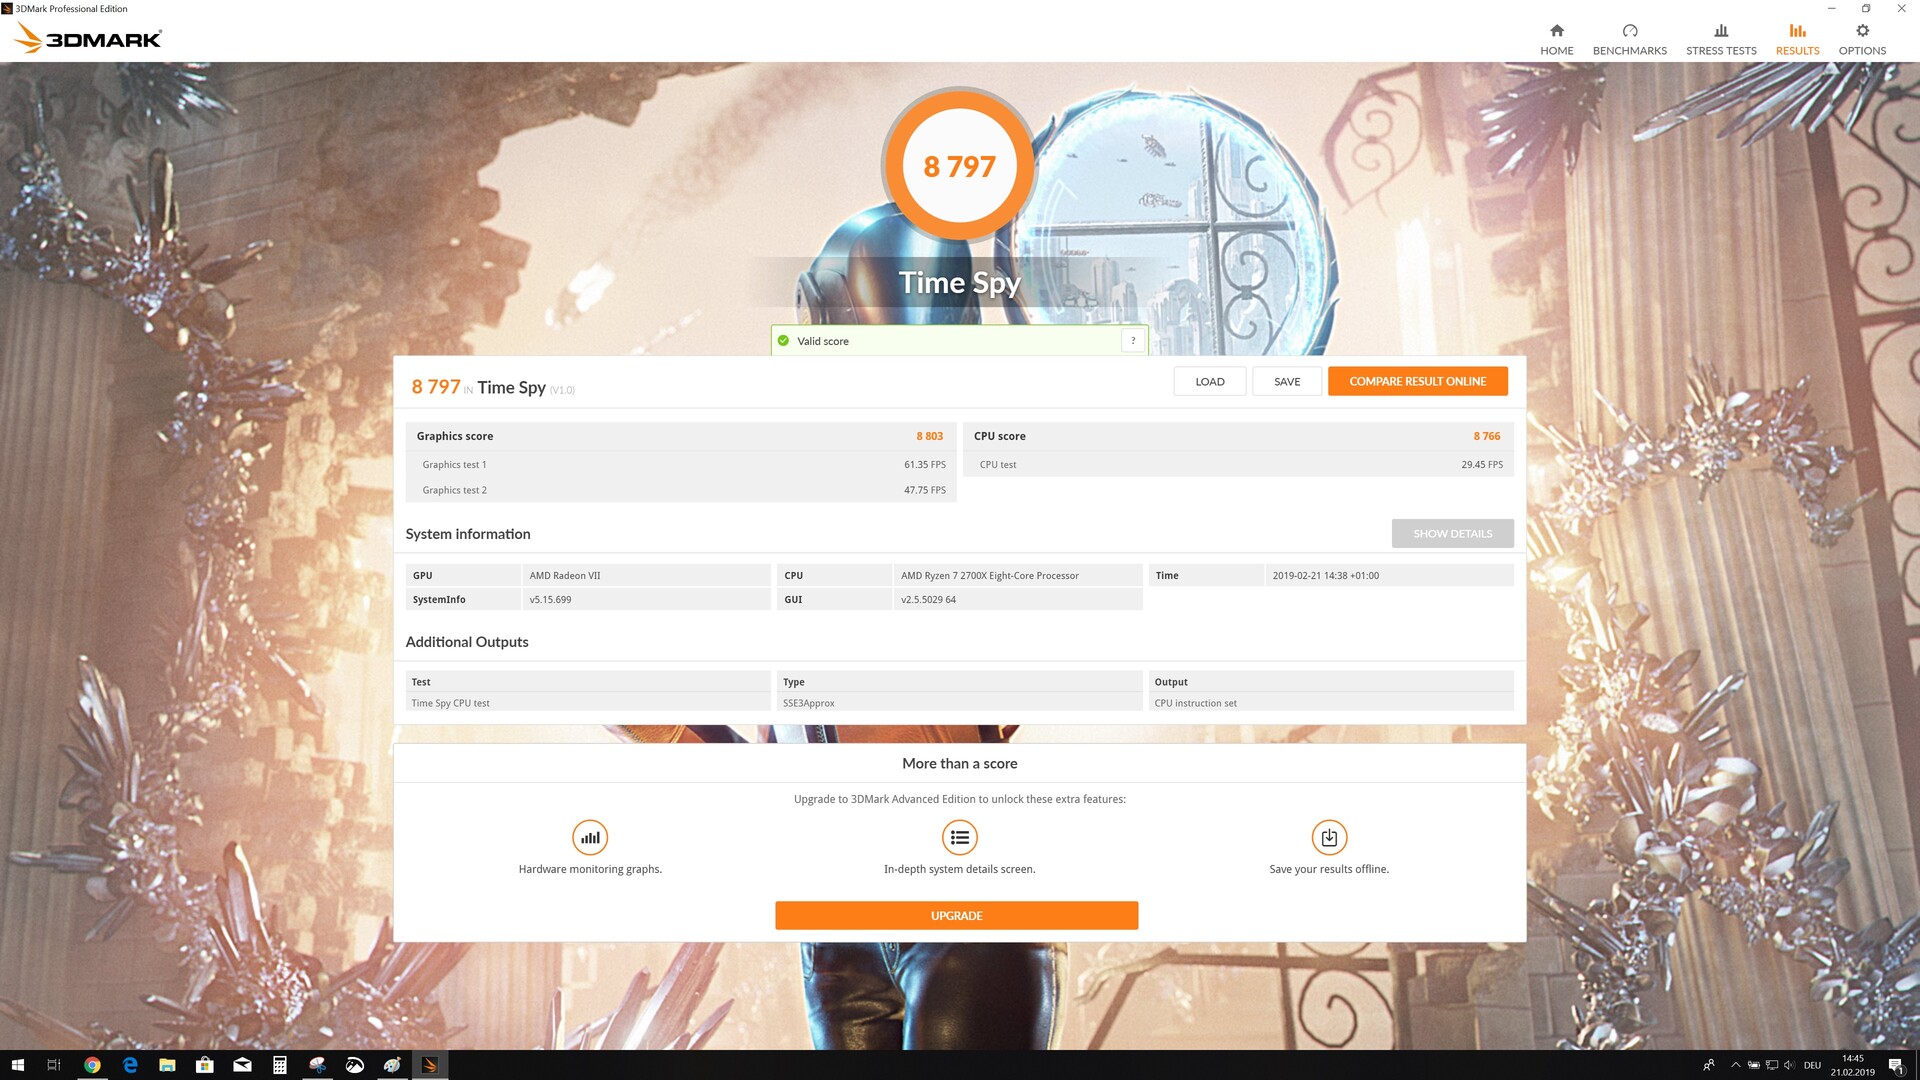
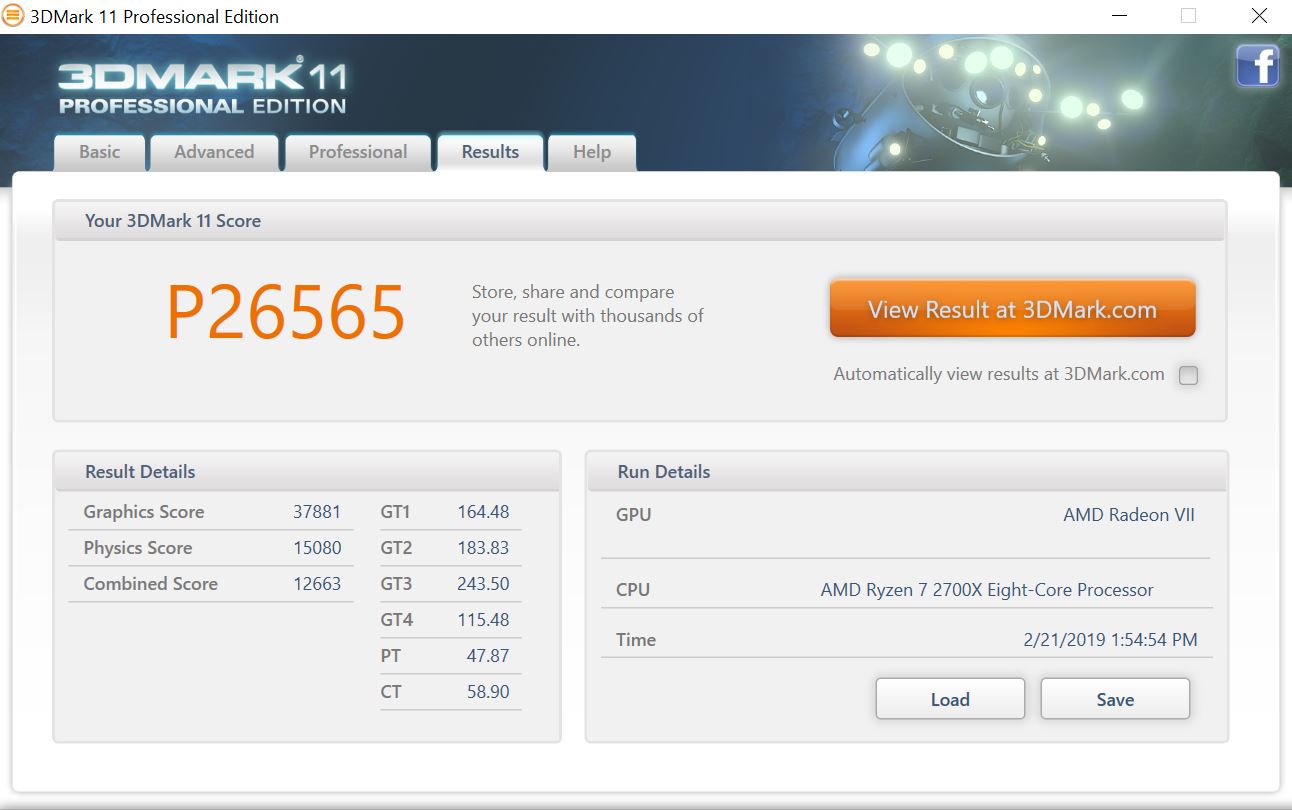
| 3DMark 11 Performance | 26565 points | |
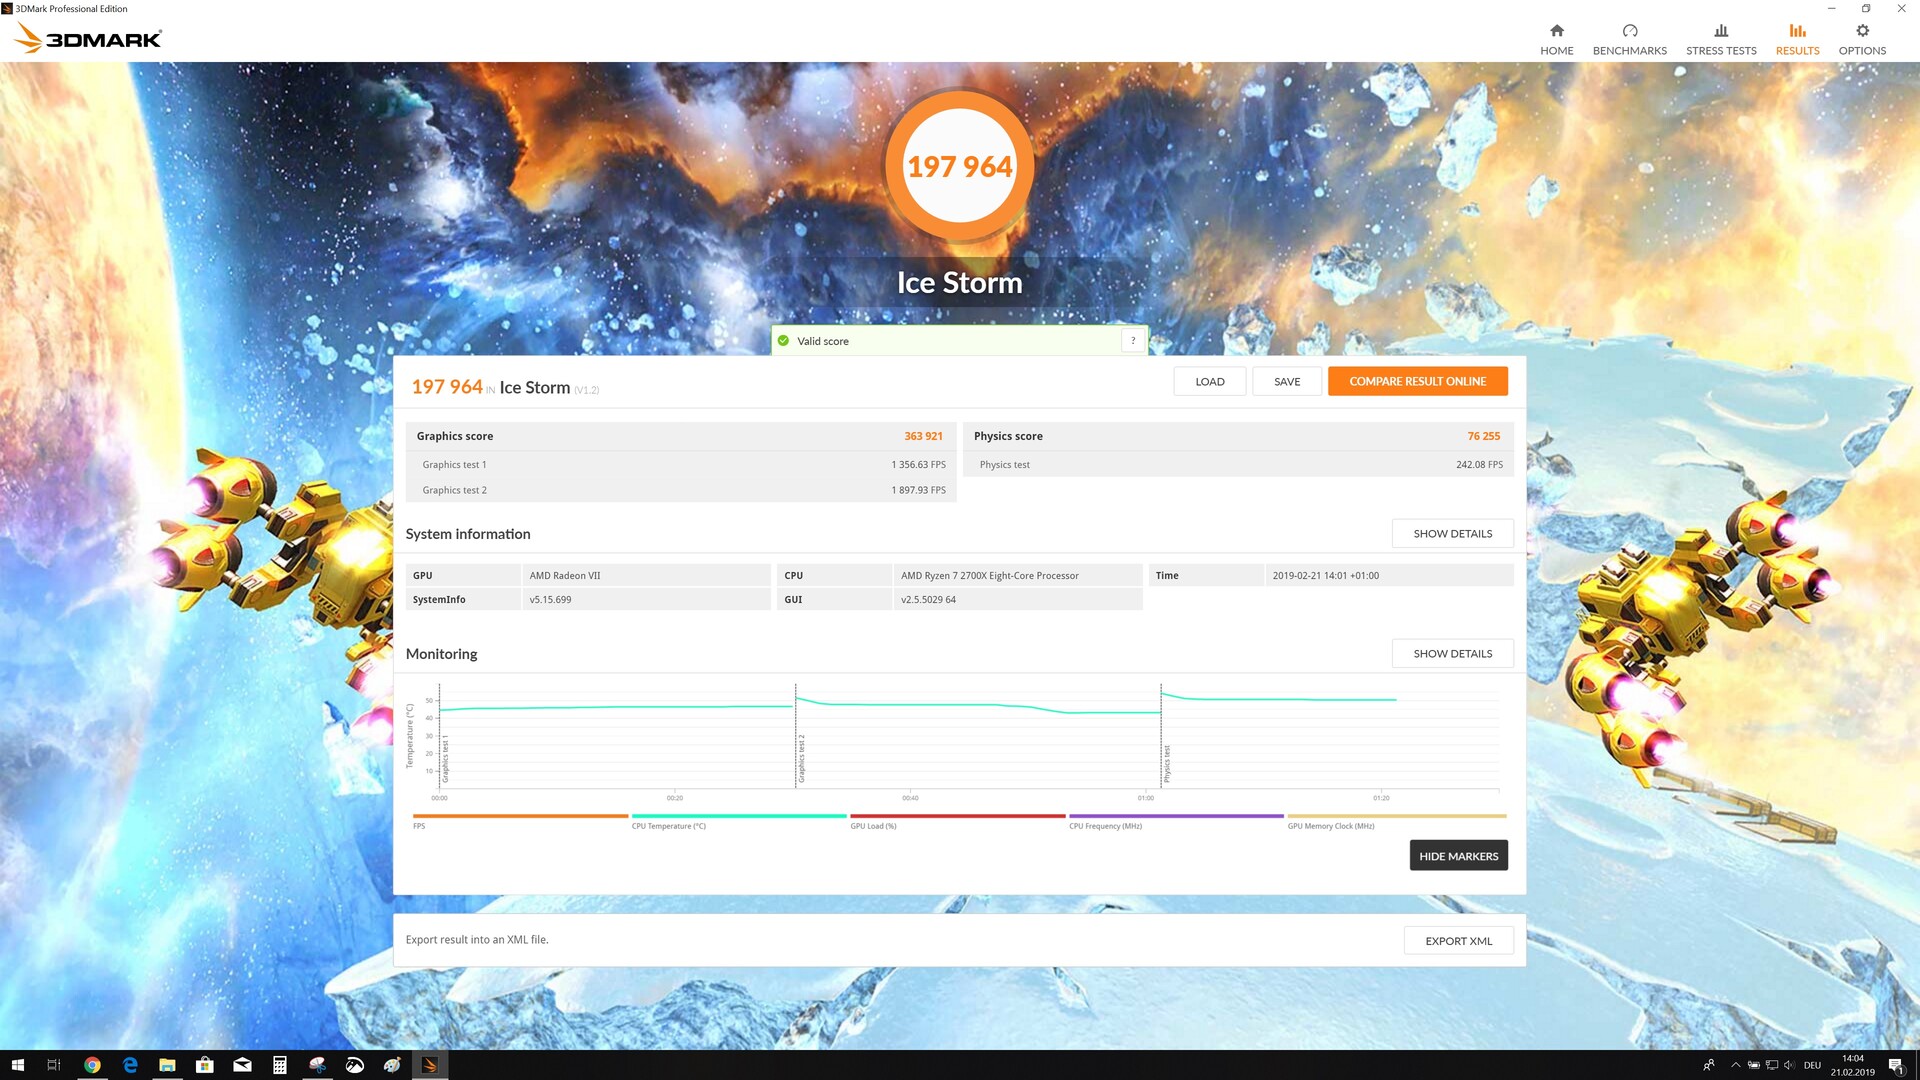
| 3DMark Ice Storm Standard Score | 197964 points | |
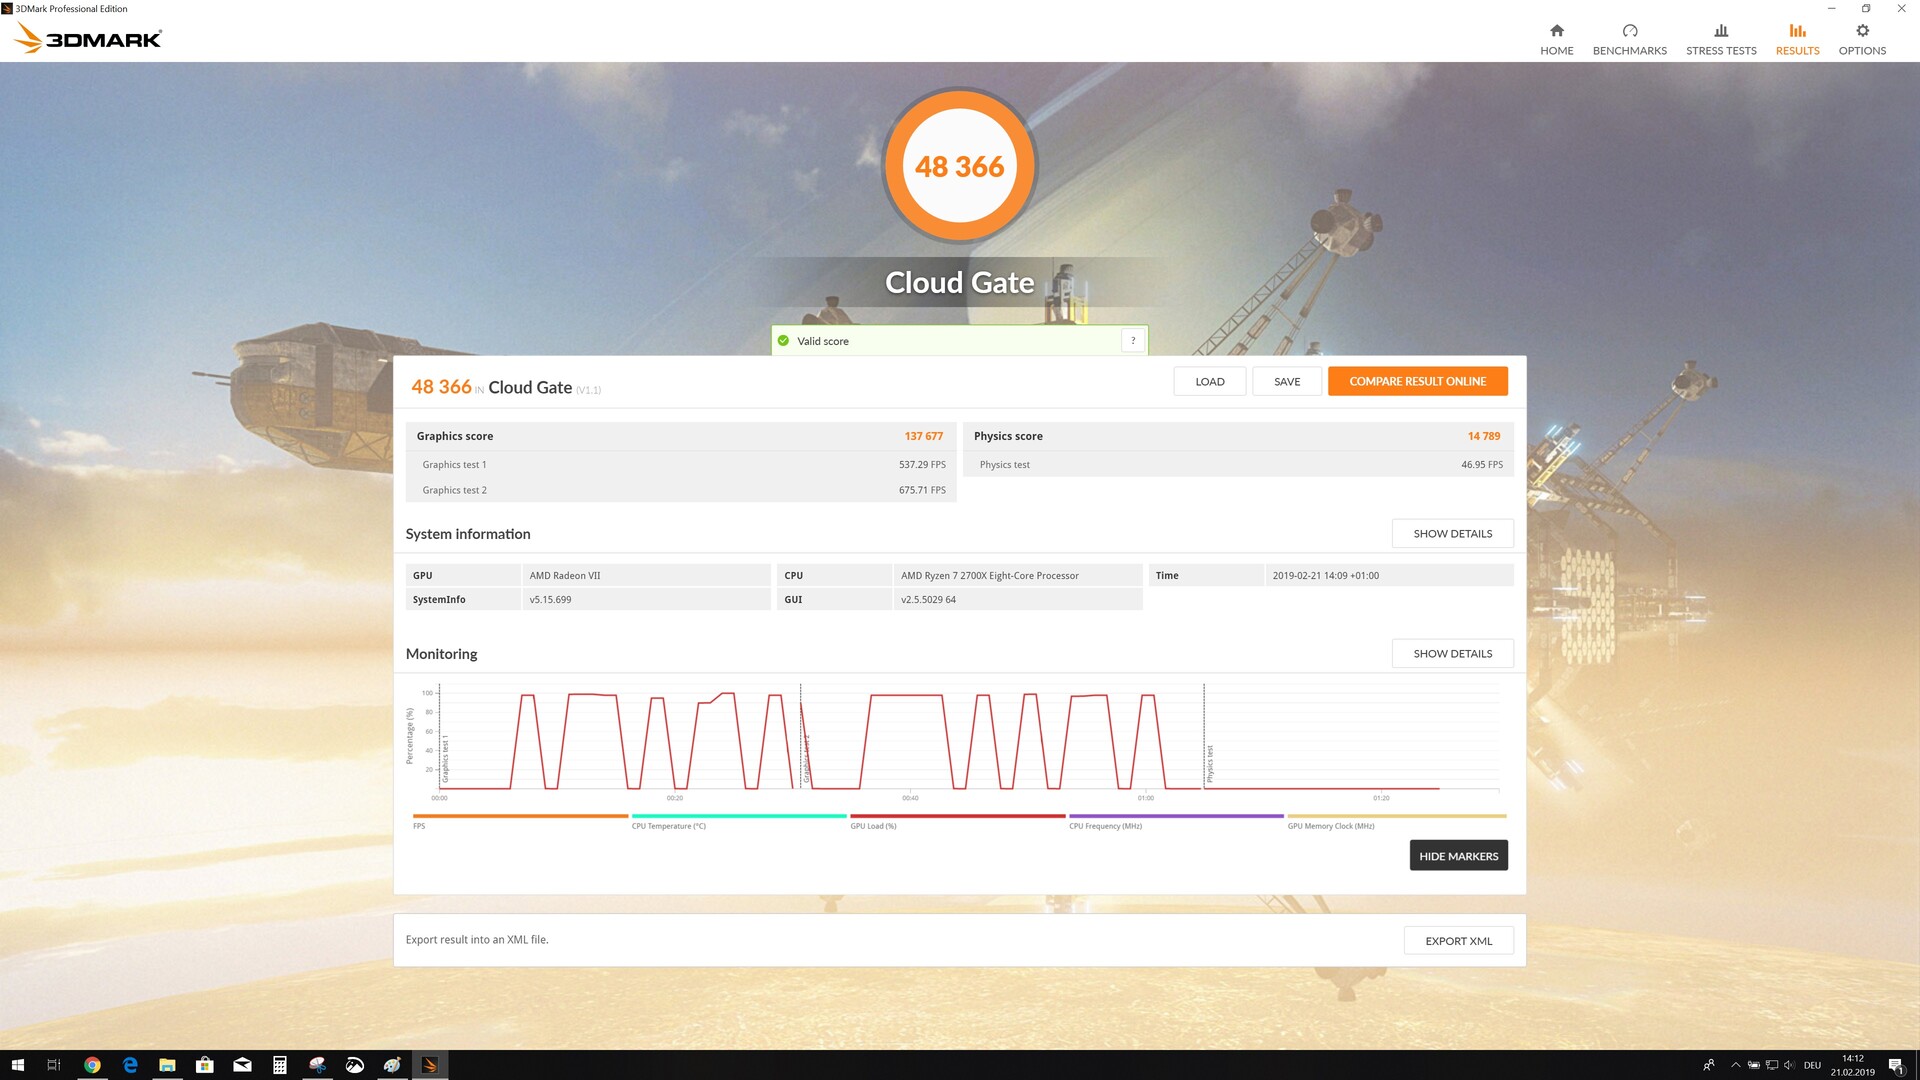
| 3DMark Cloud Gate Standard Score | 48366 points | |
| 3DMark Fire Strike Score | 20451 points | |
| 3DMark Fire Strike Extreme Score | 12092 points | |
| 3DMark Time Spy Score | 8797 points | |
Help | ||
Game Benchmarks
The Radeon VII shines when playing games at 4K, but the RX Vega 64 would be a better purchase if you play games at 1080p as there is little practical difference between the two cards at this resolution. Overall, the Radeon VII hardly breaks a sweat modern in modern triple-A games even at 4K, with exception to "Kingdom Come: Deliverance" and "Monster Hunter World", where it averaged less than 35 FPS in our tests.
It is worth keeping in mind that the GeForce RTX 2080 generally outperformed our review unit and achieved up to 50% higher framerates in games such as "GTA V" at 4K. Predictably, the Titan RTX finished top of almost all our 4K comparison tables with the RTX 20 series cards outperforming their older Titan counterpart at 1080p.
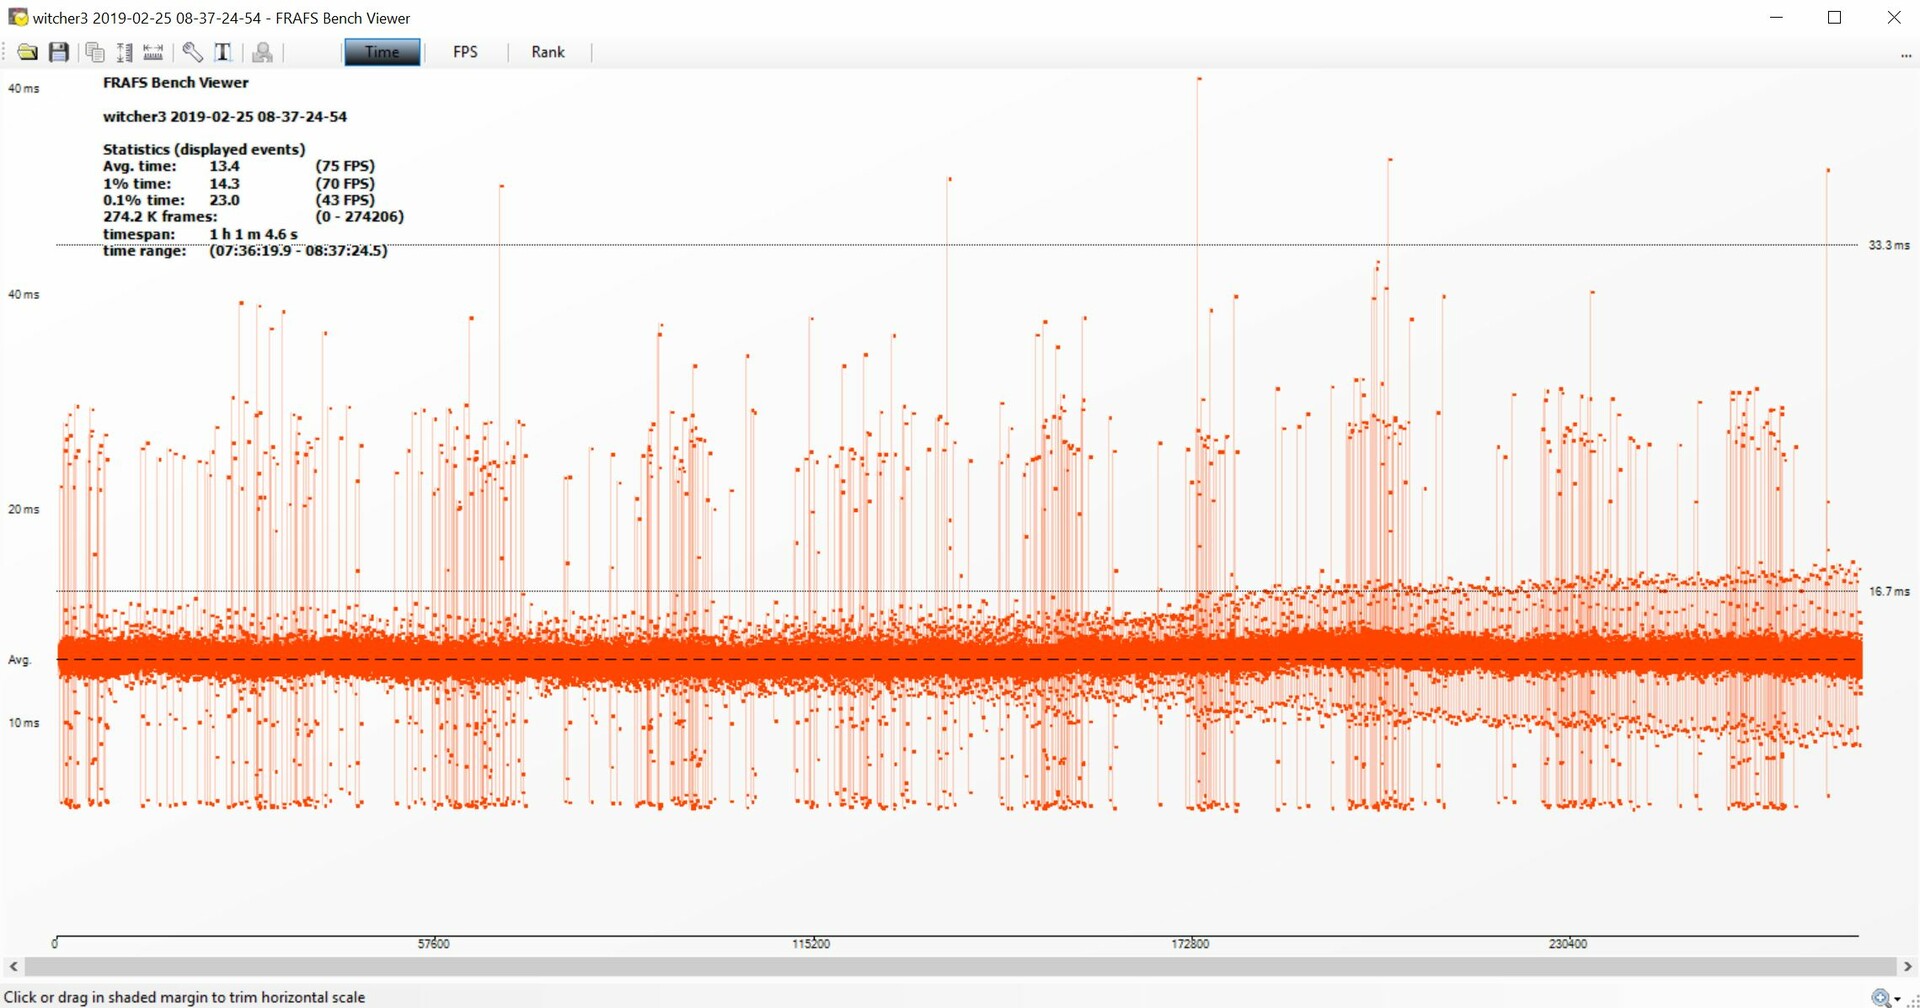
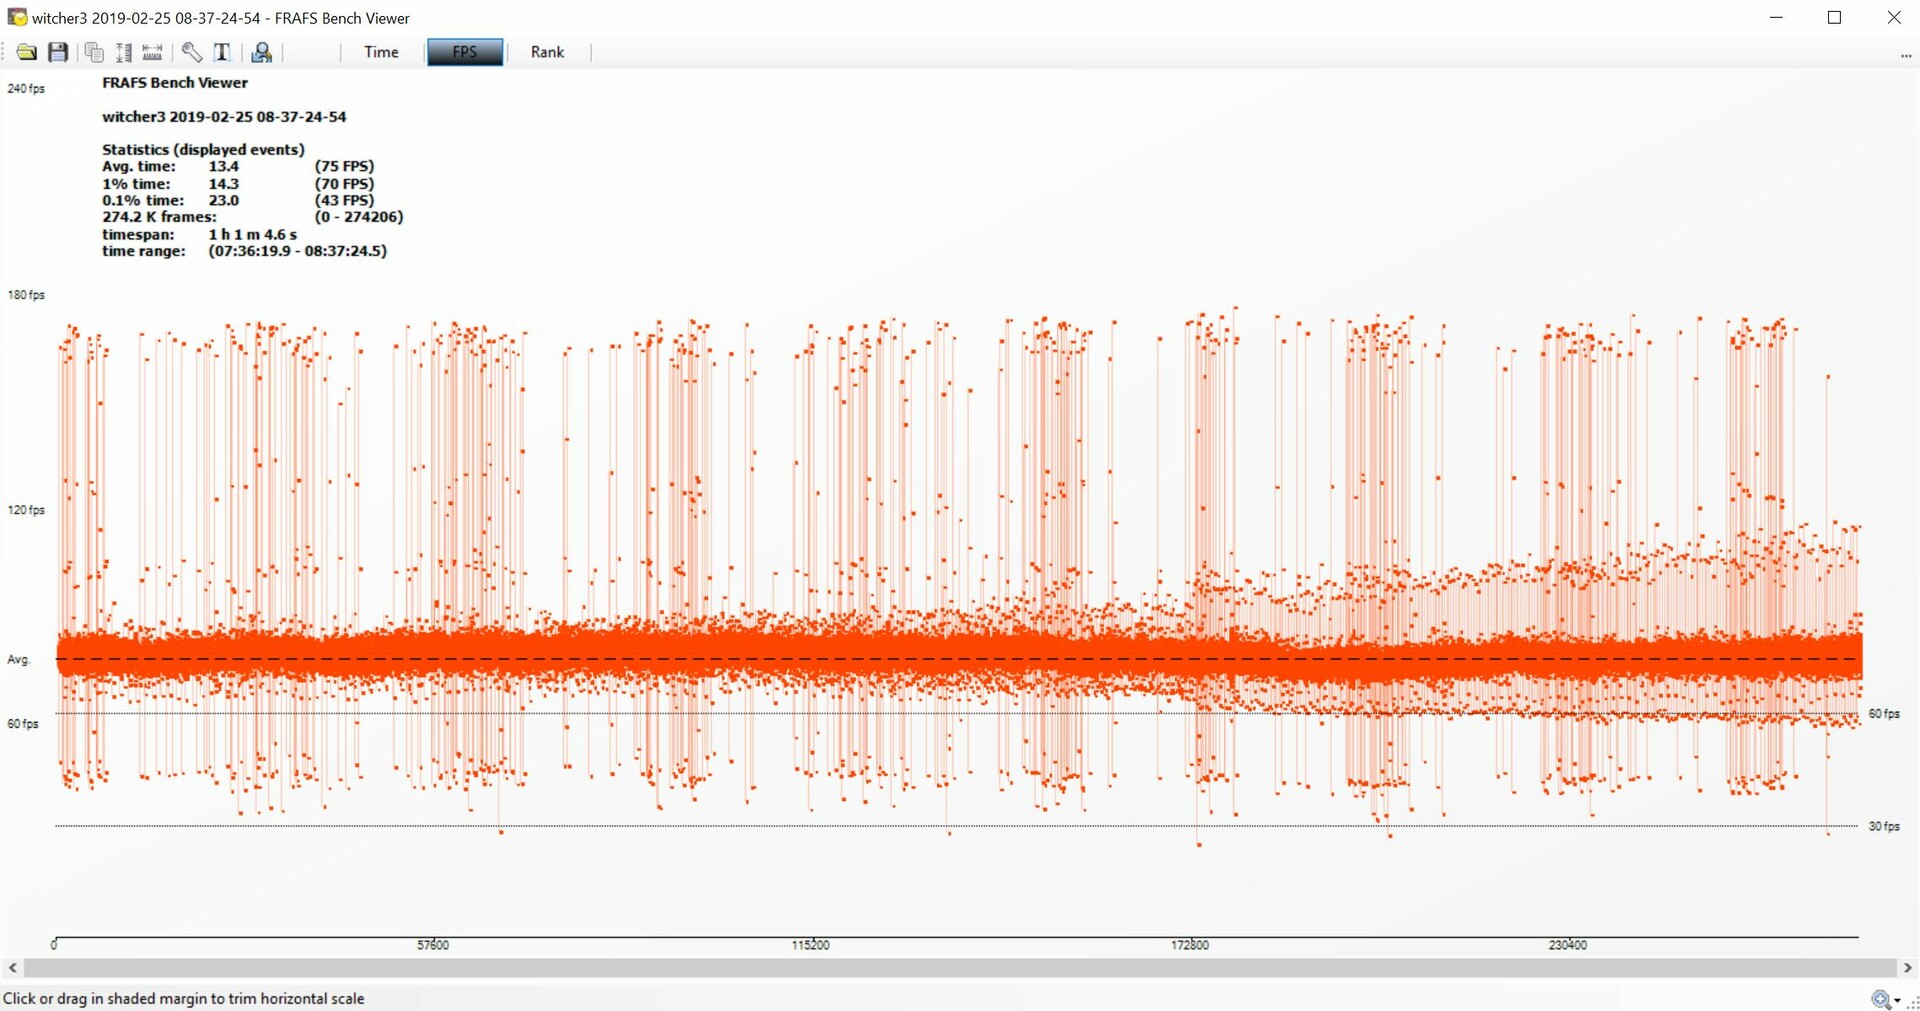
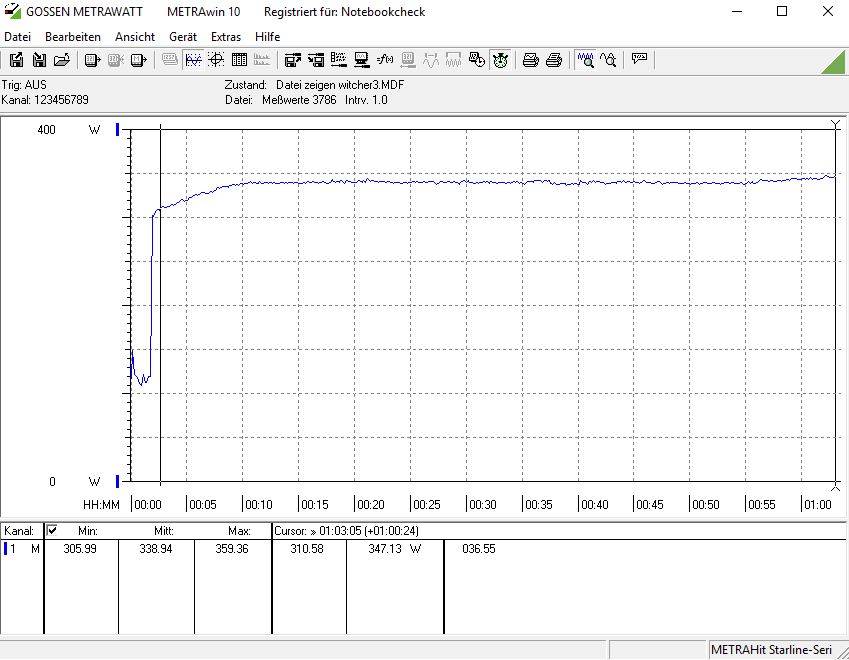
We also subjected the Radeon VII to an hour-long "The Witcher 3" benchmark, which we ran on the ultra preset. Our review unit averaged 75 FPS even after one hour, which underlines the effectiveness of AMD’s new cooling system.
The Witcher 3: Ultra Preset
| Just Cause 4 | |
| 3840x2160 Very High / On AA:SM AF:16x | |
| NVIDIA Titan RTX | |
| NVIDIA Titan X Pascal | |
| AMD Radeon VII | |
| AMD Radeon RX Vega 64 | |
| AMD Radeon RX 590 (Desktop) | |
| 1920x1080 Very High / On AA:SM AF:16x | |
| NVIDIA Titan RTX | |
| NVIDIA Titan X Pascal | |
| AMD Radeon VII | |
| AMD Radeon RX Vega 64 | |
| AMD Radeon RX 590 (Desktop) | |
| Battlefield V | |
| 3840x2160 Ultra Preset | |
| NVIDIA Titan RTX | |
| AMD Radeon VII | |
| NVIDIA Titan X Pascal | |
| AMD Radeon RX Vega 64 | |
| AMD Radeon RX 590 (Desktop) | |
| 1920x1080 Ultra Preset | |
| NVIDIA Titan RTX | |
| AMD Radeon RX Vega 64 | |
| NVIDIA Titan X Pascal | |
| AMD Radeon VII | |
| AMD Radeon RX 590 (Desktop) | |
| Call of Duty Black Ops 4 | |
| 1920x1080 Very High / On | |
| NVIDIA Titan RTX | |
| NVIDIA GeForce RTX 2080 (Desktop) | |
| AMD Radeon RX Vega 64 | |
| NVIDIA Titan X Pascal | |
| NVIDIA GeForce RTX 2070 (Desktop) | |
| AMD Radeon VII | |
| AMD Radeon RX 590 (Desktop) | |
| 3840x2160 Very High / On | |
| NVIDIA Titan RTX | |
| NVIDIA GeForce RTX 2080 (Desktop) | |
| NVIDIA Titan X Pascal | |
| AMD Radeon RX Vega 64 | |
| AMD Radeon VII | |
| NVIDIA GeForce RTX 2070 (Desktop) | |
| AMD Radeon RX 590 (Desktop) | |
| Assassin´s Creed Odyssey | |
| 1920x1080 Ultra High Preset | |
| NVIDIA Titan RTX | |
| NVIDIA GeForce RTX 2080 (Desktop) | |
| NVIDIA Titan X Pascal | |
| AMD Radeon VII | |
| NVIDIA GeForce RTX 2070 (Desktop) | |
| AMD Radeon RX Vega 64 | |
| AMD Radeon RX 590 (Desktop) | |
| AMD Radeon RX 580 (Desktop) | |
| 3840x2160 Ultra High Preset | |
| NVIDIA Titan RTX | |
| AMD Radeon VII | |
| NVIDIA GeForce RTX 2080 (Desktop) | |
| NVIDIA Titan X Pascal | |
| NVIDIA GeForce RTX 2070 (Desktop) | |
| AMD Radeon RX Vega 64 | |
| AMD Radeon RX 590 (Desktop) | |
| AMD Radeon RX 580 (Desktop) | |
| FIFA 19 | |
| 1920x1080 Ultra Preset AA:4x MS | |
| AMD Radeon RX Vega 64 | |
| AMD Radeon RX 580 (Desktop) | |
| NVIDIA Titan RTX | |
| AMD Radeon RX 590 (Desktop) | |
| NVIDIA GeForce RTX 2080 (Desktop) | |
| AMD Radeon VII | |
| NVIDIA Titan X Pascal | |
| NVIDIA GeForce RTX 2070 (Desktop) | |
| 3840x2160 Ultra Preset AA:4x MS | |
| NVIDIA Titan RTX | |
| NVIDIA GeForce RTX 2080 (Desktop) | |
| AMD Radeon VII | |
| NVIDIA Titan X Pascal | |
| NVIDIA GeForce RTX 2070 (Desktop) | |
| AMD Radeon RX Vega 64 | |
| AMD Radeon RX 580 (Desktop) | |
| AMD Radeon RX 590 (Desktop) | |
| Forza Horizon 4 | |
| 1920x1080 Ultra Preset AA:2xMS | |
| NVIDIA Titan RTX | |
| AMD Radeon VII | |
| NVIDIA GeForce RTX 2080 (Desktop) | |
| AMD Radeon RX Vega 64 | |
| NVIDIA Titan X Pascal | |
| NVIDIA GeForce RTX 2070 (Desktop) | |
| AMD Radeon RX 590 (Desktop) | |
| AMD Radeon RX 580 (Desktop) | |
| 3840x2160 Ultra Preset AA:2xMS | |
| NVIDIA Titan RTX | |
| NVIDIA GeForce RTX 2080 (Desktop) | |
| AMD Radeon VII | |
| NVIDIA Titan X Pascal | |
| AMD Radeon RX Vega 64 | |
| NVIDIA GeForce RTX 2070 (Desktop) | |
| AMD Radeon RX 590 (Desktop) | |
| AMD Radeon RX 580 (Desktop) | |
| F1 2018 | |
| 1920x1080 Ultra High Preset AA:T AF:16x | |
| NVIDIA Titan RTX | |
| NVIDIA GeForce RTX 2080 (Desktop) | |
| AMD Radeon VII | |
| NVIDIA GeForce RTX 2070 (Desktop) | |
| NVIDIA Titan X Pascal | |
| AMD Radeon RX Vega 64 | |
| AMD Radeon RX 590 (Desktop) | |
| AMD Radeon RX 580 (Desktop) | |
| 3840x2160 Ultra High Preset AA:T AF:16x | |
| NVIDIA Titan RTX | |
| NVIDIA GeForce RTX 2080 (Desktop) | |
| NVIDIA Titan X Pascal | |
| AMD Radeon VII | |
| NVIDIA GeForce RTX 2070 (Desktop) | |
| AMD Radeon RX Vega 64 | |
| AMD Radeon RX 590 (Desktop) | |
| Monster Hunter World | |
| 1920x1080 Highest Preset (Image Quality High) | |
| NVIDIA Titan RTX | |
| NVIDIA GeForce RTX 2080 (Desktop) | |
| NVIDIA Titan X Pascal | |
| NVIDIA GeForce RTX 2070 (Desktop) | |
| AMD Radeon VII | |
| AMD Radeon RX Vega 64 | |
| AMD Radeon RX 590 (Desktop) | |
| AMD Radeon RX 580 (Desktop) | |
| 3840x2160 Highest Preset (Image Quality High) | |
| NVIDIA Titan RTX | |
| NVIDIA GeForce RTX 2080 (Desktop) | |
| NVIDIA Titan X Pascal | |
| AMD Radeon VII | |
| NVIDIA GeForce RTX 2070 (Desktop) | |
| AMD Radeon RX Vega 64 | |
| AMD Radeon RX 590 (Desktop) | |
| AMD Radeon RX 580 (Desktop) | |
| Far Cry 5 | |
| 1920x1080 Ultra Preset AA:T | |
| NVIDIA GeForce RTX 2070 (Desktop) | |
| NVIDIA GeForce RTX 2080 (Desktop) | |
| NVIDIA Titan RTX | |
| AMD Radeon RX Vega 64 | |
| AMD Radeon VII | |
| NVIDIA Titan X Pascal | |
| AMD Radeon RX 590 (Desktop) | |
| AMD Radeon RX 580 (Desktop) | |
| 3840x2160 Ultra Preset AA:T | |
| NVIDIA Titan RTX | |
| AMD Radeon VII | |
| NVIDIA GeForce RTX 2080 (Desktop) | |
| NVIDIA Titan X Pascal | |
| NVIDIA GeForce RTX 2070 (Desktop) | |
| AMD Radeon RX Vega 64 | |
| AMD Radeon RX 580 (Desktop) | |
| AMD Radeon RX 590 (Desktop) | |
| The Crew 2 | |
| 1920x1080 Ultra Preset | |
| NVIDIA Titan X Pascal | |
| AMD Radeon RX 580 (Desktop) | |
| NVIDIA GeForce RTX 2070 (Desktop) | |
| NVIDIA GeForce RTX 2080 (Desktop) | |
| AMD Radeon RX 590 (Desktop) | |
| NVIDIA Titan RTX | |
| AMD Radeon VII | |
| 3840x2160 Ultra Preset | |
| NVIDIA GeForce RTX 2080 (Desktop) | |
| NVIDIA Titan RTX | |
| NVIDIA GeForce RTX 2070 (Desktop) | |
| NVIDIA Titan X Pascal | |
| AMD Radeon VII | |
| AMD Radeon RX 580 (Desktop) | |
| AMD Radeon RX 590 (Desktop) | |
| Assassin´s Creed Origins | |
| 1920x1080 Ultra High Preset | |
| NVIDIA GeForce RTX 2080 (Desktop) | |
| NVIDIA Titan RTX | |
| NVIDIA GeForce RTX 2070 (Desktop) | |
| AMD Radeon RX Vega 64 | |
| AMD Radeon VII | |
| AMD Radeon RX 590 (Desktop) | |
| AMD Radeon RX 580 (Desktop) | |
| AMD Radeon RX 580 (Desktop) | |
| 3840x2160 Ultra High Preset | |
| NVIDIA Titan RTX | |
| NVIDIA GeForce RTX 2080 (Desktop) | |
| AMD Radeon VII | |
| NVIDIA GeForce RTX 2070 (Desktop) | |
| AMD Radeon RX Vega 64 | |
| AMD Radeon RX 590 (Desktop) | |
| AMD Radeon RX 580 (Desktop) | |
| AMD Radeon RX 580 (Desktop) | |
| Kingdom Come: Deliverance | |
| 1920x1080 Ultra High Preset | |
| NVIDIA GeForce RTX 2080 (Desktop) | |
| NVIDIA GeForce RTX 2070 (Desktop) | |
| NVIDIA Titan RTX | |
| AMD Radeon RX Vega 64 | |
| AMD Radeon VII | |
| AMD Radeon RX 590 (Desktop) | |
| AMD Radeon RX 580 (Desktop) | |
| AMD Radeon RX 580 (Desktop) | |
| 3840x2160 Ultra High Preset | |
| NVIDIA Titan RTX | |
| NVIDIA GeForce RTX 2080 (Desktop) | |
| AMD Radeon RX Vega 64 | |
| NVIDIA GeForce RTX 2070 (Desktop) | |
| AMD Radeon VII | |
| AMD Radeon RX 590 (Desktop) | |
| AMD Radeon RX 580 (Desktop) | |
| AMD Radeon RX 580 (Desktop) | |
| Fortnite | |
| 1920x1080 Epic Preset | |
| NVIDIA GeForce RTX 2080 (Desktop) | |
| NVIDIA GeForce RTX 2070 (Desktop) | |
| NVIDIA Titan RTX | |
| AMD Radeon VII | |
| AMD Radeon RX 590 (Desktop) | |
| AMD Radeon RX 580 (Desktop) | |
| AMD Radeon RX 580 (Desktop) | |
| 3840x2160 Epic Preset | |
| NVIDIA Titan RTX | |
| NVIDIA GeForce RTX 2080 (Desktop) | |
| NVIDIA GeForce RTX 2070 (Desktop) | |
| AMD Radeon VII | |
| AMD Radeon RX 590 (Desktop) | |
| AMD Radeon RX 580 (Desktop) | |
| AMD Radeon RX 580 (Desktop) | |
| Destiny 2 | |
| 1920x1080 Highest Preset AA:SM AF:16x | |
| NVIDIA GeForce RTX 2080 (Desktop) | |
| NVIDIA GeForce RTX 2070 (Desktop) | |
| NVIDIA Titan RTX | |
| AMD Radeon VII | |
| AMD Radeon RX 580 (Desktop) | |
| 3840x2160 Highest Preset AA:SM AF:16x | |
| NVIDIA Titan RTX | |
| NVIDIA GeForce RTX 2080 (Desktop) | |
| NVIDIA GeForce RTX 2070 (Desktop) | |
| AMD Radeon VII | |
| AMD Radeon RX 580 (Desktop) | |
| The Witcher 3 | |
| 1920x1080 Ultra Graphics & Postprocessing (HBAO+) | |
| NVIDIA Titan RTX | |
| NVIDIA GeForce RTX 2080 (Desktop) | |
| NVIDIA GeForce GTX 1080 Ti (Desktop) | |
| NVIDIA GeForce RTX 2070 (Desktop) | |
| NVIDIA GeForce GTX 1080 (Desktop) | |
| AMD Radeon RX Vega 64 | |
| NVIDIA GeForce GTX 1080 (Desktop) | |
| AMD Radeon VII | |
| NVIDIA GeForce GTX 1070 (Desktop) | |
| AMD Radeon RX 590 (Desktop) | |
| AMD Radeon RX 580 (Desktop) | |
| NVIDIA GeForce GTX 1060 (Desktop) | |
| AMD Radeon RX 580 (Desktop) | |
| 3840x2160 High Graphics & Postprocessing (Nvidia HairWorks Off) | |
| NVIDIA Titan RTX | |
| NVIDIA GeForce RTX 2080 (Desktop) | |
| NVIDIA GeForce RTX 2070 (Desktop) | |
| NVIDIA GeForce GTX 1080 (Desktop) | |
| NVIDIA GeForce GTX 1080 (Desktop) | |
| AMD Radeon VII | |
| AMD Radeon RX Vega 64 | |
| NVIDIA GeForce GTX 1070 (Desktop) | |
| AMD Radeon RX 590 (Desktop) | |
| NVIDIA GeForce GTX 1060 (Desktop) | |
| AMD Radeon RX 580 (Desktop) | |
| AMD Radeon RX 580 (Desktop) | |
| Watch Dogs 2 | |
| 1920x1080 Ultra Preset | |
| NVIDIA Titan RTX | |
| NVIDIA GeForce RTX 2080 (Desktop) | |
| NVIDIA GeForce RTX 2070 (Desktop) | |
| NVIDIA GeForce GTX 1080 (Desktop) | |
| AMD Radeon RX Vega 64 | |
| AMD Radeon VII | |
| AMD Radeon RX 590 (Desktop) | |
| AMD Radeon RX 580 (Desktop) | |
| AMD Radeon RX 580 (Desktop) | |
| 3840x2160 High Preset | |
| NVIDIA Titan RTX | |
| NVIDIA GeForce RTX 2080 (Desktop) | |
| NVIDIA GeForce RTX 2070 (Desktop) | |
| NVIDIA GeForce GTX 1080 (Desktop) | |
| AMD Radeon VII | |
| AMD Radeon RX Vega 64 | |
| AMD Radeon RX 590 (Desktop) | |
| AMD Radeon RX 580 (Desktop) | |
| AMD Radeon RX 580 (Desktop) | |
| Battlefield 1 | |
| 1920x1080 Ultra Preset AA:T | |
| NVIDIA Titan RTX | |
| NVIDIA GeForce RTX 2080 (Desktop) | |
| NVIDIA GeForce GTX 1080 (Desktop) | |
| NVIDIA GeForce GTX 1080 (Desktop) | |
| AMD Radeon RX Vega 64 | |
| AMD Radeon VII | |
| NVIDIA GeForce RTX 2070 (Desktop) | |
| AMD Radeon RX 590 (Desktop) | |
| AMD Radeon RX 580 (Desktop) | |
| 3840x2160 High Preset AA:T | |
| NVIDIA Titan RTX | |
| NVIDIA GeForce RTX 2080 (Desktop) | |
| AMD Radeon VII | |
| NVIDIA GeForce RTX 2070 (Desktop) | |
| NVIDIA GeForce GTX 1080 (Desktop) | |
| NVIDIA GeForce GTX 1080 (Desktop) | |
| AMD Radeon RX Vega 64 | |
| AMD Radeon RX 590 (Desktop) | |
| AMD Radeon RX 580 (Desktop) | |
| For Honor | |
| 1920x1080 Extreme Preset AA:T AF:16x | |
| NVIDIA Titan RTX | |
| NVIDIA GeForce RTX 2080 (Desktop) | |
| NVIDIA GeForce RTX 2070 (Desktop) | |
| NVIDIA GeForce GTX 1080 (Desktop) | |
| AMD Radeon RX Vega 64 | |
| AMD Radeon VII | |
| NVIDIA GeForce GTX 1070 (Desktop) | |
| AMD Radeon RX 590 (Desktop) | |
| AMD Radeon RX 580 (Desktop) | |
| AMD Radeon RX 580 (Desktop) | |
| 3840x2160 High Preset AA:T AF:8x | |
| NVIDIA Titan RTX | |
| NVIDIA GeForce GTX 1080 Ti (Desktop) | |
| NVIDIA GeForce RTX 2080 (Desktop) | |
| AMD Radeon VII | |
| NVIDIA GeForce GTX 1080 (Desktop) | |
| NVIDIA GeForce RTX 2070 (Desktop) | |
| AMD Radeon RX Vega 64 | |
| NVIDIA GeForce GTX 1070 (Desktop) | |
| AMD Radeon RX 590 (Desktop) | |
| AMD Radeon RX 580 (Desktop) | |
| AMD Radeon RX 580 (Desktop) | |
| Ghost Recon Wildlands | |
| 1920x1080 Ultra Preset AA:T AF:16x | |
| NVIDIA Titan RTX | |
| NVIDIA GeForce RTX 2080 (Desktop) | |
| NVIDIA GeForce RTX 2070 (Desktop) | |
| AMD Radeon RX Vega 64 | |
| NVIDIA GeForce GTX 1070 (Desktop) | |
| AMD Radeon VII | |
| AMD Radeon RX 590 (Desktop) | |
| AMD Radeon RX 580 (Desktop) | |
| AMD Radeon RX 580 (Desktop) | |
| 3840x2160 Ultra Preset AA:T AF:16x | |
| NVIDIA Titan RTX | |
| GTA V | |
| 1920x1080 Highest AA:4xMSAA + FX AF:16x | |
| NVIDIA GeForce RTX 2080 (Desktop) | |
| NVIDIA Titan RTX | |
| AMD Radeon VII | |
| NVIDIA GeForce RTX 2070 (Desktop) | |
| NVIDIA GeForce GTX 1080 (Desktop) | |
| NVIDIA GeForce GTX 1080 (Desktop) | |
| NVIDIA GeForce GTX 1070 (Desktop) | |
| AMD Radeon RX 590 (Desktop) | |
| AMD Radeon RX 580 (Desktop) | |
| 3840x2160 High/On (Advanced Graphics Off) AA:FX AF:8x | |
| NVIDIA Titan RTX | |
| NVIDIA GeForce RTX 2080 (Desktop) | |
| NVIDIA GeForce RTX 2070 (Desktop) | |
| AMD Radeon VII | |
| NVIDIA GeForce GTX 1080 (Desktop) | |
| NVIDIA GeForce GTX 1080 (Desktop) | |
| NVIDIA GeForce GTX 1070 (Desktop) | |
| AMD Radeon RX 580 (Desktop) | |
| AMD Radeon RX 590 (Desktop) | |
| Battlefield 4 - 3840x2160 High Preset | |
| NVIDIA Titan RTX | |
| NVIDIA GeForce RTX 2080 (Desktop) | |
| NVIDIA GeForce RTX 2070 (Desktop) | |
| NVIDIA GeForce GTX 1080 (Desktop) | |
| AMD Radeon RX Vega 64 | |
| AMD Radeon VII | |
| NVIDIA GeForce GTX 1070 (Desktop) | |
| AMD Radeon RX 590 (Desktop) | |
| AMD Radeon RX 580 (Desktop) | |
| Deus Ex Mankind Divided | |
| 3840x2160 High Preset AF:4x | |
| NVIDIA Titan RTX | |
| NVIDIA GeForce RTX 2080 (Desktop) | |
| AMD Radeon VII | |
| NVIDIA GeForce RTX 2070 (Desktop) | |
| AMD Radeon RX Vega 64 | |
| NVIDIA GeForce GTX 1080 (Desktop) | |
| NVIDIA GeForce GTX 1080 (Desktop) | |
| NVIDIA GeForce GTX 1070 (Desktop) | |
| AMD Radeon RX 590 (Desktop) | |
| AMD Radeon RX 580 (Desktop) | |
| 1920x1080 Ultra Preset AA:2xMS AF:8x | |
| NVIDIA Titan RTX | |
| NVIDIA GeForce RTX 2080 (Desktop) | |
| AMD Radeon VII | |
| NVIDIA GeForce RTX 2070 (Desktop) | |
| NVIDIA GeForce GTX 1080 (Desktop) | |
| AMD Radeon RX Vega 64 | |
| NVIDIA GeForce GTX 1080 (Desktop) | |
| AMD Radeon RX 590 (Desktop) | |
| AMD Radeon RX 580 (Desktop) | |
| Dirt 4 | |
| 3840x2160 Ultra Preset AF:16x | |
| NVIDIA Titan RTX | |
| NVIDIA GeForce RTX 2080 (Desktop) | |
| AMD Radeon VII | |
| NVIDIA GeForce RTX 2070 (Desktop) | |
| AMD Radeon RX 590 (Desktop) | |
| AMD Radeon RX 580 (Desktop) | |
| 1920x1080 Ultra Preset AA:4xMS AF:16x | |
| NVIDIA Titan RTX | |
| NVIDIA GeForce RTX 2080 (Desktop) | |
| AMD Radeon VII | |
| NVIDIA GeForce RTX 2070 (Desktop) | |
| AMD Radeon RX 590 (Desktop) | |
| AMD Radeon RX 580 (Desktop) | |
| Farming Simulator 19 | |
| 3840x2160 Very High Preset | |
| NVIDIA Titan RTX | |
| NVIDIA Titan X Pascal | |
| AMD Radeon VII | |
| AMD Radeon RX Vega 64 | |
| AMD Radeon RX 590 (Desktop) | |
| 1920x1080 Very High Preset | |
| NVIDIA Titan RTX | |
| AMD Radeon VII | |
| AMD Radeon RX Vega 64 | |
| NVIDIA Titan X Pascal | |
| AMD Radeon RX 590 (Desktop) | |
| Hitman 2 | |
| 3840x2160 Ultra AF:16x | |
| NVIDIA Titan RTX | |
| AMD Radeon VII | |
| NVIDIA Titan X Pascal | |
| AMD Radeon RX Vega 64 | |
| AMD Radeon RX 590 (Desktop) | |
| 1920x1080 Ultra AF:16x | |
| AMD Radeon VII | |
| AMD Radeon RX Vega 64 | |
| NVIDIA Titan RTX | |
| AMD Radeon RX 590 (Desktop) | |
| NVIDIA Titan X Pascal | |
| Overwatch | |
| 3840x2160 High (Render Scale 100 %) AA:SM AF:4x | |
| NVIDIA Titan RTX | |
| NVIDIA GeForce RTX 2080 (Desktop) | |
| NVIDIA GeForce RTX 2070 (Desktop) | |
| NVIDIA GeForce GTX 1080 (Desktop) | |
| NVIDIA GeForce GTX 1080 (Desktop) | |
| AMD Radeon VII | |
| NVIDIA GeForce GTX 1070 (Desktop) | |
| AMD Radeon RX 590 (Desktop) | |
| AMD Radeon RX 580 (Desktop) | |
| NVIDIA GeForce GTX 1060 (Desktop) | |
| 1920x1080 Epic (Render Scale 100 %) AA:SM AF:16x | |
| NVIDIA Titan RTX | |
| NVIDIA GeForce RTX 2080 (Desktop) | |
| NVIDIA GeForce RTX 2070 (Desktop) | |
| NVIDIA GeForce GTX 1080 (Desktop) | |
| NVIDIA GeForce GTX 1070 (Desktop) | |
| AMD Radeon RX 580 (Desktop) | |
| AMD Radeon VII | |
| AMD Radeon RX 590 (Desktop) | |
| NVIDIA GeForce GTX 1060 (Desktop) | |
| Shadow of the Tomb Raider | |
| 3840x2160 Highest Preset AA:T | |
| NVIDIA Titan RTX | |
| NVIDIA GeForce RTX 2080 (Desktop) | |
| AMD Radeon VII | |
| NVIDIA Titan X Pascal | |
| NVIDIA GeForce RTX 2070 (Desktop) | |
| AMD Radeon RX Vega 64 | |
| AMD Radeon RX 590 (Desktop) | |
| 1920x1080 Highest Preset AA:T | |
| NVIDIA Titan RTX | |
| NVIDIA GeForce RTX 2080 (Desktop) | |
| AMD Radeon VII | |
| NVIDIA Titan X Pascal | |
| NVIDIA GeForce RTX 2070 (Desktop) | |
| AMD Radeon RX Vega 64 | |
| AMD Radeon RX 590 (Desktop) | |
| Darksiders III | |
| 3840x2160 Epic | |
| NVIDIA Titan RTX | |
| NVIDIA Titan X Pascal | |
| AMD Radeon VII | |
| AMD Radeon RX Vega 64 | |
| AMD Radeon RX 590 (Desktop) | |
| 1920x1080 Epic | |
| NVIDIA Titan RTX | |
| AMD Radeon VII | |
| NVIDIA Titan X Pascal | |
| AMD Radeon RX Vega 64 | |
| AMD Radeon RX 590 (Desktop) | |
| Need for Speed Payback | |
| 3840x2160 Ultra Preset | |
| NVIDIA Titan RTX | |
| AMD Radeon RX 590 (Desktop) | |
| AMD Radeon RX 580 (Desktop) | |
| 1920x1080 Ultra Preset | |
| NVIDIA Titan RTX | |
| AMD Radeon RX 590 (Desktop) | |
| AMD Radeon RX 580 (Desktop) | |
| low | med. | high | ultra | QHD | 4K | |
|---|---|---|---|---|---|---|
| Battlefield 4 (2013) | 199.1 | 199.8 | 199.8 | 180.6 | 70.4 | |
| GTA V (2015) | 169 | 163 | 142 | 115 | 81 | |
| The Witcher 3 (2015) | 223 | 208 | 139 | 75 | 54.3 | |
| Rainbow Six Siege (2015) | 227 | 225 | 200 | 190 | 93 | |
| Rise of the Tomb Raider (2016) | 232 | 163 | 105 | 89 | 56.3 | |
| Far Cry Primal (2016) | 125 | 111 | 101 | 94 | 69 | |
| The Division (2016) | 203 | 174 | 117 | 91 | 60 | |
| Overwatch (2016) | 300 | 226 | 226 | 128 | 101 | |
| Deus Ex Mankind Divided (2016) | 124 | 120 | 109 | 70 | 47 | |
| Battlefield 1 (2016) | 187 | 169 | 153 | 138 | 82 | |
| Watch Dogs 2 (2016) | 107 | 94 | 78 | 55 | 39 | |
| For Honor (2017) | 226 | 169 | 159 | 121 | 64 | |
| Ghost Recon Wildlands (2017) | 127 | 88 | 82 | 49 | 42 | |
| Dirt 4 (2017) | 324 | 255 | 224 | 150 | 84 | |
| Playerunknown's Battlegrounds (PUBG) (2017) | 161 | 157 | 158 | 143 | 58 | |
| Destiny 2 (2017) | 147 | 136 | 134 | 112 | 51 | |
| Assassin´s Creed Origins (2017) | 75 | 70 | 68 | 63 | 49 | |
| Fortnite (2018) | 197 | 195 | 154 | 114 | 44.4 | |
| Kingdom Come: Deliverance (2018) | 134 | 116 | 90 | 71 | 30.8 | |
| Far Cry 5 (2018) | 118 | 99 | 95 | 91 | 59 | |
| The Crew 2 (2018) | 60 | 60 | 60 | 60 | 41 | |
| Monster Hunter World (2018) | 120 | 117 | 116 | 94 | 33.5 | |
| F1 2018 (2018) | 220 | 196 | 149 | 133 | 71 | |
| Shadow of the Tomb Raider (2018) | 137 | 120 | 116 | 110 | 44 | |
| FIFA 19 (2018) | 227 | 227 | 227 | 227 | 208 | |
| Forza Horizon 4 (2018) | 188 | 163 | 157 | 130 | 77 | |
| Assassin´s Creed Odyssey (2018) | 82 | 76 | 70 | 63 | 44 | |
| Call of Duty Black Ops 4 (2018) | 220 | 160 | 153 | 146 | 58.1 | |
| Hitman 2 (2018) | 88 | 92 | 84 | 82 | 52.9 | |
| Fallout 76 (2018) | 59.9 | 59.9 | 59.9 | 59.9 | 59.2 | |
| Battlefield V (2018) | 183 | 136 | 137 | 127 | 73 | |
| Farming Simulator 19 (2018) | 180 | 166 | 121 | 111 | 51.1 | |
| Darksiders III (2018) | 183 | 138 | 125 | 119 | 44.2 | |
| Just Cause 4 (2018) | 119 | 113 | 102 | 101 | 45.7 | |
| Far Cry New Dawn (2019) | 107 | 95 | 92 | 83 | 83 | 61 |
| Metro Exodus (2019) | 146.1 | 113.7 | 82.8 | 67.2 | 55.8 | 37.4 |
| Anthem (2019) | 113.2 | 100.3 | 93.8 | 90.5 | 82.8 | 48.3 |
| Dirt Rally 2.0 (2019) | 249.4 | 180.4 | 164.6 | 106.5 | 83.3 | 52.5 |
Compute Performance
The Radeon VII outperforms the GeForce RTX 2080 in LuxMark Room, but the two GPUs regularly traded places in our comparison tables in other benchmarks. By contrast, the Radeon VII finished around 15% behind the RTX 2080 in LuxMark Sala and ComputeMark. However, the Radeon VII even outperformed the Titan RTX in some benchmarks, which is impressive. Overall, the Radeon VII performed comparatively better in these sets of benchmarks than it did during our gaming tests.
Professional Applications
The Radeon VII is also powerful enough for use in professional applications. The GPU performed on par with its predecessor in benchmarks such as SPECviewperf 12, but we would have expected the Radeon VII to perform better here. The GPU consistently outscored its RTX 20 series competitors, but it cannot come close to matching the performance of the Titan RTX.
Emissions
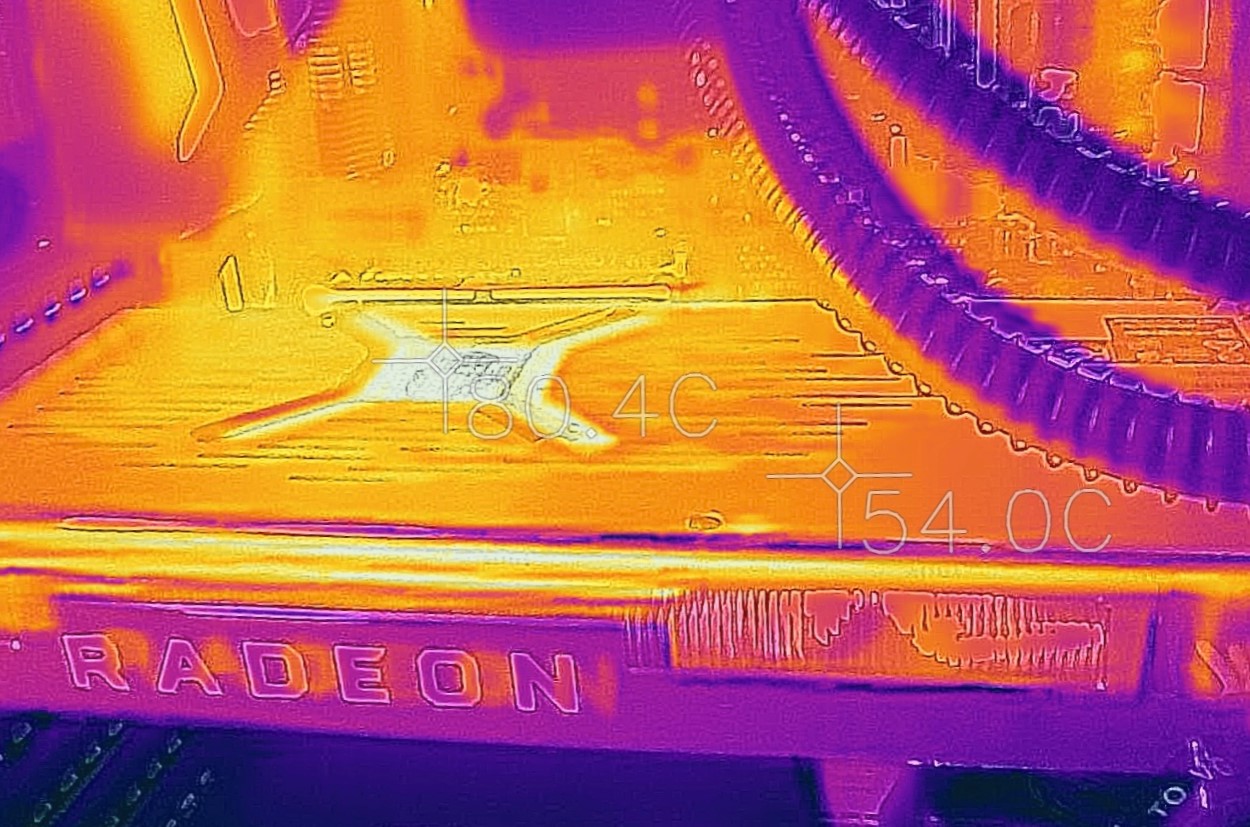
The Radeon VII is more efficient than its NVIDIA counterparts, but there is still room for improvement in both power consumption and fan noise though. Overall, the triple-fan cooler allows the GPU to maintain its 1,750 MHz base clock speed at stock settings. However, this excellent thermal performance comes at the expense of fan noise, which spin at around 2,800 RPM under sustained load, which equates to 61% fan speed. Moreover, our review unit reached 78 °C (~172 °F) during our stress tests, which is way off from the 106 °C (~223 °F) at which it will thermal throttle.
Lowering the GPU voltage can improve its efficiency, but the level to which the voltage can be lowered varies from card to card, so please keep that in mind if you choose to lower the voltage of your GPU. Our review unit could operate stably at 0.965 V, which represents a 0.103 V undervolt and helped lower power consumption during a FurMark stress test by over 50 W. The card still consumed 203 W under sustained load though. The undervolt also did not affect core temperatures much, but the fan speed dropped noticeably.
In short, undervolting the Radeon VII makes the GPU a much more attractive option in our opinion. The undervolt did not affect framerates in games and allows it to consume less power than its NVIDIA counterparts while still delivering exceptional performance.
Please keep in mind that the Radeon VII does not have much headroom for overclocking. Our efforts results in performance improvements of less than 10%, but you may be able to extract a higher overclock with a more powerful water cooler.
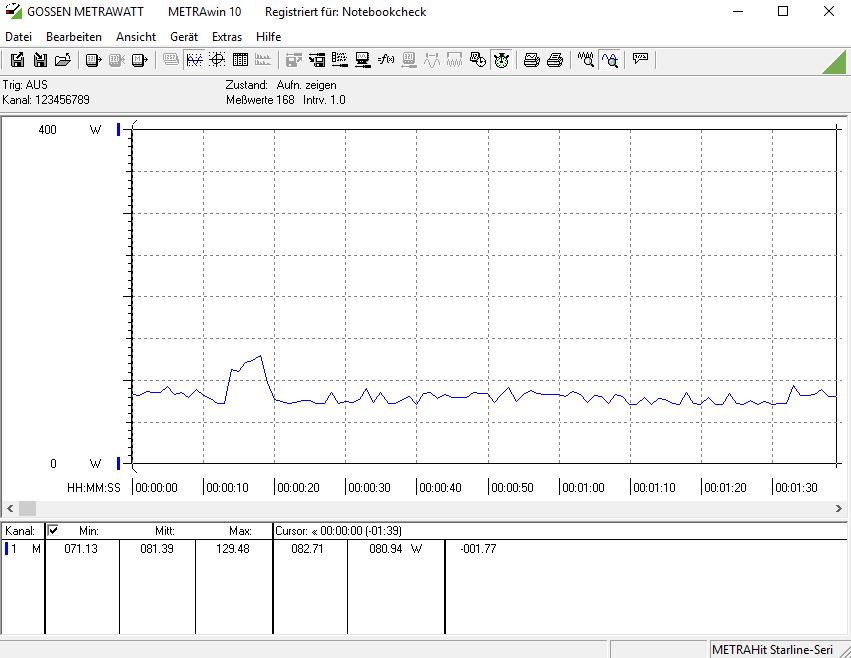
Finally, we looked at the power consumption of our test system in games, which we conducted with "The Witcher 3" played at the ultra preset. Our test system averaged 339 W during our gaming test, which is around 17% or 69 W less than our RX Vega 64 powered test system. Likewise, the Radeon VII proved more efficient than the Radeon RX 590 too, but consumed around 4 W more than the GeForce RTX 2070 did.
| Power Consumption - 1920x1080 The Witcher 3 ultra (external Monitor) | |
| AMD Ryzen 7 2700X | |
| AMD Ryzen 7 2700X (Idle: 74.3 W) | |
| Intel Core i9-7900X (99 fps, Idle: 63.4 W) | |
| AMD Ryzen 7 2700X | |
| AMD Ryzen 7 2700X (Idle: 81.39 W) | |
| Intel Core i7-4790K (Idle: 71.1 W) | |
| AMD Ryzen 7 2700X | |
| Intel Core i7-4790K (Idle: 68.3 W) | |
| Intel Core i7-4790K (Idle: 68 W) | |
* ... smaller is better
Verdict
The Radeon VII is AMD's answer to NVIDIA’s RTX 20 series. The GPU is a big leap from the Radeon RX Vega 64 and offers improved performance with reduced energy consumption. The improvements stem from the Radeon VII being manufactured on a 7 nm FinFET process and its generous 16 GB of HBM2 VRAM, However, while the Radeon VII has 5 GB more VRAM than the RTX 2080 Ti, the difference is currently hardly noticeable games as even the most complex triple-A games need only 8 GB to 10 GB of VRAM. Few titles require more than 11 GB even at the highest resolutions and at maximum details. It remains to be seen whether this situation will change in the future.
The Radeon VII is an excellent desktop GPU and AMD’s answer to the NVIDIA RTX 20 series. While the card offers great value for money, it cannot compete with the RTX 2080 in games.
The Radeon VII sits behind the RTX 2080 in gaming tests, but the opposite is true in professional applications where the Radeon VII generally outperforms its NVIDIA counterpart.
The GPU is excellent out of the box too, but lowering the voltage takes the Radeon VII to the next level and helps reduce fan noise along with power consumption. Overall, the AMD Radeon VII is a worthwhile upgrade from the Radeon RX Vega 64 and is an all-round fantastic desktop GPU, but it is beaten by the best that NVIDIA currently has to offer in games.
Benchmarks
3DM Vant. Perf. total +
specvp12 sw-03 +
* Smaller numbers mean a higher performance
Game Benchmarks
The following benchmarks stem from our benchmarks of review laptops. The performance depends on the used graphics memory, clock rate, processor, system settings, drivers, and operating systems. So the results don't have to be representative for all laptops with this GPU. For detailed information on the benchmark results, click on the fps number.

Cyberpunk 2077 1.0
2020

Yakuza Like a Dragon
2020


Dirt 5
2020
Watch Dogs Legion
2020
FIFA 21
2020
Star Wars Squadrons
2020

Serious Sam 4
2020
Crysis Remastered
2020
Horizon Zero Dawn
2020
Death Stranding
2020
F1 2020
2020
Gears Tactics
2020
Doom Eternal
2020
Hunt Showdown
2020


GRID 2019
2019
Borderlands 3
2019
Control
2019
Anno 1800
2019
The Division 2
2019
Dirt Rally 2.0
2019
Anthem
2019
Far Cry New Dawn
2019
Metro Exodus
2019
Just Cause 4
2018
Darksiders III
2018
Battlefield V
2018
Farming Simulator 19
2018
Fallout 76
2018
Hitman 2
2018


Forza Horizon 4
2018
FIFA 19
2018

Strange Brigade
2018
F1 2018
2018
Monster Hunter World
2018
The Crew 2
2018
Far Cry 5
2018
X-Plane 11.11
2018


Fortnite
2018

Destiny 2
2017
Dirt 4
2017For Honor
2017Watch Dogs 2
2016
Battlefield 1
2016
Overwatch
2016
The Division
2016
Far Cry Primal
2016

Rainbow Six Siege
2015Dota 2 Reborn
2015
The Witcher 3
2015
GTA V
2015
Battlefield 4
2013| low | med. | high | ultra | QHD | 4K | |
|---|---|---|---|---|---|---|
| Cyberpunk 2077 1.0 | 134.4 | 79 | 65.4 | 56.9 | 38.2 | 18.4 |
| Immortals Fenyx Rising | 103 | 92 | 85 | 79 | 67 | 46 |
| Yakuza Like a Dragon | 86.2 | 80.8 | 78.6 | 75.4 | 65.8 | 35.3 |
| Call of Duty Black Ops Cold War | 182.5 | 126.6 | 104.6 | 79.2 | 59.5 | 37.2 |
| Assassin´s Creed Valhalla | 134 | 99 | 82 | 72 | 57 | 35 |
| Dirt 5 | 171 | 113 | 93.7 | 85.7 | 69.1 | 44.8 |
| Watch Dogs Legion | 147 | 113 | 99 | 63 | 48.4 | 29.1 |
| FIFA 21 | 217 | 214 | 211 | 211 | 200 | 186 |
| Star Wars Squadrons | 421.4 | 364.3 | 339 | 326.6 | 220.4 | 115 |
| Mafia Definitive Edition | 143 | 110.9 | 100.8 | 74.2 | 42.2 | |
| Serious Sam 4 | 157.9 | 112.2 | 97.2 | 77.9 | 65.8 | 46.5 |
| Crysis Remastered | 230.3 | 152.3 | 80.4 | 63.8 | 48.7 | 30.7 |
| Horizon Zero Dawn | 161 | 121 | 102 | 89 | 72 | 42 |
| Death Stranding | 203.5 | 143.2 | 132.3 | 129.6 | 96.2 | 55.3 |
| F1 2020 | 185 | 155 | 130 | 95 | 80 | 57 |
| Gears Tactics | 181 | 120 | 80 | 65 | 63 | 42 |
| Doom Eternal | 373.1 | 237.9 | 198 | 197.2 | 156.4 | 88.8 |
| Hunt Showdown | 213.4 | 159.4 | 142.5 | 100.8 | 53.8 | |
| Red Dead Redemption 2 | 155.7 | 125.6 | 84.7 | 56 | 45.9 | 30.1 |
| Star Wars Jedi Fallen Order | 125.9 | 120.7 | 119.1 | 86.1 | 43.4 | |
| Call of Duty Modern Warfare 2019 | 203.2 | 147.9 | 134.9 | 119.1 | 90.6 | 52.1 |
| GRID 2019 | 221.7 | 155.6 | 139.3 | 107.1 | 88.5 | 58.2 |
| Borderlands 3 | 146 | 128 | 96.9 | 78.9 | 57 | 31.8 |
| Control | 194 | 124.3 | 87.9 | 56.8 | 28.6 | |
| Anno 1800 | 143.7 | 129.8 | 87.6 | 50.4 | 46 | 27.6 |
| The Division 2 | 193 | 143 | 113 | 87 | 63 | 35 |
| Dirt Rally 2.0 | 249.4 | 180.4 | 164.6 | 106.5 | 83.3 | 52.5 |
| Anthem | 113.2 | 100.3 | 93.8 | 90.5 | 82.8 | 48.3 |
| Far Cry New Dawn | 107 | 95 | 92 | 83 | 83 | 61 |
| Metro Exodus | 146.1 | 113.7 | 82.8 | 67.2 | 55.8 | 37.4 |
| Just Cause 4 | 119 | 113 | 102 | 101 | 45.7 | |
| Darksiders III | 183 | 138 | 125 | 119 | 44.2 | |
| Battlefield V | 183 | 136 | 137 | 127 | 73 | |
| Farming Simulator 19 | 180 | 166 | 121 | 111 | 51.1 | |
| Fallout 76 | 59.9 | 59.9 | 59.9 | 59.9 | 59.2 | |
| Hitman 2 | 88 | 92 | 84 | 82 | 52.9 | |
| Call of Duty Black Ops 4 | 220 | 160 | 153 | 146 | 58.1 | |
| Assassin´s Creed Odyssey | 82 | 76 | 70 | 63 | 44 | |
| Forza Horizon 4 | 188 | 163 | 157 | 130 | 77 | |
| FIFA 19 | 227 | 227 | 227 | 227 | 208 | |
| Shadow of the Tomb Raider | 137 | 120 | 116 | 110 | 44 | |
| Strange Brigade | 289 | 118 | 97.3 | 83.5 | 61 | 33.4 |
| F1 2018 | 220 | 196 | 149 | 133 | 71 | |
| Monster Hunter World | 120 | 117 | 116 | 94 | 33.5 | |
| The Crew 2 | 60 | 60 | 60 | 60 | 41 | |
| Far Cry 5 | 118 | 99 | 95 | 91 | 59 | |
| X-Plane 11.11 | 149 | 133 | 103 | 88.1 | ||
| Kingdom Come: Deliverance | 134 | 116 | 90 | 71 | 30.8 | |
| Final Fantasy XV Benchmark | 130 | 69 | 48.7 | 35.1 | 19.2 | |
| Fortnite | 197 | 195 | 154 | 114 | 44.4 | |
| Assassin´s Creed Origins | 75 | 70 | 68 | 63 | 49 | |
| Destiny 2 | 147 | 136 | 134 | 112 | 51 | |
| Playerunknown's Battlegrounds (PUBG) | 161 | 157 | 158 | 143 | 58 | |
| Dirt 4 | 324 | 255 | 224 | 150 | 84 | |
| Ghost Recon Wildlands | 127 | 88 | 82 | 49 | 42 | |
| For Honor | 226 | 169 | 159 | 121 | 64 | |
| Watch Dogs 2 | 107 | 94 | 78 | 55 | 39 | |
| Battlefield 1 | 187 | 169 | 153 | 138 | 82 | |
| Deus Ex Mankind Divided | 124 | 120 | 109 | 70 | 47 | |
| Overwatch | 300 | 226 | 226 | 128 | 101 | |
| The Division | 203 | 174 | 117 | 91 | 60 | |
| Far Cry Primal | 125 | 111 | 101 | 94 | 69 | |
| Rise of the Tomb Raider | 232 | 163 | 105 | 89 | 56.3 | |
| Rainbow Six Siege | 227 | 225 | 200 | 190 | 93 | |
| Dota 2 Reborn | 185.2 | 164.3 | 159.9 | 147.4 | 78.4 | |
| The Witcher 3 | 223 | 208 | 139 | 75 | 54.3 | |
| GTA V | 178 | 173 | 135 | 88 | 43.4 | 62 |
| Battlefield 4 | 199.1 | 199.8 | 199.8 | 180.6 | 70.4 | |
| low | med. | high | ultra | QHD | 4K | < 30 fps < 60 fps < 120 fps ≥ 120 fps | 1 11 55 | 1 24 43 | 2 37 29 | 6 40 17 | 12 18 3 | 5 44 17 2 |
For more games that might be playable and a list of all games and graphics cards visit our Gaming List
No reviews found.
