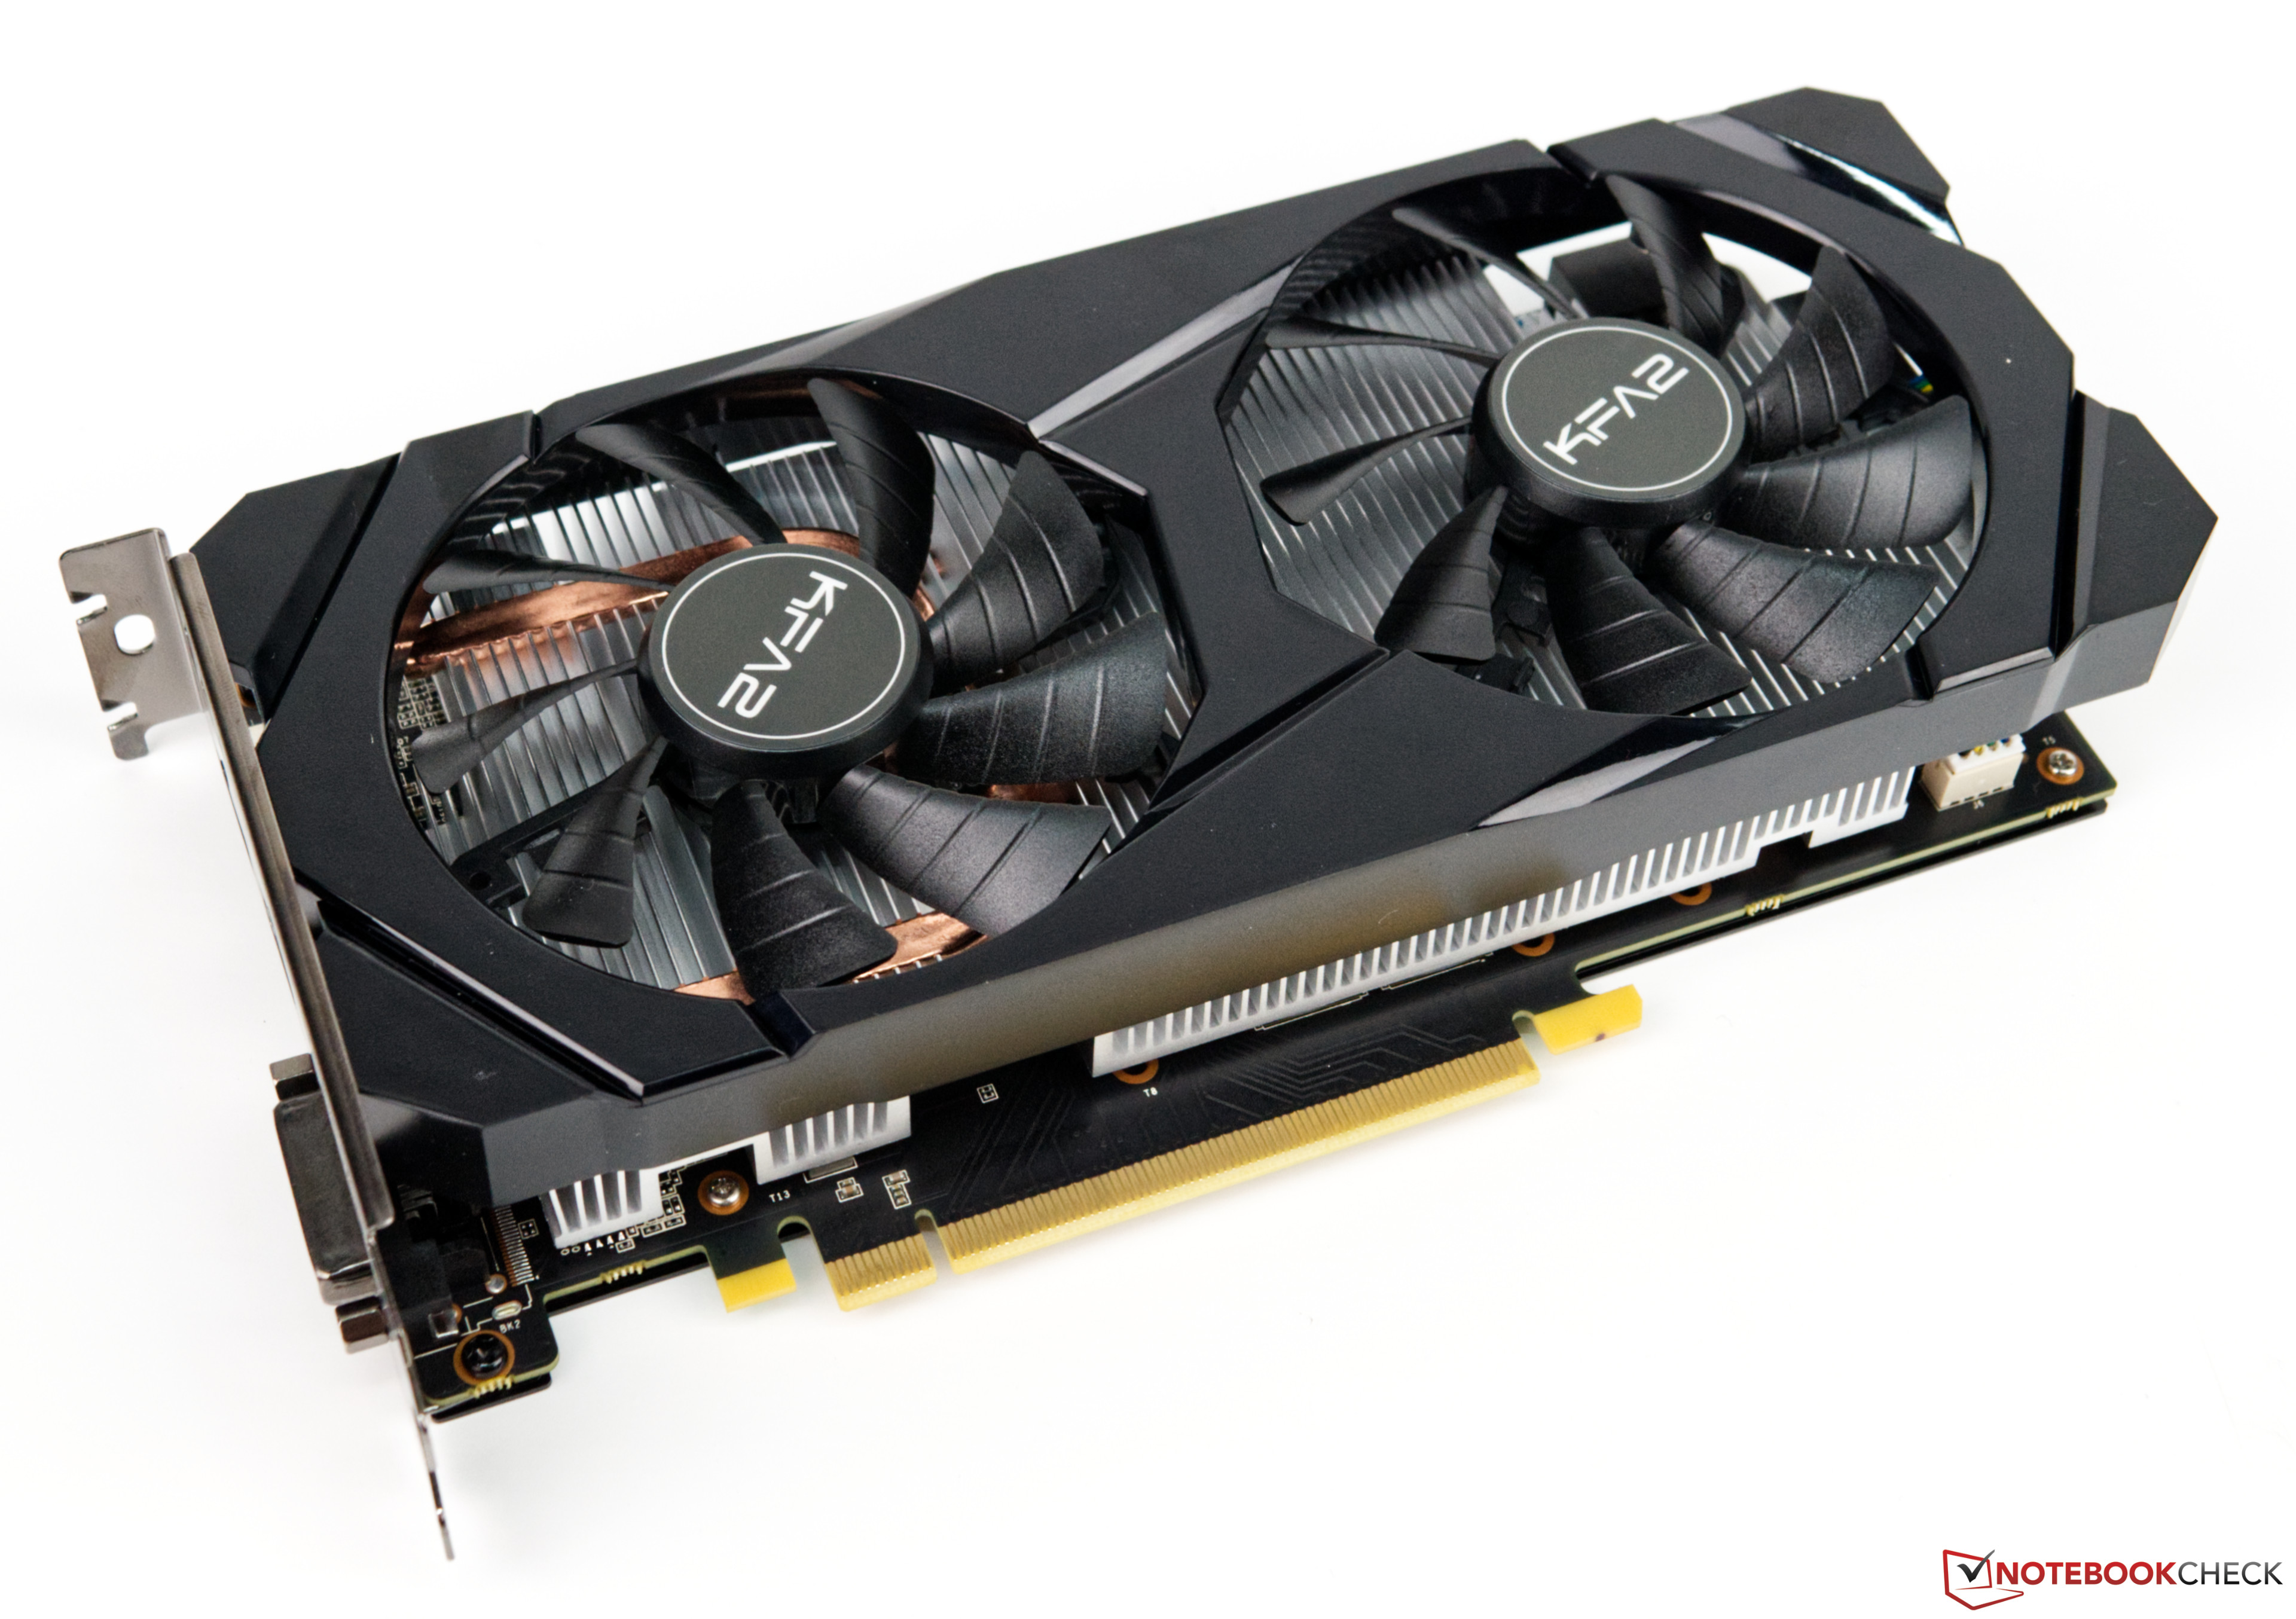
Notebookcheck Logo

NVIDIA GeForce GTX 1660 Super (Desktop)

NVIDIA GeForce GTX 1660 Super (Desktop)

The Nvidia GeForce GTX 1660 Super is a powerful, mid-tier, Turing-based, desktop GPU. The GTX 1660 Super is based on the TU116 chip with 1,408 shader units, 48 ROPs, 88 TMUs and a 192-bit-wide memory bus (GDDR6 clocked at 7 GHz, effectively 14 GHz, bandwidth: up to 336 GB/s).

The TU116 chip and other Turing-based GPUs are produced using the 12-nm manufacturing process. However, the GeForce GTX 1660 does not offer the latest features such as DLSS (Deep Learning Super Sampling) and Real Time Ray Tracing. Nevertheless, there are some architectural improvements when it comes to floating point and integer performance. These operations can now be carried out simultaneously. Other notable features include Adaptive Shading, unified cache, DisplayPort 1.4, HDMI 2.0b, HDR, Simultaneous Multi-Projection (SMP) as well as H.265 encoding and decoding (PlayReady 3.0).

At Full HD resolution, the GeForce GTX 1660 Super performance lies between a GeForce GTX 1660 / GTX 1060 and a GTX 1660 Ti / 1070. Therefore, it is most suited for demanding games of 2019 in full HD resolution and maximum detail settings, or QHD at slightly reduced settings.

The energy consumption of the GeForce GTX 1660 Super amounts to 125 watts and therefore 5 Watt higher than the GTX 1060 or GTX 1660 Ti.

GeForce GTX 1600 Series

GeForce GTX 1660 Ti (Desktop) compare 1536 @ 1.5 - 1.77 GHz192 Bit @ 12000 MHz
GeForce GTX 1660 Super (Desktop) 1408 @ 1.53 - 1.79 GHz192 Bit @ 14000 MHz
GeForce GTX 1660 Ti Mobile compare 1536 @ 1.46 - 1.59 GHz192 Bit @ 12000 MHz
GeForce GTX 1660 (Desktop) compare 1408 @ 1.53 - 1.79 GHz192 Bit @ 8000 MHz
GeForce GTX 1650 Super (Desktop) compare 1280 @ 1.53 GHz192 Bit @ 14000 MHz
GeForce GTX 1660 Ti Max-Q compare 1536 @ 1.14 - 1.34 GHz192 Bit @ 12000 MHz
GeForce GTX 1650 Ti Mobile compare 1024 @ 1.35 - 1.49 GHz128 Bit @ 12000 MHz
GeForce GTX 1650 (Desktop) compare 896 @ 1.49 - 1.67 GHz128 Bit @ 8000 MHz
GeForce GTX 1650 Mobile compare 1024 @ 1.38 - 1.56 GHz128 Bit @ 12000 MHz
GeForce GTX 1650 Ti Max-Q compare 1024 @ 1.04 - 1.2 GHz128 Bit @ 10000 MHz
GeForce GTX 1650 Max-Q compare 1024 @ 1.02 - 1.25 GHz128 Bit @ 8000 MHz
CodenameTuring TU116
ArchitectureTuring
Pipelines1408 - unified
Core Speed1530 - 1785 (Boost) MHz
Memory Speed14000 MHz
Memory Bus Width192 Bit
Memory TypeGDDR6
Max. Amount of Memory6 GB
Shared Memoryno
APIDirectX 12_1, Shader 6.4, OpenGL 4.6
Power Consumption125 Watt
Transistor Count6.6 Billion
Man. Technology12 nm
Date of Announcement29.10.2019

Benchmarks

Performance Rating - 3DMark 11 + Fire Strike + Time Spy
6 pt (18%)
Restrict / Search: Model: Max. age: years
3DMark - 3DMark Steel Nomad
1282 Points (9%)
3DMark - 3DMark Steel Nomad Light
5670 Points (13%)
3DMark - 3DMark Wild Life Unlimited
39692 Points (20%)
3DMark - 3DMark Fire Strike Standard Score
min: 14656     avg: 15234     median: 15509 (23%)     max: 15631 Points
3DMark - 3DMark Fire Strike Standard Graphics
min: 15498     avg: 15855     median: 15995 (15%)     max: 16123 Points
3DMark - 3DMark Ice Storm Graphics
min: 337164     avg: 384514     median: 406127 (45%)     max: 416905 Points
3DMark - 3DMark Time Spy Score
min: 6421     avg: 6569     median: 6583 (17%)     max: 6706 Points
3DMark - 3DMark Time Spy Graphics
min: 5958     avg: 5979     median: 5965 (12%)     max: 6021 Points
Restrict / Search: Model: Max. age: years
3DMark - 3DMark Ice Storm Unlimited Graphics
min: 471219     avg: 544860     median: 477037 (48%)     max: 686323 Points
3DMark - 3DMark Ice Storm Extreme Graphics
min: 281104     avg: 306863     median: 318804 (37%)     max: 326774 Points
3DMark - 3DMark Cloud Gate Score
min: 48162     avg: 57166     median: 60782 (57%)     max: 63018 Points
3DMark - 3DMark Cloud Gate Graphics
min: 88797     avg: 93568     median: 95473 (23%)     max: 97089 Points
3DMark - 3DMark Night Raid
min: 44634     avg: 45691     median: 45691 (43%)     max: 46748 Points
3DMark - 3DMark Night Raid Graphics Score
min: 71384     avg: 72579     median: 72578.5 (28%)     max: 73773 Points
3DMark 11 - 3DM11 Performance Score
min: 20610     avg: 22347     median: 22780.5 (28%)     max: 23216 Points
3DMark 11 - 3DM11 Performance GPU
min: 21347     avg: 21831     median: 21980.5 (17%)     max: 22017 Points
Restrict / Search: Model: Max. age: years
3DMark Vantage
3DM Vant. Perf. total +
3DMark Vantage - 3DM Vant. Perf. total
min: 60318     avg: 71283     median: 76654 (22%)     max: 76878 Points
3DM Vant. Perf. GPU no PhysX +
3DMark Vantage - 3DM Vant. Perf. GPU no PhysX
min: 58063     avg: 66360     median: 70321 (38%)     max: 70697 Points
Restrict / Search: Model: Max. age: years
3DMark 05 - 3DMark 05 - Standard
min: 53106     avg: 76840     median: 87771 (96%)     max: 89643 Points
Restrict / Search: Model: Max. age: years
3DMark 06 3DMark 06 - Standard 1280x1024 +
3DMark 06
min: 44443     avg: 60480     median: 68377 (89%)     max: 68619 Points
Unigine Valley 1.0 - Unigine Valley 1.0 DX
min: 77.6     avg: 78.2     median: 77.7 (24%)     max: 79.3 fps
SPECviewperf 12
specvp12 sw-03 +
SPECviewperf 12 - specvp12 sw-03
min: 53     avg: 63.8     median: 63.6 (16%)     max: 75 fps
specvp12 snx-02 +
SPECviewperf 12 - specvp12 snx-02
min: 8.21     avg: 9.1     median: 9 (1%)     max: 10.2 fps
specvp12 showcase-01 +
SPECviewperf 12 - specvp12 showcase-01
min: 80.2     avg: 84.6     median: 84 (15%)     max: 90 fps
specvp12 mediacal-01 +
SPECviewperf 12 - specvp12 mediacal-01
min: 28.22     avg: 37.4     median: 34.7 (9%)     max: 52 fps
specvp12 maya-04 +
SPECviewperf 12 - specvp12 maya-04
min: 127.8     avg: 141     median: 141.5 (39%)     max: 153 fps
specvp12 energy-01 +
SPECviewperf 12 - specvp12 energy-01
min: 7.75     avg: 8.3     median: 8.3 (7%)     max: 8.83 fps
specvp12 creo-01 +
SPECviewperf 12 - specvp12 creo-01
min: 35.51     avg: 42.7     median: 43 (17%)     max: 49.2 fps
specvp12 catia-04 +
SPECviewperf 12 - specvp12 catia-04
min: 62.6     avg: 66     median: 65.5 (11%)     max: 70.2 fps
specvp12 3dsmax-05 +
SPECviewperf 12 - specvp12 3dsmax-05
min: 144     avg: 157.1     median: 158.8 (24%)     max: 167 fps
SPECviewperf 13 specvp13 sw-04 +
SPECviewperf 13 - specvp13 sw-04
min: 71.7     avg: 91.1     median: 91.4 (25%)     max: 110 fps
specvp13 snx-03 +
SPECviewperf 13 - specvp13 snx-03
min: 14.76     avg: 16.4     median: 16.1 (2%)     max: 18.4 fps
specvp13 showcase-02 +
SPECviewperf 13 - specvp13 showcase-02
min: 78.6     avg: 82.9     median: 83.7 (14%)     max: 85.5 fps
specvp13 medical-02 +
SPECviewperf 13 - specvp13 medical-02
min: 36.6     avg: 39.3     median: 40 (7%)     max: 40.7 fps
specvp13 maya-05 +
SPECviewperf 13 - specvp13 maya-05
min: 20.7     avg: 163.9     median: 208.5 (24%)     max: 218 fps
specvp13 energy-02 +
SPECviewperf 13 - specvp13 energy-02
min: 11.25     avg: 11.3     median: 11.3 (4%)     max: 11.31 fps
specvp13 creo-02 +
SPECviewperf 13 - specvp13 creo-02
min: 130.3     avg: 137.6     median: 137.5 (20%)     max: 145 fps
specvp13 catia-05 +
SPECviewperf 13 - specvp13 catia-05
min: 89.8     avg: 93.2     median: 93 (10%)     max: 96.9 fps
specvp13 3dsmax-06 +
SPECviewperf 13 - specvp13 3dsmax-06
min: 143     avg: 156     median: 157.6 (25%)     max: 166 fps
SPECviewperf 2020 specvp2020 solidworks-05 4k +
SPECviewperf 2020 - specvp2020 solidworks-05 4k
64.1 fps (15%)
specvp2020 snx-04 4k +
SPECviewperf 2020 - specvp2020 snx-04 4k
min: 11.7     avg: 12.7     median: 12.7 (1%)     max: 13.6 fps
specvp2020 medical-03 4k +
SPECviewperf 2020 - specvp2020 medical-03 4k
min: 6.11     avg: 6.8     median: 6.9 (4%)     max: 7.41 fps
specvp2020 maya-06 4k +
SPECviewperf 2020 - specvp2020 maya-06 4k
min: 113     avg: 117     median: 118 (17%)     max: 120 fps
specvp2020 energy-03 4k +
SPECviewperf 2020 - specvp2020 energy-03 4k
min: 13.7     avg: 13.8     median: 13.8 (3%)     max: 13.8 fps
specvp2020 creo-03 4k +
SPECviewperf 2020 - specvp2020 creo-03 4k
min: 52.9     avg: 56.7     median: 57.7 (26%)     max: 59.4 fps
specvp2020 catia-06 4k +
SPECviewperf 2020 - specvp2020 catia-06 4k
min: 20.53     avg: 20.9     median: 21 (14%)     max: 21.1 fps
specvp2020 3dsmax-07 4k +
SPECviewperf 2020 - specvp2020 3dsmax-07 4k
min: 42.19     avg: 46.1     median: 47.7 (16%)     max: 48.3 fps
LuxMark v2.0 64Bit - LuxMark v2.0 Room GPU
2286 Samples/s (8%)
LuxMark v2.0 64Bit - LuxMark v2.0 Sala GPU
4490 Samples/s (8%)
ComputeMark v2.1 - ComputeMark v2.1 Result
11098 points (9%)
Power Consumption - Furmark Stress Test Power Consumption - external Monitor *
min: 247.6     avg: 247.8     median: 247.8 (33%)     max: 248 Watt
020406080100120140160180200220240260280300320Tooltip
Power Consumption - The Witcher 3 Power Consumption - external Monitor *
min: 246     avg: 253.2     median: 253.2 (35%)     max: 260.4 Watt
020406080100120140160180200220240260280300320Tooltip
Power Consumption - Power Efficiency - Witcher 3 ultra external Monitor
0.2 fps per Watt (19%)
Power Consumption - Cyberpunk 2077 Power Consumption - external Monitor *
318 Watt (40%)
020406080100120140160180200220240260280300320340Tooltip
Clock Speed - GPU Clock Speed Furmark
1590 MHz (63%)
- Range of benchmark values
red legend - Average benchmark values
* Smaller numbers mean a higher performance

Game Benchmarks

The following benchmarks stem from our benchmarks of review laptops. The performance depends on the used graphics memory, clock rate, processor, system settings, drivers, and operating systems. So the results don't have to be representative for all laptops with this GPU. For detailed information on the benchmark results, click on the fps number.

F1 25

F1 25

2025
low 1920x1080
163.4  fps    + Compare
med. 1920x1080
131.4  fps    + Compare
high 1920x1080
96.2  fps    + Compare
» With all tested laptops playable in detail settings high.
low 1920x1080
76.2  fps    + Compare + 📈 Graph
med. 1920x1080
35.7  fps    + Compare + 📈 Graph
high 1920x1080
31.2  fps    + Compare + 📈 Graph
» With all tested laptops playable in detail settings med..
low 1920x1080
236  fps    + Compare + 📈 Graph
med. 1920x1080
143.4  fps    + Compare + 📈 Graph
high 1920x1080
73.7  fps    + Compare + 📈 Graph
QHD 2560x1440
45.8  fps    + Compare + 📈 Graph
4K 3840x2160
21.7  fps    + Compare + 📈 Graph
» With all tested laptops playable in detail settings high.
low 1920x1080
40.8  fps    + Compare
med. 1920x1080
34.1  fps    + Compare
» With all tested laptops playable in detail settings low.
low 1920x1080
74.3  fps    + Compare + 📈 Graph
med. 1920x1080
56.2  fps    + Compare + 📈 Graph
high 1920x1080
45.5  fps    + Compare + 📈 Graph
ultra 1920x1080
30.7  fps    + Compare + 📈 Graph
QHD 2560x1440
21.5  fps    + Compare + 📈 Graph
4K 3840x2160
7.4  fps    + Compare + 📈 Graph
» With all tested laptops playable in detail settings high.
Stalker 2

Stalker 2

2024
low 1920x1080
41.9  fps    + Compare + 📈 Graph
med. 1920x1080
15.8  fps    + Compare + 📈 Graph
high 1920x1080
9.7  fps    + Compare + 📈 Graph
» With all tested laptops playable in detail settings low.
Additional Benchmarks
Low Preset 1280x720
62.7
low 1920x1080
57  fps    + Compare
med. 1920x1080
53  fps    + Compare
high 1920x1080
33  fps    + Compare
ultra 1920x1080
31  fps    + Compare
QHD 2560x1440
19  fps    + Compare
» With all tested laptops playable in detail settings med..
Additional Benchmarks
Minimum Preset 1280x720
94
low 1920x1080
100.7  fps    + Compare + 📈 Graph
med. 1920x1080
60.1  fps    + Compare + 📈 Graph
high 1920x1080
40.9  fps    + Compare + 📈 Graph
ultra 1920x1080
29.4  fps    + Compare + 📈 Graph
» With all tested laptops playable in detail settings high.
Additional Benchmarks
Low Preset 1280x720
136.7
low 1920x1080
72.6  fps    + Compare + 📈 Graph
med. 1920x1080
59.1  fps    + Compare + 📈 Graph
high 1920x1080
49.4  fps    + Compare + 📈 Graph
ultra 1920x1080
44.9  fps    + Compare + 📈 Graph
QHD 2560x1440
31.8  fps    + Compare + 📈 Graph
» With all tested laptops playable in detail settings ultra.
Additional Benchmarks
Low Preset TAA 1280x720
110
low 1920x1080
42.8  fps    + Compare + 📈 Graph
med. 1920x1080
42.5  fps    + Compare + 📈 Graph
high 1920x1080
36.1  fps    + Compare + 📈 Graph
ultra 1920x1080
32.5  fps    + Compare + 📈 Graph
» With all tested laptops playable in detail settings high.
Additional Benchmarks
Low Preset (Super Resolution off) 1280x720
71.8
low 1920x1080
62  fps    + Compare + 📈 Graph
med. 1920x1080
52.1  fps    + Compare + 📈 Graph
high 1920x1080
49.8  fps    + Compare + 📈 Graph
ultra 1920x1080
43.3  fps    + Compare + 📈 Graph
QHD 2560x1440
13.4  fps    + Compare + 📈 Graph
» With all tested laptops playable in detail settings ultra.
Additional Benchmarks
Low Preset TAA 1280x720
93.5
low 1920x1080 cinem.
25.5  fps    + Compare + 📈 Graph
med. 1920x1080 cinem.
22.1  fps    + Compare + 📈 Graph
high 1920x1080 cinem.
18.5  fps    + Compare + 📈 Graph
ultra 1920x1080 cinem.
13.9  fps    + Compare + 📈 Graph
» The benchmarks indicate that the game is not playable in the tested settings.
Additional Benchmarks
low 1280x720 cinem.
37.3
low 1920x1080
47  fps    + Compare
med. 1920x1080
34  fps    + Compare
high 1920x1080
25  fps    + Compare
ultra 1920x1080
13  fps    + Compare
QHD 2560x1440
12  fps    + Compare
» With all tested laptops playable in detail settings low.
Additional Benchmarks
low TSR 100 1280x720
80
low 1920x1080
123.7  fps    + Compare + 📈 Graph
med. 1920x1080
85.7  fps    + Compare + 📈 Graph
high 1920x1080
71.2  fps    + Compare + 📈 Graph
ultra 1920x1080
61.3  fps    + Compare + 📈 Graph
QHD 2560x1440
38.8  fps    + Compare + 📈 Graph
4K 3840x2160
19  fps    + Compare + 📈 Graph
» With all tested laptops playable in detail settings ultra.
Additional Benchmarks
Very Low Preset 1280x720
243
low 1920x1080
106.5  fps    + Compare + 📈 Graph
med. 1920x1080
64.3  fps    + Compare + 📈 Graph
high 1920x1080
51  fps    + Compare + 📈 Graph
ultra 1920x1080
40.3  fps    + Compare + 📈 Graph
QHD 2560x1440
24.9  fps    + Compare + 📈 Graph
4K 3840x2160
12.4  fps    + Compare + 📈 Graph
» With all tested laptops playable in detail settings ultra.
Additional Benchmarks
Low Preset 1280x720
148.3
F1 24

F1 24

2024
low 1920x1080
179.8  fps    + Compare
med. 1920x1080
151.4  fps    + Compare
high 1920x1080
109.9  fps    + Compare
» With all tested laptops playable in detail settings high.
low 1920x1080
37.1  fps    + Compare + 📈 Graph
med. 1920x1080
29.1  fps    + Compare + 📈 Graph
high 1920x1080
9  fps    + Compare + 📈 Graph
» With all tested laptops playable in detail settings low.
low 1920x1080
64.4  fps    + Compare + 📈 Graph
med. 1920x1080
55.9  fps    + Compare + 📈 Graph
high 1920x1080
48.4  fps    + Compare + 📈 Graph
ultra 1920x1080
34.3  fps    + Compare + 📈 Graph
» With all tested laptops playable in detail settings high.
low 1920x1080
70  fps    + Compare + 📈 Graph
med. 1920x1080
62.2  fps    + Compare + 📈 Graph
high 1920x1080
41.7  fps    + Compare + 📈 Graph
ultra 1920x1080
38.5  fps    + Compare + 📈 Graph
QHD 2560x1440
26.7  fps    + Compare + 📈 Graph
4K 3840x2160
11.8  fps    + Compare + 📈 Graph
4K FSR 3840x2160
11.3  fps    + Compare + 📈 Graph
» With all tested laptops playable in detail settings ultra.
Additional Benchmarks
Very Low Preset 1280x720
110.6
low 1920x1080
168.4  fps    + Compare + 📈 Graph
med. 1920x1080
132.4  fps    + Compare + 📈 Graph
high 1920x1080
109.4  fps    + Compare + 📈 Graph
ultra 1920x1080
38  fps    + Compare + 📈 Graph
QHD 2560x1440
15.9  fps    + Compare + 📈 Graph
» With all tested laptops playable in detail settings ultra.
Additional Benchmarks
Low Preset 1280x720
296
low 1920x1080
45.5  fps    + Compare + 📈 Graph
high 1920x1080
41.1  fps    + Compare + 📈 Graph
QHD 2560x1440
29.9  fps    + Compare + 📈 Graph
4K 3840x2160
15.9  fps    + Compare + 📈 Graph
» With all tested laptops playable in detail settings high.
Additional Benchmarks
Low Preset 1280x720
60.3
low 1920x1080
175.5  fps    + Compare + 📈 Graph
med. 1920x1080
135.5  fps    + Compare + 📈 Graph
high 1920x1080
115.7  fps    + Compare + 📈 Graph
ultra 1920x1080
84.6  fps    + Compare + 📈 Graph
QHD 2560x1440
53.4  fps    + Compare + 📈 Graph
4K 3840x2160
23.1  fps    + Compare + 📈 Graph
» With all tested laptops playable in detail settings ultra.
Additional Benchmarks
Very Low Preset 1280x720
298
low 1920x1080
79  fps    + Compare
med. 1920x1080
72  fps    + Compare
high 1920x1080
57  fps    + Compare
ultra 1920x1080
48  fps    + Compare
QHD 2560x1440
35  fps    + Compare
4K 3840x2160
19  fps    + Compare
4K FSR 3840x2160
28  fps    + Compare
» With all tested laptops playable in detail settings ultra.
Additional Benchmarks
Low Preset TAA 1280x720
108
low 1920x1080
93.1  fps    + Compare + 📈 Graph
med. 1920x1080
68.8  fps    + Compare + 📈 Graph
high 1920x1080
58.7  fps    + Compare + 📈 Graph
ultra 1920x1080
57.3  fps    + Compare + 📈 Graph
QHD 2560x1440
39.3  fps    + Compare + 📈 Graph
4K 3840x2160
19.3  fps    + Compare + 📈 Graph
» With all tested laptops playable in detail settings ultra.
Additional Benchmarks
Low Preset 1280x720
138.3
low 1920x1080
48.1  fps    + Compare + 📈 Graph
med. 1920x1080
42.7  fps    + Compare + 📈 Graph
high 1920x1080
32.9  fps    + Compare + 📈 Graph
ultra 1920x1080
24.1  fps    + Compare + 📈 Graph
QHD 2560x1440
17.8  fps    + Compare + 📈 Graph
4K 3840x2160
8.2  fps    + Compare + 📈 Graph
4K FSR 3840x2160
14  fps    + Compare + 📈 Graph
» With all tested laptops playable in detail settings med..
Additional Benchmarks
Max. Performance 1280x720
81.1
Palworld

Palworld

2024
low 1920x1080
90.3  fps    + Compare + 📈 Graph
med. 1920x1080
73.6  fps    + Compare + 📈 Graph
high 1920x1080
56.9  fps    + Compare + 📈 Graph
ultra 1920x1080
52.6  fps    + Compare + 📈 Graph
QHD 2560x1440
34.4  fps    + Compare + 📈 Graph
4K 3840x2160
17.5  fps    + Compare + 📈 Graph
» With all tested laptops playable in detail settings ultra.
Additional Benchmarks
Very Low Preset 1280x720
201
med. 1920x1080
358  fps    + Compare + 📈 Graph
high 1920x1080
356  fps    + Compare + 📈 Graph
ultra 1920x1080
350  fps    + Compare + 📈 Graph
QHD 2560x1440
216  fps    + Compare + 📈 Graph
4K 3840x2160
106.2  fps    + Compare + 📈 Graph
» With all tested laptops playable in detail settings ultra.
low 1920x1080
144.2  fps    + Compare + 📈 Graph
med. 1920x1080
128.2  fps    + Compare + 📈 Graph
high 1920x1080
112.5  fps    + Compare + 📈 Graph
ultra 1920x1080
69.6  fps    + Compare + 📈 Graph
QHD 2560x1440
39.2  fps    + Compare + 📈 Graph
4K 3840x2160
9.5  fps    + Compare + 📈 Graph
» With all tested laptops playable in detail settings ultra.
low 1920x1080
165.4  fps    + Compare + 📈 Graph
med. 1920x1080
116.3  fps    + Compare + 📈 Graph
high 1920x1080
101.7  fps    + Compare + 📈 Graph
ultra 1920x1080
75.3  fps    + Compare + 📈 Graph
QHD 2560x1440
44.1  fps    + Compare + 📈 Graph
4K 3840x2160
18.1  fps    + Compare + 📈 Graph
» With all tested laptops playable in detail settings ultra.
Additional Benchmarks
Low Preset 1280x720
269
low 1920x1080
53  fps    + Compare
med. 1920x1080
47  fps    + Compare
high 1920x1080
38  fps    + Compare
ultra 1920x1080
28  fps    + Compare
QHD 2560x1440
21  fps    + Compare
4K 3840x2160
17  fps    + Compare
» With all tested laptops playable in detail settings high.
Additional Benchmarks
Low Preset TAA 1280x720
73
low 1920x1080
75  fps    + Compare
med. 1920x1080
68  fps    + Compare
high 1920x1080
47  fps    + Compare
ultra 1920x1080
40  fps    + Compare
QHD 2560x1440
28  fps    + Compare
4K 3840x2160
16  fps    + Compare
» With all tested laptops playable in detail settings ultra.
Additional Benchmarks
Minimum Preset 1280x720
125
low 1920x1080
82  fps    + Compare + 📈 Graph
med. 1920x1080
59.6  fps    + Compare + 📈 Graph
high 1920x1080
55.4  fps    + Compare + 📈 Graph
ultra 1920x1080
50.6  fps    + Compare + 📈 Graph
QHD 2560x1440
35.7  fps    + Compare + 📈 Graph
4K 3840x2160
11.1  fps    + Compare + 📈 Graph
» With all tested laptops playable in detail settings ultra.
Additional Benchmarks
Ultra Low Preset LowAA 1280x720
182.1
low 1920x1080
38.8  fps    + Compare + 📈 Graph
med. 1920x1080
32.2  fps    + Compare + 📈 Graph
high 1920x1080
29.9  fps    + Compare + 📈 Graph
QHD 2560x1440
19.6  fps    + Compare + 📈 Graph
4K 3840x2160
9.2  fps    + Compare + 📈 Graph
» With all tested laptops playable in detail settings low.
Additional Benchmarks
Low Preset 1280x720
65.3
low 1920x1080
55.4  fps    + Compare + 📈 Graph
med. 1920x1080
44.8  fps    + Compare + 📈 Graph
ultra 1920x1080
21.3  fps    + Compare + 📈 Graph
QHD 2560x1440
13.1  fps    + Compare + 📈 Graph
4K 3840x2160
5.3  fps    + Compare + 📈 Graph
» With all tested laptops playable in detail settings med..
Additional Benchmarks
Low Preset 1280x720
32.2
low 1920x1080
252.3  fps    + Compare
med. 1920x1080
165  fps    + Compare
high 1920x1080
92.6  fps    + Compare
ultra 1920x1080
72.7  fps    + Compare
QHD 2560x1440
48  fps    + Compare
4K 3840x2160
23.5  fps    + Compare
» With all tested laptops playable in detail settings ultra.
Additional Benchmarks
Low Preset 1280x720
430.5
low 1920x1080
82  fps    + Compare
med. 1920x1080
75  fps    + Compare
high 1920x1080
70  fps    + Compare
ultra 1920x1080
52  fps    + Compare
QHD 2560x1440
39  fps    + Compare
4K 3840x2160
22  fps    + Compare
» With all tested laptops playable in detail settings ultra.
Additional Benchmarks
Low Preset (Adaptive Quality Off) 1280x720
121
low 1920x1080
180.8  fps    + Compare + 📈 Graph
med. 1920x1080
164  fps    + Compare + 📈 Graph
high 1920x1080
141.7  fps    + Compare + 📈 Graph
ultra 1920x1080
120.8  fps    + Compare + 📈 Graph
QHD 2560x1440
89.2  fps    + Compare + 📈 Graph
4K 3840x2160
18.8  fps    + Compare + 📈 Graph
» With all tested laptops playable in detail settings ultra.
Additional Benchmarks
Low Preset 1280x720
284
low 1920x1080
285  fps    + Compare + 📈 Graph
med. 1920x1080
243  fps    + Compare + 📈 Graph
high 1920x1080
136.1  fps    + Compare + 📈 Graph
ultra 1920x1080
102.5  fps    + Compare + 📈 Graph
QHD 2560x1440
67.2  fps    + Compare + 📈 Graph
4K 3840x2160
32.8  fps    + Compare + 📈 Graph
» With all tested laptops playable in detail settings ultra.
Additional Benchmarks
Low Preset 1280x720
326
low 1920x1080
79.5 100 ~ 90 fps    + Compare
med. 1920x1080
61.9  fps    + Compare
high 1920x1080
52.4  fps    + Compare
ultra 1920x1080
47.5  fps    + Compare
QHD 2560x1440
28.8  fps    + Compare
4K 3840x2160
12.5  fps    + Compare
» With all tested laptops playable in detail settings ultra.
Additional Benchmarks
Low Preset (FSR off) 1280x720
126.2
Steam Deck 1280x800
139.2
30min Start Ultra Preset (FSR off) 1920x1080
43.2
low 1920x1080
76  fps    + Compare + 📈 Graph
med. 1920x1080
60.5  fps    + Compare + 📈 Graph
high 1920x1080
50.7  fps    + Compare + 📈 Graph
ultra 1920x1080
50.3  fps    + Compare + 📈 Graph
QHD 2560x1440
33  fps    + Compare + 📈 Graph
4K 3840x2160
16.9  fps    + Compare + 📈 Graph
» With all tested laptops playable in detail settings ultra.
Additional Benchmarks
Low Preset SMAA 1280x720
113.3
Lies of P

Lies of P

2023
low 1920x1080
112.6  fps    + Compare + 📈 Graph
med. 1920x1080
97.9  fps    + Compare + 📈 Graph
high 1920x1080
84.3  fps    + Compare + 📈 Graph
ultra 1920x1080
74.1  fps    + Compare + 📈 Graph
QHD 2560x1440
48  fps    + Compare + 📈 Graph
4K 3840x2160
21.7  fps    + Compare + 📈 Graph
» With all tested laptops playable in detail settings ultra.
Additional Benchmarks
Low Preset 1280x720
189.5
Starfield

Starfield

2023
low 1920x1080
42.2  fps    + Compare + 📈 Graph
med. 1920x1080
35.5  fps    + Compare + 📈 Graph
high 1920x1080
26  fps    + Compare + 📈 Graph
ultra 1920x1080
25.8  fps    + Compare + 📈 Graph
QHD 2560x1440
20.3  fps    + Compare + 📈 Graph
4K 3840x2160
12.6  fps    + Compare + 📈 Graph
» With all tested laptops playable in detail settings med..
Additional Benchmarks
Low Preset 1280x720
53.7
low 1920x1080
115.3  fps    + Compare + 📈 Graph
med. 1920x1080
97.2  fps    + Compare + 📈 Graph
high 1920x1080
85.5  fps    + Compare + 📈 Graph
ultra 1920x1080
68.5  fps    + Compare + 📈 Graph
QHD 2560x1440
49.5  fps    + Compare + 📈 Graph
4K 3840x2160
20.4  fps    + Compare + 📈 Graph
» With all tested laptops playable in detail settings ultra.
Additional Benchmarks
Low Preset 1280x720
119.7
low 1920x1080
36.4  fps    + Compare + 📈 Graph
high 1920x1080
30.5  fps    + Compare + 📈 Graph
ultra 1920x1080
22.1  fps    + Compare + 📈 Graph
QHD 2560x1440
14.1  fps    + Compare + 📈 Graph
4K 3840x2160
6.8  fps    + Compare + 📈 Graph
» With all tested laptops playable in detail settings low.
Additional Benchmarks
Low 1280x720
61.5
low 1920x1080
89.3  fps    + Compare + 📈 Graph
med. 1920x1080
84.1  fps    + Compare + 📈 Graph
high 1920x1080
78.7  fps    + Compare + 📈 Graph
ultra 1920x1080
65.5  fps    + Compare + 📈 Graph
QHD 2560x1440
46.8  fps    + Compare + 📈 Graph
4K 3840x2160
22  fps    + Compare + 📈 Graph
» With all tested laptops playable in detail settings ultra.
Additional Benchmarks
Low Preset 1280x720
151.5
low 1920x1080
63.4  fps    + Compare + 📈 Graph
med. 1920x1080
52.4  fps    + Compare + 📈 Graph
high 1920x1080
44.7  fps    + Compare + 📈 Graph
ultra 1920x1080
33.4  fps    + Compare + 📈 Graph
QHD 2560x1440
26.6  fps    + Compare + 📈 Graph
4K 3840x2160
14.3  fps    + Compare + 📈 Graph
» With all tested laptops playable in detail settings high.
Additional Benchmarks
Very Low Preset 1280x720
88.3
F1 23

F1 23

2023
low 1920x1080
196.8  fps    + Compare
med. 1920x1080
171  fps    + Compare
high 1920x1080
116.6  fps    + Compare
ultra 1920x1080
82.9  fps    + Compare
QHD 2560x1440
59.9  fps    + Compare
4K 3840x2160
30.7  fps    + Compare
» With all tested laptops playable in detail settings ultra.
Additional Benchmarks
Ultra Low Preset TAA 1280x720
340
Diablo 4

Diablo 4

2023
low 1920x1080
167.1  fps    + Compare + 📈 Graph
med. 1920x1080
142.4  fps    + Compare + 📈 Graph
high 1920x1080
124.8  fps    + Compare + 📈 Graph
ultra 1920x1080
101.7  fps    + Compare + 📈 Graph
QHD 2560x1440
65.4  fps    + Compare + 📈 Graph
4K 3840x2160
33.1  fps    + Compare + 📈 Graph
» With all tested laptops playable in detail settings ultra.
Additional Benchmarks
Low Preset 1280x720
298
low 1920x1080
51.9  fps    + Compare + 📈 Graph
med. 1920x1080
43.7  fps    + Compare + 📈 Graph
high 1920x1080
41.4  fps    + Compare + 📈 Graph
ultra 1920x1080
38.8  fps    + Compare + 📈 Graph
QHD 2560x1440
23.6  fps    + Compare + 📈 Graph
4K 3840x2160
10.5  fps    + Compare + 📈 Graph
» With all tested laptops playable in detail settings ultra.
Additional Benchmarks
Low Preset 1280x720
93.8
low 1920x1080
168.1  fps    + Compare + 📈 Graph
med. 1920x1080
143.2  fps    + Compare + 📈 Graph
high 1920x1080
98.8  fps    + Compare + 📈 Graph
ultra 1920x1080
74.6  fps    + Compare + 📈 Graph
QHD 2560x1440
43.7  fps    + Compare + 📈 Graph
4K 3840x2160
21.4  fps    + Compare + 📈 Graph
» With all tested laptops playable in detail settings ultra.
Additional Benchmarks
Low Preset Low TAA 1280x720
291
low 1920x1080
66.8  fps    + Compare + 📈 Graph
med. 1920x1080
52.3  fps    + Compare + 📈 Graph
high 1920x1080
43.2  fps    + Compare + 📈 Graph
ultra 1920x1080
32.8  fps    + Compare + 📈 Graph
QHD 2560x1440
19.9  fps    + Compare + 📈 Graph
4K 3840x2160
3.7  fps    + Compare + 📈 Graph
» With all tested laptops playable in detail settings high.
Additional Benchmarks
Low Preset 1280x720
101.3
low 1920x1080
85.8  fps    + Compare + 📈 Graph
med. 1920x1080
58  fps    + Compare + 📈 Graph
high 1920x1080
53.5  fps    + Compare + 📈 Graph
ultra 1920x1080
43.2  fps    + Compare + 📈 Graph
QHD 2560x1440
32.2  fps    + Compare + 📈 Graph
4K 3840x2160
15.1  fps    + Compare + 📈 Graph
» With all tested laptops playable in detail settings ultra.
Additional Benchmarks
Prioritize Performance Preset 1280x720
131.4
low 1920x1080
121.9  fps    + Compare
med. 1920x1080
103.8  fps    + Compare
high 1920x1080
78.5  fps    + Compare
ultra 1920x1080
78.1  fps    + Compare
QHD 2560x1440
56.2  fps    + Compare
4K 3840x2160
31  fps    + Compare
» With all tested laptops playable in detail settings ultra.
Additional Benchmarks
Minimum Settings 1280x720
207.2
low 1920x1080
71.6  fps    + Compare + 📈 Graph
med. 1920x1080
55  fps    + Compare + 📈 Graph
high 1920x1080
52.9  fps    + Compare + 📈 Graph
ultra 1920x1080
51.4  fps    + Compare + 📈 Graph
QHD 2560x1440
37.2  fps    + Compare + 📈 Graph
4K 3840x2160
20.4  fps    + Compare + 📈 Graph
» With all tested laptops playable in detail settings ultra.
Additional Benchmarks
Ultra Low Preset 1280x720
105.2
low 1920x1080
124.2  fps    + Compare + 📈 Graph
med. 1920x1080
90.7  fps    + Compare + 📈 Graph
high 1920x1080
52  fps    + Compare + 📈 Graph
ultra 1920x1080
41.5  fps    + Compare + 📈 Graph
QHD 2560x1440
30.7  fps    + Compare + 📈 Graph
4K 3840x2160
17  fps    + Compare + 📈 Graph
» With all tested laptops playable in detail settings ultra.
Additional Benchmarks
Low Preset 1280x720
195
Returnal

Returnal

2023
low 1920x1080
66  fps    + Compare
med. 1920x1080
63  fps    + Compare
high 1920x1080
57  fps    + Compare
ultra 1920x1080
48  fps    + Compare
QHD 2560x1440
35  fps    + Compare
4K 3840x2160
18  fps    + Compare
» With all tested laptops playable in detail settings ultra.
Additional Benchmarks
Low Preset 1280x720
88
low 1920x1080
88.2  fps    + Compare + 📈 Graph
med. 1920x1080
65.3  fps    + Compare + 📈 Graph
high 1920x1080
51.1  fps    + Compare + 📈 Graph
ultra 1920x1080
27.4  fps    + Compare + 📈 Graph
QHD 2560x1440
39.2  fps    + Compare + 📈 Graph
4K 3840x2160
14.6  fps    + Compare + 📈 Graph
» With all tested laptops playable in detail settings high.
Additional Benchmarks
Low Preset Low TAA 1280x720
139.6
low 1920x1080
57.5  fps    + Compare + 📈 Graph
med. 1920x1080
53.7  fps    + Compare + 📈 Graph
high 1920x1080
46.9  fps    + Compare + 📈 Graph
ultra 1920x1080
46.3  fps    + Compare + 📈 Graph
QHD 2560x1440
30.3  fps    + Compare + 📈 Graph
4K 3840x2160
14.3  fps    + Compare + 📈 Graph
» With all tested laptops playable in detail settings ultra.
Additional Benchmarks
Low Preset TAA 1280x720
91
low 1920x1080
141  fps    + Compare + 📈 Graph
med. 1920x1080
105.8  fps    + Compare + 📈 Graph
high 1920x1080
87.6  fps    + Compare + 📈 Graph
ultra 1920x1080
71.4  fps    + Compare + 📈 Graph
QHD 2560x1440
49.8  fps    + Compare + 📈 Graph
4K 3840x2160
27.5  fps    + Compare + 📈 Graph
» With all tested laptops playable in detail settings ultra.
Additional Benchmarks
Low Preset / Off 1280x720
225
low 1920x1080
172.8  fps    + Compare + 📈 Graph
med. 1920x1080
99  fps    + Compare + 📈 Graph
high 1920x1080
79.4  fps    + Compare + 📈 Graph
ultra 1920x1080
63.6  fps    + Compare + 📈 Graph
QHD 2560x1440
37.1  fps    + Compare + 📈 Graph
4K 3840x2160
15.8  fps    + Compare + 📈 Graph
» With all tested laptops playable in detail settings ultra.
Additional Benchmarks
Low Preset 1280x720
268
low 1920x1080
99.7  fps    + Compare
med. 1920x1080
69.8  fps    + Compare
high 1920x1080
45.3  fps    + Compare
ultra 1920x1080
45.1  fps    + Compare
QHD 2560x1440
30.3  fps    + Compare
4K 3840x2160
12.4  fps    + Compare
» With all tested laptops playable in detail settings ultra.
Additional Benchmarks
Low Preset (without FSR Upscaling) 1280x720
160.7
Ultra Preset (without FSR Upscaling) + Full Ray-Tracing 1920x1080
7.8
low 1920x1080
105.8  fps    + Compare + 📈 Graph
med. 1920x1080
92.7  fps    + Compare + 📈 Graph
high 1920x1080
72.7  fps    + Compare + 📈 Graph
ultra 1920x1080
57.7  fps    + Compare + 📈 Graph
QHD 2560x1440
34.2  fps    + Compare + 📈 Graph
4K 3840x2160
20.3  fps    + Compare + 📈 Graph
» With all tested laptops playable in detail settings ultra.
Additional Benchmarks
Low Preset 1280x720
159.4
low 1920x1080
92.8  fps    + Compare + 📈 Graph
med. 1920x1080
82.9  fps    + Compare + 📈 Graph
high 1920x1080
81.7  fps    + Compare + 📈 Graph
ultra 1920x1080
69  fps    + Compare + 📈 Graph
QHD 2560x1440
37.9  fps    + Compare + 📈 Graph
4K 3840x2160
17.9  fps    + Compare + 📈 Graph
» With all tested laptops playable in detail settings ultra.
Additional Benchmarks
Very Low Preset 1280x720
134.3
low 1920x1080
89  fps    + Compare
med. 1920x1080
80  fps    + Compare
high 1920x1080
56  fps    + Compare
ultra 1920x1080
54  fps    + Compare
QHD 2560x1440
38  fps    + Compare
4K 3840x2160
22  fps    + Compare
» With all tested laptops playable in detail settings ultra.
Additional Benchmarks
Basic Quality Preset T2X SMAA 1280x720
136
low 1920x1080
62.8  fps    + Compare + 📈 Graph
med. 1920x1080
60  fps    + Compare + 📈 Graph
high 1920x1080
43.6  fps    + Compare + 📈 Graph
ultra 1920x1080
40.8  fps    + Compare + 📈 Graph
QHD 2560x1440
26.2  fps    + Compare + 📈 Graph
4K 3840x2160
10.7  fps    + Compare + 📈 Graph
» With all tested laptops playable in detail settings ultra.
Additional Benchmarks
Low Preset 1280x720
86.2
low 1920x1080
73.3  fps    + Compare + 📈 Graph
med. 1920x1080
54.1  fps    + Compare + 📈 Graph
high 1920x1080
39.8  fps    + Compare + 📈 Graph
ultra 1920x1080
29.8  fps    + Compare + 📈 Graph
QHD 2560x1440
20.8  fps    + Compare + 📈 Graph
4K 3840x2160
11.1  fps    + Compare + 📈 Graph
» With all tested laptops playable in detail settings high.
Additional Benchmarks
Low Preset 1280x720
101.8
FIFA 23

FIFA 23

2022
low 1920x1080
201  fps    + Compare + 📈 Graph
med. 1920x1080
186.6  fps    + Compare + 📈 Graph
high 1920x1080
124.4  fps    + Compare + 📈 Graph
ultra 1920x1080
119.8  fps    + Compare + 📈 Graph
QHD 2560x1440
88.4  fps    + Compare + 📈 Graph
4K 3840x2160
50.9  fps    + Compare + 📈 Graph
» With all tested laptops playable in detail settings ultra.
Additional Benchmarks
Low Rendering Quality 1280x720
306
low 1920x1080
95.7 98 ~ 97 fps    + Compare + 📈 Graph
med. 1920x1080
71 74 ~ 73 fps    + Compare + 📈 Graph
high 1920x1080
59.2 60.2 ~ 60 fps    + Compare + 📈 Graph
ultra 1920x1080
44.7 45.6 ~ 45 fps    + Compare + 📈 Graph
QHD 2560x1440
26 26.5 ~ 26 fps    + Compare + 📈 Graph
4K 3840x2160
8.1 8.3 ~ 8 fps    + Compare + 📈 Graph
» With all tested laptops playable in detail settings ultra.
Additional Benchmarks
Low Preset 1280x720
145.6
F1 22

F1 22

2022
low 1920x1080
191.2 205 ~ 198 fps    + Compare
med. 1920x1080
170 184 ~ 177 fps    + Compare
high 1920x1080
120.2 131.7 ~ 126 fps    + Compare
ultra 1920x1080
85.9 96.9 ~ 91 fps    + Compare
QHD 2560x1440
62.7 70 ~ 66 fps    + Compare
4K 3840x2160
34.1 37.8 ~ 36 fps    + Compare
» With all tested laptops playable in detail settings ultra.
Additional Benchmarks
Ultra Low Preset 16xAF TAA 1280x720
334
348
low 1920x1080
238  fps    + Compare + 📈 Graph
med. 1920x1080
123.9  fps    + Compare + 📈 Graph
high 1920x1080
120.3  fps    + Compare + 📈 Graph
ultra 1920x1080
116.9  fps    + Compare + 📈 Graph
QHD 2560x1440
74.6  fps    + Compare + 📈 Graph
4K 3840x2160
36.7  fps    + Compare + 📈 Graph
» With all tested laptops playable in detail settings ultra.
Additional Benchmarks
Low Preset 1280x720
377
low 1920x1080
93.6  fps    + Compare + 📈 Graph
med. 1920x1080
92.2  fps    + Compare + 📈 Graph
high 1920x1080
89.7  fps    + Compare + 📈 Graph
ultra 1920x1080
91.3  fps    + Compare + 📈 Graph
QHD 2560x1440
57.3  fps    + Compare + 📈 Graph
4K 3840x2160
26.7  fps    + Compare + 📈 Graph
» With all tested laptops playable in detail settings ultra.
Additional Benchmarks
Lowest Settings 1280x720
164.8
Highest Settings + Maximum Ray Tracing 1920x1080
15
low 1920x1080
115.6 125.5 128.9 ~ 123 fps    + Compare
med. 1920x1080
95 100.1 102.3 ~ 99 fps    + Compare
high 1920x1080
66.1 66.4 68.3 ~ 67 fps    + Compare
ultra 1920x1080
51.4 51.5 52.7 ~ 52 fps    + Compare
QHD 2560x1440
34.9 35.7 35.8 ~ 35 fps    + Compare
4K 3840x2160
12.9 13.2 13.2 ~ 13 fps    + Compare
» With all tested laptops playable in detail settings ultra.
Additional Benchmarks
Lowest Preset (DX12) 1280x720
210
249
low 1920x1080
74.4 76.6 ~ 76 fps    + Compare
med. 1920x1080
58.4 67.3 ~ 63 fps    + Compare
high 1920x1080
50.2 53.1 ~ 52 fps    + Compare
ultra 1920x1080
44.5 53 ~ 49 fps    + Compare
QHD 2560x1440
25.8 26.9 ~ 26 fps    + Compare
4K 3840x2160
11 11.1 ~ 11 fps    + Compare
» With all tested laptops playable in detail settings ultra.
Additional Benchmarks
Low Preset 1280x720
80.6
117.5
Elex 2

Elex 2

2022
low 1920x1080
71.8  fps    + Compare + 📈 Graph
med. 1920x1080
65  fps    + Compare + 📈 Graph
high 1920x1080
57.5  fps    + Compare + 📈 Graph
ultra 1920x1080
53.1  fps    + Compare + 📈 Graph
QHD 2560x1440
35.2  fps    + Compare + 📈 Graph
4K 3840x2160
18.4  fps    + Compare + 📈 Graph
» With all tested laptops playable in detail settings ultra.
Additional Benchmarks
Low / Off 1280x720
93.9
low 1920x1080
186 196.8 230 ~ 204 fps    + Compare
med. 1920x1080
130 145 169.8 ~ 148 fps    + Compare
high 1920x1080
89 113.5 132.5 ~ 112 fps    + Compare
ultra 1920x1080
60 84.3 94.6 ~ 80 fps    + Compare
QHD 2560x1440
49 65.1 70.9 ~ 62 fps    + Compare
4K 3840x2160
37 38.7 39.5 ~ 38 fps    + Compare
» With all tested laptops playable in detail settings ultra.
Additional Benchmarks
Low Preset 1280x720
234
311
low 1920x1080
59.9  fps    + Compare + 📈 Graph
med. 1920x1080
59.9  fps    + Compare + 📈 Graph
high 1920x1080
59.8  fps    + Compare + 📈 Graph
ultra 1920x1080
57.1  fps    + Compare + 📈 Graph
QHD 2560x1440
47  fps    + Compare + 📈 Graph
4K 3840x2160
27.7  fps    + Compare + 📈 Graph
» With all tested laptops playable in detail settings ultra.
low 1920x1080
87.5  fps    + Compare + 📈 Graph
med. 1920x1080
44.6  fps    + Compare + 📈 Graph
high 1920x1080
36.3  fps    + Compare + 📈 Graph
QHD 2560x1440
24.7  fps    + Compare + 📈 Graph
4K 3840x2160
12.6  fps    + Compare + 📈 Graph
» With all tested laptops playable in detail settings high.
Additional Benchmarks
Low Quality 1280x720
117
low 1920x1080
131  fps    + Compare
med. 1920x1080
109  fps    + Compare
high 1920x1080
105  fps    + Compare
ultra 1920x1080
74  fps    + Compare
QHD 2560x1440
56  fps    + Compare
4K 3840x2160