Notebookcheck Logo

AMD Radeon RX 5500 XT (Desktop)

AMD Radeon RX 5500 XT (Desktop)

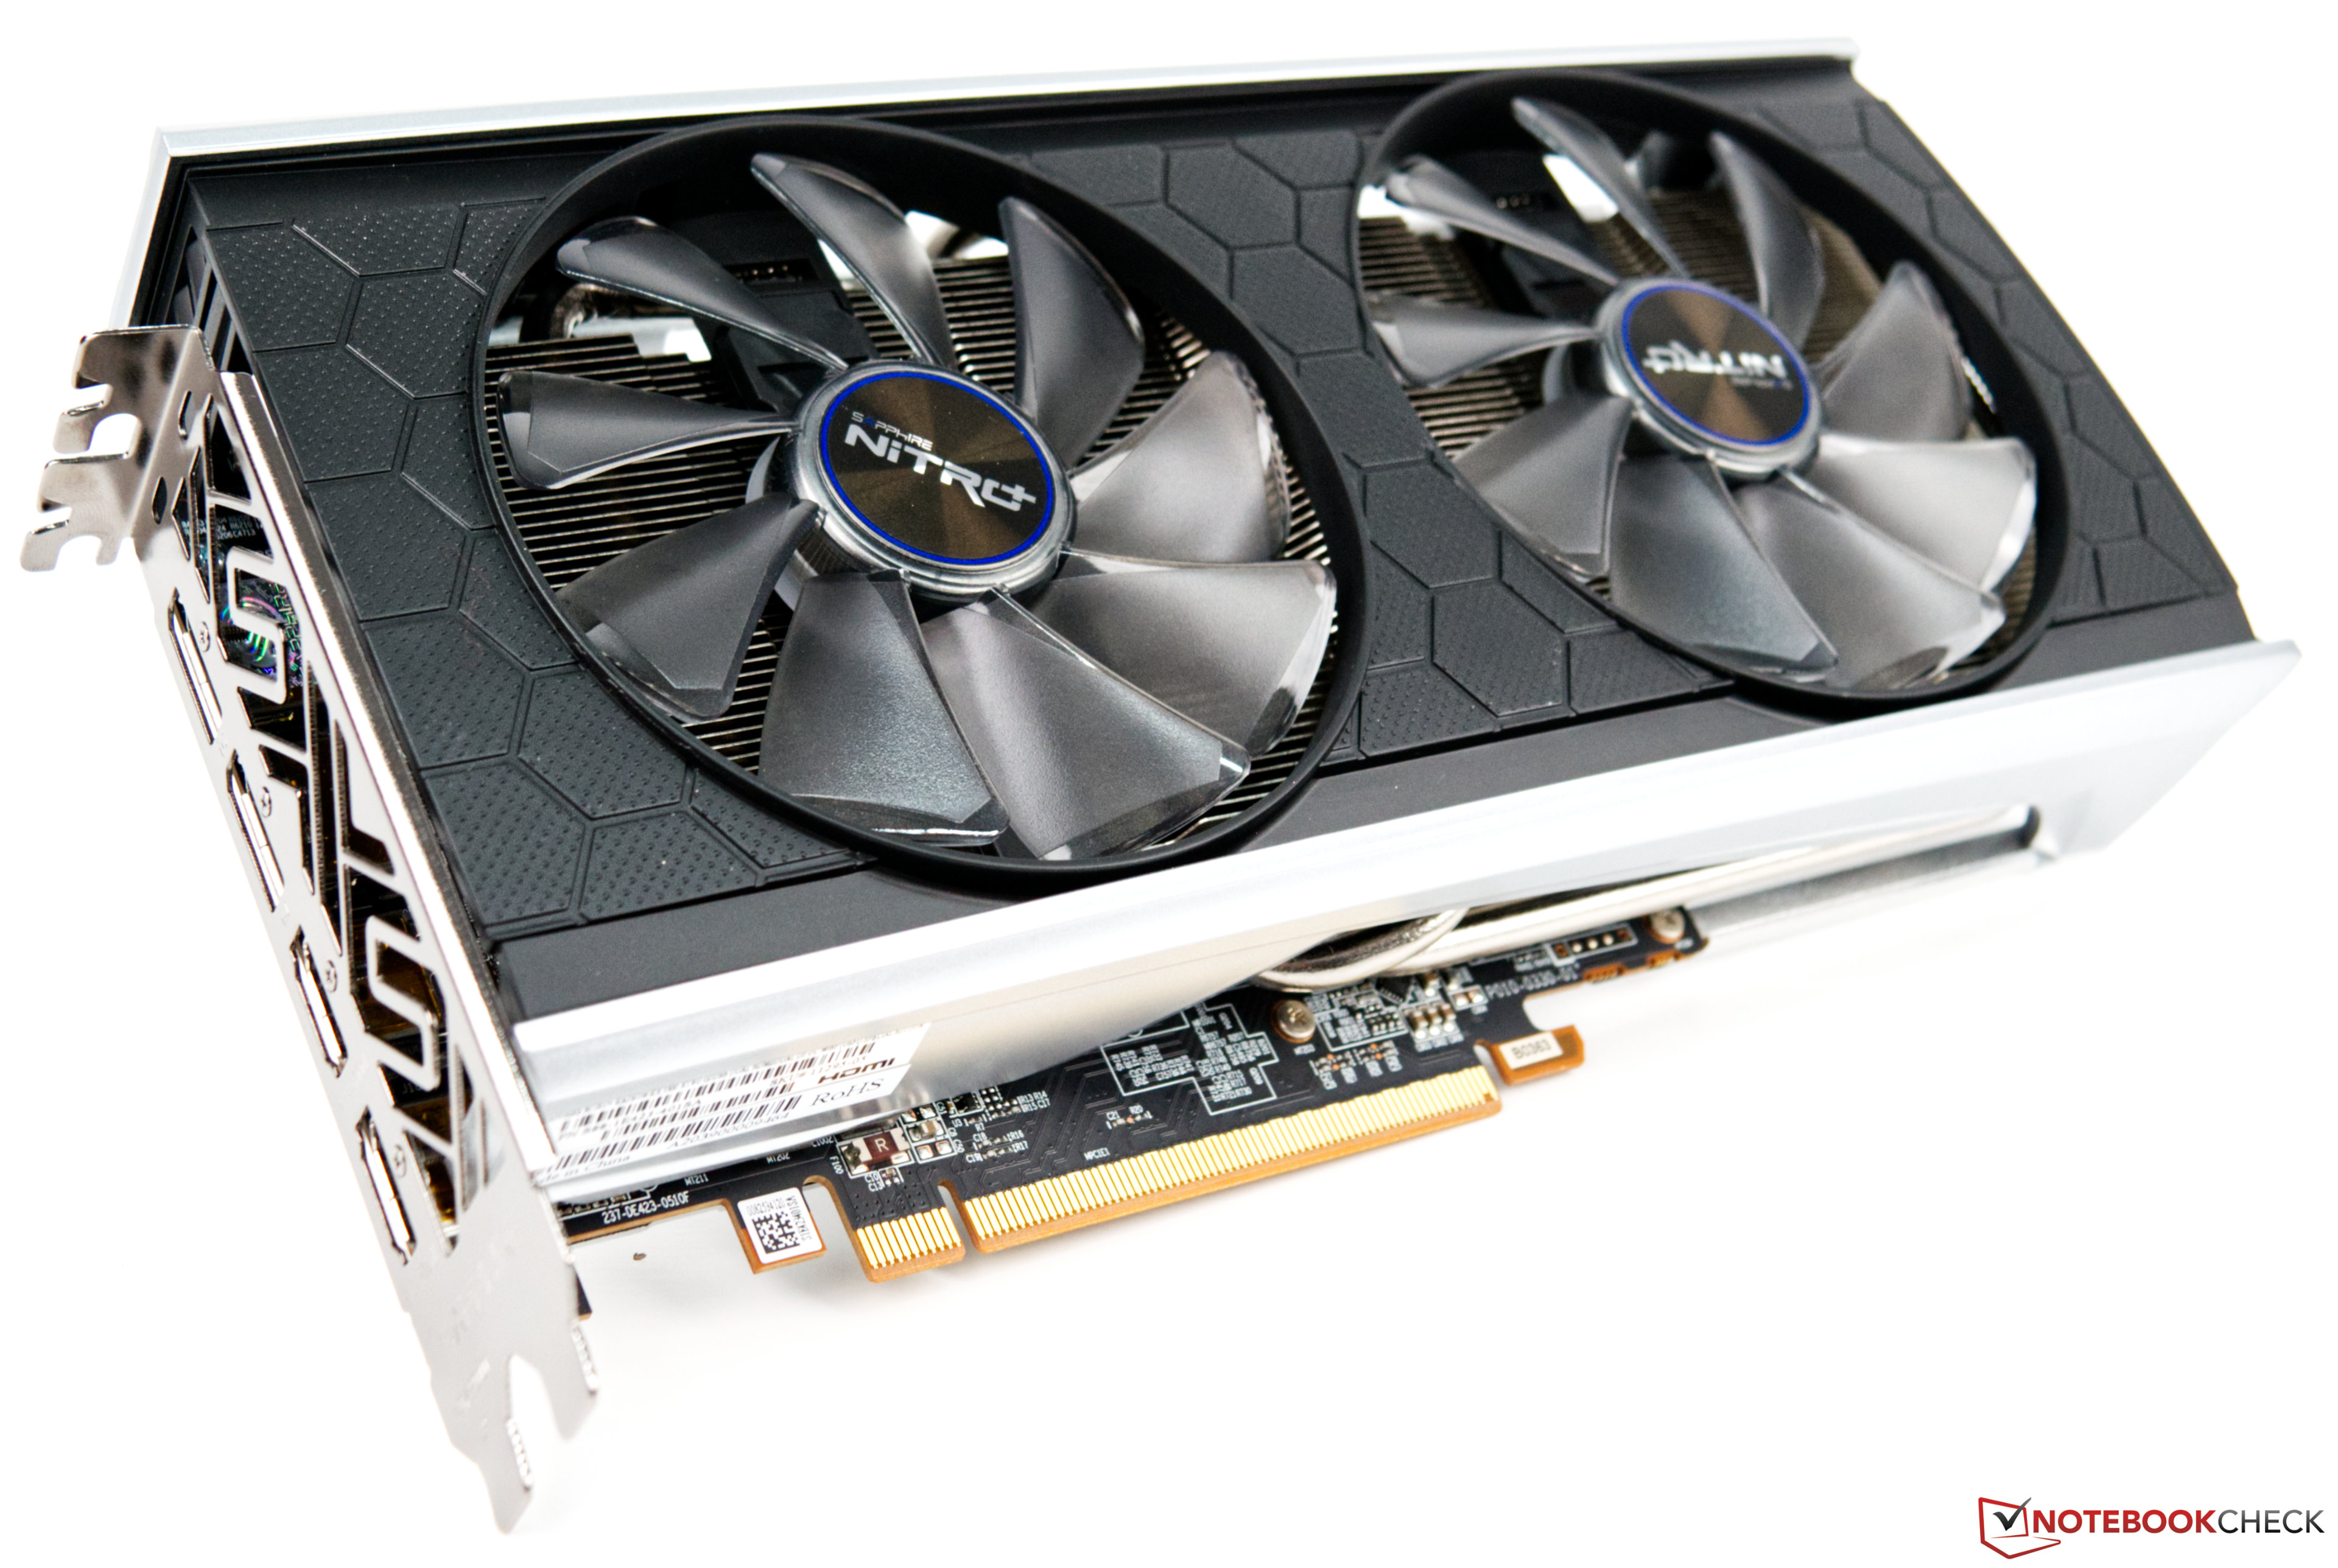
The AMd Radeon RX 5500 XT is a lower mid-range desktop graphics card. It is manufactured in 7nm and based on the RDNA architecture. The RX 5500 XT offers 1,408 cores and 4 or 8 GB GDDR6 video RAM that is connected via a 128 Bit memory bus (max. 224 GB/s).

The Navi 14 chip uses the RDNA architecture with support for PCIe 4.0, RIS (Radeon Image Sharpening) and a new Media Engine for 4K H.265 content.

The gaming performance of the RX 5500XT is comparable to a Nvidia GeForce GTX 1660 desktop card and stays behind the AMD Radeon RX 5600 XT. This means, most demanding games of 2020 can be played in 1080p and high settings.

The RX5500XT is rated at 130 Watt (TGP) and therefore similar to a GTX 1660 (120 Watt).

CodenameNavi 14 XTX
Pipelines1408 - unified
Core Speed1607 - 1845 (Boost) MHz
Memory Speed1750 MHz
Memory Bus Width128 Bit
Memory TypeGDDR6
Max. Amount of Memory8 GB
Shared Memoryno
APIDirectX 12, Shader 6.4, OpenGL 4.6
Power Consumption130 Watt
Transistor Count6.4 Billion
technology7 nm
Date of Announcement12.12.2019

Benchmarks

Performance Rating - 3DMark 11 + Fire Strike + Time Spy
5.4 pt (16%)
Restrict / Search: Model: Max. age: years
3DMark - 3DMark Time Spy Score
min: 5370     avg: 5480     median: 5518 (15%)     max: 5553 Points
3DMark - 3DMark Time Spy Graphics
min: 4891     avg: 4932     median: 4941 (10%)     max: 4965 Points
Restrict / Search: Model: Max. age: years
3DMark - 3DMark Ice Storm Unlimited Graphics
min: 407594     avg: 517070     median: 560812 (57%)     max: 582805 Points
3DMark - 3DMark Ice Storm Extreme Graphics
min: 273779     avg: 318008     median: 307145 (36%)     max: 373100 Points
3DMark - 3DMark Cloud Gate Score
min: 51133     avg: 55435     median: 57069 (54%)     max: 58102 Points
3DMark - 3DMark Cloud Gate Graphics
min: 86097     avg: 87497     median: 86609 (21%)     max: 89786 Points
3DMark - 3DMark Fire Strike Standard Score
min: 13064     avg: 13122     median: 13146 (20%)     max: 13156 Points
3DMark - 3DMark Fire Strike Standard Graphics
min: 14229     avg: 14287     median: 14305 (13%)     max: 14328 Points
3DMark - 3DMark Ice Storm Graphics
min: 323783     avg: 402770     median: 392253 (43%)     max: 492273 Points
3DMark - 3DMark Night Raid
41295 Points (39%)
3DMark - 3DMark Night Raid Graphics Score
57618 Points (22%)
3DMark 11 - 3DM11 Performance Score
min: 18897     avg: 19625     median: 19887 (24%)     max: 20092 Points
3DMark 11 - 3DM11 Performance GPU
min: 19286     avg: 19503     median: 19499 (15%)     max: 19723 Points
Restrict / Search: Model: Max. age: years
3DMark Vantage
3DM Vant. Perf. total +
3DMark Vantage - 3DM Vant. Perf. total
min: 61298     avg: 66278     median: 68429 (20%)     max: 69108 Points
3DM Vant. Perf. GPU no PhysX +
3DMark Vantage - 3DM Vant. Perf. GPU no PhysX
min: 57413     avg: 60334     median: 61687 (34%)     max: 61902 Points
Restrict / Search: Model: Max. age: years
3DMark 05 - 3DMark 05 - Standard
min: 48230     avg: 69854     median: 80356 (88%)     max: 80976 Points
Restrict / Search: Model: Max. age: years
3DMark 06 3DMark 06 - Standard 1280x1024 +
3DMark 06
min: 42835     avg: 56609     median: 63326 (83%)     max: 63667 Points
Unigine Valley 1.0 - Unigine Valley 1.0 DX
min: 60.9     avg: 61.1     median: 61 (18%)     max: 61.4 fps
SPECviewperf 12
specvp12 sw-03 +
SPECviewperf 12 - specvp12 sw-03
min: 88     avg: 122     median: 122 (30%)     max: 156 fps
specvp12 snx-02 +
SPECviewperf 12 - specvp12 snx-02
min: 39.3     avg: 78.2     median: 78.2 (12%)     max: 117 fps
specvp12 showcase-01 +
SPECviewperf 12 - specvp12 showcase-01
min: 73.3     avg: 78.3     median: 78.3 (14%)     max: 83.2 fps
specvp12 mediacal-01 +
SPECviewperf 12 - specvp12 mediacal-01
min: 30.8     avg: 50.7     median: 50.7 (13%)     max: 70.6 fps
specvp12 maya-04 +
SPECviewperf 12 - specvp12 maya-04
min: 79.2     avg: 109.6     median: 109.6 (30%)     max: 140 fps
specvp12 energy-01 +
SPECviewperf 12 - specvp12 energy-01
min: 7.05     avg: 15.1     median: 15.1 (13%)     max: 23.1 fps
specvp12 creo-01 +
SPECviewperf 12 - specvp12 creo-01
min: 54.7     avg: 63.7     median: 63.7 (25%)     max: 72.7 fps
specvp12 catia-04 +
SPECviewperf 12 - specvp12 catia-04
min: 102     avg: 105     median: 105 (17%)     max: 108 fps
specvp12 3dsmax-05 +
SPECviewperf 12 - specvp12 3dsmax-05
min: 115     avg: 128     median: 128 (19%)     max: 141 fps
SPECviewperf 13 specvp13 sw-04 +
SPECviewperf 13 - specvp13 sw-04
min: 102     avg: 135     median: 135 (36%)     max: 168 fps
specvp13 snx-03 +
SPECviewperf 13 - specvp13 snx-03
min: 67.3     avg: 139.2     median: 139.2 (15%)     max: 211 fps
specvp13 showcase-02 +
SPECviewperf 13 - specvp13 showcase-02
min: 73     avg: 78.1     median: 78.1 (13%)     max: 83.2 fps
specvp13 medical-02 +
SPECviewperf 13 - specvp13 medical-02
min: 51     avg: 55.6     median: 55.6 (9%)     max: 60.2 fps
specvp13 maya-05 +
SPECviewperf 13 - specvp13 maya-05
min: 144     avg: 176     median: 176 (20%)     max: 208 fps
specvp13 energy-02 +
SPECviewperf 13 - specvp13 energy-02
min: 14.3     avg: 21.9     median: 21.9 (7%)     max: 29.4 fps
specvp13 creo-02 +
SPECviewperf 13 - specvp13 creo-02
min: 93.4     avg: 116.2     median: 116.2 (17%)     max: 139 fps
specvp13 catia-05 +
SPECviewperf 13 - specvp13 catia-05
154 fps (17%)
specvp13 3dsmax-06 +
SPECviewperf 13 - specvp13 3dsmax-06
min: 117     avg: 129     median: 129 (20%)     max: 141 fps
SPECviewperf 2020 specvp2020 solidworks-05 4k +
SPECviewperf 2020 - specvp2020 solidworks-05 4k
34.4 fps (8%)
specvp2020 snx-04 4k +
SPECviewperf 2020 - specvp2020 snx-04 4k
min: 60.1     avg: 96.6     median: 96.6 (10%)     max: 133 fps
specvp2020 medical-03 4k +
SPECviewperf 2020 - specvp2020 medical-03 4k
min: 8.25     avg: 10.5     median: 10.5 (7%)     max: 12.7 fps
specvp2020 maya-06 4k +
SPECviewperf 2020 - specvp2020 maya-06 4k
min: 77.9     avg: 87.5     median: 87.5 (13%)     max: 97.1 fps
specvp2020 energy-03 4k +
SPECviewperf 2020 - specvp2020 energy-03 4k
min: 13.8     avg: 15.4     median: 15.4 (2%)     max: 16.9 fps
specvp2020 creo-03 4k +
SPECviewperf 2020 - specvp2020 creo-03 4k
min: 33.8     avg: 46.2     median: 46.2 (21%)     max: 58.6 fps
specvp2020 catia-06 4k +
SPECviewperf 2020 - specvp2020 catia-06 4k
min: 19.1     avg: 24.7     median: 24.7 (16%)     max: 30.3 fps
specvp2020 3dsmax-07 4k +
SPECviewperf 2020 - specvp2020 3dsmax-07 4k
min: 25.2     avg: 26.3     median: 26.3 (9%)     max: 27.4 fps
GFXBench (DX / GLBenchmark) 2.7
GFXBench T-Rex HD Offscreen C24Z16 +
GFXBench (DX / GLBenchmark) 2.7 - GFXBench T-Rex HD Offscreen C24Z16
63.6 fps (1%)
LuxMark v2.0 64Bit - LuxMark v2.0 Room GPU
min: 1281     avg: 1412     median: 1412 (5%)     max: 1543 Samples/s
LuxMark v2.0 64Bit - LuxMark v2.0 Sala GPU
min: 2949     avg: 3420     median: 3420 (6%)     max: 3891 Samples/s
ComputeMark v2.1 - ComputeMark v2.1 Result
min: 10626     avg: 10697     median: 10697 (9%)     max: 10768 points
Power Consumption - Furmark Stress Test Power Consumption - external Monitor *
min: 259.1     avg: 263.6     median: 263.6 (35%)     max: 268 Watt
020406080100120140160180200220240260280300Tooltip
Power Consumption - The Witcher 3 Power Consumption - external Monitor *
min: 226     avg: 238.1     median: 238.1 (33%)     max: 250.2 Watt
0153045607590105120135150165180195210225240255Tooltip
Power Consumption - Power Efficiency - Witcher 3 ultra external Monitor
0.2 fps per Watt (19%)
Power Consumption - Cyberpunk 2077 Power Consumption - external Monitor *
307 Watt (39%)
020406080100120140160180200220240260280300320340360Tooltip
Clock Speed - GPU Clock Speed Furmark
1828 MHz (72%)
- Range of benchmark values
red legend - Average benchmark values
* Smaller numbers mean a higher performance

Game Benchmarks

The following benchmarks stem from our benchmarks of review laptops. The performance depends on the used graphics memory, clock rate, processor, system settings, drivers, and operating systems. So the results don't have to be representative for all laptops with this GPU. For detailed information on the benchmark results, click on the fps number.

F1 24

F1 24

2024
low 1920x1080
157.5  fps    + Compare
med. 1920x1080
133.1  fps    + Compare
high 1920x1080
96.6  fps    + Compare
» With all tested laptops playable in detail settings high.
low 1920x1080
31.4  fps    + Compare + 📈 Graph
med. 1920x1080
25.9  fps    + Compare + 📈 Graph
high 1920x1080
14.5  fps    + Compare + 📈 Graph
QHD 2560x1440
6.7  fps    + Compare + 📈 Graph
» The benchmarks indicate that the game is not playable in the tested settings.
low 1920x1080
63.8  fps    + Compare + 📈 Graph
med. 1920x1080
53.2  fps    + Compare + 📈 Graph
high 1920x1080
46.4  fps    + Compare + 📈 Graph
ultra 1920x1080
34.5  fps    + Compare + 📈 Graph
QHD 2560x1440
25.5  fps    + Compare + 📈 Graph
4K 3840x2160
10  fps    + Compare + 📈 Graph
» With all tested laptops playable in detail settings high.
low 1920x1080
36  fps    + Compare + 📈 Graph
high 1920x1080
31.2  fps    + Compare + 📈 Graph
QHD 2560x1440
23.5  fps    + Compare + 📈 Graph
4K 3840x2160
14.1  fps    + Compare + 📈 Graph
» With all tested laptops playable in detail settings low.
Additional Benchmarks
Low Preset 1280x720
45.9
low 1920x1080
59.8  fps    + Compare + 📈 Graph
med. 1920x1080
53.2  fps    + Compare + 📈 Graph
high 1920x1080
36.1  fps    + Compare + 📈 Graph
ultra 1920x1080
34.8  fps    + Compare + 📈 Graph
QHD 2560x1440
26.1  fps    + Compare + 📈 Graph
4K 3840x2160
13.8  fps    + Compare + 📈 Graph
4K FSR 3840x2160
15.1  fps    + Compare + 📈 Graph
» With all tested laptops playable in detail settings high.
Additional Benchmarks
Very Low Preset 1280x720
93
low 1920x1080
133.4  fps    + Compare + 📈 Graph
med. 1920x1080
109.9  fps    + Compare + 📈 Graph
high 1920x1080
92.4  fps    + Compare + 📈 Graph
ultra 1920x1080
46.9  fps    + Compare + 📈 Graph
QHD 2560x1440
25.2  fps    + Compare + 📈 Graph
» With all tested laptops playable in detail settings ultra.
Additional Benchmarks
Low Preset 1280x720
238
low 1920x1080
146.4  fps    + Compare + 📈 Graph
med. 1920x1080
116.6  fps    + Compare + 📈 Graph
high 1920x1080
94.7  fps    + Compare + 📈 Graph
ultra 1920x1080
64.9  fps    + Compare + 📈 Graph
QHD 2560x1440
41  fps    + Compare + 📈 Graph
4K 3840x2160
19  fps    + Compare + 📈 Graph
» With all tested laptops playable in detail settings ultra.
Additional Benchmarks
Very Low Preset 1280x720
295
low 1920x1080
64  fps    + Compare
med. 1920x1080
59  fps    + Compare
high 1920x1080
47  fps    + Compare
ultra 1920x1080
41  fps    + Compare
QHD 2560x1440
29  fps    + Compare
4K 3840x2160
16  fps    + Compare
4K FSR 3840x2160
25  fps    + Compare
» With all tested laptops playable in detail settings ultra.
Additional Benchmarks
Low Preset TAA 1280x720
91
low 1920x1080
62.5  fps    + Compare + 📈 Graph
med. 1920x1080
48.6  fps    + Compare + 📈 Graph
high 1920x1080
42.5  fps    + Compare + 📈 Graph
ultra 1920x1080
41.9  fps    + Compare + 📈 Graph
QHD 2560x1440
29.1  fps    + Compare + 📈 Graph
4K 3840x2160
12.9  fps    + Compare + 📈 Graph
» With all tested laptops playable in detail settings ultra.
Additional Benchmarks
Low Preset 1280x720
92.7
low 1920x1080
38.9  fps    + Compare + 📈 Graph
med. 1920x1080
34.1  fps    + Compare + 📈 Graph
high 1920x1080
28.1  fps    + Compare + 📈 Graph
ultra 1920x1080
23.5  fps    + Compare + 📈 Graph
QHD 2560x1440
17.7  fps    + Compare + 📈 Graph
» With all tested laptops playable in detail settings low.
Additional Benchmarks
Max. Performance 1280x720
67.4
Palworld

Palworld

2024
low 1920x1080
71.8  fps    + Compare + 📈 Graph
med. 1920x1080
60.7  fps    + Compare + 📈 Graph
high 1920x1080
43.4  fps    + Compare + 📈 Graph
ultra 1920x1080
40.8  fps    + Compare + 📈 Graph
QHD 2560x1440
28  fps    + Compare + 📈 Graph
4K 3840x2160
14.9  fps    + Compare + 📈 Graph
» With all tested laptops playable in detail settings ultra.
Additional Benchmarks
Very Low Preset 1280x720
143.1
med. 1920x1080
357  fps    + Compare + 📈 Graph
high 1920x1080
339  fps    + Compare + 📈 Graph
ultra 1920x1080
324  fps    + Compare + 📈 Graph
QHD 2560x1440
194.1  fps    + Compare + 📈 Graph
4K 3840x2160
97  fps    + Compare + 📈 Graph
» With all tested laptops playable in detail settings ultra.
low 1920x1080
107.1  fps    + Compare + 📈 Graph
med. 1920x1080
95  fps    + Compare + 📈 Graph
high 1920x1080
91.8  fps    + Compare + 📈 Graph
ultra 1920x1080
57.1  fps    + Compare + 📈 Graph
QHD 2560x1440
34.3  fps    + Compare + 📈 Graph
4K 3840x2160
15  fps    + Compare + 📈 Graph
» With all tested laptops playable in detail settings ultra.
low 1920x1080
135.1  fps    + Compare + 📈 Graph
med. 1920x1080
99.7  fps    + Compare + 📈 Graph
high 1920x1080
82.6  fps    + Compare + 📈 Graph
ultra 1920x1080
62.6  fps    + Compare + 📈 Graph
QHD 2560x1440
36.7  fps    + Compare + 📈 Graph
4K 3840x2160
16.7  fps    + Compare + 📈 Graph
» With all tested laptops playable in detail settings ultra.
Additional Benchmarks
Low Preset 1280x720
227
low 1920x1080
46  fps    + Compare
med. 1920x1080
42  fps    + Compare
high 1920x1080
34  fps    + Compare
ultra 1920x1080
26  fps    + Compare
QHD 2560x1440
20  fps    + Compare
4K 3840x2160
17  fps    + Compare
» With all tested laptops playable in detail settings med..
Additional Benchmarks
Low Preset TAA 1280x720
64
low 1920x1080
78  fps    + Compare
med. 1920x1080
70  fps    + Compare
high 1920x1080
52  fps    + Compare
ultra 1920x1080
48  fps    + Compare
QHD 2560x1440
32  fps    + Compare
4K 3840x2160
19  fps    + Compare
» With all tested laptops playable in detail settings ultra.
Additional Benchmarks
Minimum Preset 1280x720
127
low 1920x1080
79  fps    + Compare + 📈 Graph
med. 1920x1080
50  fps    + Compare + 📈 Graph
high 1920x1080
44.9  fps    + Compare + 📈 Graph
ultra 1920x1080
40.9  fps    + Compare + 📈 Graph
QHD 2560x1440
29.6  fps    + Compare + 📈 Graph
4K 3840x2160
16.6  fps    + Compare + 📈 Graph
» With all tested laptops playable in detail settings ultra.
Additional Benchmarks
Ultra Low Preset LowAA 1280x720
192.2
low 1920x1080
27.8  fps    + Compare + 📈 Graph
med. 1920x1080
25.1  fps    + Compare + 📈 Graph
high 1920x1080
23.2  fps    + Compare + 📈 Graph
QHD 2560x1440
14.5  fps    + Compare + 📈 Graph
4K 3840x2160
8.7  fps    + Compare + 📈 Graph
» The benchmarks indicate that the game is not playable in the tested settings.
Additional Benchmarks
Low Preset 1280x720
39.1
low 1920x1080
45.9  fps    + Compare + 📈 Graph
med. 1920x1080
37.8  fps    + Compare + 📈 Graph
high 1920x1080
24.9  fps    + Compare + 📈 Graph
ultra 1920x1080
17.1  fps    + Compare + 📈 Graph
QHD 2560x1440
11.3  fps    + Compare + 📈 Graph
4K 3840x2160
4.9  fps    + Compare + 📈 Graph
» With all tested laptops playable in detail settings med..
Additional Benchmarks
Low Preset 1280x720
73.6
low 1920x1080
191.7  fps    + Compare
med. 1920x1080
136.7  fps    + Compare
high 1920x1080
70.5  fps    + Compare
ultra 1920x1080
58.3  fps    + Compare
QHD 2560x1440
37  fps    + Compare
4K 3840x2160
17.7  fps    + Compare
» With all tested laptops playable in detail settings ultra.
Additional Benchmarks
Low Preset 1280x720
337.7
low 1920x1080
65  fps    + Compare
med. 1920x1080
58  fps    + Compare
high 1920x1080
54  fps    + Compare
ultra 1920x1080
42  fps    + Compare
QHD 2560x1440
32  fps    + Compare
4K 3840x2160
19  fps    + Compare
» With all tested laptops playable in detail settings ultra.
Additional Benchmarks
Low Preset (Adaptive Quality Off) 1280x720
91
low 1920x1080
170.7  fps    + Compare + 📈 Graph
med. 1920x1080
151.7  fps    + Compare + 📈 Graph
high 1920x1080
124.8  fps    + Compare + 📈 Graph
ultra 1920x1080
101.3  fps    + Compare + 📈 Graph
QHD 2560x1440
77.8  fps    + Compare + 📈 Graph
4K 3840x2160
46.4  fps    + Compare + 📈 Graph
» With all tested laptops playable in detail settings ultra.
Additional Benchmarks
Low Preset 1280x720
256
low 1920x1080
254  fps    + Compare + 📈 Graph
med. 1920x1080
195.5  fps    + Compare + 📈 Graph
high 1920x1080
108.6  fps    + Compare + 📈 Graph
ultra 1920x1080
87.5  fps    + Compare + 📈 Graph
QHD 2560x1440
55  fps    + Compare + 📈 Graph
4K 3840x2160
26.6  fps    + Compare + 📈 Graph
» With all tested laptops playable in detail settings ultra.
Additional Benchmarks
Low Preset 1280x720
311
low 1920x1080
65.5  fps    + Compare
med. 1920x1080
49.9  fps    + Compare
high 1920x1080
40.6  fps    + Compare
ultra 1920x1080
34.5  fps    + Compare
QHD 2560x1440
19.1  fps    + Compare
4K 3840x2160
7.3  fps    + Compare
» With all tested laptops playable in detail settings high.
Additional Benchmarks
Low Preset (FSR off) 1280x720
105.1
Steam Deck 1280x800
121.8
Ultra Preset (FSR2 on) 1920x1080
44.5
30min Start Ultra Preset (FSR off) 1920x1080
34.7
low 1920x1080
58.9  fps    + Compare + 📈 Graph
med. 1920x1080
48.4  fps    + Compare + 📈 Graph
high 1920x1080
40  fps    + Compare + 📈 Graph
ultra 1920x1080
38.7  fps    + Compare + 📈 Graph
QHD 2560x1440
27.7  fps    + Compare + 📈 Graph
4K 3840x2160
14.9  fps    + Compare + 📈 Graph
» With all tested laptops playable in detail settings ultra.
Additional Benchmarks
Low Preset SMAA 1280x720
82.6
Lies of P

Lies of P

2023
low 1920x1080
94.3  fps    + Compare + 📈 Graph
med. 1920x1080
80.9  fps    + Compare + 📈 Graph
high 1920x1080
70  fps    + Compare + 📈 Graph
ultra 1920x1080
59.1  fps    + Compare + 📈 Graph
QHD 2560x1440
39.5  fps    + Compare + 📈 Graph
4K 3840x2160
19.6  fps    + Compare + 📈 Graph
» With all tested laptops playable in detail settings ultra.
Additional Benchmarks
Low Preset 1280x720
155.9
Starfield

Starfield

2023
low 1920x1080
40.8  fps    + Compare + 📈 Graph
med. 1920x1080
34.2  fps    + Compare + 📈 Graph
high 1920x1080
28.1  fps    + Compare + 📈 Graph
ultra 1920x1080
25.3  fps    + Compare + 📈 Graph
QHD 2560x1440
19.1  fps    + Compare + 📈 Graph
4K 3840x2160
11  fps    + Compare + 📈 Graph
» With all tested laptops playable in detail settings low.
Additional Benchmarks
Low Preset 1280x720
52.9
low 1920x1080
87.6  fps    + Compare + 📈 Graph
med. 1920x1080
69.3  fps    + Compare + 📈 Graph
high 1920x1080
62.1  fps    + Compare + 📈 Graph
ultra 1920x1080
50.8  fps    + Compare + 📈 Graph
QHD 2560x1440
37.5  fps    + Compare + 📈 Graph
4K 3840x2160
21.9  fps    + Compare + 📈 Graph
» With all tested laptops playable in detail settings ultra.
Additional Benchmarks
Low Preset 1280x720
113.5
low 1920x1080
37.7  fps    + Compare + 📈 Graph
high 1920x1080
30.4  fps    + Compare + 📈 Graph
ultra 1920x1080
21.9  fps    + Compare + 📈 Graph
QHD 2560x1440
13.9  fps    + Compare + 📈 Graph
4K 3840x2160
7.8  fps    + Compare + 📈 Graph
» With all tested laptops playable in detail settings low.
Additional Benchmarks
Low 1280x720
65.6
low 1920x1080
71.3  fps    + Compare + 📈 Graph
med. 1920x1080
69.2  fps    + Compare + 📈 Graph
high 1920x1080
63.2  fps    + Compare + 📈 Graph
ultra 1920x1080
53.5  fps    + Compare + 📈 Graph
QHD 2560x1440
37.6  fps    + Compare + 📈 Graph
4K 3840x2160
19.4  fps    + Compare + 📈 Graph
» With all tested laptops playable in detail settings ultra.
Additional Benchmarks
Low Preset 1280x720
118.9
low 1920x1080
44.5  fps    + Compare + 📈 Graph
med. 1920x1080
38  fps    + Compare + 📈 Graph
high 1920x1080
28.6  fps    + Compare + 📈 Graph
ultra 1920x1080
24.7  fps    + Compare + 📈 Graph
QHD 2560x1440
19.6  fps    + Compare + 📈 Graph
4K 3840x2160
12.1  fps    + Compare + 📈 Graph
» With all tested laptops playable in detail settings med..
Additional Benchmarks
Very Low Preset 1280x720
62
F1 23

F1 23

2023
low 1920x1080
159.8  fps    + Compare
med. 1920x1080
140.5  fps    + Compare
high 1920x1080
97  fps    + Compare
ultra 1920x1080
66.2  fps    + Compare
QHD 2560x1440
49.6  fps    + Compare
4K 3840x2160
28.6  fps    + Compare
» With all tested laptops playable in detail settings ultra.
Additional Benchmarks
Ultra Low Preset TAA 1280x720
263
Diablo 4

Diablo 4

2023
low 1920x1080
118.8  fps    + Compare + 📈 Graph
med. 1920x1080
98.9  fps    + Compare + 📈 Graph
high 1920x1080
87.7  fps    + Compare + 📈 Graph
ultra 1920x1080
74.1  fps    + Compare + 📈 Graph
QHD 2560x1440
50.2  fps    + Compare + 📈 Graph
4K 3840x2160
26.8  fps    + Compare + 📈 Graph
» With all tested laptops playable in detail settings ultra.
Additional Benchmarks
Low Preset 1280x720
196.8
low 1920x1080
42.5  fps    + Compare + 📈 Graph
med. 1920x1080
36.2  fps    + Compare + 📈 Graph
high 1920x1080
33.5  fps    + Compare + 📈 Graph
ultra 1920x1080
31.6  fps    + Compare + 📈 Graph
QHD 2560x1440
20.2  fps    + Compare + 📈 Graph
4K 3840x2160
10.2  fps    + Compare + 📈 Graph
» With all tested laptops playable in detail settings med..
Additional Benchmarks
Low Preset 1280x720
71.7
low 1920x1080
135.8  fps    + Compare + 📈 Graph
med. 1920x1080
115.6  fps    + Compare + 📈 Graph
high 1920x1080
79.4  fps    + Compare + 📈 Graph
ultra 1920x1080
59.3  fps    + Compare + 📈 Graph
QHD 2560x1440
39  fps    + Compare + 📈 Graph
4K 3840x2160
19.1  fps    + Compare + 📈 Graph
» With all tested laptops playable in detail settings ultra.
Additional Benchmarks
Low Preset Low TAA 1280x720
235
low 1920x1080
57.2  fps    + Compare + 📈 Graph
med. 1920x1080
45.6  fps    + Compare + 📈 Graph
high 1920x1080
33 40 ~ 37 fps    + Compare + 📈 Graph
QHD 2560x1440
19.6  fps    + Compare + 📈 Graph
4K 3840x2160
9.1  fps    + Compare + 📈 Graph
» With most tested laptops playable in detail settings high.
Additional Benchmarks
Low Preset 1280x720
87.8
low 1920x1080
77.3  fps    + Compare + 📈 Graph
med. 1920x1080
57.7  fps    + Compare + 📈 Graph
high 1920x1080
49.7  fps    + Compare + 📈 Graph
ultra 1920x1080
42.5  fps    + Compare + 📈 Graph
QHD 2560x1440
30.2  fps    + Compare + 📈 Graph
4K 3840x2160
16.8  fps    + Compare + 📈 Graph
» With all tested laptops playable in detail settings ultra.
Additional Benchmarks
Prioritize Performance Preset 1280x720
113.2
low 1920x1080
99.3  fps    + Compare
med. 1920x1080
82.6  fps    + Compare
high 1920x1080
64.7  fps    + Compare
ultra 1920x1080
64.5  fps    + Compare
QHD 2560x1440
46.7  fps    + Compare
4K 3840x2160
27.6  fps    + Compare
» With all tested laptops playable in detail settings ultra.
Additional Benchmarks
Minimum Settings 1280x720
178.2
low 1920x1080
59.7  fps    + Compare + 📈 Graph
med. 1920x1080
44.9  fps    + Compare + 📈 Graph
high 1920x1080
47.7  fps    + Compare + 📈 Graph
ultra 1920x1080
44.7  fps    + Compare + 📈 Graph
QHD 2560x1440
32  fps    + Compare + 📈 Graph
4K 3840x2160
17.9  fps    + Compare + 📈 Graph
» With all tested laptops playable in detail settings ultra.
Additional Benchmarks
Ultra Low Preset 1280x720
90.9
low 1920x1080
97.5  fps    + Compare + 📈 Graph
med. 1920x1080
75.4  fps    + Compare + 📈 Graph
high 1920x1080
43.4  fps    + Compare + 📈 Graph
ultra 1920x1080
34.7  fps    + Compare + 📈 Graph
QHD 2560x1440
26.2  fps    + Compare + 📈 Graph
4K 3840x2160
15.1  fps    + Compare + 📈 Graph
» With all tested laptops playable in detail settings high.
Additional Benchmarks
Low Preset 1280x720
151.9
Returnal

Returnal

2023
low 1920x1080
44  fps    + Compare
med. 1920x1080
42  fps    + Compare
high 1920x1080
39  fps    + Compare
ultra 1920x1080
33  fps    + Compare
QHD 2560x1440
25  fps    + Compare
4K 3840x2160
14  fps    + Compare
» With all tested laptops playable in detail settings high.
Additional Benchmarks
Low Preset 1280x720
55
low 1920x1080
72.4  fps    + Compare + 📈 Graph
med. 1920x1080
56  fps    + Compare + 📈 Graph
high 1920x1080
42.4  fps    + Compare + 📈 Graph
ultra 1920x1080
31.3  fps    + Compare + 📈 Graph
QHD 2560x1440
22.6  fps    + Compare + 📈 Graph
4K 3840x2160
12.4  fps    + Compare + 📈 Graph
» With all tested laptops playable in detail settings high.
Additional Benchmarks
Low Preset Low TAA 1280x720
104.5
Ultra Preset + Full Ray Tracing High TAA 3840x2160
22.6
low 1920x1080
46.6  fps    + Compare + 📈 Graph
med. 1920x1080
44.7  fps    + Compare + 📈 Graph
high 1920x1080
37.1  fps    + Compare + 📈 Graph
ultra 1920x1080
37.4  fps    + Compare + 📈 Graph
QHD 2560x1440
24.9  fps    + Compare + 📈 Graph
4K 3840x2160
11.5  fps    + Compare + 📈 Graph
» With all tested laptops playable in detail settings ultra.
Additional Benchmarks
Low Preset TAA 1280x720
69.9
low 1920x1080
106.7  fps    + Compare + 📈 Graph
med. 1920x1080
82.6  fps    + Compare + 📈 Graph
high 1920x1080
71  fps    + Compare + 📈 Graph
ultra 1920x1080
58  fps    + Compare + 📈 Graph
QHD 2560x1440
41.1  fps    + Compare + 📈 Graph
4K 3840x2160
22.5  fps    + Compare + 📈 Graph
» With all tested laptops playable in detail settings ultra.
Additional Benchmarks
Low Preset / Off 1280x720
172.9
low 1920x1080
147  fps    + Compare + 📈 Graph
med. 1920x1080
86.3  fps    + Compare + 📈 Graph
high 1920x1080
72.2  fps    + Compare + 📈 Graph
ultra 1920x1080
55.5  fps    + Compare + 📈 Graph
QHD 2560x1440
32.8  fps    + Compare + 📈 Graph
4K 3840x2160
14  fps    + Compare + 📈 Graph
» With all tested laptops playable in detail settings ultra.
Additional Benchmarks
Low Preset 1280x720
214
low 1920x1080
83.6  fps    + Compare
med. 1920x1080
57.5  fps    + Compare
high 1920x1080
36.1  fps    + Compare
ultra 1920x1080
35.9  fps    + Compare
QHD 2560x1440
25.8  fps    + Compare
4K 3840x2160
15  fps    + Compare
» With all tested laptops playable in detail settings ultra.
Additional Benchmarks
Low Preset (without FSR Upscaling) 1280x720
134.5
low 1920x1080
84  fps    + Compare + 📈 Graph
med. 1920x1080
80.5  fps    + Compare + 📈 Graph
high 1920x1080
62.3  fps    + Compare + 📈 Graph
ultra 1920x1080
50  fps    + Compare + 📈 Graph
QHD 2560x1440
37.3  fps    + Compare + 📈 Graph
4K 3840x2160
20.9  fps    + Compare + 📈 Graph
» With all tested laptops playable in detail settings ultra.
Additional Benchmarks
Low Preset 1280x720
110.4
low 1920x1080
77.6  fps    + Compare + 📈 Graph
med. 1920x1080
65.7  fps    + Compare + 📈 Graph
high 1920x1080
67.6  fps    + Compare + 📈 Graph
ultra 1920x1080
56.6  fps    + Compare + 📈 Graph
QHD 2560x1440
40.1  fps    + Compare + 📈 Graph
4K 3840x2160
19.4  fps    + Compare + 📈 Graph
» With all tested laptops playable in detail settings ultra.
Additional Benchmarks
Very Low Preset 1280x720
117.4
low 1920x1080
93  fps    + Compare
med. 1920x1080
83  fps    + Compare
high 1920x1080
58  fps    + Compare
ultra 1920x1080
54  fps    + Compare
QHD 2560x1440
37  fps    + Compare
4K 3840x2160
24  fps    + Compare
» With all tested laptops playable in detail settings ultra.
Additional Benchmarks
Basic Quality Preset T2X SMAA 1280x720
142
low 1920x1080
56.3  fps    + Compare + 📈 Graph
med. 1920x1080
53.5  fps    + Compare + 📈 Graph
high 1920x1080
49.8  fps    + Compare + 📈 Graph
ultra 1920x1080
45.7  fps    + Compare + 📈 Graph
QHD 2560x1440
32.1  fps    + Compare + 📈 Graph
4K 3840x2160
16.2  fps    + Compare + 📈 Graph
» With all tested laptops playable in detail settings ultra.
Additional Benchmarks
Low Preset 1280x720
75.2
low 1920x1080
59.7  fps    + Compare + 📈 Graph
med. 1920x1080
45.7  fps    + Compare + 📈 Graph
high 1920x1080
32.7  fps    + Compare + 📈 Graph
ultra 1920x1080
24.5  fps    + Compare + 📈 Graph
QHD 2560x1440
18.4  fps    + Compare + 📈 Graph
4K 3840x2160
10.2  fps    + Compare + 📈 Graph
» With all tested laptops playable in detail settings med..
Additional Benchmarks
Low Preset 1280x720
78.4
FIFA 23

FIFA 23

2022
low 1920x1080
184.7  fps    + Compare + 📈 Graph
med. 1920x1080
169.4  fps    + Compare + 📈 Graph
high 1920x1080
100.5  fps    + Compare + 📈 Graph
ultra 1920x1080
100.4  fps    + Compare + 📈 Graph
QHD 2560x1440
78  fps    + Compare + 📈 Graph
4K 3840x2160
46.5  fps    + Compare + 📈 Graph
» With all tested laptops playable in detail settings ultra.
Additional Benchmarks
Low Rendering Quality 1280x720
282
low 1920x1080
75.3  fps    + Compare + 📈 Graph
med. 1920x1080
57.3 58.1 ~ 58 fps    + Compare + 📈 Graph
high 1920x1080
46.7 46.9 ~ 47 fps    + Compare + 📈 Graph
ultra 1920x1080
33.5 74.9 ~ 54 fps    + Compare + 📈 Graph
QHD 2560x1440
22.5 22.6 ~ 23 fps    + Compare + 📈 Graph
4K 3840x2160
8.8 9.7 ~ 9 fps    + Compare + 📈 Graph
» With most tested laptops playable in detail settings ultra.
Additional Benchmarks
Low Preset 1280x720
104.9
106.4
F1 22

F1 22

2022
low 1920x1080
172 175.3 ~ 174 fps    + Compare
med. 1920x1080
152.9 156.2 ~ 155 fps    + Compare
high 1920x1080
109.4 109.9 ~ 110 fps    + Compare
ultra 1920x1080
73.4 74.9 ~ 74 fps    + Compare
QHD 2560x1440
54.7 54.8 ~ 55 fps    + Compare
4K 3840x2160
31.7 31.7 ~ 32 fps    + Compare
» With all tested laptops playable in detail settings ultra.
Additional Benchmarks
Ultra Low Preset 16xAF TAA 1280x720
275
289
low 1920x1080
203  fps    + Compare + 📈 Graph
med. 1920x1080
111.7  fps    + Compare + 📈 Graph
high 1920x1080
103.4  fps    + Compare + 📈 Graph
ultra 1920x1080
100.4  fps    + Compare + 📈 Graph
QHD 2560x1440
63.2  fps    + Compare + 📈 Graph
4K 3840x2160
30.2  fps    + Compare + 📈 Graph
» With all tested laptops playable in detail settings ultra.
Additional Benchmarks
Low Preset 1280x720
340
low 1920x1080
78 81.3 ~ 80 fps    + Compare + 📈 Graph
med. 1920x1080
72.8 80.1 ~ 76 fps    + Compare + 📈 Graph
high 1920x1080
72.2 76 ~ 74 fps    + Compare + 📈 Graph
ultra 1920x1080
71.1 75.1 ~ 73 fps    + Compare + 📈 Graph
QHD 2560x1440
47.1 48.1 ~ 48 fps    + Compare + 📈 Graph
4K 3840x2160
21.8 22.7 ~ 22 fps    + Compare + 📈 Graph
» With all tested laptops playable in detail settings ultra.
Additional Benchmarks
Lowest Settings 1280x720
140.3
156.8
low 1920x1080
114.8 127.3 128.1 ~ 123 fps    + Compare
med. 1920x1080
90.8 97.9 98.3 ~ 96 fps    + Compare
high 1920x1080
58 59.7 59.8 ~ 59 fps    + Compare
ultra 1920x1080
44.2 44.8 45 ~ 45 fps    + Compare
QHD 2560x1440
31.4 31.4 31.4 ~ 31 fps    + Compare
4K 3840x2160
15 16.3 16.6 ~ 16 fps    + Compare
» With all tested laptops playable in detail settings ultra.
Additional Benchmarks
Lowest Preset (DX12) 1280x720
194.4
243
242
low 1920x1080
71.5 83.5 ~ 78 fps    + Compare
med. 1920x1080
58.5 63.7 ~ 61 fps    + Compare
high 1920x1080
42.9 47.2 ~ 45 fps    + Compare
ultra 1920x1080
33.8 47 ~ 40 fps    + Compare
QHD 2560x1440
18.9 21 ~ 20 fps    + Compare
4K 3840x2160
7.6 8.1 ~ 8 fps    + Compare
» With most tested laptops playable in detail settings ultra.
Additional Benchmarks
Low Preset 1280x720
78.3
138.7
Elex 2

Elex 2

2022
low 1920x1080
60.3  fps    + Compare + 📈 Graph
med. 1920x1080
55.3  fps    + Compare + 📈 Graph
high 1920x1080
48.4  fps    + Compare + 📈 Graph
ultra 1920x1080
42.9  fps    + Compare + 📈 Graph
QHD 2560x1440
30.1  fps    + Compare + 📈 Graph
4K 3840x2160
16.7  fps    + Compare + 📈 Graph
» With all tested laptops playable in detail settings ultra.
Additional Benchmarks
Low / Off 1280x720
66.3
low 1920x1080
155.5 163 186.4 ~ 168 fps    + Compare
med. 1920x1080
120 125.7 149.7 ~ 132 fps    + Compare
high 1920x1080
97 103.3 121.1 ~ 107 fps    + Compare
ultra 1920x1080
74 83.7 95.7 ~ 84 fps    + Compare
QHD 2560x1440
58 64.5 73 ~ 65 fps    + Compare
4K 3840x2160
37 38.7 42.9 ~ 40 fps    + Compare
» With all tested laptops playable in detail settings ultra.
Additional Benchmarks
Low Preset 1280x720
211
210
low 1920x1080
59.8  fps    + Compare + 📈 Graph
med. 1920x1080
59.6  fps    + Compare + 📈 Graph
high 1920x1080
56.5  fps    + Compare + 📈 Graph
ultra 1920x1080
46.8  fps    + Compare + 📈 Graph
QHD 2560x1440
34.7  fps    + Compare + 📈 Graph
4K 3840x2160
22  fps    + Compare + 📈 Graph
» With all tested laptops playable in detail settings ultra.
low 1920x1080
85.9  fps    + Compare + 📈 Graph
med. 1920x1080
43.4  fps    + Compare + 📈 Graph
high 1920x1080
35.3  fps    + Compare + 📈 Graph
QHD 2560x1440
24.3  fps    + Compare + 📈 Graph
4K 3840x2160
12.6  fps    + Compare + 📈 Graph
» With all tested laptops playable in detail settings high.
Additional Benchmarks
Low Quality 1280x720
116
low 1920x1080
131  fps    + Compare
med. 1920x1080
100  fps    + Compare
high 1920x1080
97  fps    + Compare
ultra 1920x1080
84  fps    + Compare
QHD 2560x1440
51  fps    + Compare
4K 3840x2160
20  fps    + Compare
» With all tested laptops playable in detail settings ultra.
Additional Benchmarks
Ultra Low Preset (with Fixed Resolution Quality) 1280x720
229
low 1920x1080
75.1 77.5 78.2 ~ 77 fps    + Compare + 📈 Graph
med. 1920x1080
61.8 64.9 65.2 ~ 64 fps    + Compare + 📈 Graph
high 1920x1080
48.7 51.7 52.5 ~ 51 fps    + Compare + 📈 Graph
ultra 1920x1080
28.5 32.9 35.8 ~ 32 fps    + Compare + 📈 Graph
QHD 2560x1440
26.3 28 35.1 ~ 30 fps    + Compare + 📈 Graph
4K 3840x2160
16.4 16.9 17.1 ~ 17 fps    + Compare + 📈 Graph
» With all tested laptops playable in detail settings high.
Additional Benchmarks
Low Preset 1280x720
113
117.4
118.5
med. 1920x1080
69.9  fps    + Compare + 📈 Graph
high 1920x1080
65.6  fps    + Compare + 📈 Graph
ultra 1920x1080
64.2  fps    + Compare + 📈 Graph
QHD 2560x1440
55.3  fps    + Compare + 📈 Graph
4K 3840x2160
23.8  fps    + Compare + 📈 Graph
» With all tested laptops playable in detail settings ultra.
Additional Benchmarks
Low Preset 1920x1080
76.1
low 1280x720
241  fps    + Compare + 📈 Graph
med. 1920x1080
109  fps    + Compare + 📈 Graph
high 1920x1080
82.3  fps    + Compare + 📈 Graph
ultra 1920x1080
65.9  fps    + Compare + 📈 Graph
QHD 2560x1440
50.4  fps    + Compare + 📈 Graph
4K 3840x2160
36.2  fps    + Compare + 📈 Graph
» With all tested laptops playable in detail settings ultra.
Additional Benchmarks
Low Preset 1920x1080
203
low 1280x720
145  fps    + Compare + 📈 Graph
med. 1920x1080
83.8  fps    + Compare + 📈 Graph
high 1920x1080
70.4  fps    + Compare + 📈 Graph
ultra 1920x1080
57.9  fps    + Compare + 📈 Graph
QHD 2560x1440
42.6  fps    + Compare + 📈 Graph
4K 3840x2160
24.2  fps    + Compare + 📈 Graph
» With all tested laptops playable in detail settings ultra.
Additional Benchmarks
Low Preset 1920x1080
97
low 1280x720
163 221 230 ~ 205 fps    + Compare
med. 1920x1080
86 109 114 ~ 103 fps    + Compare
high 1920x1080
78 94 97 ~ 90 fps    + Compare
ultra 1920x1080
28 46 48 ~ 41 fps    + Compare
QHD 2560x1440
27 37 39 ~ 34 fps    + Compare
4K 3840x2160
21 24 25 ~ 23 fps    + Compare
» With most tested laptops playable in detail settings ultra.
Additional Benchmarks
Low Preset 1920x1080
133
132
low 1280x720
76.6  fps    + Compare
med. 1920x1080
84.1  fps    + Compare
high 1920x1080
61.1  fps    + Compare
ultra 1920x1080
57.5  fps    + Compare
QHD 2560x1440
38.9  fps    + Compare
4K 3840x2160
20.7  fps    + Compare
» With all tested laptops playable in detail settings ultra.
Additional Benchmarks
Low Preset 1920x1080
95.5
low 1280x720
128  fps    + Compare
med. 1920x1080
92  fps    + Compare
high 1920x1080
71  fps    + Compare
ultra 1920x1080
62  fps    + Compare
QHD 2560x1440
43  fps    + Compare
4K 3840x2160
22  fps    + Compare
» With all tested laptops playable in detail settings ultra.
Additional Benchmarks
Low Preset 1920x1080
113
low 1280x720
78  fps    + Compare
med. 1920x1080
65  fps    + Compare
high 1920x1080
63  fps    + Compare
ultra 1920x1080
60  fps    + Compare
QHD 2560x1440
45  fps    + Compare
4K 3840x2160
25  fps    + Compare
» With all tested laptops playable in detail settings ultra.
Additional Benchmarks
Low Preset 1920x1080
64
med. 1920x1080
121  fps    + Compare + 📈 Graph
high 1920x1080
103  fps    + Compare + 📈 Graph
ultra 1920x1080
93.6  fps    + Compare + 📈 Graph
QHD 2560x1440
62.2  fps    + Compare + 📈 Graph
4K 3840x2160
30.8  fps    + Compare + 📈 Graph
» With all tested laptops playable in detail settings ultra.
Additional Benchmarks
Low Preset (DX12) 1920x1080
177
Far Cry 6

Far Cry 6

2021
low 1280x720
148 171 172.4 ~ 164 fps    + Compare + 📈 Graph
med. 1920x1080
88 90.9 91.3 ~ 90 fps    + Compare + 📈 Graph
high 1920x1080
75 77.3 77.6 ~ 77 fps    + Compare + 📈 Graph
ultra 1920x1080
62.9 65.6 66 ~ 65 fps    + Compare + 📈 Graph
QHD 2560x1440
42.2 43 43.7 ~ 43 fps    + Compare + 📈 Graph
4K 3840x2160
11.6 12 12.2 ~ 12 fps    + Compare + 📈 Graph
» With all tested laptops playable in detail settings ultra.
Additional Benchmarks
Low Graphics Quality 1920x1080
99
109.4
108.5
med. 1920x1080
92.2  fps    + Compare + 📈 Graph
high 1920x1080
87.6  fps    + Compare + 📈 Graph
QHD 2560x1440
85.4  fps    + Compare + 📈 Graph
4K 3840x2160
52.4  fps    + Compare + 📈 Graph
» With all tested laptops playable in detail settings high.
Additional Benchmarks
Low Preset 1920x1080
97
New World

New World

2021
low 1280x720
124  fps    + Compare + 📈 Graph
med. 1920x1080
59.2  fps    + Compare + 📈 Graph
high 1920x1080
52.5  fps    + Compare + 📈 Graph
ultra 1920x1080
45.3  fps    + Compare + 📈 Graph
QHD 2560x1440
32.5  fps    + Compare + 📈 Graph
4K 3840x2160
21.3  fps    + Compare + 📈 Graph
» With all tested laptops playable in detail settings ultra.
Additional Benchmarks
Low Video Quality 1920x1080
76.5
Deathloop

Deathloop

2021
low 1280x720
118  fps    + Compare + 📈 Graph
med. 1920x1080
69.4  fps    + Compare + 📈 Graph
high 1920x1080
57  fps    + Compare + 📈 Graph
ultra 1920x1080
41.3  fps    + Compare + 📈 Graph
QHD 2560x1440
28.8  fps    + Compare + 📈 Graph
4K 3840x2160
14.5  fps    + Compare + 📈 Graph
» With all tested laptops playable in detail settings ultra.
Additional Benchmarks
Low Preset 1920x1080
80.3
F1 2021

F1 2021

2021
low 1280x720
380 406 409 ~ 398 fps    + Compare
med. 1920x1080
193 198.5 198.9 ~ 197 fps    + Compare
high 1920x1080
153 156.1 157.5 ~ 156 fps    + Compare
ultra 1920x1080
98.8 98.8 99.9 ~ 99 fps    + Compare
QHD 2560x1440
73.4 73.5 73.8 ~ 74 fps    + Compare
4K 3840x2160
42.6 42.7 42.8 ~ 43 fps    + Compare
» With all tested laptops playable in detail settings ultra.
low 1280x720
119  fps    + Compare + 📈 Graph
med. 1920x1080
115  fps    + Compare + 📈 Graph
high 1920x1080
109  fps    + Compare + 📈 Graph
QHD 2560x1440
109  fps    + Compare + 📈 Graph
4K 3840x2160
68.8  fps    + Compare + 📈 Graph
» With all tested laptops playable in detail settings high.
Additional Benchmarks
Low Preset 1920x1080
114
Days Gone

Days Gone

2021
low 1280x720
146  fps    + Compare + 📈 Graph
med. 1920x1080
85.1  fps    + Compare + 📈 Graph
high 1920x1080
73.3  fps    + Compare + 📈 Graph
ultra 1920x1080
52  fps    + Compare + 📈 Graph
QHD 2560x1440
36.9  fps    + Compare + 📈 Graph
4K 3840x2160
19.6  fps    + Compare + 📈 Graph
» With all tested laptops playable in detail settings ultra.
Additional Benchmarks
Low Preset 1920x1080
101
low 1280x720
108  fps    + Compare + 📈 Graph
ultra 1920x1080
99.6  fps    + Compare + 📈 Graph
QHD 2560x1440
80.9  fps    + Compare + 📈 Graph
4K 3840x2160
41  fps    + Compare + 📈 Graph
» With all tested laptops playable in detail settings ultra.
low 1280x720
249  fps    + Compare + 📈 Graph
med. 1920x1080
104  fps    + Compare + 📈 Graph
high 1920x1080
103  fps    + Compare + 📈 Graph
ultra 1920x1080
85.9  fps    + Compare + 📈 Graph
QHD 2560x1440
54.5  fps    + Compare + 📈 Graph
4K 3840x2160
26.5  fps    + Compare + 📈 Graph
» With all tested laptops playable in detail settings ultra.
Additional Benchmarks
Prioritize Performance Preset 1920x1080
159
Outriders

Outriders

2021
low 1280x720
133  fps    + Compare + 📈 Graph
med. 1920x1080
93.1  fps    + Compare + 📈 Graph
high 1920x1080
74.6  fps    + Compare + 📈 Graph
ultra 1920x1080
61.9  fps    + Compare + 📈 Graph
QHD 2560x1440
41.8  fps    + Compare + 📈 Graph
4K 3840x2160
28.3  fps    + Compare + 📈 Graph
» With all tested laptops playable in detail settings ultra.
Additional Benchmarks
Low Preset 1920x1080
117
Hitman 3

Hitman 3

2021
low 1280x720
220  fps    + Compare
med. 1920x1080
101  fps    + Compare
high 1920x1080
91  fps    + Compare
ultra 1920x1080
83  fps    + Compare
QHD 2560x1440
54  fps    + Compare
4K 3840x2160
30  fps    + Compare
» With all tested laptops playable in detail settings ultra.
low 1280x720
104.9  fps    + Compare
med. 1920x1080
50.4  fps    + Compare
high 1920x1080
39  fps    + Compare
ultra 1920x1080
32.5  fps    + Compare
QHD 2560x1440
18.8  fps    + Compare
4K 3840x2160
7.5  fps    + Compare
» With all tested laptops playable in detail settings high.
Additional Benchmarks
Low Preset 1920x1080
64.9
low 1280x720
110  fps    + Compare
med. 1920x1080
74  fps    + Compare
high 1920x1080
65  fps    + Compare