Notebook reviews with NVIDIA GeForce RTX 4070 Laptop GPU graphics card
Zotac Zbox Magnus EN374070 review – A mini gaming PC inside a 2.65-liter case with the Nvidia GeForce RTX 4070
The Zotac Zbox Magnus EN374070 combines powerful hardware with a compact footprint: The Intel Core i7-13700HX and Nvidia GeForce RTX 4070 Laptop GPU promise powerful performance for gaming and everyday use. During our test, we examined its performance, noise emissions and power consumption, and showed whether the mini PC can keep up with the competition.
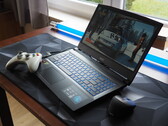
Intel Core i7-13700HX, NVIDIA GeForce RTX 4070 Laptop GPU, 1.6 kgMSI Katana A17 AI laptop review: Strong graphics let down by a weak display
The Katana A17 is a cheaper alternative to the GE, GS, or GT series while still offering excellent graphics performance with its 105 W GeForce RTX 4070 GPU. Unfortunately, its 1080p panel lacks full sRGB colors, fast response times, and G-Sync support.
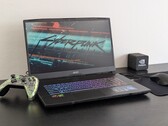
AMD Ryzen 7 8845HS, NVIDIA GeForce RTX 4070 Laptop GPU, 17.3", 2.7 kgMSI Katana A15 AI laptop review: RTX 4070 gamer hurt by cost-saving measures
MSI ventures into the competitive mid-range gaming laptop sector with the Katana A15 AI. This 15-inch laptop features a powerful Ryzen processor along with a GeForce RTX 4060 or RTX 4070 - and is massively disappointing in one crucial area.
AMD Ryzen 9 8945HS, NVIDIA GeForce RTX 4070 Laptop GPU, 15.6", 2.3 kgAcer Predator Triton Neo 16 review: A premium laptop with an RTX 4070 for gamers and creators
While the Nitro V 16 that we tested recently only impressed us a limited amount due to its poor display, the Predator Triton Neo 16 cut a much better figure. We put the 16-inch gamer with a Meteor Lake CPU and a GeForce RTX 4070 to the test.
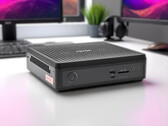
Intel Core Ultra 9 185H, NVIDIA GeForce RTX 4070 Laptop GPU, 16", 2 kgMinisforum AtomMan G7 Ti review: Gaming laptop without a screen as a space-saving alternative to the desktop PC
The Minisforum AtomMan G7 Ti promises desktop performance in a compact format. Equipped with the powerful Intel Core i9-14900HX and the Nvidia GeForce RTX 4070 laptop GPU, it is aimed at gamers, creatives, and professionals who need maximum performance in minimal space. In this test, we examine the mini PC closely and check whether it lives up to the high expectations.
Intel Core i9-14900HX, NVIDIA GeForce RTX 4070 Laptop GPU, 2.6 kgMSI Sword 16 HX B14VGKG: Intel Core i7-14700HX, 16.00", 2.3 kg
Review » MSI Sword 16 HX Laptop Review: Gaming powerhouse stifled by an unimpressive screen
Maingear ML-16 MK2: Intel Core Ultra 7 155H, 16.00", 2.1 kg
Review » Maingear ML-16 MK2 laptop review: GeForce RTX 4070 performance for a decent price
Acer Predator Helios Neo 14 (2024): Intel Core Ultra 9 185H, 14.50", 1.9 kg
Review » Acer Predator Helios Neo 14 (2024) review: The portable RTX 4070 laptop with long runtimes
Asus ROG NUC 14-90AS0051: Intel Core Ultra 9 185H, 2.6 kg
Review » Asus ROG NUC gaming mini PC review: Intel Core Ultra 9 185H and Nvidia GeForce RTX 4070 laptop in a 2.5-liter case
Asus ProArt P16 H7606WI: AMD Ryzen AI 9 HX 370, 16.00", 1.8 kg
Review » Asus ProArt P16 laptop review - AMD Zen 5 meets RTX 4070 laptop and 4K OLED
Asus ProArt PX13 HN7306: AMD Ryzen AI 9 HX 370, 13.30", 1.4 kg
Review » AMD Zen 5 Strix Point CPU analysis - Ryzen AI 9 HX 370 versus Intel Core Ultra, Apple M3 and Qualcomm Snapdragon X Elite
Review » Asus ProArt PX13 review - The world's fastest 13.3-inch 2-in-1 thanks to AMD Zen 5 and RTX 4070 laptop
HP Omen 17-db0079ng: AMD Ryzen 7 8845HS, 17.30", 2.8 kg
Review » HP Omen 17 (2024) review: RTX 4070 and Ryzen 7 show their size in the gaming laptop
Schenker XMG Pro 16 Studio (Mid 24): Intel Core i9-14900HX, 16.00", 2.3 kg
Review » XMG Pro 16 Studio (Mid 24) review: Core i9 and RTX 4070 for gamers and creators
Acer Predator Helios Neo 16 (2024): Intel Core i7-14700HX, 16.00", 2.6 kg
Review » Acer Predator Helios Neo 16 (2024) review: Gaming laptop with RTX 4070 and DCI-P3 panel
Schenker XMG Fusion 15 (Early 24): Intel Core i9-14900HX, 15.30", 2.1 kg
Review » XMG Fusion 15 (Early 24) review: A compact RTX 4070 laptop for gamers and creators
Lenovo Yoga Pro 9 16IMH9: Intel Core Ultra 9 185H, 16.00", 2.1 kg
Review » Lenovo Yoga Pro 9i 16 G9 laptop review: MiniLED with 1200 nits and Core Ultra 9
Lenovo Legion 7 16 IRX G9: Intel Core i9-14900HX, 16.00", 2.3 kg
Review » Lenovo Legion 7 16 G9 laptop review - A gaming machine with a 3.2K display, HX CPU and an overclocked RTX 4070 laptop
Aorus 16X 2024: Intel Core i9-14900HX, 16.00", 2.3 kg
Review » Aorus 16X (2024) review: Core i9 and RTX 4070 for US$2,000
Dell XPS 16 9640: Intel Core Ultra 7 155H, 16.30", 2.3 kg
Review » Dell XPS 16 9640 review - The multimedia laptop with 4K OLED and an annoying touch bar
Lenovo Legion Pro 5 16IRX9: Intel Core i9-14900HX, 16.00", 2.5 kg
Review » Lenovo Legion Pro 5 16IRX9 laptop review: Great performance, but a little heavy
Alienware m16 R2: Intel Core Ultra 7 155H, 16.00", 2.5 kg
Review » Alienware m16 R2 laptop review: Big and risky changes
Razer Blade 14 RZ09-0508: AMD Ryzen 9 8945HS, 14.00", 1.9 kg
Review » Razer Blade 14 2024 laptop review: Futureproofing with Ryzen AI
HP Omen Transcend 16-u1095ng: Intel Core i9-14900HX, 16.00", 2.3 kg
Review » HP Omen Transcend 16 (2024) laptop review: An RTX 4070 gaming machine with an OLED display
Asus ROG Zephyrus G14 2024 GA403U: AMD Ryzen 9 8945HS, 14.00", 1.5 kg
Review » Asus ROG Zephyrus G14 2024 review - The gaming/multimedia laptop with Ryzen 8000 and G-Sync OLED
Asus ROG Zephyrus G16 2024 GU605M: Intel Core Ultra 7 155H, 16.00", 1.8 kg
Review » Asus ROG Zephyrus G16 2024 review - The gaming laptop now with G-Sync OLED and Intel Meteor Lake
Asus TUF Gaming A17 FA707XI-NS94: AMD Ryzen 9 7940HS, 17.30", 2.5 kg
Review » Asus TUF Gaming A17 FA707XI laptop review: 140 W GeForce RTX 4070 for $1400
MSI Stealth 16 Mercedes-AMG Motorsport A13VG: Intel Core i9-13900H, 16.00", 1.9 kg
Review » MSI Stealth 16 Mercedes-AMG Motorsport laptop in review: Mobile racing car with OLED display
Schenker XMG Pro 16 Studio (Mid 23): Intel Core i9-13900H, 16.00", 2.6 kg
Review » XMG Pro 16 Studio (Mid 23) review: The RTX 4070 laptop for gamers and creators
Schenker XMG CORE 16 (L23): AMD Ryzen 7 7840HS, 16.00", 2.4 kg
Review » SCHENKER XMG Core 16 gaming laptop review - A real competitor to the Lenovo Legion Pro 5 16
HP Victus 16-r0077ng: Intel Core i7-13700H, 16.10", 2.4 kg
Review » HP Victus 16 laptop review: Full HD gamer with RTX 4070
HP Omen 16-xf0376ng: AMD Ryzen 7 7840HS, 16.10", 2.4 kg
Review » HP Omen 16 laptop review: A good choice for gamers even with Zen 4
Acer Nitro 17 AN17-41-R9LN: AMD Ryzen 7 7735HS, 17.30", 3 kg
Review » Acer Nitro 17 Ryzen edition review: The QHD gaming laptop with an RTX 4070
Aorus 15 BSF: Intel Core i7-13700H, 15.60", 2.4 kg
Review » Aorus 15 BSF review: The QHD gaming laptop with an RTX 4070 and great runtimes
HP Omen Transcend 16: Intel Core i9-13900HX, 16.00", 2.3 kg
Review » HP Omen Transcend 16 laptop review: More than just a small name difference
Schenker VISION 16 Pro (M23): Intel Core i7-13700H, 16.00", 1.6 kg
Review » Schenker Vision 16 Pro 2023 review: 1.6 kg light and powerful package with RTX 4070 Laptop
MSI Pulse 17 B13VGK: Intel Core i7-13700H, 17.30", 2.7 kg
Review » MSI Pulse 17 B13V gaming laptop review: With quiet wings
MSI Stealth 16 Studio A13VG: Intel Core i7-13700H, 16.00", 2 kg
Review » MSI Stealth 16 Studio laptop review: An extremely light, 16-inch, Core i7, RTX 4070 device for gamers and creators
Lenovo Legion Slim 7i 16 Gen 8: Intel Core i9-13900H, 16.00", 2.1 kg
Review » Lenovo Legion Slim 7i 16 Gen 8 laptop review: Slimmer than the Razer Blade 16
Asus ProArt Studiobook 16 OLED H7604: Intel Core i9-13980HX, 16.00", 2.4 kg
Review » Asus ProArt Studiobook 16 OLED review: Multimedia laptop with extreme CPU performance
Razer Blade 14 RTX 4070: AMD Ryzen 9 7940HS, 14.00", 1.8 kg
Review » Razer Blade 14 Zen 4 laptop review: Lots of changes that matter
Acer Nitro 16 AN16-41: AMD Ryzen 7 7735HS, 16.00", 2.7 kg
Review » Acer Nitro 16 AN16-41 review: An RTX 4070 gaming laptop with good battery life
Schenker XMG Focus 17 (E23): Intel Core i9-13900HX, 17.30", 2.9 kg
Review » Schenker XMG Focus 17 (E23) in review: Gaming laptop with RTX 4070 doesn't skimp on performance
Asus Zenbook Pro 14 OLED UX6404VI: Intel Core i9-13900H, 14.50", 1.7 kg
Review » Asus Zenbook Pro 14 OLED laptop review: MacBook Pro rival with 120 Hz OLED display
Dell XPS 17 9730 RTX 4070: Intel Core i7-13700H, 17.00", 2.5 kg
Review » Dell XPS 17 9730 laptop review: GeForce RTX 4070 multimedia monster
Lenovo Legion Pro 5 16ARX8: AMD Ryzen 7 7745HX, 16.00", 2.5 kg
Review » Ryzen 7 7745HX performance debut: Lenovo Legion Pro 5 16 Gen 8 laptop review
Samsung Galaxy Book3 Ultra 16, i9-13900H RTX 4070: Intel Core i9-13900H, 16.00", 1.8 kg
Review » Samsung Galaxy Book3 Ultra 16 with RTX 4070 in review: High graphics performance in a business-like notebook
Medion Erazer Major X20: Intel Core i9-13900HX, 16.00", 2.4 kg
Review » Medion Erazer Major X20 review: Gaming notebook with RTX 4070 and solid hardware
Dell XPS 15 9530 RTX 4070: Intel Core i7-13700H, 15.60", 1.9 kg
Review » Dell XPS 15 9530 RTX 4070 laptop review: Both impressive and underwhelming
Asus ROG Flow Z13 ACRNM: Intel Core i9-13900H, 13.40", 1.7 kg
Review » Asus ROG Flow Z13 ACRNM Review - Gaming Convertible with RTX 4070 Laptop
Aorus 15X ASF: Intel Core i7-13700HX, 15.60", 2.3 kg
Review » Aorus 15X ASF review: Gaming laptop with RTX 4070 power and stamina
Asus ROG Strix G17 G713PI: AMD Ryzen 9 7945HX, 17.30", 2.8 kg
Review » AMD Ryzen 9 7945HX Analysis - Zen4 Dragon Range is faster and more efficient than Intel Raptor Lake-HX
Uniwill GM6PX7X RTX 4070: Intel Core i7-13700HX, 16.00", 2.2 kg
Review » Core i7-13700HX performance debut: Uniwill GM6PX7X IDX laptop review
Asus ROG Strix G17 G713PI: AMD Ryzen 9 7945HX, 17.30", 2.8 kg
Review » Asus ROG Strix G17 G713PI: Gaming laptop impresses in the test with the new Ryzen 9
Gigabyte AERO 16 OLED BSF: Intel Core i9-13900H, 16.00", 2.1 kg
Review » Slim Gigabyte AERO 16 OLED laptop review: Efficient RTX 4070 for gamers and creatives
Asus ROG Strix G18 G814JI: Intel Core i7-13650HX, 18.00", 3 kg
Review » Asus ROG Strix G18 G814JI laptop review: Light and shade with the 18-inch gaming machine
Schenker XMG Neo 17 2023 Engineering Sample: Intel Core i9-13900HX
Review » GeForce RTX 4070, 4060, 4050 Laptop Analysis - Nvidia's new Mainstream Laptop GPUs in Review
Razer Blade 18 RTX 4070: Intel Core i9-13950HX, 18.00", 3 kg
Review » Razer Blade 18 laptop review: Smaller than many 17-inch gaming laptops
MSI Creator A16 AI+ A3XVFG: AMD Ryzen AI 9 365, 16.00", 2.1 kg
External Review » MSI Creator A16 AI+ A3XVFG
MSI Katana 15 B13VGK, i7-13700H: Intel Core i7-13700H, 15.60", 2.3 kg
External Review » MSI Katana 15 B13VGK, i7-13700H
HP Victus 16-s1000: AMD Ryzen 7 8845HS, 16.10", 2.3 kg
External Review » HP Victus 16-s1000
Tulpar 6 V3.2.2: Intel Core i7-13700HX, 16.00", 2.3 kg
External Review » Tulpar 6 V3.2.2
MSI Creator A16 AI+ A3HVGG: AMD Ryzen AI 9 365, 16.00", 2.1 kg
External Review » MSI Creator A16 AI+ A3HVGG
Lenovo Legion 5 16IRX9, i7-14700HX: Intel Core i7-14700HX, 6.00", 2.5 kg
External Review » Lenovo Legion 5 16IRX9, i7-14700HX
MSI Prestige 16 AI Studio B1VGG: Intel Core Ultra 9 185H, 16.00", 1.6 kg
External Review » MSI Prestige 16 AI Studio B1VGG
MSI Sword 16 HX B14VGKG, i7-14650HX: Intel Core i7-14650HX, 16.00", 2.3 kg
External Review » MSI Sword 16 HX B14VGKG, i7-14650HX
MSI Pulse 17 AI C1VGKG: Intel Core Ultra 7 155H, 17.00", 2.8 kg
External Review » MSI Pulse 17 AI C1VGKG
MSI Stealth A16 AI+ A3XVGG: AMD Ryzen AI 9 365, 16.00", 2.1 kg
External Review » MSI Stealth A16 AI+ A3XVGG
MSI Stealth 16 AI Studio A1VGG, Ultra 7 155H: Intel Core Ultra 7 155H, 16.00", 2 kg
External Review » MSI Stealth 16 AI Studio A1VGG, Ultra 7 155H
Asus ROG Zephyrus G16 GA605WI: AMD Ryzen AI 9 HX 370, 16.00", 1.9 kg
External Review » Asus ROG Zephyrus G16 GA605WI
Acer Predator Helios Neo 14 (2024): Intel Core Ultra 9 185H, 14.50", 1.9 kg
External Review » Acer Predator Helios Neo 14 (2024)
Asus TUF Gaming F15 FX507VI: Intel Core i7-13620H, 15.60", 2.2 kg
External Review » Asus TUF Gaming F15 FX507VI
HP Omen Transcend 14-fb: Intel Core Ultra 7 155H, 14.00", 1.6 kg
External Review » HP Omen Transcend 14-fb
MSI Stealth 16 AI Studio A1VGG: Intel Core Ultra 9 185H, 16.00", 2 kg
External Review » MSI Stealth 16 AI Studio A1VGG
Asus ProArt P16 H7606WI: AMD Ryzen AI 9 HX 370, 16.00", 1.8 kg
External Review » Asus ProArt P16 H7606WI
MSI Creator M16 HX C14VGG: Intel Core i9-14900HX, 16.00", 2.4 kg
External Review » MSI Creator M16 HX C14VGG
Aorus 16X 9SG: Intel Core i7-13650HX, 16.00", 2.3 kg
External Review » Aorus 16X 9SG
HP Omen 17-db0079ng: AMD Ryzen 7 8845HS, 17.30", 2.8 kg
External Review » HP Omen 17-db0079ng
Lenovo Legion 7 16IRX9, i7-14700HX: Intel Core i7-14700HX, 16.00", 2.2 kg
External Review » Lenovo Legion 7 16IRX9, i7-14700HX
Asus ProArt PX13 HN7306: AMD Ryzen AI 9 HX 370, 13.30", 1.4 kg
External Review » Asus ProArt PX13 HN7306
Maingear ML-16 MK2: Intel Core Ultra 7 155H, 16.00", 2.1 kg
External Review » Maingear ML-16 MK2
Schenker XMG Fusion 15 (Early 24): Intel Core i9-14900HX, 15.30", 2.1 kg
External Review » SCHENKER XMG Fusion 15 (Early 24)
Acer Nitro 16 AN16-42: AMD Ryzen 7 8845HS, 16.00", 2.7 kg
External Review » Acer Nitro 16 AN16-42
HP Omen 16-wf0000: Intel Core i7-13650HX, 16.10", 2.4 kg
External Review » HP Omen 16-wf0000
Acer Predator Triton Neo 16 PTN16-51, RTX 4070: Intel Core Ultra 9 185H, 16.00", 2.1 kg
External Review » Acer Predator Triton Neo 16 PTN16-51, RTX 4070
Medion Erazer Beast X40 2024, RTX 4070: Intel Core i9-14900HX, 17.00", 2.9 kg
External Review » Medion Erazer Beast X40 2024, RTX 4070
Acer Swift X OLED SFX14-72G, RTX 4070: Intel Core Ultra 7 155H, 14.50", 1.6 kg
External Review » Acer Swift X OLED SFX14-72G, RTX 4070
MSI Katana A17 AI B8VG: AMD Ryzen 9 8945HS, 17.30", 2.7 kg
External Review » MSI Katana A17 AI B8VG
Medion Erazer Deputy P60: Intel Core i7-12650H, 15.60", 2.1 kg
External Review » Medion Erazer Deputy P60
Acer Nitro 17 AN17-41-R3S4: AMD Ryzen 9 7940HS, 17.30", 3.1 kg
External Review » Acer Nitro 17 AN17-41-R3S4
Asus ROG Strix G16 G614JZR: Intel Core i9-14900HX, 16.00", 2.8 kg
External Review » Asus ROG Strix G16 G614JZR
HP Victus 16-r1000: Intel Core i7-14700HX, 16.10", 2.3 kg
External Review » HP Victus 16-r1000
MSI Katana A15 AI B8VG: AMD Ryzen 9 8945HS, 15.60", 2.3 kg
External Review » MSI Katana A15 AI B8VG
Asus ROG Strix G18 G814JIR: Intel Core i9-14900HX, 18.00", 3 kg
External Review » Asus ROG Strix G18 G814JIR
Asus TUF Gaming A16 FA608: AMD Ryzen AI 9 HX 370, 16.00", 2.2 kg
External Review » Asus TUF Gaming A16 FA608
Asus ROG Strix G16 G614JIR: Intel Core i9-14900HX, 16.00", 2.8 kg
External Review » Asus ROG Strix G16 G614JIR
MSI Pulse 16 AI C1VGKG: Intel Core Ultra 9 185H, 16.00", 2.5 kg
External Review » MSI Pulse 16 AI C1VGKG
Acer Predator Helios Neo 14 PHN14-51: Intel Core Ultra 7 155H, 14.50", 1.9 kg
External Review » Acer Predator Helios Neo 14 PHN14-51
MSI Stealth 14 AI Studio A1VGG: Intel Core Ultra 9 185H, 14.00", 1.7 kg
External Review » MSI Stealth 14 AI Studio A1VGG
MSI Sword 16 HX B14VGKG: Intel Core i7-14700HX, 16.00", 2.3 kg
External Review » MSI Sword 16 HX B14VGKG
MSI Sword 17 HX B14VGKG: Intel Core i7-14700HX, 17.00", 2.6 kg
External Review » MSI Sword 17 HX B14VGKG
Lenovo Legion 7 16IRX9, i9-14900HX: Intel Core i9-14900HX, 16.00", 2.2 kg
External Review » Lenovo Legion 7 16IRX9, i9-14900HX
Acer Nitro 16 AN16-41-R6KQ: AMD Ryzen 7 7840HS, 16.00", 2.7 kg
External Review » Acer Nitro 16 AN16-41-R6KQ
Samsung Galaxy Book4 Ultra, RTX 4070: Intel Core Ultra 9 185H, 16.00", 1.9 kg
External Review » Samsung Galaxy Book4 Ultra, RTX 4070
Lenovo Legion Slim 5 16AHP9: AMD Ryzen 7 8845HS, 16.00", 2.3 kg
External Review » Lenovo Legion Slim 5 16AHP9
Lenovo Legion 5 16IRX9, i7-14650HX: Intel Core i7-14650HX, 16.00", 2.3 kg
External Review » Lenovo Legion 5 16IRX9, i7-14650HX
Asus ROG Zephyrus G16 GU605MI, Ultra 9 185H: Intel Core Ultra 9 185H, 16.00", 1.8 kg
External Review » Asus ROG Zephyrus G16 GU605MI, Ultra 9 185H
Asus TUF Gaming A16 FA607PI: AMD Ryzen 9 7845HX, 16.00", 2.3 kg
External Review » Asus TUF Gaming A16 FA607PI
Dell XPS 16 9640, Ultra 7 165H RTX 4070: Intel Core Ultra 7 165H, 16.30", 2.1 kg
External Review » Dell XPS 16 9640, Ultra 7 165H RTX 4070
HP Omen 16-xf0079ng: AMD Ryzen 7 7840HS, 16.10", 2.4 kg
External Review » HP Omen 16-xf0079ng
HP Omen Transcend 16-u1095ng: Intel Core i9-14900HX, 16.00", 2.3 kg
External Review » HP Omen Transcend 16-u1095ng
MSI Vector 17 HX A14VGG: Intel Core i9-14900HX, 17.30", 3 kg
External Review » MSI Vector 17 HX A14VGG
Lenovo Legion Pro 5 16IRX9, i7-14700HX: Intel Core i7-14700HX, 16.00", 2.5 kg
External Review » Lenovo Legion Pro 5 16IRX9, i7-14700HX
Lenovo Legion Slim 7 16IRH8, i9-13900H RTX 4070: Intel Core i9-13900H, 16.00", 2 kg
External Review » Lenovo Legion Slim 7 16IRH8, i9-13900H RTX 4070
Lenovo Yoga Pro 9 16IMH9: Intel Core Ultra 9 185H, 16.00", 2.1 kg
External Review » Lenovo Yoga Pro 9 16IMH9
Lenovo Legion 7 16IRX9: Intel Core i7-14650HX, 16.00", 2.3 kg
External Review » Lenovo Legion 7 16IRX9
Lenovo ThinkPad P1 G6, i7-13800H RTX 4070: Intel Core i7-13800H, 16.00", 1.8 kg
External Review » Lenovo ThinkPad P1 G6, i7-13800H RTX 4070
Acer Nitro 16 AN16-41, R9 7940HS: AMD Ryzen 9 7940HS, 16.00", 2.7 kg
External Review » Acer Nitro 16 AN16-41, R9 7940HS
HP Omen Transcend 14-fb0000ng: Intel Core Ultra 9 185H, 14.00", 1.6 kg
External Review » HP Omen Transcend 14-fb0000ng
Aorus 16X 2024: Intel Core i9-14900HX, 16.00", 2.3 kg
External Review » Aorus 16X 2024
Lenovo Legion Pro 5 16IRX9: Intel Core i9-14900HX, 16.00", 2.5 kg
External Review » Lenovo Legion Pro 5 16IRX9
Razer Blade 14 RZ09-0508: AMD Ryzen 9 8945HS, 14.00", 1.9 kg
External Review » Razer Blade 14 RZ09-0508
Acer Predator Helios Neo 18 PHN18-71: Intel Core i9-14900HX, 18.00", 3.4 kg
External Review » Acer Predator Helios Neo 18 PHN18-71
Acer Predator Helios Neo 16 (2024): Intel Core i7-14700HX, 16.00", 2.6 kg
External Review » Acer Predator Helios Neo 16 PHN16-72
Alienware m16 R2: Intel Core Ultra 7 155H, 16.00", 2.5 kg
External Review » Alienware m16 R2
Asus ROG Zephyrus G16 2024 GU605M: Intel Core Ultra 7 155H, 16.00", 1.8 kg
External Review » Asus ROG Zephyrus G16 2024 GU605M
Asus ROG Zephyrus G14 2024 GA403U: AMD Ryzen 9 8945HS, 14.00", 1.5 kg
External Review » Asus ROG Zephyrus G14 2024 GA403U
Acer Predator Helios Neo 16 PHN16-71, i5-13700HX RTX 4070: Intel Core i7-13700HX, 16.00", 2.6 kg
External Review » Acer Predator Helios Neo 16 PHN16-71, i5-13700HX RTX 4070
Dell XPS 16 9640: Intel Core Ultra 7 155H, 16.30", 2.3 kg
External Review » Dell XPS 16 9640
Aorus 16X ASG: Intel Core i7-14650HX, 16.00", 2.3 kg
External Review » Aorus 16X ASG
MSI Alpha 17 C7VG: AMD Ryzen 9 7945HX, 17.30", 2.8 kg
External Review » MSI Alpha 17 C7VG
Dell XPS 17 9730, i9-13900H: Intel Core i9-13900H, 17.00", 2.4 kg
External Review » Dell XPS 17 9730, i9-13900H
Dell G16 7630, i9-13900HX RTX 4070: Intel Core i9-13900HX, 16.00", 2.9 kg
External Review » Dell G16 7630, i9-13900HX RTX 4070
Acer Nitro 17 AN17-41: AMD Ryzen 7 7840HS, 17.30", 3 kg
External Review » Acer Nitro 17 AN17-41
HP Omen 16-xf0000ng: AMD Ryzen 9 7940HS, 16.10", 2.4 kg
External Review » HP Omen 16-xf0000ng
Schenker XMG CORE 16 (L23): AMD Ryzen 7 7840HS, 16.00", 2.4 kg
External Review » SCHENKER XMG CORE 16 (L23)
Asus ROG Zephyrus G14 GA402XI: AMD Ryzen 9 7940HS, 14.00", 1.7 kg
External Review » Asus ROG Zephyrus G14 GA402XI
MSI Creator Z17 HX Studio A13VGT, i7-13700HX: Intel Core i7-13700HX, 17.00", 2.5 kg
External Review » MSI Creator Z17 HX Studio A13VGT, i7-13700HX
Acer Predator Helios 16 PH16-71-97H2: Intel Core i9-13900HX, 16.00", 2.7 kg
External Review » Acer Predator Helios 16 PH16-71-97H2
HP Victus 16-s0000: AMD Ryzen 7 7840HS, 16.10", 2.3 kg
External Review » HP Victus 16-s0000
Schenker VISION 16 Pro (M23): Intel Core i7-13700H, 16.00", 1.6 kg
External Review » SCHENKER VISION 16 Pro (M23)
Lenovo Yoga Pro 9i RTX4070: Intel Core i9-13905H, 16.00"
External Review » Lenovo Yoga Pro 9i RTX4070
HP Victus 16-r0077ng: Intel Core i7-13700H, 16.10", 2.4 kg
External Review » HP Victus 16-r0077ng
Asus TUF Gaming A15 FA507XI: AMD Ryzen 9 7940HS, 15.60", 2.2 kg
External Review » Asus TUF Gaming A15 FA507XI
Lenovo Legion Pro 5 16IRX8, i7-13700HX RTX 4070: Intel Core i7-13700HX, 16.00", 2.6 kg
External Review » Lenovo Legion Pro 5 16IRX8, i7-13700HX RTX 4070
Acer Predator Helios 16 PH16-71-76FS: Intel Core i7-13700HX, 16.00", 2.7 kg
External Review » Acer Predator Helios 16 PH16-71-76FS
Lenovo Yoga Pro 9 16IRP8, RTX 4070: Intel Core i9-13905H, 16.00", 2.2 kg
External Review » Lenovo Yoga Pro 9 16IRP8, RTX 4070
MSI Katana 17 B13VGK: Intel Core i7-13620H, 17.30", 2.6 kg
External Review » MSI Katana 17 B13VGK
Acer Predator Helios 16 PH16-71-74AS: Intel Core i7-13700HX, 16.00", 2.6 kg
External Review » Acer Predator Helios 16 PH16-71-74AS
Lenovo Legion 5 Pro 16ARX8: AMD Ryzen 7 7745HX, 16.00", 2.5 kg
External Review » Lenovo Legion 5 Pro 16ARX8
HP Omen Transcend 16-u0027TX: Intel Core i7-13700HX, 16.00", 2.2 kg
External Review » HP Omen Transcend 16-u0027TX
Acer Predator Triton 14 PT14-51, i7-13700H RTX 4070: Intel Core i7-13700H, 14.00", 1.7 kg
External Review » Acer Predator Triton 14 PT14-51, i7-13700H RTX 4070
HP Omen Transcend 16-u0000: Intel Core i9-13900HX, 16.00", 2.2 kg
External Review » HP Omen Transcend 16-u0000
Lenovo Legion Pro 7 16IRX8, i7-13700HX RTX 4070: Intel Core i7-13700HX, 16.00", 2.8 kg
External Review » Lenovo Legion Pro 7 16IRX8, i7-13700HX RTX 4070
Acer Nitro 16 AN16-41: AMD Ryzen 7 7735HS, 16.00", 2.7 kg
External Review » Acer Nitro 16 AN16-41
Asus TUF Gaming A17 FA707XI: AMD Ryzen 9 7940HS, 17.30", 2.6 kg
External Review » Asus TUF Gaming A17 FA707XI
Alienware m16 R1 AMD, RTX 4070: AMD Ryzen 9 7845HX, 16.00", 3.1 kg
External Review » Alienware m16 R1 AMD, RTX 4070
Acer Nitro 16 AN16-41-R8UR: AMD Ryzen 7 7735HS, 16.00", 2.7 kg
External Review » Acer Nitro 16 AN16-41-R8UR
HP Victus 16-r0000ns: Intel Core i7-13700H, 16.10", 2.3 kg
External Review » HP Victus 16-r0000ns
Asus ROG Flow X13 GV302XI: AMD Ryzen 9 7940HS, 13.40", 1.3 kg
External Review » Asus ROG Flow X13 GV302XI
Asus ProArt StudioBook 16 OLED H7604JI: Intel Core i9-13980HX, 16.00", 2.4 kg
External Review » Asus ProArt StudioBook 16 OLED H7604JI
Asus VivoBook Pro 16 OLED K6604JI: Intel Core i9-13980HX, 16.00", 2 kg
External Review » Asus VivoBook Pro 16 OLED K6604JI
Origin PC EON14-S 2023: Intel Core i9-13900H, 14.00", 1.8 kg
External Review » Origin PC EON14-S 2023
MSI Katana 15 B12VGK: Intel Core i7-12650H, 15.60", 2.3 kg
External Review » MSI Katana 15 B12VGK
HP Omen Transcend 16: Intel Core i9-13900HX, 16.00", 2.3 kg
External Review » HP Omen Transcend 16
Lenovo Legion Slim 7i 16 Gen 8: Intel Core i9-13900H, 16.00", 2.1 kg
External Review » Lenovo Legion Slim 7i 16 Gen 8
HP Omen Transcend 16-u0095ng: Intel Core i9-13900HX, 16.00", 2.2 kg
External Review » HP Omen Transcend 16-u0095ng
MSI Crosshair 15 C12VG: Intel Core i7-12650H, 15.60", 2.3 kg
External Review » MSI Crosshair 15 C12VG
Hyperbook SL606, i9-13900H RTX 4070: Intel Core i9-13900H, 16.00", 2.7 kg
External Review » Hyperbook SL606, i9-13900H RTX 4070
MSI Alpha 17 C7VF: AMD Ryzen 9 7945HX, 17.30", 2.8 kg
External Review » MSI Alpha 17 C7VF
Lenovo Legion Pro 5 16ARX8: AMD Ryzen 7 7745HX, 16.00", 2.5 kg
External Review » Lenovo Legion Pro 5 16ARX8
MSI Creator Z17 HX Studio A13VGT: Intel Core i9-13950HX, 17.00", 2.5 kg
External Review » MSI Creator Z17 HX Studio A13VGT
Origin PC EVO16-S 2023: Intel Core i9-13900H, 16.10", 2.5 kg
External Review » Origin PC EVO16-S 2023
Acer Nitro 17 AN17-41-R9LN: AMD Ryzen 7 7735HS, 17.30", 3 kg
External Review » Acer Nitro 17 AN17-41-R9LN
Razer Blade 14 RTX 4070: AMD Ryzen 9 7940HS, 14.00", 1.8 kg
External Review » Razer Blade 14 RTX 4070
MSI Stealth 14 Studio A13VG, i7-13620H: Intel Core i7-13620H, 14.00", 1.7 kg
External Review » MSI Stealth 14 Studio A13VG, i7-13620H
Dell XPS 17 9730 RTX 4070: Intel Core i7-13700H, 17.00", 2.5 kg
External Review » Dell XPS 17 9730 RTX 4070
Asus ProArt Studiobook 16 OLED H7604: Intel Core i9-13980HX, 16.00", 2.4 kg
External Review » Asus ProArt Studiobook 16 OLED H7604
Lenovo Legion Pro 5 16IRX8, i9-13900HX RTX 4070: Intel Core i9-13900HX, 16.00", 2.6 kg
External Review » Lenovo Legion Pro 5 16IRX8, i9-13900HX RTX 4070
Asus ROG Zephyrus M16 GU604VI: Intel Core i9-13900H, 16.00", 2.3 kg
External Review » Asus ROG Zephyrus M16 GU604VI
Lenovo Legion Pro 7 16IRX8H, i9-13900HX RTX 4070: Intel Core i9-13900HX, 16.00", 2.5 kg
External Review » Lenovo Legion Pro 7 16IRX8H, i9-13900HX RTX 4070
Asus Zenbook Pro 14 OLED UX6404VI: Intel Core i9-13900H, 14.50", 1.7 kg
External Review » Asus Zenbook Pro 14 OLED UX6404VI
Lenovo Yoga Pro 9i 14 2023: Intel Core i9-13905H, 14.50", 1.7 kg
External Review » Lenovo Yoga Pro 9i 14 2023
Razer Blade 16 Early 2023 RTX 4070: Intel Core i9-13950HX, 16.00", 2.5 kg
External Review » Razer Blade 16 Early 2023 RTX 4070
MSI Stealth 14 Studio A13VG: Intel Core i7-13700H, 14.00", 1.7 kg
External Review » MSI Stealth 14 Studio A13VG
Acer Predator Helios 16 PH16-71: Intel Core i9-13900HX, 16.00", 2.7 kg
External Review » Acer Predator Helios 16 PH16-71
Acer Predator Helios 16 PH16-71-96HK: Intel Core i9-13900HK, 16.00", 2.7 kg
External Review » Acer Predator Helios 16 PH16-71-96HK
Dell XPS 15 9530 RTX 4070: Intel Core i7-13700H, 15.60", 1.9 kg
External Review » Dell XPS 15 9530 RTX 4070
Asus ROG Strix G17 G713PI: AMD Ryzen 9 7945HX, 17.30", 2.8 kg
External Review » Asus ROG Strix G17 G713PI
Asus ROG Strix G18 G814JI, i9-13980HX: Intel Core i9-13980HX, 18.00", 3 kg
External Review » Asus ROG Strix G18 G814JI, i9-13980HX
Gigabyte Aorus 15 BSF: Intel Core i7-13700H, 15.60", 2.3 kg
External Review » Gigabyte Aorus 15 BSF
MSI Raider GE68 HX 13VG: Intel Core i9-13950HX, 15.60", 2.7 kg
External Review » MSI Raider GE68 HX 13VG
MSI Raider GE68 HX 13VG, i7-13700HX: Intel Core i7-13700HX, 16.00", 2.7 kg
External Review » MSI Raider GE68 HX 13VG, i7-13700HX
Medion Erazer Major X20: Intel Core i9-13900HX, 16.00", 2.4 kg
External Review » Medion Erazer Major X20
MSI Stealth 16 Studio A13VG: Intel Core i7-13700H, 16.00", 2 kg
External Review » MSI Stealth 16 Studio A13VG
Asus ROG Strix G16 G614JI: Intel Core i9-13980HX, 16.00", 2.5 kg
External Review » Asus ROG Strix G16 G614JI
Asus ROG Flow X16 GV601VI: Intel Core i9-13900H, 16.00", 2.2 kg
External Review » Asus ROG Flow X16 GV601VI
MSI Pulse 15 B13VGK: Intel Core i7-13700H, 17.30", 2.7 kg
External Review » MSI Pulse 15 B13VGK
Gigabyte AERO 16 OLED BSF: Intel Core i9-13900H, 16.00", 2.1 kg
External Review » Gigabyte AERO 16 OLED BSF
Asus ROG Flow Z13 ACRNM: Intel Core i9-13900H, 13.40", 1.7 kg
External Review » Asus ROG Flow Z13 ACRNM
MSI Katana 15 B13VGK: Intel Core i7-13620H, 15.60", 2.3 kg
External Review » MSI Katana 15 2023 B13VGK
MSI Vector GP77 13VG: Intel Core i7-13700H, 17.30", 2.8 kg
External Review » MSI Vector GP77 13VG
MSI Pulse 17 B13VGK: Intel Core i7-13700H, 17.30", 2.7 kg
External Review » MSI Pulse 17 B13VGK
Asus ROG Strix G18 G814JI: Intel Core i7-13650HX, 18.00", 3 kg
External Review » Asus ROG Strix G18 G814JI
Aorus 15X ASF: Intel Core i7-13700HX, 15.60", 2.3 kg
External Review » Aorus 15X ASF
Razer Blade 18 RTX 4070: Intel Core i9-13950HX, 18.00", 3 kg
External Review » Razer Blade 18 RTX 4070
Samsung Galaxy Book3 Ultra 16, i9-13900H RTX 4070: Intel Core i9-13900H, 16.00", 1.8 kg
External Review » Samsung Galaxy Book3 Ultra 16, i9-13900H RTX 4070
Lenovo Yoga Pro 9 16IMH9: Intel Core Ultra 9 185H, 16.00", 2.1 kg
» Lenovo Yoga Pro 9 leaks with Nvidia RTX 5060 and sharp, 120 Hz OLED display
Asus ROG Zephyrus G16 2024 GU605M: Intel Core Ultra 7 155H, 16.00", 1.8 kg
» Highly-rated Asus ROG Zephyrus G16 with 240 Hz OLED panel and RTX 4070 is 30% cheaper vs list price
Dell G16 7630, i9-13900HX RTX 4070: Intel Core i9-13900HX, 16.00", 2.9 kg
» RTX 4070-powered Dell G16 with Core i9 and 240Hz QHD display is 39% off again
Asus ProArt P16 H7606WI: AMD Ryzen AI 9 HX 370, 16.00", 1.8 kg
» Highly rated Asus ProArt P16 OLED laptop in "Open-Box Excellent" condition scores big $520 discount
Lenovo Legion Slim 5 16AHP9: AMD Ryzen 7 8845HS, 16.00", 2.3 kg
» RTX 4070-powered Lenovo Legion Slim 5 G9 is 34% off right now
Lenovo Yoga Pro 9 16IMH9: Intel Core Ultra 9 185H, 16.00", 2.1 kg
» Lenovo Yoga Pro 9i Gen 9 with Mini LED display, Core Ultra 9 185H, and RTX 4060 records double-digit price drop
Asus ROG Strix G17 G713PI: AMD Ryzen 9 7945HX, 17.30", 2.8 kg
» RTX 4070-powered Asus ROG Strix G17 drops to another record-low price
Asus ROG Zephyrus G14 2024 GA403U: AMD Ryzen 9 8945HS, 14.00", 1.5 kg
» 2025 Asus ROG Zephyrus G14 announced with up to RTX 5080 laptop GPU, ROG Nebula OLED display and thinner build
Alienware m16 R2: Intel Core Ultra 7 155H, 16.00", 2.5 kg
» Open-box Alienware m16 R2 (2024) RTX 4070 gaming laptop in pristine condition is now on sale at enticing price
Asus ROG Zephyrus G16 2024 GU605M: Intel Core Ultra 7 155H, 16.00", 1.8 kg
» Asus Rog Zephyrus G16 RTX 4070 gaming laptop price reaches new record-low after 28% discount on list MSRP
Asus ProArt P16 H7606WI: AMD Ryzen AI 9 HX 370, 16.00", 1.8 kg
» Asus ProArt P16 4K OLED laptop with Ryzen AI 9 HX 370 and RTX 4060 now on sale at lowest ever price
Asus ProArt PX13 HN7306: AMD Ryzen AI 9 HX 370, 13.30", 1.4 kg
» Asus ProArt P16 4K OLED laptop with Ryzen AI 9 HX 370 and RTX 4060 now on sale at lowest ever price
Acer Predator Helios Neo 14 (2024): Intel Core Ultra 9 185H, 14.50", 1.9 kg
» RTX 4070-powered Acer Predator Helios Neo 14-inch gaming laptop drops to lowest price yet
Lenovo Legion 7 16 IRX G9: Intel Core i9-14900HX, 16.00", 2.3 kg
» Highly rated Lenovo Legion 7i Gen 9 (2024) with RTX 4070 is now on sale at $500 discount
» Lenovo Legion 5i Gen 9 (2024) price for RTX 4060 and Core i7-13650HX SKU slashed by massive 32%
Alienware m16 R2: Intel Core Ultra 7 155H, 16.00", 2.5 kg
» Outstanding Alienware m16 R2 RTX 4070 gaming laptop is now up to 32% cheaper than list price
Acer Nitro 17 AN17-41-R9LN: AMD Ryzen 7 7735HS, 17.30", 3 kg
» RTX 4060-equipped Acer Nitro 17 gaming laptop in "certified-refurbished" condition is on sale for less than $750
Lenovo Legion Pro 5 16IRX9: Intel Core i9-14900HX, 16.00", 2.5 kg
» Lenovo Legion Pro 5i Gen 9 gaming laptop with RTX 4070 receives steep 34% price cut
Lenovo Legion Slim 5 16AHP9: AMD Ryzen 7 8845HS, 16.00", 2.3 kg
» RTX 4070-powered Lenovo Legion Slim 5 Gen 9 gaming laptop now discounted by 35%
Acer Predator Helios Neo 14 (2024): Intel Core Ultra 9 185H, 14.50", 1.9 kg
» Acer Predator Helios Neo 14 with RTX 4070, Core Ultra 9 and QHD display drops back to all-time low
Lenovo Yoga Pro 9 16IMH9: Intel Core Ultra 9 185H, 16.00", 2.1 kg
» Lenovo Yoga Pro 9i Gen 9 price drops by $300 for RTX 4060 SKU with 16-inch Mini-LED display
Asus ROG Zephyrus G14 2024 GA403U: AMD Ryzen 9 8945HS, 14.00", 1.5 kg
» Asus ROG Zephyrus G14 with RTX 4070, 120Hz OLED and AMD Ryzen 9 gets big discount
Acer Predator Helios Neo 14 (2024): Intel Core Ultra 9 185H, 14.50", 1.9 kg
» Acer Predator Helios Neo 16 (2024) gaming laptop with full-power RTX 4060 drops to lowest price ever
Acer Predator Helios Neo 16 (2024): Intel Core i7-14700HX, 16.00", 2.6 kg
» Acer Predator Helios Neo 16 (2024) gaming laptop with full-power RTX 4060 drops to lowest price ever
Asus ProArt P16 H7606WI: AMD Ryzen AI 9 HX 370, 16.00", 1.8 kg
» Latest Asus ProArt PX13 OLED creator laptop with Ryzen AI 9 HX 370 drops to lowest price ever
Asus ProArt PX13 HN7306: AMD Ryzen AI 9 HX 370, 13.30", 1.4 kg
» Latest Asus ProArt PX13 OLED creator laptop with Ryzen AI 9 HX 370 drops to lowest price ever
Dell G16 7630, i9-13900HX RTX 4070: Intel Core i9-13900HX, 16.00", 2.9 kg
» Dell G16 7630 with RTX 4070 gets huge 38% discount as Core i9 laptop drops to incredibly enticing price
Acer Predator Helios Neo 14 (2024): Intel Core Ultra 9 185H, 14.50", 1.9 kg
» RTX 4070-powered Acer Predator Helios Neo 14 with Core Ultra 9 and 32GB RAM gets biggest discount yet
» Speedy Acer Predator Helios 18 gaming laptop with RTX 4090 and 250 Hz mini-LED display drops back to record-low price
Acer Predator Helios Neo 16 (2024): Intel Core i7-14700HX, 16.00", 2.6 kg
» Speedy Acer Predator Helios 18 gaming laptop with RTX 4090 and 250 Hz mini-LED display drops back to record-low price
Lenovo Yoga Pro 9 16IMH9: Intel Core Ultra 9 185H, 16.00", 2.1 kg
» Latest Lenovo Yoga Pro 9i Gen 9 with 1200-nit mini LED display and RTX 4060 is on sale at noticeable discount
Dell G16 7630, i9-13900HX RTX 4070: Intel Core i9-13900HX, 16.00", 2.9 kg
» Dell G16 7630 with Core i9-13900HX and RTX 4070 returns to lowest price yet
Lenovo Legion Pro 5 16IRX9, i7-14700HX: Intel Core i7-14700HX, 16.00", 2.5 kg
» Lenovo Legion Pro 5i Gen 9 with RTX 4070 hits record low thanks to huge 41% Labor Day discount
Asus ROG Strix G17 G713PI: AMD Ryzen 9 7945HX, 17.30", 2.8 kg
» Ryzen 9-powered Asus ROG Strix G17 gaming laptop with RTX 4070 hits lowest price ever
Dell G16 7630, i9-13900HX RTX 4070: Intel Core i9-13900HX, 16.00", 2.9 kg
» Core i9-powered Dell G16 7630 gaming laptop with RTX 4070 is back on sale for 33% off
Asus ProArt PX13 HN7306: AMD Ryzen AI 9 HX 370, 13.30", 1.4 kg
» Strix Point APU handheld performance simulation: Ryzen AI 9 HX 370 shines in gaming even when tested at just 17 W
HP Omen 17-db0079ng: AMD Ryzen 7 8845HS, 17.30", 2.8 kg
» Power efficiency improvements, performance uplift, and hardly any noise: HP Omen 17 (2024) evaluated
Lenovo Legion Slim 5 16AHP9: AMD Ryzen 7 8845HS, 16.00", 2.3 kg
» Ryzen 7-equipped Lenovo Legion Slim 5 Gen 9 gaming laptop with RTX 4070 gets steep 30% price cut
Dell G16 7630, i9-13900HX RTX 4070: Intel Core i9-13900HX, 16.00", 2.9 kg
» RTX 4070-equipped Dell G16 7630 gaming laptop with Core i9 and 32GB RAM is 35% off right now
Asus ROG Zephyrus G16 GU605MI, Ultra 9 185H: Intel Core Ultra 9 185H, 16.00", 1.8 kg
» Asus ROG Zephyrus G16 with 240Hz OLED, Core Ultra 9 and RTX 4070 drops to lowest price yet
Lenovo Legion Pro 5 16ARX8: AMD Ryzen 7 7745HX, 16.00", 2.5 kg
» RTX 4070-powered Lenovo Legion Pro 5 gaming laptop with AMD Ryzen 9 and 32GB RAM gets 31% price cut
Lenovo Legion Pro 5 16IRX8, i9-13900HX RTX 4070: Intel Core i9-13900HX, 16.00", 2.6 kg
» Lenovo Legion Pro 5i with RTX 4070 marked down by 30%
Asus ROG Zephyrus G16 2024 GU605M: Intel Core Ultra 7 155H, 16.00", 1.8 kg
» 2024 Asus ROG Zephyrus G16 with RTX 4070 and gorgeous 240Hz OLED gets largest price cut yet
Acer Predator Helios Neo 16 (2024): Intel Core i7-14700HX, 16.00", 2.6 kg
» Acer Predator Helios Neo 16 (2024) with a bright display, RTX 4070, and Thunderbolt 4
Lenovo Legion Pro 5 16ARX8: AMD Ryzen 7 7745HX, 16.00", 2.5 kg
» Lenovo Legion Pro 5i Gen 9 with Core i9-14900HX and RTX 4070 can now be yours at a whopping 34% discount
Lenovo Legion Pro 5 16IRX9: Intel Core i9-14900HX, 16.00", 2.5 kg
» Lenovo Legion Pro 5i Gen 9 with Core i9-14900HX and RTX 4070 can now be yours at a whopping 34% discount
Schenker XMG Fusion 15 (Early 24): Intel Core i9-14900HX, 15.30", 2.1 kg
» XMG Fusion 15 (Early 24) with top ranking among the RTX 4070 laptops
Dell G16 7630, i9-13900HX RTX 4070: Intel Core i9-13900HX, 16.00", 2.9 kg
» RTX 4070-powered Dell G16 gaming laptop with Core i9 and 32GB RAM is $600 off today
Lenovo Legion Pro 5 16IRX8, i9-13900HX RTX 4070: Intel Core i9-13900HX, 16.00", 2.6 kg
» Core i9-powered Lenovo Legion Pro 5i gaming laptop with RTX 4070 returns to record-low price
Lenovo Yoga Pro 9 16IMH9: Intel Core Ultra 9 185H, 16.00", 2.1 kg
» Lenovo Yoga Pro 9i 16 G9 still comes with a great mini LED panel at 1200 nits, but also new problems
Lenovo Legion Pro 5 16ARX8: AMD Ryzen 7 7745HX, 16.00", 2.5 kg
» Lenovo Legion Pro 5 with RTX 4070 and 32 GB RAM receives sizeable $641 discount
Asus ROG Zephyrus G16 2024 GU605M: Intel Core Ultra 7 155H, 16.00", 1.8 kg
» Asus ROG Zephyrus G16 OLED gaming laptop with RTX 4070 and Core Ultra 9 gets first discount
Aorus 16X 2024: Intel Core i9-14900HX, 16.00", 2.3 kg
» Aorus 16X (2024): Bright display, long runtimes, RTX 4070
Asus ROG Zephyrus G14 GA402XI: AMD Ryzen 9 7940HS, 14.00", 1.7 kg
» Asus ROG Zephyrus G14 gaming laptop with RTX 4070 back on sale for record-low price
Dell XPS 17 9730 RTX 4070: Intel Core i7-13700H, 17.00", 2.5 kg
» Monstrous Dell XPS 17 laptop with RTX 4080, 4K display, 32GB RAM and Core i9 gets largest discount ever
Dell XPS 15 9530 RTX 4070: Intel Core i7-13700H, 15.60", 1.9 kg
» Dell XPS 15 laptop with Core i7 and Intel ARC A370M dGPU gets sweet $510 discount
Lenovo Legion Pro 5 16ARX8: AMD Ryzen 7 7745HX, 16.00", 2.5 kg
» RTX 4070-powered Legion Pro 5 Gen 8 gets big 32% price cut in Lenovo's new gaming laptop sale
Dell G16 7630, i9-13900HX RTX 4070: Intel Core i9-13900HX, 16.00", 2.9 kg
» Dell G16 with RTX 4070 and Core i9 drops by $400 in Amazon's limited-time gaming laptop sale
Asus ROG Zephyrus G14 2024 GA403U: AMD Ryzen 9 8945HS, 14.00", 1.5 kg
» Asus ROG Zephyrus G14 and G16 go on sale with OLED displays starting at €1,899
Asus ROG Zephyrus G16 2024 GU605M: Intel Core Ultra 7 155H, 16.00", 1.8 kg
» Asus ROG Zephyrus G14 and G16 go on sale with OLED displays starting at €1,899
HP Omen 16-xf0000ng: AMD Ryzen 9 7940HS, 16.10", 2.4 kg
» HP Omen 16 gaming laptop with RTX 4070 and Ryzen 9 now discounted by $750
HP Omen 16-xf0376ng: AMD Ryzen 7 7840HS, 16.10", 2.4 kg
» HP OMEN 16 2023 price drops again to 120-day low at Best Buy for Ryzen 9 7940HS and RTX 4070 SKU
HP Omen Transcend 16: Intel Core i9-13900HX, 16.00", 2.3 kg
» HP OMEN 16 2023 price drops again to 120-day low at Best Buy for Ryzen 9 7940HS and RTX 4070 SKU
MSI Vector GP77 13VG: Intel Core i7-13700H, 17.30", 2.8 kg
» MSI Vector GP77 gaming laptop with Core i9, RTX 4070 and 64GB RAM gets massive $650 discount
Asus ROG Zephyrus M16 GU604VI: Intel Core i9-13900H, 16.00", 2.3 kg
» Stealthy Asus ROG Zephyrus M16 gaming laptop with RTX 4070 and Core i9 drops back to record-low price
Asus ROG Strix G17 G713PI: AMD Ryzen 9 7945HX, 17.30", 2.8 kg
» Asus ROG Strix G17 gaming laptop with RTX 4070, AMD Ryzen 9 7945HX and 240Hz QHD display discounted by 27% in Amazon's Black Friday sale
Schenker XMG Pro 16 Studio (Mid 23): Intel Core i9-13900H, 16.00", 2.6 kg
» XMG Pro 16 Studio: Lots of power for gamers and creators
HP Victus 16-r0077ng: Intel Core i7-13700H, 16.10", 2.4 kg
» Affordable HP Victus 15 gaming laptop records massive 33% discount at Best Buy
Aorus 15 BSF: Intel Core i7-13700H, 15.60", 2.4 kg
» Aorus 15 BSF: The RTX 4070 laptop with 10-hour runtimes
Asus ROG Strix G17 G713PI: AMD Ryzen 9 7945HX, 17.30", 2.8 kg
» Asus ROG Strix G17 with RTX 4060, AMD Ryzen 9 7845HX and 240Hz QHD display gets US$300 discount in new gaming laptop sale
HP Omen Transcend 16: Intel Core i9-13900HX, 16.00", 2.3 kg
» HP Omen Transcend 16 is three steps forward and one step back for the series
Asus ROG Zephyrus M16 GU604VI: Intel Core i9-13900H, 16.00", 2.3 kg
» Powerful Asus ROG Zephyrus M16 QHD gaming laptop with RTX 4070 and Core i9 on sale with its largest discount yet
MSI Pulse 17 B13VGK: Intel Core i7-13700H, 17.30", 2.7 kg
» MSI Pulse 17 reviewed: Gaming laptop with a questionable price-performance ratio
Schenker VISION 16 Pro (M23): Intel Core i7-13700H, 16.00", 1.6 kg
» Highest performance per kg: Schenker Vision 16 Pro impresses with RTX 4070 Laptop and magnesium case
Lenovo Legion Slim 7i 16 Gen 8: Intel Core i9-13900H, 16.00", 2.1 kg
» Small attention to detail on the Lenovo Legion Slim Gen 8 solves an annoying issue on the Alienware x16 r1
Asus ProArt Studiobook 16 OLED H7604: Intel Core i9-13980HX, 16.00", 2.4 kg
» The ProArt Studiobook 16 OLED is fast, but too loud
Asus Zenbook Pro 14 OLED UX6404VI: Intel Core i9-13900H, 14.50", 1.7 kg
» The Asus Zenbook Pro 14 impresses with a lot of performance and the world's first 120 Hz OLED display
Samsung Galaxy Book3 Ultra 16, i9-13900H RTX 4070: Intel Core i9-13900H, 16.00", 1.8 kg
» A quiet and hot creator laptop: Samsung Galaxy Book3 Ultra 16 reviewed
Dell XPS 15 9530 RTX 4070: Intel Core i7-13700H, 15.60", 1.9 kg
» Dell XPS 15 9530 comes with 40 W to 50 W TGP GeForce RTX 4070 graphics
Medion Erazer Major X20: Intel Core i9-13900HX, 16.00", 2.4 kg
» Medion Erazer Major X20: RTX 4070 notebook with mechanical keyboard
Uniwill GM6PX7X RTX 4070: Intel Core i7-13700HX, 16.00", 2.2 kg
» First in-house Core i7-13700HX benchmarks show a 25 percent performance boost over the popular Core i7-12700H
Asus ROG Strix G17 G713PI: AMD Ryzen 9 7945HX, 17.30", 2.8 kg
» Focus on gaming performance: Asus ROG Strix G17 with remarkable single purpose
Gigabyte AERO 16 OLED BSF: Intel Core i9-13900H, 16.00", 2.1 kg
» New Aero 16 OLED reviewed: OLED and new Intel/Nvidia generations on the rise
Razer Blade 18 RTX 4070: Intel Core i9-13950HX, 18.00", 3 kg
» Nvidia driver 528.49 is borked on the Blade 18 RTX 4070, Razer says a fix should be coming soon