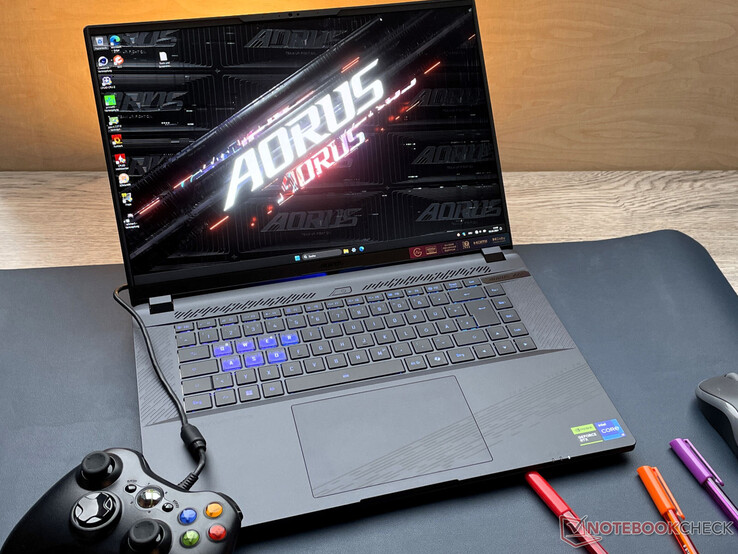
Aorus 16X (2024) review: Core i9 and RTX 4070 for US$2,000
Gaming, rendering and content creation are advertized as being the main strengths of the Aorus 16X ASG. Raptor Lake and Ada Lovelace deliver the required performance. Its competitors include devices like the Alienware m16 R2, HP Omen Transcend 16, XMG Pro 16 Studio (Mid 23), Asus TUF Gaming A17 FA707XI and the Lenovo Legion Pro 5 16IRX9.
Possible competitors compared
Rating | Date | Model | Weight | Height | Size | Resolution | Price |
|---|---|---|---|---|---|---|---|
| 87.4 % v7 (old) | 04 / 2024 | Aorus 16X 2024 i9-14900HX, GeForce RTX 4070 Laptop GPU | 2.3 kg | 20 mm | 16.00" | 2560x1600 | |
| 90.2 % v7 (old) | 03 / 2024 | Alienware m16 R2 Ultra 7 155H, GeForce RTX 4070 Laptop GPU | 2.5 kg | 23.5 mm | 16.00" | 2560x1600 | |
| 88.4 % v7 (old) | 02 / 2024 | HP Omen Transcend 16-u1095ng i9-14900HX, GeForce RTX 4070 Laptop GPU | 2.3 kg | 20 mm | 16.00" | 2560x1600 | |
| 85.6 % v7 (old) | 01 / 2024 | Asus TUF Gaming A17 FA707XI-NS94 R9 7940HS, GeForce RTX 4070 Laptop GPU | 2.5 kg | 25.4 mm | 17.30" | 1920x1080 | |
| 87.9 % v7 (old) | 10 / 2023 | Schenker XMG Pro 16 Studio (Mid 23) i9-13900H, GeForce RTX 4070 Laptop GPU | 2.6 kg | 19.9 mm | 16.00" | 2560x1600 | |
| 89.3 % v7 (old) | 03 / 2024 | Lenovo Legion Pro 5 16IRX9 i9-14900HX, GeForce RTX 4070 Laptop GPU | 2.5 kg | 26.95 mm | 16.00" | 2560x1600 |
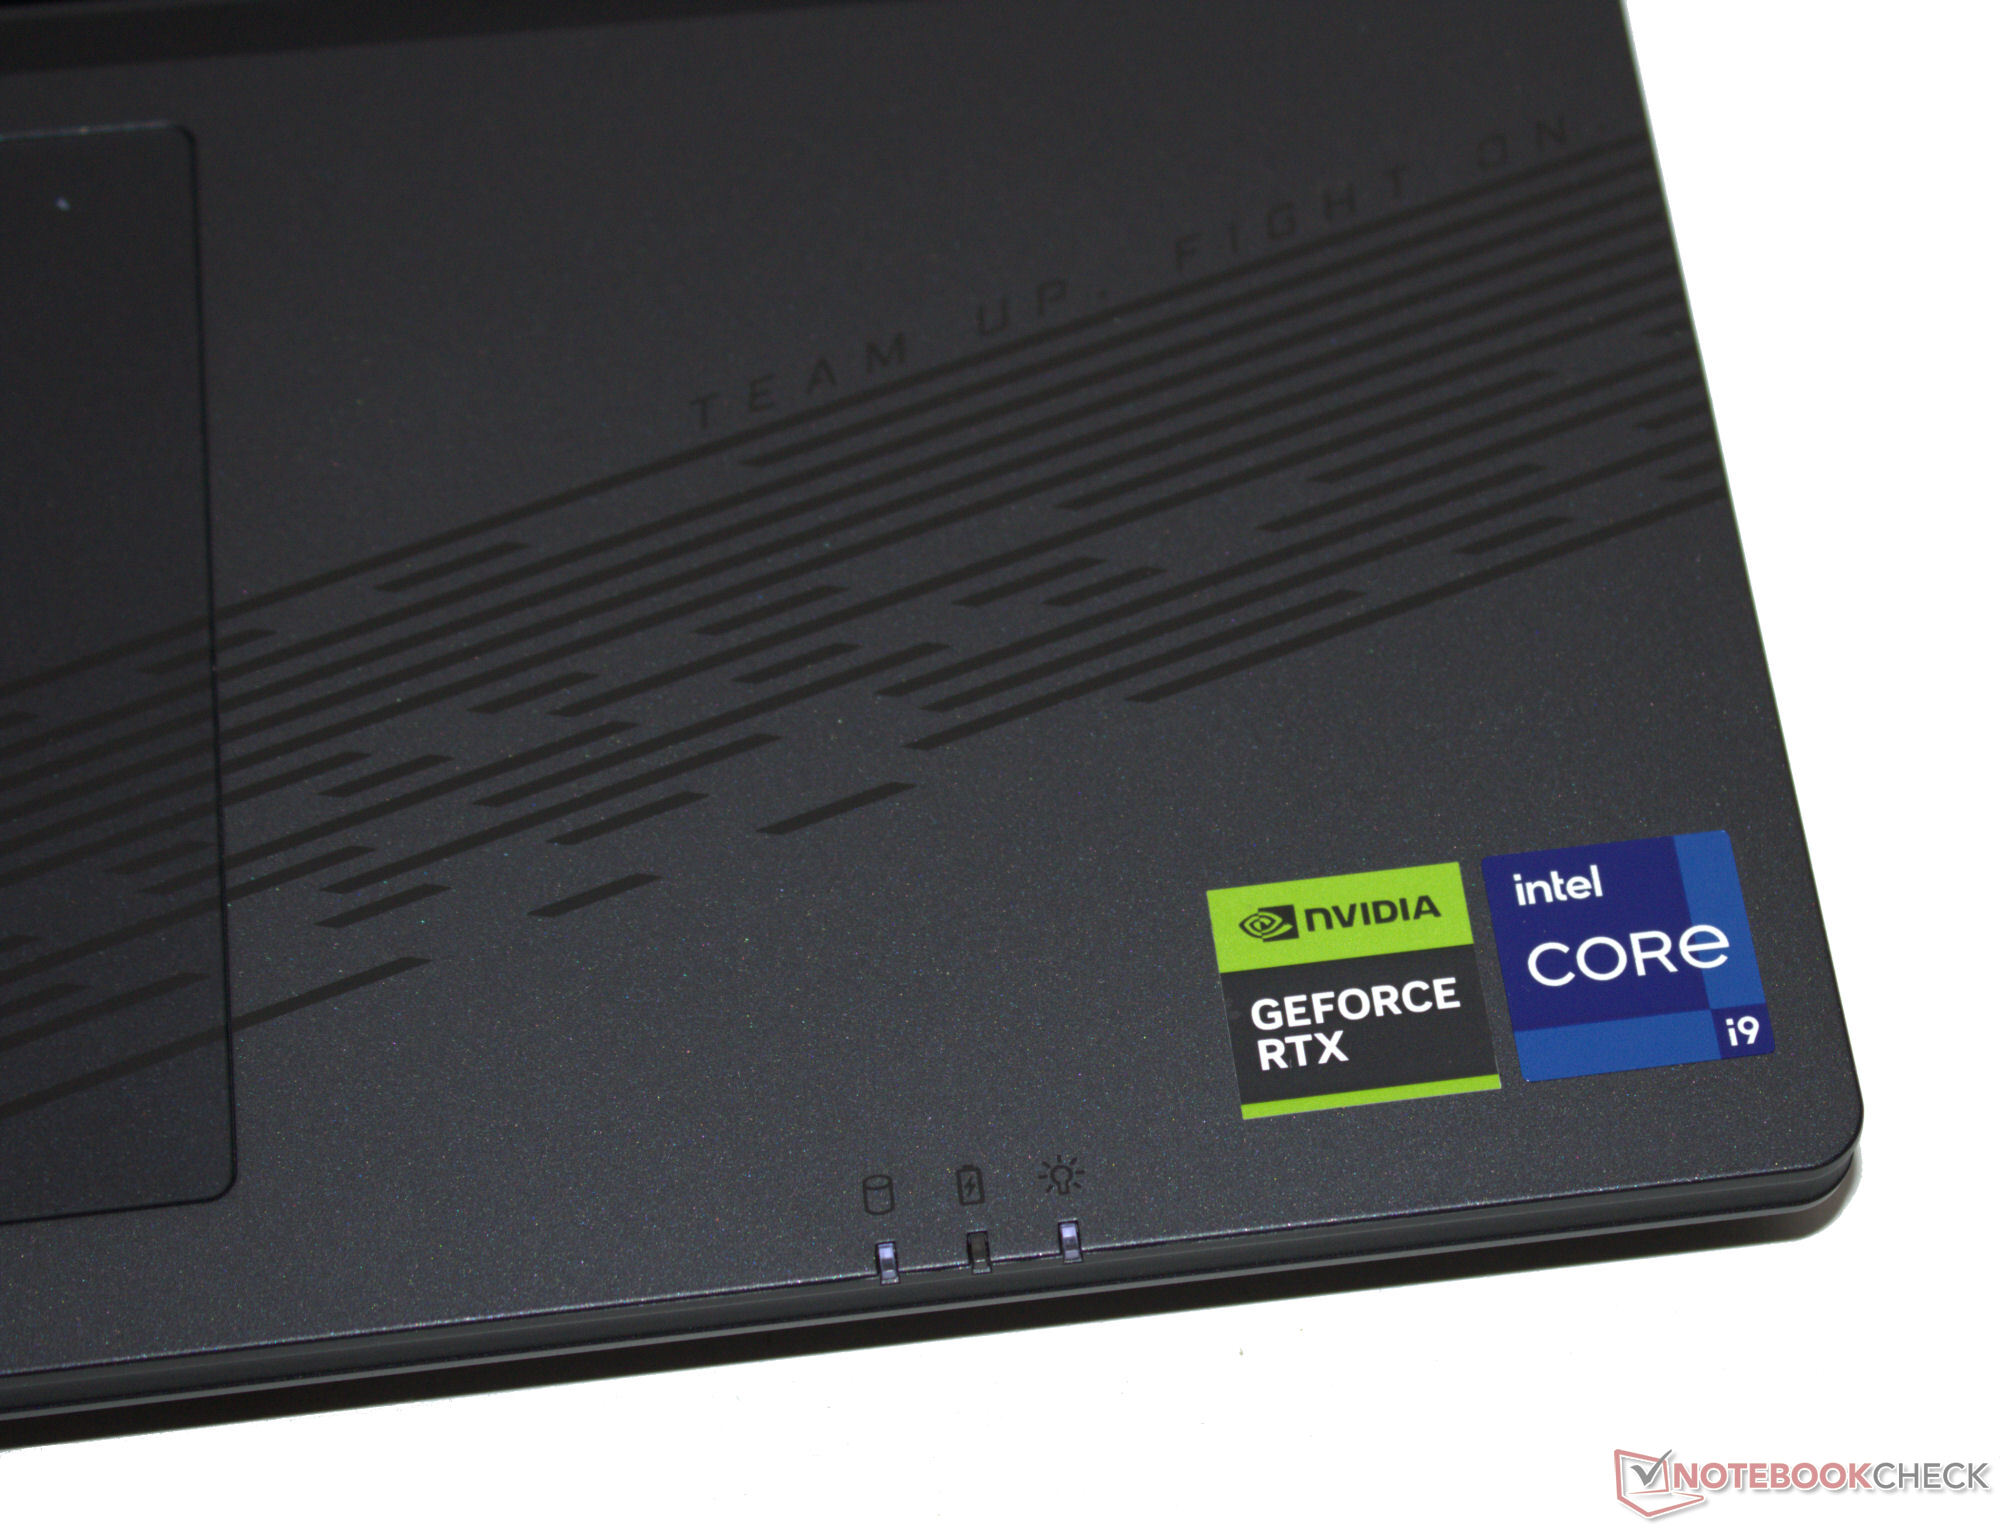
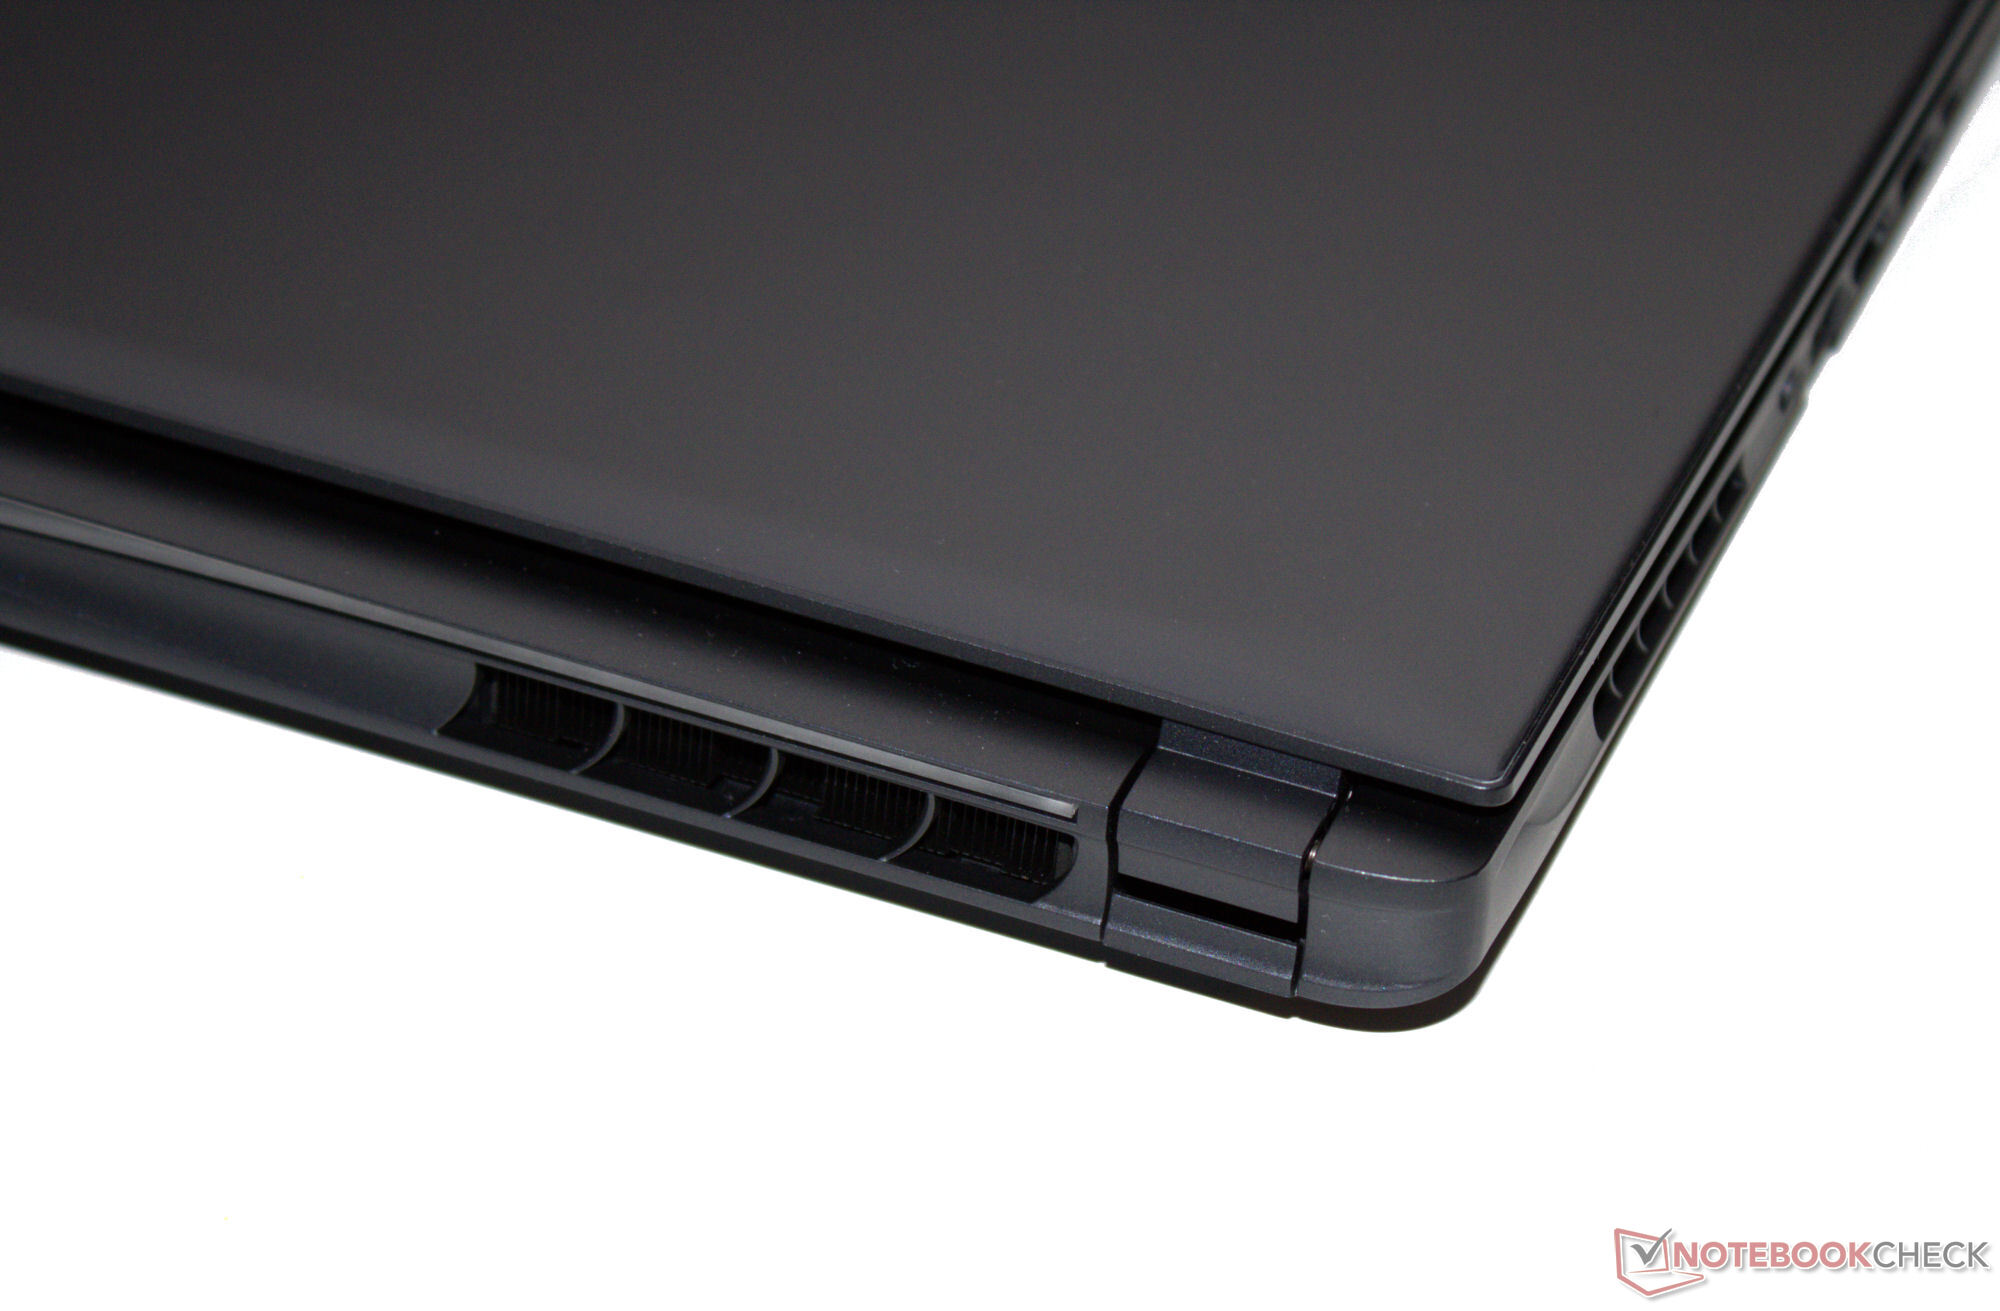
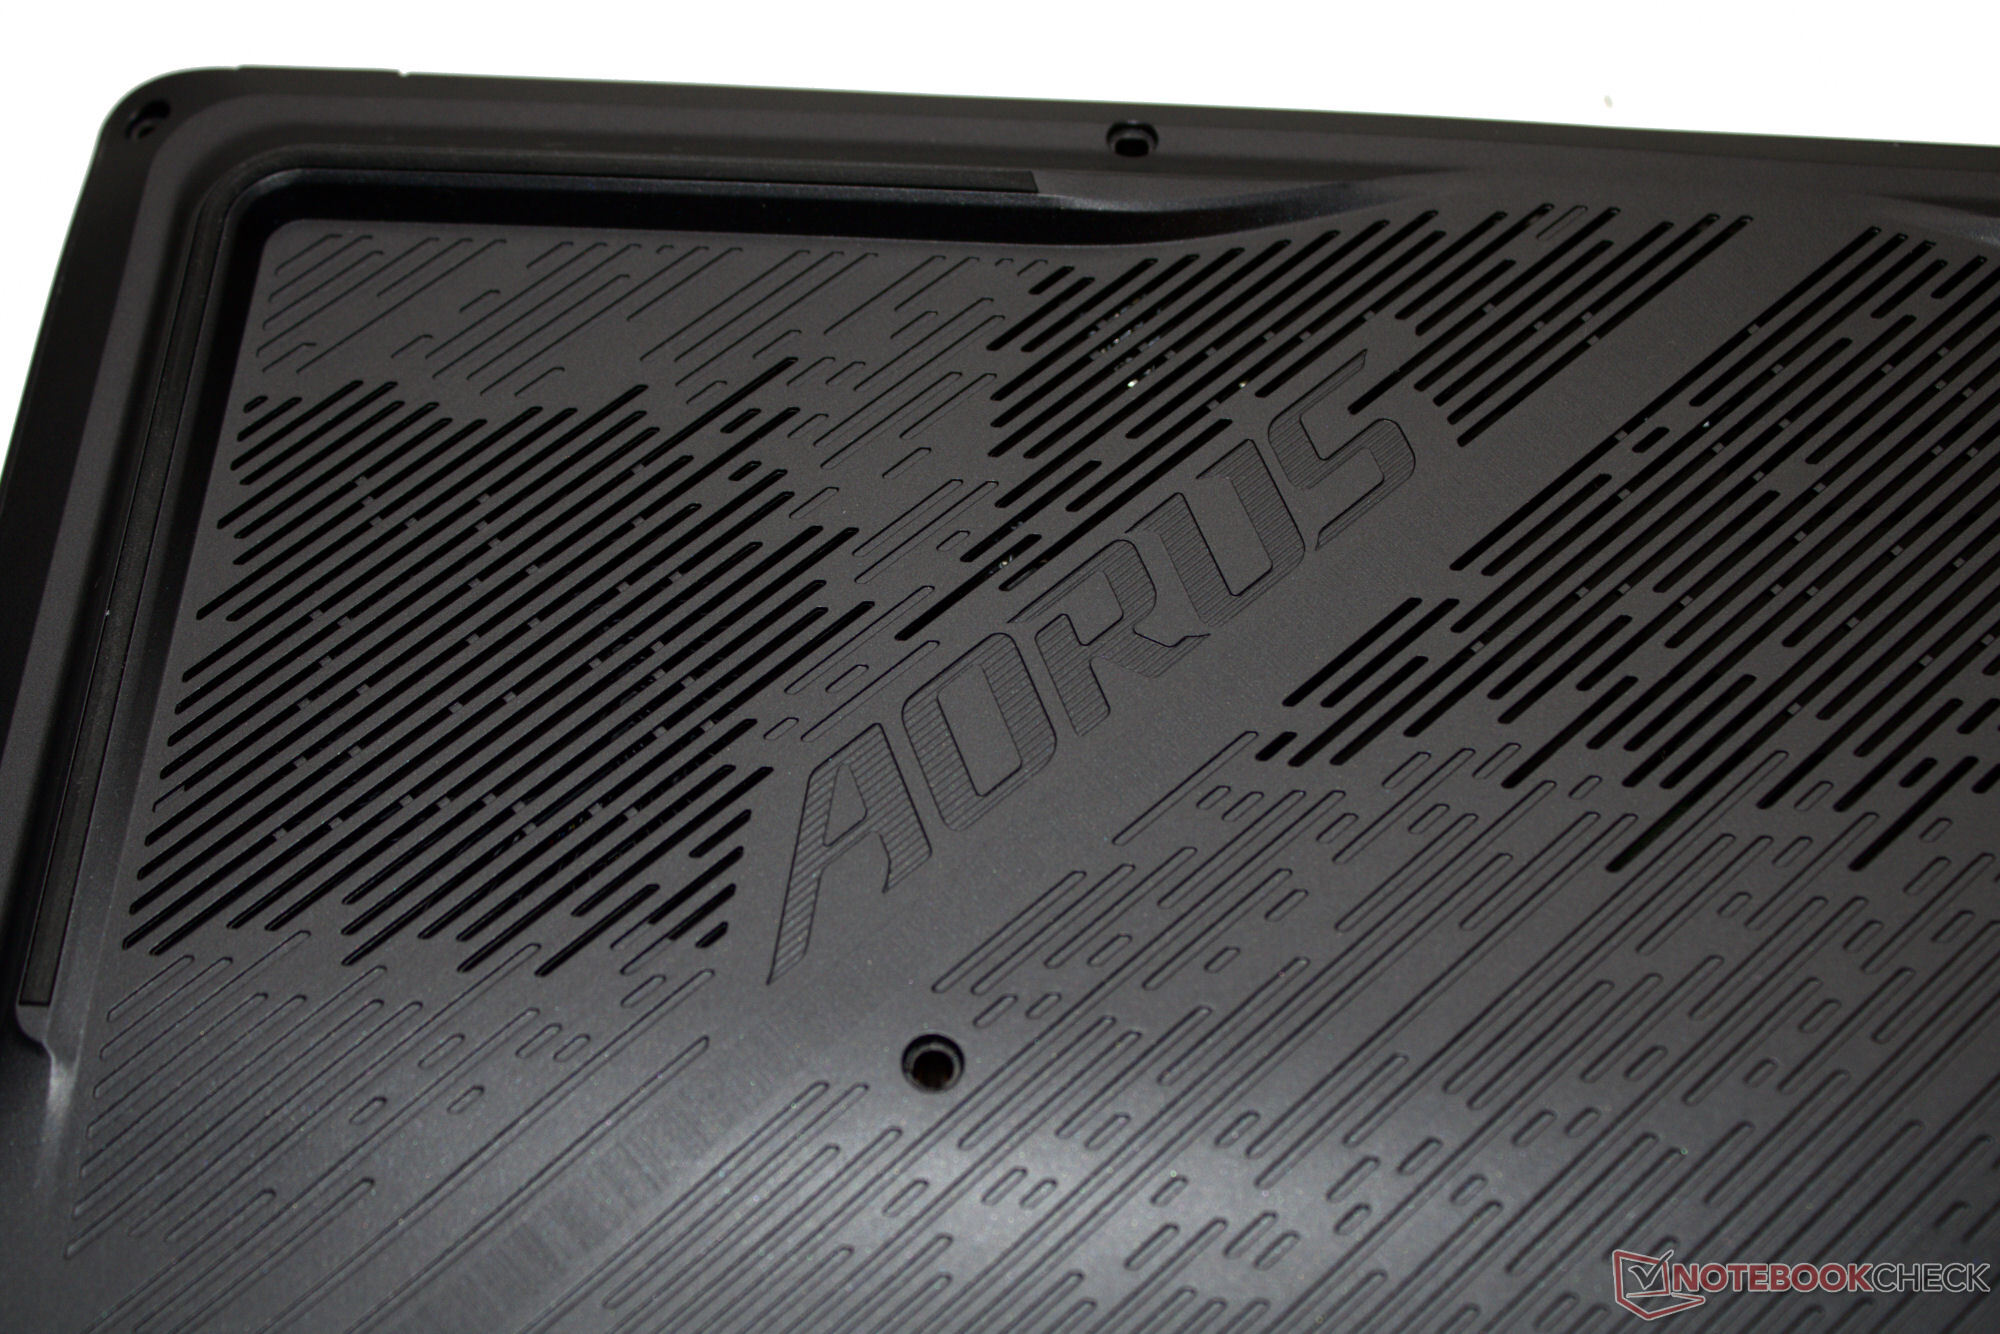
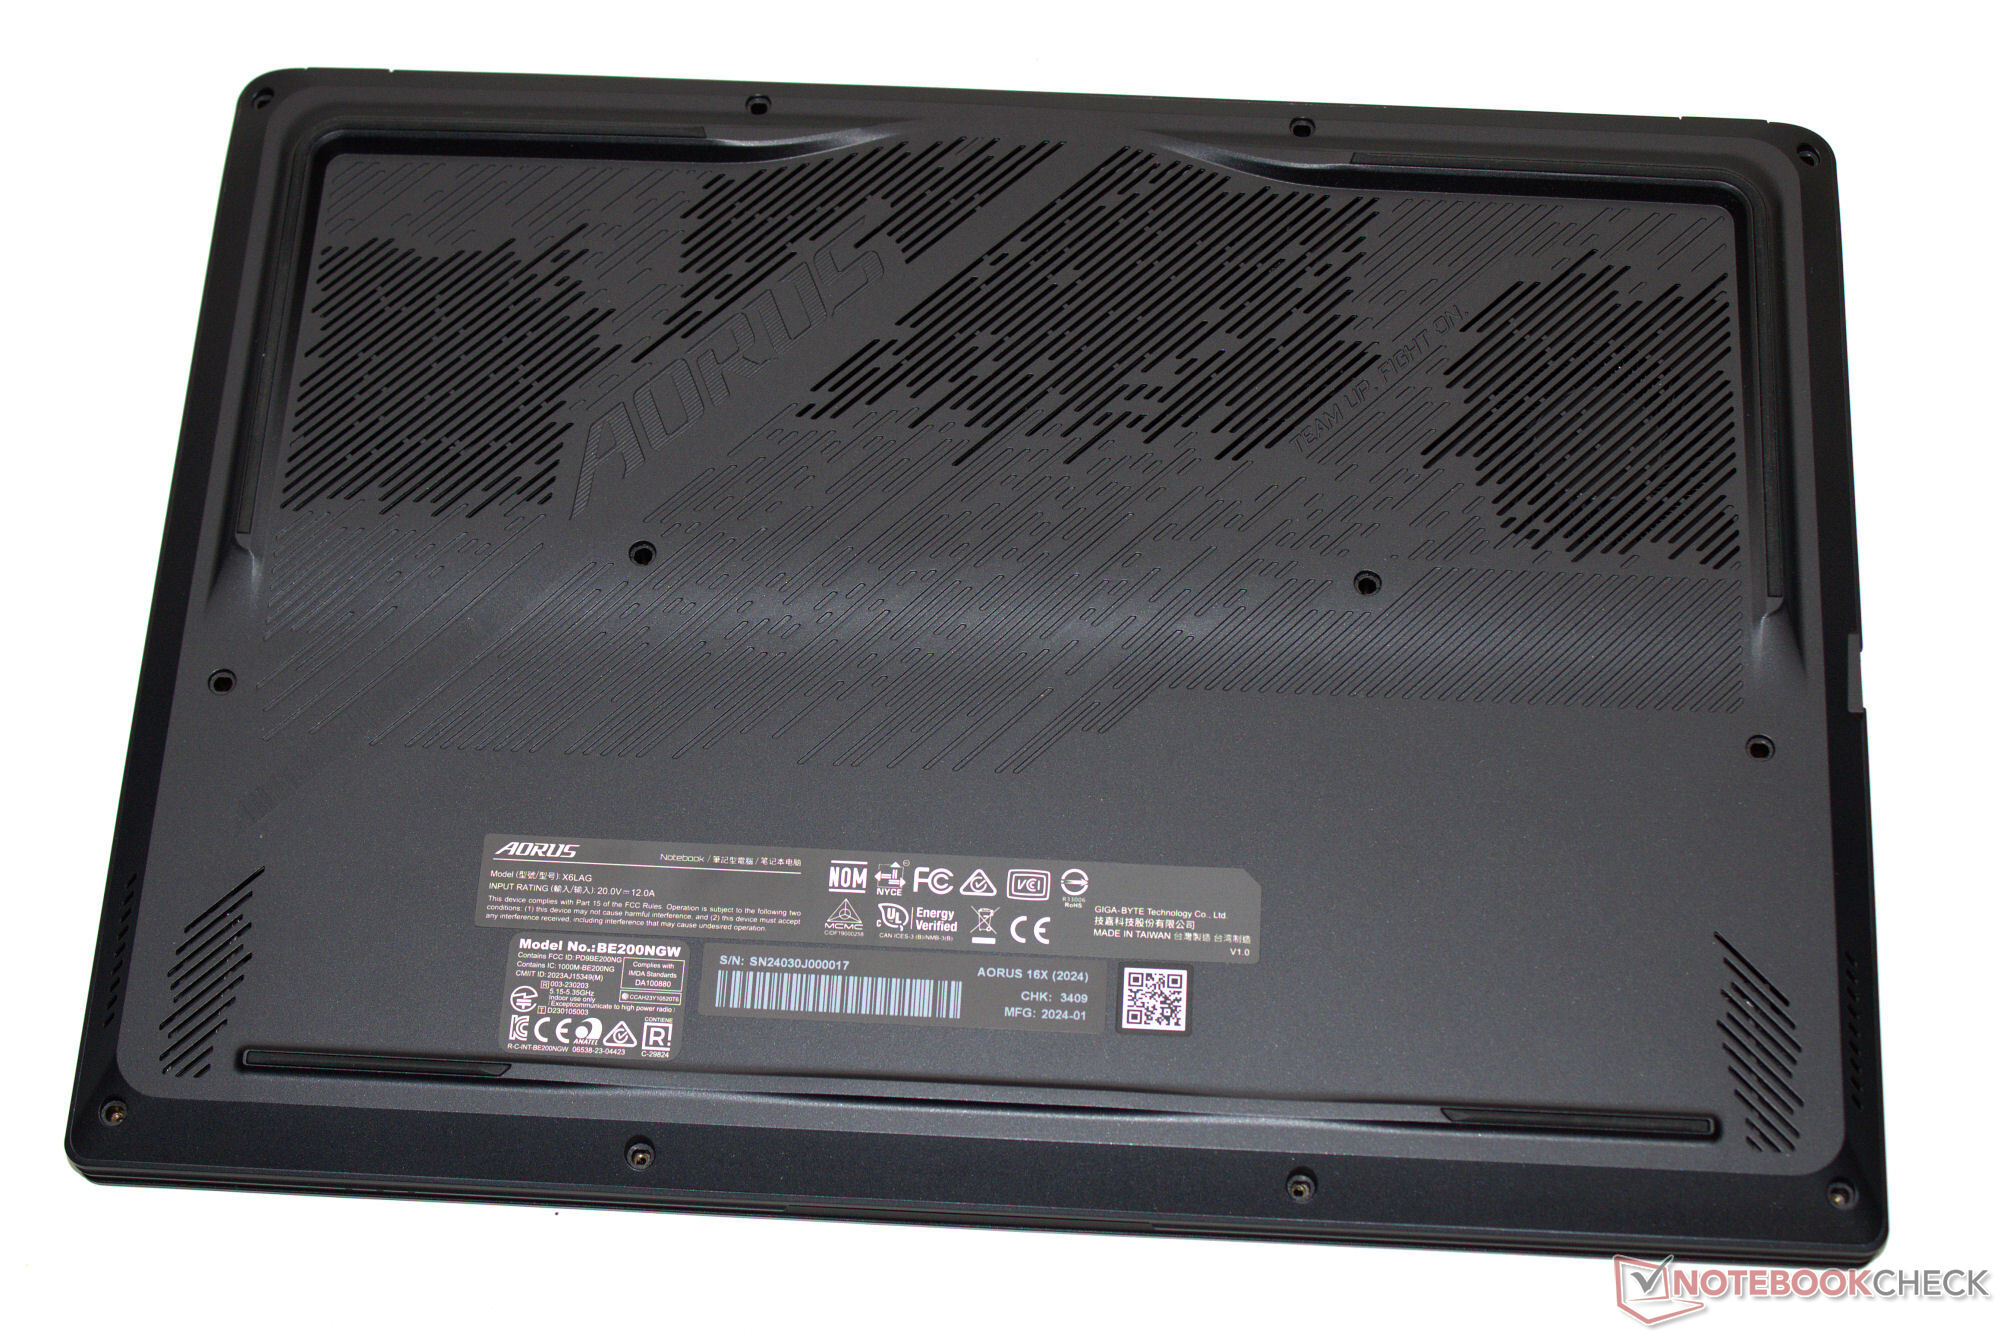
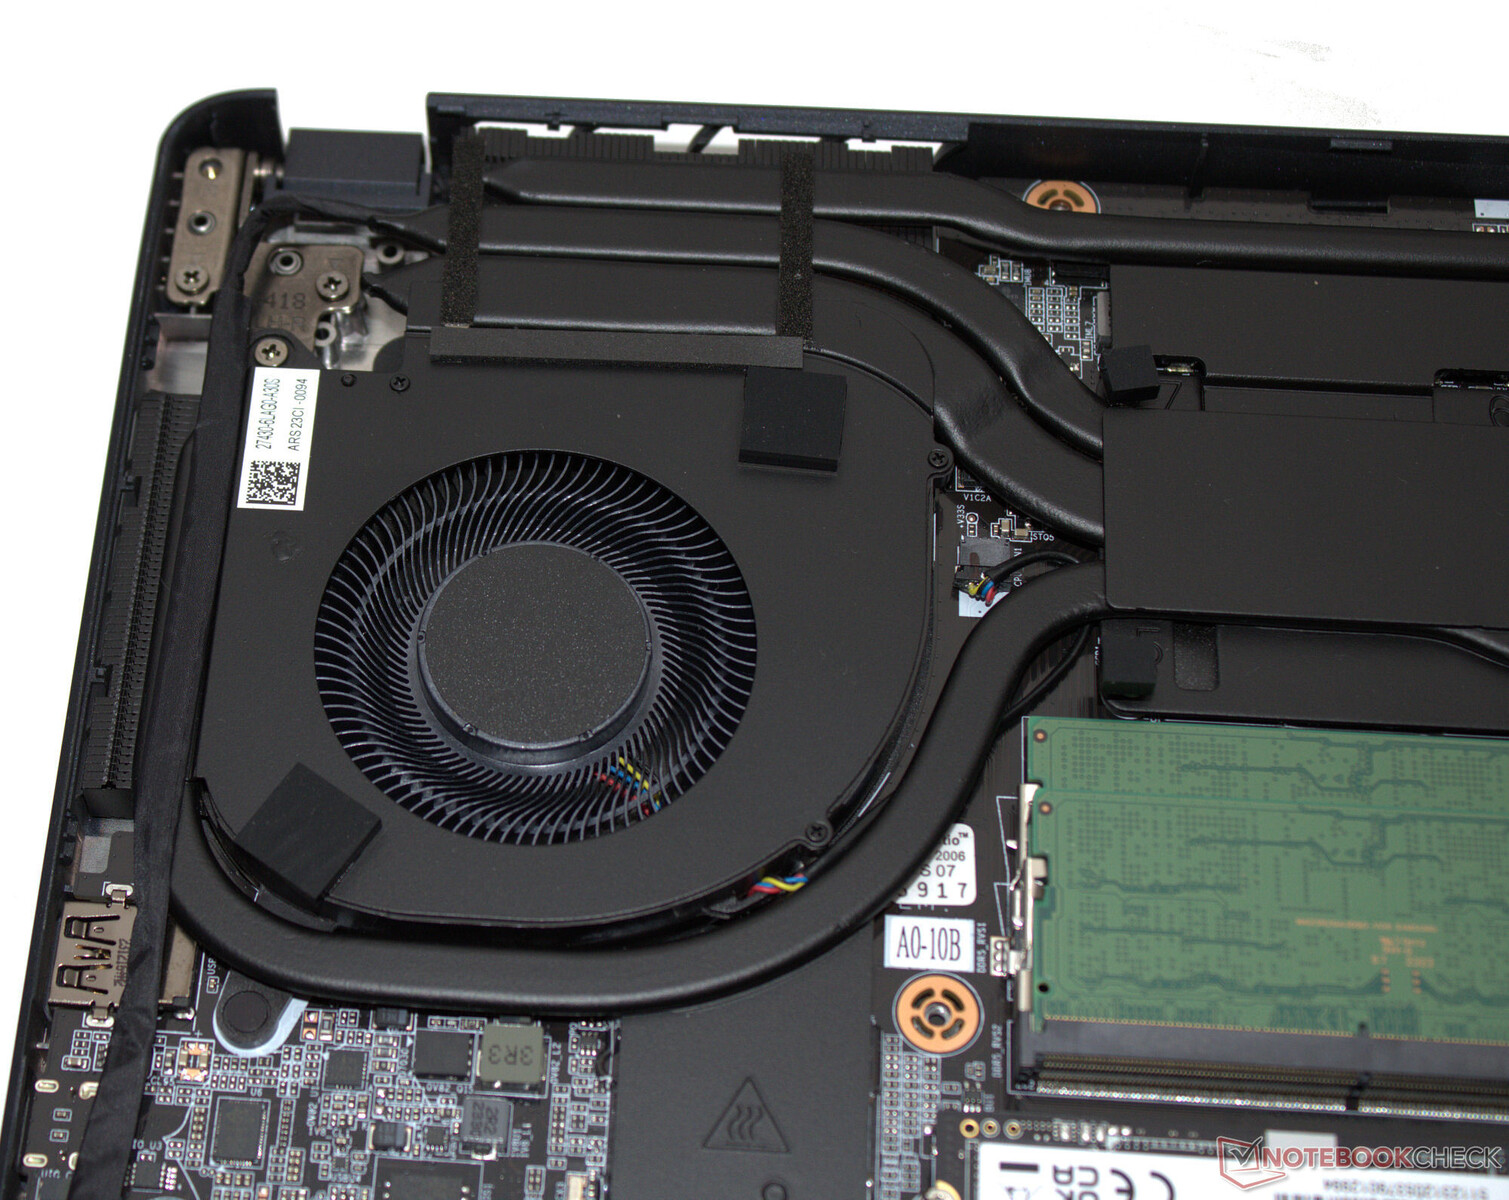
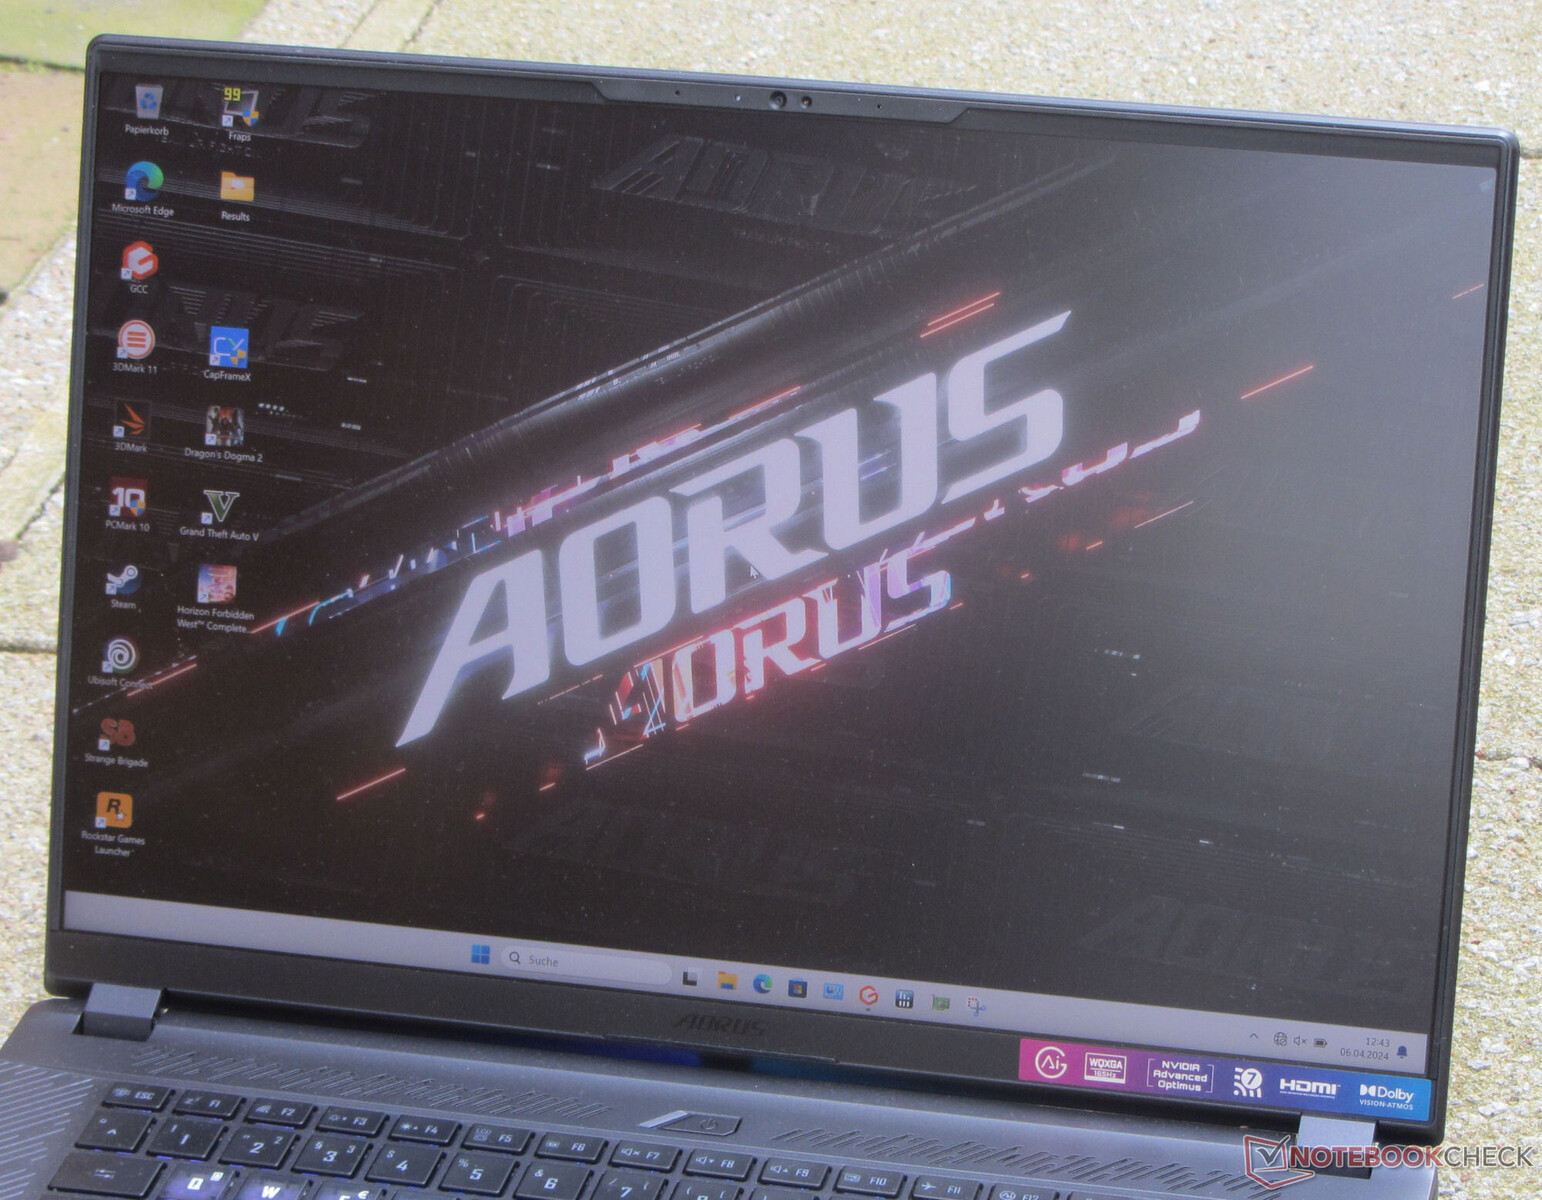
Case - LED strips add a touch of fun
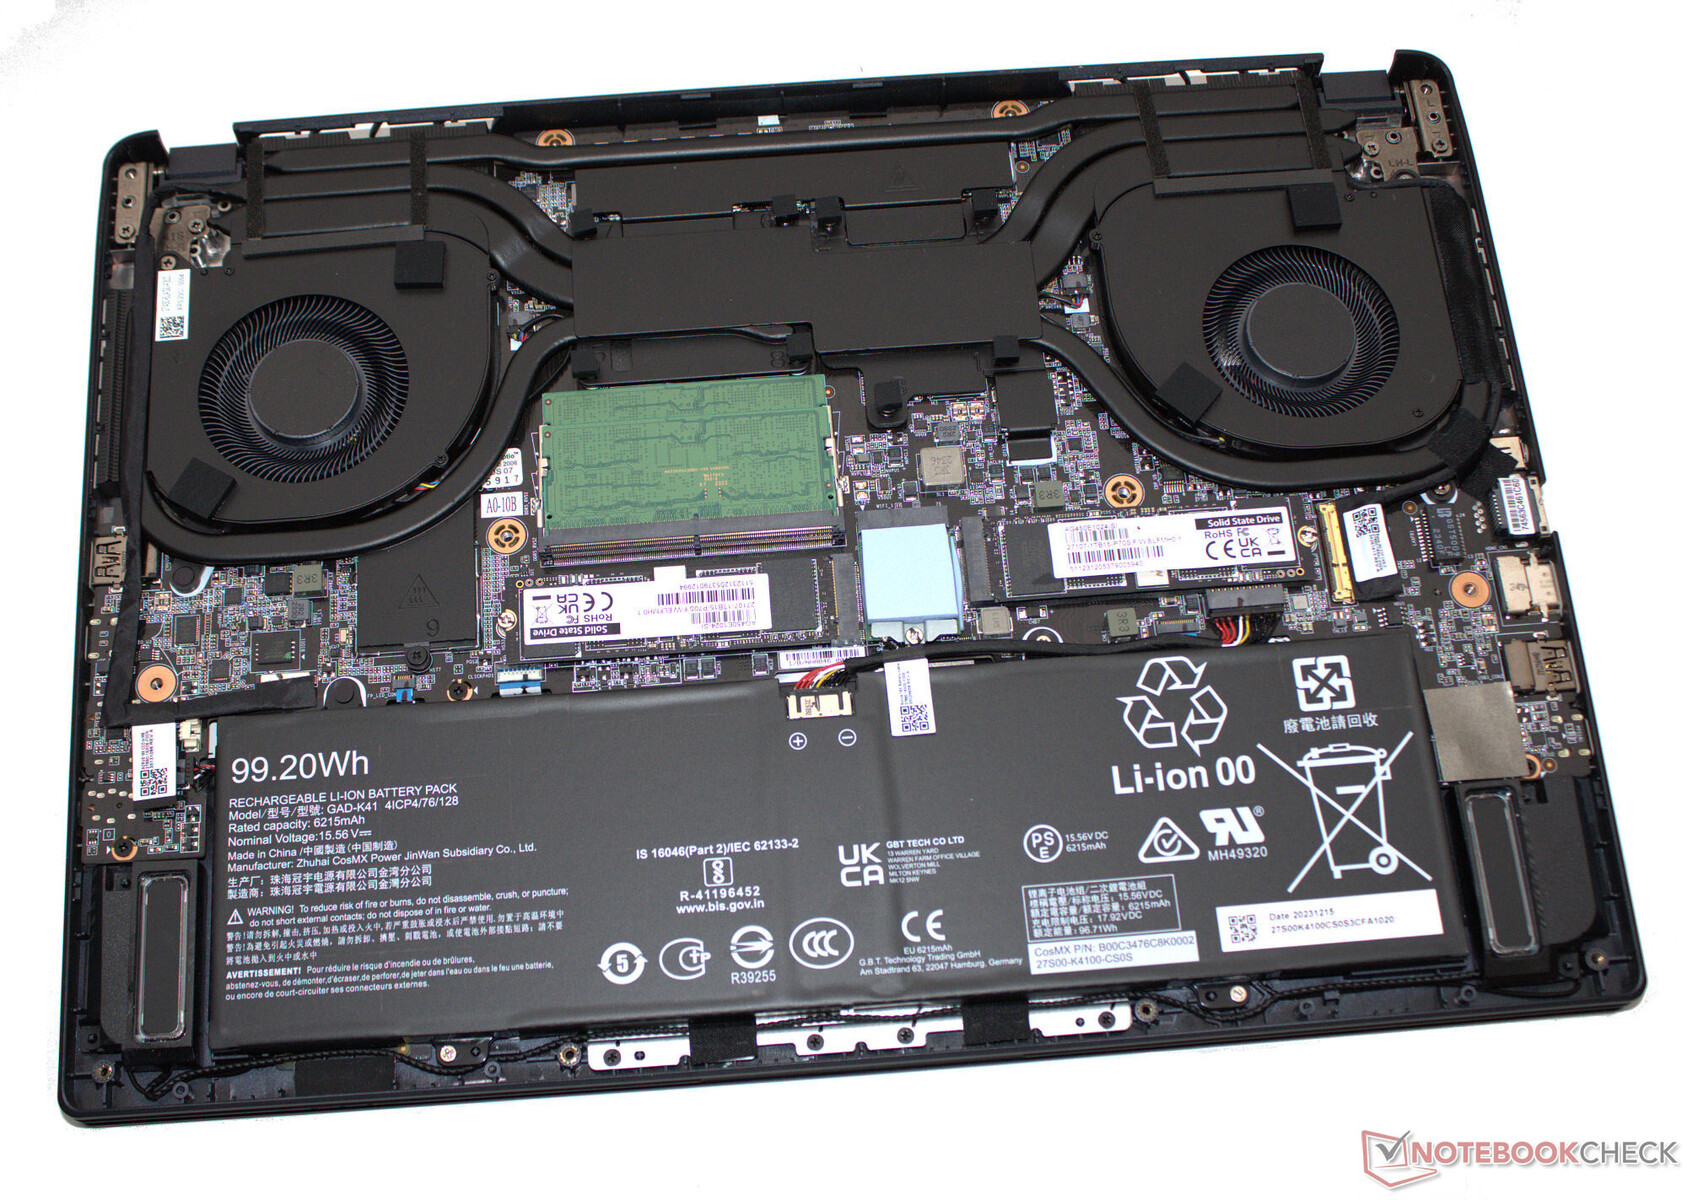
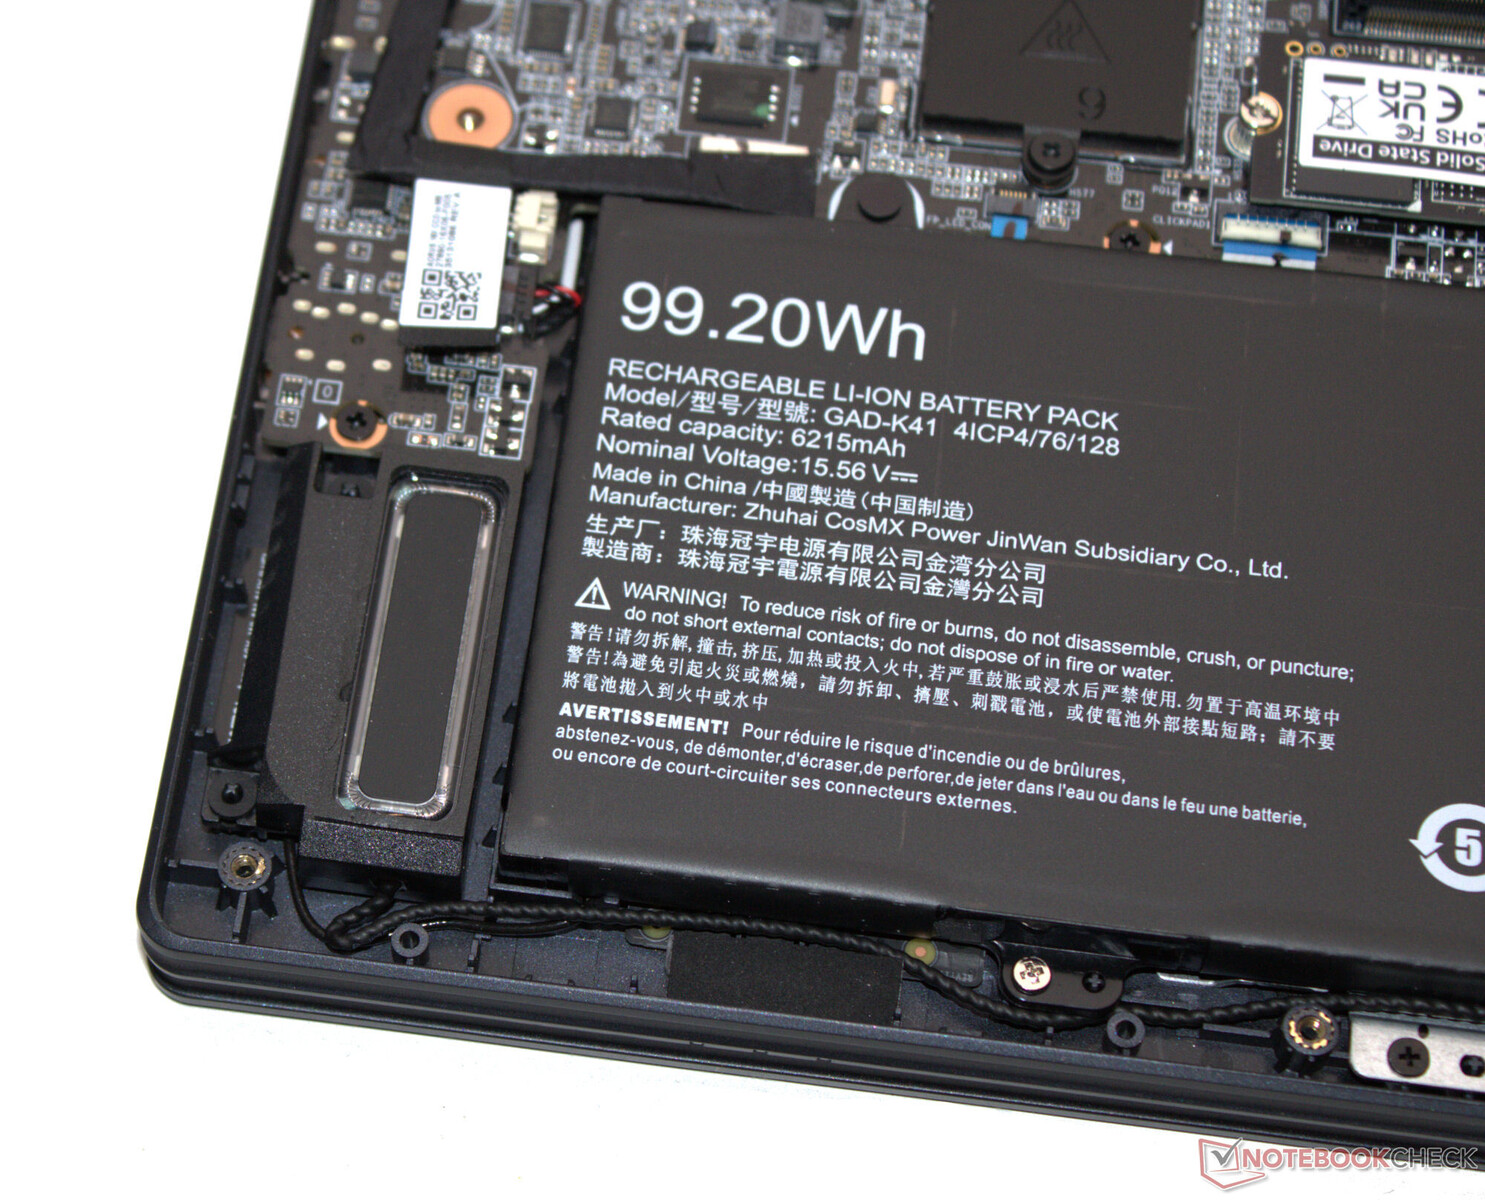
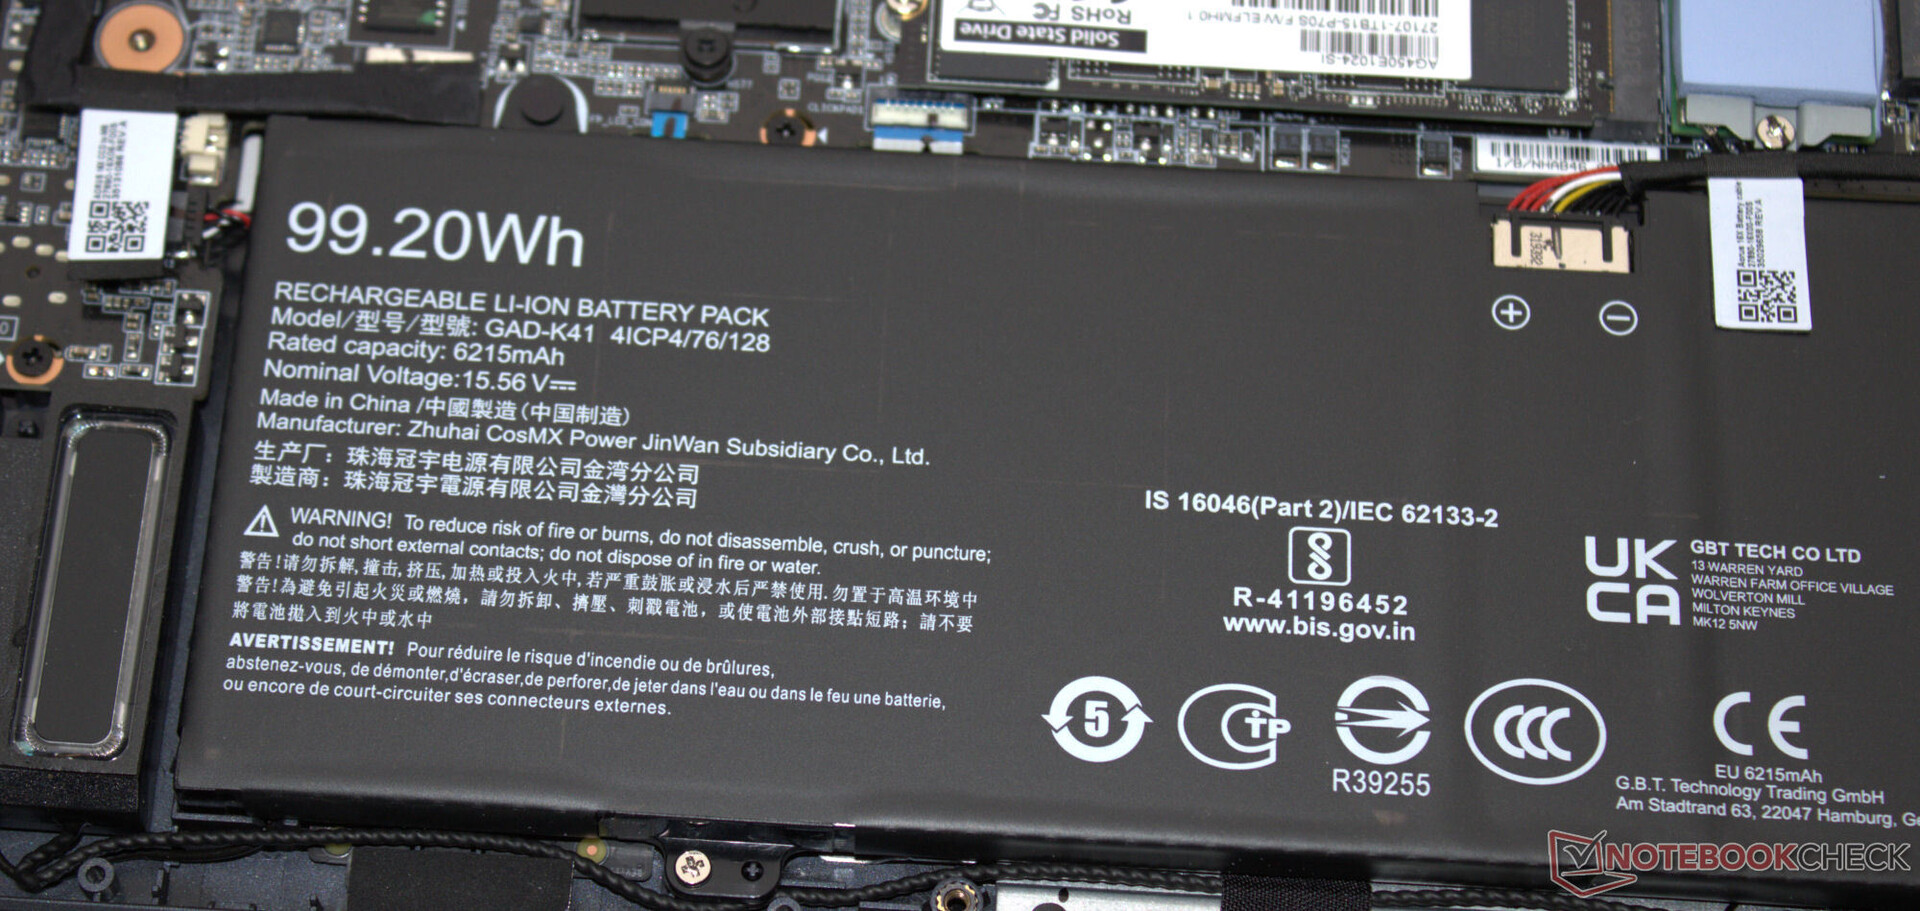
The laptop's tech sits within a dark-gray case with matte surfaces. In total, Gigabyte has gone for more of a stripped-back look. In addition to the keyboard's backlighting, two LED strips on the back of the device add a bit of colorful fun to its appearance. While the base unit is made from plastic, the lid relies on aluminum. The battery (screwed in, not glued in) as well as the rest of the laptop's innards can be accessed once the bottom part of the case is removed.
We didn't note any build errors and all the gaps line up well. The lid and base unit can be twisted ever so slightly—but this is nothing out of the ordinary. The hinges hold the lid securely in place, but the lid does bounce a little when you adjust its angle. Its maximum opening angle is about 130 degrees. It can be opened with one hand.
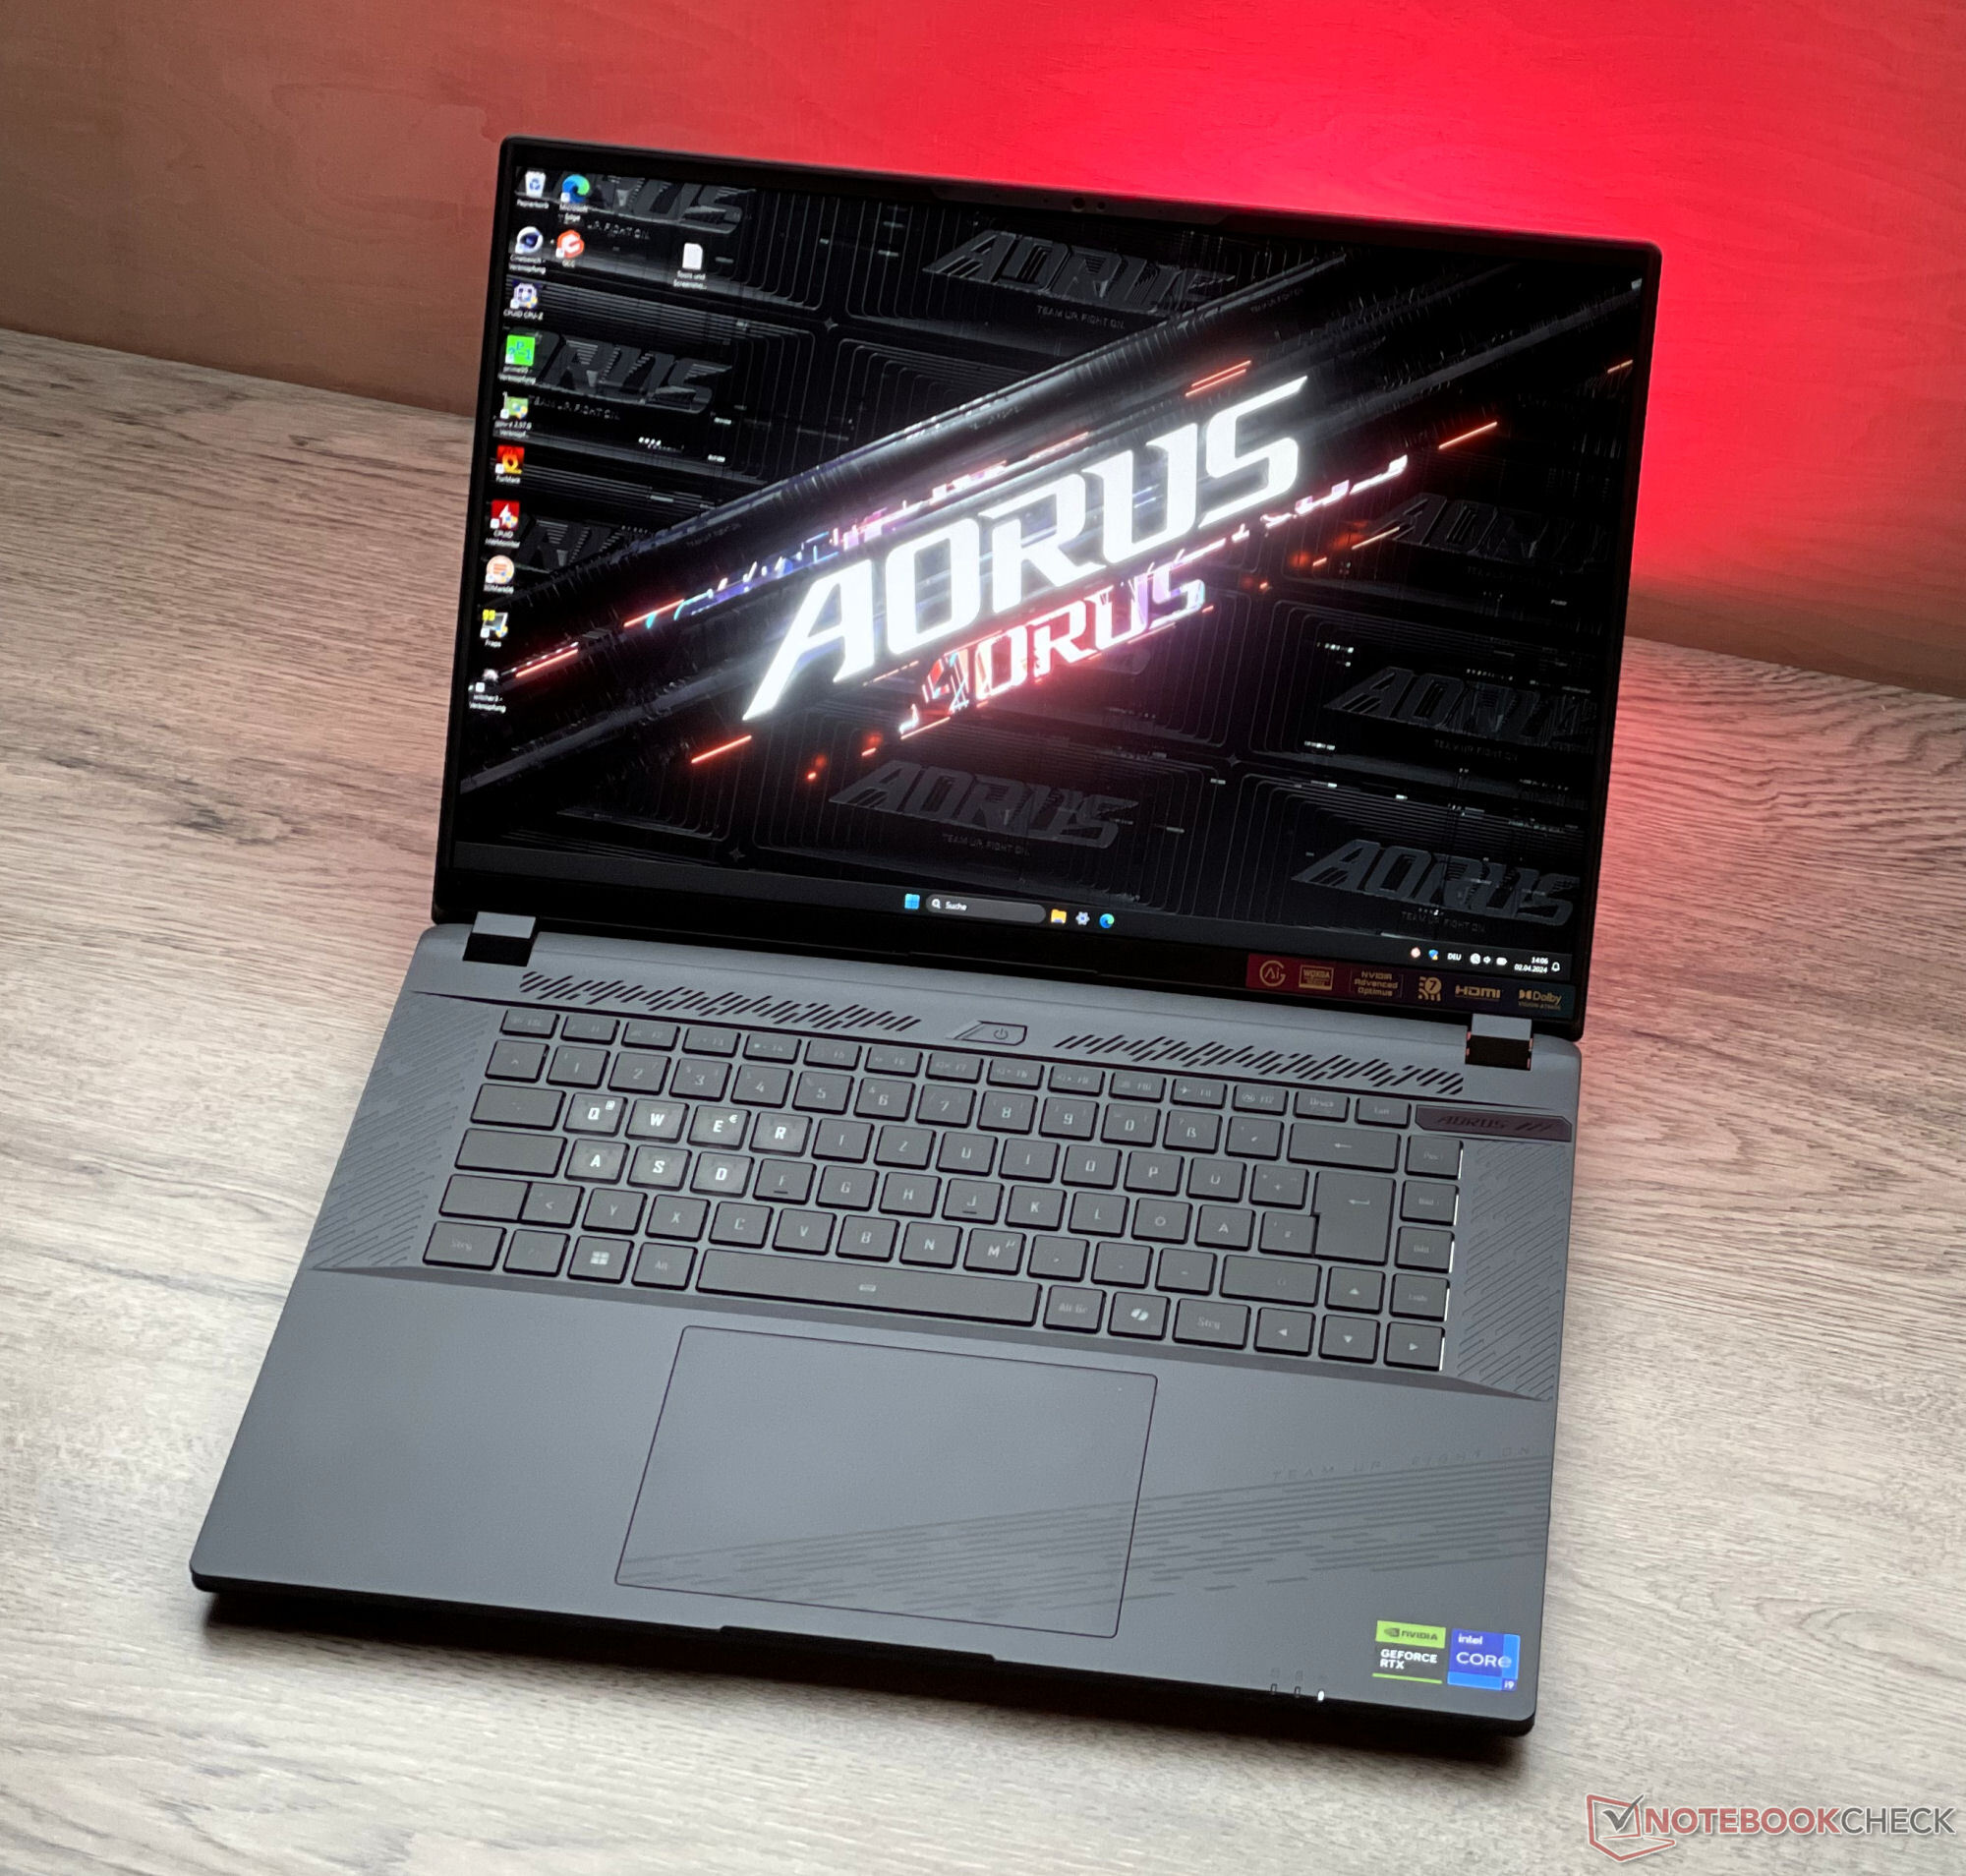
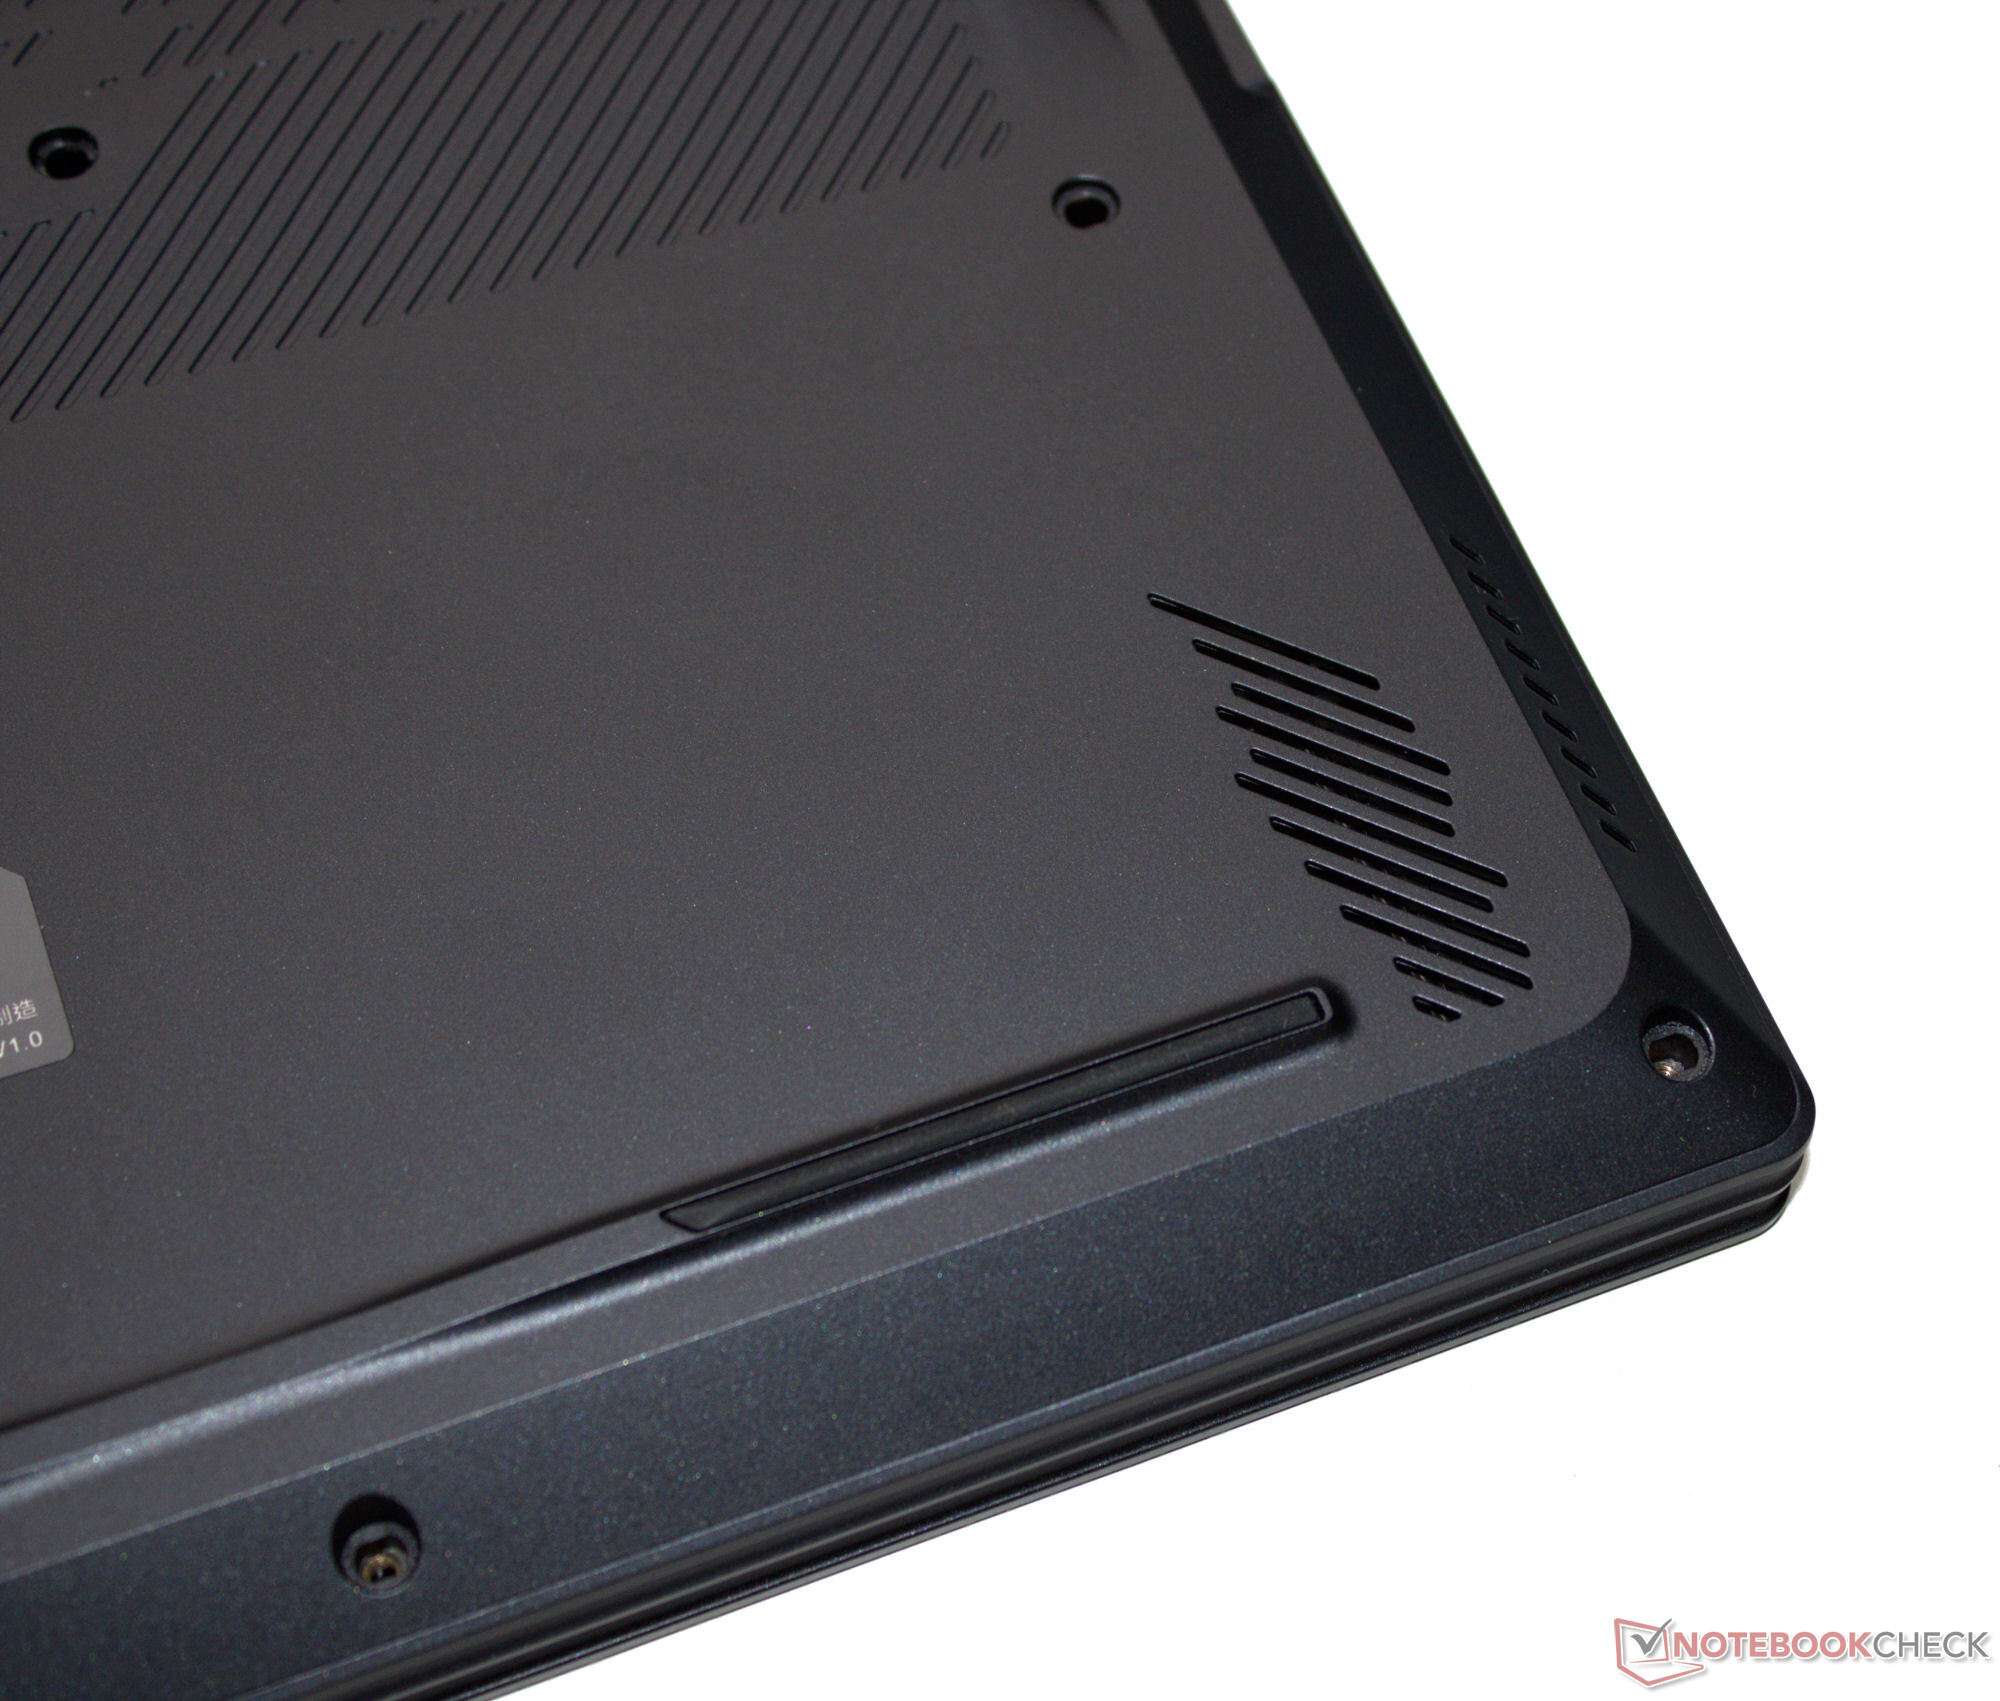
The Aorus 16X is one of the most compact and lightweight devices within the comparison field.
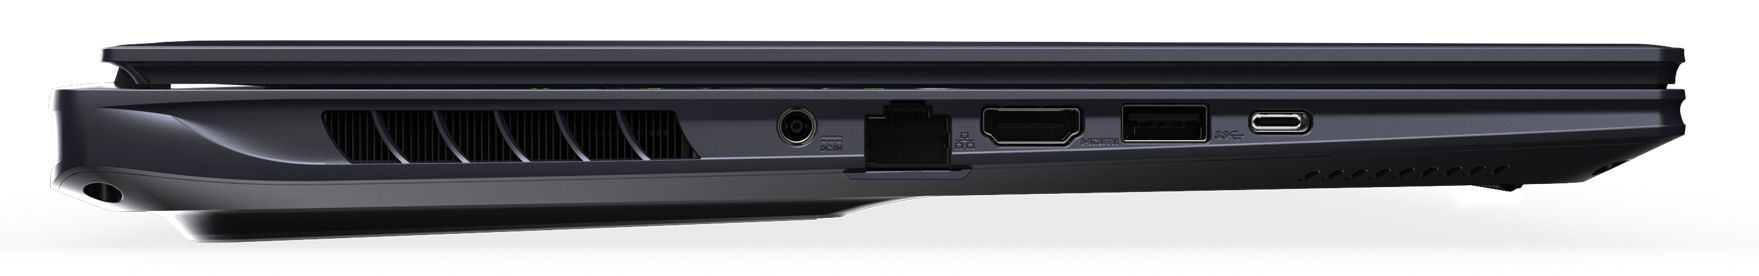
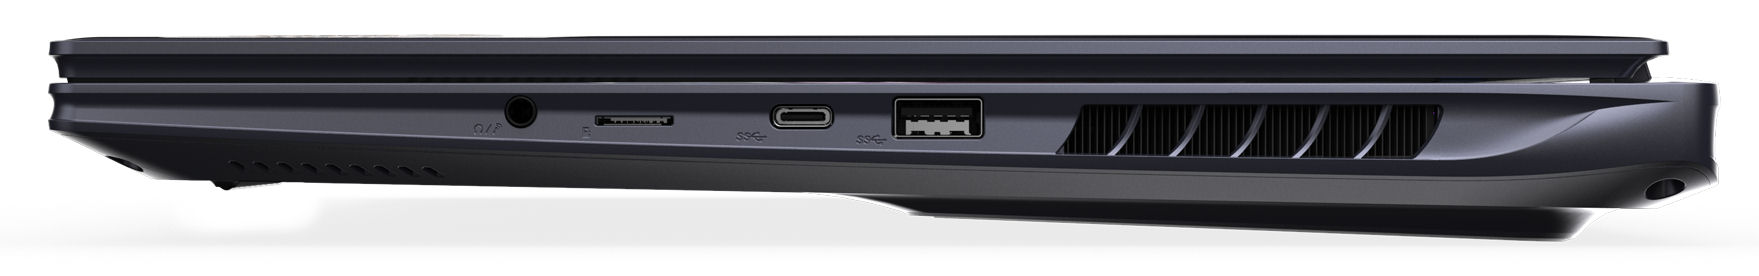
Connectivity - The Gigabyte laptop features Thunderbolt 4
The 16X has two USB-A ports (USB 3.2 Gen 2) and two USB-C ports (1x USB 3.2 Gen 2, 1x Thunderbolt 4). The TB4 port supports Power Delivery and both USB-C connections can output a DisplayPort signal. In total, the laptop is fitted with three video outputs (1x HDMI, 2x DP). An audio jack and a Gigabit Ethernet port round out the package.
Gigabyte has placed all connections along the middle of the right and left sides of the device. The areas next to the pam rest generally remain free from cables.
SD card reader
The device's MicroSD card reader (reference card: AV PRO microSD 128 GB V60) is one of the faster models, achieving maximum transfer rates of 186 MB/s (transferring 250 jpg images, each around 5 MB in size) and 188 MB/s (copying larger data blocks).
| SD Card Reader | |
| average JPG Copy Test (av. of 3 runs) | |
| Aorus 16X 2024 (AV PRO microSD 128 GB V60) | |
| Average of class Gaming (20.9 - 210, n=54, last 2 years) | |
| Schenker XMG Pro 16 Studio (Mid 23) (AV PRO microSD 128 GB V60) | |
| Alienware m16 R2 (AV PRO microSD 128 GB V60) | |
| maximum AS SSD Seq Read Test (1GB) | |
| Alienware m16 R2 (AV PRO microSD 128 GB V60) | |
| Aorus 16X 2024 (AV PRO microSD 128 GB V60) | |
| Average of class Gaming (25.5 - 261, n=51, last 2 years) | |
| Schenker XMG Pro 16 Studio (Mid 23) (AV PRO microSD 128 GB V60) | |
Communication
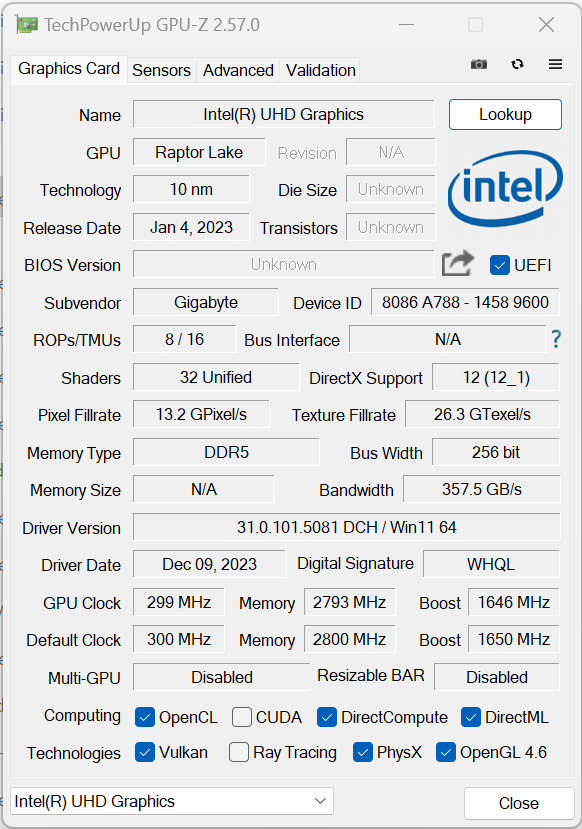
Under optimum conditions (no WLAN devices in close vicinity, short distance between laptop and server PC), we noted very good WiFi data rates. The 16X's poor values when sending data are likely due to driver issues. The Gigabyte laptop uses a WiFi 7 chip (Intel BE200). Wired connections are taken care of by a controller (RTL8168/8111; 1 GBit/s) made by Realtek.
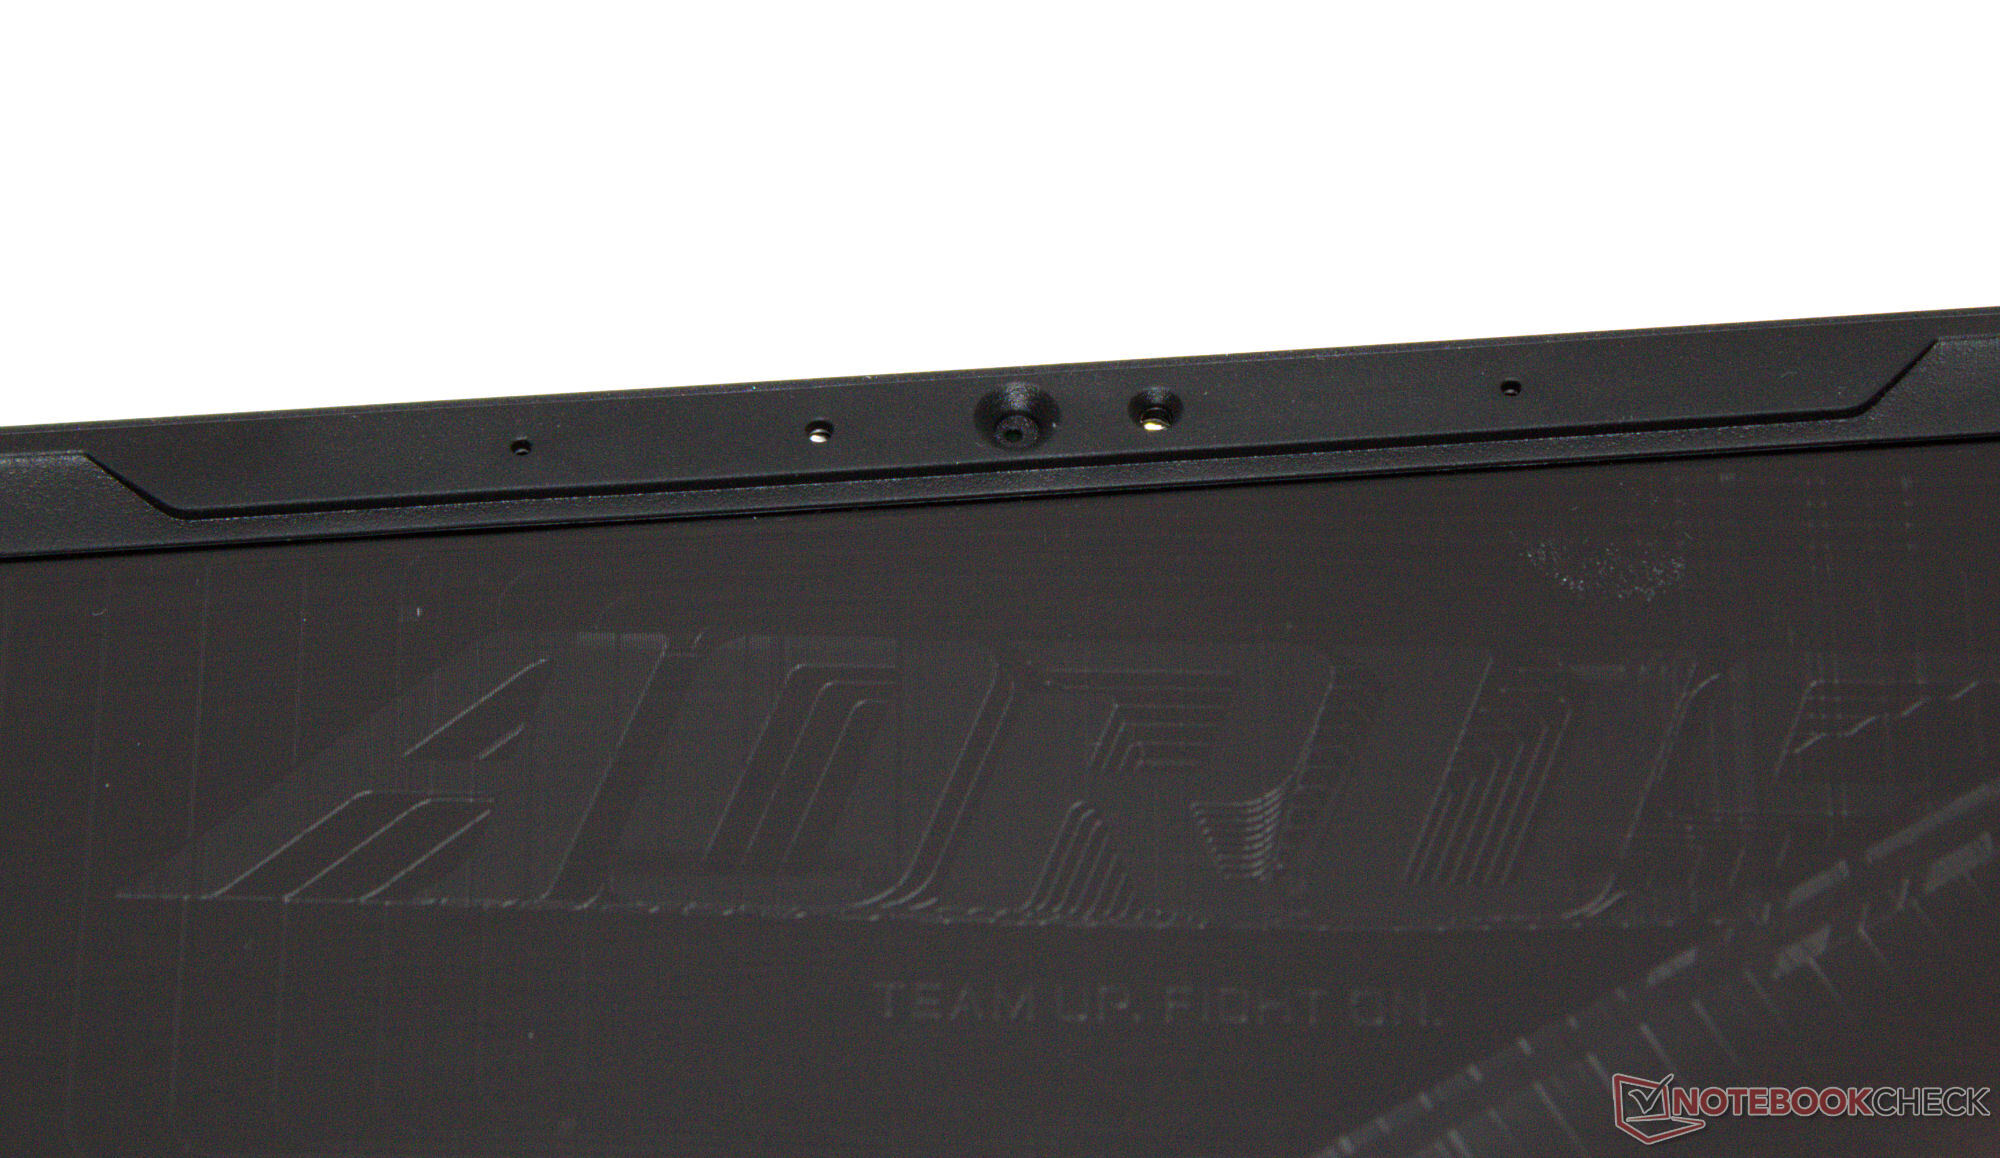
Webcam
The webcam (2.1 MP, max. 1,920 x 1,080 pixels, IR) only delivers average-quality picture. Its color accuracy is where it fails: With a deviation of around 10, the target value (DeltaE lower than 3) has been missed. It does, however, support Windows Hello. In turn, it doesn't feature a mechanical cover.


Accessories
Aside from the usual documents (quick-start guide and warranty information), no additional accessories come delivered with the laptop.
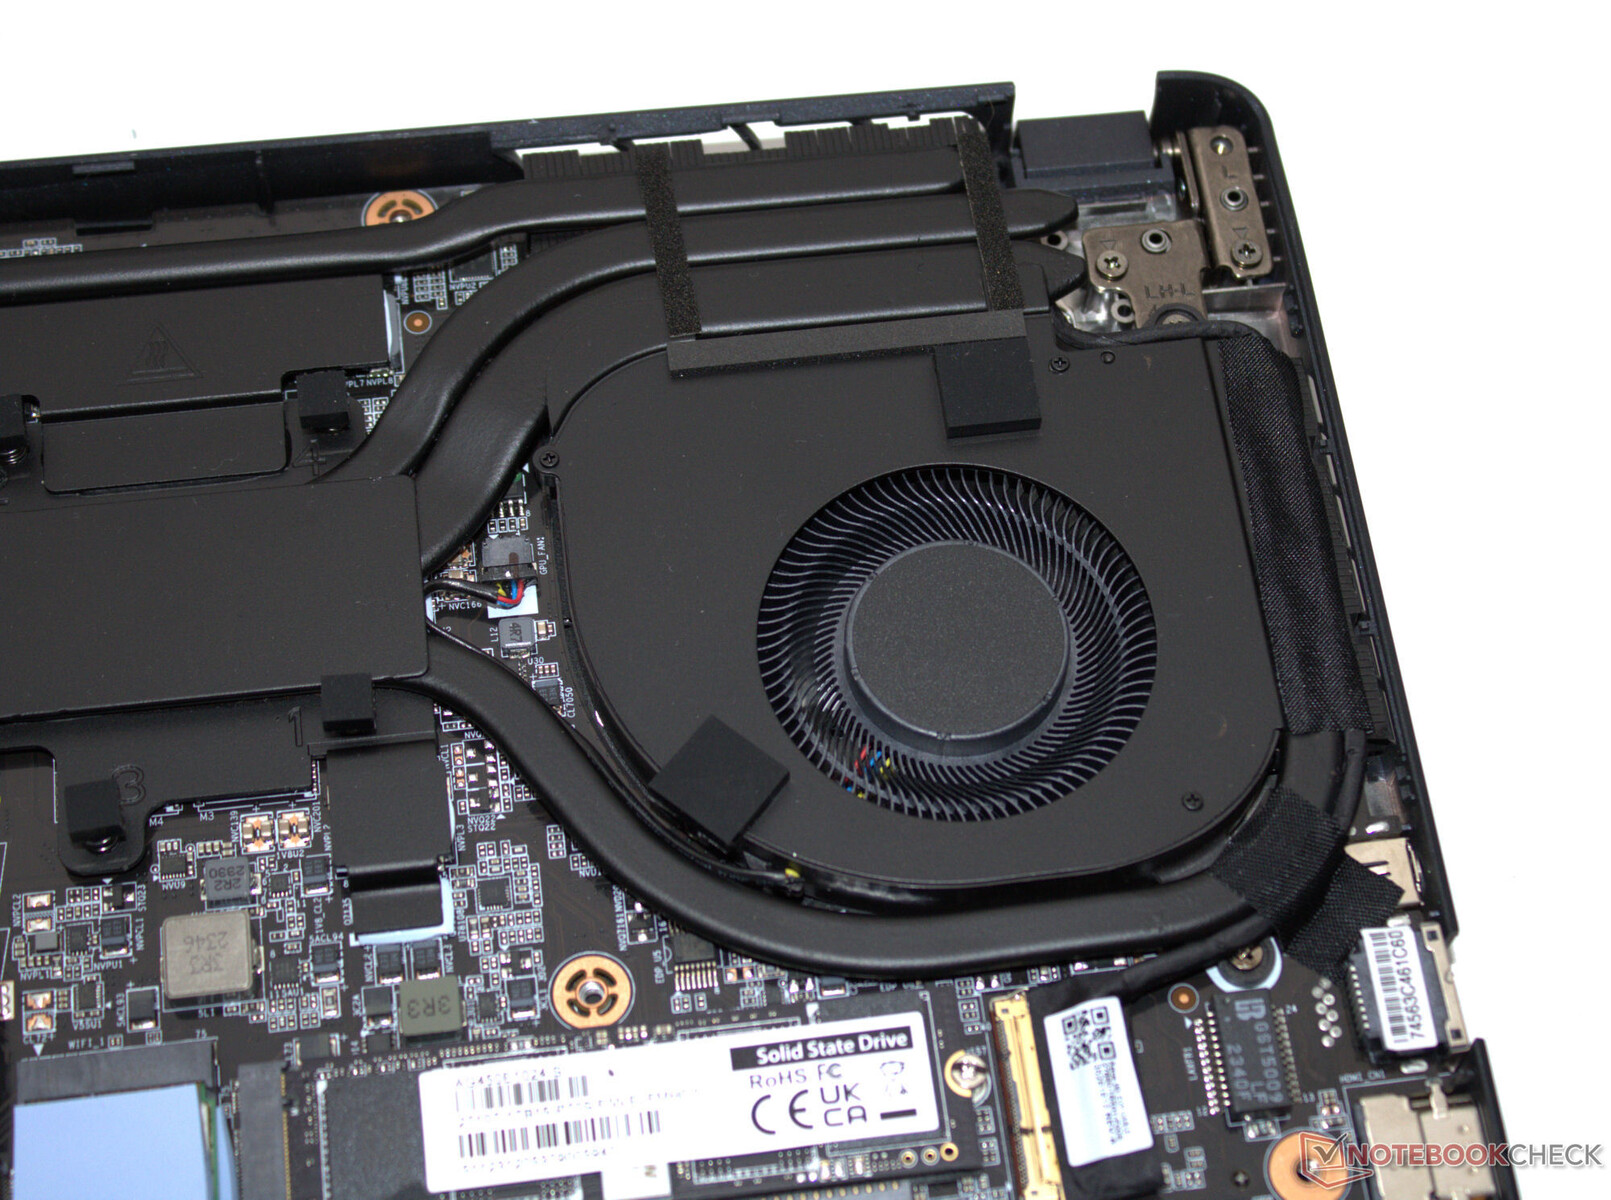
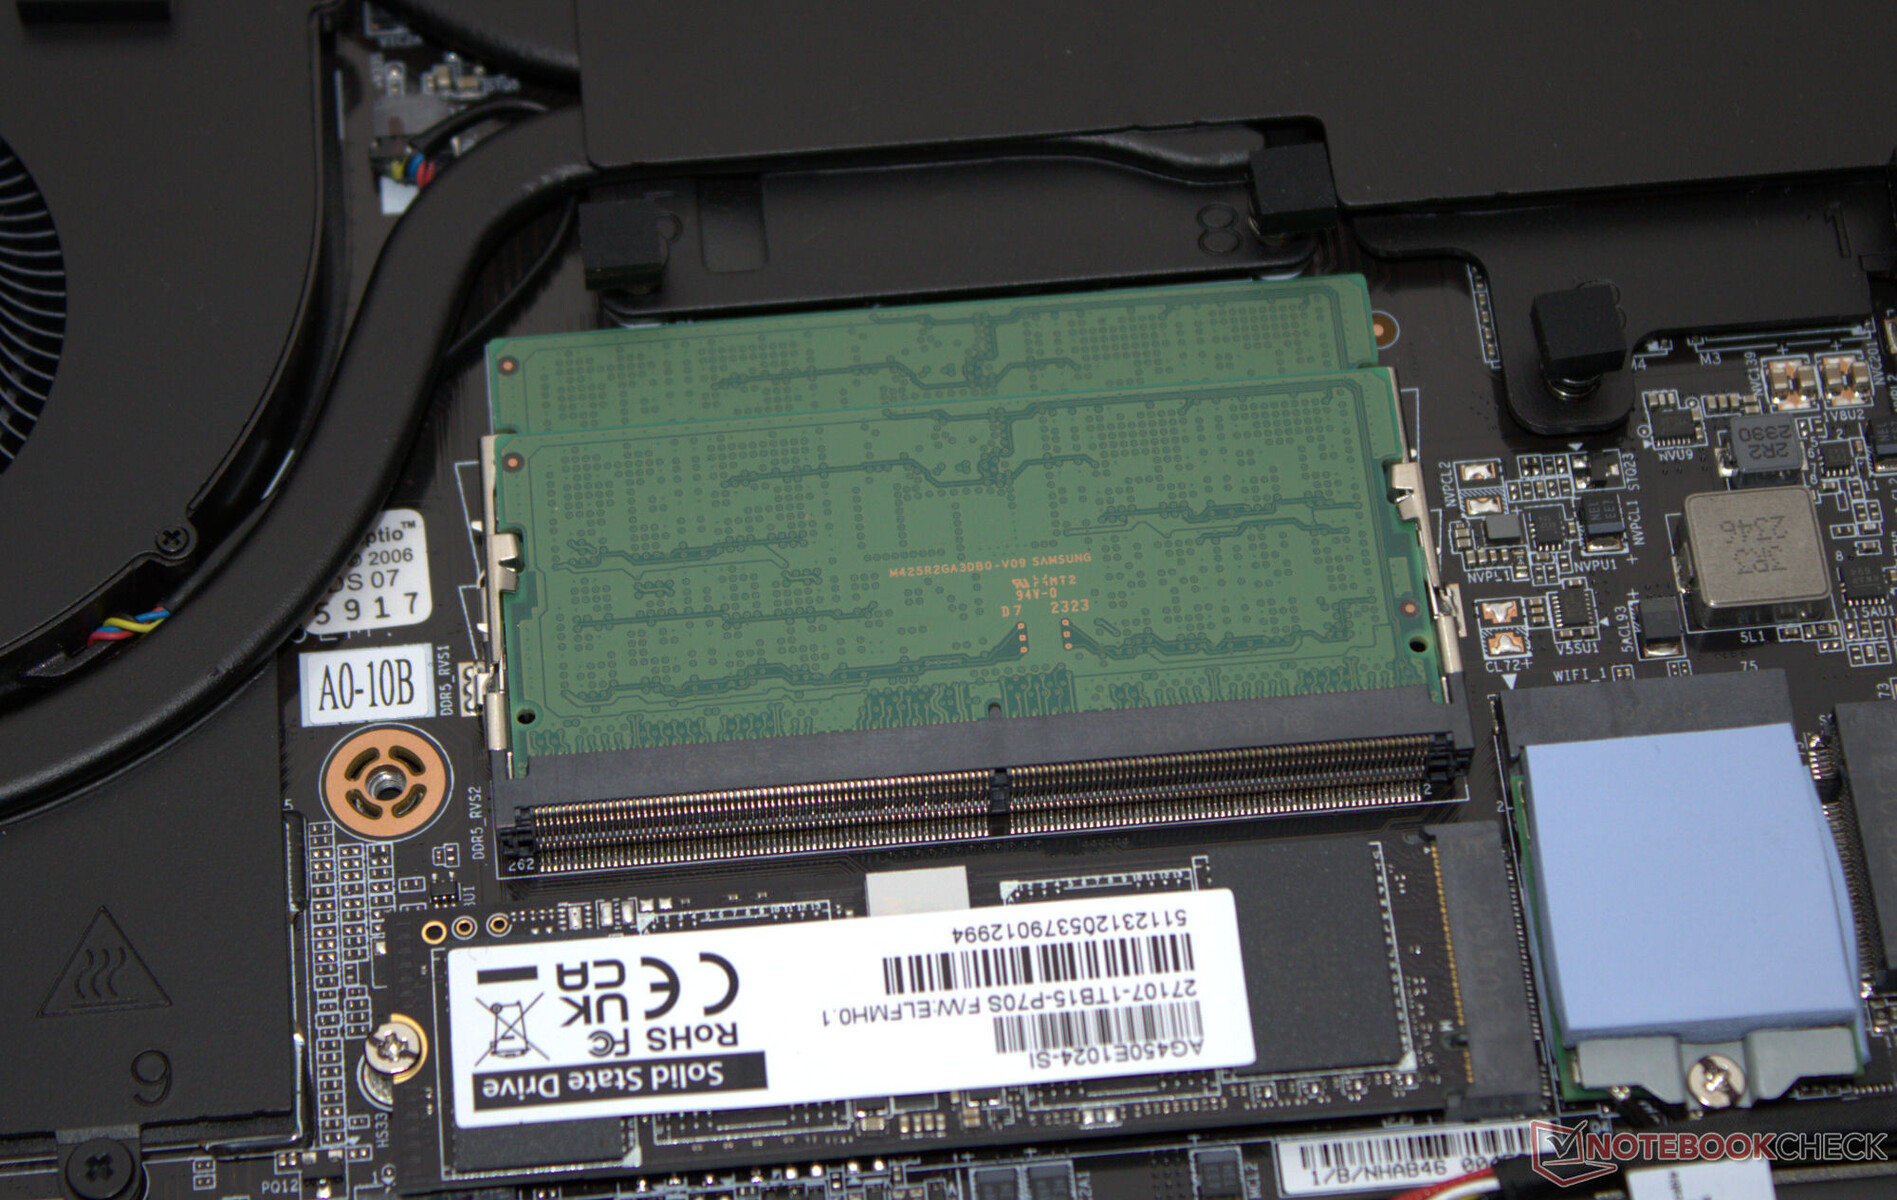
Maintenance
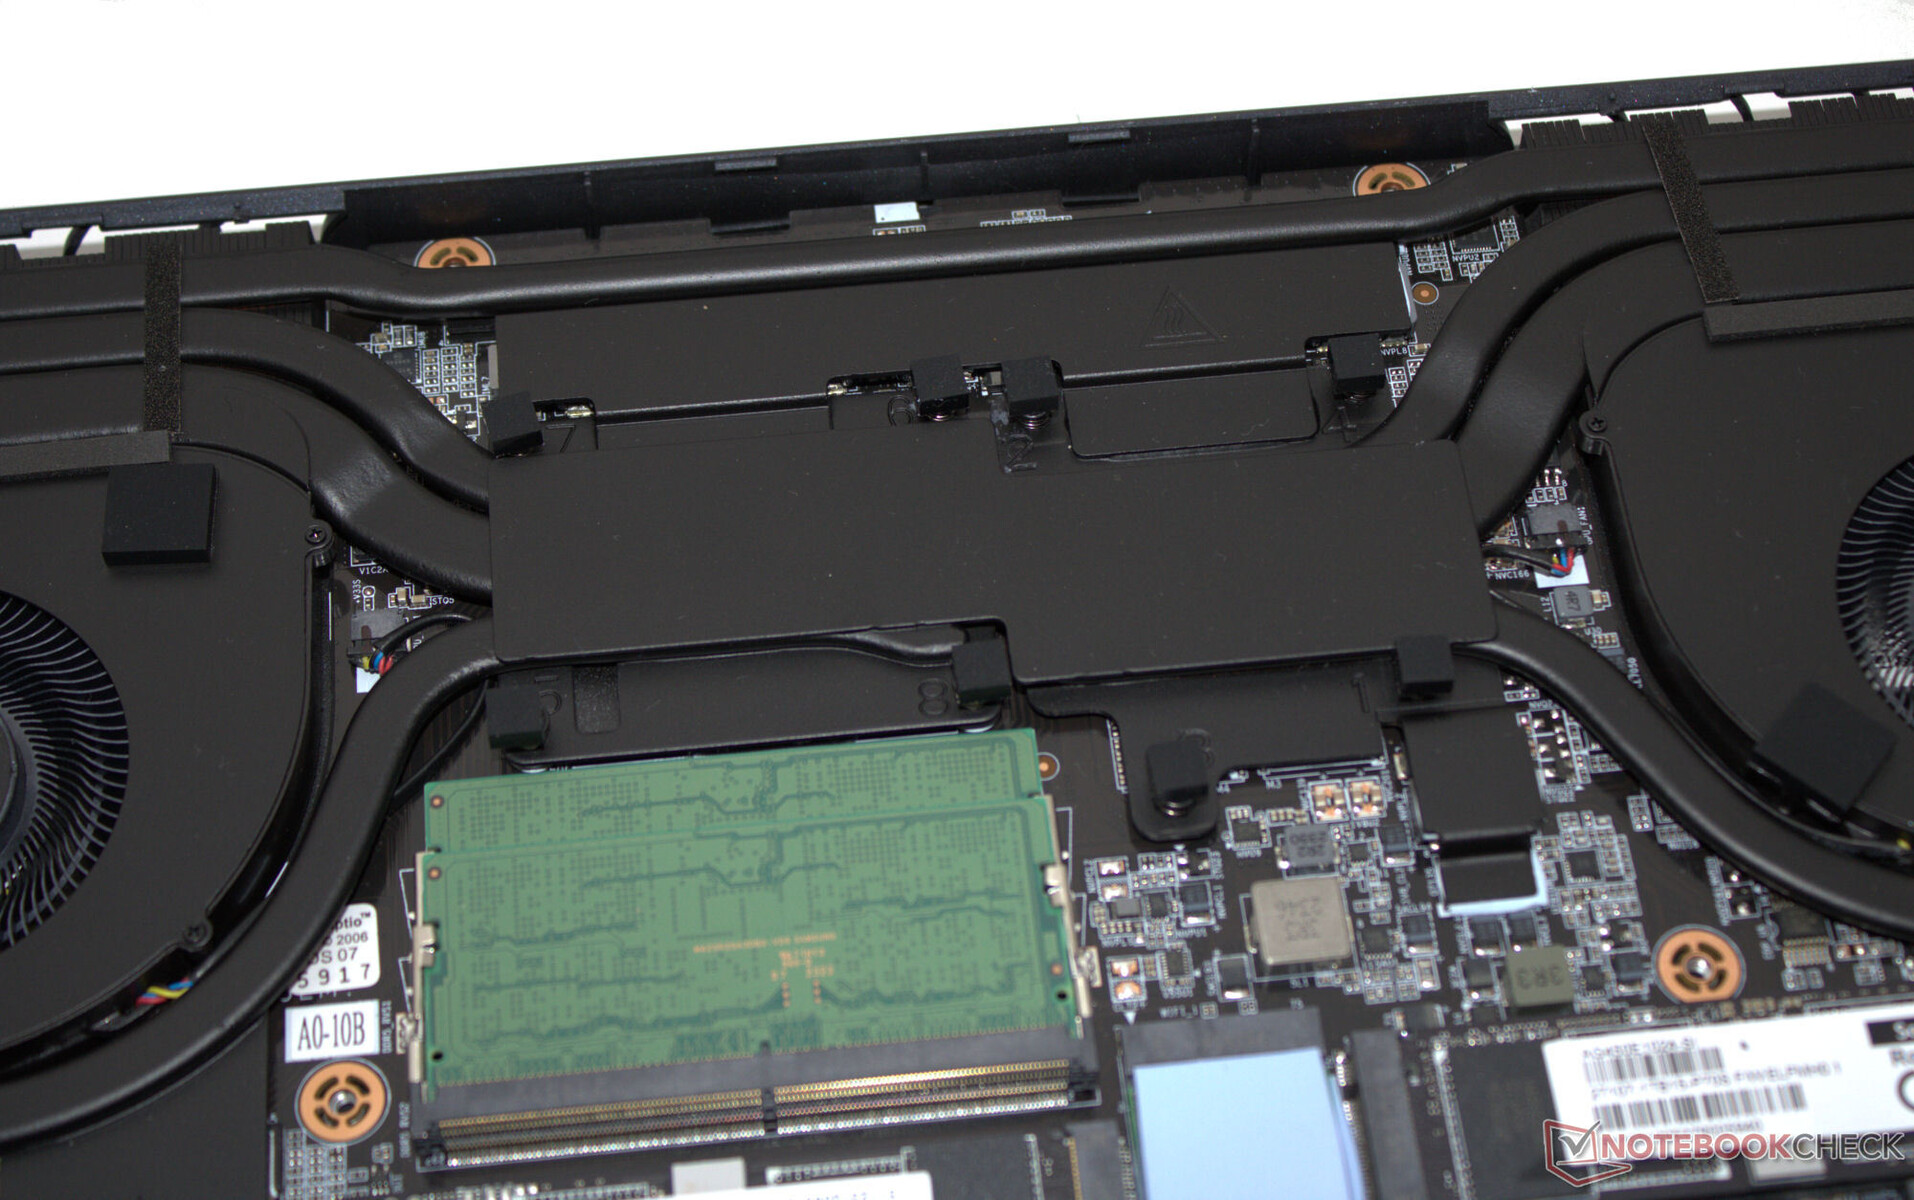
After removing all of the screws on the bottom of the device, you can use a flat spatula or plectrum to help remove the bottom case part. Subsequently, you can access the memory banks (both occupied), both SSDs (PCIe 4, M.2-2280), the WLAN module, fans, BIOS battery as well as the regular battery.
Warranty
The 16-inch device is covered by a standard 12-month warranty. Options to extend this are not available.
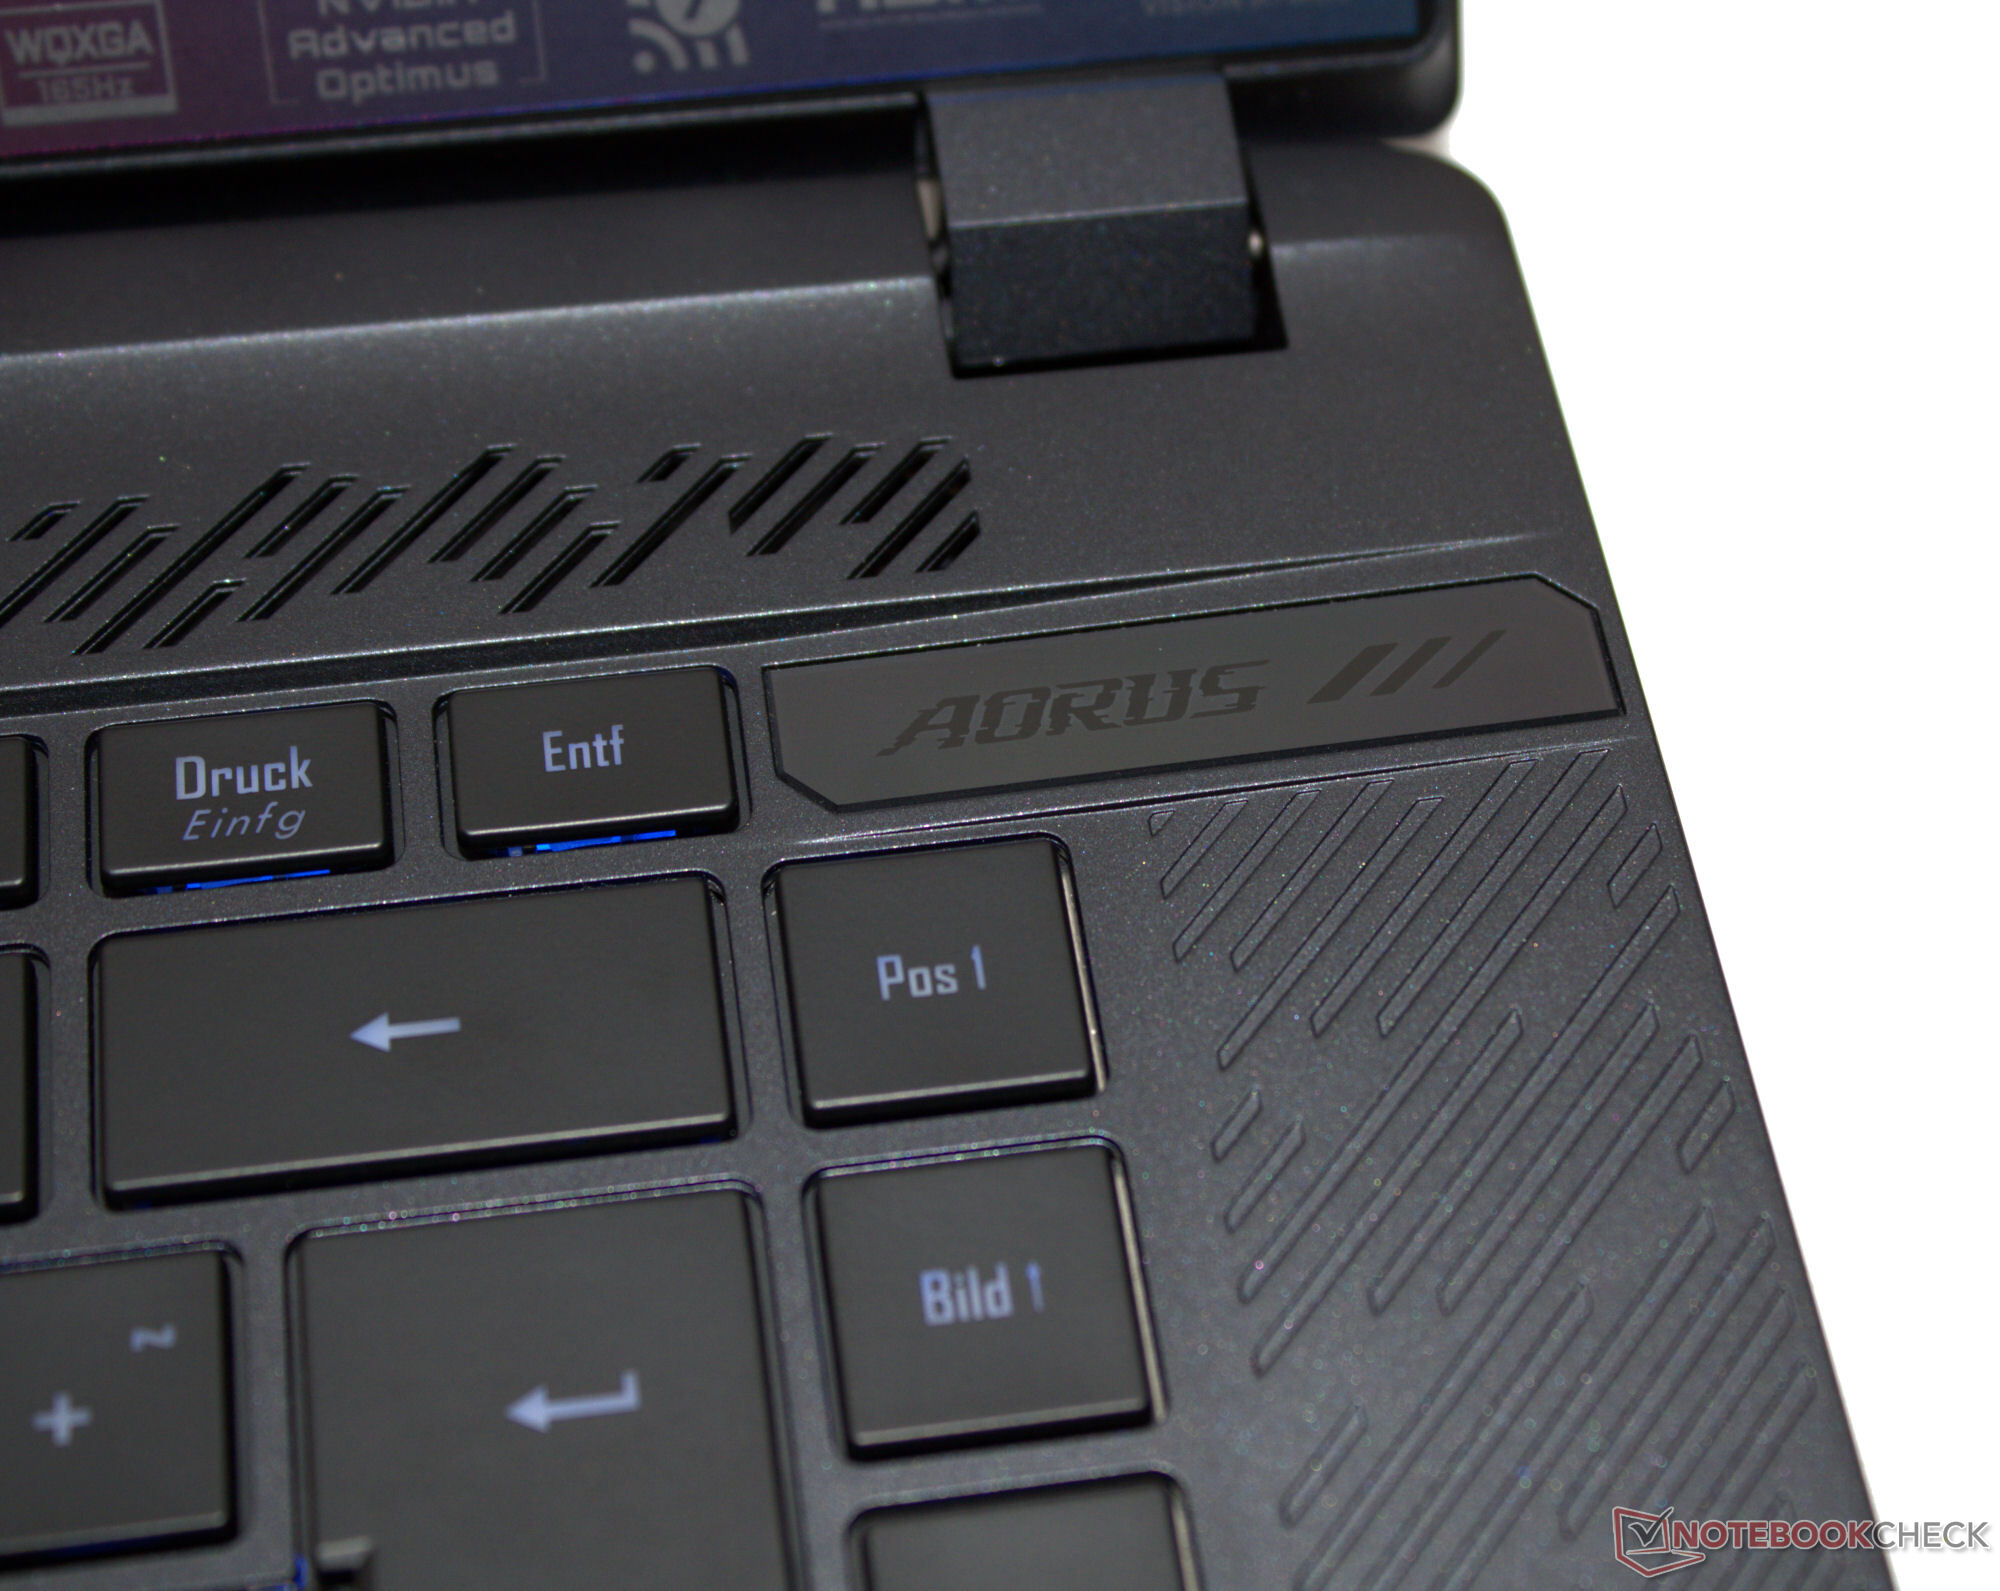
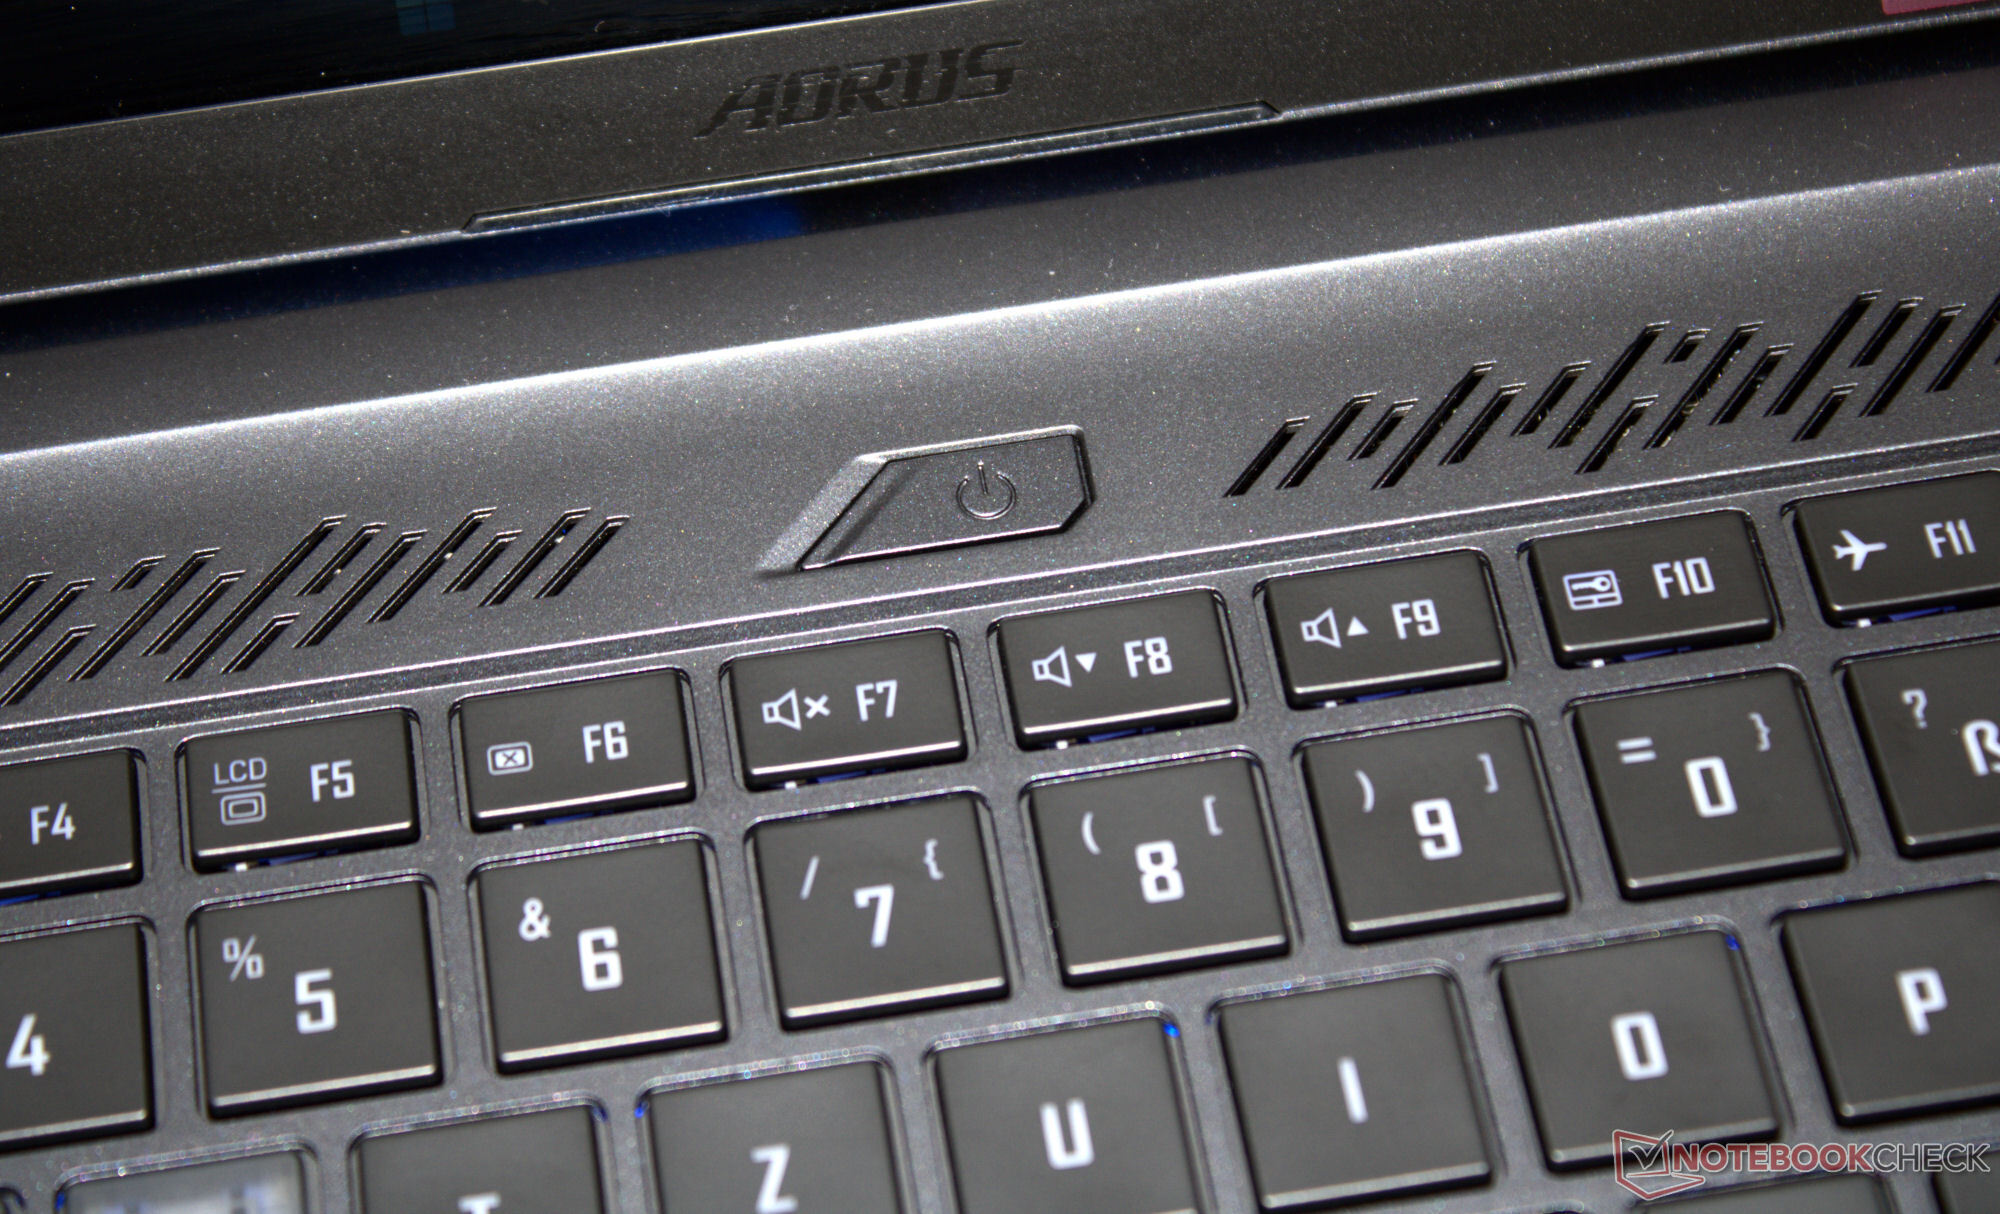
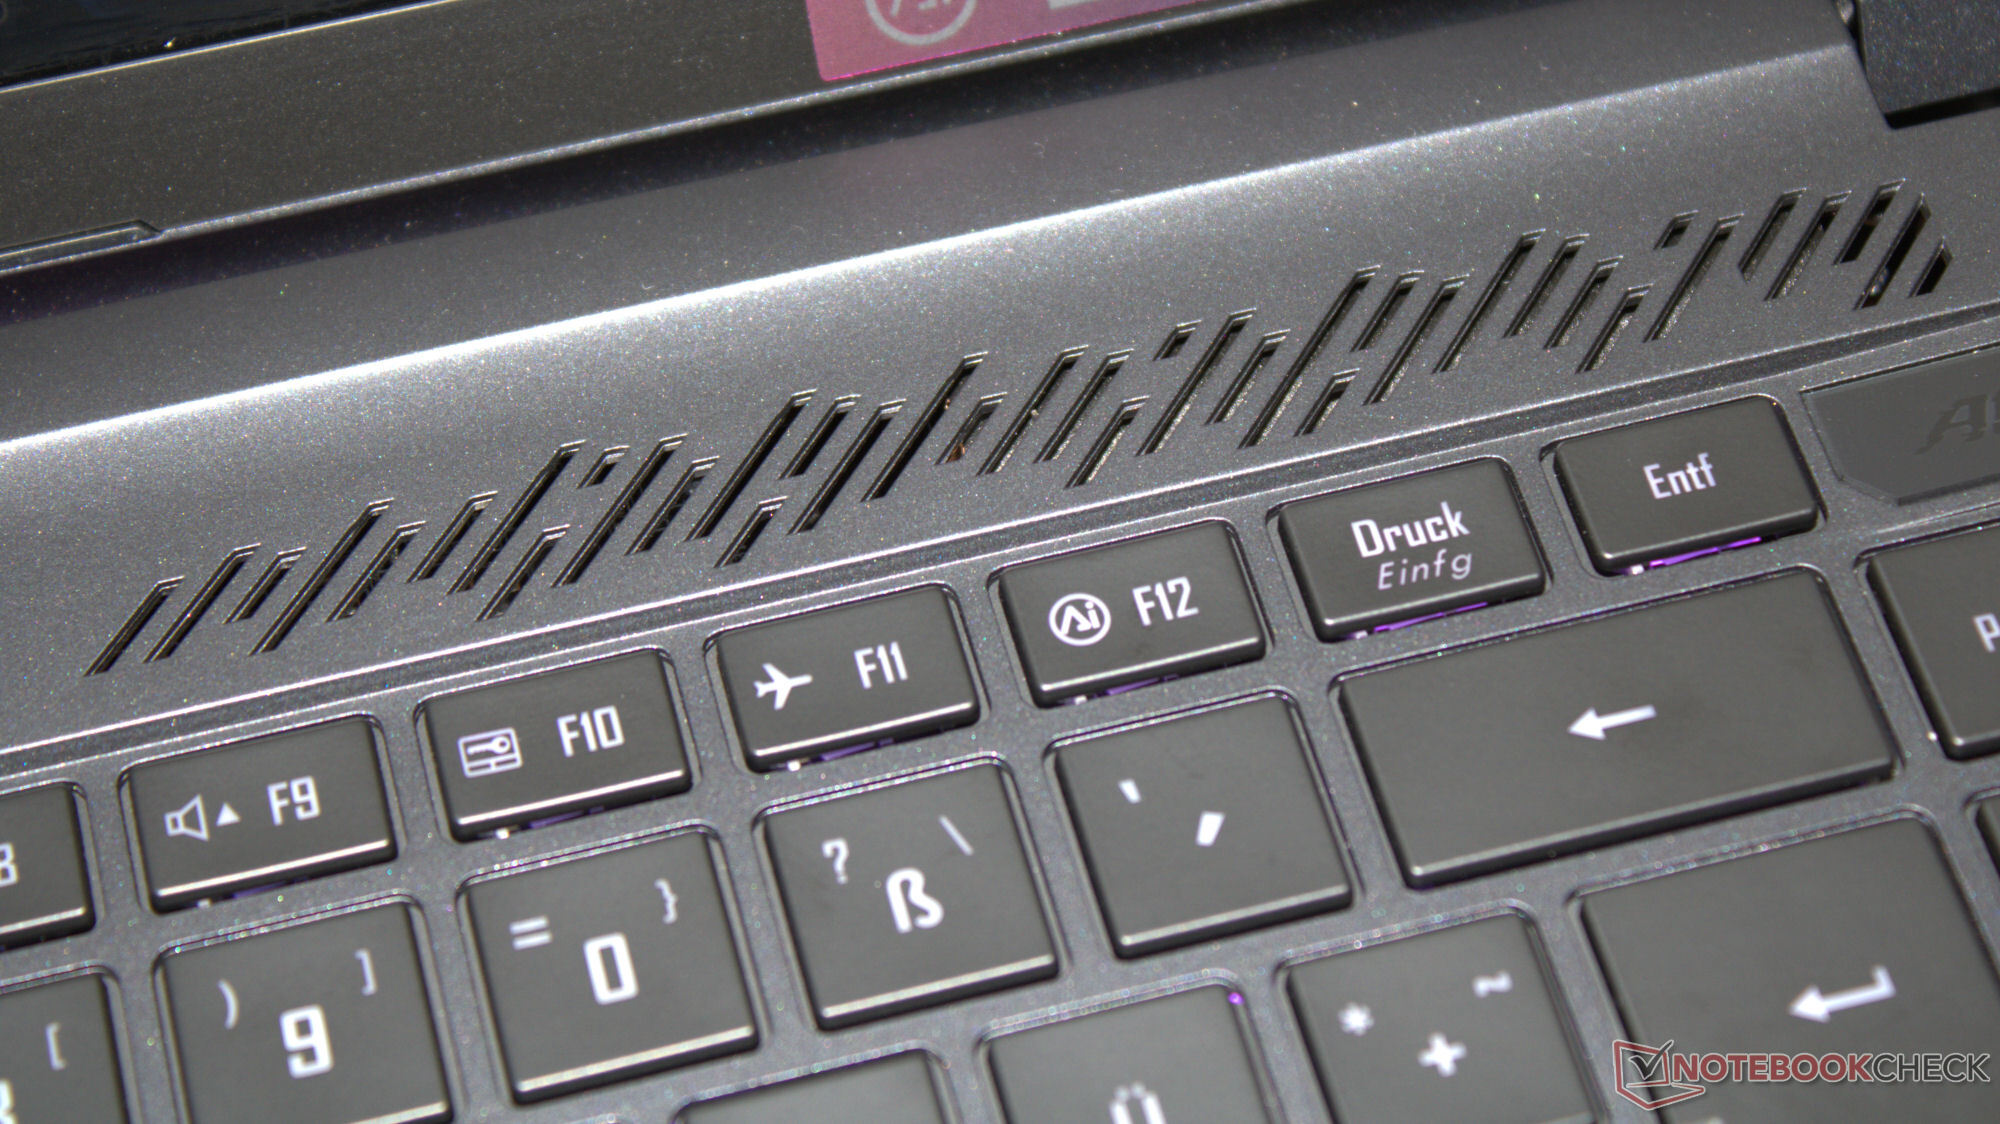
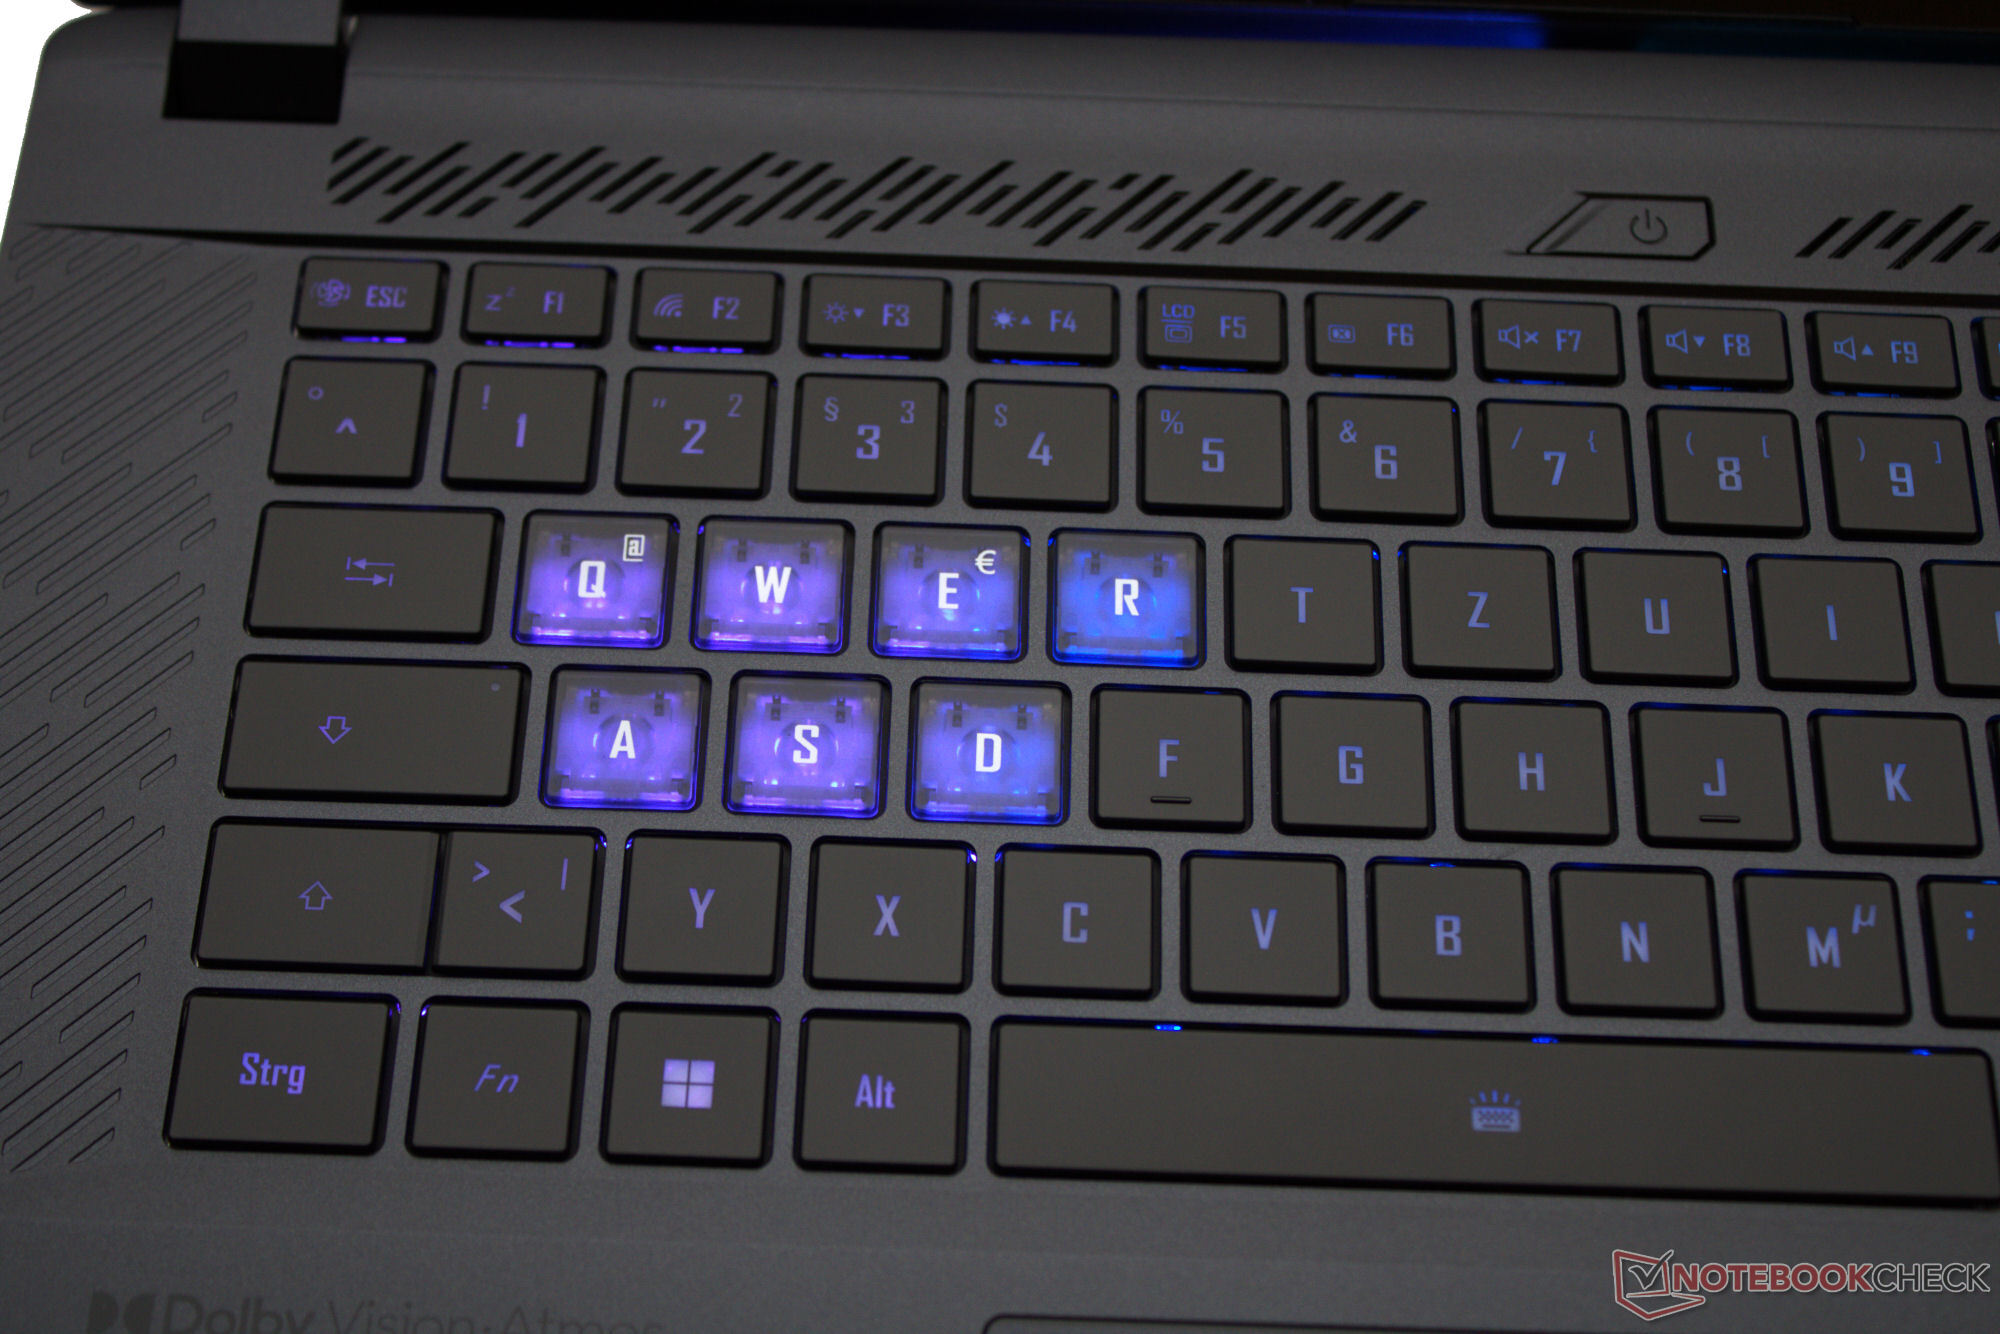
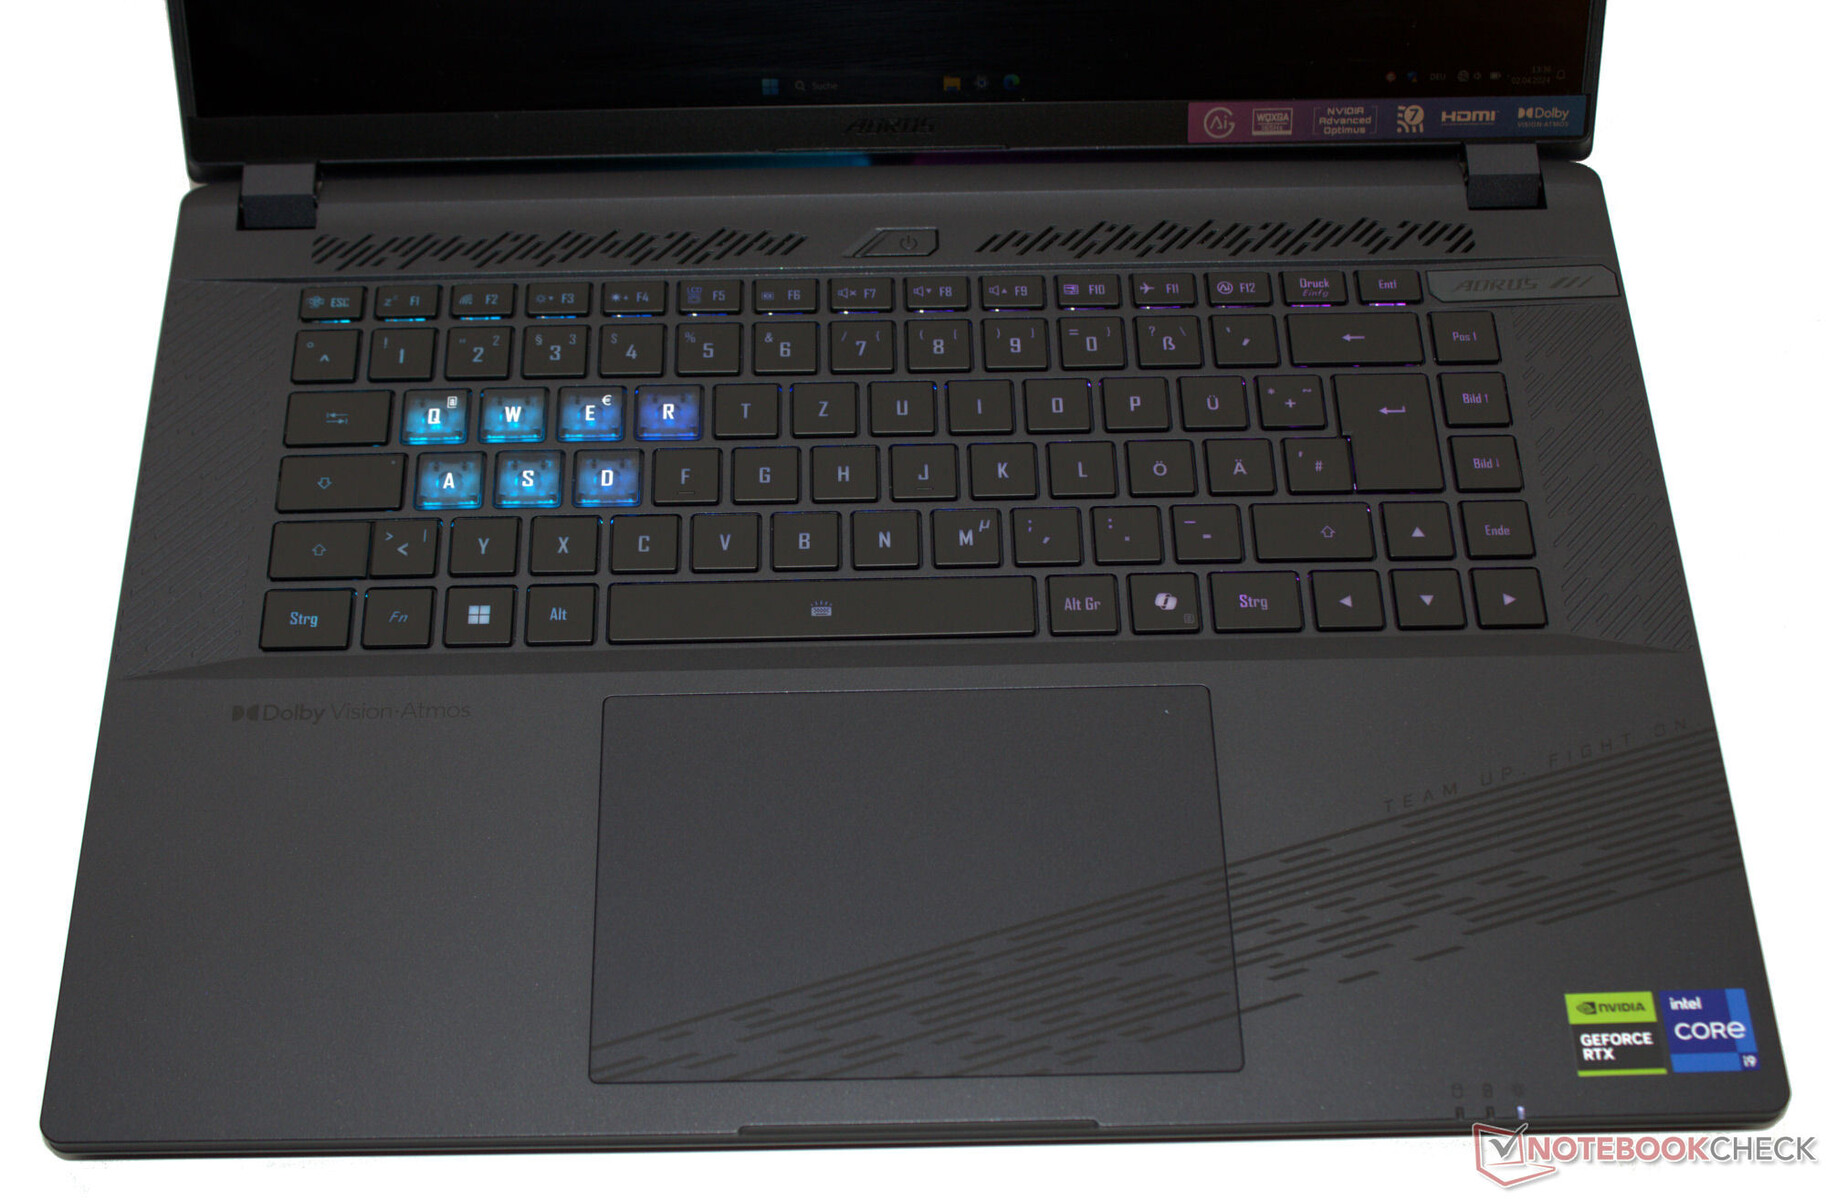
Input devices - The Aorus laptop has a backlit keyboard
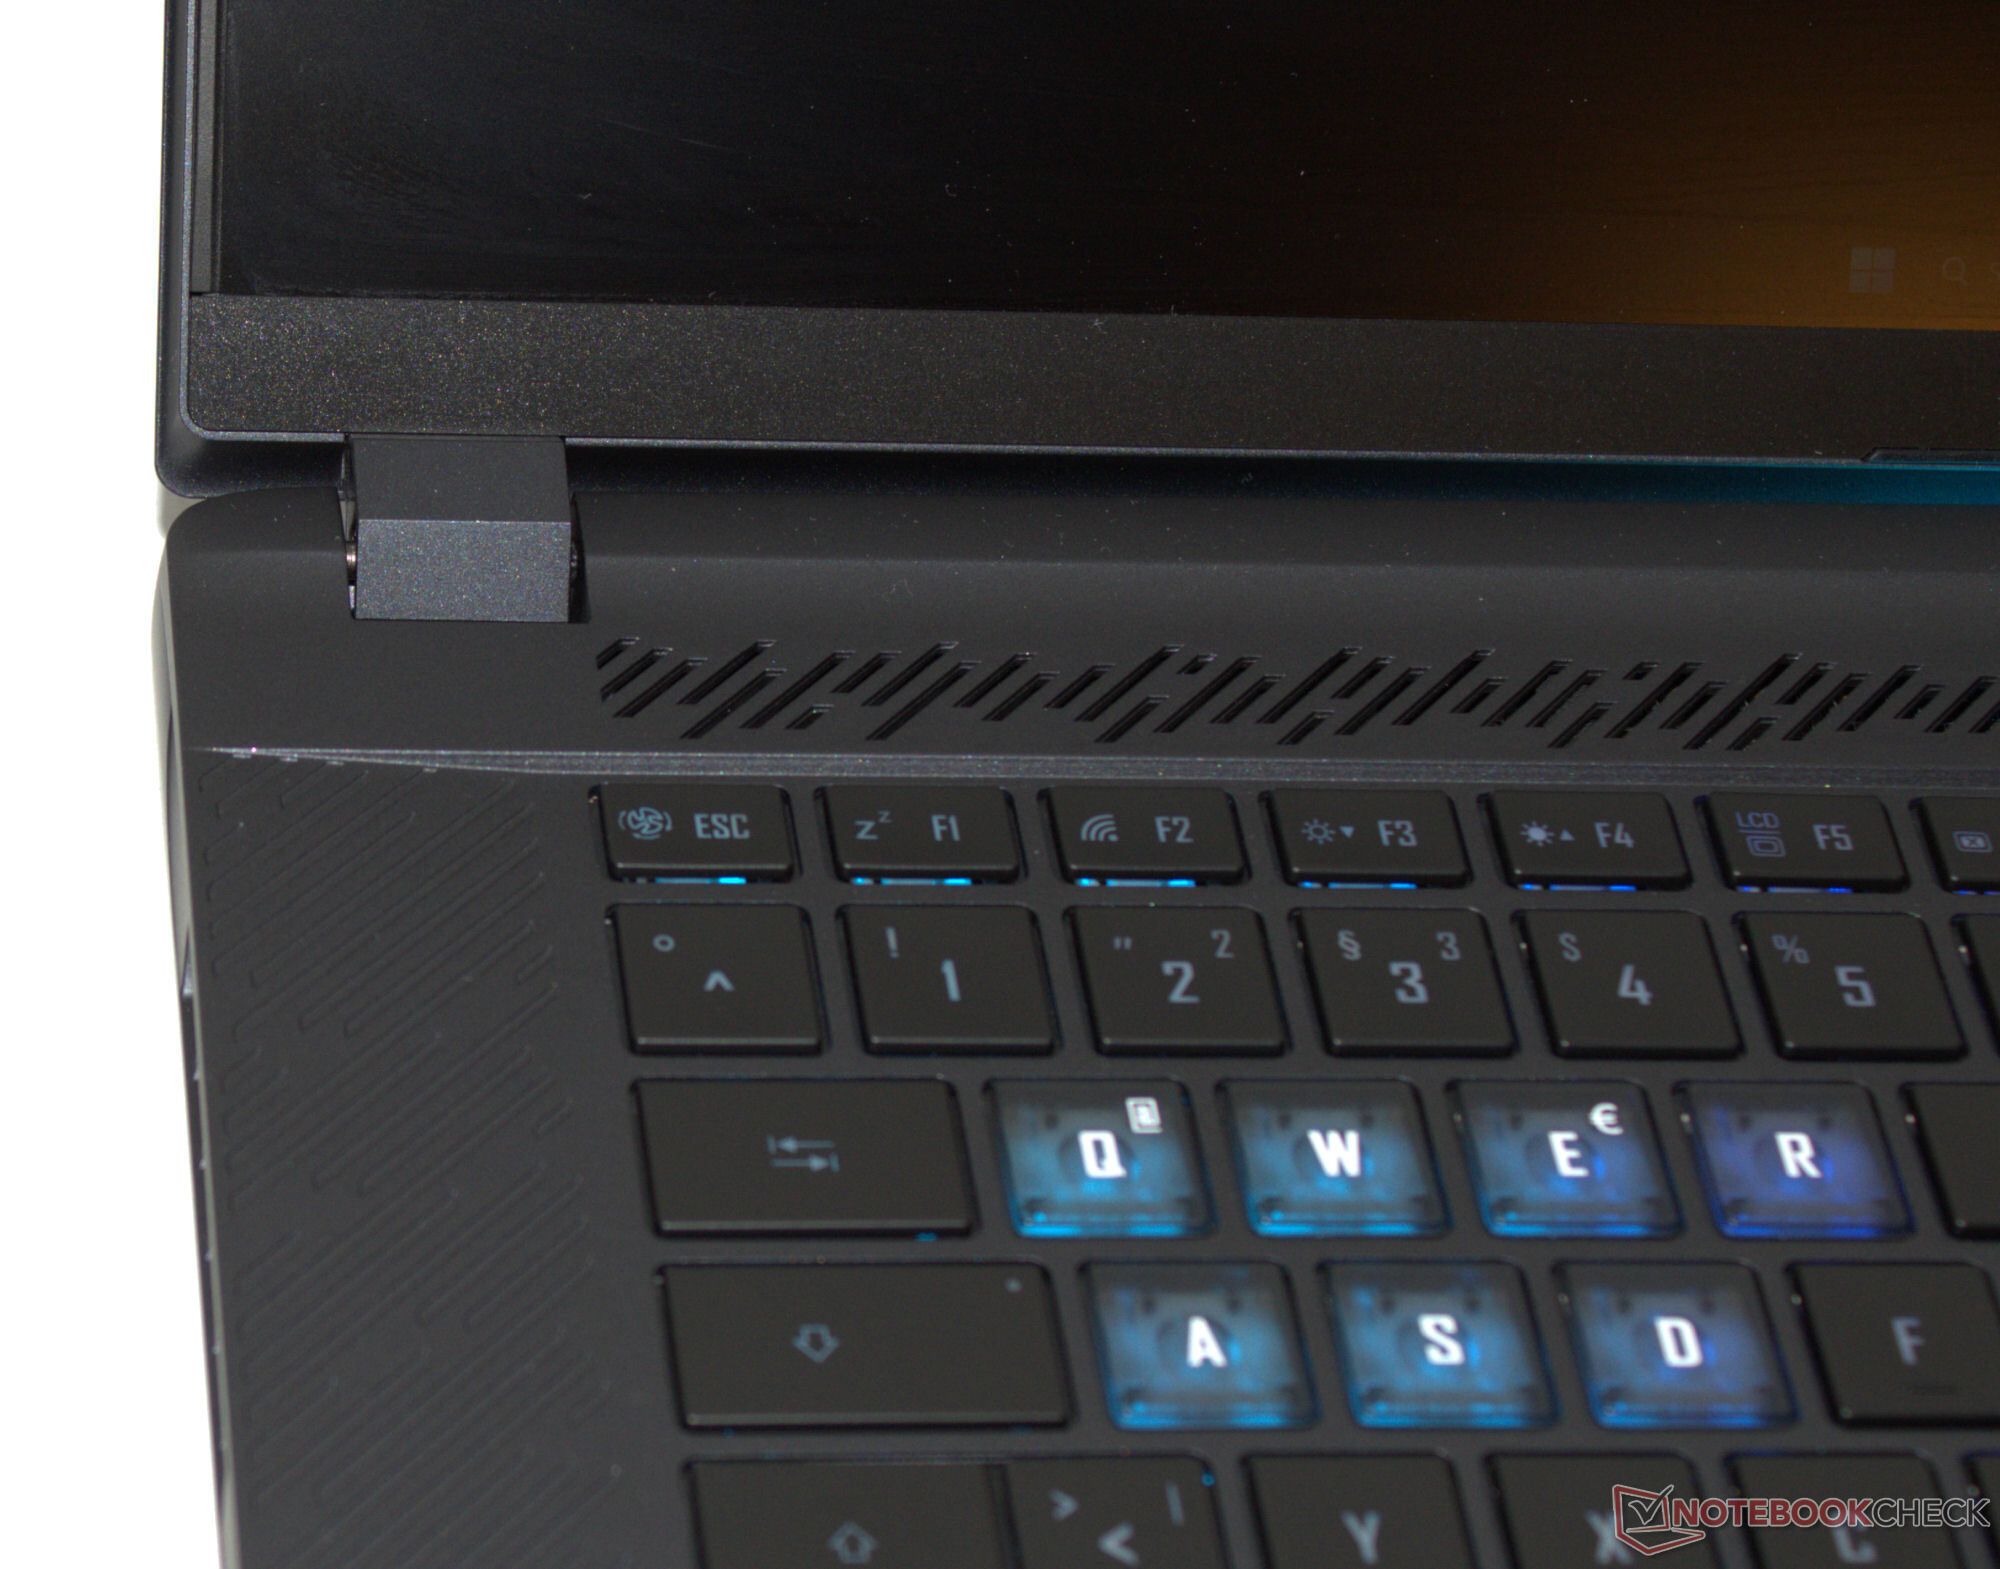
Keyboard
The keys on the chiclet keyboard (three-stage RGB illumination) feature a medium lift and a clear pressure point. Their resistance is okay. The keyboard yields slightly when typing, but this has not yet proven to be annoying. Good: The four arrow keys are full-sized. Gigabyte has decided against installing a numeric keypad. All in all, the manufacturer has delivered a keyboard suitable for everyday use.
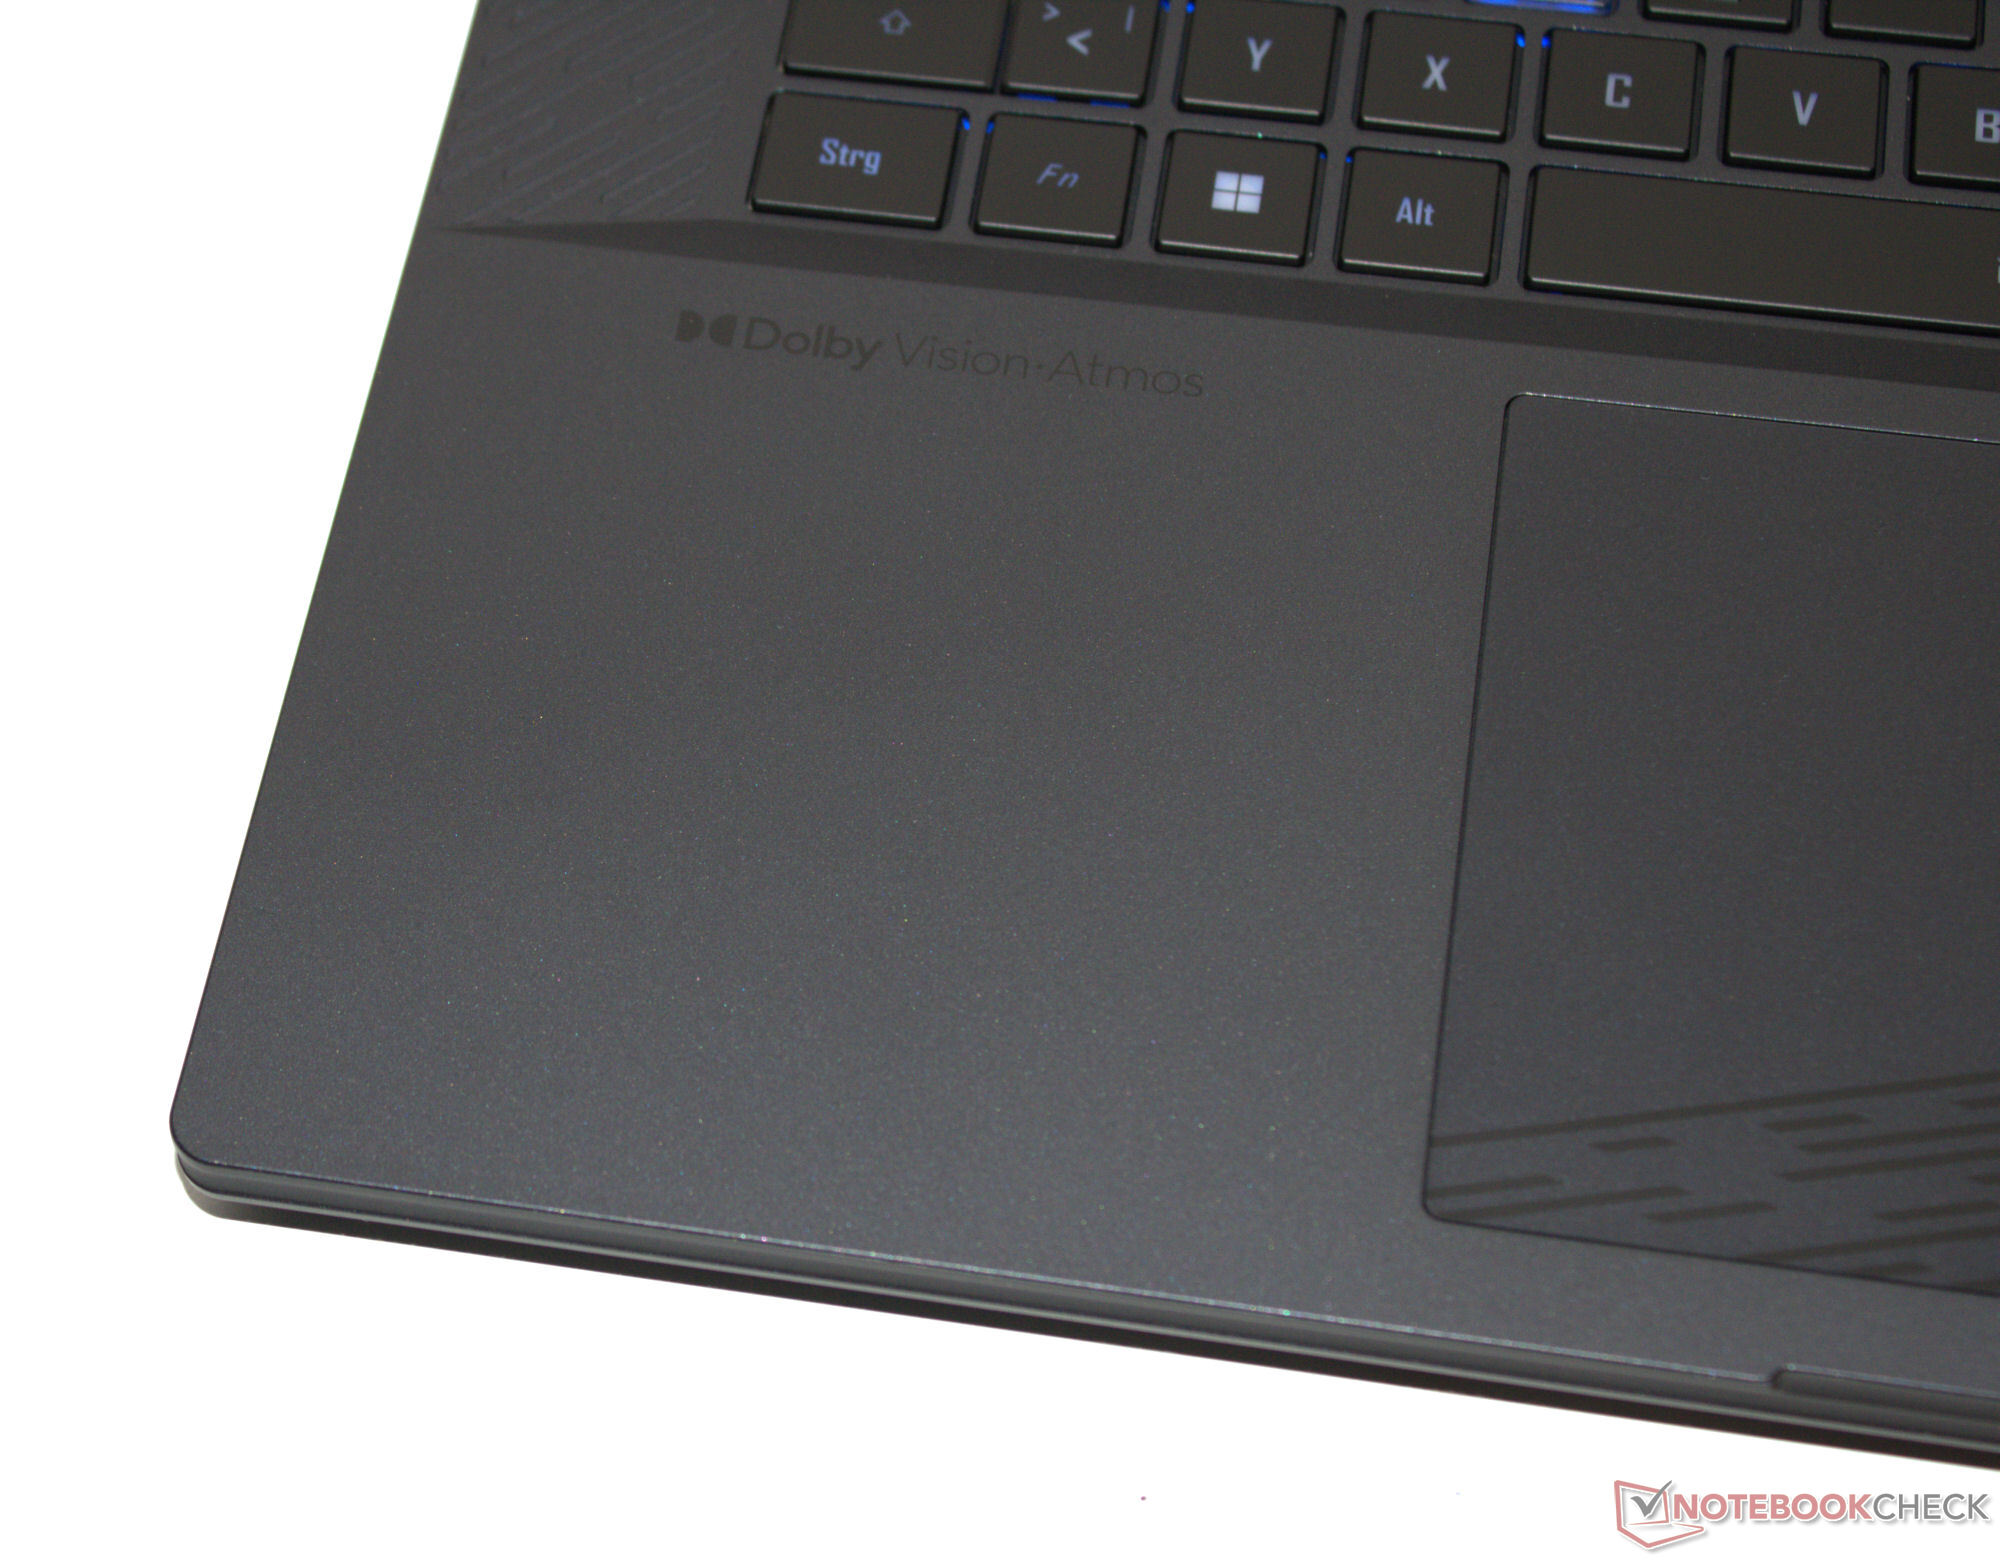
Touchpad
A multi-touch clickpad (approx. 13.3 x 9 cm) serves as a mouse replacement, whose smooth surface makes it easy for fingers to glide. It features a short lift and a clear pressure point.
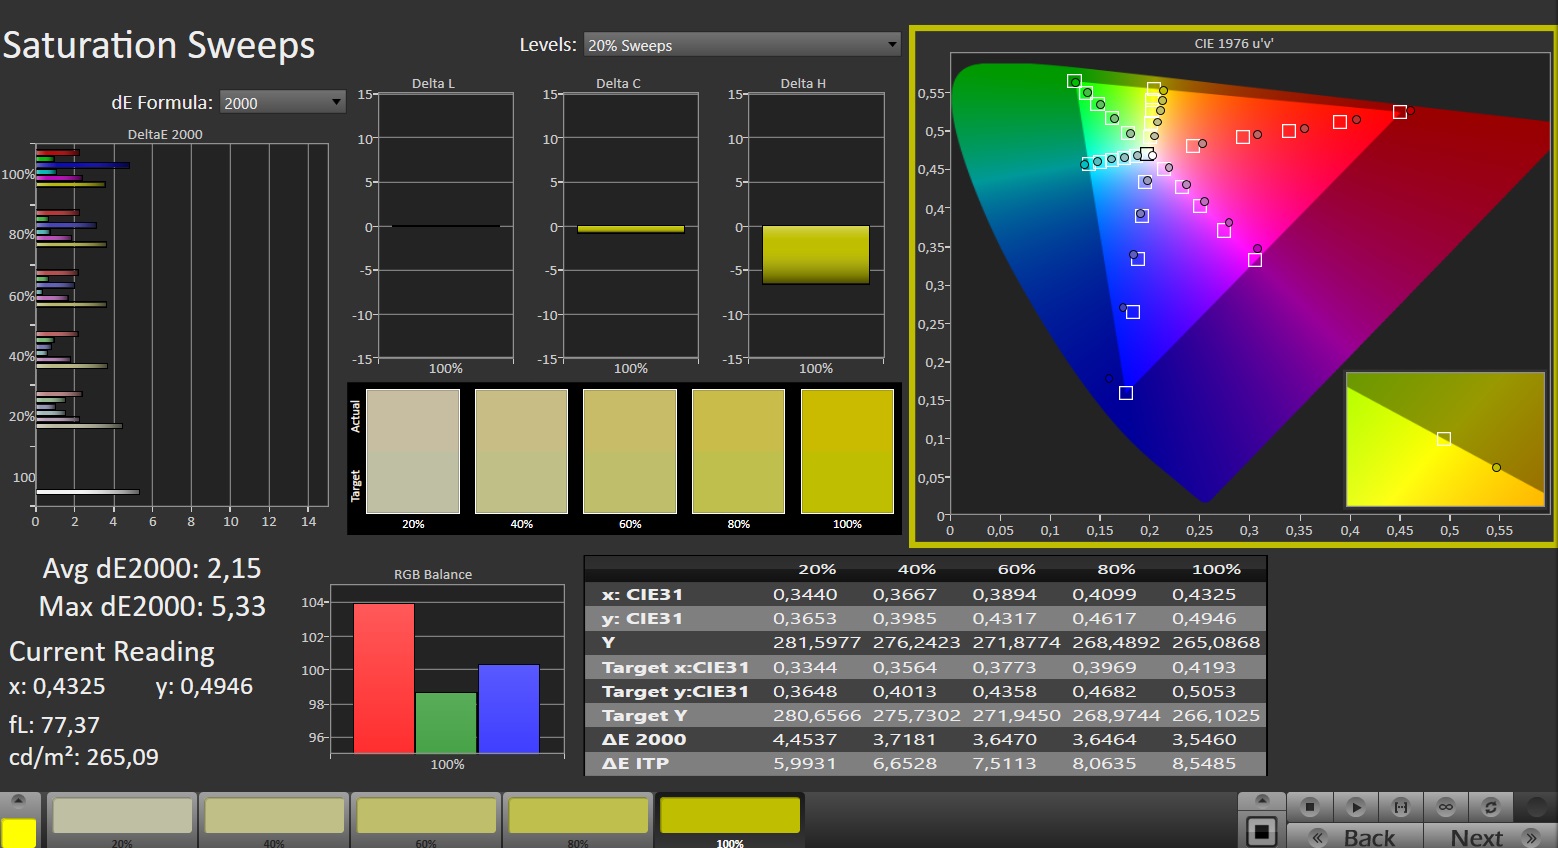
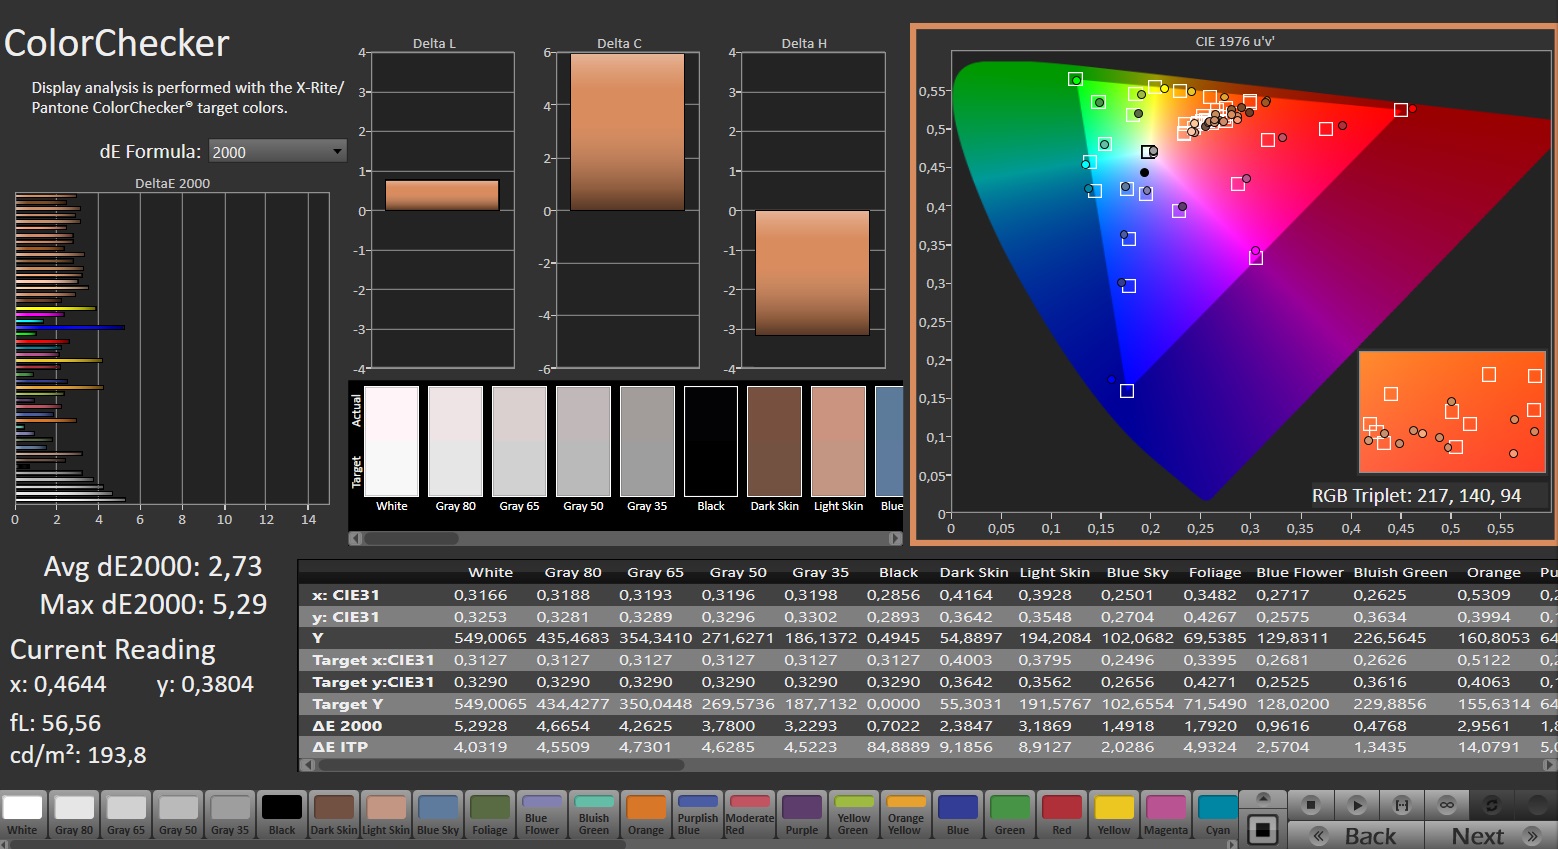
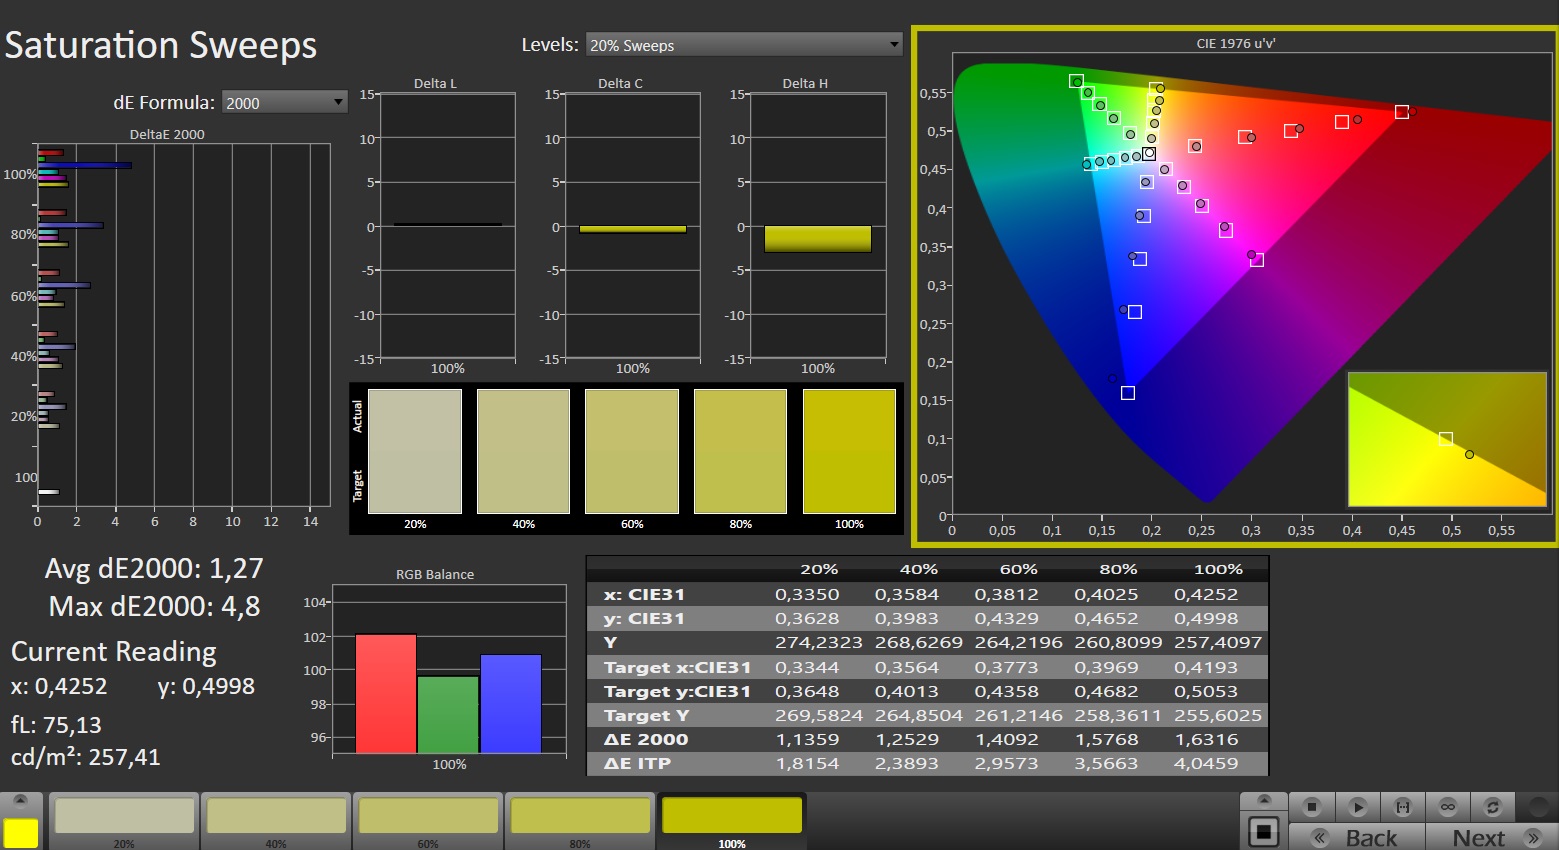
Display - Bright, 16:10, sRGB
Gigabyte has installed a 165-Hz panel including G-Sync support. The latter dynamically adjusts the refresh rates of the display and GPU to create the smoothest possible picture—especially when gaming.
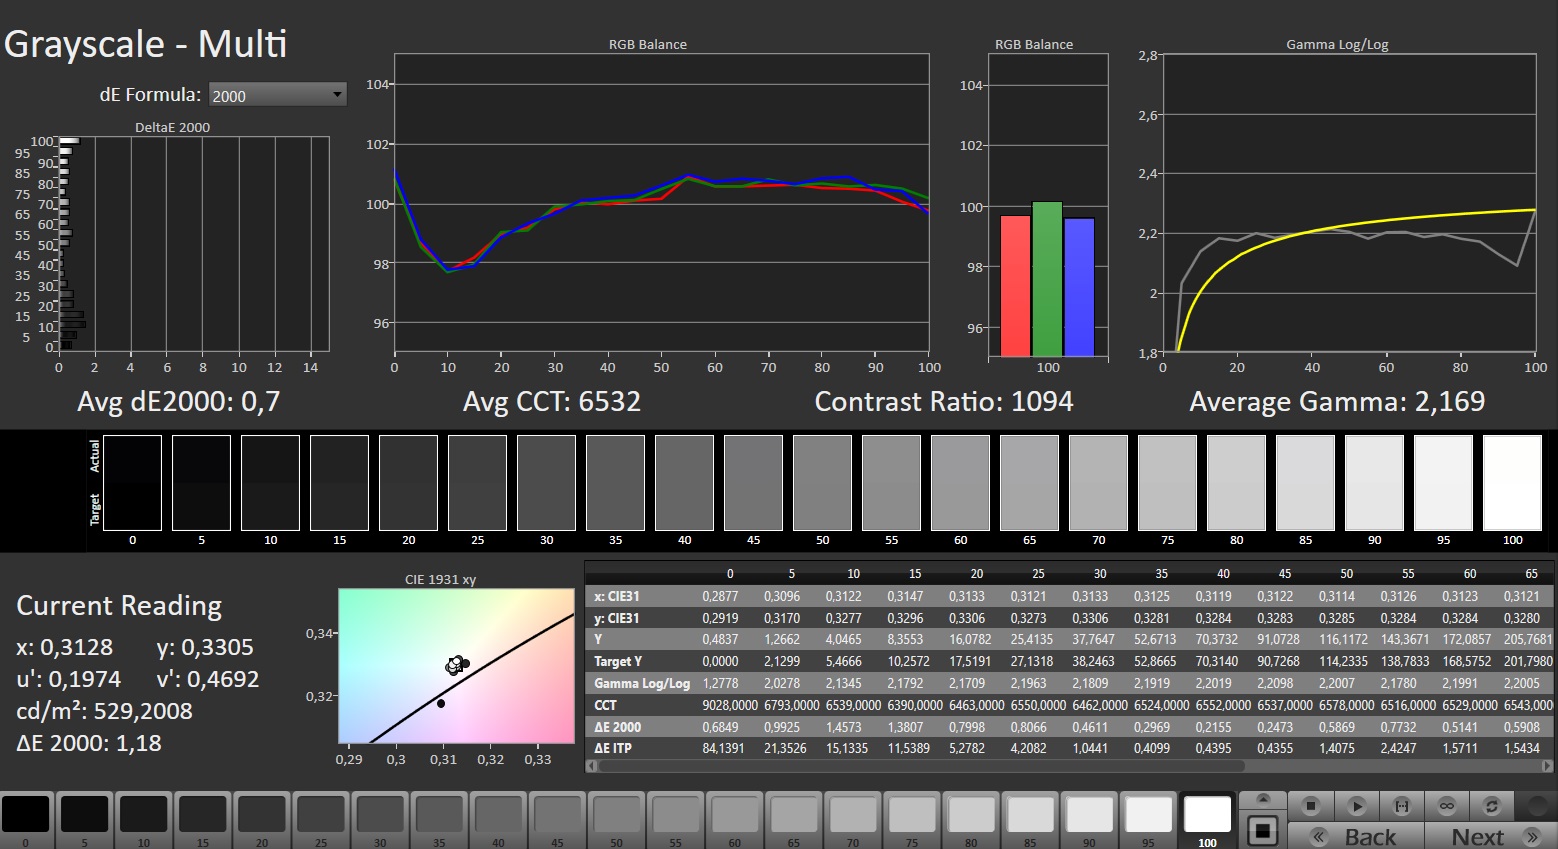
We noted no signs of PWM flickering at any brightness setting. The 16:10 matte 16-inch panel's (2,560 x 1,600 pixels) brightness and contrast meet their respective targets (> 300 cd/m² or 1,000:1). Its high brightness is particularly noteworthy.
| |||||||||||||||||||||||||
Brightness Distribution: 86 %
Center on Battery: 542 cd/m²
Contrast: 1204:1 (Black: 0.45 cd/m²)
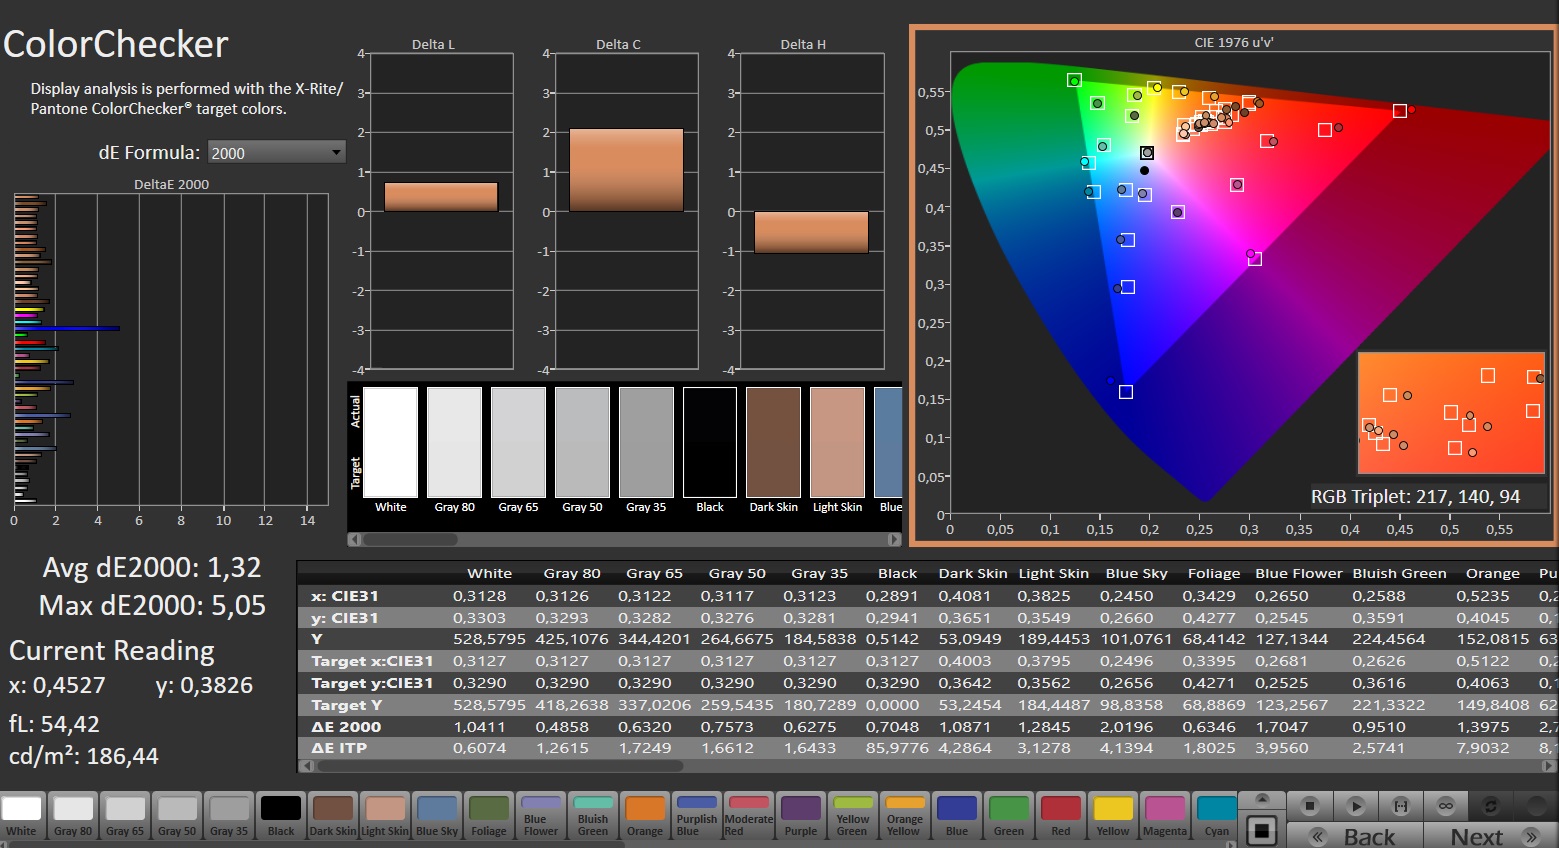
ΔE ColorChecker Calman: 2.73 | ∀{0.5-29.43 Ø4.73}
calibrated: 1.32
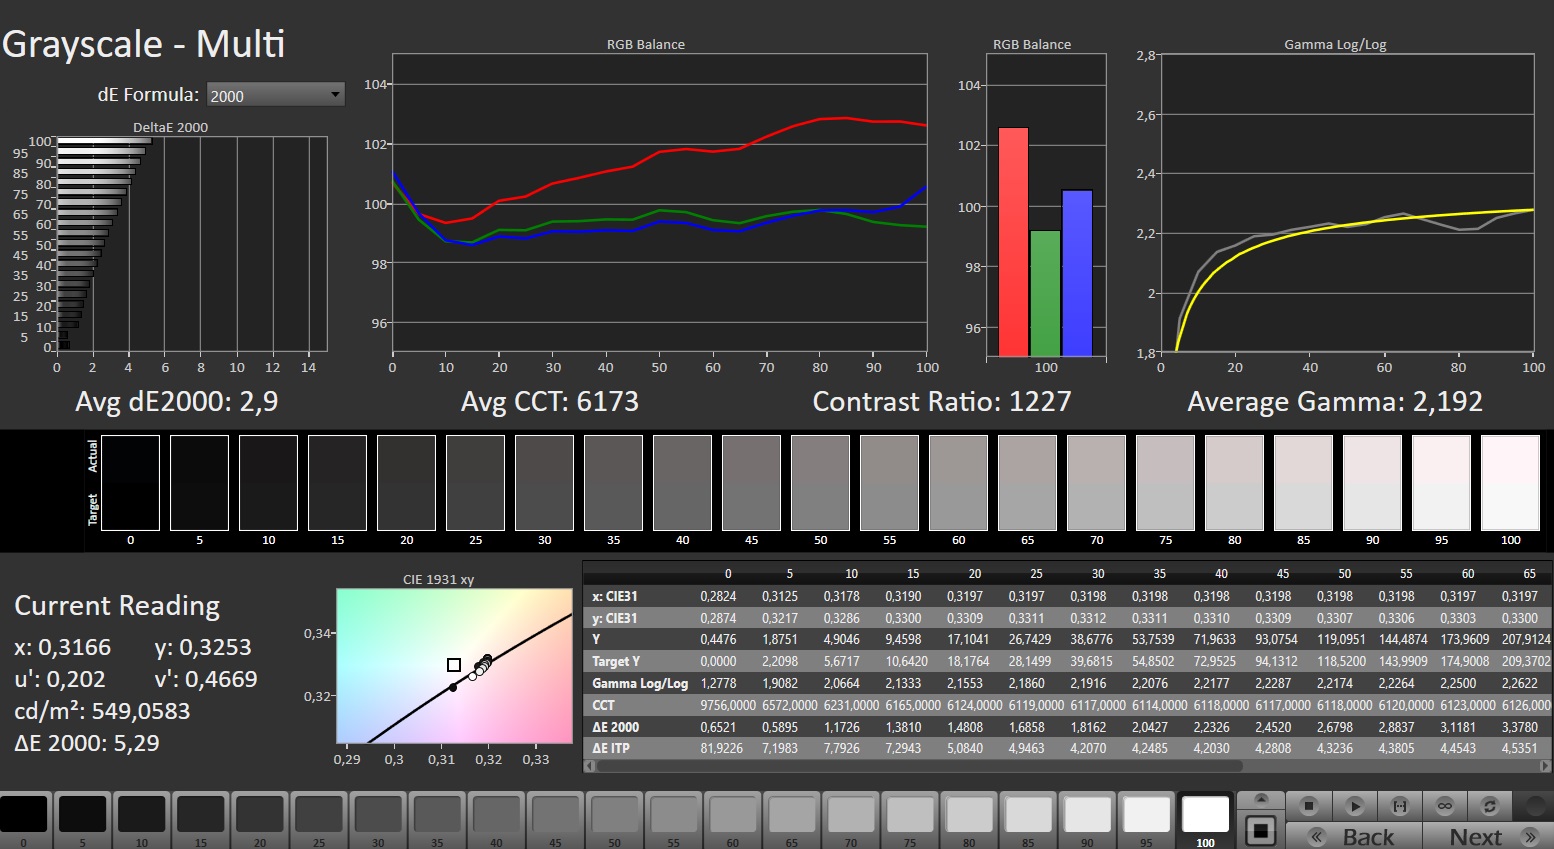
ΔE Greyscale Calman: 2.9 | ∀{0.09-98 Ø4.97}
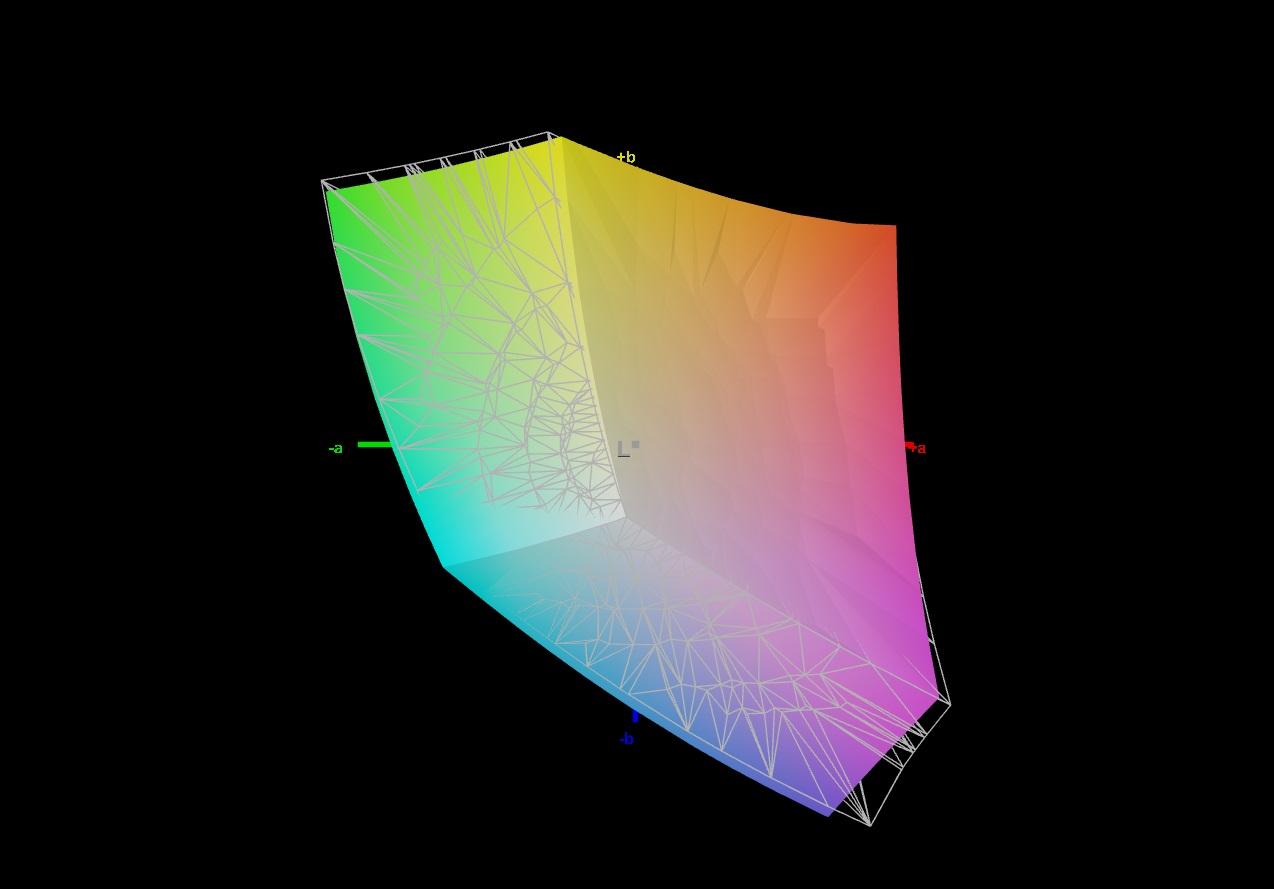
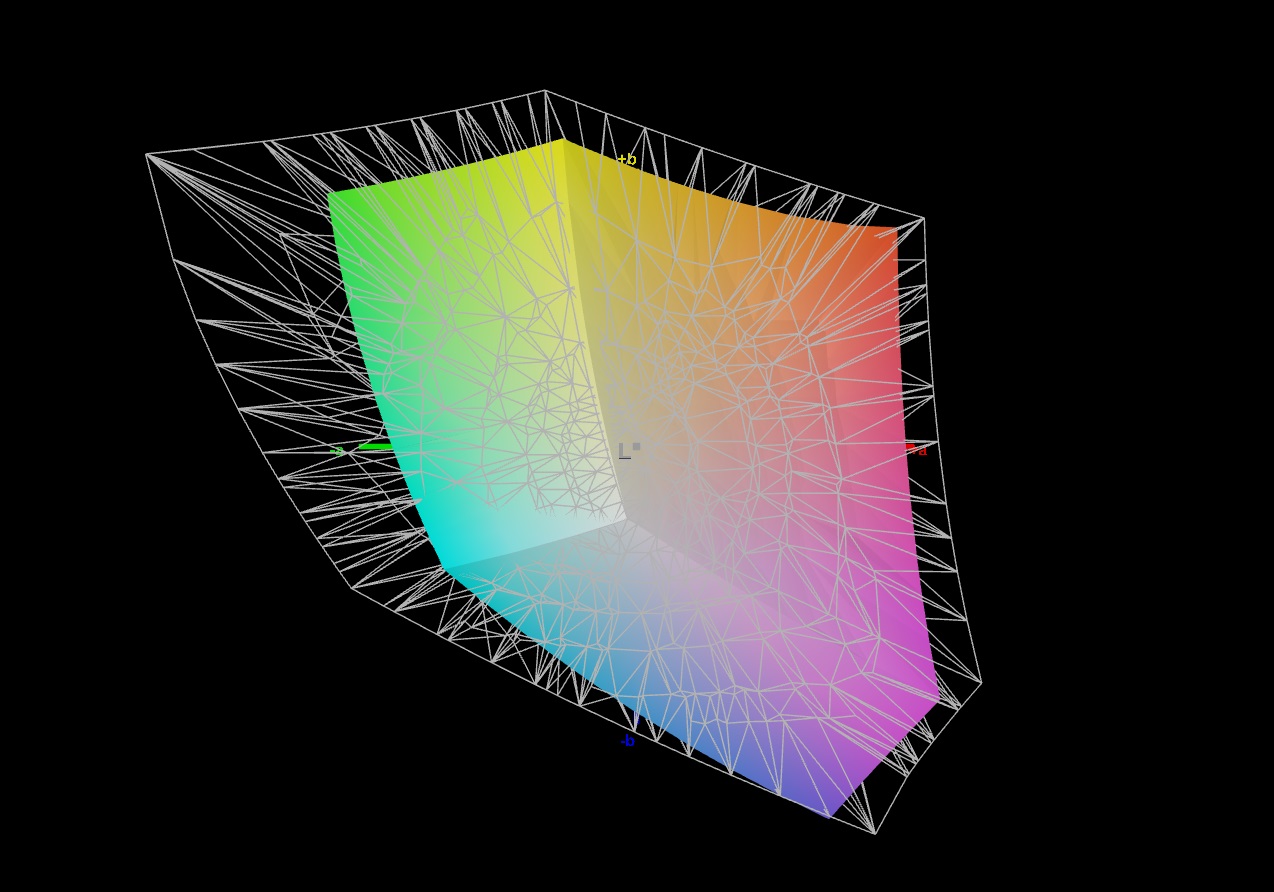
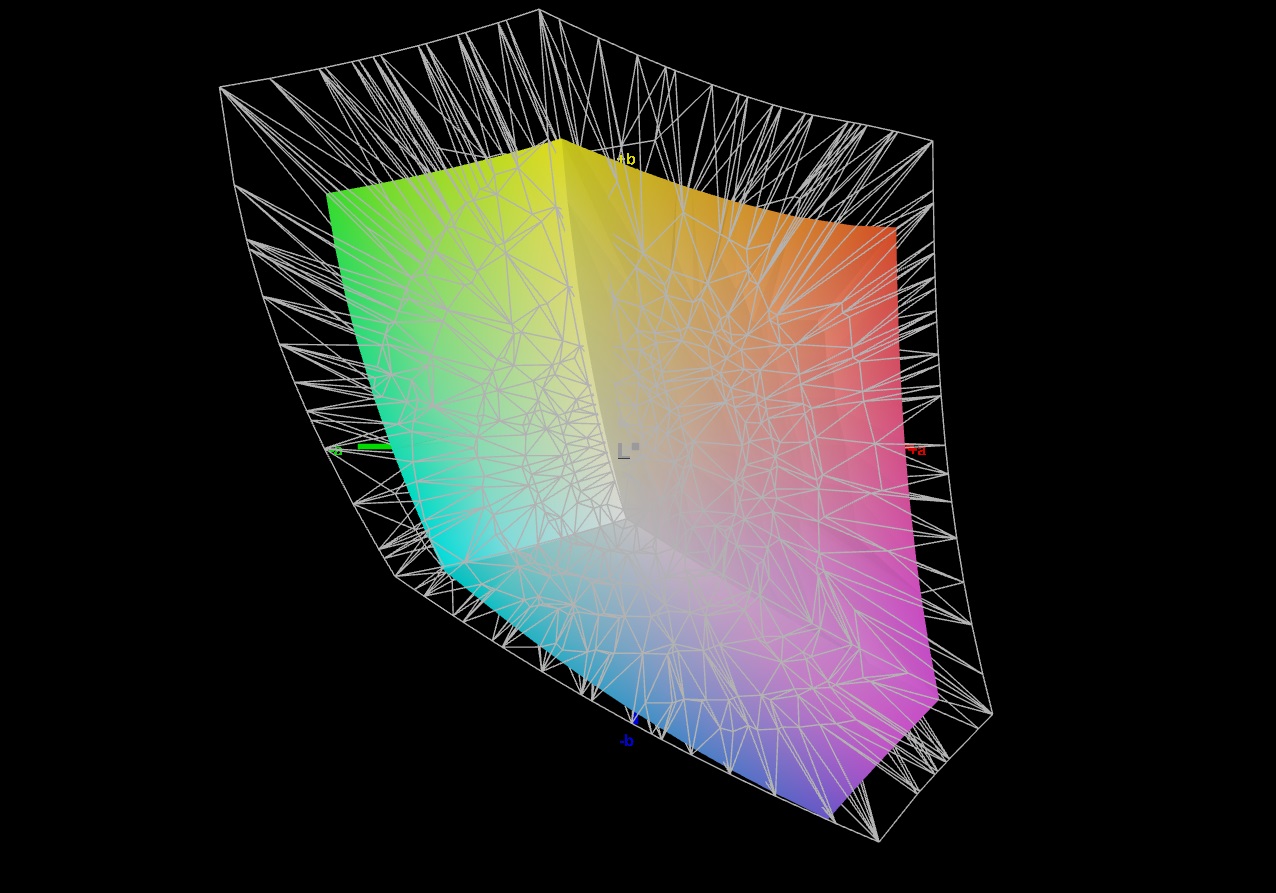
69.3% AdobeRGB 1998 (Argyll 3D)
96.7% sRGB (Argyll 3D)
67.2% Display P3 (Argyll 3D)
Gamma: 2.192
CCT: 6173 K
| Aorus 16X 2024 BOE CQ NE160QDM-NY1, IPS, 2560x1600, 16" | Alienware m16 R2 BOE NE16NYH, IPS, 2560x1600, 16" | HP Omen Transcend 16-u1095ng ATNA60DL02-0 (SDC41A4), OLED, 2560x1600, 16" | Asus TUF Gaming A17 FA707XI-NS94 AU Optronics B173HAN04.9, IPS, 1920x1080, 17.3" | Schenker XMG Pro 16 Studio (Mid 23) BOE CQ NE160QDM-NZ1, IPS, 2560x1600, 16" | Lenovo Legion Pro 5 16IRX9 BOE NE160QDM-NYC, IPS, 2560x1600, 16" | |
|---|---|---|---|---|---|---|
| Display | 4% | 31% | -40% | 2% | 2% | |
| Display P3 Coverage (%) | 67.2 | 71 6% | 99.8 49% | 39.7 -41% | 69.4 3% | 69.3 3% |
| sRGB Coverage (%) | 96.7 | 100 3% | 100 3% | 59.1 -39% | 98.2 2% | 99.4 3% |
| AdobeRGB 1998 Coverage (%) | 69.3 | 71.4 3% | 97 40% | 41 -41% | 70.1 1% | 70.1 1% |
| Response Times | -19% | 97% | -409% | -53% | -62% | |
| Response Time Grey 50% / Grey 80% * (ms) | 7.5 ? | 5.7 ? 24% | 0.2 ? 97% | 39 ? -420% | 12.2 ? -63% | 11.9 ? -59% |
| Response Time Black / White * (ms) | 5.4 ? | 8.7 ? -61% | 0.2 ? 96% | 26.9 ? -398% | 7.7 ? -43% | 8.9 ? -65% |
| PWM Frequency (Hz) | 120 ? | |||||
| Screen | 11% | 162% | -50% | -9% | 17% | |
| Brightness middle (cd/m²) | 542 | 345.8 -36% | 390 -28% | 255.9 -53% | 349 -36% | 384 -29% |
| Brightness (cd/m²) | 504 | 337 -33% | 392 -22% | 248 -51% | 348 -31% | 366 -27% |
| Brightness Distribution (%) | 86 | 87 1% | 98 14% | 91 6% | 93 8% | 91 6% |
| Black Level * (cd/m²) | 0.45 | 0.3 33% | 0.02 96% | 0.21 53% | 0.32 29% | 0.35 22% |
| Contrast (:1) | 1204 | 1153 -4% | 19500 1520% | 1219 1% | 1091 -9% | 1097 -9% |
| Colorchecker dE 2000 * | 2.73 | 1.99 27% | 1.94 29% | 4.51 -65% | 1.98 27% | 0.97 64% |
| Colorchecker dE 2000 max. * | 5.29 | 3.52 33% | 4.26 19% | 20.77 -293% | 7.56 -43% | 3.57 33% |
| Colorchecker dE 2000 calibrated * | 1.32 | 0.62 53% | 4.21 -219% | 1.82 -38% | 1.45 -10% | 0.77 42% |
| Greyscale dE 2000 * | 2.9 | 2.1 28% | 1.5 48% | 3.2 -10% | 3.3 -14% | 1.5 48% |
| Gamma | 2.192 100% | 2.32 95% | 2.221 99% | 2.08 106% | 2.137 103% | 2.24 98% |
| CCT | 6173 105% | 6369 102% | 6395 102% | 6054 107% | 6672 97% | 6709 97% |
| Total Average (Program / Settings) | -1% /
6% | 97% /
124% | -166% /
-99% | -20% /
-13% | -14% /
2% |
* ... smaller is better
The screen already showed good color depiction straight out of the box: With a deviation of around 2.7, the target (DeltaE < 3) has been met. Calibration reduces the deviation to 1.3 and ensures more balanced shades of gray. The panel can completely reproduce the sRGB color space, but not the AdobeRGB and DCI P3 color spaces. This is no different for the displays of most competitors.
Display Response Times
| ↔ Response Time Black to White | ||
|---|---|---|
| 5.4 ms ... rise ↗ and fall ↘ combined | ↗ 1.5 ms rise | 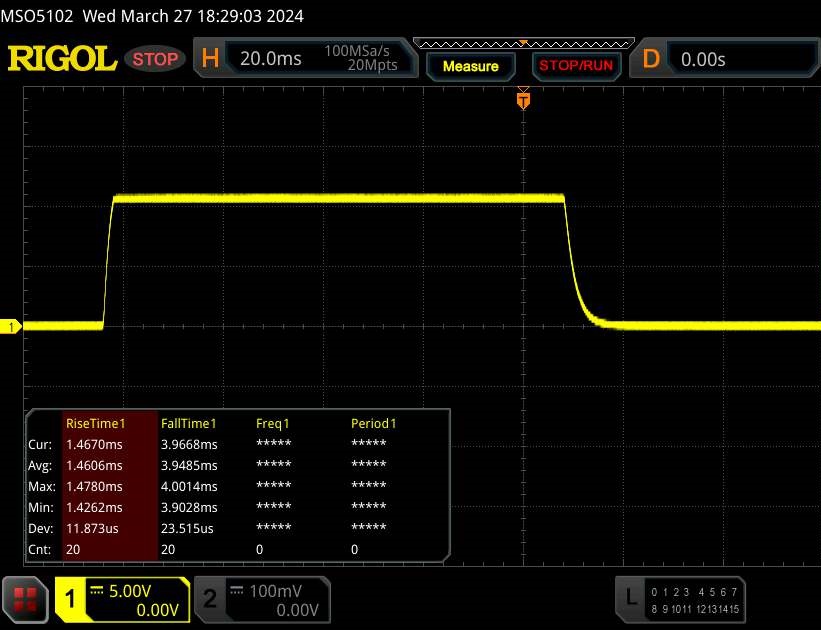 |
| ↘ 3.9 ms fall | ||
| The screen shows very fast response rates in our tests and should be very well suited for fast-paced gaming. In comparison, all tested devices range from 0.1 (minimum) to 240 (maximum) ms. » 18 % of all devices are better. This means that the measured response time is better than the average of all tested devices (19.9 ms). | ||
| ↔ Response Time 50% Grey to 80% Grey | ||
| 7.5 ms ... rise ↗ and fall ↘ combined | ↗ 3.3 ms rise | 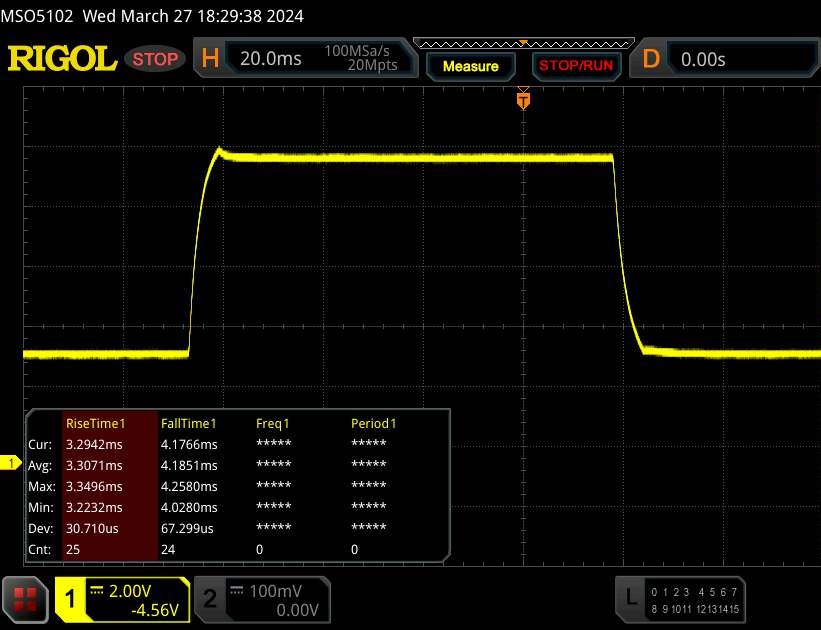 |
| ↘ 4.2 ms fall | ||
| The screen shows very fast response rates in our tests and should be very well suited for fast-paced gaming. In comparison, all tested devices range from 0.165 (minimum) to 636 (maximum) ms. » 20 % of all devices are better. This means that the measured response time is better than the average of all tested devices (31.1 ms). | ||
Screen Flickering / PWM (Pulse-Width Modulation)
| Screen flickering / PWM not detected | 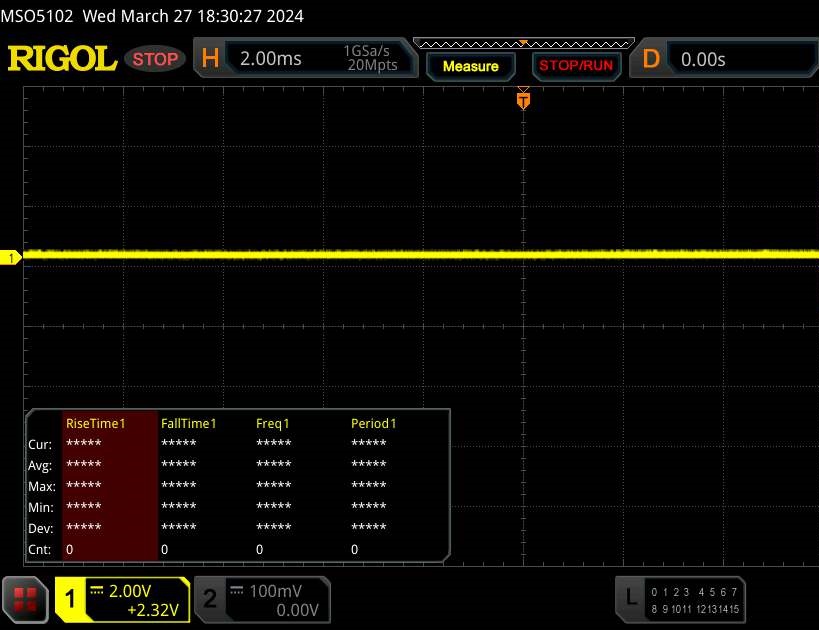 | ||
In comparison: 52 % of all tested devices do not use PWM to dim the display. If PWM was detected, an average of 7810 (minimum: 5 - maximum: 343500) Hz was measured. | |||
The viewing-angle stable IPS panel remains legible from every angle. Outside, you can read from the panel as long as the sun isn't shining too brightly.

Performance - Raptor Lake and Ada Lovelace power the device
Gigabyte's Aorus 16X is a laptop for gamers and creators. The necessary computing power is delivered by Raptor Lake and Ada Lovelace. The present model can currently be purchased for around US$2,000. Cheaper variants are also available.
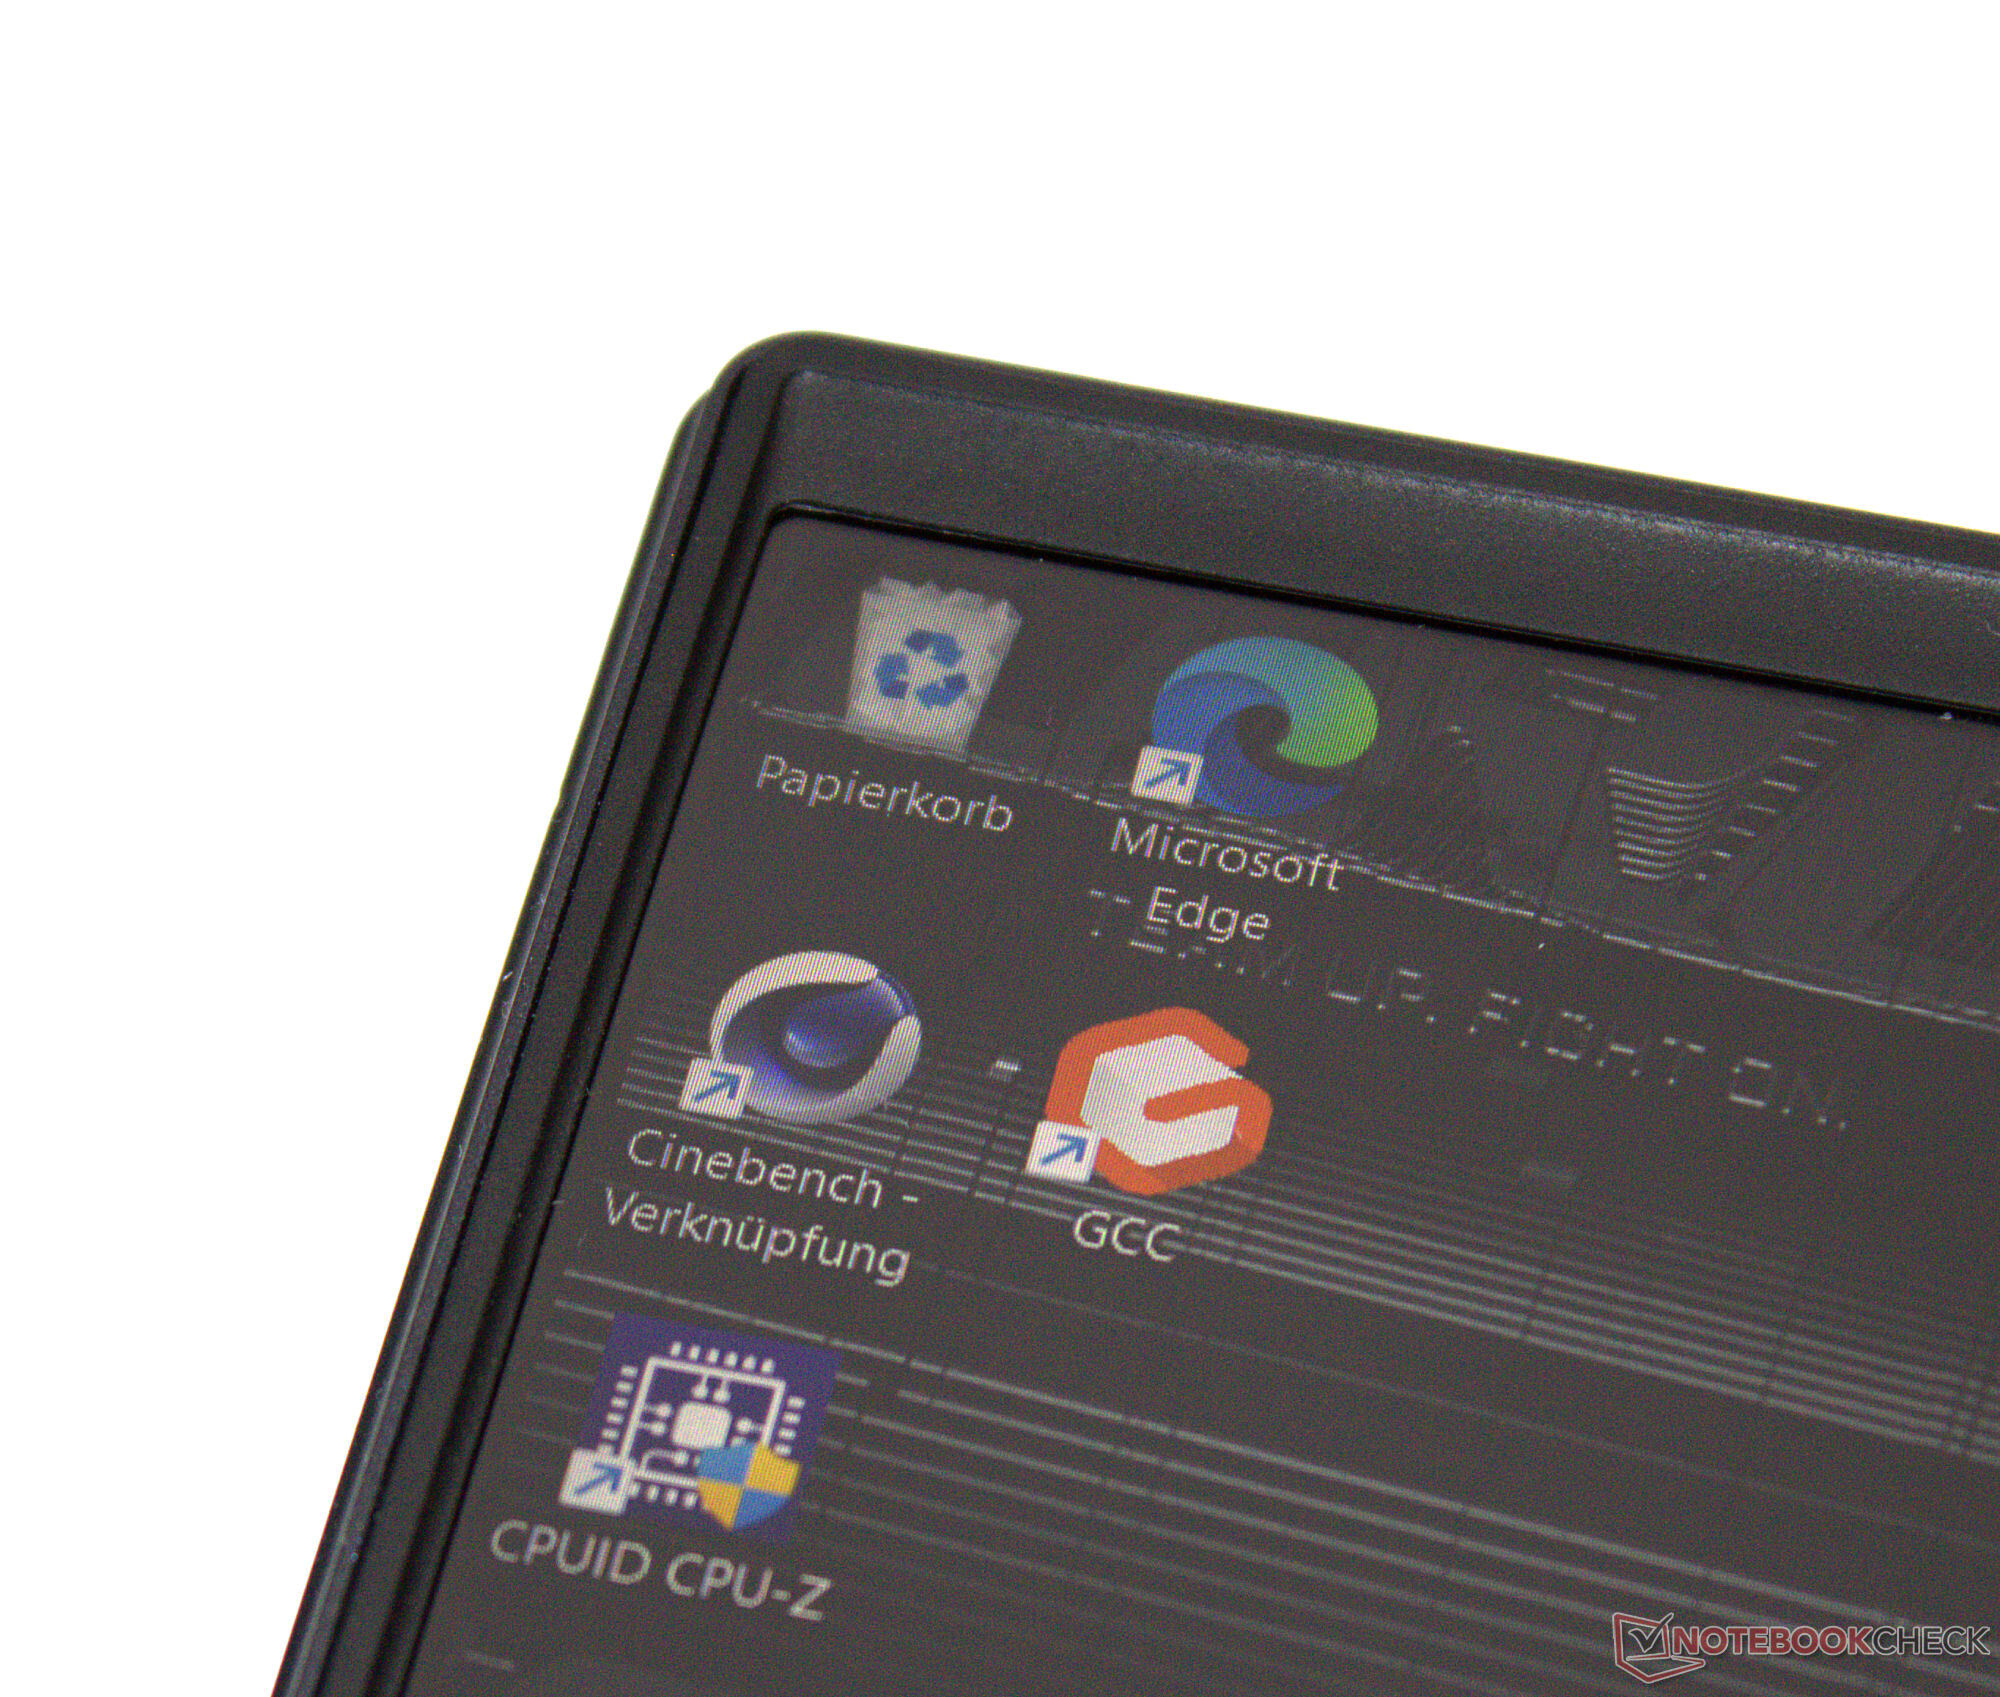
Testing conditions
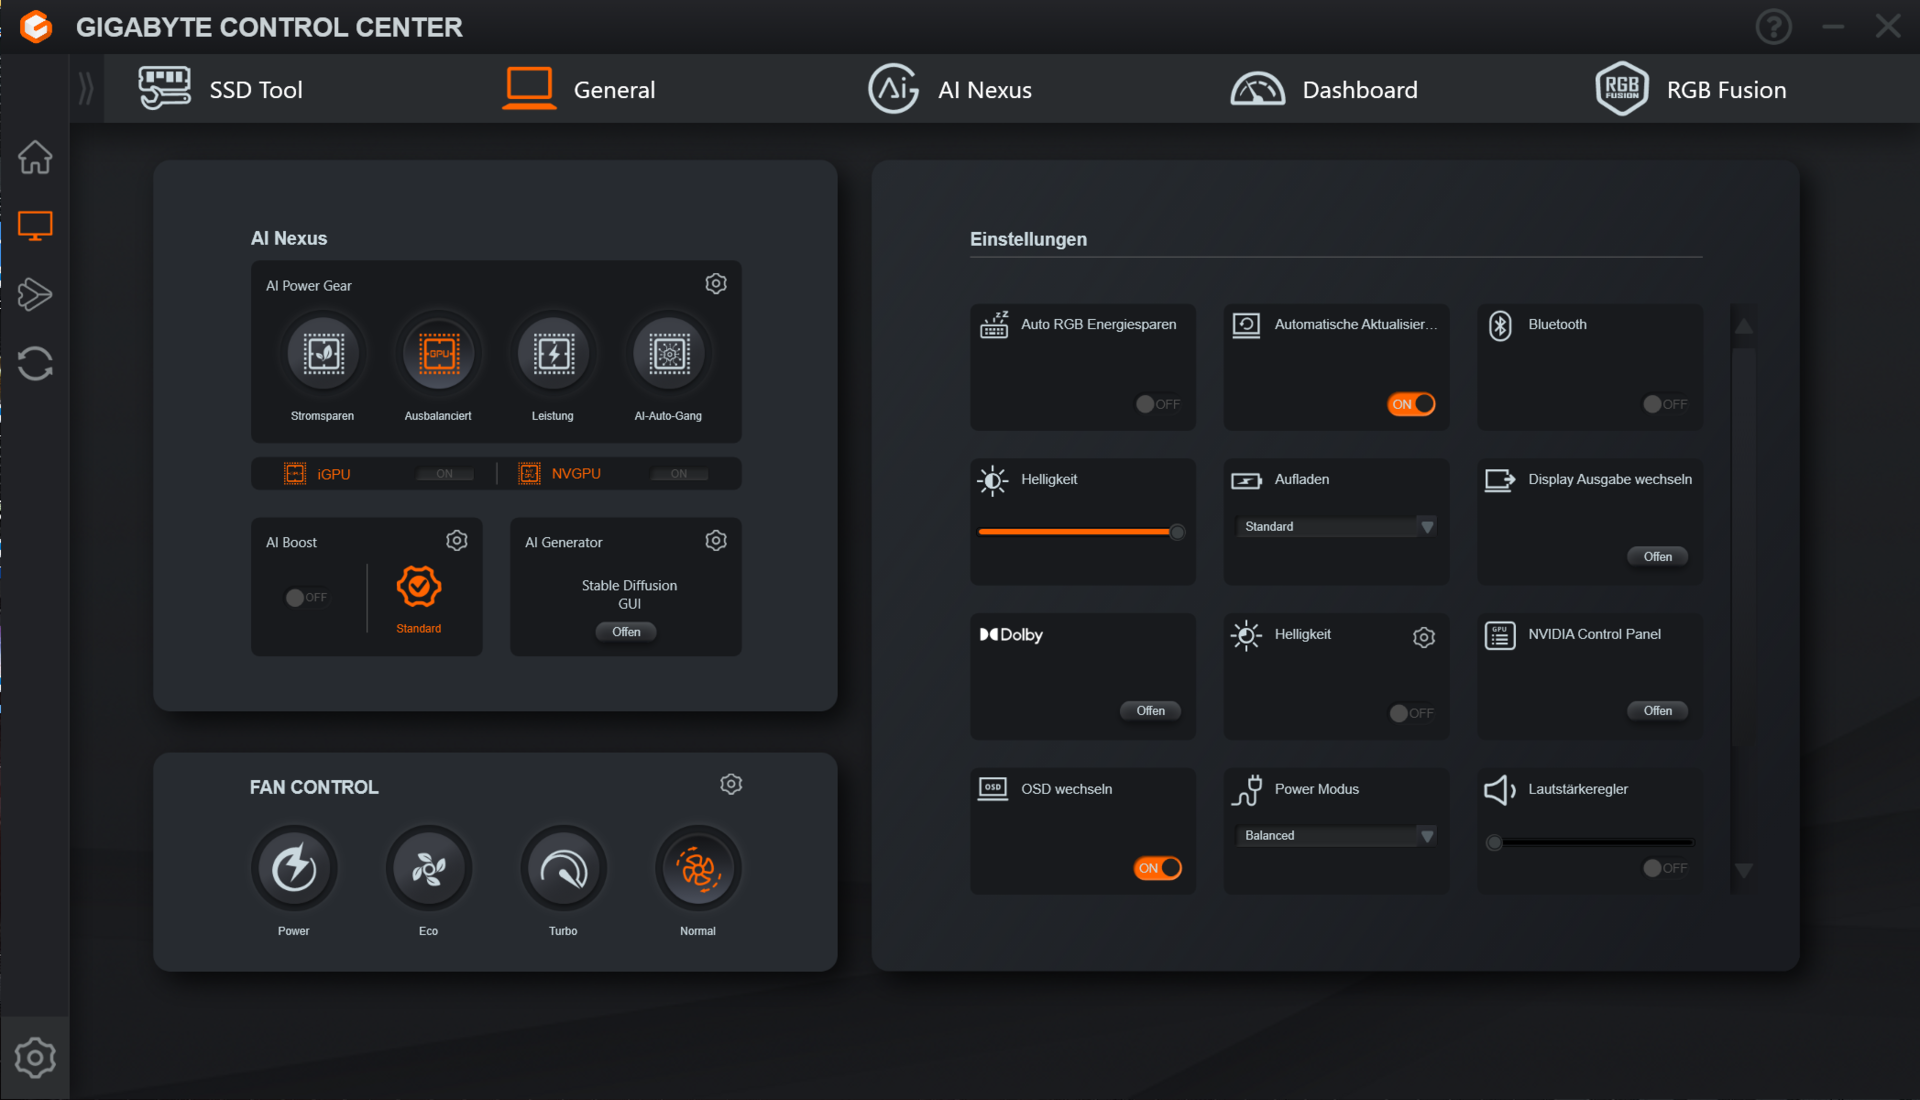
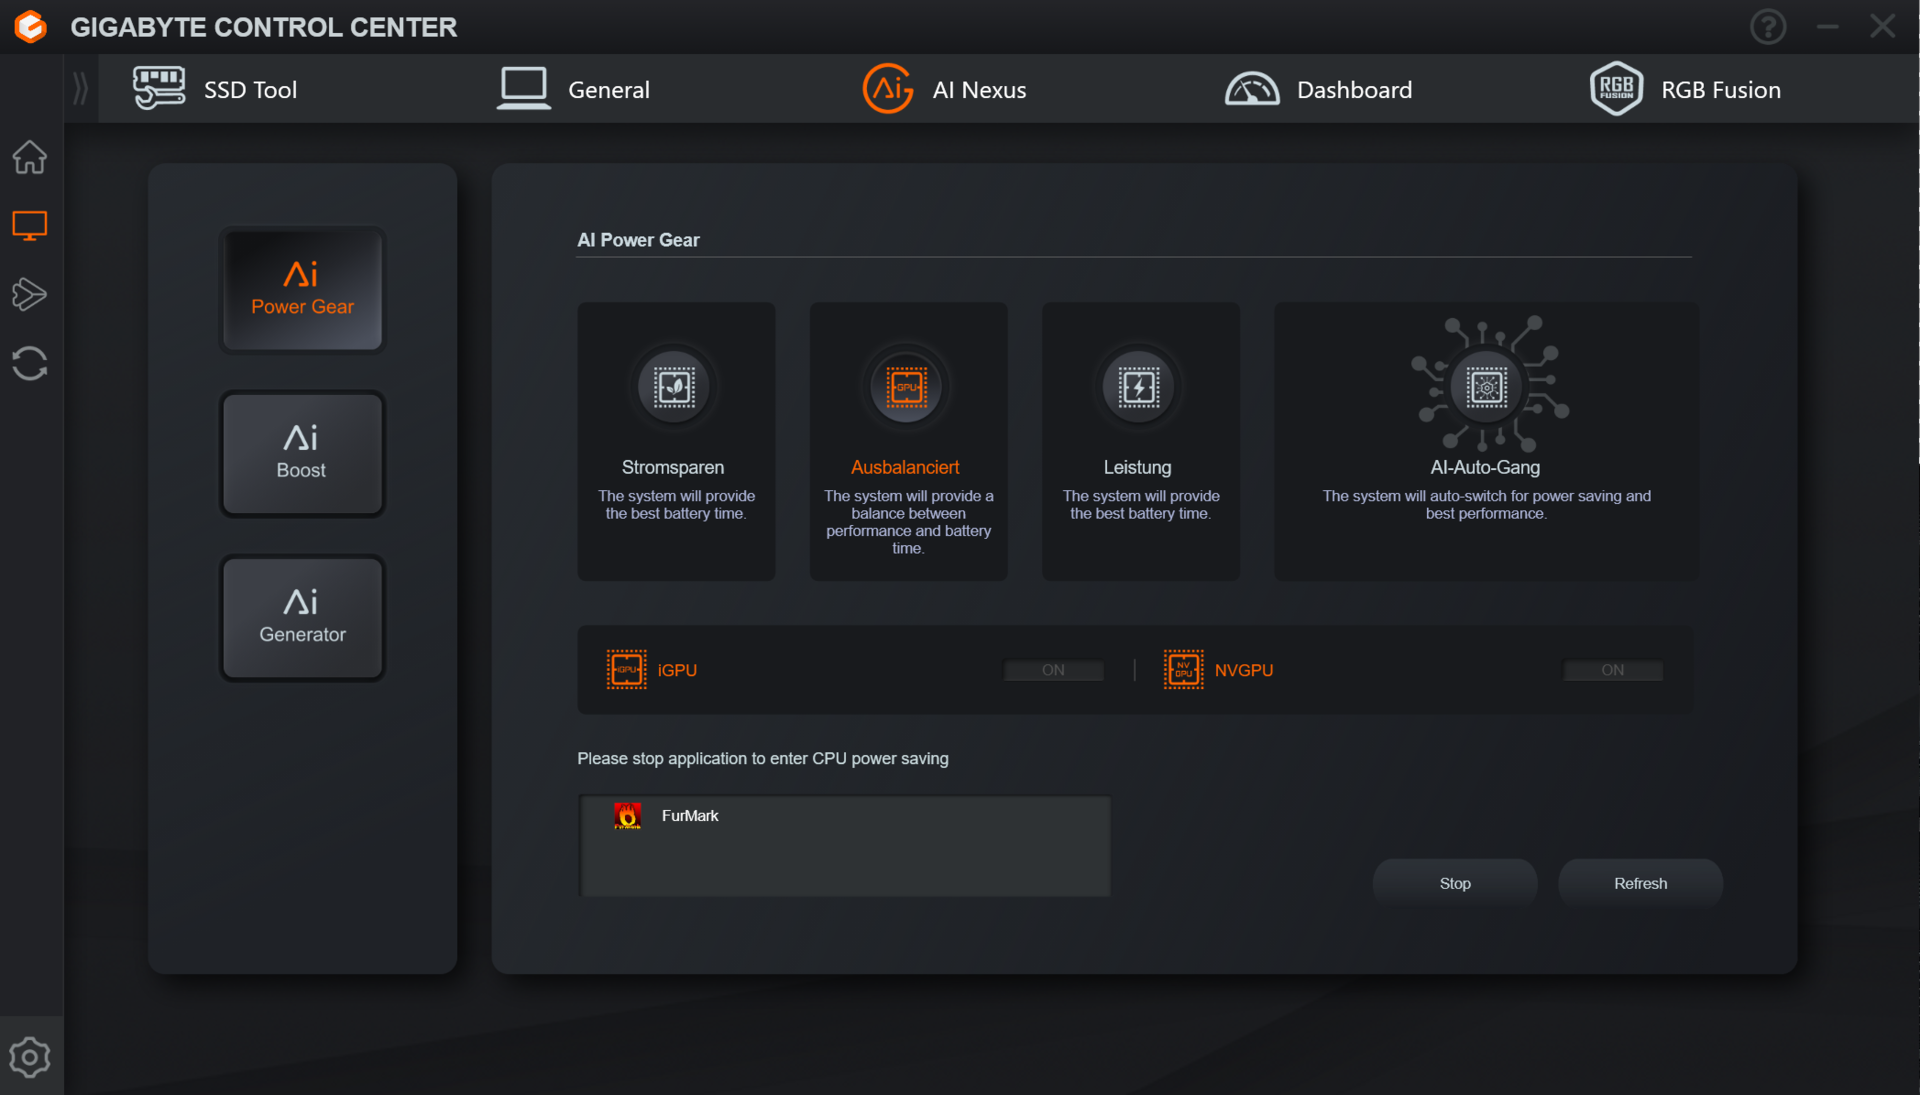
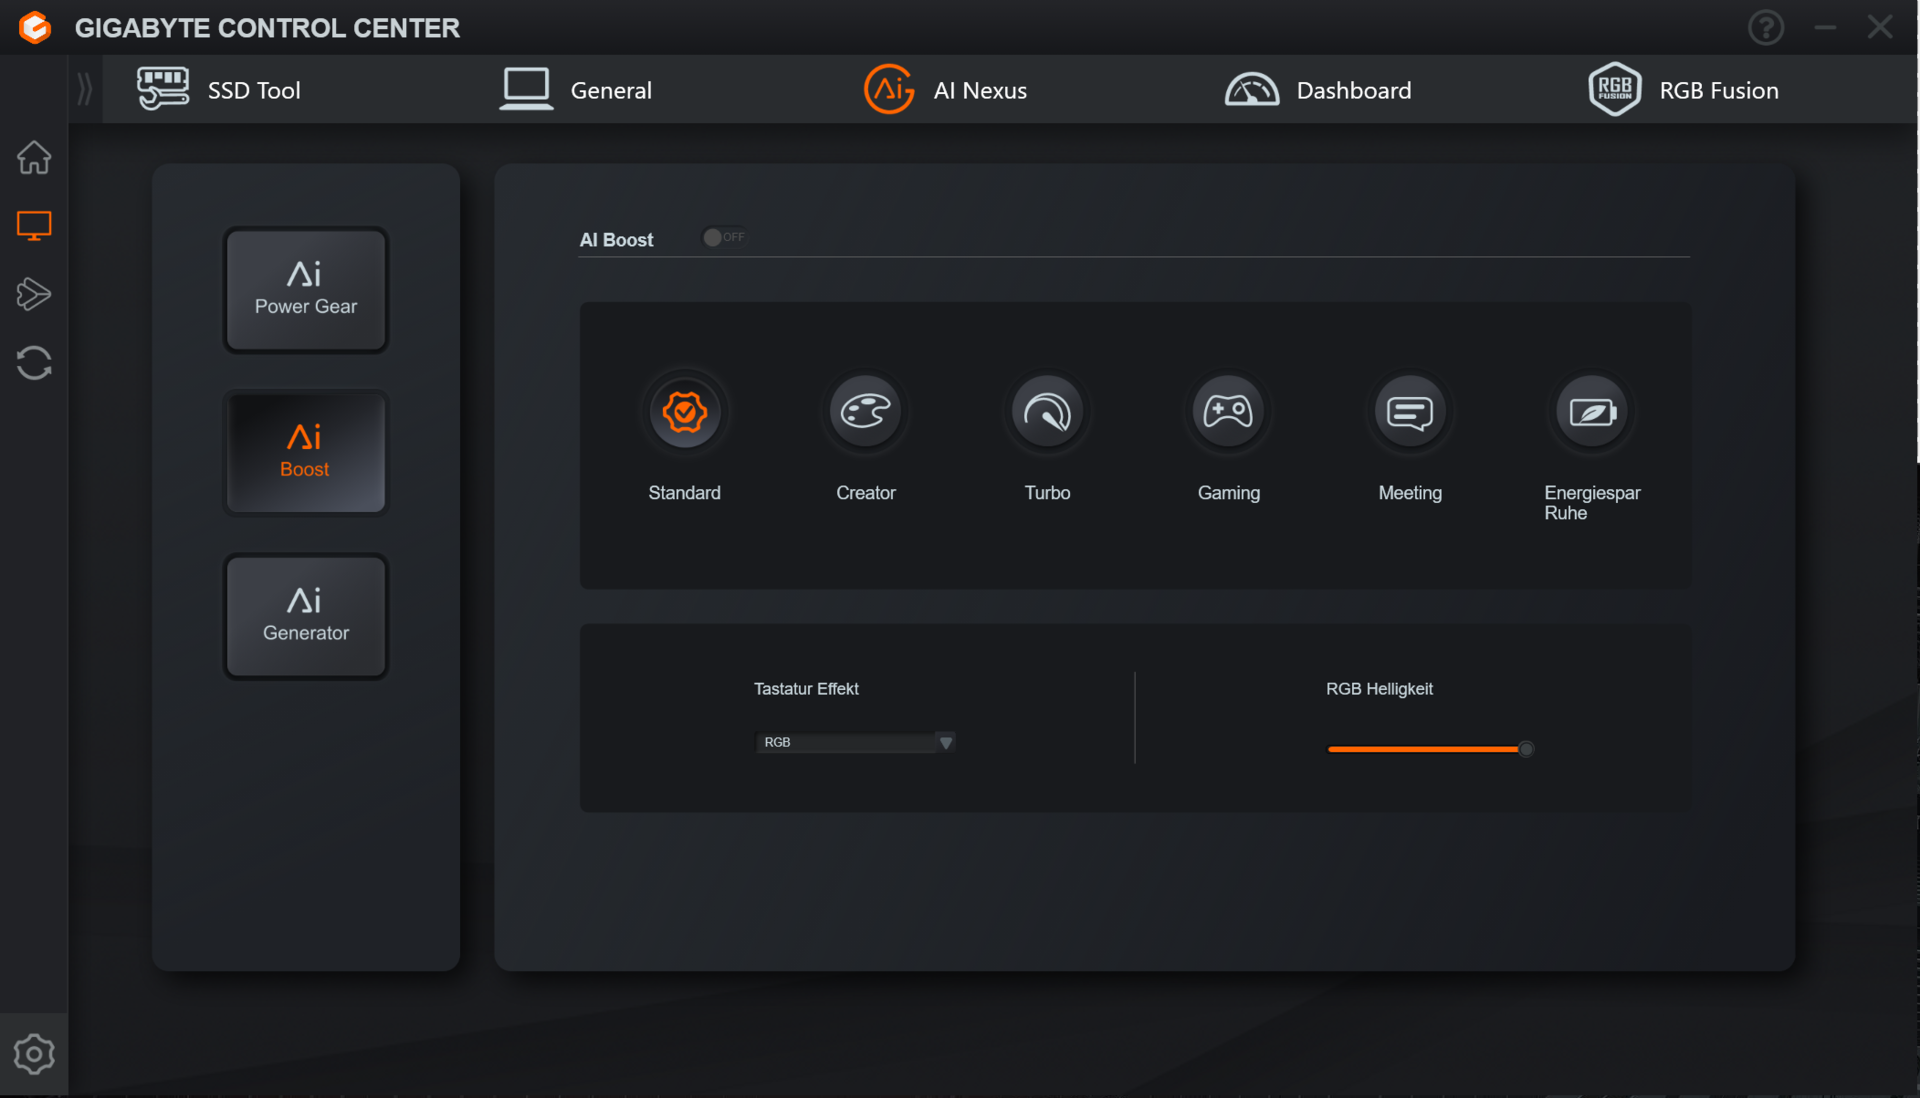
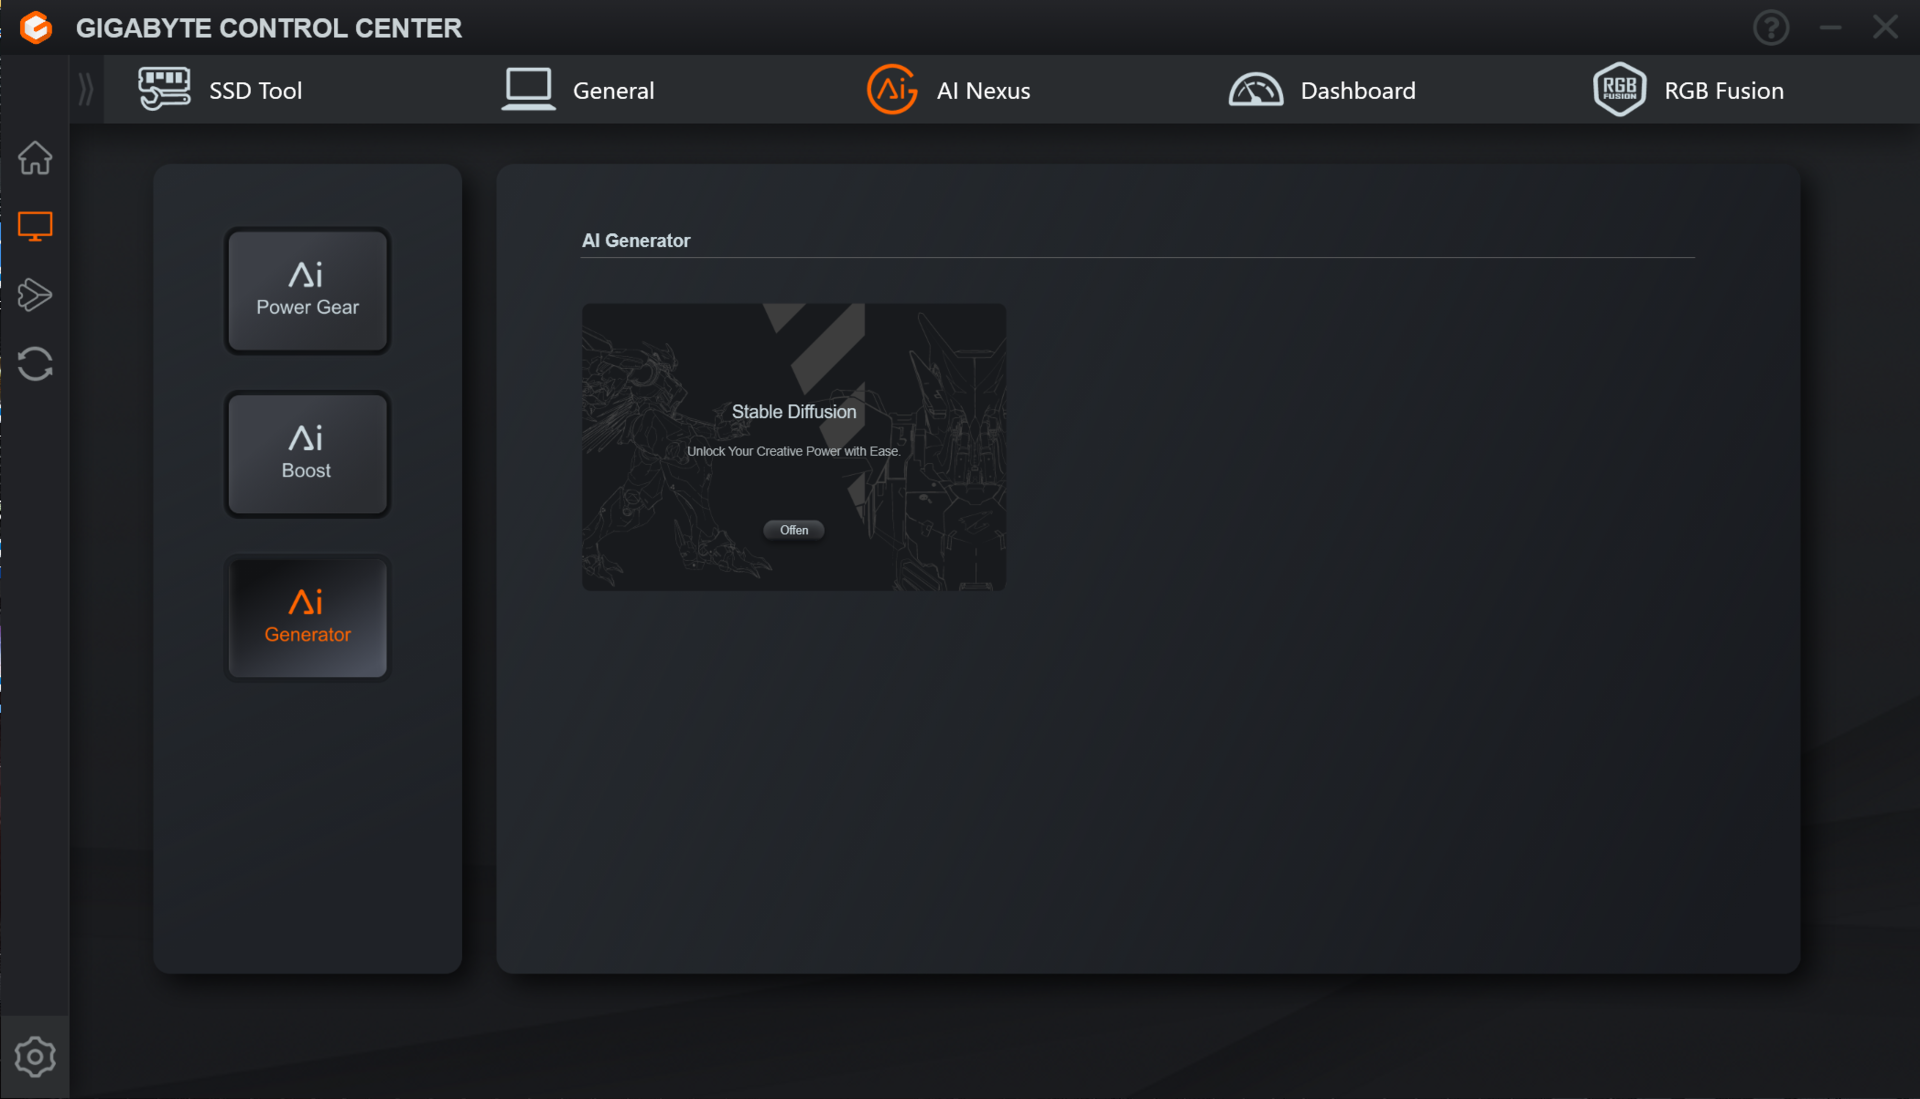
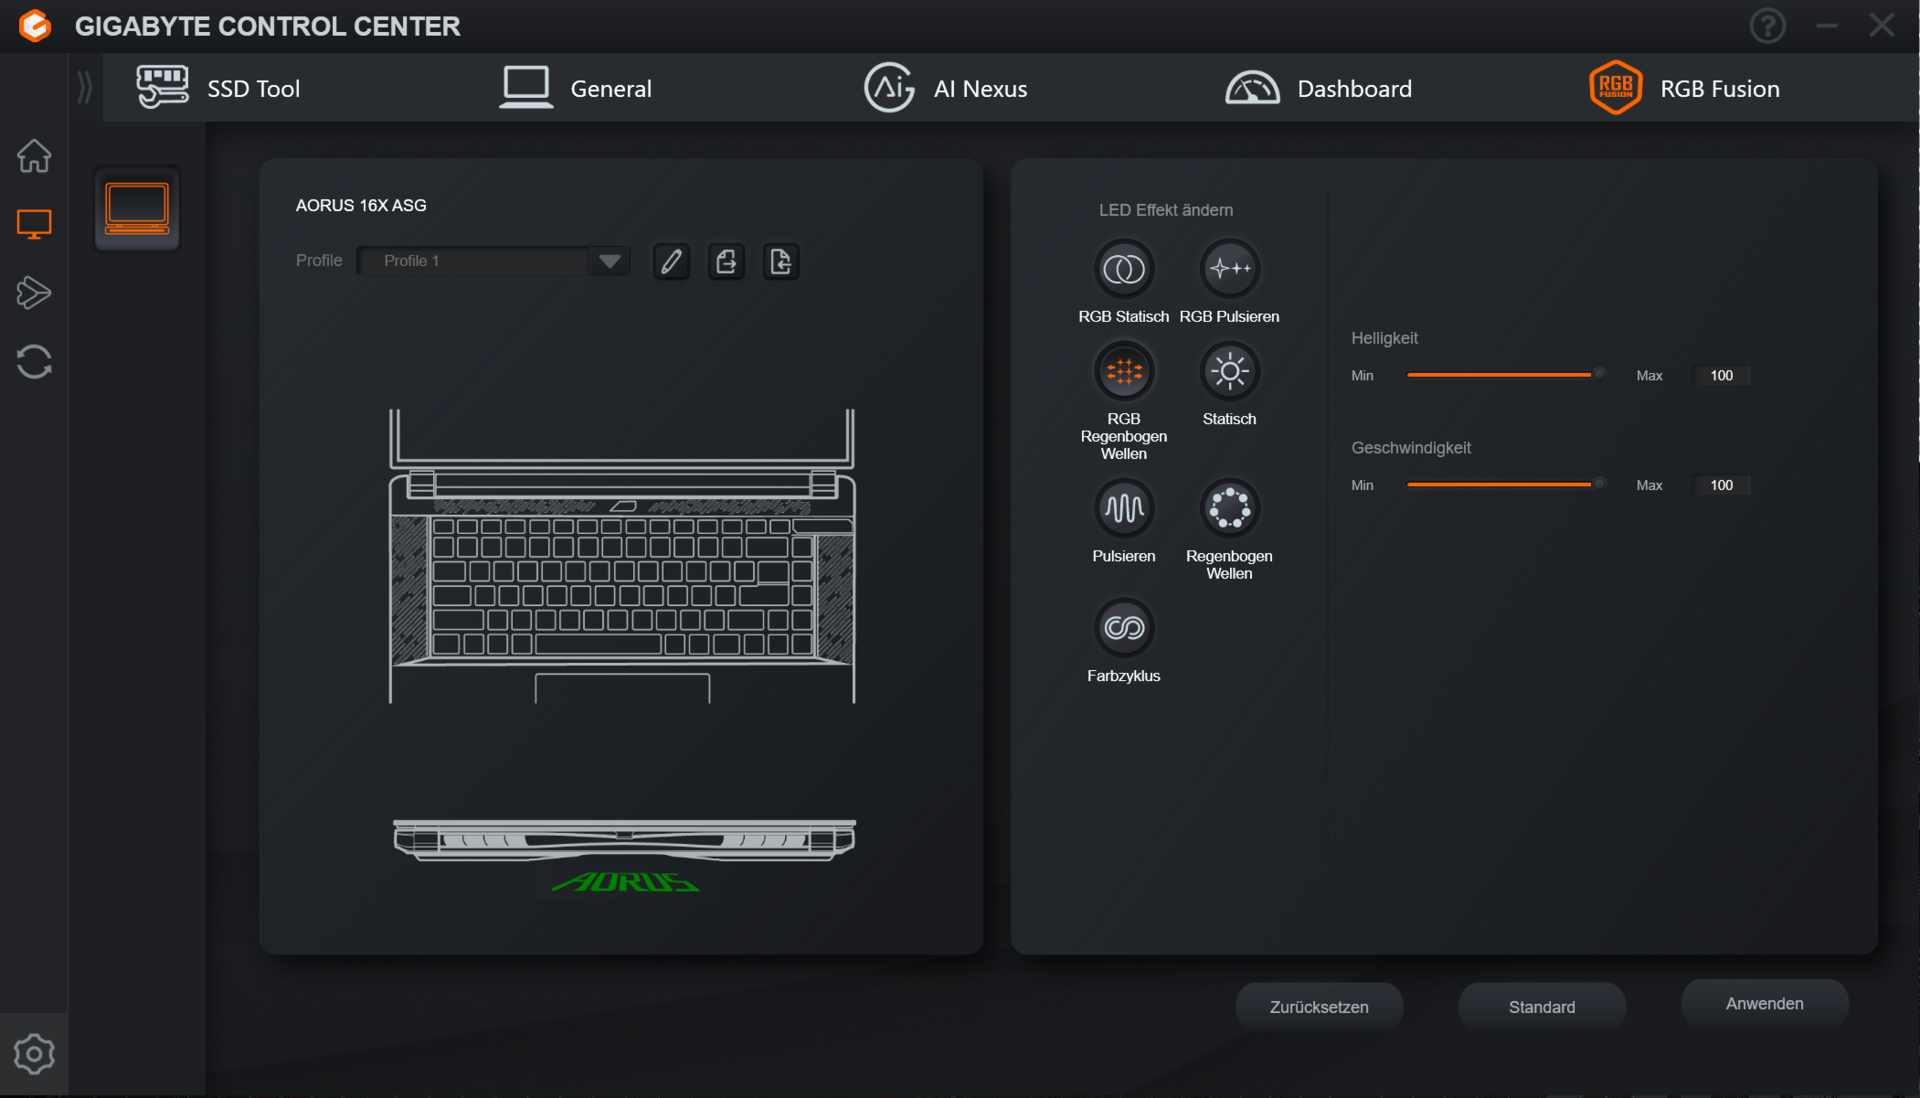
The 16X offers six manufacturer-specific performance modes (see table), which can be switched between via the Gigabyte Control Center (the laptop's control center). We used the modes Standard (benchmarks) and Energy-Saving Quiet (battery tests). Turbo, Gaming and Creator can only be used with the laptop connected to the mains.
Note: The available performance settings are not very clearly communicated within the Gigabyte Control Center. The system-wide performance profiles can be found in the "AI Boost" section. The "AI Power Gear" section only refers to the operating status of the dGPU (dGPU only or off, graphics switching).
| Standard | Creator | Turbo | Gaming | Meeting | Energy-Saving Quiet | |
|---|---|---|---|---|---|---|
| Power Limit 1 (HWInfo) | 90 watts | 110 watts | 125 watts | 110 watts | 65 watts | 65 watts |
| Power Limit 2 (HWInfo) | 120 watts | 135 watts | 150 watts | 135 watts | 100 watts | 100 watts |
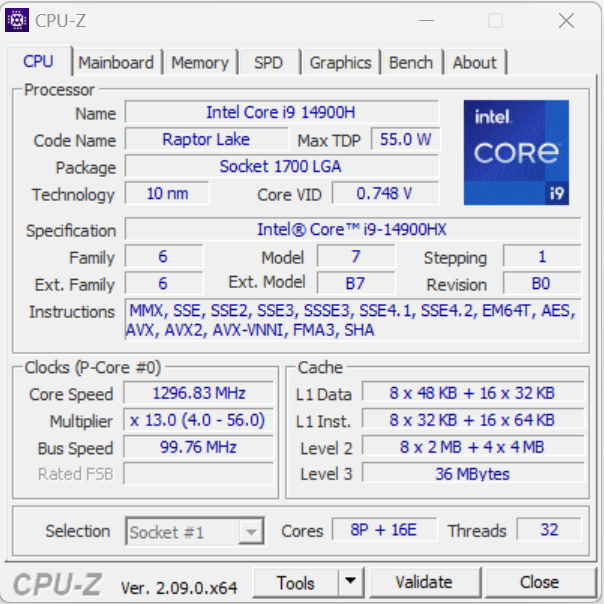
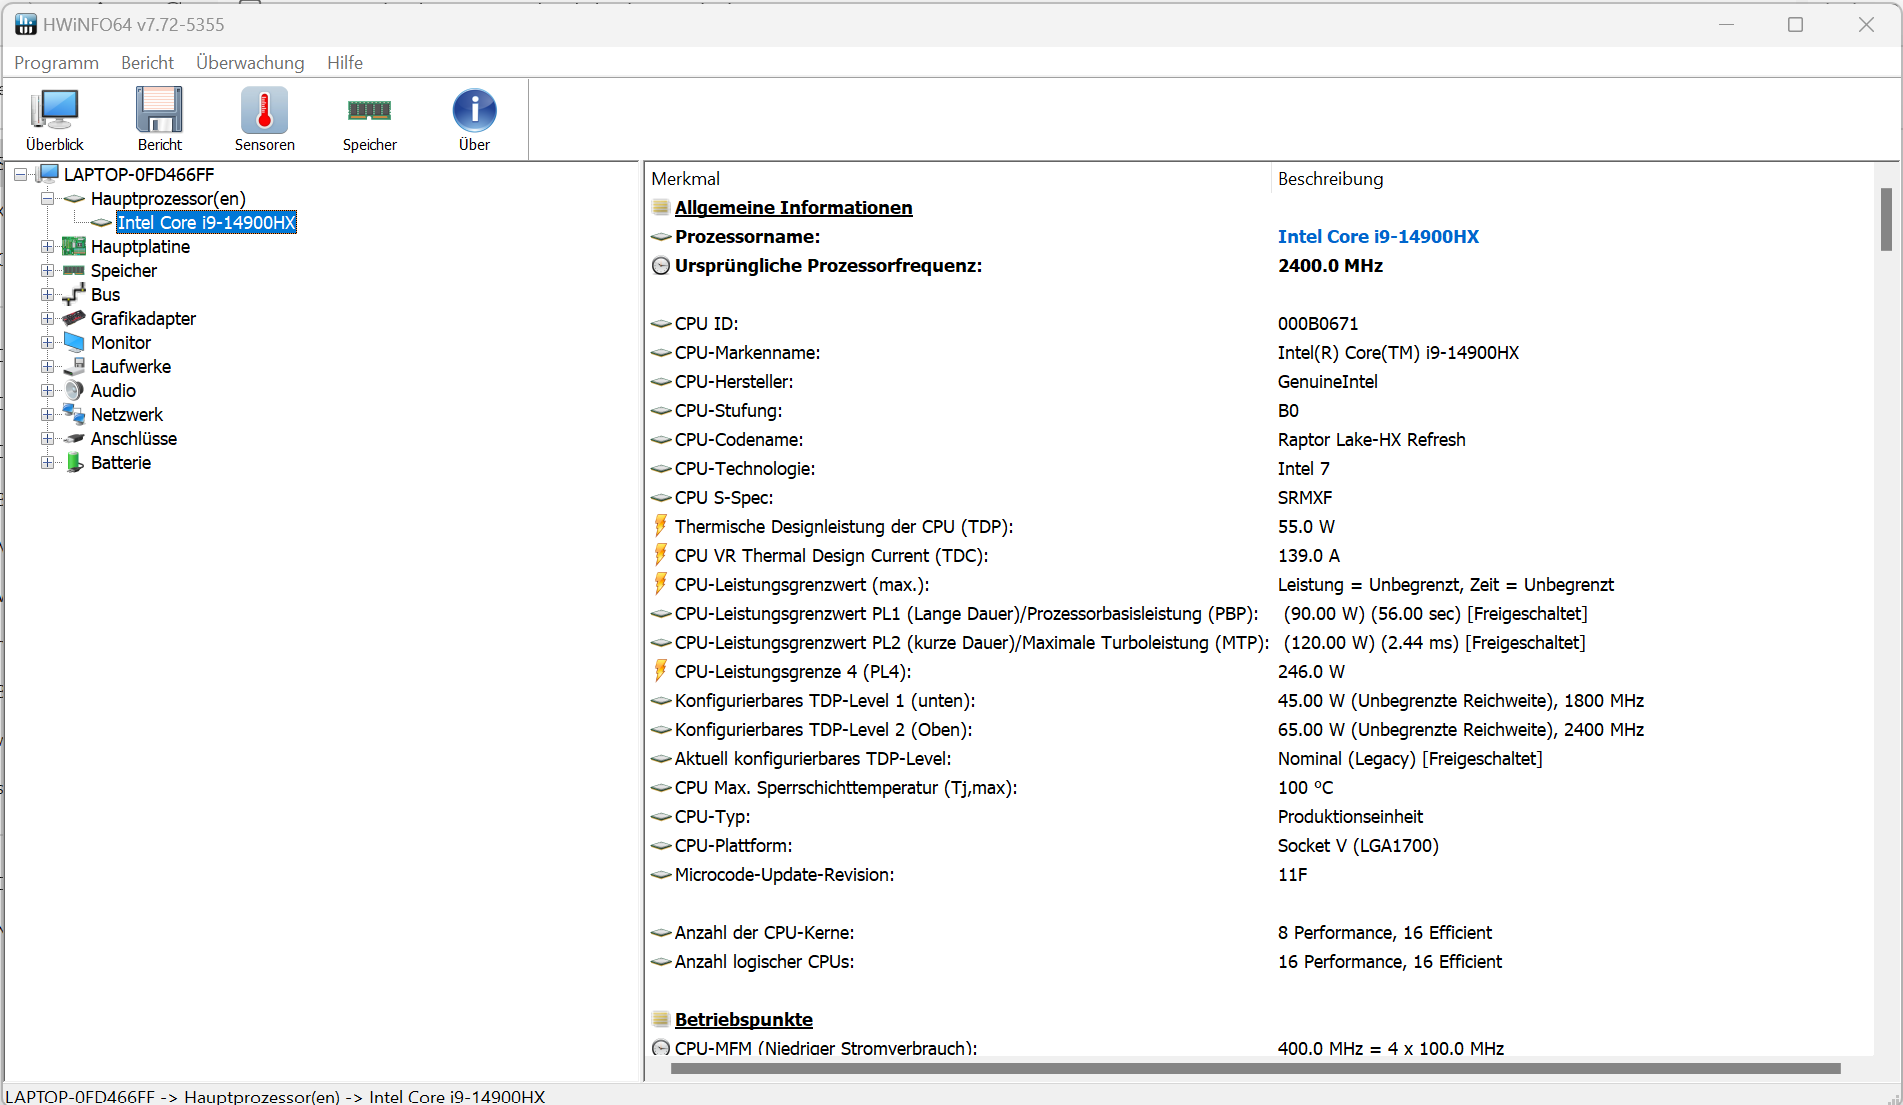
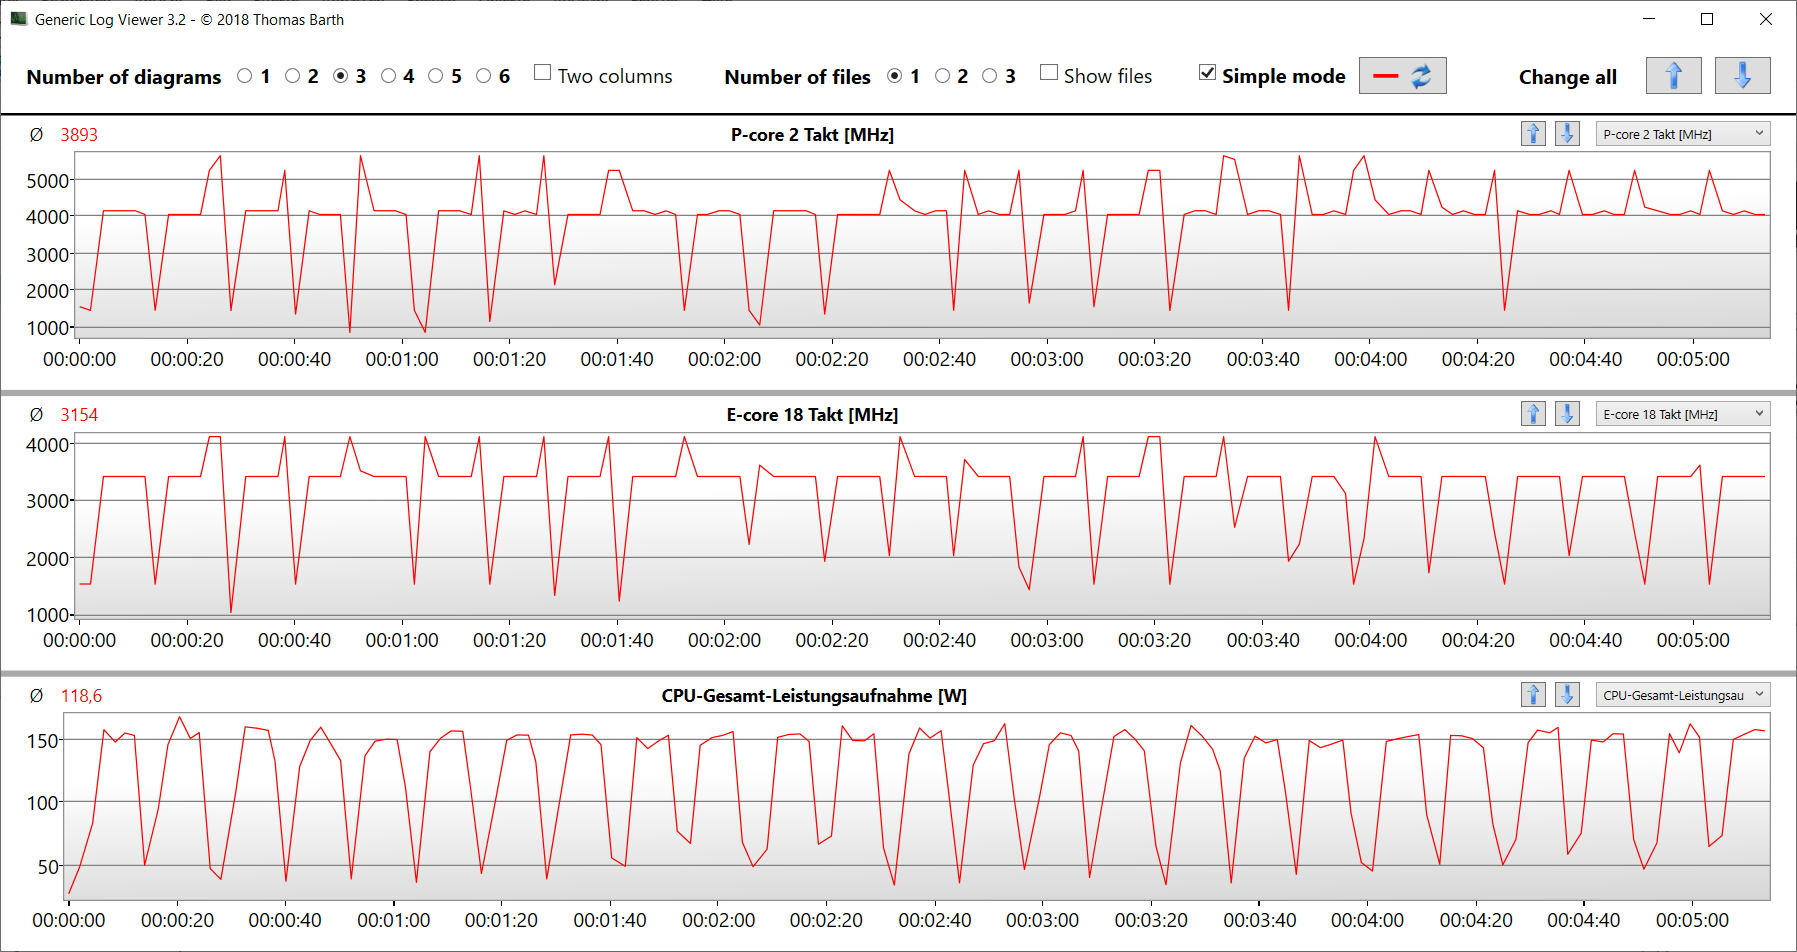
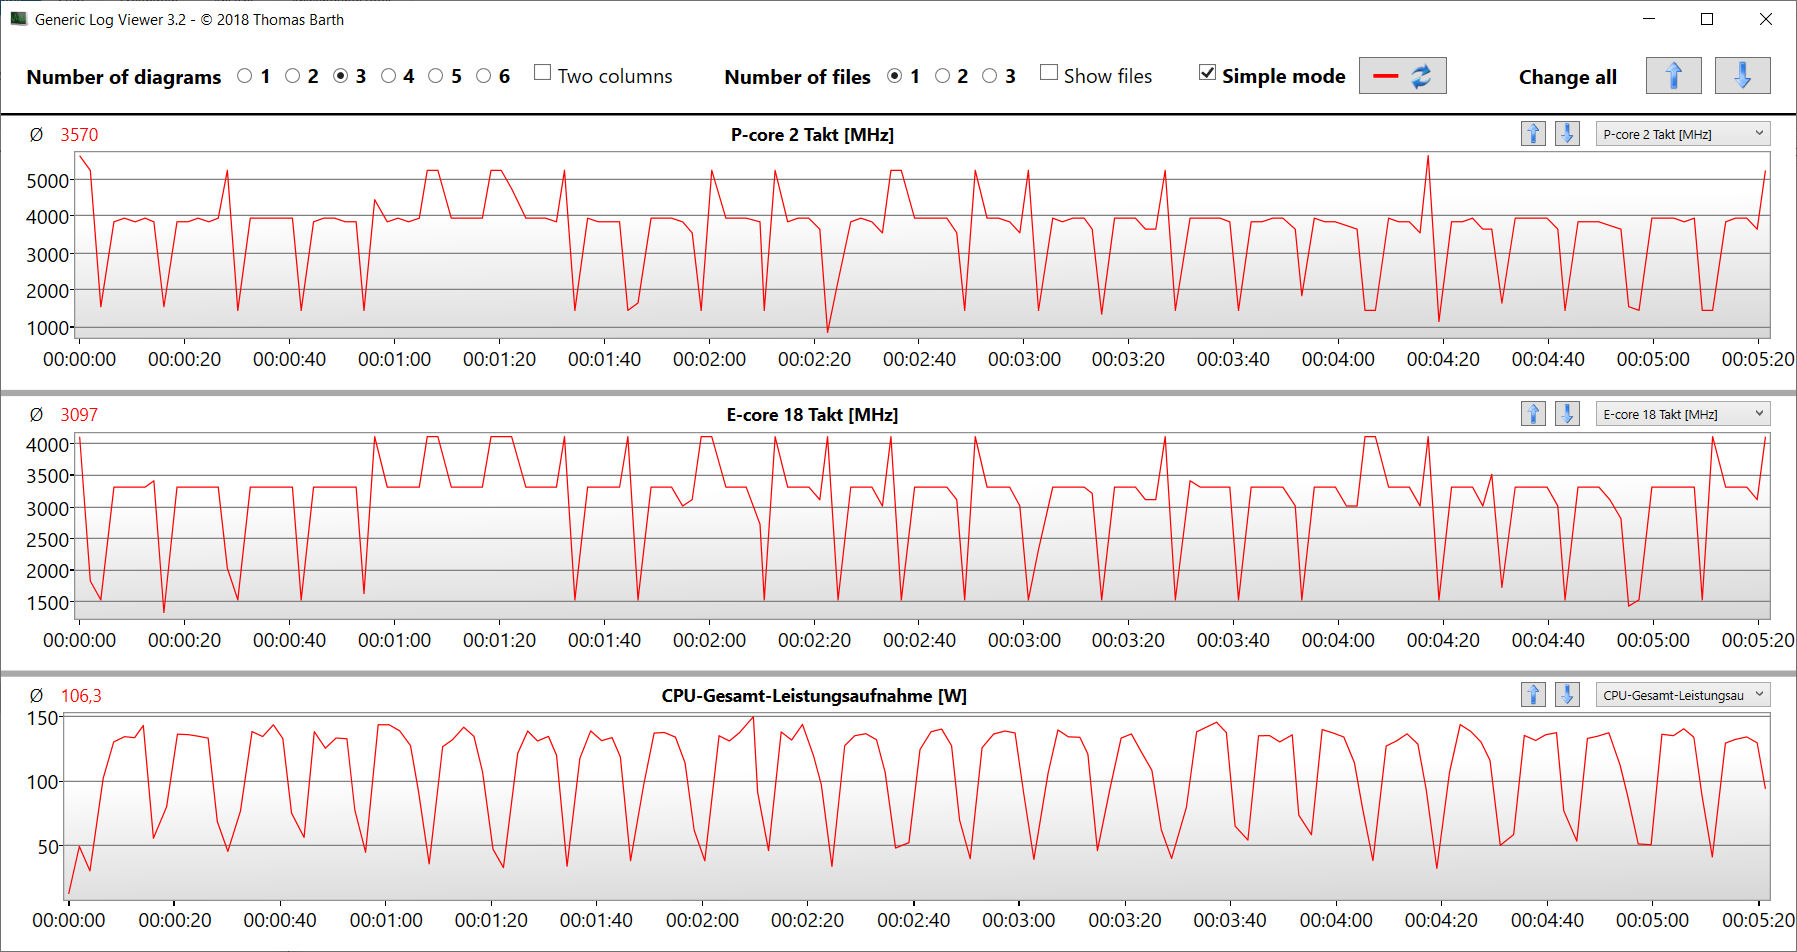
Processor
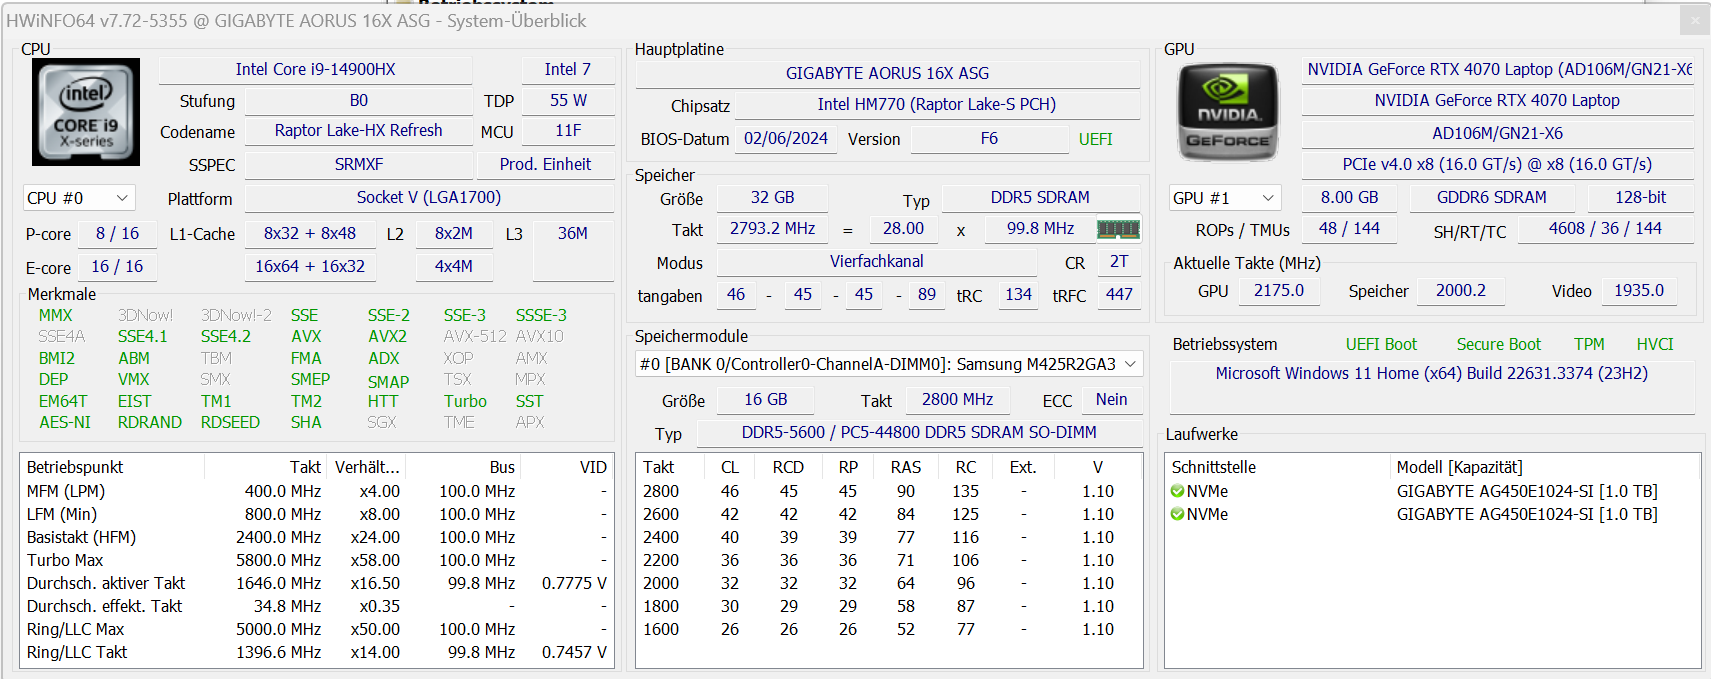
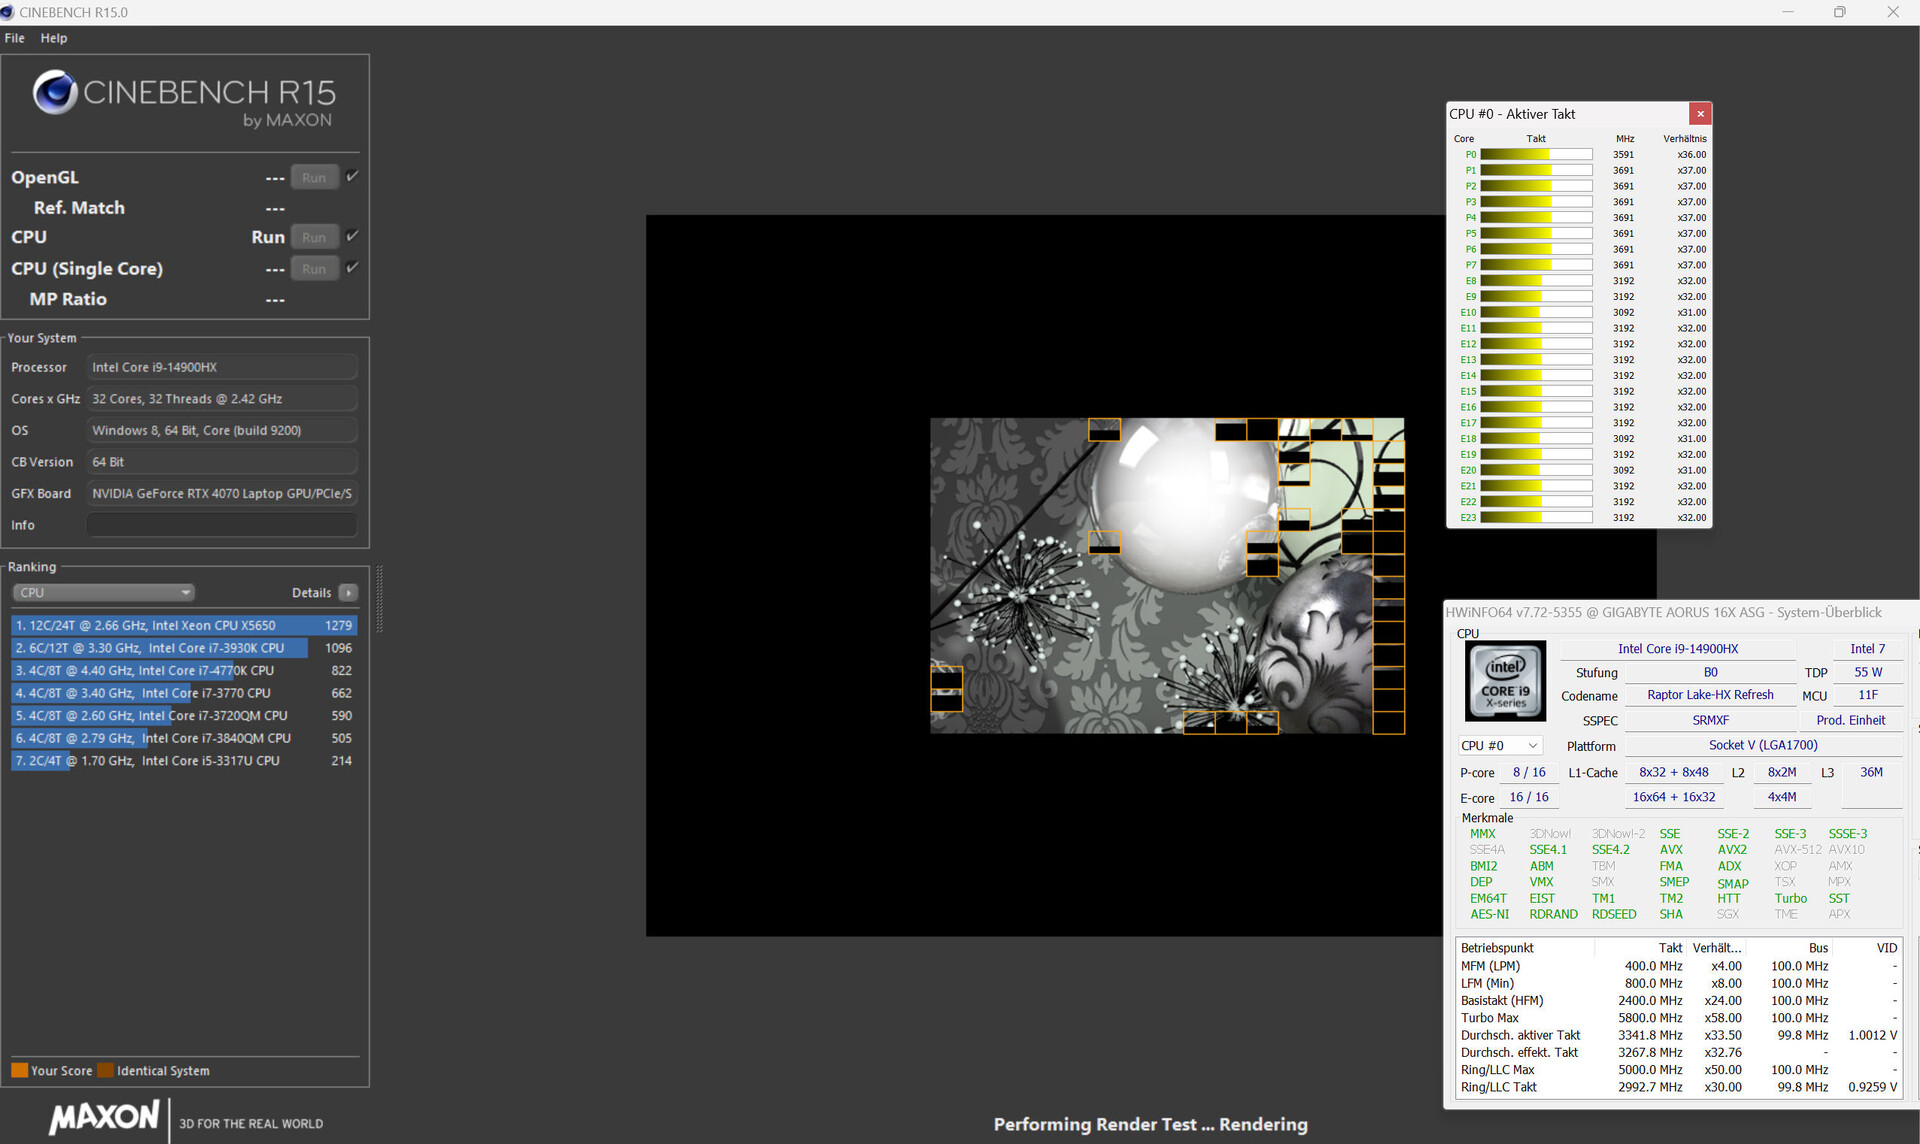
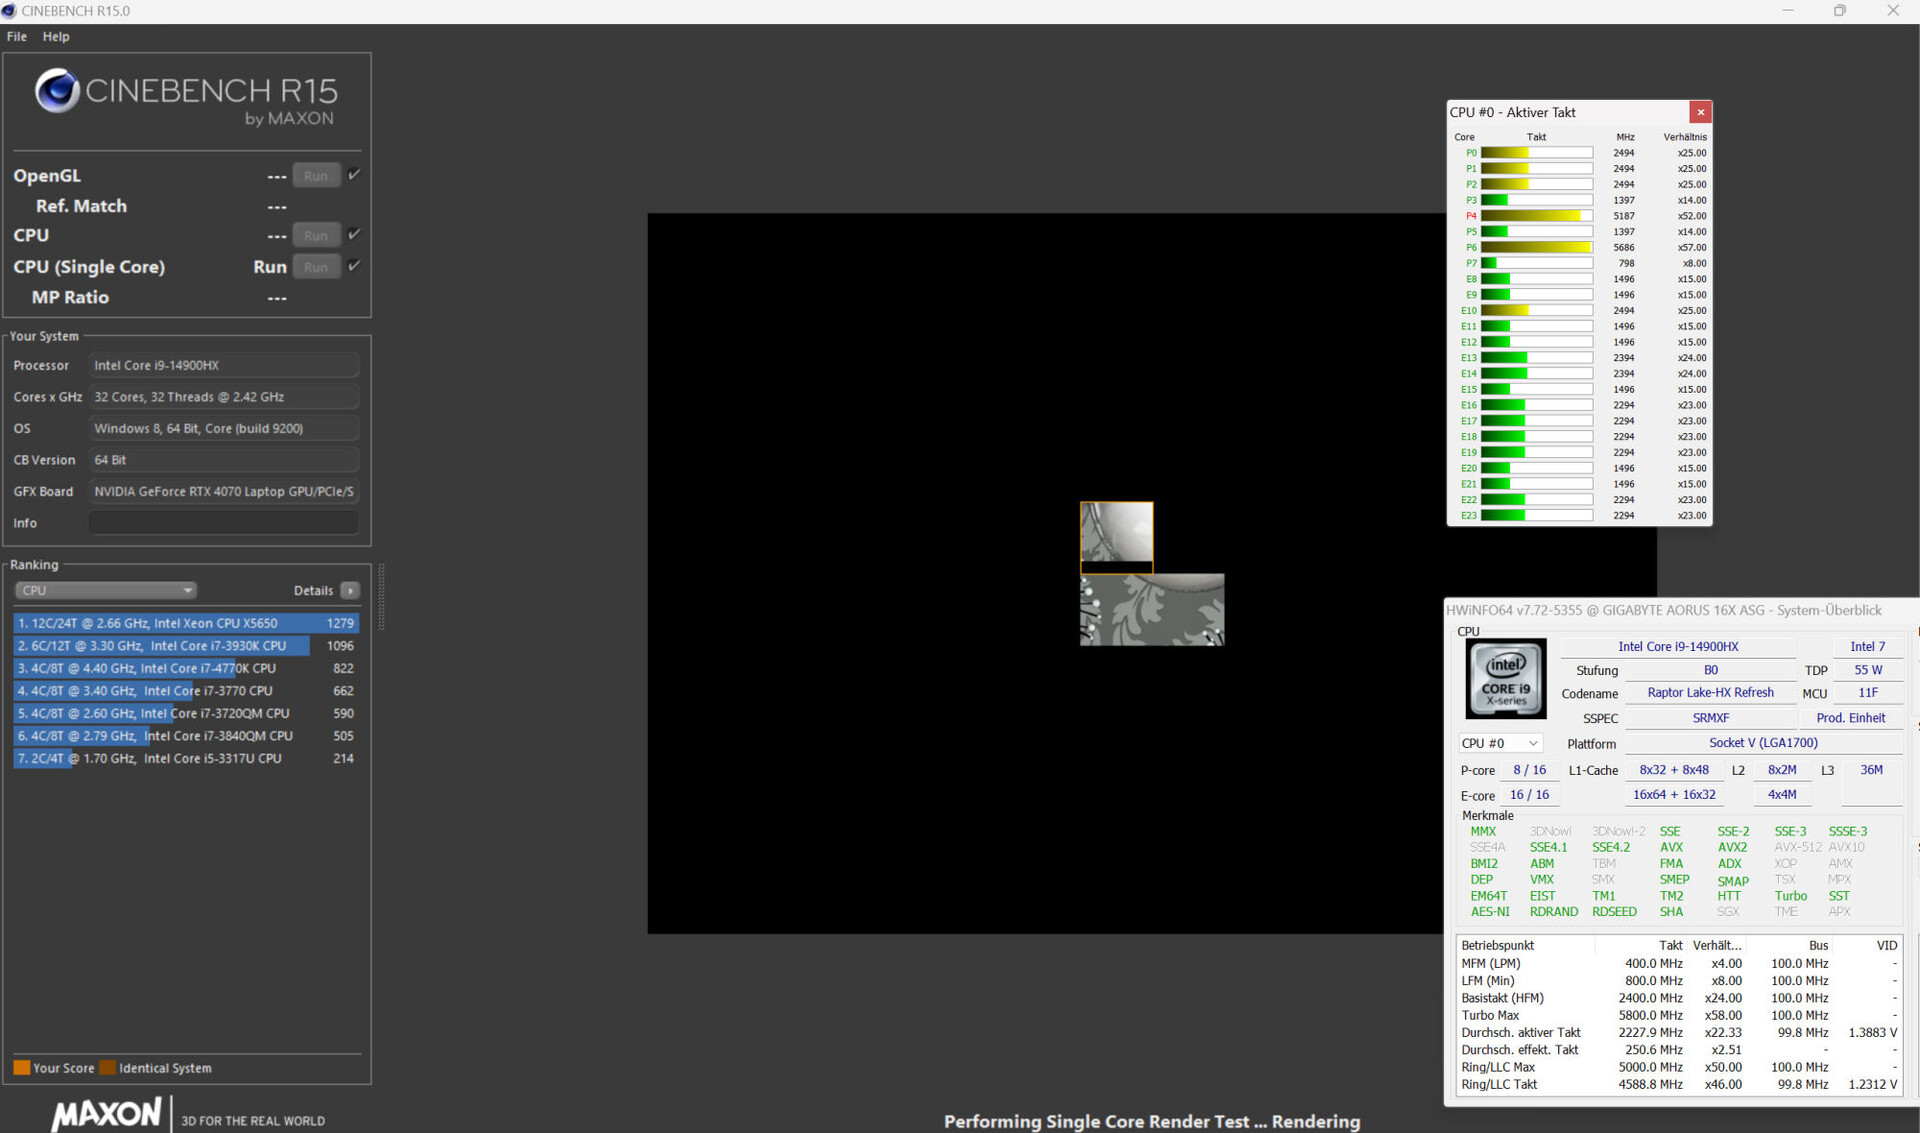
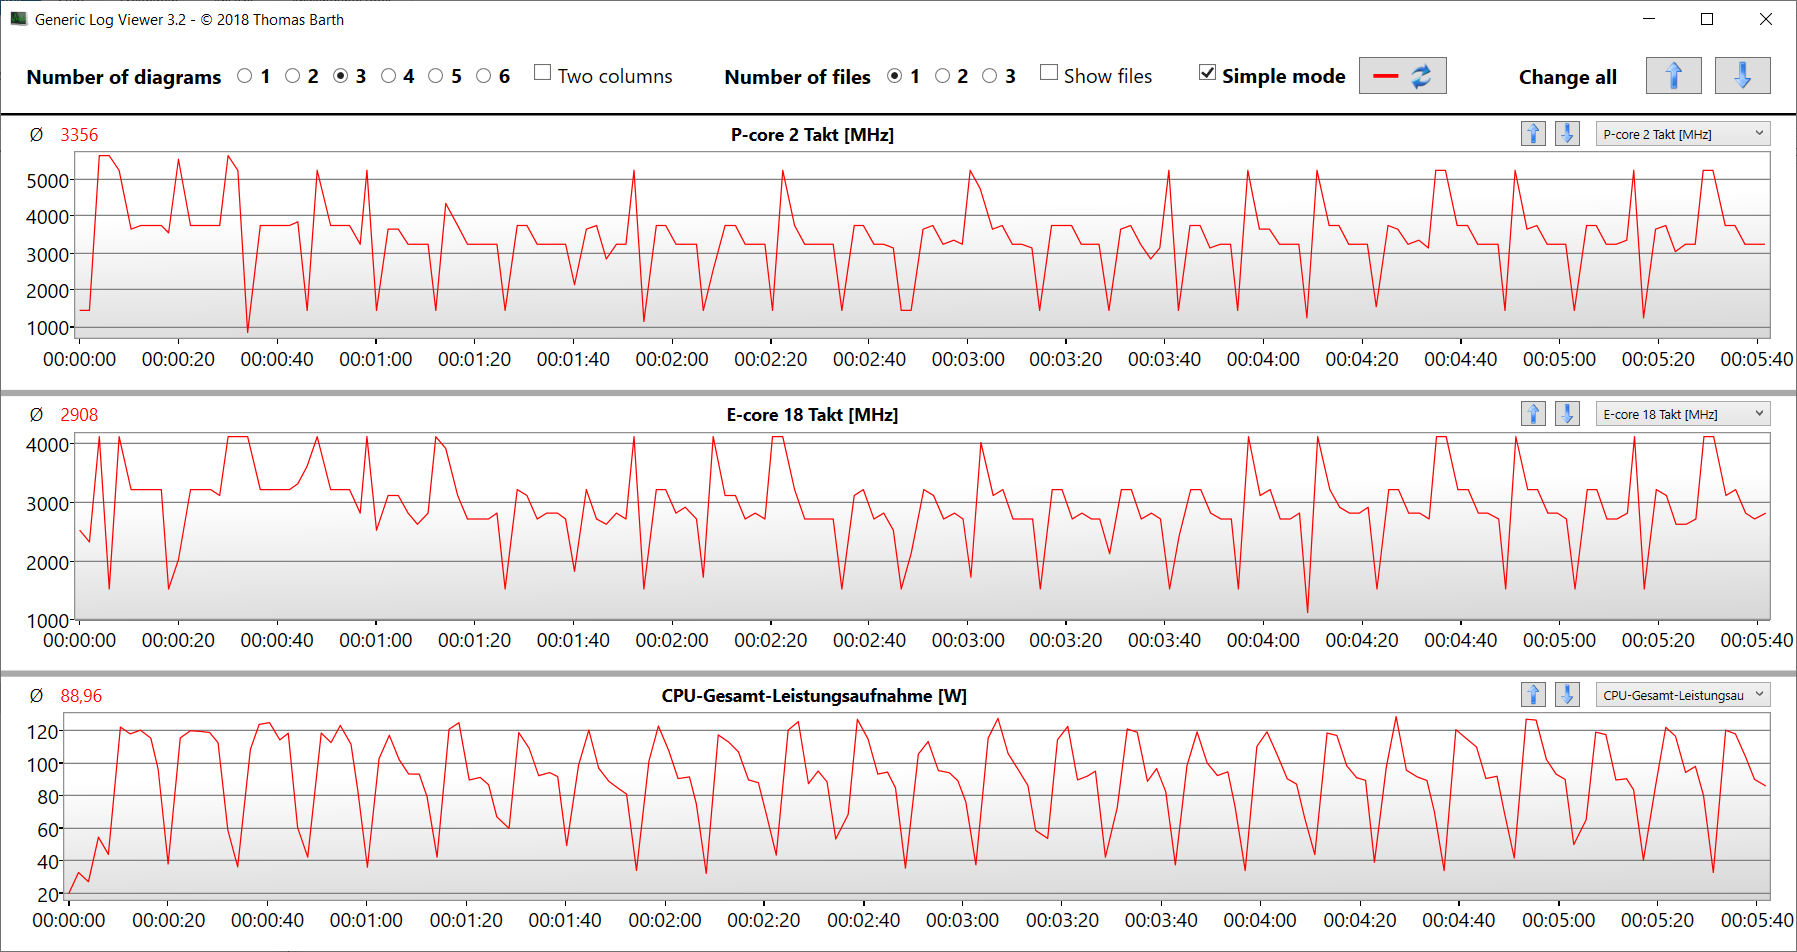
The Core i9-14900HX's (Raptor Lake) 24 CPU cores (8P + 16E = 32 threads) achieve maximum clock rates of 5.8 GHz (P) and 4.1 GHz (E). Continuous multi-thread load (CB15 Loop) resulted in its clock rate dropping from the fourth to the fifth run. Afterwards, it kept quite a stable level. The profiles Turbo, Gaming and Creator lead to a consistently higher performance level.
Its benchmark scores are on par with the CPU's average. In battery mode, its more relevant single-thread performance (187 points; CB15) dropped to a lesser extent than its multi-thread performance (1,533 points; CB15).
More information on the Core i9 can be found in our analysis article.
Cinebench R15 Multi continuous test
| CPU Performance rating - Percent | |
| Aorus 16X 2024 | |
| Lenovo Legion Pro 5 16IRX9 | |
| Aorus 16X 2024 | |
| Average Intel Core i9-14900HX | |
| Average of class Gaming | |
| HP Omen Transcend 16-u1095ng | |
| Asus TUF Gaming A17 FA707XI-NS94 | |
| Schenker XMG Pro 16 Studio (Mid 23) | |
| Alienware m16 R2 -1! | |
| Geekbench 6.6 | |
| Multi-Core | |
| Lenovo Legion Pro 5 16IRX9 (6.2.1) | |
| Aorus 16X 2024 (6.2.1, Turbo) | |
| Aorus 16X 2024 (6.2.1) | |
| Average Intel Core i9-14900HX (13158 - 19665, n=37) | |
| HP Omen Transcend 16-u1095ng (6.2.1) | |
| Average of class Gaming (6625 - 22104, n=110, last 2 years) | |
| Schenker XMG Pro 16 Studio (Mid 23) | |
| Alienware m16 R2 (6.2.1) | |
| Asus TUF Gaming A17 FA707XI-NS94 (6.2.1) | |
| Single-Core | |
| Aorus 16X 2024 (6.2.1, Turbo) | |
| Aorus 16X 2024 (6.2.1) | |
| Average Intel Core i9-14900HX (2419 - 3129, n=37) | |
| Lenovo Legion Pro 5 16IRX9 (6.2.1) | |
| Average of class Gaming (1490 - 3259, n=110, last 2 years) | |
| HP Omen Transcend 16-u1095ng (6.2.1) | |
| Asus TUF Gaming A17 FA707XI-NS94 (6.2.1) | |
| Schenker XMG Pro 16 Studio (Mid 23) | |
| Alienware m16 R2 (6.2.1) | |
| HWBOT x265 Benchmark v2.2 - 4k Preset | |
| Aorus 16X 2024 (Turbo) | |
| Lenovo Legion Pro 5 16IRX9 | |
| Average Intel Core i9-14900HX (16.8 - 38.9, n=37) | |
| Average of class Gaming (11.5 - 44.3, n=110, last 2 years) | |
| Aorus 16X 2024 | |
| HP Omen Transcend 16-u1095ng | |
| Asus TUF Gaming A17 FA707XI-NS94 | |
| Alienware m16 R2 | |
| Schenker XMG Pro 16 Studio (Mid 23) | |
| LibreOffice - 20 Documents To PDF | |
| HP Omen Transcend 16-u1095ng (6.3.4.2) | |
| Alienware m16 R2 (6.3.4.2) | |
| Asus TUF Gaming A17 FA707XI-NS94 (6.3.4.2) | |
| Average of class Gaming (19 - 88.8, n=110, last 2 years) | |
| Schenker XMG Pro 16 Studio (Mid 23) | |
| Average Intel Core i9-14900HX (19 - 85.1, n=37) | |
| Lenovo Legion Pro 5 16IRX9 (6.3.4.2) | |
| Aorus 16X 2024 (6.3.4.2) | |
| Aorus 16X 2024 (6.3.4.2, Turbo) | |
* ... smaller is better
AIDA64: FP32 Ray-Trace | FPU Julia | CPU SHA3 | CPU Queen | FPU SinJulia | FPU Mandel | CPU AES | CPU ZLib | FP64 Ray-Trace | CPU PhotoWorxx
| Performance rating | |
| Aorus 16X 2024 | |
| Lenovo Legion Pro 5 16IRX9 | |
| Average Intel Core i9-14900HX | |
| Average of class Gaming | |
| Aorus 16X 2024 | |
| Asus TUF Gaming A17 FA707XI-NS94 | |
| HP Omen Transcend 16-u1095ng | |
| Schenker XMG Pro 16 Studio (Mid 23) | |
| Alienware m16 R2 | |
| AIDA64 / FP32 Ray-Trace | |
| Average of class Gaming (10227 - 85542, n=109, last 2 years) | |
| Asus TUF Gaming A17 FA707XI-NS94 (v6.92.6600) | |
| Aorus 16X 2024 (v6.92.6600, Turbo) | |
| Lenovo Legion Pro 5 16IRX9 (v6.92.6600) | |
| Average Intel Core i9-14900HX (13098 - 33474, n=36) | |
| Aorus 16X 2024 (v6.92.6600) | |
| Alienware m16 R2 (v6.92.6600) | |
| HP Omen Transcend 16-u1095ng (v6.92.6600) | |
| Schenker XMG Pro 16 Studio (Mid 23) (v6.75.6100) | |
| AIDA64 / FPU Julia | |
| Average of class Gaming (51376 - 238426, n=109, last 2 years) | |
| Aorus 16X 2024 (v6.92.6600, Turbo) | |
| Lenovo Legion Pro 5 16IRX9 (v6.92.6600) | |
| Average Intel Core i9-14900HX (67573 - 166040, n=36) | |
| Asus TUF Gaming A17 FA707XI-NS94 (v6.92.6600) | |
| Aorus 16X 2024 (v6.92.6600) | |
| Alienware m16 R2 (v6.92.6600) | |
| HP Omen Transcend 16-u1095ng (v6.92.6600) | |
| Schenker XMG Pro 16 Studio (Mid 23) (v6.75.6100) | |
| AIDA64 / CPU SHA3 | |
| Aorus 16X 2024 (v6.92.6600, Turbo) | |
| Lenovo Legion Pro 5 16IRX9 (v6.92.6600) | |
| Average Intel Core i9-14900HX (3589 - 7979, n=36) | |
| Average of class Gaming (2180 - 9817, n=109, last 2 years) | |
| Aorus 16X 2024 (v6.92.6600) | |
| Asus TUF Gaming A17 FA707XI-NS94 (v6.92.6600) | |
| HP Omen Transcend 16-u1095ng (v6.92.6600) | |
| Alienware m16 R2 (v6.92.6600) | |
| Schenker XMG Pro 16 Studio (Mid 23) (v6.75.6100) | |
| AIDA64 / CPU Queen | |
| Lenovo Legion Pro 5 16IRX9 (v6.92.6600) | |
| Aorus 16X 2024 (v6.92.6600, Turbo) | |
| Aorus 16X 2024 (v6.92.6600) | |
| Average Intel Core i9-14900HX (118405 - 148966, n=36) | |
| Asus TUF Gaming A17 FA707XI-NS94 (v6.92.6600) | |
| HP Omen Transcend 16-u1095ng (v6.92.6600) | |
| Average of class Gaming (49785 - 173351, n=101, last 2 years) | |
| Schenker XMG Pro 16 Studio (Mid 23) (v6.75.6100) | |
| Alienware m16 R2 (v6.92.6600) | |
| AIDA64 / FPU SinJulia | |
| Aorus 16X 2024 (v6.92.6600, Turbo) | |
| Asus TUF Gaming A17 FA707XI-NS94 (v6.92.6600) | |
| Lenovo Legion Pro 5 16IRX9 (v6.92.6600) | |
| Average Intel Core i9-14900HX (10475 - 18517, n=36) | |
| Aorus 16X 2024 (v6.92.6600) | |
| Average of class Gaming (4424 - 33636, n=109, last 2 years) | |
| HP Omen Transcend 16-u1095ng (v6.92.6600) | |
| Alienware m16 R2 (v6.92.6600) | |
| Schenker XMG Pro 16 Studio (Mid 23) (v6.75.6100) | |
| AIDA64 / FPU Mandel | |
| Average of class Gaming (25115 - 128721, n=109, last 2 years) | |
| Aorus 16X 2024 (v6.92.6600, Turbo) | |
| Asus TUF Gaming A17 FA707XI-NS94 (v6.92.6600) | |
| Lenovo Legion Pro 5 16IRX9 (v6.92.6600) | |
| Average Intel Core i9-14900HX (32543 - 83662, n=36) | |
| Aorus 16X 2024 (v6.92.6600) | |
| Alienware m16 R2 (v6.92.6600) | |
| HP Omen Transcend 16-u1095ng (v6.92.6600) | |
| Schenker XMG Pro 16 Studio (Mid 23) (v6.75.6100) | |
| AIDA64 / CPU AES | |
| Schenker XMG Pro 16 Studio (Mid 23) (v6.75.6100) | |
| Average Intel Core i9-14900HX (86964 - 241777, n=36) | |
| Aorus 16X 2024 (v6.92.6600, Turbo) | |
| Lenovo Legion Pro 5 16IRX9 (v6.92.6600) | |
| Aorus 16X 2024 (v6.92.6600) | |
| Average of class Gaming (39258 - 247074, n=109, last 2 years) | |
| Asus TUF Gaming A17 FA707XI-NS94 (v6.92.6600) | |
| HP Omen Transcend 16-u1095ng (v6.92.6600) | |
| Alienware m16 R2 (v6.92.6600) | |
| AIDA64 / CPU ZLib | |
| Aorus 16X 2024 (v6.92.6600, Turbo) | |
| Lenovo Legion Pro 5 16IRX9 (v6.92.6600) | |
| Average Intel Core i9-14900HX (1054 - 2292, n=36) | |
| Aorus 16X 2024 (v6.92.6600) | |
| Average of class Gaming (574 - 2531, n=109, last 2 years) | |
| HP Omen Transcend 16-u1095ng (v6.92.6600) | |
| Alienware m16 R2 (v6.92.6600) | |
| Asus TUF Gaming A17 FA707XI-NS94 (v6.92.6600) | |
| Schenker XMG Pro 16 Studio (Mid 23) (v6.75.6100) | |
| AIDA64 / FP64 Ray-Trace | |
| Average of class Gaming (5509 - 45446, n=109, last 2 years) | |
| Asus TUF Gaming A17 FA707XI-NS94 (v6.92.6600) | |
| Aorus 16X 2024 (v6.92.6600, Turbo) | |
| Lenovo Legion Pro 5 16IRX9 (v6.92.6600) | |
| Average Intel Core i9-14900HX (6809 - 18349, n=36) | |
| Aorus 16X 2024 (v6.92.6600) | |
| Alienware m16 R2 (v6.92.6600) | |
| HP Omen Transcend 16-u1095ng (v6.92.6600) | |
| Schenker XMG Pro 16 Studio (Mid 23) (v6.75.6100) | |
| AIDA64 / CPU PhotoWorxx | |
| Lenovo Legion Pro 5 16IRX9 (v6.92.6600) | |
| HP Omen Transcend 16-u1095ng (v6.92.6600) | |
| Aorus 16X 2024 (v6.92.6600, Turbo) | |
| Aorus 16X 2024 (v6.92.6600) | |
| Schenker XMG Pro 16 Studio (Mid 23) (v6.75.6100) | |
| Average Intel Core i9-14900HX (23903 - 54702, n=36) | |
| Average of class Gaming (12271 - 89891, n=109, last 2 years) | |
| Alienware m16 R2 (v6.92.6600) | |
| Asus TUF Gaming A17 FA707XI-NS94 (v6.92.6600) | |
System performance
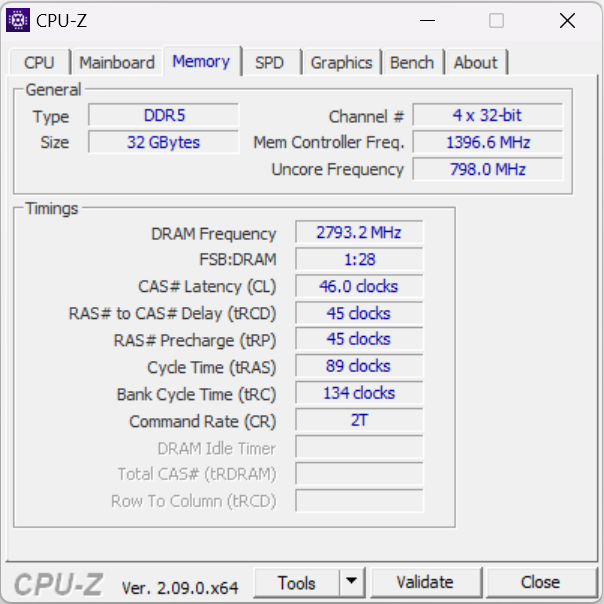
The smooth-running system doesn't lack computing power. Gaming, streaming and rendering do not pose any major challenges for the laptop. The RAM's transfer rates are on a normal level for DDR5-5600 RAM.
CrossMark: Overall | Productivity | Creativity | Responsiveness
WebXPRT 3: Overall
WebXPRT 4: Overall
Mozilla Kraken 1.1: Total
| PCMark 10 / Score | |
| Lenovo Legion Pro 5 16IRX9 | |
| Aorus 16X 2024 | |
| Average of class Gaming (5828 - 11574, n=95, last 2 years) | |
| Average Intel Core i9-14900HX, NVIDIA GeForce RTX 4070 Laptop GPU (7768 - 8550, n=8) | |
| Asus TUF Gaming A17 FA707XI-NS94 | |
| Schenker XMG Pro 16 Studio (Mid 23) | |
| HP Omen Transcend 16-u1095ng | |
| Alienware m16 R2 | |
| PCMark 10 / Essentials | |
| Schenker XMG Pro 16 Studio (Mid 23) | |
| Lenovo Legion Pro 5 16IRX9 | |
| Aorus 16X 2024 | |
| Asus TUF Gaming A17 FA707XI-NS94 | |
| Average Intel Core i9-14900HX, NVIDIA GeForce RTX 4070 Laptop GPU (10104 - 11815, n=8) | |
| Average of class Gaming (8810 - 12600, n=99, last 2 years) | |
| HP Omen Transcend 16-u1095ng | |
| Alienware m16 R2 | |
| PCMark 10 / Productivity | |
| Aorus 16X 2024 | |
| Average of class Gaming (6845 - 18766, n=97, last 2 years) | |
| Average Intel Core i9-14900HX, NVIDIA GeForce RTX 4070 Laptop GPU (9577 - 11103, n=8) | |
| Schenker XMG Pro 16 Studio (Mid 23) | |
| HP Omen Transcend 16-u1095ng | |
| Lenovo Legion Pro 5 16IRX9 | |
| Asus TUF Gaming A17 FA707XI-NS94 | |
| Alienware m16 R2 | |
| PCMark 10 / Digital Content Creation | |
| Lenovo Legion Pro 5 16IRX9 | |
| Average of class Gaming (7602 - 19657, n=97, last 2 years) | |
| Asus TUF Gaming A17 FA707XI-NS94 | |
| Average Intel Core i9-14900HX, NVIDIA GeForce RTX 4070 Laptop GPU (12114 - 14827, n=8) | |
| Aorus 16X 2024 | |
| Alienware m16 R2 | |
| HP Omen Transcend 16-u1095ng | |
| Schenker XMG Pro 16 Studio (Mid 23) | |
| CrossMark / Overall | |
| Aorus 16X 2024 | |
| Average Intel Core i9-14900HX, NVIDIA GeForce RTX 4070 Laptop GPU (2002 - 2312, n=7) | |
| Lenovo Legion Pro 5 16IRX9 | |
| Average of class Gaming (1366 - 2409, n=97, last 2 years) | |
| Schenker XMG Pro 16 Studio (Mid 23) | |
| Asus TUF Gaming A17 FA707XI-NS94 | |
| Alienware m16 R2 | |
| CrossMark / Productivity | |
| Aorus 16X 2024 | |
| Average Intel Core i9-14900HX, NVIDIA GeForce RTX 4070 Laptop GPU (1827 - 2191, n=7) | |
| Schenker XMG Pro 16 Studio (Mid 23) | |
| Average of class Gaming (1386 - 2254, n=97, last 2 years) | |
| Lenovo Legion Pro 5 16IRX9 | |
| Asus TUF Gaming A17 FA707XI-NS94 | |
| Alienware m16 R2 | |
| CrossMark / Creativity | |
| Aorus 16X 2024 | |
| Average Intel Core i9-14900HX, NVIDIA GeForce RTX 4070 Laptop GPU (2258 - 2458, n=7) | |
| Lenovo Legion Pro 5 16IRX9 | |
| Average of class Gaming (1343 - 2729, n=97, last 2 years) | |
| Schenker XMG Pro 16 Studio (Mid 23) | |
| Asus TUF Gaming A17 FA707XI-NS94 | |
| Alienware m16 R2 | |
| CrossMark / Responsiveness | |
| Aorus 16X 2024 | |
| Average Intel Core i9-14900HX, NVIDIA GeForce RTX 4070 Laptop GPU (1734 - 2330, n=7) | |
| Schenker XMG Pro 16 Studio (Mid 23) | |
| Lenovo Legion Pro 5 16IRX9 | |
| Average of class Gaming (1226 - 2334, n=97, last 2 years) | |
| Alienware m16 R2 | |
| Asus TUF Gaming A17 FA707XI-NS94 | |
| WebXPRT 3 / Overall | |
| HP Omen Transcend 16-u1095ng | |
| Aorus 16X 2024 | |
| Lenovo Legion Pro 5 16IRX9 | |
| Average Intel Core i9-14900HX, NVIDIA GeForce RTX 4070 Laptop GPU (269 - 342, n=8) | |
| Schenker XMG Pro 16 Studio (Mid 23) | |
| Asus TUF Gaming A17 FA707XI-NS94 | |
| Average of class Gaming (242 - 532, n=100, last 2 years) | |
| Alienware m16 R2 | |
| WebXPRT 4 / Overall | |
| Average Intel Core i9-14900HX, NVIDIA GeForce RTX 4070 Laptop GPU (291 - 304, n=6) | |
| Lenovo Legion Pro 5 16IRX9 | |
| Average of class Gaming (176.4 - 354, n=100, last 2 years) | |
| Asus TUF Gaming A17 FA707XI-NS94 | |
| Alienware m16 R2 | |
| Mozilla Kraken 1.1 / Total | |
| Alienware m16 R2 | |
| Schenker XMG Pro 16 Studio (Mid 23) | |
| Asus TUF Gaming A17 FA707XI-NS94 | |
| Average of class Gaming (391 - 590, n=105, last 2 years) | |
| Lenovo Legion Pro 5 16IRX9 | |
| Average Intel Core i9-14900HX, NVIDIA GeForce RTX 4070 Laptop GPU (431 - 469, n=8) | |
| HP Omen Transcend 16-u1095ng | |
| Aorus 16X 2024 | |
* ... smaller is better
| PCMark 10 Score | 8389 points | |
Help | ||
| AIDA64 / Memory Copy | |
| Lenovo Legion Pro 5 16IRX9 | |
| Aorus 16X 2024 | |
| HP Omen Transcend 16-u1095ng | |
| Average Intel Core i9-14900HX (38028 - 83392, n=36) | |
| Average of class Gaming (21750 - 129946, n=109, last 2 years) | |
| Schenker XMG Pro 16 Studio (Mid 23) | |
| Alienware m16 R2 | |
| Asus TUF Gaming A17 FA707XI-NS94 | |
| AIDA64 / Memory Read | |
| Aorus 16X 2024 | |
| Lenovo Legion Pro 5 16IRX9 | |
| HP Omen Transcend 16-u1095ng | |
| Average Intel Core i9-14900HX (43306 - 87568, n=36) | |
| Alienware m16 R2 | |
| Schenker XMG Pro 16 Studio (Mid 23) | |
| Average of class Gaming (22956 - 118858, n=109, last 2 years) | |
| Asus TUF Gaming A17 FA707XI-NS94 | |
| AIDA64 / Memory Write | |
| HP Omen Transcend 16-u1095ng | |
| Aorus 16X 2024 | |
| Lenovo Legion Pro 5 16IRX9 | |
| Average of class Gaming (22297 - 135096, n=109, last 2 years) | |
| Asus TUF Gaming A17 FA707XI-NS94 | |
| Average Intel Core i9-14900HX (37146 - 80589, n=36) | |
| Schenker XMG Pro 16 Studio (Mid 23) | |
| Alienware m16 R2 | |
| AIDA64 / Memory Latency | |
| Alienware m16 R2 | |
| Average of class Gaming (75.3 - 259, n=109, last 2 years) | |
| Asus TUF Gaming A17 FA707XI-NS94 | |
| Schenker XMG Pro 16 Studio (Mid 23) | |
| HP Omen Transcend 16-u1095ng | |
| Average Intel Core i9-14900HX (76.1 - 105, n=36) | |
| Lenovo Legion Pro 5 16IRX9 | |
| Aorus 16X 2024 | |
* ... smaller is better
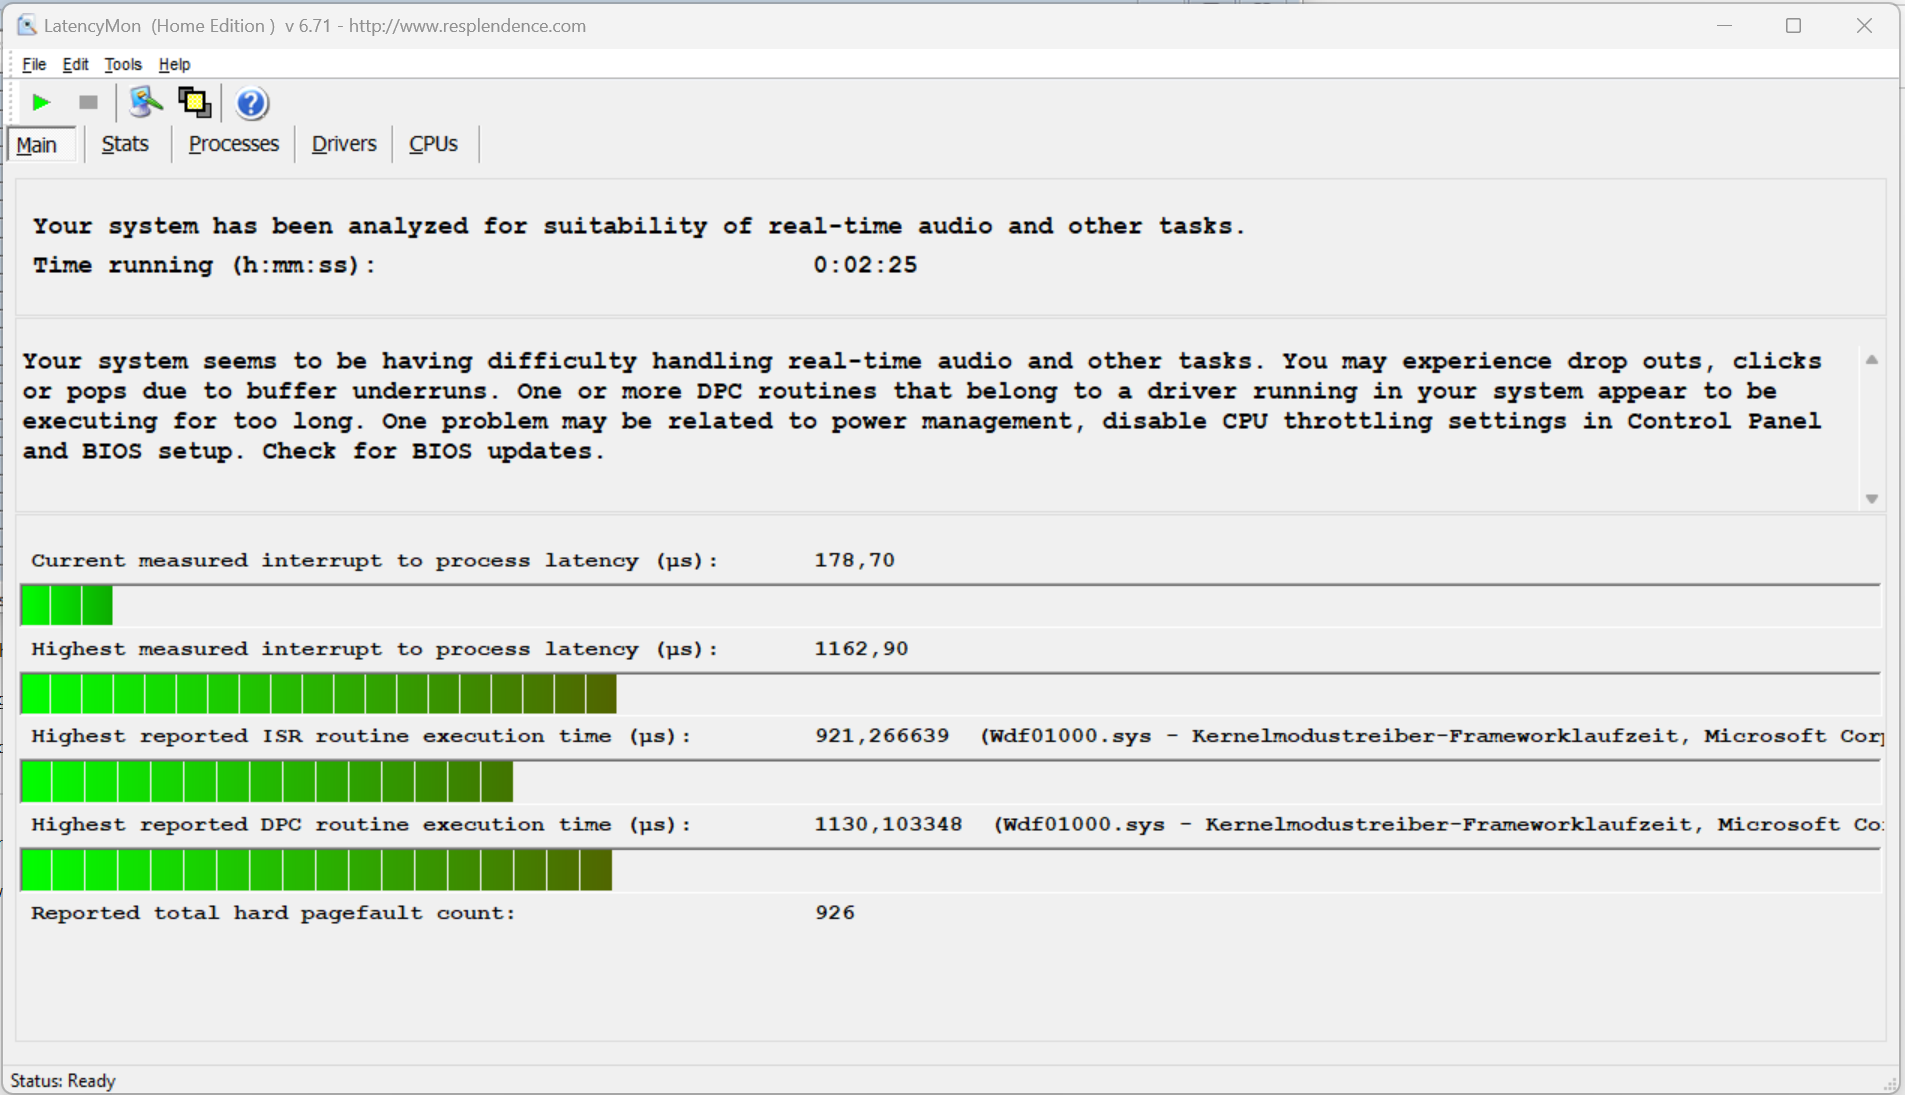
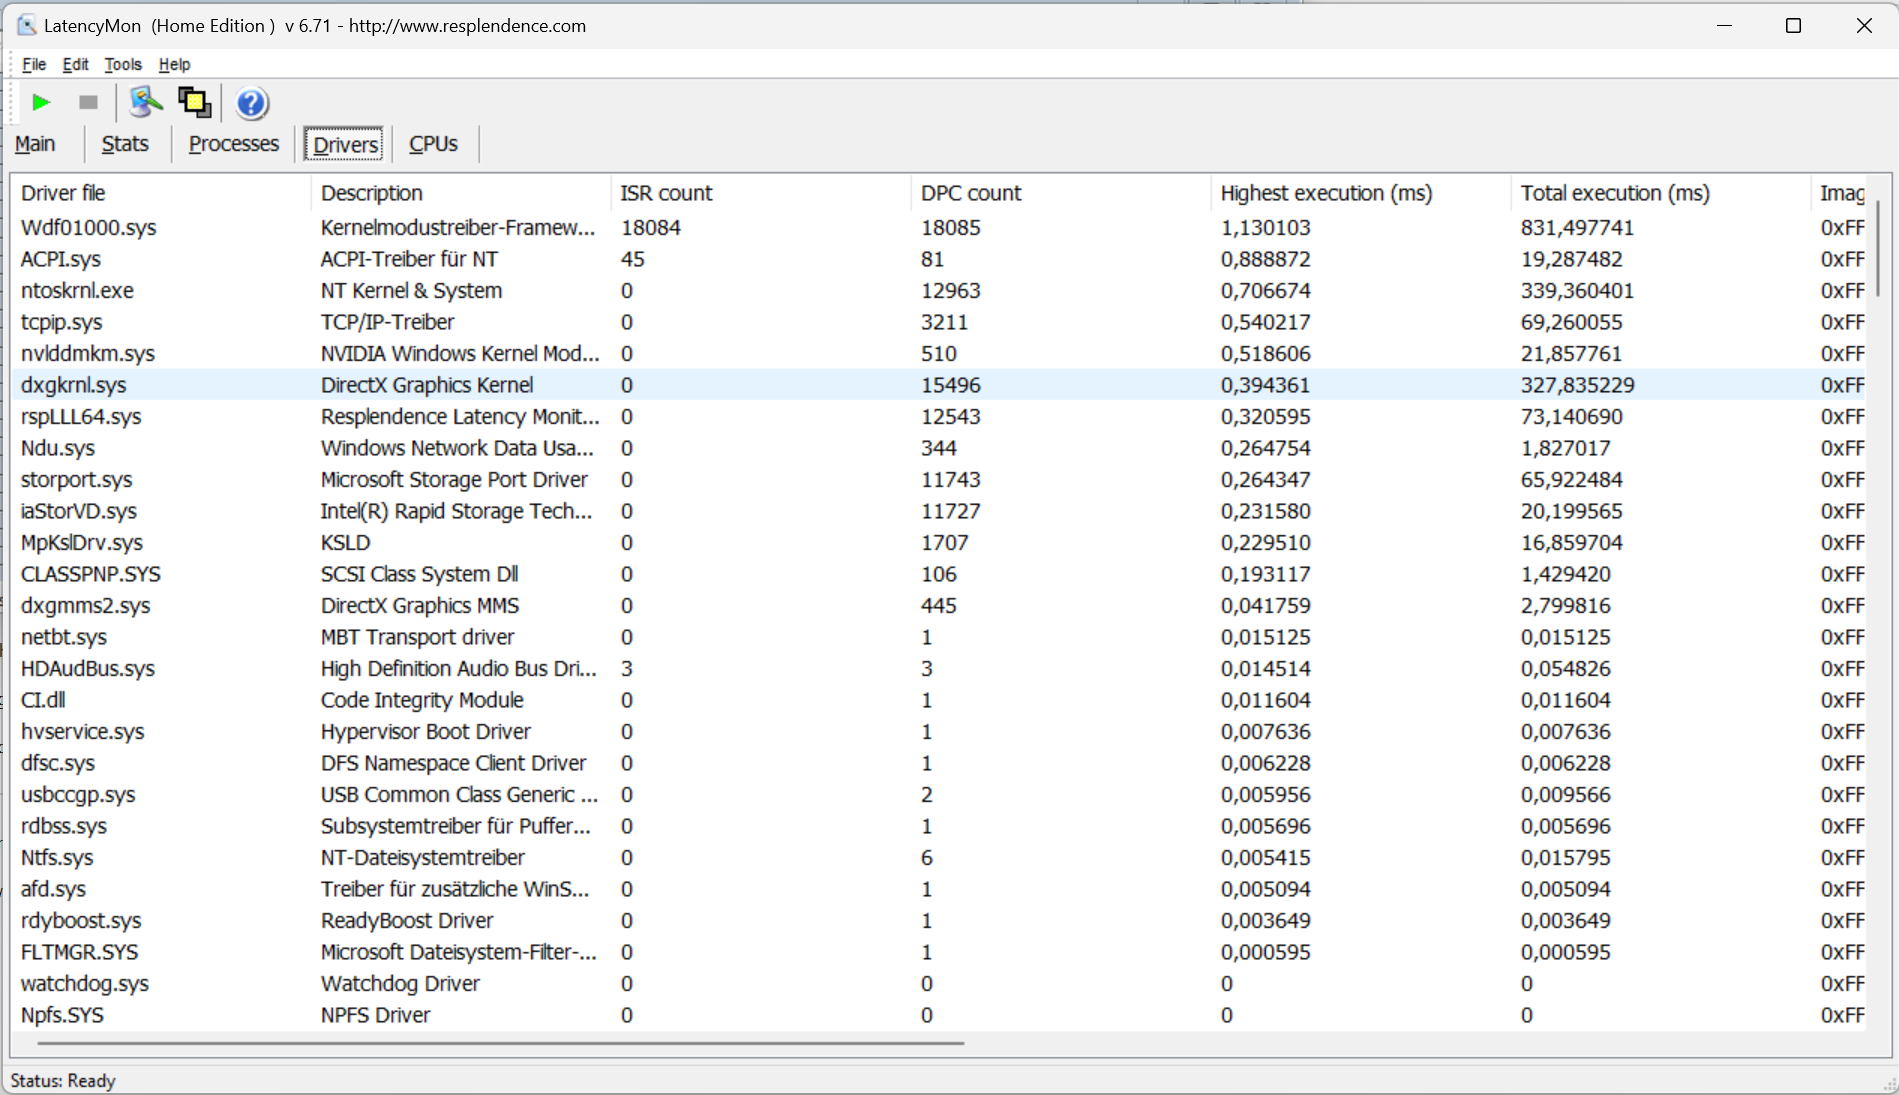
DPC latencies
The standardized Latency Monitor test (web surfing, 4k video playback, Prime95 high load) revealed some anomalies. The system does not appear to be suitable for video and audio editing in real-time. Future software updates could lead to improvements or even deteriorations.
| DPC Latencies / LatencyMon - interrupt to process latency (max), Web, Youtube, Prime95 | |
| Alienware m16 R2 | |
| Schenker XMG Pro 16 Studio (Mid 23) | |
| Asus TUF Gaming A17 FA707XI-NS94 | |
| HP Omen Transcend 16-u1095ng | |
| Aorus 16X 2024 | |
| Lenovo Legion Pro 5 16IRX9 | |
* ... smaller is better
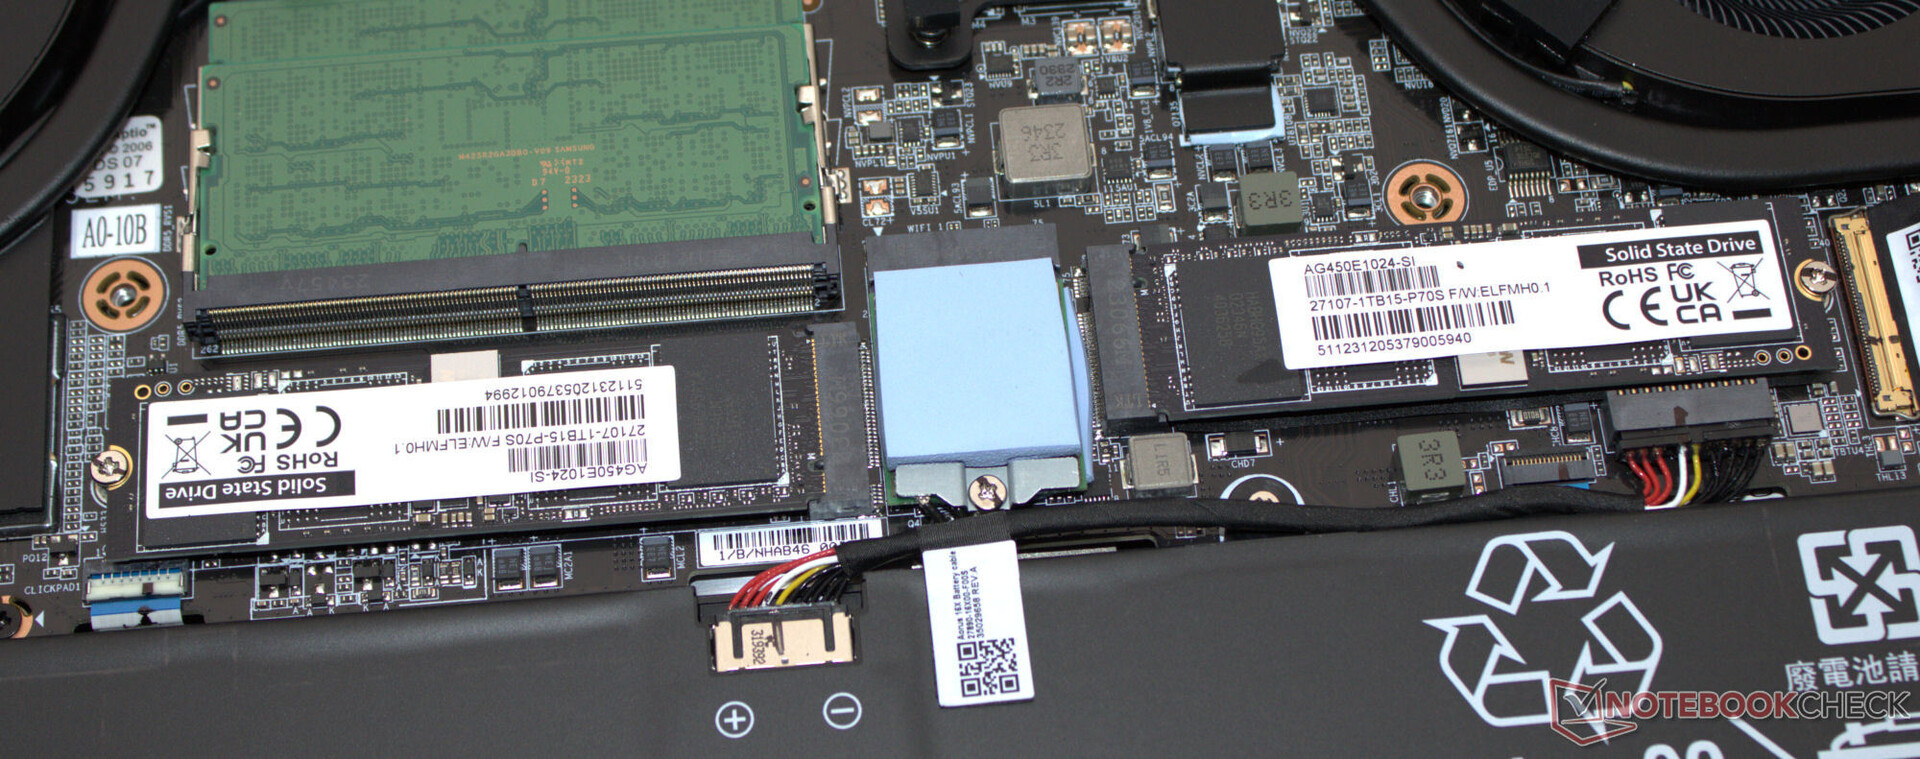
Storage devices
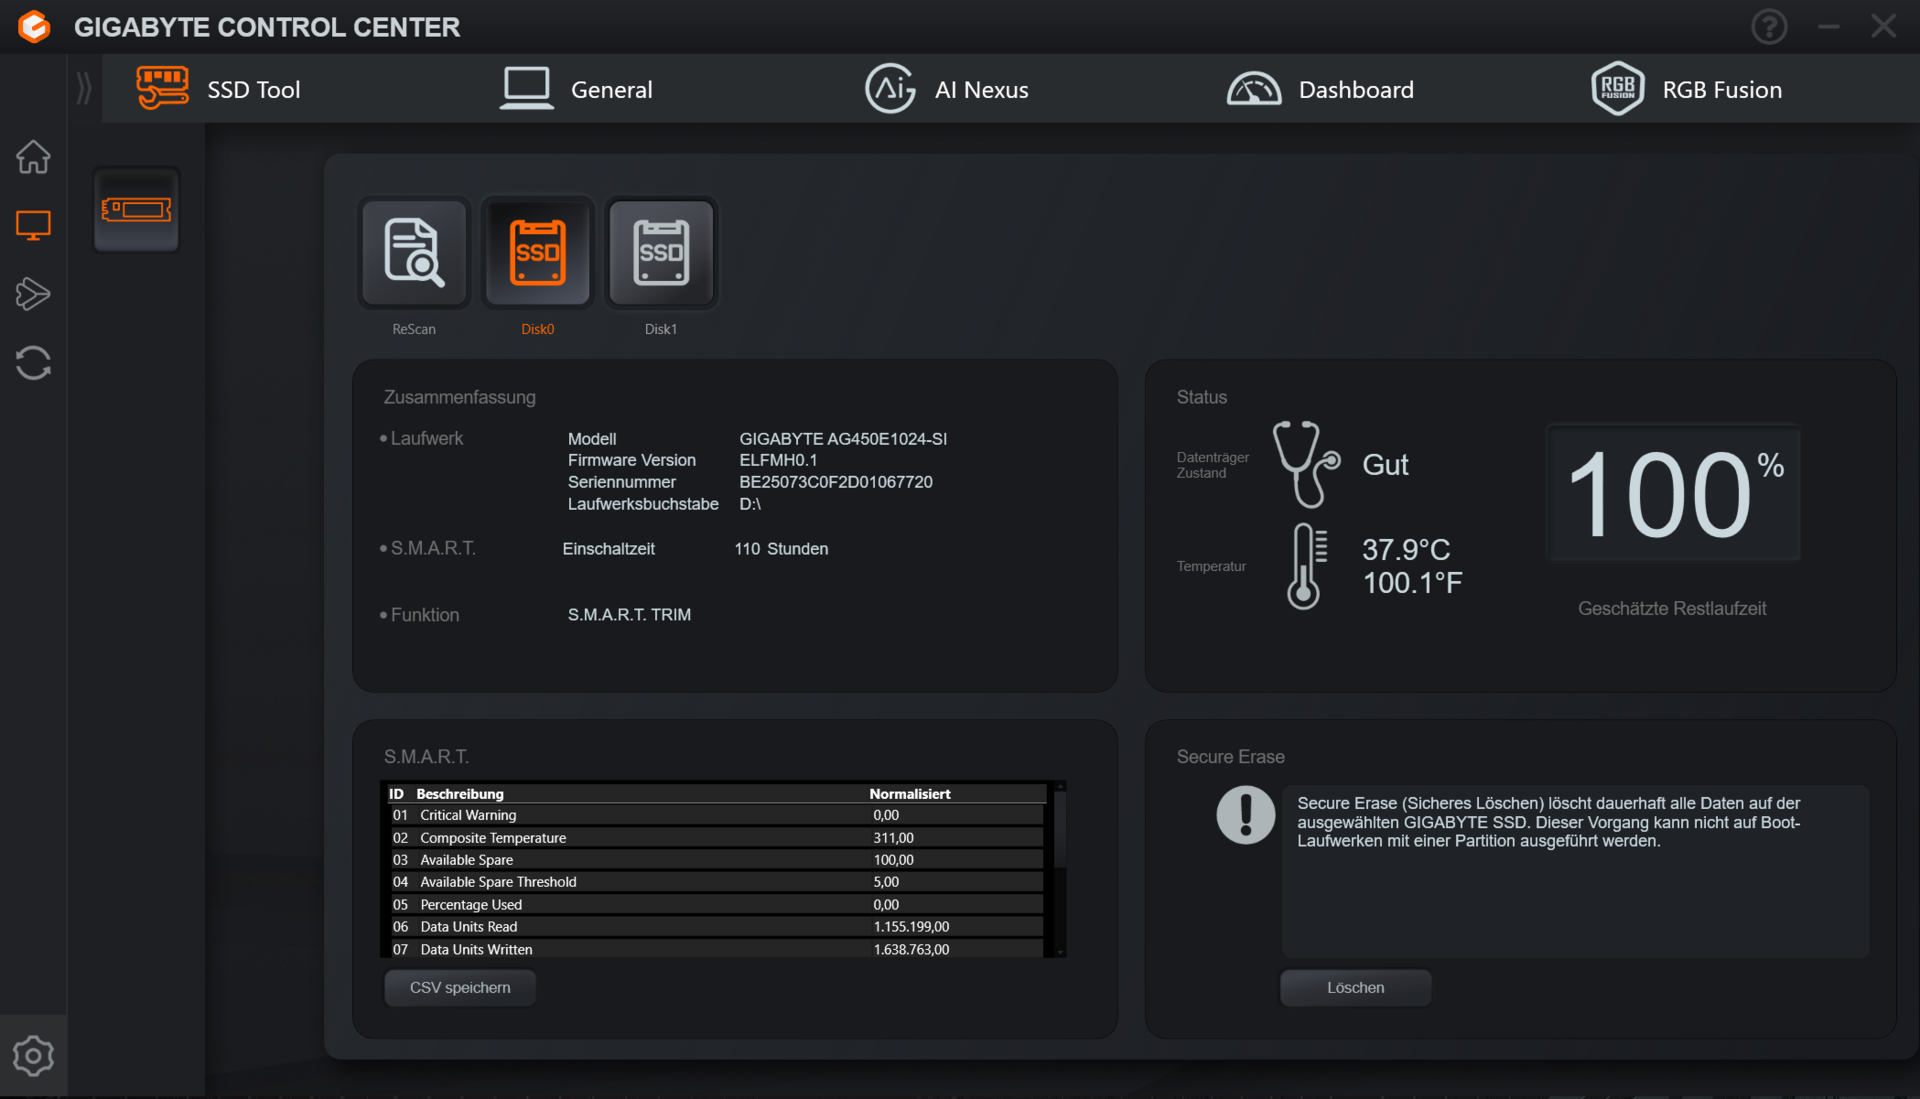
The 16X features two PCIe 4 SSDs with 1 TB of storage each (M.2-2280)—they do not form a RAID array. One SSD serves as a system drive, the other as data storage—both achieve very good data rates. We noted no drops due to thermal throttling.
The 16X generally supports RAID. However, the corresponding option would first have to be activated in the BIOS, after which Windows would have to be reinstalled. This procedure is not recommended for the inexperienced.

* ... smaller is better
Reading continuous performance: DiskSpd Read Loop, Queue Depth 8
Graphics card
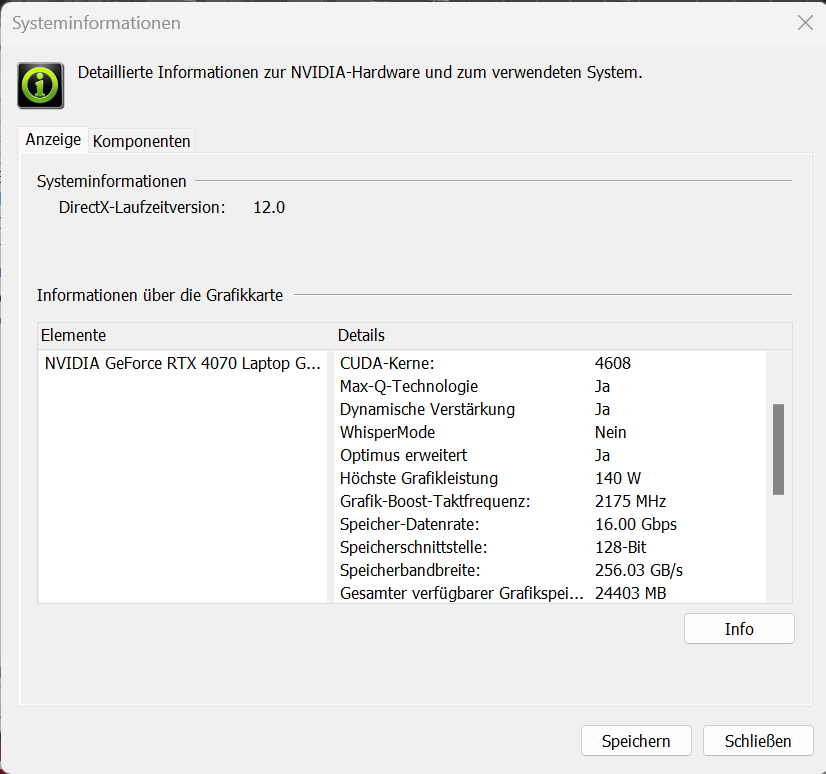
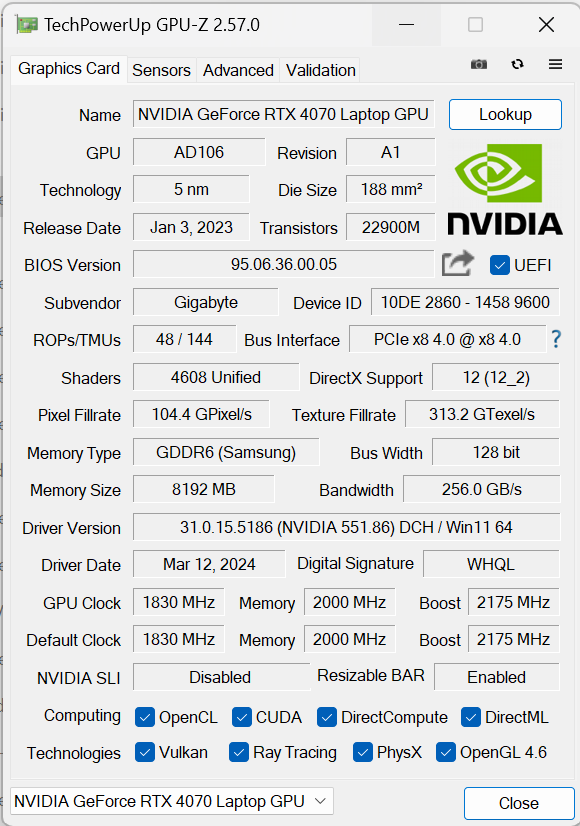
Gigabyte has set the installed GeForce RTX 4070's maximum TGP to 140 watts (115 watts + 25 watts Dynamic Boost)—more isn't specified by Nvidia. The GPU has 8 GB VRAM (GDDR6) available—a little on the low side for today's demands. Its benchmark results were slightly above the RTX-4070 average (Standard), the more powerful profiles deliver a small boost at most. Switching between the dGPU and Optimus doesn't require a system restart. Advanced Optimus is supported.


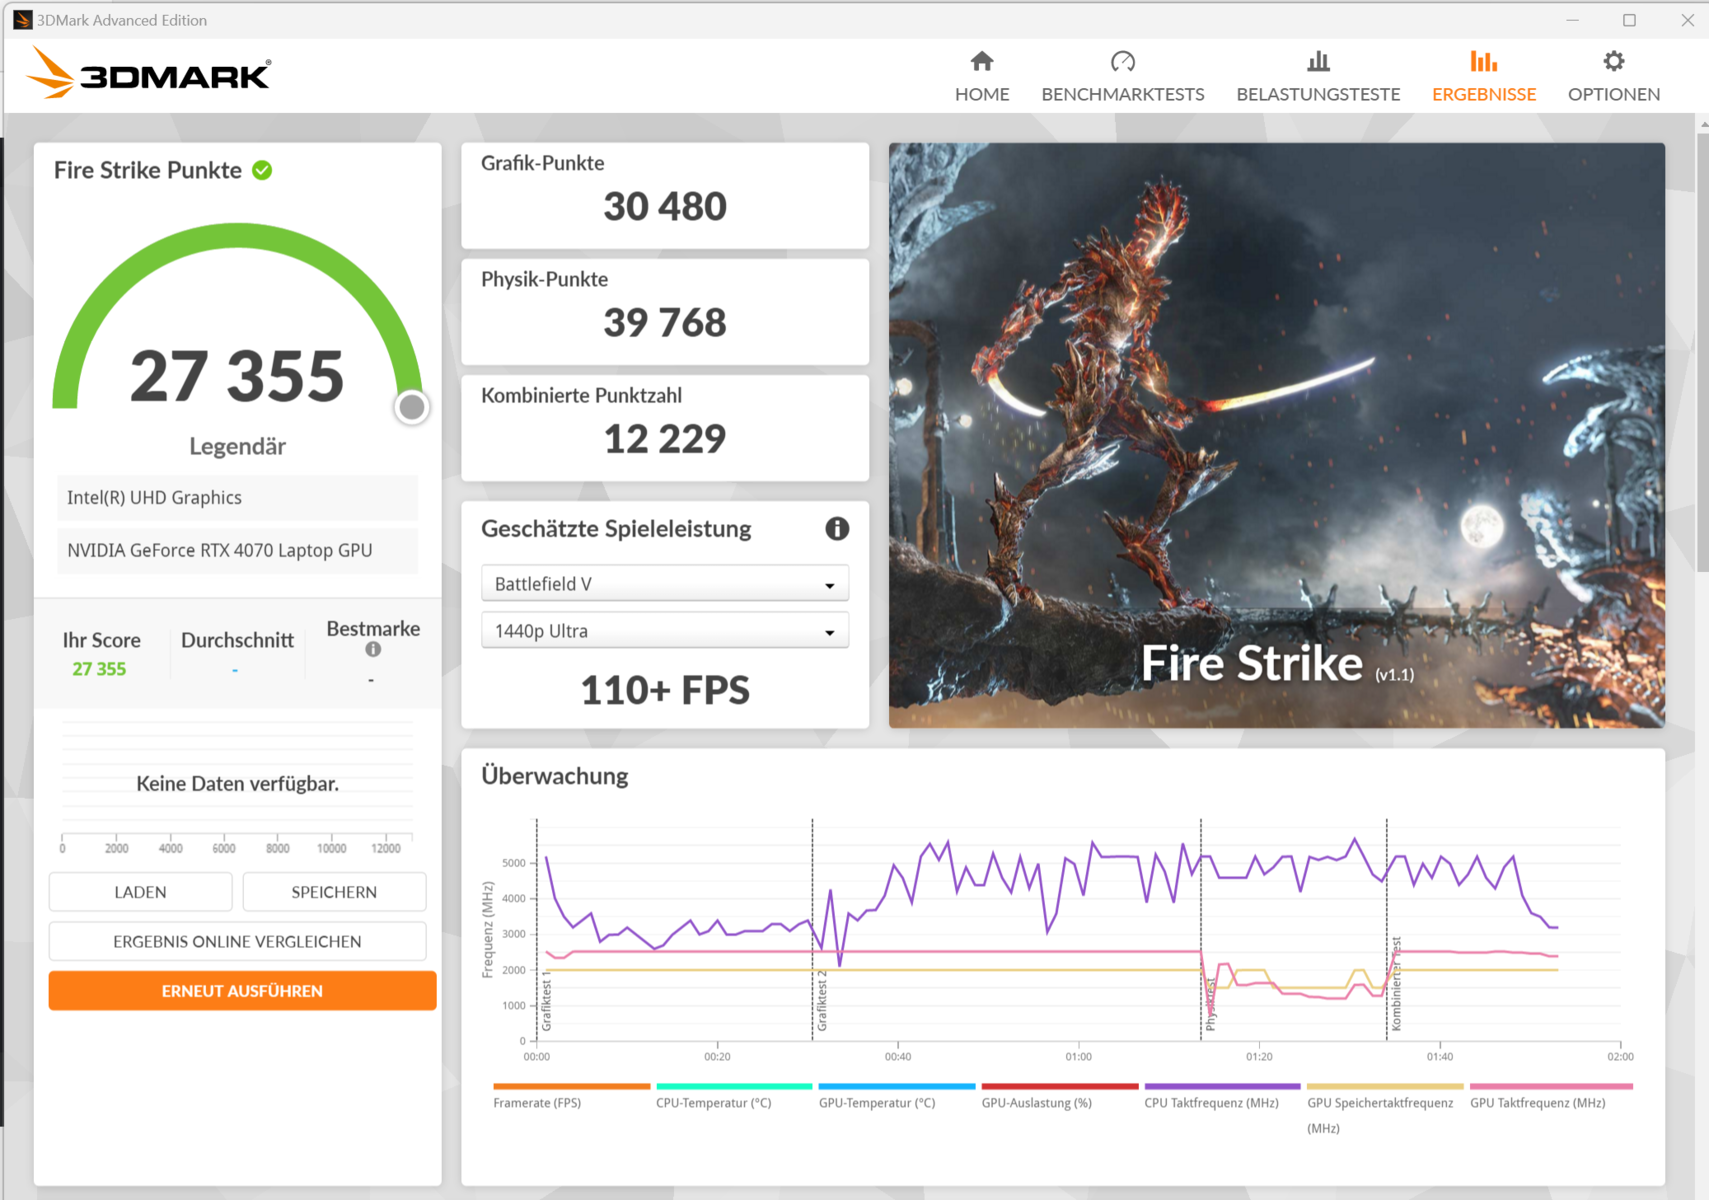
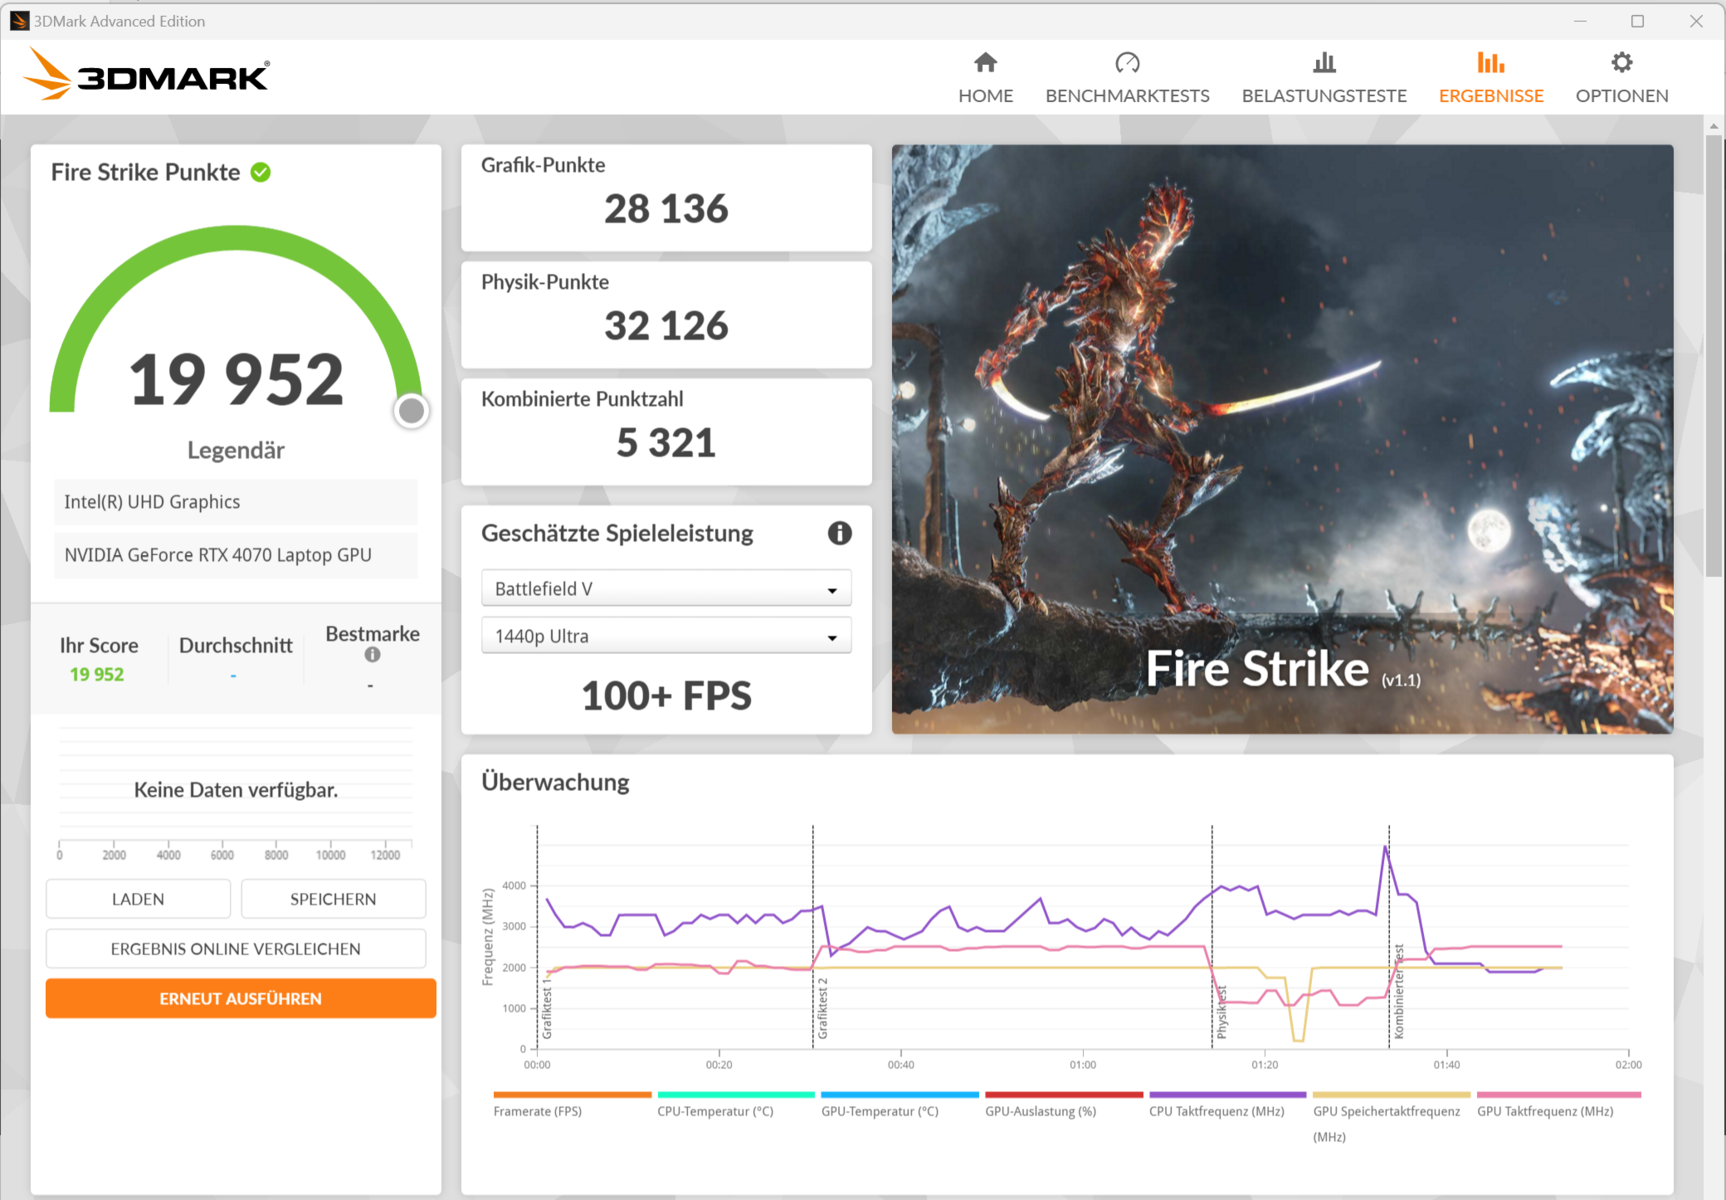
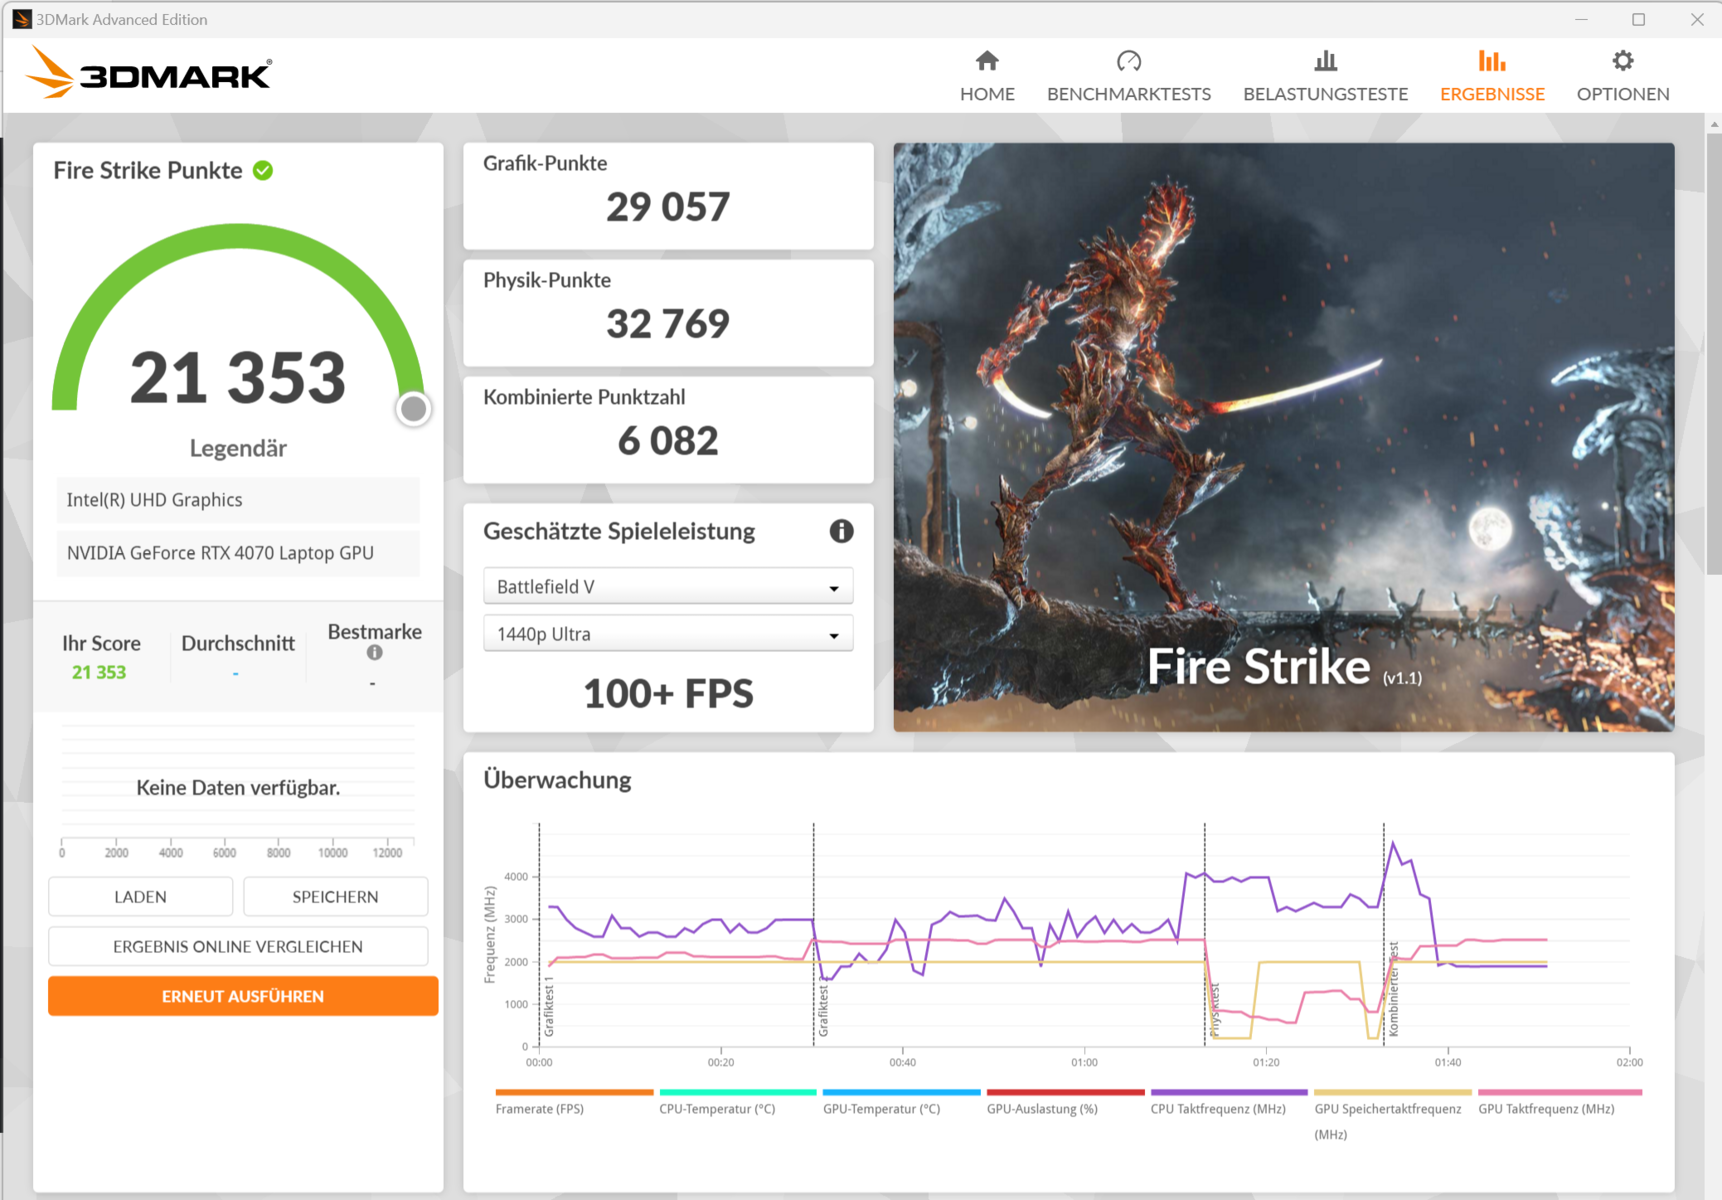
| 3DMark 11 Performance | 35473 points | |
| 3DMark Fire Strike Score | 23487 points | |
| 3DMark Time Spy Score | 12612 points | |
Help | ||
* ... smaller is better
Gaming performance
The graphics core allows for QHD gaming at high to maximum settings. This results in frame rates above the previous RTX 4070 average (Standard); the more powerful profiles can result in a small increase at best. Using DLSS 3 and Frame Generation, maximum settings including ray tracing could also be possible at higher resolutions—but only for games that support these.
| The Witcher 3 - 1920x1080 Ultra Graphics & Postprocessing (HBAO+) | |
| Average of class Gaming (95 - 240, n=8, last 2 years) | |
| Lenovo Legion Pro 5 16IRX9 | |
| Aorus 16X 2024 | |
| Alienware m16 R2 | |
| Asus TUF Gaming A17 FA707XI-NS94 | |
| Schenker XMG Pro 16 Studio (Mid 23) | |
| HP Omen Transcend 16-u1095ng | |
| Average NVIDIA GeForce RTX 4070 Laptop GPU (69.8 - 133.7, n=57) | |
| Horizon Forbidden West | |
| 1920x1080 Very High Preset AA:T | |
| Average of class Gaming (14.7 - 140.3, n=13, last 2 years) | |
| Aorus 16X 2024 | |
| XMG Pro 15 E23 | |
| Average NVIDIA GeForce RTX 4070 Laptop GPU (53.2 - 76.7, n=10) | |
| 2560x1440 Very High Preset AA:T | |
| Average of class Gaming (39.6 - 100.9, n=10, last 2 years) | |
| Aorus 16X 2024 | |
| XMG Pro 15 E23 | |
| Average NVIDIA GeForce RTX 4070 Laptop GPU (40.3 - 59.1, n=9) | |
| Alone in the Dark | |
| 1920x1080 High Preset | |
| XMG Pro 15 E23 | |
| Average NVIDIA GeForce RTX 4070 Laptop GPU (125.8 - 196.5, n=5) | |
| Aorus 16X 2024 | |
| Average of class Gaming (n=1last 2 years) | |
| 2560x1440 Cinematic Preset | |
| XMG Pro 15 E23 | |
| Average NVIDIA GeForce RTX 4070 Laptop GPU (37.4 - 76.6, n=5) | |
| Aorus 16X 2024 | |
| Skull & Bones | |
| 1920x1080 Ultra High Preset AA:T | |
| Aorus 16X 2024 | |
| Average NVIDIA GeForce RTX 4070 Laptop GPU (75 - 81, n=3) | |
| XMG Pro 15 E23 | |
| 2560x1440 Ultra High Preset AA:T | |
| Aorus 16X 2024 | |
| Average NVIDIA GeForce RTX 4070 Laptop GPU (56 - 63, n=3) | |
| XMG Pro 15 E23 | |
| Last Epoch | |
| 1920x1080 Ultra Preset AA:T | |
| XMG Pro 15 E23 | |
| Average NVIDIA GeForce RTX 4070 Laptop GPU (133.8 - 140, n=2) | |
| Aorus 16X 2024 | |
| Average of class Gaming (n=1last 2 years) | |
| 2560x1440 Ultra Preset AA:T | |
| XMG Pro 15 E23 | |
| Average NVIDIA GeForce RTX 4070 Laptop GPU (80.4 - 81.1, n=2) | |
| Aorus 16X 2024 | |
| Average of class Gaming (n=1last 2 years) | |
In order to check whether the device's frame rates remain largely constant over a longer period of time, we ran the game The Witcher 3 for around 60 minutes in Full HD resolution and with maximum quality settings. The game character was not moved. There was no noticeable drop in frame rate.
Witcher 3 FPS diagram
| low | med. | high | ultra | QHD | |
|---|---|---|---|---|---|
| GTA V (2015) | 187.5 | 187 | 176.5 | 107.2 | 90.5 |
| The Witcher 3 (2015) | 435 | 338 | 223 | 122 | 88.5 |
| Dota 2 Reborn (2015) | 233 | 208 | 199.1 | 180.9 | |
| Final Fantasy XV Benchmark (2018) | 176.6 | 139.1 | 111.5 | 85.8 | |
| X-Plane 11.11 (2018) | 194.4 | 163 | 126.4 | ||
| Far Cry 5 (2018) | 184 | 124 | 114 | 109 | 98 |
| Strange Brigade (2018) | 455 | 277 | 233 | 204 | 136.2 |
| Cyberpunk 2077 (2023) | 90.2 | 81.6 | 76.9 | 75.8 | 49.4 |
| Skull & Bones (2024) | 107 | 101 | 94 | 81 | 63 |
| Last Epoch (2024) | 169.7 | 156 | 155.9 | 133.8 | 80.4 |
| Alone in the Dark (2024) | 185.9 | 157.3 | 151.1 | 124.7 | 64.7 |
| Horizon Forbidden West (2024) | 92.3 | 77.3 | 73.4 | 71.1 | 54.5 |
Emissions - The Aorus laptop doesn't get terribly warm
Noise emissions
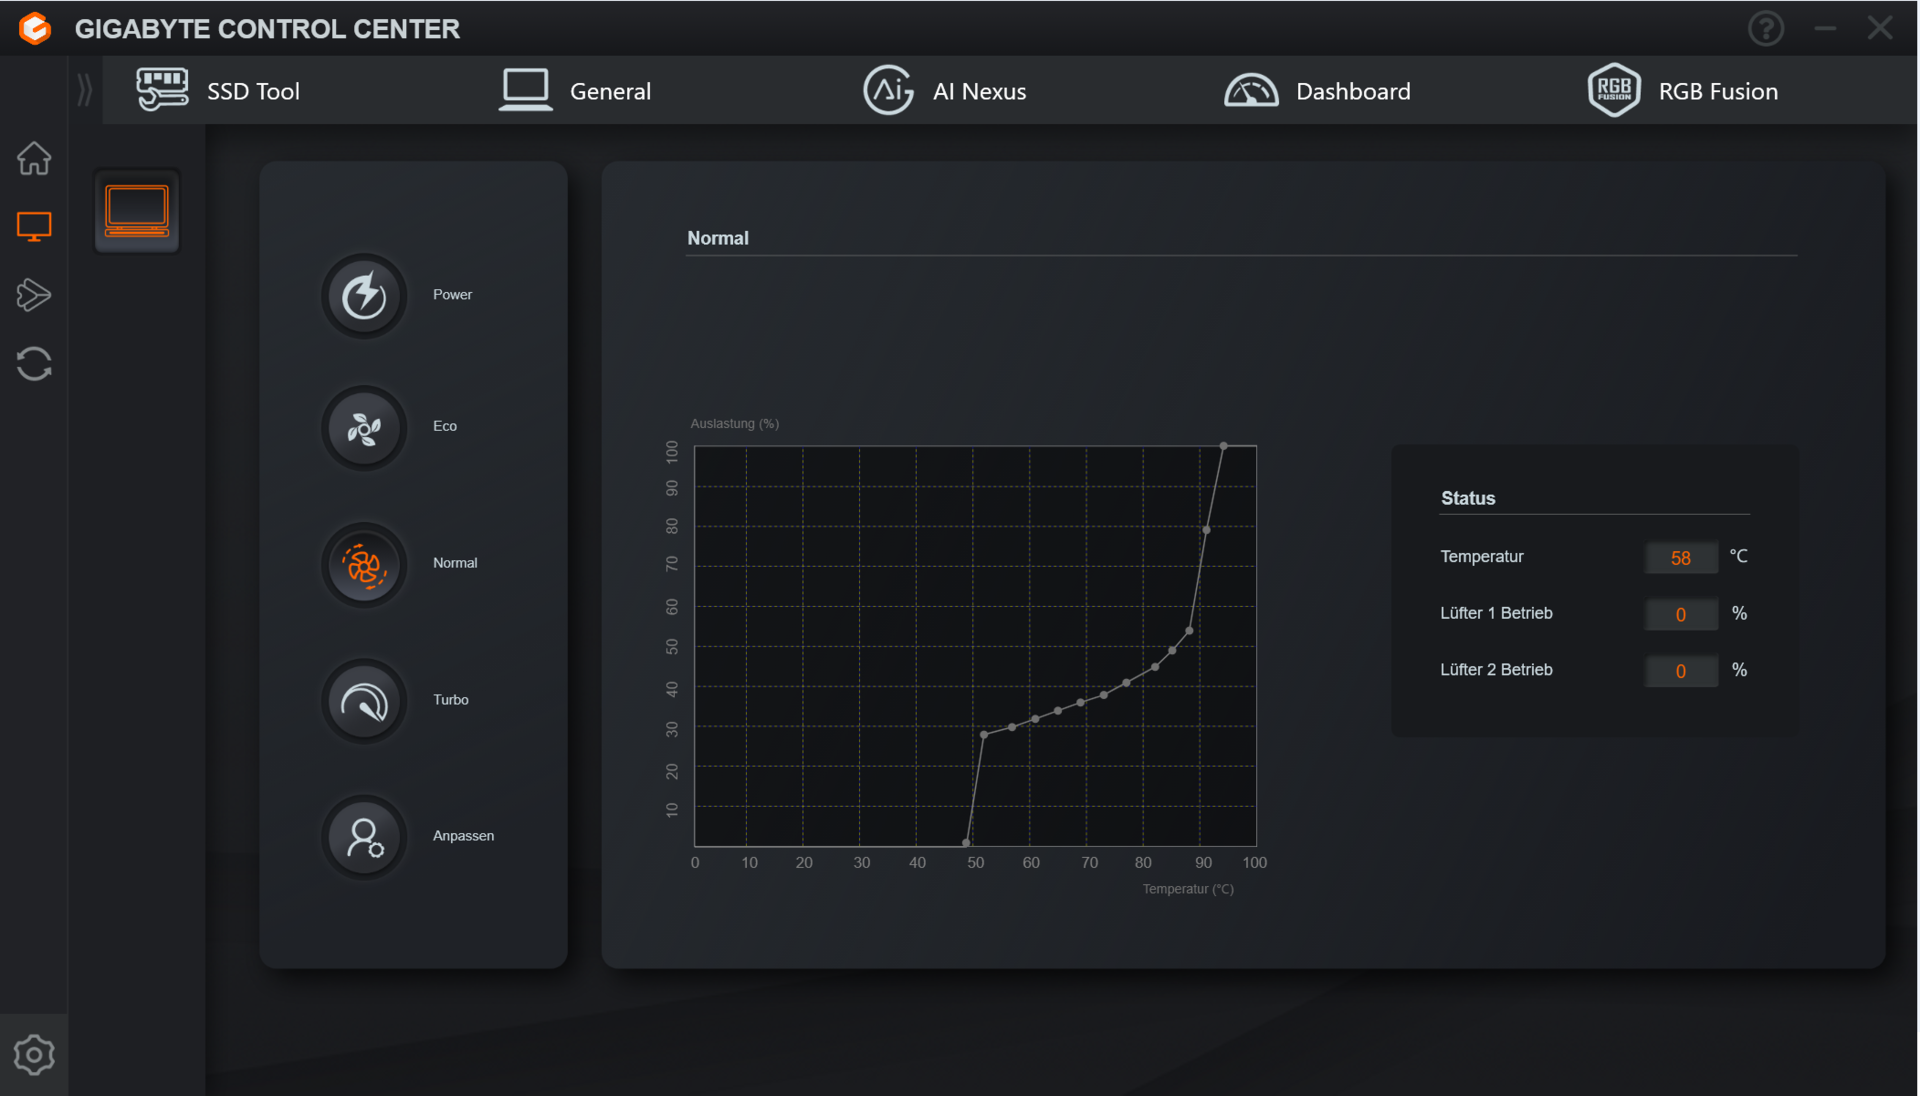
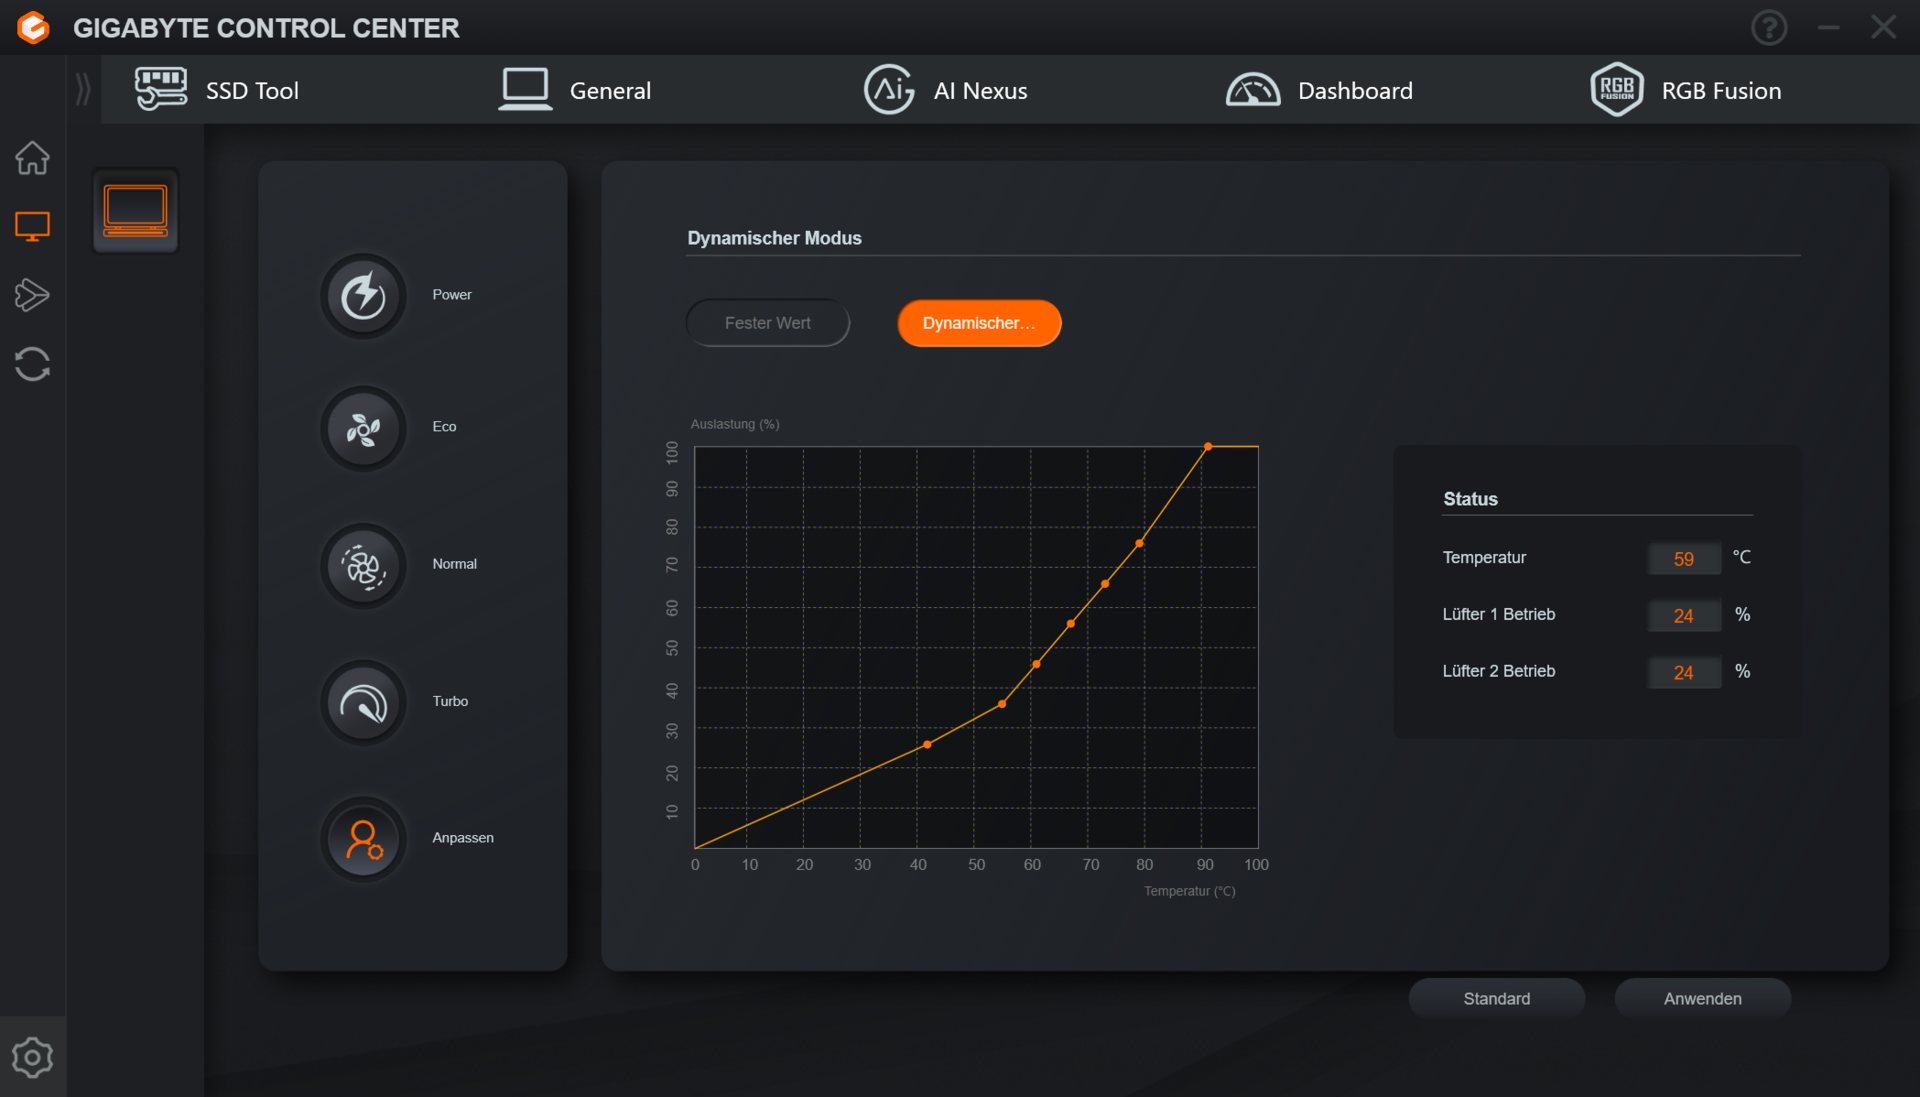
Under full load, the laptop produces noise emissions of up to 55 dB(A). The energy profiles Meeting and Energy-Saving Quiet result in an overall quieter experience—at the cost of some performance. Alternatively, fan activity can be controlled via four fan profiles (within the Gigabyte Control Center). You can also create a custom fan curve if desired. When idle and during everyday use (office, internet), the laptop generally runs quietly—sometimes even silently. At times, the fans start to spin quite fast.
Noise level
| Idle |
| 26 / 32 / 38 dB(A) |
| Load |
| 54 / 55 dB(A) |
 | ||
30 dB silent 40 dB(A) audible 50 dB(A) loud |
||
min: | ||
| Aorus 16X 2024 i9-14900HX, GeForce RTX 4070 Laptop GPU | Alienware m16 R2 Ultra 7 155H, GeForce RTX 4070 Laptop GPU | HP Omen Transcend 16-u1095ng i9-14900HX, GeForce RTX 4070 Laptop GPU | Asus TUF Gaming A17 FA707XI-NS94 R9 7940HS, GeForce RTX 4070 Laptop GPU | Schenker XMG Pro 16 Studio (Mid 23) i9-13900H, GeForce RTX 4070 Laptop GPU | Lenovo Legion Pro 5 16IRX9 i9-14900HX, GeForce RTX 4070 Laptop GPU | |
|---|---|---|---|---|---|---|
| Noise | 12% | 9% | 4% | 9% | 10% | |
| off / environment * (dB) | 26 | 24.7 5% | 24 8% | 27.9 -7% | 25 4% | 23.9 8% |
| Idle Minimum * (dB) | 26 | 25.3 3% | 29 -12% | 28.5 -10% | 26 -0% | 24.3 7% |
| Idle Average * (dB) | 32 | 25.3 21% | 30 6% | 29.8 7% | 29 9% | 24.3 24% |
| Idle Maximum * (dB) | 38 | 25.3 33% | 31 18% | 29.8 22% | 34 11% | 28.9 24% |
| Load Average * (dB) | 54 | 31.7 41% | 45 17% | 34.8 36% | 43 20% | 45.8 15% |
| Witcher 3 ultra * (dB) | 50 | 53.8 -8% | 44 12% | 57.1 -14% | 48 4% | 51 -2% |
| Load Maximum * (dB) | 55 | 62 -13% | 47 15% | 57.3 -4% | 48 13% | 56.6 -3% |
* ... smaller is better
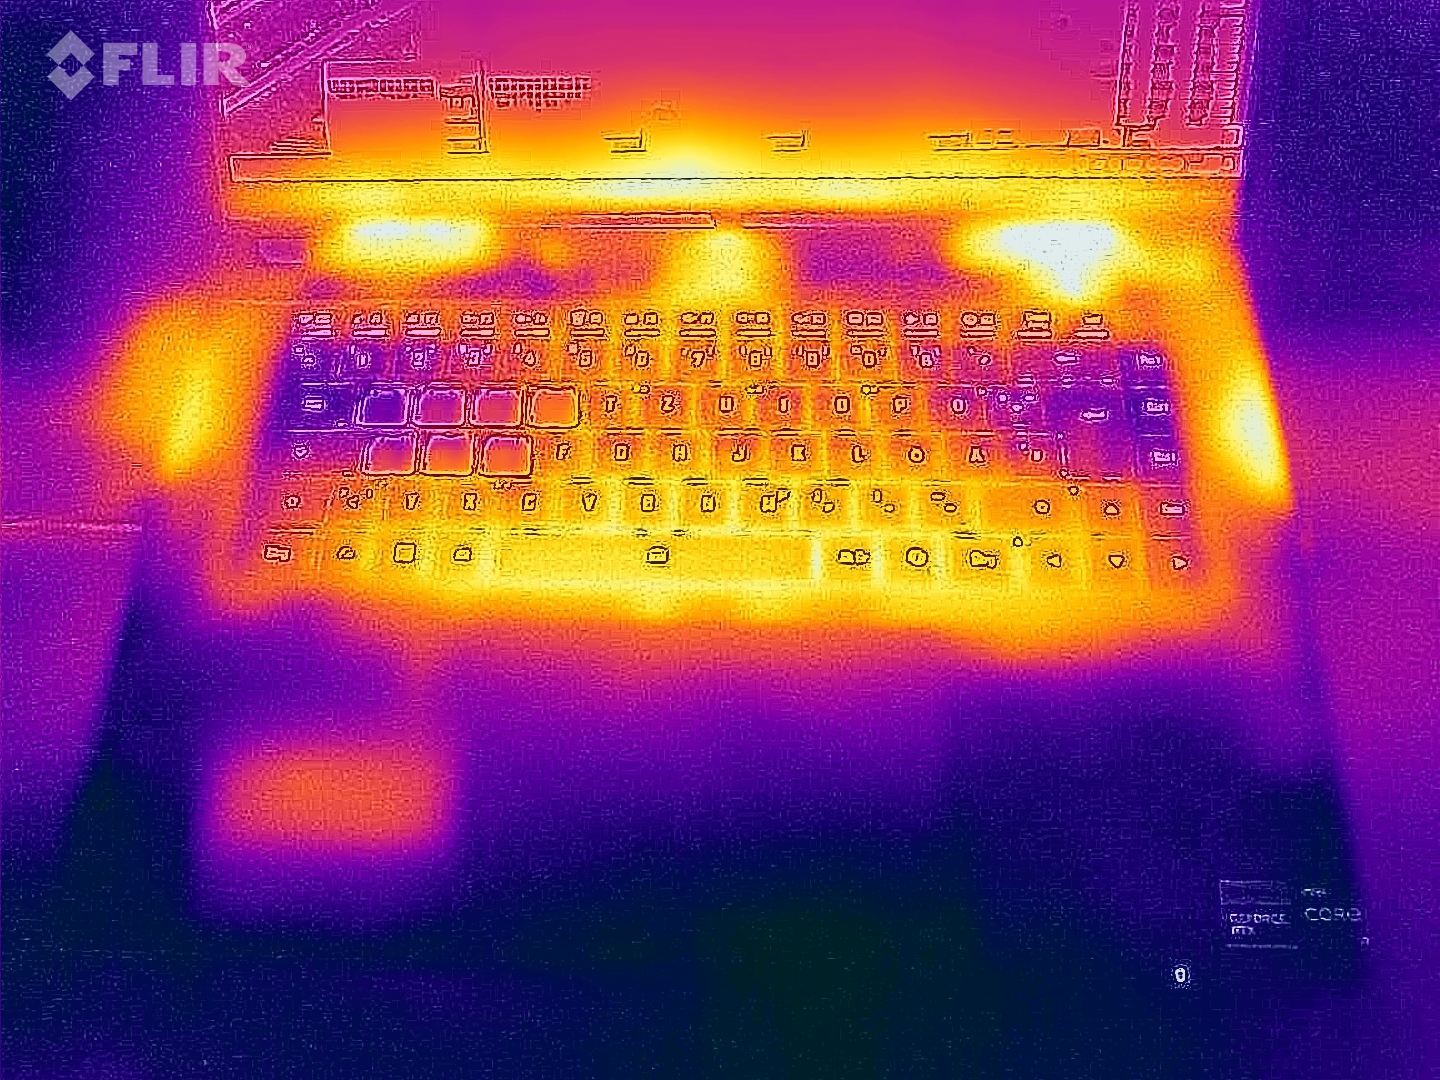
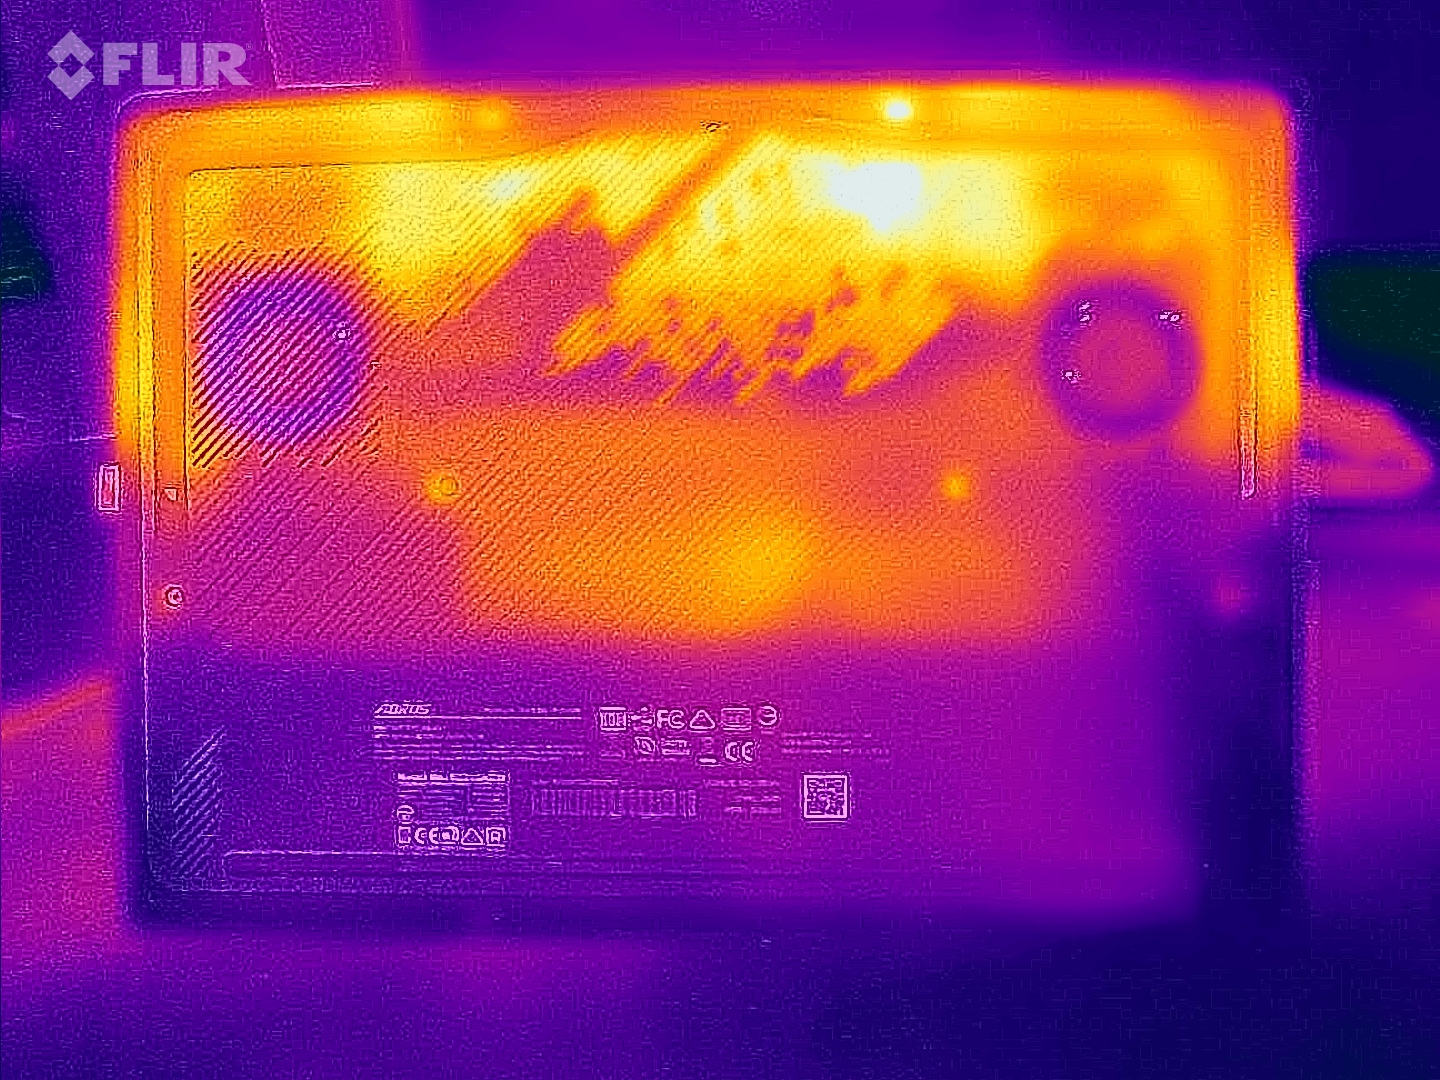
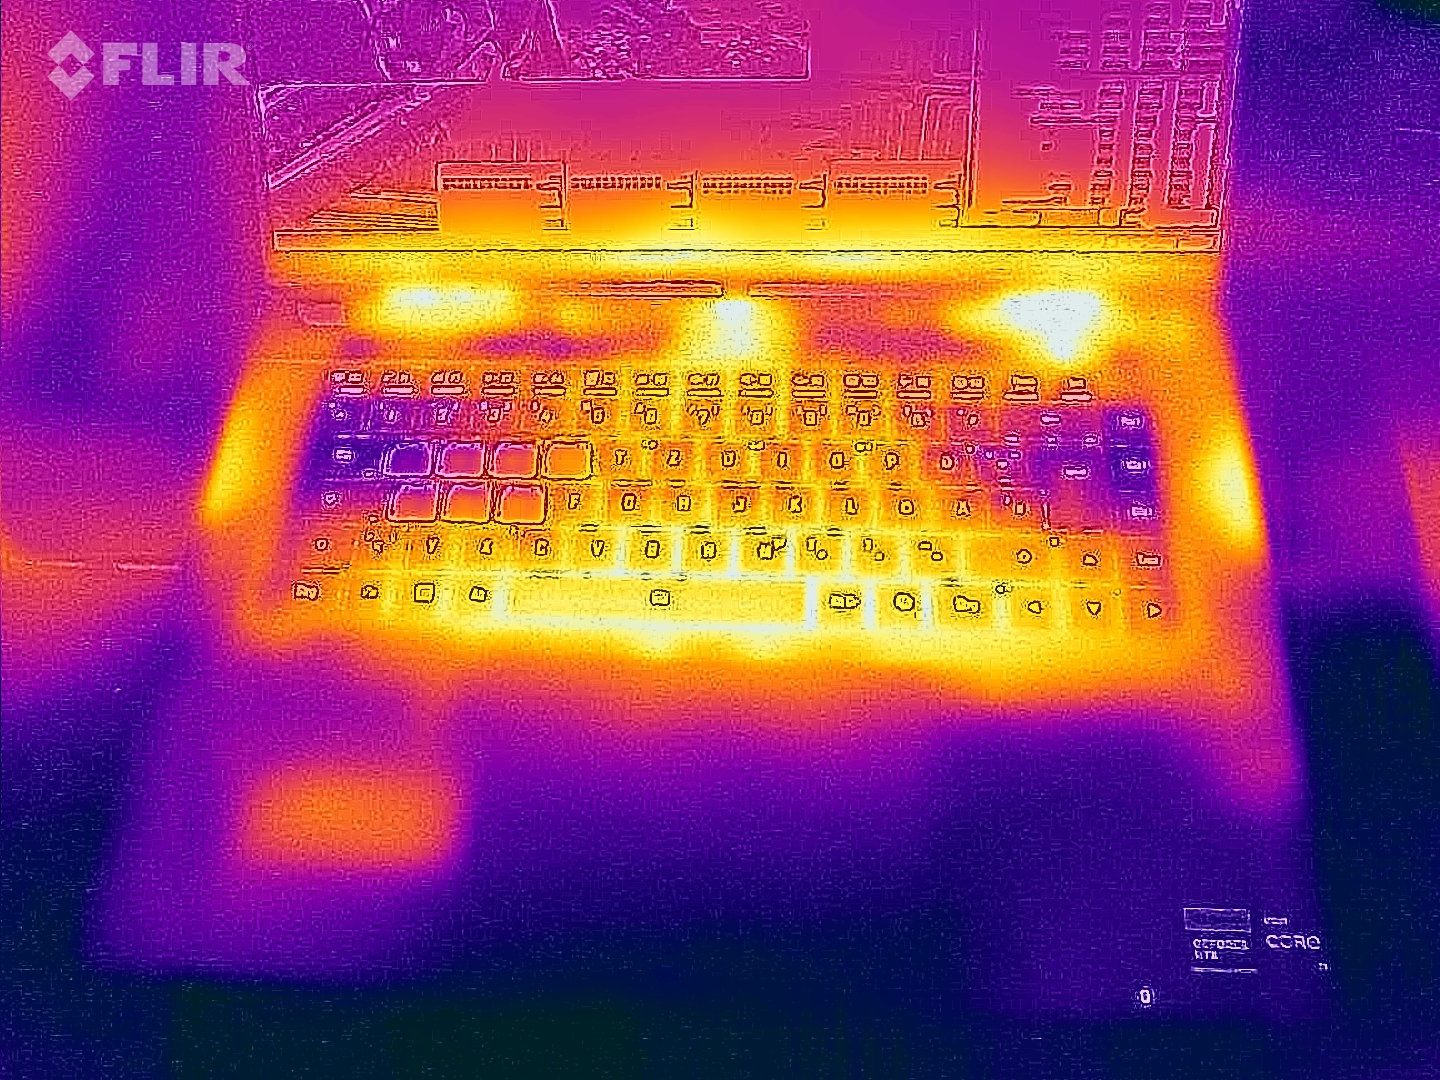
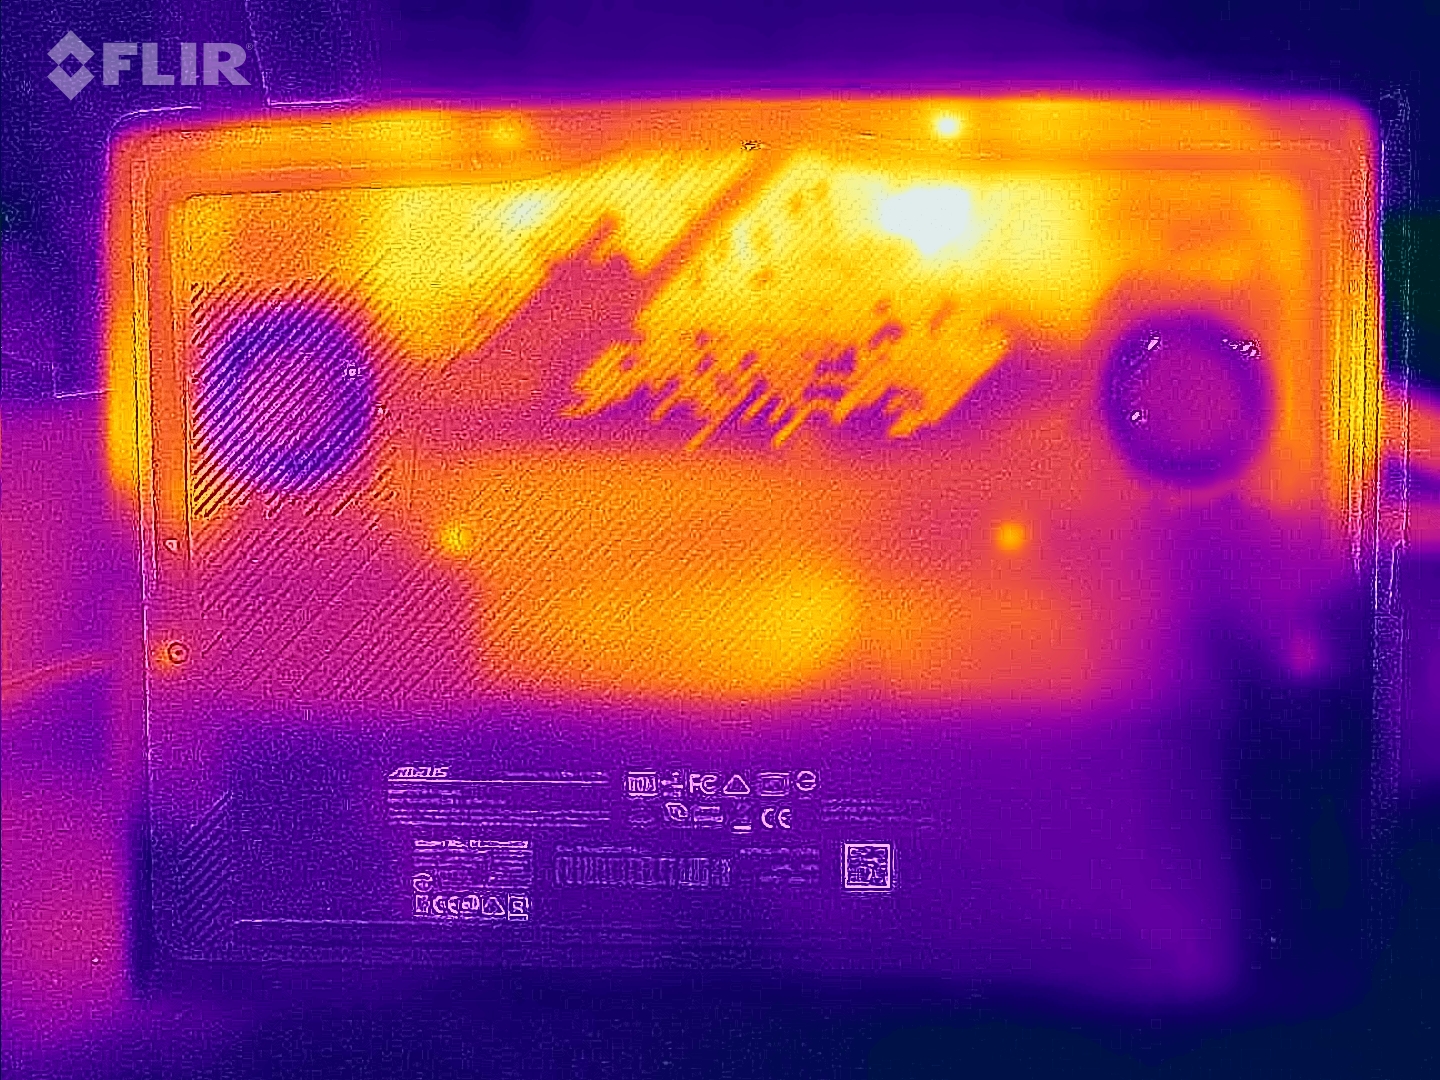
Temperature
The stress test and Witcher 3 test only caused the laptop to heat up a little. In some cases, we measured values in the lower to mid 40-degree Celsius range. In everyday use (office, internet), the values will largely remain in the green zone, however, they are above average.
(±) The maximum temperature on the upper side is 41 °C / 106 F, compared to the average of 40.4 °C / 105 F, ranging from 21.2 to 68.8 °C for the class Gaming.
(±) The bottom heats up to a maximum of 41 °C / 106 F, compared to the average of 43.2 °C / 110 F
(±) In idle usage, the average temperature for the upper side is 33.2 °C / 92 F, compared to the device average of 33.9 °C / 93 F.
(±) Playing The Witcher 3, the average temperature for the upper side is 35.7 °C / 96 F, compared to the device average of 33.9 °C / 93 F.
(+) The palmrests and touchpad are cooler than skin temperature with a maximum of 30 °C / 86 F and are therefore cool to the touch.
(±) The average temperature of the palmrest area of similar devices was 28.8 °C / 83.8 F (-1.2 °C / -2.2 F).
| Aorus 16X 2024 i9-14900HX, GeForce RTX 4070 Laptop GPU | Alienware m16 R2 Ultra 7 155H, GeForce RTX 4070 Laptop GPU | HP Omen Transcend 16-u1095ng i9-14900HX, GeForce RTX 4070 Laptop GPU | Asus TUF Gaming A17 FA707XI-NS94 R9 7940HS, GeForce RTX 4070 Laptop GPU | Schenker XMG Pro 16 Studio (Mid 23) i9-13900H, GeForce RTX 4070 Laptop GPU | Lenovo Legion Pro 5 16IRX9 i9-14900HX, GeForce RTX 4070 Laptop GPU | |
|---|---|---|---|---|---|---|
| Heat | -10% | -8% | 21% | -19% | -7% | |
| Maximum Upper Side * (°C) | 41 | 44.8 -9% | 49 -20% | 40 2% | 55 -34% | 43.8 -7% |
| Maximum Bottom * (°C) | 41 | 48 -17% | 63 -54% | 33.6 18% | 66 -61% | 55.4 -35% |
| Idle Upper Side * (°C) | 37 | 37.2 -1% | 30 19% | 26.6 28% | 33 11% | 32.8 11% |
| Idle Bottom * (°C) | 38 | 42 -11% | 29 24% | 24.4 36% | 35 8% | 36 5% |
* ... smaller is better
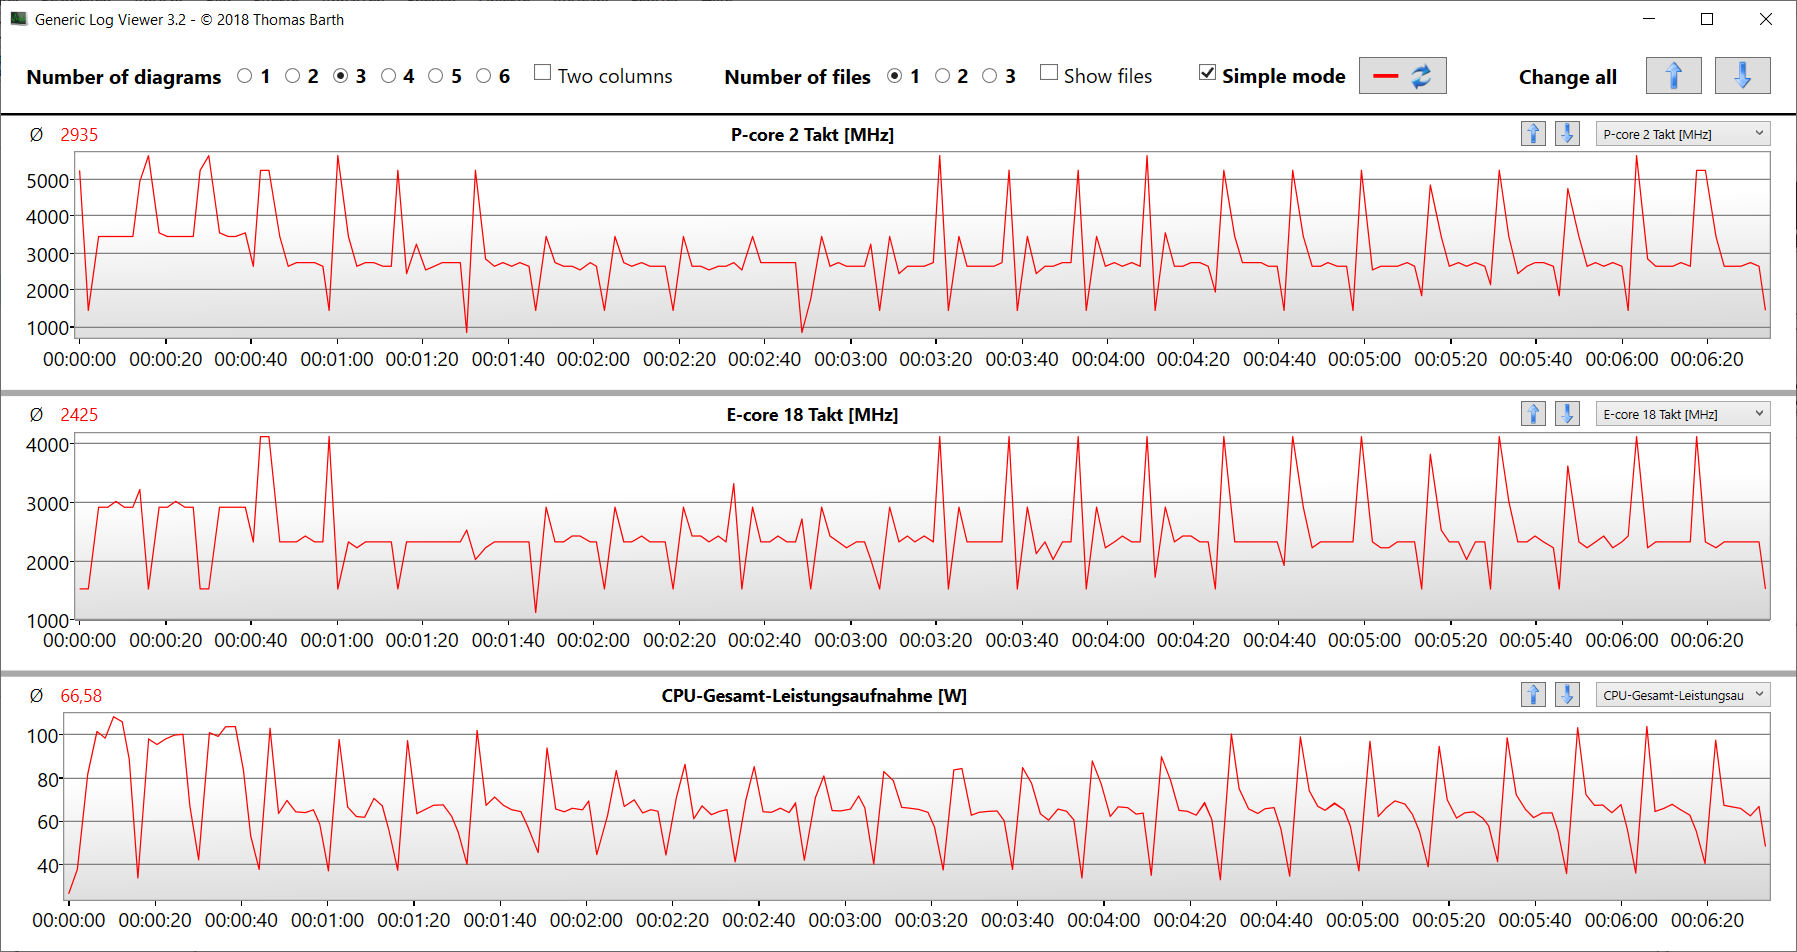
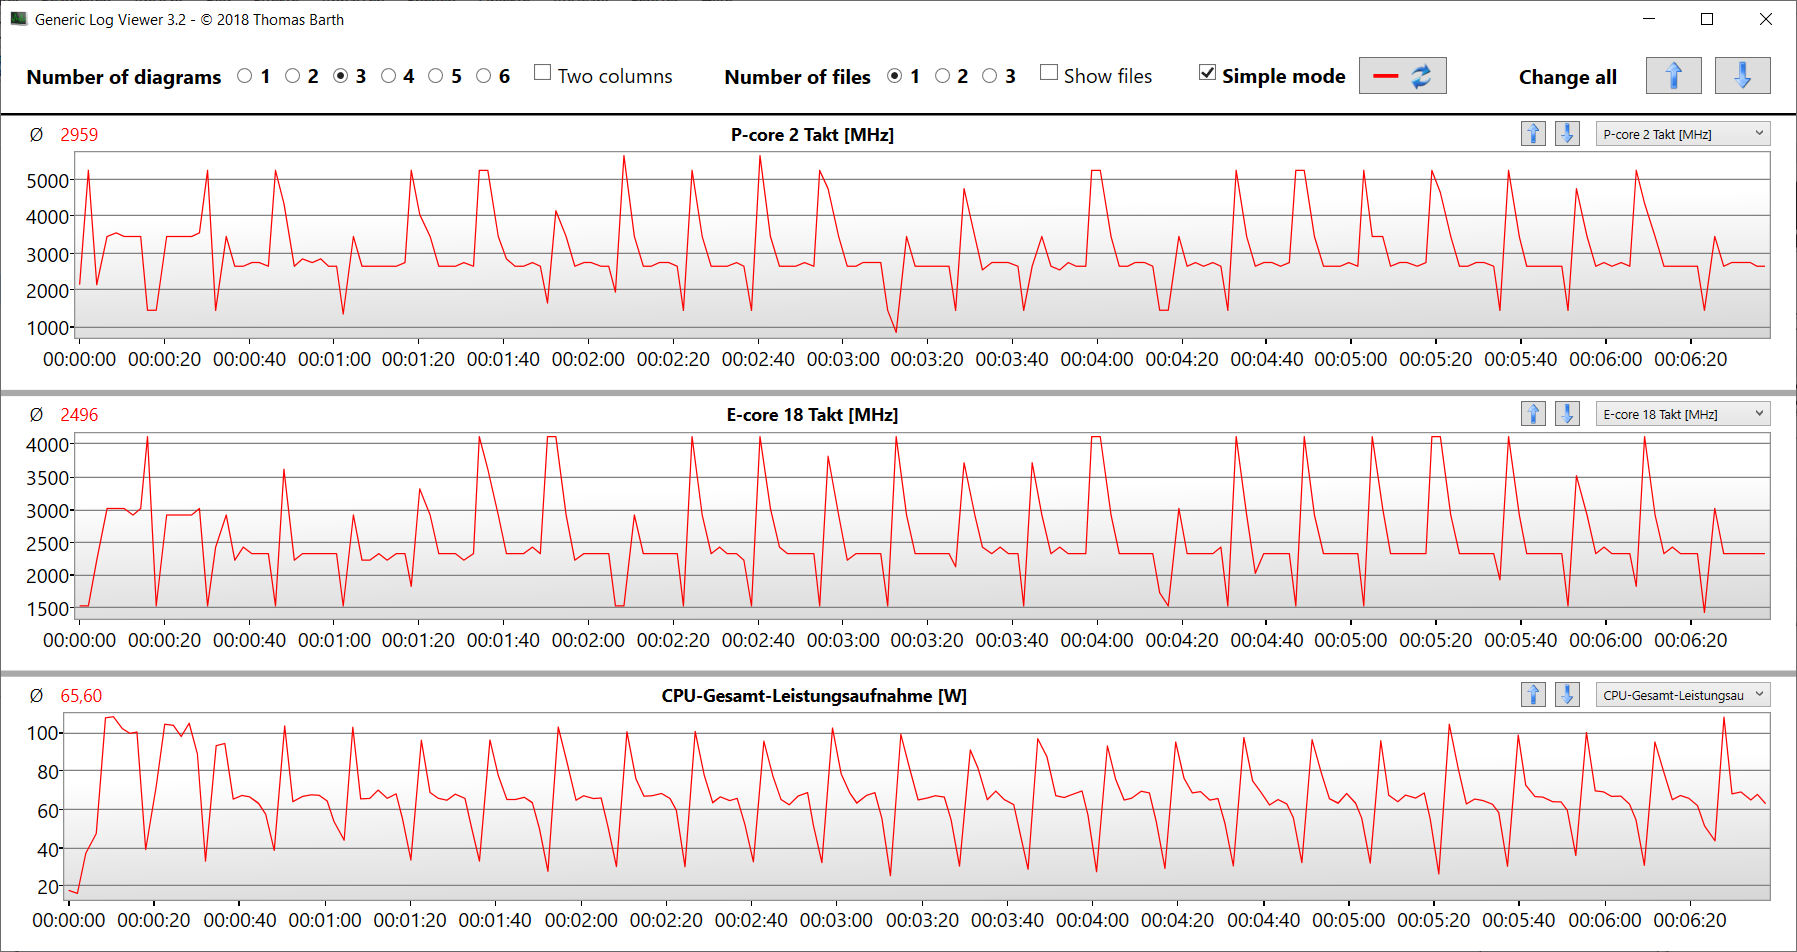
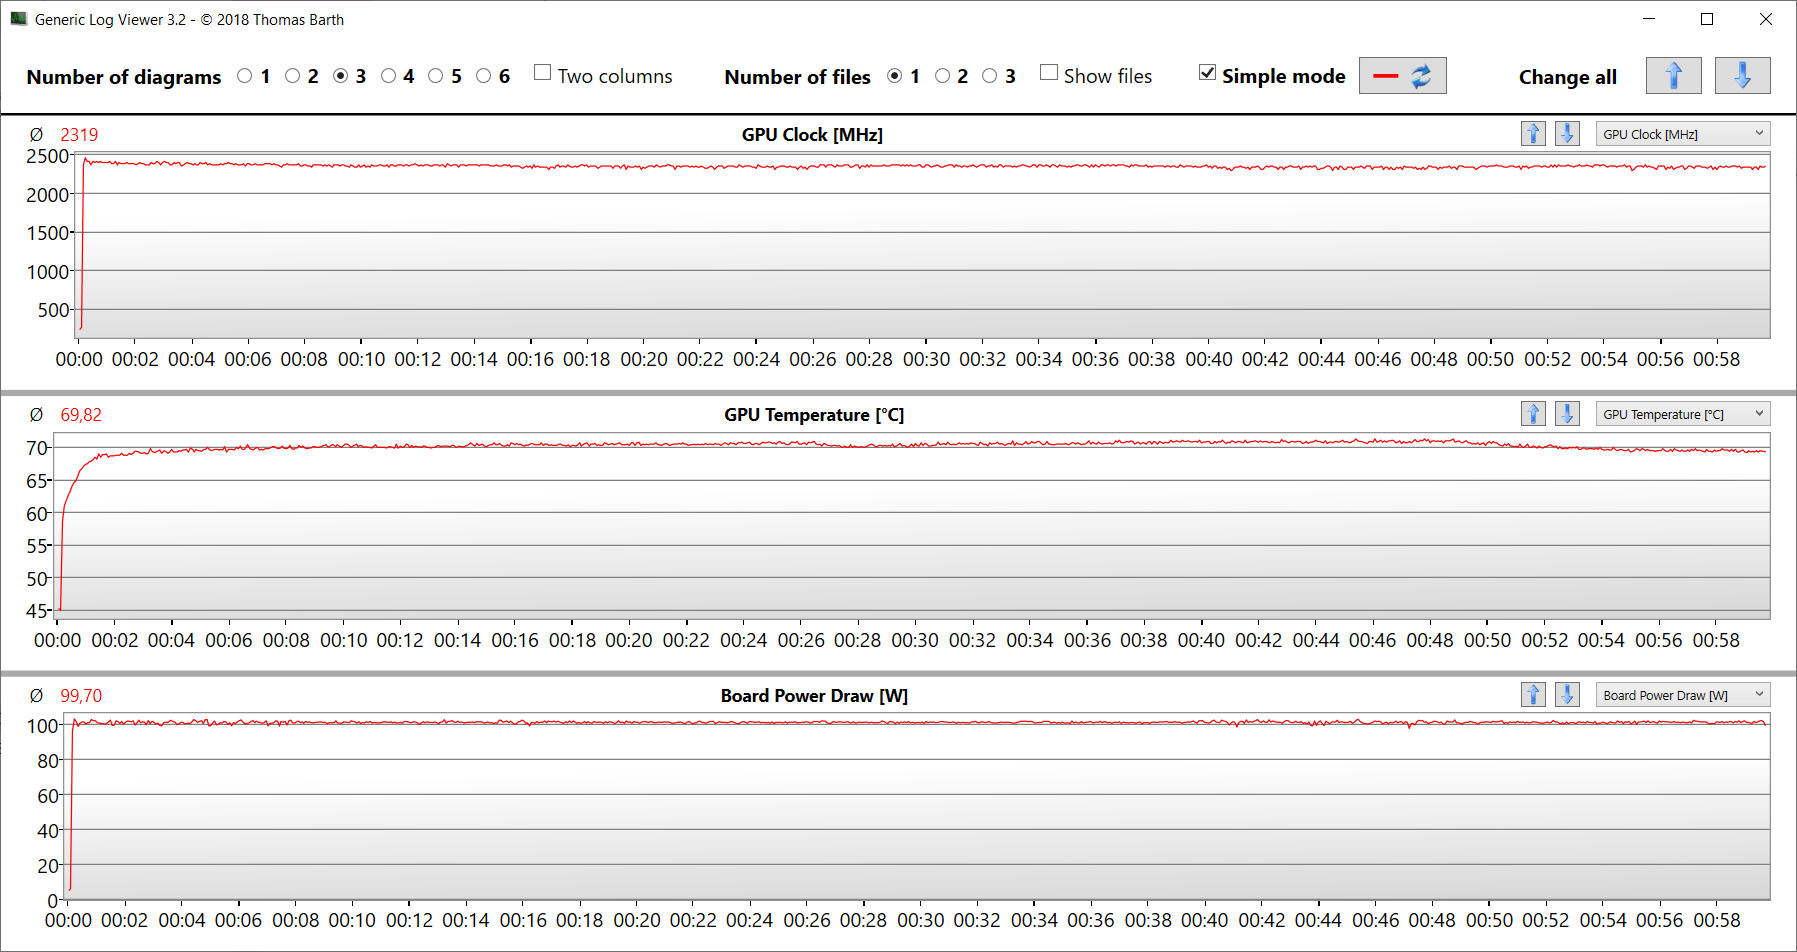
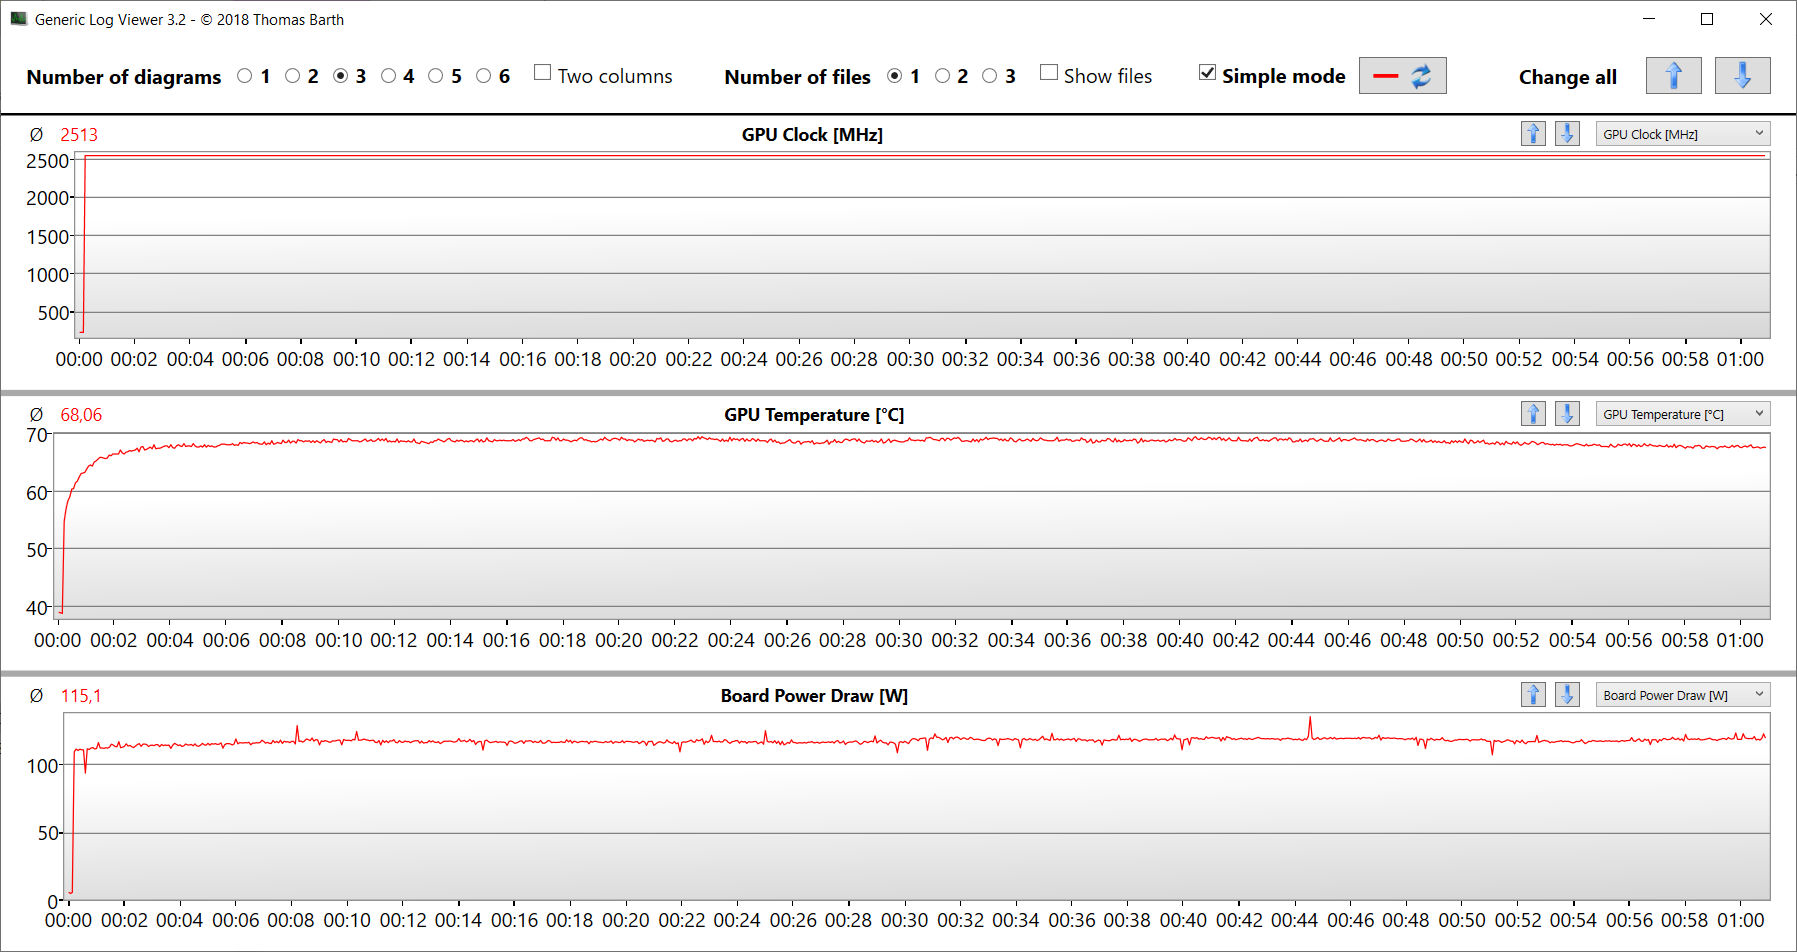
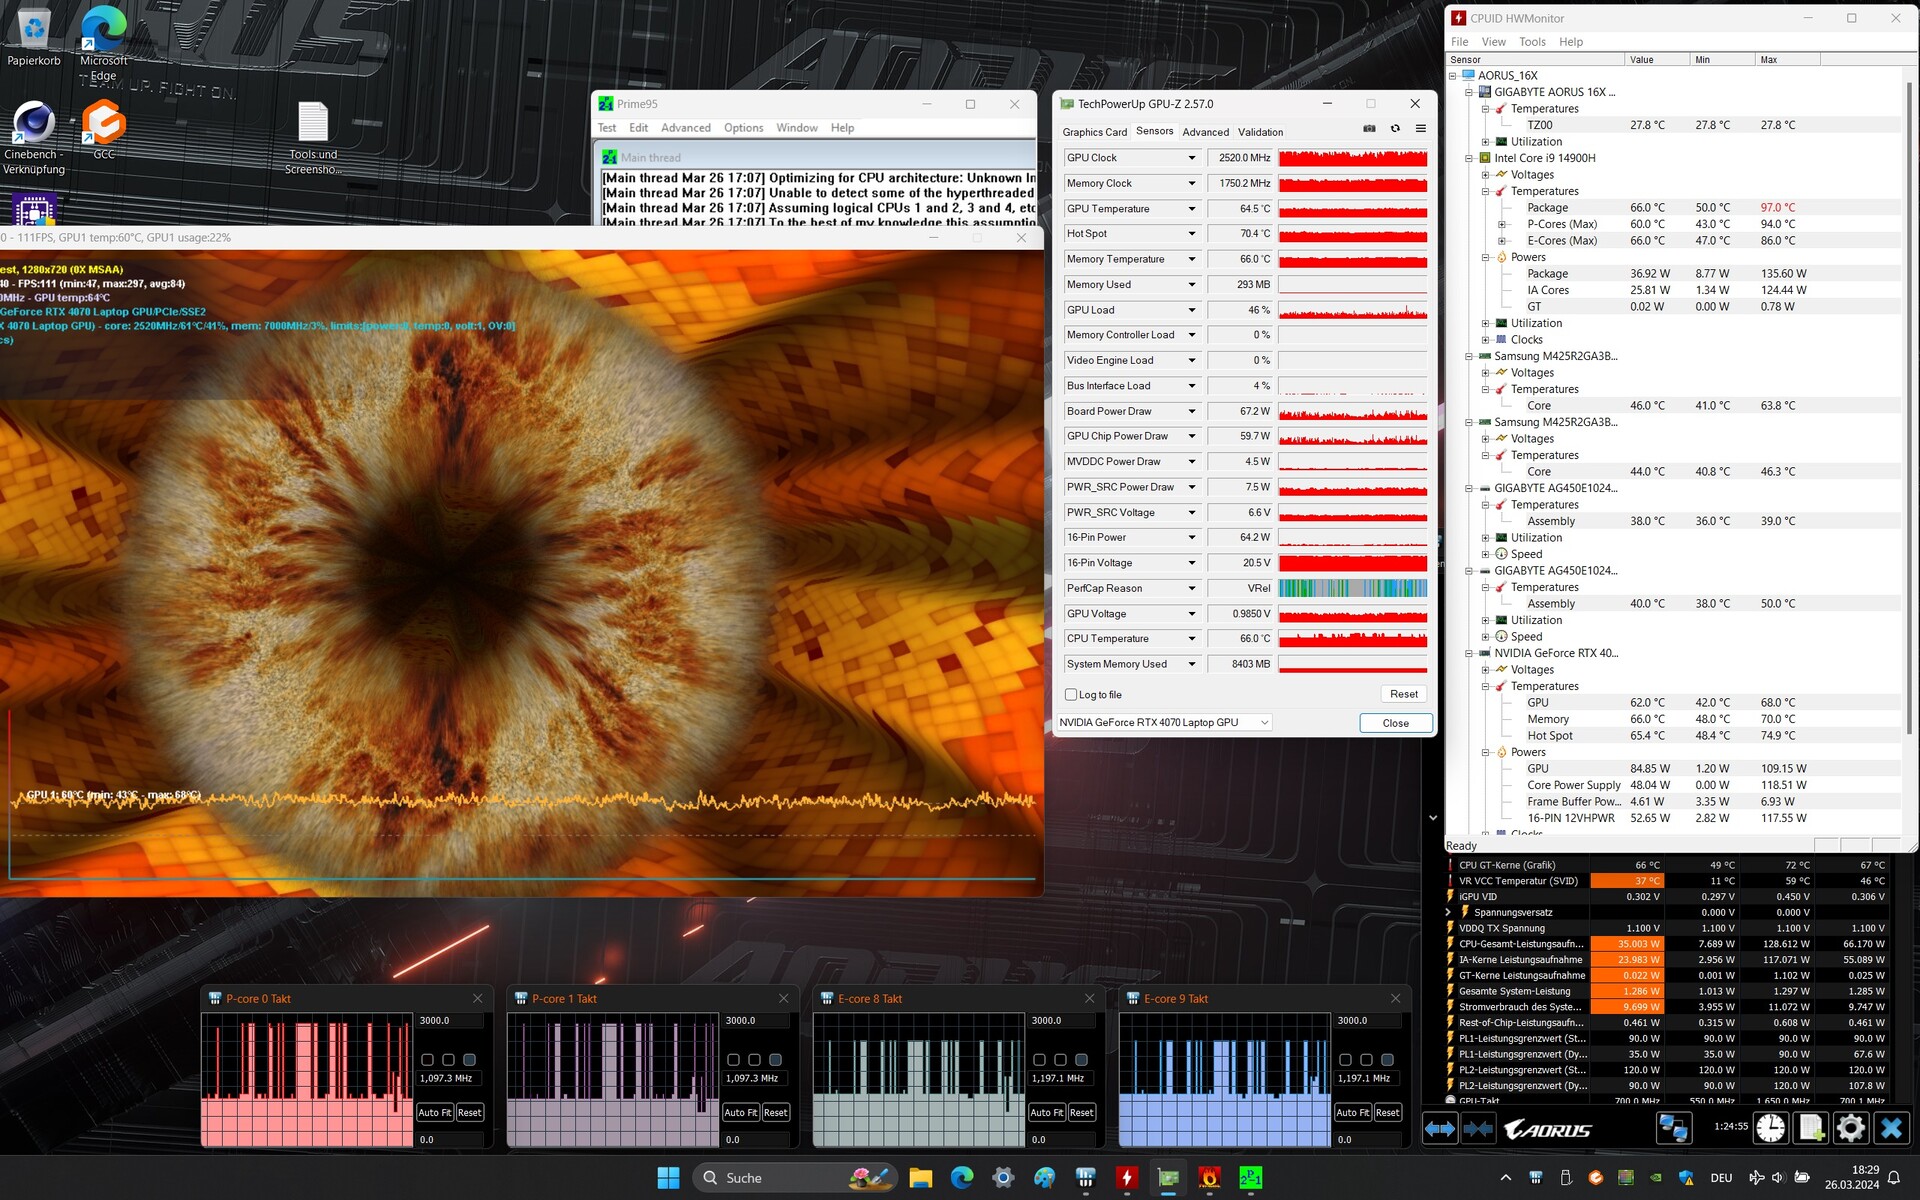
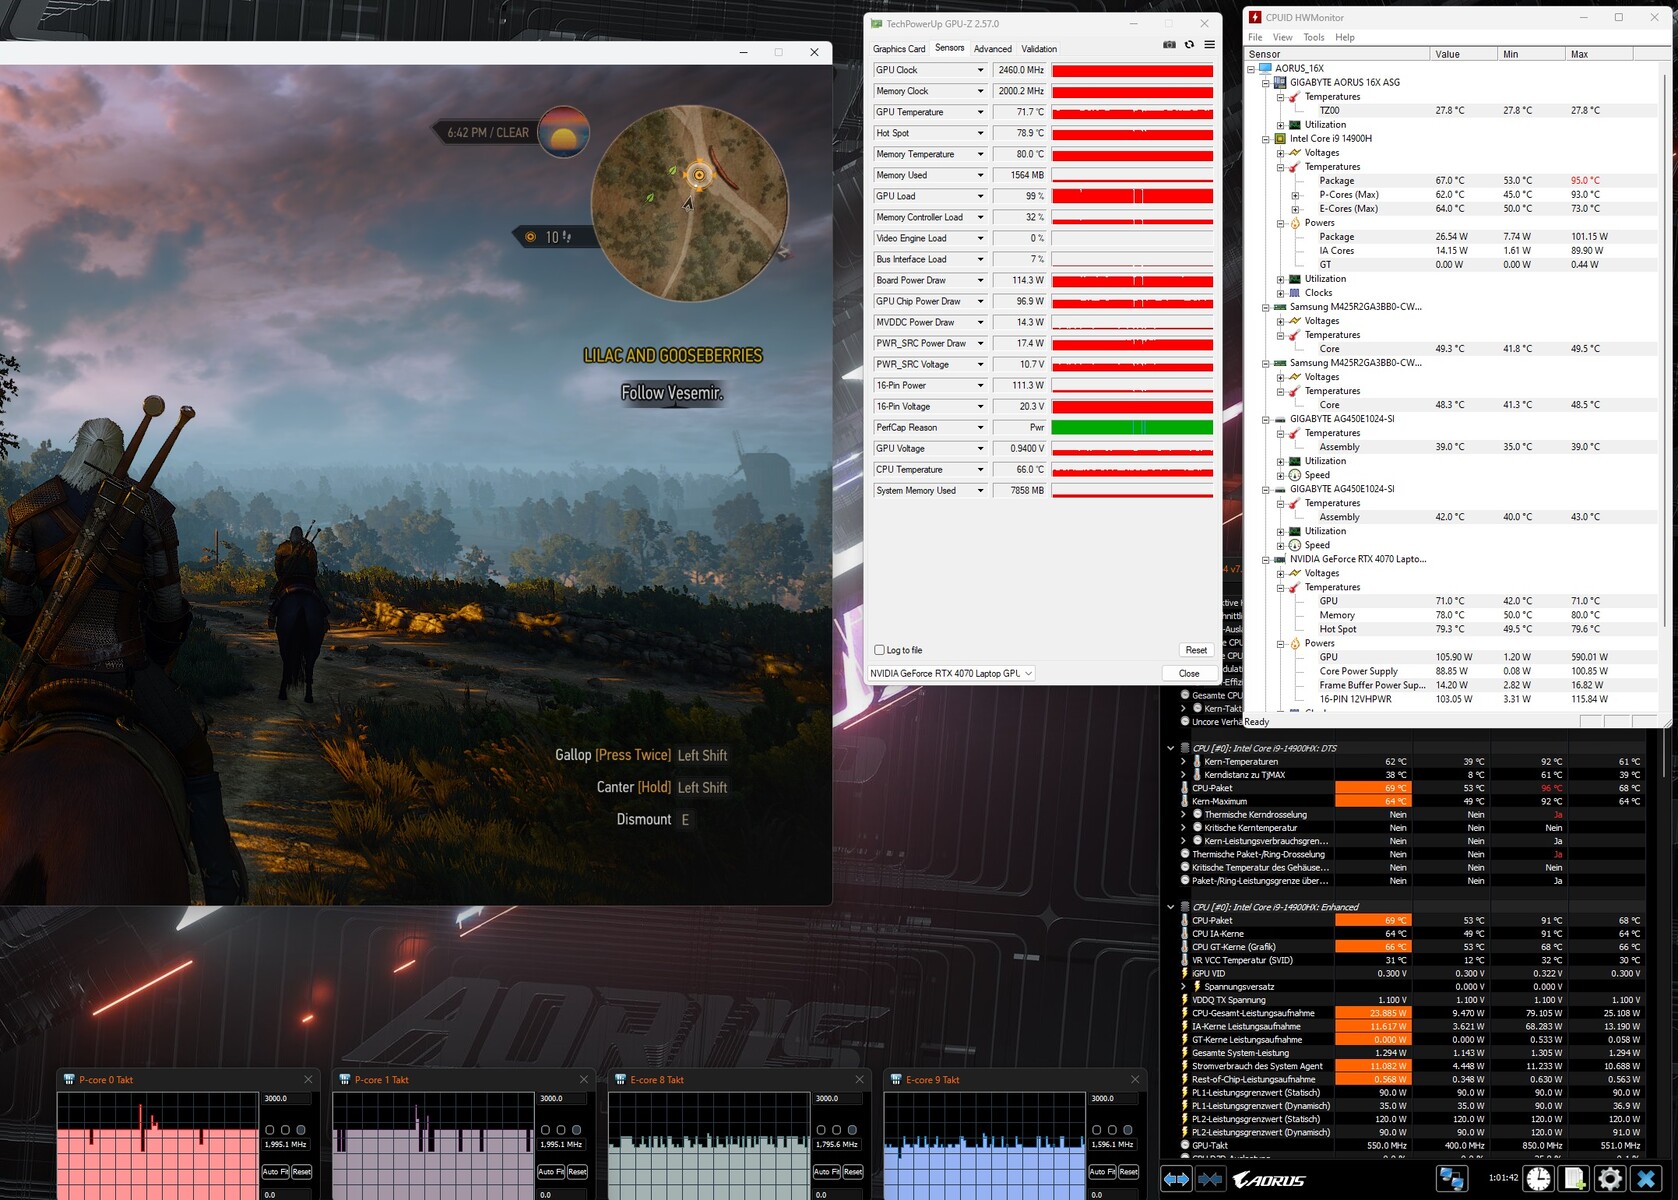
Stress test
The extreme stress test scenario (Prime95 and Furmark in continuous operation) checks the system's stability under full load. The CPU clock fluctuated between 1 and 3 GHz for quite a long time but then stabilized at a low level after a while. The graphics core ran at high speeds.
Speakers
The laptop's stereo speakers produce a good sound overall. An even better sound experience can be achieved by using headphones or external speakers.
Aorus 16X 2024 audio analysis
(+) | speakers can play relatively loud (85 dB)
Bass 100 - 315 Hz
(±) | reduced bass - on average 8.5% lower than median
(±) | linearity of bass is average (8.3% delta to prev. frequency)
Mids 400 - 2000 Hz
(+) | balanced mids - only 3.1% away from median
(+) | mids are linear (5.8% delta to prev. frequency)
Highs 2 - 16 kHz
(+) | balanced highs - only 2.5% away from median
(±) | linearity of highs is average (7% delta to prev. frequency)
Overall 100 - 16.000 Hz
(+) | overall sound is linear (8.4% difference to median)
Compared to same class
» 2% of all tested devices in this class were better, 1% similar, 97% worse
» The best had a delta of 6%, average was 18%, worst was 132%
Compared to all devices tested
» 2% of all tested devices were better, 1% similar, 97% worse
» The best had a delta of 4%, average was 24%, worst was 134%
Alienware m16 R2 audio analysis
(+) | speakers can play relatively loud (82.4 dB)
Bass 100 - 315 Hz
(-) | nearly no bass - on average 20.1% lower than median
(±) | linearity of bass is average (11.1% delta to prev. frequency)
Mids 400 - 2000 Hz
(+) | balanced mids - only 2.2% away from median
(+) | mids are linear (3.1% delta to prev. frequency)
Highs 2 - 16 kHz
(+) | balanced highs - only 2.2% away from median
(+) | highs are linear (3.5% delta to prev. frequency)
Overall 100 - 16.000 Hz
(+) | overall sound is linear (12.9% difference to median)
Compared to same class
» 17% of all tested devices in this class were better, 4% similar, 79% worse
» The best had a delta of 6%, average was 18%, worst was 132%
Compared to all devices tested
» 12% of all tested devices were better, 3% similar, 85% worse
» The best had a delta of 4%, average was 24%, worst was 134%
Power management - The gaming laptop with decent stamina
Power consumption
The device's power consumption is at a normal level for the installed hardware. While the Witcher 3 test ran with constant power consumption, the laptop's demand fluctuated significantly in the first few minutes of the stress test. The power supply unit (240 watts) is sufficiently sized.
| Off / Standby | |
| Idle | |
| Load |
|
Key:
min: | |
| Aorus 16X 2024 i9-14900HX, GeForce RTX 4070 Laptop GPU | Alienware m16 R2 Ultra 7 155H, GeForce RTX 4070 Laptop GPU | HP Omen Transcend 16-u1095ng i9-14900HX, GeForce RTX 4070 Laptop GPU | Asus TUF Gaming A17 FA707XI-NS94 R9 7940HS, GeForce RTX 4070 Laptop GPU | Schenker XMG Pro 16 Studio (Mid 23) i9-13900H, GeForce RTX 4070 Laptop GPU | Average of class Gaming | |
|---|---|---|---|---|---|---|
| Power Consumption | 12% | 7% | 17% | 23% | 5% | |
| Idle Minimum * (Watt) | 13 | 8.1 38% | 10 23% | 6.2 52% | 8 38% | 13.4 ? -3% |
| Idle Average * (Watt) | 18 | 13 28% | 18 -0% | 21.8 -21% | 12 33% | 19.1 ? -6% |
| Idle Maximum * (Watt) | 35 | 40.3 -15% | 32 9% | 22 37% | 23 34% | 24.7 ? 29% |
| Load Average * (Watt) | 138 | 79 43% | 128 7% | 59.2 57% | 94 32% | 108.4 ? 21% |
| Witcher 3 ultra * (Watt) | 172.6 | 188.1 -9% | 148.4 14% | 189.7 -10% | 181.5 -5% | |
| Load Maximum * (Watt) | 222 | 254.9 -15% | 242 -9% | 247.8 -12% | 215 3% | 254 ? -14% |
* ... smaller is better
Power consumption Witcher 3 / stress test
Power consumption with external monitor
Runtimes
The 16-inch device achieved runtimes of 8:01 h and 9:01 h during the WLAN test (accessing websites using a script) and video test (short film Big Buck Bunny (H.264 encoding, FHD) in a loop). All in all, the Aorus 16X delivered very good results. However, none of the comparison computers came close to the endurance of the Asus A17.
| Aorus 16X 2024 i9-14900HX, GeForce RTX 4070 Laptop GPU, 99 Wh | Alienware m16 R2 Ultra 7 155H, GeForce RTX 4070 Laptop GPU, 90 Wh | HP Omen Transcend 16-u1095ng i9-14900HX, GeForce RTX 4070 Laptop GPU, 97 Wh | Asus TUF Gaming A17 FA707XI-NS94 R9 7940HS, GeForce RTX 4070 Laptop GPU, 90 Wh | Schenker XMG Pro 16 Studio (Mid 23) i9-13900H, GeForce RTX 4070 Laptop GPU, 73 Wh | Lenovo Legion Pro 5 16IRX9 i9-14900HX, GeForce RTX 4070 Laptop GPU, 80 Wh | Average of class Gaming | |
|---|---|---|---|---|---|---|---|
| Battery runtime | -13% | -39% | 23% | -15% | -41% | -17% | |
| Reader / Idle (h) | 12.6 | 12.6 0% | 19.7 56% | 6.7 -47% | 8.71 ? -31% | ||
| H.264 (h) | 9 | 8.26 ? -8% | |||||
| WiFi v1.3 (h) | 8 | 8.1 1% | 4.9 -39% | 9.1 14% | 6.8 -15% | 4.8 -40% | 6.94 ? -13% |
| Load (h) | 1.7 | 1 -41% | 1.7 0% | 1.1 -35% | 1.47 ? -14% |
Pros
Cons
Verdict - A well-rounded upper mid-range gaming laptop
The Aorus 16X is optimized for QHD+ gaming, streaming and rendering. The Core i9-14900HX and the GeForce RTX 4070 deliver the necessary performance. The CPU and graphics core operate at consistently high clock rates. Two fast PCIe-4 SSDs (1 TB each) ensure short loading times.
Gigabyte's Aorus 16X (2024) is a powerful, well-equipped laptop for gamers and creators which doesn't seem to have any major flaws.
The laptop doesn't get particularly warm under load, but it can produce quite a bit of noise. Quieter operation comes at the expense of some computing performance. The installed IPS screen (16 inches, 2,560 x 1,600 pixels, 165 Hz) features a work-friendly 16:10 aspect ratio and left an overall good impression on us. It boasts extremely good brightness in particular.
Two USB-C ports (1x Thunderbolt 4, 1x USB 3.2 Gen 2) make it easy to integrate the laptop into existing workplace setups and open up further expansion options (external GPU, docking). Both ports can output a DisplayPort signal and in addition, one supports Power Delivery. The device's runtimes are impressive.
One alternative to the Aorus 16X could potentially be the Lenovo Legion Pro 5 16IRX9. It offers slightly better graphics performance using the same CPU/GPU configuration, but it only features one SSD and still uses a WiFi 6E module (Aorus: WiFi 7).
Price and availability
Currently, the Aorus 16X ASG can be purchased for US$1,949.99 on Amazon.
Aorus 16X 2024
- 04/09/2024 v7 (old)
Sascha Mölck
Transparency
The selection of devices to be reviewed is made by our editorial team. The test sample was provided to the author as a loan by the manufacturer or retailer for the purpose of this review. The lender had no influence on this review, nor did the manufacturer receive a copy of this review before publication. There was no obligation to publish this review. As an independent media company, Notebookcheck is not subjected to the authority of manufacturers, retailers or publishers.
This is how Notebookcheck is testing
Every year, Notebookcheck independently reviews hundreds of laptops and smartphones using standardized procedures to ensure that all results are comparable. We have continuously developed our test methods for around 20 years and set industry standards in the process. In our test labs, high-quality measuring equipment is utilized by experienced technicians and editors. These tests involve a multi-stage validation process. Our complex rating system is based on hundreds of well-founded measurements and benchmarks, which maintains objectivity. Further information on our test methods can be found here.
Price comparison

