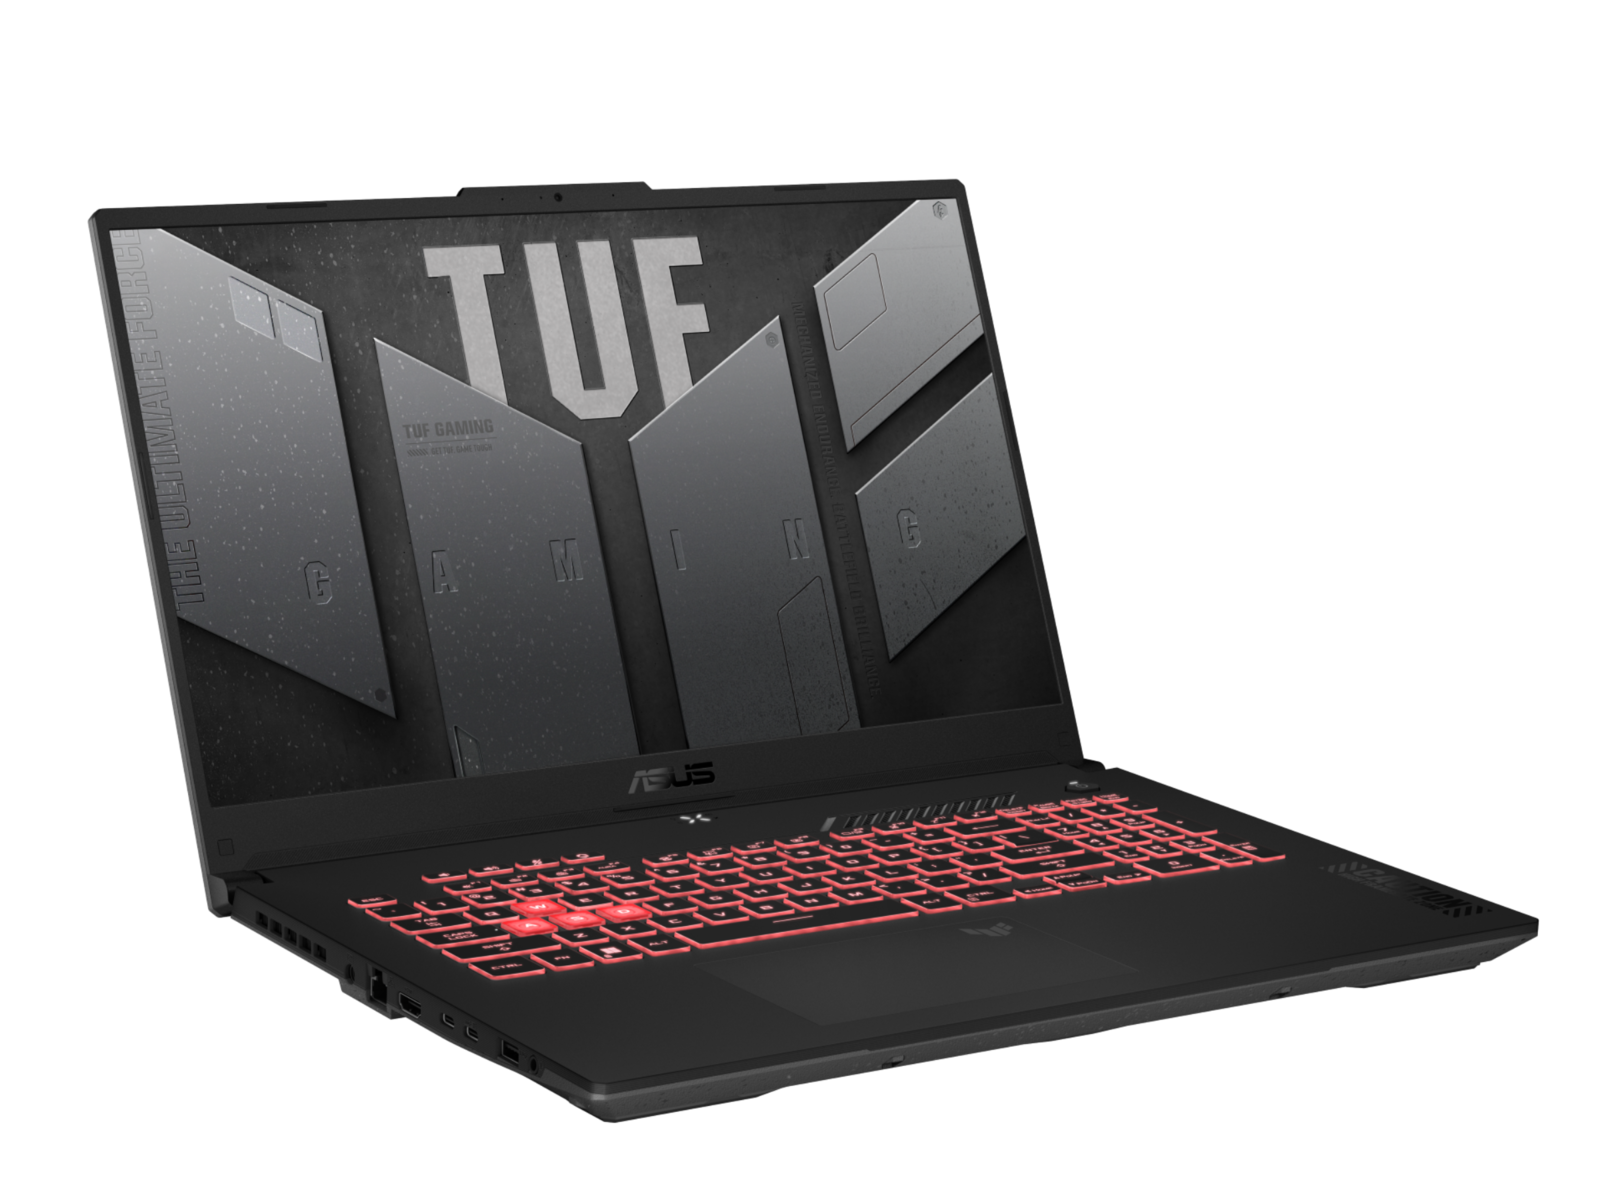
Asus TUF Gaming A17 FA707XI laptop review: 140 W GeForce RTX 4070 for $1400

The Asus TUF Gaming A17 FA707 is the AMD version of the Intel-based TUF Gaming F17 FX707. The TUF series consists of midrange gaming laptops to contrast the pricier and higher-end ROG series.
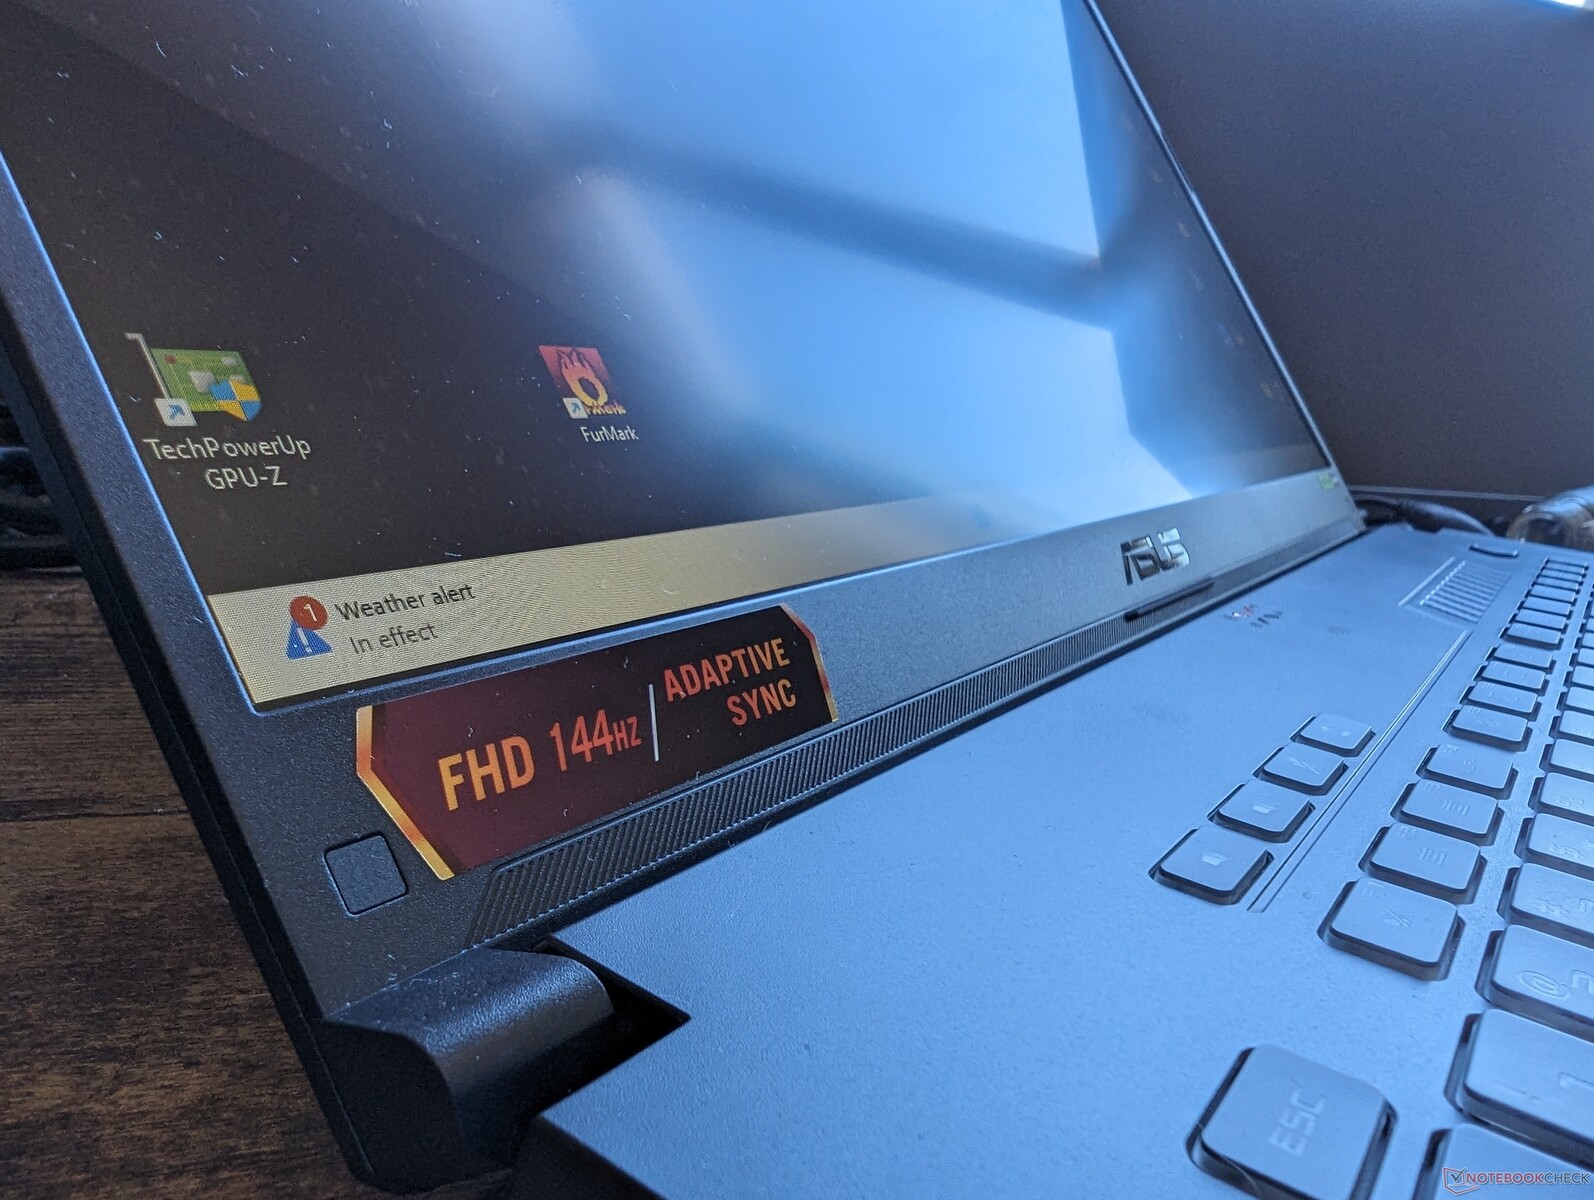
Our configuration is the latest SKU with the Zen 4 Ryzen 9 7940HS CPU, 140 W GeForce RTX 4070 GPU, and 1080p 144 Hz IPS display for approximately $1400 USD retail. Other SKUs of this model ship with the slower Ryzen 7 7735HS, GeForce RTX 4050 or 4060, or higher resolution 1440p display with even faster 240 Hz or 360 Hz refresh rates.
Alternatives to the TUF Gaming A17 include other midrange gaming laptops like the MSI Pulse 17, HP Pavilion Gaming 17, Lenovo Legion 5 series, or the Acer Nitro 17 series.
More Asus reviews:
Potential Competitors in Comparison
Rating | Date | Model | Weight | Height | Size | Resolution | Price |
|---|---|---|---|---|---|---|---|
| 85.6 % v7 (old) | 01 / 2024 | Asus TUF Gaming A17 FA707XI-NS94 R9 7940HS, GeForce RTX 4070 Laptop GPU | 2.5 kg | 25.4 mm | 17.30" | 1920x1080 | |
| 84.1 % v7 (old) | 04 / 2022 | Asus TUF Gaming F17 FX707Z-HX011W i7-12700H, GeForce RTX 3060 Laptop GPU | 2.5 kg | 25 mm | 17.30" | 1920x1080 | |
| 86.3 % v7 (old) | 07 / 2023 | MSI Pulse 17 B13VGK i7-13700H, GeForce RTX 4070 Laptop GPU | 2.7 kg | 27.2 mm | 17.30" | 1920x1080 | |
| 82.1 % v7 (old) | 02 / 2023 | MSI Katana 17 B13VFK i7-13620H, GeForce RTX 4060 Laptop GPU | 2.8 kg | 25.2 mm | 17.30" | 1920x1080 | |
| 90.1 % v7 (old) | 05 / 2022 | Razer Blade 17 (i7-12800H, RTX 3070 Ti) i7-12800H, GeForce RTX 3070 Ti Laptop GPU | 2.8 kg | 19.9 mm | 17.30" | 2560x1440 | |
| 82.7 % v7 (old) | 09 / 2022 | HP Pavilion Gaming 17-cd2146ng i5-11300H, GeForce RTX 3050 Ti Laptop GPU | 2.8 kg | 25 mm | 17.30" | 1920x1080 |
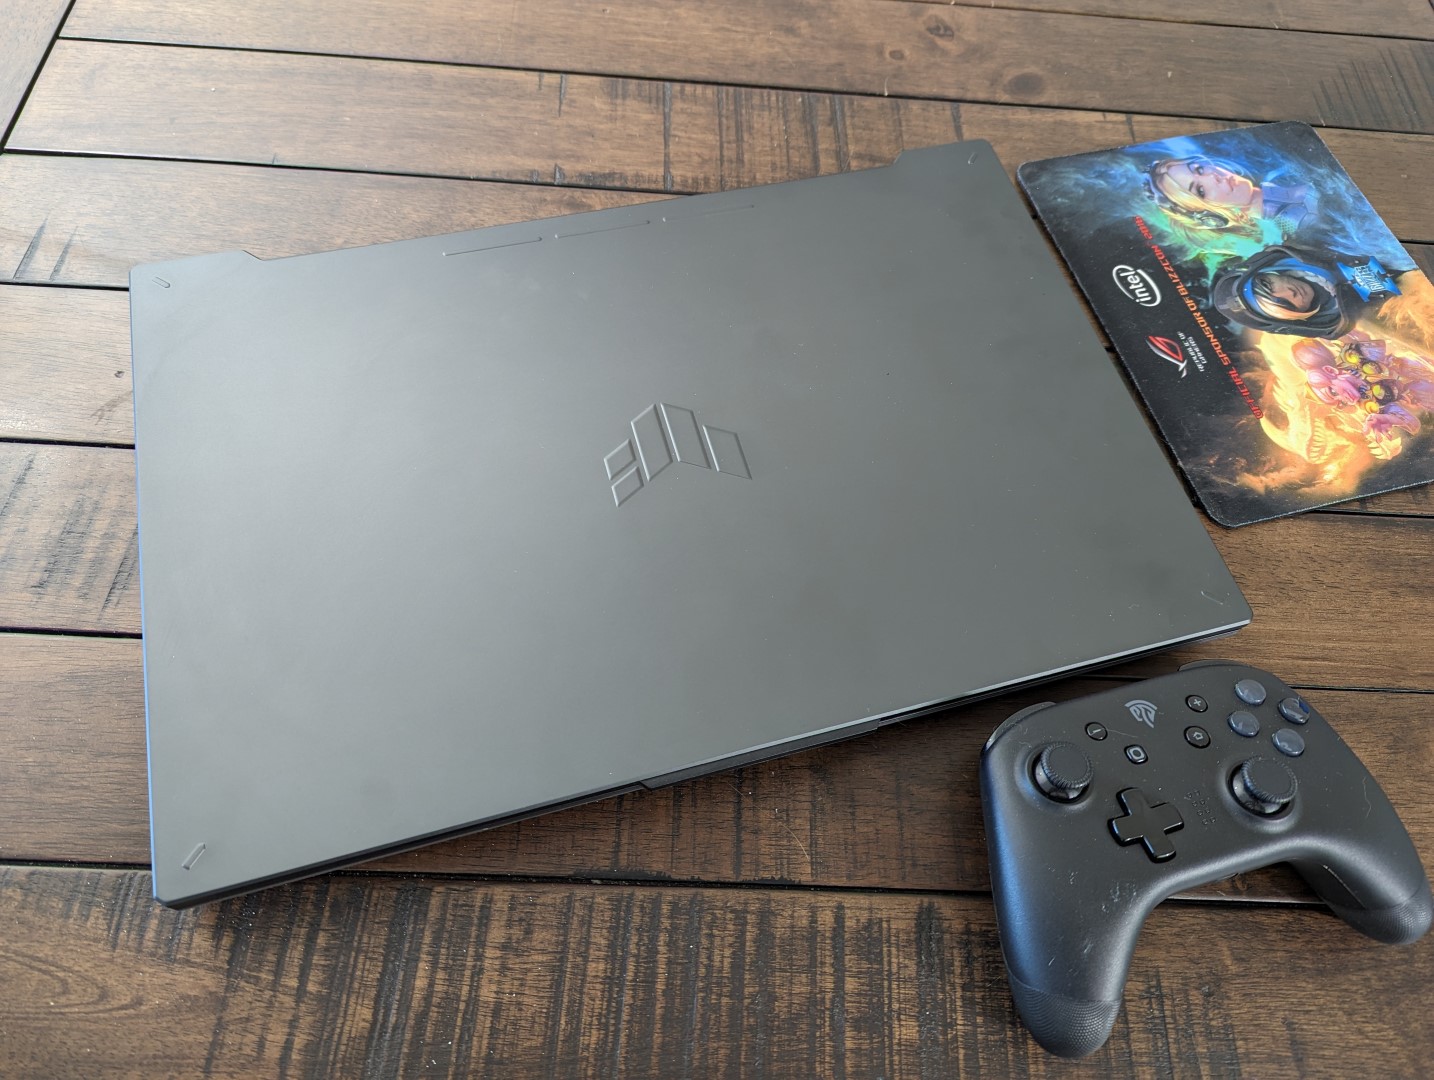
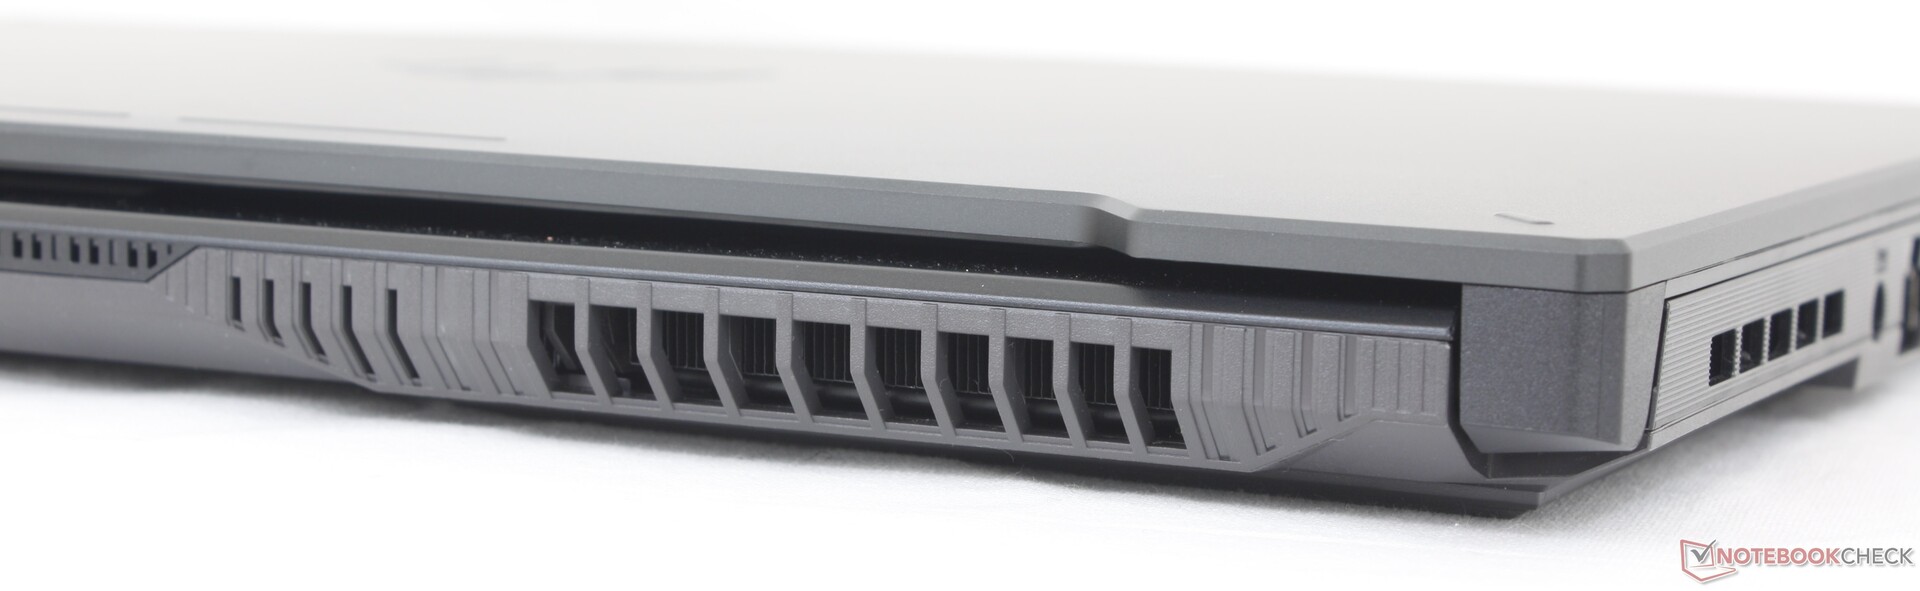
Case
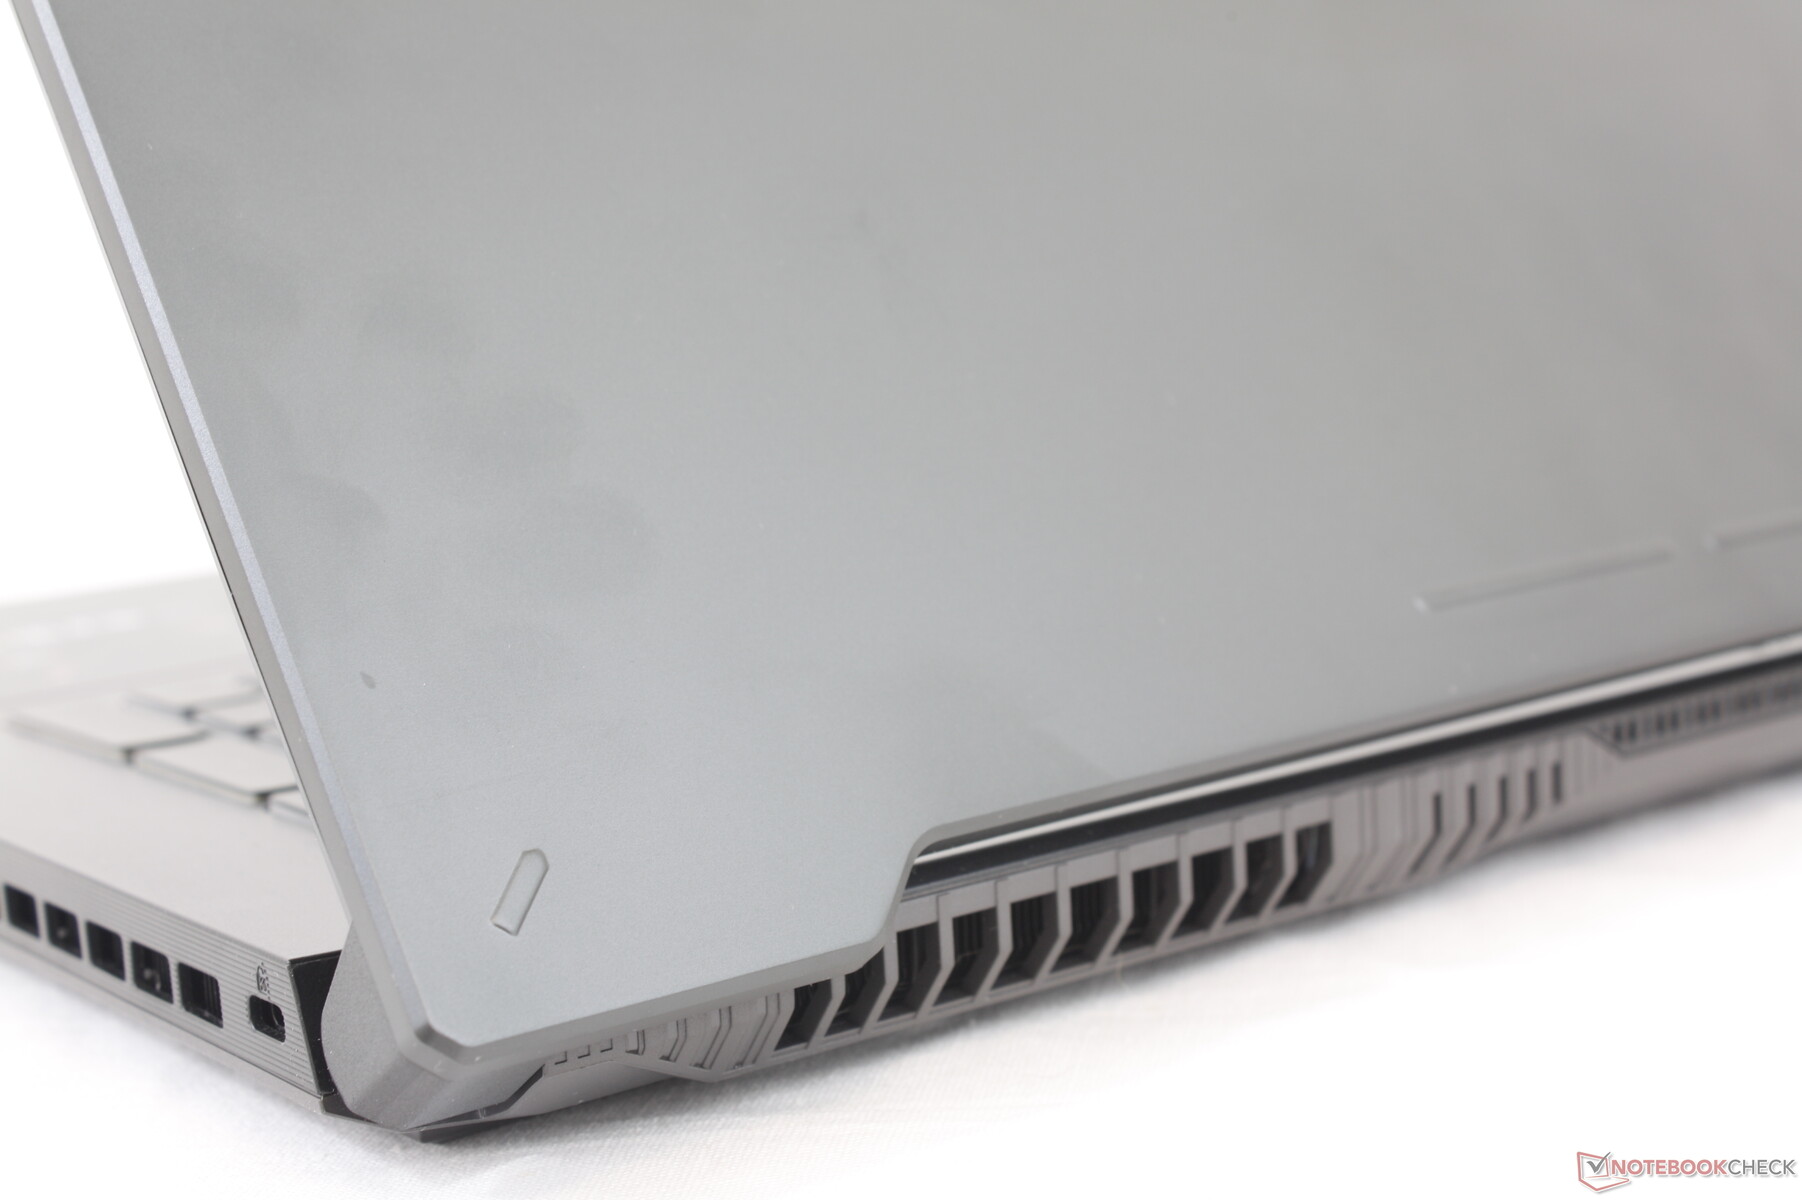
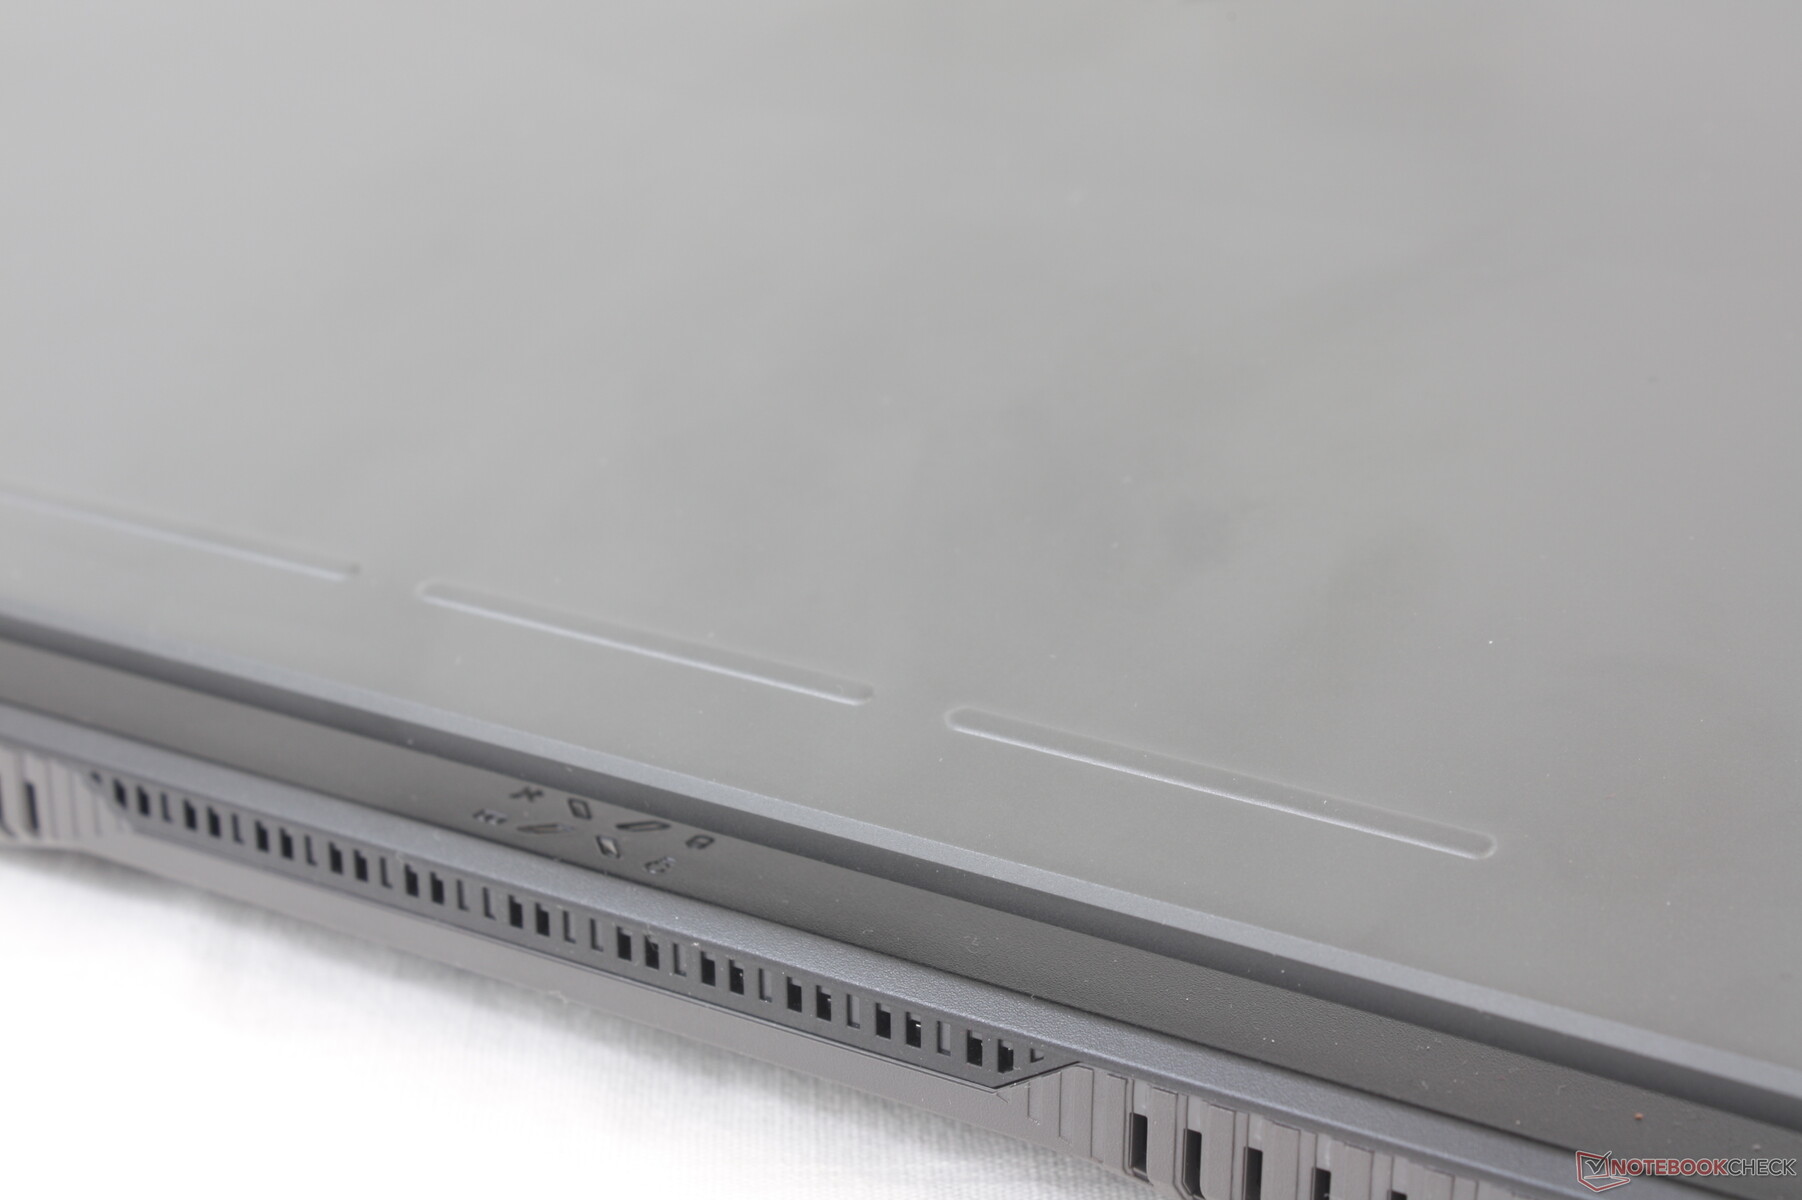
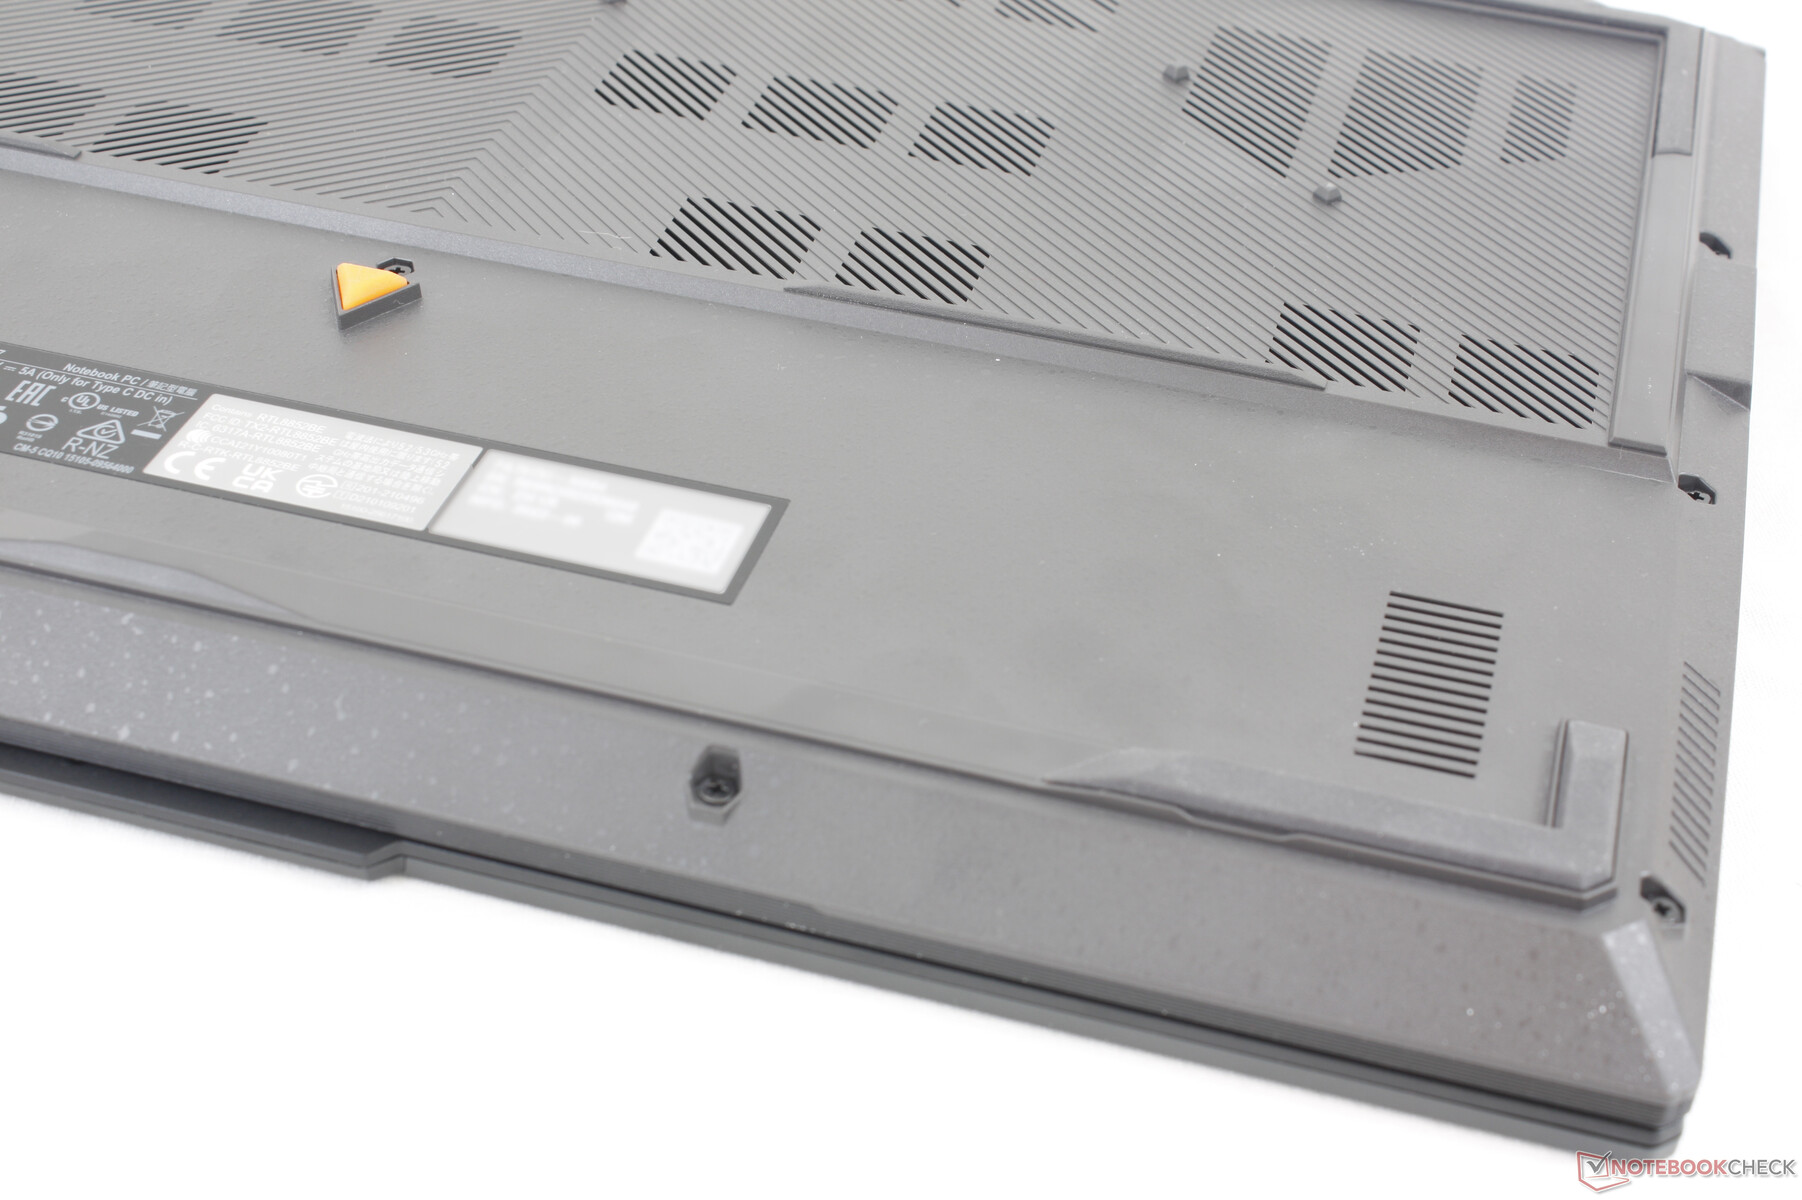
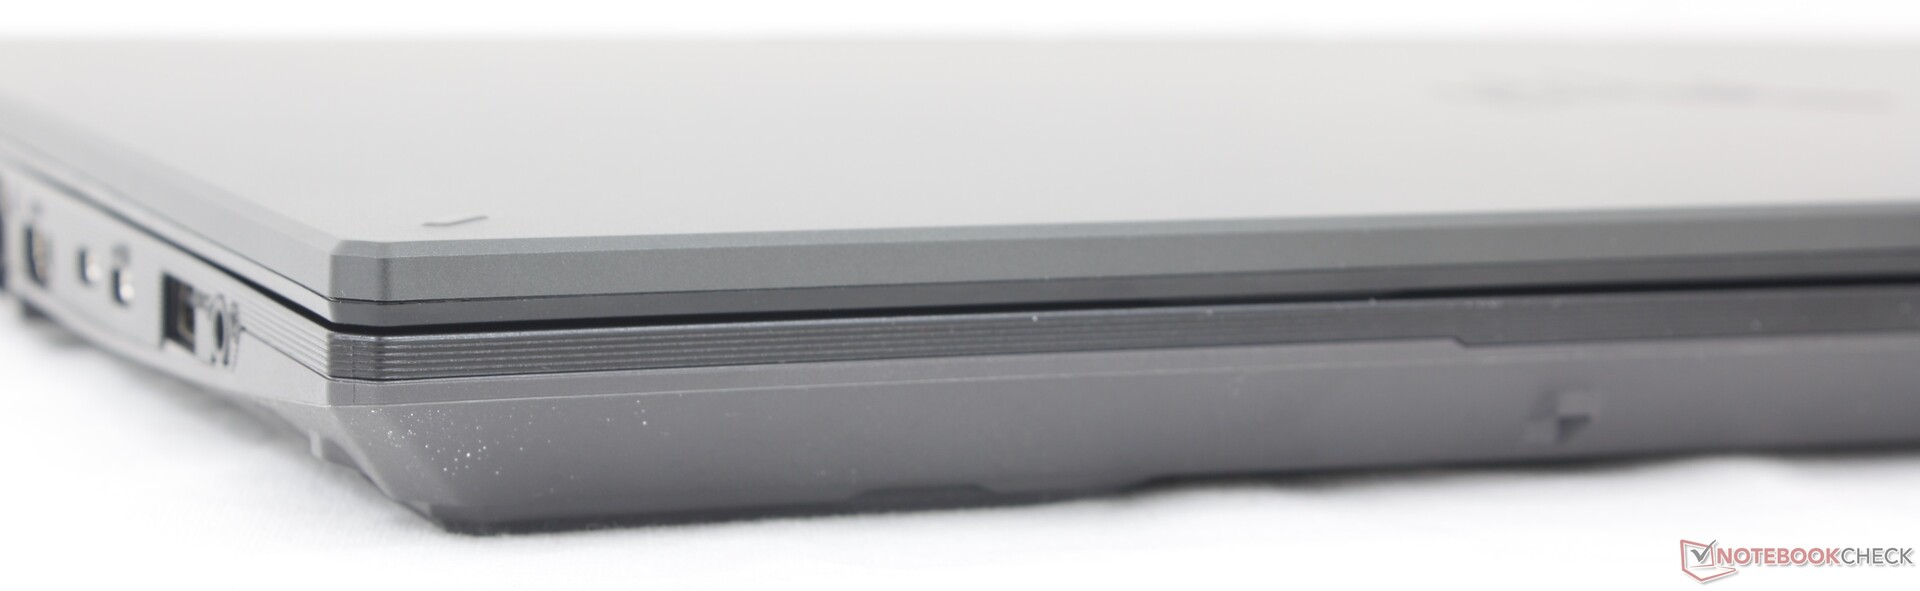
The chassis is largely identical to the TUF Gaming F17 FX707 including the positioning of the ports and the metal and plastic materials for the outer lid and base, respectively. Nonetheless, there are small superficial differences on the outer lid to help visually distinguish the TUF Gaming A17 from the TUF Gaming F17. The corner circles on the F17, for example, are now diagonal lines. There are also additional marks along the bottom edge of the lid whereas these are completely absent on the F17. If flipped upside-down, the rubber triangle on the bottom of the chassis is now orange instead of red.
Our impressions on the build quality of the Intel-based F17 apply here for the AMD-based A17.
Despite its unexciting visual design, the TUF Gaming A17 is still thinner and lighter than many other midrange 17.3-inch gaming laptops like the HP Pavilion Gaming 17, Acer Nitro 17, or MSI Pulse 17 by 200 to 500 grams each depending on the model. The differences are wide enough to be noticeable when traveling and so the relatively small size of the Asus can be a distinct advantage.
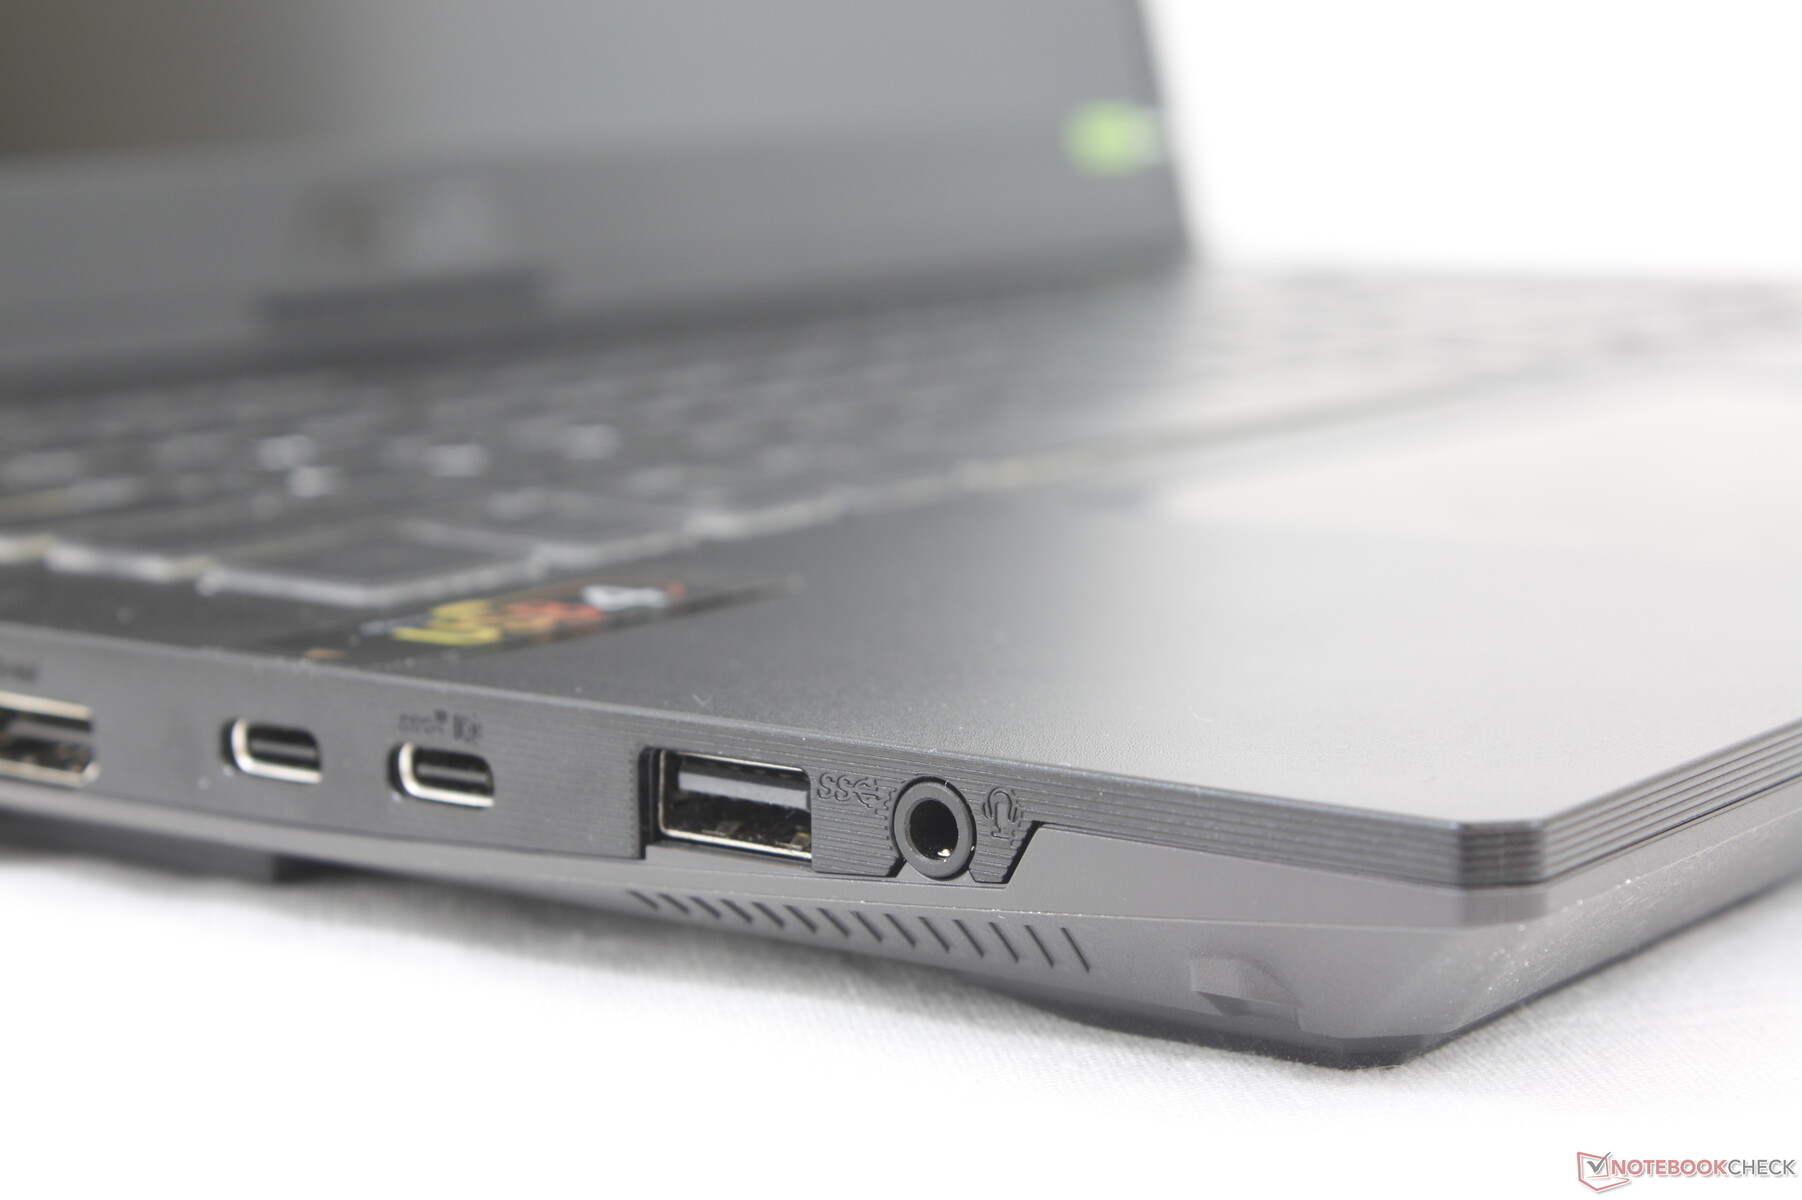
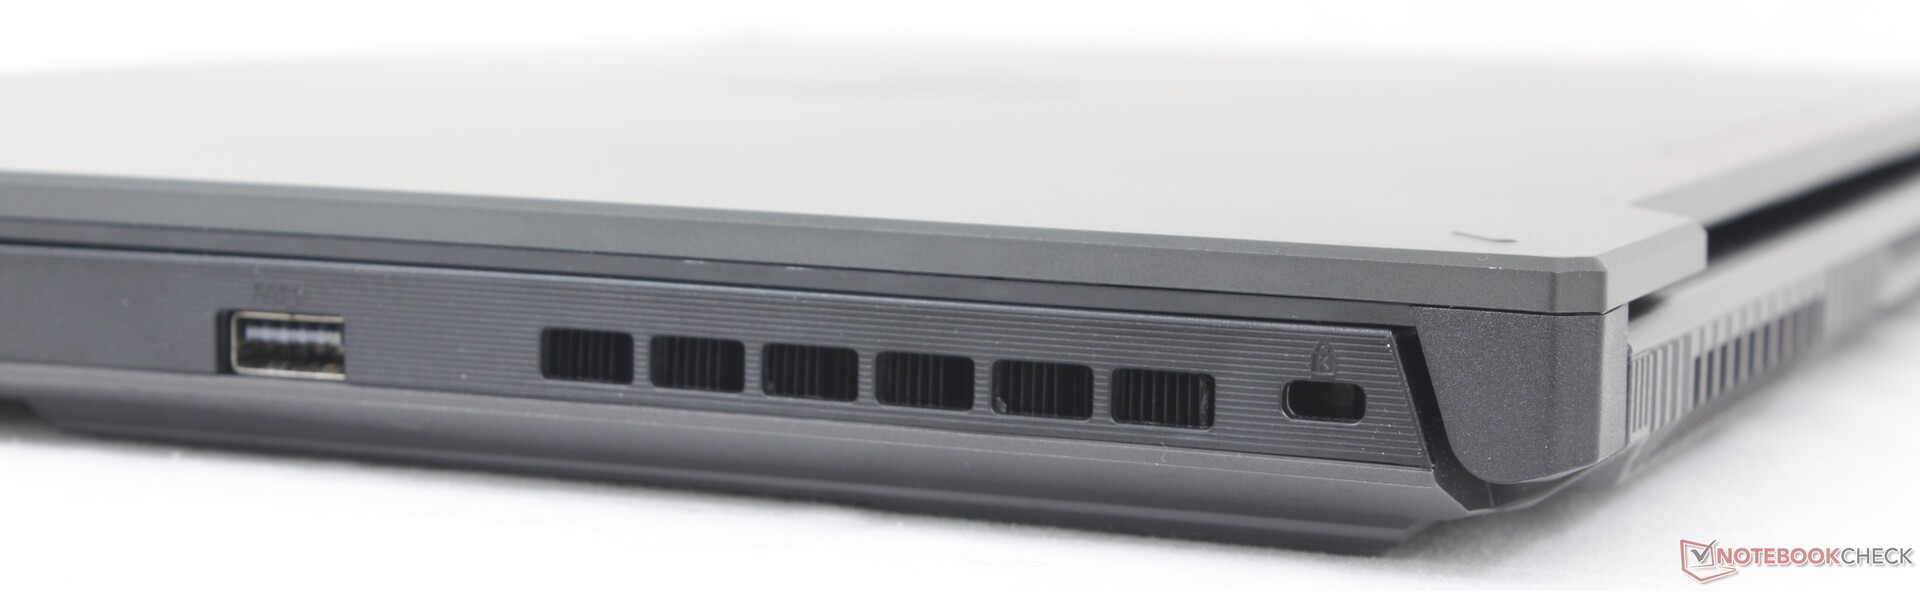
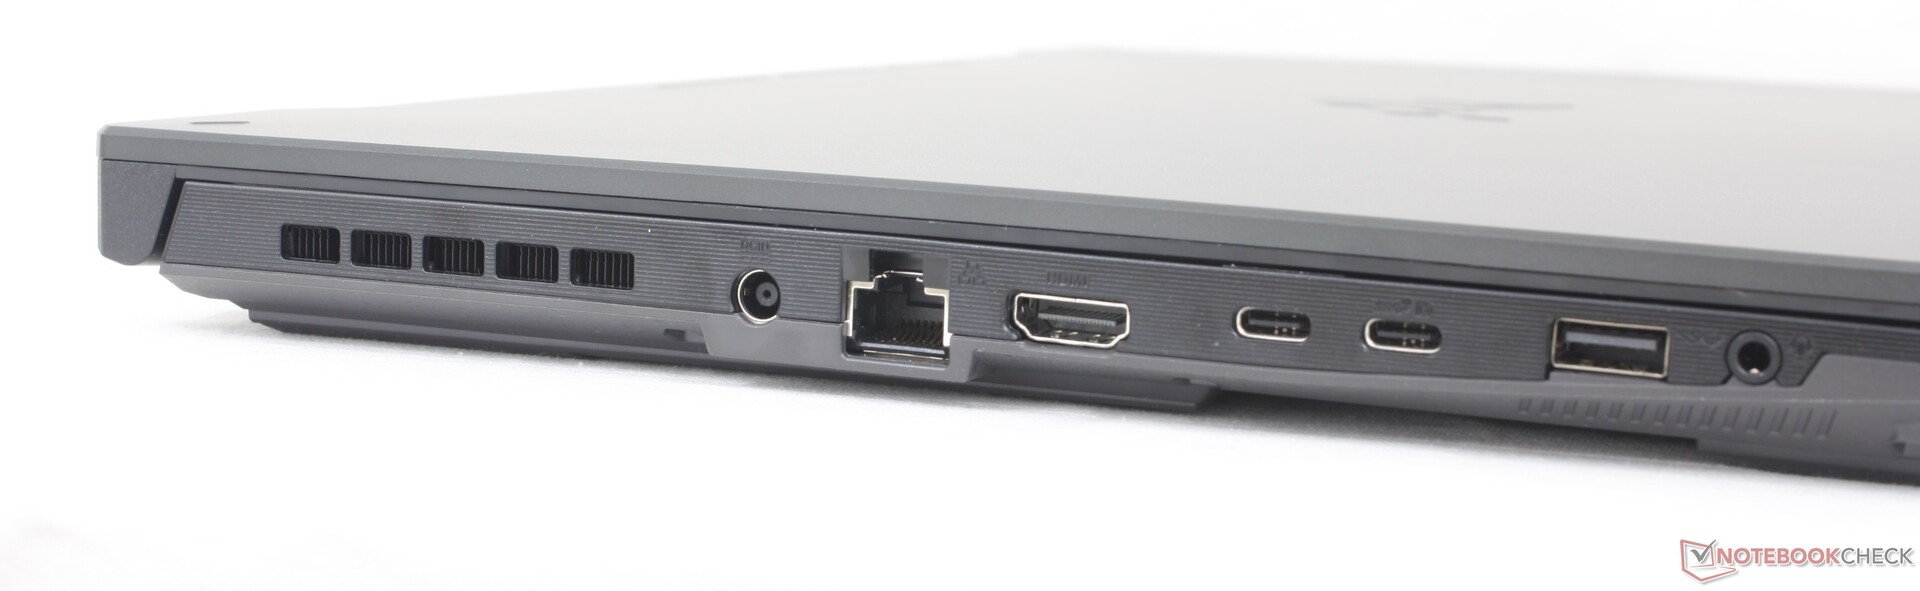
Connectivity
Our model retains all the ports as found on the F17 FX707 but with one minor exception: the Thunderbolt 4 port has been swapped with USB-C 4. Most Thunderbolt devices are nonetheless compatible with USB4 and so this small difference should not impact the vast majority of users.
Note that while there are two USB-C ports on the system, only the one closest to the front edge is compatible with USB-C AC adapters. For example, our 135 W USB-C Lenovo adapter could recharge the Asus via one USB-C port but not the other. The system must also be on dGPU mode to support external USB-C monitors.
Interestingly, our external monitor would only work with one of the two USB-C ports even though Asus claims that both ports should be compatible.
Communication
A Realtek RTL8852BE comes standard for Wi-Fi 6 and Bluetooth 5.3 connectivity. There are no configurations with Wi-Fi 6E or the Intel AX series likely to save on costs. We nonetheless experienced no connectivity issues when paired to our Wi-Fi 6 network even though throughout is slower than expected.
| Networking | |
| iperf3 transmit AX12 | |
| Asus TUF Gaming F17 FX707Z-HX011W | |
| iperf3 receive AX12 | |
| Asus TUF Gaming F17 FX707Z-HX011W | |
| iperf3 transmit AXE11000 | |
| MSI Katana 17 B13VFK | |
| MSI Pulse 17 B13VGK | |
| Asus TUF Gaming A17 FA707XI-NS94 | |
| iperf3 receive AXE11000 | |
| MSI Katana 17 B13VFK | |
| MSI Pulse 17 B13VGK | |
| HP Pavilion Gaming 17-cd2146ng | |
| Asus TUF Gaming A17 FA707XI-NS94 | |
| iperf3 transmit AXE11000 6GHz | |
| Razer Blade 17 (i7-12800H, RTX 3070 Ti) | |
| iperf3 receive AXE11000 6GHz | |
| Razer Blade 17 (i7-12800H, RTX 3070 Ti) | |
Webcam
The model integrates a 1 MP or 720p webcam whereas most other gaming laptops have already moved on to 2 MP or 1080p. While better than nothing, it's clear that the TUF Gaming A17 wasn't designed for Zoom calls.


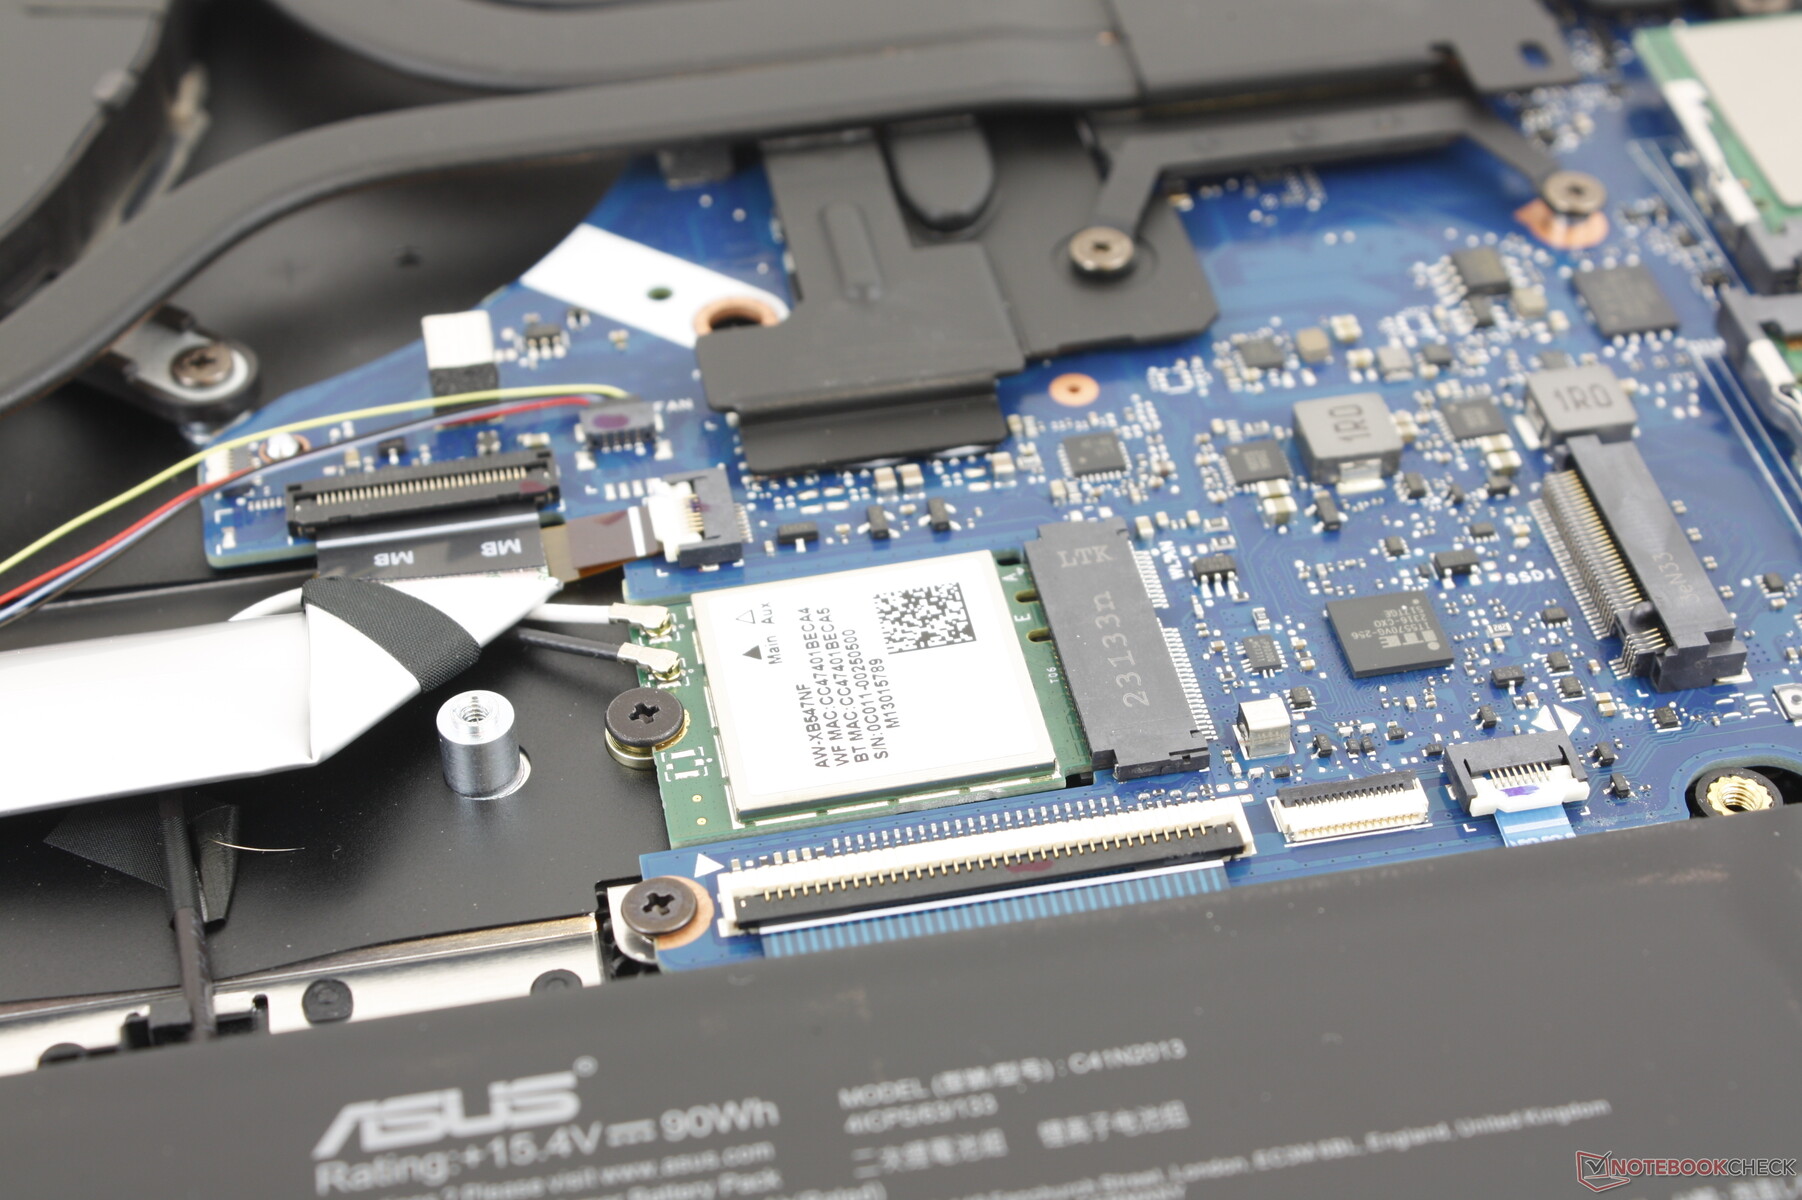
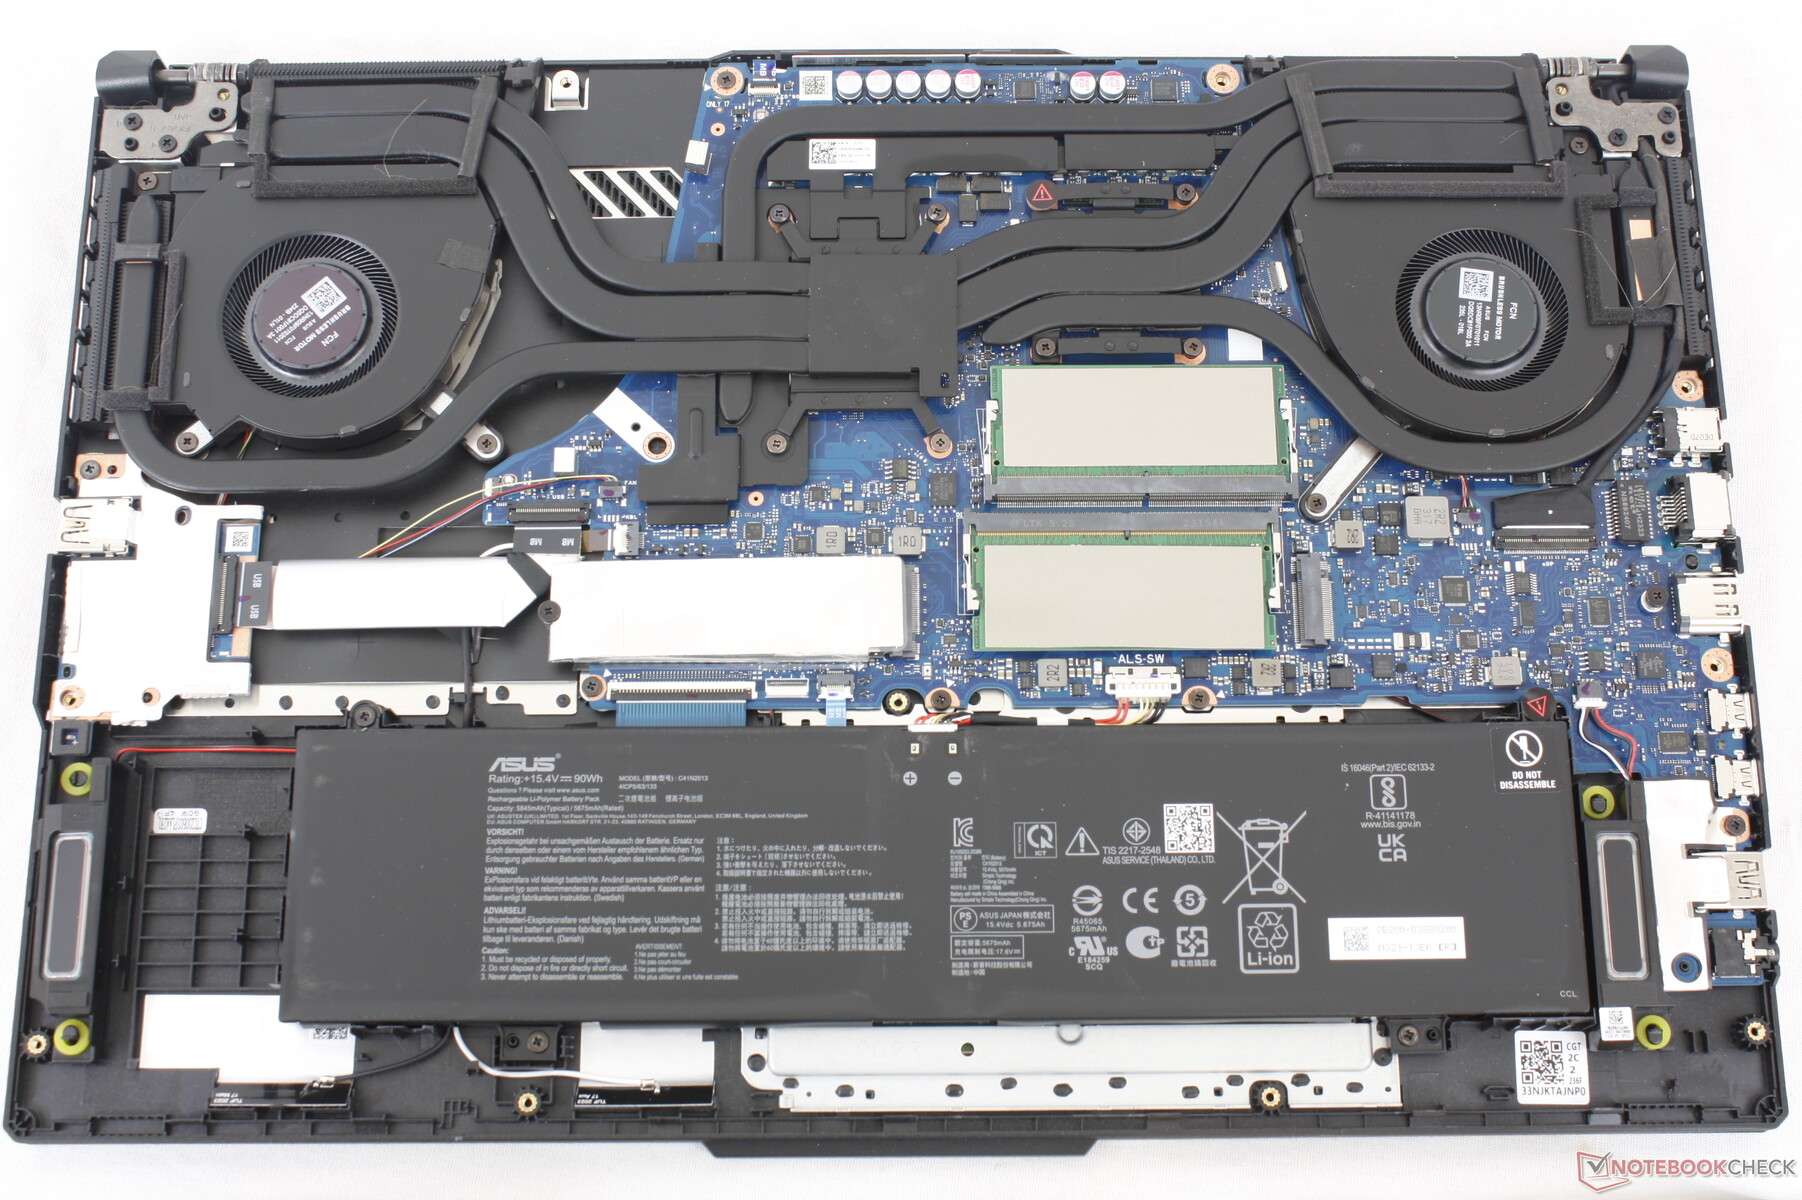
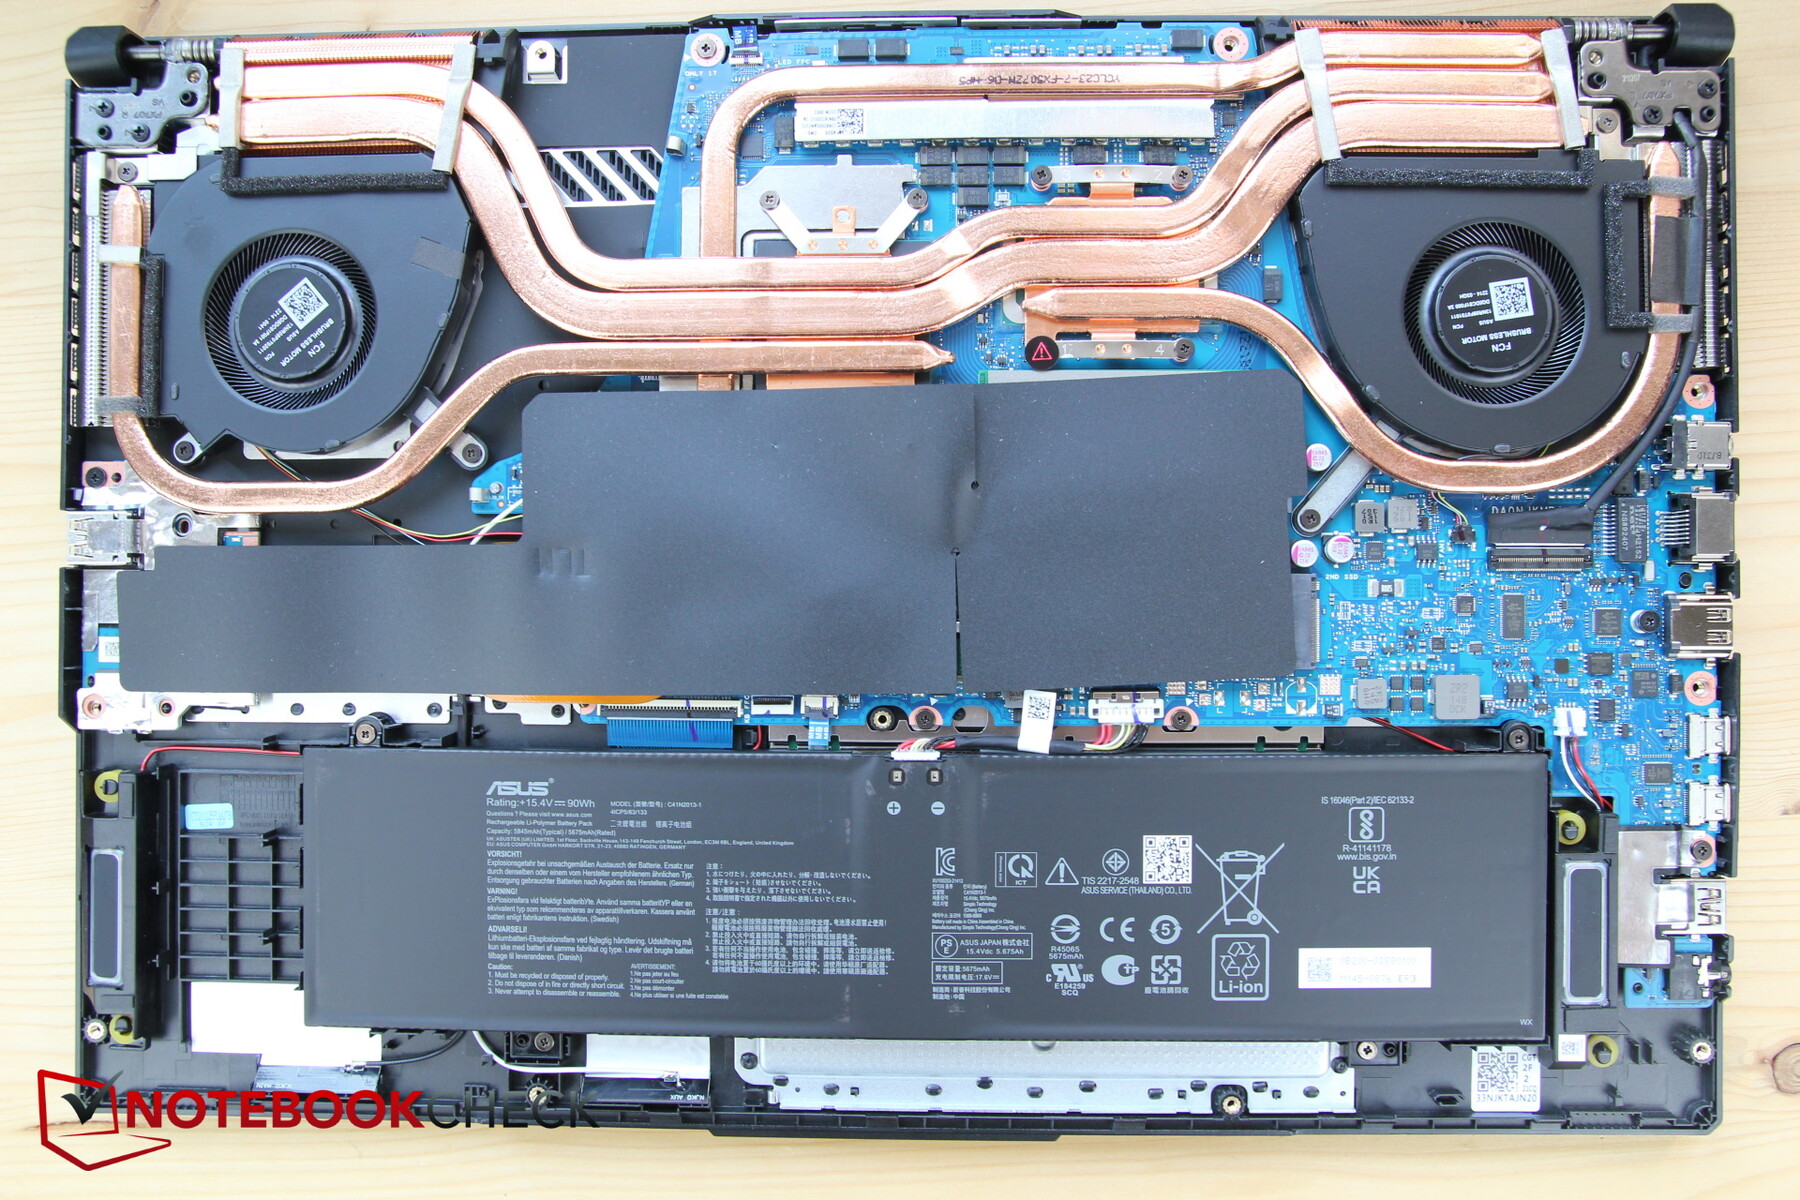
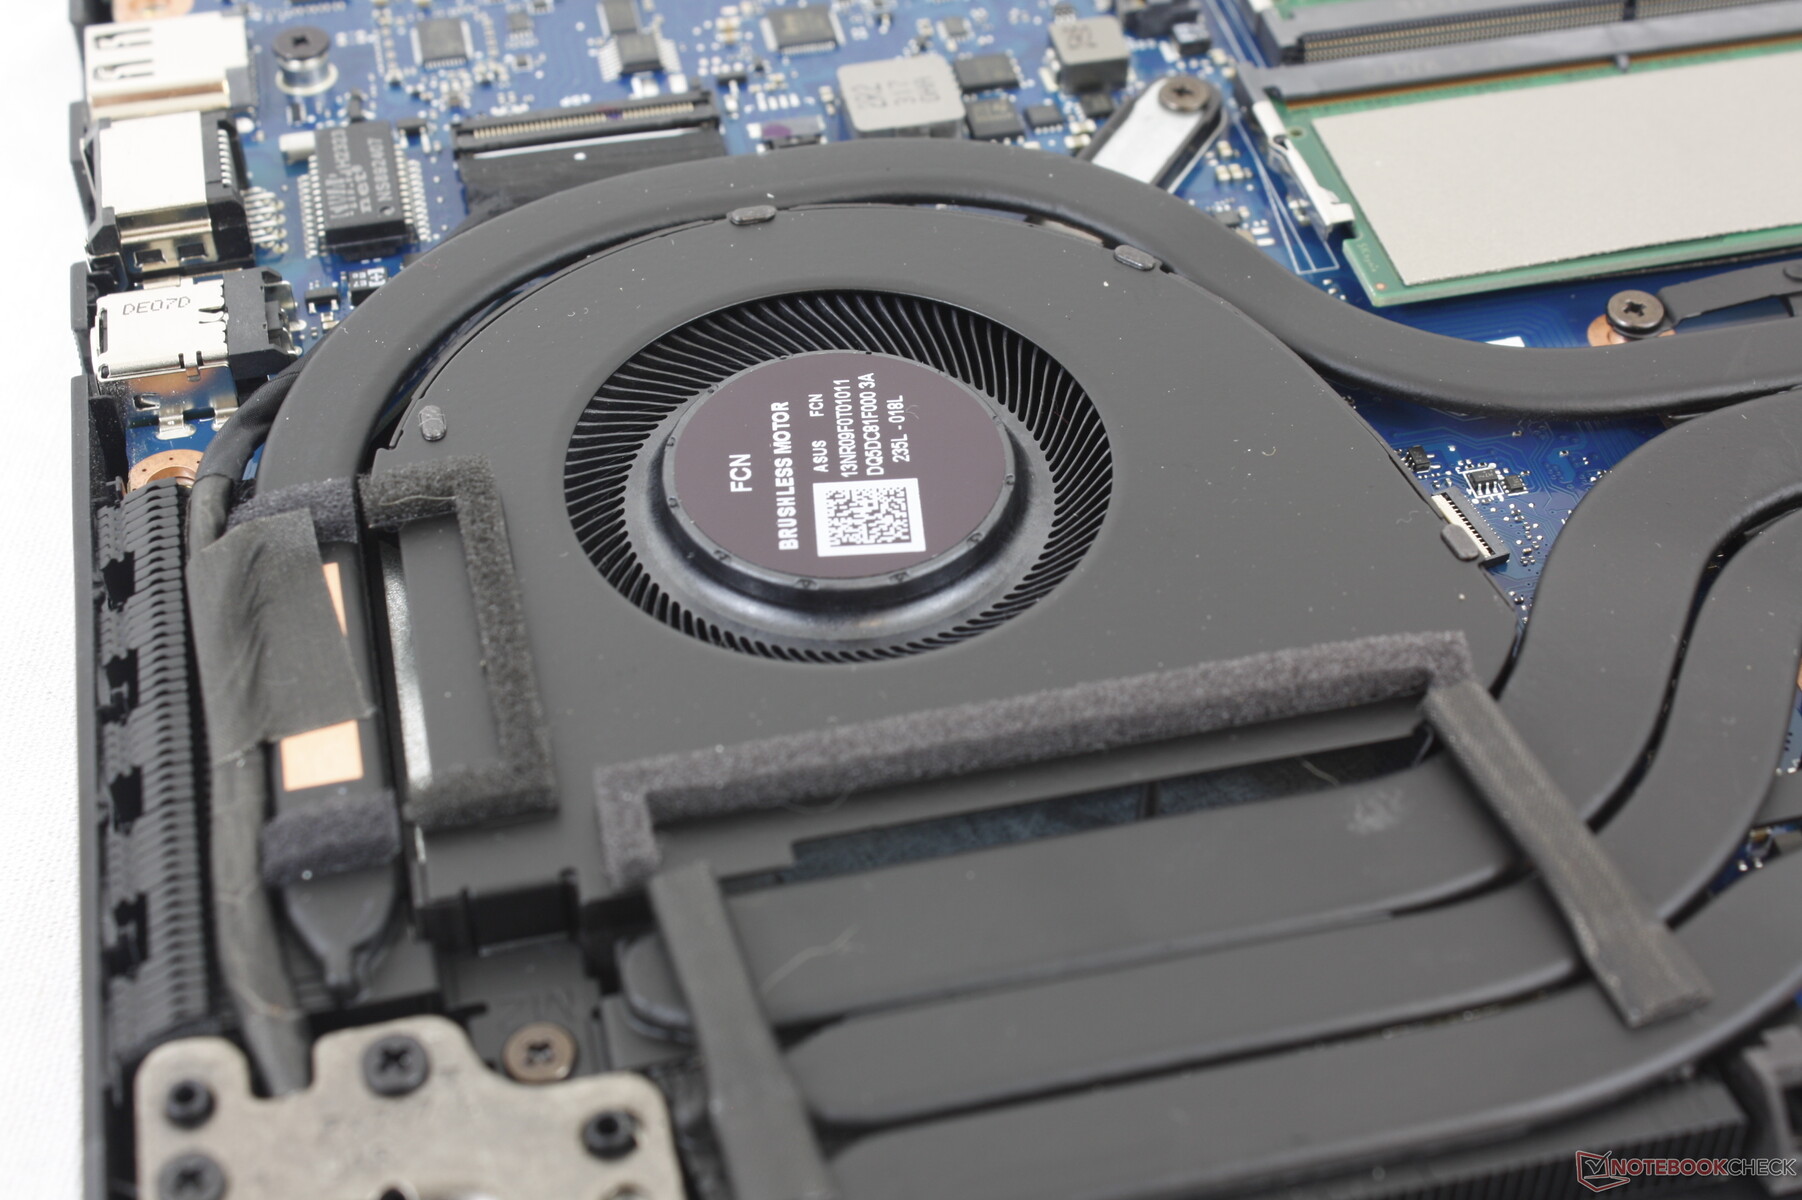
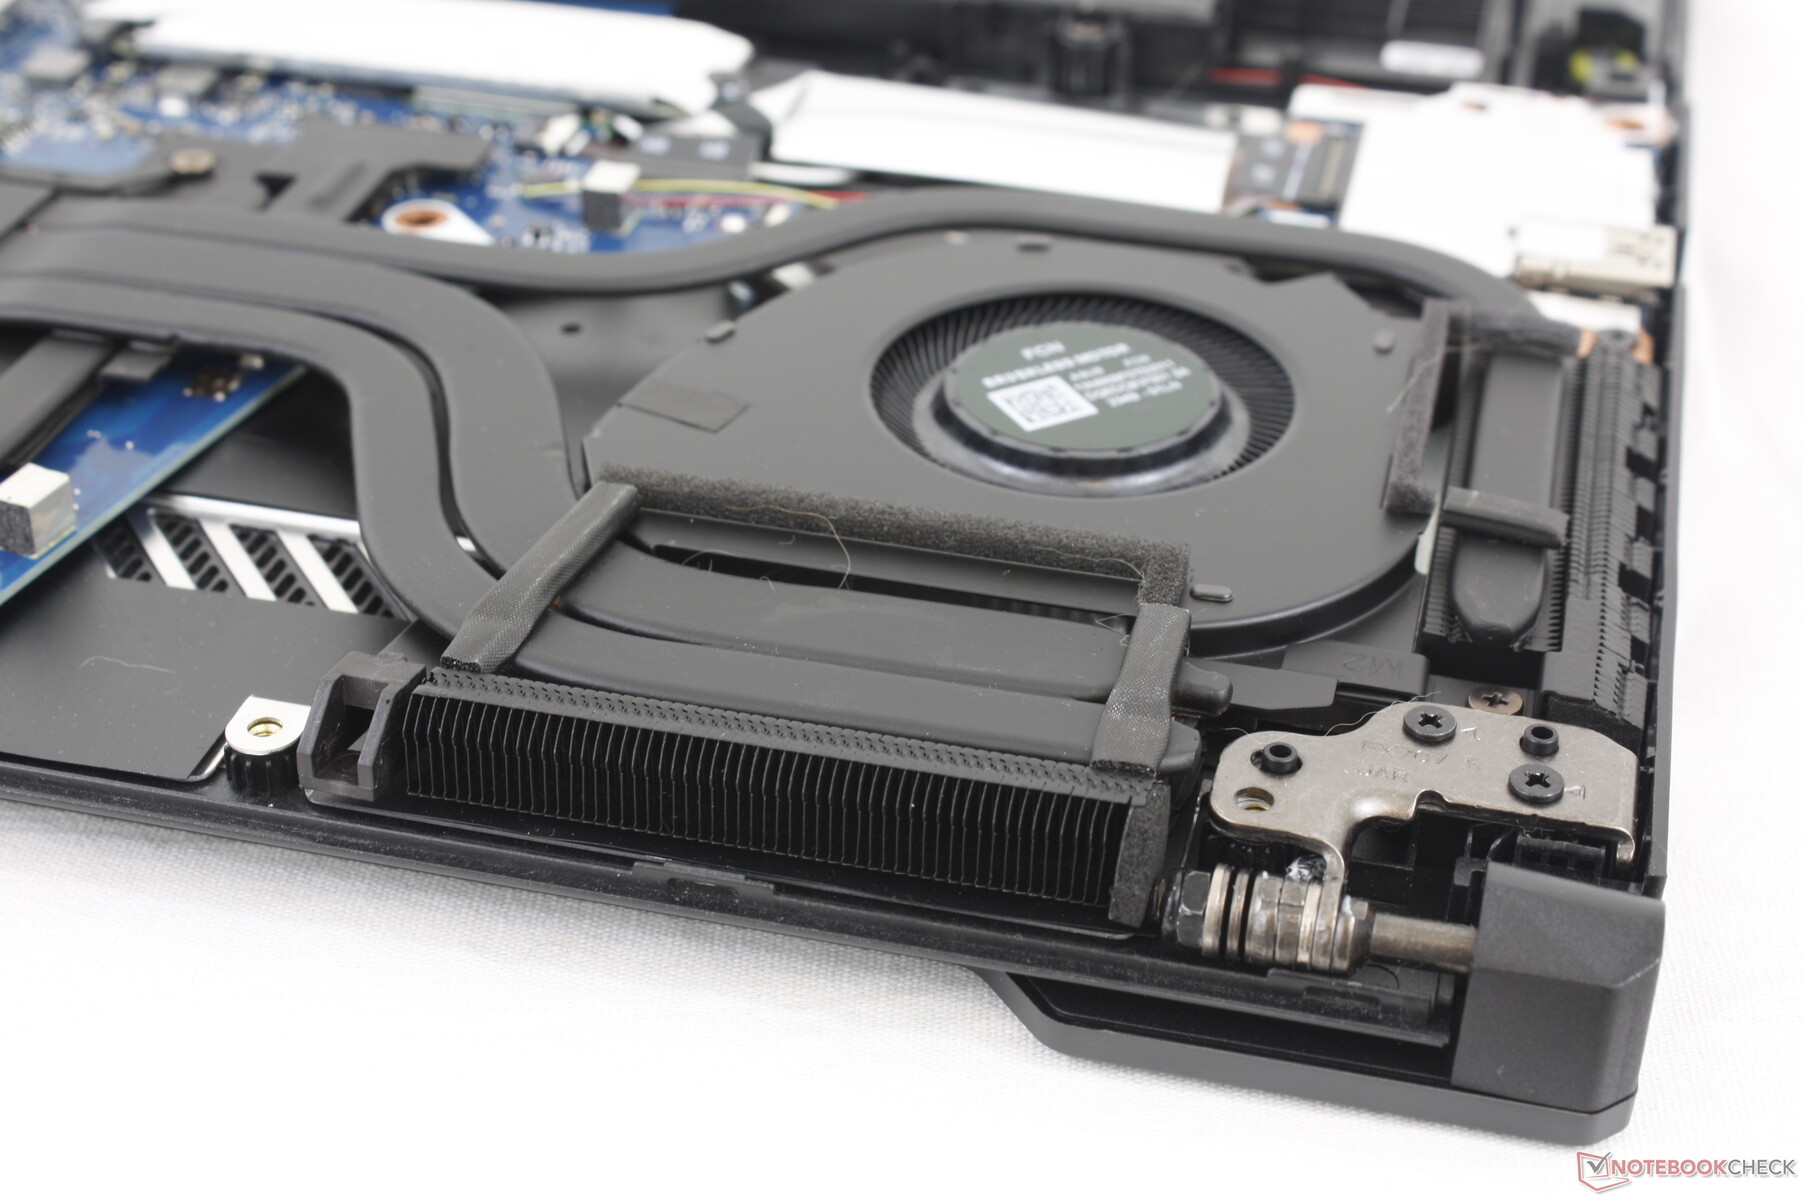
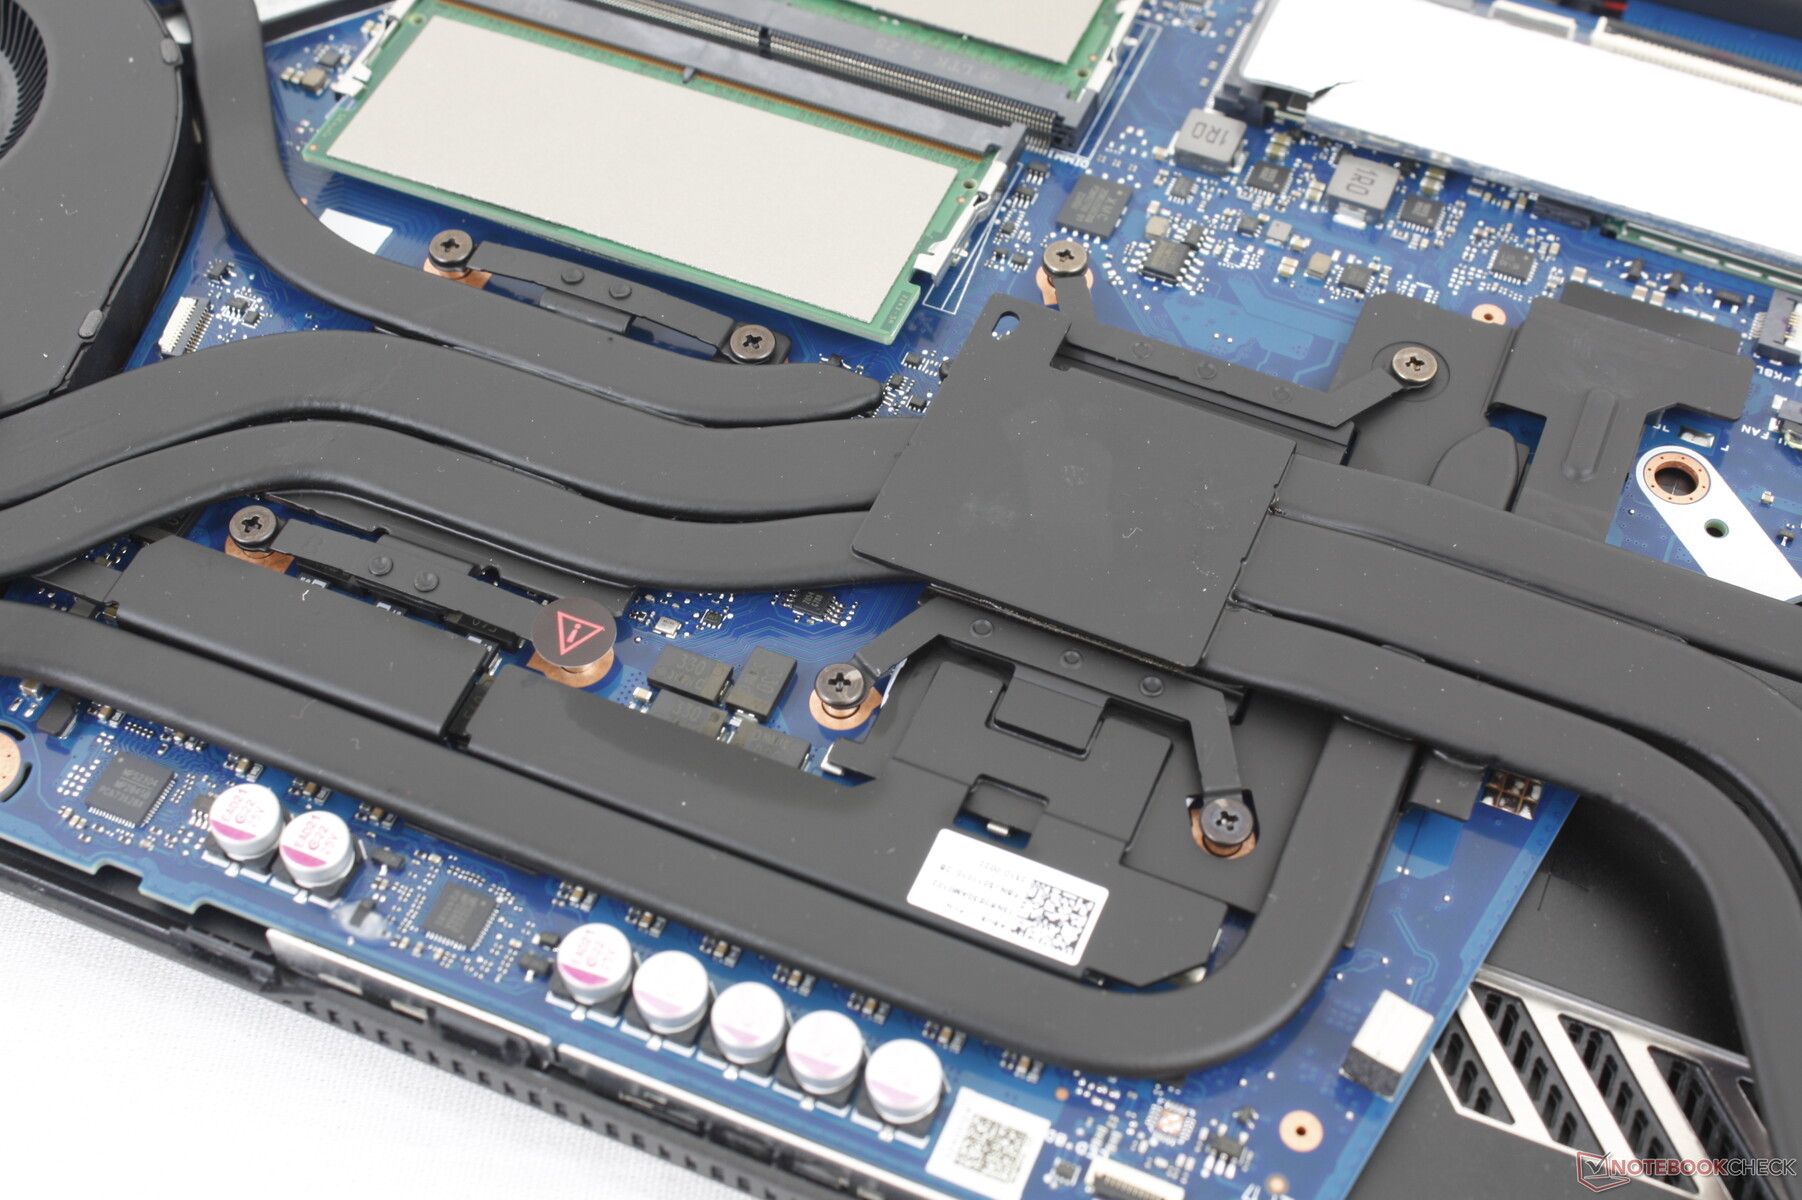
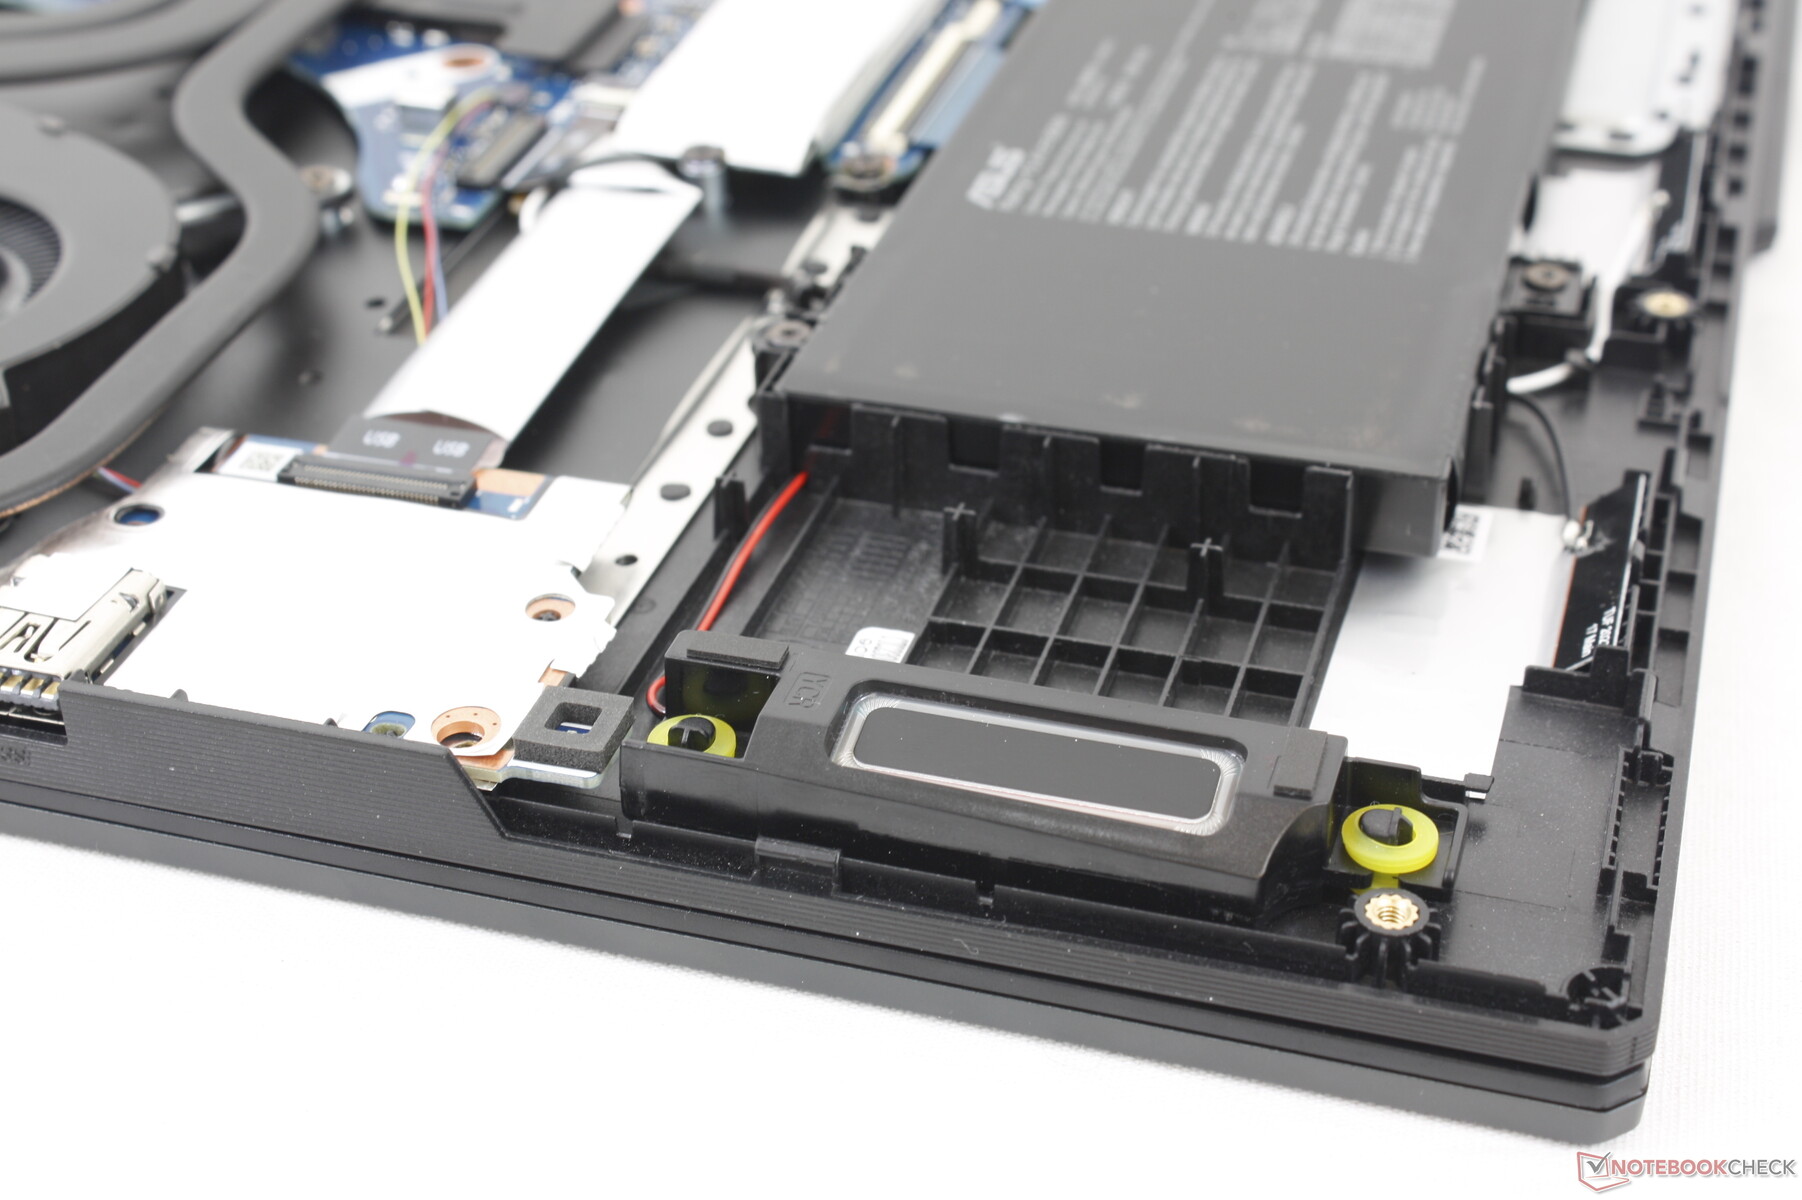
Maintenance
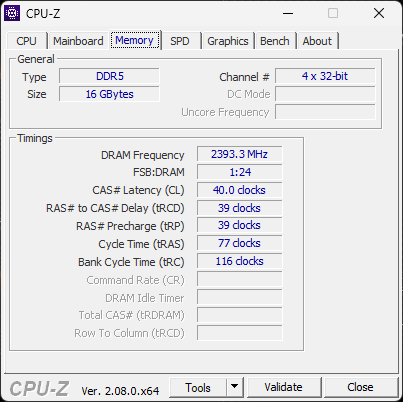
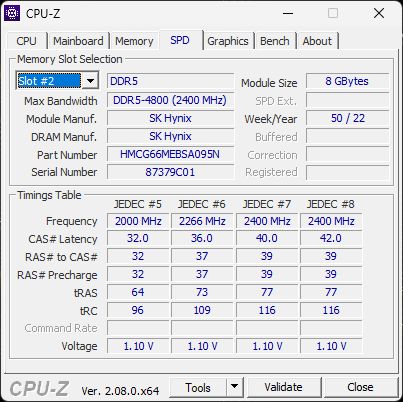
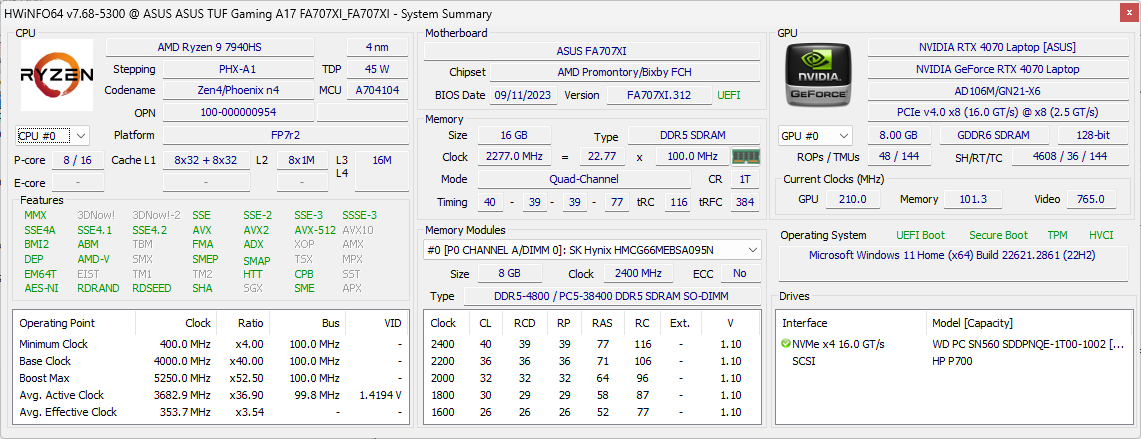
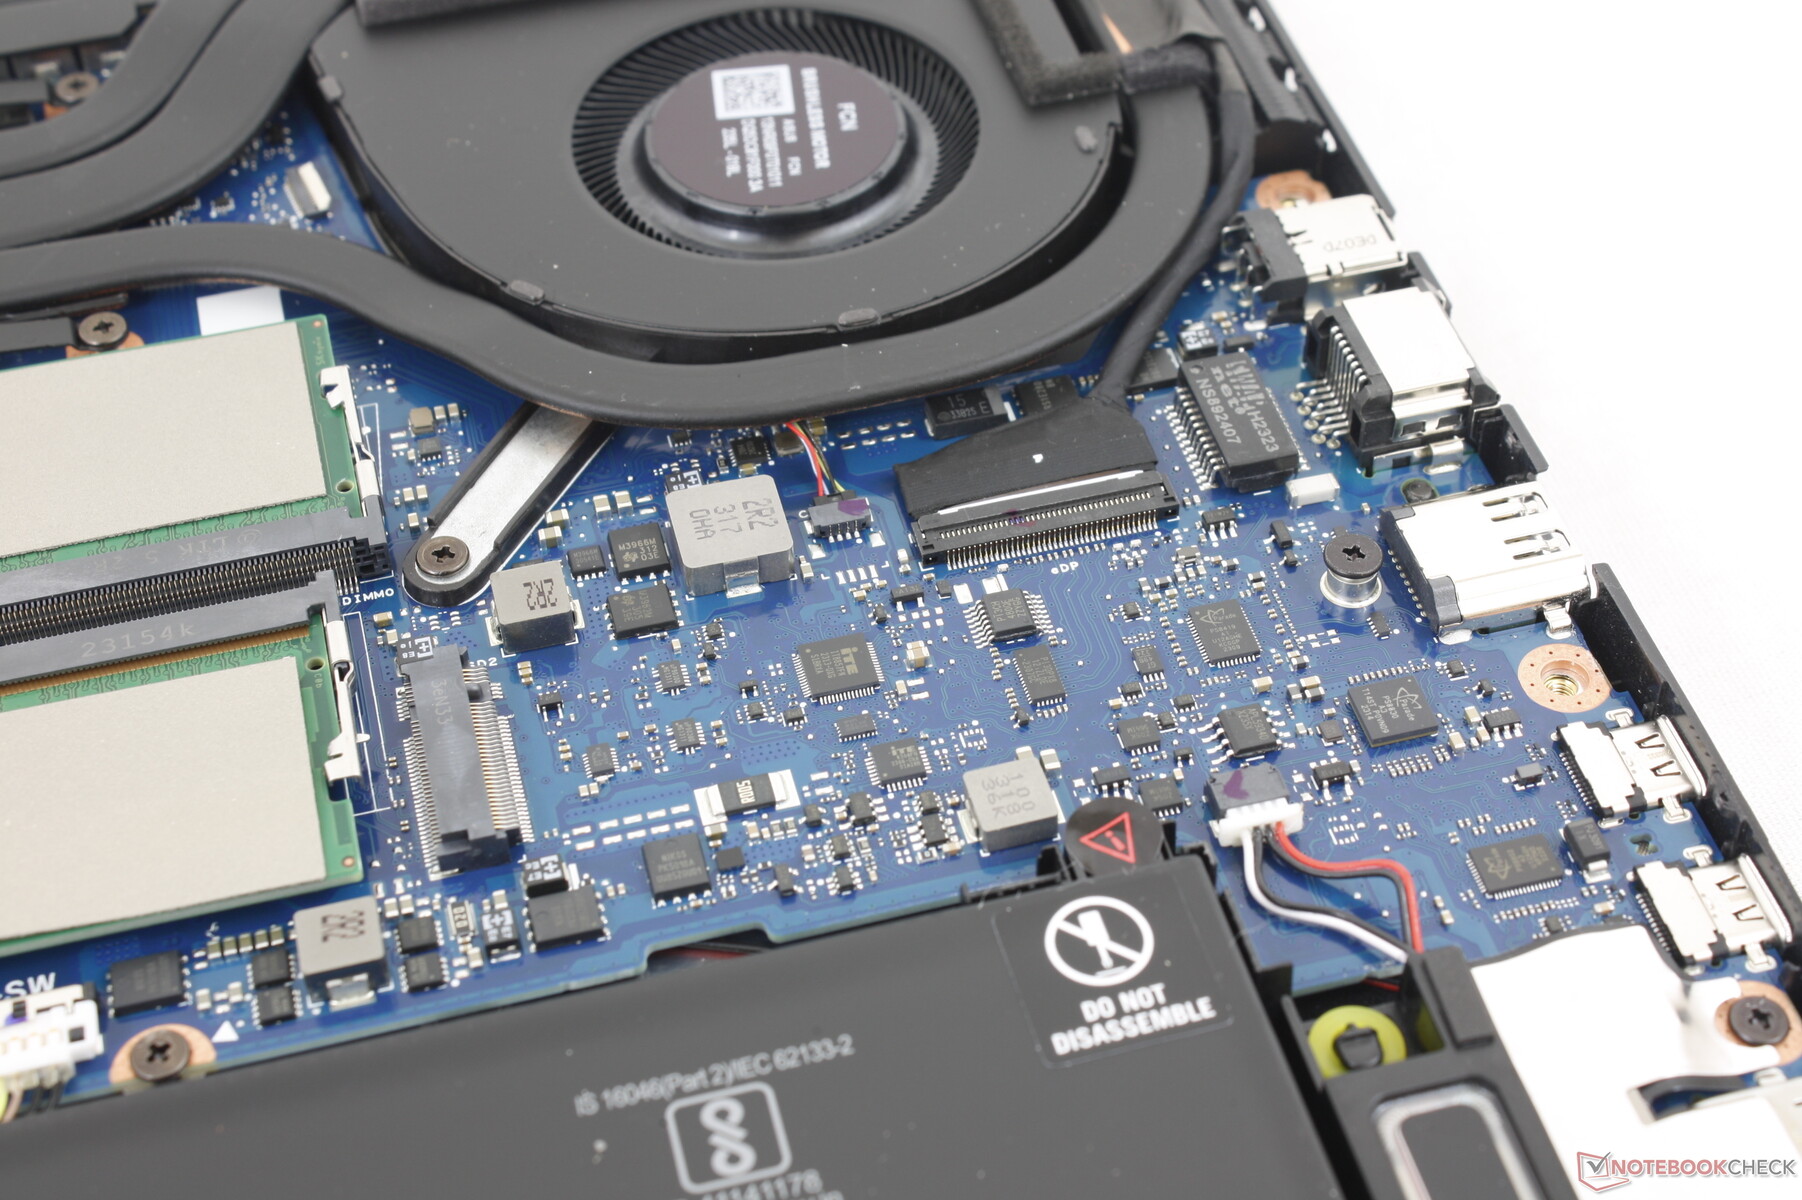
The bottom panel pops off relatively easily after removing its 12 Phillips screws. There are no major internal differences between the Intel and AMD versions and so users are still getting two M.2 SSD slots and two SODIMM slots. RAM is limited to 4800 MHz.
Accessories And Warranty
There are no extras in the box other than the AC adapter and paperwork. The usual one-year limited warranty applies if purchased in the US.
Input Devices
Keyboard
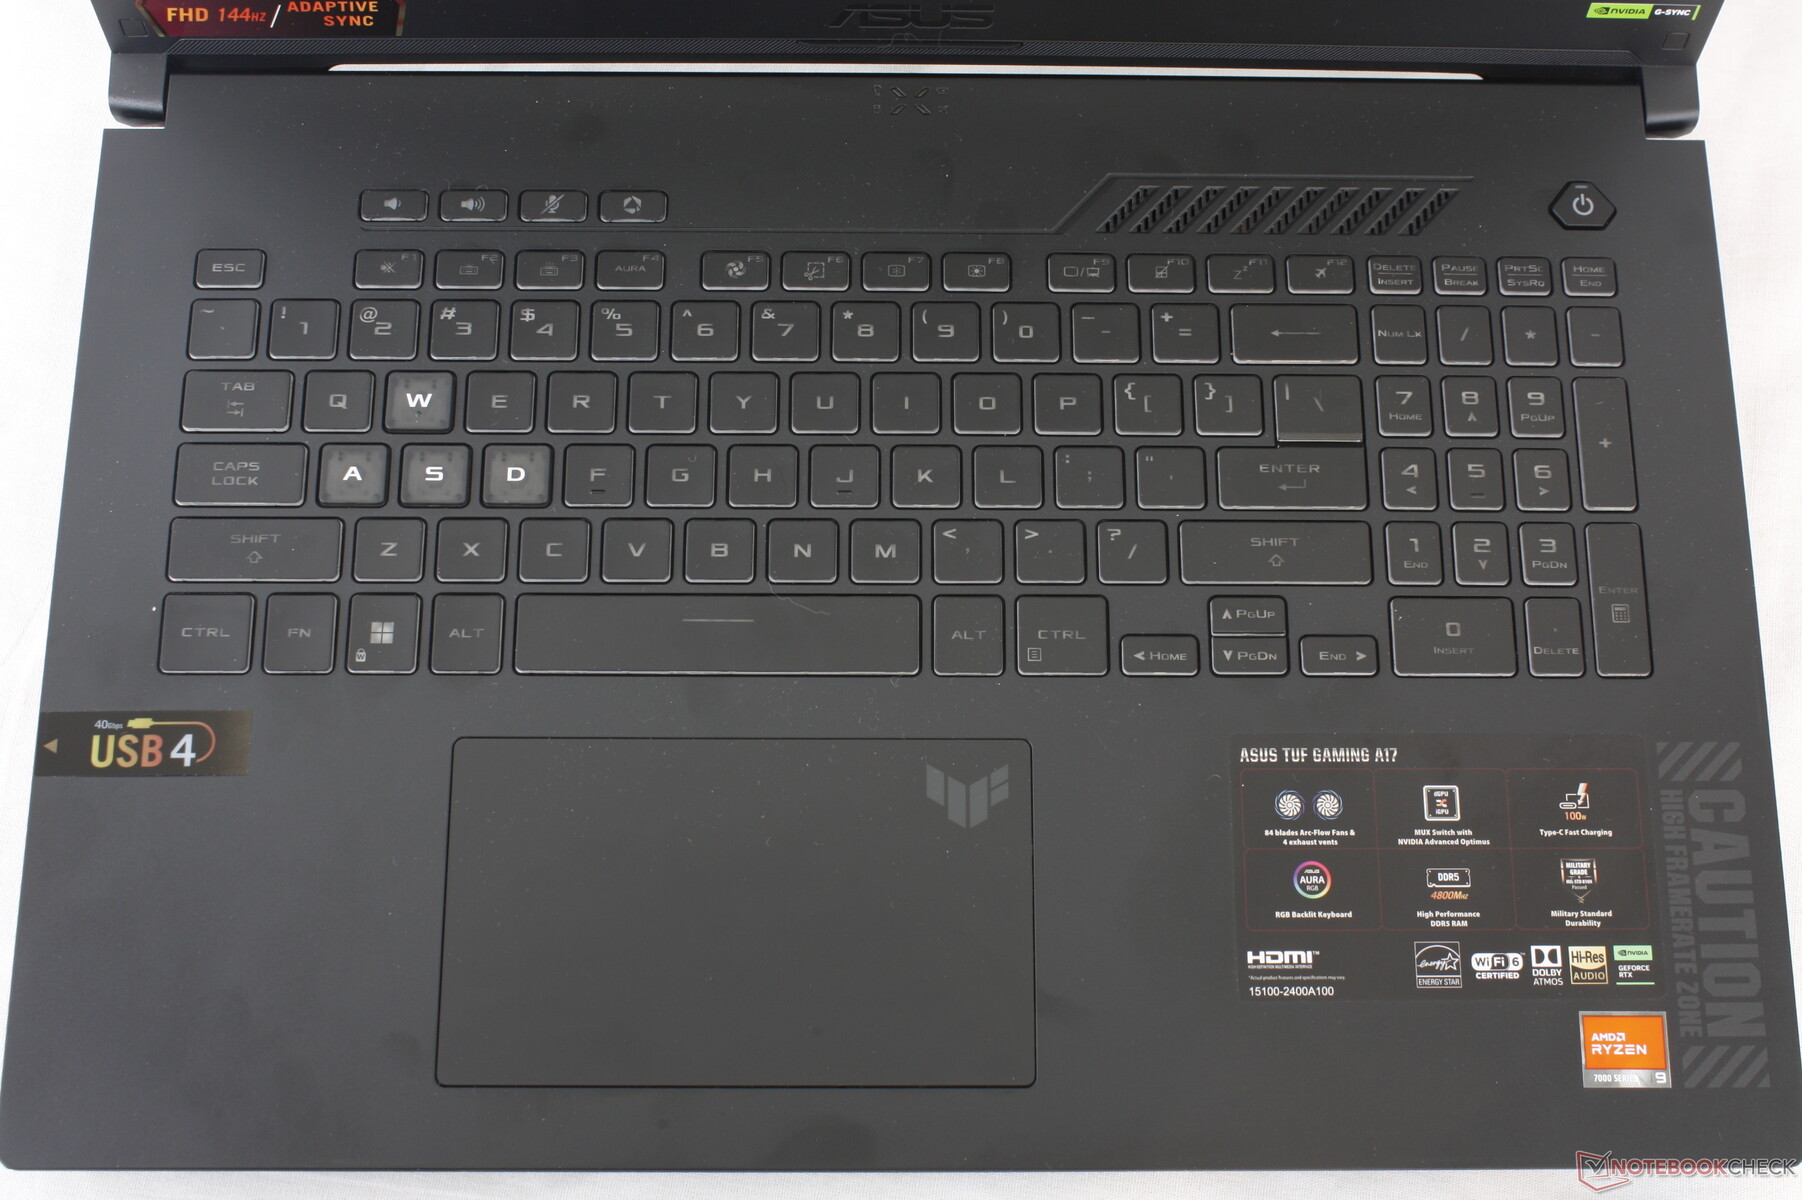
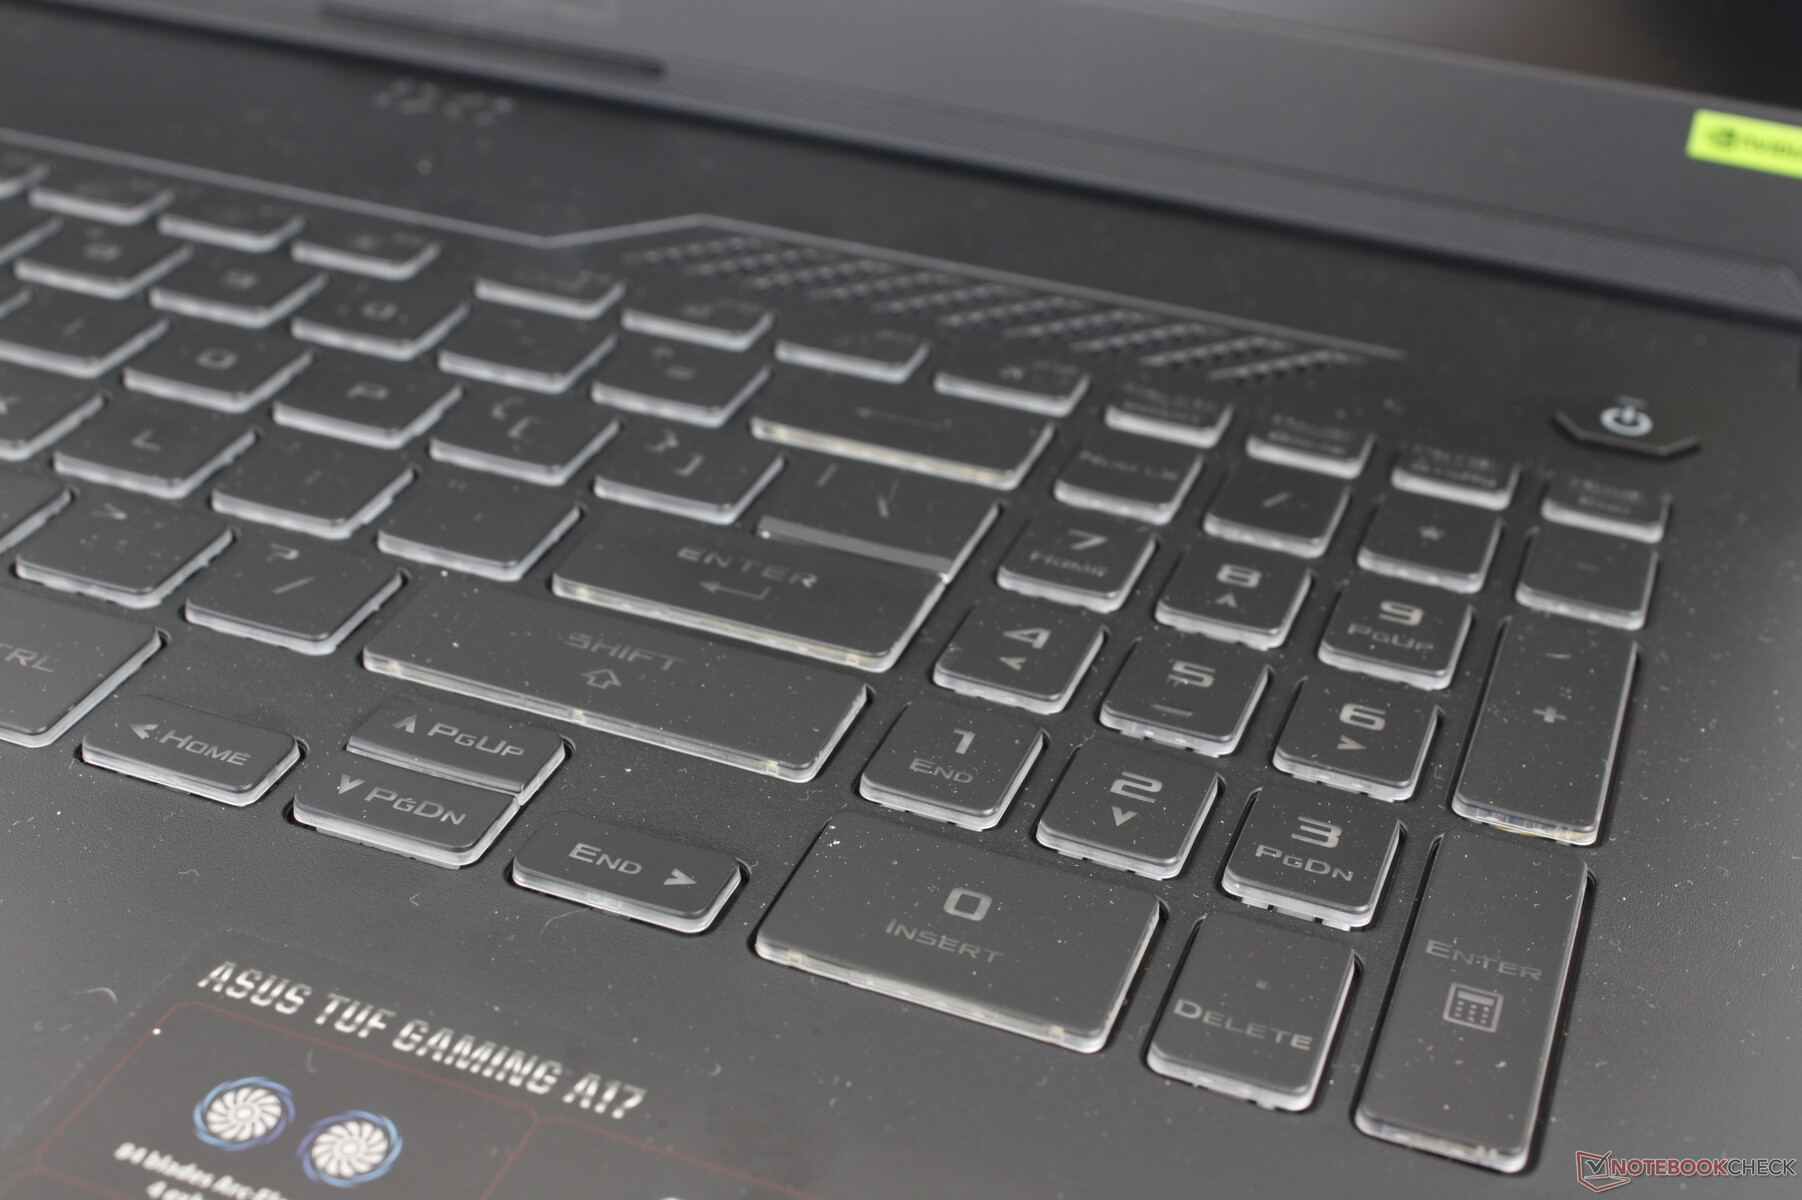
The tri-zone RGB keyboard provides 1.7 mm of key travel to be slightly deeper than the keys on most Ultrabooks. The typing experience is pleasant for a gaming laptop so long as you can forgive the cramped arrow keys and numpad.
Key visibility is not great as the dark gray font contrasts poorly with the black key caps. It's a bizarre decision by Asus to highlight only the WASD letters in white while all other symbols are much darker. This forces the user to enable the keyboard backlight for easier readability even when under bright conditions or if battery life is a concern.
Touchpad
At 13 x 7.7 cm, the clickpad remains the same as on the TUF Gaming F17. However, we can notice no issues on our clickpad here whereas the one on our Intel version had a "dead spot" near the bottom right corner. Feedback is decent if not slightly on the soft side when pressed.

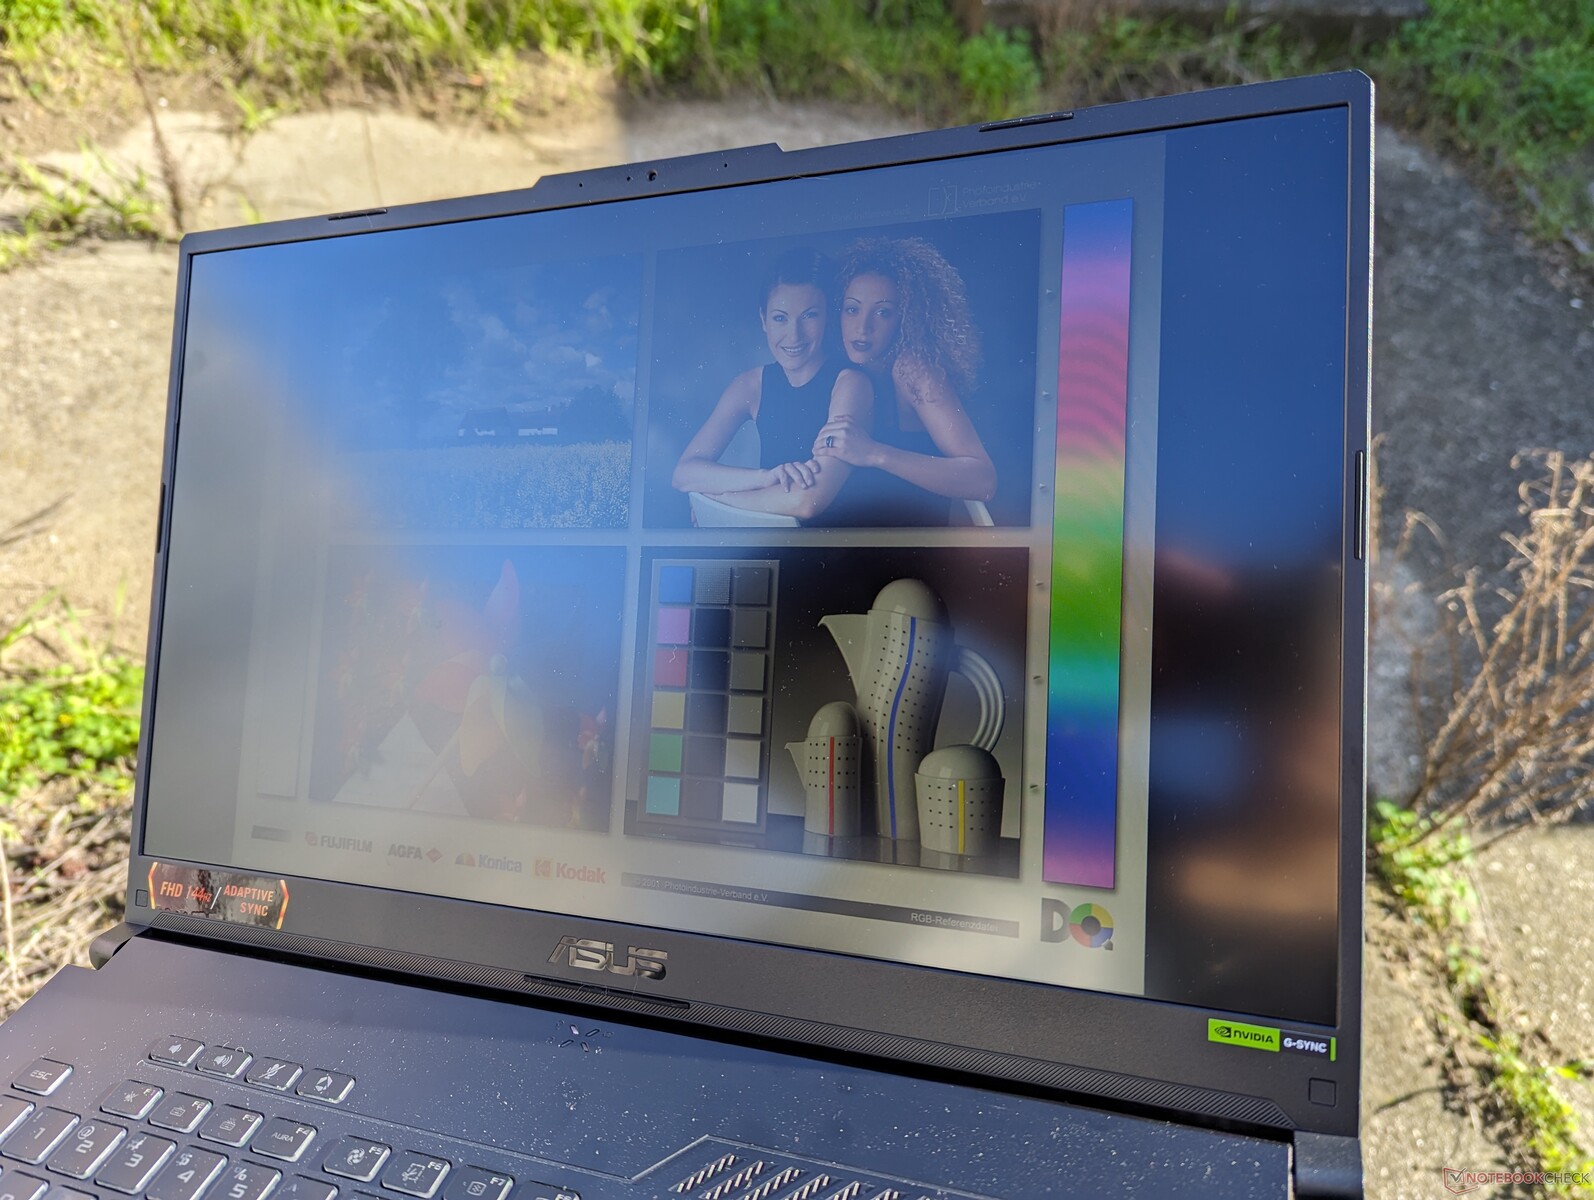
Display
Our 1080p AU Optronics B173HAN04.9 IPS panel is an entry-level display found on many other gaming laptops including the MSI Pulse 17 or Katana 17. It is typically the cheapest and lowest-end option distinguished by its poor ~60% sRGB color reproduction and slow black-white response times. Thankfully, Asus offers a total of three displays to choose from for its FA707 series:
- 1920 x 1080, IPS, ~60% sRGB, 144 Hz
- 2560 x 1440, IPS, 100% DCI-P3, 240 Hz
- 2560 x 1440, IPS, 100% sRGB, 360 Hz
While there are no OLED or mini-LED options, we highly recommend any of the two 1440p panels as they each offer significantly better colors than the base 1080p panel while maintaining both adaptive sync and Advanced Optimus.

| |||||||||||||||||||||||||
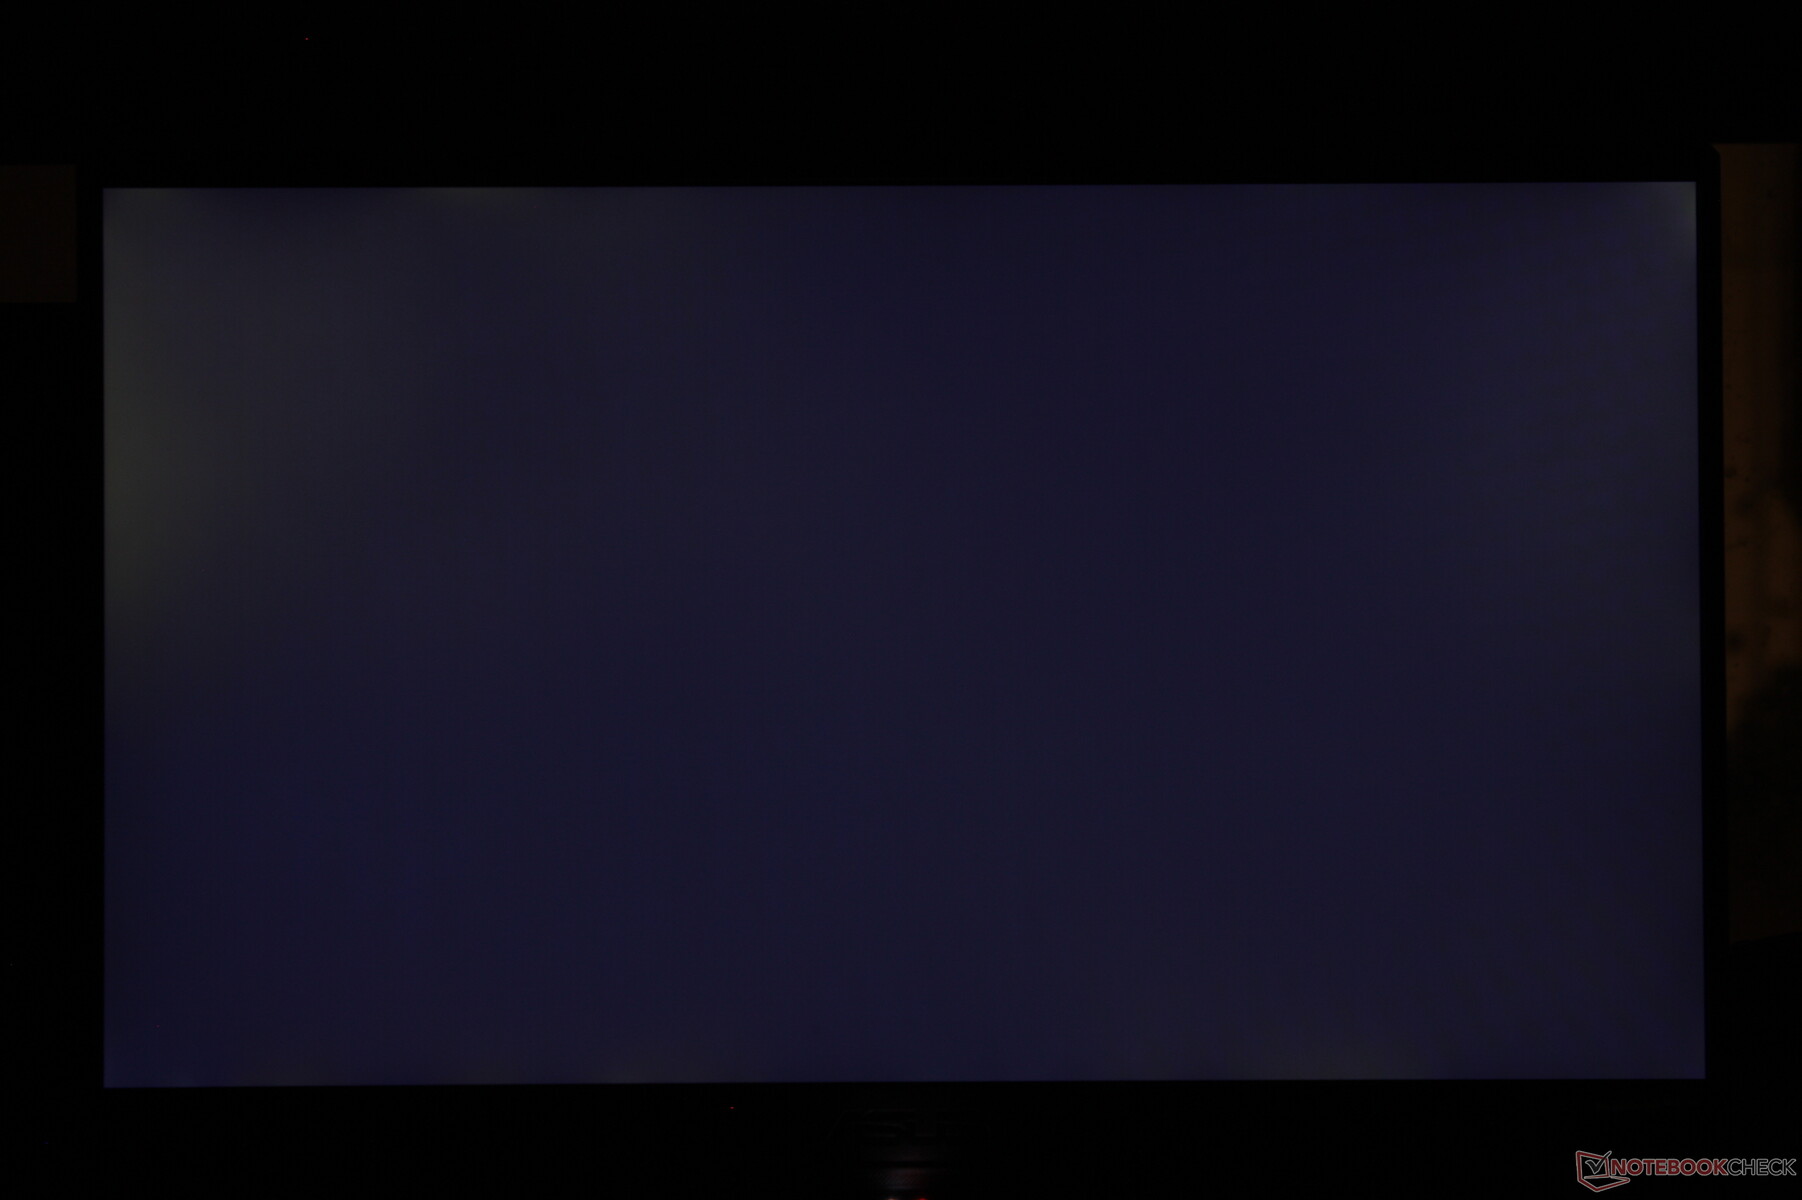
Brightness Distribution: 91 %
Center on Battery: 255.9 cd/m²
Contrast: 1219:1 (Black: 0.21 cd/m²)
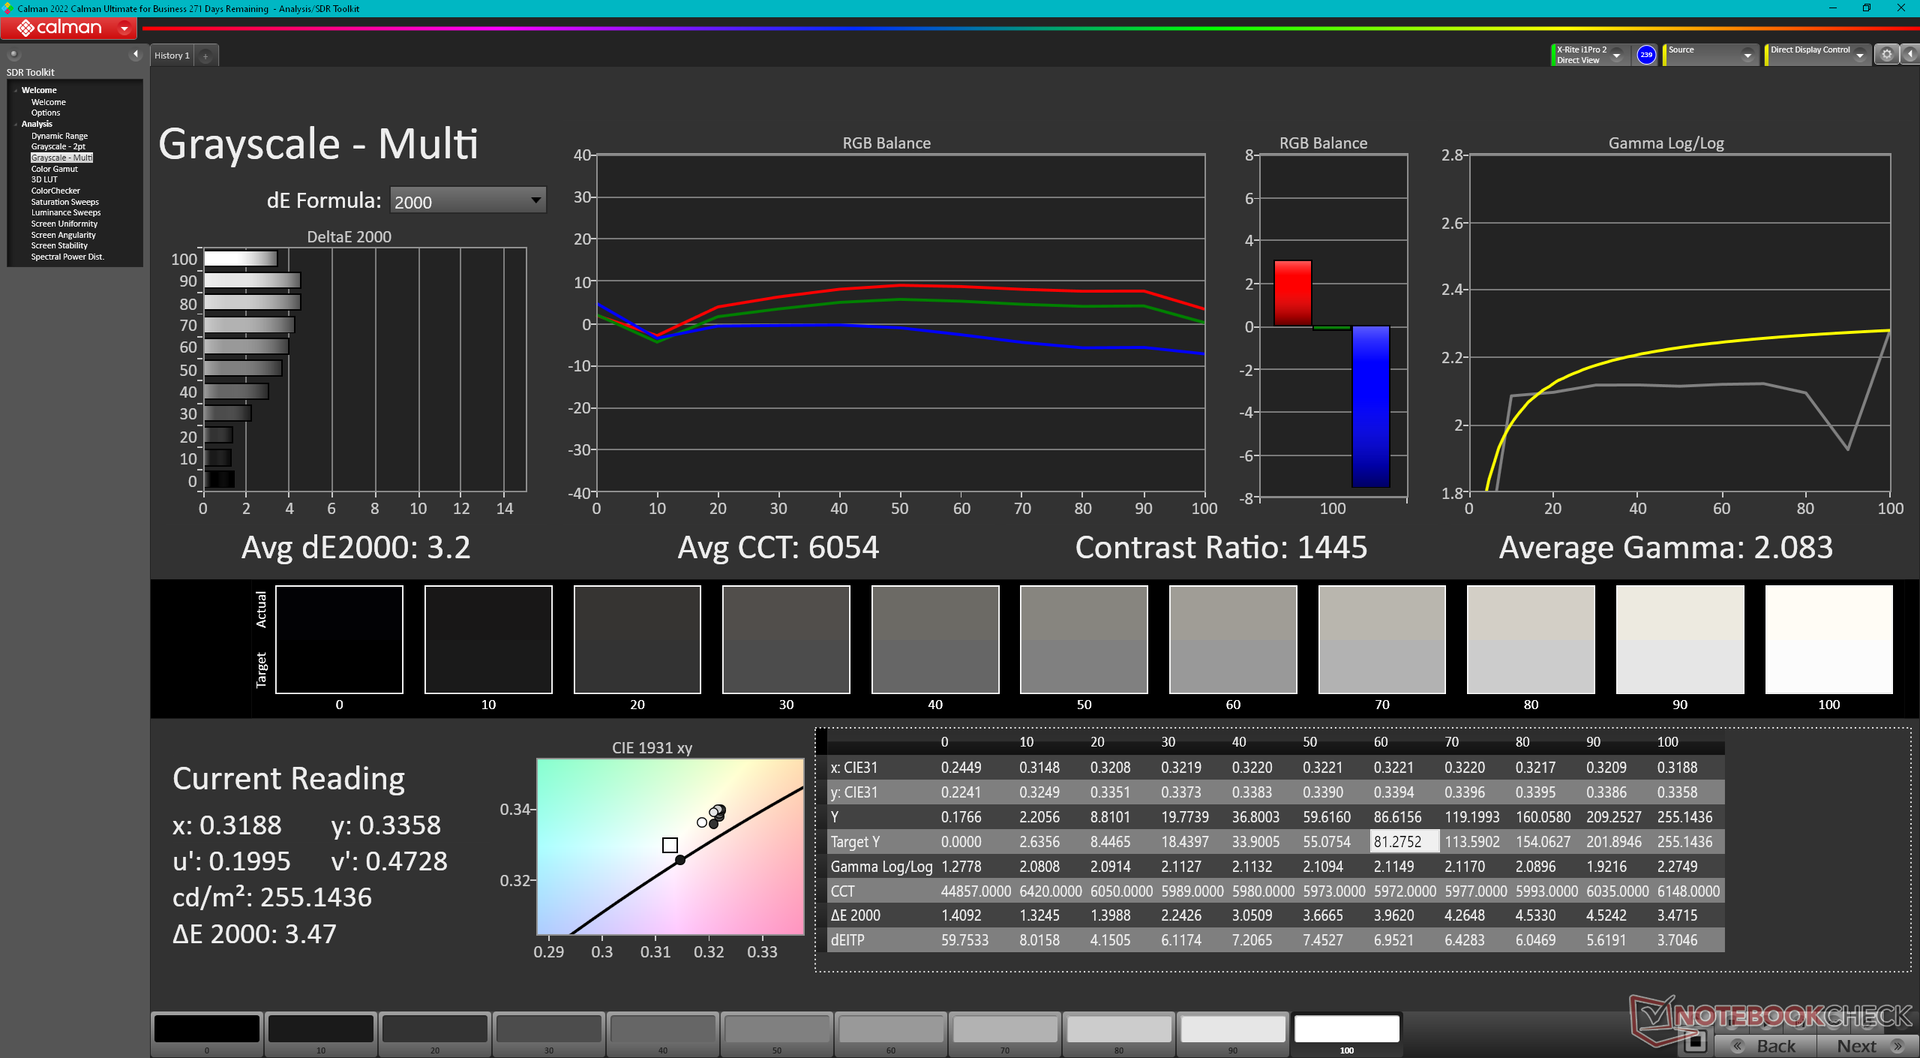
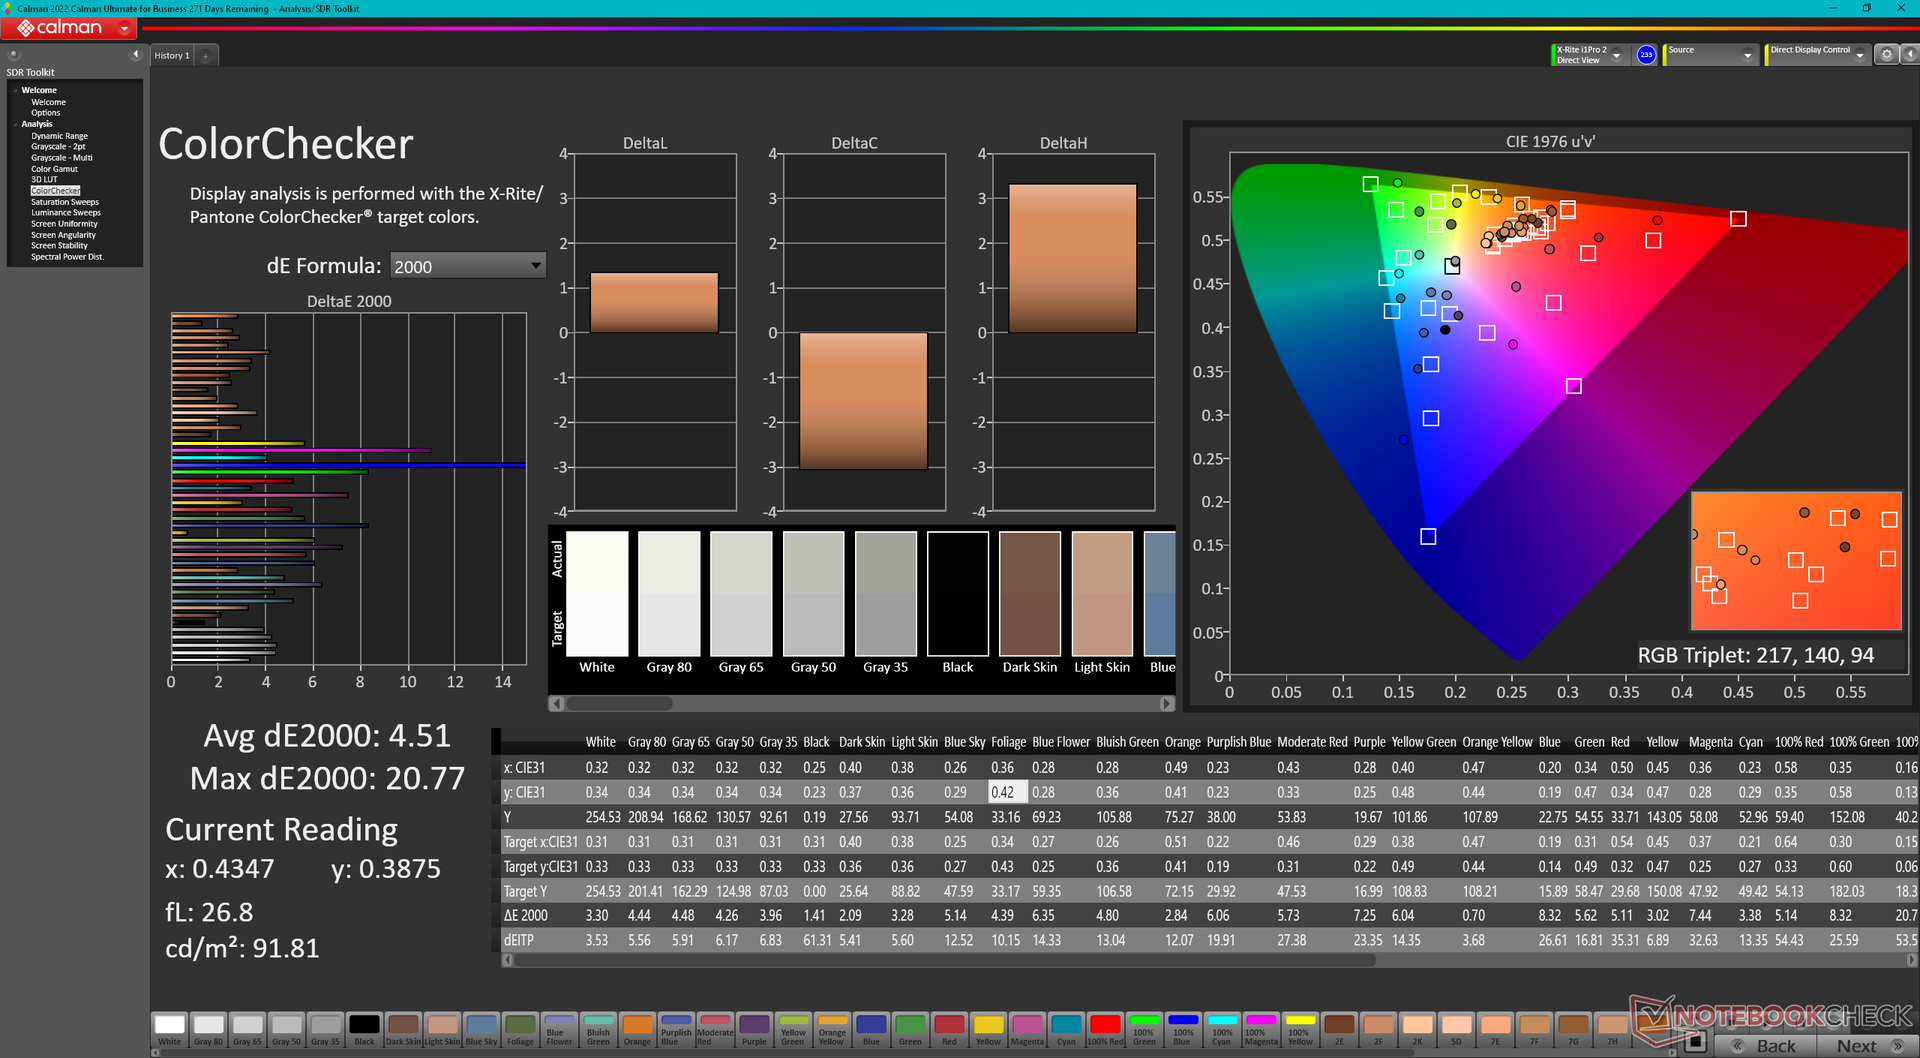
ΔE ColorChecker Calman: 4.51 | ∀{0.5-29.43 Ø4.71}
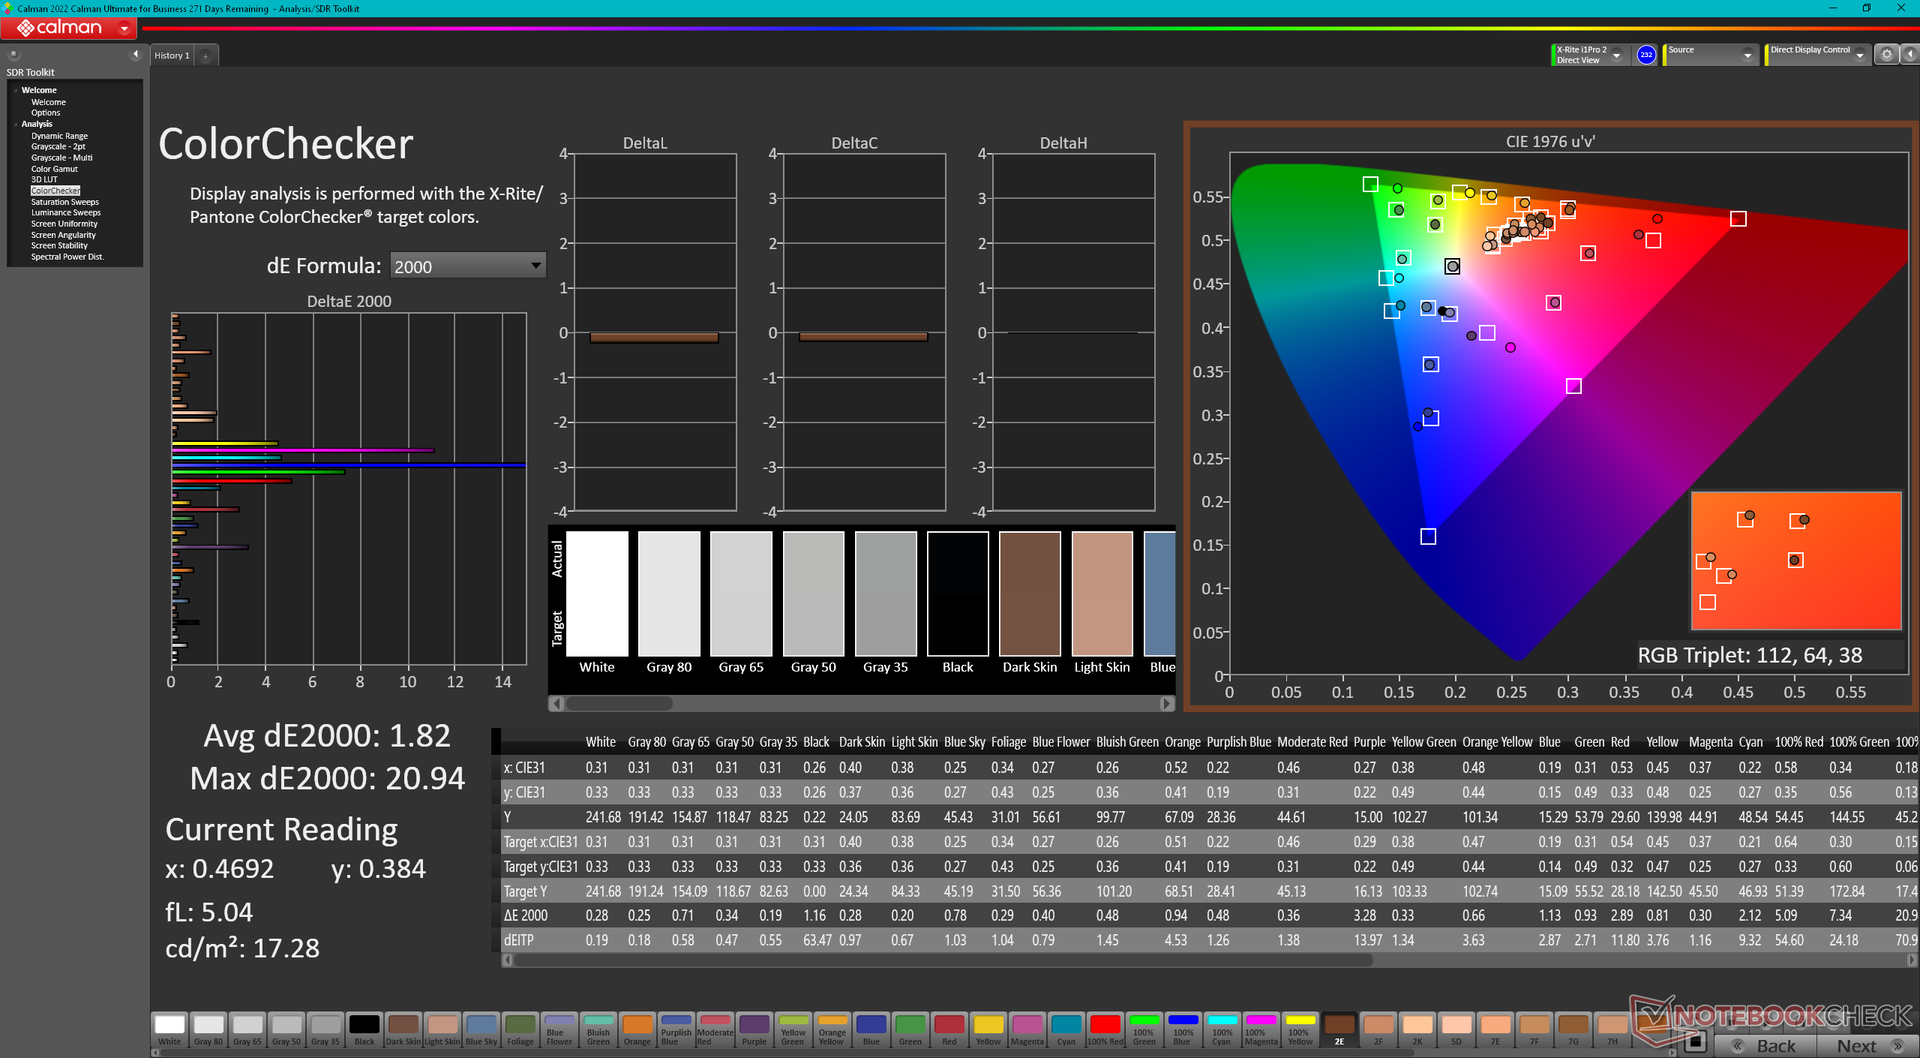
calibrated: 1.82
ΔE Greyscale Calman: 3.2 | ∀{0.09-98 Ø4.96}
41% AdobeRGB 1998 (Argyll 3D)
59.1% sRGB (Argyll 3D)
39.7% Display P3 (Argyll 3D)
Gamma: 2.08
CCT: 6054 K
| Asus TUF Gaming A17 FA707XI-NS94 AU Optronics B173HAN04.9, IPS, 1920x1080, 17.3" | Asus TUF Gaming F17 FX707Z-HX011W AU Optronics B173HAN04.9 (AUO4B9D), IPS, 1920x1080, 17.3" | MSI Pulse 17 B13VGK AU Optronics B173HAN04.9, IPS, 1920x1080, 17.3" | MSI Katana 17 B13VFK B173HAN04.9, IPS LED, 1920x1080, 17.3" | Razer Blade 17 (i7-12800H, RTX 3070 Ti) BOE CQ NE173QHM-NZ1 (BOE09F9), IPS, 2560x1440, 17.3" | HP Pavilion Gaming 17-cd2146ng LGD0611, IPS, 1920x1080, 17.3" | |
|---|---|---|---|---|---|---|
| Display | 1% | -3% | 3% | 108% | 63% | |
| Display P3 Coverage (%) | 39.7 | 40.2 1% | 38.4 -3% | 40.8 3% | 97.9 147% | 64.8 63% |
| sRGB Coverage (%) | 59.1 | 59.7 1% | 57.5 -3% | 61 3% | 99.9 69% | 96.8 64% |
| AdobeRGB 1998 Coverage (%) | 41 | 41.5 1% | 39.7 -3% | 42.2 3% | 85.5 109% | 66.5 62% |
| Response Times | -6% | 16% | 9% | 60% | 68% | |
| Response Time Grey 50% / Grey 80% * (ms) | 39 ? | 39.2 ? -1% | 31.2 ? 20% | 33 ? 15% | 15.2 ? 61% | 12.7 ? 67% |
| Response Time Black / White * (ms) | 26.9 ? | 29.6 ? -10% | 23.6 ? 12% | 26 ? 3% | 11.2 ? 58% | 8.7 ? 68% |
| PWM Frequency (Hz) | ||||||
| Screen | -10% | 0% | -9% | -18% | 16% | |
| Brightness middle (cd/m²) | 255.9 | 287 12% | 254 -1% | 267 4% | 341 33% | 328 28% |
| Brightness (cd/m²) | 248 | 268 8% | 250 1% | 256 3% | 308 24% | 317 28% |
| Brightness Distribution (%) | 91 | 89 -2% | 91 0% | 93 2% | 82 -10% | 94 3% |
| Black Level * (cd/m²) | 0.21 | 0.17 19% | 0.14 33% | 0.21 -0% | 0.45 -114% | 0.23 -10% |
| Contrast (:1) | 1219 | 1688 38% | 1814 49% | 1271 4% | 758 -38% | 1426 17% |
| Colorchecker dE 2000 * | 4.51 | 5.1 -13% | 4.52 -0% | 4.7 -4% | 4.16 8% | 3.83 15% |
| Colorchecker dE 2000 max. * | 20.77 | 8.72 58% | 21.22 -2% | 20.4 2% | 8.14 61% | 8.51 59% |
| Colorchecker dE 2000 calibrated * | 1.82 | 5.1 -180% | 4.52 -148% | 4.5 -147% | 3 -65% | 0.83 54% |
| Greyscale dE 2000 * | 3.2 | 4.24 -33% | 1 69% | 1.5 53% | 5.09 -59% | 4.9 -53% |
| Gamma | 2.08 106% | 2.44 90% | 2.44 90% | 2.12 104% | 2.48 89% | 2.177 101% |
| CCT | 6054 107% | 6008 108% | 6502 100% | 6552 99% | 6884 94% | 7881 82% |
| Total Average (Program / Settings) | -5% /
-7% | 4% /
2% | 1% /
-4% | 50% /
20% | 49% /
33% |
* ... smaller is better
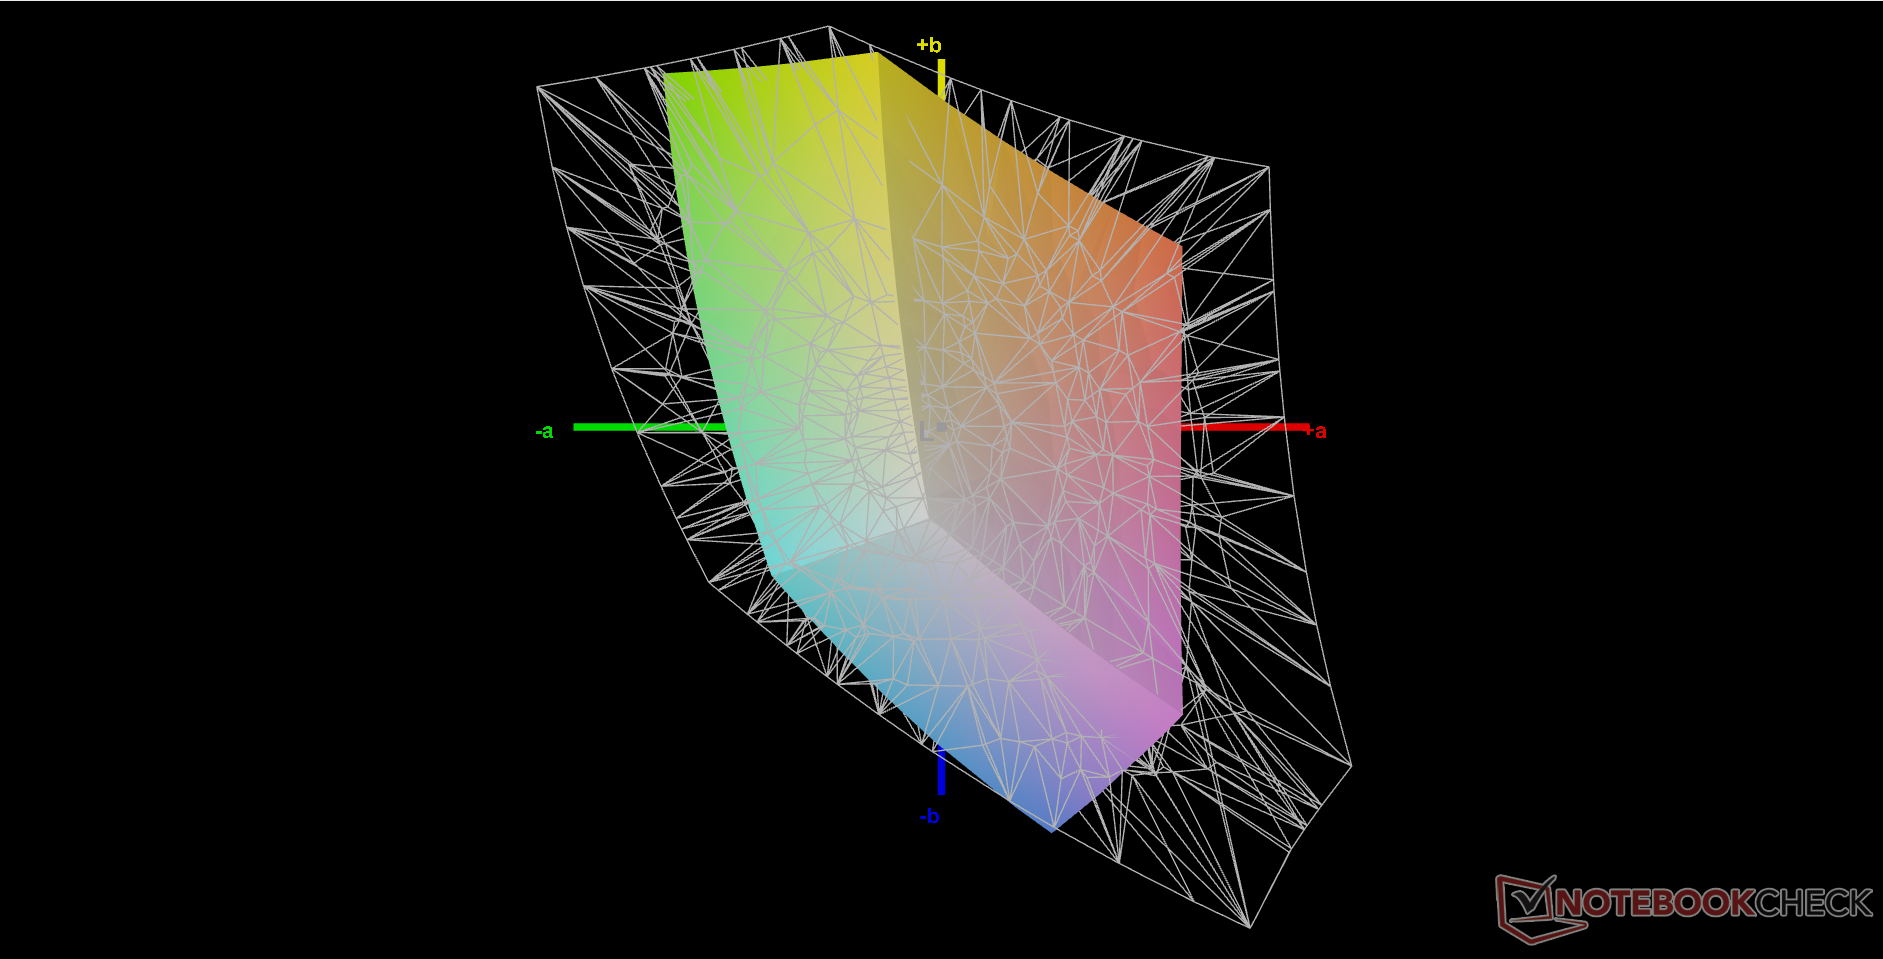
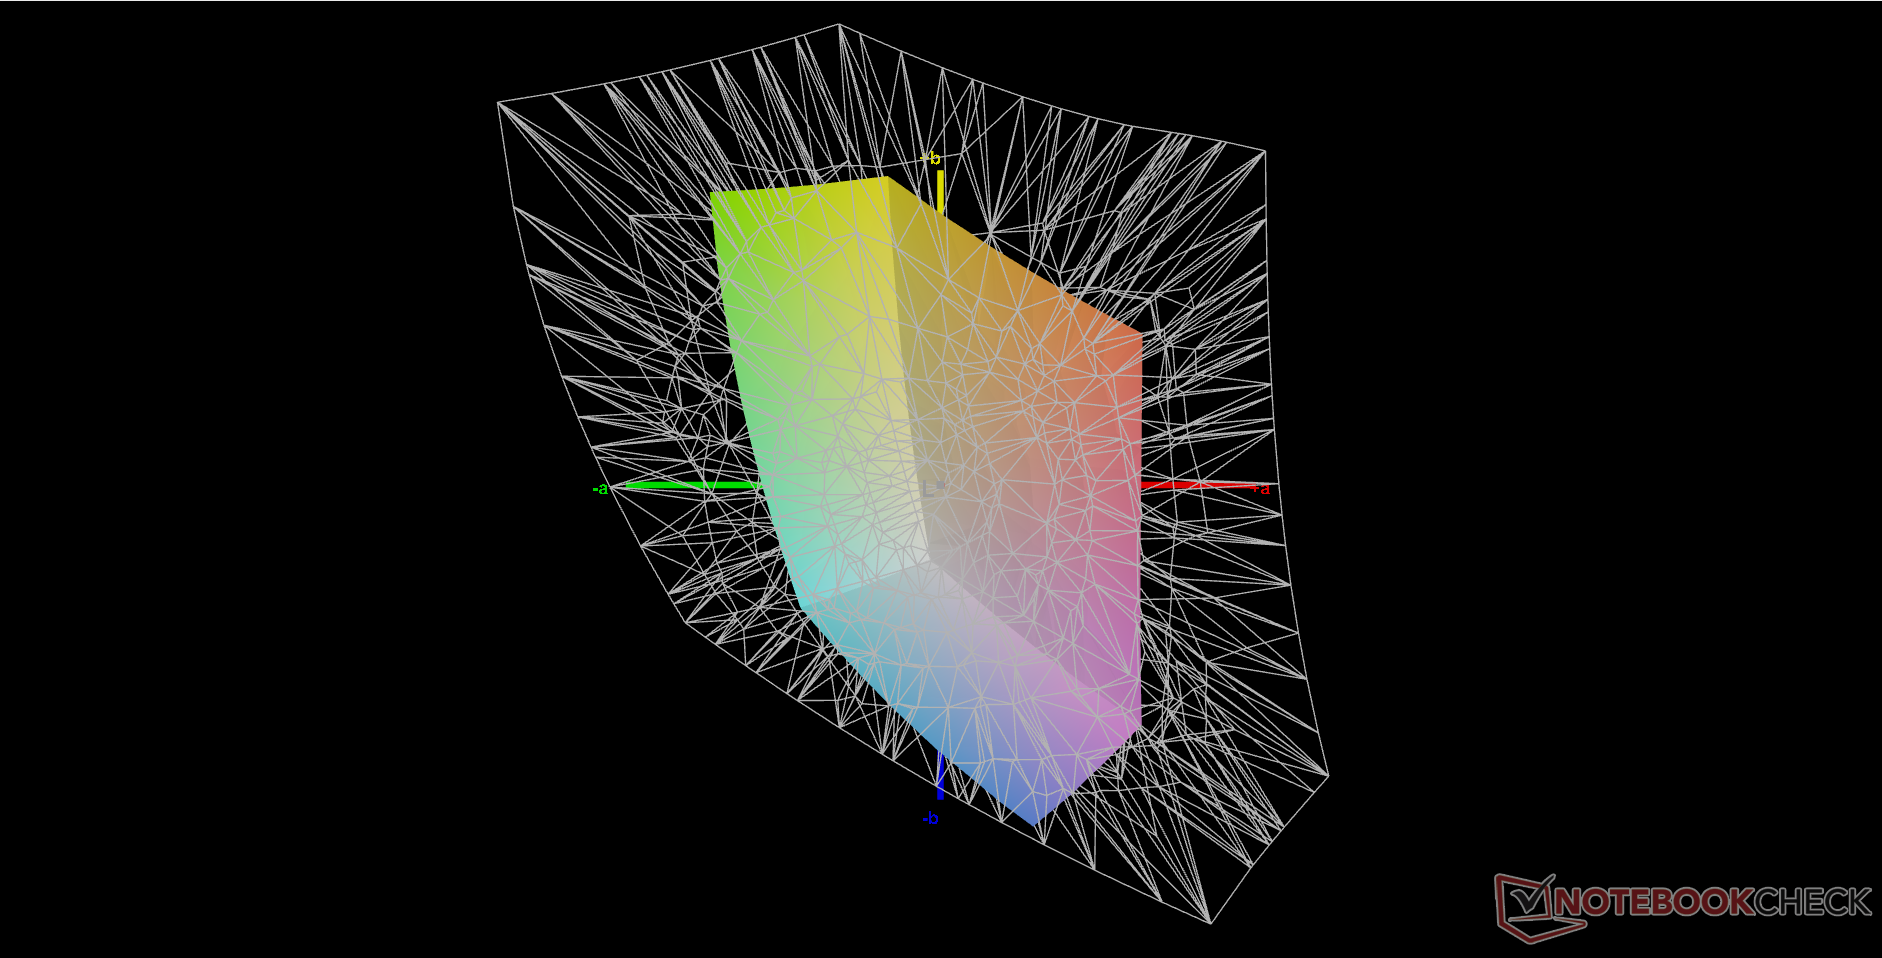
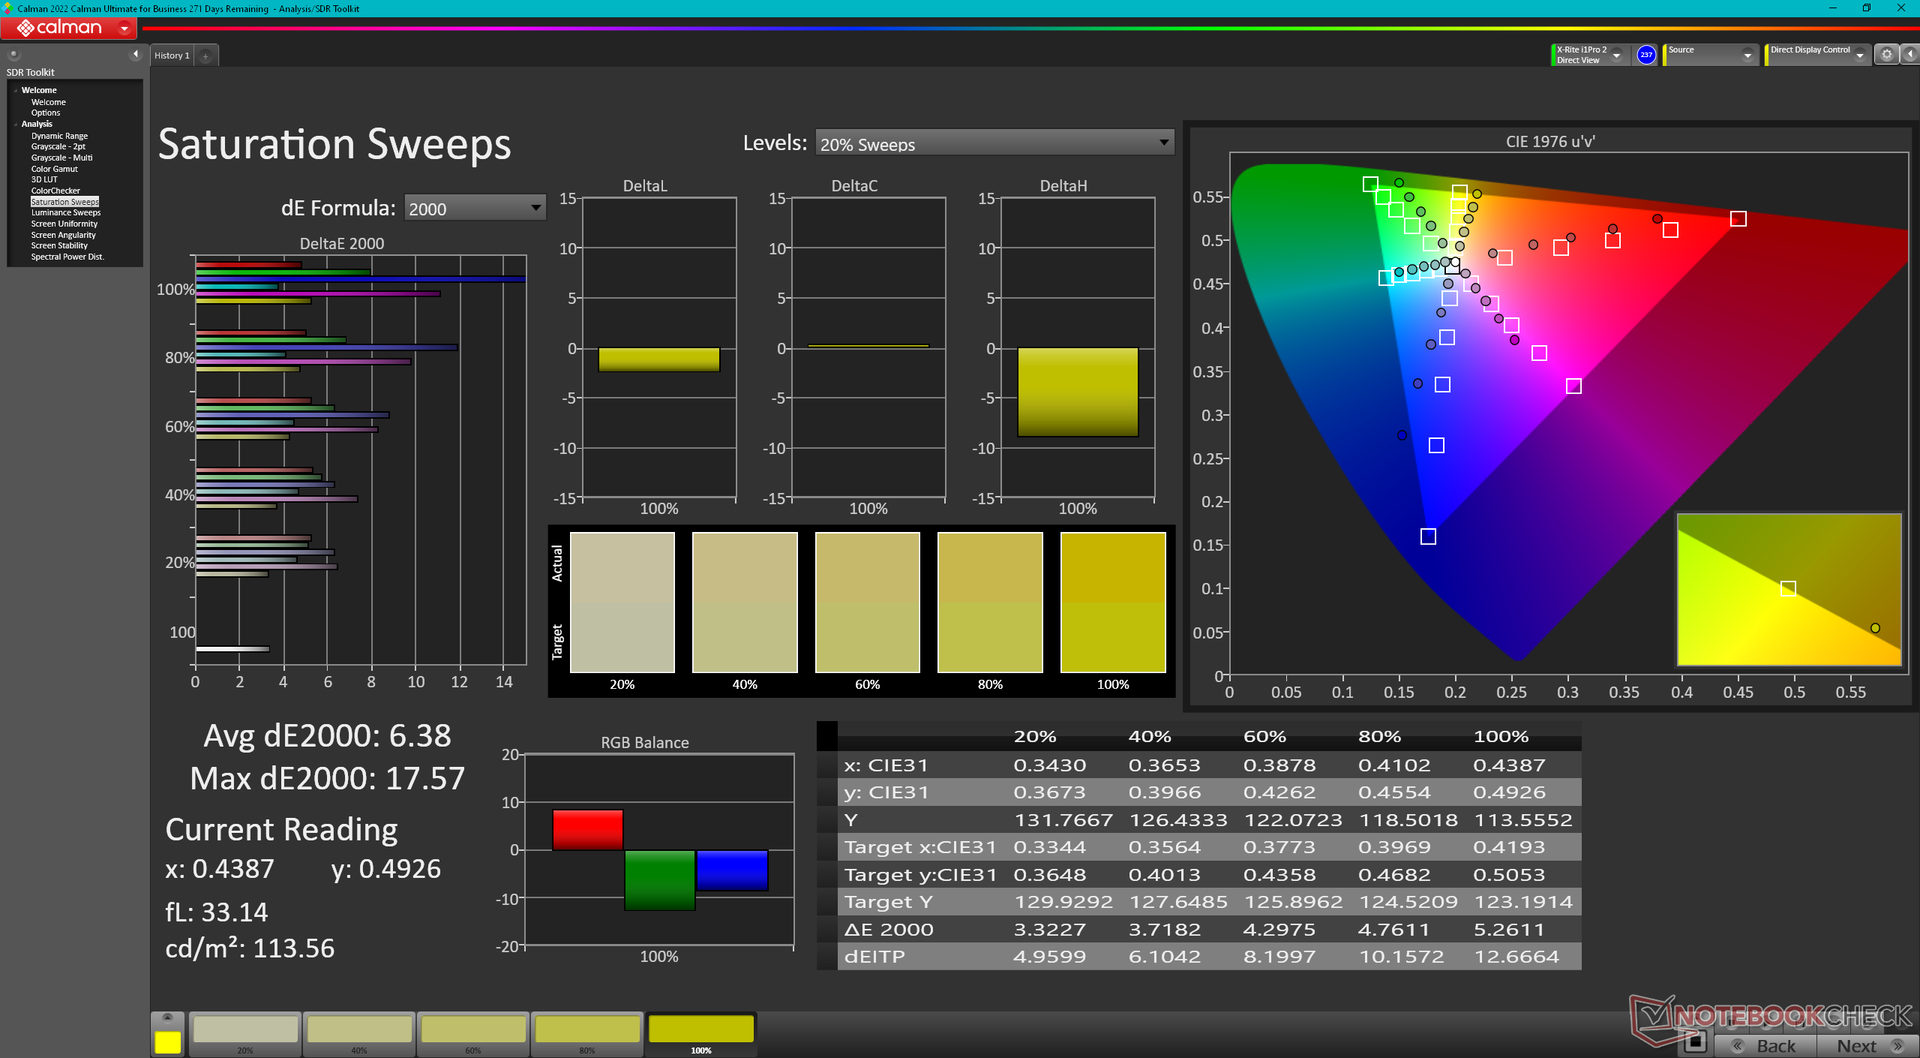
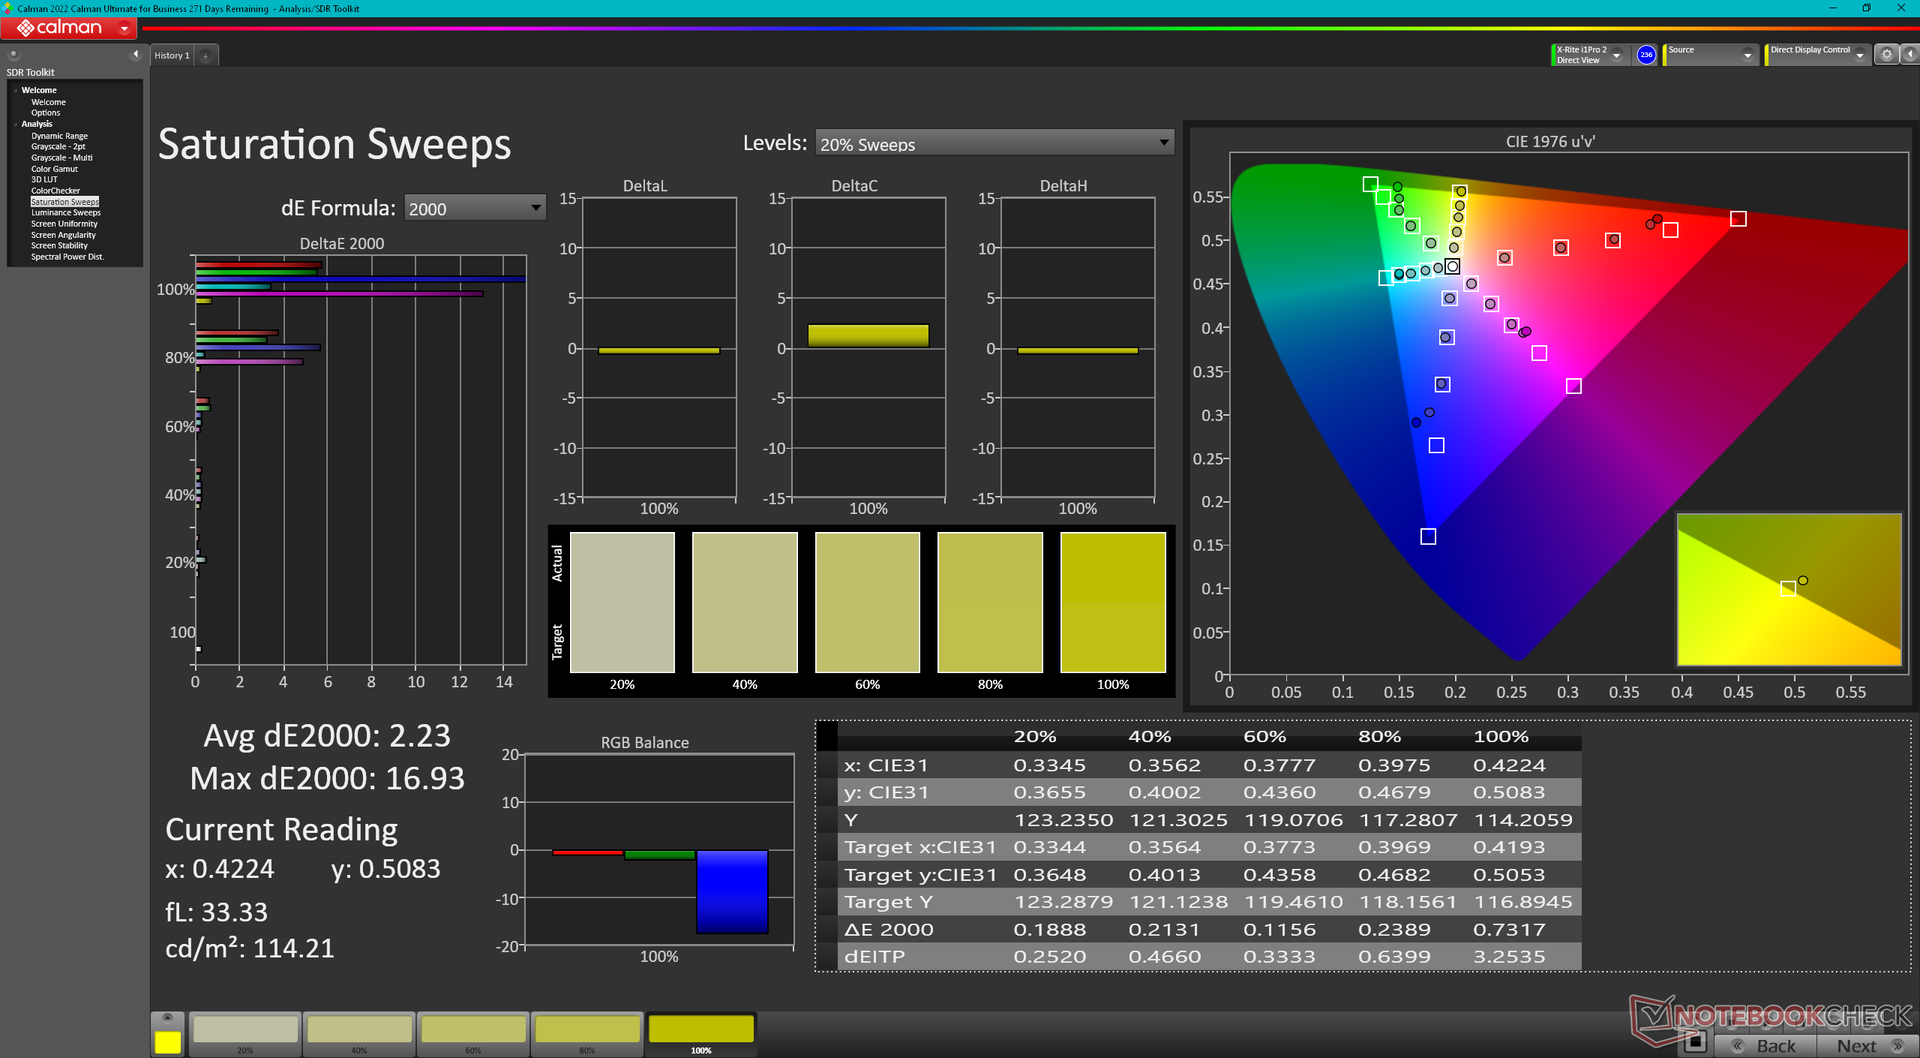
The display does not come calibrated with its average grayscale and color deltaE values of 3.2 and 4.51, respectively. Calibrating the display ourselves with an X-Rite colorimeter would improve these respective averages down to just 0.3 and 1.82. However, colors still become increasingly inaccurate at higher saturation levels due to the limited color space mentioned above. Blue, for example, suffers from a very high deltaE of 20.94 even after calibration.
Our calibrated ICM profile is available to download above for free.

Display Response Times
| ↔ Response Time Black to White | ||
|---|---|---|
| 26.9 ms ... rise ↗ and fall ↘ combined | ↗ 13.8 ms rise | 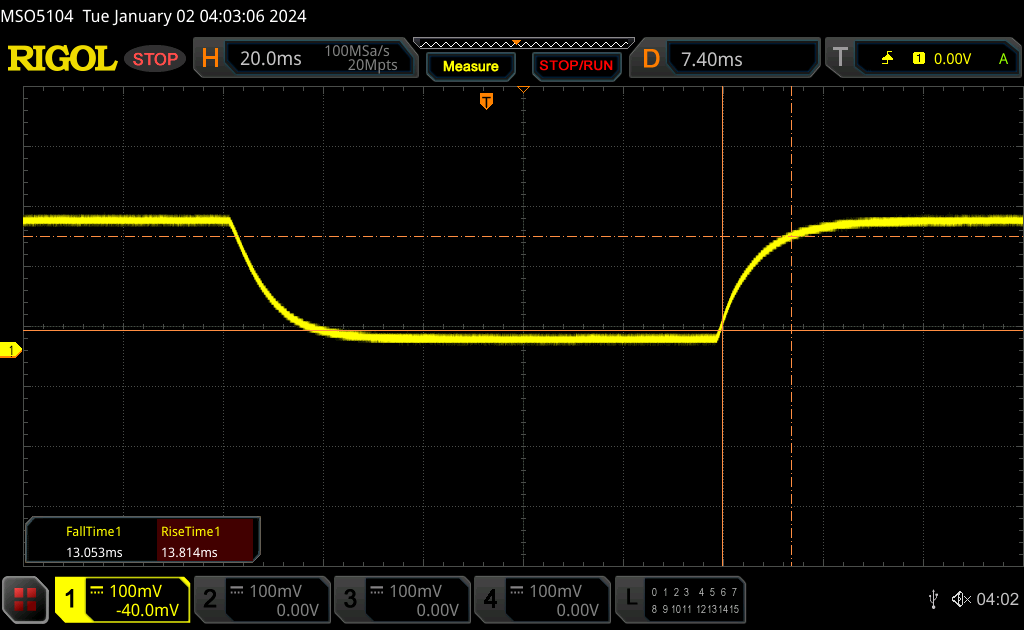 |
| ↘ 13.1 ms fall | ||
| The screen shows relatively slow response rates in our tests and may be too slow for gamers. In comparison, all tested devices range from 0.1 (minimum) to 240 (maximum) ms. » 67 % of all devices are better. This means that the measured response time is worse than the average of all tested devices (19.8 ms). | ||
| ↔ Response Time 50% Grey to 80% Grey | ||
| 39 ms ... rise ↗ and fall ↘ combined | ↗ 18 ms rise | 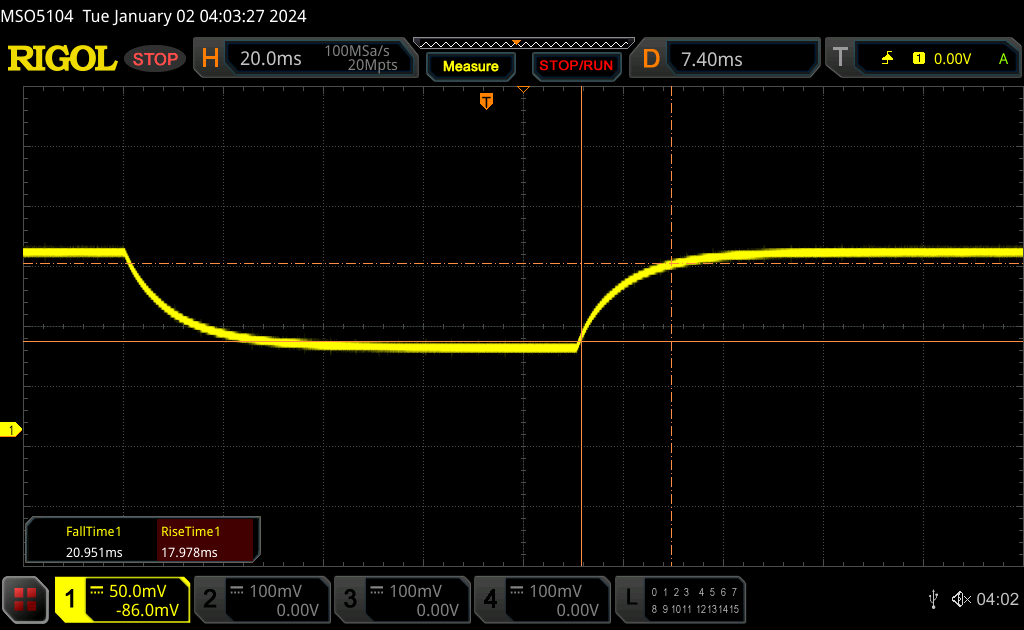 |
| ↘ 21 ms fall | ||
| The screen shows slow response rates in our tests and will be unsatisfactory for gamers. In comparison, all tested devices range from 0.165 (minimum) to 636 (maximum) ms. » 59 % of all devices are better. This means that the measured response time is worse than the average of all tested devices (31 ms). | ||
Screen Flickering / PWM (Pulse-Width Modulation)
| Screen flickering / PWM not detected | 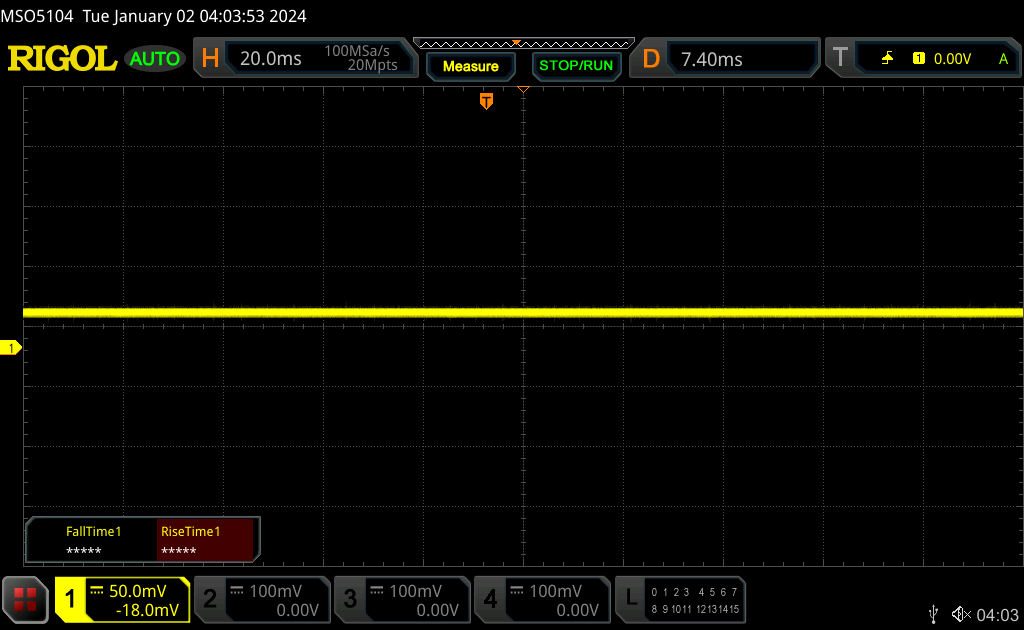 | ||
In comparison: 52 % of all tested devices do not use PWM to dim the display. If PWM was detected, an average of 7757 (minimum: 5 - maximum: 343500) Hz was measured. | |||
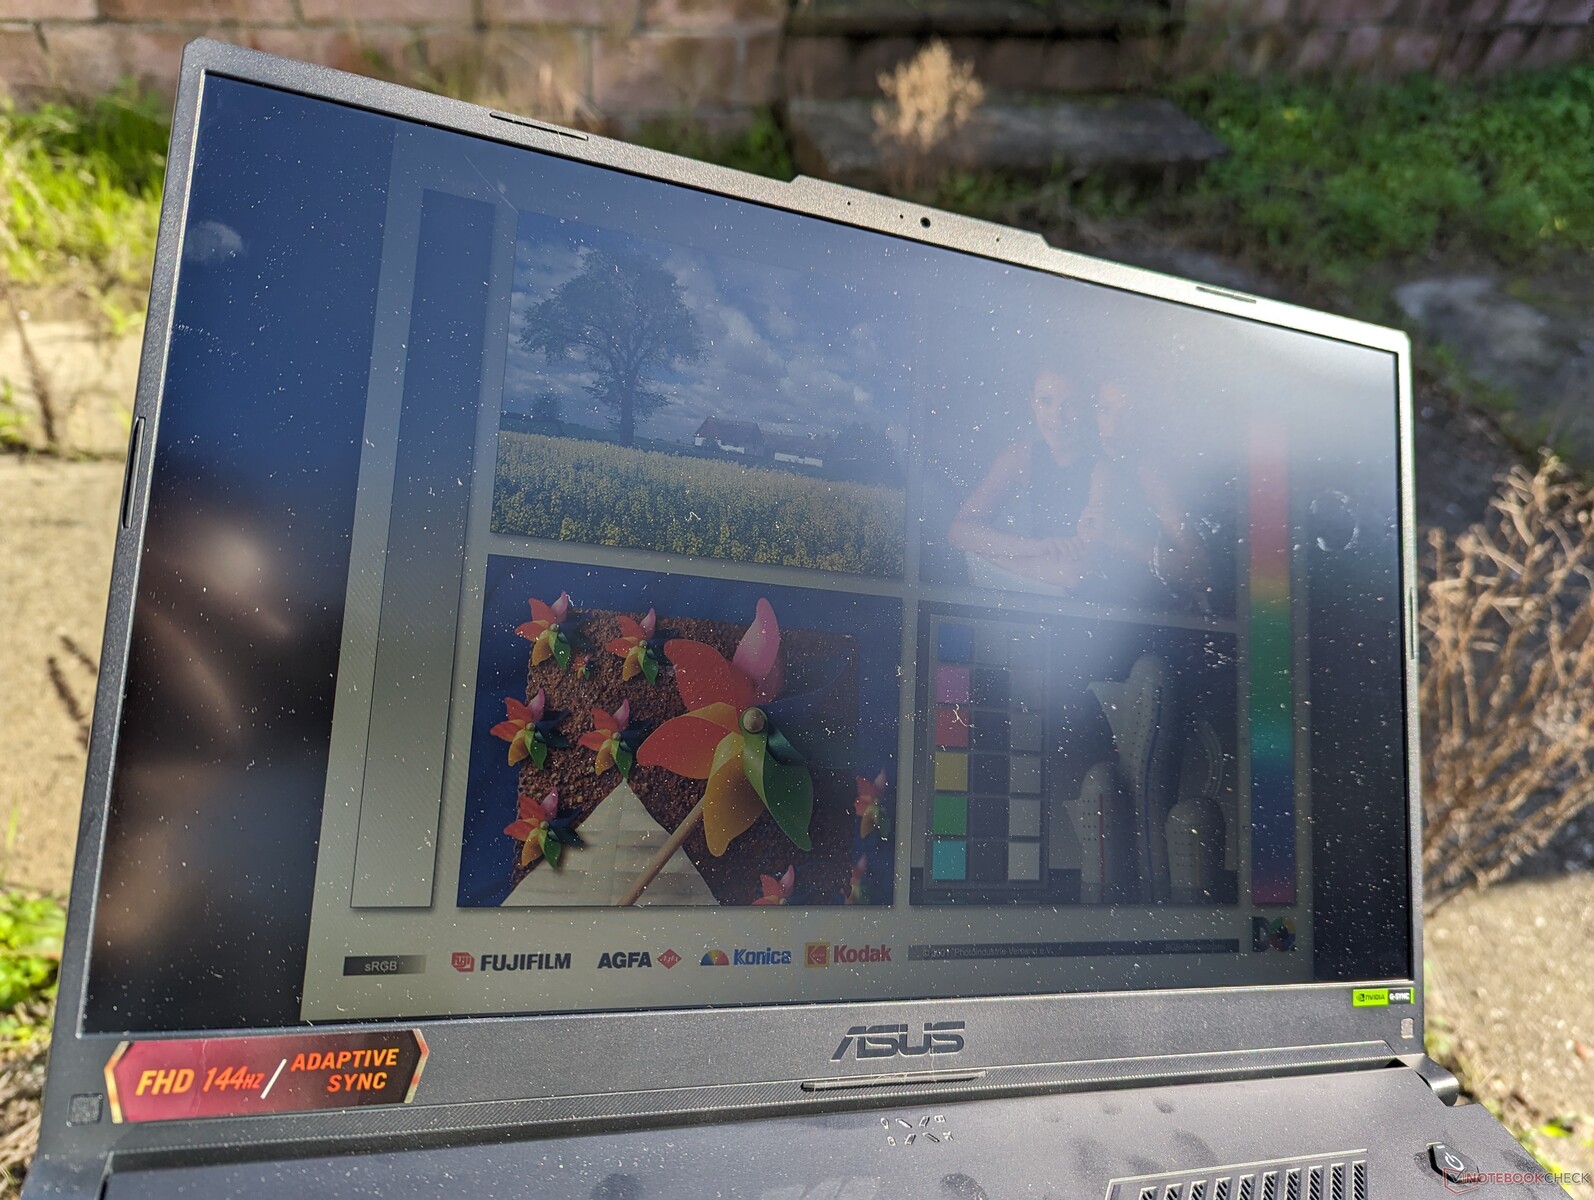
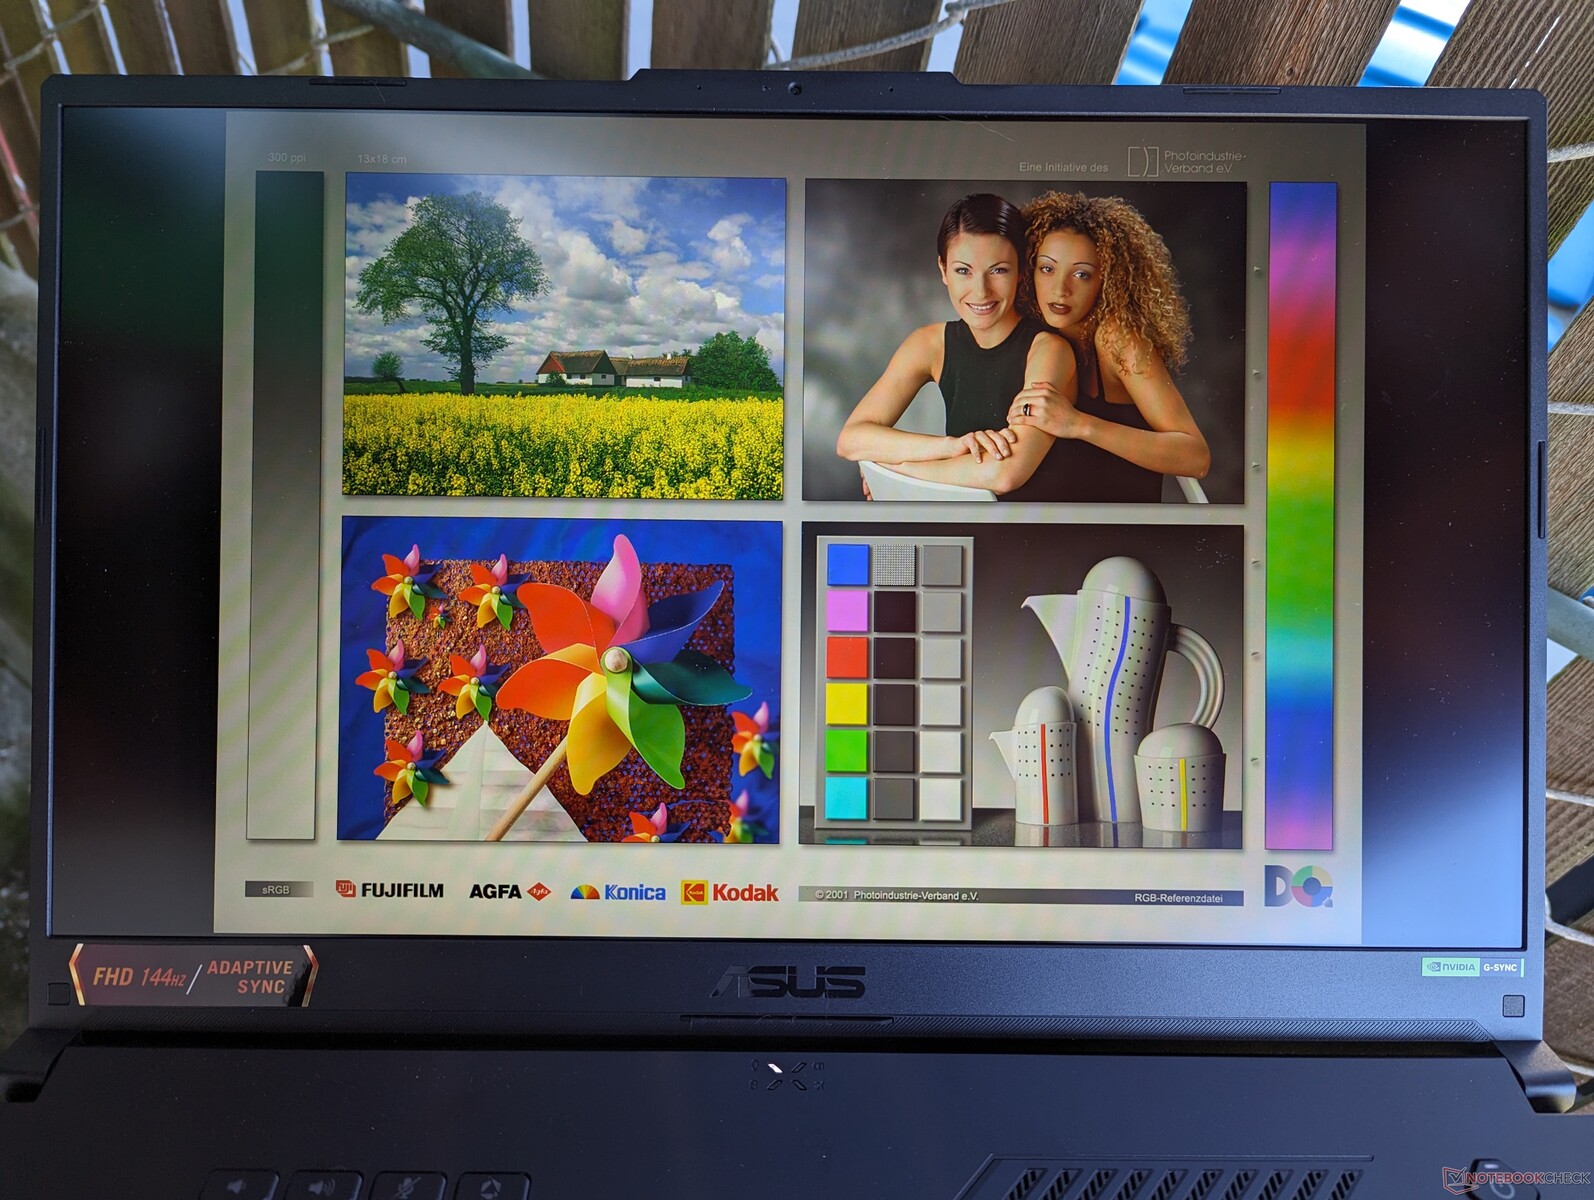
Outdoor visibility is relatively poor despite the matte panel to reduce glare. Maximum brightness is only around 250 to 300 nits compared to almost twice that on laptops like the MacBook Pro 16 or the competing Lenovo Legion Slim 7 16.

Performance
Testing Conditions
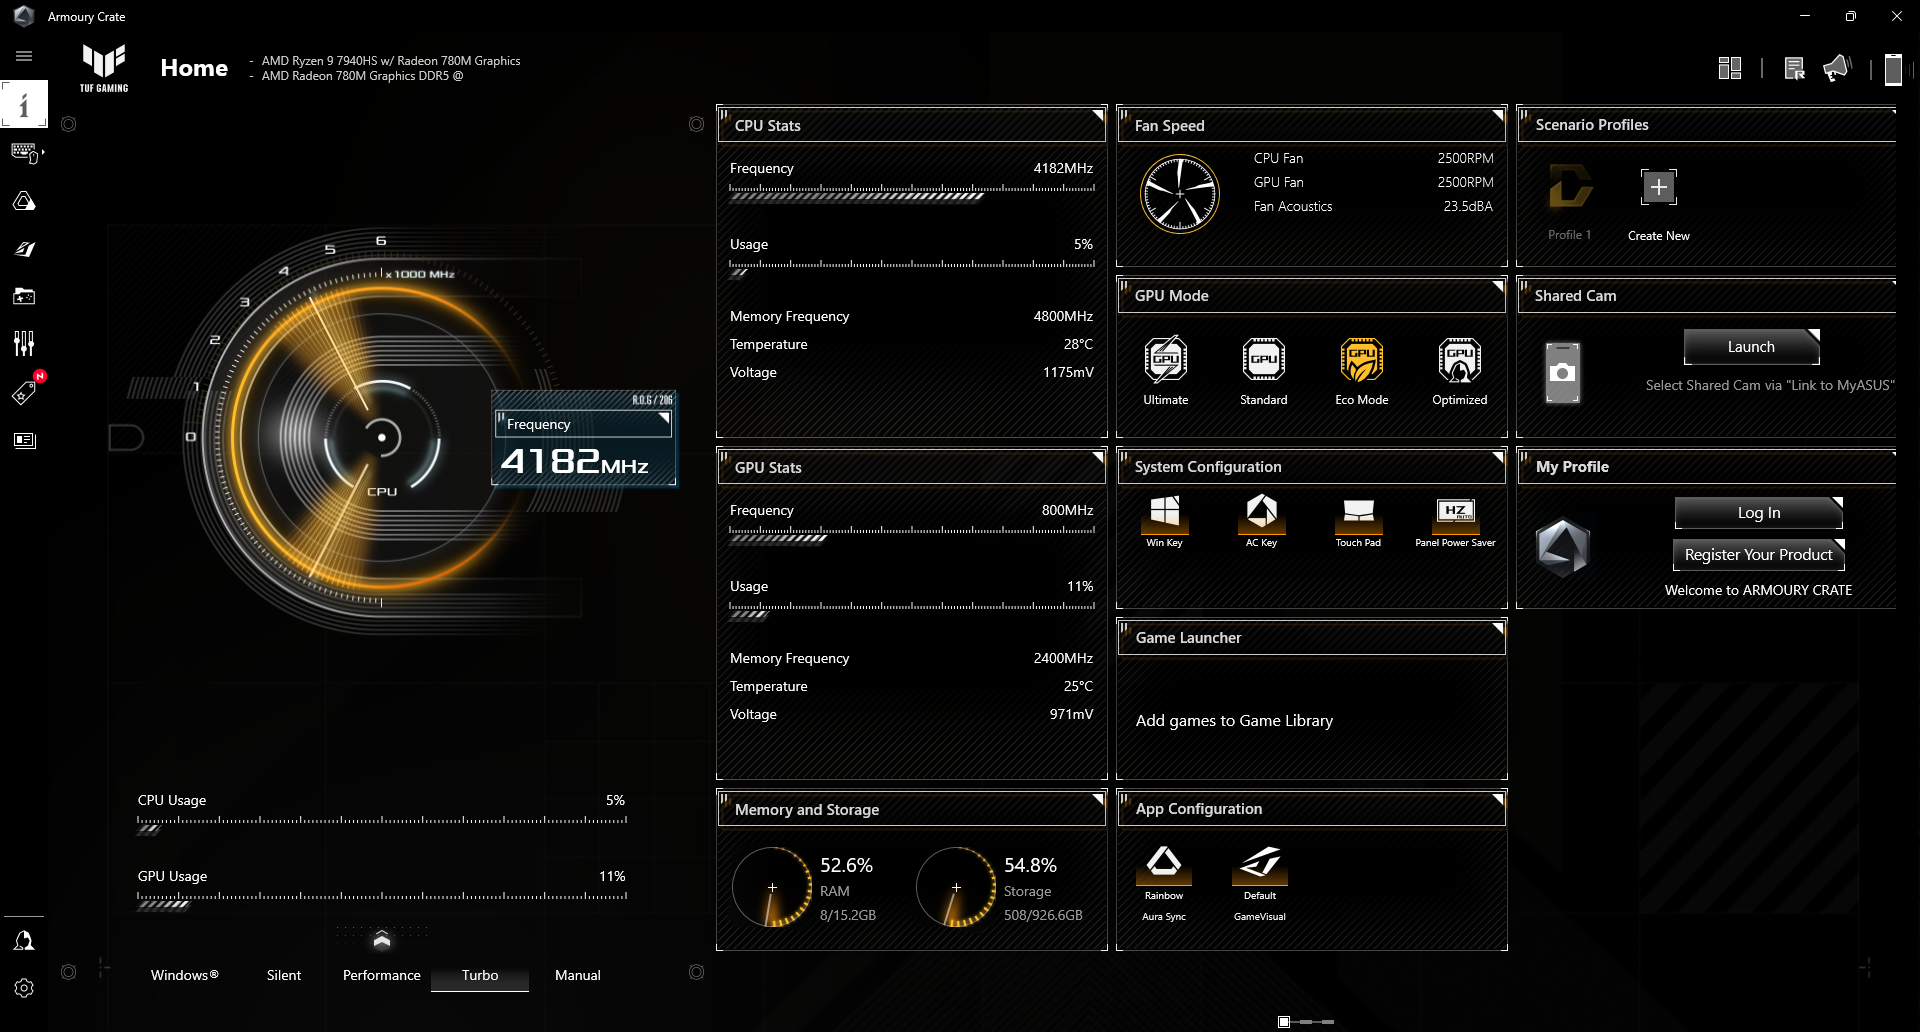
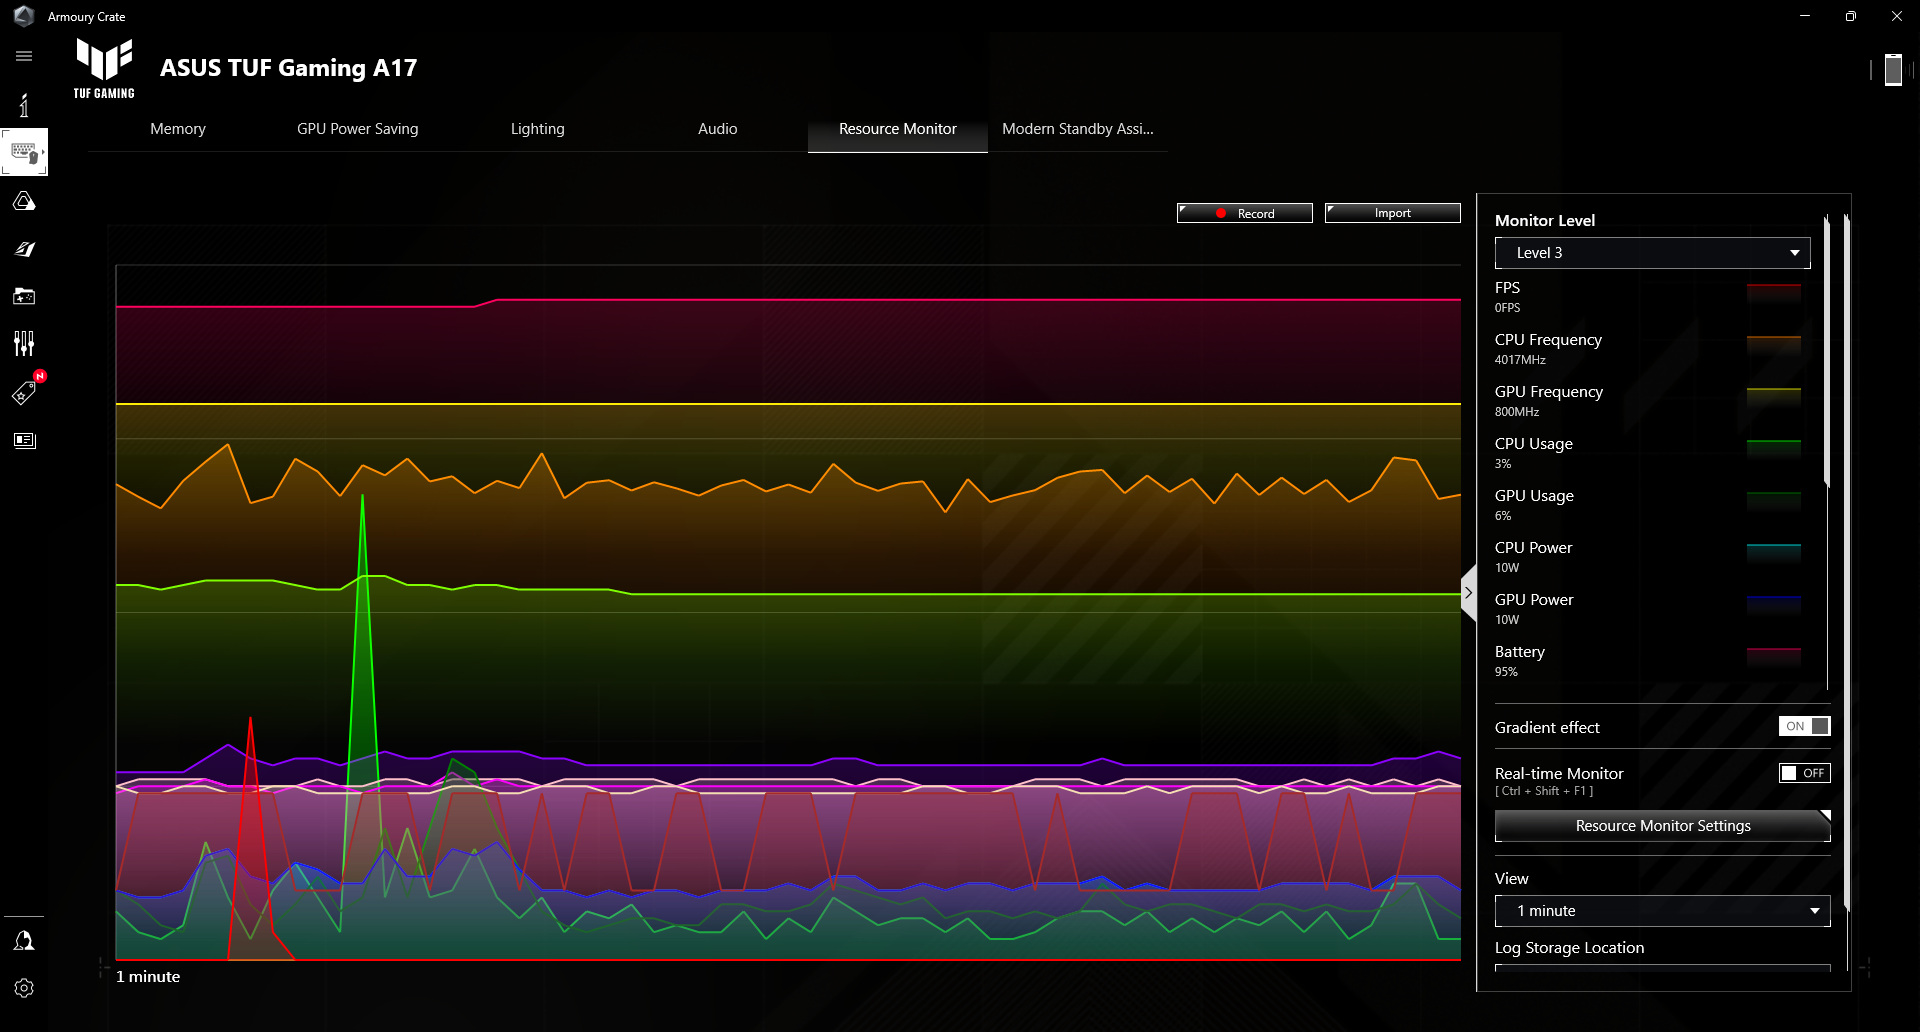
We set Asus Armoury Crate to Turbo mode and Ultimate GPU mode prior to running the benchmarks below. Changing the Armoury Crate power profiles automatically changes the Windows power profiles as well. Note that Performance mode is not the fastest power profile available; that title instead goes to Turbo mode.
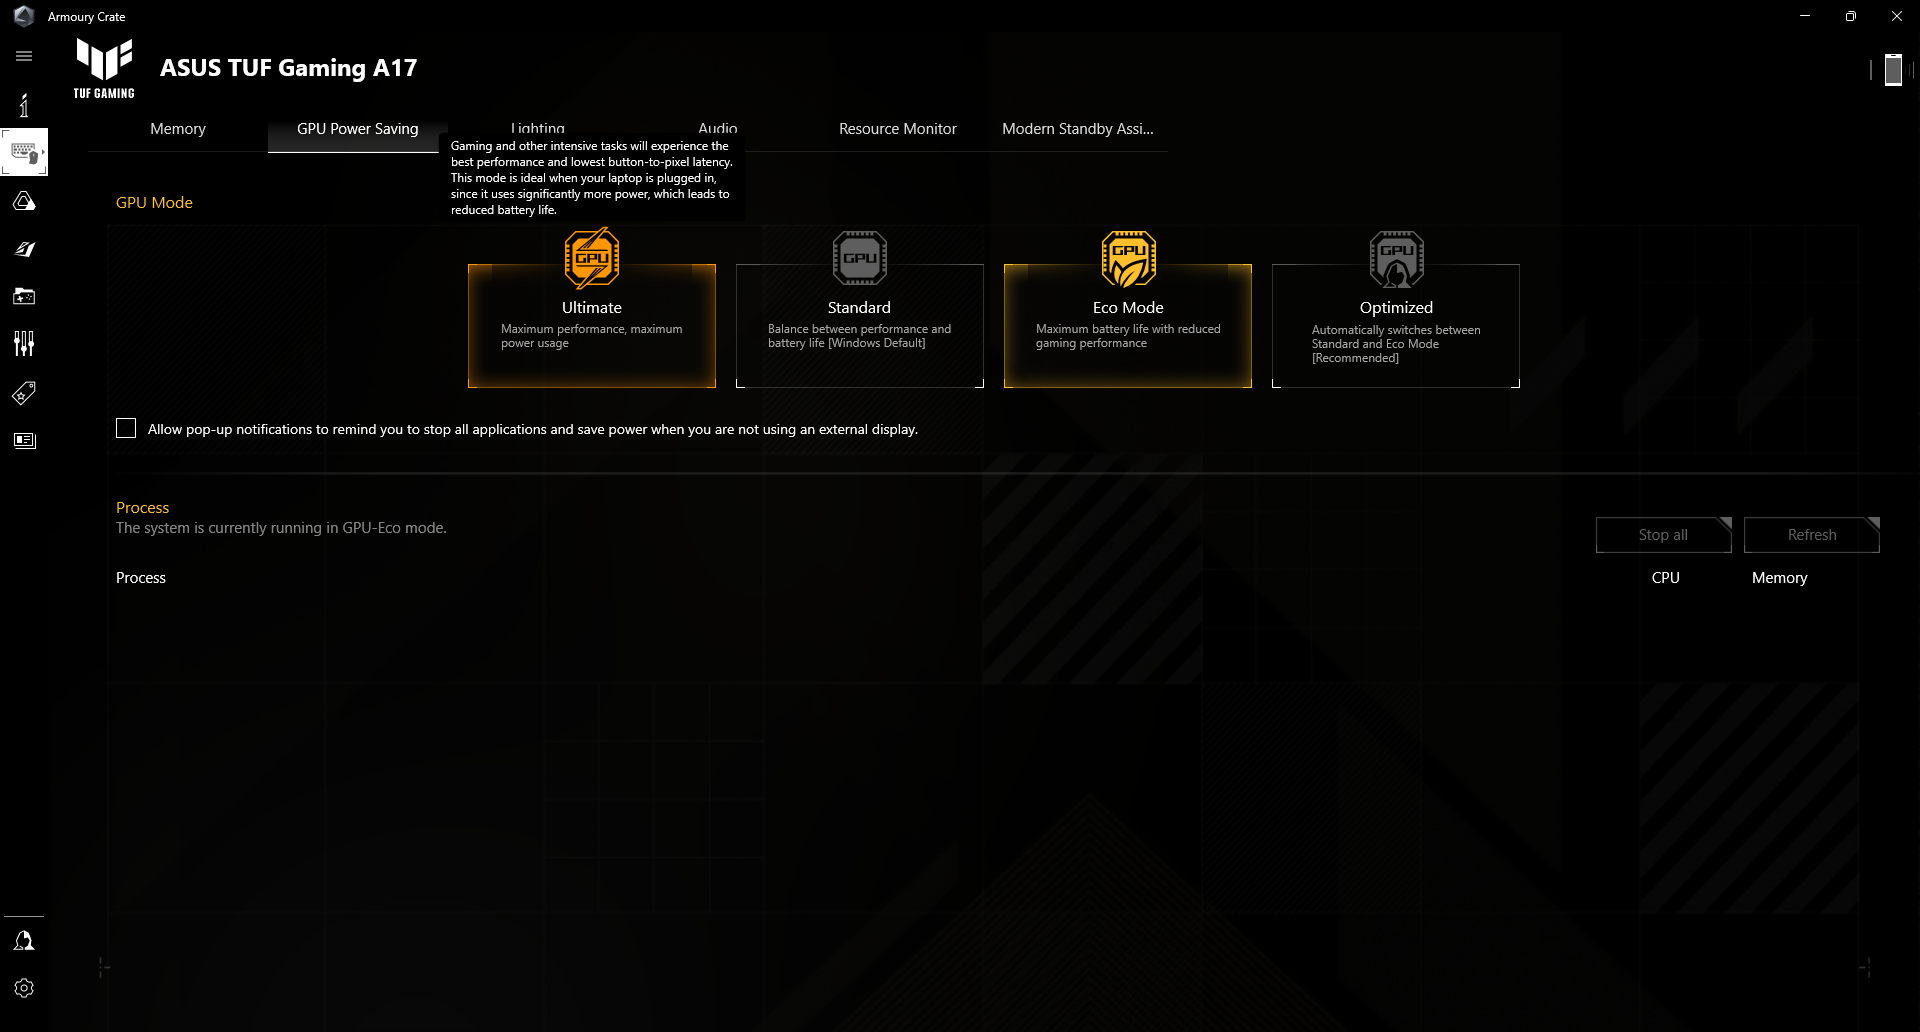
Meanwhile, the four GPU modes are tied to MUX and Advanced Optimus as follows:
- Ultimate mode: Discrete GPU is active for all tasks. A soft reboot is required. This is also required to enable G-Sync on the internal monitor.
- Standard mode: Otherwise known as Microsoft MSHybrid. Automatic switching between dGPU for demanding applications and iGPU for other tasks.
- Eco mode: Discrete GPU is disabled and all applications will run on the iGPU.
- Optimized mode: Automatic switching between dGPU for demanding applications and iGPU for other tasks when on AC power. If on battery power, the dGPU is automatically disabled.
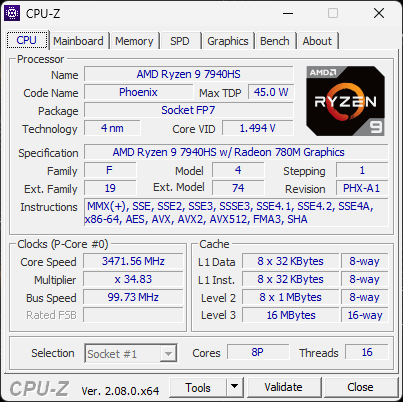
Processor
The Ryzen 9 7940HS competes directly with the common Core i7-13700H. Raw performance is within just a few percentage points of its Intel counterpart in both single- and multi-threaded loads. We can observe no major throttling issues as well unlike on the TUF Gaming F17 FX707Z with the older 12th gen Core i7-12700H.
Downgrading to the Ryzen 7 7735HS from our Ryzen 9 7940HS will impact processor performance by about 15 to 20 percent. The Ryzen 7 option is still plenty fast for gaming especially at our midrange level where the GPU is almost always the bottleneck, but gamers looking to squeeze every last frame from the high refresh rate panel should consider the Ryzen 9.
Cinebench R15 Multi Loop
Cinebench R23: Multi Core | Single Core
Cinebench R20: CPU (Multi Core) | CPU (Single Core)
Cinebench R15: CPU Multi 64Bit | CPU Single 64Bit
Blender: v2.79 BMW27 CPU
7-Zip 18.03: 7z b 4 | 7z b 4 -mmt1
Geekbench 5.5: Multi-Core | Single-Core
HWBOT x265 Benchmark v2.2: 4k Preset
LibreOffice : 20 Documents To PDF
R Benchmark 2.5: Overall mean
| CPU Performance rating | |
| MSI Raider GE78 HX 13VI | |
| Asus ROG Strix G17 G713PI | |
| Eurocom Raptor X17 | |
| MSI Stealth 17 Studio A13VH-014 | |
| Asus TUF Gaming A17 FA707XI-NS94 | |
| Average AMD Ryzen 9 7940HS | |
| MSI Pulse 17 B13VGK | |
| Razer Blade 17 (i7-12800H, RTX 3070 Ti) | |
| MSI Katana 17 B13VFK | |
| Asus TUF Gaming F17 FX707Z-HX011W | |
| Acer Nitro 17 AN17-41-R9LN | |
| Asus ROG Strix G17 G713QE-RB74 -2! | |
| HP Pavilion Gaming 17-cd2146ng | |
| Cinebench R23 / Single Core | |
| MSI Raider GE78 HX 13VI | |
| Eurocom Raptor X17 | |
| Asus ROG Strix G17 G713PI | |
| Asus TUF Gaming A17 FA707XI-NS94 | |
| Razer Blade 17 (i7-12800H, RTX 3070 Ti) | |
| MSI Katana 17 B13VFK | |
| Asus TUF Gaming F17 FX707Z-HX011W | |
| Average AMD Ryzen 9 7940HS (1733 - 1832, n=12) | |
| MSI Stealth 17 Studio A13VH-014 | |
| MSI Pulse 17 B13VGK | |
| Acer Nitro 17 AN17-41-R9LN | |
| Asus ROG Strix G17 G713QE-RB74 | |
| HP Pavilion Gaming 17-cd2146ng | |
| Cinebench R20 / CPU (Multi Core) | |
| MSI Raider GE78 HX 13VI | |
| Eurocom Raptor X17 | |
| Asus ROG Strix G17 G713PI | |
| MSI Stealth 17 Studio A13VH-014 | |
| MSI Pulse 17 B13VGK | |
| Asus TUF Gaming A17 FA707XI-NS94 | |
| Average AMD Ryzen 9 7940HS (6277 - 7111, n=12) | |
| MSI Katana 17 B13VFK | |
| Acer Nitro 17 AN17-41-R9LN | |
| Razer Blade 17 (i7-12800H, RTX 3070 Ti) | |
| Asus ROG Strix G17 G713QE-RB74 | |
| Asus TUF Gaming F17 FX707Z-HX011W | |
| HP Pavilion Gaming 17-cd2146ng | |
| Cinebench R20 / CPU (Single Core) | |
| MSI Raider GE78 HX 13VI | |
| Eurocom Raptor X17 | |
| Asus TUF Gaming A17 FA707XI-NS94 | |
| Asus ROG Strix G17 G713PI | |
| Razer Blade 17 (i7-12800H, RTX 3070 Ti) | |
| Average AMD Ryzen 9 7940HS (679 - 714, n=12) | |
| MSI Katana 17 B13VFK | |
| Asus TUF Gaming F17 FX707Z-HX011W | |
| MSI Pulse 17 B13VGK | |
| MSI Stealth 17 Studio A13VH-014 | |
| Acer Nitro 17 AN17-41-R9LN | |
| Asus ROG Strix G17 G713QE-RB74 | |
| HP Pavilion Gaming 17-cd2146ng | |
| Cinebench R15 / CPU Multi 64Bit | |
| Asus ROG Strix G17 G713PI | |
| MSI Raider GE78 HX 13VI | |
| Eurocom Raptor X17 | |
| MSI Stealth 17 Studio A13VH-014 | |
| MSI Pulse 17 B13VGK | |
| Asus TUF Gaming F17 FX707Z-HX011W | |
| Asus TUF Gaming A17 FA707XI-NS94 | |
| Razer Blade 17 (i7-12800H, RTX 3070 Ti) | |
| Average AMD Ryzen 9 7940HS (2470 - 2848, n=12) | |
| MSI Katana 17 B13VFK | |
| Acer Nitro 17 AN17-41-R9LN | |
| Asus ROG Strix G17 G713QE-RB74 | |
| HP Pavilion Gaming 17-cd2146ng | |
| Cinebench R15 / CPU Single 64Bit | |
| MSI Raider GE78 HX 13VI | |
| Asus ROG Strix G17 G713PI | |
| Eurocom Raptor X17 | |
| Asus TUF Gaming A17 FA707XI-NS94 | |
| MSI Stealth 17 Studio A13VH-014 | |
| Average AMD Ryzen 9 7940HS (258 - 288, n=12) | |
| Razer Blade 17 (i7-12800H, RTX 3070 Ti) | |
| MSI Katana 17 B13VFK | |
| Asus TUF Gaming F17 FX707Z-HX011W | |
| Acer Nitro 17 AN17-41-R9LN | |
| MSI Pulse 17 B13VGK | |
| Asus ROG Strix G17 G713QE-RB74 | |
| HP Pavilion Gaming 17-cd2146ng | |
| Geekbench 5.5 / Multi-Core | |
| MSI Raider GE78 HX 13VI | |
| Eurocom Raptor X17 | |
| Asus ROG Strix G17 G713PI | |
| MSI Stealth 17 Studio A13VH-014 | |
| MSI Pulse 17 B13VGK | |
| Asus TUF Gaming F17 FX707Z-HX011W | |
| Razer Blade 17 (i7-12800H, RTX 3070 Ti) | |
| Average AMD Ryzen 9 7940HS (10089 - 12500, n=13) | |
| Asus TUF Gaming A17 FA707XI-NS94 | |
| MSI Katana 17 B13VFK | |
| Acer Nitro 17 AN17-41-R9LN | |
| HP Pavilion Gaming 17-cd2146ng | |
| Geekbench 5.5 / Single-Core | |
| Asus ROG Strix G17 G713PI | |
| MSI Stealth 17 Studio A13VH-014 | |
| Asus TUF Gaming A17 FA707XI-NS94 | |
| MSI Raider GE78 HX 13VI | |
| Average AMD Ryzen 9 7940HS (1823 - 2032, n=13) | |
| Eurocom Raptor X17 | |
| MSI Katana 17 B13VFK | |
| Razer Blade 17 (i7-12800H, RTX 3070 Ti) | |
| Asus TUF Gaming F17 FX707Z-HX011W | |
| MSI Pulse 17 B13VGK | |
| Acer Nitro 17 AN17-41-R9LN | |
| HP Pavilion Gaming 17-cd2146ng | |
| HWBOT x265 Benchmark v2.2 / 4k Preset | |
| Asus ROG Strix G17 G713PI | |
| MSI Raider GE78 HX 13VI | |
| Eurocom Raptor X17 | |
| MSI Stealth 17 Studio A13VH-014 | |
| Asus TUF Gaming A17 FA707XI-NS94 | |
| MSI Pulse 17 B13VGK | |
| Average AMD Ryzen 9 7940HS (18.5 - 22.6, n=11) | |
| MSI Katana 17 B13VFK | |
| Acer Nitro 17 AN17-41-R9LN | |
| Razer Blade 17 (i7-12800H, RTX 3070 Ti) | |
| Asus ROG Strix G17 G713QE-RB74 | |
| Asus TUF Gaming F17 FX707Z-HX011W | |
| HP Pavilion Gaming 17-cd2146ng | |
| LibreOffice / 20 Documents To PDF | |
| Asus TUF Gaming F17 FX707Z-HX011W | |
| Acer Nitro 17 AN17-41-R9LN | |
| MSI Pulse 17 B13VGK | |
| HP Pavilion Gaming 17-cd2146ng | |
| MSI Katana 17 B13VFK | |
| Asus ROG Strix G17 G713QE-RB74 | |
| MSI Stealth 17 Studio A13VH-014 | |
| Asus TUF Gaming A17 FA707XI-NS94 | |
| Average AMD Ryzen 9 7940HS (36.9 - 54.8, n=12) | |
| Asus ROG Strix G17 G713PI | |
| MSI Raider GE78 HX 13VI | |
| Razer Blade 17 (i7-12800H, RTX 3070 Ti) | |
| Eurocom Raptor X17 | |
| R Benchmark 2.5 / Overall mean | |
| HP Pavilion Gaming 17-cd2146ng | |
| Asus ROG Strix G17 G713QE-RB74 | |
| Acer Nitro 17 AN17-41-R9LN | |
| MSI Pulse 17 B13VGK | |
| Asus TUF Gaming F17 FX707Z-HX011W | |
| Razer Blade 17 (i7-12800H, RTX 3070 Ti) | |
| MSI Katana 17 B13VFK | |
| Average AMD Ryzen 9 7940HS (0.4159 - 0.4467, n=12) | |
| MSI Stealth 17 Studio A13VH-014 | |
| Asus TUF Gaming A17 FA707XI-NS94 | |
| Asus ROG Strix G17 G713PI | |
| Eurocom Raptor X17 | |
| MSI Raider GE78 HX 13VI | |
Cinebench R23: Multi Core | Single Core
Cinebench R20: CPU (Multi Core) | CPU (Single Core)
Cinebench R15: CPU Multi 64Bit | CPU Single 64Bit
Blender: v2.79 BMW27 CPU
7-Zip 18.03: 7z b 4 | 7z b 4 -mmt1
Geekbench 5.5: Multi-Core | Single-Core
HWBOT x265 Benchmark v2.2: 4k Preset
LibreOffice : 20 Documents To PDF
R Benchmark 2.5: Overall mean
* ... smaller is better
AIDA64: FP32 Ray-Trace | FPU Julia | CPU SHA3 | CPU Queen | FPU SinJulia | FPU Mandel | CPU AES | CPU ZLib | FP64 Ray-Trace | CPU PhotoWorxx
| Performance rating | |
| Asus TUF Gaming A17 FA707XI-NS94 | |
| Average AMD Ryzen 9 7940HS | |
| MSI Pulse 17 B13VGK | |
| MSI Katana 17 B13VFK | |
| Razer Blade 17 (i7-12800H, RTX 3070 Ti) | |
| Asus TUF Gaming F17 FX707Z-HX011W | |
| HP Pavilion Gaming 17-cd2146ng | |
| AIDA64 / FP32 Ray-Trace | |
| Asus TUF Gaming A17 FA707XI-NS94 | |
| Average AMD Ryzen 9 7940HS (25226 - 29109, n=10) | |
| MSI Pulse 17 B13VGK | |
| MSI Katana 17 B13VFK | |
| Razer Blade 17 (i7-12800H, RTX 3070 Ti) | |
| HP Pavilion Gaming 17-cd2146ng | |
| Asus TUF Gaming F17 FX707Z-HX011W | |
| AIDA64 / FPU SinJulia | |
| Asus TUF Gaming A17 FA707XI-NS94 | |
| Average AMD Ryzen 9 7940HS (14663 - 15551, n=10) | |
| MSI Pulse 17 B13VGK | |
| Razer Blade 17 (i7-12800H, RTX 3070 Ti) | |
| MSI Katana 17 B13VFK | |
| Asus TUF Gaming F17 FX707Z-HX011W | |
| HP Pavilion Gaming 17-cd2146ng | |
| AIDA64 / FPU Mandel | |
| Asus TUF Gaming A17 FA707XI-NS94 | |
| Average AMD Ryzen 9 7940HS (56839 - 66238, n=10) | |
| MSI Pulse 17 B13VGK | |
| MSI Katana 17 B13VFK | |
| Razer Blade 17 (i7-12800H, RTX 3070 Ti) | |
| Asus TUF Gaming F17 FX707Z-HX011W | |
| HP Pavilion Gaming 17-cd2146ng | |
| AIDA64 / FP64 Ray-Trace | |
| Asus TUF Gaming A17 FA707XI-NS94 | |
| Average AMD Ryzen 9 7940HS (13175 - 15675, n=10) | |
| MSI Pulse 17 B13VGK | |
| MSI Katana 17 B13VFK | |
| Razer Blade 17 (i7-12800H, RTX 3070 Ti) | |
| Asus TUF Gaming F17 FX707Z-HX011W | |
| HP Pavilion Gaming 17-cd2146ng | |
| AIDA64 / CPU PhotoWorxx | |
| MSI Pulse 17 B13VGK | |
| Average AMD Ryzen 9 7940HS (22477 - 41567, n=10) | |
| MSI Katana 17 B13VFK | |
| Asus TUF Gaming A17 FA707XI-NS94 | |
| Asus TUF Gaming F17 FX707Z-HX011W | |
| Razer Blade 17 (i7-12800H, RTX 3070 Ti) | |
| HP Pavilion Gaming 17-cd2146ng | |
System Performance
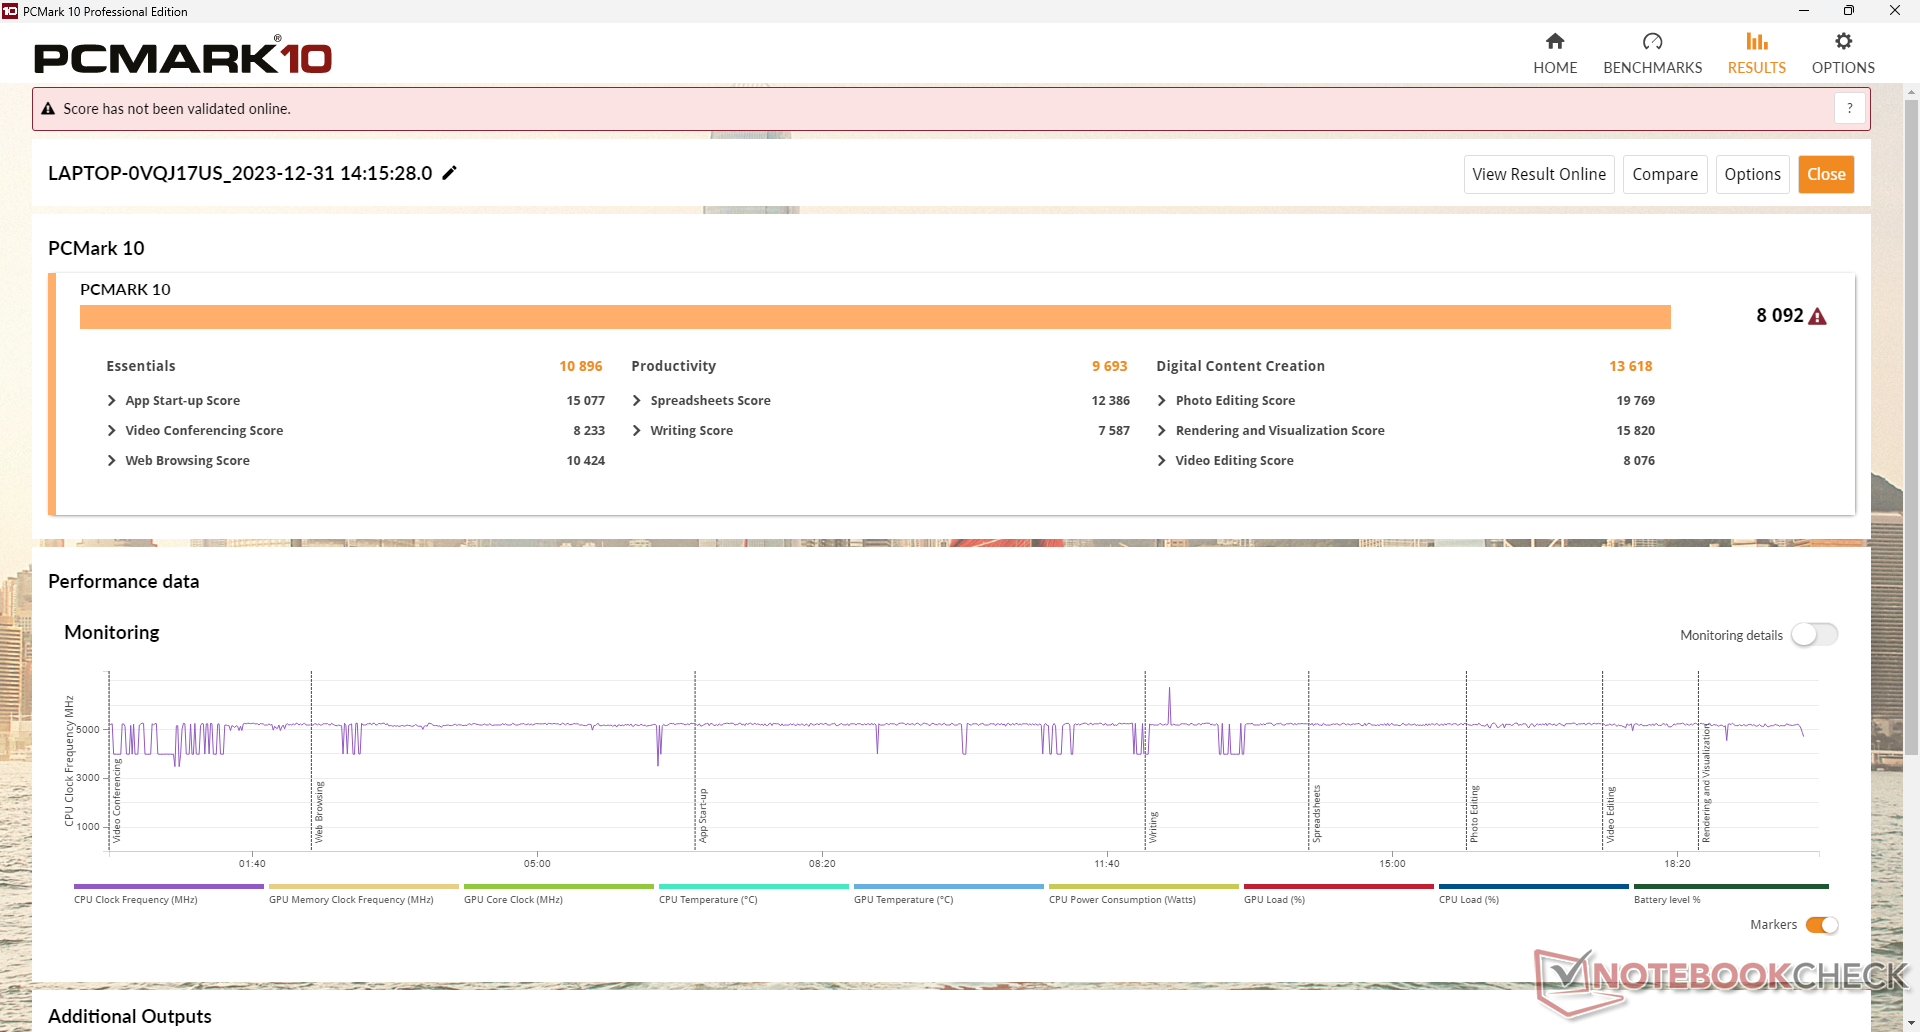
PCMark scores are some of the highest of any 13th gen Core i7-powered gaming laptop due to the fast Zen 4 Ryzen 7 CPU and GeForce RTX 4070 GPU. We didn't experience any crashes during testing, but the display would sometimes have wake-from-sleep issues possibly due to the automatic GPU switching.
CrossMark: Overall | Productivity | Creativity | Responsiveness
WebXPRT 3: Overall
WebXPRT 4: Overall
Mozilla Kraken 1.1: Total
| PCMark 10 / Score | |
| Average AMD Ryzen 9 7940HS, NVIDIA GeForce RTX 4070 Laptop GPU (8092 - 8205, n=2) | |
| Asus TUF Gaming A17 FA707XI-NS94 | |
| MSI Pulse 17 B13VGK | |
| Razer Blade 17 (i7-12800H, RTX 3070 Ti) | |
| MSI Katana 17 B13VFK | |
| Asus TUF Gaming F17 FX707Z-HX011W | |
| HP Pavilion Gaming 17-cd2146ng | |
| PCMark 10 / Essentials | |
| Average AMD Ryzen 9 7940HS, NVIDIA GeForce RTX 4070 Laptop GPU (10896 - 10952, n=2) | |
| Asus TUF Gaming A17 FA707XI-NS94 | |
| MSI Katana 17 B13VFK | |
| MSI Pulse 17 B13VGK | |
| Razer Blade 17 (i7-12800H, RTX 3070 Ti) | |
| Asus TUF Gaming F17 FX707Z-HX011W | |
| HP Pavilion Gaming 17-cd2146ng | |
| PCMark 10 / Productivity | |
| MSI Pulse 17 B13VGK | |
| Average AMD Ryzen 9 7940HS, NVIDIA GeForce RTX 4070 Laptop GPU (9693 - 10805, n=2) | |
| Asus TUF Gaming A17 FA707XI-NS94 | |
| MSI Katana 17 B13VFK | |
| Razer Blade 17 (i7-12800H, RTX 3070 Ti) | |
| HP Pavilion Gaming 17-cd2146ng | |
| Asus TUF Gaming F17 FX707Z-HX011W | |
| PCMark 10 / Digital Content Creation | |
| Asus TUF Gaming A17 FA707XI-NS94 | |
| Average AMD Ryzen 9 7940HS, NVIDIA GeForce RTX 4070 Laptop GPU (12666 - 13618, n=2) | |
| MSI Pulse 17 B13VGK | |
| Razer Blade 17 (i7-12800H, RTX 3070 Ti) | |
| Asus TUF Gaming F17 FX707Z-HX011W | |
| MSI Katana 17 B13VFK | |
| HP Pavilion Gaming 17-cd2146ng | |
| CrossMark / Overall | |
| MSI Pulse 17 B13VGK | |
| MSI Katana 17 B13VFK | |
| Average AMD Ryzen 9 7940HS, NVIDIA GeForce RTX 4070 Laptop GPU (1797 - 1812, n=2) | |
| Asus TUF Gaming A17 FA707XI-NS94 | |
| Razer Blade 17 (i7-12800H, RTX 3070 Ti) | |
| Asus TUF Gaming F17 FX707Z-HX011W | |
| CrossMark / Productivity | |
| MSI Pulse 17 B13VGK | |
| MSI Katana 17 B13VFK | |
| Average AMD Ryzen 9 7940HS, NVIDIA GeForce RTX 4070 Laptop GPU (1740 - 1762, n=2) | |
| Asus TUF Gaming A17 FA707XI-NS94 | |
| Razer Blade 17 (i7-12800H, RTX 3070 Ti) | |
| Asus TUF Gaming F17 FX707Z-HX011W | |
| CrossMark / Creativity | |
| MSI Pulse 17 B13VGK | |
| MSI Katana 17 B13VFK | |
| Asus TUF Gaming A17 FA707XI-NS94 | |
| Average AMD Ryzen 9 7940HS, NVIDIA GeForce RTX 4070 Laptop GPU (1952 - 1979, n=2) | |
| Asus TUF Gaming F17 FX707Z-HX011W | |
| Razer Blade 17 (i7-12800H, RTX 3070 Ti) | |
| CrossMark / Responsiveness | |
| MSI Pulse 17 B13VGK | |
| MSI Katana 17 B13VFK | |
| Razer Blade 17 (i7-12800H, RTX 3070 Ti) | |
| Average AMD Ryzen 9 7940HS, NVIDIA GeForce RTX 4070 Laptop GPU (1478 - 1575, n=2) | |
| Asus TUF Gaming A17 FA707XI-NS94 | |
| Asus TUF Gaming F17 FX707Z-HX011W | |
| WebXPRT 3 / Overall | |
| Asus TUF Gaming A17 FA707XI-NS94 | |
| Average AMD Ryzen 9 7940HS, NVIDIA GeForce RTX 4070 Laptop GPU (317 - 319, n=2) | |
| MSI Katana 17 B13VFK | |
| MSI Pulse 17 B13VGK | |
| HP Pavilion Gaming 17-cd2146ng | |
| WebXPRT 4 / Overall | |
| Asus TUF Gaming A17 FA707XI-NS94 | |
| MSI Katana 17 B13VFK | |
| Average AMD Ryzen 9 7940HS, NVIDIA GeForce RTX 4070 Laptop GPU (260 - 271, n=2) | |
| MSI Pulse 17 B13VGK | |
| Mozilla Kraken 1.1 / Total | |
| HP Pavilion Gaming 17-cd2146ng | |
| MSI Pulse 17 B13VGK | |
| MSI Katana 17 B13VFK | |
| Average AMD Ryzen 9 7940HS, NVIDIA GeForce RTX 4070 Laptop GPU (481 - 499, n=2) | |
| Asus TUF Gaming A17 FA707XI-NS94 | |
* ... smaller is better
| PCMark 10 Score | 8092 points | |
Help | ||
| AIDA64 / Memory Copy | |
| Average AMD Ryzen 9 7940HS (35327 - 78739, n=10) | |
| MSI Pulse 17 B13VGK | |
| Asus TUF Gaming A17 FA707XI-NS94 | |
| MSI Katana 17 B13VFK | |
| Asus TUF Gaming F17 FX707Z-HX011W | |
| Razer Blade 17 (i7-12800H, RTX 3070 Ti) | |
| HP Pavilion Gaming 17-cd2146ng | |
| AIDA64 / Memory Read | |
| MSI Pulse 17 B13VGK | |
| Asus TUF Gaming F17 FX707Z-HX011W | |
| MSI Katana 17 B13VFK | |
| Asus TUF Gaming A17 FA707XI-NS94 | |
| Average AMD Ryzen 9 7940HS (30769 - 61836, n=10) | |
| Razer Blade 17 (i7-12800H, RTX 3070 Ti) | |
| HP Pavilion Gaming 17-cd2146ng | |
| AIDA64 / Memory Write | |
| Average AMD Ryzen 9 7940HS (42217 - 91567, n=10) | |
| Asus TUF Gaming A17 FA707XI-NS94 | |
| MSI Pulse 17 B13VGK | |
| Asus TUF Gaming F17 FX707Z-HX011W | |
| Razer Blade 17 (i7-12800H, RTX 3070 Ti) | |
| MSI Katana 17 B13VFK | |
| HP Pavilion Gaming 17-cd2146ng | |
| AIDA64 / Memory Latency | |
| MSI Katana 17 B13VFK | |
| MSI Pulse 17 B13VGK | |
| Average AMD Ryzen 9 7940HS (87.6 - 111.1, n=10) | |
| Asus TUF Gaming A17 FA707XI-NS94 | |
| HP Pavilion Gaming 17-cd2146ng | |
| Asus TUF Gaming F17 FX707Z-HX011W | |
| Razer Blade 17 (i7-12800H, RTX 3070 Ti) | |
* ... smaller is better
DPC Latency
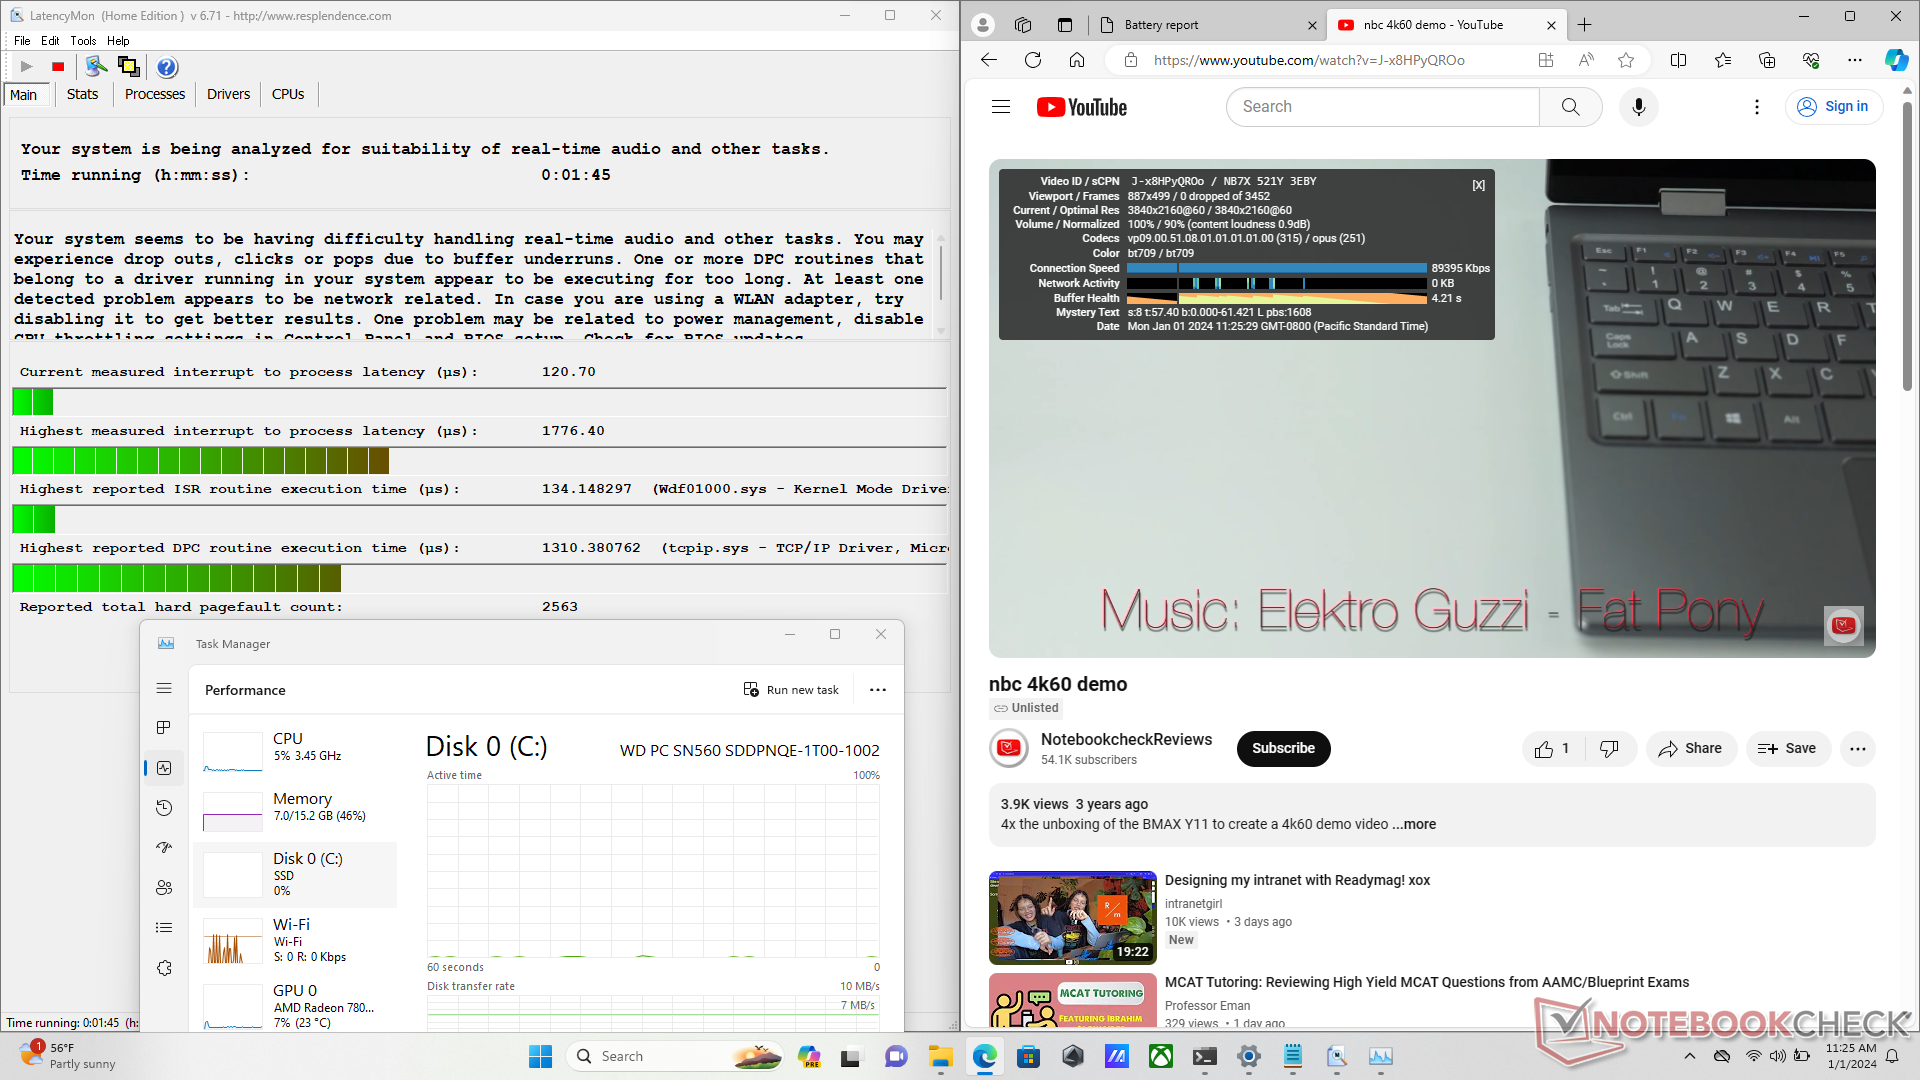
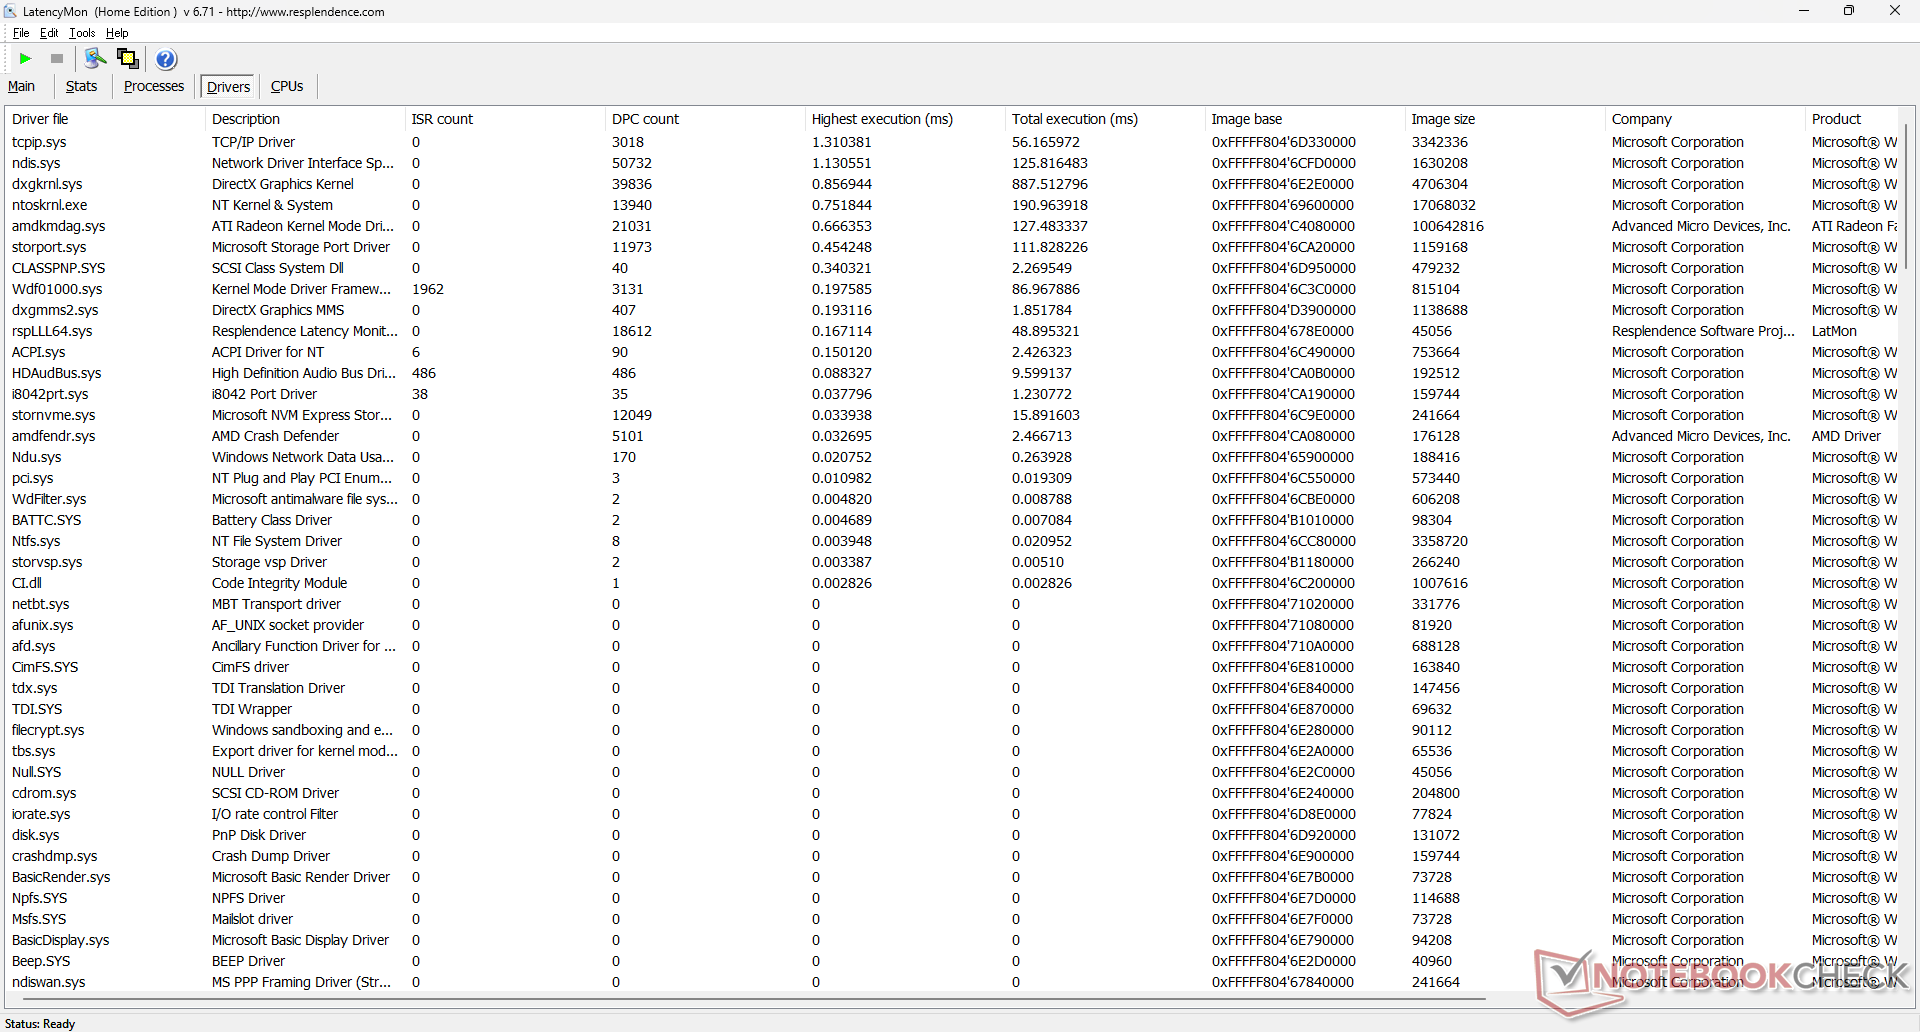
LatencyMon reveals DPC issues when opening multiple browser tabs of our homepage. 4K video playback at 60 FPS is otherwise perfect with no dropped frames recorded.
| DPC Latencies / LatencyMon - interrupt to process latency (max), Web, Youtube, Prime95 | |
| MSI Katana 17 B13VFK | |
| Asus TUF Gaming F17 FX707Z-HX011W | |
| Asus TUF Gaming A17 FA707XI-NS94 | |
| HP Pavilion Gaming 17-cd2146ng | |
| MSI Pulse 17 B13VGK | |
| Razer Blade 17 (i7-12800H, RTX 3070 Ti) | |
* ... smaller is better
Storage Devices
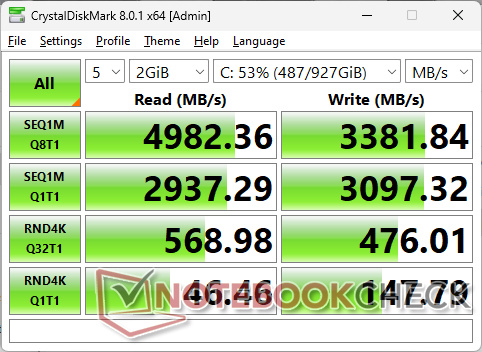
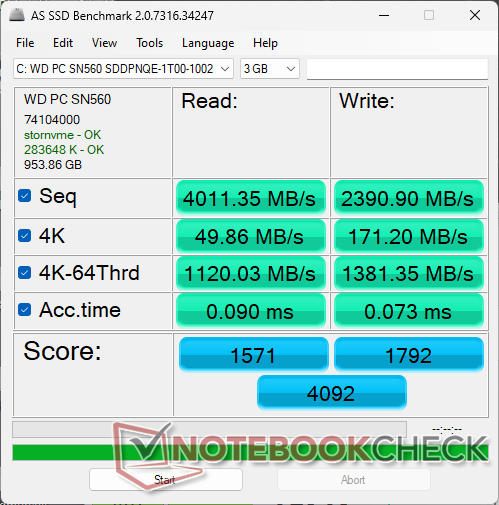
Our test unit ships with the WD SN560 which is a midrange PCIe4 x4 NVMe SSD in contrast to the higher-end WDC SN850X series. Transfer rates top out at around 5000 MB/s instead of 7000+ MB/s on the aforementioned SN850X. For a midrange gaming laptop, however, the WD SN560 is more than sufficient. We can record no performance throttling issues on our drive as shown by our DiskSpd stress test results below.


* ... smaller is better
Disk Throttling: DiskSpd Read Loop, Queue Depth 8
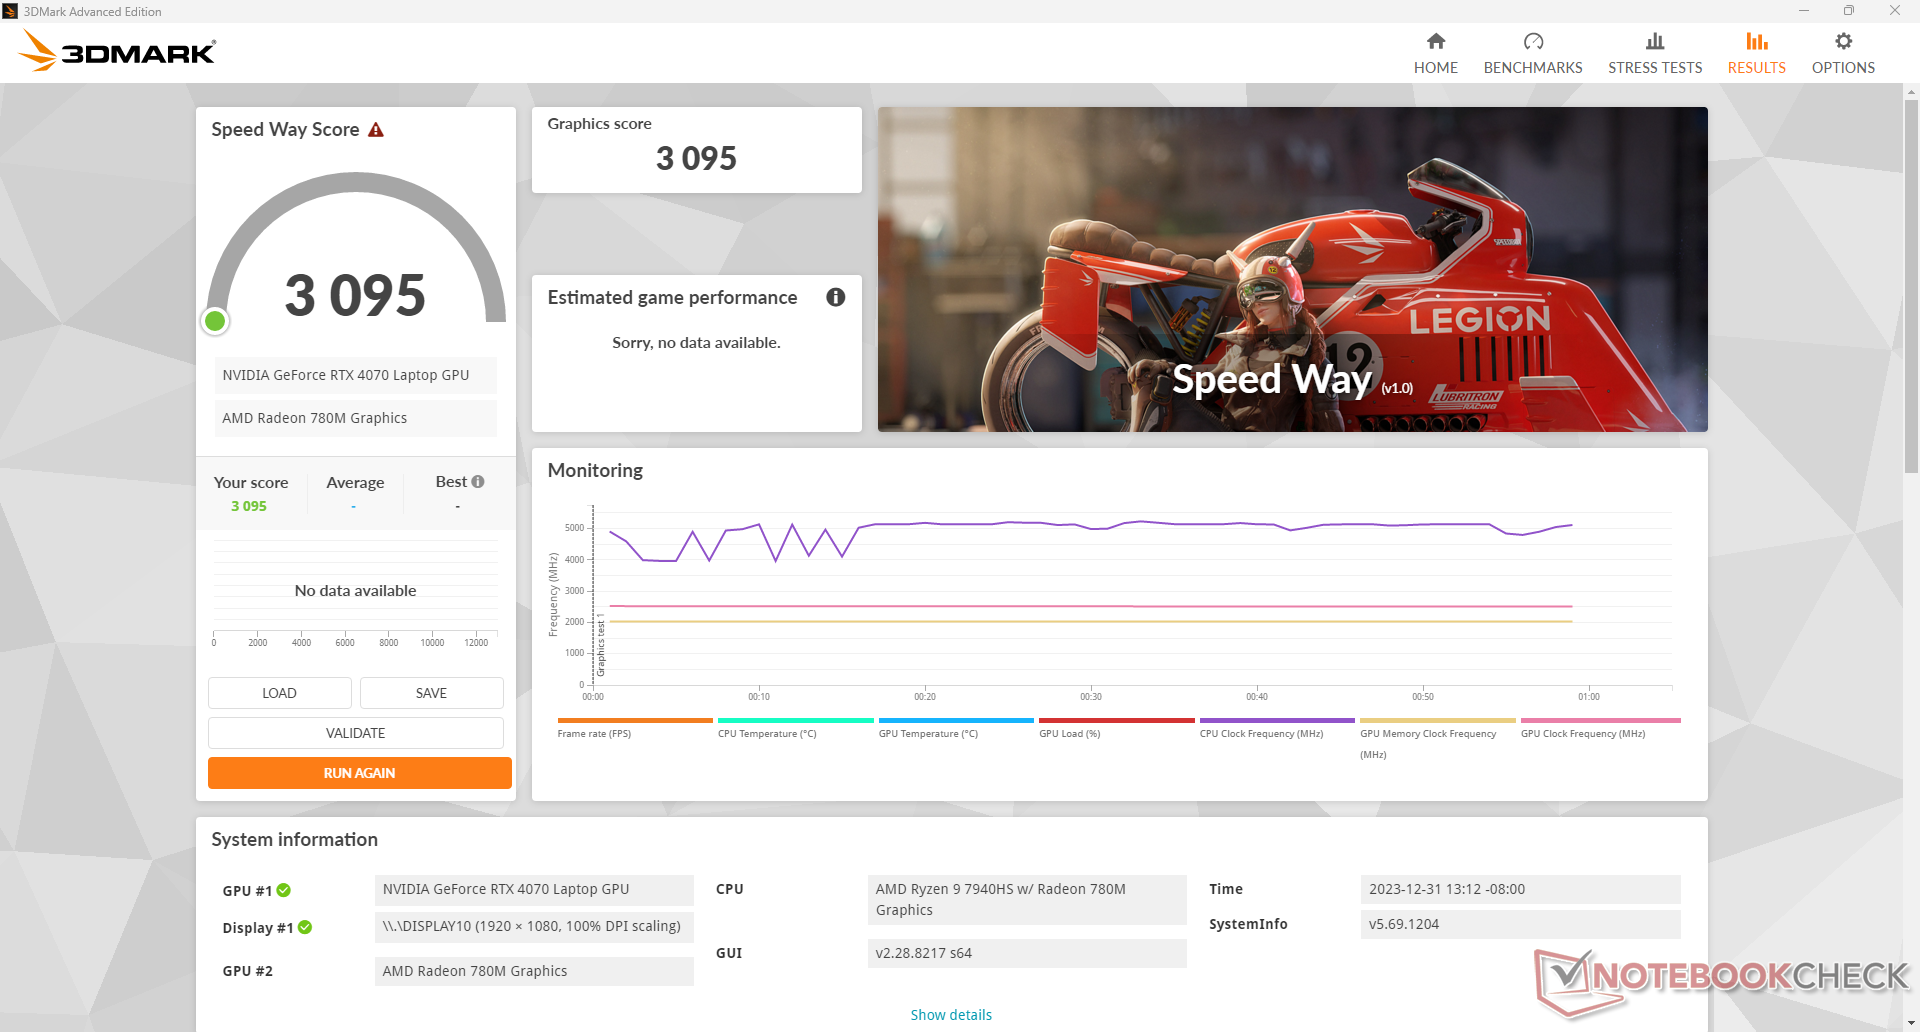
GPU Performance
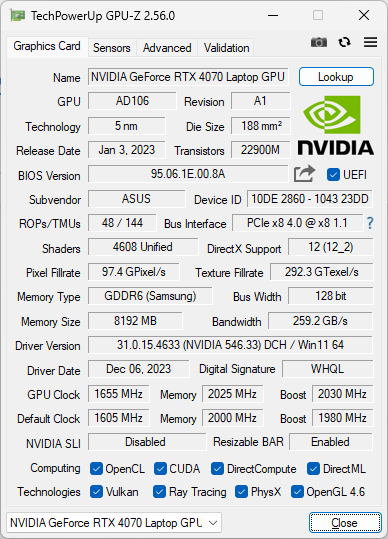
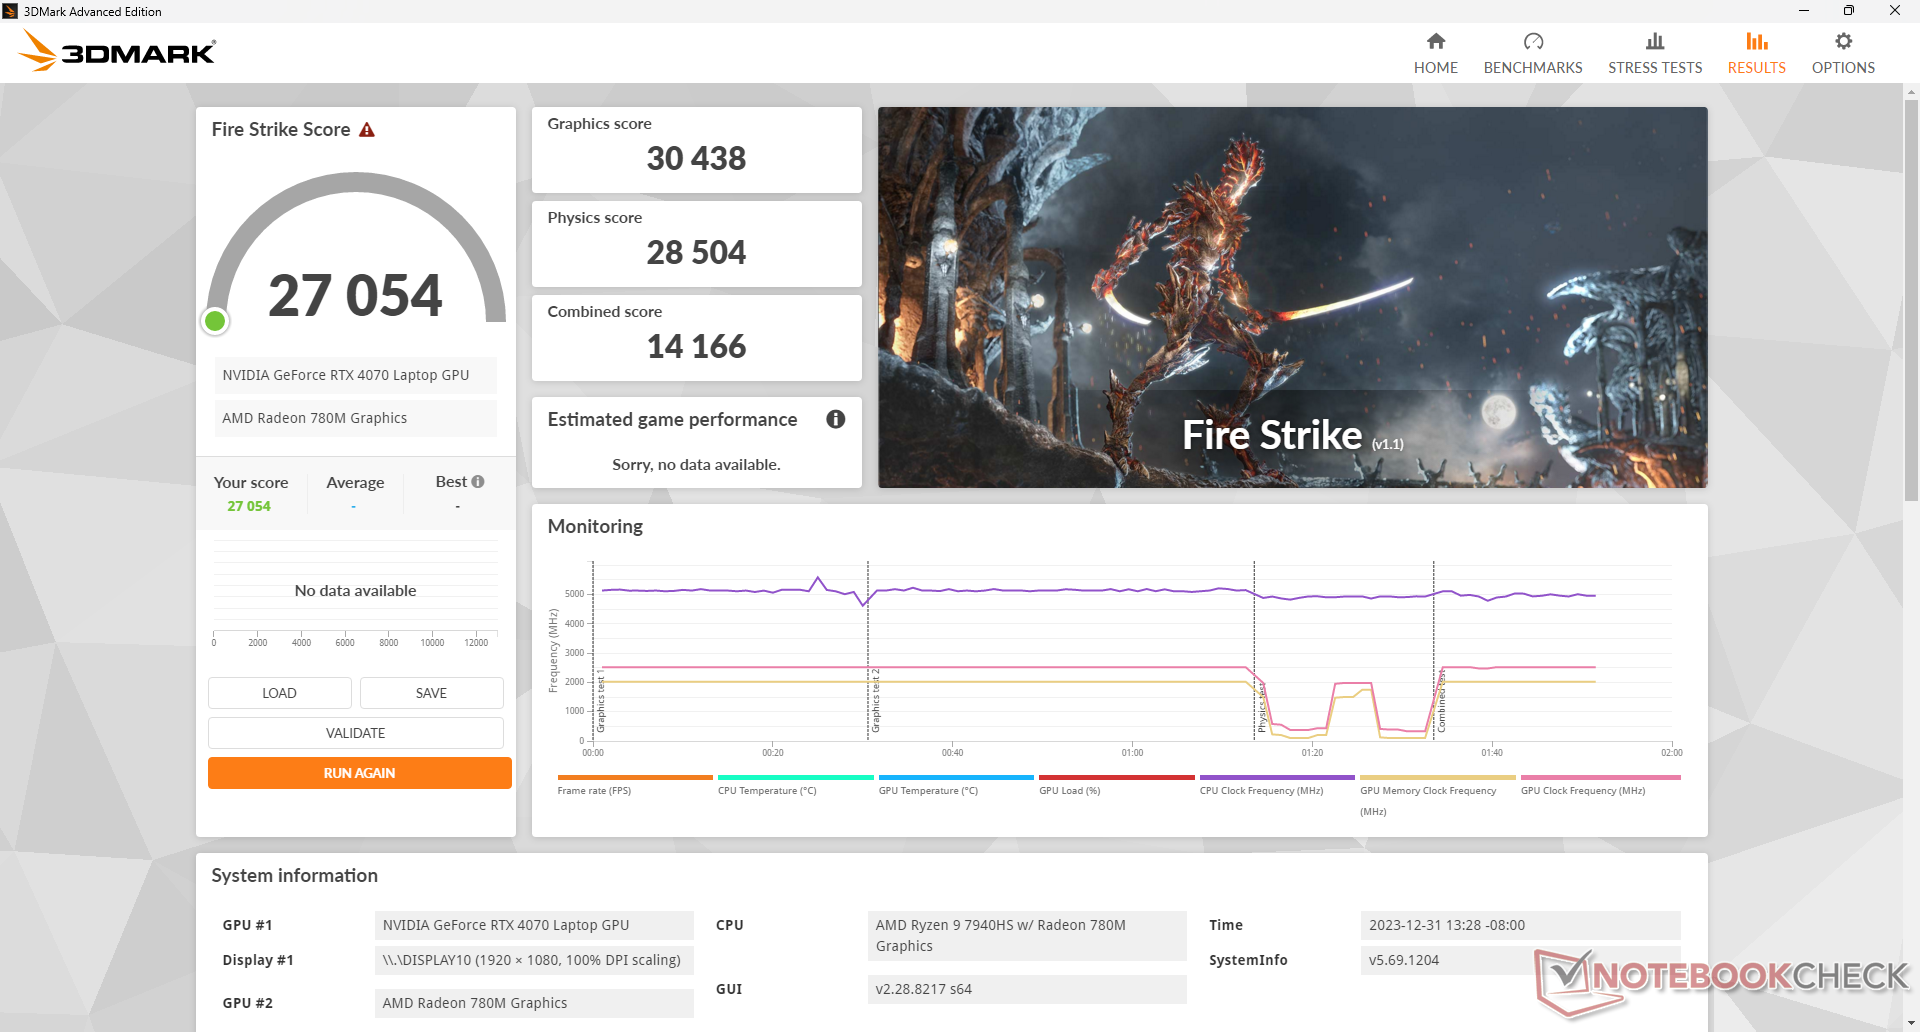
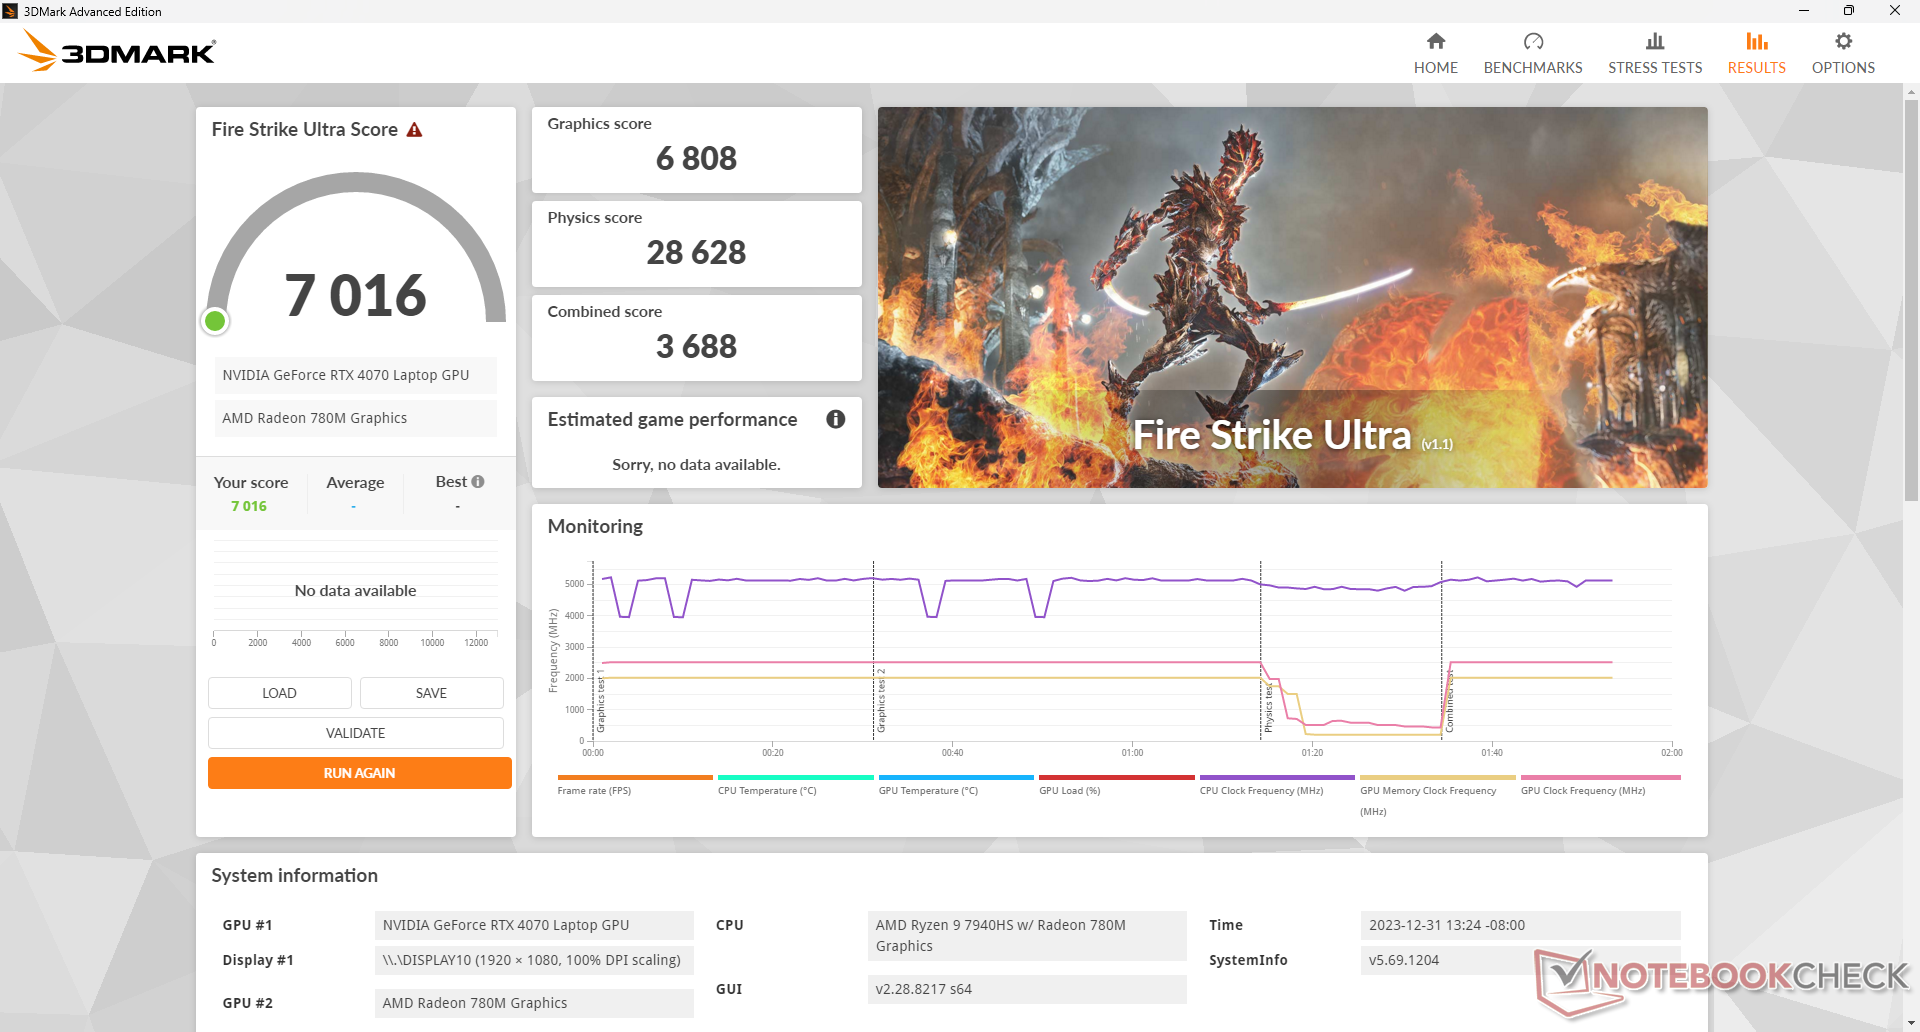
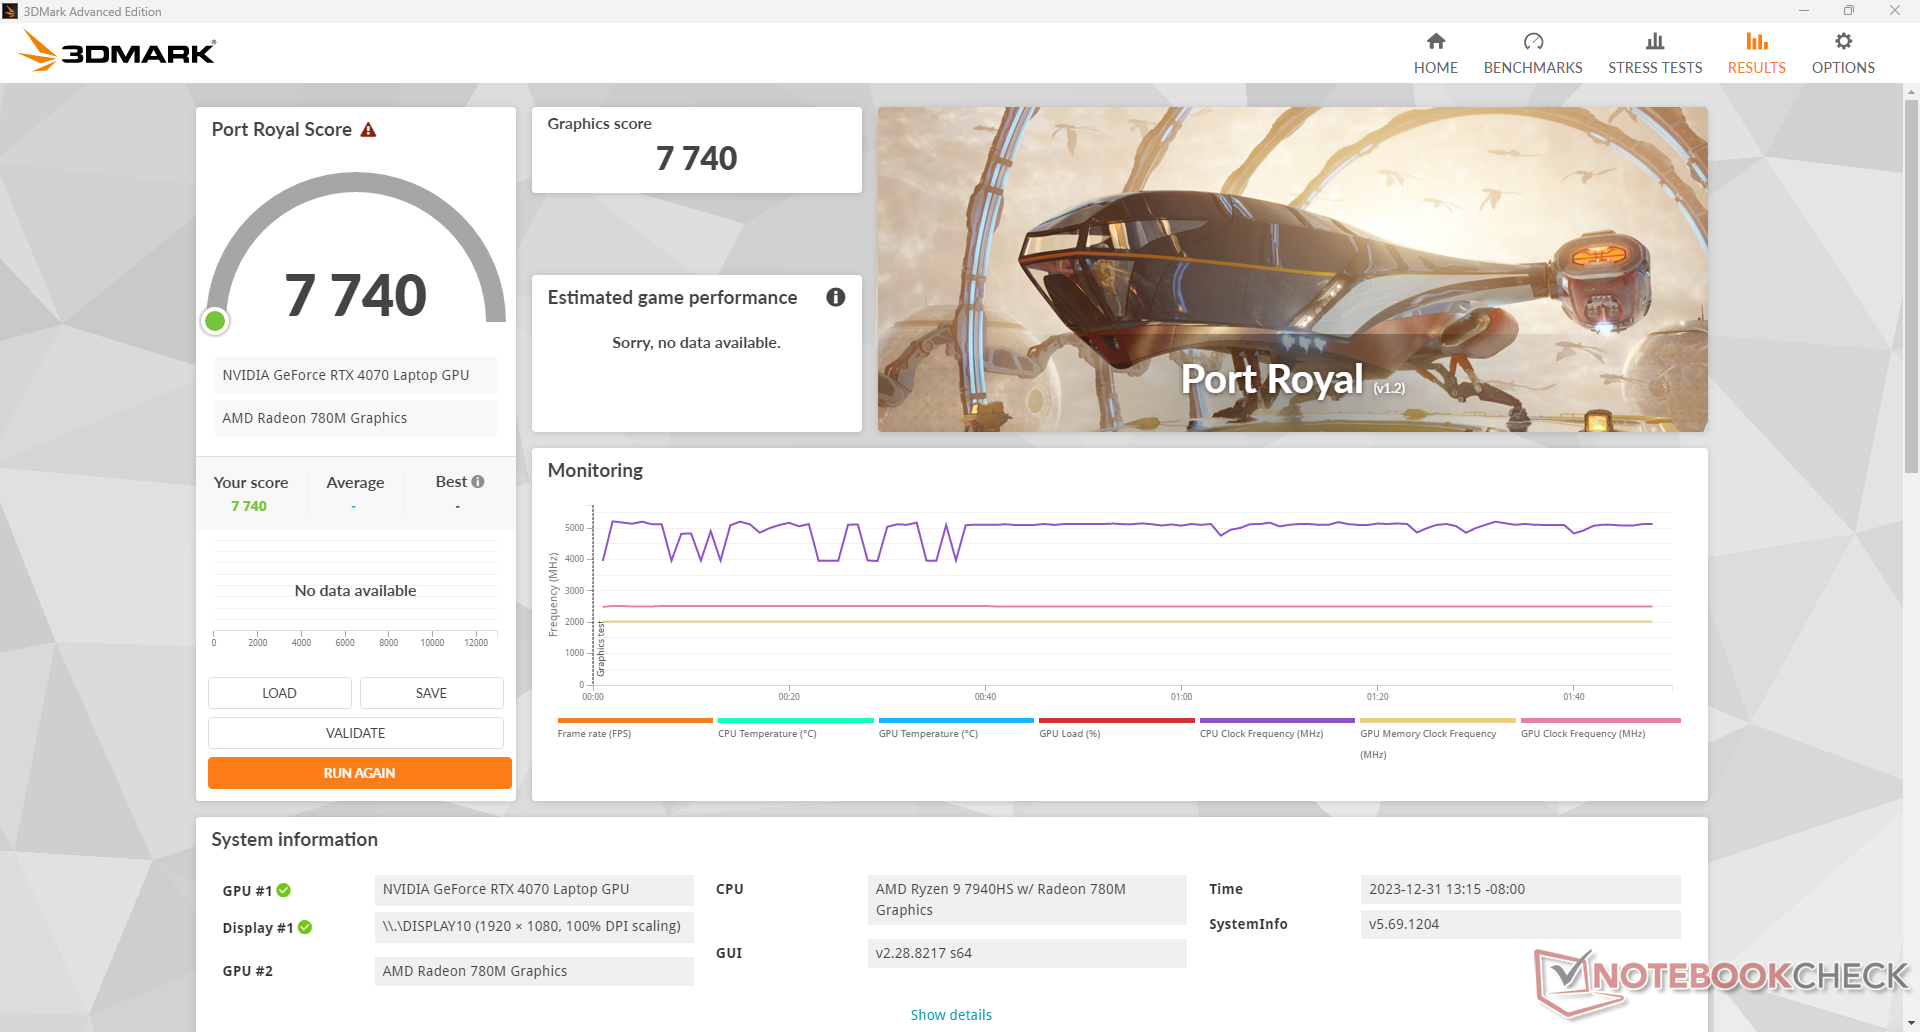
Overall graphics performance is roughly 25 to 30 percent slower than the desktop version of the GeForce RTX 4070. Users upgrading from an older RTX 3060 laptop will still see notable boosts in performance of up to 50 percent before accounting for any DLSS-enabled features. The relatively high 140 W TGP target allows our TUF Gaming A17 to outperform the average laptop in our database with the same RTX 4070 GPU by about 5 to 15 percent.
Downgrading to the RTX 4060 or RTX 4050 configuration will impact performance by about 20 percent and 35 percent, respectively. The performance delta is more or less a straight line when jumping between the RTX 4050, RTX 4060, and RTX 4070 options. The faster RTX 4080 or 4090 are only available on Asus' higher-end ROG models.
| Power Profile | Graphics Score | Physics Score | Combined Score |
| Turbo Mode | 30438 | 28504 | 14166 |
| Performance Mode | 29222 (-4%) | 28345 (-1%) | 13129 (-7%) |
| Balanced Mode | 29472 (-3%) | 27605 (-3%) | 12947 (-9%) |
| Battery Power | 23884 (-22%) | 26213 (-8%) | 11027 (-22%) |
Running on the slower Performance or Balanced power profiles impacts system performance just slightly as shown by our Fire Strike results table above. The most significant impact comes from running on battery power as to be expected.
| 3DMark Performance rating - Percent | |
| MSI Raider GE78 HX 13VI -1! | |
| Alienware m18 R1 AMD -1! | |
| Alienware m16 R1 AMD | |
| KFA2 GeForce RTX 4070 EX Gamer | |
| Asus TUF Gaming A17 FA707XI-NS94 | |
| Lenovo Legion 7 16ARHA7 -1! | |
| Average NVIDIA GeForce RTX 4070 Laptop GPU | |
| Razer Blade 17 (i7-12800H, RTX 3070 Ti) -1! | |
| MSI Katana 17 B13VFK -1! | |
| Asus TUF Gaming F17 FX707Z-HX011W -1! | |
| Medion Erazer Scout E20 | |
| Asus ROG Strix G17 G713QE-RB74 -1! | |
| Lenovo ThinkPad Z16 Gen 2 -1! | |
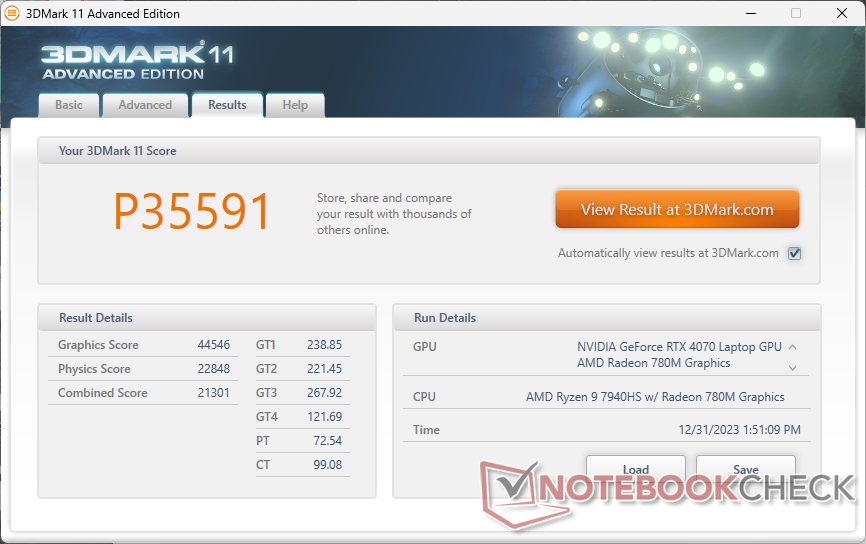
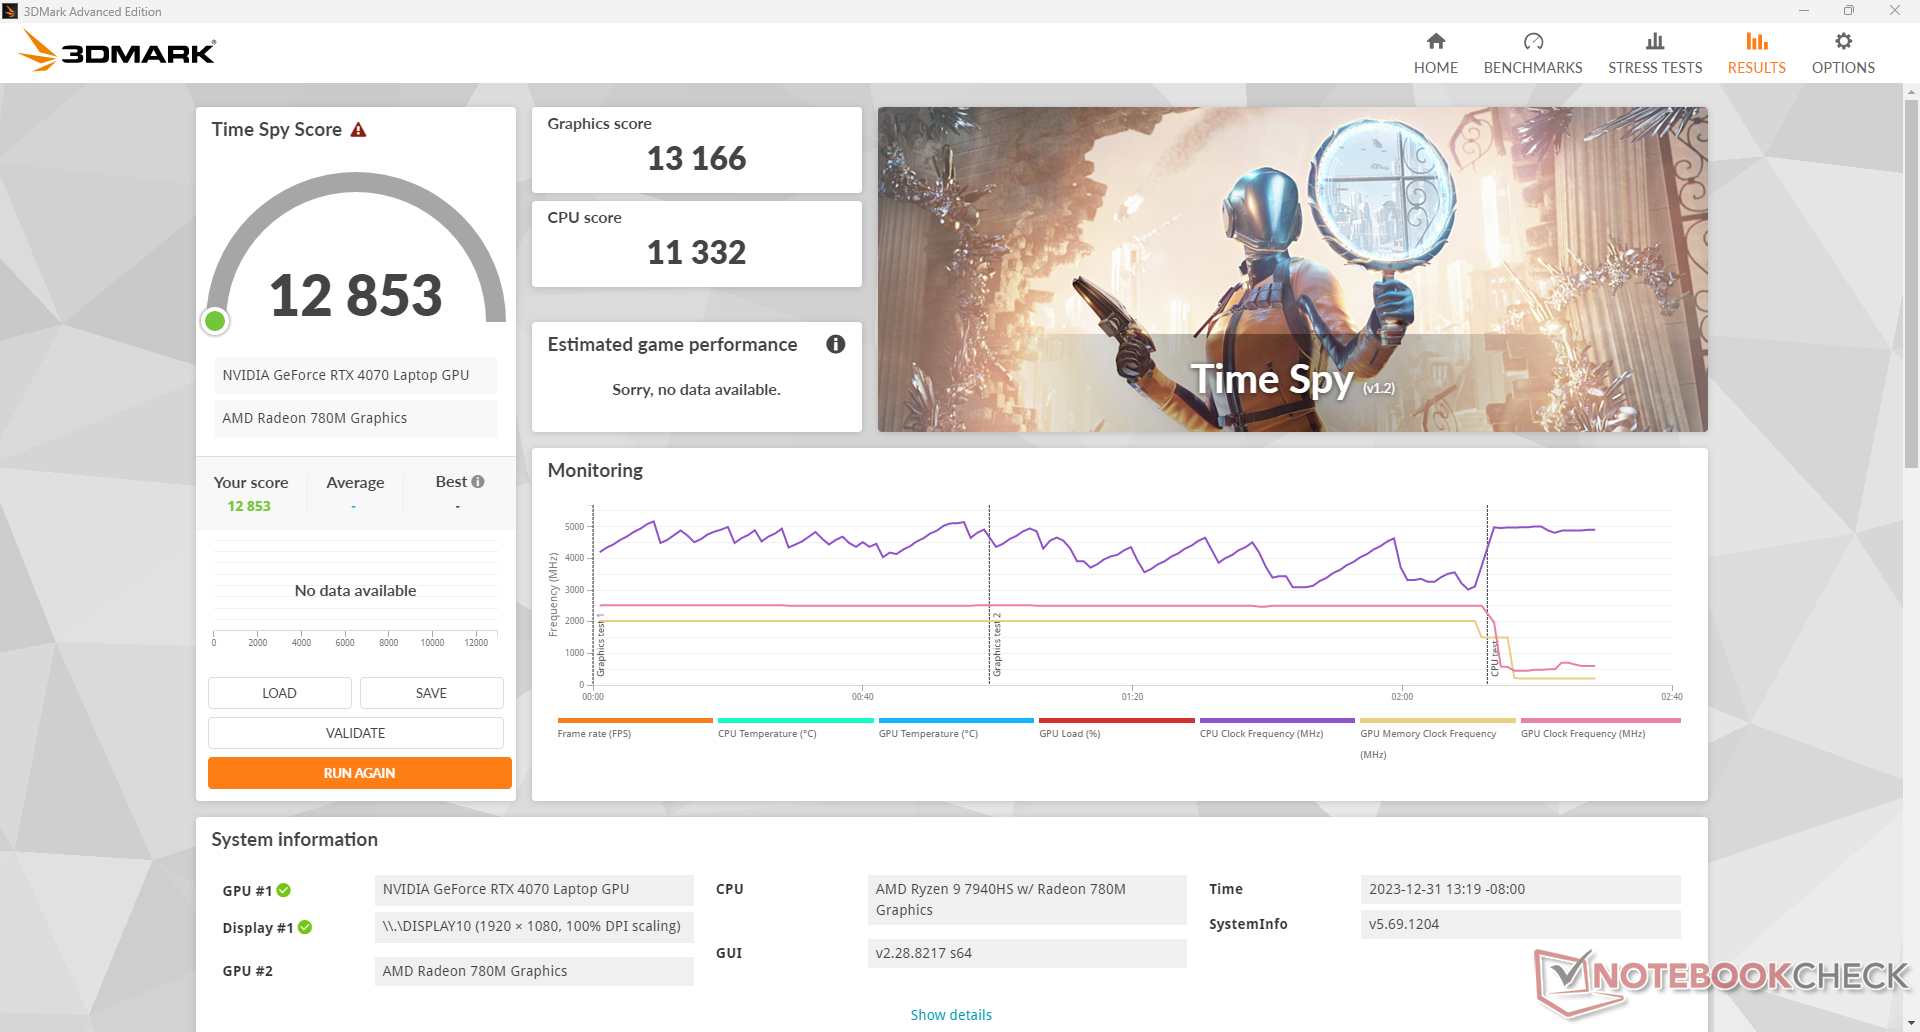
| 3DMark 11 Performance | 35591 points | |
| 3DMark Fire Strike Score | 27054 points | |
| 3DMark Time Spy Score | 12853 points | |
Help | ||
* ... smaller is better
| Performance rating - Percent | |
| MSI Raider GE78 HX 13VI | |
| Alienware m16 R1 AMD -1! | |
| Alienware m18 R1 AMD | |
| MSI Katana 17 B13VFK | |
| Razer Blade 17 (i7-12800H, RTX 3070 Ti) | |
| Asus TUF Gaming A17 FA707XI-NS94 -1! | |
| Asus TUF Gaming F17 FX707Z-HX011W | |
| Lenovo Legion 7 16ARHA7 | |
| Asus ROG Strix G17 G713QE-RB74 | |
| Lenovo ThinkPad Z16 Gen 2 -1! | |
| The Witcher 3 - 1920x1080 Ultra Graphics & Postprocessing (HBAO+) | |
| MSI Raider GE78 HX 13VI | |
| Alienware m16 R1 AMD | |
| Alienware m18 R1 AMD | |
| Asus TUF Gaming A17 FA707XI-NS94 | |
| Lenovo Legion 7 16ARHA7 | |
| Razer Blade 17 (i7-12800H, RTX 3070 Ti) | |
| MSI Katana 17 B13VFK | |
| Asus TUF Gaming F17 FX707Z-HX011W | |
| Asus ROG Strix G17 G713QE-RB74 | |
| Lenovo ThinkPad Z16 Gen 2 | |
| GTA V - 1920x1080 Highest AA:4xMSAA + FX AF:16x | |
| MSI Raider GE78 HX 13VI | |
| MSI Katana 17 B13VFK | |
| Alienware m18 R1 AMD | |
| Razer Blade 17 (i7-12800H, RTX 3070 Ti) | |
| Asus TUF Gaming F17 FX707Z-HX011W | |
| Lenovo Legion 7 16ARHA7 | |
| Asus ROG Strix G17 G713QE-RB74 | |
| Final Fantasy XV Benchmark - 1920x1080 High Quality | |
| MSI Raider GE78 HX 13VI | |
| Alienware m16 R1 AMD | |
| Alienware m18 R1 AMD | |
| Asus TUF Gaming A17 FA707XI-NS94 | |
| Lenovo Legion 7 16ARHA7 | |
| Razer Blade 17 (i7-12800H, RTX 3070 Ti) | |
| MSI Katana 17 B13VFK | |
| Asus TUF Gaming F17 FX707Z-HX011W | |
| Asus ROG Strix G17 G713QE-RB74 | |
| Lenovo ThinkPad Z16 Gen 2 | |
| Strange Brigade - 1920x1080 ultra AA:ultra AF:16 | |
| MSI Raider GE78 HX 13VI | |
| Alienware m16 R1 AMD | |
| Alienware m18 R1 AMD | |
| Lenovo Legion 7 16ARHA7 | |
| Asus TUF Gaming A17 FA707XI-NS94 | |
| Razer Blade 17 (i7-12800H, RTX 3070 Ti) | |
| MSI Katana 17 B13VFK | |
| Asus TUF Gaming F17 FX707Z-HX011W | |
| Asus ROG Strix G17 G713QE-RB74 | |
| Lenovo ThinkPad Z16 Gen 2 | |
| Dota 2 Reborn - 1920x1080 ultra (3/3) best looking | |
| MSI Raider GE78 HX 13VI | |
| Alienware m16 R1 AMD | |
| MSI Katana 17 B13VFK | |
| Alienware m18 R1 AMD | |
| Razer Blade 17 (i7-12800H, RTX 3070 Ti) | |
| Asus TUF Gaming F17 FX707Z-HX011W | |
| Asus TUF Gaming A17 FA707XI-NS94 | |
| Asus ROG Strix G17 G713QE-RB74 | |
| Lenovo ThinkPad Z16 Gen 2 | |
| Lenovo Legion 7 16ARHA7 | |
| X-Plane 11.11 - 1920x1080 high (fps_test=3) | |
| MSI Raider GE78 HX 13VI | |
| MSI Katana 17 B13VFK | |
| Alienware m16 R1 AMD | |
| Razer Blade 17 (i7-12800H, RTX 3070 Ti) | |
| Asus TUF Gaming F17 FX707Z-HX011W | |
| Alienware m18 R1 AMD | |
| Asus TUF Gaming A17 FA707XI-NS94 | |
| Asus ROG Strix G17 G713QE-RB74 | |
| Lenovo Legion 7 16ARHA7 | |
| Lenovo ThinkPad Z16 Gen 2 | |
| Tiny Tina's Wonderlands | |
| 1920x1080 Badass Preset (DX12) | |
| Alienware m16 R1 AMD | |
| Alienware m18 R1 AMD | |
| Asus TUF Gaming A17 FA707XI-NS94 | |
| Average NVIDIA GeForce RTX 4070 Laptop GPU (58.6 - 115.9, n=18) | |
| MSI Katana 17 B13VFK | |
| Lenovo ThinkPad Z16 Gen 2 | |
| 2560x1440 Badass Preset (DX12) | |
| Alienware m16 R1 AMD | |
| Alienware m18 R1 AMD | |
| Asus TUF Gaming A17 FA707XI-NS94 | |
| Average NVIDIA GeForce RTX 4070 Laptop GPU (49.8 - 79.5, n=17) | |
| Lenovo ThinkPad Z16 Gen 2 | |
| 3840x2160 Badass Preset (DX12) | |
| Alienware m16 R1 AMD | |
| Alienware m18 R1 AMD | |
| Asus TUF Gaming A17 FA707XI-NS94 | |
| Average NVIDIA GeForce RTX 4070 Laptop GPU (28.3 - 39.7, n=13) | |
| Baldur's Gate 3 | |
| 1920x1080 Ultra Preset AA:T | |
| Alienware m18 R1 AMD | |
| Asus TUF Gaming A17 FA707XI-NS94 | |
| Average NVIDIA GeForce RTX 4070 Laptop GPU (66.7 - 128.5, n=30) | |
| Lenovo ThinkPad Z16 Gen 2 | |
| 2560x1440 Ultra Preset AA:T | |
| Alienware m18 R1 AMD | |
| Asus TUF Gaming A17 FA707XI-NS94 | |
| Average NVIDIA GeForce RTX 4070 Laptop GPU (54.4 - 89.6, n=25) | |
| Lenovo ThinkPad Z16 Gen 2 | |
| 3840x2160 Ultra Preset AA:T | |
| Alienware m18 R1 AMD | |
| Asus TUF Gaming A17 FA707XI-NS94 | |
| Average NVIDIA GeForce RTX 4070 Laptop GPU (33.4 - 45.2, n=12) | |
| Cyberpunk 2077 | |
| 1920x1080 High Preset (FSR off) | |
| Alienware m18 R1 AMD | |
| Asus TUF Gaming A17 FA707XI-NS94 | |
| Average NVIDIA GeForce RTX 4070 Laptop GPU (74.7 - 103.6, n=32) | |
| Lenovo ThinkPad Z16 Gen 2 | |
| 1920x1080 Ultra Preset (FSR off) | |
| Alienware m18 R1 AMD | |
| MSI Raider GE78 HX 13VI | |
| Asus TUF Gaming A17 FA707XI-NS94 | |
| Average NVIDIA GeForce RTX 4070 Laptop GPU (30.7 - 90.7, n=40) | |
| Lenovo ThinkPad Z16 Gen 2 | |
| 2560x1440 Ultra Preset (FSR off) | |
| MSI Raider GE78 HX 13VI | |
| Alienware m18 R1 AMD | |
| Asus TUF Gaming A17 FA707XI-NS94 | |
| Average NVIDIA GeForce RTX 4070 Laptop GPU (24.8 - 57.1, n=37) | |
| Lenovo ThinkPad Z16 Gen 2 | |
| 3840x2160 Ultra Preset (FSR off) | |
| MSI Raider GE78 HX 13VI | |
| Alienware m18 R1 AMD | |
| Asus TUF Gaming A17 FA707XI-NS94 | |
| Average NVIDIA GeForce RTX 4070 Laptop GPU (20.2 - 24, n=13) | |
| 1920x1080 Ray Tracing Ultra Preset (DLSS off) | |
| MSI Raider GE78 HX 13VI | |
| Asus TUF Gaming A17 FA707XI-NS94 | |
| Alienware m18 R1 AMD | |
| Average NVIDIA GeForce RTX 4070 Laptop GPU (19.1 - 46.8, n=23) | |
| Lenovo ThinkPad Z16 Gen 2 | |
| The Witcher 3 | |
| 1920x1080 Ultra Graphics & Postprocessing (HBAO+) | |
| MSI Raider GE78 HX 13VI | |
| Alienware m16 R1 AMD | |
| Alienware m18 R1 AMD | |
| Asus TUF Gaming A17 FA707XI-NS94 | |
| Lenovo Legion 7 16ARHA7 | |
| Average NVIDIA GeForce RTX 4070 Laptop GPU (69.8 - 133.7, n=57) | |
| Razer Blade 17 (i7-12800H, RTX 3070 Ti) | |
| MSI Katana 17 B13VFK | |
| Asus TUF Gaming F17 FX707Z-HX011W | |
| Asus ROG Strix G17 G713QE-RB74 | |
| Lenovo ThinkPad Z16 Gen 2 | |
| 3840x2160 High Graphics & Postprocessing (Nvidia HairWorks Off) | |
| MSI Raider GE78 HX 13VI | |
| Alienware m16 R1 AMD | |
| Alienware m18 R1 AMD | |
| Asus TUF Gaming A17 FA707XI-NS94 | |
| Average NVIDIA GeForce RTX 4070 Laptop GPU (26.5 - 83.5, n=16) | |
| MSI Katana 17 B13VFK | |
| Strange Brigade | |
| 1920x1080 ultra AA:ultra AF:16 | |
| MSI Raider GE78 HX 13VI | |
| Alienware m16 R1 AMD | |
| Alienware m18 R1 AMD | |
| Lenovo Legion 7 16ARHA7 | |
| Asus TUF Gaming A17 FA707XI-NS94 | |
| Average NVIDIA GeForce RTX 4070 Laptop GPU (76.3 - 234, n=63) | |
| Razer Blade 17 (i7-12800H, RTX 3070 Ti) | |
| MSI Katana 17 B13VFK | |
| Asus TUF Gaming F17 FX707Z-HX011W | |
| Asus ROG Strix G17 G713QE-RB74 | |
| Lenovo ThinkPad Z16 Gen 2 | |
| 2560x1440 ultra AA:ultra AF:16 | |
| MSI Raider GE78 HX 13VI | |
| Alienware m18 R1 AMD | |
| Alienware m16 R1 AMD | |
| Lenovo Legion 7 16ARHA7 | |
| Asus TUF Gaming A17 FA707XI-NS94 | |
| Average NVIDIA GeForce RTX 4070 Laptop GPU (52.8 - 150.9, n=55) | |
| MSI Katana 17 B13VFK | |
| 3840x2160 ultra AA:ultra AF:16 | |
| MSI Raider GE78 HX 13VI | |
| Alienware m18 R1 AMD | |
| Alienware m16 R1 AMD | |
| Asus TUF Gaming A17 FA707XI-NS94 | |
| Average NVIDIA GeForce RTX 4070 Laptop GPU (42.7 - 77.9, n=18) | |
| MSI Katana 17 B13VFK | |
| X-Plane 11.11 | |
| 1920x1080 high (fps_test=3) | |
| MSI Raider GE78 HX 13VI | |
| MSI Katana 17 B13VFK | |
| Alienware m16 R1 AMD | |
| Average NVIDIA GeForce RTX 4070 Laptop GPU (52.1 - 147.9, n=69) | |
| Razer Blade 17 (i7-12800H, RTX 3070 Ti) | |
| Asus TUF Gaming F17 FX707Z-HX011W | |
| Alienware m18 R1 AMD | |
| Asus TUF Gaming A17 FA707XI-NS94 | |
| Asus ROG Strix G17 G713QE-RB74 | |
| Lenovo Legion 7 16ARHA7 | |
| Lenovo ThinkPad Z16 Gen 2 | |
| 3840x2160 high (fps_test=3) | |
| MSI Raider GE78 HX 13VI | |
| MSI Katana 17 B13VFK | |
| Alienware m16 R1 AMD | |
| Average NVIDIA GeForce RTX 4070 Laptop GPU (63.4 - 125.8, n=26) | |
| Asus TUF Gaming A17 FA707XI-NS94 | |
| Alienware m18 R1 AMD | |
| Dota 2 Reborn | |
| 1920x1080 ultra (3/3) best looking | |
| MSI Raider GE78 HX 13VI | |
| Alienware m16 R1 AMD | |
| MSI Katana 17 B13VFK | |
| Average NVIDIA GeForce RTX 4070 Laptop GPU (89.7 - 191.2, n=67) | |
| Alienware m18 R1 AMD | |
| Razer Blade 17 (i7-12800H, RTX 3070 Ti) | |
| Asus TUF Gaming F17 FX707Z-HX011W | |
| Asus TUF Gaming A17 FA707XI-NS94 | |
| Asus ROG Strix G17 G713QE-RB74 | |
| Lenovo ThinkPad Z16 Gen 2 | |
| Lenovo Legion 7 16ARHA7 | |
| 3840x2160 ultra (3/3) best looking | |
| MSI Raider GE78 HX 13VI | |
| Alienware m16 R1 AMD | |
| Average NVIDIA GeForce RTX 4070 Laptop GPU (88.4 - 153.3, n=26) | |
| MSI Katana 17 B13VFK | |
| Alienware m18 R1 AMD | |
| Asus TUF Gaming A17 FA707XI-NS94 | |
Witcher 3 FPS Chart
| low | med. | high | ultra | QHD | 4K | |
|---|---|---|---|---|---|---|
| The Witcher 3 (2015) | 120.7 | 75.2 | ||||
| Dota 2 Reborn (2015) | 161.6 | 146.4 | 138.1 | 130 | 112.2 | |
| Final Fantasy XV Benchmark (2018) | 121.9 | 88.9 | 49.4 | |||
| X-Plane 11.11 (2018) | 114.7 | 101.7 | 80.7 | 68.6 | ||
| Far Cry 5 (2018) | 121 | 114 | 62 | |||
| Strange Brigade (2018) | 214 | 139.3 | 72.6 | |||
| Tiny Tina's Wonderlands (2022) | 109.4 | 75.6 | 35.5 | |||
| F1 22 (2022) | 210 | 83.8 | 54.7 | 26.5 | ||
| Baldur's Gate 3 (2023) | 114.7 | 81.1 | 41.1 | |||
| Cyberpunk 2077 (2023) | 135.8 | 118.1 | 99.4 | 86.3 | 51.8 | 22.3 |
Emissions
System Noise
Not only is fan noise generally louder than what we recorded on the Intel model, it is also much louder if set to Turbo mode. Running Witcher 3 on Performance mode would result in a fan noise of just 41 dB(A) compared to 57 dB(A) when on Turbo mode. Since Turbo mode is only slightly faster than Performance mode, users may want to consider gaming on Performance mode instead of Turbo mode for its much quieter fans. Otherwise, we generally recommend headphones whenever gaming laptops reach 50 dB(A) or louder.

Noise level
| Idle |
| 28.5 / 29.8 / 29.8 dB(A) |
| Load |
| 34.8 / 57.3 dB(A) |
 | ||
30 dB silent 40 dB(A) audible 50 dB(A) loud |
||
min: | ||
| Asus TUF Gaming A17 FA707XI-NS94 GeForce RTX 4070 Laptop GPU, R9 7940HS, WD PC SN560 SDDPNQE-1T00 | Asus TUF Gaming F17 FX707Z-HX011W GeForce RTX 3060 Laptop GPU, i7-12700H, SK Hynix HFM001TD3JX013N | MSI Pulse 17 B13VGK GeForce RTX 4070 Laptop GPU, i7-13700H, Micron 2400 MTFDKBA1T0QFM | MSI Katana 17 B13VFK GeForce RTX 4060 Laptop GPU, i7-13620H, Micron 2400 MTFDKBA1T0QFM | Razer Blade 17 (i7-12800H, RTX 3070 Ti) GeForce RTX 3070 Ti Laptop GPU, i7-12800H, Samsung PM9A1 MZVL21T0HCLR | HP Pavilion Gaming 17-cd2146ng GeForce RTX 3050 Ti Laptop GPU, i5-11300H, SK Hynix BC711 512GB HFM512GD3GX013N | |
|---|---|---|---|---|---|---|
| Noise | 12% | 16% | -4% | 15% | 7% | |
| off / environment * (dB) | 27.9 | 24 14% | 24 14% | 24.5 12% | 23 18% | 25 10% |
| Idle Minimum * (dB) | 28.5 | 24 16% | 24 16% | 24.5 14% | 23 19% | 27 5% |
| Idle Average * (dB) | 29.8 | 24 19% | 24 19% | 24.5 18% | 23 23% | 28 6% |
| Idle Maximum * (dB) | 29.8 | 24 19% | 24 19% | 40 -34% | 23 23% | 30 -1% |
| Load Average * (dB) | 34.8 | 42.6 -22% | 32.49 7% | 48.3 -39% | 36.92 -6% | 39 -12% |
| Witcher 3 ultra * (dB) | 57.1 | 46.84 18% | 46.51 19% | 56 2% | 50 12% | 44 23% |
| Load Maximum * (dB) | 57.3 | 46.84 18% | 46.51 19% | 59.1 -3% | 50 13% | 46 20% |
* ... smaller is better
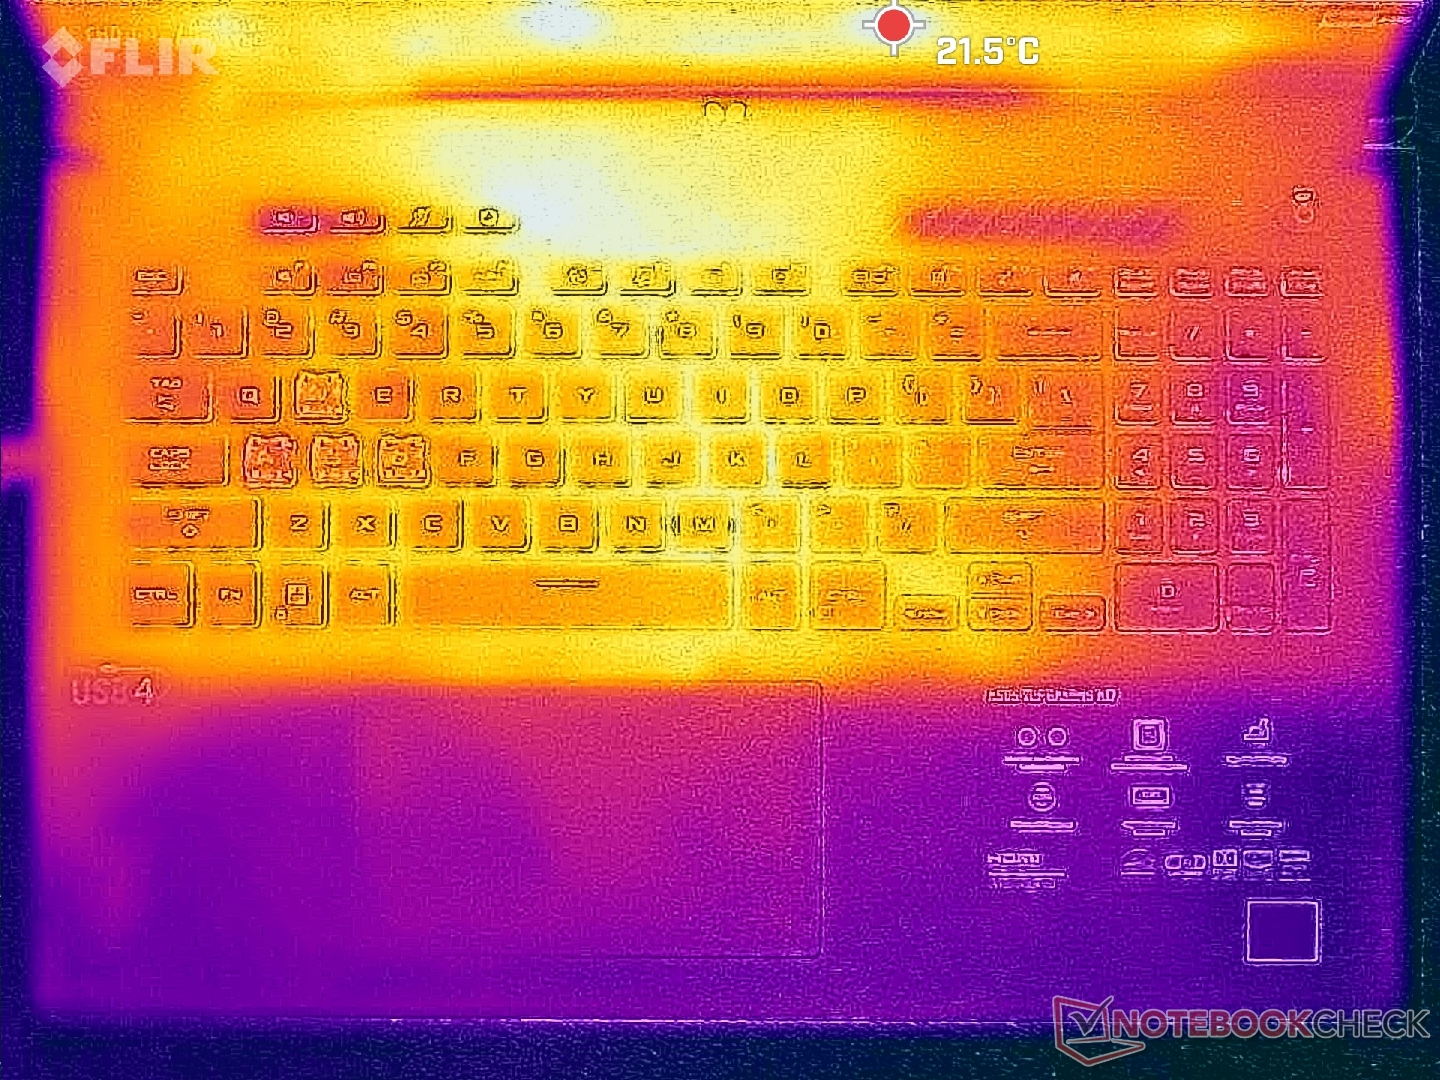
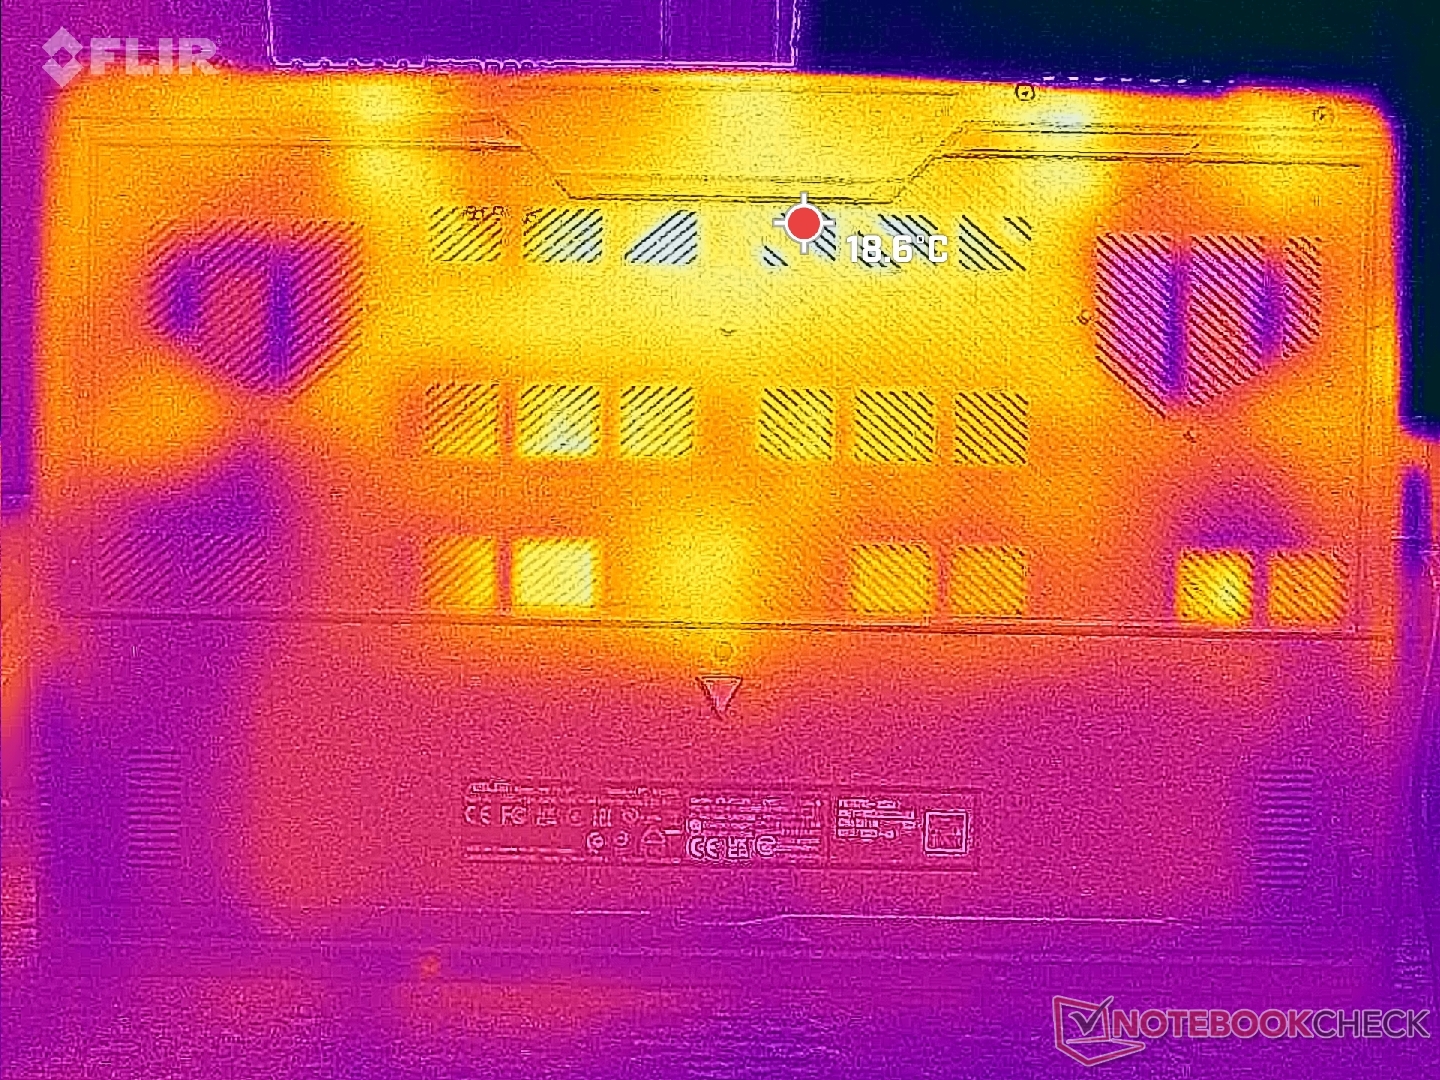
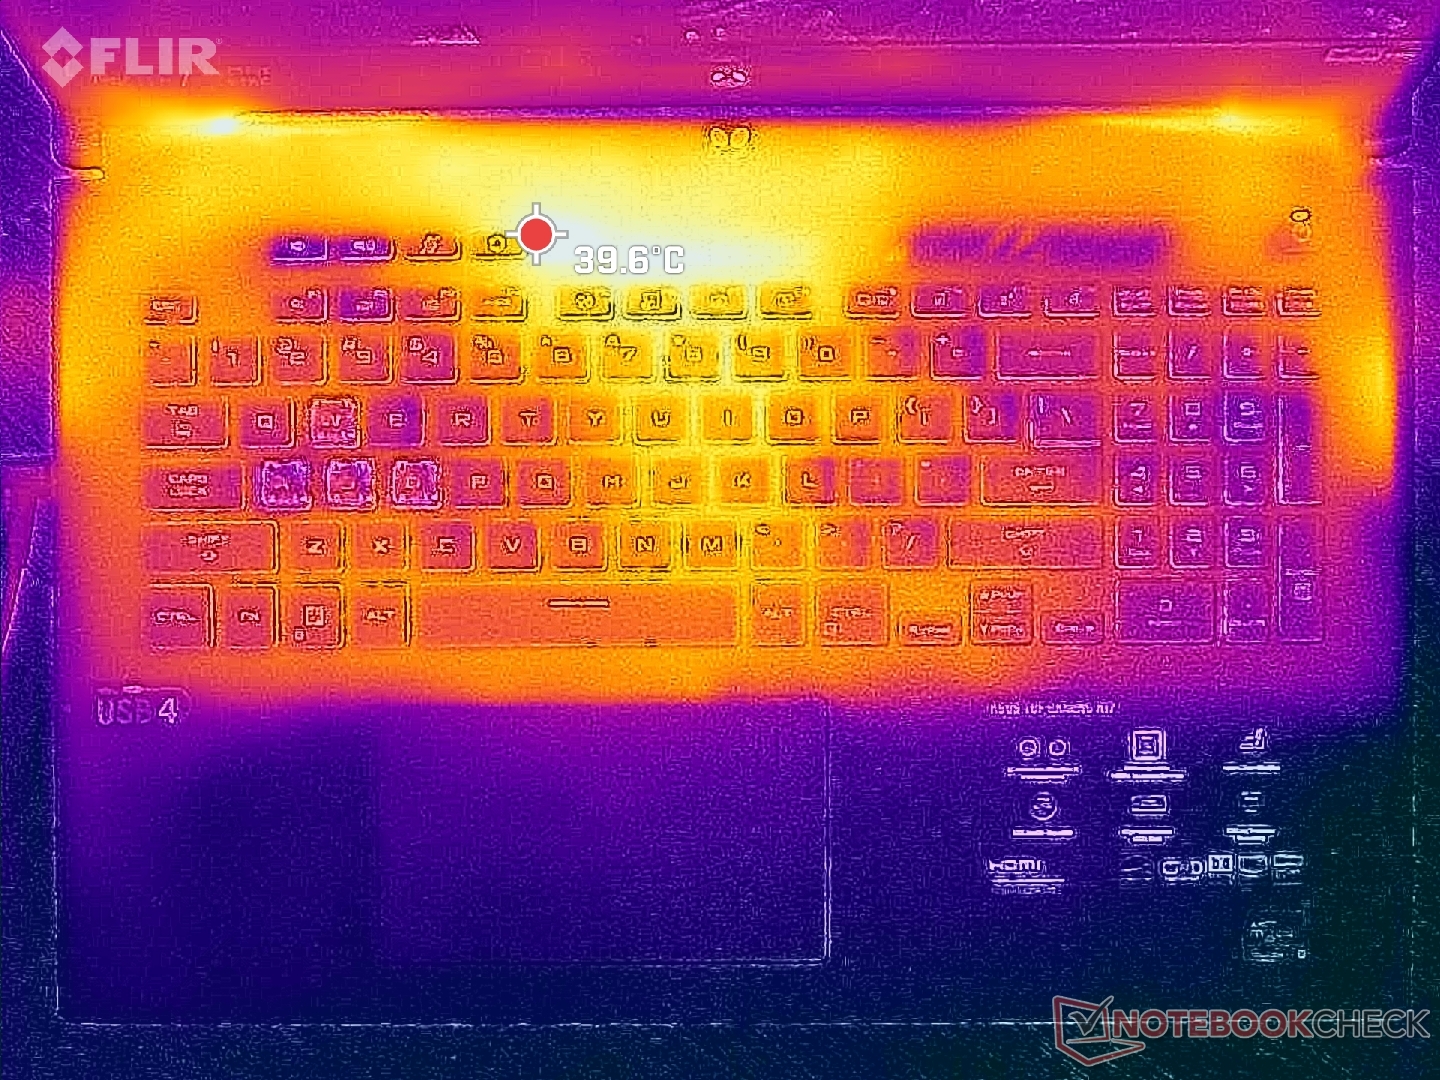
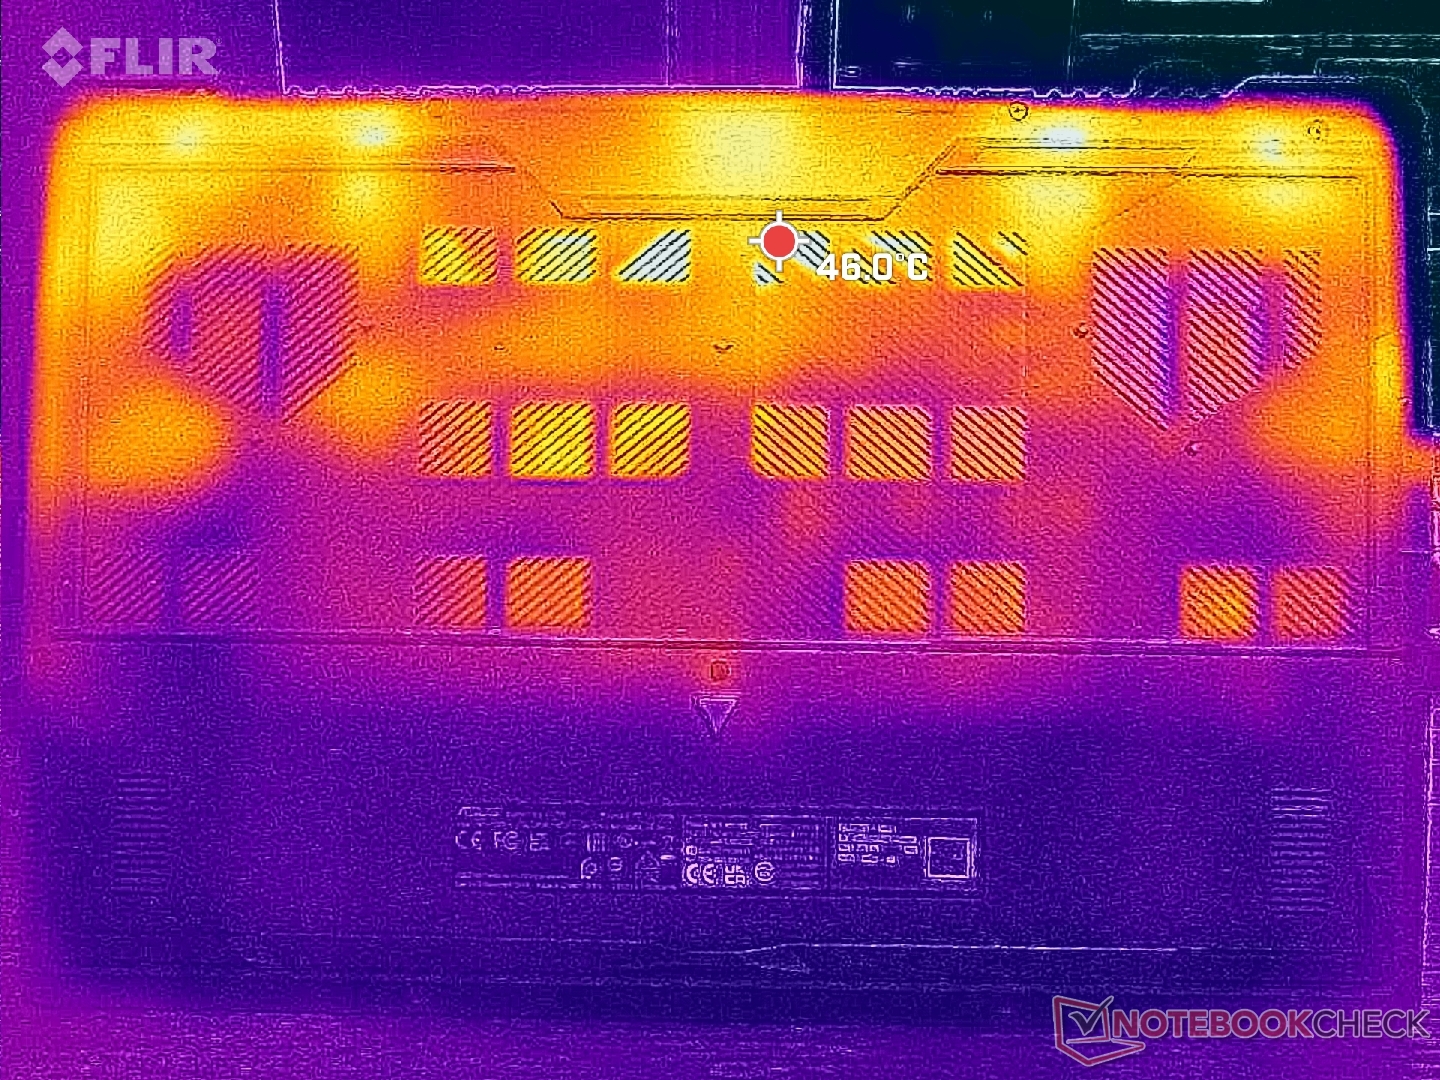
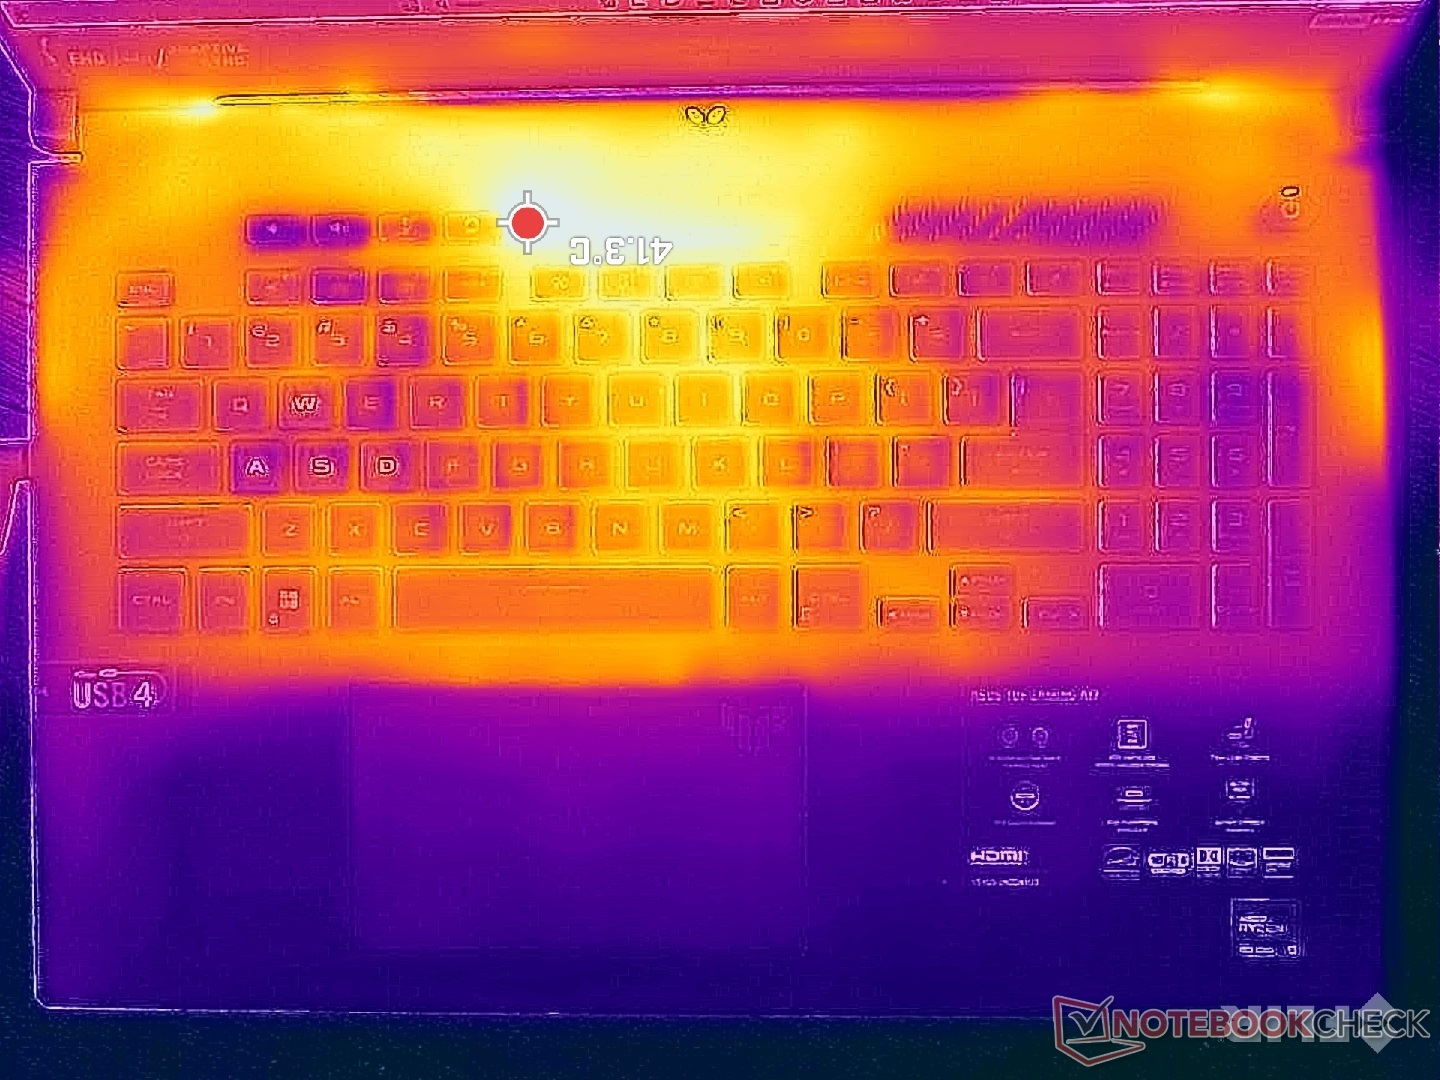
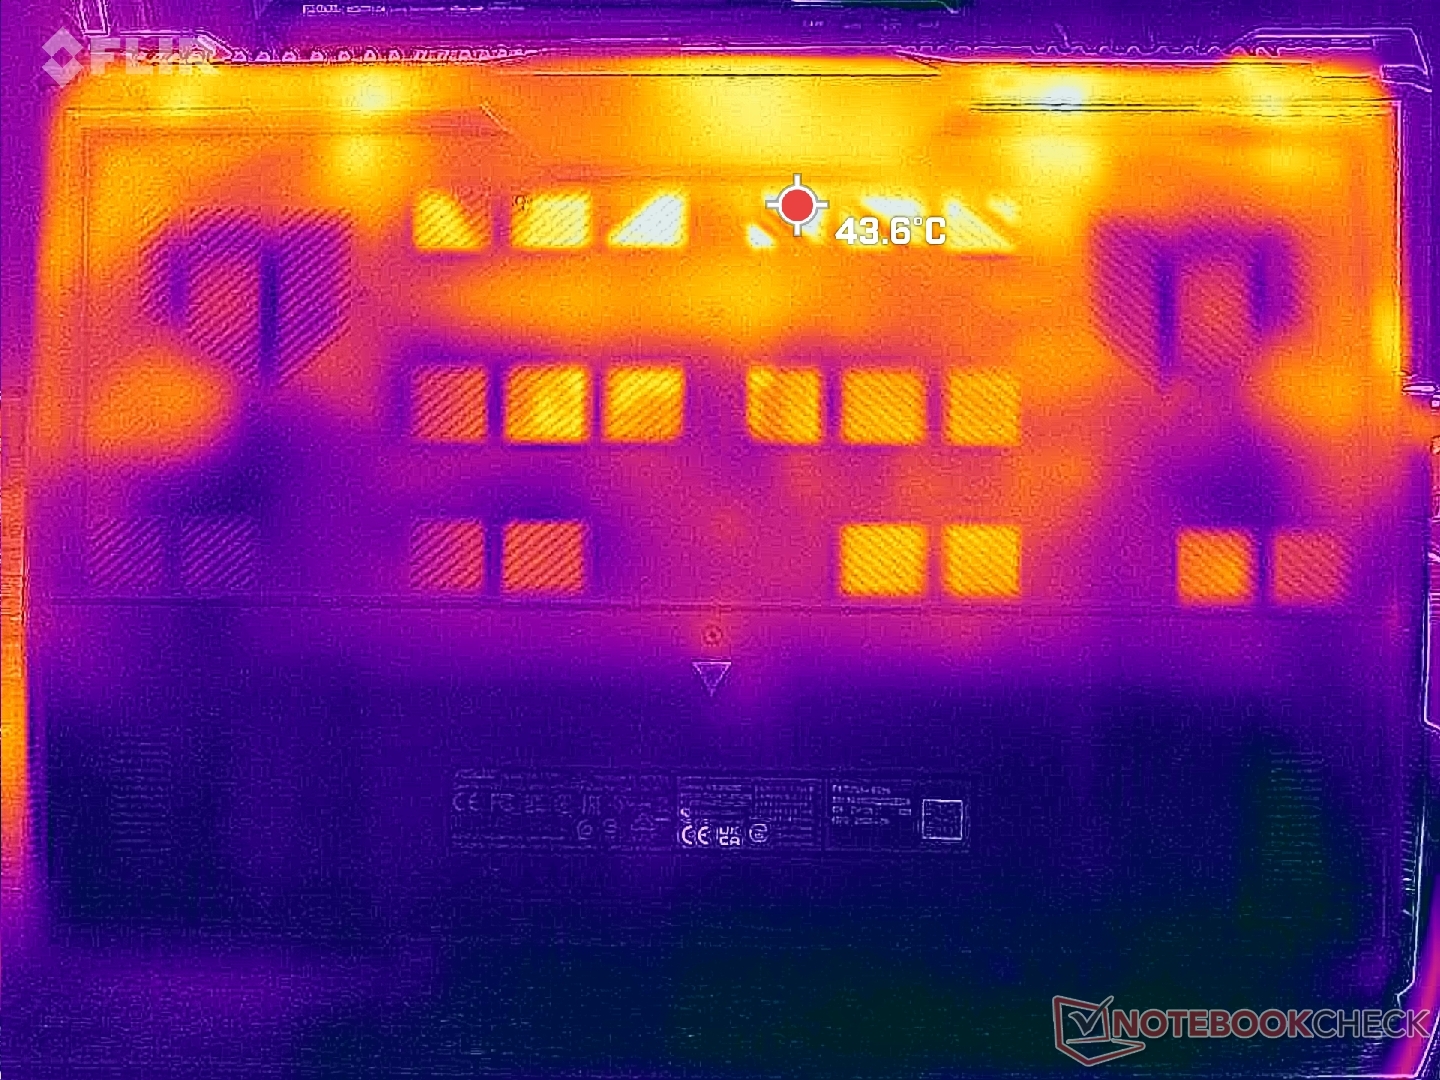
Temperature
Surface temperatures are cooler than on most other gaming laptops due largely to the plastic materials of the base and ample ventilation grilles. For example, the average surface temperature of our Asus when gaming would reach just 29 C compared to 39 C on the Razer Blade 17 which is comparatively thinner, incorporates fewer ventilation grilles, and is mostly metal alloy. The hot spots on our Asus are also further toward the rear where fingers are less likely to touch.
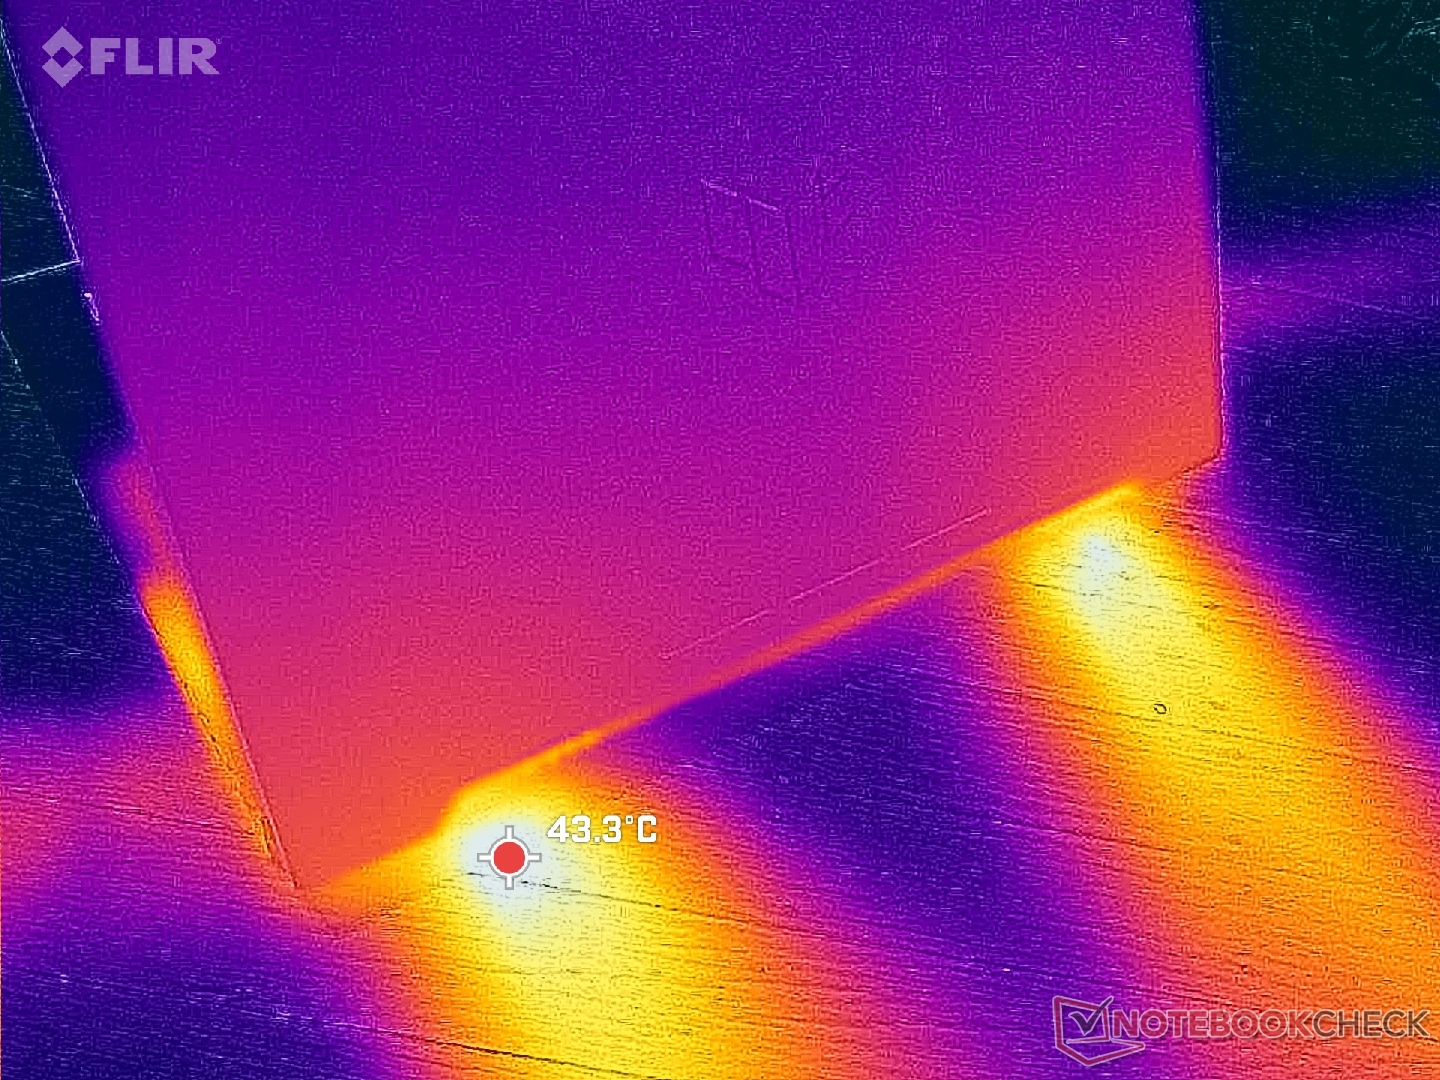
(±) The maximum temperature on the upper side is 40 °C / 104 F, compared to the average of 40.4 °C / 105 F, ranging from 21.2 to 68.8 °C for the class Gaming.
(+) The bottom heats up to a maximum of 33.6 °C / 92 F, compared to the average of 43.2 °C / 110 F
(+) In idle usage, the average temperature for the upper side is 23 °C / 73 F, compared to the device average of 33.9 °C / 93 F.
(+) Playing The Witcher 3, the average temperature for the upper side is 29.6 °C / 85 F, compared to the device average of 33.9 °C / 93 F.
(+) The palmrests and touchpad are cooler than skin temperature with a maximum of 22 °C / 71.6 F and are therefore cool to the touch.
(+) The average temperature of the palmrest area of similar devices was 28.8 °C / 83.8 F (+6.8 °C / 12.2 F).
| Asus TUF Gaming A17 FA707XI-NS94 AMD Ryzen 9 7940HS, NVIDIA GeForce RTX 4070 Laptop GPU | Asus TUF Gaming F17 FX707Z-HX011W Intel Core i7-12700H, NVIDIA GeForce RTX 3060 Laptop GPU | MSI Pulse 17 B13VGK Intel Core i7-13700H, NVIDIA GeForce RTX 4070 Laptop GPU | MSI Katana 17 B13VFK Intel Core i7-13620H, NVIDIA GeForce RTX 4060 Laptop GPU | Razer Blade 17 (i7-12800H, RTX 3070 Ti) Intel Core i7-12800H, NVIDIA GeForce RTX 3070 Ti Laptop GPU | HP Pavilion Gaming 17-cd2146ng Intel Core i5-11300H, NVIDIA GeForce RTX 3050 Ti Laptop GPU | |
|---|---|---|---|---|---|---|
| Heat | -29% | -29% | -25% | -25% | -17% | |
| Maximum Upper Side * (°C) | 40 | 52 -30% | 48 -20% | 41.6 -4% | 43 -8% | 44 -10% |
| Maximum Bottom * (°C) | 33.6 | 47 -40% | 50 -49% | 43.1 -28% | 44 -31% | 48 -43% |
| Idle Upper Side * (°C) | 26.6 | 31 -17% | 30 -13% | 32 -20% | 32 -20% | 27 -2% |
| Idle Bottom * (°C) | 24.4 | 31 -27% | 33 -35% | 35.8 -47% | 34 -39% | 27 -11% |
* ... smaller is better
Stress Test
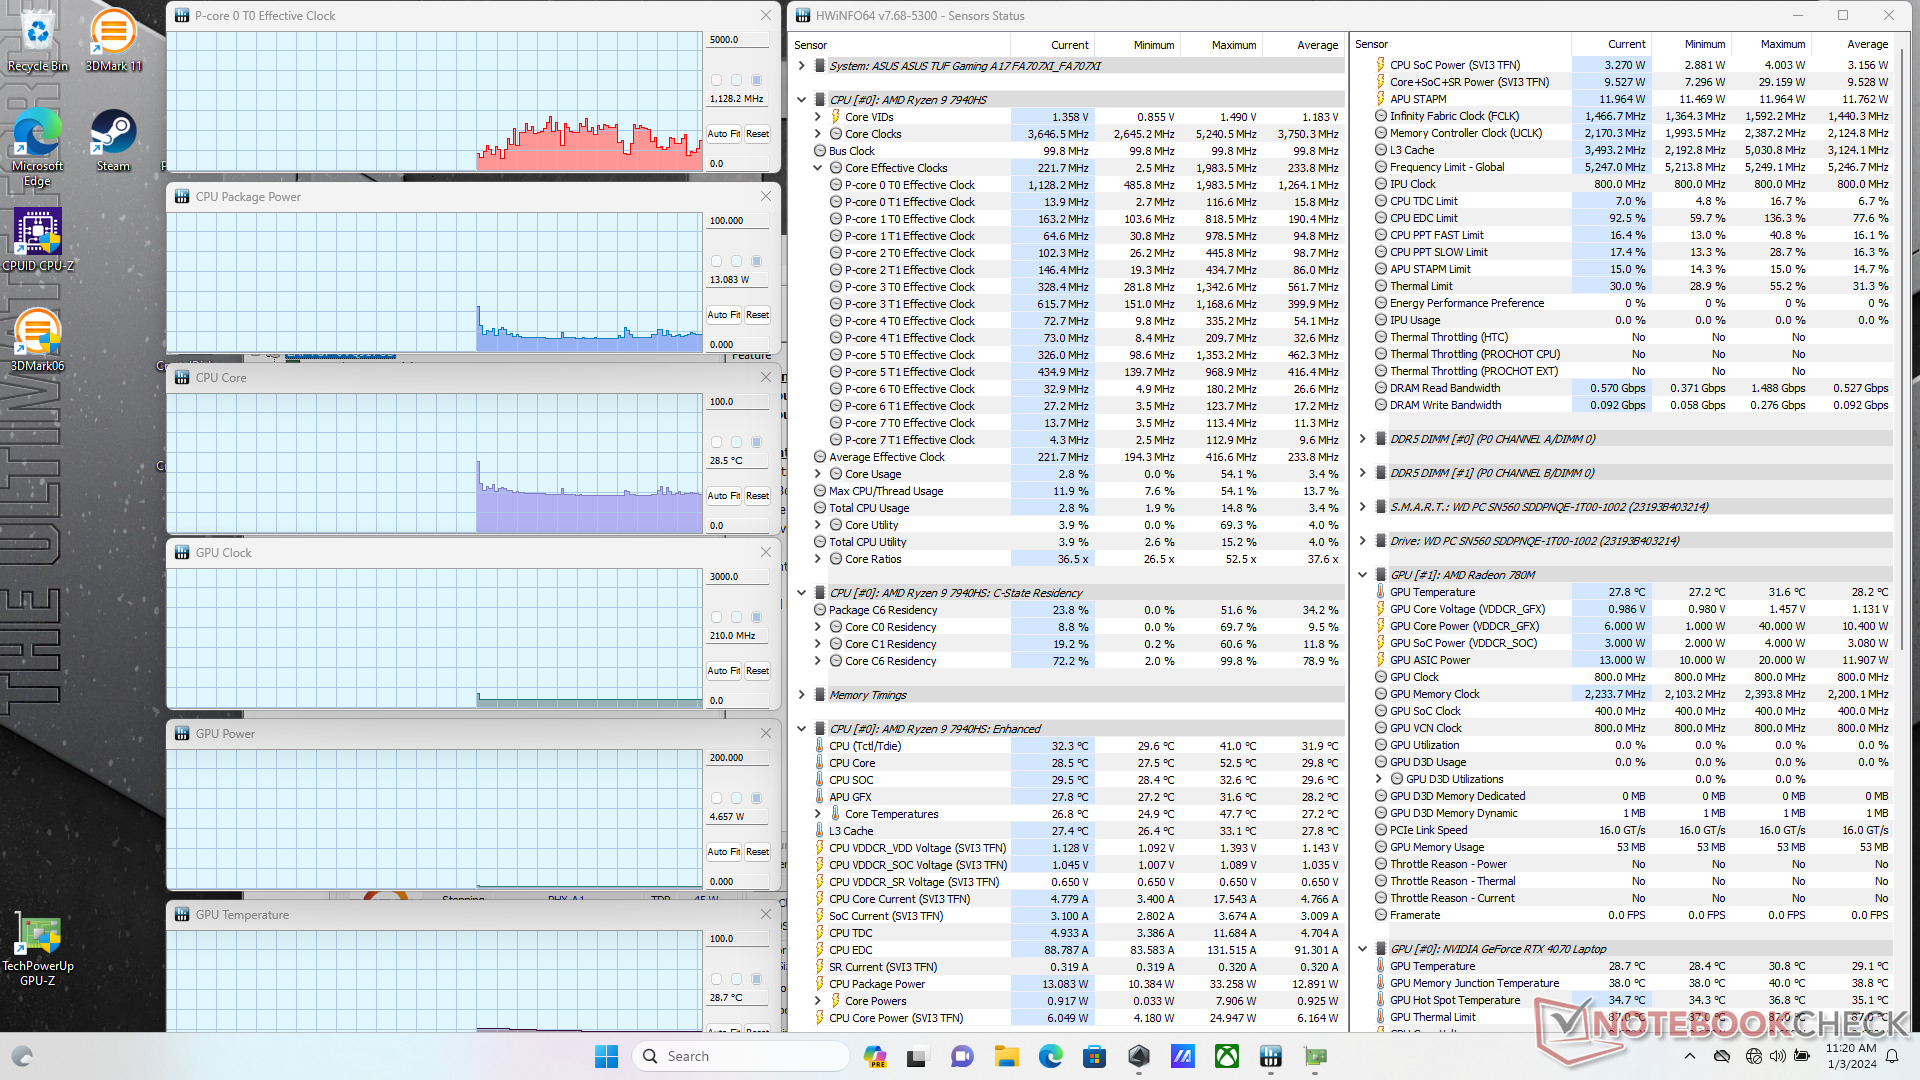
When stressed under Prime95, the CPU would boost to 4.8 GHz before falling just slightly and stabilizing at 4.5 GHz, 80 W, and 82 C.
The GPU would stabilize at 2505 MHz core, 2025 MHz RAM, and 106 W when running Witcher 3 on Turbo mode whereas running on Performance mode would lower all of these values to 2325 MHz, 2000 MHz, and 95 W, respectively. Performance mode subsequently entails a slight hit to graphics as mentioned in the GPU Performance section above. Note that both the GPU and especially CPU run noticeably warmer when on Turbo mode despite the higher fan ceiling on Turbo mode.
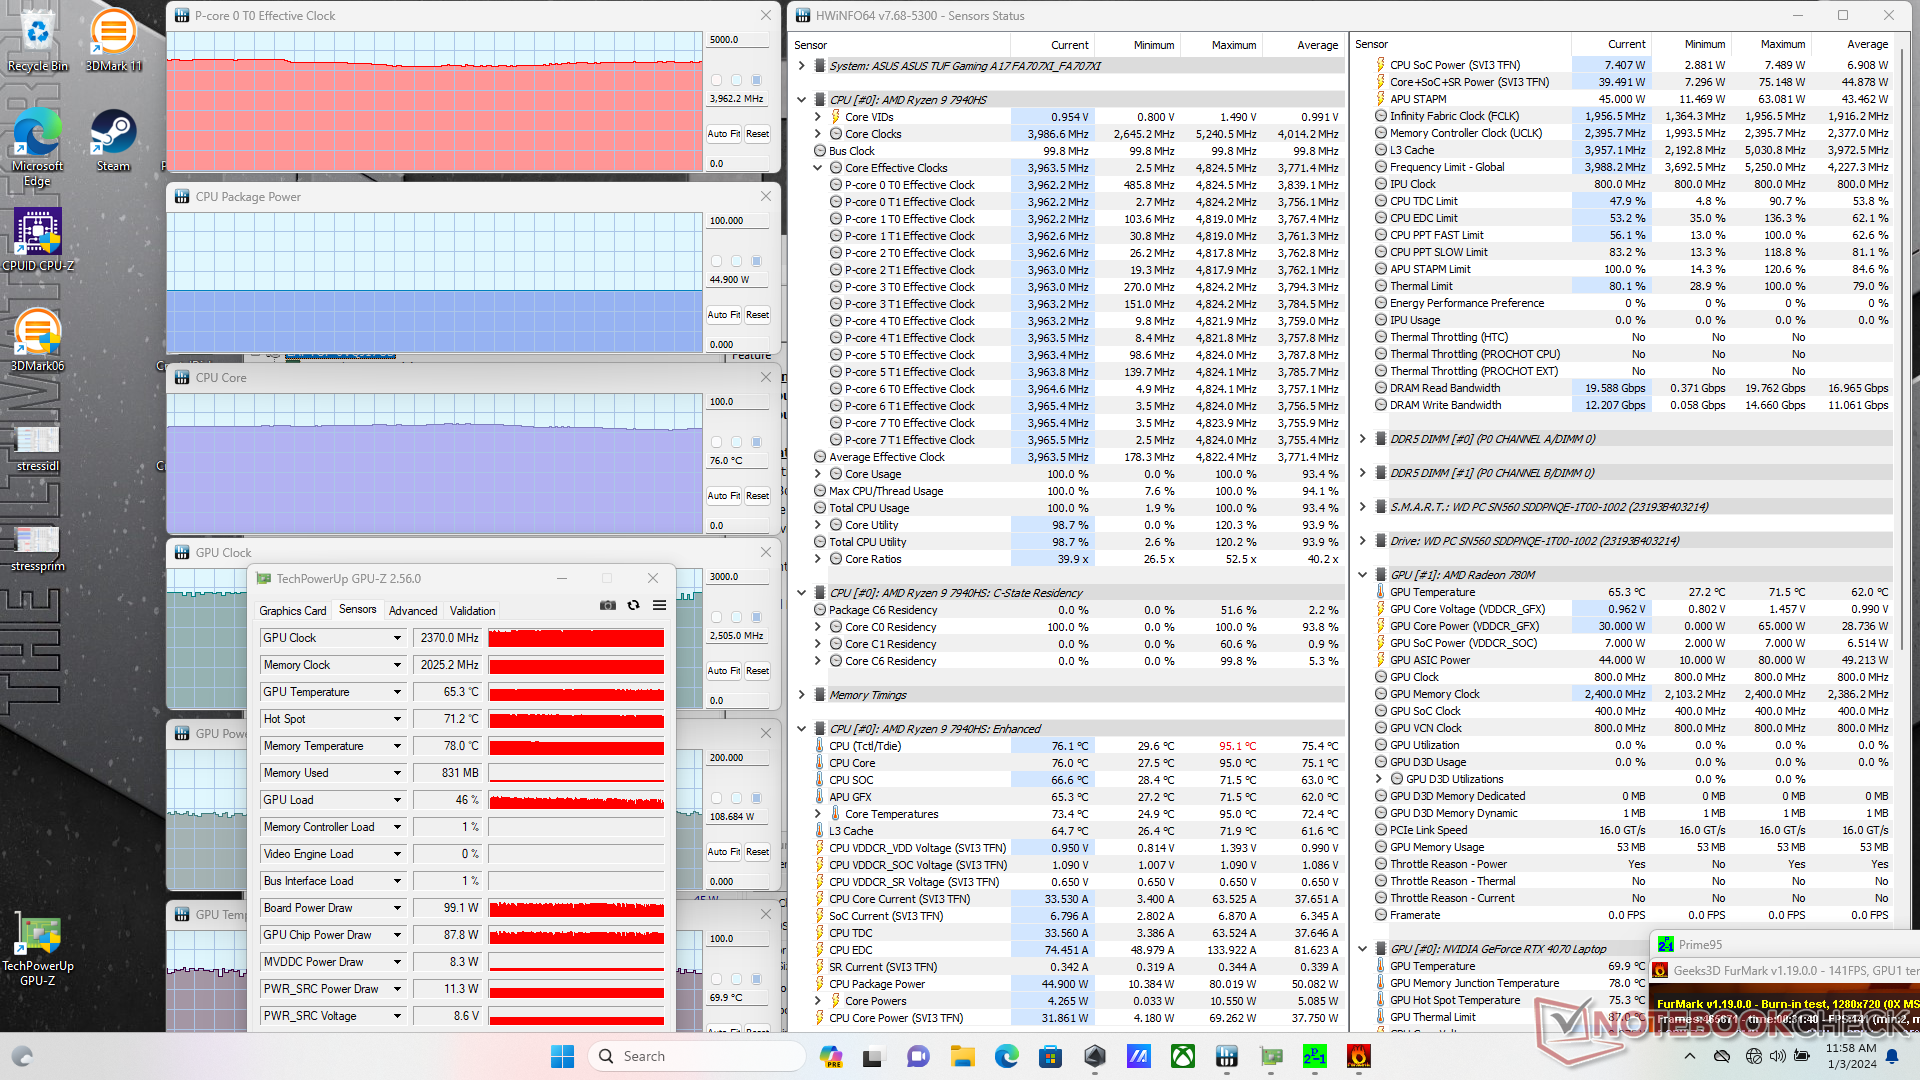
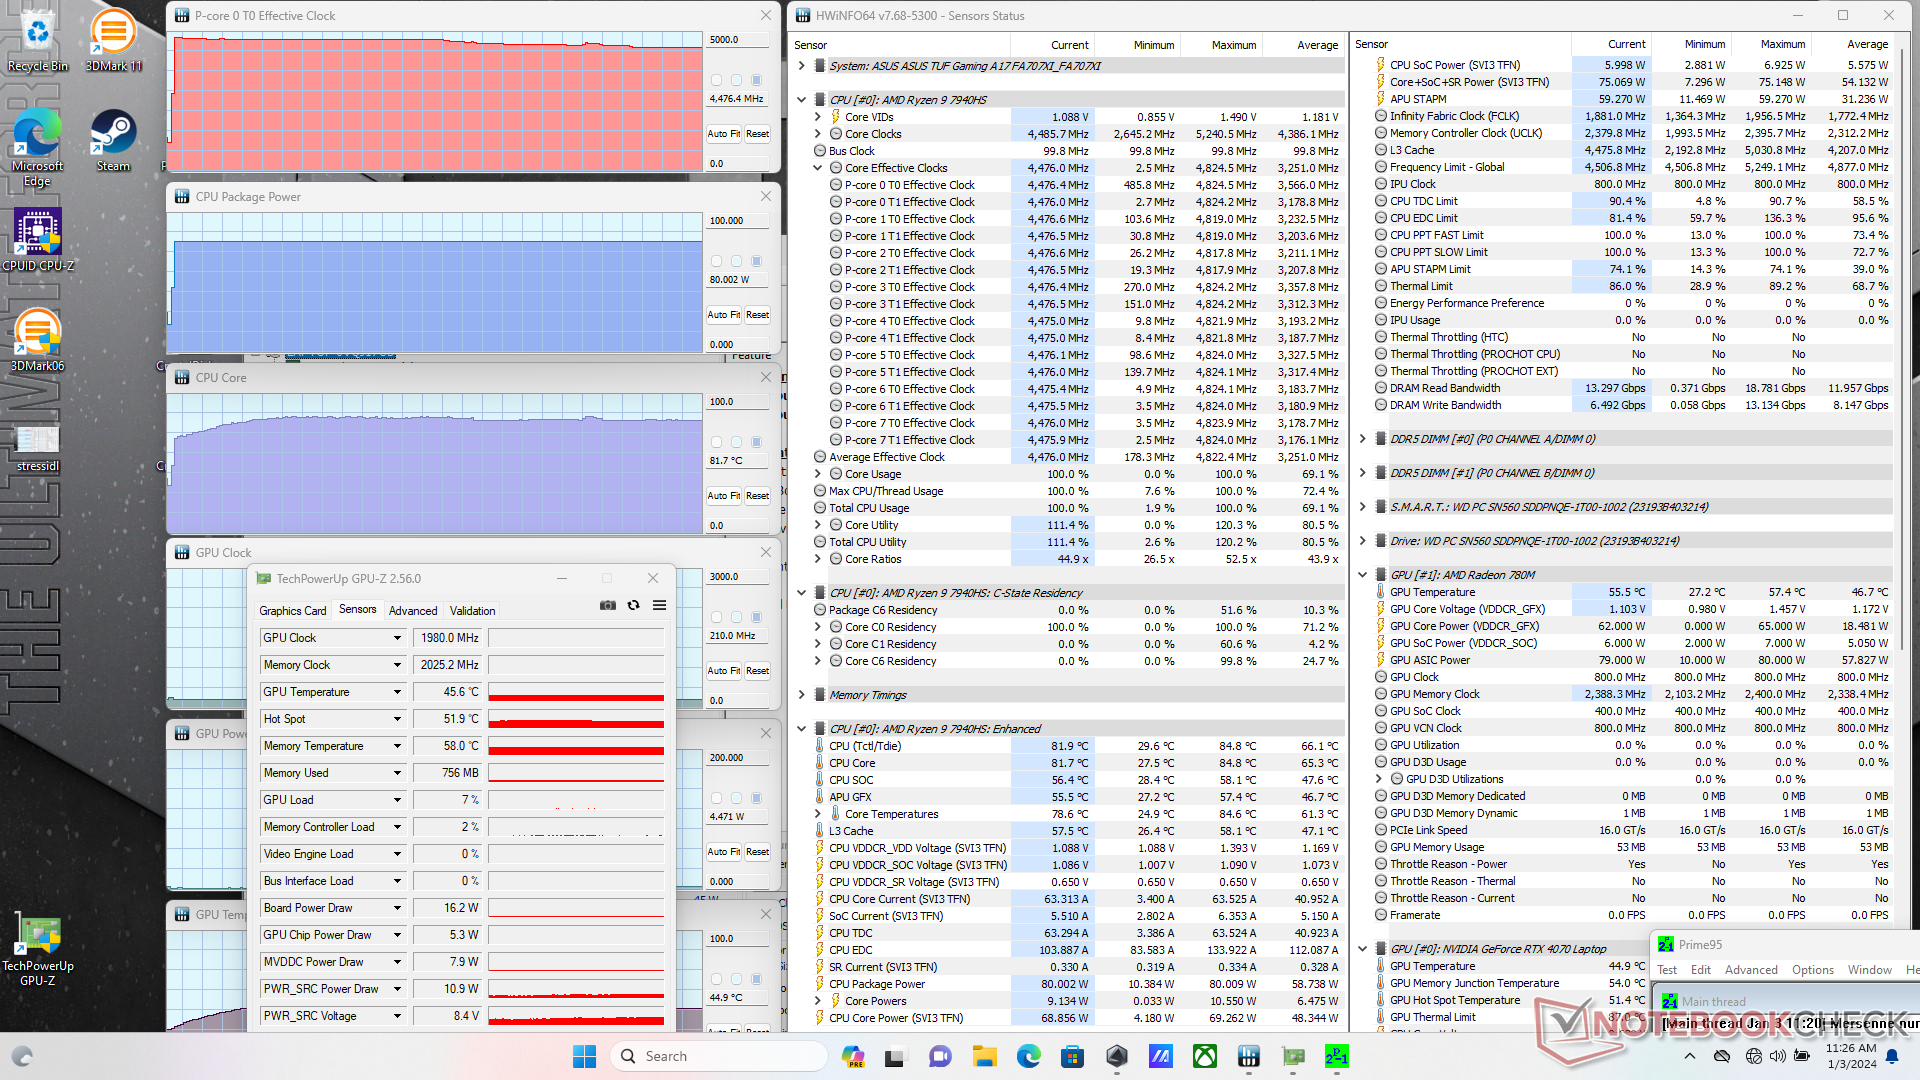
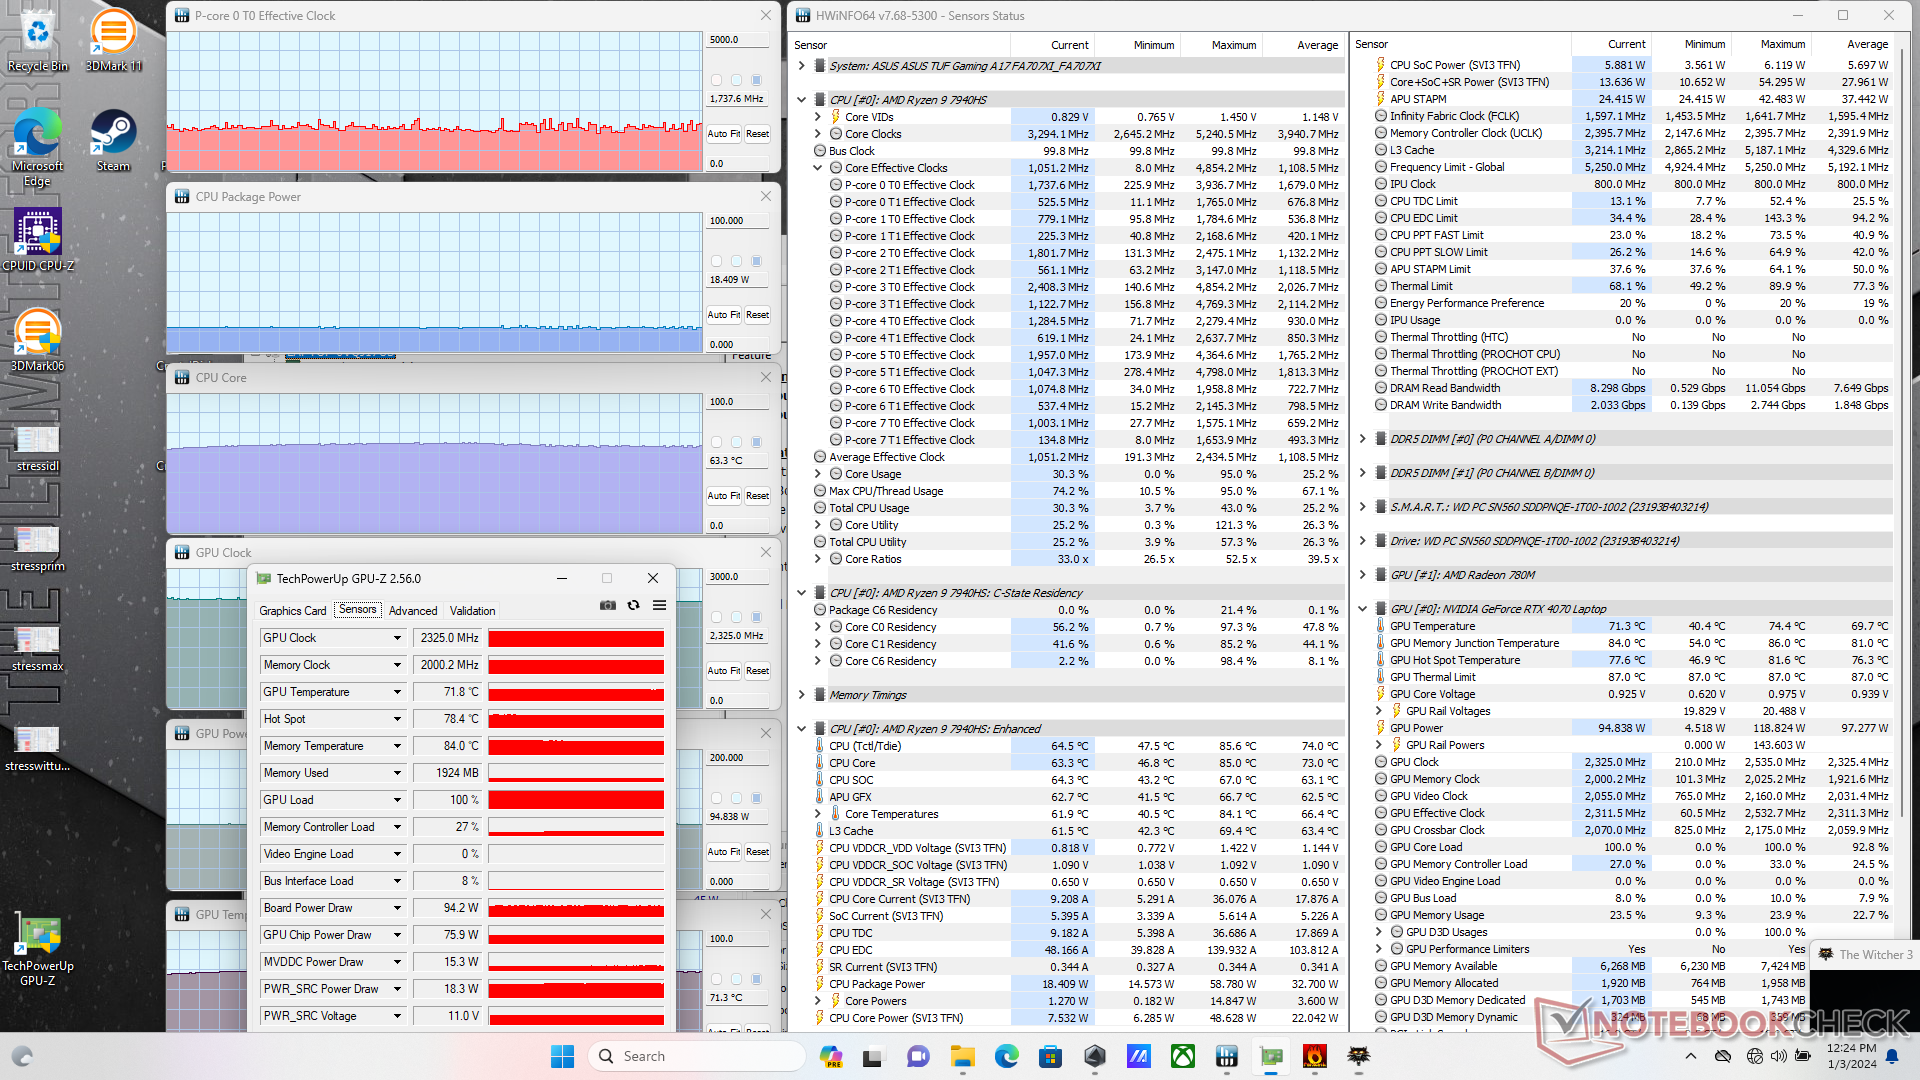
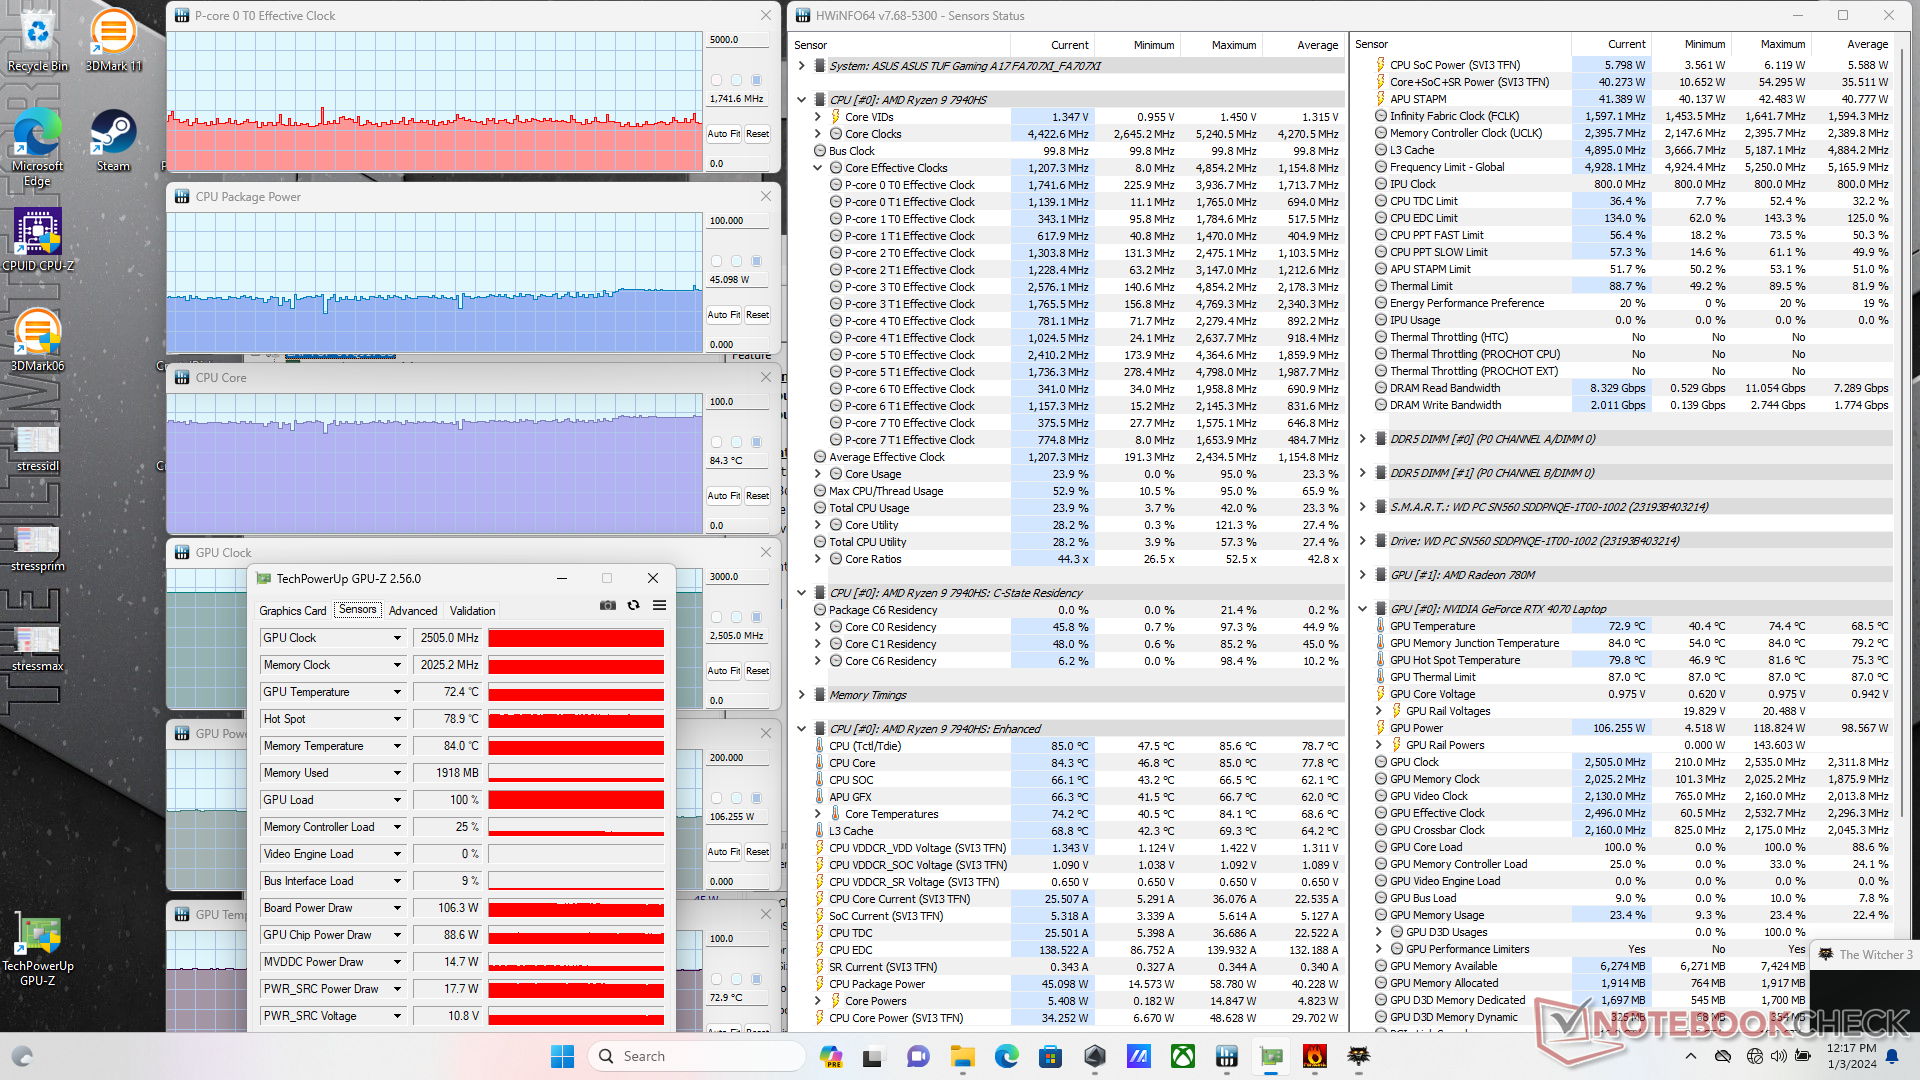
| CPU Clock (GHz) | GPU Clock (MHz) | Average CPU Temperature (°C) | Average GPU Temperature (°C) | |
| System Idle | -- | -- | 29 | 29 |
| Prime95 Stress | 4.5 | -- | 82 | 45 |
| Prime95 + FurMark Stress | 4.0 | 2370 | 76 | 70 |
| Witcher 3 Stress (Performance mode) | ~1.7 | 2325 | 63 | 71 |
| Witcher 3 Stress (Turbo mode) | ~1.7 | 2505 | 84 | 73 |
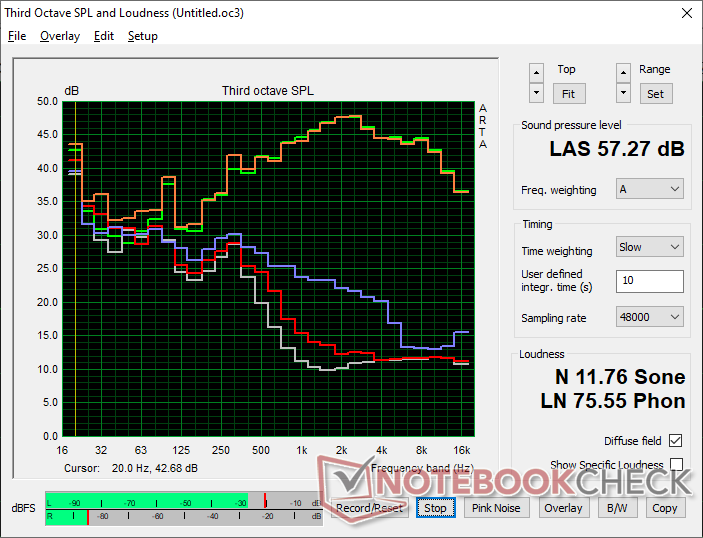
Speakers
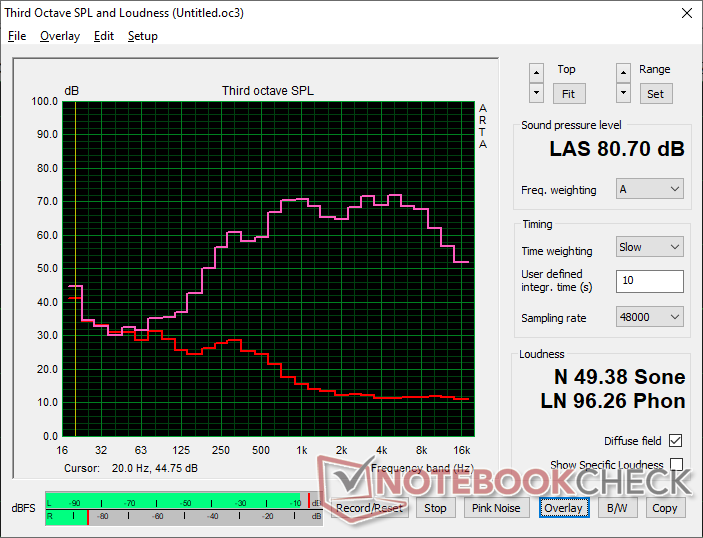
Asus TUF Gaming A17 FA707XI-NS94 audio analysis
(±) | speaker loudness is average but good (80.7 dB)
Bass 100 - 315 Hz
(-) | nearly no bass - on average 17.7% lower than median
(±) | linearity of bass is average (8.4% delta to prev. frequency)
Mids 400 - 2000 Hz
(+) | balanced mids - only 3.7% away from median
(+) | mids are linear (5.1% delta to prev. frequency)
Highs 2 - 16 kHz
(+) | balanced highs - only 4.4% away from median
(+) | highs are linear (6.2% delta to prev. frequency)
Overall 100 - 16.000 Hz
(±) | linearity of overall sound is average (17.3% difference to median)
Compared to same class
» 47% of all tested devices in this class were better, 12% similar, 41% worse
» The best had a delta of 6%, average was 18%, worst was 132%
Compared to all devices tested
» 32% of all tested devices were better, 8% similar, 59% worse
» The best had a delta of 4%, average was 23%, worst was 134%
Apple MacBook Pro 16 2021 M1 Pro audio analysis
(+) | speakers can play relatively loud (84.7 dB)
Bass 100 - 315 Hz
(+) | good bass - only 3.8% away from median
(+) | bass is linear (5.2% delta to prev. frequency)
Mids 400 - 2000 Hz
(+) | balanced mids - only 1.3% away from median
(+) | mids are linear (2.1% delta to prev. frequency)
Highs 2 - 16 kHz
(+) | balanced highs - only 1.9% away from median
(+) | highs are linear (2.7% delta to prev. frequency)
Overall 100 - 16.000 Hz
(+) | overall sound is linear (4.6% difference to median)
Compared to same class
» 0% of all tested devices in this class were better, 0% similar, 100% worse
» The best had a delta of 5%, average was 17%, worst was 45%
Compared to all devices tested
» 0% of all tested devices were better, 0% similar, 100% worse
» The best had a delta of 4%, average was 23%, worst was 134%
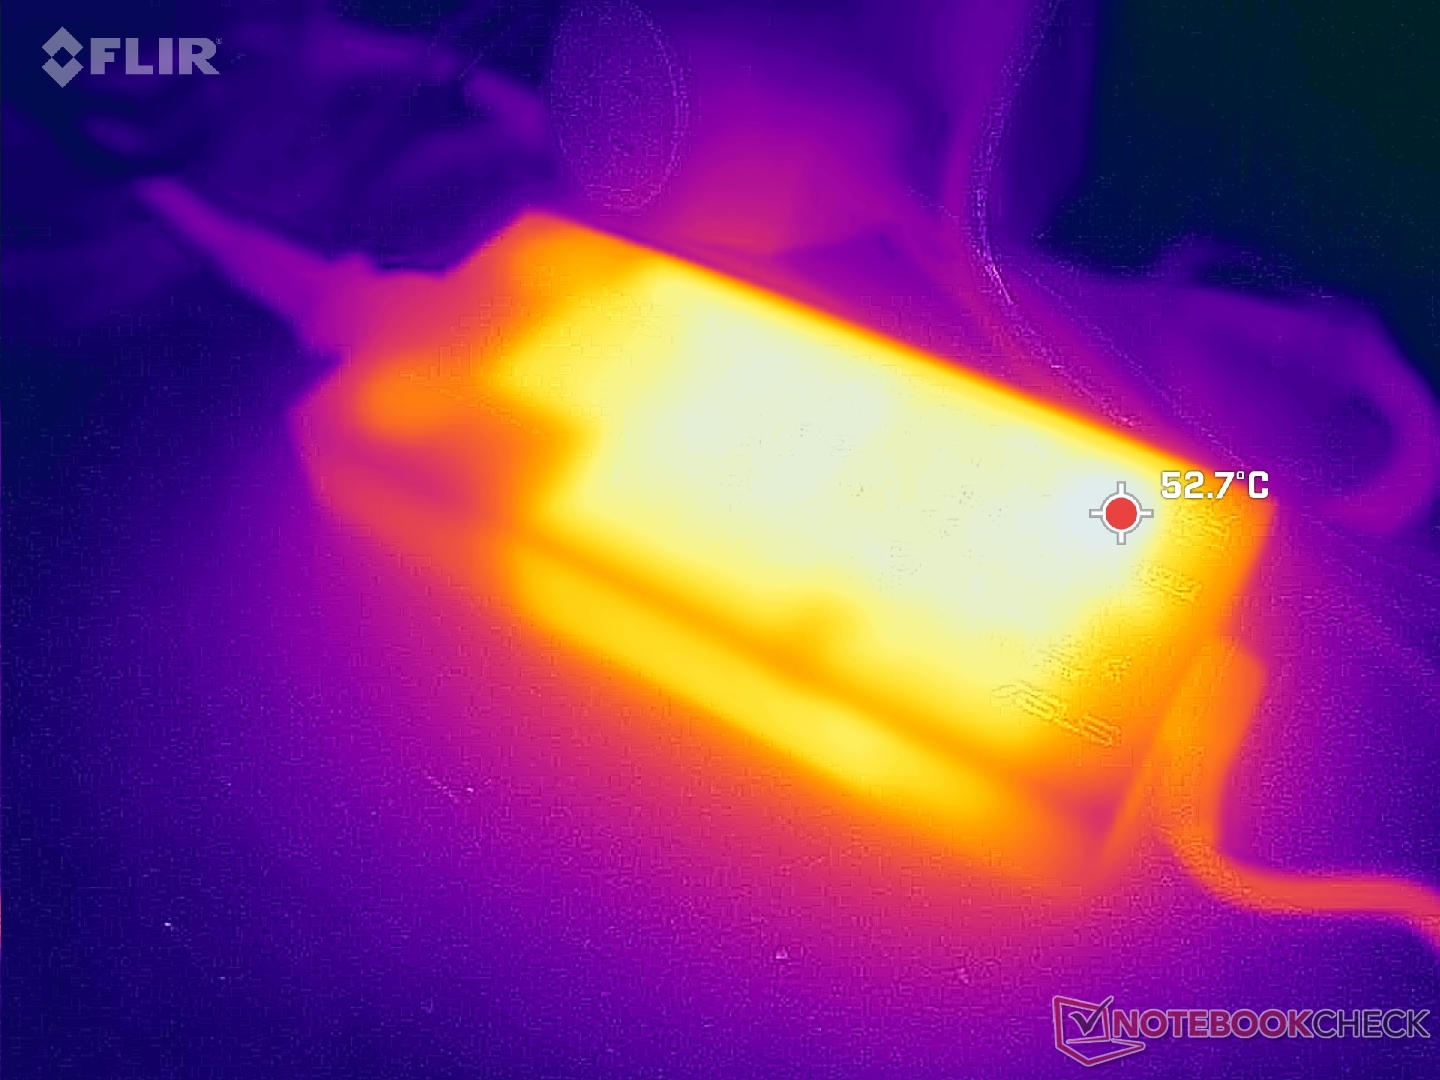
Energy Management
Power Consumption
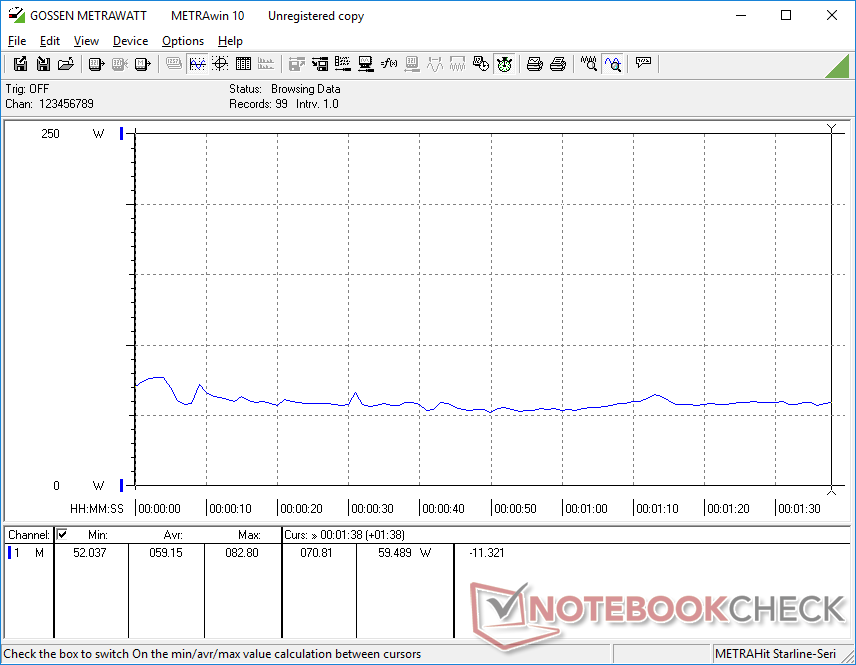
Power consumption can be as low as 6 W when running on Power Saver mode with the dGPU disabled. If set to maximum brightness with the dGPU enabled, consumption can be as high as 22 W which is two times more demanding than the TUF Gaming F17 or Pulse 17 under similar conditions. It's therefore important to set the system to iGPU mode if battery life is of utmost importance.
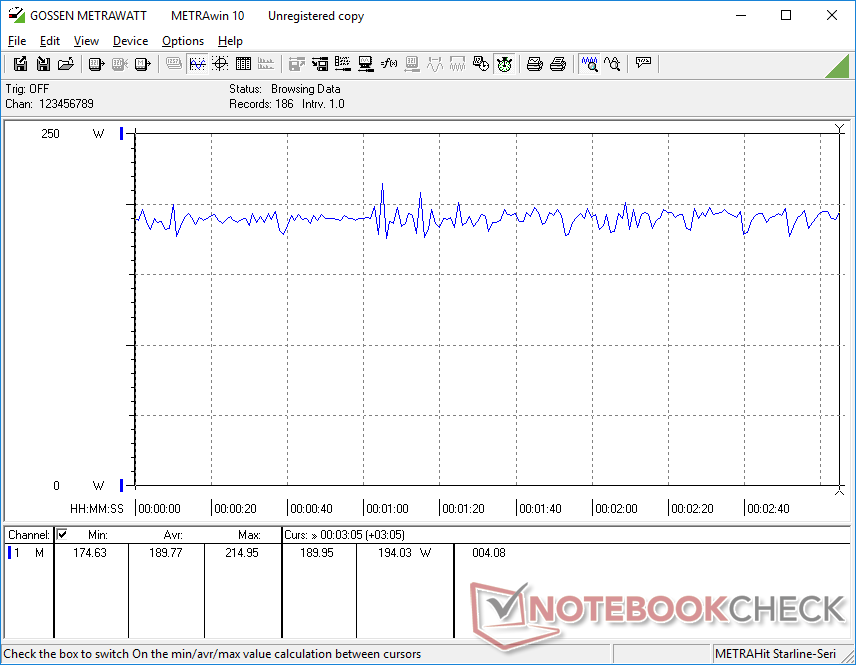
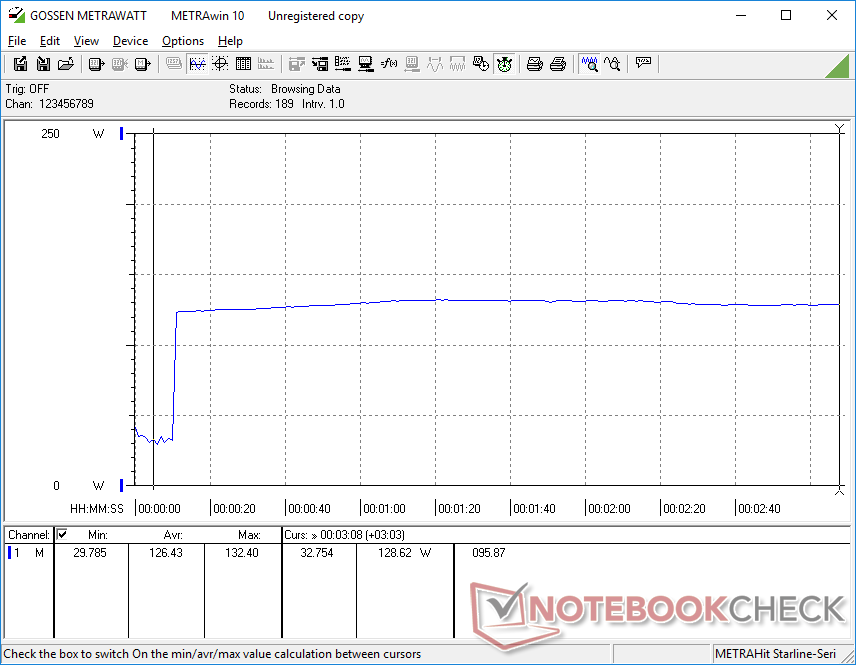
Running Witcher 3 on Turbo mode would consume as much as 190 W or almost 60 W more than the MSI Pulse 17 with the same GeForce RTX 4070 GPU. Consumption would drop to 150 W if running on Performance mode instead. Though generally more demanding than gaming laptops with the older RTX 3060, the performance gains more than make up for it.
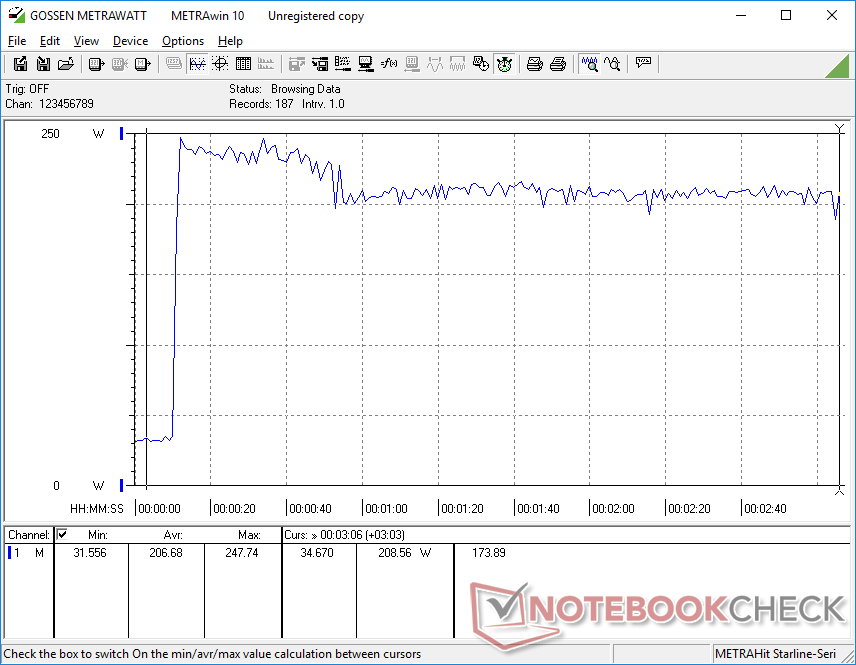
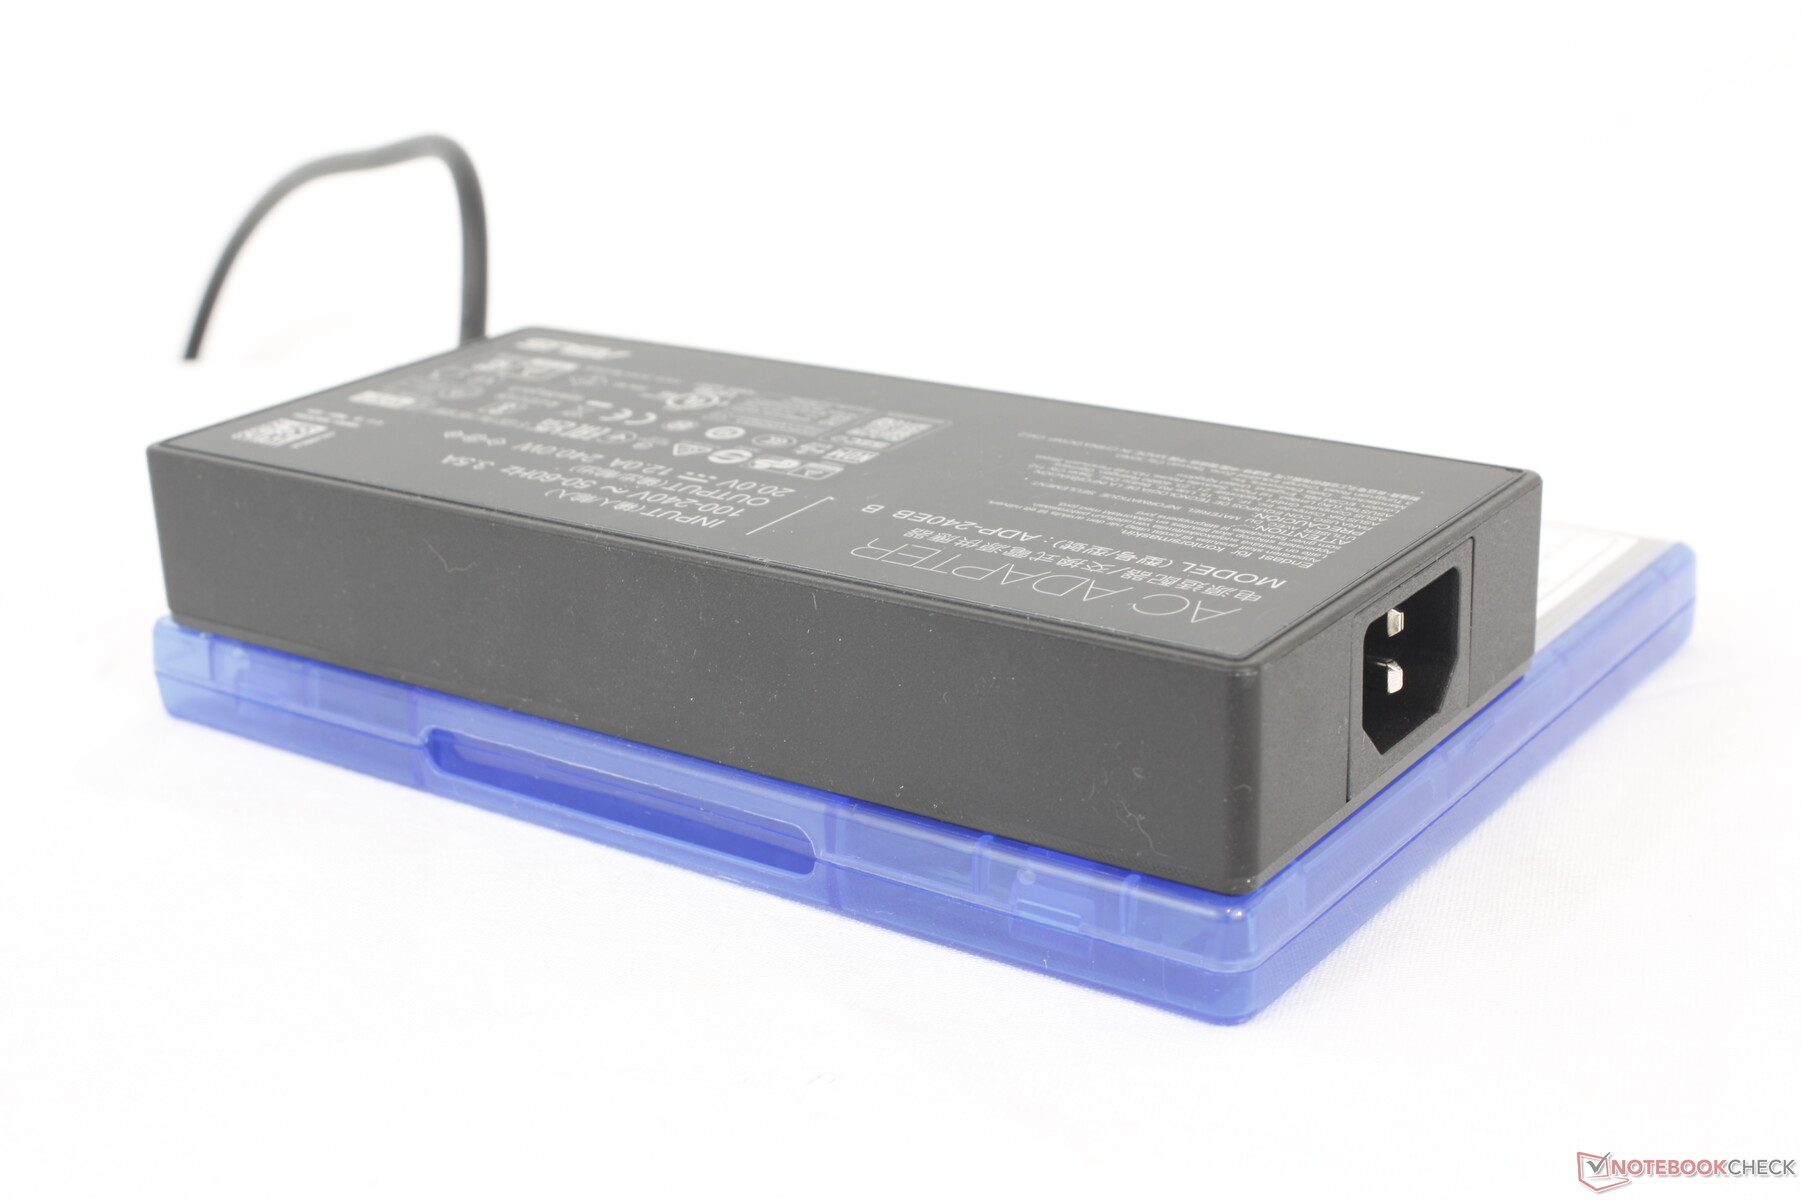
We're able to measure a maximum draw of 248 W from the medium-sized (~16.5 x 7.6 x 2.5 cm) 240 W AC adapter when the CPU and GPU are each at 100 percent utilization. This rate only lasts for about 30 seconds as shown by the screenshot below due to thermal limitations.
| Off / Standby | |
| Idle | |
| Load |
|
Key:
min: | |
| Asus TUF Gaming A17 FA707XI-NS94 R9 7940HS, GeForce RTX 4070 Laptop GPU, WD PC SN560 SDDPNQE-1T00, IPS, 1920x1080, 17.3" | Asus TUF Gaming F17 FX707Z-HX011W i7-12700H, GeForce RTX 3060 Laptop GPU, SK Hynix HFM001TD3JX013N, IPS, 1920x1080, 17.3" | MSI Pulse 17 B13VGK i7-13700H, GeForce RTX 4070 Laptop GPU, Micron 2400 MTFDKBA1T0QFM, IPS, 1920x1080, 17.3" | MSI Katana 17 B13VFK i7-13620H, GeForce RTX 4060 Laptop GPU, Micron 2400 MTFDKBA1T0QFM, IPS LED, 1920x1080, 17.3" | Razer Blade 17 (i7-12800H, RTX 3070 Ti) i7-12800H, GeForce RTX 3070 Ti Laptop GPU, Samsung PM9A1 MZVL21T0HCLR, IPS, 2560x1440, 17.3" | HP Pavilion Gaming 17-cd2146ng i5-11300H, GeForce RTX 3050 Ti Laptop GPU, SK Hynix BC711 512GB HFM512GD3GX013N, IPS, 1920x1080, 17.3" | |
|---|---|---|---|---|---|---|
| Power Consumption | 4% | 13% | -8% | -40% | 21% | |
| Idle Minimum * (Watt) | 6.2 | 6.6 -6% | 9 -45% | 12.2 -97% | 14.4 -132% | 3 52% |
| Idle Average * (Watt) | 21.8 | 8.3 62% | 10.2 53% | 14.9 32% | 20 8% | 8 63% |
| Idle Maximum * (Watt) | 22 | 11.8 46% | 10.8 51% | 15.8 28% | 21.5 2% | 28 -27% |
| Load Average * (Watt) | 59.2 | 119 -101% | 72 -22% | 85.22 -44% | 119 -101% | 88 -49% |
| Witcher 3 ultra * (Watt) | 189.7 | 169 11% | 130 31% | 151.1 20% | 218 -15% | 98.2 48% |
| Load Maximum * (Watt) | 247.8 | 222 10% | 221 11% | 212.8 14% | 248 -0% | 152 39% |
* ... smaller is better
Power Consumption Witcher 3 / Stresstest
Power Consumption external Monitor
Battery Life
Runtimes are essentially identical to the TUF Gaming F17 despite our faster CPU and GPU. WLAN browsing in particular can last for just over 9 hours to be very impressive for a large 17.3-inch gaming laptop. Of course, users must remember to run on iGPU mode in order to reach such long runtimes.
Charging from empty to full capacity takes just under 90 minutes with the included proprietary AC adapter. Charging with third-party USB-C adapters is slower but nonetheless supported.
| Asus TUF Gaming A17 FA707XI-NS94 R9 7940HS, GeForce RTX 4070 Laptop GPU, 90 Wh | Asus TUF Gaming F17 FX707Z-HX011W i7-12700H, GeForce RTX 3060 Laptop GPU, 90 Wh | MSI Pulse 17 B13VGK i7-13700H, GeForce RTX 4070 Laptop GPU, 90 Wh | MSI Katana 17 B13VFK i7-13620H, GeForce RTX 4060 Laptop GPU, 53.5 Wh | Razer Blade 17 (i7-12800H, RTX 3070 Ti) i7-12800H, GeForce RTX 3070 Ti Laptop GPU, 82 Wh | HP Pavilion Gaming 17-cd2146ng i5-11300H, GeForce RTX 3050 Ti Laptop GPU, 52.5 Wh | |
|---|---|---|---|---|---|---|
| Battery runtime | 16% | 14% | -55% | -15% | -45% | |
| Reader / Idle (h) | 19.7 | |||||
| WiFi v1.3 (h) | 9.1 | 8.7 -4% | 9 -1% | 2.9 -68% | 5.9 -35% | 5 -45% |
| Load (h) | 1.7 | 2.3 35% | 2.2 29% | 1 -41% | 1.8 6% | |
| H.264 (h) | 7.7 | 4.9 |
Pros
Cons
Verdict — Great Performance With A Poor Display
The TUF Gaming A17 FA707 is one of the least expensive 17.3-inch gaming laptops with the GeForce RTX 4070. It's especially impressive that the system comes with a Zen 4 Ryzen 9 CPU meaning you don't have to sacrifice processor performance for the low price. The strong CPU and GPU combination makes this model easy to recommend for gamers who want to maximize performance-per-dollar.
The cut corners instead revolve around the rest of the laptop surrounding the processors. More specifically, the narrow color gamut and average response times of the display pale in comparison to the displays on higher-end gaming laptops like those in the ROG series. Thankfully, Asus offers multiple display options for the TUF Gaming A17 with much better colors and attributes than our review configuration. If possible, we recommend trading the Ryzen 9 CPU and poor 1080p panel of our review configuration for a unit with the Ryzen 7 CPU and 1440p panel. The CPU may be a bit slower, but the improvements to display quality will be much more noticeable and well worth the trade-off.
The Asus TUF Gaming A17 balances price, performance, and form factor very well so long as you can find the right configuration. SKUs with the 1080p panel have noticeably worse colors than the 1440p options.
Other disadvantages include Wi-Fi 6 connectivity instead of Wi-Fi 6E, a low resolution 720p webcam, and no per-key RGB lighting. However, these drawbacks don't directly impact the gaming experience. The system retains most core features that are arguably more desirable such as the thin profile, long battery life, and accessible internals for upgrades.
Price and Availability
Asus TUF Gaming A17 FA707XI-NS94
- 01/06/2024 v7 (old)
Allen Ngo
Transparency
The selection of devices to be reviewed is made by our editorial team. The test sample was freely purchased by the author at his/her own expense. The lender had no influence on this review, nor did the manufacturer receive a copy of this review before publication. There was no obligation to publish this review. As an independent media company, Notebookcheck is not subjected to the authority of manufacturers, retailers or publishers.
This is how Notebookcheck is testing
Every year, Notebookcheck independently reviews hundreds of laptops and smartphones using standardized procedures to ensure that all results are comparable. We have continuously developed our test methods for around 20 years and set industry standards in the process. In our test labs, high-quality measuring equipment is utilized by experienced technicians and editors. These tests involve a multi-stage validation process. Our complex rating system is based on hundreds of well-founded measurements and benchmarks, which maintains objectivity. Further information on our test methods can be found here.
Price comparison
