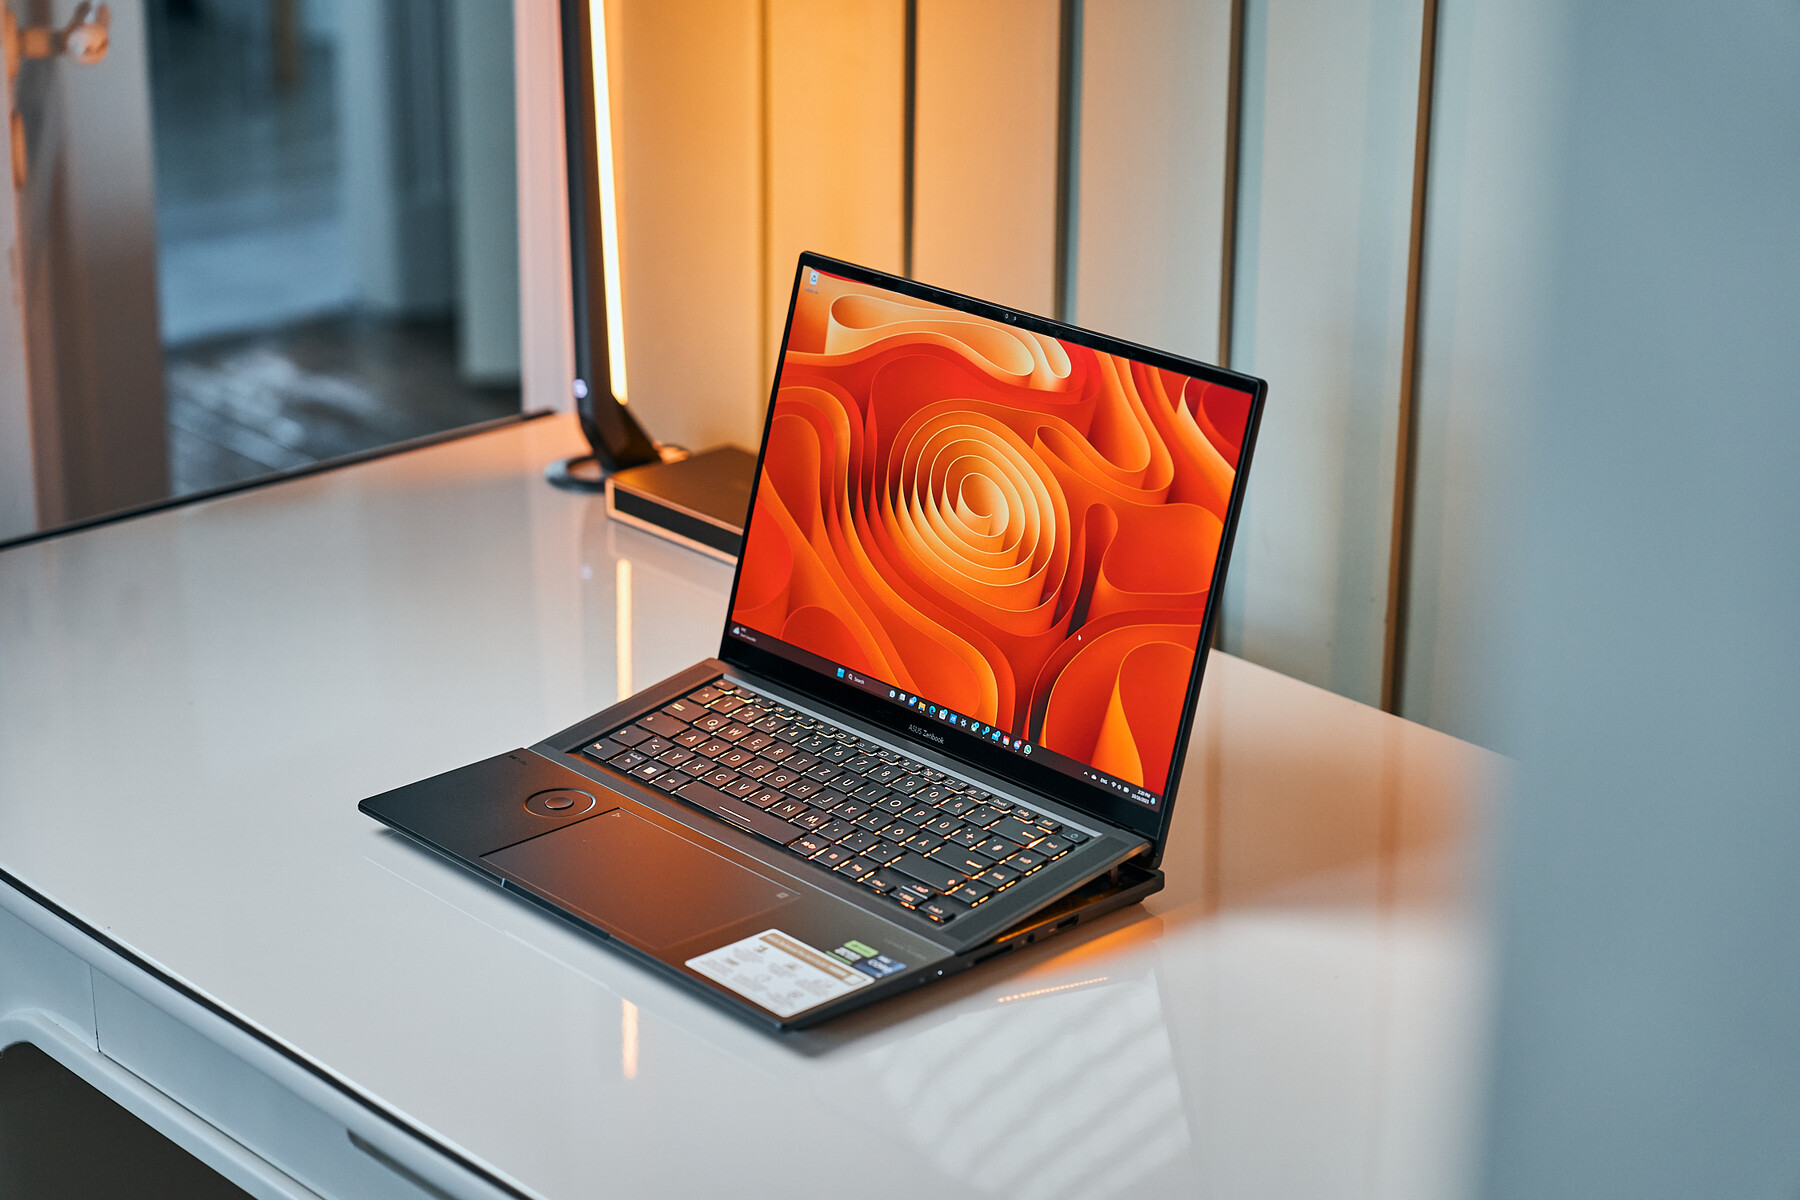
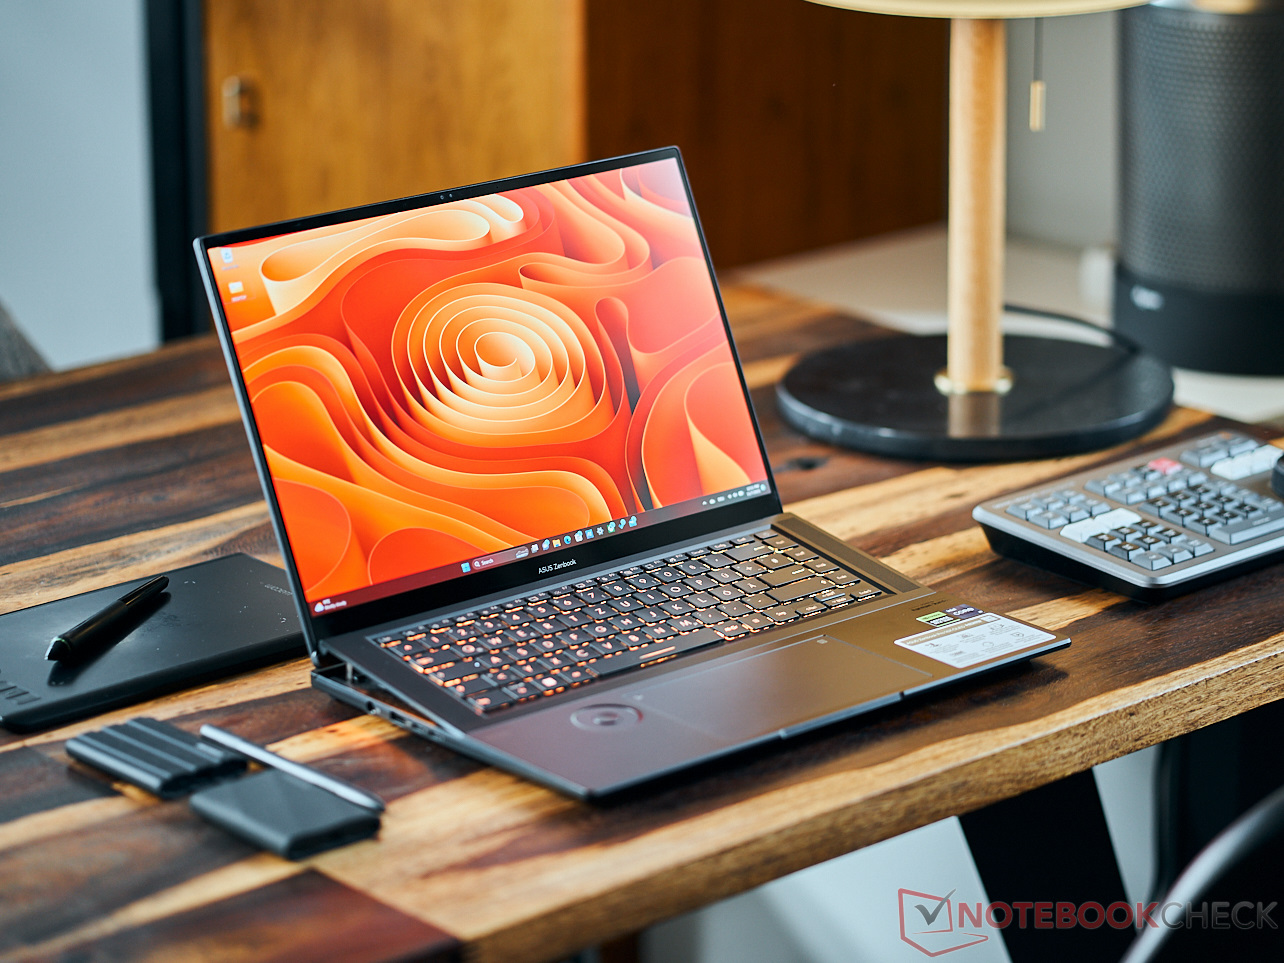
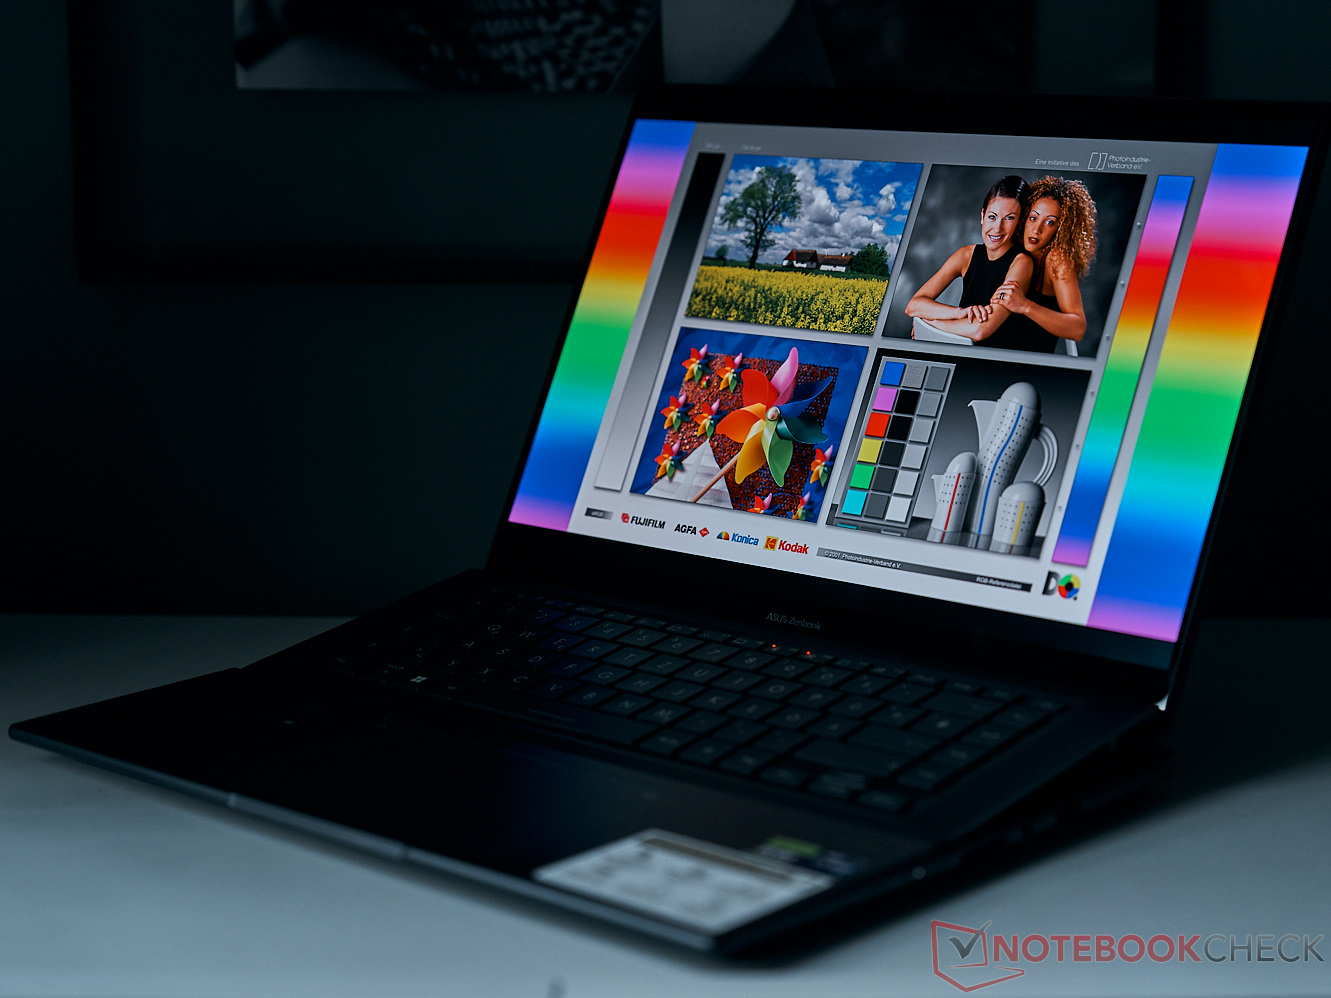
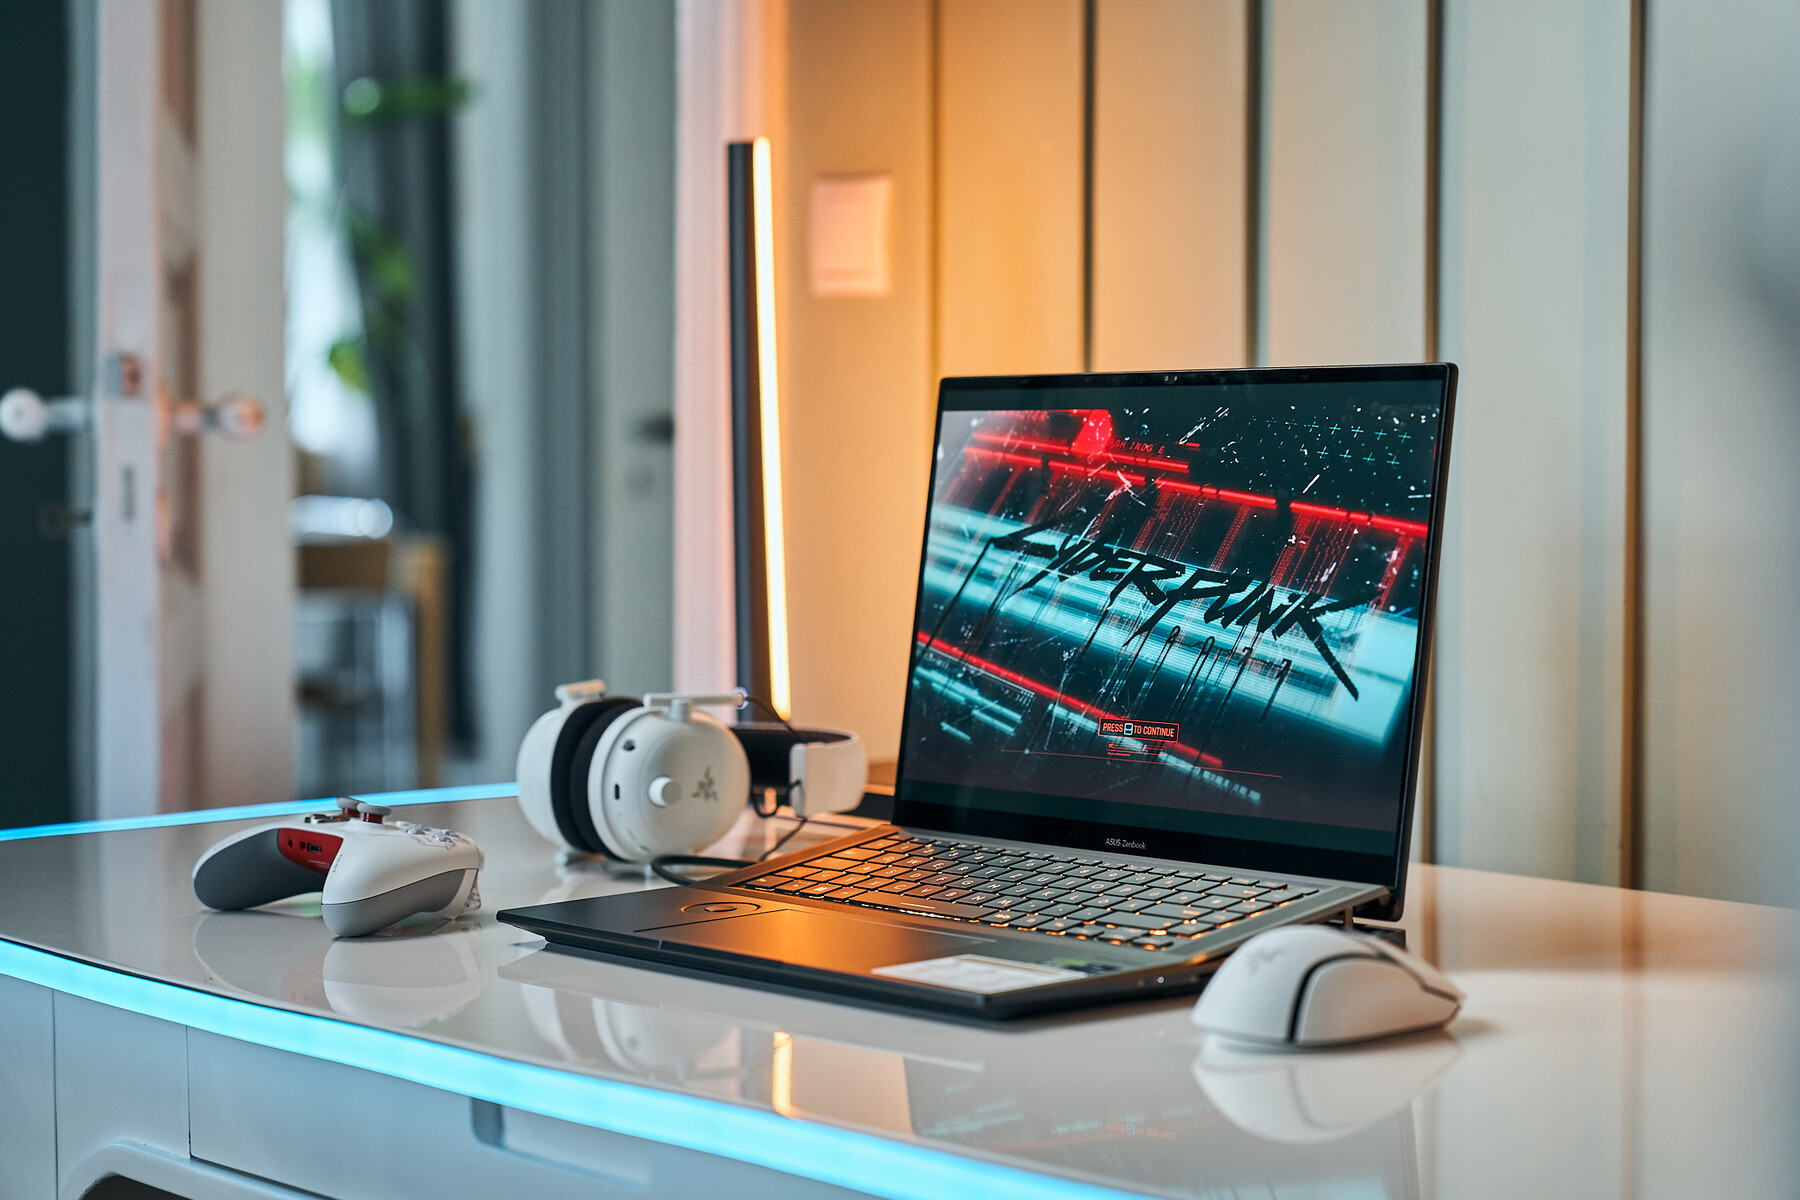
Zenbook Pro 16X (2023) review: Maximum power from the Asus flagship at last

Optically, hardly anything has changed on the Zenbook Pro 16X, whose predecessor was subject to an extensive review last year. Inside the notebook, on the other hand, there is now much more power. While the somewhat weak RTX 3060 of last year was a point of criticism, the current Zenbook shines with a powerful Nvidia GeForce RTX 4080. The new CPU and LPDDR5 RAM arrangement should ensure faster memory access, so the already powerful Intel Core i9-13905H should work even faster.
Of course, powerful hardware also requires proper cooling. This is once again ensured by AAS cooling under the flip-up keyboard from Asus, combined with 3D vapor chambers, liquid metal and 3D-shaped 12 V fans. This allows the system to consume up to 200 watts without heat build-up. Accordingly, the new Zenbook Pro 16X is able to more than double the performance of its predecessor in some benchmarks.
Asus has also tweaked the screen and is now finally offering a 120 Hz OLED display. This comes well calibrated out of the box and offers full DisplayP3 and DCI P3 coverage, meaning that this powerhouse may also be an excellent choice for media designers. The possibility of pen input also supports this notion, as well as the Asus Dial, which can be used to quickly access numerous functions in creative software. Lastly, the powerful graphics capabilities of the new Zenbook Pro 16X makes it interesting for gamers who are looking for a not-so-flashy laptop.
There are quite a few competitors to choose from here. At the lower end of the price scale is the Asus ROG Strix G16 G614JZ, which also comes with an RTX 4080 and an Intel Core i9, but does not have an OLED display. Instead, an excellent IPS panel is installed. The MSI Stealth 17 Studio A13VH-014, which is also equipped with an RTX 4080, is somewhat more geared towards creative use. The Lenovo Legion Pro 7 and the Asus ROG Zephyrus M16 are even better equipped, both coming with an RTX 4090.
We also compare downward with the Lenovo Legion Slim 7i 16 Gen 8 and the Asus Vivobook Pro 16X, as they are equipped with RTX 4070 and RTX 4060, respectively. Of course, last year's Zenbook Pro 16X is also included for comparison.
Possible competitors in comparison
Rating | Date | Model | Weight | Height | Size | Resolution | Price |
|---|---|---|---|---|---|---|---|
| 90.5 % v7 (old) | 11 / 2023 | Asus Zenbook Pro 16X UX7602BZ-MY005W i9-13905H, GeForce RTX 4080 Laptop GPU | 2.4 kg | 17.8 mm | 16.00" | 3200x2000 | |
| 88.4 % v7 (old) | 12 / 2022 | Asus ZenBook Pro 16X OLED UX7602ZM-ME115W i9-12900H, GeForce RTX 3060 Laptop GPU | 2.4 kg | 19.5 mm | 16.00" | 3840x2400 | |
| 88.4 % v7 (old) | 03 / 2023 | Asus ROG Strix G16 G614JZ i9-13980HX, GeForce RTX 4080 Laptop GPU | 2.4 kg | 30.4 mm | 16.00" | 2560x1600 | |
| 89.4 % v7 (old) | 03 / 2023 | Asus ROG Zephyrus M16 GU604VY-NM042X i9-13900H, GeForce RTX 4090 Laptop GPU | 2.3 kg | 22.9 mm | 16.00" | 2560x1600 | |
| 89.2 % v7 (old) | 04 / 2023 | MSI Stealth 17 Studio A13VH-014 i9-13900H, GeForce RTX 4080 Laptop GPU | 3 kg | 21.3 mm | 17.30" | 3840x2160 | |
| 88.8 % v7 (old) | 06 / 2023 | Lenovo Legion Pro 7 RTX4090 i9-13900HX, GeForce RTX 4090 Laptop GPU | 2.7 kg | 26 mm | 16.00" | 2560x1600 | |
| 90 % v7 (old) | 07 / 2023 | Lenovo Legion Slim 7i 16 Gen 8 i9-13900H, GeForce RTX 4070 Laptop GPU | 2.1 kg | 19.9 mm | 16.00" | 2560x1600 | |
| 86.2 % v7 (old) | 07 / 2023 | Asus Vivobook Pro 16X K6604JV-MX016W i9-13980HX, GeForce RTX 4060 Laptop GPU | 2.1 kg | 22.8 mm | 16.00" | 3200x2000 |
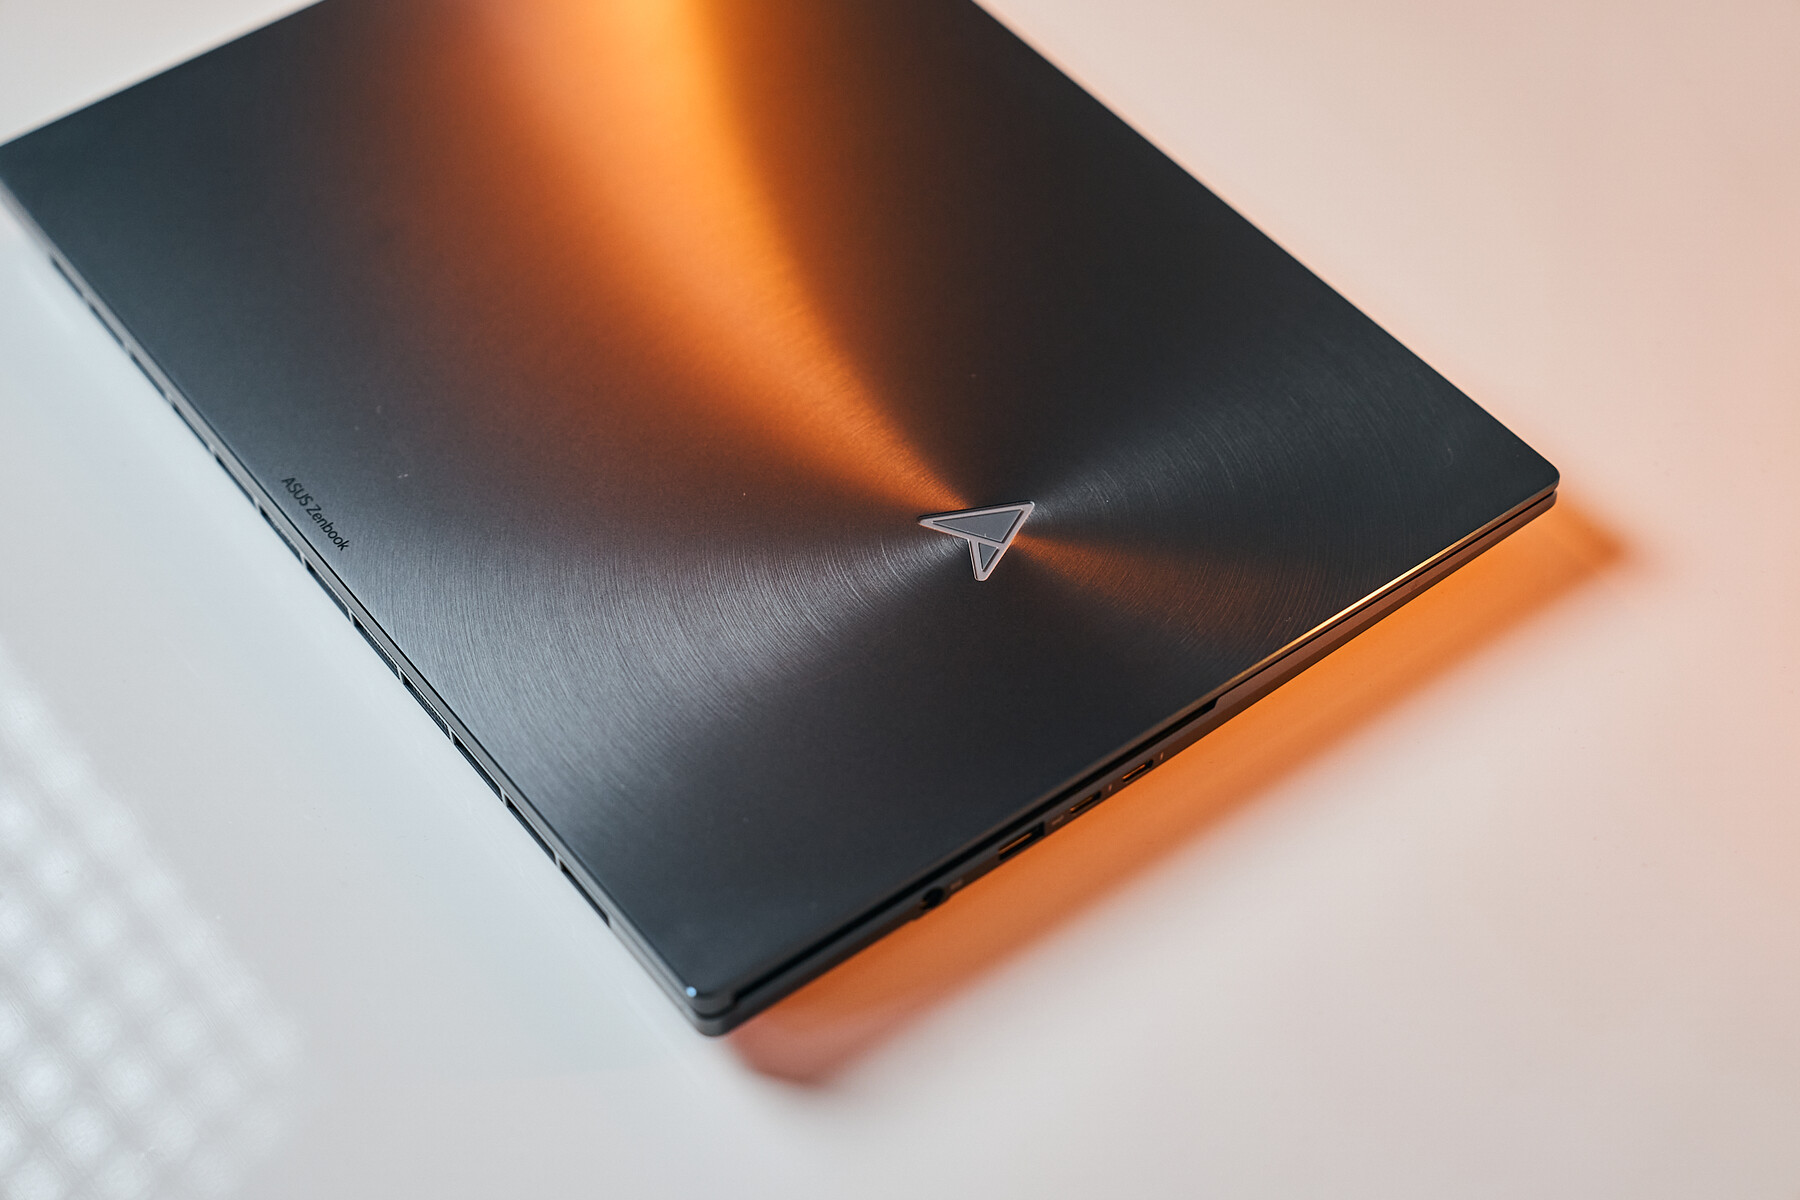
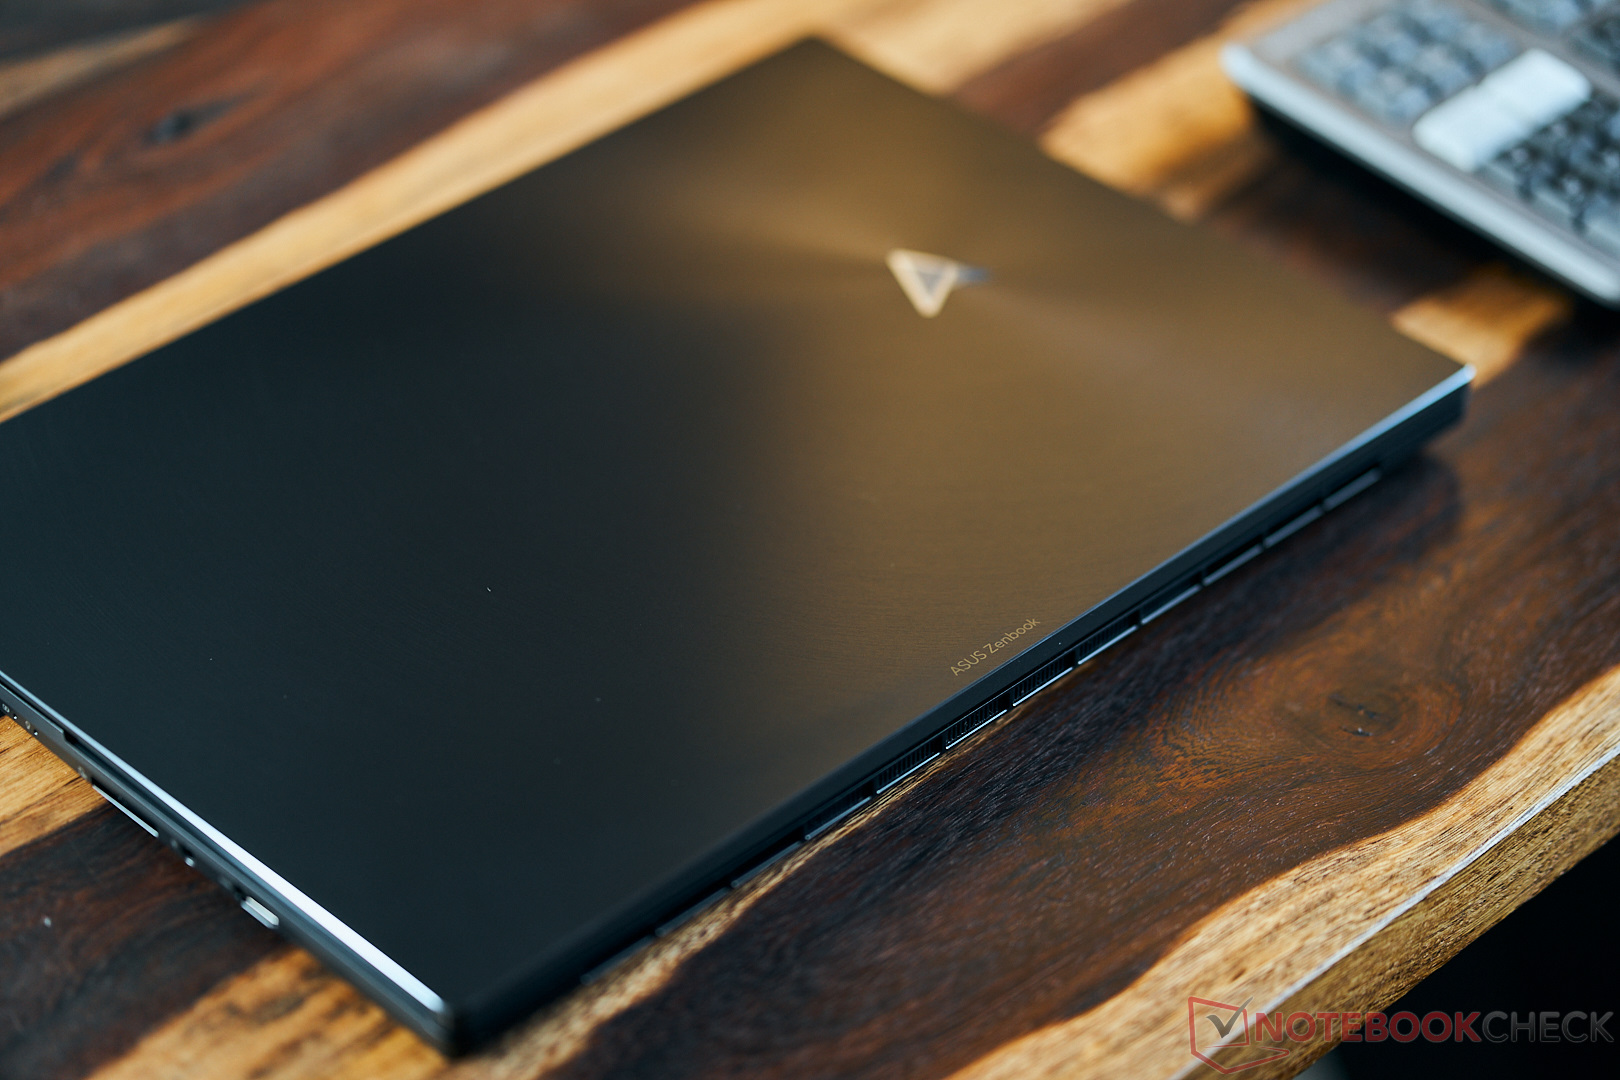
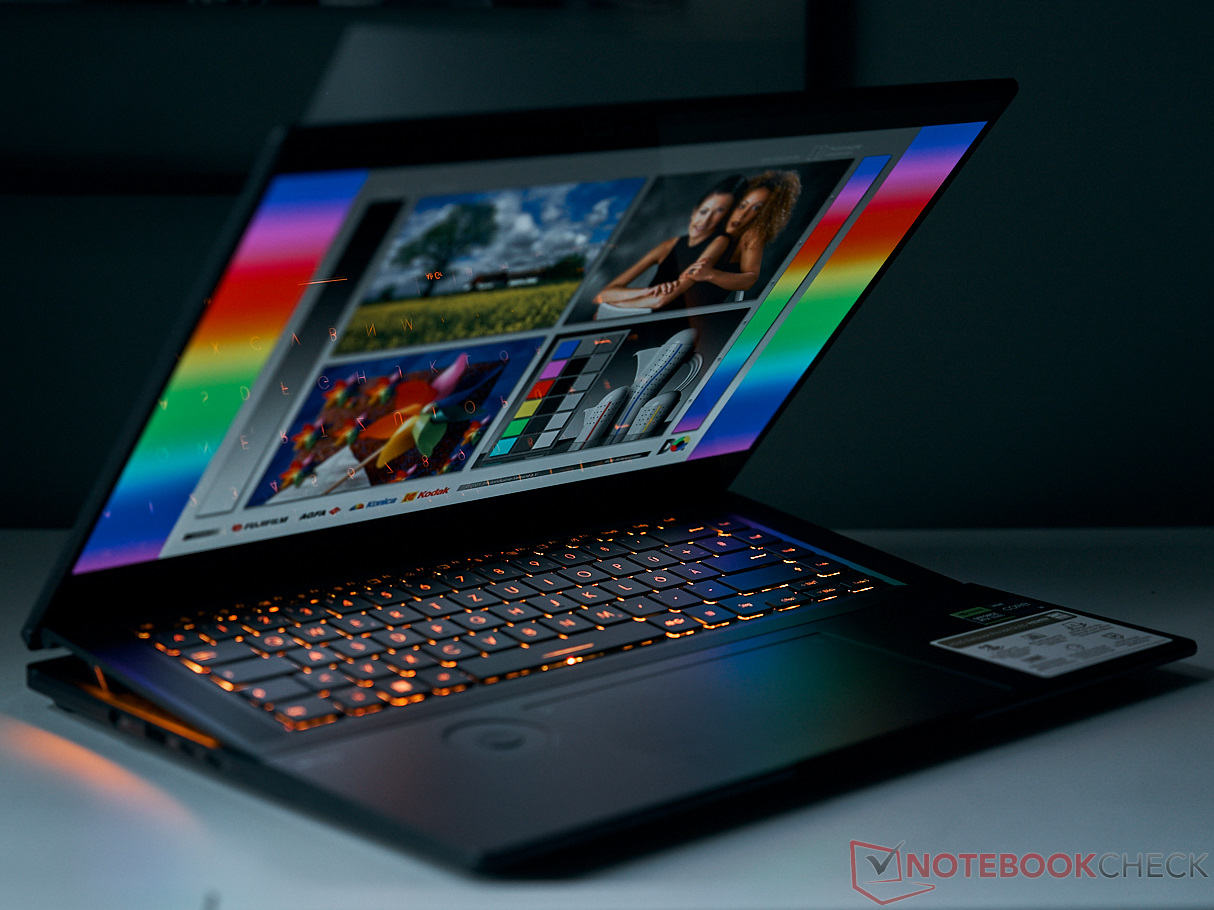
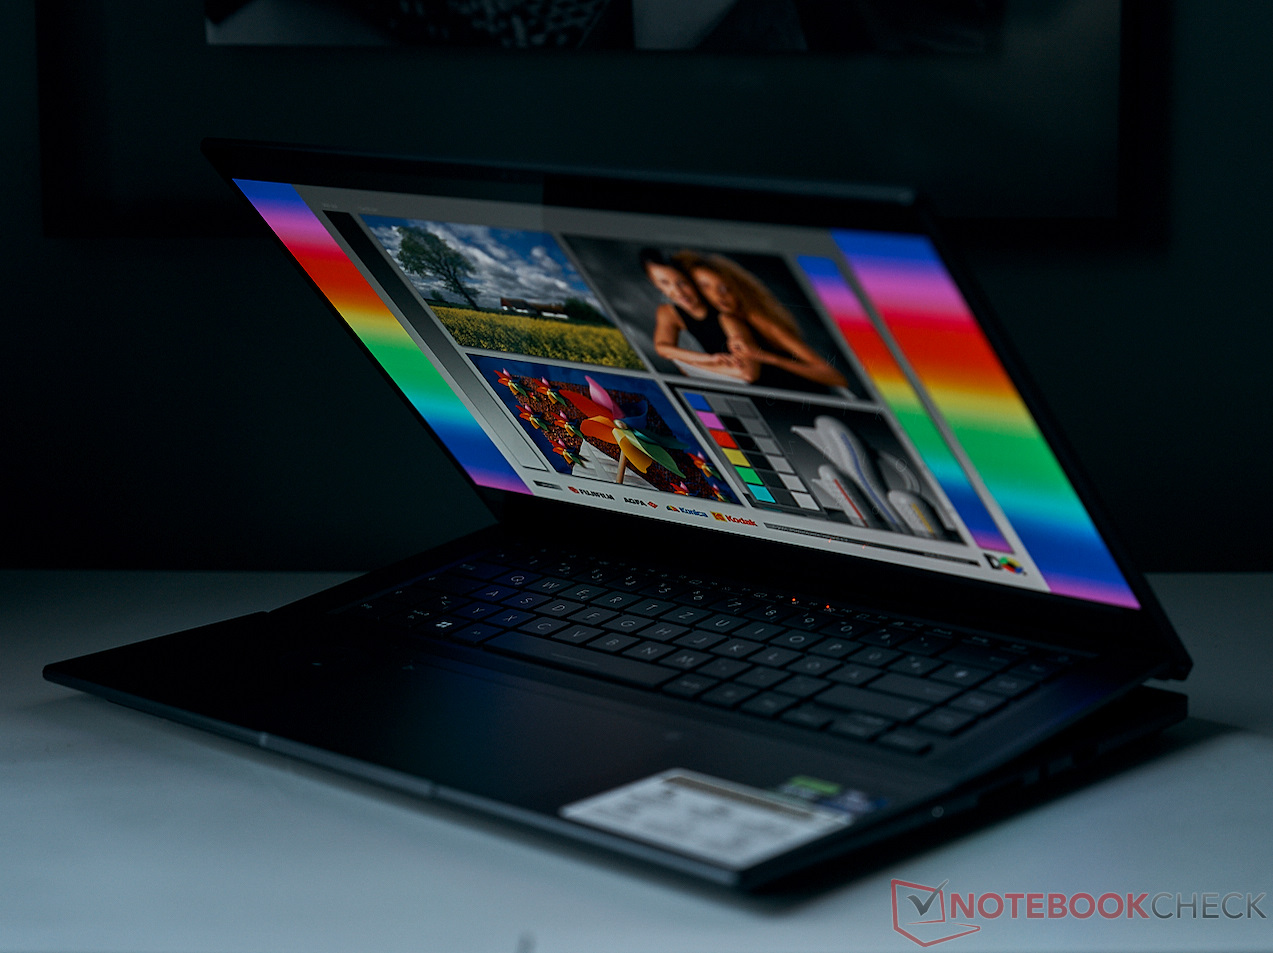
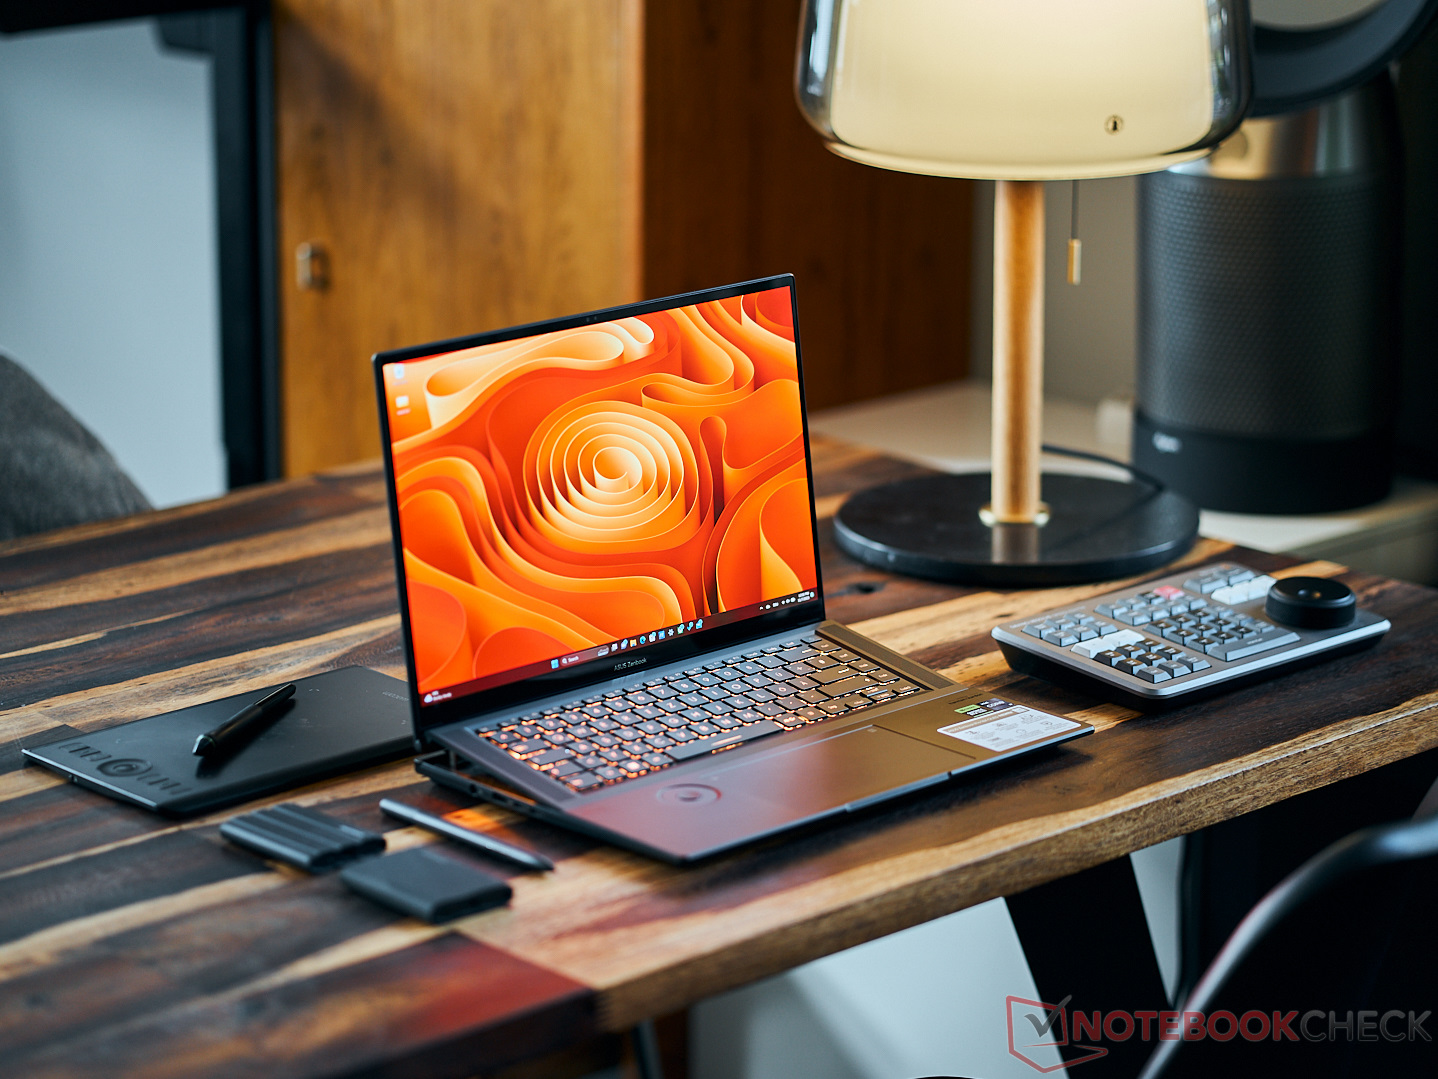
Case - A unique build made of light metal

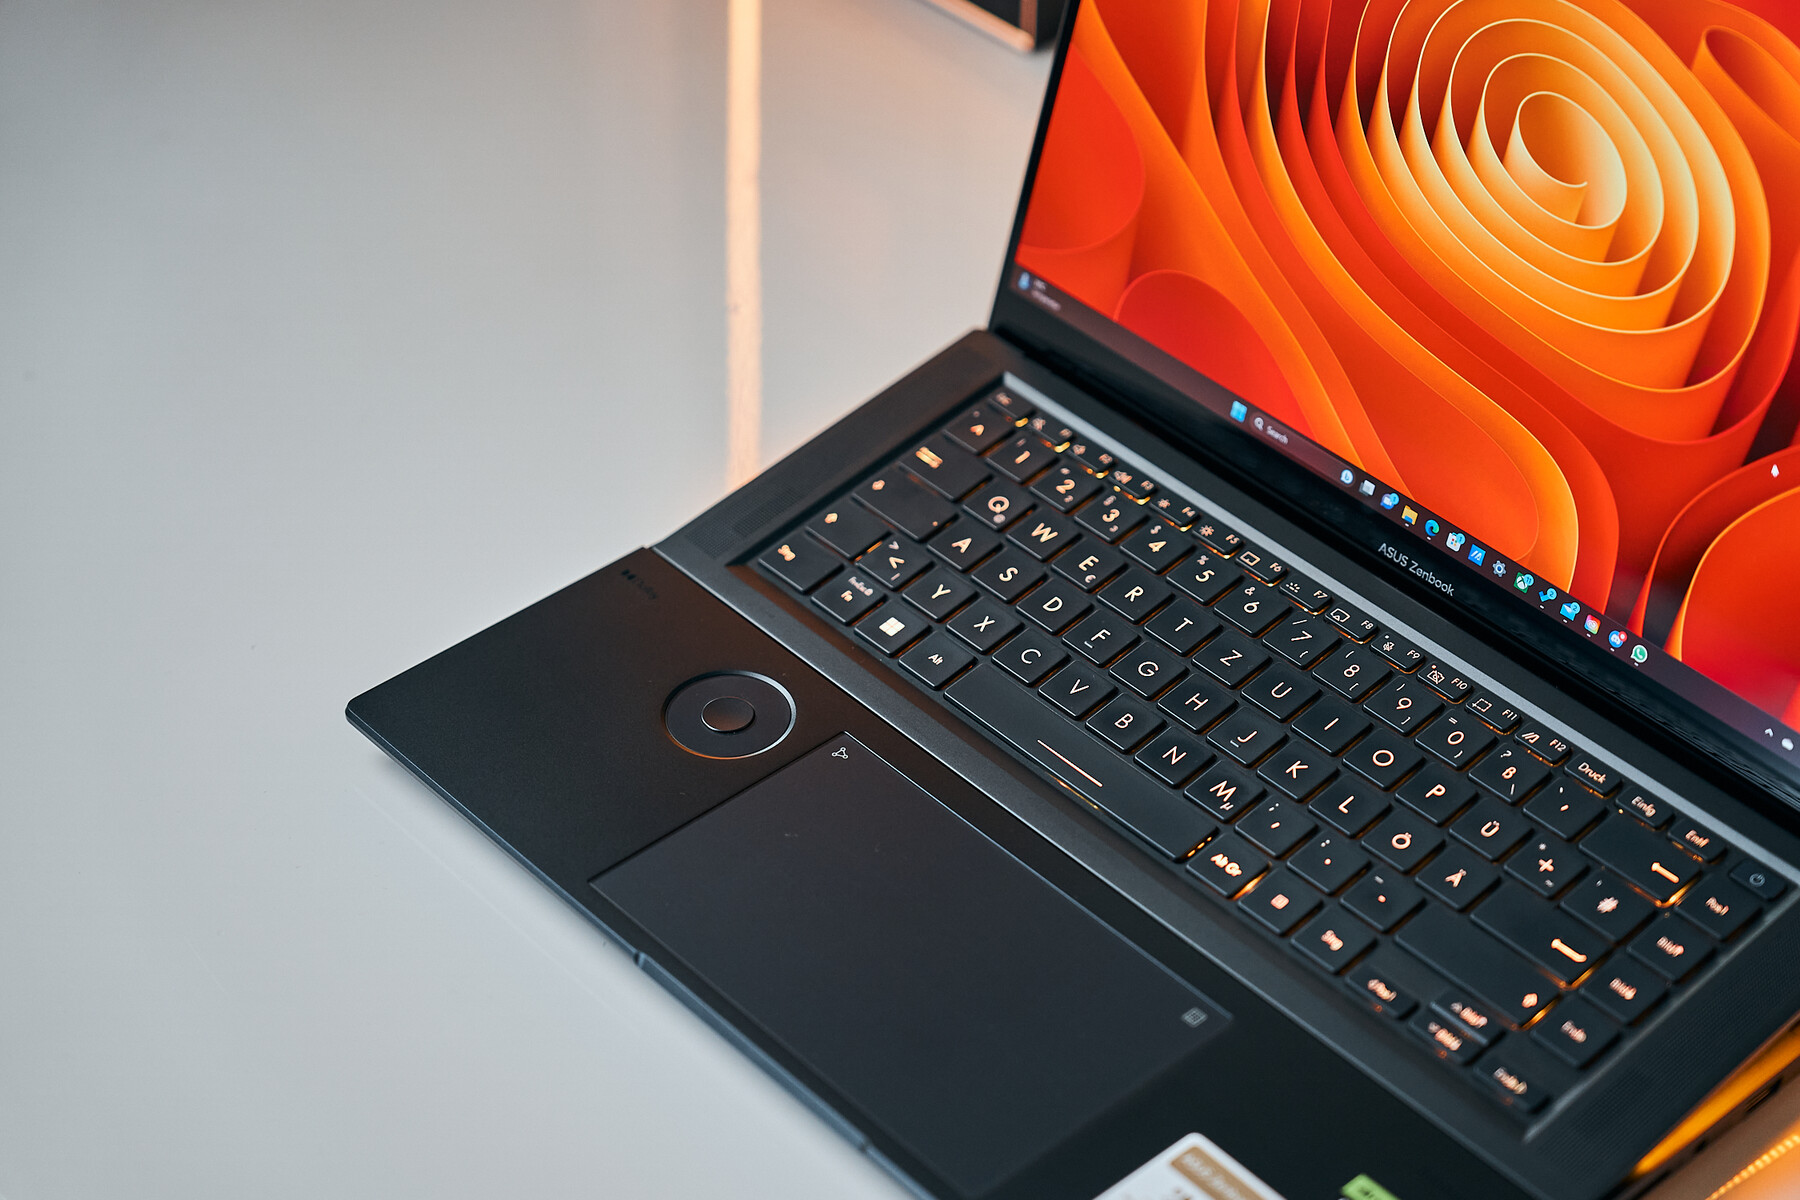
No significant changes appear to have been made to the case of the new Zenbook Pro 16x. At most, the keyboard is more distinctively colored. In our opinion, the stability of the hinges has improved slightly compared to the predecessor. The hinges in particular are elaborately designed because, when you open the laptop, the keyboard is raised by 2 cm at the back. Underneath, two fans draw in cold air, which Asus calls AAS Ultra Cooling. Another advantage of the propped-up keyboard is that it remains very cool, as there is no direct temperature conduction between the warm hardware and the keyboard.
Glass and metal distinguish the haptics of the Zenbook Pro 16X. Only the housing of the keyboard unit is made of plastic. Overall, the laptop feels stable, doesn't creak when twisted and is of excellent workmanship.
Discreet RGB lighting also adorns the laptop. Controllable LEDs are located under the keyboard and in the logo on the lid. The keys can also be individually illuminated. Asus manages a decent balancing act between a discreet appearance and trendy RGB, which you would otherwise expect from eye-catching gaming laptops.

At just over 2 kg, our test device lands in the middle of the comparison field. In terms of size and thickness, only the 3 kg MSI Stealth 17 Studio stands out among most competitors. However, when it comes to the thinnest possible device, the Lenovo Legion Slim and our Zenbook have no competition.
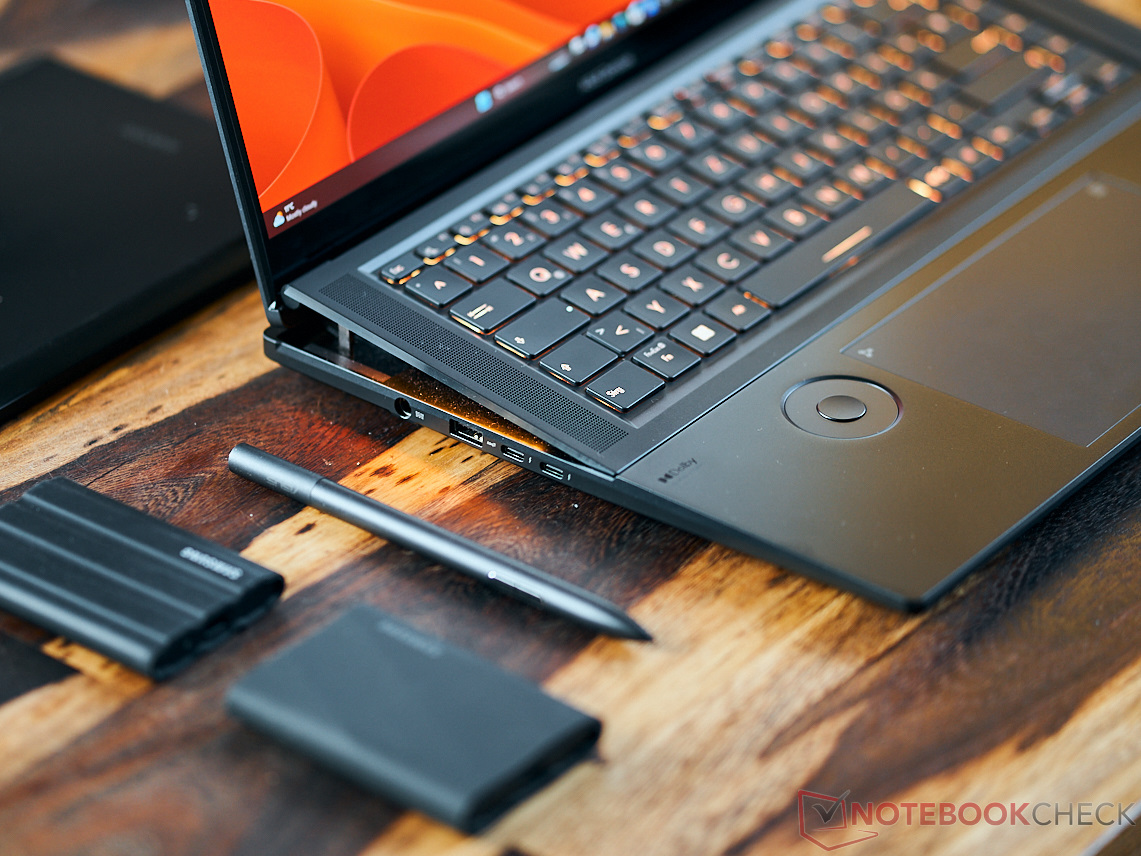
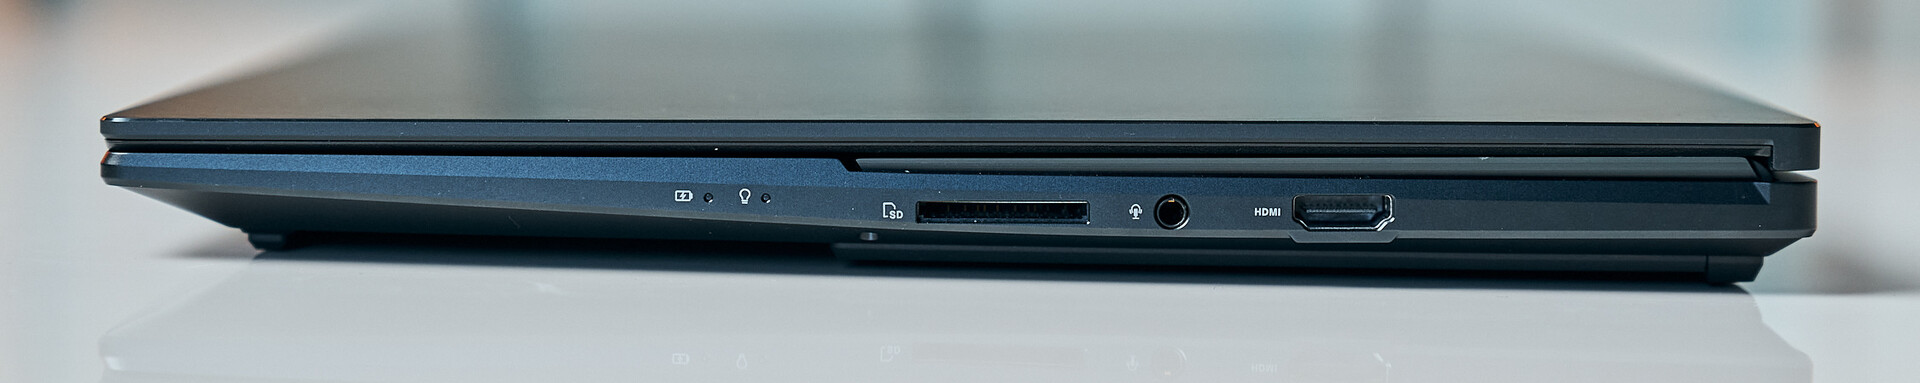
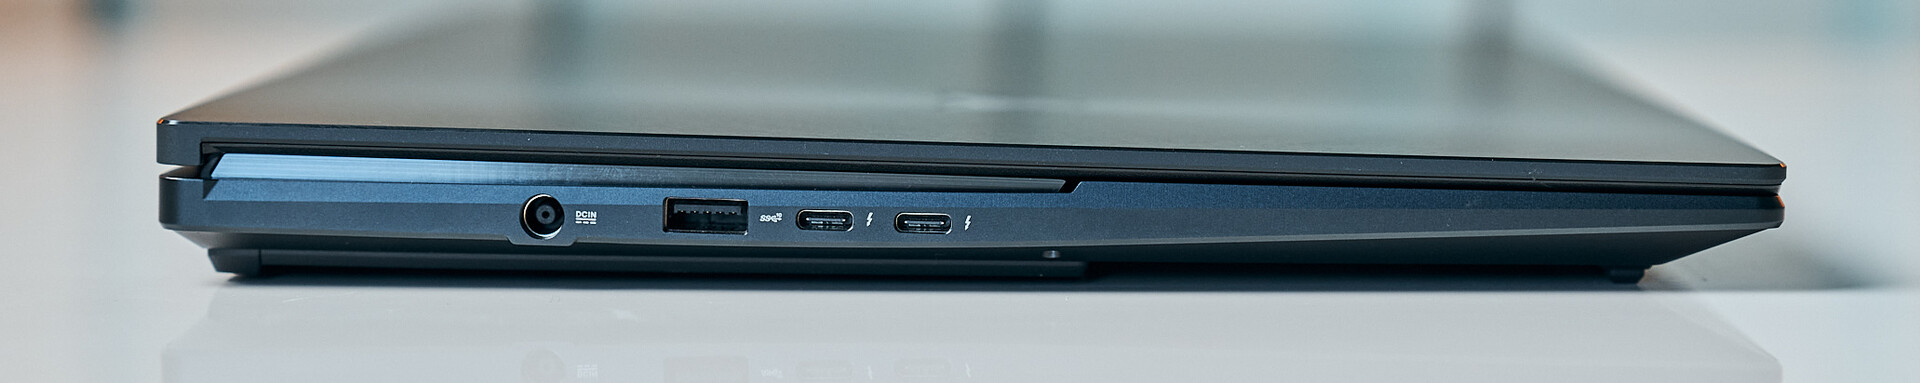
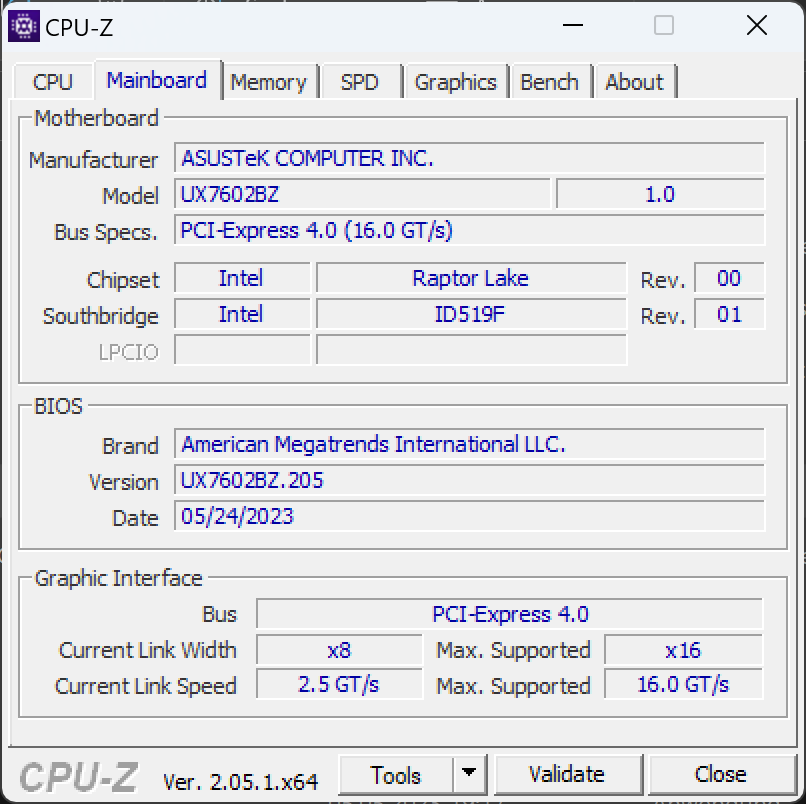
Equipment - Three USB ports are quite few despite Thunderbolt
One point of criticism about the predecessor was the poor connectivity. Unfortunately, nothing has changed here: USB ports are only available on the left-hand side of the laptop, while the HDMI and audio ports as well as the not particularly fast card reader are on the right-hand side.
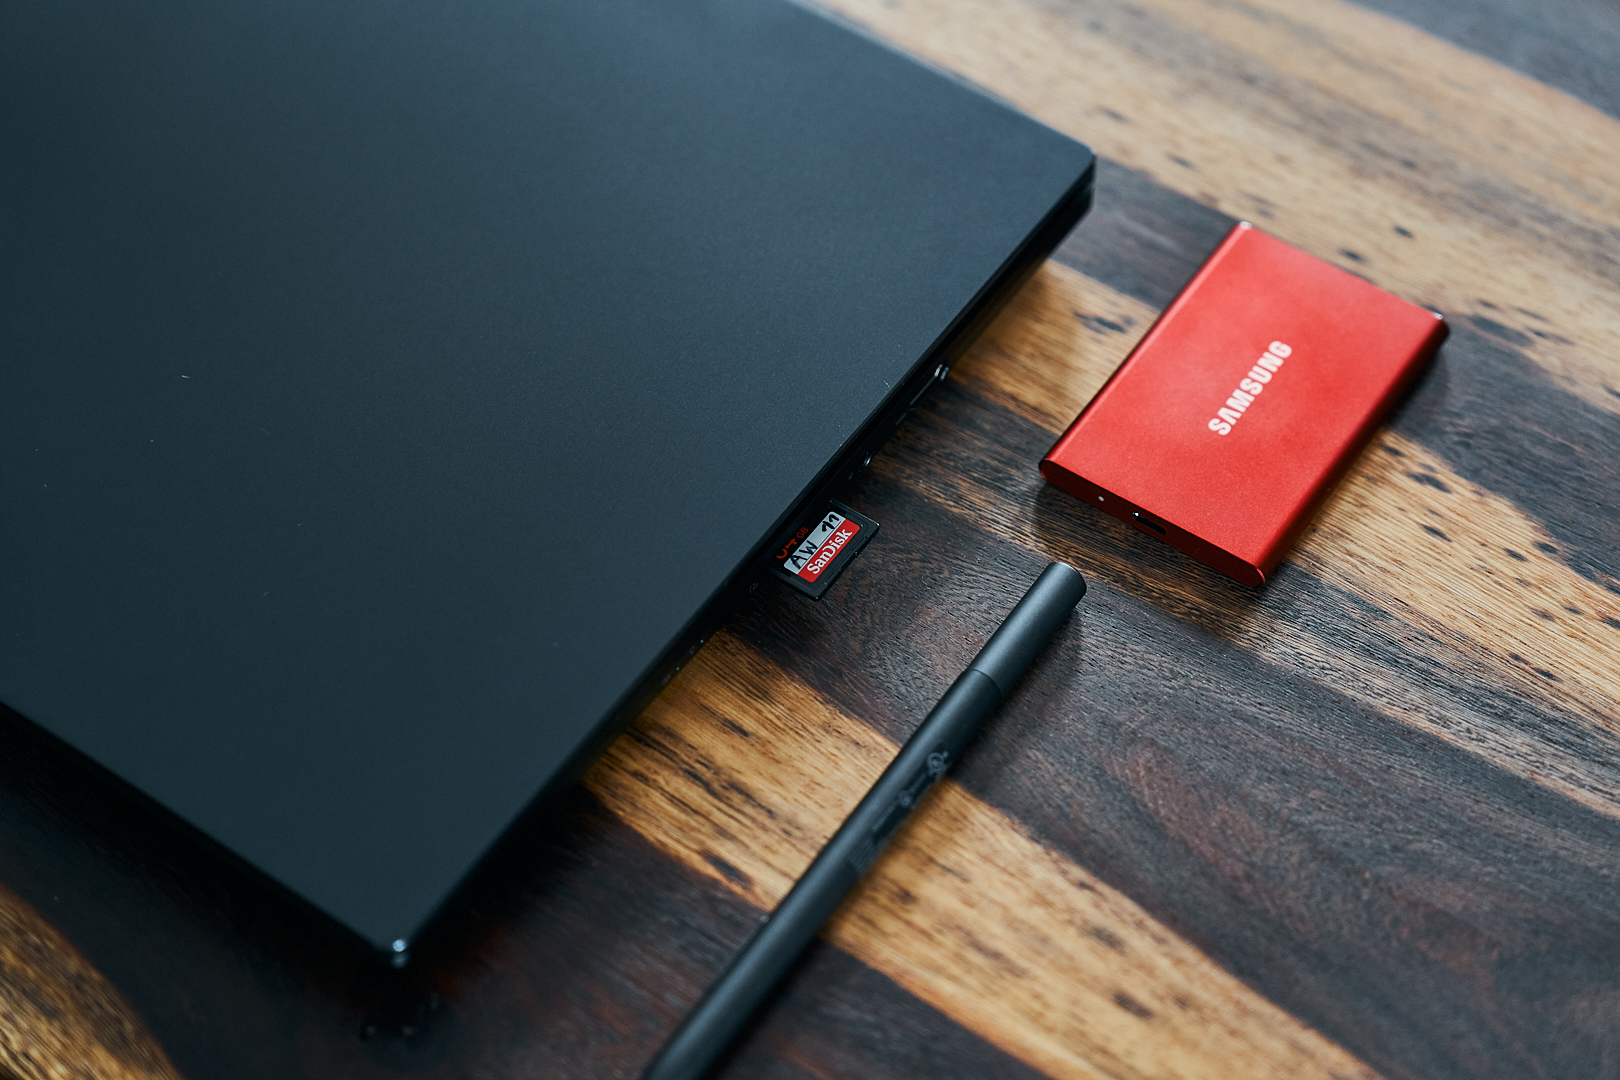
SD Card Reader
Using our AV PRO microSD, the transfer speeds have increased slightly compared to the predecessor, but the laptop is still unable to manage 100 MB/s in reading. If our 128 GB card was completely filled with pictures, we would likely have to wait a good 20 minutes for a full transfer.
| SD Card Reader | |
| average JPG Copy Test (av. of 3 runs) | |
| Asus ROG Zephyrus M16 GU604VY-NM042X | |
| Average of class Gaming (20.9 - 210, n=54, last 2 years) | |
| Asus Vivobook Pro 16X K6604JV-MX016W | |
| Asus Zenbook Pro 16X UX7602BZ-MY005W | |
| Lenovo Legion Slim 7i 16 Gen 8 (Toshiba Exceria Pro SDXC 64 GB UHS-II) | |
| Asus ZenBook Pro 16X OLED UX7602ZM-ME115W (AV Pro SD microSD 128 GB V60) | |
| MSI Stealth 17 Studio A13VH-014 | |
| maximum AS SSD Seq Read Test (1GB) | |
| Asus ROG Zephyrus M16 GU604VY-NM042X | |
| Average of class Gaming (25.5 - 261, n=51, last 2 years) | |
| Asus Vivobook Pro 16X K6604JV-MX016W | |
| Lenovo Legion Slim 7i 16 Gen 8 (Toshiba Exceria Pro SDXC 64 GB UHS-II) | |
| Asus Zenbook Pro 16X UX7602BZ-MY005W | |
| Asus ZenBook Pro 16X OLED UX7602ZM-ME115W (AV Pro SD microSD 128 GB V60) | |
| MSI Stealth 17 Studio A13VH-014 | |
Communication
Despite three WLAN antennas with a smart switch, we only saw average transmission speeds when connected to our Asus ROG AX11000 reference router. Those needing a stable network connection can also use the included LAN adapter.
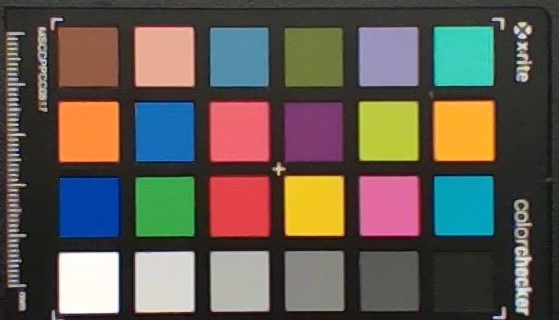
Webcam
The built-in Windows Hello-capable webcam on the Zenbook is relatively good and has a resolution of 1920 × 1080. Color deviations, contrast and sharpness are okay, but not exceptional.


Security
The Zenbook Pro 16X is equipped with a fingerprint scanner and facial recognition. Both work quickly and smoothly. The usual various security features of modern processors are also available. TPM 2.0 and SecureBoot are on board.
Accessories
In addition to the laptop and a matching 280-watt power supply, a protective case and the Asus Pen 2.0 are included. There is also a corresponding charging cable and three replacement tips. An RJ45 USB-C adapter is also supplied so that the laptop can be connected to the network via cable. Last but not least, the packaging of the Zenbook should not be forgotten - it is particularly stylish and can be used as a laptop stand.
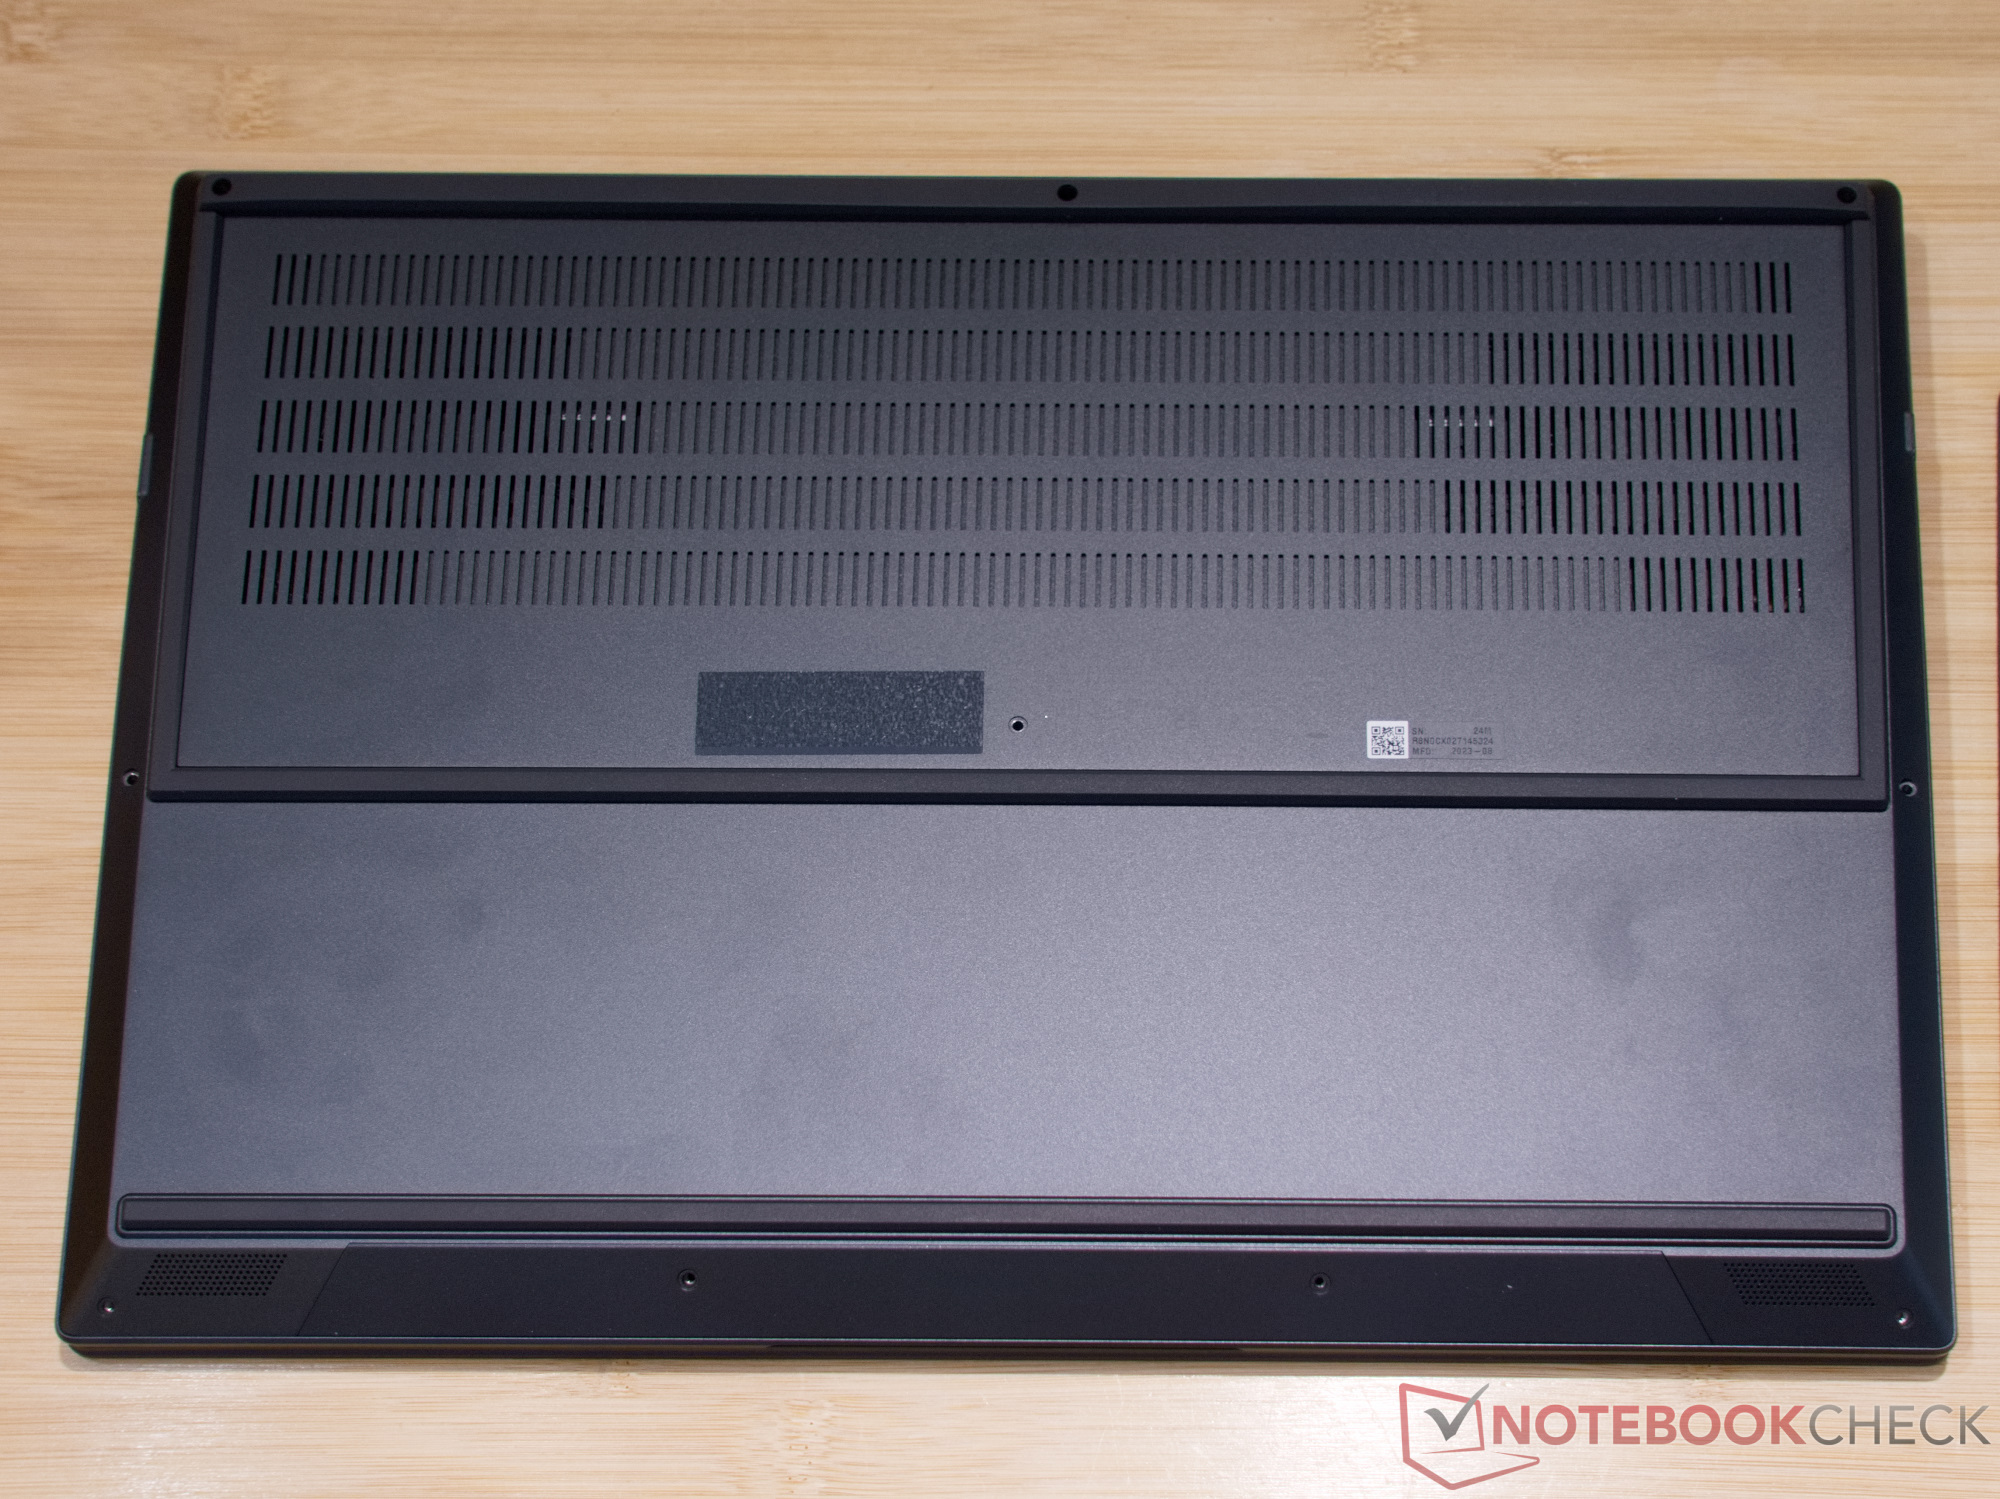
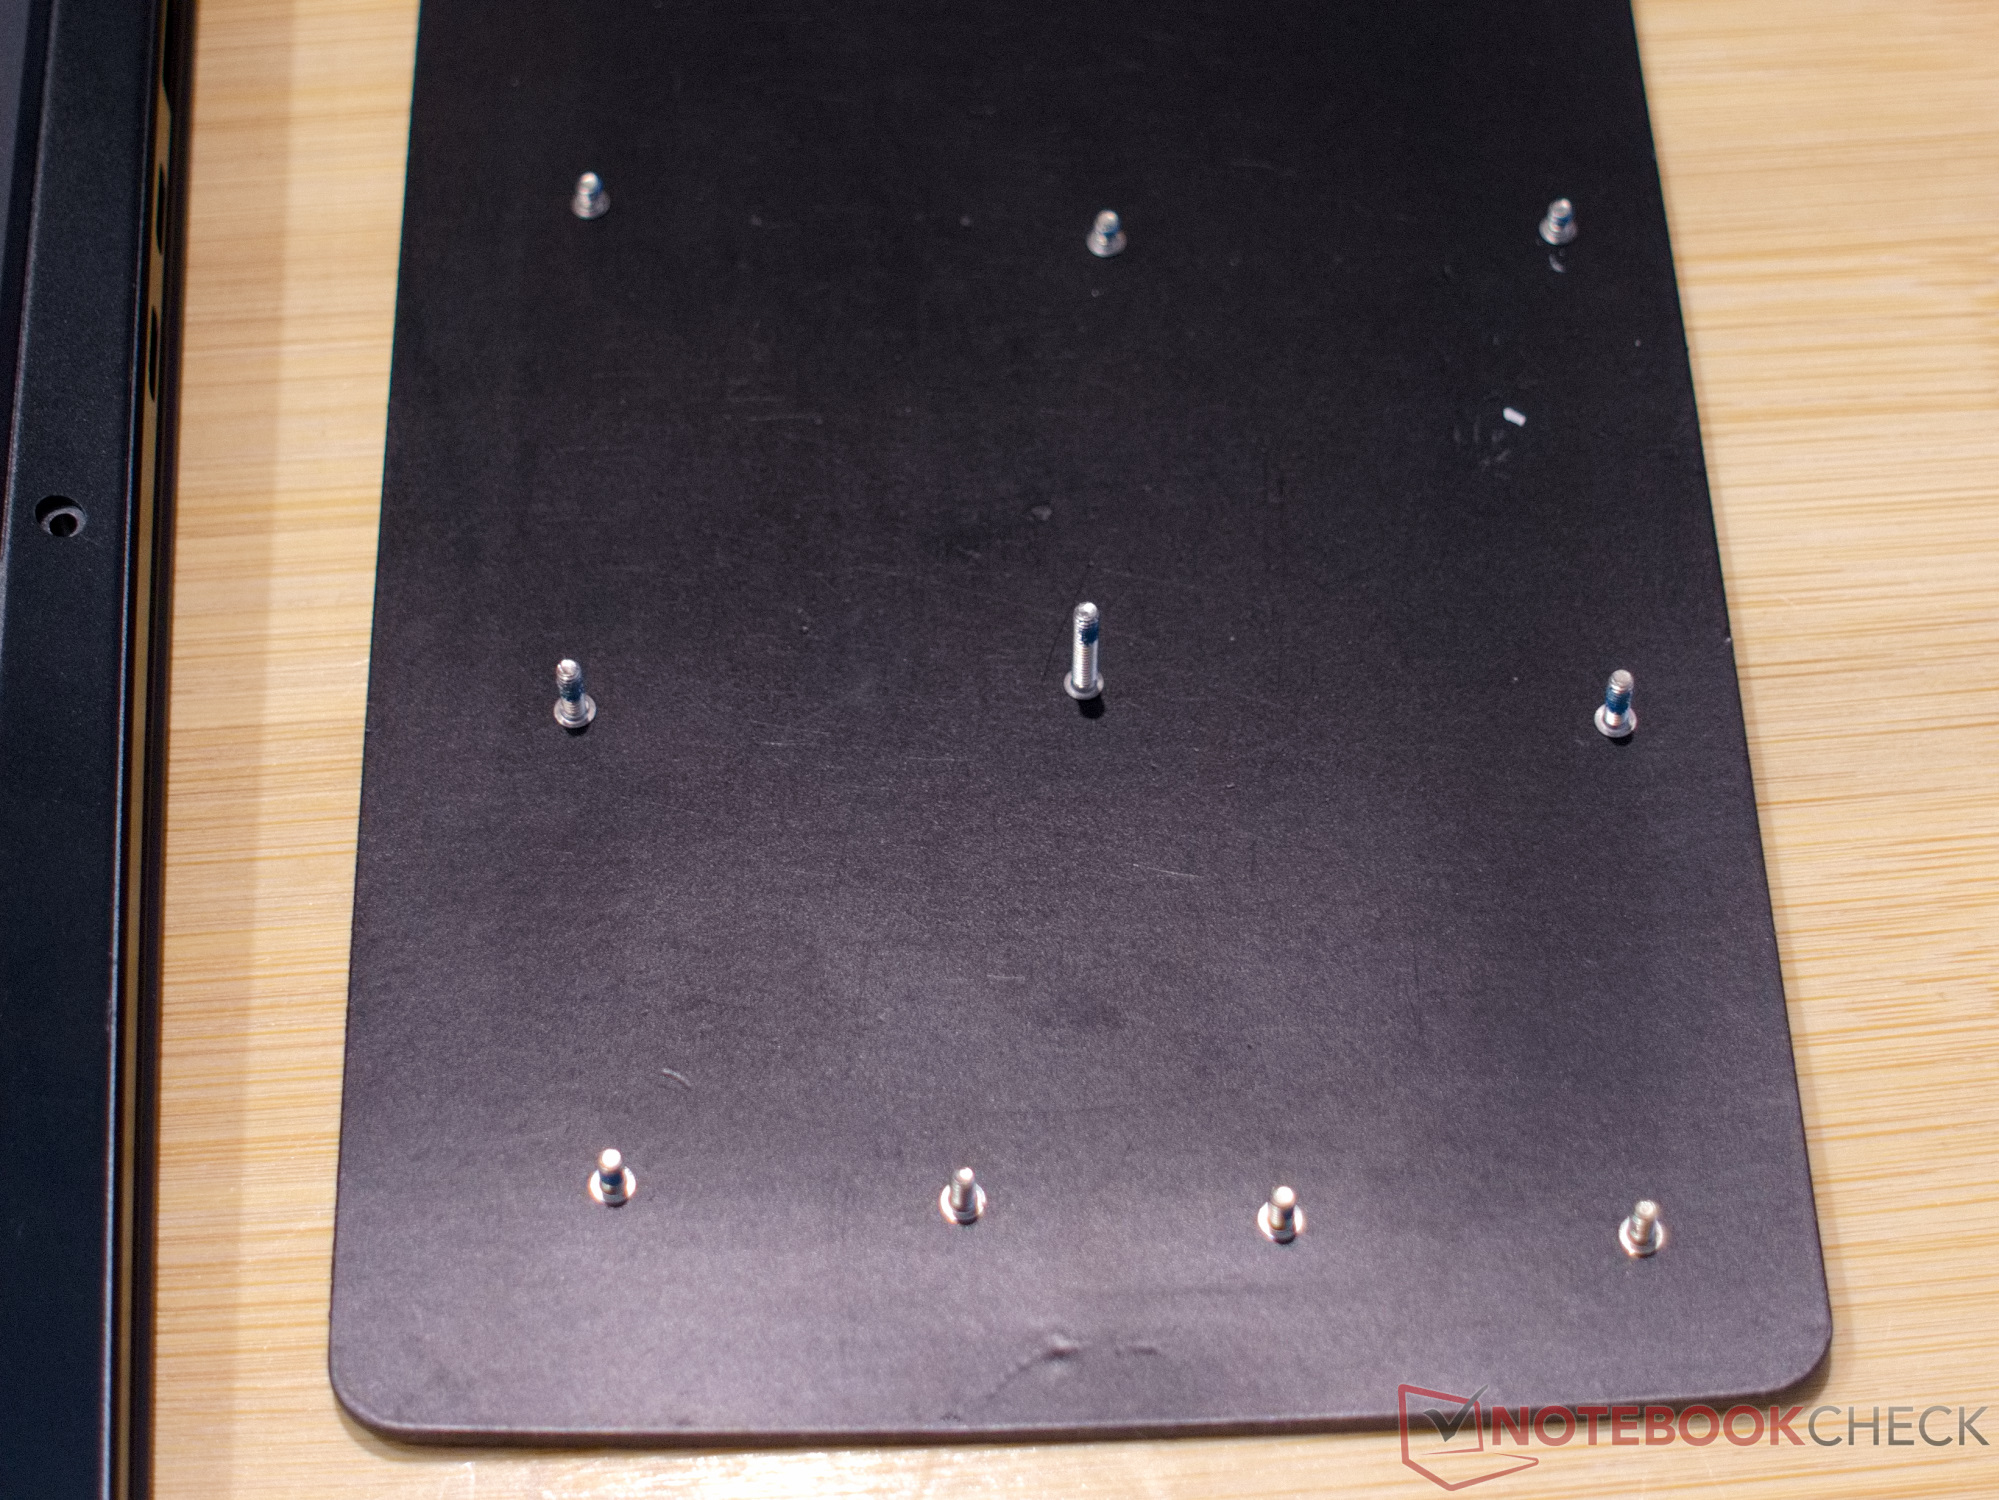
Maintenance
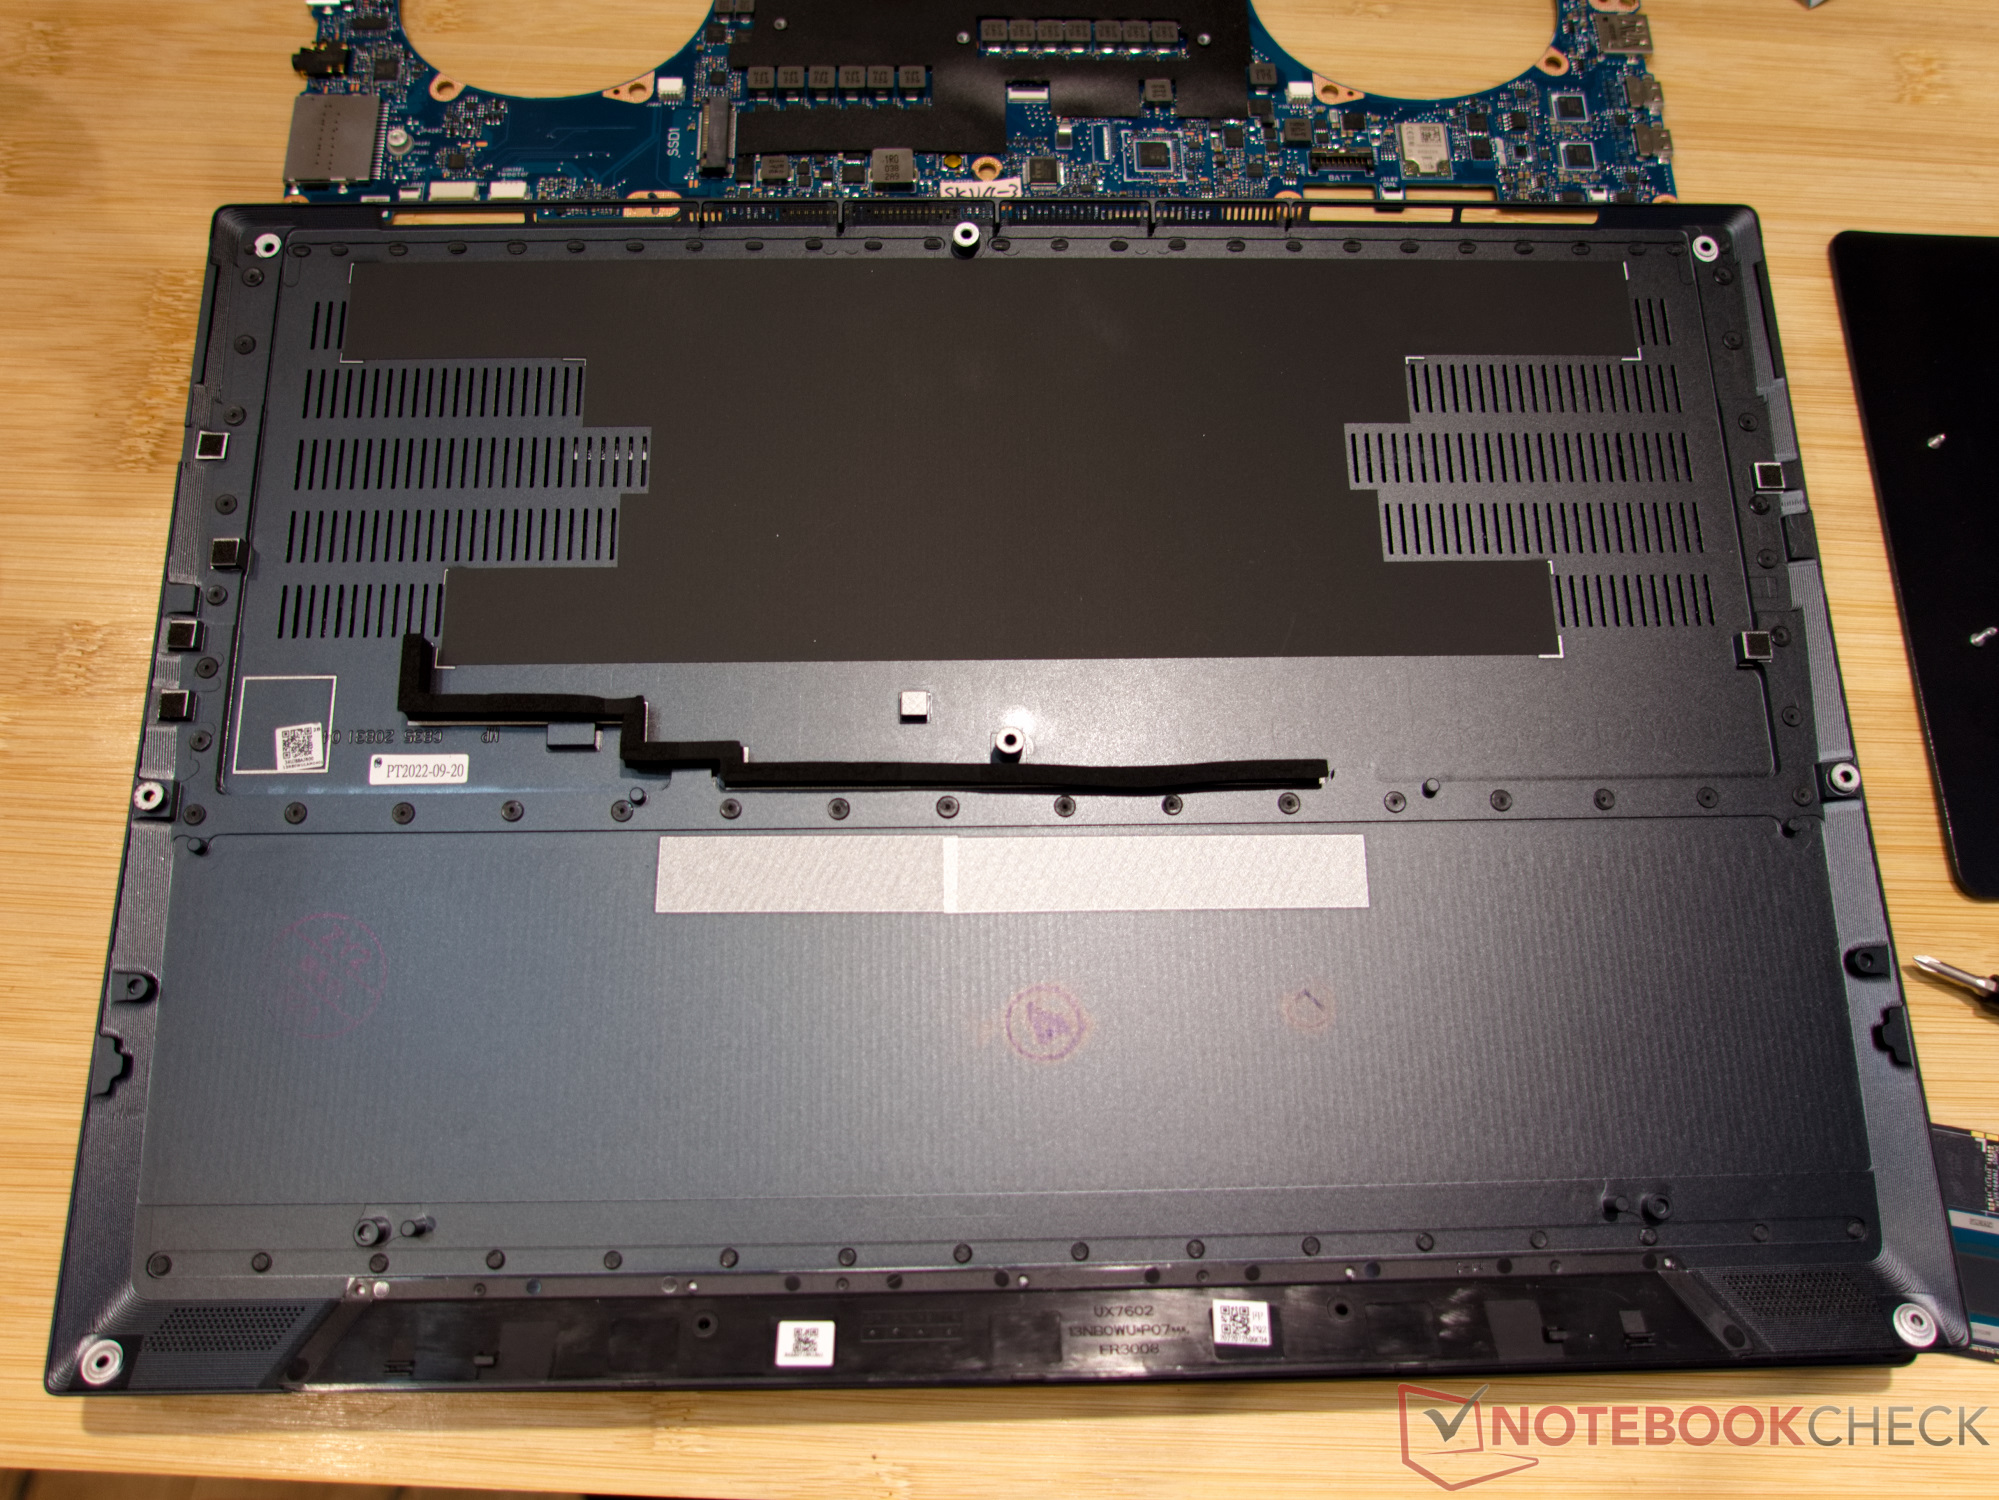
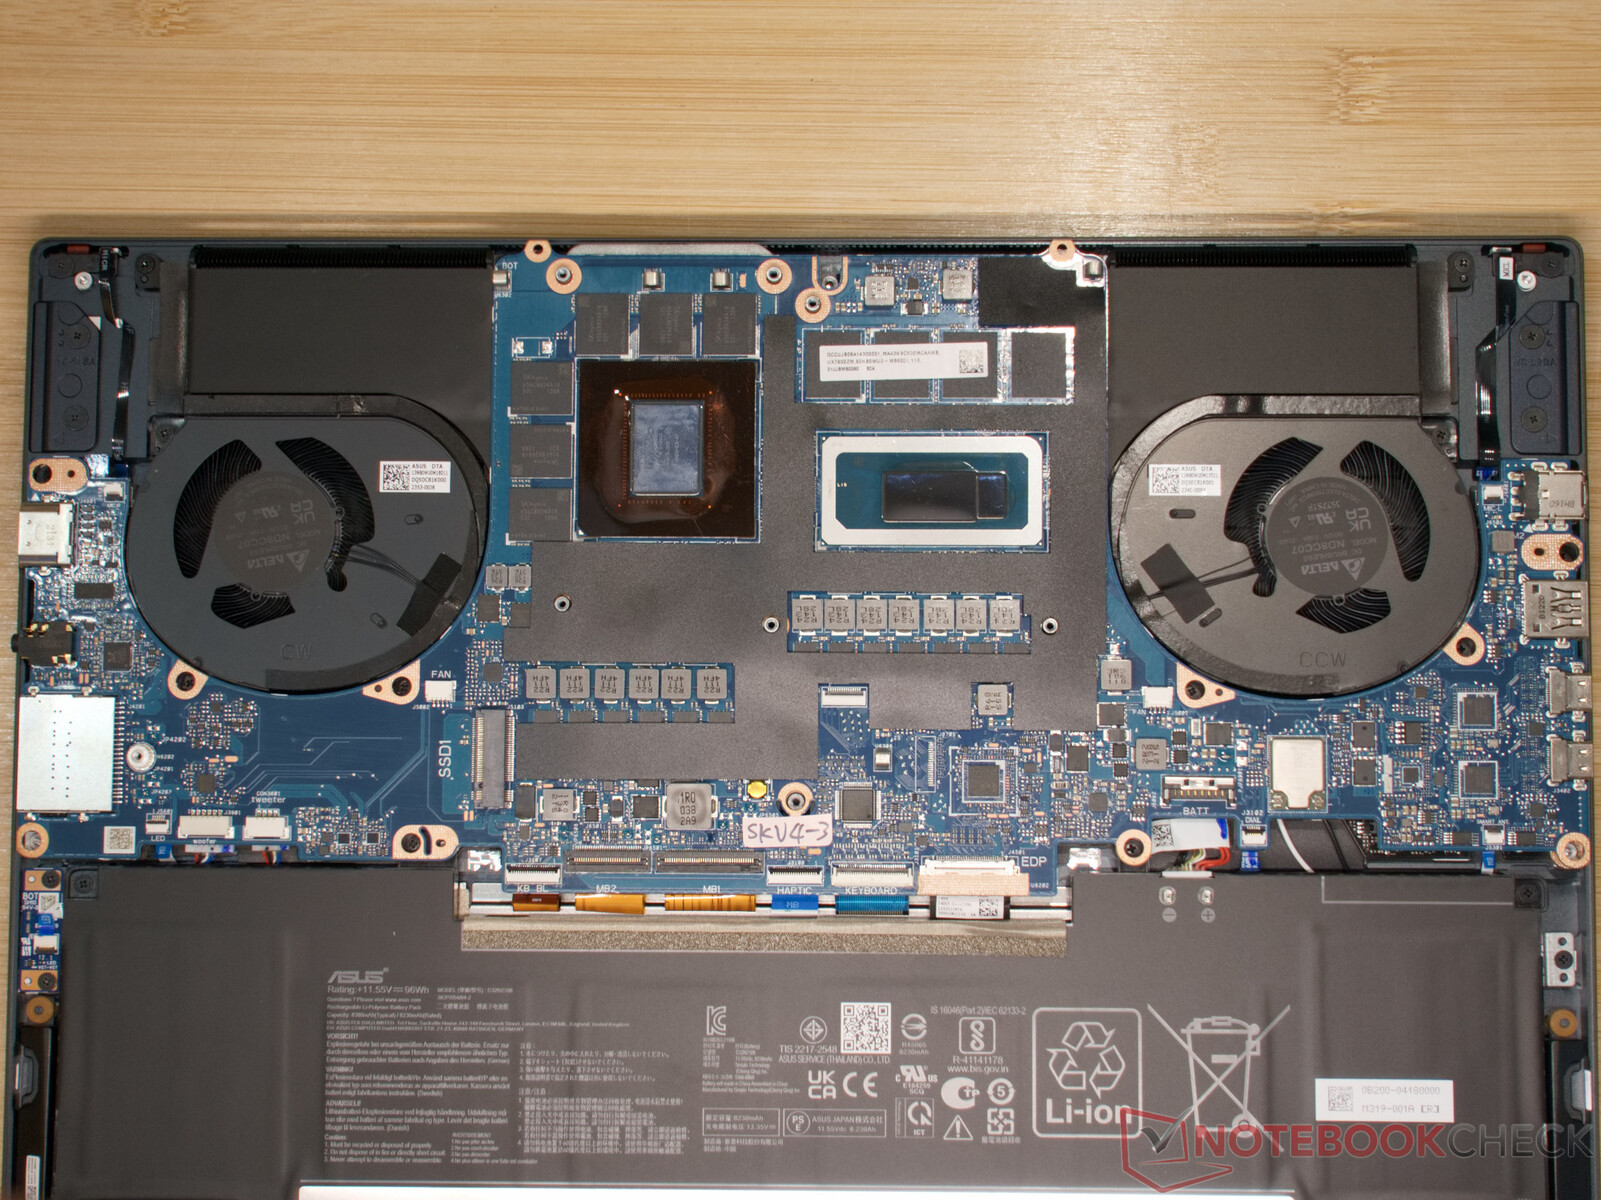
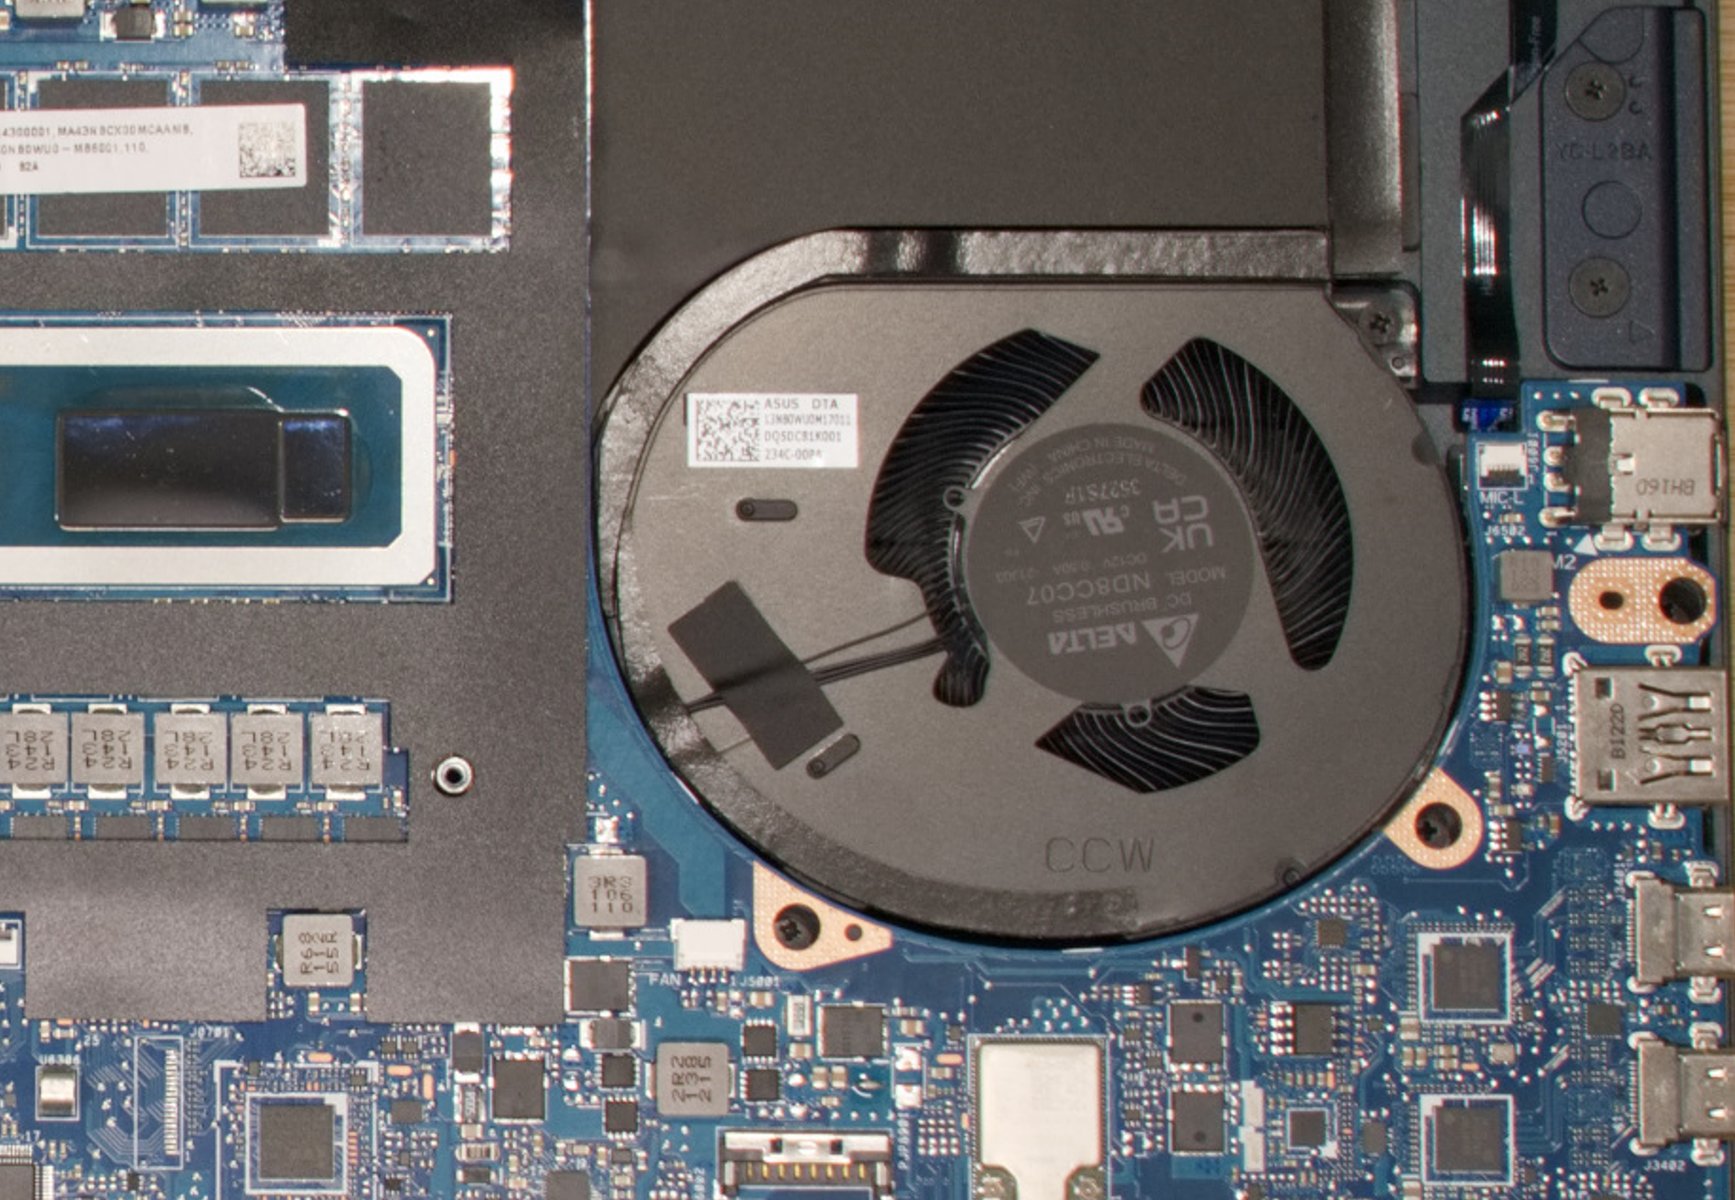
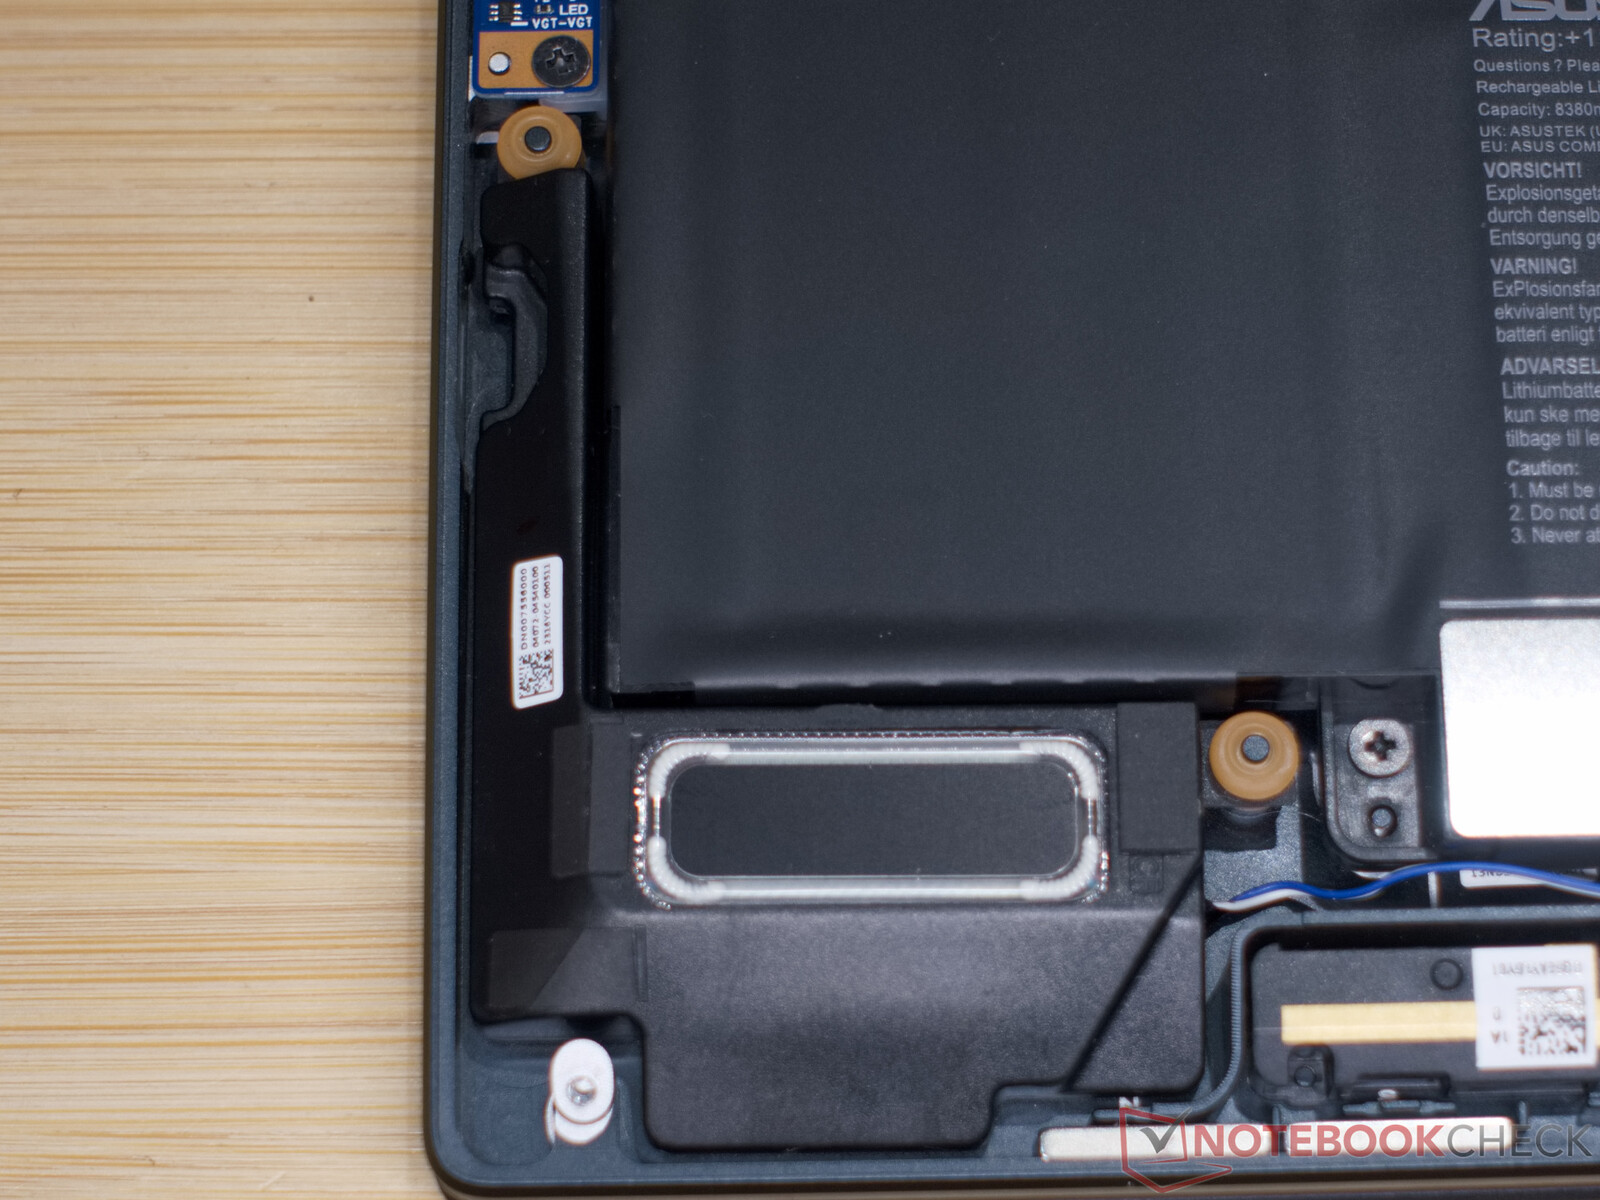
Ten screws in four different lengths keep the base plate securely fixed in place. Owners should thus note the locations of individual screws when unscrewing. Otherwise, not much effort is required to get inside the laptop. There are no clips or clamps and the base plate can be easily removed without the screws.
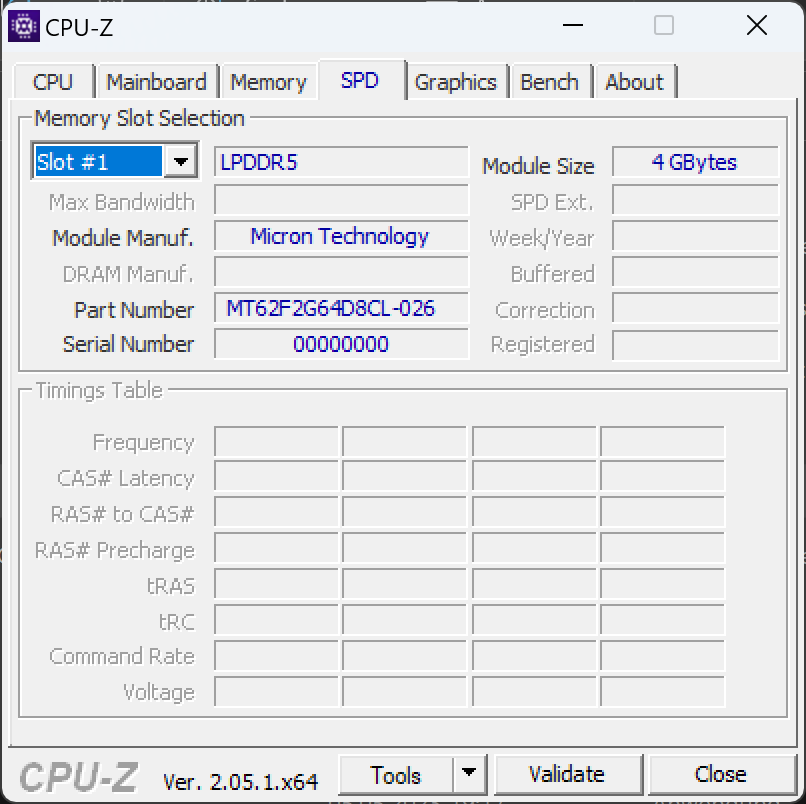
Inside, there is a replaceable SSD, while the RAM and WLAN module are soldered. The Zenbook is therefore not really user-friendly in terms of repair or maintenance.
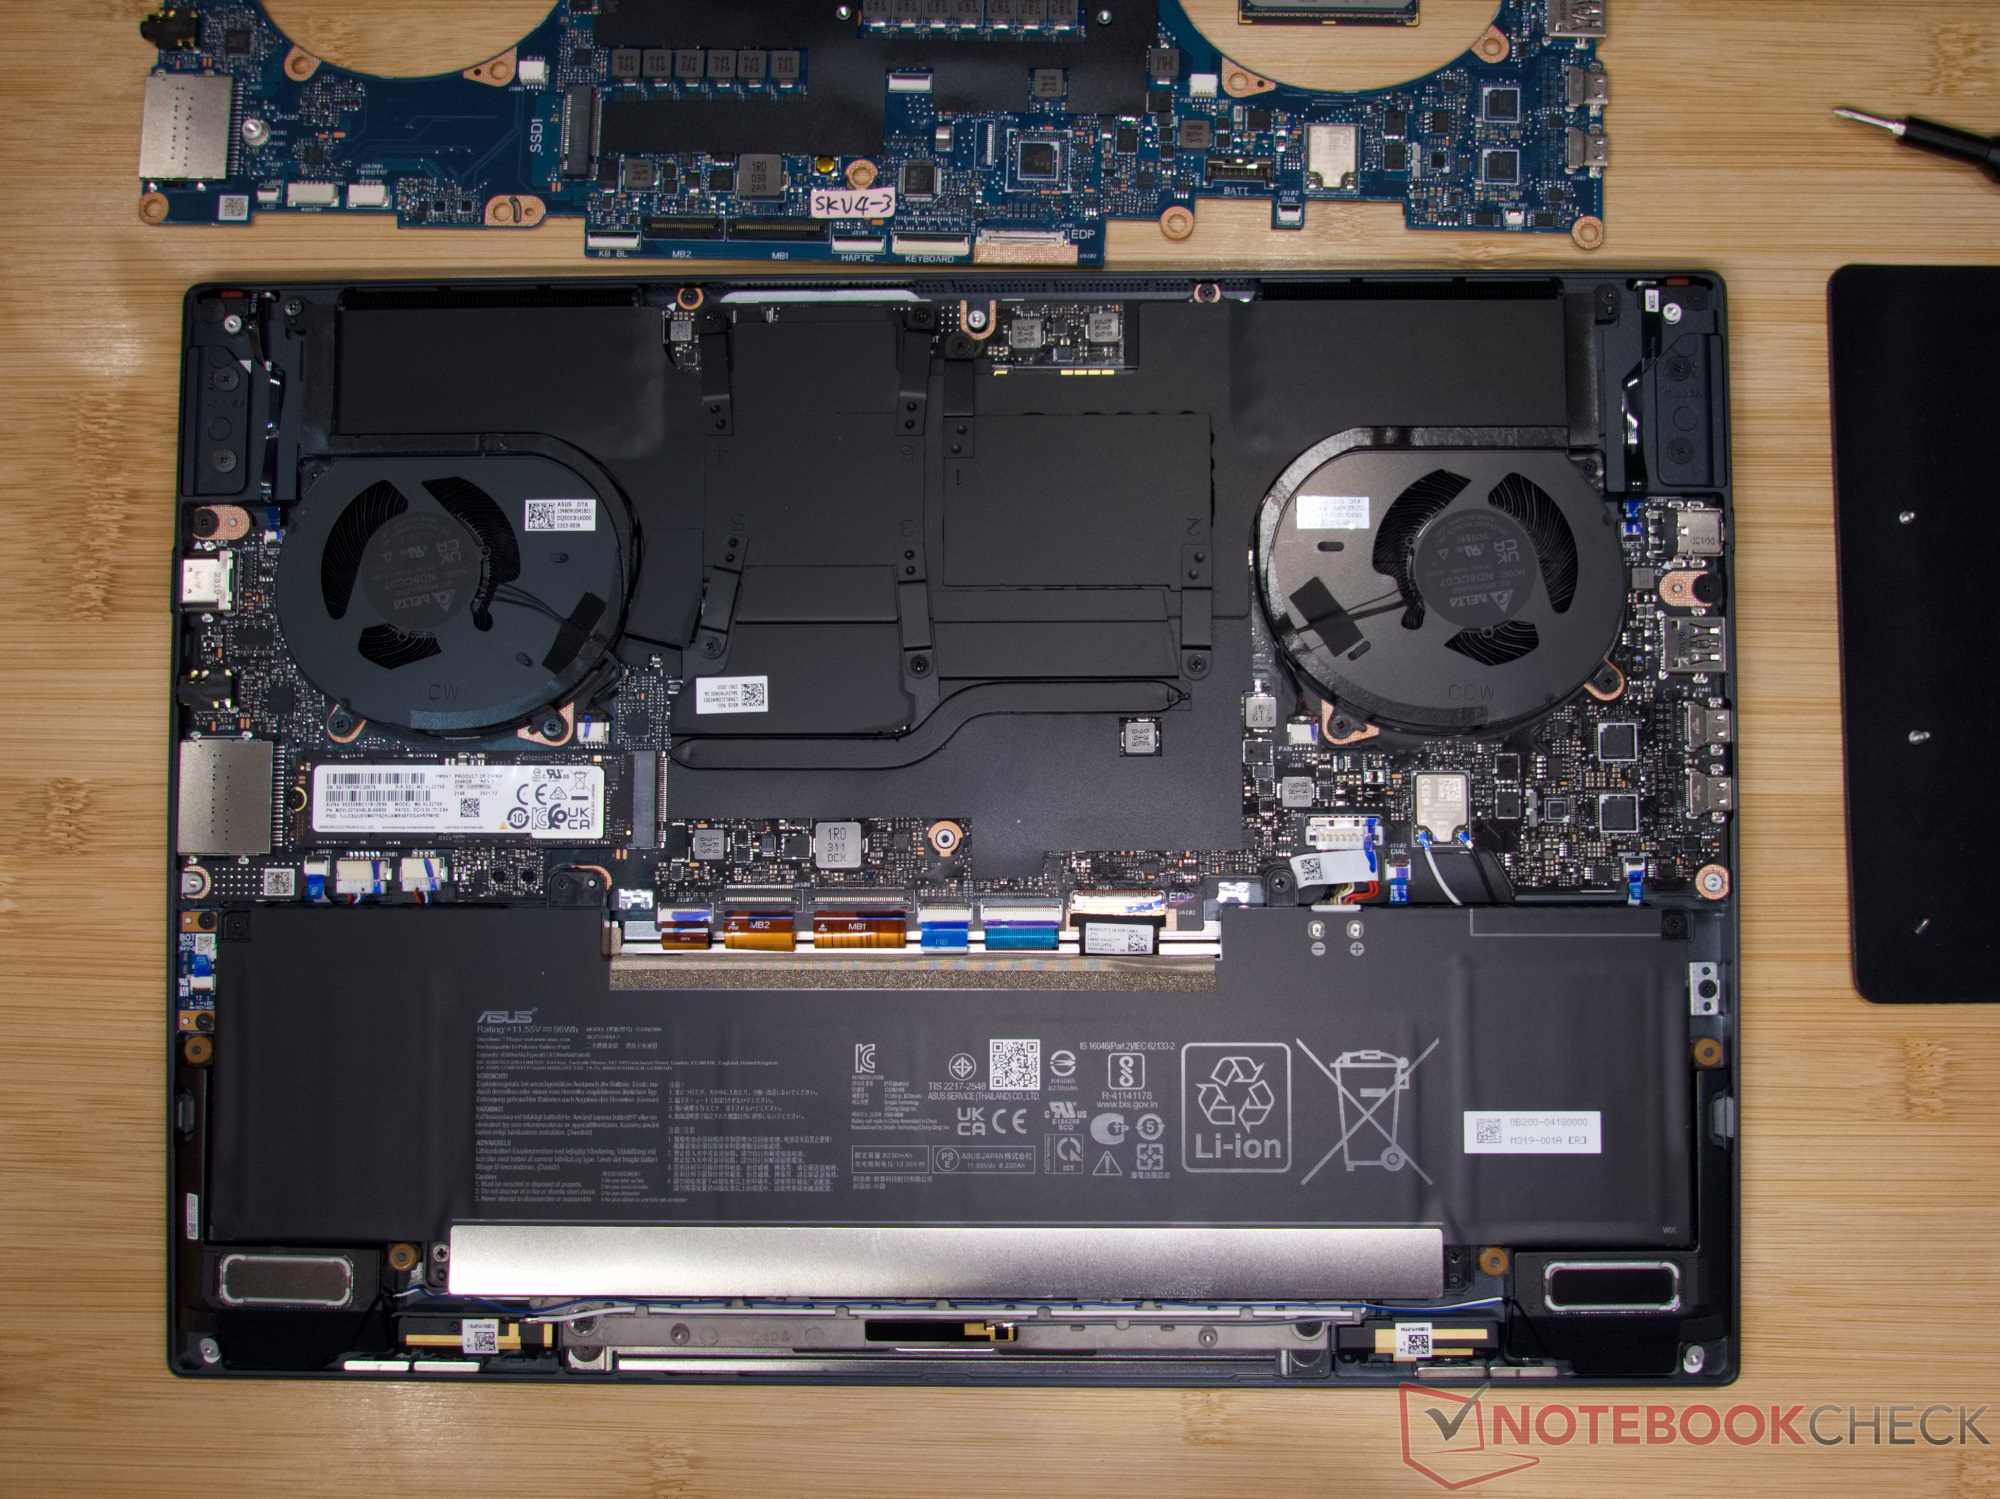
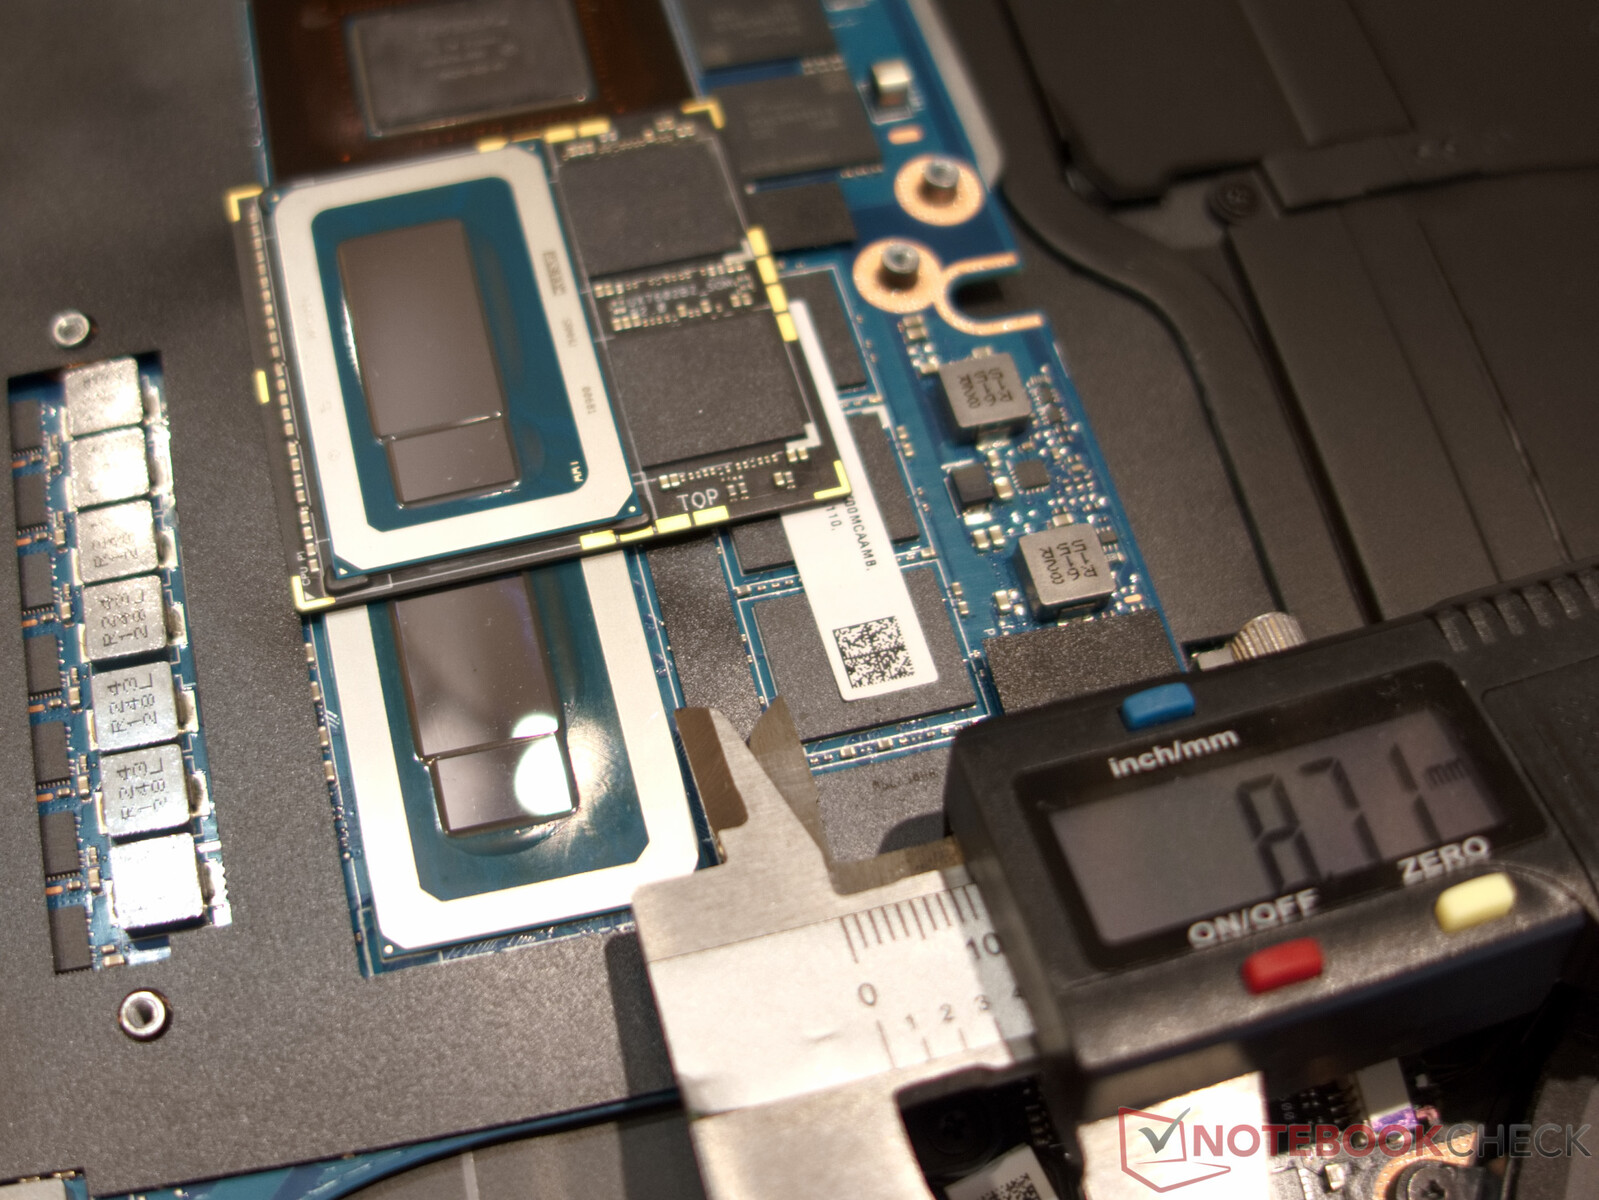
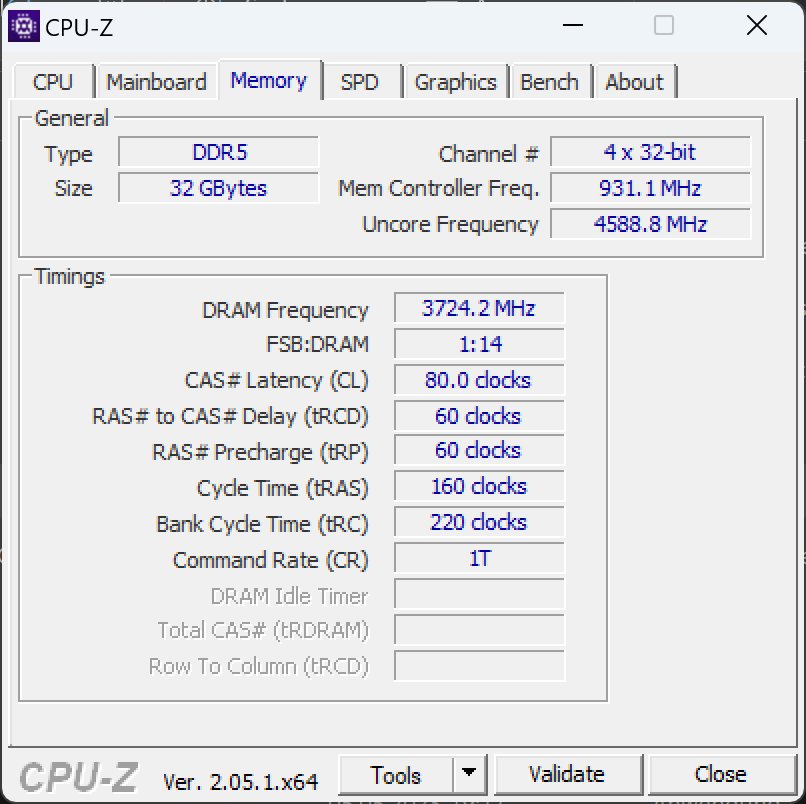
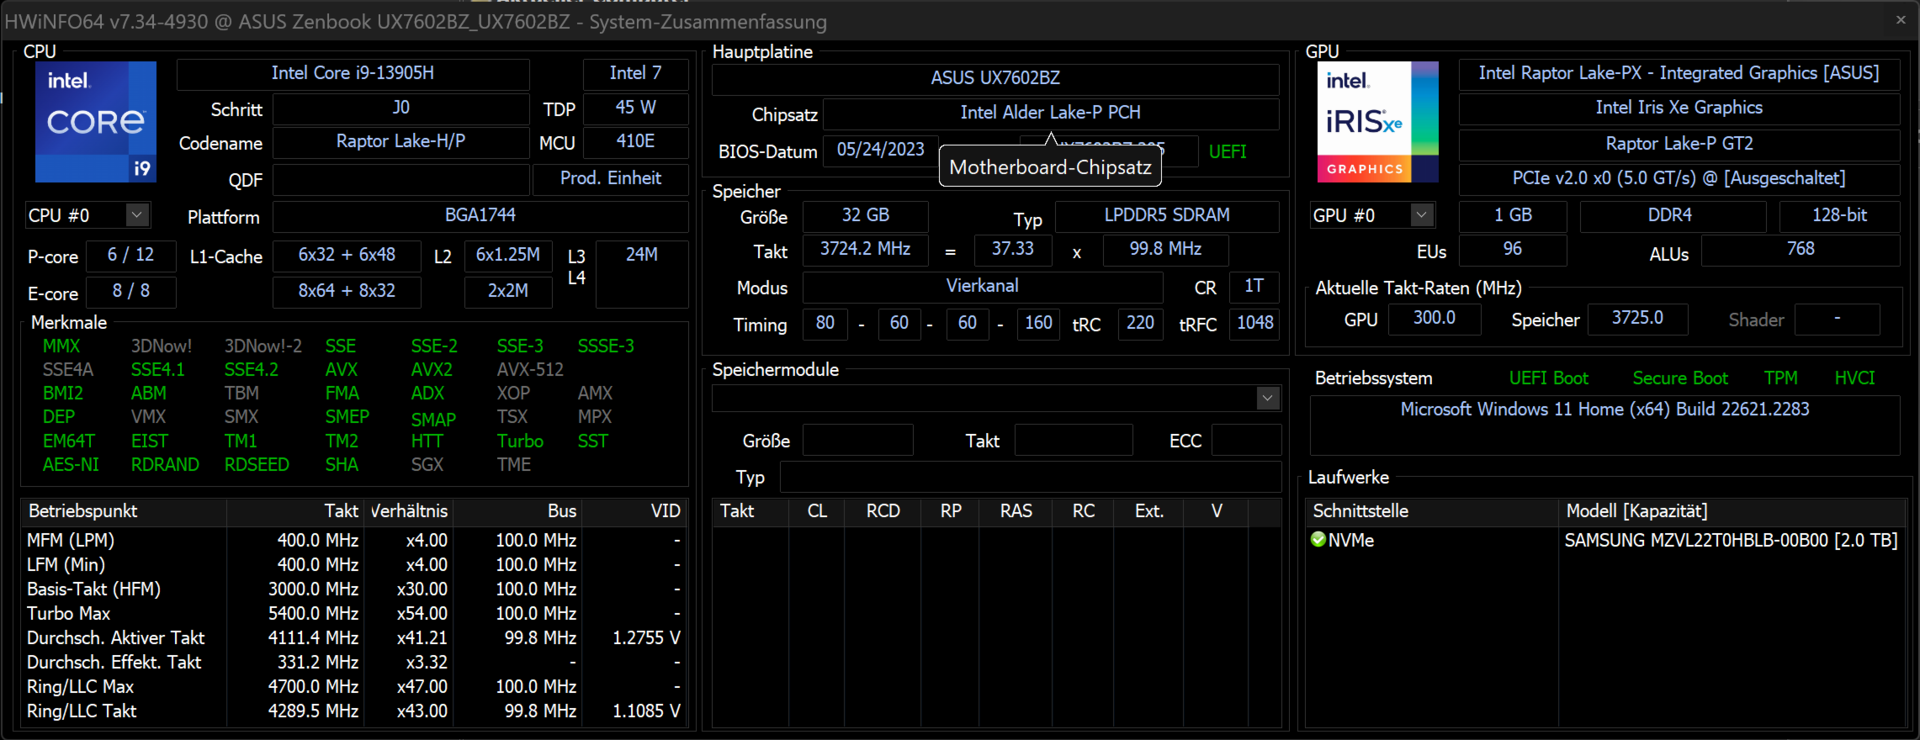
To compare the old and new Zenbook Pro 16X, Asus sent us a motherboard of the predecessor and a processor module in SoM design with integrated LPDDR5X RAM. We can therefore see that in the new Zenbook Pro 16X that the distance between RAM and CPU has been reduced by a whole 8 mm. The reduced surface area occupied by the components should also improve the cooling performance somewhat. Ultimately, however, we can say that the old board would have also fitted into the new Zenbook.
Warranty
Asus offers a 24-month warranty for purchases in Europe, which of course may differ in other regions, so buyers are advised to double check before purchasing.
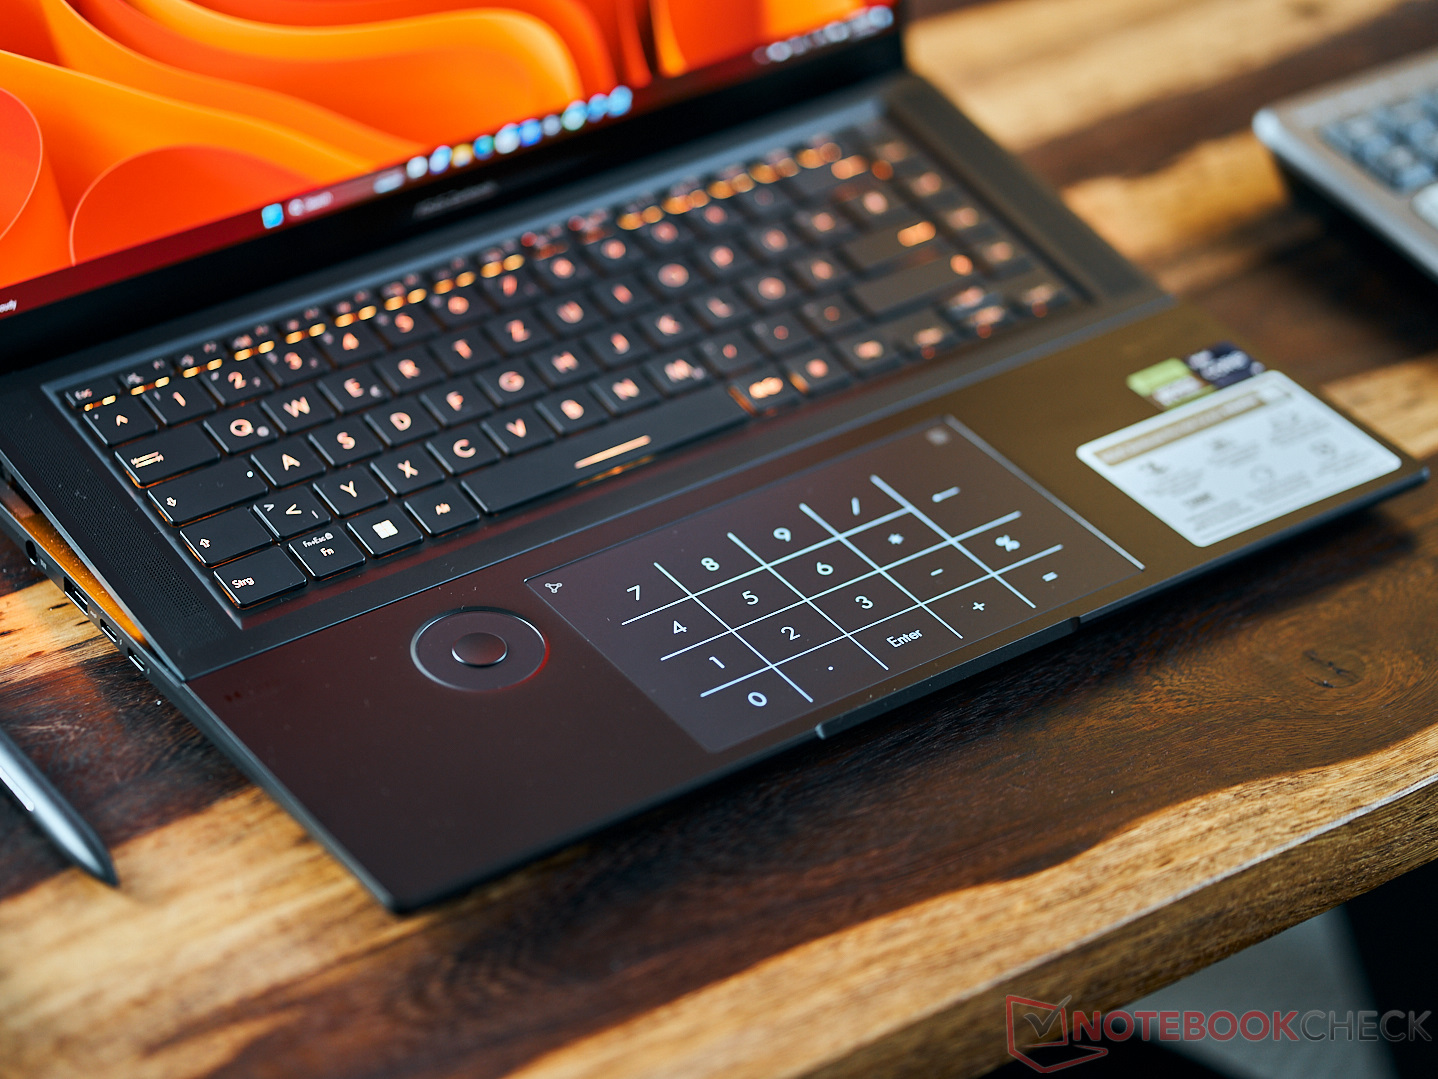
Input devices - Asus puts everything it can into the Zenbook
At most, the Zenbook still lacks input via gesture control. Apart from that, the selection of input methods on our test device is large, consisting of the keyboard, touchpad, touchscreen, Asus Dial and Asus Pen 2.0. All input devices work without issue, but we still find that they sometimes get in each other's way.
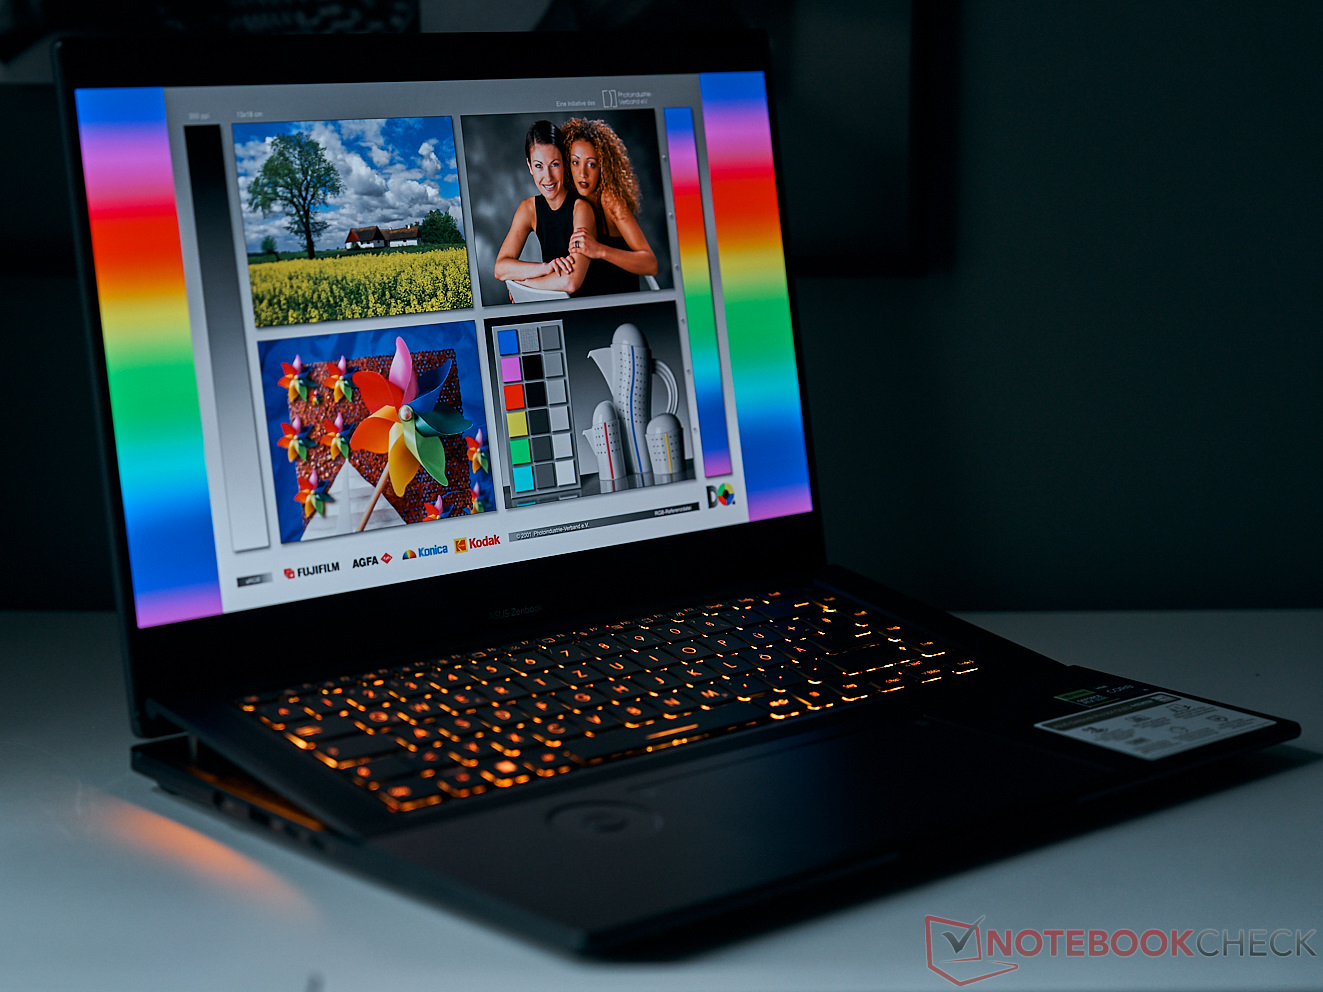
Keyboard
Having a drop of around 1.7 mm, the chiclet keyboard on the Zenbook offers pleasant key travel and sufficient haptic feedback. The slightly higher keyboard angle in particular makes the Zenbook a pleasant device for typing long texts. Gamers should also enjoy the keyboard: in addition to the aforementioned advantages, it offers RGB illumination of individual keys and N-key rollover
Touchpad
The touchpad on the Zenbook still has no physical keys or buttons. The pleasant "click" is generated by a configurable haptic motor. Despite this, or perhaps precisely because of this, the precise clickpad is easy to work with. Fingers glide easily on the matte glass surface, but fingerprints quickly become visible. If desired, users can also have a numpad displayed here. However, this only works properly if the US keyboard layout has been activated in Windows.

Additional input options
The Asus Pen 2.0 is included and the MPPT 2.0 stylus from Asus works flawlessly on the Zenbook's touchscreen. The stylus has a built-in battery that can be charged via a USB-C cable. Up to ten fingers are accurately recognized on the touchscreen. The Asus Dial also offers numerous functions. However, as was the case with the predecessor, the individual input devices often get in each other's way. When typing, you tend to place your hand on the dial, which can lead to incorrect entries. In order to work on the screen with the Asus Pen, users are recommended to rest their arm on the keyboard, but this doesn't work without problems either. Ultimately, the screen is occasionally too wobbly for a stylus.
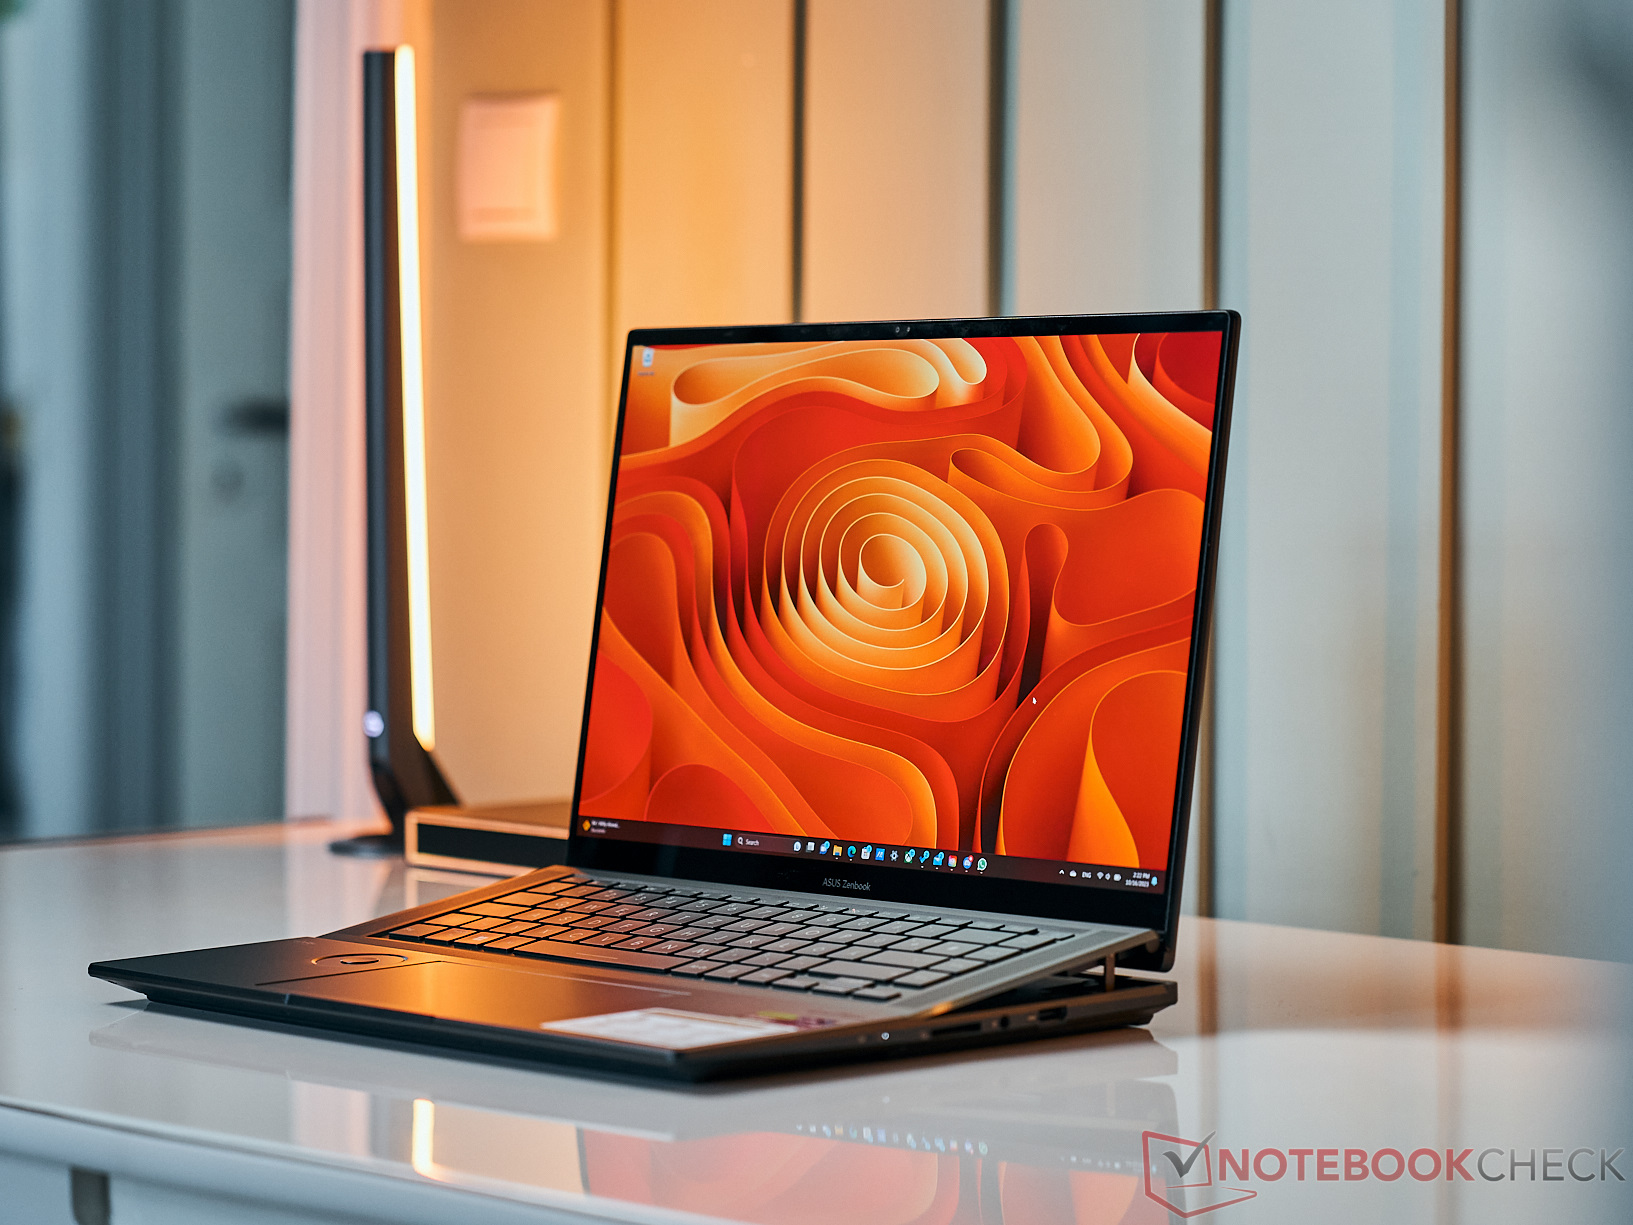
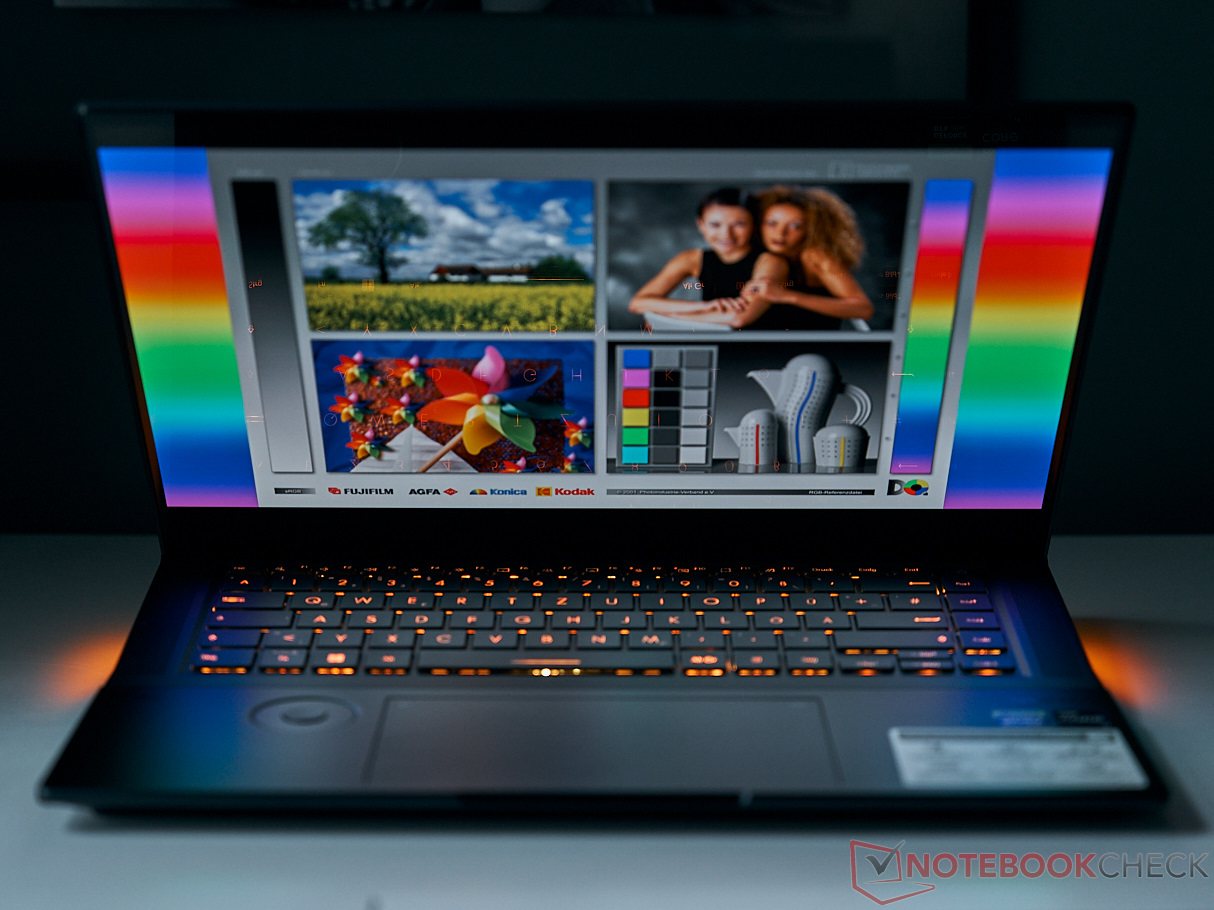
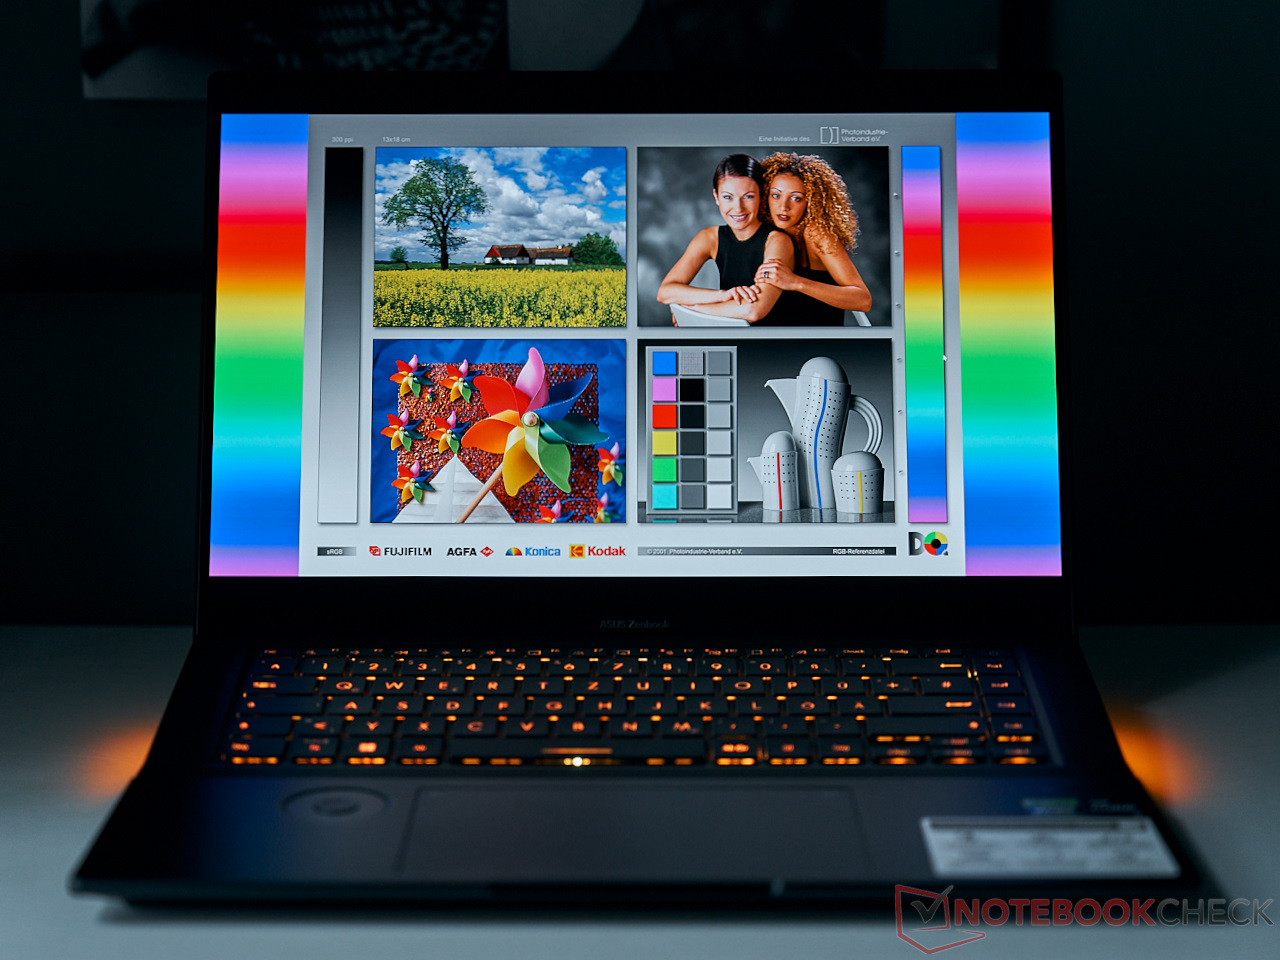
Display - A 120 Hz OLED at last

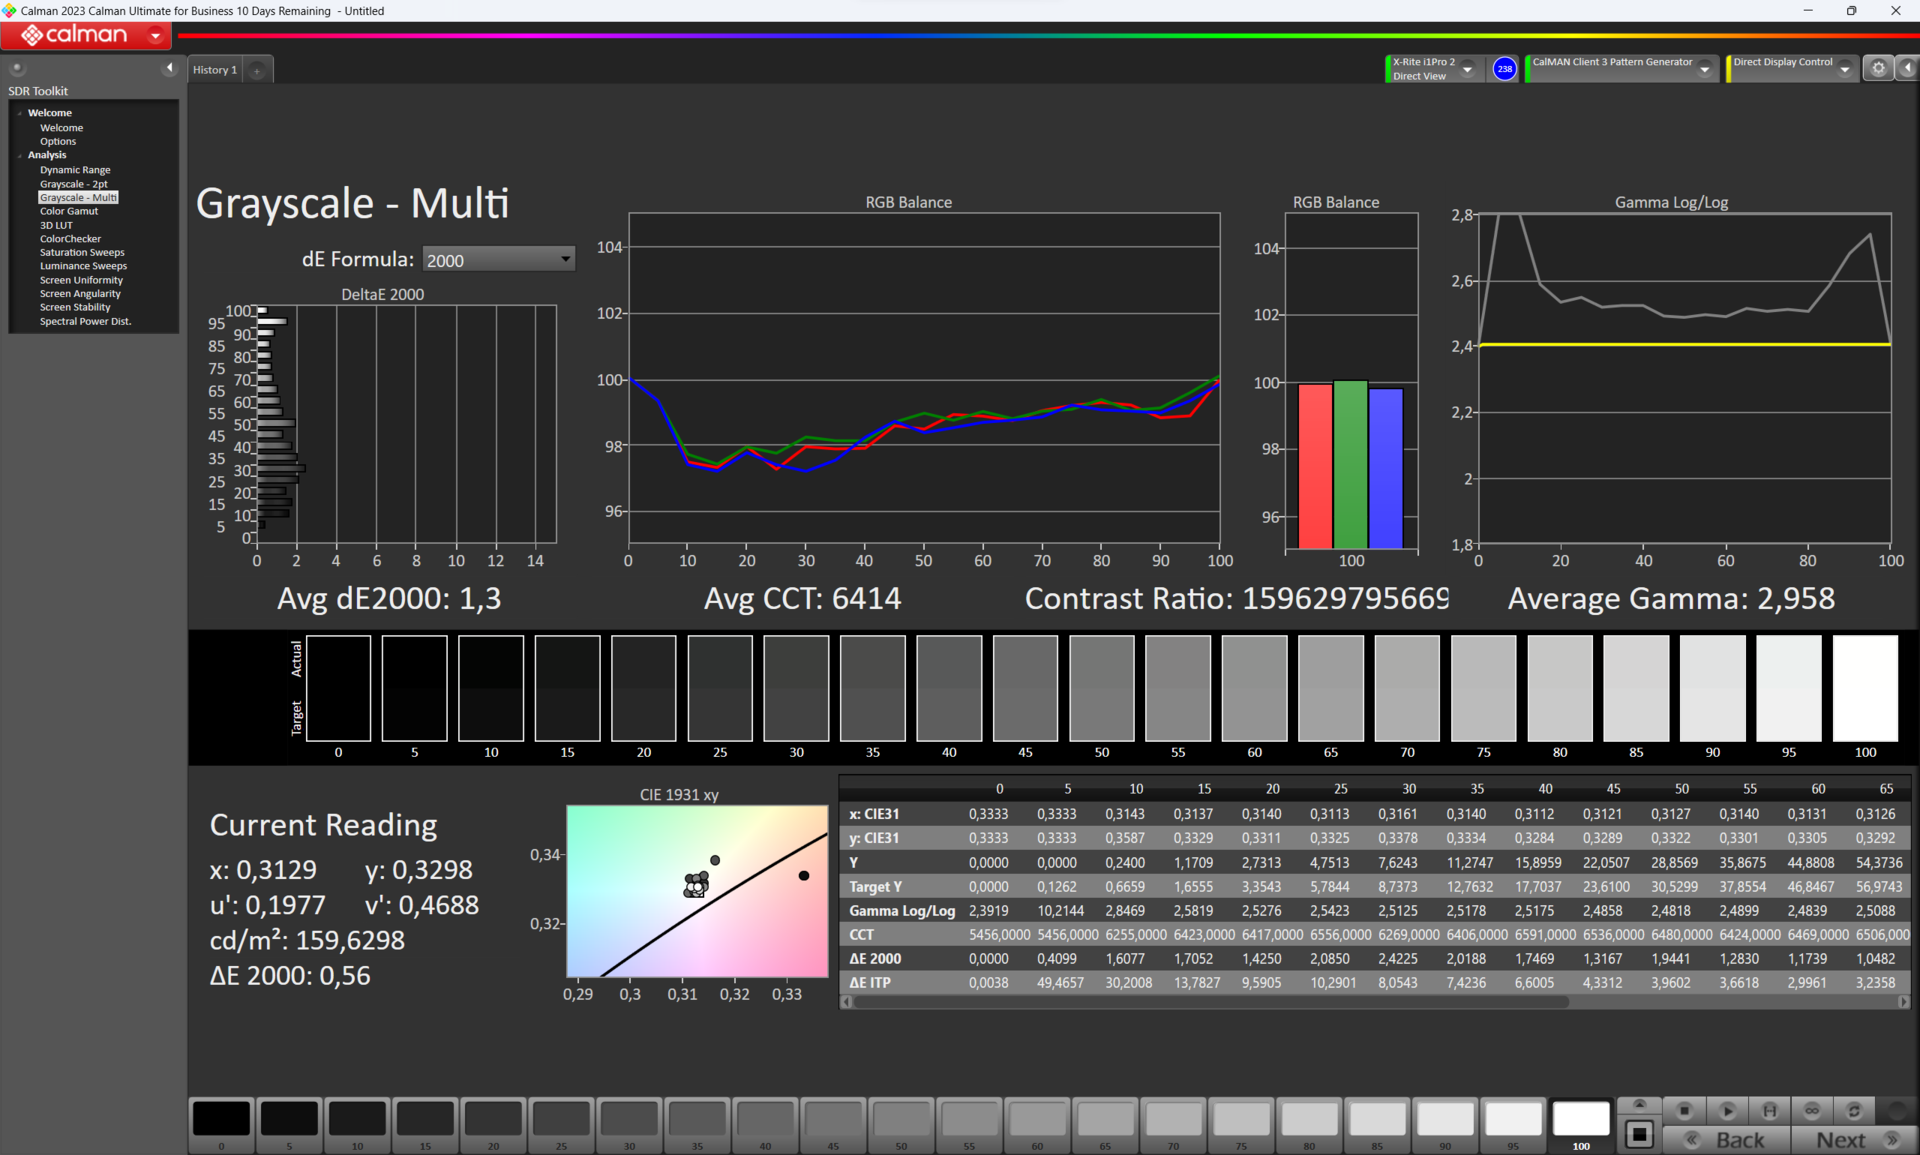
Like the predecessor, the screen in the current Zenbook is Pantone certified. It is around 350 cd/m² bright and has a frame rate of 120 Hz. In typical Asus fashion, there are various optional settings for the screen in the MyAsus app. Screen tests were first carried out in native mode and then in DisplayP3 mode.
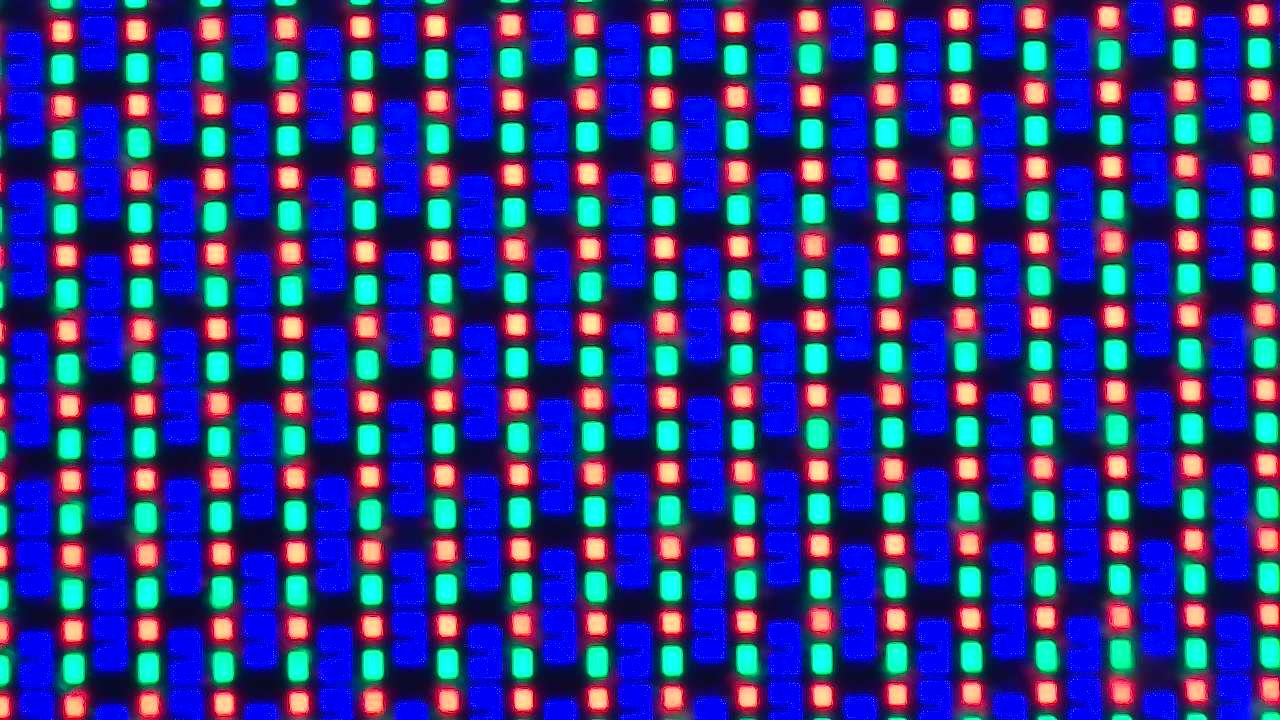
Unfortunately, the new Zenbook has inherited one negative aspect from its predecessor: in the subpixel matrix, the blue subpixels are so far apart that people with high visual acuity can make out the gaps.
| |||||||||||||||||||||||||
Brightness Distribution: 98 %
Center on Battery: 329.66 cd/m²
Contrast: 4740:1 (Black: 0.07 cd/m²)
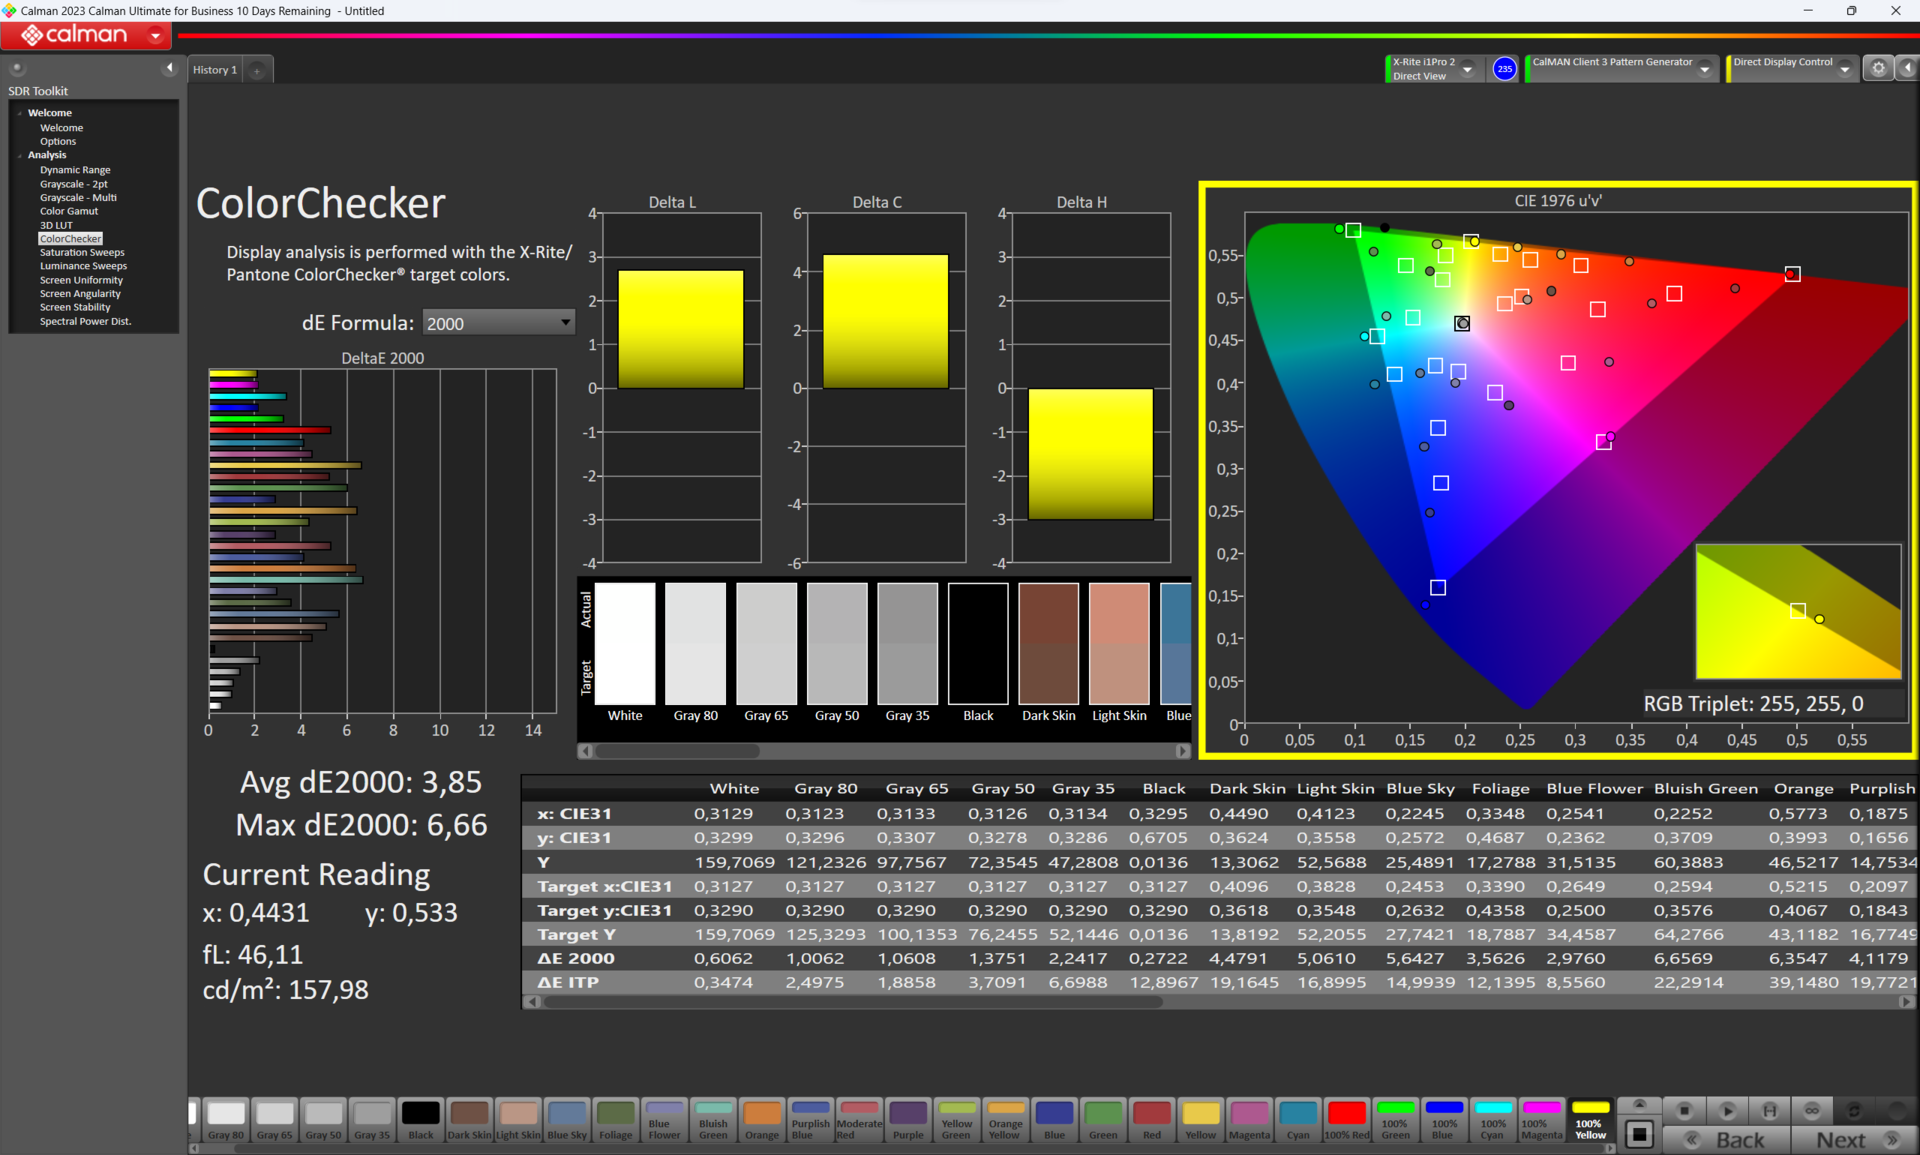
ΔE ColorChecker Calman: 1.58 | ∀{0.5-29.43 Ø4.71}
calibrated: 6.66
ΔE Greyscale Calman: 4.25 | ∀{0.09-98 Ø4.96}
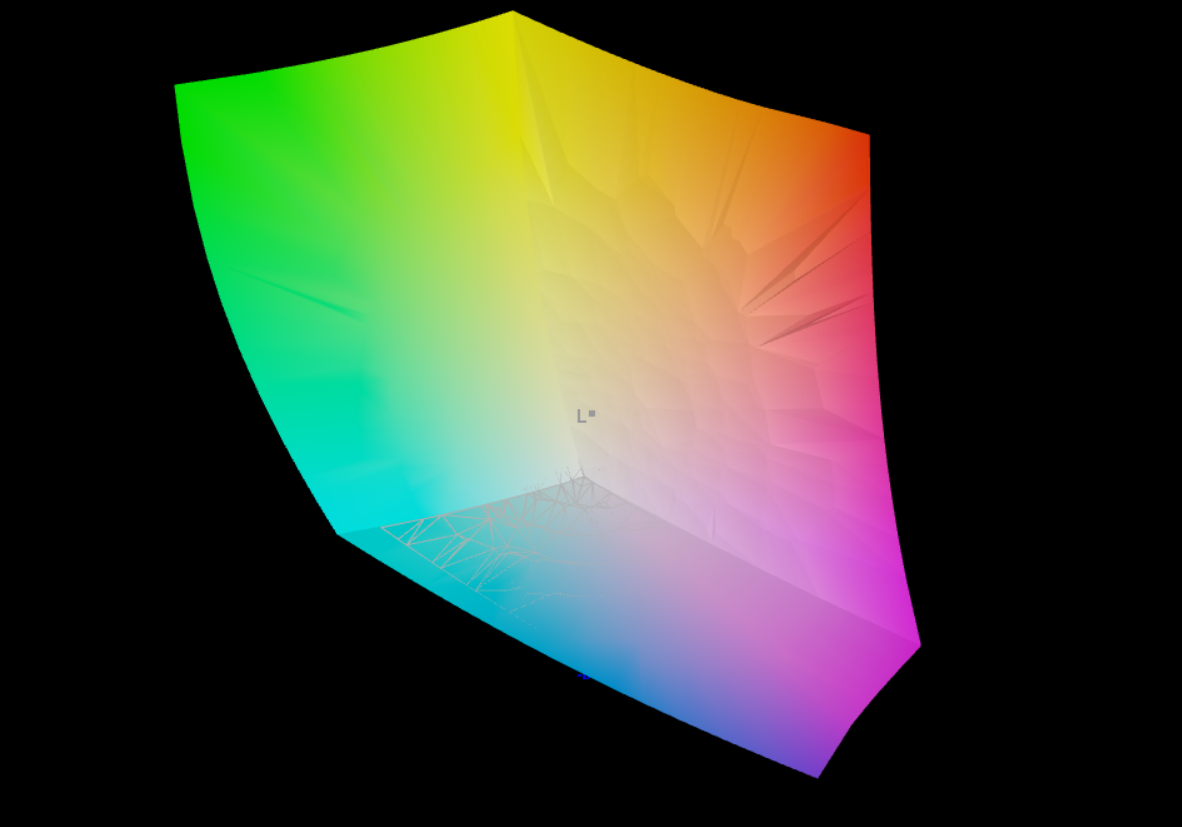
97.48% AdobeRGB 1998 (Argyll 3D)
100% sRGB (Argyll 3D)
99.93% Display P3 (Argyll 3D)
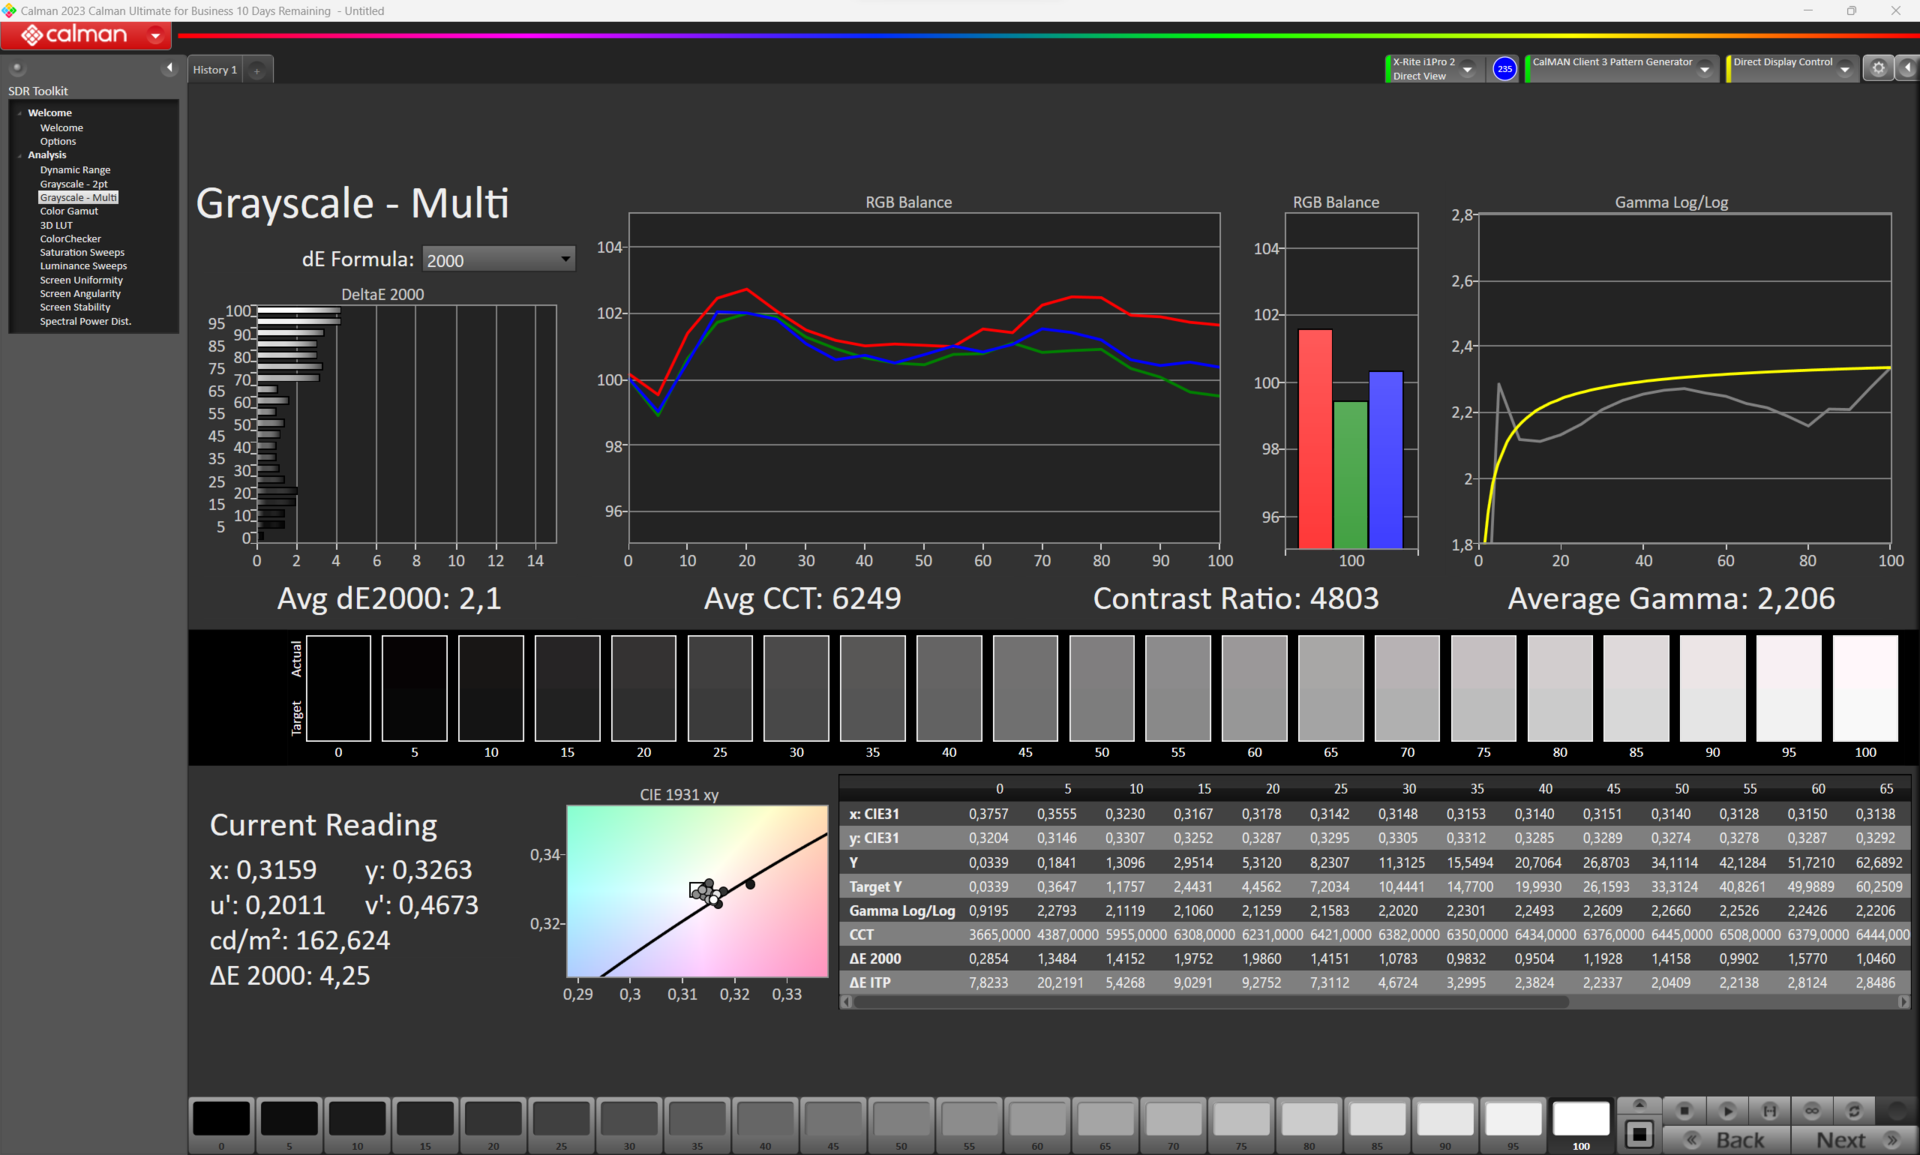
Gamma: 2.206
CCT: 6249 K
| Asus Zenbook Pro 16X UX7602BZ-MY005W ATNA60BX01-1, OLED, 3200x2000, 16" | Asus ZenBook Pro 16X OLED UX7602ZM-ME115W Samsung SDC415D, OLED, 3840x2400, 16" | Asus ROG Strix G16 G614JZ TL160ADMP03-0, IPS, 2560x1600, 16" | Asus ROG Zephyrus M16 GU604VY-NM042X BOE0B74 (NE160QDM-NM4, IPS, 2560x1600, 16" | MSI Stealth 17 Studio A13VH-014 AUO41A2 B173ZAN06.C, Mini LED, 3840x2160, 17.3" | Lenovo Legion Pro 7 RTX4090 MNG007DA2-3 (CSO1628), IPS, 2560x1600, 16" | Lenovo Legion Slim 7i 16 Gen 8 CSOT T3 MNG007DA2-3, IPS, 2560x1600, 16" | Asus Vivobook Pro 16X K6604JV-MX016W Samsung SDC4178 ATNA60BX01-1, OLED, 3200x2000, 16" | |
|---|---|---|---|---|---|---|---|---|
| Display | -3% | -5% | -3% | -4% | -19% | -19% | -1% | |
| Display P3 Coverage (%) | 99.93 | 99.84 0% | 97 -3% | 99.33 -1% | 92 -8% | 69.5 -30% | 70.4 -30% | 98.4 -2% |
| sRGB Coverage (%) | 100 | 99.99 0% | 99.9 0% | 99.9 0% | 99.1 -1% | 99.8 0% | 99.4 -1% | 99.7 0% |
| AdobeRGB 1998 Coverage (%) | 97.48 | 88.9 -9% | 84.9 -13% | 90.01 -8% | 94.07 -3% | 71.6 -27% | 72.5 -26% | 95.8 -2% |
| Response Times | -22% | -247% | -2455% | -1573% | -405% | -551% | 8% | |
| Response Time Grey 50% / Grey 80% * (ms) | 1.4 ? | 2 ? -43% | 5.1 ? -264% | 50.8 ? -3529% | 46.4 ? -3214% | 10.9 ? -679% | 12 ? -757% | 1.6 ? -14% |
| Response Time Black / White * (ms) | 2 ? | 2 ? -0% | 6.6 ? -230% | 29.6 ? -1380% | 0.62 ? 69% | 4.6 ? -130% | 8.9 ? -345% | 1.4 ? 30% |
| PWM Frequency (Hz) | 250 ? | 59 ? | 12000 | 2400 | 120 ? | |||
| Screen | 11% | -43% | 93% | 52% | -41% | -43% | 20% | |
| Brightness middle (cd/m²) | 331.8 | 346 4% | 470 42% | 634 91% | 397.29 20% | 491 48% | 474.6 43% | 347 5% |
| Brightness (cd/m²) | 334 | 354 6% | 459 37% | 627 88% | 392 17% | 472 41% | 445 33% | 346 4% |
| Brightness Distribution (%) | 98 | 96 -2% | 93 -5% | 92 -6% | 93 -5% | 91 -7% | 86 -12% | 97 -1% |
| Black Level * (cd/m²) | 0.07 | 0.42 -500% | 0.03 57% | 0.02 71% | 0.4 -471% | 0.39 -457% | 0.06 14% | |
| Contrast (:1) | 4740 | 1119 -76% | 21133 346% | 19865 319% | 1228 -74% | 1217 -74% | 5783 22% | |
| Colorchecker dE 2000 * | 1.58 | 2.28 -44% | 1.86 -18% | 0.89 44% | 2.52 -59% | 1.6 -1% | 2.12 -34% | 1.89 -20% |
| Colorchecker dE 2000 max. * | 4.23 | 4.94 -17% | 3.87 9% | 1.79 58% | 3.91 8% | 5.15 -22% | 4.73 -12% | 3.26 23% |
| Colorchecker dE 2000 calibrated * | 6.66 | 2.16 68% | 0.93 86% | 0.91 86% | 2.52 62% | 0.97 85% | 0.57 91% | 1.97 70% |
| Greyscale dE 2000 * | 4.25 | 1.64 61% | 2.7 36% | 1.13 73% | 2.78 35% | 3 29% | 2.8 34% | 1.55 64% |
| Gamma | 2.206 100% | 2.37 93% | 2.246 98% | 2.47 89% | 2.63 84% | 2.211 100% | 2.22 99% | 2.39 92% |
| CCT | 6249 104% | 6384 102% | 6711 97% | 6497 100% | 6412 101% | 6979 93% | 6542 99% | 6458 101% |
| Total Average (Program / Settings) | -5% /
2% | -98% /
-64% | -788% /
-292% | -508% /
-192% | -155% /
-88% | -204% /
-111% | 9% /
14% |
* ... smaller is better
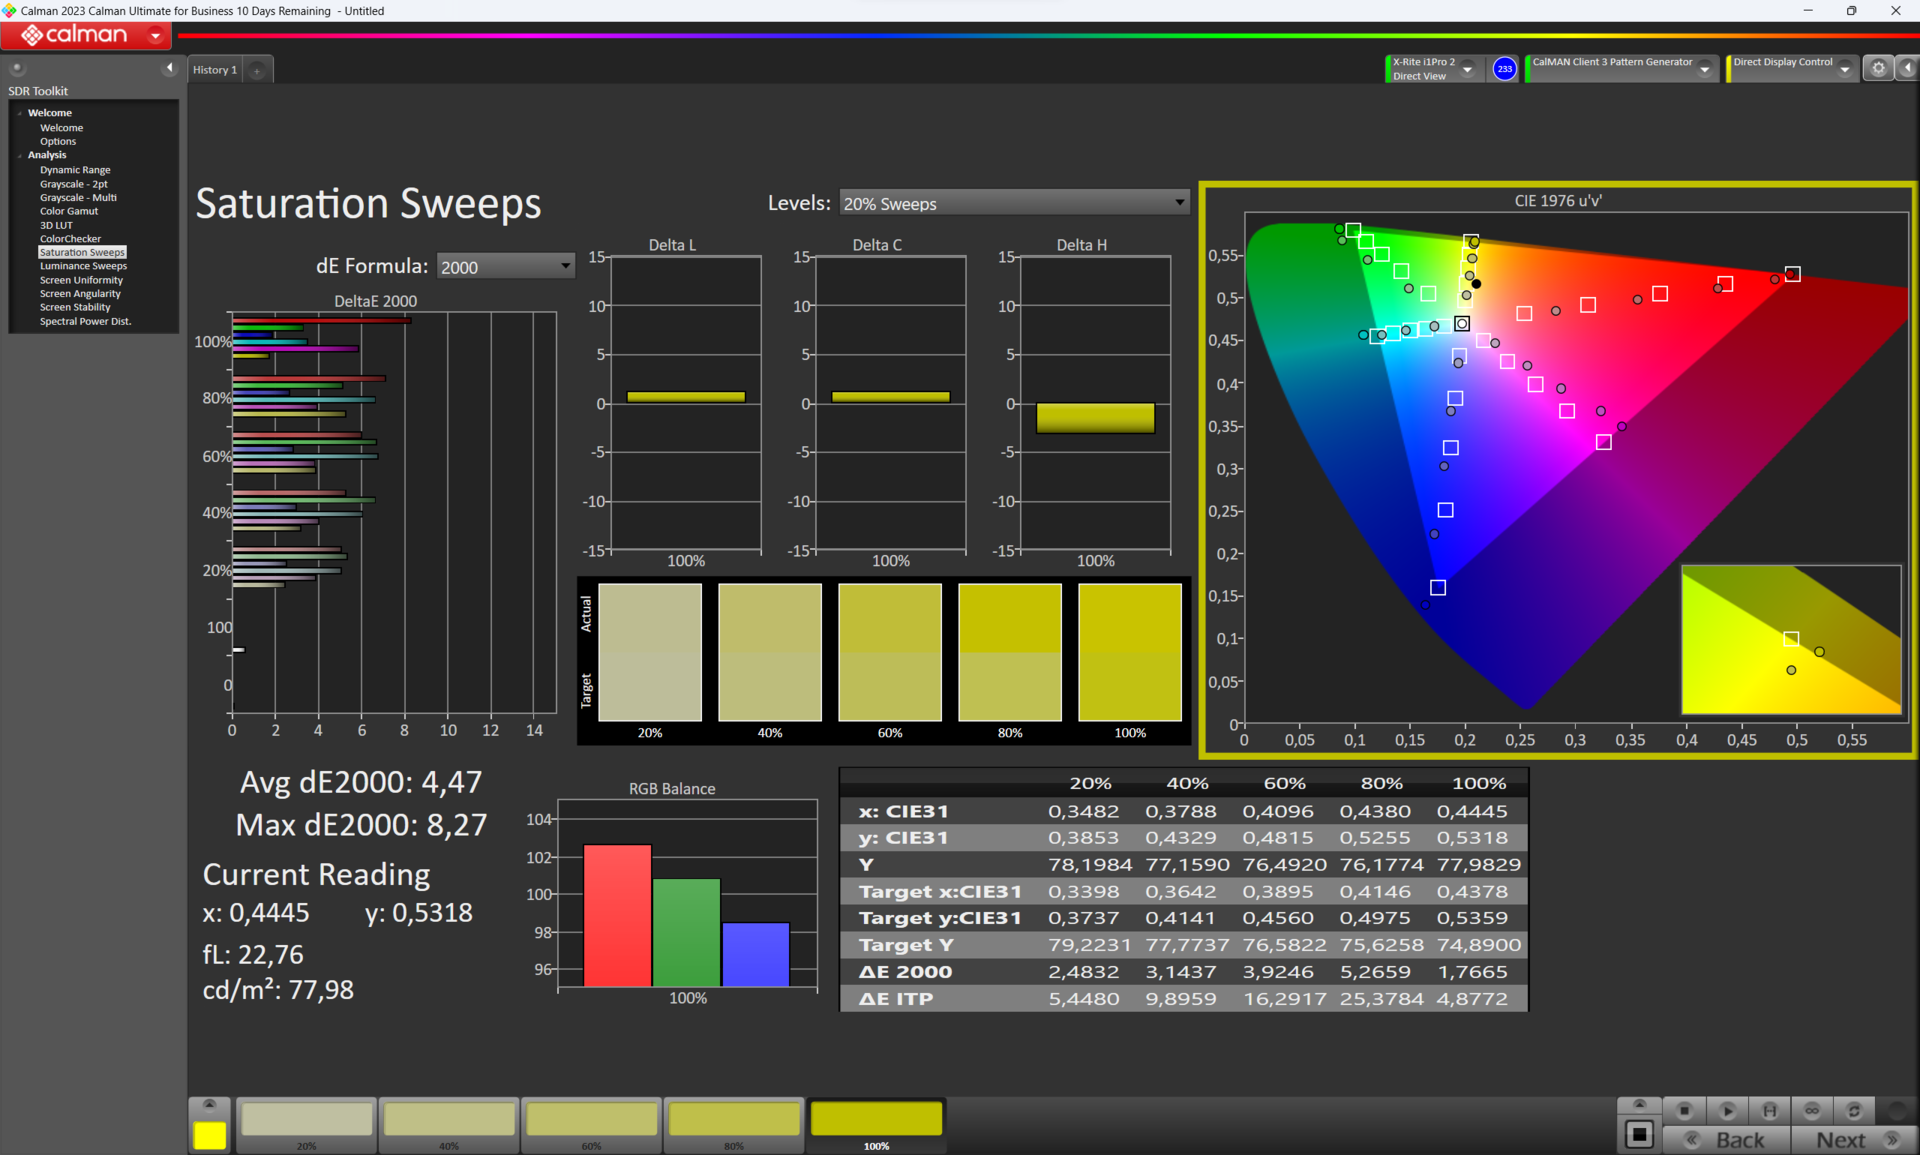
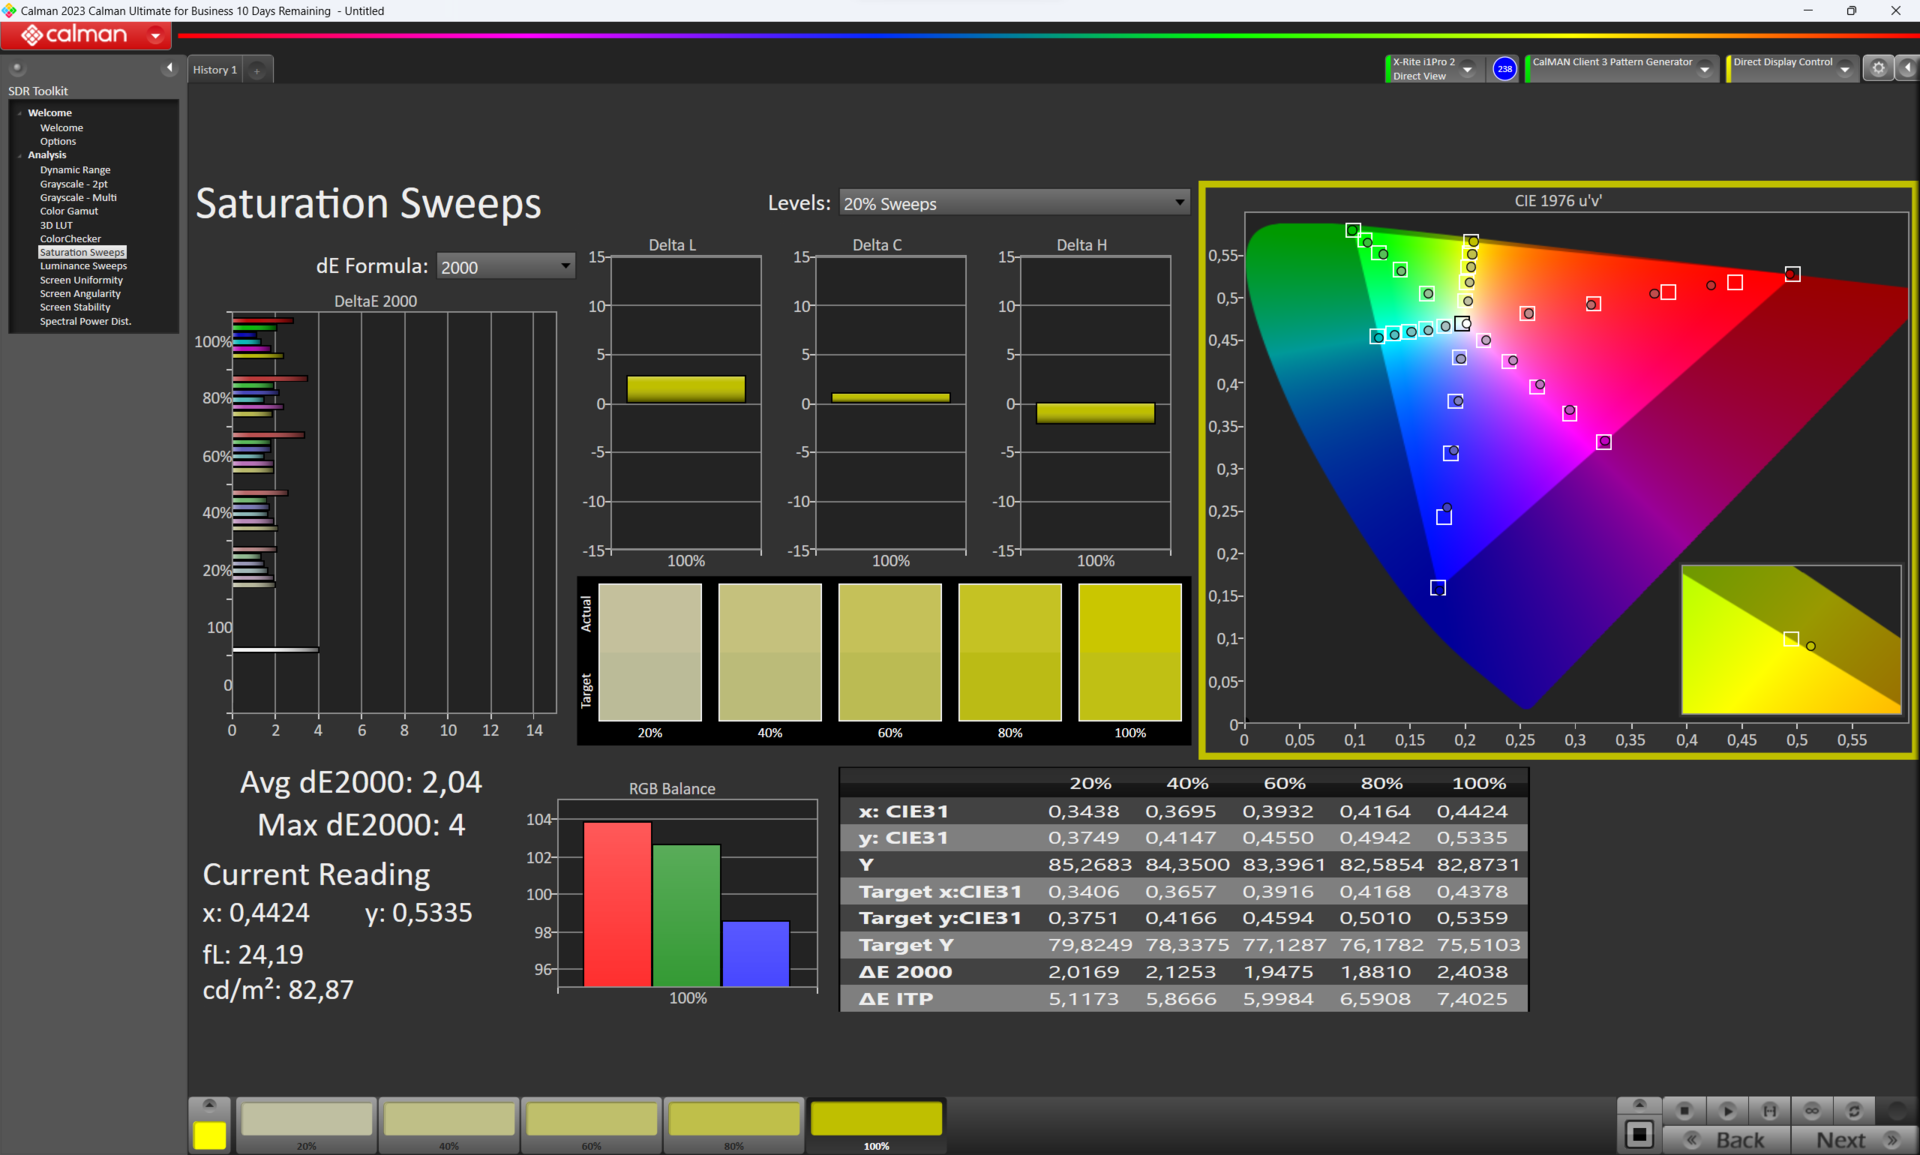
The Zenbook covers almost 100% of the three important color spaces, namely AdobeRGB, DisplayP3 and sRGB. This should benefit creative professionals from all fields.

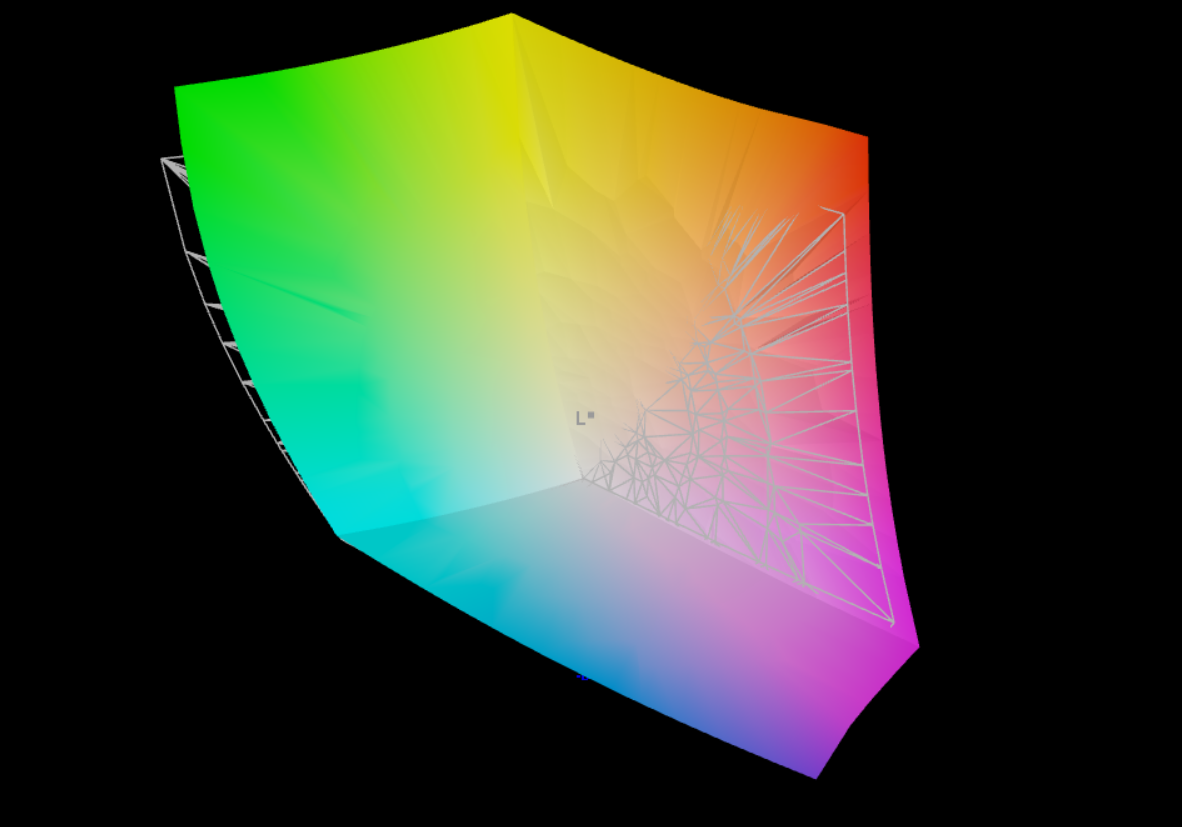
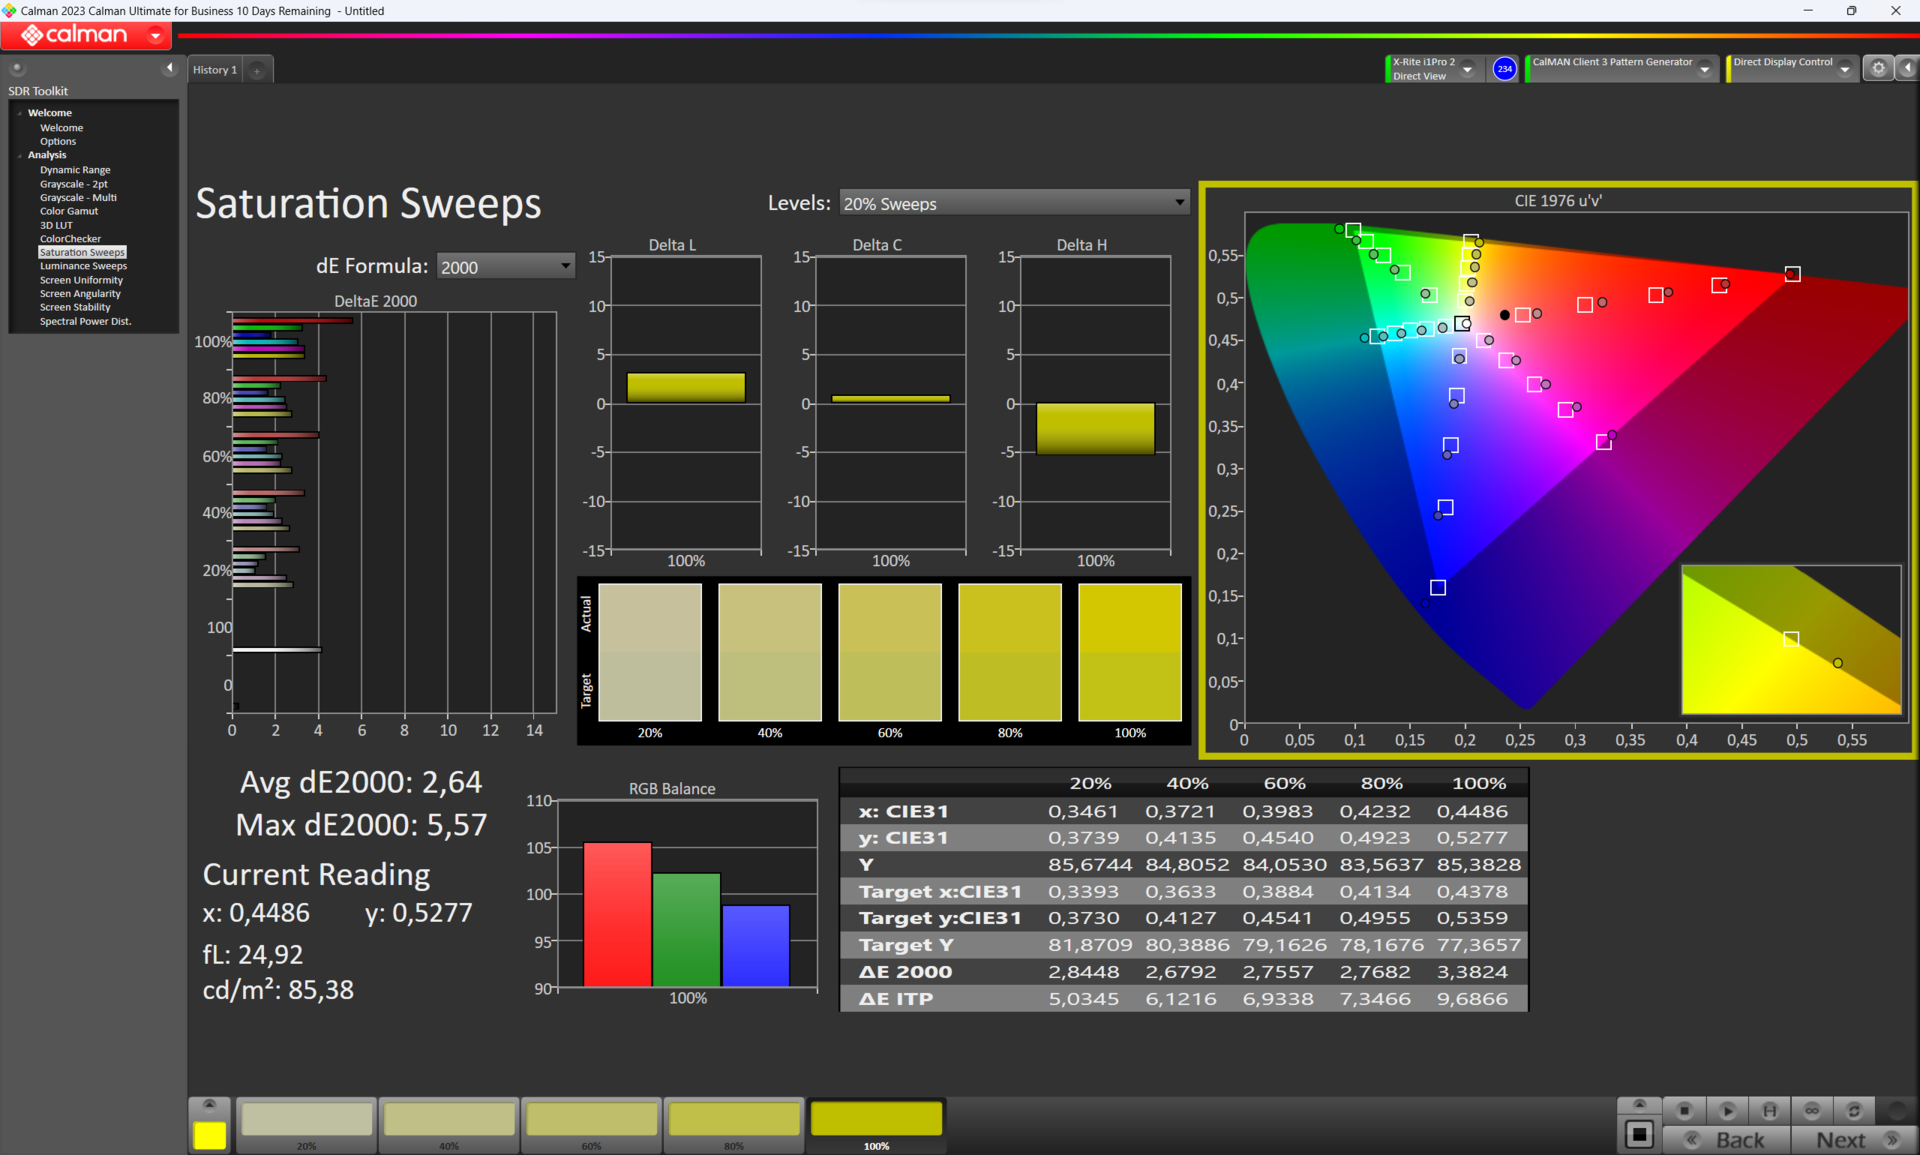
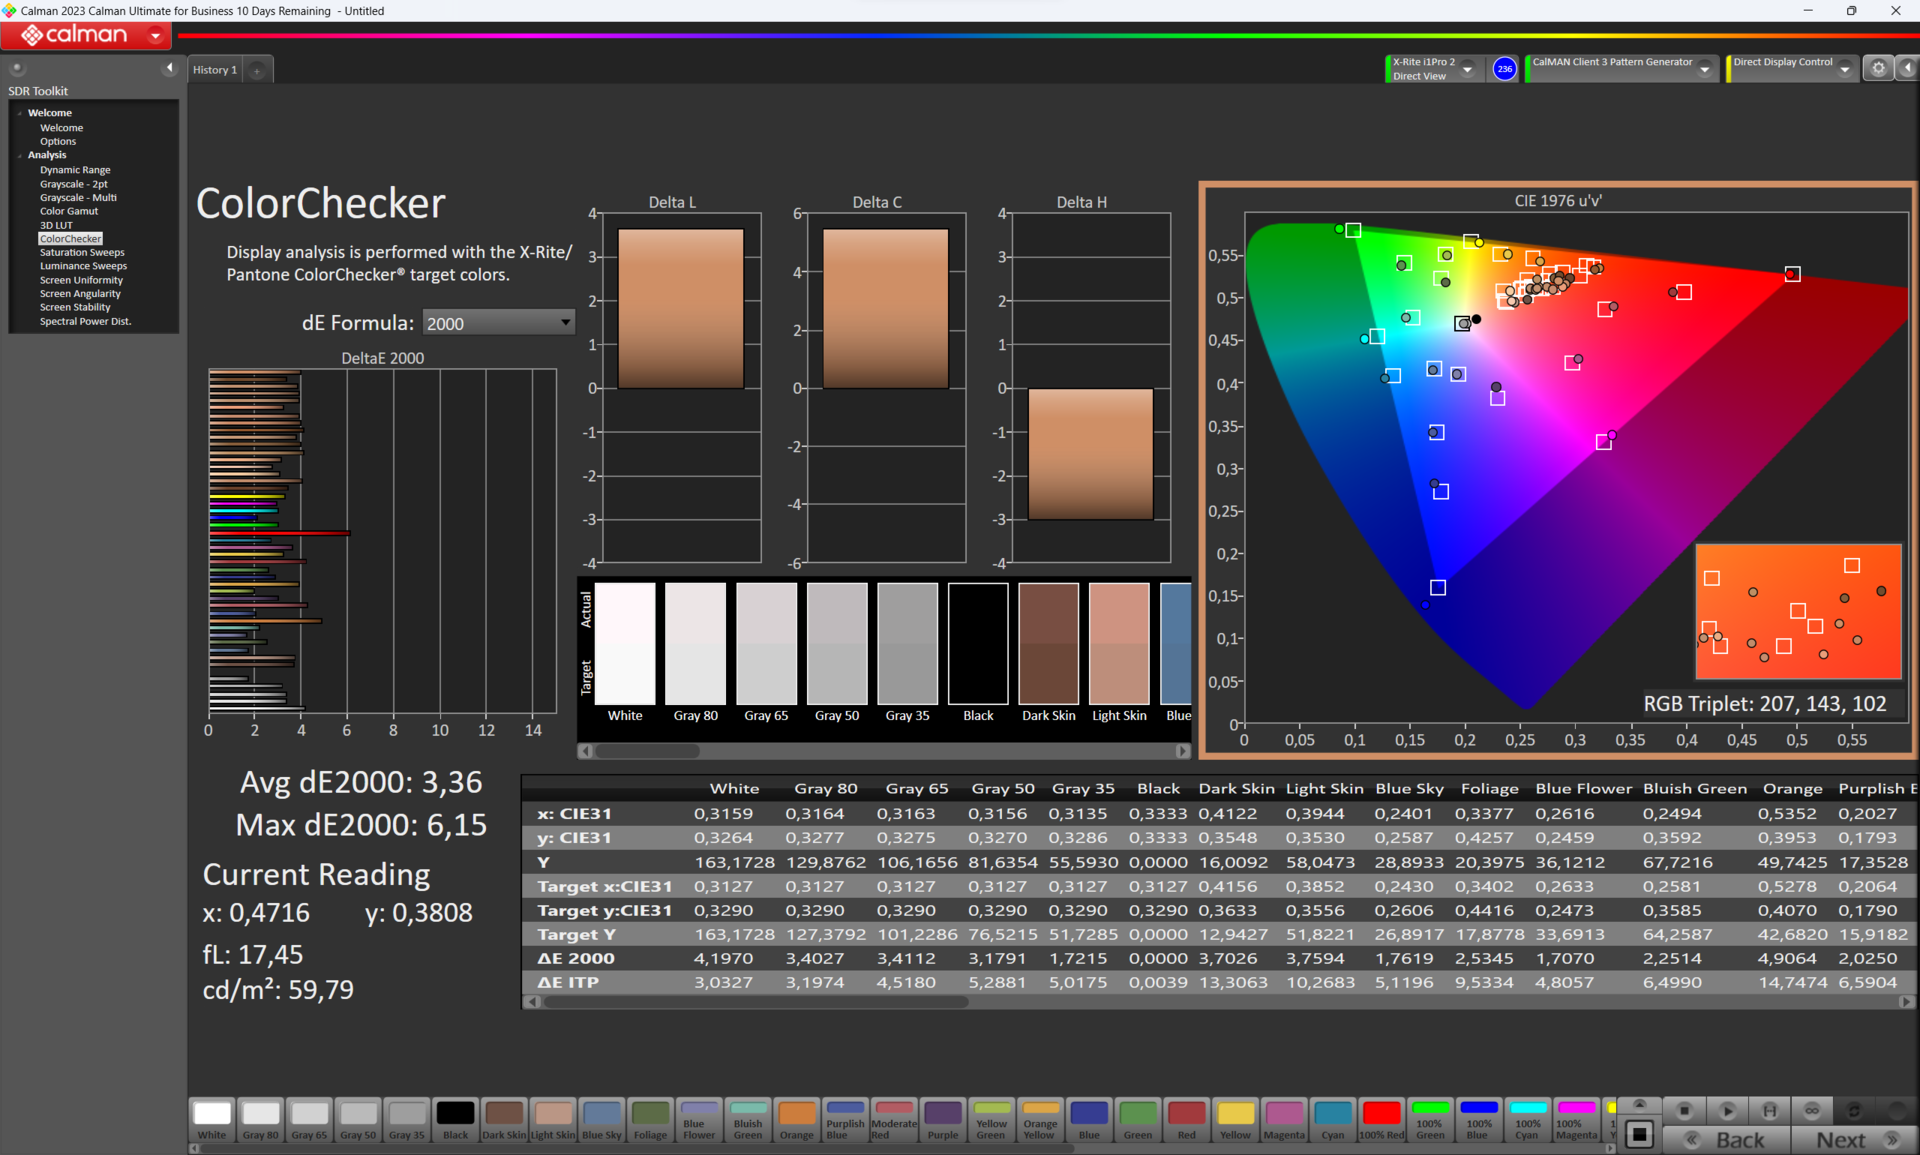
The different display modes on the Asus Zenbook Pro 16X ensure accurate color representation. In native mode, the display has an average color deviation of ΔΕ2000 3.36 (DisplayP3 target color space). The DisplayP3 preset from Asus ensures a very low color deviation of only ΔΕ2000 1.58 in the same color space. This means that even a trained eye is unlikely to notice any color differences.

Display Response Times
| ↔ Response Time Black to White | ||
|---|---|---|
| 2 ms ... rise ↗ and fall ↘ combined | ↗ 1 ms rise |  |
| ↘ 1 ms fall | ||
| The screen shows very fast response rates in our tests and should be very well suited for fast-paced gaming. In comparison, all tested devices range from 0.1 (minimum) to 240 (maximum) ms. » 11 % of all devices are better. This means that the measured response time is better than the average of all tested devices (19.8 ms). | ||
| ↔ Response Time 50% Grey to 80% Grey | ||
| 1.4 ms ... rise ↗ and fall ↘ combined | ↗ 0.6 ms rise |  |
| ↘ 0.8 ms fall | ||
| The screen shows very fast response rates in our tests and should be very well suited for fast-paced gaming. In comparison, all tested devices range from 0.165 (minimum) to 636 (maximum) ms. » 7 % of all devices are better. This means that the measured response time is better than the average of all tested devices (30.9 ms). | ||
Screen Flickering / PWM (Pulse-Width Modulation)
| Screen flickering / PWM detected | 250 Hz | ≤ 100 % brightness setting |  |
The display backlight flickers at 250 Hz (worst case, e.g., utilizing PWM) Flickering detected at a brightness setting of 100 % and below. There should be no flickering or PWM above this brightness setting. The frequency of 250 Hz is relatively low, so sensitive users will likely notice flickering and experience eyestrain at the stated brightness setting and below. In comparison: 52 % of all tested devices do not use PWM to dim the display. If PWM was detected, an average of 7744 (minimum: 5 - maximum: 343500) Hz was measured. | |||


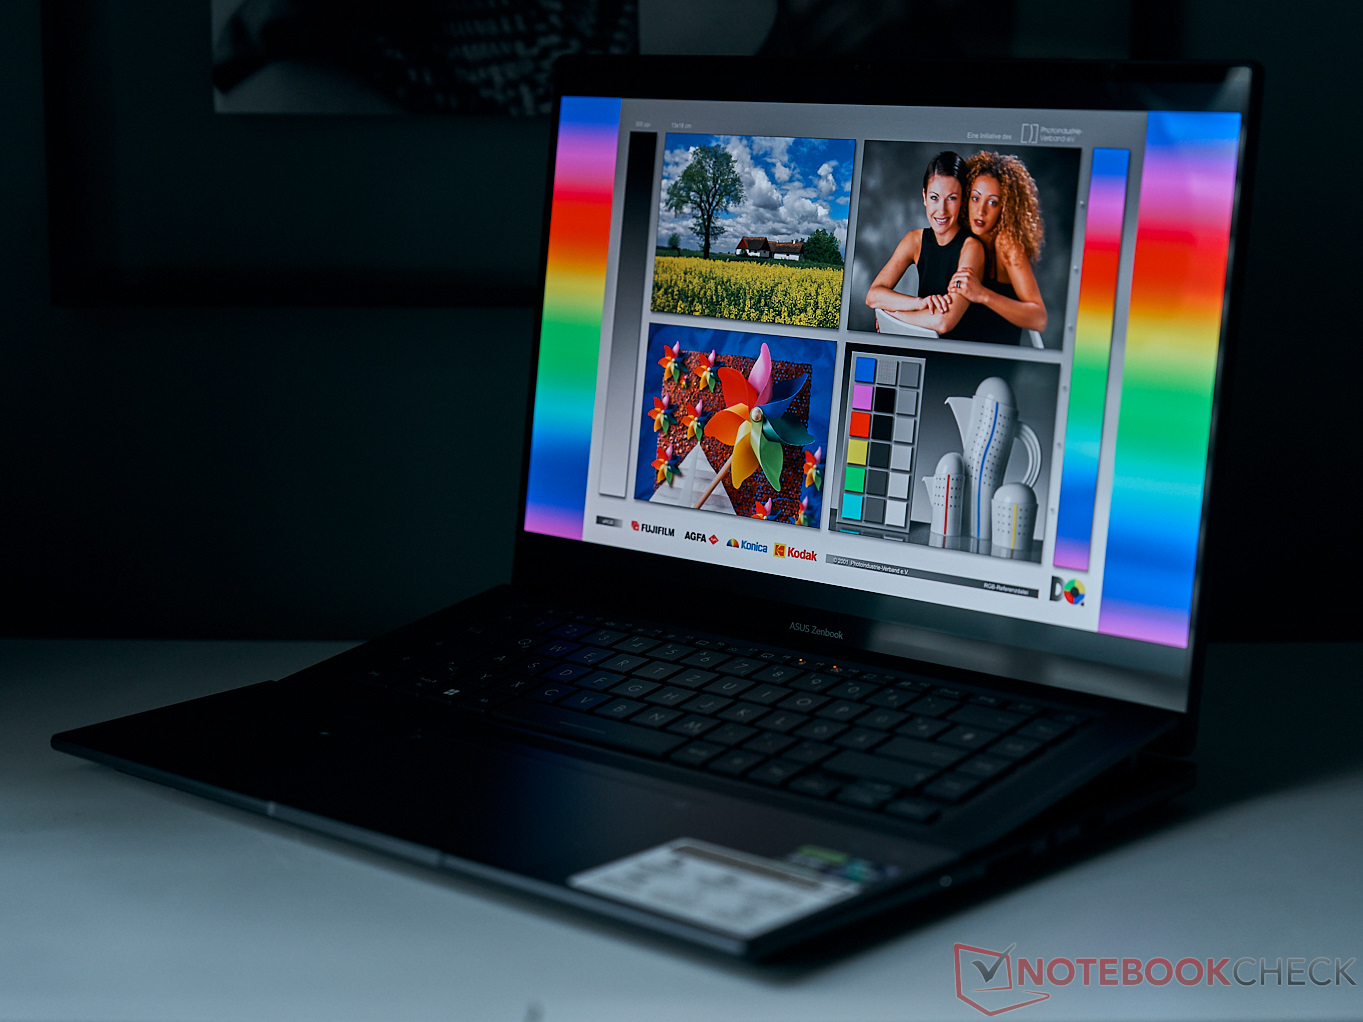
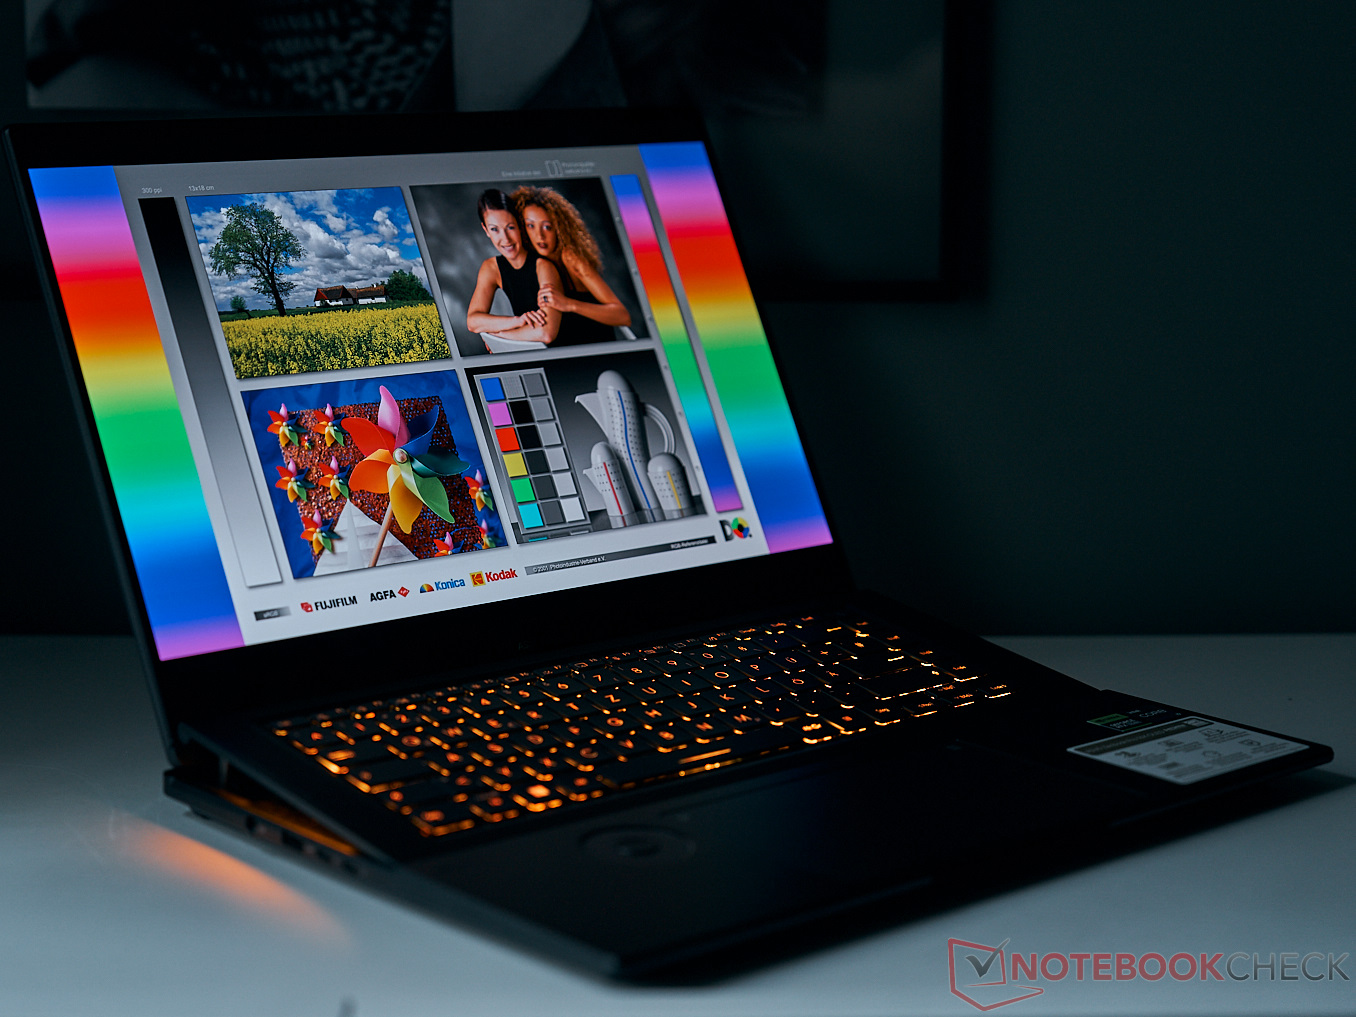
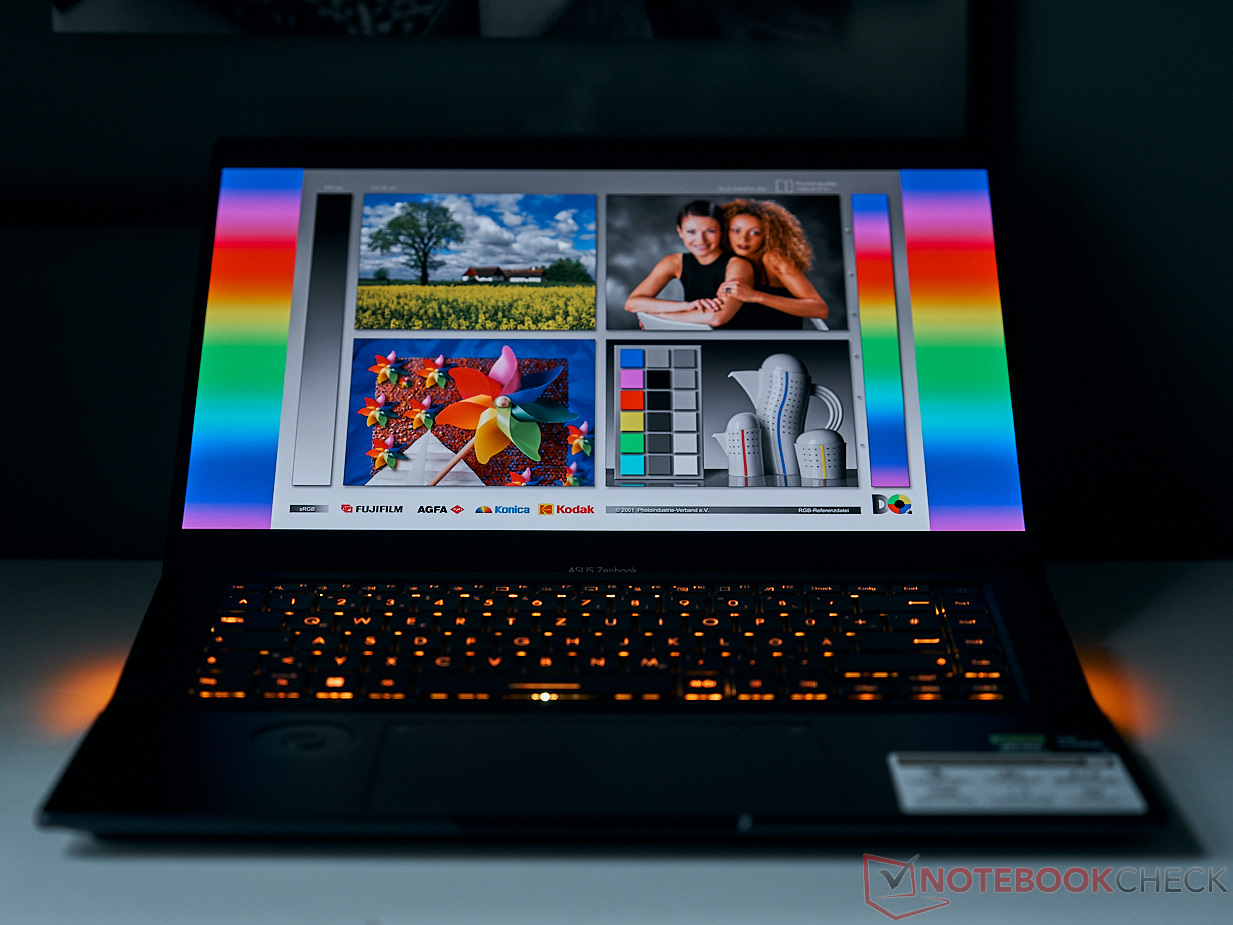
Thanks to the good viewing angle stability of OLED displays, one can always find an angle at which the display is reasonably easy to read, even outdoors. But the reflective surface can cause problems, so it's best to find a shady spot. As our viewing angle photos show, even the keyboard lighting is sometimes enough to produce clear reflections on the screen.
Performance - On gaming laptop level
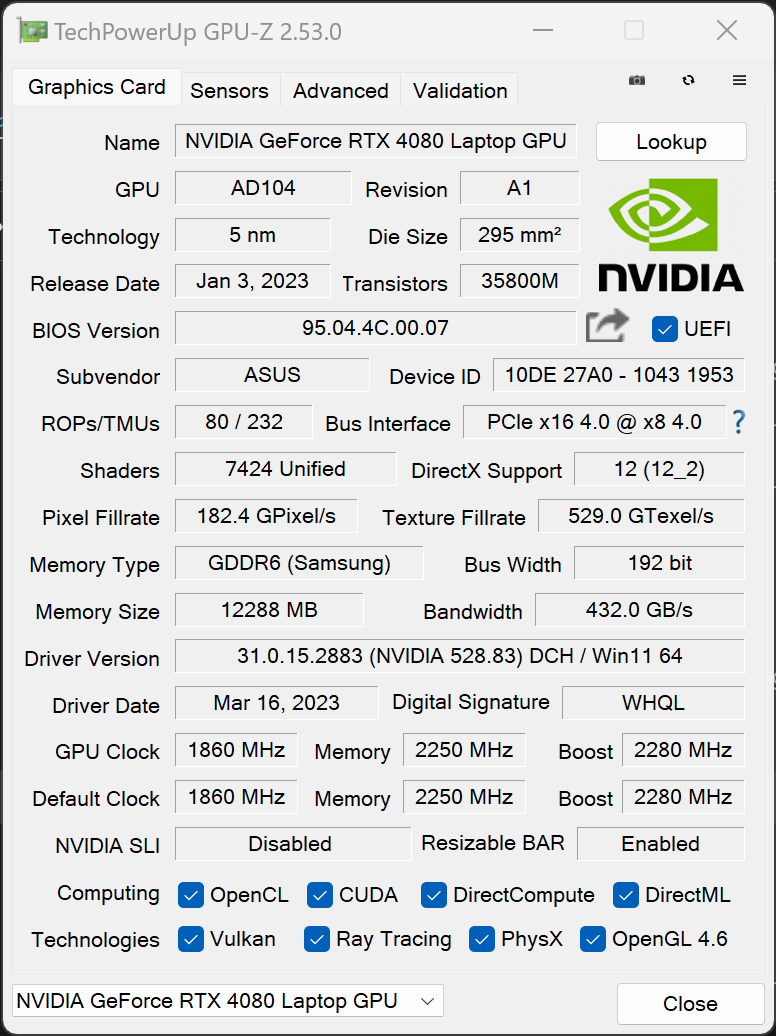
With an Nvidia GeForce RTX 4080 and the Intel Core i9-13905H, the hardware in this year's Zenbook has been significantly improved. The laptop is clearly aimed at content creators, gamers and other users who rely on extremely powerful hardware. With more than 170 watts at their disposal, the two chips in this notebook can work together well.
Testing conditions
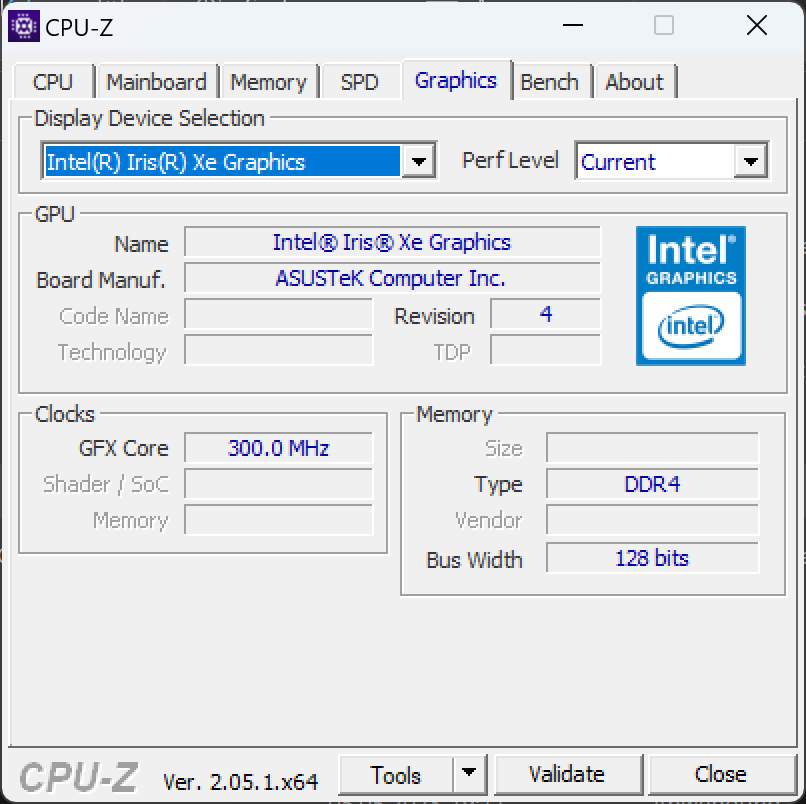
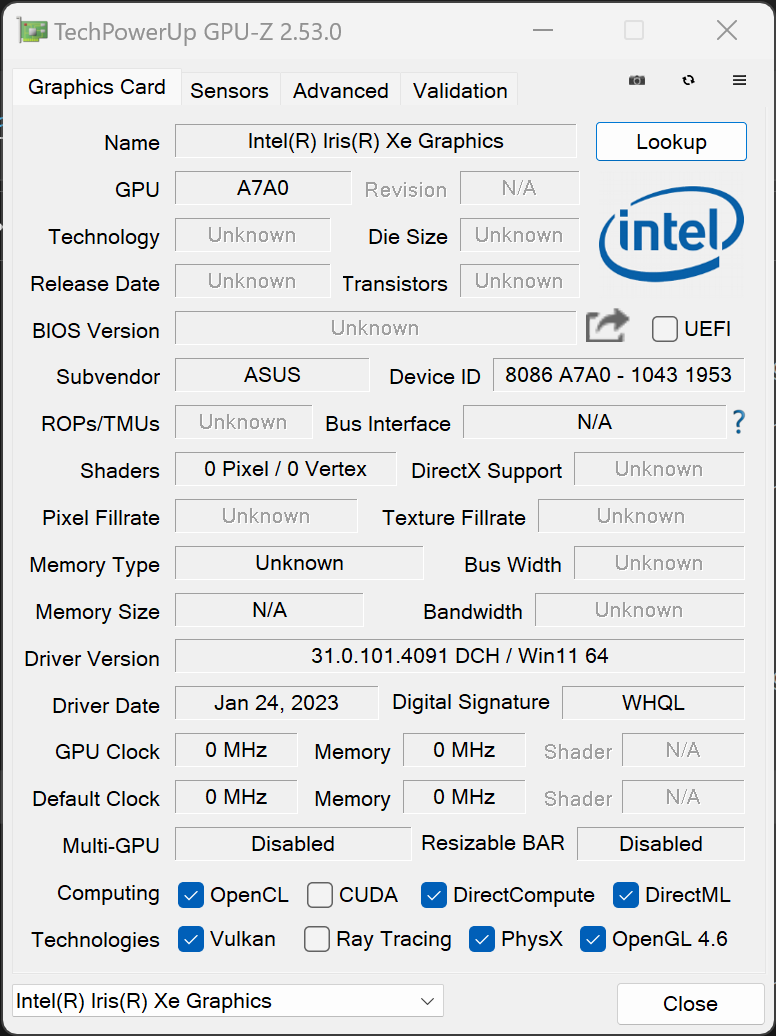
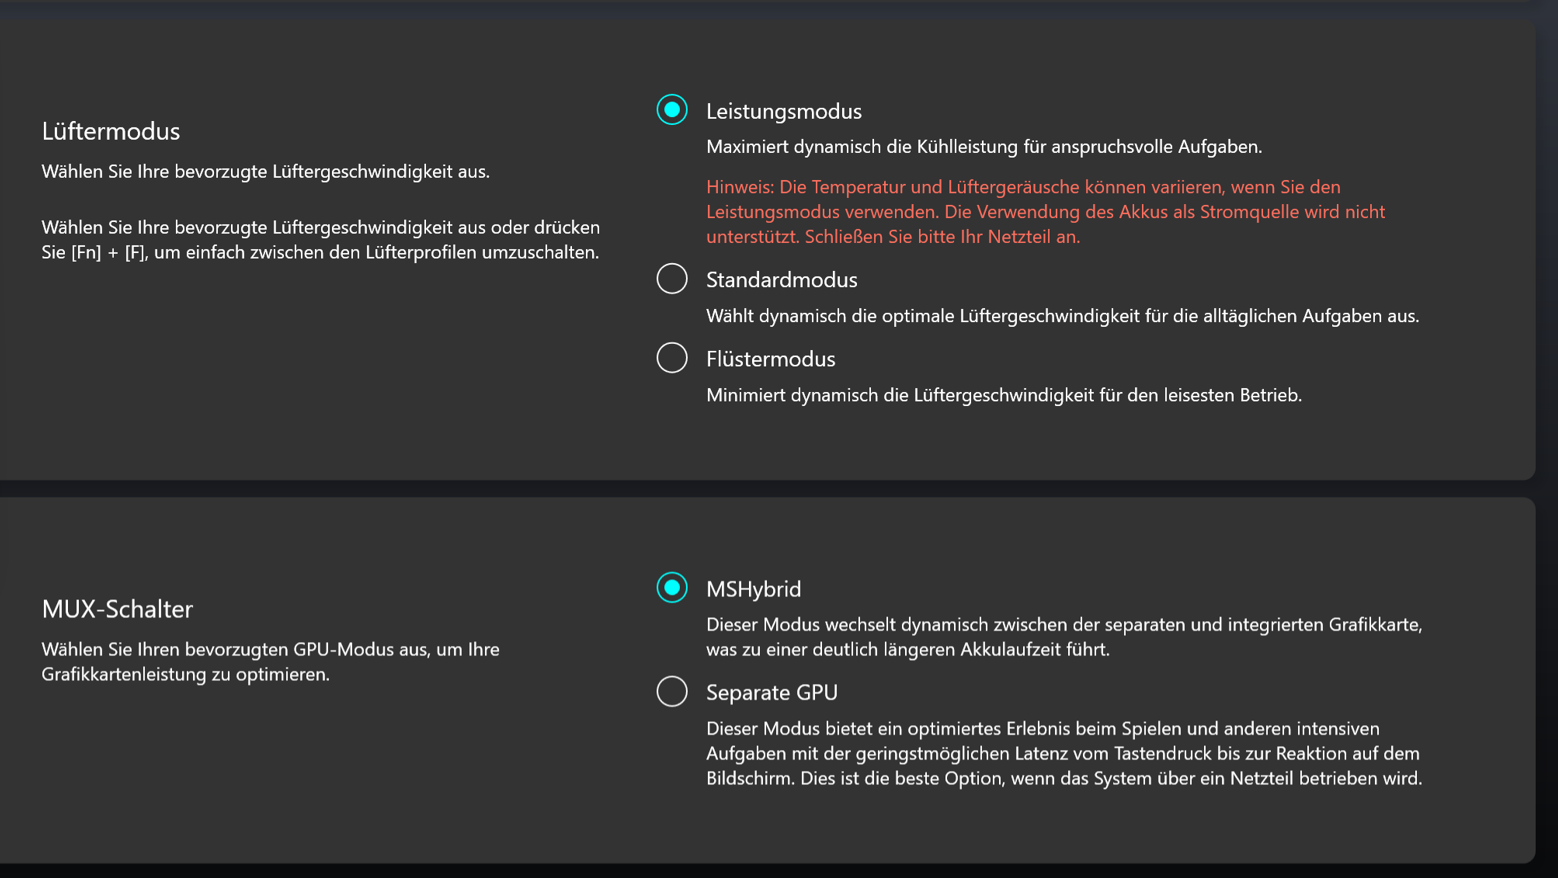
Three different power profiles can be toggled via the MyAsus app. We decided to use Performance mode in order to put the hardware through its paces. However, to ensure that the laptop was as economical as possible when running on battery, MSHybrid mode remained active with both graphics units. This allows the Zenbook to deativate the RTX 4080 for undemanding tasks. Performance mode is not available in battery mode; the laptop automatically switches to Standard mode.
The RTX 4080 operates at a constant maximum of 140 watts. The Intel Core i9 reaches a PL2 of 130 watts and a PL1 of 90 watts. In the Prime95 and Furmark stress tests, we see that the processor runs continuously at 45 watts and the graphics chip at 117 watts.
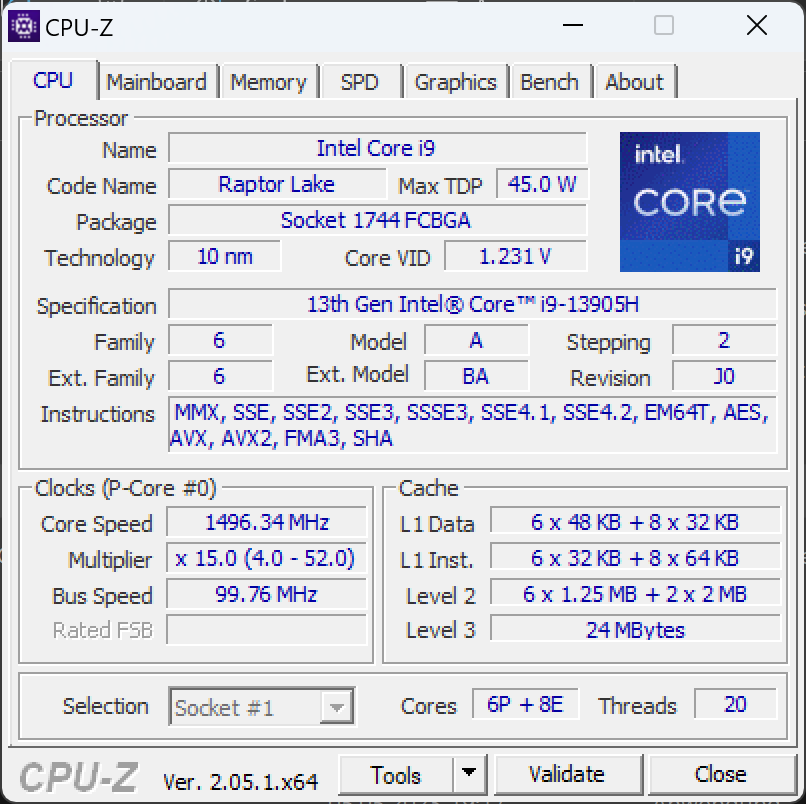
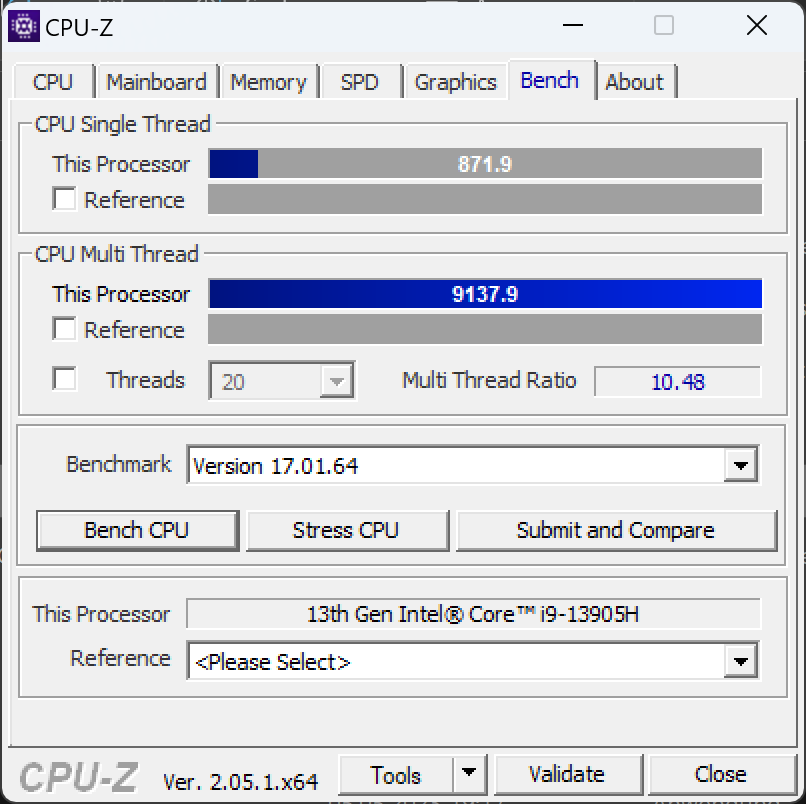
Processor
With 14 cores, the Intel Core i9-13905H has 20 threads. This means that there are 6 P and 8 E cores working at high performance levels. The Zenbook is in a top position performance wise, but the rival devices are also strong. Jostling for top position is the Lenovo Legion Pro 7, the Asus ROG Strix G16 and, surprisingly, the cheaper Asus Vivobook Pro 16X. The current Zenbook Pro 16X does not have a clear performance advantage over its predecessor in regard to processor performance, as the raw performance values of the Core i9-13905H and the Core i9-12900H from last year are just too similar. Nevertheless, Intel has optimized a little, so the generic benchmarks of Aida64 show a different picture. The current model clearly stands out here and is only beaten by the three rival devices mentioned above.
What stands out again and again in our benchmarks is that the Zenbook doesn't really utilize its fans. These only kick in only much later in the Cinebench R23 multi-core run and top scores are achieved only after several runs in the Cinebench R15 loop. Some performance is possibly lost in the process. But during shorter load peaks and in everyday use, the Asus laptop often remains very quiet or completely silent.
Cinebench R15 Multi Sustained Load
Cinebench R23: Multi Core | Single Core
Cinebench R20: CPU (Multi Core) | CPU (Single Core)
Cinebench R15: CPU Multi 64Bit | CPU Single 64Bit
Blender: v2.79 BMW27 CPU
7-Zip 18.03: 7z b 4 | 7z b 4 -mmt1
Geekbench 5.5: Multi-Core | Single-Core
HWBOT x265 Benchmark v2.2: 4k Preset
LibreOffice : 20 Documents To PDF
R Benchmark 2.5: Overall mean
| CPU Performance rating | |
| Lenovo Legion Pro 7 RTX4090 | |
| Asus ROG Strix G16 G614JZ | |
| Asus Vivobook Pro 16X K6604JV-MX016W | |
| Average of class Gaming | |
| Lenovo Legion Slim 7i 16 Gen 8 -1! | |
| Asus ROG Zephyrus M16 GU604VY-NM042X | |
| MSI Stealth 17 Studio A13VH-014 | |
| Asus Zenbook Pro 16X UX7602BZ-MY005W | |
| Average Intel Core i9-13905H | |
| Asus ZenBook Pro 16X OLED UX7602ZM-ME115W | |
| Cinebench R23 / Multi Core | |
| Lenovo Legion Pro 7 RTX4090 | |
| Asus ROG Strix G16 G614JZ | |
| Asus Vivobook Pro 16X K6604JV-MX016W | |
| Average of class Gaming (10488 - 42661, n=104, last 2 years) | |
| MSI Stealth 17 Studio A13VH-014 | |
| Asus Zenbook Pro 16X UX7602BZ-MY005W | |
| Lenovo Legion Slim 7i 16 Gen 8 | |
| Asus ROG Zephyrus M16 GU604VY-NM042X | |
| Average Intel Core i9-13905H (17880 - 20237, n=3) | |
| Asus ZenBook Pro 16X OLED UX7602ZM-ME115W | |
| Cinebench R23 / Single Core | |
| Asus ROG Strix G16 G614JZ | |
| Lenovo Legion Pro 7 RTX4090 | |
| Asus Zenbook Pro 16X UX7602BZ-MY005W | |
| Lenovo Legion Slim 7i 16 Gen 8 | |
| Average of class Gaming (1601 - 2415, n=104, last 2 years) | |
| Asus ROG Zephyrus M16 GU604VY-NM042X | |
| Average Intel Core i9-13905H (1652 - 2030, n=3) | |
| Asus Vivobook Pro 16X K6604JV-MX016W | |
| Asus ZenBook Pro 16X OLED UX7602ZM-ME115W | |
| MSI Stealth 17 Studio A13VH-014 | |
| Cinebench R20 / CPU (Multi Core) | |
| Lenovo Legion Pro 7 RTX4090 | |
| Asus ROG Strix G16 G614JZ | |
| Asus Vivobook Pro 16X K6604JV-MX016W | |
| Average of class Gaming (4029 - 16433, n=103, last 2 years) | |
| MSI Stealth 17 Studio A13VH-014 | |
| Lenovo Legion Slim 7i 16 Gen 8 | |
| Asus ROG Zephyrus M16 GU604VY-NM042X | |
| Asus Zenbook Pro 16X UX7602BZ-MY005W | |
| Average Intel Core i9-13905H (6462 - 7469, n=3) | |
| Asus ZenBook Pro 16X OLED UX7602ZM-ME115W | |
| Cinebench R20 / CPU (Single Core) | |
| Asus ROG Strix G16 G614JZ | |
| Average of class Gaming (622 - 913, n=103, last 2 years) | |
| Lenovo Legion Pro 7 RTX4090 | |
| Lenovo Legion Slim 7i 16 Gen 8 | |
| Asus ROG Zephyrus M16 GU604VY-NM042X | |
| Asus Vivobook Pro 16X K6604JV-MX016W | |
| Asus ZenBook Pro 16X OLED UX7602ZM-ME115W | |
| Average Intel Core i9-13905H (622 - 775, n=3) | |
| MSI Stealth 17 Studio A13VH-014 | |
| Asus Zenbook Pro 16X UX7602BZ-MY005W | |
| Cinebench R15 / CPU Multi 64Bit | |
| Asus ROG Strix G16 G614JZ | |
| Asus ROG Strix G16 G614JZ | |
| Asus Vivobook Pro 16X K6604JV-MX016W | |
| Lenovo Legion Pro 7 RTX4090 | |
| Average of class Gaming (1578 - 6330, n=102, last 2 years) | |
| Asus ROG Zephyrus M16 GU604VY-NM042X | |
| MSI Stealth 17 Studio A13VH-014 | |
| Lenovo Legion Slim 7i 16 Gen 8 | |
| Asus Zenbook Pro 16X UX7602BZ-MY005W | |
| Average Intel Core i9-13905H (2676 - 2931, n=3) | |
| Asus ZenBook Pro 16X OLED UX7602ZM-ME115W | |
| Blender / v2.79 BMW27 CPU | |
| Asus ZenBook Pro 16X OLED UX7602ZM-ME115W | |
| Average Intel Core i9-13905H (163 - 178, n=3) | |
| Asus ROG Zephyrus M16 GU604VY-NM042X | |
| MSI Stealth 17 Studio A13VH-014 | |
| Asus Zenbook Pro 16X UX7602BZ-MY005W | |
| Average of class Gaming (79 - 330, n=101, last 2 years) | |
| Asus Vivobook Pro 16X K6604JV-MX016W | |
| Asus ROG Strix G16 G614JZ | |
| Lenovo Legion Pro 7 RTX4090 | |
| 7-Zip 18.03 / 7z b 4 -mmt1 | |
| Asus Vivobook Pro 16X K6604JV-MX016W | |
| Lenovo Legion Pro 7 RTX4090 | |
| Asus ROG Strix G16 G614JZ | |
| Average of class Gaming (4824 - 7436, n=102, last 2 years) | |
| Lenovo Legion Slim 7i 16 Gen 8 | |
| Asus ROG Zephyrus M16 GU604VY-NM042X | |
| MSI Stealth 17 Studio A13VH-014 | |
| Asus ZenBook Pro 16X OLED UX7602ZM-ME115W | |
| Asus Zenbook Pro 16X UX7602BZ-MY005W | |
| Average Intel Core i9-13905H (4871 - 6069, n=3) | |
| Geekbench 5.5 / Multi-Core | |
| Lenovo Legion Pro 7 RTX4090 | |
| Asus ROG Strix G16 G614JZ | |
| Asus Vivobook Pro 16X K6604JV-MX016W | |
| Average of class Gaming (6460 - 28263, n=102, last 2 years) | |
| Asus ROG Zephyrus M16 GU604VY-NM042X | |
| Average Intel Core i9-13905H (13661 - 14999, n=3) | |
| MSI Stealth 17 Studio A13VH-014 | |
| Asus Zenbook Pro 16X UX7602BZ-MY005W | |
| Asus ZenBook Pro 16X OLED UX7602ZM-ME115W | |
| Lenovo Legion Slim 7i 16 Gen 8 | |
| Geekbench 5.5 / Single-Core | |
| Average of class Gaming (1403 - 2474, n=102, last 2 years) | |
| Asus ROG Strix G16 G614JZ | |
| MSI Stealth 17 Studio A13VH-014 | |
| Lenovo Legion Pro 7 RTX4090 | |
| Asus Vivobook Pro 16X K6604JV-MX016W | |
| Asus ROG Zephyrus M16 GU604VY-NM042X | |
| Lenovo Legion Slim 7i 16 Gen 8 | |
| Asus ZenBook Pro 16X OLED UX7602ZM-ME115W | |
| Average Intel Core i9-13905H (1672 - 1966, n=3) | |
| Asus Zenbook Pro 16X UX7602BZ-MY005W | |
| HWBOT x265 Benchmark v2.2 / 4k Preset | |
| Lenovo Legion Pro 7 RTX4090 | |
| Asus ROG Strix G16 G614JZ | |
| Average of class Gaming (11.5 - 44.4, n=102, last 2 years) | |
| Asus Vivobook Pro 16X K6604JV-MX016W | |
| MSI Stealth 17 Studio A13VH-014 | |
| Asus ROG Zephyrus M16 GU604VY-NM042X | |
| Lenovo Legion Slim 7i 16 Gen 8 | |
| Average Intel Core i9-13905H (20.5 - 22.9, n=3) | |
| Asus Zenbook Pro 16X UX7602BZ-MY005W | |
| Asus ZenBook Pro 16X OLED UX7602ZM-ME115W | |
| LibreOffice / 20 Documents To PDF | |
| Average Intel Core i9-13905H (42.8 - 94.8, n=3) | |
| MSI Stealth 17 Studio A13VH-014 | |
| Asus Vivobook Pro 16X K6604JV-MX016W | |
| Asus ROG Zephyrus M16 GU604VY-NM042X | |
| Average of class Gaming (33.2 - 88.8, n=102, last 2 years) | |
| Asus ROG Strix G16 G614JZ | |
| Asus Zenbook Pro 16X UX7602BZ-MY005W | |
| Lenovo Legion Pro 7 RTX4090 | |
| Asus ZenBook Pro 16X OLED UX7602ZM-ME115W | |
| Lenovo Legion Slim 7i 16 Gen 8 | |
| R Benchmark 2.5 / Overall mean | |
| Asus Zenbook Pro 16X UX7602BZ-MY005W | |
| Average Intel Core i9-13905H (0.4178 - 0.4974, n=3) | |
| Asus ZenBook Pro 16X OLED UX7602ZM-ME115W | |
| MSI Stealth 17 Studio A13VH-014 | |
| Average of class Gaming (0.3439 - 0.59, n=102, last 2 years) | |
| Lenovo Legion Slim 7i 16 Gen 8 | |
| Asus ROG Zephyrus M16 GU604VY-NM042X | |
| Asus Vivobook Pro 16X K6604JV-MX016W | |
| Lenovo Legion Pro 7 RTX4090 | |
| Asus ROG Strix G16 G614JZ | |
* ... smaller is better
AIDA64: FP32 Ray-Trace | FPU Julia | CPU SHA3 | CPU Queen | FPU SinJulia | FPU Mandel | CPU AES | CPU ZLib | FP64 Ray-Trace | CPU PhotoWorxx
| Performance rating | |
| Lenovo Legion Pro 7 RTX4090 | |
| Average of class Gaming | |
| Asus ROG Strix G16 G614JZ | |
| Asus Vivobook Pro 16X K6604JV-MX016W | |
| Asus Zenbook Pro 16X UX7602BZ-MY005W | |
| Asus ROG Zephyrus M16 GU604VY-NM042X | |
| MSI Stealth 17 Studio A13VH-014 | |
| Average Intel Core i9-13905H | |
| Lenovo Legion Slim 7i 16 Gen 8 | |
| Asus ZenBook Pro 16X OLED UX7602ZM-ME115W | |
| AIDA64 / FP32 Ray-Trace | |
| Average of class Gaming (10227 - 85542, n=102, last 2 years) | |
| Asus ROG Strix G16 G614JZ | |
| Lenovo Legion Pro 7 RTX4090 | |
| Asus Vivobook Pro 16X K6604JV-MX016W | |
| Asus Zenbook Pro 16X UX7602BZ-MY005W | |
| MSI Stealth 17 Studio A13VH-014 | |
| Asus ROG Zephyrus M16 GU604VY-NM042X | |
| Average Intel Core i9-13905H (17642 - 19900, n=3) | |
| Lenovo Legion Slim 7i 16 Gen 8 | |
| Asus ZenBook Pro 16X OLED UX7602ZM-ME115W | |
| AIDA64 / FPU SinJulia | |
| Asus ROG Strix G16 G614JZ | |
| Lenovo Legion Pro 7 RTX4090 | |
| Average of class Gaming (4424 - 33636, n=102, last 2 years) | |
| Asus Vivobook Pro 16X K6604JV-MX016W | |
| Asus ROG Zephyrus M16 GU604VY-NM042X | |
| Lenovo Legion Slim 7i 16 Gen 8 | |
| Average Intel Core i9-13905H (10478 - 11328, n=3) | |
| MSI Stealth 17 Studio A13VH-014 | |
| Asus Zenbook Pro 16X UX7602BZ-MY005W | |
| Asus ZenBook Pro 16X OLED UX7602ZM-ME115W | |
| AIDA64 / FP64 Ray-Trace | |
| Average of class Gaming (5509 - 45446, n=102, last 2 years) | |
| Asus ROG Strix G16 G614JZ | |
| Lenovo Legion Pro 7 RTX4090 | |
| Asus Vivobook Pro 16X K6604JV-MX016W | |
| Asus Zenbook Pro 16X UX7602BZ-MY005W | |
| MSI Stealth 17 Studio A13VH-014 | |
| Asus ROG Zephyrus M16 GU604VY-NM042X | |
| Average Intel Core i9-13905H (9483 - 10804, n=3) | |
| Lenovo Legion Slim 7i 16 Gen 8 | |
| Asus ZenBook Pro 16X OLED UX7602ZM-ME115W | |
| AIDA64 / CPU PhotoWorxx | |
| Asus Zenbook Pro 16X UX7602BZ-MY005W | |
| Average Intel Core i9-13905H (51720 - 60161, n=3) | |
| Lenovo Legion Pro 7 RTX4090 | |
| MSI Stealth 17 Studio A13VH-014 | |
| Asus ROG Zephyrus M16 GU604VY-NM042X | |
| Asus ZenBook Pro 16X OLED UX7602ZM-ME115W | |
| Average of class Gaming (12271 - 89891, n=102, last 2 years) | |
| Asus Vivobook Pro 16X K6604JV-MX016W | |
| Asus ROG Strix G16 G614JZ | |
| Lenovo Legion Slim 7i 16 Gen 8 | |
System Performance
With a more powerful graphics card and a processor that is at least on par, the new Zenbook Pro 16X should actually perform far better than its predecessor in the PCMark 10 and CrossMark benchmarks. We also expected a clear lead in the AIDA64 memory benchmarks. But the memory latencies are hardly any lower despite the shortened path to the RAM chips. Only the write and copy speeds of the RAM clearly benefit from the new SoM design.
The results show that the RTX 4080 achieves a significant increase in points in the digital content creation sub-area. The other sub-areas in PCMark10 also saw a small increase in points compared to the predecessor. The comparison to the Asus ROG Zephyrus M16 or the Lenovo Legion Pro 7 with their RTX 4090 reveals that the nominally stronger graphics card confers virtually no advantages in these benchmarks. The closed 18 mm thin case hardly seems to influence the extreme performance of the notebook, but another factor does: the fans and the power control of the Zenbook Pro 16X react very slowly to changes under load. This fact was already visible in the long-term Cinebench R15 test. A "preheated" system occasionally offers more performance than a freshly started laptop. Ultimately, however, this is splitting hairs because the Asus Zenbook Pro 16X is an extremely high-performance laptop that can easily handle PhotoShop or Premiere Pro.
CrossMark: Overall | Productivity | Creativity | Responsiveness
WebXPRT 4: Overall
| PCMark 10 / Score | |
| Lenovo Legion Slim 7i 16 Gen 8 | |
| Average of class Gaming (5828 - 12414, n=93, last 2 years) | |
| Asus ROG Zephyrus M16 GU604VY-NM042X | |
| Lenovo Legion Pro 7 RTX4090 | |
| Asus Zenbook Pro 16X UX7602BZ-MY005W | |
| Average Intel Core i9-13905H, NVIDIA GeForce RTX 4080 Laptop GPU (n=1) | |
| MSI Stealth 17 Studio A13VH-014 | |
| Asus ZenBook Pro 16X OLED UX7602ZM-ME115W | |
| Asus ROG Strix G16 G614JZ | |
| Asus Vivobook Pro 16X K6604JV-MX016W | |
| PCMark 10 / Essentials | |
| Asus ROG Strix G16 G614JZ | |
| Asus ROG Zephyrus M16 GU604VY-NM042X | |
| Asus Zenbook Pro 16X UX7602BZ-MY005W | |
| Average Intel Core i9-13905H, NVIDIA GeForce RTX 4080 Laptop GPU (n=1) | |
| Lenovo Legion Slim 7i 16 Gen 8 | |
| Lenovo Legion Pro 7 RTX4090 | |
| Asus ZenBook Pro 16X OLED UX7602ZM-ME115W | |
| Average of class Gaming (8810 - 11935, n=97, last 2 years) | |
| Asus Vivobook Pro 16X K6604JV-MX016W | |
| MSI Stealth 17 Studio A13VH-014 | |
| PCMark 10 / Productivity | |
| Average of class Gaming (6845 - 25323, n=95, last 2 years) | |
| Asus ROG Zephyrus M16 GU604VY-NM042X | |
| Lenovo Legion Slim 7i 16 Gen 8 | |
| Asus Zenbook Pro 16X UX7602BZ-MY005W | |
| Average Intel Core i9-13905H, NVIDIA GeForce RTX 4080 Laptop GPU (n=1) | |
| Asus ZenBook Pro 16X OLED UX7602ZM-ME115W | |
| MSI Stealth 17 Studio A13VH-014 | |
| Lenovo Legion Pro 7 RTX4090 | |
| Asus Vivobook Pro 16X K6604JV-MX016W | |
| Asus ROG Strix G16 G614JZ | |
| PCMark 10 / Digital Content Creation | |
| Lenovo Legion Pro 7 RTX4090 | |
| Average of class Gaming (7602 - 19954, n=95, last 2 years) | |
| Lenovo Legion Slim 7i 16 Gen 8 | |
| Asus Zenbook Pro 16X UX7602BZ-MY005W | |
| Average Intel Core i9-13905H, NVIDIA GeForce RTX 4080 Laptop GPU (n=1) | |
| Asus ROG Zephyrus M16 GU604VY-NM042X | |
| MSI Stealth 17 Studio A13VH-014 | |
| Asus ROG Strix G16 G614JZ | |
| Asus ZenBook Pro 16X OLED UX7602ZM-ME115W | |
| Asus Vivobook Pro 16X K6604JV-MX016W | |
| CrossMark / Overall | |
| Asus ROG Strix G16 G614JZ | |
| Asus Vivobook Pro 16X K6604JV-MX016W | |
| Asus Zenbook Pro 16X UX7602BZ-MY005W | |
| Average Intel Core i9-13905H, NVIDIA GeForce RTX 4080 Laptop GPU (n=1) | |
| Average of class Gaming (1366 - 2409, n=94, last 2 years) | |
| Lenovo Legion Slim 7i 16 Gen 8 | |
| Asus ROG Zephyrus M16 GU604VY-NM042X | |
| Asus ZenBook Pro 16X OLED UX7602ZM-ME115W | |
| MSI Stealth 17 Studio A13VH-014 | |
| CrossMark / Productivity | |
| Asus ROG Strix G16 G614JZ | |
| Asus Vivobook Pro 16X K6604JV-MX016W | |
| Lenovo Legion Slim 7i 16 Gen 8 | |
| Average of class Gaming (1386 - 2254, n=94, last 2 years) | |
| Asus ROG Zephyrus M16 GU604VY-NM042X | |
| Asus Zenbook Pro 16X UX7602BZ-MY005W | |
| Average Intel Core i9-13905H, NVIDIA GeForce RTX 4080 Laptop GPU (n=1) | |
| Asus ZenBook Pro 16X OLED UX7602ZM-ME115W | |
| MSI Stealth 17 Studio A13VH-014 | |
| CrossMark / Creativity | |
| Asus ROG Strix G16 G614JZ | |
| Asus Vivobook Pro 16X K6604JV-MX016W | |
| Asus Zenbook Pro 16X UX7602BZ-MY005W | |
| Average Intel Core i9-13905H, NVIDIA GeForce RTX 4080 Laptop GPU (n=1) | |
| Average of class Gaming (1343 - 2786, n=94, last 2 years) | |
| Asus ROG Zephyrus M16 GU604VY-NM042X | |
| Lenovo Legion Slim 7i 16 Gen 8 | |
| Asus ZenBook Pro 16X OLED UX7602ZM-ME115W | |
| MSI Stealth 17 Studio A13VH-014 | |
| CrossMark / Responsiveness | |
| Asus ROG Strix G16 G614JZ | |
| Lenovo Legion Slim 7i 16 Gen 8 | |
| Average of class Gaming (1226 - 2334, n=94, last 2 years) | |
| Asus ROG Zephyrus M16 GU604VY-NM042X | |
| Asus Vivobook Pro 16X K6604JV-MX016W | |
| Asus Zenbook Pro 16X UX7602BZ-MY005W | |
| Average Intel Core i9-13905H, NVIDIA GeForce RTX 4080 Laptop GPU (n=1) | |
| MSI Stealth 17 Studio A13VH-014 | |
| Asus ZenBook Pro 16X OLED UX7602ZM-ME115W | |
| WebXPRT 4 / Overall | |
| Asus ROG Strix G16 G614JZ | |
| Asus ROG Zephyrus M16 GU604VY-NM042X | |
| Lenovo Legion Slim 7i 16 Gen 8 | |
| Average of class Gaming (165 - 354, n=98, last 2 years) | |
| Lenovo Legion Pro 7 RTX4090 | |
| Asus ZenBook Pro 16X OLED UX7602ZM-ME115W | |
| Asus Vivobook Pro 16X K6604JV-MX016W | |
| Asus Zenbook Pro 16X UX7602BZ-MY005W | |
| Average Intel Core i9-13905H, NVIDIA GeForce RTX 4080 Laptop GPU (n=1) | |
| MSI Stealth 17 Studio A13VH-014 | |
| PCMark 10 Score | 8033 points | |
Help | ||
| AIDA64 / Memory Write | |
| Asus Zenbook Pro 16X UX7602BZ-MY005W | |
| Average Intel Core i9-13905H (89545 - 103259, n=3) | |
| Lenovo Legion Pro 7 RTX4090 | |
| Average of class Gaming (22297 - 135096, n=102, last 2 years) | |
| MSI Stealth 17 Studio A13VH-014 | |
| Asus ROG Zephyrus M16 GU604VY-NM042X | |
| Asus Vivobook Pro 16X K6604JV-MX016W | |
| Asus ZenBook Pro 16X OLED UX7602ZM-ME115W | |
| Asus ROG Strix G16 G614JZ | |
| Lenovo Legion Slim 7i 16 Gen 8 | |
| AIDA64 / Memory Latency | |
| Average Intel Core i9-13905H (101.4 - 134.8, n=3) | |
| Asus ZenBook Pro 16X OLED UX7602ZM-ME115W | |
| Average of class Gaming (75.3 - 165.4, n=102, last 2 years) | |
| Asus Zenbook Pro 16X UX7602BZ-MY005W | |
| MSI Stealth 17 Studio A13VH-014 | |
| Asus Vivobook Pro 16X K6604JV-MX016W | |
| Asus ROG Zephyrus M16 GU604VY-NM042X | |
| Asus ROG Strix G16 G614JZ | |
| Lenovo Legion Pro 7 RTX4090 | |
| Lenovo Legion Slim 7i 16 Gen 8 | |
* ... smaller is better
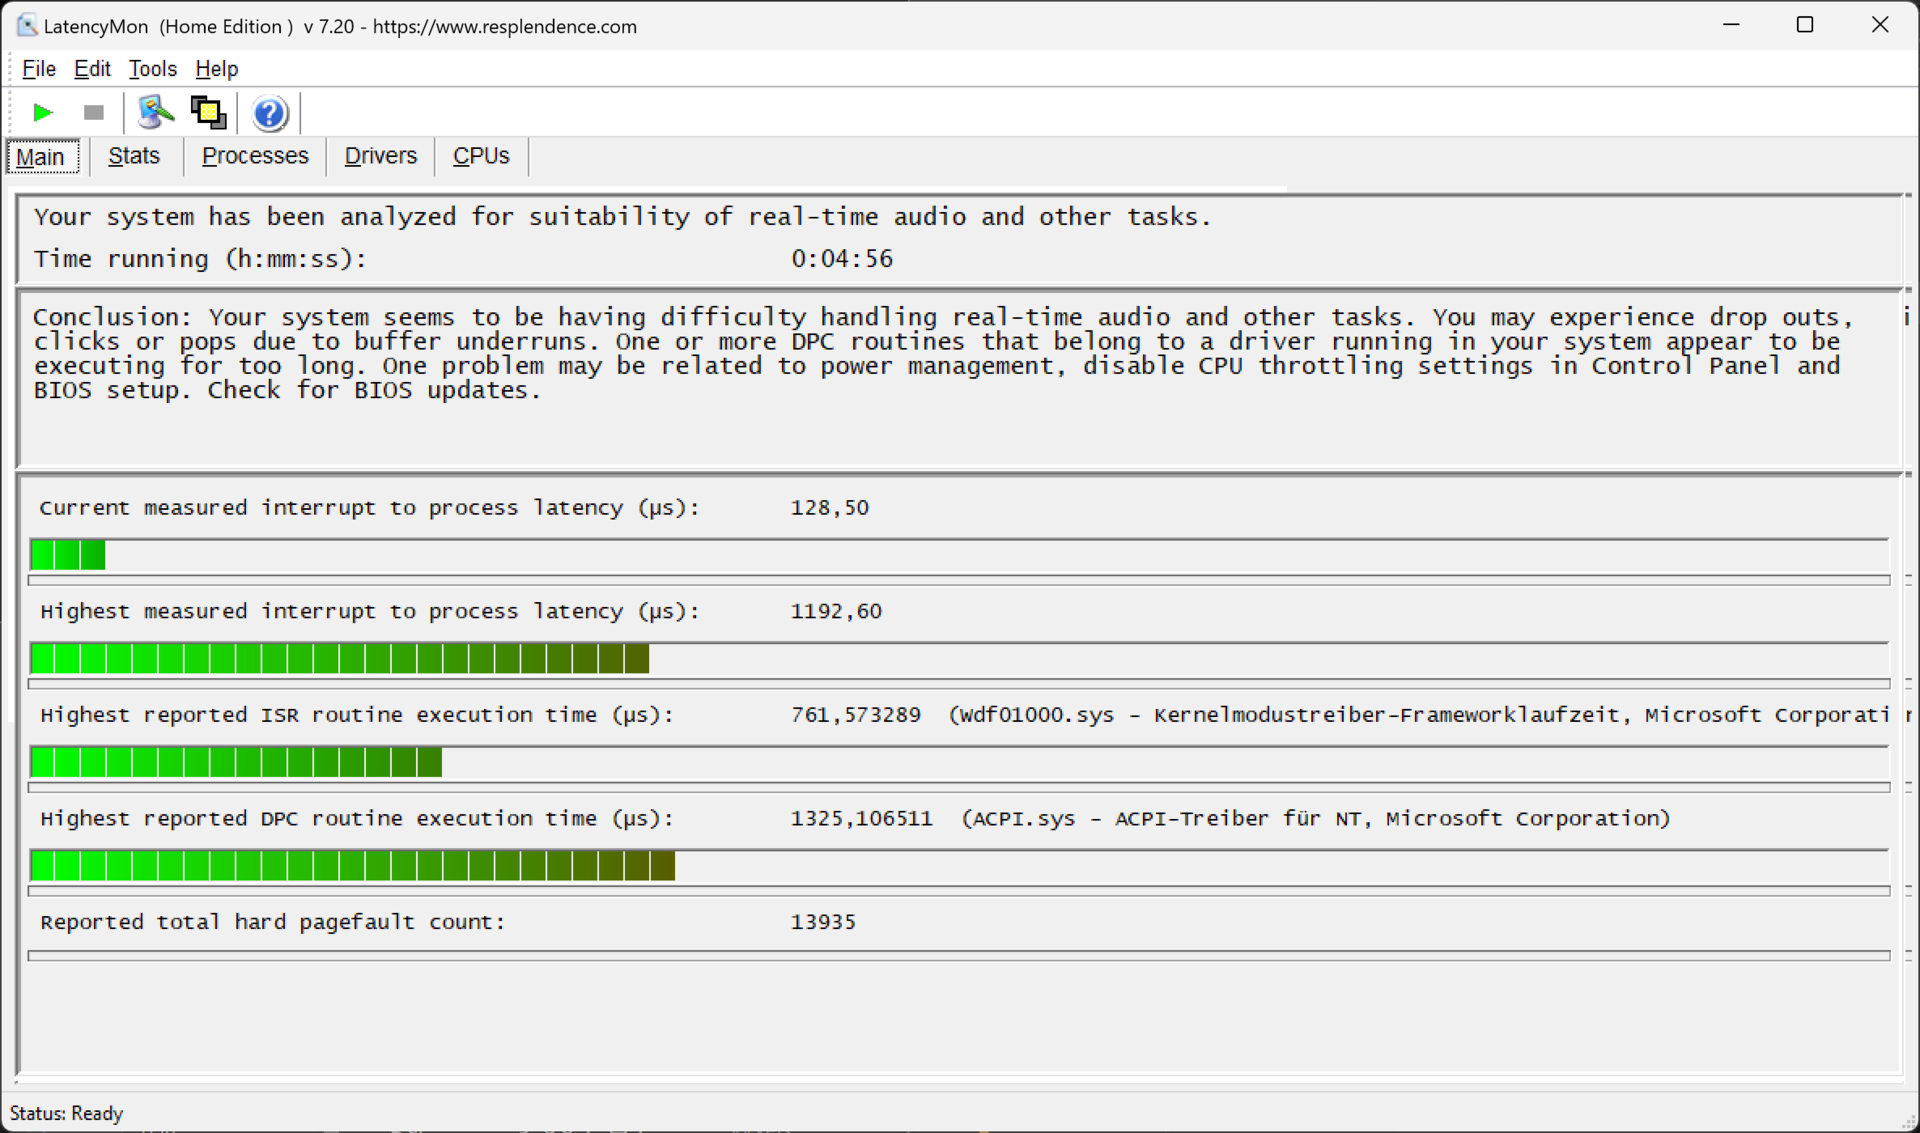
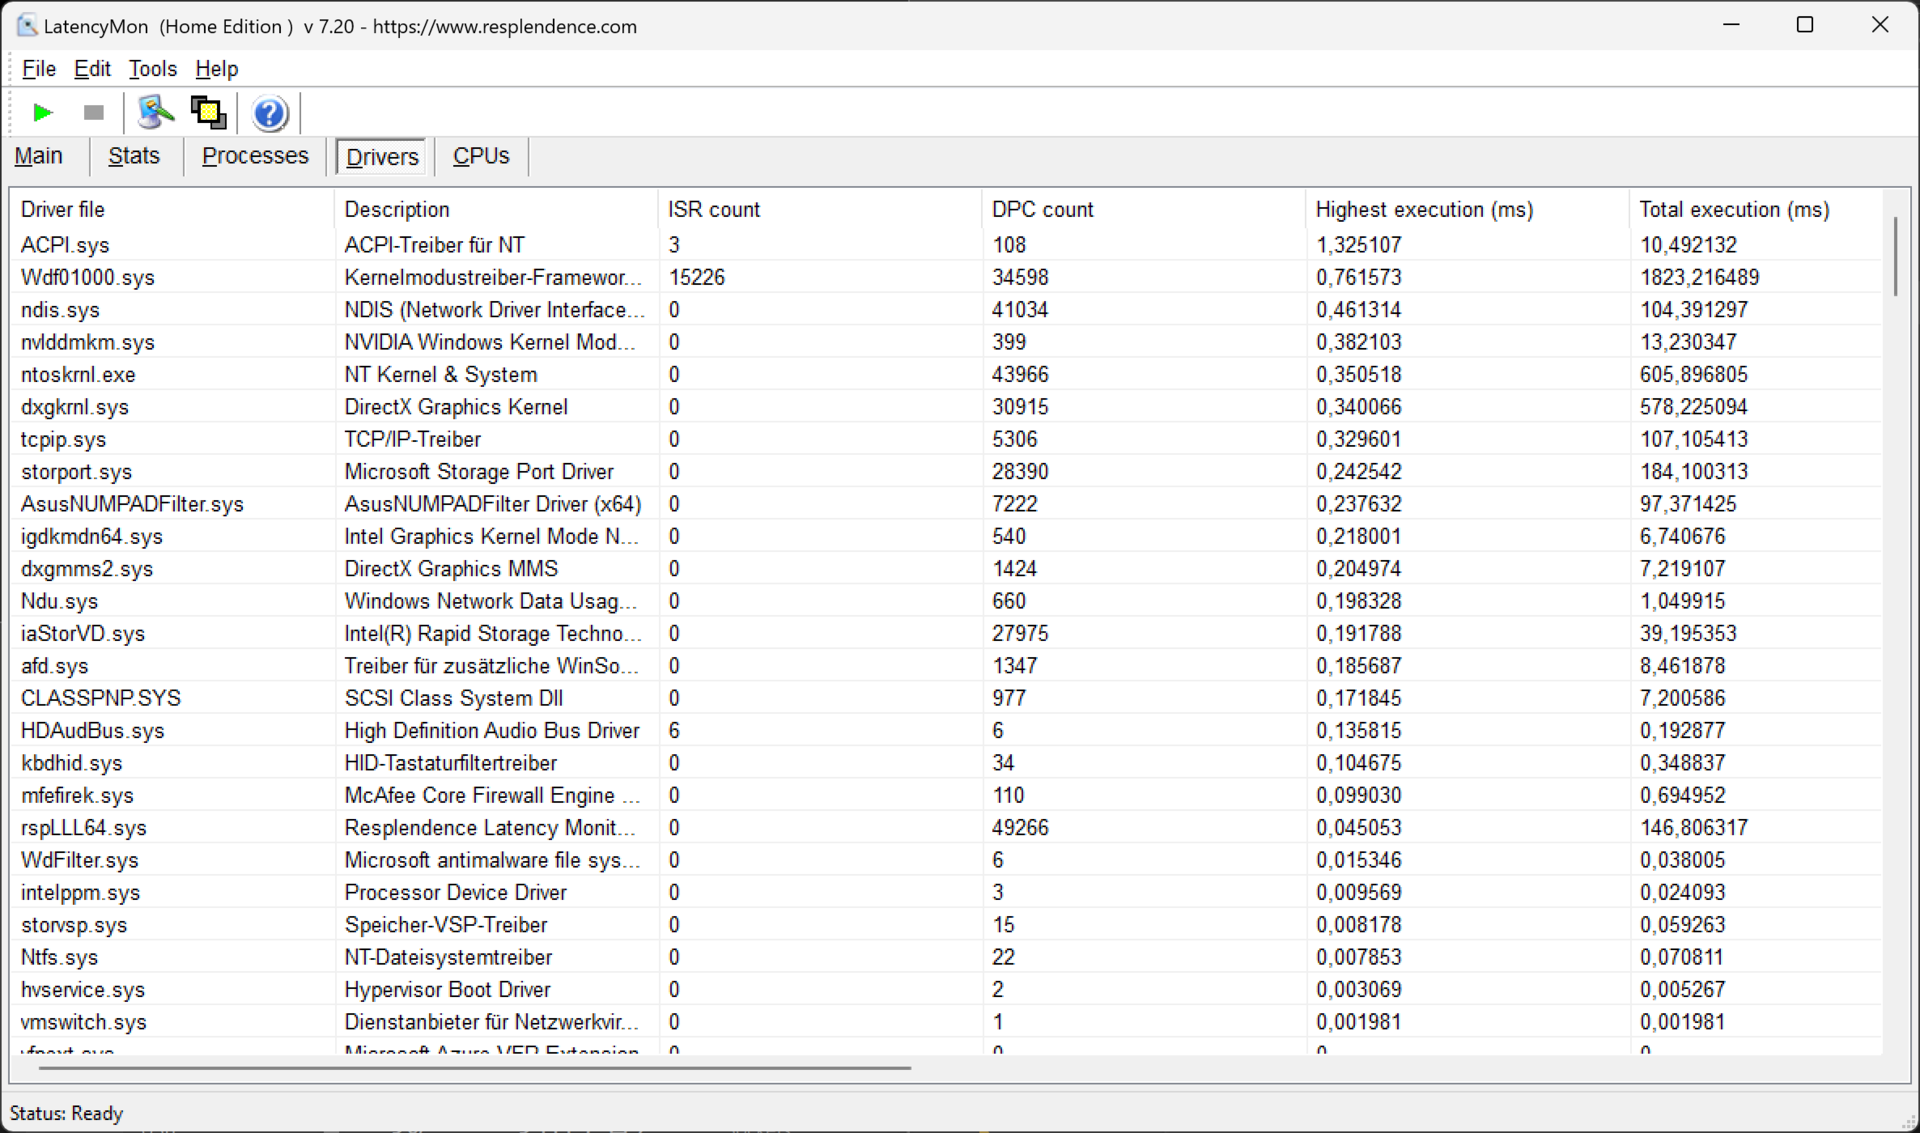
DPC latency
In terms of latency, the Zenbook Pro 16X actually performs quite well compared to its competitors. But even at 1164 µs, LatencyMon still states that there could be problems with real-time applications. Ultimately, the current driver configuration and device firmware are decisive for DPC latencies. Both could see significant changes through updates.
| DPC Latencies / LatencyMon - interrupt to process latency (max), Web, Youtube, Prime95 | |
| Lenovo Legion Pro 7 RTX4090 | |
| Lenovo Legion Slim 7i 16 Gen 8 | |
| Asus ROG Zephyrus M16 GU604VY-NM042X | |
| MSI Stealth 17 Studio A13VH-014 | |
| Asus ROG Strix G16 G614JZ | |
| Asus Vivobook Pro 16X K6604JV-MX016W | |
| Asus Zenbook Pro 16X UX7602BZ-MY005W | |
| Asus ZenBook Pro 16X OLED UX7602ZM-ME115W | |
* ... smaller is better
Storage devices
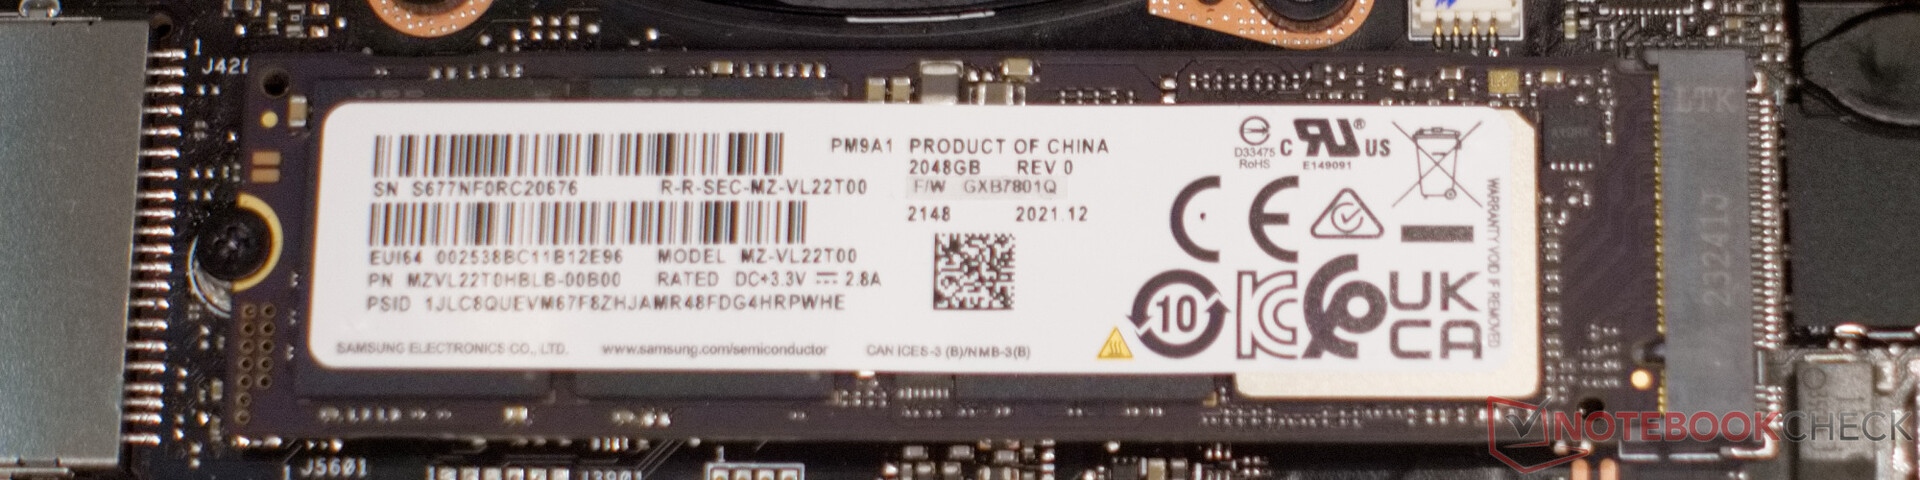
In principle, the Samsung PM9A1 is a powerful NVMe SSD. A module with a capacity of 2 TB is installed in our test device. All read and write speeds are good in our tests, even if we noticed a slight drop in 4K write speeds compared to other laptops. In sequential read and write, the SSD is in top form and without any dropouts.

* ... smaller is better
Sustained read performance: DiskSpd Read Loop, Queue Depth 8
Graphics card
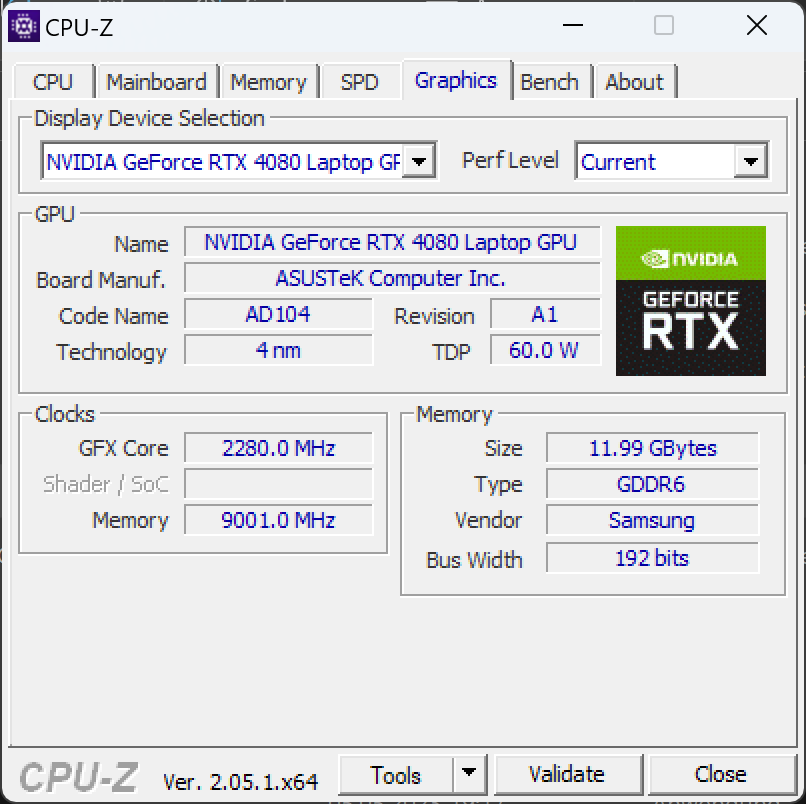
The RTX 4080 in the Asus Zenbook Pro 16X provides 12 GB of GDDR6X RAM. This means that the graphics unit here is much better suited to video editing than the RTX 3060 in the predecessor. Thanks to a power supply of up to 140 watts, the graphics chip is clearly in the upper range of its performance spectrum. Nvidia offers up to 150 watts for the chip, which is also noticeable in our 3DMark, Blender and PugetBench benchmarks. The Zenbook achieves high scores in all applications. In some scenarios, it even comes within striking distance of the RTX 4090 in the Asus ROG Zephyrus M16. Only the Lenovo Legion Pro 7 and the Asus ROG Strix G16 really stand out from the test field.
One of our strongest criticisms of the predecessor has been eliminated via the significantly more powerful graphics chip. The Nvidia RTX 4080 is a solid choice here and is also suitable for gaming at a native display resolution of 3200 × 2000.
| 3DMark 11 Performance | 42771 points | |
| 3DMark Cloud Gate Standard Score | 61442 points | |
| 3DMark Fire Strike Score | 31314 points | |
| 3DMark Time Spy Score | 16666 points | |
Help | ||
* ... smaller is better
| Premiere Pro PugetBench - Overall Score 0.98 | |
| Asus Zenbook Pro 16X UX7602BZ-MY005W | |
| Apple MacBook Pro 16 2023 M3 Max | |
| Apple MacBook Pro 14 2023 M3 | |
Gaming performance
4K gaming presents no difficulty for the Asus Zenbook Pro 16X. Ray tracing is also usually possible. Only Cyberpunk and Alan Wake 2 bring the laptop to its knees a little, although the frame rates are still at a reasonably playable 30 fps. The native QHD resolution of the screen runs at 60 fps in all tested games and settings. The slim laptop proves to be a strong gaming laptop in the benchmarks and also in our live stream on YouTube.
Witcher 3 FPS chart
| low | med. | high | ultra | QHD | 4K DLSS | 4K | |
|---|---|---|---|---|---|---|---|
| GTA V (2015) | 184.4 | 184.2 | 180.2 | 132.1 | 115.3 | 159.7 | |
| The Witcher 3 (2015) | 172.4 | 131.4 | 114.2 | ||||
| Dota 2 Reborn (2015) | 176.2 | 152.4 | 146 | 138.3 | 138.7 | ||
| Final Fantasy XV Benchmark (2018) | 201 | 180.1 | 152.9 | 123.3 | |||
| X-Plane 11.11 (2018) | 138.1 | 122.3 | 95.3 | 82.8 | |||
| Strange Brigade (2018) | 444 | 349 | 324 | 297 | 221 | 144.3 | |
| Shadow of the Tomb Raider (2018) | 176 | 142 | 79 | ||||
| Far Cry 6 (2021) | 130 | 110 | 70 | ||||
| Tiny Tina's Wonderlands (2022) | 144.93 | 105.29 | 55.65 | ||||
| Call of Duty Modern Warfare 2 2022 (2022) | 148 | 108 | 65 | ||||
| F1 23 (2023) | 236 | 238 | 227 | 90.8 | 60 | 65.1 | |
| Cyberpunk 2077 (2023) | 109.17 | 71.31 | 30.89 | ||||
| Alan Wake 2 (2023) | 76.7 | 66.8 | 34.3 | 34.9 |
Emissions - The Zenbook is whisper quiet on request
Noise
The Zenbook remains at a very pleasant noise level under light to medium load. At a distance of 15 cm we only measured 38 dB(A). Under full load in Standard mode, the laptop is clearly audible at 41 dB(A), but not disturbingly loud. Only in Performance mode do the fans rev up to full speed and generate up to 51 dB(A). Medium and low frequencies are audible in all speed ranges, so the background noise is more of a pleasant hiss.
Noise level
| Idle |
| 24.9 / 24.9 / 24.9 dB(A) |
| Load |
| 38 / 51 dB(A) |
 | ||
30 dB silent 40 dB(A) audible 50 dB(A) loud |
||
min: | ||
| Asus Zenbook Pro 16X UX7602BZ-MY005W GeForce RTX 4080 Laptop GPU, i9-13905H, Samsung PM9A1 MZVL22T0HBLB | Asus ZenBook Pro 16X OLED UX7602ZM-ME115W GeForce RTX 3060 Laptop GPU, i9-12900H, Samsung PM9A1 MZVL21T0HCLR | Asus ROG Strix G16 G614JZ GeForce RTX 4080 Laptop GPU, i9-13980HX, WD PC SN560 SDDPNQE-1T00 | Asus ROG Zephyrus M16 GU604VY-NM042X GeForce RTX 4090 Laptop GPU, i9-13900H, Samsung PM9A1 MZVL22T0HBLB | MSI Stealth 17 Studio A13VH-014 GeForce RTX 4080 Laptop GPU, i9-13900H, Samsung PM9A1 MZVL22T0HBLB | Lenovo Legion Pro 7 RTX4090 GeForce RTX 4090 Laptop GPU, i9-13900HX, Samsung PM9A1 MZVL21T0HCLR | Lenovo Legion Slim 7i 16 Gen 8 GeForce RTX 4070 Laptop GPU, i9-13900H, Samsung PM9A1 MZVL21T0HCLR | Asus Vivobook Pro 16X K6604JV-MX016W GeForce RTX 4060 Laptop GPU, i9-13980HX, Solidigm P41 Plus SSDPFKNU010TZ | |
|---|---|---|---|---|---|---|---|---|
| Noise | -8% | -11% | -10% | 5% | -20% | 6% | -14% | |
| off / environment * (dB) | 24.9 | 26 -4% | 25 -0% | 24 4% | 24 4% | 25 -0% | 22.8 8% | 25.2 -1% |
| Idle Minimum * (dB) | 24.9 | 26 -4% | 26 -4% | 24 4% | 24 4% | 28 -12% | 23.6 5% | 26.6 -7% |
| Idle Average * (dB) | 24.9 | 26 -4% | 28 -12% | 29.96 -20% | 24 4% | 30 -20% | 23.6 5% | 26.6 -7% |
| Idle Maximum * (dB) | 24.9 | 26 -4% | 30 -20% | 34.27 -38% | 24 4% | 38 -53% | 25.7 -3% | 29.2 -17% |
| Load Average * (dB) | 38 | 48 -26% | 48 -26% | 35.89 6% | 34.49 9% | 48 -26% | 27.6 27% | 53.4 -41% |
| Load Maximum * (dB) | 51 | 54.6 -7% | 52 -2% | 57.54 -13% | 49.66 3% | 55 -8% | 54.4 -7% | 56.9 -12% |
| Witcher 3 ultra * (dB) | 49 | 57.5 | 48.29 | 53 | 54.4 |
* ... smaller is better
Temperature
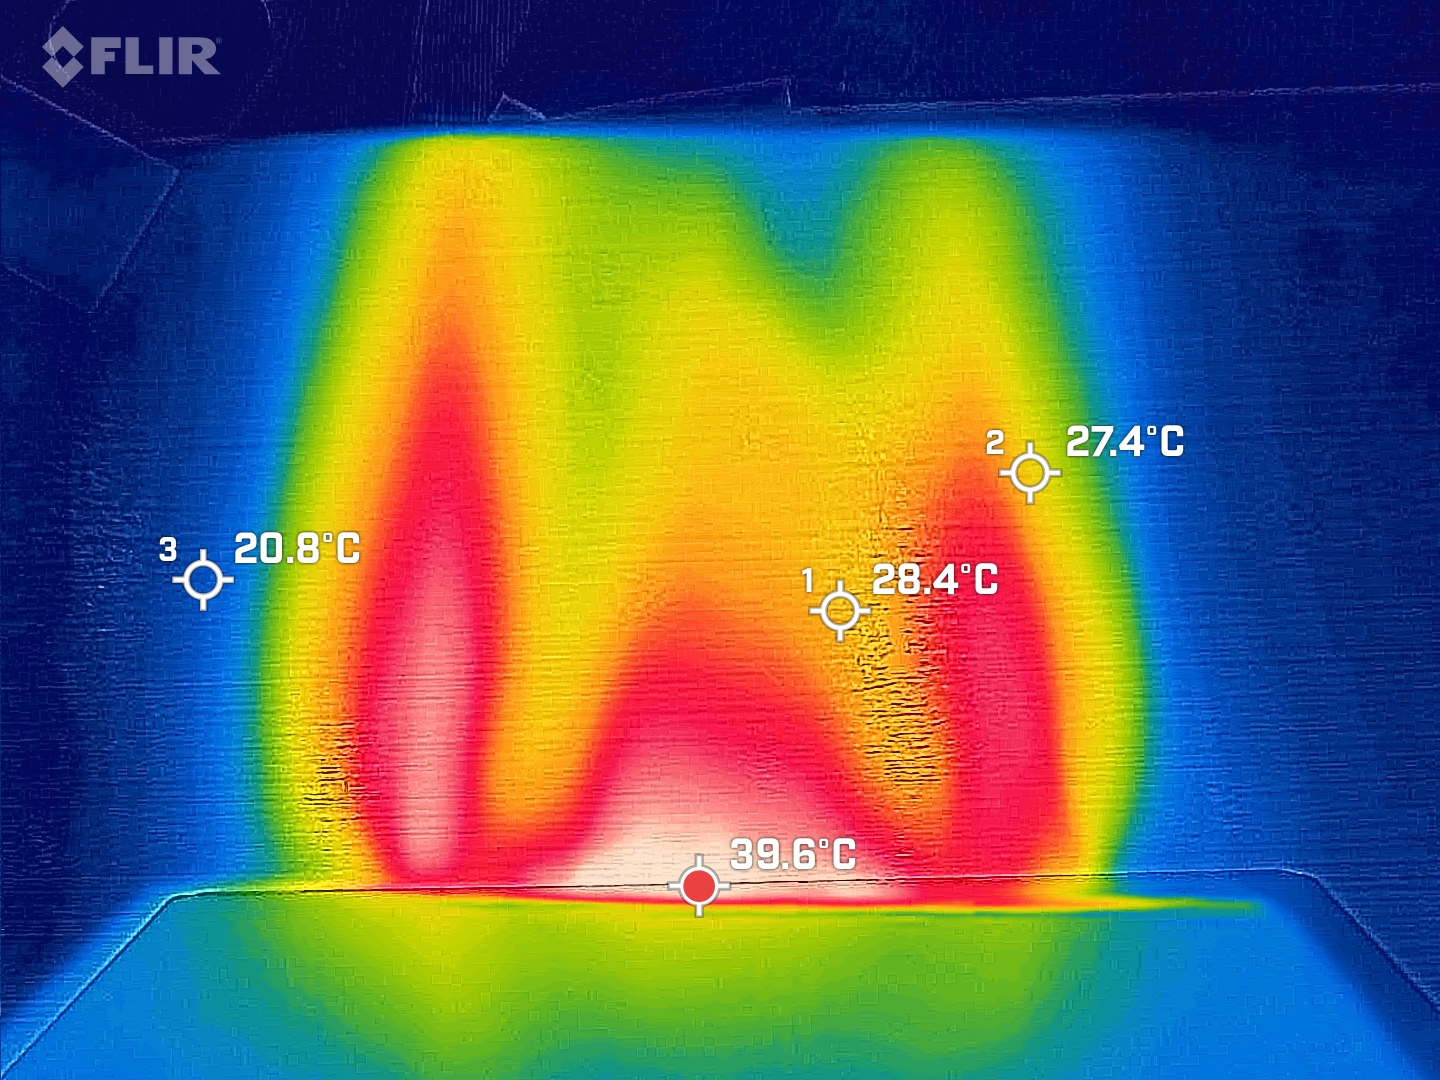
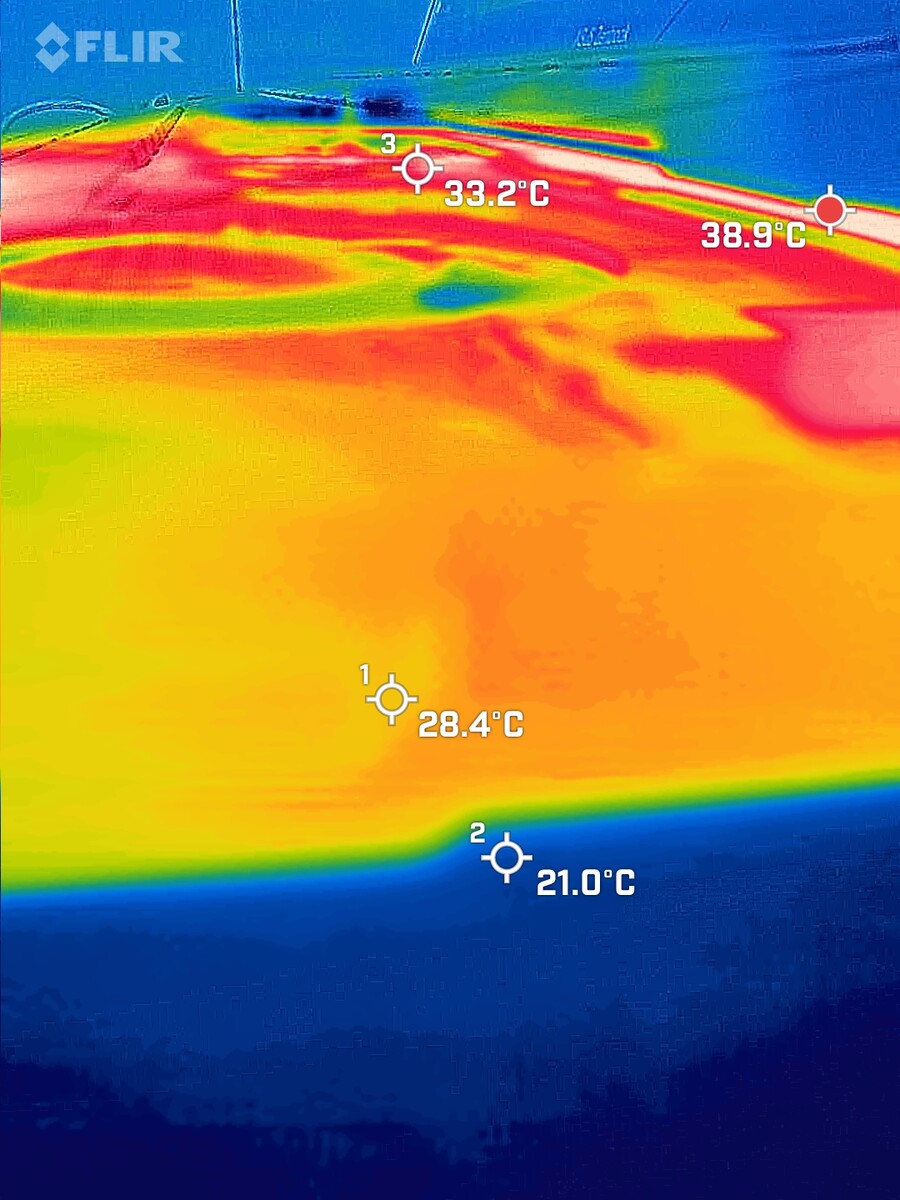
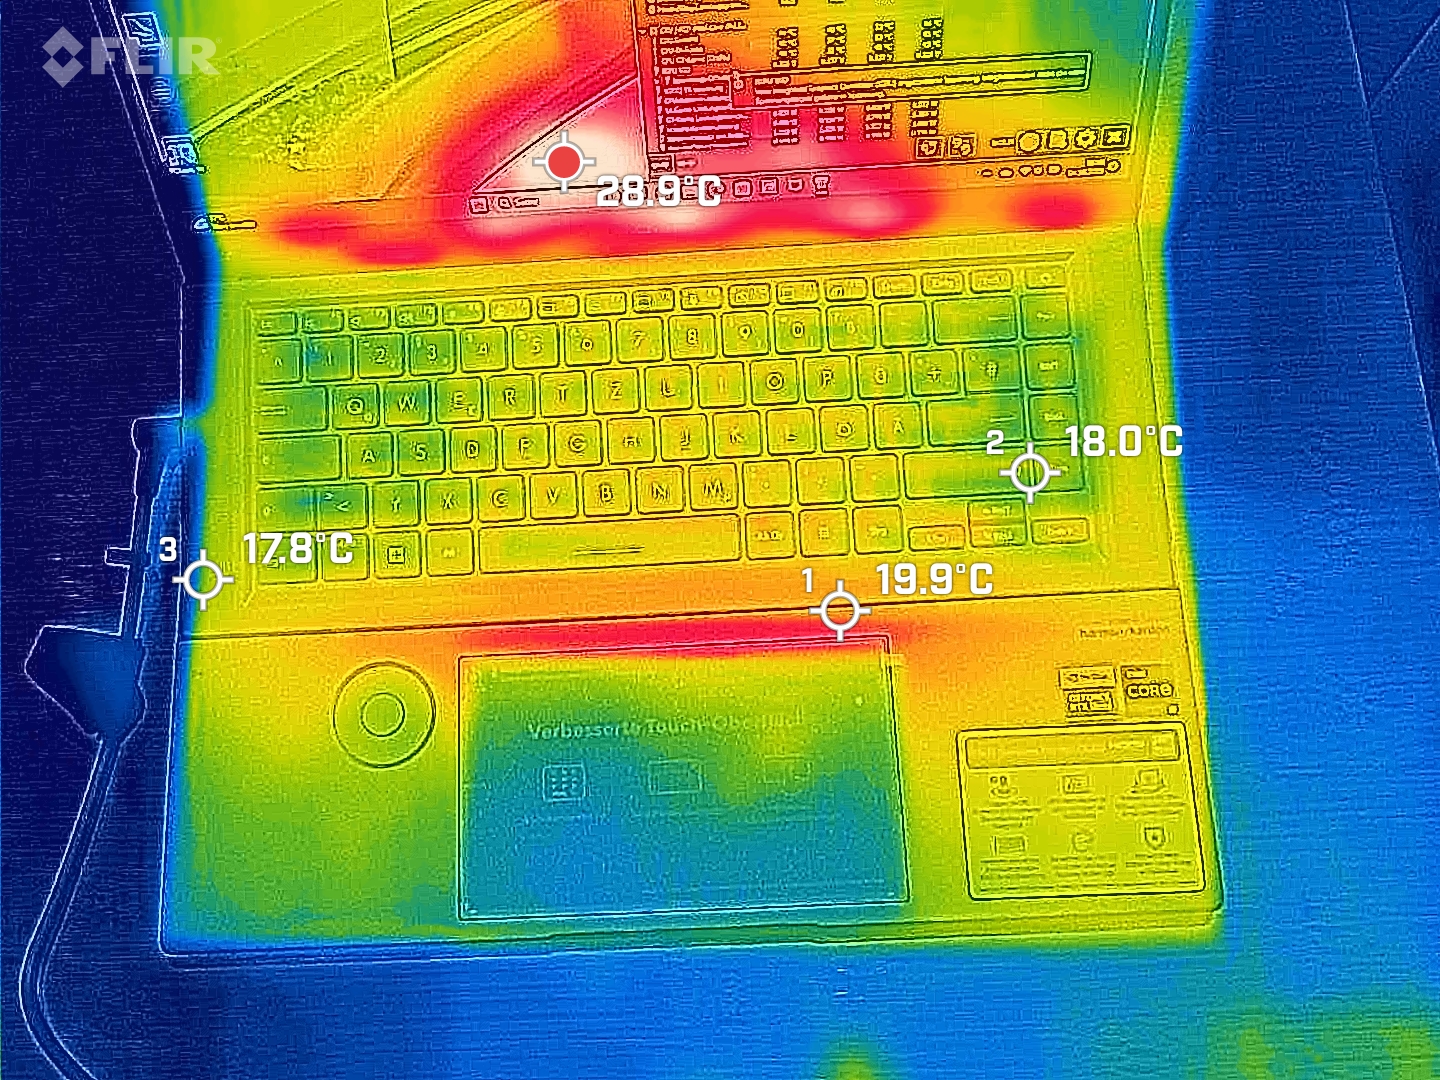
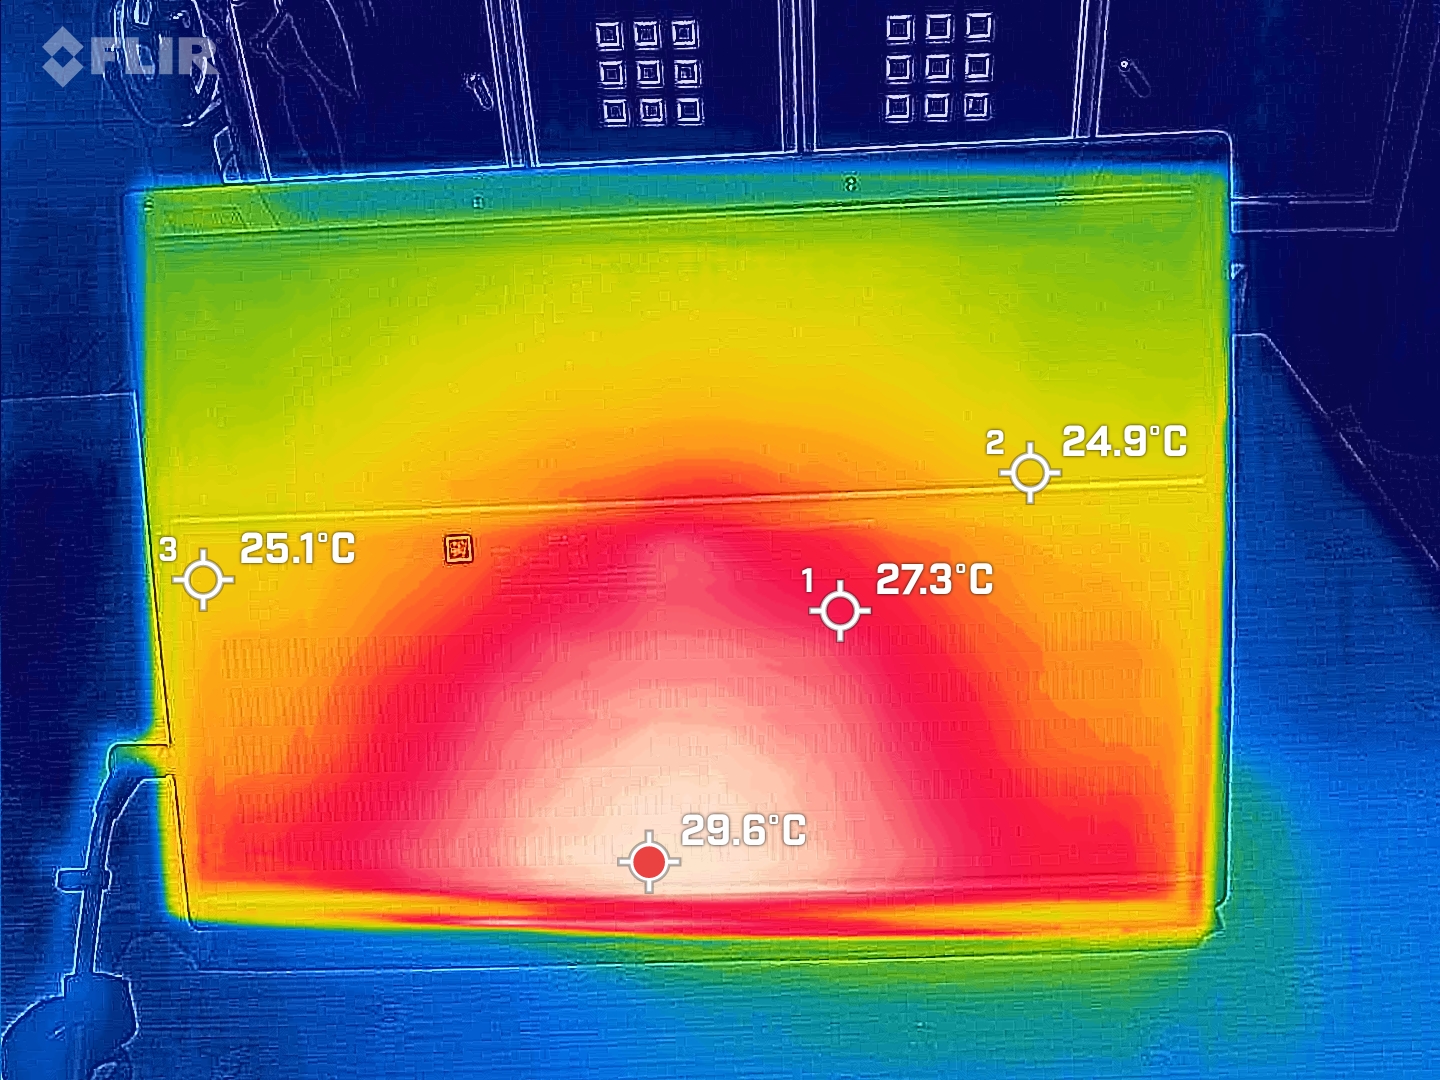
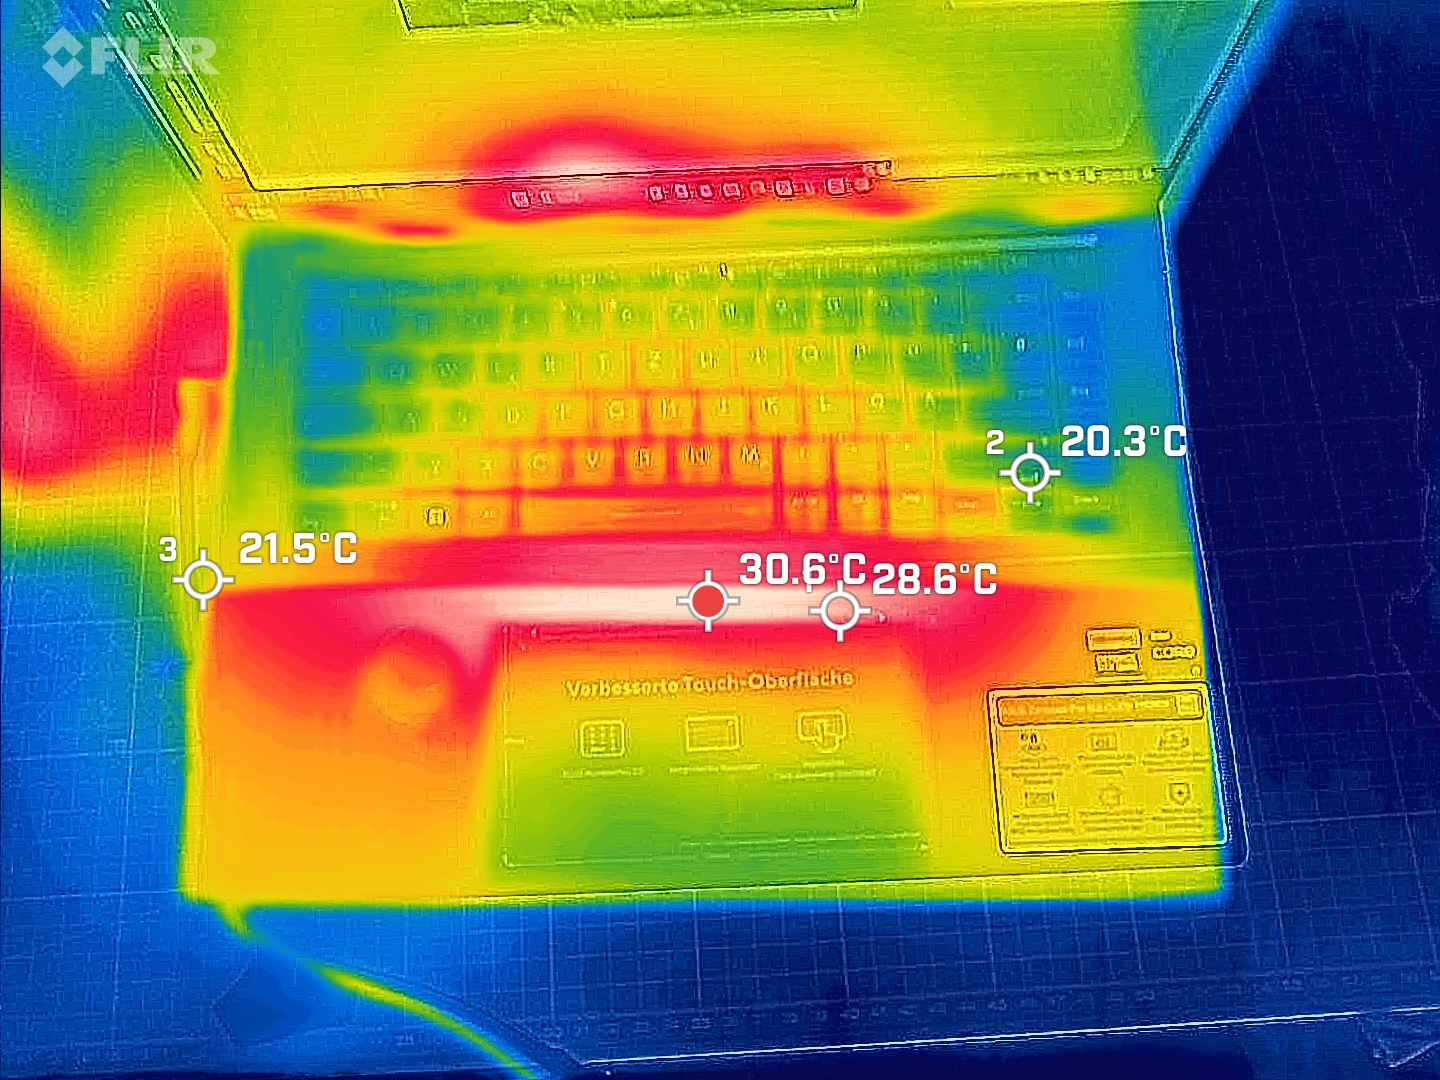
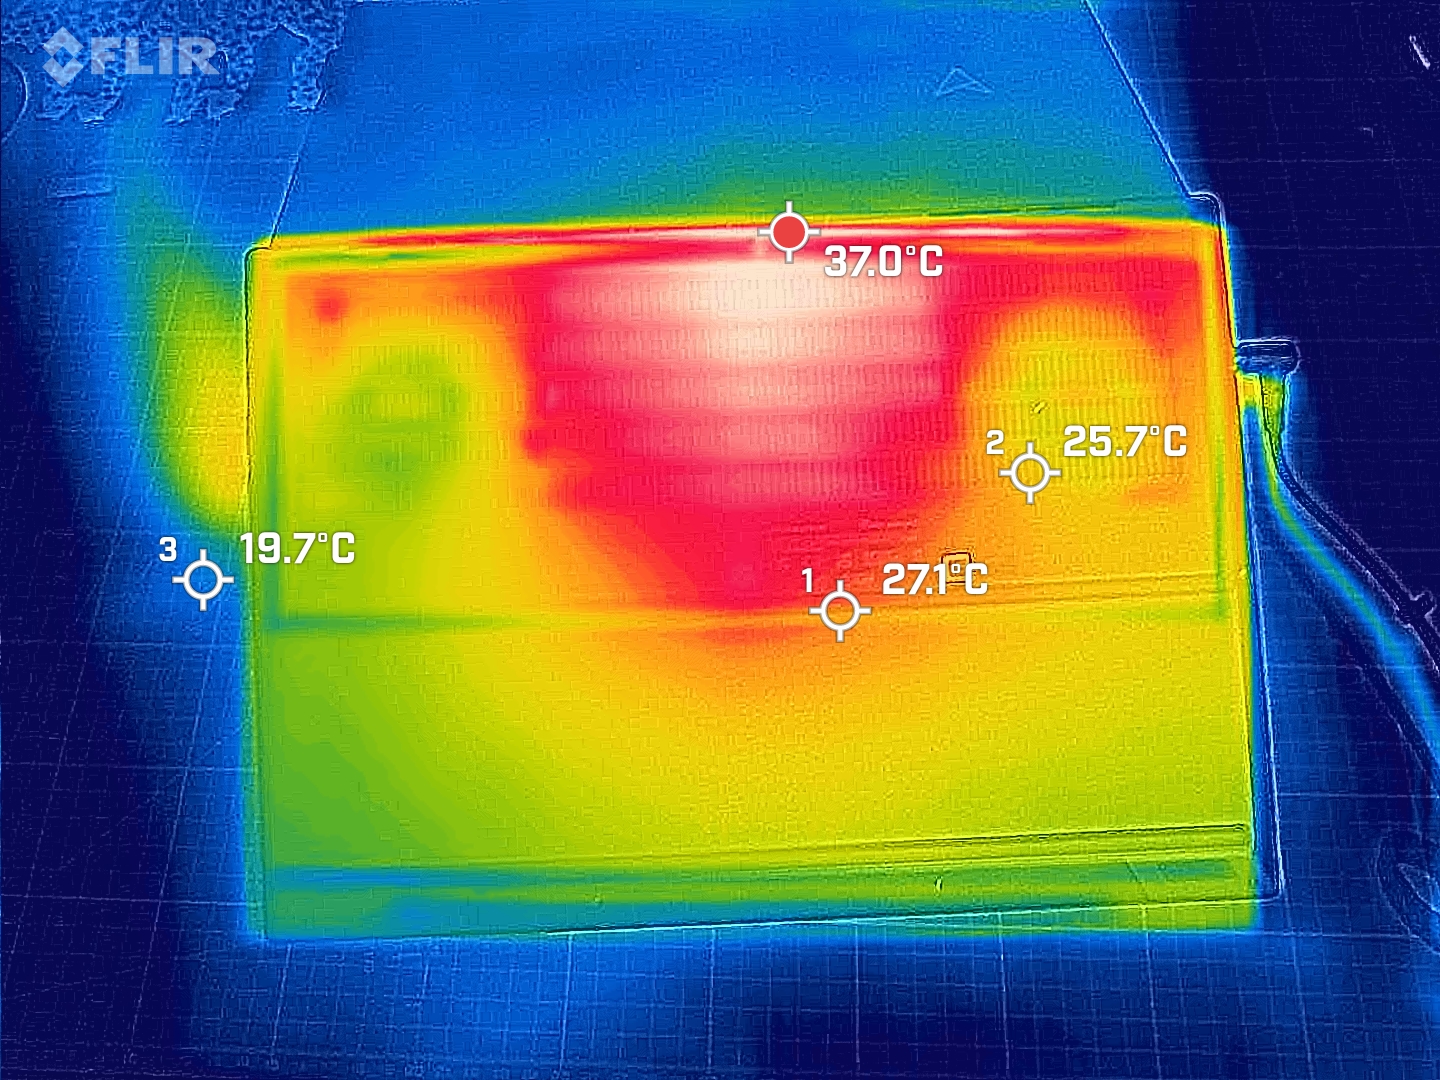
One particularly noticeable thing about the Zenbook Pro 16X is that the laptop heats up its surroundings more than itself. The cooling system is so powerful that the laptop's chassis, at a maximum of 36 °C, remains three degrees cooler than the tabletop behind the air vents at the rear in our stress test. The thermal image also clearly shows how powerful the two fans in the Zenbook are.
The surface of the laptop also remained largely cool during our tests. The keyboard in particular is almost at ambient temperature thanks to the gap to the hardware. A peek under the keyboard with the Flir One Pro does reveal warmer areas, but even in the gap we measure a maximum of 39 °C. Thus, the Zenbook remains surprisingly cool despite the 200 watts of power drawn from the socket.
(+) The maximum temperature on the upper side is 28.2 °C / 83 F, compared to the average of 40.4 °C / 105 F, ranging from 21.2 to 68.8 °C for the class Gaming.
(+) The bottom heats up to a maximum of 35.1 °C / 95 F, compared to the average of 43.2 °C / 110 F
(+) In idle usage, the average temperature for the upper side is 22.8 °C / 73 F, compared to the device average of 33.9 °C / 93 F.
(+) The palmrests and touchpad are cooler than skin temperature with a maximum of 26.1 °C / 79 F and are therefore cool to the touch.
(+) The average temperature of the palmrest area of similar devices was 28.8 °C / 83.8 F (+2.7 °C / 4.8 F).
| Asus Zenbook Pro 16X UX7602BZ-MY005W Intel Core i9-13905H, NVIDIA GeForce RTX 4080 Laptop GPU | Asus ZenBook Pro 16X OLED UX7602ZM-ME115W Intel Core i9-12900H, NVIDIA GeForce RTX 3060 Laptop GPU | Asus ROG Strix G16 G614JZ Intel Core i9-13980HX, NVIDIA GeForce RTX 4080 Laptop GPU | Asus ROG Zephyrus M16 GU604VY-NM042X Intel Core i9-13900H, NVIDIA GeForce RTX 4090 Laptop GPU | MSI Stealth 17 Studio A13VH-014 Intel Core i9-13900H, NVIDIA GeForce RTX 4080 Laptop GPU | Lenovo Legion Pro 7 RTX4090 Intel Core i9-13900HX, NVIDIA GeForce RTX 4090 Laptop GPU | Lenovo Legion Slim 7i 16 Gen 8 Intel Core i9-13900H, NVIDIA GeForce RTX 4070 Laptop GPU | Asus Vivobook Pro 16X K6604JV-MX016W Intel Core i9-13980HX, NVIDIA GeForce RTX 4060 Laptop GPU | |
|---|---|---|---|---|---|---|---|---|
| Heat | -22% | -45% | -36% | -38% | -51% | -35% | -39% | |
| Maximum Upper Side * (°C) | 28.2 | 32 -13% | 54 -91% | 50 -77% | 47 -67% | 53 -88% | 49.8 -77% | 39.7 -41% |
| Maximum Bottom * (°C) | 35.1 | 41.6 -19% | 55 -57% | 58 -65% | 54 -54% | 59 -68% | 48.8 -39% | 60 -71% |
| Idle Upper Side * (°C) | 24.6 | 32.6 -33% | 29 -18% | 26 -6% | 30 -22% | 34 -38% | 29.4 -20% | 30.9 -26% |
| Idle Bottom * (°C) | 29.4 | 36 -22% | 33 -12% | 28 5% | 32 -9% | 32 -9% | 30 -2% | 34.7 -18% |
* ... smaller is better
Stress testing
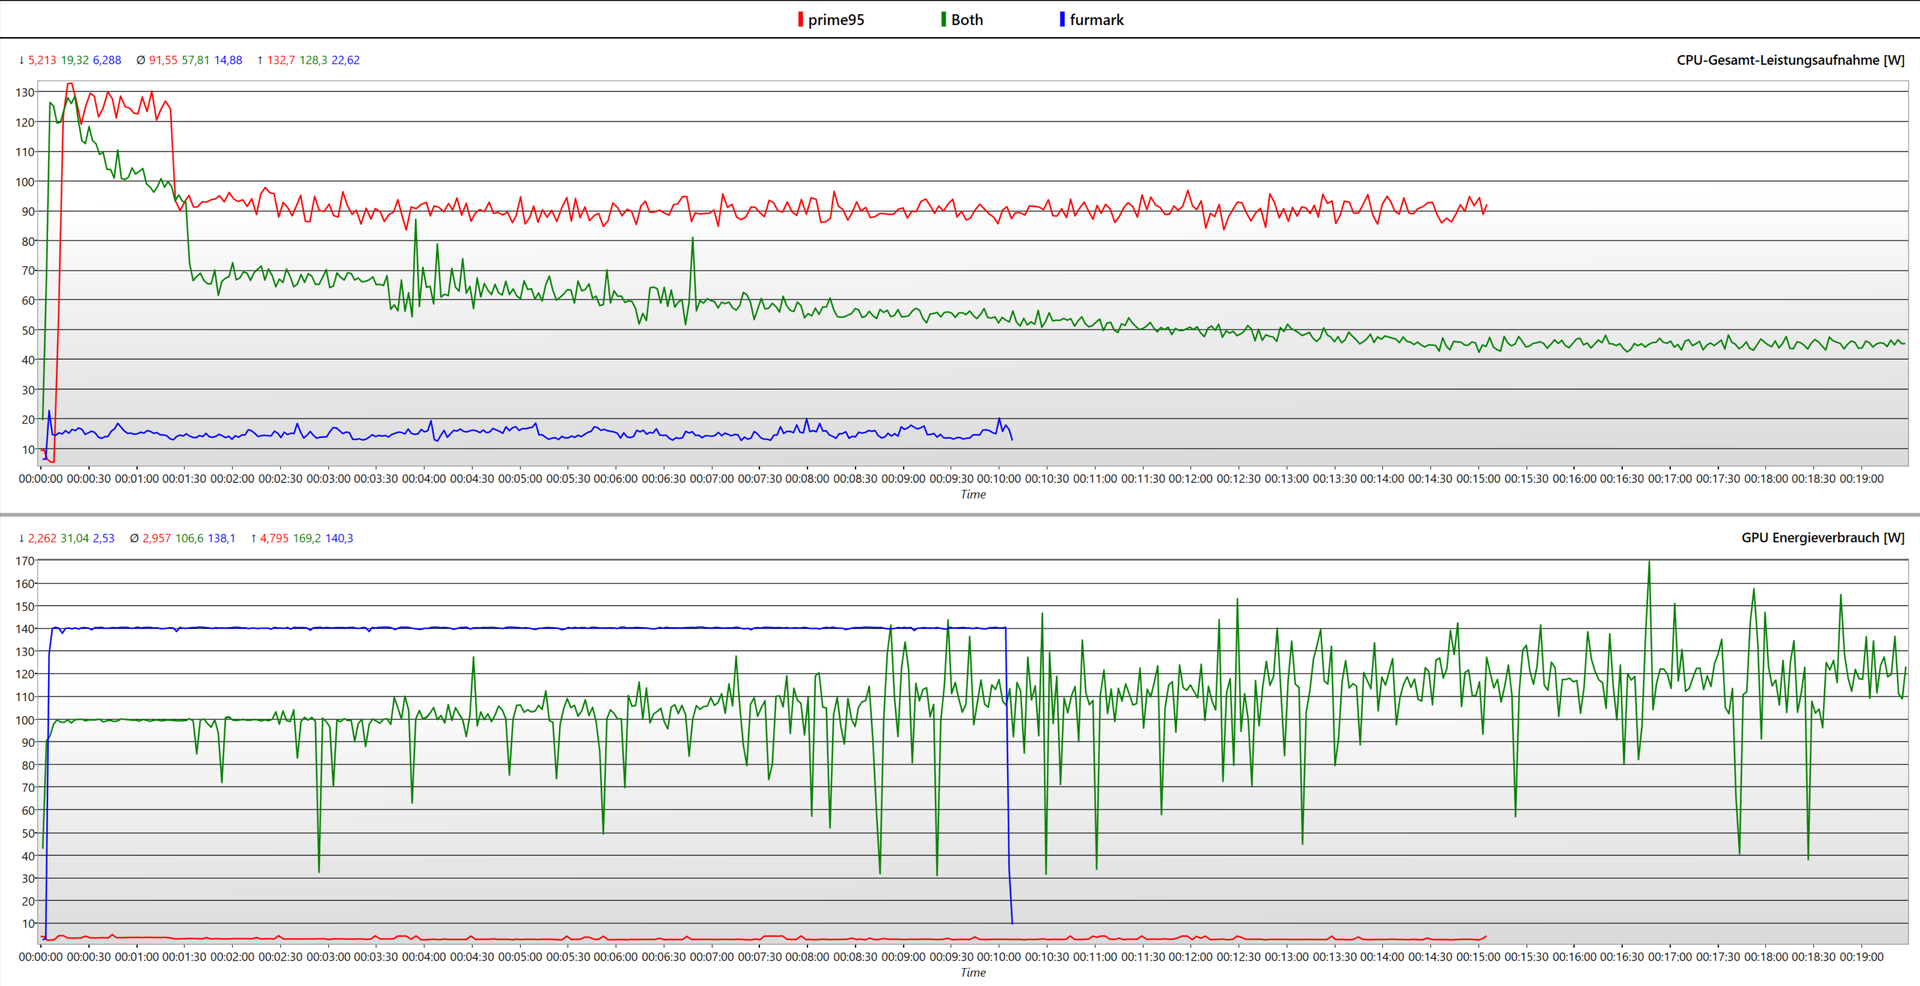
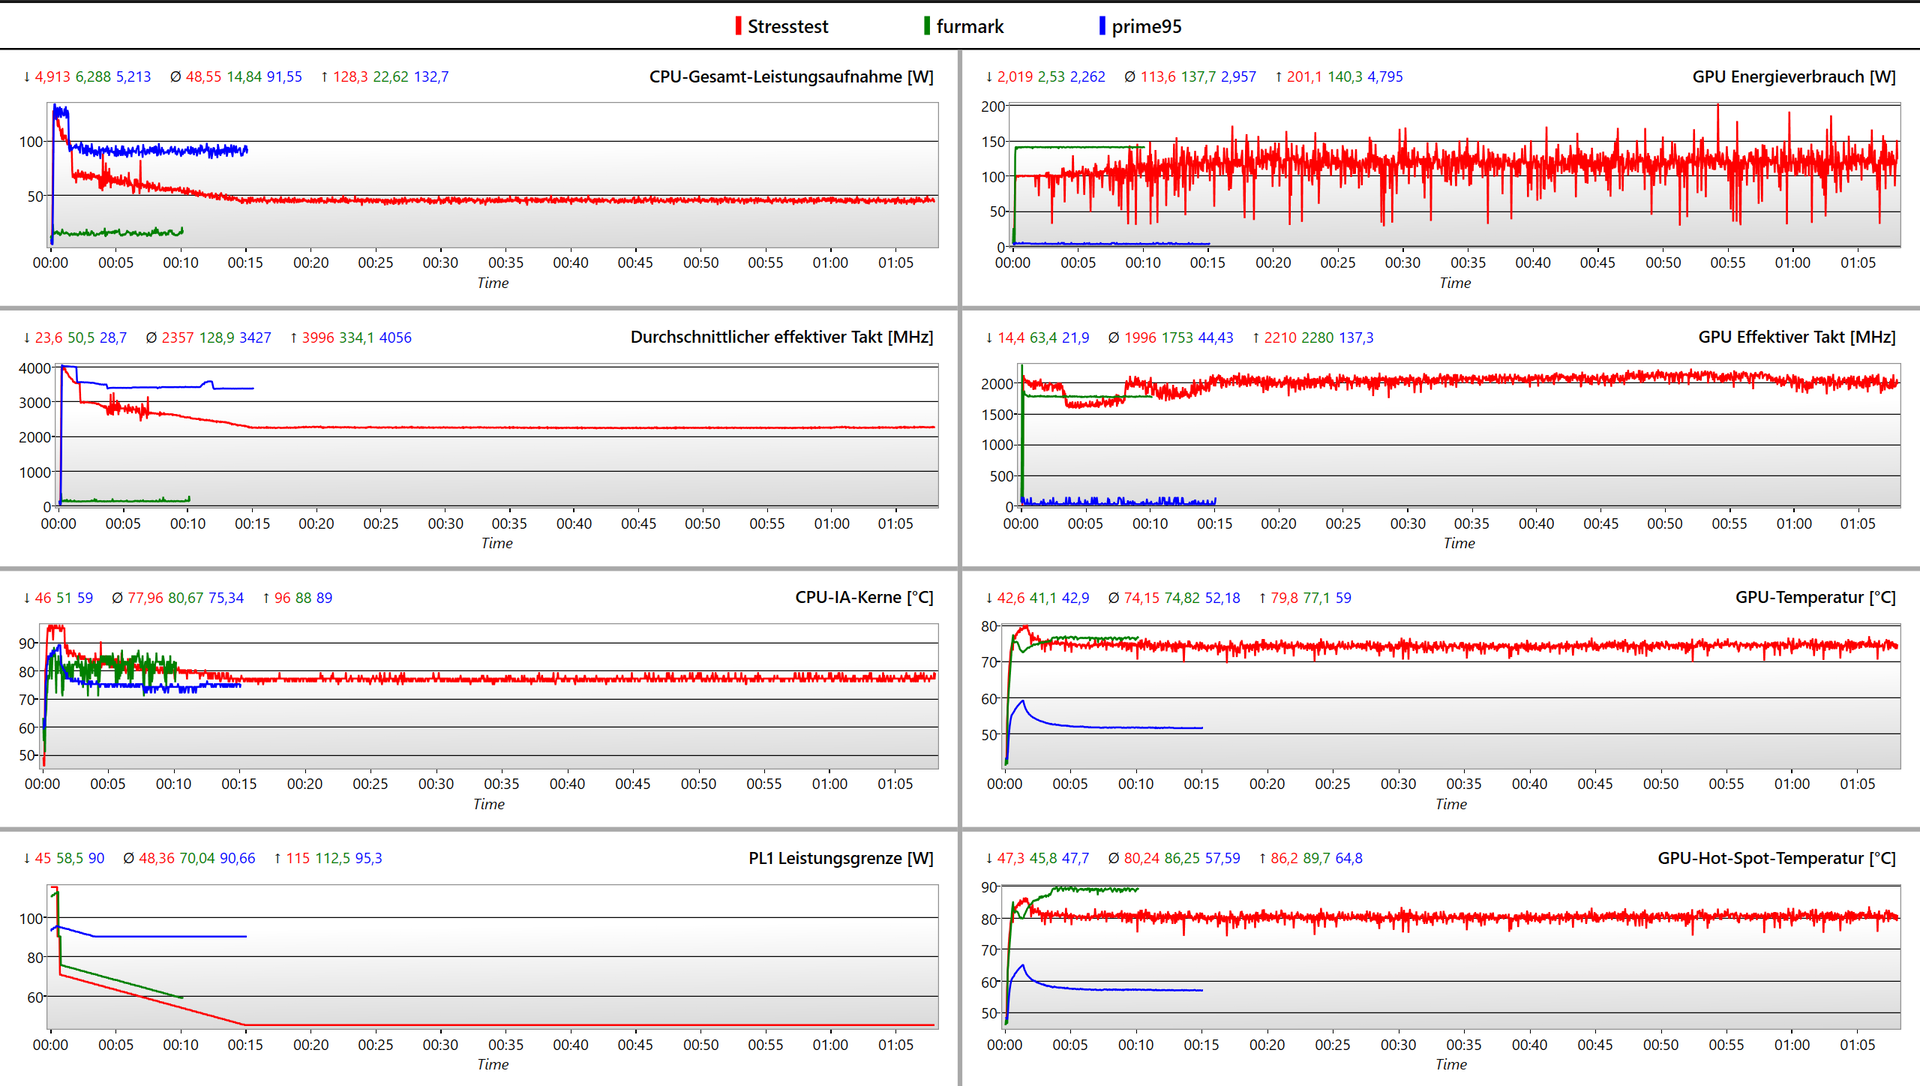
While a balance is achieved relatively quickly in the individual Prime95 or Furmark stress tests, the Zenbook shifts the performance from the CPU to the GPU quite slowly in both benchmarks. The Intel Core i9-13905H is in boost mode for almost two minutes. In Prime95 alone this is around 125 watts; if Furmark is also running, the boost power drops from 126 watts to 100 watts. In stress testing with both programs running at the same time, an initial equilibrium is achieved after two minutes with 70 watts for the processor and 100 watts for the RTX 4080. However, the performance continues to gradually shift over the next 12 minutes, wherein CPU performance drops by around 25 watts while GPU performance increases to an average of 120 watts.
Temperatures of the CPU and GPU remain within limits in all tests at around 75 °C. The Nvidia GeForce RTX 4080's slightly higher hotspot temperature of 90 °C in the Furmark stress test caused us some discomfort. In special cases where only the graphics card is fully stressed for long periods of time, performance may be slightly affected.
Speakers
There are four speaker modules with six drivers in the Zenbook Pro 16X. Tweeters are located on the left and right of the keyboard and two full-range speakers with two drivers each in the base. The overall result is a well-rounded sound quality. At around 88 dB(A), the Zenbook can also get quite loud and doesn't have to shy away from a comparison with the MacBook Pro 16.
Asus Zenbook Pro 16X UX7602BZ-MY005W audio analysis
(+) | speakers can play relatively loud (88.5 dB)
Bass 100 - 315 Hz
(±) | reduced bass - on average 9.8% lower than median
(±) | linearity of bass is average (7.7% delta to prev. frequency)
Mids 400 - 2000 Hz
(+) | balanced mids - only 1.6% away from median
(+) | mids are linear (4.5% delta to prev. frequency)
Highs 2 - 16 kHz
(+) | balanced highs - only 2.1% away from median
(+) | highs are linear (3.3% delta to prev. frequency)
Overall 100 - 16.000 Hz
(+) | overall sound is linear (8.1% difference to median)
Compared to same class
» 1% of all tested devices in this class were better, 1% similar, 98% worse
» The best had a delta of 6%, average was 18%, worst was 132%
Compared to all devices tested
» 2% of all tested devices were better, 1% similar, 98% worse
» The best had a delta of 4%, average was 23%, worst was 134%
Apple MacBook Pro 16 2021 M1 Pro audio analysis
(+) | speakers can play relatively loud (84.7 dB)
Bass 100 - 315 Hz
(+) | good bass - only 3.8% away from median
(+) | bass is linear (5.2% delta to prev. frequency)
Mids 400 - 2000 Hz
(+) | balanced mids - only 1.3% away from median
(+) | mids are linear (2.1% delta to prev. frequency)
Highs 2 - 16 kHz
(+) | balanced highs - only 1.9% away from median
(+) | highs are linear (2.7% delta to prev. frequency)
Overall 100 - 16.000 Hz
(+) | overall sound is linear (4.6% difference to median)
Compared to same class
» 0% of all tested devices in this class were better, 0% similar, 100% worse
» The best had a delta of 5%, average was 17%, worst was 45%
Compared to all devices tested
» 0% of all tested devices were better, 0% similar, 100% worse
» The best had a delta of 4%, average was 23%, worst was 134%
Energy management - Powerful hardware requires a high energy input
Power consumption
Asus includes a 280-watt power supply with the Zenbook Pro 16X. For good reason, as we soon discovered in our energy measurements. The notebook extracts up to 262 watts in stress testing. Under full load, the notebook's power consumption is constant at around 200 watts. This is completely appropriate in view of the computing power on offer.
The comparison field also shows that the Zenbook can be quite economical in idle mode and under low loads.
| Off / Standby | |
| Idle | |
| Load |
|
Key:
min: | |
| Asus Zenbook Pro 16X UX7602BZ-MY005W i9-13905H, GeForce RTX 4080 Laptop GPU, Samsung PM9A1 MZVL22T0HBLB, OLED, 3200x2000, 16" | Asus ZenBook Pro 16X OLED UX7602ZM-ME115W i9-12900H, GeForce RTX 3060 Laptop GPU, Samsung PM9A1 MZVL21T0HCLR, OLED, 3840x2400, 16" | Asus ROG Strix G16 G614JZ i9-13980HX, GeForce RTX 4080 Laptop GPU, WD PC SN560 SDDPNQE-1T00, IPS, 2560x1600, 16" | Asus ROG Zephyrus M16 GU604VY-NM042X i9-13900H, GeForce RTX 4090 Laptop GPU, Samsung PM9A1 MZVL22T0HBLB, IPS, 2560x1600, 16" | MSI Stealth 17 Studio A13VH-014 i9-13900H, GeForce RTX 4080 Laptop GPU, Samsung PM9A1 MZVL22T0HBLB, Mini LED, 3840x2160, 17.3" | Lenovo Legion Pro 7 RTX4090 i9-13900HX, GeForce RTX 4090 Laptop GPU, Samsung PM9A1 MZVL21T0HCLR, IPS, 2560x1600, 16" | Lenovo Legion Slim 7i 16 Gen 8 i9-13900H, GeForce RTX 4070 Laptop GPU, Samsung PM9A1 MZVL21T0HCLR, IPS, 2560x1600, 16" | Asus Vivobook Pro 16X K6604JV-MX016W i9-13980HX, GeForce RTX 4060 Laptop GPU, Solidigm P41 Plus SSDPFKNU010TZ, OLED, 3200x2000, 16" | Average NVIDIA GeForce RTX 4080 Laptop GPU | Average of class Gaming | |
|---|---|---|---|---|---|---|---|---|---|---|
| Power Consumption | 4% | -28% | -44% | -11% | -69% | -59% | -17% | -55% | -28% | |
| Idle Minimum * (Watt) | 9 | 11.1 -23% | 10 -11% | 20 -122% | 13.9 -54% | 20 -122% | 22 -144% | 13.8 -53% | 16.9 ? -88% | 13.1 ? -46% |
| Idle Average * (Watt) | 11.9 | 11.4 4% | 16 -34% | 24 -102% | 20 -68% | 25 -110% | 29 -144% | 16 -34% | 22 ? -85% | 19 ? -60% |
| Idle Maximum * (Watt) | 20.5 | 14.4 30% | 27 -32% | 25 -22% | 20.6 -0% | 35 -71% | 39.5 -93% | 19 7% | 34.1 ? -66% | 24.6 ? -20% |
| Load Average * (Watt) | 93.5 | 137.4 -47% | 129 -38% | 107 -14% | 77 18% | 136 -45% | 98.7 -6% | 147 -57% | 117.9 ? -26% | 111.3 ? -19% |
| Witcher 3 ultra * (Watt) | 195.7 | 136 31% | 247 -26% | 208 -6% | 162 17% | 282 -44% | 171.8 12% | 147.8 24% | ||
| Load Maximum * (Watt) | 267 | 197 26% | 342 -28% | 267 -0% | 216 19% | 320 -20% | 213.2 20% | 244 9% | 297 ? -11% | 260 ? 3% |
* ... smaller is better
Power consumption Witcher 3 / Stress test
Power consumption with an external monitor
Battery life
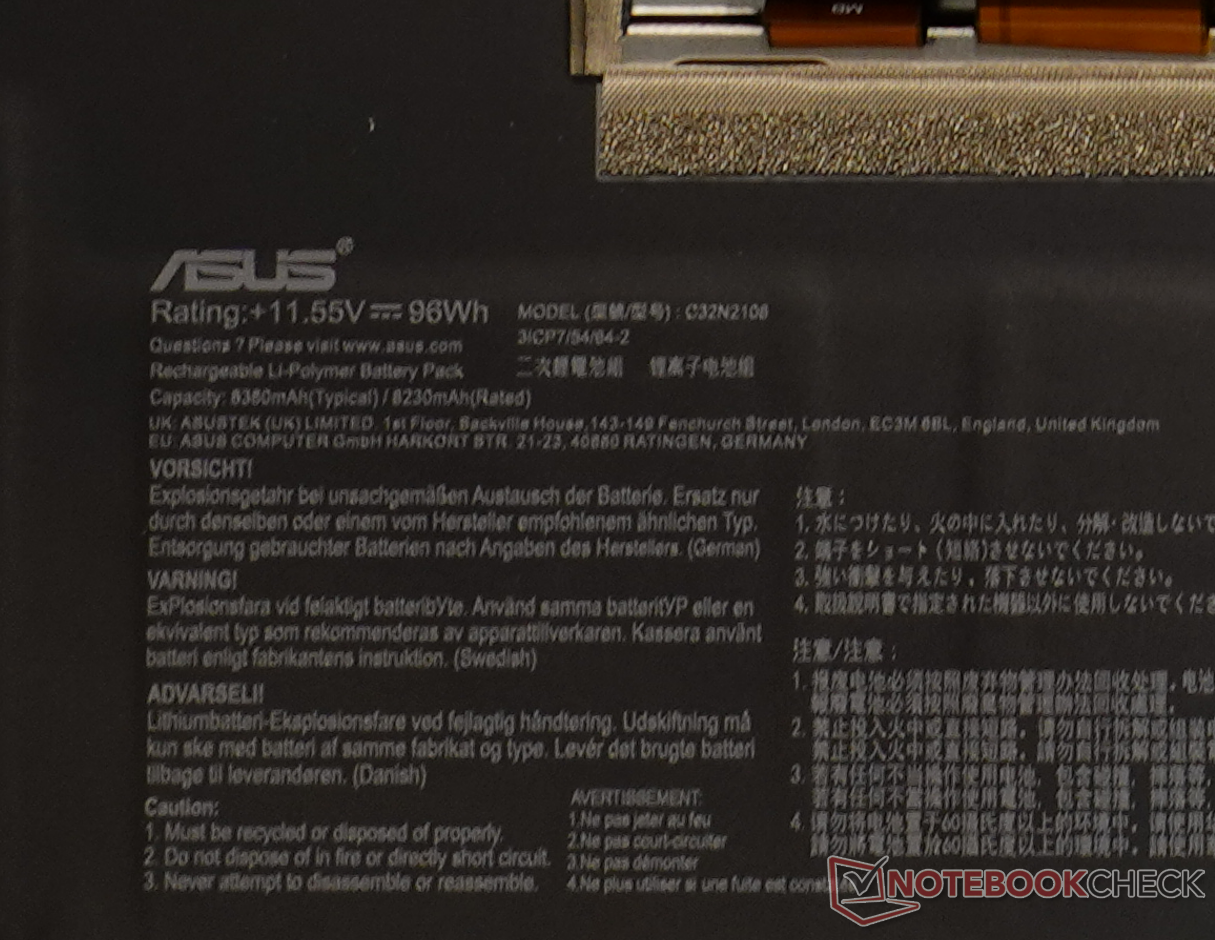
A 96 Wh battery is installed in the Zenbook, which even has the same part number as its predecessor. In our WiFi web surfing test, the runtime achieved fell by a good hour. Only when idle does the new Zenbook last little longer than its predecessor. You won't be able to manage an entire working day without power supply, but at least the Zenbook has better endurance compared to its rivals. As long as you don't need to draw on full power from the notebook on the go, you can at least take a smaller power supply or a corresponding power bank thanks to USB-PD.
| Asus Zenbook Pro 16X UX7602BZ-MY005W i9-13905H, GeForce RTX 4080 Laptop GPU, 96 Wh | Asus ZenBook Pro 16X OLED UX7602ZM-ME115W i9-12900H, GeForce RTX 3060 Laptop GPU, 96 Wh | Asus ROG Strix G16 G614JZ i9-13980HX, GeForce RTX 4080 Laptop GPU, 90 Wh | Asus ROG Zephyrus M16 GU604VY-NM042X i9-13900H, GeForce RTX 4090 Laptop GPU, 90 Wh | MSI Stealth 17 Studio A13VH-014 i9-13900H, GeForce RTX 4080 Laptop GPU, 99 Wh | Lenovo Legion Pro 7 RTX4090 i9-13900HX, GeForce RTX 4090 Laptop GPU, 99.9 Wh | Lenovo Legion Slim 7i 16 Gen 8 i9-13900H, GeForce RTX 4070 Laptop GPU, 99.9 Wh | Asus Vivobook Pro 16X K6604JV-MX016W i9-13980HX, GeForce RTX 4060 Laptop GPU, 90 Wh | Average of class Gaming | |
|---|---|---|---|---|---|---|---|---|---|
| Battery runtime | 6% | -16% | -13% | -31% | -35% | -56% | -28% | -29% | |
| Reader / Idle (h) | 13 | 12.7 -2% | 5.1 -61% | 7.84 ? -40% | |||||
| WiFi v1.3 (h) | 7.9 | 8.9 13% | 9.7 23% | 4.3 -46% | 5.6 -29% | 5.1 -35% | 4.4 -44% | 6.5 -18% | 7.08 ? -10% |
| Load (h) | 2.4 | 2.6 8% | 1.1 -54% | 2.9 21% | 1.6 -33% | 0.9 -62% | 1.5 -37% | 1.496 ? -38% | |
| H.264 (h) | 4.8 | 5.6 | 5.3 | 8.27 ? | |||||
| Witcher 3 ultra (h) | 2.6 |
Pros
Cons
Verdict - Almost uncompromising performance
In the case of the predecessor, we made a clear statement: high performance capabilities, yet wasted potential. Asus has made huge improvements here. The new Zenbook Pro 16X is more powerful, quieter and doesn't need to shy away from dedicated workstations and gamers. It is also comparatively compact, and our test device is the best Zenbook that we've reviewed so far. It seems equally suitable for content creators and gamers or anyone looking for a very powerful laptop that is still slim. However, some points of criticisms from last year remain: Asus has considerably loosened the reins on power control, but the fans still kick in quite late here, which means that a little boost time is wasted. Nonetheless, the Zenbook clearly holds it own against gaming devices such as the Lenovo Legion Slim 7i or MSI Stealth.
The new Zenbook Pro 16X can rightly be described as a flagship. Asus shows what is possible despite an 18 mm thin chassis.
Last year, we criticized a number of minor things about the Zenbook and these unfortunately remain in the current model. The laptop is still overloaded with input methods that sometimes interfere with each other. The gaps between the blue subpixels are also still visible. The connectivity could be more extensive, and ultimately the high purchase price is also deserving of criticism in the eyes of some.
OLED, AAS cooling and a slim chassis cannot be the only purchase criteria, as the Asus ROG Strix G16 and the Lenovo Legion Slim 7i 16 have similar features and both cost over US$1000 less. Sure, the Zenbook has a greater input selection and more metal for the chassis, but the price difference here still seems excessive for all those who don't want or need to use the Zenbook's full range of functions. On the other hand, for all those who need a powerful graphics card, a very good (touch) screen and perhaps also pen input and the Asus Dial, the Zenbook is very much without an alternative.
Price and availability
The Zenbook Pro 16X is currently available in two configurations. The weaker configuration with a Nvidia GeForce RTX 4070, 32 LPDDR5X RAM and 1 TB can be purchased via newgg for US$2699.99. The stronger configuration with an RTX 4080, 32 GB RAM and 2 TB is priced at US$3,394.00 at Adorama.
Asus Zenbook Pro 16X UX7602BZ-MY005W
- 11/09/2023 v7 (old)
Marc Herter/ Alex Wätzel
Transparency
The selection of devices to be reviewed is made by our editorial team. The test sample was provided to the author as a loan by the manufacturer or retailer for the purpose of this review. The lender had no influence on this review, nor did the manufacturer receive a copy of this review before publication. There was no obligation to publish this review. As an independent media company, Notebookcheck is not subjected to the authority of manufacturers, retailers or publishers.
This is how Notebookcheck is testing
Every year, Notebookcheck independently reviews hundreds of laptops and smartphones using standardized procedures to ensure that all results are comparable. We have continuously developed our test methods for around 20 years and set industry standards in the process. In our test labs, high-quality measuring equipment is utilized by experienced technicians and editors. These tests involve a multi-stage validation process. Our complex rating system is based on hundreds of well-founded measurements and benchmarks, which maintains objectivity. Further information on our test methods can be found here.
Price comparison

