MSI Stealth 14 Studio review - An expensive gaming laptop that has made too many compromises
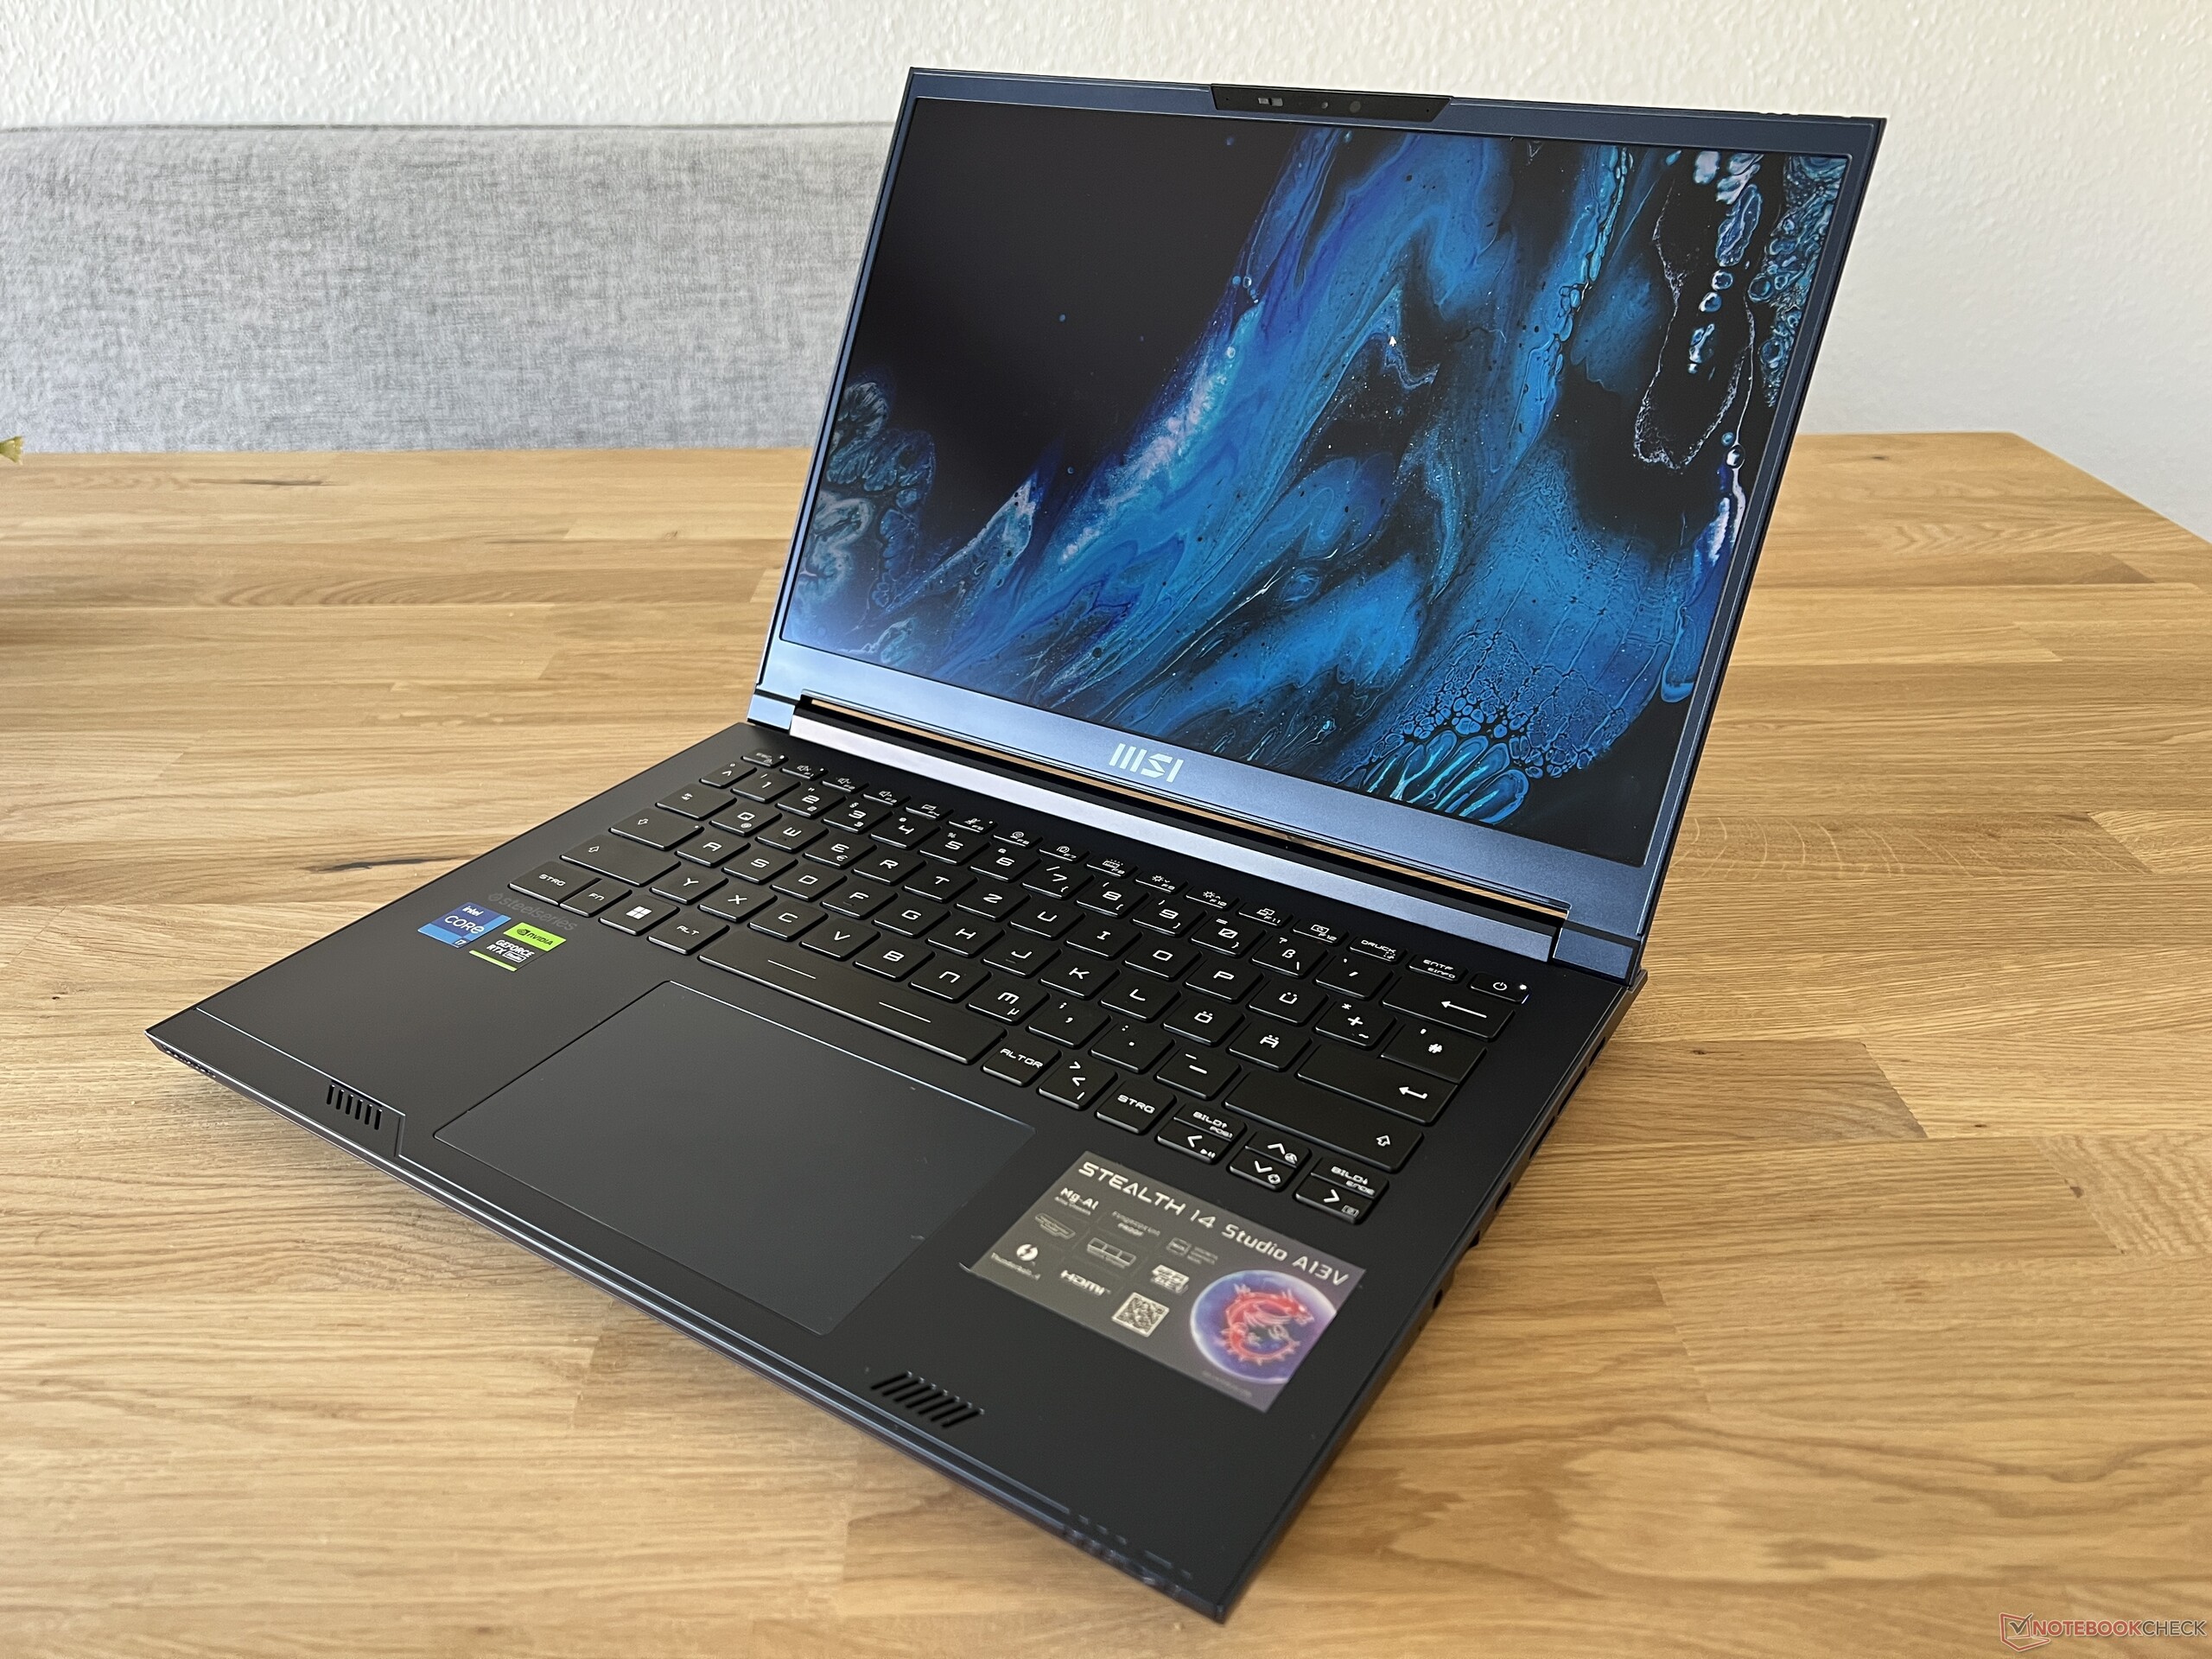
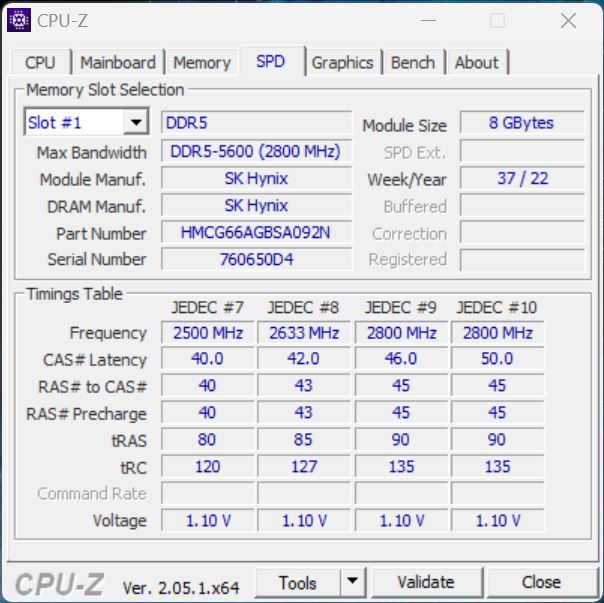
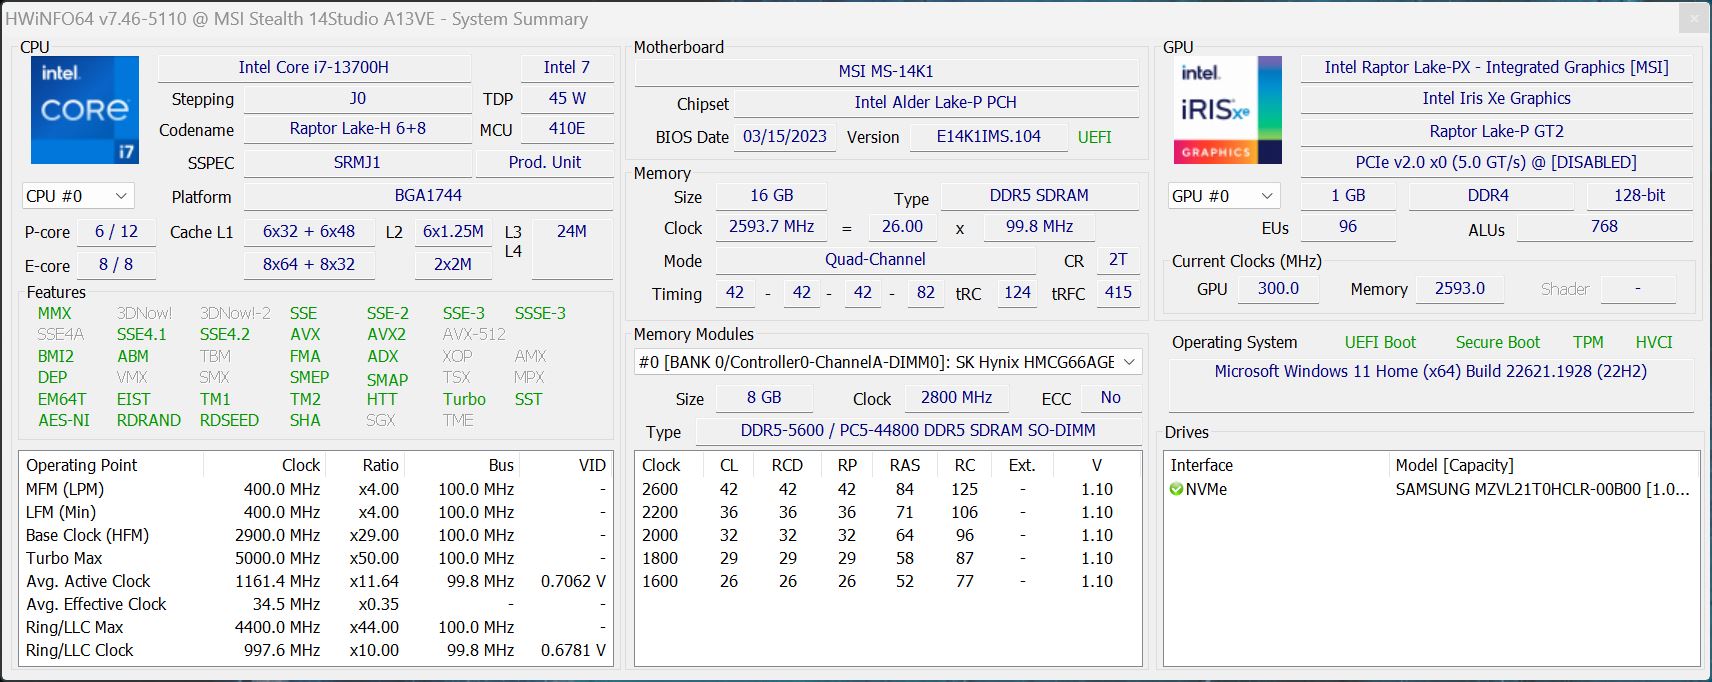
The MSI Stealth 14 Studio aims to be a compact yet powerful 14-inch gaming laptop, which also aims to speak to content creators - or any users that are looking for good performance levels within a small case. The manufacturer has relied on its tried-and-tested recipe, combining Intel Raptor Lake chips from the H45 build series with the new RTX 4000 Laptops from Nvidia. Our test device is a Stealth 14 Studio A13VE-029, and for $1,699.99, it offers a Core i7-13700H, the GeForce RTX 4050 Laptop, 16 GB RAM as well as a 1-TB NVMe SSD. It features a matte IPS panel (2.560 x 1,600 pixels) with a 240-Hz refresh rate. Optionally, the Stealth 14 Studio can be purchased with the RTX 4070 Laptop and 32 GB RAM.
Possible competitors compared
Rating | Date | Model | Weight | Height | Size | Resolution | Price |
|---|---|---|---|---|---|---|---|
| 85.4 % v7 (old) | 07 / 2023 | MSI Stealth 14 Studio A13V i7-13700H, GeForce RTX 4050 Laptop GPU | 1.7 kg | 19 mm | 14.00" | 2560x1600 | |
| 89.4 % v7 (old) | 05 / 2023 | Gigabyte Aero 14 OLED BMF i7-13700H, GeForce RTX 4050 Laptop GPU | 1.4 kg | 17 mm | 14.00" | 2880x1800 | |
| 88.8 % v7 (old) | 10 / 2022 | Schenker Vision 14 2022 RTX 3050 Ti i7-12700H, GeForce RTX 3050 Ti Laptop GPU | 1.3 kg | 16.6 mm | 14.00" | 2880x1800 | |
| 86.8 % v7 (old) | 03 / 2022 | Asus ROG Flow Z13 GZ301ZE i9-12900H, GeForce RTX 3050 Ti Laptop GPU | 1.2 kg | 12 mm | 13.40" | 1920x1200 | |
| 86.7 % v7 (old) | 03 / 2022 | Alienware x14 i7 RTX 3060 i7-12700H, GeForce RTX 3060 Laptop GPU | 1.8 kg | 14.5 mm | 14.00" | 1920x1080 | |
| 89.4 % v7 (old) | 05 / 2022 | Razer Blade 14 Ryzen 9 6900HX R9 6900HX, GeForce RTX 3070 Ti Laptop GPU | 1.8 kg | 16.8 mm | 14.00" | 2560x1440 | |
| 86 % v7 (old) | 11 / 2022 | Acer Predator Triton 300 SE i9-12900H, GeForce RTX 3060 Laptop GPU | 1.7 kg | 19.8 mm | 14.00" | 2880x1800 |
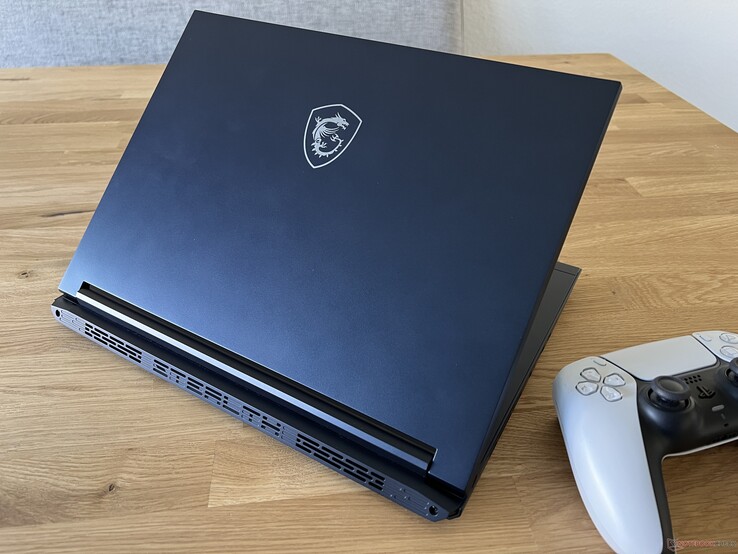
Case - Blue or white metal
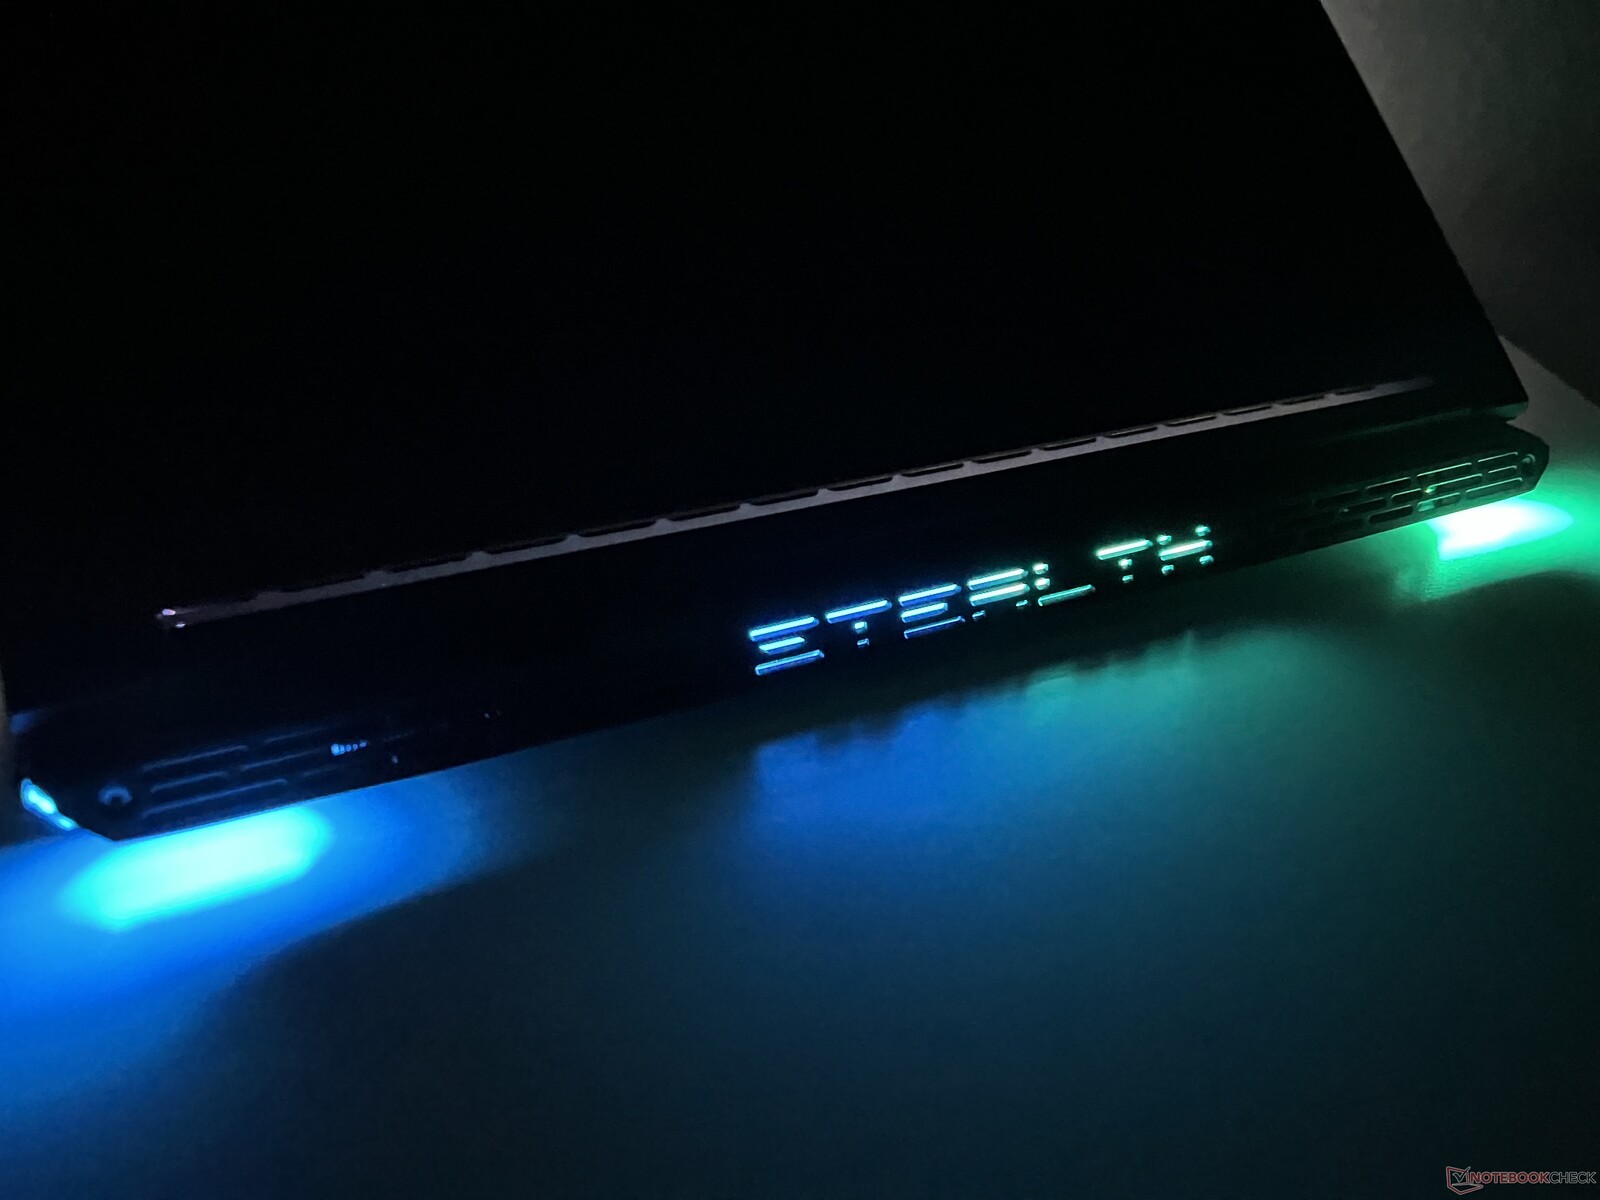
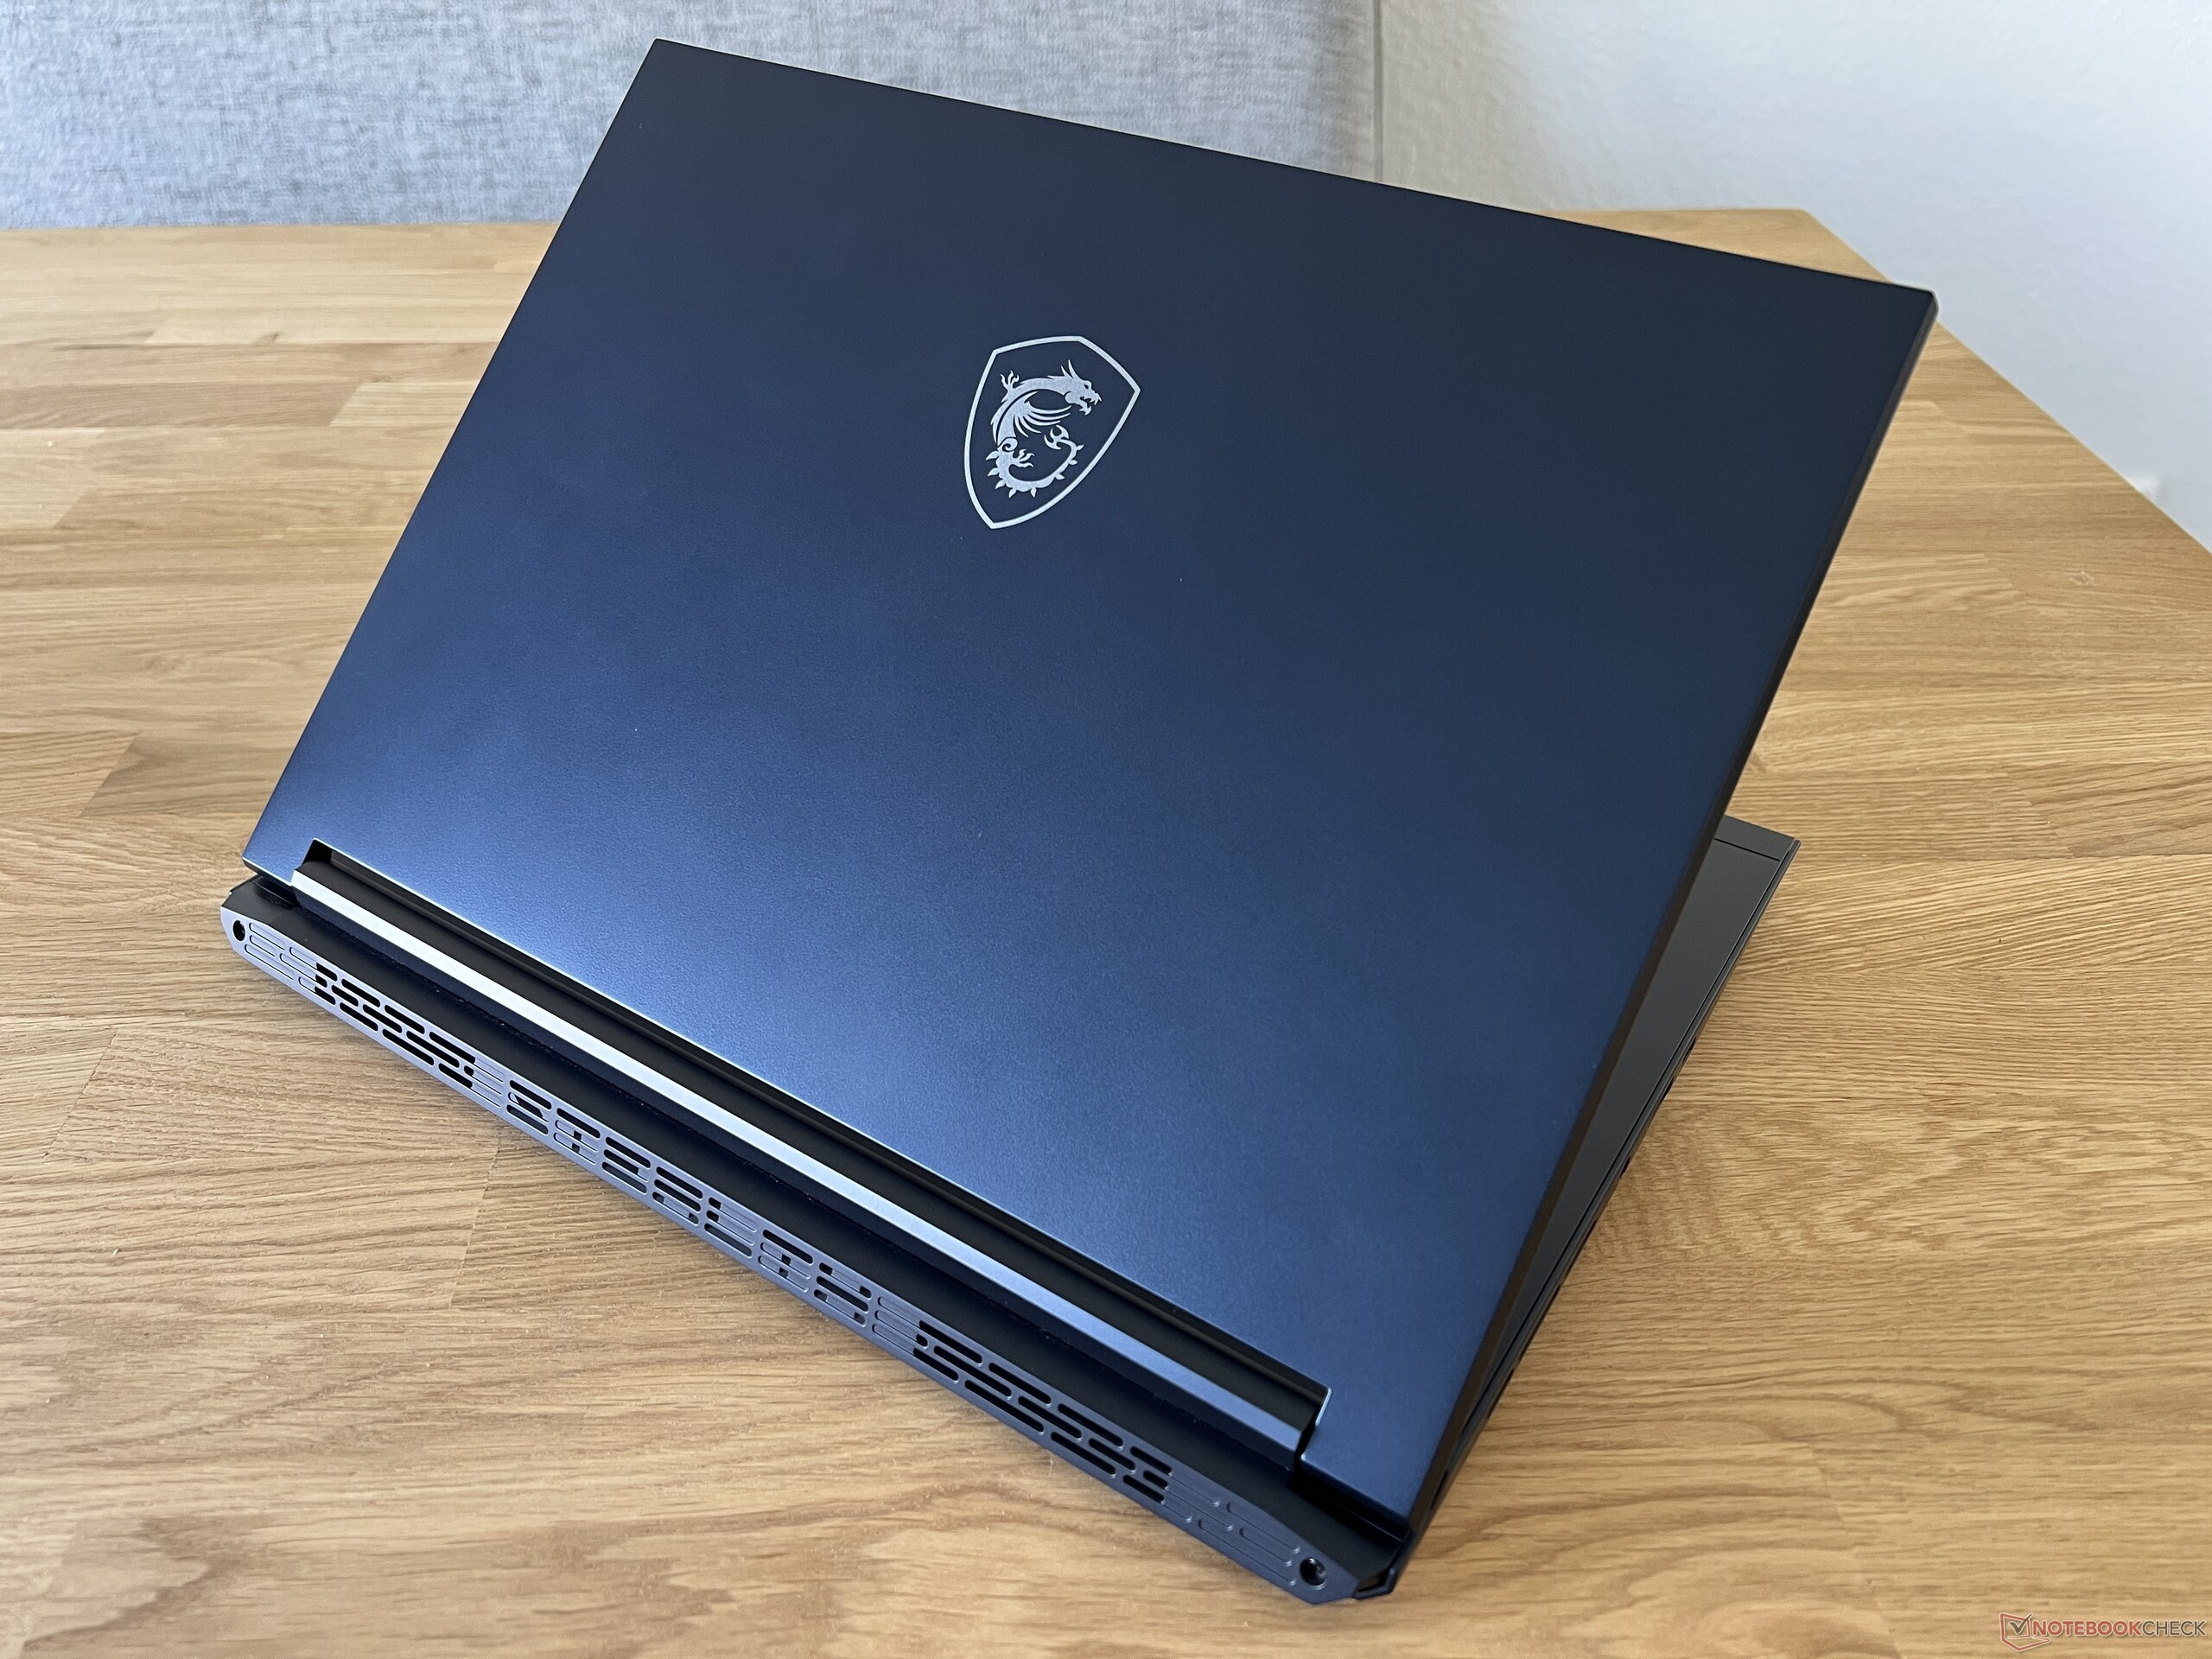
MSI offers the Stealth 14 Studio in either dark blue or white. We are testing the blue model which looks quite elegant but has a tendency to show quite a few fingerprint marks. For a gaming laptop, this design is actually quite reserved - the dragon logo on the lid is the only thing that draws attention to the device series. On the rear side, there are some additional lighting elements (which you can activate via the MSI Center) - both of the corners, as well as the Stealth logo, can be illuminated. Unfortunately, you can't change the lighting's color or intensity.
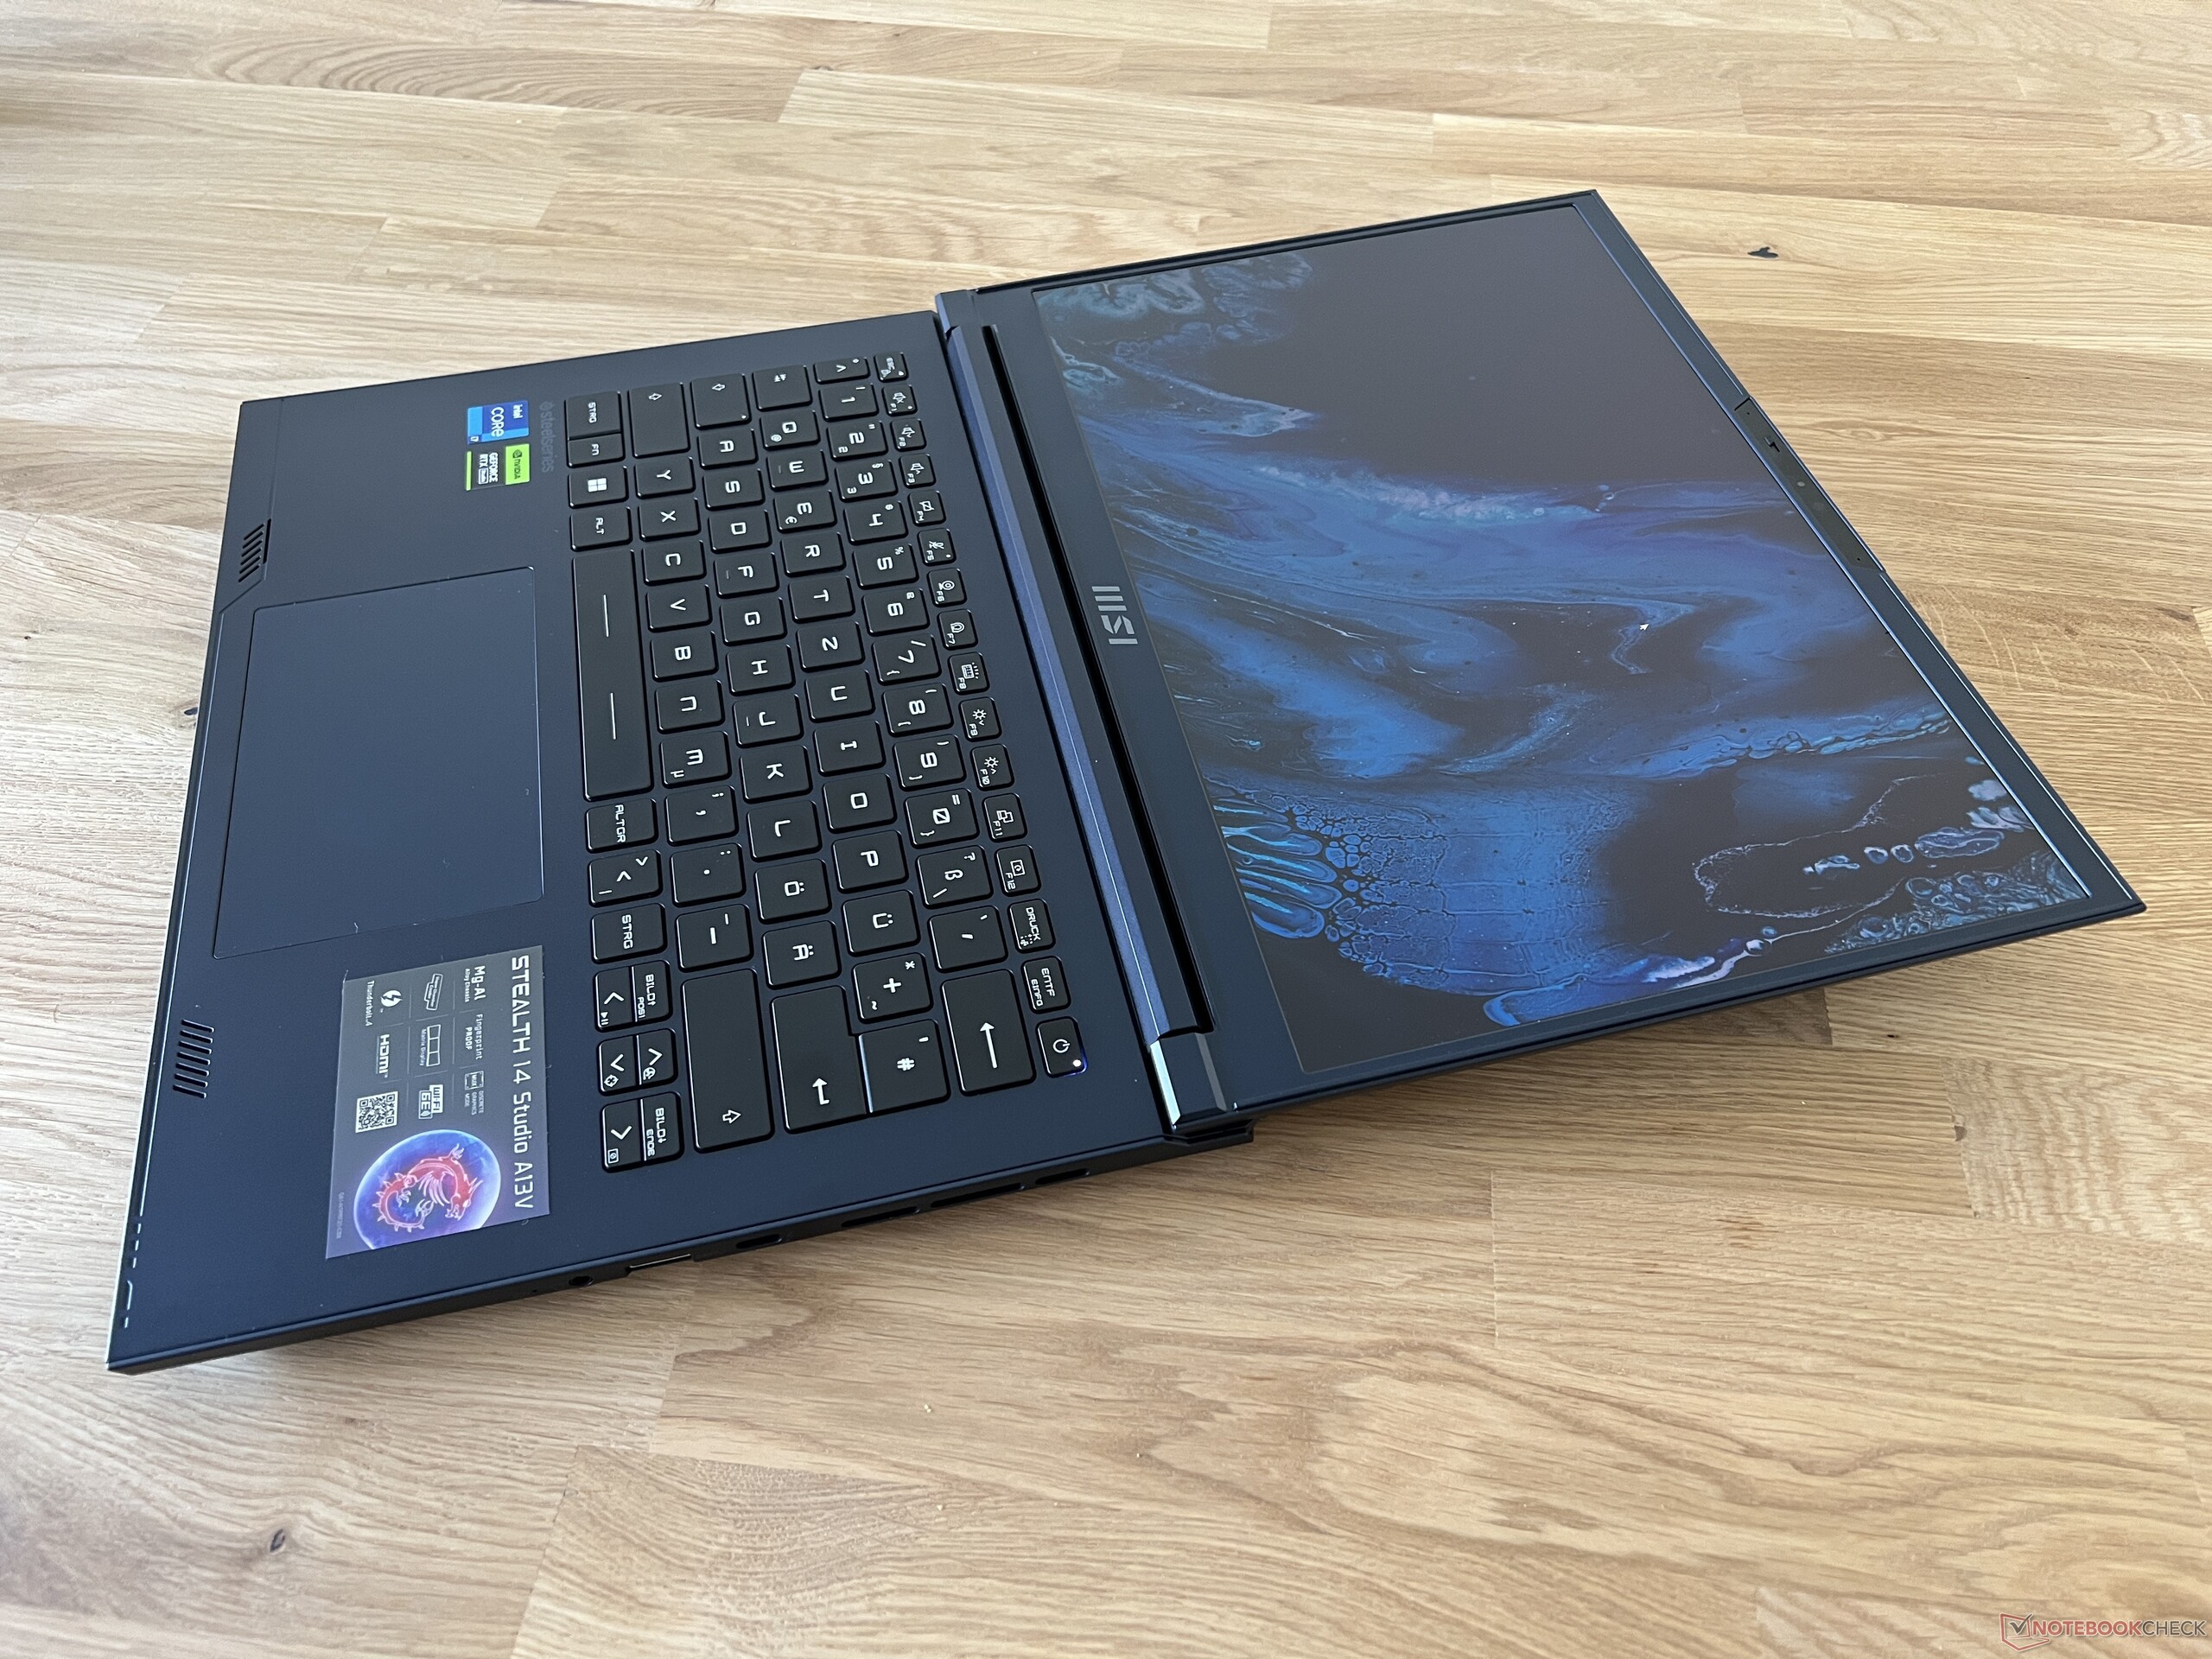
The case is made from a magnesium-aluminum alloy and the base unit is extremely stable. It cannot be bent or twisted and there are no creaking noises. The same unfortunately can't be said for the device's lid, which is considerably more flexible and can even be bent ever so slightly, leading to audible creaking noises. Usually, these issues are long forgotten about on modern devices, so you definitely have to be careful not to pick the laptop up by its screen in order to avoid causing permanent damage. Both hinges are adjusted well and allow for a maximum opening angle of 180 degrees. The bezels are quite thick for a modern device - its screen-to-body ratio only lies at 73 %.
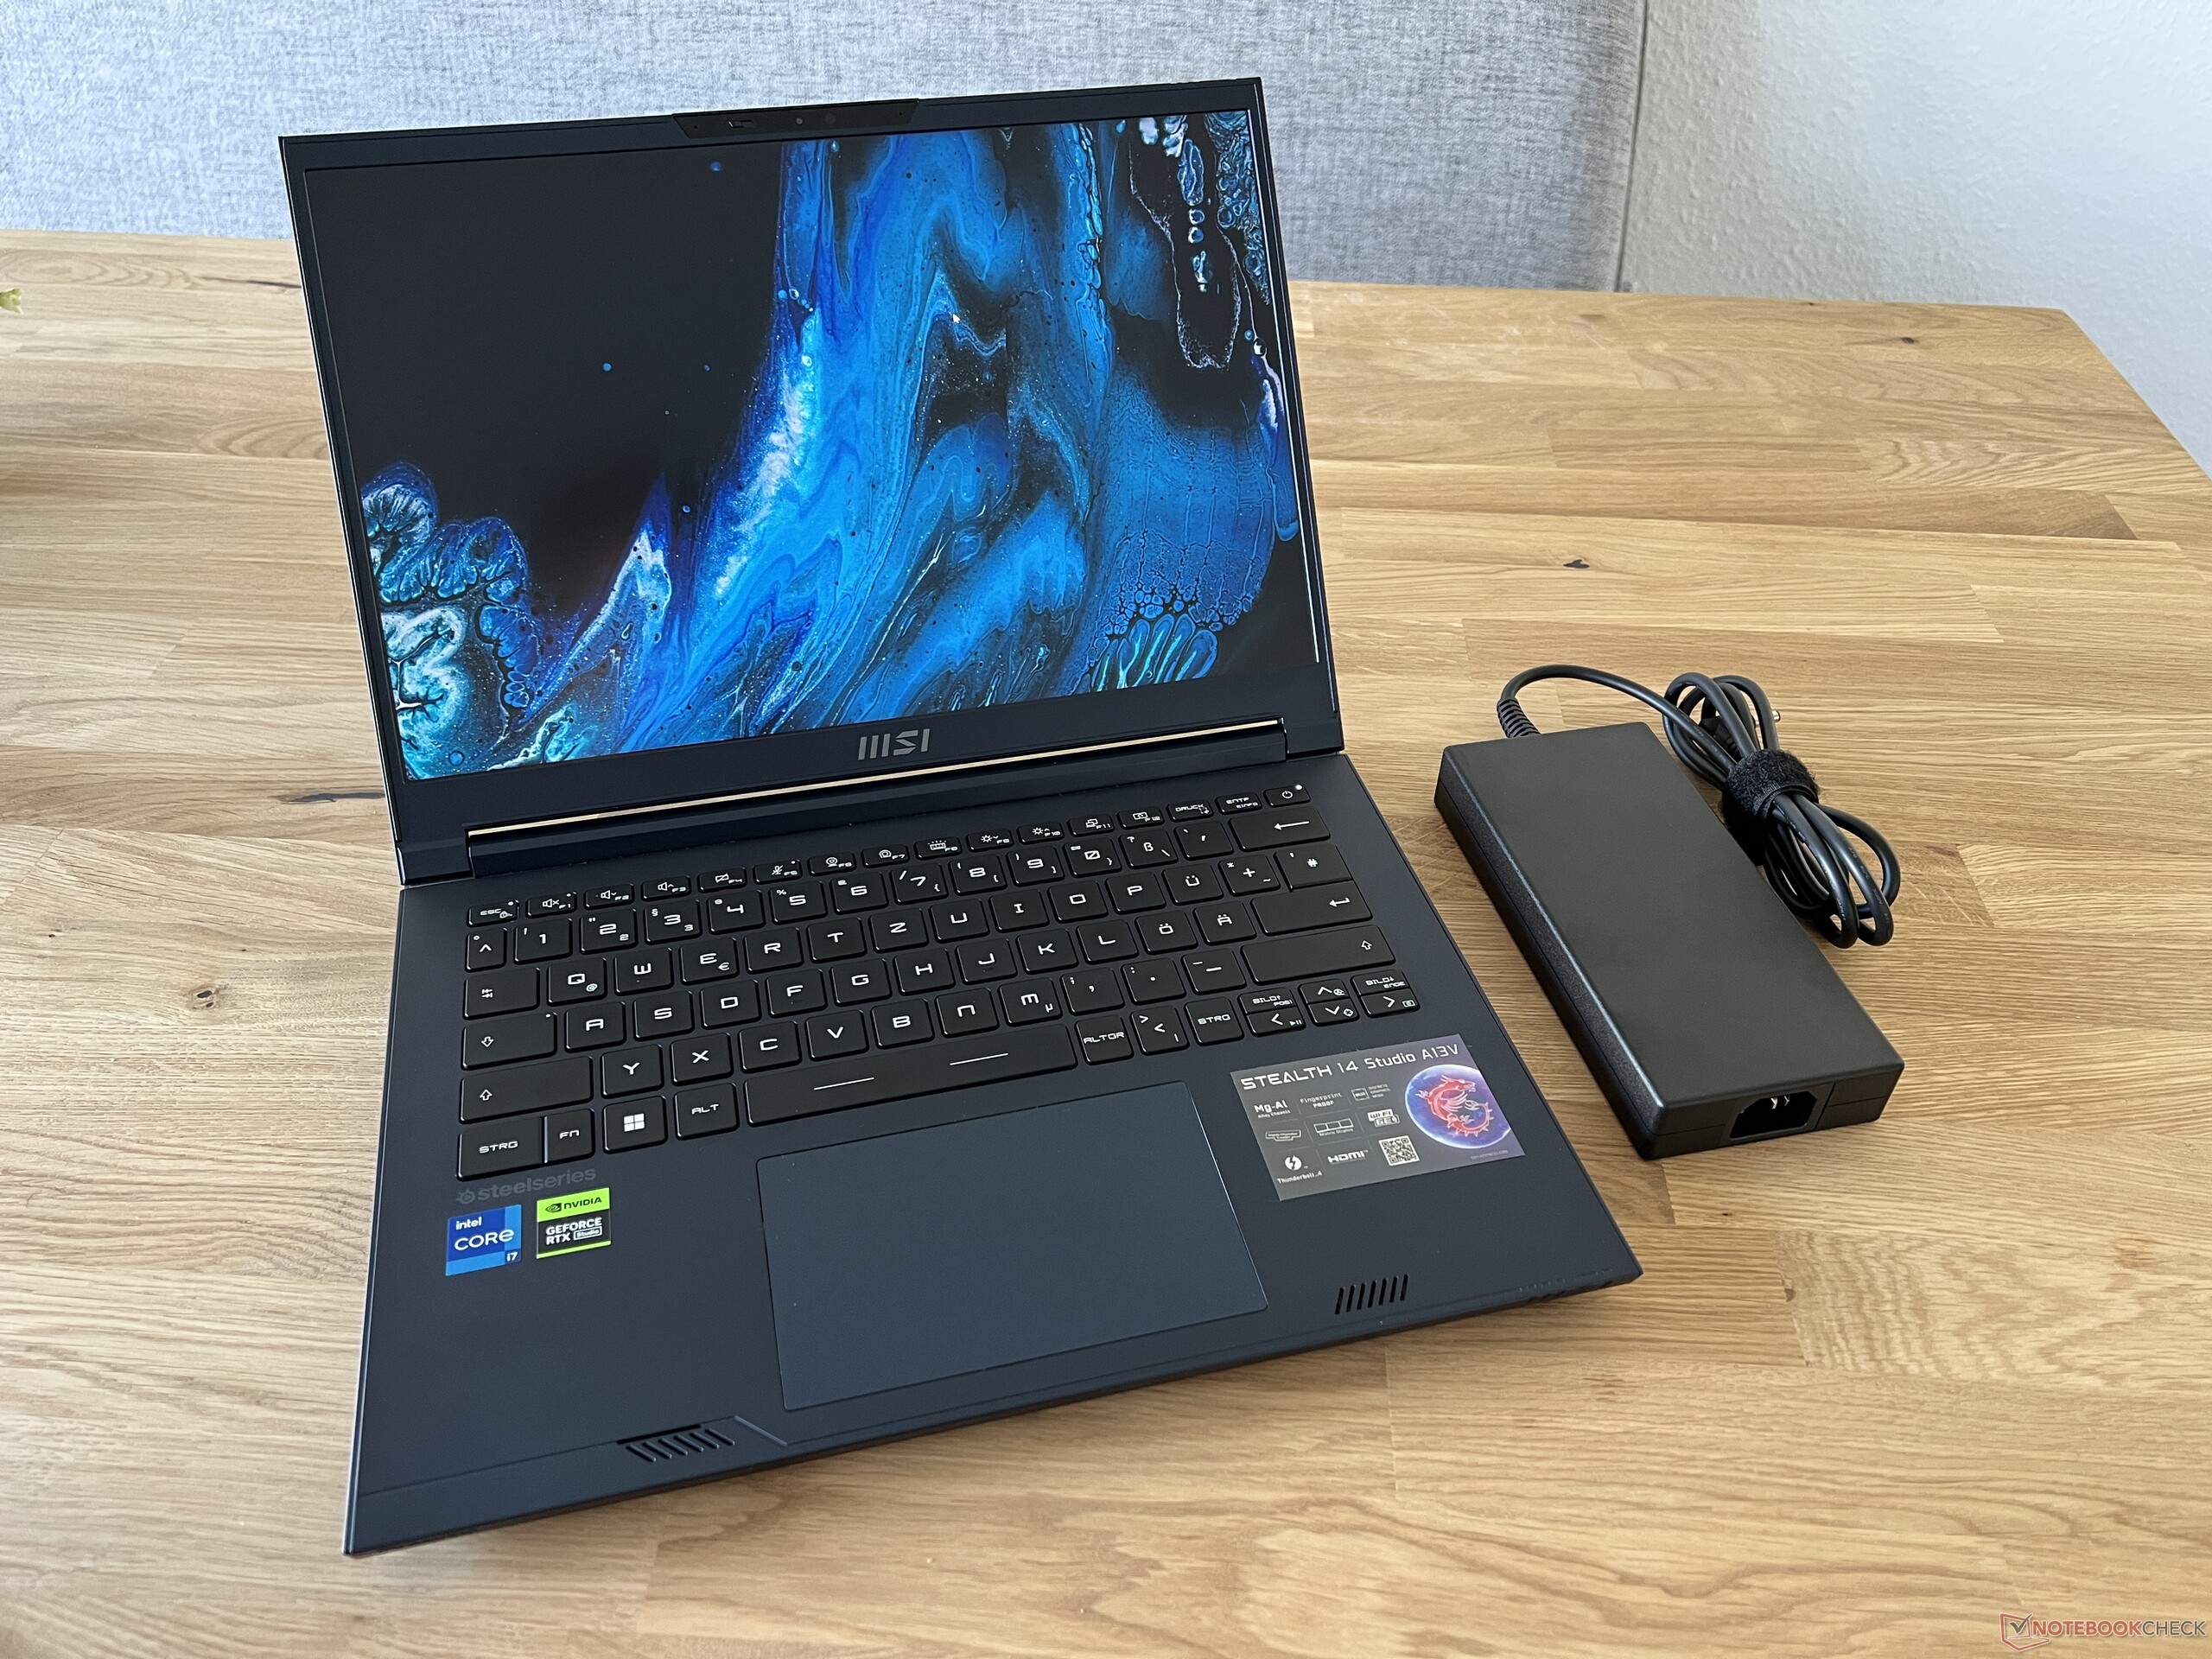

The Stealth 14 Studio is one of the largest devices within our comparison group - only the Alienware x14 takes up even more space. At just over 1.7 kg, its weight is about average. The 240-watt power supply adds another 700 grams to the scales.
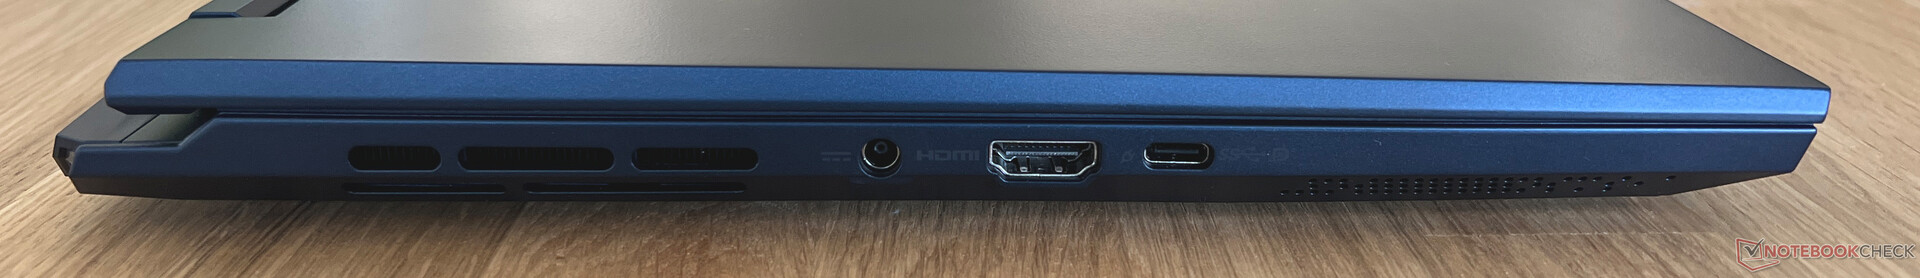
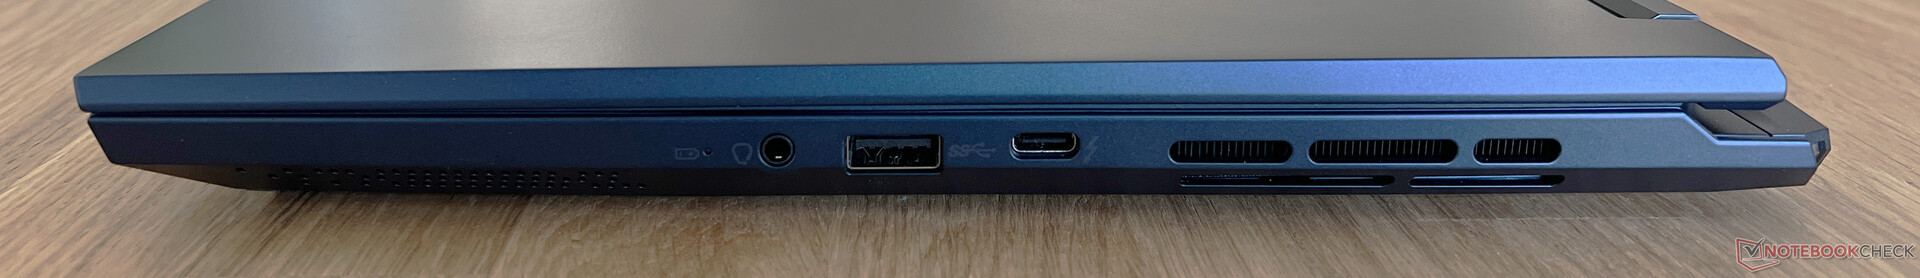
Connectivity - Thunderbolt 4, but no SD card reader
The Stealth 14 Studio's ports are in the middle on both sides of the device, although there are only three on each side. You'll only be able to find the most necessary connections, but the laptop's ports are at least up-to-date, as they include Thunderbolt 4 and HDMI 2.1. An SD card reader and Ethernet port are unfortunately not included - instead, you will have to rely on an adapter.
Communication
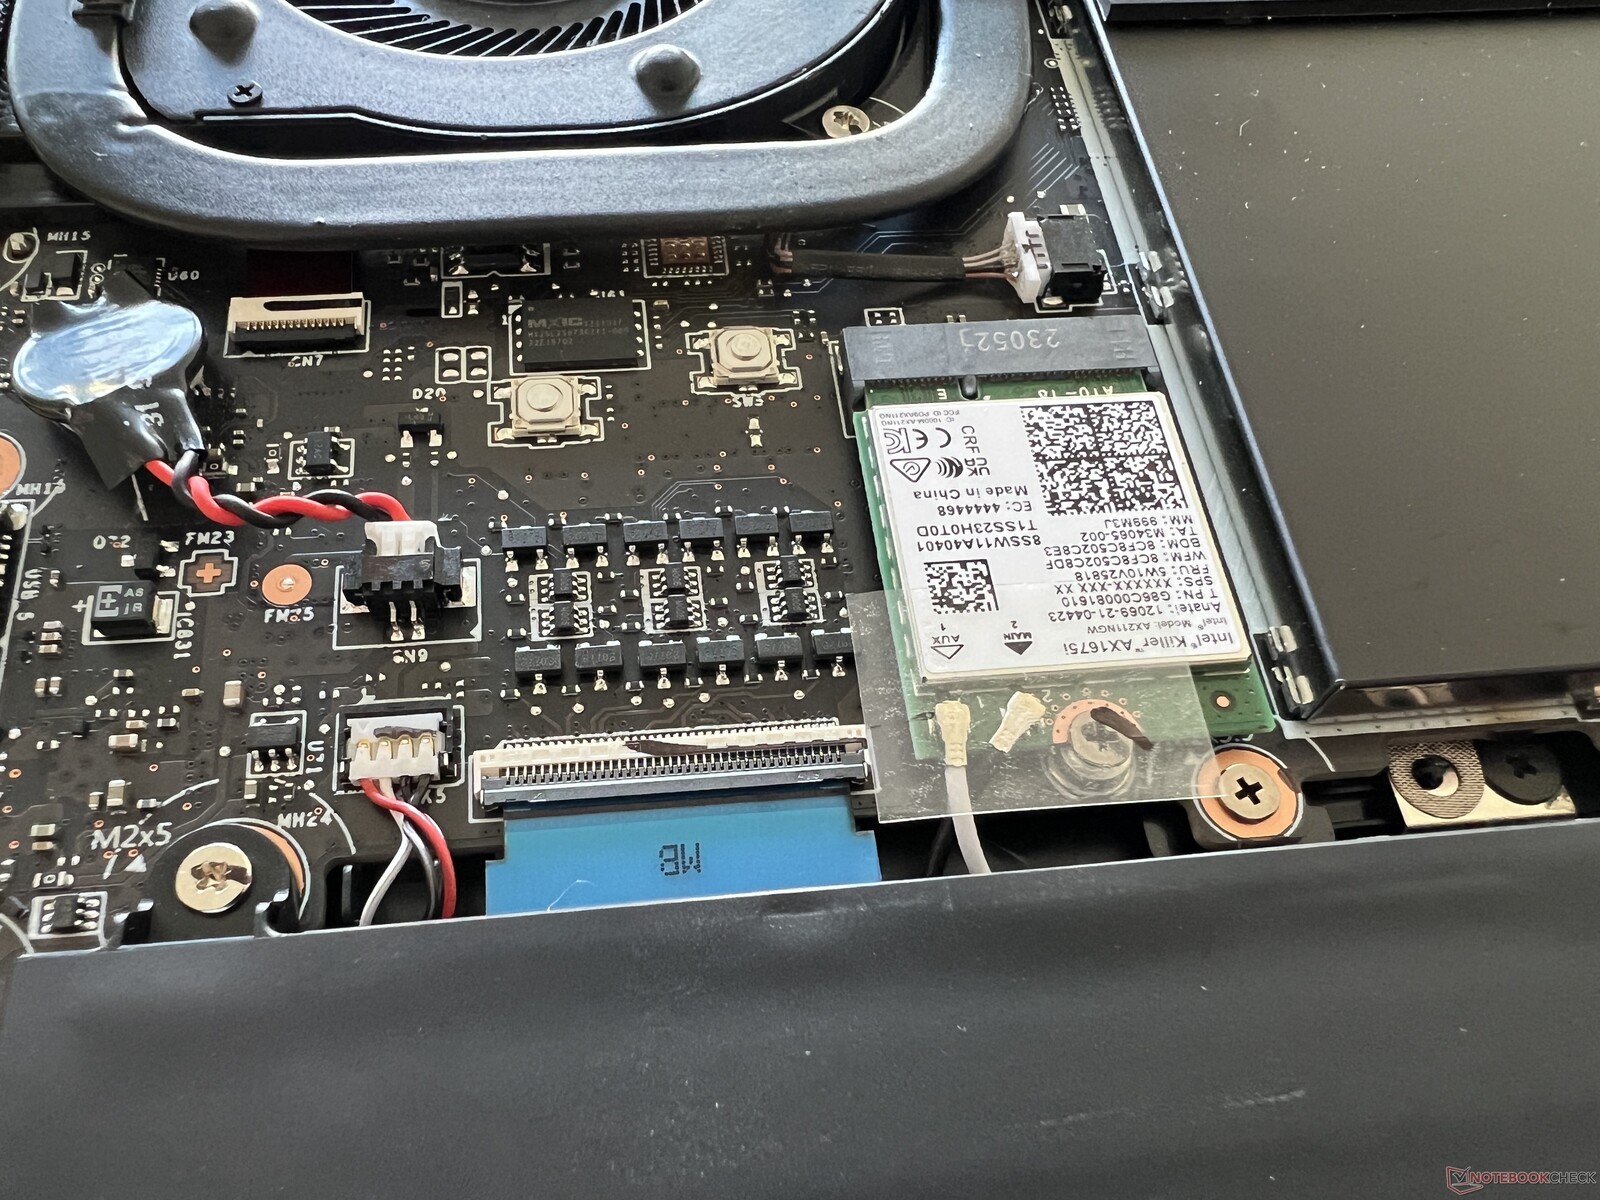
The laptop relies on a Killer AX1675i as its WLAN module, which also supports modern 6-GHz connections (Wi-Fi 6E). Using our reference router from Asus, we measured good (but not great) transfer results. In everyday use, this should not lead to any issues and we also never had any signal stability issues in our test.
| Networking | |
| MSI Stealth 14 Studio A13V | |
| iperf3 transmit AXE11000 | |
| iperf3 receive AXE11000 | |
| Gigabyte Aero 14 OLED BMF | |
| iperf3 transmit AXE11000 | |
| iperf3 receive AXE11000 | |
| iperf3 transmit AXE11000 6GHz | |
| iperf3 receive AXE11000 6GHz | |
| Schenker Vision 14 2022 RTX 3050 Ti | |
| iperf3 transmit AXE11000 | |
| iperf3 receive AXE11000 | |
| Asus ROG Flow Z13 GZ301ZE | |
| iperf3 transmit AX12 | |
| iperf3 receive AX12 | |
| Alienware x14 i7 RTX 3060 | |
| iperf3 transmit AX12 | |
| iperf3 receive AX12 | |
| Razer Blade 14 Ryzen 9 6900HX | |
| iperf3 transmit AX12 | |
| iperf3 receive AX12 | |
| Acer Predator Triton 300 SE | |
| iperf3 transmit AXE11000 6GHz | |
| iperf3 receive AXE11000 6GHz | |
Webcam
Slightly surprising is the Stealth 14 Studio's meagre 720p webcam which struggles to deliver a decent picture even in good lighting conditions. Additionally, there is an IR module installed - facial recognition is supported via Windows Hello.


Maintenance
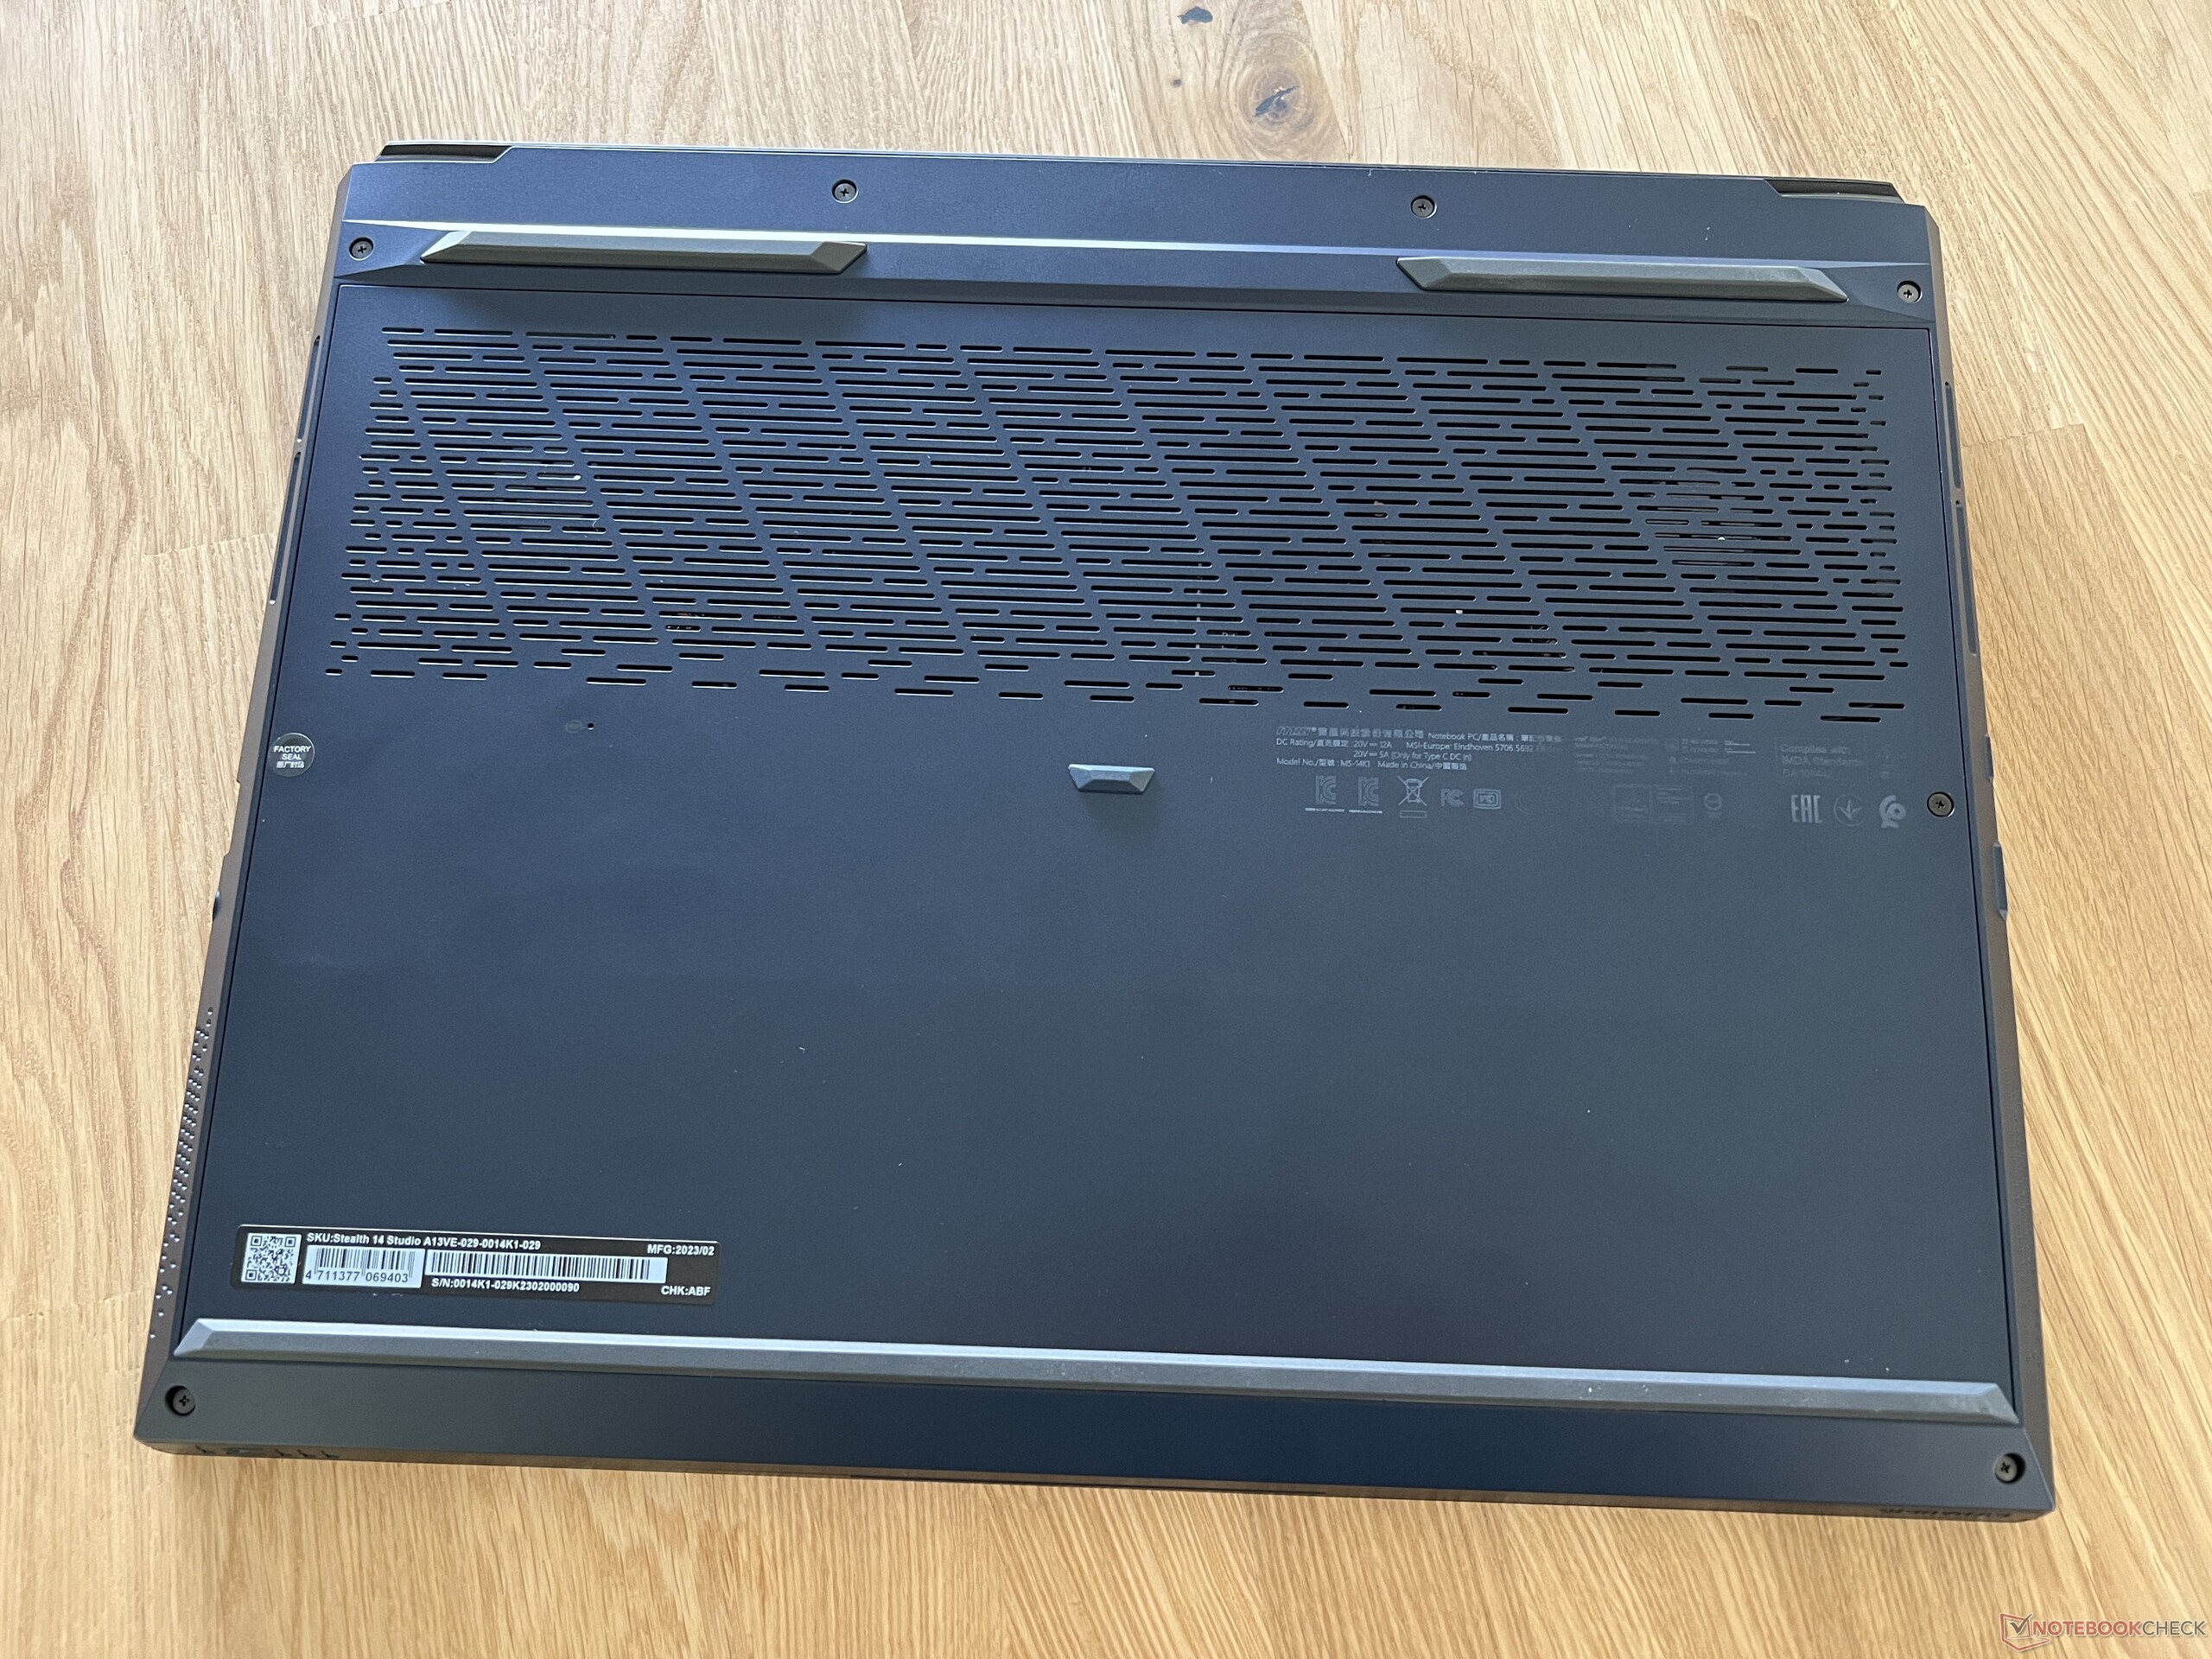
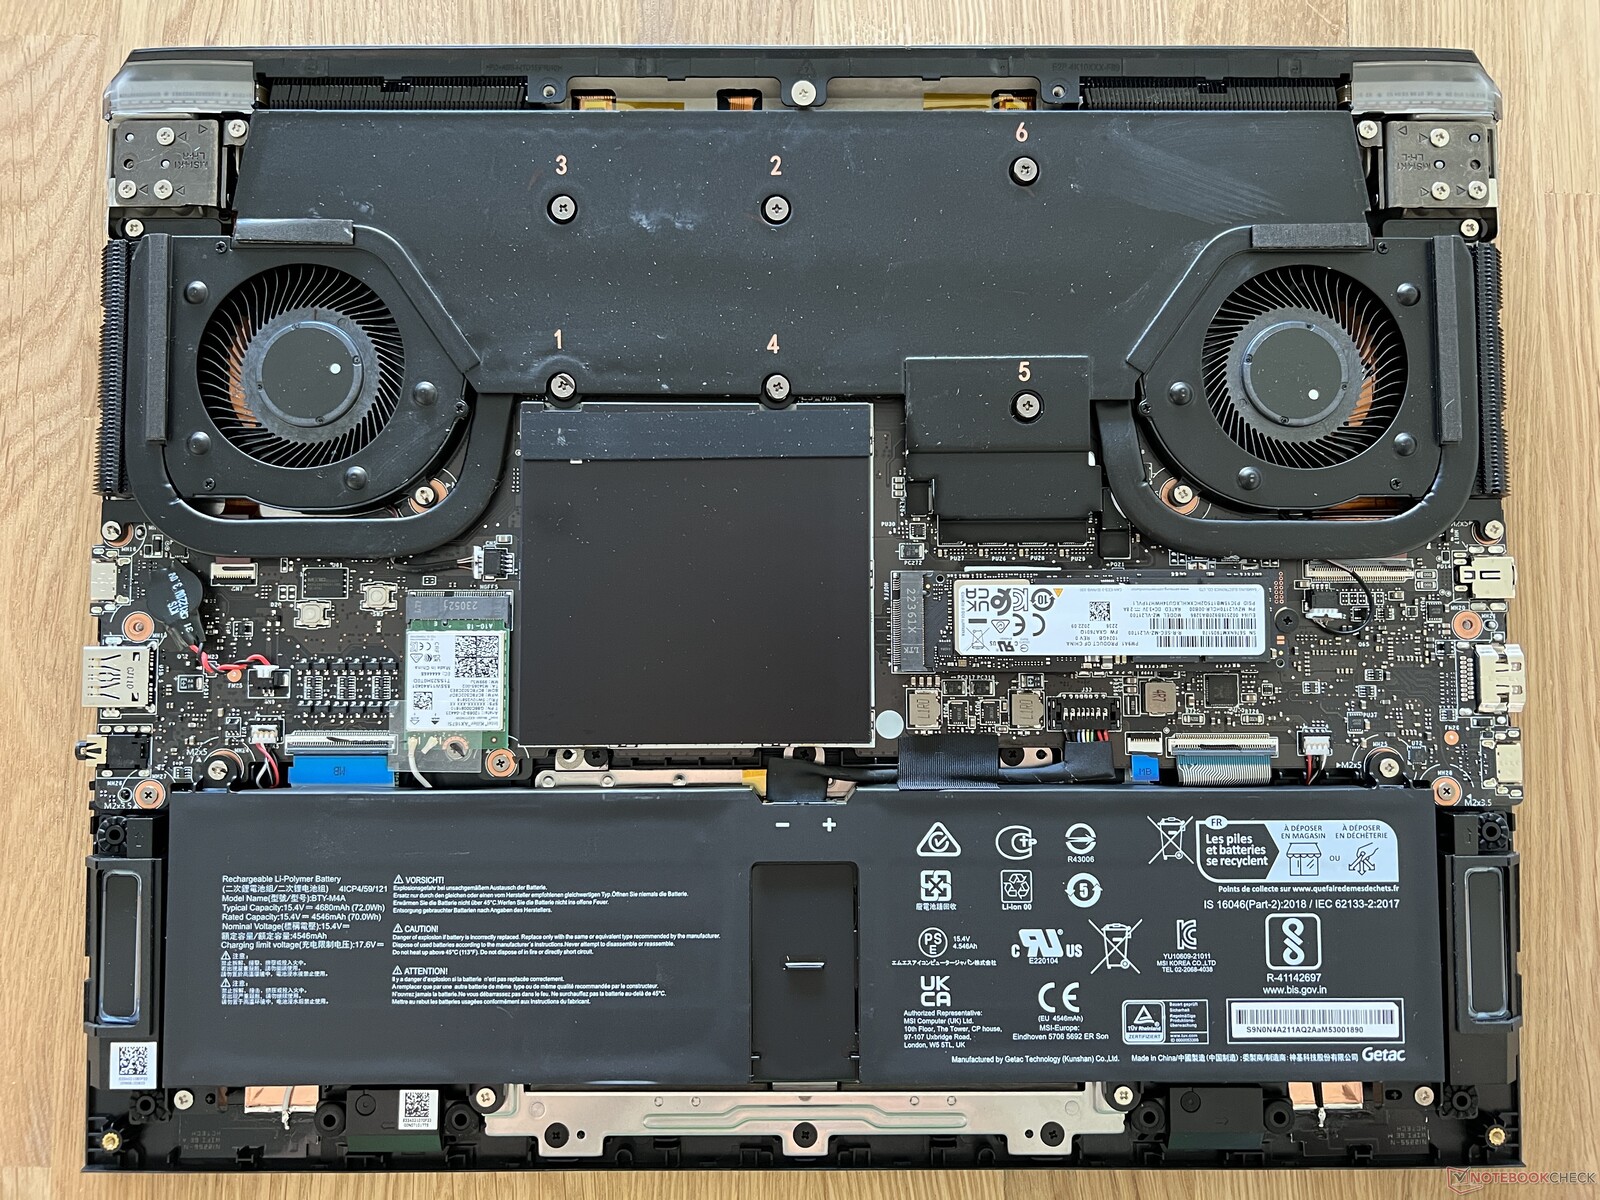
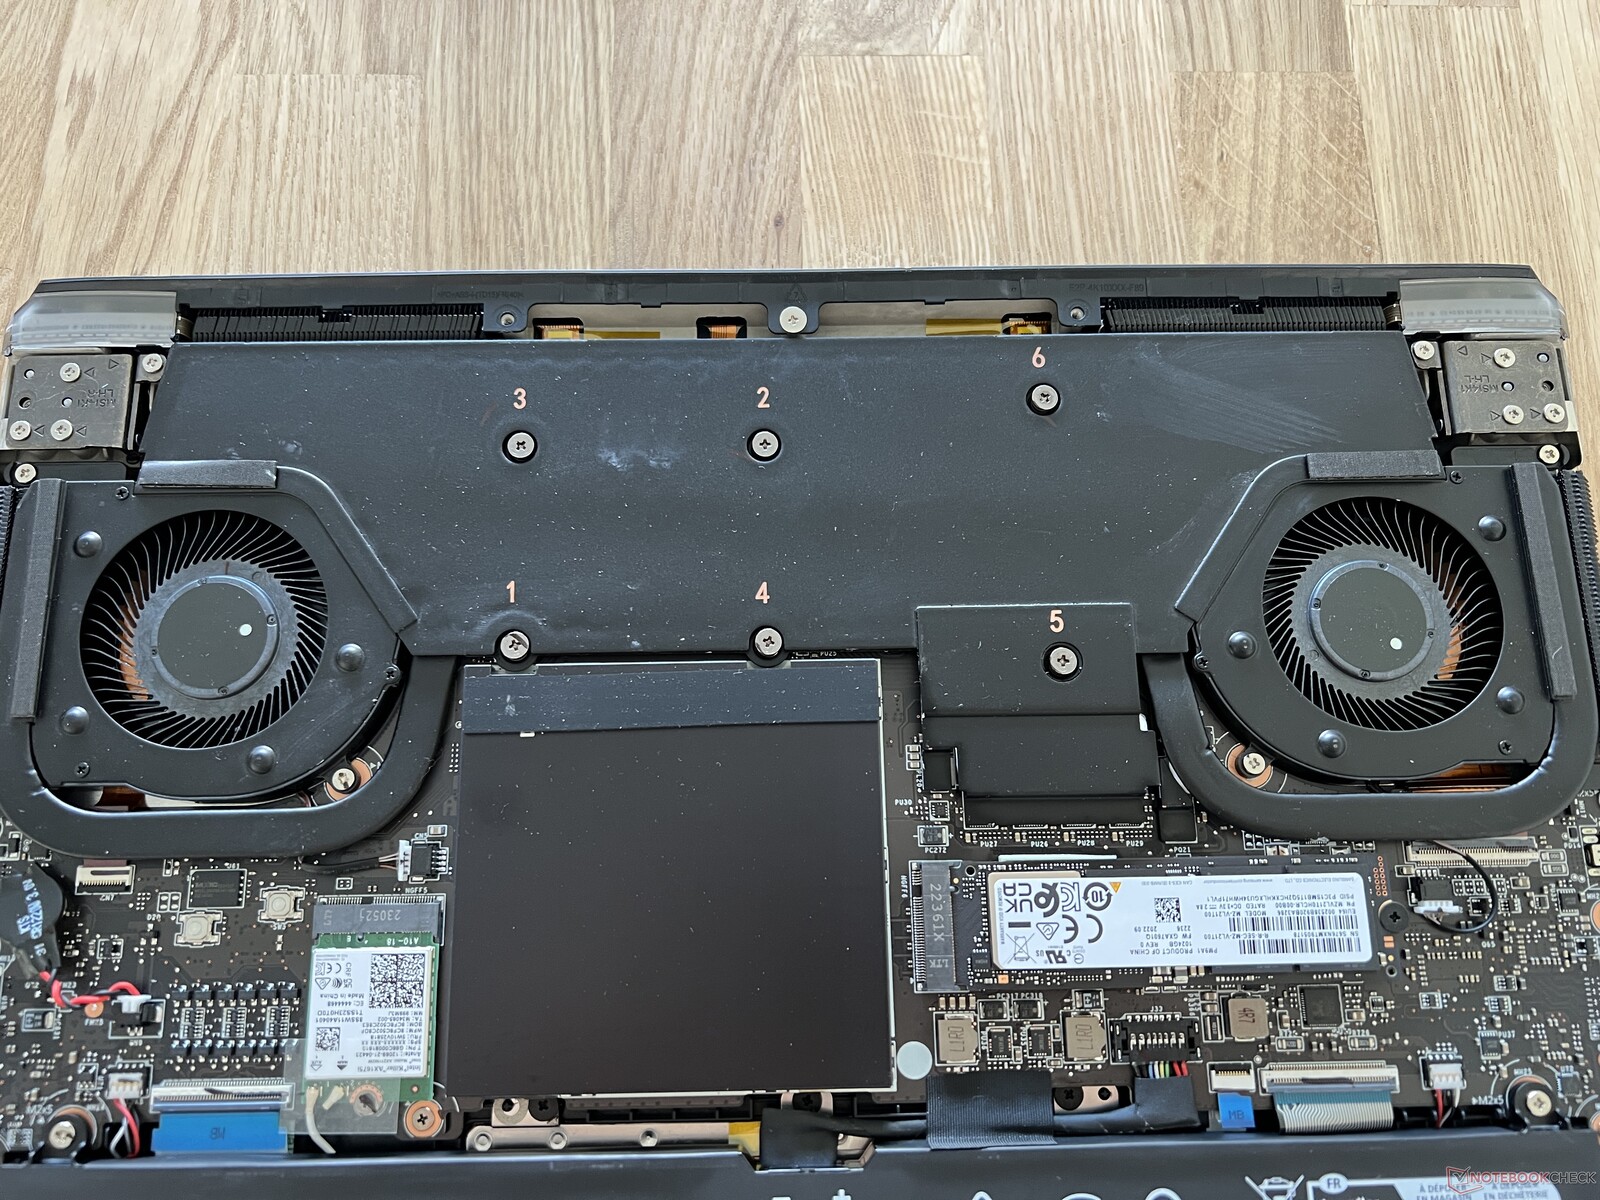
In order to access the laptop's components, you have to take apart the entire lower part of the case. One of the cross-headed screws is covered by a seal, at least in Germany (where we are conducting this test), appropriate use of this shouldn't affect your warranty. Inside, you can clean the fans and swap out the WLAN module and the M.2 2280 SSD. Theoretically, you could also swap out the RAM module, however, the additional cover was attached so tightly that we weren't able to remove it (and didn't want to cause any damage to our test sample). There is probably an additional glue pad holding it in place, which makes it extra difficult for the user to take it out.
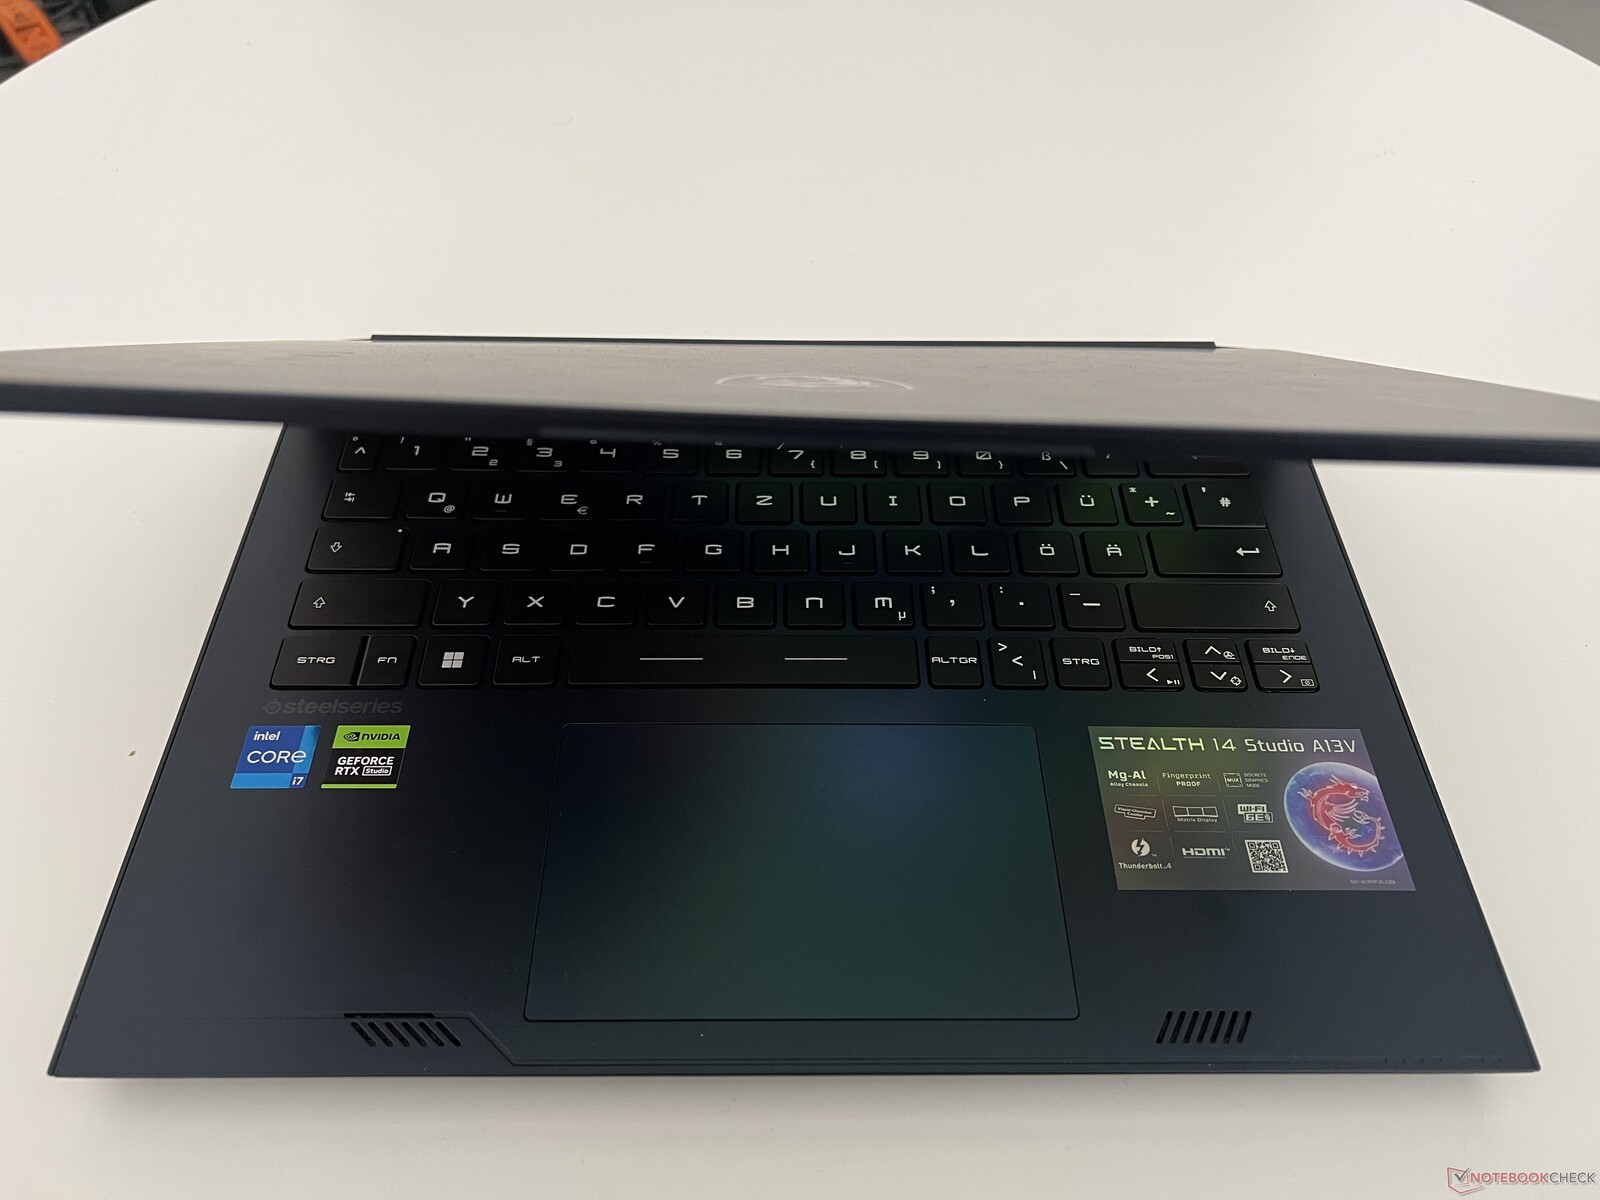
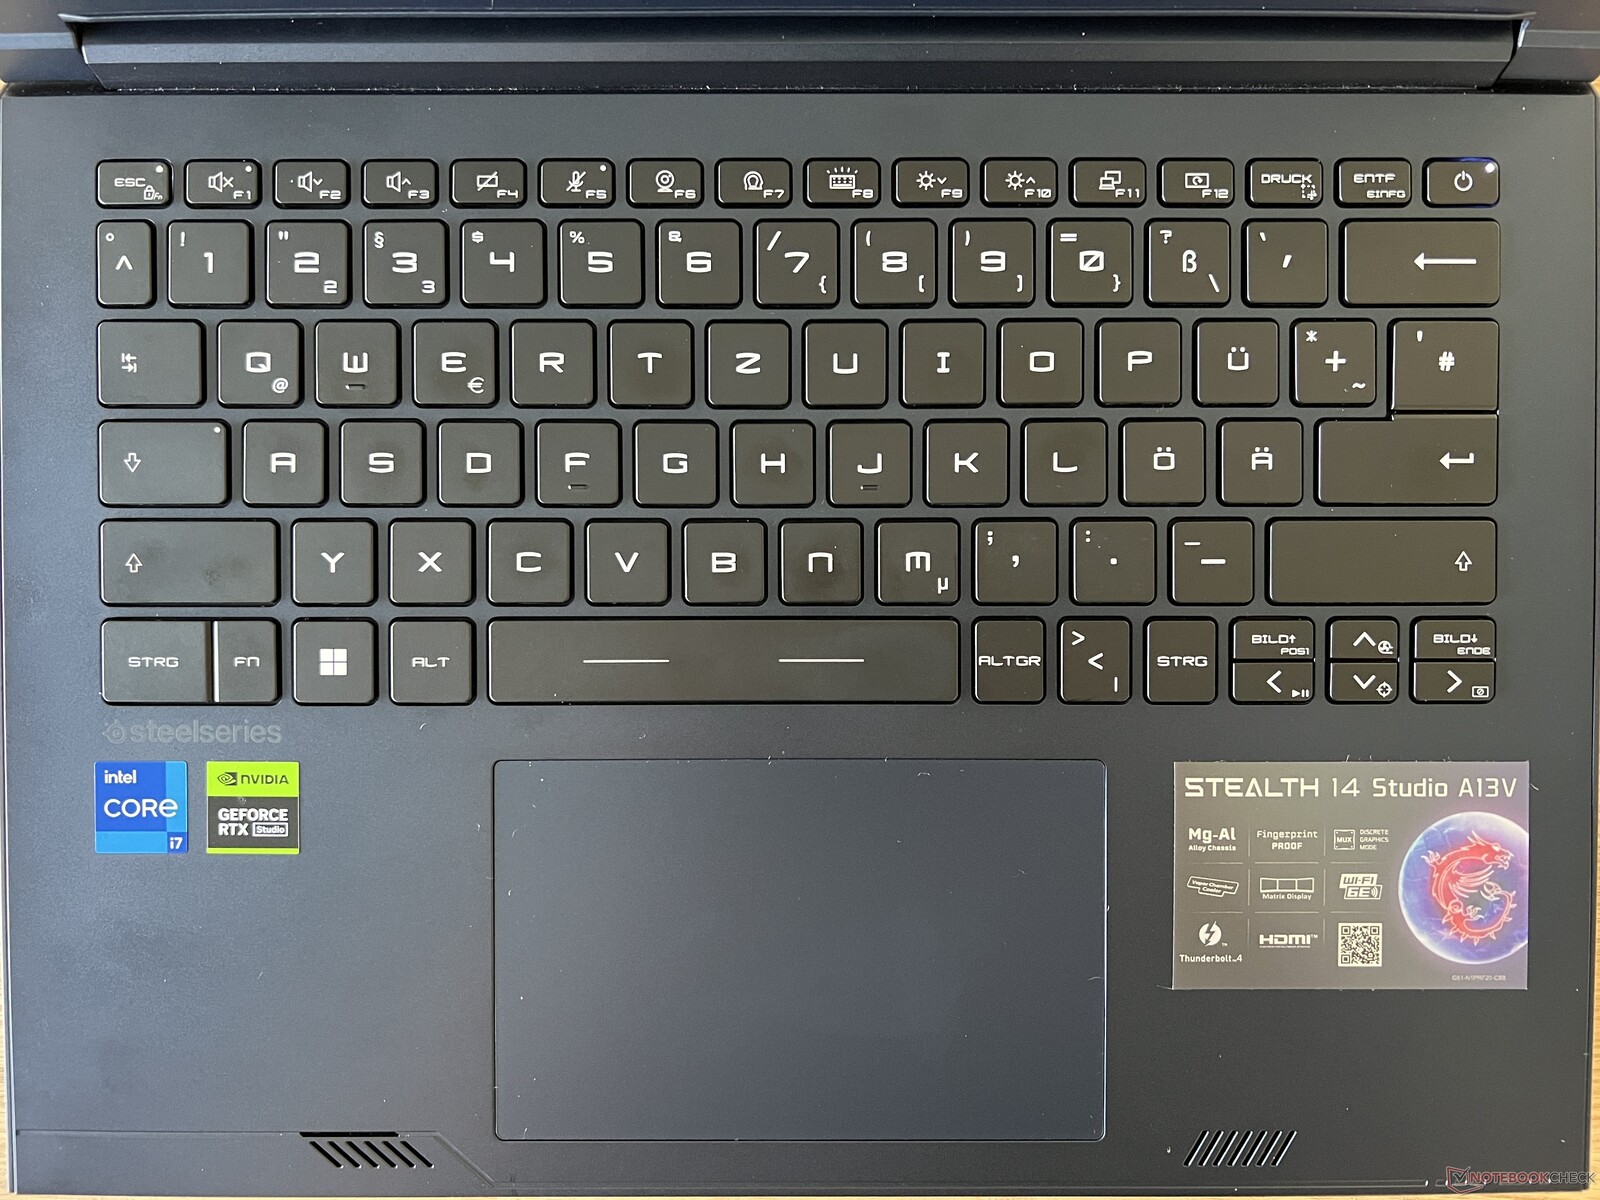
Input devices - A keyboard with individually lit keys
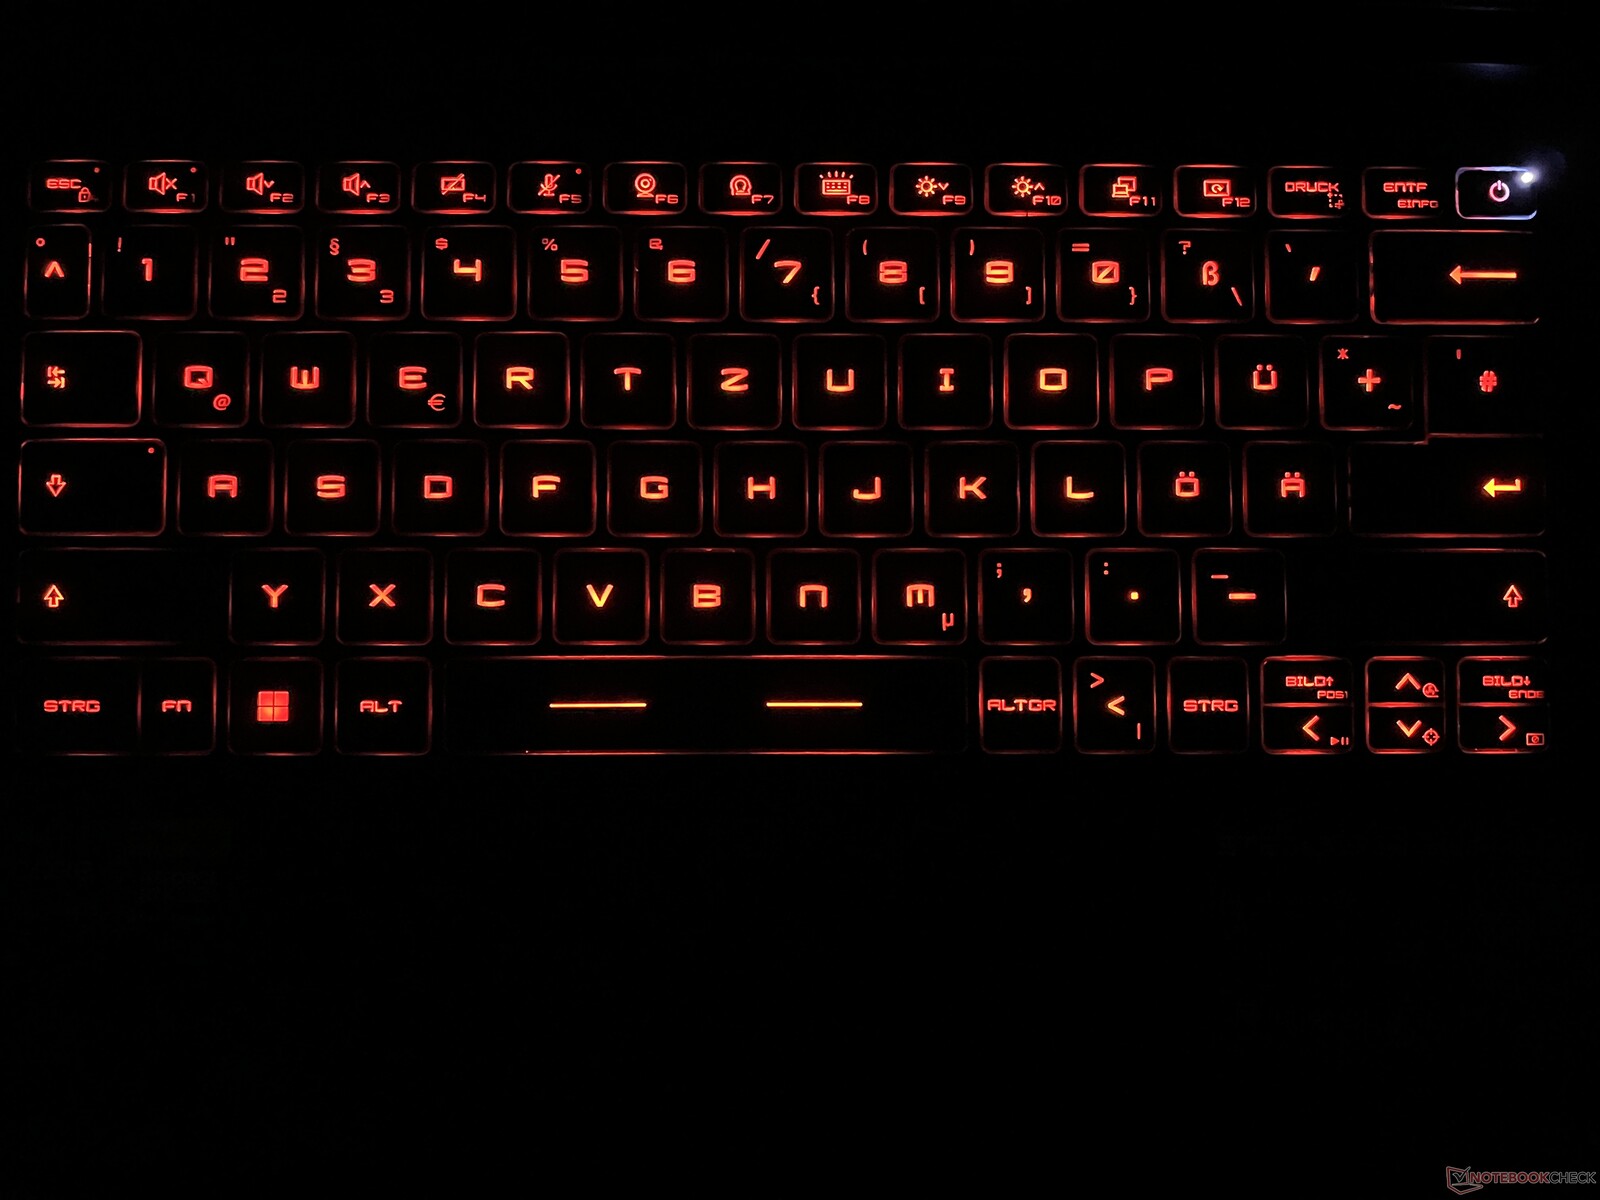
The keyboard can be counted as one of the Stealth 14 Studio's flaws, as its key lift is very shallow and the keys have quite a rickety feel to them. Even so, tapping the keys does end up being quite precise and we didn't note any false inputs. You just have to get used to its layout, as it has a single-line enter key and the "|<>" key is in a slightly unusual spot. The four arrow keys are also quite small, but at least there are designated "picture up" and "picture down" keys. Each individual key's lighting can be adjusted using the Steelseries software, but it isn't very intuitive at all.
The smooth click pad (12 x 7.5 cm) works well in everyday use, but we would recommend just tapping it to input commands. If you actually press down the bottom part of the pad, it results in a very loud and cheap-sounding click noise.
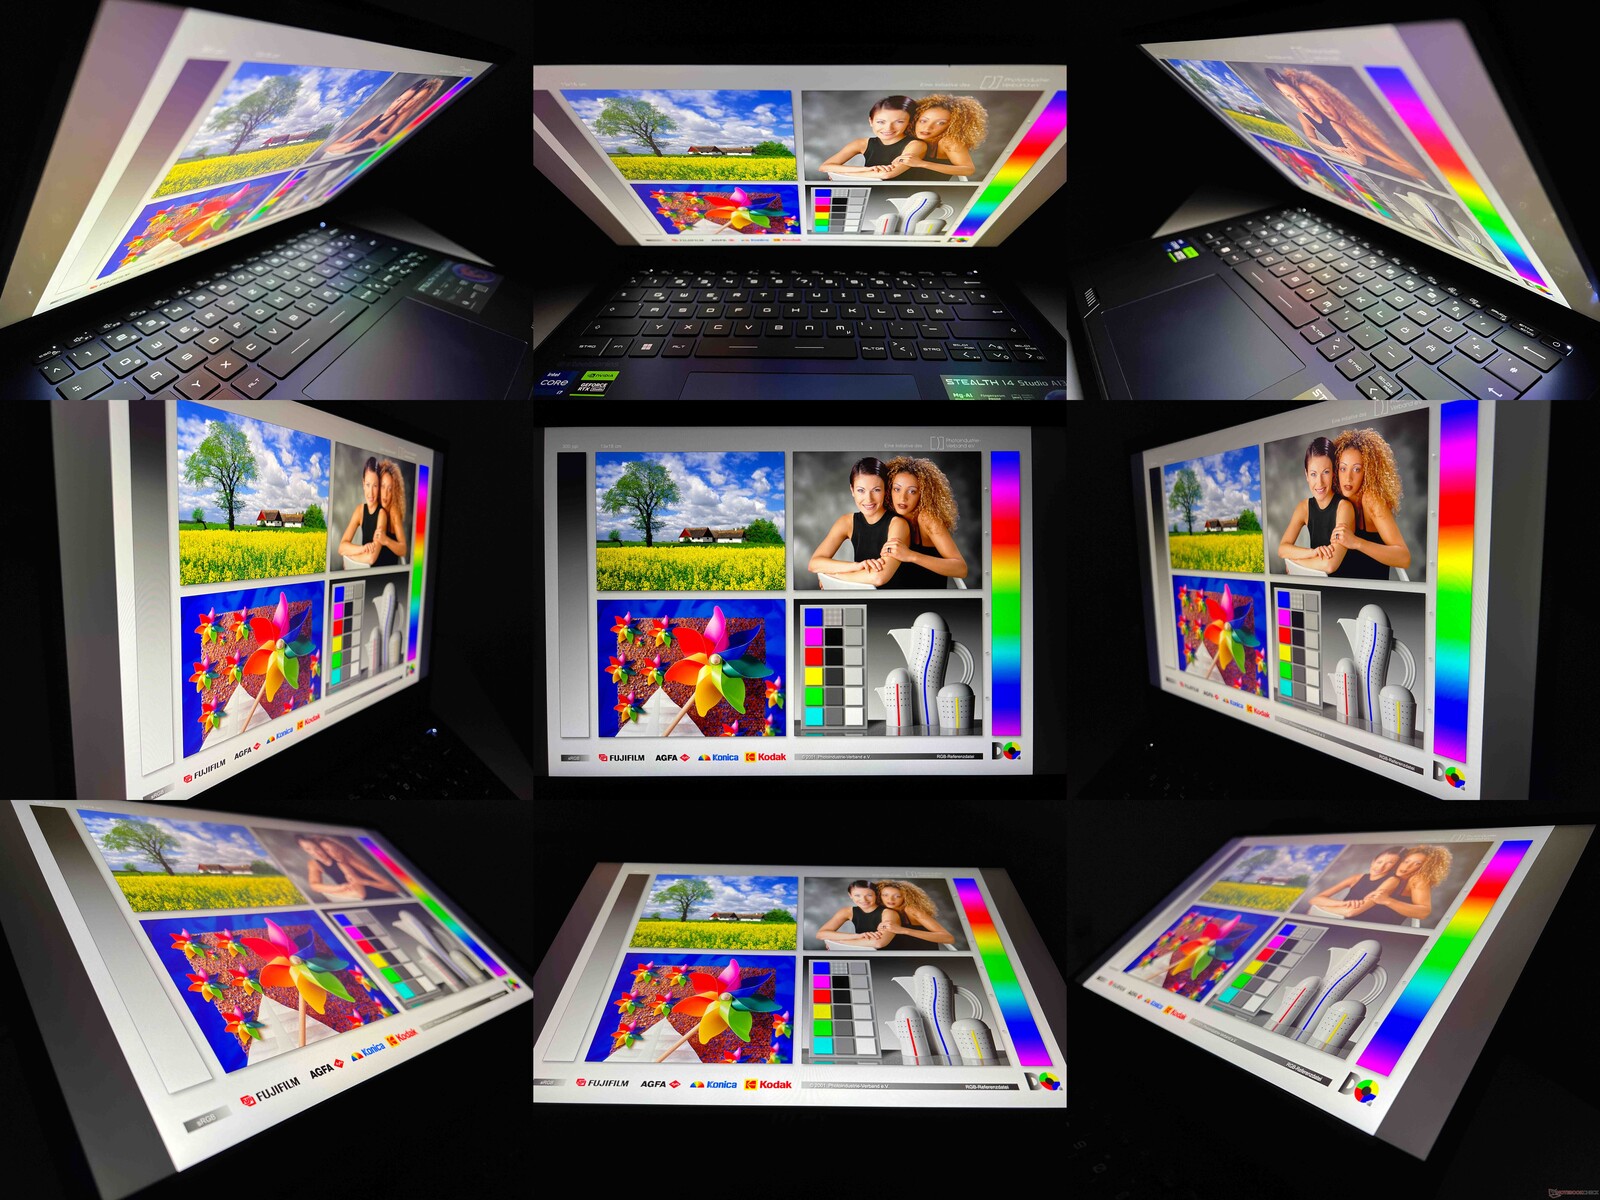
Display - A quick 240-Hz panel
MSI have gone for a 14-inch IPS panel with a resolution of 2,560 x 1,600 pixels. The main highlight of this is its 240-Hz refresh rate as well as its fast reaction times - although, subjectively, we weren't entirely impressed by its picture quality. Its sharpness levels are good, but dark areas always look a little as if they have a gray veil hanging over them.
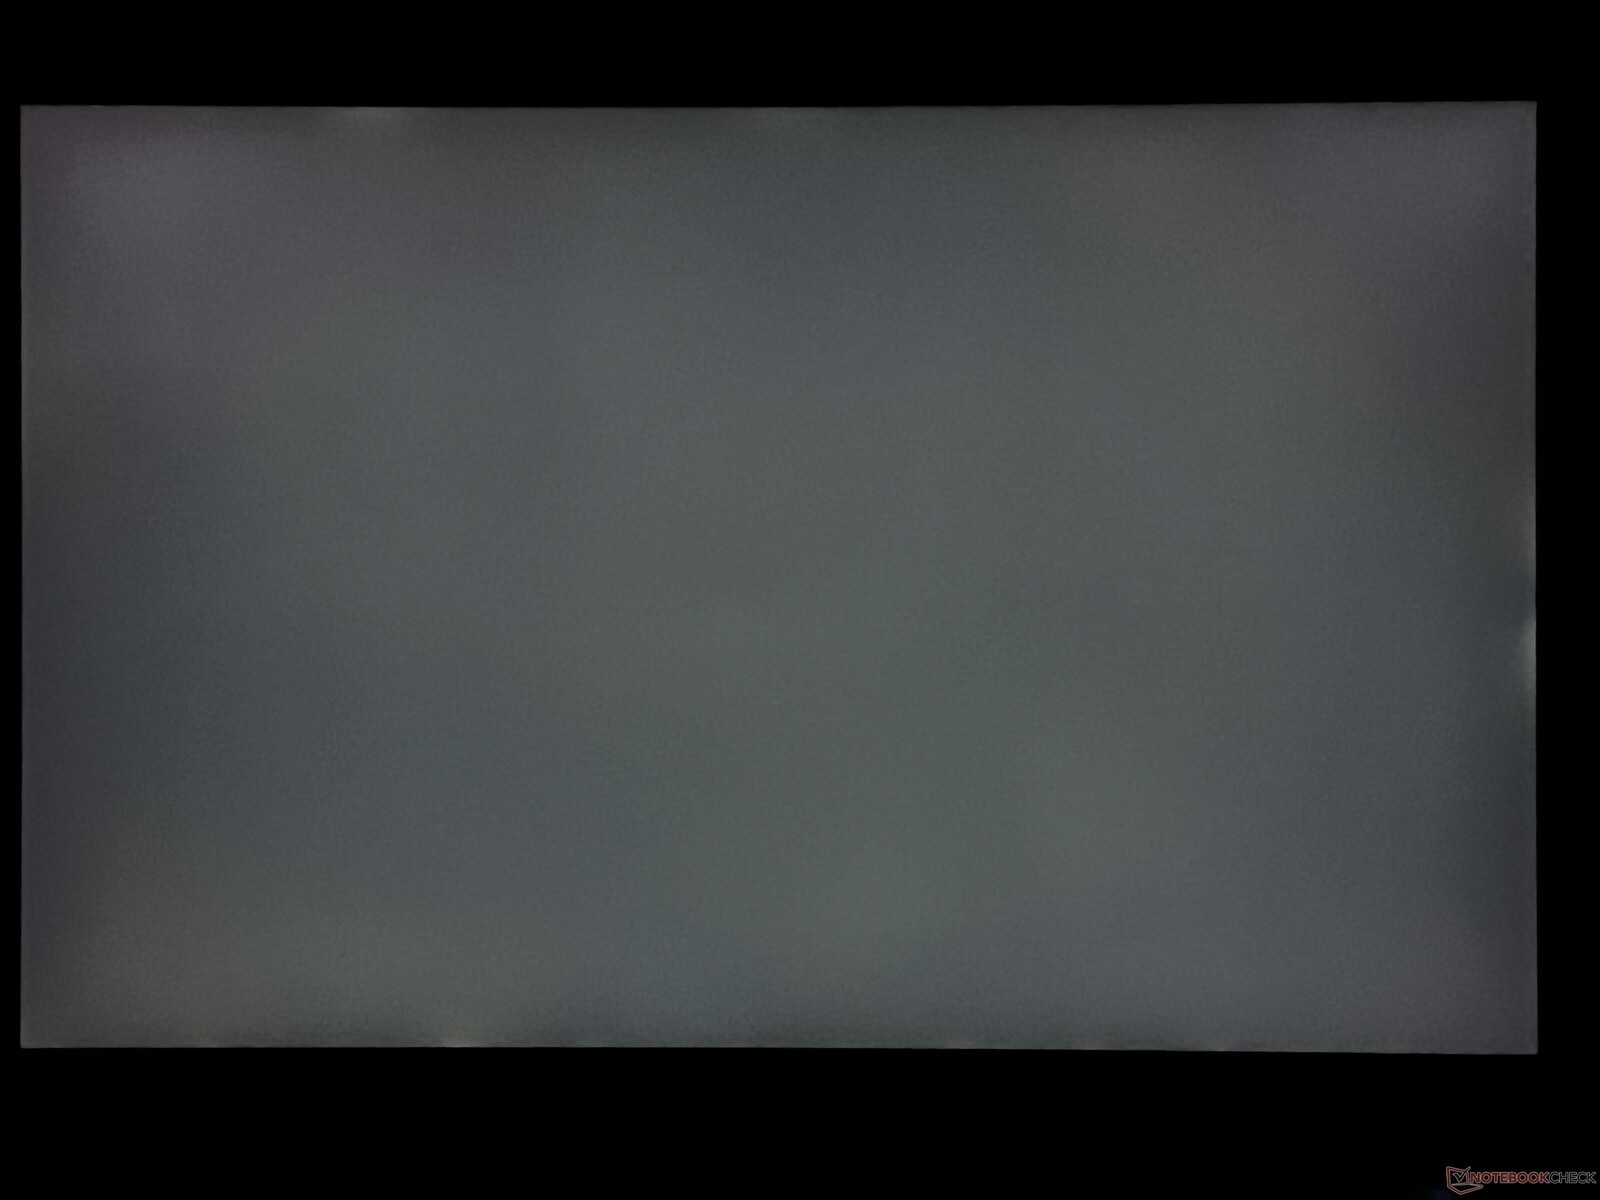
The screen's high black value of 0.43 cd/m² is responsible for this, which - even in combination with its decent brightness of around 400 cd/m² - leads to a mediocre contrast ratio of under 1.000:1. The display is by no means bad, but especially in times of Mini LEDs and OLEDs, the installed panel leaves a lot to be desired subjectively. Backlight bleeding doesn't seem to be too big a problem and we didn't note any PWM flickering.
| |||||||||||||||||||||||||
Brightness Distribution: 89 %
Center on Battery: 422 cd/m²
Contrast: 974:1 (Black: 0.43 cd/m²)
ΔE ColorChecker Calman: 2.3 | ∀{0.5-29.43 Ø4.71}
calibrated: 0.9
ΔE Greyscale Calman: 3.3 | ∀{0.09-98 Ø4.96}
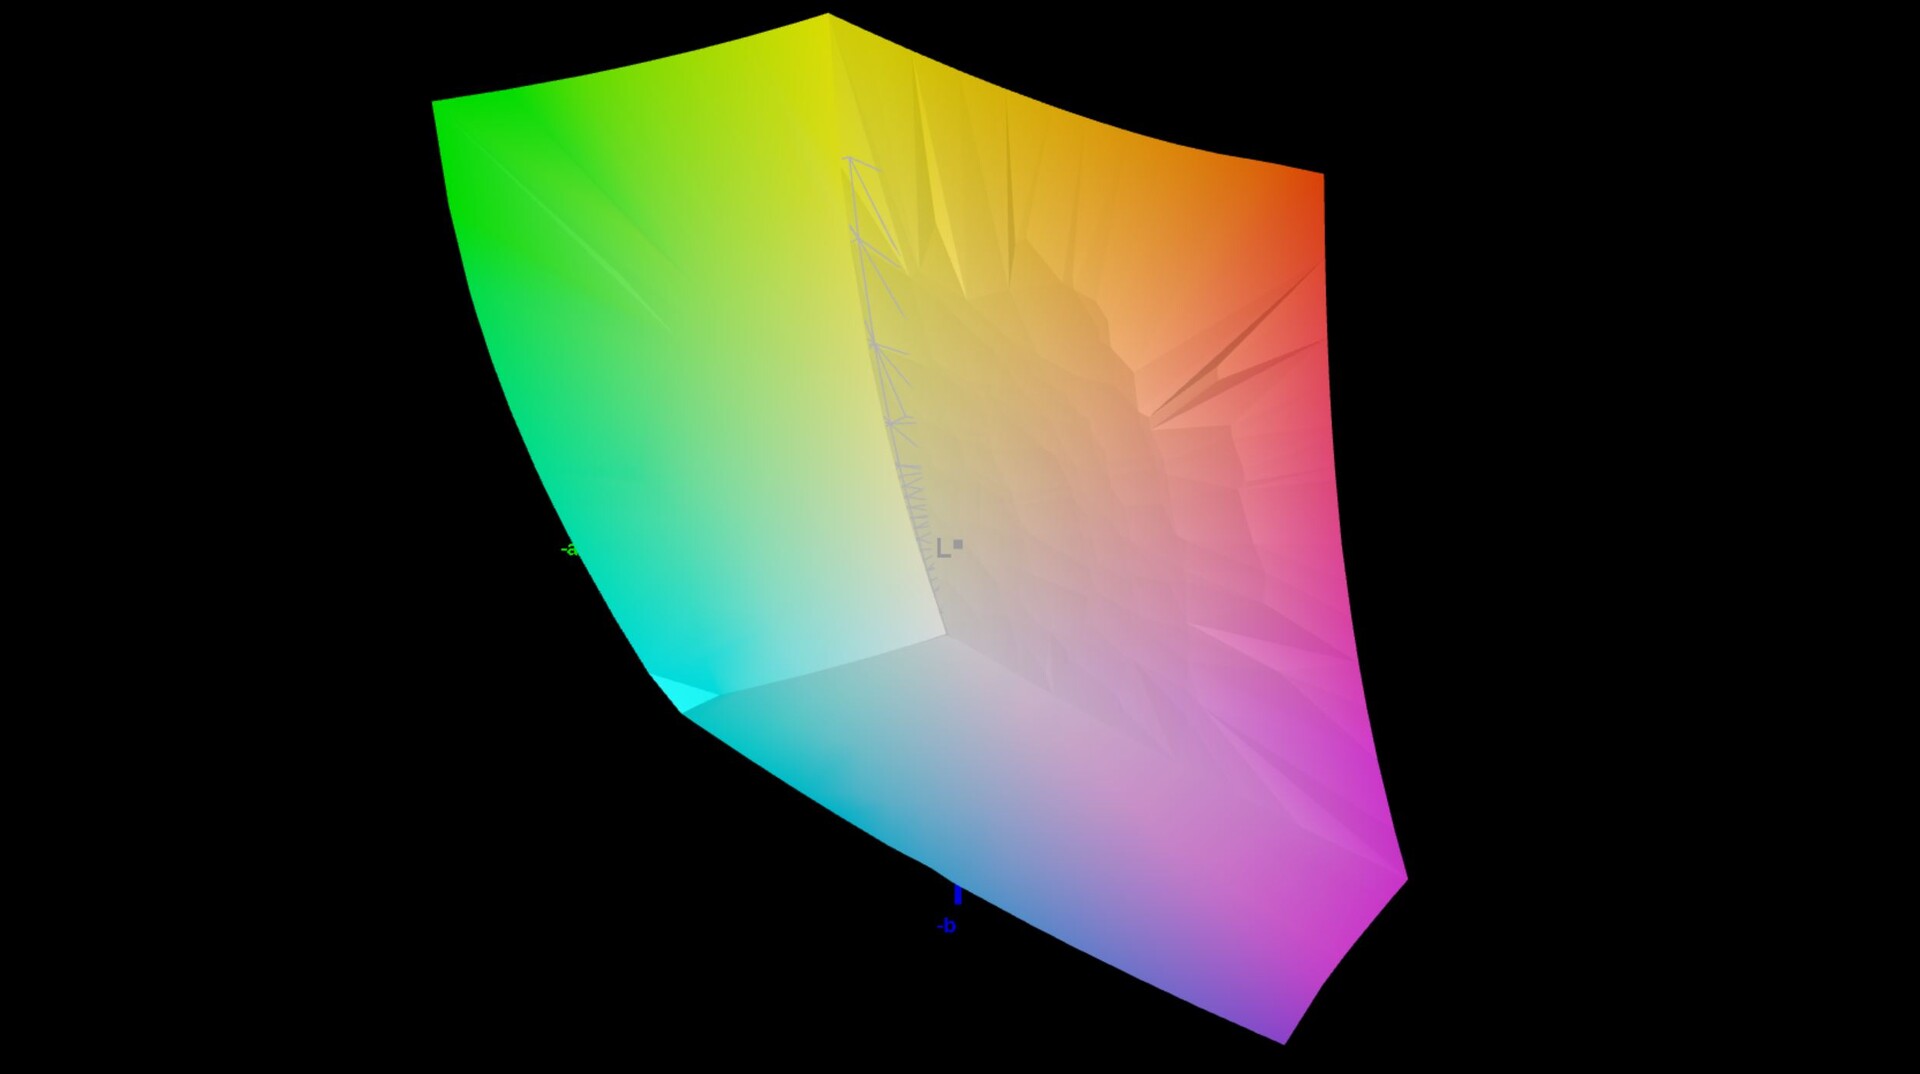
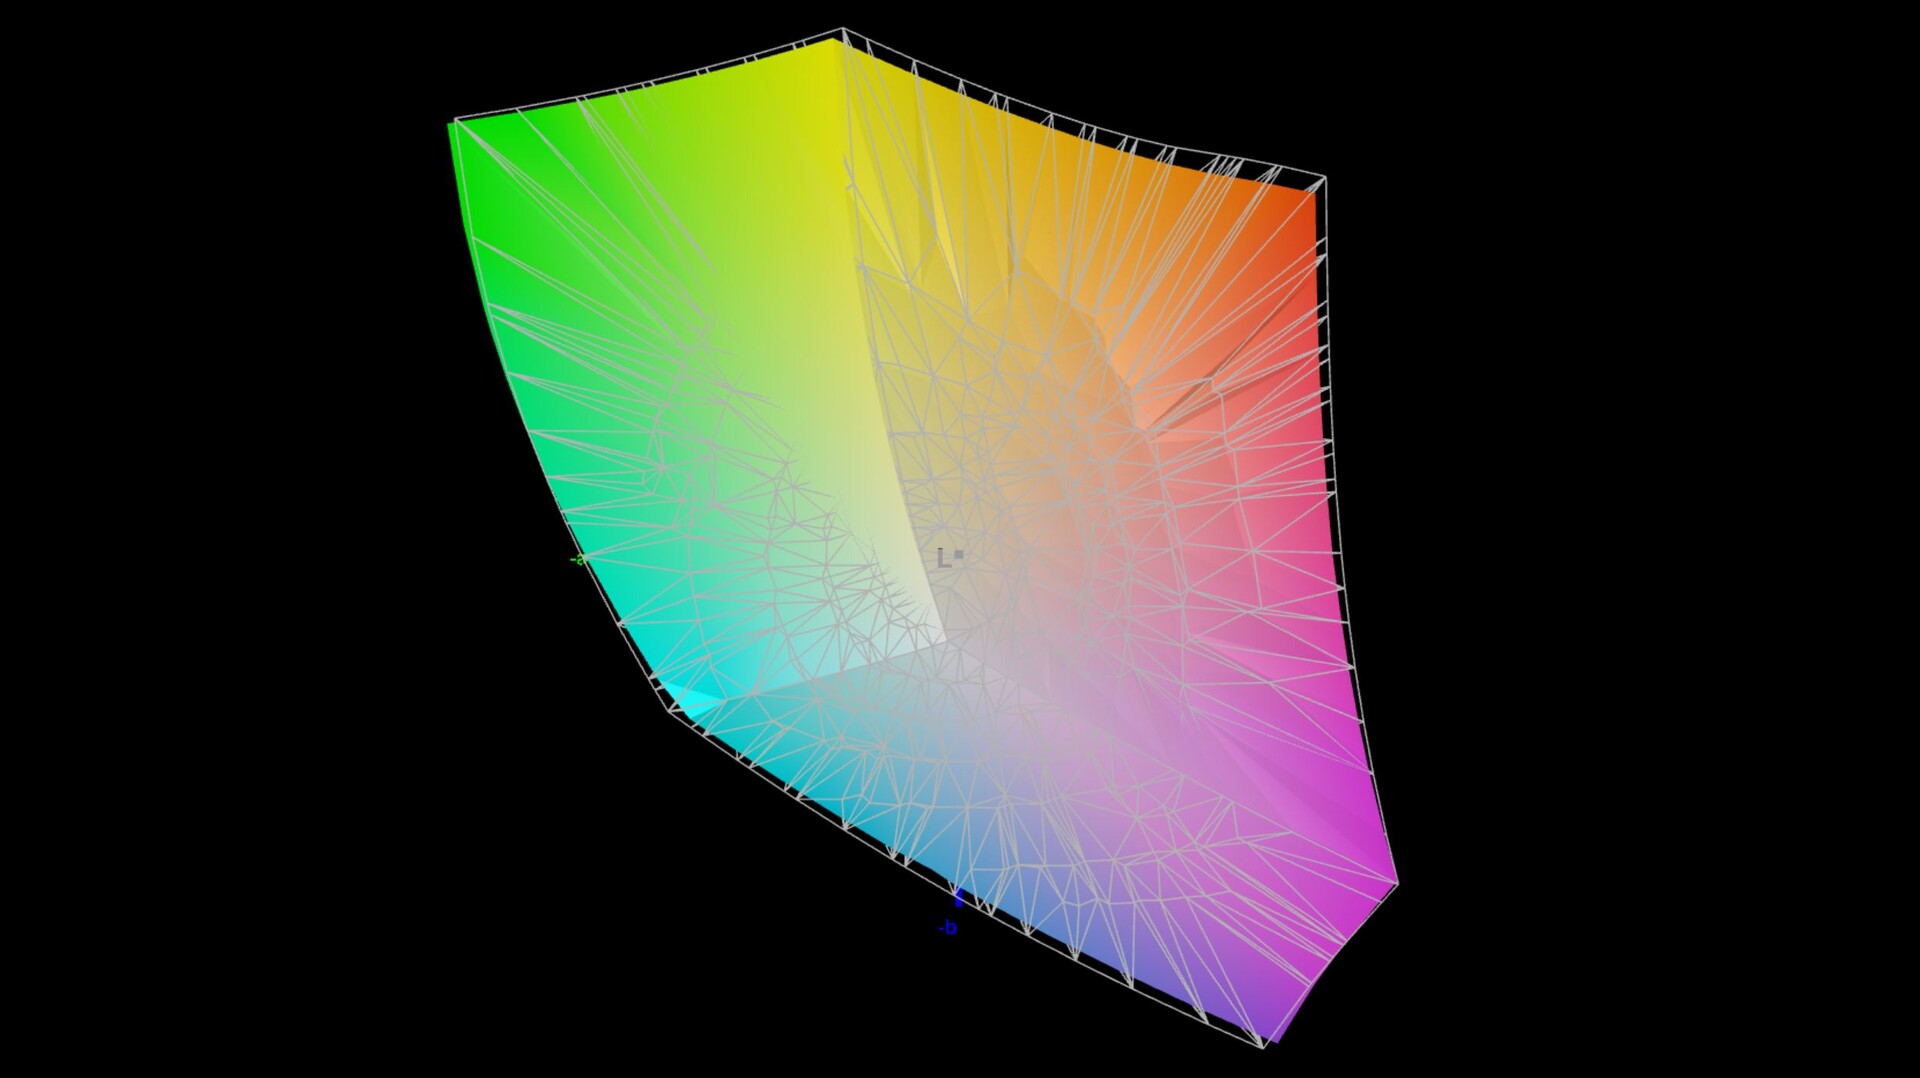
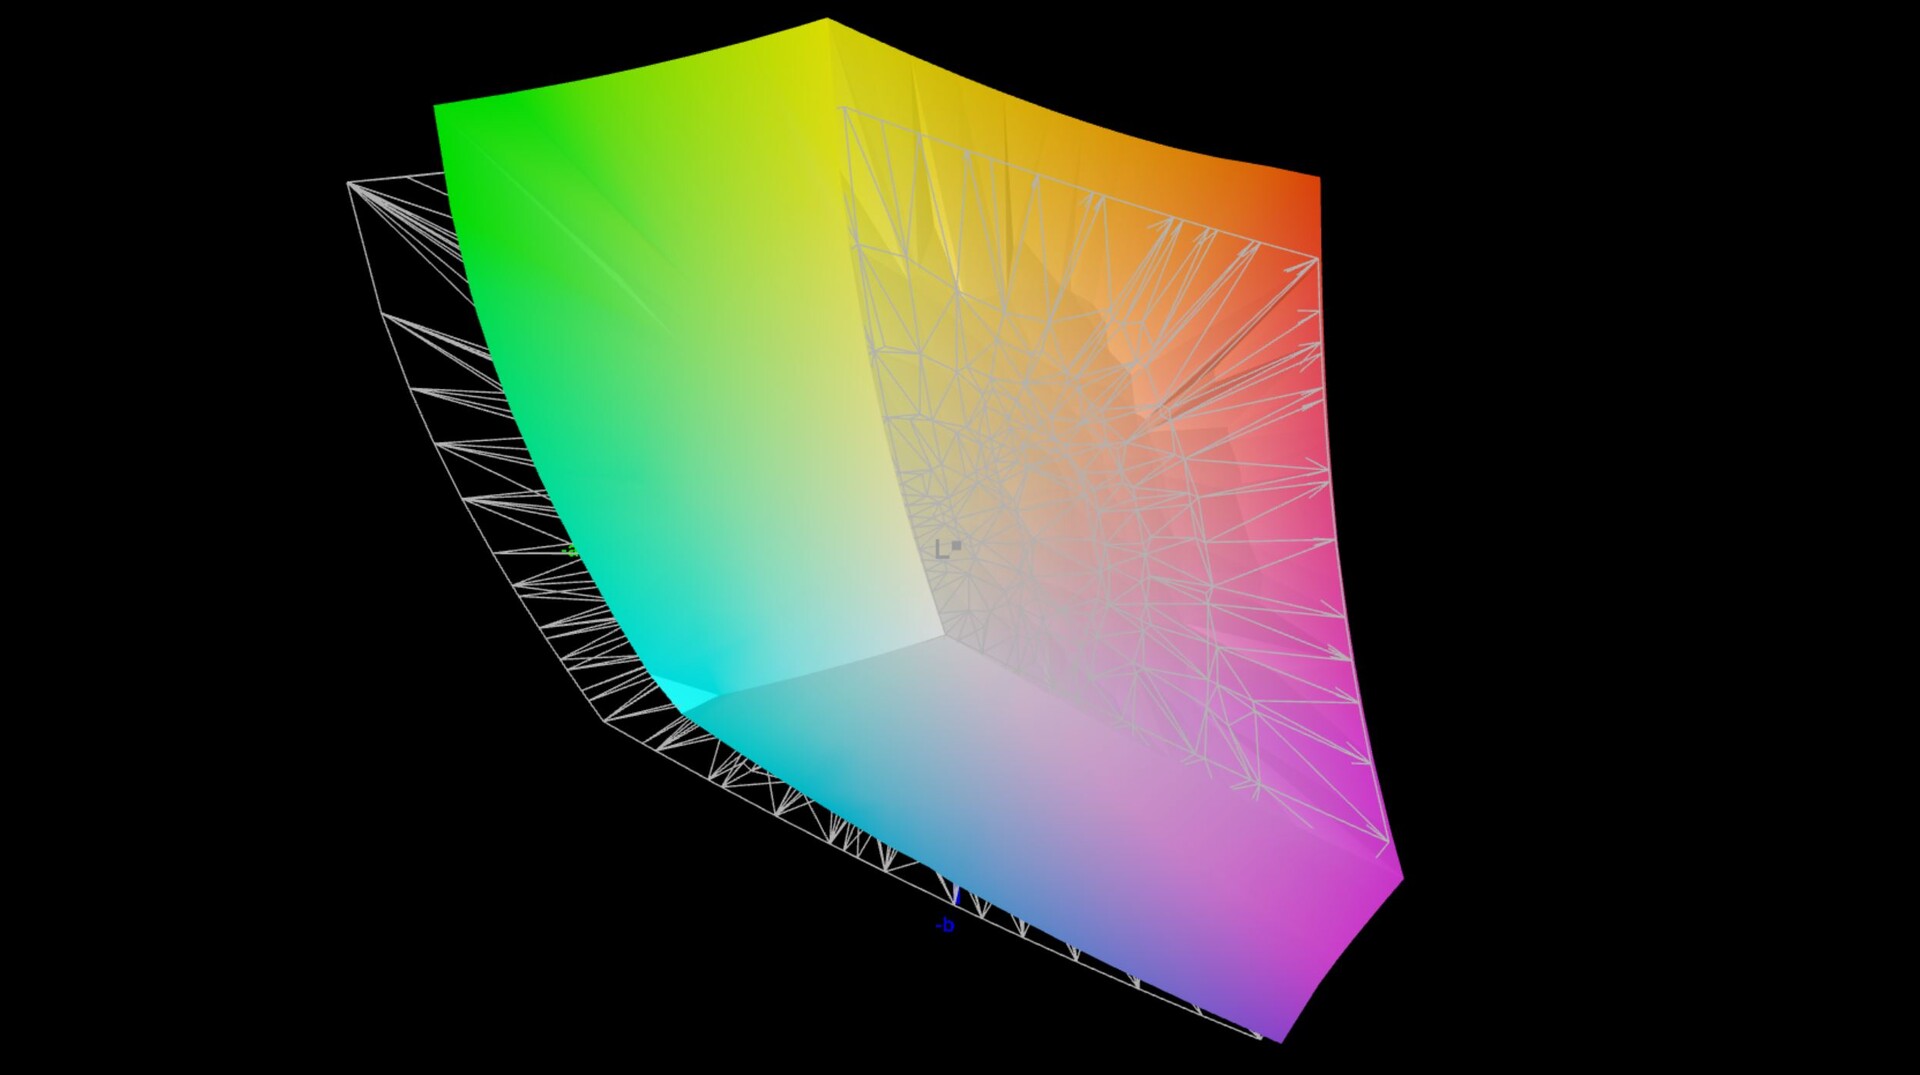
85.3% AdobeRGB 1998 (Argyll 3D)
99.6% sRGB (Argyll 3D)
96.2% Display P3 (Argyll 3D)
Gamma: 2.14
CCT: 6550 K
| MSI Stealth 14 Studio A13V B140QAN06.T, IPS, 2560x1600, 14" | Gigabyte Aero 14 OLED BMF Samsung SDC4192 (ATNA40YK14-0), OLED, 2880x1800, 14" | Schenker Vision 14 2022 RTX 3050 Ti MNE007ZA1-1, IPS, 2880x1800, 14" | Asus ROG Flow Z13 GZ301ZE LQ134N1JW54, IPS, 1920x1200, 13.4" | Alienware x14 i7 RTX 3060 SHP154D, IPS, 1920x1080, 14" | Razer Blade 14 Ryzen 9 6900HX TL140BDXP02-0, IPS, 2560x1440, 14" | Acer Predator Triton 300 SE Samsung ATNA40YK07-0, OLED, 2880x1800, 14" | |
|---|---|---|---|---|---|---|---|
| Display | 3% | -12% | -17% | 2% | 0% | 7% | |
| Display P3 Coverage (%) | 96.2 | 99.8 4% | 74.1 -23% | 67.5 -30% | 99.6 4% | 97.2 1% | 99.9 4% |
| sRGB Coverage (%) | 99.6 | 100 0% | 97.4 -2% | 97.1 -3% | 100 0% | 99.9 0% | 100 0% |
| AdobeRGB 1998 Coverage (%) | 85.3 | 88.7 4% | 75.3 -12% | 69.3 -19% | 87.6 3% | 85.7 0% | 99 16% |
| Response Times | 58% | -312% | -452% | -53% | -184% | 76% | |
| Response Time Grey 50% / Grey 80% * (ms) | 5.5 ? | 2.4 ? 56% | 31.5 ? -473% | 44 ? -700% | 9.6 ? -75% | 16.8 ? -205% | 1.36 ? 75% |
| Response Time Black / White * (ms) | 5.8 ? | 2.4 ? 59% | 14.5 ? -150% | 17.6 ? -203% | 7.6 ? -31% | 15.2 ? -162% | 1.36 ? 77% |
| PWM Frequency (Hz) | 300 | 367.6 ? | |||||
| Screen | 71% | -11% | 18% | 5% | 11% | -13% | |
| Brightness middle (cd/m²) | 419 | 423 1% | 421 0% | 515 23% | 434 4% | 354 -16% | 414.3 -1% |
| Brightness (cd/m²) | 402 | 427 6% | 416 3% | 476 18% | 411 2% | 328 -18% | 416 3% |
| Brightness Distribution (%) | 89 | 98 10% | 89 0% | 87 -2% | 89 0% | 86 -3% | 99 11% |
| Black Level * (cd/m²) | 0.43 | 0.1 77% | 0.28 35% | 0.35 19% | 0.25 42% | 0.37 14% | |
| Contrast (:1) | 974 | 4230 334% | 1504 54% | 1471 51% | 1736 78% | 957 -2% | |
| Colorchecker dE 2000 * | 2.3 | 0.55 76% | 3.2 -39% | 1.6 30% | 3 -30% | 1.66 28% | 4.68 -103% |
| Colorchecker dE 2000 max. * | 5.8 | 1.15 80% | 5.5 5% | 4 31% | 7.1 -22% | 3.83 34% | 7.78 -34% |
| Colorchecker dE 2000 calibrated * | 0.9 | 1.15 -28% | 2 -122% | 1.2 -33% | 0.7 22% | ||
| Greyscale dE 2000 * | 3.3 | 0.69 79% | 4.4 -33% | 2.5 24% | 5.1 -55% | 1.6 52% | 1.8 45% |
| Gamma | 2.14 103% | 2.42 91% | 2.22 99% | 2.2 100% | 2.19 100% | 2.23 99% | 2.22 99% |
| CCT | 6550 99% | 6479 100% | 6384 102% | 6939 94% | 6204 105% | 6542 99% | 6207 105% |
| Total Average (Program / Settings) | 44% /
54% | -112% /
-54% | -150% /
-57% | -15% /
-4% | -58% /
-21% | 23% /
8% |
* ... smaller is better
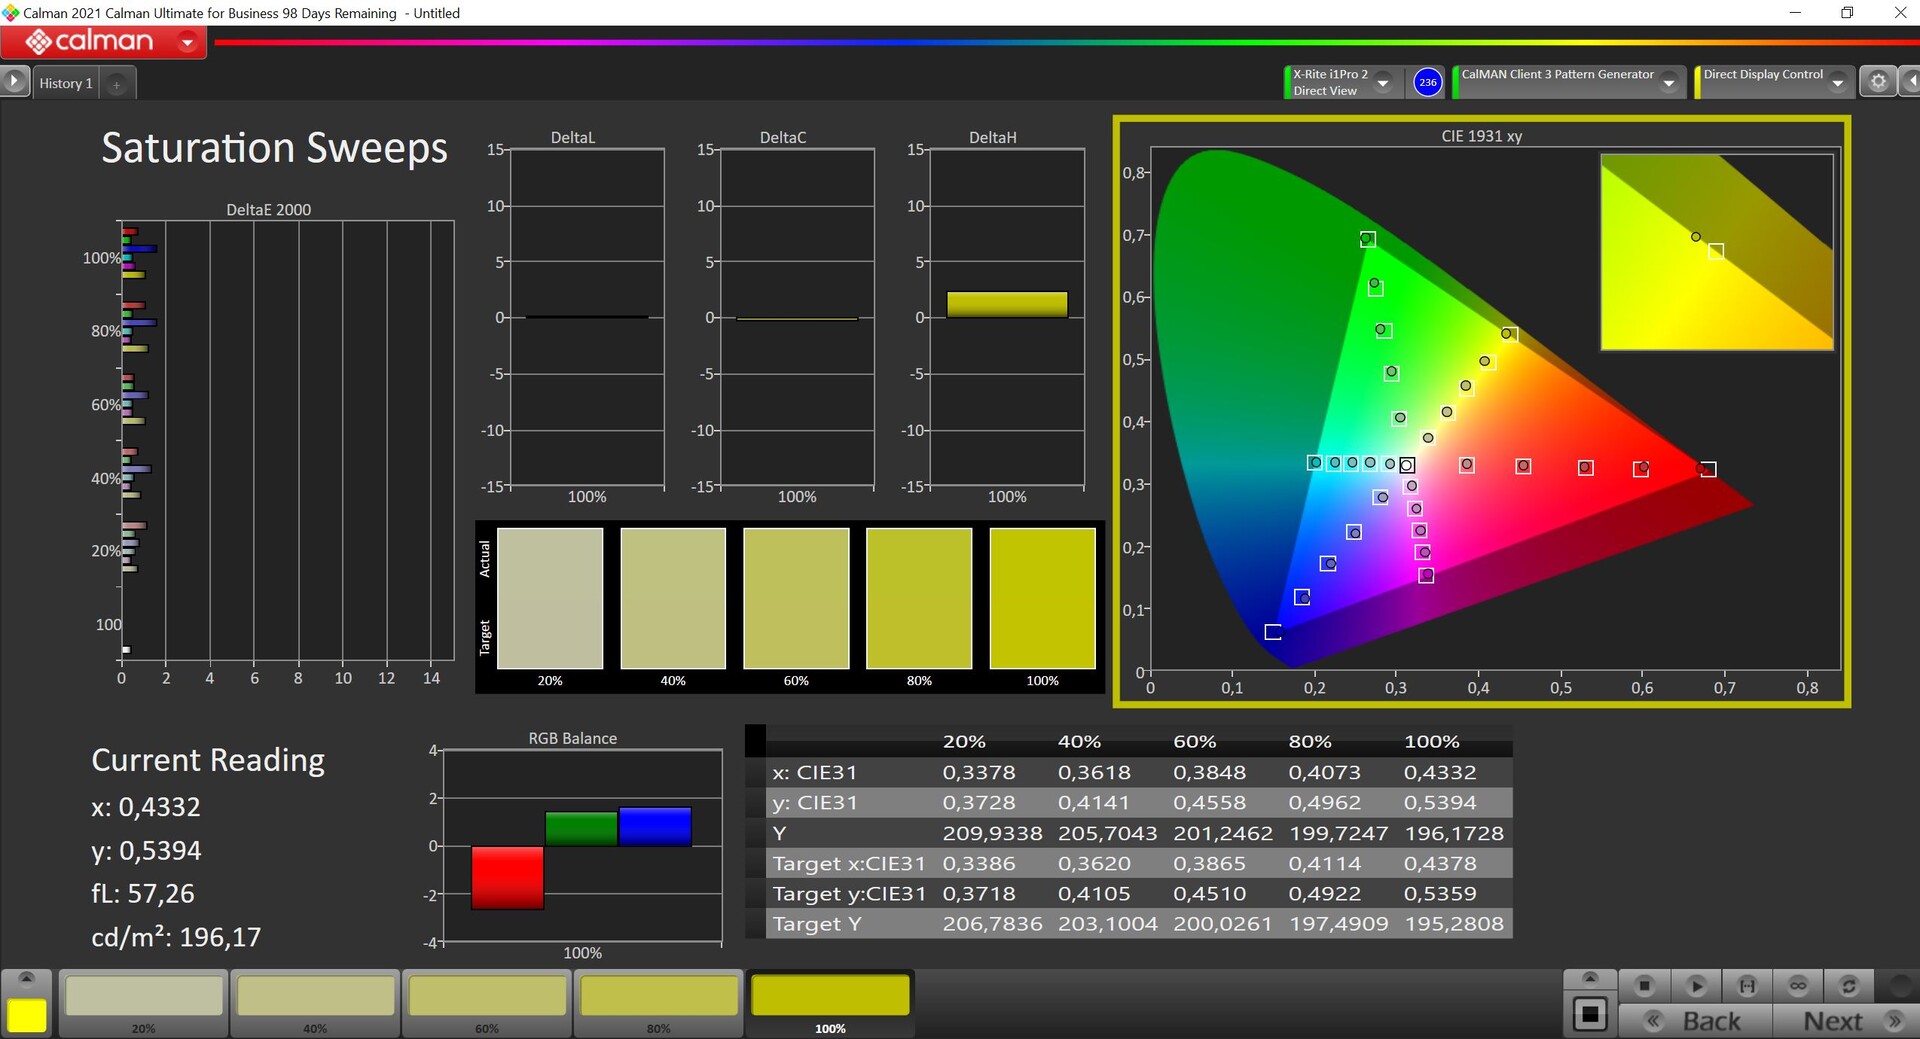

MSI offer multiple different color profiles via their TrueColor software and we chose the mode Display P3 for our measurements using professional CalMAN software (X-Rite i1 Pro2). It is the mode which is activated by standard. The colors we measured lay below the important DeltaE 2000 deviation of 3 compared to the P3 reference, however, the gray tones seemed to show a slight purple tint. Using our own calibration (you can download our profile for free above), we easily managed to get this under control. The P3 color space was able to be depicted almost in full.
Display Response Times
| ↔ Response Time Black to White | ||
|---|---|---|
| 5.8 ms ... rise ↗ and fall ↘ combined | ↗ 2.1 ms rise | 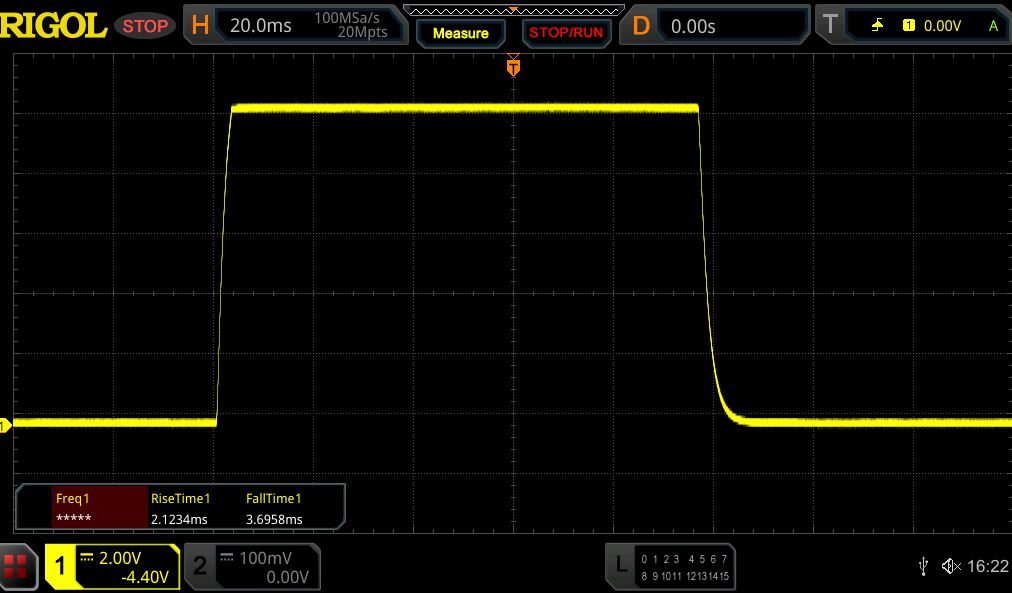 |
| ↘ 3.7 ms fall | ||
| The screen shows very fast response rates in our tests and should be very well suited for fast-paced gaming. In comparison, all tested devices range from 0.1 (minimum) to 240 (maximum) ms. » 18 % of all devices are better. This means that the measured response time is better than the average of all tested devices (19.8 ms). | ||
| ↔ Response Time 50% Grey to 80% Grey | ||
| 5.5 ms ... rise ↗ and fall ↘ combined | ↗ 2.7 ms rise | 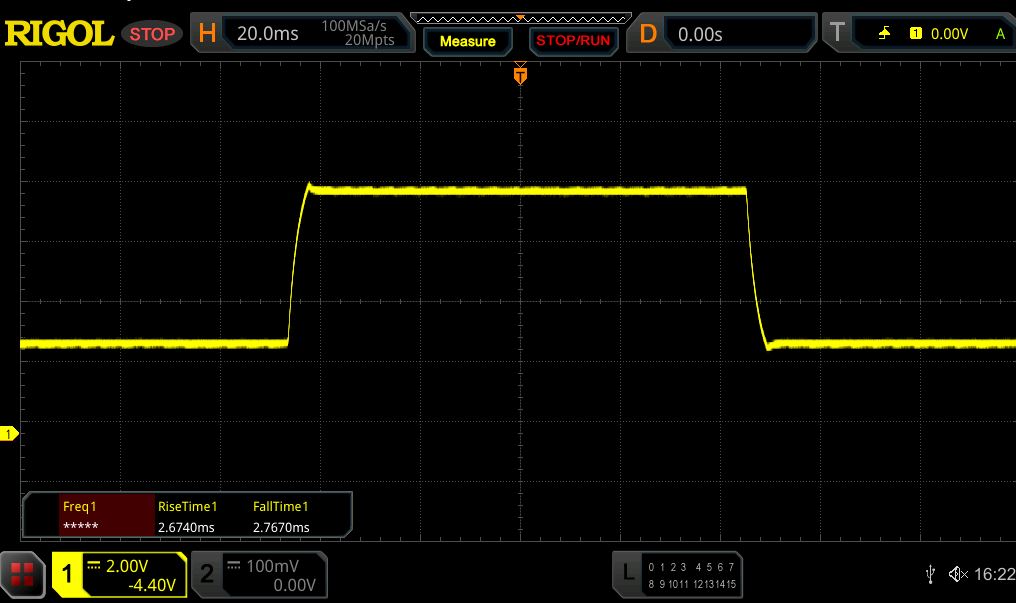 |
| ↘ 2.8 ms fall | ||
| The screen shows very fast response rates in our tests and should be very well suited for fast-paced gaming. In comparison, all tested devices range from 0.165 (minimum) to 636 (maximum) ms. » 18 % of all devices are better. This means that the measured response time is better than the average of all tested devices (31 ms). | ||
Screen Flickering / PWM (Pulse-Width Modulation)
| Screen flickering / PWM not detected | 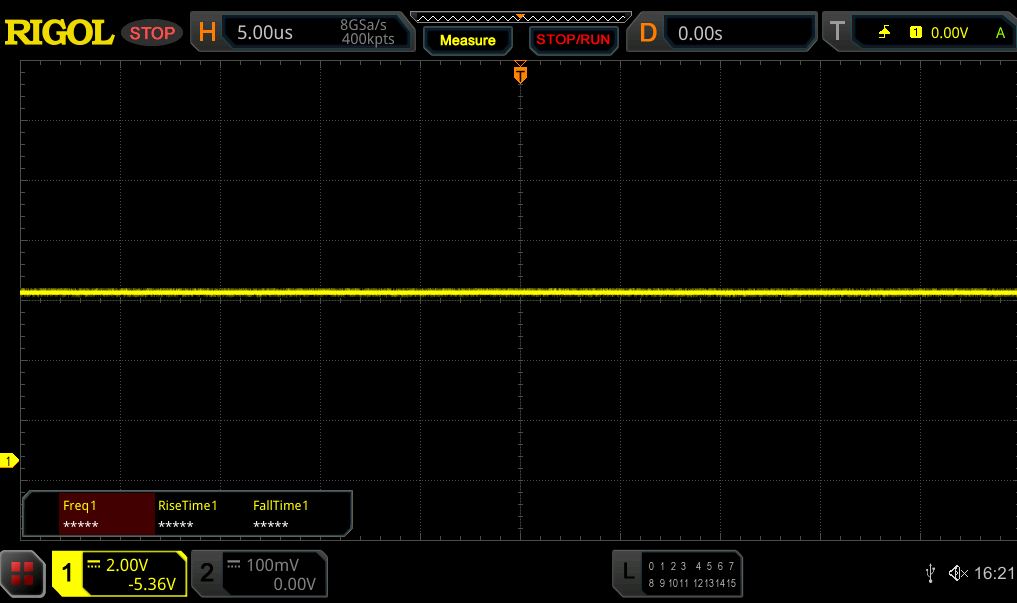 | ||
In comparison: 52 % of all tested devices do not use PWM to dim the display. If PWM was detected, an average of 7751 (minimum: 5 - maximum: 343500) Hz was measured. | |||
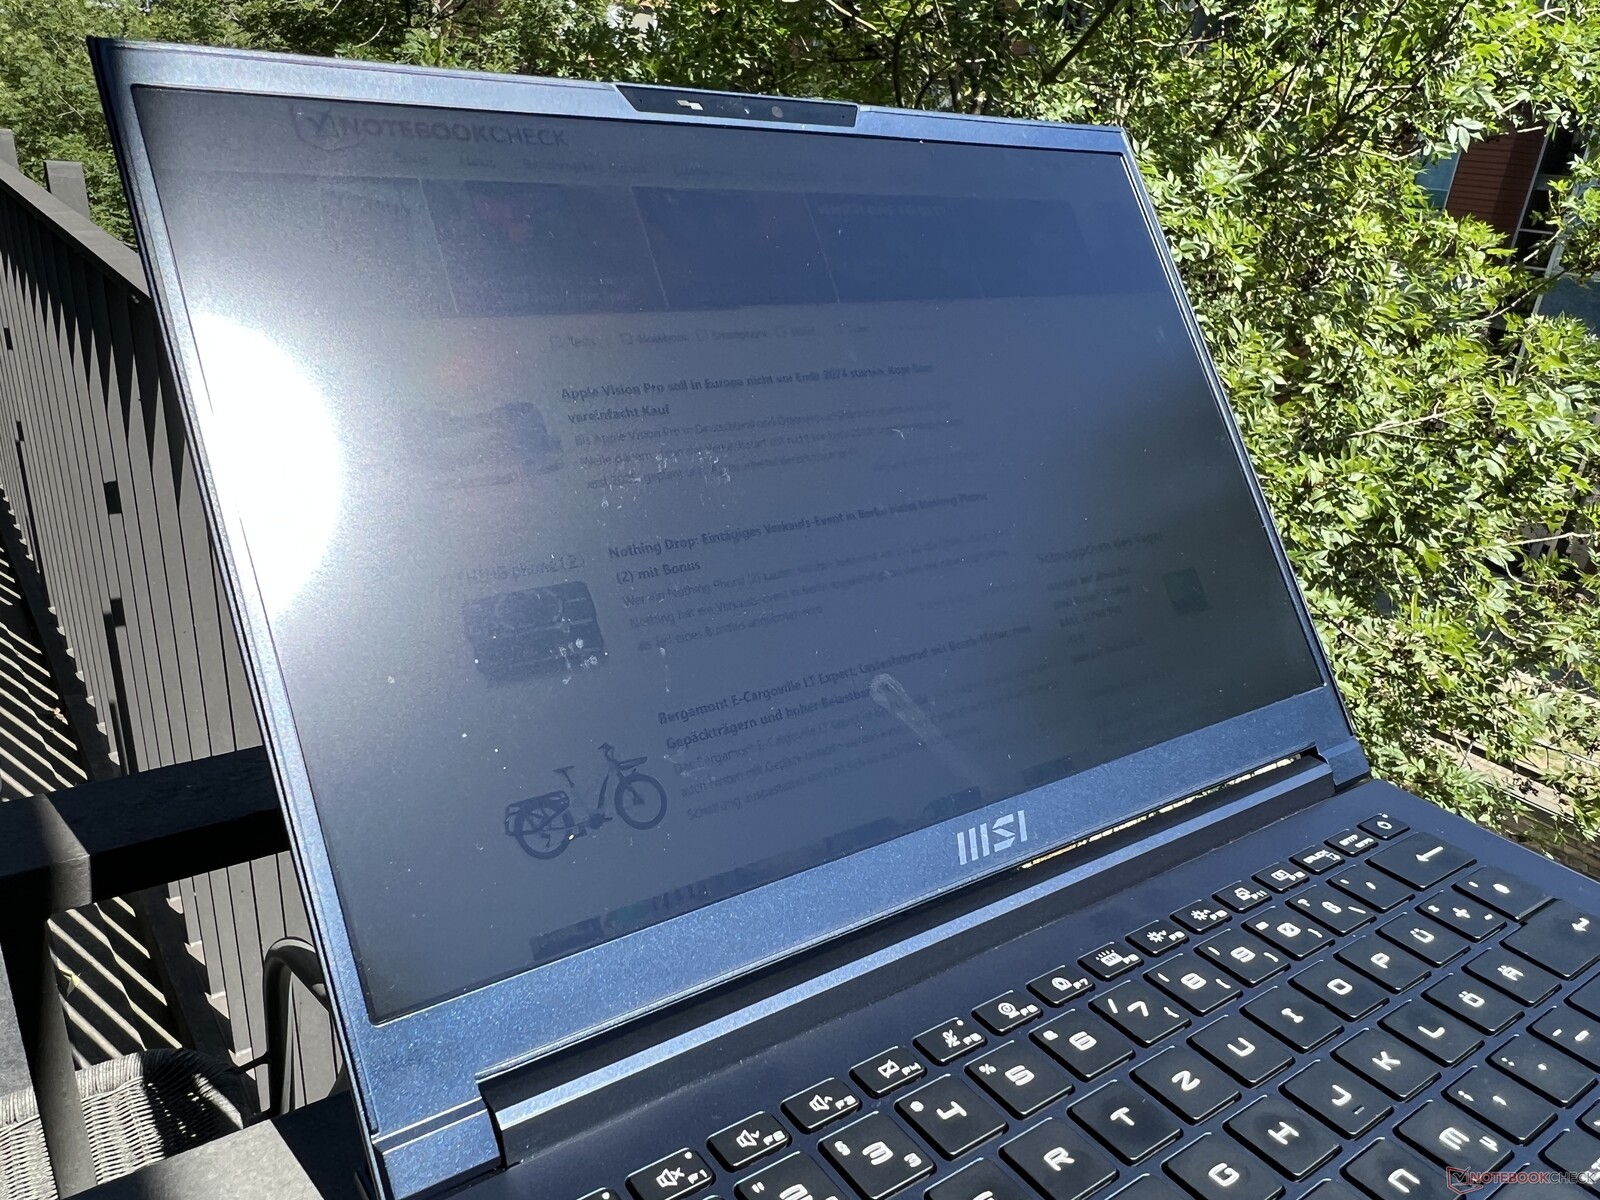

As long as you don't set up the Stealth 14 Studio in direct sunlight, you should have no problems being able to read from the matte display outside - even on quite bright days. Its viewing angle stability is fine, but it could be better. Especially viewing from diagonally above, the picture quickly becomes too light and loses quite a bit of contrast.
Performance - Raptor Lake and an RTX 4050 Laptop
Testing conditions
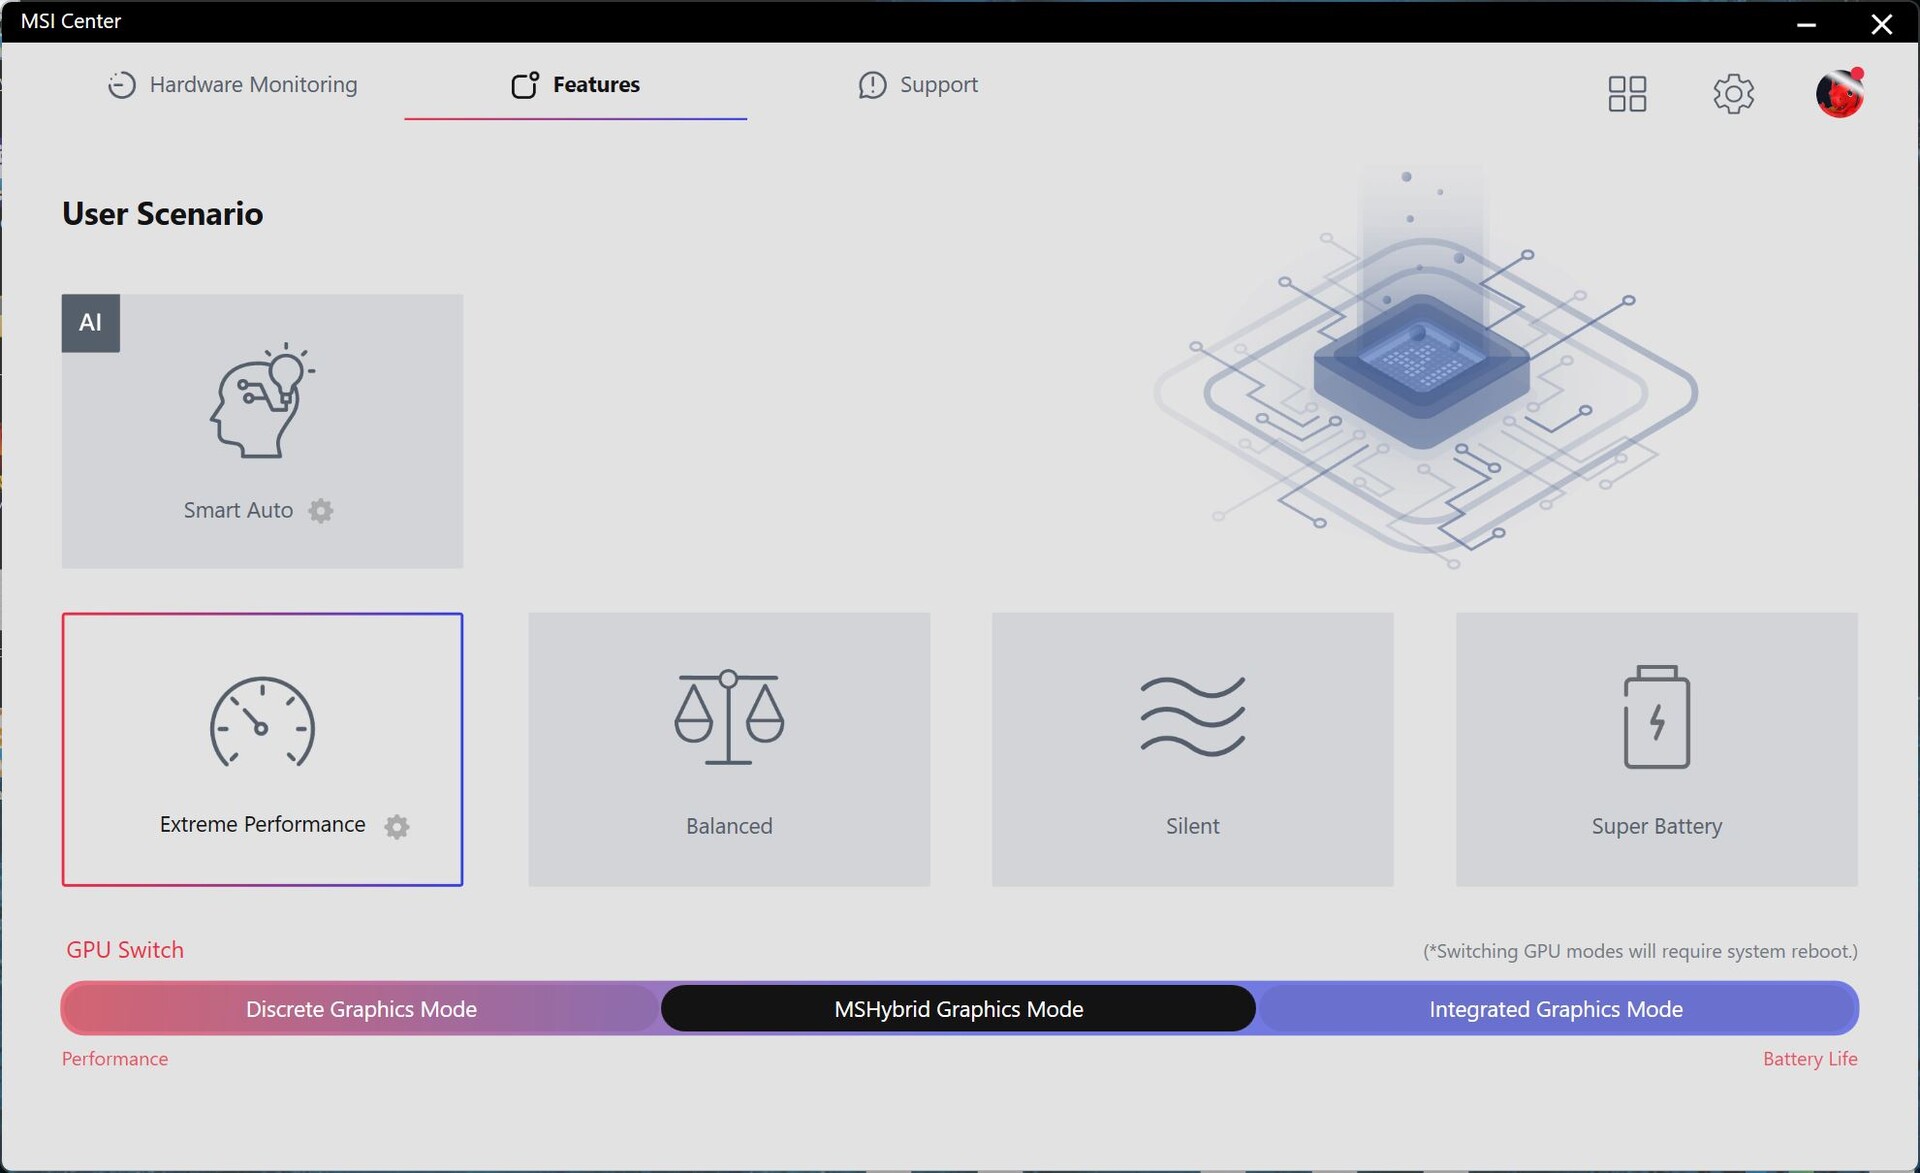
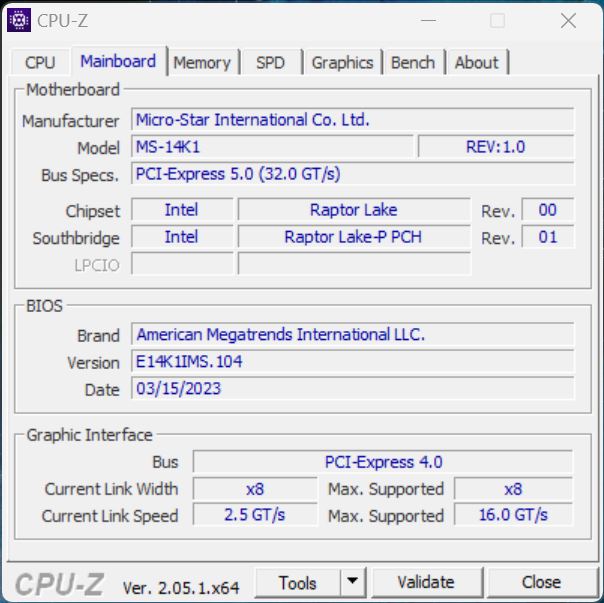
There are different energy profiles to choose from in the pre-installed MSI Center. Smart Auto mode is supposed to dynamically adapt performance levels in accordance with the laptop's requirements with the help of a few different parameters - in our test, results didn't seem to always remain consistent. As a result, we decided to use the energy mode Extreme Performance for our benchmarks and measurements, in order to maximize performance levels - especially during periods of combined CPU/GPU load. We used the profile Balanced for our battery tests. At the same time, MSI's Hybrid Graphics Mode was always activated, which switches to the dedicated Nvidia GPU when necessary. A MUX control is available, but switching requires a restart. With regards to the price, we would love to have seen the Advanced Optimus technology utilized here.
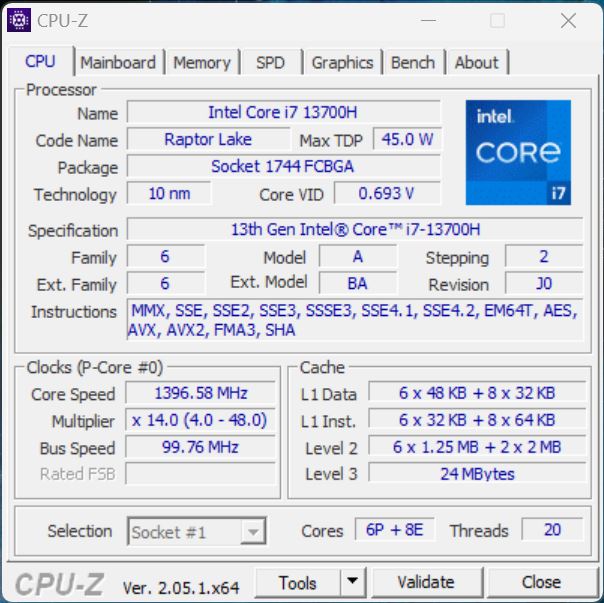
Prozessor - Core i7-13700H
The Stealth 14 Studio is equipped with Intel's current bread-and-butter processor, their Core i7-13700H - designed for multimedia and gaming laptops. It has 6 fast performance cores and 8 efficiency cores, meaning it can process a total of 20 threads at once. Compared to its predecessor, it shows only slight improvements including a slightly higher turbo clock. Its power yield is very good, as the processor consumes a lot of energy. We measured peaks of 115 watts and during continuous load, the laptop still consumes slightly more than 80 watts - although, we did measure some fluctuations. In the single-core tests, the laptop's performance didn't quite meet our expectations.
During battery use, its multi-core performance is considerably reduced, as the processor only consumes a maximum of 35 watts - leading to a deficit of around 33 %. More CPU benchmarks can be found here.
Cinebench R15 Multi continuous test

Cinebench R23: Multi Core | Single Core
Cinebench R20: CPU (Multi Core) | CPU (Single Core)
Cinebench R15: CPU Multi 64Bit | CPU Single 64Bit
Blender: v2.79 BMW27 CPU
7-Zip 18.03: 7z b 4 | 7z b 4 -mmt1
Geekbench 5.5: Multi-Core | Single-Core
HWBOT x265 Benchmark v2.2: 4k Preset
LibreOffice : 20 Documents To PDF
R Benchmark 2.5: Overall mean
| CPU Performance rating | |
| Average of class Gaming | |
| Asus ROG Flow Z13 GZ301ZE | |
| Acer Predator Triton 300 SE | |
| Alienware x14 i7 RTX 3060 | |
| Gigabyte Aero 14 OLED BMF | |
| MSI Stealth 14 Studio A13V | |
| Average Intel Core i7-13700H | |
| Schenker Vision 14 2022 RTX 3050 Ti | |
| Razer Blade 14 Ryzen 9 6900HX | |
| Cinebench R23 / Multi Core | |
| Average of class Gaming (10488 - 42661, n=108, last 2 years) | |
| MSI Stealth 14 Studio A13V | |
| Acer Predator Triton 300 SE | |
| Alienware x14 i7 RTX 3060 | |
| Asus ROG Flow Z13 GZ301ZE | |
| Average Intel Core i7-13700H (5890 - 20034, n=29) | |
| Schenker Vision 14 2022 RTX 3050 Ti | |
| Gigabyte Aero 14 OLED BMF | |
| Razer Blade 14 Ryzen 9 6900HX | |
| Cinebench R23 / Single Core | |
| Average of class Gaming (1166 - 2415, n=108, last 2 years) | |
| Asus ROG Flow Z13 GZ301ZE | |
| Acer Predator Triton 300 SE | |
| Gigabyte Aero 14 OLED BMF | |
| Average Intel Core i7-13700H (1323 - 1914, n=29) | |
| Alienware x14 i7 RTX 3060 | |
| Schenker Vision 14 2022 RTX 3050 Ti | |
| MSI Stealth 14 Studio A13V | |
| Razer Blade 14 Ryzen 9 6900HX | |
| Cinebench R20 / CPU (Multi Core) | |
| Average of class Gaming (4029 - 16433, n=107, last 2 years) | |
| MSI Stealth 14 Studio A13V | |
| Acer Predator Triton 300 SE | |
| Alienware x14 i7 RTX 3060 | |
| Average Intel Core i7-13700H (2322 - 7674, n=29) | |
| Schenker Vision 14 2022 RTX 3050 Ti | |
| Asus ROG Flow Z13 GZ301ZE | |
| Razer Blade 14 Ryzen 9 6900HX | |
| Gigabyte Aero 14 OLED BMF | |
| Cinebench R20 / CPU (Single Core) | |
| Average of class Gaming (442 - 913, n=107, last 2 years) | |
| Asus ROG Flow Z13 GZ301ZE | |
| Acer Predator Triton 300 SE | |
| Gigabyte Aero 14 OLED BMF | |
| Schenker Vision 14 2022 RTX 3050 Ti | |
| Average Intel Core i7-13700H (508 - 741, n=29) | |
| Alienware x14 i7 RTX 3060 | |
| MSI Stealth 14 Studio A13V | |
| Razer Blade 14 Ryzen 9 6900HX | |
| Cinebench R15 / CPU Multi 64Bit | |
| Average of class Gaming (1578 - 6330, n=106, last 2 years) | |
| Asus ROG Flow Z13 GZ301ZE | |
| MSI Stealth 14 Studio A13V | |
| Alienware x14 i7 RTX 3060 | |
| Gigabyte Aero 14 OLED BMF | |
| Average Intel Core i7-13700H (905 - 2982, n=29) | |
| Acer Predator Triton 300 SE | |
| Razer Blade 14 Ryzen 9 6900HX | |
| Schenker Vision 14 2022 RTX 3050 Ti | |
| Cinebench R15 / CPU Single 64Bit | |
| Average of class Gaming (188.8 - 350, n=107, last 2 years) | |
| Asus ROG Flow Z13 GZ301ZE | |
| Acer Predator Triton 300 SE | |
| Gigabyte Aero 14 OLED BMF | |
| Schenker Vision 14 2022 RTX 3050 Ti | |
| Average Intel Core i7-13700H (213 - 278, n=29) | |
| Alienware x14 i7 RTX 3060 | |
| Razer Blade 14 Ryzen 9 6900HX | |
| MSI Stealth 14 Studio A13V | |
| Blender / v2.79 BMW27 CPU | |
| Schenker Vision 14 2022 RTX 3050 Ti | |
| Gigabyte Aero 14 OLED BMF | |
| Average Intel Core i7-13700H (169 - 555, n=29) | |
| Alienware x14 i7 RTX 3060 | |
| Razer Blade 14 Ryzen 9 6900HX | |
| Asus ROG Flow Z13 GZ301ZE | |
| Acer Predator Triton 300 SE | |
| MSI Stealth 14 Studio A13V | |
| Average of class Gaming (79 - 330, n=105, last 2 years) | |
| 7-Zip 18.03 / 7z b 4 | |
| Average of class Gaming (33491 - 148086, n=106, last 2 years) | |
| MSI Stealth 14 Studio A13V | |
| Alienware x14 i7 RTX 3060 | |
| Acer Predator Triton 300 SE | |
| Asus ROG Flow Z13 GZ301ZE | |
| Razer Blade 14 Ryzen 9 6900HX | |
| Average Intel Core i7-13700H (27322 - 76344, n=29) | |
| Gigabyte Aero 14 OLED BMF | |
| Schenker Vision 14 2022 RTX 3050 Ti | |
| 7-Zip 18.03 / 7z b 4 -mmt1 | |
| Average of class Gaming (4199 - 7436, n=106, last 2 years) | |
| Asus ROG Flow Z13 GZ301ZE | |
| Gigabyte Aero 14 OLED BMF | |
| Average Intel Core i7-13700H (4825 - 6238, n=29) | |
| Razer Blade 14 Ryzen 9 6900HX | |
| Schenker Vision 14 2022 RTX 3050 Ti | |
| Alienware x14 i7 RTX 3060 | |
| Acer Predator Triton 300 SE | |
| MSI Stealth 14 Studio A13V | |
| Geekbench 5.5 / Multi-Core | |
| Average of class Gaming (6460 - 28263, n=106, last 2 years) | |
| Asus ROG Flow Z13 GZ301ZE | |
| Alienware x14 i7 RTX 3060 | |
| MSI Stealth 14 Studio A13V | |
| Acer Predator Triton 300 SE | |
| Average Intel Core i7-13700H (6165 - 14215, n=29) | |
| Schenker Vision 14 2022 RTX 3050 Ti | |
| Gigabyte Aero 14 OLED BMF | |
| Razer Blade 14 Ryzen 9 6900HX | |
| Geekbench 5.5 / Single-Core | |
| Average of class Gaming (986 - 2474, n=106, last 2 years) | |
| Asus ROG Flow Z13 GZ301ZE | |
| Gigabyte Aero 14 OLED BMF | |
| Acer Predator Triton 300 SE | |
| Alienware x14 i7 RTX 3060 | |
| Average Intel Core i7-13700H (1362 - 1919, n=29) | |
| Schenker Vision 14 2022 RTX 3050 Ti | |
| MSI Stealth 14 Studio A13V | |
| Razer Blade 14 Ryzen 9 6900HX | |
| HWBOT x265 Benchmark v2.2 / 4k Preset | |
| Average of class Gaming (11.5 - 44.4, n=106, last 2 years) | |
| Acer Predator Triton 300 SE | |
| MSI Stealth 14 Studio A13V | |
| Razer Blade 14 Ryzen 9 6900HX | |
| Alienware x14 i7 RTX 3060 | |
| Asus ROG Flow Z13 GZ301ZE | |
| Average Intel Core i7-13700H (6.72 - 21.2, n=29) | |
| Gigabyte Aero 14 OLED BMF | |
| Schenker Vision 14 2022 RTX 3050 Ti | |
| LibreOffice / 20 Documents To PDF | |
| MSI Stealth 14 Studio A13V | |
| Razer Blade 14 Ryzen 9 6900HX | |
| Average of class Gaming (33.2 - 88.8, n=106, last 2 years) | |
| Average Intel Core i7-13700H (31.3 - 62.4, n=29) | |
| Schenker Vision 14 2022 RTX 3050 Ti | |
| Asus ROG Flow Z13 GZ301ZE | |
| Acer Predator Triton 300 SE | |
| Gigabyte Aero 14 OLED BMF | |
| Alienware x14 i7 RTX 3060 | |
| R Benchmark 2.5 / Overall mean | |
| MSI Stealth 14 Studio A13V | |
| Razer Blade 14 Ryzen 9 6900HX | |
| Average Intel Core i7-13700H (0.4308 - 0.607, n=29) | |
| Schenker Vision 14 2022 RTX 3050 Ti | |
| Alienware x14 i7 RTX 3060 | |
| Gigabyte Aero 14 OLED BMF | |
| Acer Predator Triton 300 SE | |
| Asus ROG Flow Z13 GZ301ZE | |
| Average of class Gaming (0.3439 - 0.759, n=107, last 2 years) | |
* ... smaller is better
AIDA64: FP32 Ray-Trace | FPU Julia | CPU SHA3 | CPU Queen | FPU SinJulia | FPU Mandel | CPU AES | CPU ZLib | FP64 Ray-Trace | CPU PhotoWorxx
| Performance rating | |
| Average of class Gaming | |
| Razer Blade 14 Ryzen 9 6900HX | |
| Acer Predator Triton 300 SE | |
| MSI Stealth 14 Studio A13V | |
| Gigabyte Aero 14 OLED BMF | |
| Average Intel Core i7-13700H | |
| Alienware x14 i7 RTX 3060 | |
| Schenker Vision 14 2022 RTX 3050 Ti | |
| Asus ROG Flow Z13 GZ301ZE | |
| AIDA64 / FP32 Ray-Trace | |
| Average of class Gaming (10227 - 85542, n=106, last 2 years) | |
| MSI Stealth 14 Studio A13V | |
| Razer Blade 14 Ryzen 9 6900HX | |
| Acer Predator Triton 300 SE | |
| Average Intel Core i7-13700H (4986 - 18908, n=29) | |
| Gigabyte Aero 14 OLED BMF | |
| Schenker Vision 14 2022 RTX 3050 Ti | |
| Alienware x14 i7 RTX 3060 | |
| Asus ROG Flow Z13 GZ301ZE | |
| AIDA64 / FPU Julia | |
| Average of class Gaming (51376 - 372155, n=106, last 2 years) | |
| Razer Blade 14 Ryzen 9 6900HX | |
| MSI Stealth 14 Studio A13V | |
| Acer Predator Triton 300 SE | |
| Average Intel Core i7-13700H (25360 - 92359, n=29) | |
| Gigabyte Aero 14 OLED BMF | |
| Schenker Vision 14 2022 RTX 3050 Ti | |
| Alienware x14 i7 RTX 3060 | |
| Asus ROG Flow Z13 GZ301ZE | |
| AIDA64 / CPU SHA3 | |
| Average of class Gaming (2180 - 10115, n=106, last 2 years) | |
| MSI Stealth 14 Studio A13V | |
| Acer Predator Triton 300 SE | |
| Razer Blade 14 Ryzen 9 6900HX | |
| Average Intel Core i7-13700H (1339 - 4224, n=29) | |
| Gigabyte Aero 14 OLED BMF | |
| Alienware x14 i7 RTX 3060 | |
| Schenker Vision 14 2022 RTX 3050 Ti | |
| Asus ROG Flow Z13 GZ301ZE | |
| AIDA64 / CPU Queen | |
| Average of class Gaming (49785 - 173351, n=90, last 2 years) | |
| Acer Predator Triton 300 SE | |
| Gigabyte Aero 14 OLED BMF | |
| MSI Stealth 14 Studio A13V | |
| Asus ROG Flow Z13 GZ301ZE | |
| Razer Blade 14 Ryzen 9 6900HX | |
| Alienware x14 i7 RTX 3060 | |
| Average Intel Core i7-13700H (59324 - 107159, n=29) | |
| Schenker Vision 14 2022 RTX 3050 Ti | |
| AIDA64 / FPU SinJulia | |
| Average of class Gaming (4424 - 33636, n=106, last 2 years) | |
| Razer Blade 14 Ryzen 9 6900HX | |
| MSI Stealth 14 Studio A13V | |
| Acer Predator Triton 300 SE | |
| Alienware x14 i7 RTX 3060 | |
| Asus ROG Flow Z13 GZ301ZE | |
| Average Intel Core i7-13700H (4800 - 11050, n=29) | |
| Gigabyte Aero 14 OLED BMF | |
| Schenker Vision 14 2022 RTX 3050 Ti | |
| AIDA64 / FPU Mandel | |
| Average of class Gaming (25115 - 196829, n=106, last 2 years) | |
| Razer Blade 14 Ryzen 9 6900HX | |
| MSI Stealth 14 Studio A13V | |
| Acer Predator Triton 300 SE | |
| Average Intel Core i7-13700H (12321 - 45118, n=29) | |
| Gigabyte Aero 14 OLED BMF | |
| Schenker Vision 14 2022 RTX 3050 Ti | |
| Alienware x14 i7 RTX 3060 | |
| Asus ROG Flow Z13 GZ301ZE | |
| AIDA64 / CPU AES | |
| Razer Blade 14 Ryzen 9 6900HX | |
| Acer Predator Triton 300 SE | |
| Gigabyte Aero 14 OLED BMF | |
| Average of class Gaming (39258 - 247074, n=106, last 2 years) | |
| Alienware x14 i7 RTX 3060 | |
| Asus ROG Flow Z13 GZ301ZE | |
| MSI Stealth 14 Studio A13V | |
| Average Intel Core i7-13700H (28769 - 151254, n=29) | |
| Schenker Vision 14 2022 RTX 3050 Ti | |
| AIDA64 / CPU ZLib | |
| Average of class Gaming (574 - 2531, n=106, last 2 years) | |
| MSI Stealth 14 Studio A13V | |
| Acer Predator Triton 300 SE | |
| Alienware x14 i7 RTX 3060 | |
| Schenker Vision 14 2022 RTX 3050 Ti | |
| Average Intel Core i7-13700H (389 - 1215, n=29) | |
| Asus ROG Flow Z13 GZ301ZE | |
| Razer Blade 14 Ryzen 9 6900HX | |
| Gigabyte Aero 14 OLED BMF | |
| AIDA64 / FP64 Ray-Trace | |
| Average of class Gaming (5509 - 45446, n=106, last 2 years) | |
| MSI Stealth 14 Studio A13V | |
| Razer Blade 14 Ryzen 9 6900HX | |
| Acer Predator Triton 300 SE | |
| Average Intel Core i7-13700H (2540 - 10135, n=29) | |
| Gigabyte Aero 14 OLED BMF | |
| Schenker Vision 14 2022 RTX 3050 Ti | |
| Alienware x14 i7 RTX 3060 | |
| Asus ROG Flow Z13 GZ301ZE | |
| AIDA64 / CPU PhotoWorxx | |
| Gigabyte Aero 14 OLED BMF | |
| Acer Predator Triton 300 SE | |
| Alienware x14 i7 RTX 3060 | |
| Average of class Gaming (12271 - 89891, n=106, last 2 years) | |
| Asus ROG Flow Z13 GZ301ZE | |
| Average Intel Core i7-13700H (12872 - 52727, n=29) | |
| MSI Stealth 14 Studio A13V | |
| Schenker Vision 14 2022 RTX 3050 Ti | |
| Razer Blade 14 Ryzen 9 6900HX | |
System performance
Subjectively (and unsurprisingly), this component left a great impression on us in terms of its performance - even though our test device only achieved average results during the synthetic benchmarks. We didn't note any problems during the test.
CrossMark: Overall | Productivity | Creativity | Responsiveness
| PCMark 10 / Score | |
| Average of class Gaming (5828 - 12414, n=94, last 2 years) | |
| Acer Predator Triton 300 SE | |
| Razer Blade 14 Ryzen 9 6900HX | |
| Gigabyte Aero 14 OLED BMF | |
| Average Intel Core i7-13700H, NVIDIA GeForce RTX 4050 Laptop GPU (6822 - 7556, n=7) | |
| Alienware x14 i7 RTX 3060 | |
| MSI Stealth 14 Studio A13V | |
| Schenker Vision 14 2022 RTX 3050 Ti | |
| Asus ROG Flow Z13 GZ301ZE | |
| PCMark 10 / Essentials | |
| Gigabyte Aero 14 OLED BMF | |
| Acer Predator Triton 300 SE | |
| Razer Blade 14 Ryzen 9 6900HX | |
| Average Intel Core i7-13700H, NVIDIA GeForce RTX 4050 Laptop GPU (10283 - 11549, n=7) | |
| Asus ROG Flow Z13 GZ301ZE | |
| Average of class Gaming (8810 - 11935, n=98, last 2 years) | |
| Schenker Vision 14 2022 RTX 3050 Ti | |
| Alienware x14 i7 RTX 3060 | |
| MSI Stealth 14 Studio A13V | |
| PCMark 10 / Productivity | |
| Average of class Gaming (6845 - 25323, n=96, last 2 years) | |
| Acer Predator Triton 300 SE | |
| Asus ROG Flow Z13 GZ301ZE | |
| Alienware x14 i7 RTX 3060 | |
| Gigabyte Aero 14 OLED BMF | |
| Average Intel Core i7-13700H, NVIDIA GeForce RTX 4050 Laptop GPU (8368 - 9836, n=7) | |
| Razer Blade 14 Ryzen 9 6900HX | |
| Schenker Vision 14 2022 RTX 3050 Ti | |
| MSI Stealth 14 Studio A13V | |
| PCMark 10 / Digital Content Creation | |
| Average of class Gaming (7602 - 19954, n=96, last 2 years) | |
| Razer Blade 14 Ryzen 9 6900HX | |
| Acer Predator Triton 300 SE | |
| MSI Stealth 14 Studio A13V | |
| Average Intel Core i7-13700H, NVIDIA GeForce RTX 4050 Laptop GPU (9527 - 10643, n=7) | |
| Alienware x14 i7 RTX 3060 | |
| Gigabyte Aero 14 OLED BMF | |
| Schenker Vision 14 2022 RTX 3050 Ti | |
| Asus ROG Flow Z13 GZ301ZE | |
| CrossMark / Overall | |
| Asus ROG Flow Z13 GZ301ZE | |
| Average of class Gaming (1366 - 2409, n=95, last 2 years) | |
| Acer Predator Triton 300 SE | |
| Alienware x14 i7 RTX 3060 | |
| Gigabyte Aero 14 OLED BMF | |
| MSI Stealth 14 Studio A13V | |
| Average Intel Core i7-13700H, NVIDIA GeForce RTX 4050 Laptop GPU (1205 - 1937, n=9) | |
| Schenker Vision 14 2022 RTX 3050 Ti | |
| CrossMark / Productivity | |
| Asus ROG Flow Z13 GZ301ZE | |
| Acer Predator Triton 300 SE | |
| Average of class Gaming (1386 - 2254, n=95, last 2 years) | |
| Alienware x14 i7 RTX 3060 | |
| Gigabyte Aero 14 OLED BMF | |
| Average Intel Core i7-13700H, NVIDIA GeForce RTX 4050 Laptop GPU (1158 - 1877, n=9) | |
| MSI Stealth 14 Studio A13V | |
| Schenker Vision 14 2022 RTX 3050 Ti | |
| CrossMark / Creativity | |
| Average of class Gaming (1343 - 2786, n=95, last 2 years) | |
| Asus ROG Flow Z13 GZ301ZE | |
| Acer Predator Triton 300 SE | |
| Alienware x14 i7 RTX 3060 | |
| Gigabyte Aero 14 OLED BMF | |
| MSI Stealth 14 Studio A13V | |
| Average Intel Core i7-13700H, NVIDIA GeForce RTX 4050 Laptop GPU (1293 - 2044, n=9) | |
| Schenker Vision 14 2022 RTX 3050 Ti | |
| CrossMark / Responsiveness | |
| Asus ROG Flow Z13 GZ301ZE | |
| Acer Predator Triton 300 SE | |
| Alienware x14 i7 RTX 3060 | |
| Gigabyte Aero 14 OLED BMF | |
| Average of class Gaming (1226 - 2334, n=95, last 2 years) | |
| Average Intel Core i7-13700H, NVIDIA GeForce RTX 4050 Laptop GPU (1097 - 1929, n=9) | |
| MSI Stealth 14 Studio A13V | |
| Schenker Vision 14 2022 RTX 3050 Ti | |
| PCMark 10 Score | 6924 points | |
Help | ||
| AIDA64 / Memory Copy | |
| Gigabyte Aero 14 OLED BMF | |
| Alienware x14 i7 RTX 3060 | |
| Asus ROG Flow Z13 GZ301ZE | |
| Acer Predator Triton 300 SE | |
| Average of class Gaming (21750 - 129946, n=106, last 2 years) | |
| Average Intel Core i7-13700H (24334 - 78081, n=29) | |
| MSI Stealth 14 Studio A13V | |
| Razer Blade 14 Ryzen 9 6900HX | |
| Schenker Vision 14 2022 RTX 3050 Ti | |
| AIDA64 / Memory Read | |
| Gigabyte Aero 14 OLED BMF | |
| Alienware x14 i7 RTX 3060 | |
| Acer Predator Triton 300 SE | |
| Average of class Gaming (22956 - 118858, n=106, last 2 years) | |
| Asus ROG Flow Z13 GZ301ZE | |
| MSI Stealth 14 Studio A13V | |
| Average Intel Core i7-13700H (23681 - 79656, n=29) | |
| Razer Blade 14 Ryzen 9 6900HX | |
| Schenker Vision 14 2022 RTX 3050 Ti | |
| AIDA64 / Memory Write | |
| Gigabyte Aero 14 OLED BMF | |
| Average of class Gaming (22297 - 135096, n=106, last 2 years) | |
| Average Intel Core i7-13700H (22986 - 99898, n=29) | |
| Alienware x14 i7 RTX 3060 | |
| Acer Predator Triton 300 SE | |
| Asus ROG Flow Z13 GZ301ZE | |
| Razer Blade 14 Ryzen 9 6900HX | |
| MSI Stealth 14 Studio A13V | |
| Schenker Vision 14 2022 RTX 3050 Ti | |
| AIDA64 / Memory Latency | |
| Alienware x14 i7 RTX 3060 | |
| Average of class Gaming (75.3 - 259, n=106, last 2 years) | |
| Asus ROG Flow Z13 GZ301ZE | |
| Acer Predator Triton 300 SE | |
| Average Intel Core i7-13700H (82.4 - 136.8, n=29) | |
| Gigabyte Aero 14 OLED BMF | |
| Schenker Vision 14 2022 RTX 3050 Ti | |
| MSI Stealth 14 Studio A13V | |
| Razer Blade 14 Ryzen 9 6900HX | |
* ... smaller is better
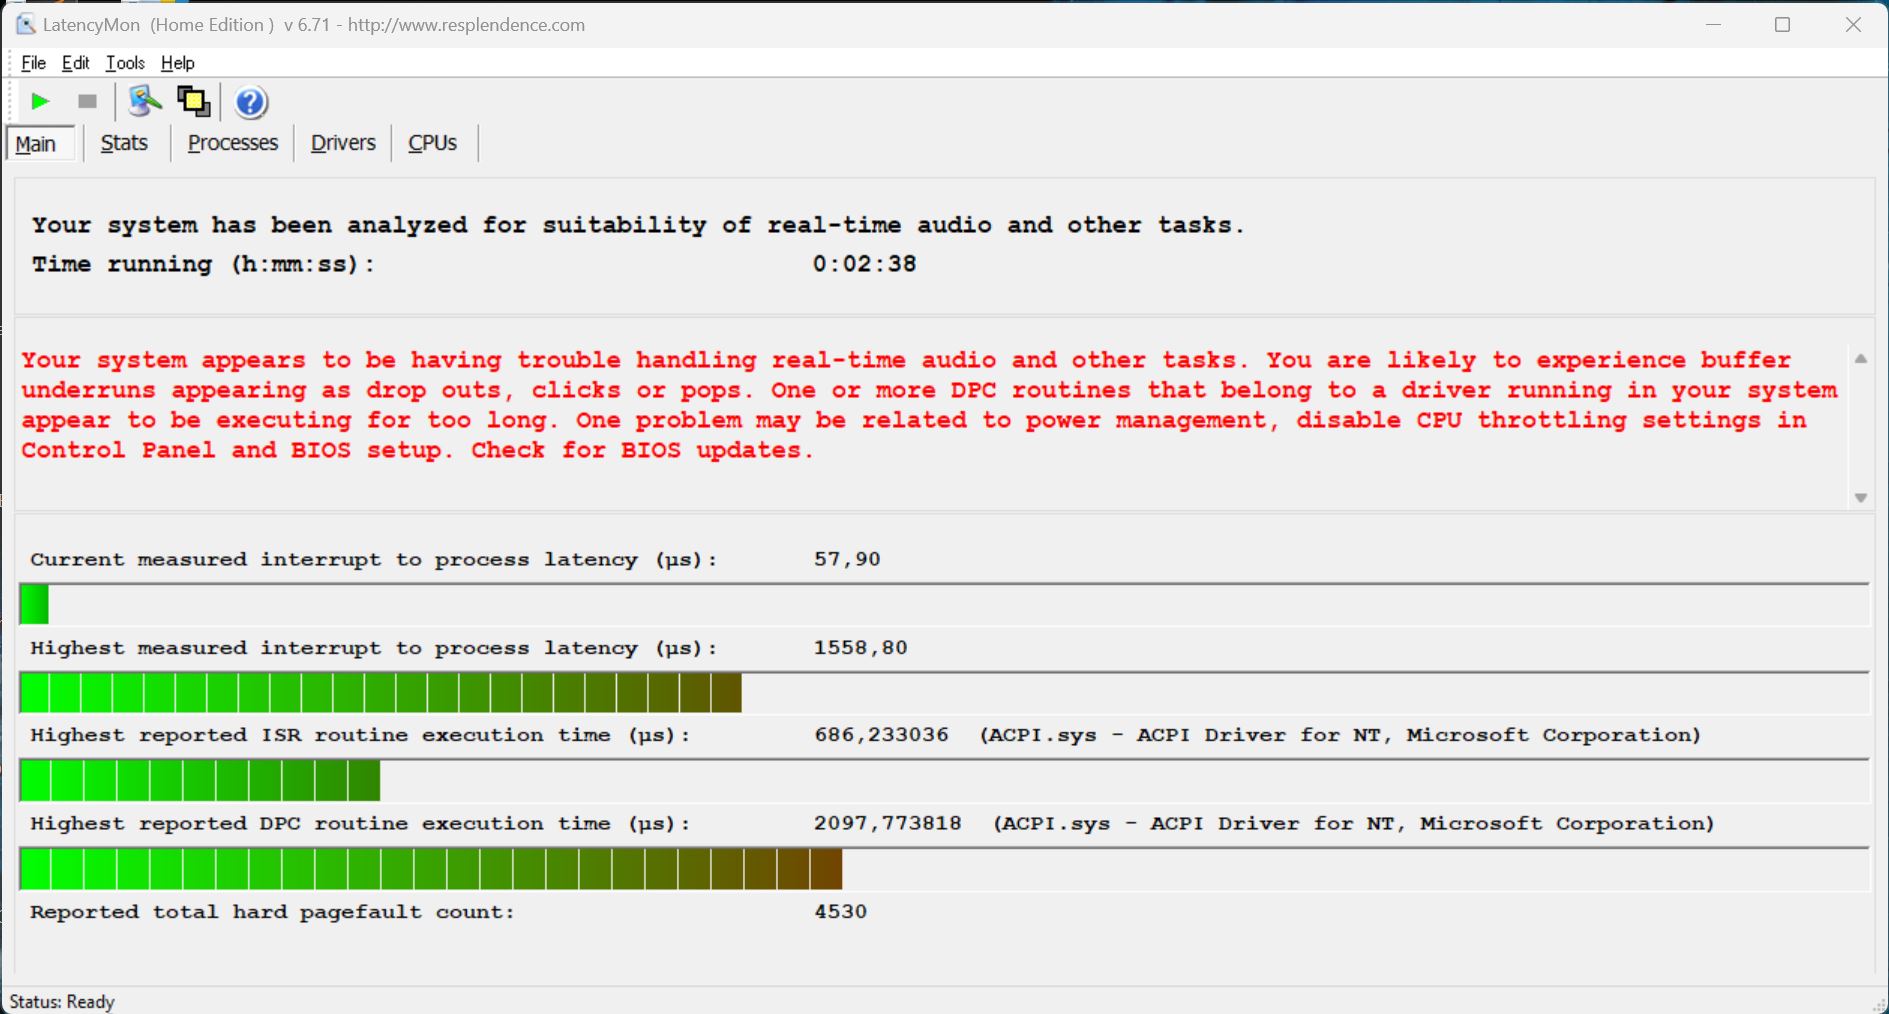
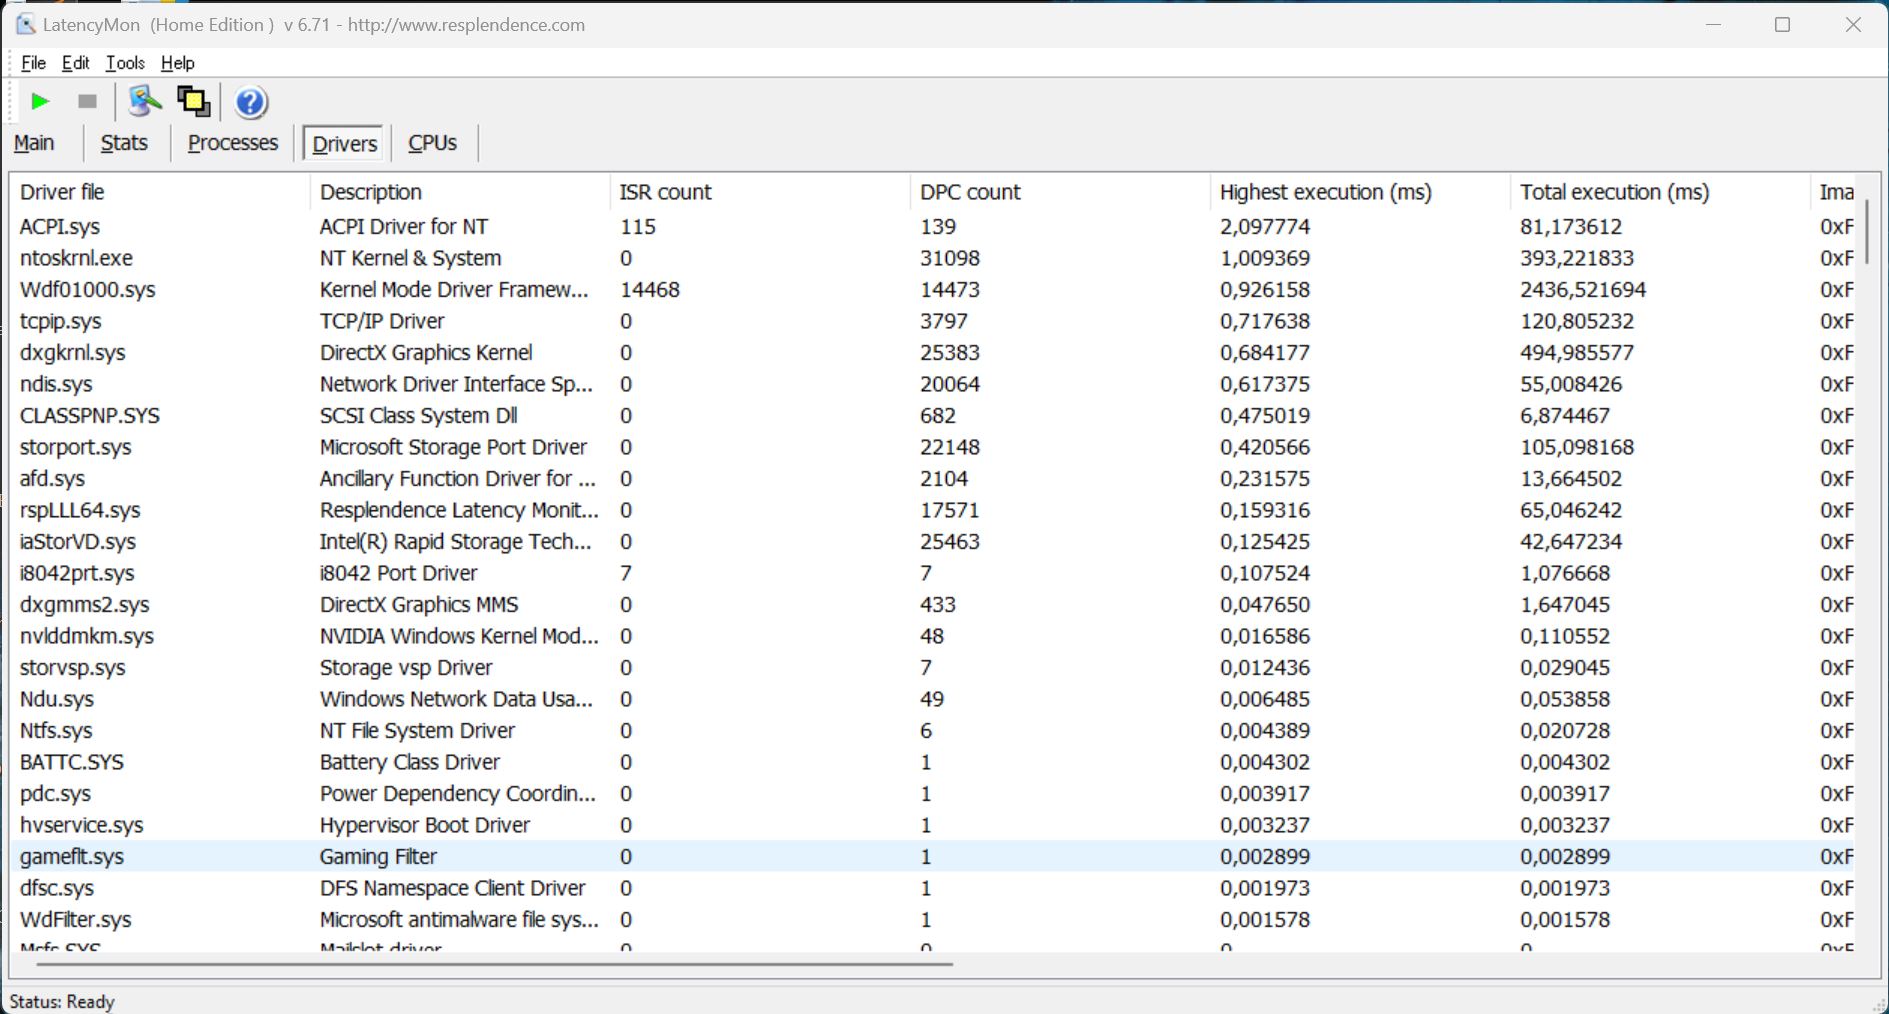
DPC latency
Our test device is only partially suitable for real-time audio uses using the present BIOS version, as our standardized latency test (surfing on the internet, 4K YouTube playback, CPU load) flagged up a few minor issues.
| DPC Latencies / LatencyMon - interrupt to process latency (max), Web, Youtube, Prime95 | |
| Acer Predator Triton 300 SE | |
| Gigabyte Aero 14 OLED BMF | |
| MSI Stealth 14 Studio A13V | |
| Asus ROG Flow Z13 GZ301ZE | |
| Razer Blade 14 Ryzen 9 6900HX | |
| Alienware x14 i7 RTX 3060 | |
| Schenker Vision 14 2022 RTX 3050 Ti | |
* ... smaller is better
Storage devices
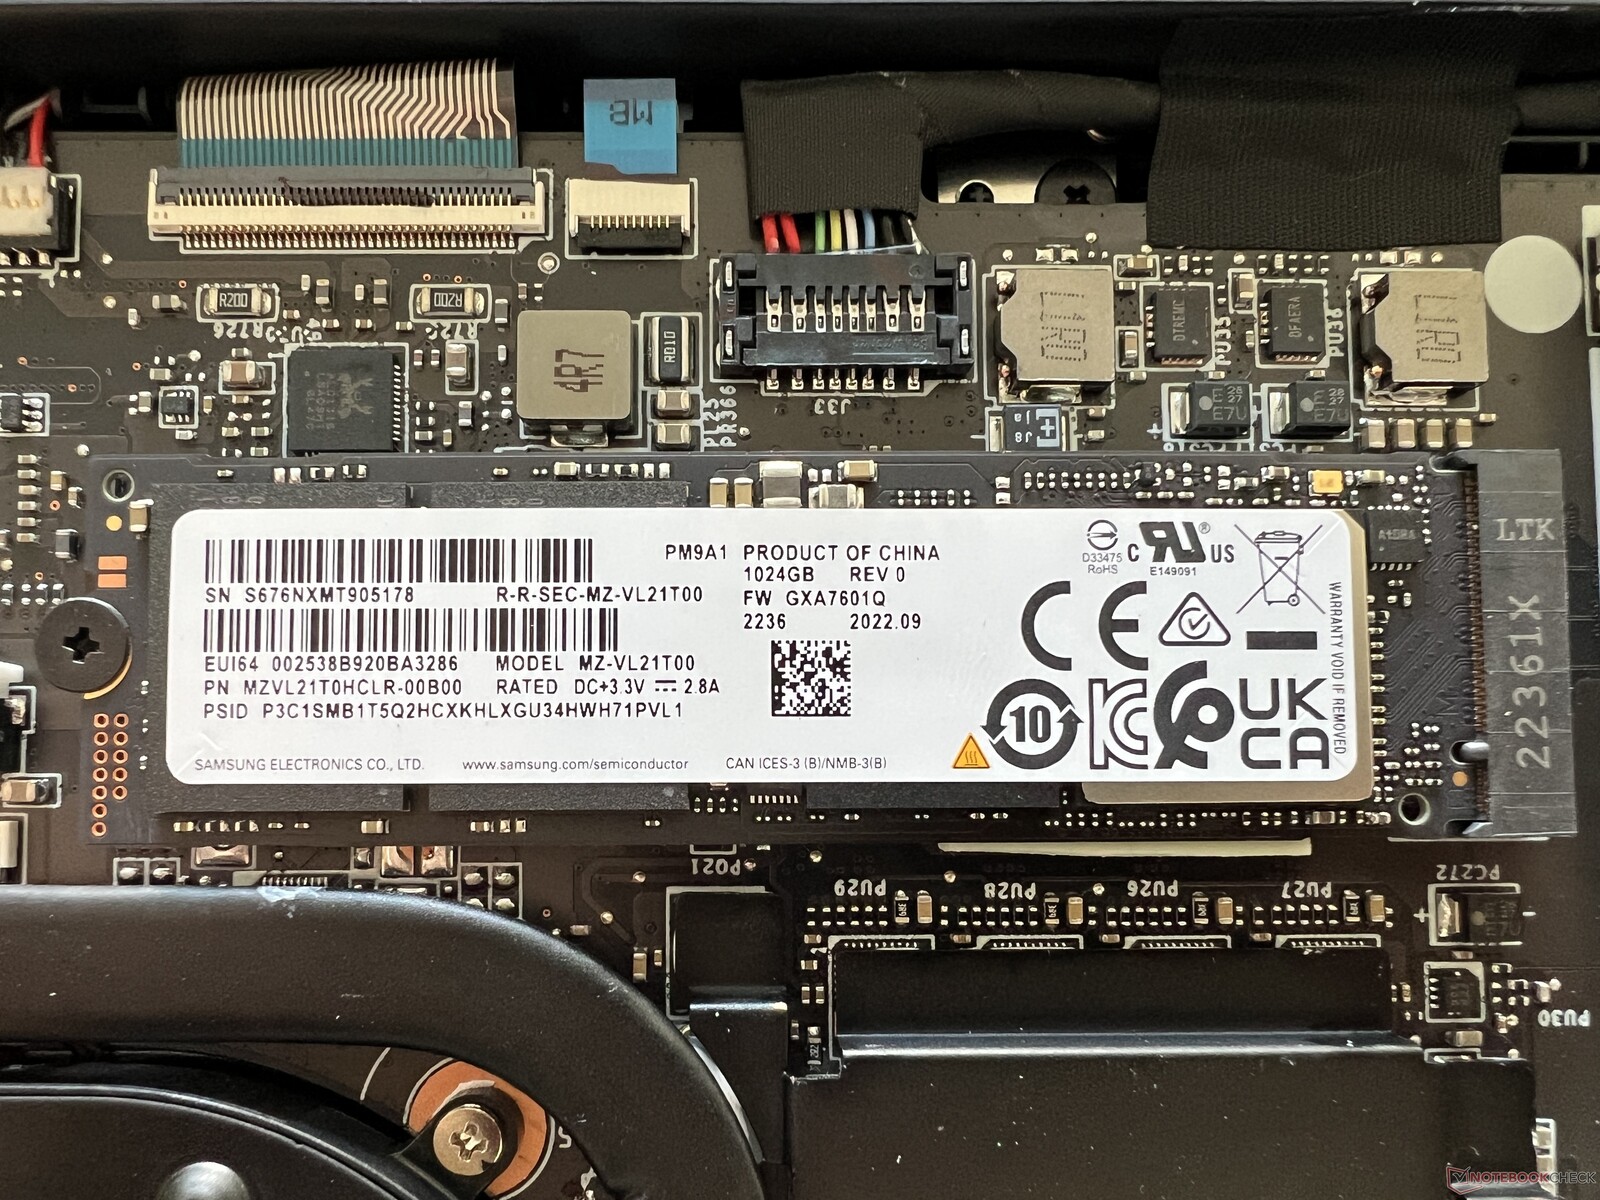
Our test sample is fitted with the 1-TB version of the Samsung PM9A1. This is a fast PCIe 4.0 drive and transfer rates in our benchmarks were quite good, with results of up to 7 GB/s - however, its performance didn't remain stable. After a few minutes, the SSD had to throttle its performance by about 50 %, which shouldn't really be that noticeable in everyday use. The fact that the SSD is positioned right next to the heat pipe surely can't be good for the SSD's temperatures. Further SSD benchmarks can be found here.

* ... smaller is better
Reading continuous performance: DiskSpd Read Loop, Queue Depth 8
Graphics card - GeForce RTX 4050 Laptop
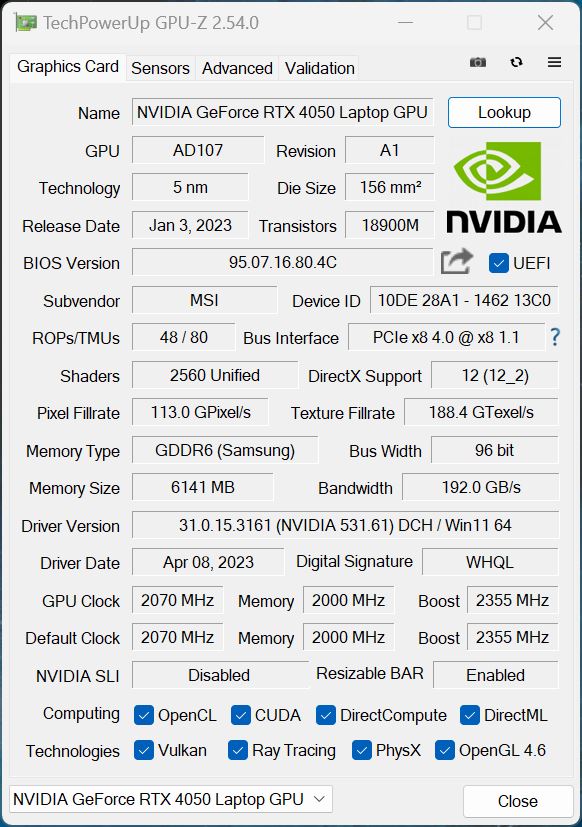
As already mentioned, the Stealth 14 Studio may have an MUX control with which you can completely deactivate the integrated GPU, however, this requires a restart which might get annoying during everyday use at some point. We would have preferred to see Nvidia's Advanced Optimus technology. As a result, we relied on the normal method of switching graphics via Optimus. The GeForce RTX 4050 Laptop is Nvidia's new mid-range GPU and in contrast to many other current multimedia laptops (mostly with between 40 - 50 watt TGPs), one of the fastest variants is in use, with a TGP of 90 watts.
Subsequently, the laptop's benchmark results were accordingly good and about on the same level as the RTX 3060 in the Acer Predator Triton 300 SE. We also included additional models with the RTX 4060 and the RTX 4070 Laptop and which have similar TGP values in our comparison, so that we were able to get a better idea of how well the faster models of the Stealth 14 Studio might perform. In general, you can expect about 20 - 35 % better graphics performance.
Under continuous load, graphics performance remained stable but during battery use, the GPU only consumed 35 watts, meaning the GPU performance sinks on average by about 35 % if you are not connected to an outlet. Further GPU benchmarks can be found in our tech section.
| 3DMark 11 Performance | 26475 points | |
| 3DMark Cloud Gate Standard Score | 48584 points | |
| 3DMark Fire Strike Score | 19121 points | |
| 3DMark Time Spy Score | 7845 points | |
Help | ||
| Blender / v3.3 Classroom OPTIX/RTX | |
| Schenker Vision 14 2022 RTX 3050 Ti | |
| Acer Predator Triton 300 SE | |
| Gigabyte Aero 14 OLED BMF | |
| Average NVIDIA GeForce RTX 4050 Laptop GPU (25 - 37, n=40) | |
| MSI Stealth 14 Studio A13V | |
| Average of class Gaming (9 - 32, n=107, last 2 years) | |
| Blender / v3.3 Classroom CUDA | |
| Schenker Vision 14 2022 RTX 3050 Ti | |
| Gigabyte Aero 14 OLED BMF | |
| Acer Predator Triton 300 SE | |
| Average NVIDIA GeForce RTX 4050 Laptop GPU (47 - 68, n=39) | |
| Average of class Gaming (15 - 228, n=107, last 2 years) | |
| Blender / v3.3 Classroom CPU | |
| Schenker Vision 14 2022 RTX 3050 Ti | |
| Gigabyte Aero 14 OLED BMF | |
| Average NVIDIA GeForce RTX 4050 Laptop GPU (243 - 907, n=40) | |
| Acer Predator Triton 300 SE | |
| MSI Stealth 14 Studio A13V | |
| Average of class Gaming (122 - 565, n=103, last 2 years) | |
* ... smaller is better
Gaming performance
The Stealth 14 Studio's actual gaming performance lies ahead of its competitor, the Gigabyte Aero 14, which is also fitted with the RTX 4050 Laptop. In turn, the old RTX 3060 (e.g. Alienware x14, Acer Triton 300 SE) has a clear advantage when it comes to playing games. The same can of course be said for the faster GPUs RTX 4060 Laptop and RTX 4070 Laptop. In general, you can play most games smoothly in QHD using the RTX 4050 Laptop - only a few more complex games might require you to lower the detail/resolution settings or to use upsampling technology such as DLSS (if the game supports this). The same counts for ray tracing, for which the RTX 4050 Laptop would otherwise not be powerful enough. Furthermore, you have to note that especially in higher resolutions, the laptop's small 6-GB graphics memory isn't entirely future-proof. The same as in the pure GPU tests, the Stealth 14 Studio's gaming performance also remained completely stable during longer sessions.
| F1 2021 - 1920x1080 Ultra High Preset + Raytracing AA:T AF:16x | |
| MSI Katana 17 B13VFK (874931) | |
| Asus Zenbook Pro 14 OLED UX6404VI (874931) | |
| MSI Stealth 14 Studio A13V (874931) | |
| Average NVIDIA GeForce RTX 4050 Laptop GPU (70.7 - 119.5, n=7) | |
| Alienware x14 i7 RTX 3060 | |
| Schenker Vision 14 2022 RTX 3050 Ti (874931) | |
| Asus ROG Flow Z13 GZ301ZE (843175) | |
| F1 22 - 1920x1080 Ultra High Preset AA:T AF:16x | |
| Razer Blade 14 RTX 4070 (959964) | |
| Average of class Gaming (40.1 - 121.2, n=4, last 2 years) | |
| Asus Zenbook Pro 14 OLED UX6404VI (959964) | |
| MSI Katana 17 B13VFK (946728) | |
| MSI Stealth 14 Studio A13V (959964) | |
| Average NVIDIA GeForce RTX 4050 Laptop GPU (10.9 - 56.4, n=24) | |
| Gigabyte Aero 14 OLED BMF (959964) | |
| Schenker Vision 14 2022 RTX 3050 Ti (923650) | |
| Call of Duty Modern Warfare 2 2022 - 1920x1080 Extreme Quality Preset AA:T2X Filmic SM | |
| Razer Blade 14 RTX 4070 | |
| MSI Katana 17 B13VFK | |
| MSI Stealth 14 Studio A13V | |
| Average NVIDIA GeForce RTX 4050 Laptop GPU (54 - 77, n=3) | |
Witcher 3 FPS diagram
| low | med. | high | ultra | QHD | 4K | |
|---|---|---|---|---|---|---|
| GTA V (2015) | 161.7 | 142.4 | 55.9 | 55.7 | ||
| The Witcher 3 (2015) | 168.5 | 121.7 | 76.7 | |||
| Dota 2 Reborn (2015) | 172.1 | 157.1 | 142.8 | 135.3 | 101.2 | |
| Final Fantasy XV Benchmark (2018) | 180.2 | 116.2 | 82 | 59.7 | ||
| X-Plane 11.11 (2018) | 141.6 | 124.7 | 97.8 | |||
| Strange Brigade (2018) | 277 | 191.9 | 145.3 | 123.1 | 79.8 | |
| Shadow of the Tomb Raider (2018) | 102 | 95 | 86 | 60 | ||
| F1 2021 (2021) | 323 | 245 | 194.5 | 105.4 | 74.3 | |
| Cyberpunk 2077 1.6 (2022) | 72.78 | 60.72 | 57.77 | 37.66 | ||
| F1 22 (2022) | 156.5 | 149.6 | 133.6 | 48.4 | 29.9 | |
| Call of Duty Modern Warfare 2 2022 (2022) | 101 | 75 | 70 | 47 |
Emissions - Vapor chamber with moderate success rates
Noise emissions
The laptop's cooling system consists of a large vapor chamber as well as two fans that get particularly annoying during everyday use. Under low load and sometimes even in idle mode, we noted whirring noises up to almost 34 dB(A), which you can definitely hear. At times, we even noted short peaks of more than 40 dB(A) as the fans started up, which is completely unnecessary. Under load, the Extreme Performance mode was the loudest, measuring 51 dB(A) - although the 47 dB(A) we measured using Balanced mode isn't exactly much quieter. We would definitely recommend wearing headphones while gaming. We didn't note any other electronic noises.
| Use | Silent | Balanced | Extreme Performance |
|---|---|---|---|
| 3DMark 06 | 36.6 dB(A) | 42.2 dB(A) | 42.2 dB(A) |
| Witcher 3 | 42.2 dB(A) | 47.3 dB(A) | 51 dB(A) |
| Stress test | 42.2 dB(A) | 47.3 dB(A) | 51 dB(A) |
Noise level
| Idle |
| 25.3 / 25 / 33.7 dB(A) |
| Load |
| 42.2 / 51 dB(A) |
 | ||
30 dB silent 40 dB(A) audible 50 dB(A) loud |
||
min: | ||
| MSI Stealth 14 Studio A13V GeForce RTX 4050 Laptop GPU, i7-13700H, Samsung PM9A1 MZVL21T0HCLR | Gigabyte Aero 14 OLED BMF GeForce RTX 4050 Laptop GPU, i7-13700H, Gigabyte AG470S1TB-SI B10 | Schenker Vision 14 2022 RTX 3050 Ti GeForce RTX 3050 Ti Laptop GPU, i7-12700H, Samsung SSD 980 Pro 1TB MZ-V8P1T0BW | Asus ROG Flow Z13 GZ301ZE GeForce RTX 3050 Ti Laptop GPU, i9-12900H, Micron 2450 1TB MTFDKBK1T0TFK | Alienware x14 i7 RTX 3060 GeForce RTX 3060 Laptop GPU, i7-12700H, WDC PC SN810 1TB | Razer Blade 14 Ryzen 9 6900HX GeForce RTX 3070 Ti Laptop GPU, R9 6900HX, Samsung PM9A1 MZVL21T0HCLR | Acer Predator Triton 300 SE GeForce RTX 3060 Laptop GPU, i9-12900H, Micron 3400 1TB MTFDKBA1T0TFH | |
|---|---|---|---|---|---|---|---|
| Noise | 5% | 5% | 11% | 2% | 15% | -2% | |
| off / environment * (dB) | 25.3 | 24 5% | 24.4 4% | 24.5 3% | 24.7 2% | 23.3 8% | 23.8 6% |
| Idle Minimum * (dB) | 25.3 | 24 5% | 24.4 4% | 24.5 3% | 24.7 2% | 23.3 8% | 23.8 6% |
| Idle Average * (dB) | 25 | 24 4% | 24.4 2% | 24.5 2% | 24.7 1% | 23.3 7% | 23.8 5% |
| Idle Maximum * (dB) | 33.7 | 35.71 -6% | 27.8 18% | 24.5 27% | 30.9 8% | 23.3 31% | 30.6 9% |
| Load Average * (dB) | 42.2 | 43.3 -3% | 41 3% | 40 5% | 34.7 18% | 44.2 -5% | |
| Witcher 3 ultra * (dB) | 51 | 40.22 21% | 48.2 5% | 41 20% | 51.5 -1% | 42.1 17% | 60.1 -18% |
| Load Maximum * (dB) | 51 | 51.93 -2% | 48.8 4% | 41 20% | 51.5 -1% | 42.1 17% | 60 -18% |
* ... smaller is better
Temperature
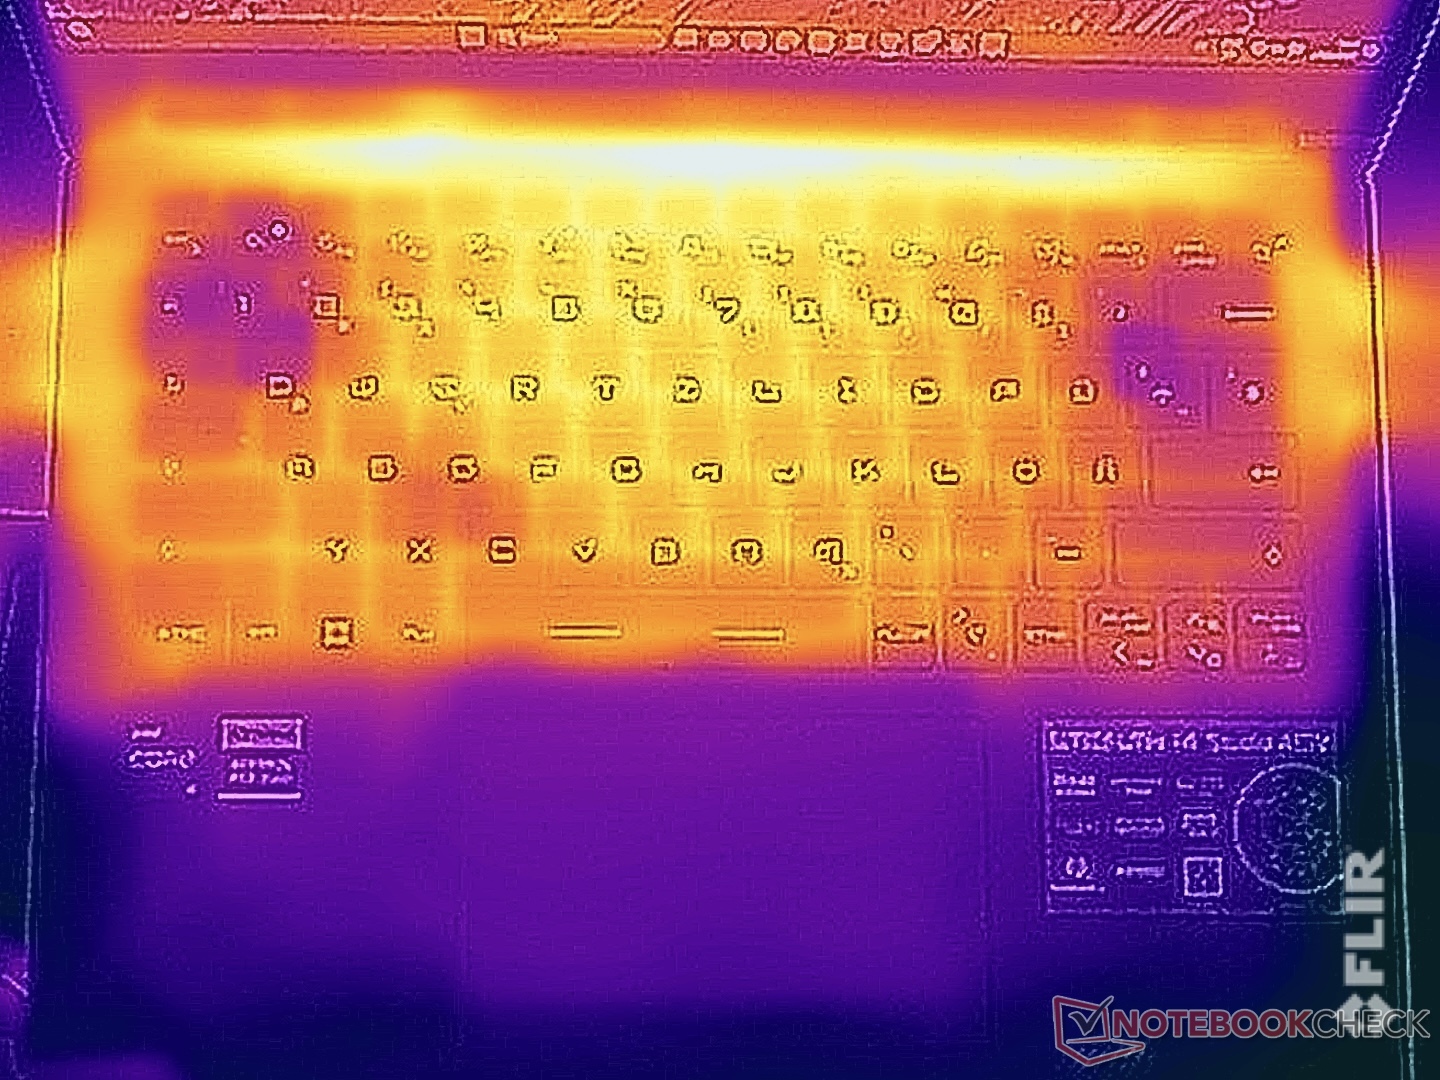
We already noticed the Stealth 14 Studio getting quite warm in idle more, especially the bottom of the device. During simple everyday tasks, you can still comfortably manage to sit the laptop on your thighs. As soon as the device is placed under larger amounts of load or when you start gaming, then you should probably avoid doing this, as it will quickly start to get uncomfortable. We measured over 55 °C on the bottom of the device. Even the keyboard heated up and reached up to 45 °C, which you can definitely notice while playing games and after a longer period of time, it starts to get a bit uncomfortable.
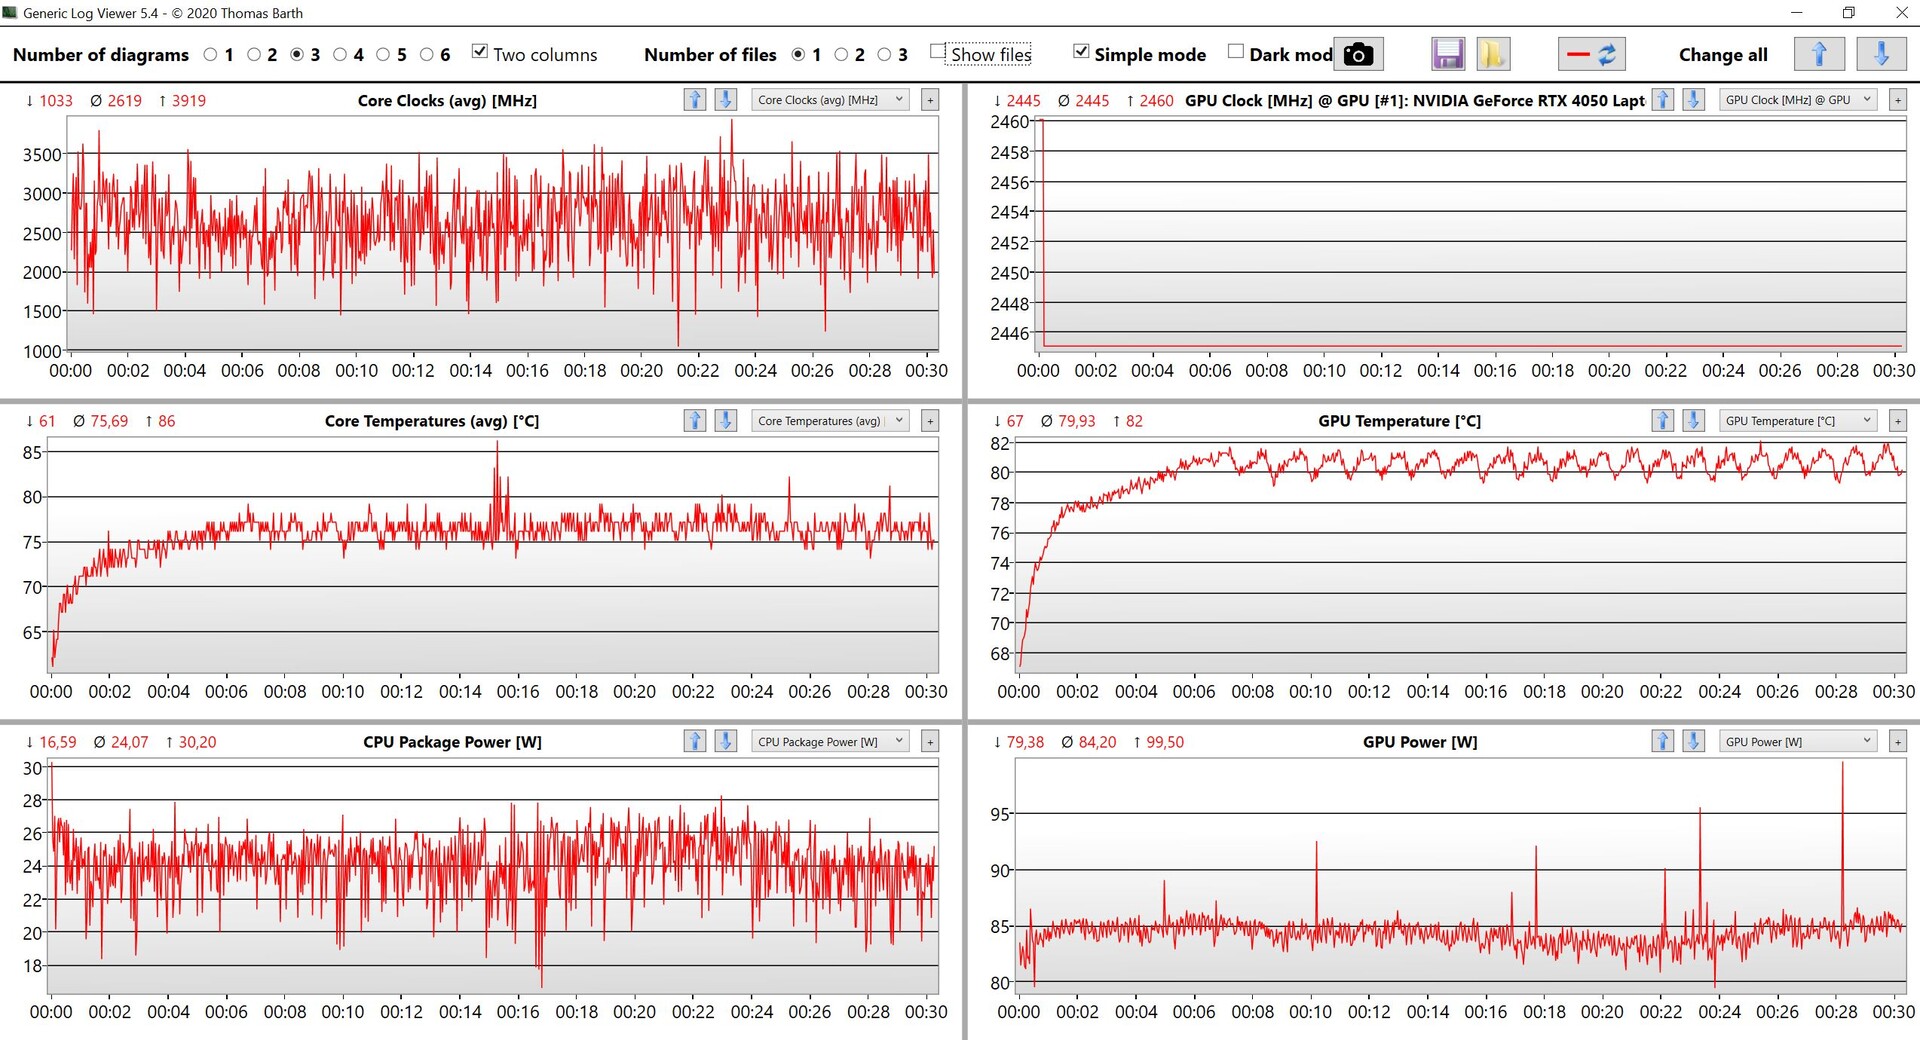
During the stress test, the CPU and GPU quickly evened out at 45 and 70 watts respectively, which means the laptop has to cool 115 watts over time. Directly after the stress test, we noted no reduction in performance.

(-) The maximum temperature on the upper side is 46.9 °C / 116 F, compared to the average of 40.4 °C / 105 F, ranging from 21.2 to 68.8 °C for the class Gaming.
(-) The bottom heats up to a maximum of 56.1 °C / 133 F, compared to the average of 43.2 °C / 110 F
(+) In idle usage, the average temperature for the upper side is 29.7 °C / 85 F, compared to the device average of 33.9 °C / 93 F.
(-) Playing The Witcher 3, the average temperature for the upper side is 38.3 °C / 101 F, compared to the device average of 33.9 °C / 93 F.
(+) The palmrests and touchpad are cooler than skin temperature with a maximum of 27.5 °C / 81.5 F and are therefore cool to the touch.
(±) The average temperature of the palmrest area of similar devices was 28.8 °C / 83.8 F (+1.3 °C / 2.3 F).

| MSI Stealth 14 Studio A13V Intel Core i7-13700H, NVIDIA GeForce RTX 4050 Laptop GPU | Gigabyte Aero 14 OLED BMF Intel Core i7-13700H, NVIDIA GeForce RTX 4050 Laptop GPU | Schenker Vision 14 2022 RTX 3050 Ti Intel Core i7-12700H, NVIDIA GeForce RTX 3050 Ti Laptop GPU | Asus ROG Flow Z13 GZ301ZE Intel Core i9-12900H, NVIDIA GeForce RTX 3050 Ti Laptop GPU | Alienware x14 i7 RTX 3060 Intel Core i7-12700H, NVIDIA GeForce RTX 3060 Laptop GPU | Razer Blade 14 Ryzen 9 6900HX AMD Ryzen 9 6900HX, NVIDIA GeForce RTX 3070 Ti Laptop GPU | Acer Predator Triton 300 SE Intel Core i9-12900H, NVIDIA GeForce RTX 3060 Laptop GPU | |
|---|---|---|---|---|---|---|---|
| Heat | 17% | 9% | 13% | 16% | 7% | 17% | |
| Maximum Upper Side * (°C) | 46.9 | 42 10% | 48.4 -3% | 45.3 3% | 51.3 -9% | 40.6 13% | 43 8% |
| Maximum Bottom * (°C) | 56.1 | 52 7% | 57.1 -2% | 48.3 14% | 44.4 21% | 42.6 24% | 46.4 17% |
| Idle Upper Side * (°C) | 33.8 | 26 23% | 28.1 17% | 29.2 14% | 27.2 20% | 38 -12% | 28.2 17% |
| Idle Bottom * (°C) | 37.9 | 27 29% | 29 23% | 30 21% | 26.6 30% | 37 2% | 28.4 25% |
* ... smaller is better
Speakers
MSI have fitted the Stealth 14 Studio with four speakers including their Nahimic Audio software. This software offers different profiles that can be further adapted (for example with more bass or more pronounced vocals) and we would definitely recommend using this software. All-in-all, we noted good results and definitely better than the comparison devices - the only devices the MSI laptop couldn't come near were a few of the multimedia laptops with really good sound systems. Unfortunately, the speakers aren't really the best for gaming anyway, as the laptop's loud fans drown out almost anything.
MSI Stealth 14 Studio A13V audio analysis
(±) | speaker loudness is average but good (81 dB)
Bass 100 - 315 Hz
(±) | reduced bass - on average 11.2% lower than median
(+) | bass is linear (6.7% delta to prev. frequency)
Mids 400 - 2000 Hz
(+) | balanced mids - only 1.6% away from median
(+) | mids are linear (2.9% delta to prev. frequency)
Highs 2 - 16 kHz
(±) | higher highs - on average 5.3% higher than median
(±) | linearity of highs is average (7.5% delta to prev. frequency)
Overall 100 - 16.000 Hz
(+) | overall sound is linear (11.9% difference to median)
Compared to same class
» 12% of all tested devices in this class were better, 4% similar, 84% worse
» The best had a delta of 6%, average was 18%, worst was 132%
Compared to all devices tested
» 9% of all tested devices were better, 2% similar, 89% worse
» The best had a delta of 4%, average was 23%, worst was 134%
Acer Predator Triton 300 SE audio analysis
(±) | speaker loudness is average but good (79.9 dB)
Bass 100 - 315 Hz
(±) | reduced bass - on average 10.3% lower than median
(±) | linearity of bass is average (9.7% delta to prev. frequency)
Mids 400 - 2000 Hz
(±) | higher mids - on average 5% higher than median
(+) | mids are linear (4% delta to prev. frequency)
Highs 2 - 16 kHz
(±) | higher highs - on average 5.5% higher than median
(±) | linearity of highs is average (7.6% delta to prev. frequency)
Overall 100 - 16.000 Hz
(±) | linearity of overall sound is average (15.1% difference to median)
Compared to same class
» 32% of all tested devices in this class were better, 6% similar, 62% worse
» The best had a delta of 6%, average was 18%, worst was 132%
Compared to all devices tested
» 21% of all tested devices were better, 4% similar, 75% worse
» The best had a delta of 4%, average was 23%, worst was 134%
Power management - Little endurance
Power consumption

Especially in idle mode, we were surprised by how much power the device uses despite its graphics switching. We definitely noticed a big disadvantage over its competitors in this aspect. At full brightness, we measured about 20 watts in idle mode, which is a lot for a compact 14-inch device with a brightness of 400 cd/m². The MSI laptop uses a lot during gaming, too; the manufacturer could really do with taking a look at this. During our stress test, we measured a maximum of 200 watts - this quickly levelled out at around 150 watts. As a result, the supplied 240-watt power supply is completely sufficient - maybe even a bit too powerful.
| Off / Standby | |
| Idle | |
| Load |
|
Key:
min: | |
| MSI Stealth 14 Studio A13V i7-13700H, GeForce RTX 4050 Laptop GPU, Samsung PM9A1 MZVL21T0HCLR, IPS, 2560x1600, 14" | Gigabyte Aero 14 OLED BMF i7-13700H, GeForce RTX 4050 Laptop GPU, Gigabyte AG470S1TB-SI B10, OLED, 2880x1800, 14" | Schenker Vision 14 2022 RTX 3050 Ti i7-12700H, GeForce RTX 3050 Ti Laptop GPU, Samsung SSD 980 Pro 1TB MZ-V8P1T0BW, IPS, 2880x1800, 14" | Asus ROG Flow Z13 GZ301ZE i9-12900H, GeForce RTX 3050 Ti Laptop GPU, Micron 2450 1TB MTFDKBK1T0TFK, IPS, 1920x1200, 13.4" | Alienware x14 i7 RTX 3060 i7-12700H, GeForce RTX 3060 Laptop GPU, WDC PC SN810 1TB, IPS, 1920x1080, 14" | Razer Blade 14 Ryzen 9 6900HX R9 6900HX, GeForce RTX 3070 Ti Laptop GPU, Samsung PM9A1 MZVL21T0HCLR, IPS, 2560x1440, 14" | Acer Predator Triton 300 SE i9-12900H, GeForce RTX 3060 Laptop GPU, Micron 3400 1TB MTFDKBA1T0TFH, OLED, 2880x1800, 14" | Average NVIDIA GeForce RTX 4050 Laptop GPU | Average of class Gaming | |
|---|---|---|---|---|---|---|---|---|---|
| Power Consumption | 41% | 35% | 34% | 24% | -15% | 9% | 8% | -19% | |
| Idle Minimum * (Watt) | 10.4 | 7.4 29% | 7.5 28% | 8.8 15% | 7.9 24% | 10.2 2% | 7.6 27% | 9.95 ? 4% | 13 ? -25% |
| Idle Average * (Watt) | 19.1 | 8.3 57% | 10.4 46% | 12.1 37% | 11.1 42% | 26 -36% | 12.3 36% | 15.8 ? 17% | 19 ? 1% |
| Idle Maximum * (Watt) | 19.4 | 8.7 55% | 11.4 41% | 12.7 35% | 11.8 39% | 26.7 -38% | 17.6 9% | 20.1 ? -4% | 24.6 ? -27% |
| Load Average * (Watt) | 95.9 | 76 21% | 83.3 13% | 72.3 25% | 107.4 -12% | 89.3 7% | 111 -16% | 88 ? 8% | 110.7 ? -15% |
| Witcher 3 ultra * (Watt) | 141.6 | 70 51% | 92.7 35% | 77.3 45% | 111 22% | 158.7 -12% | 117.1 17% | ||
| Load Maximum * (Watt) | 203 | 132 35% | 110.3 46% | 103.1 49% | 140.4 31% | 227.5 -12% | 245.8 -21% | 176.3 ? 13% | 259 ? -28% |
* ... smaller is better
Power consumption Witcher 3 / stress test
Power consumption with external monitor
Runtimes
Despite its 72-Wh battery capacity, the MSI laptop's runtimes are not especially good, even in 60-Hz mode. With an adapted brightness of 150 cd/m² (meaning about 36 % of our test sample's brightness), our WLAN test ended after just over 6 hours. At 240 Hz, the test didn't even last 5 hours. When we repeated the test using the laptop's full brightness, it only lasted 5 hours at 60 Hz, and 4 hours at 240 Hz. Even the video test at 150 cd/m² and 60 Hz only lasted just over 6.5 hours. For a compact 14-inch device with a relatively large battery and graphics switching, this is a disappointing result. It takes around 2 hours to charge the device fully, and 75 % of its capacity is reached after 45 minutes. The laptop can also be charged via USB-C on the go.
| MSI Stealth 14 Studio A13V i7-13700H, GeForce RTX 4050 Laptop GPU, 72 Wh | Gigabyte Aero 14 OLED BMF i7-13700H, GeForce RTX 4050 Laptop GPU, 63 Wh | Schenker Vision 14 2022 RTX 3050 Ti i7-12700H, GeForce RTX 3050 Ti Laptop GPU, 99.8 Wh | Asus ROG Flow Z13 GZ301ZE i9-12900H, GeForce RTX 3050 Ti Laptop GPU, 56 Wh | Alienware x14 i7 RTX 3060 i7-12700H, GeForce RTX 3060 Laptop GPU, 80 Wh | Razer Blade 14 Ryzen 9 6900HX R9 6900HX, GeForce RTX 3070 Ti Laptop GPU, 62 Wh | Acer Predator Triton 300 SE i9-12900H, GeForce RTX 3060 Laptop GPU, 76 Wh | Average of class Gaming | |
|---|---|---|---|---|---|---|---|---|
| Battery runtime | 23% | 68% | -7% | 17% | 42% | 3% | 21% | |
| H.264 (h) | 6.6 | 11.1 68% | 6 -9% | 9.4 42% | 8.32 ? 26% | |||
| WiFi v1.3 (h) | 6.3 | 7.6 21% | 10.1 60% | 5.6 -11% | 8.9 41% | 9.5 51% | 6.2 -2% | 7.11 ? 13% |
| Load (h) | 1.2 | 1.5 25% | 2.1 75% | 1.2 0% | 0.8 -33% | 1.6 33% | 1.3 8% | 1.502 ? 25% |
| Reader / Idle (h) | 11.3 | 12.2 | 8.1 | 8.27 ? | ||||
| Witcher 3 ultra (h) | 0.8 | 0.8 |
Pros
Cons
Verdict - The MSI Stealth 14 Studio left mixed impressions

The MSI Stealth 14 Studio sets out to be a powerful yet compact laptop for gamers and creative users. During our test, we had a few negative points to note that prove to be an issue for a laptop costing $1,699.99. For one, the device is "only" fitted with the small RTX 4050 Laptop without Advanced Optimus - this performance is simply insufficient for the price. While its power output is good in theory, the cooling system didn't impress us in everyday use. Loud fans under maximum load are expected, but it confuses us why the fans always seem to be running audibly - we even noted noise emission spikes of over 40 dB(A) when using the weaker power modes. This simply gets in the way while you are using the laptop. Generally, its power consumption is also very high (despite its graphics switching), which in turn also contributes to shorter runtimes.
The laptop's case also left quite a mixed impression on us - in comparison to its extremely stable base unit, the screen lid can be twisted quite a bit and you have to be really careful not to cause any permanent damage. We also have a few negatives to note about its keyboard. While its individual key illumination is nice (even though the software to control this is anything but intuitive), its key lift is very shallow and in general, it has quite a rickety feel to it.
The MSI Stealth 14 Studio wants to be the perfect compact allrounder that offers great performance for gamers and creative users. Unfortunately, - while its gaming performance is good - the laptop features far too many flaws such as annoying fans, a mediocre keyboard and a flexible display lid. For $1,699.99, this is simply not enough.
The device's display is also a double-edged sword, as it features positive aspects such as its quick reaction speeds, a 240-Hz refresh rate and great color accuracy. On the other hand, its black value is quite high. This leads to black content being depicted as more of a dark gray, and contrast levels aren't always too great. Of course, this is whinging on the highest of levels, but in total, it subjectively just doesn't look as good as OLEDs or even very good IPS/mini LED panels. At the end of the day, the MSI laptop simply has too many weaknesses - taking into account its premium price - for us to be able to confidently recommend it.
Price and availability
The MSI Stealth 14 Studio can be purchased from Best Buy for $1,699.99.
MSI Stealth 14 Studio A13V
- 07/12/2023 v7 (old)
Andreas Osthoff
Transparency
The selection of devices to be reviewed is made by our editorial team. The test sample was provided to the author as a loan by the manufacturer or retailer for the purpose of this review. The lender had no influence on this review, nor did the manufacturer receive a copy of this review before publication. There was no obligation to publish this review. As an independent media company, Notebookcheck is not subjected to the authority of manufacturers, retailers or publishers.
This is how Notebookcheck is testing
Every year, Notebookcheck independently reviews hundreds of laptops and smartphones using standardized procedures to ensure that all results are comparable. We have continuously developed our test methods for around 20 years and set industry standards in the process. In our test labs, high-quality measuring equipment is utilized by experienced technicians and editors. These tests involve a multi-stage validation process. Our complex rating system is based on hundreds of well-founded measurements and benchmarks, which maintains objectivity. Further information on our test methods can be found here.
Price comparison

