MSI Prestige 16 B1MG laptop review: From Core i7 Xe to Core Ultra 7 Arc

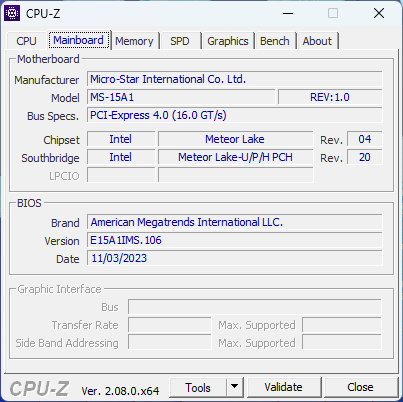
The 16-inch MSI Prestige 16 AI B1MG is one of the first laptops in the market with 1st gen Core Ultra Meteor Lake CPU options. It succeeds the older 15.6-inch Prestige 15 with both revamped internals and externals for a brand new user experience. The MSI Prestige family consists of upper midrange laptops in between the lower-end Modern family and higher-end Summit family.
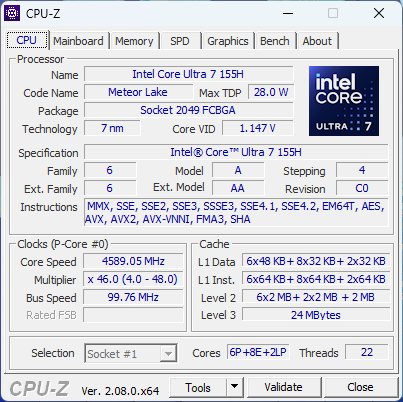
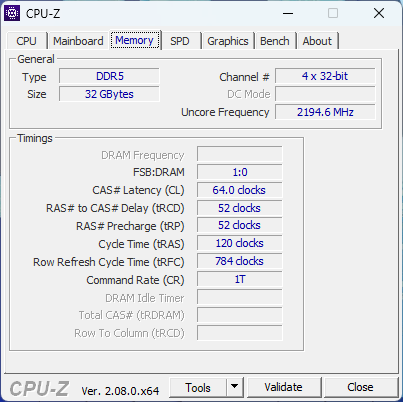
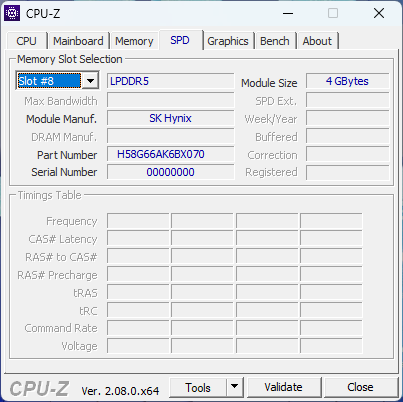
Our configuration in review is a retail unit for $1400 USD with the Core Ultra 7 155H CPU, integrated Arc 8 graphics, 1600p IPS display, 32 GB LPDDR5-6400 MHz RAM, and 2 TB NVMe SSD. Higher-end SKUs with the Core Ultra 9 185H, GeForce RTX 4060 or 4070 graphics, Arc 370M graphics, and 4K (2400p) OLED are also available.
Competitors to the Prestige 16 include other thin-and-light multimedia or content creator laptops like the Dell XPS series, Asus VivoBook Pro 16, LG Gram 16 2-in-1, or the Lenovo Yoga Pro 9i 16.
More MSI reviews:
Potential Competitors in Comparison
Rating | Date | Model | Weight | Height | Size | Resolution | Price |
|---|---|---|---|---|---|---|---|
| 88.1 % v7 (old) | 12 / 2023 | MSI Prestige 16 B1MG-001US Ultra 7 155H, Arc 8-Core | 1.6 kg | 19.1 mm | 16.00" | 2560x1600 | |
| 85.4 % v7 (old) | 12 / 2022 | MSI Prestige 15 A12UD-093 i7-1280P, GeForce RTX 3050 Ti Laptop GPU | 1.8 kg | 20.1 mm | 15.60" | 3840x2160 | |
| 85.8 % v7 (old) | 11 / 2023 | LG Gram 2in1 16 16T90R - G.AA78G i7-1360P, Iris Xe G7 96EUs | 1.5 kg | 17.2 mm | 16.00" | 2560x1600 | |
| 85.7 % v7 (old) | 11 / 2023 | Lenovo ThinkBook 16 G6 ABP R5 7530U, Vega 7 | 1.8 kg | 17.5 mm | 16.00" | 1920x1200 | |
| 87.6 % v7 (old) | 11 / 2023 | Asus VivoBook Pro 16 K6602VU i9-13900H, GeForce RTX 4050 Laptop GPU | 1.9 kg | 19 mm | 16.00" | 3200x2000 | |
| 87.1 % v7 (old) | 08 / 2023 | Dell Inspiron 16 Plus 7630 i7-13700H, GeForce RTX 4060 Laptop GPU | 2.2 kg | 19.95 mm | 16.00" | 2560x1600 |
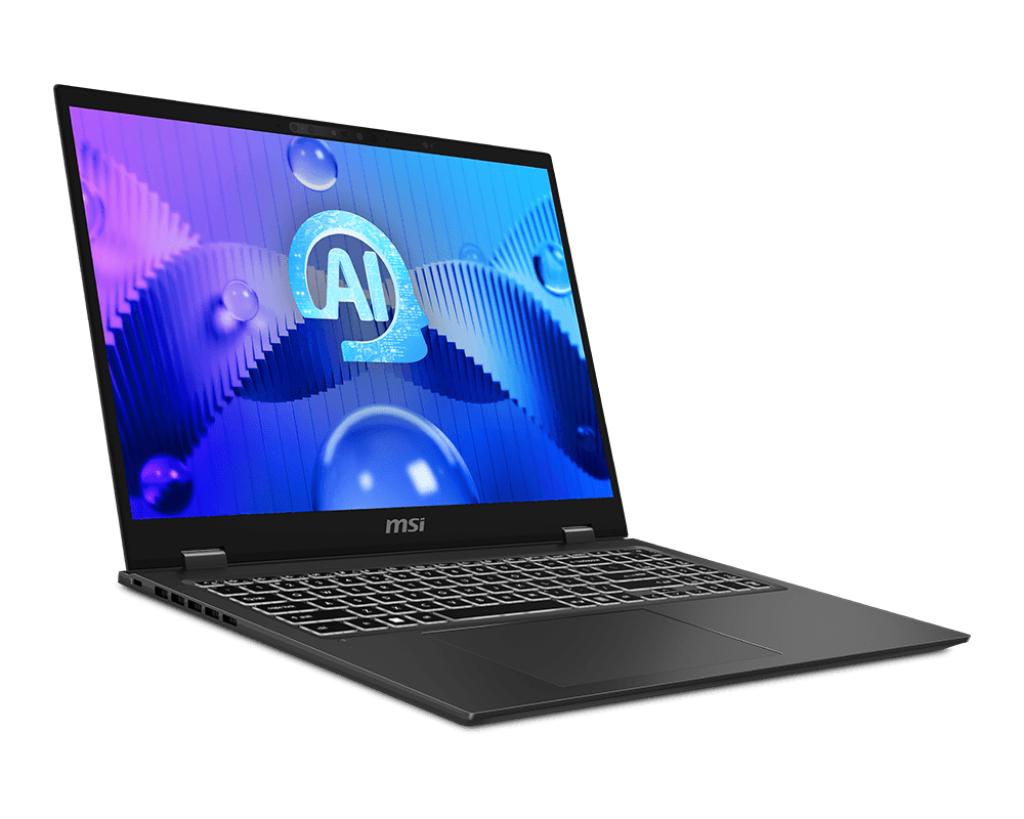
Case — Thin Looks, Thin Materials
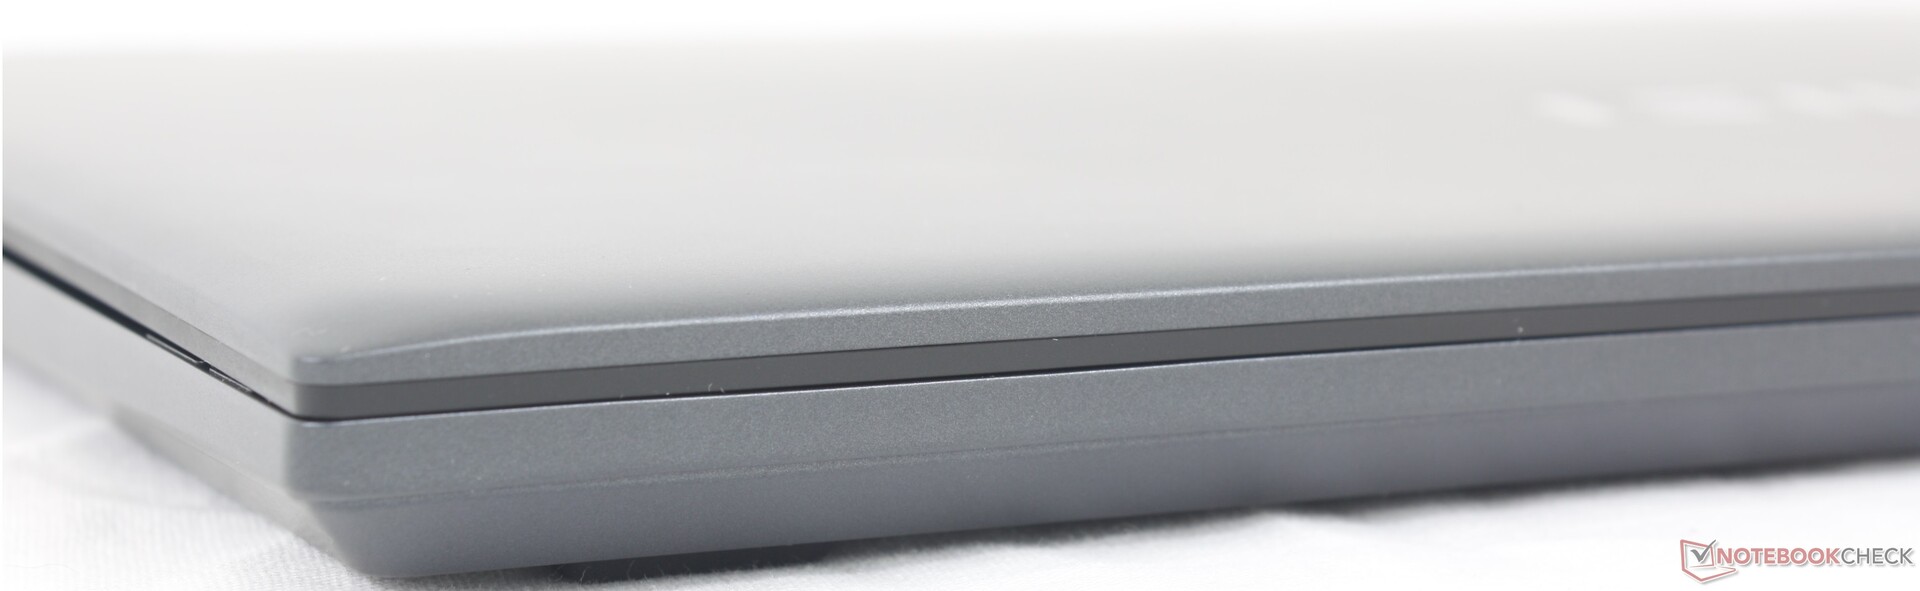
The metal chassis is firmer and sturdier than what you'd find on a less expensive MSI Modern or Asus VivoBook series. Applying pressure on the keyboard center, for example, would barely warp the surface. The lid is comparatively more susceptible to twisting and damage especially since it lacks Gorilla Glass reinforcement. Applying pressure on the center of the outer lid would warp its surface more than we would like to see. In this case, alternatives like the HP Spectre or Razer Blade are much stronger even though they are heavier.
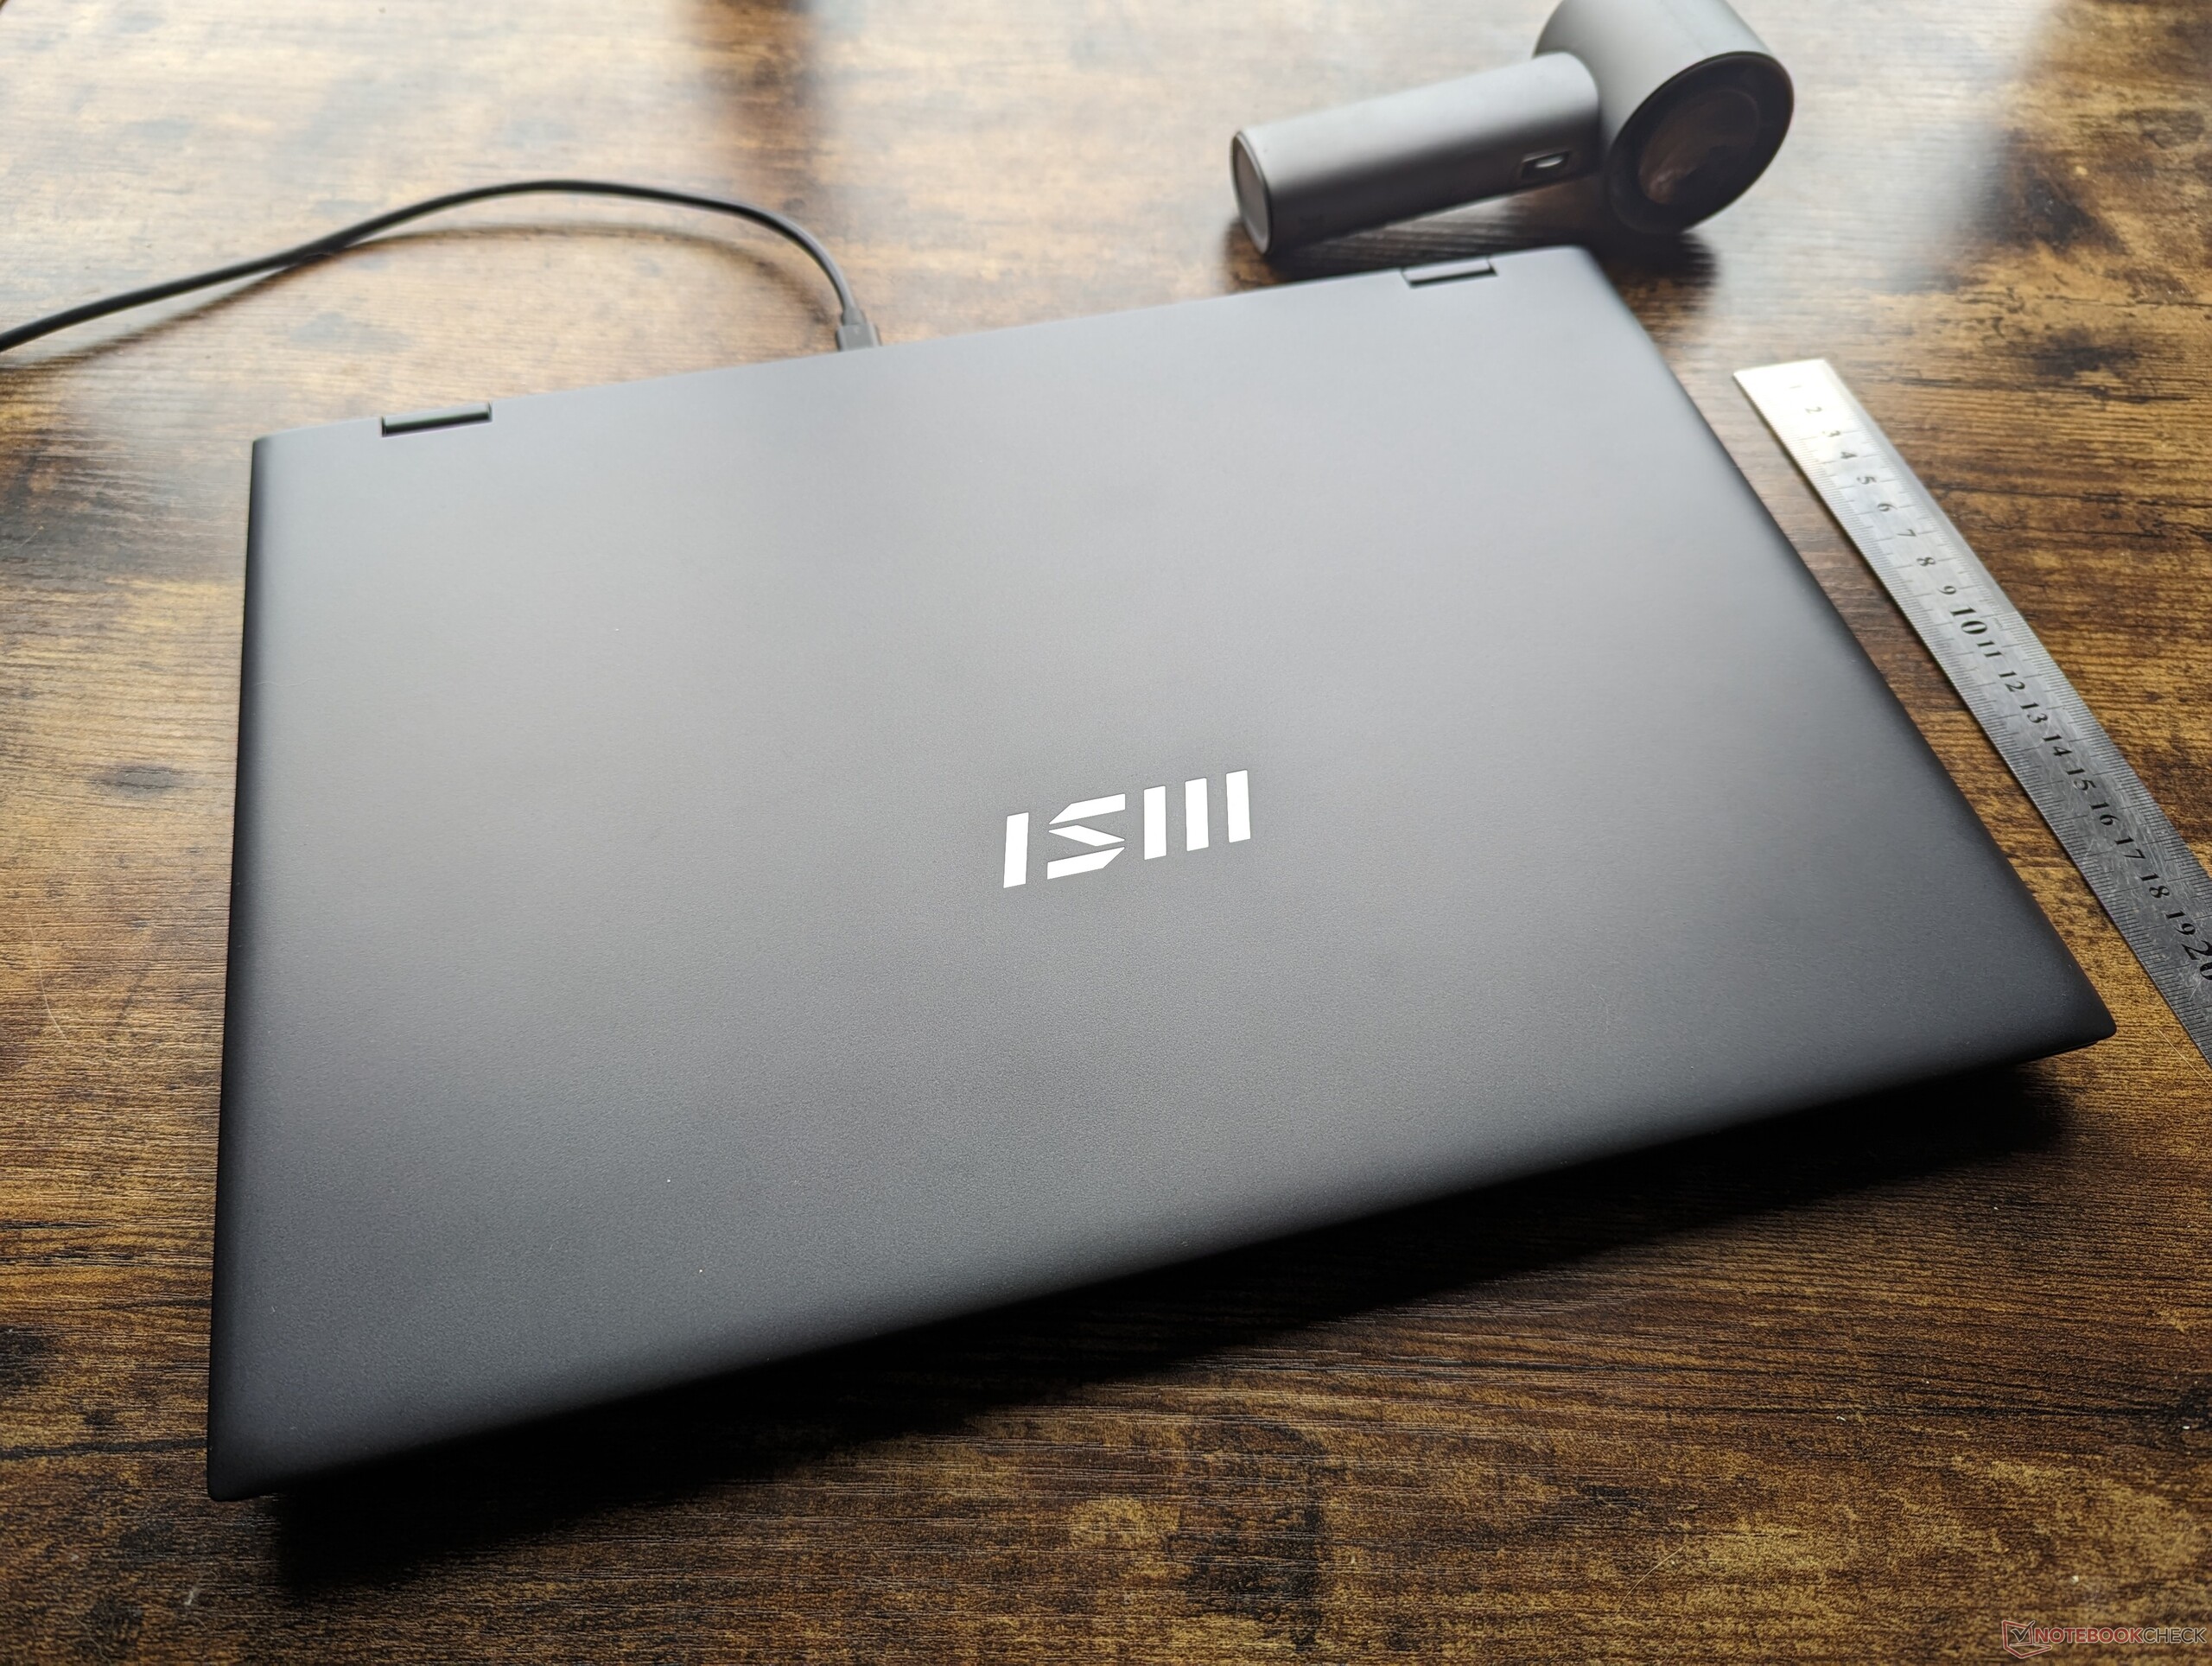
The squarer 16:10 aspect ratio gives the Prestige 16 a larger footprint than the outgoing Prestige 15. However, it makes up the difference with both a thinner profile and lighter weight. In fact, the Prestige 16 is one of the lightest 16-inch multimedia laptops rivaling the LG Gram 16 2-in-1. We expect SKUs with discrete graphics to be a bit heavier, however.
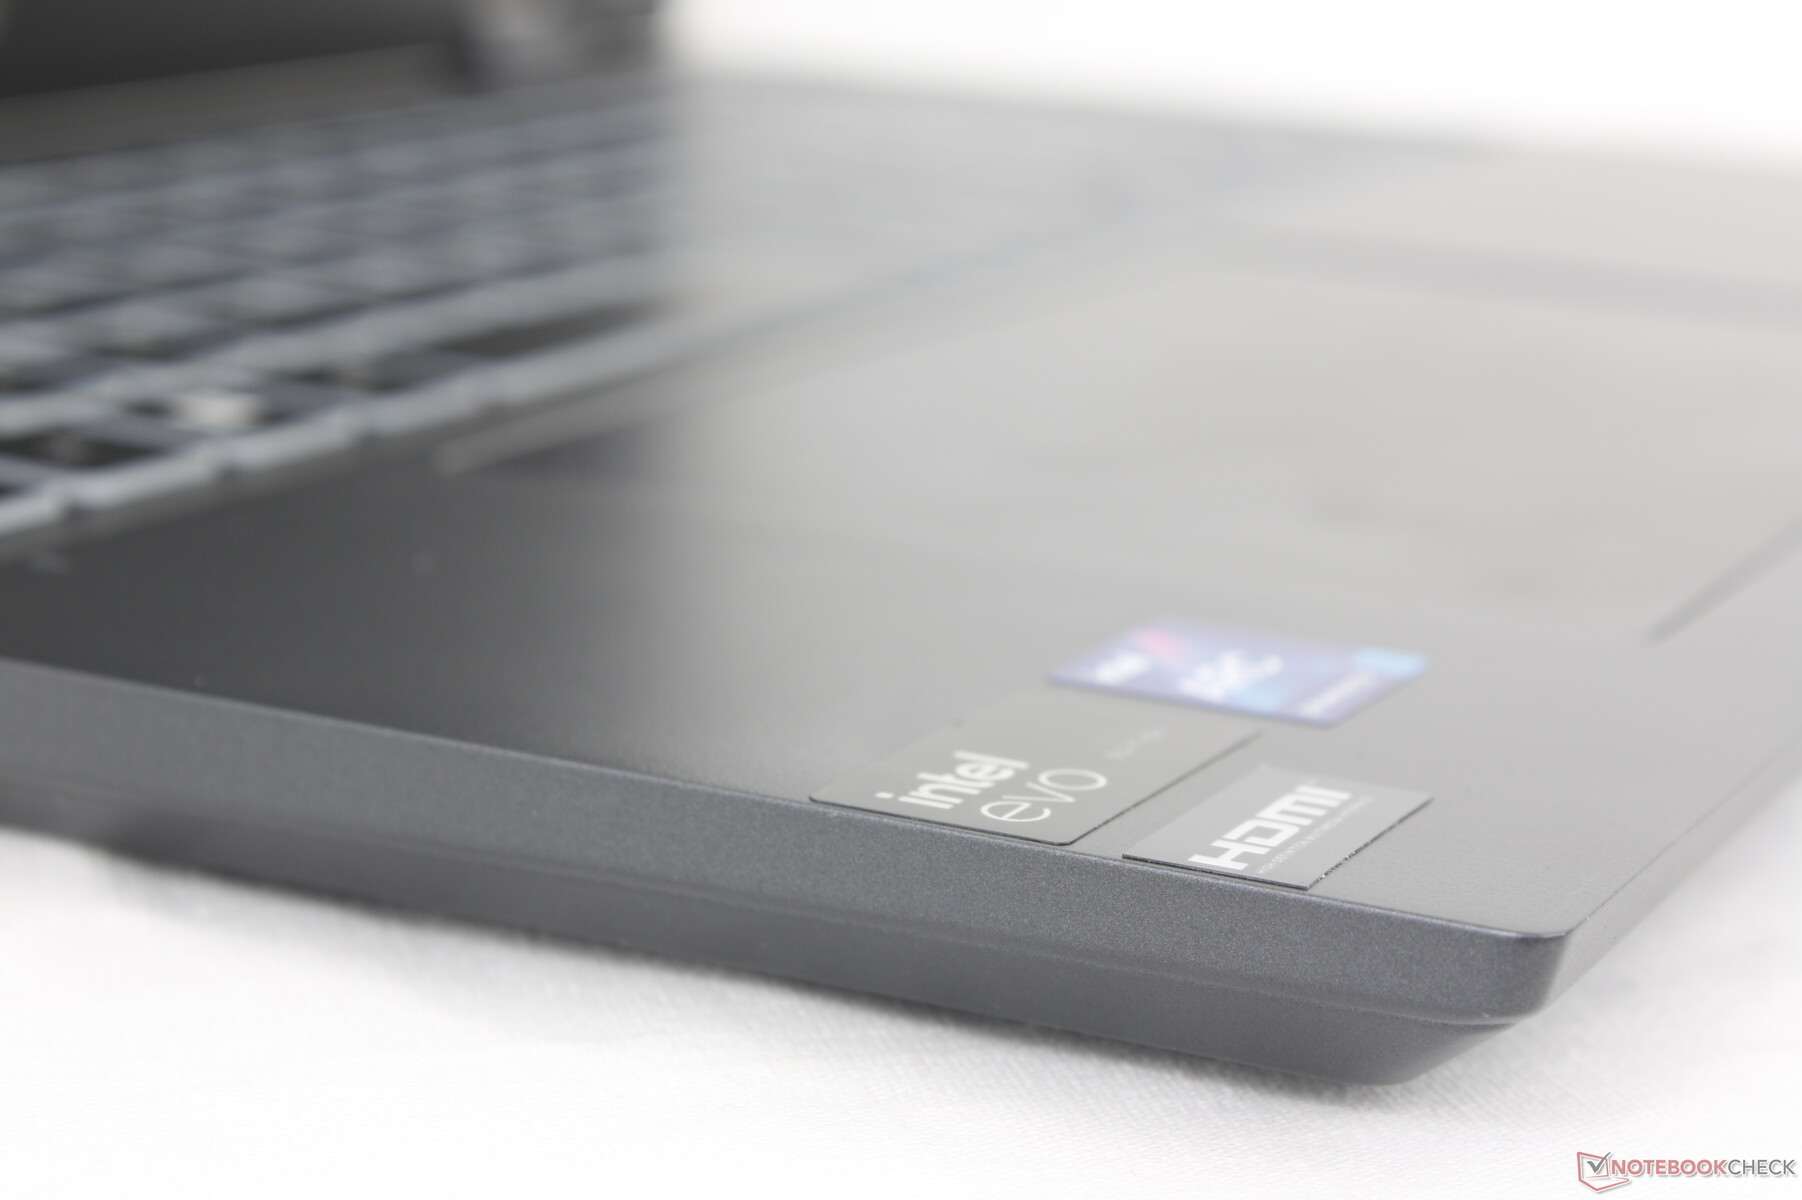
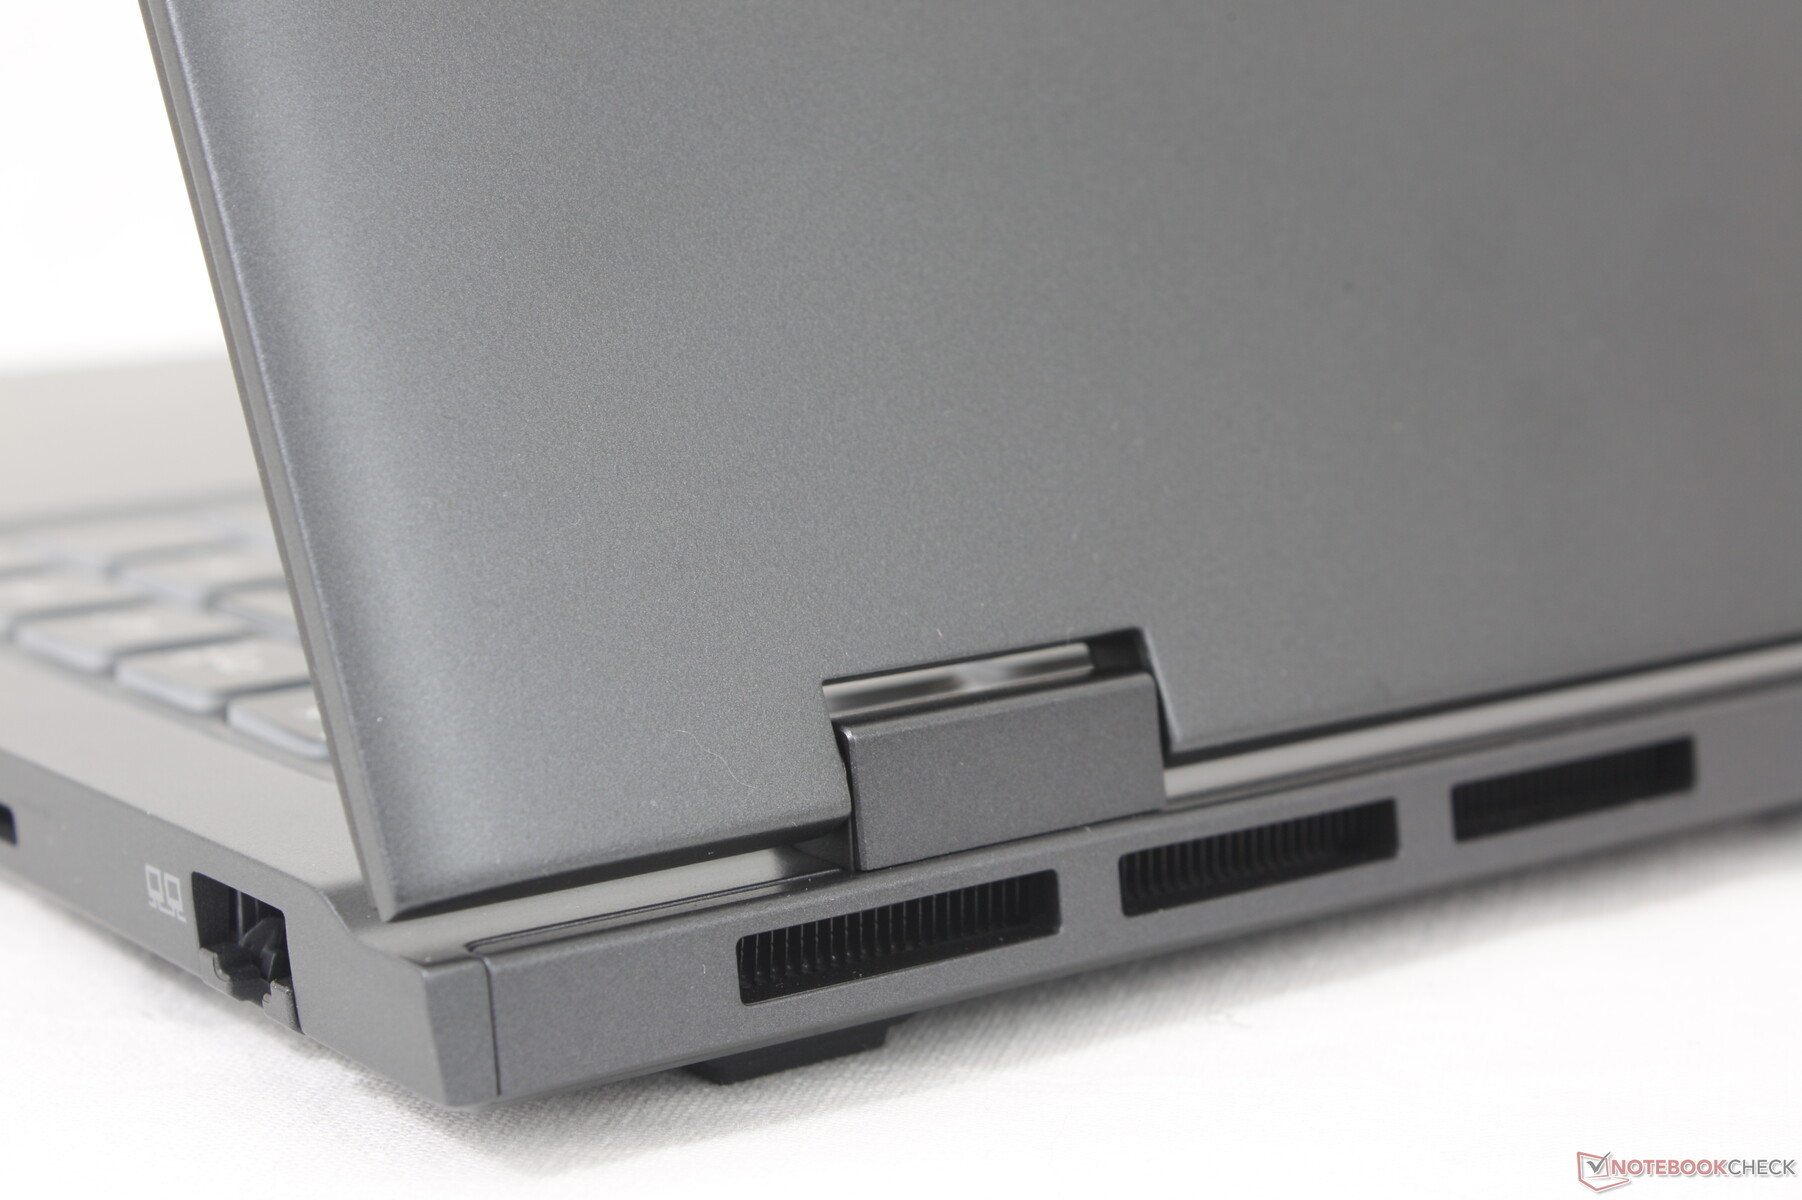
Connectivity — Ready For Wi-Fi 7
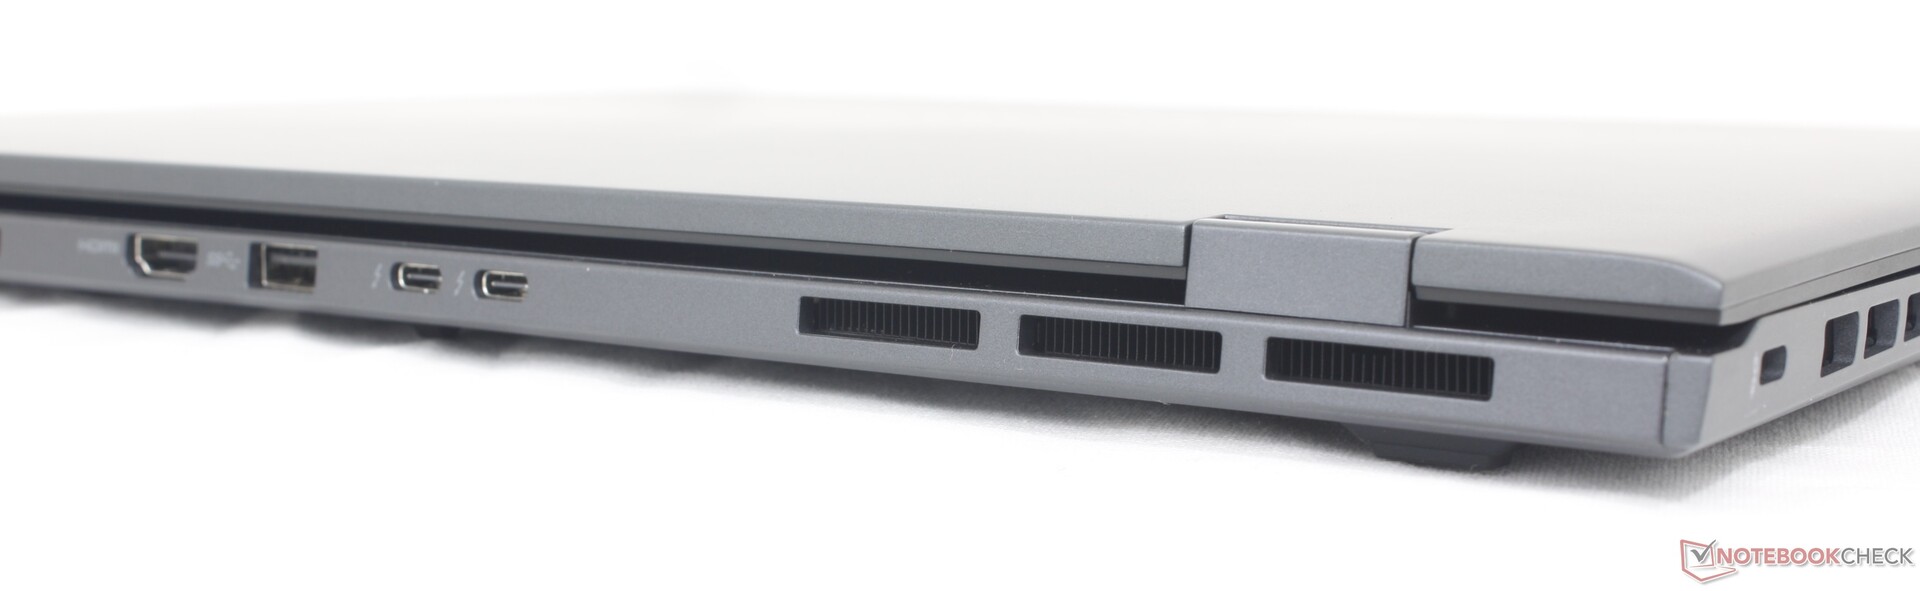
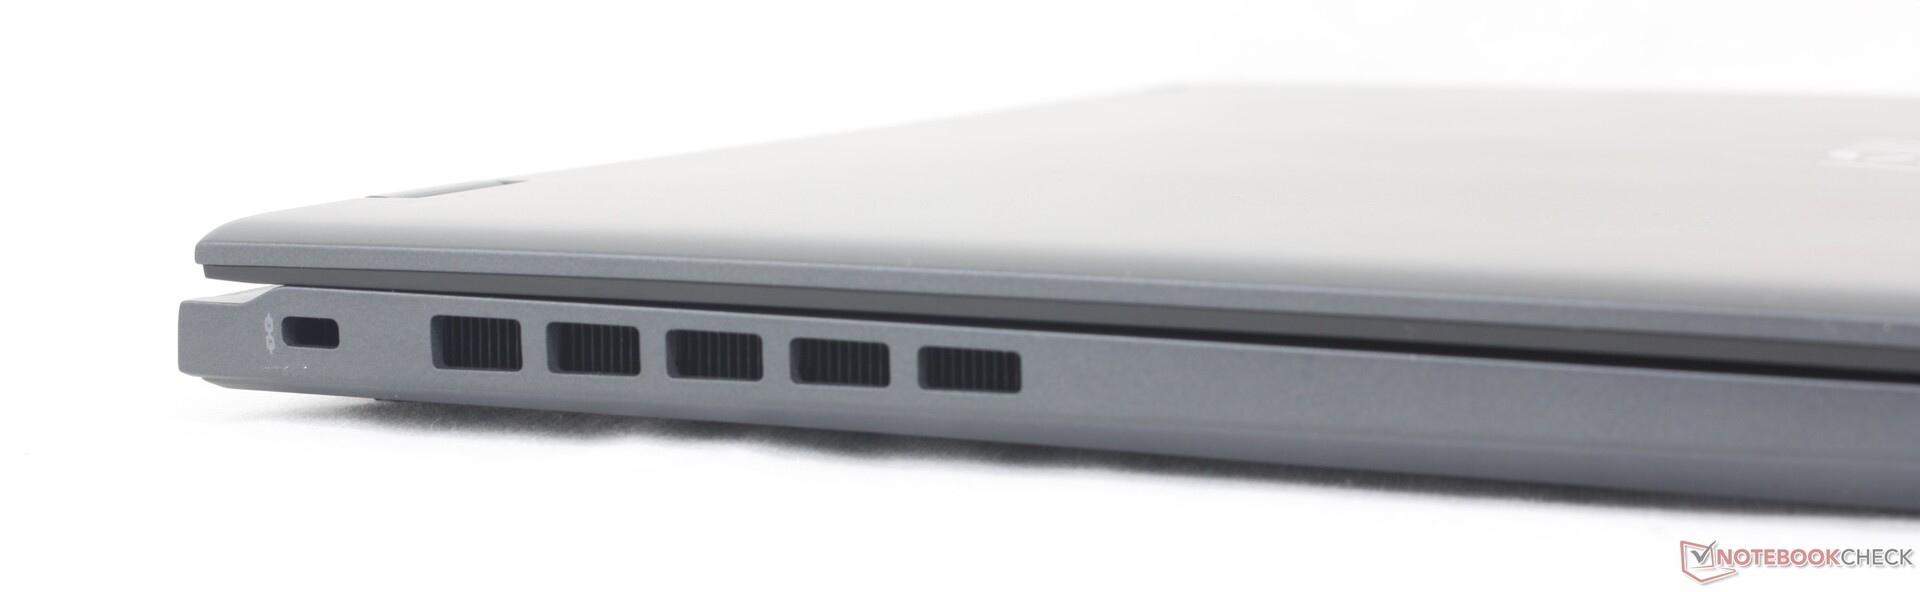
Unlike on most other Ultrabooks, ports on the Prestige 16 are concentrated along the rear instead of the sides. This design approach allows for better ventilation along the sides albeit at the cost of poorer port accessibility. Commonly used ports like HDMI, USB-C, and even USB-A are all along the rear which may not be ideal for most users.
When compared to the Prestige 15, the Prestige 16 has swapped out one USB-A port for an RJ-45 port. The two Thunderbolt 4 ports remain intact for SKUs with only integrated graphics. If configured with discrete graphics, only one of the two USB-C ports are Thunderbolt compatible.

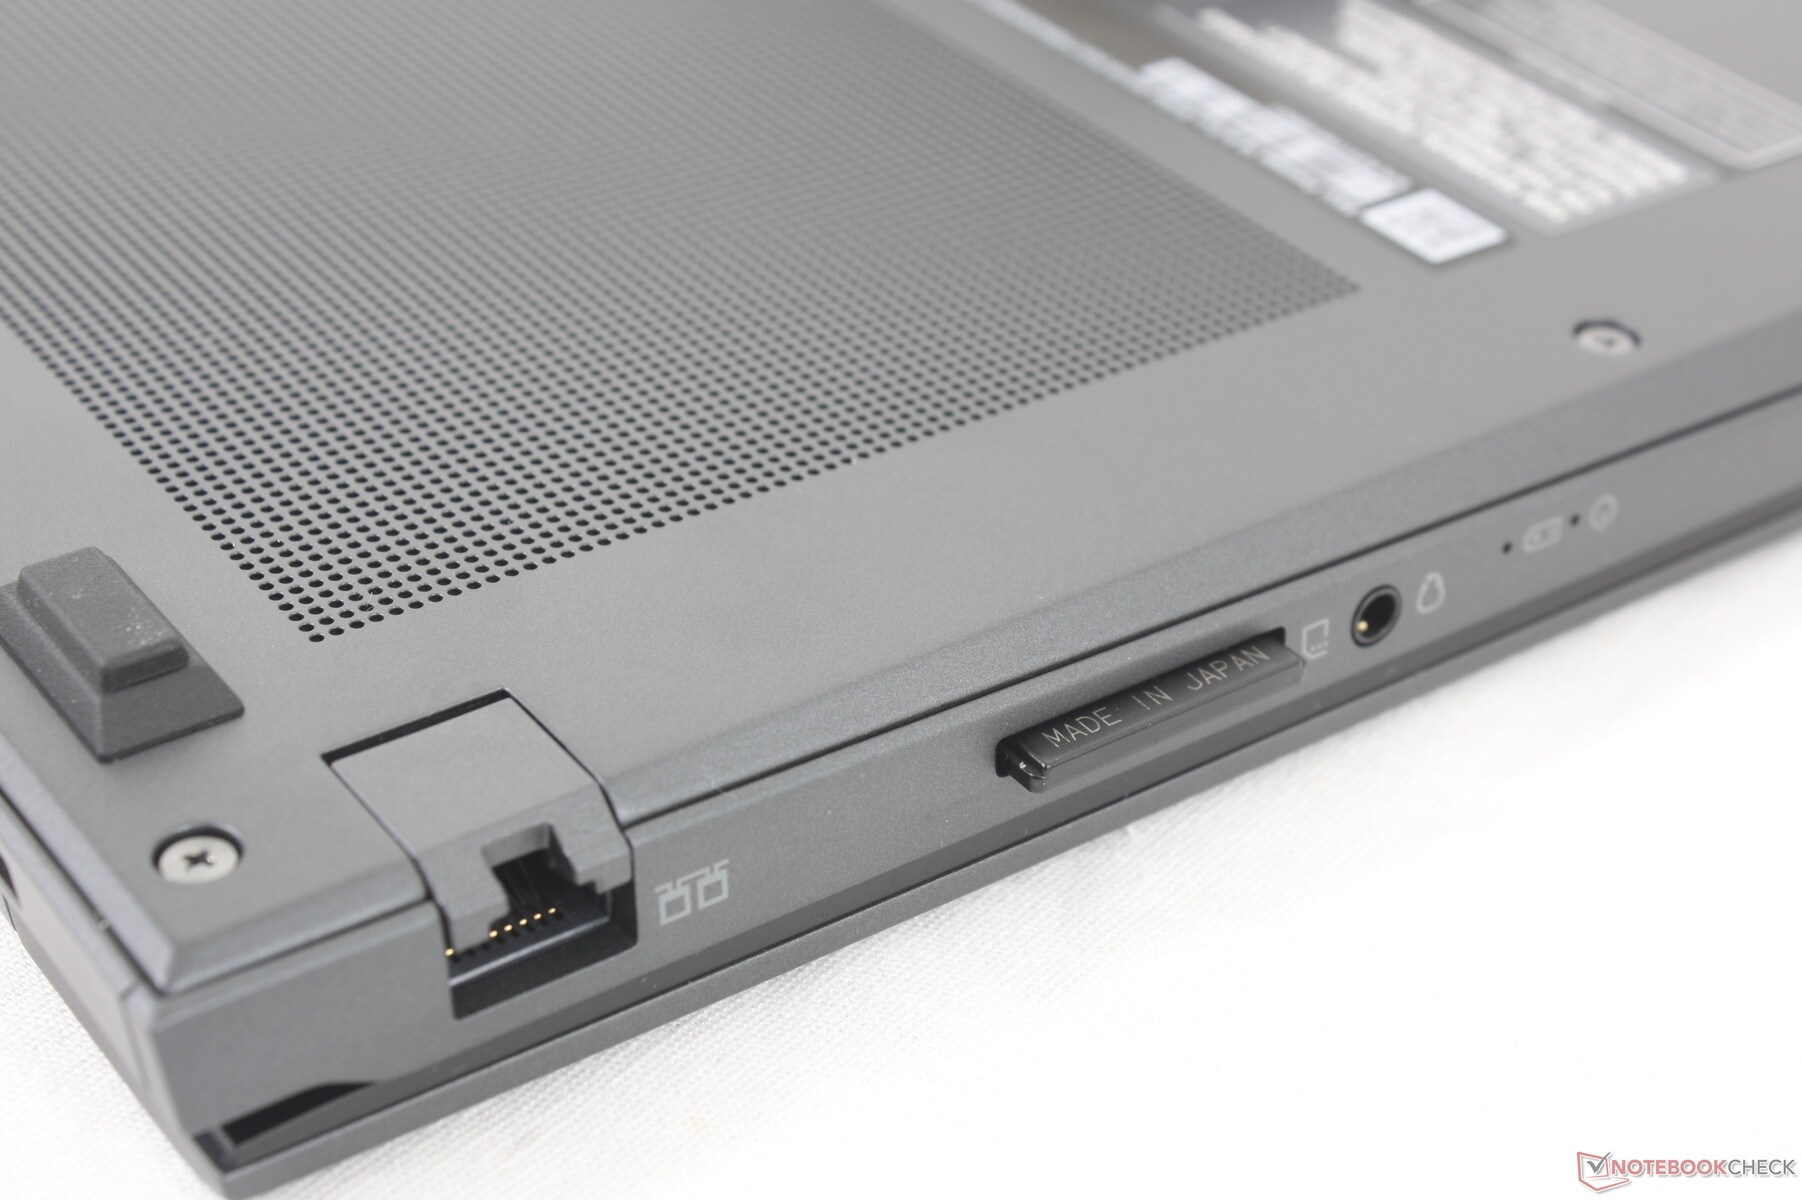
SD Card Reader
The integrated SD card reader has been upgraded for much faster speeds. Transferring 1 GB of pictures from our UHS-II test card to desktop would take just under 6 seconds compared to 12+ seconds on the Prestige 15.
| SD Card Reader | |
| average JPG Copy Test (av. of 3 runs) | |
| MSI Prestige 16 B1MG-001US (Toshiba Exceria Pro SDXC 64 GB UHS-II) | |
| Asus VivoBook Pro 16 K6602VU (Angelbird AV Pro V60) | |
| Lenovo ThinkBook 16 G6 ABP (Angelbird AV Pro V60) | |
| MSI Prestige 15 A12UD-093 (AV Pro SD microSD 128 GB V60) | |
| LG Gram 2in1 16 16T90R - G.AA78G | |
| Dell Inspiron 16 Plus 7630 (AV Pro SD microSD 128 GB V60) | |
| maximum AS SSD Seq Read Test (1GB) | |
| Asus VivoBook Pro 16 K6602VU (Angelbird AV Pro V60) | |
| MSI Prestige 16 B1MG-001US (Toshiba Exceria Pro SDXC 64 GB UHS-II) | |
| Lenovo ThinkBook 16 G6 ABP (Angelbird AV Pro V60) | |
| MSI Prestige 15 A12UD-093 (AV Pro SD microSD 128 GB V60) | |
| Dell Inspiron 16 Plus 7630 (AV Pro SD microSD 128 GB V60) | |
| LG Gram 2in1 16 16T90R - G.AA78G | |
Communication
The Prestige 16 is one of the first laptops to ship with the Killer BE1750W WLAN module for Wi-Fi 7 compatibility. Wi-Fi 7 routers are not yet widely available, however, and so the inclusion of Wi-Fi 7 at the moment is more about future-proofing than any immediate benefits. We nonetheless experienced no connectivity issues when paired to our Wi-Fi 6E test router.
Webcam
A 2 MP webcam with IR and physical privacy shutter come standard. Alternatives like the HP Spectre have already begun shipping with higher resolution 5 MP sensors.


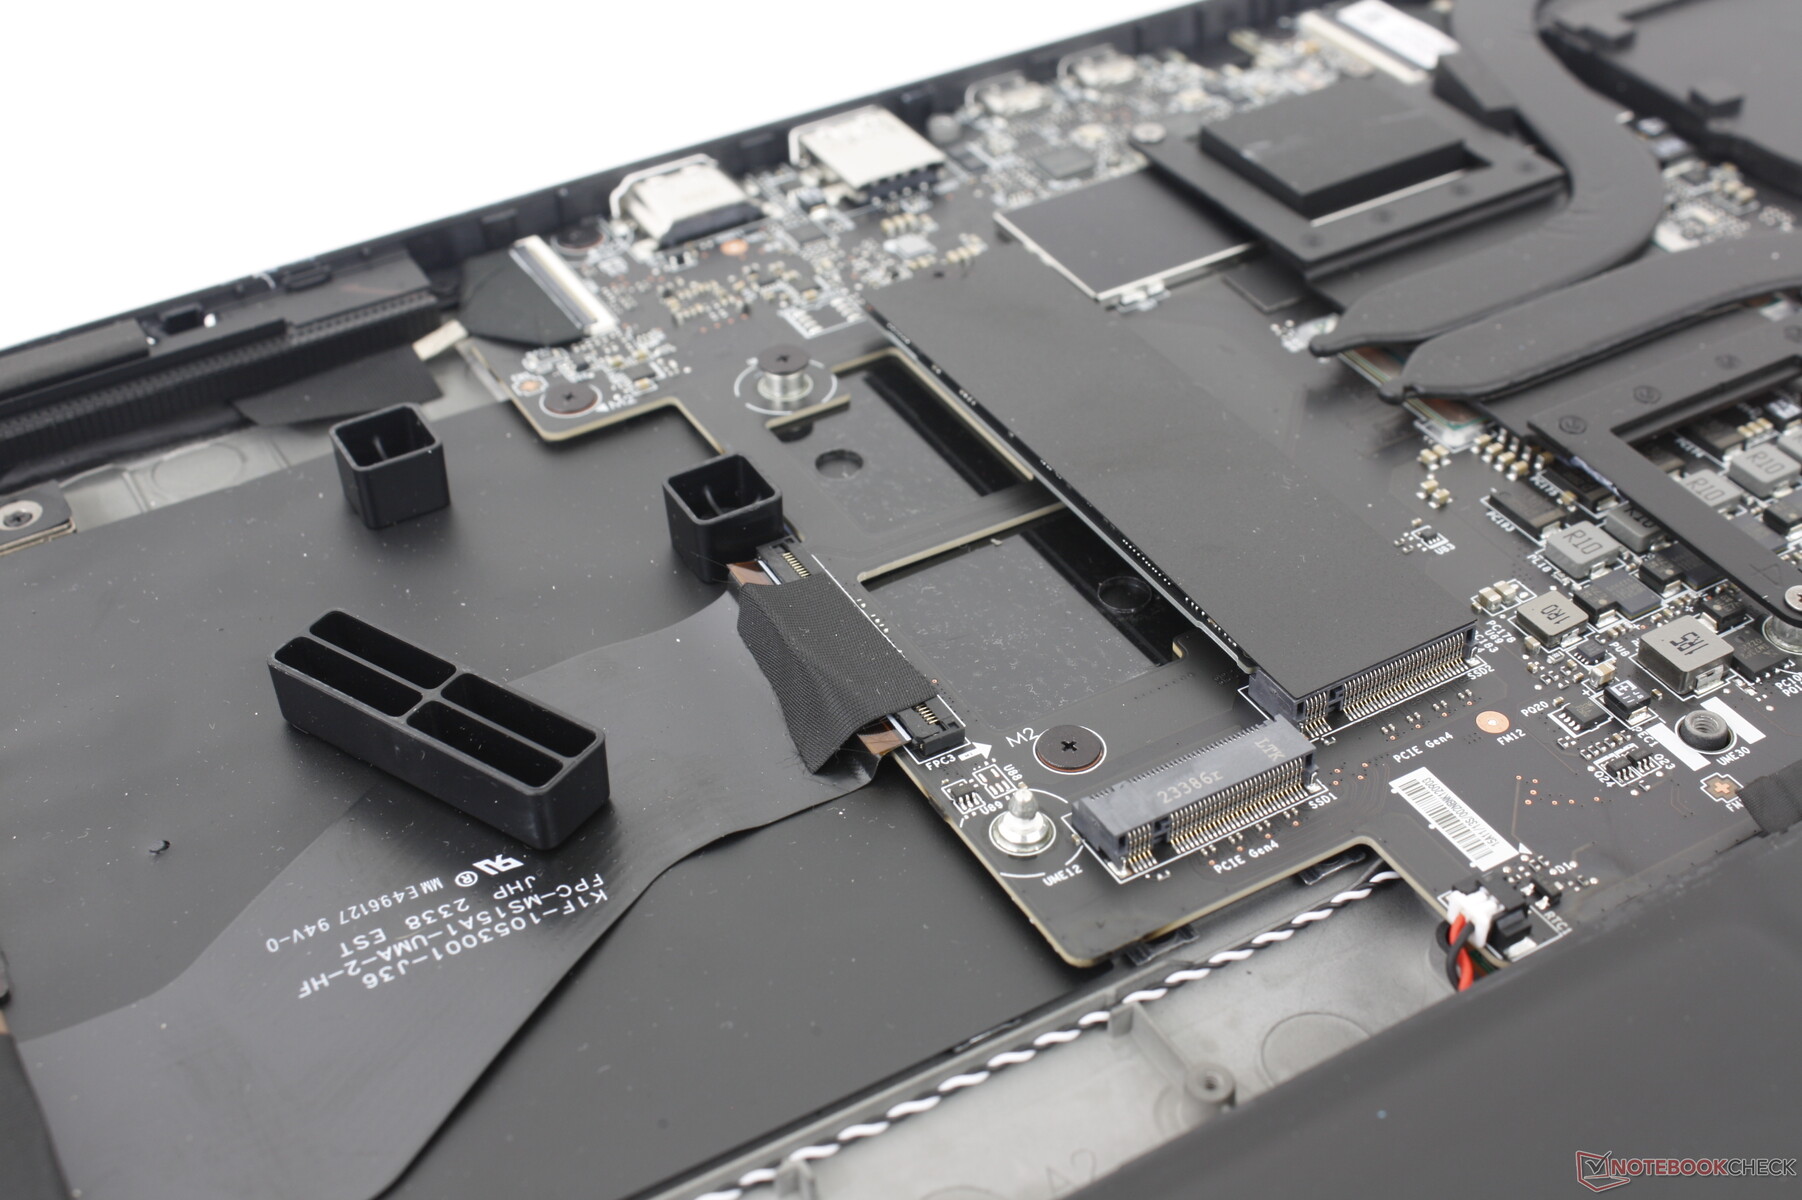
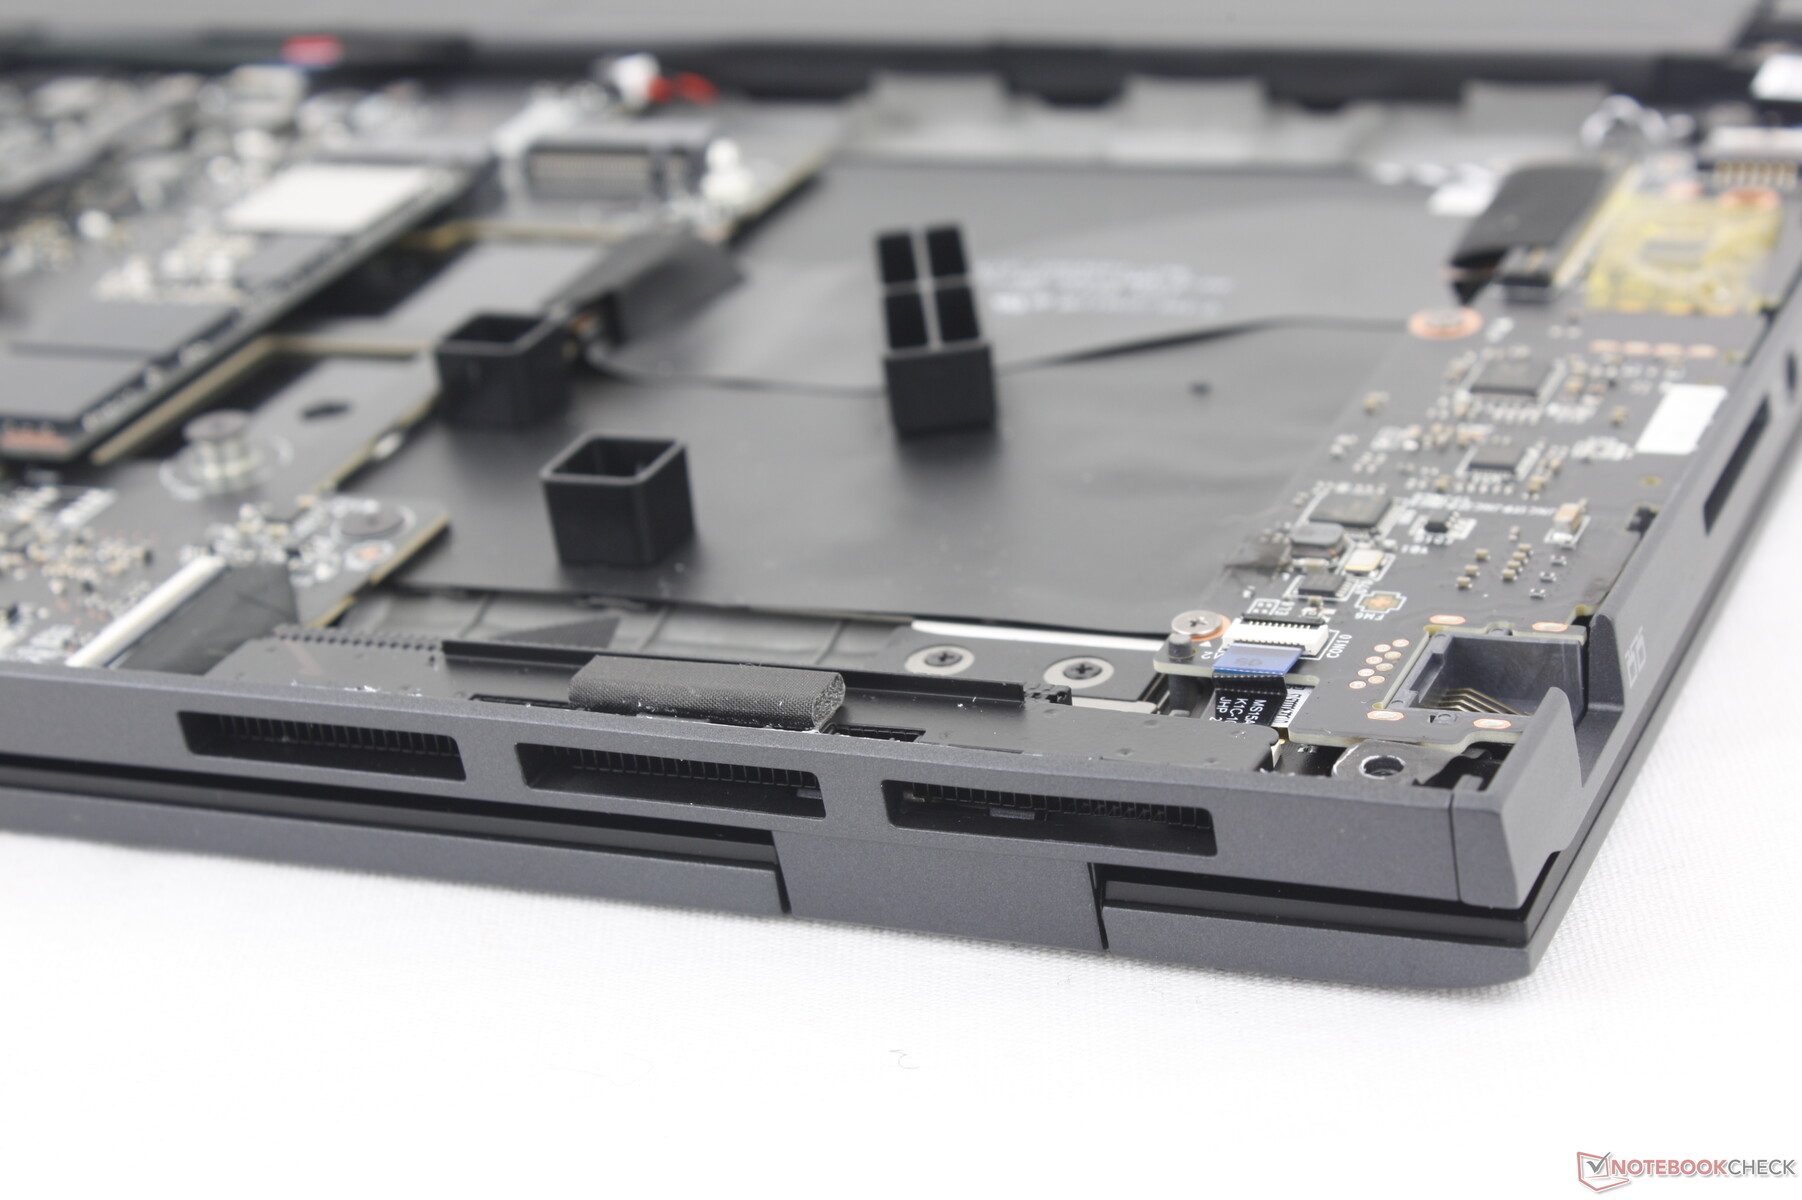
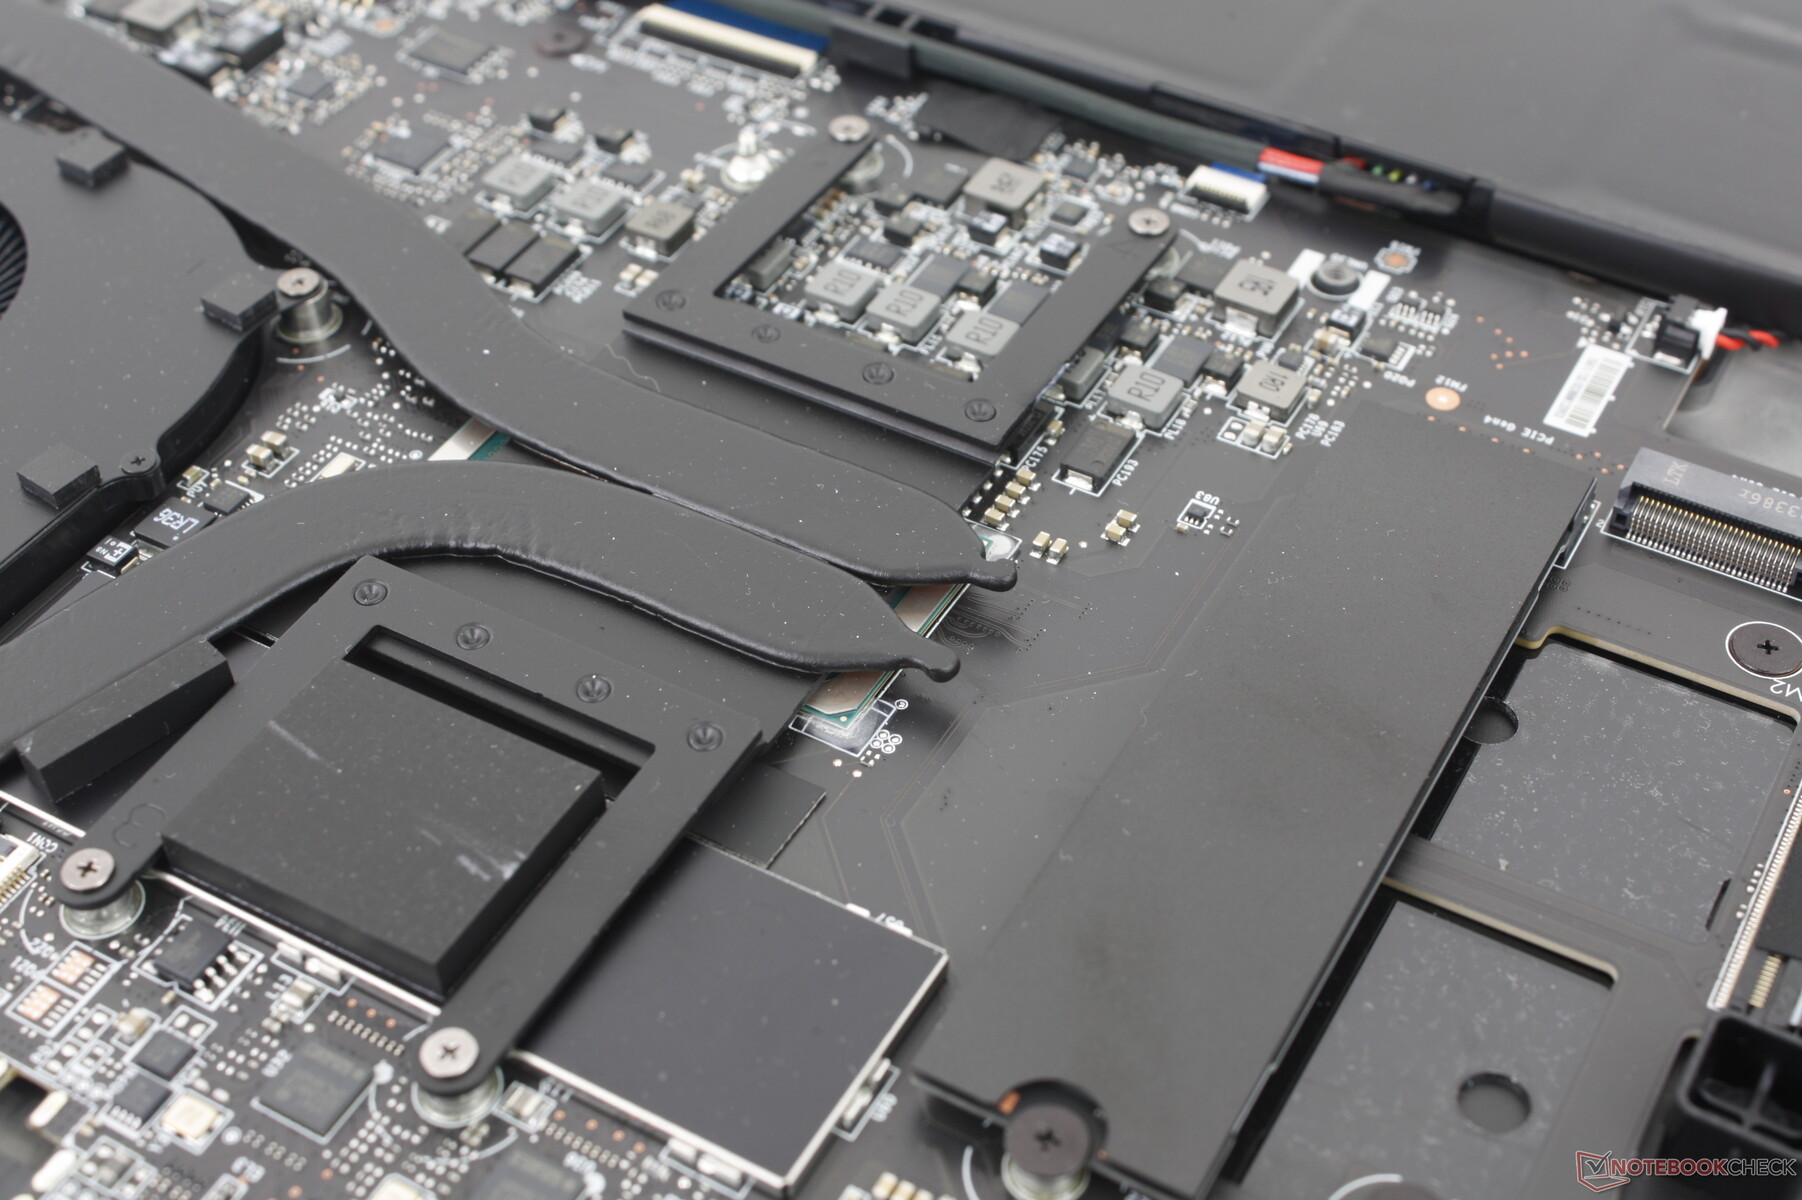
Maintenance
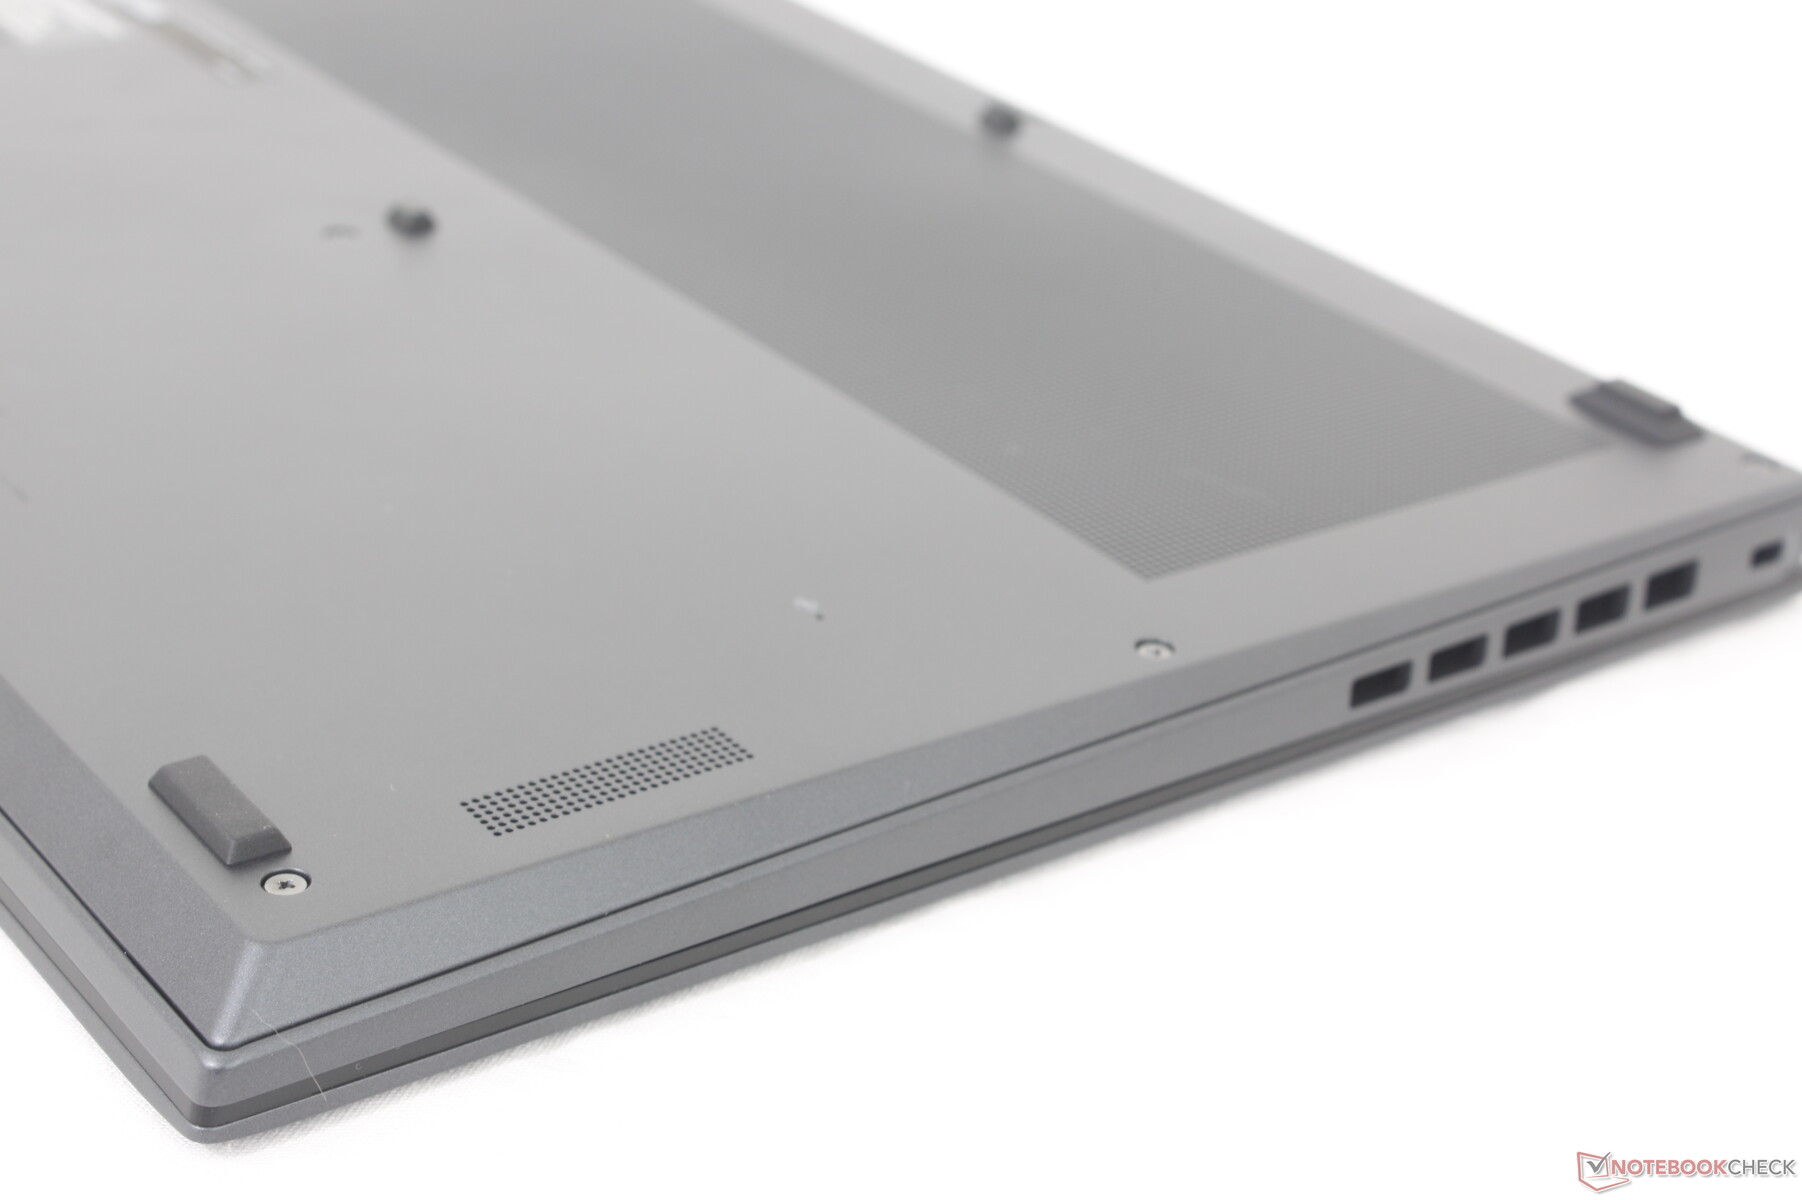
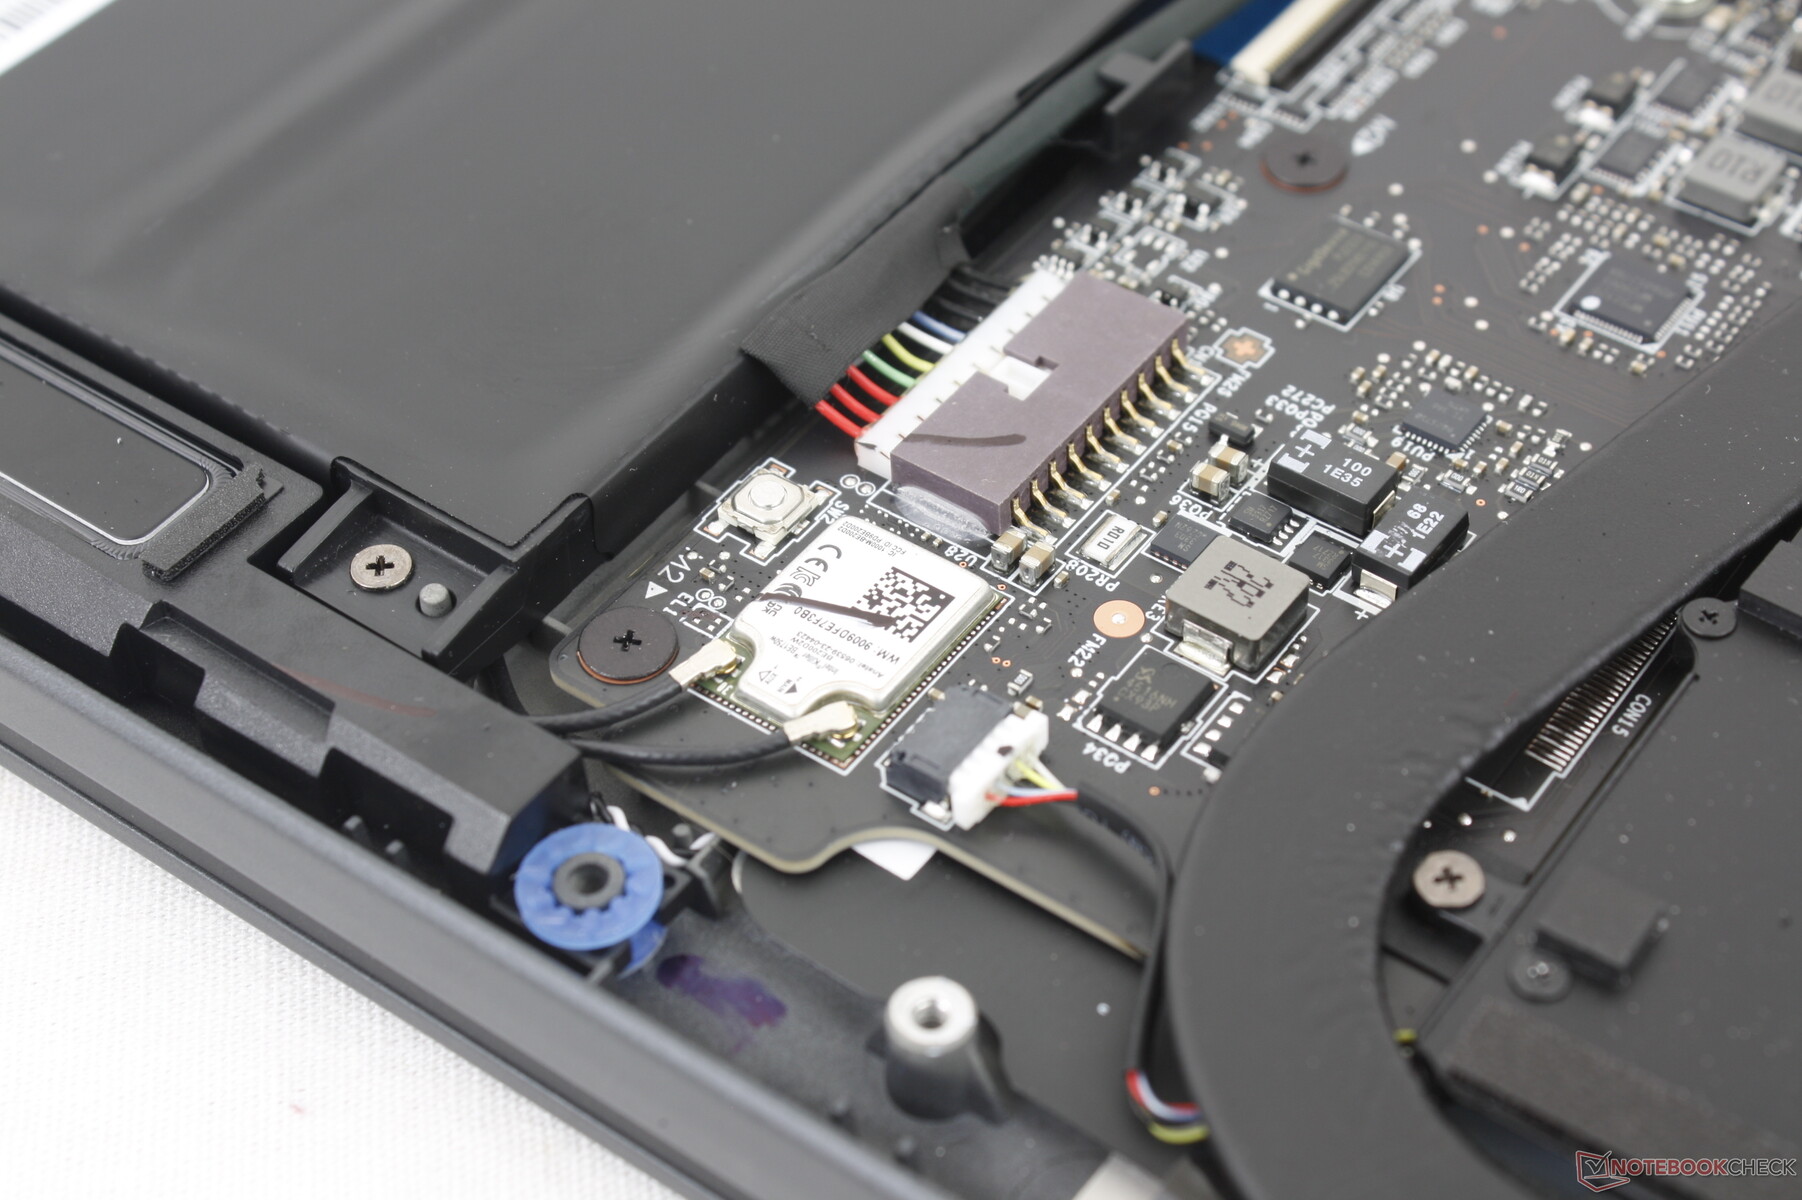
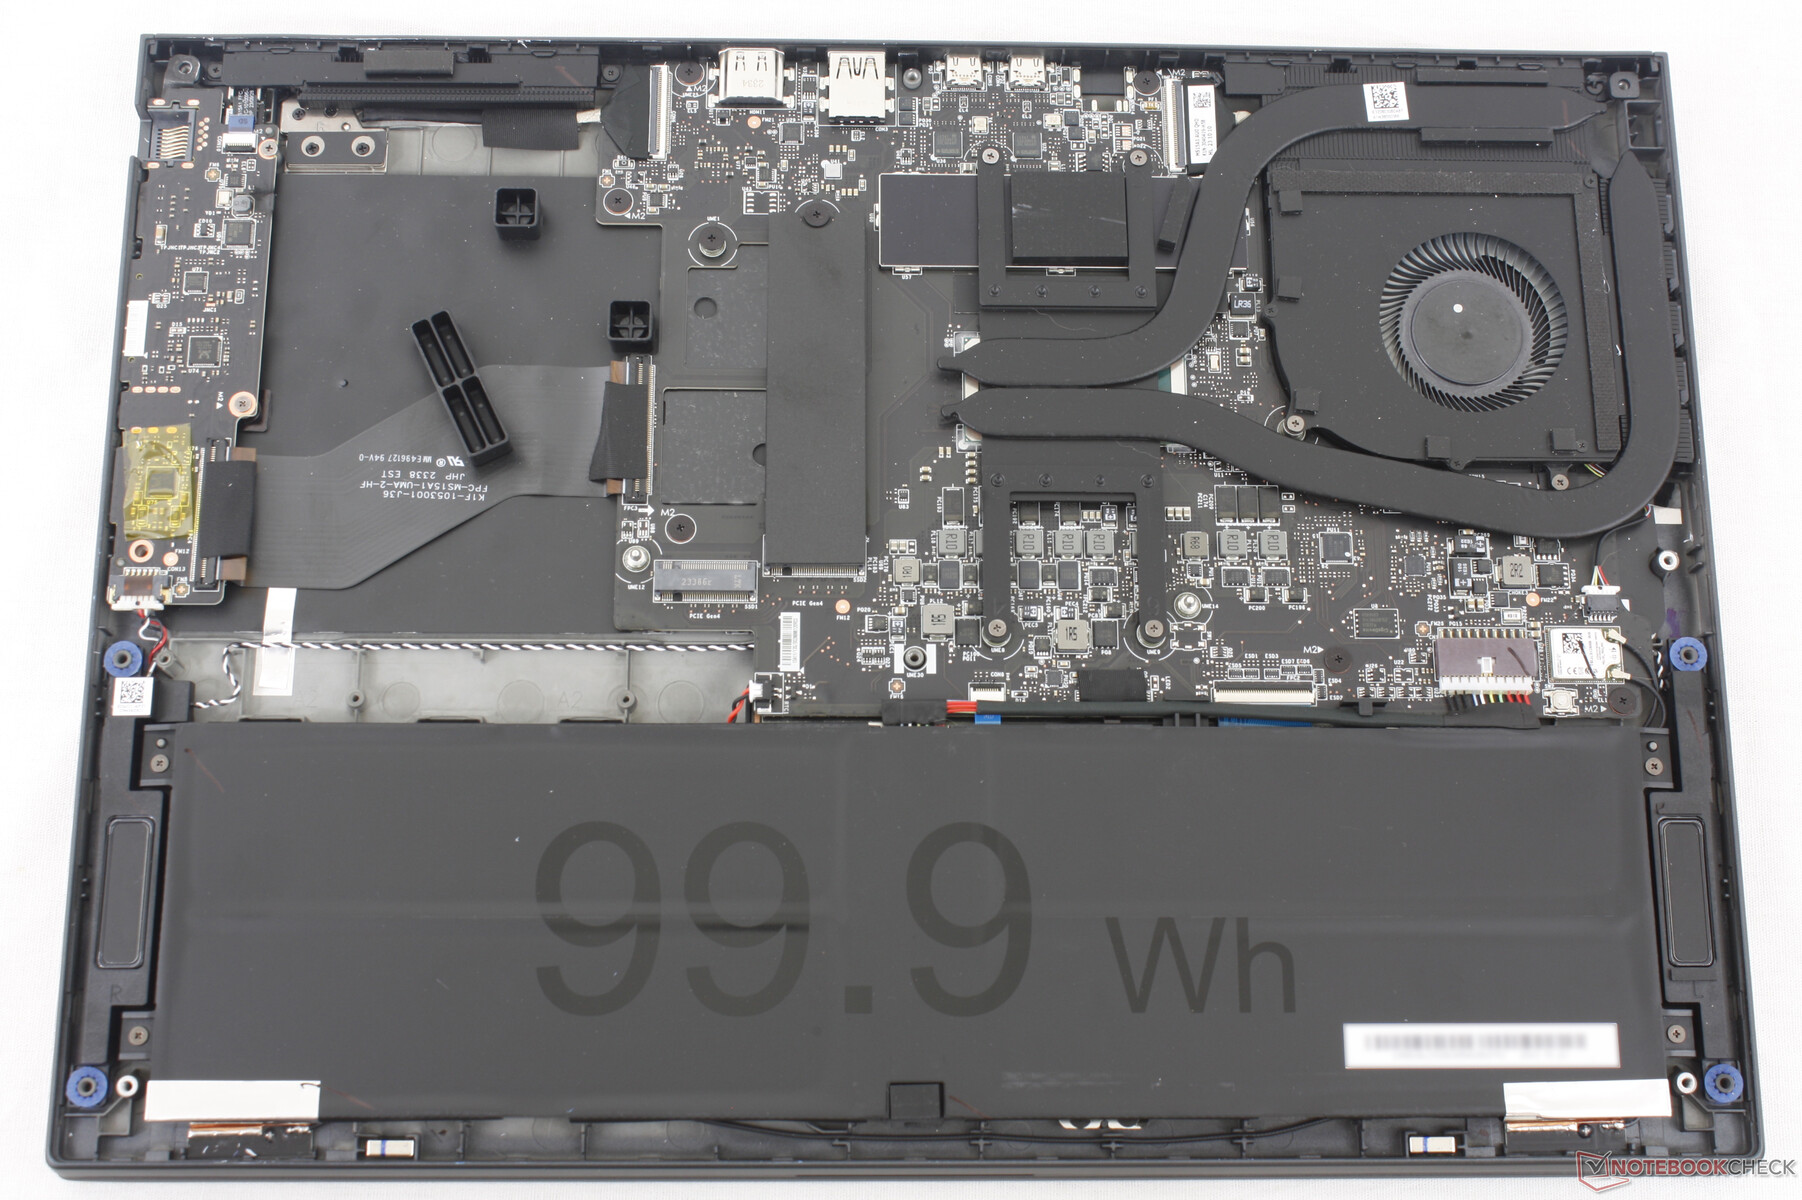
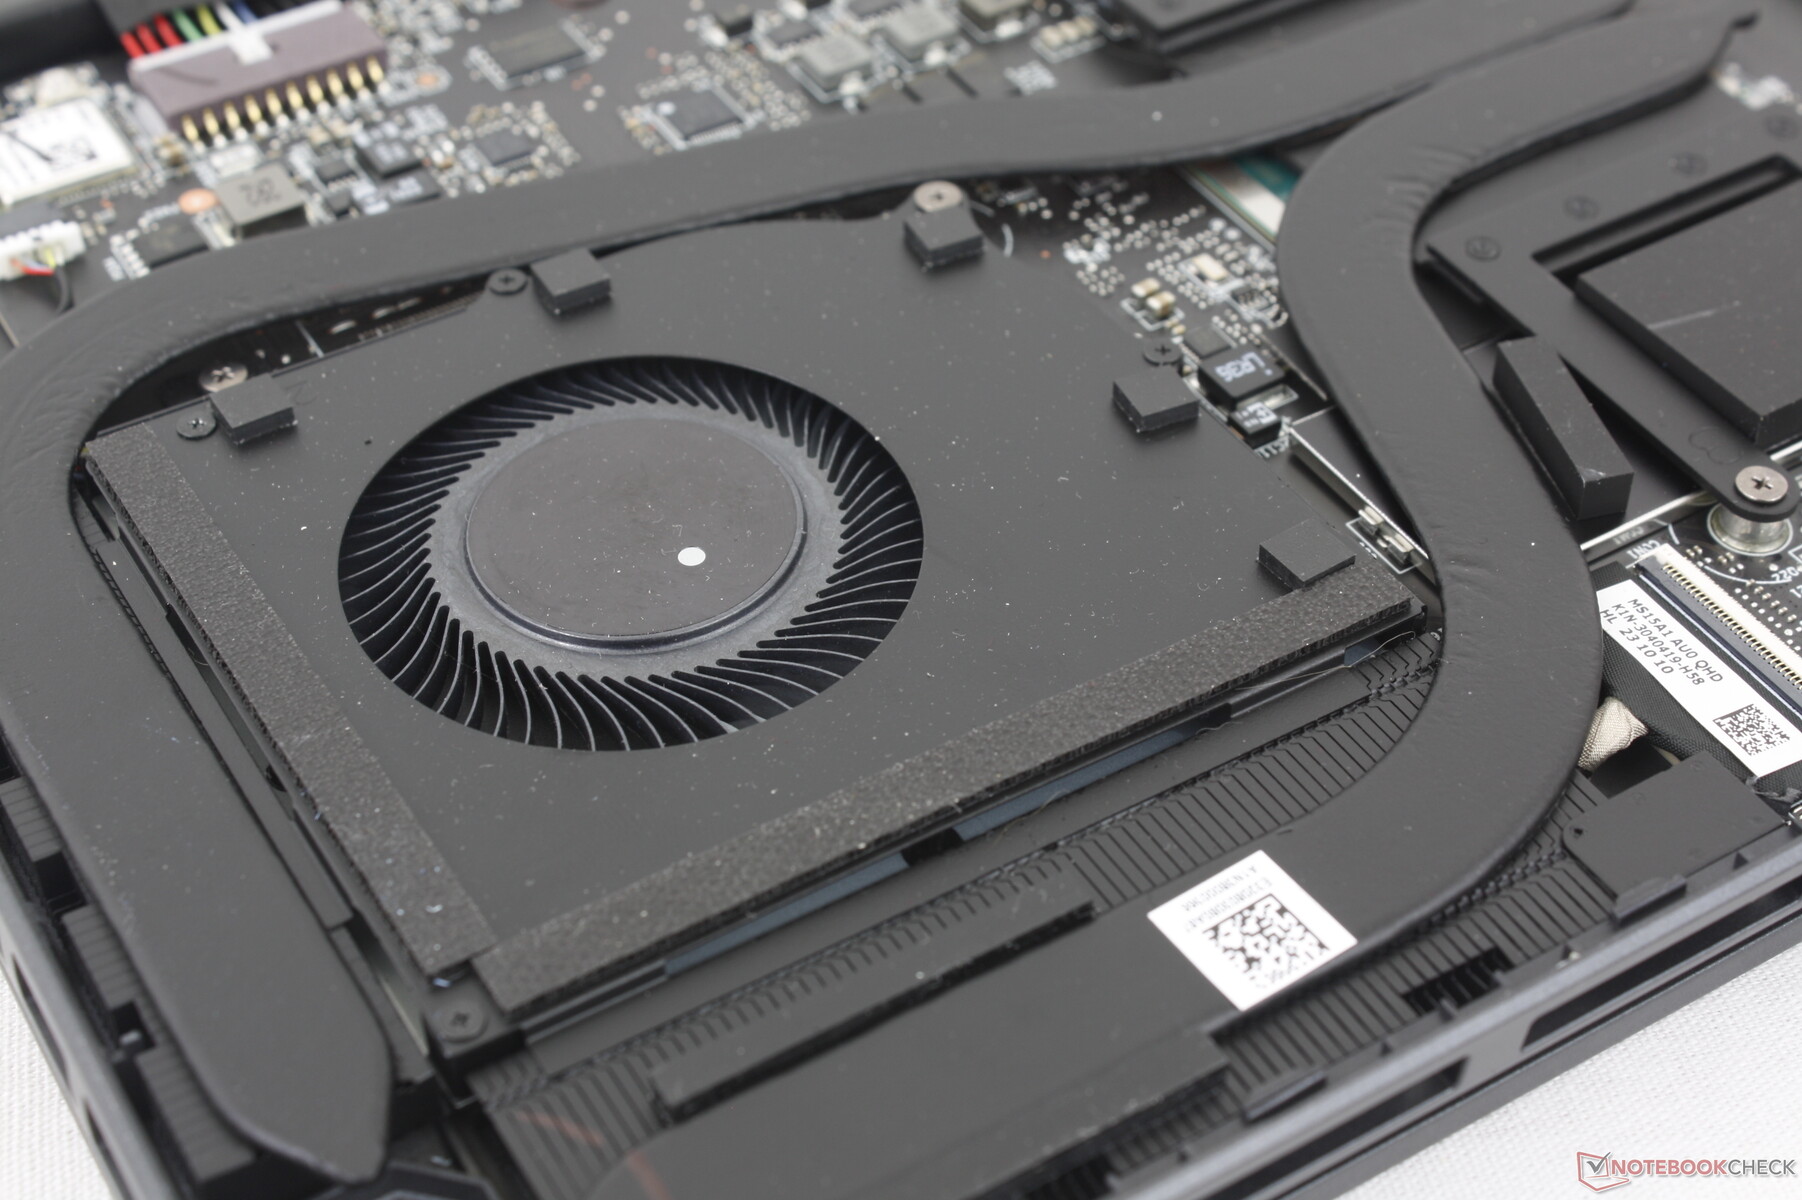
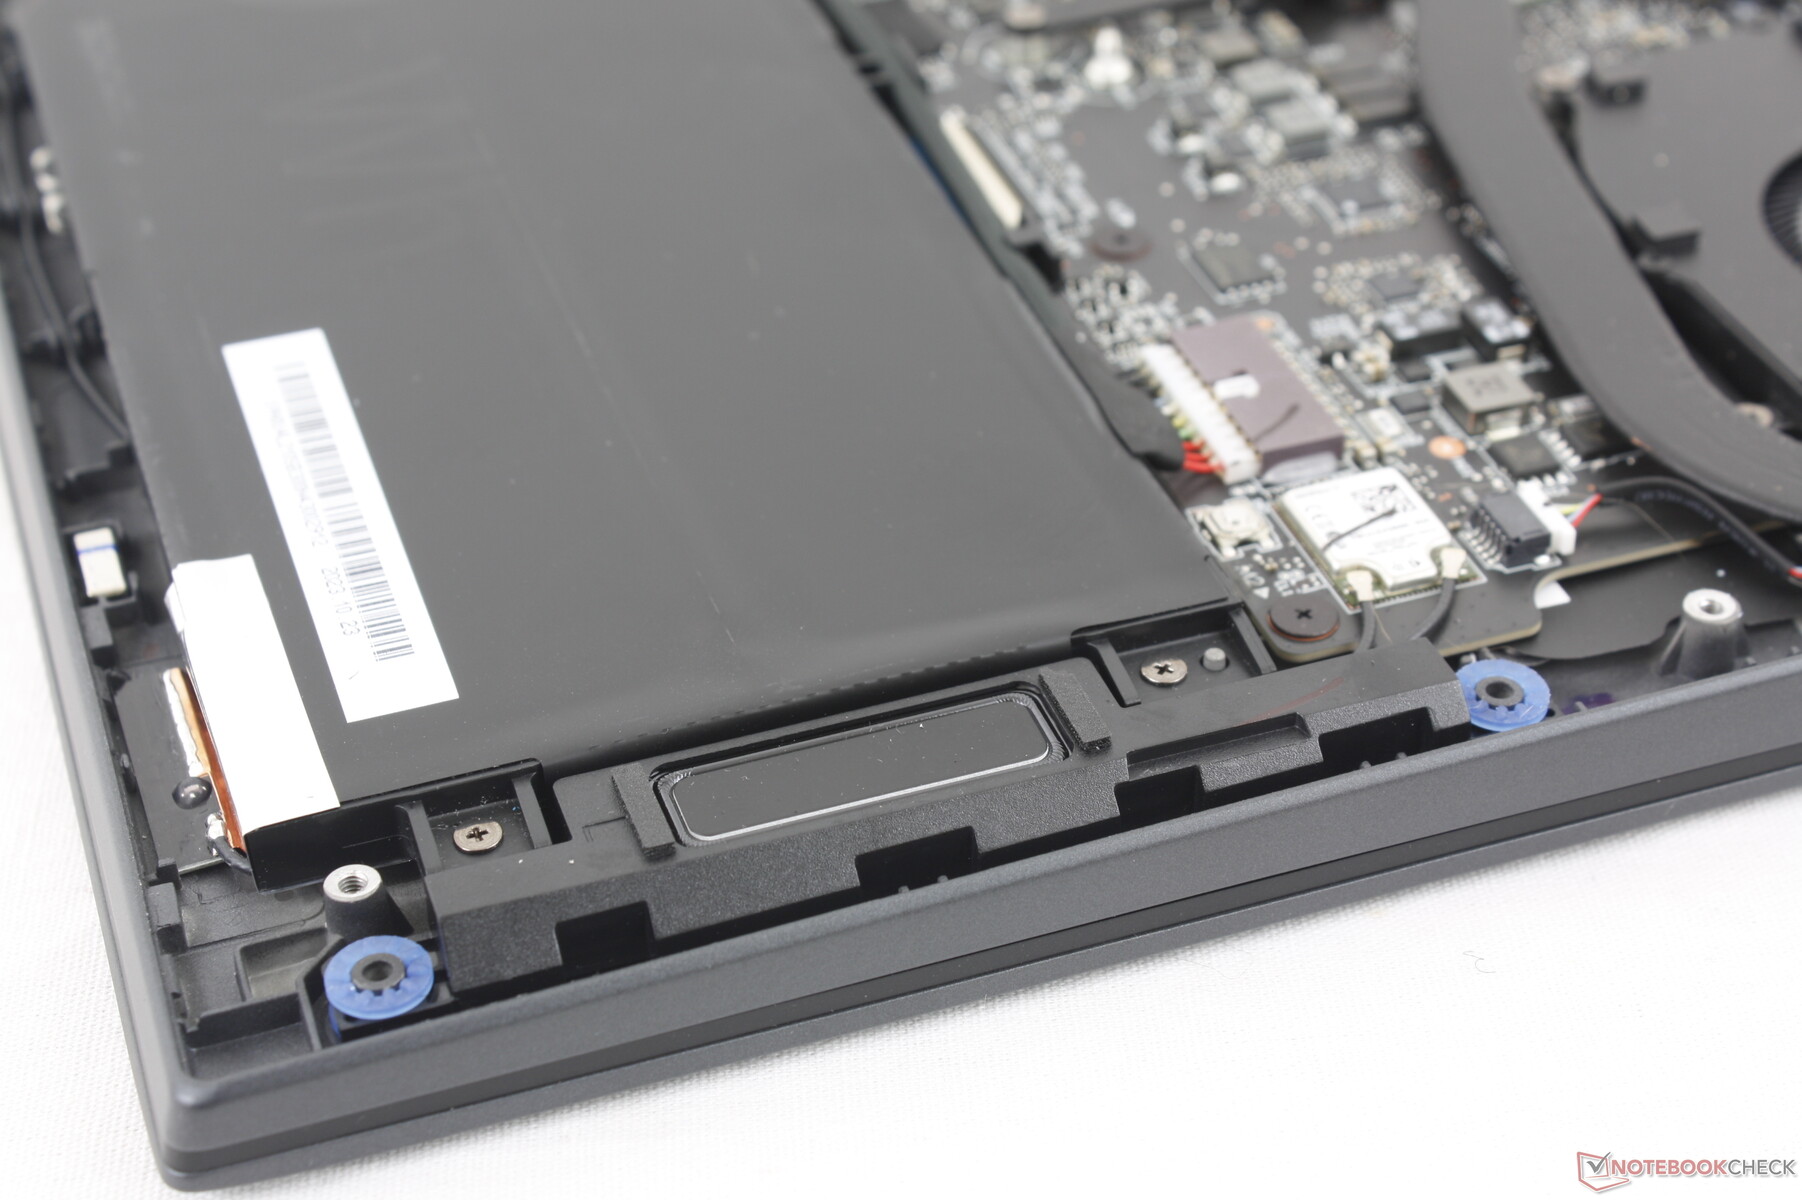
The bottom panel pops off fairly easily after removing the eight Phillips screws. Keep in mind that a factory seal sticker must be broken in order to access the internals.
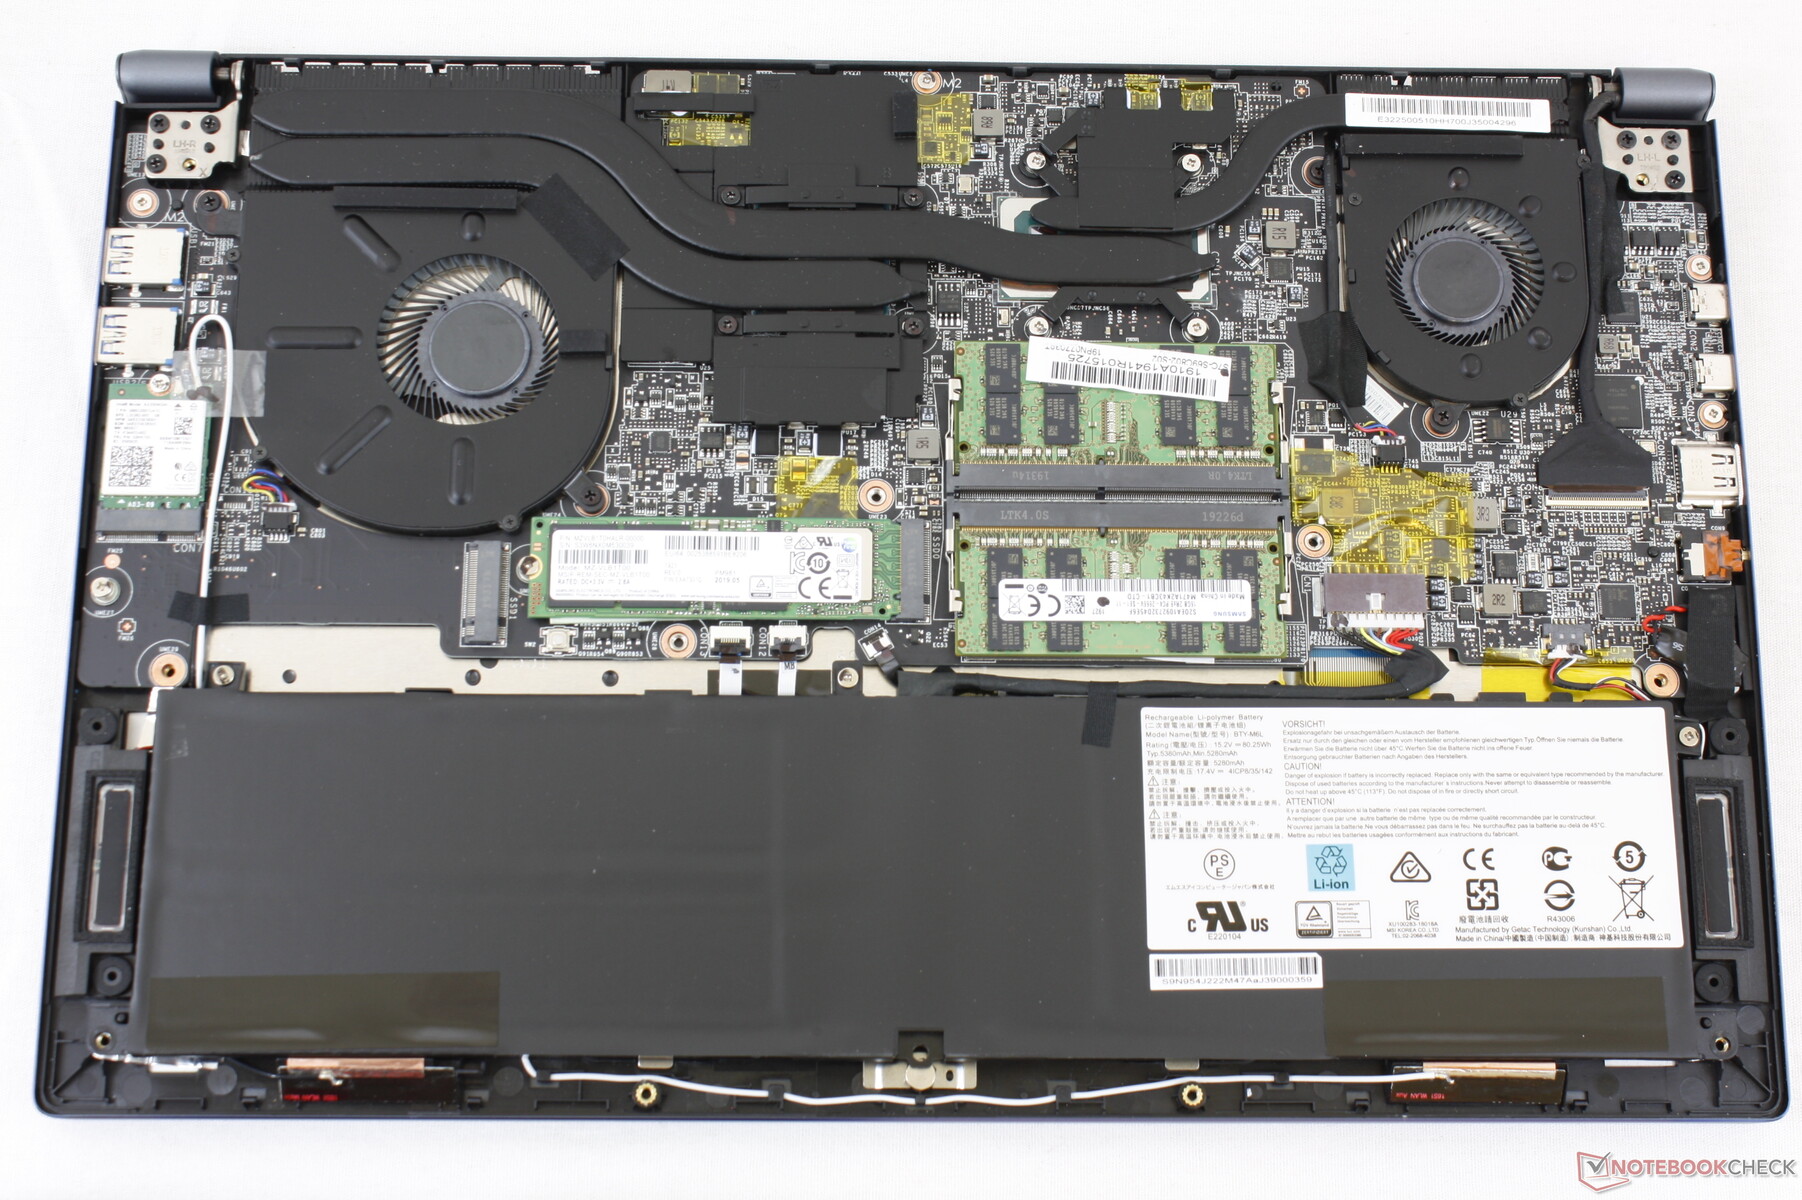
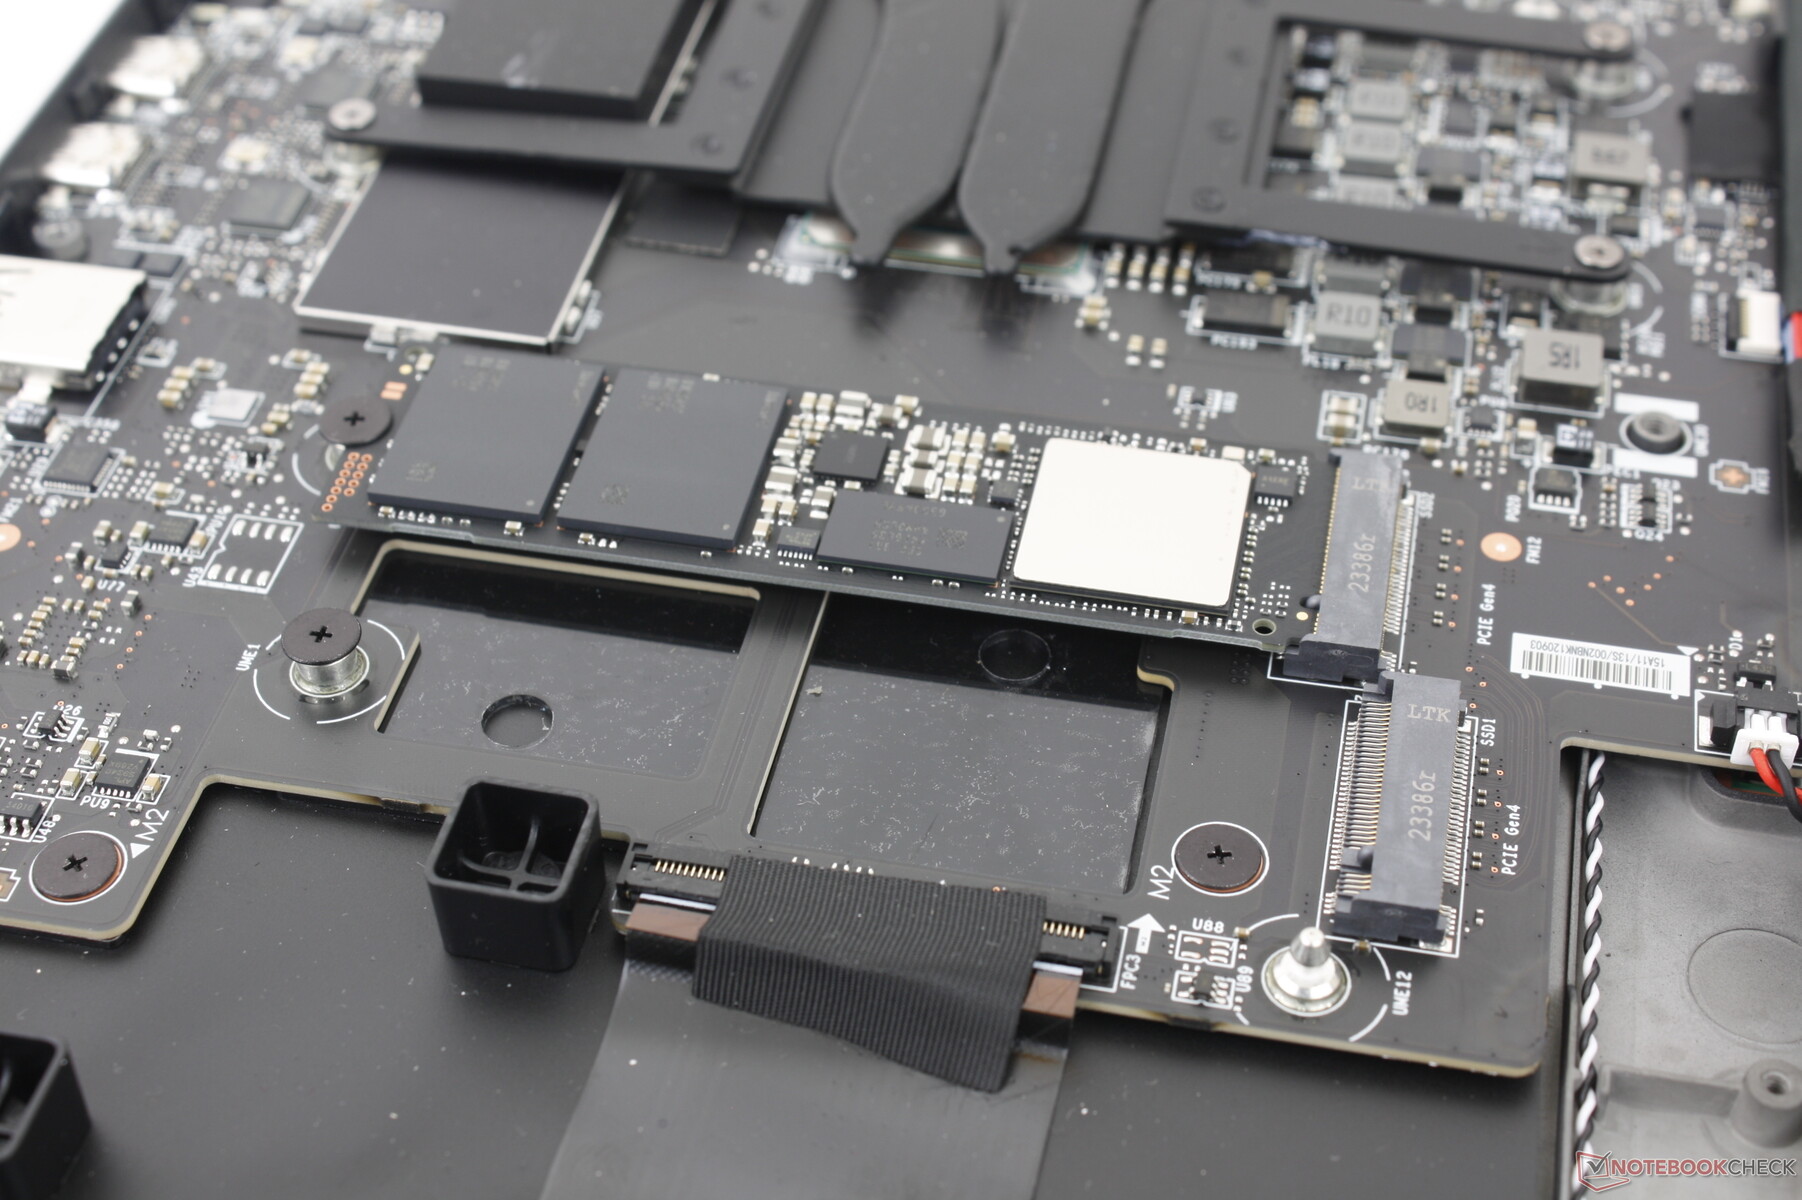
Once inside, owners will have access to two M.2 2280 PCIe4 x4 NVMe SSD slots while the RAM and WLAN modules are all soldered. In comparison, all of these modules are removable on the older Prestige 15 design.
Note the large empty space reserved for SKUs with discrete graphics. The model comes equipped with more heat pipes, an additional fan, and rearranged M.2 SSDs if configured with a dedicated GPU.
Accessories And Warranty
There are no extras in the box beyond the AC adapter and paperwork. The usual one-year limited warranty applies if purchased in the US.
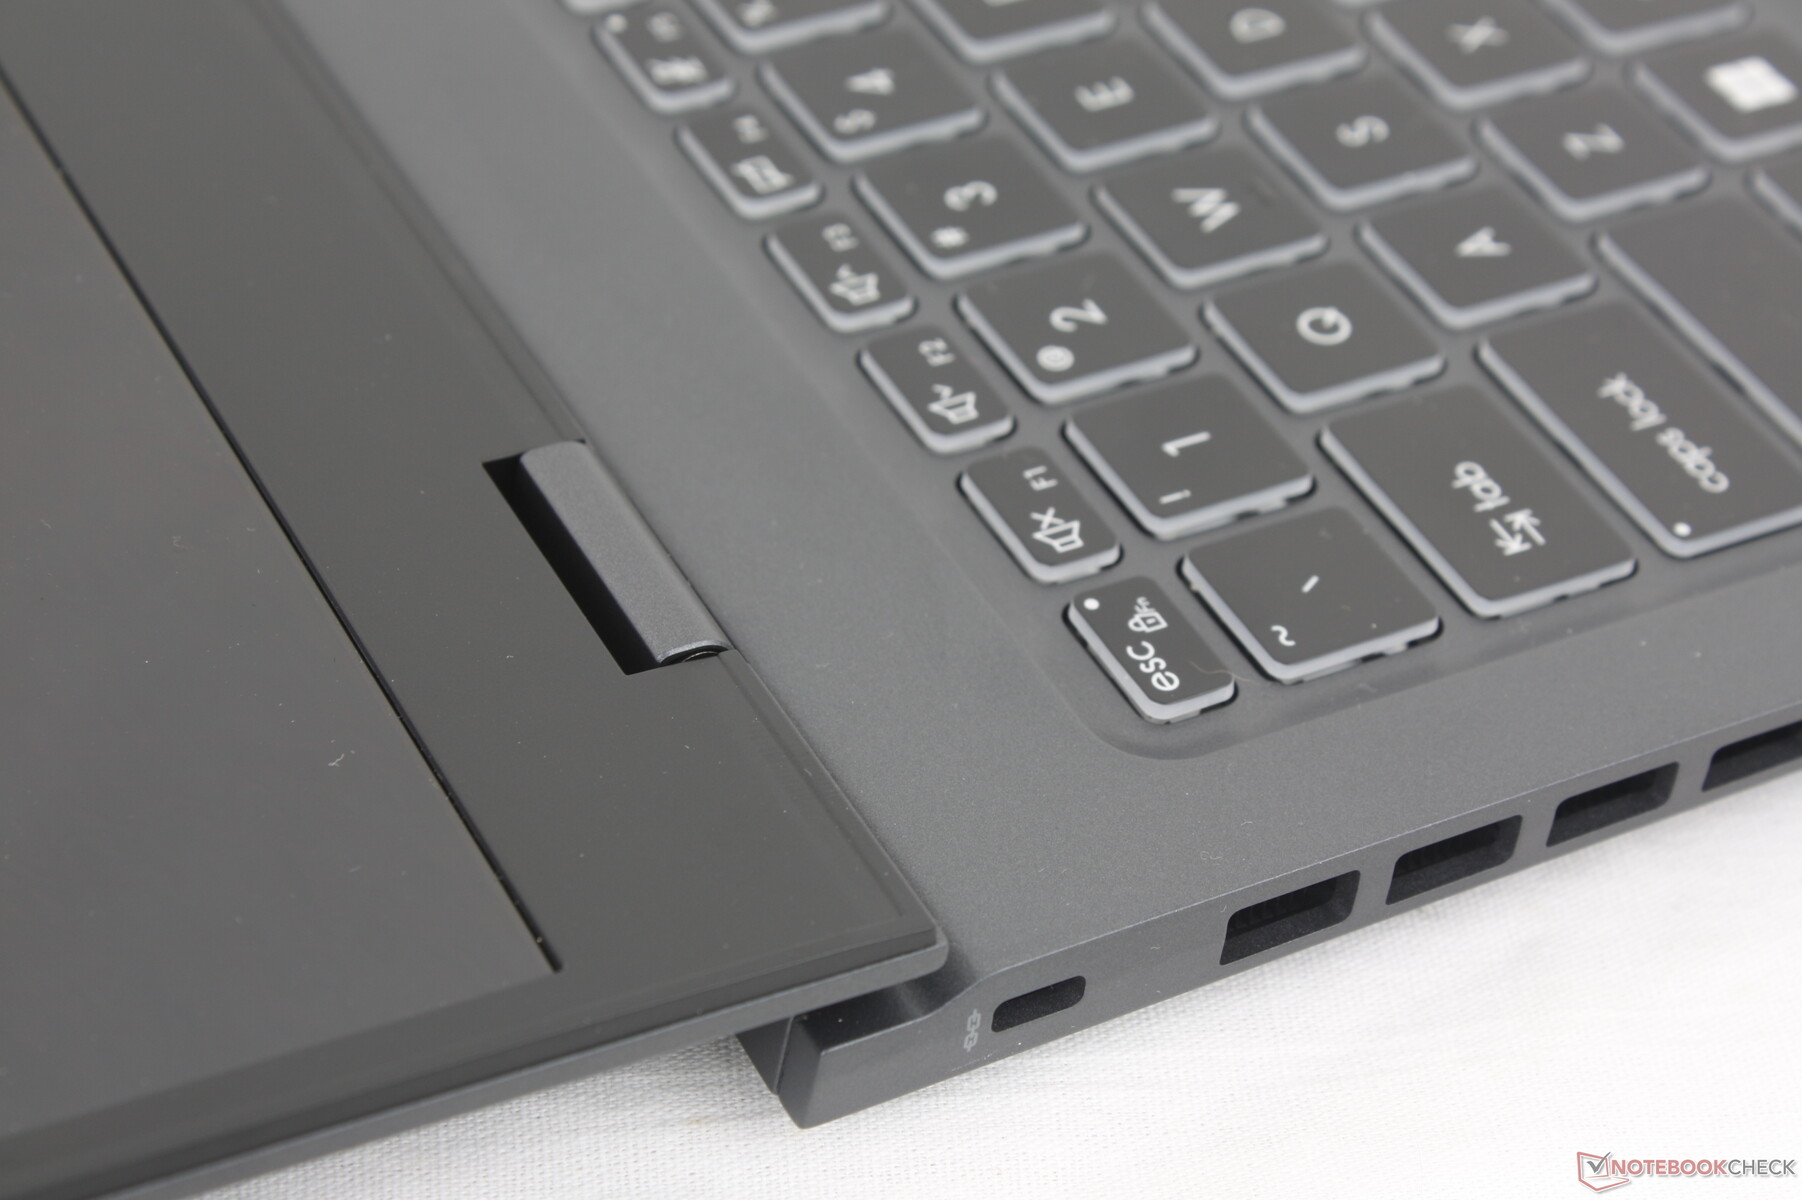
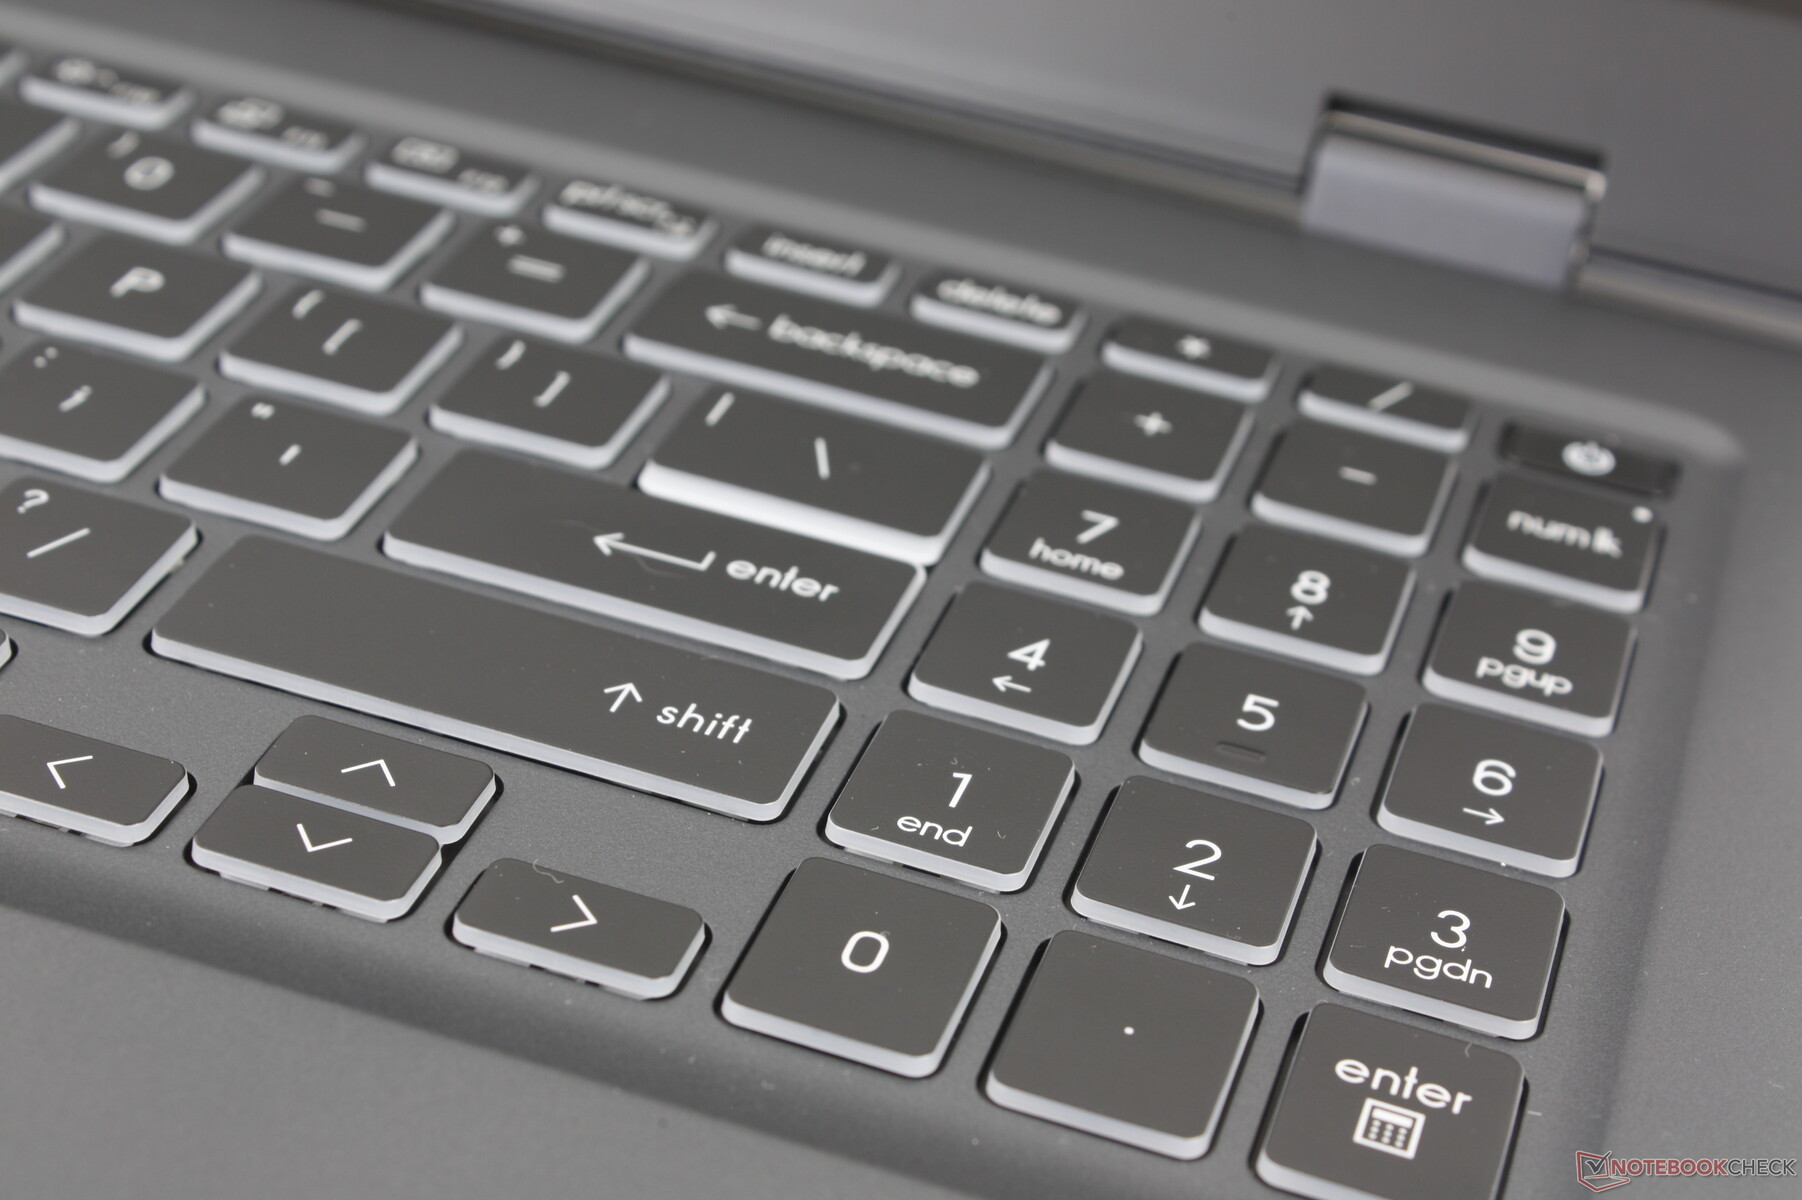
Input Devices — Bigger Than Before
Keyboard
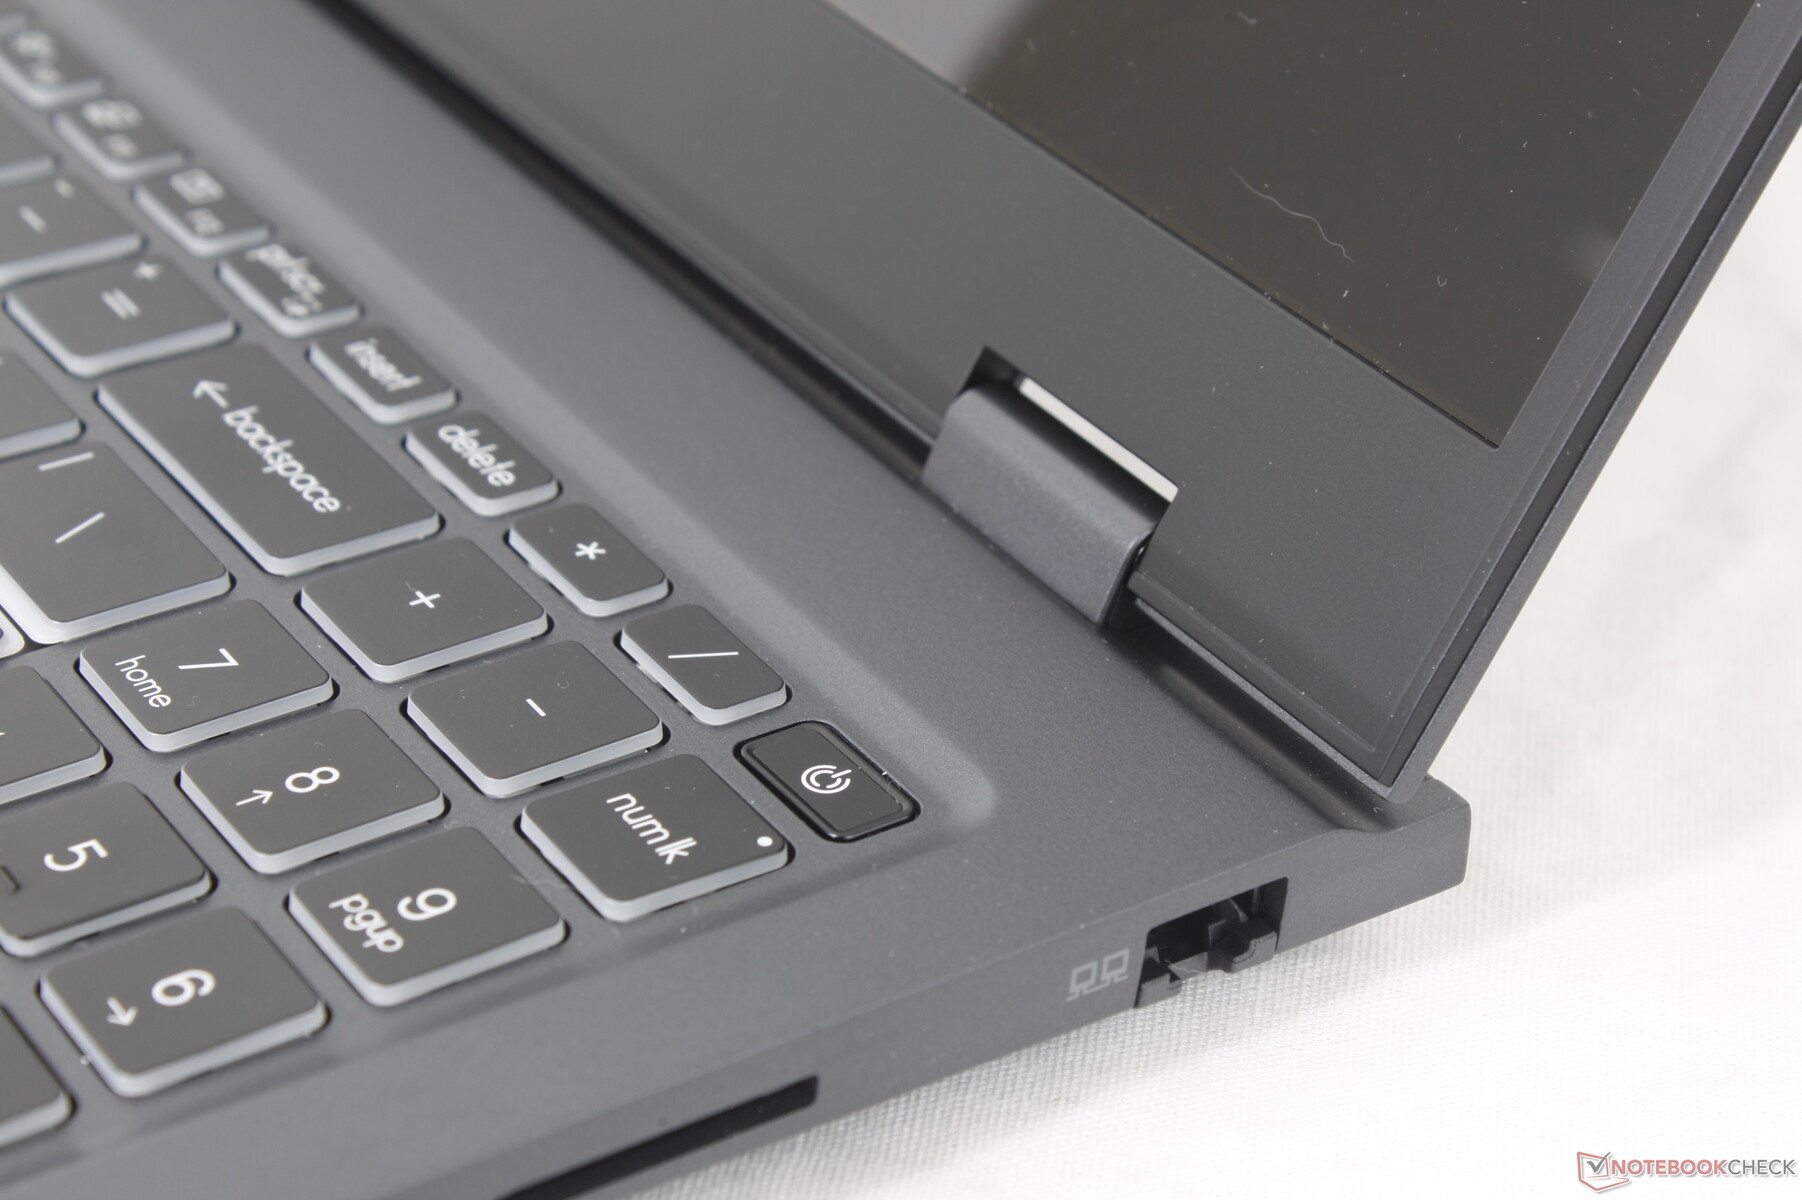
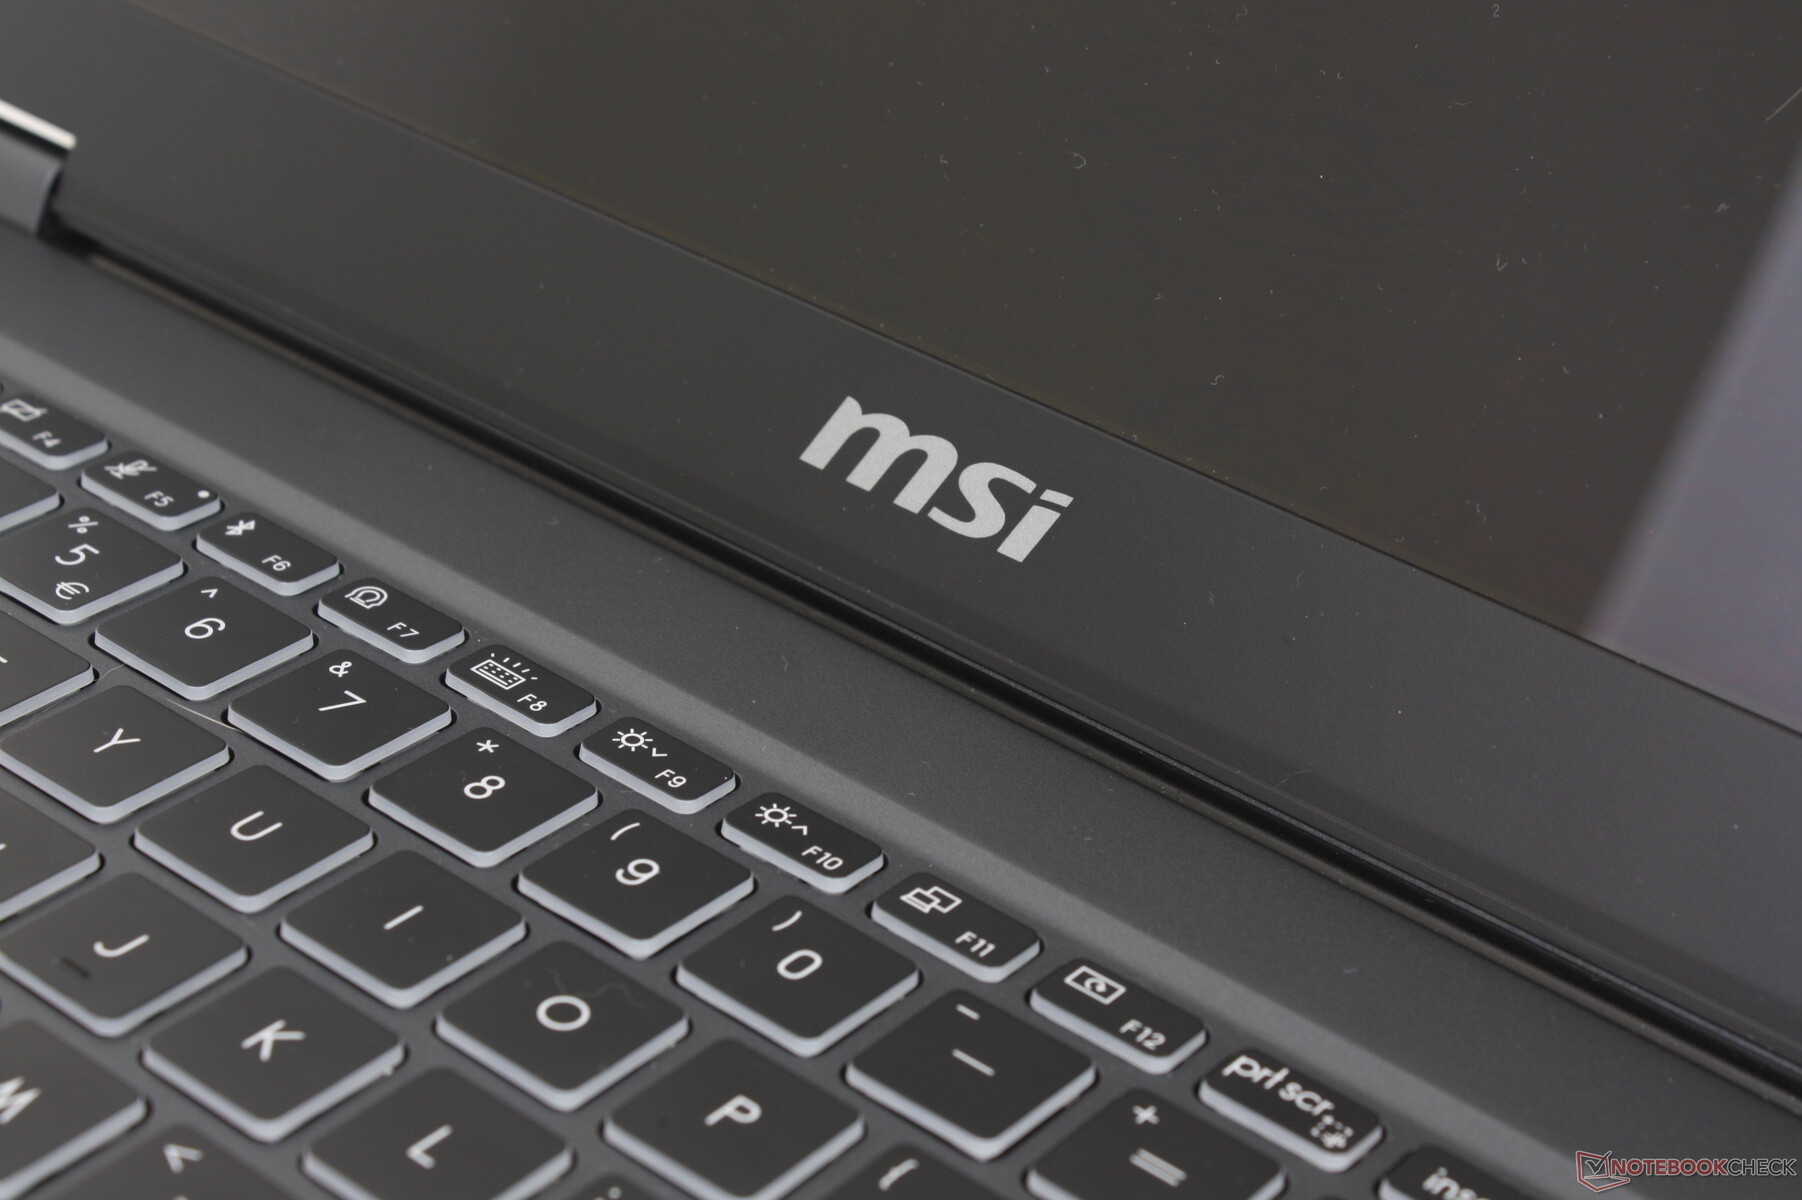
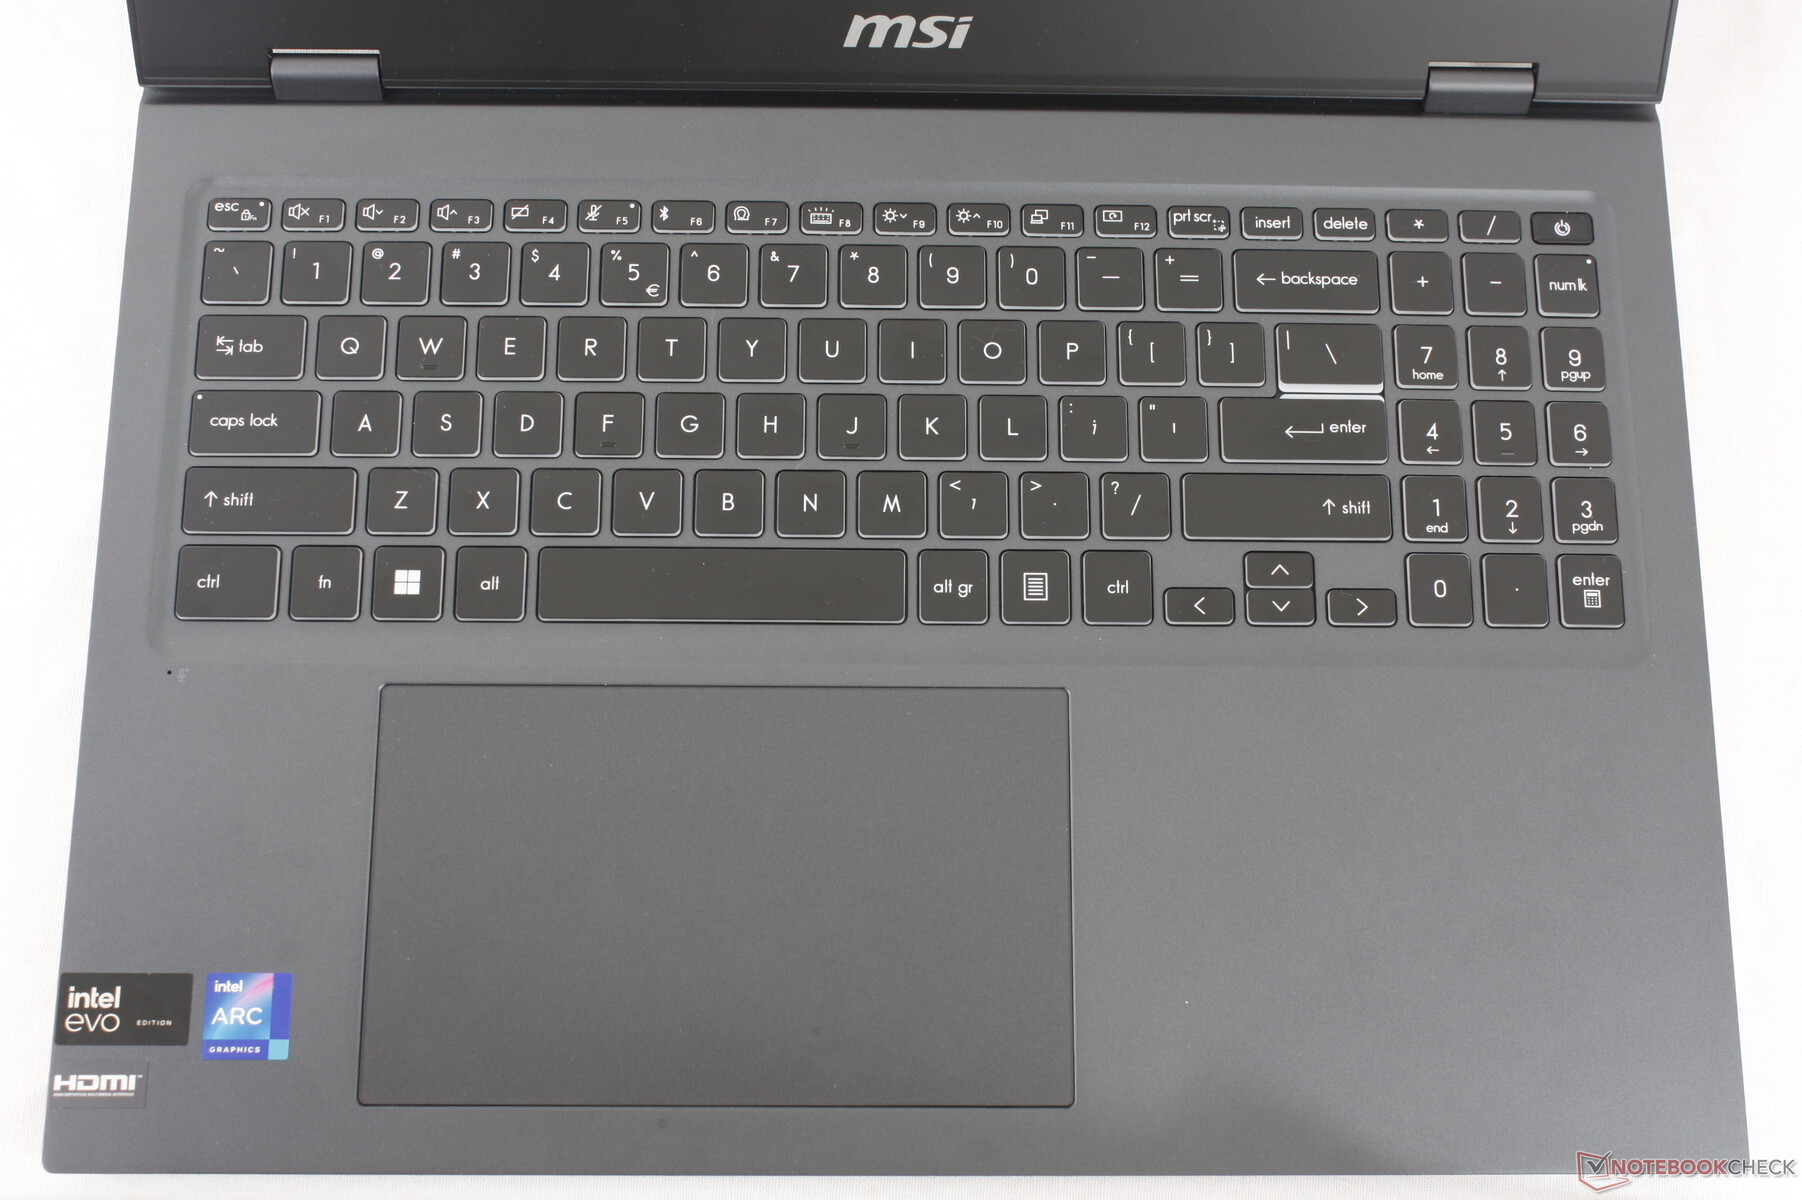
The keyboard has been revamped to include an integrated numpad. Otherwise, key feedback feels the same as on the Prestige 15 for a similar typing experience despite the layout changes. We still find key travel to be noticeably shallower than the keys on MSI gaming laptops or the competing HP Spectre series. They're not overly soft or uncomfortable, but having firmer or sharper feedback on each press wouldn't hurt, either.
Touchpad
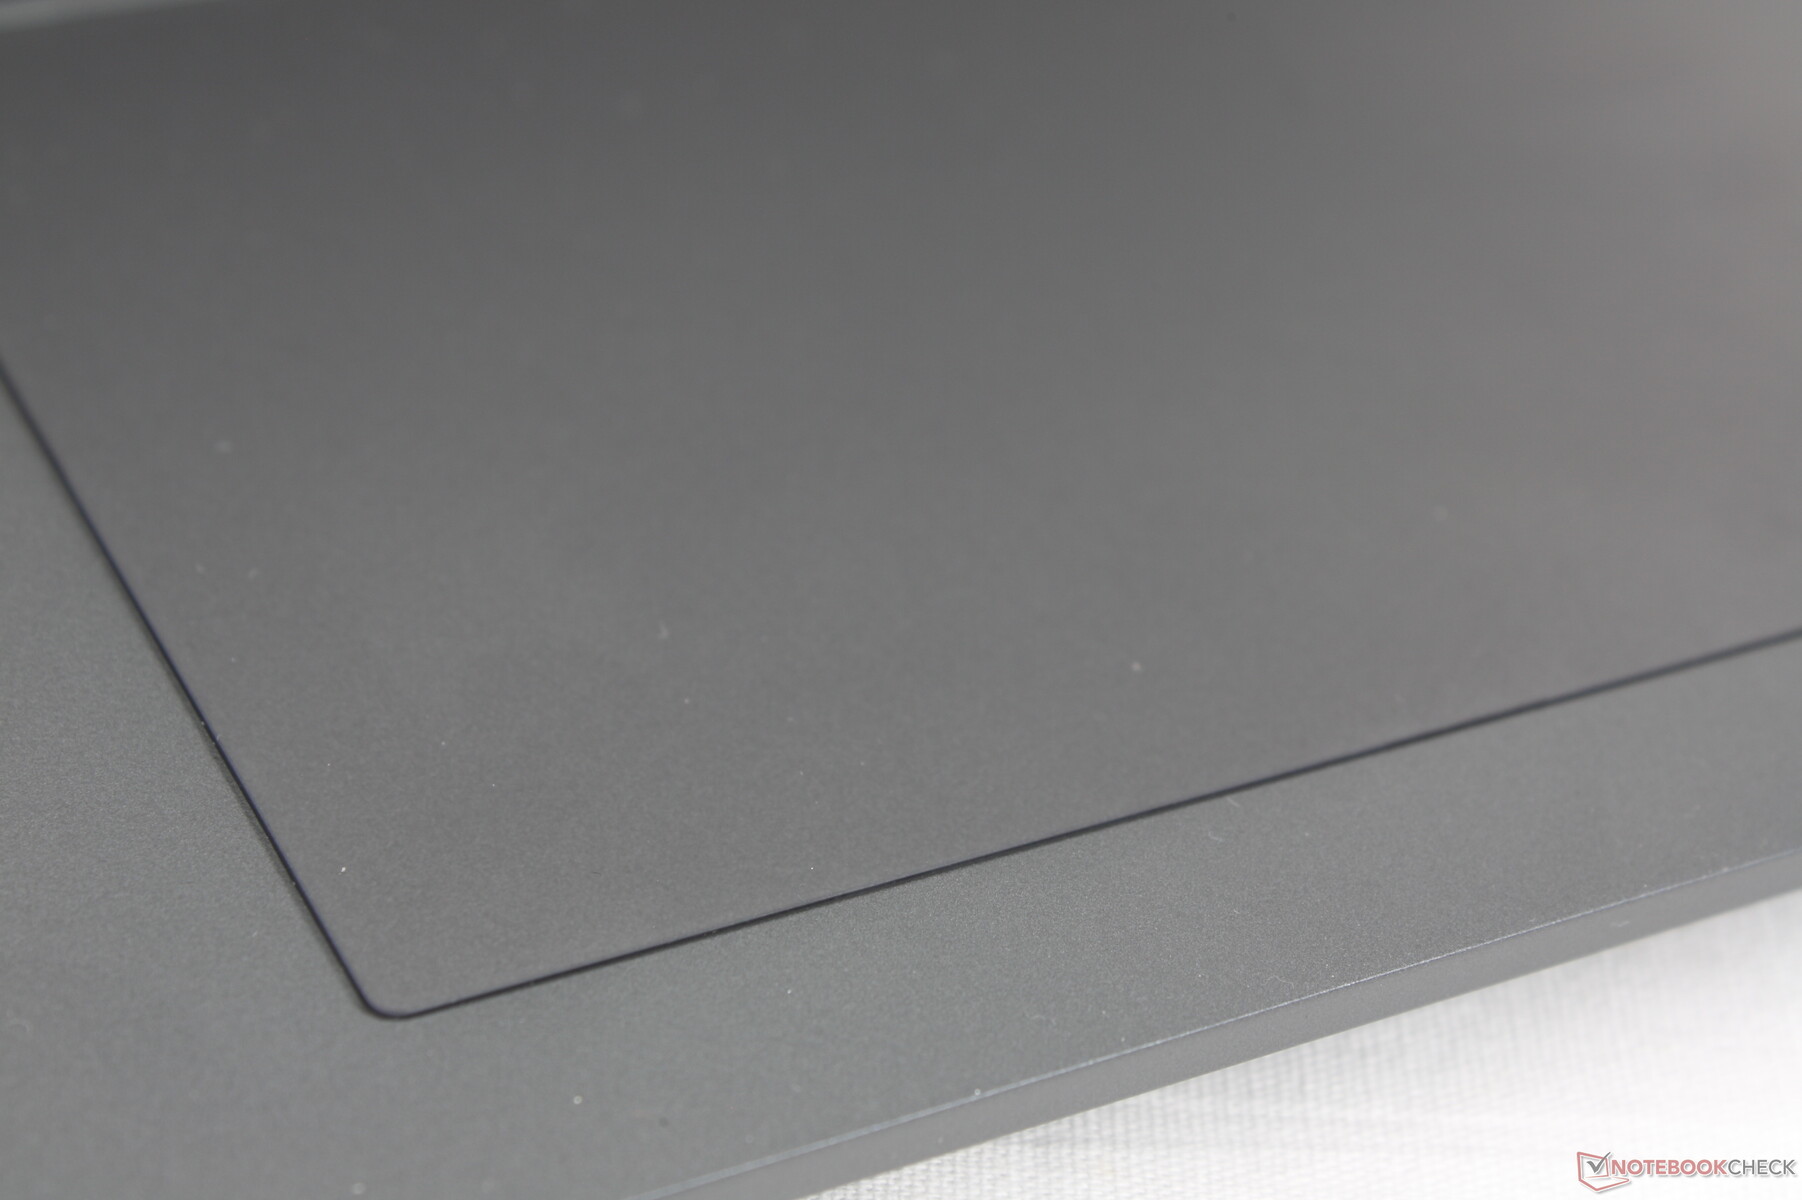
The clickpad is now much larger (15 x 9 cm) to address the awkwardly narrow dimensions of the clickpad on the older Prestige 15 design. Traction is smooth and reliable with no sticking even when gliding at slower speeds.
Feedback when clicking is only average if not a bit on the spongy side. Pressing down requires a lot of force from the finger and so actions can get tiring without an external mouse.

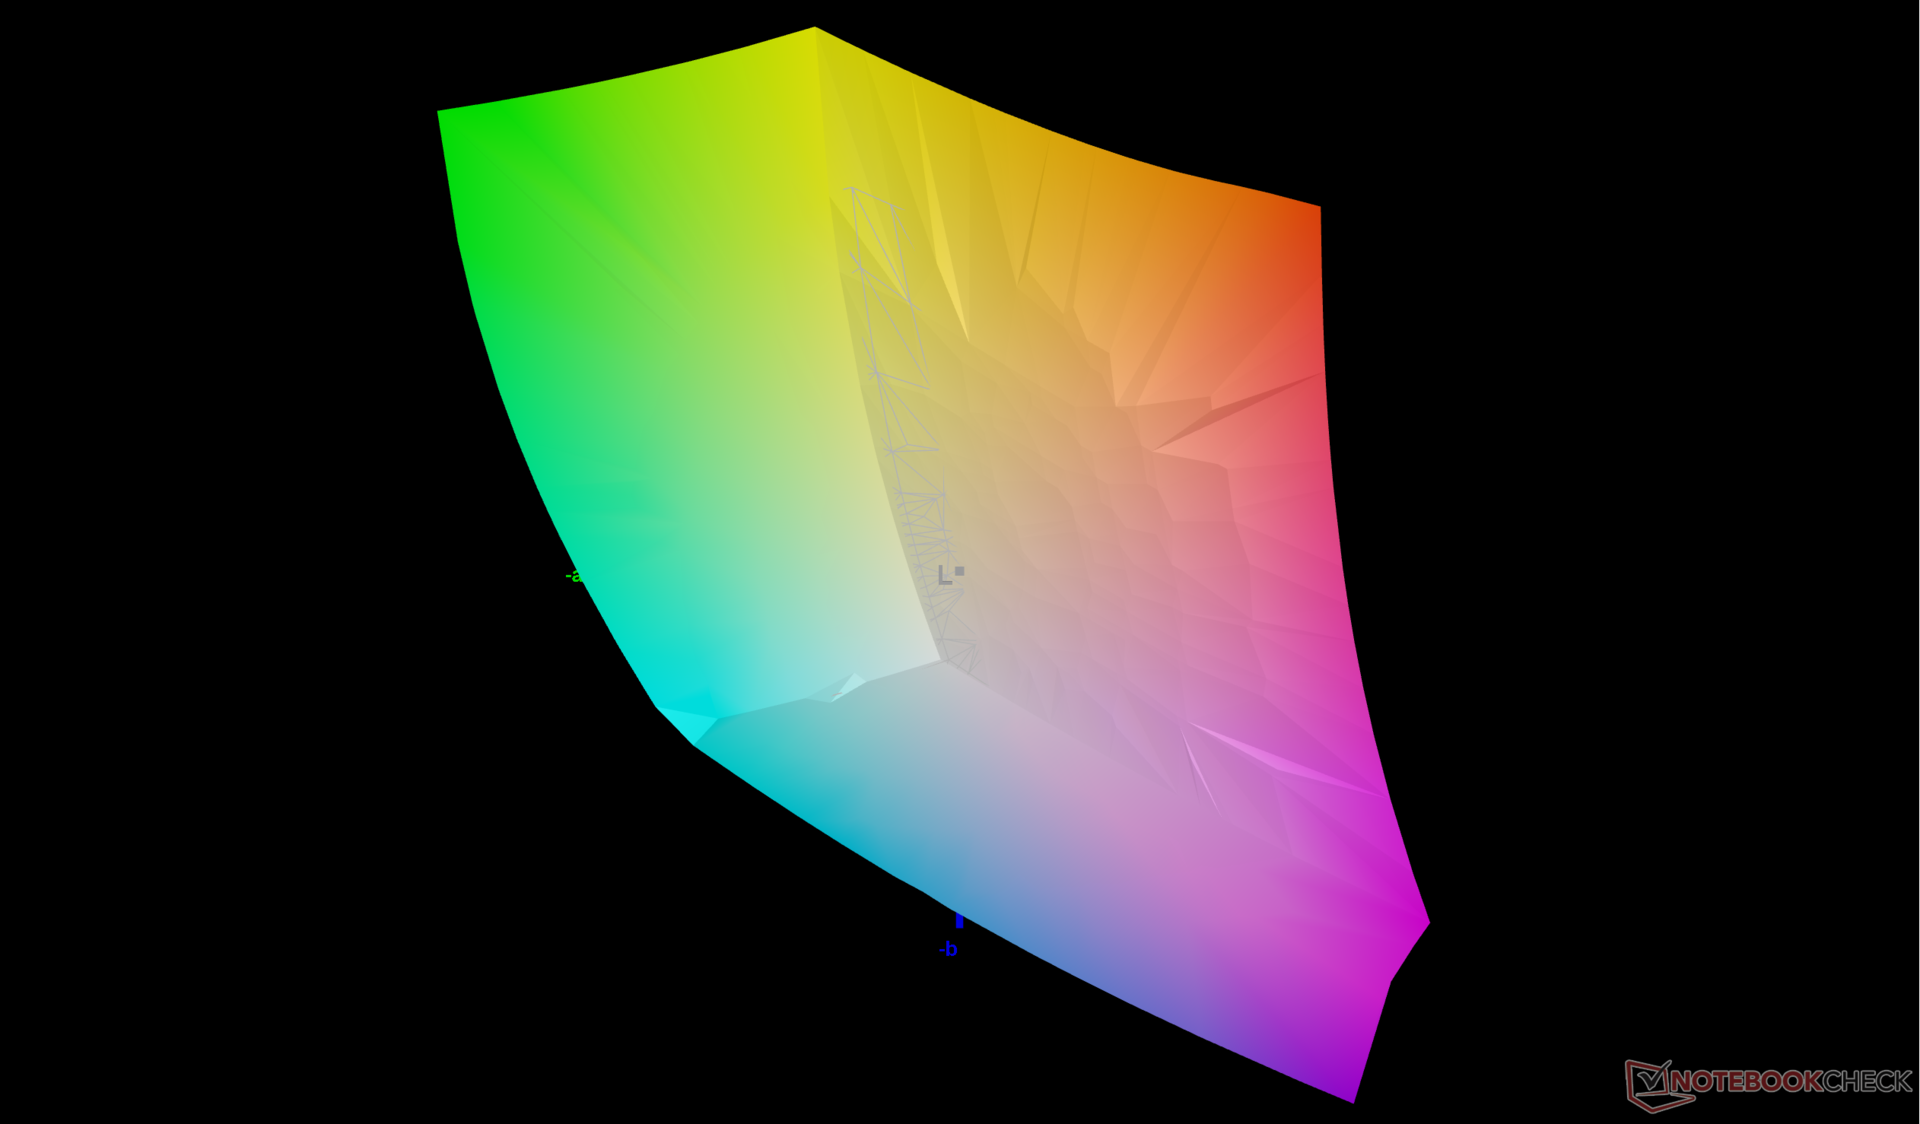
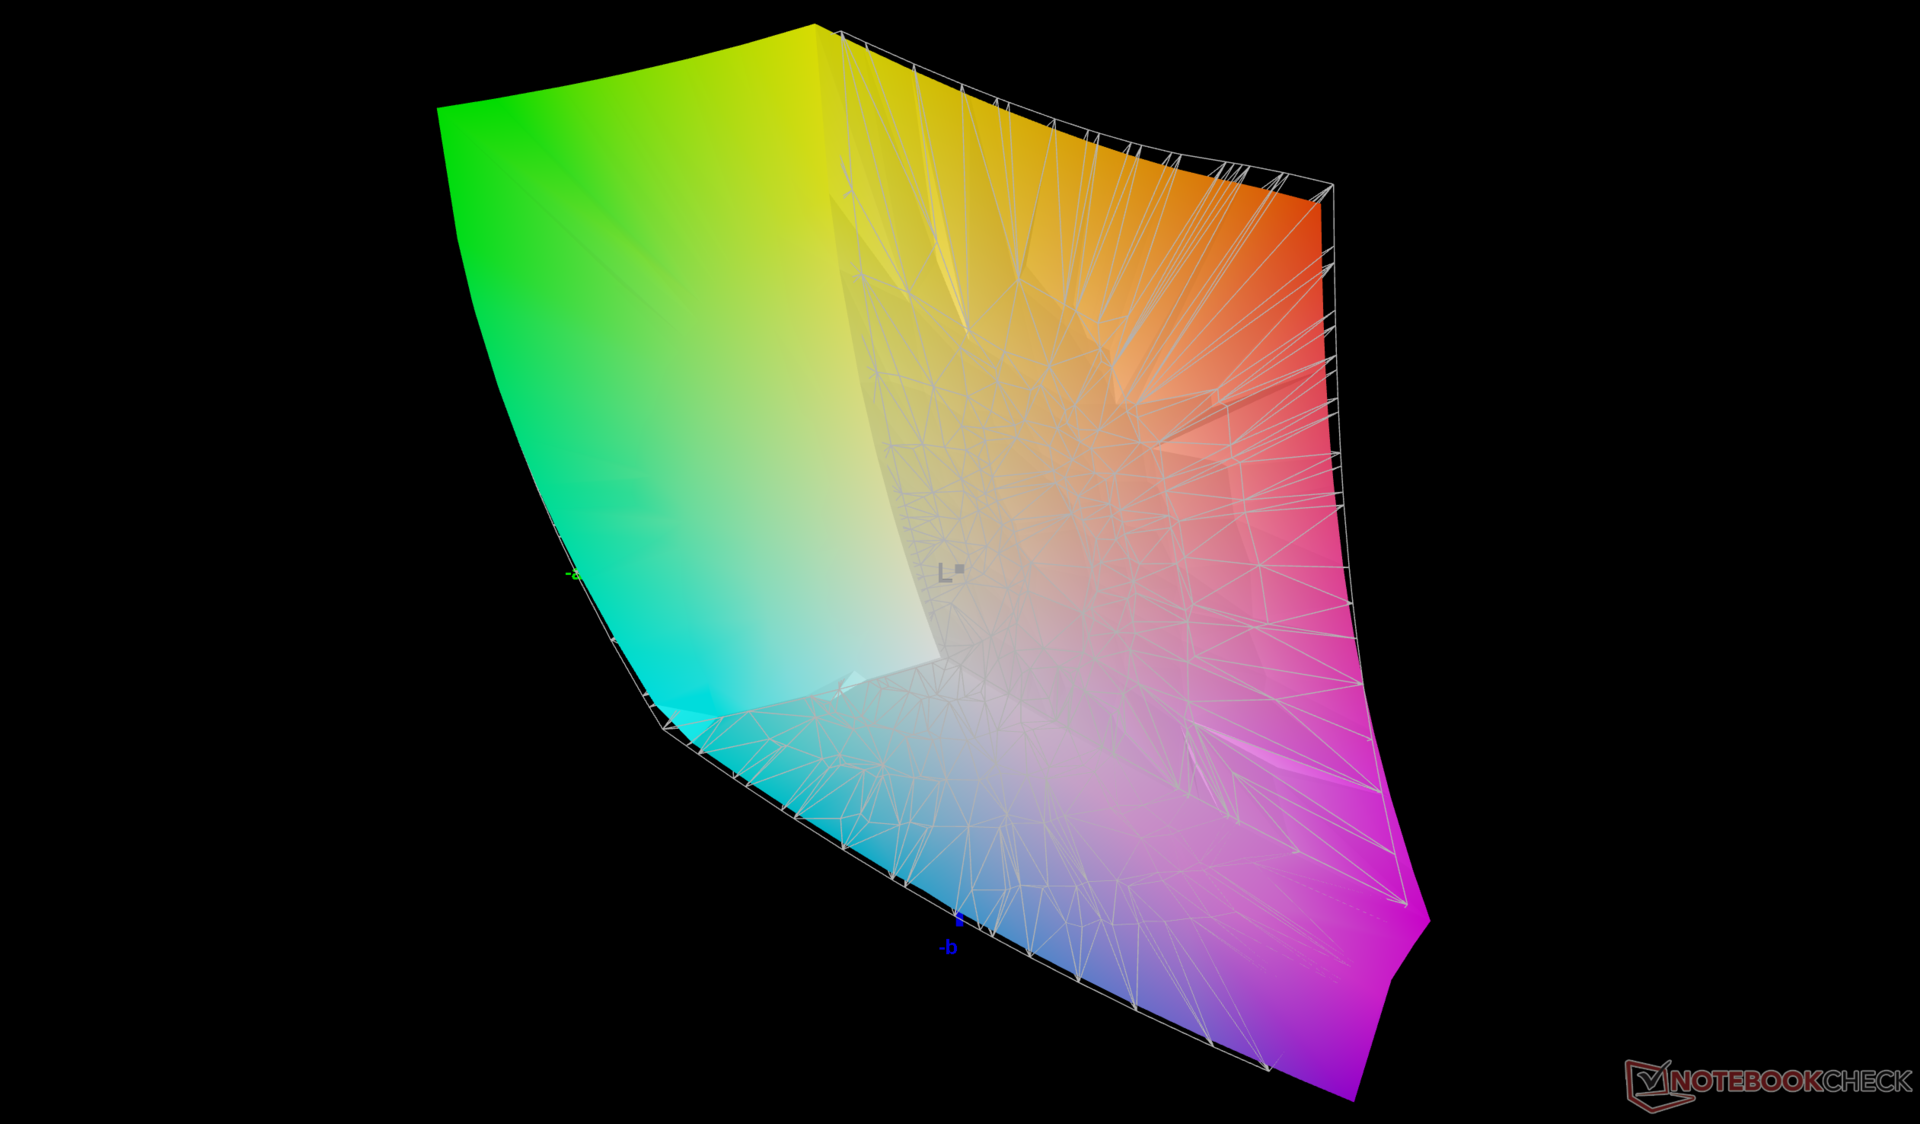
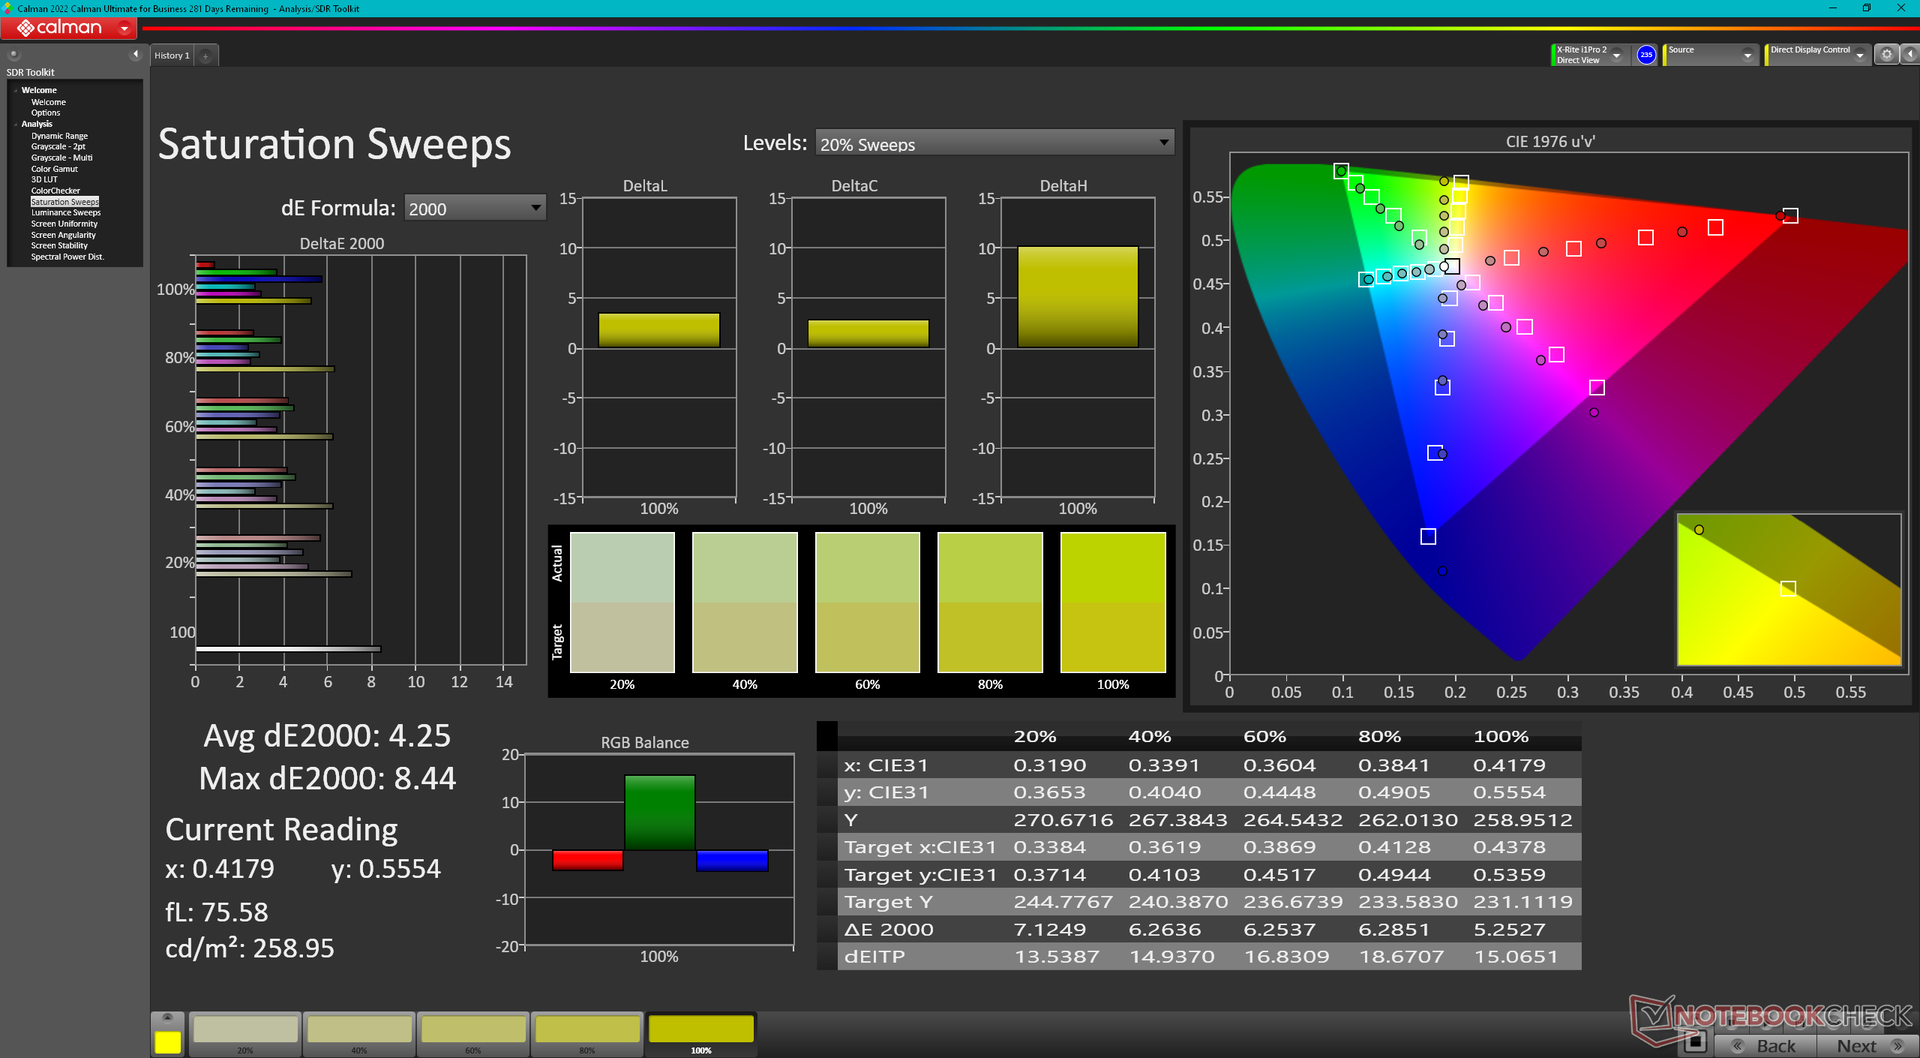
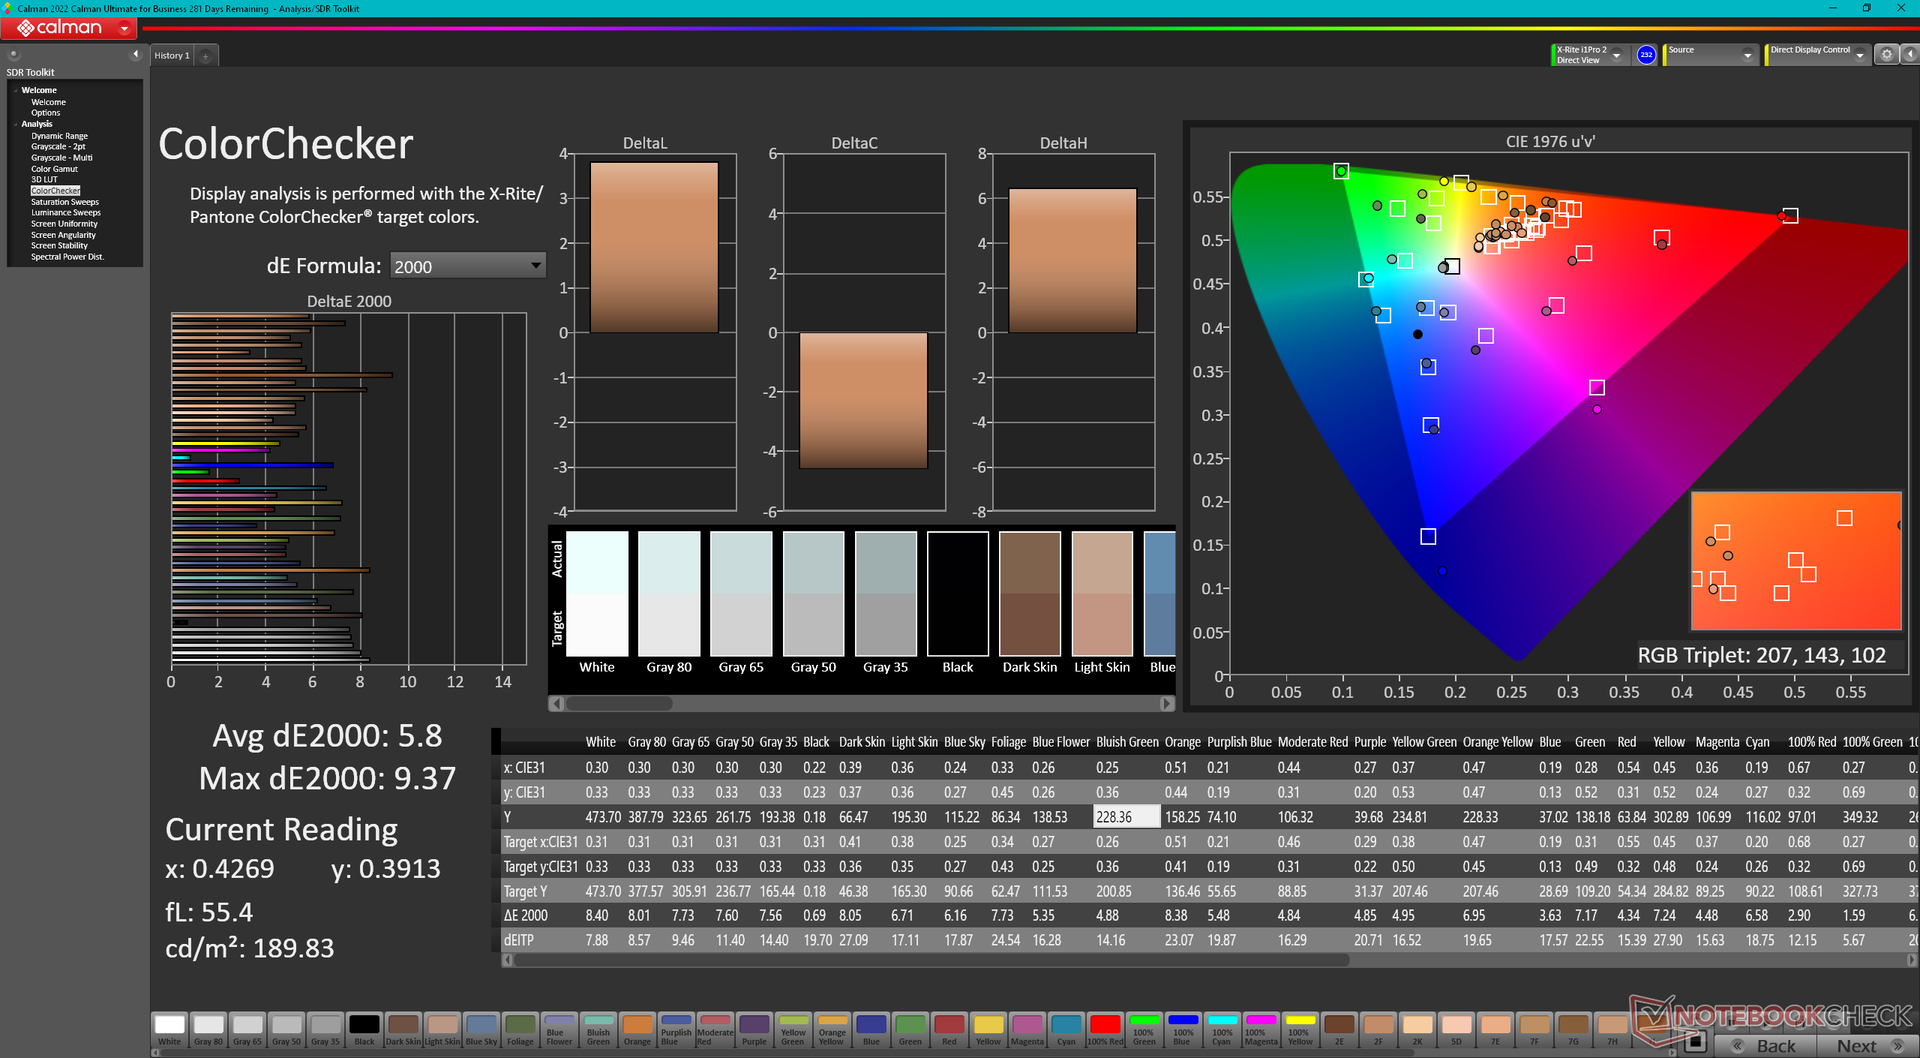
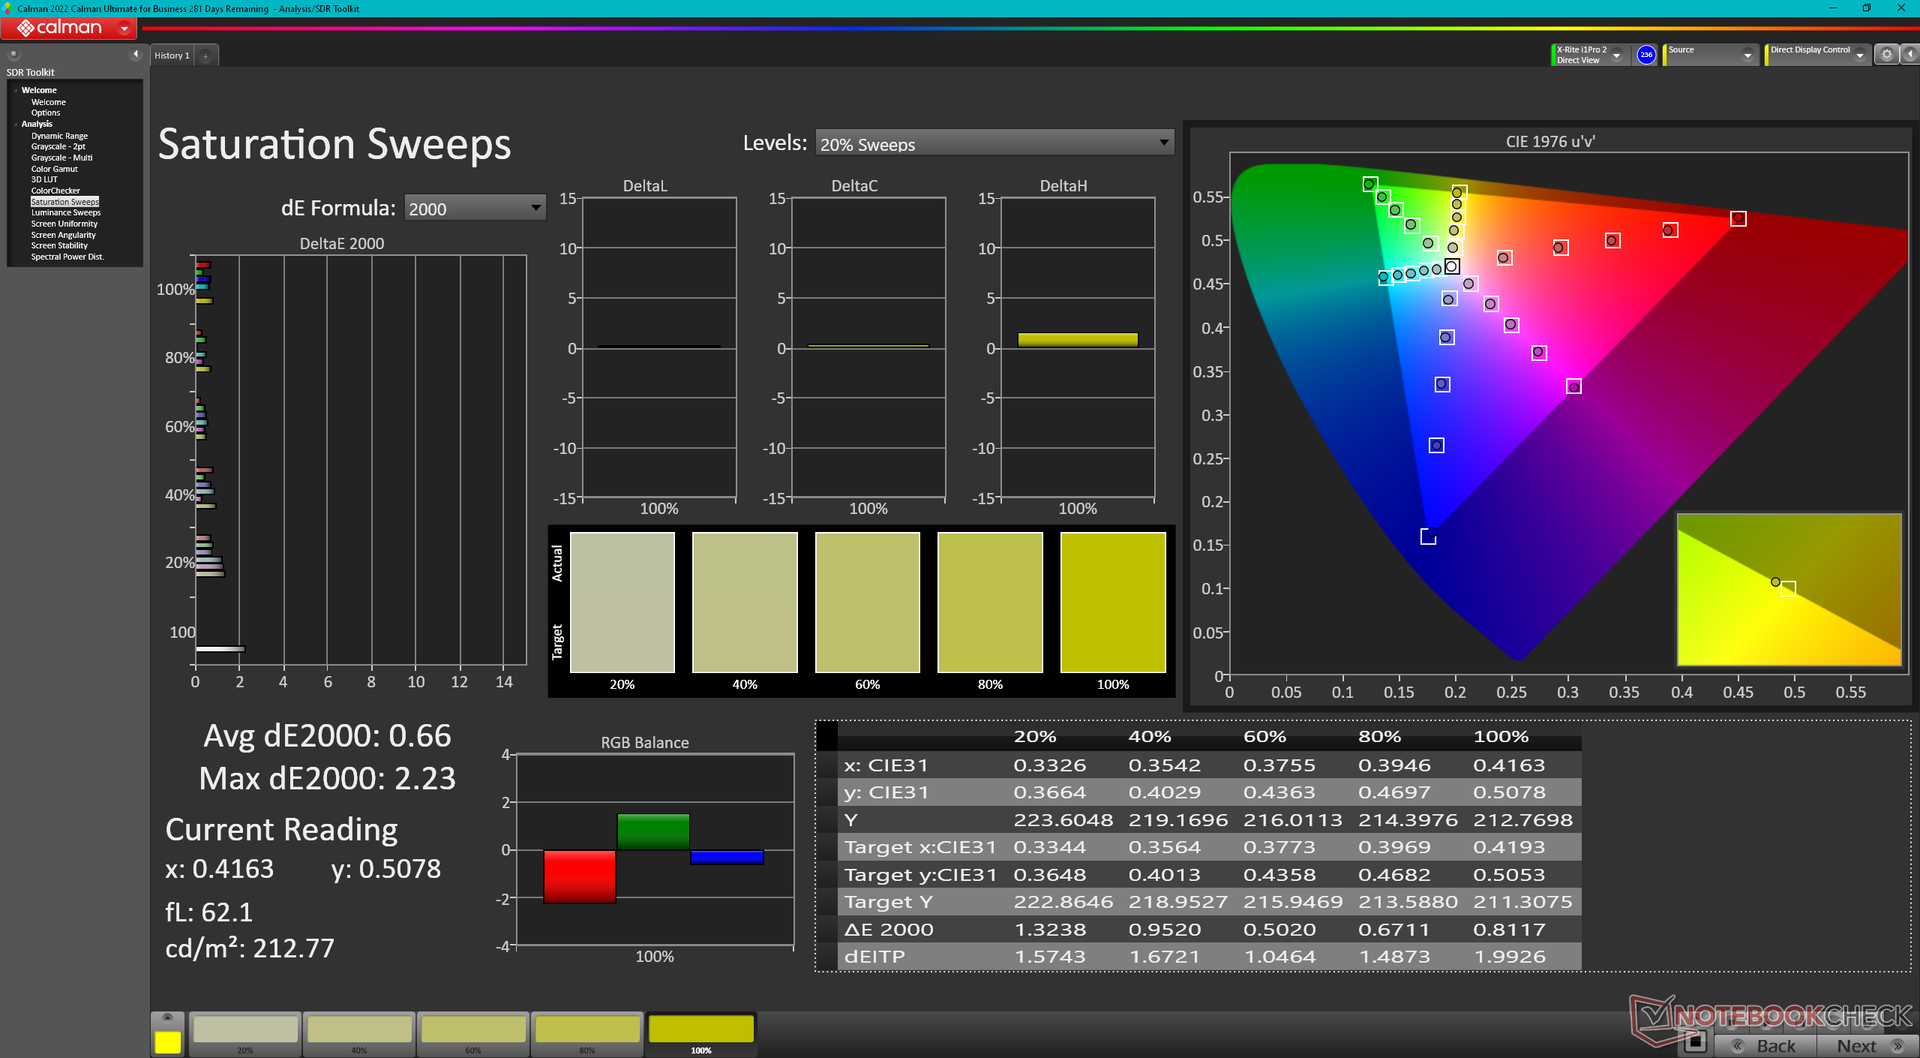
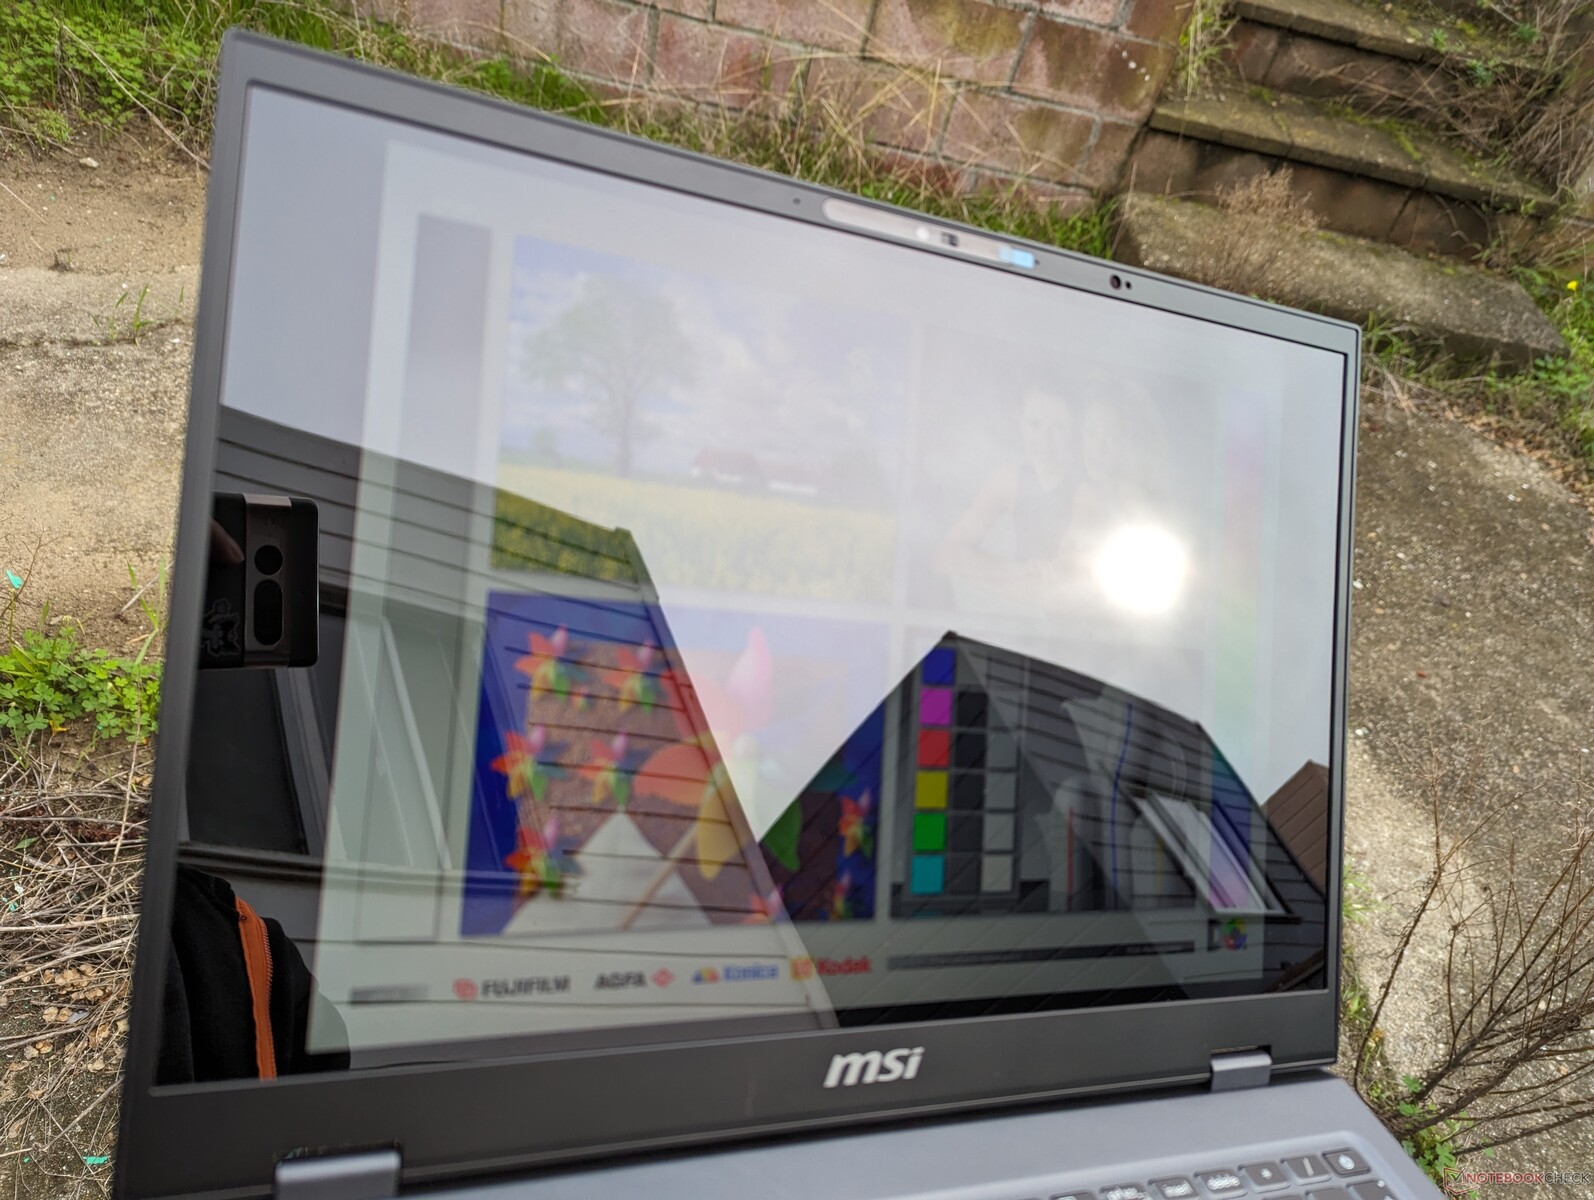
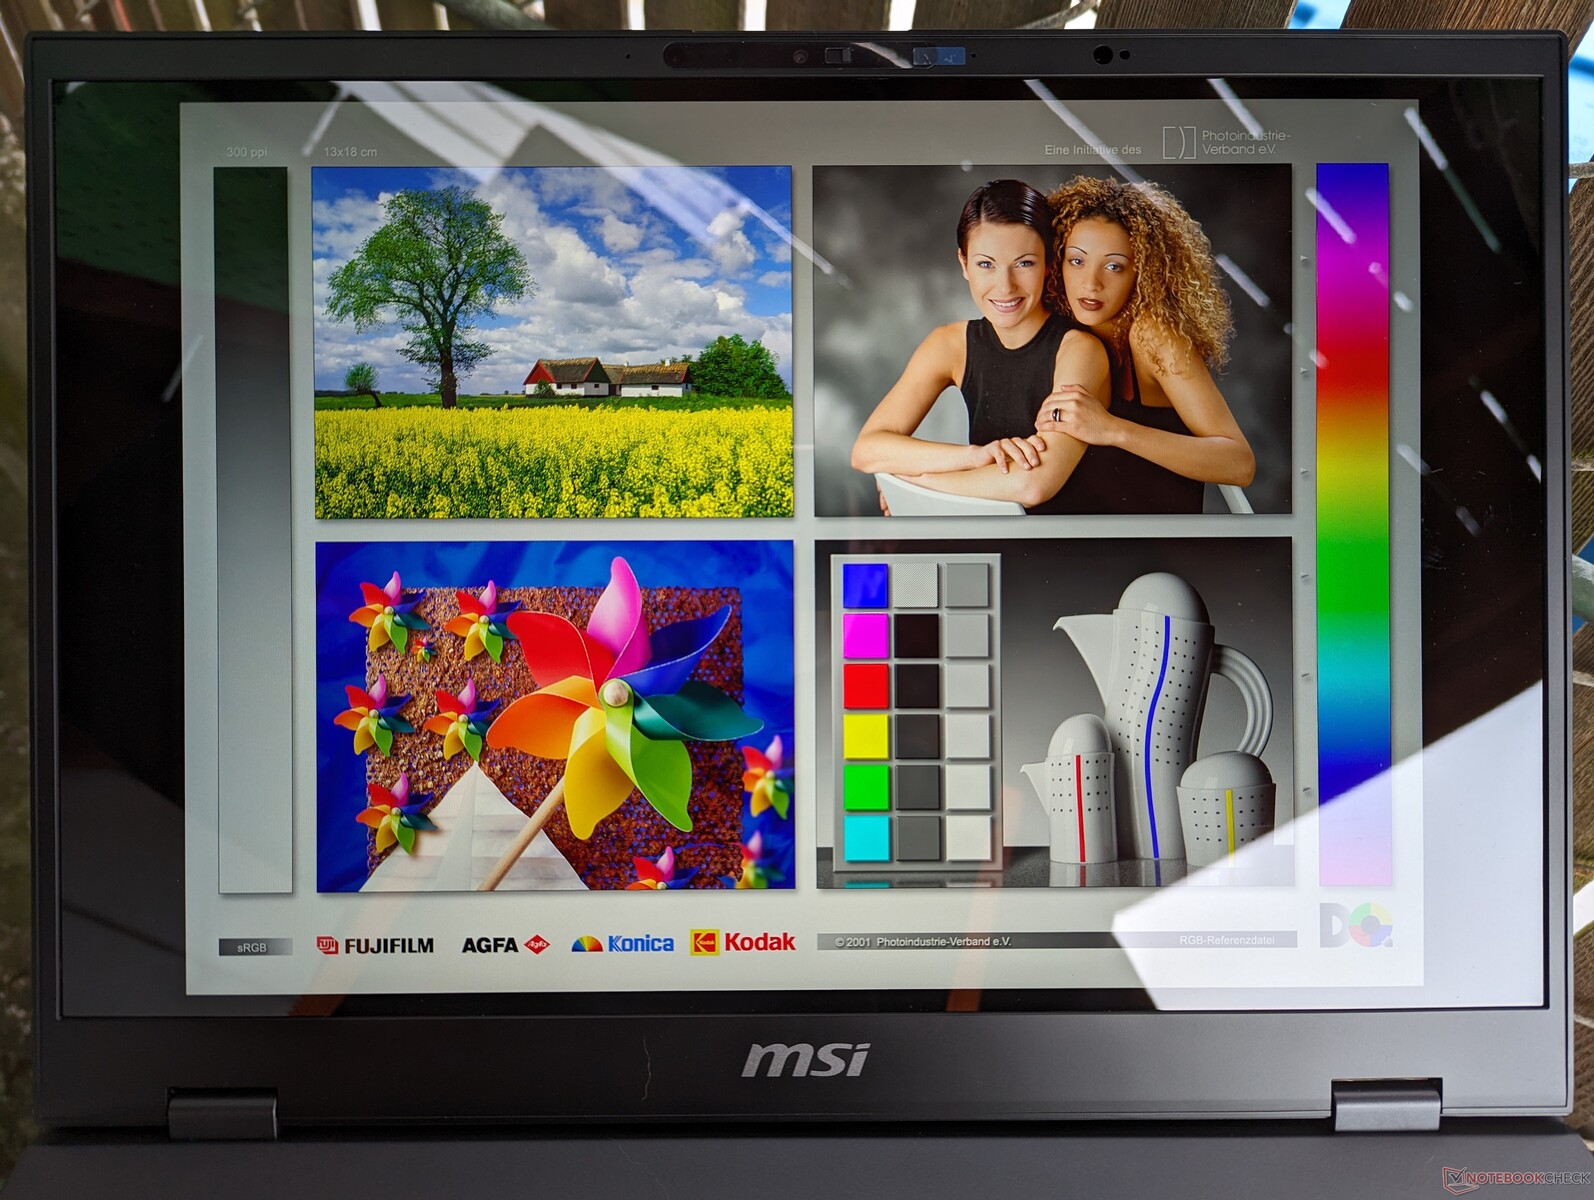
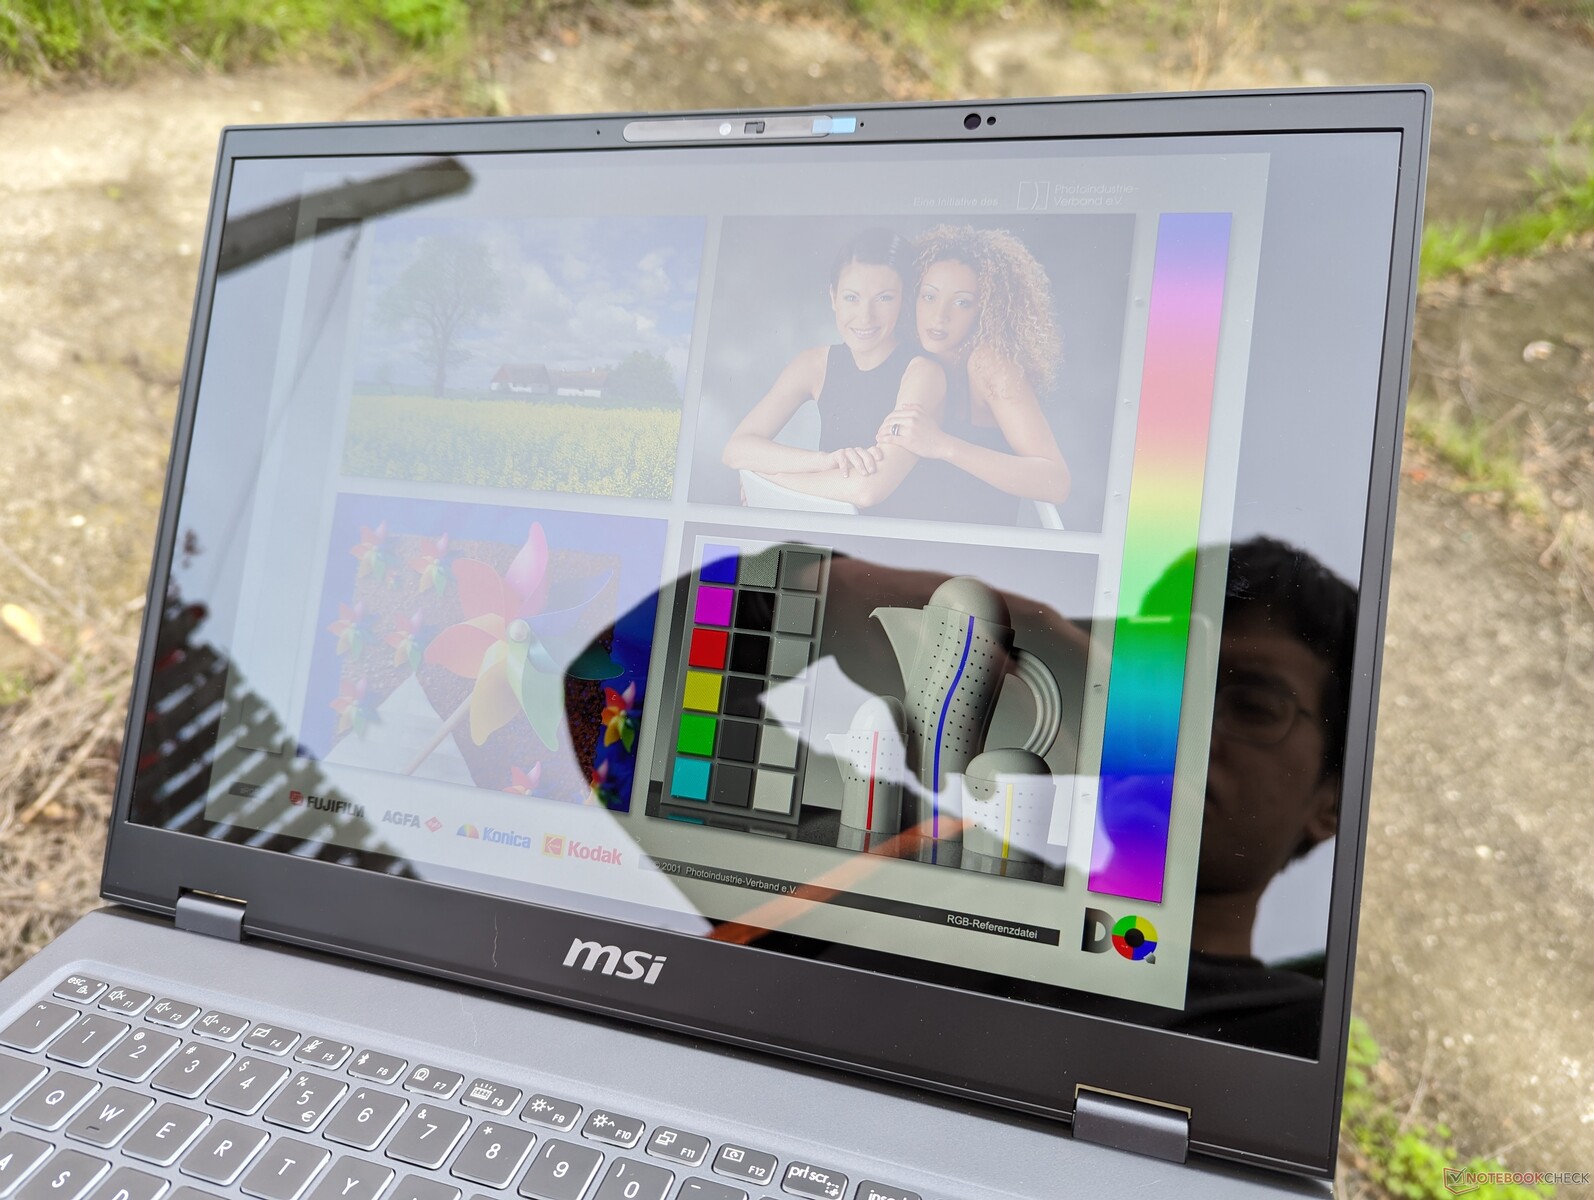
Display — Full DCI-P3 On All SKUs
The Prestige 16 is the first in our database to come with the AU Optronics B160QAN03.R. This bright and glossy IPS panel is of very high quality with full DCI-P3 colors and no graininess issues whatsoever. However, the slow black-white response times, lack of adaptive sync, and modest 60 Hz refresh rate make it more fit for graphics editing than gaming.
A second display option is available with OLED and a higher native resolution. Neither panel supports touchscreen functionality.


| |||||||||||||||||||||||||
Brightness Distribution: 87 %
Center on Battery: 473.6 cd/m²
Contrast: 2493:1 (Black: 0.19 cd/m²)
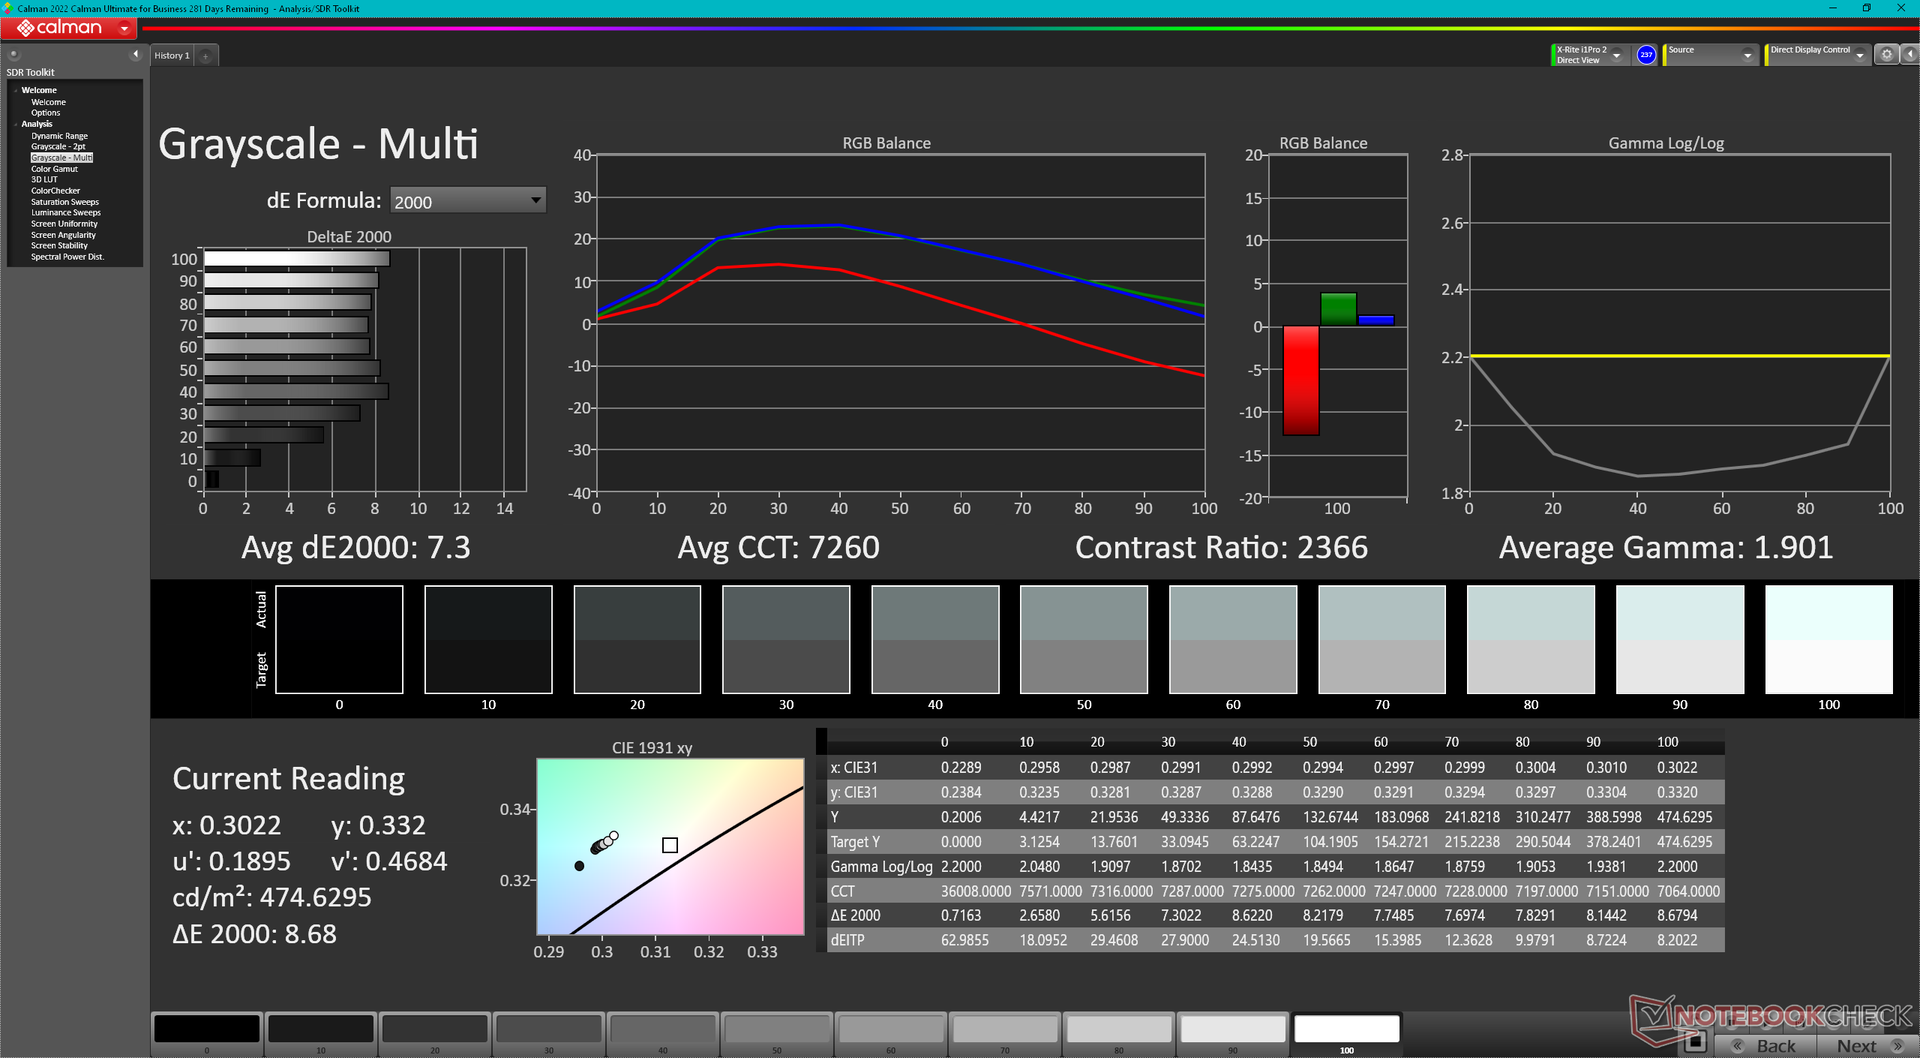
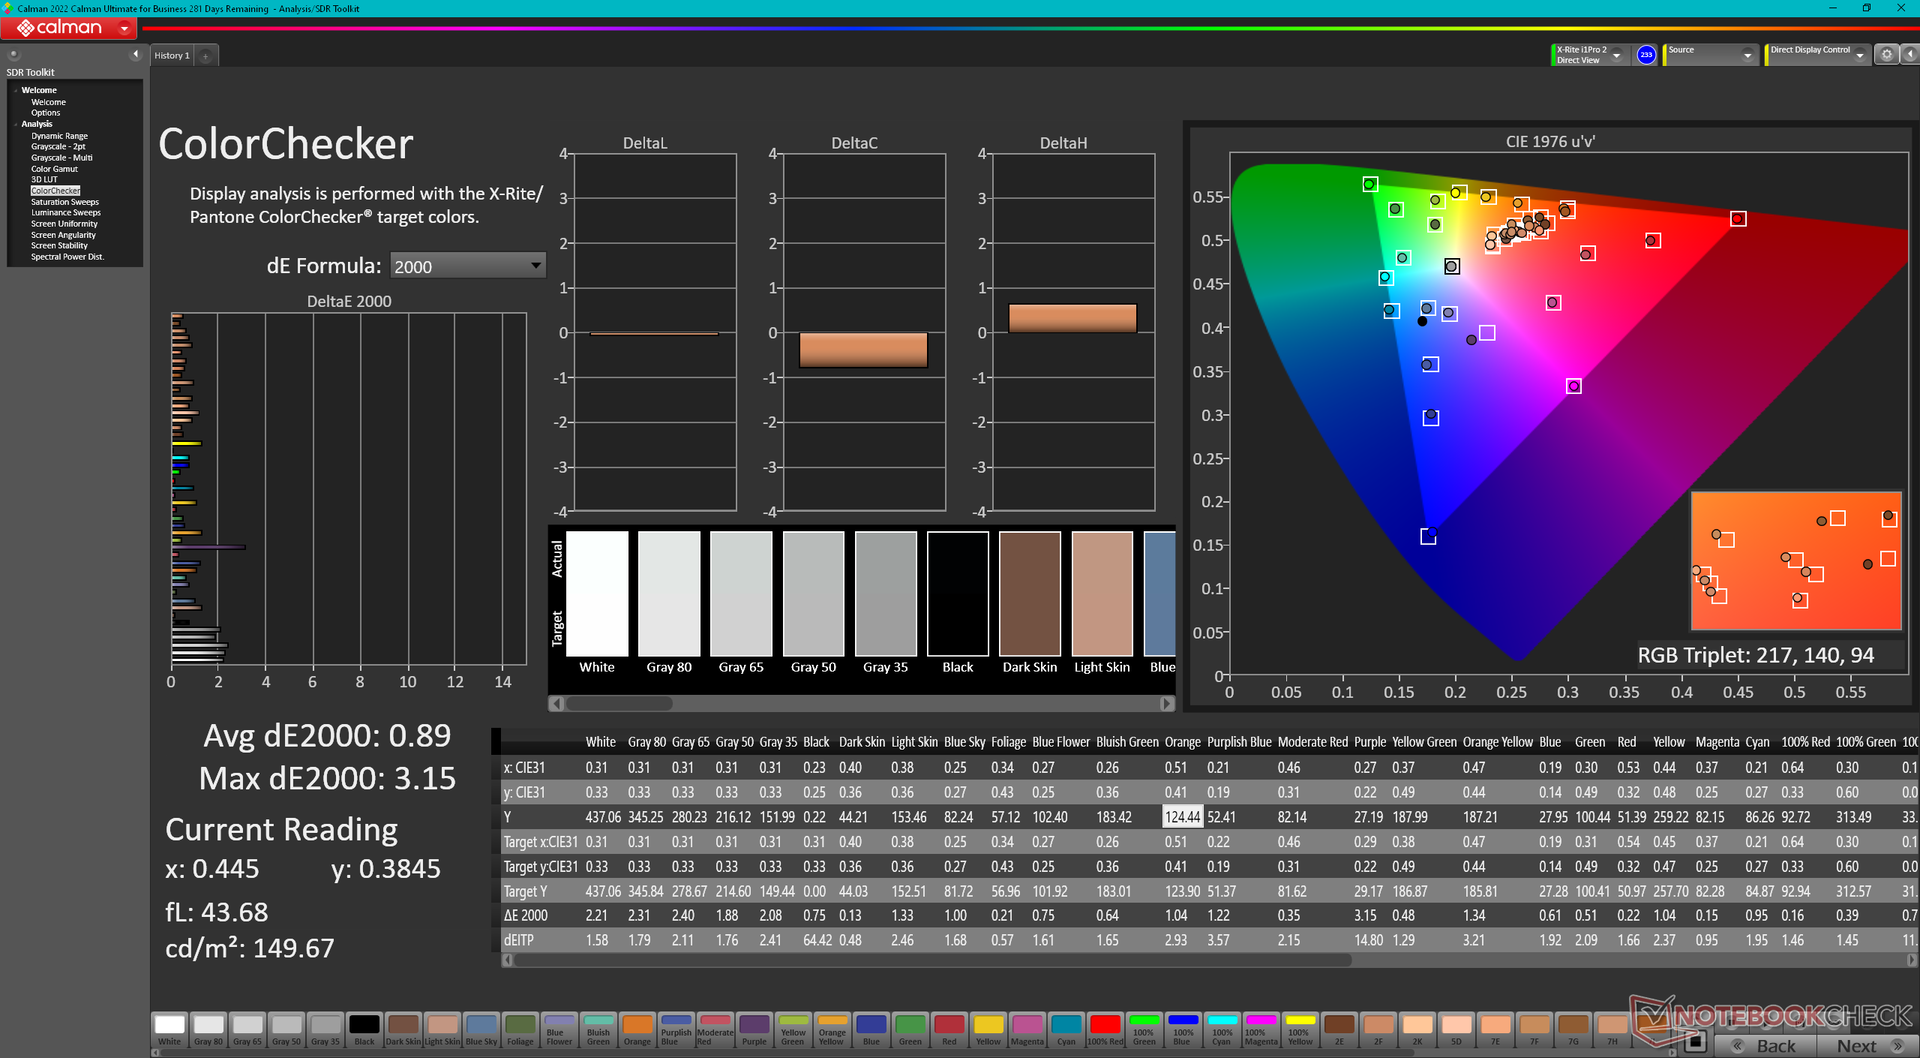
ΔE ColorChecker Calman: 5.9 | ∀{0.5-29.43 Ø4.73}
calibrated: 0.89
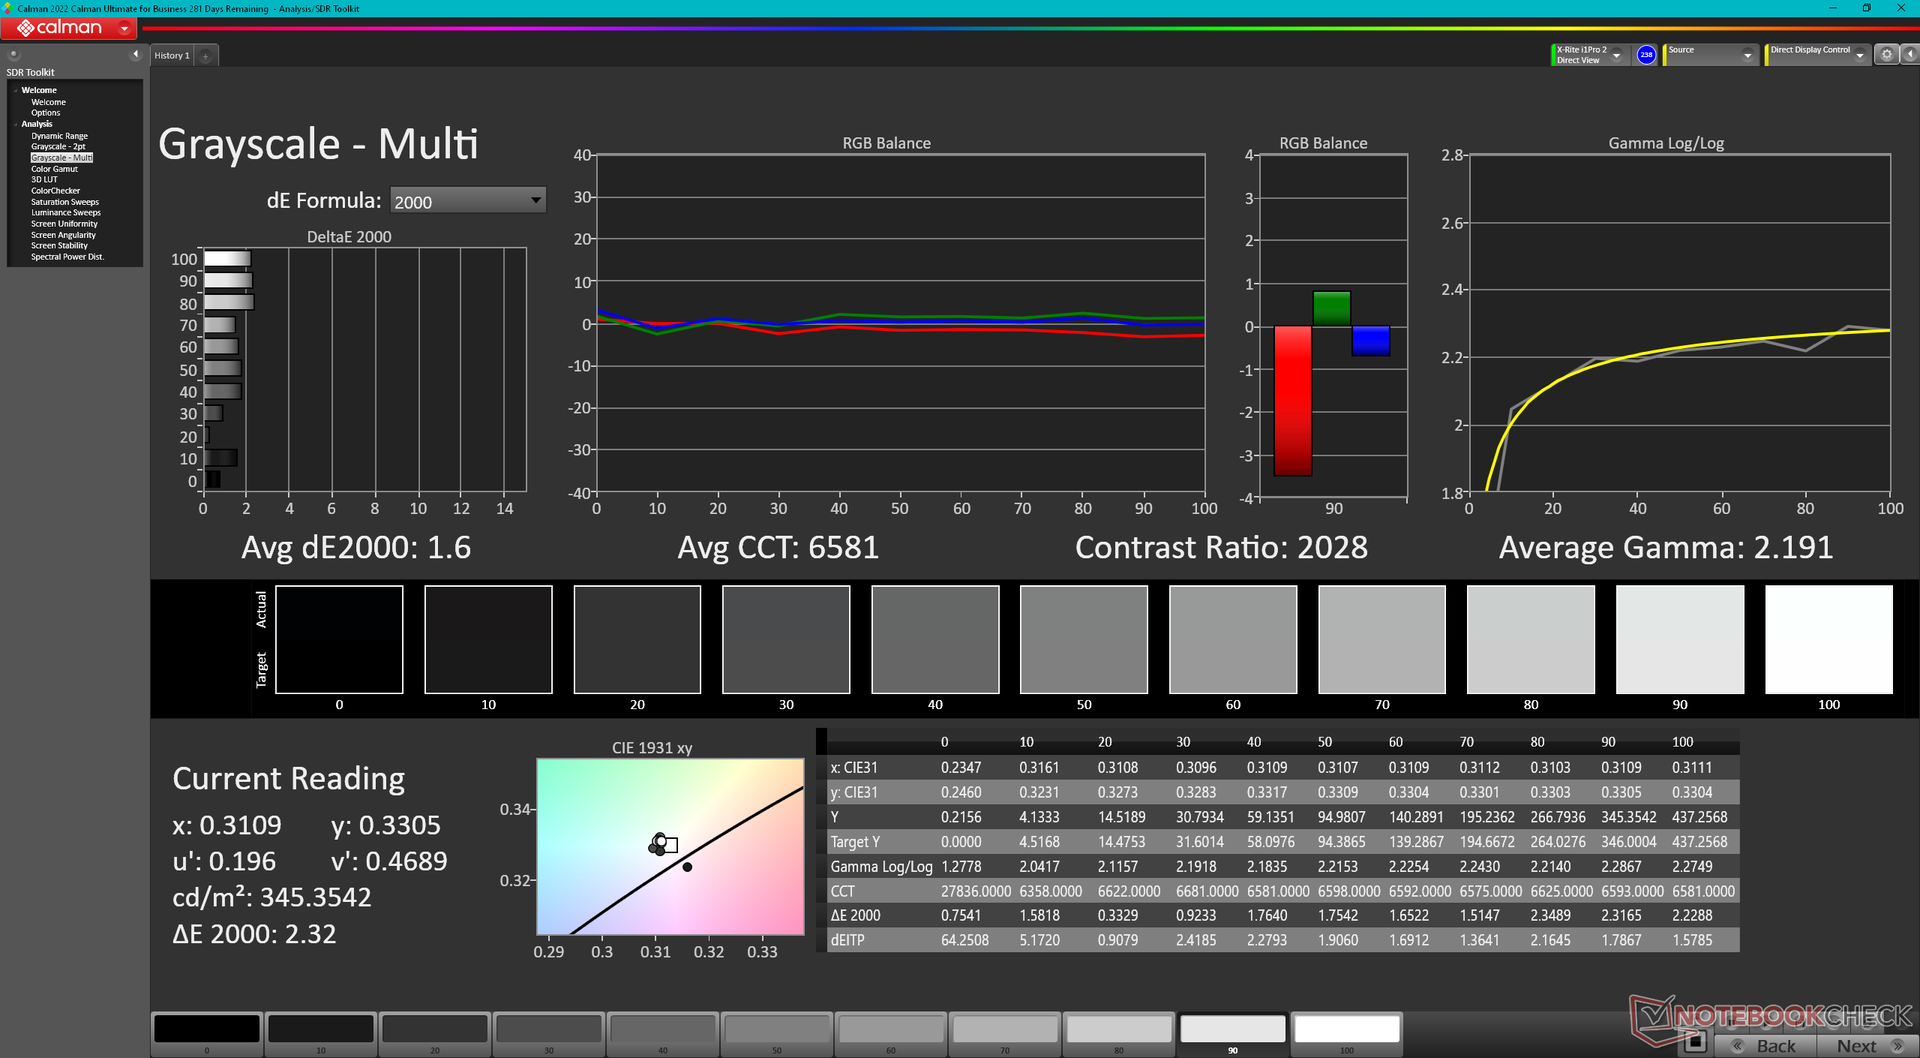
ΔE Greyscale Calman: 7.3 | ∀{0.09-98 Ø4.97}
84.6% AdobeRGB 1998 (Argyll 3D)
99.8% sRGB (Argyll 3D)
96.7% Display P3 (Argyll 3D)
Gamma: 1.9
CCT: 7260 K
| MSI Prestige 16 B1MG-001US AU Optronics B160QAN03.R, IPS, 2560x1600, 16" | MSI Prestige 15 A12UD-093 Sharp LQ156D1JW42, IPS, 3840x2160, 15.6" | LG Gram 2in1 16 16T90R - G.AA78G LP160WQ1-SPB2, IPS, 2560x1600, 16" | Lenovo ThinkBook 16 G6 ABP LEN160WUXGA, IPS, 1920x1200, 16" | Asus VivoBook Pro 16 K6602VU Samsung ATNA60BX01-1, OLED, 3200x2000, 16" | Dell Inspiron 16 Plus 7630 LG Philips 160WQ2, IPS, 2560x1600, 16" | |
|---|---|---|---|---|---|---|
| Display | -3% | 0% | -49% | 5% | -14% | |
| Display P3 Coverage (%) | 96.7 | 80.48 -17% | 96.5 0% | 40.4 -58% | 98.7 2% | 70.1 -28% |
| sRGB Coverage (%) | 99.8 | 96.95 -3% | 99.9 0% | 59.8 -40% | 99.7 0% | 99.6 0% |
| AdobeRGB 1998 Coverage (%) | 84.6 | 94.02 11% | 84.6 0% | 42 -50% | 96.5 14% | 72.3 -15% |
| Response Times | 10% | 30% | 32% | 80% | 29% | |
| Response Time Grey 50% / Grey 80% * (ms) | 49.4 ? | 51 ? -3% | 38.4 ? 22% | 32.8 ? 34% | 0.68 ? 99% | 35 ? 29% |
| Response Time Black / White * (ms) | 33.9 ? | 26 ? 23% | 21.4 ? 37% | 23.9 ? 29% | 13.2 ? 61% | 24.2 ? 29% |
| PWM Frequency (Hz) | 240 ? | |||||
| Screen | 27% | -19% | -83% | -13% | 0% | |
| Brightness middle (cd/m²) | 473.6 | 441 -7% | 329 -31% | 310 -35% | 353 -25% | 299.4 -37% |
| Brightness (cd/m²) | 456 | 416 -9% | 310 -32% | 290 -36% | 354 -22% | 290 -36% |
| Brightness Distribution (%) | 87 | 85 -2% | 88 1% | 86 -1% | 98 13% | 92 6% |
| Black Level * (cd/m²) | 0.19 | 0.155 18% | 0.39 -105% | 0.22 -16% | 0.21 -11% | |
| Contrast (:1) | 2493 | 2845 14% | 844 -66% | 1409 -43% | 1426 -43% | |
| Colorchecker dE 2000 * | 5.9 | 1.51 74% | 3.52 40% | 6.2 -5% | 4.23 28% | 4.25 28% |
| Colorchecker dE 2000 max. * | 9.37 | 3.56 62% | 6.96 26% | 24.7 -164% | 7.13 24% | 6.71 28% |
| Colorchecker dE 2000 calibrated * | 0.89 | 1.15 -29% | 5.3 -496% | 2.42 -172% | 0.52 42% | |
| Greyscale dE 2000 * | 7.3 | 2.49 66% | 5.75 21% | 3.8 48% | 2.5 66% | 5.5 25% |
| Gamma | 1.9 116% | 2.17 101% | 2.137 103% | 2.22 99% | 2.4 92% | 2.35 94% |
| CCT | 7260 90% | 6292 103% | 7584 86% | 6011 108% | 6642 98% | 6368 102% |
| Total Average (Program / Settings) | 11% /
17% | 4% /
-8% | -33% /
-60% | 24% /
7% | 5% /
1% |
* ... smaller is better
The display does not come pre-calibrated which is a shame since all SKUs support DCI-P3 colors. Color temperature is overly cool for relatively high average grayscale and color DeltaE values of 7.3 and 5.8, respectively. Calibrating the panel ourselves would drop these average values down to <2 each. Our calibrated ICM profile is available to download above for free.
Display Response Times
| ↔ Response Time Black to White | ||
|---|---|---|
| 33.9 ms ... rise ↗ and fall ↘ combined | ↗ 15.6 ms rise | 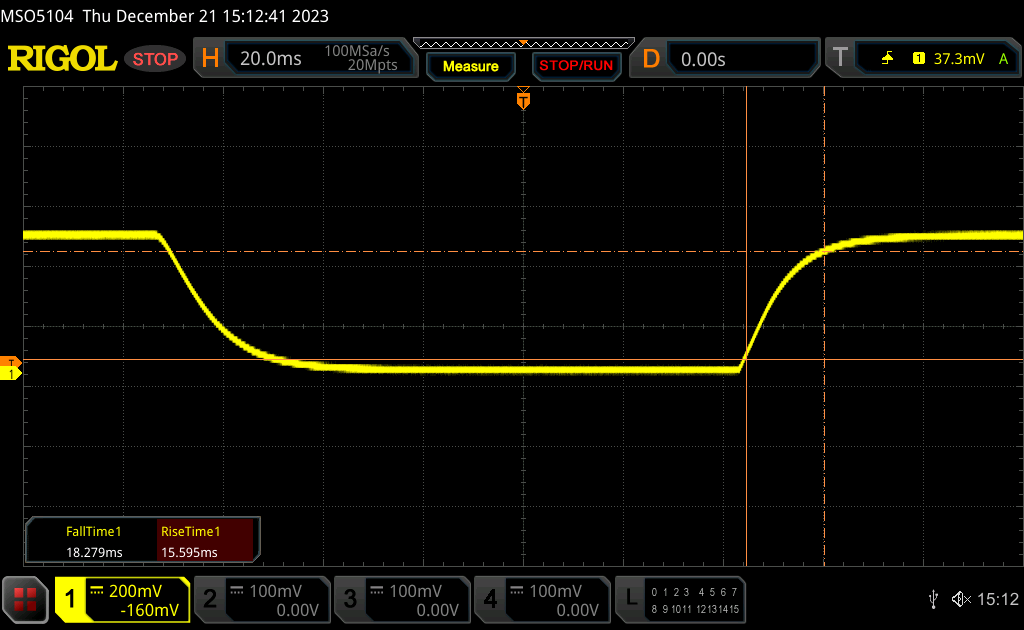 |
| ↘ 18.3 ms fall | ||
| The screen shows slow response rates in our tests and will be unsatisfactory for gamers. In comparison, all tested devices range from 0.1 (minimum) to 240 (maximum) ms. » 91 % of all devices are better. This means that the measured response time is worse than the average of all tested devices (19.9 ms). | ||
| ↔ Response Time 50% Grey to 80% Grey | ||
| 49.4 ms ... rise ↗ and fall ↘ combined | ↗ 22.6 ms rise | 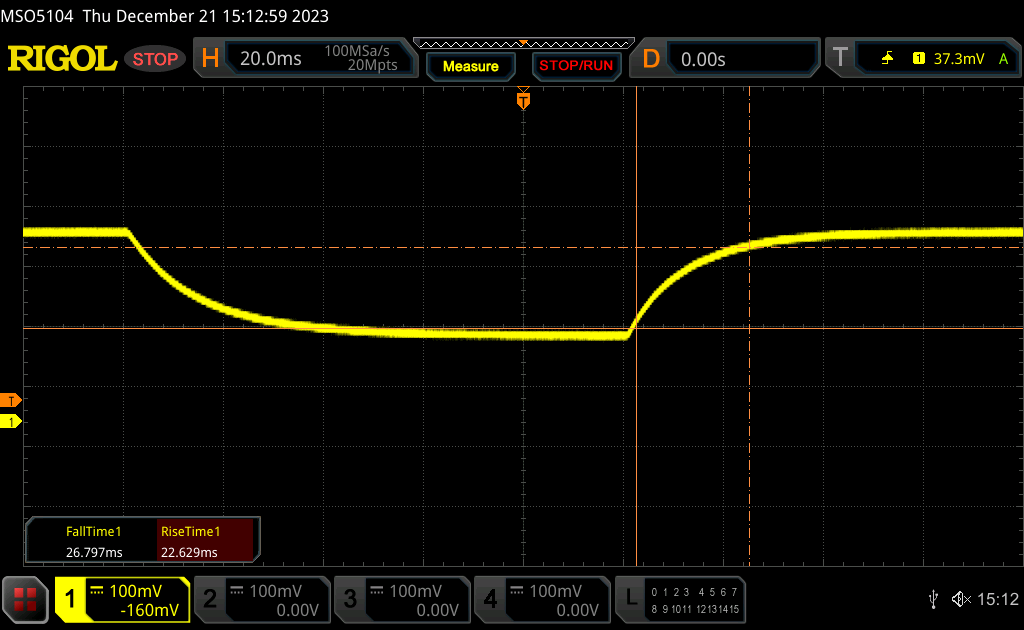 |
| ↘ 26.8 ms fall | ||
| The screen shows slow response rates in our tests and will be unsatisfactory for gamers. In comparison, all tested devices range from 0.165 (minimum) to 636 (maximum) ms. » 85 % of all devices are better. This means that the measured response time is worse than the average of all tested devices (31.1 ms). | ||
Screen Flickering / PWM (Pulse-Width Modulation)
| Screen flickering / PWM not detected | 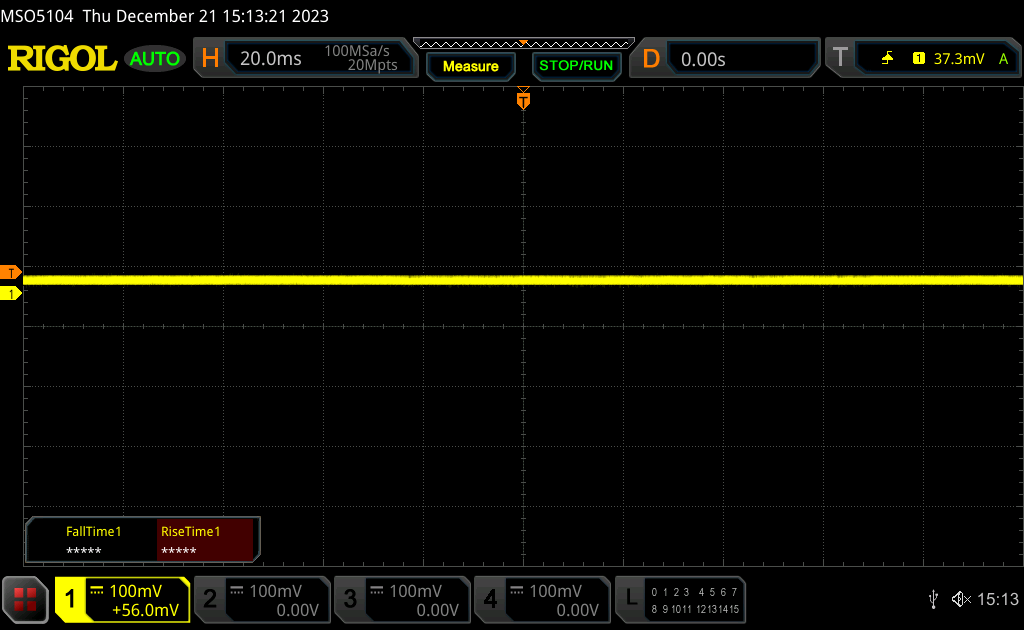 | ||
In comparison: 52 % of all tested devices do not use PWM to dim the display. If PWM was detected, an average of 7810 (minimum: 5 - maximum: 343500) Hz was measured. | |||
The super-glossy screen may contribute to a sharper picture, but it also contributes to excessive glare under most usage scenarios especially if outdoors. The Mini-LED screen of the MacBook Pro 16 is about 30 percent brighter than our MSI for generally better visibility if under bright ambient lighting.

Performance — A Meteoric Rise
Testing Conditions
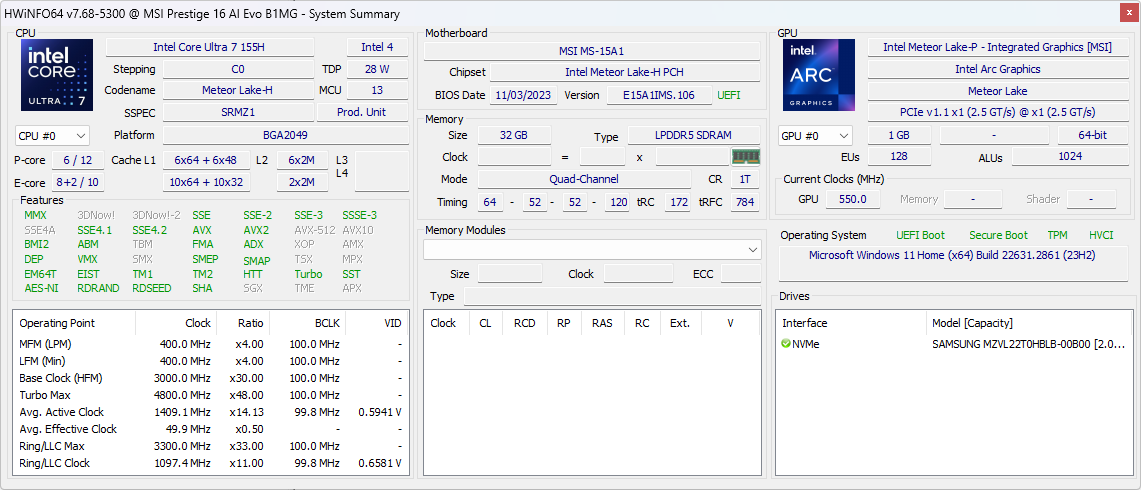
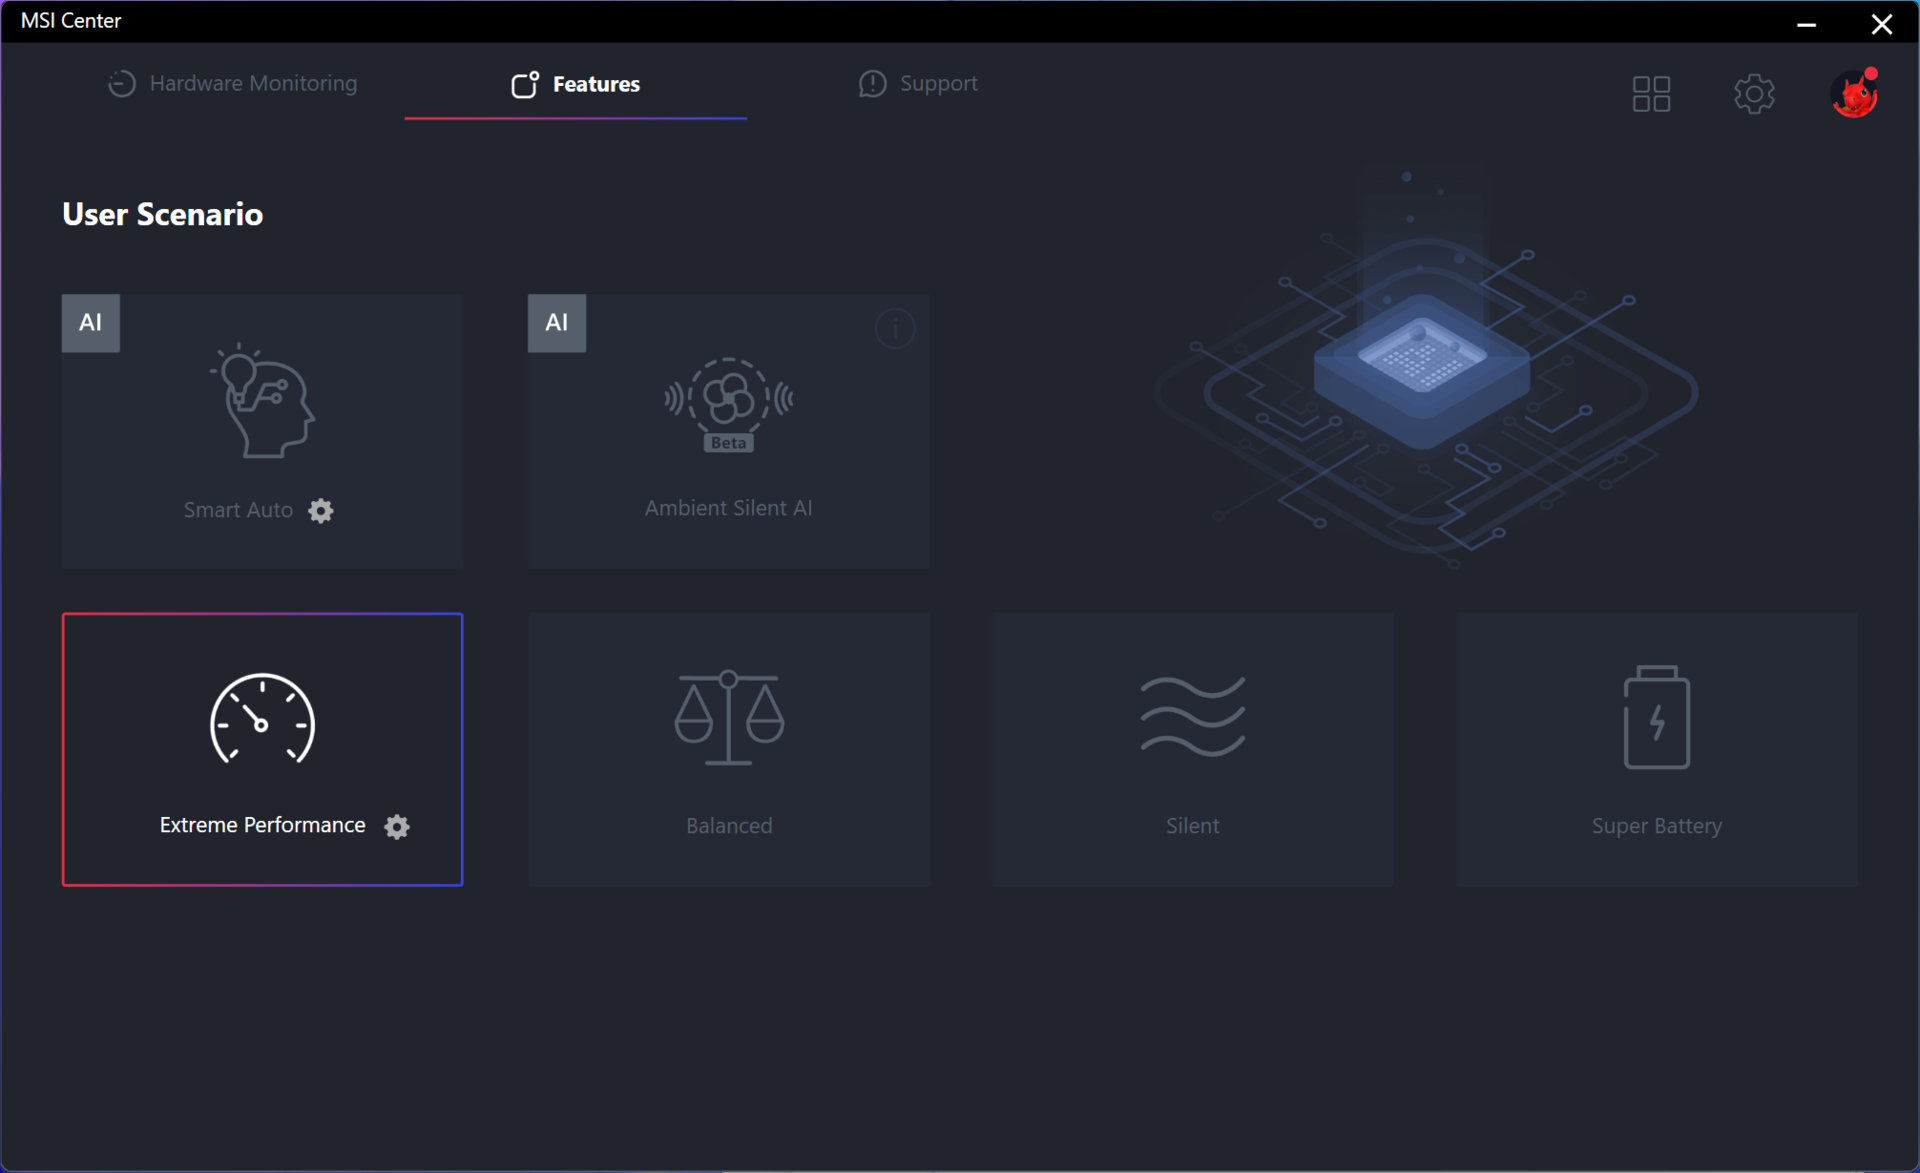
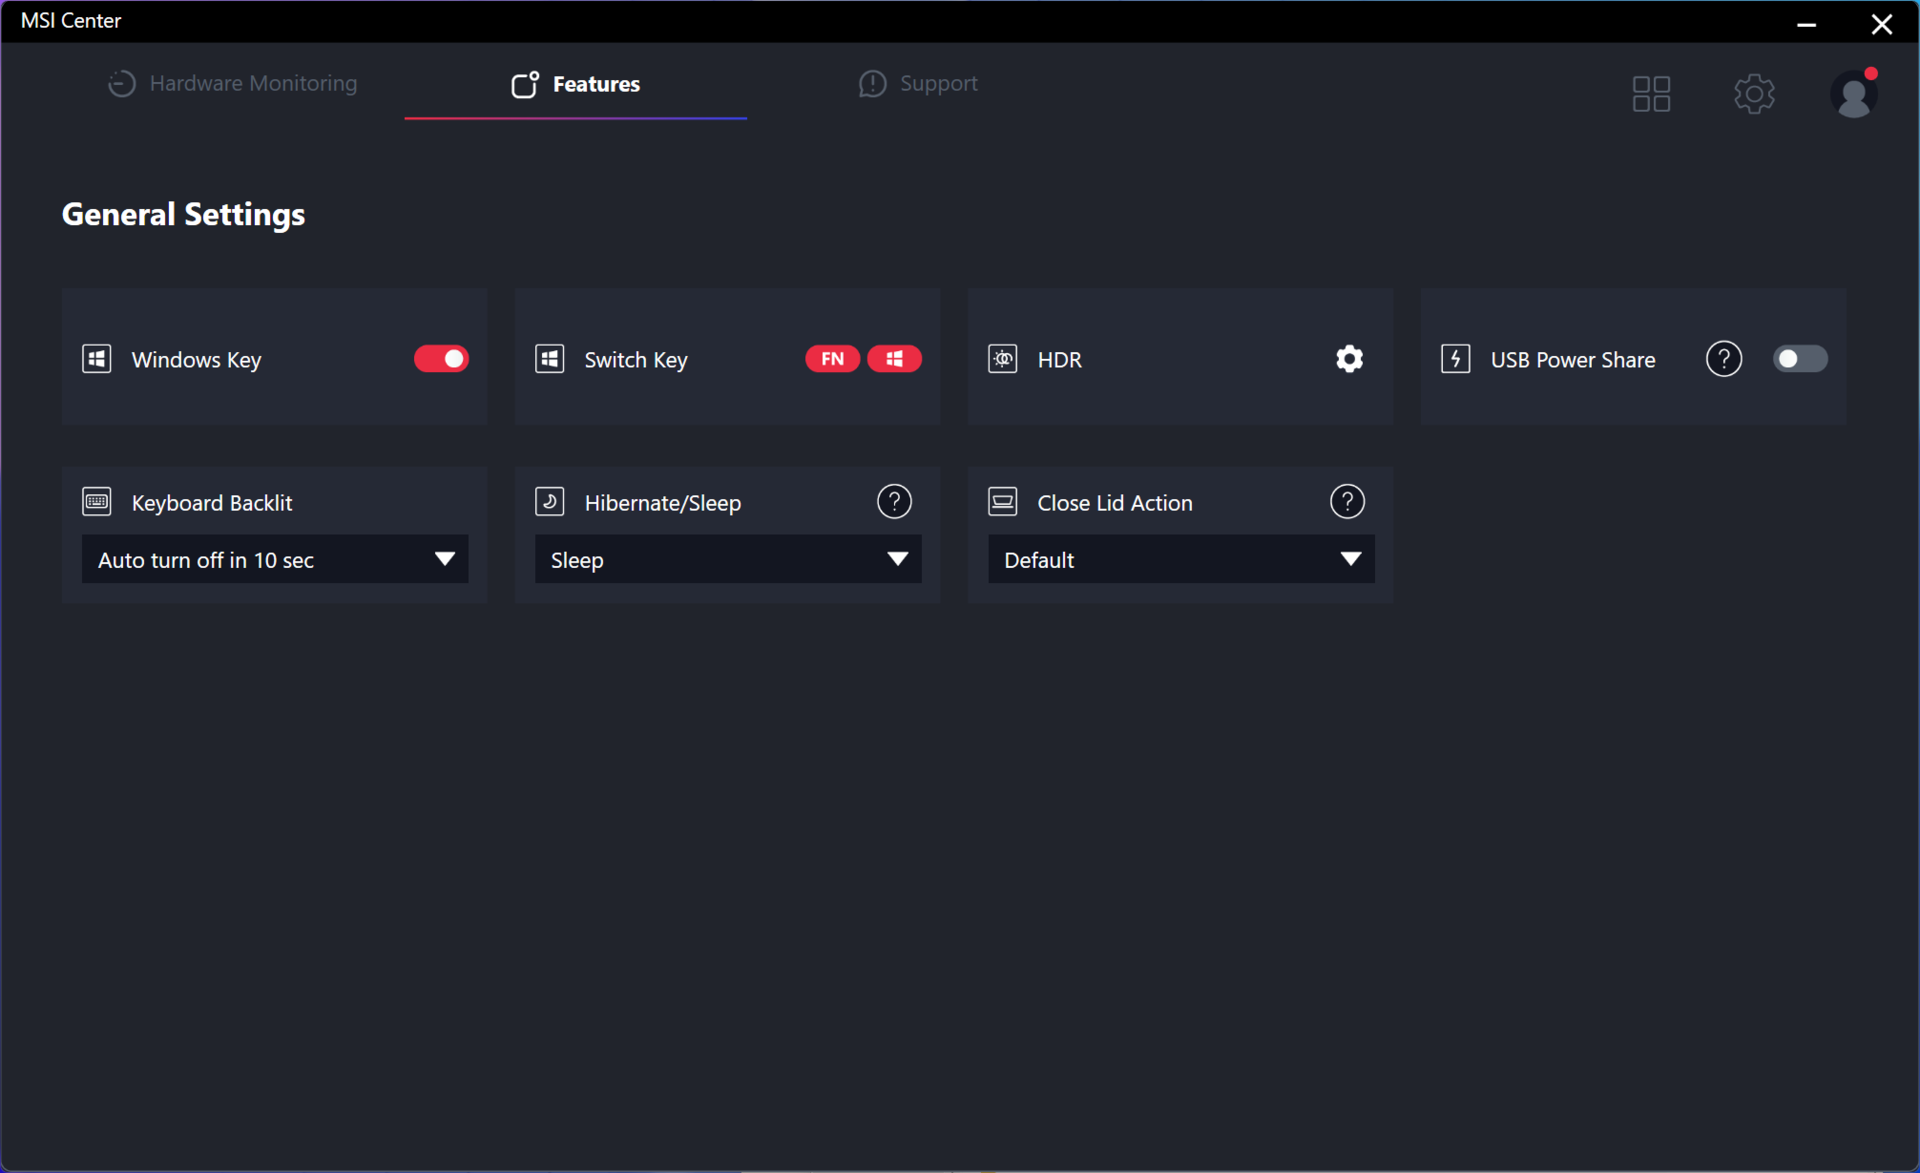
We set Windows to Performance mode and MSI Center to Extreme Performance mode prior to running the benchmarks below. Owners should become familiar with MSI Center as it is the hub for MSI-specific updates and features.
Processor
CPU performance is a huge leap over last generation Core U and Core P options. Our Core Ultra 7 155H holds a comfortable 20 to 25 percent lead over the Core i7-1360P and AMD's fastest Zen 4 U-series option the Ryzen 7 7840U.
Users expecting noticeable gains over 13th gen Core H options may still be disappointed. For example, raw single- and multi-thread performance falls a bit short of the Core i7-13700H. The biggest differentiators between 13th gen Core i and 1st gen Core Ultra instead relate to the improved iGPU and AI acceleration of the newer options.
A higher-end Core Ultra 9 185H SKU is also available for the Prestige 16, but we do not expect it to perform much faster than our Core Ultra 7 155H configuration as both CPUs carry the exact same number of cores with only slight differences in clock rates.
Cinebench R15 Multi Loop
Cinebench R23: Multi Core | Single Core
Cinebench R20: CPU (Multi Core) | CPU (Single Core)
Cinebench R15: CPU Multi 64Bit | CPU Single 64Bit
Blender: v2.79 BMW27 CPU
7-Zip 18.03: 7z b 4 | 7z b 4 -mmt1
Geekbench 5.5: Multi-Core | Single-Core
HWBOT x265 Benchmark v2.2: 4k Preset
LibreOffice : 20 Documents To PDF
R Benchmark 2.5: Overall mean
* ... smaller is better
AIDA64: FP32 Ray-Trace | FPU Julia | CPU SHA3 | CPU Queen | FPU SinJulia | FPU Mandel | CPU AES | CPU ZLib | FP64 Ray-Trace | CPU PhotoWorxx
| Performance rating | |
| MSI Prestige 16 B1MG-001US | |
| Asus VivoBook Pro 16 K6602VU | |
| Average Intel Core Ultra 7 155H | |
| Dell Inspiron 16 Plus 7630 | |
| MSI Prestige 15 A12UD-093 | |
| LG Gram 2in1 16 16T90R - G.AA78G | |
| Lenovo ThinkBook 16 G6 ABP | |
| AIDA64 / FP32 Ray-Trace | |
| MSI Prestige 16 B1MG-001US | |
| Dell Inspiron 16 Plus 7630 | |
| Asus VivoBook Pro 16 K6602VU | |
| Average Intel Core Ultra 7 155H (6670 - 18470, n=50) | |
| Lenovo ThinkBook 16 G6 ABP | |
| MSI Prestige 15 A12UD-093 | |
| LG Gram 2in1 16 16T90R - G.AA78G | |
| LG Gram 2in1 16 16T90R - G.AA78G | |
| AIDA64 / FPU Julia | |
| MSI Prestige 16 B1MG-001US | |
| Asus VivoBook Pro 16 K6602VU | |
| Average Intel Core Ultra 7 155H (40905 - 93181, n=50) | |
| Lenovo ThinkBook 16 G6 ABP | |
| Dell Inspiron 16 Plus 7630 | |
| MSI Prestige 15 A12UD-093 | |
| LG Gram 2in1 16 16T90R - G.AA78G | |
| AIDA64 / CPU SHA3 | |
| MSI Prestige 16 B1MG-001US | |
| Asus VivoBook Pro 16 K6602VU | |
| Average Intel Core Ultra 7 155H (1940 - 4436, n=50) | |
| Dell Inspiron 16 Plus 7630 | |
| MSI Prestige 15 A12UD-093 | |
| LG Gram 2in1 16 16T90R - G.AA78G | |
| Lenovo ThinkBook 16 G6 ABP | |
| AIDA64 / CPU Queen | |
| Dell Inspiron 16 Plus 7630 | |
| Asus VivoBook Pro 16 K6602VU | |
| MSI Prestige 16 B1MG-001US | |
| Average Intel Core Ultra 7 155H (64698 - 94181, n=50) | |
| LG Gram 2in1 16 16T90R - G.AA78G | |
| MSI Prestige 15 A12UD-093 | |
| Lenovo ThinkBook 16 G6 ABP | |
| AIDA64 / FPU SinJulia | |
| MSI Prestige 16 B1MG-001US | |
| Lenovo ThinkBook 16 G6 ABP | |
| Average Intel Core Ultra 7 155H (5639 - 10647, n=50) | |
| Dell Inspiron 16 Plus 7630 | |
| Asus VivoBook Pro 16 K6602VU | |
| MSI Prestige 15 A12UD-093 | |
| LG Gram 2in1 16 16T90R - G.AA78G | |
| AIDA64 / FPU Mandel | |
| MSI Prestige 16 B1MG-001US | |
| Lenovo ThinkBook 16 G6 ABP | |
| Average Intel Core Ultra 7 155H (18236 - 47685, n=50) | |
| Asus VivoBook Pro 16 K6602VU | |
| Dell Inspiron 16 Plus 7630 | |
| MSI Prestige 15 A12UD-093 | |
| LG Gram 2in1 16 16T90R - G.AA78G | |
| AIDA64 / CPU AES | |
| Asus VivoBook Pro 16 K6602VU | |
| MSI Prestige 15 A12UD-093 | |
| LG Gram 2in1 16 16T90R - G.AA78G | |
| Average Intel Core Ultra 7 155H (45713 - 152179, n=50) | |
| MSI Prestige 16 B1MG-001US | |
| Dell Inspiron 16 Plus 7630 | |
| Lenovo ThinkBook 16 G6 ABP | |
| AIDA64 / CPU ZLib | |
| MSI Prestige 16 B1MG-001US | |
| Asus VivoBook Pro 16 K6602VU | |
| Average Intel Core Ultra 7 155H (557 - 1250, n=50) | |
| Dell Inspiron 16 Plus 7630 | |
| LG Gram 2in1 16 16T90R - G.AA78G | |
| MSI Prestige 15 A12UD-093 | |
| Lenovo ThinkBook 16 G6 ABP | |
| AIDA64 / FP64 Ray-Trace | |
| MSI Prestige 16 B1MG-001US | |
| Asus VivoBook Pro 16 K6602VU | |
| Dell Inspiron 16 Plus 7630 | |
| Average Intel Core Ultra 7 155H (3569 - 9802, n=50) | |
| Lenovo ThinkBook 16 G6 ABP | |
| MSI Prestige 15 A12UD-093 | |
| LG Gram 2in1 16 16T90R - G.AA78G | |
| AIDA64 / CPU PhotoWorxx | |
| Average Intel Core Ultra 7 155H (32719 - 54223, n=50) | |
| MSI Prestige 16 B1MG-001US | |
| MSI Prestige 15 A12UD-093 | |
| LG Gram 2in1 16 16T90R - G.AA78G | |
| Asus VivoBook Pro 16 K6602VU | |
| Dell Inspiron 16 Plus 7630 | |
| Lenovo ThinkBook 16 G6 ABP | |
System Performance
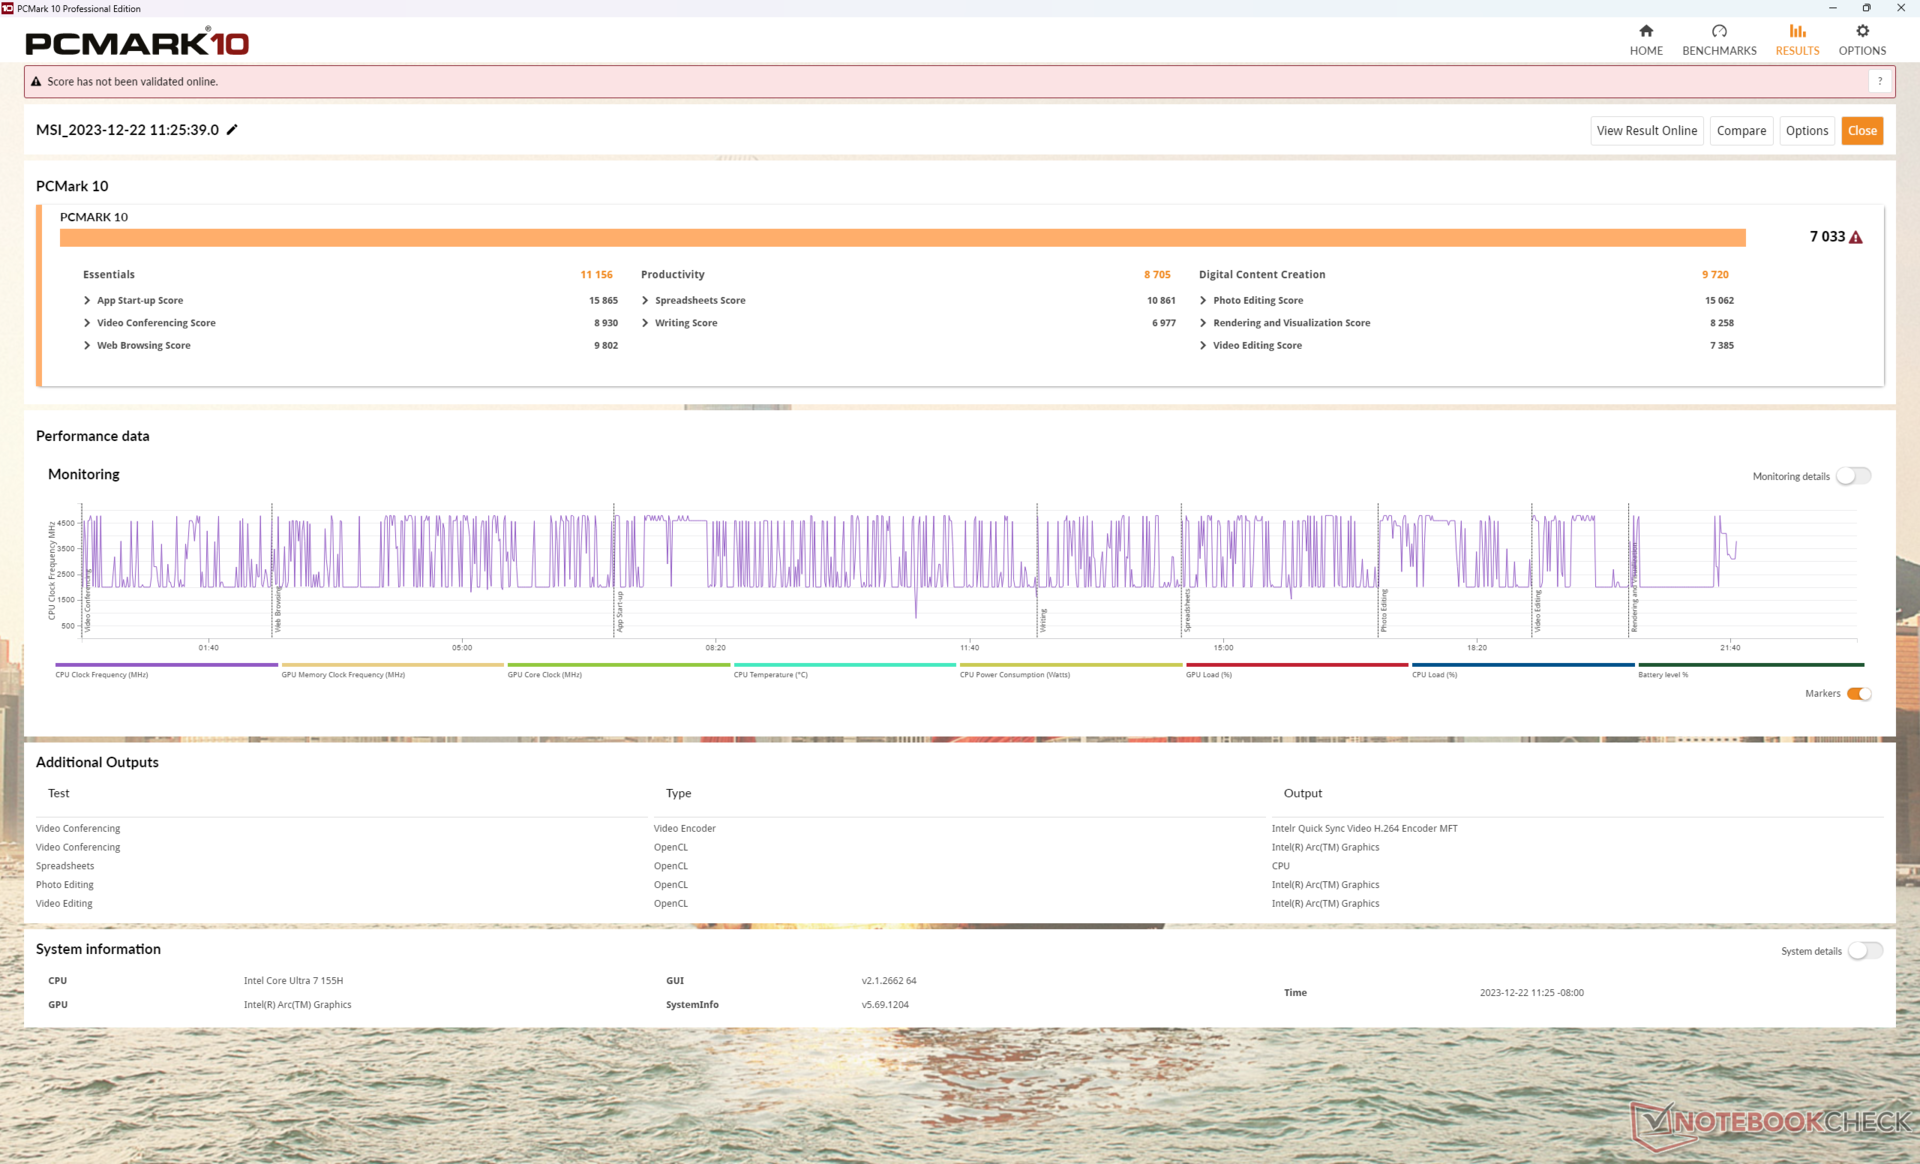
PCMark results are comparable to multimedia laptops with midrange discrete graphics like the Asus VivoBook Pro 16. However, the significance of the scores is questionable as the numbers are difficult to directly compare between laptops with iGPUs and dGPUs.
The fast 6400 MHz system RAM is worth mentioning especially since iGPU performance is closely tied to RAM performance.
CrossMark: Overall | Productivity | Creativity | Responsiveness
WebXPRT 3: Overall
WebXPRT 4: Overall
Mozilla Kraken 1.1: Total
| PCMark 10 / Score | |
| Dell Inspiron 16 Plus 7630 | |
| Asus VivoBook Pro 16 K6602VU | |
| MSI Prestige 16 B1MG-001US | |
| Average Intel Core Ultra 7 155H, Intel Arc 8-Core iGPU (4809 - 7529, n=34) | |
| MSI Prestige 15 A12UD-093 | |
| Lenovo ThinkBook 16 G6 ABP | |
| LG Gram 2in1 16 16T90R - G.AA78G | |
| PCMark 10 / Essentials | |
| LG Gram 2in1 16 16T90R - G.AA78G | |
| Dell Inspiron 16 Plus 7630 | |
| MSI Prestige 16 B1MG-001US | |
| Lenovo ThinkBook 16 G6 ABP | |
| Average Intel Core Ultra 7 155H, Intel Arc 8-Core iGPU (7605 - 11289, n=34) | |
| Asus VivoBook Pro 16 K6602VU | |
| MSI Prestige 15 A12UD-093 | |
| PCMark 10 / Productivity | |
| Dell Inspiron 16 Plus 7630 | |
| Lenovo ThinkBook 16 G6 ABP | |
| MSI Prestige 15 A12UD-093 | |
| MSI Prestige 16 B1MG-001US | |
| Asus VivoBook Pro 16 K6602VU | |
| Average Intel Core Ultra 7 155H, Intel Arc 8-Core iGPU (6042 - 10591, n=34) | |
| LG Gram 2in1 16 16T90R - G.AA78G | |
| PCMark 10 / Digital Content Creation | |
| Dell Inspiron 16 Plus 7630 | |
| Asus VivoBook Pro 16 K6602VU | |
| MSI Prestige 16 B1MG-001US | |
| Average Intel Core Ultra 7 155H, Intel Arc 8-Core iGPU (4985 - 10709, n=34) | |
| MSI Prestige 15 A12UD-093 | |
| LG Gram 2in1 16 16T90R - G.AA78G | |
| Lenovo ThinkBook 16 G6 ABP | |
| CrossMark / Overall | |
| Dell Inspiron 16 Plus 7630 | |
| MSI Prestige 16 B1MG-001US | |
| Asus VivoBook Pro 16 K6602VU | |
| MSI Prestige 15 A12UD-093 | |
| Average Intel Core Ultra 7 155H, Intel Arc 8-Core iGPU (1366 - 1903, n=34) | |
| LG Gram 2in1 16 16T90R - G.AA78G | |
| Lenovo ThinkBook 16 G6 ABP | |
| CrossMark / Productivity | |
| Dell Inspiron 16 Plus 7630 | |
| MSI Prestige 16 B1MG-001US | |
| Asus VivoBook Pro 16 K6602VU | |
| MSI Prestige 15 A12UD-093 | |
| Average Intel Core Ultra 7 155H, Intel Arc 8-Core iGPU (1291 - 1798, n=33) | |
| LG Gram 2in1 16 16T90R - G.AA78G | |
| Lenovo ThinkBook 16 G6 ABP | |
| CrossMark / Creativity | |
| Dell Inspiron 16 Plus 7630 | |
| MSI Prestige 16 B1MG-001US | |
| Asus VivoBook Pro 16 K6602VU | |
| Average Intel Core Ultra 7 155H, Intel Arc 8-Core iGPU (1519 - 1929, n=33) | |
| MSI Prestige 15 A12UD-093 | |
| LG Gram 2in1 16 16T90R - G.AA78G | |
| Lenovo ThinkBook 16 G6 ABP | |
| CrossMark / Responsiveness | |
| MSI Prestige 15 A12UD-093 | |
| Dell Inspiron 16 Plus 7630 | |
| MSI Prestige 16 B1MG-001US | |
| Asus VivoBook Pro 16 K6602VU | |
| LG Gram 2in1 16 16T90R - G.AA78G | |
| Average Intel Core Ultra 7 155H, Intel Arc 8-Core iGPU (939 - 1802, n=33) | |
| Lenovo ThinkBook 16 G6 ABP | |
| WebXPRT 3 / Overall | |
| Dell Inspiron 16 Plus 7630 | |
| MSI Prestige 16 B1MG-001US | |
| Average Intel Core Ultra 7 155H, Intel Arc 8-Core iGPU (252 - 299, n=34) | |
| Lenovo ThinkBook 16 G6 ABP | |
| LG Gram 2in1 16 16T90R - G.AA78G | |
| MSI Prestige 15 A12UD-093 | |
| WebXPRT 4 / Overall | |
| Dell Inspiron 16 Plus 7630 | |
| MSI Prestige 16 B1MG-001US | |
| Average Intel Core Ultra 7 155H, Intel Arc 8-Core iGPU (166.4 - 309, n=29) | |
| Asus VivoBook Pro 16 K6602VU | |
| Lenovo ThinkBook 16 G6 ABP | |
| Mozilla Kraken 1.1 / Total | |
| MSI Prestige 15 A12UD-093 | |
| LG Gram 2in1 16 16T90R - G.AA78G | |
| Lenovo ThinkBook 16 G6 ABP | |
| Asus VivoBook Pro 16 K6602VU | |
| Average Intel Core Ultra 7 155H, Intel Arc 8-Core iGPU (517 - 614, n=35) | |
| MSI Prestige 16 B1MG-001US | |
| Dell Inspiron 16 Plus 7630 | |
* ... smaller is better
| PCMark 10 Score | 7033 points | |
Help | ||
| AIDA64 / Memory Copy | |
| Average Intel Core Ultra 7 155H (62397 - 96791, n=50) | |
| MSI Prestige 16 B1MG-001US | |
| MSI Prestige 15 A12UD-093 | |
| LG Gram 2in1 16 16T90R - G.AA78G | |
| Dell Inspiron 16 Plus 7630 | |
| Asus VivoBook Pro 16 K6602VU | |
| Lenovo ThinkBook 16 G6 ABP | |
| AIDA64 / Memory Read | |
| Average Intel Core Ultra 7 155H (60544 - 90647, n=50) | |
| MSI Prestige 16 B1MG-001US | |
| Dell Inspiron 16 Plus 7630 | |
| Asus VivoBook Pro 16 K6602VU | |
| MSI Prestige 15 A12UD-093 | |
| LG Gram 2in1 16 16T90R - G.AA78G | |
| Lenovo ThinkBook 16 G6 ABP | |
| AIDA64 / Memory Write | |
| LG Gram 2in1 16 16T90R - G.AA78G | |
| MSI Prestige 16 B1MG-001US | |
| Average Intel Core Ultra 7 155H (58692 - 93451, n=50) | |
| MSI Prestige 15 A12UD-093 | |
| Asus VivoBook Pro 16 K6602VU | |
| Dell Inspiron 16 Plus 7630 | |
| Lenovo ThinkBook 16 G6 ABP | |
| AIDA64 / Memory Latency | |
| Average Intel Core Ultra 7 155H (116.2 - 233, n=50) | |
| MSI Prestige 16 B1MG-001US | |
| LG Gram 2in1 16 16T90R - G.AA78G | |
| MSI Prestige 15 A12UD-093 | |
| Lenovo ThinkBook 16 G6 ABP | |
| Dell Inspiron 16 Plus 7630 | |
| Asus VivoBook Pro 16 K6602VU | |
* ... smaller is better
DPC Latency
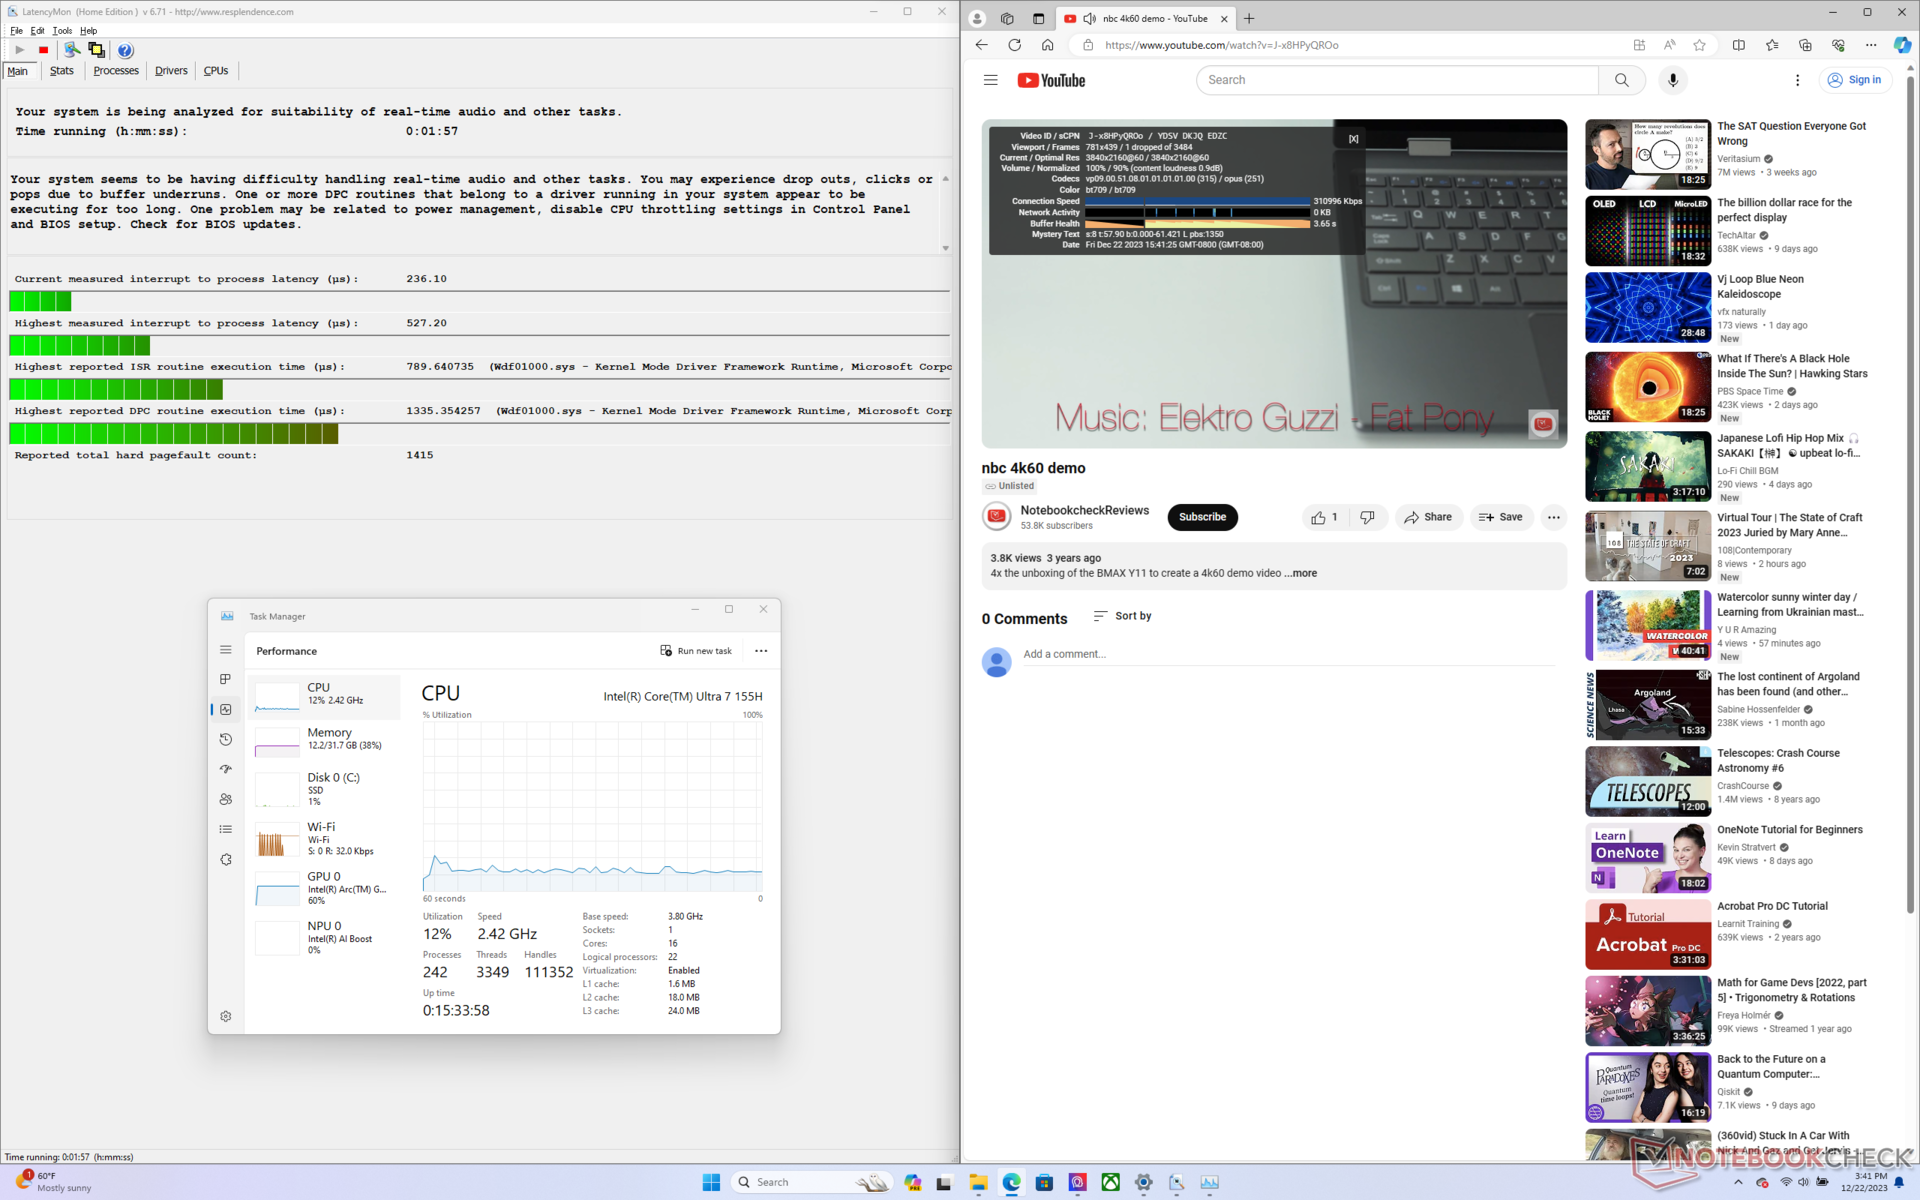
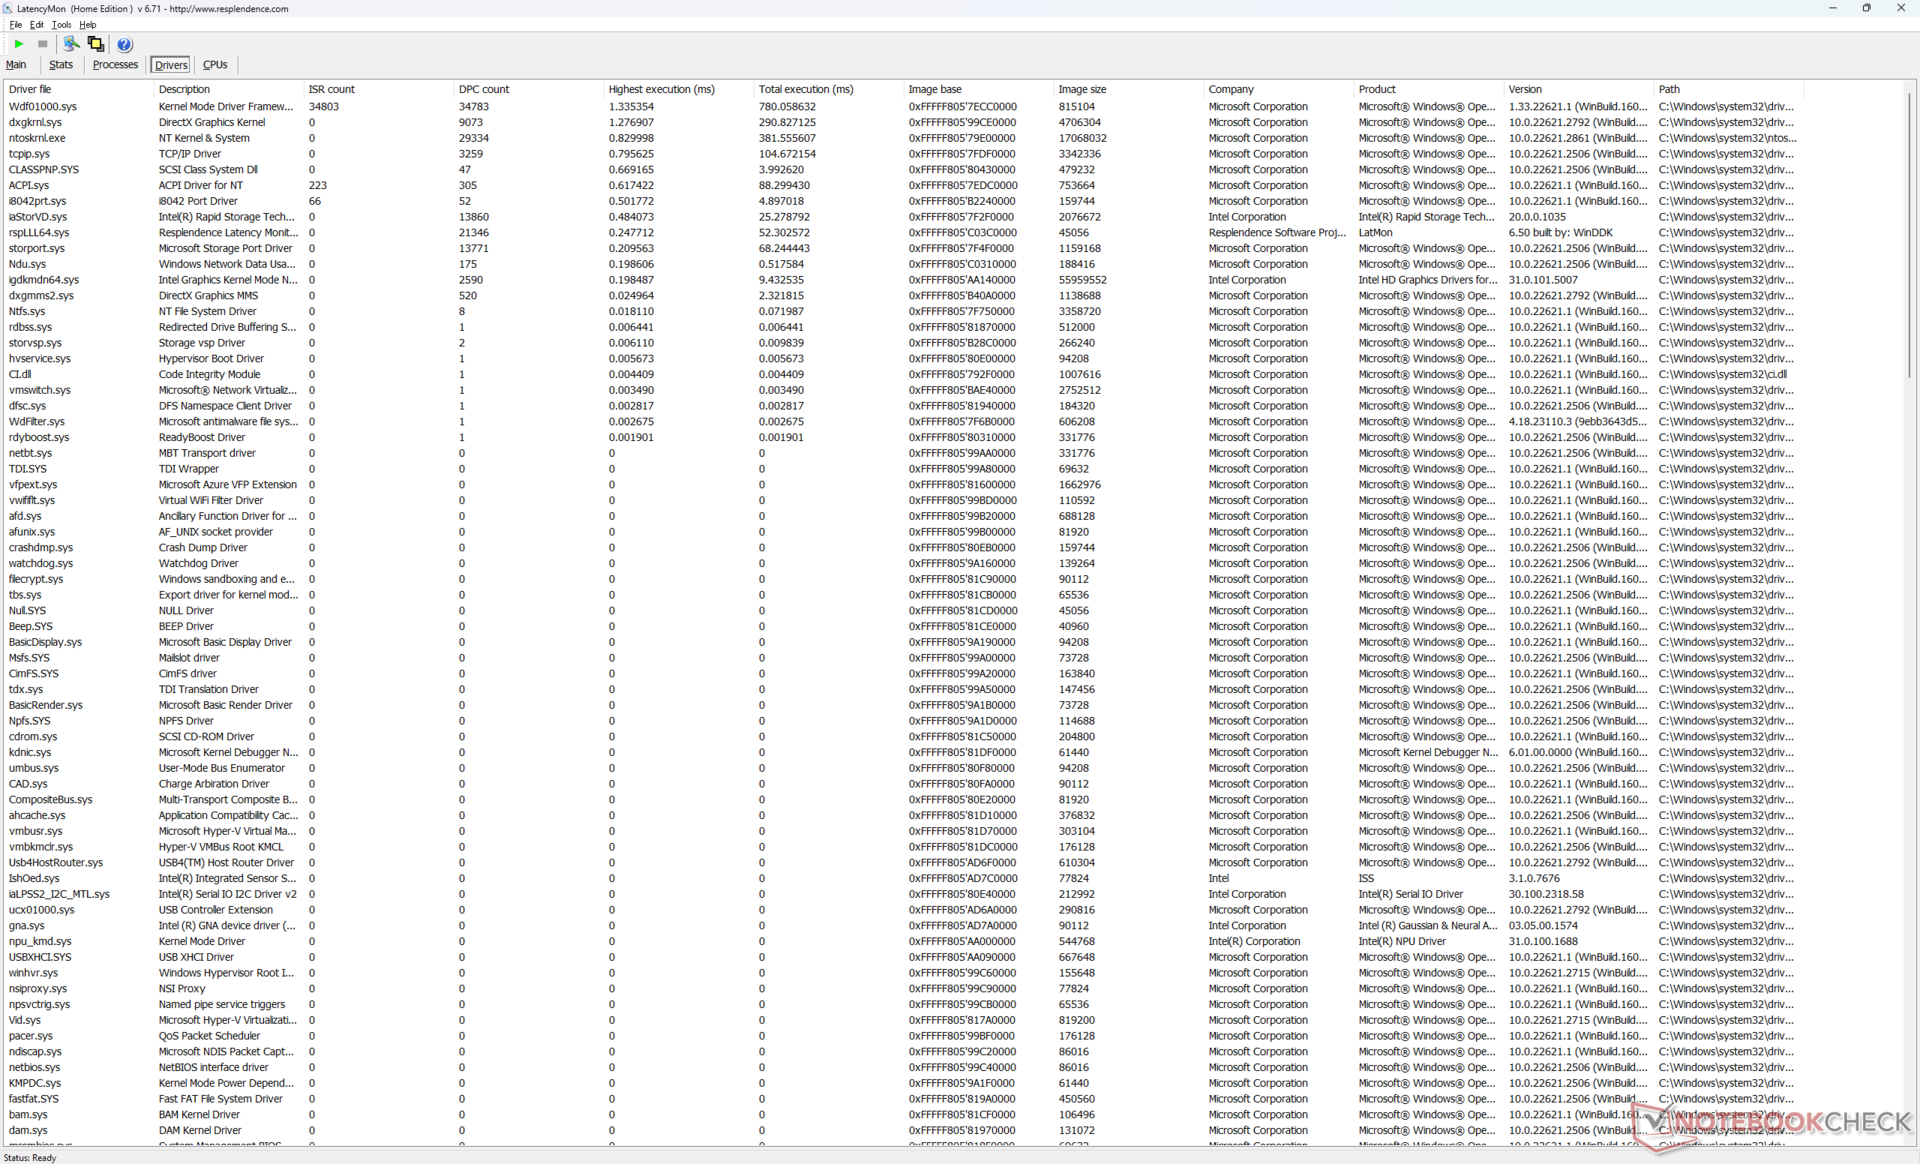
LatencyMon reveals just minor DPC issues when opening multiple browser tabs of our homepage. 4K video playback at 60 FPS is nearly perfect with just one dropped frame recorded during a 60-second test video.
| DPC Latencies / LatencyMon - interrupt to process latency (max), Web, Youtube, Prime95 | |
| LG Gram 2in1 16 16T90R - G.AA78G | |
| Asus VivoBook Pro 16 K6602VU | |
| MSI Prestige 15 A12UD-093 | |
| Lenovo ThinkBook 16 G6 ABP | |
| Dell Inspiron 16 Plus 7630 | |
| MSI Prestige 16 B1MG-001US | |
* ... smaller is better
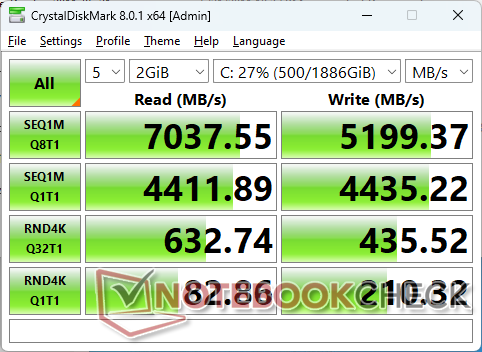
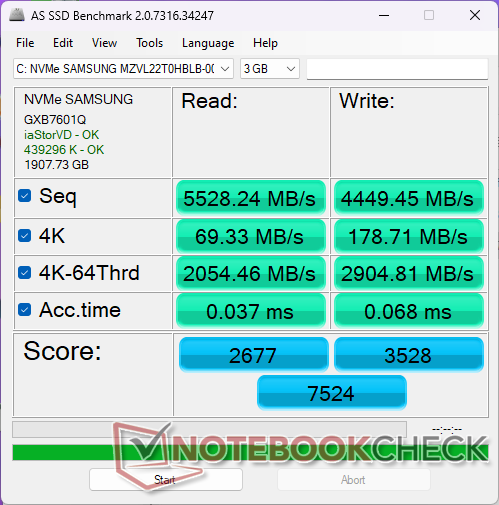
Storage Devices
Our unit comes equipped with a 2 TB Samsung PM9A1 which is one of the fastest consumer-grade PCIe4 x4 NVMe SSDs available and an upgrade from the Micron 3400 on our older Prestige 15. The drive is able to maintain speeds of ~7100 MB/s even when stressed which is impressive considering the thinness of the chassis.

| Drive Performance rating - Percent | |
| MSI Prestige 16 B1MG-001US | |
| LG Gram 2in1 16 16T90R - G.AA78G | |
| MSI Prestige 15 A12UD-093 | |
| Dell Inspiron 16 Plus 7630 | |
| Lenovo ThinkBook 16 G6 ABP | |
| Asus VivoBook Pro 16 K6602VU | |
* ... smaller is better
Disk Throttling: DiskSpd Read Loop, Queue Depth 8
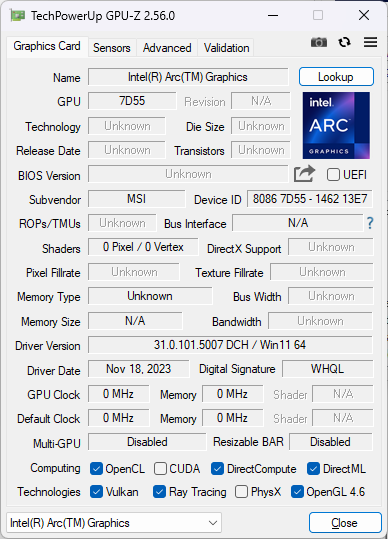
GPU Performance — Retaking The Integrated Graphics Crown
After a stagnant past few years, Intel has finally revamped its integrated GPU to be more competitive against the competing Radeon 680M and 780M series. 3DMark results pit our Arc 8 ahead of the Radeon 780M by about 20 percent or even up to 50 percent on DX12 supported titles. Users upgrading from the common Iris Xe 96 EUs should expect a raw performance boost of about 1.5x to 2x. It's not quite at the level of a GeForce RTX 3050 Ti, but scores are definitely inching closer to a GeForce RTX 2050.
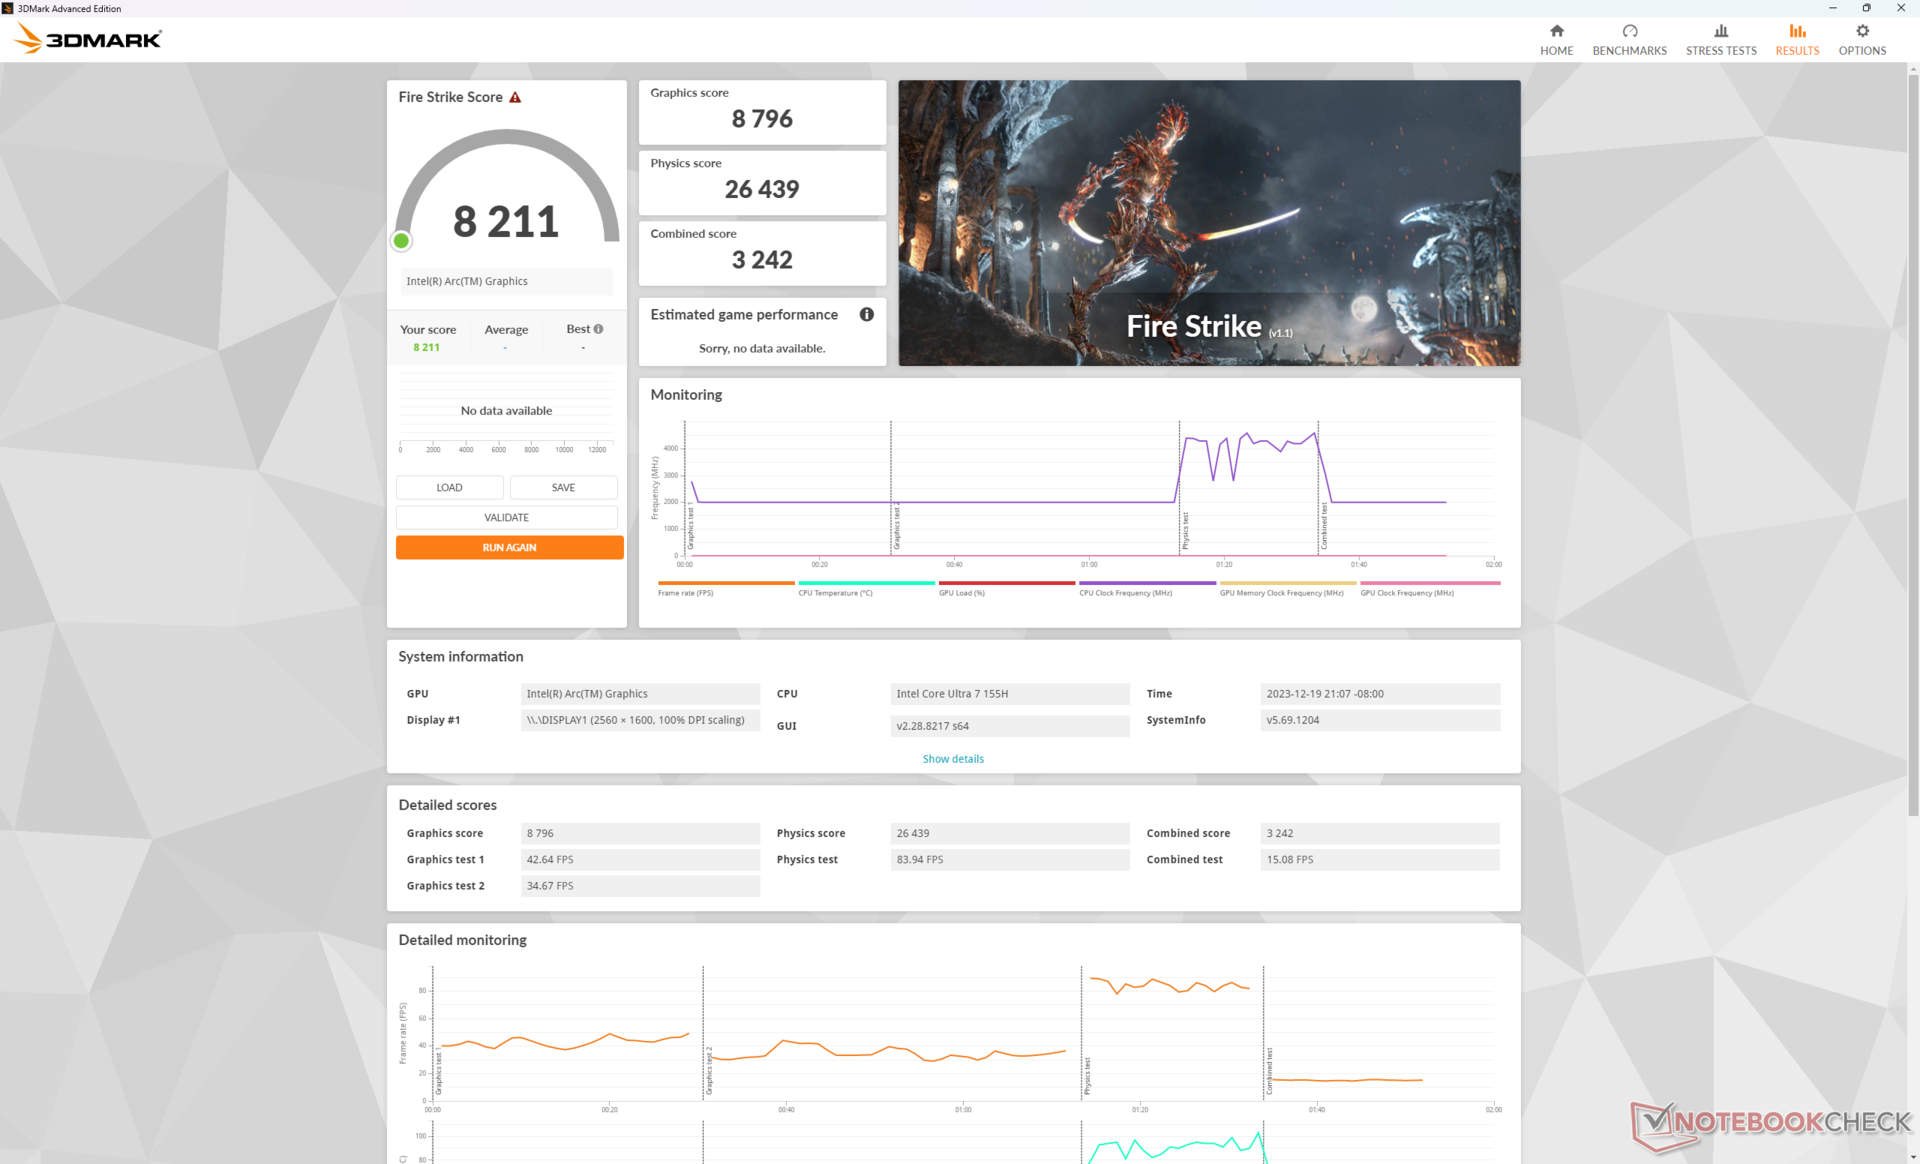
| Power Profile | Physics Score | Graphics Score | Combined Score |
| Extreme Performance (Cooler Boost on) | 26439 | 8796 | 3242 |
| Extreme Performance (Cooler Boost off) | 26460 (-0%) | 8614 (-2%) | 3187 (-2%) |
| Balanced mode | 25110 (-5%) | 8814 (-0%) | 3306 (-0%) |
| Battery mode | 21717 (-18%) | 7425 (-16%) | 2761 (-15%) |
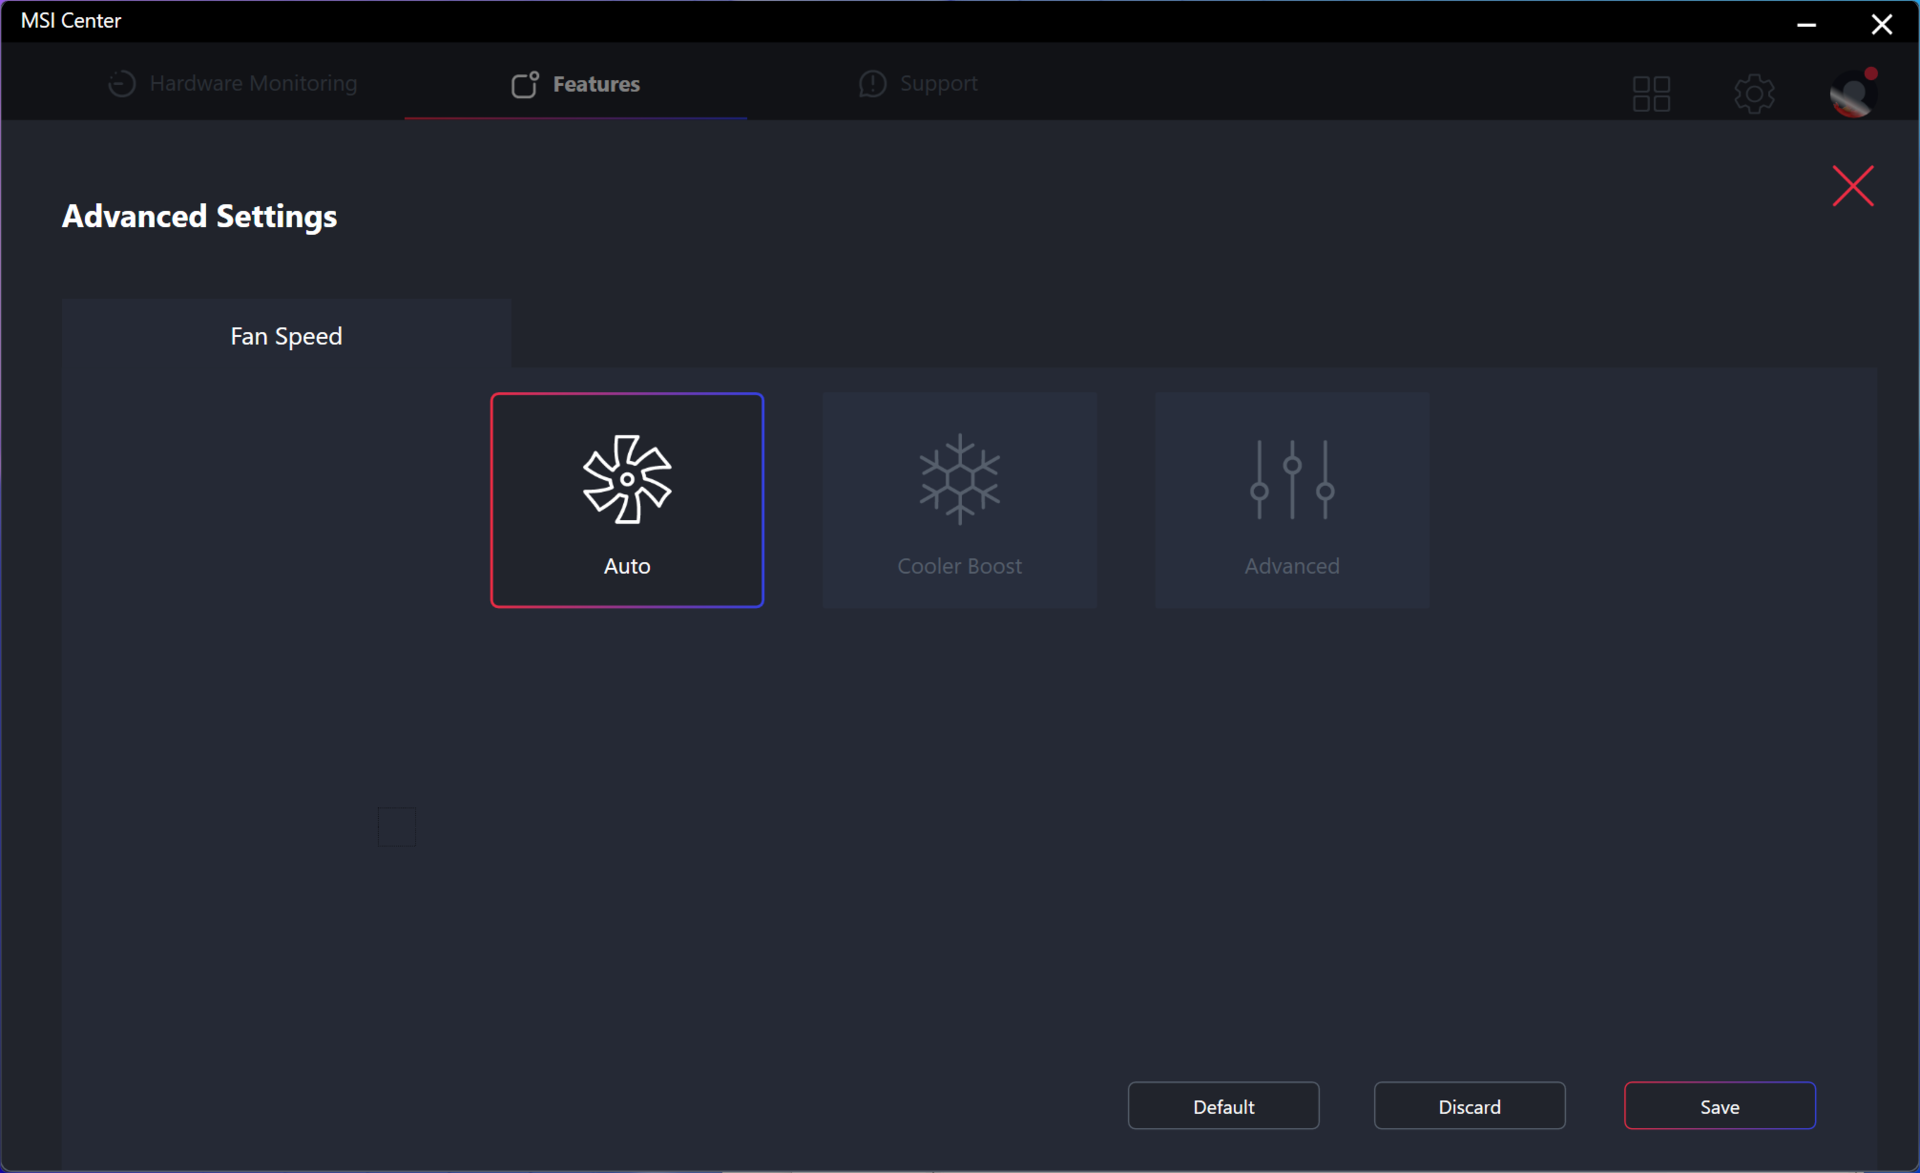
Enabling Cooler Boost does not appear to significantly impact performance according to our Fire Strike results table above. Running on Balanced mode would impact CPU performance just slightly while Battery mode would reduce performance more significantly by about 15 percent.
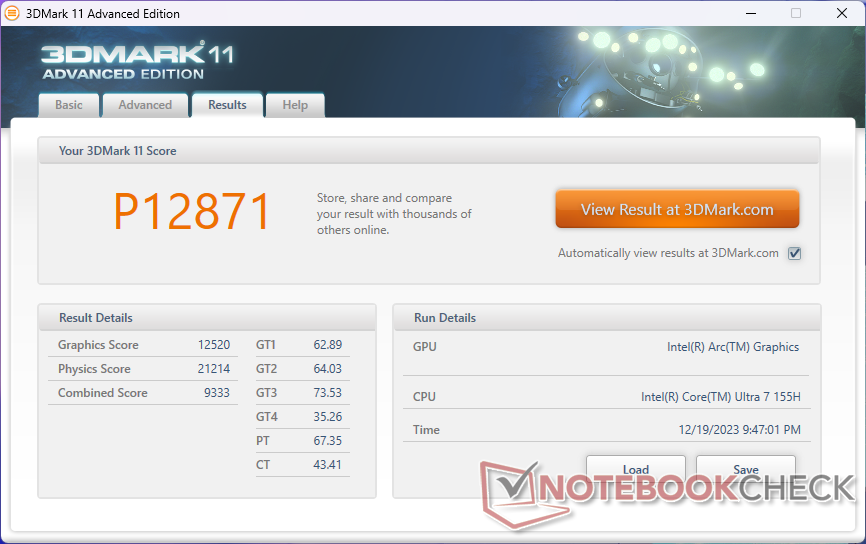
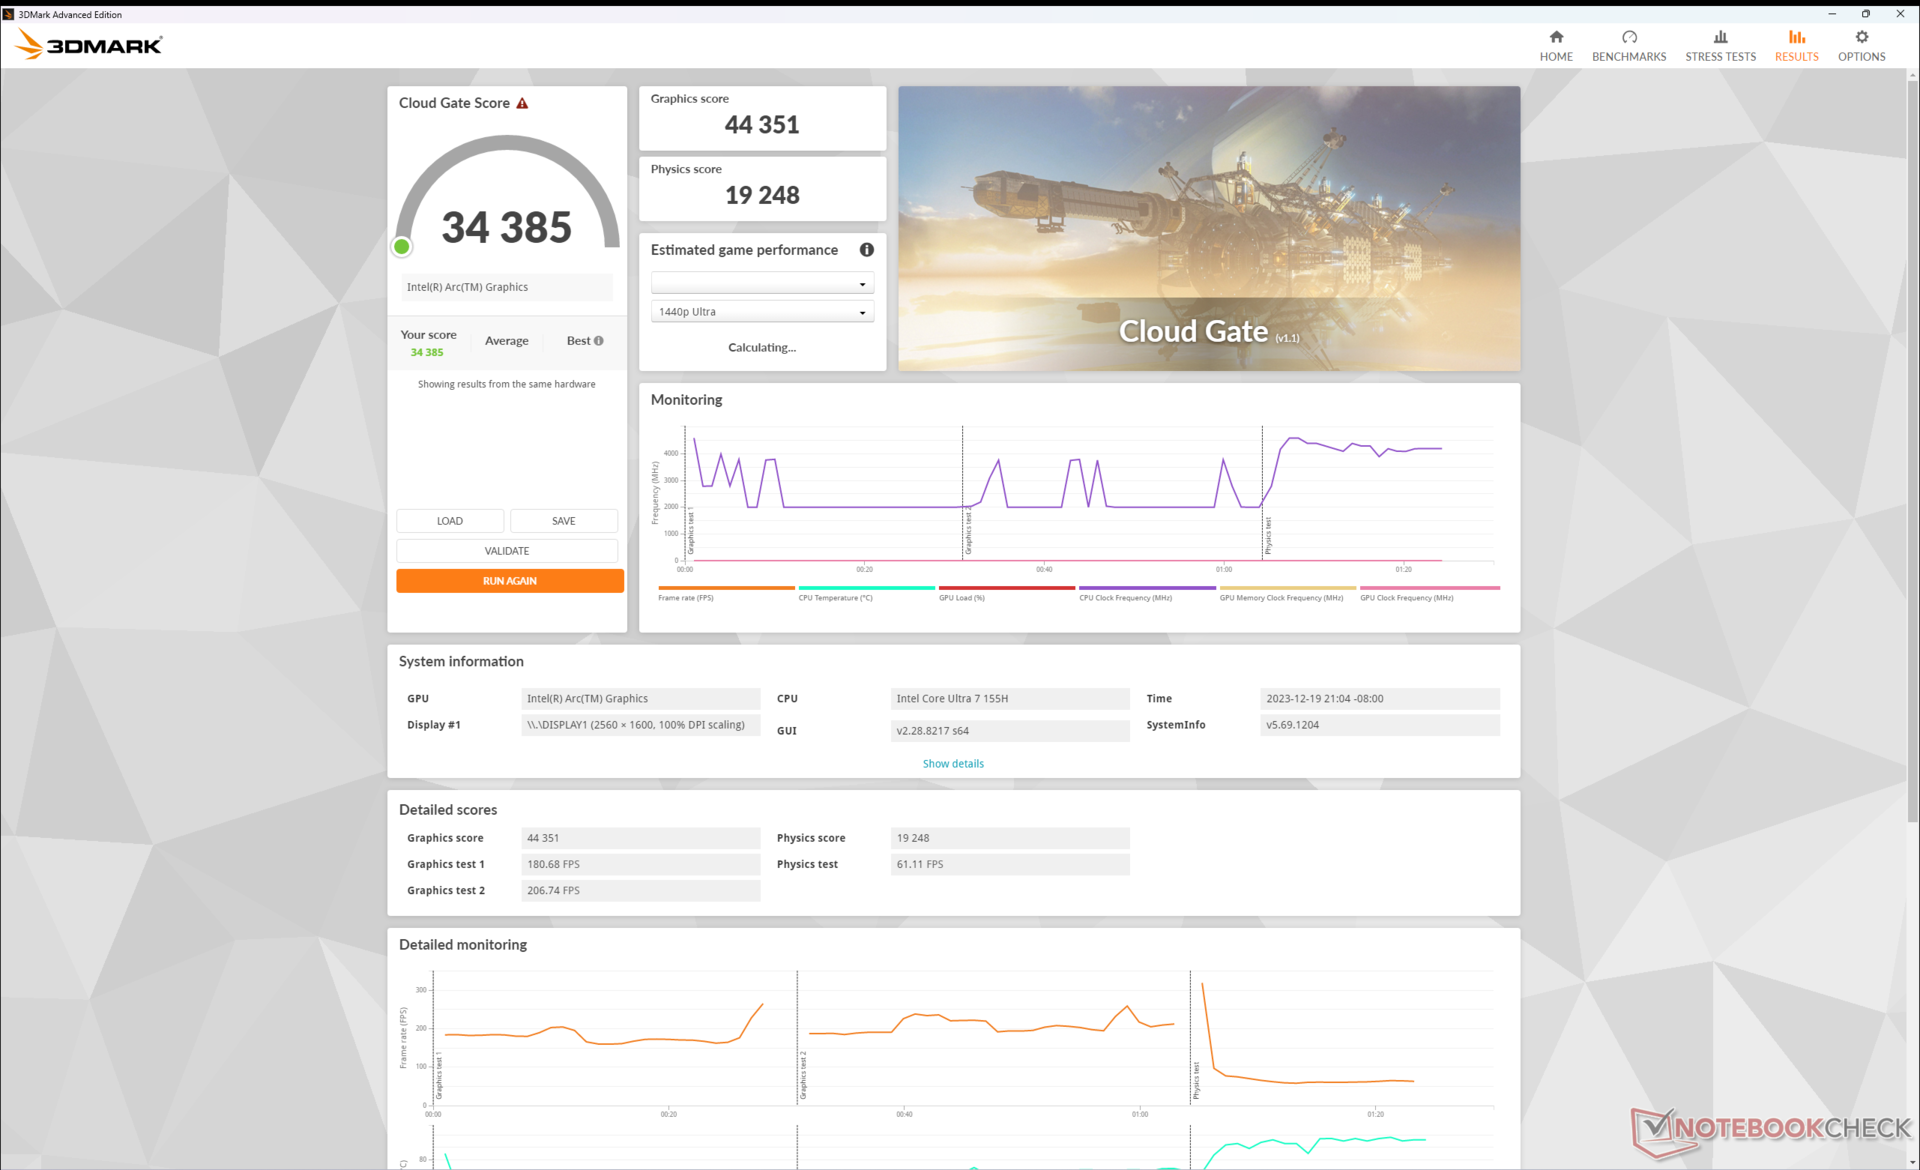
| 3DMark 11 Performance | 12871 points | |
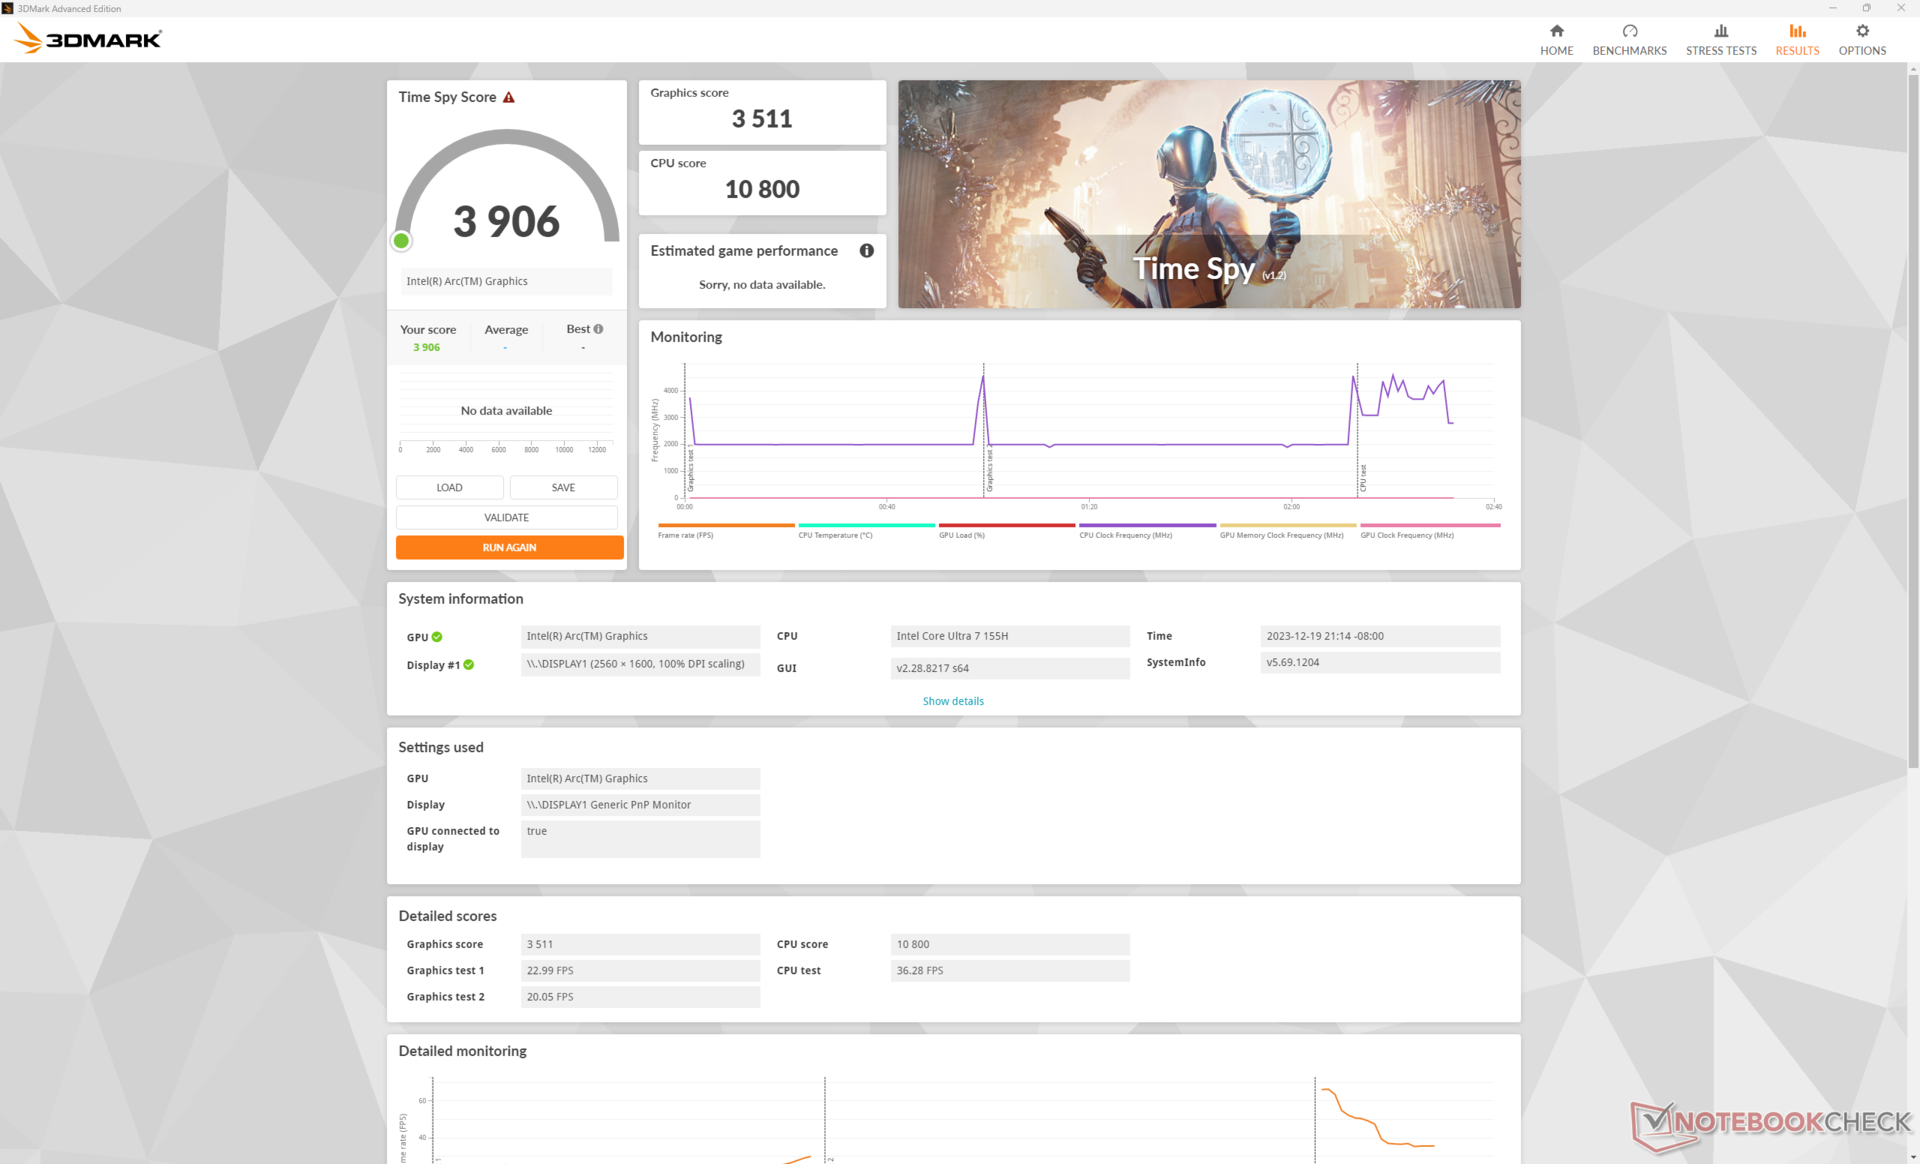
| 3DMark Cloud Gate Standard Score | 34385 points | |
| 3DMark Fire Strike Score | 8211 points | |
| 3DMark Time Spy Score | 3906 points | |
Help | ||
* ... smaller is better
Gaming Performance
Real-world performance when running games is excellent with results that rival the GeForce 3050 Ti in last year's Prestige 15 as hinted at by the synthetic benchmark results above. Far Cry 5 and F1 22, for example, perform within just 5 to 15 percent of the Prestige 15. Keep in mind that the GeForce GPU in the Prestige 15 would exhibit noteworthy throttling issues that impacted its performance greatly; the vast majority of other GeForce RTX 3050 Ti laptops, like the Asus Vivobook Pro 16X, would still run games significantly faster than our integrated Arc 8.
Overall performance is nonetheless consistently better than the Radeon 780M across all tested games by about 5 to 20 percent. A few DX12 games, such as Tiny Tina's Wonderlands and F1 22, would even run up to 50 to 60 percent better on the new Intel GPU.
| The Witcher 3 - 1920x1080 Ultra Graphics & Postprocessing (HBAO+) | |
| Dell Inspiron 16 Plus 7630 | |
| Asus VivoBook Pro 16 K6602VU | |
| MSI Prestige 16 B1MG-001US | |
| MSI Prestige 15 A12UD-093 | |
| LG Gram 2in1 16 16T90R - G.AA78G | |
| Lenovo ThinkBook 16 G6 ABP | |
| GTA V - 1920x1080 Highest AA:4xMSAA + FX AF:16x | |
| Asus VivoBook Pro 16 K6602VU | |
| MSI Prestige 15 A12UD-093 | |
| Lenovo ThinkBook 16 G6 ABP | |
| LG Gram 2in1 16 16T90R - G.AA78G | |
| Final Fantasy XV Benchmark - 1920x1080 High Quality | |
| Dell Inspiron 16 Plus 7630 | |
| Asus VivoBook Pro 16 K6602VU | |
| MSI Prestige 16 B1MG-001US | |
| MSI Prestige 15 A12UD-093 | |
| LG Gram 2in1 16 16T90R - G.AA78G | |
| Lenovo ThinkBook 16 G6 ABP | |
| Strange Brigade - 1920x1080 ultra AA:ultra AF:16 | |
| Dell Inspiron 16 Plus 7630 | |
| Asus VivoBook Pro 16 K6602VU | |
| MSI Prestige 16 B1MG-001US | |
| MSI Prestige 15 A12UD-093 | |
| LG Gram 2in1 16 16T90R - G.AA78G | |
| Lenovo ThinkBook 16 G6 ABP | |
| Dota 2 Reborn - 1920x1080 ultra (3/3) best looking | |
| Dell Inspiron 16 Plus 7630 | |
| Asus VivoBook Pro 16 K6602VU | |
| MSI Prestige 16 B1MG-001US | |
| MSI Prestige 15 A12UD-093 | |
| LG Gram 2in1 16 16T90R - G.AA78G | |
| Lenovo ThinkBook 16 G6 ABP | |
| X-Plane 11.11 - 1920x1080 high (fps_test=3) | |
| Dell Inspiron 16 Plus 7630 | |
| Asus VivoBook Pro 16 K6602VU | |
| MSI Prestige 15 A12UD-093 | |
| LG Gram 2in1 16 16T90R - G.AA78G | |
| MSI Prestige 16 B1MG-001US | |
| Lenovo ThinkBook 16 G6 ABP | |
| Baldur's Gate 3 | |
| 1280x720 Low Preset AA:SM | |
| MSI Prestige 16 B1MG-001US | |
| Average Intel Arc 8-Core iGPU (31.8 - 57.6, n=14) | |
| 1920x1080 Low Preset AA:SM | |
| MSI Prestige 16 B1MG-001US | |
| Average Intel Arc 8-Core iGPU (21 - 40.3, n=26) | |
| 1920x1080 Medium Preset AA:T | |
| MSI Prestige 16 B1MG-001US | |
| Average Intel Arc 8-Core iGPU (16.3 - 31.1, n=27) | |
| 1920x1080 High Preset AA:T | |
| MSI Prestige 16 B1MG-001US | |
| Average Intel Arc 8-Core iGPU (15.4 - 27.7, n=26) | |
| 1920x1080 Ultra Preset AA:T | |
| MSI Prestige 16 B1MG-001US | |
| Average Intel Arc 8-Core iGPU (14.2 - 26.2, n=25) | |
| Cyberpunk 2077 | |
| 1280x720 Low Preset (FSR off) | |
| MSI Prestige 16 B1MG-001US | |
| Average Intel Arc 8-Core iGPU (34.5 - 58, n=19) | |
| LG Gram 2in1 16 16T90R - G.AA78G | |
| 1920x1080 Low Preset (FSR off) | |
| MSI Prestige 16 B1MG-001US | |
| Average Intel Arc 8-Core iGPU (11.3 - 38, n=37) | |
| LG Gram 2in1 16 16T90R - G.AA78G | |
| 1920x1080 Medium Preset (FSR off) | |
| MSI Prestige 16 B1MG-001US | |
| Average Intel Arc 8-Core iGPU (9.42 - 31.4, n=35) | |
| LG Gram 2in1 16 16T90R - G.AA78G | |
| 1920x1080 High Preset (FSR off) | |
| MSI Prestige 16 B1MG-001US | |
| Average Intel Arc 8-Core iGPU (7.3 - 27.6, n=35) | |
| LG Gram 2in1 16 16T90R - G.AA78G | |
| 1920x1080 Ultra Preset (FSR off) | |
| MSI Prestige 16 B1MG-001US | |
| Average Intel Arc 8-Core iGPU (13 - 24.7, n=27) | |
| LG Gram 2in1 16 16T90R - G.AA78G | |
Witcher 3 FPS Chart
| low | med. | high | ultra | |
|---|---|---|---|---|
| The Witcher 3 (2015) | 135.6 | 88.2 | 54.1 | 25.2 |
| Dota 2 Reborn (2015) | 101.7 | 92.8 | 79.1 | 75.6 |
| Final Fantasy XV Benchmark (2018) | 61 | 37.3 | 24.6 | |
| X-Plane 11.11 (2018) | 52.2 | 46.7 | 37.8 | |
| Far Cry 5 (2018) | 63 | 39 | 36 | 34 |
| Strange Brigade (2018) | 179.5 | 71 | 57.8 | 46.1 |
| Tiny Tina's Wonderlands (2022) | 53.3 | 41.2 | 30.1 | 25.1 |
| F1 22 (2022) | 77.7 | 71.6 | 53.3 | 15.3 |
| Baldur's Gate 3 (2023) | 31.9 | 28.2 | 24.1 | 23.4 |
| Cyberpunk 2077 (2023) | 35.7 | 29.5 | 25.2 | 22.1 |
Emissions — Loud For A Laptop With Integrated Graphics
System Noise
Fan noise is quieter than the Prestige 15 when running lower loads while the opposite is true when running higher loads. When browsing or video streaming, for example, fan noise tends to range between 26 and 37 dB(A) compared to 31 to 42 dB(A) on the older model. Running demanding loads like Witcher 3 would increase fan noise to 46 dB(A) or even up to 53 dB(A) if Cooler Boost is active. The mid 40 dB(A) range is rather loud for a laptop running only on integrated graphics.
We expect fan noise on SKUs with discrete graphics to behave differently than what we experienced on our iGPU test unit.
Noise level
| Idle |
| 24.5 / 26.3 / 26.3 dB(A) |
| Load |
| 36.5 / 52.9 dB(A) |
 | ||
30 dB silent 40 dB(A) audible 50 dB(A) loud |
||
min: | ||
| MSI Prestige 16 B1MG-001US Arc 8-Core, Ultra 7 155H, Samsung PM9A1 MZVL22T0HBLB | MSI Prestige 15 A12UD-093 GeForce RTX 3050 Ti Laptop GPU, i7-1280P, Micron 3400 1TB MTFDKBA1T0TFH | LG Gram 2in1 16 16T90R - G.AA78G Iris Xe G7 96EUs, i7-1360P, Samsung PM9A1 MZVL21T0HCLR | Lenovo ThinkBook 16 G6 ABP Vega 7, R5 7530U, SK hynix HFS512GEJ9X125N | Asus VivoBook Pro 16 K6602VU GeForce RTX 4050 Laptop GPU, i9-13900H, Micron 2400 MTFDKBA1T0QFM | Dell Inspiron 16 Plus 7630 GeForce RTX 4060 Laptop GPU, i7-13700H, WD PC SN740 SDDPTQD-1T00 | |
|---|---|---|---|---|---|---|
| Noise | -6% | 8% | 13% | -4% | 4% | |
| off / environment * (dB) | 24.5 | 26 -6% | 25.1 -2% | 24.3 1% | 20.96 14% | 23.2 5% |
| Idle Minimum * (dB) | 24.5 | 26 -6% | 25.1 -2% | 24.3 1% | 25.28 -3% | 23.2 5% |
| Idle Average * (dB) | 26.3 | 30.7 -17% | 25.1 5% | 24.3 8% | 25.28 4% | 23.2 12% |
| Idle Maximum * (dB) | 26.3 | 30.7 -17% | 26.1 1% | 24.3 8% | 25.28 4% | 23.2 12% |
| Load Average * (dB) | 36.5 | 41.9 -15% | 31.4 14% | 29.7 19% | 51.88 -42% | 35.1 4% |
| Witcher 3 ultra * (dB) | 46.3 | 41.1 11% | 32.1 31% | 49 -6% | 52.5 -13% | |
| Load Maximum * (dB) | 52.9 | 40.7 23% | 36.6 31% | 41.4 22% | 51.8 2% | 52.5 1% |
* ... smaller is better
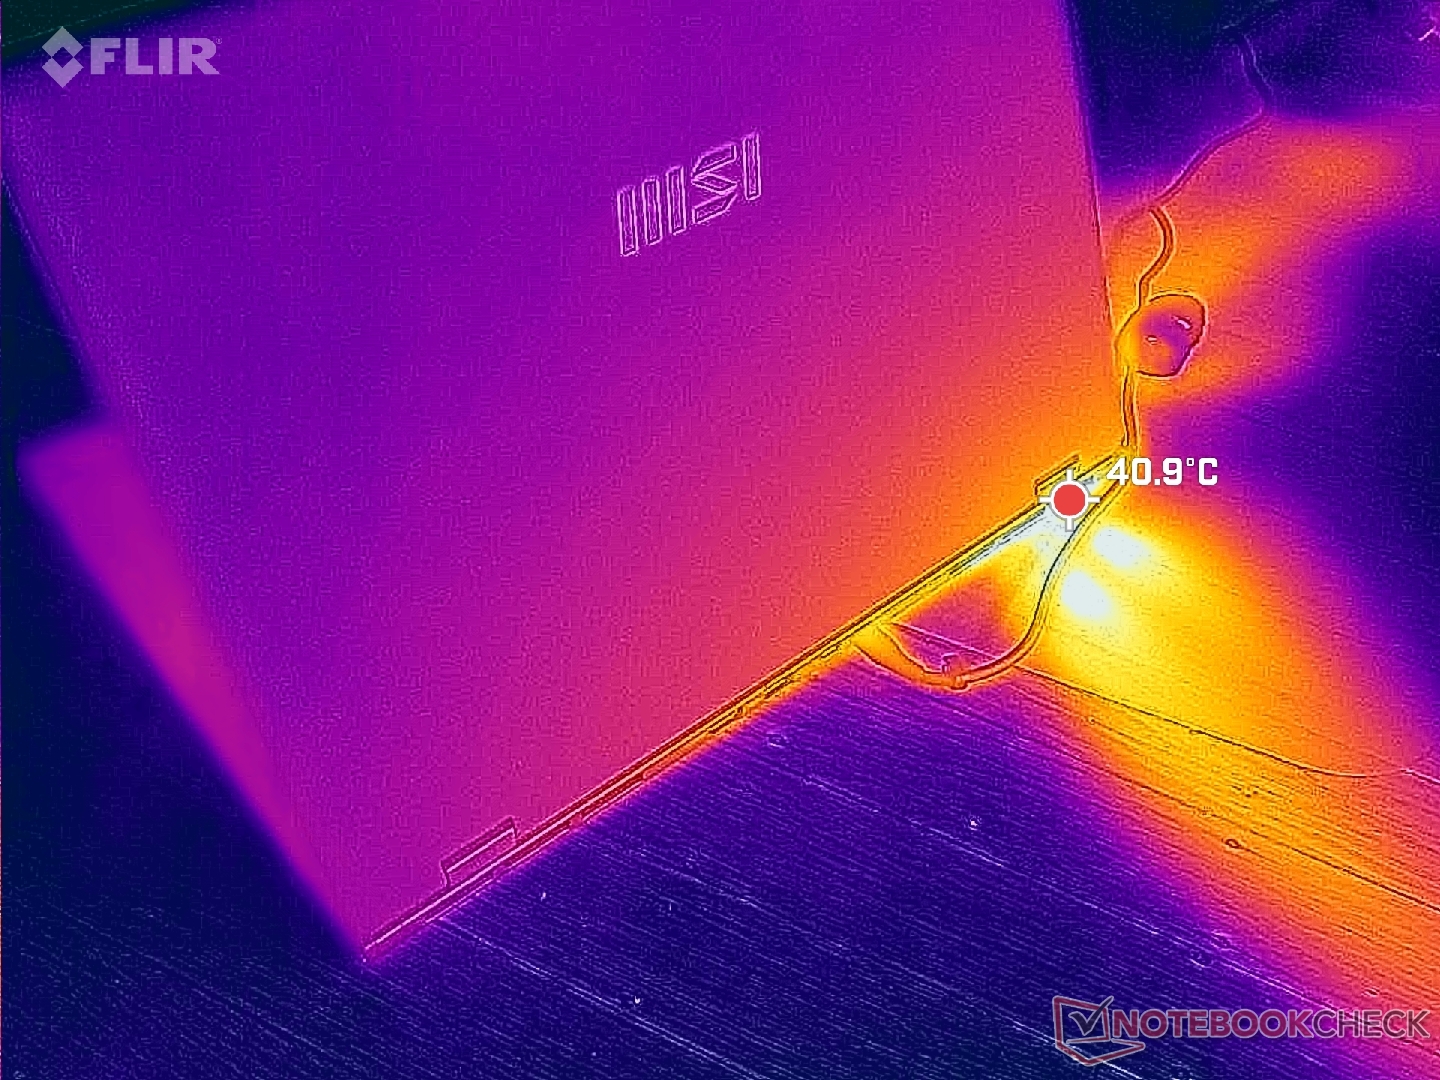
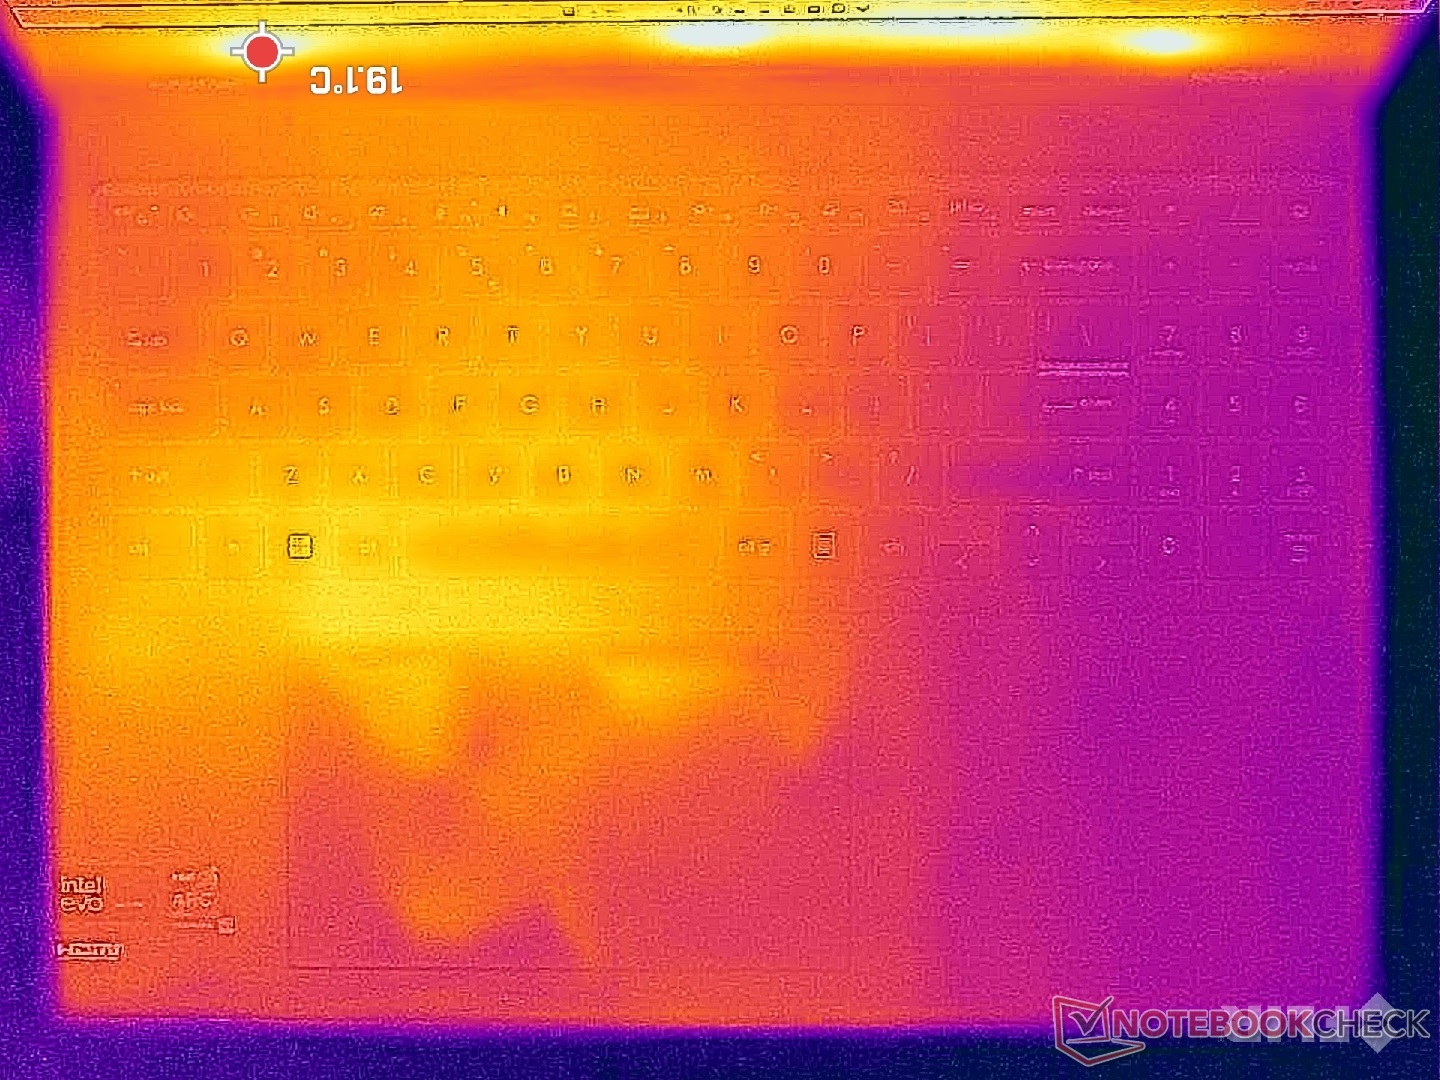
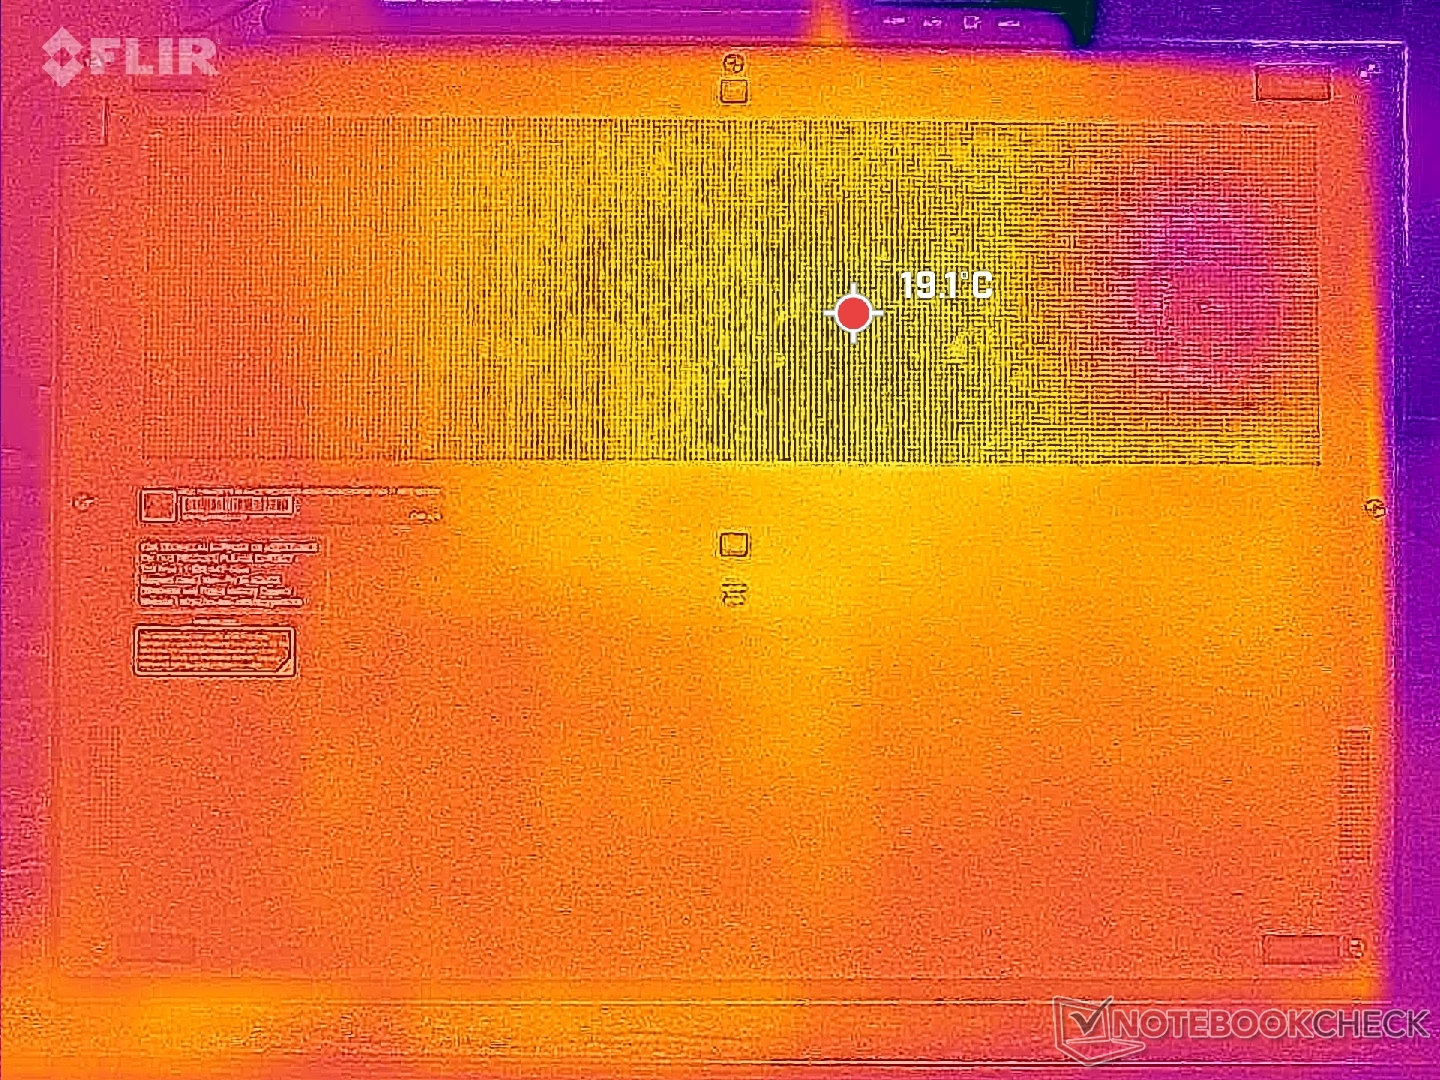
Temperature
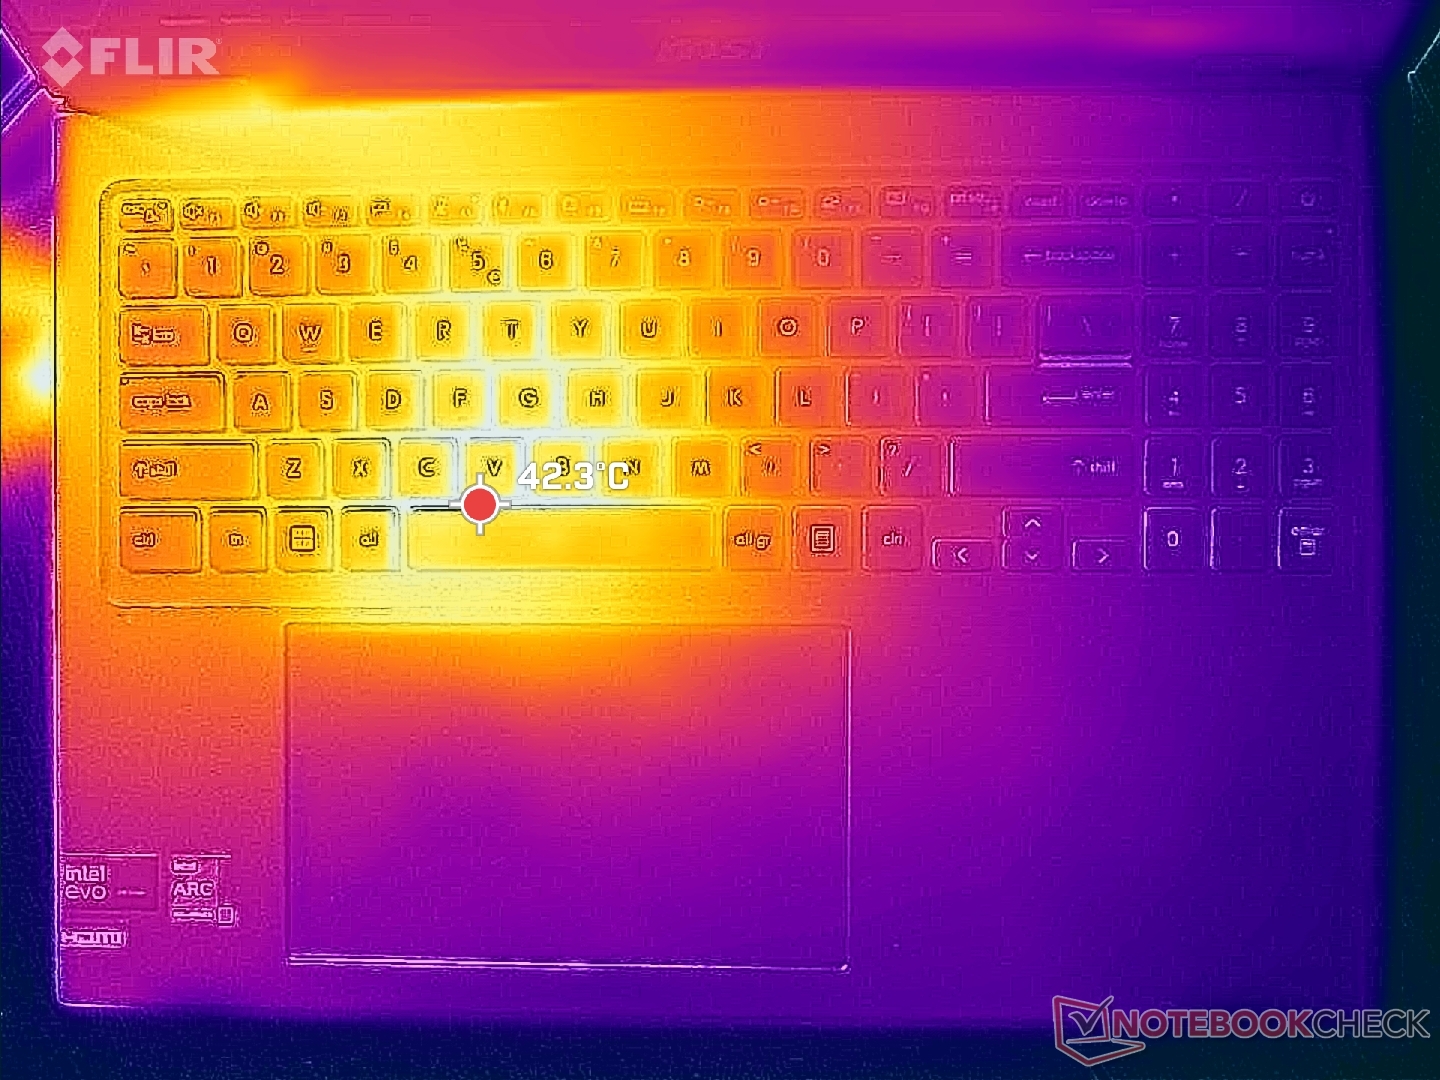
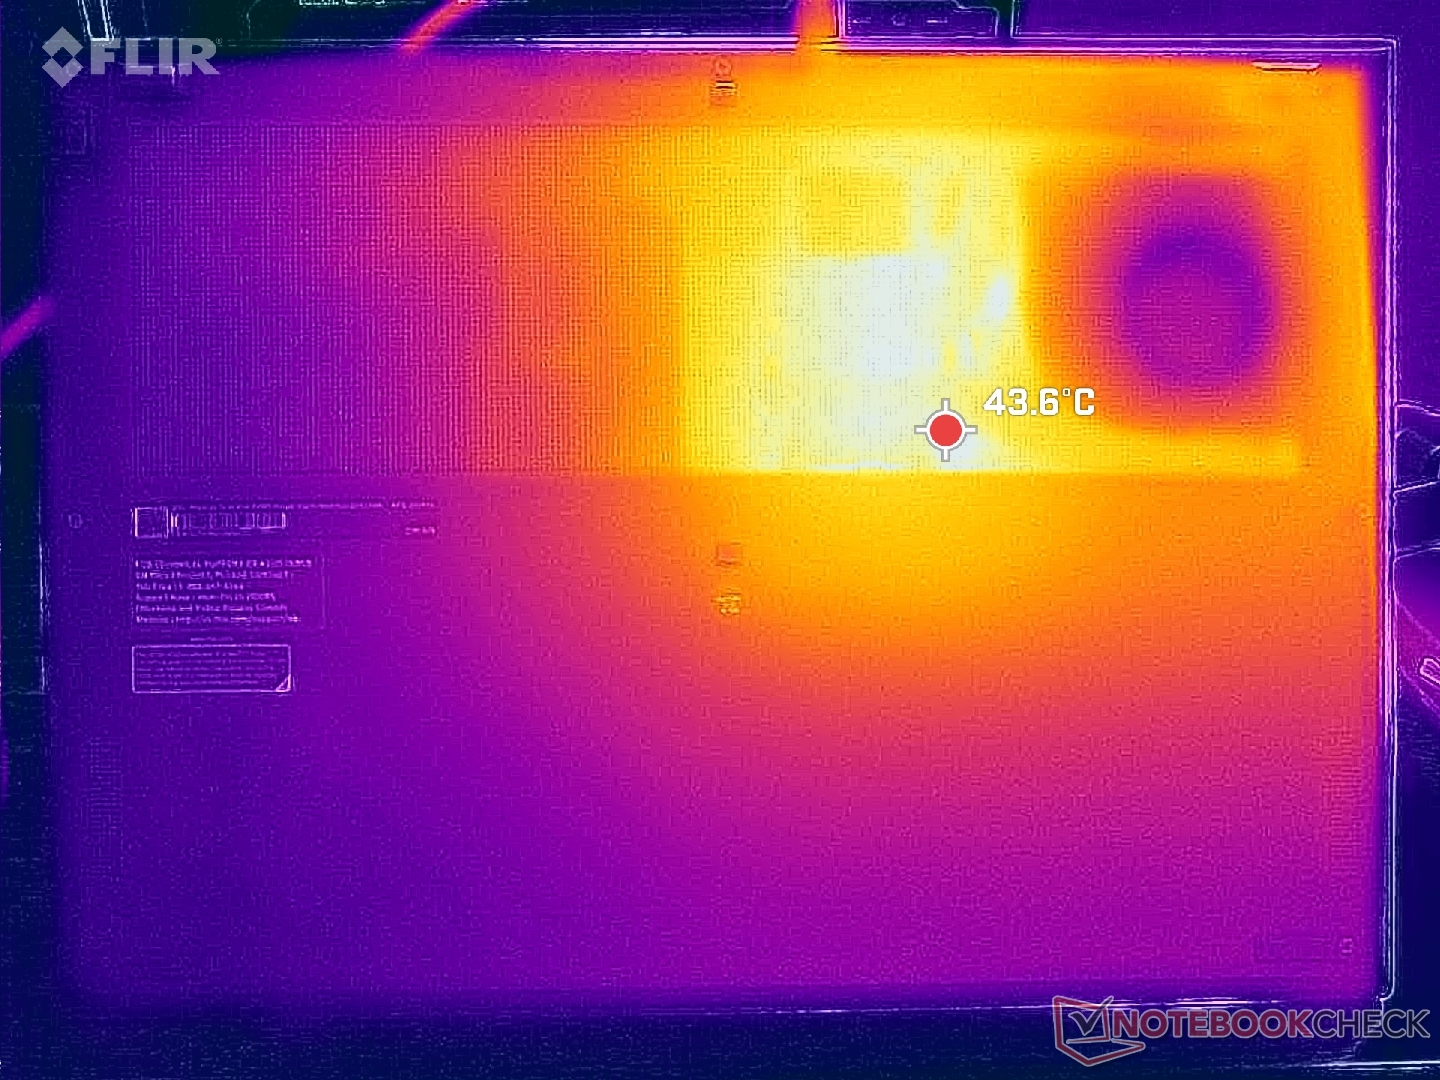
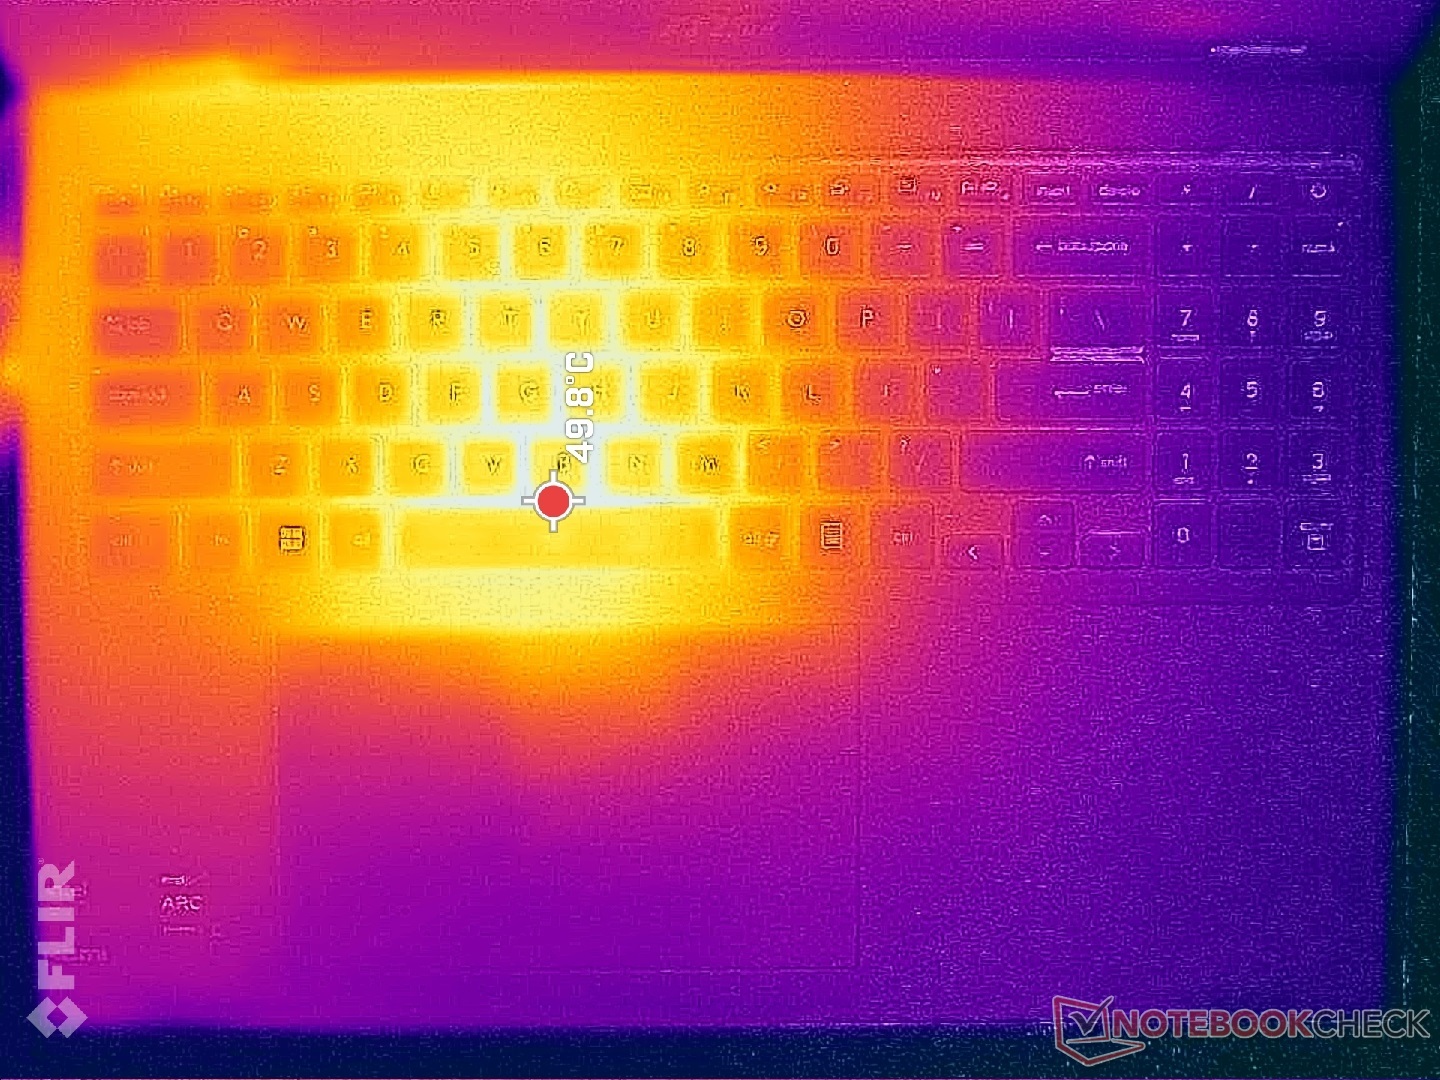
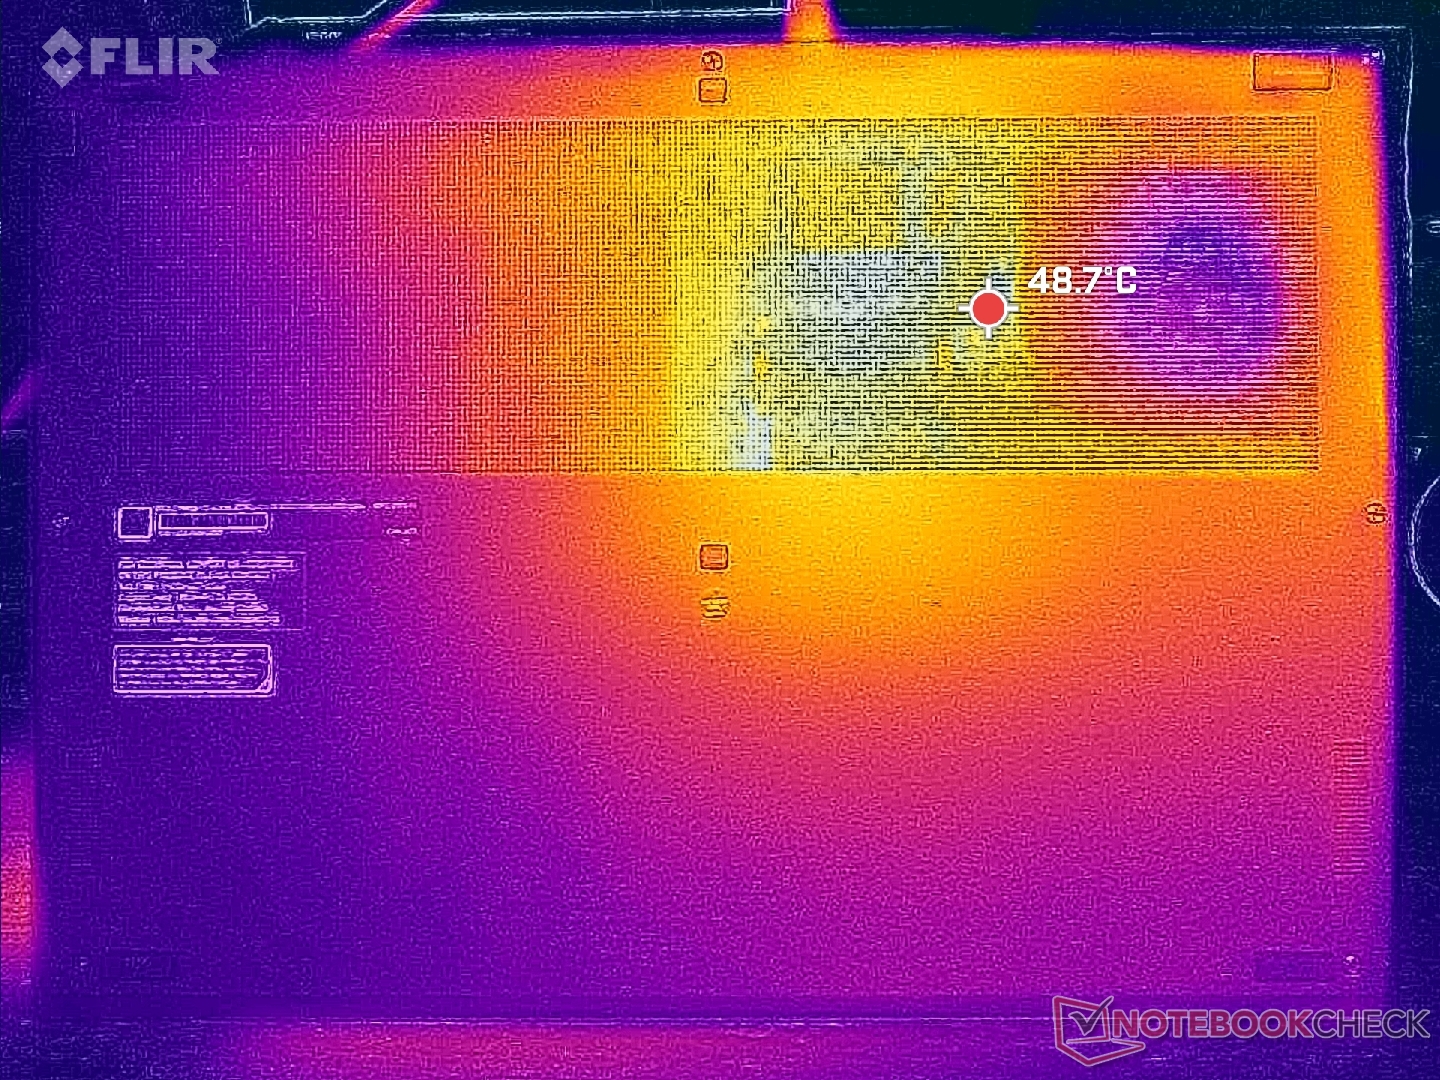
Surface temperatures are warmer on the left half of the laptop than the right due to the positioning of the CPU and cooling solution within. The hot spot near the Space key can reach up to 50 C when running demanding loads which is similar to the hot spot on last year's Prestige 15 with the dedicated GeForce RTX GPU. The WASD keys can feel rather warm when gaming as a result, but the palm rests and arrow keys would remain much cooler. Prestige laptops are generally warmer than the average Ultrabook under load due to their compact designs and the Prestige 16 is no exception.
(-) The maximum temperature on the upper side is 48.8 °C / 120 F, compared to the average of 36.8 °C / 98 F, ranging from 21 to 71 °C for the class Multimedia.
(-) The bottom heats up to a maximum of 47.6 °C / 118 F, compared to the average of 39.1 °C / 102 F
(+) In idle usage, the average temperature for the upper side is 23 °C / 73 F, compared to the device average of 31.3 °C / 88 F.
(±) Playing The Witcher 3, the average temperature for the upper side is 33.3 °C / 92 F, compared to the device average of 31.3 °C / 88 F.
(+) The palmrests and touchpad are cooler than skin temperature with a maximum of 30 °C / 86 F and are therefore cool to the touch.
(±) The average temperature of the palmrest area of similar devices was 28.7 °C / 83.7 F (-1.3 °C / -2.3 F).
| MSI Prestige 16 B1MG-001US Intel Core Ultra 7 155H, Intel Arc 8-Core iGPU | MSI Prestige 15 A12UD-093 Intel Core i7-1280P, NVIDIA GeForce RTX 3050 Ti Laptop GPU | LG Gram 2in1 16 16T90R - G.AA78G Intel Core i7-1360P, Intel Iris Xe Graphics G7 96EUs | Lenovo ThinkBook 16 G6 ABP AMD Ryzen 5 7530U, AMD Radeon RX Vega 7 | Asus VivoBook Pro 16 K6602VU Intel Core i9-13900H, NVIDIA GeForce RTX 4050 Laptop GPU | Dell Inspiron 16 Plus 7630 Intel Core i7-13700H, NVIDIA GeForce RTX 4060 Laptop GPU | |
|---|---|---|---|---|---|---|
| Heat | -16% | -25% | -15% | -30% | -20% | |
| Maximum Upper Side * (°C) | 48.8 | 49 -0% | 55 -13% | 40.8 16% | 42.6 13% | 47.8 2% |
| Maximum Bottom * (°C) | 47.6 | 52.6 -11% | 55.4 -16% | 50.5 -6% | 48.4 -2% | 42.2 11% |
| Idle Upper Side * (°C) | 24.2 | 29.7 -23% | 34.9 -44% | 29.3 -21% | 39.4 -63% | 35.2 -45% |
| Idle Bottom * (°C) | 23.6 | 30.7 -30% | 30 -27% | 35.2 -49% | 39.8 -69% | 35 -48% |
* ... smaller is better
Stress Test
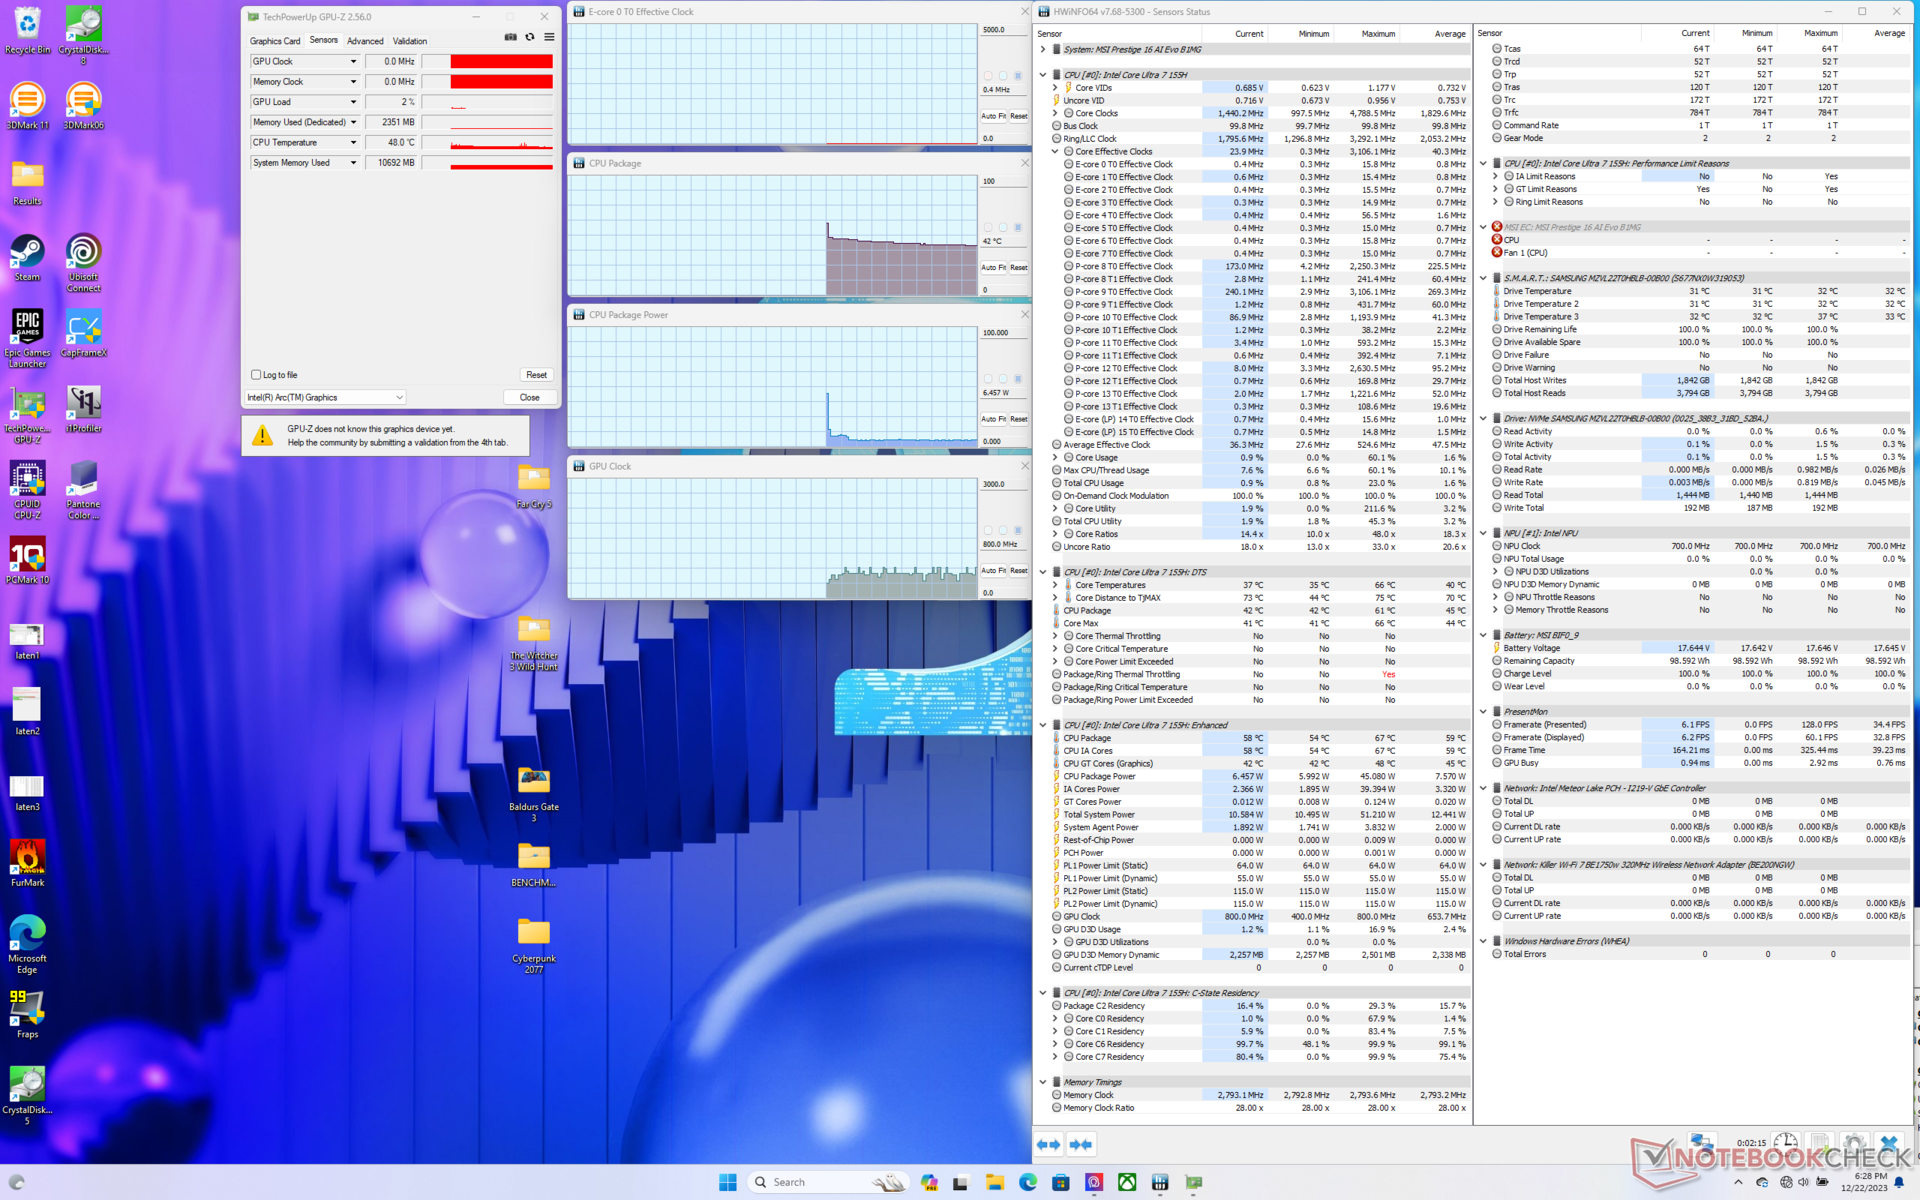
CPU package power would boost to as high as 110 W, 2.8 GHz, and 96 C for just a couple of seconds when initiating Prime95 stress before quickly falling and stabilizing at 2.2 GHz, 44 W, and 83 C. This range is warmer than average for an Ultrabook but it is otherwise typical of a Prestige model. The Acer Swift Edge SFE16 with the Ryzen 7 7840U, for example, would stabilize at a cooler 64 C while the Core H-powered Lenovo Slim Pro 9i 16IRP8 would stabilize at 77 C each under similar conditions.
Running with Cooler Boost active does not appear to impact performance. For example, the CPU would stabilize at 85 C when running Witcher 3 with Cooler Boost off versus 77 C with Cooler Boost on while GPU clock rates would remain unchanged. Unless if core temperatures are a concern, then Cooler Boost mode is generally not needed for maximum performance. This observation aligns with our experiences on many other MSI laptops that feature Cooler Boost.
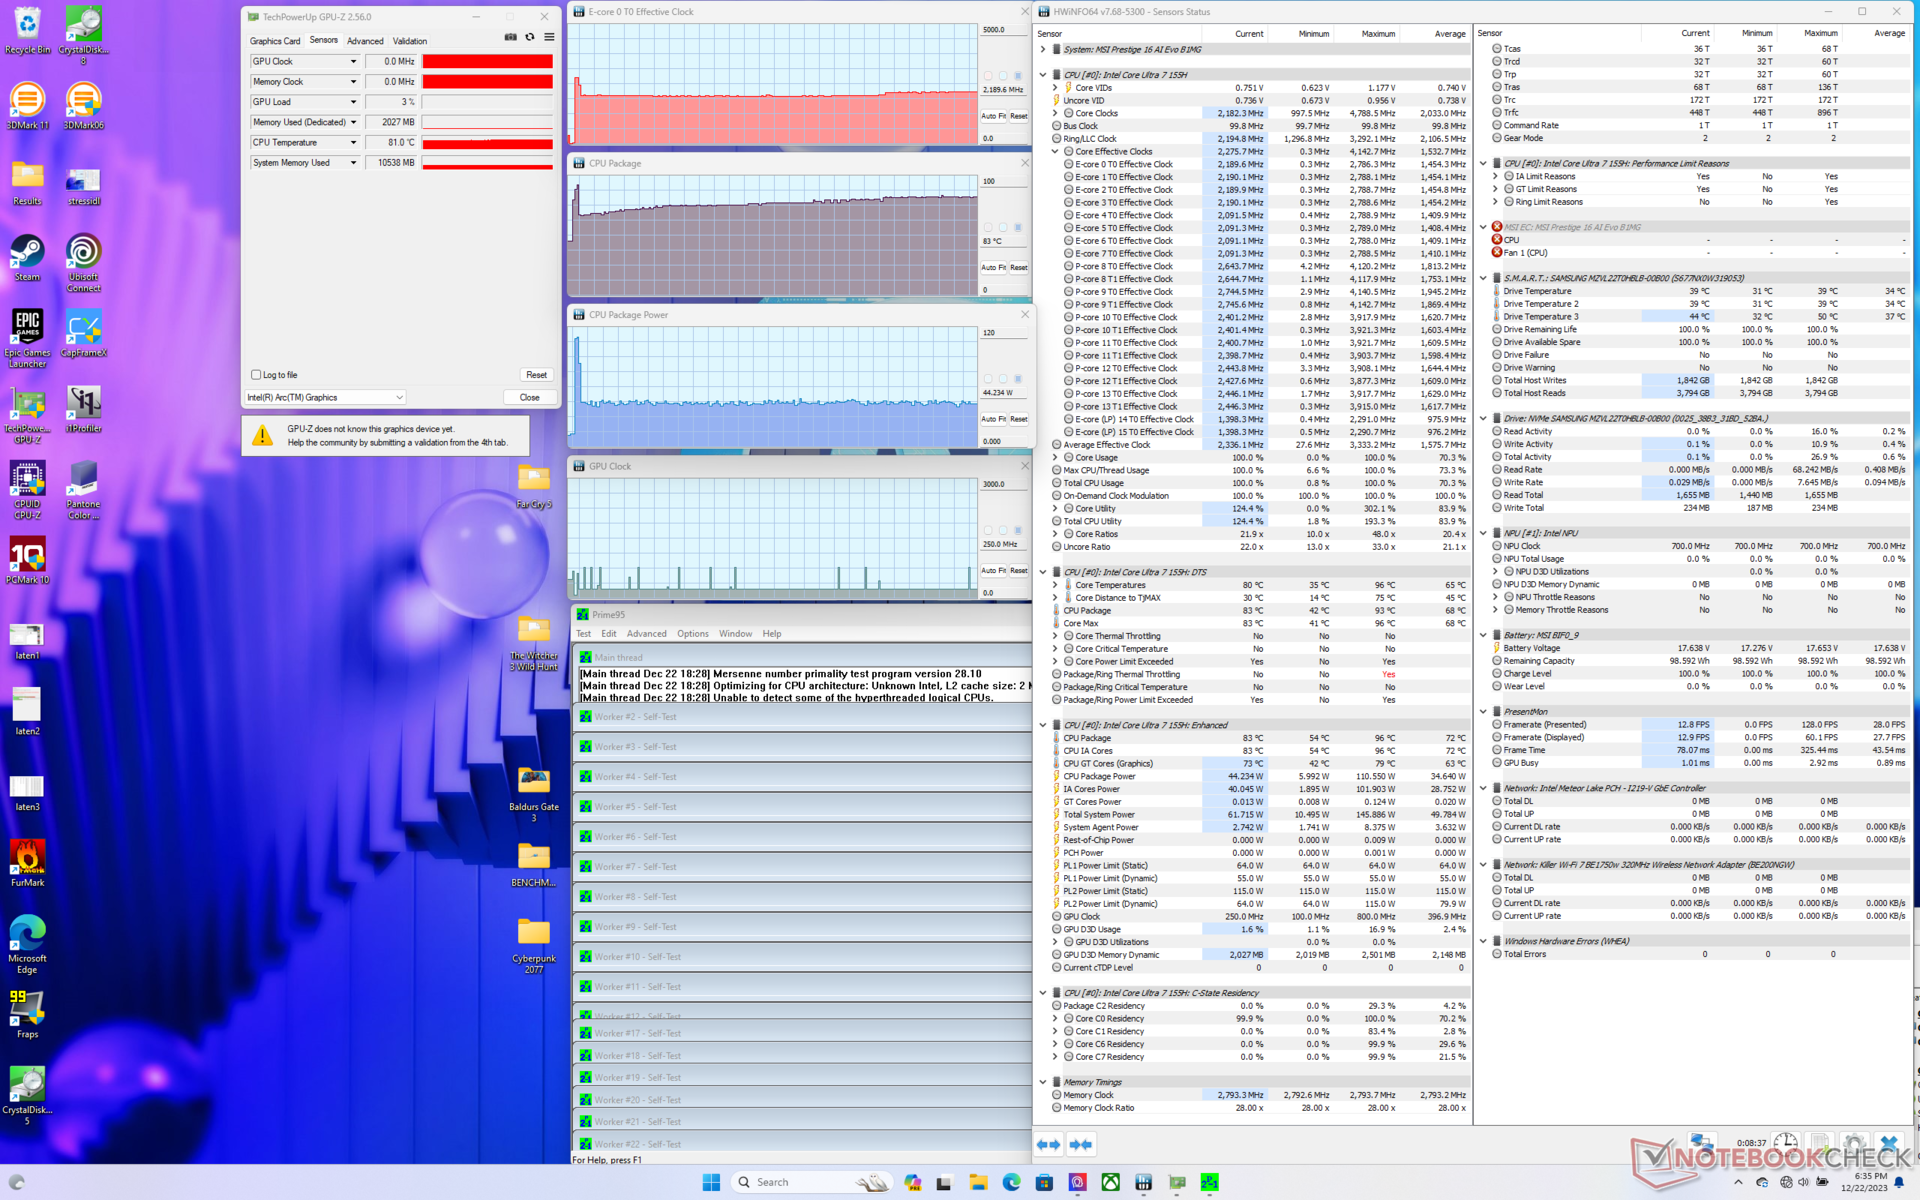
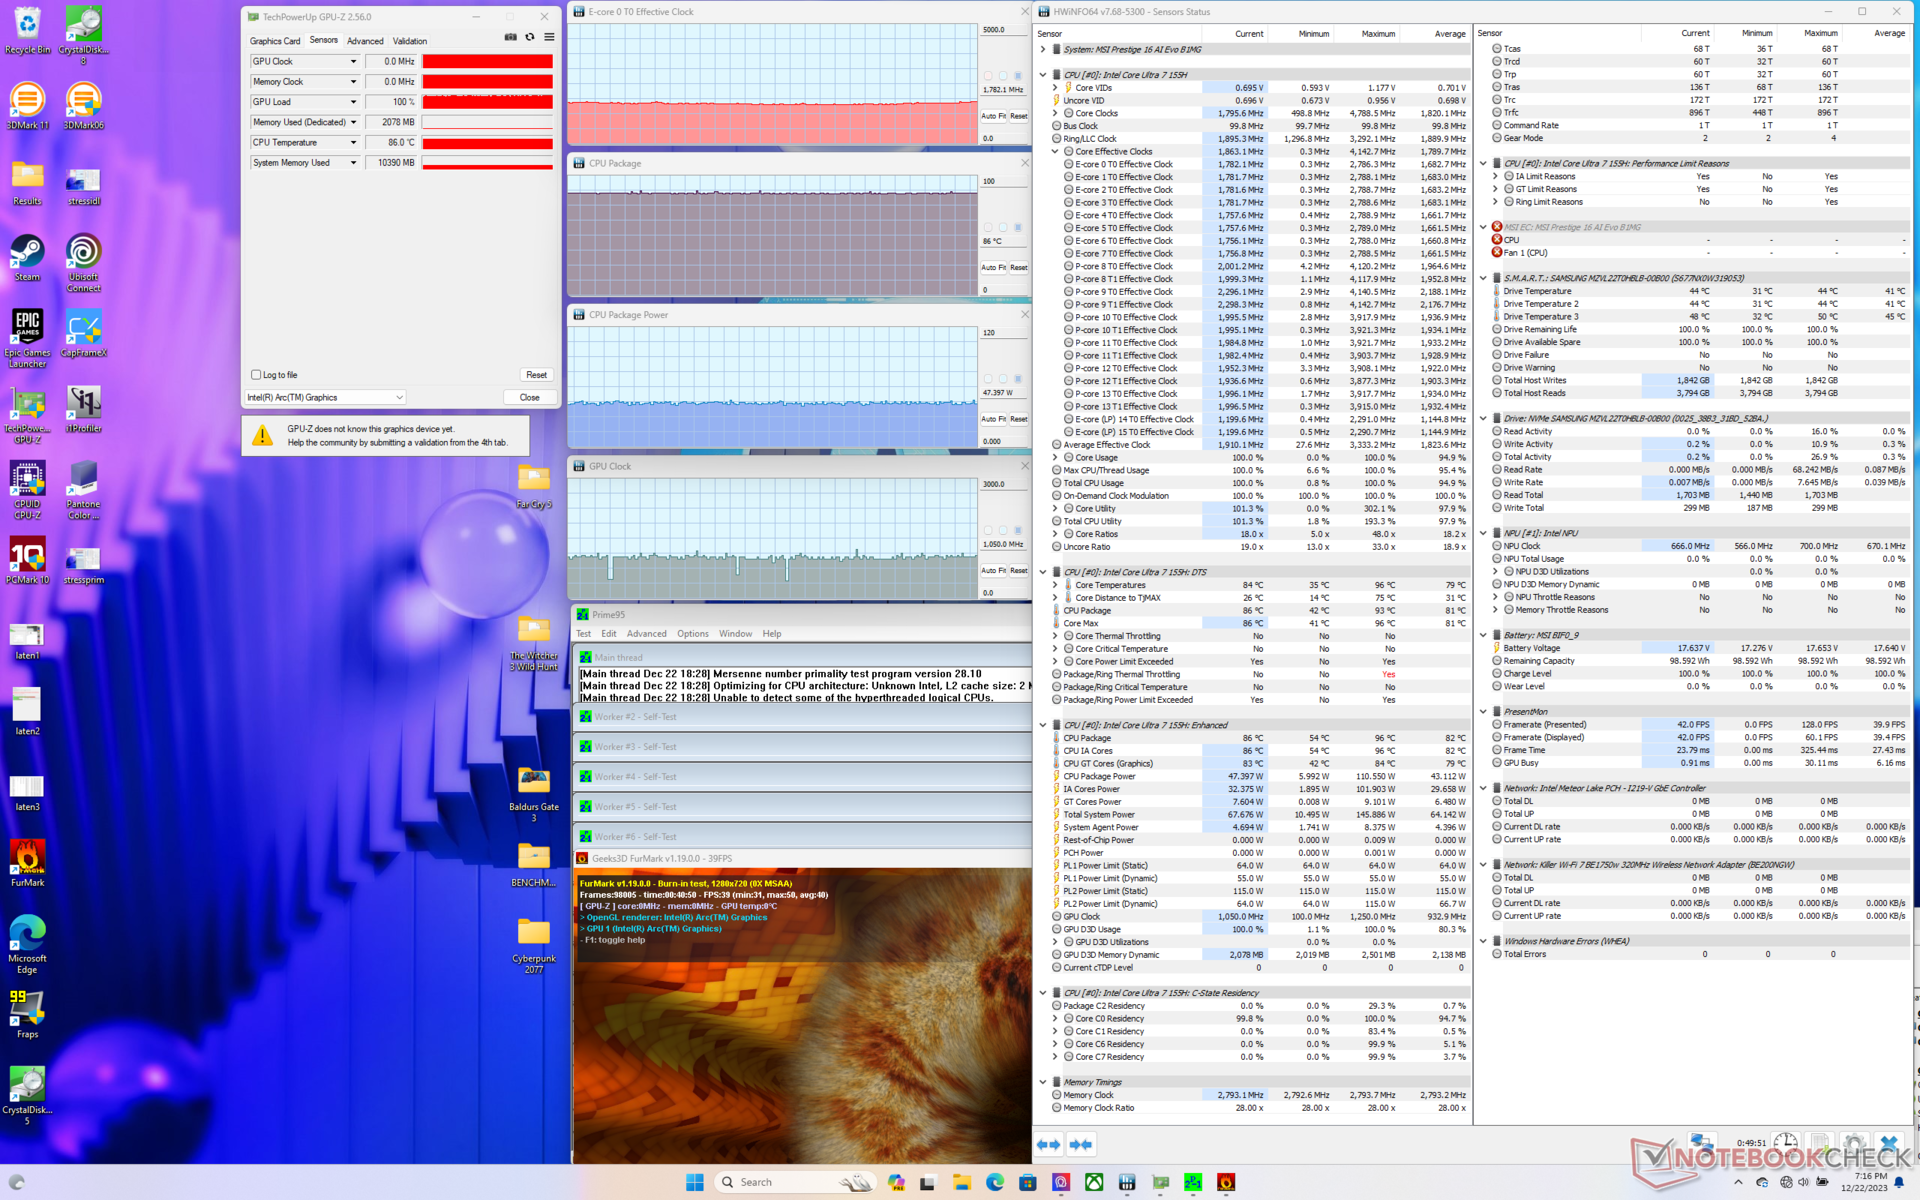
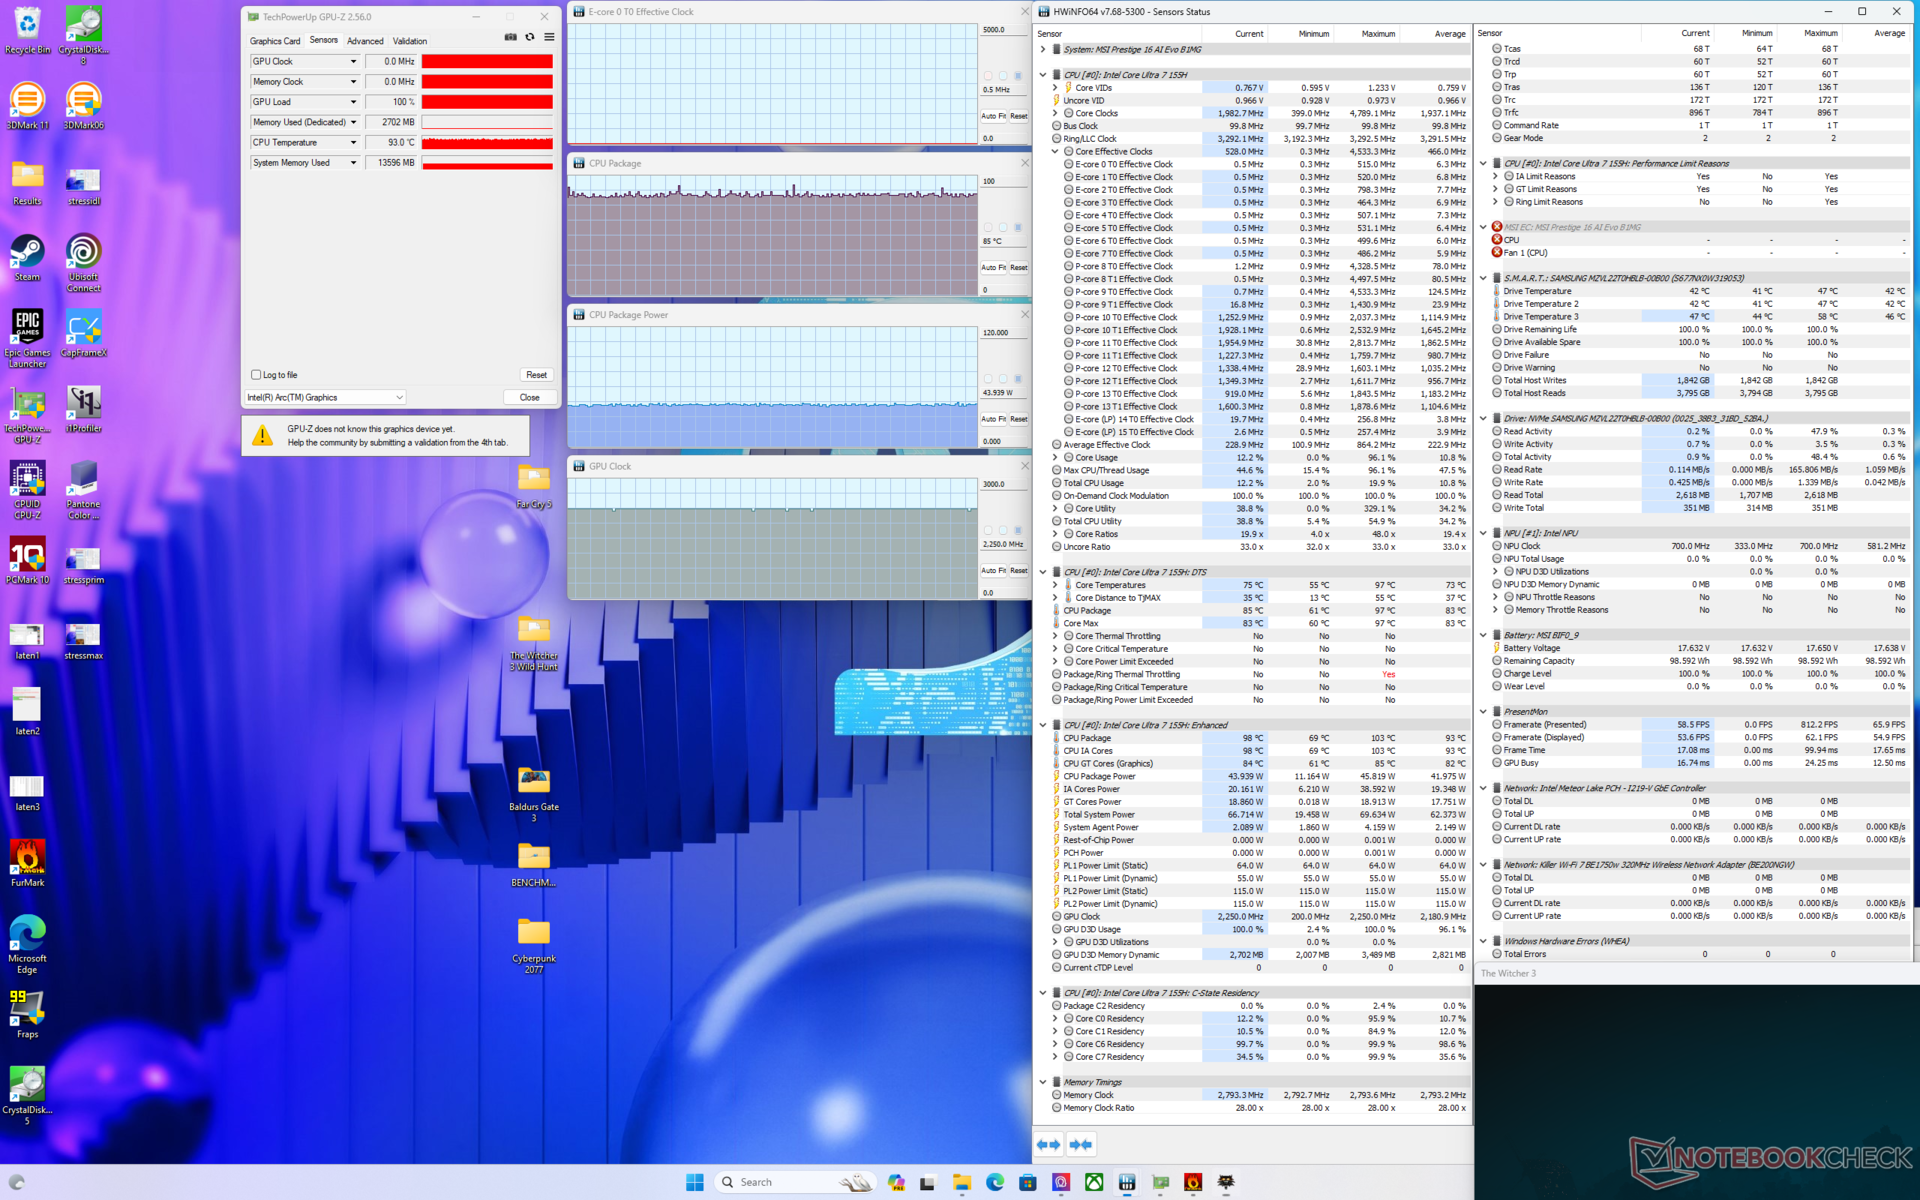

| CPU Clock (GHz) | GPU Clock (MHz) | Average CPU Temperature (°C) | |
| System Idle | -- | -- | 42 |
| Prime95 Stress | 2.2 | -- | 83 |
| Prime95 + FurMark Stress | 1.8 | 1050 | 86 |
| Witcher 3 Stress (Extreme Performance w/ Cooler Boost off) | 0.5 | 2250 | 85 |
| Witcher 3 Stress (Extreme Performance w/ Cooler Boost on) | 0.5 | 2250 | 77 |
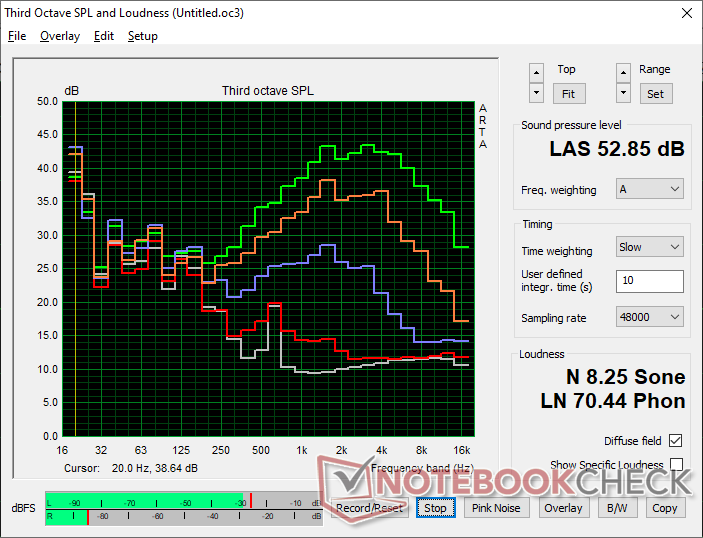
Speakers
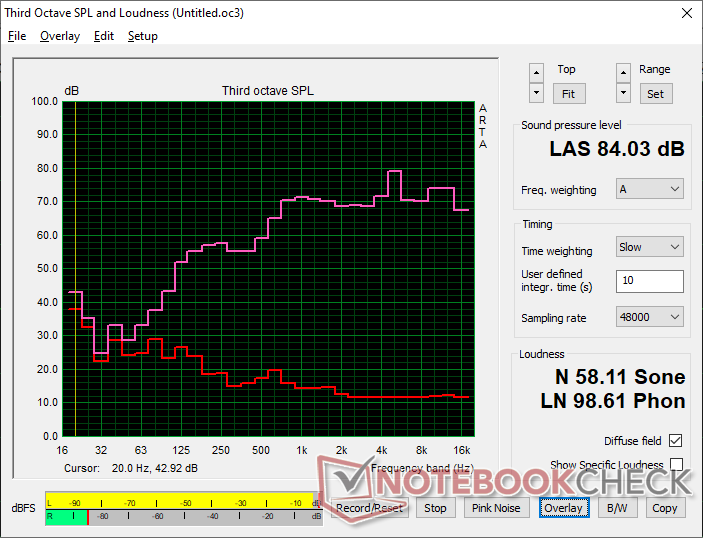
MSI Prestige 16 B1MG-001US audio analysis
(+) | speakers can play relatively loud (84 dB)
Bass 100 - 315 Hz
(-) | nearly no bass - on average 15.3% lower than median
(±) | linearity of bass is average (7% delta to prev. frequency)
Mids 400 - 2000 Hz
(+) | balanced mids - only 4.3% away from median
(+) | mids are linear (4.3% delta to prev. frequency)
Highs 2 - 16 kHz
(+) | balanced highs - only 3.2% away from median
(+) | highs are linear (6.5% delta to prev. frequency)
Overall 100 - 16.000 Hz
(+) | overall sound is linear (13.3% difference to median)
Compared to same class
» 28% of all tested devices in this class were better, 4% similar, 68% worse
» The best had a delta of 5%, average was 17%, worst was 45%
Compared to all devices tested
» 14% of all tested devices were better, 3% similar, 83% worse
» The best had a delta of 4%, average was 24%, worst was 134%
Apple MacBook Pro 16 2021 M1 Pro audio analysis
(+) | speakers can play relatively loud (84.7 dB)
Bass 100 - 315 Hz
(+) | good bass - only 3.8% away from median
(+) | bass is linear (5.2% delta to prev. frequency)
Mids 400 - 2000 Hz
(+) | balanced mids - only 1.3% away from median
(+) | mids are linear (2.1% delta to prev. frequency)
Highs 2 - 16 kHz
(+) | balanced highs - only 1.9% away from median
(+) | highs are linear (2.7% delta to prev. frequency)
Overall 100 - 16.000 Hz
(+) | overall sound is linear (4.6% difference to median)
Compared to same class
» 0% of all tested devices in this class were better, 0% similar, 100% worse
» The best had a delta of 5%, average was 17%, worst was 45%
Compared to all devices tested
» 0% of all tested devices were better, 0% similar, 100% worse
» The best had a delta of 4%, average was 24%, worst was 134%
Energy Management — Lower Lows With Higher Highs
Power Consumption
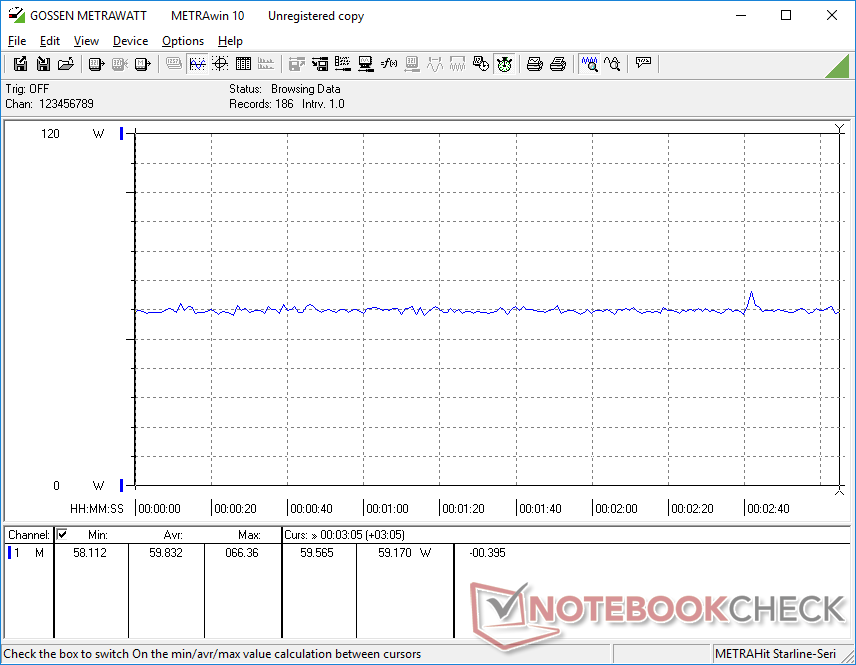
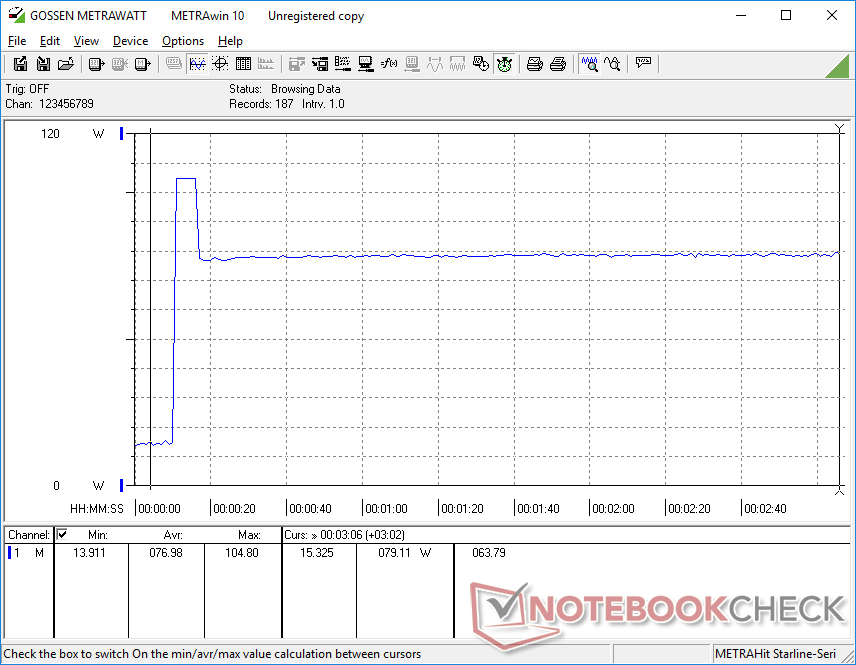
Power consumption can be as low as 3 W when idling which is one of the lowest of any 16-inch Intel laptop we've tested. The very low floor is likely responsible for the extra-long battery life in the next section below.
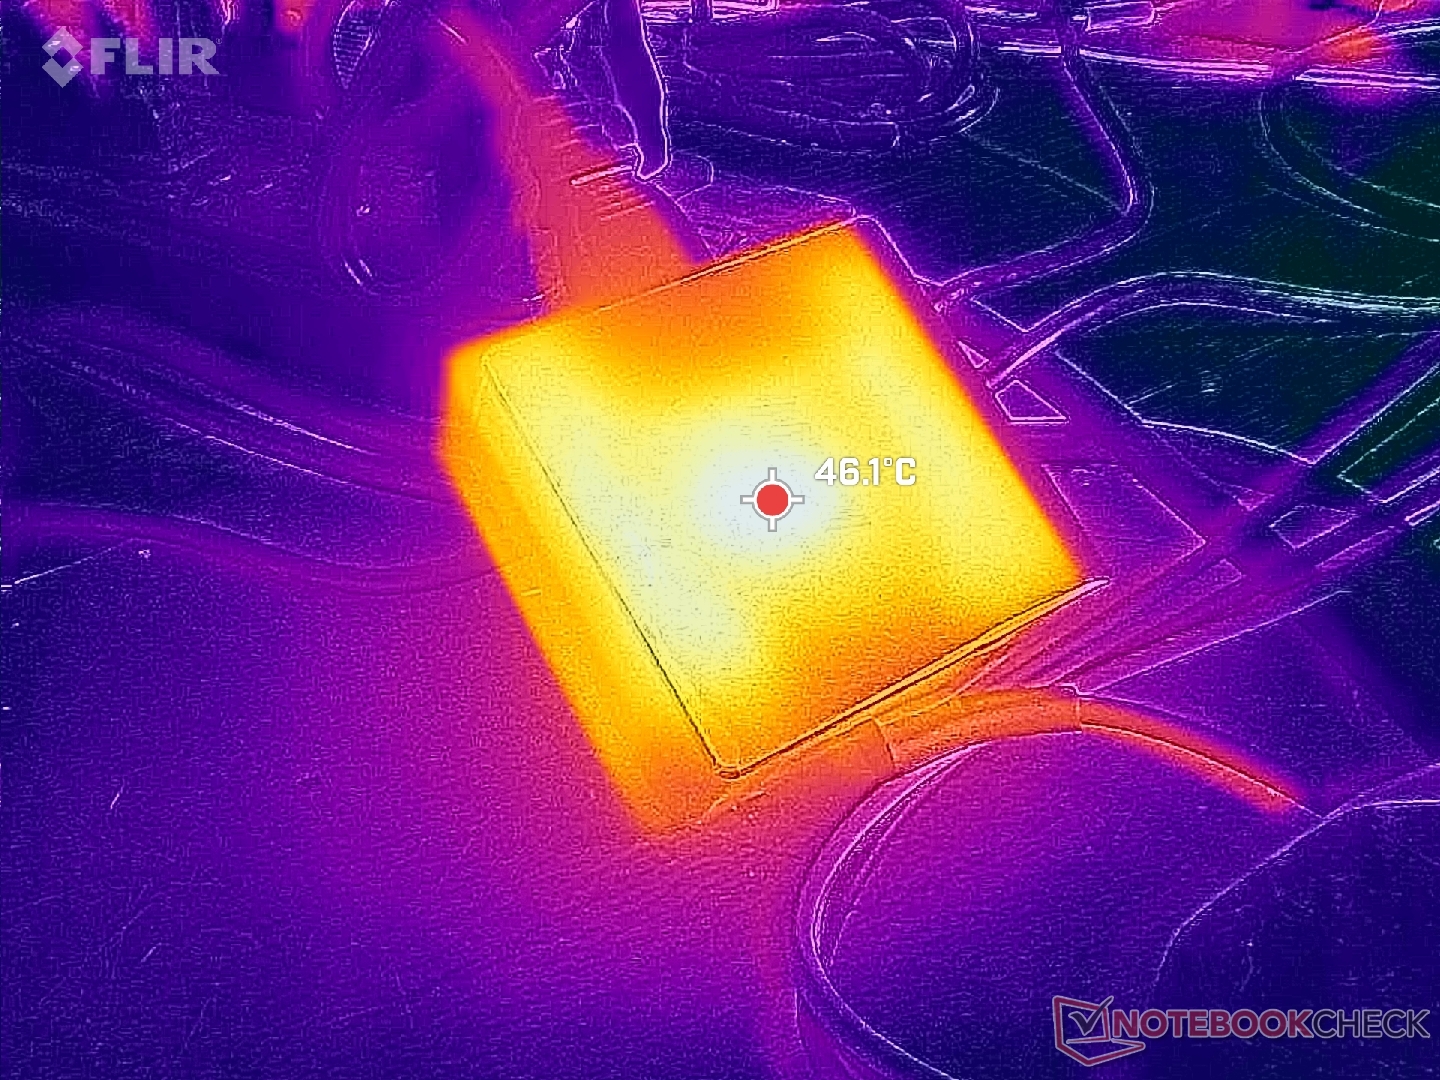
On the flip side of things, consumption appears to be greater than most other U-series laptops when running more demanding loads. Running 3DMark 06 or games, for example, would consume between 60 W to 70 W compared to 40 W to 55 W on the MSI Prestige 15, LG Gram 16 2-in-1, Acer Swift Edge SFE16, or the Core H-powered Schenker Vision 14 under similar conditions. This also holds true when the CPU is fully stressed with Prime95. Nonetheless, performance-per-watt is still in favor of the newer 1st gen Core Ultra CPU and so the higher power consumption isn't necessarily a drawback.
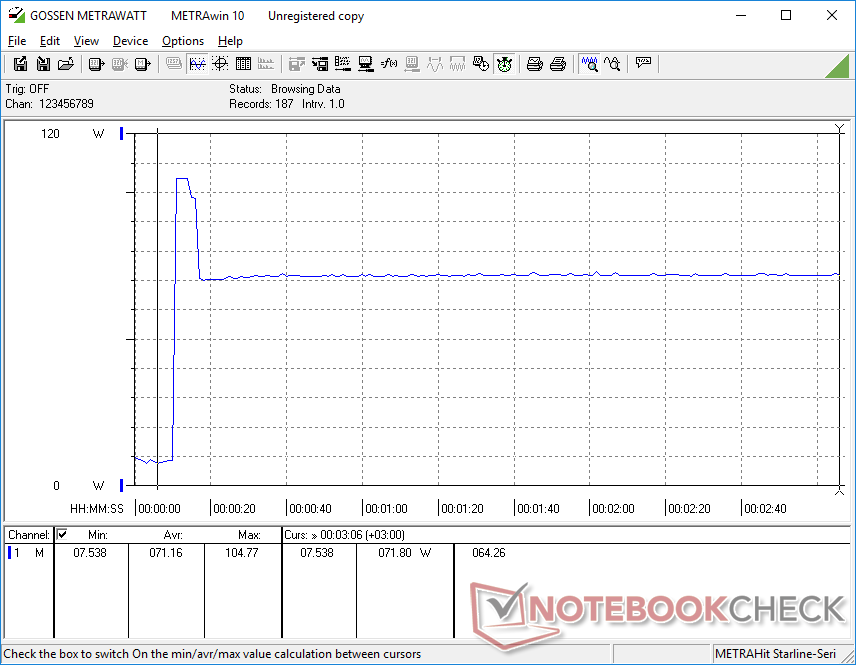
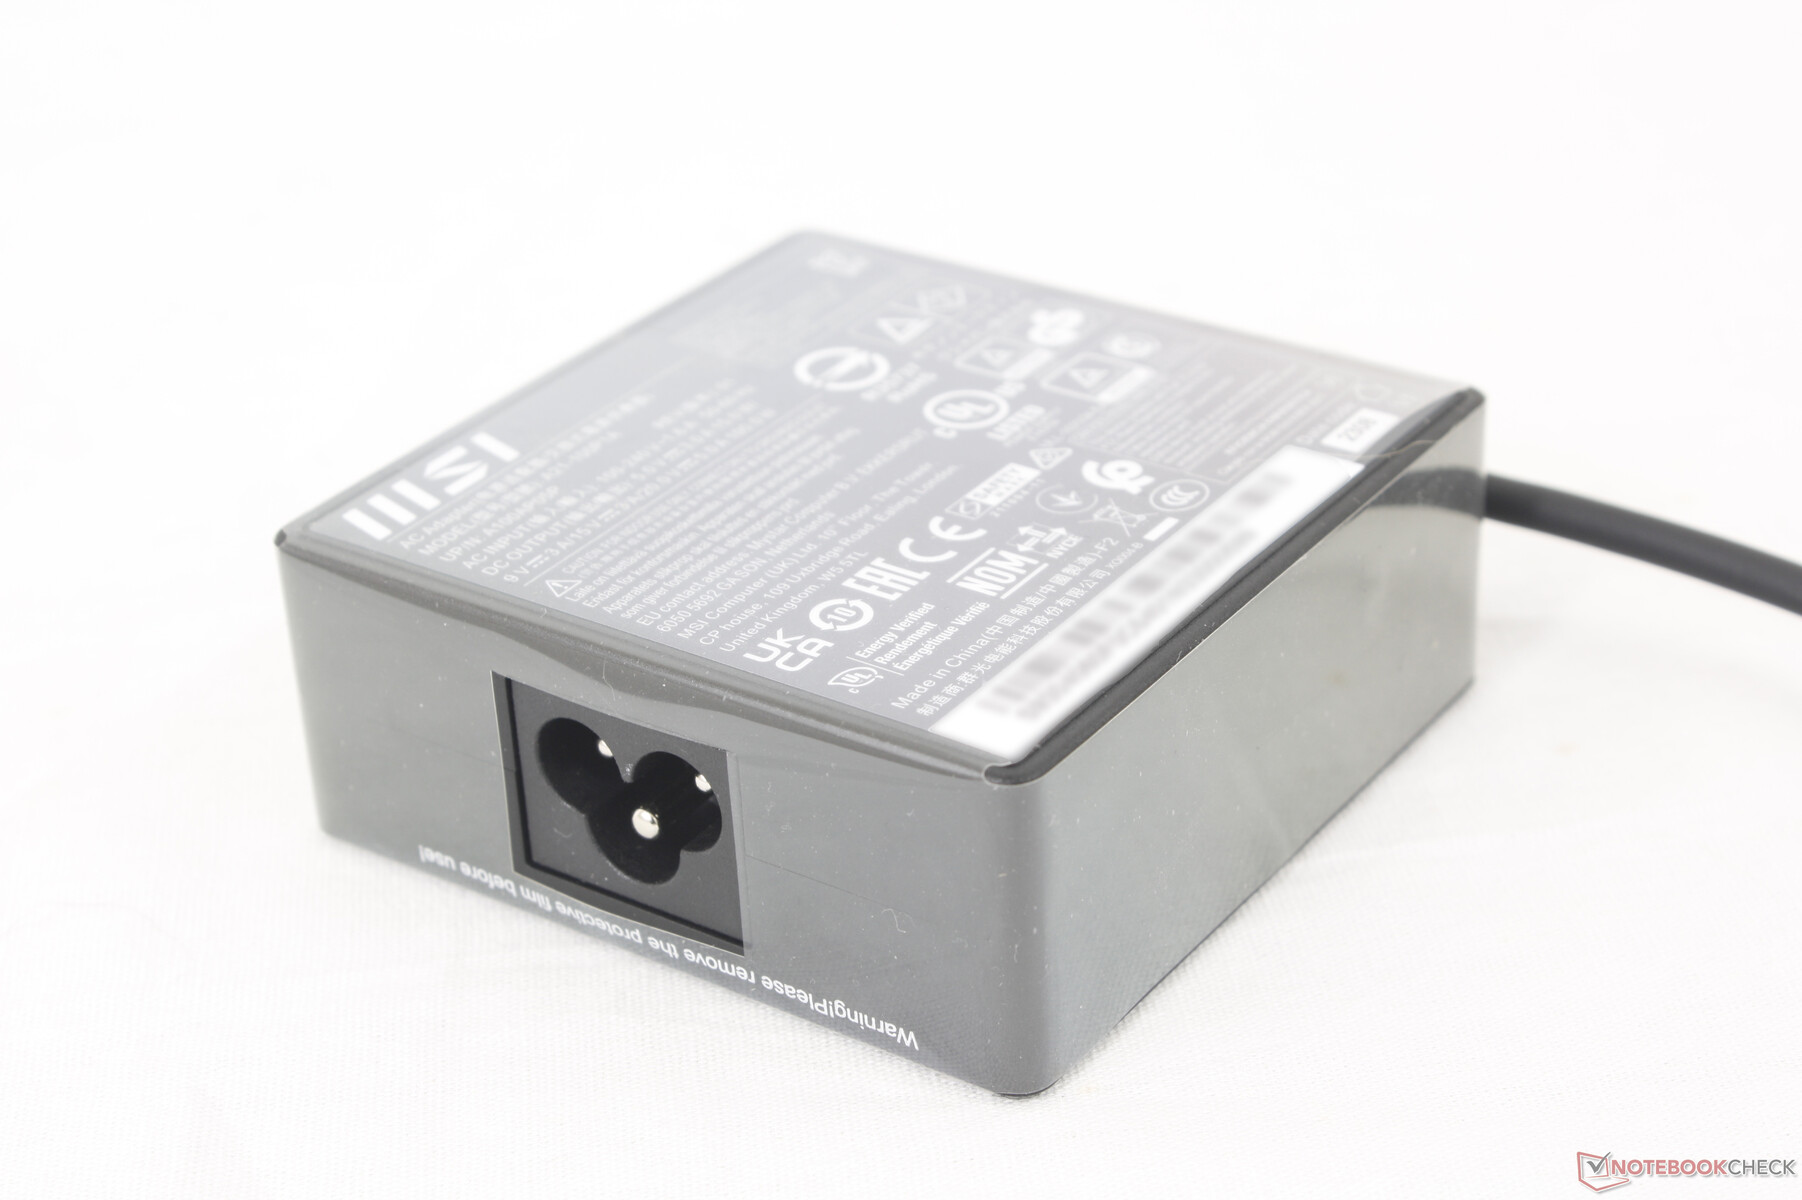
We're able to record a maximum draw of 105 W from the small (~7.5 x 7.5 x 3 cm) 100 W USB-C AC adapter when the CPU is at 100 percent utilization. This rate is only temporary due to limited Turbo Boost potential and so it tends to stabilize at around 70 W when running heavy loads. Note that SKUs with discrete RTX 4060 or 4070 graphics come with a larger 140 W USB-C AC adapter instead.

| Off / Standby | |
| Idle | |
| Load |
|
Key:
min: | |
| MSI Prestige 16 B1MG-001US Ultra 7 155H, Arc 8-Core, Samsung PM9A1 MZVL22T0HBLB, IPS, 2560x1600, 16" | MSI Prestige 15 A12UD-093 i7-1280P, GeForce RTX 3050 Ti Laptop GPU, Micron 3400 1TB MTFDKBA1T0TFH, IPS, 3840x2160, 15.6" | LG Gram 2in1 16 16T90R - G.AA78G i7-1360P, Iris Xe G7 96EUs, Samsung PM9A1 MZVL21T0HCLR, IPS, 2560x1600, 16" | Lenovo ThinkBook 16 G6 ABP R5 7530U, Vega 7, SK hynix HFS512GEJ9X125N, IPS, 1920x1200, 16" | Asus VivoBook Pro 16 K6602VU i9-13900H, GeForce RTX 4050 Laptop GPU, Micron 2400 MTFDKBA1T0QFM, OLED, 3200x2000, 16" | Dell Inspiron 16 Plus 7630 i7-13700H, GeForce RTX 4060 Laptop GPU, WD PC SN740 SDDPTQD-1T00, IPS, 2560x1600, 16" | |
|---|---|---|---|---|---|---|
| Power Consumption | -2% | 2% | 24% | -161% | -124% | |
| Idle Minimum * (Watt) | 3 | 5.4 -80% | 5.5 -83% | 3.7 -23% | 21.06 -602% | 15.6 -420% |
| Idle Average * (Watt) | 9.5 | 11.8 -24% | 7.2 24% | 7.1 25% | 24.27 -155% | 17.7 -86% |
| Idle Maximum * (Watt) | 12 | 12.7 -6% | 12.9 -8% | 7.7 36% | 25.12 -109% | 20.6 -72% |
| Load Average * (Watt) | 68.3 | 45.9 33% | 55 19% | 43.9 36% | 52.4 23% | 87.4 -28% |
| Witcher 3 ultra * (Watt) | 59.8 | 45.7 24% | 47 21% | 40.8 32% | 110.2 -84% | 121.7 -104% |
| Load Maximum * (Watt) | 104.8 | 63 40% | 63.6 39% | 66.6 36% | 146 -39% | 138 -32% |
* ... smaller is better
Power Consumption Witcher 3 / Stresstest
Power Consumption external Monitor
Battery Life
Battery capacity has increased from 80 Wh on the Prestige 15 to 99 Wh on our Prestige 16. Combine this with the efficiency of the new 1st gen Core Ultra CPU and you can get extremely long runtimes of almost 18.5 hours of real-world WLAN browsing. This is one of the longest-lasting Windows laptops we've tested with results that rival the MacBook series.
Charging from empty to full capacity takes about 90 minutes.
| MSI Prestige 16 B1MG-001US Ultra 7 155H, Arc 8-Core, 99.9 Wh | MSI Prestige 15 A12UD-093 i7-1280P, GeForce RTX 3050 Ti Laptop GPU, 80 Wh | LG Gram 2in1 16 16T90R - G.AA78G i7-1360P, Iris Xe G7 96EUs, 80 Wh | Lenovo ThinkBook 16 G6 ABP R5 7530U, Vega 7, 45 Wh | Asus VivoBook Pro 16 K6602VU i9-13900H, GeForce RTX 4050 Laptop GPU, 96 Wh | Dell Inspiron 16 Plus 7630 i7-13700H, GeForce RTX 4060 Laptop GPU, 86 Wh | |
|---|---|---|---|---|---|---|
| Battery runtime | -51% | -32% | -45% | -45% | -43% | |
| Reader / Idle (h) | 25.1 | 17.6 -30% | ||||
| WiFi v1.3 (h) | 18.3 | 8.9 -51% | 11.9 -35% | 10.1 -45% | 10.1 -45% | 9.4 -49% |
| Load (h) | 2.8 | 1.4 -50% | 2 -29% | 1.4 -50% | ||
| H.264 (h) | 7.1 | 11.6 | 9.8 |
Pros
Cons
Verdict — Prestige Series At Its Best
1st Gen Core Ultra should prove to be a huge boon to Ultrabooks like the MSI Prestige 16. While raw CPU performance isn't that much greater than the previous generation, the gains in integrated graphics performance and battery life are arguably just as important for the Ultrabook category. Intel Arc 8 has successfully ousted the AMD Radeon 780M by notable margins to the point where most casual gamers and photo editors should be satisfied by its performance.
A few aspects of the model can be improved upon. Firstly, the lack of high refresh rate or touchscreen options means alternatives like the HP Spectre or Asus Vivobook still have some advantages. Secondly, ghosting is very noticeable on the IPS configuration to the point where even casual gamers might be bothered by its effects. The OLED SKU may therefore be worthwhile despite the inevitable hit to battery life. And lastly, the higher iGPU performance comes at the cost of higher power consumption and louder fan noise than most other U-series Ultrabooks when running GPU-intensive tasks.
Students in particular will love the long battery life, sharp DCI-P3 display, and wide array of graphics options of the Prestige 16 to be a worthwhile alternative to the MacBook Pro.
The portable design, colorful screen, long battery life, fast integrated graphics and fast SD card reader are key highlights of the Prestige 16. Users will want to exploit these strengths to make the most out of the MSI model.
Price and Availability
The MSI Prestige 16 with 1st gen Core Ultra CPU is now widely available on Amazon with OLED for $1650 USD or Best Buy with discrete Arc A370M graphics for $1400.
MSI Prestige 16 B1MG-001US
- 12/28/2023 v7 (old)
Allen Ngo
Transparency
The selection of devices to be reviewed is made by our editorial team. The test sample was freely purchased by the author at his/her own expense. The lender had no influence on this review, nor did the manufacturer receive a copy of this review before publication. There was no obligation to publish this review. As an independent media company, Notebookcheck is not subjected to the authority of manufacturers, retailers or publishers.
This is how Notebookcheck is testing
Every year, Notebookcheck independently reviews hundreds of laptops and smartphones using standardized procedures to ensure that all results are comparable. We have continuously developed our test methods for around 20 years and set industry standards in the process. In our test labs, high-quality measuring equipment is utilized by experienced technicians and editors. These tests involve a multi-stage validation process. Our complex rating system is based on hundreds of well-founded measurements and benchmarks, which maintains objectivity. Further information on our test methods can be found here.
Price comparison
