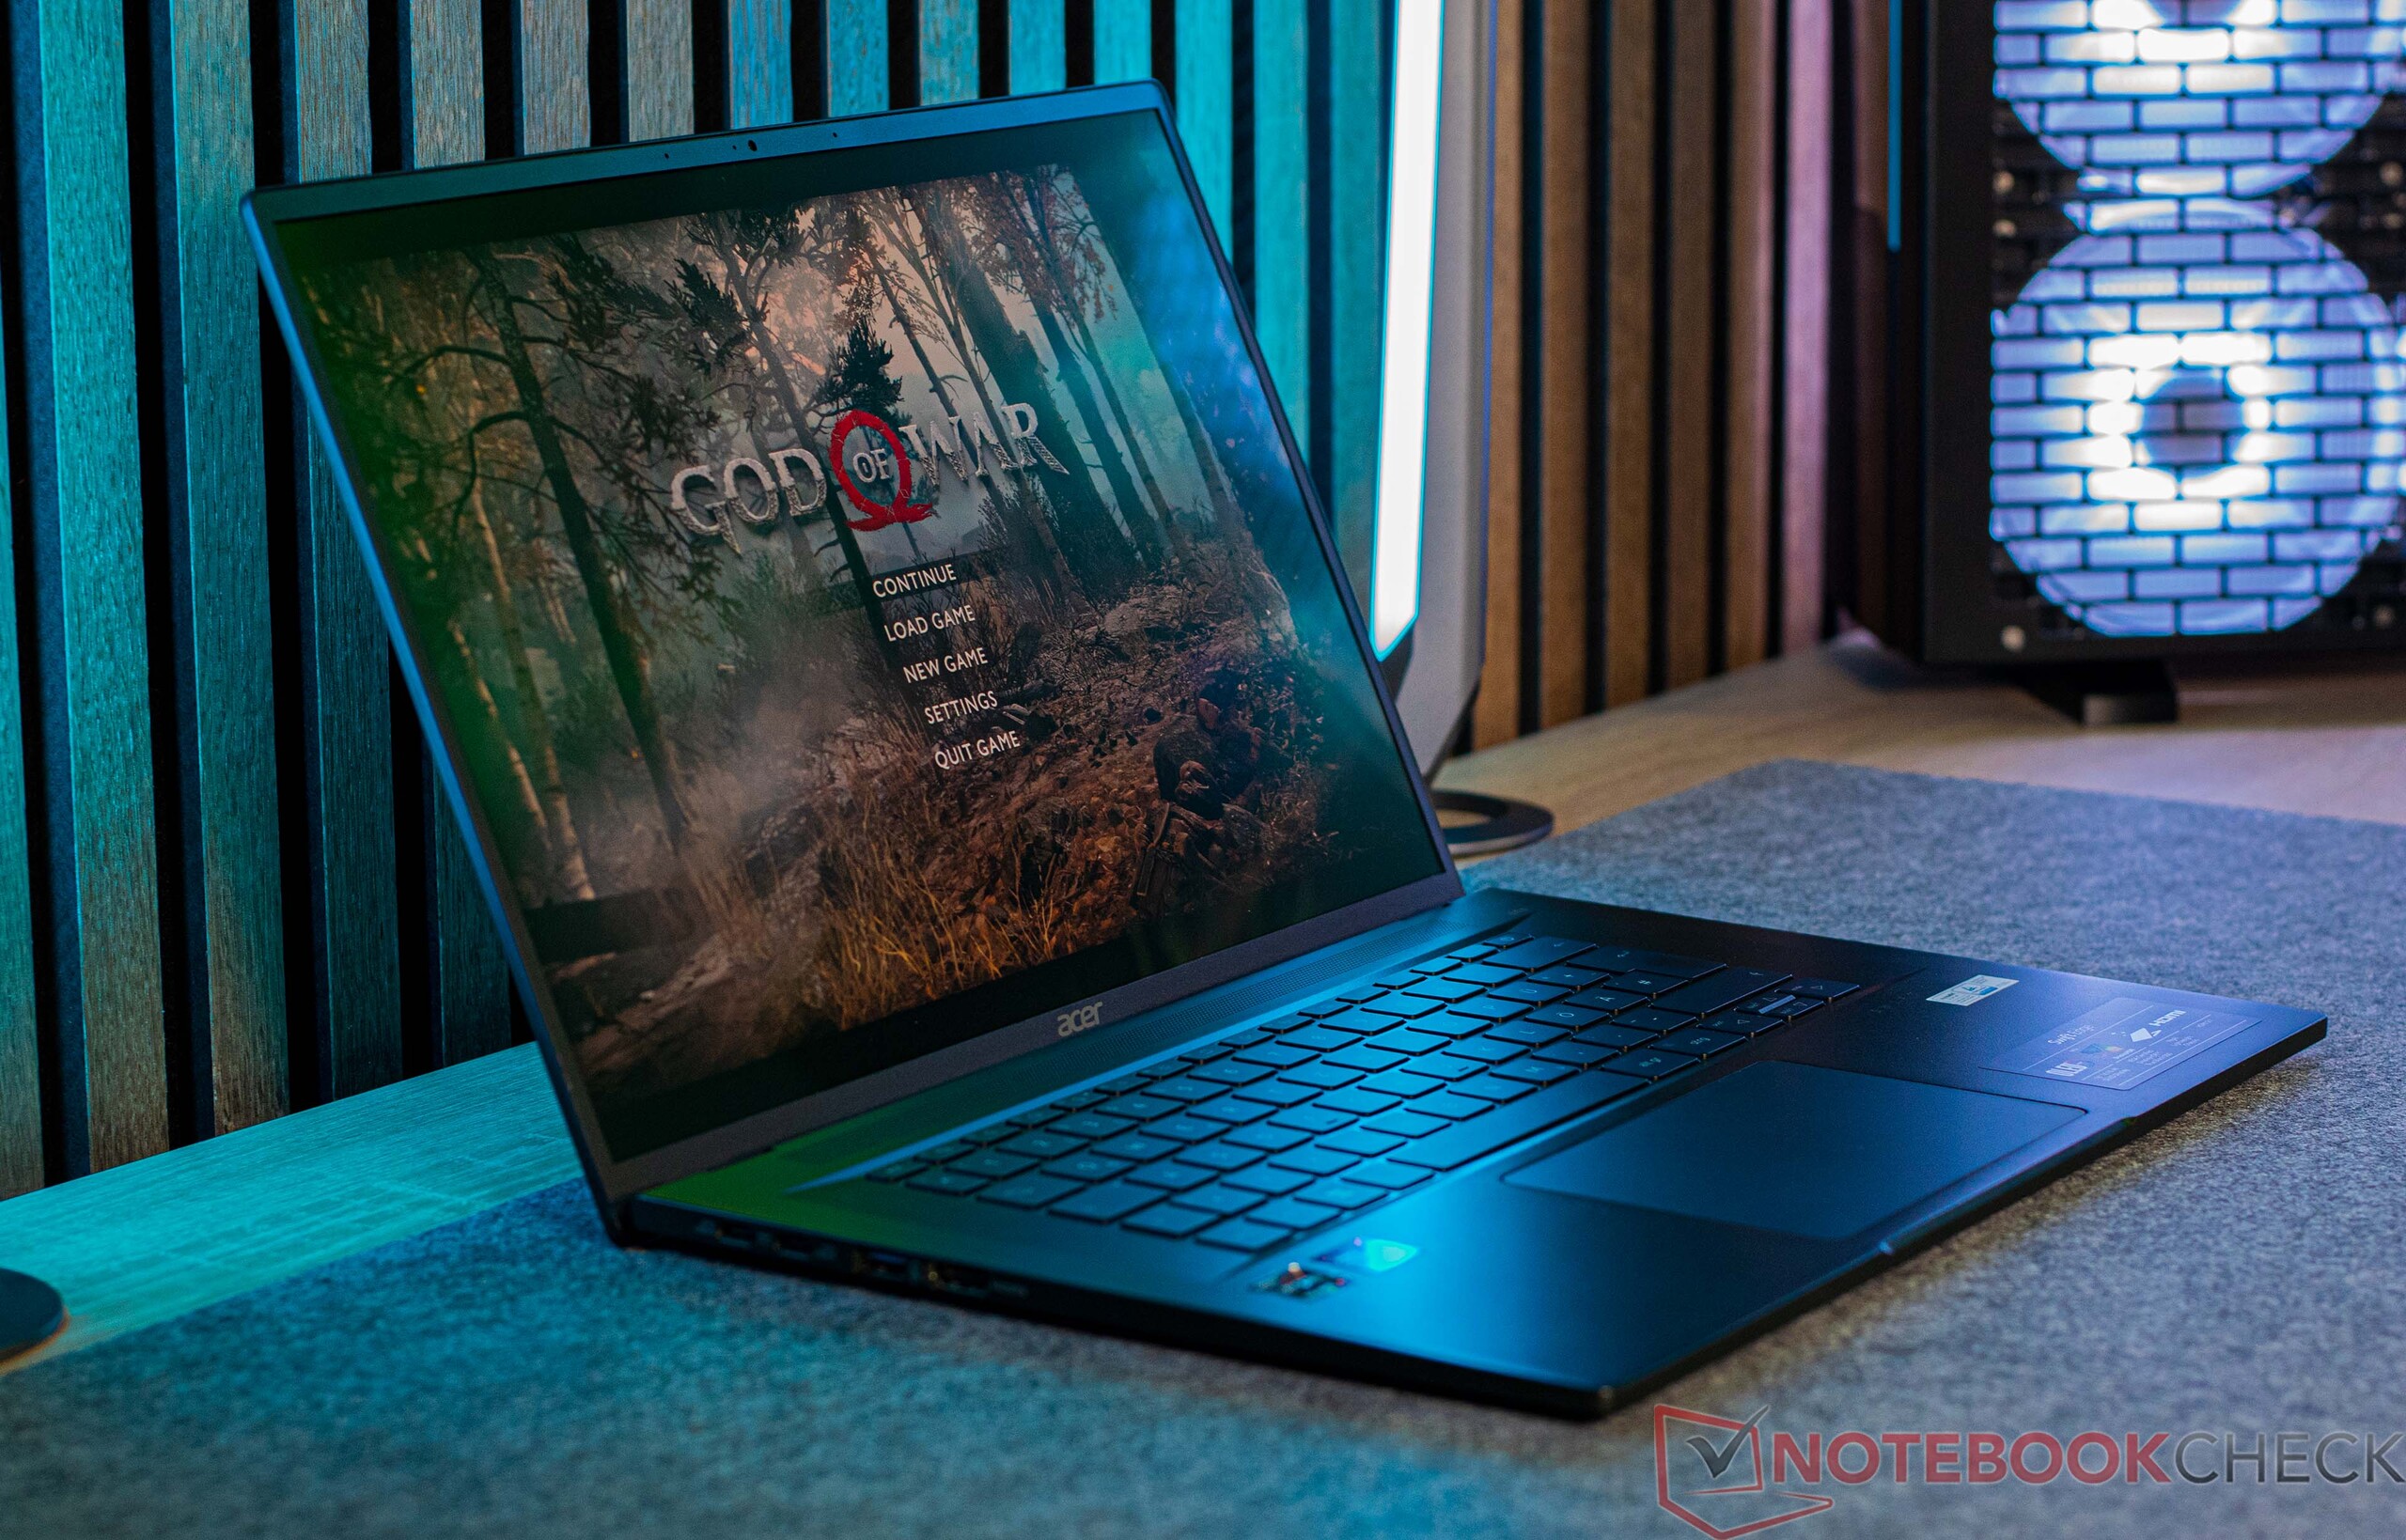
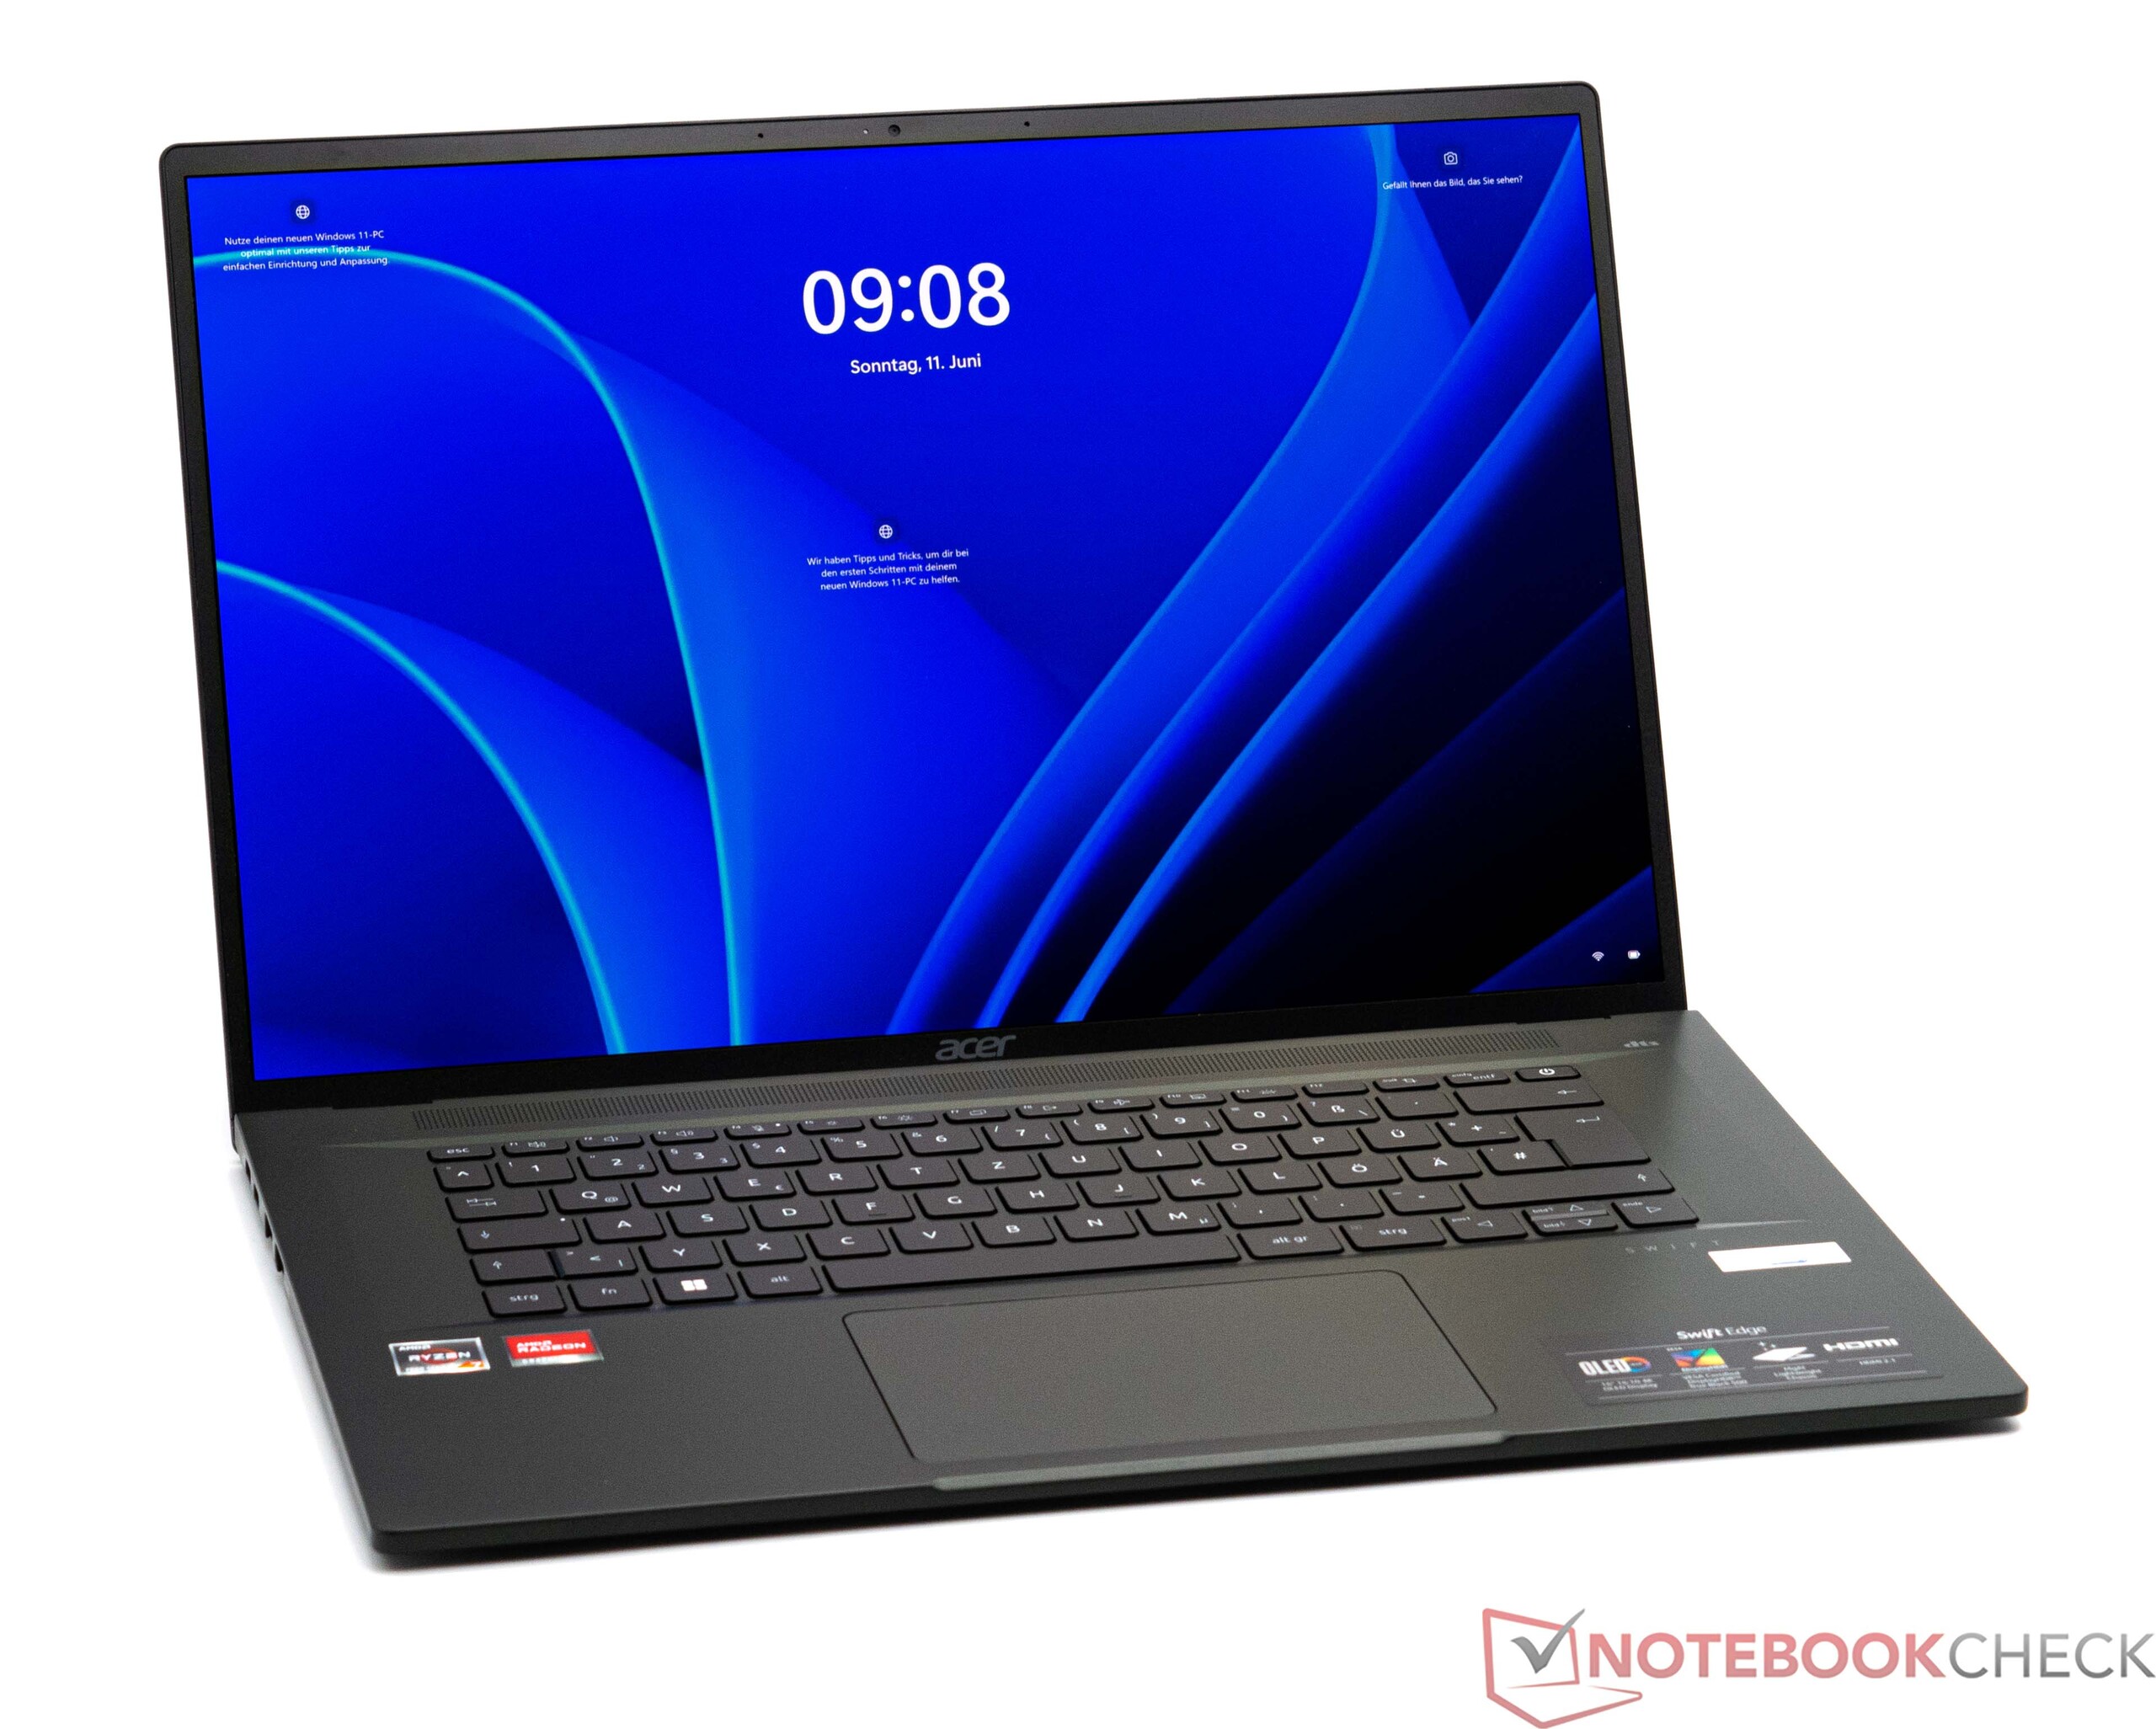
Acer Swift Edge SFE16 review - A lightweight 16-inch laptop with AMD power and an OLED display

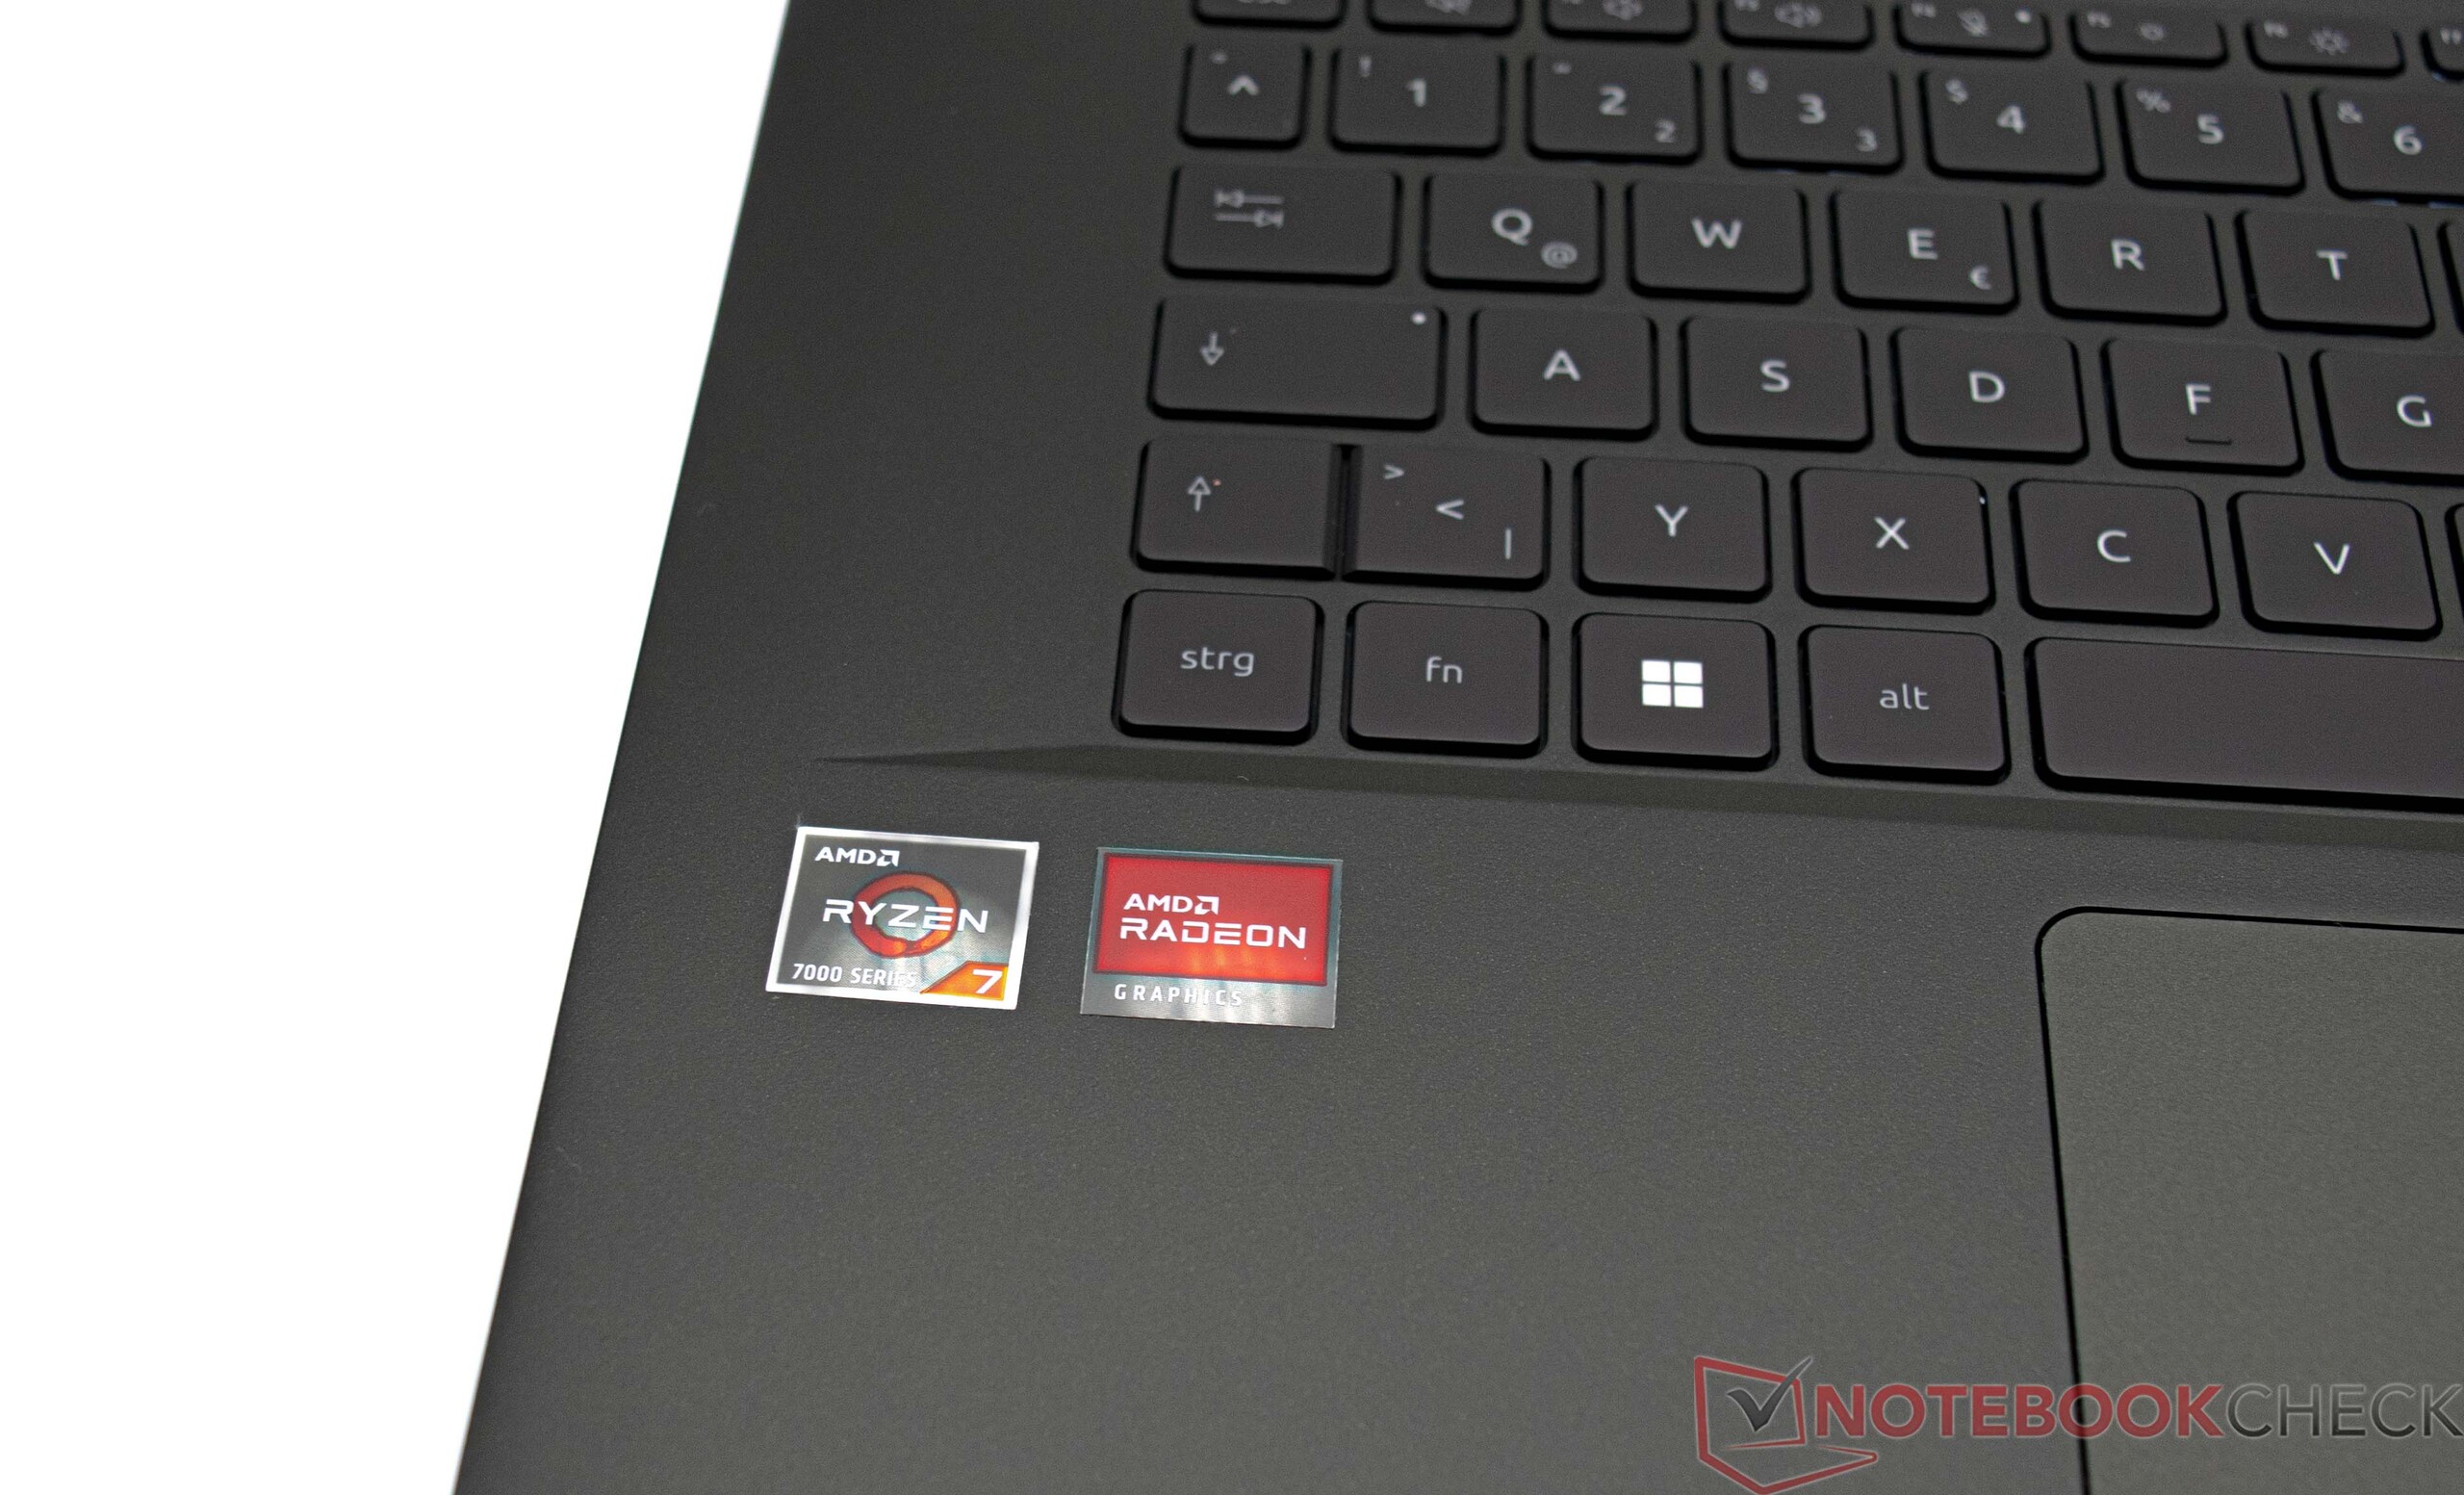
The Acer Swift Edge SFE16 is a super-lightweight 16-inch laptop and with its AMD Ryzen 7 7735U, it offers a brand-new and top-of-the-range SoC with a strong iGPU. This means that currently, AMD offer the better total package and especially compared to Intel when it comes to 3D performance. Its CPU performance can't be overlooked, too, as the laptop features a native 8-core processor. We will discuss further details about this later on in the review. Currently, the laptop can be bought online for $1,079. This setup includes 16 GB DDR5 RAM, a 1-TB SSD and an OLED panel. This price makes the laptop an upper-mid-range device and it will be put up against similarly powerful competitors in our tests. All of the devices we have compared are 16-inch models. You can find a list of all these competitors below.
Possible competitors compared
Rating | Date | Model | Weight | Height | Size | Resolution | Price |
|---|---|---|---|---|---|---|---|
| 87.5 % v7 (old) | 06 / 2023 | Acer Swift Edge SFE16-42-R1GM R7 7735U, Radeon 680M | 1.2 kg | 13.95 mm | 16.00" | 3840x2400 | |
| 90.2 % v7 (old) | 02 / 2023 | Lenovo ThinkPad T16 G1 21CH004MGE R5 PRO 6650U, Radeon 660M | 1.8 kg | 20.5 mm | 16.00" | 2560x1600 | |
| 86.6 % v7 (old) | 01 / 2023 | LG Gram 16Z90Q i7-1260P, Iris Xe G7 96EUs | 1.2 kg | 16.8 mm | 16.00" | 2560x1600 | |
| 86 % v7 (old) | 04 / 2023 | Acer TravelMate P4 TMP416-51-55KN i5-1240P, Iris Xe G7 80EUs | 1.6 kg | 18.5 mm | 16.00" | 1920x1200 | |
| 85.6 % v7 (old) | 05 / 2023 | Samsung Galaxy Book3 Pro 16 i5-1340P, Iris Xe G7 80EUs | 1.6 kg | 12.5 mm | 16.00" | 2880x1800 | |
| 83.8 % v7 (old) | 10 / 2022 | LG Ultra-PC 16 16U70Q-G.AR36G R3 5300U, Vega 6 | 1.6 kg | 16.3 mm | 16.00" | 1280x1200 |
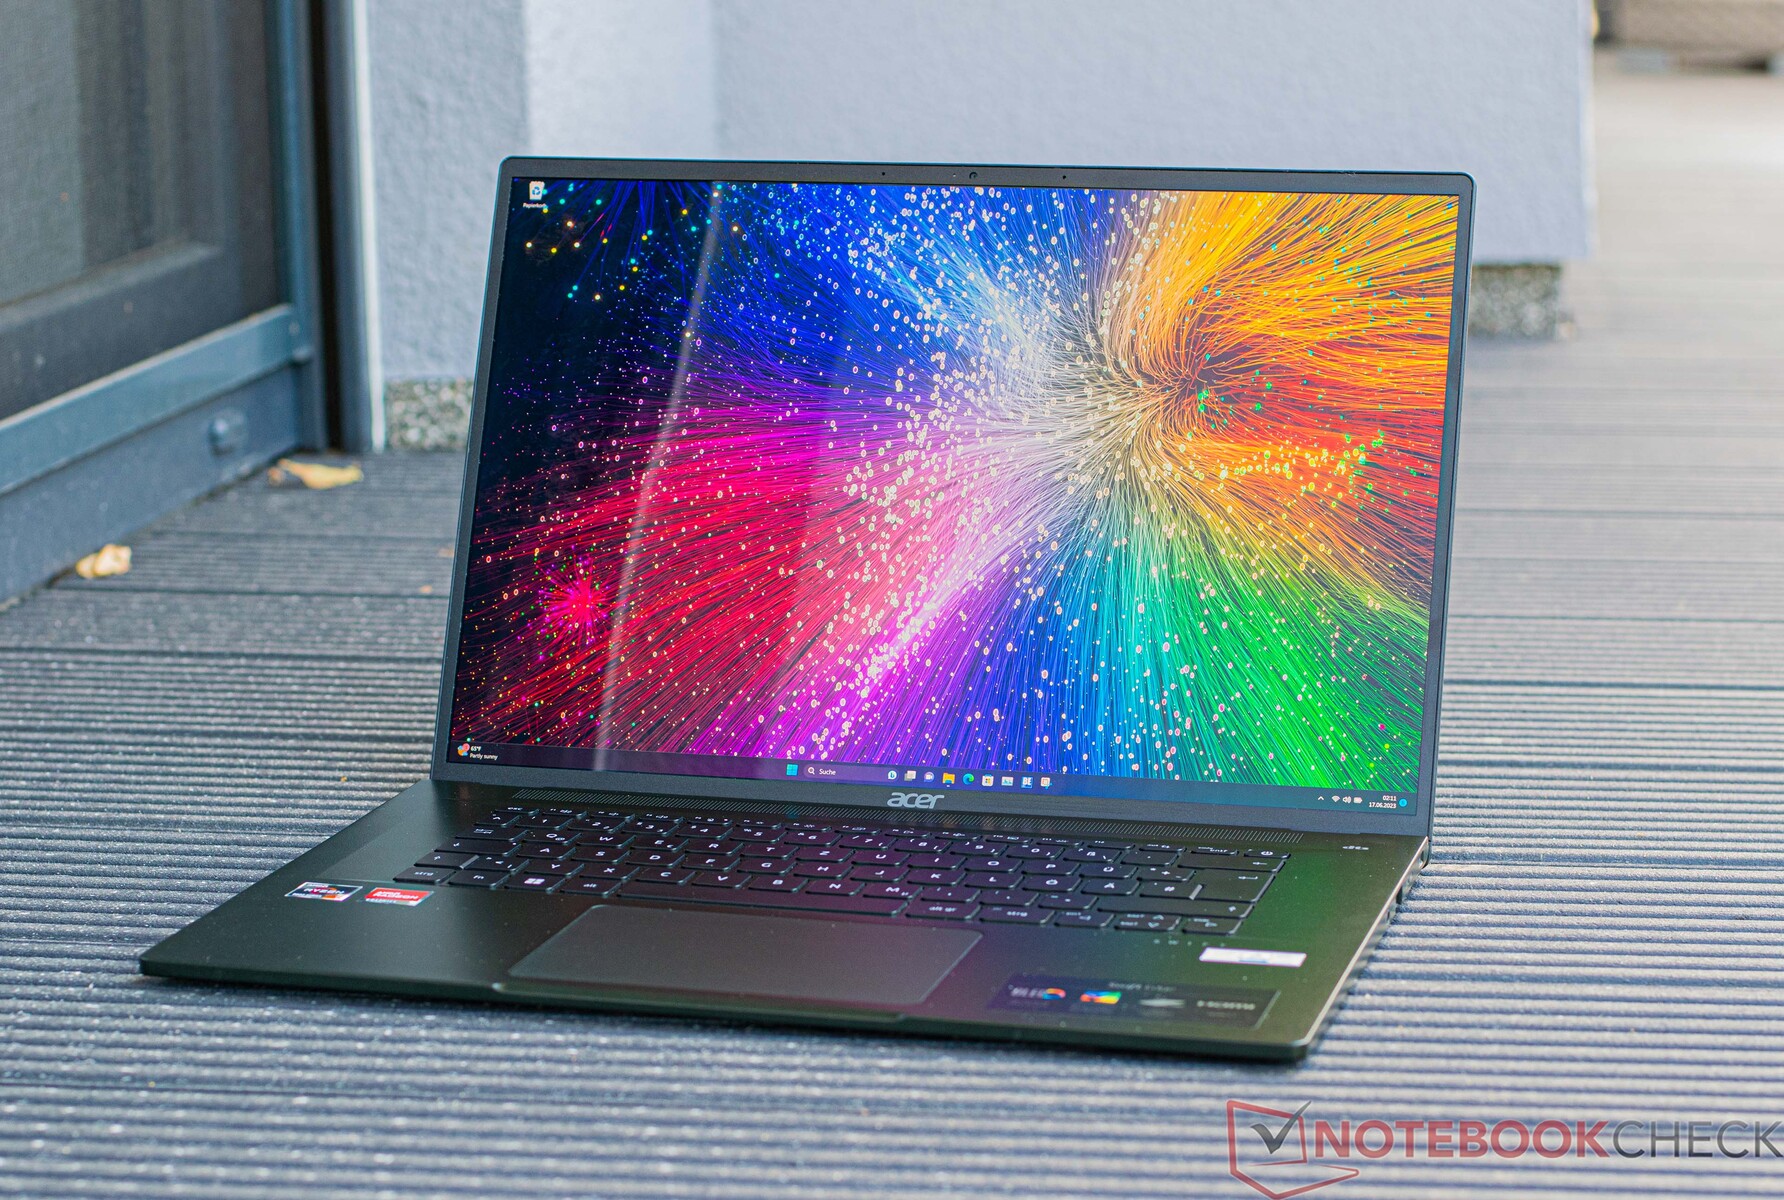
Case - Magnesium und aluminum keep things light
The Acer Swift Edge SFE16 is an extremely slim device made perfectly from high-quality materials (magnesium and aluminum). The base is stiff enough, although, due to the metals used, it does retain a certain level of flexibility. Thankfully, this doesn't pose to be an issue when you hold the laptop in one hand, as the device is so light anyway. The only time the base and display lid can be bent is if you explicitly try to do so. The same can be said for the keyboard: There are a few areas where you can press it in ever so slightly - specifically the top back part of the keyboard. Again, this shouldn't prove to be an issue in everyday use. The Acer Swift Edge SFE16 hasn't attempted anything crazy with its colors - the device is all black. Although, it must be said that fingerprints are quite visible on the laptop's smooth surfaces.
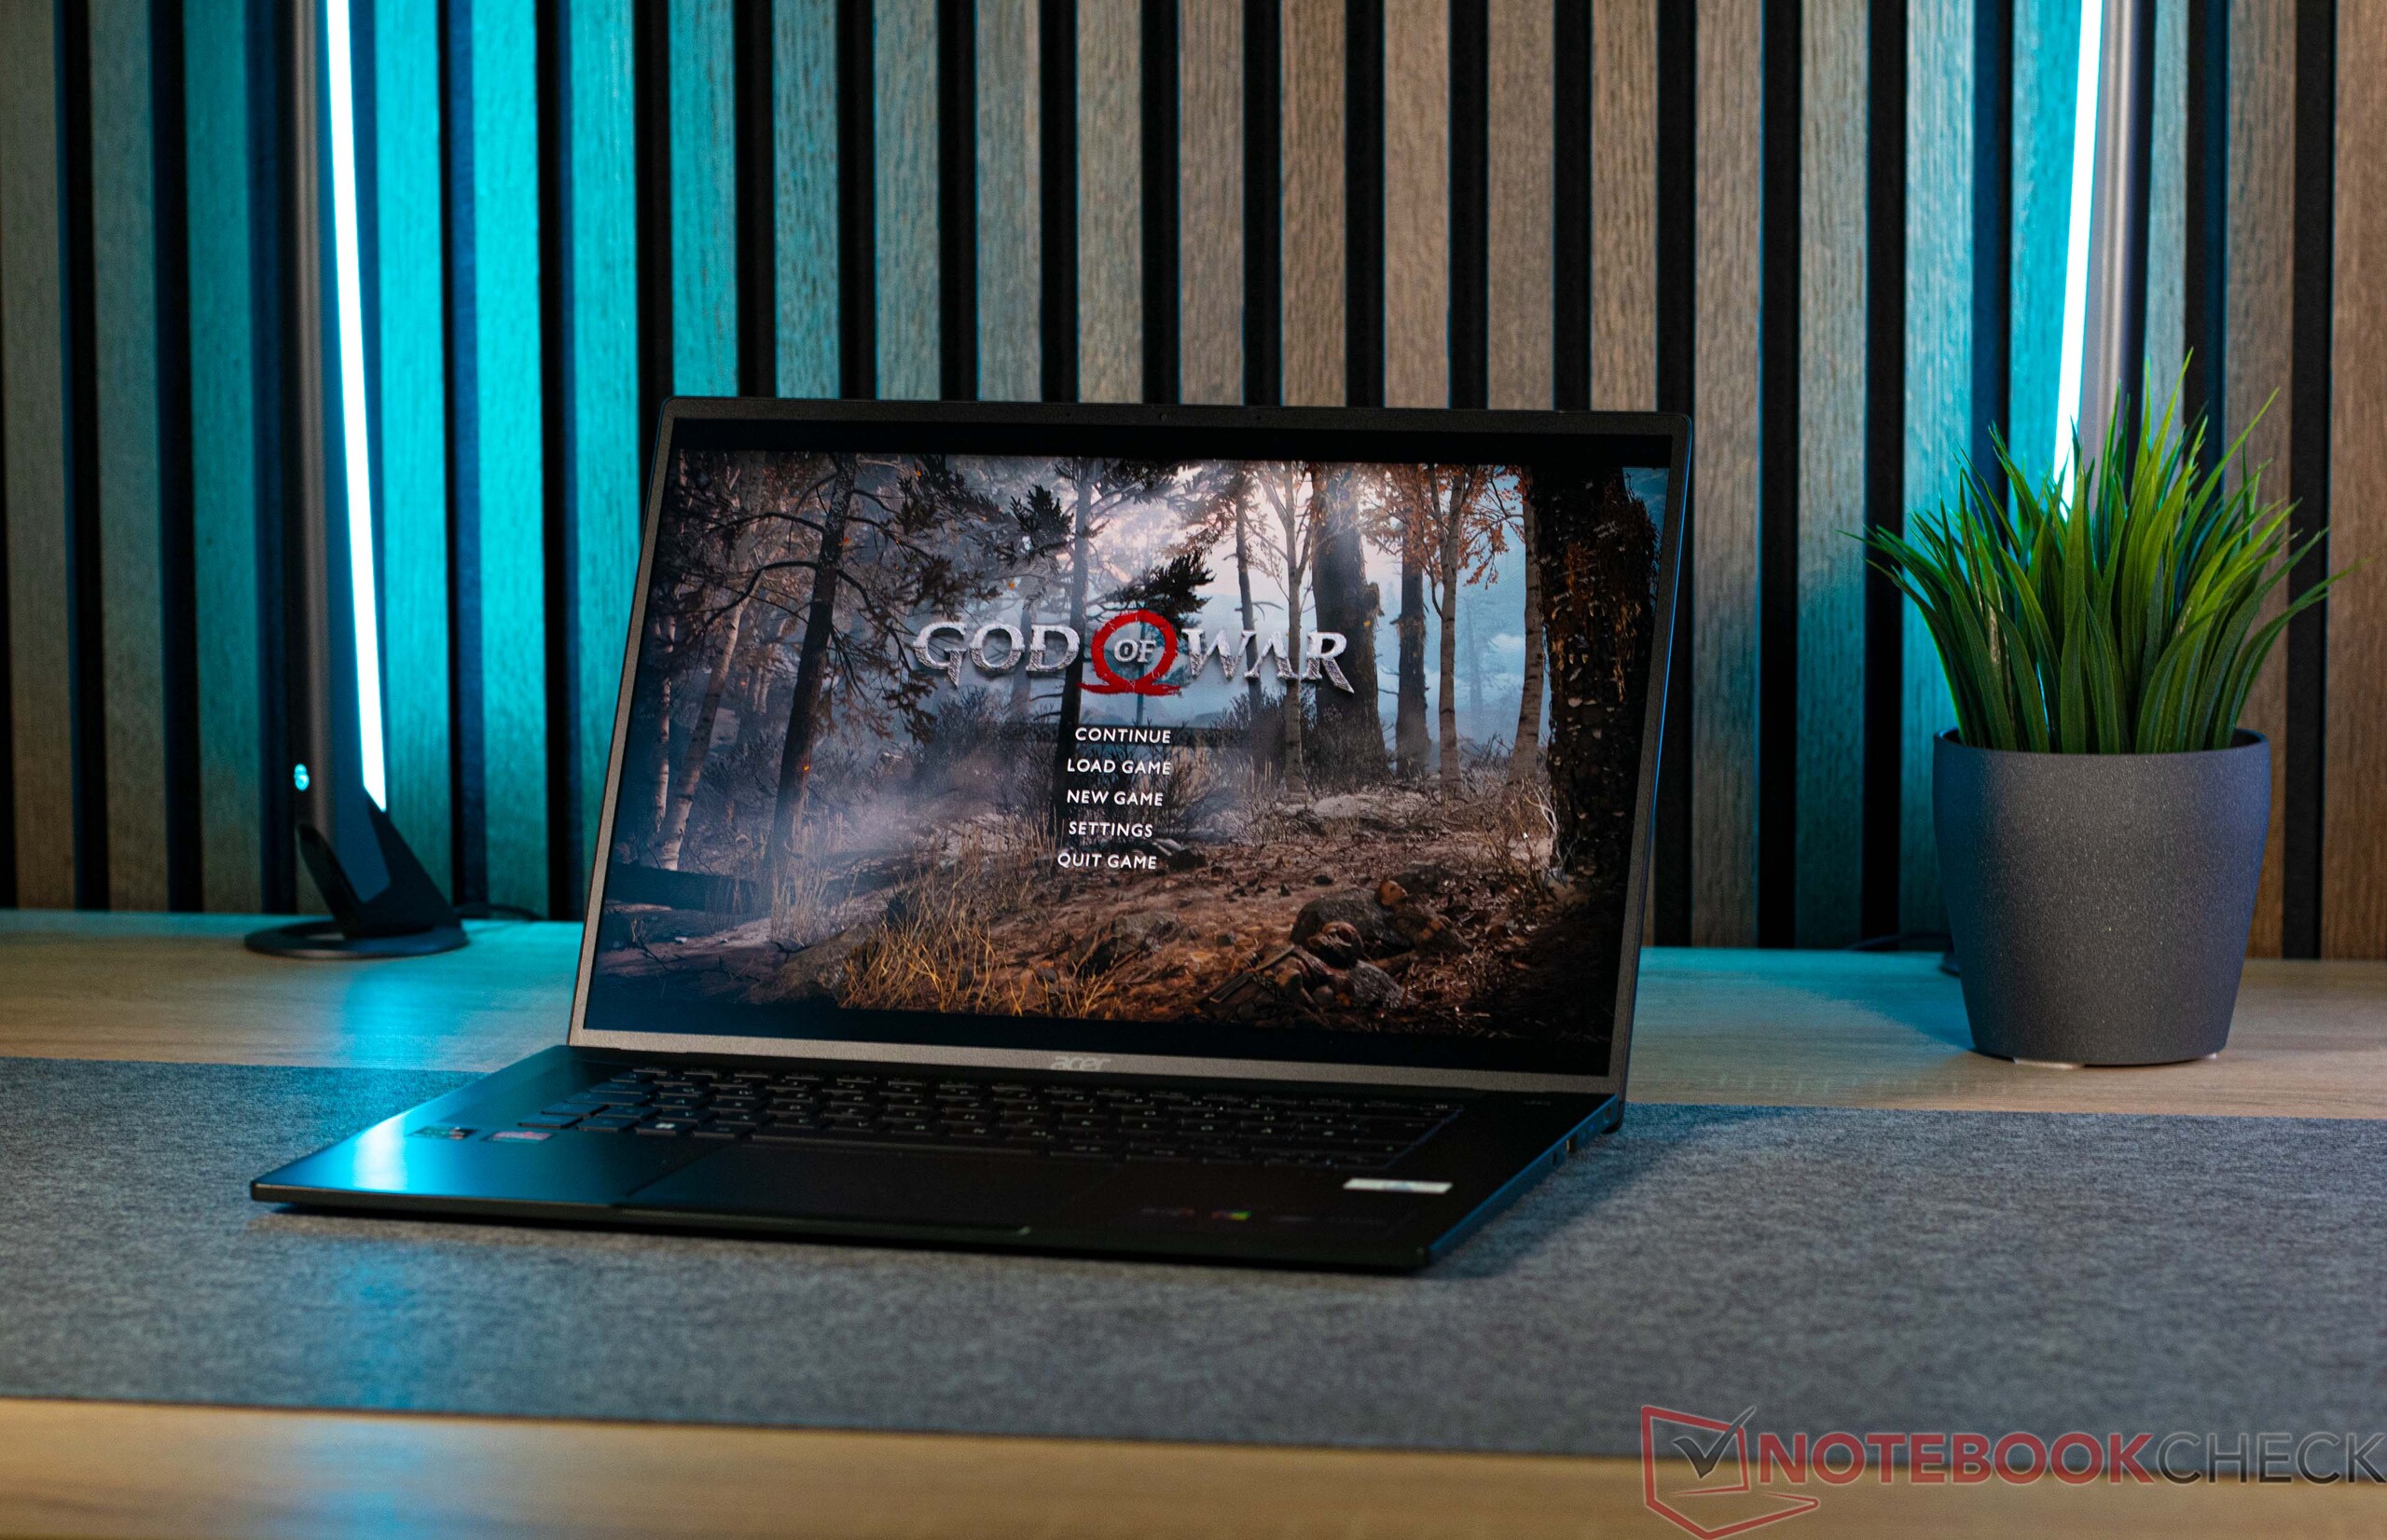
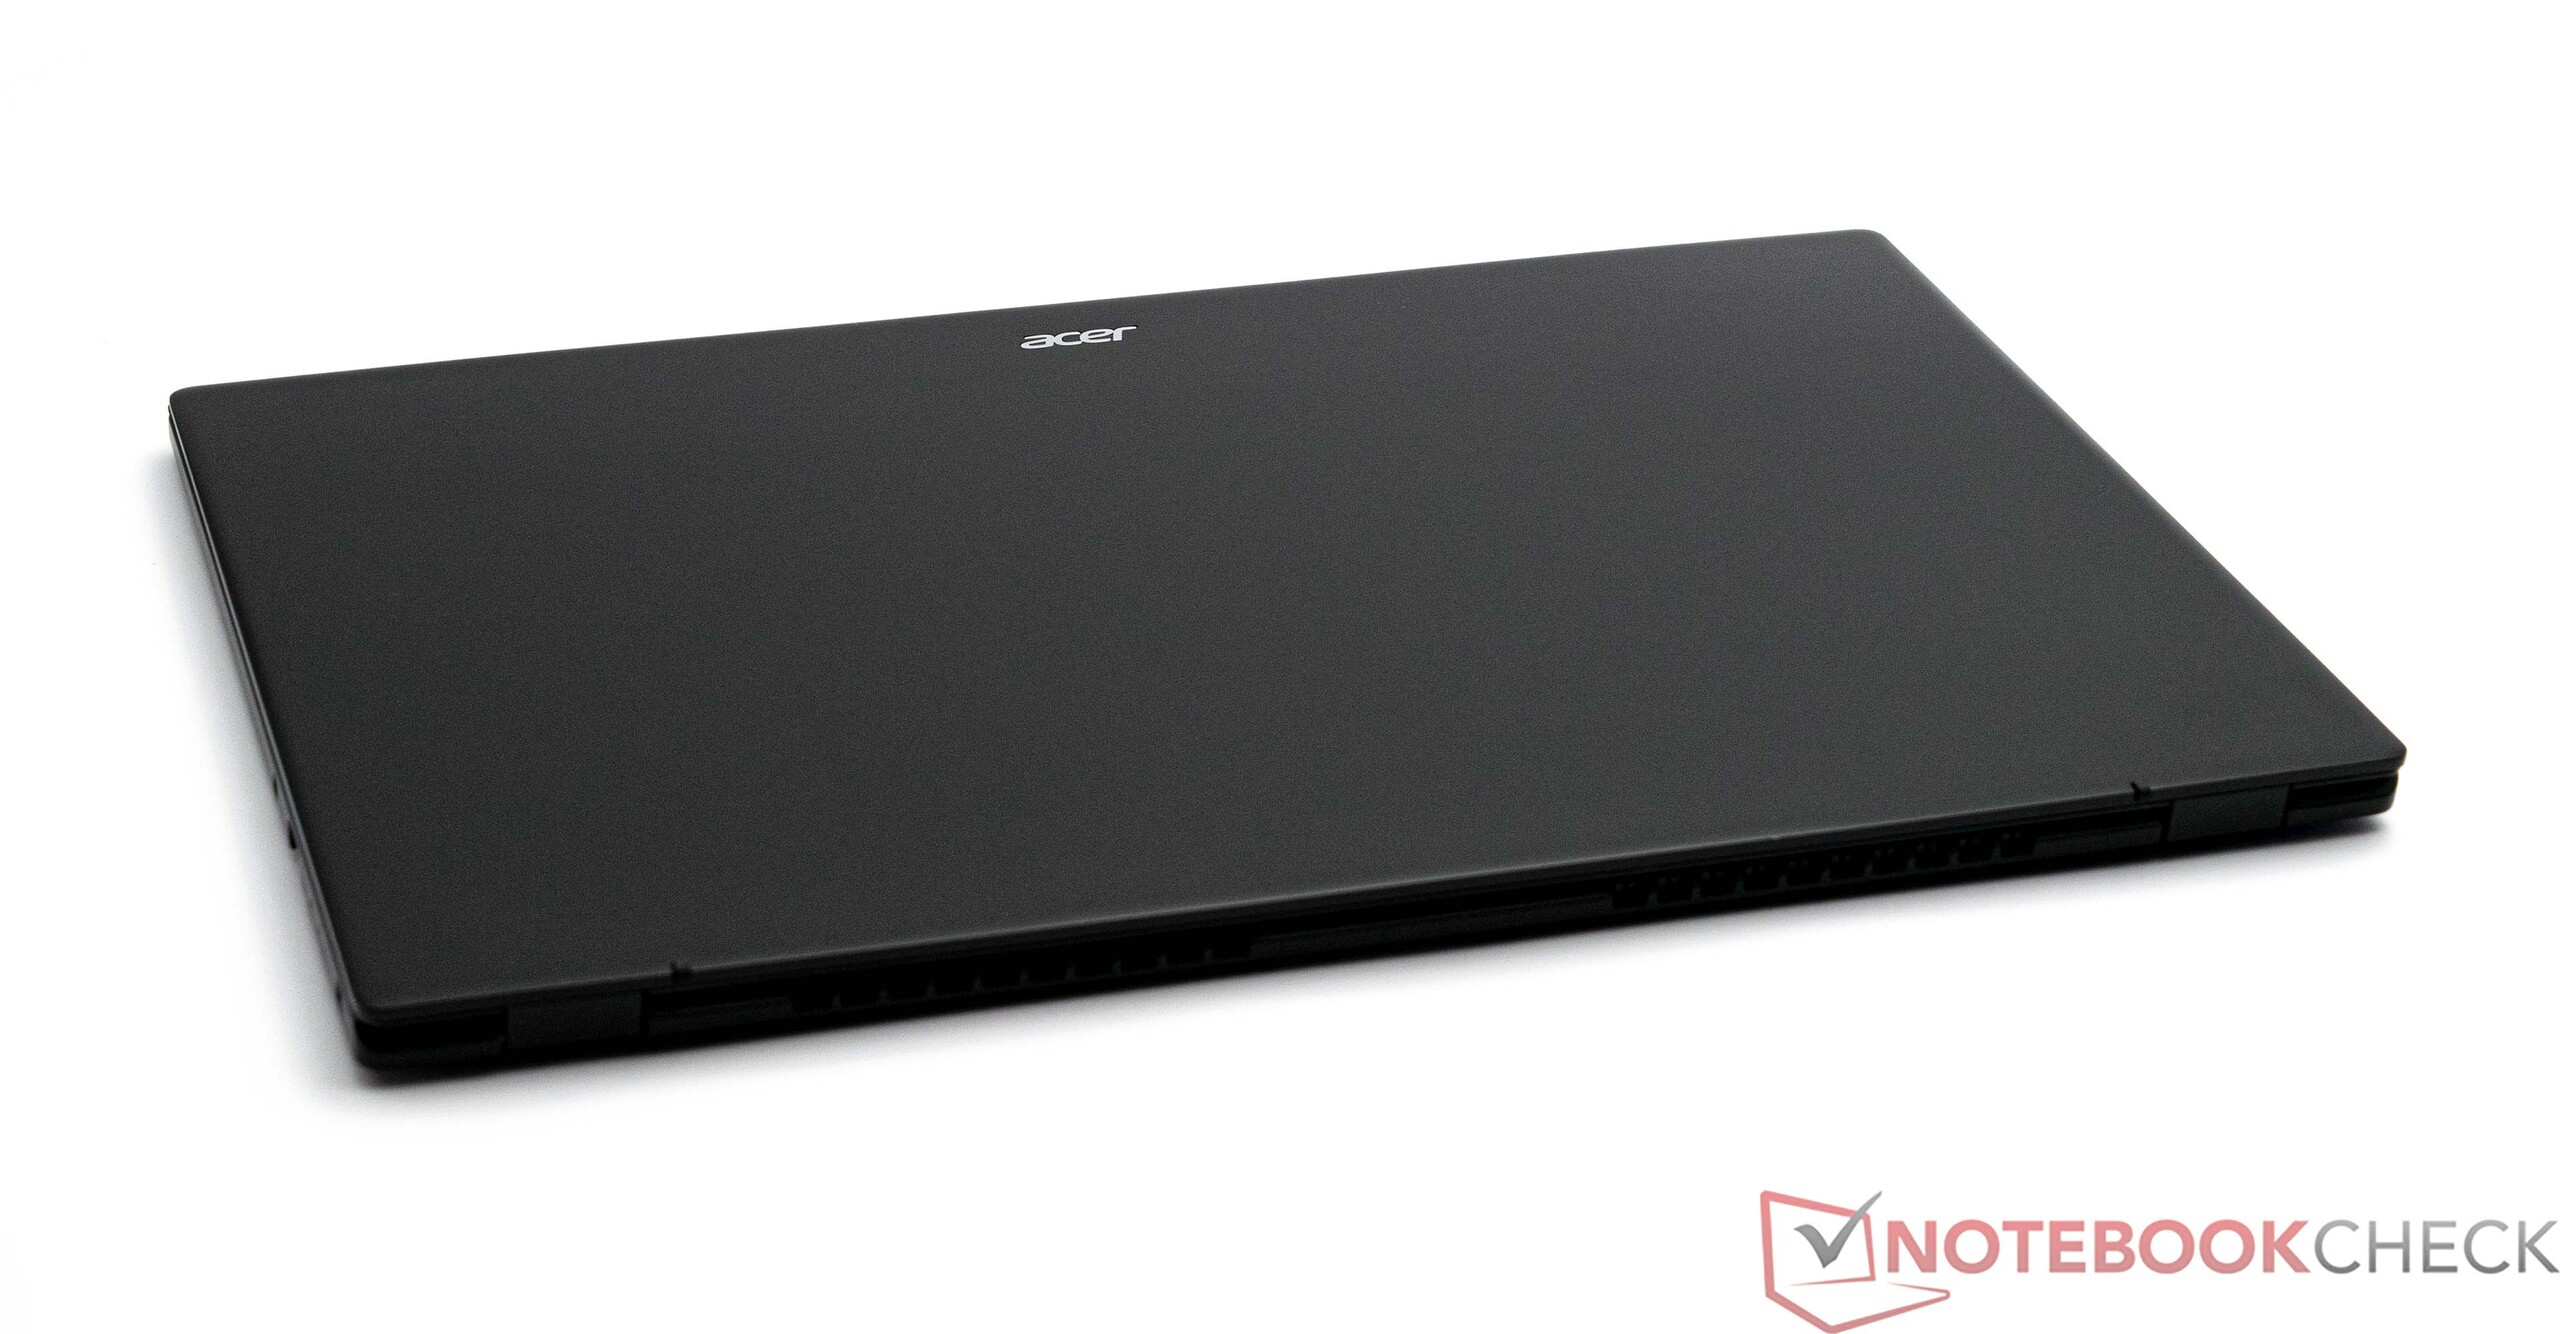
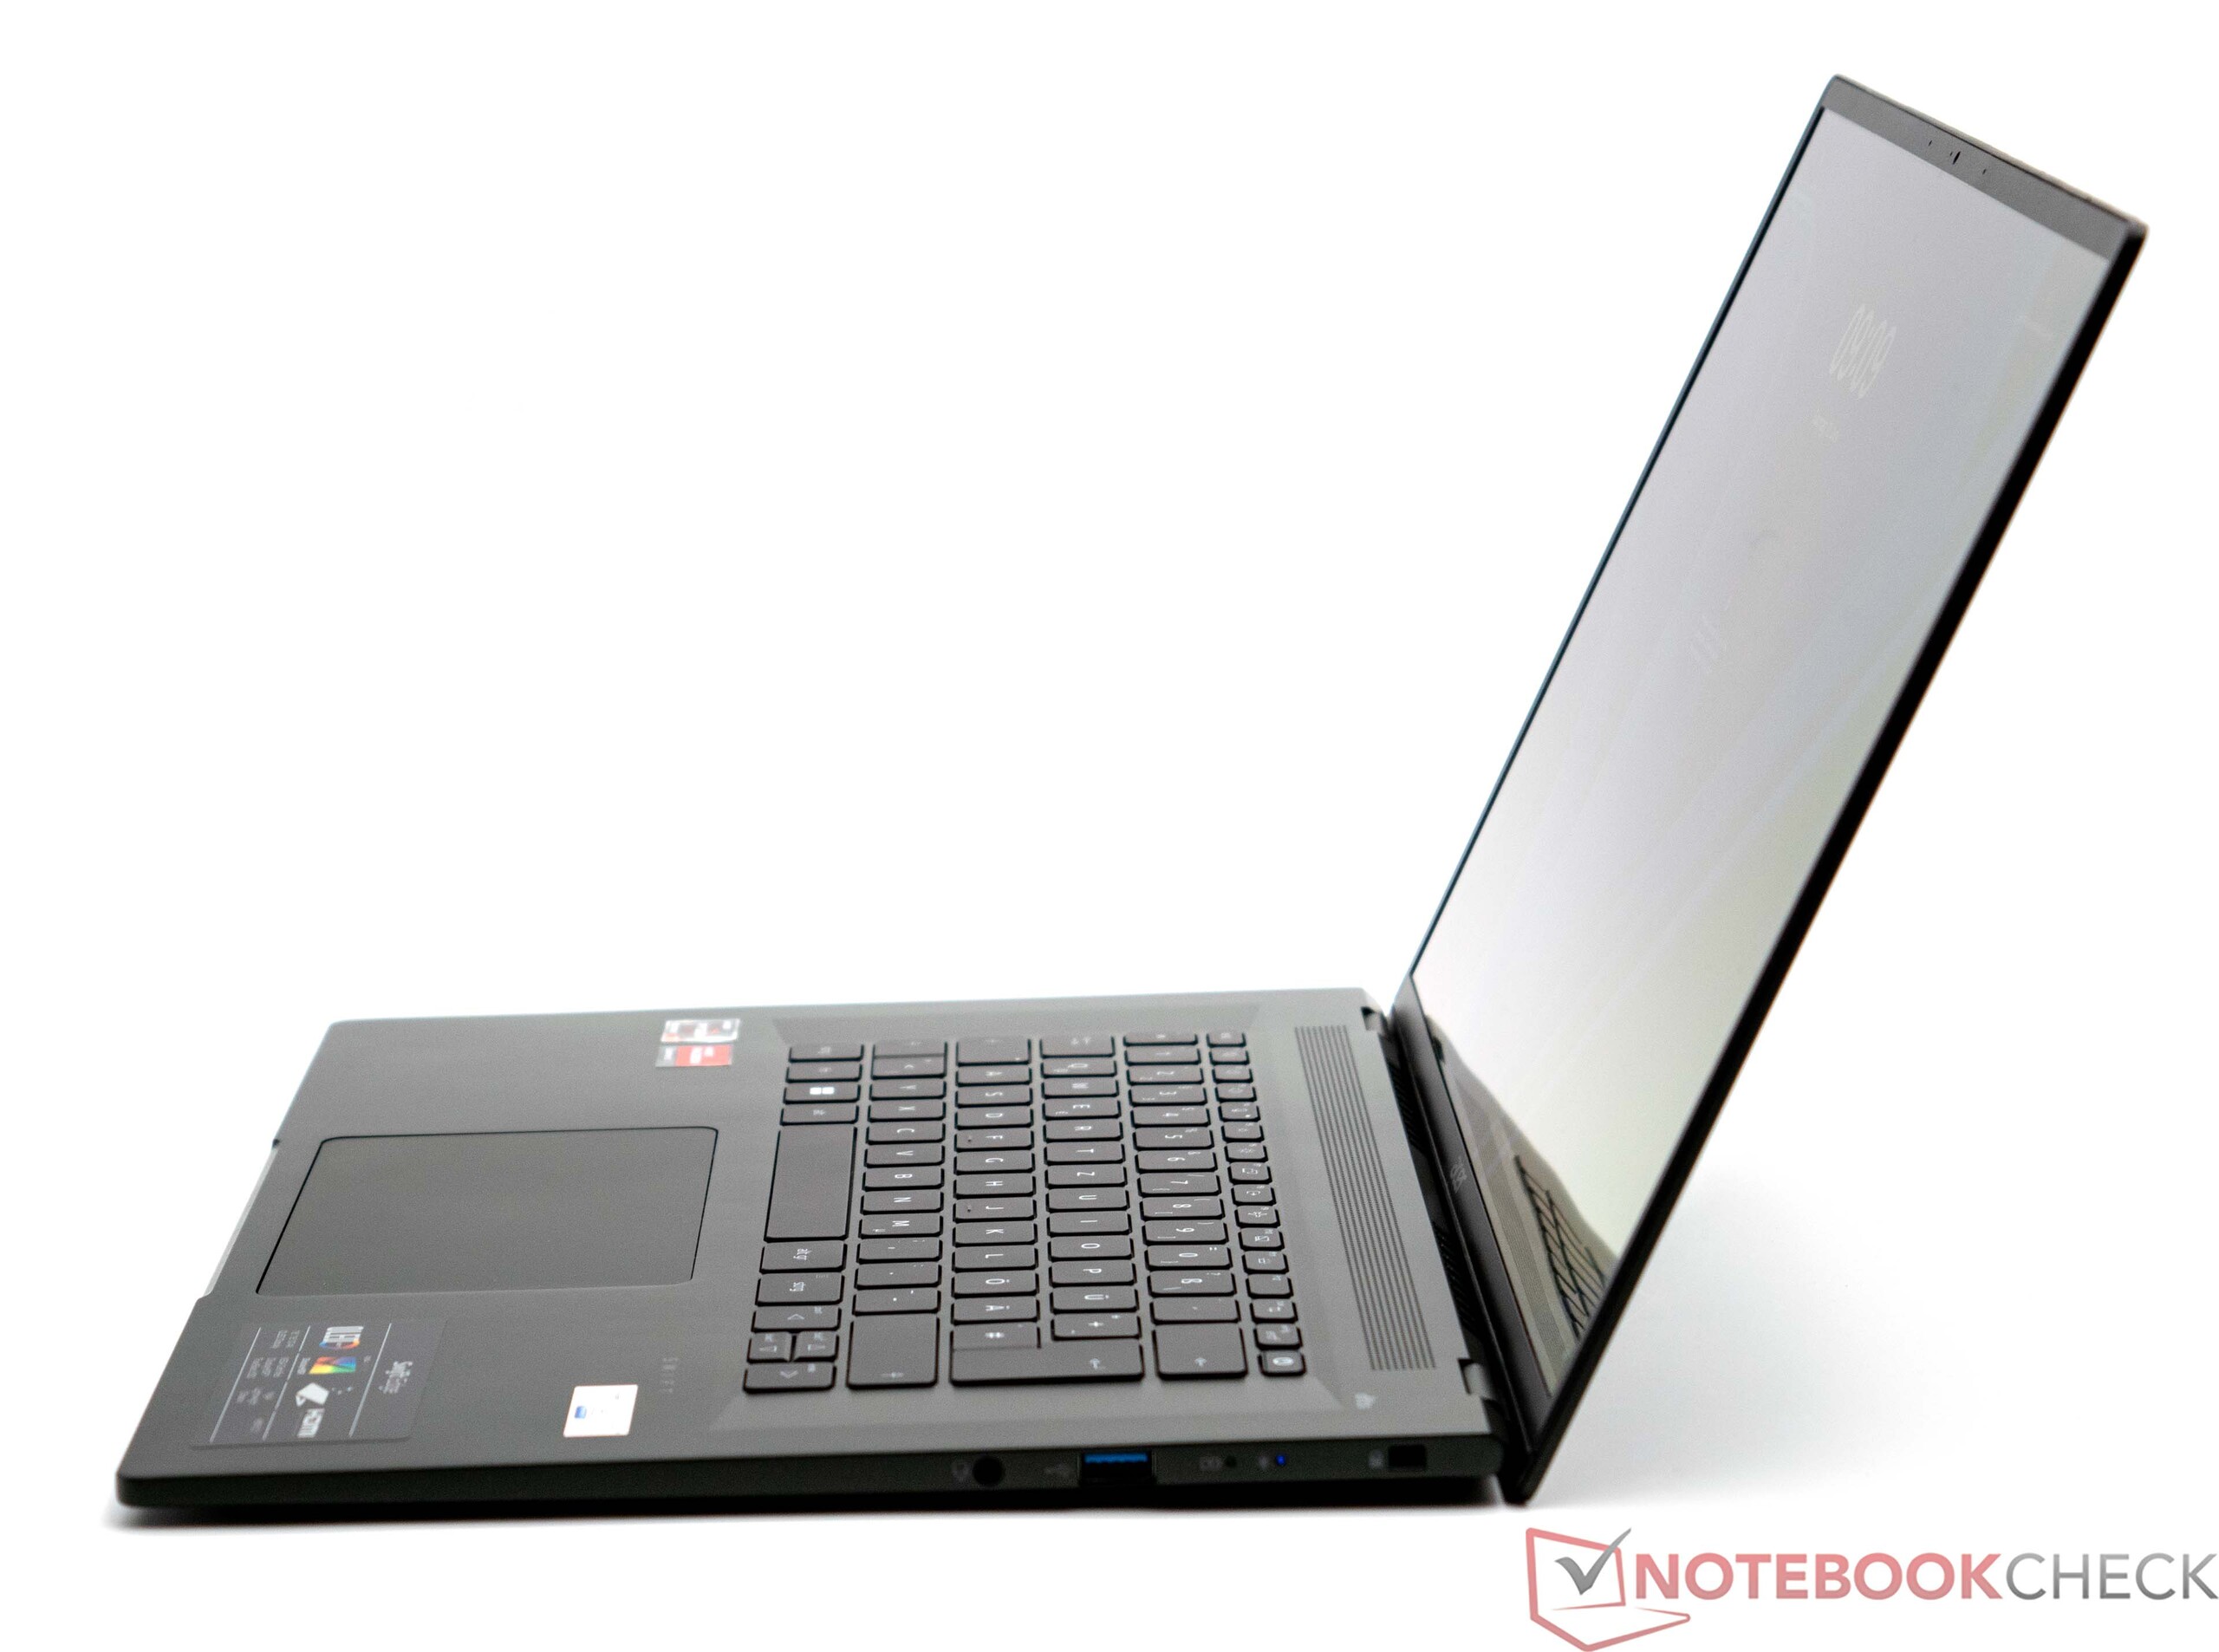

In terms of weight, the Acer Swift Edge SFE16 is by far one of the lightest of the devices we tested, alongside the LG Gram 16Z90Q. There is nothing noteworthy about the device's footprint - neither in a negative nor positive way. At only 14 millimetres thick, our test sample is very thin indeed - but this measurement is beaten by the Samsung Galaxy Book3.
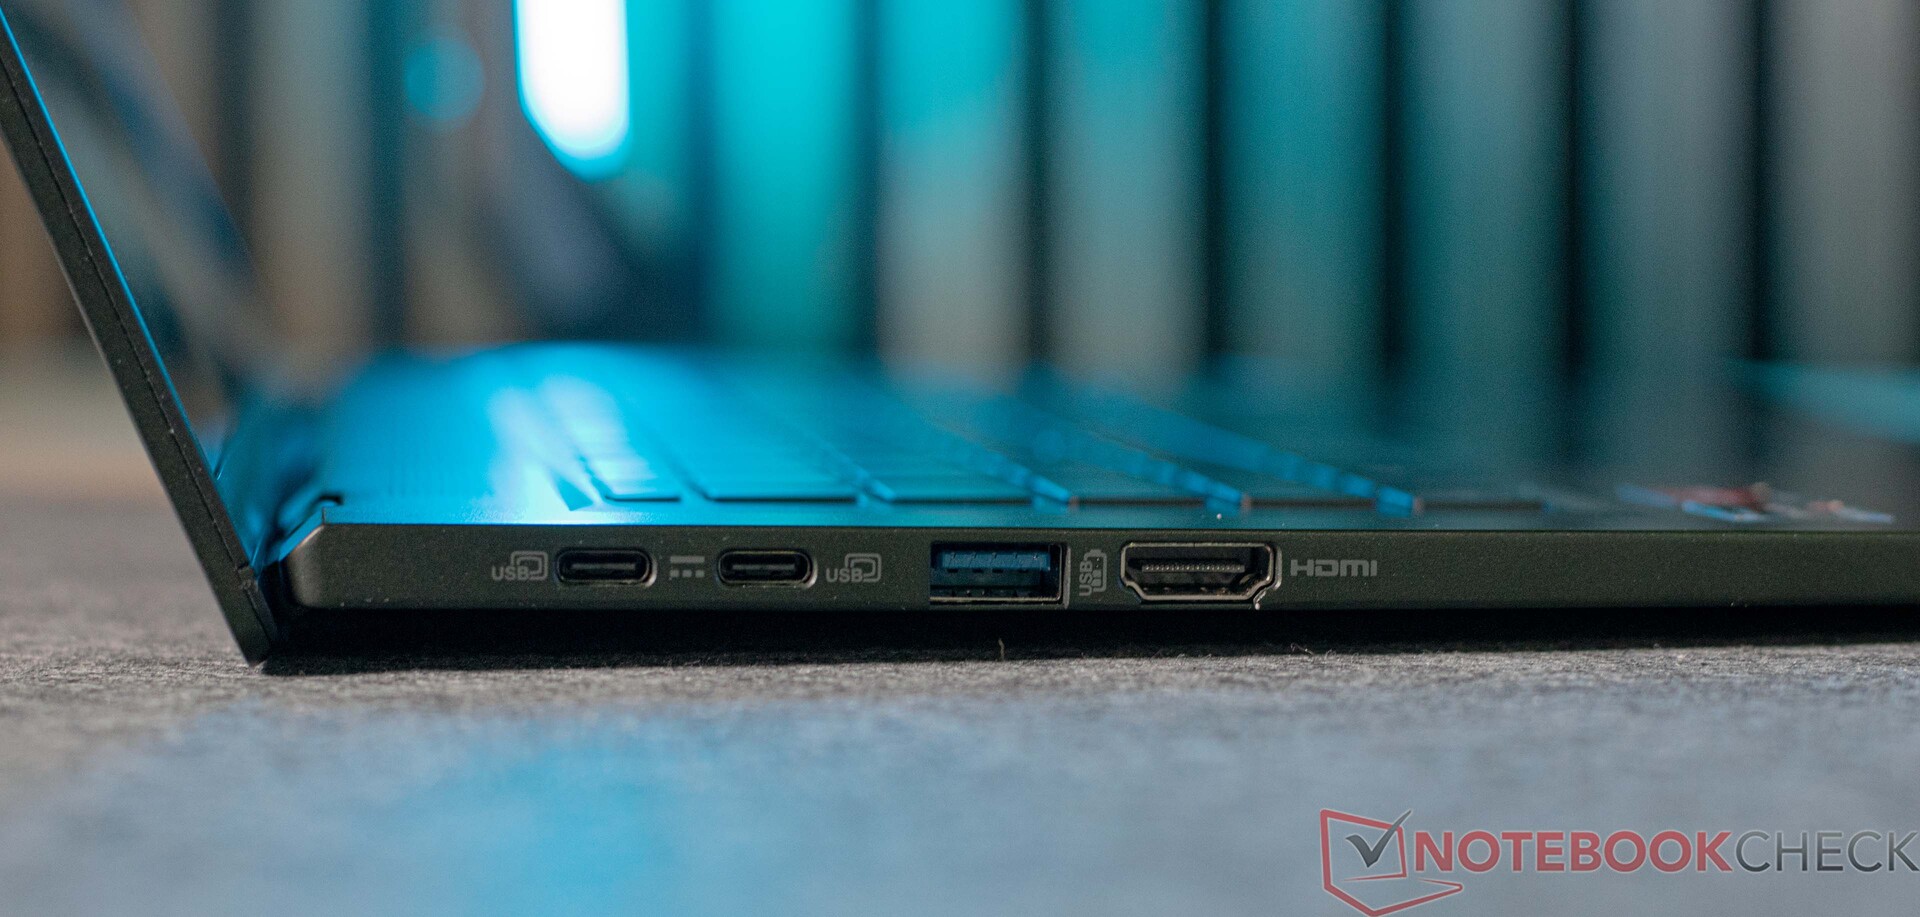
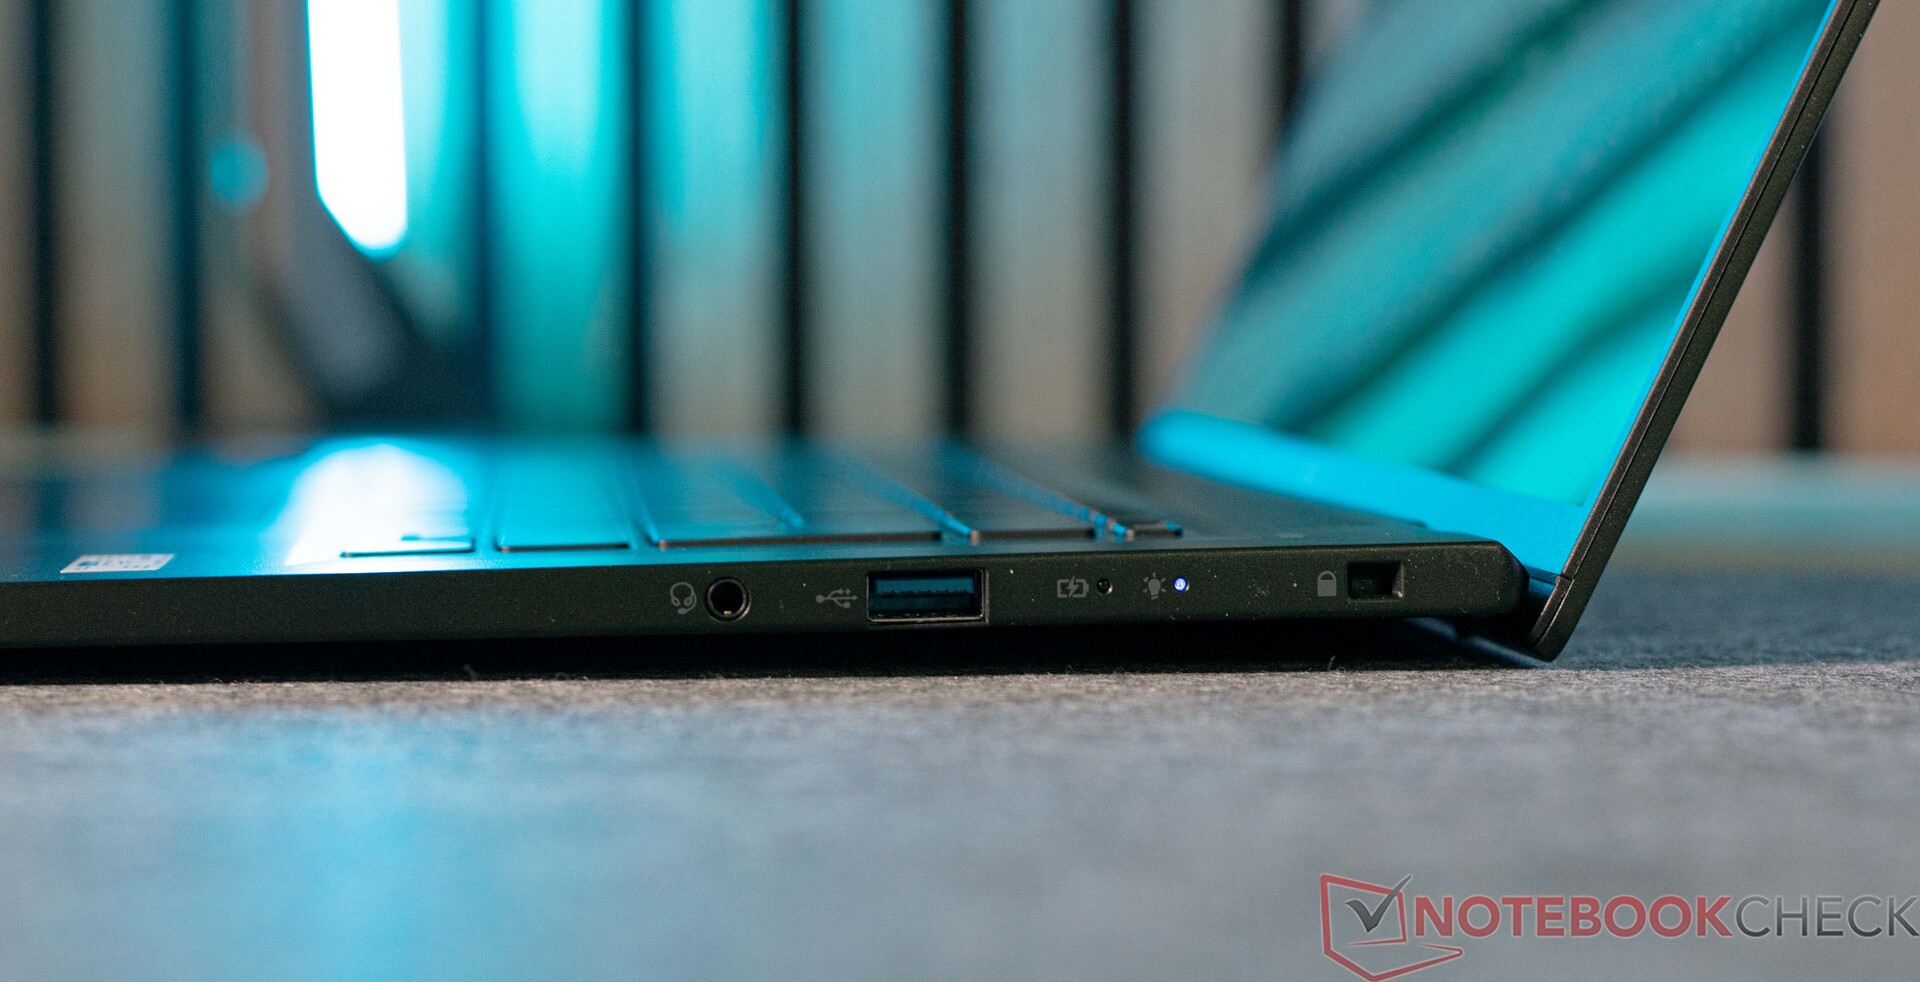
Connectivity - The Acer Swift Edge with Thunderbolt 4
The Acer Swift Edge SFE16 features modern connectivity options including Thunderbolt 4, which is situated on the left side of the laptop. Additionally, it has two USB-A ports and an HDMI port. Alternatively, you can connect external monitors via Thunderbolt. Unfortunately, the device doesn't have an Ethernet connection.
Communication
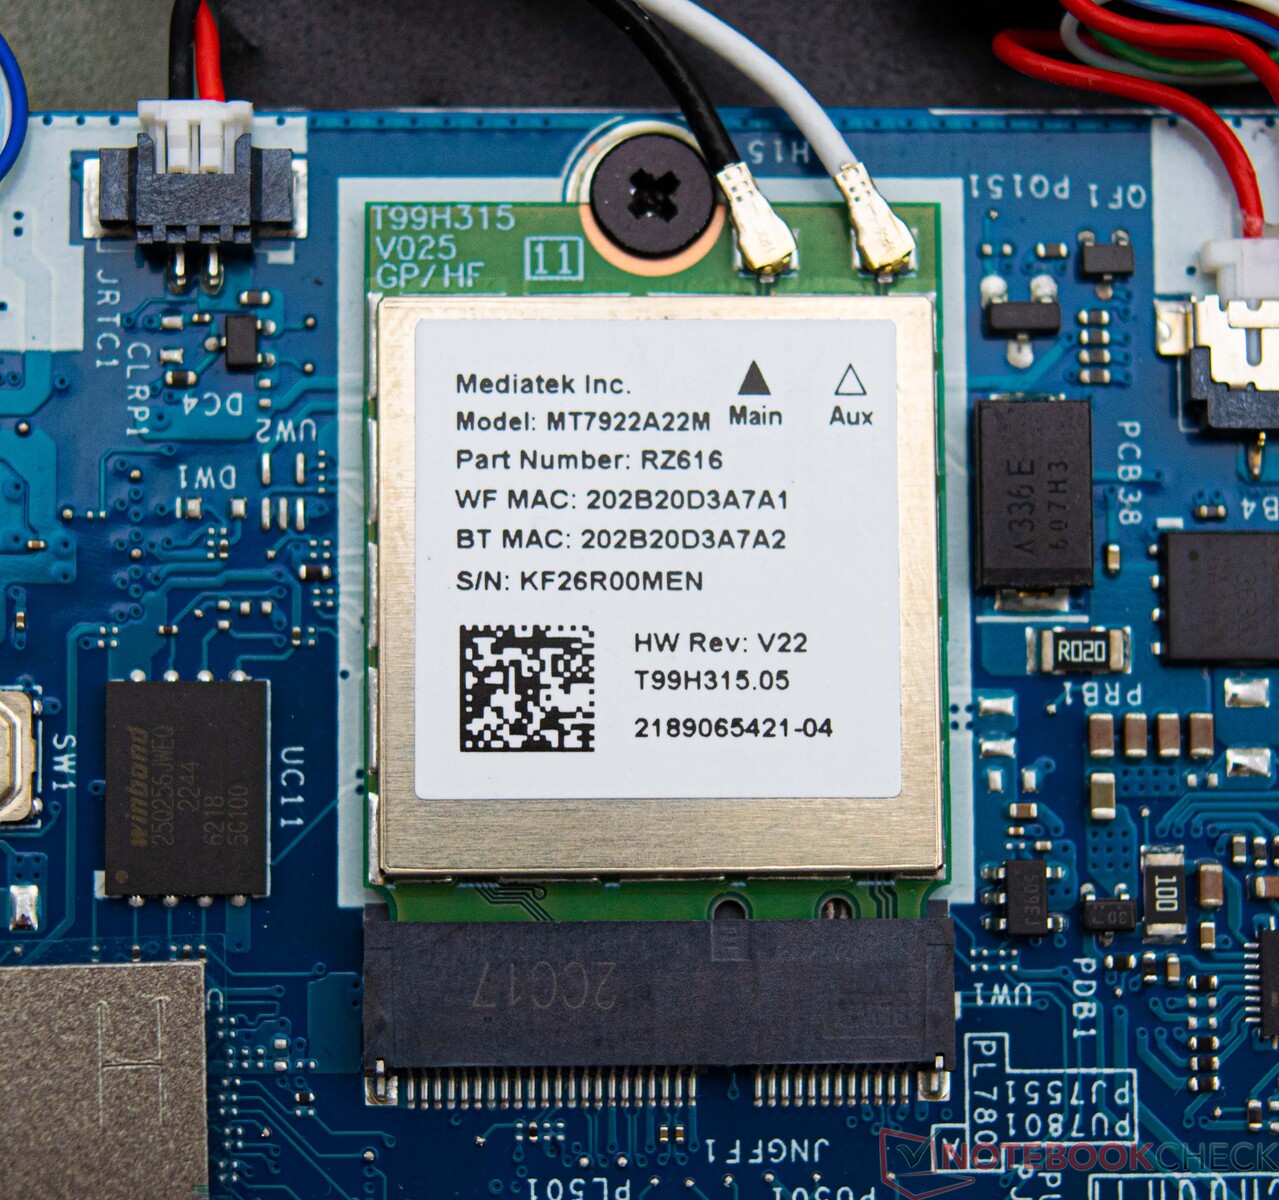
The Acer Swift Edge SFE16 is equipped with a modern Wi-Fi 6E module that also supports Bluetooth 5.2, which you can use to connect further accessories. In our test, we measured some somewhat disappointing results within the 5-GHz frequency band. Using 6 GHz, the results were slightly better, although the laptop's competitors did a little better overall. We used an Asus ROG Rapture GT-AXE11000 as a test router for these tests.
Webcam
The laptop's webcam has a resolution of 1080p (HD), meaning it is a little more detailed than most basic 720p models. lt must be said, its color accuracy isn't the greatest.


Accessories
Included with the laptop is also a lightweight and compact 65-watt USB-C power supply (194 grams) and a few info pamphlets.
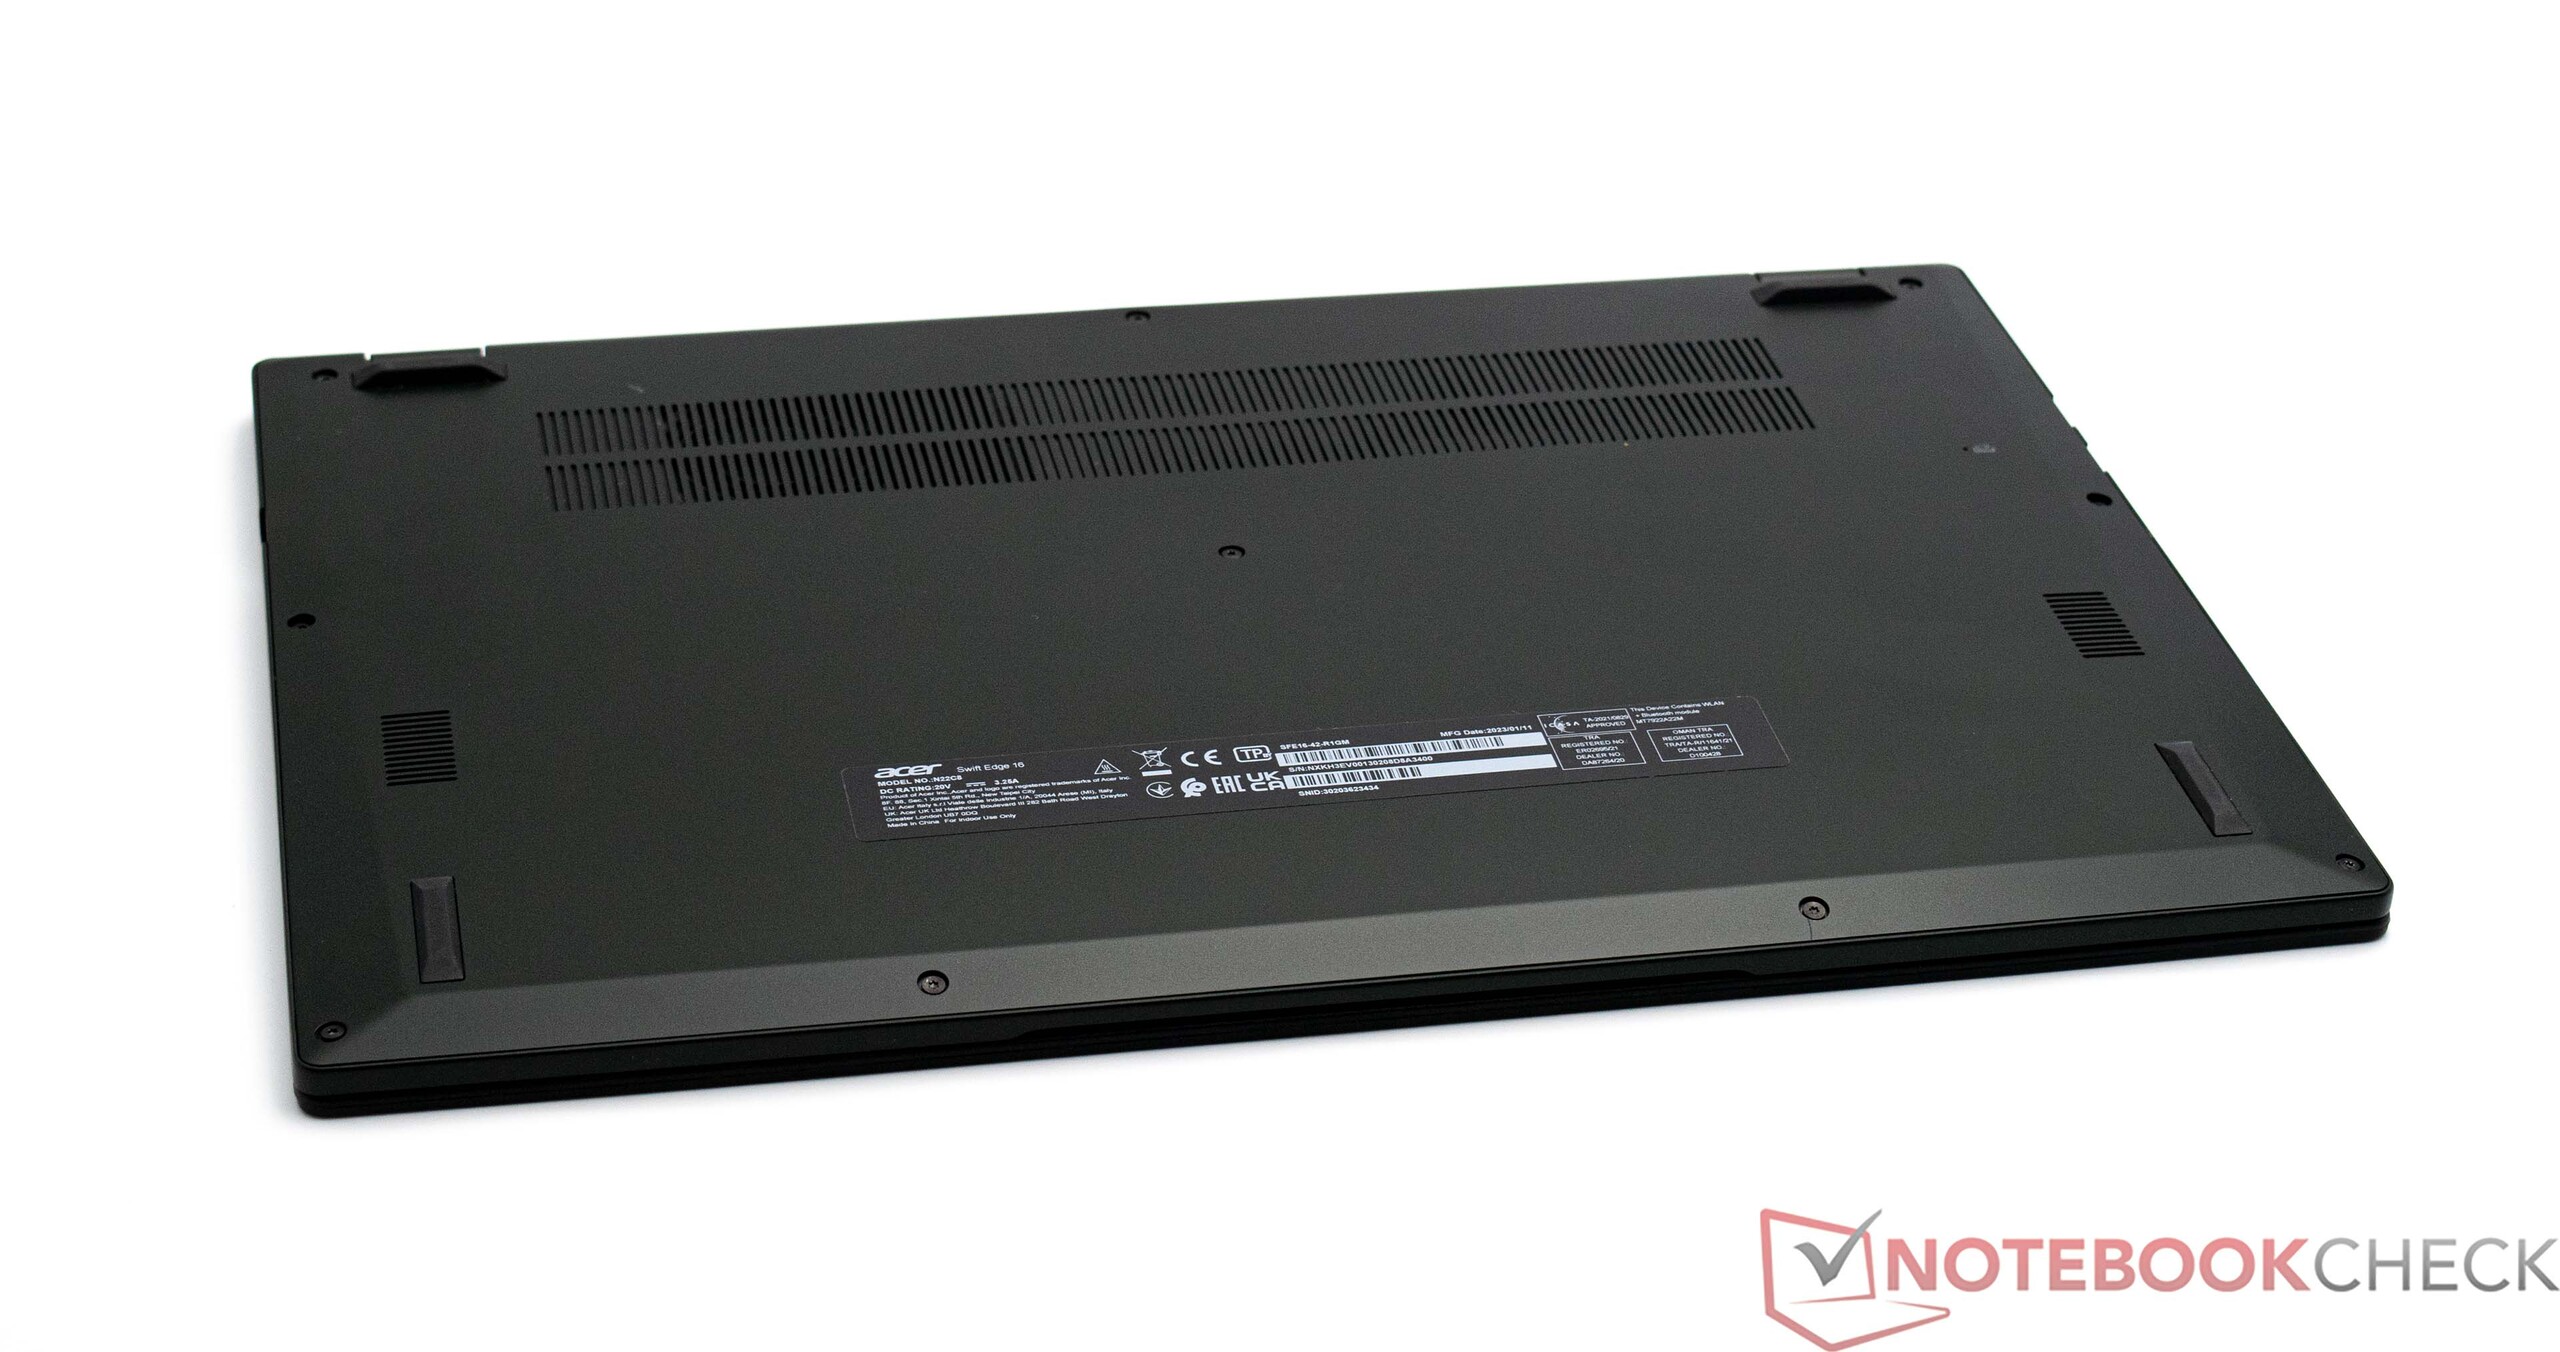
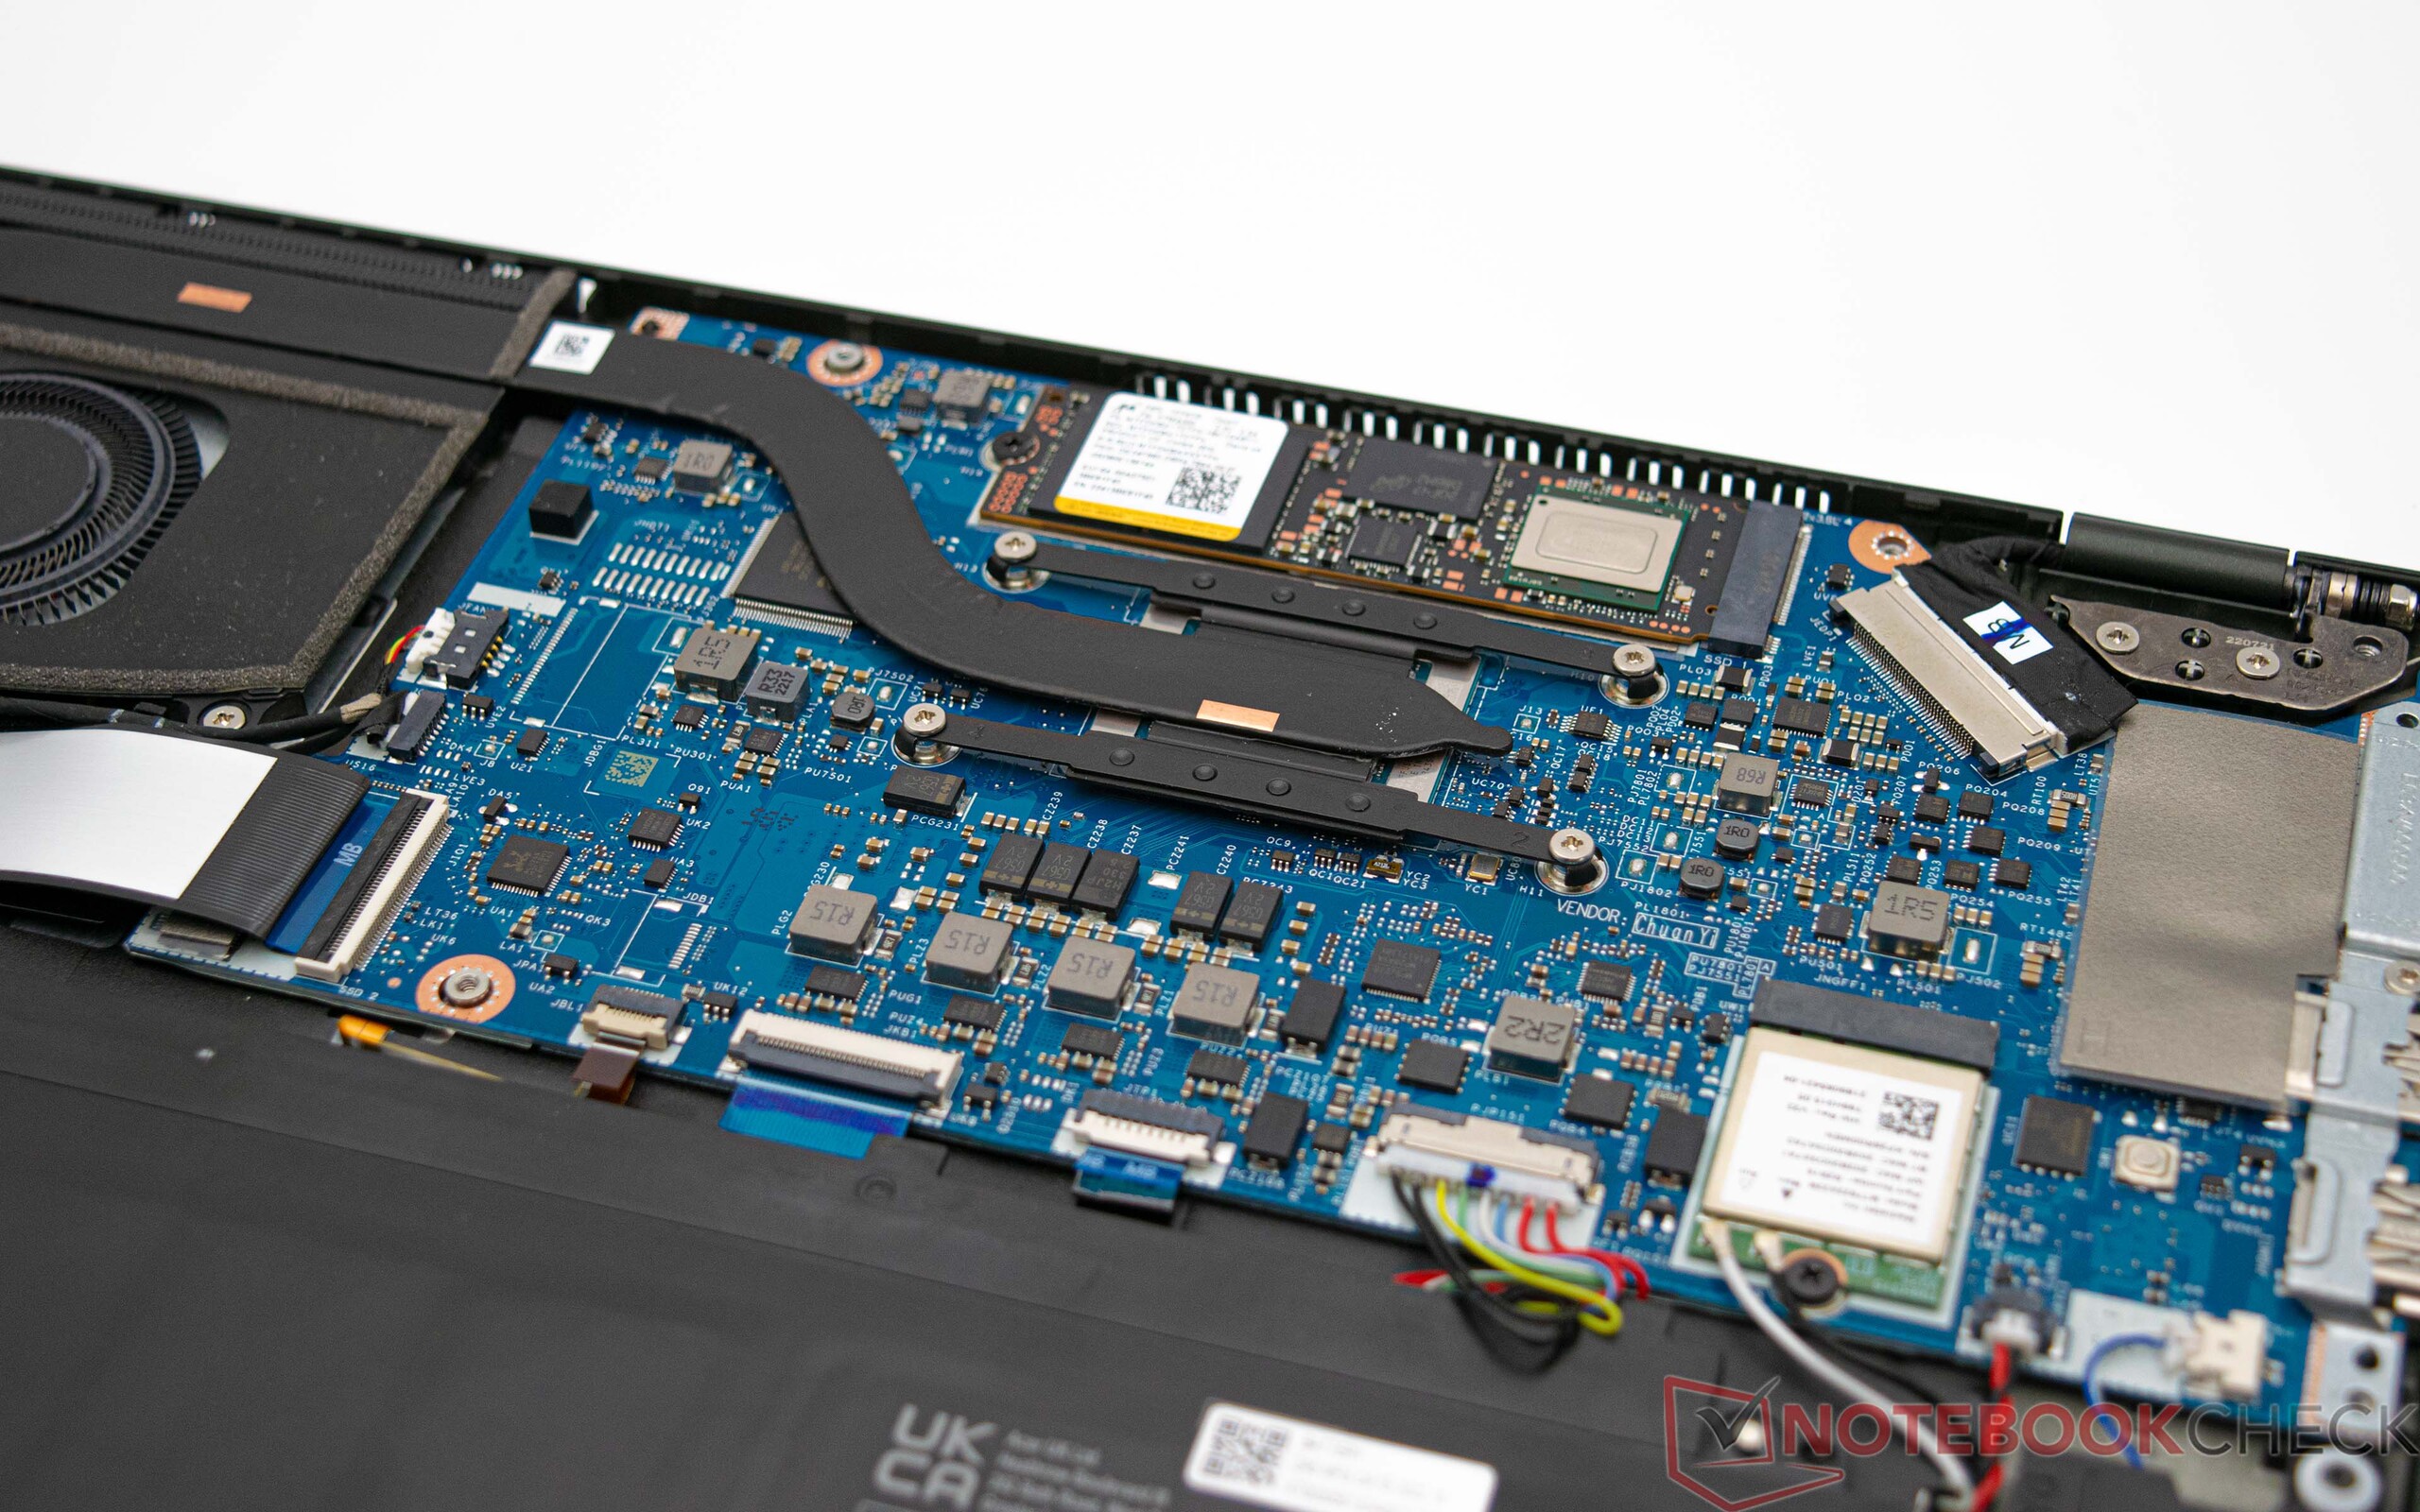
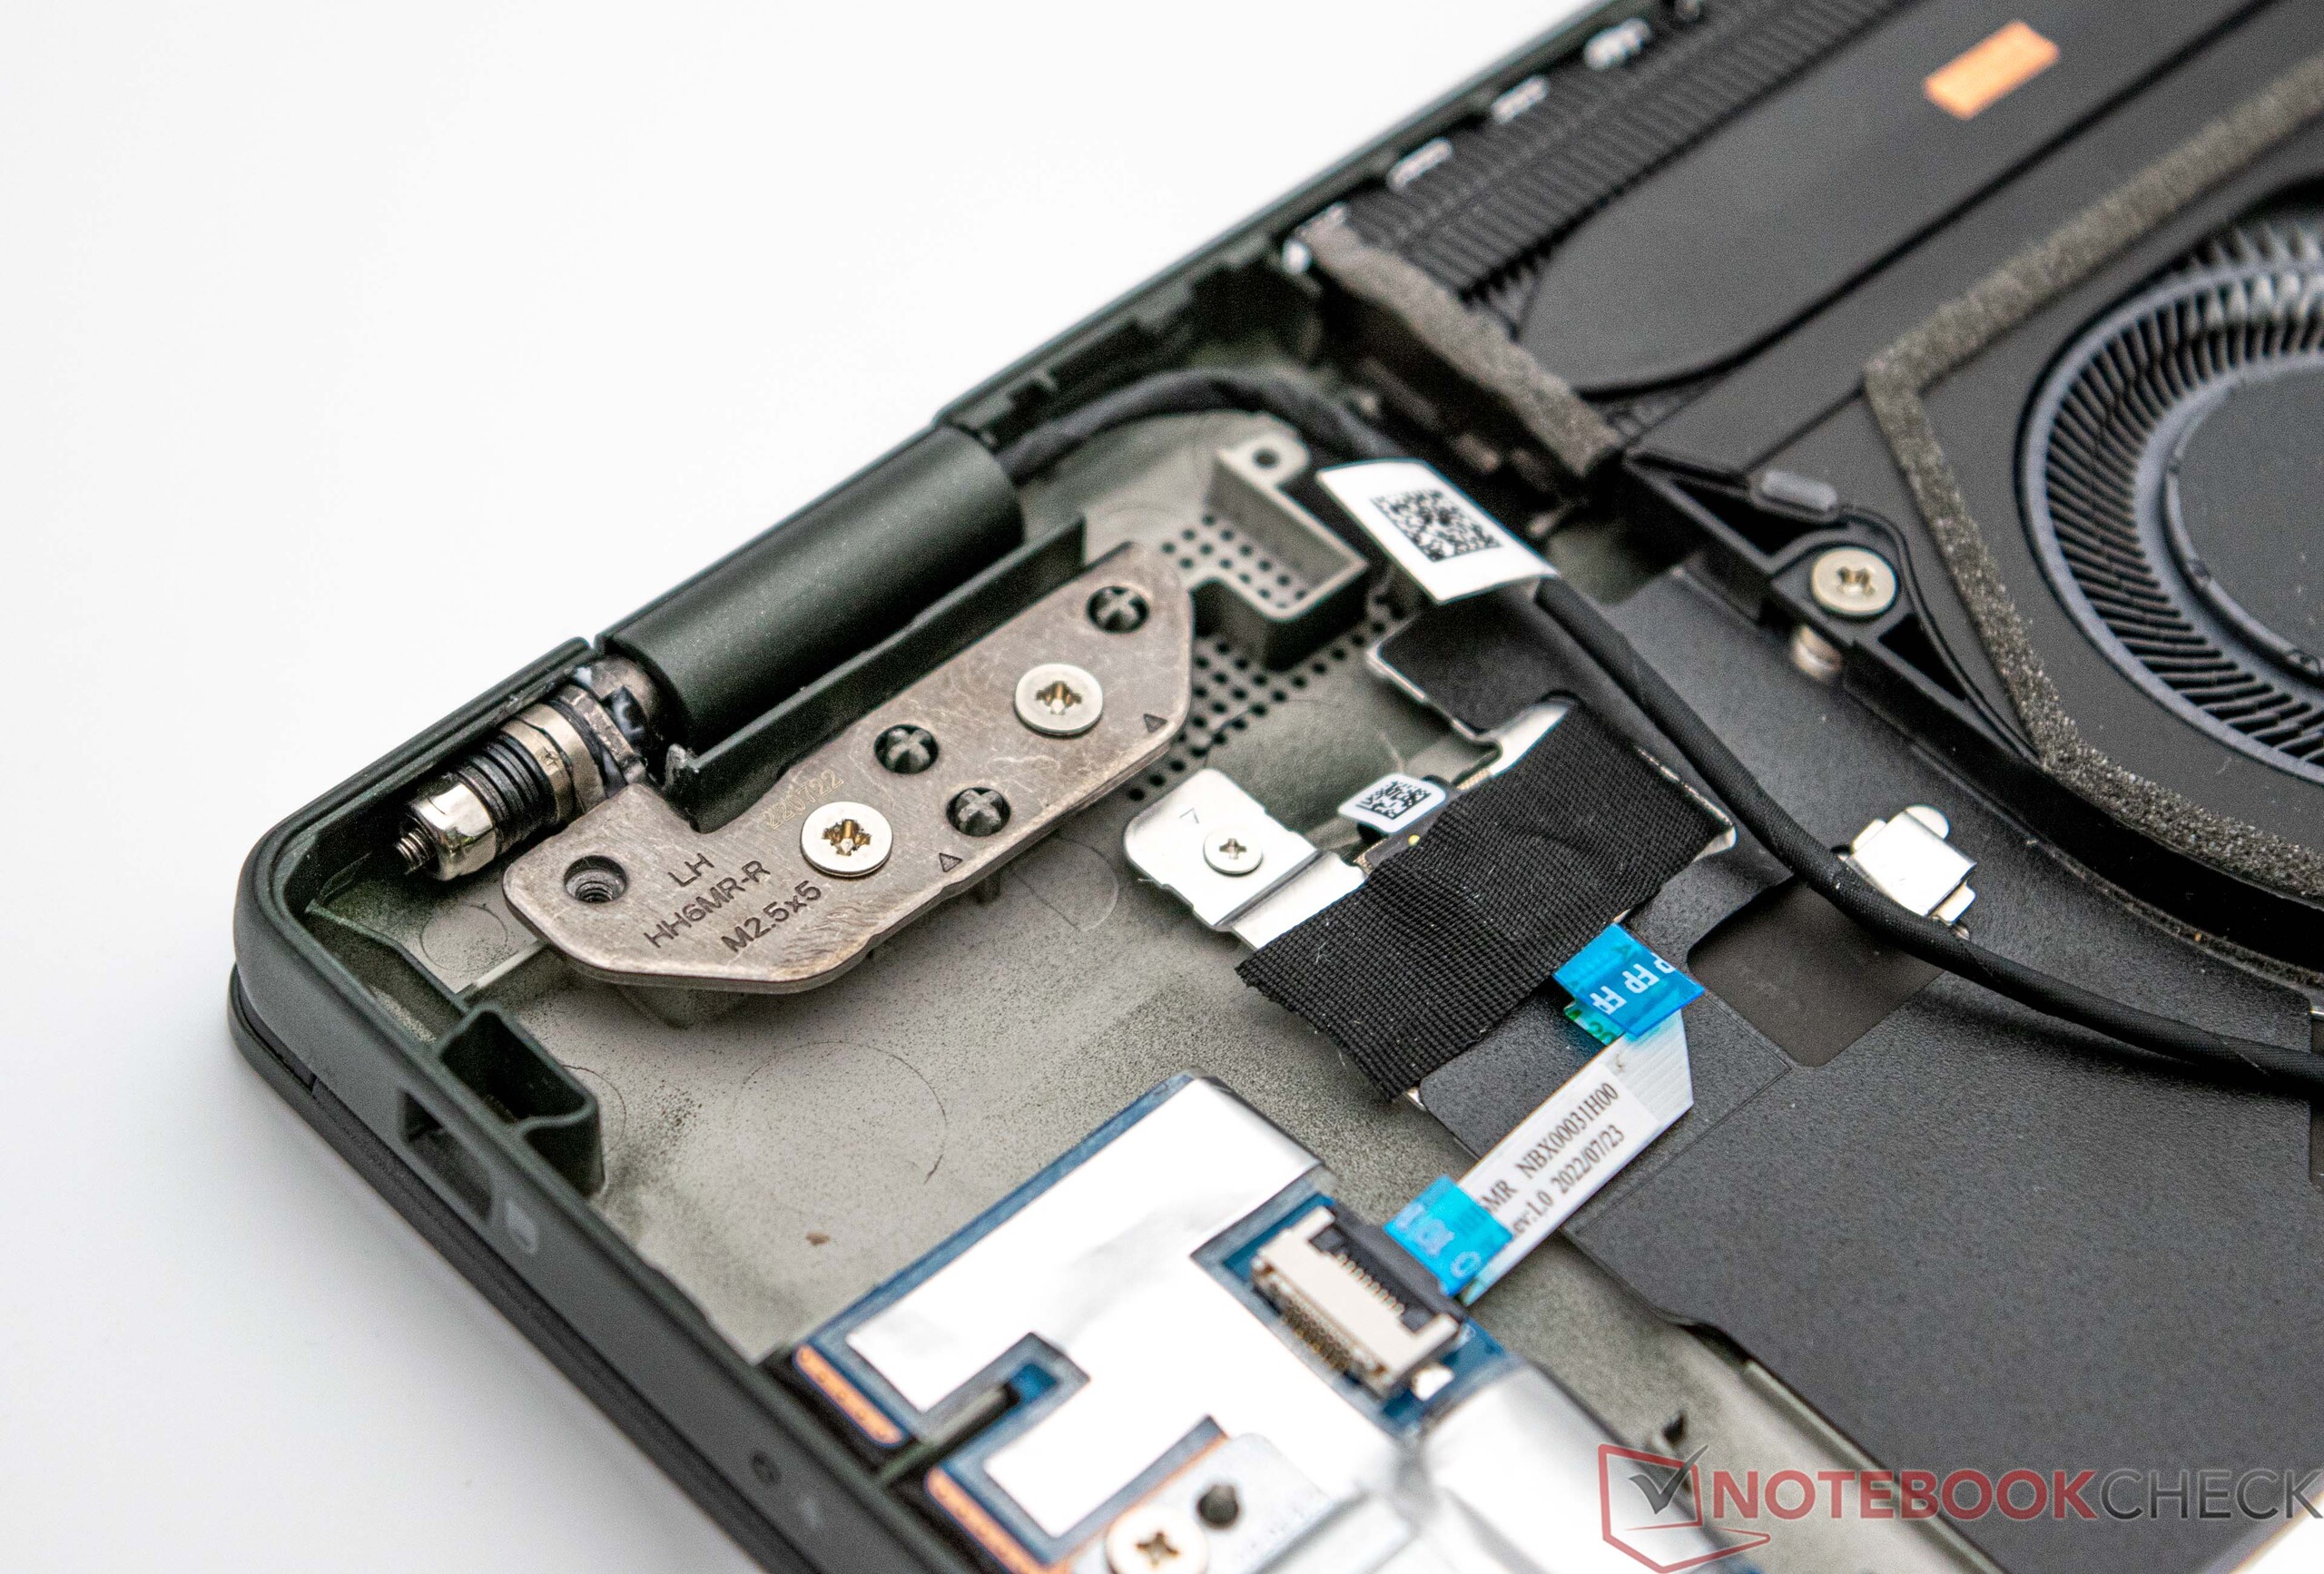
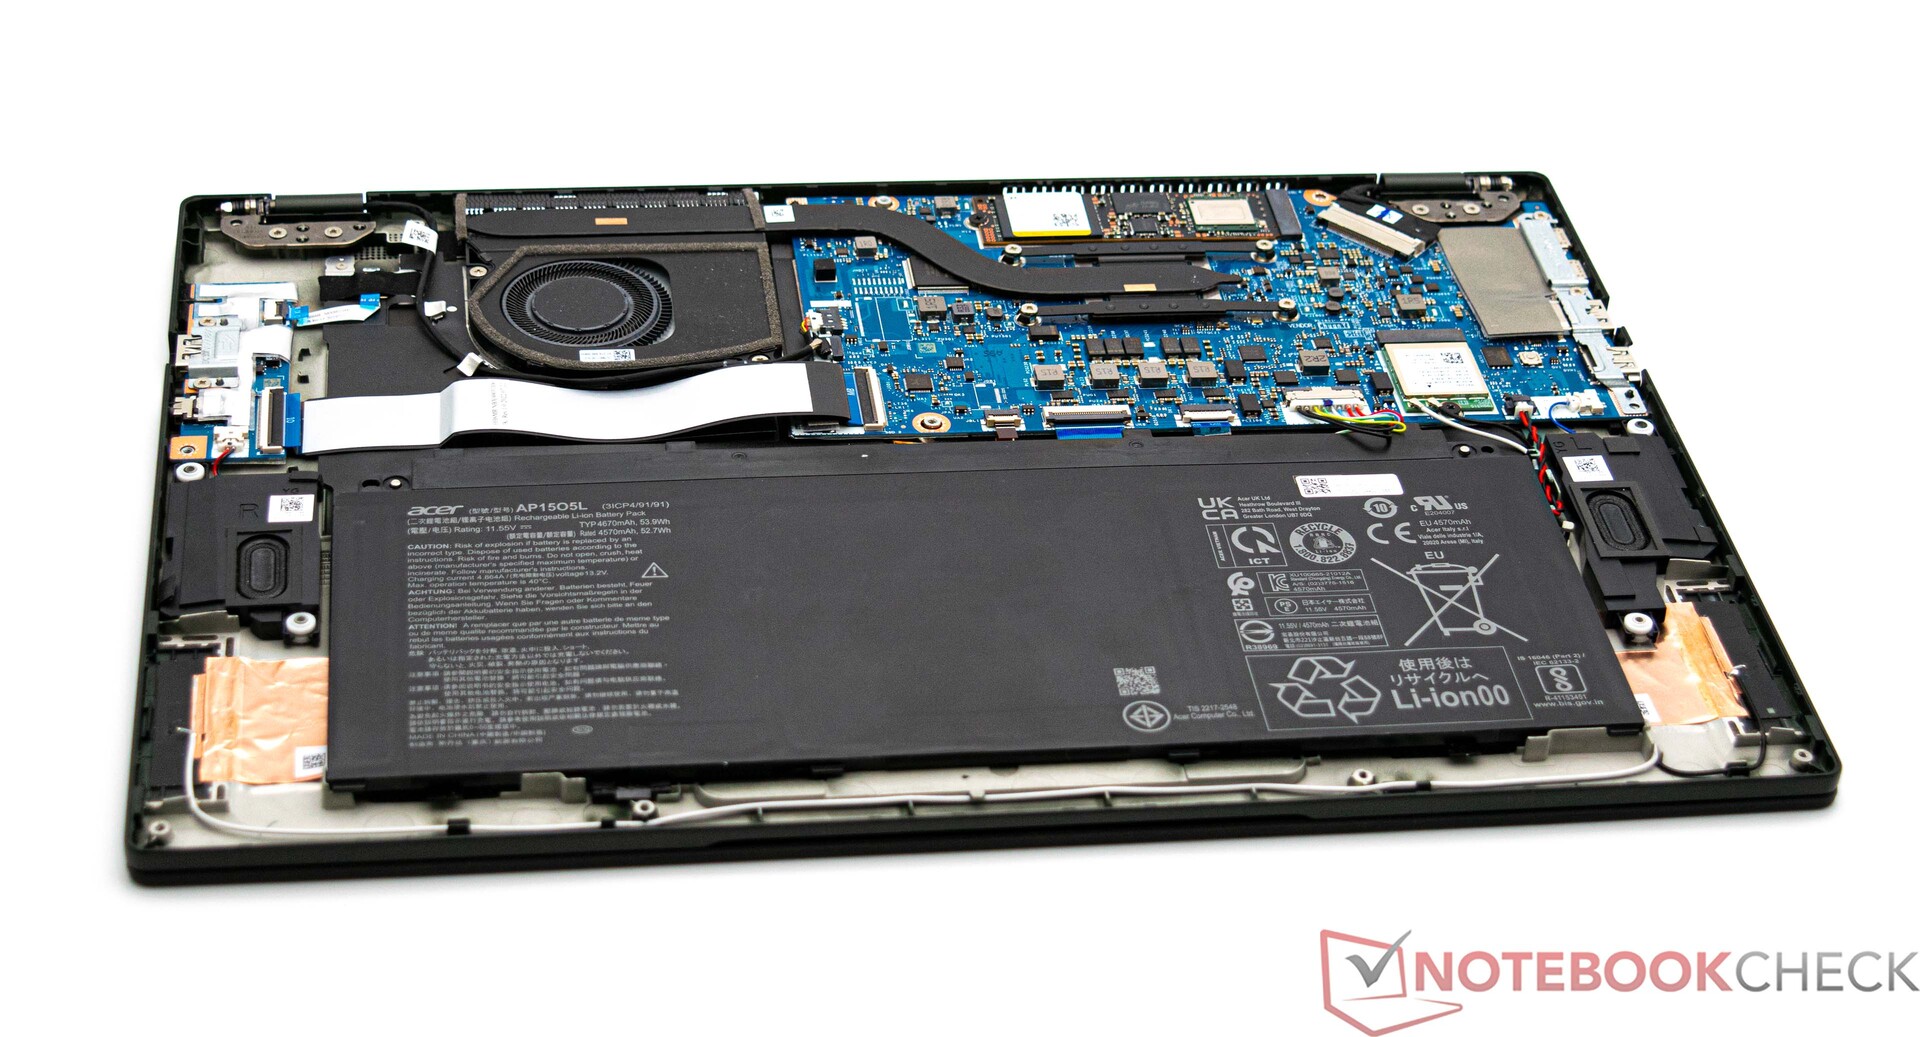
Maintenance
It is generally possible to do some maintenance work on the Acer Swift Edge SFE16. At the same time, it has to be noted that the laptop's RAM is securely built-in and you also can't install a second SSD. Even so, the bottom plate can be removed quite easily, for example to remove dirt from the device. You can swap out the SSD as well as the WLAN module.
Warranty
The laptop is covered by a standard one-year warranty in the USA which currently cannot be extended.
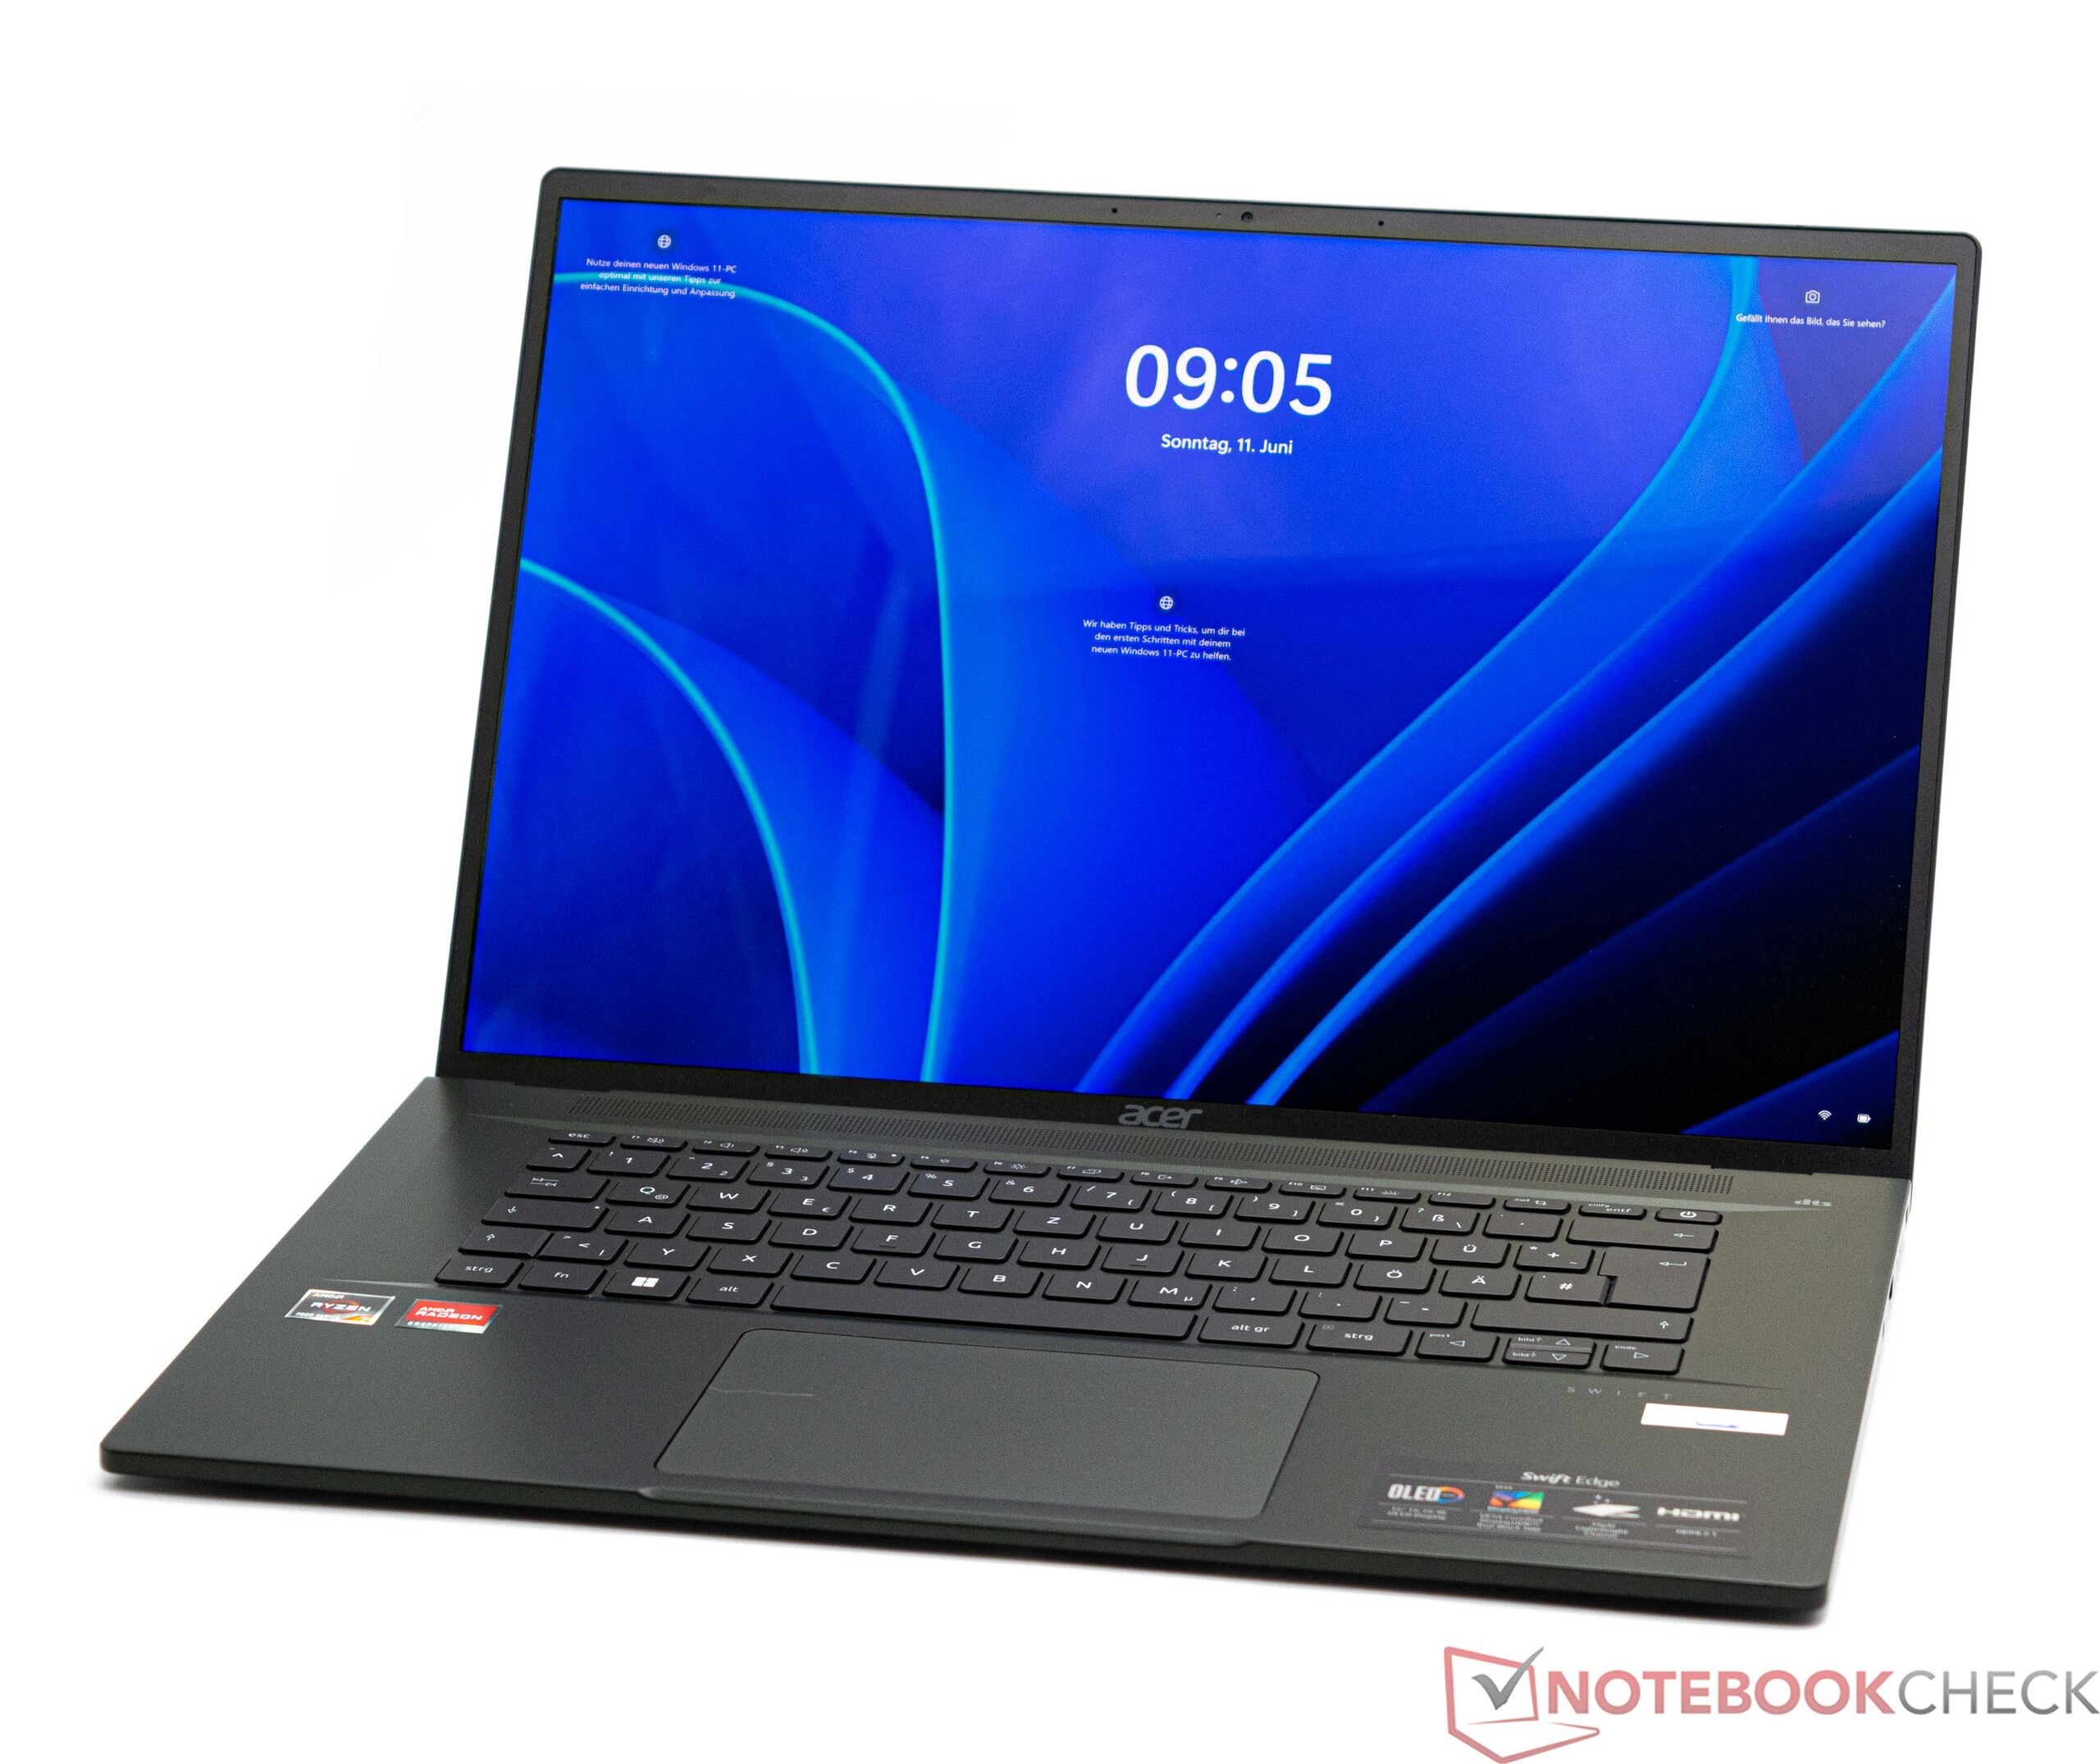
Input devices - The Swift Edge doesn't have a numeric keypad
Keyboard
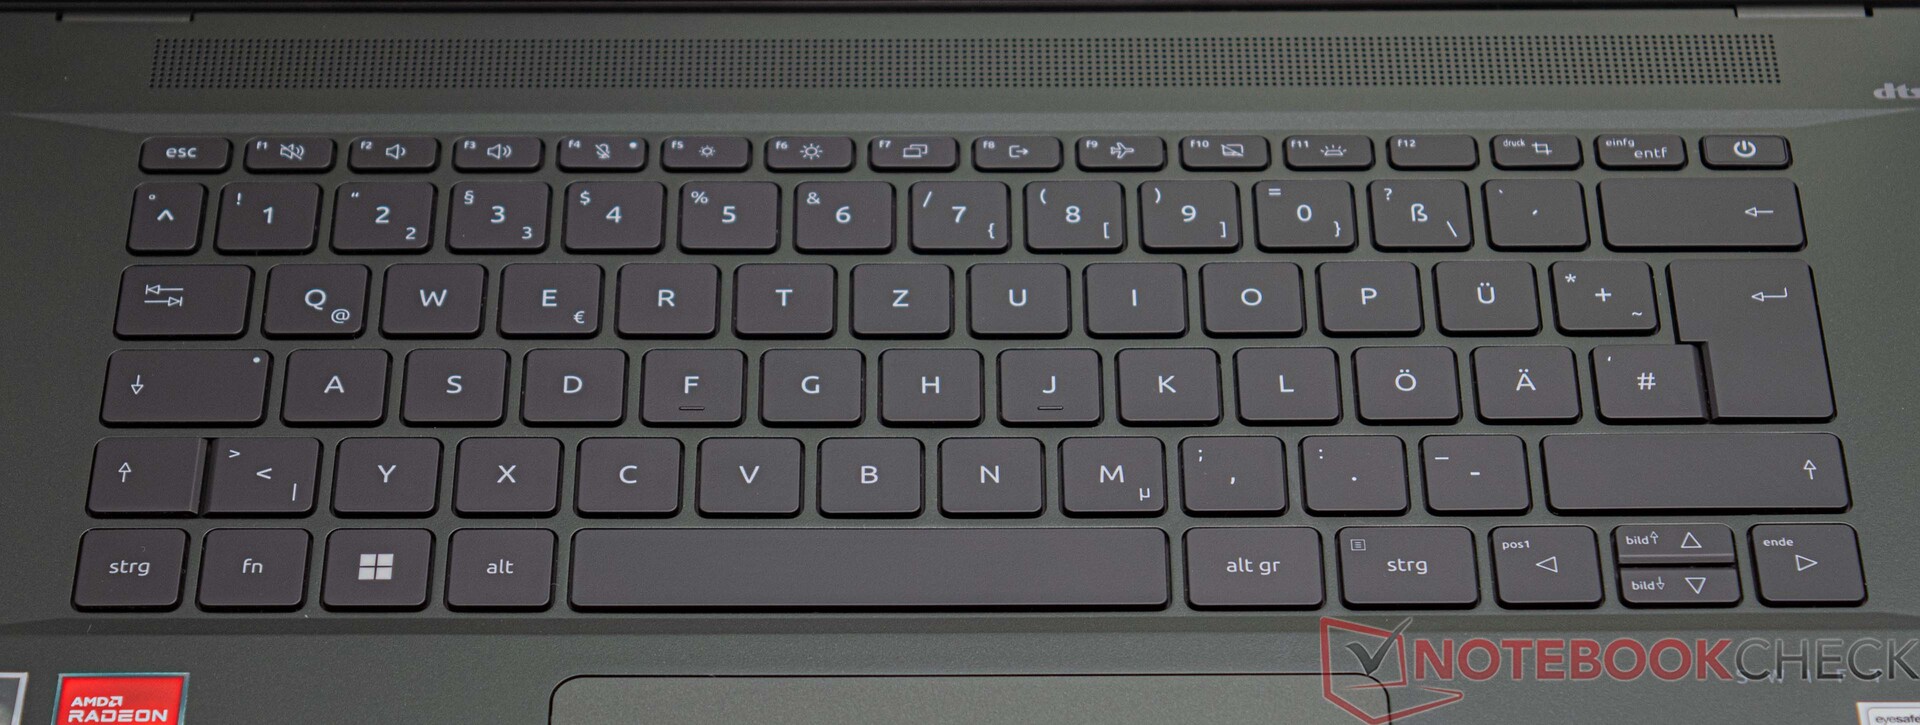
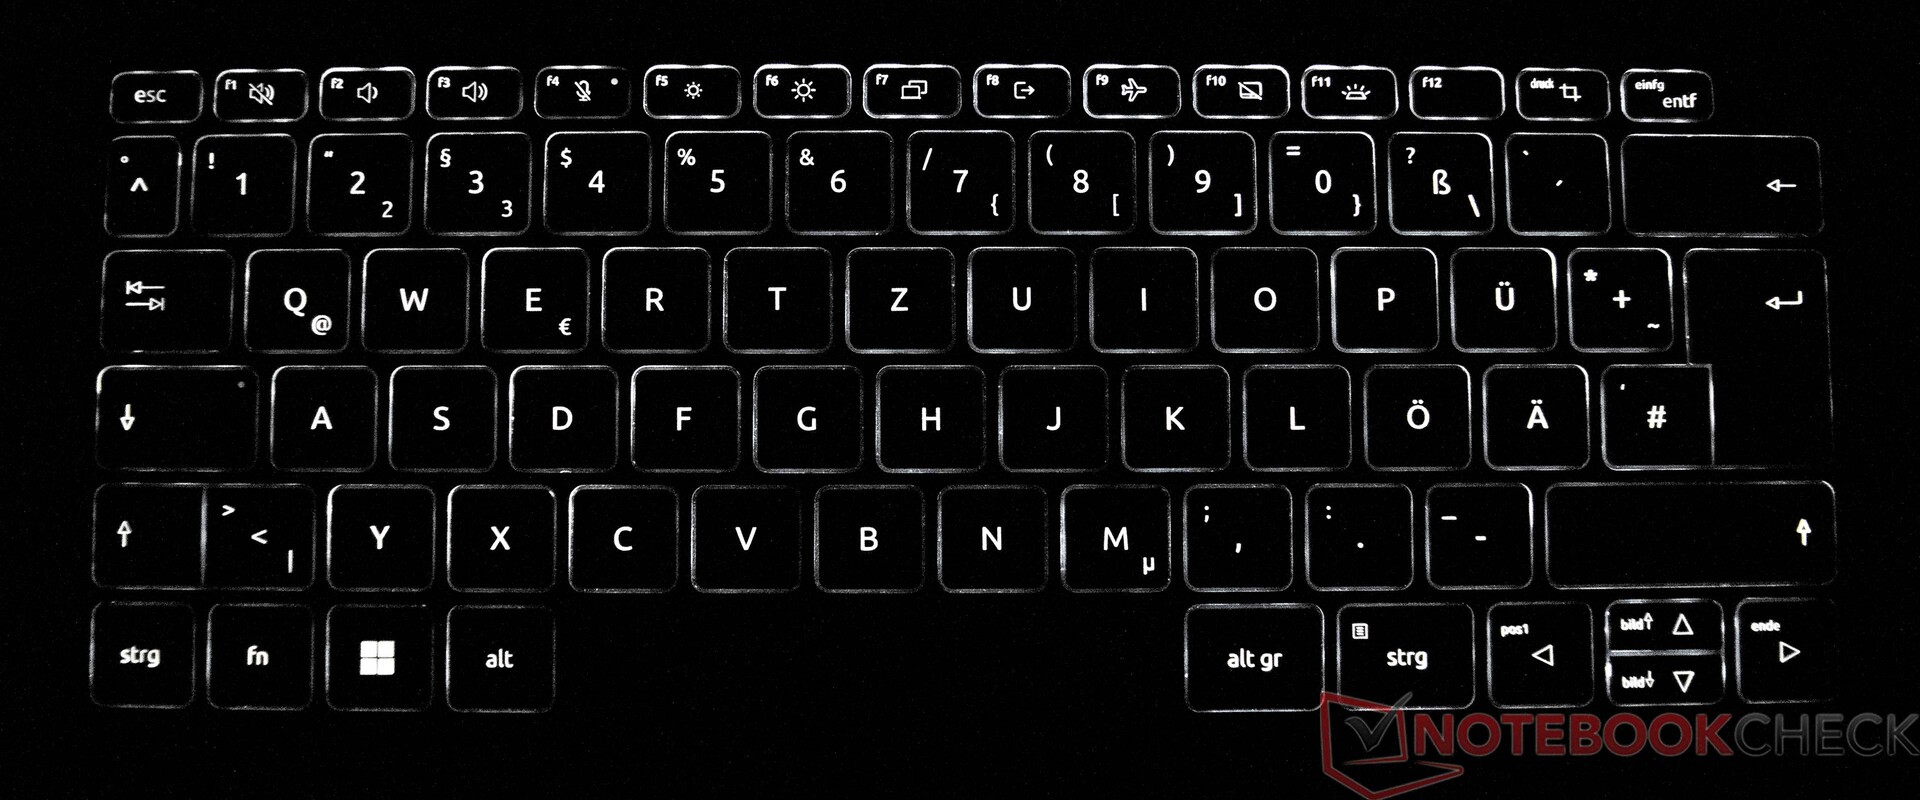
We already touched on the topic of stability - in everyday use, the little bit of flexibility shouldn't pose to be an issue. All-in-all, the keyboard left quite a good impression on us. You do, however, have to take into consideration the missing numerical keypad. In addition to this, the function keys in the first row are a bit on the small side. The same can be said for the arrow keys "up" and "down". The subjective feedback you get while typing is nice and most people should manage fine enough with this keyboard. As is standard on most current devices, the Acer Swift Edge SFE16's keyboard has white backlighting which has two intensity levels to pick from.
Touchpad
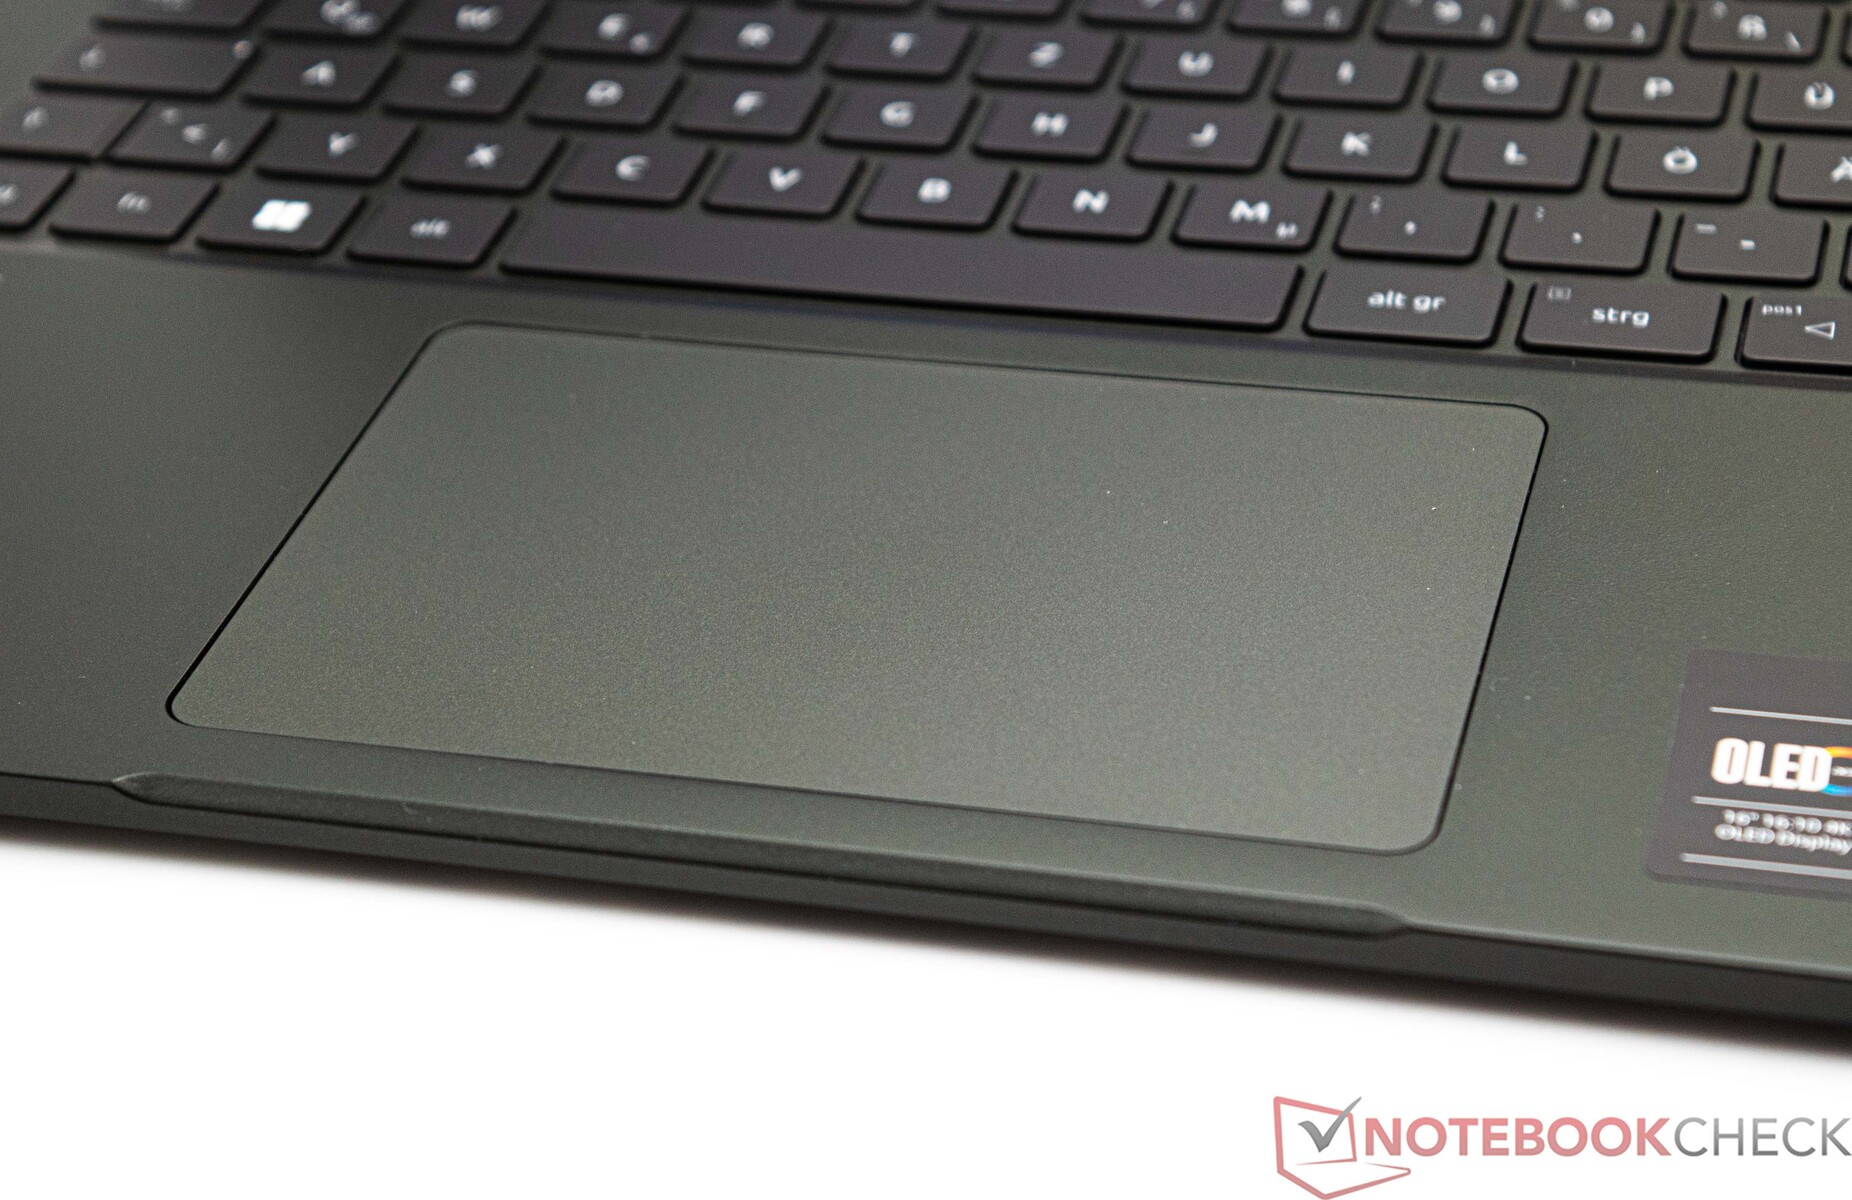
At 12.6 x 8.4 cm, the laptop's touchpad is decently sized. At the same time, the touchpad on the Samsung Galaxy Book3 is slightly bigger. Even so, we find the touchpad on this laptop to be sufficient as an alternative to a mouse - it reacts well to inputs and the surface feels nice and smooth. Its preciseness and gesture support function pose no need for critique. Both click areas give you clear audible feedback upon pressing. Although, its pressure point could have been a little firmer.
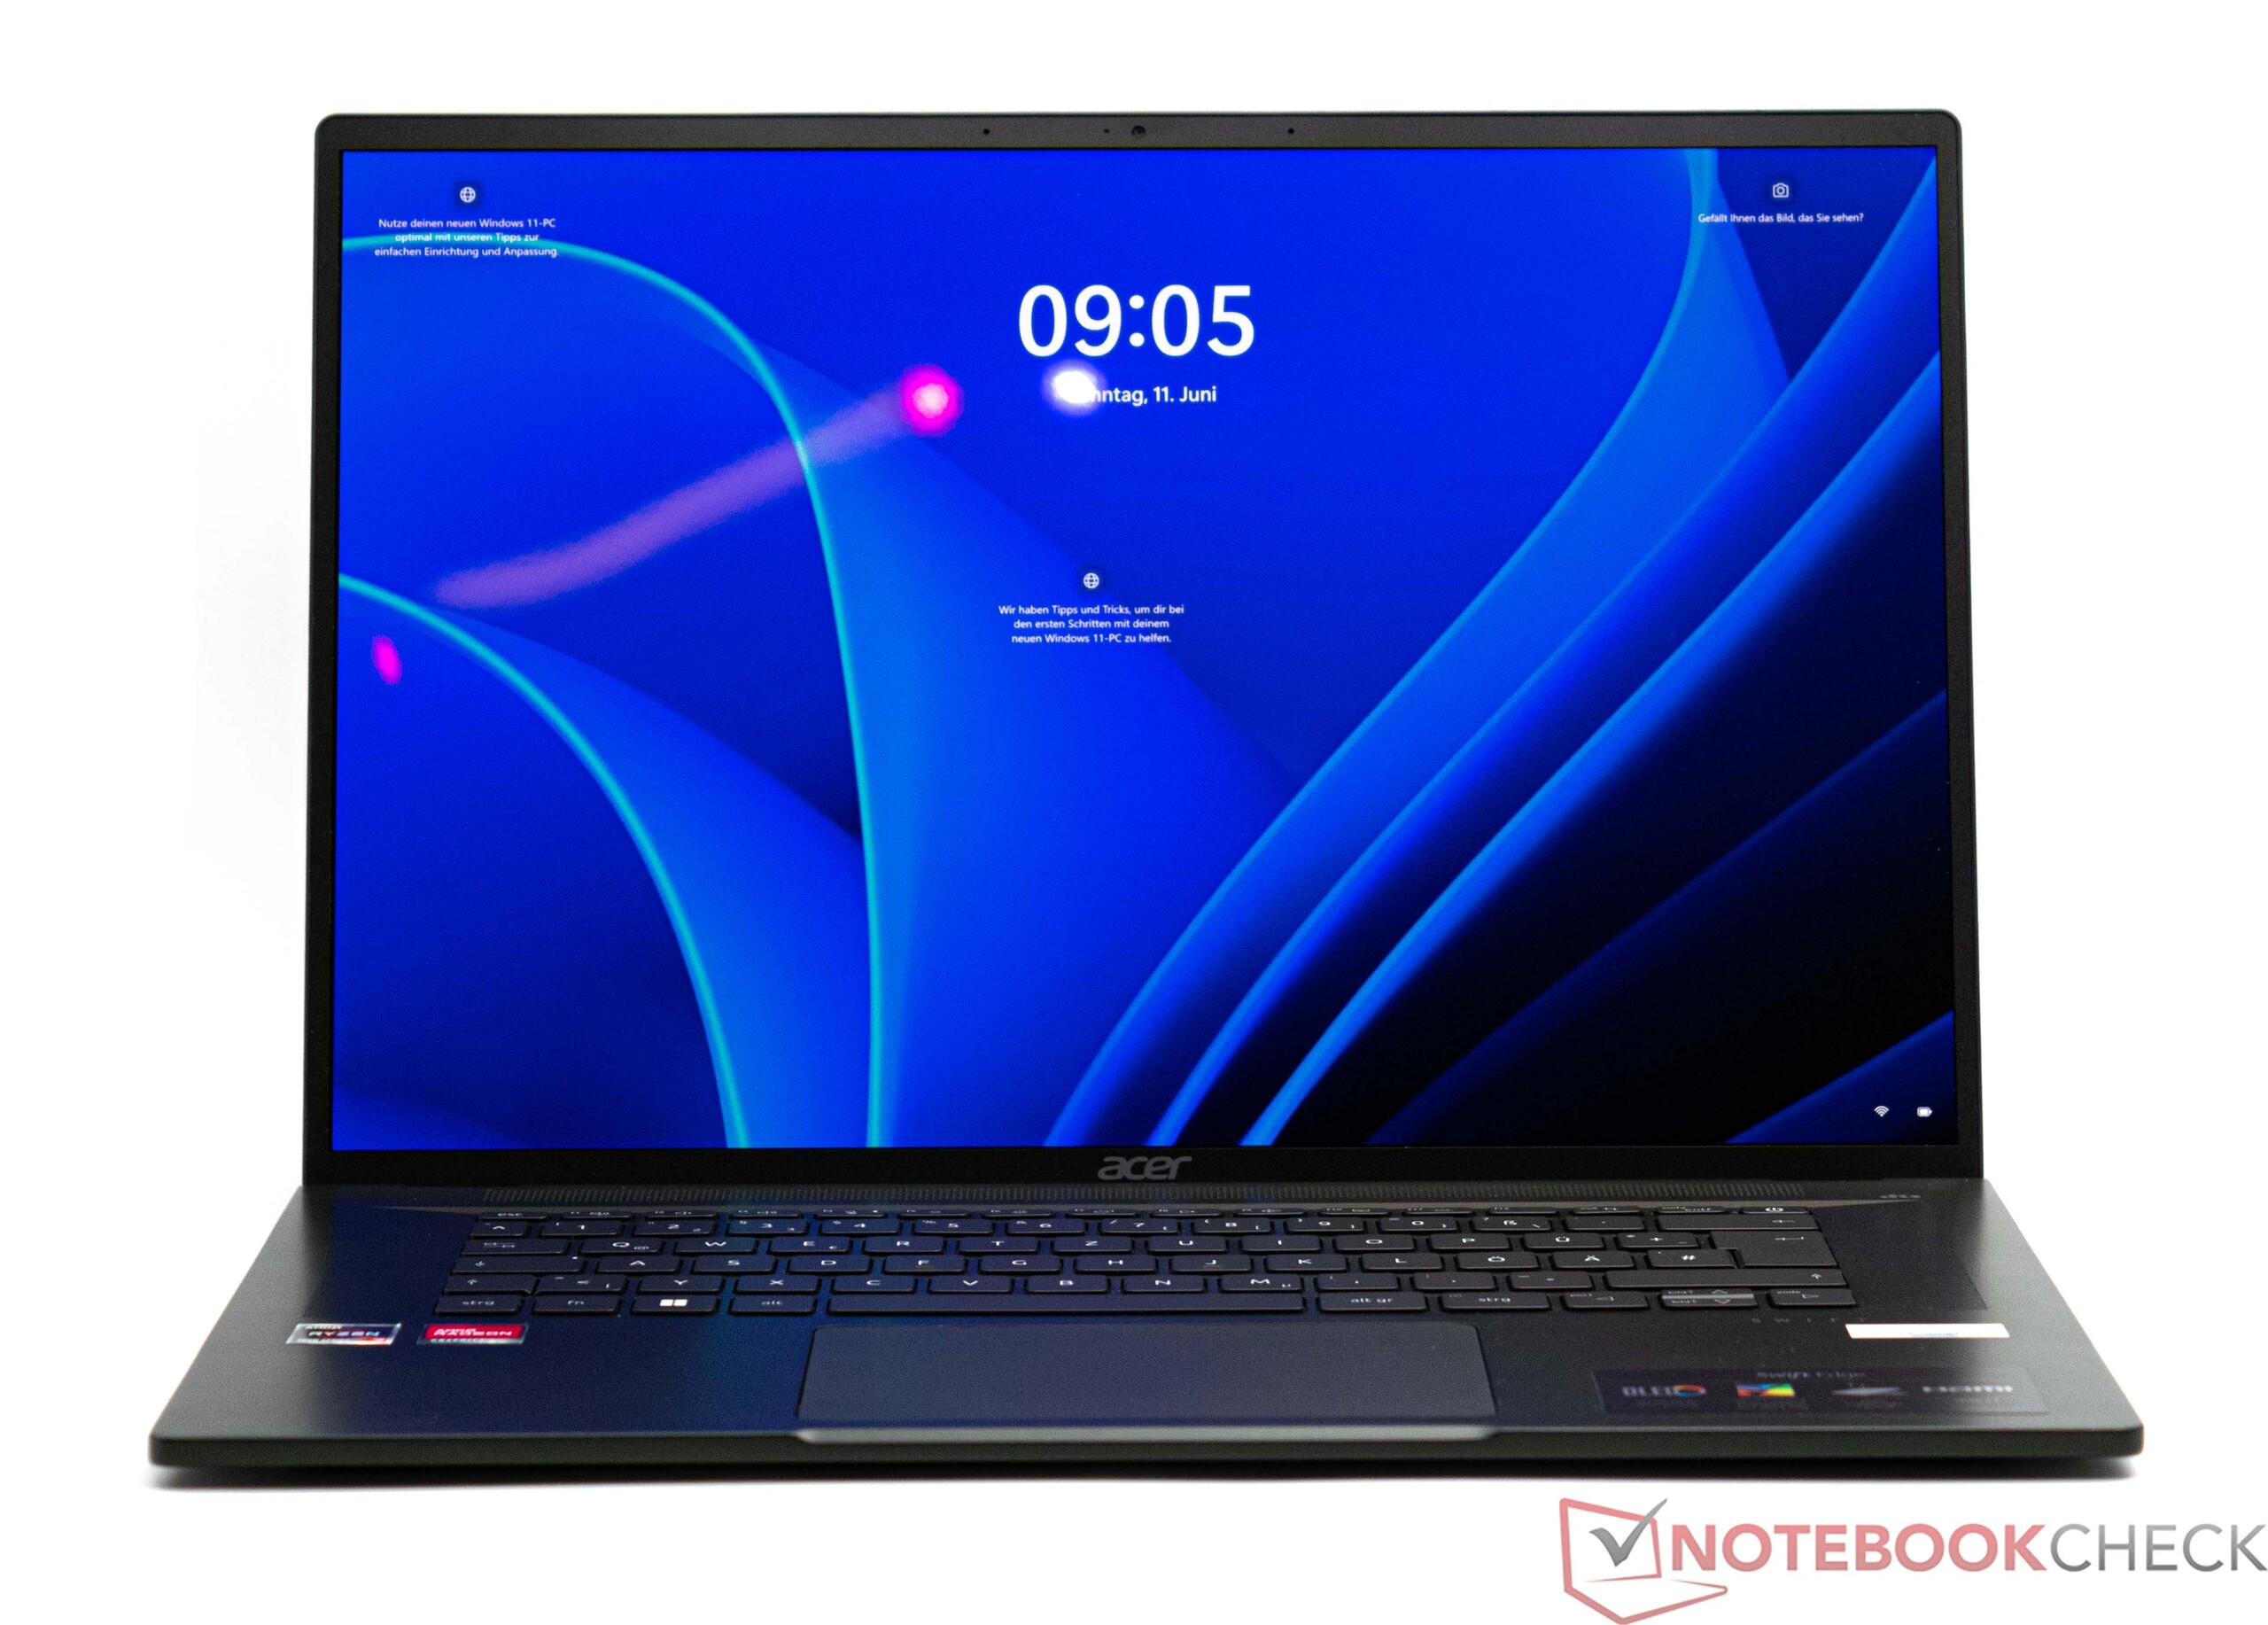
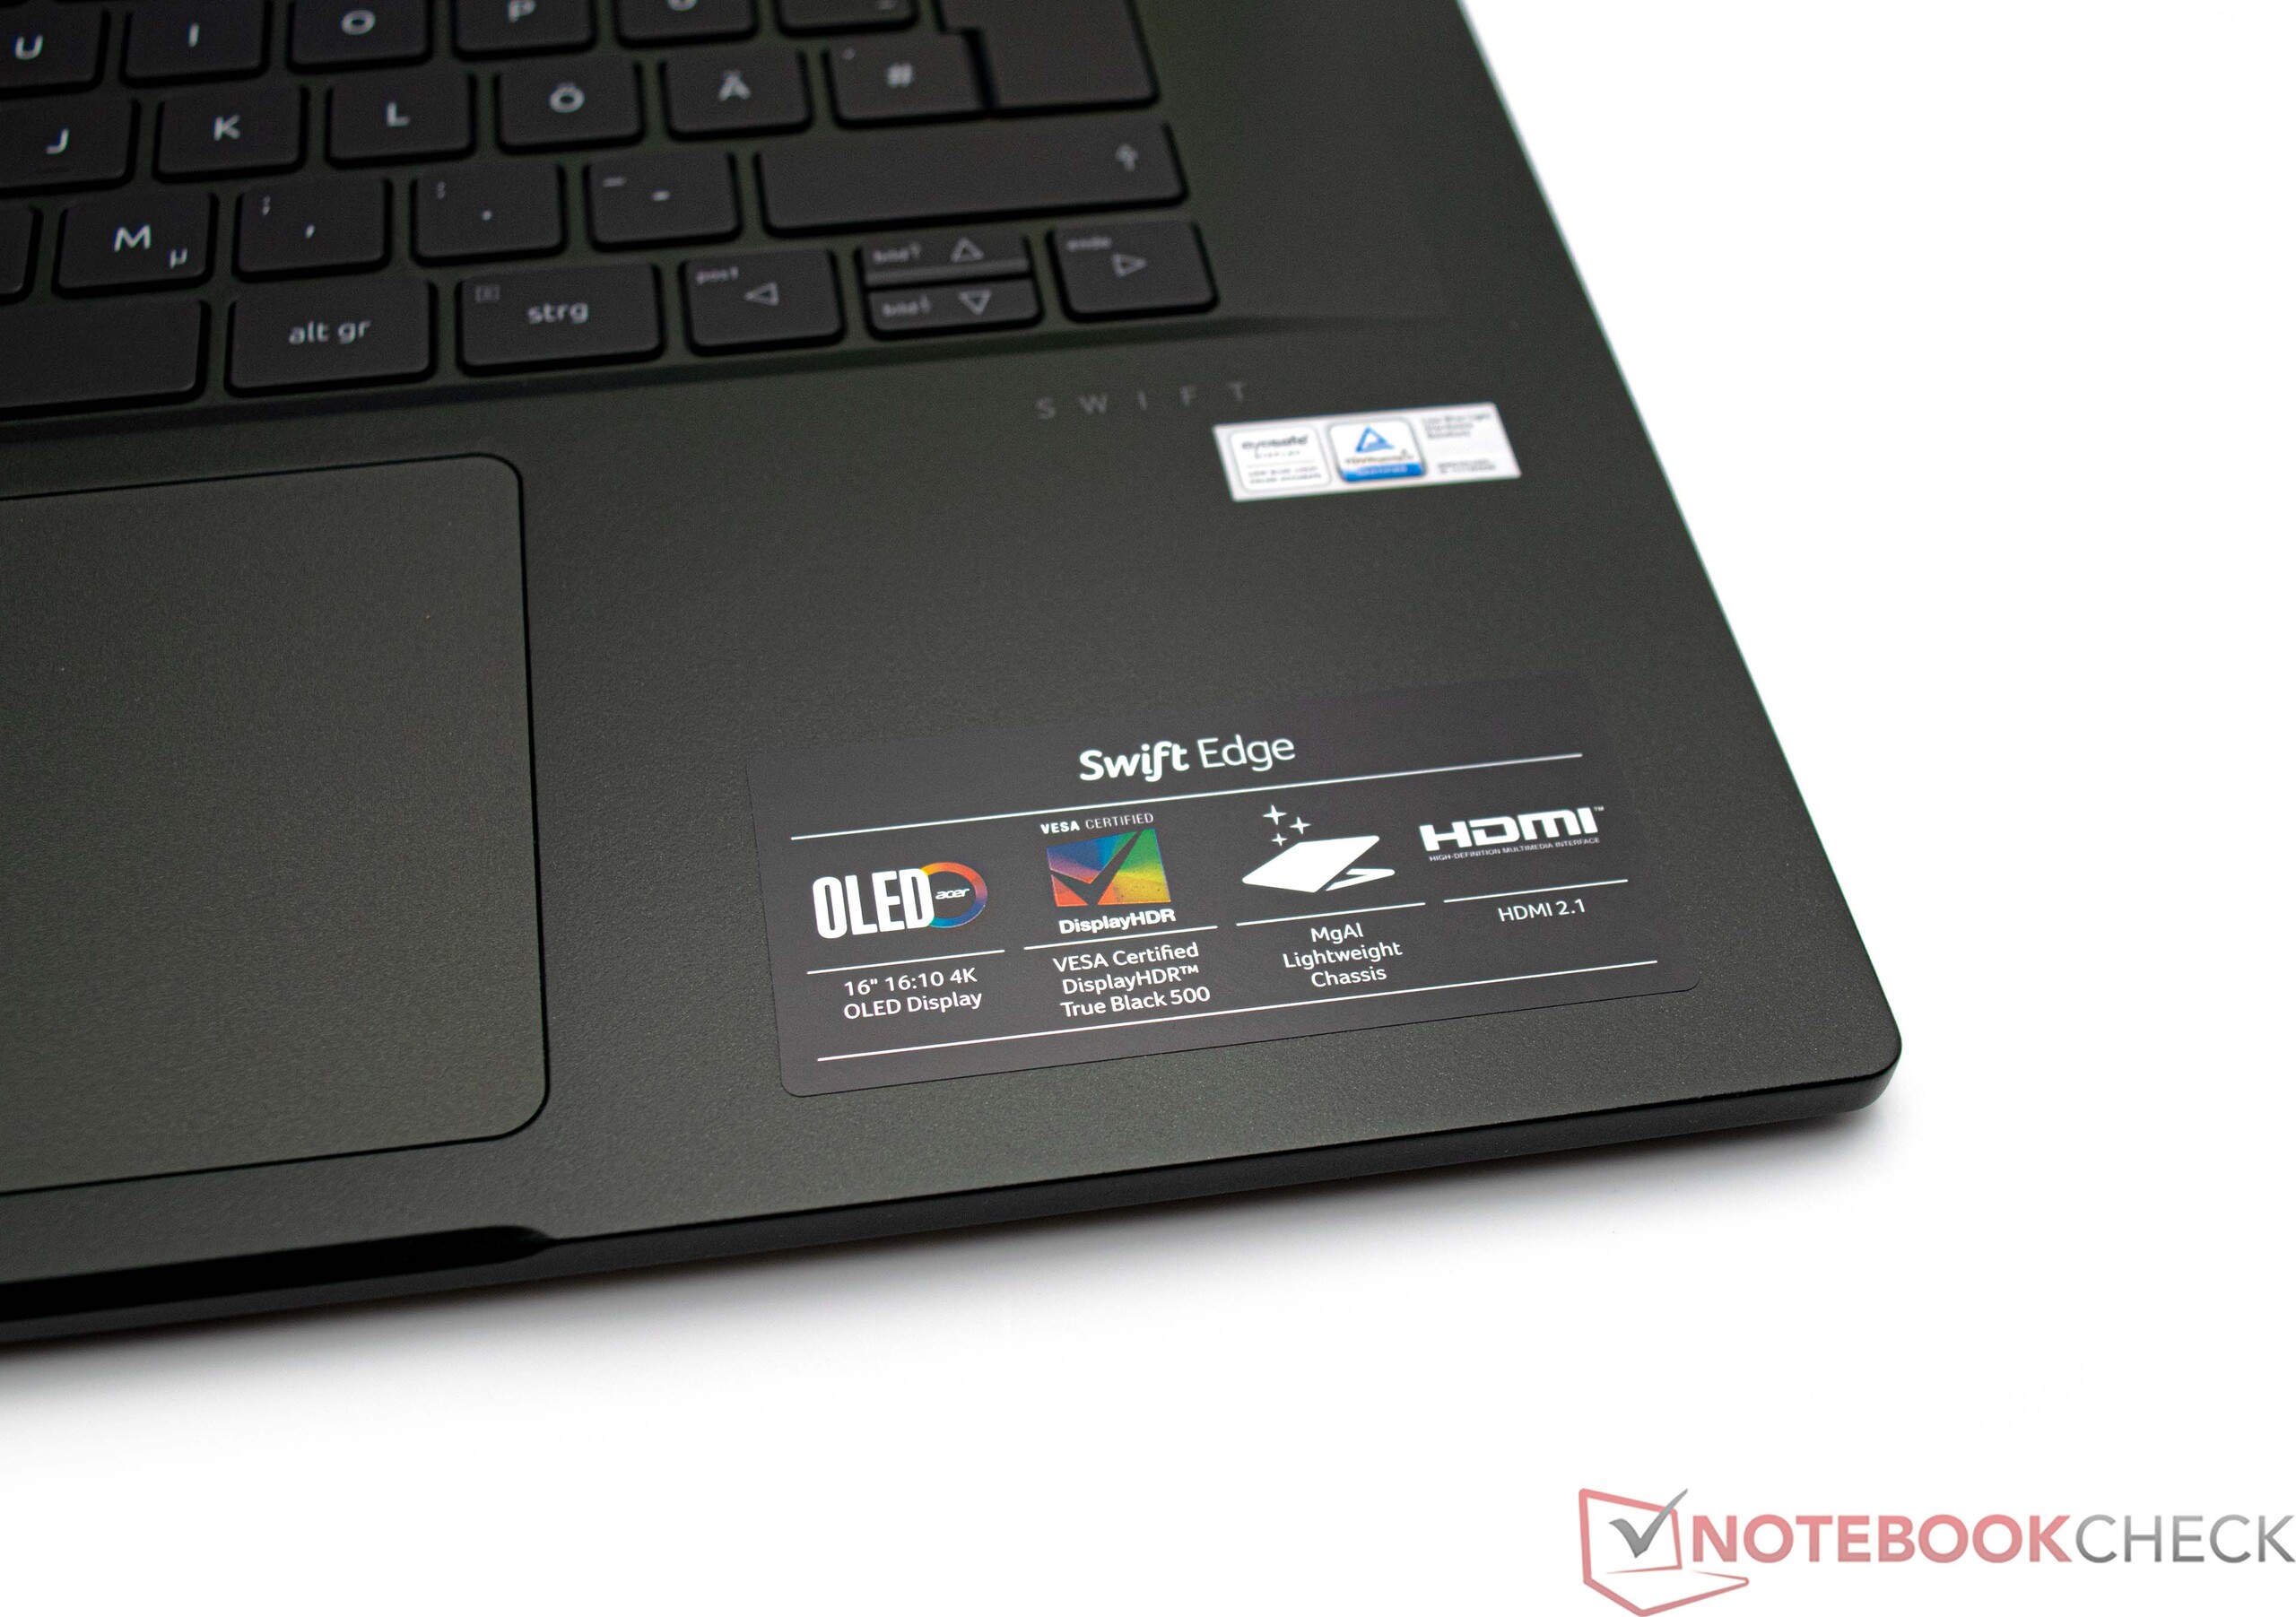
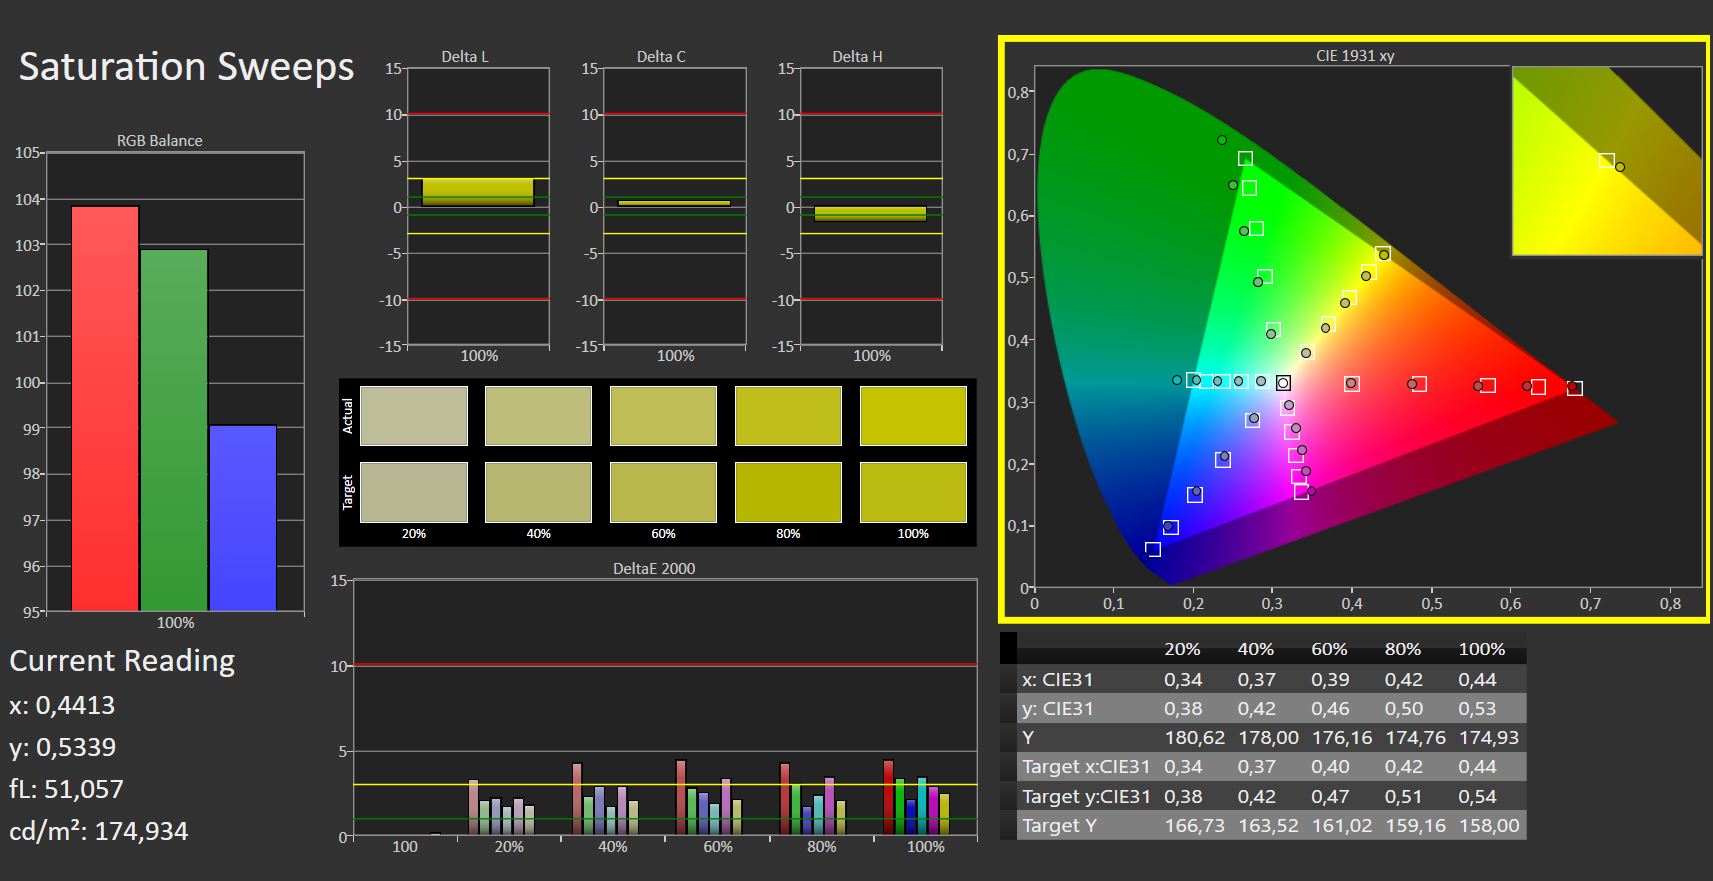
Display - OLED with accurate colors

The Acer Swift Edge SFE16 has a 16-inch OLED display with a resolution of 3,840 x 2,400 pixels. With a ratio of 16:10, working is fun on the device. Together with its high resolution, this gives the laptop a pixel density of 283 PPI.
In our test, we achieved great measurements which, at times, left its competitors in the dust. Even so, we would note its average brightness of 369 cd/m² as being its biggest critique point. Subjectively, this is a small issue on the highest of standards, as the display is definitely bright enough for everyday use. Furthermore, an even brighter display would mean putting further pressure on the device's already small battery. Its illumination levels were almost perfect (97 %) thanks to its OLED technology. As there is no backlighting, the Acer Swift Edge SFE16 has no issues with clouding. Although, we did measure a relatively low PWM frequency which began at a display brightness of 50 % and below.
| |||||||||||||||||||||||||
Brightness Distribution: 97 %
Center on Battery: 369 cd/m²
Contrast: ∞:1 (Black: 0 cd/m²)
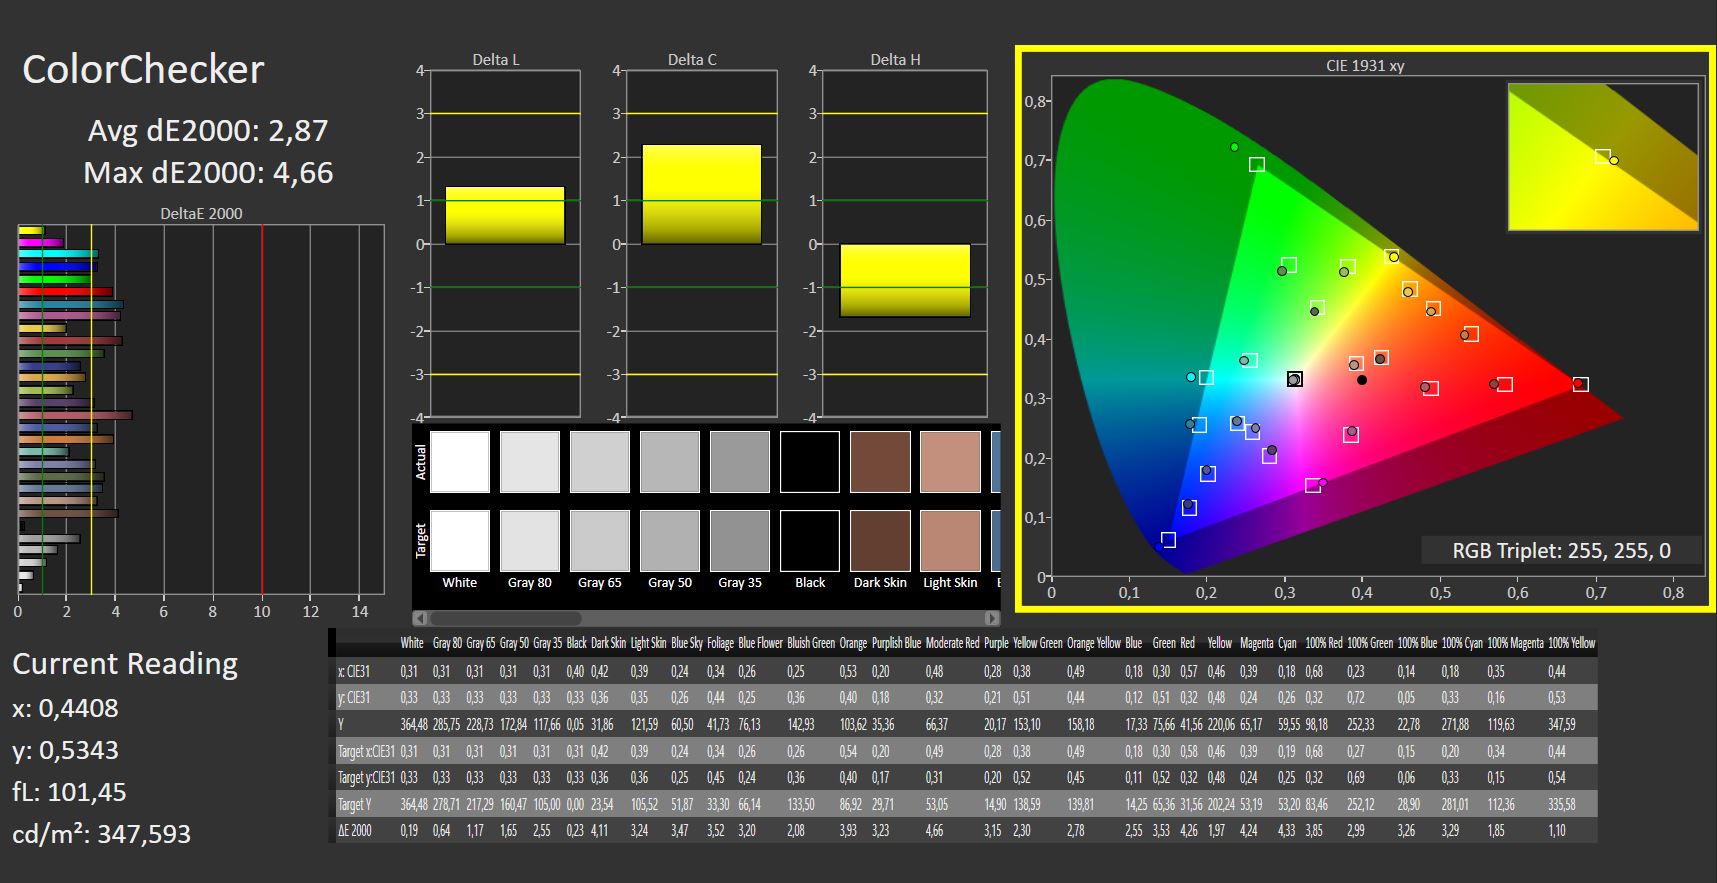
ΔE ColorChecker Calman: 2.3 | ∀{0.5-29.43 Ø4.71}
calibrated: 2.87
ΔE Greyscale Calman: 1.83 | ∀{0.09-98 Ø4.96}
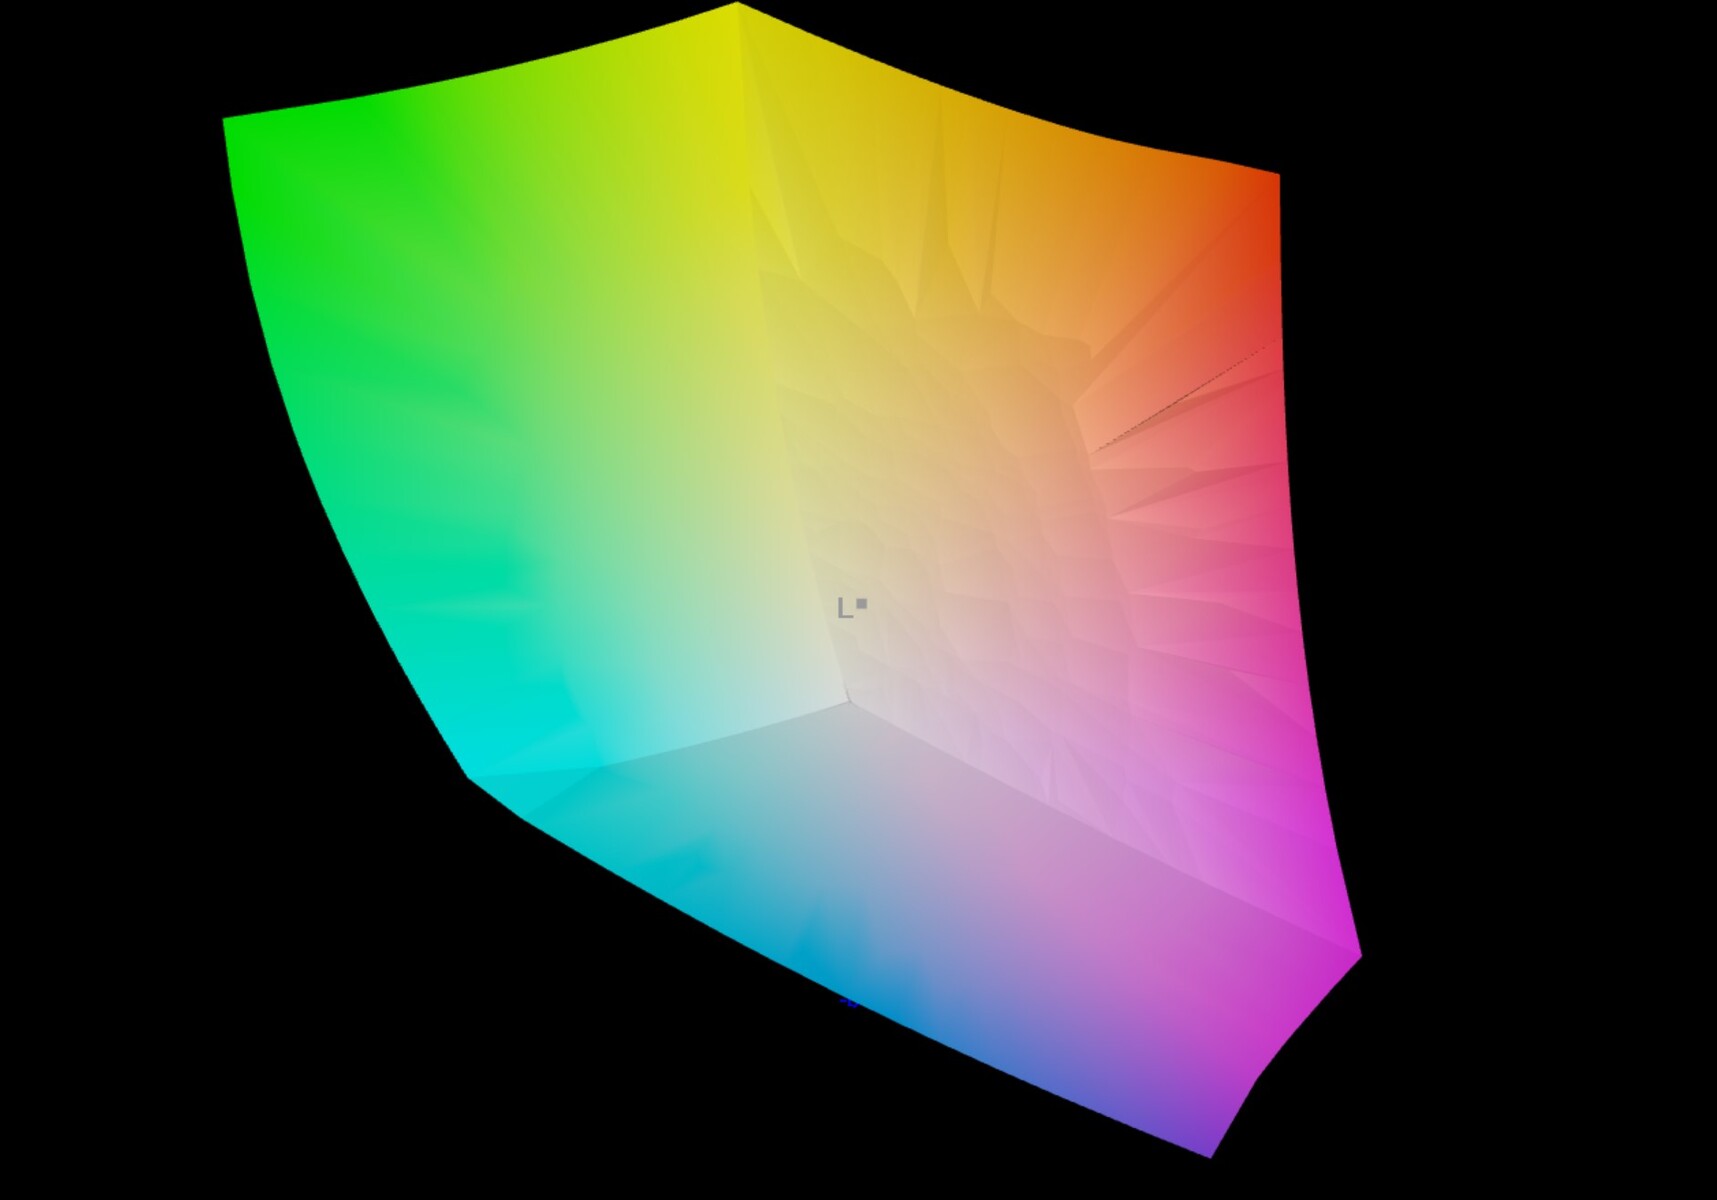
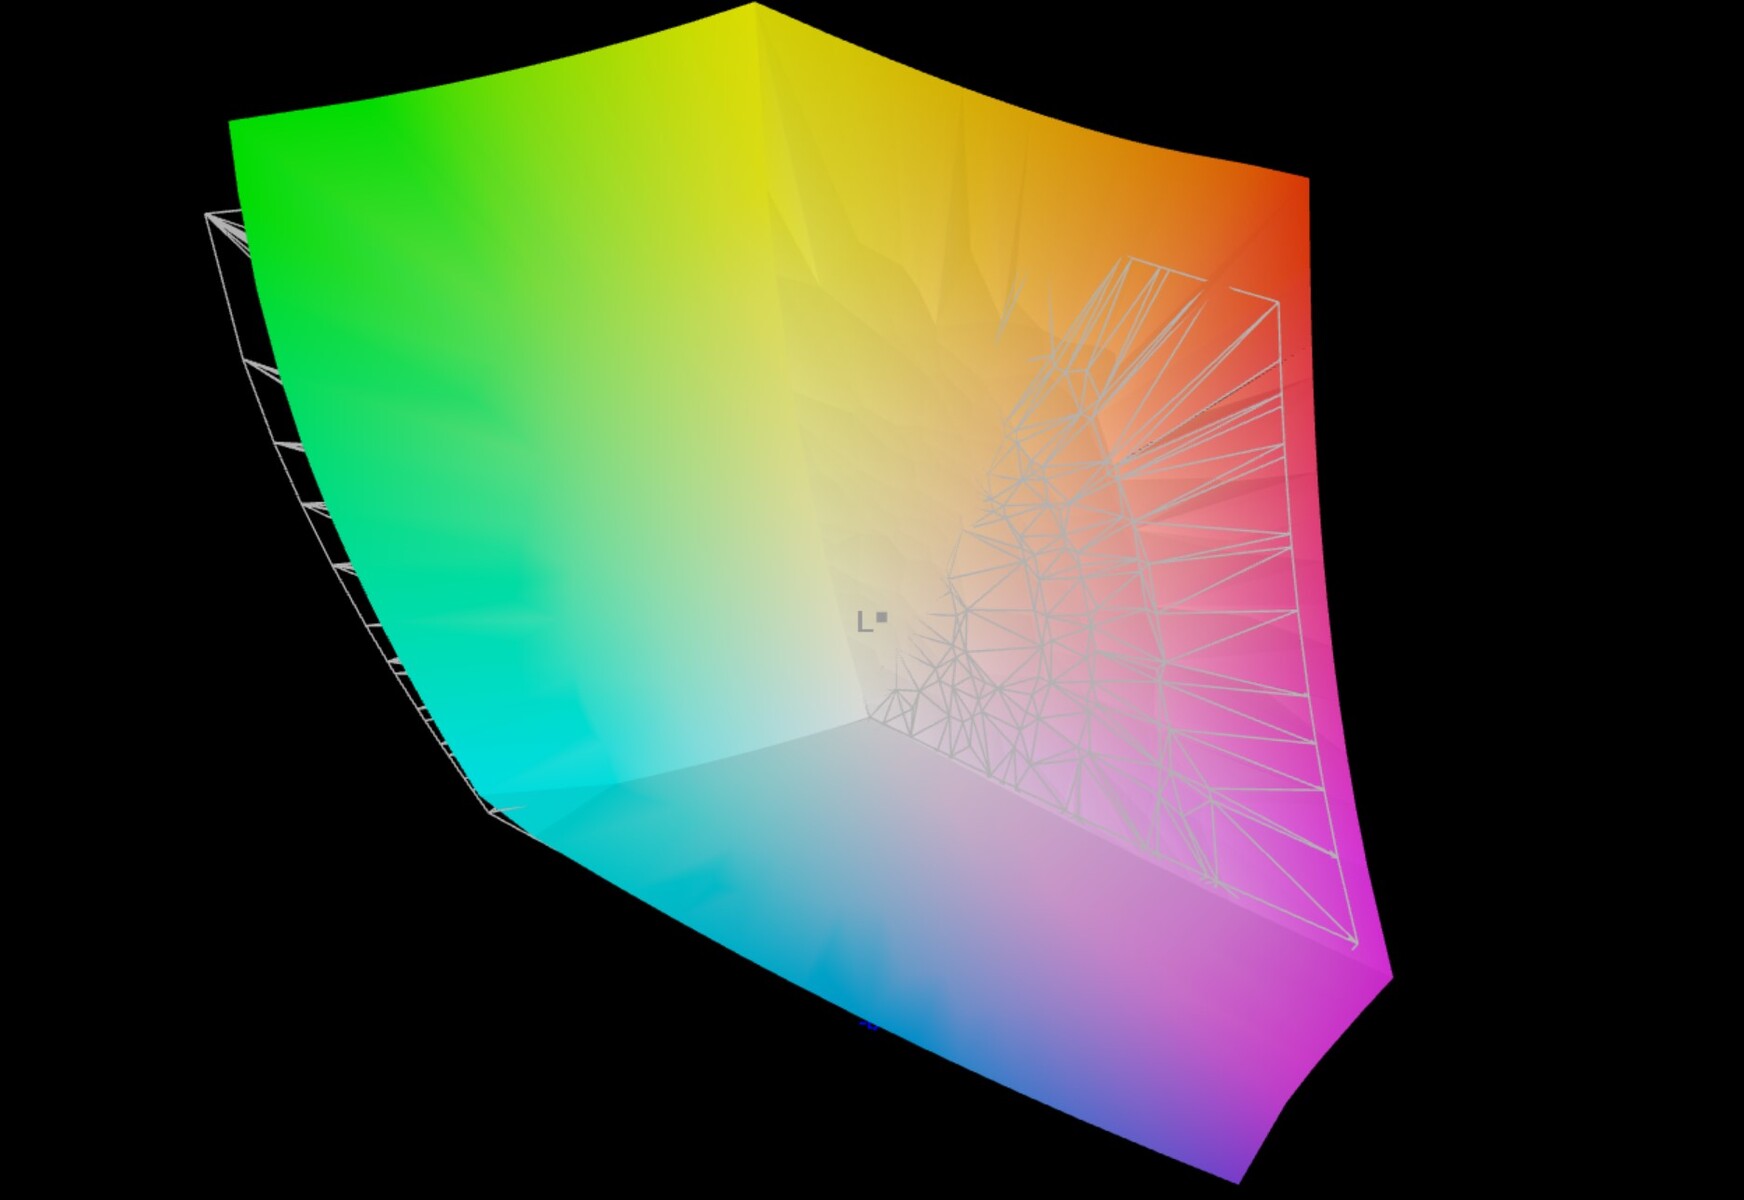
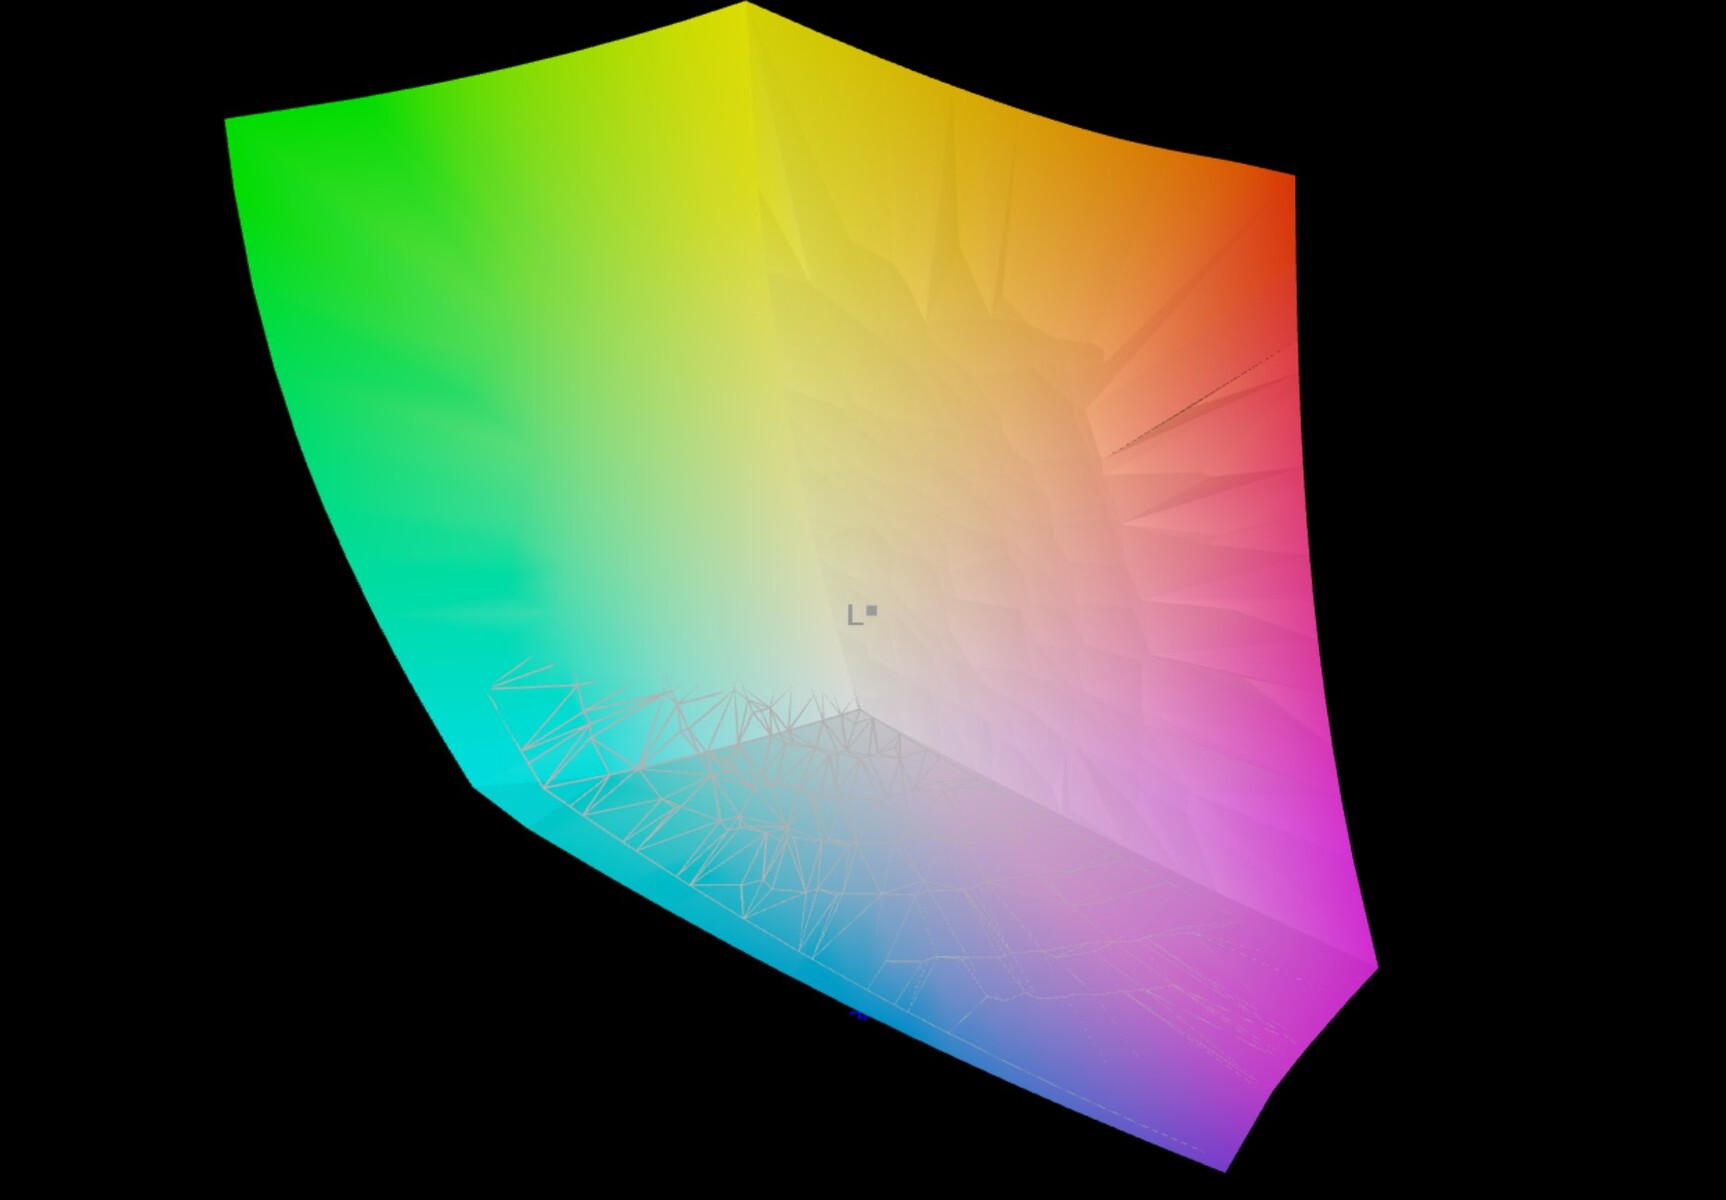
97.2% AdobeRGB 1998 (Argyll 3D)
100% sRGB (Argyll 3D)
99.7% Display P3 (Argyll 3D)
Gamma: 2.39
CCT: 6392 K
| Acer Swift Edge SFE16-42-R1GM Samsung SDC4168, OLED, 3840x2400, 16" | LG Gram 16Z90Q LG LP160WQ1-SPB2 (LGD06EB), IPS, 2560x1600, 16" | Samsung Galaxy Book3 Pro 16 Samsung ATNA60CL03-0, AMOLED, 2880x1800, 16" | Acer TravelMate P4 TMP416-51-55KN BOE BOE0A32, IPS, 1920x1200, 16" | LG Ultra-PC 16 16U70Q-G.AR36G LG Display LP160WU1-SPH1, IPS, 1280x1200, 16" | Lenovo ThinkPad T16 G1 21CH004MGE MNG007DA1-C, IPS-LED, 2560x1600, 16" | |
|---|---|---|---|---|---|---|
| Display | -5% | 0% | -54% | -57% | -22% | |
| Display P3 Coverage (%) | 99.7 | 96.8 -3% | 99.7 0% | 38.9 -61% | 36 -64% | 66.7 -33% |
| sRGB Coverage (%) | 100 | 99.9 0% | 100 0% | 58.1 -42% | 55 -45% | 95.7 -4% |
| AdobeRGB 1998 Coverage (%) | 97.2 | 84.6 -13% | 97 0% | 40.2 -59% | 37 -62% | 69.1 -29% |
| Response Times | -1371% | 17% | -550% | -1317% | -1018% | |
| Response Time Grey 50% / Grey 80% * (ms) | 2 ? | 45.7 ? -2185% | 2 ? -0% | 20 ? -900% | 38 ? -1800% | 32.1 ? -1505% |
| Response Time Black / White * (ms) | 3 ? | 19.7 ? -557% | 2 ? 33% | 9 ? -200% | 28 ? -833% | 18.9 ? -530% |
| PWM Frequency (Hz) | 239 ? | |||||
| Screen | -9% | -1% | -59% | -63% | 10% | |
| Brightness middle (cd/m²) | 369 | 366 -1% | 412 12% | 269 -27% | 299 -19% | 417 13% |
| Brightness (cd/m²) | 371 | 347 -6% | 412 11% | 265 -29% | 270 -27% | 388 5% |
| Brightness Distribution (%) | 97 | 89 -8% | 98 1% | 94 -3% | 85 -12% | 81 -16% |
| Black Level * (cd/m²) | 0.32 | 0.015 | 0.305 | 0.265 | 0.24 | |
| Colorchecker dE 2000 * | 2.3 | 2.82 -23% | 2.34 -2% | 4.89 -113% | 4.57 -99% | 1.7 26% |
| Colorchecker dE 2000 max. * | 4.37 | 4.65 -6% | 3.34 24% | 8.81 -102% | 8.92 -104% | 3.5 20% |
| Colorchecker dE 2000 calibrated * | 2.87 | 2.69 6% | 2.95 -3% | 5.12 -78% | 5.02 -75% | 1.4 51% |
| Greyscale dE 2000 * | 1.83 | 2.3 -26% | 2.78 -52% | 2.91 -59% | 3.8 -108% | 2.4 -31% |
| Gamma | 2.39 92% | 1.971 112% | 2.5 88% | 2.28 96% | 2.6 85% | 2.16 102% |
| CCT | 6392 102% | 6796 96% | 6879 94% | 6920 94% | 6142 106% | 6924 94% |
| Contrast (:1) | 1144 | 27467 | 882 | 1128 | 1738 | |
| Total Average (Program / Settings) | -462% /
-235% | 5% /
2% | -221% /
-139% | -479% /
-271% | -343% /
-169% |
* ... smaller is better
Its depiction quality is almost perfect - our DeltaE 2000 color measurements confirmed this. Ex works, we noted values below the target value of 3, which means that Acer deliver the Swift Edge SFE16 with a manufacturer-specific calibration. In terms of color accuracy, the laptop also achieved near-perfect rates and as a result, places itself on the same level as the AMOLED display on the Samsung Galaxy Book3. This means we could definitely see the Acer Swift Edge SFE16 being used in professional fields.


Display Response Times
| ↔ Response Time Black to White | ||
|---|---|---|
| 3 ms ... rise ↗ and fall ↘ combined | ↗ 2 ms rise |  |
| ↘ 1 ms fall | ||
| The screen shows very fast response rates in our tests and should be very well suited for fast-paced gaming. In comparison, all tested devices range from 0.1 (minimum) to 240 (maximum) ms. » 15 % of all devices are better. This means that the measured response time is better than the average of all tested devices (19.8 ms). | ||
| ↔ Response Time 50% Grey to 80% Grey | ||
| 2 ms ... rise ↗ and fall ↘ combined | ↗ 1 ms rise |  |
| ↘ 1 ms fall | ||
| The screen shows very fast response rates in our tests and should be very well suited for fast-paced gaming. In comparison, all tested devices range from 0.165 (minimum) to 636 (maximum) ms. » 10 % of all devices are better. This means that the measured response time is better than the average of all tested devices (30.9 ms). | ||
Screen Flickering / PWM (Pulse-Width Modulation)
| Screen flickering / PWM detected | 239 Hz | ≤ 50 % brightness setting |  |
The display backlight flickers at 239 Hz (worst case, e.g., utilizing PWM) Flickering detected at a brightness setting of 50 % and below. There should be no flickering or PWM above this brightness setting. The frequency of 239 Hz is relatively low, so sensitive users will likely notice flickering and experience eyestrain at the stated brightness setting and below. In comparison: 52 % of all tested devices do not use PWM to dim the display. If PWM was detected, an average of 7744 (minimum: 5 - maximum: 343500) Hz was measured. | |||


The laptop's shiny display leads to quite annoying reflections outside, which limits its uses considerably. The display brightness also doesn't help at all. This means your only solution if you have to use the laptop outside will be to find a very shaded spot to sit in.

The laptop's OLED panel is very viewing-angle stable, which you can see in the graphic below. We didn't note any haziness or changes in color.

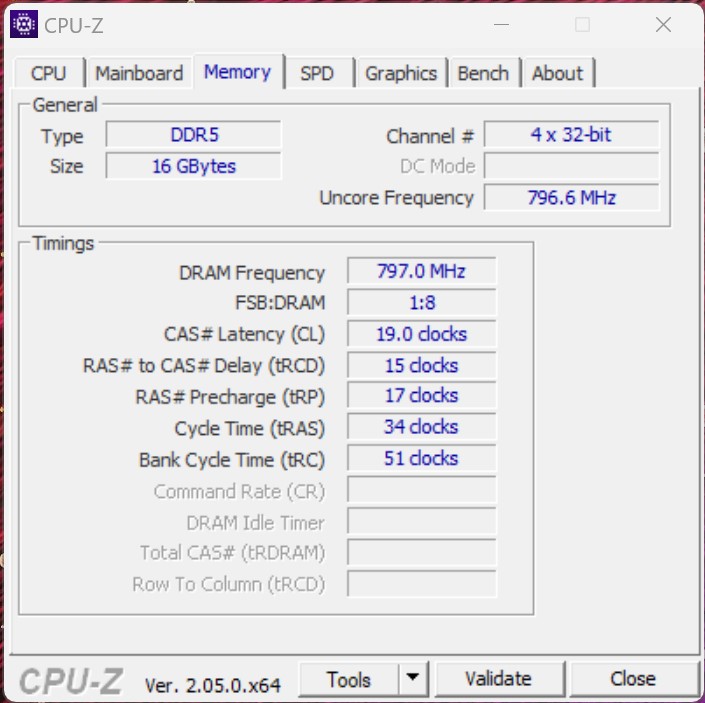
Performance - A frugal Ryzen 7 7735U
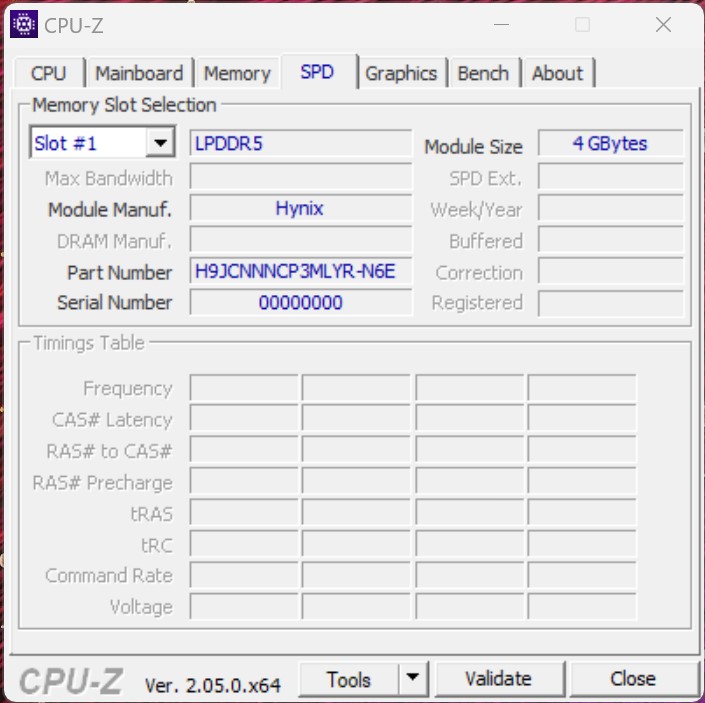
The Acer Swift Edge SFE16's AMD Ryzen 7 7735U is a modern SoC with a good iGPU and 16 GB RAM. Alternatively, the laptop can be purchased with the same base but with 32 GB RAM. You have to keep in mind that you cannot upgrade the RAM after purchasing. Its prices are $1,079 - $1,288, depending on the model.
Testing conditions
You can switch between three manufacturer-specific performance modes using the key combination "Fn" + "F", which change the fan speeds. We used "Performance Mode" (benchmarks) and "Silent mode" (battery test).
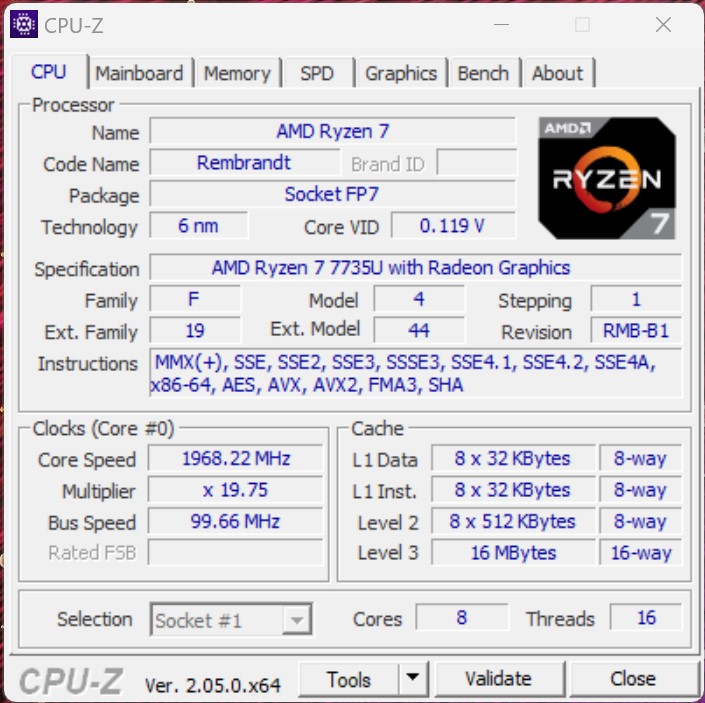
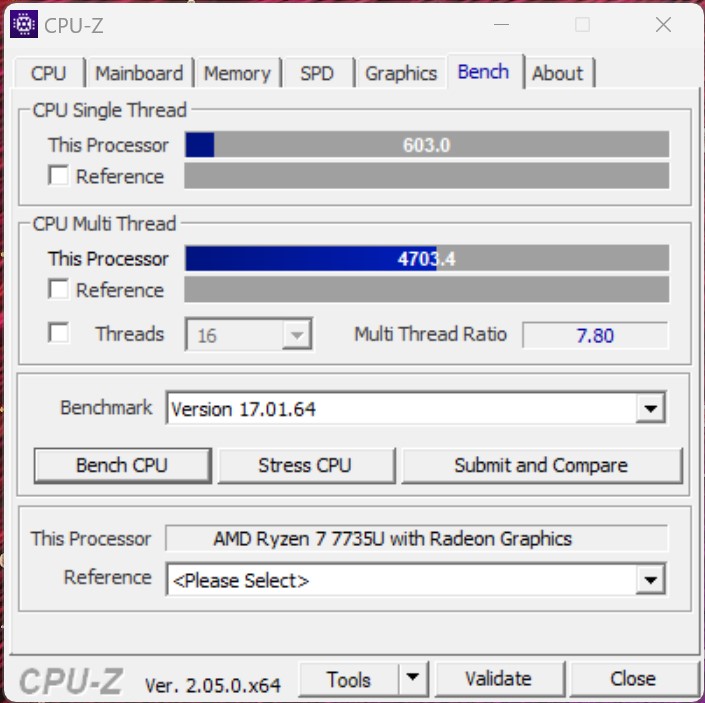
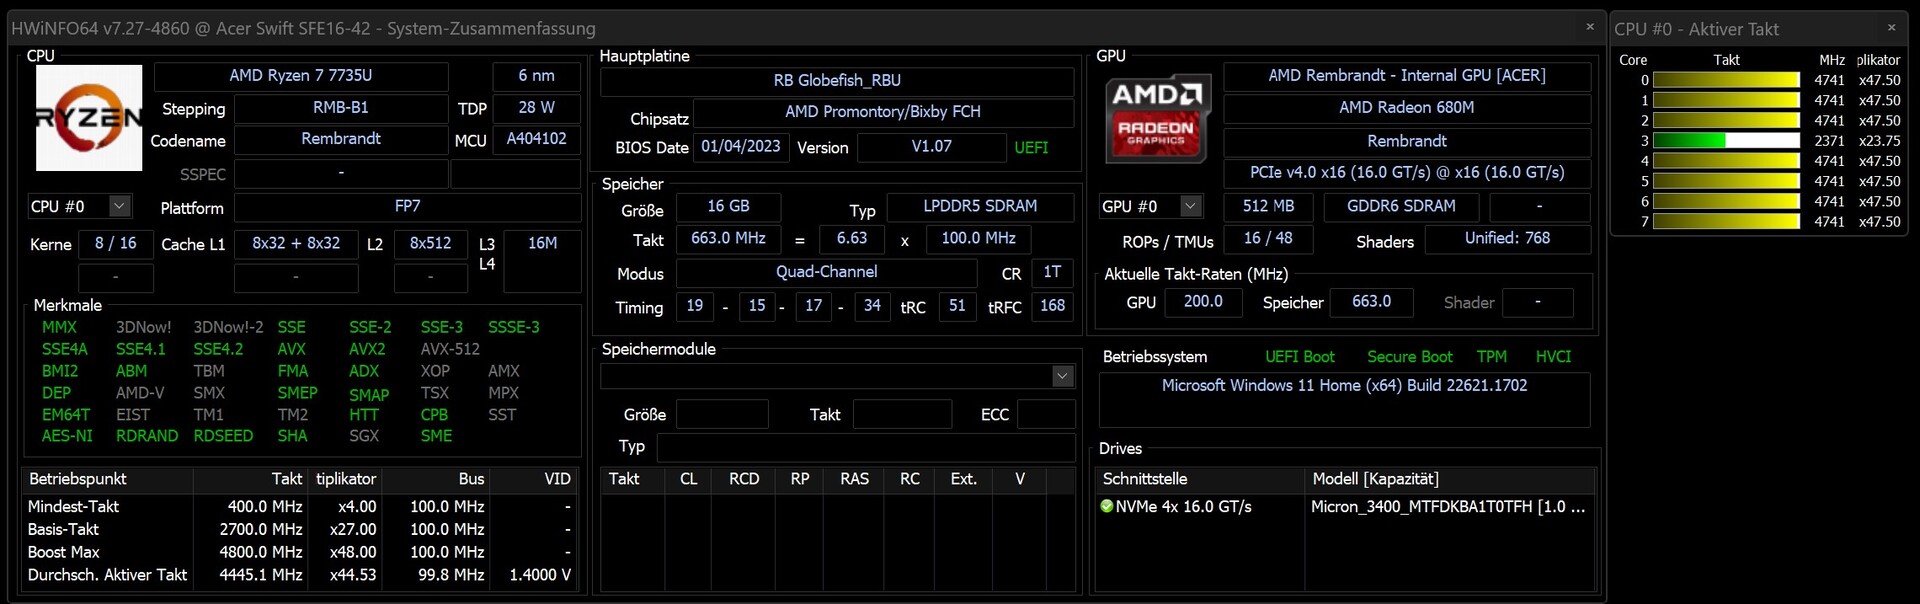
Processor
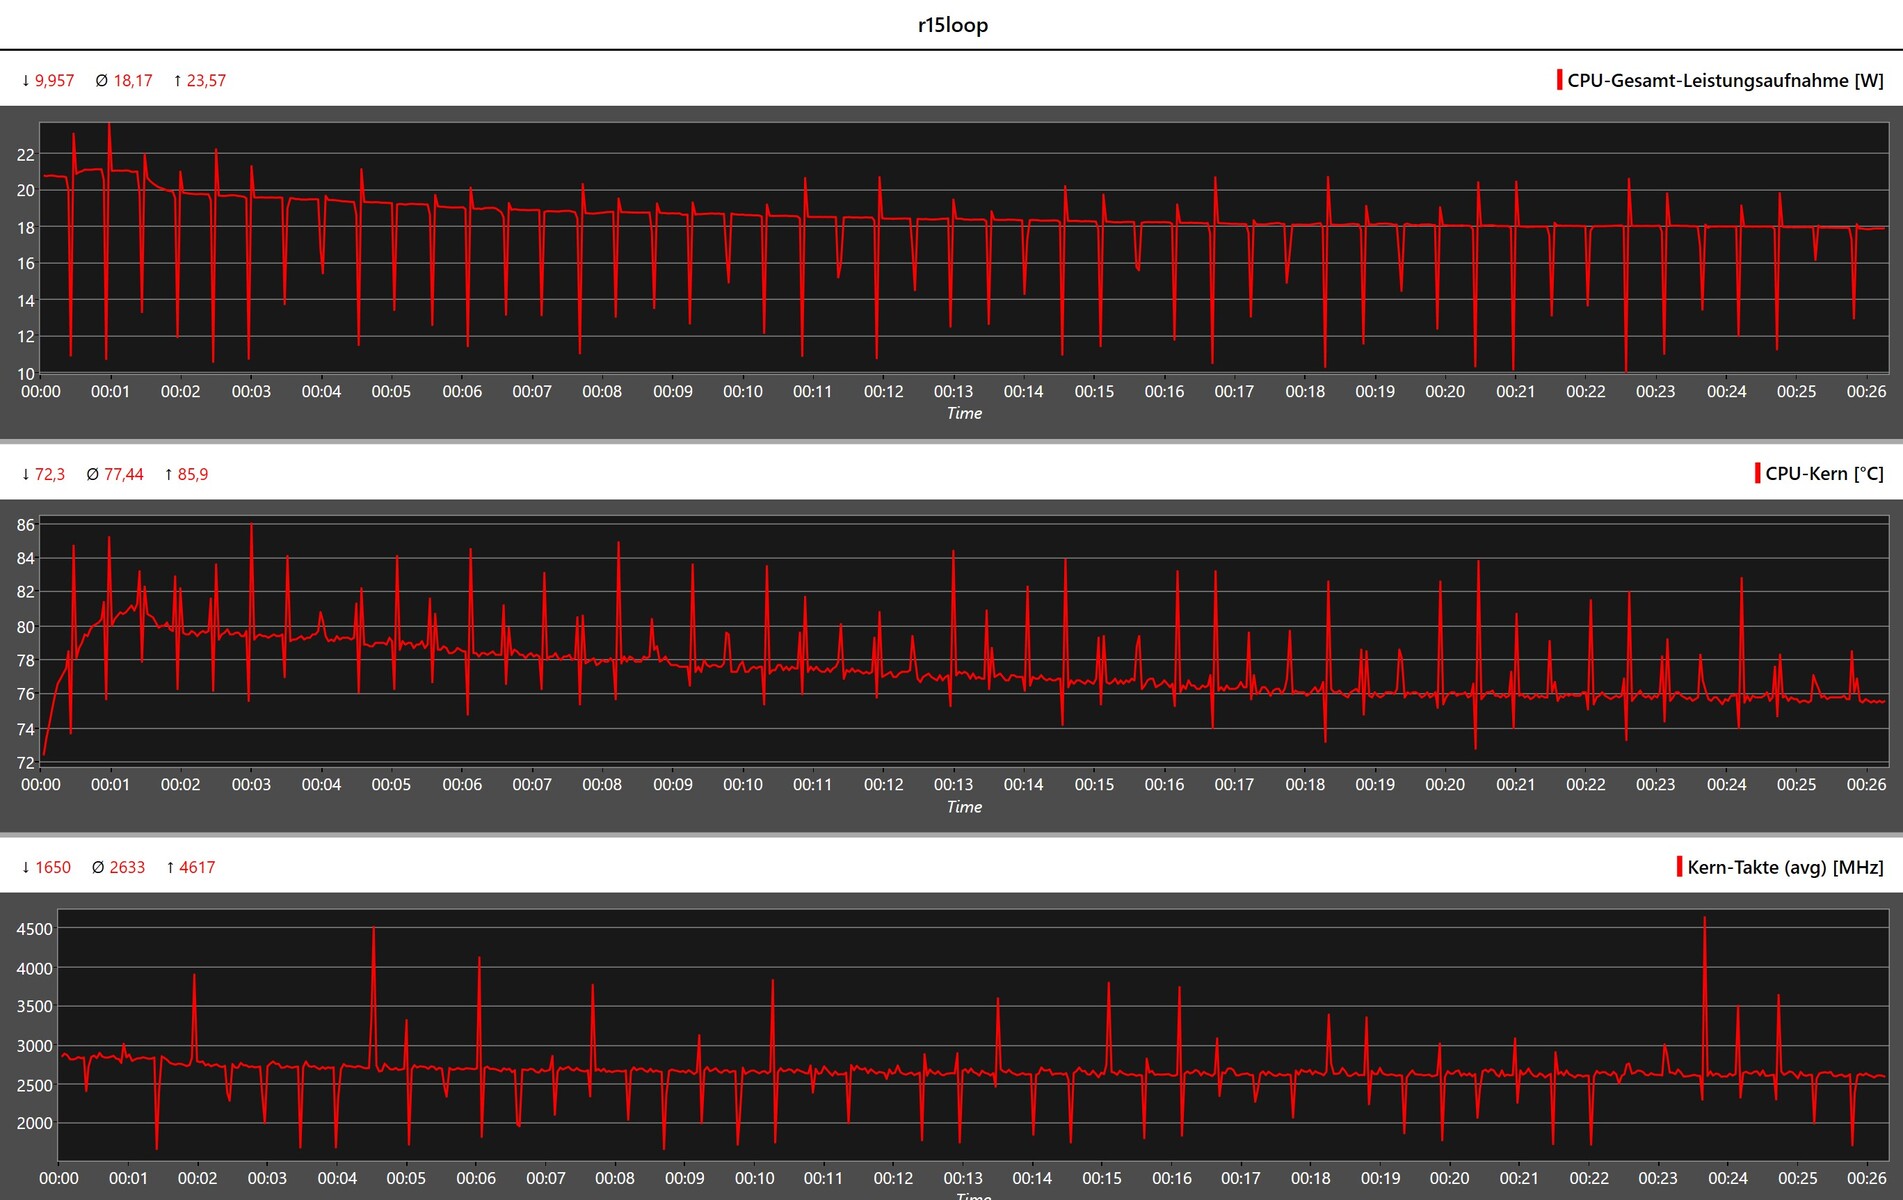
An AMD Ryzen 7 7735U is the powerhouse within the Acer Swift Edge SFE16. The SoC has 8 cores and can process a total of 16 threads at once. The Rembrandt SoC's power consumption is limited to 28 watts at most. In our test, however, we didn't achieve this value - as seen in the Cinebench R15 Multi loop results, the laptop's SoC only used a maximum of 23.5 watts. On average, the AMD Ryzen 7 7735U's power consumption plateaued at just over 18 watts.
In our CPU tests, we noted good results - better than the Lenovo ThinkPad T16 based on an AMD Ryzen 5 PRO 6650U. It has to be noted that this device features two fewer cores. Its single-core performance was about on the same level. The Intel Core i5-1240P and Intel Core i5-1340P delivered better performance, meaning the Samsung Galaxy Book3 and the Acer TravelMate P4 took first and second place, respectively.
For further comparisons and benchmarks, take a look at our CPU comparison table.
Cinebench R15 Multi continuous test
Cinebench R23: Multi Core | Single Core
Cinebench R20: CPU (Multi Core) | CPU (Single Core)
Cinebench R15: CPU Multi 64Bit | CPU Single 64Bit
Blender: v2.79 BMW27 CPU
7-Zip 18.03: 7z b 4 | 7z b 4 -mmt1
Geekbench 5.5: Multi-Core | Single-Core
HWBOT x265 Benchmark v2.2: 4k Preset
LibreOffice : 20 Documents To PDF
R Benchmark 2.5: Overall mean
| CPU Performance rating | |
| Samsung Galaxy Book3 Pro 16 | |
| Average of class Office | |
| Acer TravelMate P4 TMP416-51-55KN | |
| Acer Swift Edge SFE16-42-R1GM | |
| Average AMD Ryzen 7 7735U | |
| Lenovo ThinkPad T16 G1 21CH004MGE | |
| LG Gram 16Z90Q | |
| LG Ultra-PC 16 16U70Q-G.AR36G -2! | |
| Cinebench R23 / Multi Core | |
| Average of class Office (1673 - 22808, n=76, last 2 years) | |
| Samsung Galaxy Book3 Pro 16 | |
| Acer TravelMate P4 TMP416-51-55KN | |
| Acer Swift Edge SFE16-42-R1GM | |
| Average AMD Ryzen 7 7735U (n=1) | |
| Lenovo ThinkPad T16 G1 21CH004MGE | |
| LG Gram 16Z90Q | |
| LG Ultra-PC 16 16U70Q-G.AR36G | |
| Cinebench R23 / Single Core | |
| Samsung Galaxy Book3 Pro 16 | |
| Average of class Office (708 - 2130, n=76, last 2 years) | |
| Acer TravelMate P4 TMP416-51-55KN | |
| LG Gram 16Z90Q | |
| Acer Swift Edge SFE16-42-R1GM | |
| Average AMD Ryzen 7 7735U (n=1) | |
| Lenovo ThinkPad T16 G1 21CH004MGE | |
| LG Ultra-PC 16 16U70Q-G.AR36G | |
| Cinebench R20 / CPU (Multi Core) | |
| Average of class Office (648 - 8840, n=75, last 2 years) | |
| Samsung Galaxy Book3 Pro 16 | |
| Acer TravelMate P4 TMP416-51-55KN | |
| Acer Swift Edge SFE16-42-R1GM | |
| Average AMD Ryzen 7 7735U (n=1) | |
| Lenovo ThinkPad T16 G1 21CH004MGE | |
| LG Gram 16Z90Q | |
| LG Ultra-PC 16 16U70Q-G.AR36G | |
| Cinebench R20 / CPU (Single Core) | |
| Average of class Office (345 - 816, n=75, last 2 years) | |
| Samsung Galaxy Book3 Pro 16 | |
| Acer TravelMate P4 TMP416-51-55KN | |
| LG Gram 16Z90Q | |
| Lenovo ThinkPad T16 G1 21CH004MGE | |
| Acer Swift Edge SFE16-42-R1GM | |
| Average AMD Ryzen 7 7735U (n=1) | |
| LG Ultra-PC 16 16U70Q-G.AR36G | |
| Cinebench R15 / CPU Multi 64Bit | |
| Acer TravelMate P4 TMP416-51-55KN | |
| Average of class Office (250 - 3380, n=77, last 2 years) | |
| Samsung Galaxy Book3 Pro 16 | |
| Acer Swift Edge SFE16-42-R1GM | |
| Average AMD Ryzen 7 7735U (n=1) | |
| Lenovo ThinkPad T16 G1 21CH004MGE | |
| LG Gram 16Z90Q | |
| LG Ultra-PC 16 16U70Q-G.AR36G | |
| Cinebench R15 / CPU Single 64Bit | |
| Average of class Office (99.5 - 316, n=77, last 2 years) | |
| Samsung Galaxy Book3 Pro 16 | |
| Acer TravelMate P4 TMP416-51-55KN | |
| Acer Swift Edge SFE16-42-R1GM | |
| Average AMD Ryzen 7 7735U (n=1) | |
| Lenovo ThinkPad T16 G1 21CH004MGE | |
| LG Gram 16Z90Q | |
| LG Ultra-PC 16 16U70Q-G.AR36G | |
| Blender / v2.79 BMW27 CPU | |
| LG Ultra-PC 16 16U70Q-G.AR36G | |
| LG Gram 16Z90Q | |
| Average of class Office (158 - 1940, n=76, last 2 years) | |
| Lenovo ThinkPad T16 G1 21CH004MGE | |
| Acer TravelMate P4 TMP416-51-55KN | |
| Acer Swift Edge SFE16-42-R1GM | |
| Average AMD Ryzen 7 7735U (n=1) | |
| Samsung Galaxy Book3 Pro 16 | |
| 7-Zip 18.03 / 7z b 4 | |
| Acer Swift Edge SFE16-42-R1GM | |
| Average AMD Ryzen 7 7735U (n=1) | |
| Samsung Galaxy Book3 Pro 16 | |
| Average of class Office (7098 - 76886, n=77, last 2 years) | |
| Acer TravelMate P4 TMP416-51-55KN | |
| Lenovo ThinkPad T16 G1 21CH004MGE | |
| LG Gram 16Z90Q | |
| LG Ultra-PC 16 16U70Q-G.AR36G | |
| 7-Zip 18.03 / 7z b 4 -mmt1 | |
| Acer Swift Edge SFE16-42-R1GM | |
| Average AMD Ryzen 7 7735U (n=1) | |
| Average of class Office (3387 - 6469, n=77, last 2 years) | |
| Acer TravelMate P4 TMP416-51-55KN | |
| Samsung Galaxy Book3 Pro 16 | |
| Lenovo ThinkPad T16 G1 21CH004MGE | |
| LG Gram 16Z90Q | |
| LG Ultra-PC 16 16U70Q-G.AR36G | |
| Geekbench 5.5 / Multi-Core | |
| Samsung Galaxy Book3 Pro 16 | |
| Average of class Office (1483 - 16999, n=73, last 2 years) | |
| Acer TravelMate P4 TMP416-51-55KN | |
| LG Gram 16Z90Q | |
| Acer Swift Edge SFE16-42-R1GM | |
| Average AMD Ryzen 7 7735U (n=1) | |
| Lenovo ThinkPad T16 G1 21CH004MGE | |
| Geekbench 5.5 / Single-Core | |
| Average of class Office (811 - 2175, n=73, last 2 years) | |
| Samsung Galaxy Book3 Pro 16 | |
| LG Gram 16Z90Q | |
| Acer TravelMate P4 TMP416-51-55KN | |
| Acer Swift Edge SFE16-42-R1GM | |
| Average AMD Ryzen 7 7735U (n=1) | |
| Lenovo ThinkPad T16 G1 21CH004MGE | |
| HWBOT x265 Benchmark v2.2 / 4k Preset | |
| Average of class Office (2.21 - 26, n=76, last 2 years) | |
| Samsung Galaxy Book3 Pro 16 | |
| Acer Swift Edge SFE16-42-R1GM | |
| Average AMD Ryzen 7 7735U (n=1) | |
| Acer TravelMate P4 TMP416-51-55KN | |
| Lenovo ThinkPad T16 G1 21CH004MGE | |
| LG Gram 16Z90Q | |
| LG Ultra-PC 16 16U70Q-G.AR36G | |
| LibreOffice / 20 Documents To PDF | |
| LG Ultra-PC 16 16U70Q-G.AR36G | |
| Acer Swift Edge SFE16-42-R1GM | |
| Average AMD Ryzen 7 7735U (n=1) | |
| Average of class Office (39.9 - 102.3, n=76, last 2 years) | |
| LG Gram 16Z90Q | |
| Acer TravelMate P4 TMP416-51-55KN | |
| Lenovo ThinkPad T16 G1 21CH004MGE | |
| Samsung Galaxy Book3 Pro 16 | |
| R Benchmark 2.5 / Overall mean | |
| LG Ultra-PC 16 16U70Q-G.AR36G | |
| LG Gram 16Z90Q | |
| Lenovo ThinkPad T16 G1 21CH004MGE | |
| Average of class Office (0.393 - 0.888, n=76, last 2 years) | |
| Acer TravelMate P4 TMP416-51-55KN | |
| Acer Swift Edge SFE16-42-R1GM | |
| Average AMD Ryzen 7 7735U (n=1) | |
| Samsung Galaxy Book3 Pro 16 | |
* ... smaller is better
AIDA64: FP32 Ray-Trace | FPU Julia | CPU SHA3 | CPU Queen | FPU SinJulia | FPU Mandel | CPU AES | CPU ZLib | FP64 Ray-Trace | CPU PhotoWorxx
| Performance rating | |
| Average of class Office | |
| Acer Swift Edge SFE16-42-R1GM | |
| Average AMD Ryzen 7 7735U | |
| Lenovo ThinkPad T16 G1 21CH004MGE | |
| Samsung Galaxy Book3 Pro 16 | |
| Acer TravelMate P4 TMP416-51-55KN | |
| LG Gram 16Z90Q | |
| LG Ultra-PC 16 16U70Q-G.AR36G -1! | |
| AIDA64 / FP32 Ray-Trace | |
| Average of class Office (2083 - 31245, n=83, last 2 years) | |
| Acer Swift Edge SFE16-42-R1GM | |
| Average AMD Ryzen 7 7735U (n=1) | |
| Lenovo ThinkPad T16 G1 21CH004MGE | |
| Acer TravelMate P4 TMP416-51-55KN | |
| Samsung Galaxy Book3 Pro 16 | |
| LG Gram 16Z90Q | |
| LG Ultra-PC 16 16U70Q-G.AR36G | |
| AIDA64 / FPU Julia | |
| Acer Swift Edge SFE16-42-R1GM | |
| Average AMD Ryzen 7 7735U (n=1) | |
| Lenovo ThinkPad T16 G1 21CH004MGE | |
| Average of class Office (8191 - 125394, n=83, last 2 years) | |
| Samsung Galaxy Book3 Pro 16 | |
| Acer TravelMate P4 TMP416-51-55KN | |
| LG Ultra-PC 16 16U70Q-G.AR36G | |
| LG Gram 16Z90Q | |
| AIDA64 / CPU SHA3 | |
| Average of class Office (433 - 5755, n=83, last 2 years) | |
| Samsung Galaxy Book3 Pro 16 | |
| Acer Swift Edge SFE16-42-R1GM | |
| Average AMD Ryzen 7 7735U (n=1) | |
| Acer TravelMate P4 TMP416-51-55KN | |
| Lenovo ThinkPad T16 G1 21CH004MGE | |
| LG Gram 16Z90Q | |
| AIDA64 / CPU Queen | |
| Acer Swift Edge SFE16-42-R1GM | |
| Average AMD Ryzen 7 7735U (n=1) | |
| Samsung Galaxy Book3 Pro 16 | |
| Lenovo ThinkPad T16 G1 21CH004MGE | |
| Acer TravelMate P4 TMP416-51-55KN | |
| LG Gram 16Z90Q | |
| Average of class Office (22784 - 115197, n=67, last 2 years) | |
| LG Ultra-PC 16 16U70Q-G.AR36G | |
| AIDA64 / FPU SinJulia | |
| Acer Swift Edge SFE16-42-R1GM | |
| Average AMD Ryzen 7 7735U (n=1) | |
| Lenovo ThinkPad T16 G1 21CH004MGE | |
| Average of class Office (1378 - 18321, n=83, last 2 years) | |
| LG Ultra-PC 16 16U70Q-G.AR36G | |
| Samsung Galaxy Book3 Pro 16 | |
| Acer TravelMate P4 TMP416-51-55KN | |
| LG Gram 16Z90Q | |
| AIDA64 / FPU Mandel | |
| Acer Swift Edge SFE16-42-R1GM | |
| Average AMD Ryzen 7 7735U (n=1) | |
| Lenovo ThinkPad T16 G1 21CH004MGE | |
| Average of class Office (4601 - 66922, n=83, last 2 years) | |
| Samsung Galaxy Book3 Pro 16 | |
| Acer TravelMate P4 TMP416-51-55KN | |
| LG Ultra-PC 16 16U70Q-G.AR36G | |
| LG Gram 16Z90Q | |
| AIDA64 / CPU AES | |
| Lenovo ThinkPad T16 G1 21CH004MGE | |
| Samsung Galaxy Book3 Pro 16 | |
| Average of class Office (4854 - 155900, n=83, last 2 years) | |
| Acer TravelMate P4 TMP416-51-55KN | |
| Acer Swift Edge SFE16-42-R1GM | |
| Average AMD Ryzen 7 7735U (n=1) | |
| LG Gram 16Z90Q | |
| LG Ultra-PC 16 16U70Q-G.AR36G | |
| AIDA64 / CPU ZLib | |
| Samsung Galaxy Book3 Pro 16 | |
| Average of class Office (114.6 - 1366, n=83, last 2 years) | |
| Acer TravelMate P4 TMP416-51-55KN | |
| Acer Swift Edge SFE16-42-R1GM | |
| Average AMD Ryzen 7 7735U (n=1) | |
| Lenovo ThinkPad T16 G1 21CH004MGE | |
| LG Gram 16Z90Q | |
| LG Ultra-PC 16 16U70Q-G.AR36G | |
| AIDA64 / FP64 Ray-Trace | |
| Average of class Office (1109 - 17834, n=83, last 2 years) | |
| Acer Swift Edge SFE16-42-R1GM | |
| Average AMD Ryzen 7 7735U (n=1) | |
| Lenovo ThinkPad T16 G1 21CH004MGE | |
| Acer TravelMate P4 TMP416-51-55KN | |
| Samsung Galaxy Book3 Pro 16 | |
| LG Gram 16Z90Q | |
| LG Ultra-PC 16 16U70Q-G.AR36G | |
| AIDA64 / CPU PhotoWorxx | |
| Samsung Galaxy Book3 Pro 16 | |
| LG Gram 16Z90Q | |
| Average of class Office (11090 - 65229, n=83, last 2 years) | |
| Acer TravelMate P4 TMP416-51-55KN | |
| Acer Swift Edge SFE16-42-R1GM | |
| Average AMD Ryzen 7 7735U (n=1) | |
| Lenovo ThinkPad T16 G1 21CH004MGE | |
| LG Ultra-PC 16 16U70Q-G.AR36G | |
System performance
A combination of a brand-new SoC with a strong iGPU and DDR5 RAM left a very good subjective impression on us in terms of performance, which was solidified by the benchmark results. However, in our ranking, the Intel-powered devices did a little better, meaning the Acer Swift Edge SFE16 landed somewhere in the middle.
CrossMark: Overall | Productivity | Creativity | Responsiveness
| PCMark 10 / Score | |
| Average of class Office (2601 - 9298, n=68, last 2 years) | |
| Acer Swift Edge SFE16-42-R1GM | |
| Average AMD Ryzen 7 7735U, AMD Radeon 680M (n=1) | |
| Lenovo ThinkPad T16 G1 21CH004MGE | |
| Samsung Galaxy Book3 Pro 16 | |
| Acer TravelMate P4 TMP416-51-55KN | |
| LG Gram 16Z90Q | |
| LG Ultra-PC 16 16U70Q-G.AR36G | |
| PCMark 10 / Essentials | |
| Samsung Galaxy Book3 Pro 16 | |
| Average of class Office (3245 - 11594, n=68, last 2 years) | |
| LG Gram 16Z90Q | |
| Lenovo ThinkPad T16 G1 21CH004MGE | |
| Acer TravelMate P4 TMP416-51-55KN | |
| Acer Swift Edge SFE16-42-R1GM | |
| Average AMD Ryzen 7 7735U, AMD Radeon 680M (n=1) | |
| LG Ultra-PC 16 16U70Q-G.AR36G | |
| PCMark 10 / Productivity | |
| Average of class Office (5336 - 17243, n=68, last 2 years) | |
| Acer Swift Edge SFE16-42-R1GM | |
| Average AMD Ryzen 7 7735U, AMD Radeon 680M (n=1) | |
| Lenovo ThinkPad T16 G1 21CH004MGE | |
| Acer TravelMate P4 TMP416-51-55KN | |
| Samsung Galaxy Book3 Pro 16 | |
| LG Gram 16Z90Q | |
| LG Ultra-PC 16 16U70Q-G.AR36G | |
| PCMark 10 / Digital Content Creation | |
| Average of class Office (2049 - 13541, n=68, last 2 years) | |
| Acer Swift Edge SFE16-42-R1GM | |
| Average AMD Ryzen 7 7735U, AMD Radeon 680M (n=1) | |
| Samsung Galaxy Book3 Pro 16 | |
| Lenovo ThinkPad T16 G1 21CH004MGE | |
| Acer TravelMate P4 TMP416-51-55KN | |
| LG Gram 16Z90Q | |
| LG Ultra-PC 16 16U70Q-G.AR36G | |
| CrossMark / Overall | |
| Samsung Galaxy Book3 Pro 16 | |
| Acer TravelMate P4 TMP416-51-55KN | |
| Average of class Office (381 - 2010, n=75, last 2 years) | |
| Lenovo ThinkPad T16 G1 21CH004MGE | |
| Acer Swift Edge SFE16-42-R1GM | |
| Average AMD Ryzen 7 7735U, AMD Radeon 680M (n=1) | |
| LG Ultra-PC 16 16U70Q-G.AR36G | |
| CrossMark / Productivity | |
| Samsung Galaxy Book3 Pro 16 | |
| Acer TravelMate P4 TMP416-51-55KN | |
| Average of class Office (464 - 1880, n=75, last 2 years) | |
| Lenovo ThinkPad T16 G1 21CH004MGE | |
| Acer Swift Edge SFE16-42-R1GM | |
| Average AMD Ryzen 7 7735U, AMD Radeon 680M (n=1) | |
| LG Ultra-PC 16 16U70Q-G.AR36G | |
| CrossMark / Creativity | |
| Average of class Office (319 - 2361, n=75, last 2 years) | |
| Samsung Galaxy Book3 Pro 16 | |
| Acer TravelMate P4 TMP416-51-55KN | |
| Lenovo ThinkPad T16 G1 21CH004MGE | |
| Acer Swift Edge SFE16-42-R1GM | |
| Average AMD Ryzen 7 7735U, AMD Radeon 680M (n=1) | |
| LG Ultra-PC 16 16U70Q-G.AR36G | |
| CrossMark / Responsiveness | |
| Acer TravelMate P4 TMP416-51-55KN | |
| Samsung Galaxy Book3 Pro 16 | |
| Average of class Office (360 - 1820, n=75, last 2 years) | |
| Lenovo ThinkPad T16 G1 21CH004MGE | |
| Acer Swift Edge SFE16-42-R1GM | |
| Average AMD Ryzen 7 7735U, AMD Radeon 680M (n=1) | |
| LG Ultra-PC 16 16U70Q-G.AR36G | |
| PCMark 10 Score | 6147 points | |
Help | ||
| AIDA64 / Memory Copy | |
| LG Gram 16Z90Q | |
| Samsung Galaxy Book3 Pro 16 | |
| Average of class Office (20075 - 110930, n=80, last 2 years) | |
| Acer Swift Edge SFE16-42-R1GM | |
| Average AMD Ryzen 7 7735U (n=1) | |
| Lenovo ThinkPad T16 G1 21CH004MGE | |
| Acer TravelMate P4 TMP416-51-55KN | |
| LG Ultra-PC 16 16U70Q-G.AR36G | |
| AIDA64 / Memory Read | |
| Average of class Office (10084 - 128030, n=81, last 2 years) | |
| LG Gram 16Z90Q | |
| Samsung Galaxy Book3 Pro 16 | |
| Acer TravelMate P4 TMP416-51-55KN | |
| Acer Swift Edge SFE16-42-R1GM | |
| Average AMD Ryzen 7 7735U (n=1) | |
| Lenovo ThinkPad T16 G1 21CH004MGE | |
| LG Ultra-PC 16 16U70Q-G.AR36G | |
| AIDA64 / Memory Write | |
| Samsung Galaxy Book3 Pro 16 | |
| Average of class Office (20073 - 119858, n=81, last 2 years) | |
| LG Gram 16Z90Q | |
| Lenovo ThinkPad T16 G1 21CH004MGE | |
| Acer Swift Edge SFE16-42-R1GM | |
| Average AMD Ryzen 7 7735U (n=1) | |
| Acer TravelMate P4 TMP416-51-55KN | |
| LG Ultra-PC 16 16U70Q-G.AR36G | |
| AIDA64 / Memory Latency | |
| Lenovo ThinkPad T16 G1 21CH004MGE | |
| LG Ultra-PC 16 16U70Q-G.AR36G | |
| LG Gram 16Z90Q | |
| Average of class Office (7.6 - 162.9, n=76, last 2 years) | |
| Acer Swift Edge SFE16-42-R1GM | |
| Average AMD Ryzen 7 7735U (n=1) | |
| Samsung Galaxy Book3 Pro 16 | |
| Acer TravelMate P4 TMP416-51-55KN | |
* ... smaller is better
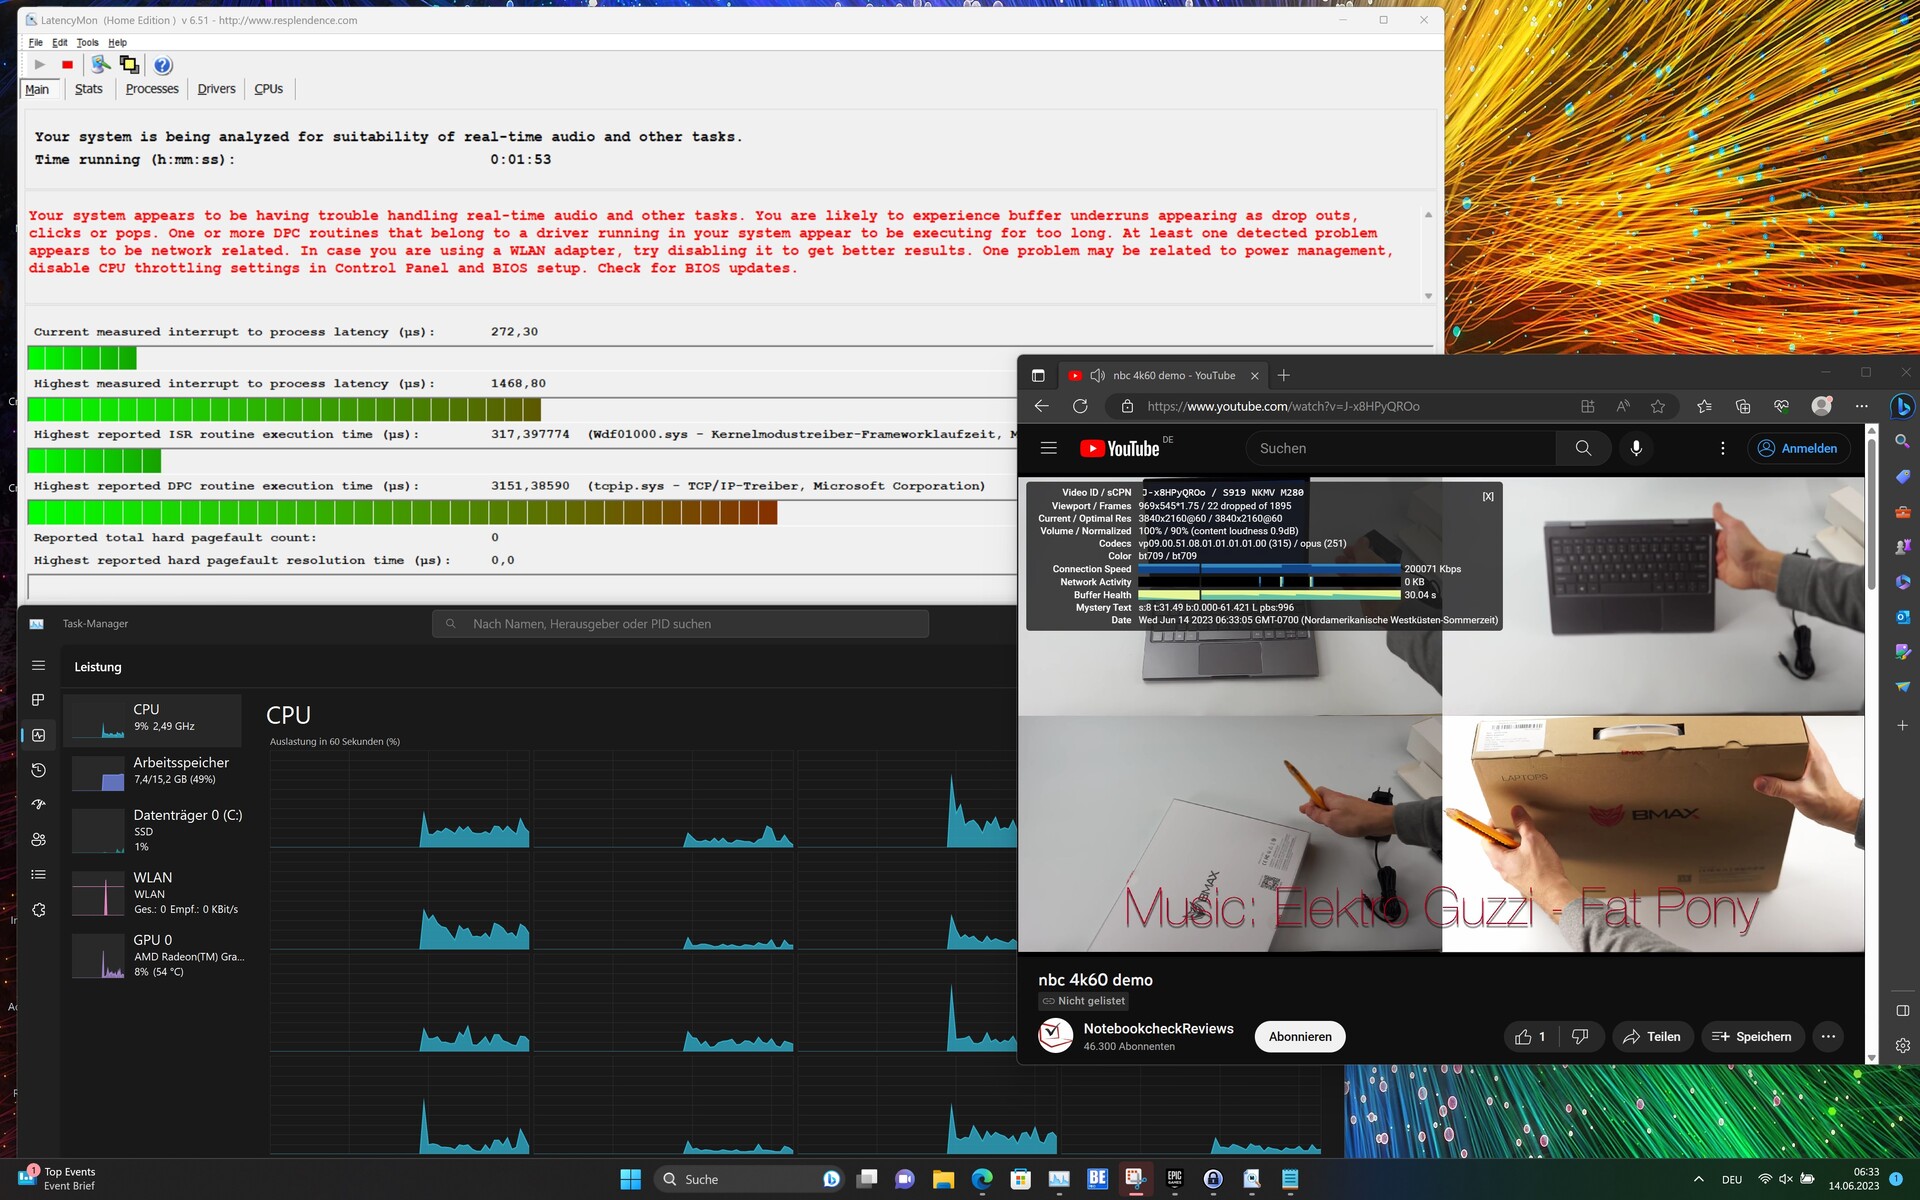
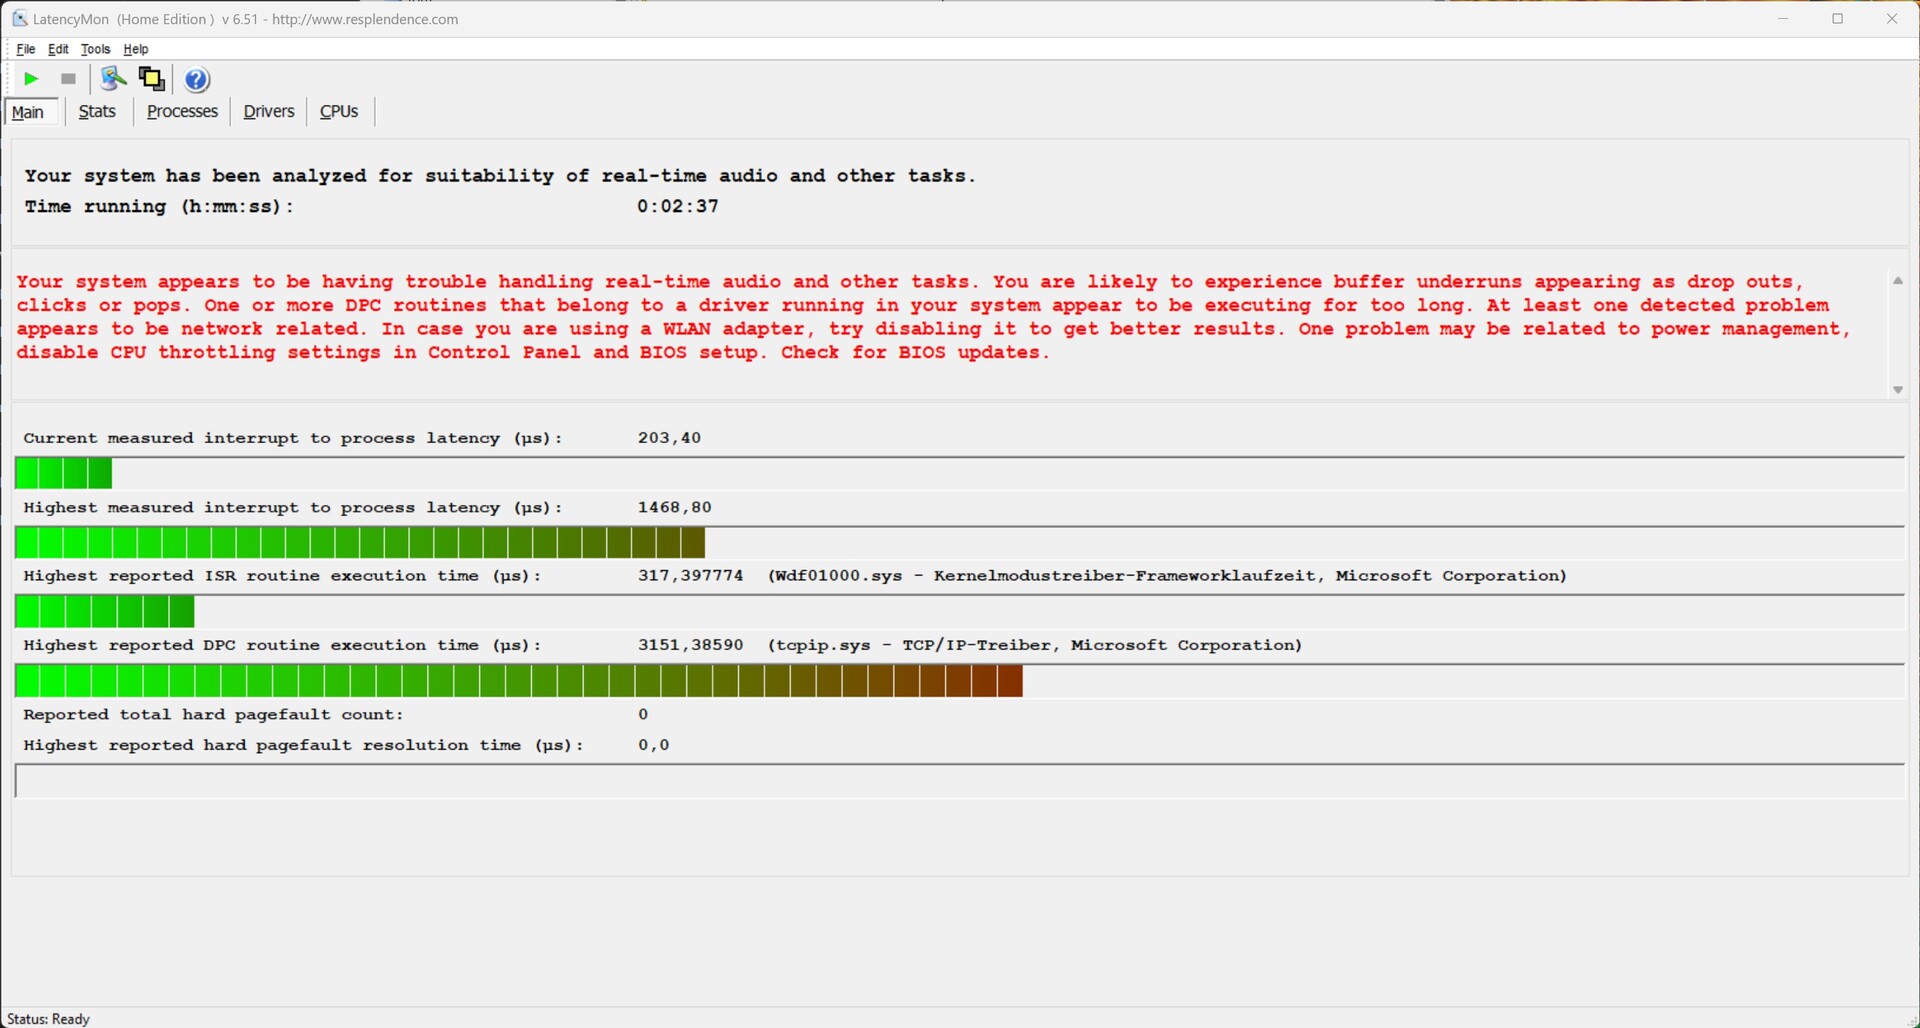
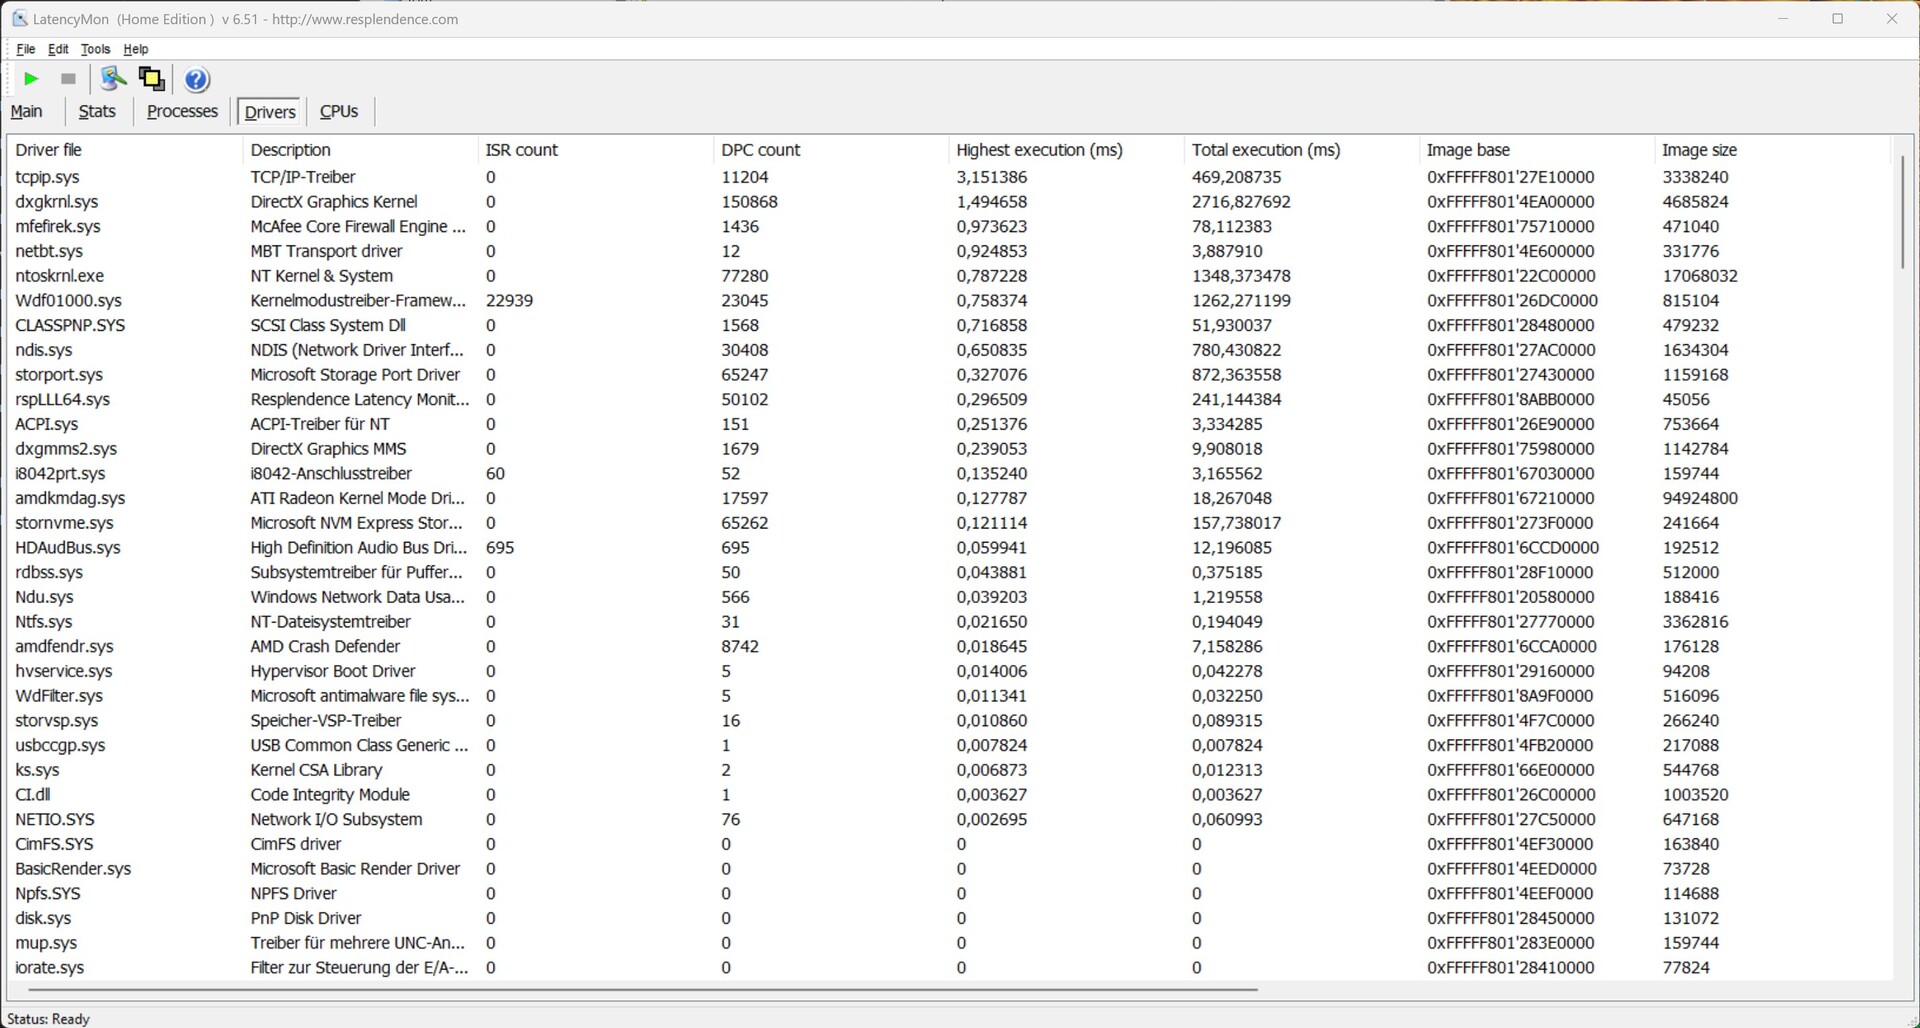
DPC latency
The LatencyMon tool already revealed a high latency value when opening several tabs in Edge, which didn't worsen further when playing our 4K test video and using Prime95.
| DPC Latencies / LatencyMon - interrupt to process latency (max), Web, Youtube, Prime95 | |
| Acer Swift Edge SFE16-42-R1GM | |
| Acer TravelMate P4 TMP416-51-55KN | |
| LG Gram 16Z90Q | |
| Lenovo ThinkPad T16 G1 21CH004MGE | |
| LG Ultra-PC 16 16U70Q-G.AR36G | |
| Samsung Galaxy Book3 Pro 16 | |
* ... smaller is better
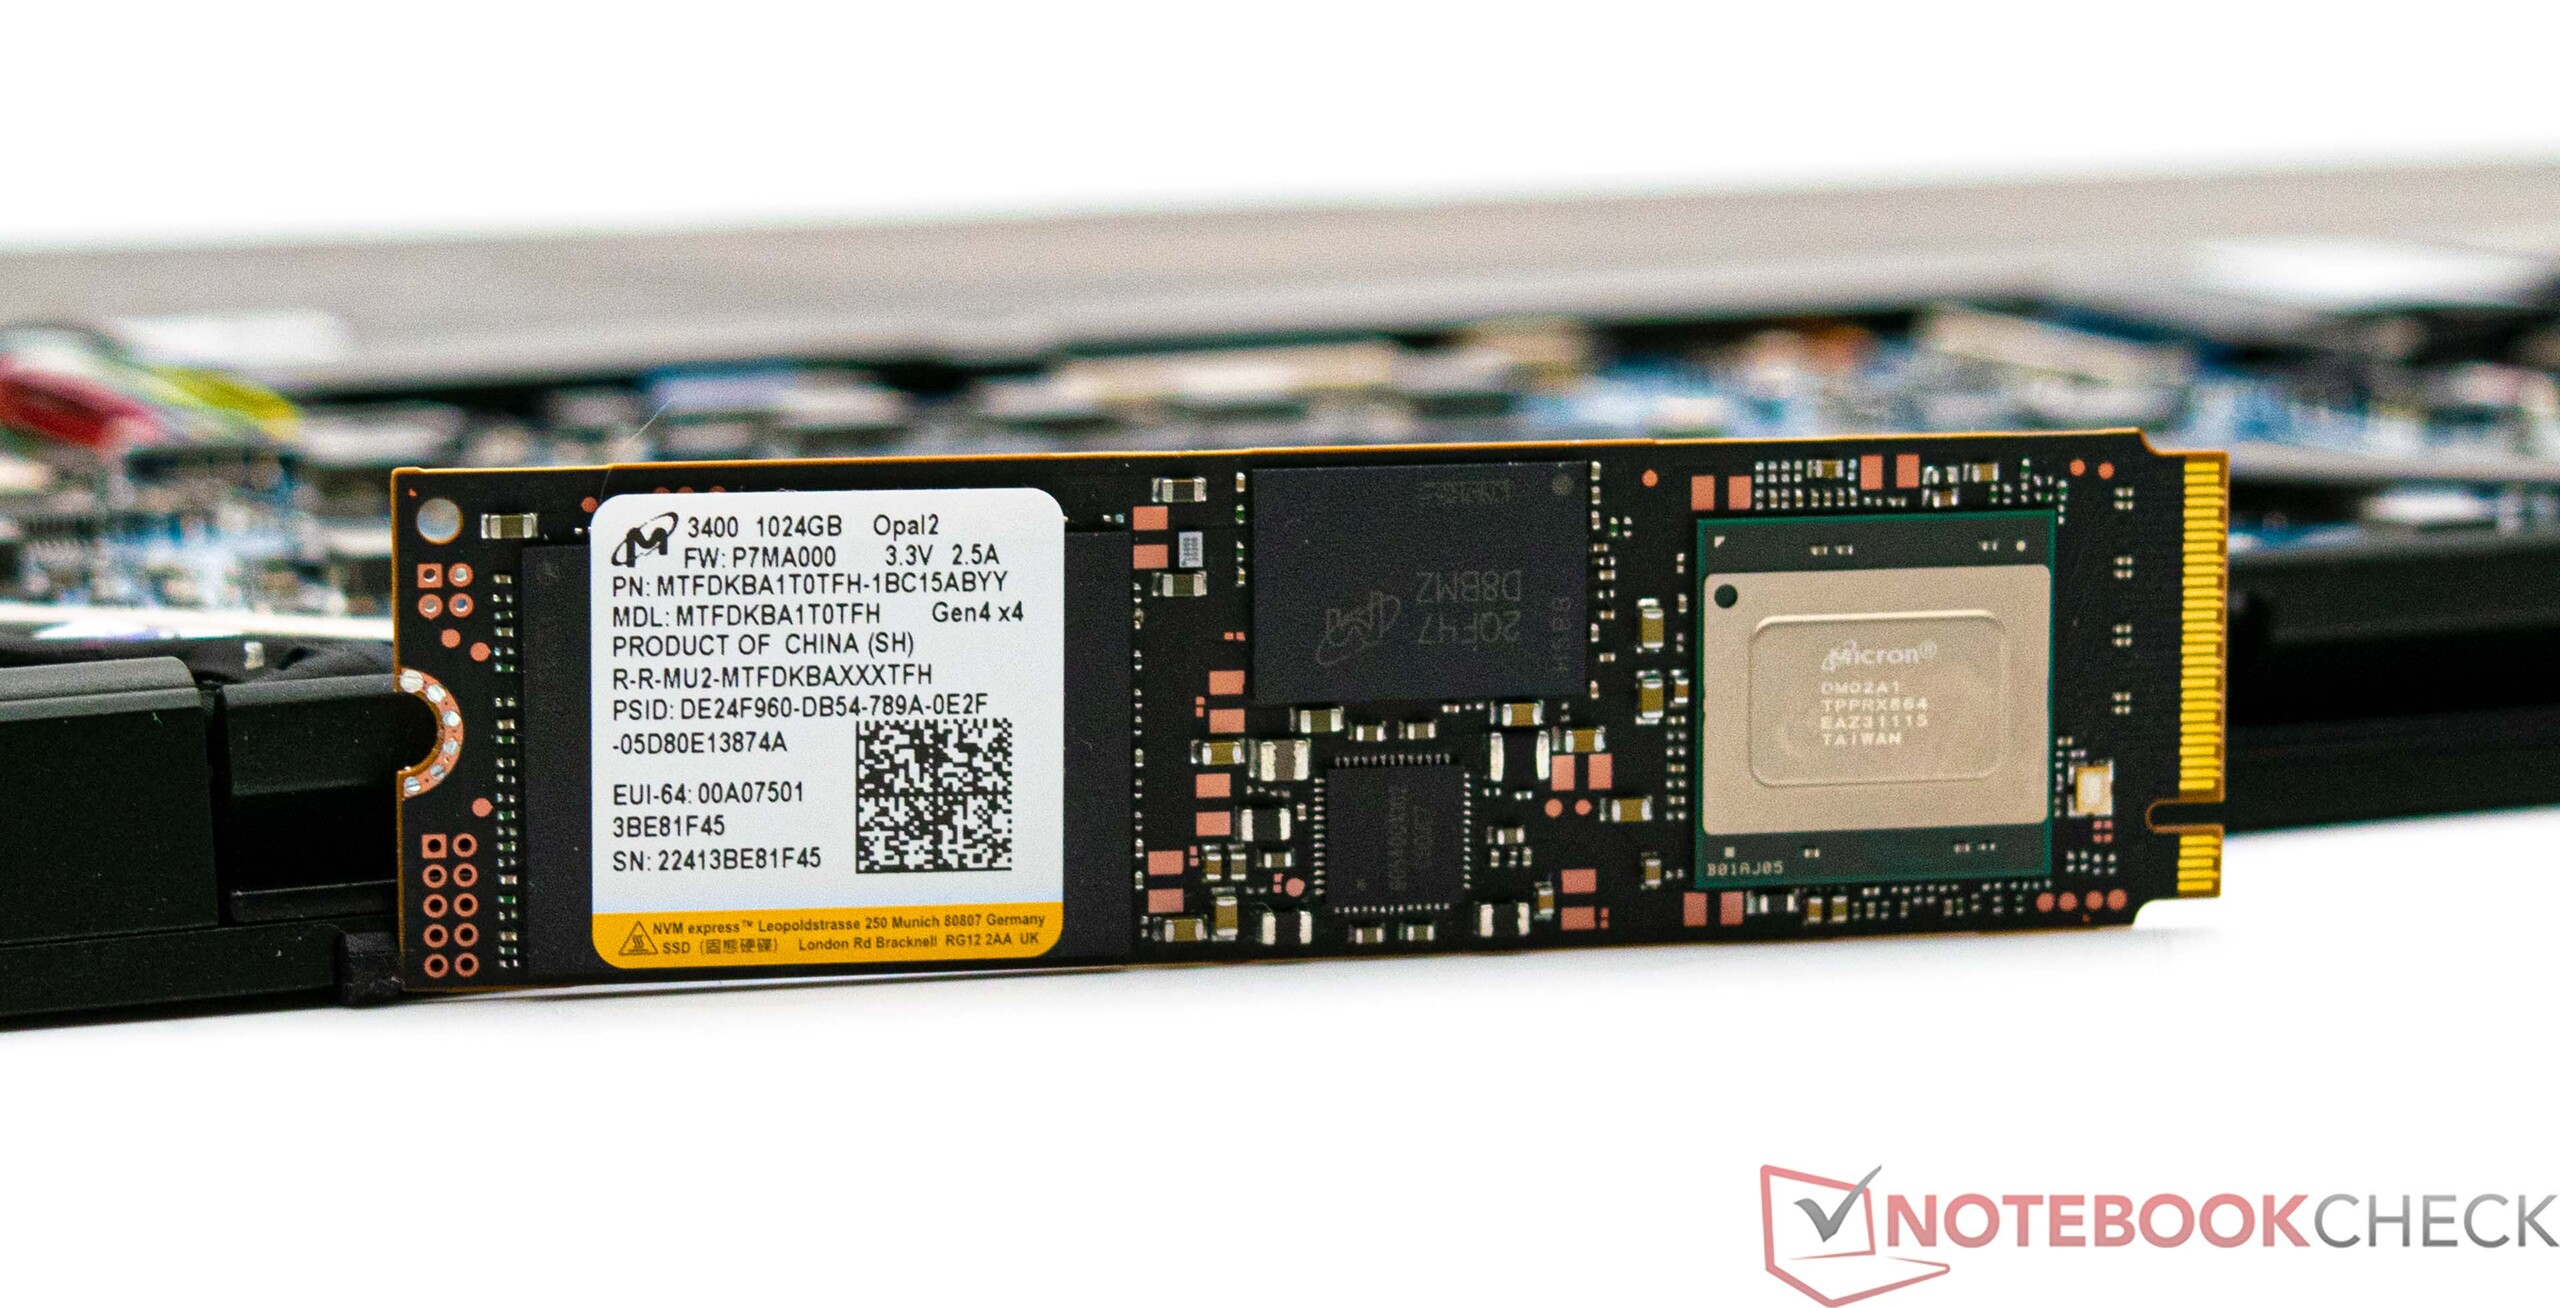
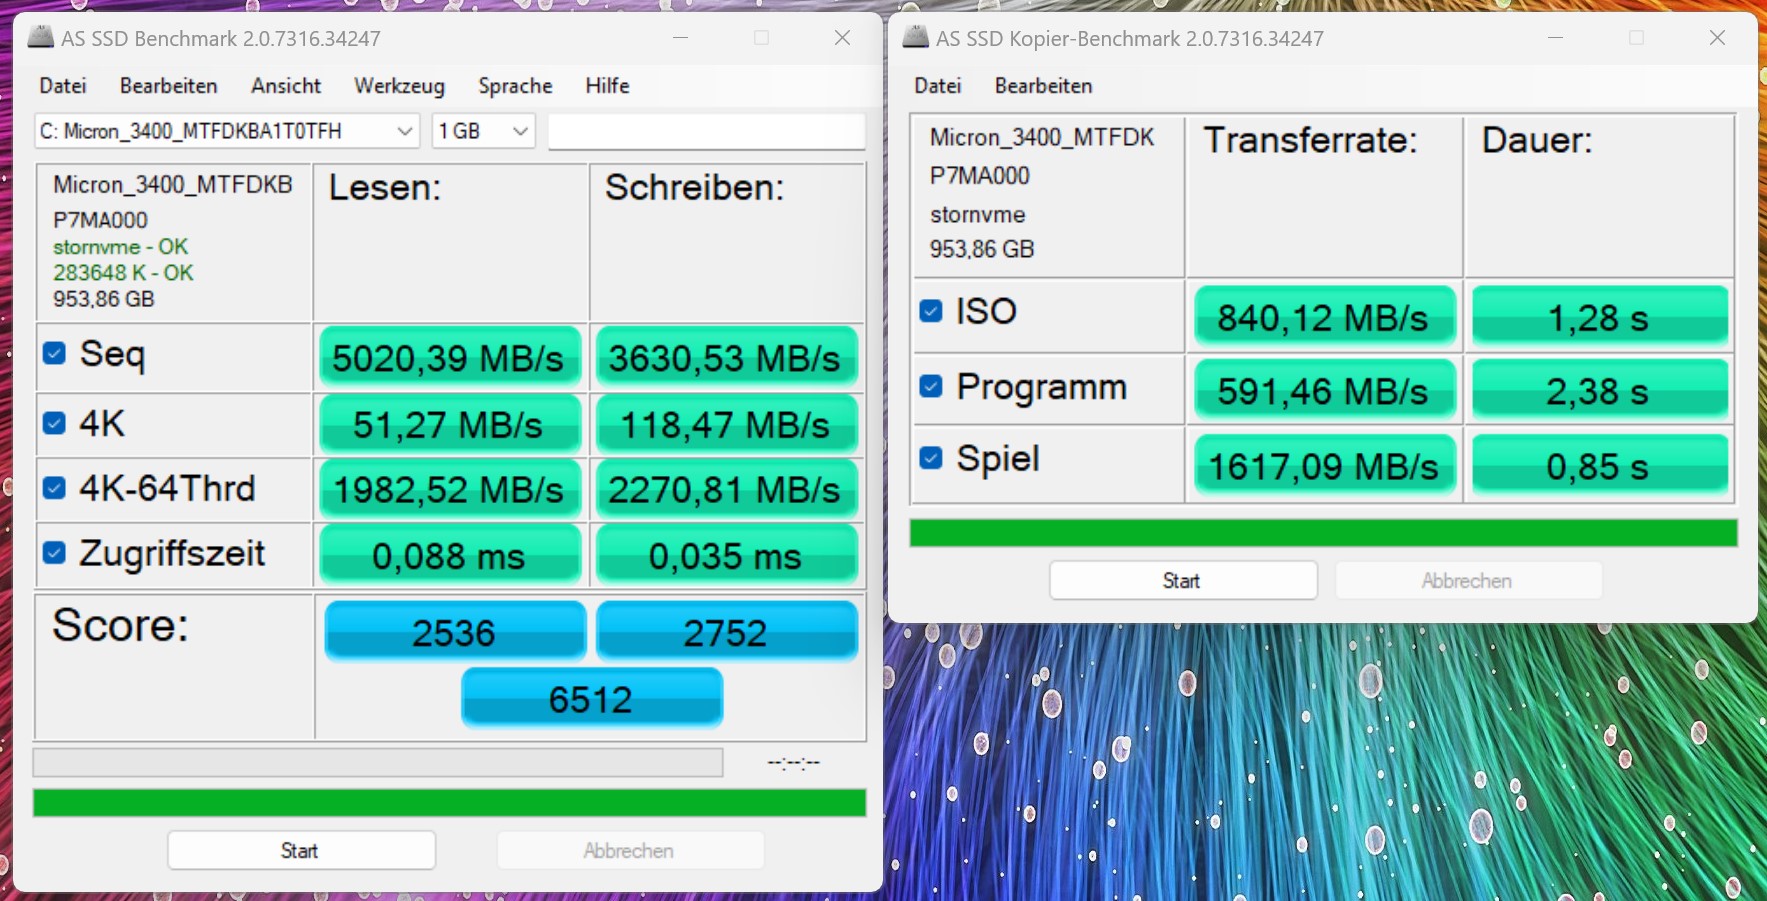
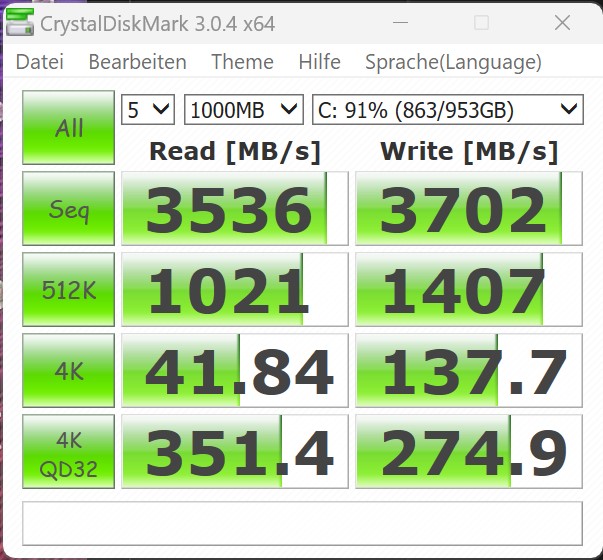
Storage devices
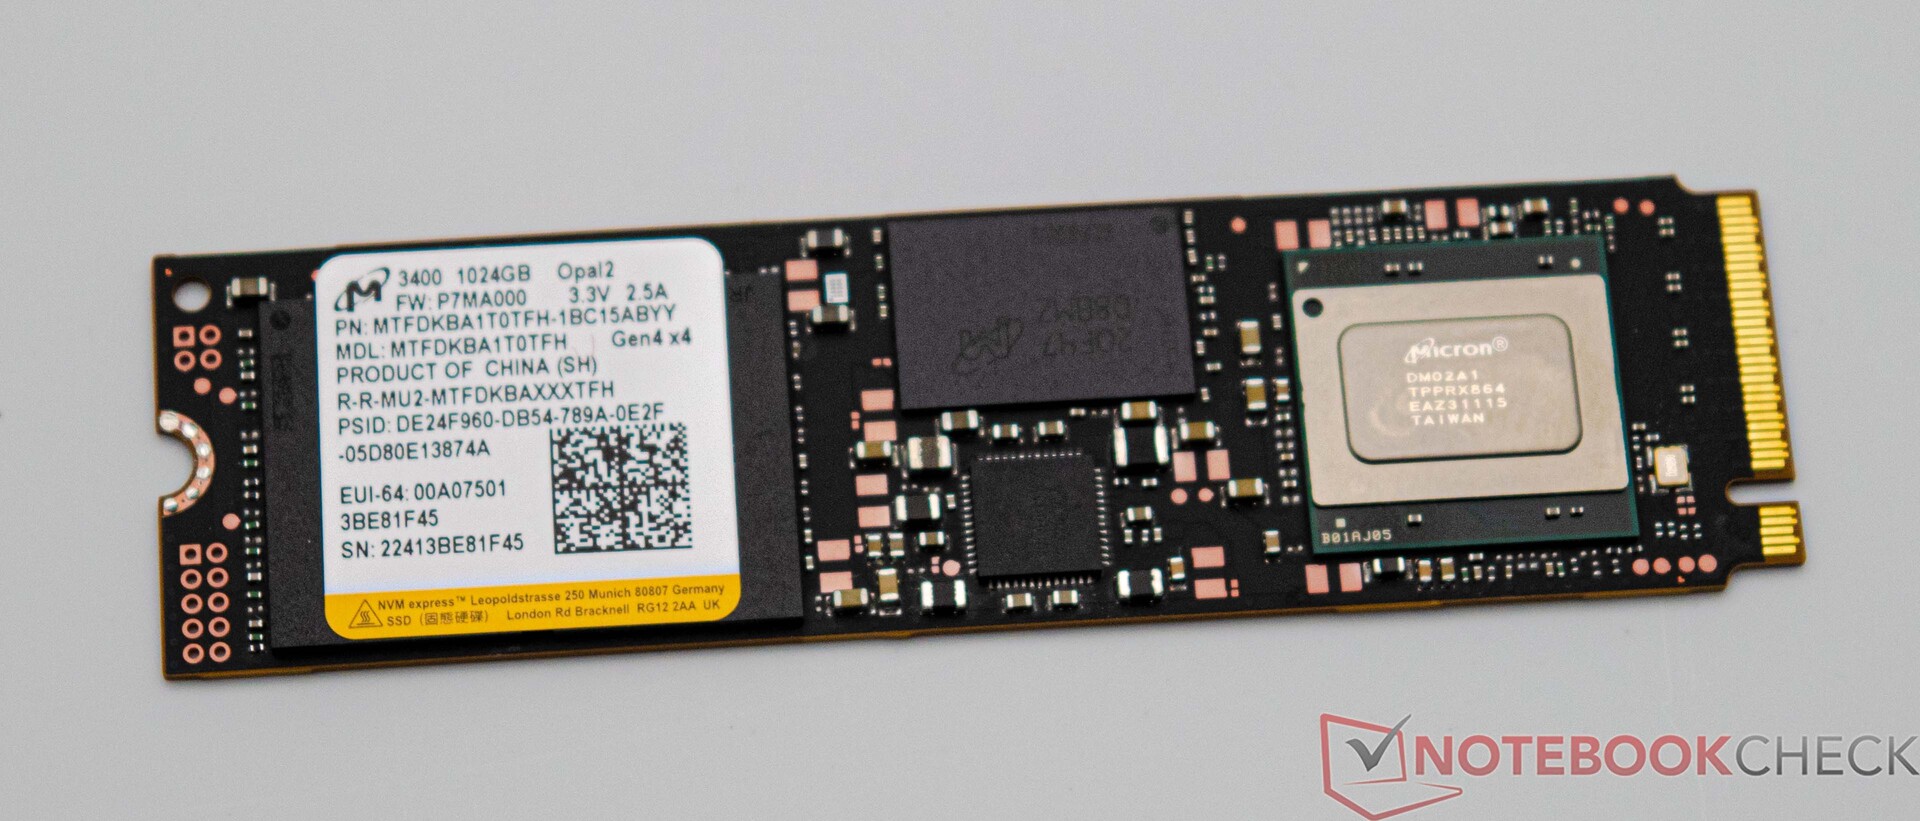
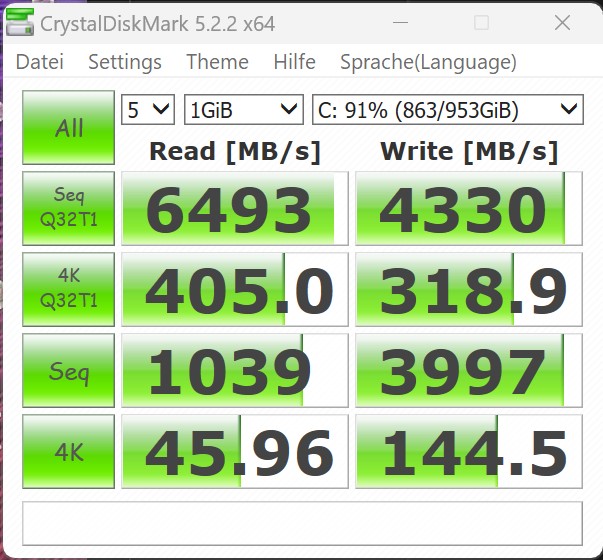
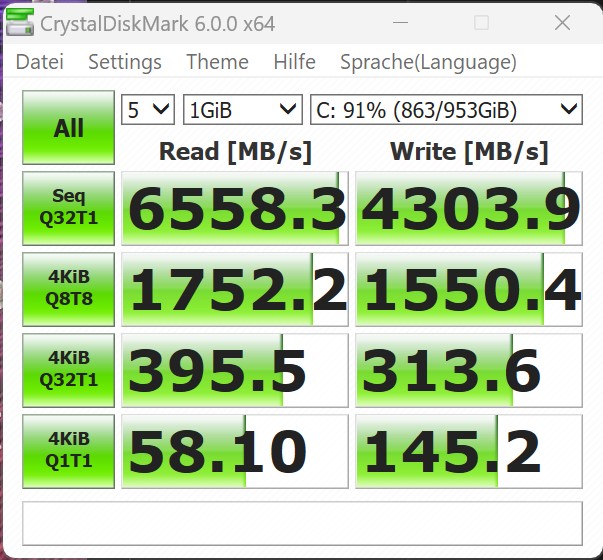
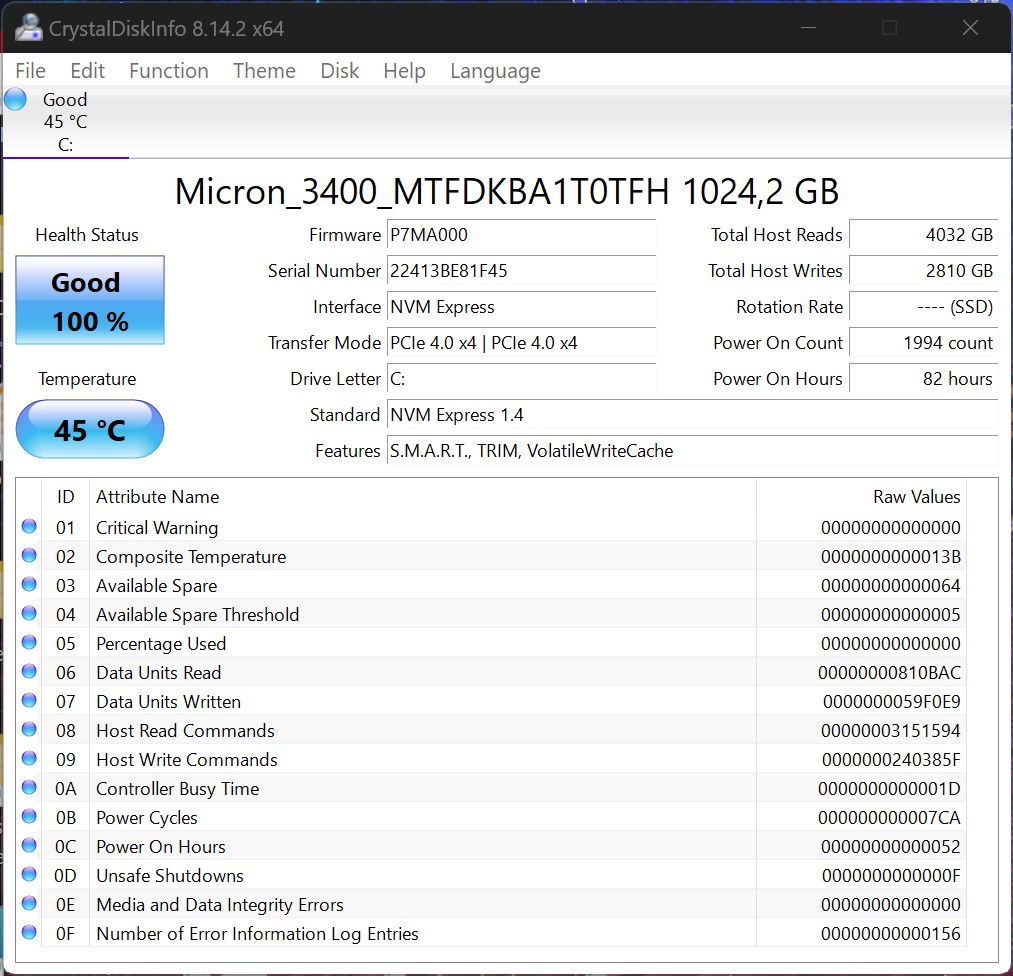
A fast SSD from Micron sits within the Acer Swift Edge SFE16. The present model has 1 TB storage space which isn't divided into partitions. The M.2 interface is optimally utilized because the installed SSD also natively supports the PCIe 4.0 interface in full bandwidth. This results in a great score, which puts our review sample in first place in this comparison. The second-placed LG Gram 16 was clearly beaten with a gap of 18 percentage points.
To limit thermal load ever so slightly, the bottom plate is used to cool the device. There is a small heat conduction pad in the area of the Micron controller. However, this couldn't completely prevent an overload during continuous performance. This resulted in sporadic performance drops down to about 1,700 MB/s while reading. However, we couldn't determine a noticeable performance loss during our extensive test phase with numerous installations.
For further comparisons and benchmarks, take a look at our comparison table.

* ... smaller is better
Reading continuous performance: DiskSpd Read Loop, Queue Depth 8
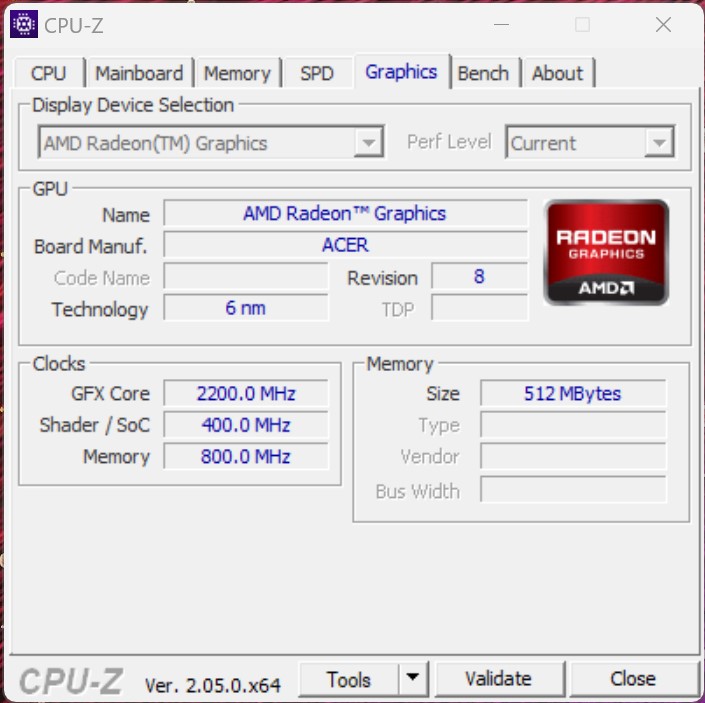
Graphics card
The AMD Ryzen 7 7735U is part of the current Rembrandt series, meaning it also has an AMD Radeon 680M iGPU. We have already analyzed this iGPU in other devices and it has to be said, the AMD did much better than its competitors in terms of performance. Intel, with their Iris Xe AMD, simply couldn't keep up. In current comparison, we noted the Acer Swift Edge SFE16 to deliver the exact performance levels which were to be expected. The AMD Radeon 680M's previous recorded average performance levels could even be exceeded at times.
Further AMD Radeon 680M benchmarks can be found here.
AMD Radeon 680M
| 3DMark 05 Standard | 35594 points | |
| 3DMark 06 Standard Score | 28361 points | |
| 3DMark Vantage P Result | 26483 points | |
| 3DMark 11 Performance | 9712 points | |
| 3DMark Ice Storm Standard Score | 132250 points | |
| 3DMark Cloud Gate Standard Score | 30339 points | |
| 3DMark Fire Strike Score | 6208 points | |
| 3DMark Fire Strike Extreme Score | 3175 points | |
| 3DMark Time Spy Score | 2532 points | |
Help | ||
* ... smaller is better
Gaming performance
Thanks to its comparatively powerful AMD Radeon 680M, the Acer Swift Edge SFE16 came out on top in our gaming tests. Even so, you must remember that this laptop is an office/multimedia device. As a result, we could only measure playable frame rates at low to medium detail settings. However, its performance is highly dependent on the individual game, so we are unable to form a generalized opinion on how well-suited this laptop is for gaming.
For further details on the iGPU's performance in comparison to other graphics cards, take a look at our GPU games list.
| The Witcher 3 - 1920x1080 Ultra Graphics & Postprocessing (HBAO+) | |
| Acer Swift Edge SFE16-42-R1GM | |
| Average of class Office (14.8 - 28.1, n=3, last 2 years) | |
| Lenovo ThinkPad T16 G1 21CH004MGE | |
| Samsung Galaxy Book3 Pro 16 | |
| LG Gram 16Z90Q | |
| Acer TravelMate P4 TMP416-51-55KN | |
| LG Ultra-PC 16 16U70Q-G.AR36G | |
| Final Fantasy XV Benchmark - 1920x1080 High Quality | |
| Average of class Office (8.09 - 79.5, n=71, last 2 years) | |
| Acer Swift Edge SFE16-42-R1GM | |
| Lenovo ThinkPad T16 G1 21CH004MGE | |
| Acer TravelMate P4 TMP416-51-55KN | |
| Samsung Galaxy Book3 Pro 16 | |
| LG Gram 16Z90Q | |
| Strange Brigade - 1920x1080 ultra AA:ultra AF:16 | |
| Average of class Office (12.9 - 142.1, n=53, last 2 years) | |
| Acer Swift Edge SFE16-42-R1GM | |
| Lenovo ThinkPad T16 G1 21CH004MGE | |
| Acer TravelMate P4 TMP416-51-55KN | |
| LG Ultra-PC 16 16U70Q-G.AR36G | |
| LG Gram 16Z90Q | |
| Shadow of the Tomb Raider | |
| 1280x720 Lowest Preset | |
| Average AMD Radeon 680M (53.3 - 92.9, n=14) | |
| Lenovo ThinkPad T16 G1 21CH004MGE | |
| Acer Swift Edge SFE16-42-R1GM | |
| Average of class Office (16 - 105, n=2, last 2 years) | |
| 1920x1080 Medium Preset | |
| Average AMD Radeon 680M (20.7 - 45, n=14) | |
| Acer Swift Edge SFE16-42-R1GM | |
| Lenovo ThinkPad T16 G1 21CH004MGE | |
| Average of class Office (15 - 40, n=2, last 2 years) | |
| 1920x1080 High Preset AA:SM | |
| Average AMD Radeon 680M (18.7 - 40, n=14) | |
| Acer Swift Edge SFE16-42-R1GM | |
| Lenovo ThinkPad T16 G1 21CH004MGE | |
| Average of class Office (13 - 38, n=2, last 2 years) | |
| 1920x1080 Highest Preset AA:T | |
| Average of class Office (n=1last 2 years) | |
| Average AMD Radeon 680M (16.4 - 34, n=14) | |
| Lenovo ThinkPad T16 G1 21CH004MGE | |
| Acer Swift Edge SFE16-42-R1GM | |
| Far Cry New Dawn | |
| 1280x720 Low Preset | |
| Average AMD Radeon 680M (36 - 66, n=12) | |
| Acer Swift Edge SFE16-42-R1GM | |
| 1920x1080 Medium Preset | |
| Average AMD Radeon 680M (23 - 42, n=12) | |
| Acer Swift Edge SFE16-42-R1GM | |
| 1920x1080 High Preset | |
| Average AMD Radeon 680M (21 - 40, n=12) | |
| Acer Swift Edge SFE16-42-R1GM | |
| 1920x1080 Ultra Preset | |
| Average AMD Radeon 680M (20 - 37, n=12) | |
| Acer Swift Edge SFE16-42-R1GM | |
| Metro Exodus | |
| 1280x720 Low Quality AF:4x | |
| Average AMD Radeon 680M (41.9 - 76.2, n=13) | |
| Acer Swift Edge SFE16-42-R1GM | |
| 1920x1080 Medium Quality AF:4x | |
| Average AMD Radeon 680M (17.6 - 31, n=13) | |
| Acer Swift Edge SFE16-42-R1GM | |
| 1920x1080 High Quality AF:16x | |
| Average AMD Radeon 680M (13.8 - 24.1, n=13) | |
| Acer Swift Edge SFE16-42-R1GM | |
| 1920x1080 Ultra Quality AF:16x | |
| Average AMD Radeon 680M (11.7 - 19.8, n=13) | |
| Acer Swift Edge SFE16-42-R1GM | |
| Borderlands 3 | |
| 1280x720 Very Low Overall Quality (DX11) | |
| Average AMD Radeon 680M (38.3 - 90.7, n=13) | |
| Acer Swift Edge SFE16-42-R1GM | |
| 1920x1080 Medium Overall Quality (DX11) | |
| Average of class Office (n=1last 2 years) | |
| Average AMD Radeon 680M (23.8 - 45.6, n=13) | |
| Acer Swift Edge SFE16-42-R1GM | |
| 1920x1080 High Overall Quality (DX11) | |
| Average of class Office (n=1last 2 years) | |
| Average AMD Radeon 680M (15.7 - 28.4, n=13) | |
| Acer Swift Edge SFE16-42-R1GM | |
| 1920x1080 Badass Overall Quality (DX11) | |
| Average of class Office (n=1last 2 years) | |
| Average AMD Radeon 680M (12.5 - 22.4, n=13) | |
| Acer Swift Edge SFE16-42-R1GM | |
| F1 2020 | |
| 1280x720 Ultra Low Preset | |
| Average AMD Radeon 680M (92.3 - 177, n=13) | |
| Acer Swift Edge SFE16-42-R1GM | |
| 1920x1080 Medium Preset AF:16x | |
| Average AMD Radeon 680M (49.8 - 87.4, n=13) | |
| Acer Swift Edge SFE16-42-R1GM | |
| 1920x1080 High Preset AA:T AF:16x | |
| Average AMD Radeon 680M (39.1 - 67.6, n=13) | |
| Acer Swift Edge SFE16-42-R1GM | |
| 1920x1080 Ultra High Preset AA:T AF:16x | |
| Average AMD Radeon 680M (27.5 - 46.7, n=13) | |
| Acer Swift Edge SFE16-42-R1GM | |
| F1 2021 | |
| 1280x720 Ultra Low Preset | |
| Average AMD Radeon 680M (97 - 193, n=20) | |
| Acer Swift Edge SFE16-42-R1GM | |
| LG Ultra-PC 16 16U70Q-G.AR36G | |
| 1920x1080 Medium Preset AA:T AF:16x | |
| Average AMD Radeon 680M (49.7 - 92.3, n=20) | |
| Acer Swift Edge SFE16-42-R1GM | |
| LG Ultra-PC 16 16U70Q-G.AR36G | |
| 1920x1080 High Preset AA:T AF:16x | |
| Average AMD Radeon 680M (26.8 - 69, n=21) | |
| Acer Swift Edge SFE16-42-R1GM | |
| 1920x1080 Ultra High Preset + Raytracing AA:T AF:16x | |
| Average AMD Radeon 680M (16.1 - 29.1, n=18) | |
| Acer Swift Edge SFE16-42-R1GM | |
| Far Cry 6 | |
| 1280x720 Low Graphics Quality | |
| Average AMD Radeon 680M (29.6 - 82, n=11) | |
| Acer Swift Edge SFE16-42-R1GM | |
| 1920x1080 Medium Graphics Quality AA:SM | |
| Average AMD Radeon 680M (18.8 - 46, n=11) | |
| Acer Swift Edge SFE16-42-R1GM | |
| 1920x1080 High Graphics Quality AA:T | |
| Average AMD Radeon 680M (16.1 - 38.4, n=11) | |
| Acer Swift Edge SFE16-42-R1GM | |
| GRID Legends | |
| 1280x720 Low Preset | |
| Average AMD Radeon 680M (42.1 - 170, n=12) | |
| Acer Swift Edge SFE16-42-R1GM | |
| 1920x1080 Medium Preset | |
| Average AMD Radeon 680M (29.5 - 82.2, n=12) | |
| Acer Swift Edge SFE16-42-R1GM | |
| 1920x1080 High Preset | |
| Average AMD Radeon 680M (24.4 - 64.9, n=12) | |
| Acer Swift Edge SFE16-42-R1GM | |
| 1920x1080 Ultra Preset | |
| Average AMD Radeon 680M (21.2 - 46.3, n=12) | |
| Acer Swift Edge SFE16-42-R1GM | |
| Tiny Tina's Wonderlands | |
| 1280x720 Lowest Preset (DX12) | |
| Average AMD Radeon 680M (59.3 - 126.2, n=17) | |
| Average of class Office (48.7 - 139.5, n=6, last 2 years) | |
| Acer Swift Edge SFE16-42-R1GM | |
| 1920x1080 Medium Preset (DX12) | |
| Average AMD Radeon 680M (28.2 - 47.7, n=18) | |
| Average of class Office (20.4 - 53.8, n=6, last 2 years) | |
| Acer Swift Edge SFE16-42-R1GM | |
| 1920x1080 High Preset (DX12) | |
| Average AMD Radeon 680M (19.8 - 32.3, n=18) | |
| Average of class Office (13.7 - 36.1, n=6, last 2 years) | |
| Acer Swift Edge SFE16-42-R1GM | |
| 1920x1080 Badass Preset (DX12) | |
| Average AMD Radeon 680M (16 - 26.1, n=18) | |
| Average of class Office (11.2 - 29.4, n=6, last 2 years) | |
| Acer Swift Edge SFE16-42-R1GM | |
| F1 22 | |
| 1280x720 Ultra Low Preset AA:T AF:16x | |
| Average AMD Radeon 680M (75.5 - 147.3, n=19) | |
| Average of class Office (62.4 - 164.3, n=6, last 2 years) | |
| Acer Swift Edge SFE16-42-R1GM | |
| 1920x1080 Low Preset AA:T AF:16x | |
| Average AMD Radeon 680M (44.1 - 85.4, n=25) | |
| Average of class Office (39.2 - 101.6, n=6, last 2 years) | |
| Acer Swift Edge SFE16-42-R1GM | |
| LG Ultra-PC 16 16U70Q-G.AR36G | |
| 1920x1080 Medium Preset AA:T AF:16x | |
| Average of class Office (36.8 - 94.5, n=6, last 2 years) | |
| Average AMD Radeon 680M (38 - 75.1, n=25) | |
| Acer Swift Edge SFE16-42-R1GM | |
| LG Ultra-PC 16 16U70Q-G.AR36G | |
| 1920x1080 High Preset AA:T AF:16x | |
| Average of class Office (27.6 - 71.6, n=6, last 2 years) | |
| Average AMD Radeon 680M (30 - 56.2, n=25) | |
| Acer Swift Edge SFE16-42-R1GM | |
The frame rates we measured while running The Witcher 3 showed a slight dip in 3D performance over a longer period of time. The LG Gram 16 struggled even more to achieve consistent 3D performance levels.
Witcher 3 FPS diagram
| low | med. | high | ultra | |
|---|---|---|---|---|
| GTA V (2015) | 122.2 | 108.3 | 44.2 | 19.4 |
| The Witcher 3 (2015) | 104.3 | 32.7 | 20.3 | |
| Dota 2 Reborn (2015) | 112.9 | 97.2 | 69.7 | 61 |
| Final Fantasy XV Benchmark (2018) | 57.9 | 26.7 | 19.3 | |
| X-Plane 11.11 (2018) | 48.2 | 36.6 | 30.2 | |
| Far Cry 5 (2018) | 59 | 33 | 31 | 28 |
| Strange Brigade (2018) | 128.9 | 54.3 | 44.9 | 36.4 |
| Shadow of the Tomb Raider (2018) | 70.6 | 30.8 | 27.5 | 22.9 |
| Far Cry New Dawn (2019) | 52 | 30 | 29 | 26 |
| Metro Exodus (2019) | 57.6 | 24.7 | 18.8 | 15.1 |
| Borderlands 3 (2019) | 53.7 | 30.7 | 20.2 | 14.5 |
| F1 2020 (2020) | 137.4 | 66.3 | 49.7 | 32.5 |
| F1 2021 (2021) | 133.3 | 67.7 | 51.6 | 20.7 |
| Far Cry 6 (2021) | 60.6 | 34.7 | 27.8 | |
| God of War (2022) | 25.2 | 20.3 | 16.2 | 11.5 |
| GRID Legends (2022) | 62.1 | 47.4 | 36.7 | 26.9 |
| Tiny Tina's Wonderlands (2022) | 37.9 | 30 | 19.8 | 16 |
| F1 22 (2022) | 66.7 | 55.4 | 36.9 | 7.85 |
3D performance via eGPU dock with Nvidia GeForce RTX 3060 Ti

You can achieve much better 3D performance by using the Thunderbolt port in order to connect an external graphics card. We did exactly this using the Razer Core X and an Nvidia GeForce RTX 3060 Ti. In our synthetic benchmarks, we could see that this combination was even able to keep up with the Huawei MateBook X, which we recently took a closer look at in a similar constellation.
Of course, don't want to keep the laptop's realistic gaming performance in the same combination a secret from you. Using these accessories, it is definitely fit for gaming. In this constellation, many games can be run effortlessly at maximum detail levels. The only game which stood out was the game F1 22, which is presumably affected too strongly by bandwidth restrictions: Using Thunderbolt, you can only achieve PCI Express 3.0 speeds with 4 lanes.
| Performance rating - Percent | |
| Intel NUC 13 Pro Kit NUC13ANK (Nvidia GeForce RTX 3060 Ti FE TB3) | |
| Huawei MateBook X Pro 2023 (Nvidia GeForce RTX 3060 Ti FE TB3) | |
| Morefine M600 (Nvidia GeForce RTX 3060 Ti FE TB3) | |
| Acer Swift Edge SFE16 (Nvidia GeForce RTX 3060 Ti FE TB3) | |
| Morefine M600 (Nvidia GeForce RTX 3060 Ti FE TB3) | |
| Minisforum Venus Series UM690 (Nvidia GeForce RTX 3060 Ti FE TB3) | |
| 3DMark 11 - 1280x720 Performance GPU | |
| Intel NUC 13 Pro Kit NUC13ANK (Nvidia GeForce RTX 3060 Ti FE TB3) | |
| Huawei MateBook X Pro 2023 (Nvidia GeForce RTX 3060 Ti FE TB3) | |
| Morefine M600 (Nvidia GeForce RTX 3060 Ti FE TB3) | |
| Minisforum Venus Series UM690 (Nvidia GeForce RTX 3060 Ti FE TB3) | |
| Morefine M600 (Nvidia GeForce RTX 3060 Ti FE TB3) | |
| Acer Swift Edge SFE16 (Nvidia GeForce RTX 3060 Ti FE TB3) | |
| 3DMark | |
| 1280x720 Cloud Gate Standard Graphics | |
| Intel NUC 13 Pro Kit NUC13ANK (Nvidia GeForce RTX 3060 Ti FE TB3) | |
| Huawei MateBook X Pro 2023 (Nvidia GeForce RTX 3060 Ti FE TB3) | |
| Acer Swift Edge SFE16 (Nvidia GeForce RTX 3060 Ti FE TB3) | |
| Morefine M600 (Nvidia GeForce RTX 3060 Ti FE TB3) | |
| Minisforum Venus Series UM690 (Nvidia GeForce RTX 3060 Ti FE TB3) | |
| Morefine M600 (Nvidia GeForce RTX 3060 Ti FE TB3) | |
| 1920x1080 Fire Strike Graphics | |
| Intel NUC 13 Pro Kit NUC13ANK (Nvidia GeForce RTX 3060 Ti FE TB3) | |
| Huawei MateBook X Pro 2023 (Nvidia GeForce RTX 3060 Ti FE TB3) | |
| Acer Swift Edge SFE16 (Nvidia GeForce RTX 3060 Ti FE TB3) | |
| Morefine M600 (Nvidia GeForce RTX 3060 Ti FE TB3) | |
| Morefine M600 (Nvidia GeForce RTX 3060 Ti FE TB3) | |
| Minisforum Venus Series UM690 (Nvidia GeForce RTX 3060 Ti FE TB3) | |
| 2560x1440 Time Spy Graphics | |
| Intel NUC 13 Pro Kit NUC13ANK (Nvidia GeForce RTX 3060 Ti FE TB3) | |
| Huawei MateBook X Pro 2023 (Nvidia GeForce RTX 3060 Ti FE TB3) | |
| Morefine M600 (Nvidia GeForce RTX 3060 Ti FE TB3) | |
| Morefine M600 (Nvidia GeForce RTX 3060 Ti FE TB3) | |
| Minisforum Venus Series UM690 (Nvidia GeForce RTX 3060 Ti FE TB3) | |
| Acer Swift Edge SFE16 (Nvidia GeForce RTX 3060 Ti FE TB3) | |
| Fire Strike Extreme Graphics | |
| Intel NUC 13 Pro Kit NUC13ANK (Nvidia GeForce RTX 3060 Ti FE TB3) | |
| Huawei MateBook X Pro 2023 (Nvidia GeForce RTX 3060 Ti FE TB3) | |
| Acer Swift Edge SFE16 (Nvidia GeForce RTX 3060 Ti FE TB3) | |
| Morefine M600 (Nvidia GeForce RTX 3060 Ti FE TB3) | |
| Morefine M600 (Nvidia GeForce RTX 3060 Ti FE TB3) | |
| Minisforum Venus Series UM690 (Nvidia GeForce RTX 3060 Ti FE TB3) | |
| Performance rating - Percent | |
| Intel NUC 13 Pro Kit NUC13ANK (Nvidia GeForce RTX 3060 Ti FE TB3) | |
| Huawei MateBook X Pro 2023 (Nvidia GeForce RTX 3060 Ti FE TB3) | |
| Morefine M600 (Nvidia GeForce RTX 3060 Ti FE TB3) | |
| Minisforum Venus Series UM690 (Nvidia GeForce RTX 3060 Ti FE TB3) | |
| Morefine M600 (Nvidia GeForce RTX 3060 Ti FE TB3) | |
| Acer Swift Edge SFE16 (Nvidia GeForce RTX 3060 Ti FE TB3) -5! | |
| Unigine Heaven 4.0 | |
| Extreme Preset OpenGL | |
| Huawei MateBook X Pro 2023 (Nvidia GeForce RTX 3060 Ti FE TB3) | |
| Intel NUC 13 Pro Kit NUC13ANK (Nvidia GeForce RTX 3060 Ti FE TB3) | |
| Minisforum Venus Series UM690 (Nvidia GeForce RTX 3060 Ti FE TB3) | |
| Morefine M600 (Nvidia GeForce RTX 3060 Ti FE TB3) | |
| Morefine M600 (Nvidia GeForce RTX 3060 Ti FE TB3) | |
| Acer Swift Edge SFE16 (Nvidia GeForce RTX 3060 Ti FE TB3) | |
| Extreme Preset DX11 | |
| Intel NUC 13 Pro Kit NUC13ANK (Nvidia GeForce RTX 3060 Ti FE TB3) | |
| Huawei MateBook X Pro 2023 (Nvidia GeForce RTX 3060 Ti FE TB3) | |
| Acer Swift Edge SFE16 (Nvidia GeForce RTX 3060 Ti FE TB3) | |
| Minisforum Venus Series UM690 (Nvidia GeForce RTX 3060 Ti FE TB3) | |
| Morefine M600 (Nvidia GeForce RTX 3060 Ti FE TB3) | |
| Morefine M600 (Nvidia GeForce RTX 3060 Ti FE TB3) | |
| Unigine Valley 1.0 | |
| 1920x1080 Extreme HD DirectX AA:x8 | |
| Intel NUC 13 Pro Kit NUC13ANK (Nvidia GeForce RTX 3060 Ti FE TB3) | |
| Huawei MateBook X Pro 2023 (Nvidia GeForce RTX 3060 Ti FE TB3) | |
| Minisforum Venus Series UM690 (Nvidia GeForce RTX 3060 Ti FE TB3) | |
| Morefine M600 (Nvidia GeForce RTX 3060 Ti FE TB3) | |
| Morefine M600 (Nvidia GeForce RTX 3060 Ti FE TB3) | |
| Acer Swift Edge SFE16 (Nvidia GeForce RTX 3060 Ti FE TB3) | |
| 1920x1080 Extreme HD Preset OpenGL AA:x8 | |
| Huawei MateBook X Pro 2023 (Nvidia GeForce RTX 3060 Ti FE TB3) | |
| Intel NUC 13 Pro Kit NUC13ANK (Nvidia GeForce RTX 3060 Ti FE TB3) | |
| Minisforum Venus Series UM690 (Nvidia GeForce RTX 3060 Ti FE TB3) | |
| Morefine M600 (Nvidia GeForce RTX 3060 Ti FE TB3) | |
| Morefine M600 (Nvidia GeForce RTX 3060 Ti FE TB3) | |
| Acer Swift Edge SFE16 (Nvidia GeForce RTX 3060 Ti FE TB3) | |
| Unigine Superposition | |
| 1920x1080 1080p High | |
| Intel NUC 13 Pro Kit NUC13ANK (Nvidia GeForce RTX 3060 Ti FE TB3) | |
| Morefine M600 (Nvidia GeForce RTX 3060 Ti FE TB3) | |
| Morefine M600 (Nvidia GeForce RTX 3060 Ti FE TB3) | |
| Acer Swift Edge SFE16 (Nvidia GeForce RTX 3060 Ti FE TB3) | |
| Minisforum Venus Series UM690 (Nvidia GeForce RTX 3060 Ti FE TB3) | |
| Huawei MateBook X Pro 2023 (Nvidia GeForce RTX 3060 Ti FE TB3) | |
| 1920x1080 1080p Extreme | |
| Intel NUC 13 Pro Kit NUC13ANK (Nvidia GeForce RTX 3060 Ti FE TB3) | |
| Morefine M600 (Nvidia GeForce RTX 3060 Ti FE TB3) | |
| Minisforum Venus Series UM690 (Nvidia GeForce RTX 3060 Ti FE TB3) | |
| Huawei MateBook X Pro 2023 (Nvidia GeForce RTX 3060 Ti FE TB3) | |
| Morefine M600 (Nvidia GeForce RTX 3060 Ti FE TB3) | |
| Acer Swift Edge SFE16 (Nvidia GeForce RTX 3060 Ti FE TB3) | |
| ComputeMark v2.1 | |
| 1024x600 Normal, Score | |
| Huawei MateBook X Pro 2023 (Nvidia GeForce RTX 3060 Ti FE TB3) | |
| Morefine M600 (Nvidia GeForce RTX 3060 Ti FE TB3) | |
| Intel NUC 13 Pro Kit NUC13ANK (Nvidia GeForce RTX 3060 Ti FE TB3) | |
| Minisforum Venus Series UM690 (Nvidia GeForce RTX 3060 Ti FE TB3) | |
| Morefine M600 (Nvidia GeForce RTX 3060 Ti FE TB3) | |
| 1024x600 Normal, Fluid 3DTex | |
| Morefine M600 (Nvidia GeForce RTX 3060 Ti FE TB3) | |
| Huawei MateBook X Pro 2023 (Nvidia GeForce RTX 3060 Ti FE TB3) | |
| Intel NUC 13 Pro Kit NUC13ANK (Nvidia GeForce RTX 3060 Ti FE TB3) | |
| Minisforum Venus Series UM690 (Nvidia GeForce RTX 3060 Ti FE TB3) | |
| Morefine M600 (Nvidia GeForce RTX 3060 Ti FE TB3) | |
| 1024x600 Normal, Fluid 2DTexArr | |
| Morefine M600 (Nvidia GeForce RTX 3060 Ti FE TB3) | |
| Huawei MateBook X Pro 2023 (Nvidia GeForce RTX 3060 Ti FE TB3) | |
| Minisforum Venus Series UM690 (Nvidia GeForce RTX 3060 Ti FE TB3) | |
| Intel NUC 13 Pro Kit NUC13ANK (Nvidia GeForce RTX 3060 Ti FE TB3) | |
| Morefine M600 (Nvidia GeForce RTX 3060 Ti FE TB3) | |
| 1024x600 Normal, Mandel Vector | |
| Huawei MateBook X Pro 2023 (Nvidia GeForce RTX 3060 Ti FE TB3) | |
| Intel NUC 13 Pro Kit NUC13ANK (Nvidia GeForce RTX 3060 Ti FE TB3) | |
| Morefine M600 (Nvidia GeForce RTX 3060 Ti FE TB3) | |
| Minisforum Venus Series UM690 (Nvidia GeForce RTX 3060 Ti FE TB3) | |
| Morefine M600 (Nvidia GeForce RTX 3060 Ti FE TB3) | |
| 1024x600 Normal, QJuliaRayTrace | |
| Huawei MateBook X Pro 2023 (Nvidia GeForce RTX 3060 Ti FE TB3) | |
| Intel NUC 13 Pro Kit NUC13ANK (Nvidia GeForce RTX 3060 Ti FE TB3) | |
| Morefine M600 (Nvidia GeForce RTX 3060 Ti FE TB3) | |
| Minisforum Venus Series UM690 (Nvidia GeForce RTX 3060 Ti FE TB3) | |
| Morefine M600 (Nvidia GeForce RTX 3060 Ti FE TB3) | |
| Performance rating - Percent | |
| Intel NUC 13 Pro Kit NUC13ANK (Nvidia GeForce RTX 3060 Ti FE TB3) | |
| Huawei MateBook X Pro 2023 (Nvidia GeForce RTX 3060 Ti FE TB3) | |
| Ace Magician AM08Pro (Nvidia GeForce RTX 3060 Ti FE TB3) | |
| Minisforum Venus Series UM690 (Nvidia GeForce RTX 3060 Ti FE TB3) | |
| Morefine M600 (Nvidia GeForce RTX 3060 Ti FE TB3) | |
| Acer Swift Edge SFE16 (Nvidia GeForce RTX 3060 Ti FE TB3) | |
| GTA V - 1920x1080 Highest AA:4xMSAA + FX AF:16x | |
| Intel NUC 13 Pro Kit NUC13ANK (Nvidia GeForce RTX 3060 Ti FE TB3) | |
| Huawei MateBook X Pro 2023 (Nvidia GeForce RTX 3060 Ti FE TB3) | |
| Ace Magician AM08Pro (Nvidia GeForce RTX 3060 Ti FE TB3) | |
| Minisforum Venus Series UM690 (Nvidia GeForce RTX 3060 Ti FE TB3) | |
| Morefine M600 (Nvidia GeForce RTX 3060 Ti FE TB3) | |
| Acer Swift Edge SFE16 (Nvidia GeForce RTX 3060 Ti FE TB3) | |
| The Witcher 3 - 1920x1080 Ultra Graphics & Postprocessing (HBAO+) | |
| Huawei MateBook X Pro 2023 (Nvidia GeForce RTX 3060 Ti FE TB3) | |
| Intel NUC 13 Pro Kit NUC13ANK (Nvidia GeForce RTX 3060 Ti FE TB3) | |
| Acer Swift Edge SFE16 (Nvidia GeForce RTX 3060 Ti FE TB3) | |
| Minisforum Venus Series UM690 (Nvidia GeForce RTX 3060 Ti FE TB3) | |
| Ace Magician AM08Pro (Nvidia GeForce RTX 3060 Ti FE TB3) | |
| Morefine M600 (Nvidia GeForce RTX 3060 Ti FE TB3) | |
| Dota 2 Reborn - 1920x1080 ultra (3/3) best looking | |
| Intel NUC 13 Pro Kit NUC13ANK (Nvidia GeForce RTX 3060 Ti FE TB3) | |
| Huawei MateBook X Pro 2023 (Nvidia GeForce RTX 3060 Ti FE TB3) | |
| Ace Magician AM08Pro (Nvidia GeForce RTX 3060 Ti FE TB3) | |
| Minisforum Venus Series UM690 (Nvidia GeForce RTX 3060 Ti FE TB3) | |
| Morefine M600 (Nvidia GeForce RTX 3060 Ti FE TB3) | |
| Acer Swift Edge SFE16 (Nvidia GeForce RTX 3060 Ti FE TB3) | |
| Final Fantasy XV Benchmark - 1920x1080 High Quality | |
| Intel NUC 13 Pro Kit NUC13ANK (Nvidia GeForce RTX 3060 Ti FE TB3) | |
| Huawei MateBook X Pro 2023 (Nvidia GeForce RTX 3060 Ti FE TB3) | |
| Morefine M600 (Nvidia GeForce RTX 3060 Ti FE TB3) | |
| Acer Swift Edge SFE16 (Nvidia GeForce RTX 3060 Ti FE TB3) | |
| Ace Magician AM08Pro (Nvidia GeForce RTX 3060 Ti FE TB3) | |
| Minisforum Venus Series UM690 (Nvidia GeForce RTX 3060 Ti FE TB3) | |
| Strange Brigade - 1920x1080 ultra AA:ultra AF:16 | |
| Intel NUC 13 Pro Kit NUC13ANK (Nvidia GeForce RTX 3060 Ti FE TB3) | |
| Huawei MateBook X Pro 2023 (Nvidia GeForce RTX 3060 Ti FE TB3) | |
| Acer Swift Edge SFE16 (Nvidia GeForce RTX 3060 Ti FE TB3) | |
| Ace Magician AM08Pro (Nvidia GeForce RTX 3060 Ti FE TB3) | |
| Morefine M600 (Nvidia GeForce RTX 3060 Ti FE TB3) | |
| Minisforum Venus Series UM690 (Nvidia GeForce RTX 3060 Ti FE TB3) | |
| Far Cry 5 - 1920x1080 Ultra Preset AA:T | |
| Intel NUC 13 Pro Kit NUC13ANK (Nvidia GeForce RTX 3060 Ti FE TB3) | |
| Huawei MateBook X Pro 2023 (Nvidia GeForce RTX 3060 Ti FE TB3) | |
| Ace Magician AM08Pro (Nvidia GeForce RTX 3060 Ti FE TB3) | |
| Minisforum Venus Series UM690 (Nvidia GeForce RTX 3060 Ti FE TB3) | |
| Morefine M600 (Nvidia GeForce RTX 3060 Ti FE TB3) | |
| Acer Swift Edge SFE16 (Nvidia GeForce RTX 3060 Ti FE TB3) | |
| Far Cry New Dawn - 1920x1080 Ultra Preset | |
| Intel NUC 13 Pro Kit NUC13ANK (Nvidia GeForce RTX 3060 Ti FE TB3) | |
| Ace Magician AM08Pro (Nvidia GeForce RTX 3060 Ti FE TB3) | |
| Huawei MateBook X Pro 2023 (Nvidia GeForce RTX 3060 Ti FE TB3) | |
| Minisforum Venus Series UM690 (Nvidia GeForce RTX 3060 Ti FE TB3) | |
| Morefine M600 (Nvidia GeForce RTX 3060 Ti FE TB3) | |
| Acer Swift Edge SFE16 (Nvidia GeForce RTX 3060 Ti FE TB3) | |
| F1 2020 - 1920x1080 Ultra High Preset AA:T AF:16x | |
| Intel NUC 13 Pro Kit NUC13ANK (Nvidia GeForce RTX 3060 Ti FE TB3) | |
| Huawei MateBook X Pro 2023 (Nvidia GeForce RTX 3060 Ti FE TB3) | |
| Acer Swift Edge SFE16 (Nvidia GeForce RTX 3060 Ti FE TB3) | |
| Morefine M600 (Nvidia GeForce RTX 3060 Ti FE TB3) | |
| Ace Magician AM08Pro (Nvidia GeForce RTX 3060 Ti FE TB3) | |
| Minisforum Venus Series UM690 (Nvidia GeForce RTX 3060 Ti FE TB3) | |
| F1 2021 - 1920x1080 Ultra High Preset + Raytracing AA:T AF:16x | |
| Intel NUC 13 Pro Kit NUC13ANK (Nvidia GeForce RTX 3060 Ti FE TB3) | |
| Acer Swift Edge SFE16 (Nvidia GeForce RTX 3060 Ti FE TB3) | |
| Huawei MateBook X Pro 2023 (Nvidia GeForce RTX 3060 Ti FE TB3) | |
| Ace Magician AM08Pro (Nvidia GeForce RTX 3060 Ti FE TB3) | |
| Morefine M600 (Nvidia GeForce RTX 3060 Ti FE TB3) | |
| Minisforum Venus Series UM690 (Nvidia GeForce RTX 3060 Ti FE TB3) | |
| Borderlands 3 - 1920x1080 Badass Overall Quality (DX11) | |
| Huawei MateBook X Pro 2023 (Nvidia GeForce RTX 3060 Ti FE TB3) | |
| Intel NUC 13 Pro Kit NUC13ANK (Nvidia GeForce RTX 3060 Ti FE TB3) | |
| Acer Swift Edge SFE16 (Nvidia GeForce RTX 3060 Ti FE TB3) | |
| Ace Magician AM08Pro (Nvidia GeForce RTX 3060 Ti FE TB3) | |
| Minisforum Venus Series UM690 (Nvidia GeForce RTX 3060 Ti FE TB3) | |
| Morefine M600 (Nvidia GeForce RTX 3060 Ti FE TB3) | |
| low | med. | high | ultra | QHD | 4K | |
|---|---|---|---|---|---|---|
| GTA V (2015) | 158.4 | 150.4 | 119.7 | 70.8 | 70.8 | 97.8 |
| The Witcher 3 (2015) | 234.6 | 168.2 | 125.4 | 65.3 | 65.9 | |
| Dota 2 Reborn (2015) | 107.9 | 97.9 | 95.6 | 90.4 | 89.5 | |
| Final Fantasy XV Benchmark (2018) | 130 | 121.5 | 91.9 | 75.9 | 48 | |
| X-Plane 11.11 (2018) | 77.8 | 67.4 | 56.3 | 49.6 | ||
| Far Cry 5 (2018) | 102 | 88 | 85 | 82 | 81 | 56 |
| Strange Brigade (2018) | 182 | 143.8 | 131.1 | 136.1 | 127.1 | 84.3 |
| Shadow of the Tomb Raider (2018) | 106.5 | 96.5 | 96.1 | 92 | 84.6 | 54.3 |
| Far Cry New Dawn (2019) | 98 | 86 | 82 | 76 | 73 | 58 |
| Metro Exodus (2019) | 133.4 | 89.4 | 67.7 | 51.3 | 45 | 33.5 |
| Borderlands 3 (2019) | 120.3 | 104.3 | 94.9 | 80.8 | 64.4 | 38.1 |
| F1 2020 (2020) | 167.3 | 105.5 | 115 | 97.4 | 86.5 | 59.5 |
| F1 2021 (2021) | 128.4 | 104.3 | 68.1 | 51.3 | 49.3 | 41.2 |
| Far Cry 6 (2021) | 65.5 | 59.3 | 50 | 44.5 | 42 | |
| God of War (2022) | 104.3 | 94.7 | 81.8 | 61.3 | 52.5 | 39.2 |
| GRID Legends (2022) | 94.1 | 84.3 | 75.4 | 67.5 | 62.2 | 49.5 |
| Tiny Tina's Wonderlands (2022) | 151.3 | 131.4 | 99.8 | 81.1 | 61.6 | 36.1 |
| F1 22 (2022) | 62.3 | 57.5 | 46.1 | 29 | 27.6 | 19.8 |
Emissions - Good enough cooling, but too small battery
Noise emissions
The device's built-in cooling system is relatively compact and consists of a small heat pipe as well as one fan. In idle mode, we noted very quiet volume levels - only just more than the measured ambient noise. As soon as the laptop is placed under any sort of load, you start to hear the little fan whirring. At most, we measured 42.7 dB(A) and average noise emissions were around 42.3 dB(A). There isn't that big a difference between medium and high load when it comes to how fast the fan spins. Subjectively, the Acer Swift Edge SFE16 does feel like it's a little louder due to the high frequency generated by the airflow. Even so, the Samsung and Acer devices we tested got even louder.
Noise level
| Idle |
| 25.7 / 27 / 29.3 dB(A) |
| Load |
| 42.3 / 42.7 dB(A) |
 | ||
30 dB silent 40 dB(A) audible 50 dB(A) loud |
||
min: | ||
| Acer Swift Edge SFE16-42-R1GM Radeon 680M, R7 7735U, Micron 3400 1TB MTFDKBA1T0TFH | LG Gram 16Z90Q Iris Xe G7 96EUs, i7-1260P, Samsung PM9A1 MZVL21T0HCLR | Samsung Galaxy Book3 Pro 16 Iris Xe G7 80EUs, i5-1340P, WD PC SN740 256GB SDDPNQD-256G | Acer TravelMate P4 TMP416-51-55KN Iris Xe G7 80EUs, i5-1240P, Micron 2450 512GB MTFDKBA512TFK | LG Ultra-PC 16 16U70Q-G.AR36G Vega 6, R3 5300U, Samsung PM991 MZVLQ512HBLU | Lenovo ThinkPad T16 G1 21CH004MGE Radeon 660M, R5 PRO 6650U, Micron 2450 512GB MTFDKBA512TFK | |
|---|---|---|---|---|---|---|
| Noise | 5% | -1% | 3% | 9% | 17% | |
| off / environment * (dB) | 25.7 | 25 3% | 25.2 2% | 25.4 1% | 25 3% | 23.1 10% |
| Idle Minimum * (dB) | 25.7 | 26 -1% | 25.2 2% | 25.4 1% | 25 3% | 23.1 10% |
| Idle Average * (dB) | 27 | 27 -0% | 25.2 7% | 25.4 6% | 25 7% | 23.1 14% |
| Idle Maximum * (dB) | 29.3 | 28 4% | 29.3 -0% | 25.4 13% | 25.4 13% | 23.1 21% |
| Load Average * (dB) | 42.3 | 38 10% | 46.4 -10% | 43.9 -4% | 36.2 14% | 25.4 40% |
| Load Maximum * (dB) | 42.7 | 38 11% | 46.4 -9% | 43.7 -2% | 36.4 15% | 39.1 8% |
| Witcher 3 ultra * (dB) | 37 | 35.93 |
* ... smaller is better
Temperature
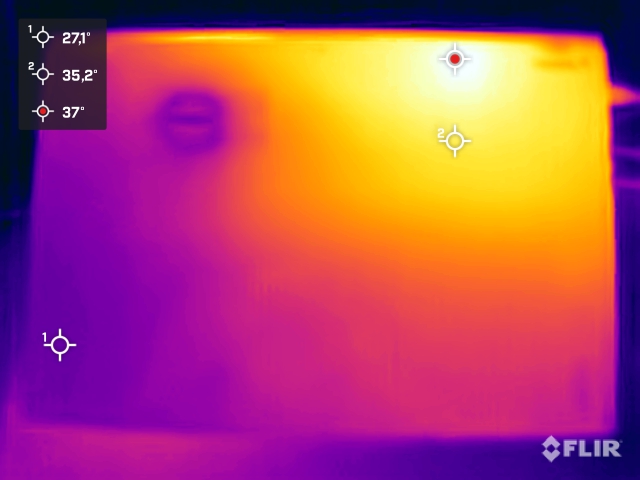
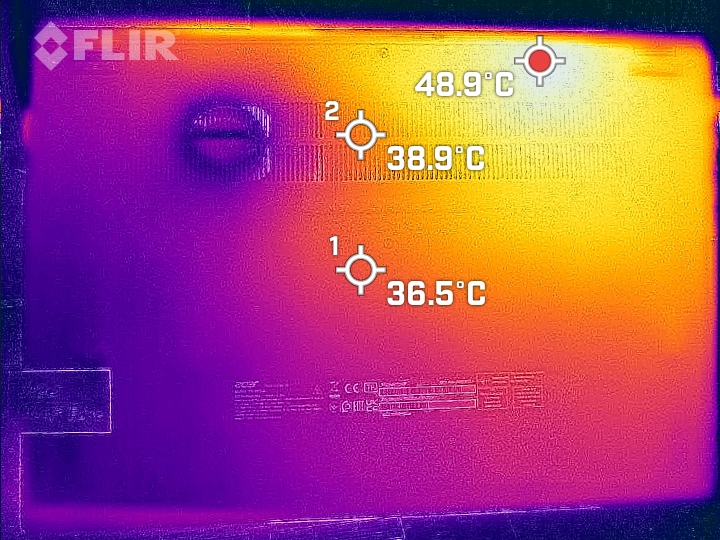
In idle mode, we didn't initially observe any extreme temperature hotspots on the laptop's surfaces. Even under load, we only measured temperatures above 40 °C in a few areas. Compared to its competitors, the Acer Swift Edge SFE16's case heated up a bit more. However, we would not consider this to be problematic in everyday use.
(-) The maximum temperature on the upper side is 49.4 °C / 121 F, compared to the average of 34.3 °C / 94 F, ranging from 21.2 to 62.5 °C for the class Office.
(±) The bottom heats up to a maximum of 44.7 °C / 112 F, compared to the average of 36.8 °C / 98 F
(+) In idle usage, the average temperature for the upper side is 28.4 °C / 83 F, compared to the device average of 29.5 °C / 85 F.
(+) The palmrests and touchpad are reaching skin temperature as a maximum (33 °C / 91.4 F) and are therefore not hot.
(-) The average temperature of the palmrest area of similar devices was 27.6 °C / 81.7 F (-5.4 °C / -9.7 F).


| Acer Swift Edge SFE16-42-R1GM AMD Ryzen 7 7735U, AMD Radeon 680M | LG Gram 16Z90Q Intel Core i7-1260P, Intel Iris Xe Graphics G7 96EUs | Samsung Galaxy Book3 Pro 16 Intel Core i5-1340P, Intel Iris Xe Graphics G7 80EUs | Acer TravelMate P4 TMP416-51-55KN Intel Core i5-1240P, Intel Iris Xe Graphics G7 80EUs | LG Ultra-PC 16 16U70Q-G.AR36G AMD Ryzen 3 5300U, AMD Radeon RX Vega 6 (Ryzen 4000/5000) | Lenovo ThinkPad T16 G1 21CH004MGE AMD Ryzen 5 PRO 6650U, AMD Radeon 660M | |
|---|---|---|---|---|---|---|
| Heat | 14% | 5% | 8% | 13% | 23% | |
| Maximum Upper Side * (°C) | 49.4 | 45 9% | 41.6 16% | 38.6 22% | 39.5 20% | 34.6 30% |
| Maximum Bottom * (°C) | 44.7 | 43 4% | 45 -1% | 44.4 1% | 45 -1% | 41.5 7% |
| Idle Upper Side * (°C) | 34 | 26 24% | 31 9% | 28.9 15% | 26.7 21% | 22.6 34% |
| Idle Bottom * (°C) | 31.6 | 26 18% | 33.6 -6% | 34 -8% | 28.2 11% | 24.5 22% |
* ... smaller is better
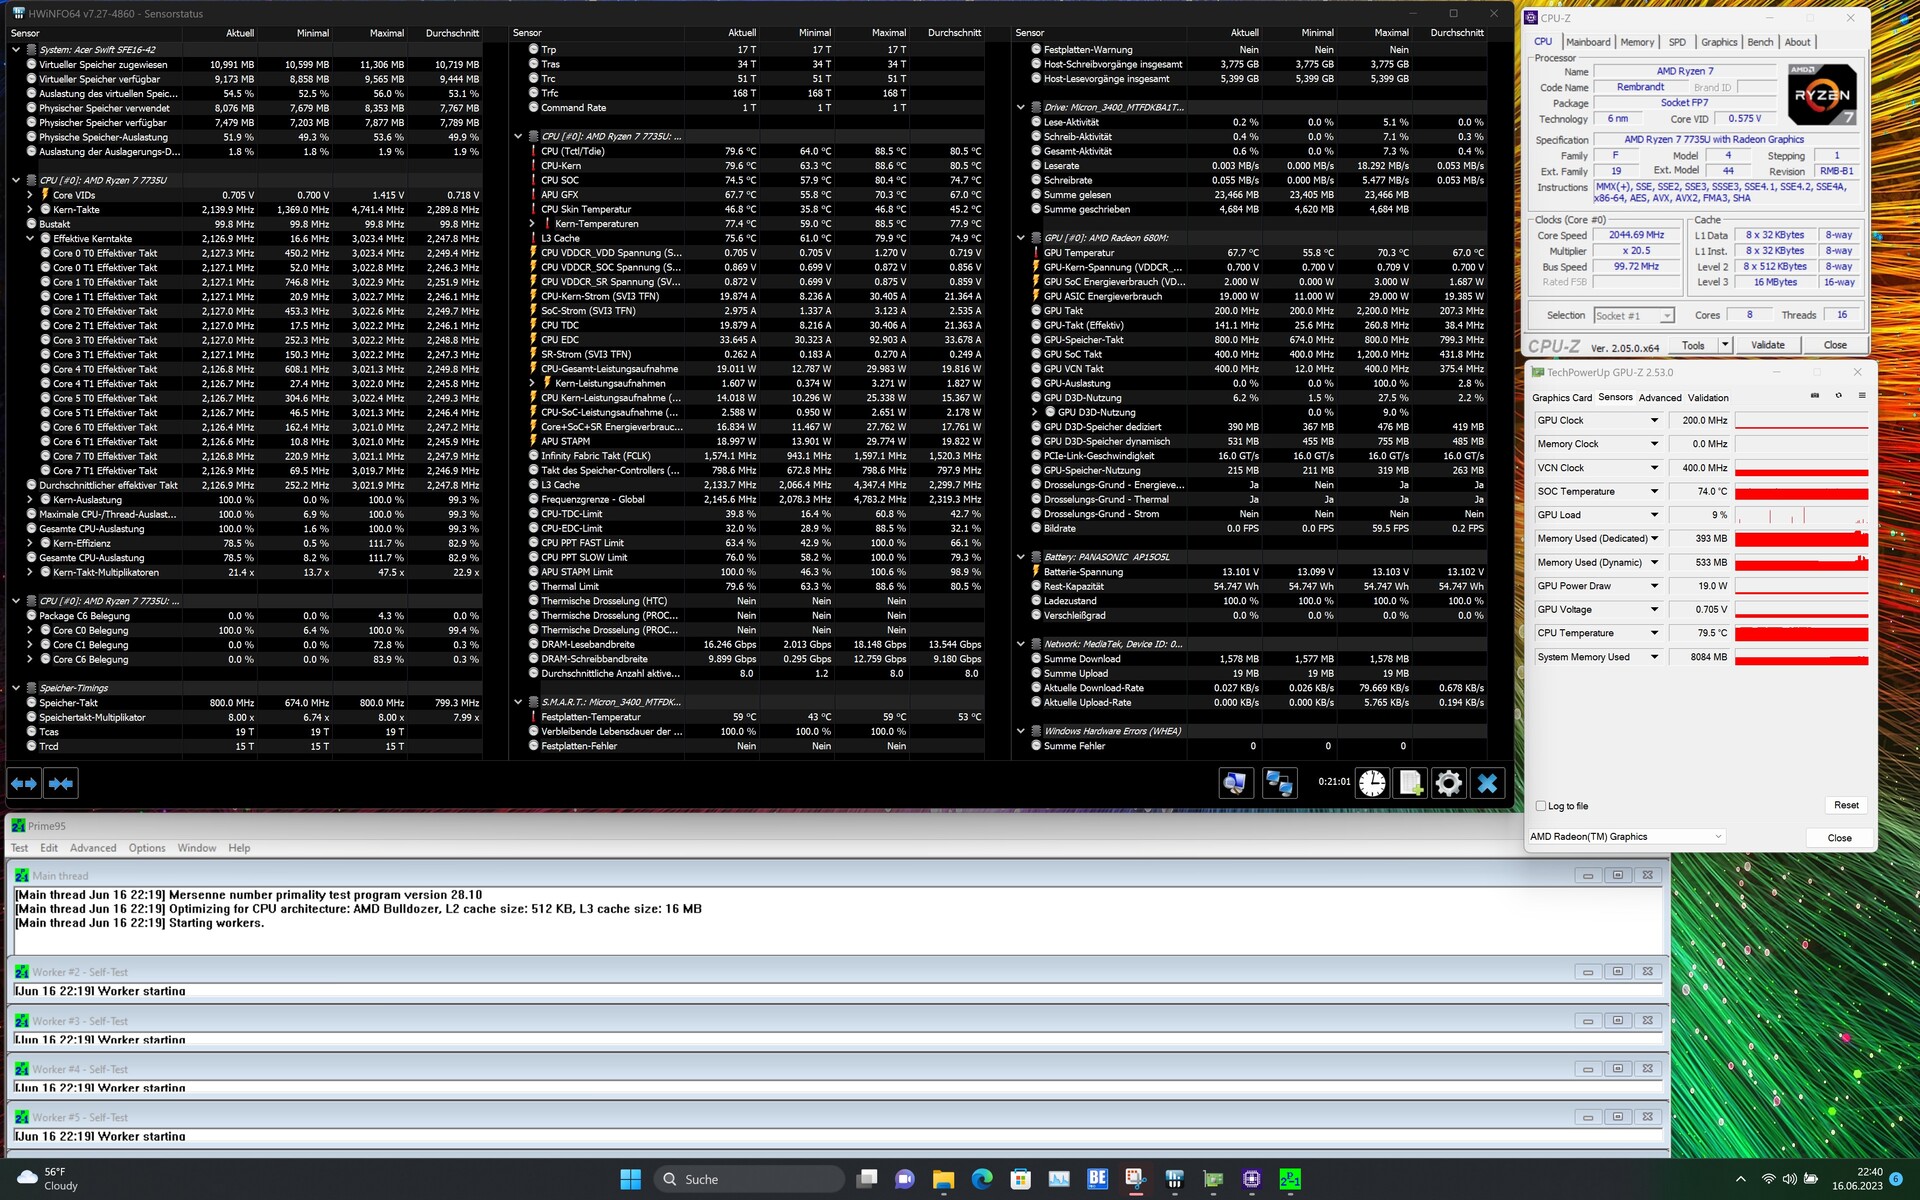
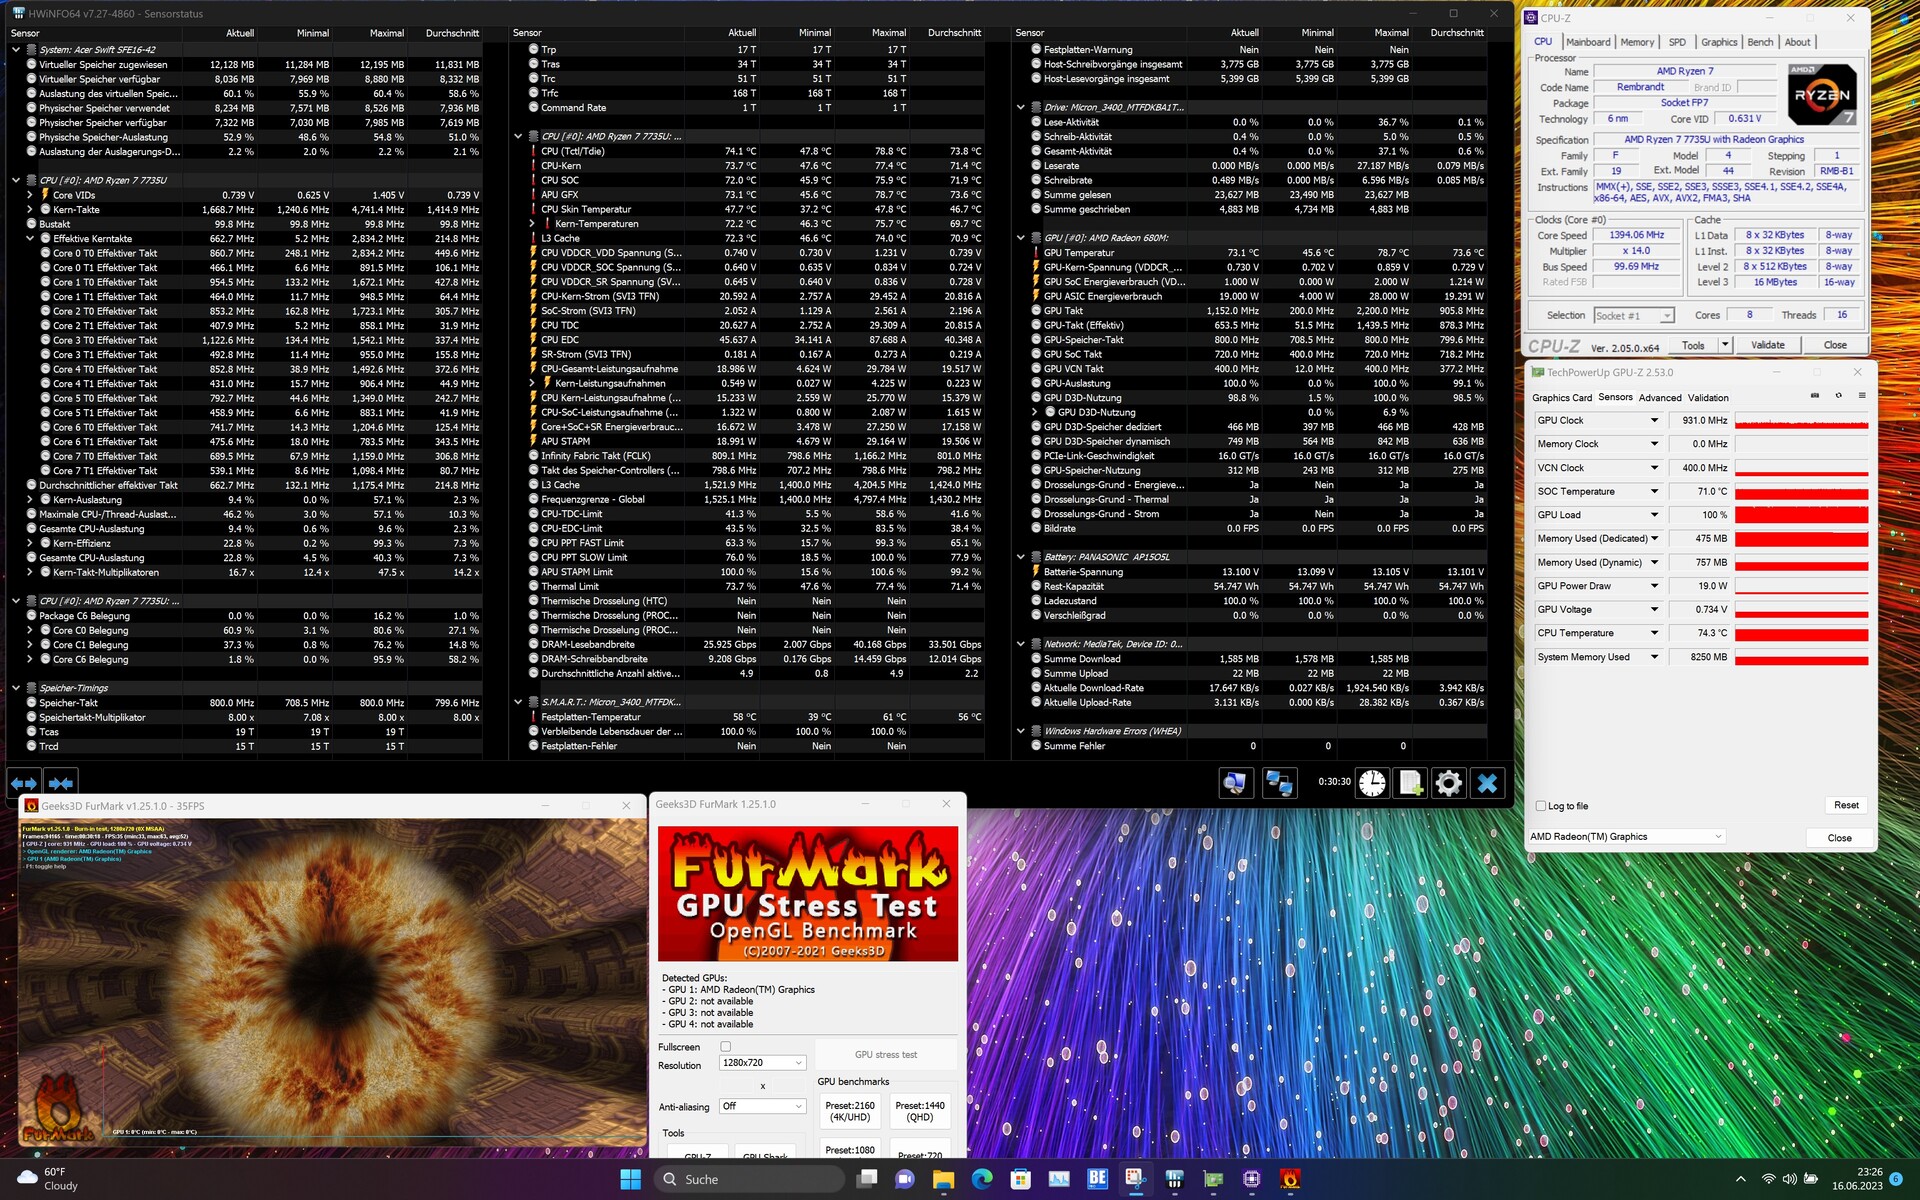
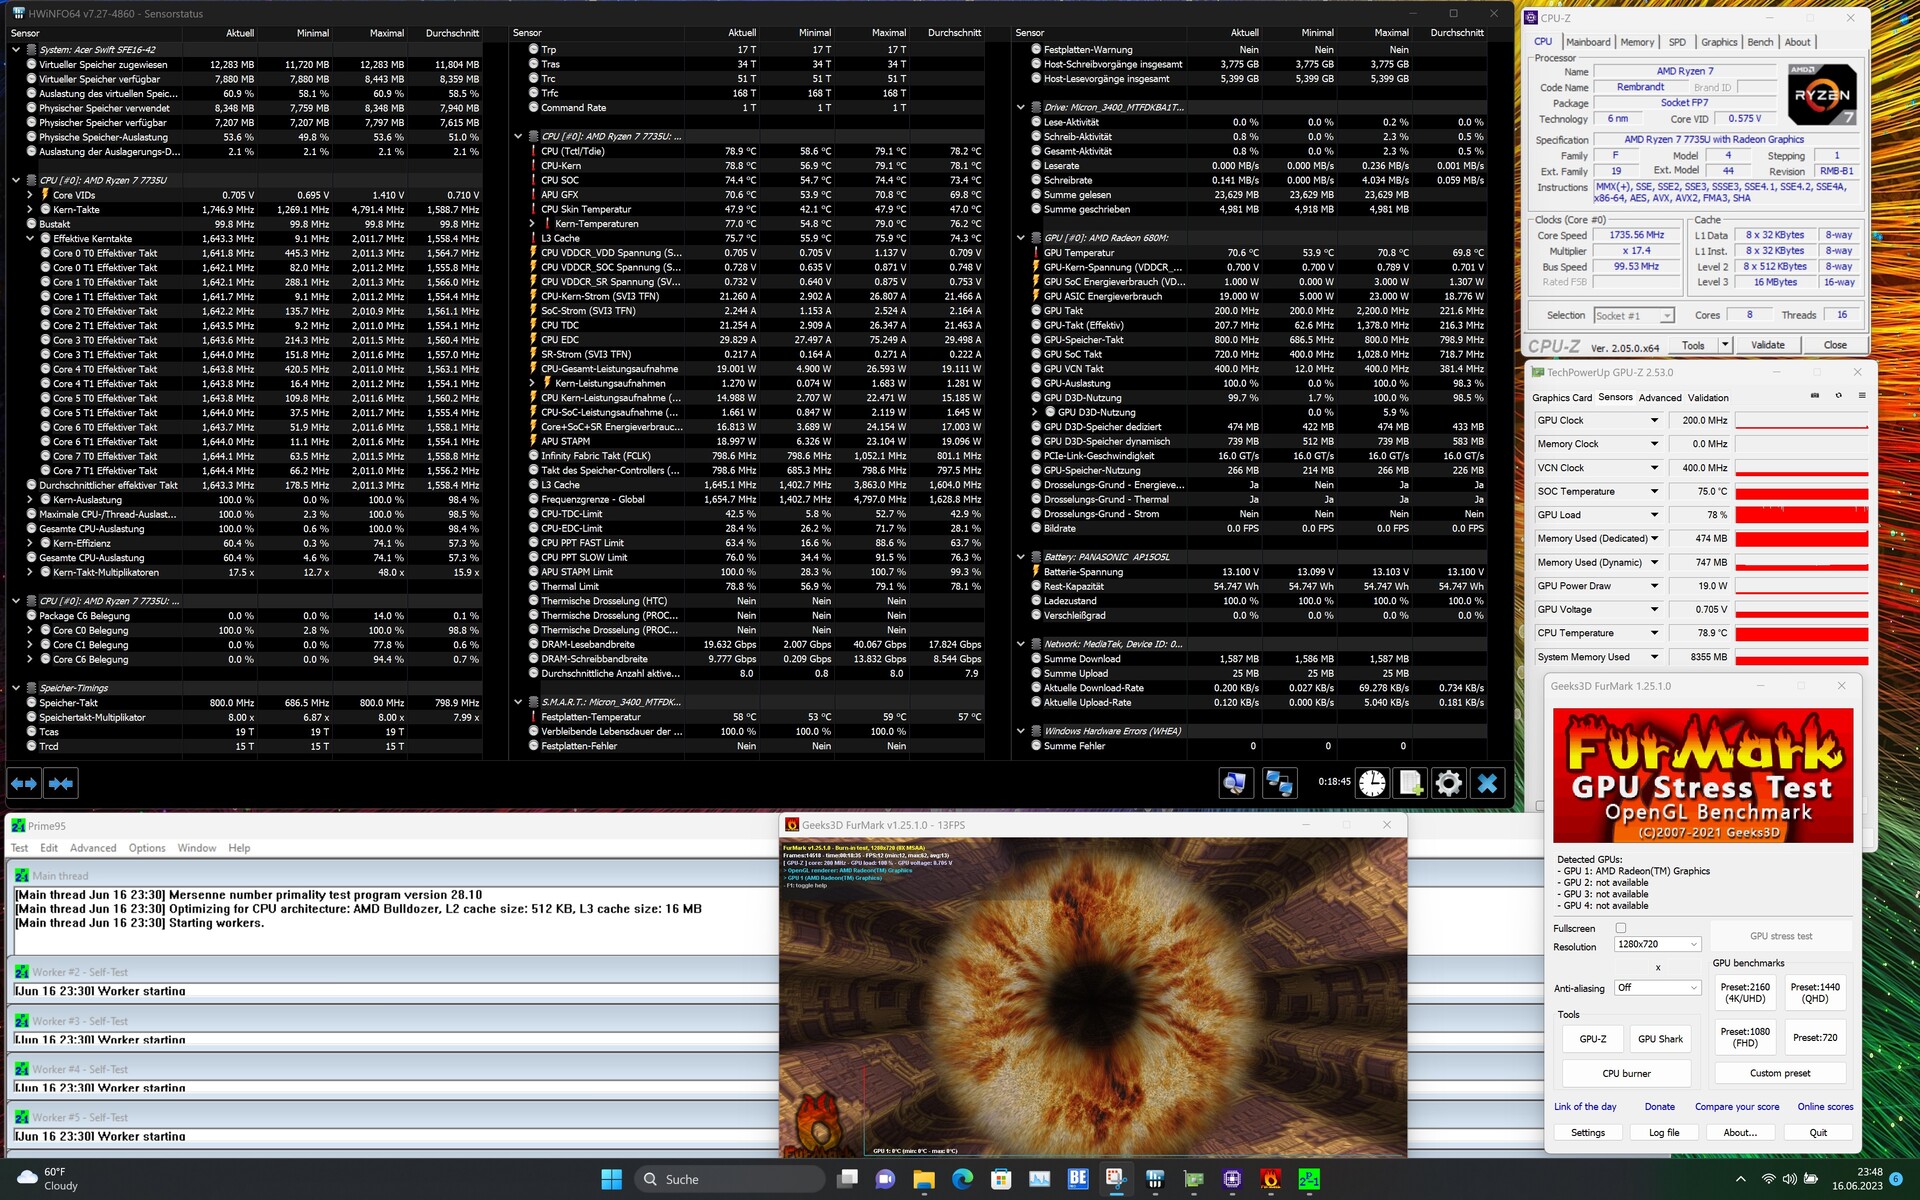
Stress test
We can hardly speak of temperature problems when talking about the Acer Swift Edge SFE16. At no point did we measure any critical temperatures. We noted a maximum of 88 °C using Prime95. In the further course, this leveled off at around 80 °C. We did, however, also see that the PL1 value could be kept at 20 watts during longer load and was not subject to big fluctuations. We measured a short spike up to around 30 watts, which was also when the temperature peaked.
Speakers

The two speakers are located next to the keyboard and are directed downwards. As a result, the sound quality varies greatly depending on the surface on which the device is placed. In general, trebles and mids predominate, although basses are actually present, too - to some extent. The speakers are good enough for video calls, and voices can be heard clearly.
Acer Swift Edge SFE16-42-R1GM audio analysis
(+) | speakers can play relatively loud (83.7 dB)
Bass 100 - 315 Hz
(-) | nearly no bass - on average 30% lower than median
(±) | linearity of bass is average (12.4% delta to prev. frequency)
Mids 400 - 2000 Hz
(+) | balanced mids - only 3.7% away from median
(±) | linearity of mids is average (8% delta to prev. frequency)
Highs 2 - 16 kHz
(±) | higher highs - on average 7.4% higher than median
(±) | linearity of highs is average (8% delta to prev. frequency)
Overall 100 - 16.000 Hz
(±) | linearity of overall sound is average (23.3% difference to median)
Compared to same class
» 66% of all tested devices in this class were better, 7% similar, 27% worse
» The best had a delta of 7%, average was 21%, worst was 53%
Compared to all devices tested
» 70% of all tested devices were better, 5% similar, 25% worse
» The best had a delta of 4%, average was 23%, worst was 134%
Apple MacBook Pro 16 2021 M1 Pro audio analysis
(+) | speakers can play relatively loud (84.7 dB)
Bass 100 - 315 Hz
(+) | good bass - only 3.8% away from median
(+) | bass is linear (5.2% delta to prev. frequency)
Mids 400 - 2000 Hz
(+) | balanced mids - only 1.3% away from median
(+) | mids are linear (2.1% delta to prev. frequency)
Highs 2 - 16 kHz
(+) | balanced highs - only 1.9% away from median
(+) | highs are linear (2.7% delta to prev. frequency)
Overall 100 - 16.000 Hz
(+) | overall sound is linear (4.6% difference to median)
Compared to same class
» 0% of all tested devices in this class were better, 0% similar, 100% worse
» The best had a delta of 5%, average was 17%, worst was 45%
Compared to all devices tested
» 0% of all tested devices were better, 0% similar, 100% worse
» The best had a delta of 4%, average was 23%, worst was 134%
Power management
Power consumption
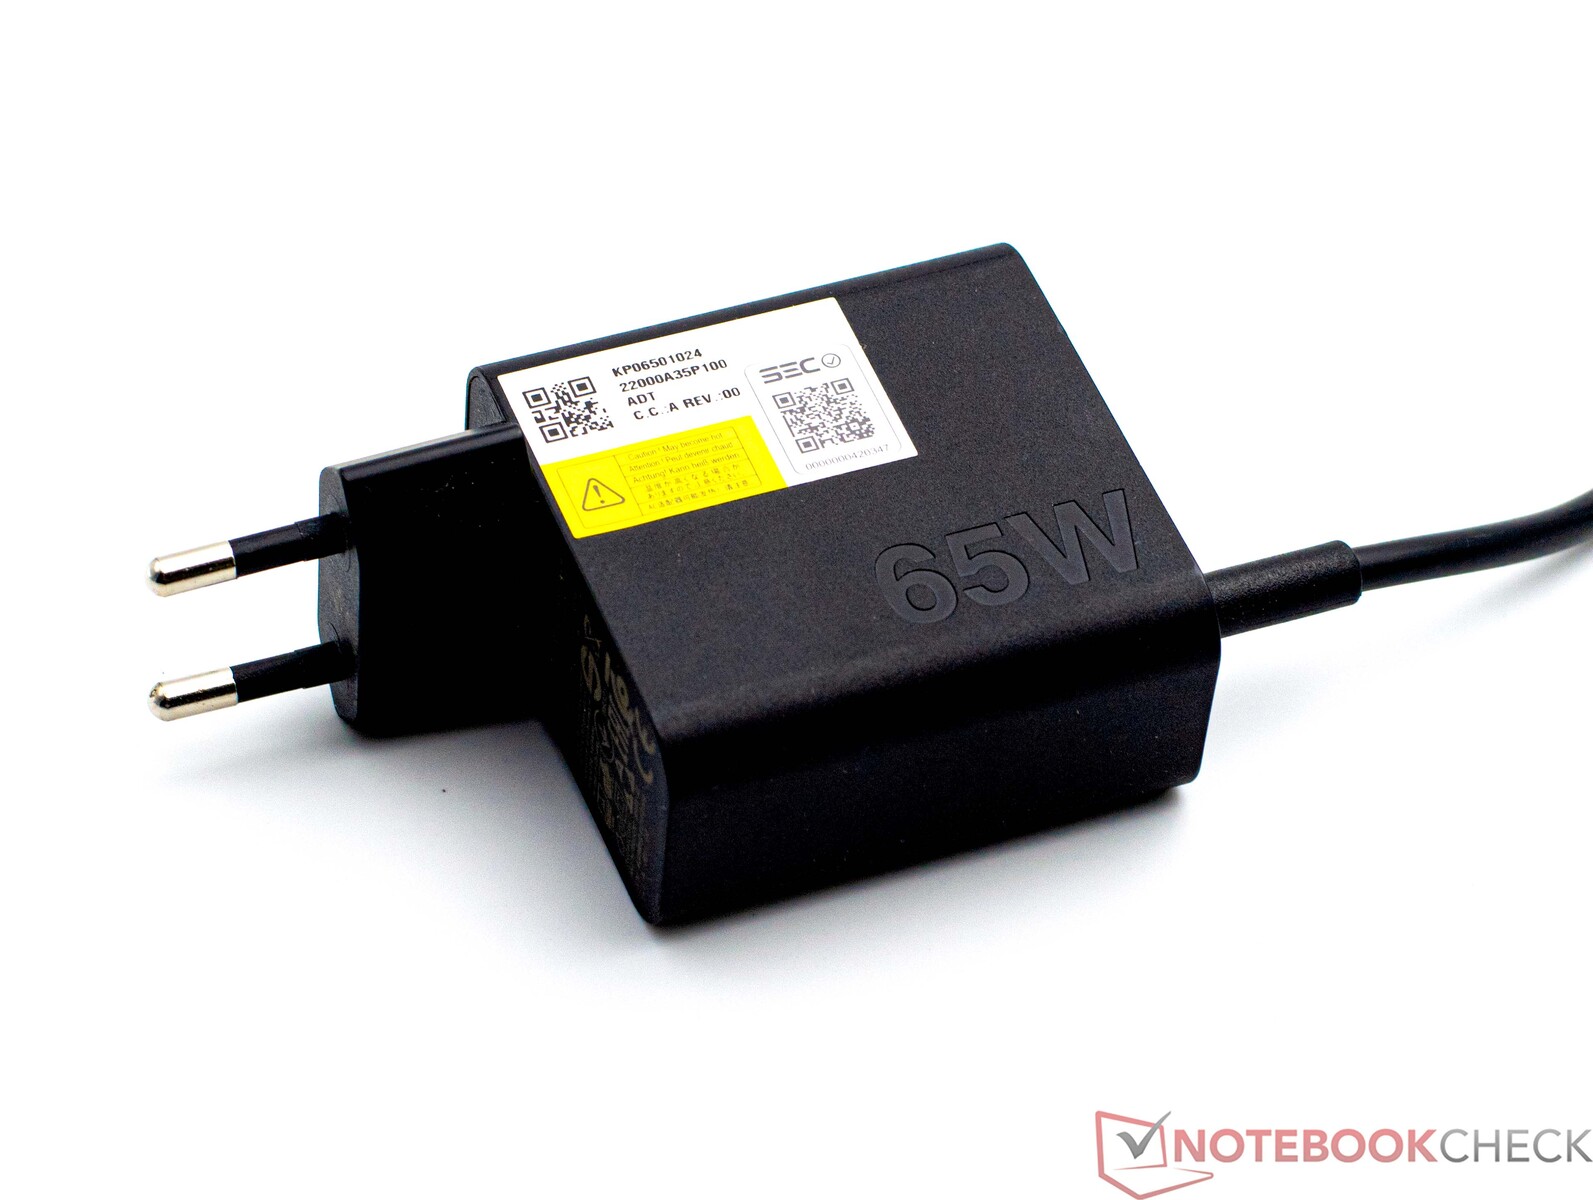
In comparison, the Acer Swift Edge SFE16 isn't very frugal. Still, we measured an average of 48 watts under load and a peak of 56 watts - a moderate power consumption level. Nevertheless, the laptop still showed room for improvement in idle mode, as its competitors were at times much more frugal. Its charger charges the device via a USB-C connector and can deliver a maximum of 65 watts. This is more than enough for the Acer Swift Edge SFE16.
| Off / Standby | |
| Idle | |
| Load |
|
Key:
min: | |
| Acer Swift Edge SFE16-42-R1GM R7 7735U, Radeon 680M, Micron 3400 1TB MTFDKBA1T0TFH, OLED, 3840x2400, 16" | LG Gram 16Z90Q i7-1260P, Iris Xe G7 96EUs, Samsung PM9A1 MZVL21T0HCLR, IPS, 2560x1600, 16" | Samsung Galaxy Book3 Pro 16 i5-1340P, Iris Xe G7 80EUs, WD PC SN740 256GB SDDPNQD-256G, AMOLED, 2880x1800, 16" | Acer TravelMate P4 TMP416-51-55KN i5-1240P, Iris Xe G7 80EUs, Micron 2450 512GB MTFDKBA512TFK, IPS, 1920x1200, 16" | LG Ultra-PC 16 16U70Q-G.AR36G R3 5300U, Vega 6, Samsung PM991 MZVLQ512HBLU, IPS, 1280x1200, 16" | Lenovo ThinkPad T16 G1 21CH004MGE R5 PRO 6650U, Radeon 660M, Micron 2450 512GB MTFDKBA512TFK, IPS-LED, 2560x1600, 16" | Average AMD Radeon 680M | Average of class Office | |
|---|---|---|---|---|---|---|---|---|
| Power Consumption | 1% | 15% | 9% | 28% | 13% | -10% | 12% | |
| Idle Minimum * (Watt) | 8.6 | 5 42% | 3.9 55% | 5.2 40% | 3.7 57% | 3.2 63% | 6.93 ? 19% | 4.25 ? 51% |
| Idle Average * (Watt) | 7.7 | 8 -4% | 4.8 38% | 7.1 8% | 6.8 12% | 8.1 -5% | 8.98 ? -17% | 7.3 ? 5% |
| Idle Maximum * (Watt) | 9.3 | 14 -51% | 10 -8% | 9.6 -3% | 8.6 8% | 8.6 8% | 10.5 ? -13% | 8.57 ? 8% |
| Load Average * (Watt) | 47.9 | 47 2% | 44 8% | 47 2% | 30 37% | 45.4 5% | 53.5 ? -12% | 43.8 ? 9% |
| Witcher 3 ultra * (Watt) | 46.3 | 37.8 18% | 42.3 9% | 43.3 6% | 30.2 35% | 40 14% | ||
| Load Maximum * (Watt) | 56 | 56 -0% | 63 -13% | 56 -0% | 45 20% | 59.6 -6% | 70.5 ? -26% | 64.5 ? -15% |
* ... smaller is better
Power consumption Witcher 3 / stress test
Power consumption with external monitor
Runtimes

The installed battery has a 54-Wh capacity, meaning the Acer Swift Edge SFE16 has quite a small battery compared to the other devices we tested. Only the Lenovo ThinkPad T16 is subjected to an even smaller battery and even so, we measured much longer runtimes on this device than on our test sample. Due to its comparatively small power storage, the Acer Swift Edge SFE16 simply cannot keep up with its competitors. Even so, its runtimes of just over 7 hours in our WLAN test are still sufficient for everyday use. In this test, the laptop's display brightness was lowered by three levels down to 150 cd/m². At maximum display brightness, you will have to factor in even shorter runtimes - about 5 hours, to be precise.
In our test, it took 163 minutes to charge the laptop fully. That is a bit longer than expected and should be taken into account during use. However, the 90% mark was already reached in just under half that time.

| Acer Swift Edge SFE16-42-R1GM R7 7735U, Radeon 680M, 54 Wh | LG Gram 16Z90Q i7-1260P, Iris Xe G7 96EUs, 80 Wh | Samsung Galaxy Book3 Pro 16 i5-1340P, Iris Xe G7 80EUs, 76 Wh | Acer TravelMate P4 TMP416-51-55KN i5-1240P, Iris Xe G7 80EUs, 56 Wh | LG Ultra-PC 16 16U70Q-G.AR36G R3 5300U, Vega 6, 72 Wh | Lenovo ThinkPad T16 G1 21CH004MGE R5 PRO 6650U, Radeon 660M, 52.5 Wh | Average of class Office | |
|---|---|---|---|---|---|---|---|
| Battery runtime | 59% | 80% | 29% | 130% | 15% | 71% | |
| Reader / Idle (h) | 10.9 | 18.1 66% | 30.4 179% | 32.3 196% | 22.2 ? 104% | ||
| H.264 (h) | 8.6 | 14.4 67% | 10.9 27% | 15.4 ? 79% | |||
| WiFi v1.3 (h) | 7.3 | 10.1 38% | 10.2 40% | 9.4 29% | 17.1 134% | 10.6 45% | 13.2 ? 81% |
| Load (h) | 1.5 | 2.6 73% | 2 33% | 2.4 60% | 1.1 -27% | 1.808 ? 21% |
Pros
Cons
Verdict - A lightweight laptop with good performance

The Acer Swift Edge SFE16 has lots to offer as an office laptop and could easily be used as a multimedia device. The 16-inch device is one of the lightest in the comparison field and in addition to this, it is extremely thin and still performs well. The installed AMD Ryzen 7 7735U, with its 8 cores, was able to deliver great multi-core performance even without throttling too much under load. Furthermore, the SoC has a good iGPU - better than pretty much all of the Intel devices in this test. You still have to take into account that Intel are the clear winners when it comes to CPU performance.
With regard to the laptop's build, we have nothing but positive things to say. Its high-quality materials justify the device's price - although, its smooth surfaces tend to attract quite a few fingerprints. The manufacturer has made sure to keep the Acer Swift Edge SFE16 up-to-date by treating it to two Thunderbolt 4 ports. We would've been happy about an additional SD card reader. Unfortunately, the laptop can only accommodate one SSD and the RAM proves to have its limitations as well, as you can't upgrade it at all. If you would like to be on the safe side, you would be better off spending the extra money and getting the model with 32 GB RAM. Still, the 1 TB storage capacity should be enough for most people.
The Acer Swift Edge SFE16 has a stunning OLED display and a fast and frugal processor. Due to its limited upgrade options, you should make sure to just go for the Swift Edge with 32 GB RAM.
The highlight of the Acer Swift Edge SFE16 is clearly its OLED display. It is super sharp and did amazingly in our tests. Thanks to its high color accuracy and good Delta E 2000 values, the Acer laptop could easily find itself on the wish lists of many professional content creators. You do have to make a compromise when it comes to battery life; the LG and Samsung devices did a little better here. The LG Gram 16 remains one of its biggest competitors, as its screen is on a similarly high level to that of the Swift Edge SFE16. Both devices are currently a little cheaper than the Acer Swift Edge SFE16, but they also come with their own individual critique points.
Price and availability
The Acer Swift Edge SFE16 can currently be found from $1,079 on Amazon.
Acer Swift Edge SFE16-42-R1GM
- 06/18/2023 v7 (old)
Sebastian Bade
Transparency
The selection of devices to be reviewed is made by our editorial team. The test sample was provided to the author as a loan by the manufacturer or retailer for the purpose of this review. The lender had no influence on this review, nor did the manufacturer receive a copy of this review before publication. There was no obligation to publish this review. As an independent media company, Notebookcheck is not subjected to the authority of manufacturers, retailers or publishers.
This is how Notebookcheck is testing
Every year, Notebookcheck independently reviews hundreds of laptops and smartphones using standardized procedures to ensure that all results are comparable. We have continuously developed our test methods for around 20 years and set industry standards in the process. In our test labs, high-quality measuring equipment is utilized by experienced technicians and editors. These tests involve a multi-stage validation process. Our complex rating system is based on hundreds of well-founded measurements and benchmarks, which maintains objectivity. Further information on our test methods can be found here.
Price comparison

