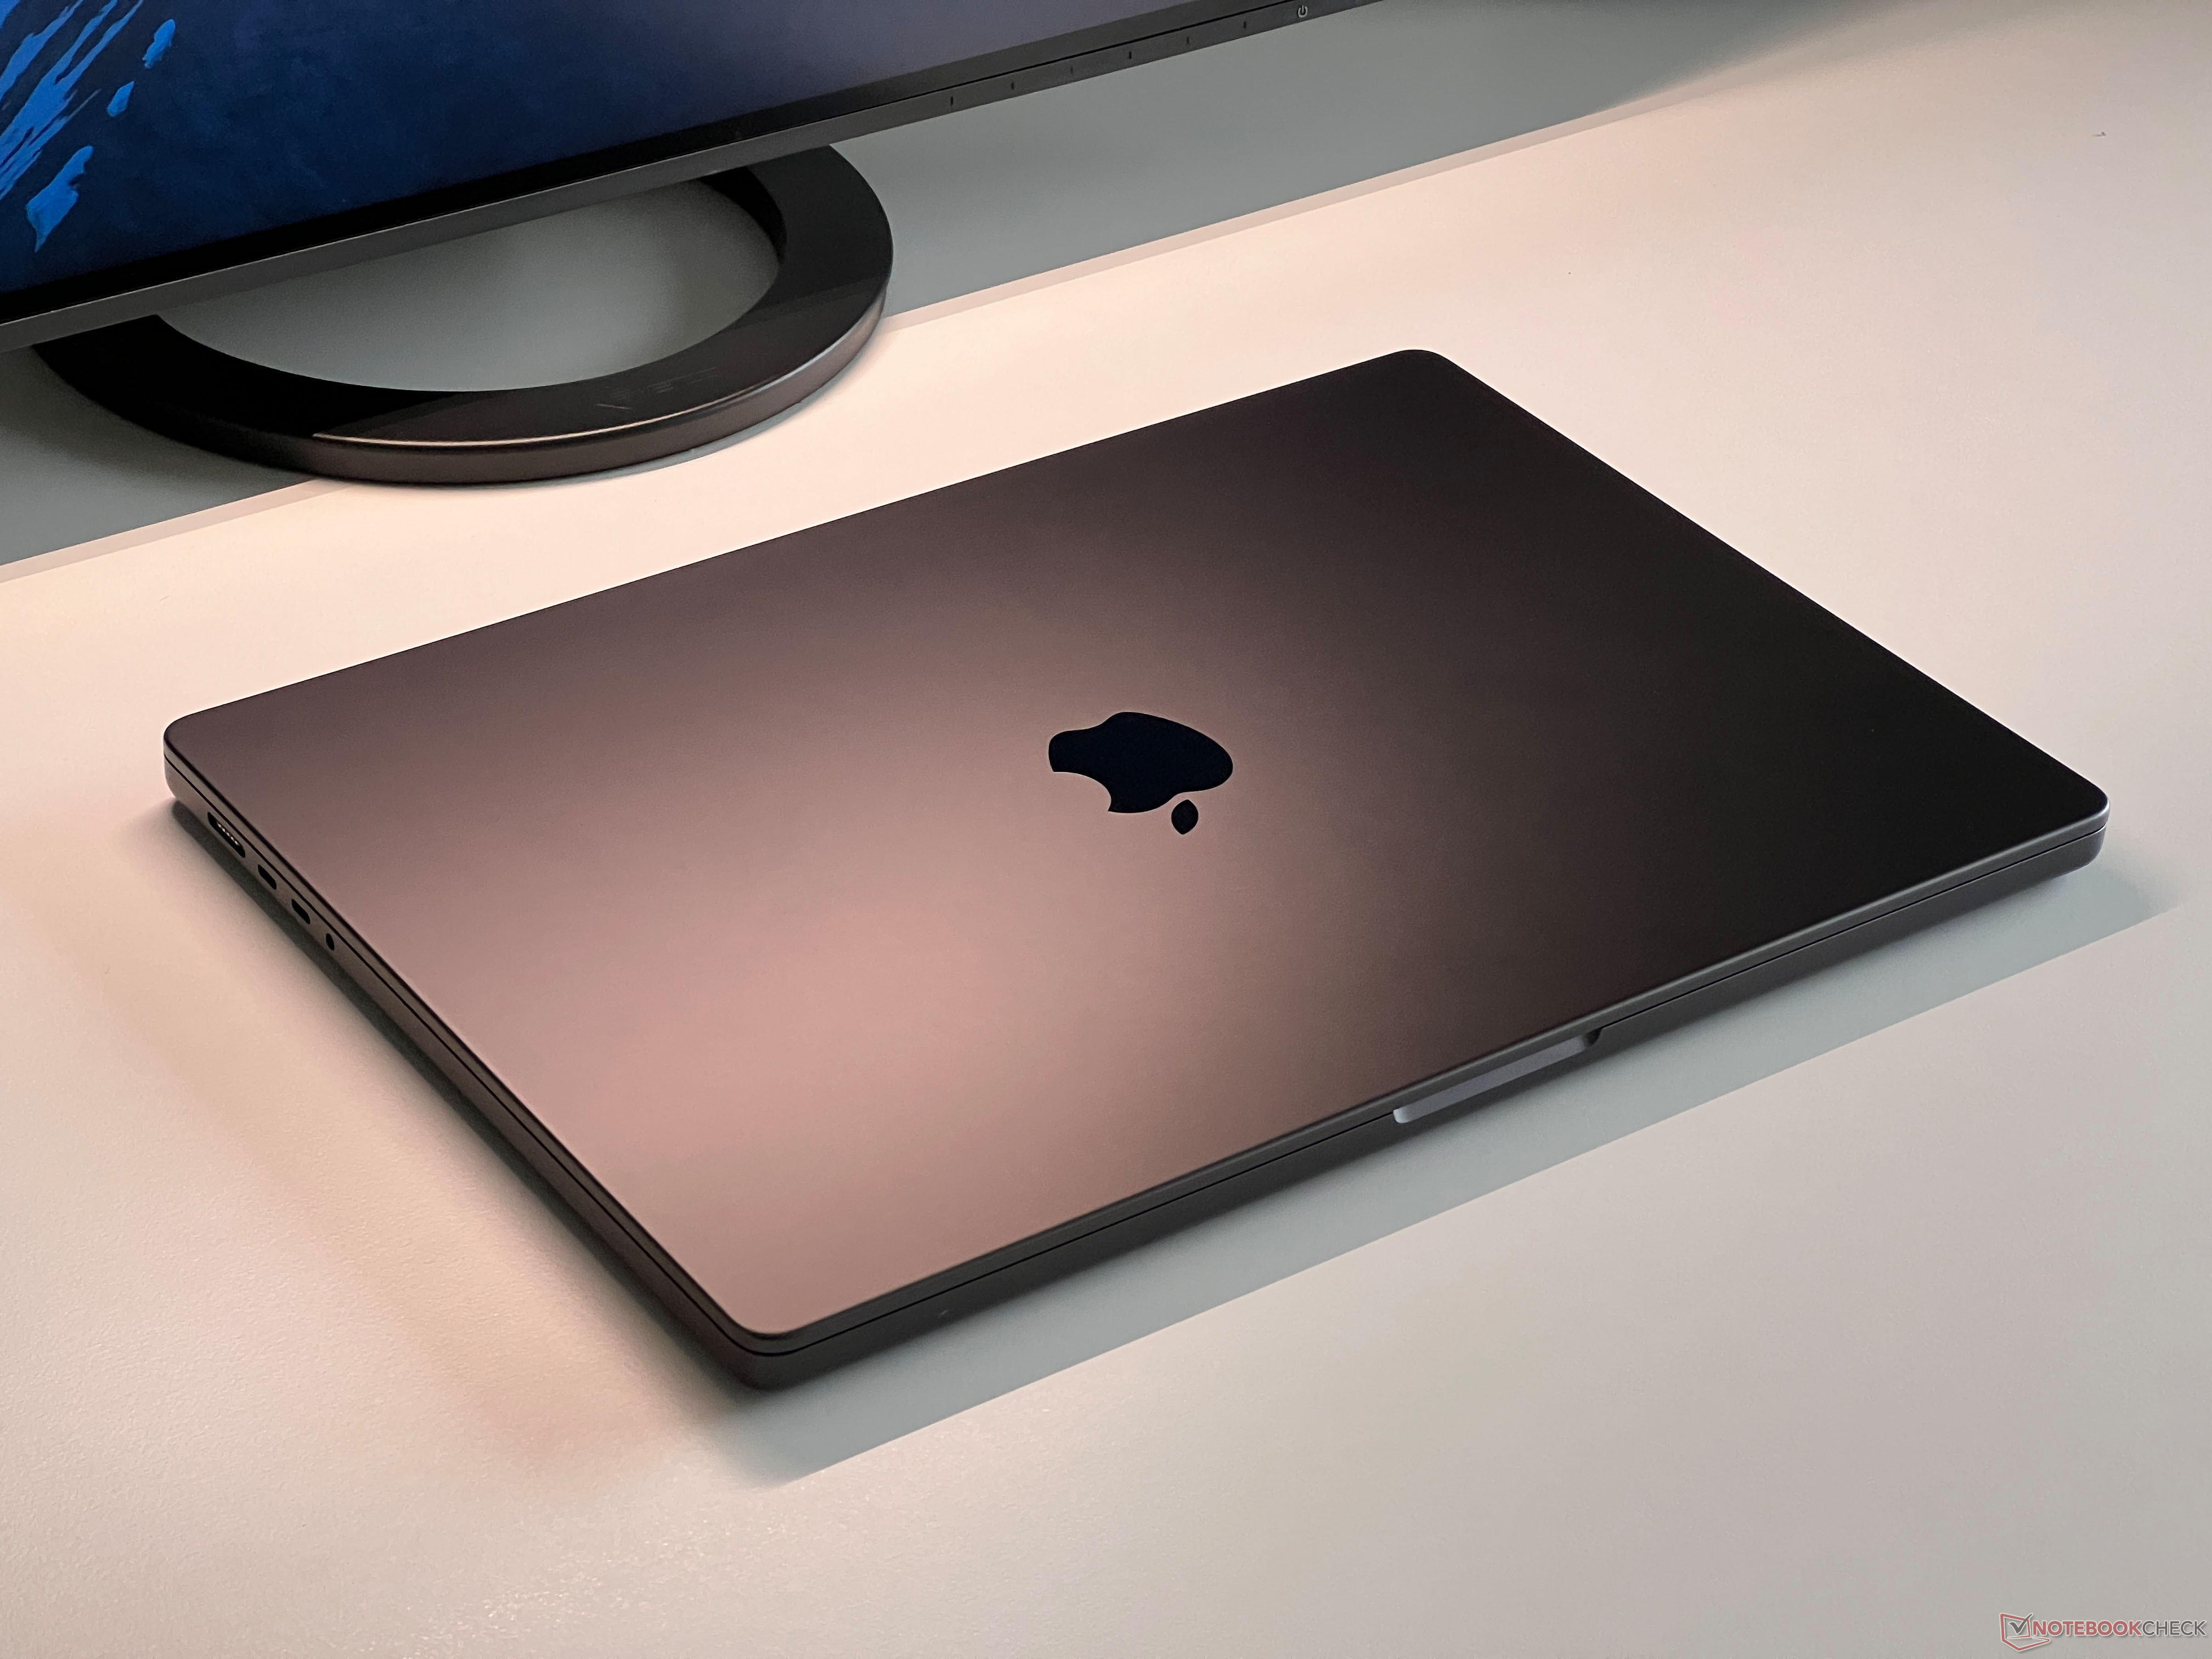
Apple MacBook Pro 16 2023 M3 Pro review - Efficiency before performance
We already tested the new high-end version of the MacBook Pro (MBP) 16 2023 with the M3 Max, but the entry model with the M3 Pro SoC at an MSRP of €2,999 (~US$3,272) might be much more interesting for most users. Even though more performance can never hurt, not every user needs the extreme performance (both CPU and GPU) of the new M3 Max.
In contrast to the smaller MacBook Pro 14, the MBP 16 only comes with the fastest version of the M3 Pro. Despite its high price, the basic model still keeps its meager 512 GB SSD.
| MBP 16 M3 Pro | MBP 16 M3 Max | MBP 16 M3 Max | |
|---|---|---|---|
| CPU | Apple M3 Pro 12 CPU cores (6P & 6E) |
Apple M3 Max 14 CPU cores (10P & 4E) |
Apple M3 Max 16 CPU cores (12P & 4E) |
| GPU | 18 GPU cores | 30 GPU cores | 40 GPU cores |
| RAM | 18 GB (36 GB) | 36 GB (96 GB) | 48 GB (64/128 GB) |
| SSD | 512 GB (1/2/4 TB) | 1 TB (2/4/8 TB) | 1 TB (2/4/8 TB) |
| Storage Bandwidth | 150 GB/s | 300 GB/s | 400 GB/s |
| Connections | 3x USB-C 4.0 with Thunderbolt 4 HDMI, SD card reader |
3x USB-C 4.0 with Thunderbolt 4 HDMI, SD card reader |
3x USB-C 4.0 with Thunderbolt 4 HDMI, SD card reader |
| Price | from 2,999 Euros (~$3,272) | from 4,249 Euros (~$4,635) | from 4,849 Euros (~$5,290) |
Our comparison devices of course include the predecessor models of the MacBook Pro 16 with M1 and M2 chips but also some high-quality Windows multimedia laptops such as the Dell XPS 15, the Lenovo Yoga Pro 9i 16, Asus Vivobook Pro 16, Schenker Vision 16, and also the Samsung Galaxy Book3 Ultra 16.
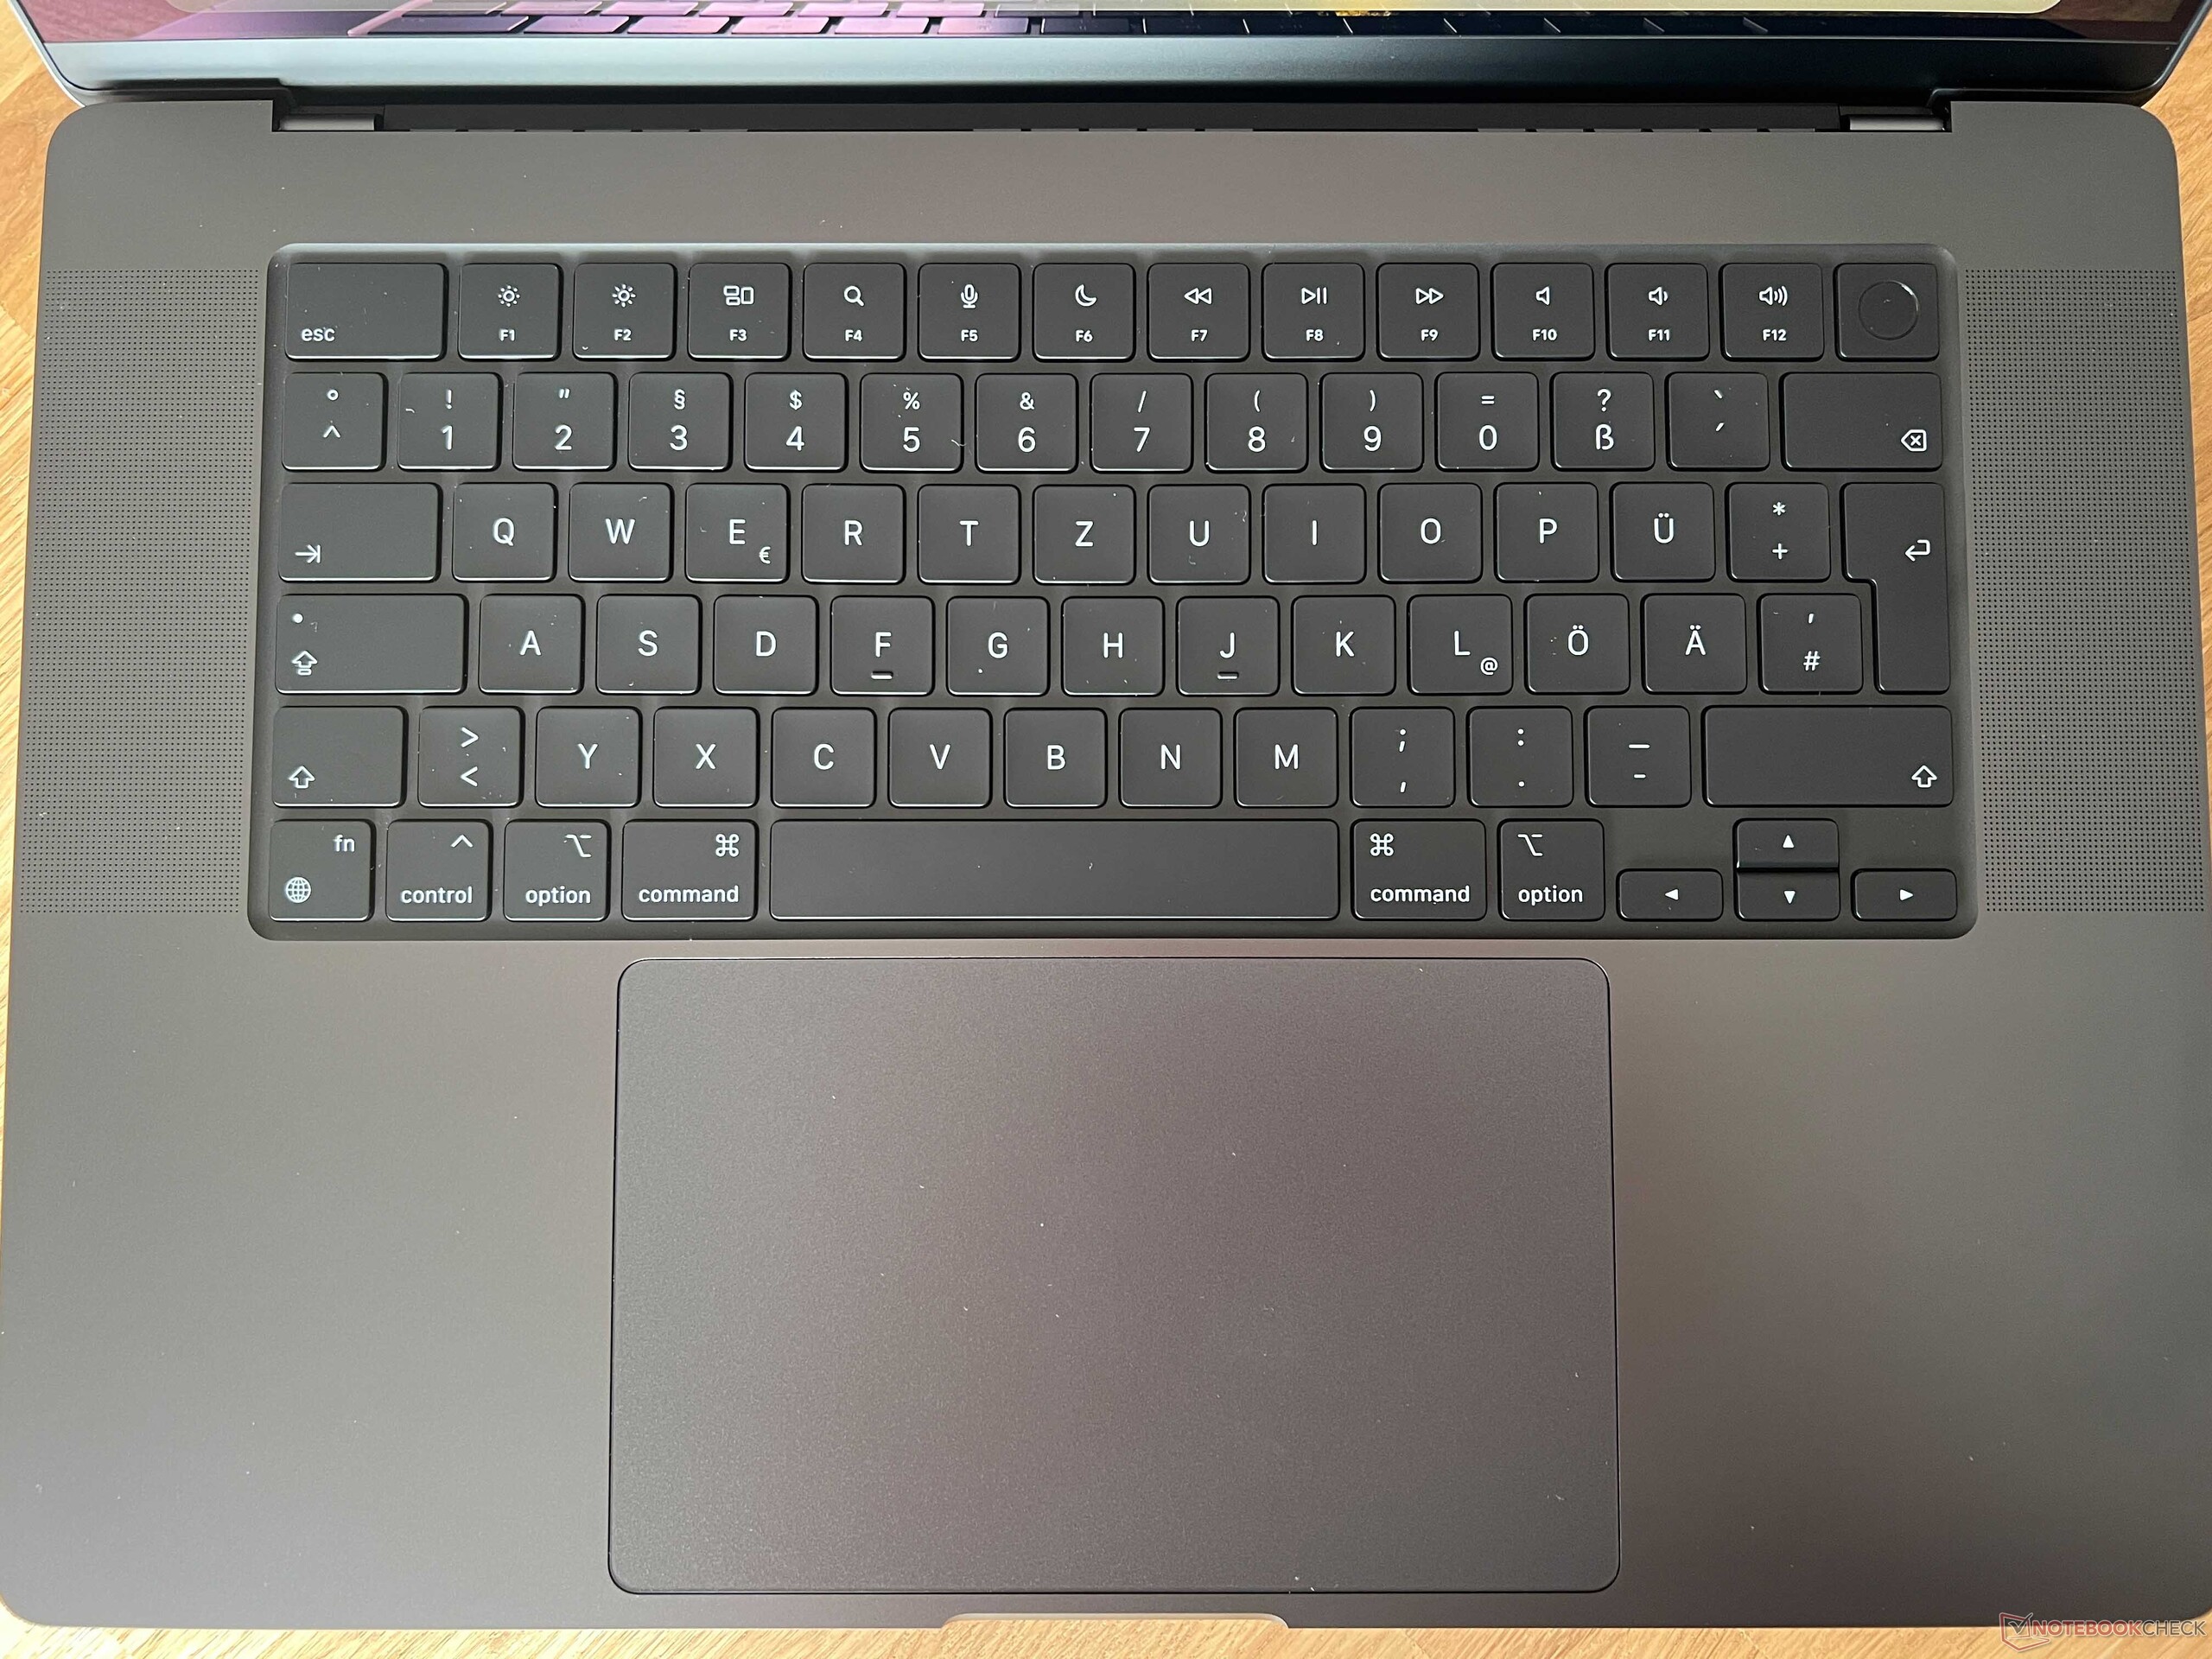
Since many characteristics of the M3 Pro models are no different than those of the MBP 16 M3 Max that we already tested, we will concentrate on the performance and emissions in this test. You can find all the information on the case, equipment, input devices, display, and speakers in our extensive test of the M3 Max version:
Possible Competitors in Comparison
Rating | Date | Model | Weight | Height | Size | Resolution | Price |
|---|---|---|---|---|---|---|---|
| 93.7 % v7 (old) | 11 / 2023 | Apple MacBook Pro 16 2023 M3 Pro Apple M3 Pro 12-Core, M3 Pro 18-Core GPU | 2.1 kg | 16.9 mm | 16.20" | 3456x2234 | |
| 87.6 % v7 (old) | 11 / 2023 | Asus VivoBook Pro 16 K6602VU i9-13900H, GeForce RTX 4050 Laptop GPU | 1.9 kg | 19 mm | 16.00" | 3200x2000 | |
| 88 % v7 (old) | 08 / 2023 | Lenovo Slim Pro 9i 16IRP8 i9-13905H, GeForce RTX 4050 Laptop GPU | 2.2 kg | 18.2 mm | 16.00" | 3200x2000 | |
| 88.6 % v7 (old) | 07 / 2023 | Schenker VISION 16 Pro (M23) i7-13700H, GeForce RTX 4070 Laptop GPU | 1.6 kg | 17.1 mm | 16.00" | 2560x1600 | |
| 89.4 % v7 (old) | 04 / 2023 | Samsung Galaxy Book3 Ultra 16 i7-13700H, GeForce RTX 4050 Laptop GPU | 1.8 kg | 16.5 mm | 16.00" | 2880x1800 | |
| 90.3 % v7 (old) | 04 / 2023 | Dell XPS 15 9530 RTX 4070 i7-13700H, GeForce RTX 4070 Laptop GPU | 1.9 kg | 18 mm | 15.60" | 3456x2160 |
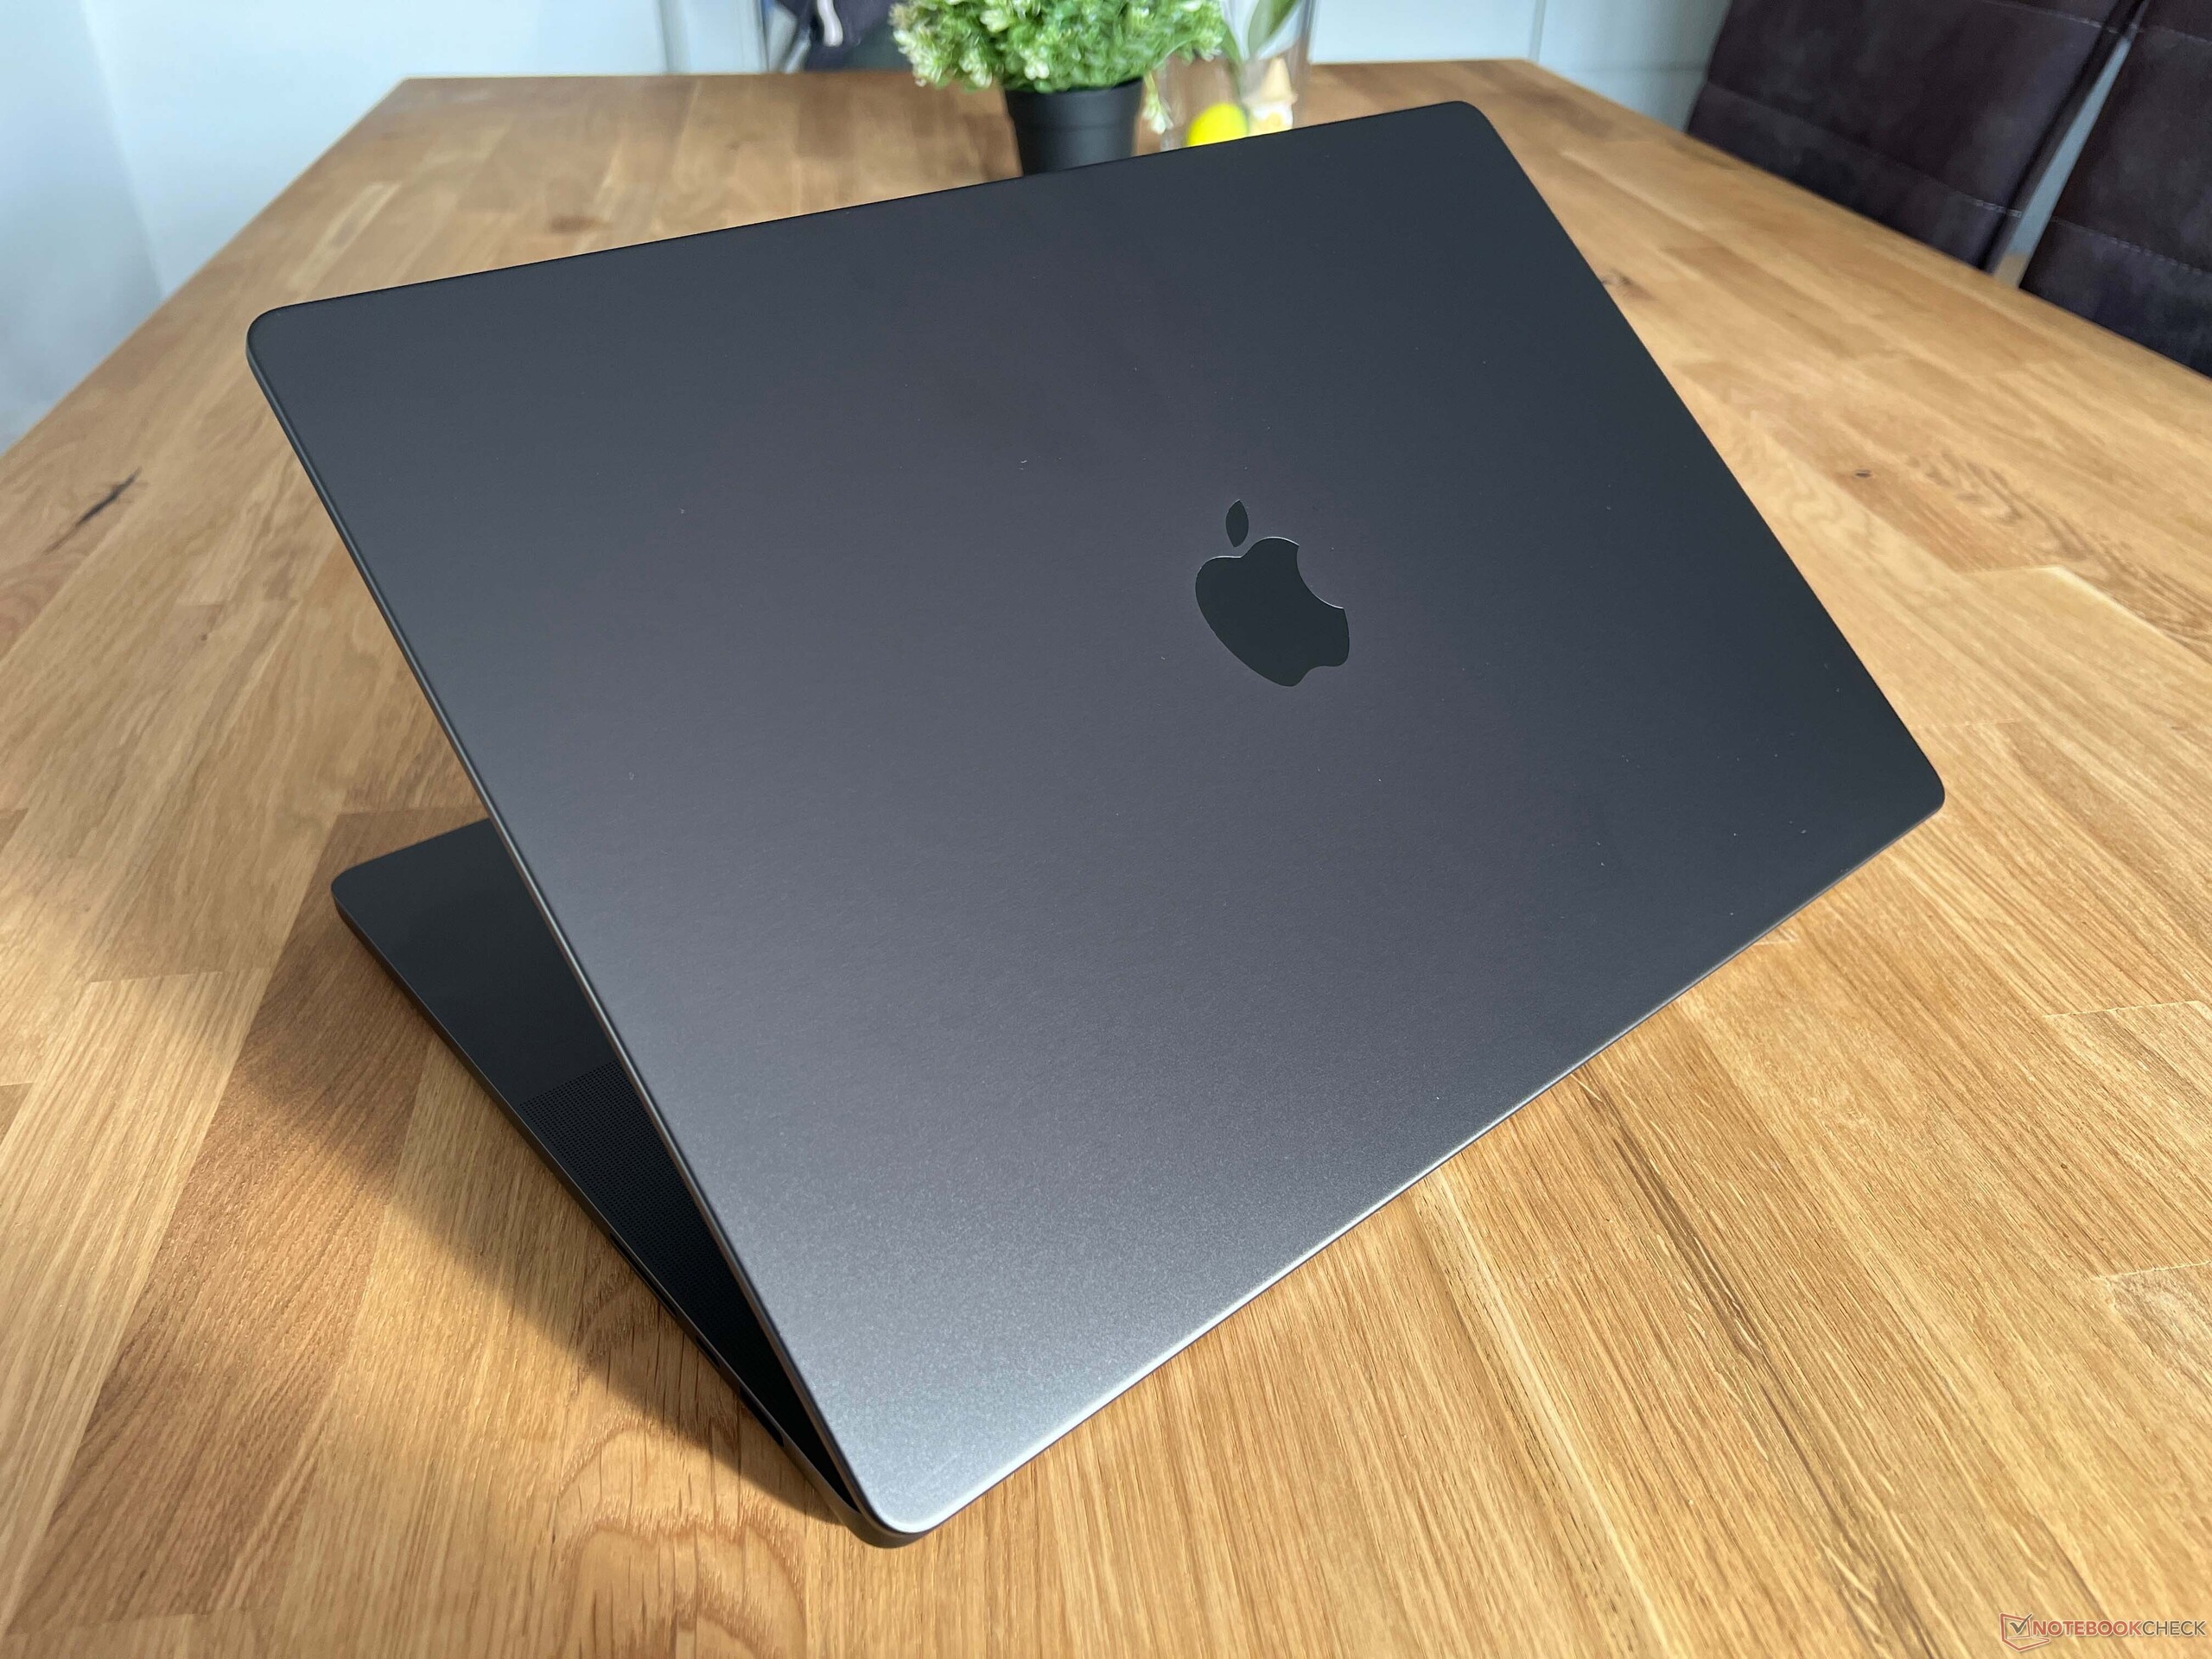
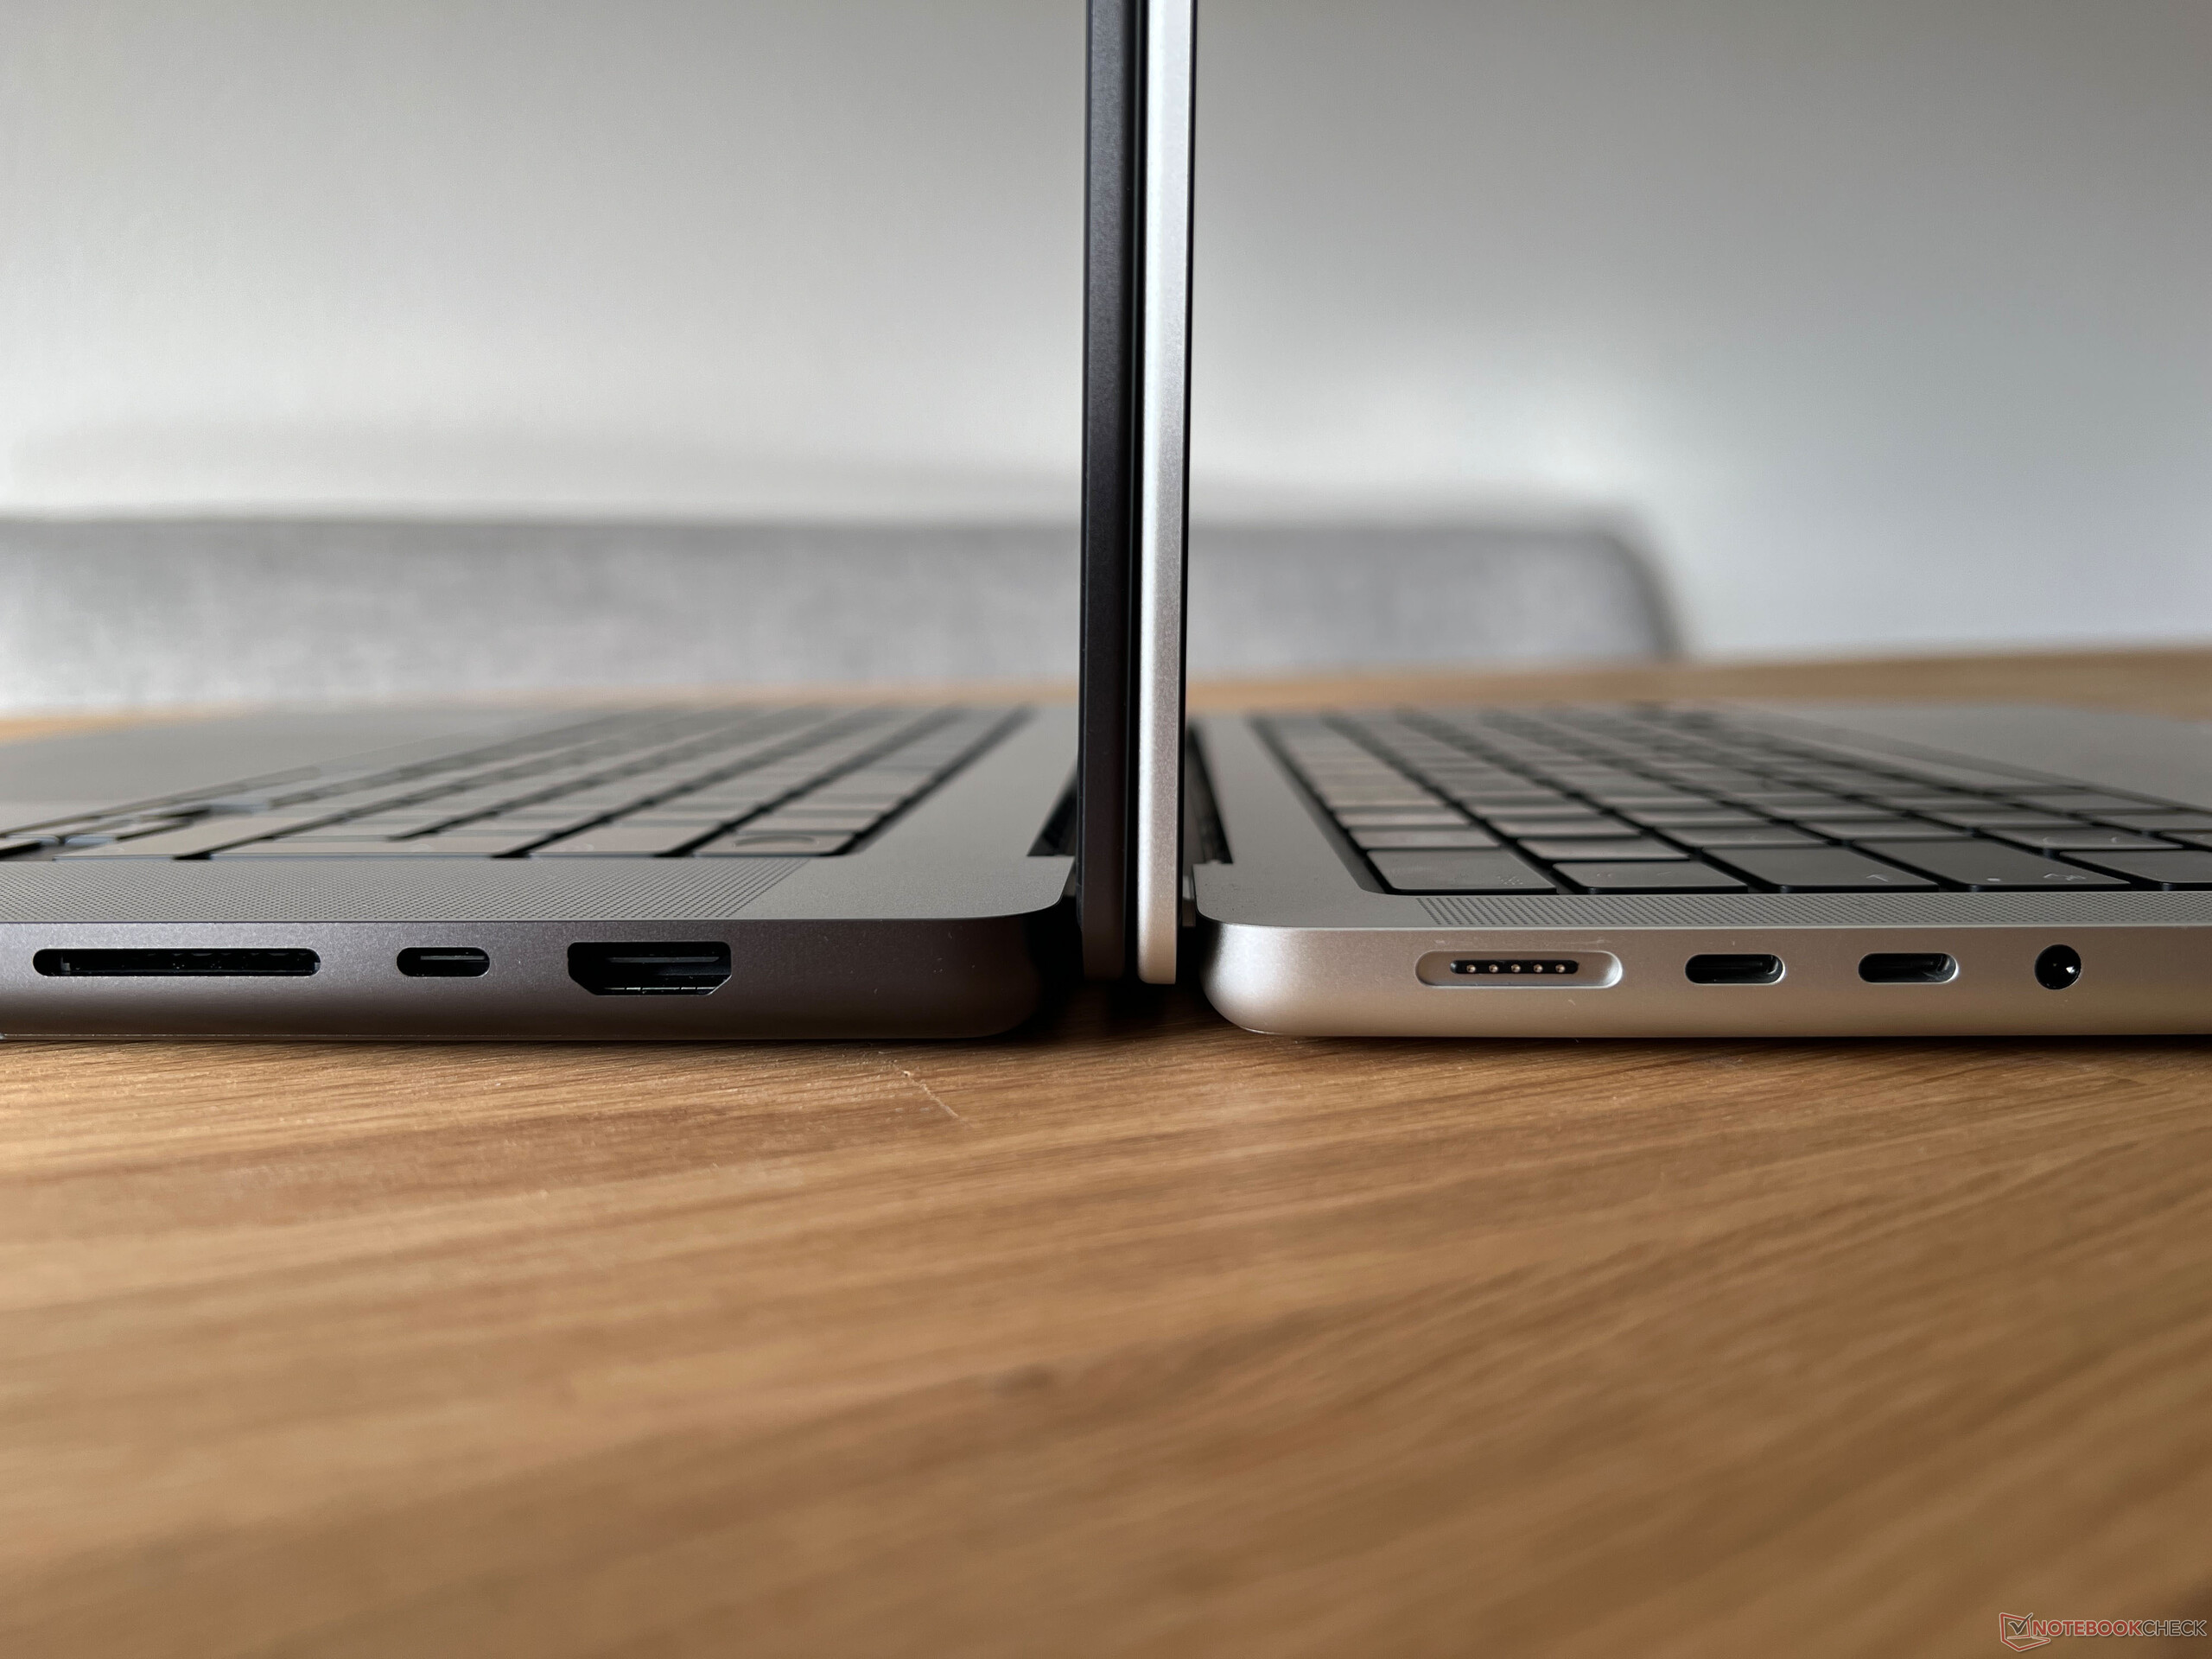
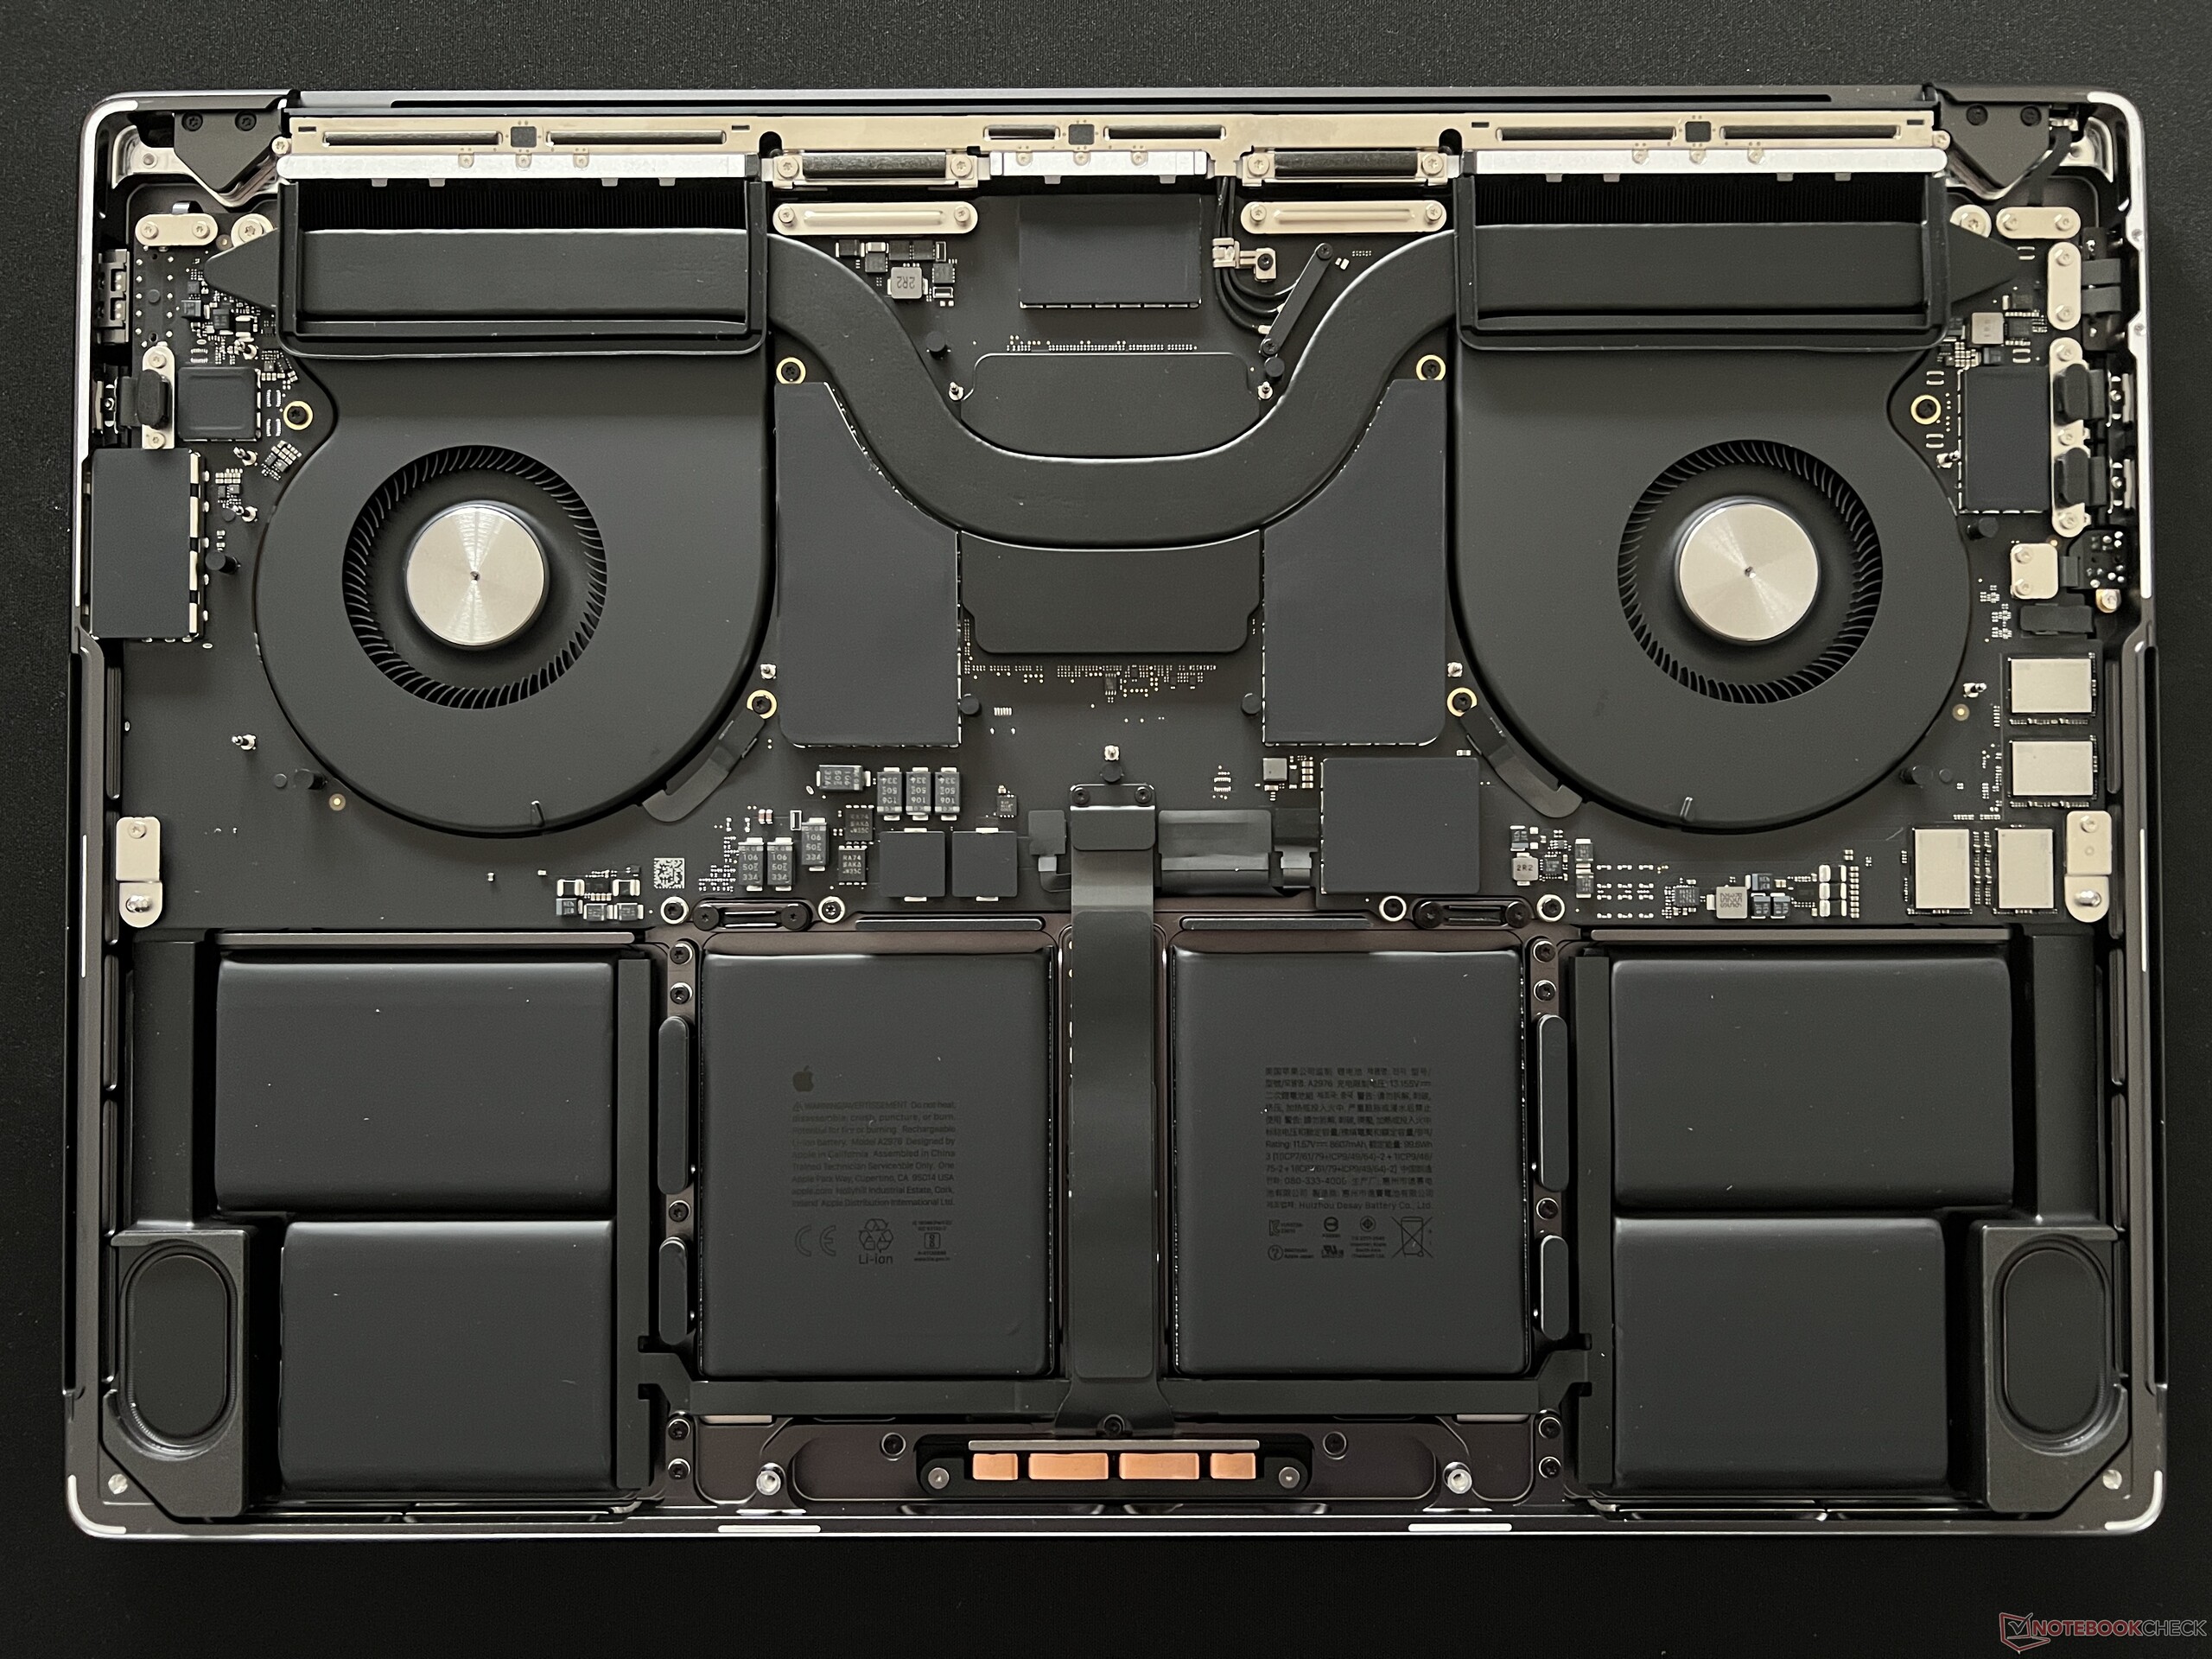
Differences from the MacBook Pro 16 with M3 Max
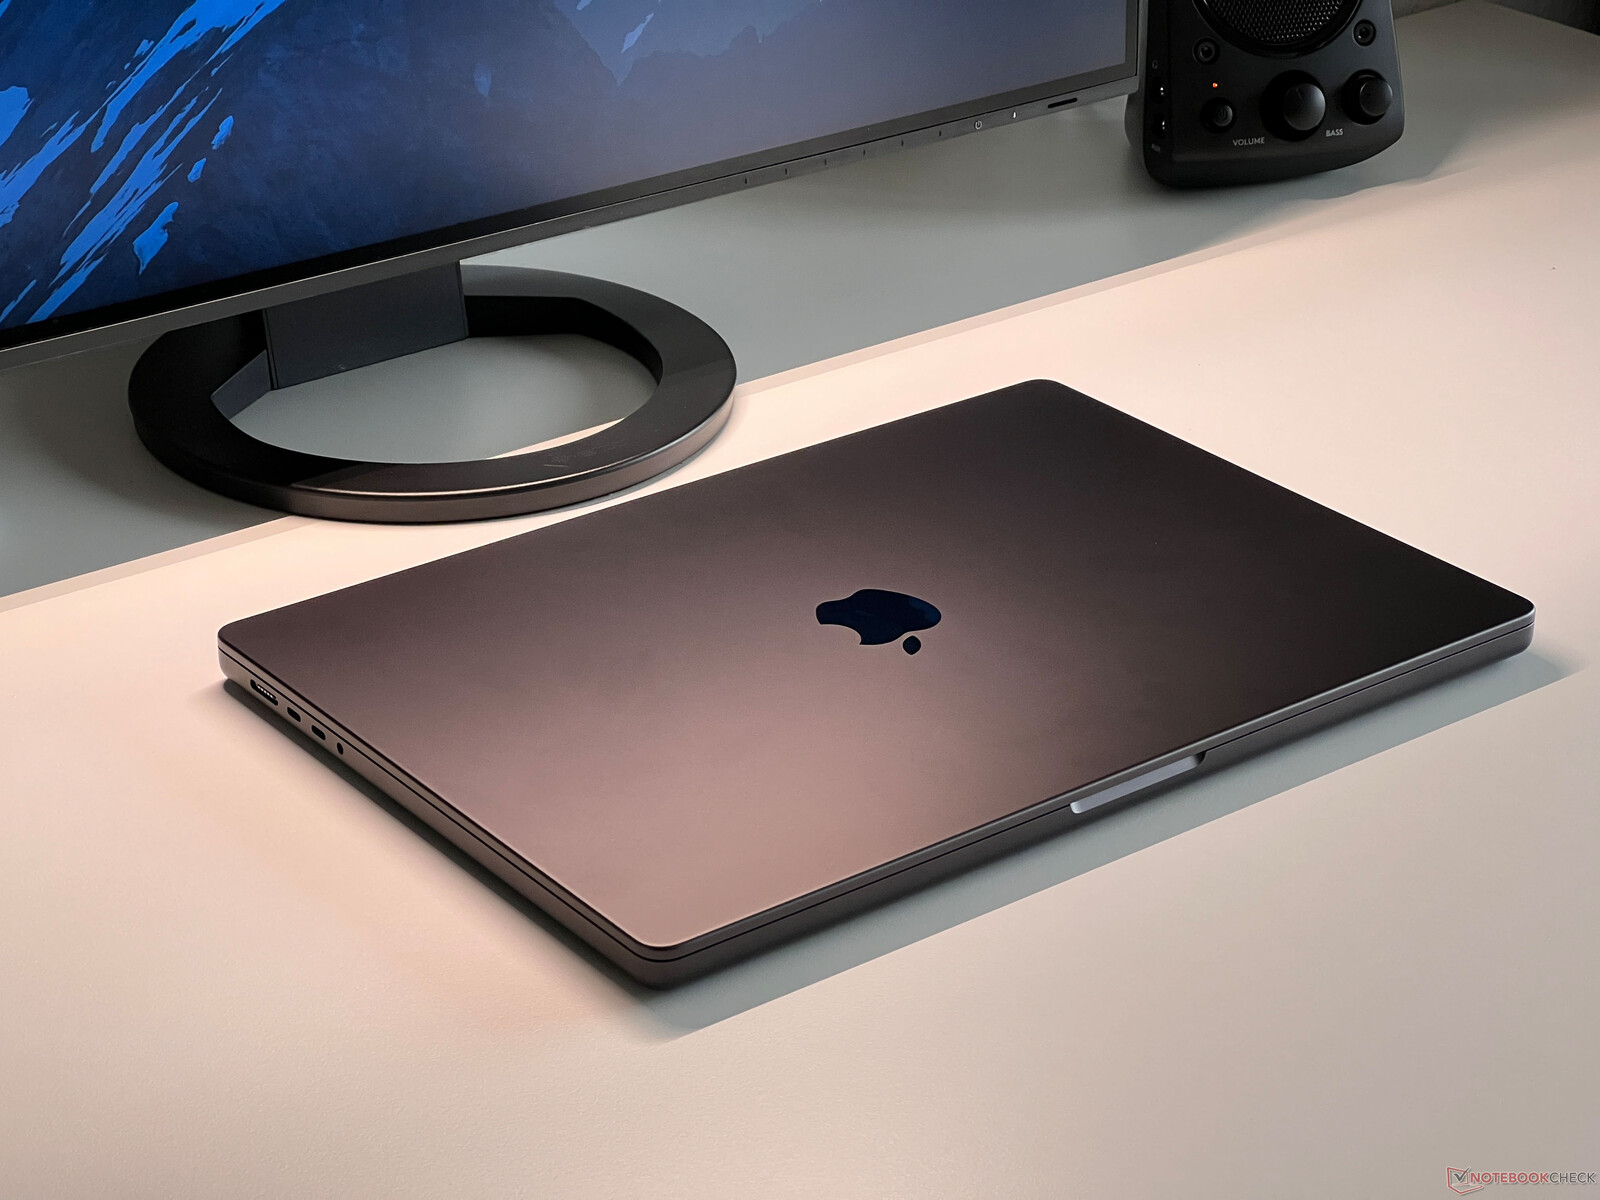
There are no differences in terms of the case and connections between the configurations with the M3 Pro and M3 Max that we already tested in great detail. The internal construction is also absolutely identical, with the exception of the video connections. While the MBP 16 with the M3 Max is able to control a maximum of four external displays simultaneously, the M3 Pro can only handle up to two external displays (with maximum resolutions identical to those of the M3 Max).
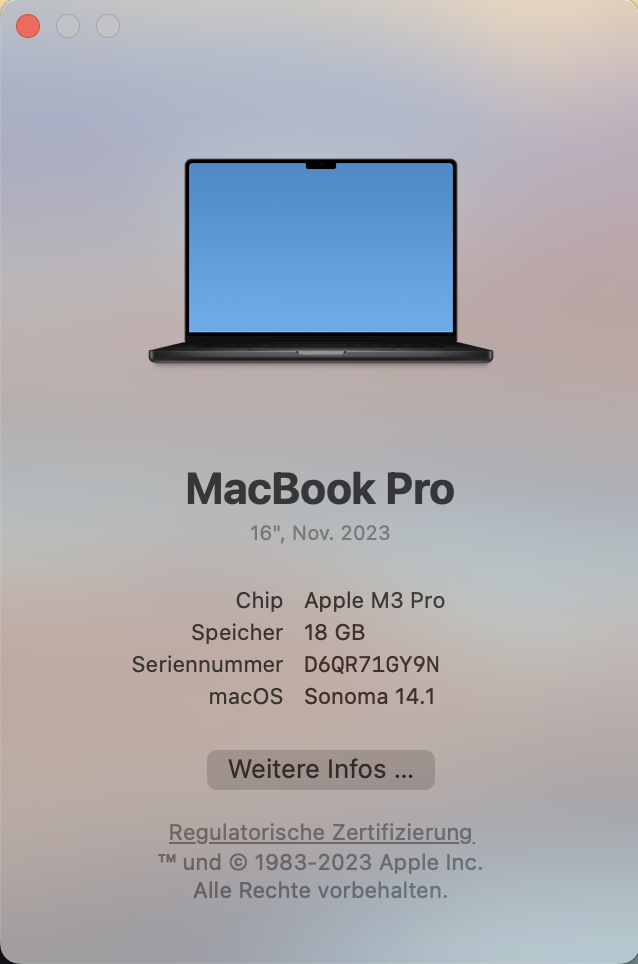
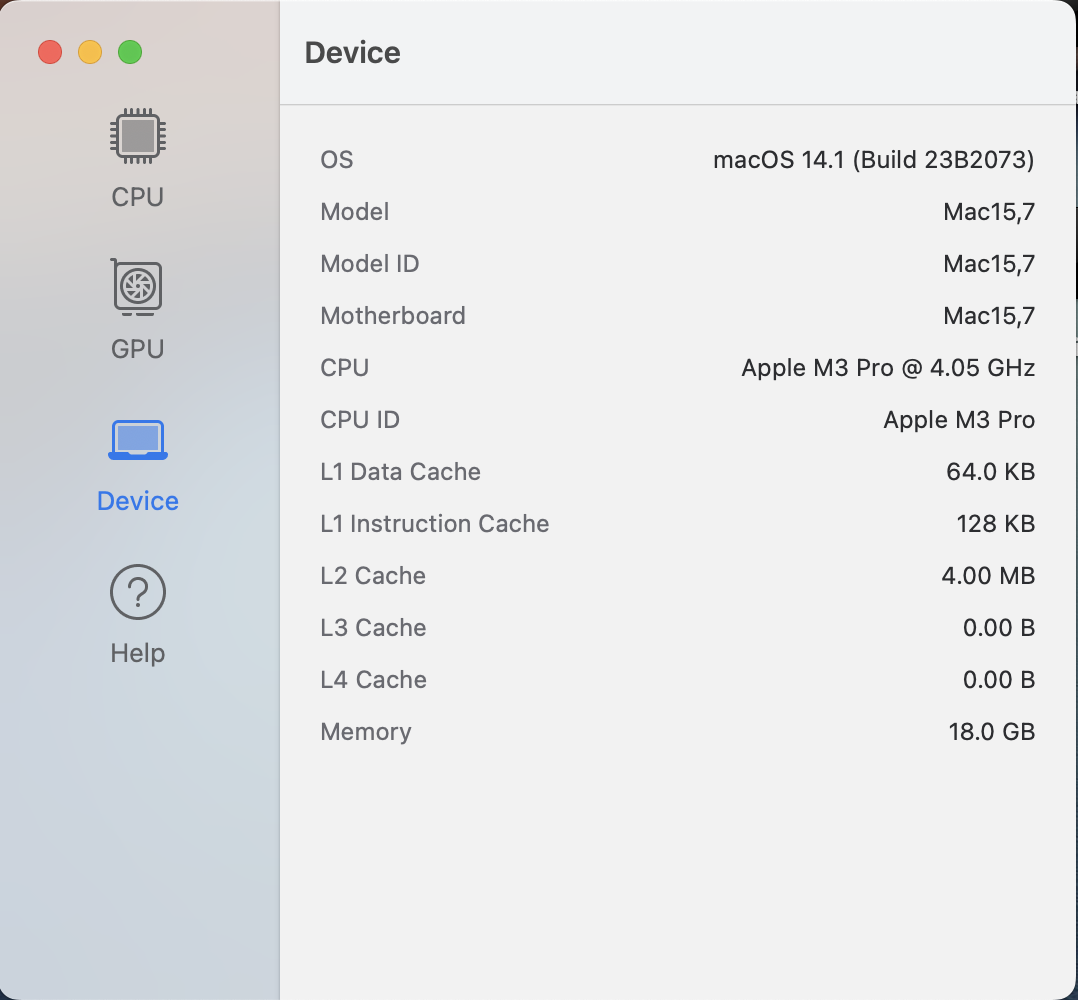
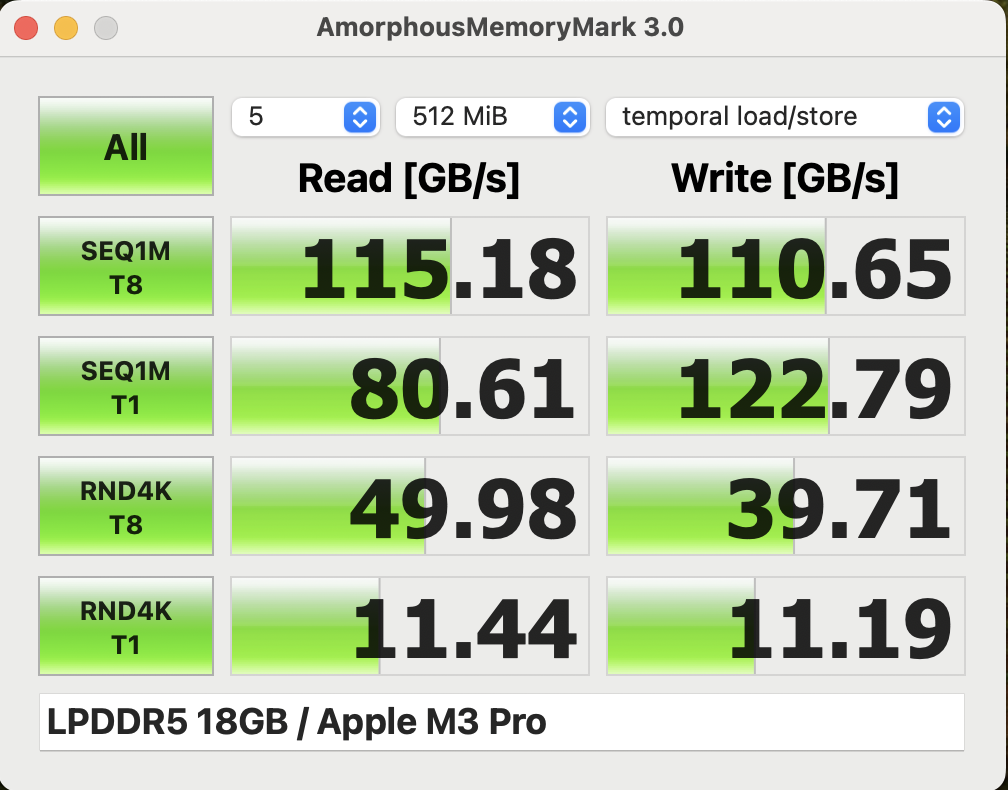
Performance: Apple M3 Pro with 18 GB of RAM
Processor: Six Performance cores
Even though the new M3 Pro SoC is available in two versions, the large MacBook Pro 16 only comes with the faster version. Like its predecessor, the processor offers a total of 12 CPU cores, but the core configuration has changed. While the M2 Pro used eight Performance and four Efficiency cores, it is now six Performance and six Efficiency cores. Compared to the old M2 chips (Pro/Max), the CPU clusters in the M3 Pro/Max now use six instead of four cores.
The cores themselves have the same specs as those of the other M3 CPUs, with the Performance cores being able to reach up to 4.056 GHz and the Efficiency cores up to 2.748 GHz, which is also the case in practice. The storage interface gets reduced from 256-bit to 192-bit, resulting in a maximum storage bandwidth of now only 150 GB/s instead of 200 GB/s.
Of course, the first interesting comparison is with the old M2 Pro, which showed a maximum power consumption of ~34 W in our tests. The multi-core performance in the native tests is only a few percentage points higher (between 2% and 6%), which makes it almost identical in practice. However, at the same time, Apple is also able to reduce the power consumption, which is now only barely 26 to 27 W. In comparison to the current Intel processors, the M3 Pro performs at the level of the Core i7-13700H in the Samsung Galaxy Book 3 Ultra or Dell XPS 15 9530 in the multi-core tests, although both of those consume significantly more power than the new Apple silicon.
Cinebench 2024: CPU Multi Core | CPU Single Core
Geekbench 5.5: Multi-Core | Single-Core
Geekbench 6.6: Multi-Core | Single-Core
Blender: v3.3 Classroom CPU
| Cinebench R23 / Multi Core | |
| Apple MacBook Pro 16 2023 M3 Max | |
| Lenovo Slim Pro 9i 16IRP8 | |
| Average of class Multimedia (4861 - 33362, n=82, last 2 years) | |
| Dell XPS 15 9530 RTX 4070 | |
| Samsung Galaxy Book3 Ultra 16 | |
| Apple MacBook Pro 16 2023 M3 Pro | |
| Average Apple M3 Pro 12-Core (n=1) | |
| Asus VivoBook Pro 16 K6602VU | |
| Apple MacBook Pro 14 2023 M2 Pro | |
| Apple MacBook Pro 14 2023 M2 Pro | |
| Schenker VISION 16 Pro (M23) | |
| Apple MacBook Pro 16 2021 M1 Pro | |
| Cinebench R23 / Single Core | |
| Lenovo Slim Pro 9i 16IRP8 | |
| Apple MacBook Pro 16 2023 M3 Pro | |
| Average Apple M3 Pro 12-Core (n=1) | |
| Apple MacBook Pro 16 2023 M3 Max | |
| Average of class Multimedia (1128 - 2459, n=74, last 2 years) | |
| Schenker VISION 16 Pro (M23) | |
| Dell XPS 15 9530 RTX 4070 | |
| Asus VivoBook Pro 16 K6602VU | |
| Samsung Galaxy Book3 Ultra 16 | |
| Apple MacBook Pro 14 2023 M2 Pro | |
| Apple MacBook Pro 14 2023 M2 Pro | |
| Apple MacBook Pro 16 2021 M1 Pro | |
| Cinebench 2024 / CPU Multi Core | |
| Apple MacBook Pro 16 2023 M3 Max | |
| Apple MacBook Pro 16 2023 M3 Pro | |
| Average Apple M3 Pro 12-Core (n=1) | |
| Average of class Multimedia (327 - 2437, n=81, last 2 years) | |
| Apple MacBook Pro 14 2023 M2 Pro | |
| Apple MacBook Pro 16 2021 M1 Pro | |
| Cinebench 2024 / CPU Single Core | |
| Apple MacBook Pro 16 2023 M3 Pro | |
| Average Apple M3 Pro 12-Core (n=1) | |
| Apple MacBook Pro 16 2023 M3 Max | |
| Average of class Multimedia (72.5 - 201, n=62, last 2 years) | |
| Apple MacBook Pro 14 2023 M2 Pro | |
| Apple MacBook Pro 16 2021 M1 Pro | |
| Geekbench 5.5 / Multi-Core | |
| Apple MacBook Pro 16 2023 M3 Max | |
| Apple MacBook Pro 16 2023 M3 Pro | |
| Average Apple M3 Pro 12-Core (n=1) | |
| Apple MacBook Pro 14 2023 M2 Pro | |
| Lenovo Slim Pro 9i 16IRP8 | |
| Apple MacBook Pro 14 2023 M2 Pro | |
| Dell XPS 15 9530 RTX 4070 | |
| Average of class Multimedia (4652 - 20422, n=63, last 2 years) | |
| Apple MacBook Pro 16 2021 M1 Pro | |
| Schenker VISION 16 Pro (M23) | |
| Samsung Galaxy Book3 Ultra 16 | |
| Asus VivoBook Pro 16 K6602VU | |
| Geekbench 5.5 / Single-Core | |
| Apple MacBook Pro 16 2023 M3 Max | |
| Apple MacBook Pro 16 2023 M3 Pro | |
| Average Apple M3 Pro 12-Core (n=1) | |
| Lenovo Slim Pro 9i 16IRP8 | |
| Apple MacBook Pro 14 2023 M2 Pro | |
| Average of class Multimedia (805 - 2974, n=63, last 2 years) | |
| Apple MacBook Pro 14 2023 M2 Pro | |
| Dell XPS 15 9530 RTX 4070 | |
| Schenker VISION 16 Pro (M23) | |
| Apple MacBook Pro 16 2021 M1 Pro | |
| Asus VivoBook Pro 16 K6602VU | |
| Samsung Galaxy Book3 Ultra 16 | |
| Geekbench 6.6 / Multi-Core | |
| Apple MacBook Pro 16 2023 M3 Max | |
| Apple MacBook Pro 16 2023 M3 Pro | |
| Average Apple M3 Pro 12-Core (n=1) | |
| Average of class Multimedia (4983 - 29415, n=77, last 2 years) | |
| Apple MacBook Pro 14 2023 M2 Pro | |
| Apple MacBook Pro 16 2021 M1 Pro | |
| Asus VivoBook Pro 16 K6602VU | |
| Geekbench 6.6 / Single-Core | |
| Apple MacBook Pro 16 2023 M3 Pro | |
| Average Apple M3 Pro 12-Core (n=1) | |
| Apple MacBook Pro 16 2023 M3 Max | |
| Average of class Multimedia (1534 - 4335, n=76, last 2 years) | |
| Apple MacBook Pro 14 2023 M2 Pro | |
| Asus VivoBook Pro 16 K6602VU | |
| Apple MacBook Pro 16 2021 M1 Pro | |
| Blender / v3.3 Classroom CPU | |
| Average of class Multimedia (134.5 - 1042, n=69, last 2 years) | |
| Schenker VISION 16 Pro (M23) | |
| Samsung Galaxy Book3 Ultra 16 | |
| Dell XPS 15 9530 RTX 4070 | |
| Asus VivoBook Pro 16 K6602VU | |
| Apple MacBook Pro 14 2023 M2 Pro | |
| Apple MacBook Pro 16 2023 M3 Pro | |
| Average Apple M3 Pro 12-Core (n=1) | |
| Lenovo Slim Pro 9i 16IRP8 | |
| Apple MacBook Pro 16 2023 M3 Max | |
* ... smaller is better
In single-core tests, however, the new M3 Pro (just like the regular M3 & M3 Max) is able to convince us completely, and we see a performance advantage of 20% compared to the old M2 generation despite a similar CPU consumption of ~5 to 6 W. With this, the Apple chip is only barely surpassed by the Core i9-13905H in our comparison but at the expense of significantly higher power consumption under single-core load. We will provide a closer analysis of the efficiency in our analysis of the M3 Pro/M3 Max that will be published shortly.
As usual, the CPU performance remains completely constant in battery operation. We also ran our usual Cinebench R15 Multi loop, but you have to note here that the performance is slightly reduced due to emulation. We also see a slight advantage compared to the old M2 Pro here, and the loop demonstrates very clearly that the CPU performance remains completely stable even under constant load.
You can find additional CPU benchmarks here.
Cinebench R15 Multi-core Load Test
System Performance
Every Macbook Pro with an Apple M SoC, regardless whether M1, M2, or M3, offers an extremely high subjective performance impression, and the increased single-core performance of the new M3 Pro further supports this impression. All applications including complex ones start quickly, and native apps run extremely well.
In the cross-platform CrossMark test, the MBP 16 M3 Pro is only surpassed by the faster MBP 16 M3 Max, while the Windows competitors are left behind. Basically, even the smallest MacBook Pro 16 is excellently suited for video and photo processing.
Programs for Intel Macs can be emulated thanks to Rosetta 2, and this also works well. But it also brings some costs in terms of the performance, which becomes particularly noticeable in more complex applications. We ran the two PugetBench tests for Adobe Photoshop and Premiere Pro, and the results were still very respectable.
Blackmagic RAW Speed Test: 12:1 8K Metal | 12:1 8K CPU
Photoshop PugetBench: Overall Score | GPU Score | General Score | Filter Score
Premiere Pro PugetBench: Overall Score 0.98 | LongGOP 0.98 | Intraframe 0.98 | RAW 0.98 | GPU Effects 0.98
Jetstream 2: 2.0 Total
Speedometer 2.0: Result 2.0
WebXPRT 3: Overall
| CrossMark / Overall | |
| Apple MacBook Pro 16 2023 M3 Max | |
| Asus Zenbook Pro 16X UX7602BZ-MY005W | |
| Apple MacBook Pro 16 2023 M3 Pro | |
| Average Apple M3 Pro 12-Core, Apple M3 Pro 18-Core GPU (n=1) | |
| Schenker VISION 16 Pro (M23) | |
| Dell XPS 15 9530 RTX 4070 | |
| Average of class Multimedia (866 - 2728, n=68, last 2 years) | |
| Asus ROG Zephyrus G14 GA402XY | |
| Apple MacBook Pro 14 2023 M2 Pro | |
| Lenovo Slim Pro 9i 16IRP8 | |
| Asus VivoBook Pro 16 K6602VU | |
| Samsung Galaxy Book3 Ultra 16 | |
| Apple MacBook Pro 16 2021 M1 Pro | |
| CrossMark / Productivity | |
| Asus Zenbook Pro 16X UX7602BZ-MY005W | |
| Apple MacBook Pro 16 2023 M3 Max | |
| Schenker VISION 16 Pro (M23) | |
| Apple MacBook Pro 16 2023 M3 Pro | |
| Average Apple M3 Pro 12-Core, Apple M3 Pro 18-Core GPU (n=1) | |
| Asus ROG Zephyrus G14 GA402XY | |
| Dell XPS 15 9530 RTX 4070 | |
| Average of class Multimedia (931 - 2489, n=68, last 2 years) | |
| Asus VivoBook Pro 16 K6602VU | |
| Lenovo Slim Pro 9i 16IRP8 | |
| Apple MacBook Pro 14 2023 M2 Pro | |
| Samsung Galaxy Book3 Ultra 16 | |
| Apple MacBook Pro 16 2021 M1 Pro | |
| CrossMark / Creativity | |
| Apple MacBook Pro 16 2023 M3 Max | |
| Apple MacBook Pro 16 2023 M3 Pro | |
| Average Apple M3 Pro 12-Core, Apple M3 Pro 18-Core GPU (n=1) | |
| Apple MacBook Pro 14 2023 M2 Pro | |
| Asus Zenbook Pro 16X UX7602BZ-MY005W | |
| Dell XPS 15 9530 RTX 4070 | |
| Average of class Multimedia (907 - 3465, n=68, last 2 years) | |
| Asus ROG Zephyrus G14 GA402XY | |
| Lenovo Slim Pro 9i 16IRP8 | |
| Apple MacBook Pro 16 2021 M1 Pro | |
| Schenker VISION 16 Pro (M23) | |
| Asus VivoBook Pro 16 K6602VU | |
| Samsung Galaxy Book3 Ultra 16 | |
| CrossMark / Responsiveness | |
| Schenker VISION 16 Pro (M23) | |
| Dell XPS 15 9530 RTX 4070 | |
| Asus Zenbook Pro 16X UX7602BZ-MY005W | |
| Asus VivoBook Pro 16 K6602VU | |
| Average of class Multimedia (605 - 2024, n=68, last 2 years) | |
| Samsung Galaxy Book3 Ultra 16 | |
| Apple MacBook Pro 16 2023 M3 Max | |
| Apple MacBook Pro 16 2023 M3 Pro | |
| Average Apple M3 Pro 12-Core, Apple M3 Pro 18-Core GPU (n=1) | |
| Asus ROG Zephyrus G14 GA402XY | |
| Lenovo Slim Pro 9i 16IRP8 | |
| Apple MacBook Pro 14 2023 M2 Pro | |
| Apple MacBook Pro 16 2021 M1 Pro | |
| Blackmagic RAW Speed Test / 12:1 8K Metal | |
| Apple MacBook Pro 16 2023 M3 Max | |
| Average of class Multimedia (78 - 430, n=7, last 2 years) | |
| Apple MacBook Pro 14 2023 M2 Pro | |
| Apple MacBook Pro 16 2021 M1 Pro | |
| Apple MacBook Pro 16 2023 M3 Pro | |
| Average Apple M3 Pro 12-Core, Apple M3 Pro 18-Core GPU (n=1) | |
| Blackmagic RAW Speed Test / 12:1 8K CPU | |
| Average of class Multimedia (44 - 102, n=7, last 2 years) | |
| Apple MacBook Pro 16 2023 M3 Max | |
| Apple MacBook Pro 14 2023 M2 Pro | |
| Apple MacBook Pro 16 2023 M3 Pro | |
| Average Apple M3 Pro 12-Core, Apple M3 Pro 18-Core GPU (n=1) | |
| Apple MacBook Pro 16 2021 M1 Pro | |
| Photoshop PugetBench / Overall Score | |
| Apple MacBook Pro 16 2023 M3 Max | |
| Asus ROG Zephyrus G14 GA402XY | |
| Asus Zenbook Pro 16X UX7602BZ-MY005W | |
| Apple MacBook Pro 16 2023 M3 Pro | |
| Average Apple M3 Pro 12-Core, Apple M3 Pro 18-Core GPU (n=1) | |
| Apple MacBook Pro 14 2023 M2 Pro | |
| Apple MacBook Pro 16 2021 M1 Pro | |
| Photoshop PugetBench / GPU Score | |
| Apple MacBook Pro 16 2023 M3 Max | |
| Apple MacBook Pro 16 2023 M3 Pro | |
| Average Apple M3 Pro 12-Core, Apple M3 Pro 18-Core GPU (n=1) | |
| Asus ROG Zephyrus G14 GA402XY | |
| Apple MacBook Pro 14 2023 M2 Pro | |
| Asus Zenbook Pro 16X UX7602BZ-MY005W | |
| Apple MacBook Pro 16 2021 M1 Pro | |
| Photoshop PugetBench / General Score | |
| Apple MacBook Pro 16 2023 M3 Max | |
| Asus ROG Zephyrus G14 GA402XY | |
| Asus Zenbook Pro 16X UX7602BZ-MY005W | |
| Apple MacBook Pro 16 2023 M3 Pro | |
| Average Apple M3 Pro 12-Core, Apple M3 Pro 18-Core GPU (n=1) | |
| Apple MacBook Pro 14 2023 M2 Pro | |
| Apple MacBook Pro 16 2021 M1 Pro | |
| Photoshop PugetBench / Filter Score | |
| Apple MacBook Pro 16 2023 M3 Max | |
| Apple MacBook Pro 16 2023 M3 Pro | |
| Average Apple M3 Pro 12-Core, Apple M3 Pro 18-Core GPU (n=1) | |
| Asus ROG Zephyrus G14 GA402XY | |
| Apple MacBook Pro 14 2023 M2 Pro | |
| Asus Zenbook Pro 16X UX7602BZ-MY005W | |
| Apple MacBook Pro 16 2021 M1 Pro | |
| Premiere Pro PugetBench / Overall Score 0.98 | |
| Asus Zenbook Pro 16X UX7602BZ-MY005W | |
| Apple MacBook Pro 16 2023 M3 Max | |
| Asus ROG Zephyrus G14 GA402XY | |
| Apple MacBook Pro 16 2023 M3 Pro | |
| Average Apple M3 Pro 12-Core, Apple M3 Pro 18-Core GPU (n=1) | |
| Apple MacBook Pro 16 2021 M1 Pro | |
| Premiere Pro PugetBench / LongGOP 0.98 | |
| Asus Zenbook Pro 16X UX7602BZ-MY005W | |
| Apple MacBook Pro 16 2023 M3 Max | |
| Asus ROG Zephyrus G14 GA402XY | |
| Apple MacBook Pro 16 2023 M3 Pro | |
| Average Apple M3 Pro 12-Core, Apple M3 Pro 18-Core GPU (n=1) | |
| Apple MacBook Pro 16 2021 M1 Pro | |
| Premiere Pro PugetBench / Intraframe 0.98 | |
| Apple MacBook Pro 16 2023 M3 Max | |
| Asus Zenbook Pro 16X UX7602BZ-MY005W | |
| Apple MacBook Pro 16 2023 M3 Pro | |
| Average Apple M3 Pro 12-Core, Apple M3 Pro 18-Core GPU (n=1) | |
| Apple MacBook Pro 16 2021 M1 Pro | |
| Asus ROG Zephyrus G14 GA402XY | |
| Premiere Pro PugetBench / RAW 0.98 | |
| Asus Zenbook Pro 16X UX7602BZ-MY005W | |
| Apple MacBook Pro 16 2023 M3 Max | |
| Asus ROG Zephyrus G14 GA402XY | |
| Apple MacBook Pro 16 2023 M3 Pro | |
| Average Apple M3 Pro 12-Core, Apple M3 Pro 18-Core GPU (n=1) | |
| Apple MacBook Pro 16 2021 M1 Pro | |
| Premiere Pro PugetBench / GPU Effects 0.98 | |
| Asus Zenbook Pro 16X UX7602BZ-MY005W | |
| Asus ROG Zephyrus G14 GA402XY | |
| Apple MacBook Pro 16 2023 M3 Max | |
| Apple MacBook Pro 16 2021 M1 Pro | |
| Apple MacBook Pro 16 2023 M3 Pro | |
| Average Apple M3 Pro 12-Core, Apple M3 Pro 18-Core GPU (n=1) | |
| Jetstream 2 / 2.0 Total | |
| Average of class Multimedia (261 - 481, n=36, last 2 years) | |
| Lenovo Slim Pro 9i 16IRP8 | |
| Apple MacBook Pro 16 2023 M3 Max | |
| Apple MacBook Pro 16 2023 M3 Pro | |
| Average Apple M3 Pro 12-Core, Apple M3 Pro 18-Core GPU (n=1) | |
| Schenker VISION 16 Pro (M23) | |
| Dell XPS 15 9530 RTX 4070 | |
| Samsung Galaxy Book3 Ultra 16 | |
| Apple MacBook Pro 14 2023 M2 Pro | |
| Apple MacBook Pro 16 2021 M1 Pro | |
| Speedometer 2.0 / Result 2.0 | |
| Average of class Multimedia (337 - 946, n=35, last 2 years) | |
| Apple MacBook Pro 16 2023 M3 Max | |
| Apple MacBook Pro 16 2023 M3 Pro | |
| Average Apple M3 Pro 12-Core, Apple M3 Pro 18-Core GPU (n=1) | |
| Apple MacBook Pro 14 2023 M2 Pro | |
| Schenker VISION 16 Pro (M23) | |
| Samsung Galaxy Book3 Ultra 16 | |
| Apple MacBook Pro 16 2021 M1 Pro | |
| WebXPRT 3 / Overall | |
| Apple MacBook Pro 16 2023 M3 Pro | |
| Average Apple M3 Pro 12-Core, Apple M3 Pro 18-Core GPU (n=1) | |
| Apple MacBook Pro 16 2023 M3 Max | |
| Apple MacBook Pro 14 2023 M2 Pro | |
| Apple MacBook Pro 16 2021 M1 Pro | |
| Lenovo Slim Pro 9i 16IRP8 | |
| Average of class Multimedia (136.4 - 596, n=71, last 2 years) | |
| Dell XPS 15 9530 RTX 4070 | |
| Asus ROG Zephyrus G14 GA402XY | |
| Schenker VISION 16 Pro (M23) | |
| Samsung Galaxy Book3 Ultra 16 | |
Storage Performance
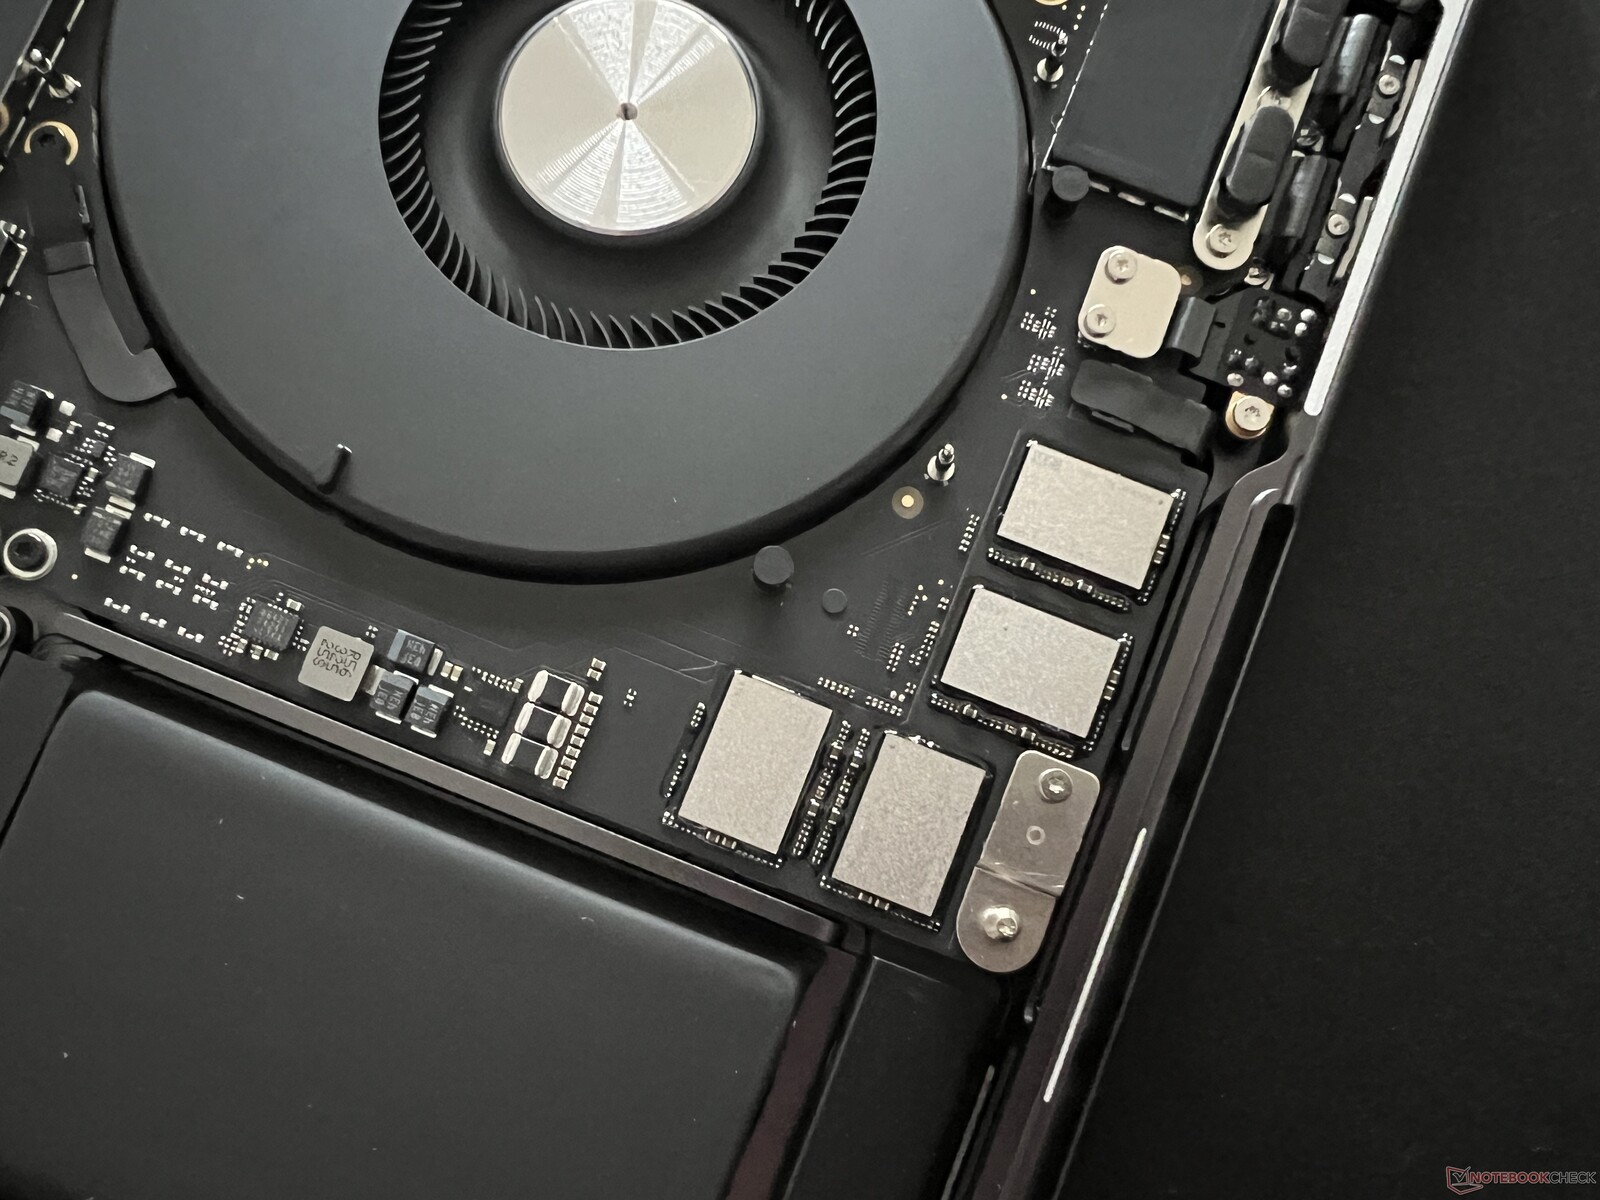
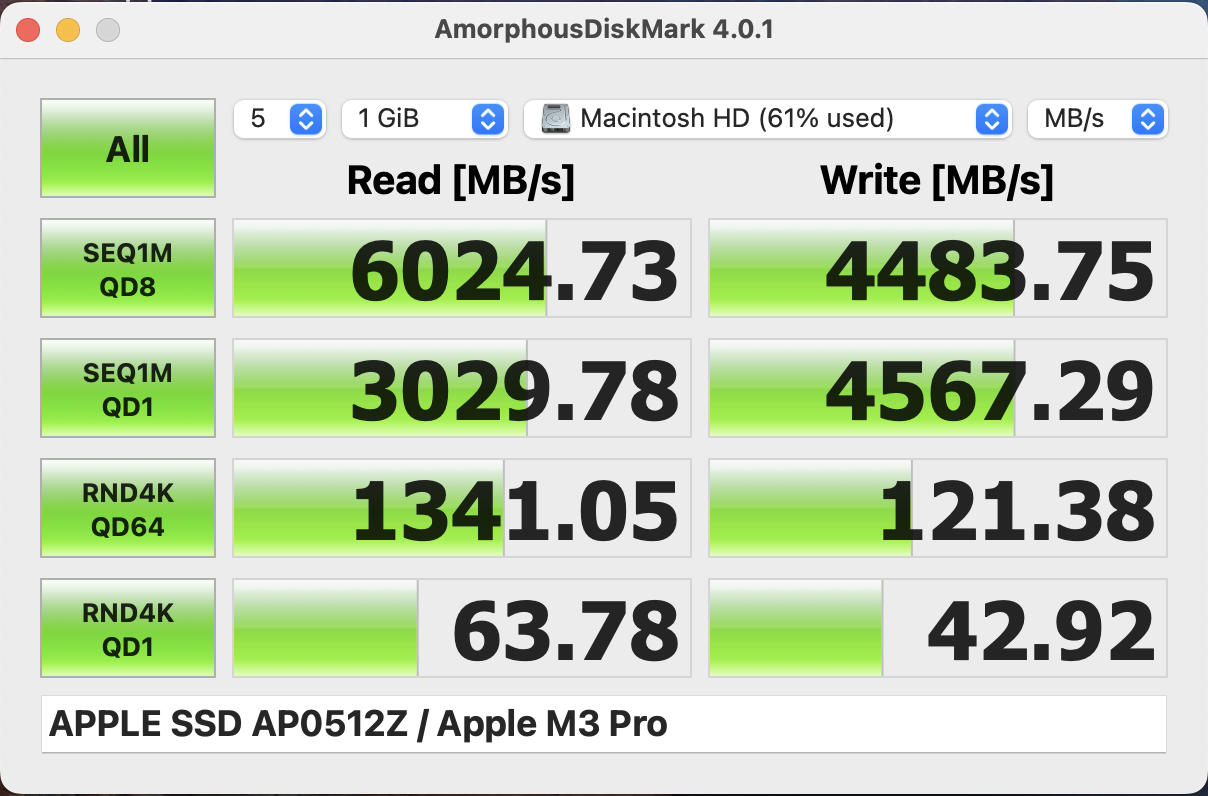
The basic version of the MacBook Pro 16 continues to come with a 512 GB SSD (AP0512Z). The old MacBook Pro 14 with the M2 Pro used less NAND chips than before, which had a negative influence on the transfer rates. We were therefore very surprised to now see four NAND chips again, which is also the case for the new MacBook Pro 14 M3 Pro with the 512 GB SSD, by the way.
The transfer rates have now increased again, and we see a maximum of almost 6 GB/s when reading and ~4.5 GB/s when writing data. Of the 512 GB in the SSD, 466 GB remain available to the user after the first startup.
You can find additional SSD benchmarks listed in our technical section.
Graphics Card
Similar to the processor, the number of cores in the graphics card has also changed. While the top model of the M2 Pro still offered 19 GPU cores, there are now 18 GPU cores in the M3 Pro. Although we are unable to read the clock speed, we assume that there is an increase here as well.
In most benchmarks, we see a slight performance increase compared to the M2 Pro with 19 GPU cores (with the exception of Geekbench 6.2). However, the power consumption has also increased slightly from 25 W to 28 W. Therefore, in contrast to the processor, the graphics card hasn't become more efficient and there is also a standstill in terms of the performance, which is a bit sobering.
In the 3DMark WildLife Extreme Unlimited test, the M3 Pro GPU places ahead of the RTX 4050 Laptop (65 W), but slightly behind the RTX 4060 Laptop (80 W). In the OpenCL tests, however, the M3 Pro GPU falls significantly behind the dedicated GeForce competitors.
The graphics performance remains stable at all times, both under constant load as well as in battery operation, which is not the case with most GeForce GPUs.
You can find additional GPU benchmarks here.
* ... smaller is better
Gaming Performance
We've already mentioned in other reviews that there are several ways to play games using the MacBook. Besides emulated games and using additional software such as CrossOver, you also have some other options at this point (such as GTA V or Cyberpunk 2077), although you won't always be able to use the full potential of the hardware and of course there are also no optimizations here.
Native games will of course run best, and at this point those also include several AAA games such as Baldur's Gate 3 or No Man's Sky. These games run very well on the MacBook Pro, and you usually can also use the highest settings.
However, compared to Windows computers, the gaming performance still remains significantly below that of a GeForce RTX 4050 Laptop. Those who want to play the occasional game on the MacBook and are content with the limited selection won't be disappointed, but you also have to understand that this isn't a real gaming laptop. In the video below, we tested several native games in their respective highest settings in the 1080p resolution.
| low | med. | high | ultra | QHD | |
|---|---|---|---|---|---|
| GTA V (2015) | 90 | 79 | 52 | 49 | |
| The Witcher 3 (2015) | 43 | ||||
| Shadow of the Tomb Raider (2018) | 71 | 65 | 57 | 37 | |
| Total War: Three Kingdoms (2019) | 87 | 56 | 41 | 25 | |
| Star Wars Jedi Survivor (2023) | 30 | 26 | 17 | ||
| Baldur's Gate 3 (2023) | 53 | 43 | |||
| Cyberpunk 2077 (2023) | 53 | 42.6 | 35 | 30.8 | |
| Total War Pharaoh (2023) | 212 | 140 | 77 | 58 | 42 |
Emissions: Almost always quiet
Noise Levels
The two fans of the MacBook Pro 16 usually remain completely unnoticeable under low to medium loads. Even the first fan level of 1,400 rpm producing 25.1 dB(A) only becomes audible if you place your ear directly next to the laptop.
Thanks to the efficient M3 Pro chip, even gaming is possible at this level. The maximum we determined during native gaming was around 1,900 rpm, which corresponded to only about 26.2 dB(A). After 20 minutes of constant load, the 3DMark WildLife Extreme stress test only led to ~1,900 rpm and, with Cinebench R23 Multi, it was a maximum of 2,400 rpm with 31.1 dB(A) after 30 minutes.
Only in the stress test with a combined CPU/GPU load did the fans reach up to 4,400 rpm in the first minutes of the test, which led to a loud 50.4 dB(A). The reason for this lies in the fan behavior, since the chip is first allowed to get very hot (more than 100 °C, 212 °F) before the fans then have to try to remedy this. During the continuation of the stress test, the fan speed then levels out at 3,600 to 3,800 rpm. In practice, this makes the MBP 16 M3 Pro even slightly louder than the MBP 16 with the M3 Max (in the Automatic mode), which we will explain in the Stress Test section below.
During the stress test under full load, the MacBook is almost at the noise level of the competitors, with only the Samsung Galaxy Book3 Ultra remaining quieter, although this is due to its significantly reduced performance under combined load (CPU: 17 W, GPU: 12 W). The MBP 16 remains significantly quieter in all the other load scenarios, though.
In contrast to the M3 Max models, we did not notice any coil whine or other electronic noises in the MacBook with the M3 Pro.
Noise level
| Idle |
| 24.4 / 24.4 / 24.4 dB(A) |
| Load |
| 26.9 / 50.4 dB(A) |
 | ||
30 dB silent 40 dB(A) audible 50 dB(A) loud |
||
min: | ||
| Apple MacBook Pro 16 2023 M3 Pro M3 Pro 18-Core GPU, Apple M3 Pro 12-Core, Apple SSD AP0512Z | Asus VivoBook Pro 16 K6602VU GeForce RTX 4050 Laptop GPU, i9-13900H, Micron 2400 MTFDKBA1T0QFM | Lenovo Slim Pro 9i 16IRP8 GeForce RTX 4050 Laptop GPU, i9-13905H, Samsung PM9A1 MZVL21T0HCLR | Schenker VISION 16 Pro (M23) GeForce RTX 4070 Laptop GPU, i7-13700H, Samsung 990 Pro 1 TB | Samsung Galaxy Book3 Ultra 16 GeForce RTX 4050 Laptop GPU, i7-13700H, Samsung PM9A1 MZVL2512HCJQ | Dell XPS 15 9530 RTX 4070 GeForce RTX 4070 Laptop GPU, i7-13700H, SK hynix PC801 HFS001TEJ9X101N | |
|---|---|---|---|---|---|---|
| Noise | -27% | -16% | -34% | -17% | -5% | |
| off / environment * (dB) | 24.4 | 20.96 14% | 22.7 7% | 25.9 -6% | 25 -2% | 23.1 5% |
| Idle Minimum * (dB) | 24.4 | 25.28 -4% | 22.7 7% | 25.9 -6% | 26 -7% | 23.1 5% |
| Idle Average * (dB) | 24.4 | 25.28 -4% | 22.7 7% | 25.9 -6% | 27 -11% | 23.1 5% |
| Idle Maximum * (dB) | 24.4 | 25.28 -4% | 27.5 -13% | 32 -31% | 28 -15% | 24.2 1% |
| Load Average * (dB) | 26.9 | 51.88 -93% | 28.9 -7% | 47.2 -75% | 40 -49% | 27.1 -1% |
| Witcher 3 ultra * (dB) | 25.1 | 49 -95% | 52.6 -110% | 53.1 -112% | 39 -55% | 40.1 -60% |
| Load Maximum * (dB) | 50.4 | 51.8 -3% | 52.5 -4% | 53.1 -5% | 41 19% | 44.6 12% |
* ... smaller is better
Temperatures
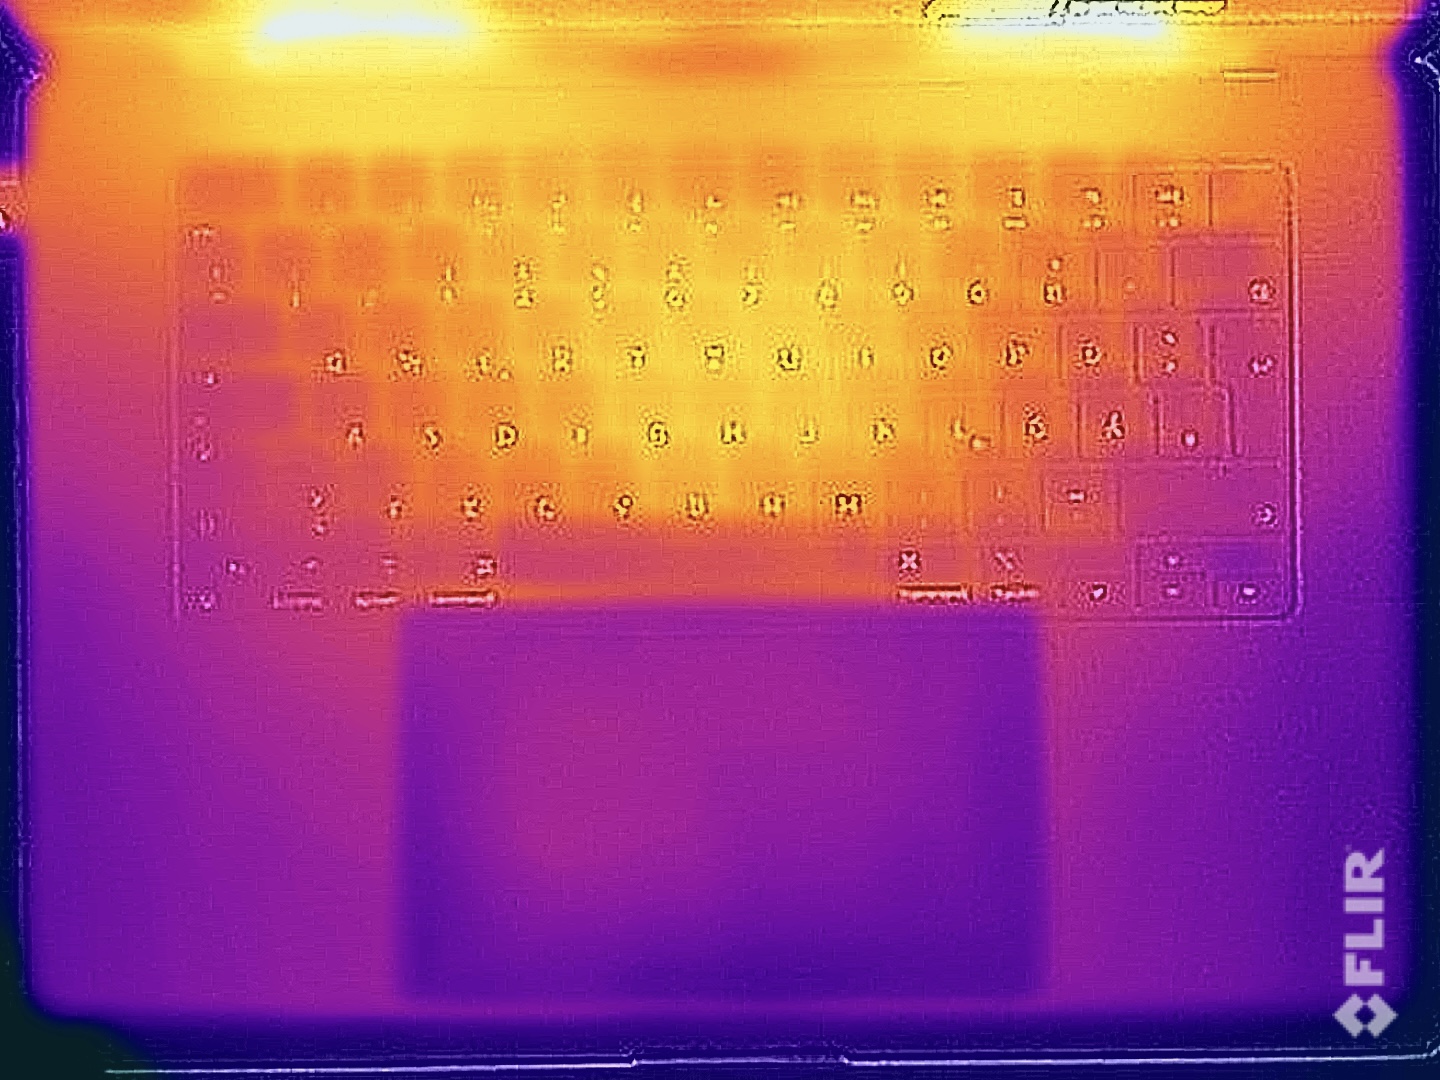
Problems with high temperatures remain foreign to the MacBook Pro 16 with the M3 Pro. With less demanding tasks, the chassis doesn't warm up at all. During the stress test, the surface temperatures reached barely 37 °C to 38 °C (99-100 °F) at the warmest spots, due to the increased fan activity.
The worst-case scenario is represented by gaming when the fans usually run at 1,400 to 1,900 rpm, but even here, a maximum of 42 °C (108 °F) gives absolutely no reason for concern. The 140 W charger reaches a maximum temperature of 45 °C (113 °F).
(+) The maximum temperature on the upper side is 38.1 °C / 101 F, compared to the average of 36.8 °C / 98 F, ranging from 21 to 71 °C for the class Multimedia.
(+) The bottom heats up to a maximum of 37 °C / 99 F, compared to the average of 39.1 °C / 102 F
(+) In idle usage, the average temperature for the upper side is 24 °C / 75 F, compared to the device average of 31.3 °C / 88 F.
(±) Playing The Witcher 3, the average temperature for the upper side is 37.6 °C / 100 F, compared to the device average of 31.3 °C / 88 F.
(+) The palmrests and touchpad are reaching skin temperature as a maximum (33.8 °C / 92.8 F) and are therefore not hot.
(-) The average temperature of the palmrest area of similar devices was 28.7 °C / 83.7 F (-5.1 °C / -9.1 F).
| Apple MacBook Pro 16 2023 M3 Pro Apple M3 Pro 12-Core, Apple M3 Pro 18-Core GPU | Asus VivoBook Pro 16 K6602VU Intel Core i9-13900H, NVIDIA GeForce RTX 4050 Laptop GPU | Lenovo Slim Pro 9i 16IRP8 Intel Core i9-13905H, NVIDIA GeForce RTX 4050 Laptop GPU | Schenker VISION 16 Pro (M23) Intel Core i7-13700H, NVIDIA GeForce RTX 4070 Laptop GPU | Samsung Galaxy Book3 Ultra 16 Intel Core i7-13700H, NVIDIA GeForce RTX 4050 Laptop GPU | Dell XPS 15 9530 RTX 4070 Intel Core i7-13700H, NVIDIA GeForce RTX 4070 Laptop GPU | |
|---|---|---|---|---|---|---|
| Heat | -42% | -18% | -22% | -7% | -28% | |
| Maximum Upper Side * (°C) | 38.1 | 42.6 -12% | 37.8 1% | 46.7 -23% | 41 -8% | 45.6 -20% |
| Maximum Bottom * (°C) | 37 | 48.4 -31% | 44.8 -21% | 54.1 -46% | 44 -19% | 42 -14% |
| Idle Upper Side * (°C) | 24.2 | 39.4 -63% | 30.6 -26% | 26.5 -10% | 23 5% | 34.4 -42% |
| Idle Bottom * (°C) | 24.6 | 39.8 -62% | 31 -26% | 26.8 -9% | 26 -6% | 33.2 -35% |
* ... smaller is better
Stress Test
The stress test with a combined CPU/GPU load is very interesting, since it shows a significant difference to the model with the M3 Max. Even in the stress test, the M3 Pro is able to deliver the full performance of the processor and graphics card for the whole time.
Overall, the power consumption lies at around 55 W. This is very interesting, since the GPU was clearly given preference in the M3 Max, and it could only be kept cool up to a limit of about 48 W overall. We suspect that the faster GPU of the M3 Max simply produces more heat, posing higher demands on the cooling.
Power Management: Enormous endurance
Power Consumption
There are no surprises in the power consumption measurements, and the device is very efficient at minimum brightness. Even the maximum consumption during idle operation of almost 17 W is completely okay, considering the high resolution and increased SDR brightness of more than 600 cd/m².
Under load during the stress test, we measure a maximum of almost 103 W, so the included 140 W charger is completely sufficient offering enough reserves to also be able to continue charging the battery even under load.
| Off / Standby | |
| Idle | |
| Load |
|
Key:
min: | |
| Apple MacBook Pro 16 2023 M3 Pro Apple M3 Pro 12-Core, M3 Pro 18-Core GPU, Apple SSD AP0512Z, Mini-LED, 3456x2234, 16.2" | Asus VivoBook Pro 16 K6602VU i9-13900H, GeForce RTX 4050 Laptop GPU, Micron 2400 MTFDKBA1T0QFM, OLED, 3200x2000, 16" | Lenovo Slim Pro 9i 16IRP8 i9-13905H, GeForce RTX 4050 Laptop GPU, Samsung PM9A1 MZVL21T0HCLR, Mini-LED, 3200x2000, 16" | Schenker VISION 16 Pro (M23) i7-13700H, GeForce RTX 4070 Laptop GPU, Samsung 990 Pro 1 TB, IPS, 2560x1600, 16" | Samsung Galaxy Book3 Ultra 16 i7-13700H, GeForce RTX 4050 Laptop GPU, Samsung PM9A1 MZVL2512HCJQ, AMOLED, 2880x1800, 16" | Dell XPS 15 9530 RTX 4070 i7-13700H, GeForce RTX 4070 Laptop GPU, SK hynix PC801 HFS001TEJ9X101N, OLED, 3456x2160, 15.6" | Average Apple M3 Pro 18-Core GPU | Average of class Multimedia | |
|---|---|---|---|---|---|---|---|---|
| Power Consumption | -101% | -121% | -54% | 13% | -91% | 0% | 4% | |
| Idle Minimum * (Watt) | 4.5 | 21.06 -368% | 16 -256% | 8.6 -91% | 3 33% | 20 -344% | 4.5 ? -0% | 5.68 ? -26% |
| Idle Average * (Watt) | 16.5 | 24.27 -47% | 30 -82% | 12 27% | 5 70% | 20.7 -25% | 16.5 ? -0% | 10 ? 39% |
| Idle Maximum * (Watt) | 16.7 | 25.12 -50% | 30.4 -82% | 12.4 26% | 11 34% | 22.4 -34% | 16.7 ? -0% | 12.4 ? 26% |
| Load Average * (Watt) | 60.4 | 52.4 13% | 78.9 -31% | 80 -32% | 72 -19% | 77.1 -28% | 60.4 ? -0% | 65.1 ? -8% |
| Witcher 3 ultra * (Watt) | 52.1 | 110.2 -112% | 155.3 -198% | 147.7 -183% | 69.7 -34% | 95.4 -83% | ||
| Load Maximum * (Watt) | 102.9 | 146 -42% | 180.4 -75% | 173.1 -68% | 108 -5% | 133.4 -30% | 102.9 ? -0% | 112.6 ? -9% |
* ... smaller is better
Power Consumption: The Witcher 3 / Stress Test
Power Consumption: External Monitor
Battery Life
At 99.6 Wh, Apple continues to use a very large battery, and the increased efficiency also ensures an extremely long battery life for the large MacBook Pro 16. Under maximum load (CPU & GPU load, maximum brightness), you can empty the battery in as little as 83 minutes in the extreme case, but you will also be able to get the full performance (until the battery reaches a minimum capacity of 3%).
On the other hand, if we reduce the brightness to 150 cd/m², the MBP 16 with the M3 Pro can reach an extremely long battery life of more than 24 hours in our video test and 20 hours in our WLAN test. The competitors don't even come close to these results, and the MBP 16 with the M3 Pro also has more endurance than the M3 Max configuration.
When we run the WLAN test at the maximum SDR brightness, the runtime is reduced to about 7.5 hours, which represents a good result for a huge 16.2-inch display with a high resolution and 600 cd/m² of brightness.
It takes barely 1.5 hours to completely recharge the device while it is turned on, with 80% of the capacity already available after 50 minutes.
| Apple MacBook Pro 16 2023 M3 Pro Apple M3 Pro 12-Core, M3 Pro 18-Core GPU, 99.6 Wh | Asus VivoBook Pro 16 K6602VU i9-13900H, GeForce RTX 4050 Laptop GPU, 96 Wh | Lenovo Slim Pro 9i 16IRP8 i9-13905H, GeForce RTX 4050 Laptop GPU, 75 Wh | Schenker VISION 16 Pro (M23) i7-13700H, GeForce RTX 4070 Laptop GPU, 80 Wh | Samsung Galaxy Book3 Ultra 16 i7-13700H, GeForce RTX 4050 Laptop GPU, 76 Wh | Dell XPS 15 9530 RTX 4070 i7-13700H, GeForce RTX 4070 Laptop GPU, 86 Wh | Apple MacBook Pro 16 2023 M3 Max Apple M3 Max 16-Core, M3 Max 40-Core GPU, 99.6 Wh | Average of class Multimedia | |
|---|---|---|---|---|---|---|---|---|
| Battery runtime | -55% | -67% | -45% | -23% | -27% | -16% | -18% | |
| H.264 (h) | 24.7 | 9.8 -60% | 7.8 -68% | 13.4 -46% | 20.4 -17% | 16.4 ? -34% | ||
| WiFi v1.3 (h) | 20.1 | 10.1 -50% | 6.6 -67% | 7.8 -61% | 9.6 -52% | 8 -60% | 16.7 -17% | 12 ? -40% |
| Load (h) | 1.4 | 1.3 -7% | 1.8 29% | 1.5 7% | 1.2 -14% | 1.675 ? 20% |
Pros
Cons
Verdict: The MacBook Pro 16 is an excellent but expensive multimedia laptop
With the new M3 Pro SoC, Apple takes a different route than with the M3 Max chips, since both the multi-core performance as well as the GPU performance practically remain the same compared to the M2 Pro. Instead, the single-core performance has increased significantly, and the M3 Pro becomes more efficient overall. In practice, this leads to an even better battery life and, in our test at 150 cd/m² of brightness, more than 20 hours are possible in the WLAN test (and even 24 hours of video playback), which are extremely good values for a large 16-inch laptop with a high-resolution mini-LED panel.
The Windows competitors often don't even reach the 10-hour mark. In addition, Apple has increased the maximum SDR brightness from 500 to 600 cd/m², and the panel continues to offer a very good image quality. Even though the response times are very slow, this is hardly noticeable in everyday operation and there is hardly any visible ghosting — the high frequency of 120 Hz also helps here.
Thanks to the more efficient M3 Pro and the significantly increased single-core performance, the MacBook Pro 16 has become even better, continuing to be the multimedia laptop with the best overall package on the market.
However, the new M3 Pro still left a slightly bland aftertaste, since the new core configuration with more Efficiency but less Performance cores leaves the impression that the performance was limited on purpose here. But due to the new cluster configuration, there aren't many alternatives here. At the same time, we also have to attest that the performance remains completely stable both in battery operation as well as under simultaneous load of CPU and GPU. This is neither the case with the new M3 Max models, nor with the Windows competitors. An additional point of critique is that a €3,000 (~US$3,273) laptop continues to come with a meager 512 GB SSD.
An upgrade from a MacBook Pro 16 with the M2 Pro or even with the M1 Pro doesn't really make sense, but the new MBP 16 M3 Pro is an ideal choice if you are still using a MacBook Pro 16 with an Intel processor, or it is the first time you are buying a MacBook Pro.
Compared to the Windows competitors in this price class, we have to clearly state that they often offer more performance particularly with the graphics cards if you also want to use your laptop for gaming. Native games such as Baldur's Gate 3, Lies of P, or No Man's Sky run smoothly on the MacBook, but the performance is lower than with the Windows competitors and more efficiency won't help much in this regard either.
On the other hand, it will be difficult to find a better overall package in the multimedia area, since there is no better combination of high-quality workmanship, a great mini-LED display, low emissions (you almost never hear the fans in everyday operation), excellent speakers, and an immense battery life. You have to make some compromises somewhere, and in Windows laptops this is usually the case with the fans or the battery life.
But Apple also makes you pay for this overall package, and the huge upgrade prices coupled with non-existent maintenance options are very clearly a large disadvantage.
Price and Availability
The base model of the MacBook Pro 16 with the M3 Pro is currently available starting from US$2,499 from Apple directly or online shops such as Amazon starting from US$2,299.
Apple MacBook Pro 16 2023 M3 Pro
- 11/24/2023 v7 (old)
Andreas Osthoff
Transparency
The selection of devices to be reviewed is made by our editorial team. The test sample was provided to the author as a loan by the manufacturer or retailer for the purpose of this review. The lender had no influence on this review, nor did the manufacturer receive a copy of this review before publication. There was no obligation to publish this review. As an independent media company, Notebookcheck is not subjected to the authority of manufacturers, retailers or publishers.
This is how Notebookcheck is testing
Every year, Notebookcheck independently reviews hundreds of laptops and smartphones using standardized procedures to ensure that all results are comparable. We have continuously developed our test methods for around 20 years and set industry standards in the process. In our test labs, high-quality measuring equipment is utilized by experienced technicians and editors. These tests involve a multi-stage validation process. Our complex rating system is based on hundreds of well-founded measurements and benchmarks, which maintains objectivity. Further information on our test methods can be found here.
Price comparison

