Samsung Galaxy Book3 Ultra 16 with RTX 4070 in review: High graphics performance in a business-like notebook
With the Galaxy Book3 Ultra, Samsung is venturing into the high-performance multimedia notebook segment. Optionally equipped with an Nvidia GeForce RTX 4050 or RTX 4070, the focus is on high-level video and image processing. At the same time, the laptop is slim, unobtrusive and almost 1 kg lighter than a similarly equipped gaming notebook.
Thanks to the strongly reduced power consumption, a small cooling system is sufficient, which also takes up less space. In the following review, we look at just how much the graphics performance is affected when the system has to make do with under 100 watts instead of 250 or 300 watts. Moreover, it remains to be seen how well Samsung has been able to limit heat emissions and fan noise in the small space available.
We recently reviewed the smaller Samsung Galaxy Book3 Ultra with the RTX 4050. A competitor for comparable tasks and with comparable hardware is, for example, the Gigabyte AERO 16 OLED. But a look at the better equipped and more expensive MSI Stealth 17 Studio certainly doesn't hurt either. And a MacBook Pro with an M2 chip should be roughly on par in terms of price and performance, although a comparison between Windows and Mac is akin to comparing apples and oranges.
Possible competitors in comparison
Rating | Date | Model | Weight | Height | Size | Resolution | Price |
|---|---|---|---|---|---|---|---|
| 88.8 % v7 (old) | 05 / 2023 | Samsung Galaxy Book3 Ultra 16, i9-13900H RTX 4070 i9-13900H, GeForce RTX 4070 Laptop GPU | 1.8 kg | 16.8 mm | 16.00" | 2880x1800 | |
| 90.3 % v7 (old) | 04 / 2023 | Dell XPS 15 9530 RTX 4070 i7-13700H, GeForce RTX 4070 Laptop GPU | 1.9 kg | 18 mm | 15.60" | 3456x2160 | |
| 89.2 % v7 (old) | 04 / 2023 | MSI Stealth 17 Studio A13VH-014 i9-13900H, GeForce RTX 4080 Laptop GPU | 3 kg | 21.3 mm | 17.30" | 3840x2160 | |
| 89 % v7 (old) | 02 / 2023 | Asus ProArt StudioBook 16 H7600ZW i9-12900H, GeForce RTX 3070 Ti Laptop GPU | 2.4 kg | 19.9 mm | 16.00" | 3840x2400 | |
| 86.2 % v7 (old) | 03 / 2023 | Gigabyte AERO 16 OLED BSF i9-13900H, GeForce RTX 4070 Laptop GPU | 2.1 kg | 18 mm | 16.00" | 3840x2400 | |
| 89.4 % v7 (old) | 04 / 2023 | Samsung Galaxy Book3 Ultra 16 i7-13700H, GeForce RTX 4050 Laptop GPU | 1.8 kg | 16.5 mm | 16.00" | 2880x1800 |
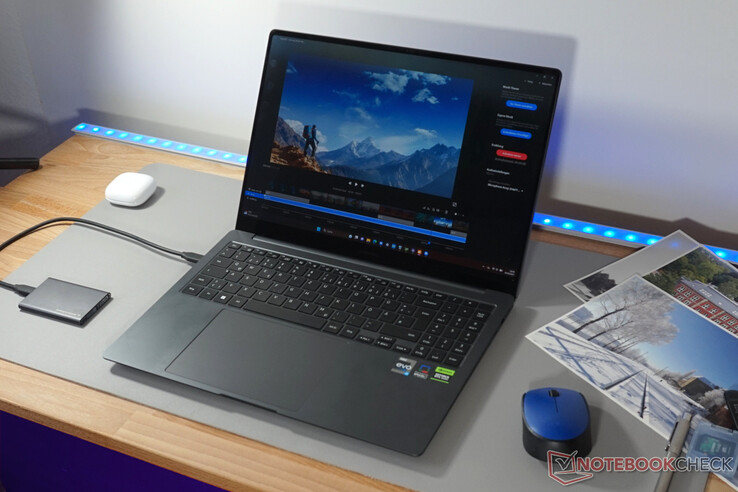
Case - Extremely thin Galaxy Book
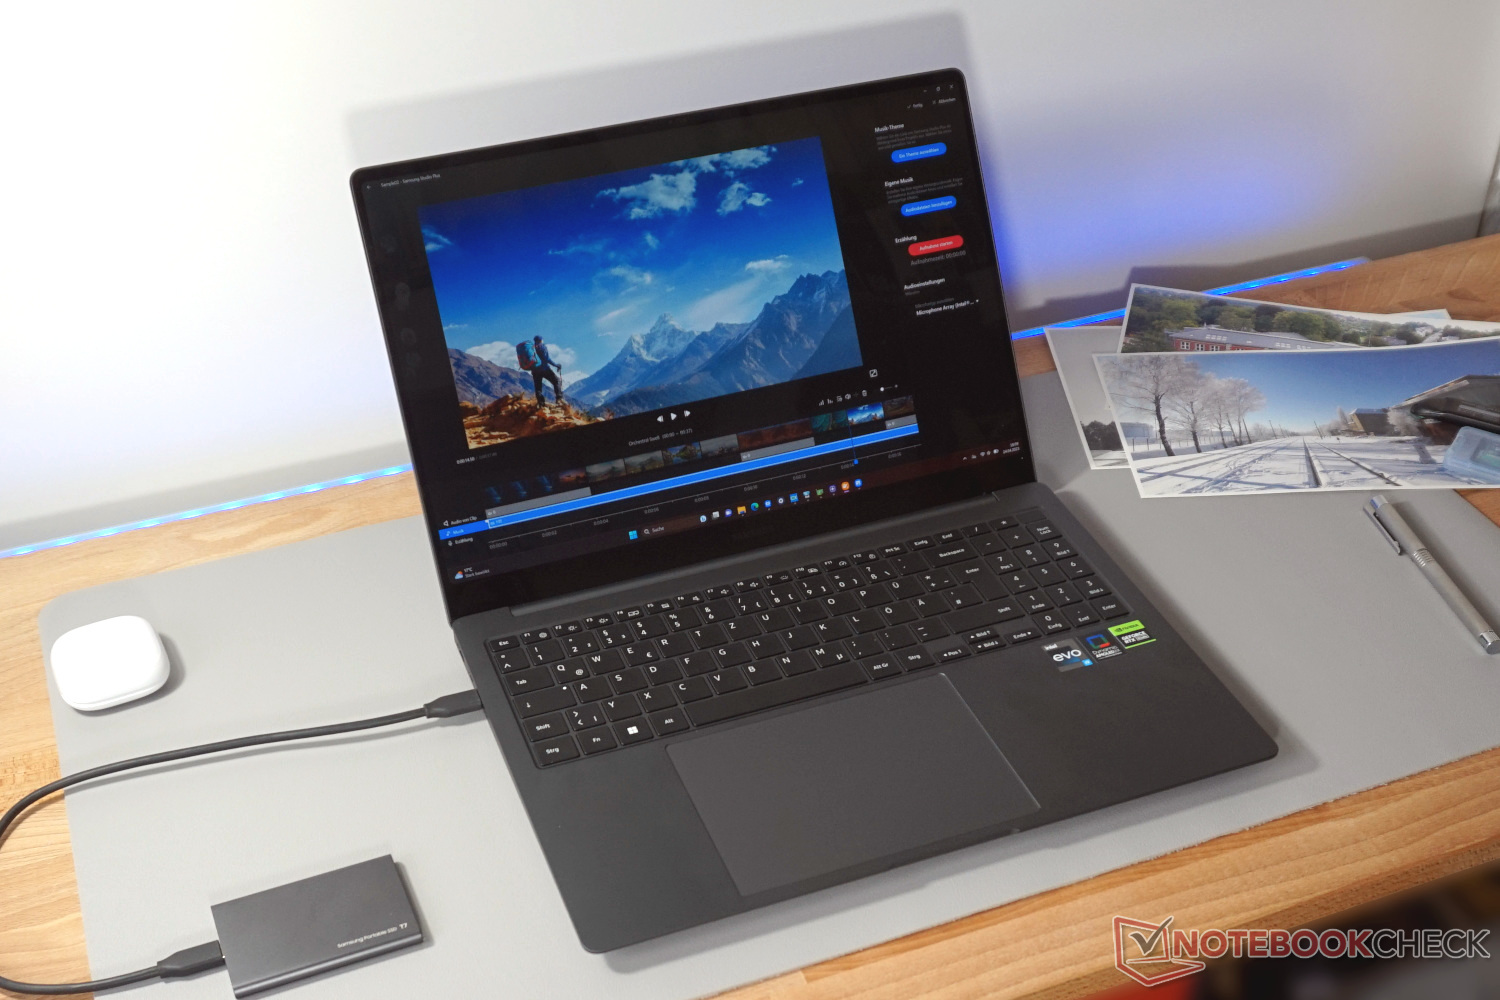
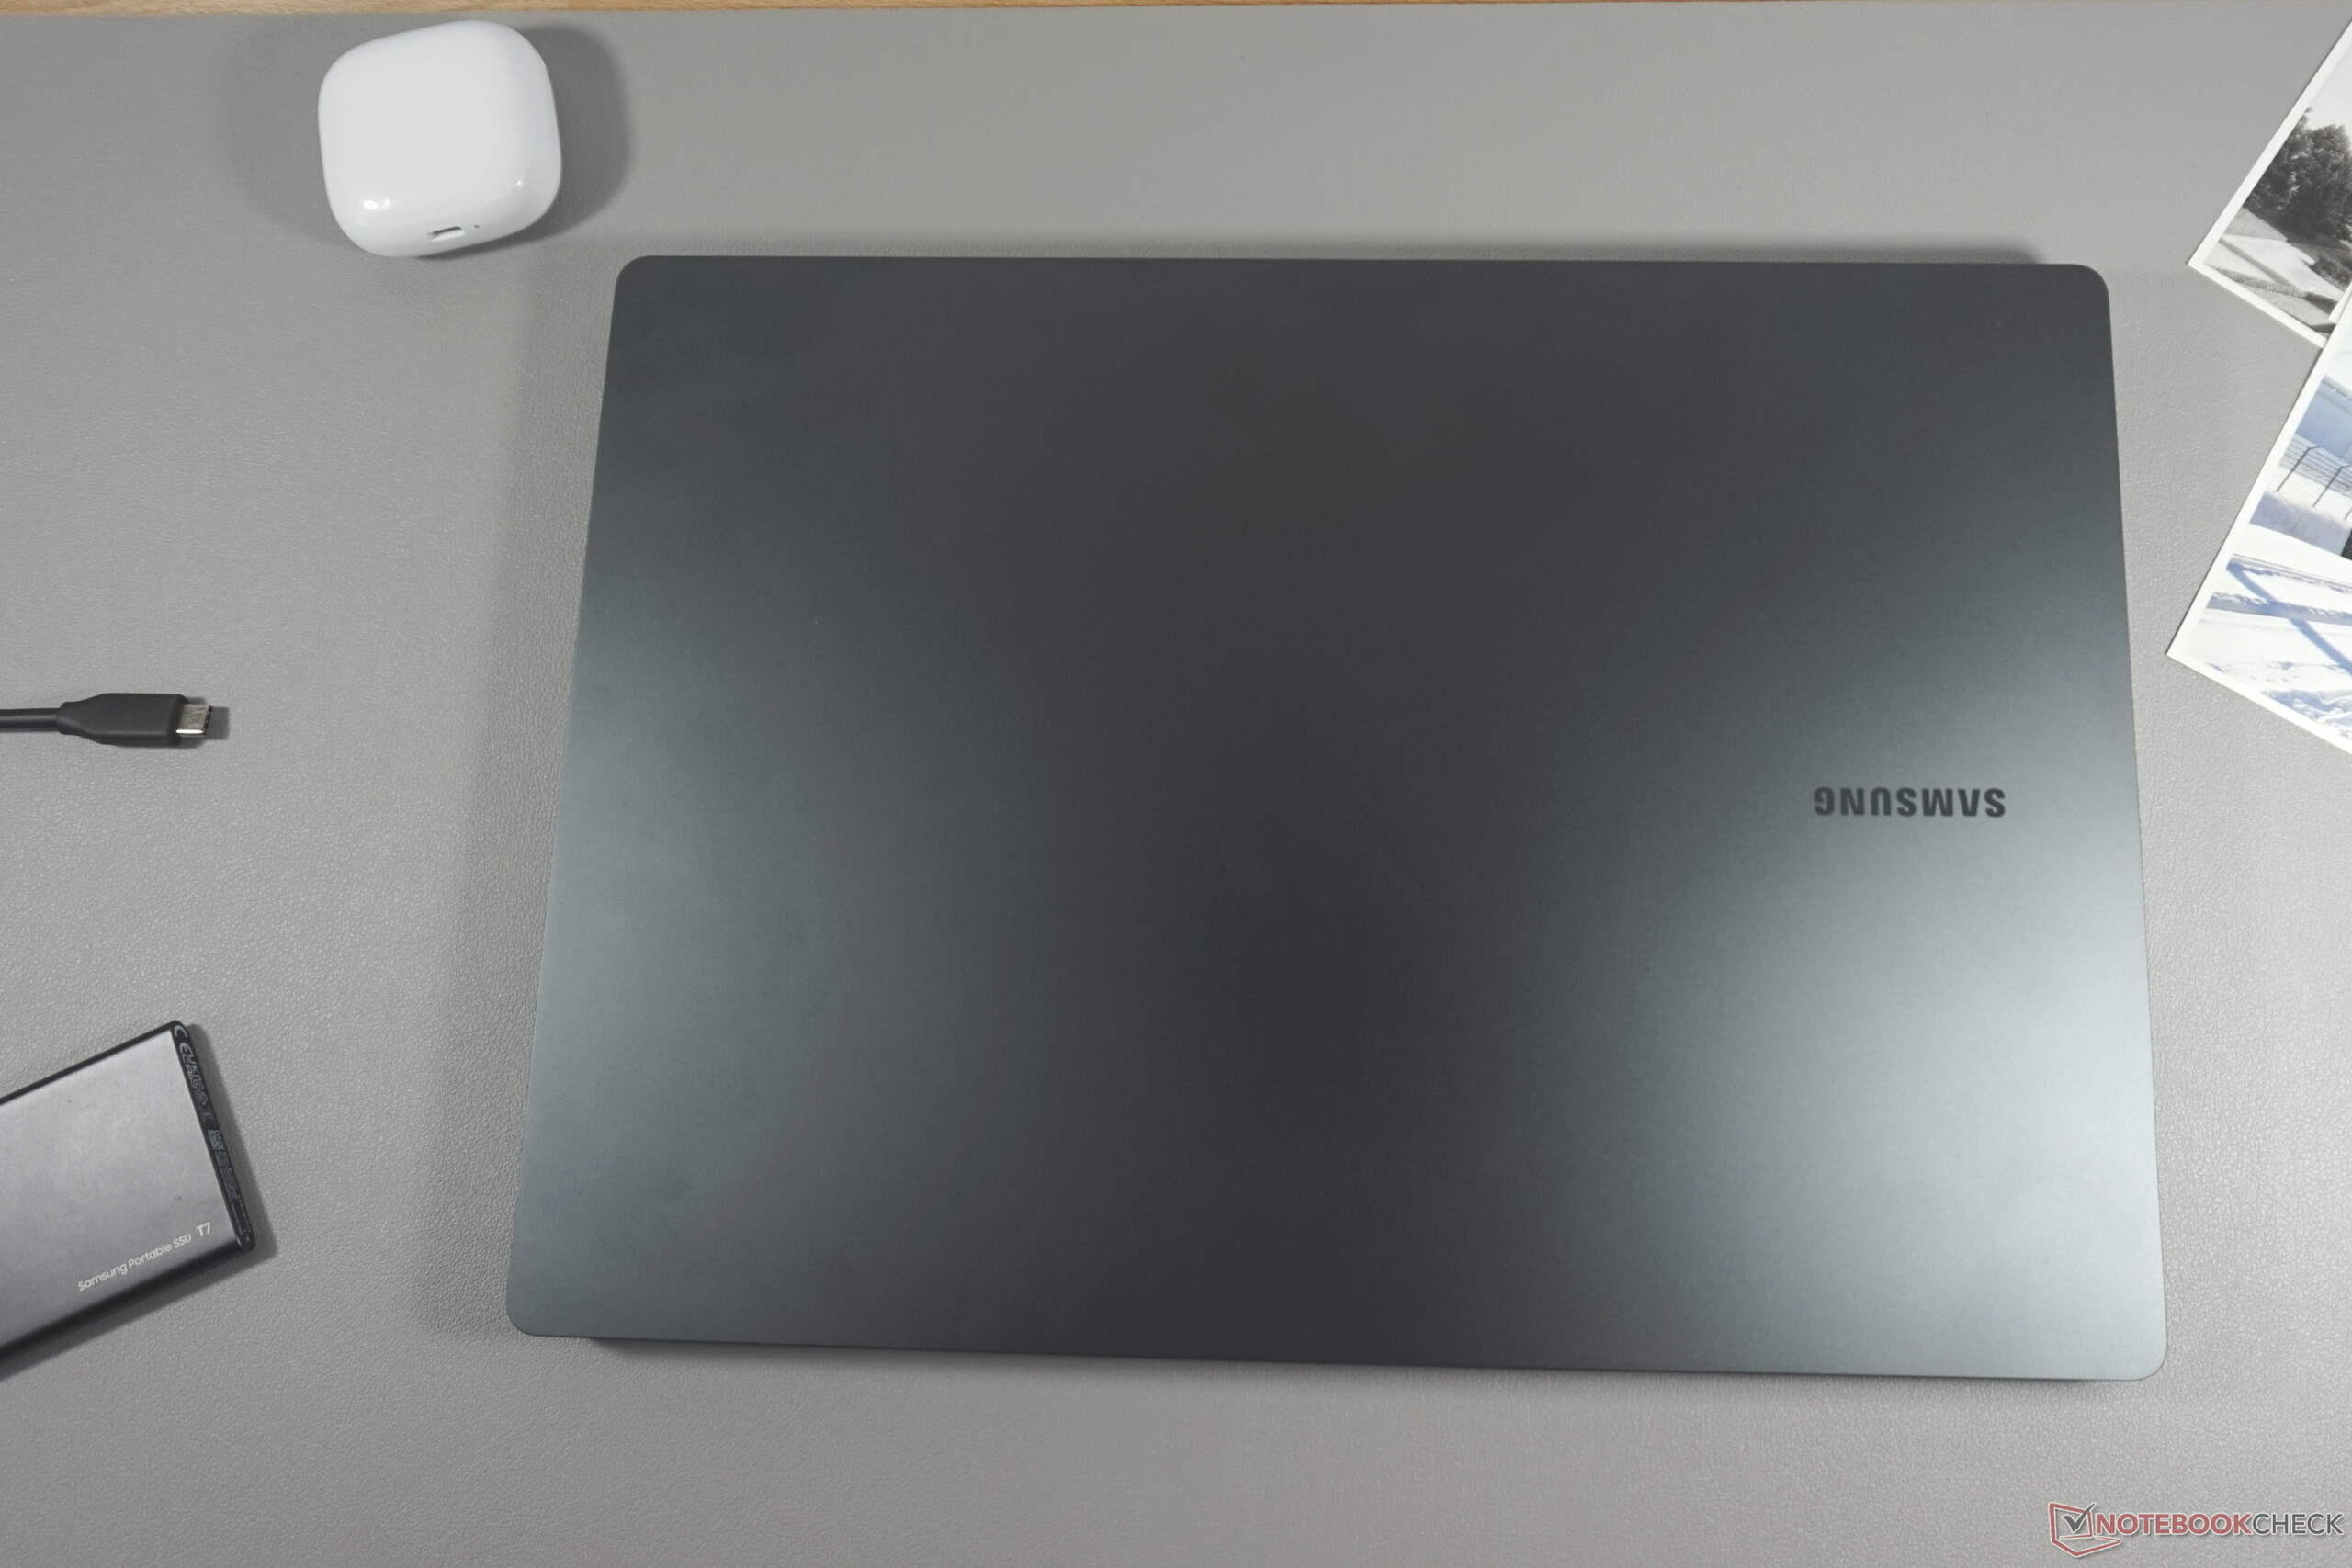
The dark gray of the Galaxy Book Ultra looks sober and inconspicuous. The underside and the keyboard frame, both made out of plastic, are hardly indistinguishable from the metal display lid, at least visually. Everything appears to seamlessly fit together, and no gaps are to be found.
Torsional stiffness is high. Only a minimal bending of the very flat case can be elicited. The display, which can be easily opened with one hand thanks to its weight and up to 135°, also appears extremely solid. Only the hinges wobble a little too much.
What is really striking is the lack of larger ventilation slots. Air exchange is only possible through the baseplate and via the very subtle grilles on the sides.
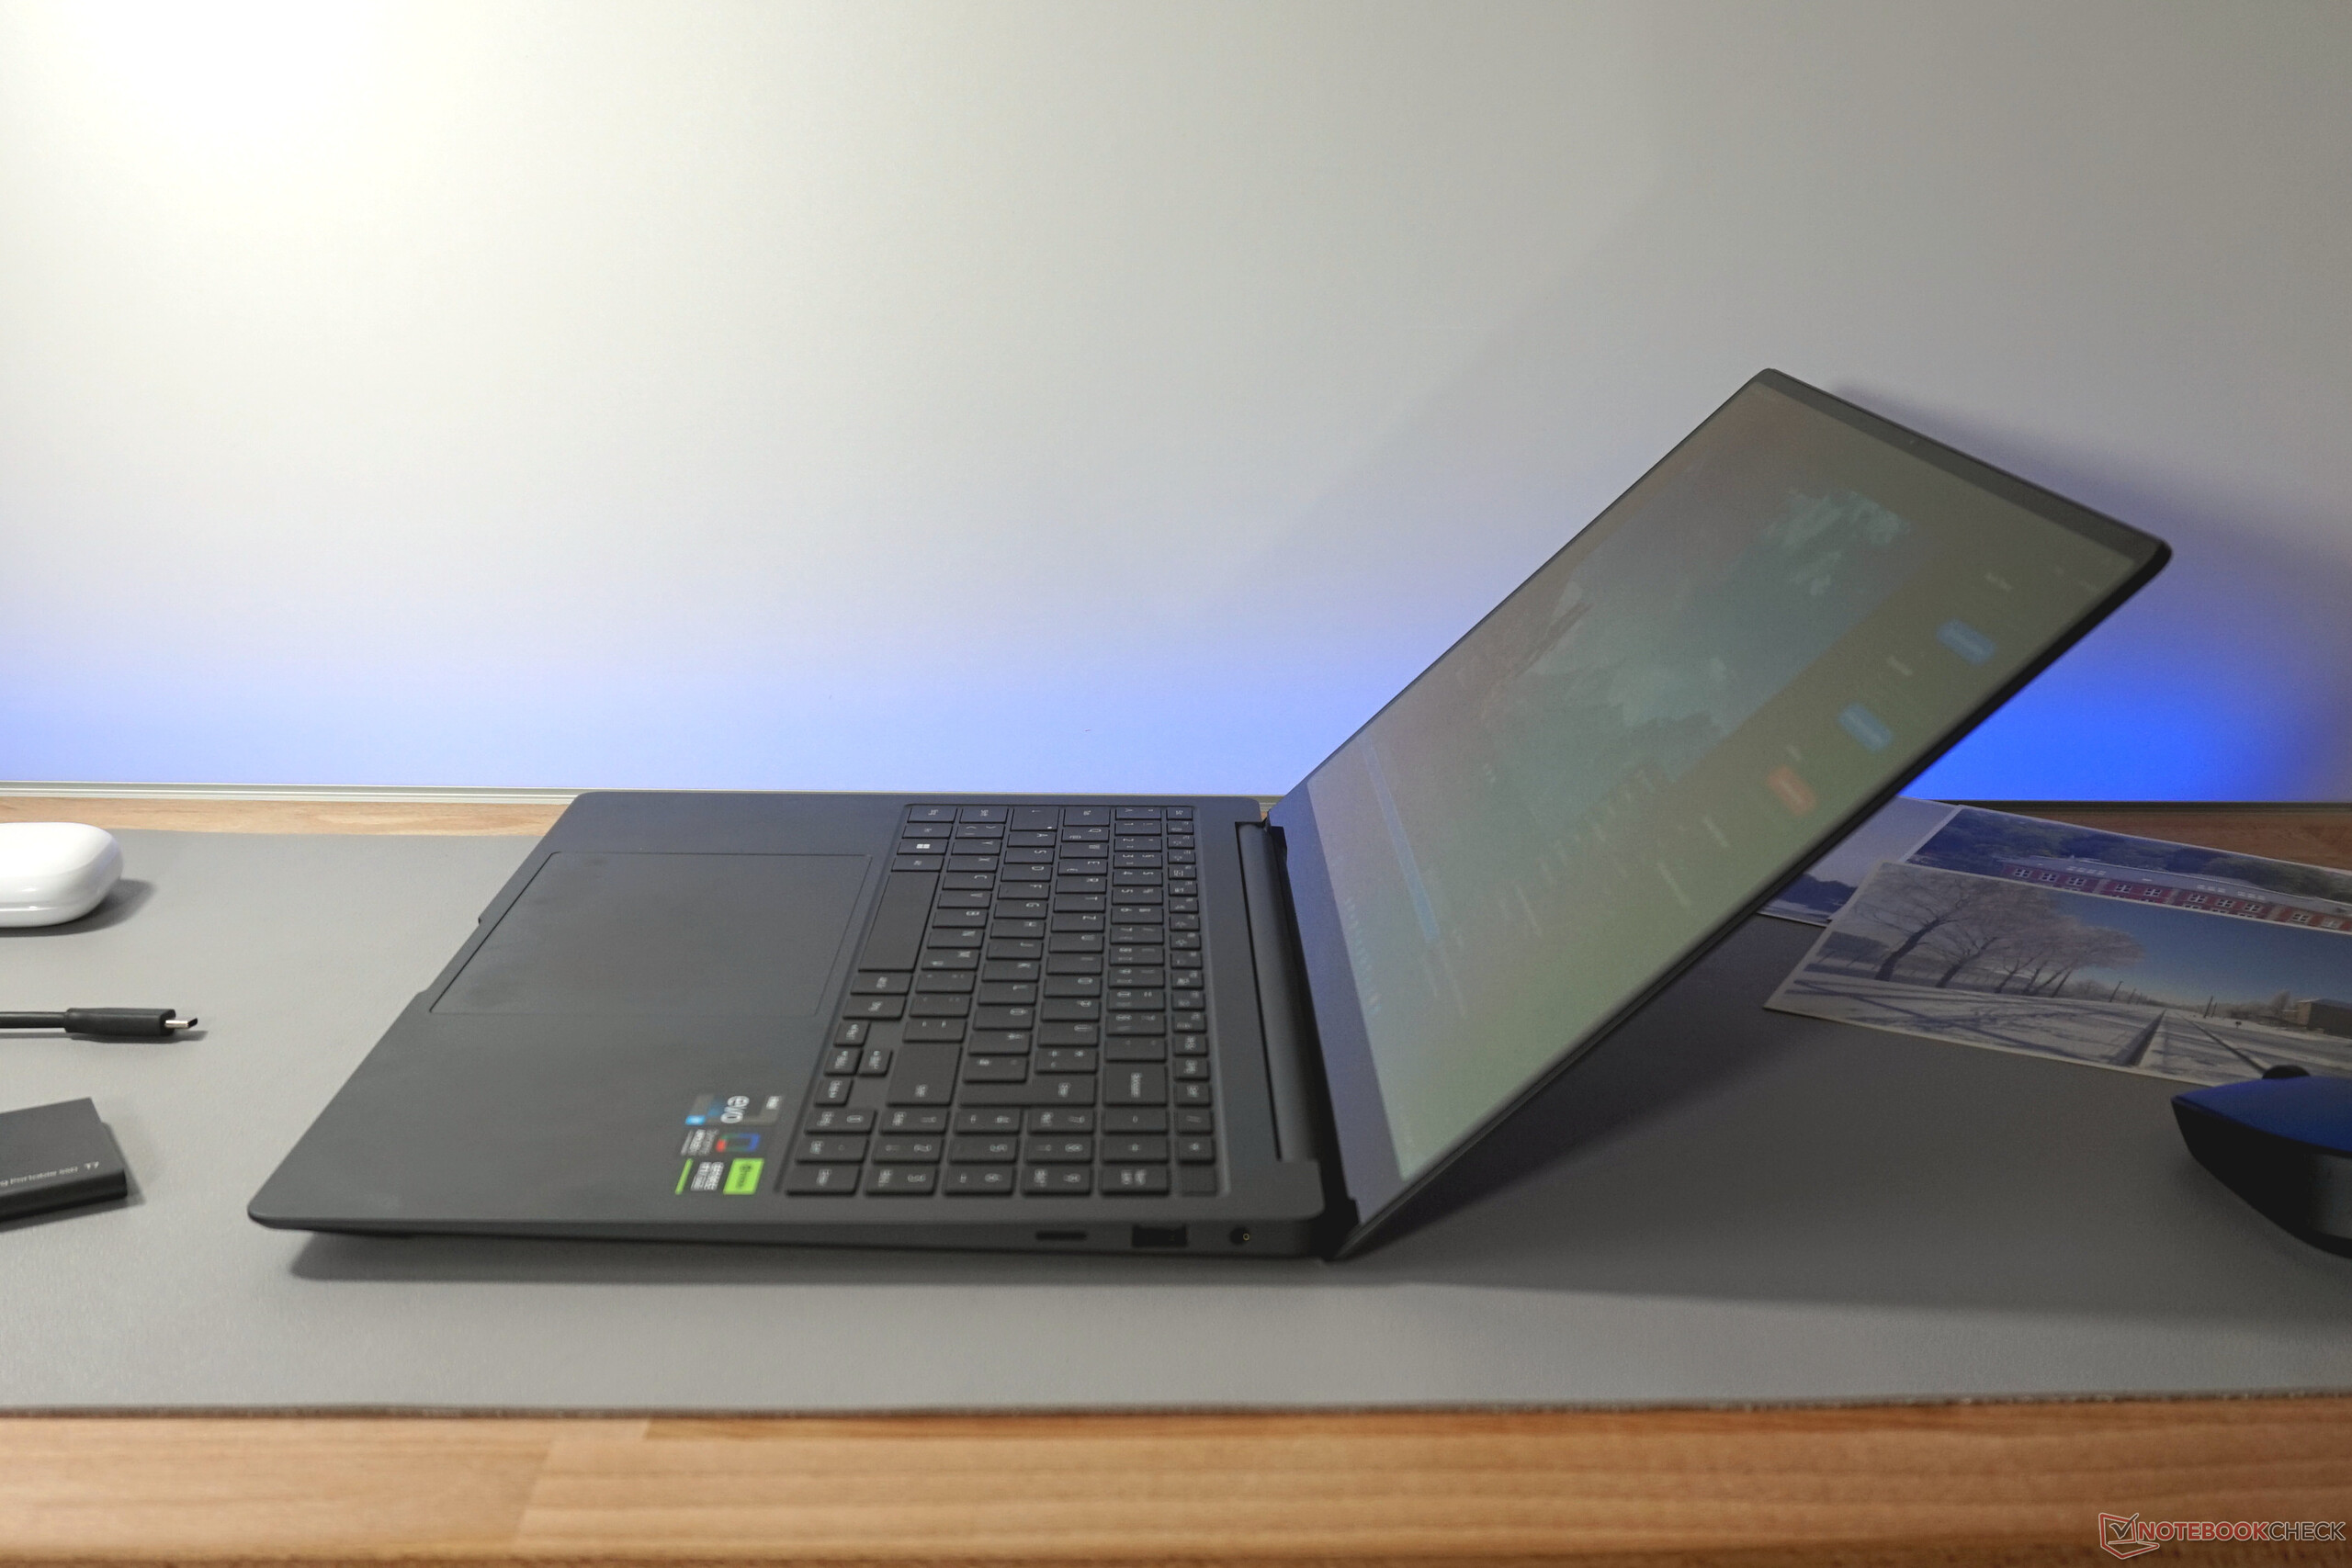


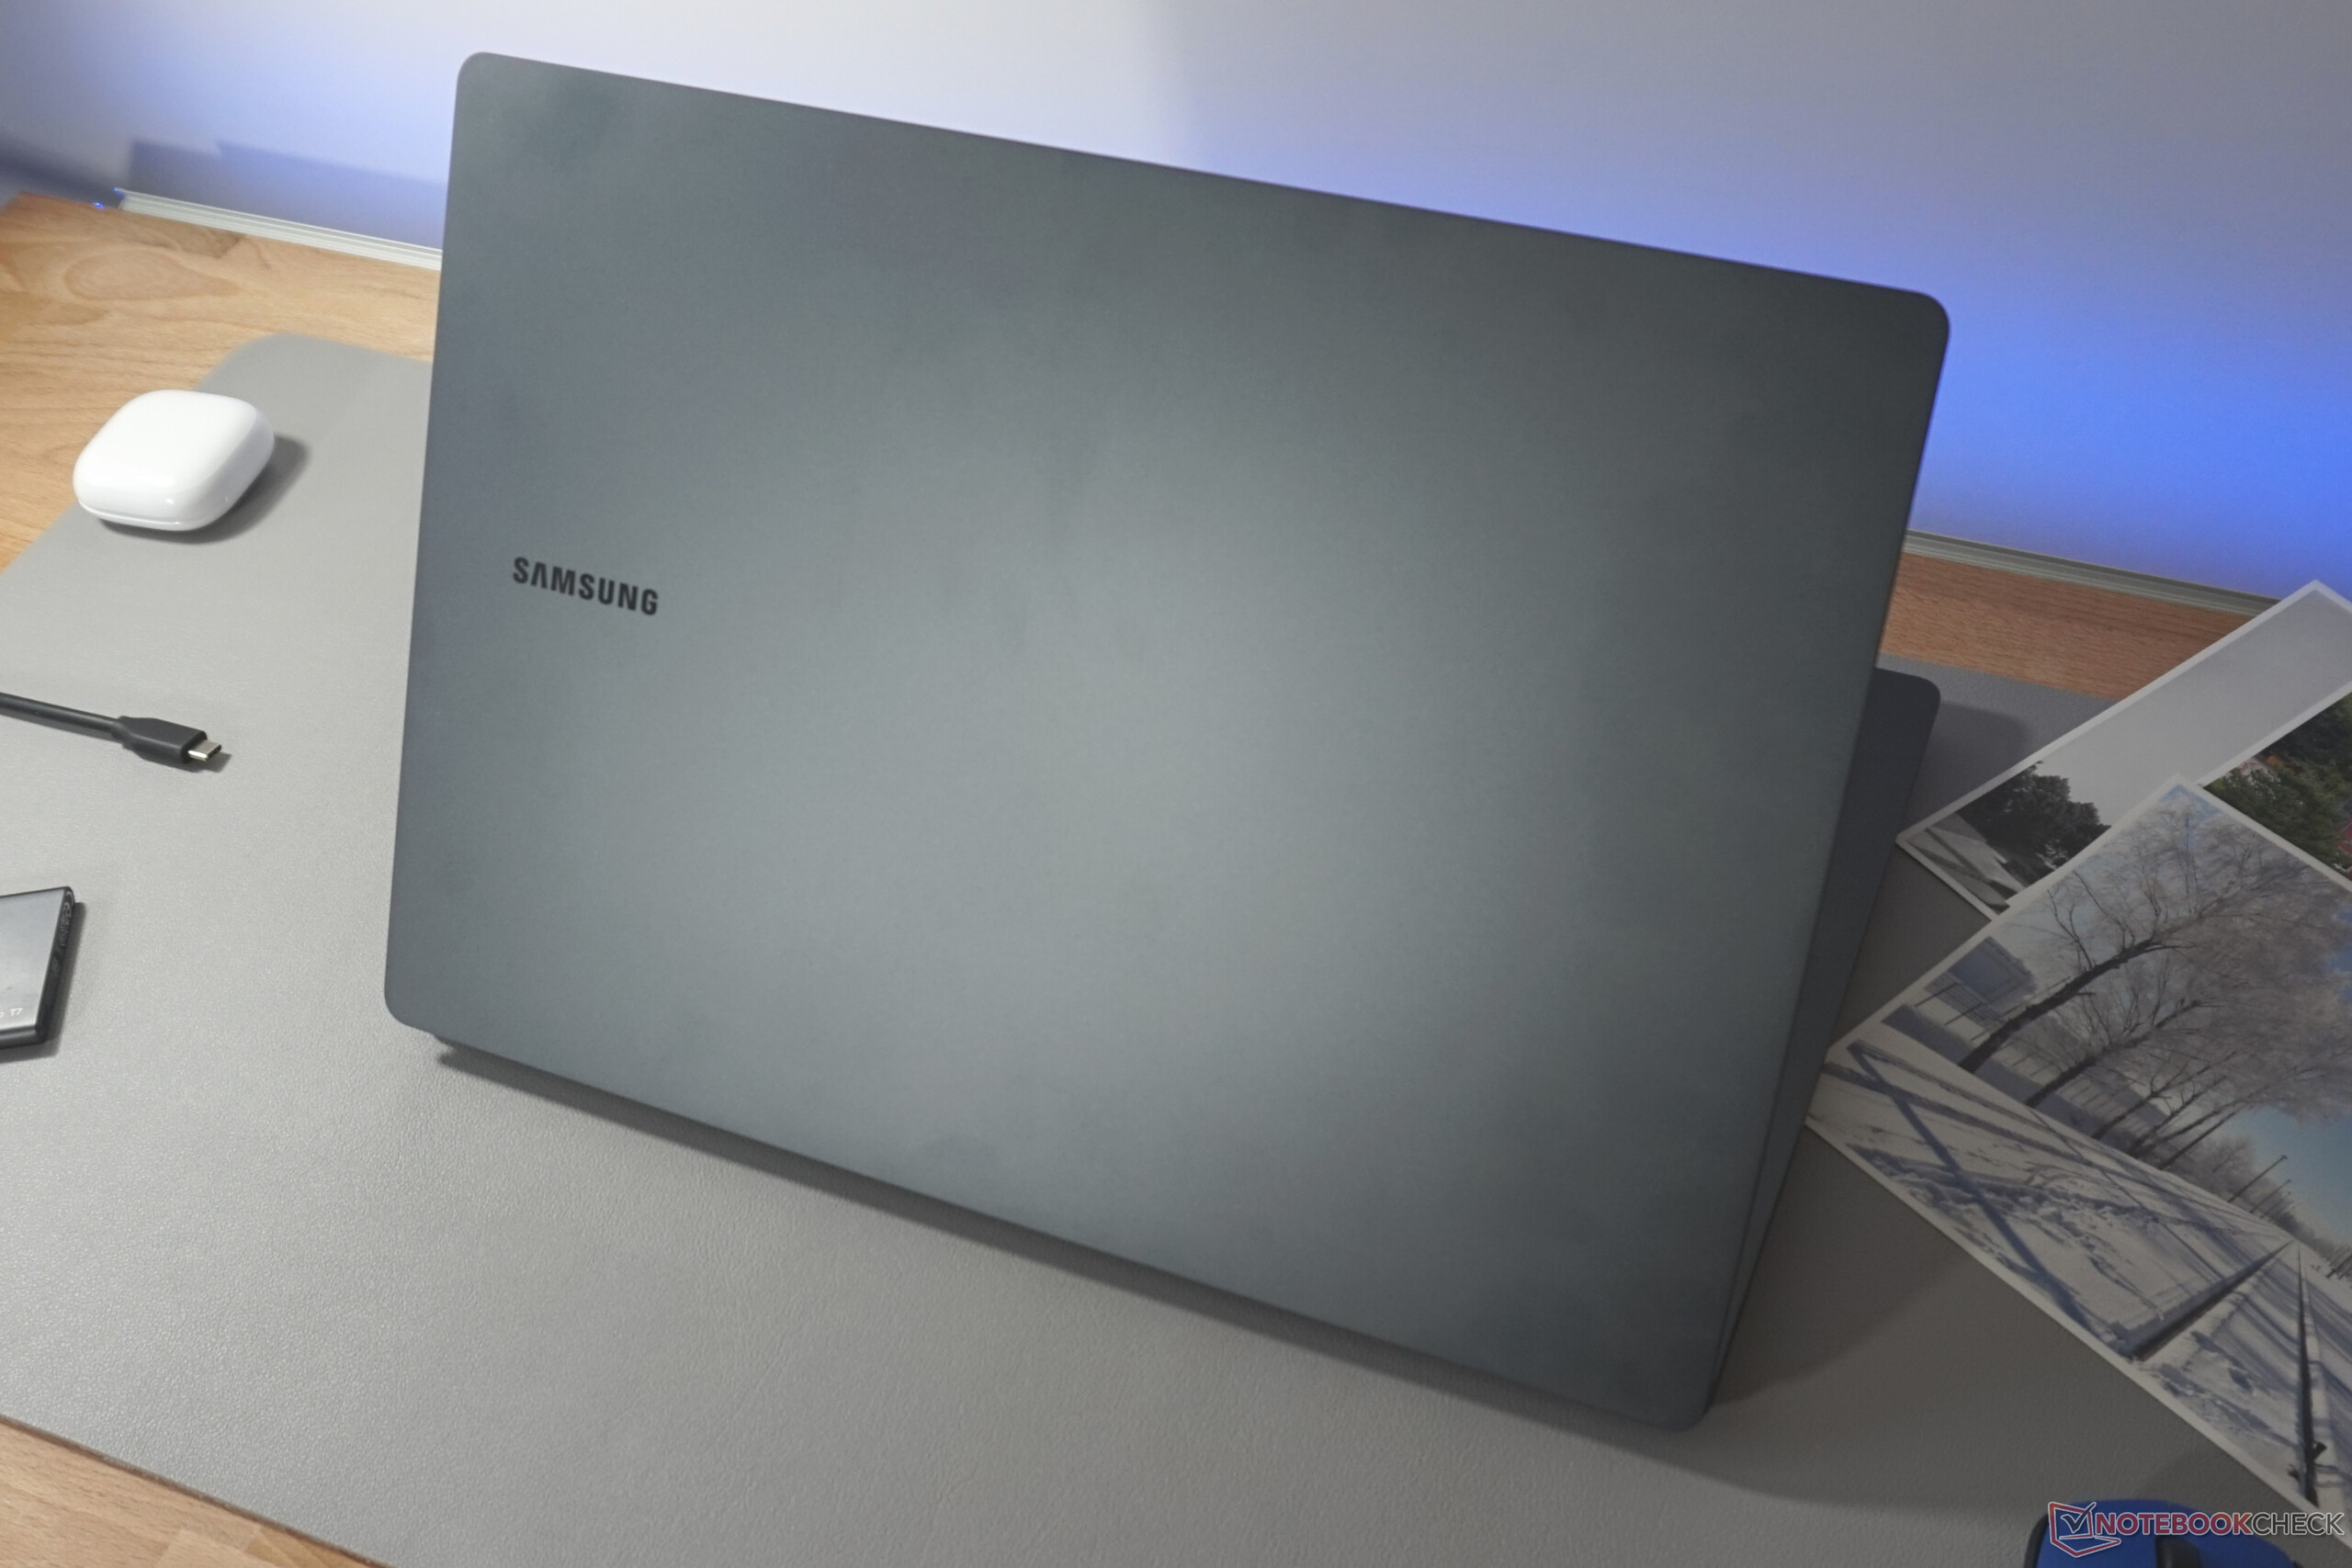
The thickness of 16.8 mm (our measured value) is difficult to beat. This measurement is all the more remarkable in view of the strong hardware. On this note, the Galaxy Book3 Ultra is also rather restrained in terms of weight.
Equipment - Two TB4s, not much else
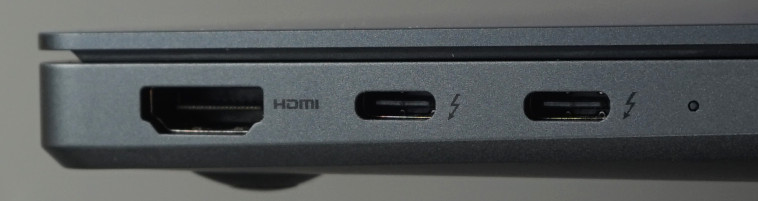
The range and number of ports seem minimalistic, but they match the equally minimalistic case. At least the most important ones are on board. There is one HDMI port and two Thunderbolt 4 ports next to it, so all video outputs are right next to each other. There is also a card slot, one USB-A for a mouse or printer and an audio jack.
The range and number of ports seem minimalistic, but they match the equally minimalistic case. At least the most important ones are on board. There is one HDMI port and two Thunderbolt 4 ports next to it, so all video outputs are right next to each other. There is also a card slot, one USB-A for a mouse or printer and the audio jack.

SD Card Reader
Transfer speeds via our AV PRO microSD 128 GB V60 reference card are unsurprising. Most rivals also achieve around 80 MB/s. The Gigabyte AERO 16 and Dell's XPS 15 9530 show that it can be done much better here. This saves a few minutes when copying a filled card, but not more.
| SD Card Reader | |
| average JPG Copy Test (av. of 3 runs) | |
| Gigabyte AERO 16 OLED BSF | |
| Dell XPS 15 9530 RTX 4070 (Toshiba Exceria Pro SDXC 64 GB UHS-II) | |
| Average of class Multimedia (23 - 531, n=43, last 2 years) | |
| Samsung Galaxy Book3 Ultra 16, i9-13900H RTX 4070 (AV Pro SD microSD 128 GB V60) | |
| Samsung Galaxy Book3 Ultra 16 (AV PRO microSD 128 GB V60) | |
| Asus ProArt StudioBook 16 H7600ZW (AV PRO microSD 128 GB V60) | |
| MSI Stealth 17 Studio A13VH-014 | |
| maximum AS SSD Seq Read Test (1GB) | |
| Average of class Multimedia (27.9 - 1455, n=42, last 2 years) | |
| Gigabyte AERO 16 OLED BSF | |
| Dell XPS 15 9530 RTX 4070 (Toshiba Exceria Pro SDXC 64 GB UHS-II) | |
| Samsung Galaxy Book3 Ultra 16, i9-13900H RTX 4070 (AV Pro SD microSD 128 GB V60) | |
| Samsung Galaxy Book3 Ultra 16 (AV PRO microSD 128 GB V60) | |
| Asus ProArt StudioBook 16 H7600ZW (AV PRO microSD 128 GB V60) | |
| MSI Stealth 17 Studio A13VH-014 | |
Communication
The lack of a LAN port won't necessarily be missed. At least in the vicinity of the router, the Samsung Galaxy Book3 transmits more than 1 Gbit/s without a cable. Our measured values fall within the average range for multimedia notebooks and for the Intel AX211 WLAN module used.
Only when transmitting on 6 GHz via Wi-Fi 6E does the module fall short of the expected rate despite repeated tests. However, this was not the case during receiving, so we can rule out a hardware error.
Webcam
For such a compact laptop, the Full HD webcam delivers quite decent results. Images look high-quality in sufficient light. No color deviations or image noise were observed. Only in a weakly-lit room or in twilight does image noise emerge and the frame rate also seems to decrease.
The dual array microphone performs well enough when it comes to suitability for video telephony. It picks up the voice from different directions and at various distances without changes in volume. Although voices sound clean for the most part, they also sound a little distorted at times. However, this is only noticeable if you pay close attention to it.


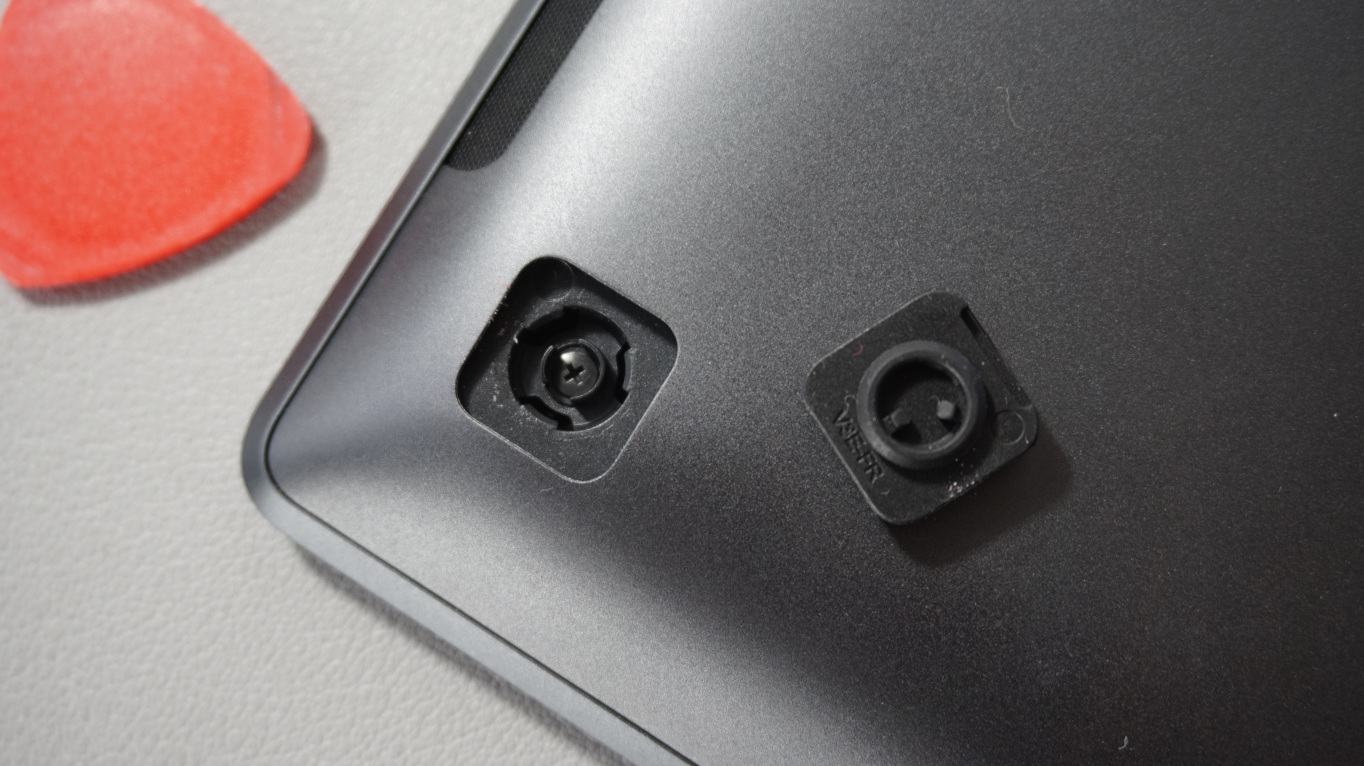
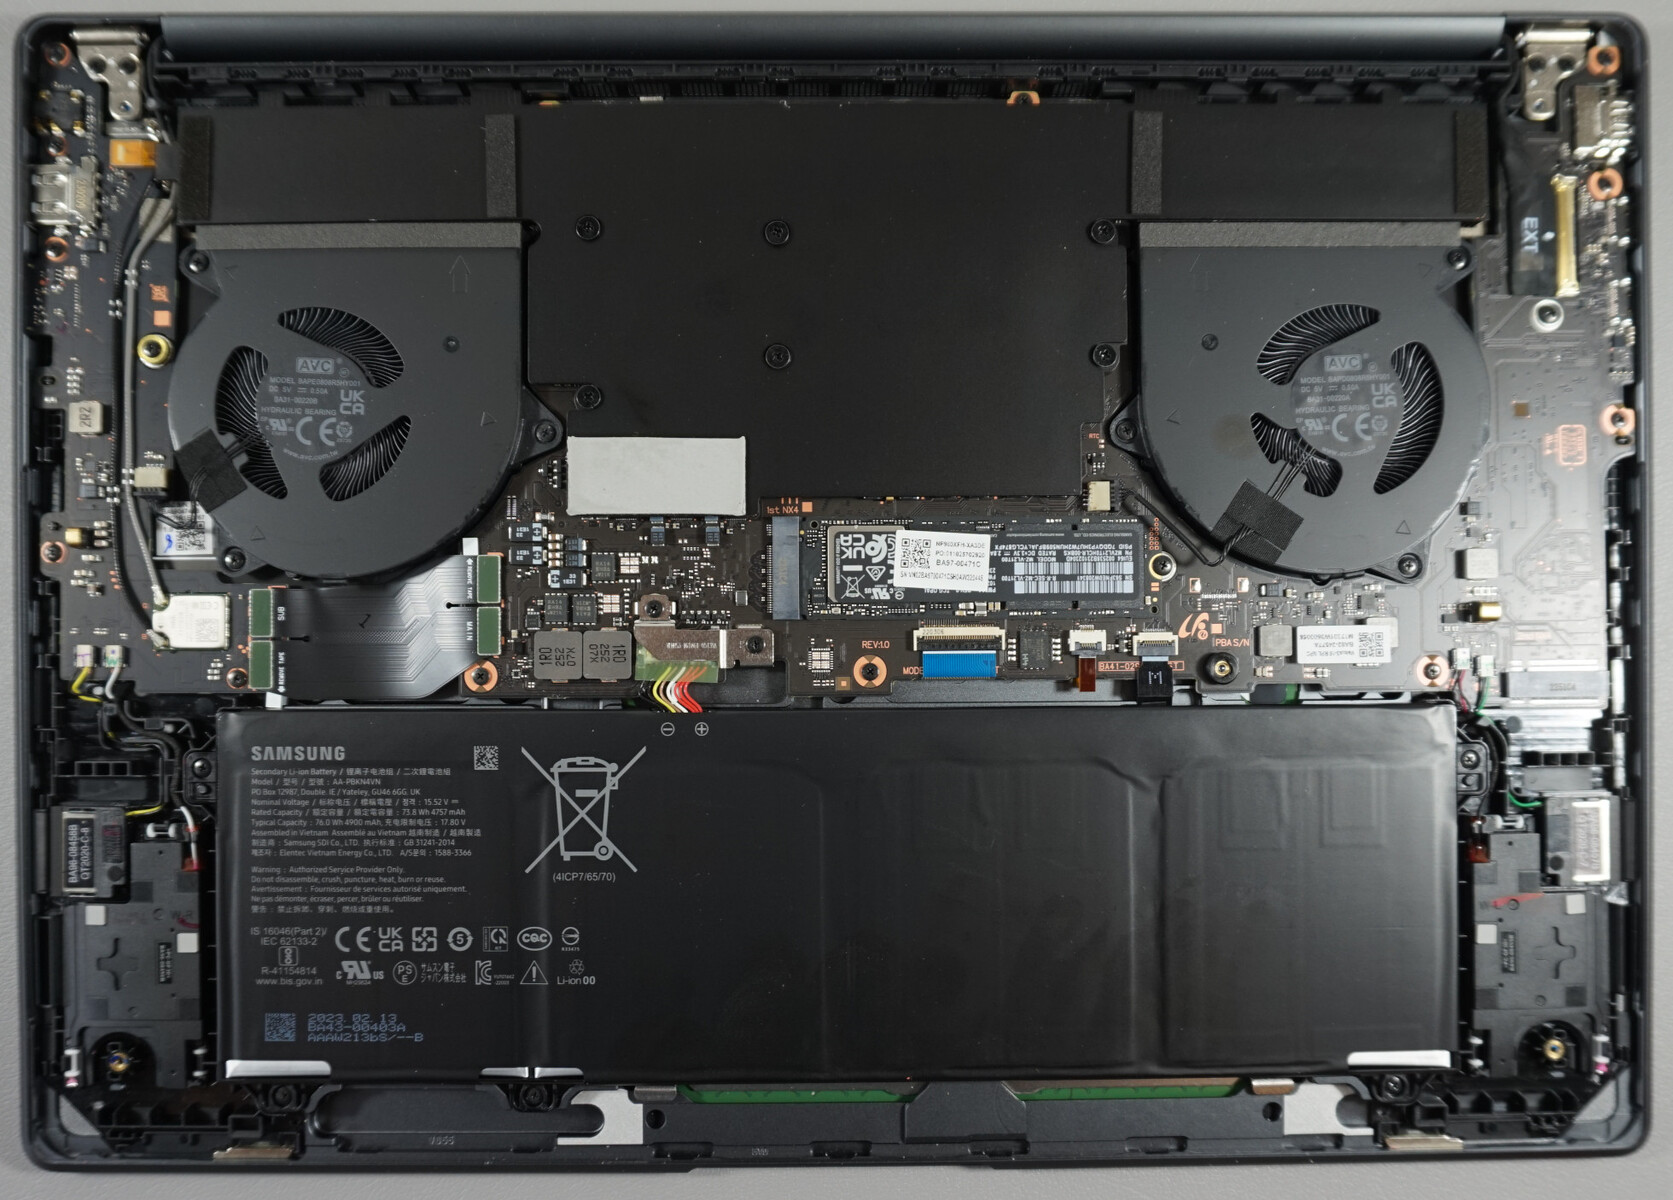
Maintenance
Only four Phillips screws have to be unscrewed to remove the baseplate. These are located under the clicked-in rubber feet, which can be removed without damage with a bit of finesse.
This makes it sounds like an easy-to-open notebook, but it is not at all. Countless plastic clips hold the baseplate tightly in place. There is also a mechanism in the center of the base plate that is also connected to the cooling system by means of a thermal pad. The mechanism can only be opened after completely loosening and bending the baseplate, and proves to be similarly complicated when putting the laptop back together.
Those who are persistent and careful enough not to bend or break anything will find a free M.2 slot with PCIe 4 for storage expansion. The primary SSD and the battery can also be swapped out. The fans can be easily cleaned.
The RAM and the WLAN module, on the other hand, are soldered. All in all, this hardly matters, since Samsung has made opening extremely cumbersome.
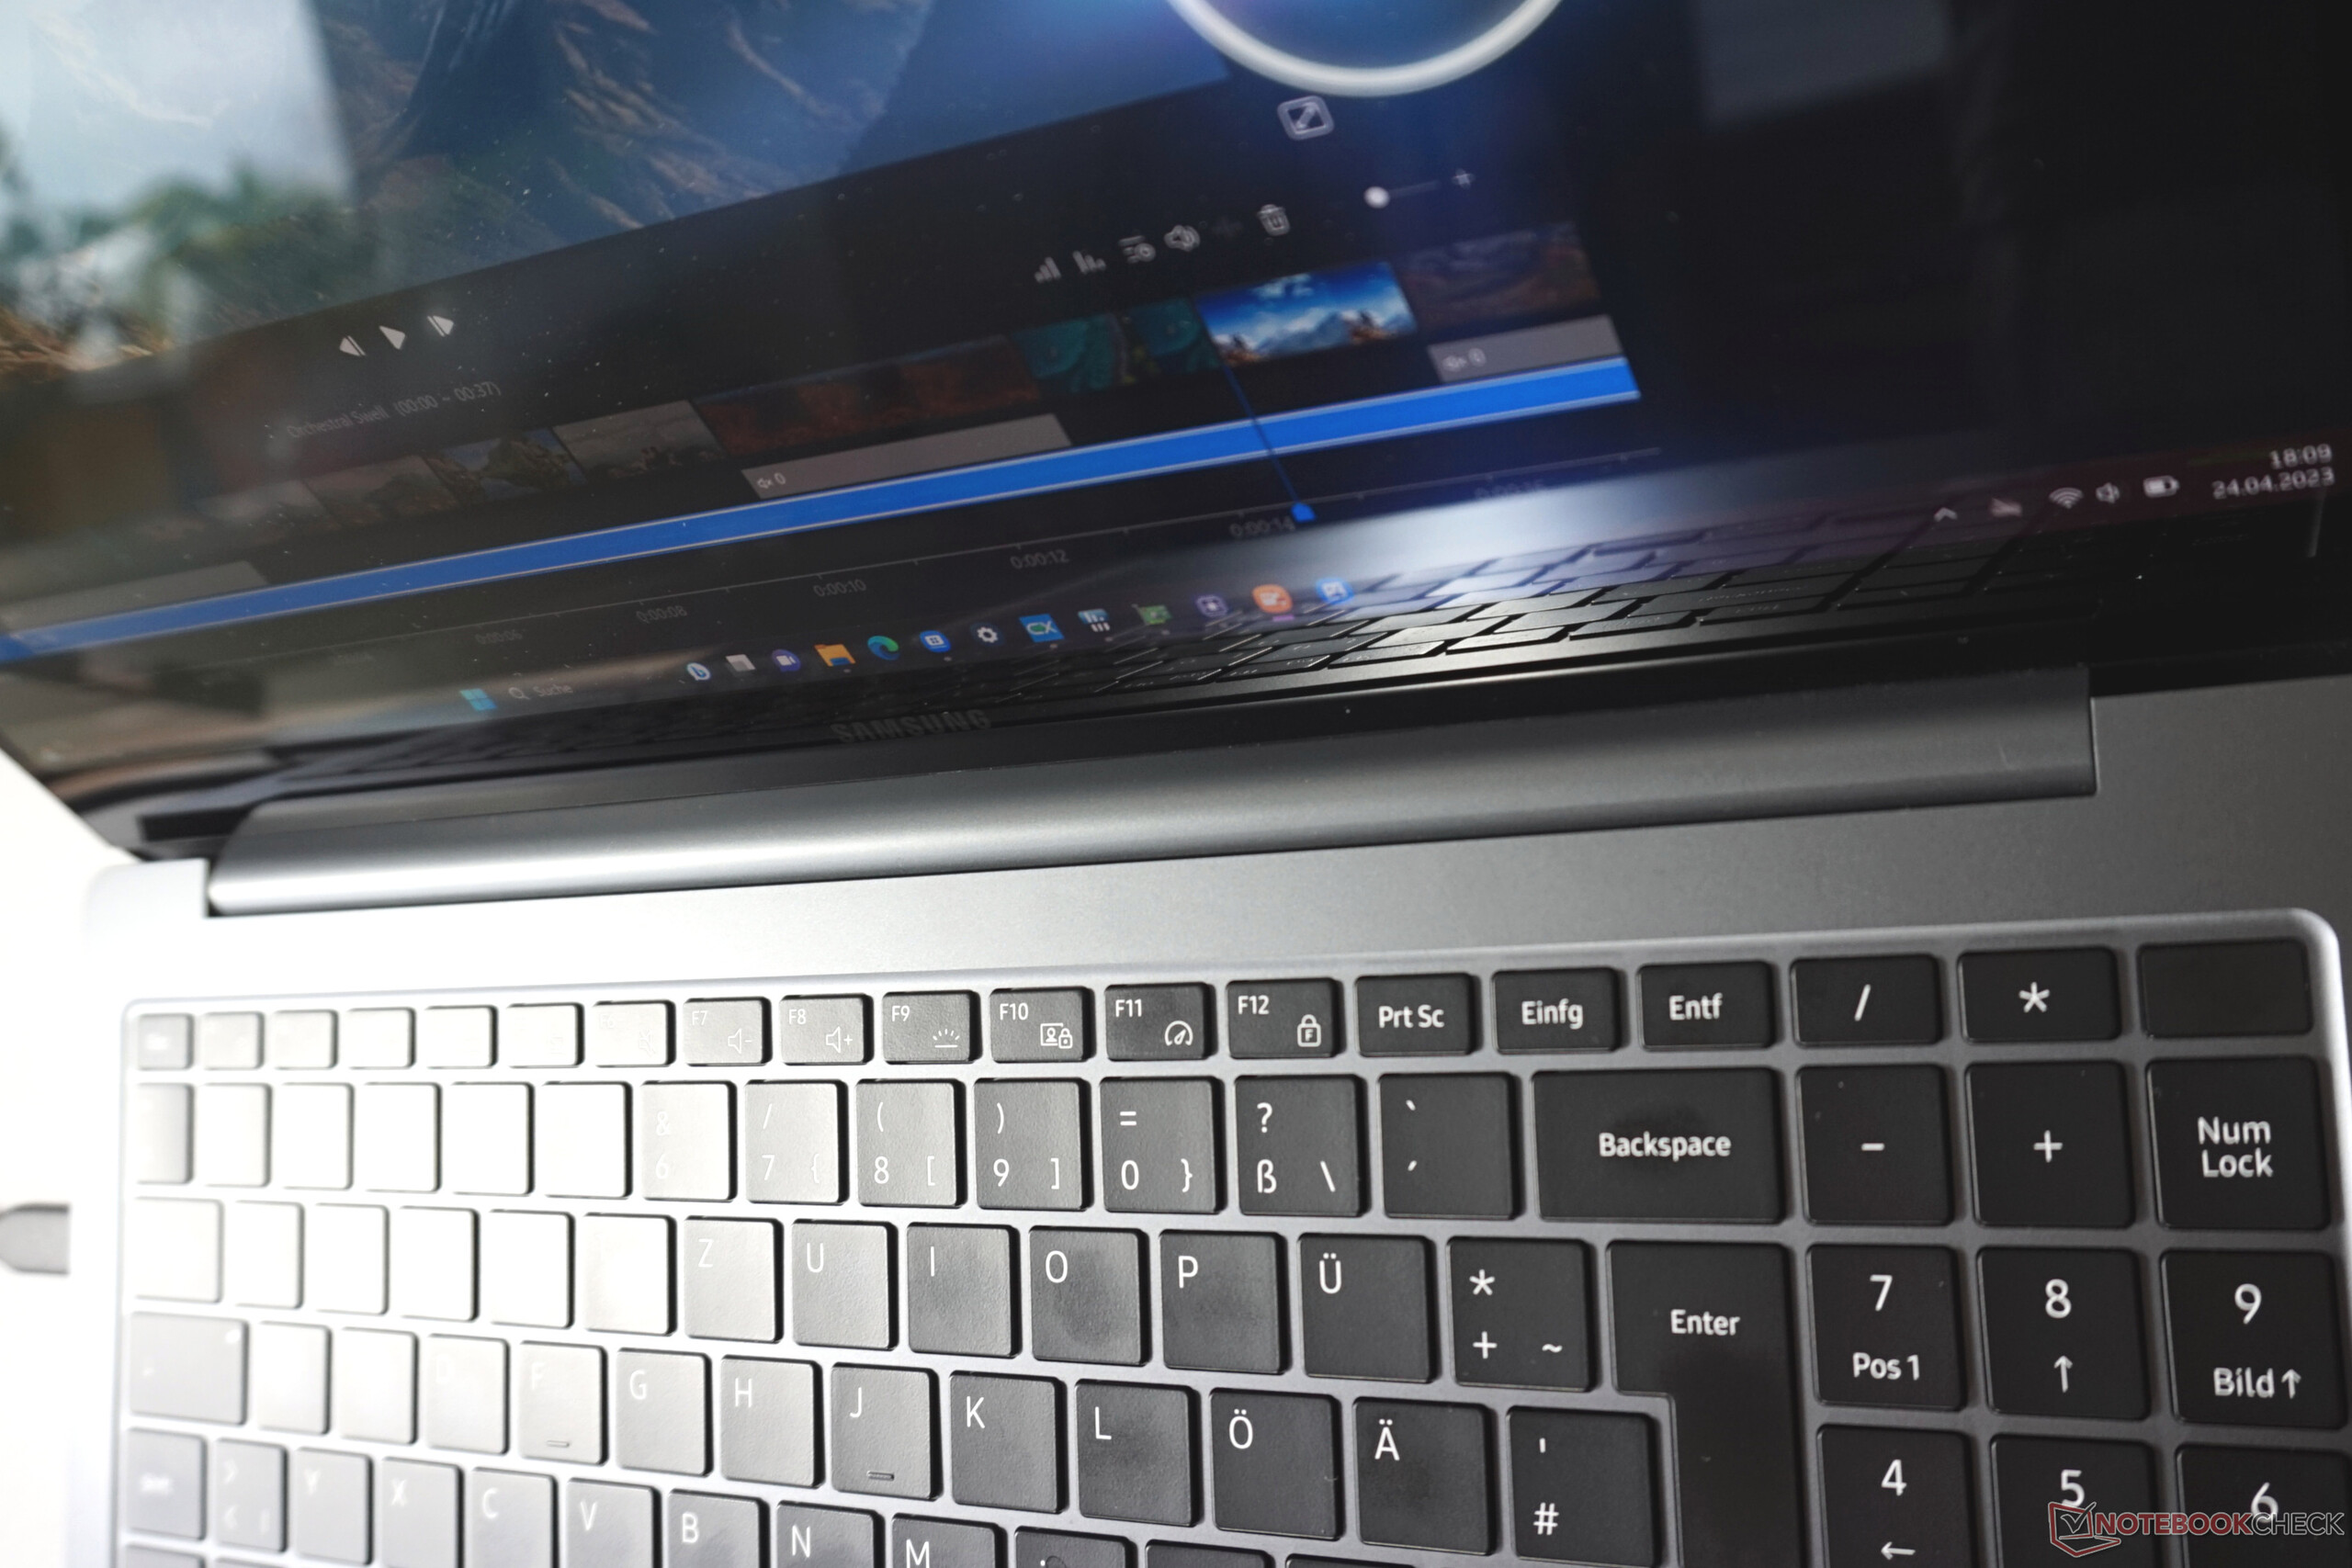
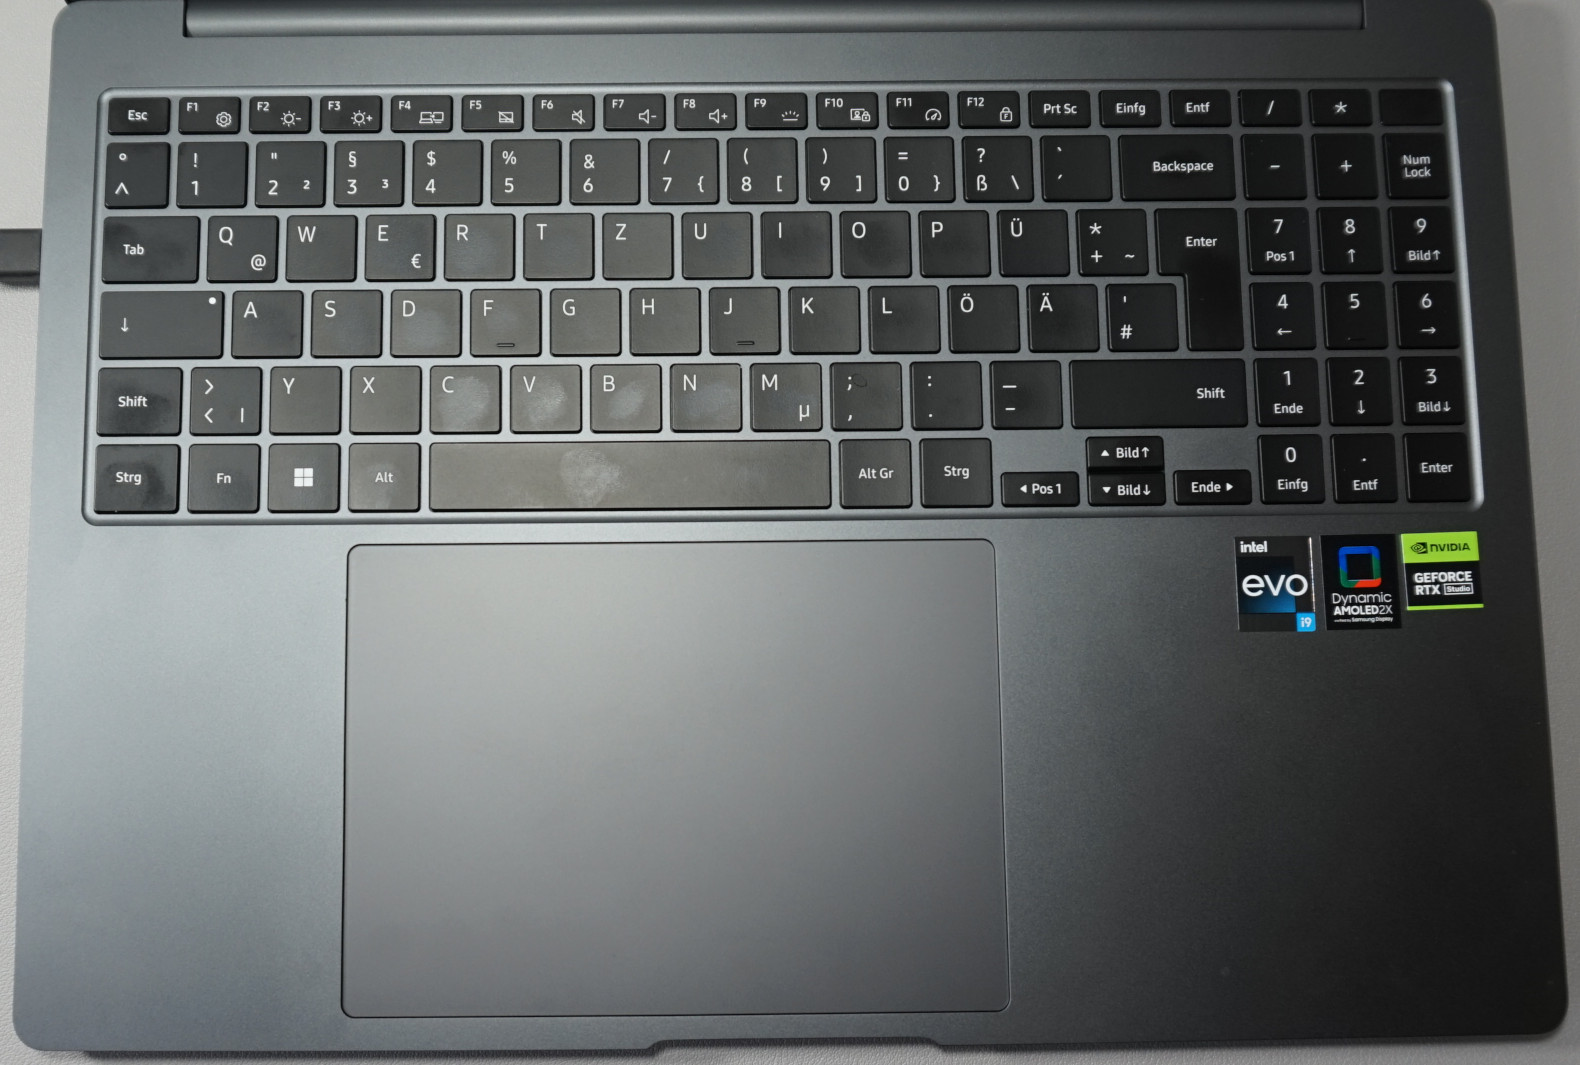
Input Devices - Creator notebook with a big extra
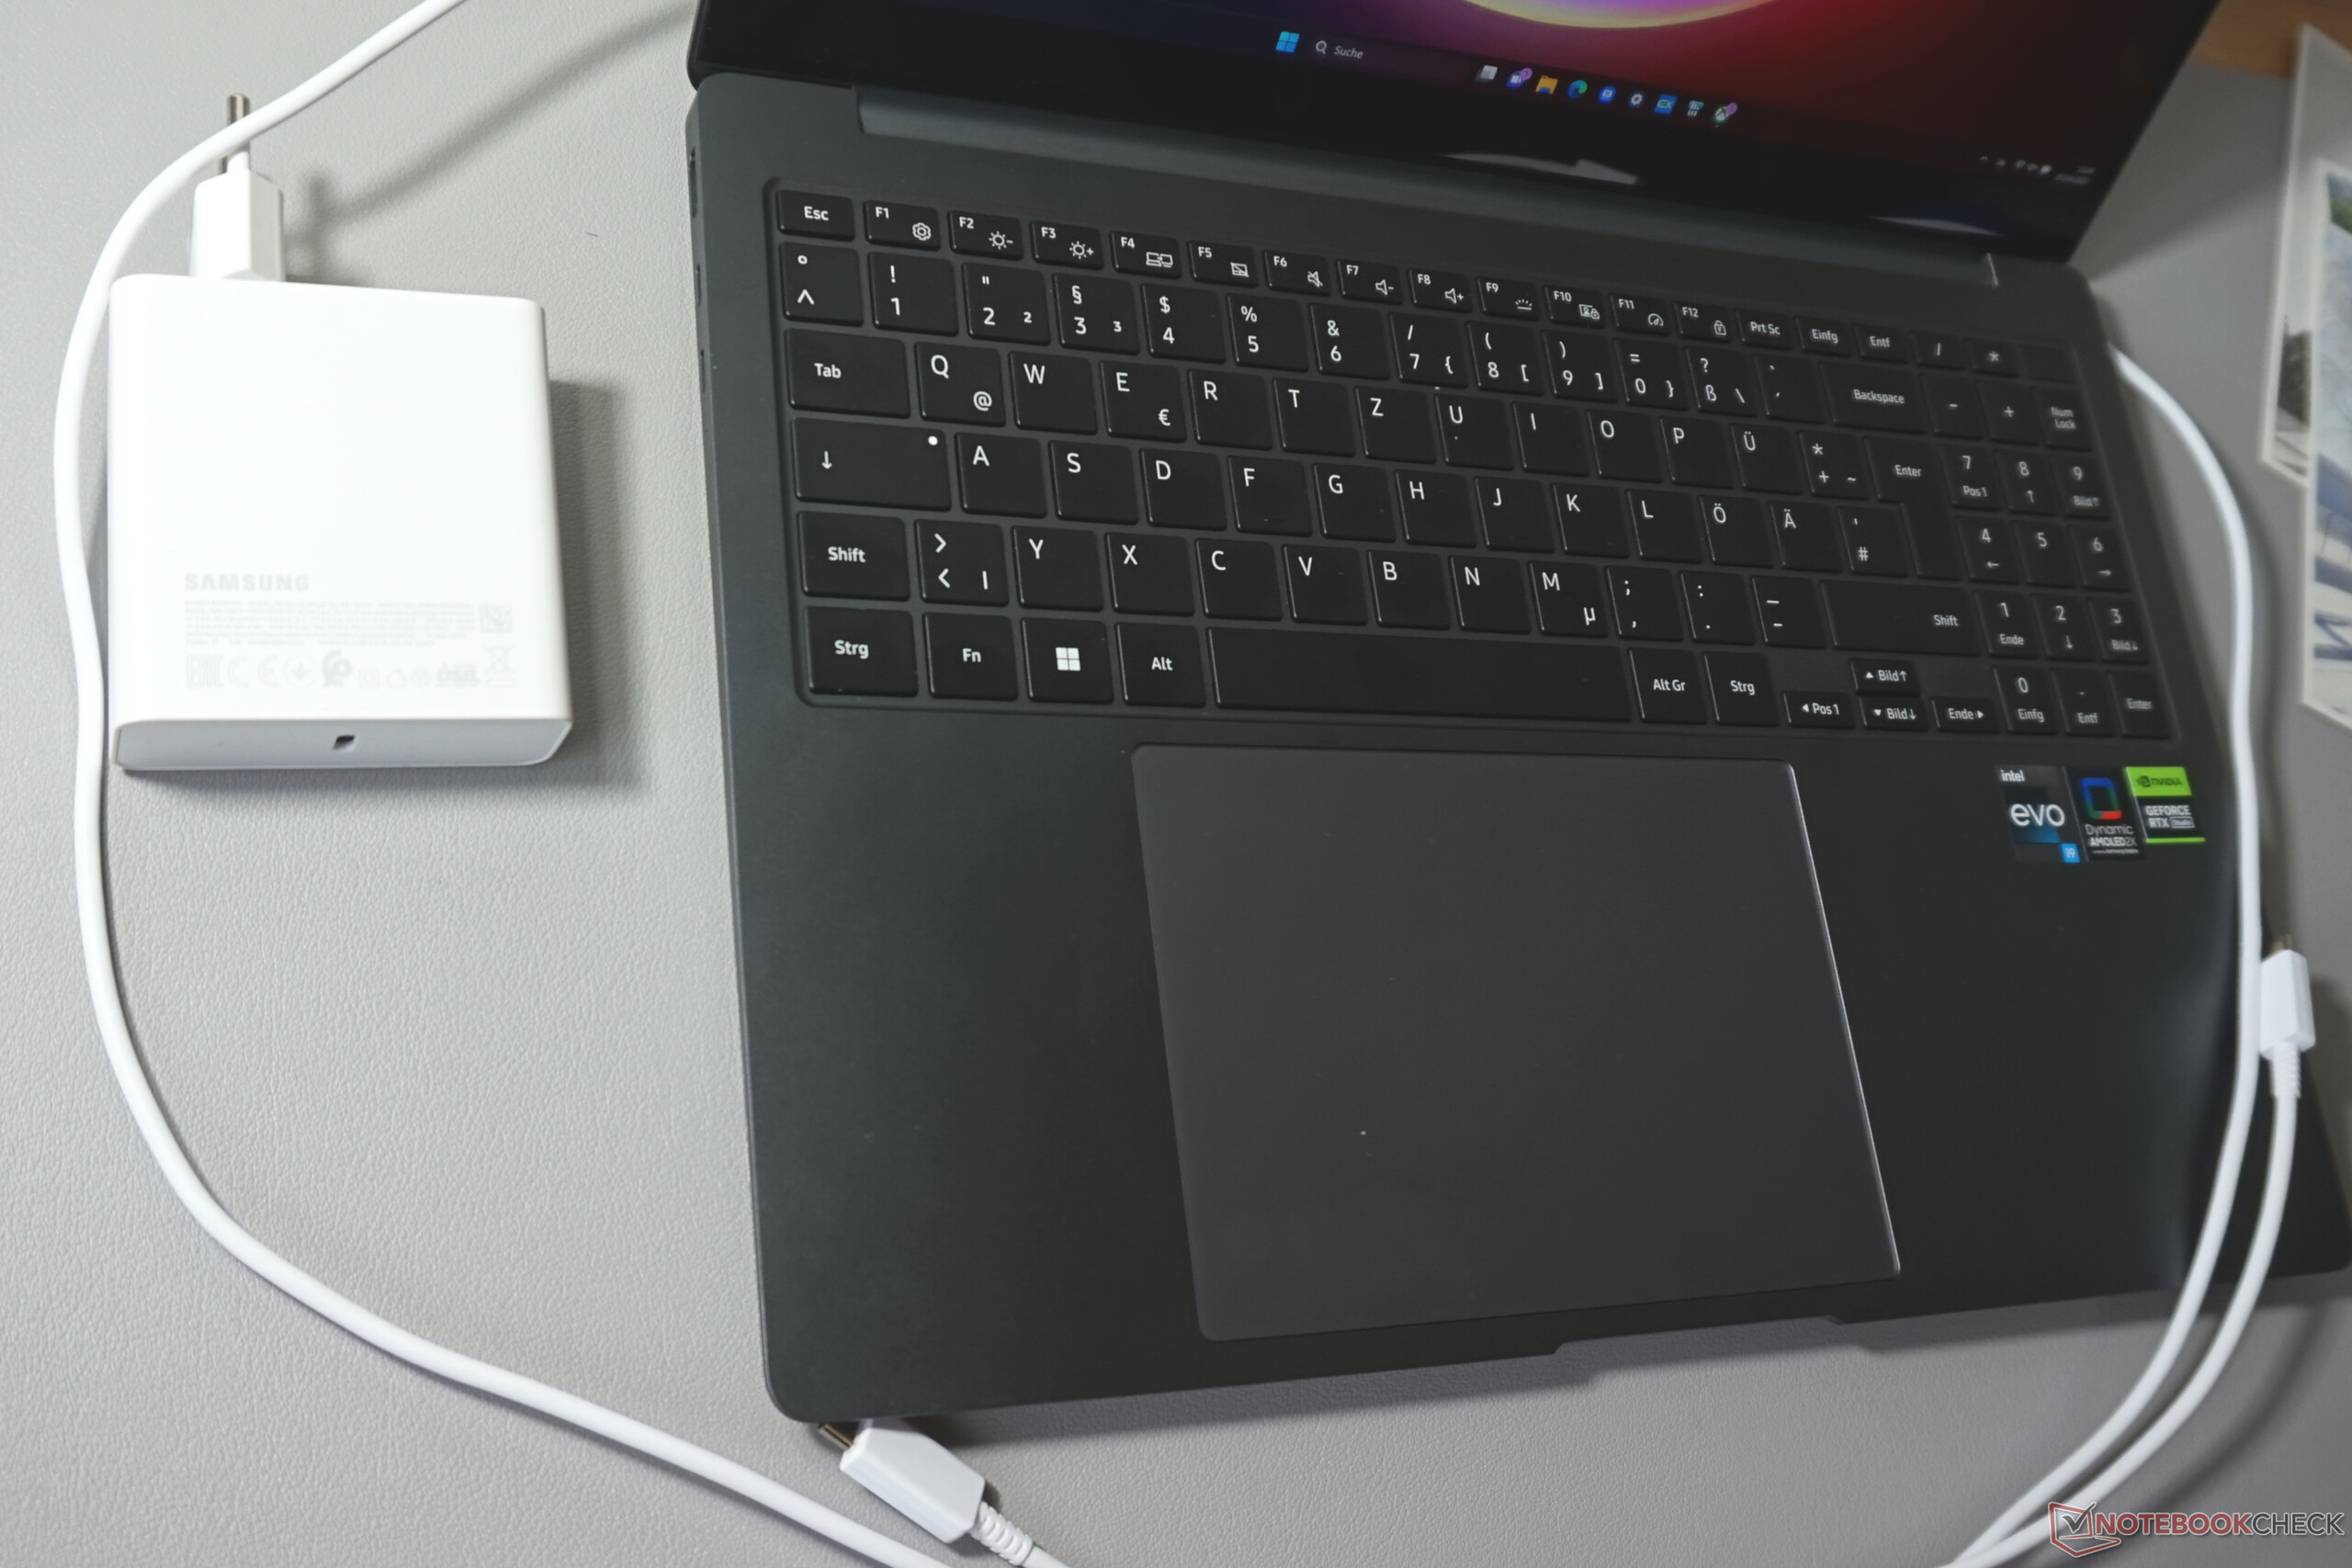
The tight dimensions of the notebook leave little room for play, so the key travel is just 1 mm, but this hardly spoils our overall positive impression of the keyboard. A non-slip surface structure and a pleasantly firm counter pressure ensure good typing dynamics. Samsung has also made excellent use of the 16-incher's available space. The number block has a normal size and thanks to the small space to the arrow keys, these can be felt without eye contact. This certainly makes work in tables easier, among other things.
The highlight, however, is the oversized touchpad. It measures 15 x 10 cm, which is significantly larger than in a typical business notebook. The controls are precise, the key travel is well dosed, and handling with several fingers also works without issue. However, it does take a certain amount of getting used to, since we repeatedly brushed the touchpad with the hand while typing. Inputs are successful for the most part, but sometimes can be imprecise or unintentional with two fingers.
Nevertheless, the touchpad looks good and should make the additional mouse obsolete if necessary.
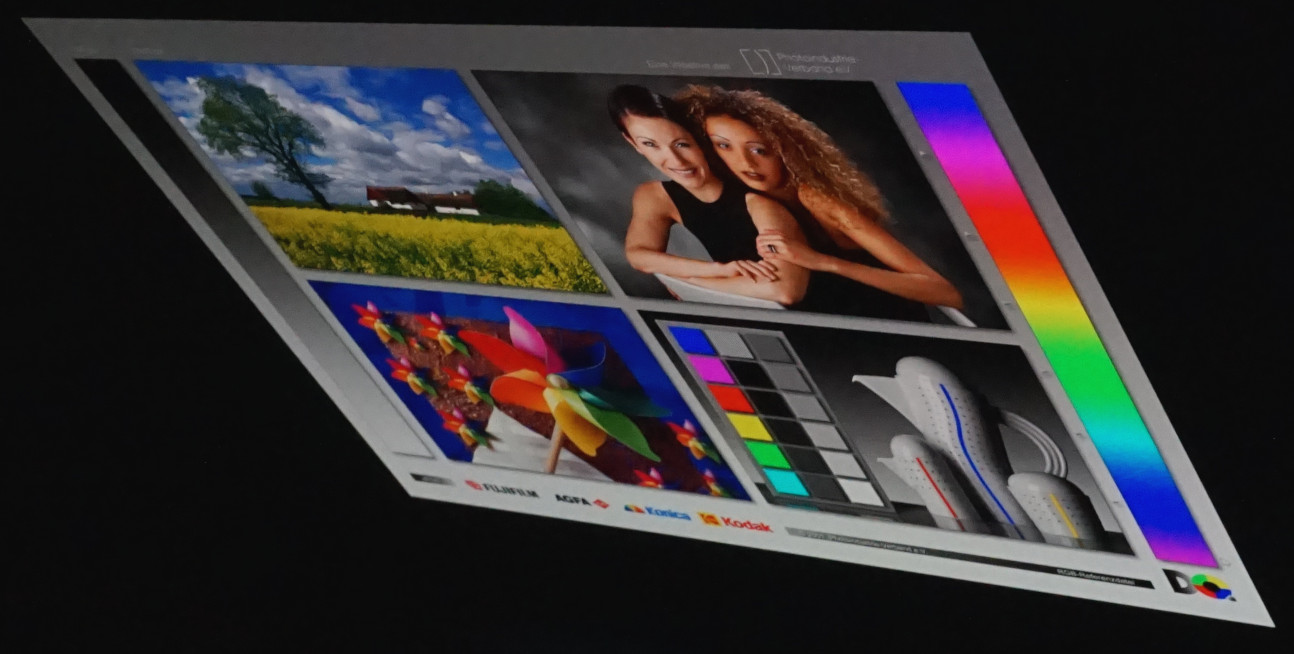
Display - OLED and 3K in the Galaxy Book3 Ultra
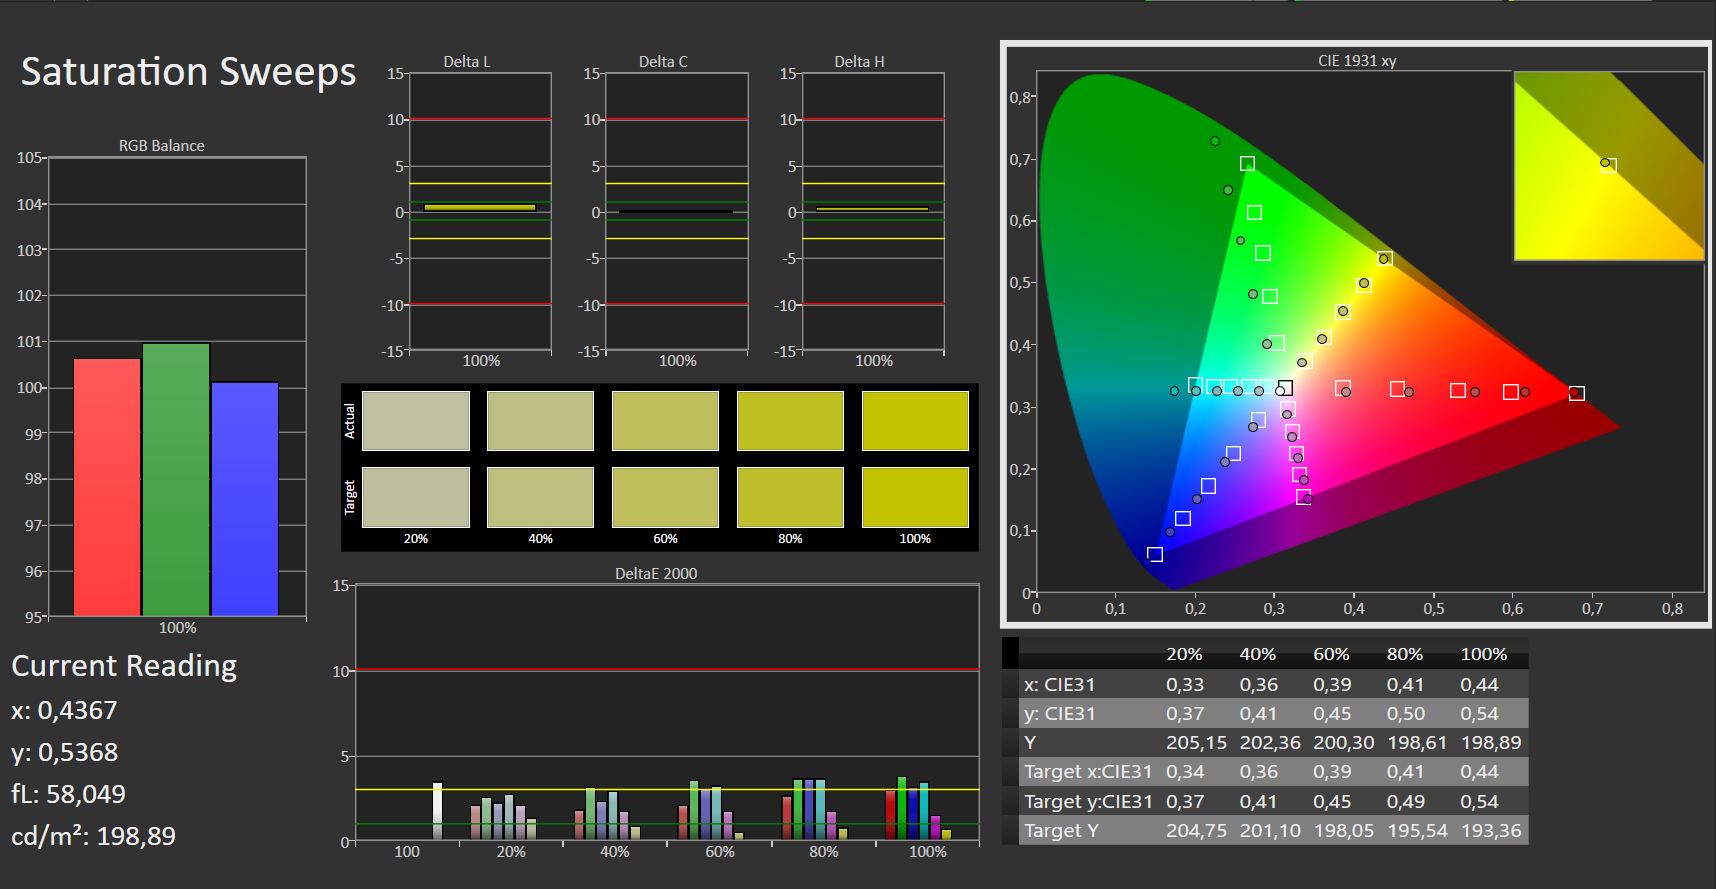
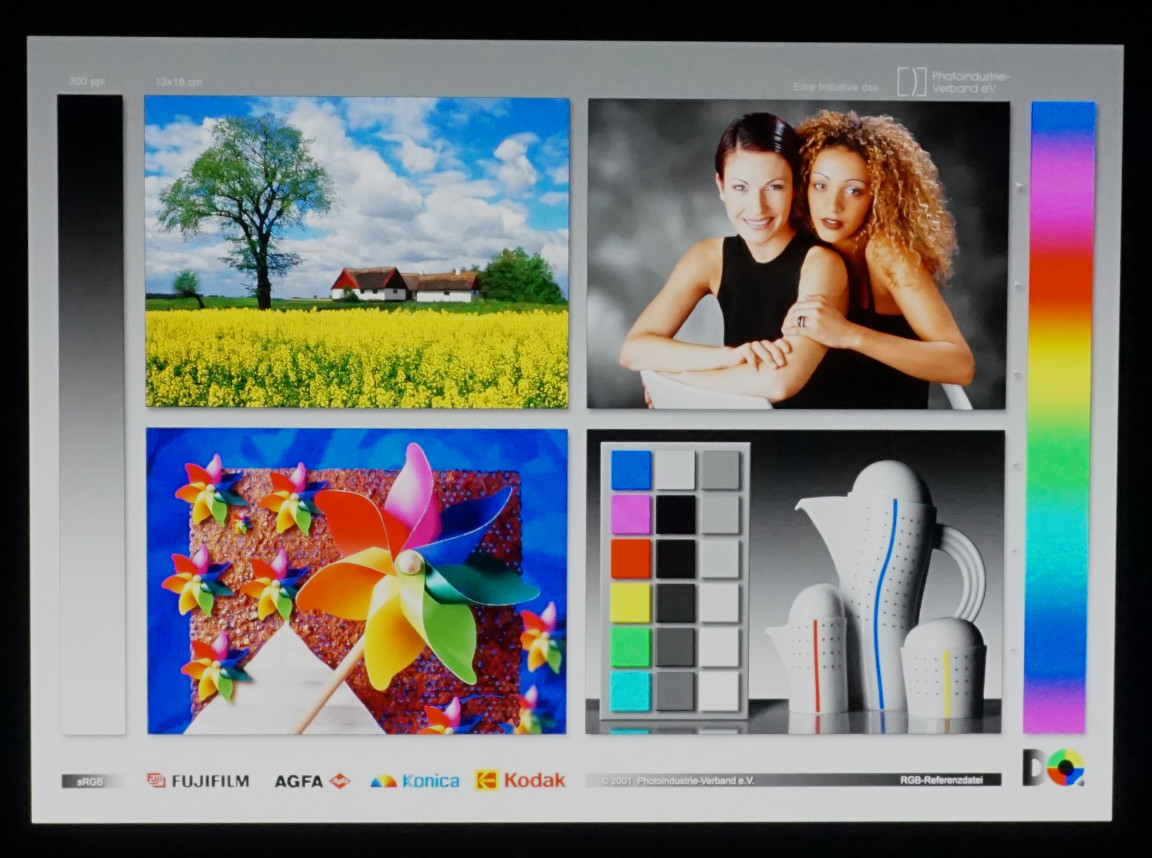
A 3K resolution, which in this case means 2,880 x 1,800 pixels, an OLED display, 120 Hz and HDR certification suit the notebook's intended purpose well. Thanks to 5 million pixels, high-resolution digital photos are displayed very well. The increased frame rate also meets the requirements for optimal video playback and editing.
On top of this, the OLED display contributes its share to the strong image values. The deep black ensures very good contrasts and makes colors appear more vivid. In addition, the Vesa Display HDR 500 certification advertises the optimal reproduction of HDR content. The glossy screen also helps to bring about very good representation of the content displayed. In the absence of surface graininess, images and videos appear consistently brilliant. However, you have to accept strong reflections from bright surfaces in the background.
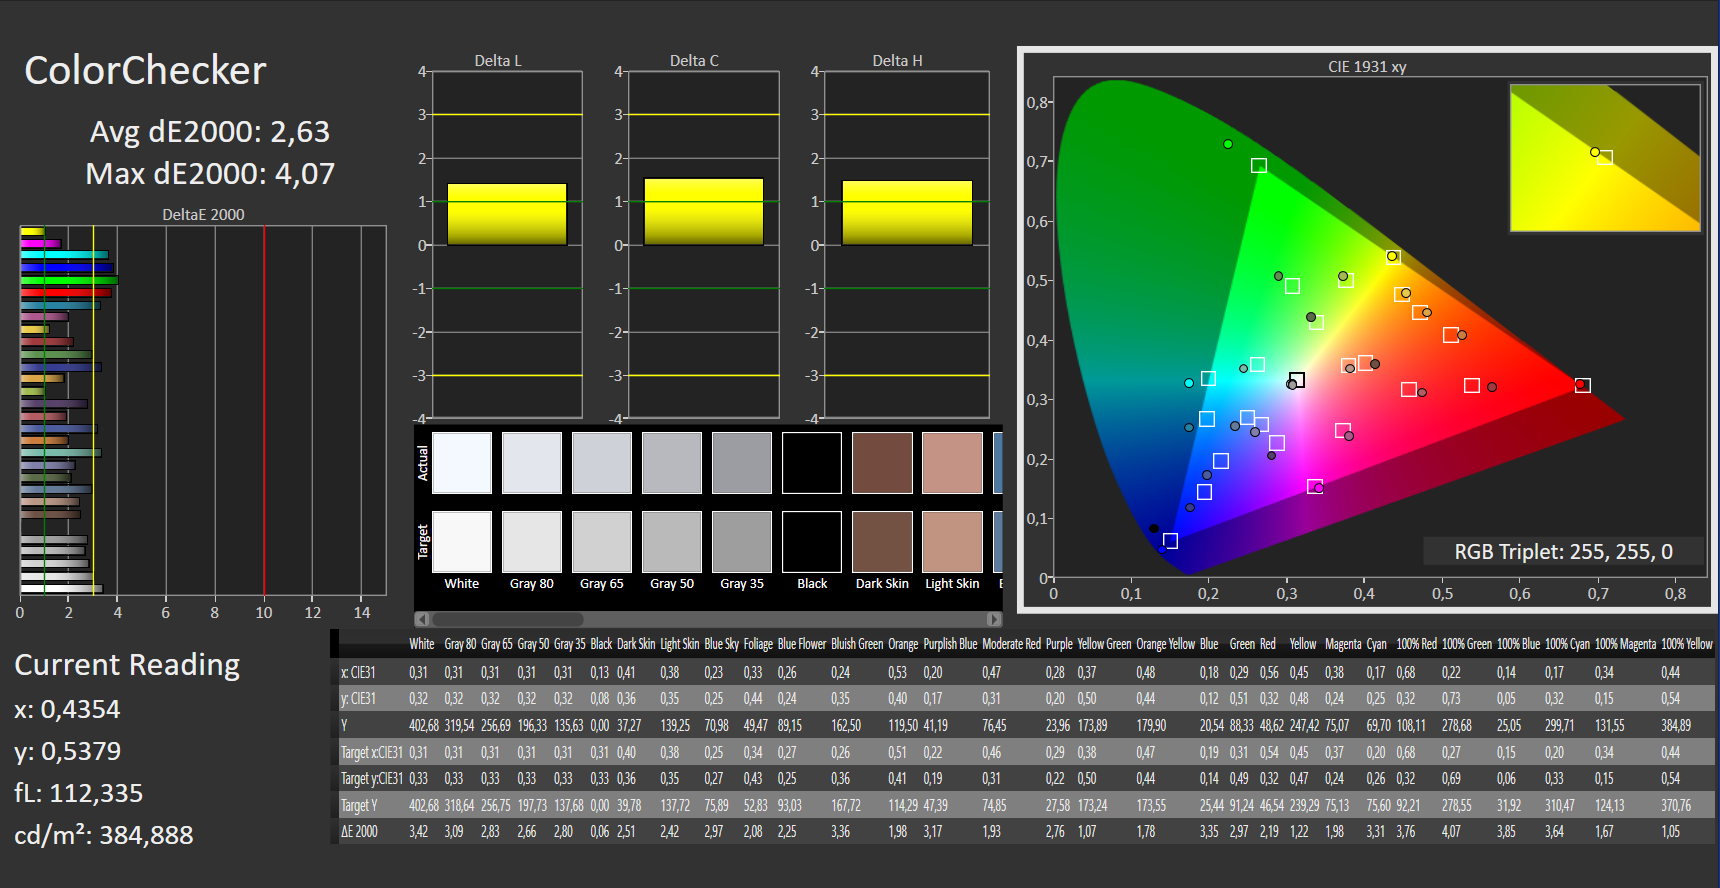
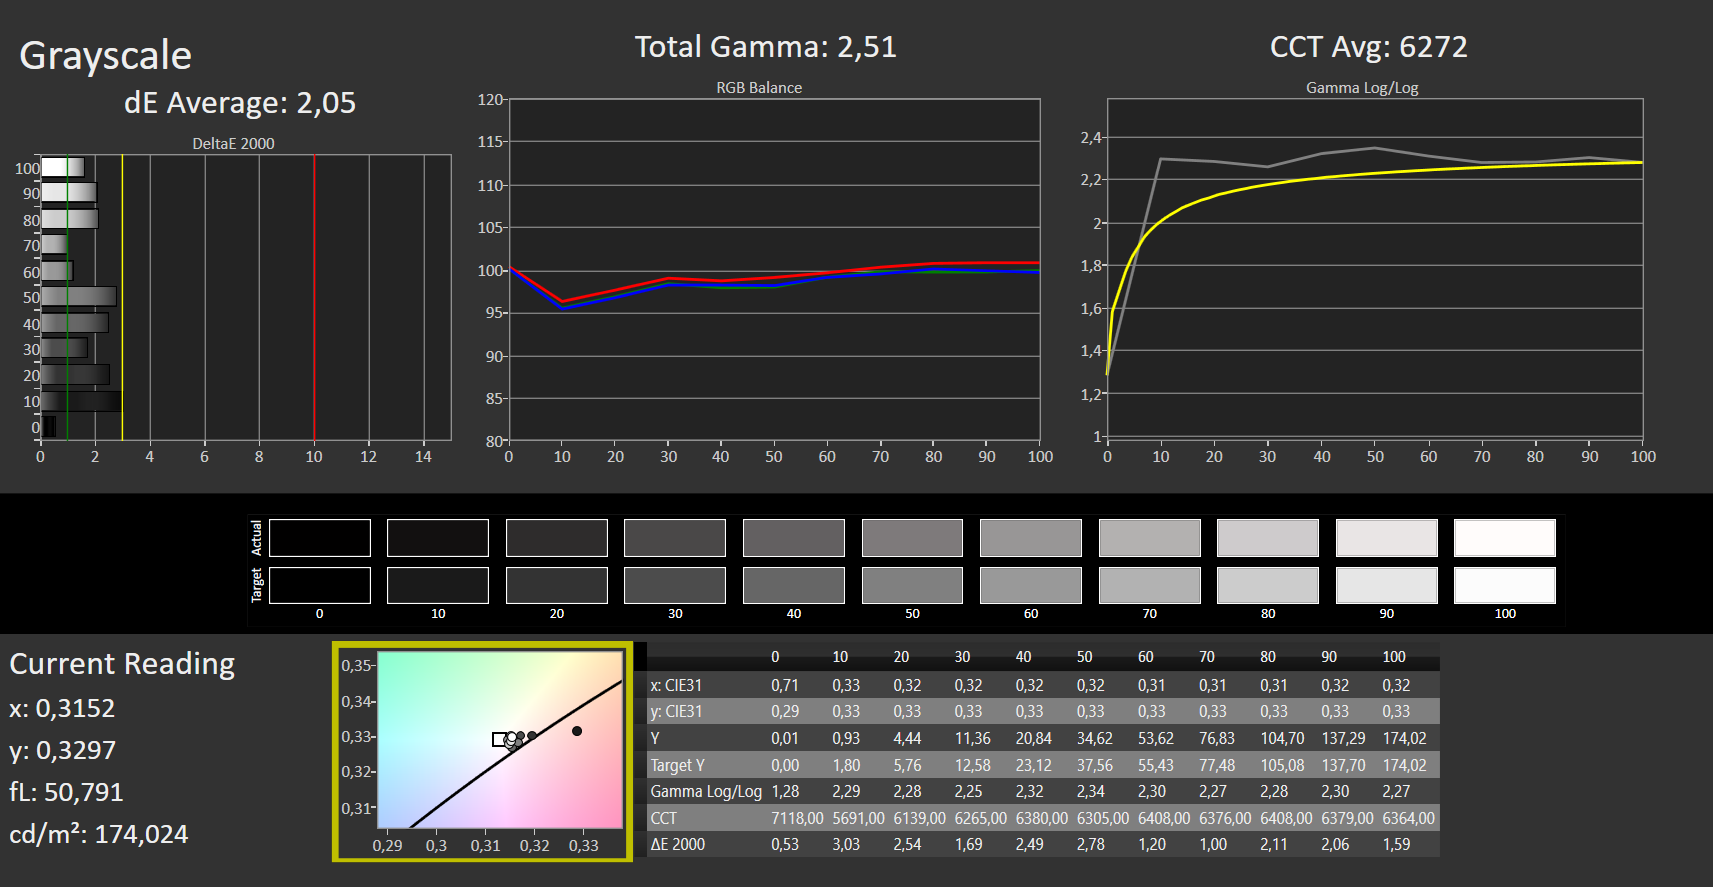
We measured a good average brightness of 408 cd/m². Rival devices with OLED displays do not quite reach this level of brightness. A slight dimming can be observed when the power adapter is unplugged, but the brightness is still acceptable at 340 cd/m².
Screen bleeding need not be feared. The self-illuminating pixels switch off when black is displayed, which results in the panel's perfect black value.
| |||||||||||||||||||||||||
Brightness Distribution: 98 %
Center on Battery: 343 cd/m²
Contrast: ∞:1 (Black: 0 cd/m²)
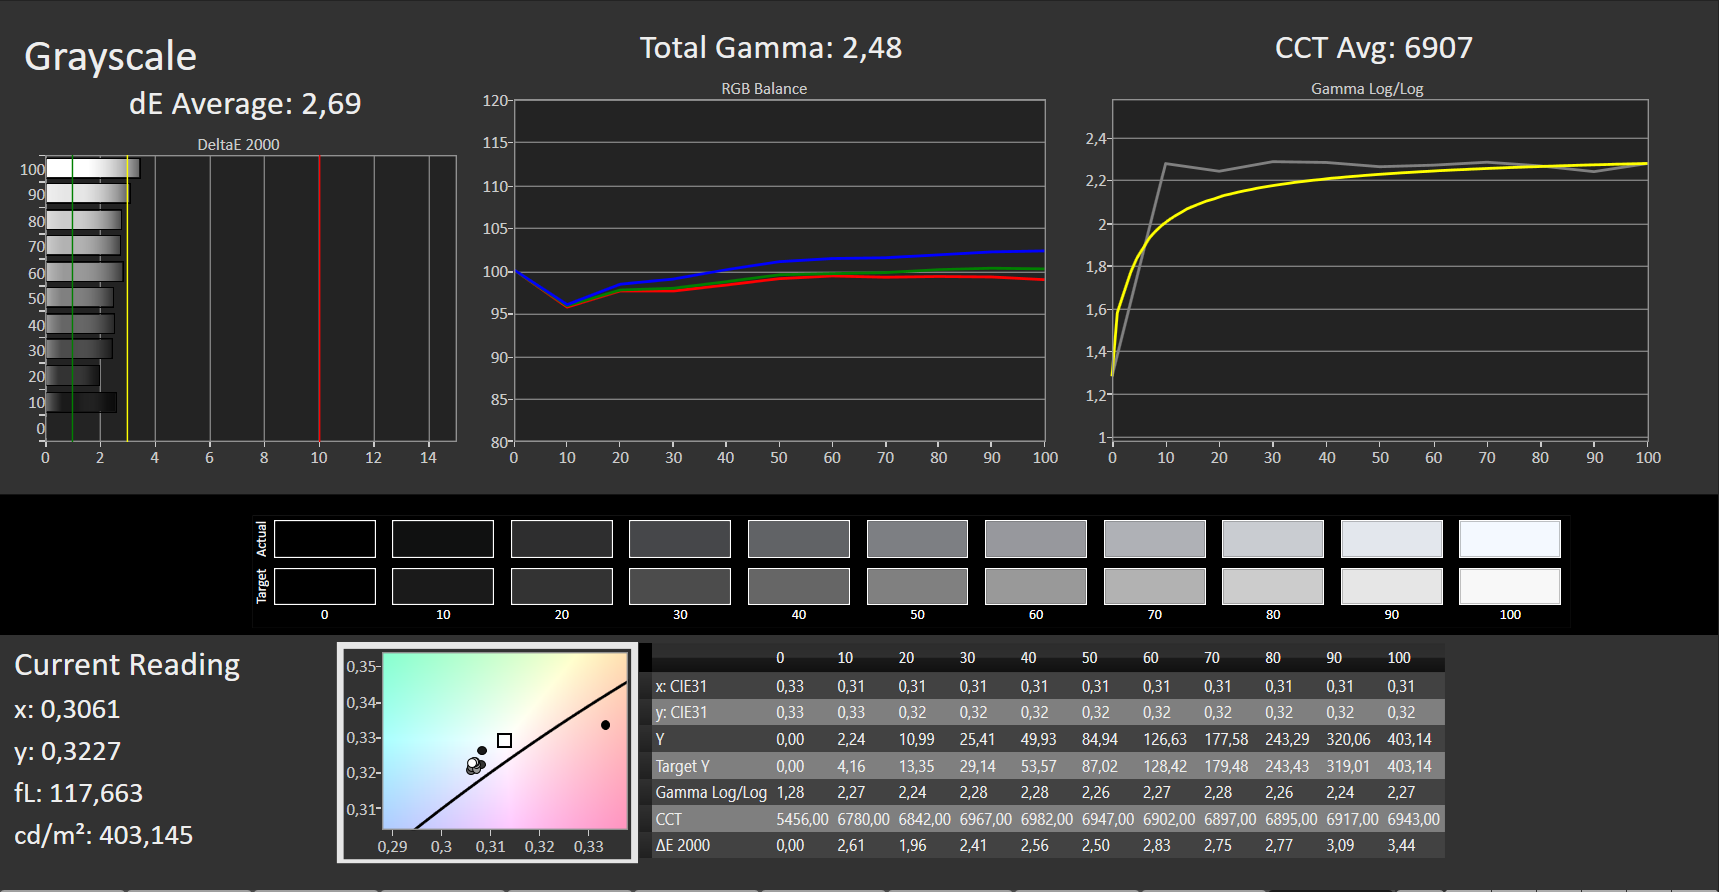
ΔE ColorChecker Calman: 2.63 | ∀{0.5-29.43 Ø4.73}
ΔE Greyscale Calman: 2.69 | ∀{0.09-98 Ø4.97}
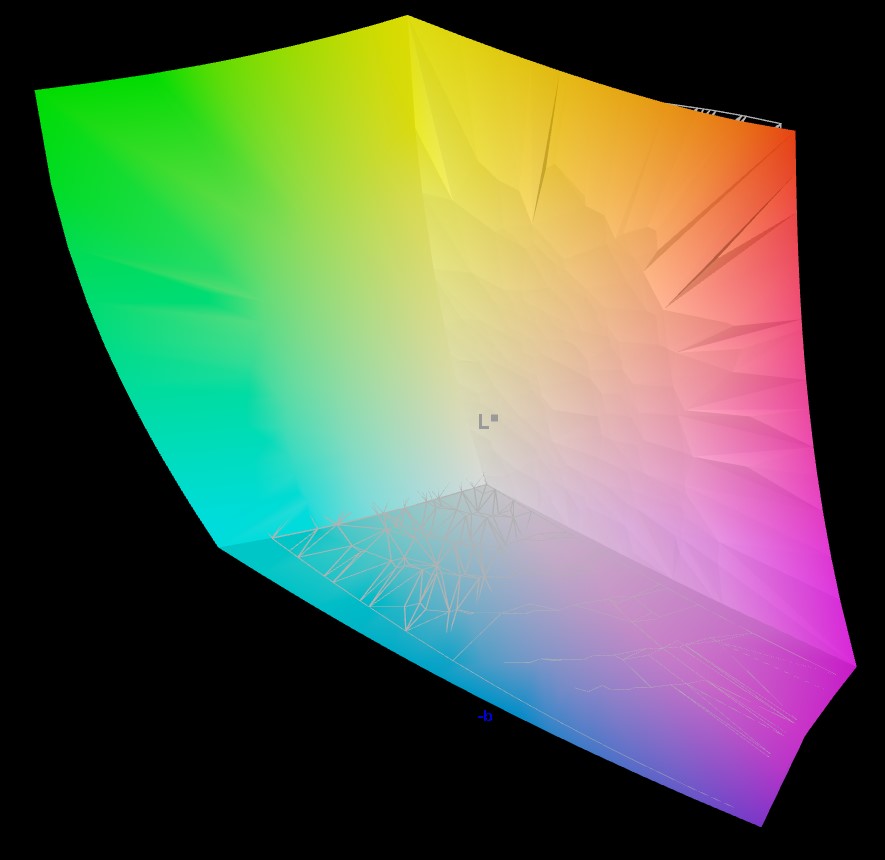
97.4% AdobeRGB 1998 (Argyll 3D)
99.1% sRGB (Argyll 3D)
95.3% Display P3 (Argyll 3D)
Gamma: 2.48
CCT: 6907 K
| Samsung Galaxy Book3 Ultra 16, i9-13900H RTX 4070 Samsung SDC4185 ATNA60CL03-0, OLED / AMOLED, 2880x1800, 16" | Dell XPS 15 9530 RTX 4070 Samsung 156XG01, OLED, 3456x2160, 15.6" | MSI Stealth 17 Studio A13VH-014 AUO41A2 B173ZAN06.C, Mini LED, 3840x2160, 17.3" | Asus ProArt StudioBook 16 H7600ZW Samsung ATNA60YV02, OLED, 3840x2400, 16" | Gigabyte AERO 16 OLED BSF Samsung SDC4191 (ATNA60YV09-0, OLED, 3840x2400, 16" | Samsung Galaxy Book3 Ultra 16 Samsung ATNA60CL03-0, AMOLED, 2880x1800, 16" | |
|---|---|---|---|---|---|---|
| Display | 2% | -2% | 2% | 2% | 2% | |
| Display P3 Coverage (%) | 95.3 | 99.8 5% | 92 -3% | 99.6 5% | 99.9 5% | 99.9 5% |
| sRGB Coverage (%) | 99.1 | 100 1% | 99.1 0% | 100 1% | 100 1% | 100 1% |
| AdobeRGB 1998 Coverage (%) | 97.4 | 98.4 1% | 94.07 -3% | 96.5 -1% | 96.4 -1% | 96.3 -1% |
| Response Times | 10% | -1076% | -398% | 1% | 71% | |
| Response Time Grey 50% / Grey 80% * (ms) | 2 ? | 1.68 ? 16% | 46.4 ? -2220% | 1.6 ? 20% | 2 ? -0% | 0.49 ? 75% |
| Response Time Black / White * (ms) | 2 ? | 1.94 ? 3% | 0.62 ? 69% | 18.32 ? -816% | 1.98 ? 1% | 0.65 ? 67% |
| PWM Frequency (Hz) | 250 ? | 239 | 2400 | 60 ? | 60 | 240 ? |
| Screen | -30% | -1% | -8% | 6% | 1% | |
| Brightness middle (cd/m²) | 403 | 389.5 -3% | 397.29 -1% | 370 -8% | 389.97 -3% | 400 -1% |
| Brightness (cd/m²) | 408 | 392 -4% | 392 -4% | 374 -8% | 395 -3% | 399 -2% |
| Brightness Distribution (%) | 98 | 98 0% | 93 -5% | 98 0% | 97 -1% | 93 -5% |
| Black Level * (cd/m²) | 0.02 | 0.03 | 0.03 | |||
| Colorchecker dE 2000 * | 2.63 | 4.95 -88% | 2.52 4% | 2.97 -13% | 2 24% | 2.3 13% |
| Colorchecker dE 2000 max. * | 4.07 | 8.65 -113% | 3.91 4% | 4.38 -8% | 4.1 -1% | 4.15 -2% |
| Greyscale dE 2000 * | 2.69 | 2 26% | 2.78 -3% | 2.9 -8% | 2.23 17% | 2.7 -0% |
| Gamma | 2.48 89% | 2.27 97% | 2.63 84% | 2.13 103% | 2.41 91% | 2.266 97% |
| CCT | 6907 94% | 6265 104% | 6412 101% | 6636 98% | 6323 103% | 7047 92% |
| Colorchecker dE 2000 calibrated * | 1.53 | 2.52 | 2.15 | 1.68 | 1.66 | |
| Contrast (:1) | 19865 | 12999 | 13333 | |||
| Total Average (Program / Settings) | -6% /
-14% | -360% /
-197% | -135% /
-76% | 3% /
4% | 25% /
14% |
* ... smaller is better
The display's P3 color space, which is usually used in professional video editing, is not reproduced quite perfectly. The OLED display cannot completely display the required yellow and orange tones. The fact that Samsung specifies 120 percent coverage is because it simply includes colors that don't even exist in the color space.
On the other hand, we measured one of the best coverage rates for AdobeRGB, which is mostly used for professional image editing, among the listed contenders. Only the Dell XPS 9530, which is also equipped with an OLED display from Samsung, performs a little better.
However, since we almost always work in the sRGB color space, the display is perfectly suitable for media creation and editing without further calibration.

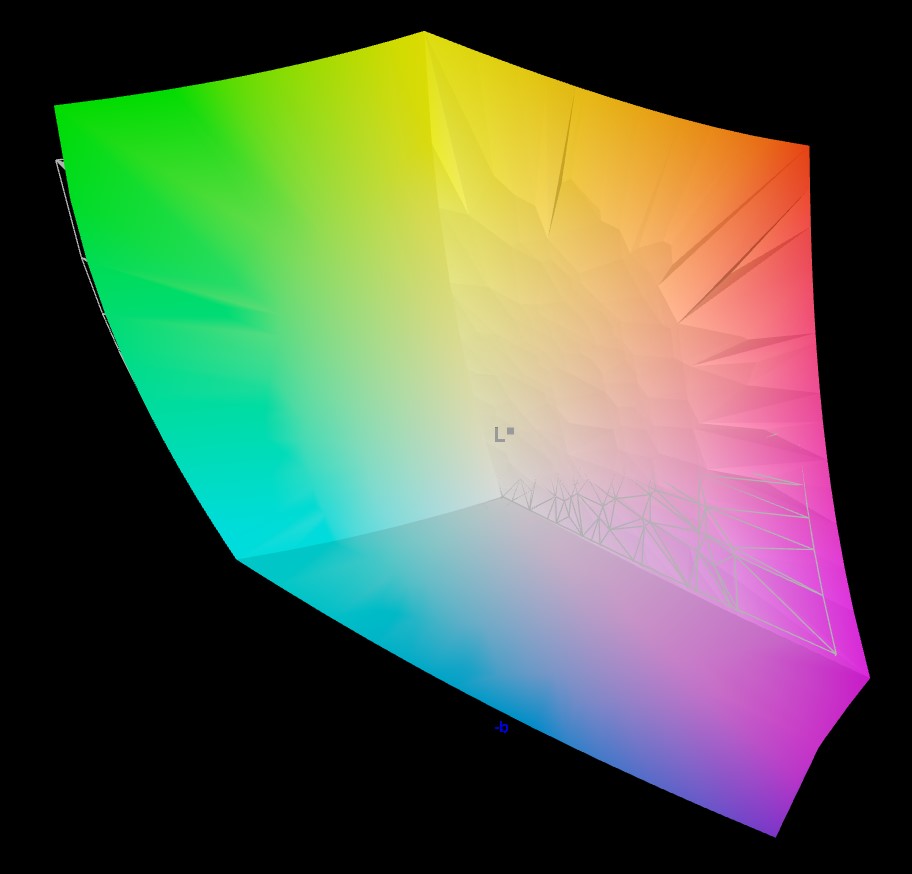
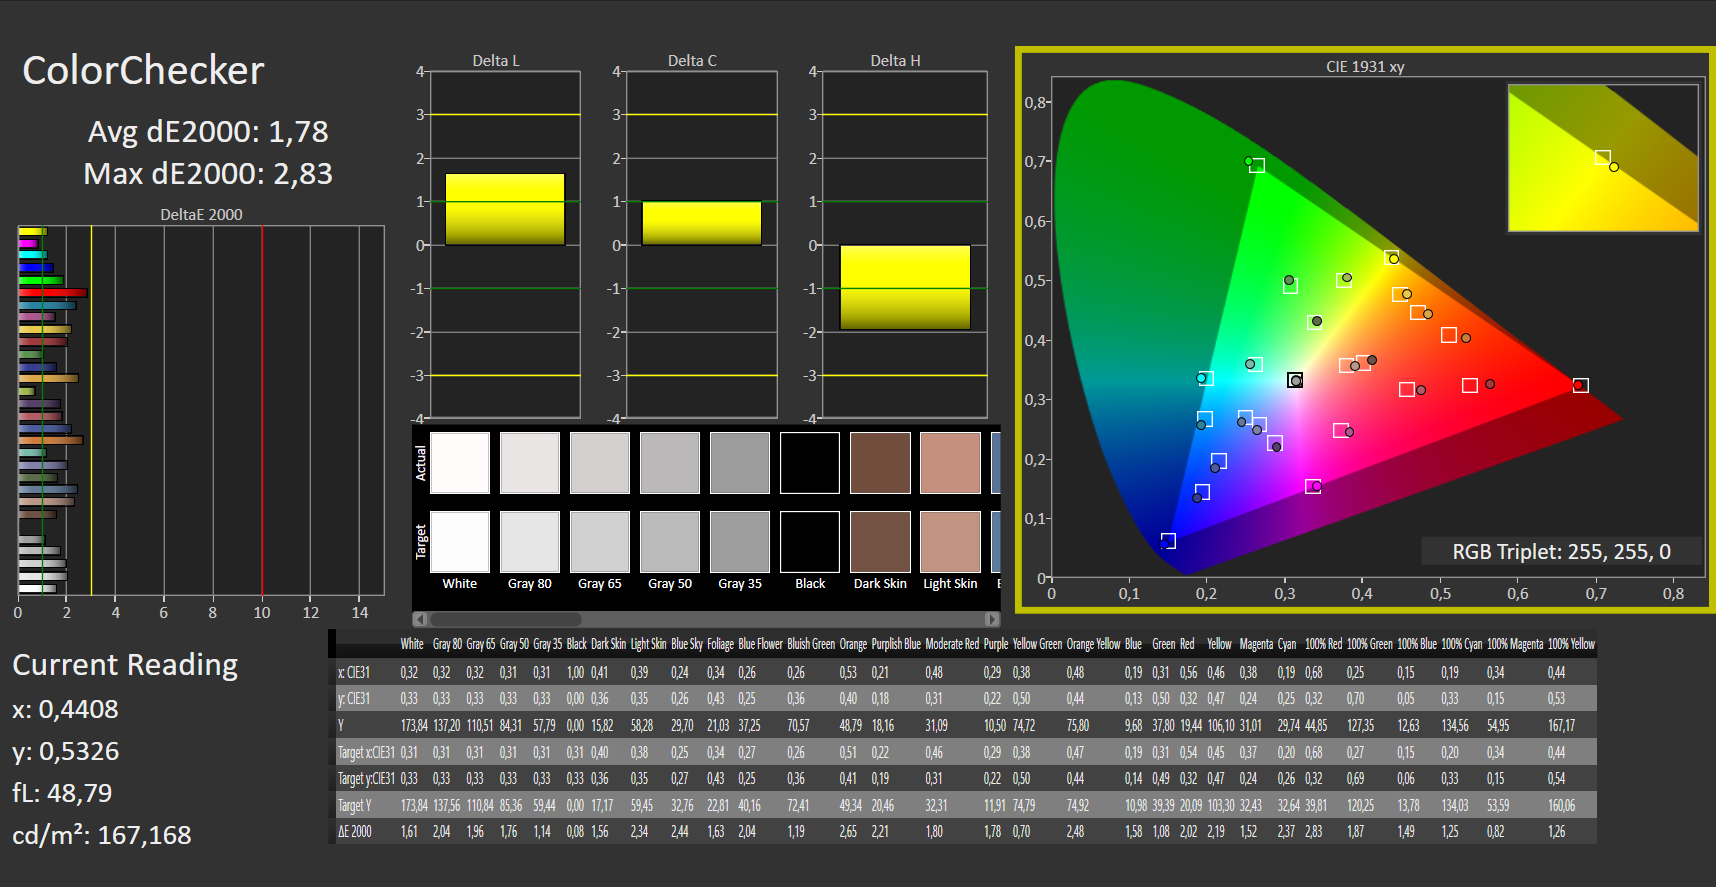
Samsung's included software allows for the direct selection of different color profiles. Even in the OLED display's native mode, the average color deviation that we determined is practically imperceptible. However, a trained eye might still notice discrepancies in some color tones.
If, on the other hand, the Display-P3 profile is selected, which visibly changes the display, all deviations are on a very low level and should no longer be perceptible. The color representation is thus near perfect without calibration.

Display Response Times
| ↔ Response Time Black to White | ||
|---|---|---|
| 2 ms ... rise ↗ and fall ↘ combined | ↗ 1 ms rise |  |
| ↘ 1 ms fall | ||
| The screen shows very fast response rates in our tests and should be very well suited for fast-paced gaming. In comparison, all tested devices range from 0.1 (minimum) to 240 (maximum) ms. » 11 % of all devices are better. This means that the measured response time is better than the average of all tested devices (19.9 ms). | ||
| ↔ Response Time 50% Grey to 80% Grey | ||
| 2 ms ... rise ↗ and fall ↘ combined | ↗ 1 ms rise |  |
| ↘ 1 ms fall | ||
| The screen shows very fast response rates in our tests and should be very well suited for fast-paced gaming. In comparison, all tested devices range from 0.165 (minimum) to 636 (maximum) ms. » 10 % of all devices are better. This means that the measured response time is better than the average of all tested devices (31.1 ms). | ||
Screen Flickering / PWM (Pulse-Width Modulation)
| Screen flickering / PWM detected | 250 Hz | ≤ 70 % brightness setting |    |
The display backlight flickers at 250 Hz (worst case, e.g., utilizing PWM) Flickering detected at a brightness setting of 70 % and below. There should be no flickering or PWM above this brightness setting. The frequency of 250 Hz is relatively low, so sensitive users will likely notice flickering and experience eyestrain at the stated brightness setting and below. In comparison: 52 % of all tested devices do not use PWM to dim the display. If PWM was detected, an average of 7791 (minimum: 5 - maximum: 343500) Hz was measured. | |||
As usual with OLED panels, we detected PWM-induced image flickering. The frequency of 240 Hz is in a range that may be noticeable for sensitive people. Camera sensors also have no problem exhibiting this effect.
However, the effect is much less pronounced than in a classic monitor with LED backlighting. On such a panel, larger areas are deactivated. On an OLED display, on the other hand, it is always only a very small area of pixels that turn black for a short time. This serves to increase the display's lifespan, among other things.
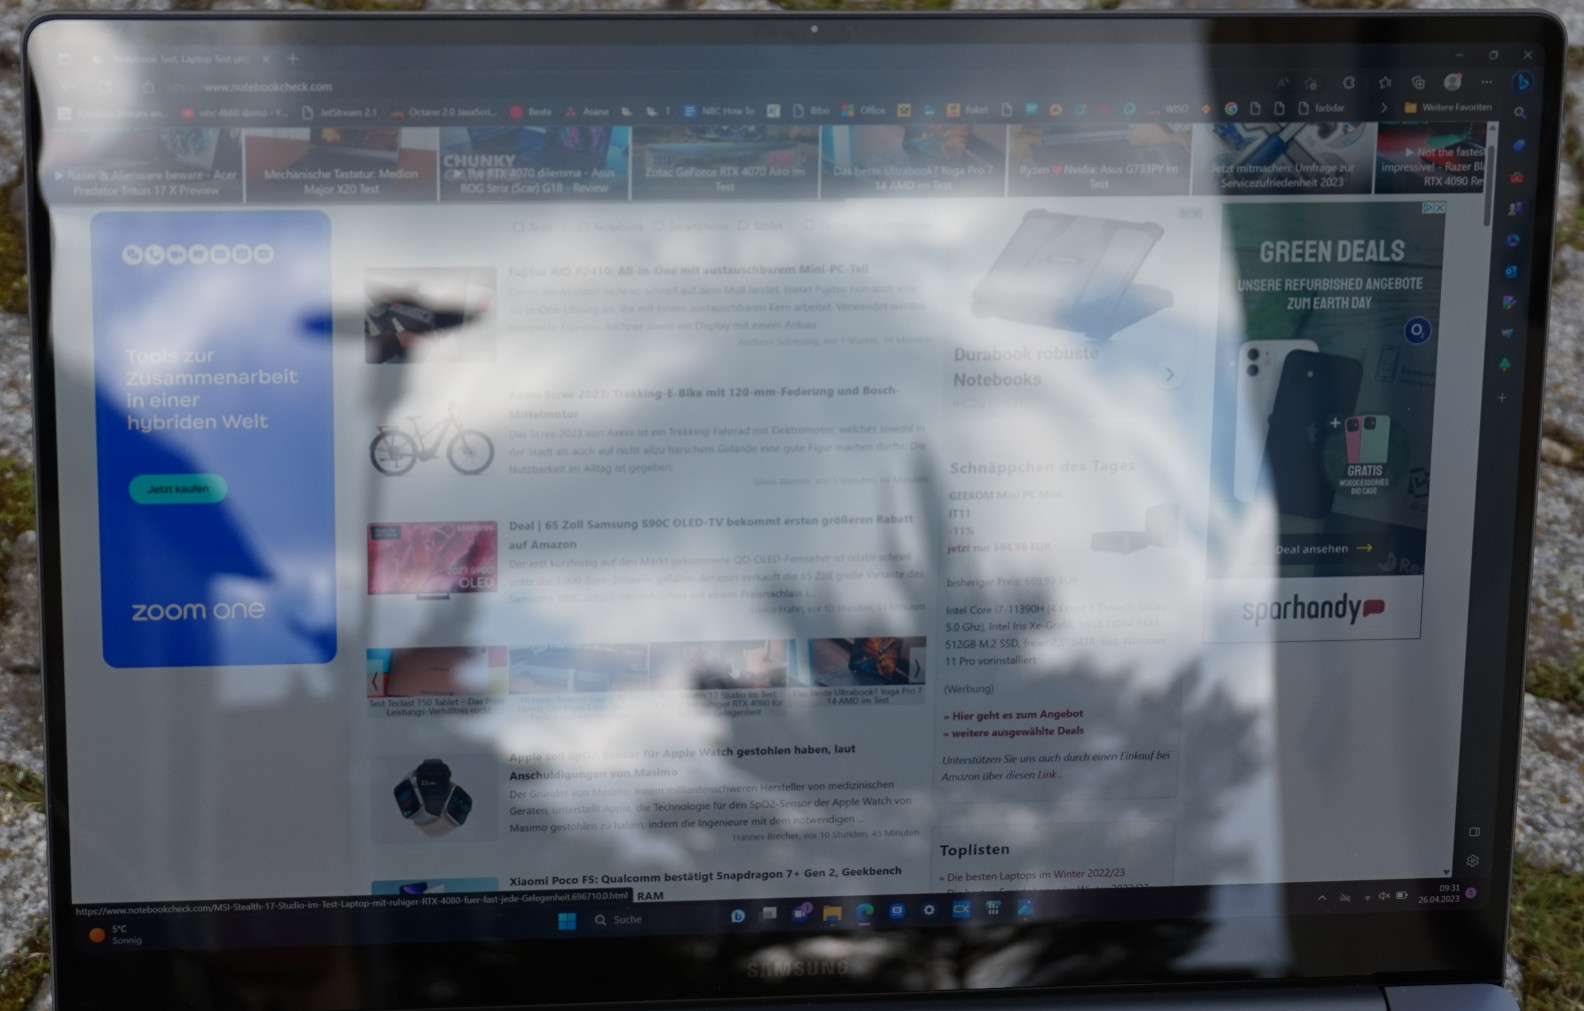
Despite sufficient brightness, the glossy display prevents outdoor use. Even on cloudy days, there are strong reflections that make screen viewing much more difficult.
Only in the shade and against the light are text and pictures well recognizable.
Deviations in color reproduction can only be observed from extremely steep viewing angles. Brightness and color reproduction remain impeccable within the usual field of view and beyond 45°.

Performance - Efficiency is the focus of the Galaxy Book3 Ultra
The powerful hardware allows you to work quickly, even with complex applications and intensive multitasking. The Intel Core Intel Core i9-13900H is rarely fully challenged in simple tasks, as is the RTX 4070. The graphics card in particular only reaches its limits in current gaming titles due to the very limited power consumption. Nevertheless, we observed almost consistently playable frame rates at the highest level of detail.
However, the system is predestined for image and video editing. 3D rendering poses no major problems either. The Galaxy Book3 Ultra can be run very quietly, but then loses some performance. The behavior in battery mode is also remarkable, as 3D performance remains high. Video editing on the go thus seems feasible.
The smaller configuration with the Intel Core i7-13700H and the Nvidia GeForce RTX 4050 requires a few more compromises. A clear difference in speed is likely to be noticeable in particularly complex tasks. Should you indeed want to play a game now and then, the stronger variant would be naturally more advantageous.
Testing Conditions
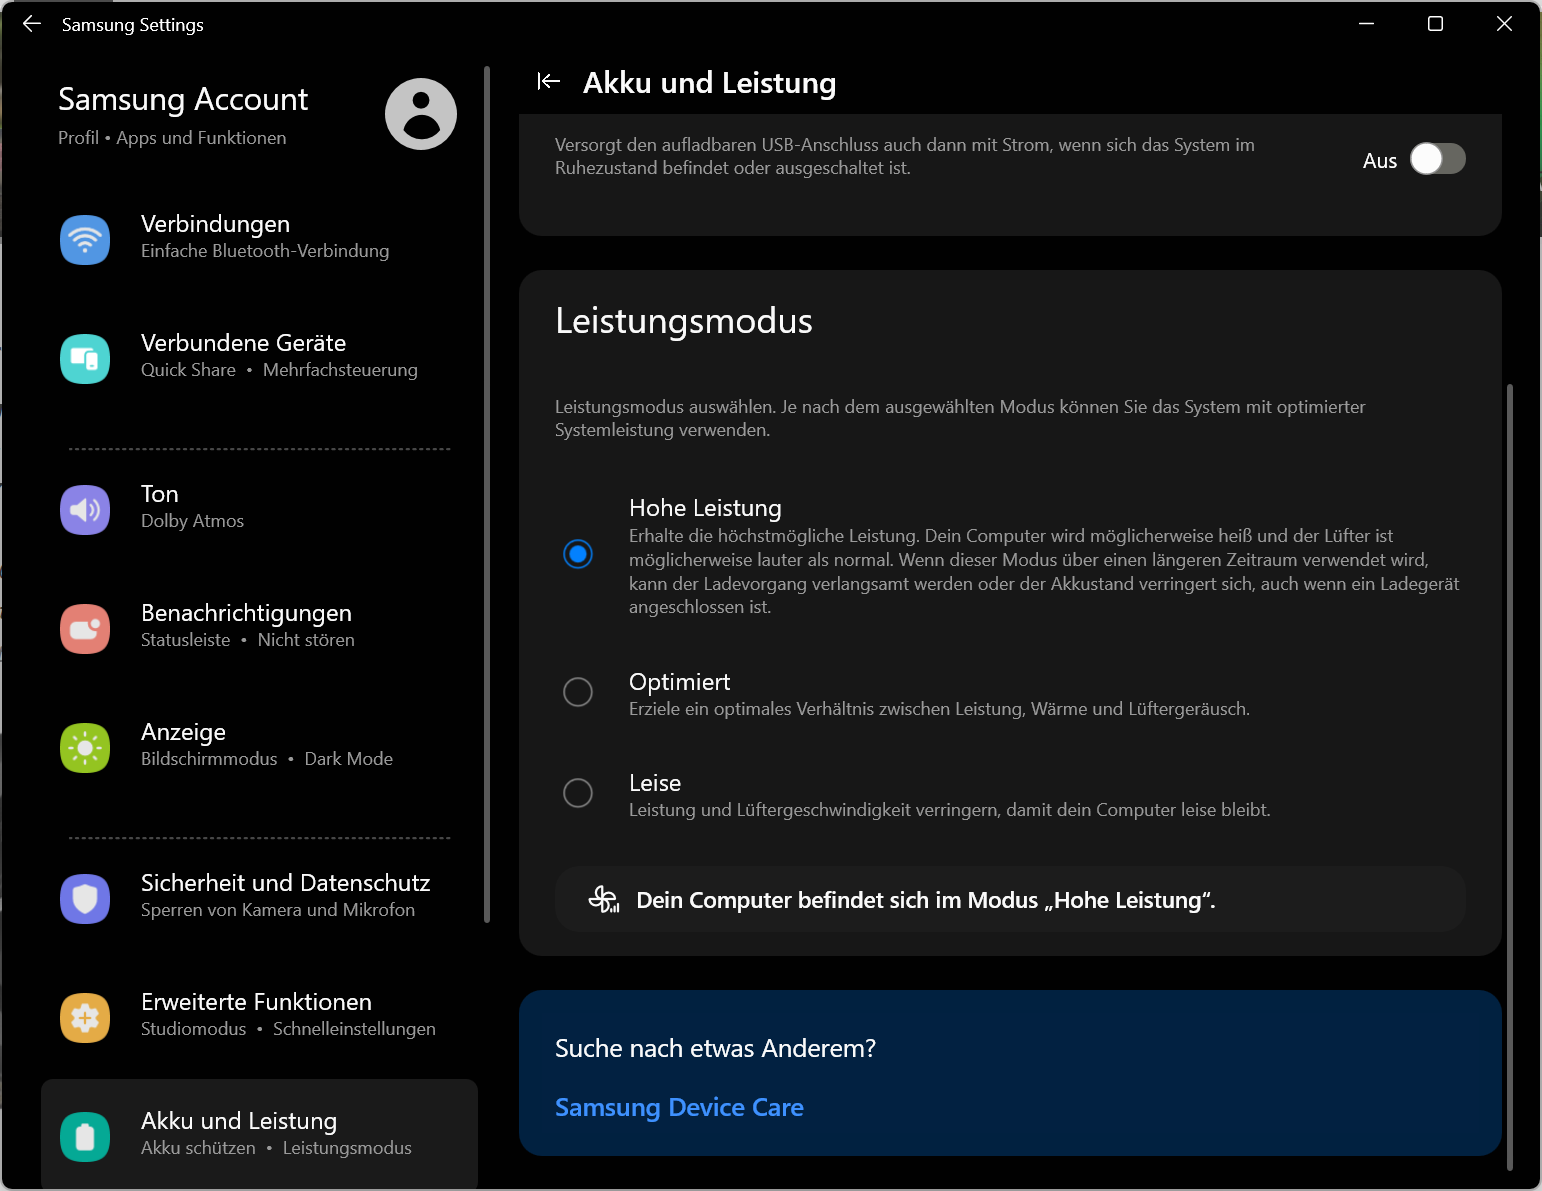
The Samsung Galaxy Book3 uses the included "Samsung Settings" software to configure some of the basic settings and behavior of the laptop. Three performance profiles are available to choose from, which can also be set via "Fn"+ "F11".
We selected High Performance mode for our benchmarks. Little consideration is given to heat and noise development. In any case, the latter is well below the level regularly exhibited by gaming notebooks.
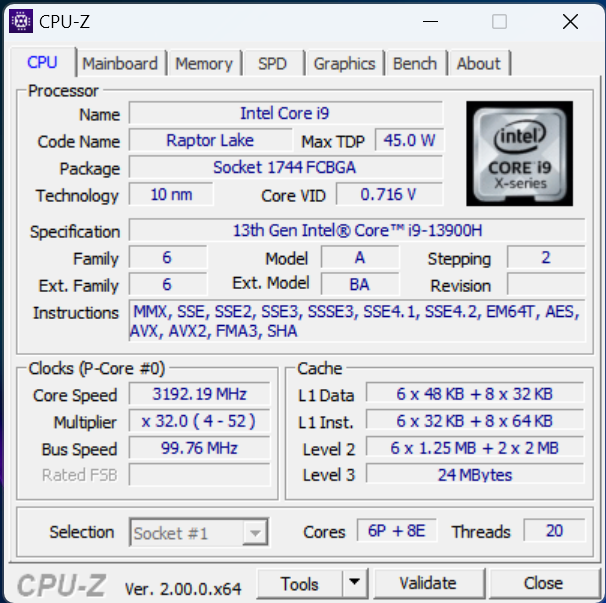
Processor
The Intel Core i9-13900H CPU belongs to the high-end segment and is outperformed by few mobile processors. With 14 cores, 20 threads, 24 MB L3 cache and a high peak clock, it is certainly capable of processing complex tasks. In the slim Galaxy Book, however, the CPU has to make do with a reduced power consumption of a maximum of 75 W. As a result, it lags far behind an Intel Core i9-12900H of the previous generation, for example, but is much more economical.
The Apple M2 Pro 10 Core shows that things can be done even more efficiently. It only needs 27 W for a marginally worse score in the Cinebench R15 endurance test. Nevertheless, the i9 in Samsung's Creator notebook is on a good level when you consider the limited space and cooling options.
The comparison with the Galaxy Book3 Ultra with the Intel Core i7-13700H shows that the CPU is more powerful under short-term load. The "smaller" notebook of the two performs significantly better in our CPU evaluation across various measurements. It seems that the i7 copes better with lower power consumption than the i9. The roughly identical CPUs mainly differ in the maximum achievable clock rate, which cannot be exploited during lower power consumption. For example, we measured a maximum clock rate of 3.7 GHz in Cinebench R23. Theoretically, up to 5.4 GHz is possible.
On the other hand, the faster i9 processor can once again assert itself in the Cinebench R15 endurance test when computing power is needed for a longer periods of time. The advantages of the stronger, but also louder cooling (compared to the i7 variant) then become apparent.
The use of Optimized mode can result in some unusual dynamics. For fractions of a second, 75 W is allowed, just like in Silent mode and even in battery operation. In contrast, the power consumption for longer periods is limited to 45 W. In Silent mode, this value drops to 30 W.
The performance modes are also available in battery operation. PL1, which sets the power consumption for up to 32 seconds, is then reduced by 10 W. In Silent mode, on the other hand, it remains at 30 W, which is actually sufficient, as will be shown below.
More benchmarks and comparison values can be found in our CPU benchmark list.
Cinebench R15 Multi Sustained Load
Cinebench R23: Multi Core | Single Core
Cinebench R20: CPU (Multi Core) | CPU (Single Core)
Cinebench R15: CPU Multi 64Bit | CPU Single 64Bit
Blender: v2.79 BMW27 CPU
7-Zip 18.03: 7z b 4 | 7z b 4 -mmt1
Geekbench 5.5: Multi-Core | Single-Core
HWBOT x265 Benchmark v2.2: 4k Preset
LibreOffice : 20 Documents To PDF
R Benchmark 2.5: Overall mean
| CPU Performance rating | |
| Asus ProArt StudioBook 16 H7600ZW | |
| MSI Stealth 17 Studio A13VH-014 | |
| Gigabyte AERO 16 OLED BSF | |
| Average Intel Core i9-13900H | |
| Average of class Multimedia | |
| Dell XPS 15 9530 RTX 4070 | |
| Samsung Galaxy Book3 Ultra 16 | |
| Apple MacBook Pro 14 2023 M2 Pro Entry -5! | |
| Lenovo ThinkPad T14 G3-21AJS00400 | |
| Samsung Galaxy Book3 Ultra 16, i9-13900H RTX 4070 | |
| Samsung Galaxy Book Pro 15 NP950XDB-KC5US | |
| Cinebench R23 / Single Core | |
| Average of class Multimedia (1128 - 2459, n=73, last 2 years) | |
| Average Intel Core i9-13900H (1297 - 2054, n=26) | |
| Asus ProArt StudioBook 16 H7600ZW | |
| Dell XPS 15 9530 RTX 4070 | |
| Lenovo ThinkPad T14 G3-21AJS00400 | |
| Gigabyte AERO 16 OLED BSF | |
| MSI Stealth 17 Studio A13VH-014 | |
| Samsung Galaxy Book3 Ultra 16 | |
| Apple MacBook Pro 14 2023 M2 Pro Entry | |
| Samsung Galaxy Book Pro 15 NP950XDB-KC5US | |
| Samsung Galaxy Book3 Ultra 16, i9-13900H RTX 4070 | |
| Cinebench R20 / CPU (Multi Core) | |
| MSI Stealth 17 Studio A13VH-014 | |
| Asus ProArt StudioBook 16 H7600ZW | |
| Gigabyte AERO 16 OLED BSF | |
| Average Intel Core i9-13900H (4935 - 7716, n=25) | |
| Average of class Multimedia (1887 - 12912, n=64, last 2 years) | |
| Dell XPS 15 9530 RTX 4070 | |
| Samsung Galaxy Book3 Ultra 16 | |
| Samsung Galaxy Book3 Ultra 16, i9-13900H RTX 4070 | |
| Lenovo ThinkPad T14 G3-21AJS00400 | |
| Apple MacBook Pro 14 2023 M2 Pro Entry | |
| Samsung Galaxy Book Pro 15 NP950XDB-KC5US | |
| Cinebench R20 / CPU (Single Core) | |
| Asus ProArt StudioBook 16 H7600ZW | |
| Average of class Multimedia (425 - 853, n=64, last 2 years) | |
| Average Intel Core i9-13900H (428 - 792, n=25) | |
| Dell XPS 15 9530 RTX 4070 | |
| Lenovo ThinkPad T14 G3-21AJS00400 | |
| MSI Stealth 17 Studio A13VH-014 | |
| Samsung Galaxy Book3 Ultra 16 | |
| Gigabyte AERO 16 OLED BSF | |
| Samsung Galaxy Book Pro 15 NP950XDB-KC5US | |
| Apple MacBook Pro 14 2023 M2 Pro Entry | |
| Samsung Galaxy Book3 Ultra 16, i9-13900H RTX 4070 | |
| Cinebench R15 / CPU Multi 64Bit | |
| MSI Stealth 17 Studio A13VH-014 | |
| Gigabyte AERO 16 OLED BSF | |
| Asus ProArt StudioBook 16 H7600ZW | |
| Average Intel Core i9-13900H (2061 - 3100, n=26) | |
| Dell XPS 15 9530 RTX 4070 | |
| Average of class Multimedia (856 - 5224, n=68, last 2 years) | |
| Samsung Galaxy Book3 Ultra 16 | |
| Samsung Galaxy Book3 Ultra 16, i9-13900H RTX 4070 | |
| Lenovo ThinkPad T14 G3-21AJS00400 | |
| Apple MacBook Pro 14 2023 M2 Pro Entry | |
| Samsung Galaxy Book Pro 15 NP950XDB-KC5US | |
| Cinebench R15 / CPU Single 64Bit | |
| MSI Stealth 17 Studio A13VH-014 | |
| Average of class Multimedia (184.8 - 326, n=66, last 2 years) | |
| Asus ProArt StudioBook 16 H7600ZW | |
| Dell XPS 15 9530 RTX 4070 | |
| Average Intel Core i9-13900H (211 - 297, n=26) | |
| Samsung Galaxy Book3 Ultra 16 | |
| Lenovo ThinkPad T14 G3-21AJS00400 | |
| Gigabyte AERO 16 OLED BSF | |
| Apple MacBook Pro 14 2023 M2 Pro Entry | |
| Samsung Galaxy Book3 Ultra 16, i9-13900H RTX 4070 | |
| Samsung Galaxy Book Pro 15 NP950XDB-KC5US | |
| Blender / v2.79 BMW27 CPU | |
| Samsung Galaxy Book Pro 15 NP950XDB-KC5US | |
| Apple MacBook Pro 14 2023 M2 Pro Entry | |
| Lenovo ThinkPad T14 G3-21AJS00400 | |
| Average of class Multimedia (100 - 557, n=65, last 2 years) | |
| Samsung Galaxy Book3 Ultra 16, i9-13900H RTX 4070 | |
| Samsung Galaxy Book3 Ultra 16 | |
| Dell XPS 15 9530 RTX 4070 | |
| Average Intel Core i9-13900H (166 - 268, n=24) | |
| Gigabyte AERO 16 OLED BSF | |
| Asus ProArt StudioBook 16 H7600ZW | |
| MSI Stealth 17 Studio A13VH-014 | |
| 7-Zip 18.03 / 7z b 4 | |
| Asus ProArt StudioBook 16 H7600ZW | |
| MSI Stealth 17 Studio A13VH-014 | |
| Gigabyte AERO 16 OLED BSF | |
| Average Intel Core i9-13900H (45045 - 79032, n=25) | |
| Samsung Galaxy Book3 Ultra 16 | |
| Dell XPS 15 9530 RTX 4070 | |
| Average of class Multimedia (29095 - 130368, n=62, last 2 years) | |
| Samsung Galaxy Book3 Ultra 16, i9-13900H RTX 4070 | |
| Lenovo ThinkPad T14 G3-21AJS00400 | |
| Samsung Galaxy Book Pro 15 NP950XDB-KC5US | |
| 7-Zip 18.03 / 7z b 4 -mmt1 | |
| Asus ProArt StudioBook 16 H7600ZW | |
| MSI Stealth 17 Studio A13VH-014 | |
| Dell XPS 15 9530 RTX 4070 | |
| Average Intel Core i9-13900H (3665 - 6600, n=25) | |
| Average of class Multimedia (3666 - 7545, n=63, last 2 years) | |
| Lenovo ThinkPad T14 G3-21AJS00400 | |
| Gigabyte AERO 16 OLED BSF | |
| Samsung Galaxy Book3 Ultra 16 | |
| Samsung Galaxy Book Pro 15 NP950XDB-KC5US | |
| Samsung Galaxy Book3 Ultra 16, i9-13900H RTX 4070 | |
| Geekbench 5.5 / Single-Core | |
| MSI Stealth 17 Studio A13VH-014 | |
| Average of class Multimedia (805 - 2974, n=62, last 2 years) | |
| Apple MacBook Pro 14 2023 M2 Pro Entry | |
| Dell XPS 15 9530 RTX 4070 | |
| Average Intel Core i9-13900H (1140 - 2043, n=26) | |
| Asus ProArt StudioBook 16 H7600ZW | |
| Gigabyte AERO 16 OLED BSF | |
| Samsung Galaxy Book3 Ultra 16 | |
| Lenovo ThinkPad T14 G3-21AJS00400 | |
| Samsung Galaxy Book Pro 15 NP950XDB-KC5US | |
| Samsung Galaxy Book3 Ultra 16, i9-13900H RTX 4070 | |
| HWBOT x265 Benchmark v2.2 / 4k Preset | |
| Asus ProArt StudioBook 16 H7600ZW | |
| MSI Stealth 17 Studio A13VH-014 | |
| Gigabyte AERO 16 OLED BSF | |
| Average of class Multimedia (5.26 - 36.1, n=63, last 2 years) | |
| Average Intel Core i9-13900H (14.1 - 22.3, n=25) | |
| Dell XPS 15 9530 RTX 4070 | |
| Samsung Galaxy Book3 Ultra 16 | |
| Samsung Galaxy Book3 Ultra 16, i9-13900H RTX 4070 | |
| Lenovo ThinkPad T14 G3-21AJS00400 | |
| Samsung Galaxy Book Pro 15 NP950XDB-KC5US | |
| LibreOffice / 20 Documents To PDF | |
| Samsung Galaxy Book3 Ultra 16, i9-13900H RTX 4070 | |
| Gigabyte AERO 16 OLED BSF | |
| Samsung Galaxy Book Pro 15 NP950XDB-KC5US | |
| MSI Stealth 17 Studio A13VH-014 | |
| Average of class Multimedia (23.9 - 146.7, n=64, last 2 years) | |
| Samsung Galaxy Book3 Ultra 16 | |
| Average Intel Core i9-13900H (34.4 - 82.8, n=25) | |
| Asus ProArt StudioBook 16 H7600ZW | |
| Dell XPS 15 9530 RTX 4070 | |
| Lenovo ThinkPad T14 G3-21AJS00400 | |
| R Benchmark 2.5 / Overall mean | |
| Samsung Galaxy Book3 Ultra 16, i9-13900H RTX 4070 | |
| Samsung Galaxy Book Pro 15 NP950XDB-KC5US | |
| Gigabyte AERO 16 OLED BSF | |
| Samsung Galaxy Book3 Ultra 16 | |
| Lenovo ThinkPad T14 G3-21AJS00400 | |
| Average of class Multimedia (0.3604 - 0.947, n=63, last 2 years) | |
| Average Intel Core i9-13900H (0.4052 - 0.723, n=25) | |
| Dell XPS 15 9530 RTX 4070 | |
| Asus ProArt StudioBook 16 H7600ZW | |
| MSI Stealth 17 Studio A13VH-014 | |
* ... smaller is better
AIDA64: FP32 Ray-Trace | FPU Julia | CPU SHA3 | CPU Queen | FPU SinJulia | FPU Mandel | CPU AES | CPU ZLib | FP64 Ray-Trace | CPU PhotoWorxx
| Performance rating | |
| Asus ProArt StudioBook 16 H7600ZW | |
| Gigabyte AERO 16 OLED BSF | |
| MSI Stealth 17 Studio A13VH-014 | |
| Average of class Multimedia | |
| Average Intel Core i9-13900H | |
| Samsung Galaxy Book3 Ultra 16 | |
| Dell XPS 15 9530 RTX 4070 | |
| Samsung Galaxy Book3 Ultra 16, i9-13900H RTX 4070 | |
| AIDA64 / FP32 Ray-Trace | |
| MSI Stealth 17 Studio A13VH-014 | |
| Gigabyte AERO 16 OLED BSF | |
| Average of class Multimedia (2214 - 50388, n=60, last 2 years) | |
| Asus ProArt StudioBook 16 H7600ZW | |
| Average Intel Core i9-13900H (6788 - 19557, n=25) | |
| Samsung Galaxy Book3 Ultra 16, i9-13900H RTX 4070 | |
| Samsung Galaxy Book3 Ultra 16 | |
| Dell XPS 15 9530 RTX 4070 | |
| AIDA64 / FPU Julia | |
| MSI Stealth 17 Studio A13VH-014 | |
| Asus ProArt StudioBook 16 H7600ZW | |
| Gigabyte AERO 16 OLED BSF | |
| Average of class Multimedia (12867 - 201874, n=61, last 2 years) | |
| Average Intel Core i9-13900H (22551 - 95579, n=25) | |
| Samsung Galaxy Book3 Ultra 16 | |
| Dell XPS 15 9530 RTX 4070 | |
| Samsung Galaxy Book3 Ultra 16, i9-13900H RTX 4070 | |
| AIDA64 / CPU SHA3 | |
| MSI Stealth 17 Studio A13VH-014 | |
| Asus ProArt StudioBook 16 H7600ZW | |
| Gigabyte AERO 16 OLED BSF | |
| Average of class Multimedia (653 - 8623, n=61, last 2 years) | |
| Average Intel Core i9-13900H (2491 - 4270, n=25) | |
| Samsung Galaxy Book3 Ultra 16, i9-13900H RTX 4070 | |
| Samsung Galaxy Book3 Ultra 16 | |
| Dell XPS 15 9530 RTX 4070 | |
| AIDA64 / CPU Queen | |
| Asus ProArt StudioBook 16 H7600ZW | |
| Average Intel Core i9-13900H (65121 - 120936, n=25) | |
| Dell XPS 15 9530 RTX 4070 | |
| Samsung Galaxy Book3 Ultra 16 | |
| MSI Stealth 17 Studio A13VH-014 | |
| Gigabyte AERO 16 OLED BSF | |
| Samsung Galaxy Book3 Ultra 16, i9-13900H RTX 4070 | |
| Average of class Multimedia (13483 - 181505, n=49, last 2 years) | |
| AIDA64 / FPU SinJulia | |
| MSI Stealth 17 Studio A13VH-014 | |
| Gigabyte AERO 16 OLED BSF | |
| Asus ProArt StudioBook 16 H7600ZW | |
| Average Intel Core i9-13900H (6108 - 11631, n=25) | |
| Average of class Multimedia (1240 - 28794, n=61, last 2 years) | |
| Samsung Galaxy Book3 Ultra 16 | |
| Dell XPS 15 9530 RTX 4070 | |
| Samsung Galaxy Book3 Ultra 16, i9-13900H RTX 4070 | |
| AIDA64 / FPU Mandel | |
| MSI Stealth 17 Studio A13VH-014 | |
| Asus ProArt StudioBook 16 H7600ZW | |
| Gigabyte AERO 16 OLED BSF | |
| Average of class Multimedia (6395 - 105740, n=60, last 2 years) | |
| Average Intel Core i9-13900H (11283 - 48474, n=25) | |
| Samsung Galaxy Book3 Ultra 16, i9-13900H RTX 4070 | |
| Samsung Galaxy Book3 Ultra 16 | |
| Dell XPS 15 9530 RTX 4070 | |
| AIDA64 / CPU AES | |
| Asus ProArt StudioBook 16 H7600ZW | |
| Gigabyte AERO 16 OLED BSF | |
| Average Intel Core i9-13900H (3691 - 149377, n=25) | |
| MSI Stealth 17 Studio A13VH-014 | |
| Samsung Galaxy Book3 Ultra 16 | |
| Average of class Multimedia (13243 - 126790, n=61, last 2 years) | |
| Dell XPS 15 9530 RTX 4070 | |
| Samsung Galaxy Book3 Ultra 16, i9-13900H RTX 4070 | |
| AIDA64 / CPU ZLib | |
| MSI Stealth 17 Studio A13VH-014 | |
| Gigabyte AERO 16 OLED BSF | |
| Asus ProArt StudioBook 16 H7600ZW | |
| Average Intel Core i9-13900H (789 - 1254, n=25) | |
| Samsung Galaxy Book3 Ultra 16 | |
| Average of class Multimedia (167.2 - 2022, n=61, last 2 years) | |
| Samsung Galaxy Book3 Ultra 16, i9-13900H RTX 4070 | |
| Dell XPS 15 9530 RTX 4070 | |
| AIDA64 / FP64 Ray-Trace | |
| MSI Stealth 17 Studio A13VH-014 | |
| Asus ProArt StudioBook 16 H7600ZW | |
| Gigabyte AERO 16 OLED BSF | |
| Average of class Multimedia (1014 - 26875, n=61, last 2 years) | |
| Average Intel Core i9-13900H (3655 - 10716, n=25) | |
| Samsung Galaxy Book3 Ultra 16 | |
| Dell XPS 15 9530 RTX 4070 | |
| Samsung Galaxy Book3 Ultra 16, i9-13900H RTX 4070 | |
| AIDA64 / CPU PhotoWorxx | |
| MSI Stealth 17 Studio A13VH-014 | |
| Average of class Multimedia (12860 - 88154, n=61, last 2 years) | |
| Samsung Galaxy Book3 Ultra 16, i9-13900H RTX 4070 | |
| Samsung Galaxy Book3 Ultra 16 | |
| Gigabyte AERO 16 OLED BSF | |
| Dell XPS 15 9530 RTX 4070 | |
| Asus ProArt StudioBook 16 H7600ZW | |
| Average Intel Core i9-13900H (10871 - 50488, n=25) | |
System Performance
The limited power consumption is hardly noticeable during normal use. Compared to the more powerful models, program starts are slightly delayed. Compared to a fast business notebook, on the other hand, the Samsung Galaxy Book3 Ultra has an advantage. The many cores of the CPU and the support provided by the dedicated graphics chip can be fully exploited here.
Fast working and multitasking do not cause the system any problems. In addition, the efficiency factor should not be overlooked. The very similarly equipped Gigabyte AERO 16 OLED has a lead of 40 to 50% in most benchmarks. However, it needs to consume twice as much power to stay ahead.
The laptop's CPU performance are echoed in the system performance: the smaller Samsung Galaxy Book3 Ultra also shows better rates here. However, the i7-13700H continues to demonstrate that it can handle the 75W limitation much better than the i9-13900H.
CrossMark: Overall | Productivity | Creativity | Responsiveness
| PCMark 10 / Score | |
| Asus ProArt StudioBook 16 H7600ZW | |
| Gigabyte AERO 16 OLED BSF | |
| Average of class Multimedia (4325 - 10386, n=58, last 2 years) | |
| Average Intel Core i9-13900H, NVIDIA GeForce RTX 4070 Laptop GPU (5855 - 8538, n=8) | |
| MSI Stealth 17 Studio A13VH-014 | |
| Dell XPS 15 9530 RTX 4070 | |
| Samsung Galaxy Book3 Ultra 16 | |
| Lenovo ThinkPad T14 G3-21AJS00400 | |
| Samsung Galaxy Book3 Ultra 16, i9-13900H RTX 4070 | |
| Samsung Galaxy Book Pro 15 NP950XDB-KC5US | |
| PCMark 10 / Essentials | |
| Asus ProArt StudioBook 16 H7600ZW | |
| Dell XPS 15 9530 RTX 4070 | |
| Gigabyte AERO 16 OLED BSF | |
| Average Intel Core i9-13900H, NVIDIA GeForce RTX 4070 Laptop GPU (8835 - 11940, n=8) | |
| Samsung Galaxy Book3 Ultra 16 | |
| Average of class Multimedia (8025 - 11664, n=57, last 2 years) | |
| MSI Stealth 17 Studio A13VH-014 | |
| Samsung Galaxy Book Pro 15 NP950XDB-KC5US | |
| Lenovo ThinkPad T14 G3-21AJS00400 | |
| Samsung Galaxy Book3 Ultra 16, i9-13900H RTX 4070 | |
| PCMark 10 / Productivity | |
| Average of class Multimedia (7323 - 18233, n=57, last 2 years) | |
| Asus ProArt StudioBook 16 H7600ZW | |
| MSI Stealth 17 Studio A13VH-014 | |
| Average Intel Core i9-13900H, NVIDIA GeForce RTX 4070 Laptop GPU (7967 - 10991, n=8) | |
| Gigabyte AERO 16 OLED BSF | |
| Samsung Galaxy Book3 Ultra 16 | |
| Dell XPS 15 9530 RTX 4070 | |
| Lenovo ThinkPad T14 G3-21AJS00400 | |
| Samsung Galaxy Book3 Ultra 16, i9-13900H RTX 4070 | |
| Samsung Galaxy Book Pro 15 NP950XDB-KC5US | |
| PCMark 10 / Digital Content Creation | |
| Gigabyte AERO 16 OLED BSF | |
| Average Intel Core i9-13900H, NVIDIA GeForce RTX 4070 Laptop GPU (7738 - 13575, n=8) | |
| Asus ProArt StudioBook 16 H7600ZW | |
| MSI Stealth 17 Studio A13VH-014 | |
| Dell XPS 15 9530 RTX 4070 | |
| Average of class Multimedia (3651 - 16240, n=57, last 2 years) | |
| Samsung Galaxy Book3 Ultra 16 | |
| Samsung Galaxy Book3 Ultra 16, i9-13900H RTX 4070 | |
| Lenovo ThinkPad T14 G3-21AJS00400 | |
| Samsung Galaxy Book Pro 15 NP950XDB-KC5US | |
| CrossMark / Overall | |
| Asus ProArt StudioBook 16 H7600ZW | |
| Dell XPS 15 9530 RTX 4070 | |
| Gigabyte AERO 16 OLED BSF | |
| Average of class Multimedia (866 - 2728, n=67, last 2 years) | |
| Average Intel Core i9-13900H, NVIDIA GeForce RTX 4070 Laptop GPU (1104 - 1974, n=7) | |
| Apple MacBook Pro 14 2023 M2 Pro Entry | |
| MSI Stealth 17 Studio A13VH-014 | |
| Samsung Galaxy Book3 Ultra 16 | |
| Lenovo ThinkPad T14 G3-21AJS00400 | |
| Samsung Galaxy Book3 Ultra 16, i9-13900H RTX 4070 | |
| CrossMark / Productivity | |
| Asus ProArt StudioBook 16 H7600ZW | |
| Gigabyte AERO 16 OLED BSF | |
| Dell XPS 15 9530 RTX 4070 | |
| Average of class Multimedia (931 - 2489, n=67, last 2 years) | |
| Average Intel Core i9-13900H, NVIDIA GeForce RTX 4070 Laptop GPU (1058 - 1914, n=7) | |
| MSI Stealth 17 Studio A13VH-014 | |
| Apple MacBook Pro 14 2023 M2 Pro Entry | |
| Lenovo ThinkPad T14 G3-21AJS00400 | |
| Samsung Galaxy Book3 Ultra 16 | |
| Samsung Galaxy Book3 Ultra 16, i9-13900H RTX 4070 | |
| CrossMark / Creativity | |
| Apple MacBook Pro 14 2023 M2 Pro Entry | |
| Dell XPS 15 9530 RTX 4070 | |
| Average of class Multimedia (907 - 3465, n=67, last 2 years) | |
| Asus ProArt StudioBook 16 H7600ZW | |
| Average Intel Core i9-13900H, NVIDIA GeForce RTX 4070 Laptop GPU (1178 - 2254, n=7) | |
| Gigabyte AERO 16 OLED BSF | |
| MSI Stealth 17 Studio A13VH-014 | |
| Samsung Galaxy Book3 Ultra 16 | |
| Lenovo ThinkPad T14 G3-21AJS00400 | |
| Samsung Galaxy Book3 Ultra 16, i9-13900H RTX 4070 | |
| CrossMark / Responsiveness | |
| Gigabyte AERO 16 OLED BSF | |
| Asus ProArt StudioBook 16 H7600ZW | |
| Average Intel Core i9-13900H, NVIDIA GeForce RTX 4070 Laptop GPU (1037 - 1952, n=7) | |
| Dell XPS 15 9530 RTX 4070 | |
| MSI Stealth 17 Studio A13VH-014 | |
| Average of class Multimedia (605 - 2024, n=67, last 2 years) | |
| Samsung Galaxy Book3 Ultra 16 | |
| Apple MacBook Pro 14 2023 M2 Pro Entry | |
| Lenovo ThinkPad T14 G3-21AJS00400 | |
| Samsung Galaxy Book3 Ultra 16, i9-13900H RTX 4070 | |
| PCMark 10 Score | 5855 points | |
Help | ||
| AIDA64 / Memory Copy | |
| Average of class Multimedia (21158 - 132135, n=61, last 2 years) | |
| MSI Stealth 17 Studio A13VH-014 | |
| Samsung Galaxy Book3 Ultra 16 | |
| Samsung Galaxy Book3 Ultra 16, i9-13900H RTX 4070 | |
| Gigabyte AERO 16 OLED BSF | |
| Dell XPS 15 9530 RTX 4070 | |
| Asus ProArt StudioBook 16 H7600ZW | |
| Average Intel Core i9-13900H (37448 - 74486, n=25) | |
| AIDA64 / Memory Read | |
| Average of class Multimedia (19699 - 174586, n=61, last 2 years) | |
| MSI Stealth 17 Studio A13VH-014 | |
| Samsung Galaxy Book3 Ultra 16, i9-13900H RTX 4070 | |
| Dell XPS 15 9530 RTX 4070 | |
| Samsung Galaxy Book3 Ultra 16 | |
| Gigabyte AERO 16 OLED BSF | |
| Asus ProArt StudioBook 16 H7600ZW | |
| Average Intel Core i9-13900H (41599 - 75433, n=25) | |
| AIDA64 / Memory Write | |
| Samsung Galaxy Book3 Ultra 16 | |
| Samsung Galaxy Book3 Ultra 16, i9-13900H RTX 4070 | |
| Average of class Multimedia (17733 - 134998, n=61, last 2 years) | |
| MSI Stealth 17 Studio A13VH-014 | |
| Gigabyte AERO 16 OLED BSF | |
| Dell XPS 15 9530 RTX 4070 | |
| Average Intel Core i9-13900H (36152 - 88505, n=25) | |
| Asus ProArt StudioBook 16 H7600ZW | |
| AIDA64 / Memory Latency | |
| Average of class Multimedia (7 - 535, n=60, last 2 years) | |
| Samsung Galaxy Book3 Ultra 16, i9-13900H RTX 4070 | |
| Samsung Galaxy Book3 Ultra 16 | |
| Gigabyte AERO 16 OLED BSF | |
| MSI Stealth 17 Studio A13VH-014 | |
| Asus ProArt StudioBook 16 H7600ZW | |
| Average Intel Core i9-13900H (75.8 - 102.3, n=25) | |
| Dell XPS 15 9530 RTX 4070 | |
* ... smaller is better
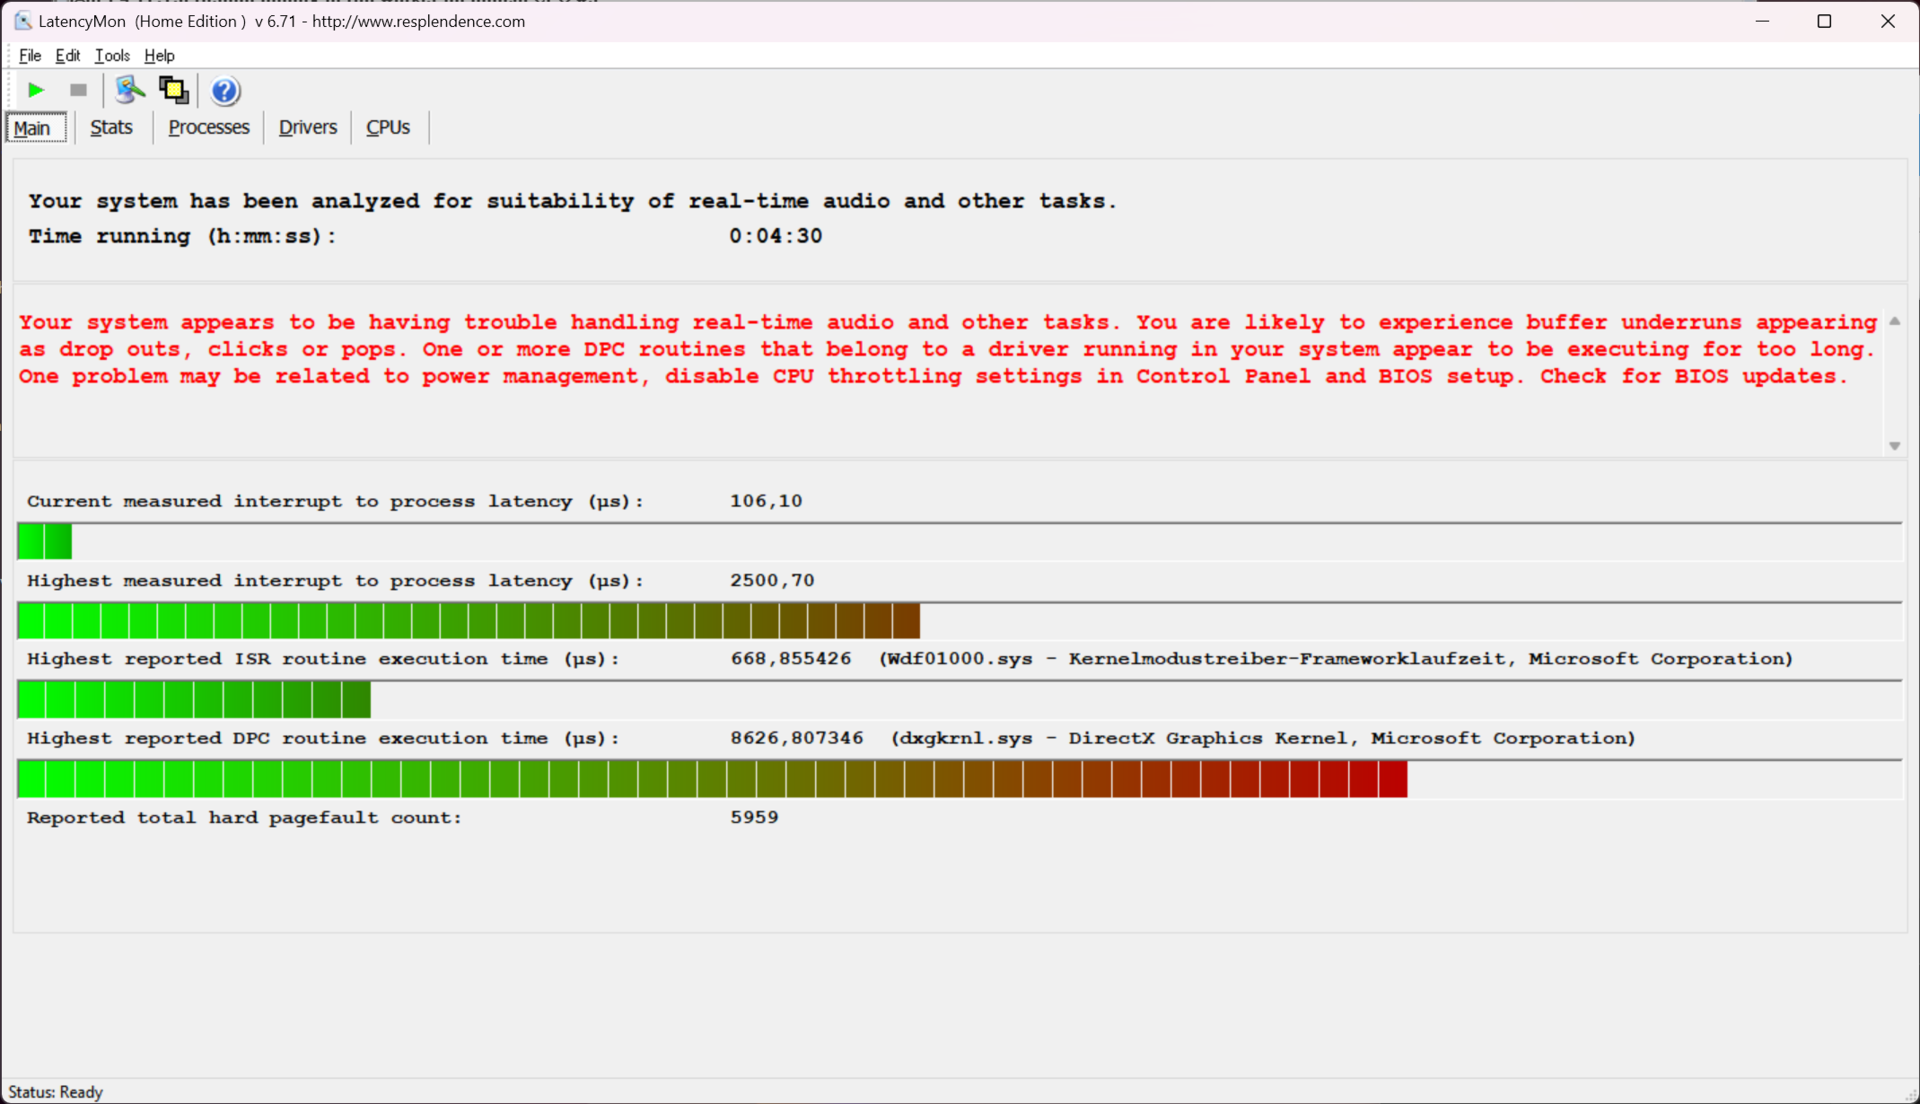
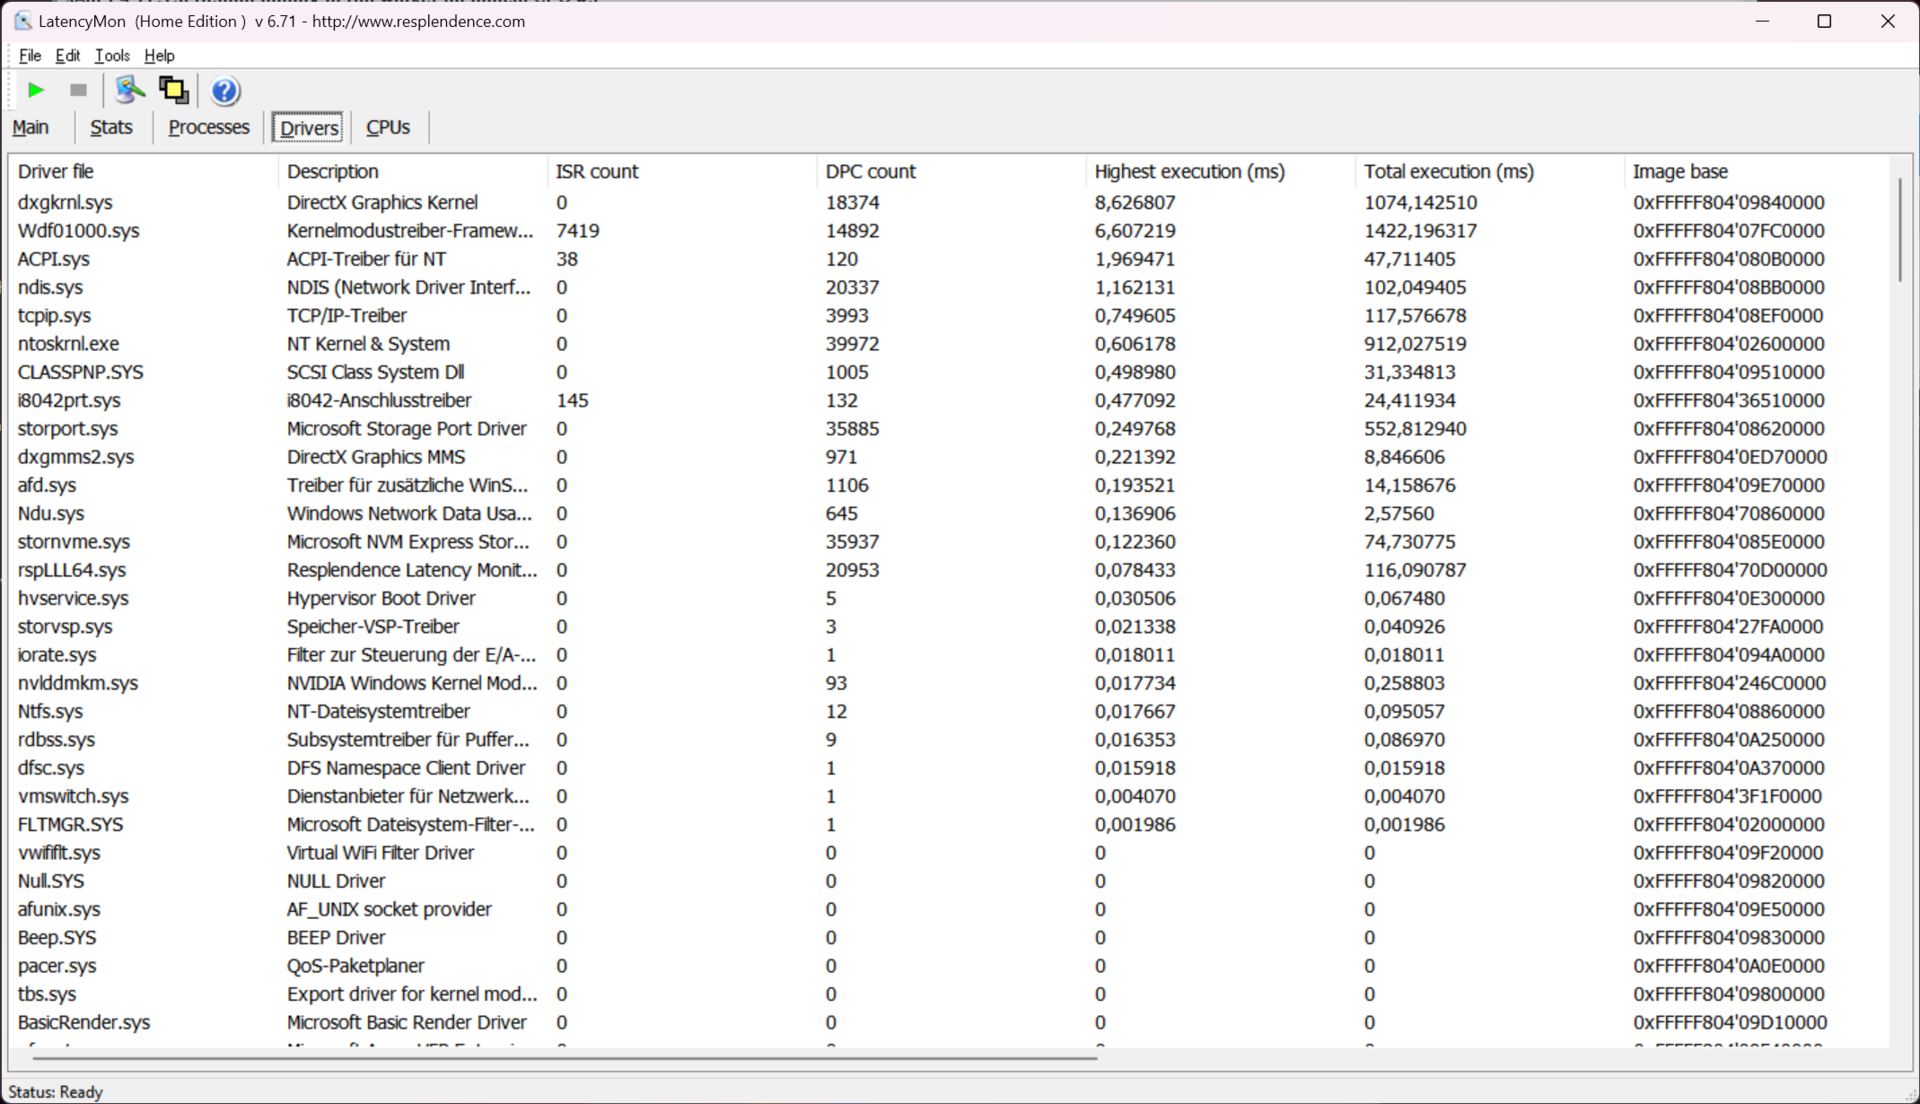
DPC Latency
The latency we measured with LatencyMon indicates driver problems with the Nvidia Studio graphics driver. However, the kernel mode driver framework also shows measurable delays. So the system is not suitable for real-time audio processing. Adjusting the software as well as future updates could lead to considerable improvements.
56 dropped frames is also a below-average value for 4K video playback on YouTube, especially for a multimedia notebook in this configuration. A driver update in the future should amend this. At the time of review, Nvidia Studio 531.61 was the latest graphics card driver installed.
| DPC Latencies / LatencyMon - interrupt to process latency (max), Web, Youtube, Prime95 | |
| Samsung Galaxy Book3 Ultra 16 | |
| MSI Stealth 17 Studio A13VH-014 | |
| Samsung Galaxy Book3 Ultra 16, i9-13900H RTX 4070 | |
| Asus ProArt StudioBook 16 H7600ZW | |
| Dell XPS 15 9530 RTX 4070 | |
| Gigabyte AERO 16 OLED BSF | |
* ... smaller is better
Storage Devices
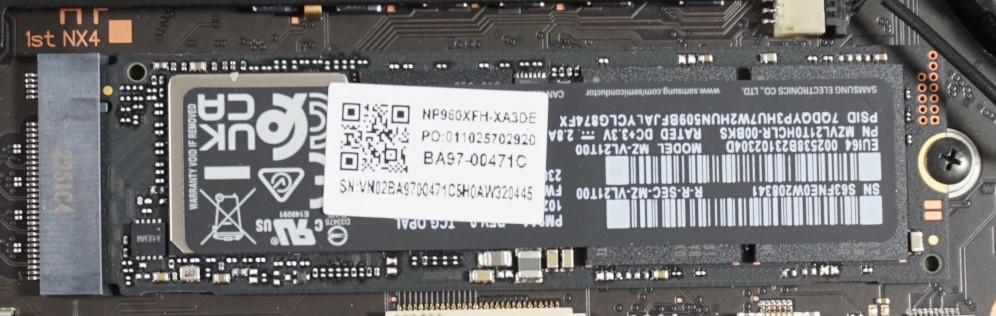
The M.2 SSD doesn't have any surprises in store. Unsurprisingly, it is a Samsung model that regularly achieves the values found here in our measurements. The maximum speed is above the capabilities of PCIe 3, but cannot compete with the best PCIe 4 SSDs.
For the tasks that the Galaxy Book3 Ultra has to handle, the SSD should not prove to be a bottleneck at any time. Moreover, access speeds remain at a high level under sustained load - quite the opposite of the identical storage device in the Asus ProArt StudioBook 16, which is forced to severely limit the data rate to prevent overheating.
At most, hard drive space could quickly become scarce when editing a lot of raw material. If the baseplate weren't so difficult to remove, an upgrade would be easy. Fortunately, the two Thunderbolt 4 ports can be used for external SSDs.

* ... smaller is better
Sustained Read Performance: DiskSpd Read Loop, Queue Depth 8
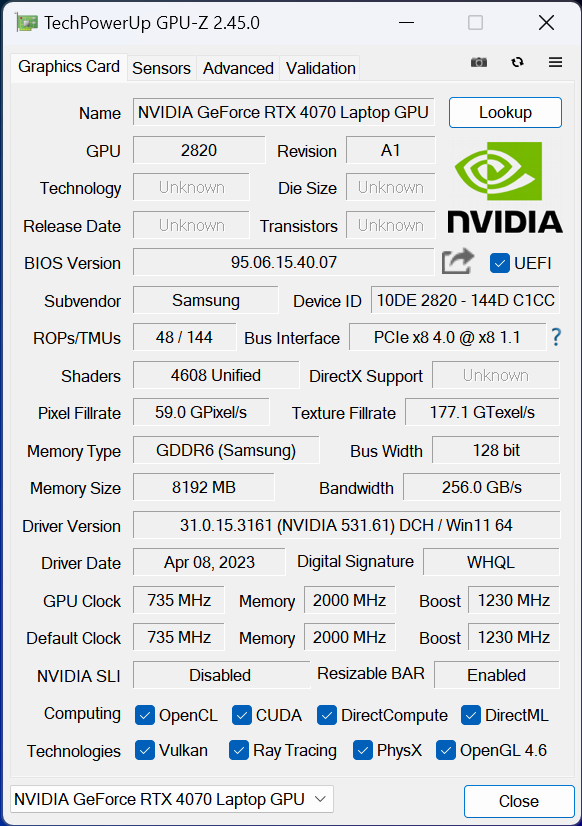
Graphics Card
The Nvidia GeForce RTX 4070 is normally beyond reproach. It handles current games at the highest level of detail and beyond Full HD. It regularly stays close to 100 fps. In a Medion Erazer Major X20, for example, it can consume 115 W for these performance values, even 140 W when Boost is activated.
In the Samsung Creator laptop, on the other hand, consumption is limited to 35 W and to 60 W with Boost. As the metrics from Witcher 3 show, the 60 watts is fully utilized under high loads, while the CPU almost looks underemployed with a consumption rate of less than 15 W. The graphics card is not tuned for permanent loads at the highest level.
On the other hand, the results of the Galaxy Book Ultra in Blender are not far from the average value of the RTX 4070. The main task, creating and editing graphical content, is handled by the notebook very well.
More measured values, fps and data can be found in our GPU benchmark list.
| 3DMark 11 Performance | 25500 points | |
| 3DMark Cloud Gate Standard Score | 34191 points | |
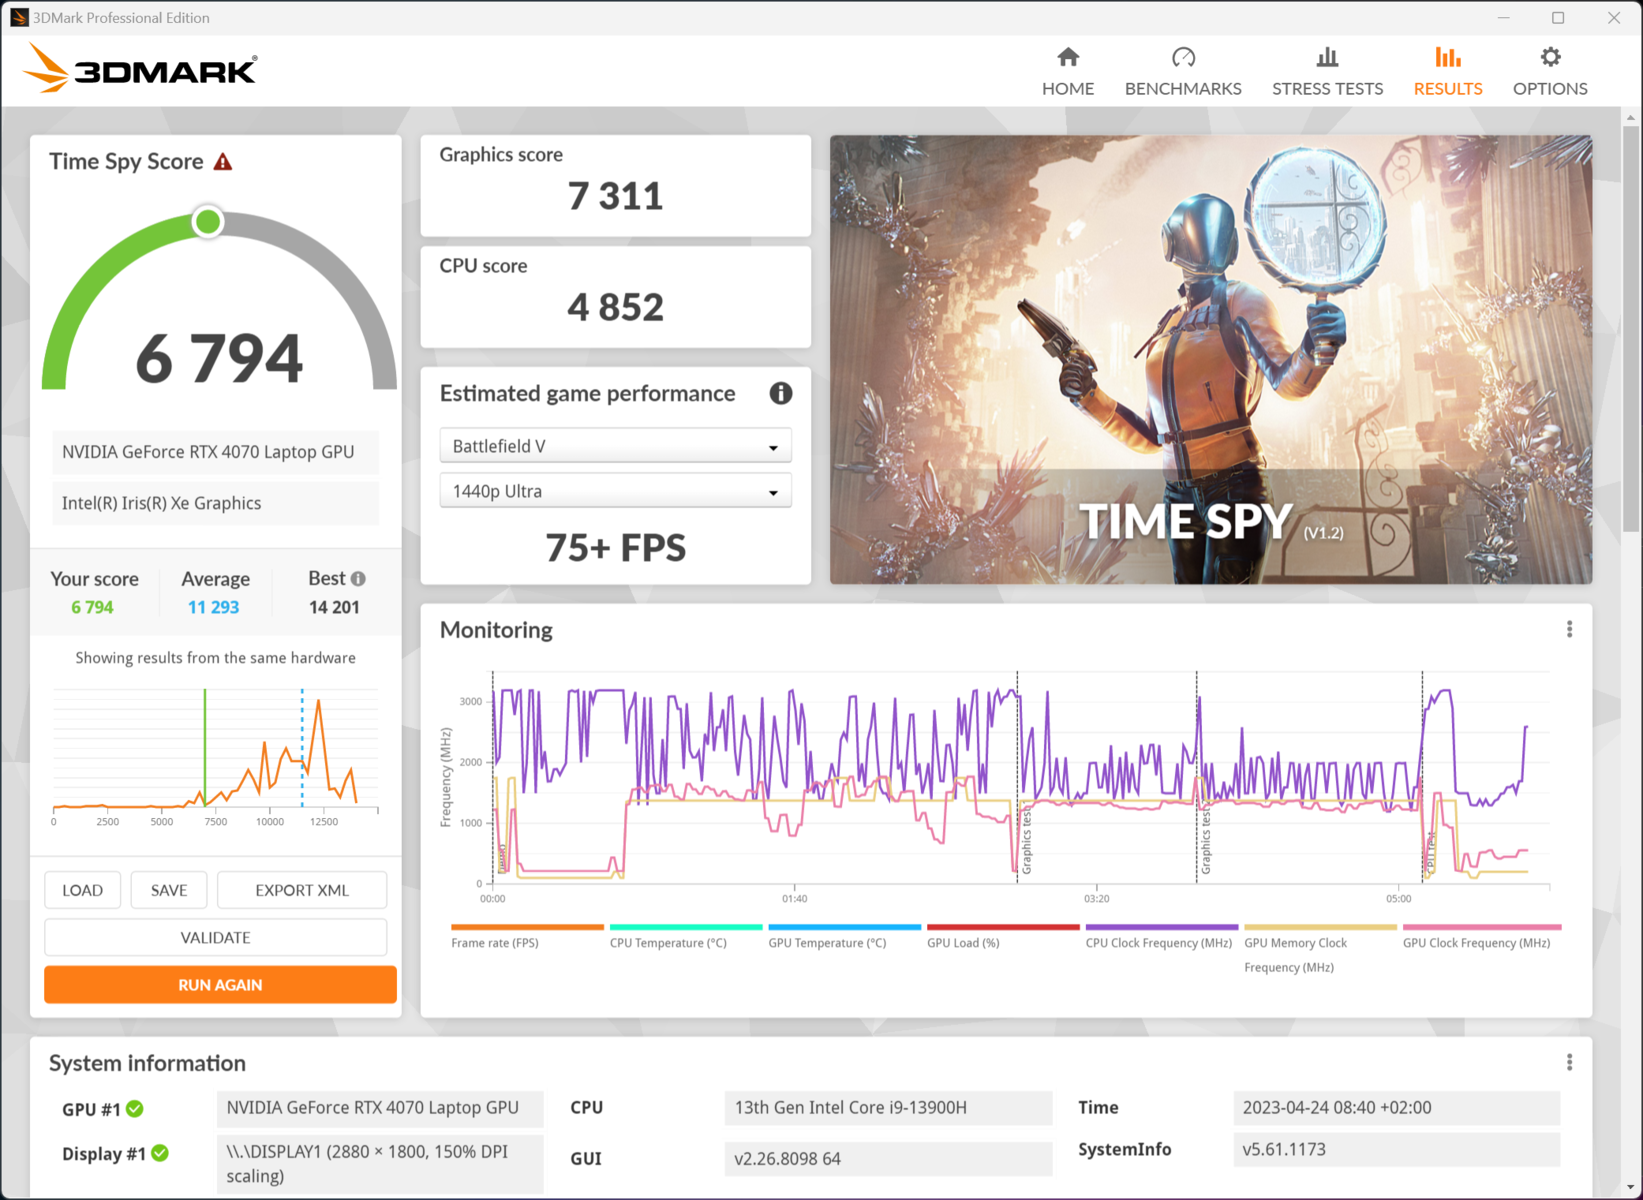
| 3DMark Fire Strike Score | 18076 points | |
| 3DMark Time Spy Score | 8692 points | |
Help | ||
* ... smaller is better
Gaming Performance

Gaming is by no means the Galaxy Book's core competence. The RTX 4070 regularly reaches its limits here because it is unable to dispel much heat in the thin notebook and is also limited to 60 W of power consumption. A comparison with similarly equipped laptops would thus be an unfair one. On the other hand, the power consumption is regularly below 100 W, even under load. In a gaming notebook like the Medion Erazer Major X20, this is somewhere between 200 to 300 W.
An HP Victus 16 with an Nvidia GeForce RTX 3060 has similar consumption rates when performance is maxed out, so Samsung's laptop for creatives is roughly on par in terms of gaming. However, the latter achieves these values in a much thinner chassis on half the energy. With a few caveats, the latest titles can be played, but the laptop is simply not designed for this due to the lack of cooling and limited power consumption.
The fps clock in Witcher 3 always remains stable. 77 frames on average is a respectable value. That this remains constant speaks for the sufficient cooling of the components. As such, Samsung's notebook should be able to process more extensive computing tasks at stable levels.
Witcher 3 FPS chart
| low | med. | high | ultra | QHD | |
|---|---|---|---|---|---|
| GTA V (2015) | 150.1 | 74.7 | 64.5 | ||
| The Witcher 3 (2015) | 161 | 71 | |||
| Dota 2 Reborn (2015) | 99.7 | 97.4 | |||
| Final Fantasy XV Benchmark (2018) | 82 | 60.2 | |||
| X-Plane 11.11 (2018) | 72.2 | ||||
| Far Cry 5 (2018) | 98 | 92 | 79 | ||
| Strange Brigade (2018) | 173.9 | 148.7 | 106.2 | ||
| Cyberpunk 2077 1.6 (2022) | 71 | 65 | 42 | ||
| F1 22 (2022) | 109 | 54 | 36 | ||
| Hogwarts Legacy (2023) | 57 | 41 | 35 |
Emissions - Quiet, hot creator notebook
Noise
As long as the hardware is not overly stressed, the Galaxy Book3 Ultra remains completely silent. Moderate fan noise sets in during higher heat development, which remains in a very tolerable range of less than 40 dB.
Only under maximum load is the fan actually loud. More than 50 dB is not a value where you can expect to work fully concentrated. This can be changed with Silent mode. Although system performance also drops noticeably, we measured an average of 8 dB less, which is almost half the volume.
Larger fans and a slightly more voluminous cooling system could have improved the results significantly, but would have made the notebook bigger overall. The MSI Stealth 17 Studio, for example, with significantly higher performance rates, demonstrates this impressively. However, it is heavier and considerably thicker.
Noise level
| Idle |
| 25.2 / 25.2 / 31.3 dB(A) |
| Load |
| 38.8 / 51.2 dB(A) |
 | ||
30 dB silent 40 dB(A) audible 50 dB(A) loud |
||
min: | ||
| Samsung Galaxy Book3 Ultra 16, i9-13900H RTX 4070 GeForce RTX 4070 Laptop GPU, i9-13900H, Samsung PM9A1 MZVL21T0HCLR | Dell XPS 15 9530 RTX 4070 GeForce RTX 4070 Laptop GPU, i7-13700H, SK hynix PC801 HFS001TEJ9X101N | MSI Stealth 17 Studio A13VH-014 GeForce RTX 4080 Laptop GPU, i9-13900H, Samsung PM9A1 MZVL22T0HBLB | Asus ProArt StudioBook 16 H7600ZW GeForce RTX 3070 Ti Laptop GPU, i9-12900H, Samsung PM9A1 MZVL21T0HCLR | Gigabyte AERO 16 OLED BSF GeForce RTX 4070 Laptop GPU, i9-13900H, Gigabyte AG470S1TB-SI B10 | Samsung Galaxy Book3 Ultra 16 GeForce RTX 4050 Laptop GPU, i7-13700H, Samsung PM9A1 MZVL2512HCJQ | |
|---|---|---|---|---|---|---|
| Noise | 15% | 9% | 19% | -4% | 3% | |
| off / environment * (dB) | 25.2 | 23.1 8% | 24 5% | 19.55 22% | 23 9% | 25 1% |
| Idle Minimum * (dB) | 25.2 | 23.1 8% | 24 5% | 20.07 20% | 23 9% | 26 -3% |
| Idle Average * (dB) | 25.2 | 23.1 8% | 24 5% | 20.07 20% | 23 9% | 27 -7% |
| Idle Maximum * (dB) | 31.3 | 24.2 23% | 24 23% | 20.07 36% | 33.64 -7% | 28 11% |
| Load Average * (dB) | 38.8 | 27.1 30% | 34.49 11% | 34.53 11% | 51.49 -33% | 40 -3% |
| Load Maximum * (dB) | 51.2 | 44.6 13% | 49.66 3% | 49.21 4% | 55.24 -8% | 41 20% |
| Witcher 3 ultra * (dB) | 40.1 | 48.29 | 49.1 | 55.27 | 39 |
* ... smaller is better
Temperature
The Galaxy Book3 gets warm on almost every occasion. Even a little bit of surfing is enough to heat up the underside to the point that resting the notebook on the lap becomes uncomfortable.
If maximum performance is required, the keyboard gets very warm. We registered higher temperatures on the bottom, so a laptop stand, for example, is advisable when rendering larger video files.
(-) The maximum temperature on the upper side is 45.9 °C / 115 F, compared to the average of 36.8 °C / 98 F, ranging from 21 to 71 °C for the class Multimedia.
(-) The bottom heats up to a maximum of 50.9 °C / 124 F, compared to the average of 39.1 °C / 102 F
(+) In idle usage, the average temperature for the upper side is 29.7 °C / 85 F, compared to the device average of 31.3 °C / 88 F.
(-) Playing The Witcher 3, the average temperature for the upper side is 39.2 °C / 103 F, compared to the device average of 31.3 °C / 88 F.
(±) The palmrests and touchpad can get very hot to the touch with a maximum of 37.2 °C / 99 F.
(-) The average temperature of the palmrest area of similar devices was 28.7 °C / 83.7 F (-8.5 °C / -15.3 F).
| Samsung Galaxy Book3 Ultra 16, i9-13900H RTX 4070 Intel Core i9-13900H, NVIDIA GeForce RTX 4070 Laptop GPU | Dell XPS 15 9530 RTX 4070 Intel Core i7-13700H, NVIDIA GeForce RTX 4070 Laptop GPU | Gigabyte AERO 16 OLED BSF Intel Core i9-13900H, NVIDIA GeForce RTX 4070 Laptop GPU | MSI Stealth 17 Studio A13VH-014 Intel Core i9-13900H, NVIDIA GeForce RTX 4080 Laptop GPU | Samsung Galaxy Book3 Ultra 16 Intel Core i7-13700H, NVIDIA GeForce RTX 4050 Laptop GPU | Asus ProArt StudioBook 16 H7600ZW Intel Core i9-12900H, NVIDIA GeForce RTX 3070 Ti Laptop GPU | |
|---|---|---|---|---|---|---|
| Heat | 3% | 20% | 1% | 19% | 11% | |
| Maximum Upper Side * (°C) | 45.9 | 45.6 1% | 41 11% | 47 -2% | 41 11% | 41.6 9% |
| Maximum Bottom * (°C) | 50.9 | 42 17% | 47 8% | 54 -6% | 44 14% | 41.4 19% |
| Idle Upper Side * (°C) | 31.6 | 34.4 -9% | 23 27% | 30 5% | 23 27% | 31.8 -1% |
| Idle Bottom * (°C) | 34.2 | 33.2 3% | 23 33% | 32 6% | 26 24% | 29.2 15% |
* ... smaller is better
Stress Testing
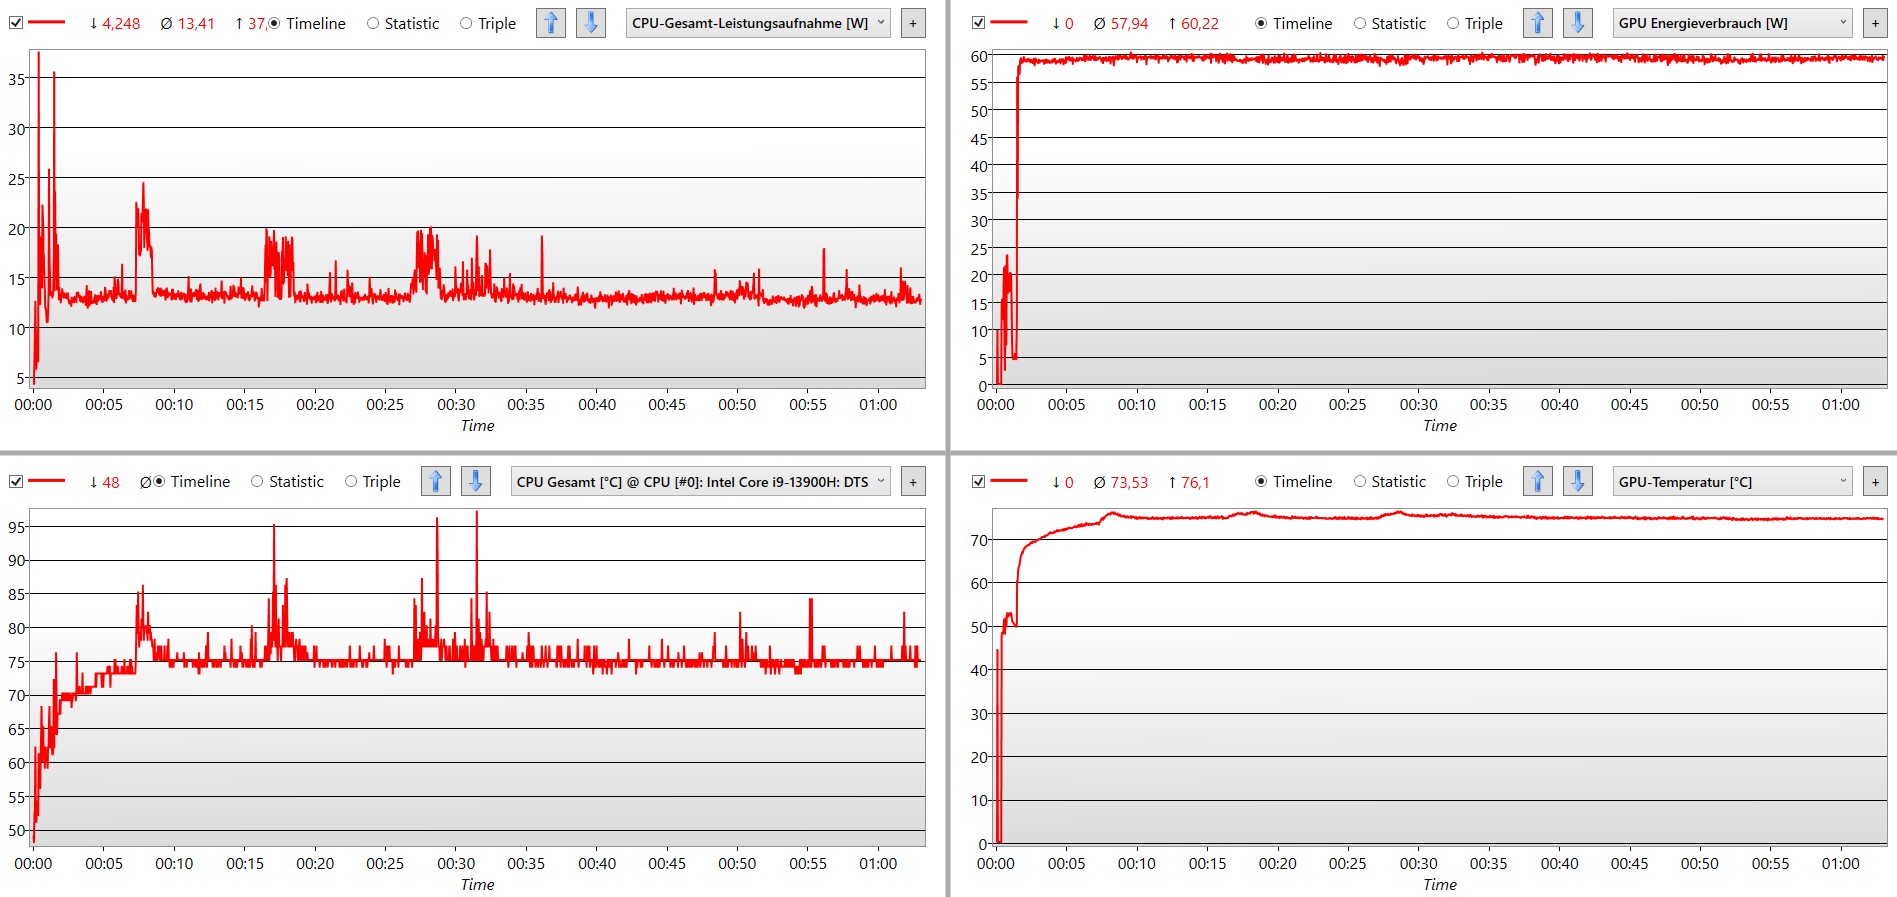
Under maximum load, the processor is allowed just under 30 W in the long run. The graphics card, on the other hand, remains relatively stable at a high level of just under 50 W. The fact that the Galaxy Book3 Ultra gets so hot is shown by the temperature curves of the CPU and GPU. Although they remain almost level after around 10 minutes, they stand at a whopping 95 and 80 °C, respectively. Together with the small cooling system, this results in a very warm case. Nevertheless, the laptop manages to utilize the 100 W allowed by the power supply over long periods of time.
Significant changes can be observed in Silent mode. Not only do the noise emissions drop sharply; the power consumption of the CPU and GPU drops from 90 to around 40 W. The temperatures of the components also remain at a much more tolerable level. Although there are significant performance losses, especially in graphics performance, the mode seems to be suitable for permanent quiet work despite increased computing demands.
Speakers
The stereo speakers from AKG can only partially live up to the expectations that the brand rightly fuels. Powerful bass and detailed mids with high sound quality make music from rock to electro sound good. However, as with many models, the lower mids could do with a little more power. Overall, the mix is absolutely fine, especially for video streaming.
Unfortunately, we observed a strong overdrive in the highs, which can also be clearly seen in the frequency chart.
Samsung Galaxy Book3 Ultra 16, i9-13900H RTX 4070 audio analysis
(+) | speakers can play relatively loud (85.7 dB)
Bass 100 - 315 Hz
(-) | nearly no bass - on average 15.8% lower than median
(-) | bass is not linear (16.6% delta to prev. frequency)
Mids 400 - 2000 Hz
(+) | balanced mids - only 2.9% away from median
(+) | mids are linear (3.8% delta to prev. frequency)
Highs 2 - 16 kHz
(+) | balanced highs - only 4.7% away from median
(±) | linearity of highs is average (9.5% delta to prev. frequency)
Overall 100 - 16.000 Hz
(+) | overall sound is linear (13.8% difference to median)
Compared to same class
» 30% of all tested devices in this class were better, 4% similar, 65% worse
» The best had a delta of 5%, average was 17%, worst was 45%
Compared to all devices tested
» 15% of all tested devices were better, 4% similar, 81% worse
» The best had a delta of 4%, average was 24%, worst was 134%
Apple MacBook Pro 16 2021 M1 Pro audio analysis
(+) | speakers can play relatively loud (84.7 dB)
Bass 100 - 315 Hz
(+) | good bass - only 3.8% away from median
(+) | bass is linear (5.2% delta to prev. frequency)
Mids 400 - 2000 Hz
(+) | balanced mids - only 1.3% away from median
(+) | mids are linear (2.1% delta to prev. frequency)
Highs 2 - 16 kHz
(+) | balanced highs - only 1.9% away from median
(+) | highs are linear (2.7% delta to prev. frequency)
Overall 100 - 16.000 Hz
(+) | overall sound is linear (4.6% difference to median)
Compared to same class
» 0% of all tested devices in this class were better, 0% similar, 100% worse
» The best had a delta of 5%, average was 17%, worst was 45%
Compared to all devices tested
» 0% of all tested devices were better, 0% similar, 100% worse
» The best had a delta of 4%, average was 24%, worst was 134%
Power Management - Creator notebook with strong stamina
Power Consumption
The Galaxy Book is extremely economical during low load. Despite the large and relatively bright display, the power consumption remains below 10 W for most simple tasks. Many rivals with such powerful hardware use twice as much.
Under load, the maximum possible supply of the power adapter, which delivers 100 W via USB-C, is fully utilized. As our measurements in the stress test show, the laptop can absorb and use this power over long periods of time. Under such loads, however, charging the battery is not likely to be possible. At least we did not observe a draining of the battery in the stress test.
| Off / Standby | |
| Idle | |
| Load |
|
Key:
min: | |
| Samsung Galaxy Book3 Ultra 16, i9-13900H RTX 4070 i9-13900H, GeForce RTX 4070 Laptop GPU, Samsung PM9A1 MZVL21T0HCLR, OLED / AMOLED, 2880x1800, 16" | Dell XPS 15 9530 RTX 4070 i7-13700H, GeForce RTX 4070 Laptop GPU, SK hynix PC801 HFS001TEJ9X101N, OLED, 3456x2160, 15.6" | MSI Stealth 17 Studio A13VH-014 i9-13900H, GeForce RTX 4080 Laptop GPU, Samsung PM9A1 MZVL22T0HBLB, Mini LED, 3840x2160, 17.3" | Asus ProArt StudioBook 16 H7600ZW i9-12900H, GeForce RTX 3070 Ti Laptop GPU, Samsung PM9A1 MZVL21T0HCLR, OLED, 3840x2400, 16" | Gigabyte AERO 16 OLED BSF i9-13900H, GeForce RTX 4070 Laptop GPU, Gigabyte AG470S1TB-SI B10, OLED, 3840x2400, 16" | Samsung Galaxy Book3 Ultra 16 i7-13700H, GeForce RTX 4050 Laptop GPU, Samsung PM9A1 MZVL2512HCJQ, AMOLED, 2880x1800, 16" | Average NVIDIA GeForce RTX 4070 Laptop GPU | Average of class Multimedia | |
|---|---|---|---|---|---|---|---|---|
| Power Consumption | -135% | -130% | -132% | -102% | 14% | -145% | -27% | |
| Idle Minimum * (Watt) | 4.3 | 20 -365% | 13.9 -223% | 12.6 -193% | 11.8 -174% | 3 30% | 13.2 ? -207% | 5.71 ? -33% |
| Idle Average * (Watt) | 4.6 | 20.7 -350% | 20 -335% | 17.41 -278% | 16.1 -250% | 5 -9% | 18.2 ? -296% | 10.1 ? -120% |
| Idle Maximum * (Watt) | 11.4 | 22.4 -96% | 20.6 -81% | 23.12 -103% | 17 -49% | 11 4% | 24.6 ? -116% | 12.4 ? -9% |
| Load Average * (Watt) | 97 | 77.1 21% | 77 21% | 117.5 -21% | 100.6 -4% | 72 26% | 97 ? -0% | 65 ? 33% |
| Witcher 3 ultra * (Watt) | 100.9 | 95.4 5% | 162 -61% | 172.6 -71% | 158 -57% | 69.7 31% | ||
| Load Maximum * (Watt) | 107 | 133.4 -25% | 216 -102% | 241.36 -126% | 192 -79% | 108 -1% | 221 ? -107% | 112.2 ? -5% |
* ... smaller is better
Power consumption Witcher 3 / Stress test
Power consumption with an external monitor
Battery Life
As already indicated by the low power consumption rates under low load, the notebook delivers very respectable runtimes. Despite the 76 Wh battery, which is rather small compared to the competition, it proves to be extremely enduring when playing videos in Full HD and during intense surfing. The weaker variant of the Galaxy Book3 Ultra 16 even delivers a few hours more.
9 hours in the video test and 8 hours in web surfing are more than impressive. The OLED display naturally has a very big impact on runtimes. We achieved a runtime of less than 6 hours at maximum brightness. On the other hand, if Dark Mode is activated in the web browser or forced for all websites, the notebook can squeeze out an additional two hours of surfing, i.e. just over 10 hours.
| Samsung Galaxy Book3 Ultra 16, i9-13900H RTX 4070 i9-13900H, GeForce RTX 4070 Laptop GPU, 76 Wh | Dell XPS 15 9530 RTX 4070 i7-13700H, GeForce RTX 4070 Laptop GPU, 86 Wh | MSI Stealth 17 Studio A13VH-014 i9-13900H, GeForce RTX 4080 Laptop GPU, 99 Wh | Asus ProArt StudioBook 16 H7600ZW i9-12900H, GeForce RTX 3070 Ti Laptop GPU, 90 Wh | Gigabyte AERO 16 OLED BSF i9-13900H, GeForce RTX 4070 Laptop GPU, 88 Wh | Samsung Galaxy Book3 Ultra 16 i7-13700H, GeForce RTX 4050 Laptop GPU, 76 Wh | Average of class Multimedia | |
|---|---|---|---|---|---|---|---|
| Battery runtime | 34% | 3% | 1% | 36% | 56% | 73% | |
| H.264 (h) | 9 | 5.6 -38% | 9.7 8% | 7.4 -18% | 13.4 49% | 16.4 ? 82% | |
| WiFi v1.3 (h) | 8 | 8 0% | 5.6 -30% | 7.5 -6% | 7.5 -6% | 9.6 20% | 12 ? 50% |
| Load (h) | 0.9 | 1.5 67% | 1.6 78% | 0.9 0% | 2.1 133% | 1.8 100% | 1.675 ? 86% |
| Witcher 3 ultra (h) | 2.6 | 1.3 |
Pros
Cons
Verdict - Galaxy Book Ultra designed for content creation
Samsung hits the bull's eye with the Galaxy Book3 Ultra 16: the notebook offers a lot of performance and the perfect display for creative work. The slim and discreet case makes the notebook look like a professional work tool all around, and this impression is only further reinforced by our measurements and benchmarks. Three video outputs, the successful touchpad and the quiet operation under load fit perfectly into the overall picture.
The Galaxy Book3 Ultra offers everything for creative tasks. Screen, system performance and build quality are all very much in tune. However, top performance has to be sacrificed for a slim case.
At the same time, the strong reduction in power supply to the CPU and GPU ensures a strong focus purely on video and image processing and rendering. The Galaxy Book3 doesn't do well in gaming, even though we were able to play the latest games at the highest settings. However, the RTX 4070 here works more on the level of an RTX 3060, although it is much more economical and quieter.
And there are a few drawbacks. The creator laptop gets hot when pushed for long periods of time. During less demanding tasks, the underside and the keyboard also get noticeably warm, a little too warm. The microSD slot could have been a full-fledged card reader. In addition, the speakers sound excellent. However, the fact that they overdrive at high frequencies should not happen at this level.
In regard to its focus on media processing, the Samsung notebook is the closest competitor to a MacBook Pro, even if Mac and Windows can only be compared to a limited extent. On the other hand, if more graphics performance is needed, which likely means a larger case and higher power consumption, the equally quiet MSI Stealth 17 Studio or Gigabyte AERO 16 OLED are good alternatives.
Price and Availability
In the USA, our reviewed configuration of the Samsung Galaxy Book3 Ultra 16 with the i9-13900H and RTX 4070 is available via Samsung's product page for US$2999.99.
Interested buyers in other countries can select their location here (where applicable) and type in Book3 Ultra 16 in the search bar to check for availability.
Prices are as of 09.05.2023 and are subject to change.
Samsung Galaxy Book3 Ultra 16, i9-13900H RTX 4070
- 04/27/2023 v7 (old)
Mario Petzold
Transparency
The selection of devices to be reviewed is made by our editorial team. The test sample was provided to the author as a loan by the manufacturer or retailer for the purpose of this review. The lender had no influence on this review, nor did the manufacturer receive a copy of this review before publication. There was no obligation to publish this review. As an independent media company, Notebookcheck is not subjected to the authority of manufacturers, retailers or publishers.
This is how Notebookcheck is testing
Every year, Notebookcheck independently reviews hundreds of laptops and smartphones using standardized procedures to ensure that all results are comparable. We have continuously developed our test methods for around 20 years and set industry standards in the process. In our test labs, high-quality measuring equipment is utilized by experienced technicians and editors. These tests involve a multi-stage validation process. Our complex rating system is based on hundreds of well-founded measurements and benchmarks, which maintains objectivity. Further information on our test methods can be found here.
Price comparison

