

Lenovo ThinkPad T14 G3 review - Business laptop is worse with Intel and Nvidia
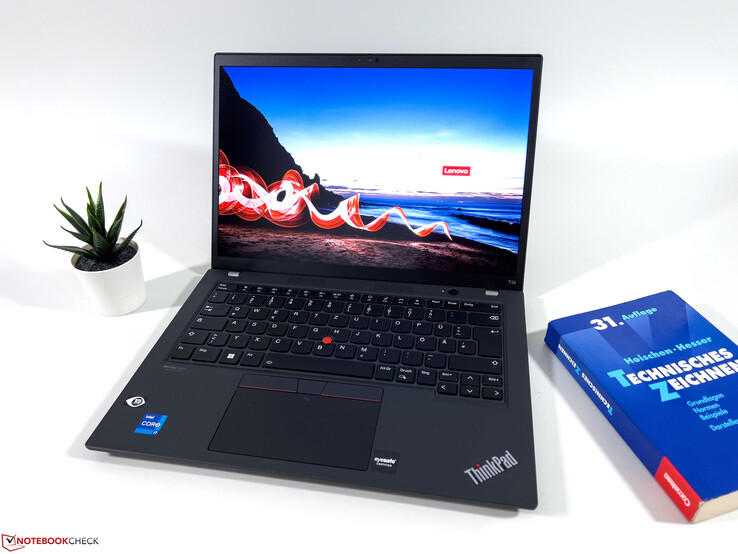
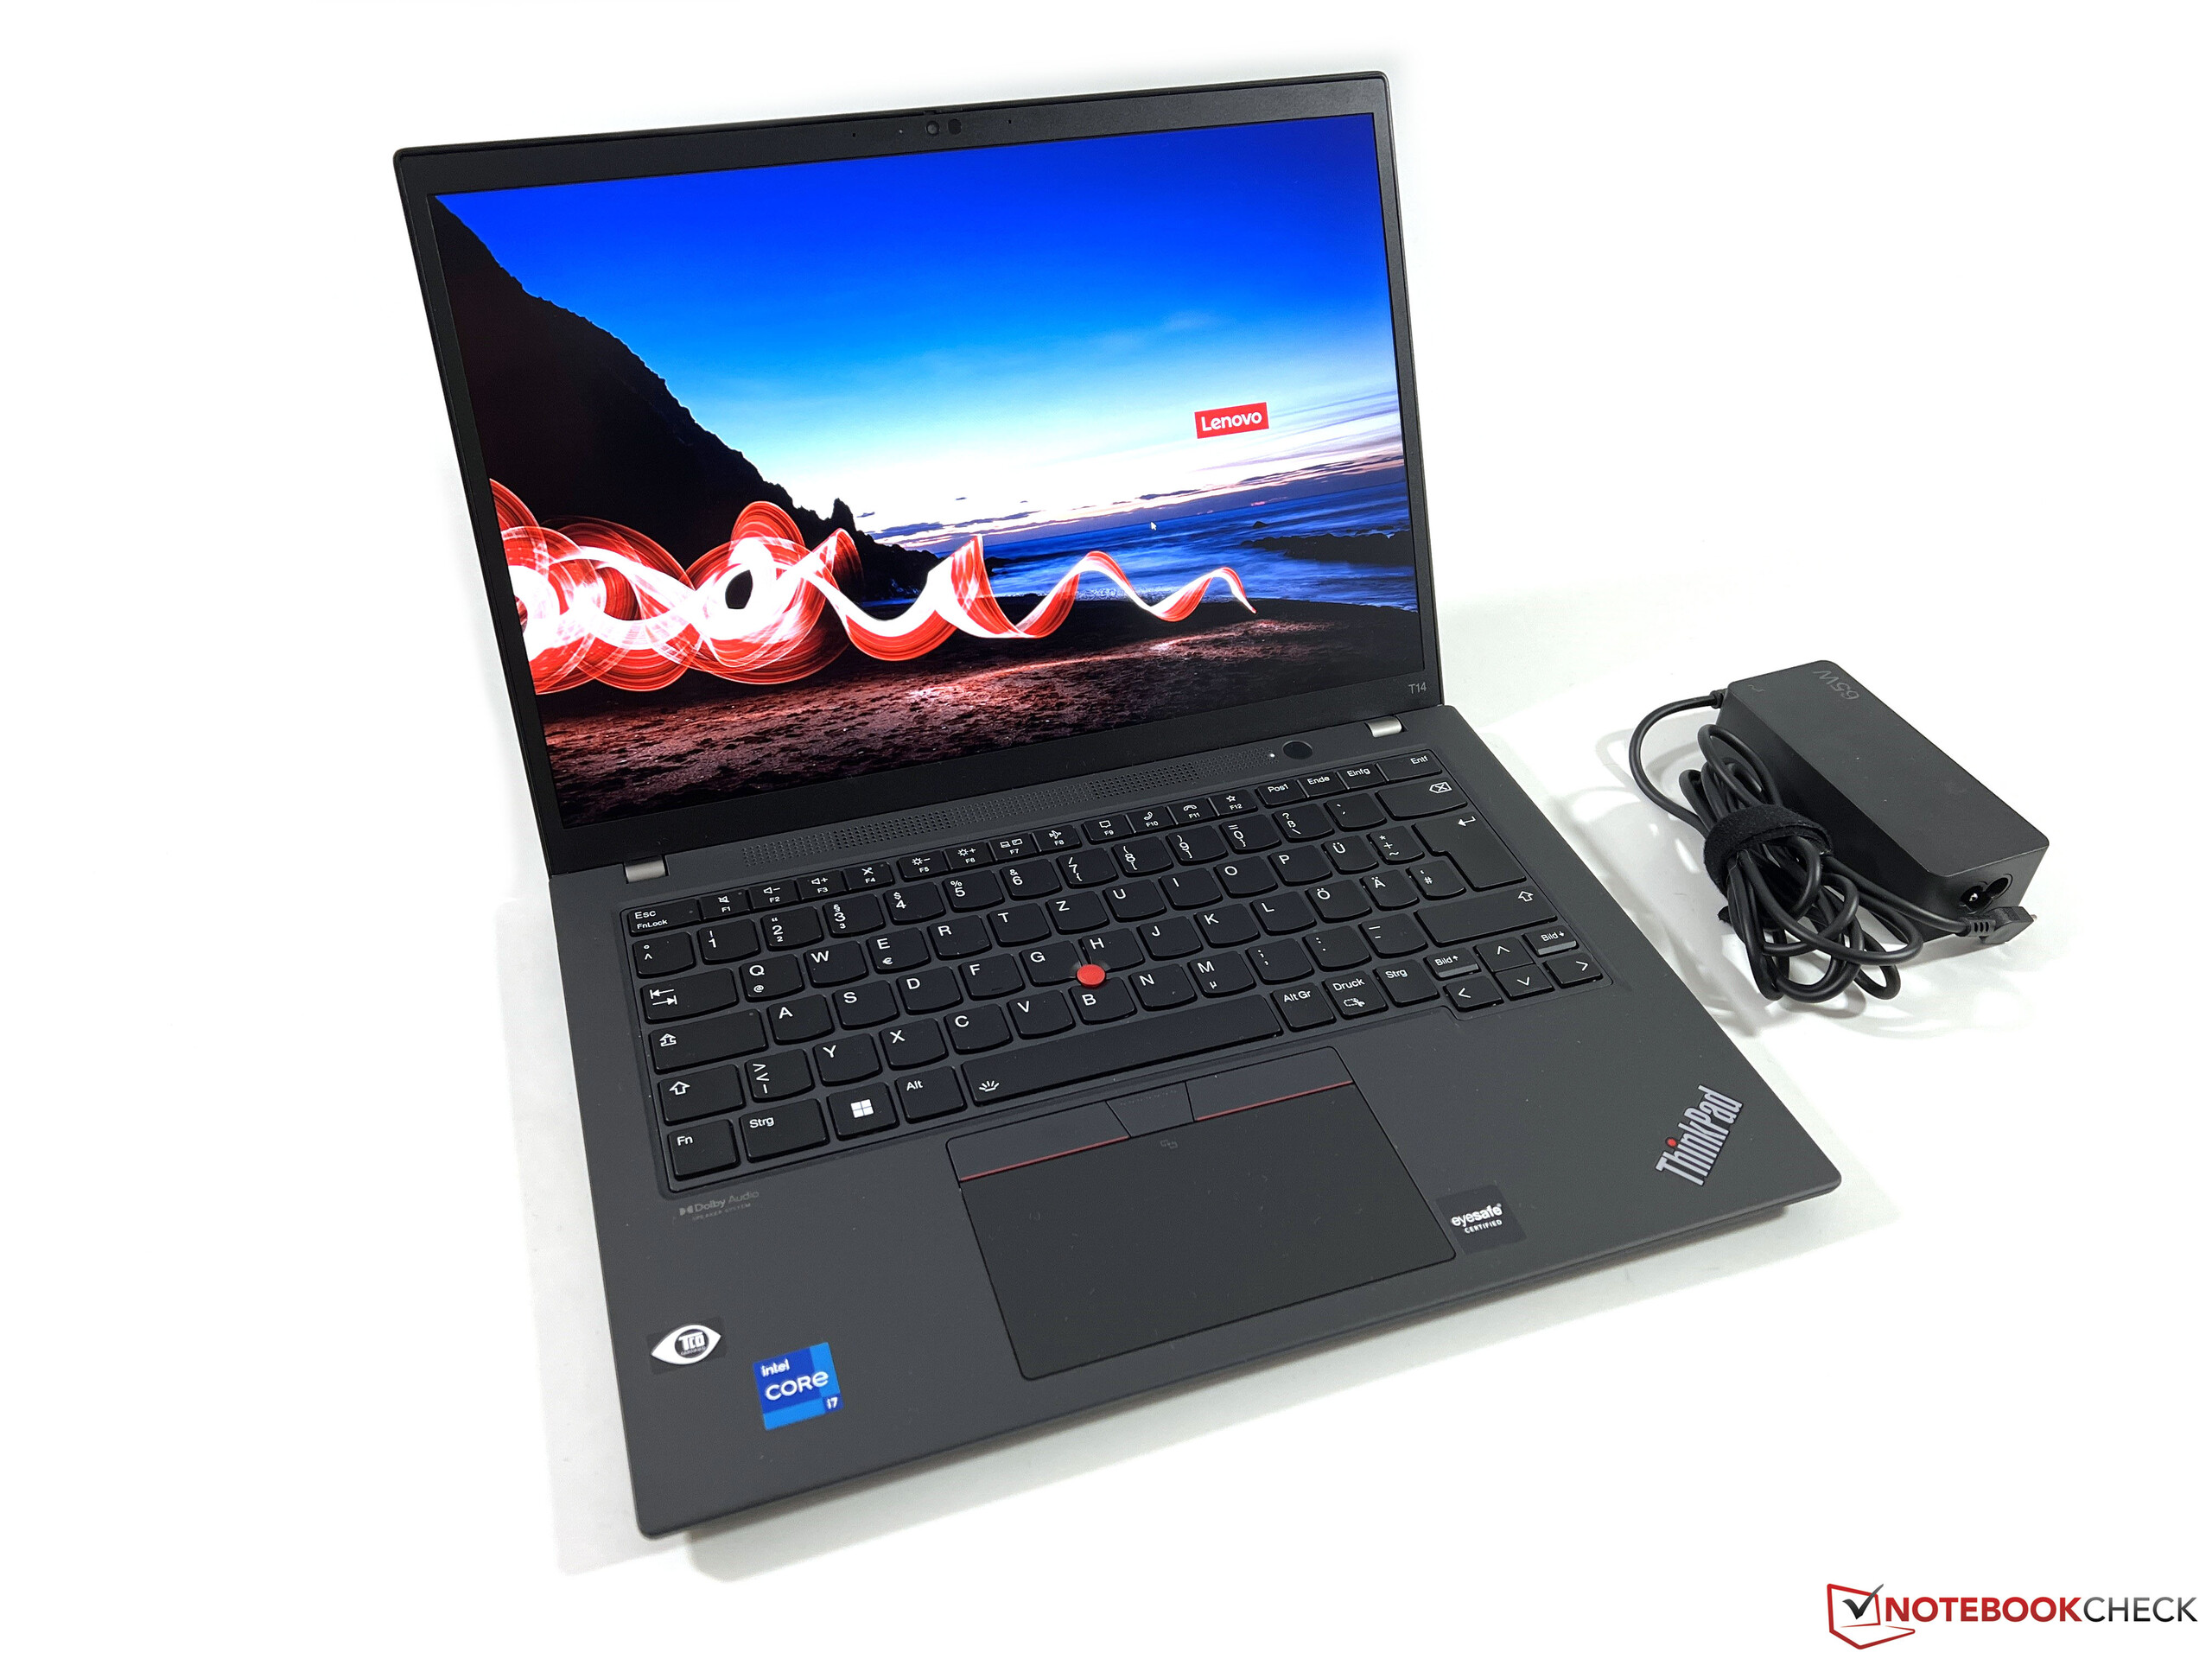
We already tested the ThinkPad T14 G3 version with the AMD Ryzen 7 Pro including the fast Radeon 680M iGPU extensively, but Lenovo also continues to offer the 14-inch business laptop with Intel processors and optional Nvidia GeForce GPU. With the 21AJS00400 model, we now have such a representative combining the Alder Lake Core i7-1260P with the GeForce MX550 on our test bench. We can neglect the fact that a Raptor Lake processor isn't used here yet, since the performance increase would only be small, as we were already able to see.
Basically, the AMD and the Intel model share the same case and input devices, webcam, and speakers. In the following test, we will therefore mainly concentrate on the question which version is better and whether the additional graphics card is really still worthwhile.
Possible Competitors in Comparison
Rating | Date | Model | Weight | Height | Size | Resolution | Price |
|---|---|---|---|---|---|---|---|
| 86.4 % v7 (old) | 03 / 2023 | Lenovo ThinkPad T14 G3-21AJS00400 i7-1260P, GeForce MX550 | 1.5 kg | 17.9 mm | 14.00" | 1920x1200 | |
| 88.8 % v7 (old) | 09 / 2022 | Lenovo ThinkPad T14 G3-21CF004NGE R7 PRO 6850U, Radeon 680M | 1.4 kg | 17.9 mm | 14.00" | 1920x1200 | |
| 88.7 % v7 (old) | 12 / 2022 | HP EliteBook 840 G9 i7-1280P, Iris Xe G7 96EUs | 1.5 kg | 19 mm | 14.00" | 1920x1200 | |
| 88.8 % v7 (old) | 10 / 2022 | Schenker Vision 14 2022 RTX 3050 Ti i7-12700H, GeForce RTX 3050 Ti Laptop GPU | 1.3 kg | 16.6 mm | 14.00" | 2880x1800 | |
| 90.3 % v7 (old) | 09 / 2022 | Huawei MateBook X Pro 2022 i7-1260P, Iris Xe G7 96EUs | 1.3 kg | 15.6 mm | 14.20" | 3120x2080 |
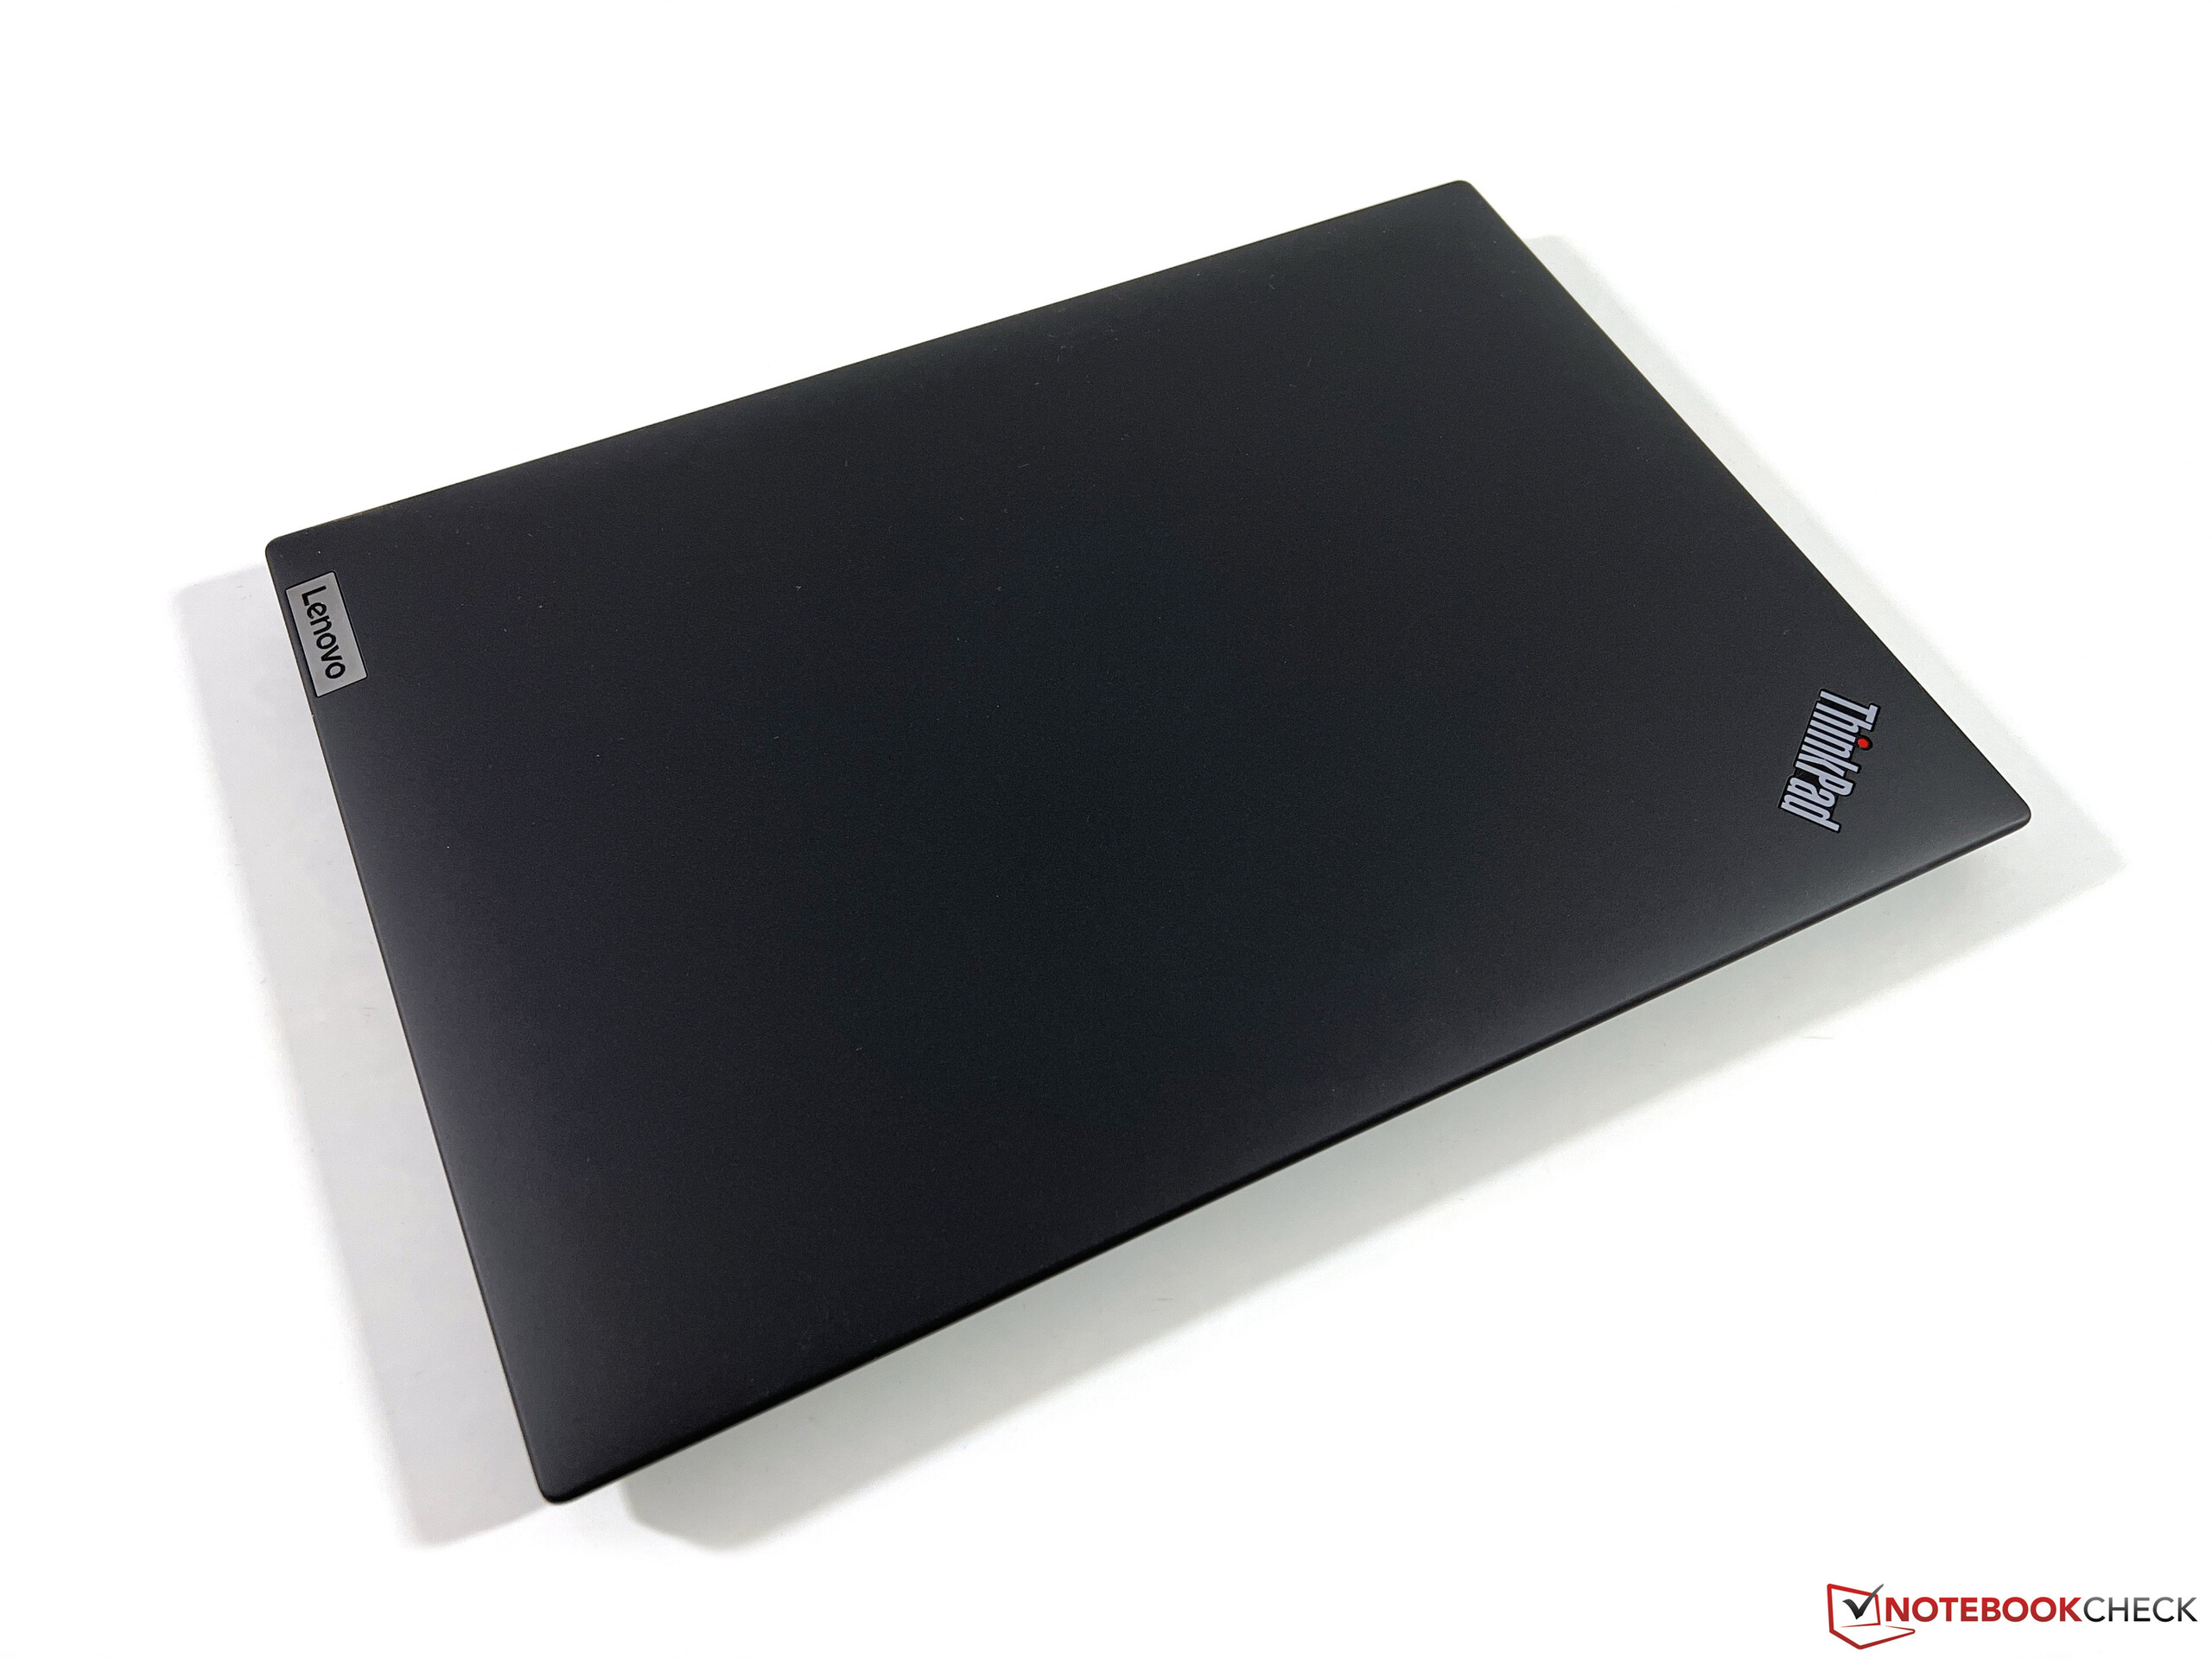
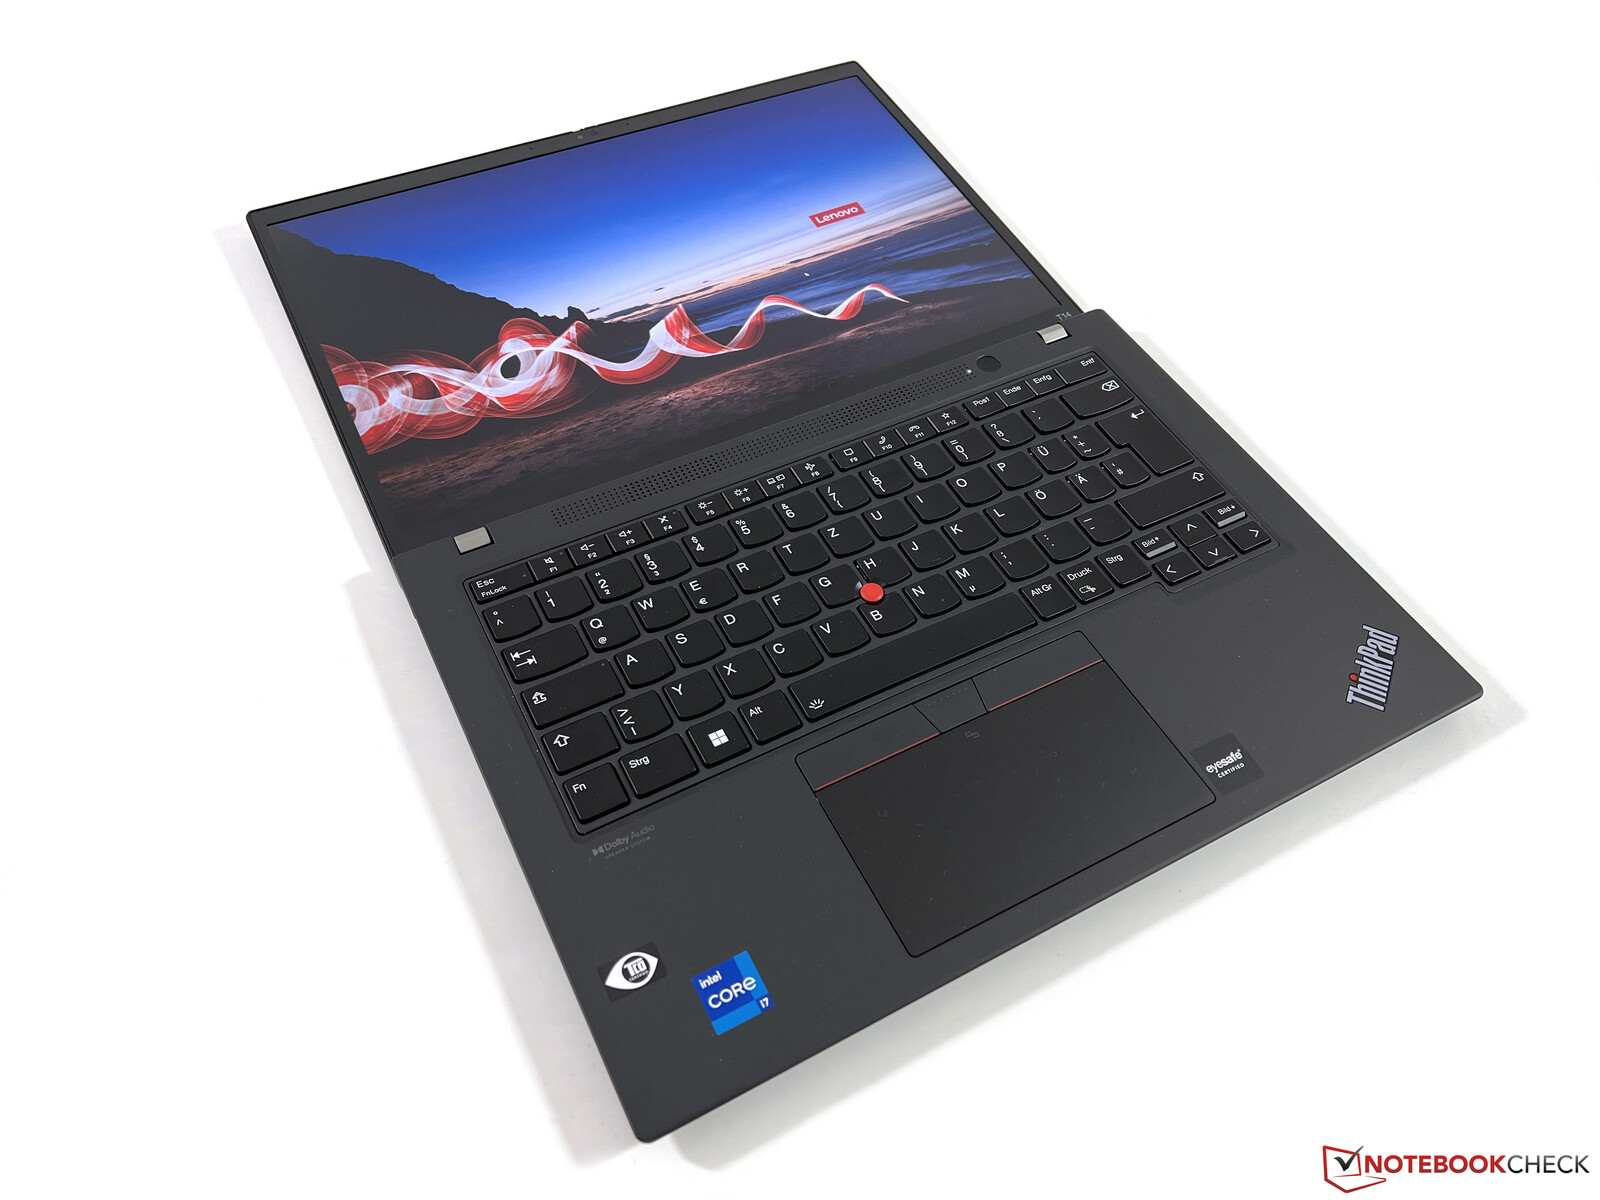
Differences to the ThinkPad T14 G3 AMD
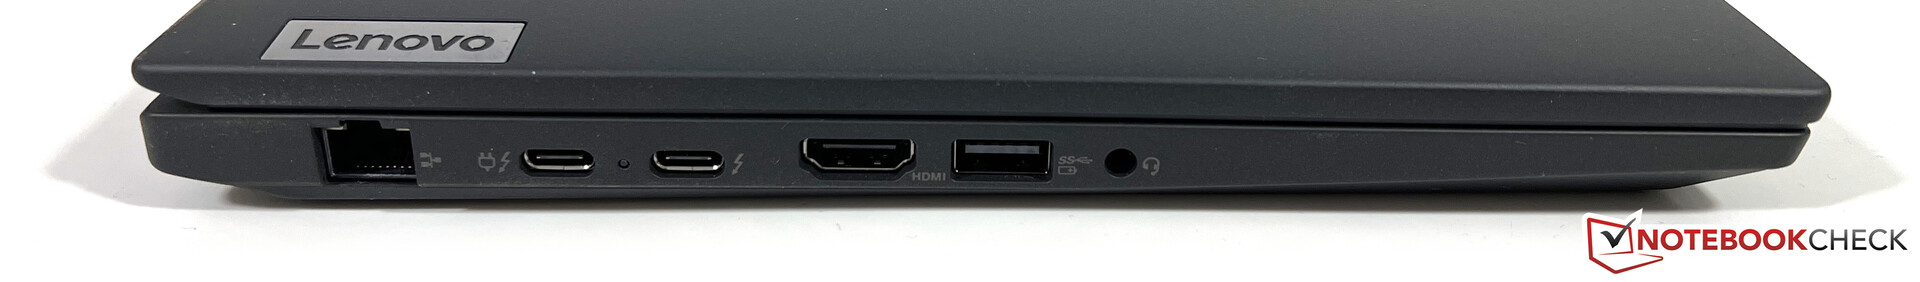
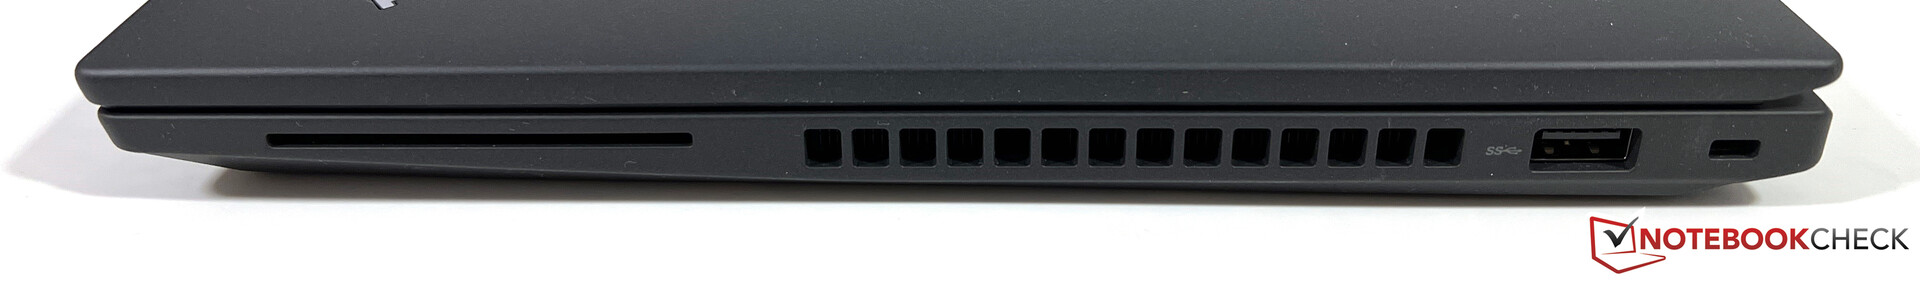
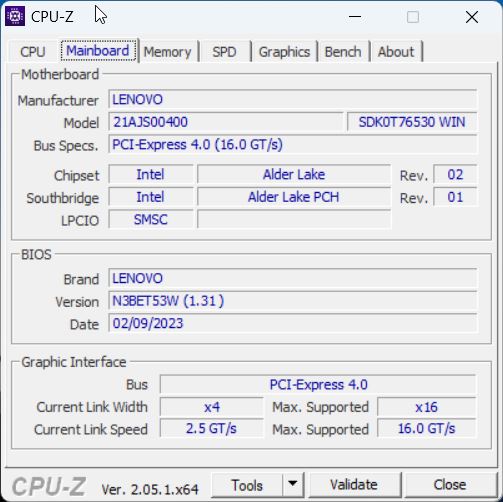
Aside from the different stickers on the palm rest, there are no differences in the exterior of the two ThinkPad T14 versions, so we refer you to our extensive test of the AMD model on this. The basic connections are also the same, but while Lenovo forgoes USB 4.0 in the AMD model, the Intel-version comes with two USB-C connections that support Thunderbolt 4.
With the AX211 WLAN card, the Intel model also supports the modern 6-GHz network, but we were unable to connect to the corresponding network using our reference network router during the test. However, the performance in the regular 5G network was also very good. Our test unit is WWAN ready, and the Nano-SIM slot in the back as well as the necessary antennas for the LTE module are already in place.

| Networking | |
| Lenovo ThinkPad T14 G3-21AJS00400 | |
| iperf3 receive AXE11000 | |
| iperf3 transmit AXE11000 | |
| Lenovo ThinkPad T14 G3-21CF004NGE | |
| iperf3 receive AXE11000 6GHz | |
| iperf3 transmit AXE11000 6GHz | |
| HP EliteBook 840 G9 | |
| iperf3 receive AXE11000 6GHz | |
| iperf3 receive AXE11000 | |
| iperf3 transmit AXE11000 6GHz | |
| iperf3 transmit AXE11000 | |
| Schenker Vision 14 2022 RTX 3050 Ti | |
| iperf3 receive AXE11000 | |
| iperf3 transmit AXE11000 | |
| Huawei MateBook X Pro 2022 | |
| iperf3 receive AXE11000 6GHz | |
| iperf3 transmit AXE11000 6GHz | |


Maintenance
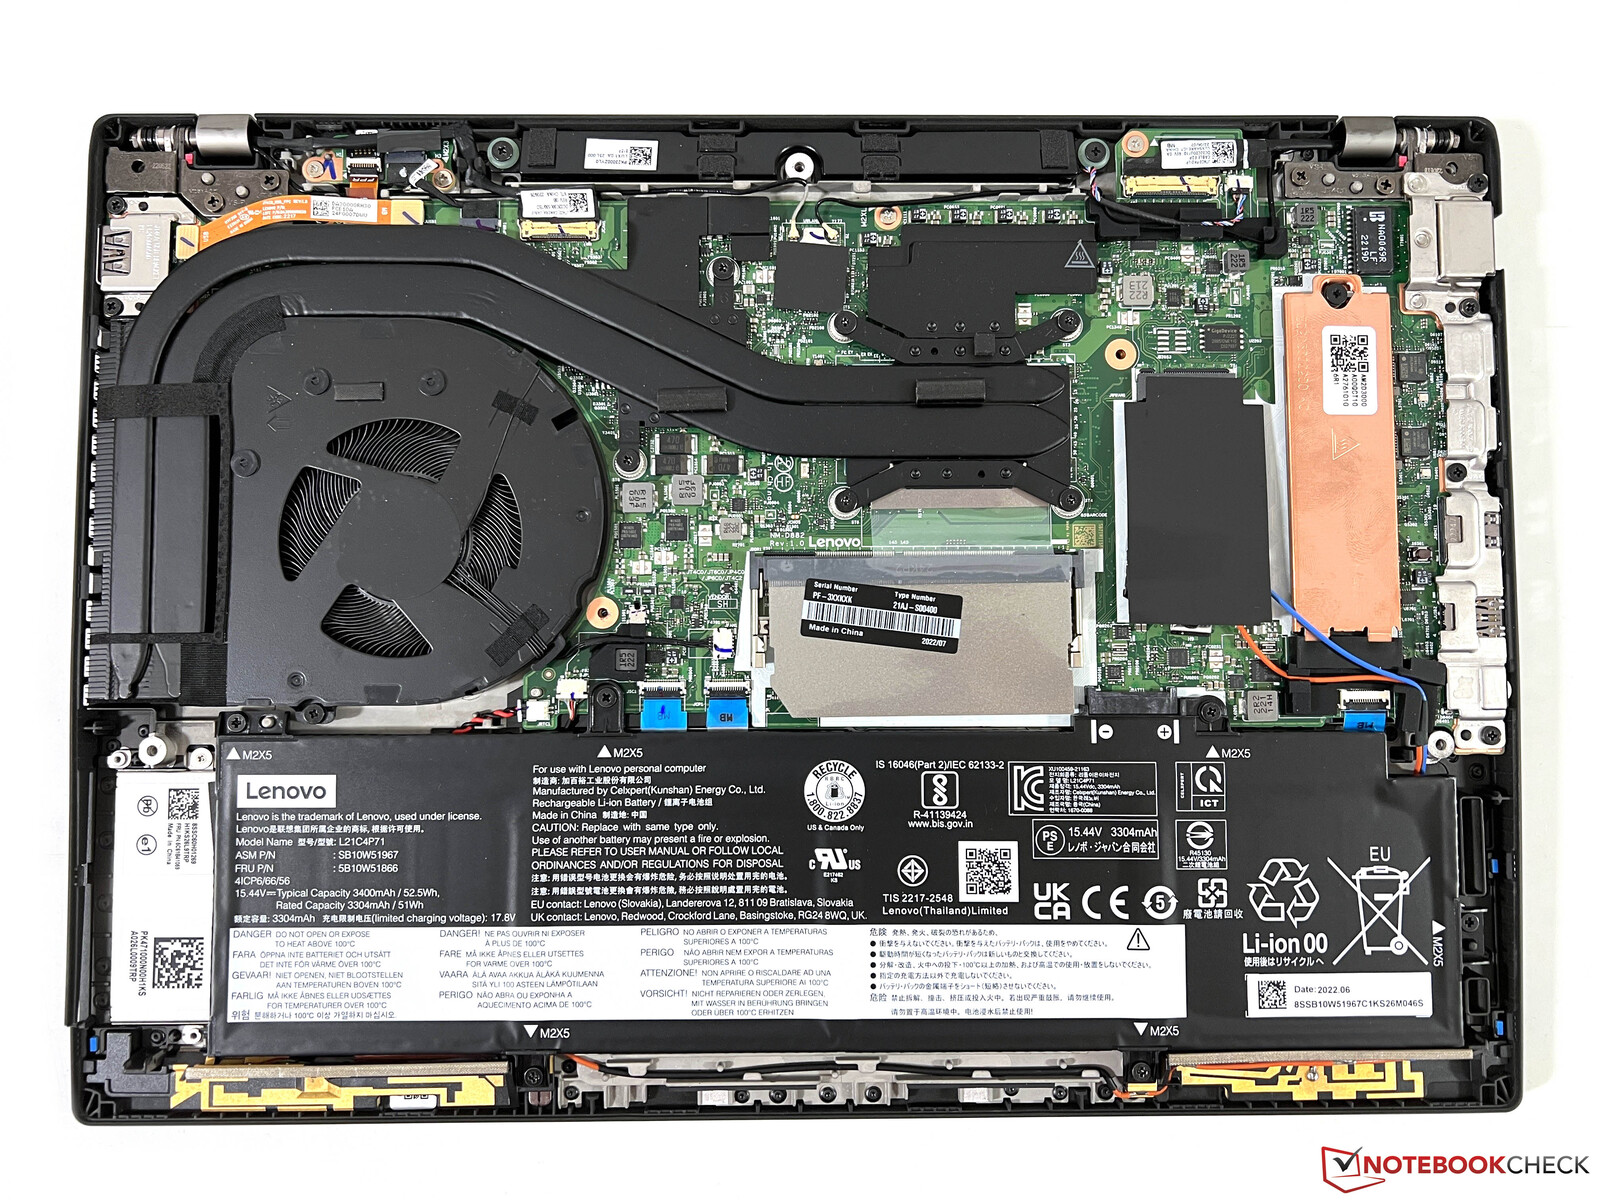
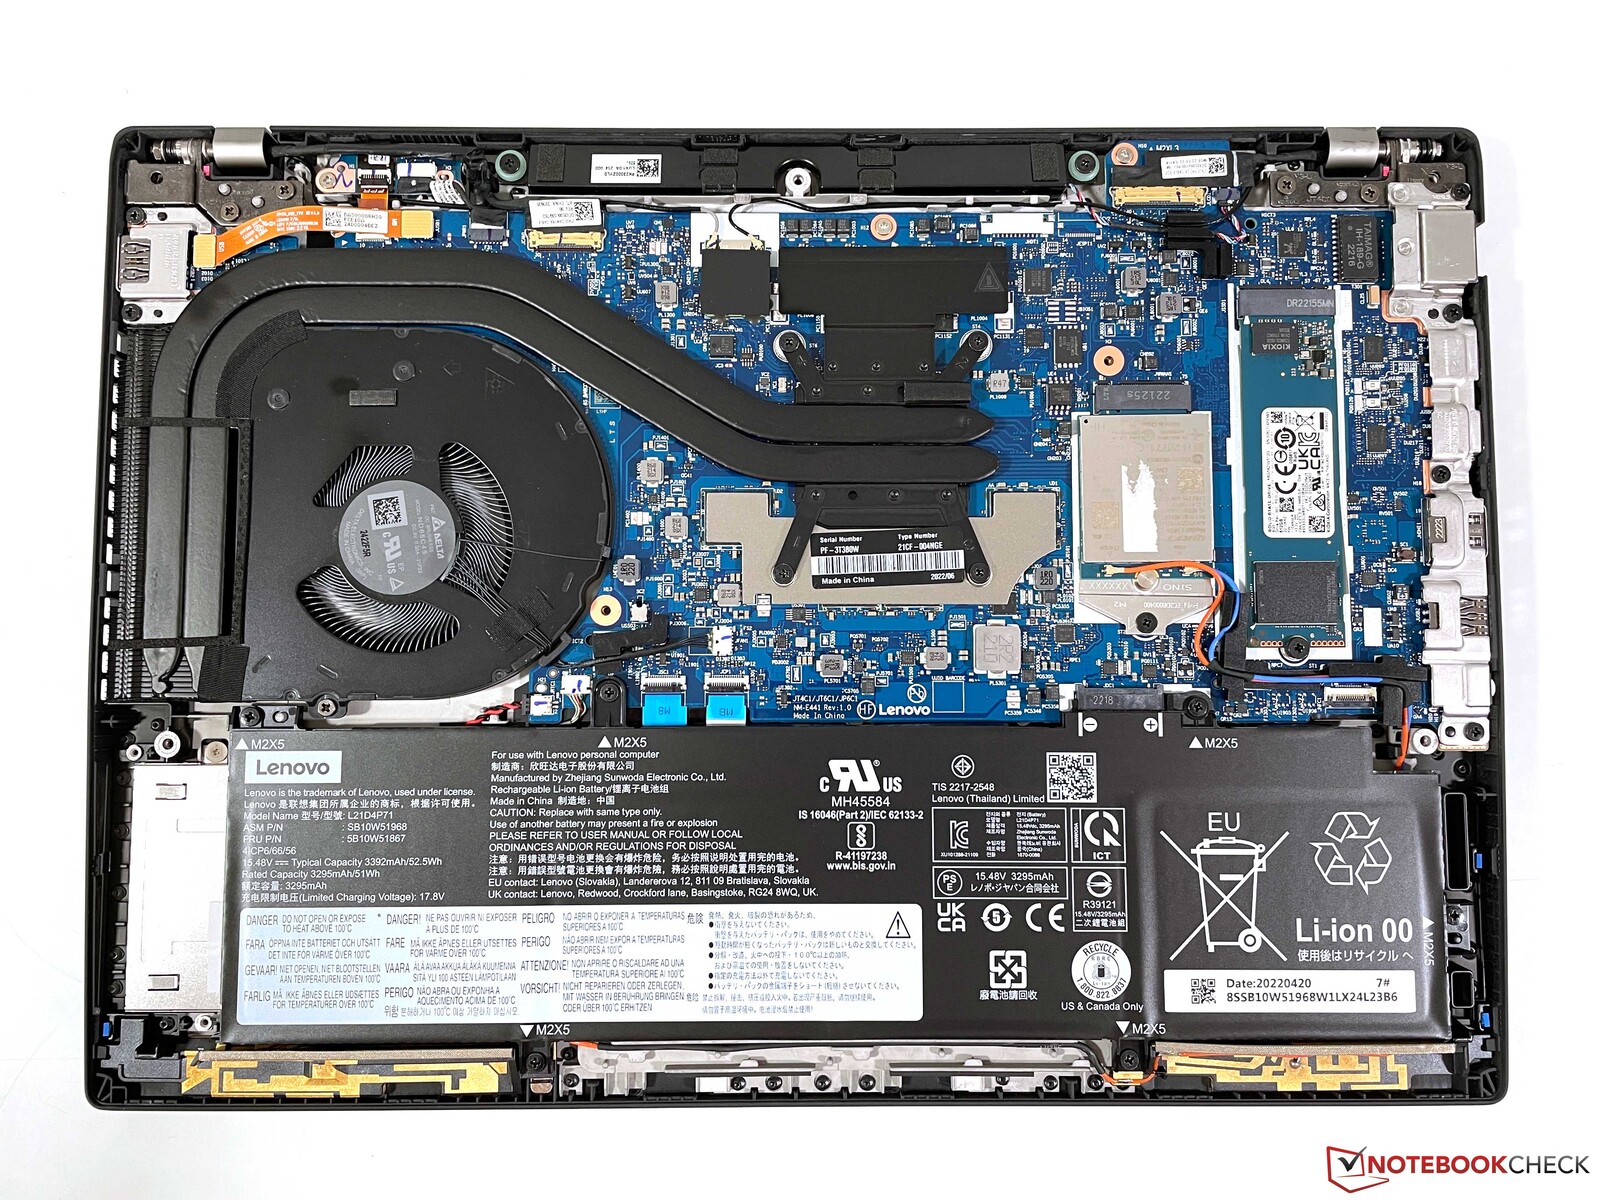
There is also a difference in the internal layout. While Lenovo delivers the AMD model exclusively with soldered RAM without offering any expansion capabilities to the user, the situation looks different for the Intel model. In addition to a soldered module (16 GB in our case), there is also a free SO-DIMM slot, bringing the possible total amount of RAM up to 48 GB.
Display - The panel lottery continues
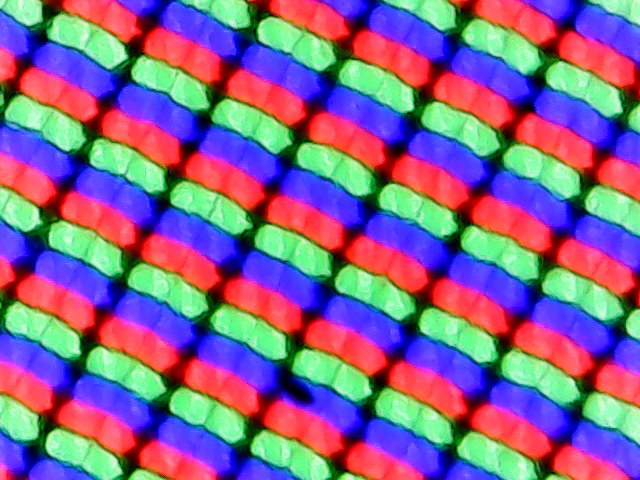
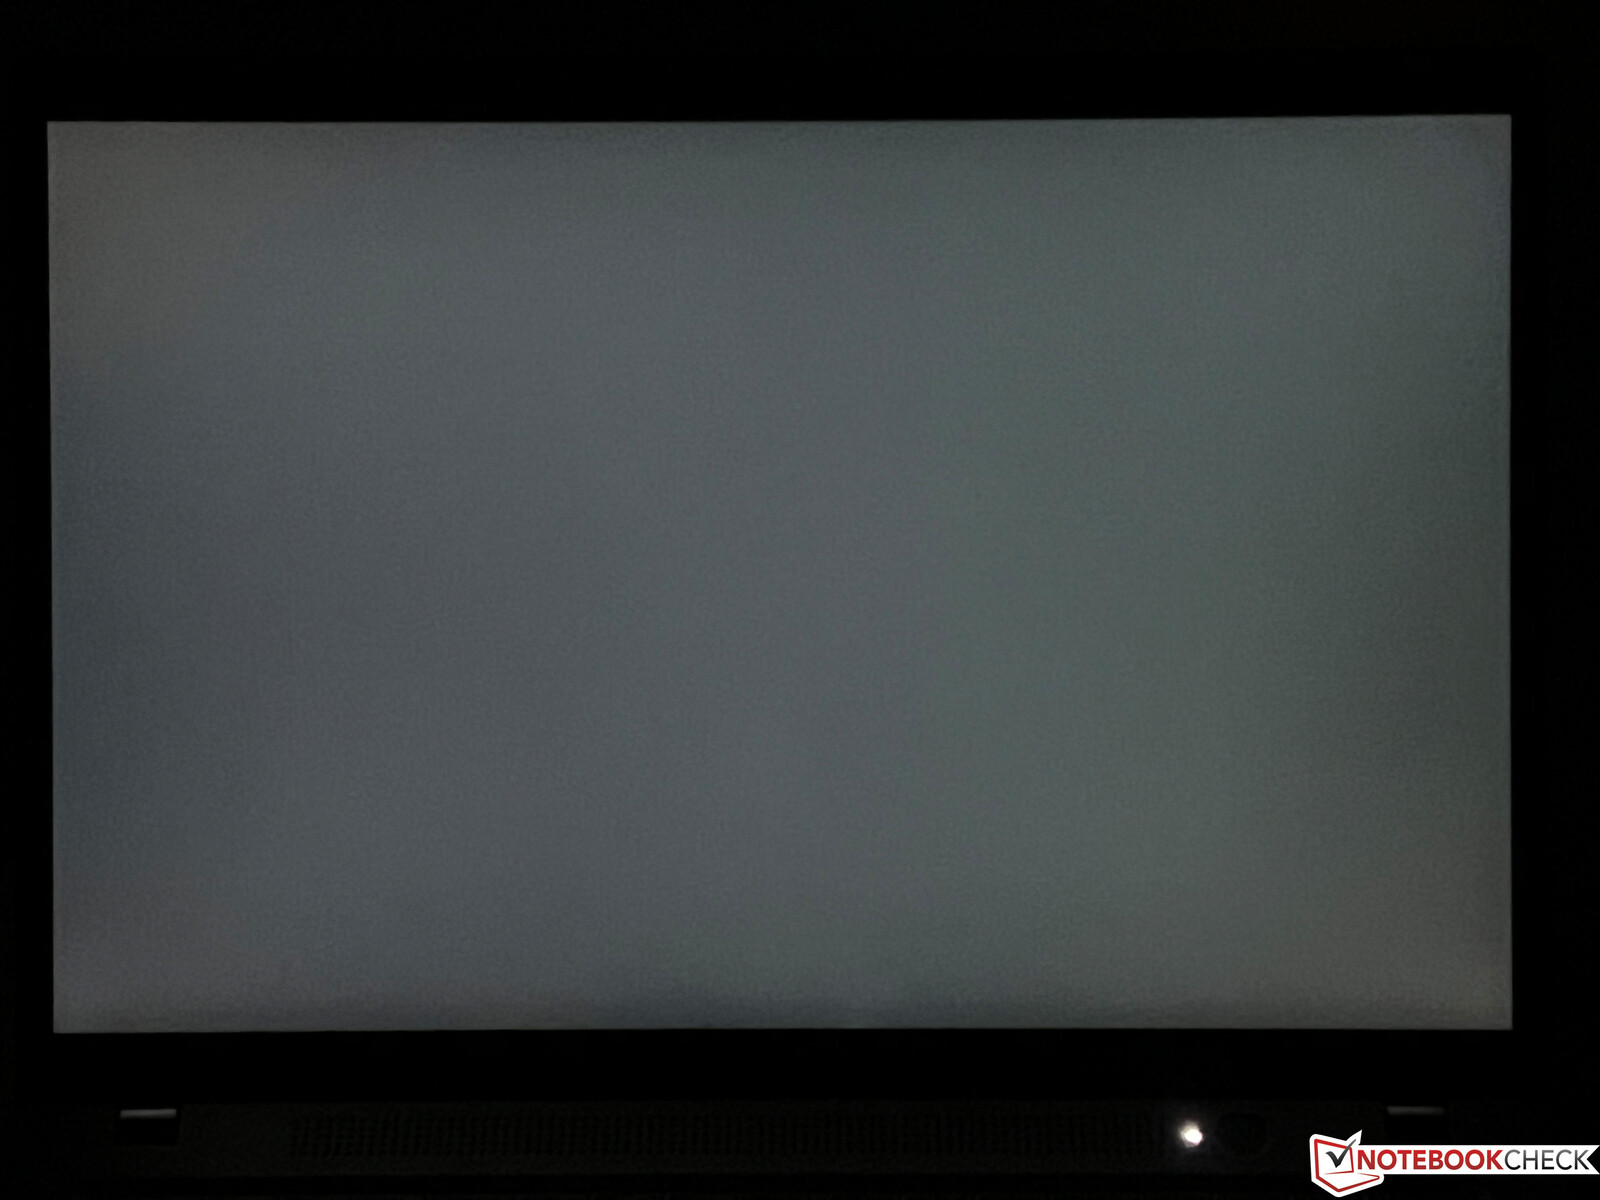
As already in previous ThinkPad models, Lenovo also uses various panel manufacturers for the current models. Although both of our test units are equipped with the 14-inch LowPower Full-HD panel, there are differences here, even if the basic technical specifications of both versions (or even more, since there were up to 4 versions in the past) are kept. In contrast to the LG panel of our previous AMD test unit, our current Intel test unit uses a panel from AUO, which subjectively isn't completely convincing, since bright areas appear slightly grainy. The response times are also significantly slower here, and there are some visible ghosting effects, for example when moving the mouse pointer. However, PWM is not used here either.
The same goes for the brightness, which turns out lower than that of the LG model. However, it still reaches the advertised 400 cd/m². Thanks to the low black value, the contrast ratio offers no reason for complaint. Our test unit doesn't have any problems with clouding or screen bleeding, not even at the highest brightness level.
| |||||||||||||||||||||||||
Brightness Distribution: 91 %
Center on Battery: 399 cd/m²
Contrast: 2105:1 (Black: 0.19 cd/m²)
ΔE ColorChecker Calman: 3.5 | ∀{0.5-29.43 Ø4.79}
calibrated: 1.6
ΔE Greyscale Calman: 4.8 | ∀{0.09-98 Ø5}
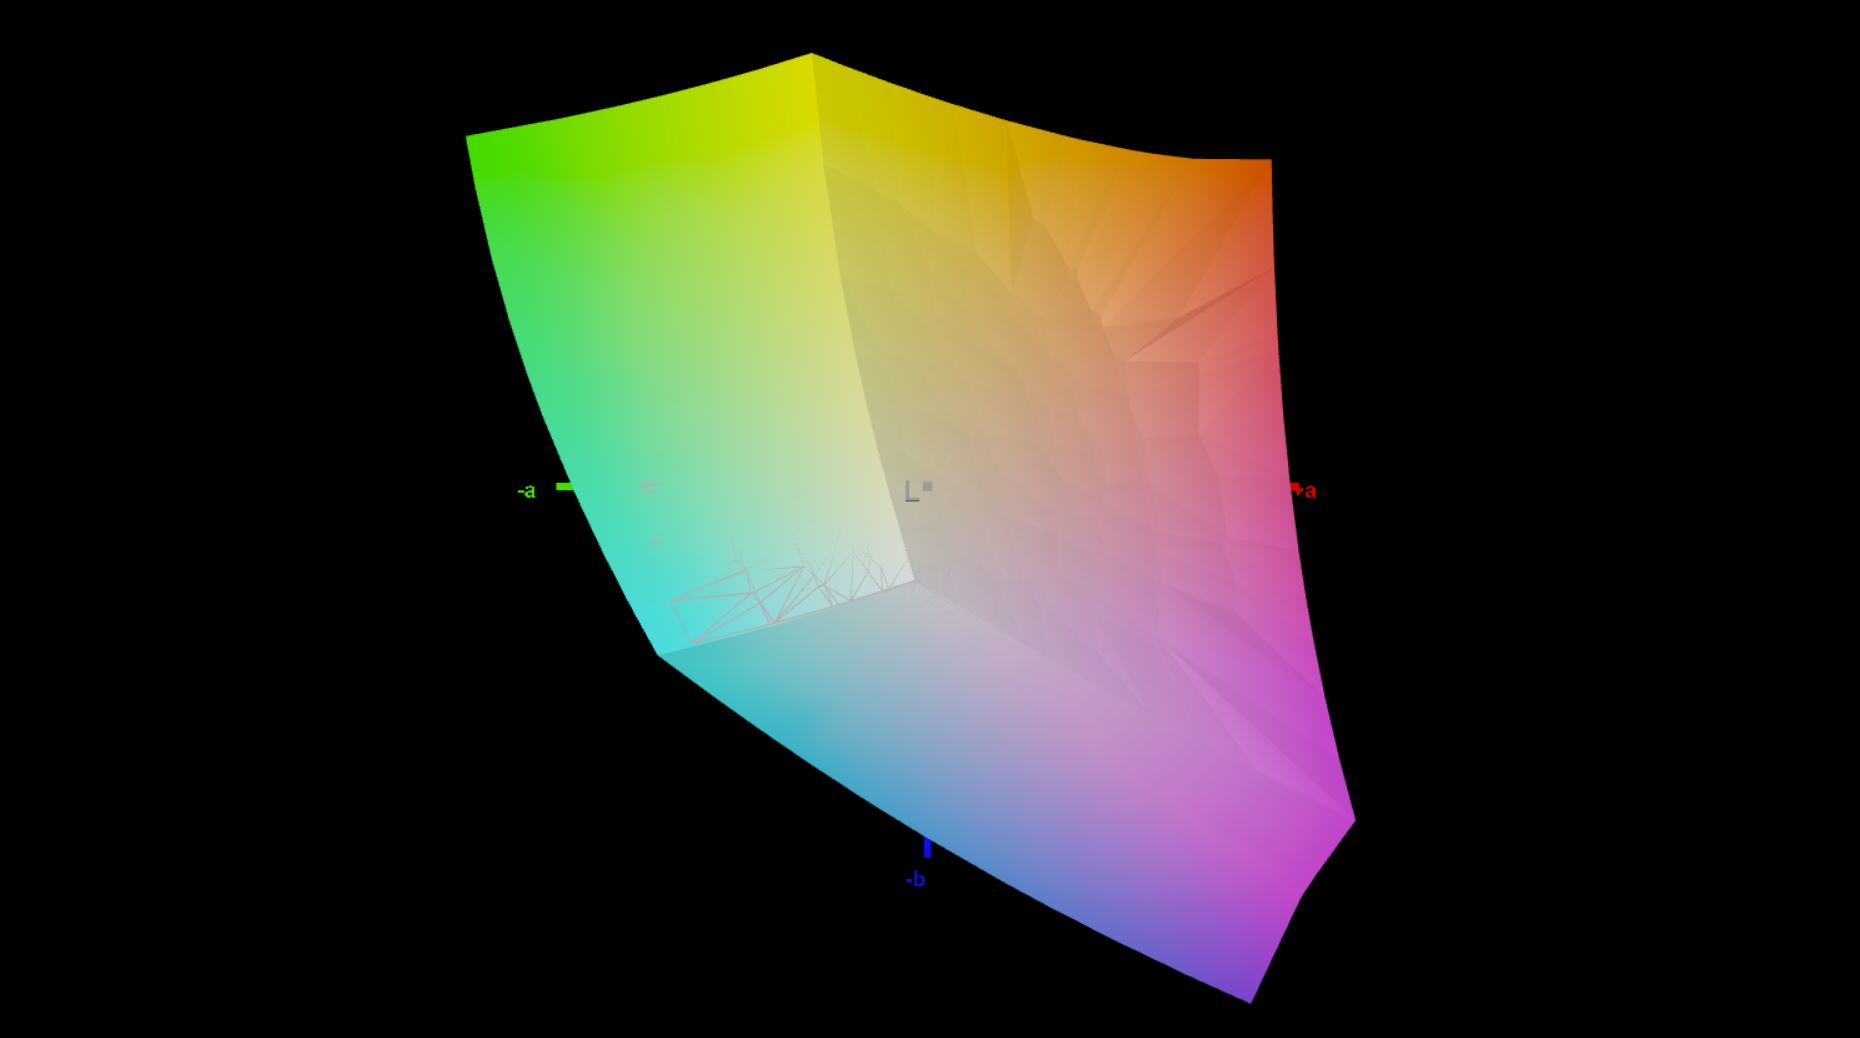
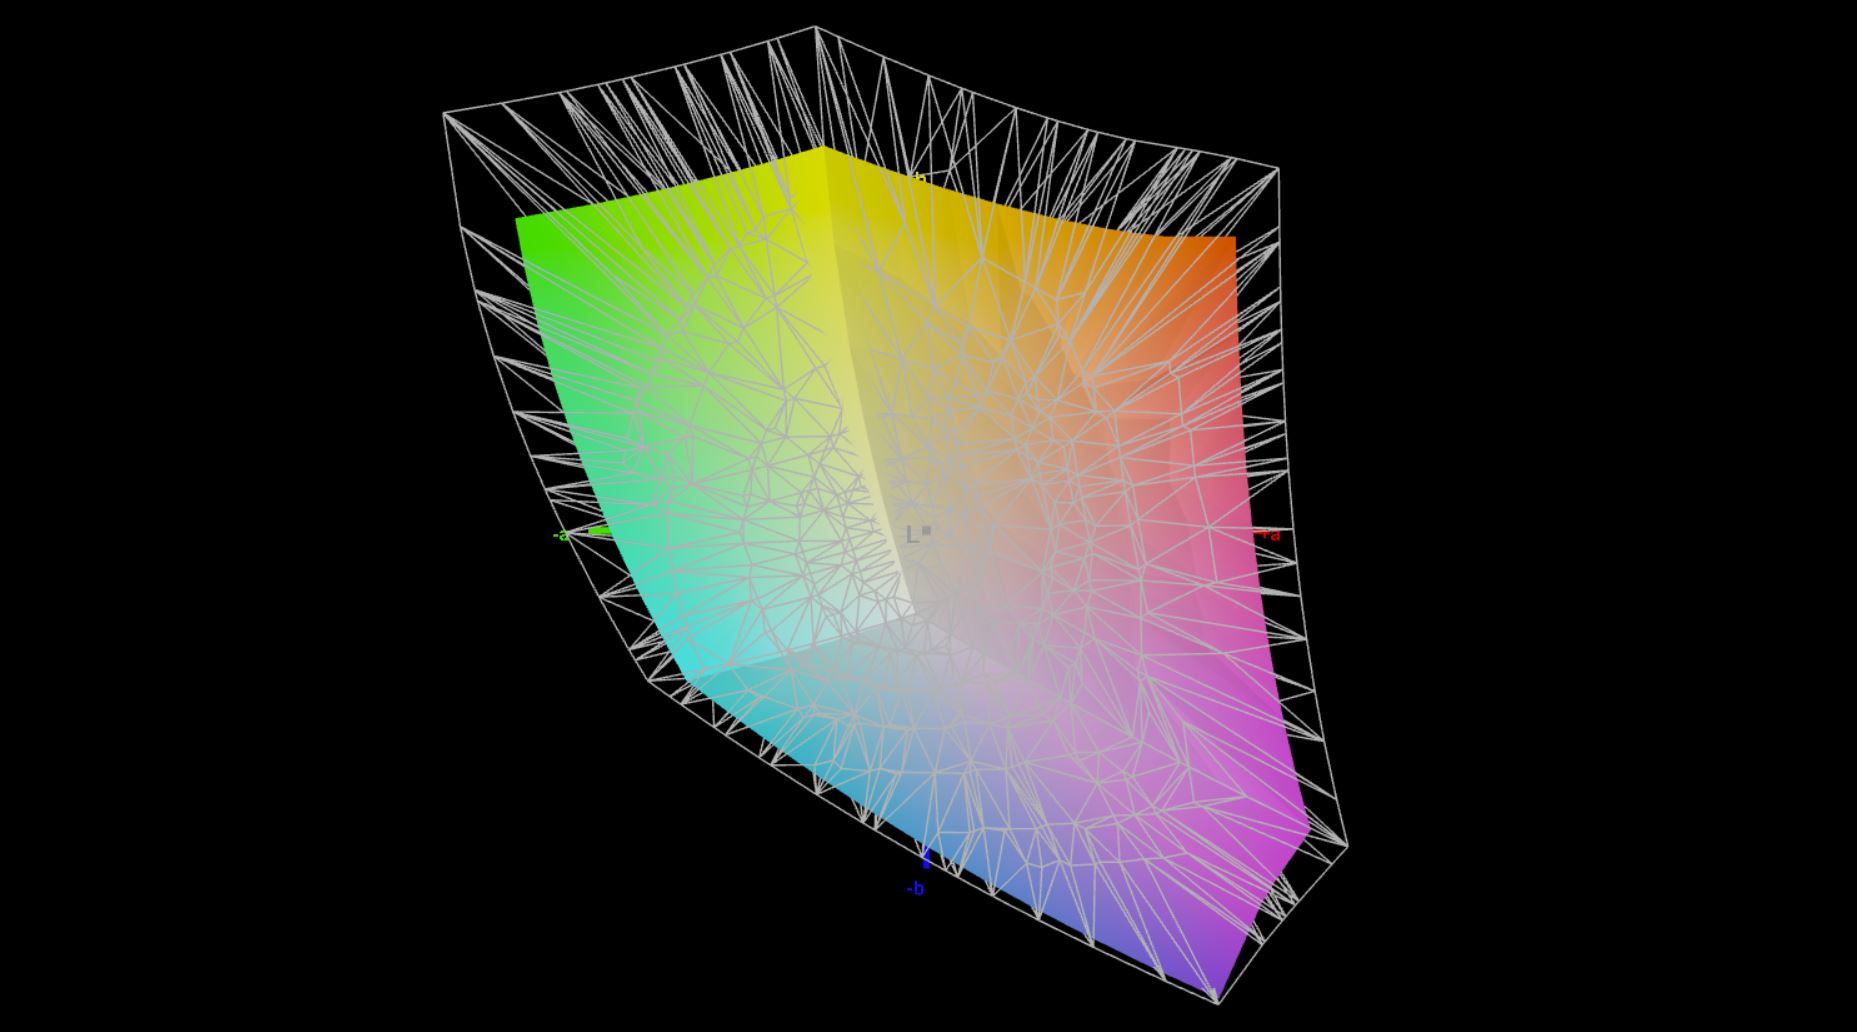
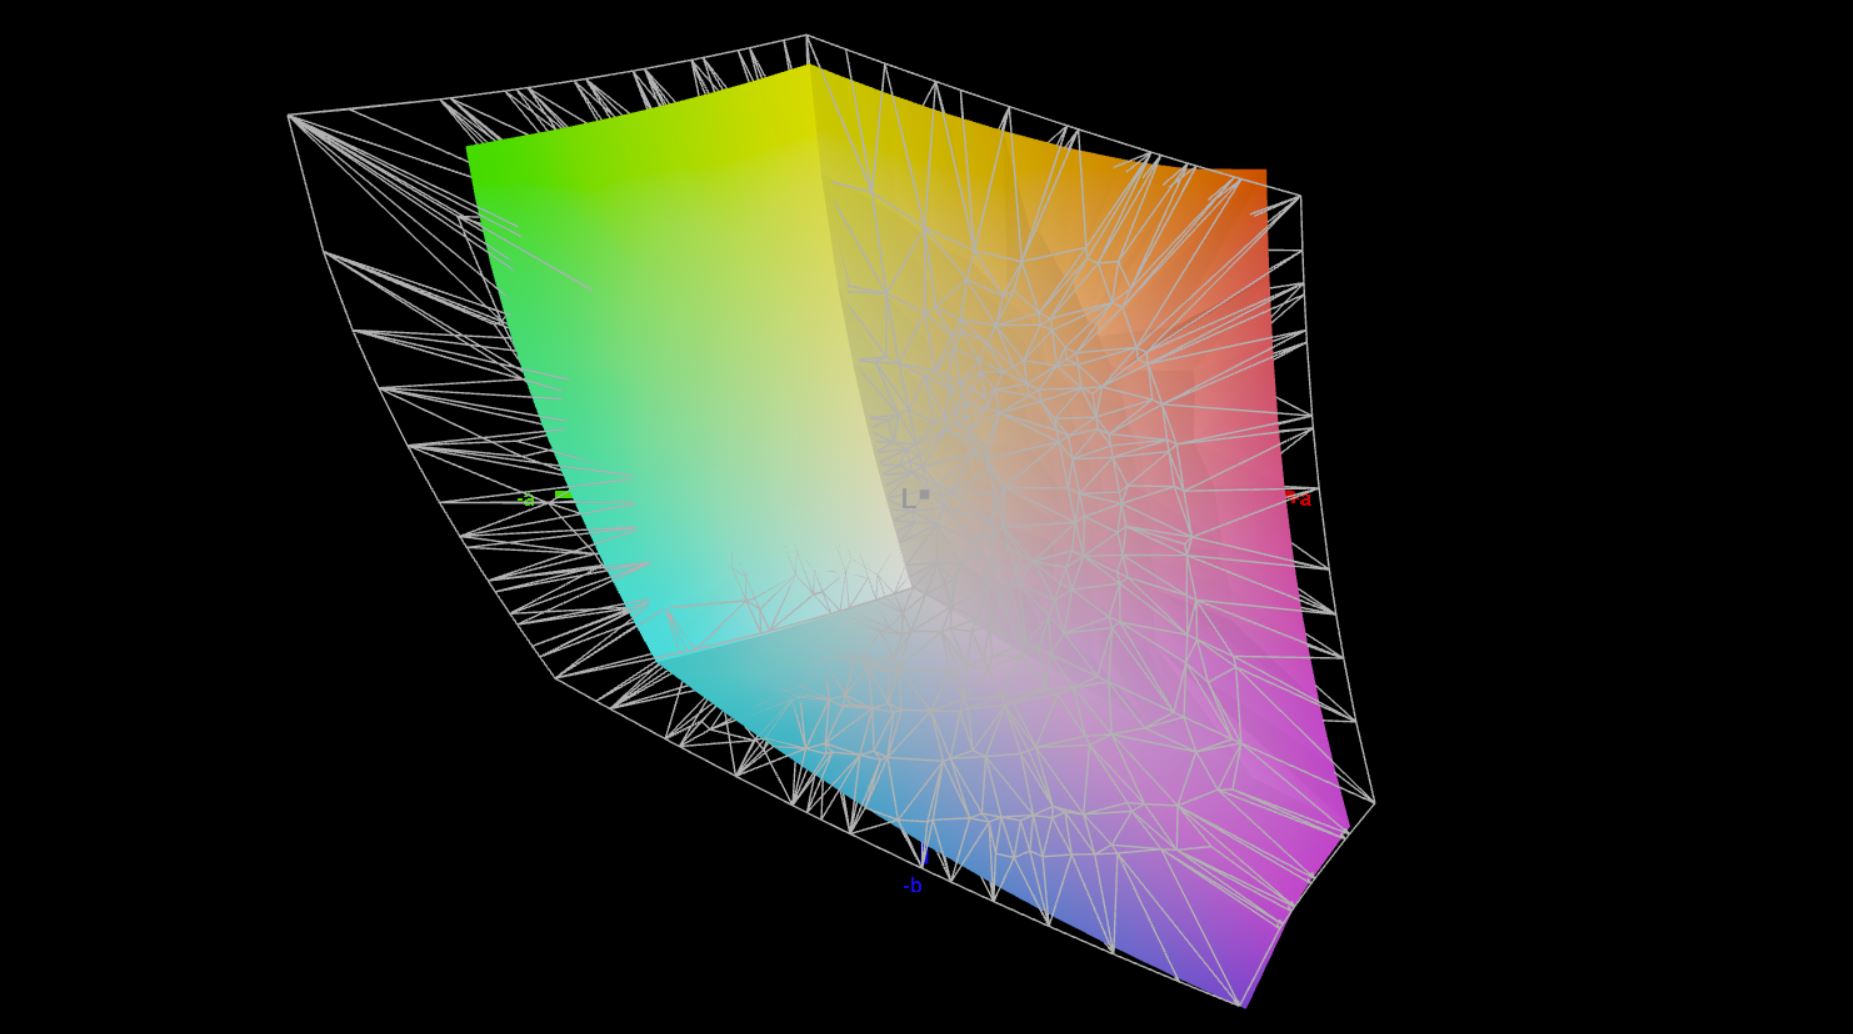
77.9% AdobeRGB 1998 (Argyll 3D)
100% sRGB (Argyll 3D)
76.3% Display P3 (Argyll 3D)
Gamma: 2.11
CCT: 6662 K
| Lenovo ThinkPad T14 G3-21AJS00400 B140UAN02.1, IPS, 1920x1200, 14" | Lenovo ThinkPad T14 G3-21CF004NGE LP140WU1-SPB2, IPS, 1920x1200, 14" | HP EliteBook 840 G9 Chi Mei CMN1435, IPS, 1920x1200, 14" | Schenker Vision 14 2022 RTX 3050 Ti MNE007ZA1-1, IPS, 2880x1800, 14" | Huawei MateBook X Pro 2022 TMX1422, IPS, 3120x2080, 14.2" | |
|---|---|---|---|---|---|
| Display | -7% | -8% | -3% | 12% | |
| Display P3 Coverage (%) | 76.3 | 69.2 -9% | 67.6 -11% | 74.1 -3% | 94.6 24% |
| sRGB Coverage (%) | 100 | 97.4 -3% | 98.7 -1% | 97.4 -3% | 99.5 0% |
| AdobeRGB 1998 Coverage (%) | 77.9 | 71.5 -8% | 69.7 -11% | 75.3 -3% | 86.5 11% |
| Response Times | 40% | -19% | 54% | 55% | |
| Response Time Grey 50% / Grey 80% * (ms) | 62.6 ? | 41.4 ? 34% | 66 ? -5% | 31.5 ? 50% | 25.4 ? 59% |
| Response Time Black / White * (ms) | 34.9 ? | 19.2 ? 45% | 46.4 ? -33% | 14.5 ? 58% | 17.1 ? 51% |
| PWM Frequency (Hz) | |||||
| Screen | 16% | 14% | -6% | 22% | |
| Brightness middle (cd/m²) | 400 | 451 13% | 391.3 -2% | 421 5% | 603 51% |
| Brightness (cd/m²) | 395 | 435 10% | 368 -7% | 416 5% | 586 48% |
| Brightness Distribution (%) | 91 | 94 3% | 86 -5% | 89 -2% | 91 0% |
| Black Level * (cd/m²) | 0.19 | 0.21 -11% | 0.32 -68% | 0.28 -47% | 0.39 -105% |
| Contrast (:1) | 2105 | 2148 2% | 1223 -42% | 1504 -29% | 1546 -27% |
| Colorchecker dE 2000 * | 3.5 | 2.4 31% | 1.49 57% | 3.2 9% | 1.1 69% |
| Colorchecker dE 2000 max. * | 7.2 | 4.1 43% | 3.29 54% | 5.5 24% | 2.2 69% |
| Colorchecker dE 2000 calibrated * | 1.6 | 1.3 19% | 0.44 72% | 2 -25% | 1.2 25% |
| Greyscale dE 2000 * | 4.8 | 3.3 31% | 1.7 65% | 4.4 8% | 1.5 69% |
| Gamma | 2.11 104% | 2.13 103% | 2.12 104% | 2.22 99% | 2.17 101% |
| CCT | 6662 98% | 6848 95% | 6488 100% | 6384 102% | 6549 99% |
| Total Average (Program / Settings) | 16% /
14% | -4% /
5% | 15% /
3% | 30% /
25% |
* ... smaller is better
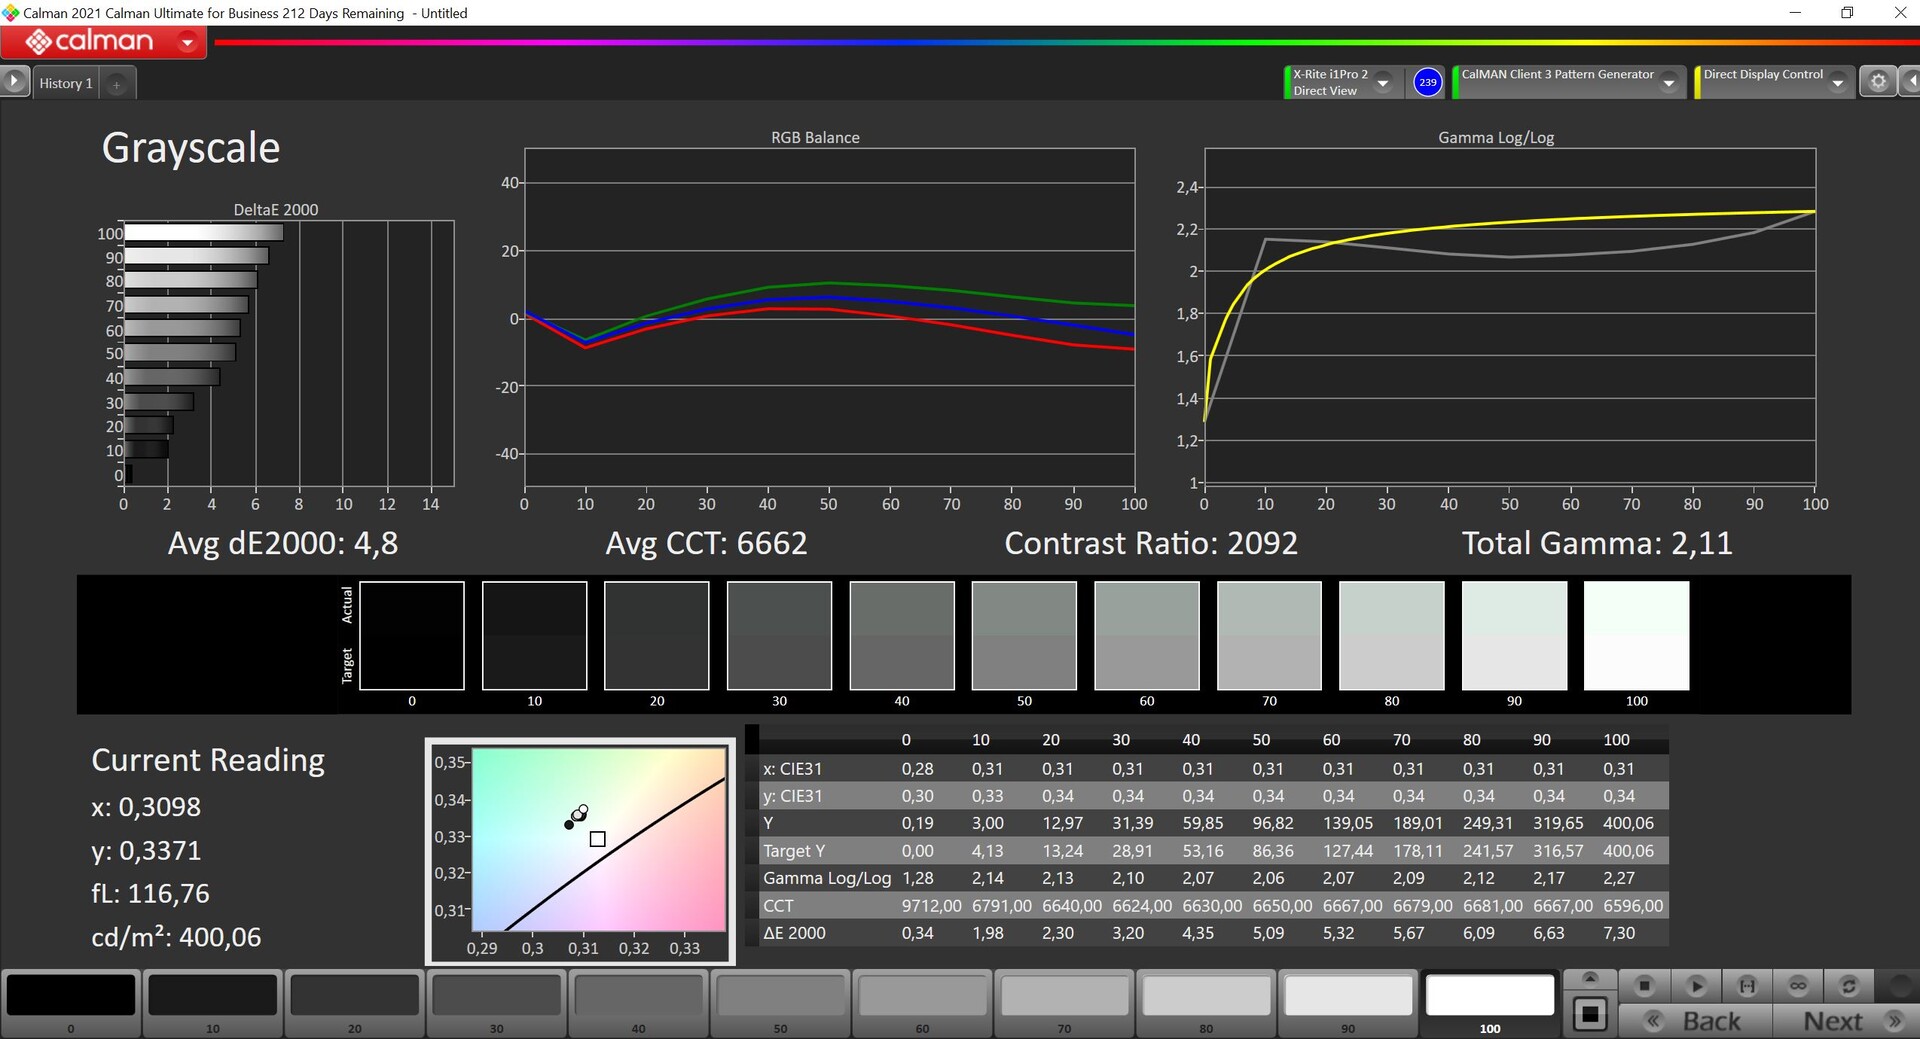
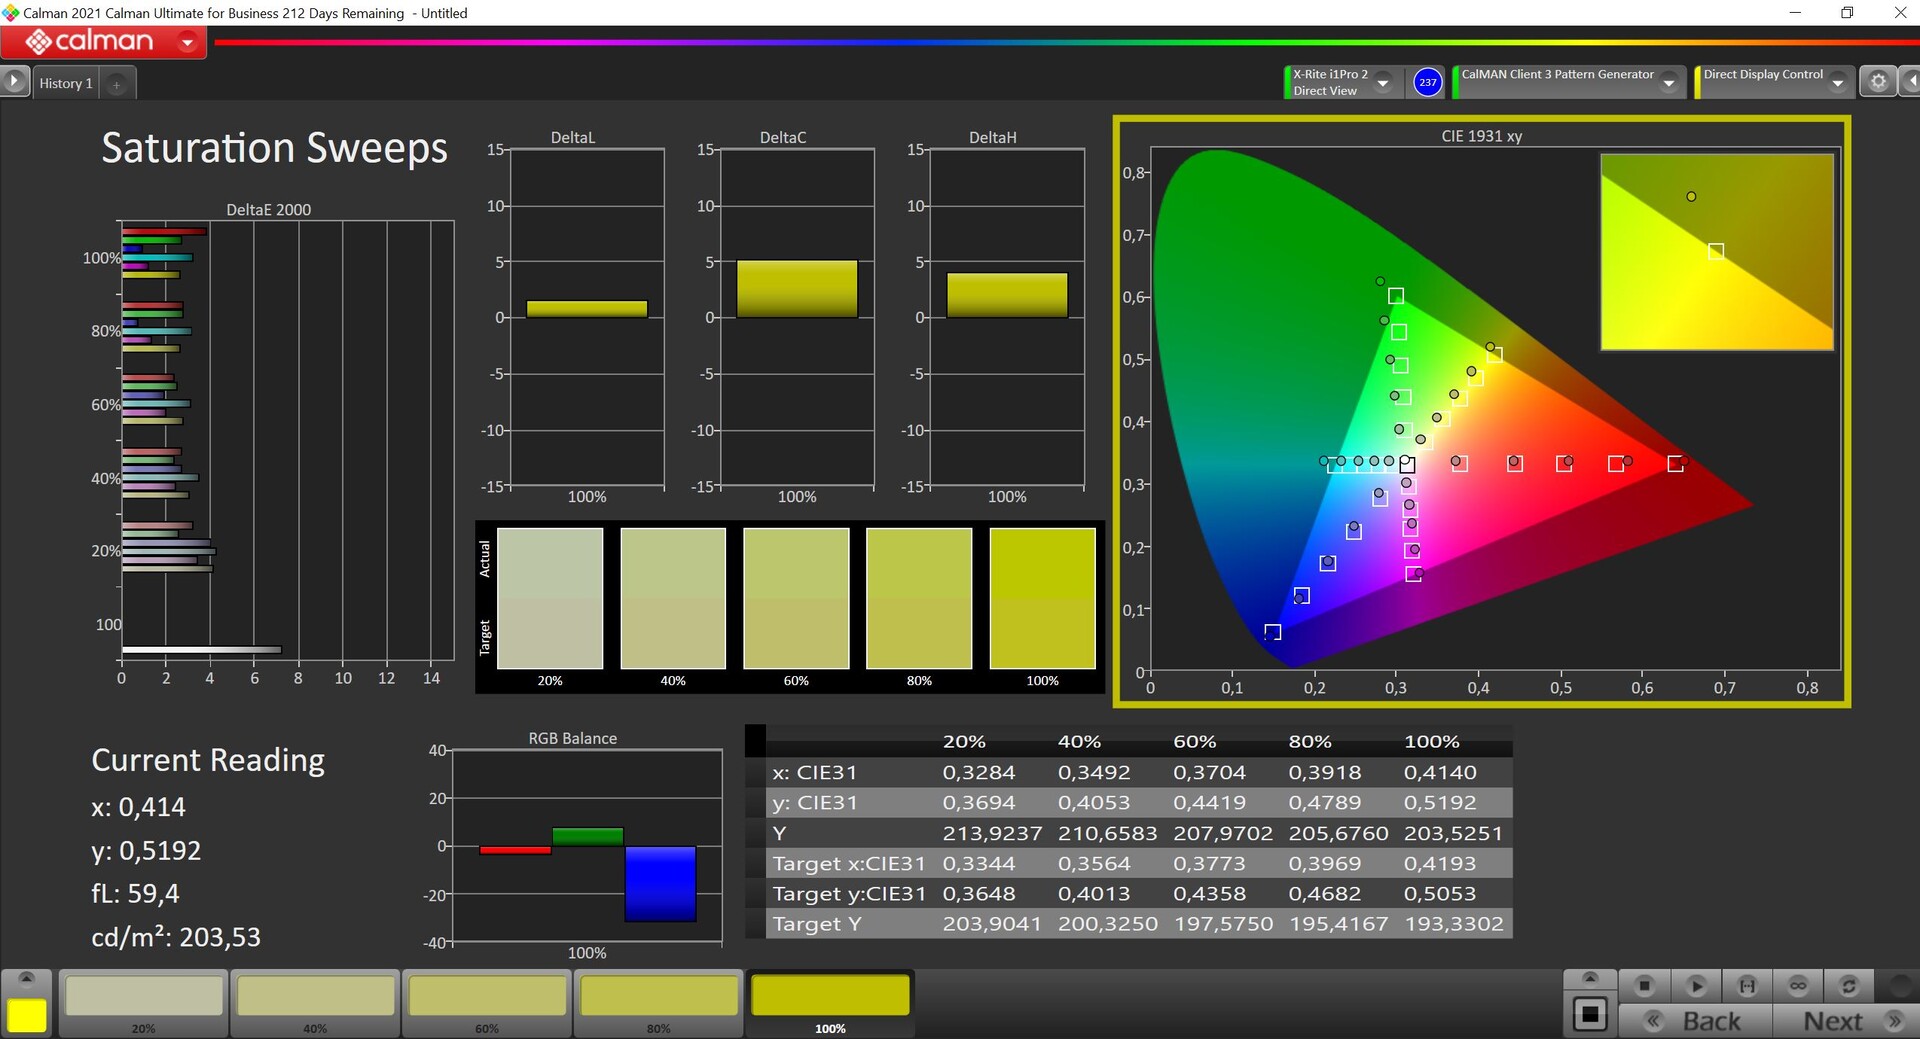
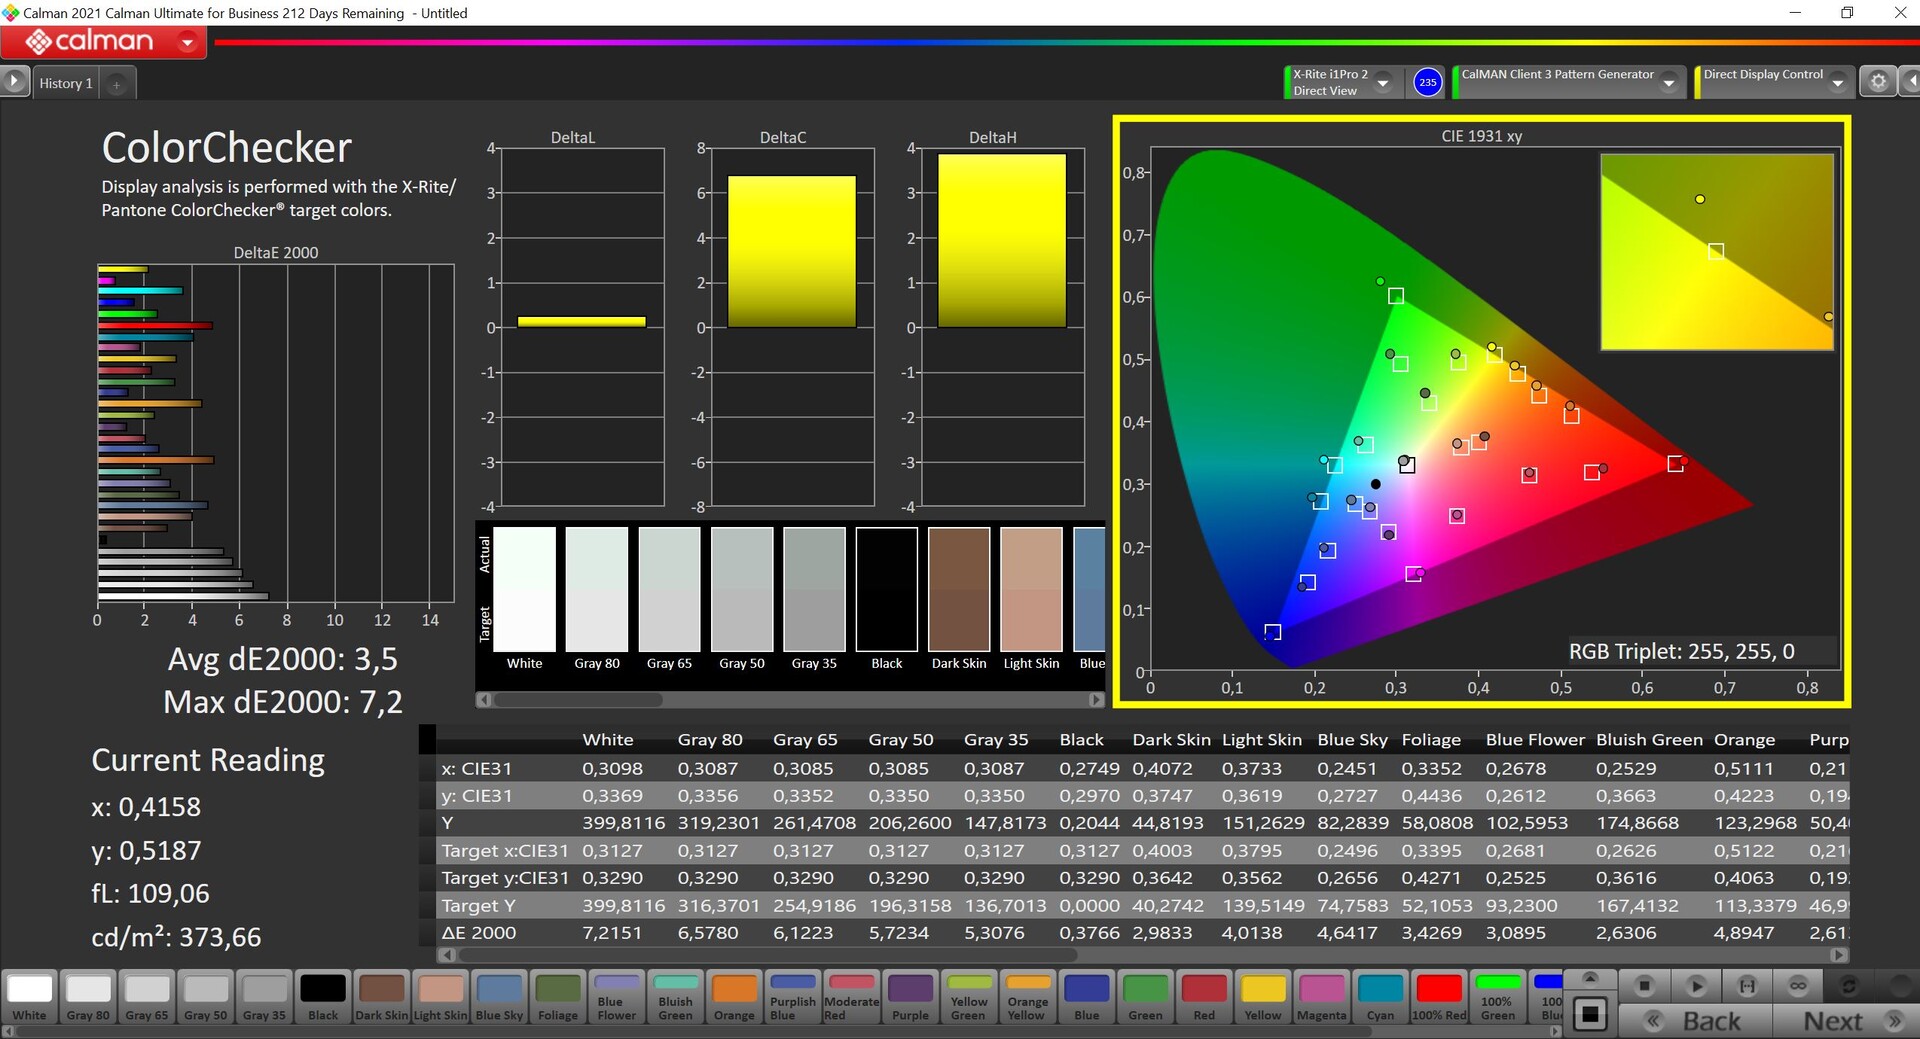
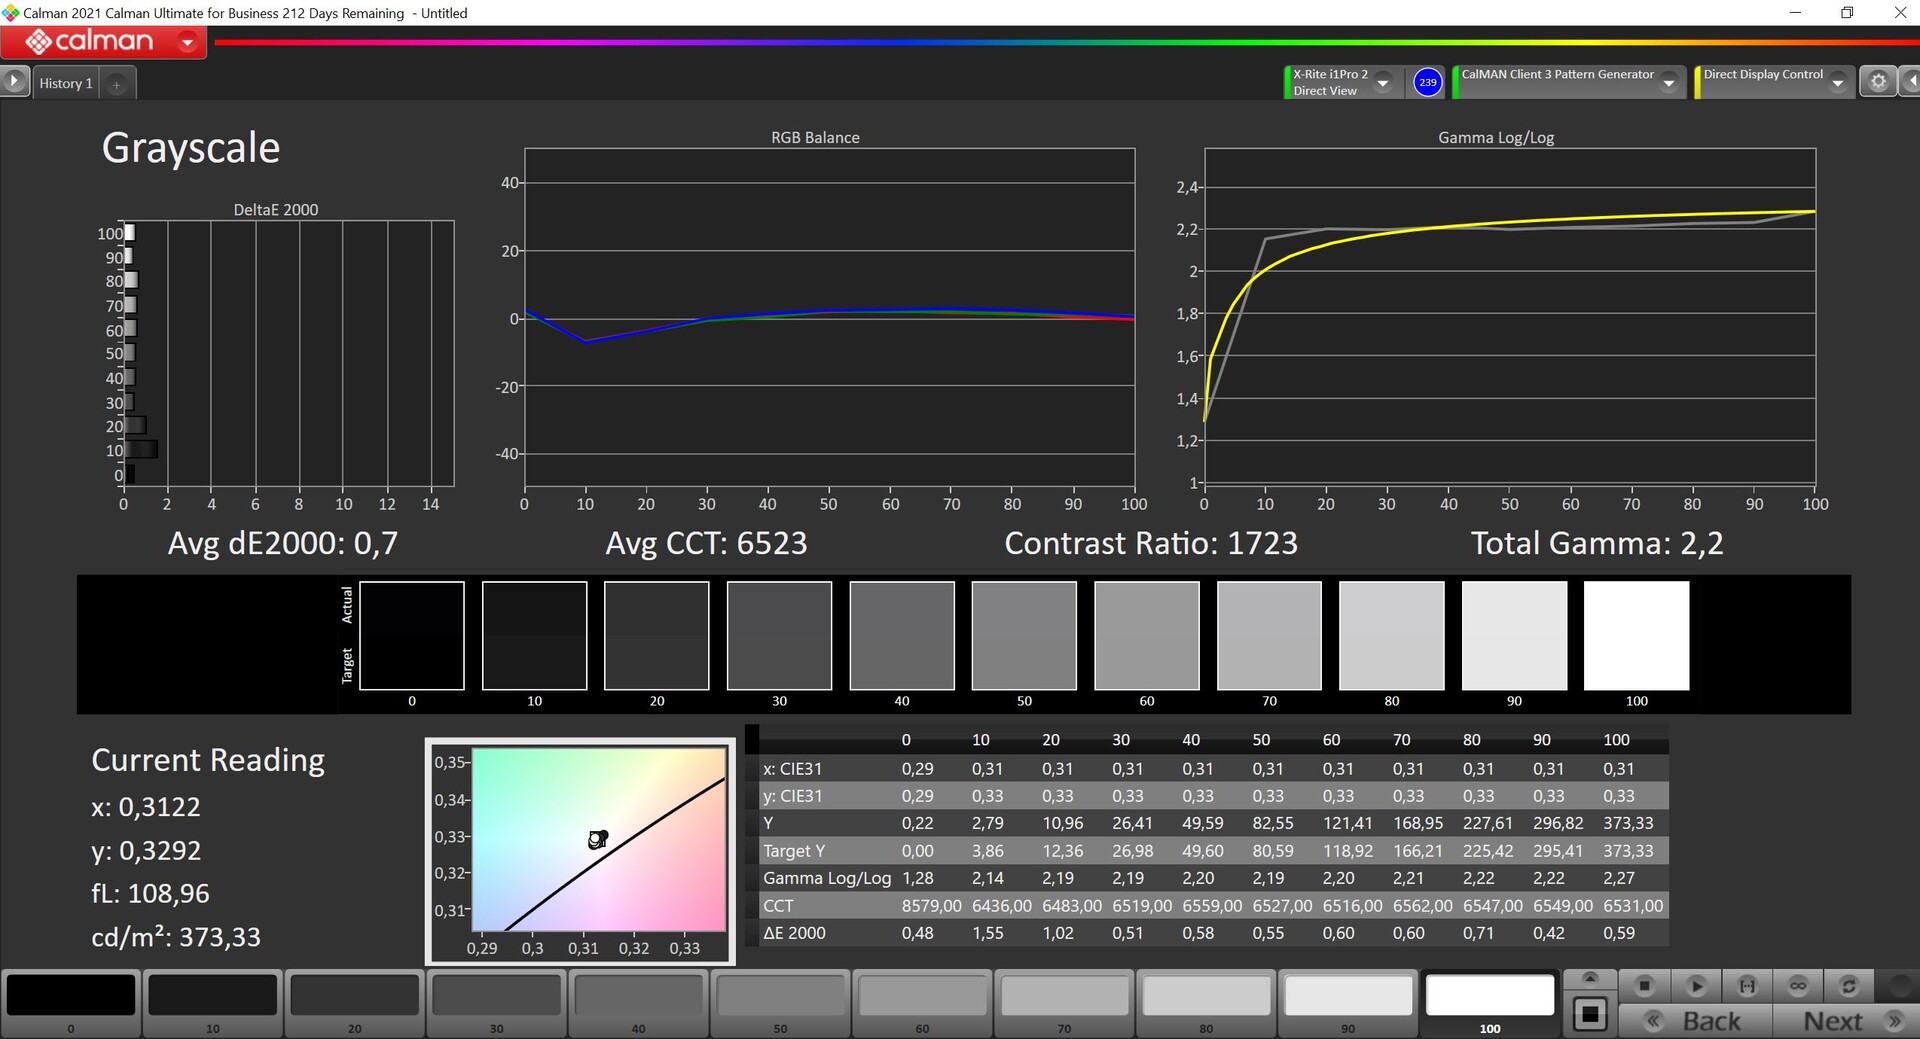
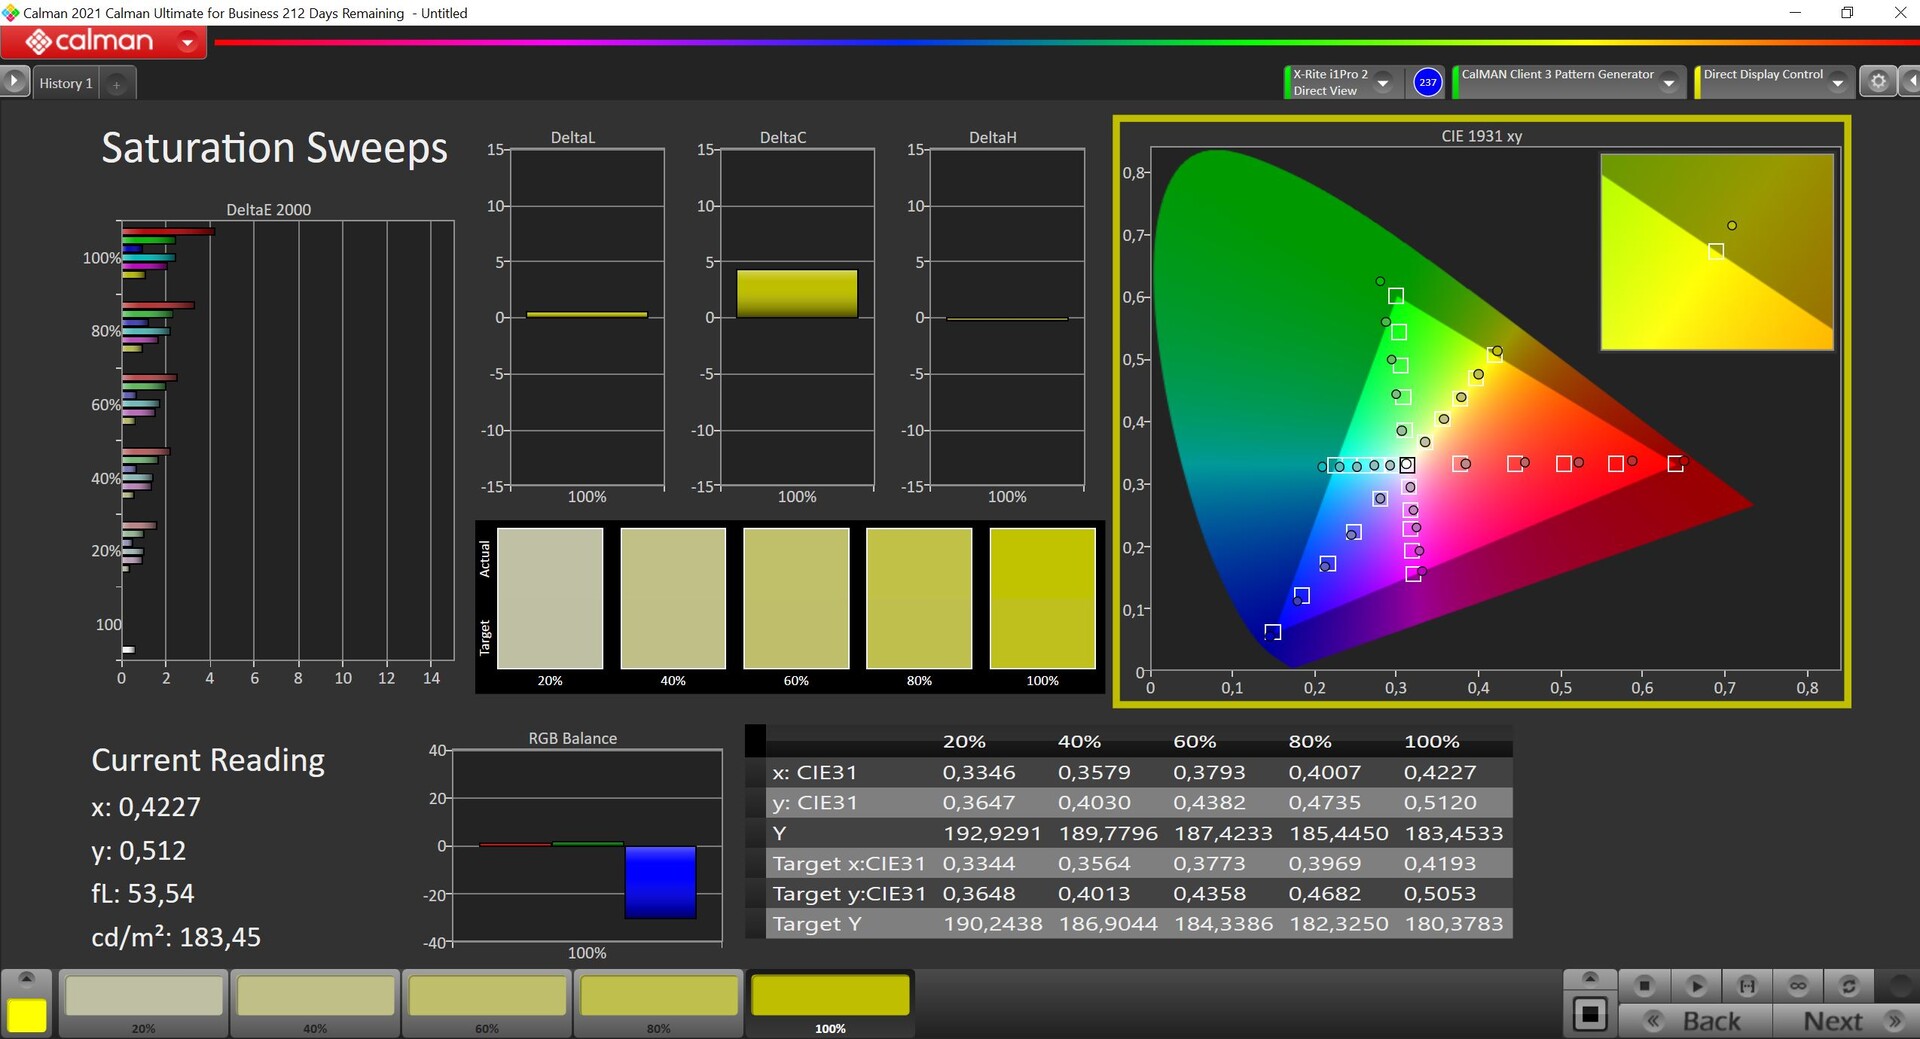
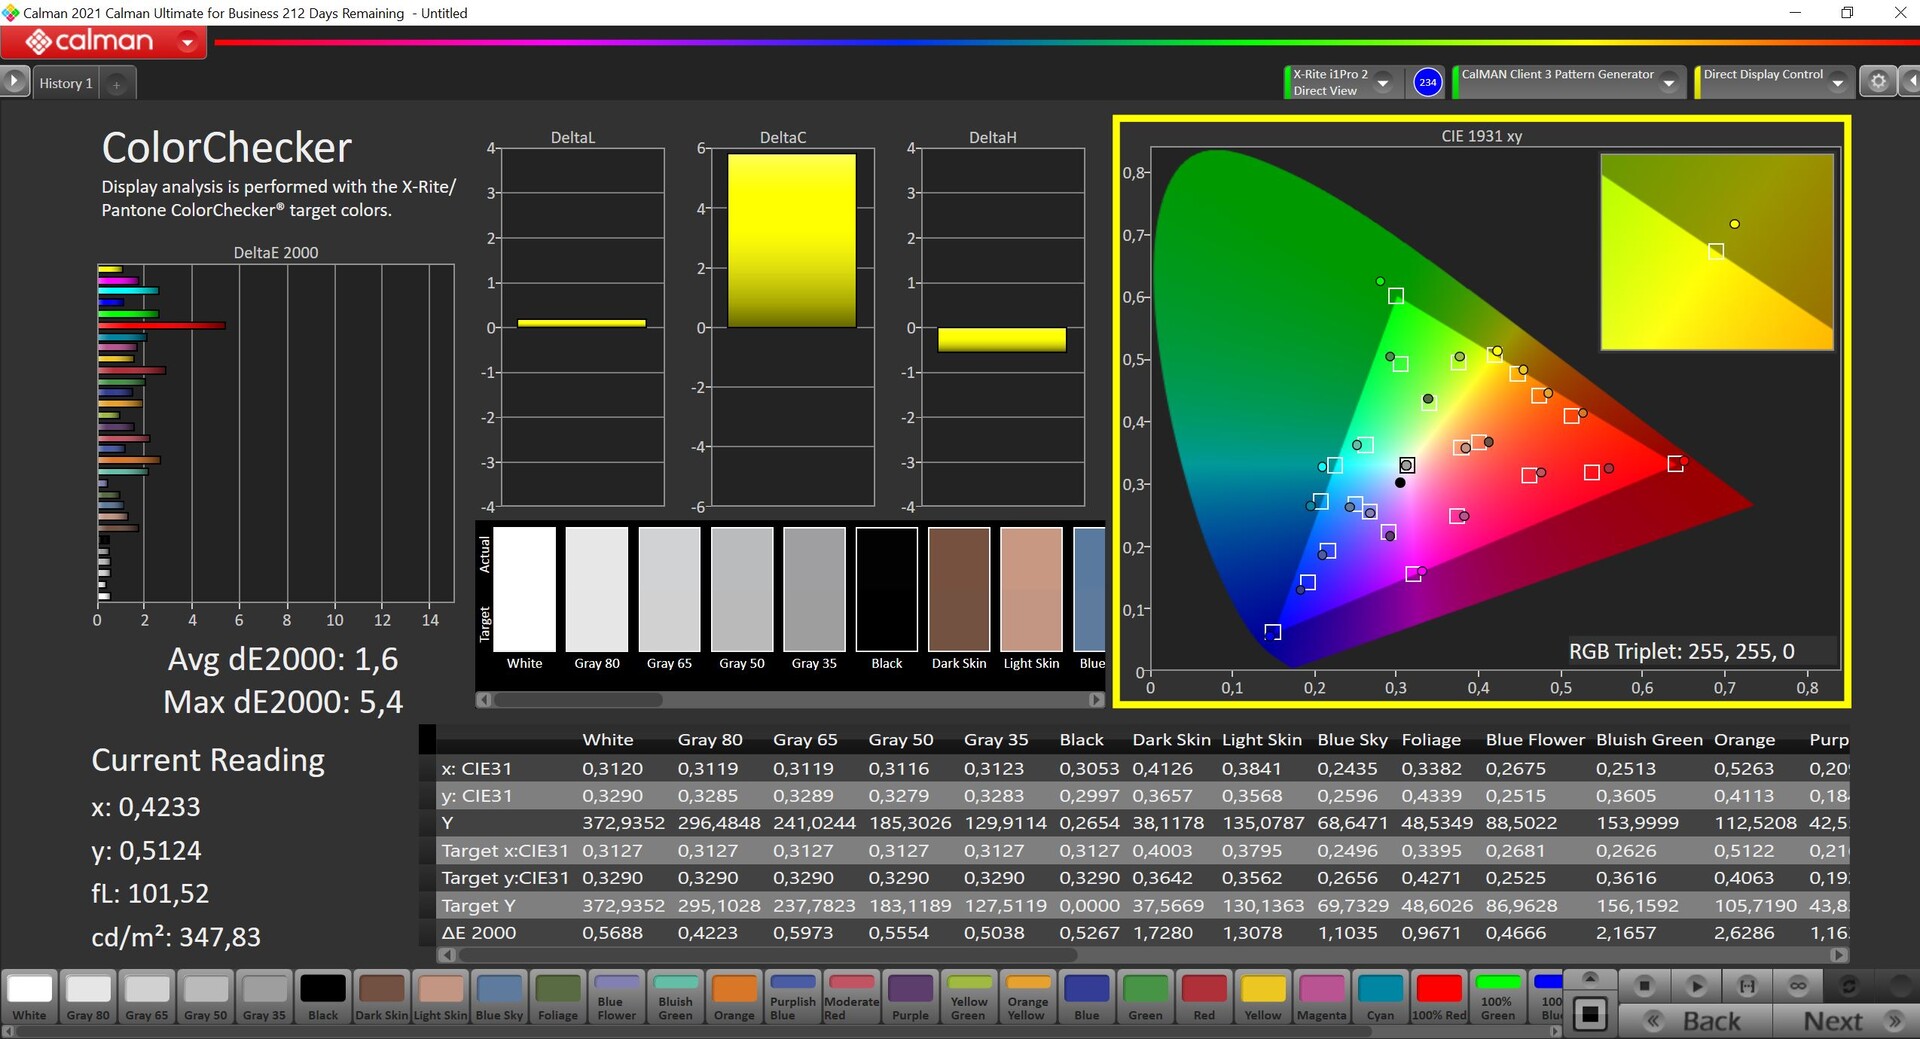
We measured the panel with the professional CalMAN software (X-Rite i1 Pro 2). Even though there is a slight color tint toward green/blue in the state of delivery, this is not very apparent in everyday operation, and the results are already decent for a business laptop. With our own calibration (color profile available for free download from the link above), we are able to further improve the color reproduction. In combination with the complete sRGB color space coverage, the panel is quite suitable for the occasional image or video processing task.
Display Response Times
| ↔ Response Time Black to White | ||
|---|---|---|
| 34.9 ms ... rise ↗ and fall ↘ combined | ↗ 16.5 ms rise | 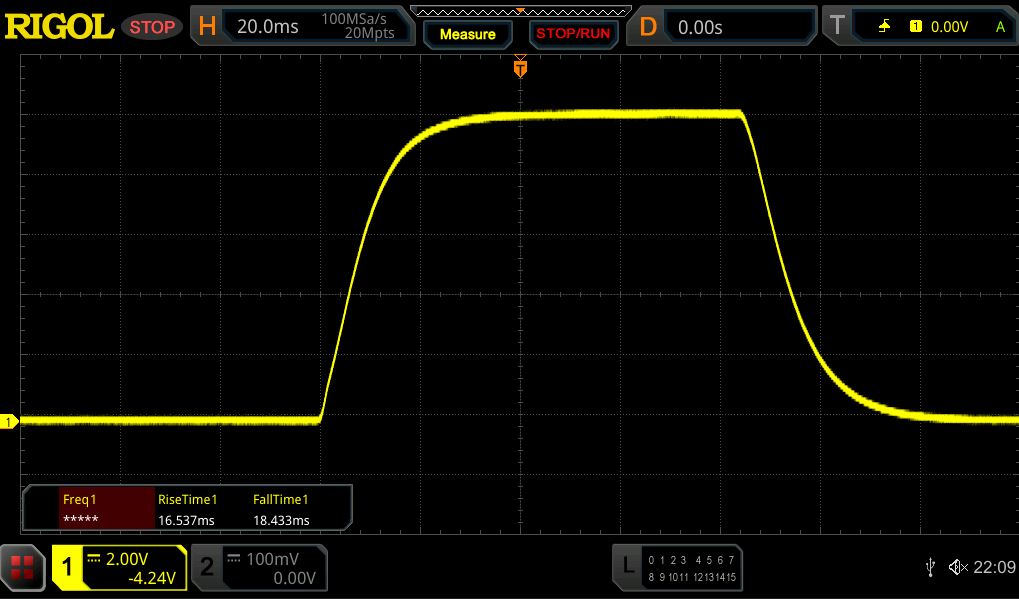 |
| ↘ 18.4 ms fall | ||
| The screen shows slow response rates in our tests and will be unsatisfactory for gamers. In comparison, all tested devices range from 0.1 (minimum) to 240 (maximum) ms. » 92 % of all devices are better. This means that the measured response time is worse than the average of all tested devices (20.3 ms). | ||
| ↔ Response Time 50% Grey to 80% Grey | ||
| 62.6 ms ... rise ↗ and fall ↘ combined | ↗ 28.2 ms rise | 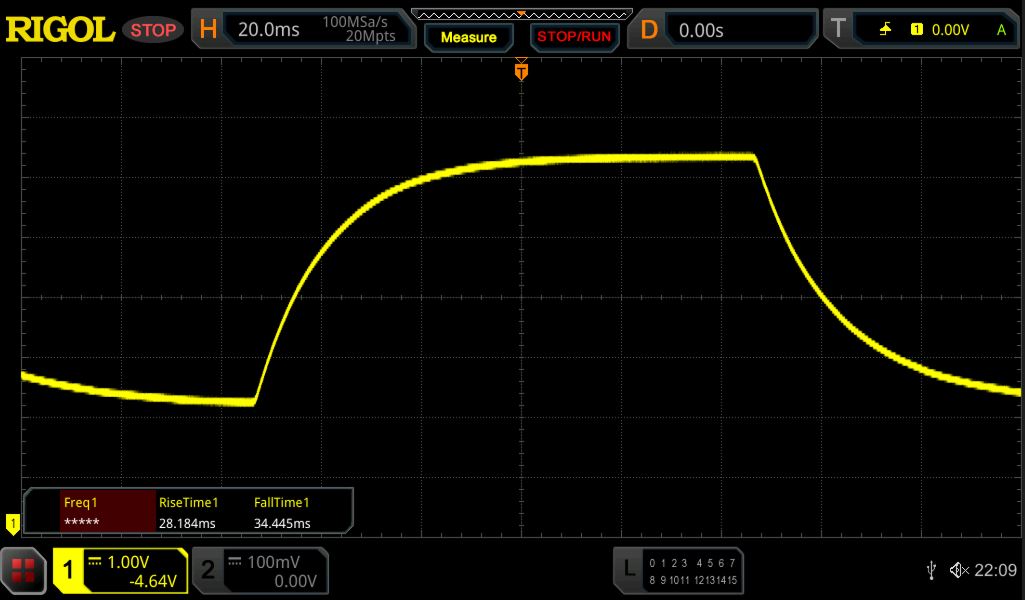 |
| ↘ 34.4 ms fall | ||
| The screen shows slow response rates in our tests and will be unsatisfactory for gamers. In comparison, all tested devices range from 0.165 (minimum) to 636 (maximum) ms. » 97 % of all devices are better. This means that the measured response time is worse than the average of all tested devices (31.7 ms). | ||
Screen Flickering / PWM (Pulse-Width Modulation)
| Screen flickering / PWM not detected |  | ||
In comparison: 53 % of all tested devices do not use PWM to dim the display. If PWM was detected, an average of 8167 (minimum: 5 - maximum: 343500) Hz was measured. | |||
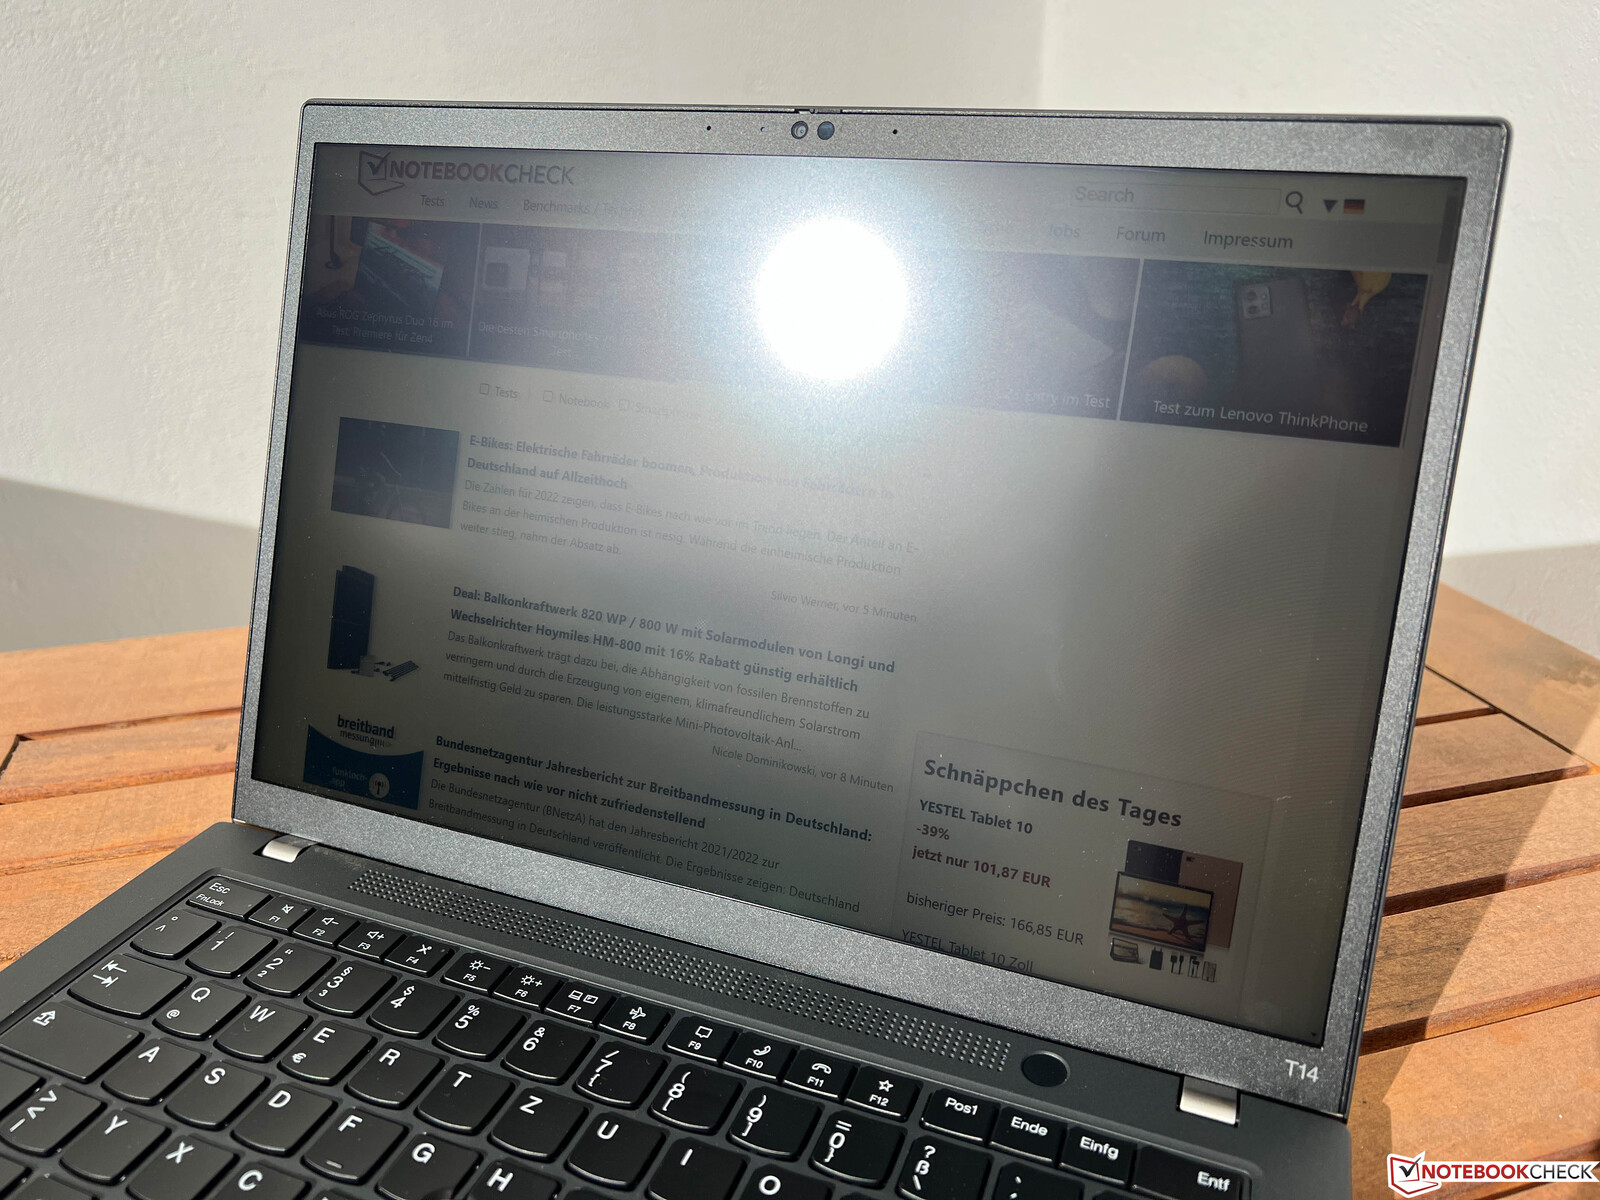
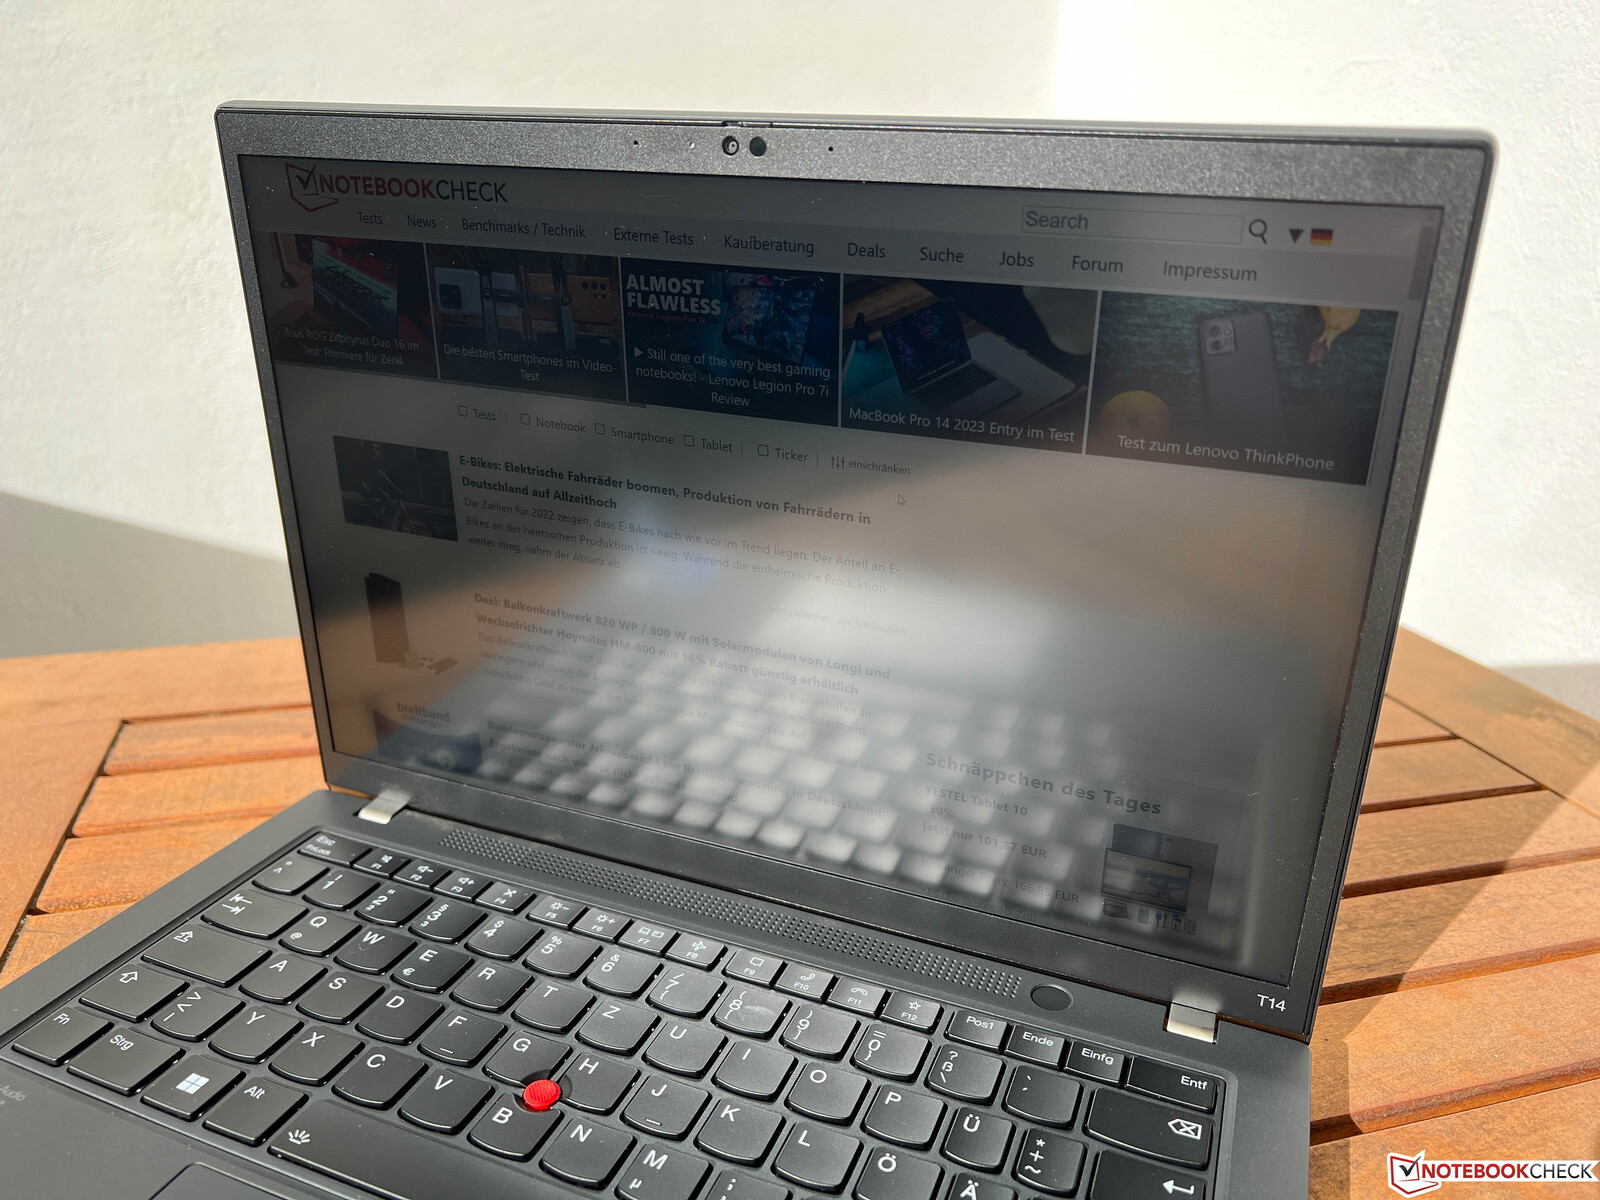
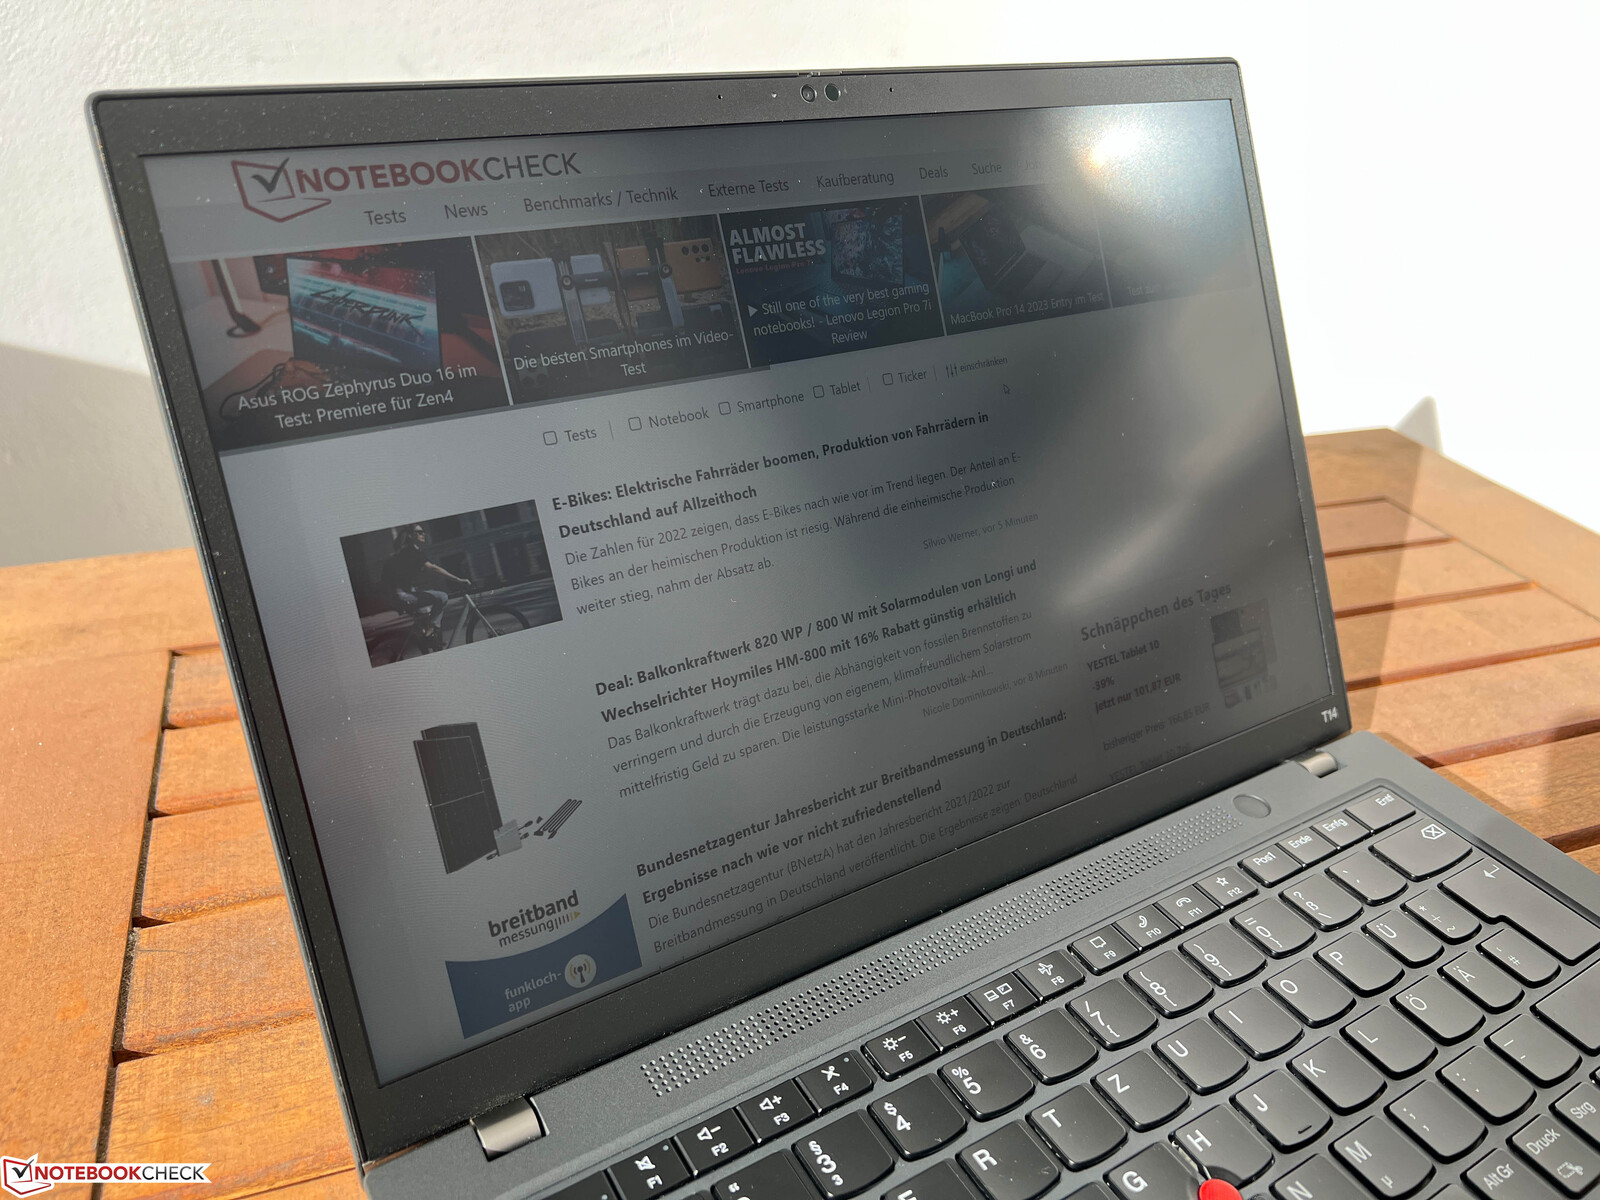
The panel does okay outdoors, but you should still avoid reflections of direct light sources. The viewing angle stability of the IPS panel is very good.

Performance - Alder Lake and GeForce MX550
Test Conditions
The Lenovo Vantage App offers an "Intelligent Cooling" mode, but in our test this had a negative effect on the performance after a short time. We therefore deactivated this mode for our benchmarks and measurements (either via app or using the Fn+T key combination).
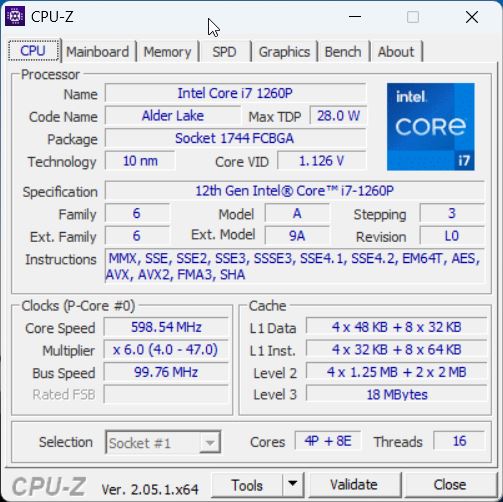
Processor - Core i7-1260P
We already know the Core i7-1260P of the Alder Lake generation, and with its 4 fast performance cores and 8 efficiency cores, the performance is very good, but the Intel processor also consumes a lot of power with this. In the ThinkPad T14 G3, the processor is allowed to consume a maximum up to 58 watts and constant 42 watts. The single-core performance is better than that of the AMD model, while the multicore performance is comparable.
Cinebench R15 Multi Constant Load Test
The performance overall remains relatively stable in the Cinebench loop. What is also interesting here is the comparison with the new Raptor Lake Core i7-1360P, which has an advantage in the first run but then drops to the level of the older Alder Lake processors. Only the single-core performance remains slightly better, but overall, you can also choose the Core i7-1260P without any concerns.
In battery operation, the processor is allowed to consume a maximum of 32 watts, leading to a performance reduction of ~30% in the multicore tests. You can find additional benchmarks in our technical section.
Cinebench R23: Multi Core | Single Core
Cinebench R20: CPU (Multi Core) | CPU (Single Core)
Cinebench R15: CPU Multi 64Bit | CPU Single 64Bit
Blender: v2.79 BMW27 CPU
7-Zip 18.03: 7z b 4 | 7z b 4 -mmt1
Geekbench 5.5: Multi-Core | Single-Core
HWBOT x265 Benchmark v2.2: 4k Preset
LibreOffice : 20 Documents To PDF
R Benchmark 2.5: Overall mean
| CPU Performance rating | |
| Schenker Vision 14 2022 RTX 3050 Ti | |
| Lenovo Yoga 9 14IRP G8 | |
| HP EliteBook 840 G9 | |
| Lenovo ThinkPad T14 G3-21AJS00400 | |
| Huawei MateBook X Pro 2022 | |
| Lenovo ThinkPad T14 G3-21CF004NGE | |
| Average Intel Core i7-1260P | |
| Average of class Office | |
| Cinebench R23 / Multi Core | |
| Schenker Vision 14 2022 RTX 3050 Ti | |
| Lenovo ThinkPad T14 G3-21AJS00400 | |
| Lenovo Yoga 9 14IRP G8 | |
| Average of class Office (1577 - 20399, n=76, last 2 years) | |
| Lenovo ThinkPad T14 G3-21CF004NGE | |
| HP EliteBook 840 G9 | |
| Average Intel Core i7-1260P (3173 - 12150, n=27) | |
| Huawei MateBook X Pro 2022 | |
| Cinebench R23 / Single Core | |
| Lenovo Yoga 9 14IRP G8 | |
| Lenovo ThinkPad T14 G3-21AJS00400 | |
| HP EliteBook 840 G9 | |
| Schenker Vision 14 2022 RTX 3050 Ti | |
| Average Intel Core i7-1260P (1155 - 1812, n=25) | |
| Huawei MateBook X Pro 2022 | |
| Average of class Office (708 - 2130, n=76, last 2 years) | |
| Lenovo ThinkPad T14 G3-21CF004NGE | |
| Cinebench R20 / CPU (Multi Core) | |
| Schenker Vision 14 2022 RTX 3050 Ti | |
| Lenovo ThinkPad T14 G3-21AJS00400 | |
| Lenovo Yoga 9 14IRP G8 | |
| HP EliteBook 840 G9 | |
| Lenovo ThinkPad T14 G3-21CF004NGE | |
| Average of class Office (590 - 8086, n=74, last 2 years) | |
| Huawei MateBook X Pro 2022 | |
| Average Intel Core i7-1260P (1234 - 4748, n=25) | |
| Cinebench R20 / CPU (Single Core) | |
| Lenovo Yoga 9 14IRP G8 | |
| Schenker Vision 14 2022 RTX 3050 Ti | |
| Lenovo ThinkPad T14 G3-21AJS00400 | |
| Huawei MateBook X Pro 2022 | |
| Average Intel Core i7-1260P (448 - 698, n=25) | |
| Average of class Office (285 - 815, n=74, last 2 years) | |
| HP EliteBook 840 G9 | |
| Lenovo ThinkPad T14 G3-21CF004NGE | |
| Cinebench R15 / CPU Multi 64Bit | |
| Schenker Vision 14 2022 RTX 3050 Ti | |
| Lenovo Yoga 9 14IRP G8 | |
| HP EliteBook 840 G9 | |
| Huawei MateBook X Pro 2022 | |
| Huawei MateBook X Pro 2022 | |
| Lenovo ThinkPad T14 G3-21AJS00400 | |
| Lenovo ThinkPad T14 G3-21CF004NGE | |
| Average of class Office (246 - 3132, n=76, last 2 years) | |
| Average Intel Core i7-1260P (549 - 2034, n=29) | |
| Cinebench R15 / CPU Single 64Bit | |
| Lenovo Yoga 9 14IRP G8 | |
| Schenker Vision 14 2022 RTX 3050 Ti | |
| HP EliteBook 840 G9 | |
| Huawei MateBook X Pro 2022 | |
| Lenovo ThinkPad T14 G3-21AJS00400 | |
| Average of class Office (99.5 - 312, n=76, last 2 years) | |
| Lenovo ThinkPad T14 G3-21CF004NGE | |
| Average Intel Core i7-1260P (165.4 - 260, n=27) | |
| Blender / v2.79 BMW27 CPU | |
| Average of class Office (163 - 1956, n=76, last 2 years) | |
| Average Intel Core i7-1260P (264 - 906, n=26) | |
| Huawei MateBook X Pro 2022 | |
| Lenovo ThinkPad T14 G3-21AJS00400 | |
| Lenovo ThinkPad T14 G3-21CF004NGE | |
| Lenovo Yoga 9 14IRP G8 | |
| HP EliteBook 840 G9 | |
| Schenker Vision 14 2022 RTX 3050 Ti | |
| 7-Zip 18.03 / 7z b 4 | |
| Schenker Vision 14 2022 RTX 3050 Ti | |
| Lenovo ThinkPad T14 G3-21CF004NGE | |
| HP EliteBook 840 G9 | |
| Lenovo Yoga 9 14IRP G8 | |
| Huawei MateBook X Pro 2022 | |
| Lenovo ThinkPad T14 G3-21AJS00400 | |
| Average of class Office (7532 - 76886, n=77, last 2 years) | |
| Average Intel Core i7-1260P (16146 - 47064, n=25) | |
| 7-Zip 18.03 / 7z b 4 -mmt1 | |
| HP EliteBook 840 G9 | |
| Lenovo Yoga 9 14IRP G8 | |
| Schenker Vision 14 2022 RTX 3050 Ti | |
| Lenovo ThinkPad T14 G3-21AJS00400 | |
| Huawei MateBook X Pro 2022 | |
| Average of class Office (3046 - 6497, n=76, last 2 years) | |
| Lenovo ThinkPad T14 G3-21CF004NGE | |
| Average Intel Core i7-1260P (4064 - 5791, n=25) | |
| Geekbench 5.5 / Multi-Core | |
| HP EliteBook 840 G9 | |
| Schenker Vision 14 2022 RTX 3050 Ti | |
| Lenovo Yoga 9 14IRP G8 | |
| Huawei MateBook X Pro 2022 | |
| Average Intel Core i7-1260P (3866 - 10570, n=25) | |
| Average of class Office (1532 - 14192, n=74, last 2 years) | |
| Lenovo ThinkPad T14 G3-21CF004NGE | |
| Lenovo ThinkPad T14 G3-21AJS00400 | |
| Geekbench 5.5 / Single-Core | |
| Lenovo Yoga 9 14IRP G8 | |
| Schenker Vision 14 2022 RTX 3050 Ti | |
| HP EliteBook 840 G9 | |
| Huawei MateBook X Pro 2022 | |
| Average Intel Core i7-1260P (1436 - 1786, n=25) | |
| Average of class Office (510 - 2128, n=75, last 2 years) | |
| Lenovo ThinkPad T14 G3-21AJS00400 | |
| Lenovo ThinkPad T14 G3-21CF004NGE | |
| HWBOT x265 Benchmark v2.2 / 4k Preset | |
| Schenker Vision 14 2022 RTX 3050 Ti | |
| Lenovo ThinkPad T14 G3-21AJS00400 | |
| Lenovo ThinkPad T14 G3-21CF004NGE | |
| Lenovo Yoga 9 14IRP G8 | |
| HP EliteBook 840 G9 | |
| Huawei MateBook X Pro 2022 | |
| Average of class Office (1.72 - 22.4, n=74, last 2 years) | |
| Average Intel Core i7-1260P (3.45 - 13.6, n=26) | |
| LibreOffice / 20 Documents To PDF | |
| Average of class Office (41.5 - 129.6, n=74, last 2 years) | |
| Lenovo ThinkPad T14 G3-21CF004NGE | |
| Average Intel Core i7-1260P (40.2 - 65.7, n=25) | |
| Lenovo Yoga 9 14IRP G8 | |
| HP EliteBook 840 G9 | |
| Schenker Vision 14 2022 RTX 3050 Ti | |
| Lenovo ThinkPad T14 G3-21AJS00400 | |
| Huawei MateBook X Pro 2022 | |
| R Benchmark 2.5 / Overall mean | |
| Average of class Office (0.4098 - 1.06, n=73, last 2 years) | |
| Lenovo ThinkPad T14 G3-21CF004NGE | |
| Average Intel Core i7-1260P (0.4559 - 0.727, n=25) | |
| Huawei MateBook X Pro 2022 | |
| Lenovo ThinkPad T14 G3-21AJS00400 | |
| HP EliteBook 840 G9 | |
| Lenovo Yoga 9 14IRP G8 | |
| Schenker Vision 14 2022 RTX 3050 Ti | |
* ... smaller is better
AIDA64: FP32 Ray-Trace | FPU Julia | CPU SHA3 | CPU Queen | FPU SinJulia | FPU Mandel | CPU AES | CPU ZLib | FP64 Ray-Trace | CPU PhotoWorxx
| Performance rating | |
| Schenker Vision 14 2022 RTX 3050 Ti | |
| Lenovo ThinkPad T14 G3-21CF004NGE | |
| HP EliteBook 840 G9 | |
| Average of class Office | |
| Lenovo ThinkPad T14 G3-21AJS00400 | |
| Huawei MateBook X Pro 2022 | |
| Average Intel Core i7-1260P | |
| AIDA64 / FP32 Ray-Trace | |
| Schenker Vision 14 2022 RTX 3050 Ti | |
| Lenovo ThinkPad T14 G3-21CF004NGE | |
| Average of class Office (1685 - 31245, n=76, last 2 years) | |
| Lenovo ThinkPad T14 G3-21AJS00400 | |
| HP EliteBook 840 G9 | |
| Average Intel Core i7-1260P (2176 - 10898, n=26) | |
| Huawei MateBook X Pro 2022 | |
| AIDA64 / FPU Julia | |
| Lenovo ThinkPad T14 G3-21CF004NGE | |
| Schenker Vision 14 2022 RTX 3050 Ti | |
| Lenovo ThinkPad T14 G3-21AJS00400 | |
| Average of class Office (8977 - 125394, n=76, last 2 years) | |
| HP EliteBook 840 G9 | |
| Average Intel Core i7-1260P (11015 - 56906, n=26) | |
| Huawei MateBook X Pro 2022 | |
| AIDA64 / CPU SHA3 | |
| Schenker Vision 14 2022 RTX 3050 Ti | |
| Lenovo ThinkPad T14 G3-21AJS00400 | |
| Average of class Office (590 - 5398, n=76, last 2 years) | |
| Lenovo ThinkPad T14 G3-21CF004NGE | |
| HP EliteBook 840 G9 | |
| Average Intel Core i7-1260P (669 - 2709, n=26) | |
| Huawei MateBook X Pro 2022 | |
| AIDA64 / CPU Queen | |
| HP EliteBook 840 G9 | |
| Schenker Vision 14 2022 RTX 3050 Ti | |
| Lenovo ThinkPad T14 G3-21CF004NGE | |
| Lenovo ThinkPad T14 G3-21AJS00400 | |
| Huawei MateBook X Pro 2022 | |
| Average Intel Core i7-1260P (42571 - 82493, n=26) | |
| Average of class Office (20636 - 115197, n=76, last 2 years) | |
| AIDA64 / FPU SinJulia | |
| Lenovo ThinkPad T14 G3-21CF004NGE | |
| Schenker Vision 14 2022 RTX 3050 Ti | |
| HP EliteBook 840 G9 | |
| Average of class Office (1064 - 18321, n=76, last 2 years) | |
| Lenovo ThinkPad T14 G3-21AJS00400 | |
| Huawei MateBook X Pro 2022 | |
| Average Intel Core i7-1260P (2901 - 6975, n=26) | |
| AIDA64 / FPU Mandel | |
| Lenovo ThinkPad T14 G3-21CF004NGE | |
| Schenker Vision 14 2022 RTX 3050 Ti | |
| Average of class Office (4415 - 66922, n=76, last 2 years) | |
| Lenovo ThinkPad T14 G3-21AJS00400 | |
| HP EliteBook 840 G9 | |
| Average Intel Core i7-1260P (5950 - 26376, n=26) | |
| Huawei MateBook X Pro 2022 | |
| AIDA64 / CPU AES | |
| Schenker Vision 14 2022 RTX 3050 Ti | |
| Huawei MateBook X Pro 2022 | |
| Lenovo ThinkPad T14 G3-21AJS00400 | |
| HP EliteBook 840 G9 | |
| Lenovo ThinkPad T14 G3-21CF004NGE | |
| Average of class Office (7254 - 155900, n=76, last 2 years) | |
| Average Intel Core i7-1260P (16041 - 92356, n=26) | |
| AIDA64 / CPU ZLib | |
| Schenker Vision 14 2022 RTX 3050 Ti | |
| Lenovo ThinkPad T14 G3-21AJS00400 | |
| HP EliteBook 840 G9 | |
| Lenovo ThinkPad T14 G3-21CF004NGE | |
| Average of class Office (138.6 - 1366, n=76, last 2 years) | |
| Huawei MateBook X Pro 2022 | |
| Average Intel Core i7-1260P (259 - 771, n=26) | |
| AIDA64 / FP64 Ray-Trace | |
| Schenker Vision 14 2022 RTX 3050 Ti | |
| Lenovo ThinkPad T14 G3-21CF004NGE | |
| Average of class Office (859 - 17834, n=76, last 2 years) | |
| Lenovo ThinkPad T14 G3-21AJS00400 | |
| HP EliteBook 840 G9 | |
| Average Intel Core i7-1260P (1237 - 5858, n=26) | |
| Huawei MateBook X Pro 2022 | |
| AIDA64 / CPU PhotoWorxx | |
| Huawei MateBook X Pro 2022 | |
| HP EliteBook 840 G9 | |
| Average of class Office (11090 - 55359, n=76, last 2 years) | |
| Average Intel Core i7-1260P (13261 - 43652, n=26) | |
| Schenker Vision 14 2022 RTX 3050 Ti | |
| Lenovo ThinkPad T14 G3-21CF004NGE | |
| Lenovo ThinkPad T14 G3-21AJS00400 | |
System Performance
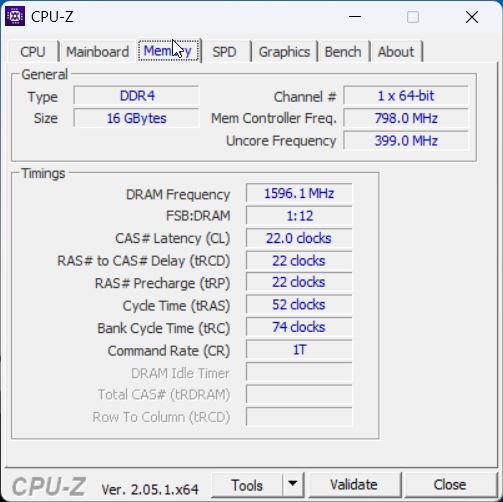
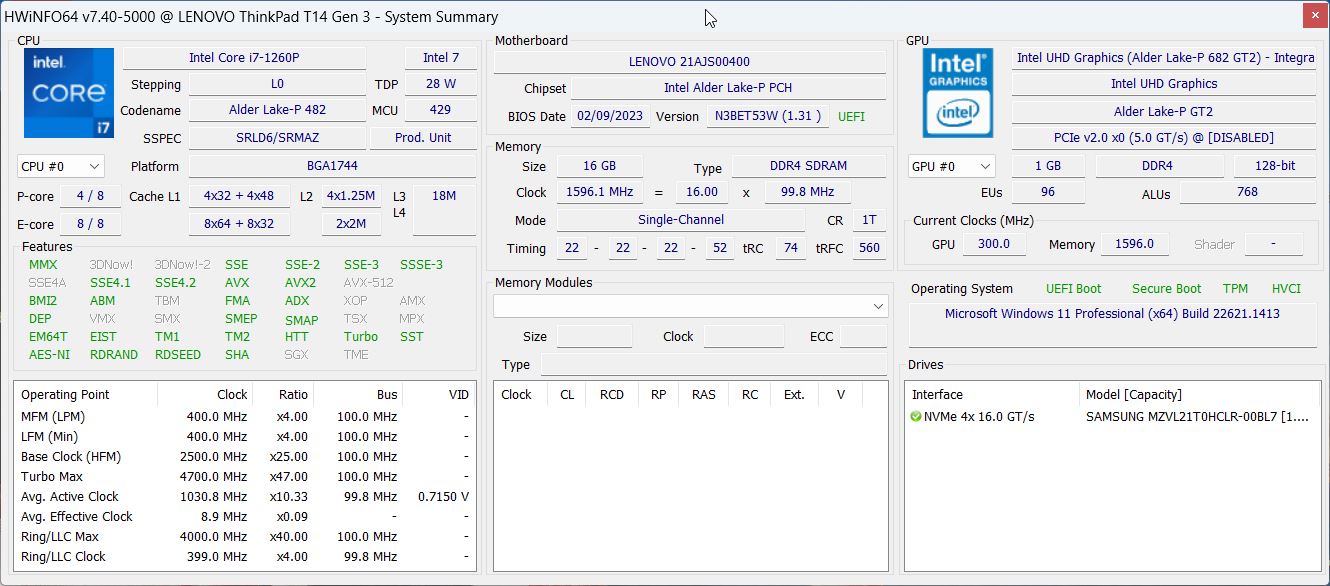
In practice, the Intel version of the ThinkPad T14 G3 is also a very responsive laptop, and we were unable to notice any problems. However, our test unit only shows an average performance in the synthetic benchmarks. This is mainly due to the bad storage performance, since the working memory only operates in a single-channel configuration.
CrossMark: Overall | Productivity | Creativity | Responsiveness
| PCMark 10 / Score | |
| Schenker Vision 14 2022 RTX 3050 Ti | |
| Average of class Office (2823 - 7626, n=65, last 2 years) | |
| Huawei MateBook X Pro 2022 | |
| Lenovo ThinkPad T14 G3-21CF004NGE | |
| Average Intel Core i7-1260P, NVIDIA GeForce MX550 (5870 - 6235, n=2) | |
| HP EliteBook 840 G9 | |
| Lenovo ThinkPad T14 G3-21AJS00400 | |
| PCMark 10 / Essentials | |
| HP EliteBook 840 G9 | |
| Huawei MateBook X Pro 2022 | |
| Schenker Vision 14 2022 RTX 3050 Ti | |
| Average of class Office (6567 - 11594, n=65, last 2 years) | |
| Average Intel Core i7-1260P, NVIDIA GeForce MX550 (9729 - 10132, n=2) | |
| Lenovo ThinkPad T14 G3-21CF004NGE | |
| Lenovo ThinkPad T14 G3-21AJS00400 | |
| PCMark 10 / Productivity | |
| Average Intel Core i7-1260P, NVIDIA GeForce MX550 (8189 - 9245, n=2) | |
| Huawei MateBook X Pro 2022 | |
| Schenker Vision 14 2022 RTX 3050 Ti | |
| Lenovo ThinkPad T14 G3-21CF004NGE | |
| Average of class Office (3041 - 10925, n=65, last 2 years) | |
| Lenovo ThinkPad T14 G3-21AJS00400 | |
| HP EliteBook 840 G9 | |
| PCMark 10 / Digital Content Creation | |
| Schenker Vision 14 2022 RTX 3050 Ti | |
| Average of class Office (2049 - 11108, n=65, last 2 years) | |
| Lenovo ThinkPad T14 G3-21CF004NGE | |
| HP EliteBook 840 G9 | |
| Average Intel Core i7-1260P, NVIDIA GeForce MX550 (6891 - 7021, n=2) | |
| Lenovo ThinkPad T14 G3-21AJS00400 | |
| Huawei MateBook X Pro 2022 | |
| CrossMark / Overall | |
| Huawei MateBook X Pro 2022 | |
| HP EliteBook 840 G9 | |
| Schenker Vision 14 2022 RTX 3050 Ti | |
| Lenovo ThinkPad T14 G3-21AJS00400 | |
| Average Intel Core i7-1260P, NVIDIA GeForce MX550 (n=1) | |
| Average of class Office (348 - 1891, n=76, last 2 years) | |
| Lenovo ThinkPad T14 G3-21CF004NGE | |
| CrossMark / Productivity | |
| Huawei MateBook X Pro 2022 | |
| HP EliteBook 840 G9 | |
| Schenker Vision 14 2022 RTX 3050 Ti | |
| Lenovo ThinkPad T14 G3-21AJS00400 | |
| Average Intel Core i7-1260P, NVIDIA GeForce MX550 (n=1) | |
| Lenovo ThinkPad T14 G3-21CF004NGE | |
| Average of class Office (393 - 1880, n=76, last 2 years) | |
| CrossMark / Creativity | |
| Huawei MateBook X Pro 2022 | |
| HP EliteBook 840 G9 | |
| Schenker Vision 14 2022 RTX 3050 Ti | |
| Lenovo ThinkPad T14 G3-21AJS00400 | |
| Average Intel Core i7-1260P, NVIDIA GeForce MX550 (n=1) | |
| Average of class Office (319 - 2155, n=76, last 2 years) | |
| Lenovo ThinkPad T14 G3-21CF004NGE | |
| CrossMark / Responsiveness | |
| Huawei MateBook X Pro 2022 | |
| HP EliteBook 840 G9 | |
| Schenker Vision 14 2022 RTX 3050 Ti | |
| Lenovo ThinkPad T14 G3-21AJS00400 | |
| Average Intel Core i7-1260P, NVIDIA GeForce MX550 (n=1) | |
| Average of class Office (258 - 1877, n=76, last 2 years) | |
| Lenovo ThinkPad T14 G3-21CF004NGE | |
| PCMark 10 Score | 5870 points | |
Help | ||
| AIDA64 / Memory Copy | |
| Huawei MateBook X Pro 2022 | |
| Average of class Office (20075 - 108783, n=76, last 2 years) | |
| HP EliteBook 840 G9 | |
| Average Intel Core i7-1260P (25125 - 71544, n=25) | |
| Lenovo ThinkPad T14 G3-21CF004NGE | |
| Schenker Vision 14 2022 RTX 3050 Ti | |
| Lenovo ThinkPad T14 G3-21AJS00400 | |
| AIDA64 / Memory Read | |
| Huawei MateBook X Pro 2022 | |
| HP EliteBook 840 G9 | |
| Average of class Office (10084 - 128030, n=76, last 2 years) | |
| Average Intel Core i7-1260P (24983 - 72065, n=25) | |
| Lenovo ThinkPad T14 G3-21CF004NGE | |
| Schenker Vision 14 2022 RTX 3050 Ti | |
| Lenovo ThinkPad T14 G3-21AJS00400 | |
| AIDA64 / Memory Write | |
| Huawei MateBook X Pro 2022 | |
| Average of class Office (20073 - 117935, n=76, last 2 years) | |
| HP EliteBook 840 G9 | |
| Average Intel Core i7-1260P (23512 - 66799, n=25) | |
| Lenovo ThinkPad T14 G3-21CF004NGE | |
| Schenker Vision 14 2022 RTX 3050 Ti | |
| Lenovo ThinkPad T14 G3-21AJS00400 | |
| AIDA64 / Memory Latency | |
| Lenovo ThinkPad T14 G3-21CF004NGE | |
| Huawei MateBook X Pro 2022 | |
| Average of class Office (7.6 - 162.9, n=72, last 2 years) | |
| HP EliteBook 840 G9 | |
| Lenovo ThinkPad T14 G3-21AJS00400 | |
| Schenker Vision 14 2022 RTX 3050 Ti | |
| Average Intel Core i7-1260P (77.9 - 118.4, n=21) | |
* ... smaller is better
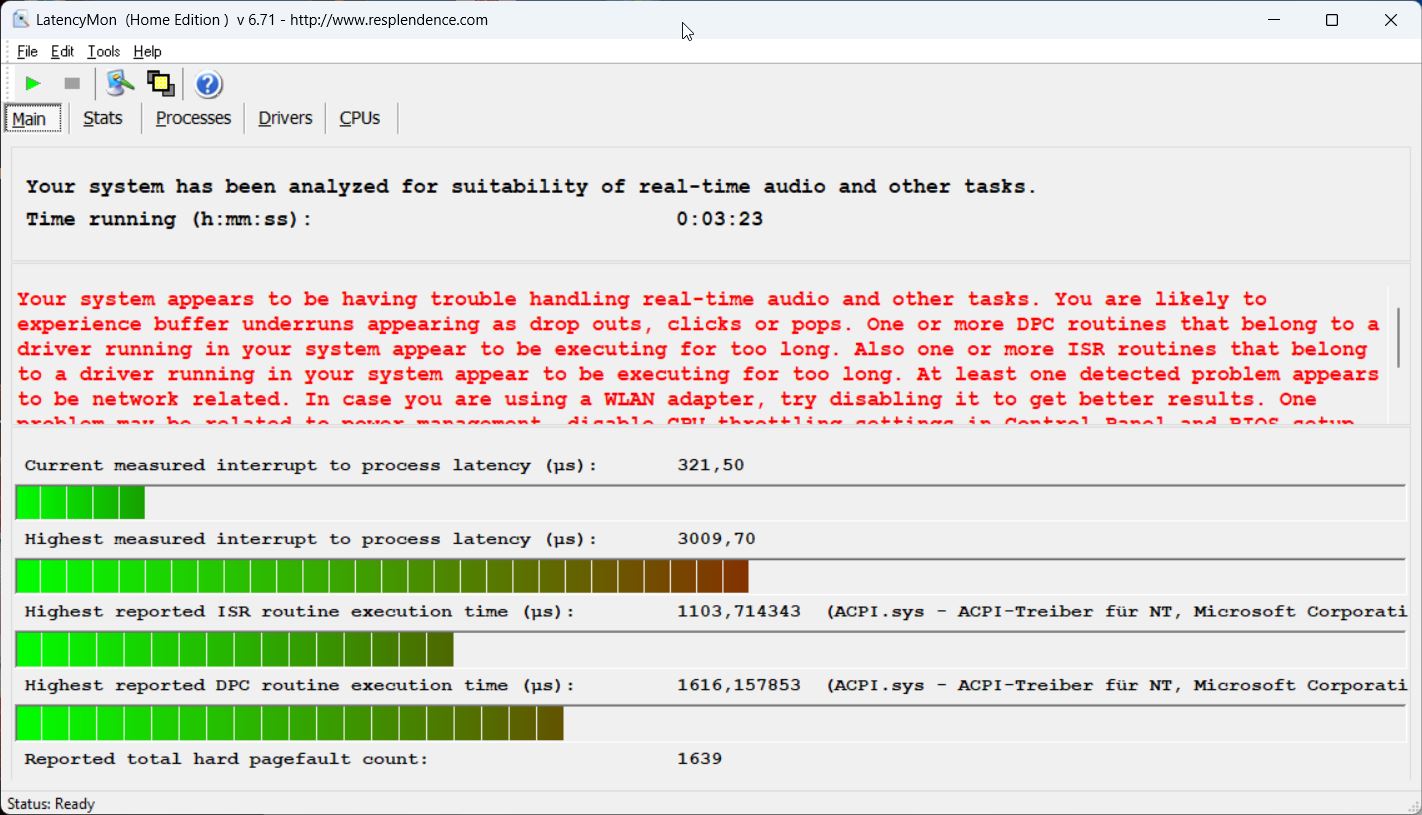
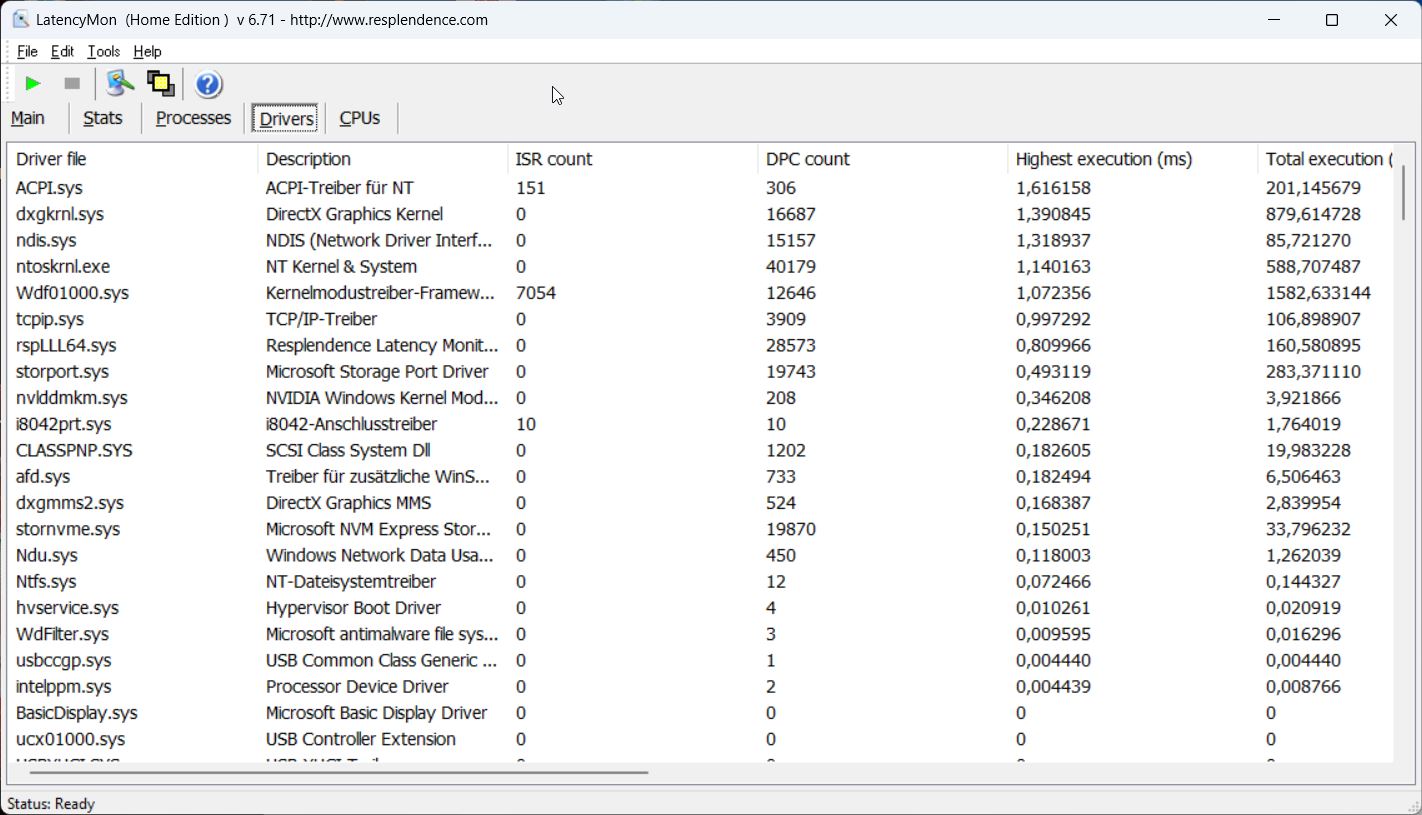
DPC Latencies
In our standardized latency test (surfing the Internet, 4K YouTube video reproduction, and CPU load), the test unit with its current BIOS version shows some significant limitations for usage in real-time audio applications. But there might also be some limitations created by the Nvidia driver, since there have been problems in this regard for several driver versions. The AMD model of the T14 G3 did not have any problems here.
| DPC Latencies / LatencyMon - interrupt to process latency (max), Web, Youtube, Prime95 | |
| HP EliteBook 840 G9 | |
| Lenovo ThinkPad T14 G3-21AJS00400 | |
| Huawei MateBook X Pro 2022 | |
| Schenker Vision 14 2022 RTX 3050 Ti | |
| Lenovo ThinkPad T14 G3-21CF004NGE | |
* ... smaller is better
Storage solution
Our test unit uses the 1-TB version of the Samsung PM9A1, which is the OEM variant of the 980 Pro. While the PCIe 4.0 SSD offers very good transfer rates, the rates drop after some time under constant load. However, this has no impact in everyday business operation. After the first startup, there are 904 GB of storage space available to the user. You can find additional SSD benchmarks here.

* ... smaller is better
Disk Throttling: DiskSpd Read Loop, Queue Depth 8
Graphics Card
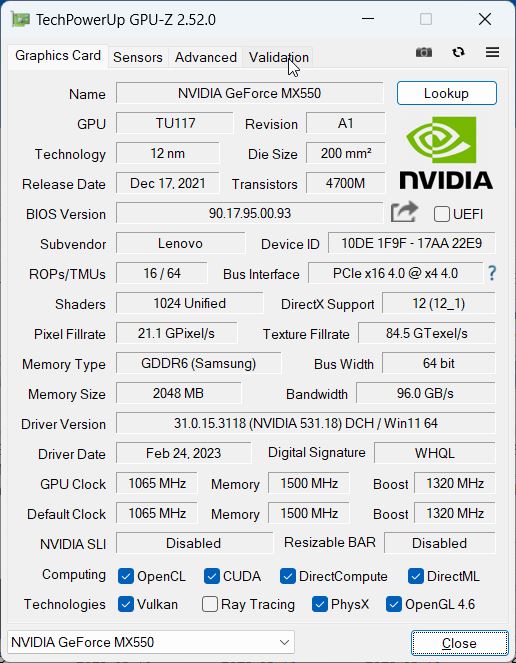
In addition to the integrated Iris Xe Graphics G7 of the processor, Lenovo also equipped our test configuration with a dedicated GeForce MX550 from Nvidia with 2 GB of VRAM. The graphics card is allowed to consume a maximum of 30 watts and also offers a noticeable advantage in the benchmarks compared to the slightly outdated iGPU from Intel. However, the integrated Radeon 680M in the AMD model performs at the same level, at least in the synthetic tests. So we must already ask the question, why you would need the additional graphics card here.
On the other hand, the GeForce GPU has a slight advantage compared to the integrated Radeon 680M in the actual gaming benchmarks, but this advantage isn't really huge. Those who like to play a round of games on their work laptop after finishing work are significantly better served by the Schenker Vision 14 and der RTX 3050 Ti, for example.
Under constant load and in battery operation, the graphics performance remains stable. You can find additional GPU benchmarks in our technical section.
| 3DMark 11 Performance | 10068 points | |
| 3DMark Fire Strike Score | 5764 points | |
| 3DMark Time Spy Score | 2695 points | |
Help | ||
| Blender / v3.3 Classroom OPTIX/RTX | |
| Lenovo ThinkPad T14 G3-21AJS00400 | |
| Average NVIDIA GeForce MX550 (n=1) | |
| Average of class Office (n=1last 2 years) | |
| Schenker Vision 14 2022 RTX 3050 Ti | |
| Blender / v3.3 Classroom CUDA | |
| Lenovo ThinkPad T14 G3-21AJS00400 | |
| Average NVIDIA GeForce MX550 (n=1) | |
| Average of class Office (n=1last 2 years) | |
| Schenker Vision 14 2022 RTX 3050 Ti | |
| Blender / v3.3 Classroom CPU | |
| Average of class Office (245 - 3964, n=73, last 2 years) | |
| HP EliteBook 840 G9 | |
| Lenovo ThinkPad T14 G3-21AJS00400 | |
| Average NVIDIA GeForce MX550 (n=1) | |
| Huawei MateBook X Pro 2022 | |
| Lenovo ThinkPad T14 G3-21CF004NGE | |
| Schenker Vision 14 2022 RTX 3050 Ti | |
| Blender / v3.3 Classroom HIP/AMD | |
| Average of class Office (296 - 710, n=7, last 2 years) | |
| Lenovo ThinkPad T14 G3-21CF004NGE | |
* ... smaller is better
| Performance rating - Percent | |
| Schenker Vision 14 2022 RTX 3050 Ti | |
| Lenovo ThinkPad T14 G3-21AJS00400 | |
| Lenovo ThinkPad T14 G3-21CF004NGE | |
| Average of class Office | |
| HP EliteBook 840 G9 | |
| Huawei MateBook X Pro 2022 | |
| The Witcher 3 - 1920x1080 Ultra Graphics & Postprocessing (HBAO+) | |
| Schenker Vision 14 2022 RTX 3050 Ti | |
| Lenovo ThinkPad T14 G3-21AJS00400 | |
| Lenovo ThinkPad T14 G3-21CF004NGE | |
| HP EliteBook 840 G9 | |
| Average of class Office (3.8 - 32.5, n=24, last 2 years) | |
| Huawei MateBook X Pro 2022 | |
| GTA V - 1920x1080 Highest Settings possible AA:4xMSAA + FX AF:16x | |
| Schenker Vision 14 2022 RTX 3050 Ti | |
| Lenovo ThinkPad T14 G3-21AJS00400 | |
| Lenovo ThinkPad T14 G3-21CF004NGE | |
| Average of class Office (3.98 - 47.8, n=66, last 2 years) | |
| Huawei MateBook X Pro 2022 | |
| HP EliteBook 840 G9 | |
| Final Fantasy XV Benchmark - 1920x1080 High Quality | |
| Schenker Vision 14 2022 RTX 3050 Ti | |
| Lenovo ThinkPad T14 G3-21CF004NGE | |
| Lenovo ThinkPad T14 G3-21AJS00400 | |
| Average of class Office (6.45 - 36.5, n=70, last 2 years) | |
| Huawei MateBook X Pro 2022 | |
| HP EliteBook 840 G9 | |
| Strange Brigade - 1920x1080 ultra AA:ultra AF:16 | |
| Schenker Vision 14 2022 RTX 3050 Ti | |
| Lenovo ThinkPad T14 G3-21AJS00400 | |
| Lenovo ThinkPad T14 G3-21CF004NGE | |
| Average of class Office (12.9 - 62, n=52, last 2 years) | |
| Huawei MateBook X Pro 2022 | |
| HP EliteBook 840 G9 | |
| Dota 2 Reborn - 1920x1080 ultra (3/3) best looking | |
| Schenker Vision 14 2022 RTX 3050 Ti | |
| Lenovo ThinkPad T14 G3-21AJS00400 | |
| Lenovo ThinkPad T14 G3-21CF004NGE | |
| HP EliteBook 840 G9 | |
| Huawei MateBook X Pro 2022 | |
| Average of class Office (13.4 - 121.2, n=75, last 2 years) | |
The Witcher 3 FPS Chart
| low | med. | high | ultra | 4K | |
|---|---|---|---|---|---|
| GTA V (2015) | 159.9 | 152.3 | 73.4 | 33.7 | |
| The Witcher 3 (2015) | 149 | 89 | 48 | 24 | |
| Dota 2 Reborn (2015) | 142.1 | 127 | 110.4 | 101.1 | |
| Final Fantasy XV Benchmark (2018) | 69.2 | 34.3 | 20.8 | ||
| X-Plane 11.11 (2018) | 109.9 | 95.2 | 73.4 | ||
| Far Cry 5 (2018) | 95 | 40 | 32 | 30 | |
| Strange Brigade (2018) | 147 | 59 | 51 | 45 | |
| F1 2021 (2021) | 152.7 | 53.5 | 47.4 | 25.7 | |
| F1 22 (2022) | 59.4 | 51.3 | 41.2 | 28.1 |
Emissions and Power Management
Noise Levels
The Intel model of the ThinkPad T14 G3 is a very quiet companion under low load, but the high-speed revving of the fan is a bit annoying. Even though the speed is reduced quickly, the fan initially revs up very noticeably. Under heavier load, the device then also becomes slightly louder overall than the AMD version, and we measure a maximum of almost 40 dB(A) while gaming and during the stress test. Our test unit doesn't produce any other electronic noises.
Noise level
| Idle |
| 23.6 / 23.6 / 23.6 dB(A) |
| Load |
| 35.1 / 39.6 dB(A) |
 | ||
30 dB silent 40 dB(A) audible 50 dB(A) loud |
||
min: | ||
| Lenovo ThinkPad T14 G3-21AJS00400 GeForce MX550, i7-1260P, Samsung PM9A1 MZVL21T0HCLR | Lenovo ThinkPad T14 G3-21CF004NGE Radeon 680M, R7 PRO 6850U, Kioxia BG5 KBG5AZNV512G | HP EliteBook 840 G9 Iris Xe G7 96EUs, i7-1280P, SK hynix PC801 HFS512GEJ9X101N BF | Schenker Vision 14 2022 RTX 3050 Ti GeForce RTX 3050 Ti Laptop GPU, i7-12700H, Samsung SSD 980 Pro 1TB MZ-V8P1T0BW | Huawei MateBook X Pro 2022 Iris Xe G7 96EUs, i7-1260P, Silicon Motion PCIe-8 SSD 1TB | |
|---|---|---|---|---|---|
| Noise | 1% | -3% | -14% | 0% | |
| off / environment * (dB) | 23.6 | 24.2 -3% | 24.3 -3% | 24.4 -3% | 23.5 -0% |
| Idle Minimum * (dB) | 23.6 | 24.2 -3% | 24.5 -4% | 24.4 -3% | 23.5 -0% |
| Idle Average * (dB) | 23.6 | 24.2 -3% | 24.5 -4% | 24.4 -3% | 23.5 -0% |
| Idle Maximum * (dB) | 23.6 | 25.8 -9% | 26 -10% | 27.8 -18% | 25.9 -10% |
| Load Average * (dB) | 35.1 | 32.2 8% | 32.3 8% | 43.3 -23% | 33.8 4% |
| Witcher 3 ultra * (dB) | 39.6 | 34.1 14% | 39 2% | 48.2 -22% | 35.4 11% |
| Load Maximum * (dB) | 39.6 | 38.8 2% | 44.7 -13% | 48.8 -23% | 40.6 -3% |
* ... smaller is better
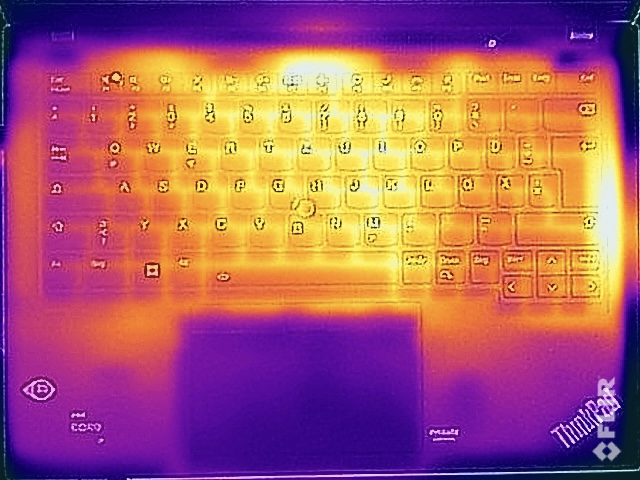
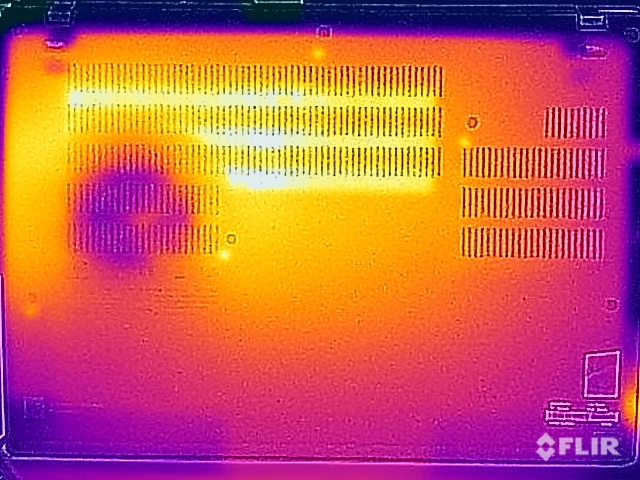
Temperatures
Lenovo has a good grip on the surface temperatures of the ThinkPad T14 G3 overall, but under low load, the device unfortunately already gets slightly warmer than the AMD model. Under heavier load, we measure a maximum temperature slightly higher than 40 °C (104 °F), so this doesn't result in any limitations here, and you can still type comfortably and also keep the device on your lap.
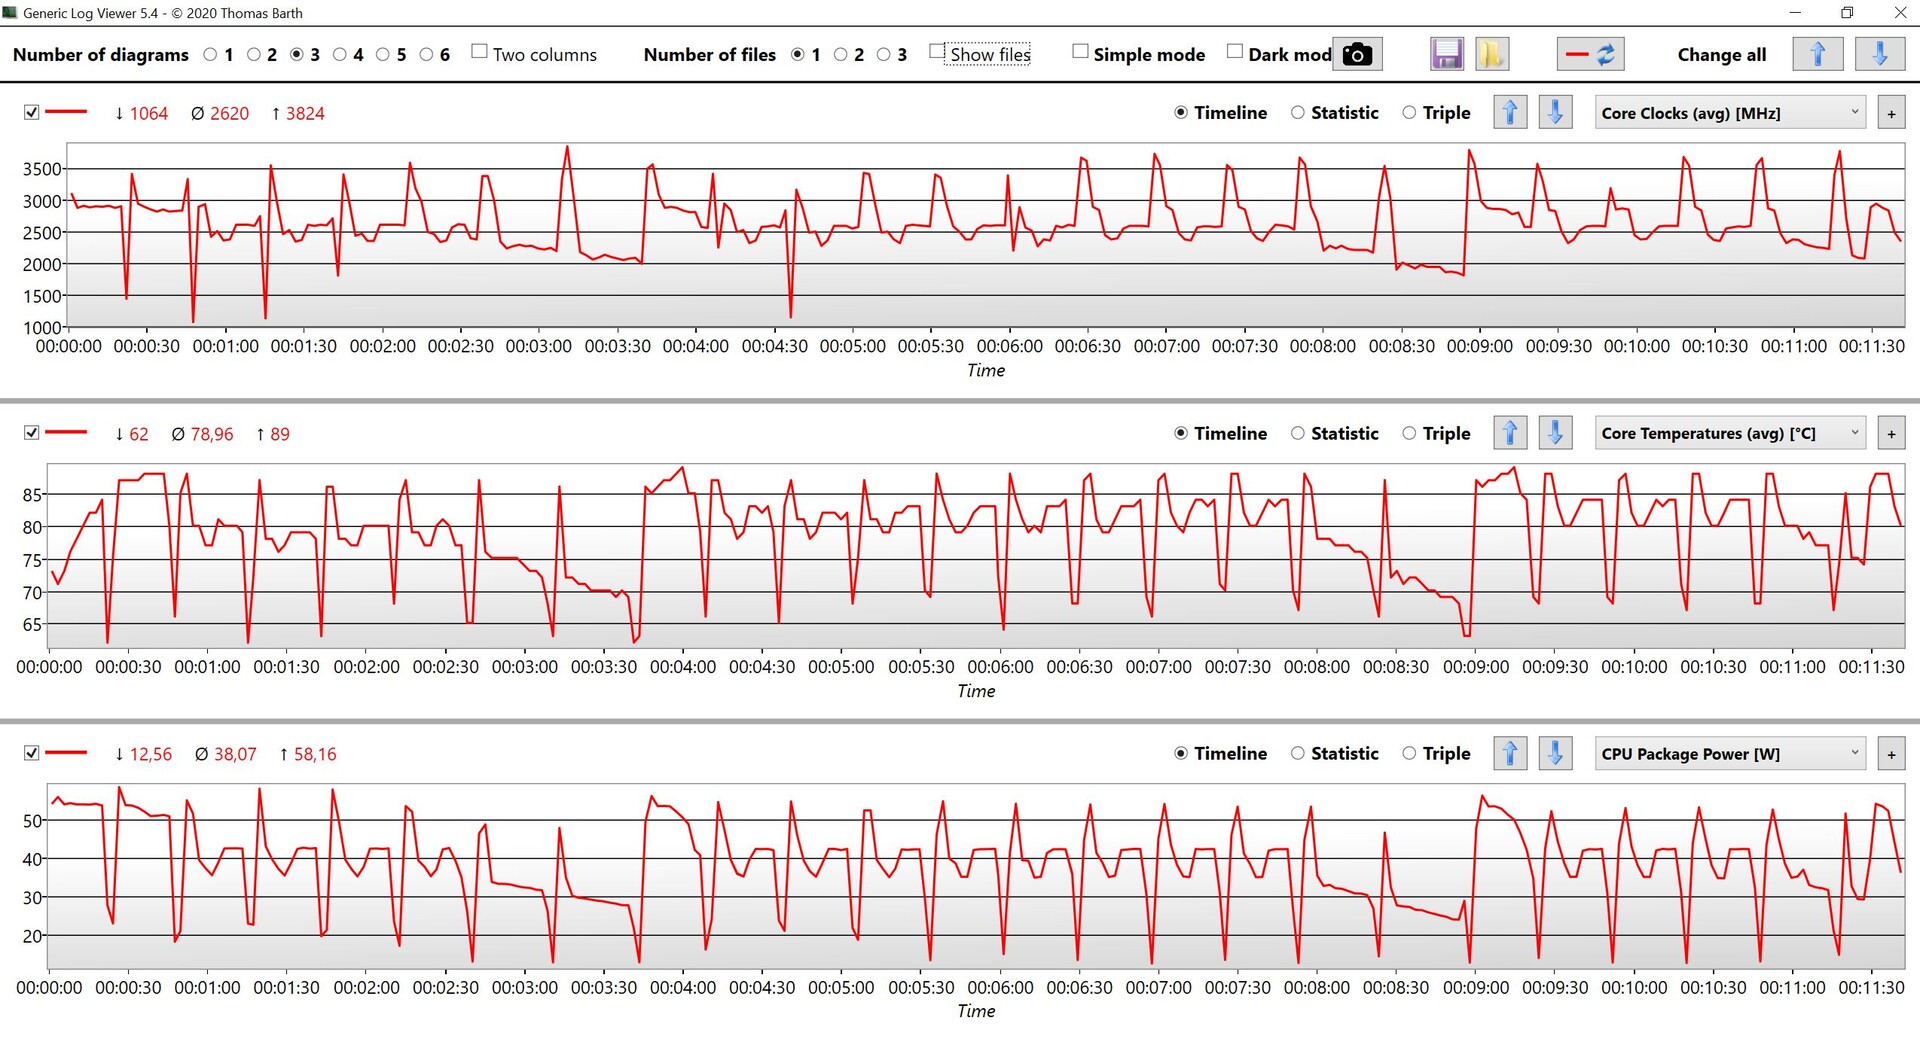
During the stress test, the GPU performance remains stable at around 30 watts, but the processor has to throttle its performance massively after a few minutes, dropping from a maximum of 50 watts to only 15 watts. If you look at the consumption, you can also immediately see that the 65-Watt power supply will never be able to provide sufficient power here, but more on that later.

(-) The maximum temperature on the upper side is 46.4 °C / 116 F, compared to the average of 34.3 °C / 94 F, ranging from 21.2 to 62.5 °C for the class Office.
(±) The bottom heats up to a maximum of 43.1 °C / 110 F, compared to the average of 36.8 °C / 98 F
(+) In idle usage, the average temperature for the upper side is 29.9 °C / 86 F, compared to the device average of 29.5 °C / 85 F.
(±) Playing The Witcher 3, the average temperature for the upper side is 37.5 °C / 100 F, compared to the device average of 29.5 °C / 85 F.
(+) The palmrests and touchpad are reaching skin temperature as a maximum (34.5 °C / 94.1 F) and are therefore not hot.
(-) The average temperature of the palmrest area of similar devices was 27.6 °C / 81.7 F (-6.9 °C / -12.4 F).
| Lenovo ThinkPad T14 G3-21AJS00400 Intel Core i7-1260P, NVIDIA GeForce MX550 | Lenovo ThinkPad T14 G3-21CF004NGE AMD Ryzen 7 PRO 6850U, AMD Radeon 680M | HP EliteBook 840 G9 Intel Core i7-1280P, Intel Iris Xe Graphics G7 96EUs | Schenker Vision 14 2022 RTX 3050 Ti Intel Core i7-12700H, NVIDIA GeForce RTX 3050 Ti Laptop GPU | Huawei MateBook X Pro 2022 Intel Core i7-1260P, Intel Iris Xe Graphics G7 96EUs | |
|---|---|---|---|---|---|
| Heat | 6% | 27% | -3% | 7% | |
| Maximum Upper Side * (°C) | 46.4 | 48.2 -4% | 32.8 29% | 48.4 -4% | 43.1 7% |
| Maximum Bottom * (°C) | 43.1 | 52.8 -23% | 36.6 15% | 57.1 -32% | 42 3% |
| Idle Upper Side * (°C) | 33.9 | 24.4 28% | 21.6 36% | 28.1 17% | 29.4 13% |
| Idle Bottom * (°C) | 31.4 | 24.5 22% | 22.2 29% | 29 8% | 29.4 6% |
* ... smaller is better
Speakers
Lenovo ThinkPad T14 G3-21AJS00400 audio analysis
(±) | speaker loudness is average but good (77.8 dB)
Bass 100 - 315 Hz
(-) | nearly no bass - on average 24.9% lower than median
(±) | linearity of bass is average (11.7% delta to prev. frequency)
Mids 400 - 2000 Hz
(+) | balanced mids - only 2.4% away from median
(+) | mids are linear (4% delta to prev. frequency)
Highs 2 - 16 kHz
(+) | balanced highs - only 2.6% away from median
(+) | highs are linear (3.8% delta to prev. frequency)
Overall 100 - 16.000 Hz
(±) | linearity of overall sound is average (18% difference to median)
Compared to same class
» 28% of all tested devices in this class were better, 7% similar, 65% worse
» The best had a delta of 7%, average was 21%, worst was 53%
Compared to all devices tested
» 36% of all tested devices were better, 8% similar, 56% worse
» The best had a delta of 4%, average was 24%, worst was 134%
Huawei MateBook X Pro 2022 audio analysis
(+) | speakers can play relatively loud (85.5 dB)
Bass 100 - 315 Hz
(±) | reduced bass - on average 5% lower than median
(+) | bass is linear (5.3% delta to prev. frequency)
Mids 400 - 2000 Hz
(+) | balanced mids - only 1.5% away from median
(+) | mids are linear (2.5% delta to prev. frequency)
Highs 2 - 16 kHz
(+) | balanced highs - only 2.1% away from median
(+) | highs are linear (5.3% delta to prev. frequency)
Overall 100 - 16.000 Hz
(+) | overall sound is linear (5% difference to median)
Compared to same class
» 0% of all tested devices in this class were better, 0% similar, 100% worse
» The best had a delta of 5%, average was 18%, worst was 53%
Compared to all devices tested
» 0% of all tested devices were better, 0% similar, 100% worse
» The best had a delta of 4%, average was 24%, worst was 134%
Power Consumption
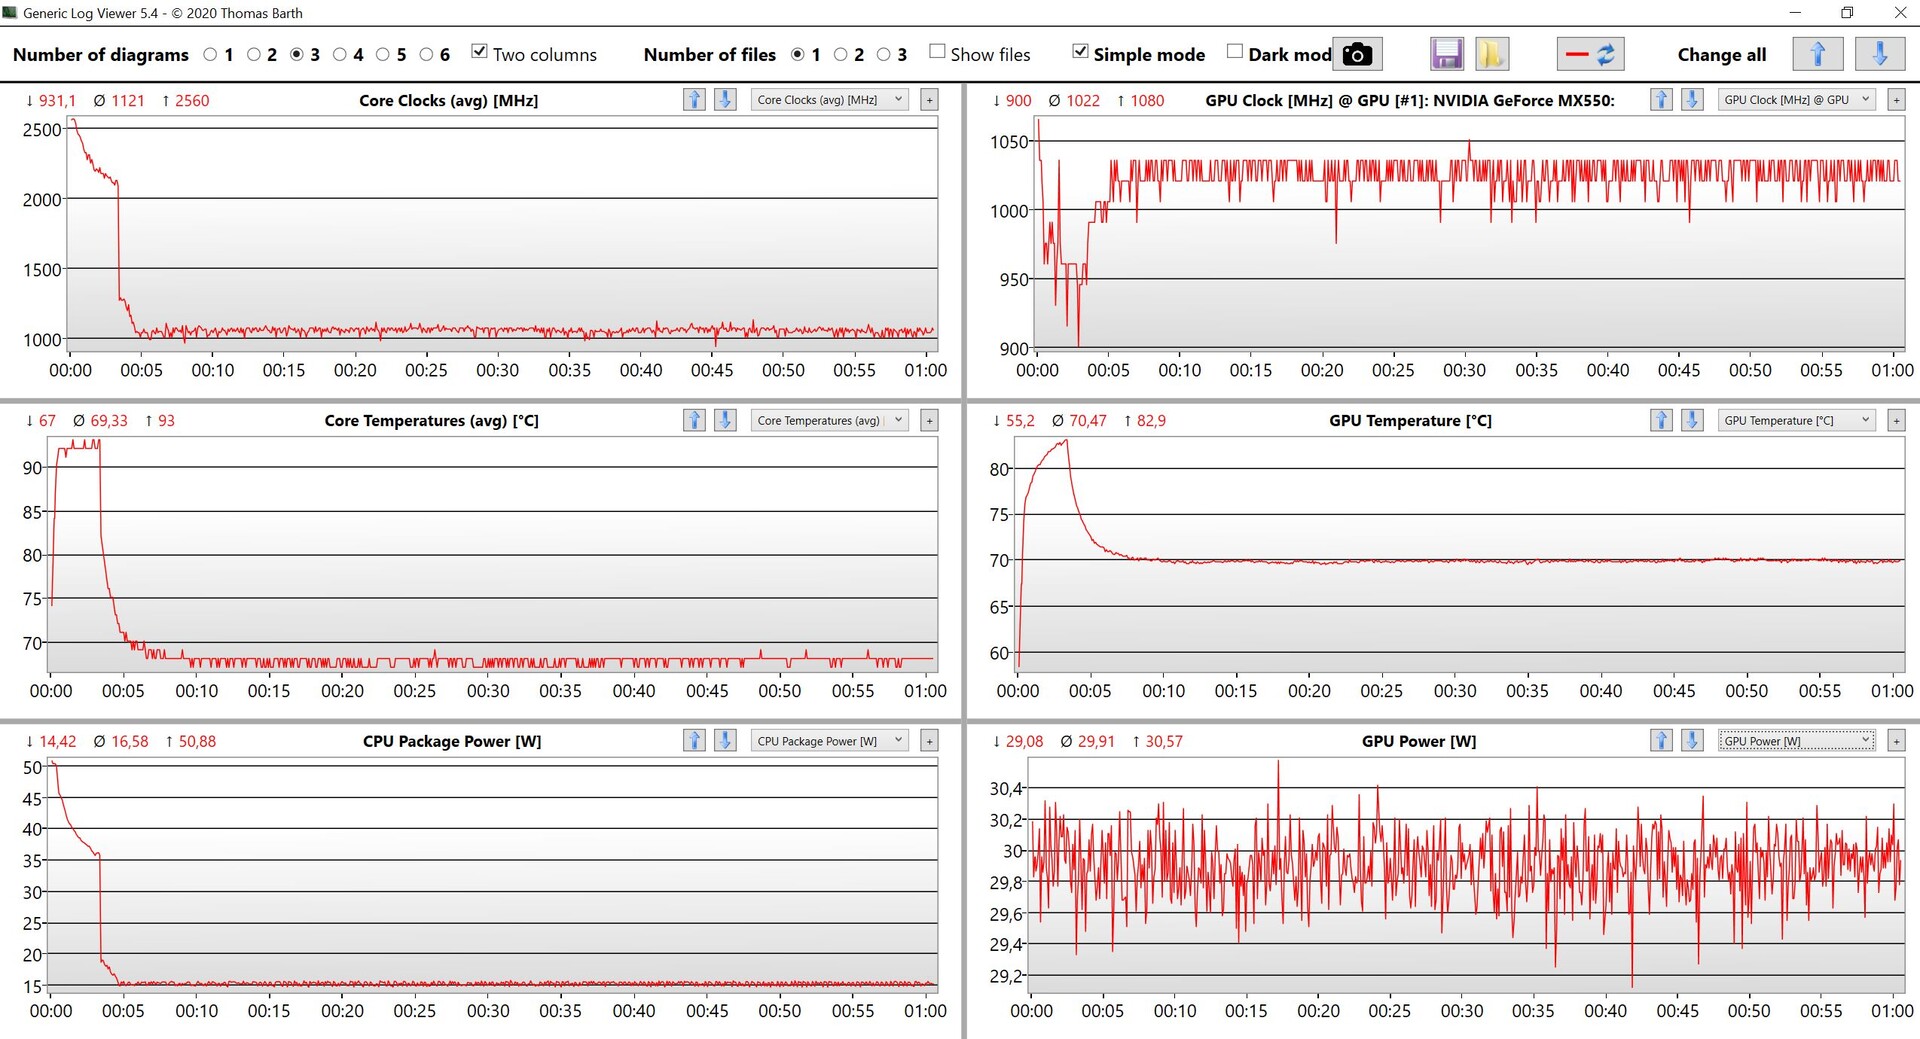
The Intel model consumes more power than the AMD version throughout all scenarios, even during idle operation (but the different panel might also play a role here). In addition, the 65-Watt power supply is not sufficiently sized under load, since the device has to draw power from the battery in the first three minutes here, with the battery capacity also dropping to ~95%. Only after the processor levels out at 15 watts (see above) is the power supply able to provide sufficient power during the stress test.
We have to say that Lenovo clearly limits the performance in this scenario. Using a 100-Watt power supply, we were able to measure a maximum consumption of 101 watts at the beginning of the stress test, before it then leveled out at ~85 watts. With this, the CPU performance would also be better, but on the other hand, that would also have an effect on the fan noise and surface temperatures as well.
| Off / Standby | |
| Idle | |
| Load |
|
Key:
min: | |
| Lenovo ThinkPad T14 G3-21AJS00400 GeForce MX550, i7-1260P, Samsung PM9A1 MZVL21T0HCLR | Lenovo ThinkPad T14 G3-21CF004NGE Radeon 680M, R7 PRO 6850U, Kioxia BG5 KBG5AZNV512G | HP EliteBook 840 G9 Iris Xe G7 96EUs, i7-1280P, SK hynix PC801 HFS512GEJ9X101N BF | Schenker Vision 14 2022 RTX 3050 Ti GeForce RTX 3050 Ti Laptop GPU, i7-12700H, Samsung SSD 980 Pro 1TB MZ-V8P1T0BW | Huawei MateBook X Pro 2022 Iris Xe G7 96EUs, i7-1260P, Silicon Motion PCIe-8 SSD 1TB | |
|---|---|---|---|---|---|
| Power Consumption | 26% | 10% | -63% | -55% | |
| Idle Minimum * (Watt) | 4.3 | 2.4 44% | 2.2 49% | 7.5 -74% | 6.5 -51% |
| Idle Average * (Watt) | 6.2 | 5.3 15% | 5.3 15% | 10.4 -68% | 13.7 -121% |
| Idle Maximum * (Watt) | 7 | 5.6 20% | 8.5 -21% | 11.4 -63% | 14.4 -106% |
| Load Average * (Watt) | 63.5 | 39.7 37% | 54.3 14% | 83.3 -31% | 64.6 -2% |
| Witcher 3 ultra * (Watt) | 52.5 | 42.8 18% | 51 3% | 92.7 -77% | 57.2 -9% |
| Load Maximum * (Watt) | 66.1 | 50.6 23% | 67.3 -2% | 110.3 -67% | 90.9 -38% |
* ... smaller is better
Power Consumption The Witcher 3 / Stress Test
Power Consumption with External Monitor
Battery Life
The same behavior continues in the battery tests, and the Intel model is clearly surpassed by the AMD version in our two WLAN tests (once at full brightness and then at 150 cd/m²). We measure between 7-8 hours when surfing, while the AMD model lasted ~9.5-13 hours.
Pros
Cons
Verdict - The ThinkPad T14 G3 is better with AMD
Looking at the ThinkPad T14 G3 by itself, it is a good business laptop also with the Intel/Nvidia combination with slightly more graphics performance than the aged iGPU from Intel. Compared to the AMD version, there are a couple of advantages, such as the higher single-core performance of the Intel processor and the slightly better gaming performance of the dedicated GeForce MX550. In addition, the Intel model also offers Thunderbolt 4 and there is a SO-DIMM slot, allowing you to expand the working memory.
On the other hand, there are also disadvantages such as the significantly higher power consumption under load, with the included 65-Watt power supply being much too weak, resulting in artificial throttling of the performance under combined CPU/GPU load. The fan also gets louder, and the battery life turns out shorter. At the same time, the AMD processor performs at the same level in the multicore tests, while consuming less power.
Due to the additional graphics card, the ThinkPad T14 G3 also consumes more power, while the additional performance compared to the AMD version is very small. So the additional module is hardly worthwhile, and those who can make do without Thunderbolt 4 will get the better business laptop with a longer battery life if they choose the AMD version of the ThinkPad T14 G3.
Another problem is the panel situation, but that also goes for all the models of the ThinkPad T14 G3. For example, the LG panel left a better impression in the test than the model from AU Optronics, even though it was the 14-inch LowPower display in both cases. We already saw this panel lottery in earlier models, and you unfortunately never know in advance which panel is used.
Even though the T14 G3 has already been on the market for some time, the new mobile Raptor Lake CPUs from Intel are a rather disappointing update overall, and at this point, we don't know when the new AMD models will arrive. At least, we don't expect an update within the next few months.
Price and Availability
The Intel version of the Lenovo ThinkPad T14 G3 is available from Lenovo starting from $1012.32, with the Nvidia configuration starting from $1067.52.
Lenovo ThinkPad T14 G3-21AJS00400
- 03/21/2023 v7 (old)
Andreas Osthoff
More articles related to this device
Lenovo ThinkPad T14 G3-21AJS00400 (ThinkPad T14 Series)Related Articles


Transparency
The selection of devices to be reviewed is made by our editorial team. The test sample was provided to the author as a loan by the manufacturer or retailer for the purpose of this review. The lender had no influence on this review, nor did the manufacturer receive a copy of this review before publication. There was no obligation to publish this review. As an independent media company, Notebookcheck is not subjected to the authority of manufacturers, retailers or publishers.
This is how Notebookcheck is testing
Every year, Notebookcheck independently reviews hundreds of laptops and smartphones using standardized procedures to ensure that all results are comparable. We have continuously developed our test methods for around 20 years and set industry standards in the process. In our test labs, high-quality measuring equipment is utilized by experienced technicians and editors. These tests involve a multi-stage validation process. Our complex rating system is based on hundreds of well-founded measurements and benchmarks, which maintains objectivity. Further information on our test methods can be found here.
Price comparison

