Lenovo ThinkPad T14 Gen 2 laptop review: Familiar benefits from Intel Tiger Lake
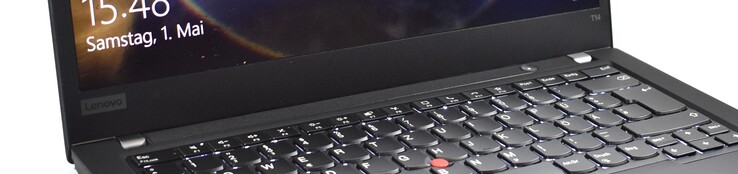
In Lenovo's current ThinkPad lineup, the T-series without the "s" suffix is like a rock: the ThinkPad T14 and ThinkPad T15, the mainstream business laptops for large corporate customers, have used the same design since 2019. Our review device today, the Lenovo ThinkPad T14 Gen 2, relies on the same basis as the ThinkPad T490. That means fewer new features, but the machine has a proven design. In addition, the standard T-series retains a keyboard with a travel of 1.8 millimeters this year.
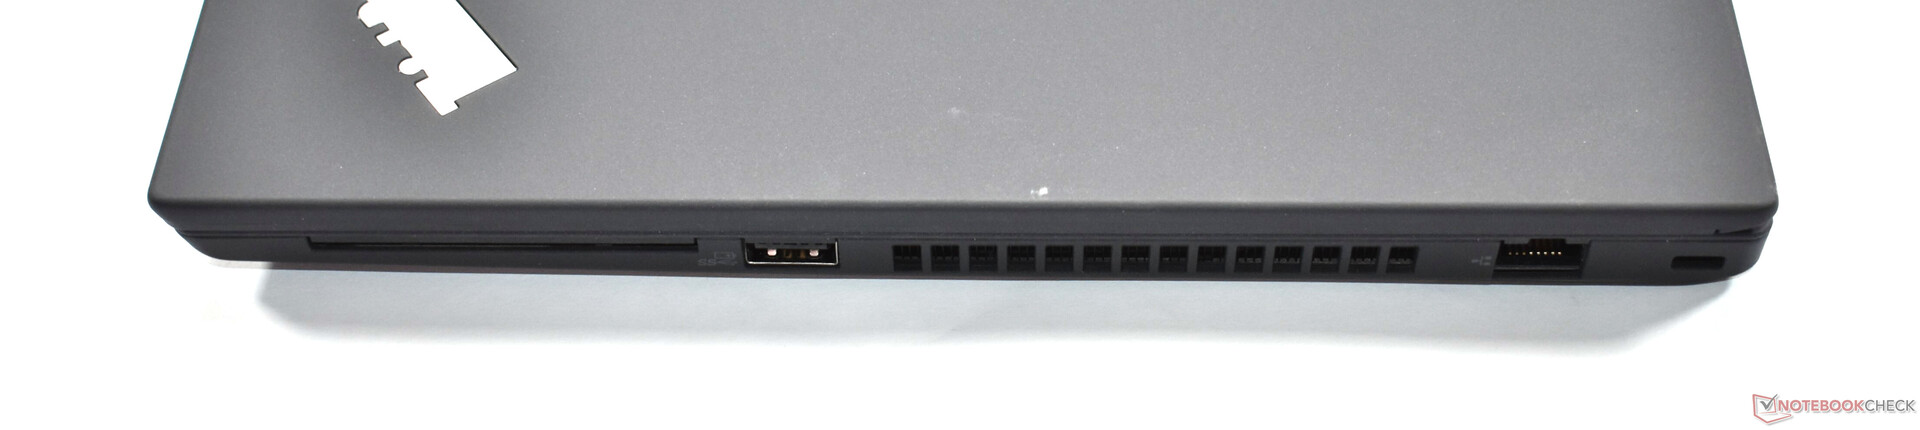
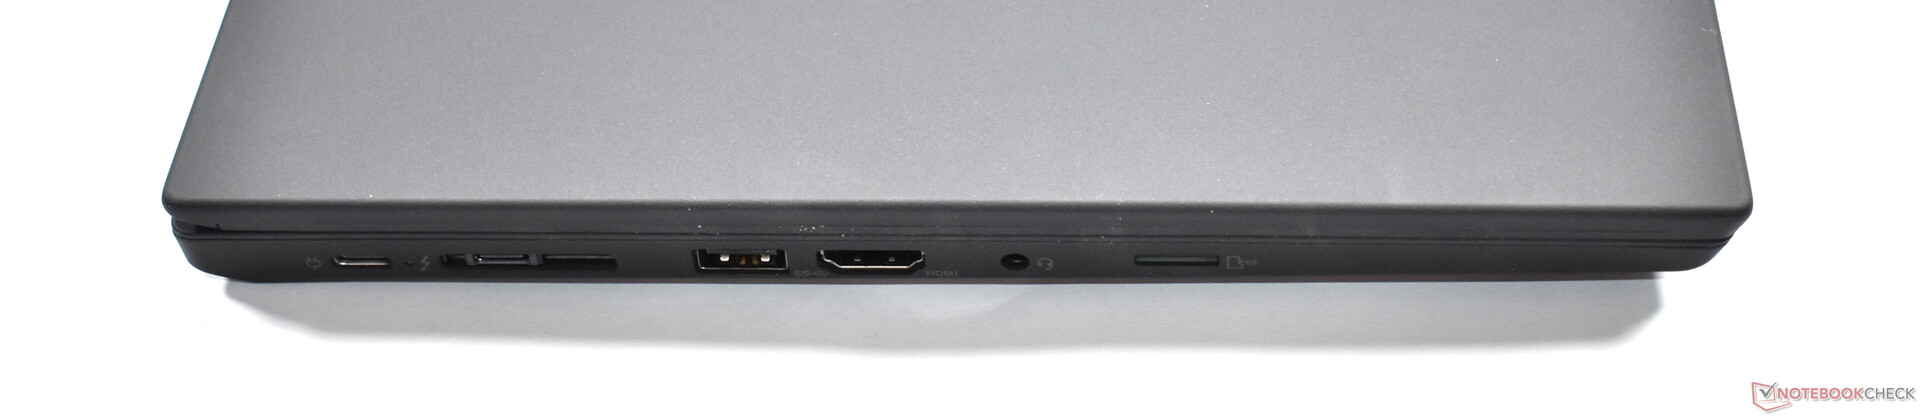
Because the T14's design is almost identical, we will refer to the review of the ThinkPad T490 for details about the case, equipment, and input devices.
Possible competitors in comparison
Rating | Date | Model | Weight | Height | Size | Resolution | Price |
|---|---|---|---|---|---|---|---|
| 88.1 % v7 (old) | 05 / 2021 | Lenovo ThinkPad T14 Gen2-20W1S00000 i7-1165G7, GeForce MX450 | 1.5 kg | 17.9 mm | 14.00" | 1920x1080 | |
| 88 % v7 (old) | 07 / 2020 | Lenovo ThinkPad T14-20S1S06B00 i5-10210U, UHD Graphics 620 | 1.5 kg | 17.9 mm | 14.00" | 1920x1080 | |
| 88.9 % v7 (old) | 11 / 2020 | Lenovo ThinkPad T14-20UES00H00 R5 PRO 4650U, Vega 6 | 1.5 kg | 17.9 mm | 14.00" | 1920x1080 | |
| 87.8 % v7 (old) | 11 / 2020 | HP EliteBook 845 G7-23Y60EA R5 PRO 4650U, Vega 6 | 1.5 kg | 17.9 mm | 14.00" | 1920x1080 | |
| 82.6 % v7 (old) | 02 / 2021 | Dell Latitude 14 5411-WJ40N i7-10850H, GeForce MX250 | 1.5 kg | 21 mm | 14.00" | 1920x1080 |

| SD Card Reader | |
| average JPG Copy Test (av. of 3 runs) | |
| Dell Latitude 14 5411-WJ40N (Toshiba Exceria Pro M501 microSDXC 64GB) | |
| Lenovo ThinkPad T14-20UES00H00 (Toshiba Exceria Pro M501 64 GB UHS-II) | |
| Lenovo ThinkPad T14-20S1S06B00 (Toshiba Exceria Pro M501 64 GB UHS-II) | |
| Lenovo ThinkPad T14 Gen2-20W1S00000 (AV Pro V60) | |
| Average of class Office (19.8 - 198.5, n=22, last 2 years) | |
| maximum AS SSD Seq Read Test (1GB) | |
| Dell Latitude 14 5411-WJ40N (Toshiba Exceria Pro M501 microSDXC 64GB) | |
| Lenovo ThinkPad T14-20UES00H00 (Toshiba Exceria Pro M501 64 GB UHS-II) | |
| Lenovo ThinkPad T14 Gen2-20W1S00000 (AV Pro V60) | |
| Lenovo ThinkPad T14-20S1S06B00 (Toshiba Exceria Pro M501 64 GB UHS-II) | |
| Average of class Office (27.4 - 249, n=21, last 2 years) | |


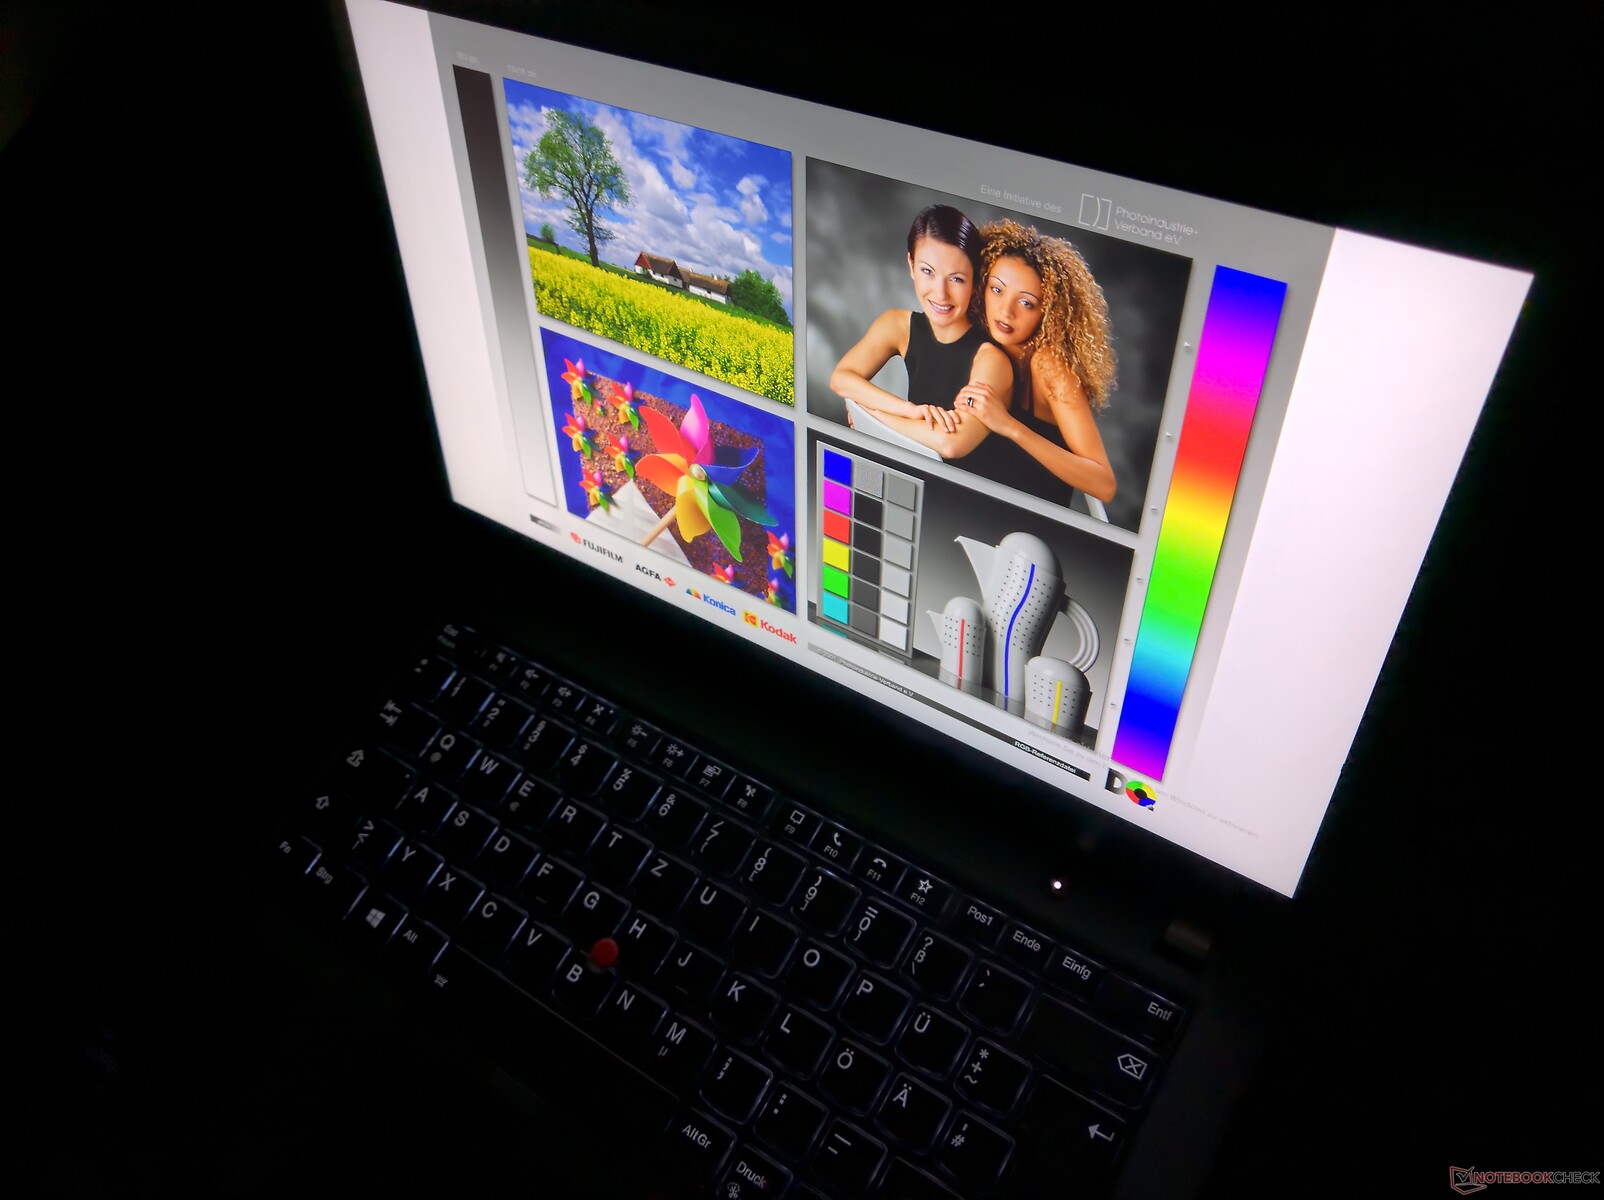
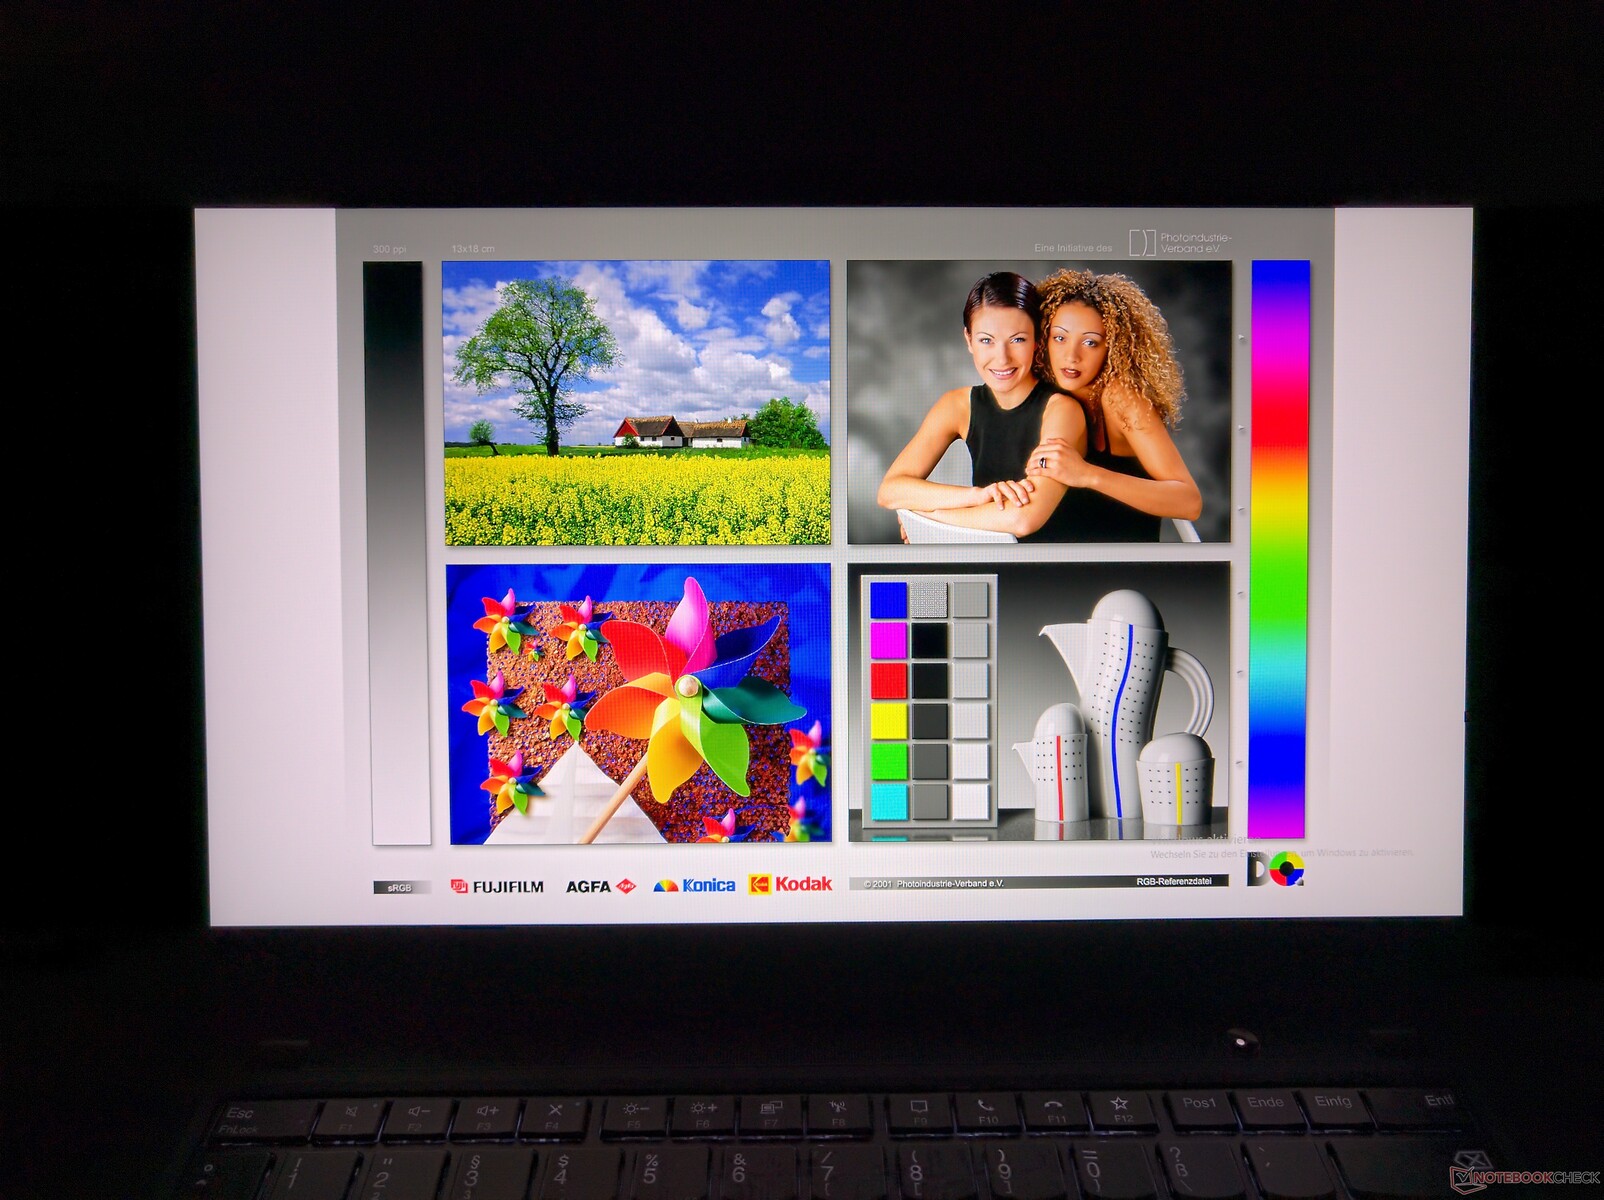
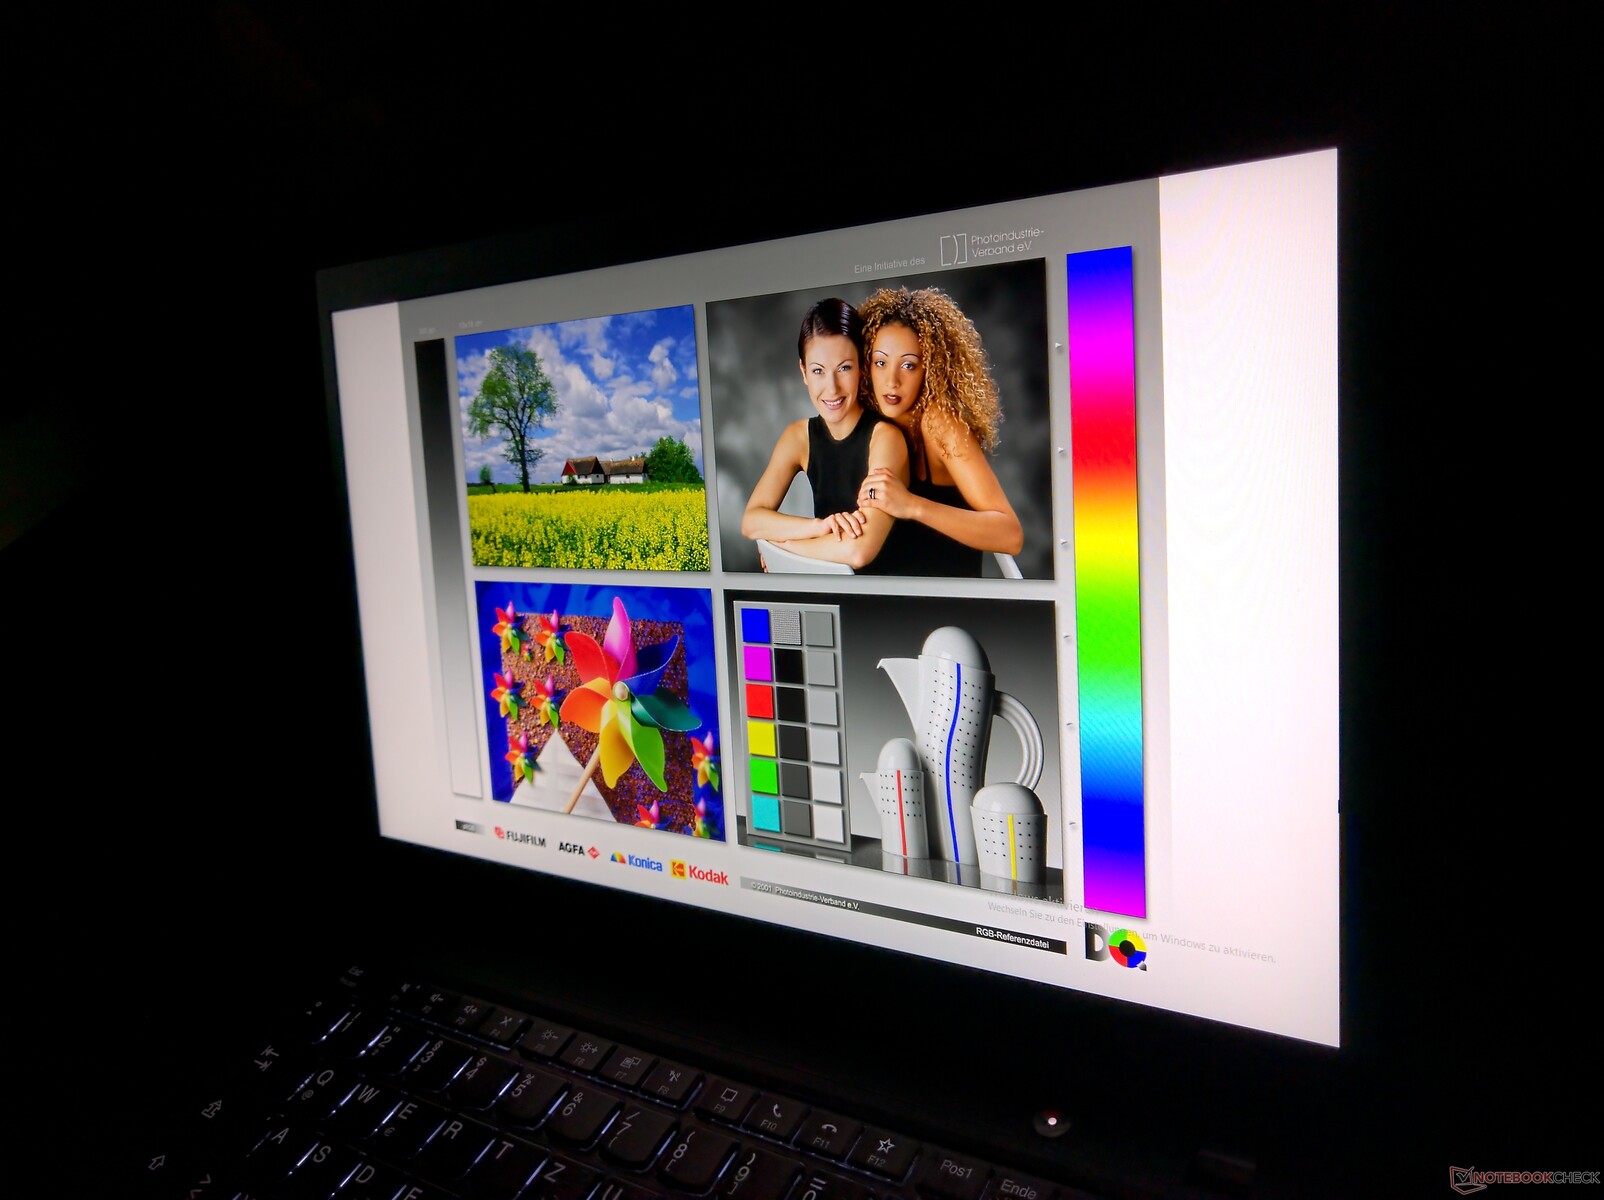
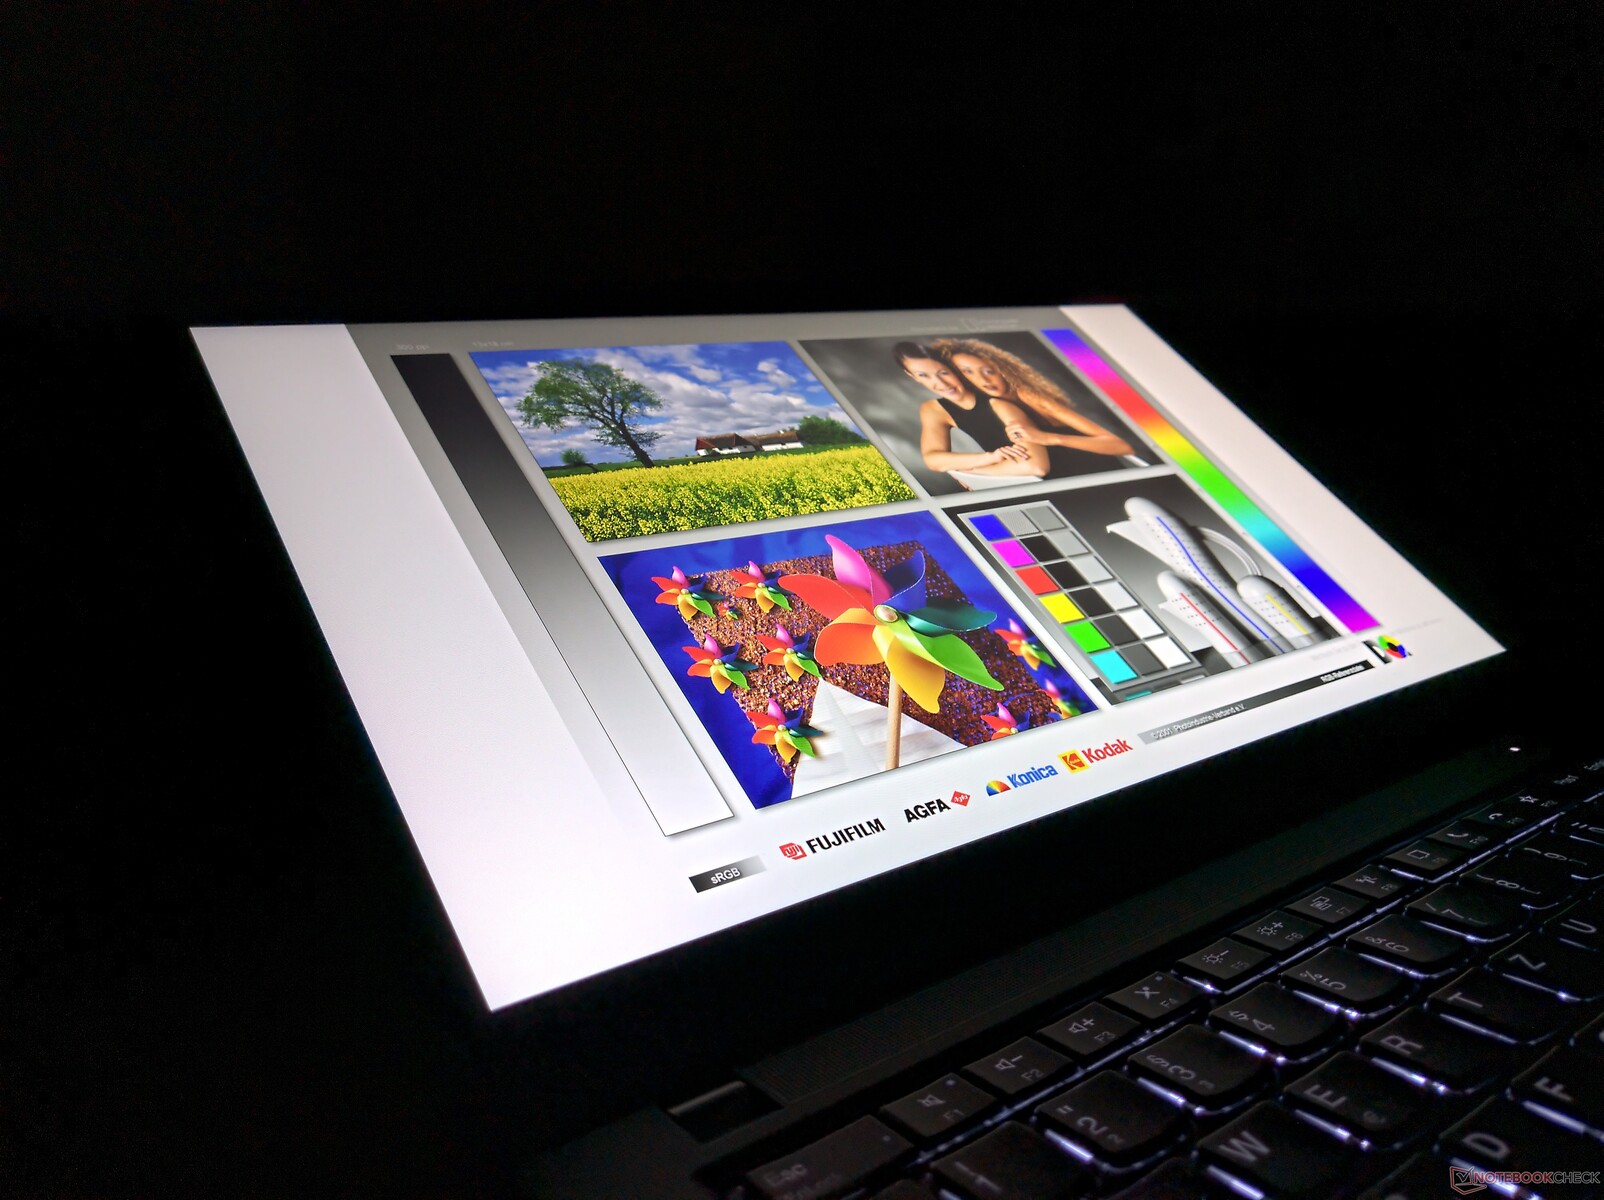
Known low-power display in the Lenovo ThinkPad T14 G2

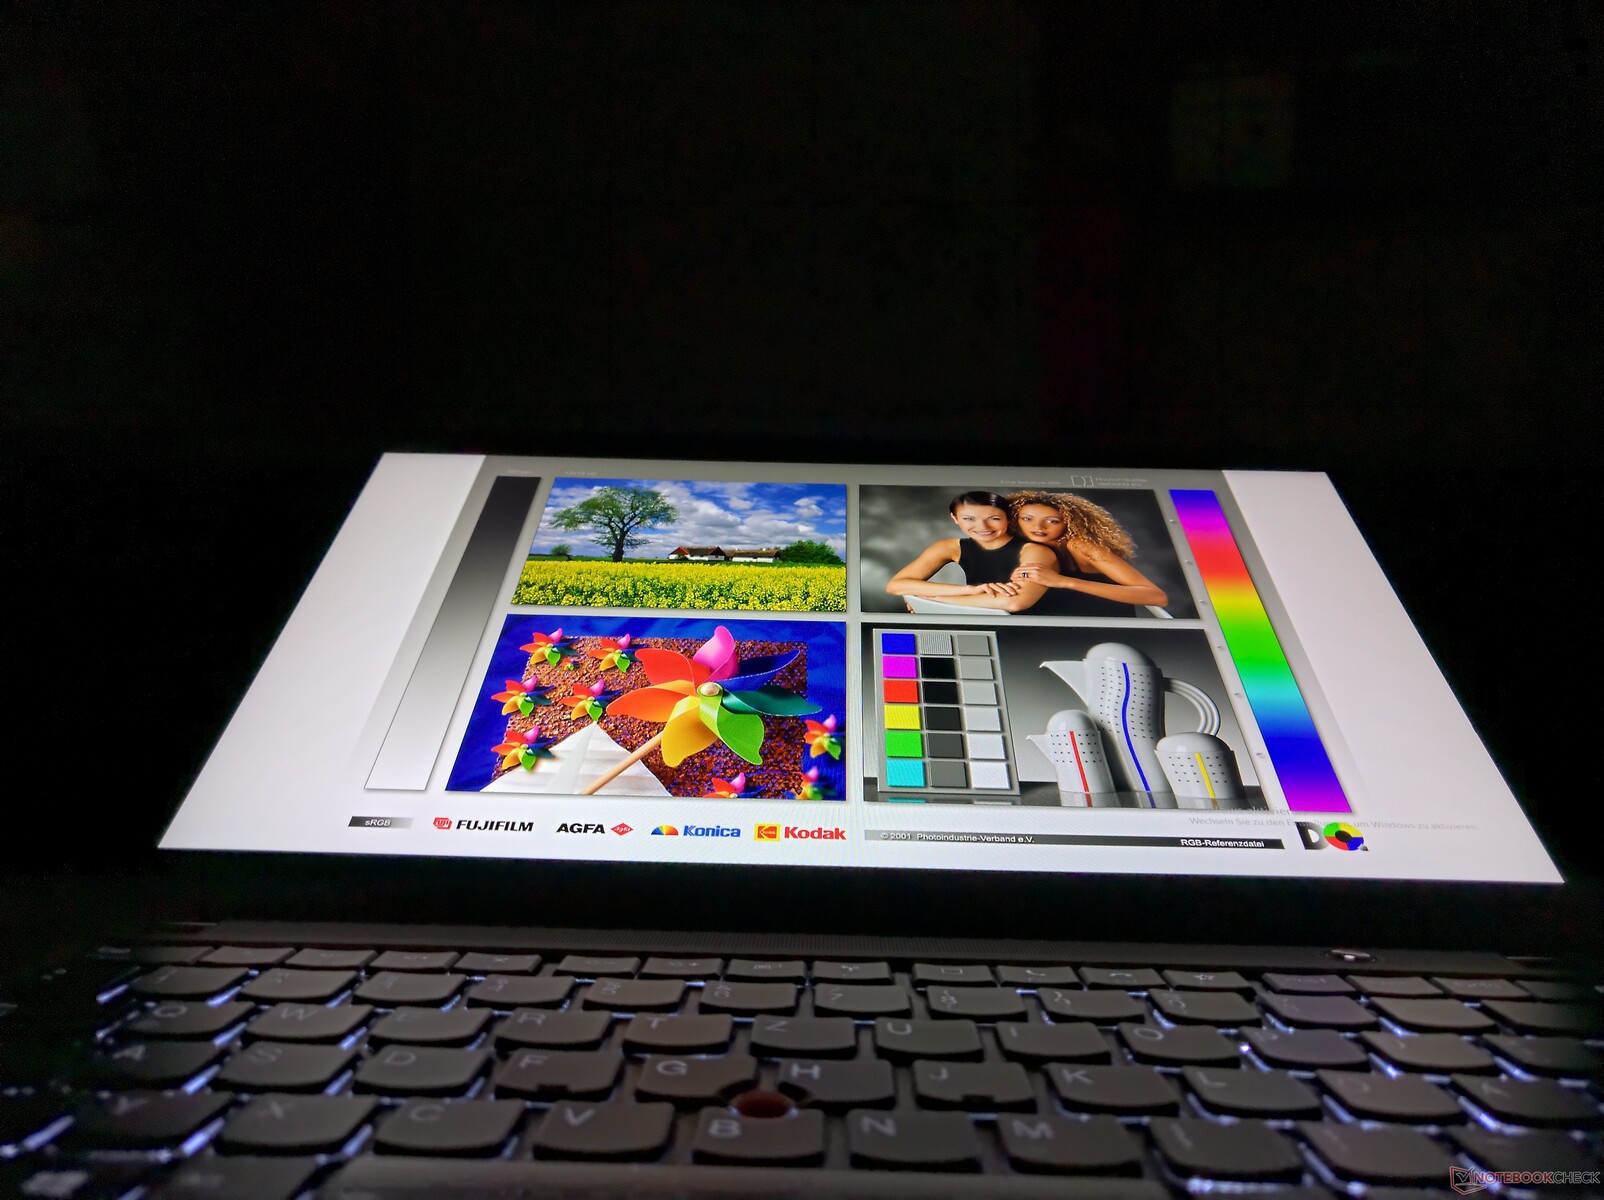
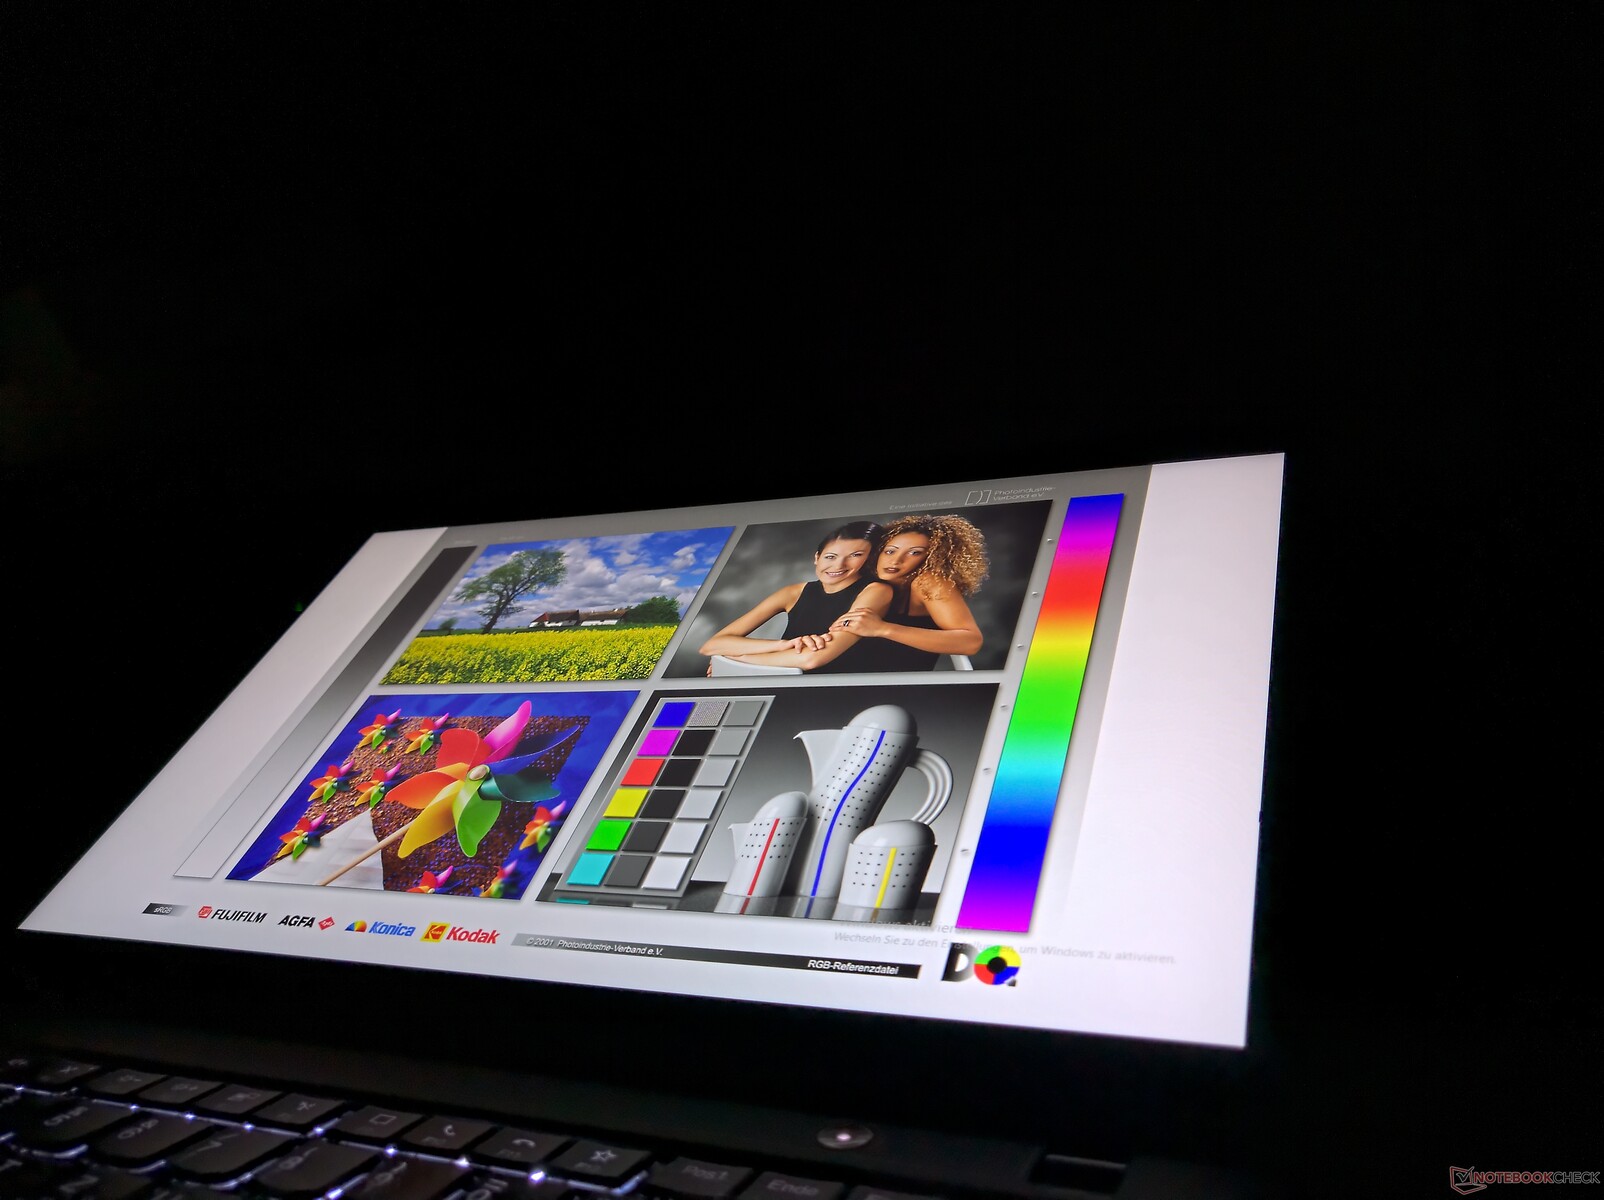
The selection of available 14-inch LCDs has not changed much from the Lenovo ThinkPad T14 Gen 1. Unlike the new X1 or X-series, Lenovo sticks with the 16:9 format for the T-series. The only changes in the LCD area: the TN HD option (1366 x 768) is finally no longer available, and Lenovo also increases the brightness of the cheapest Full HD IPS LCD to 300 cd/m² (up from 250 cd/m²).
Our review unit of the Lenovo ThinkPad T14 Gen 2 contains a low-power LCD from LG that has been used in the last couple of ThinkPad generations. Unfortunately, the T14 Gen 2 doesn't hit the advertised brightness of 400 cd/m². At 367 cd/m², it remains a bit below the results of the previous generation.
| |||||||||||||||||||||||||
Brightness Distribution: 88 %
Center on Battery: 374 cd/m²
Contrast: 2729:1 (Black: 0.14 cd/m²)
ΔE ColorChecker Calman: 4.2 | ∀{0.5-29.43 Ø4.72}
calibrated: 0.9
ΔE Greyscale Calman: 5.4 | ∀{0.09-98 Ø4.97}
95.4% sRGB (Argyll 1.6.3 3D)
60.6% AdobeRGB 1998 (Argyll 1.6.3 3D)
65.5% AdobeRGB 1998 (Argyll 3D)
95.4% sRGB (Argyll 3D)
64.3% Display P3 (Argyll 3D)
Gamma: 2.31
CCT: 7499 K
| Lenovo ThinkPad T14 Gen2-20W1S00000 LP140WF9-SPF2, IPS LED, 1920x1080, 14" | Lenovo ThinkPad T14-20S1S06B00 B140HAN05.7, LTPS IPS LED, 1920x1080, 14" | Lenovo ThinkPad T14-20UES00H00 B140HAN05.7, IPS, 1920x1080, 14" | HP EliteBook 845 G7-23Y60EA LG Philips LGD064E, IPS, 1920x1080, 14" | Dell Latitude 14 5411-WJ40N AU Optronics AUO463D, IPS, 1920x1080, 14" | |
|---|---|---|---|---|---|
| Display | 2% | 2% | -42% | -41% | |
| Display P3 Coverage (%) | 64.3 | 66 3% | 66.1 3% | 36.76 -43% | 37.43 -42% |
| sRGB Coverage (%) | 95.4 | 96.8 1% | 95.8 0% | 55.3 -42% | 56.2 -41% |
| AdobeRGB 1998 Coverage (%) | 65.5 | 67.1 2% | 67.2 3% | 37.98 -42% | 38.67 -41% |
| Response Times | -1% | -12% | 24% | 47% | |
| Response Time Grey 50% / Grey 80% * (ms) | 57.2 ? | 58.4 ? -2% | 64 ? -12% | 37 ? 35% | 31 ? 46% |
| Response Time Black / White * (ms) | 26.4 ? | 26.4 ? -0% | 29.6 ? -12% | 23 ? 13% | 14 ? 47% |
| PWM Frequency (Hz) | |||||
| Screen | -2% | -2% | -48% | -45% | |
| Brightness middle (cd/m²) | 382 | 397 4% | 406 6% | 227 -41% | 256 -33% |
| Brightness (cd/m²) | 367 | 394 7% | 403 10% | 220 -40% | 236 -36% |
| Brightness Distribution (%) | 88 | 90 2% | 88 0% | 82 -7% | 86 -2% |
| Black Level * (cd/m²) | 0.14 | 0.2 -43% | 0.2 -43% | 0.18 -29% | 0.23 -64% |
| Contrast (:1) | 2729 | 1985 -27% | 2030 -26% | 1261 -54% | 1113 -59% |
| Colorchecker dE 2000 * | 4.2 | 3.6 14% | 3.3 21% | 4.1 2% | 5.76 -37% |
| Colorchecker dE 2000 max. * | 7.9 | 5.9 25% | 4.8 39% | 7.06 11% | 20.65 -161% |
| Colorchecker dE 2000 calibrated * | 0.9 | 1.2 -33% | 1.5 -67% | 4.04 -349% | |
| Greyscale dE 2000 * | 5.4 | 3.9 28% | 3.6 33% | 1.99 63% | 4 26% |
| Gamma | 2.31 95% | 2.48 89% | 2.43 91% | 2.48 89% | 2.52 87% |
| CCT | 7499 87% | 7090 92% | 6893 94% | 6607 98% | 6182 105% |
| Color Space (Percent of AdobeRGB 1998) (%) | 60.6 | 61.4 1% | 61.5 1% | 35 -42% | 36 -41% |
| Color Space (Percent of sRGB) (%) | 95.4 | 96.6 1% | 95.5 0% | 55 -42% | 56 -41% |
| Total Average (Program / Settings) | -0% /
-1% | -4% /
-3% | -22% /
-38% | -13% /
-32% |
* ... smaller is better
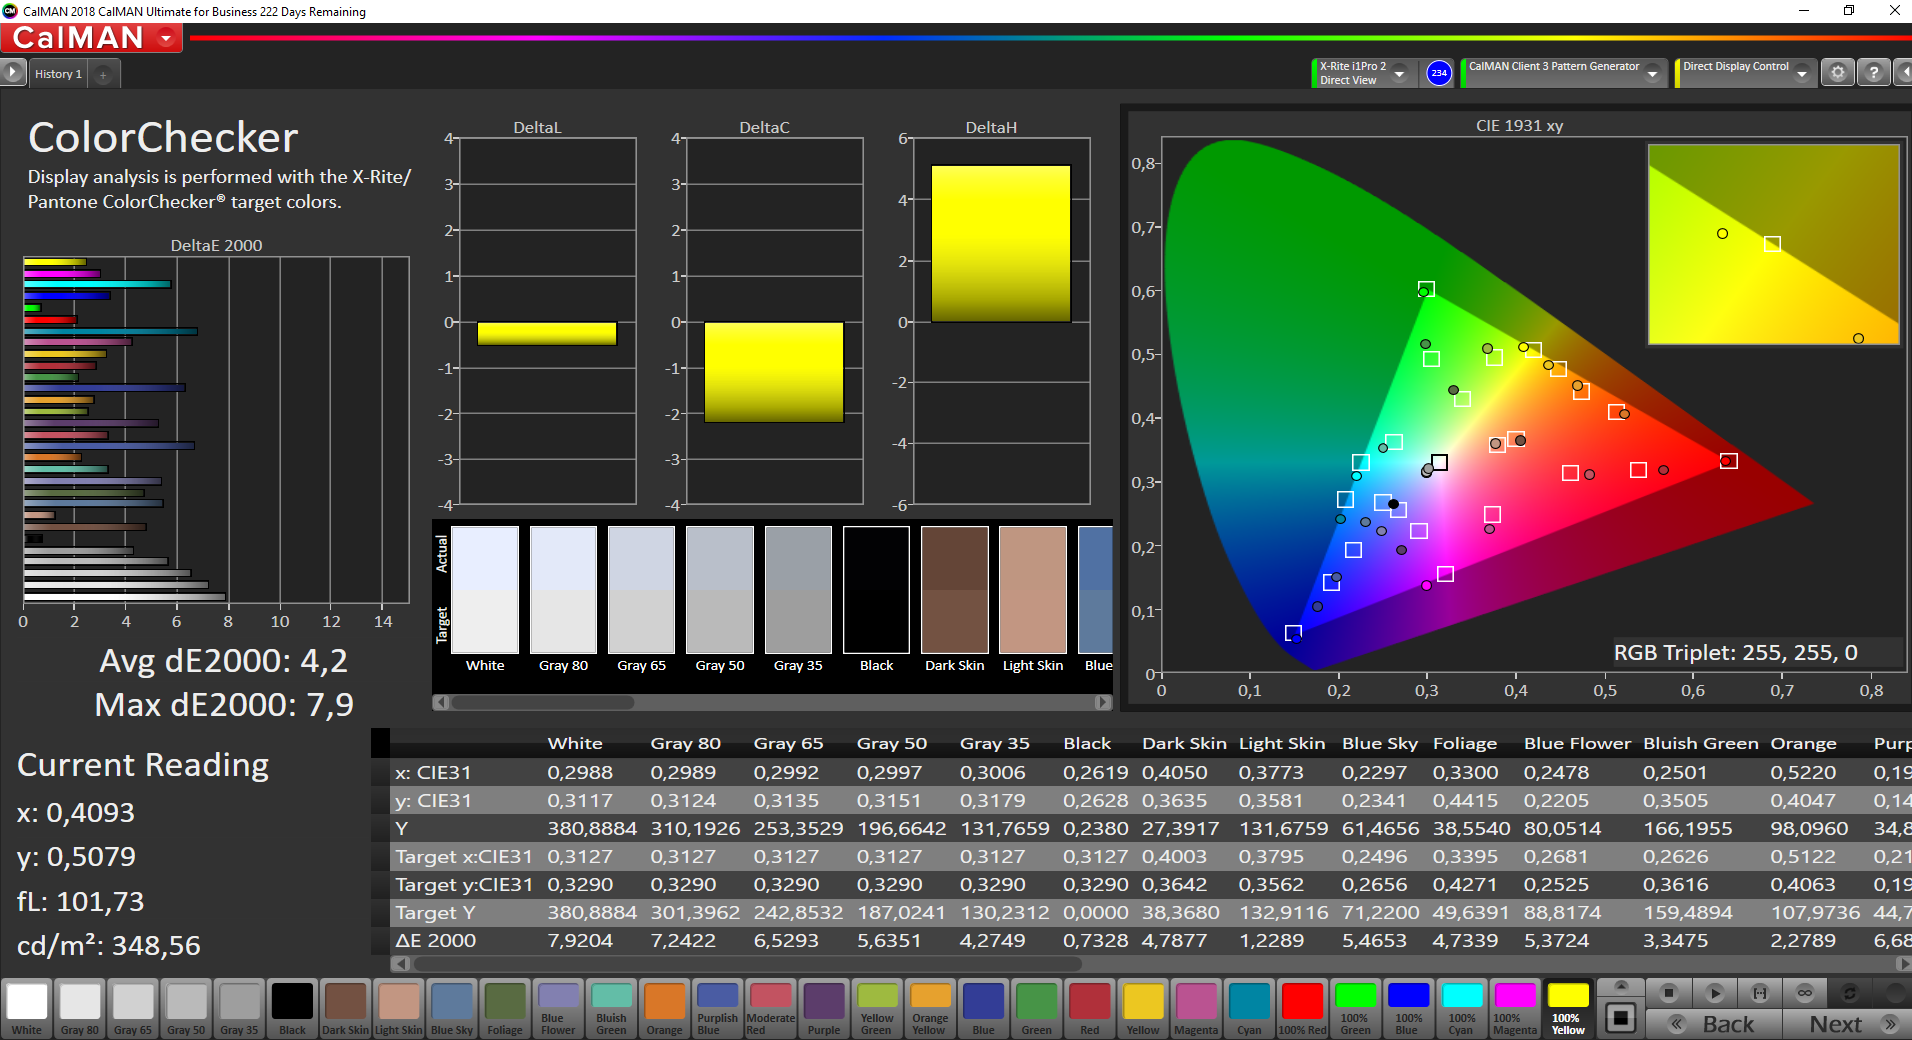
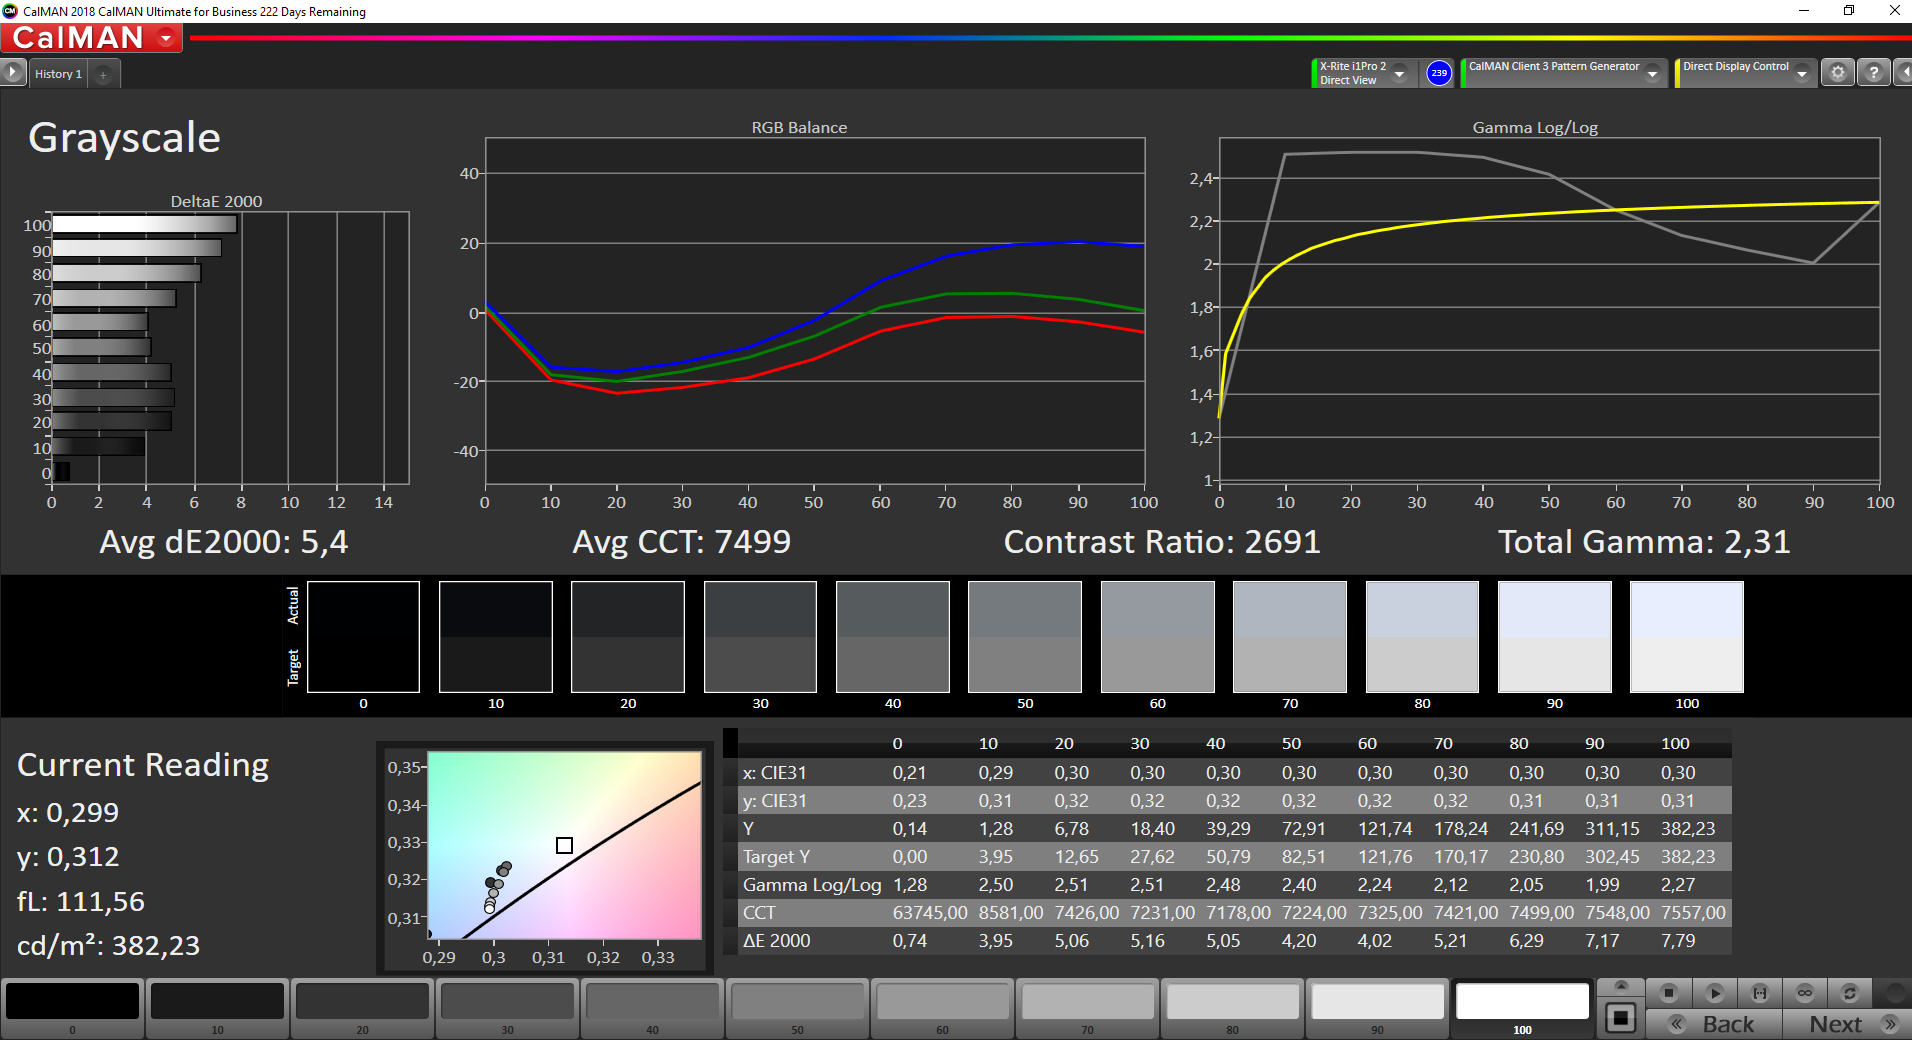
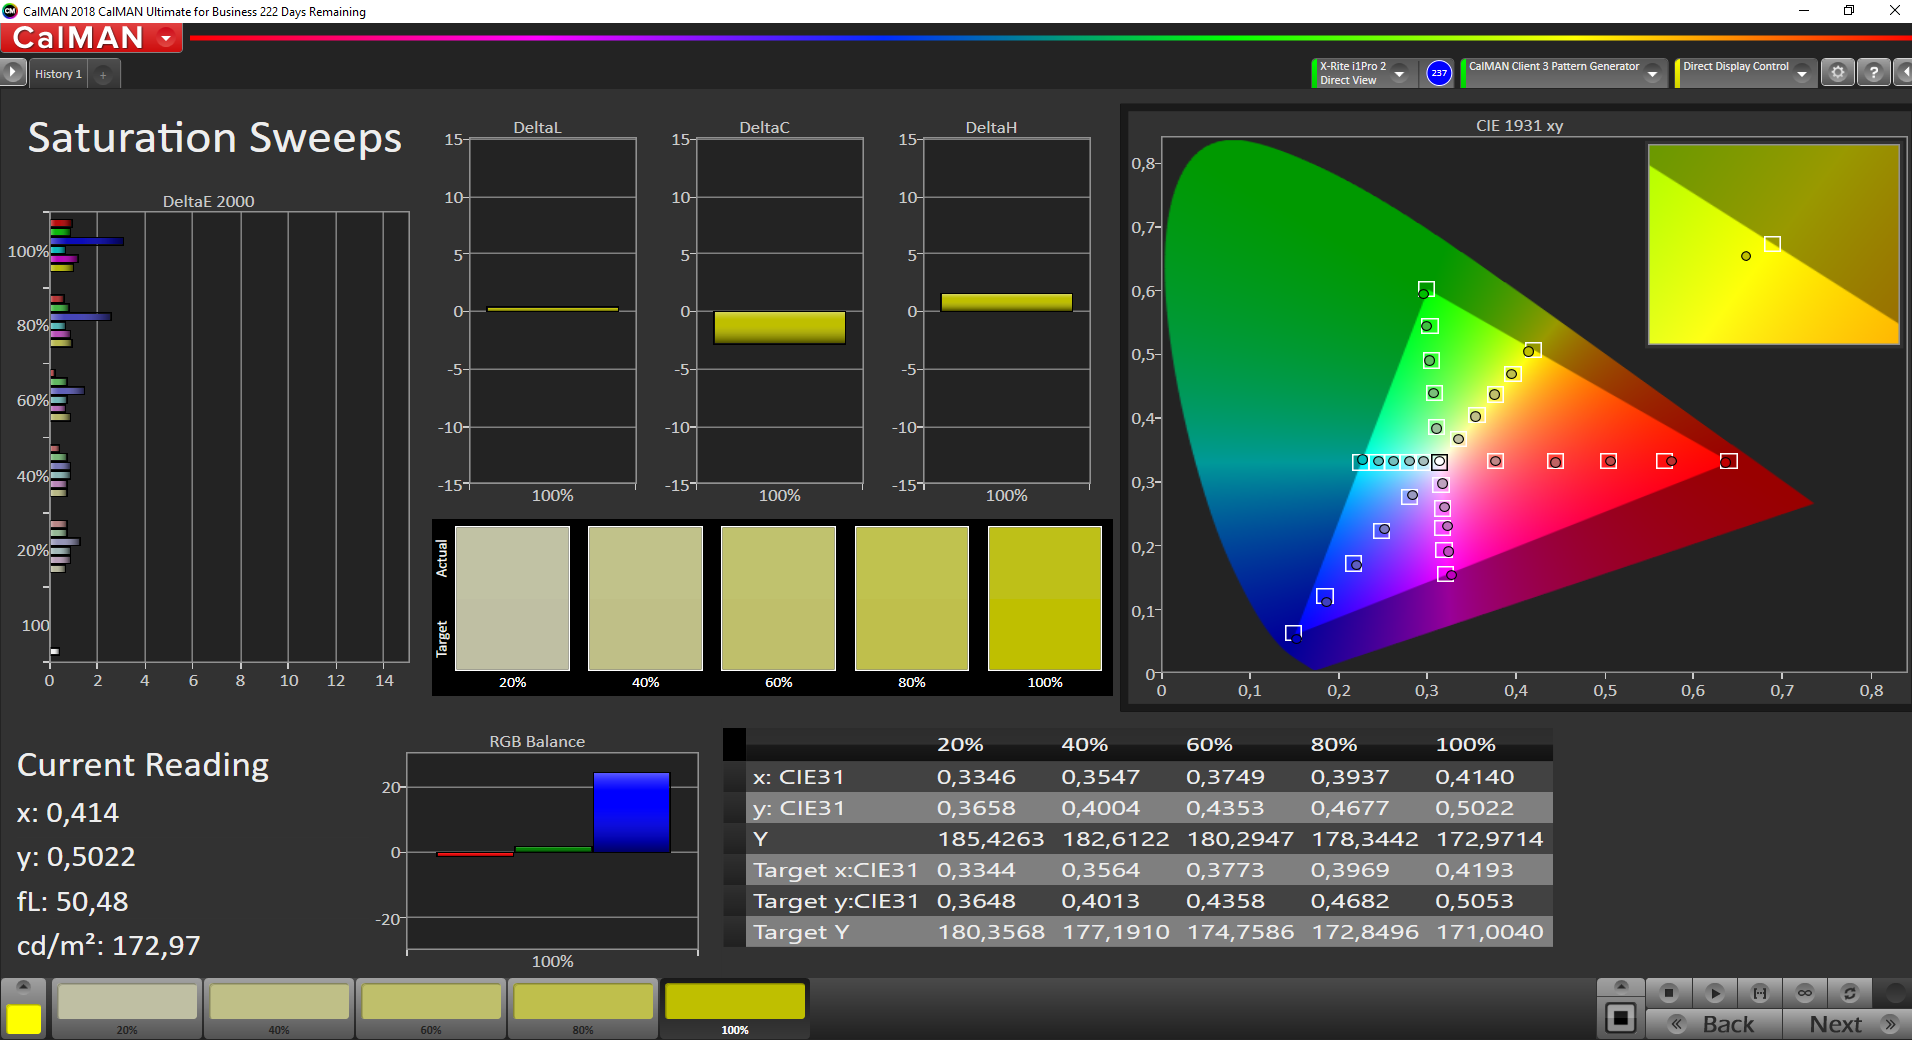
The color reproduction is quite good for an IPS LCD, and the high contrast of 2729:1 is reflected here. This is calculated from the brightness and the low black value of only 0.14 cd/m² - we measured this display with CalMan and the X-Rite i1Pro 2 colorimeter. The color profile, which is available as a free download as usual, was created with the i1Profiler.
With 95.4% sRGB, the small standard color space is not quite covered. However, the color space coverage should suffice for simple image editing.
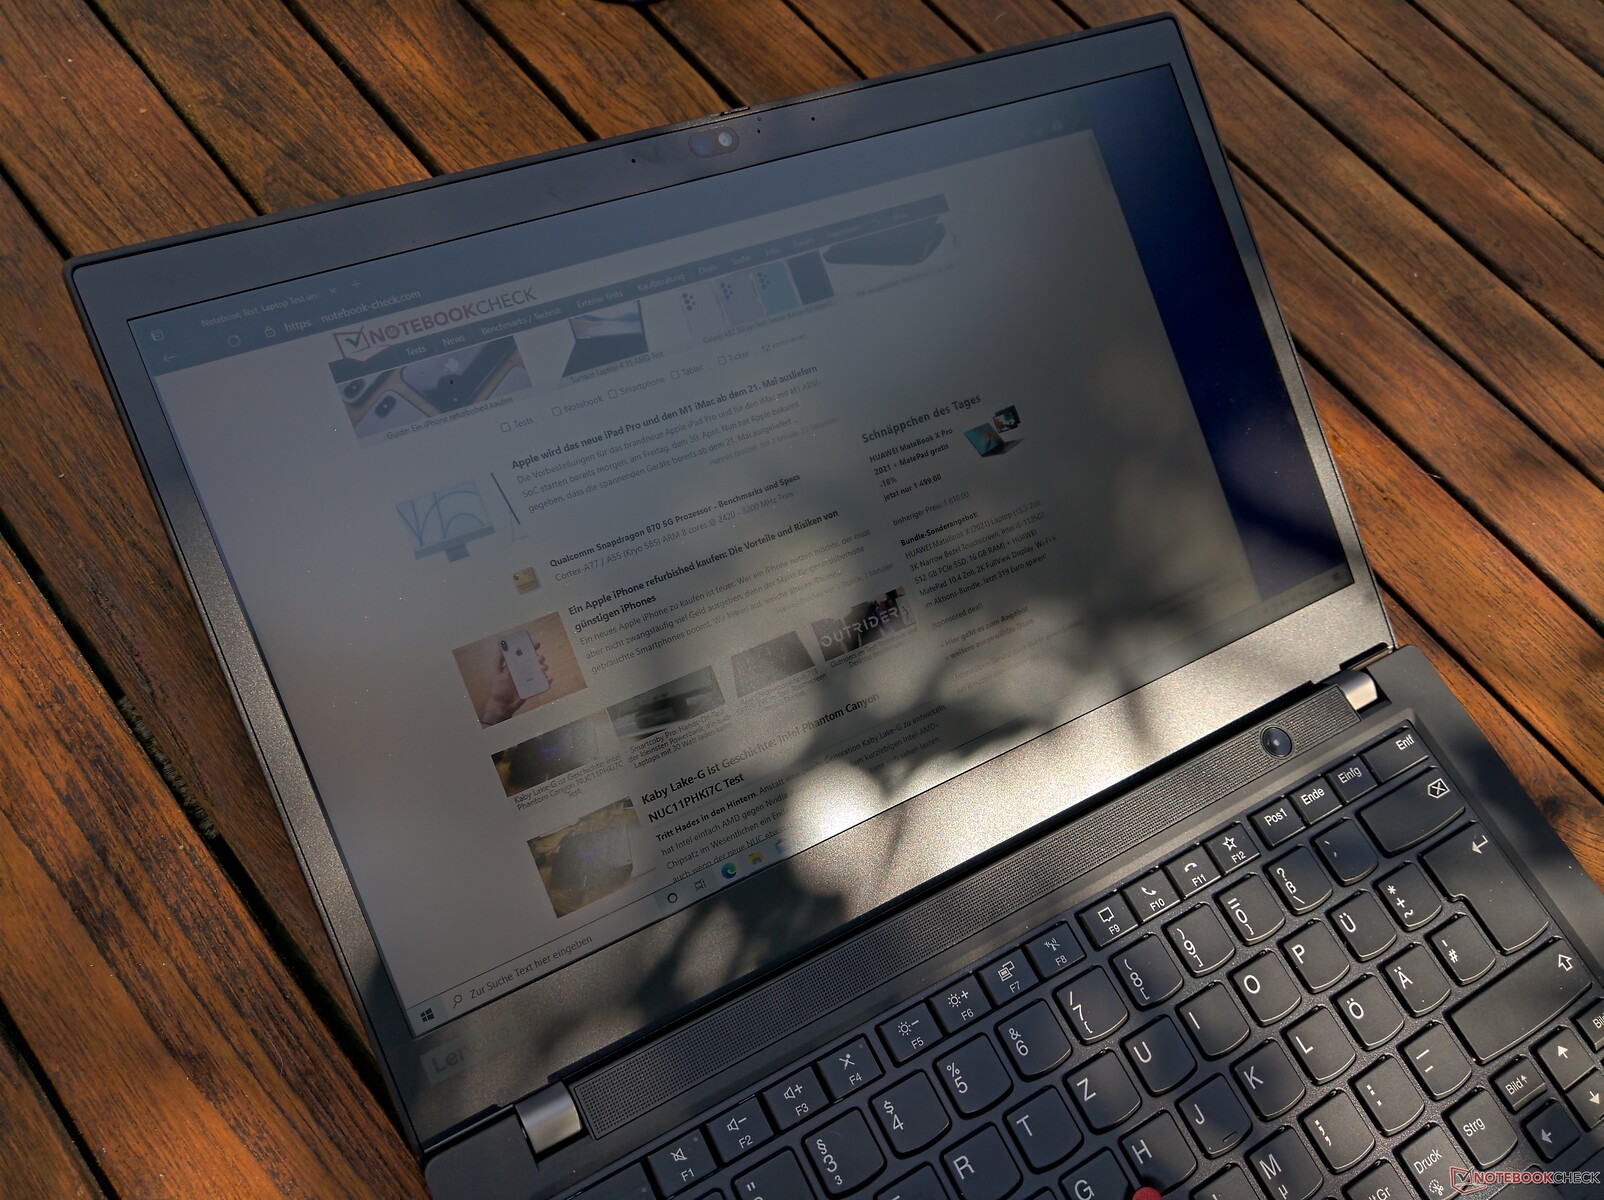
The matte surface helps when using the ThinkPad outdoors, but the screen would have to be brighter to be visible in sunlight. It is reasonably comfortable to work in the shade.
Display Response Times
| ↔ Response Time Black to White | ||
|---|---|---|
| 26.4 ms ... rise ↗ and fall ↘ combined | ↗ 12.4 ms rise | 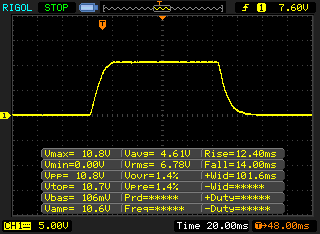 |
| ↘ 14 ms fall | ||
| The screen shows relatively slow response rates in our tests and may be too slow for gamers. In comparison, all tested devices range from 0.1 (minimum) to 240 (maximum) ms. » 66 % of all devices are better. This means that the measured response time is worse than the average of all tested devices (19.8 ms). | ||
| ↔ Response Time 50% Grey to 80% Grey | ||
| 57.2 ms ... rise ↗ and fall ↘ combined | ↗ 25.2 ms rise | 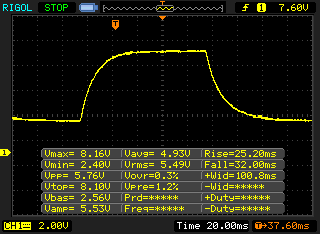 |
| ↘ 32 ms fall | ||
| The screen shows slow response rates in our tests and will be unsatisfactory for gamers. In comparison, all tested devices range from 0.165 (minimum) to 636 (maximum) ms. » 94 % of all devices are better. This means that the measured response time is worse than the average of all tested devices (31 ms). | ||
Screen Flickering / PWM (Pulse-Width Modulation)
| Screen flickering / PWM not detected | 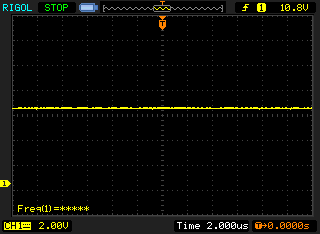 | ||
In comparison: 52 % of all tested devices do not use PWM to dim the display. If PWM was detected, an average of 7750 (minimum: 5 - maximum: 343500) Hz was measured. | |||
We cannot find fault with the viewing angle stability of the IPS display.


Performance: Tiger Lake & MX450 bring a performance boost
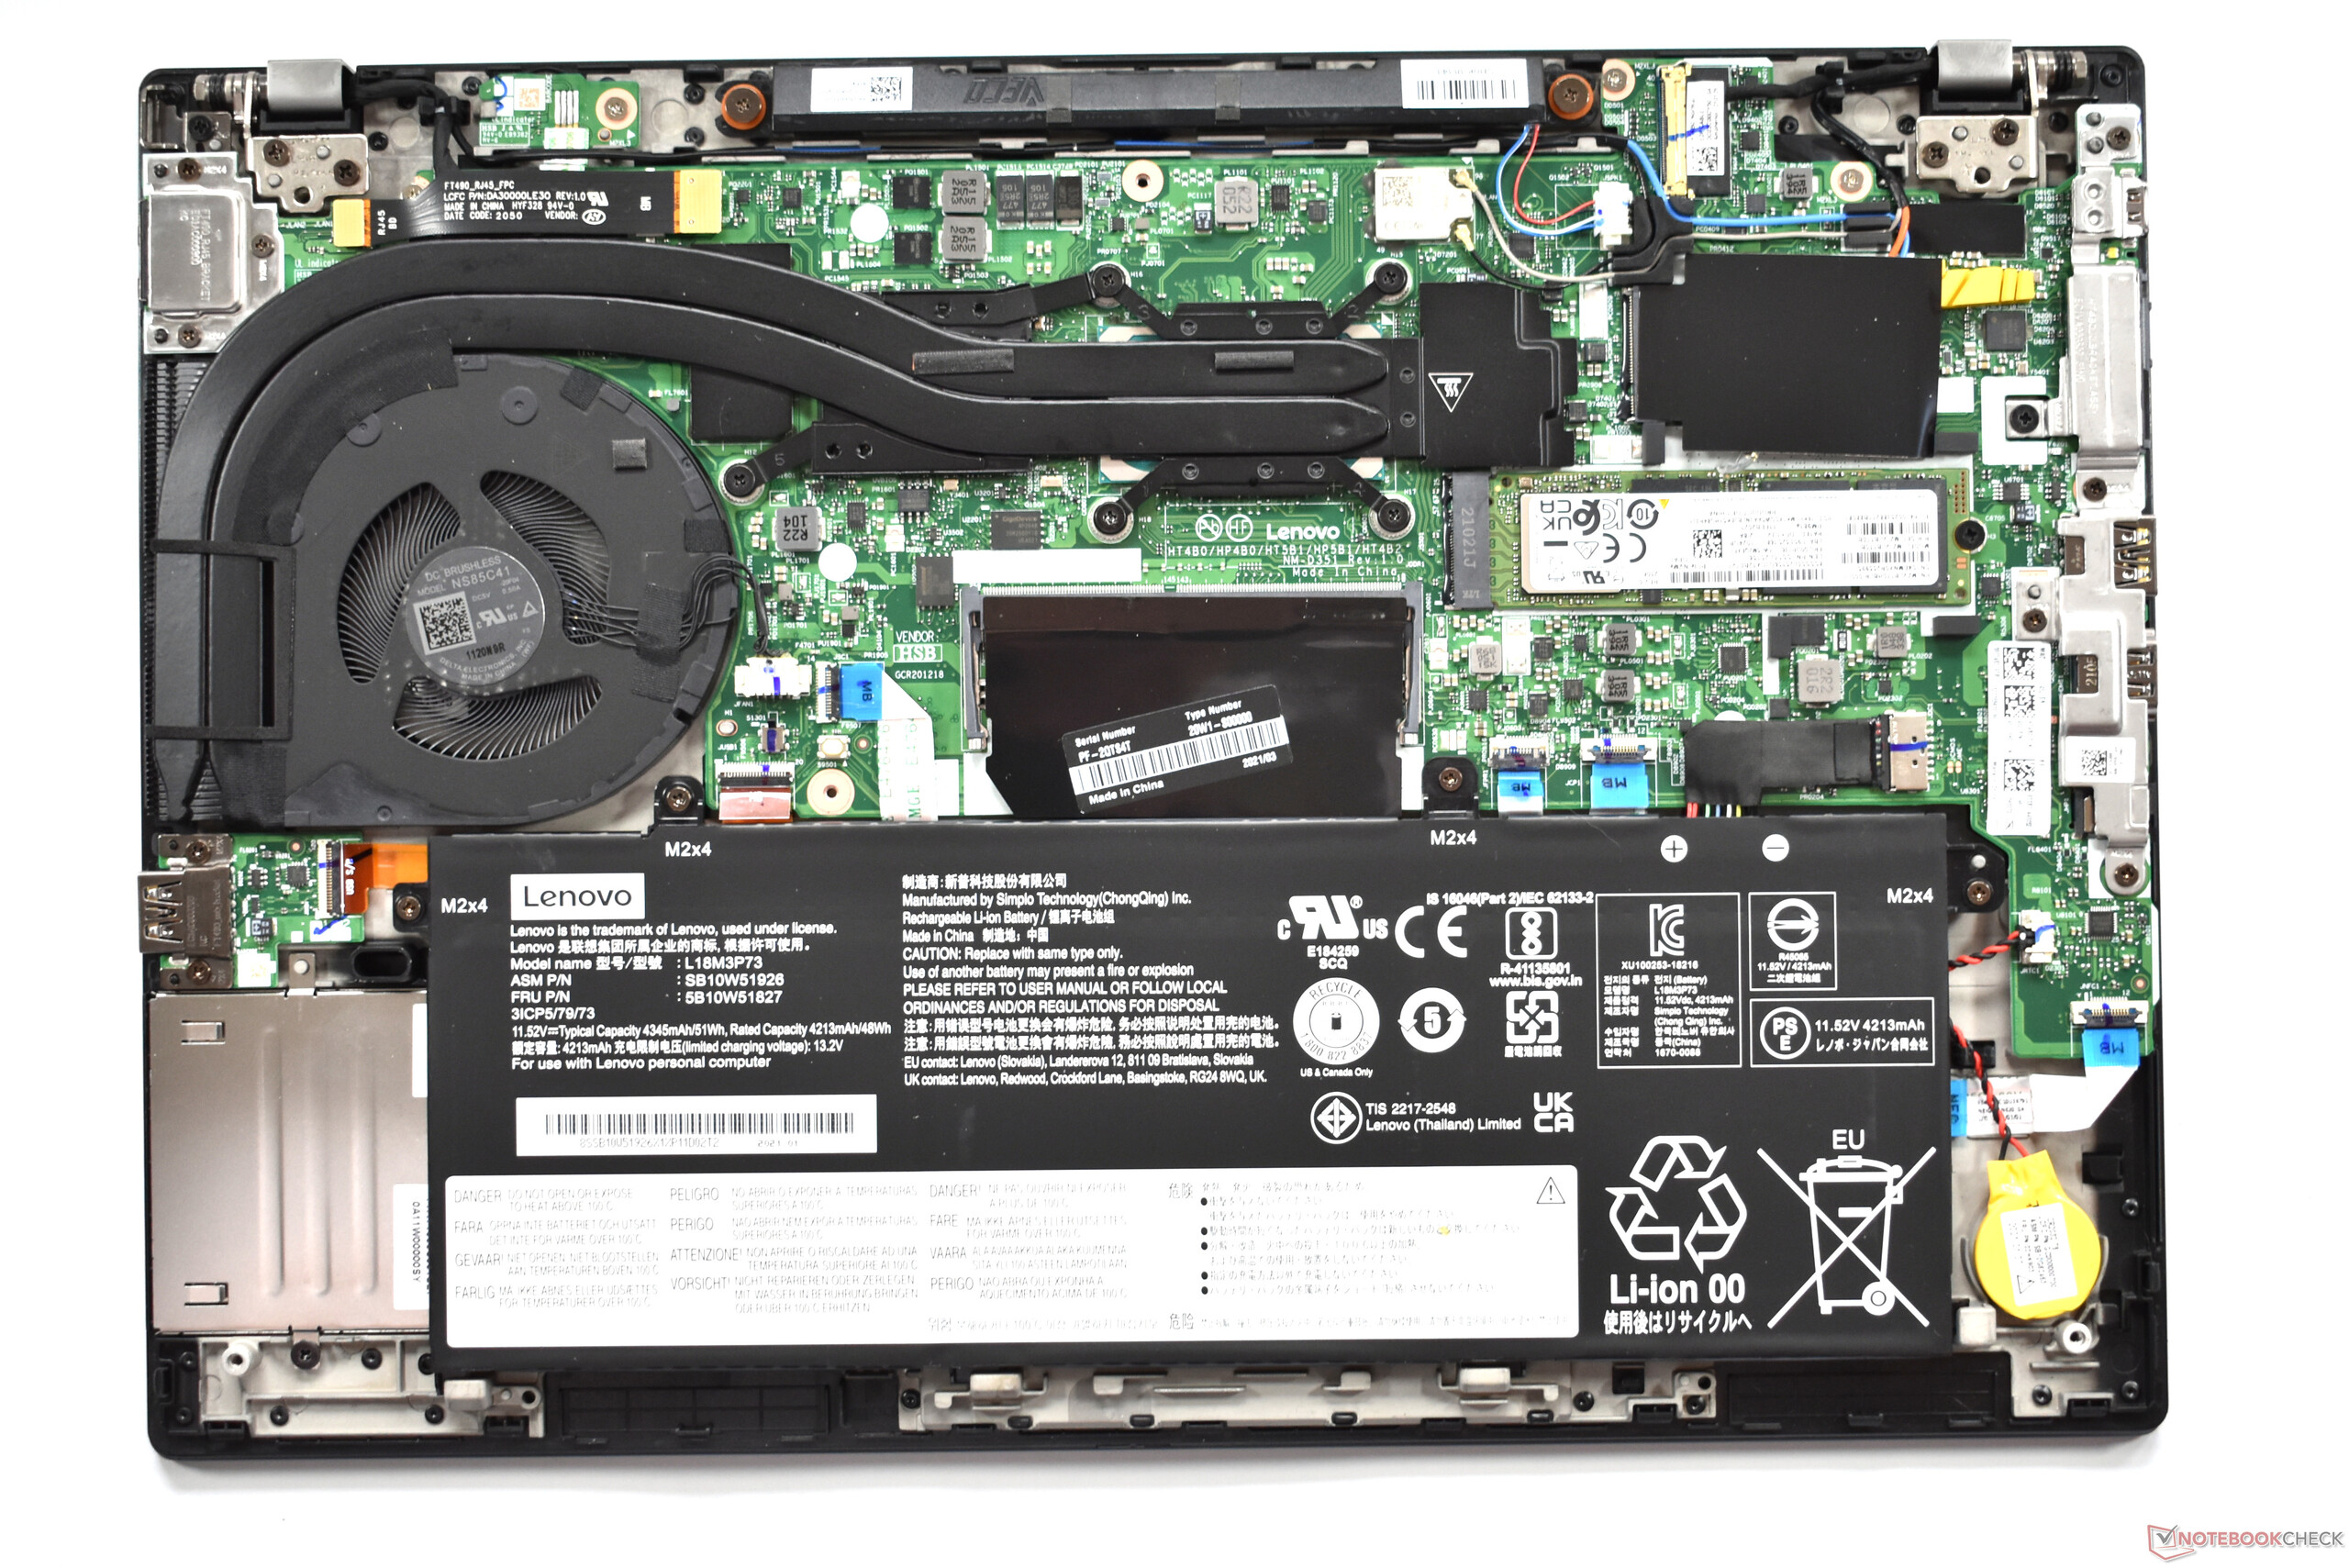
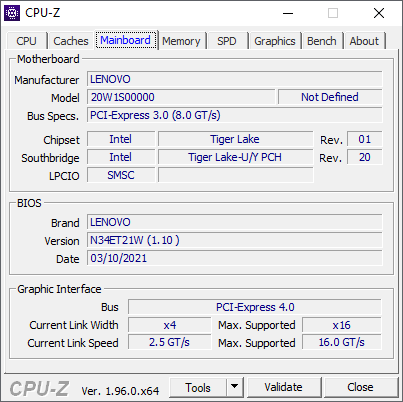
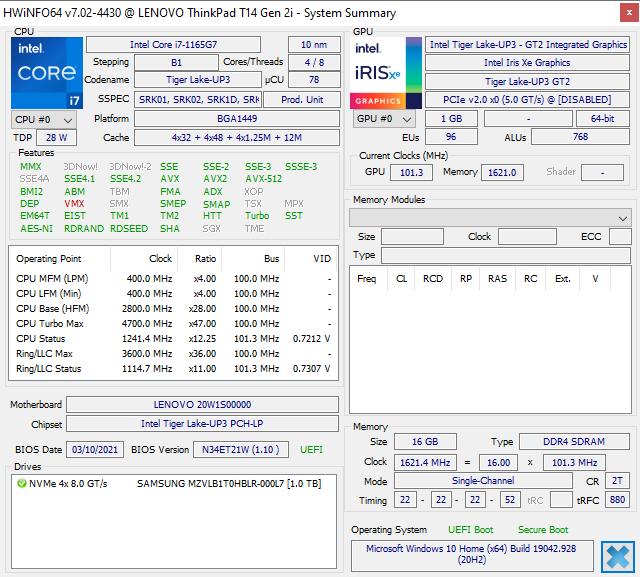
The Intel variant of Lenovo's ThinkPad T14 Gen 2 can be configured with four different Tiger-Lake UP3 processors. Two (Core i5-1145G7, i7-1185G7) are vPro CPUs for business customers. "Normal" variants (i5-1135G7, i7-1165G7) are also available. Accordingly, the integrated Intel Iris Xe GPU with either 80 or 96 EUs is available. The Nvidia GeForce MX450 GPU is also an option. Of course, the Lenovo ThinkPad T14 Gen 2 will also be available with AMD Ryzen - the corresponding variant should be available in May and will be reviewed separately.
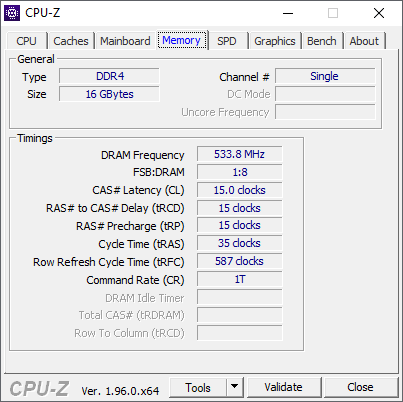
A new feature of the Intel-based T14 is support for DDR4-3200 memory; the predecessor's RAM was limited to DDR4-2666. 8 to 16 GB of memory are soldered. Users can get a maximum of 40 to 48 GB of memory via the second SO-DIMM slot. A single M.2-2280 SSD handles storage.
Processor
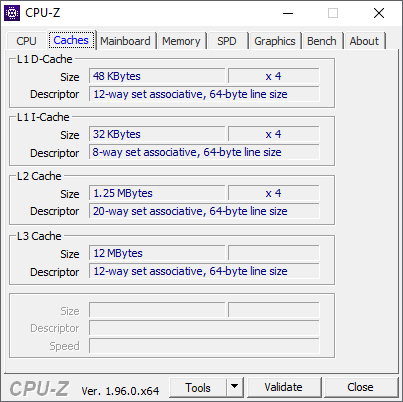
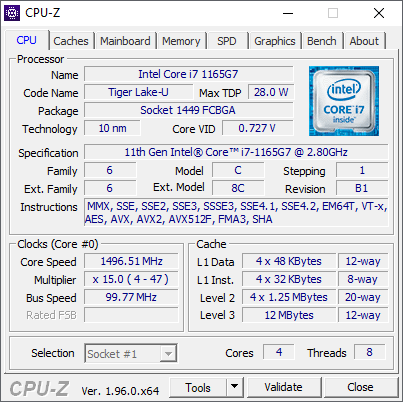
The Intel Core i7-1165G7 is from the Tiger Lake UP3 series. It has four cores (eight threads with Hyperthreading). The UP3 series processors typically have a TDP of 12 to 28 watts, which should allow clock rates of 2.8 to 4.7 GHz. For extensive performance comparisons with other CPUs, refer to our CPU list.
For a short-term boost, the Intel CPU in Lenovo's ThinkPad T14 Gen 2 can consume 40 watts. Within a few minutes, the power limit drops to 20 watts. With this consumption under extended load, the Lenovo ThinkPad T14 Gen 2 achieves a significantly better result in the Cinebench R15 multi-core test when compared with the two direct predecessor models: the T14 Gen 1 and the T490. The efficiency of Tiger Lake is clearly visible, even though the T14 Gen 1 with AMD CPU remains unattainable in terms of multi-core performance. In contrast, the Tiger Lake ThinkPad is clearly ahead in single-core performance when under load.
CPU performance took a 30% hit on battery.
Cinebench R23: Single Core | Multi Core
Cinebench R15: CPU Single 64Bit | CPU Multi 64Bit
Blender: v2.79 BMW27 CPU
7-Zip 18.03: 7z b 4 -mmt1 | 7z b 4
Geekbench 5.5: Single-Core | Multi-Core
HWBOT x265 Benchmark v2.2: 4k Preset
LibreOffice : 20 Documents To PDF
R Benchmark 2.5: Overall mean
| Cinebench R20 / CPU (Single Core) | |
| Average of class Office (345 - 816, n=72, last 2 years) | |
| Lenovo ThinkPad T14 Gen2-20W1S00000 | |
| Average Intel Core i7-1165G7 (442 - 589, n=81) | |
| Dell Latitude 14 5411-WJ40N | |
| HP EliteBook 845 G7-23Y60EA | |
| Lenovo ThinkPad T14-20UES00H00 | |
| Lenovo ThinkPad T490-20N3S02L00 | |
| Lenovo ThinkPad T14-20S1S06B00 | |
| Cinebench R20 / CPU (Multi Core) | |
| Average of class Office (648 - 8840, n=72, last 2 years) | |
| Dell Latitude 14 5411-WJ40N | |
| HP EliteBook 845 G7-23Y60EA | |
| Lenovo ThinkPad T14-20UES00H00 | |
| Average Intel Core i7-1165G7 (1060 - 2657, n=81) | |
| Lenovo ThinkPad T14 Gen2-20W1S00000 | |
| Lenovo ThinkPad T490-20N3S02L00 | |
| Lenovo ThinkPad T14-20S1S06B00 | |
| Cinebench R23 / Single Core | |
| Average of class Office (708 - 2130, n=73, last 2 years) | |
| Lenovo ThinkPad T14 Gen2-20W1S00000 | |
| Average Intel Core i7-1165G7 (1110 - 1539, n=59) | |
| Cinebench R23 / Multi Core | |
| Average of class Office (1673 - 22808, n=73, last 2 years) | |
| Lenovo ThinkPad T14 Gen2-20W1S00000 | |
| Average Intel Core i7-1165G7 (2525 - 6862, n=64) | |
| Cinebench R15 / CPU Single 64Bit | |
| Average of class Office (99.5 - 312, n=74, last 2 years) | |
| Lenovo ThinkPad T14 Gen2-20W1S00000 | |
| Average Intel Core i7-1165G7 (115 - 230, n=78) | |
| Dell Latitude 14 5411-WJ40N | |
| Lenovo ThinkPad T490-20N3S02L00 | |
| Lenovo ThinkPad T14-20UES00H00 | |
| HP EliteBook 845 G7-23Y60EA | |
| Lenovo ThinkPad T14-20S1S06B00 | |
| Cinebench R15 / CPU Multi 64Bit | |
| Average of class Office (250 - 3380, n=74, last 2 years) | |
| Dell Latitude 14 5411-WJ40N | |
| HP EliteBook 845 G7-23Y60EA | |
| Lenovo ThinkPad T14-20UES00H00 | |
| Lenovo ThinkPad T14 Gen2-20W1S00000 | |
| Average Intel Core i7-1165G7 (553 - 1027, n=86) | |
| Lenovo ThinkPad T14-20S1S06B00 | |
| Lenovo ThinkPad T490-20N3S02L00 | |
| Blender / v2.79 BMW27 CPU | |
| Lenovo ThinkPad T14-20S1S06B00 | |
| Lenovo ThinkPad T490-20N3S02L00 | |
| Lenovo ThinkPad T14 Gen2-20W1S00000 | |
| Average Intel Core i7-1165G7 (468 - 1138, n=80) | |
| Lenovo ThinkPad T14-20UES00H00 | |
| HP EliteBook 845 G7-23Y60EA | |
| Dell Latitude 14 5411-WJ40N | |
| Average of class Office (158 - 1940, n=73, last 2 years) | |
| 7-Zip 18.03 / 7z b 4 -mmt1 | |
| Average of class Office (3387 - 6469, n=74, last 2 years) | |
| Lenovo ThinkPad T14 Gen2-20W1S00000 | |
| Dell Latitude 14 5411-WJ40N | |
| Average Intel Core i7-1165G7 (4478 - 5507, n=80) | |
| Lenovo ThinkPad T490-20N3S02L00 | |
| Lenovo ThinkPad T14-20UES00H00 | |
| Lenovo ThinkPad T14-20S1S06B00 | |
| HP EliteBook 845 G7-23Y60EA | |
| 7-Zip 18.03 / 7z b 4 | |
| Average of class Office (7098 - 76886, n=74, last 2 years) | |
| HP EliteBook 845 G7-23Y60EA | |
| Dell Latitude 14 5411-WJ40N | |
| Lenovo ThinkPad T14-20UES00H00 | |
| Average Intel Core i7-1165G7 (15347 - 27405, n=80) | |
| Lenovo ThinkPad T14 Gen2-20W1S00000 | |
| Lenovo ThinkPad T490-20N3S02L00 | |
| Lenovo ThinkPad T14-20S1S06B00 | |
| Geekbench 5.5 / Single-Core | |
| Average of class Office (811 - 2148, n=70, last 2 years) | |
| Average Intel Core i7-1165G7 (1302 - 1595, n=77) | |
| Lenovo ThinkPad T14 Gen2-20W1S00000 | |
| Dell Latitude 14 5411-WJ40N | |
| Lenovo ThinkPad T14-20UES00H00 | |
| HP EliteBook 845 G7-23Y60EA | |
| Lenovo ThinkPad T14-20S1S06B00 | |
| Geekbench 5.5 / Multi-Core | |
| Average of class Office (1483 - 16999, n=70, last 2 years) | |
| Dell Latitude 14 5411-WJ40N | |
| Average Intel Core i7-1165G7 (3078 - 5926, n=77) | |
| Lenovo ThinkPad T14 Gen2-20W1S00000 | |
| HP EliteBook 845 G7-23Y60EA | |
| Lenovo ThinkPad T14-20UES00H00 | |
| Lenovo ThinkPad T14-20S1S06B00 | |
| HWBOT x265 Benchmark v2.2 / 4k Preset | |
| Average of class Office (2.21 - 26, n=73, last 2 years) | |
| Dell Latitude 14 5411-WJ40N | |
| HP EliteBook 845 G7-23Y60EA | |
| Lenovo ThinkPad T14-20UES00H00 | |
| Lenovo ThinkPad T14 Gen2-20W1S00000 | |
| Average Intel Core i7-1165G7 (1.39 - 8.47, n=80) | |
| Lenovo ThinkPad T490-20N3S02L00 | |
| Lenovo ThinkPad T14-20S1S06B00 | |
| LibreOffice / 20 Documents To PDF | |
| HP EliteBook 845 G7-23Y60EA | |
| Lenovo ThinkPad T14-20UES00H00 | |
| Lenovo ThinkPad T14-20S1S06B00 | |
| Average of class Office (39.9 - 102.3, n=73, last 2 years) | |
| Average Intel Core i7-1165G7 (21.5 - 88.1, n=78) | |
| Dell Latitude 14 5411-WJ40N | |
| Lenovo ThinkPad T14 Gen2-20W1S00000 | |
| R Benchmark 2.5 / Overall mean | |
| Lenovo ThinkPad T14-20S1S06B00 | |
| HP EliteBook 845 G7-23Y60EA | |
| Lenovo ThinkPad T14-20UES00H00 | |
| Dell Latitude 14 5411-WJ40N | |
| Average Intel Core i7-1165G7 (0.552 - 1.002, n=80) | |
| Lenovo ThinkPad T14 Gen2-20W1S00000 | |
| Average of class Office (0.4098 - 0.888, n=73, last 2 years) | |
* ... smaller is better
System performance
The Lenovo ThinkPad T14 Gen 2 is clearly at the top in the PCMark 10 benchmarks. The Lenovo PC also ran very fast in everyday use.
| PCMark 10 Score | 5525 points | |
Help | ||
DPC latencies
Unfortunately, the Lenovo ThinkPad T14 Gen 2 has to deal with DPC latency issues, which were not nearly as pronounced in the predecessor. There can be dropouts when working with audio.
| DPC Latencies / LatencyMon - interrupt to process latency (max), Web, Youtube, Prime95 | |
| Lenovo ThinkPad T14 Gen2-20W1S00000 | |
| Lenovo ThinkPad T14-20S1S06B00 | |
* ... smaller is better
Mass storage
Lenovo offers NVMe PCIe 4.0 SSDs for the first time in the ThinkPad T14 Gen 2. However, our review sample still includes a PCIe 3.0 SSD with a capacity of 1 TB in the form of the Samsung PM981a. This SSD is by no means slow, which is also evident in the very good everyday performance. PCIe 4.0 should have advantages, especially when you move large amounts of data.
| Lenovo ThinkPad T14 Gen2-20W1S00000 Samsung PM981a MZVLB1T0HBLR | Lenovo ThinkPad T14-20S1S06B00 Lite-On CA5-8D512 | Lenovo ThinkPad T14-20UES00H00 Samsung SSD PM981a MZVLB512HBJQ | HP EliteBook 845 G7-23Y60EA Samsung PM991 MZVLQ256HAJD | Dell Latitude 14 5411-WJ40N SK Hynix PC611 512GB | Average Samsung PM981a MZVLB1T0HBLR | |
|---|---|---|---|---|---|---|
| CrystalDiskMark 5.2 / 6 | -28% | -25% | -53% | -26% | -18% | |
| Write 4K (MB/s) | 228.9 | 114.1 -50% | 88.1 -62% | 80.6 -65% | 125.9 -45% | 139.7 ? -39% |
| Read 4K (MB/s) | 74.8 | 53.6 -28% | 38.28 -49% | 31.2 -58% | 42.45 -43% | 49.9 ? -33% |
| Write Seq (MB/s) | 2186 | 1743 -20% | 2002 -8% | 883 -60% | 2064 -6% | 2036 ? -7% |
| Read Seq (MB/s) | 2050 | 2092 2% | 2153 5% | 1352 -34% | 1627 -21% | 2014 ? -2% |
| Write 4K Q32T1 (MB/s) | 652 | 394.8 -39% | 423.7 -35% | 361 -45% | 419.8 -36% | 461 ? -29% |
| Read 4K Q32T1 (MB/s) | 730 | 372.6 -49% | 393.2 -46% | 272 -63% | 382.1 -48% | 499 ? -32% |
| Write Seq Q32T1 (MB/s) | 2973 | 2176 -27% | 2889 -3% | 979 -67% | 2729 -8% | 2903 ? -2% |
| Read Seq Q32T1 (MB/s) | 3539 | 3204 -9% | 3566 1% | 2286 -35% | 3441 -3% | 3479 ? -2% |

Continuous power read: DiskSpd Read Loop, Queue Depth 8
Graphics card
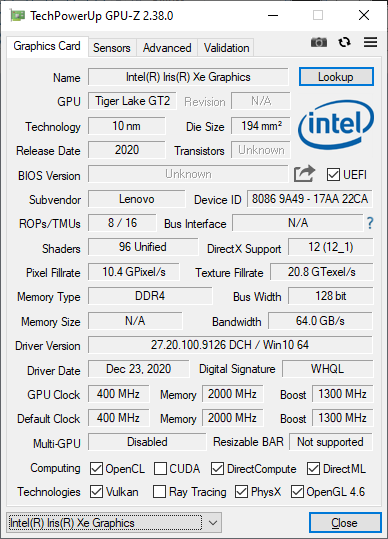
For the first time since the ThinkPad T480 from 2018, users can opt for a dedicated GPU. The Nvidia GeForce MX450 is, in contrast to the Pascal-based MX150, MX250 and MX330, built on the Nvidia Turing architecture and the TU117 GPU. This is the same architecture used for the Nvidia GeForce GTX 1650. The MX450 is clocked much lower in the ThinkPad laptop, however.
Depending on the 3DMark test, the MX450 runs 12-44% faster than the MX250 in the T490. The MX450 can't reach the older GeForce GTX 1050 of the ThinkPad T15p Gen 1. However, the most important comparison is probably the integrated GPUs in the ThinkPad T14 AMD - here the MX450 offers a good performance advantage. You can compare the MX450 to other graphics cards through our GPU list.
The Nvidia GPU runs at full performance on battery.
| 3DMark 11 Performance | 6745 points | |
| 3DMark Fire Strike Score | 4134 points | |
| 3DMark Time Spy Score | 1808 points | |
Help | ||
Gaming performance
Despite the MX450 GPU, the Lenovo ThinkPad T14 Gen 2 is not a gaming laptop. However, it is at least possible to play current games at medium details and the native Full HD resolution (1920 x 1080).
| The Witcher 3 - 1920x1080 High Graphics & Postprocessing (Nvidia HairWorks Off) | |
| Lenovo ThinkPad T15p-20TN0006GE | |
| Average of class Office (23.7 - 53.4, n=3, last 2 years) | |
| Average NVIDIA GeForce MX450 (21 - 46, n=16) | |
| Lenovo ThinkPad T14 Gen2-20W1S00000 | |
| Lenovo ThinkPad T490-20N3S02L00 | |
| Dell Latitude 14 5411-WJ40N | |
| Lenovo ThinkPad T14-20UES00H00 | |
| HP EliteBook 845 G7-23Y60EA | |
| low | med. | high | ultra | |
|---|---|---|---|---|
| The Witcher 3 (2015) | 98.1 | 55.3 | 32.1 | 18.6 |
| Dota 2 Reborn (2015) | 126 | 110 | 82.5 | 75.2 |
| X-Plane 11.11 (2018) | 70.4 | 41.4 | 59.3 | |
| Shadow of the Tomb Raider (2018) | 74.4 | 31.9 | 23.8 | |
| F1 2020 (2020) | 79.7 | 53 | 38.1 | 22.3 |
Emissions: Fan in the ThinkPad T14 2021 is louder than in the predecessor
Noise emissions
When the ThinkPad T14 Gen 2 is idle, the fan stays off. We measured an average of 35.4 dB(a) in our load test and a maximum of 40.1 dB(a). That corresponds to an audible but not extremely loud fan. However, the newer model is louder than the Lenovo ThinkPad T14 Gen 1.
We could not detect coil whine from the T14 Gen 2.
Noise level
| Idle |
| 24.2 / 24.2 / 24.2 dB(A) |
| Load |
| 35.4 / 40.1 dB(A) |
 | ||
30 dB silent 40 dB(A) audible 50 dB(A) loud |
||
min: | ||
Temperature
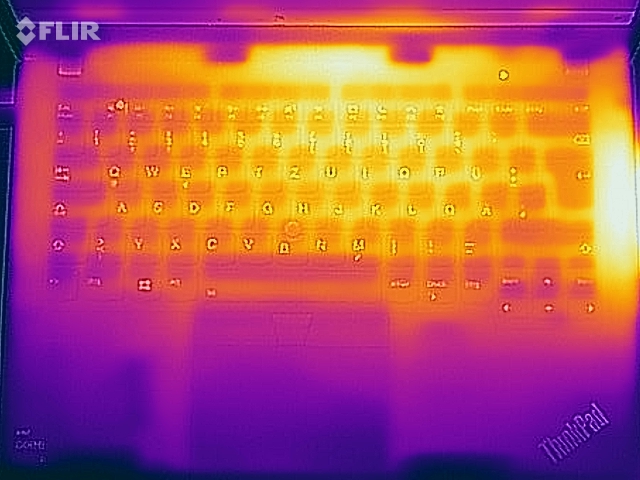
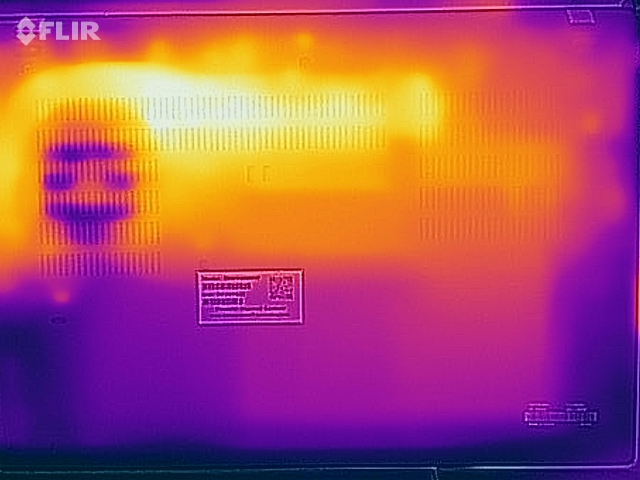
A compact, relatively thin case, a processor with 20 watts of continuous consumption under load, and a graphics chip that can consume around 25 watts - that sounds like a recipe for high chassis temperatures. It is no wonder that the ThinkPad T14 Gen 2 just misses the 60 degree mark with 58.4 degrees Celsius on the bottom. The palm rest remains relatively cool, but you should rather not use the ThinkPad on your lap under extended load.
It is also not surprising that the ThinkPad throttles in the stress test. The processor is limited to 10 watts, and the graphics chip has to lower its clock rates. Throttling should not impact the GPU in everyday use at least. The CPU, on the other hand, suffered a 60% worse result directly after the stress test.
(-) The maximum temperature on the upper side is 47 °C / 117 F, compared to the average of 34.3 °C / 94 F, ranging from 21.2 to 62.5 °C for the class Office.
(-) The bottom heats up to a maximum of 58.4 °C / 137 F, compared to the average of 36.8 °C / 98 F
(+) In idle usage, the average temperature for the upper side is 24.8 °C / 77 F, compared to the device average of 29.5 °C / 85 F.
(±) Playing The Witcher 3, the average temperature for the upper side is 37.5 °C / 100 F, compared to the device average of 29.5 °C / 85 F.
(+) The palmrests and touchpad are reaching skin temperature as a maximum (35 °C / 95 F) and are therefore not hot.
(-) The average temperature of the palmrest area of similar devices was 27.5 °C / 81.5 F (-7.5 °C / -13.5 F).
Loudspeaker
The speakers of the Lenovo laptop emit an overall good sound, which at least means that they are not completely underwhelming. The volume hits a decent level, but bass is almost completely missing.
Lenovo ThinkPad T14 Gen2-20W1S00000 audio analysis
(±) | speaker loudness is average but good (77.9 dB)
Bass 100 - 315 Hz
(±) | reduced bass - on average 14% lower than median
(±) | linearity of bass is average (13.5% delta to prev. frequency)
Mids 400 - 2000 Hz
(+) | balanced mids - only 4.2% away from median
(±) | linearity of mids is average (7% delta to prev. frequency)
Highs 2 - 16 kHz
(+) | balanced highs - only 2.1% away from median
(+) | highs are linear (3.9% delta to prev. frequency)
Overall 100 - 16.000 Hz
(+) | overall sound is linear (13.2% difference to median)
Compared to same class
» 7% of all tested devices in this class were better, 2% similar, 91% worse
» The best had a delta of 7%, average was 21%, worst was 53%
Compared to all devices tested
» 13% of all tested devices were better, 3% similar, 84% worse
» The best had a delta of 4%, average was 23%, worst was 134%
HP EliteBook 845 G7-23Y60EA audio analysis
(-) | not very loud speakers (67.8 dB)
Bass 100 - 315 Hz
(-) | nearly no bass - on average 19.7% lower than median
(±) | linearity of bass is average (11.7% delta to prev. frequency)
Mids 400 - 2000 Hz
(+) | balanced mids - only 1.3% away from median
(+) | mids are linear (4.8% delta to prev. frequency)
Highs 2 - 16 kHz
(+) | balanced highs - only 3% away from median
(+) | highs are linear (4.5% delta to prev. frequency)
Overall 100 - 16.000 Hz
(±) | linearity of overall sound is average (16.2% difference to median)
Compared to same class
» 40% of all tested devices in this class were better, 4% similar, 56% worse
» The best had a delta of 5%, average was 18%, worst was 53%
Compared to all devices tested
» 26% of all tested devices were better, 6% similar, 68% worse
» The best had a delta of 4%, average was 23%, worst was 134%
Power management: T14 Gen 2 suffers from higher consumption
Power consumption
The increased power consumption rates compared to the Lenovo ThinkPad T14 Gen 1 tell us that Lenovo has not yet sufficiently optimized the T14 Gen 2. Although the increased load rates can be explained by the additional Nvidia GPU, the higher idle power consumption cannot.
The peak draw of 67.5 watts is above the power supply capacity (65 W), but the average load consumption of 61.2 watts is within limits. Therefore, the battery should not discharge during use.
| Off / Standby | |
| Idle | |
| Load |
|
Key:
min: | |
| Lenovo ThinkPad T14 Gen2-20W1S00000 i7-1165G7, GeForce MX450, Samsung PM981a MZVLB1T0HBLR, IPS LED, 1920x1080, 14" | Lenovo ThinkPad T14-20S1S06B00 i5-10210U, UHD Graphics 620, Lite-On CA5-8D512, LTPS IPS LED, 1920x1080, 14" | Lenovo ThinkPad T14-20UES00H00 R5 PRO 4650U, Vega 6, Samsung SSD PM981a MZVLB512HBJQ, IPS, 1920x1080, 14" | HP EliteBook 845 G7-23Y60EA R5 PRO 4650U, Vega 6, Samsung PM991 MZVLQ256HAJD, IPS, 1920x1080, 14" | Dell Latitude 14 5411-WJ40N i7-10850H, GeForce MX250, SK Hynix PC611 512GB, IPS, 1920x1080, 14" | Lenovo ThinkPad T490-20N3S02L00 i7-8565U, GeForce MX250, Toshiba XG5 KXG50ZNV512G, IGZO IPS LED, 1920x1080, 14" | Average NVIDIA GeForce MX450 | Average of class Office | |
|---|---|---|---|---|---|---|---|---|
| Power Consumption | 12% | 2% | 33% | -13% | 12% | -10% | 9% | |
| Idle Minimum * (Watt) | 3.8 | 3.2 16% | 5.8 -53% | 3.1 18% | 3.1 18% | 2.16 43% | 4.91 ? -29% | 4.3 ? -13% |
| Idle Average * (Watt) | 7.3 | 6.1 16% | 8.3 -14% | 5.6 23% | 5.4 26% | 5.04 31% | 8.36 ? -15% | 7.33 ? -0% |
| Idle Maximum * (Watt) | 11.2 | 10.4 7% | 11 2% | 8.6 23% | 9 20% | 8.64 23% | 11.1 ? 1% | 8.59 ? 23% |
| Load Average * (Watt) | 61.2 | 45.6 25% | 39.5 35% | 28.4 54% | 84 -37% | 63.2 -3% | 58.4 ? 5% | 43.6 ? 29% |
| Witcher 3 ultra * (Watt) | 41.2 | 50 -21% | ||||||
| Load Maximum * (Watt) | 67.5 | 68.6 -2% | 40.8 40% | 35.4 48% | 131 -94% | 67.5 -0% | 76.2 ? -13% | 64.4 ? 5% |
* ... smaller is better
Battery life
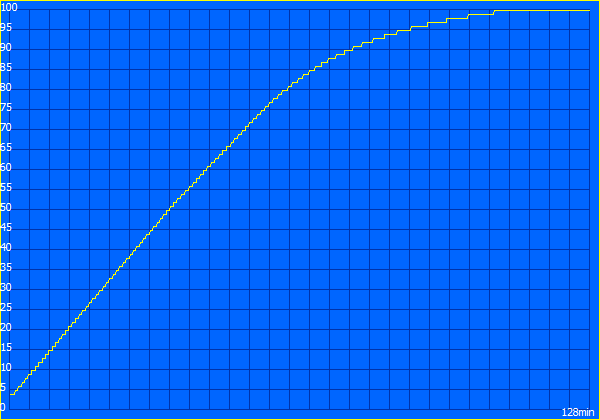
Although the battery capacity has not changed, the internal 50 watt-hour battery is burdened by a higher power consumption in the newer model. As a result, the battery runtime in the Wi-Fi test (at 150 cd/m²) is two hours shorter. Nine hours is not a bad value in absolute terms, but it is still a disappointment. At least the T14 Gen 1 AMD can be beaten.
| Lenovo ThinkPad T14 Gen2-20W1S00000 i7-1165G7, GeForce MX450, 50 Wh | Lenovo ThinkPad T14-20S1S06B00 i5-10210U, UHD Graphics 620, 50 Wh | Lenovo ThinkPad T14-20UES00H00 R5 PRO 4650U, Vega 6, 50 Wh | HP EliteBook 845 G7-23Y60EA R5 PRO 4650U, Vega 6, 56 Wh | Dell Latitude 14 5411-WJ40N i7-10850H, GeForce MX250, 68 Wh | Lenovo ThinkPad T490-20N3S02L00 i7-8565U, GeForce MX250, 50 Wh | Average of class Office | |
|---|---|---|---|---|---|---|---|
| Battery runtime | -1% | -11% | 27% | -6% | -12% | 31% | |
| H.264 (h) | 14 | 10.4 -26% | 11.6 -17% | 9.5 -32% | 8.7 -38% | 15.5 ? 11% | |
| WiFi v1.3 (h) | 9 | 11 22% | 8.4 -7% | 12.2 36% | 8.5 -6% | 9.1 1% | 13 ? 44% |
| Load (h) | 1.3 | 1.3 0% | 1.2 -8% | 2.3 77% | 1.3 0% | 1.808 ? 39% |
Pros
Cons
Verdict: Tiger-Lake in the T14 G2 is an overall step forward

A last hurrah of the old design - that could be the Lenovo ThinkPad T14 Gen 2, because we do not think that Lenovo will rely on the 2019 design next year. However, the fact that it is a small update in the same case is quite good. For example, the wide connectivity remains, and the keyboard with the comparatively generous travel of 1.8 millimeters is still here - all other current ThinkPad laptops have moved to 1.5 millimeters.
New features include the Tiger Lake CPUs and the Nvidia GeForce MX450. There are significant performance leaps in both areas, making the Lenovo ThinkPad T14 Gen 2 Intel much more attractive than the T14 Gen 1 Intel. However, the newer ThinkPad notebook is not perfect: The fan runs louder under load, the battery life is shorter, and there is CPU throttling in the stress test. In addition, the processor does not deliver the full performance on battery power.
The Lenovo ThinkPad T14 Gen 2 Intel is significantly more powerful than its predecessor. However, there is still room for optimization in some areas, especially the energy consumption.
However, we definitely recommend the ThinkPad T14 Gen 2 Intel in view of the other qualities. Hopefully, Lenovo can reduce the energy consumption a bit more with updates to make the package even more well-rounded.
Price and availability
In the tested configuration, the Lenovo ThinkPad T14 Gen 2 is currently only available in Lenovo's Campus Program, for example at Campuspoint.
Lenovo ThinkPad T14 Gen2-20W1S00000
- 05/01/2021 v7 (old)
Benjamin Herzig
Price comparison

