Dell Latitude 14 5411 laptop in review: Business laptop with powerful CPU

Dell primarily targets business users with Latitude devices. The prices range from cheap to expensive depending on the installed hardware. For example, the MSRP of the Dell Latitude 15 5511 that we tested was in the mid-range at approximately 1,250 Euros (~$1,517), and the Dell Latitude 5310 convertible was priced a bit higher. For the Latitude 14 5411, prices start at under 1,000 Euros (~$1,213). However, the configuration in our hands with the Intel Core i7-10850H, the Nvidia GeForce MX250, 16 GB of RAM, and a 512 GB SSD costs up to 1,700 Euros (~$2,062).
With the hardware mentioned above, we let Dell's 14-inch business laptop face off against the comparison devices listed below. You can also add more laptops from our database to our chosen competitors under each section.
Possible contenders in comparison
Rating | Date | Model | Weight | Height | Size | Resolution | Price |
|---|---|---|---|---|---|---|---|
| 82.6 % v7 (old) | 02 / 2021 | Dell Latitude 14 5411-WJ40N i7-10850H, GeForce MX250 | 1.5 kg | 21 mm | 14.00" | 1920x1080 | |
| 85.3 % v7 (old) | 08 / 2020 | Lenovo Yoga Slim 7-14ARE R7 4800U, Vega 8 | 1.4 kg | 14.9 mm | 14.00" | 1920x1080 | |
| 84.5 % v7 (old) | 11 / 2020 | Honor MagicBook Pro (AMD) R5 4600H, Vega 6 | 1.7 kg | 16.9 mm | 16.10" | 1920x1080 | |
| 82.5 % v7 (old) | 12 / 2020 | MSI Prestige 14 Evo A11M-005 i7-1185G7, Iris Xe G7 96EUs | 1.2 kg | 16 mm | 14.00" | 1920x1080 | |
| 85.4 % v7 (old) | 11 / 2020 | Dynabook Portégé X40-G-10K i5-10210U, UHD Graphics 620 | 1.3 kg | 16.9 mm | 14.00" | 1920x1080 |
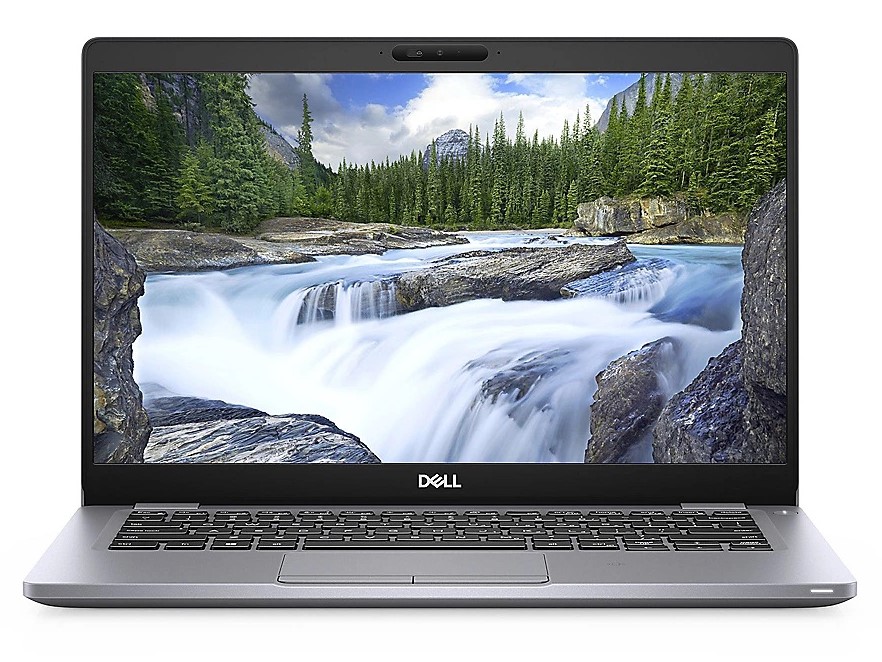
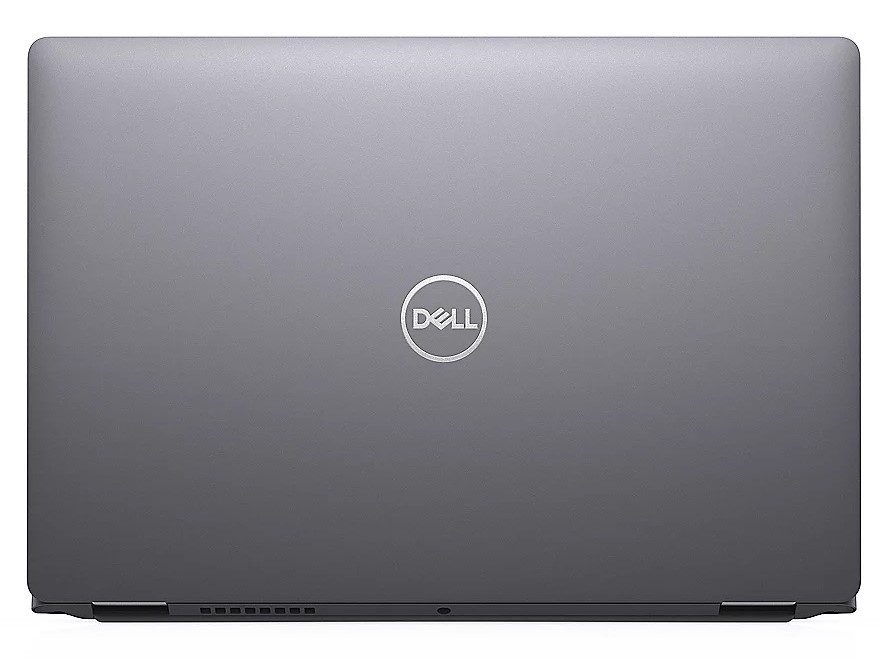
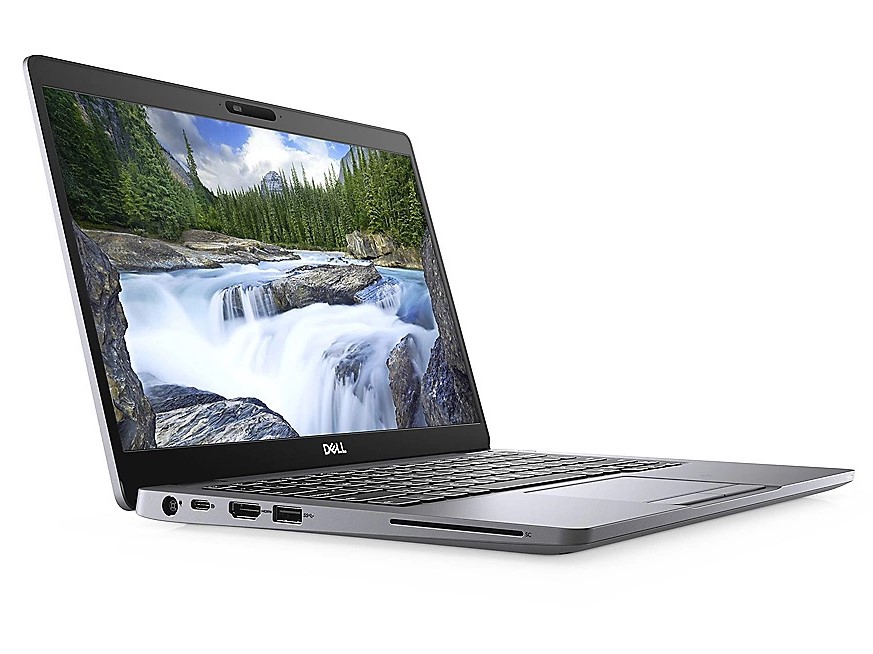
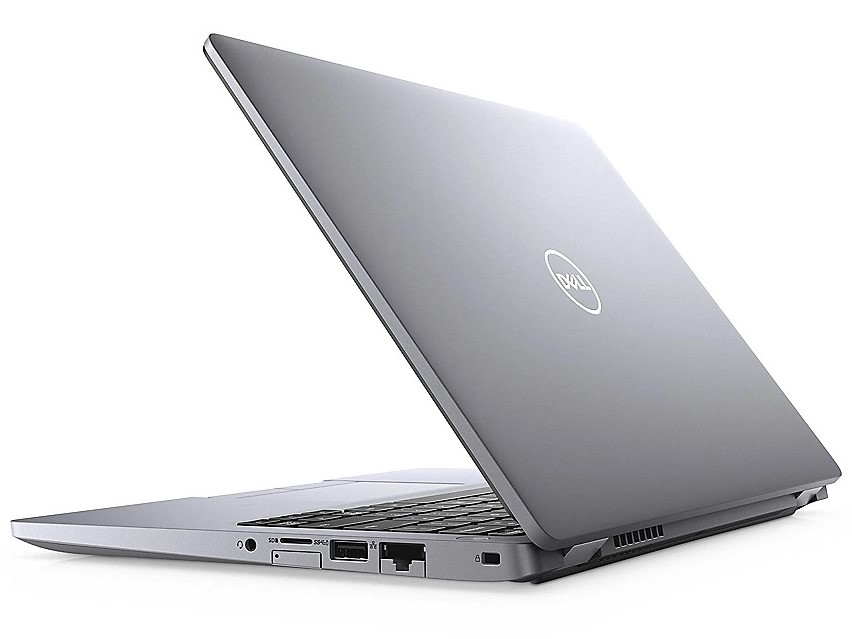
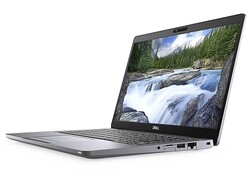
Case and connectivity - Robust 14-inch business laptop
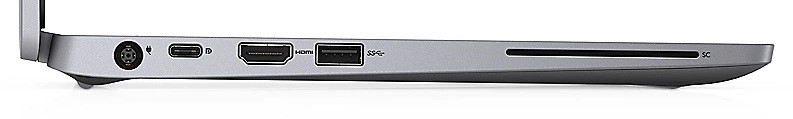
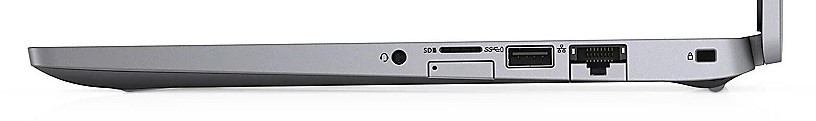
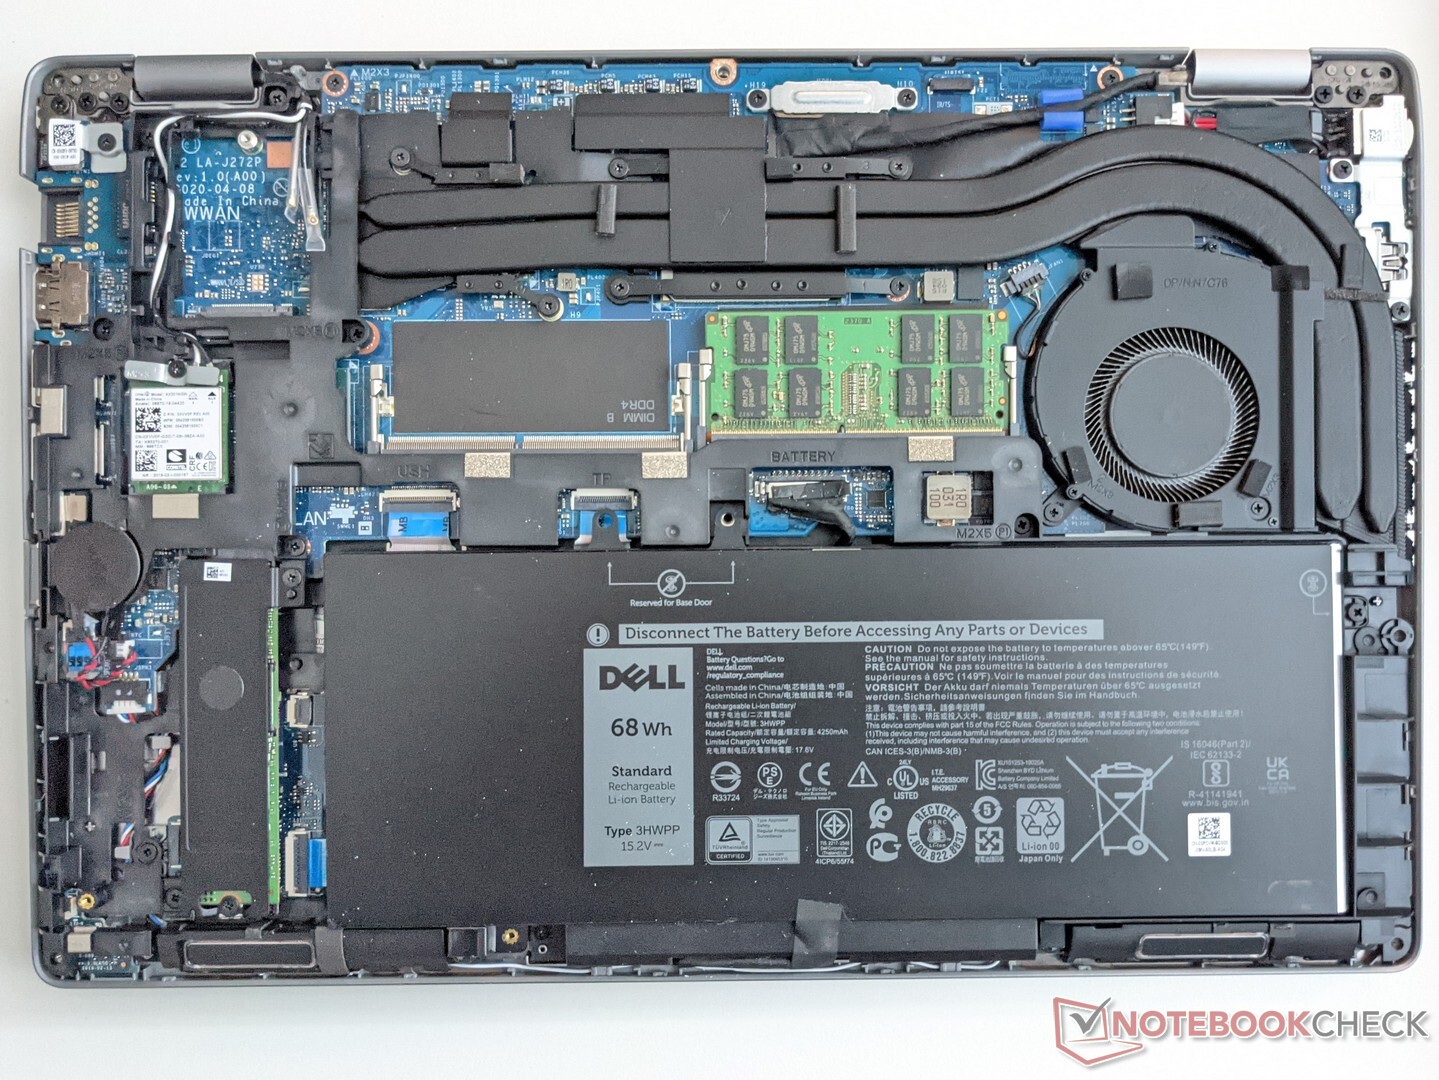
The Dell Latitude 14 5411 is made of sturdy plastic all around. It's very stable and has a high-quality finish. The screen is also resistant to torsion and can be folded backwards by up to 180 degrees. While the width and depth are similar to other 14-inch laptops, the Latitude 14 is considerably thicker at 2.1 centimeters. However, since a readily available SIM card slot, a smart card reader, and a Gigabit LAN port have also been accommodated on the sides, we don't consider this to be a disadvantage.
The above mentioned memory card reader accepts microSD cards and achieves excellent speeds of 166 MB/s for copying data and 191 MB/s for reading data with our reference memory card, the Toshiba Exceria Pro M501. The Wi-Fi test delivers very good results as well with our Netgear Nighthawk AX12 reference router and the Wi-Fi 6 standard. Here, the Latitude 14 5411 can place itself in the upper range of our test field with 1,365 Mb/s for receiving data and 1,651 Mb/s for sending data.
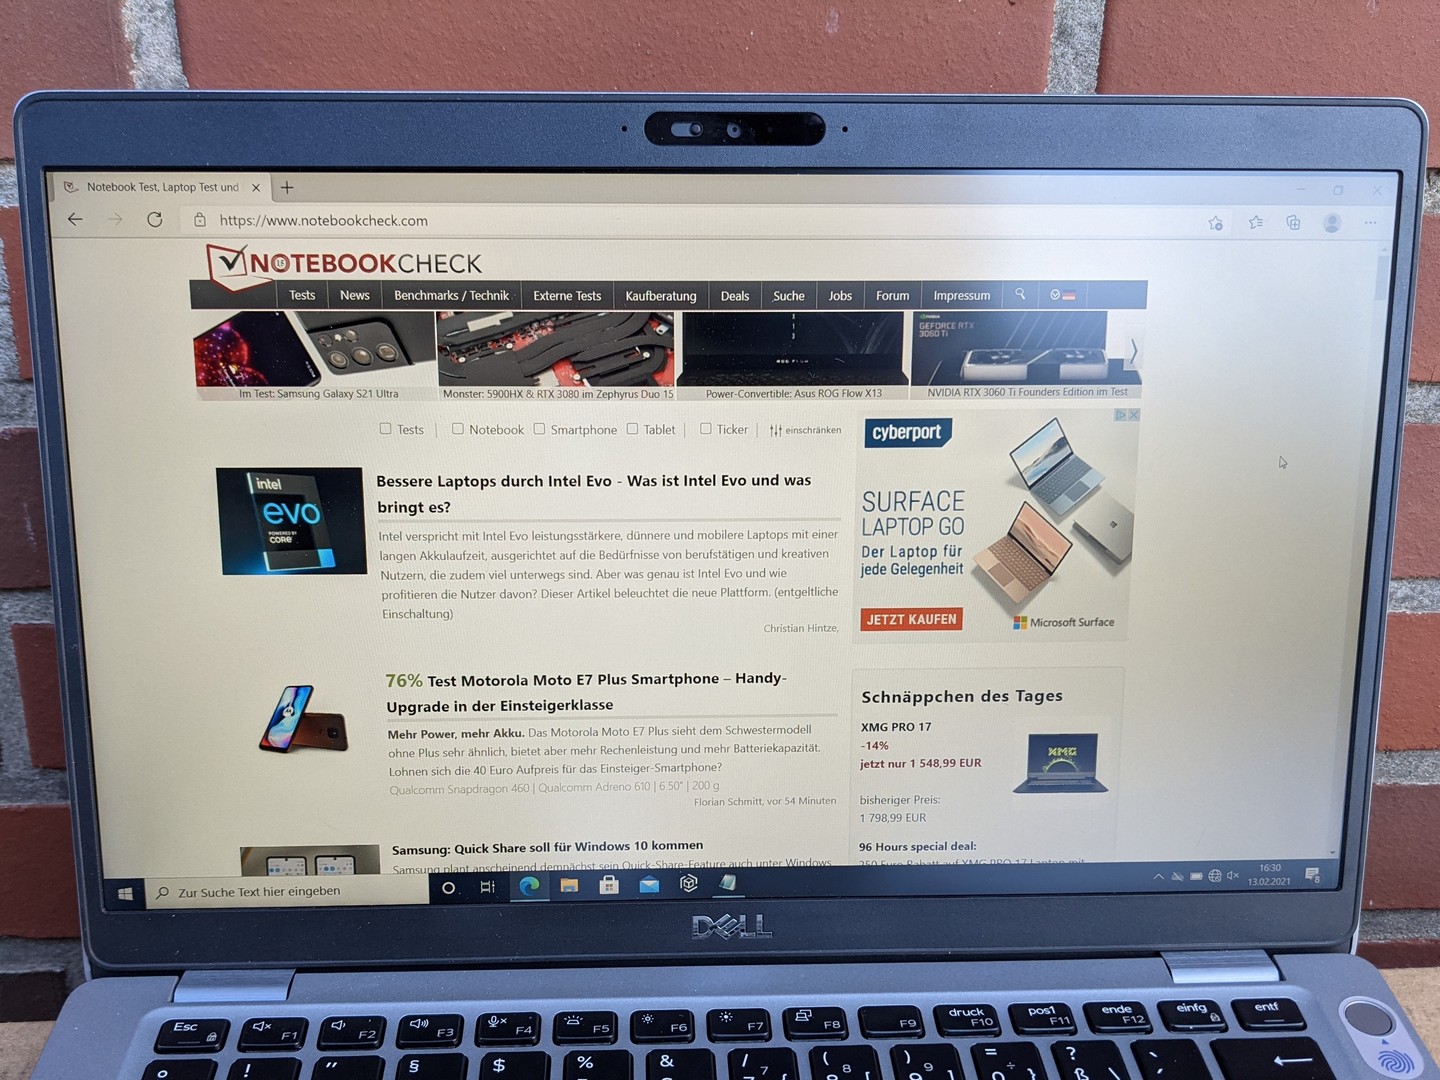
As in most current laptops, the Dell Latitude 14 5411 also uses a webcam with a low resolution of 0.9 MP. As a result, the image looks blurry even in well-lit environments, and colors have low contrast.

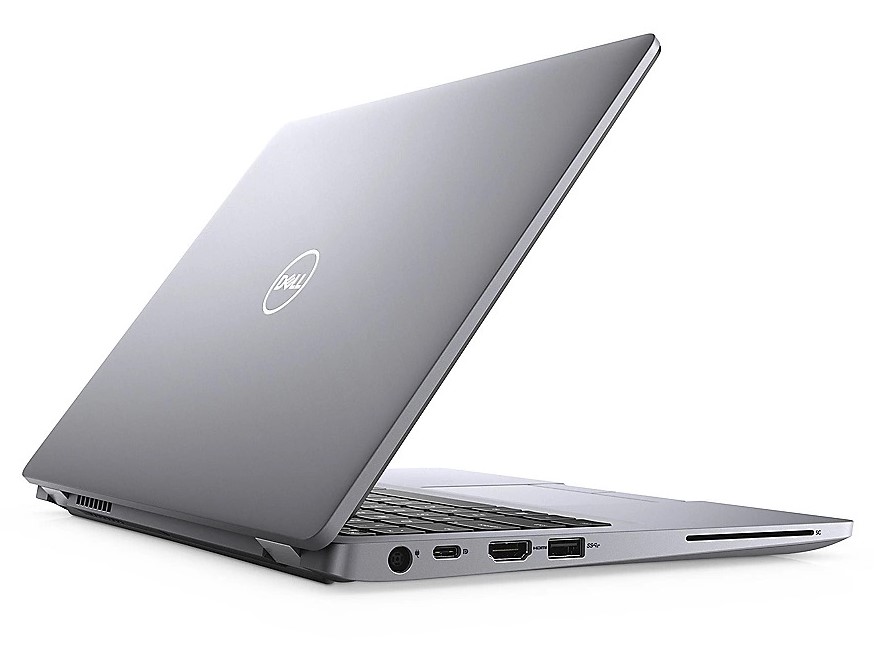
Port configuration
| SD Card Reader | |
| average JPG Copy Test (av. of 3 runs) | |
| Dell Latitude 14 5411-WJ40N (Toshiba Exceria Pro M501 microSDXC 64GB) | |
| Dynabook Portégé X40-G-10K (Toshiba Exceria Pro M501 microSDXC 64GB) | |
| Average of class Office (19.8 - 198.5, n=21, last 2 years) | |
| Lenovo Yoga Slim 7-14ARE (Toshiba Exceria Pro M501 64 GB UHS-II) | |
| maximum AS SSD Seq Read Test (1GB) | |
| Dell Latitude 14 5411-WJ40N (Toshiba Exceria Pro M501 microSDXC 64GB) | |
| Dynabook Portégé X40-G-10K (Toshiba Exceria Pro M501 microSDXC 64GB) | |
| Average of class Office (27.4 - 249, n=20, last 2 years) | |
| Lenovo Yoga Slim 7-14ARE (Toshiba Exceria Pro M501 64 GB UHS-II) | |
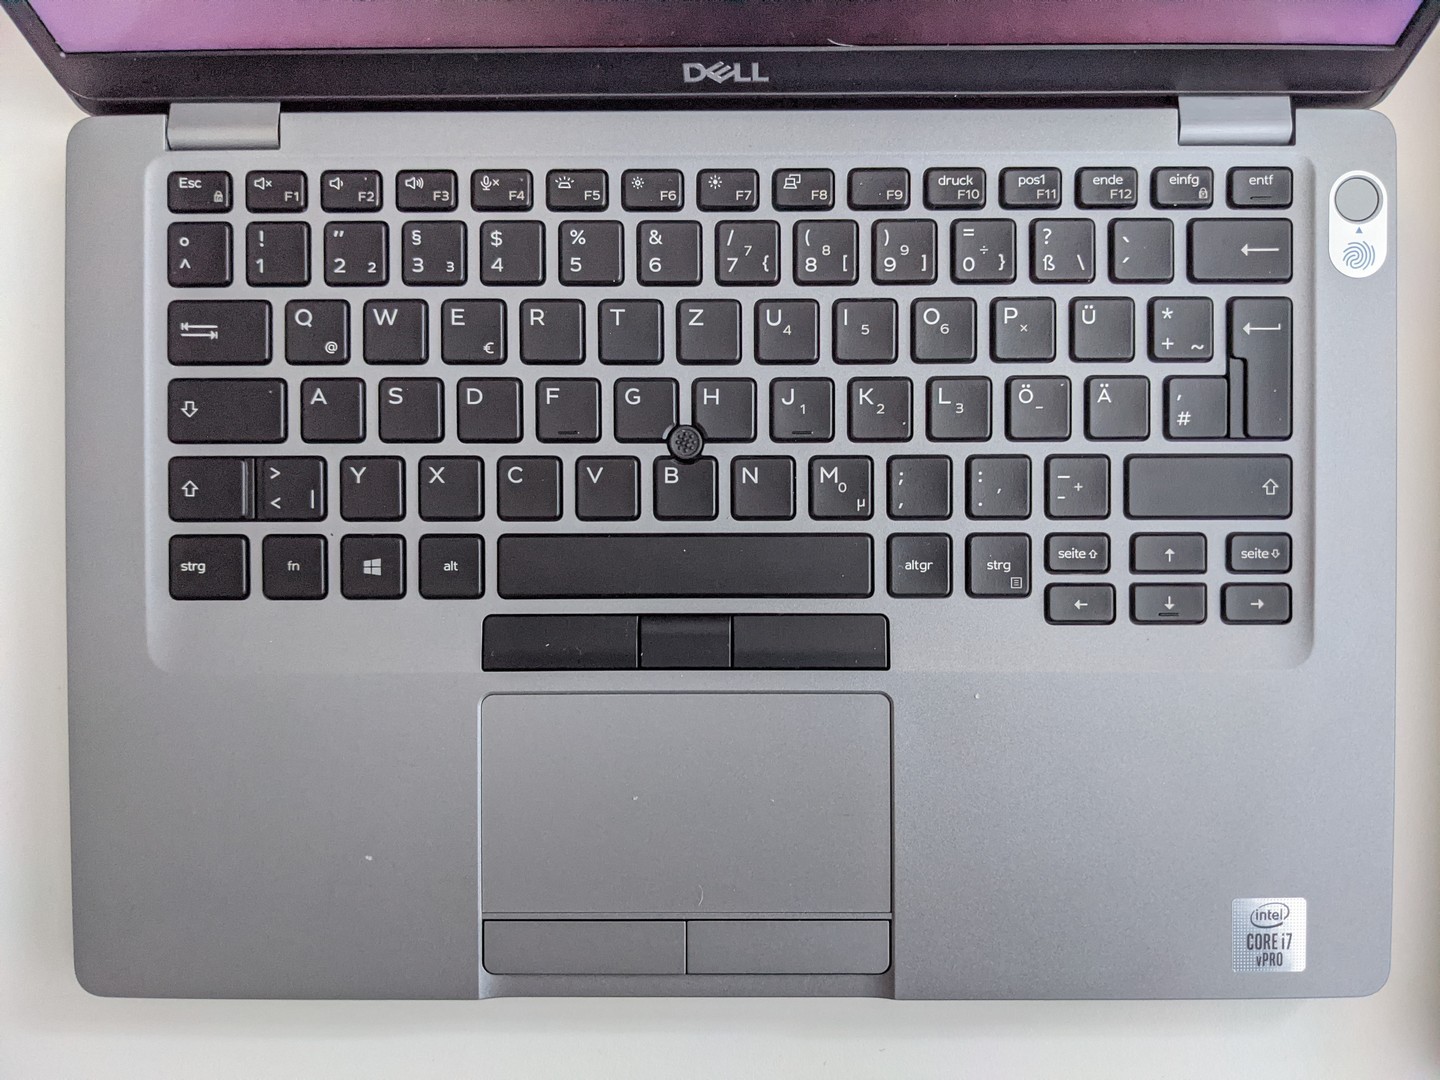
Input devices - Latitude 14 with pointing stick
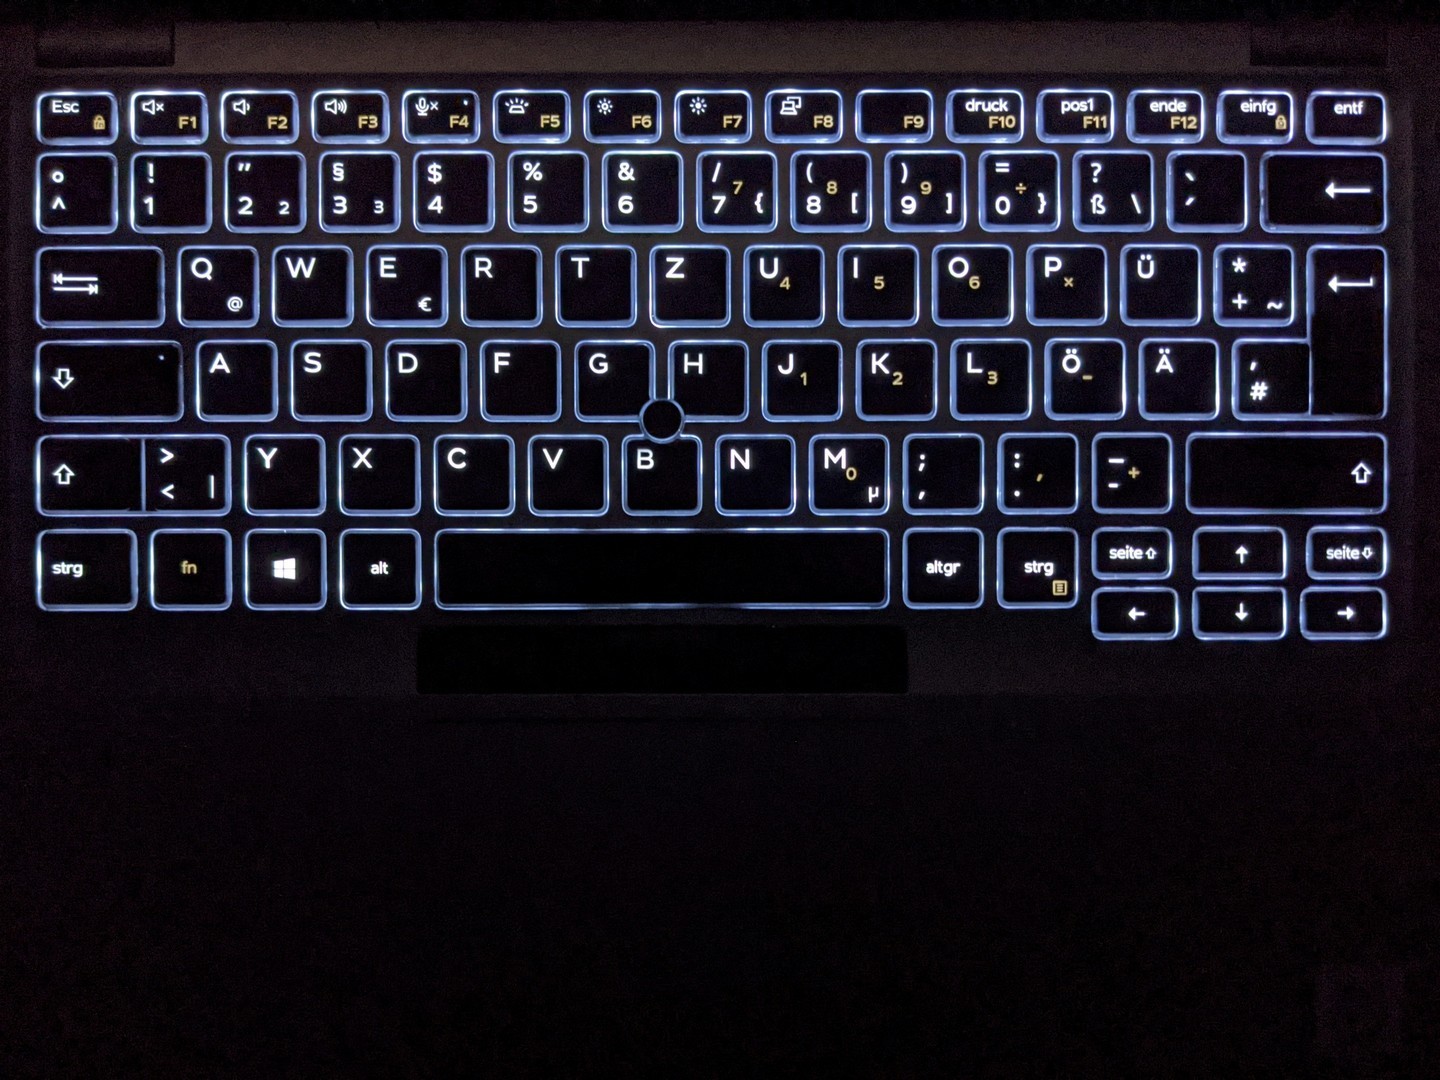
The Dell business laptop's keyboard offers a soft feedback with a noticeable pressure point when typing. Not only does this make it quiet but also well-suited for longer typing sessions. The keys are slightly smaller than in other laptops, resulting in larger key gaps. However, all keys are easy to reach after a short familiarization period. The two-stage backlight, which illuminates the labeling of the keys uniformly and without glare, is recommended for working in the dark.
As a mouse replacement, users can choose between the touchpad and the pointing stick; they both have their own separated mouse buttons. Both input methods are well suited for navigating the mouse pointer. However, the buttons belonging to the pointing stick can be pressed much more deeply and have a considerably softer feedback than the buttons assigned to the touchpad.
Display - Good contrast but low brightness

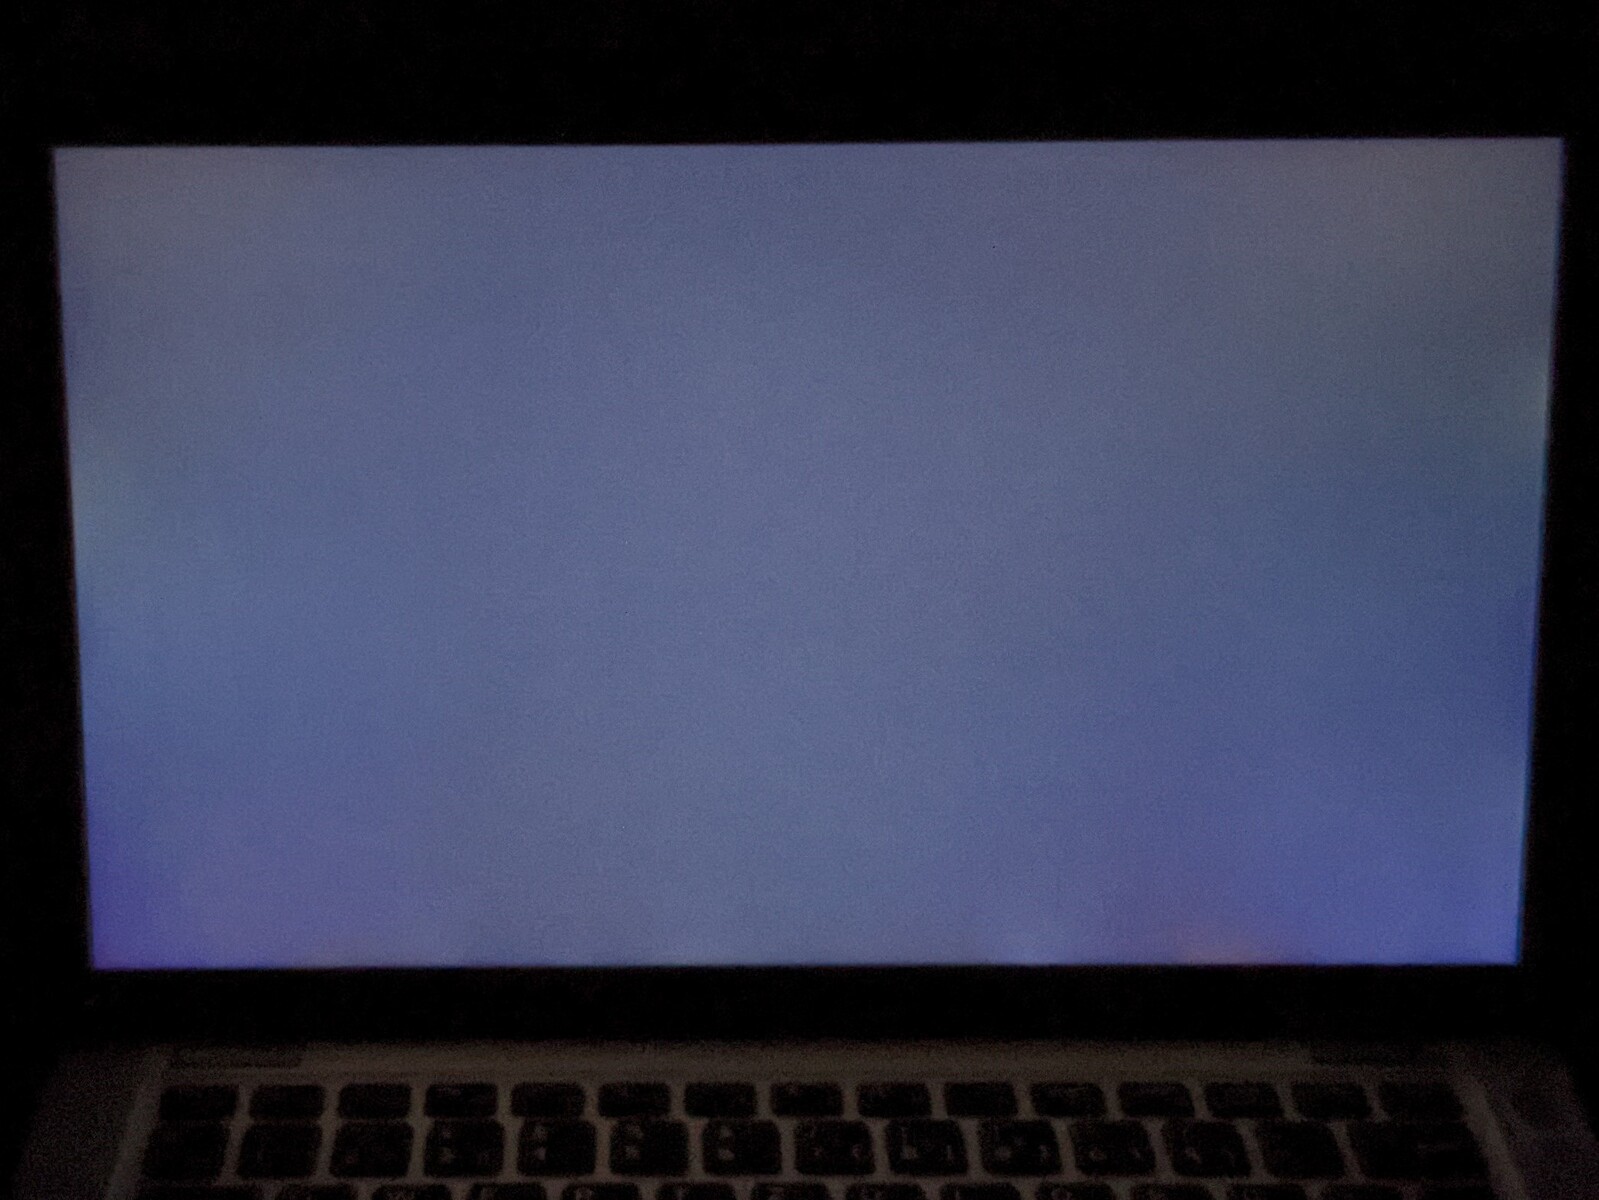
The display of the Dell Latitude 14 5411 consists of a 14-inch IPS panel and offers a resolution of 1920x1080 pixels. The average brightness of 236 cd/m² is at the lower end of our test field, and the brightness distribution of 86% is within the average range. Dell doesn't use PWM for brightness control, which is convenient for users with sensitive eyes.
Dell doesn't offer any other display variants for the Latitude 14 5411.
| |||||||||||||||||||||||||
Brightness Distribution: 86 %
Center on Battery: 251 cd/m²
Contrast: 1113:1 (Black: 0.23 cd/m²)
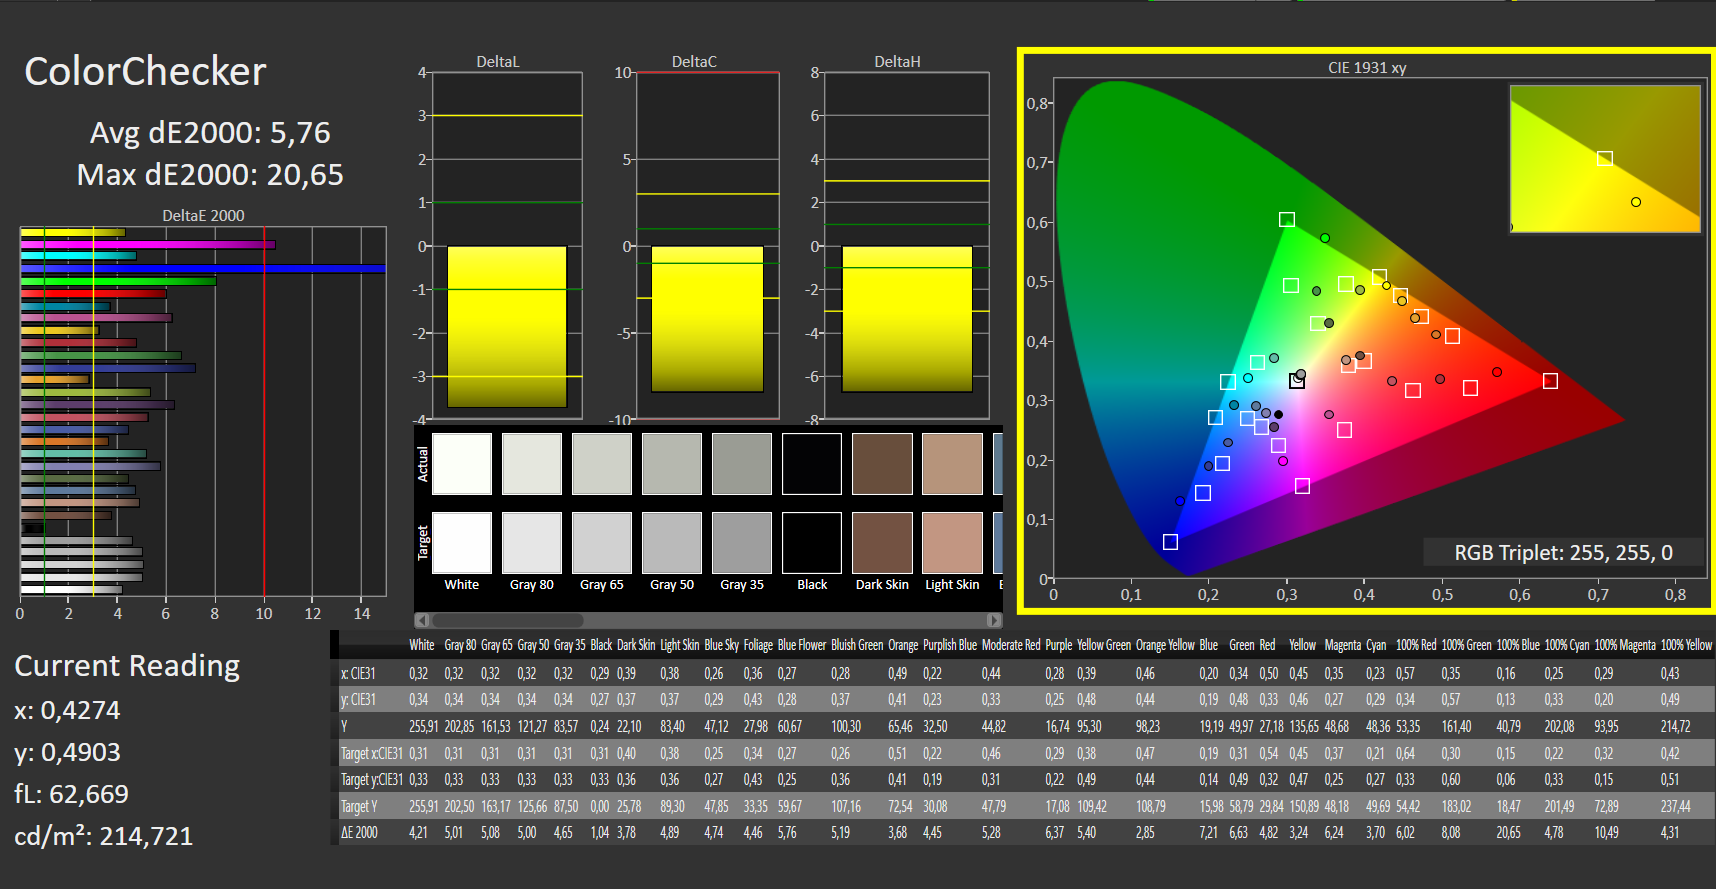
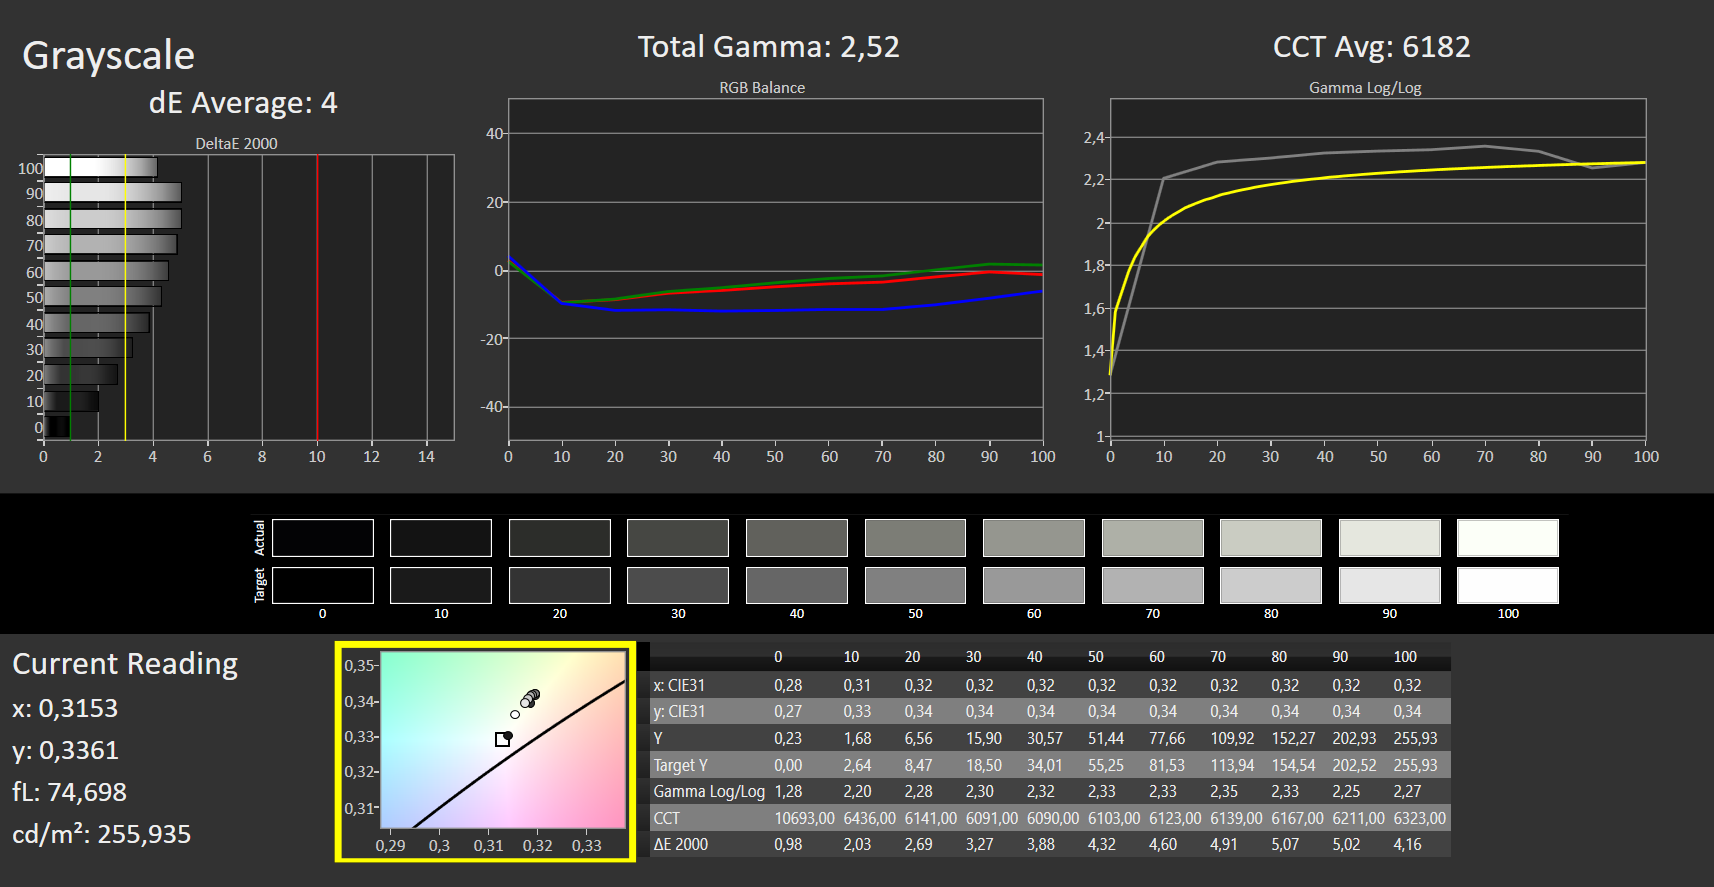
ΔE ColorChecker Calman: 5.76 | ∀{0.5-29.43 Ø4.72}
ΔE Greyscale Calman: 4 | ∀{0.09-98 Ø4.97}
56% sRGB (Argyll 1.6.3 3D)
36% AdobeRGB 1998 (Argyll 1.6.3 3D)
38.67% AdobeRGB 1998 (Argyll 3D)
56.2% sRGB (Argyll 3D)
37.43% Display P3 (Argyll 3D)
Gamma: 2.52
CCT: 6182 K
| Dell Latitude 14 5411-WJ40N AU Optronics AUO463D, IPS, 1920x1080, 14" | Lenovo Yoga Slim 7-14ARE AU Optronics B140HAN06.8, IPS, 1920x1080, 14" | Honor MagicBook Pro (AMD) N161HCA-EA3, IPS, 1920x1080, 16.1" | MSI Prestige 14 Evo A11M-005 AUO B140HAN06.2 (AUO623D), IPS-Level, 1920x1080, 14" | Dynabook Portégé X40-G-10K Toshiba TOS508F, IPS, 1920x1080, 14" | |
|---|---|---|---|---|---|
| Display | 86% | 61% | 81% | 75% | |
| Display P3 Coverage (%) | 37.43 | 71.7 92% | 67.5 80% | 68.8 84% | 66.1 77% |
| sRGB Coverage (%) | 56.2 | 99.3 77% | 69.7 24% | 99.4 77% | 96.1 71% |
| AdobeRGB 1998 Coverage (%) | 38.67 | 72.9 89% | 69.7 80% | 70.9 83% | 68 76% |
| Response Times | -79% | -52% | -113% | -56% | |
| Response Time Grey 50% / Grey 80% * (ms) | 31 ? | 45.6 ? -47% | 37.6 ? -21% | 59.6 ? -92% | 39 ? -26% |
| Response Time Black / White * (ms) | 14 ? | 29.6 ? -111% | 25.6 ? -83% | 32.8 ? -134% | 26 ? -86% |
| PWM Frequency (Hz) | 25250 ? | 24000 ? | |||
| Screen | 32% | 54% | 38% | 27% | |
| Brightness middle (cd/m²) | 256 | 399.6 56% | 337 32% | 293 14% | 408 59% |
| Brightness (cd/m²) | 236 | 385 63% | 312 32% | 277 17% | 372 58% |
| Brightness Distribution (%) | 86 | 89 3% | 89 3% | 89 3% | 85 -1% |
| Black Level * (cd/m²) | 0.23 | 0.37 -61% | 0.2 13% | 0.18 22% | 0.44 -91% |
| Contrast (:1) | 1113 | 1080 -3% | 1685 51% | 1628 46% | 927 -17% |
| Colorchecker dE 2000 * | 5.76 | 3.2 44% | 0.8 86% | 2.95 49% | 2.73 53% |
| Colorchecker dE 2000 max. * | 20.65 | 6.44 69% | 1.1 95% | 6.03 71% | 5.61 73% |
| Greyscale dE 2000 * | 4 | 4.7 -18% | 1 75% | 4.2 -5% | 4.13 -3% |
| Gamma | 2.52 87% | 2.21 100% | 2.2 100% | 2.099 105% | 2.46 89% |
| CCT | 6182 105% | 7184 90% | 6538 99% | 6622 98% | 5862 111% |
| Color Space (Percent of AdobeRGB 1998) (%) | 36 | 66.3 84% | 63.8 77% | 71 97% | 62 72% |
| Color Space (Percent of sRGB) (%) | 56 | 99.5 78% | 99.5 78% | 93 66% | 96 71% |
| Colorchecker dE 2000 calibrated * | 1.73 | 0.7 | 0.9 | ||
| Total Average (Program / Settings) | 13% /
28% | 21% /
41% | 2% /
27% | 15% /
26% |
* ... smaller is better
Display Response Times
| ↔ Response Time Black to White | ||
|---|---|---|
| 14 ms ... rise ↗ and fall ↘ combined | ↗ 4 ms rise | 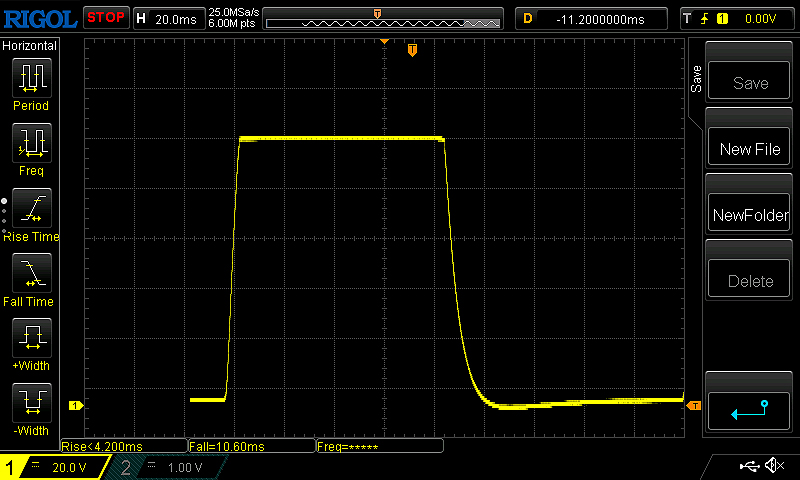 |
| ↘ 10 ms fall | ||
| The screen shows good response rates in our tests, but may be too slow for competitive gamers. In comparison, all tested devices range from 0.1 (minimum) to 240 (maximum) ms. » 34 % of all devices are better. This means that the measured response time is better than the average of all tested devices (19.8 ms). | ||
| ↔ Response Time 50% Grey to 80% Grey | ||
| 31 ms ... rise ↗ and fall ↘ combined | ↗ 9 ms rise | 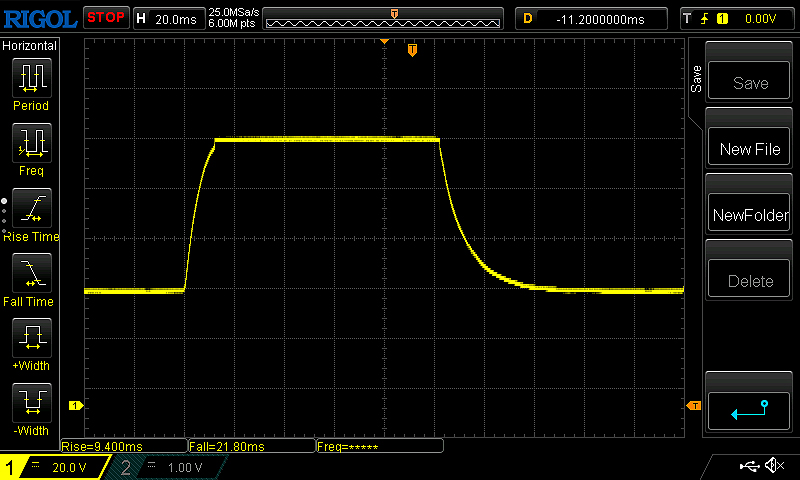 |
| ↘ 22 ms fall | ||
| The screen shows slow response rates in our tests and will be unsatisfactory for gamers. In comparison, all tested devices range from 0.165 (minimum) to 636 (maximum) ms. » 42 % of all devices are better. This means that the measured response time is similar to the average of all tested devices (31 ms). | ||
Screen Flickering / PWM (Pulse-Width Modulation)
| Screen flickering / PWM not detected | 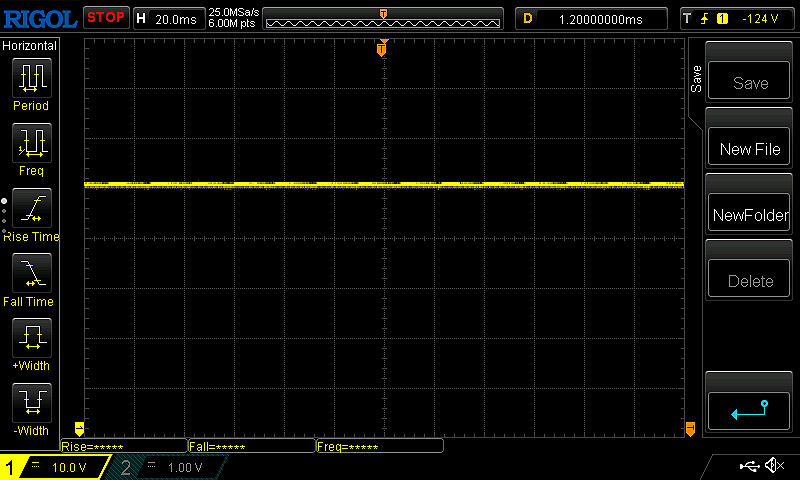 | ||
In comparison: 52 % of all tested devices do not use PWM to dim the display. If PWM was detected, an average of 7753 (minimum: 5 - maximum: 343500) Hz was measured. | |||
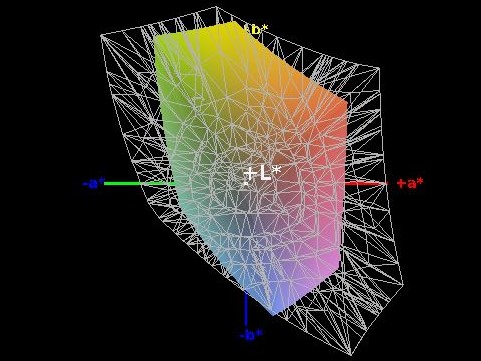
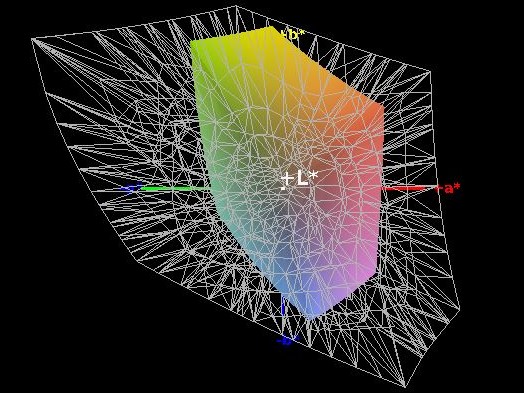
Our measurements show that the Latitude 14 5411 has a good contrast ratio of 1,113:1 and an equally good black level of 0.23 cd/m². However, these values are surpassed by most competitors in our test field. The color-space coverage of 56% (sRGB) and 36% (AdobeRGB) is also the lowest among our chosen contenders.
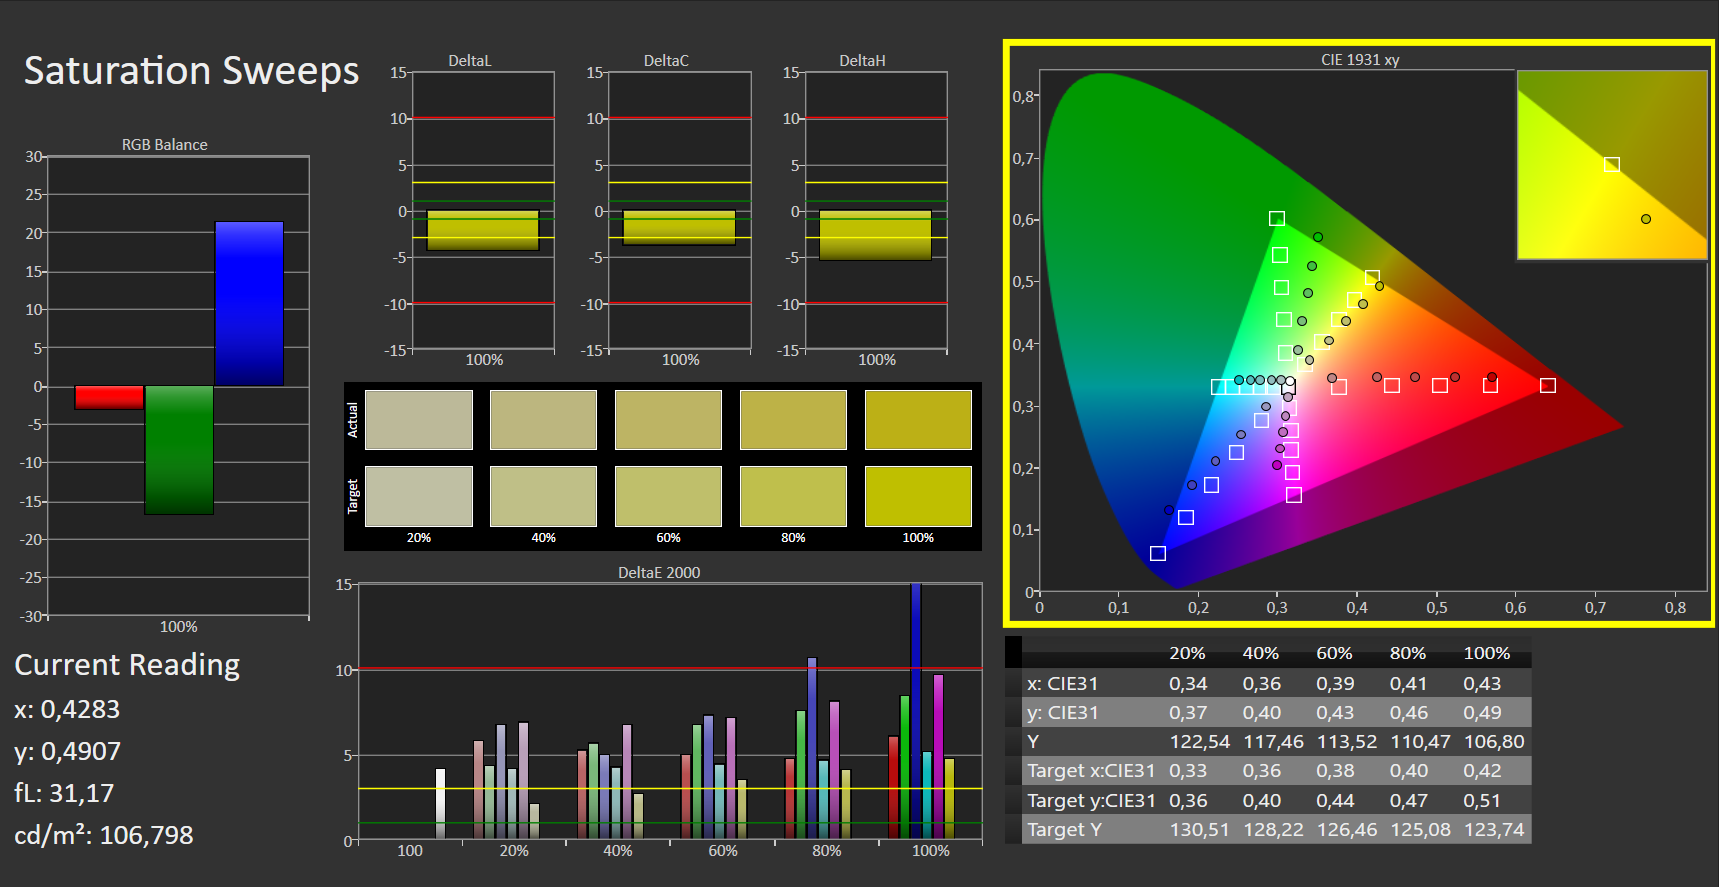
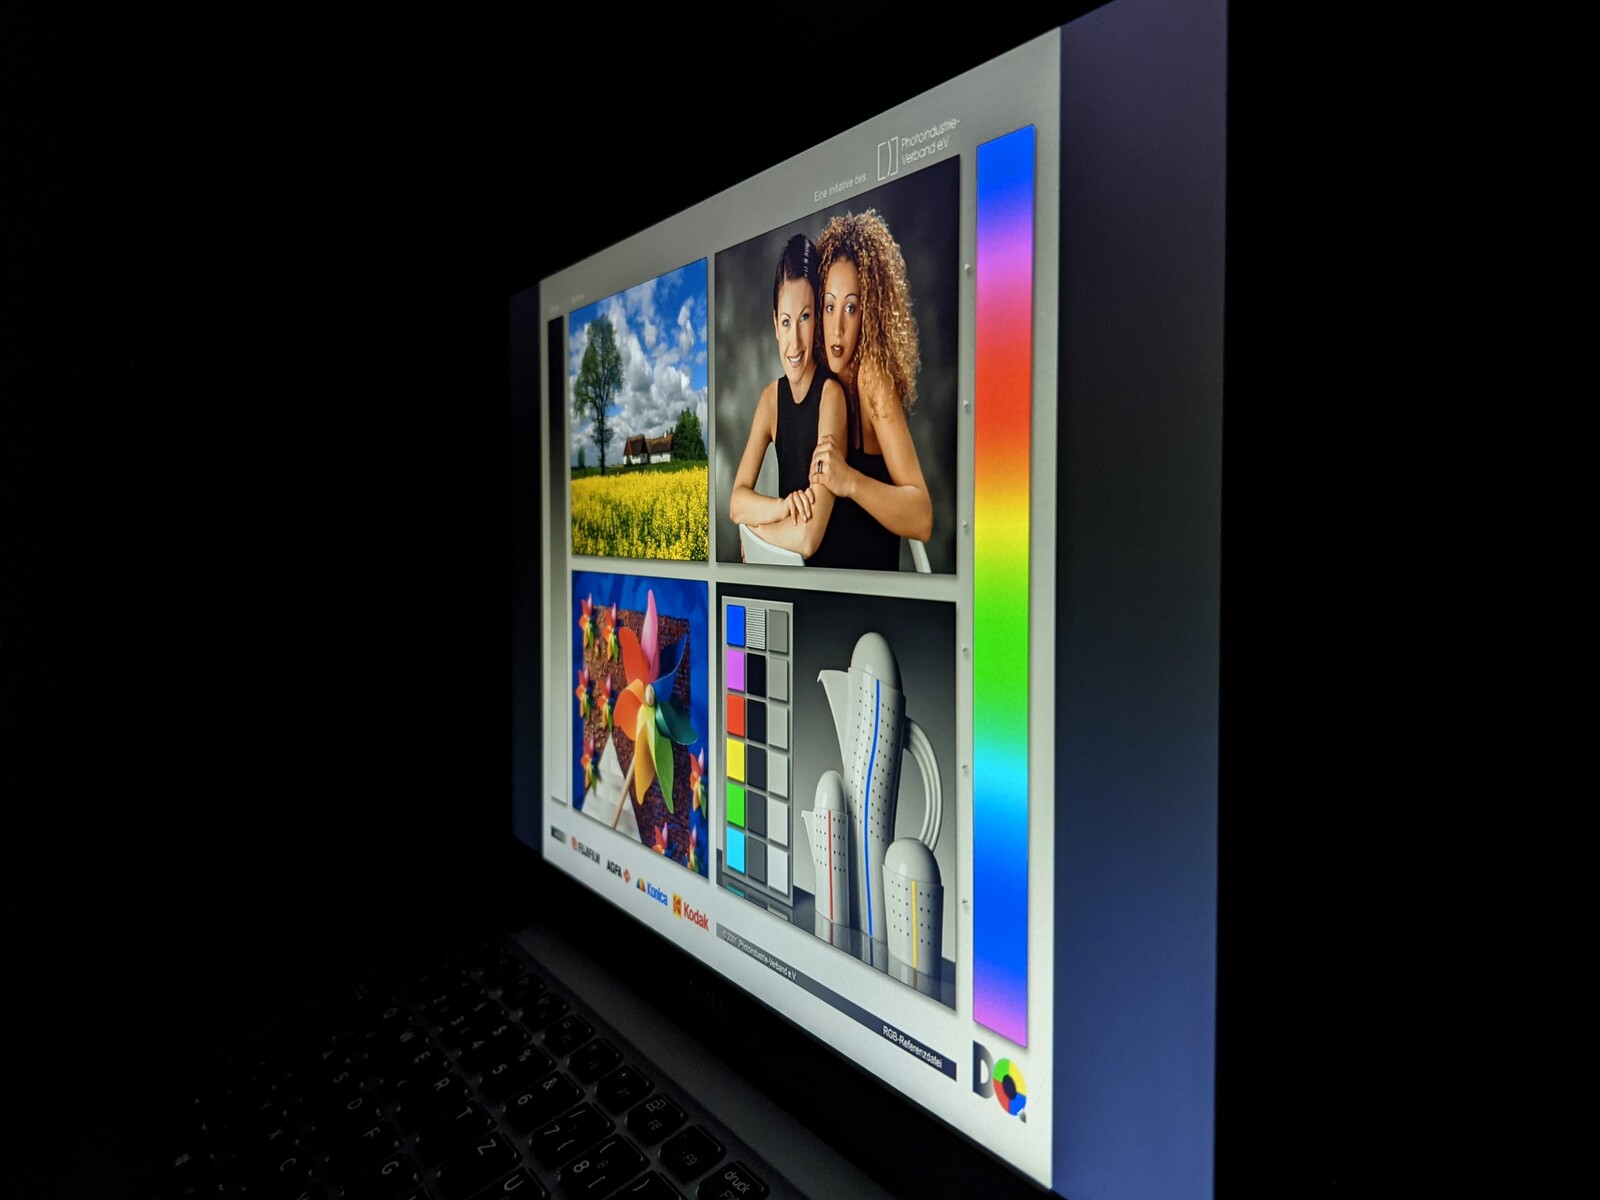
The CalMAN analysis shows that the screen already displays colors with a very low deviation out of the box. Therefore, calibration is not necessary. Furthermore, the matte screen surface makes the Dell laptop suitable for outdoor use, although you should only work in places with shade due to the low brightness. The IPS panel is also very viewing-angle stable.
Performance - Simple gaming is possible with the MX250
The Dell Latitude 14 5411 is aimed at business users who are looking for a robust laptop and good system performance as well as features like a smart card reader, a LAN port, and a fingerprint scanner. The focus on performance is evident in the CPU options offered, which include an Intel Core i5-10400H in addition to the Intel Core i7-10850H used here. For users who can do without the Nvidia GeForce MX250, the Latitude 14 5411 is also available without the dGPU.
Processor
The Intel Core i7-10850H installed here is a hexa-core processor that can process up to 12 tasks simultaneously. The clock rates are between 2.7 and 5.1 GHz, whereby long-term performance is largely dependent on the cooling system. In our Cinebench R15 test loop, the Core i7-10850H shows a very high initial value, which, however, drops quite quickly and sharply by about 15%. Nevertheless, such an effect can also be observed in other laptops like the Lenovo Yoga Slim 7, for example.
In the rest of the tests, the i7-10850H places itself between the Intel Core i7-1185G7 and AMD's Ryzen 7 4800U in multi-core disciplines. In single-core performance, the CPU of the Dell Latitude 14 5411 can place itself ahead of AMD rivals, and it alternates between first and second place in our test field with the i7-1185G7.
Cinebench R15: CPU Single 64Bit | CPU Multi 64Bit
Blender: v2.79 BMW27 CPU
7-Zip 18.03: 7z b 4 -mmt1 | 7z b 4
Geekbench 5.5: Single-Core | Multi-Core
HWBOT x265 Benchmark v2.2: 4k Preset
LibreOffice : 20 Documents To PDF
R Benchmark 2.5: Overall mean
| Cinebench R20 / CPU (Single Core) | |
| Average of class Office (345 - 816, n=71, last 2 years) | |
| MSI Prestige 14 Evo A11M-005 | |
| Dell Latitude 14 5411-WJ40N | |
| Average Intel Core i7-10850H (n=1) | |
| Lenovo Yoga Slim 7-14ARE | |
| Honor MagicBook Pro (AMD) | |
| Dynabook Portégé X40-G-10K | |
| Cinebench R20 / CPU (Multi Core) | |
| Average of class Office (648 - 8840, n=71, last 2 years) | |
| Honor MagicBook Pro (AMD) | |
| Lenovo Yoga Slim 7-14ARE | |
| Dell Latitude 14 5411-WJ40N | |
| Average Intel Core i7-10850H (n=1) | |
| MSI Prestige 14 Evo A11M-005 | |
| Dynabook Portégé X40-G-10K | |
| Cinebench R15 / CPU Single 64Bit | |
| Average of class Office (99.5 - 312, n=73, last 2 years) | |
| MSI Prestige 14 Evo A11M-005 | |
| Dell Latitude 14 5411-WJ40N | |
| Average Intel Core i7-10850H (n=1) | |
| Lenovo Yoga Slim 7-14ARE | |
| Honor MagicBook Pro (AMD) | |
| Dynabook Portégé X40-G-10K | |
| Cinebench R15 / CPU Multi 64Bit | |
| Average of class Office (250 - 3380, n=73, last 2 years) | |
| Lenovo Yoga Slim 7-14ARE | |
| Honor MagicBook Pro (AMD) | |
| Dell Latitude 14 5411-WJ40N | |
| Average Intel Core i7-10850H (n=1) | |
| MSI Prestige 14 Evo A11M-005 | |
| Dynabook Portégé X40-G-10K | |
| Blender / v2.79 BMW27 CPU | |
| Dynabook Portégé X40-G-10K | |
| MSI Prestige 14 Evo A11M-005 | |
| Dell Latitude 14 5411-WJ40N | |
| Average Intel Core i7-10850H (n=1) | |
| Average of class Office (158 - 1940, n=72, last 2 years) | |
| Honor MagicBook Pro (AMD) | |
| Lenovo Yoga Slim 7-14ARE | |
| 7-Zip 18.03 / 7z b 4 -mmt1 | |
| Average of class Office (3387 - 6469, n=73, last 2 years) | |
| Dell Latitude 14 5411-WJ40N | |
| Average Intel Core i7-10850H (n=1) | |
| MSI Prestige 14 Evo A11M-005 | |
| Lenovo Yoga Slim 7-14ARE | |
| Dynabook Portégé X40-G-10K | |
| Honor MagicBook Pro (AMD) | |
| 7-Zip 18.03 / 7z b 4 | |
| Lenovo Yoga Slim 7-14ARE | |
| Average of class Office (7098 - 76886, n=73, last 2 years) | |
| Honor MagicBook Pro (AMD) | |
| Dell Latitude 14 5411-WJ40N | |
| Average Intel Core i7-10850H (n=1) | |
| MSI Prestige 14 Evo A11M-005 | |
| Dynabook Portégé X40-G-10K | |
| Geekbench 5.5 / Single-Core | |
| Average of class Office (811 - 2148, n=69, last 2 years) | |
| MSI Prestige 14 Evo A11M-005 | |
| Dell Latitude 14 5411-WJ40N | |
| Average Intel Core i7-10850H (n=1) | |
| Lenovo Yoga Slim 7-14ARE | |
| Lenovo Yoga Slim 7-14ARE | |
| Honor MagicBook Pro (AMD) | |
| Dynabook Portégé X40-G-10K | |
| Geekbench 5.5 / Multi-Core | |
| Average of class Office (1483 - 16999, n=69, last 2 years) | |
| Lenovo Yoga Slim 7-14ARE | |
| Lenovo Yoga Slim 7-14ARE | |
| Honor MagicBook Pro (AMD) | |
| Dell Latitude 14 5411-WJ40N | |
| Average Intel Core i7-10850H (n=1) | |
| MSI Prestige 14 Evo A11M-005 | |
| Dynabook Portégé X40-G-10K | |
| HWBOT x265 Benchmark v2.2 / 4k Preset | |
| Average of class Office (2.21 - 26, n=72, last 2 years) | |
| Lenovo Yoga Slim 7-14ARE | |
| Honor MagicBook Pro (AMD) | |
| Dell Latitude 14 5411-WJ40N | |
| Average Intel Core i7-10850H (n=1) | |
| MSI Prestige 14 Evo A11M-005 | |
| Dynabook Portégé X40-G-10K | |
| LibreOffice / 20 Documents To PDF | |
| Dynabook Portégé X40-G-10K | |
| Honor MagicBook Pro (AMD) | |
| Lenovo Yoga Slim 7-14ARE | |
| Average of class Office (39.9 - 102.3, n=72, last 2 years) | |
| MSI Prestige 14 Evo A11M-005 | |
| Dell Latitude 14 5411-WJ40N | |
| Average Intel Core i7-10850H (n=1) | |
| R Benchmark 2.5 / Overall mean | |
| Dynabook Portégé X40-G-10K | |
| Honor MagicBook Pro (AMD) | |
| Lenovo Yoga Slim 7-14ARE | |
| Dell Latitude 14 5411-WJ40N | |
| Average Intel Core i7-10850H (n=1) | |
| MSI Prestige 14 Evo A11M-005 | |
| Average of class Office (0.4098 - 0.888, n=72, last 2 years) | |
* ... smaller is better
System performance
In the PCMark 10 test for system performance, the Dell Latitude 14 5411 achieves a place in the middle of our test field. The productivity score is very good in the individual disciplines. Everyday work is smooth, programs start very quickly, and file access is also fast.
Our CPU Benchmarks article shows the performance achieved by other laptops in comparison.
| PCMark 10 Score | 4725 points | |
Help | ||
DPC latencies
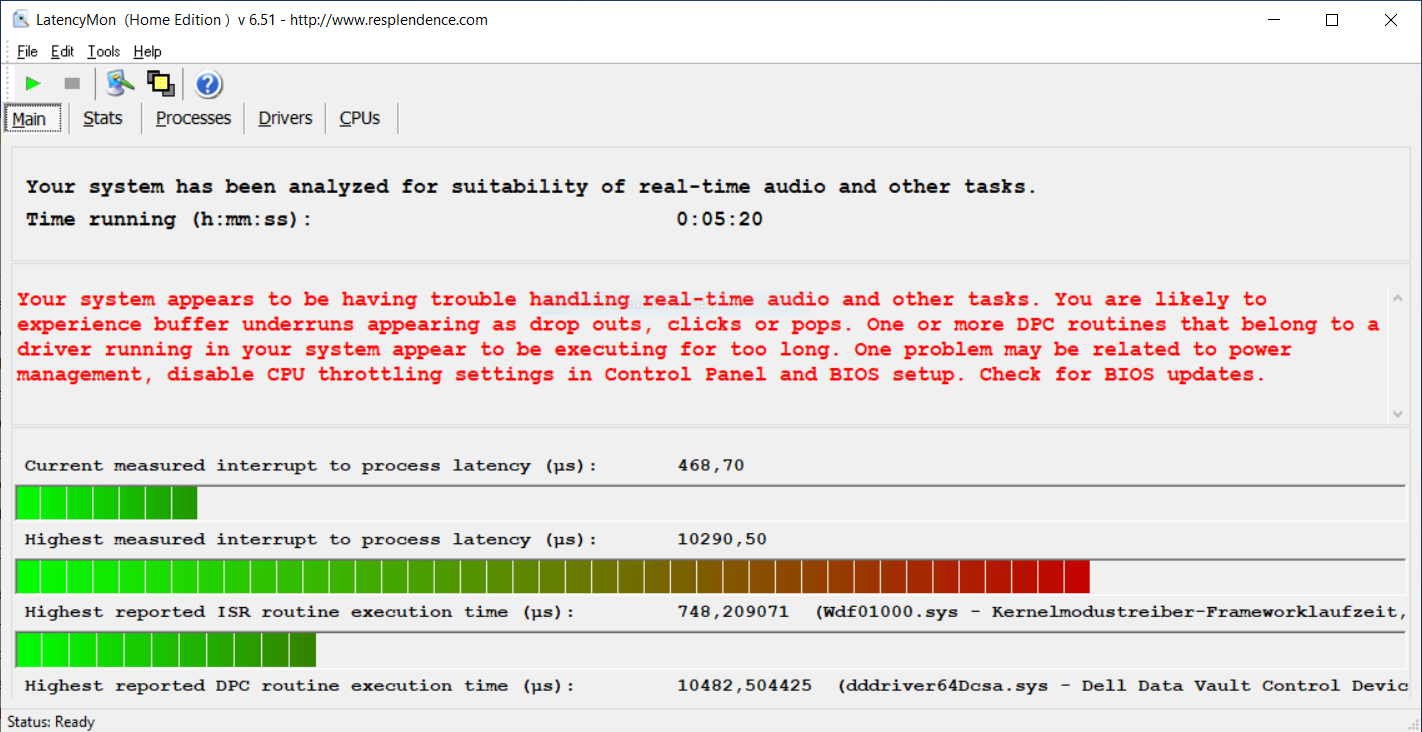
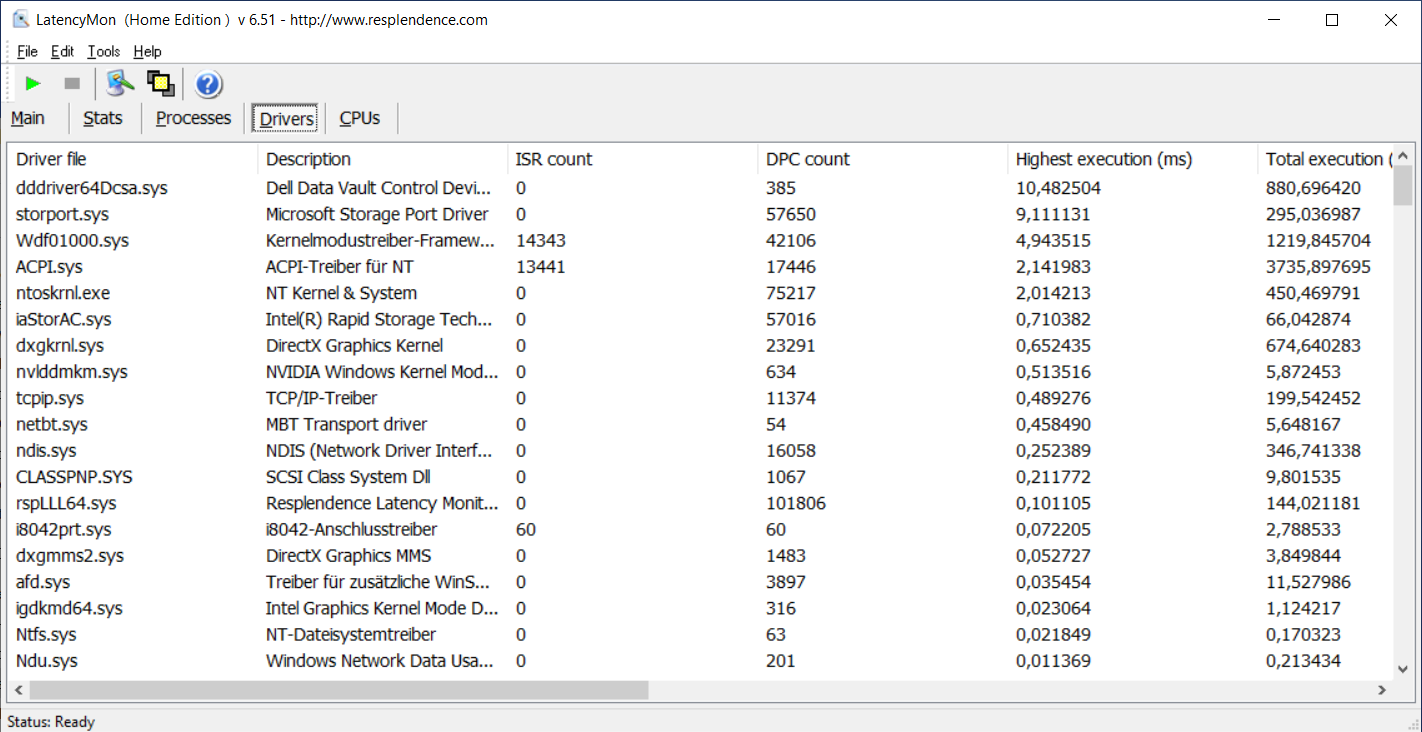
In the test with LatencyMon, the Dell Latitude 14 5411 shows very high interruption times. As a result, it's not suitable for real-time applications.
| DPC Latencies / LatencyMon - interrupt to process latency (max), Web, Youtube, Prime95 | |
| Dell Latitude 14 5411-WJ40N | |
| Dynabook Portégé X40-G-10K | |
| Lenovo Yoga Slim 7-14ARE | |
| Honor MagicBook Pro (AMD) | |
| MSI Prestige 14 Evo A11M-005 | |
* ... smaller is better
Storage
Dell installs a 512 GB SSD from SK Hynix in our test configuration. It offers average read and write rates that are sufficient for a place in the middle of our test field.
We have listed the performance that can be expected from other mass storage devices in our HDD/SSD Benchmarks article.
| Dell Latitude 14 5411-WJ40N SK Hynix PC611 512GB | Lenovo Yoga Slim 7-14ARE Samsung SSD PM981a MZVLB512HBJQ | Honor MagicBook Pro (AMD) WDC PC SN730 SDBPNTY-512G | MSI Prestige 14 Evo A11M-005 Phison 512GB SM280512GKBB4S-E162 | Dynabook Portégé X40-G-10K Samsung SSD PM981a MZVLB256HBHQ | Average SK Hynix PC611 512GB | Average of class Office | |
|---|---|---|---|---|---|---|---|
| CrystalDiskMark 5.2 / 6 | 23% | 2% | 43% | -5% | -1% | 47% | |
| Write 4K (MB/s) | 125.9 | 146.1 16% | 156.9 25% | 248.4 97% | 149.1 18% | 124.6 ? -1% | 153.5 ? 22% |
| Read 4K (MB/s) | 42.45 | 47.18 11% | 48.81 15% | 56.4 33% | 45.53 7% | 42.2 ? -1% | 73.3 ? 73% |
| Write Seq (MB/s) | 2064 | 2896 40% | 1050 -49% | 2513 22% | 1845 -11% | 2059 ? 0% | 2454 ? 19% |
| Read Seq (MB/s) | 1627 | 2754 69% | 2517 55% | 2250 38% | 1359 -16% | 1622 ? 0% | 3229 ? 98% |
| Write 4K Q32T1 (MB/s) | 419.8 | 425.8 1% | 408.7 -3% | 589 40% | 302.2 -28% | 416 ? -1% | 428 ? 2% |
| Read 4K Q32T1 (MB/s) | 382.1 | 514 35% | 504 32% | 696 82% | 382.2 0% | 380 ? -1% | 513 ? 34% |
| Write Seq Q32T1 (MB/s) | 2729 | 2989 10% | 1087 -60% | 2515 -8% | 2351 -14% | 2717 ? 0% | 4083 ? 50% |
| Read Seq Q32T1 (MB/s) | 3441 | 3568 4% | 3407 -1% | 4915 43% | 3527 2% | 3442 ? 0% | 6007 ? 75% |
| AS SSD | 5% | 23% | 27% | -24% | -18% | 8% | |
| Seq Read (MB/s) | 2681 | 1658 -38% | 2749 3% | 3760 40% | 2421 -10% | 2377 ? -11% | 4298 ? 60% |
| Seq Write (MB/s) | 1430 | 2464 72% | 2348 64% | 2335 63% | 1316 -8% | 1458 ? 2% | 2756 ? 93% |
| 4K Read (MB/s) | 49.22 | 59.5 21% | 44.22 -10% | 66.8 36% | 49.42 0% | 48.3 ? -2% | 57.7 ? 17% |
| 4K Write (MB/s) | 118 | 128.6 9% | 140.5 19% | 184.3 56% | 120.5 2% | 117.8 ? 0% | 162.9 ? 38% |
| 4K-64 Read (MB/s) | 1139 | 1576 38% | 1450 27% | 1801 58% | 648 -43% | 1053 ? -8% | 957 ? -16% |
| 4K-64 Write (MB/s) | 1488 | 1986 33% | 2346 58% | 1754 18% | 601 -60% | 1102 ? -26% | 1631 ? 10% |
| Access Time Read * (ms) | 0.057 | 0.049 14% | 0.079 -39% | 0.135 -137% | 0.061 -7% | 0.057 ? -0% | 0.08473 ? -49% |
| Access Time Write * (ms) | 0.031 | 0.087 -181% | 0.027 13% | 0.018 42% | 0.034 -10% | 0.0635 ? -105% | 0.0588 ? -90% |
| Score Read (Points) | 1456 | 1802 24% | 1769 21% | 2244 54% | 940 -35% | 1339 ? -8% | 1445 ? -1% |
| Score Write (Points) | 1749 | 2361 35% | 2721 56% | 2172 24% | 853 -51% | 1365 ? -22% | 2069 ? 18% |
| Score Total (Points) | 3895 | 5133 32% | 5376 38% | 5500 41% | 2233 -43% | 3352 ? -14% | 4188 ? 8% |
| Total Average (Program / Settings) | 14% /
13% | 13% /
14% | 35% /
34% | -15% /
-16% | -10% /
-10% | 28% /
24% |
* ... smaller is better

Continuous load read: DiskSpd Read Loop, Queue Depth 8
Graphics card
Besides the internal graphics unit of the Core i7-10850H, the Intel UHD Graphics 630, our test model of the Latitude 14 5411 is equipped with an Nvidia GeForce MX250. This graphics unit is suitable for applications with medium graphics performance requirements.
However, the MX250 has to admit defeat to the Radeon RX Vega 8 and Iris Xe Graphics G7 internal graphics units in the 3DMark benchmarks. Nevertheless, it performs much better than devices with Intel's UHD Graphics.
Our GPU Benchmarks article shows how Nvidia's GeForce MX250 performs in comparison with other graphics cards.
| 3DMark 06 Standard Score | 28611 points | |
| 3DMark 11 Performance | 5052 points | |
| 3DMark Cloud Gate Standard Score | 15697 points | |
| 3DMark Fire Strike Score | 3541 points | |
| 3DMark Time Spy Score | 1308 points | |
Help | ||
Gaming performance
Nvidia's GeForce MX250 is suitable for games with medium graphics performance requirements. While Full HD resolution at smooth frame rates is usually only possible in older titles, modern games can definitely run well with reduced details.
The gaming performance that can be expected in different titles can be found in our GPU Games article.
| The Witcher 3 | |
| 1024x768 Low Graphics & Postprocessing | |
| MSI Prestige 14 Evo A11M-005 | |
| Lenovo Yoga Slim 7-14ARE | |
| Average NVIDIA GeForce MX250 (47.4 - 70, n=24) | |
| Honor MagicBook Pro (AMD) | |
| Dell Latitude 14 5411-WJ40N | |
| Average of class Office (32.2 - 61.2, n=2, last 2 years) | |
| 1366x768 Medium Graphics & Postprocessing | |
| MSI Prestige 14 Evo A11M-005 | |
| Average of class Office (44.7 - 50.4, n=2, last 2 years) | |
| Dell Latitude 14 5411-WJ40N | |
| Average NVIDIA GeForce MX250 (30 - 40, n=27) | |
| 1920x1080 High Graphics & Postprocessing (Nvidia HairWorks Off) | |
| MSI Prestige 14 Evo A11M-005 | |
| Average of class Office (23.7 - 33.4, n=2, last 2 years) | |
| Lenovo Yoga Slim 7-14ARE | |
| Dell Latitude 14 5411-WJ40N | |
| Average NVIDIA GeForce MX250 (16.3 - 23.1, n=27) | |
| Honor MagicBook Pro (AMD) | |
| 1920x1080 Ultra Graphics & Postprocessing (HBAO+) | |
| MSI Prestige 14 Evo A11M-005 | |
| Average of class Office (14.8 - 15.3, n=2, last 2 years) | |
| Lenovo Yoga Slim 7-14ARE | |
| Average NVIDIA GeForce MX250 (9 - 16, n=24) | |
| Far Cry 5 - 1280x720 Low Preset AA:T | |
| Average of class Office (38 - 99, n=13, last 2 years) | |
| Average NVIDIA GeForce MX250 (38 - 45, n=3) | |
| Honor MagicBook Pro (AMD) | |
| Final Fantasy XV Benchmark - 1280x720 Lite Quality | |
| Average of class Office (16.5 - 171.2, n=69, last 2 years) | |
| Dell Latitude 14 5411-WJ40N | |
| Lenovo Yoga Slim 7-14ARE | |
| Average NVIDIA GeForce MX250 (33.7 - 41, n=5) | |
| low | med. | high | ultra | |
|---|---|---|---|---|
| The Witcher 3 (2015) | 50 | 36 | 21 | |
| Dota 2 Reborn (2015) | 129 | 109 | 75.5 | 67.5 |
| Final Fantasy XV Benchmark (2018) | 41 | 19 | ||
| X-Plane 11.11 (2018) | 73.6 | 57 | 52.6 |
Emissions and energy - Good battery life on WLAN
Noise emissions
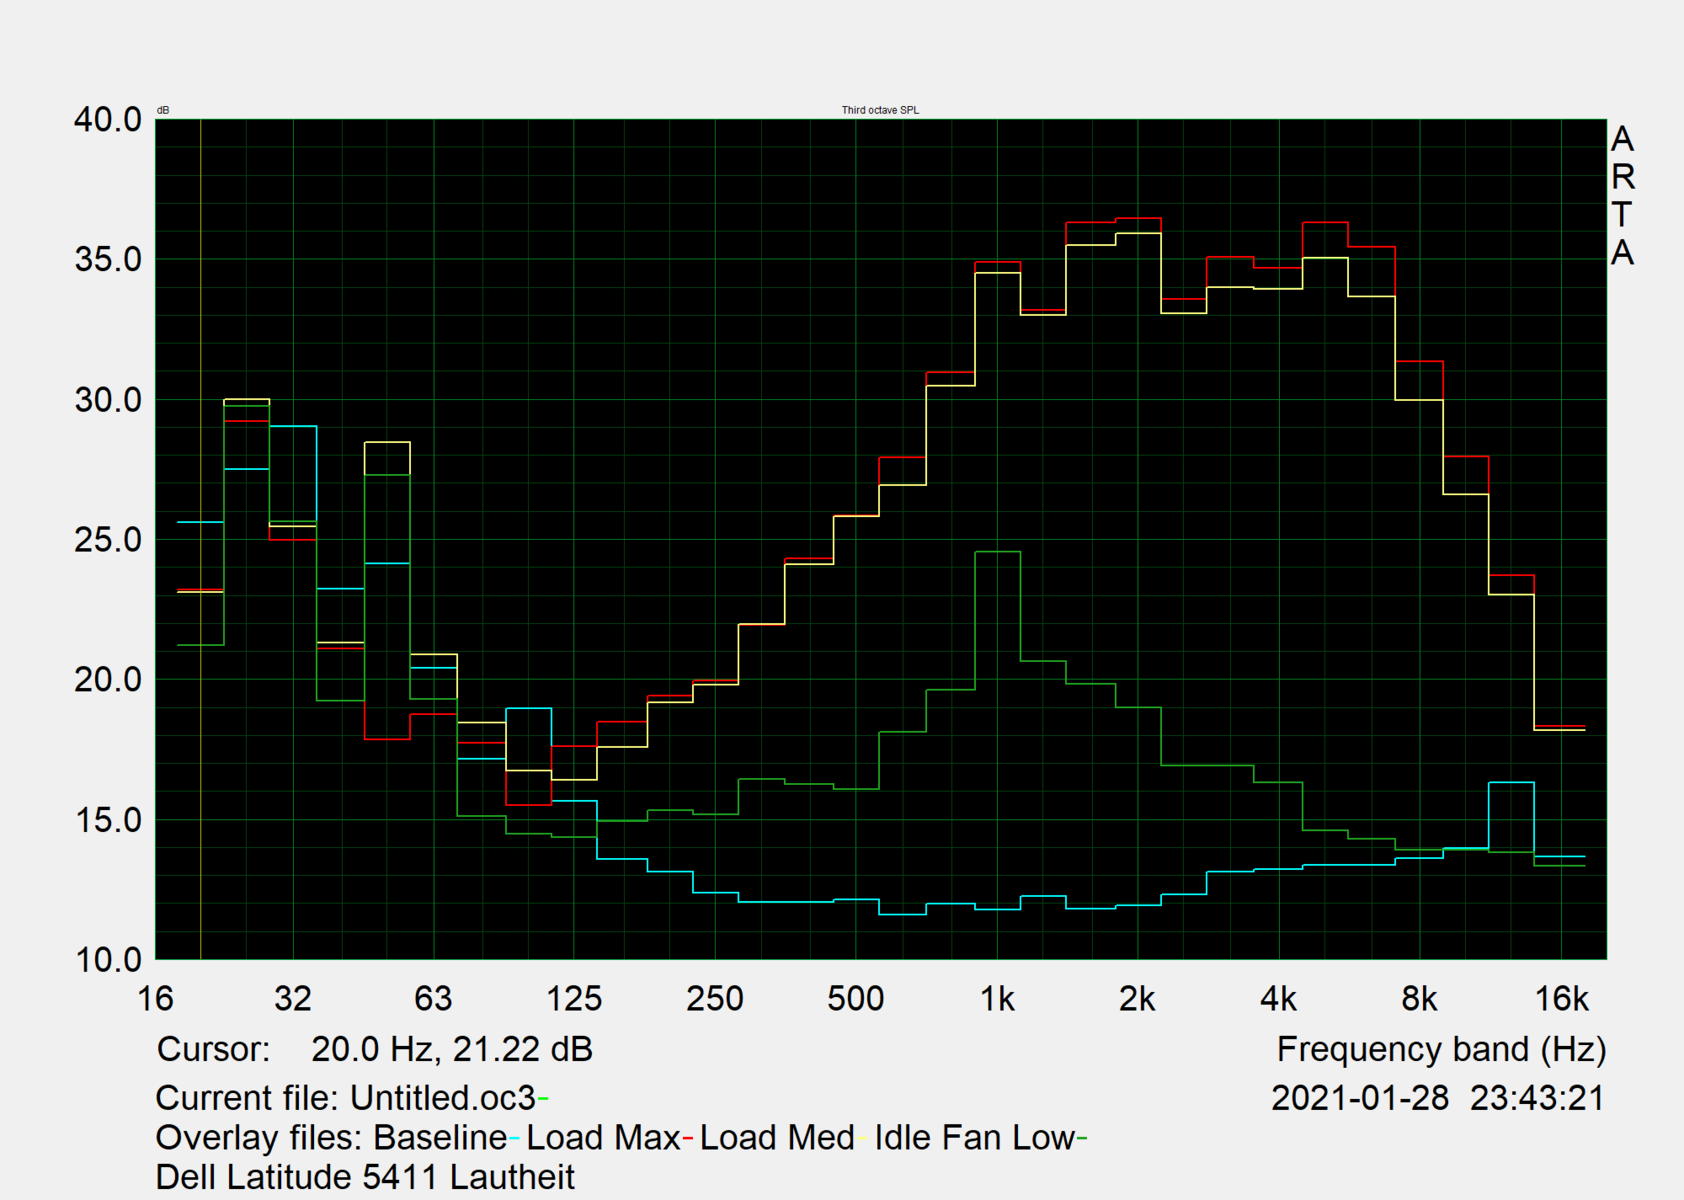
The Dell Latitude 14 5411 can be silent but also extremely loud depending on the load. The fan noise is always even, and it easily fades out in the background. However, we noticed some background noise in our test device, which is probably caused by the SSD.
Noise level
| Idle |
| 25 / 25 / 30.5 dB(A) |
| Load |
| 45.3 / 46.1 dB(A) |
 | ||
30 dB silent 40 dB(A) audible 50 dB(A) loud |
||
min: | ||
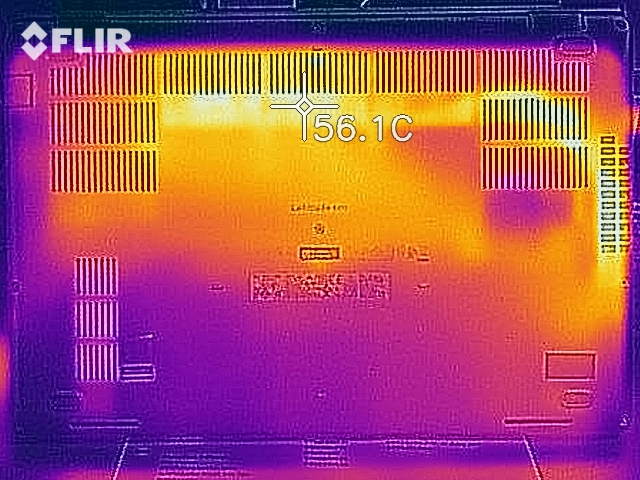
Temperature
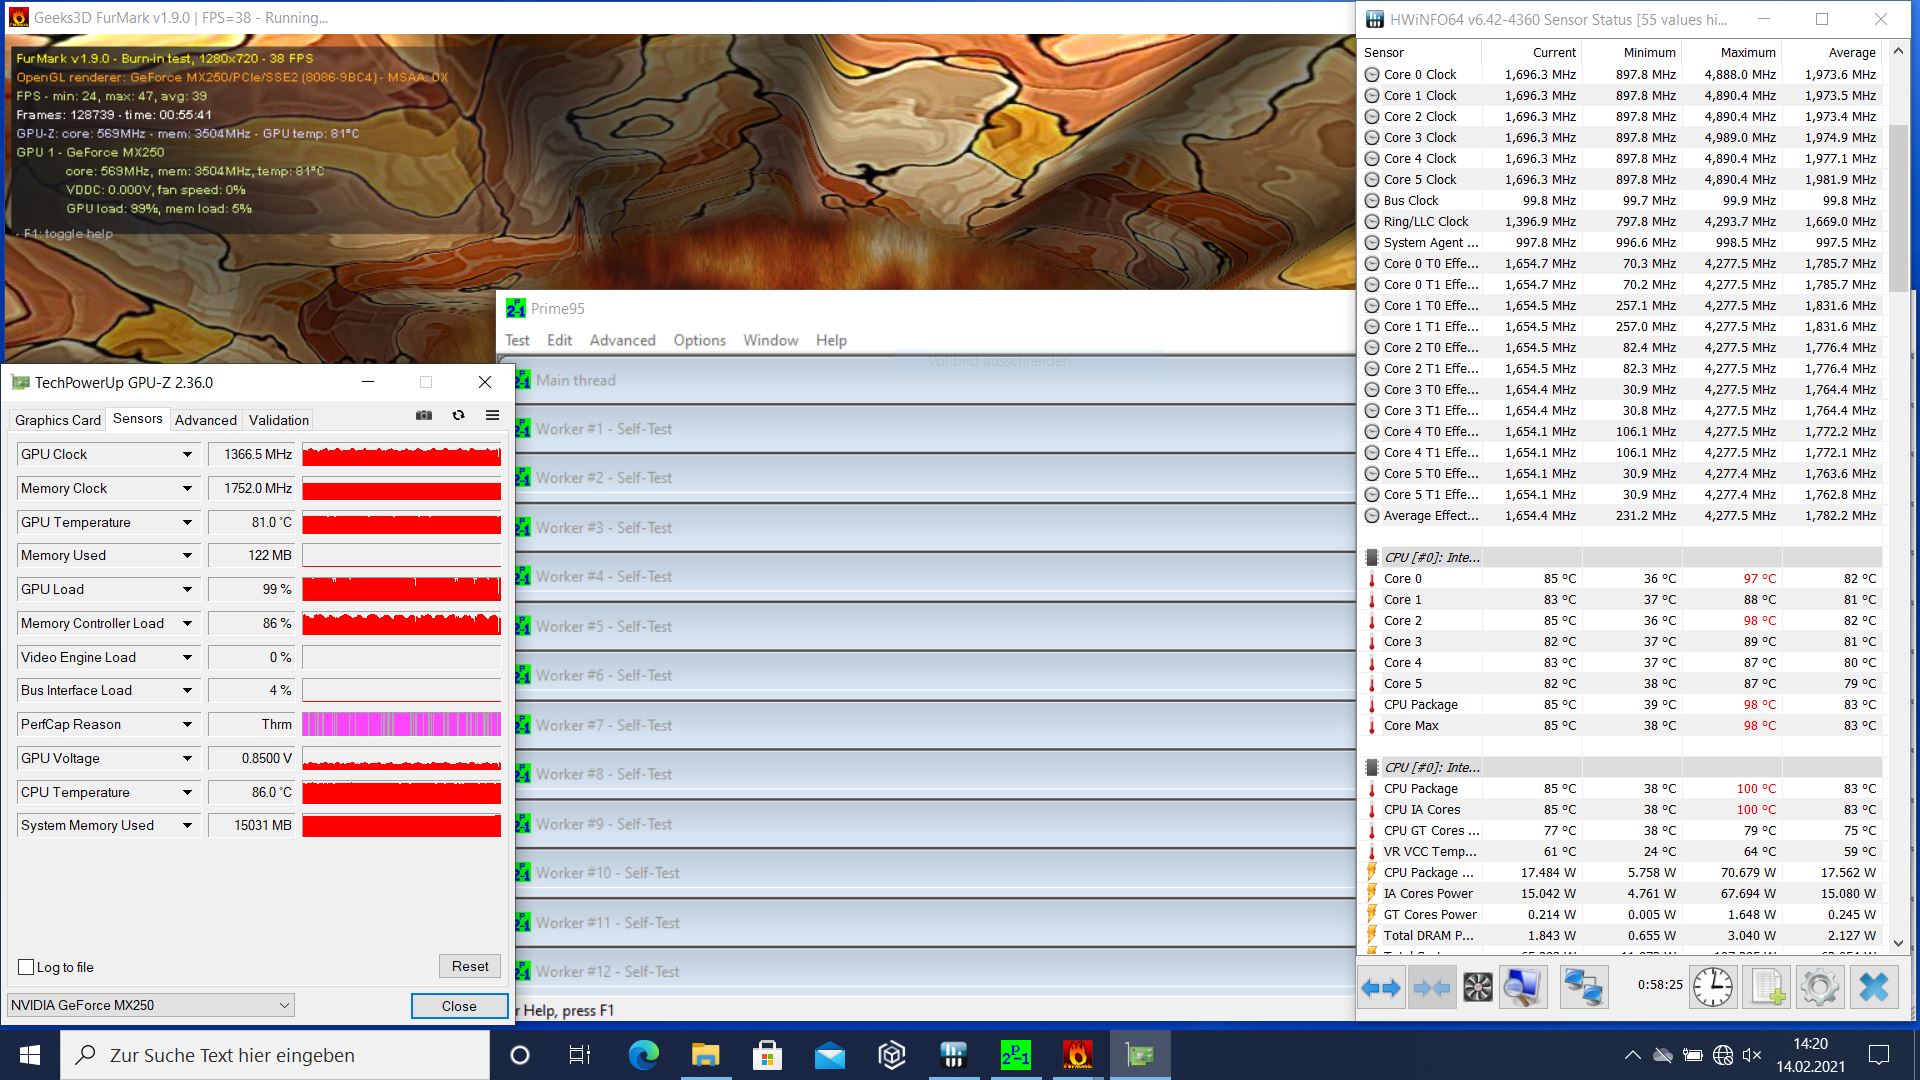
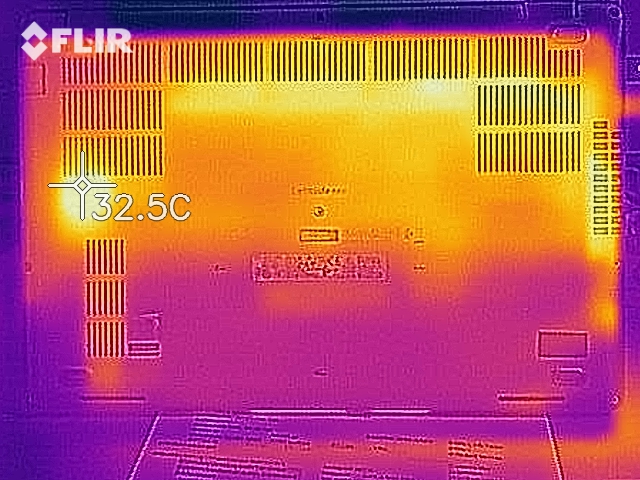
According to our measurements, the Latitude 14 5411 heats up to 46.3 °C (~115 °F) under load. The warmest point is at the bottom. During our approximately one-hour stress test, the core temperatures briefly rise to up to 98 °C (~208 °F). The cooling system kicks in with a slight delay and reduces this value to around 80 °C (~176 °F) for the remainder of the test. The clock rates are kept at an average value of 2 GHz, which is below the base clock speed. Since such a level of load is almost impossible in everyday use, users still don't have to expect restrictions due to excessively high temperatures.
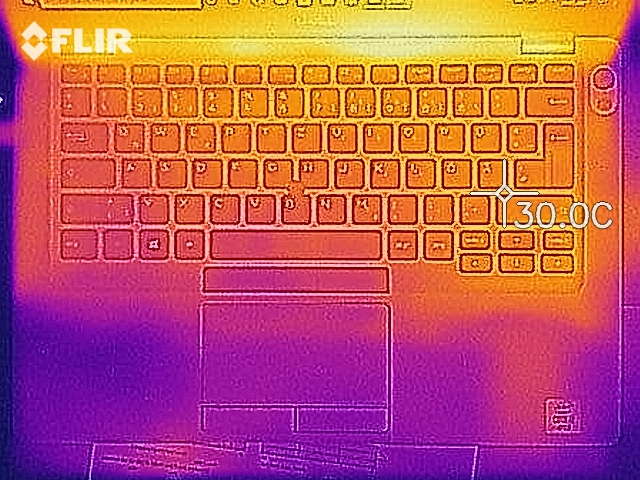
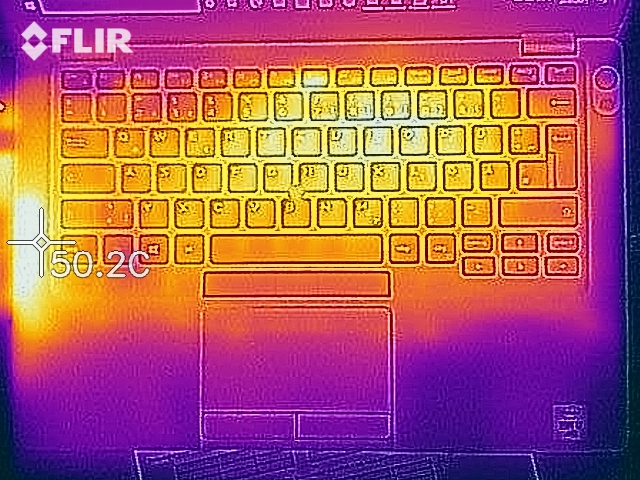
(±) The maximum temperature on the upper side is 44.7 °C / 112 F, compared to the average of 34.3 °C / 94 F, ranging from 21.2 to 62.5 °C for the class Office.
(-) The bottom heats up to a maximum of 46.3 °C / 115 F, compared to the average of 36.8 °C / 98 F
(+) In idle usage, the average temperature for the upper side is 24.3 °C / 76 F, compared to the device average of 29.5 °C / 85 F.
(+) The palmrests and touchpad are cooler than skin temperature with a maximum of 27.8 °C / 82 F and are therefore cool to the touch.
(±) The average temperature of the palmrest area of similar devices was 27.5 °C / 81.5 F (-0.3 °C / -0.5 F).
Speakers
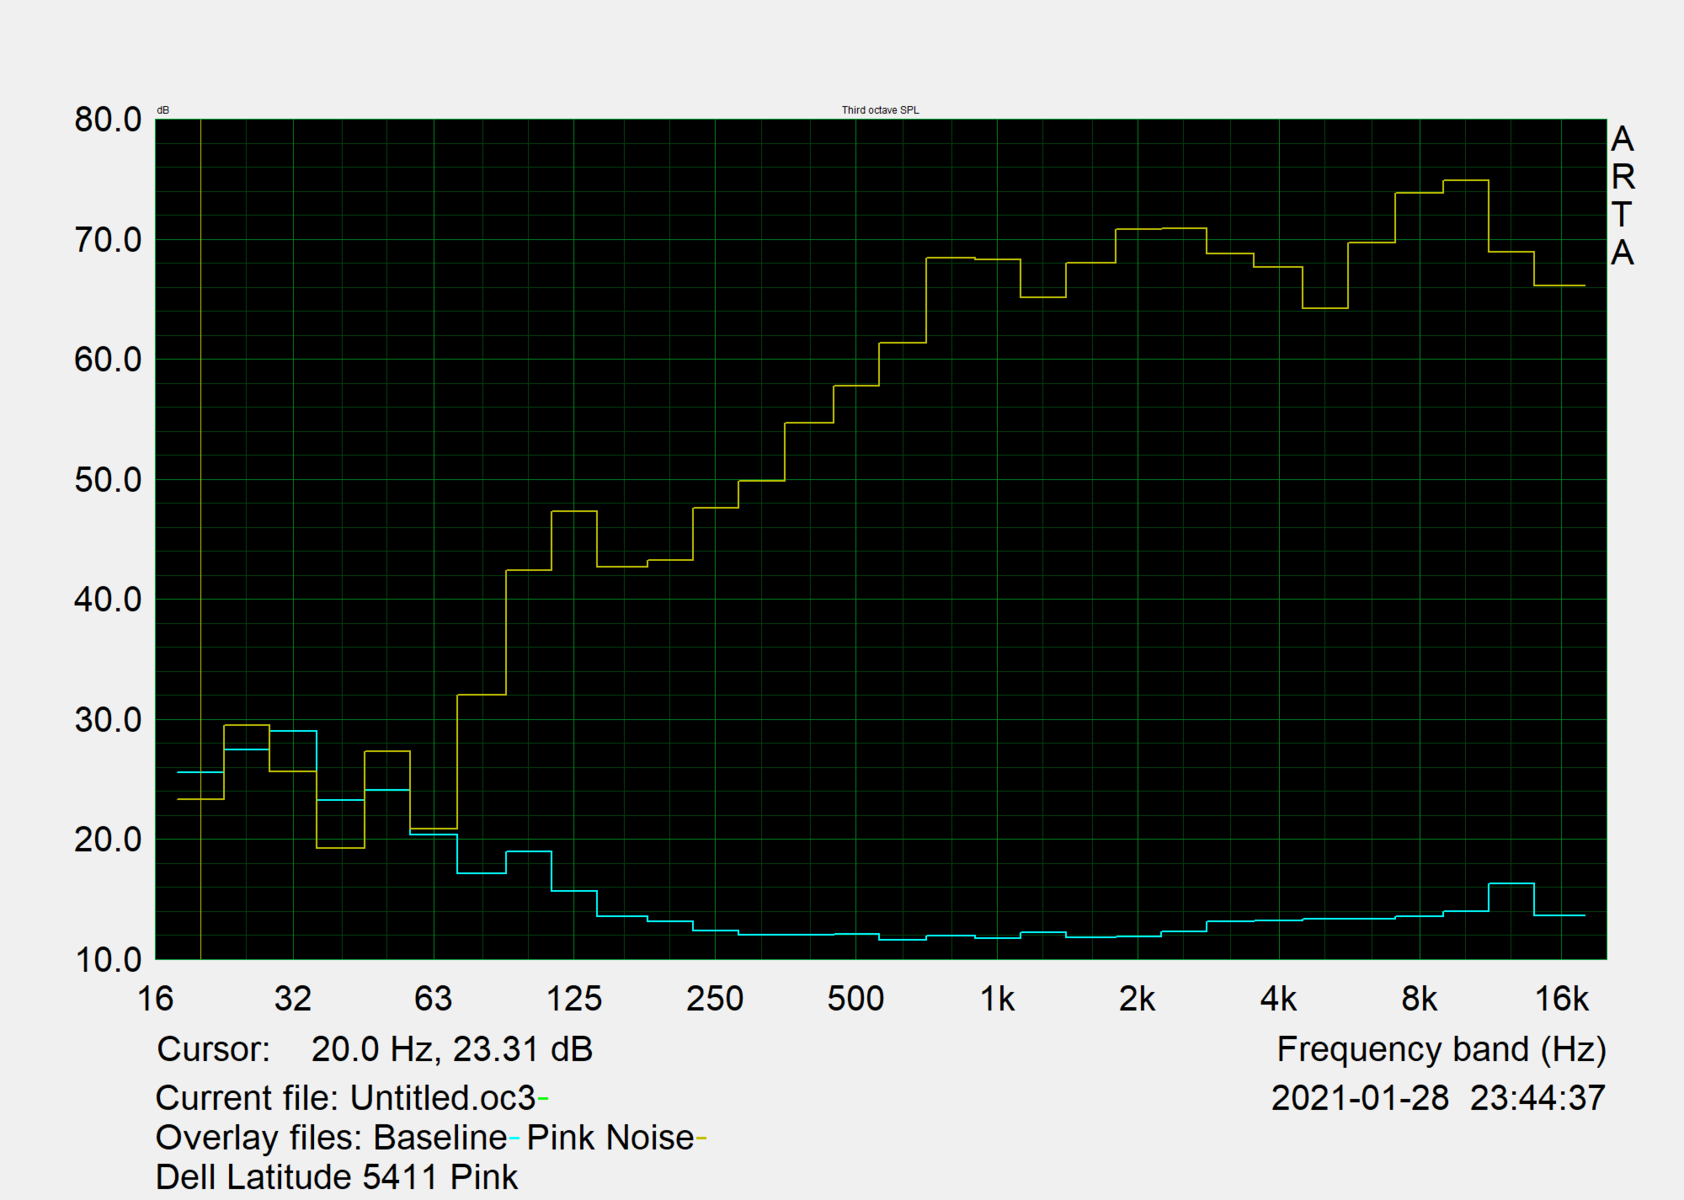
The speakers of the Latitude 14 5411 offer medium volume and a sound spectrum with pronounced higher tones. This makes them suitable for occasional playback of media content in quiet environments, but external speakers or headphones are still recommended in the long run.
Dell Latitude 14 5411-WJ40N audio analysis
(±) | speaker loudness is average but good (74.8 dB)
Bass 100 - 315 Hz
(-) | nearly no bass - on average 20.6% lower than median
(±) | linearity of bass is average (8.5% delta to prev. frequency)
Mids 400 - 2000 Hz
(+) | balanced mids - only 4.6% away from median
(+) | mids are linear (6.5% delta to prev. frequency)
Highs 2 - 16 kHz
(+) | balanced highs - only 4.4% away from median
(+) | highs are linear (4.7% delta to prev. frequency)
Overall 100 - 16.000 Hz
(±) | linearity of overall sound is average (17% difference to median)
Compared to same class
» 24% of all tested devices in this class were better, 8% similar, 69% worse
» The best had a delta of 7%, average was 21%, worst was 53%
Compared to all devices tested
» 30% of all tested devices were better, 8% similar, 62% worse
» The best had a delta of 4%, average was 23%, worst was 134%
Apple MacBook 12 (Early 2016) 1.1 GHz audio analysis
(+) | speakers can play relatively loud (83.6 dB)
Bass 100 - 315 Hz
(±) | reduced bass - on average 11.3% lower than median
(±) | linearity of bass is average (14.2% delta to prev. frequency)
Mids 400 - 2000 Hz
(+) | balanced mids - only 2.4% away from median
(+) | mids are linear (5.5% delta to prev. frequency)
Highs 2 - 16 kHz
(+) | balanced highs - only 2% away from median
(+) | highs are linear (4.5% delta to prev. frequency)
Overall 100 - 16.000 Hz
(+) | overall sound is linear (10.2% difference to median)
Compared to same class
» 7% of all tested devices in this class were better, 2% similar, 91% worse
» The best had a delta of 5%, average was 18%, worst was 53%
Compared to all devices tested
» 5% of all tested devices were better, 1% similar, 94% worse
» The best had a delta of 4%, average was 23%, worst was 134%
Energy consumption
Our measurements show that the Dell Latitude 14 5411 has an average power consumption of 5.4 watts in idle usage and of up to 131 watts under load. Consequently, the included 130-watt power adapter has a sufficiently high capacity to ensure a reliable power supply.
| Off / Standby | |
| Idle | |
| Load |
|
Key:
min: | |
Battery life
In our practical WLAN test, the Latitude 14 5411 achieves a runtime of 8:30 hours. This means that it can utilize its 68 Wh battery comparatively well.
Pros
Cons
Verdict - A lot of performance in a compact case
The Dell Latitude 14 5411 is suitable for users who don't want to do without business features like a smart card reader and optional WWAN. In the configuration that we tested, the Core i7-10850H is a powerful processor that can at least hold its own against rivals from AMD when it comes to single-core performance. Thanks to good maintenance options, the subsequent installation of more RAM or a WWAN module is also possible.
The Dell Latitude 14 5411 offers a strong CPU in a compact case. However, the display could have been a bit better.
Compared with the competition, the Latitude 14 looks a bit bulkier and also offers a slightly weaker display above all. Especially the brightness and color-space coverage are aspects that are better in other devices. It's also often the case that Dell's Latitude devices have to struggle with high latency times. However, buyers looking for a strong CPU in a compact laptop might still be satisfied with the Dell Latitude 14 5411.
Price and availability
The Dell Latitude 14 5411 is available in different configurations. For example, the configuration that we reviewed is available for approximately $1,600 on Amazon.
Dell Latitude 14 5411-WJ40N
- 02/15/2021 v7 (old)
Mike Wobker
Price comparison

