Dell Latitude 13 7320 Detachable Review: A Better Microsoft Surface Pro 7
Unveiled at CES 2021, the Dell Latitude 7320 detachable is just one of three models in the high-end 7320 series with the other two being the Latitude 7320 convertible and Latitude 7320 clamshell. Together, these models directly succeed the older 10th gen Ice Lake Latitude 7310 by introducing brand new chassis designs and newer 11th gen Tiger Lake-U options.
Latitude 7320 detachable SKUs range from $1560 USD if configured with the base Core i3-1110G4 CPU, 4 GB RAM, and 128 GB NVMe SSD up to $2540 USD if configured with the Core i7-1180G7 vPro CPU, 16 GB RAM, and 1 TB NVMe SSD. All options otherwise come equipped with the same 3:2 13-inch 1920 x 1280 touchscreen.
Direct competitors include other high-end Windows tablets or detachables including the Microsoft Surface Pro series and the Lenovo ThinkPad X12.
More Dell reviews:
potential competitors in comparison
Rating | Date | Model | Weight | Height | Size | Resolution | Price |
|---|---|---|---|---|---|---|---|
| 87.7 % v7 (old) | 06 / 2021 | Dell Latitude 13 7320 Detachable, i7-1180G7 i7-1180G7, Iris Xe G7 96EUs | 782 g | 8.44 mm | 13.00" | 1920x1280 | |
| 88.5 % v7 (old) | 03 / 2021 | Microsoft Surface Pro 7 Plus i5-1135G7, Iris Xe G7 80EUs | 796 g | 8.5 mm | 12.30" | 2736x1824 | |
| 88.5 % v7 (old) | 04 / 2021 | Lenovo ThinkPad X12 20UVS03G00 i7-1160G7, Iris Xe G7 96EUs | 1.1 kg | 14.5 mm | 12.30" | 1920x1280 | |
| 86.3 % v7 (old) | 10 / 2019 | Dell XPS 13 7390 2-in-1 Core i7 i7-1065G7, Iris Plus Graphics G7 (Ice Lake 64 EU) | 1.3 kg | 13 mm | 13.40" | 1920x1200 | |
| 87.1 % v7 (old) | 11 / 2020 | Lenovo Yoga Duet 7 13IML05-82AS000WGE i5-10210U, UHD Graphics 620 | 1.2 kg | 9.2 mm | 13.00" | 2160x1350 |
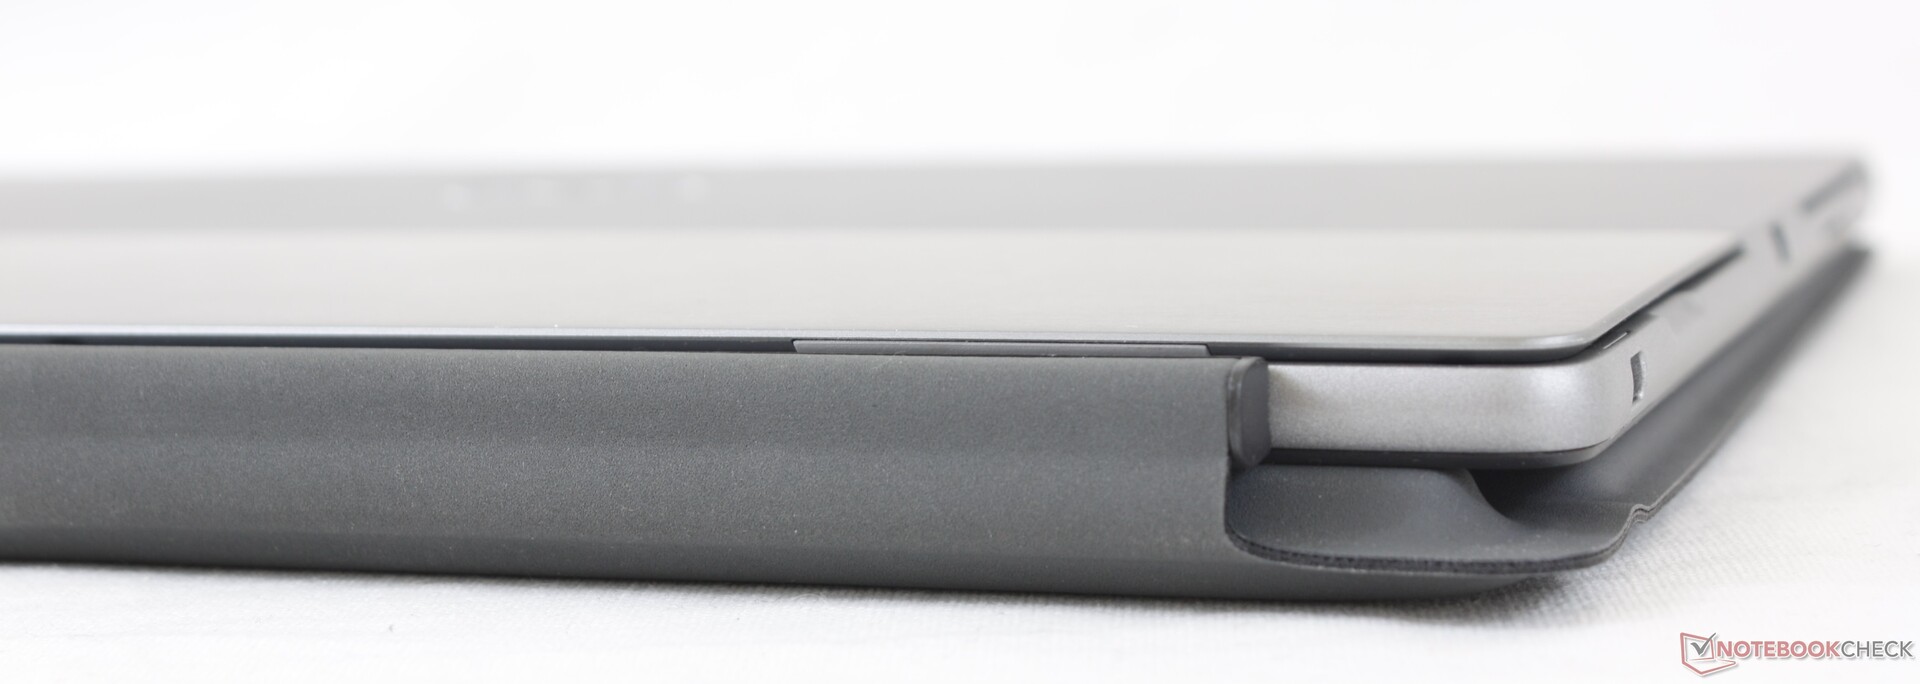
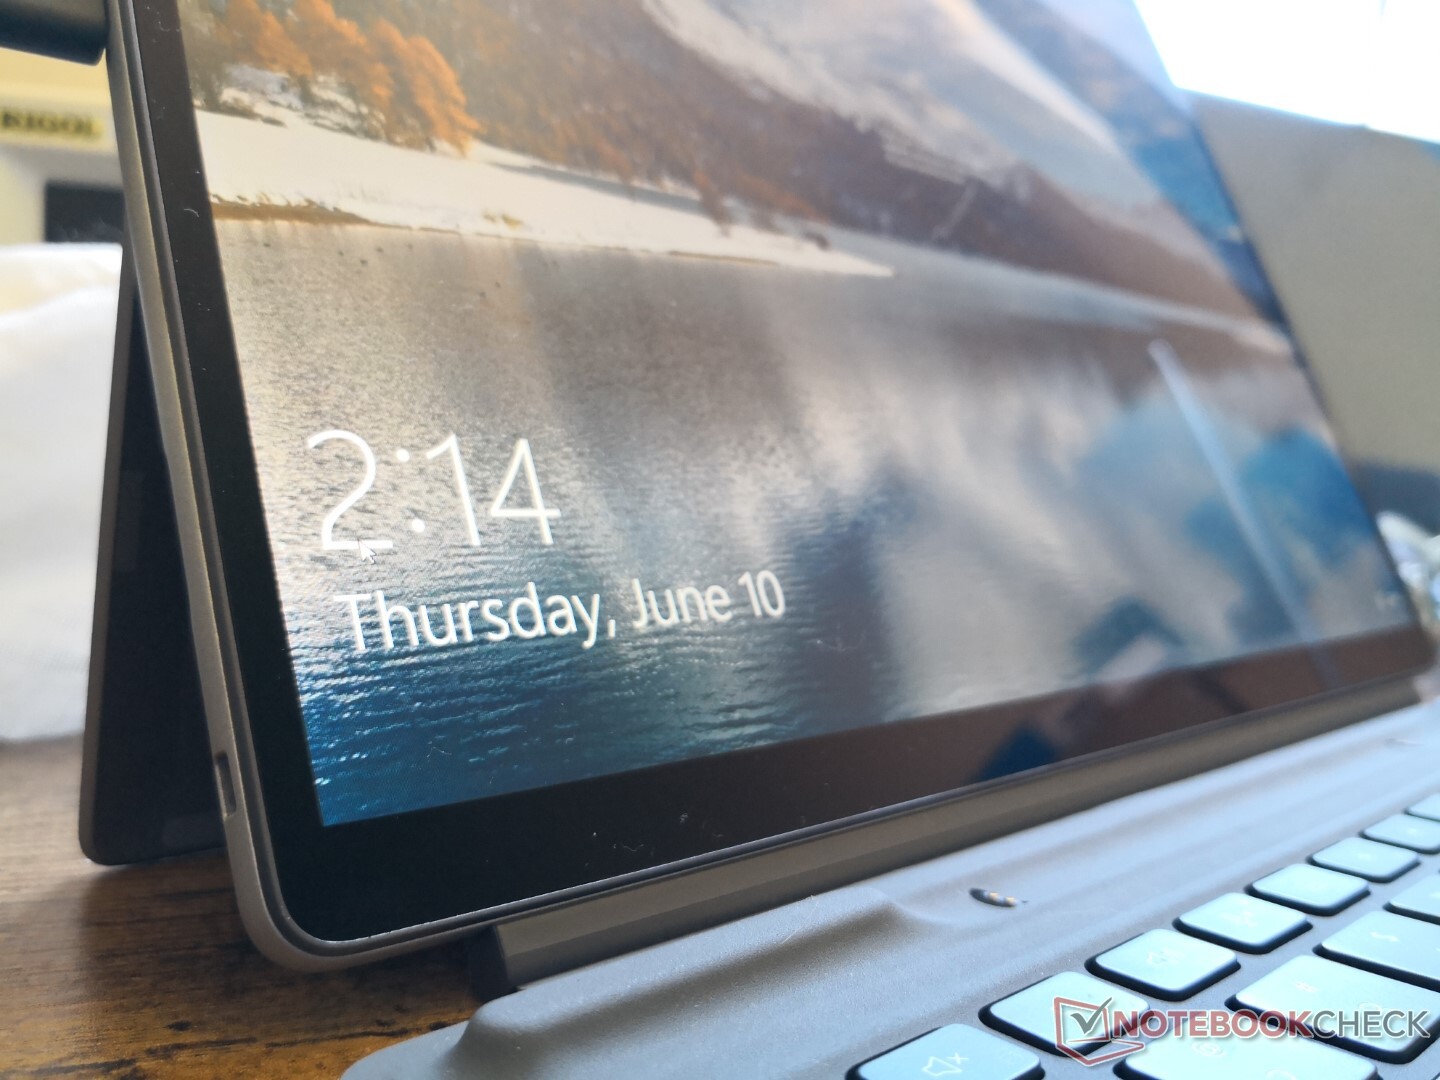
Case — Narrower Bezels Than The Surface Pro 7
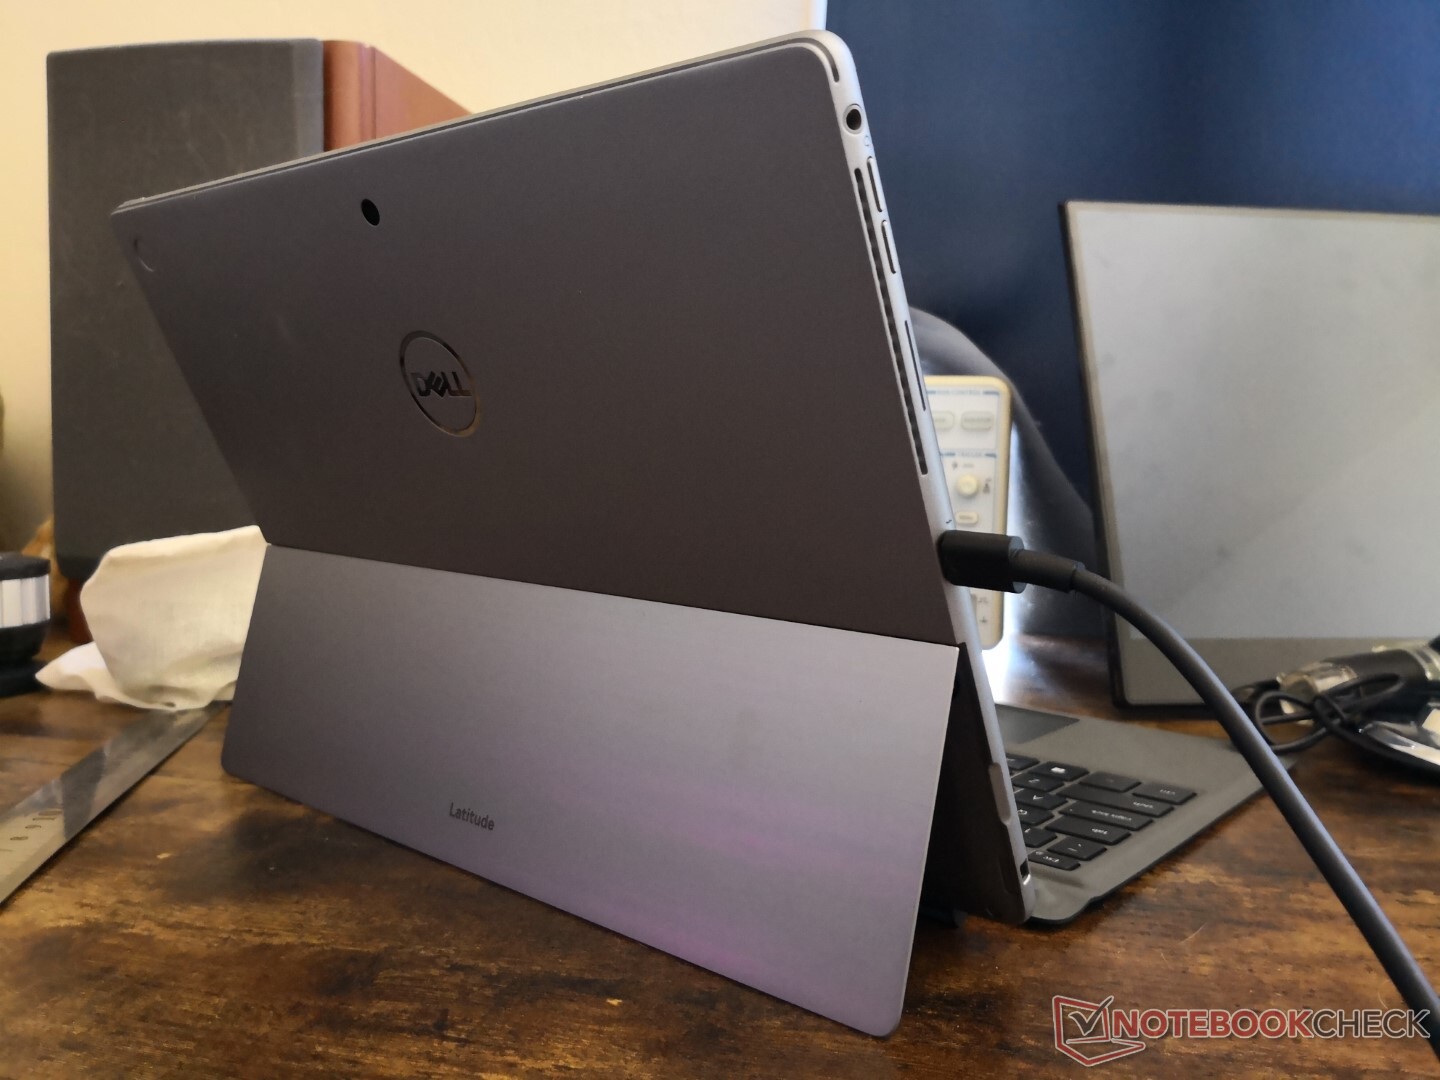
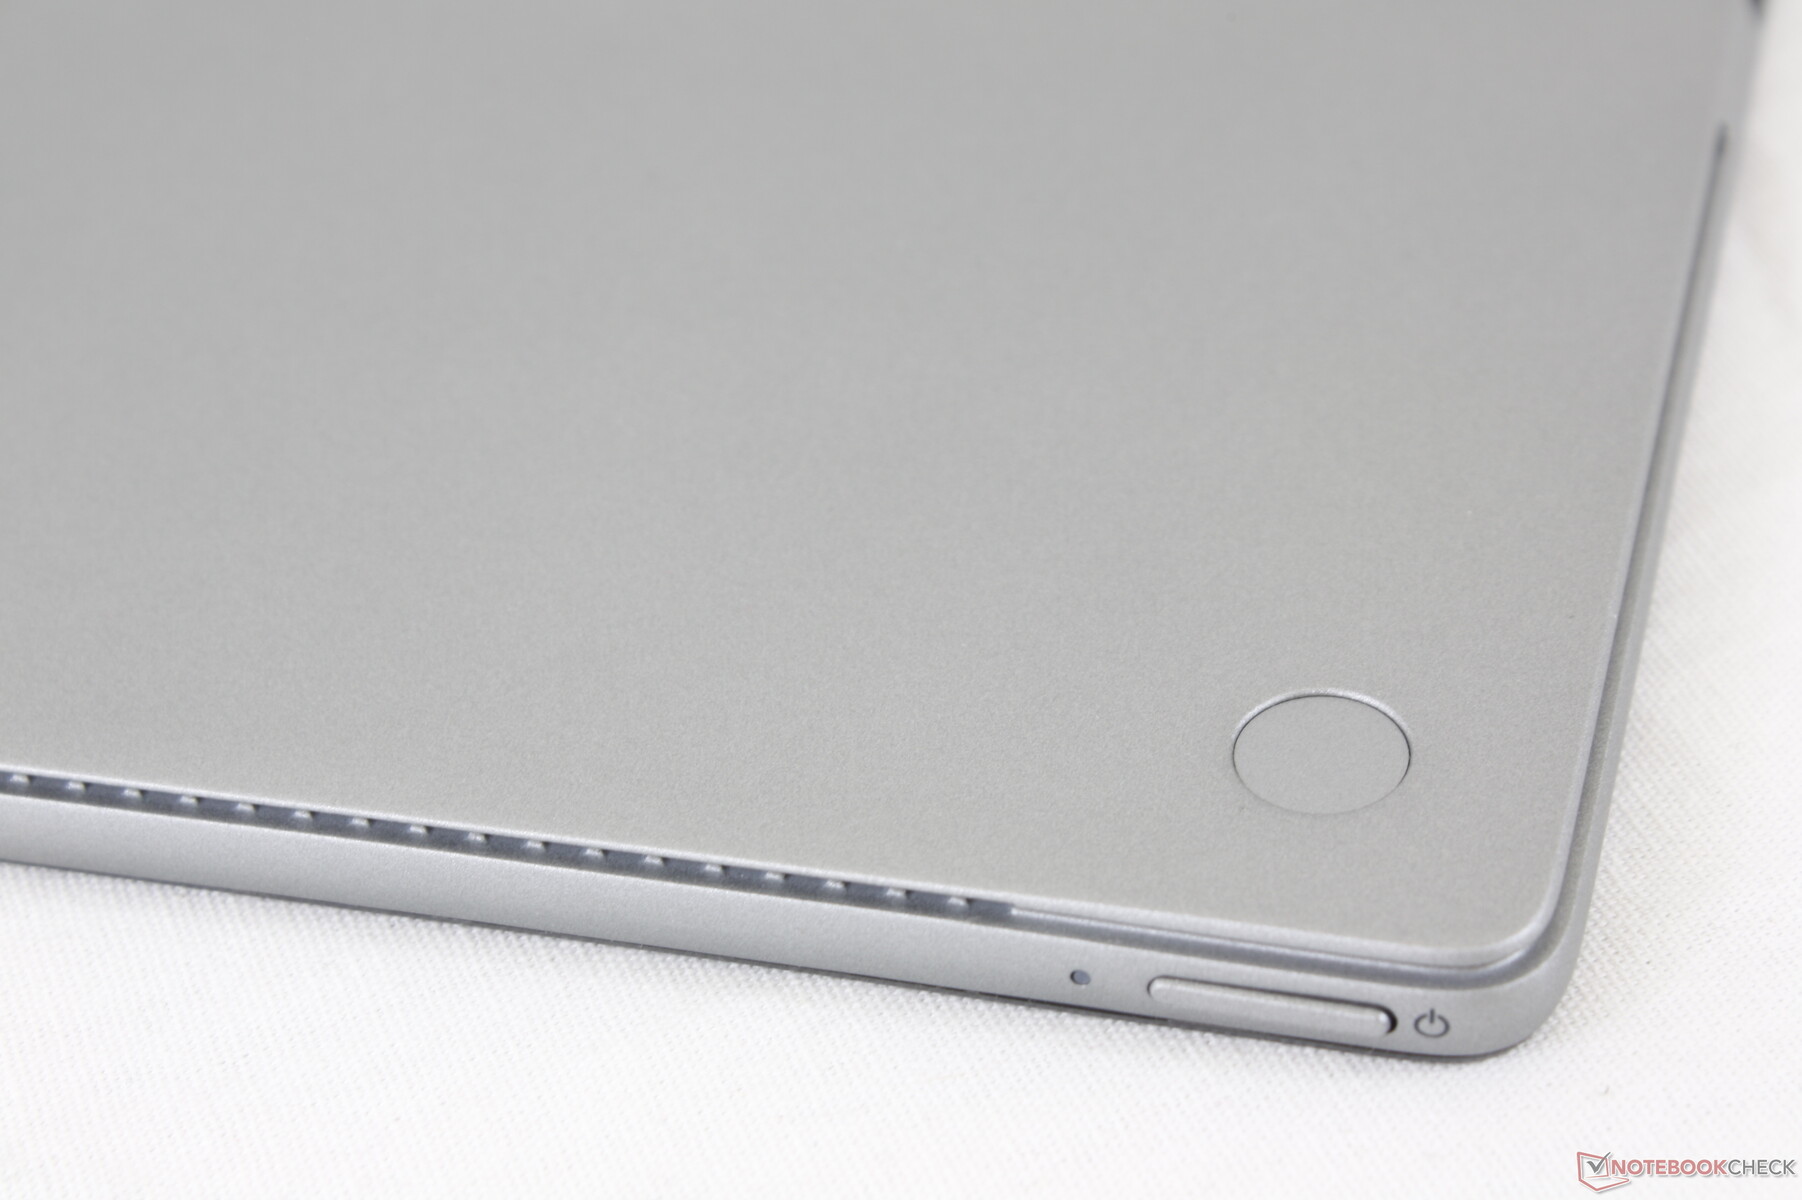
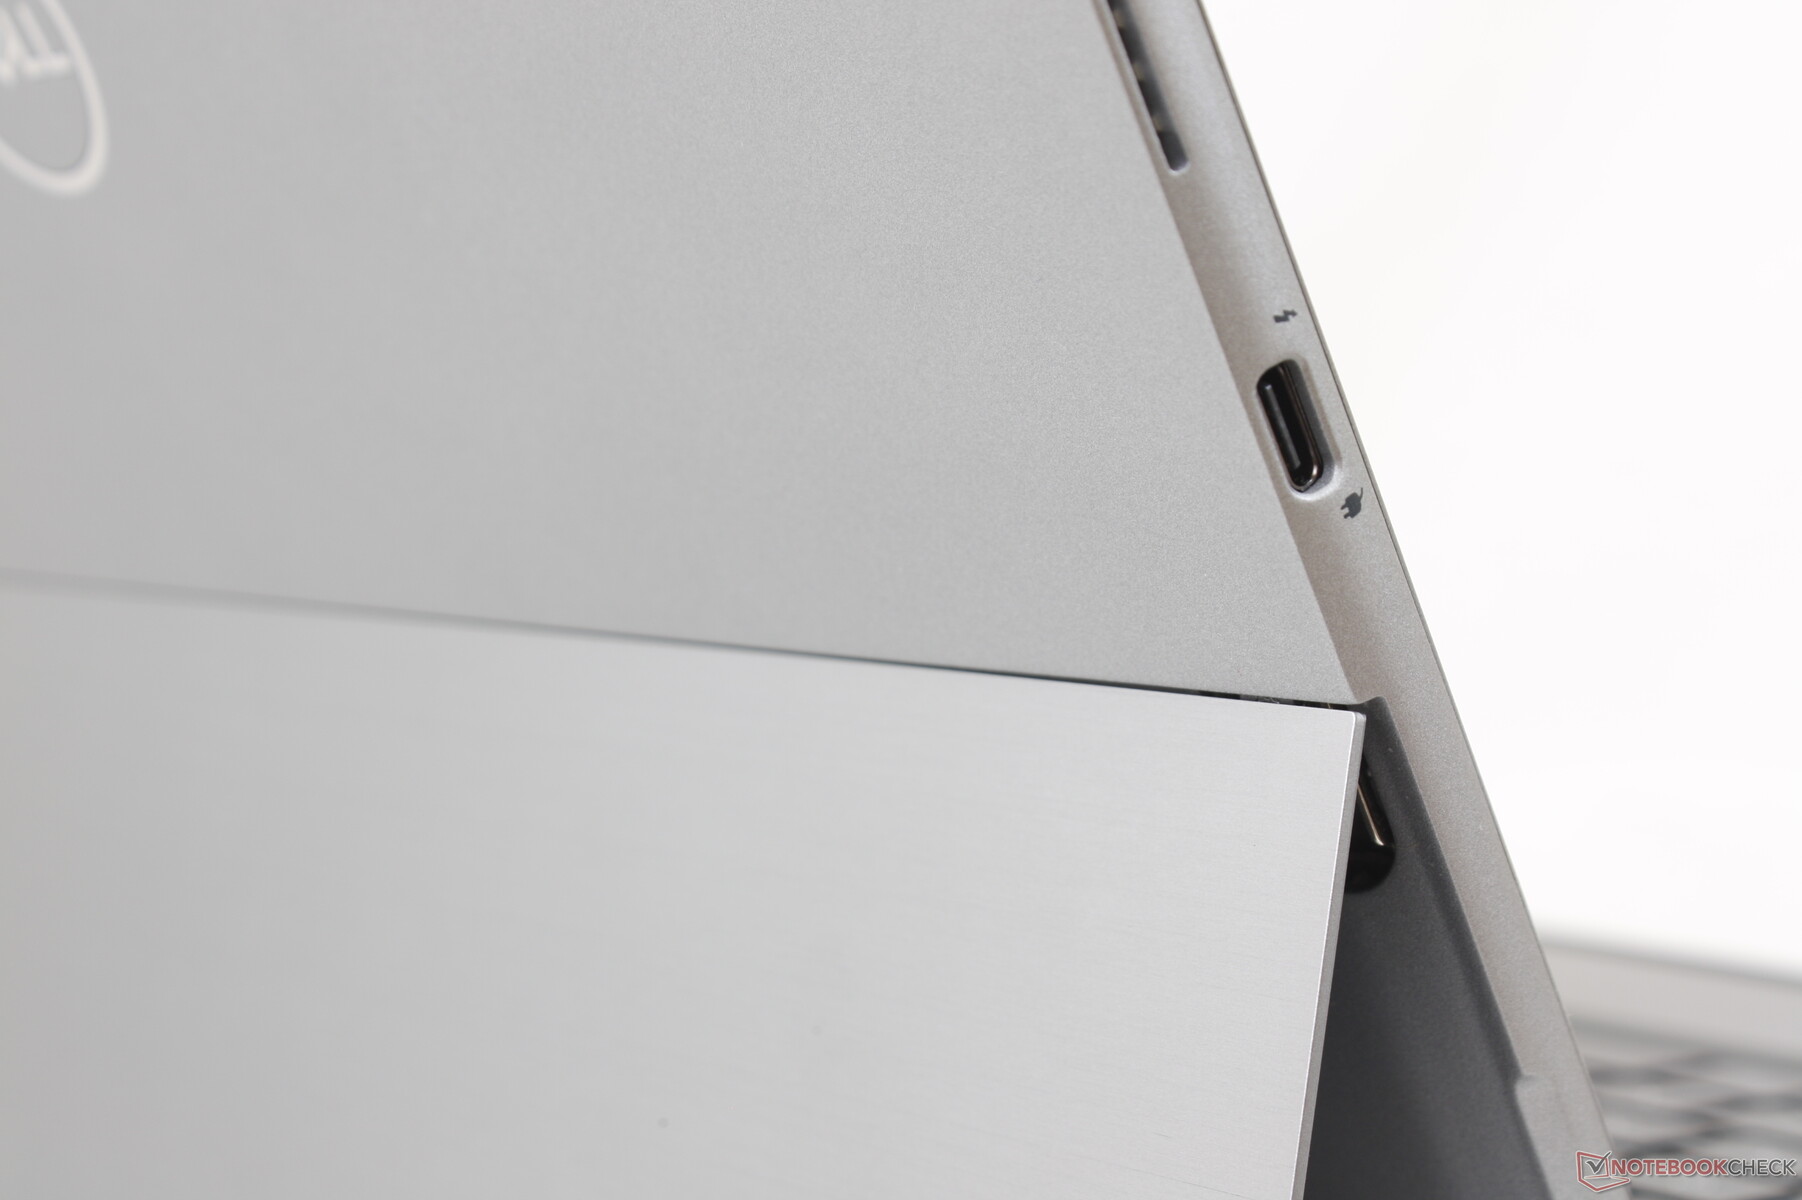
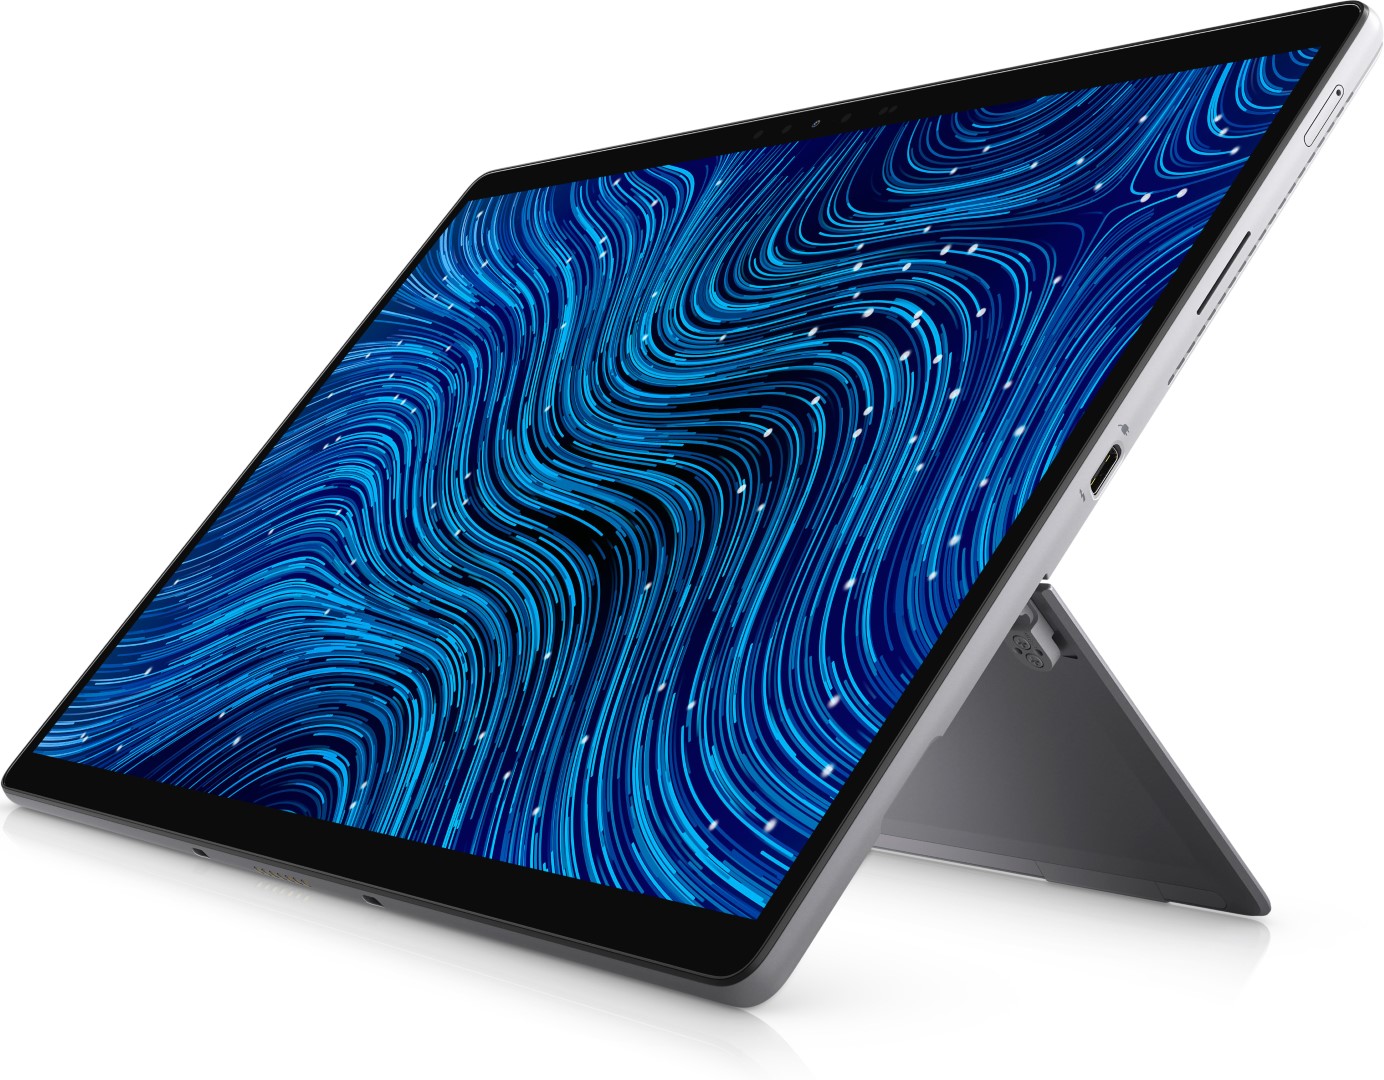
Dell Latitude devices are built tougher than the typical Inspiron or Vostro while looking more understated than an XPS to better fit professional workplaces. Unlike many of its Latitude clamshell siblings, however, the Latitude 7320 detachable is not MIL-STD 810G compliant. The metal backing and Gorilla Glass front still feel luxurious nonetheless with just minimal flexing.
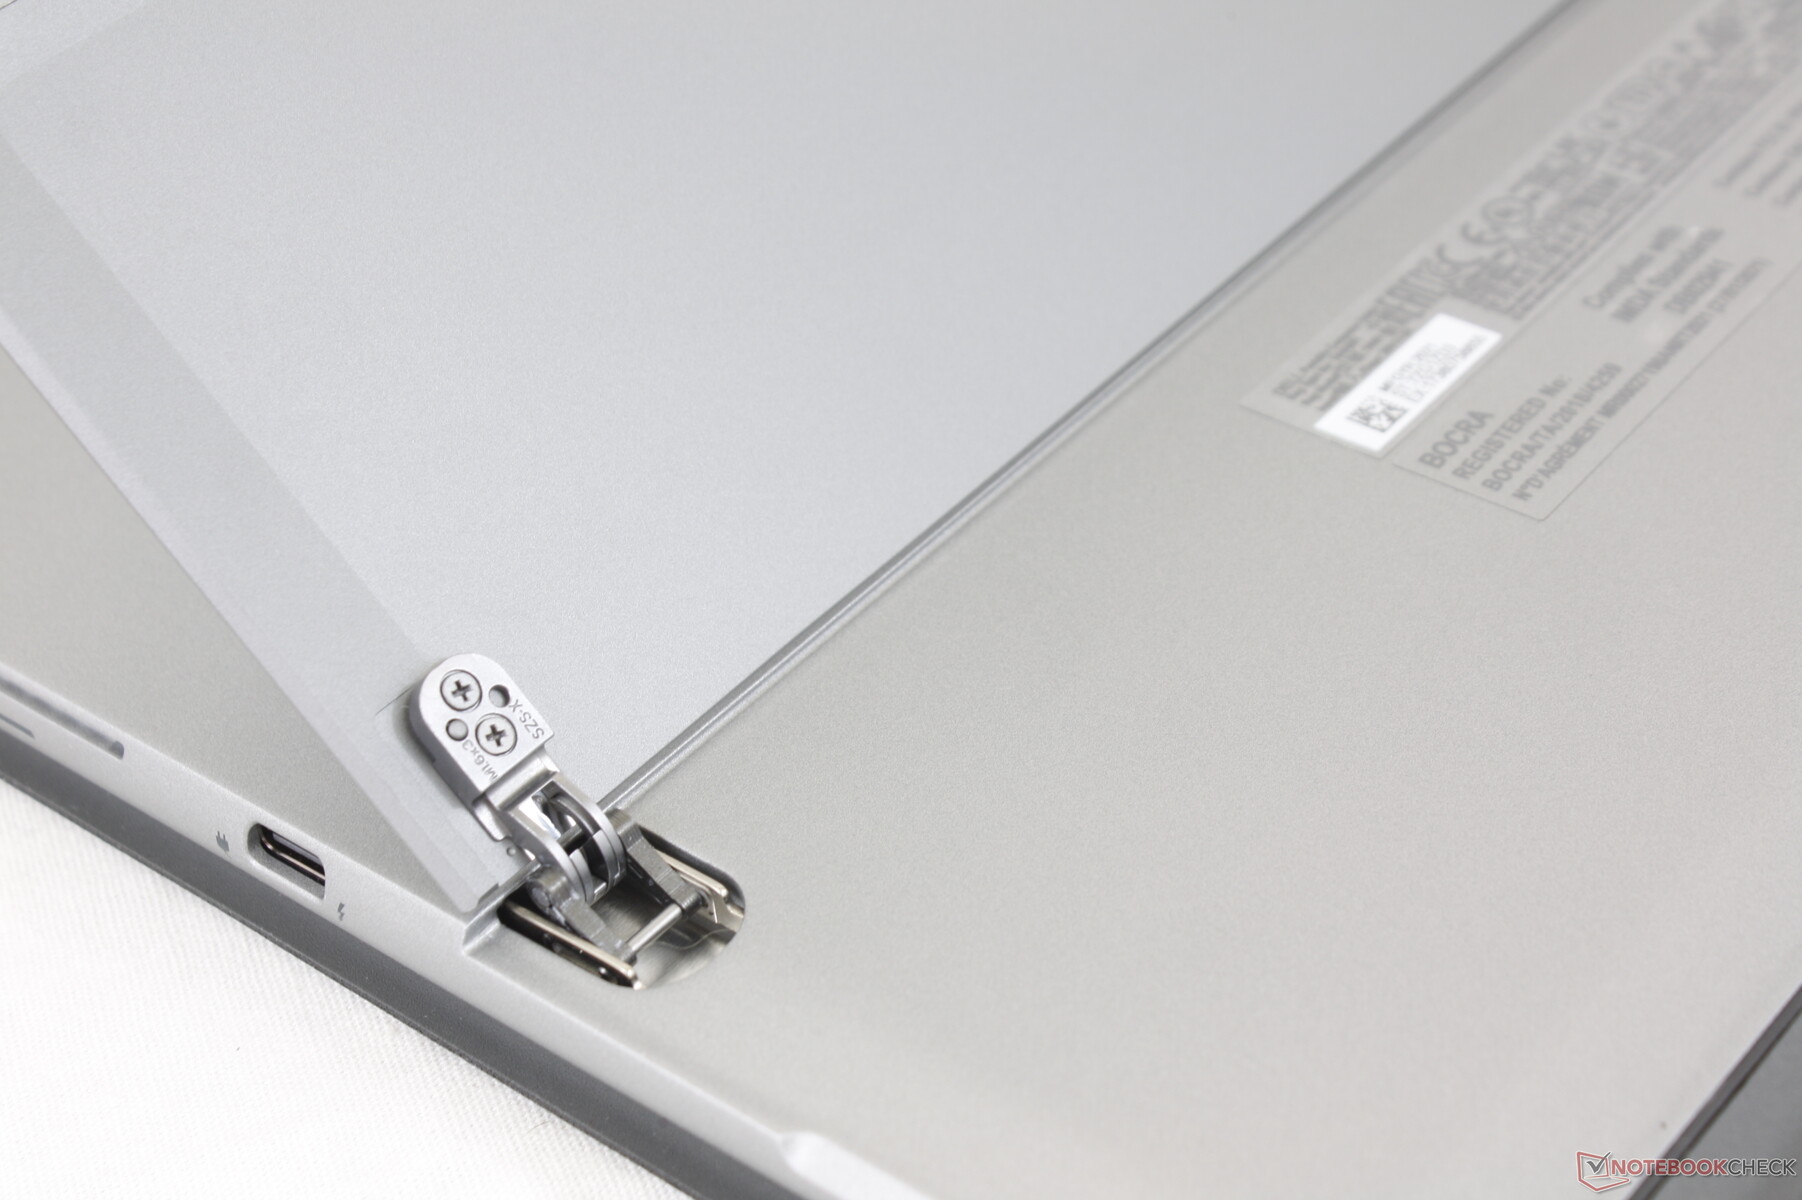
There are a couple of improvements we would like to see. The thin metal kickstand, for example, feels loose and so it tends to teeter when adjusting angles. The keyboard base also flexes more than we would like which negatively impacts the typing experience.
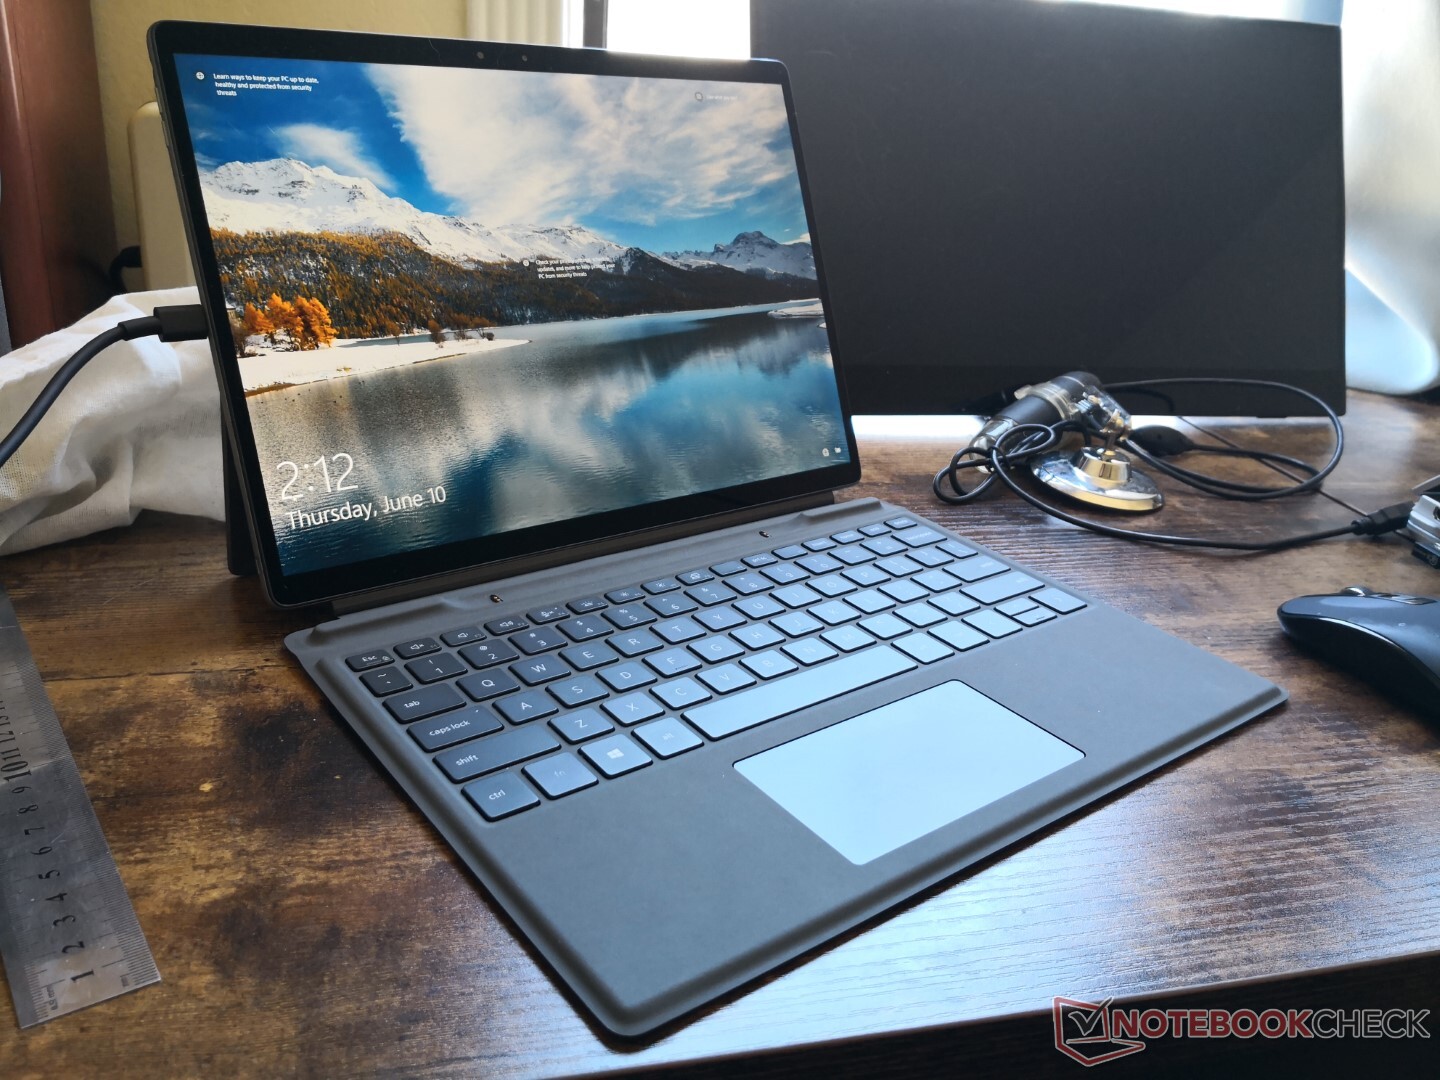
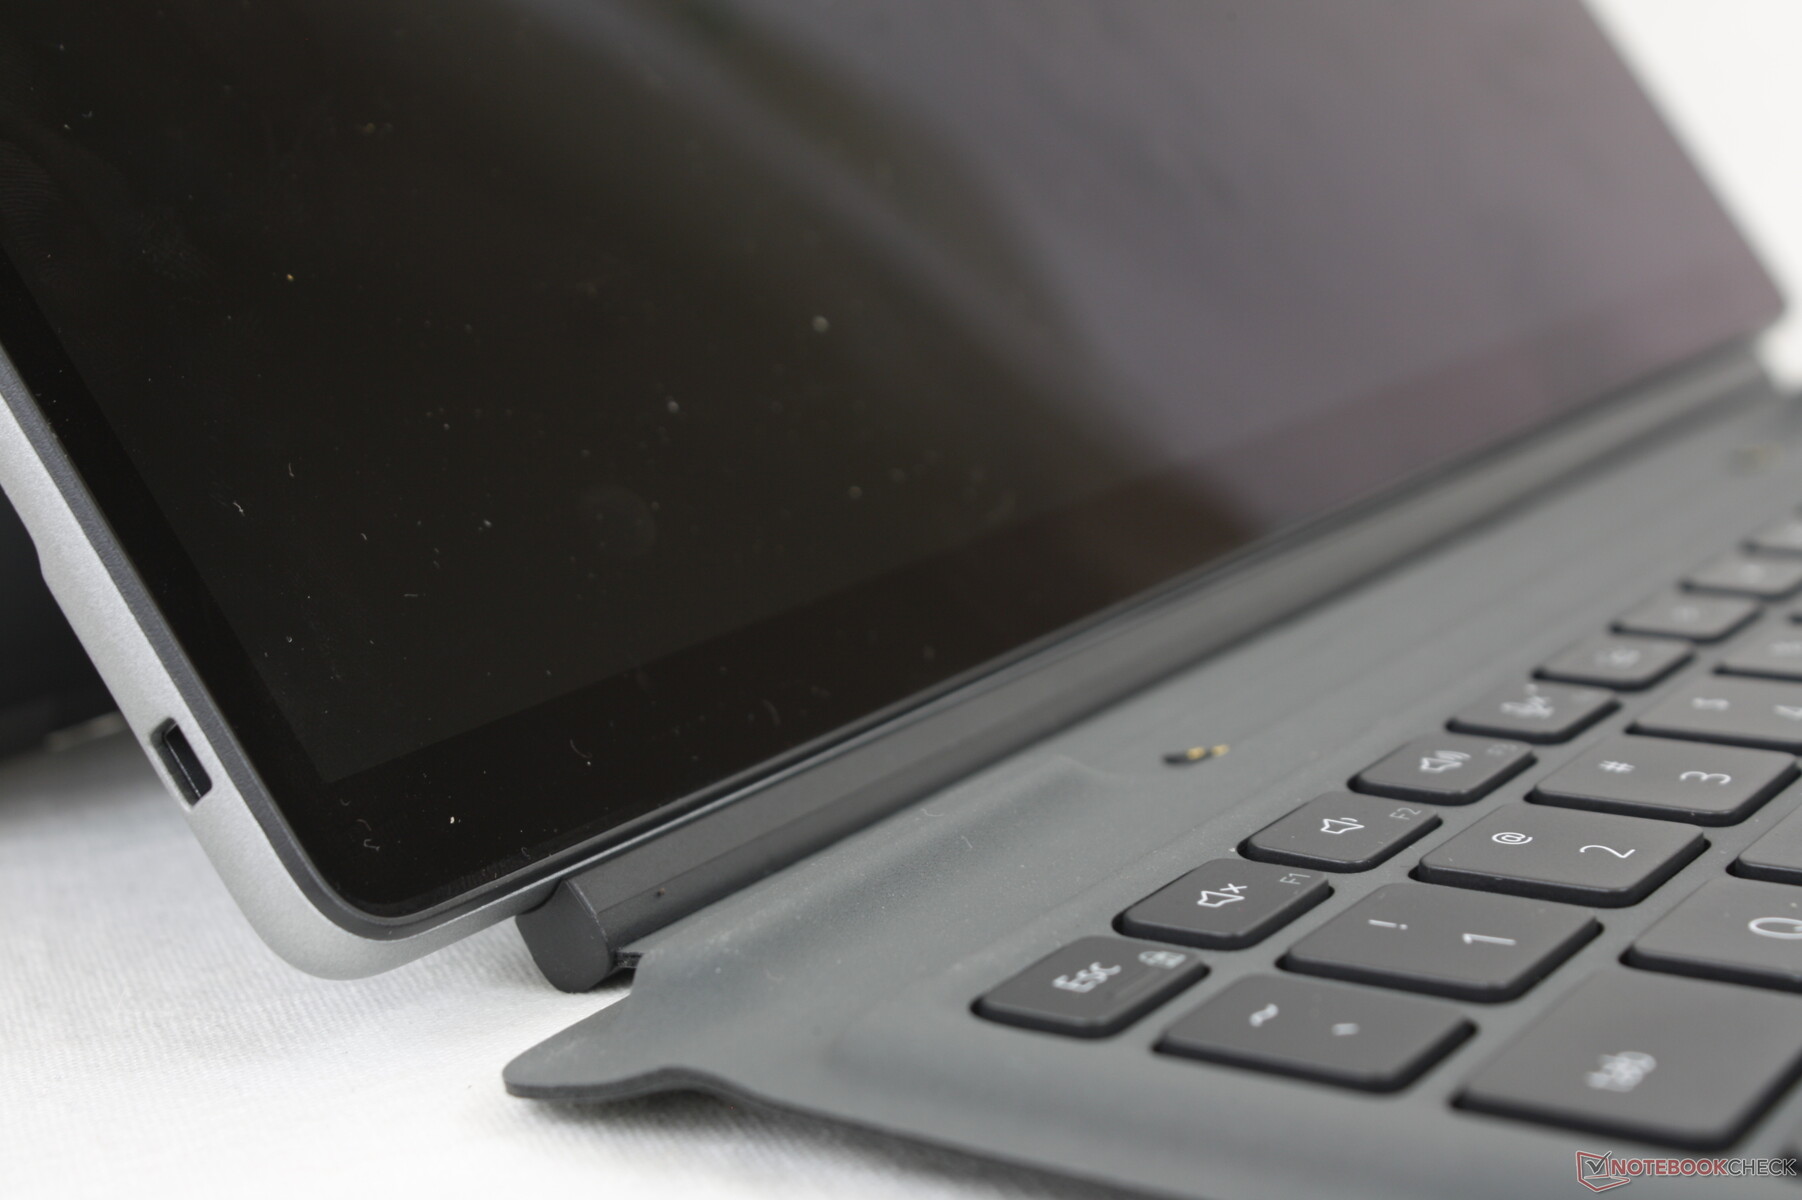
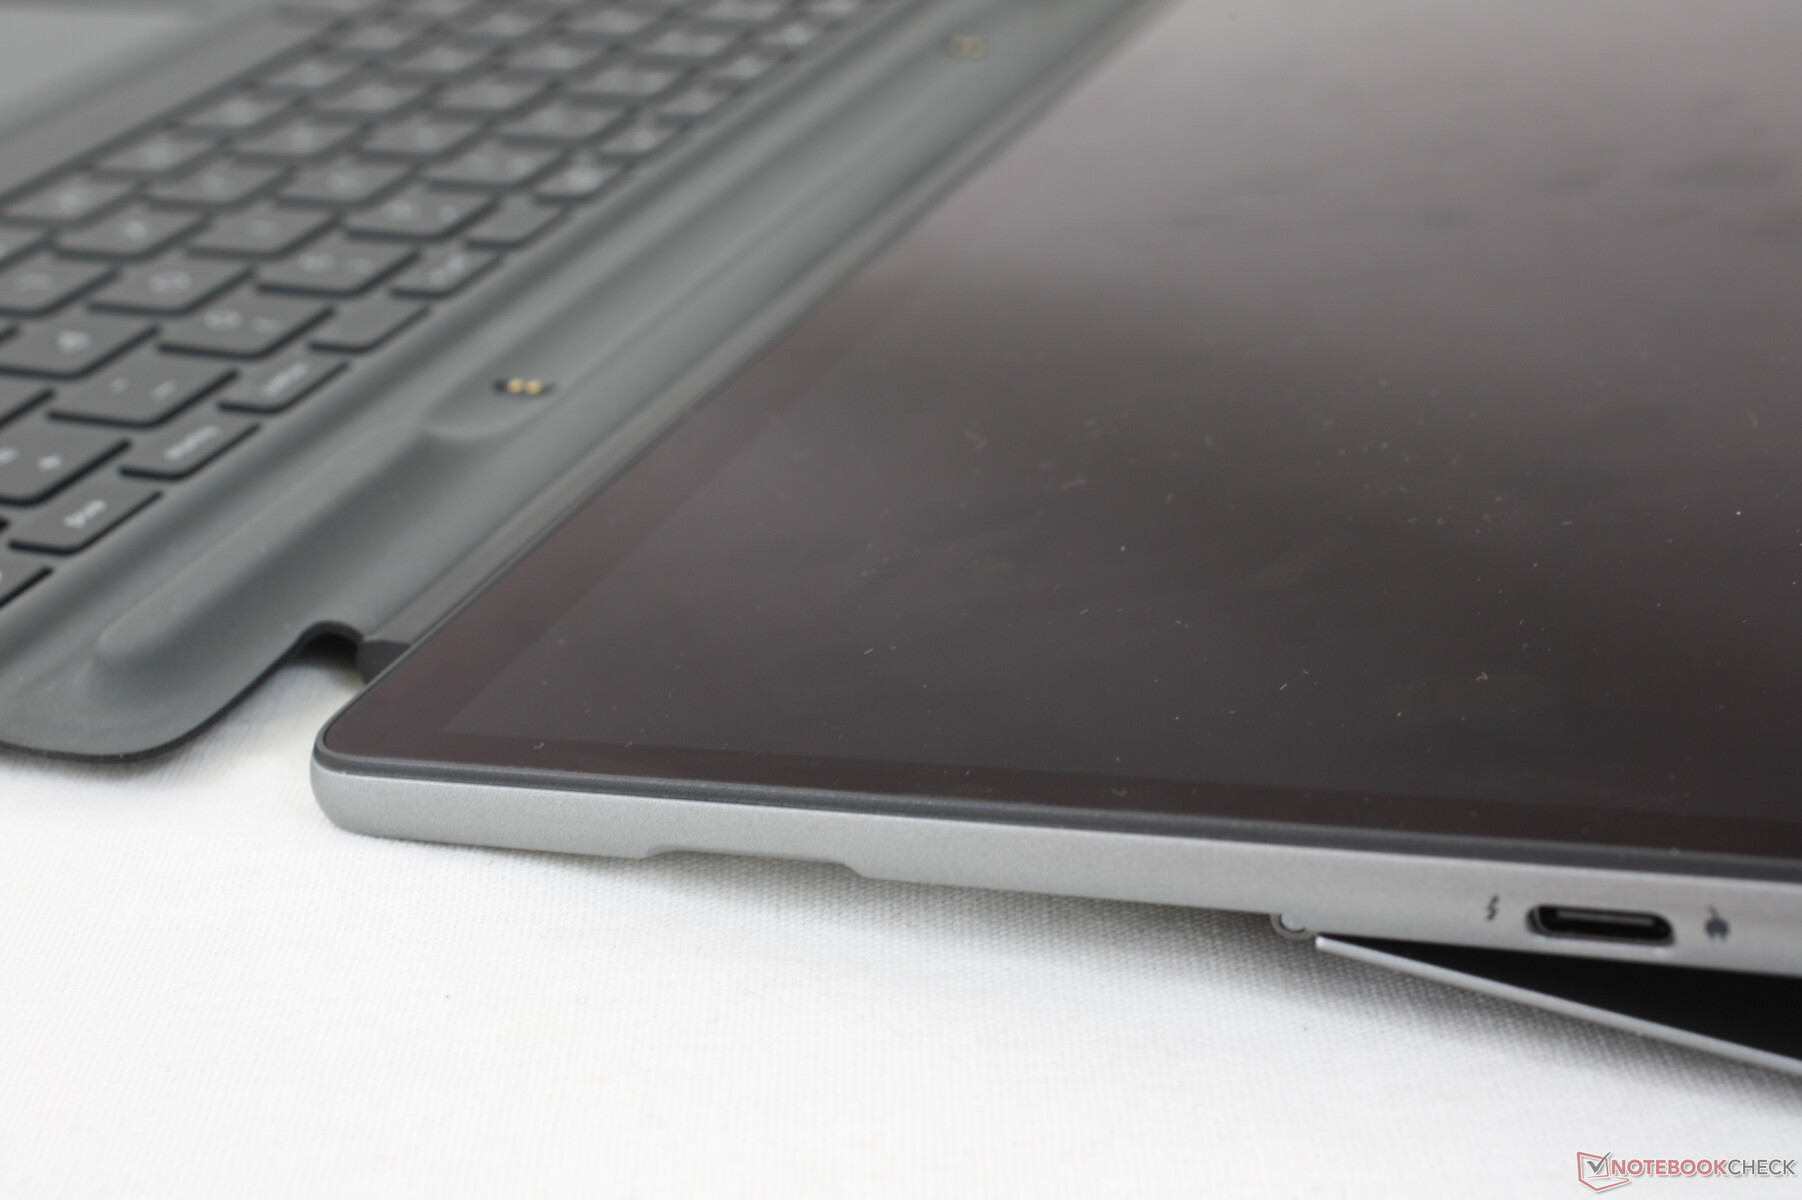
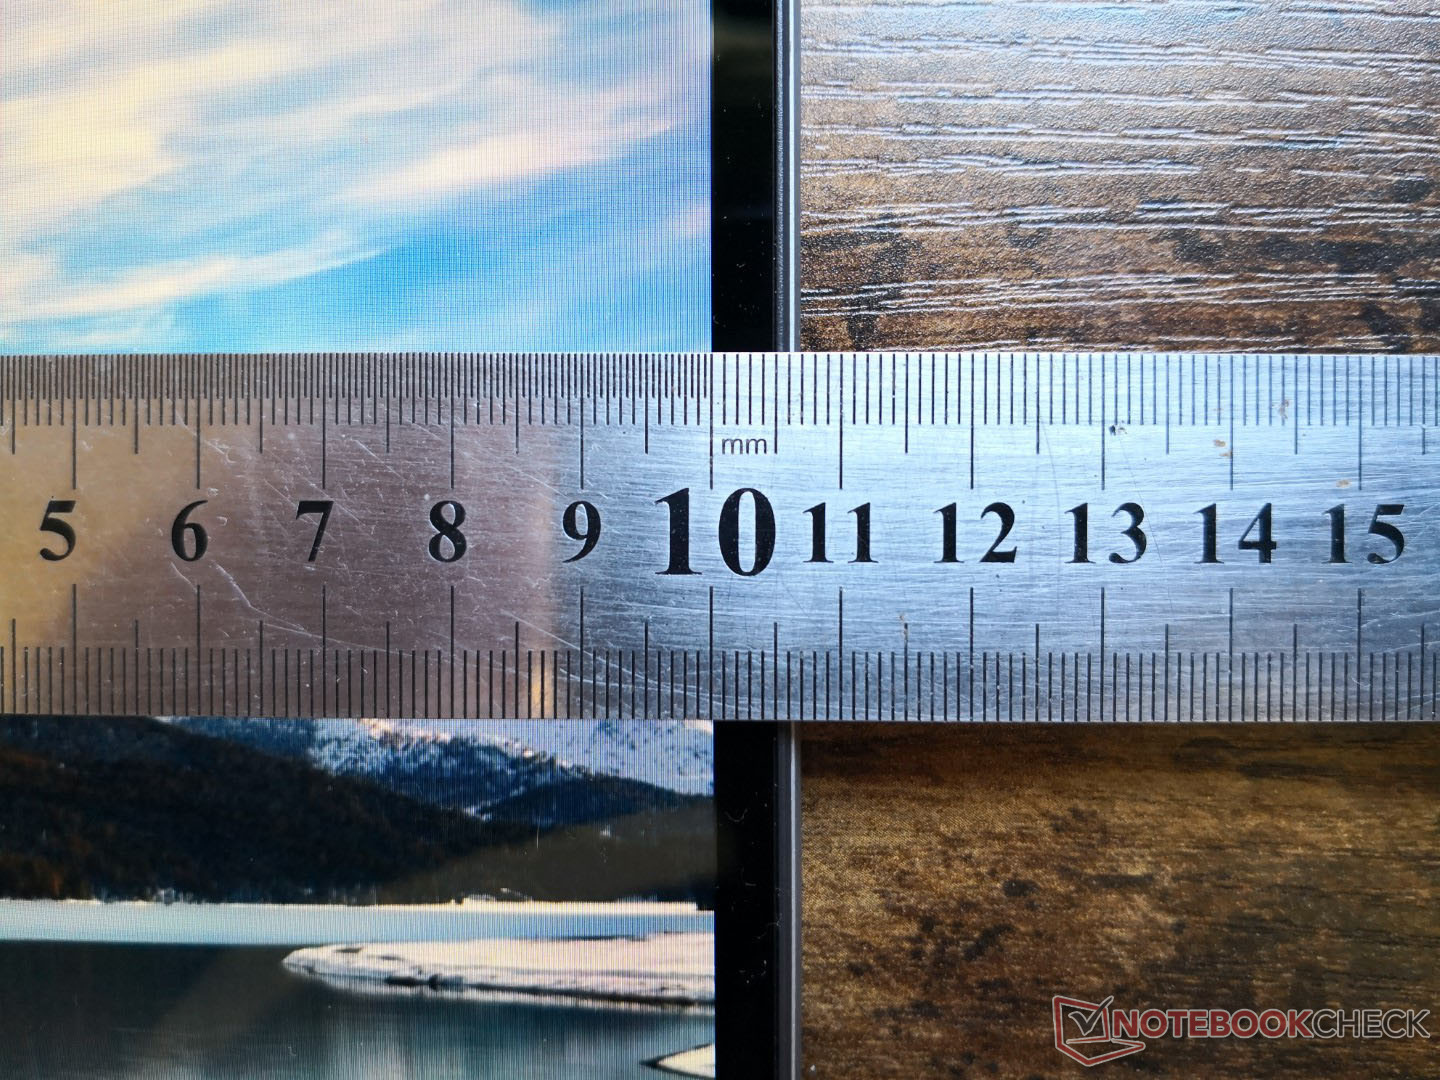
Overall dimensions and weight are very close to the 12.3-inch Surface Pro 7 meaning the Dell unit is able to integrate a larger 13-inch touchscreen without needing to increase the size of the tablet. It makes the thick bezels of the Microsoft Surface look even more outdated than it already is. We fully expect Microsoft to play catch up by introducing new Surface Pro models with narrower bezels in the near future.
| Latitude 7320 Detachable | Dimensions (mm) | Weight (g) |
| Tablet | 288.4 x 207.9 x 8.44 | 782 |
| Keyboard Dock | 284.2 x 215.6 x 5.1 | 342 |
| Tablet w/ Keyboard Dock | 288.4 x 215.6 x 13.54 | 1124 |

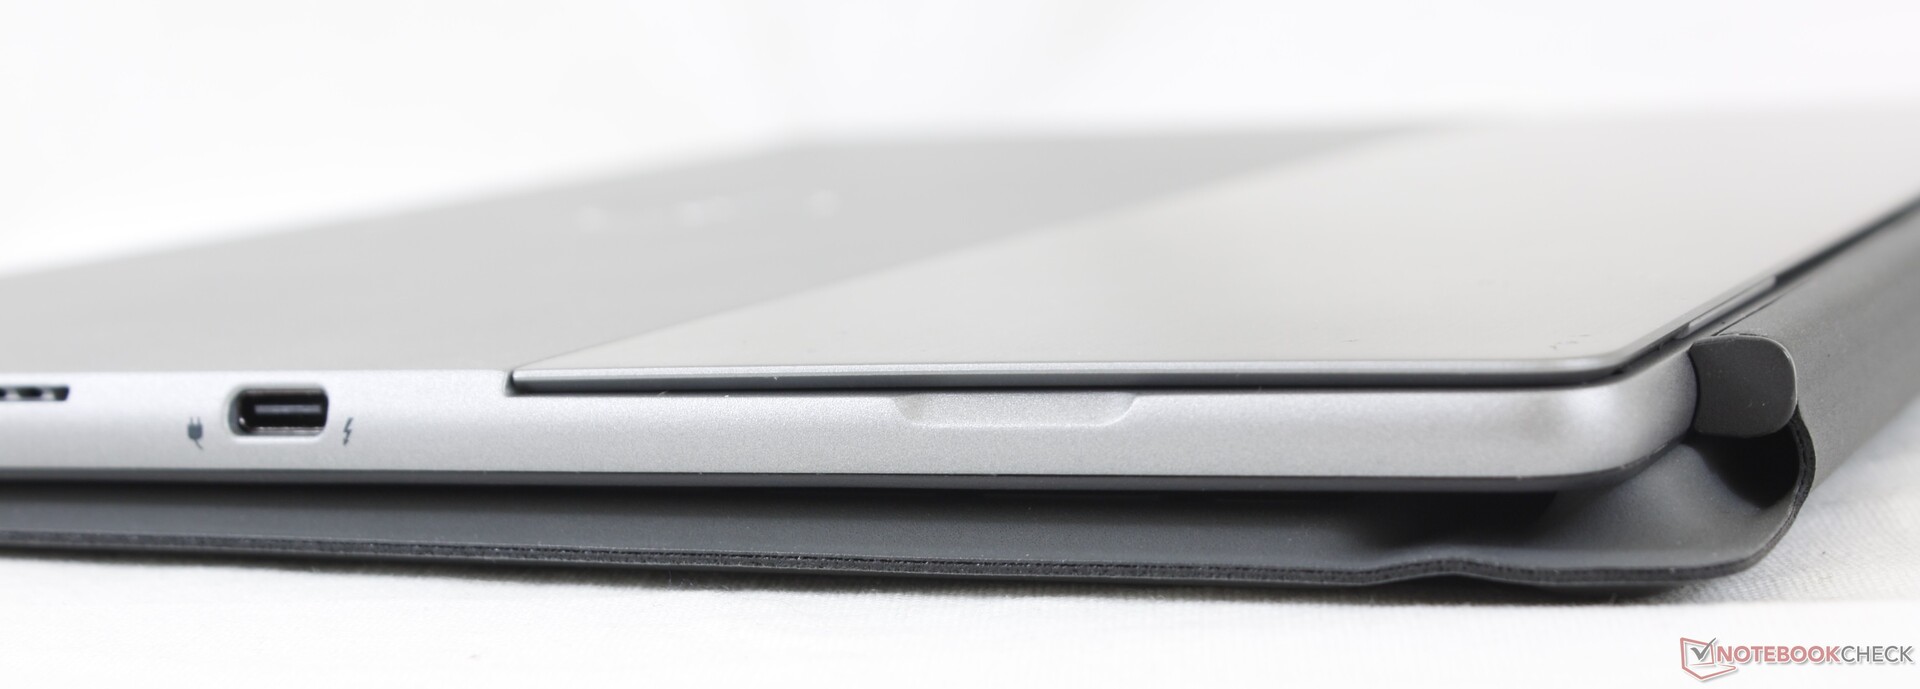
Connectivity — Thunderbolt 4 For All
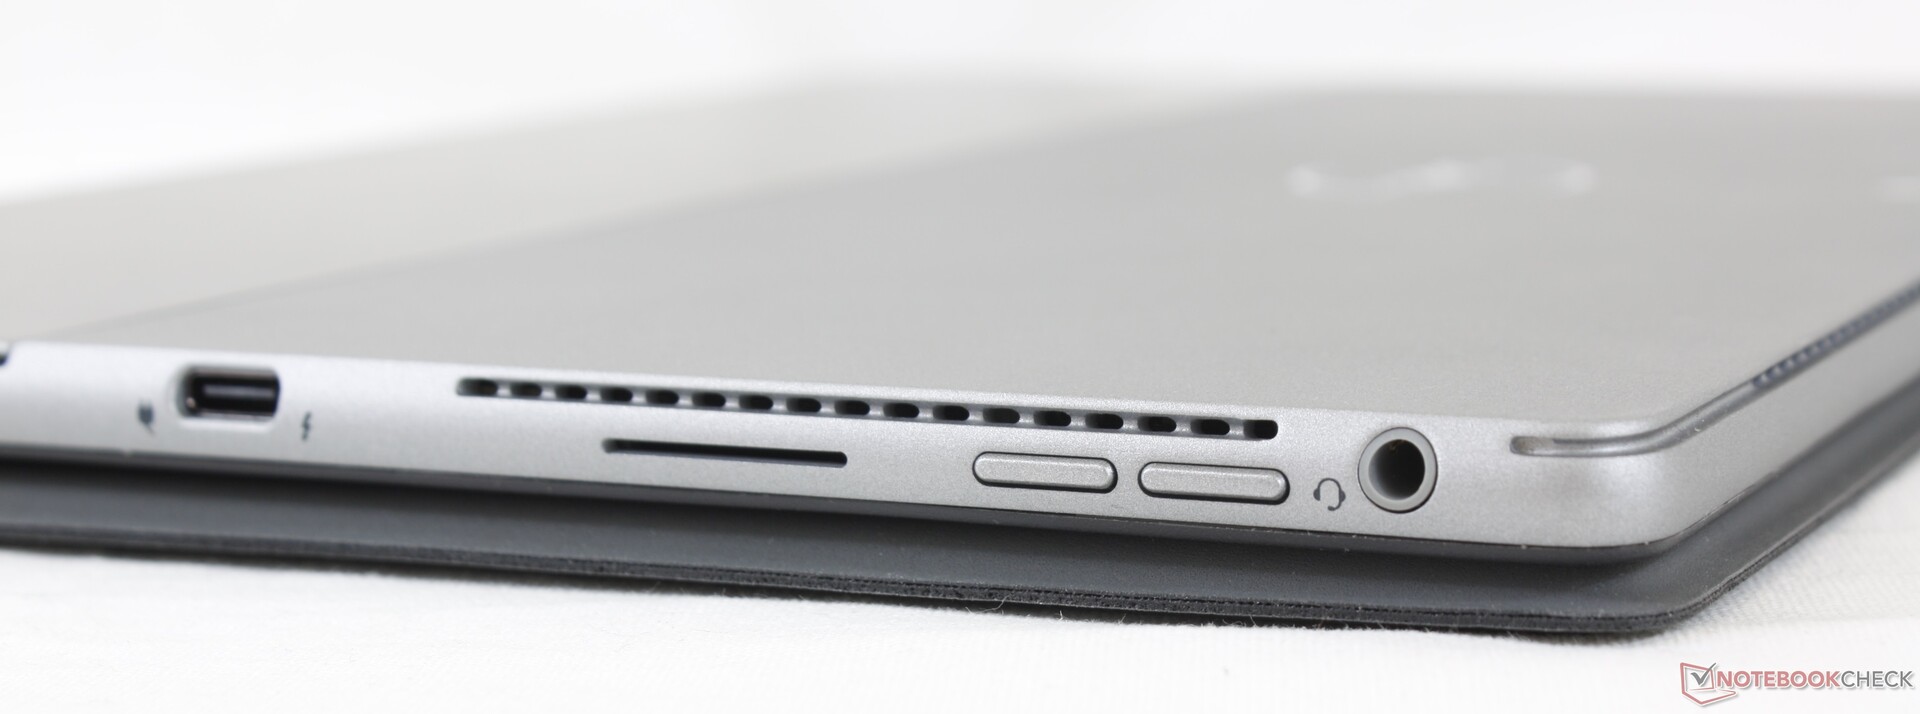
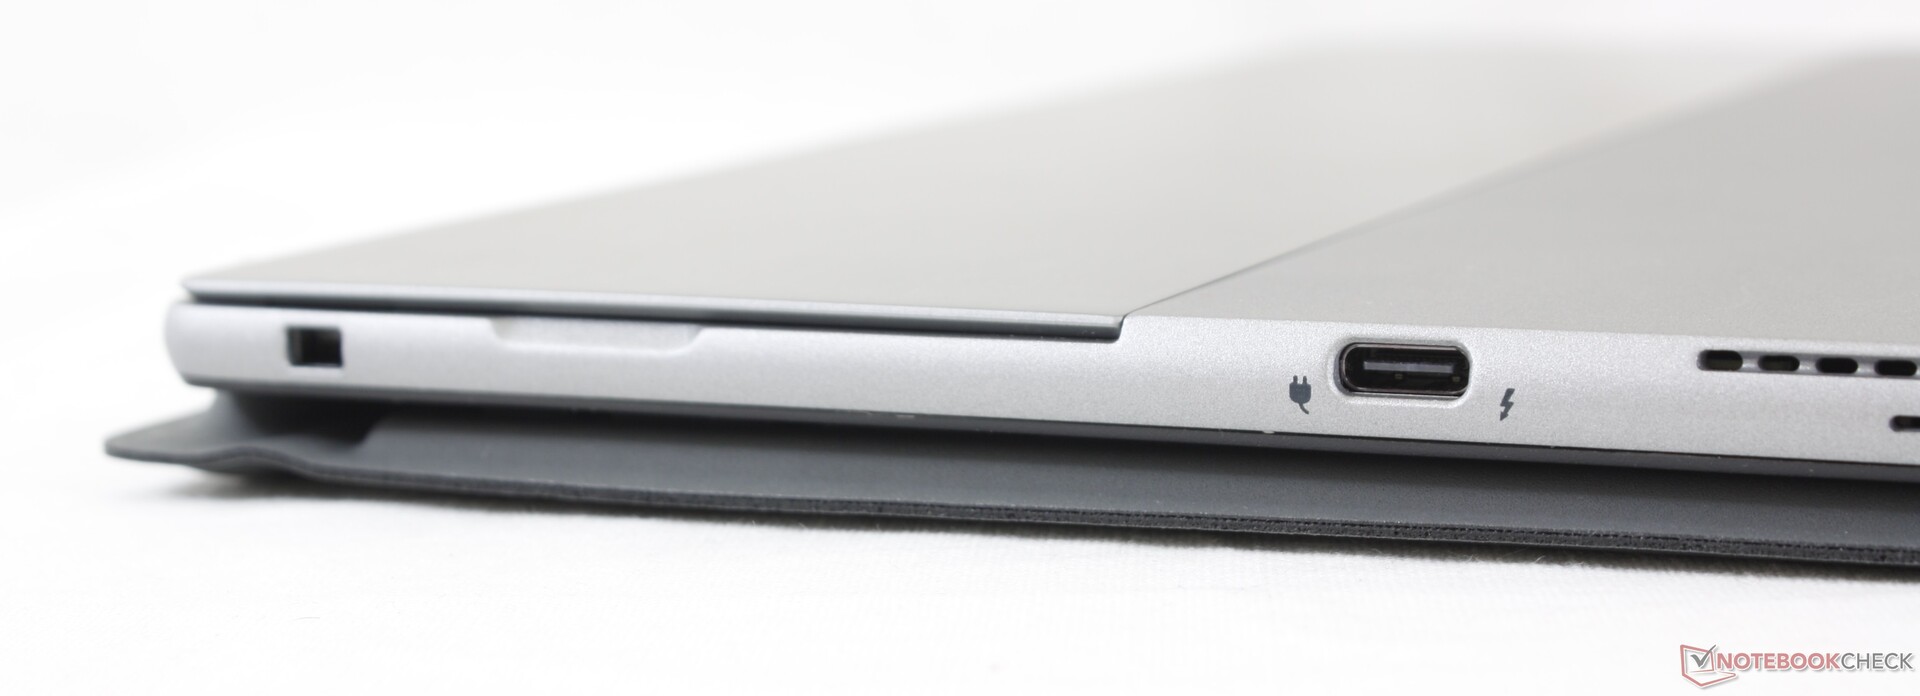
Ports include two USB-C each with charging and Thunderbolt 4 support and a 3.5 mm audio jack. Extras like the SmartCard reader and uSIM tray are optional. Dongles and Thunderbolt-based docking stations are highly recommended to fully exploit the versatility of the two USB-C ports.
There is no USB-A port or SD card reader.
Communication
The Intel AX201 comes standard for Wi-Fi 6 and Bluetooth 5.1 connectivity. For travelers, 4G LTE with eSIM support is available if configured with the optional Snapdragon X20.
Webcam
The front 5 MP and rear 8 MP cameras are of much higher quality than the typical laptop webcam. Video recording, however, is limited to just 1080p at 30 FPS on both cameras with no 60 FPS option at all.


Security
Most Latitude features like vPro, fingerprint reader, IR, and a proximity sensor to automatically sleep and wake the device are available. A webcam shutter is conspicuously absent whereas it has become standard on most newer laptops nowadays.
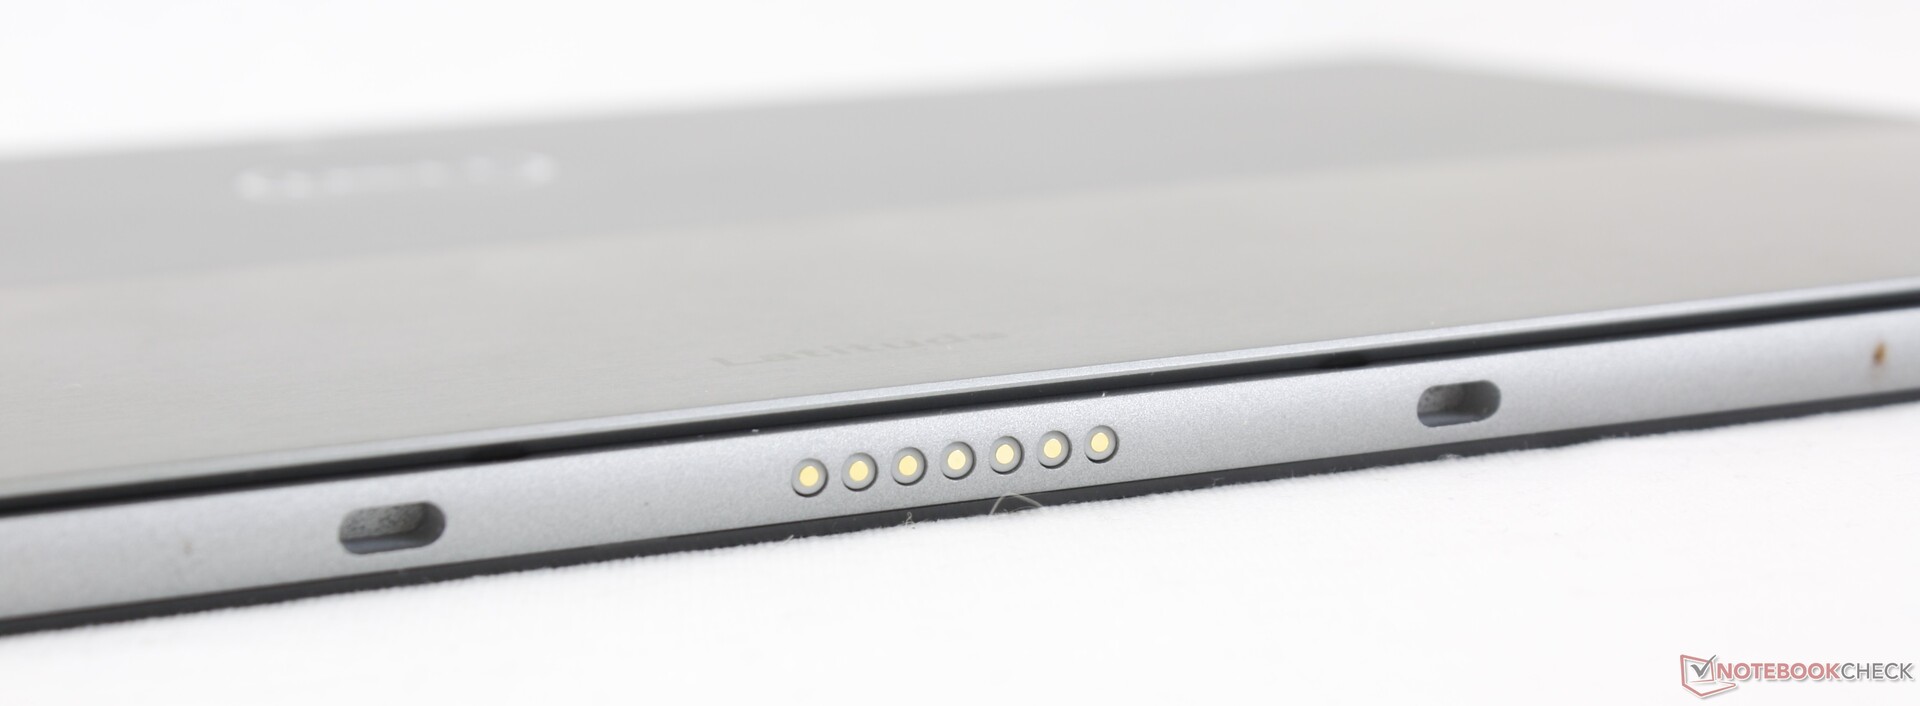
Accessories and Warranty
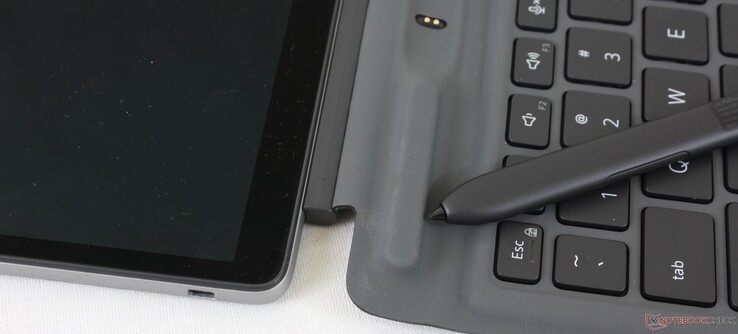
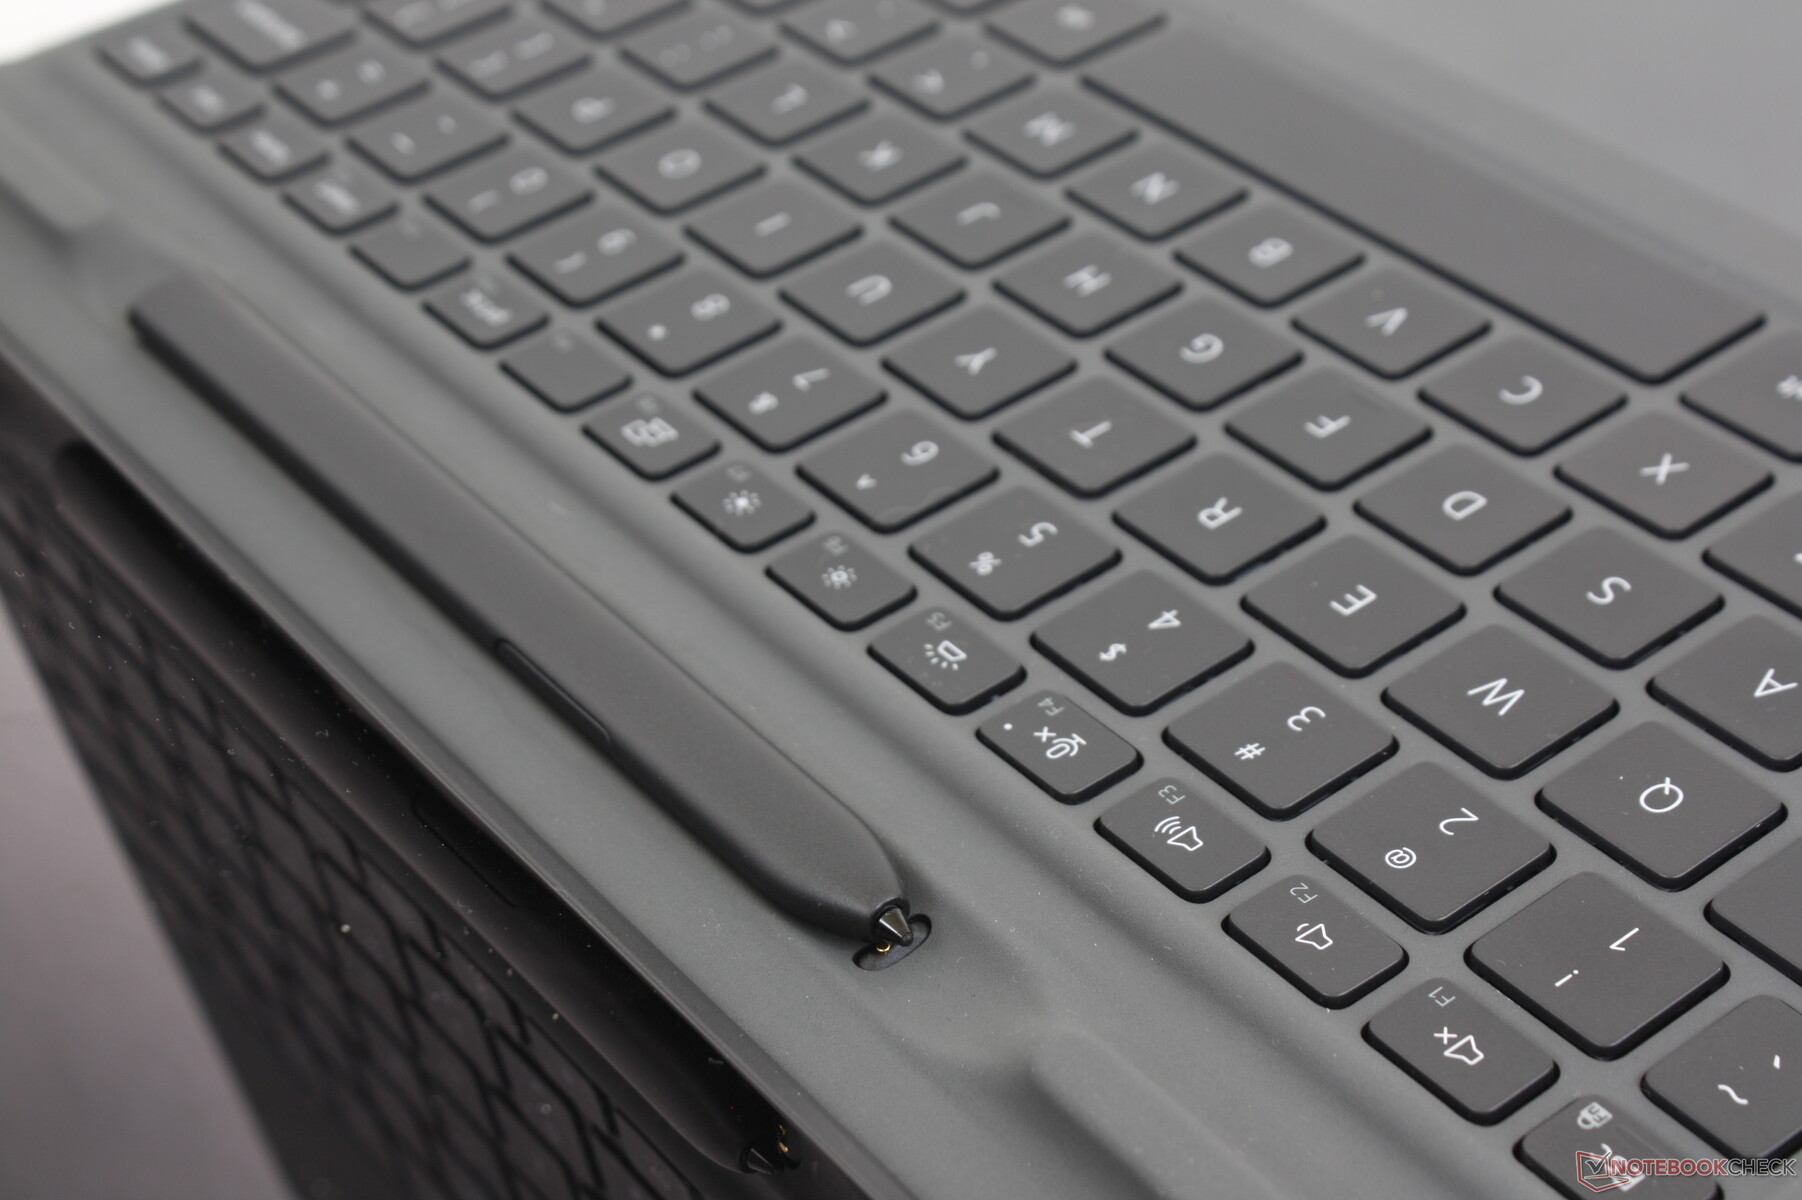
The standard retail packaging does not include the detachable M20NCC folio keyboard or PN7320A active pen which costs an additional $200 and $70 USD, respectively. In comparison, the Lenovo ThinkPad X12 has the keyboard attachment and pen included by default. It would have been great to see a USB-C to USB-A adapter or cleaning cloth with the retail packaging.
A base three-year warranty comes standard much like on other Latitude 7000 series systems.
Input Devices — Not As Good As A Laptop
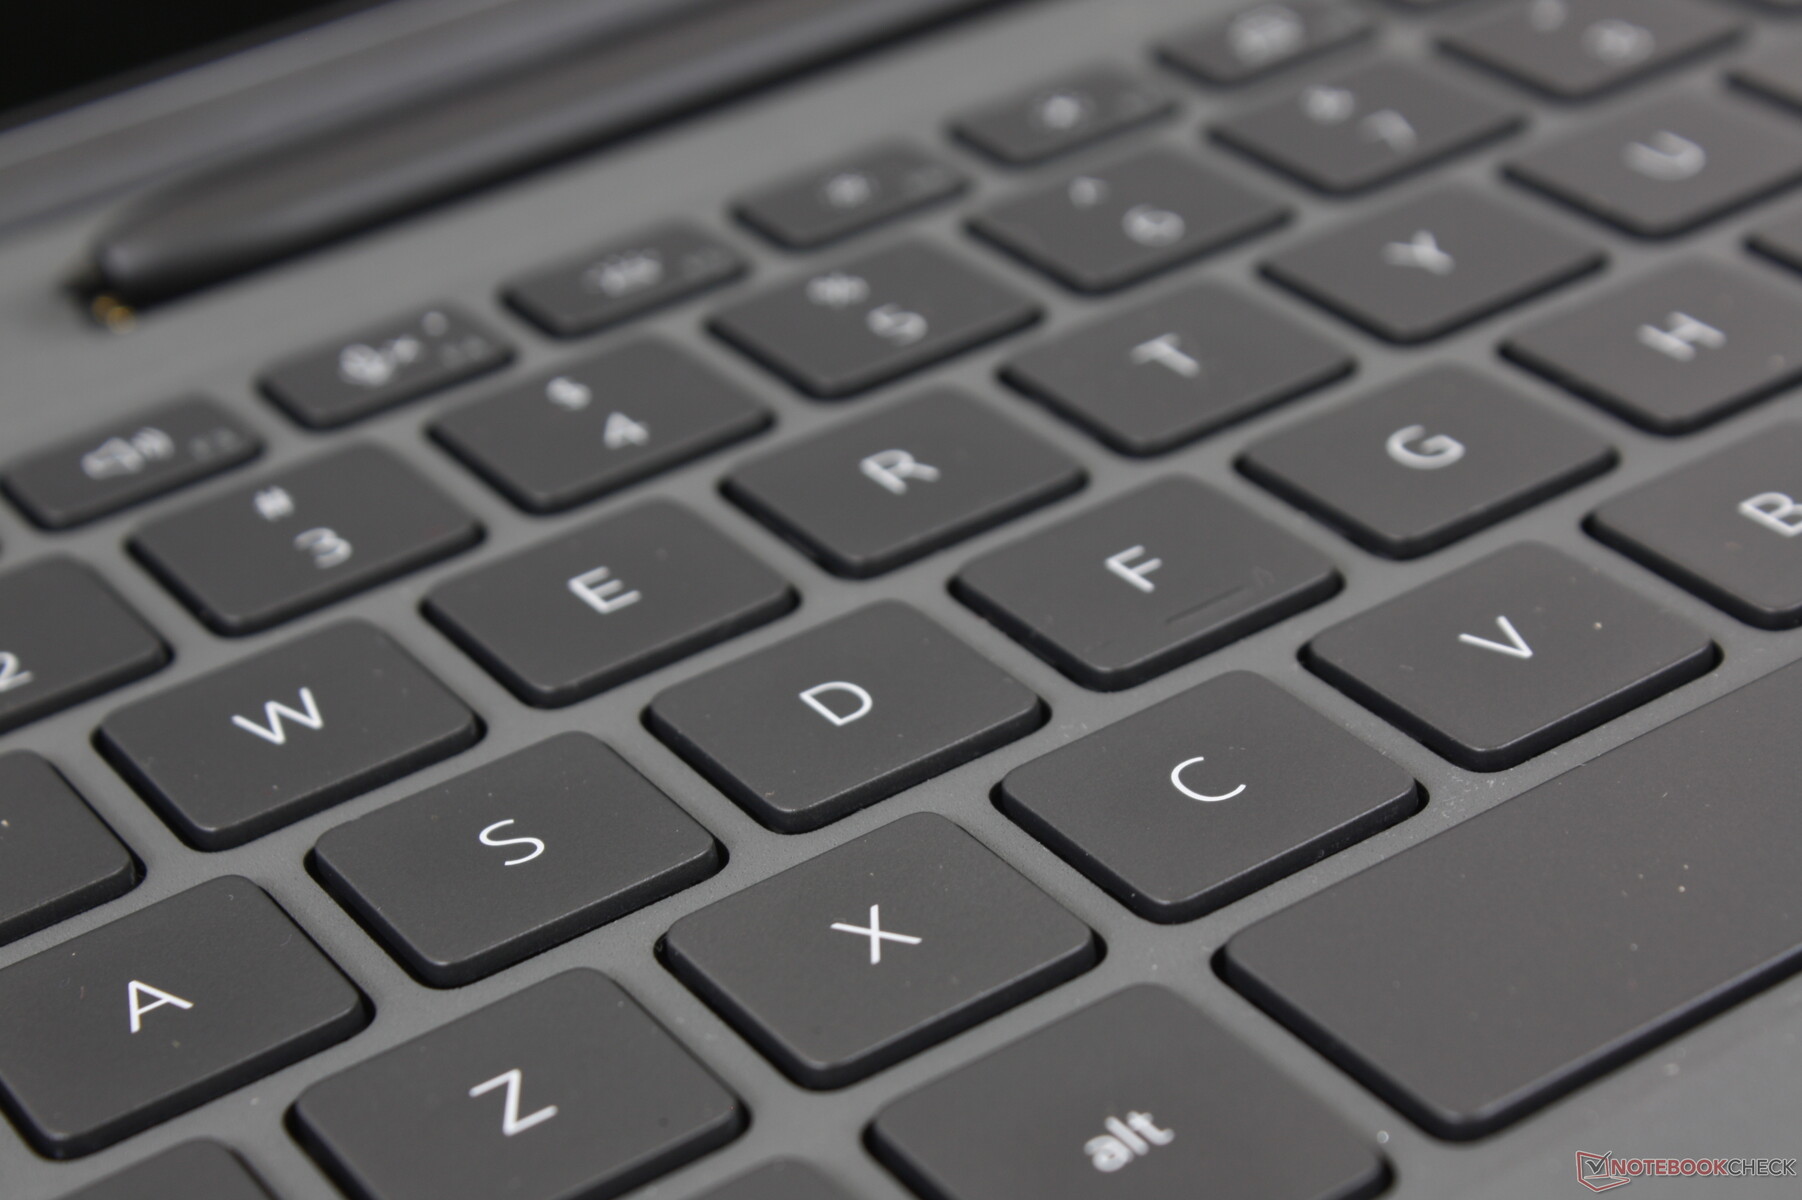
Keyboard
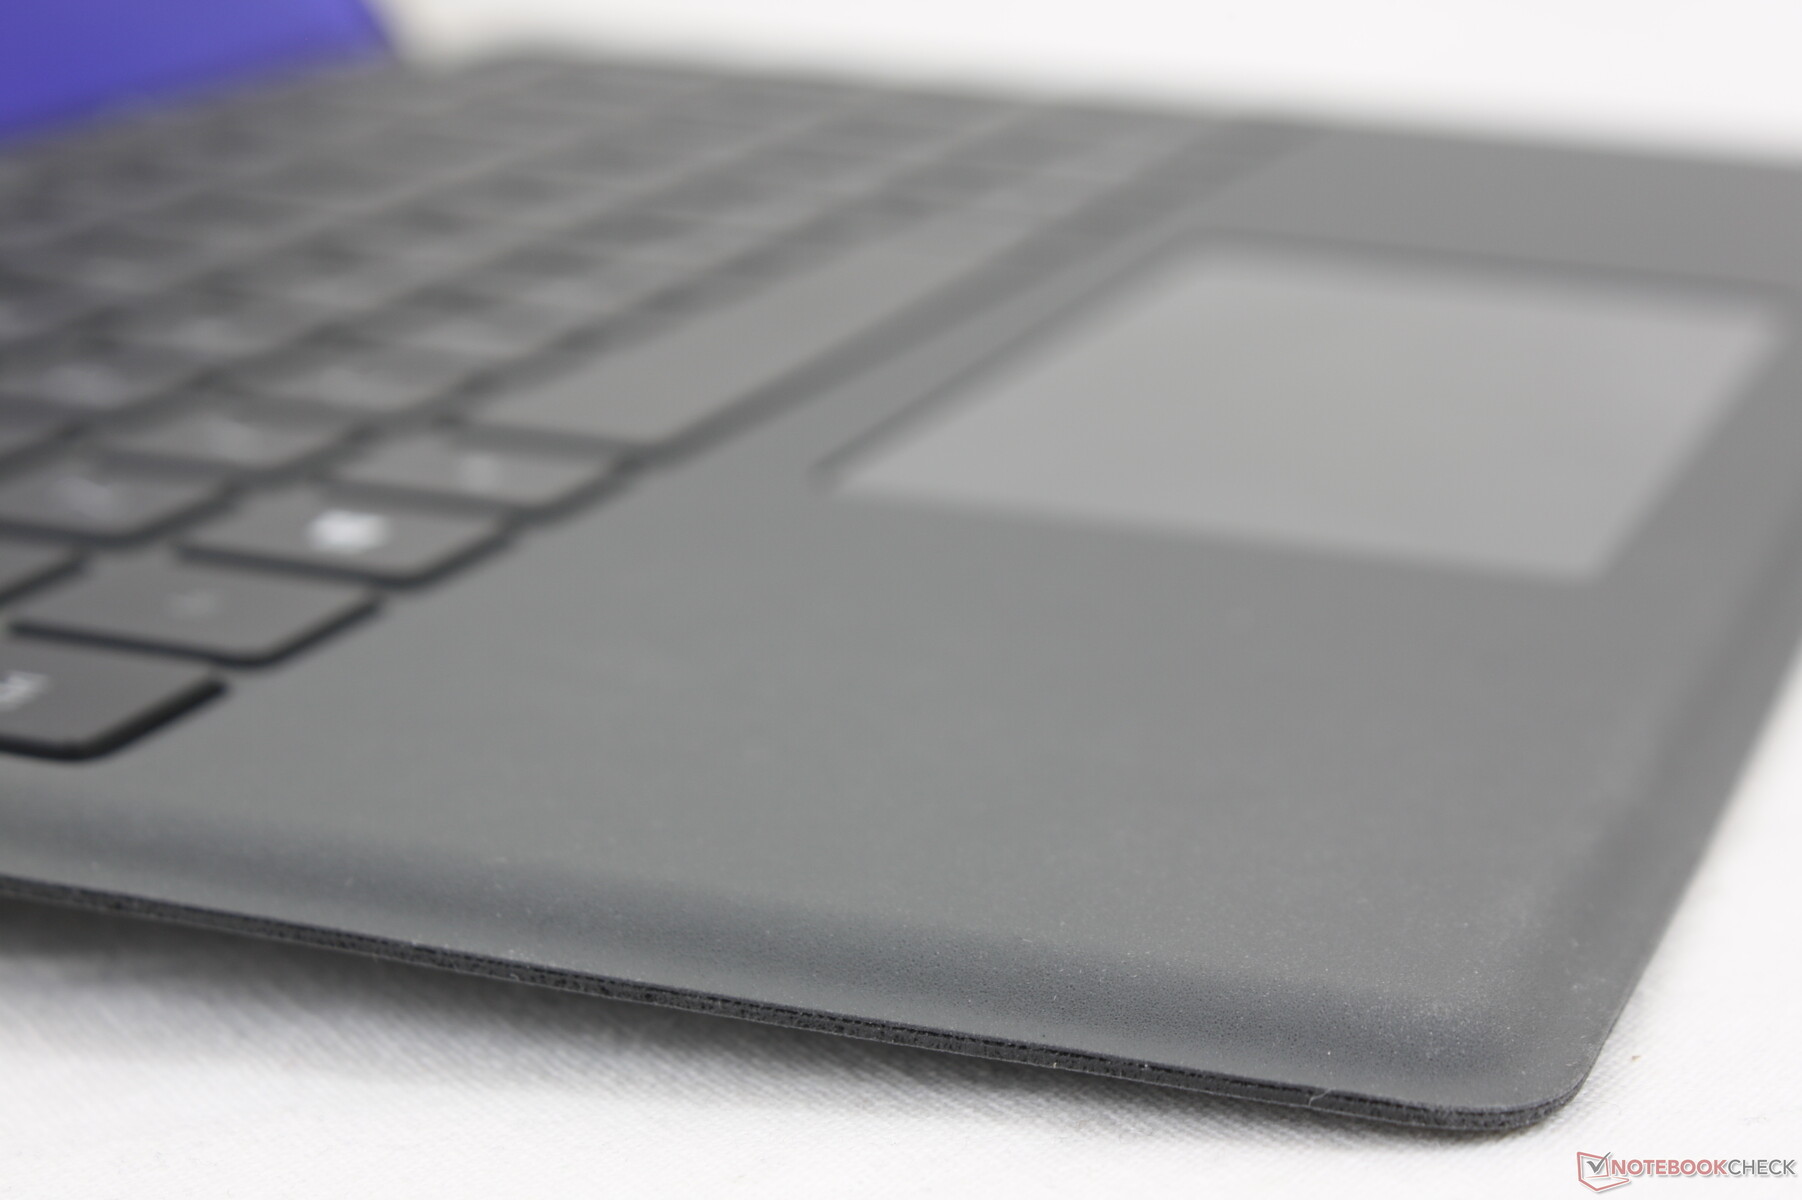
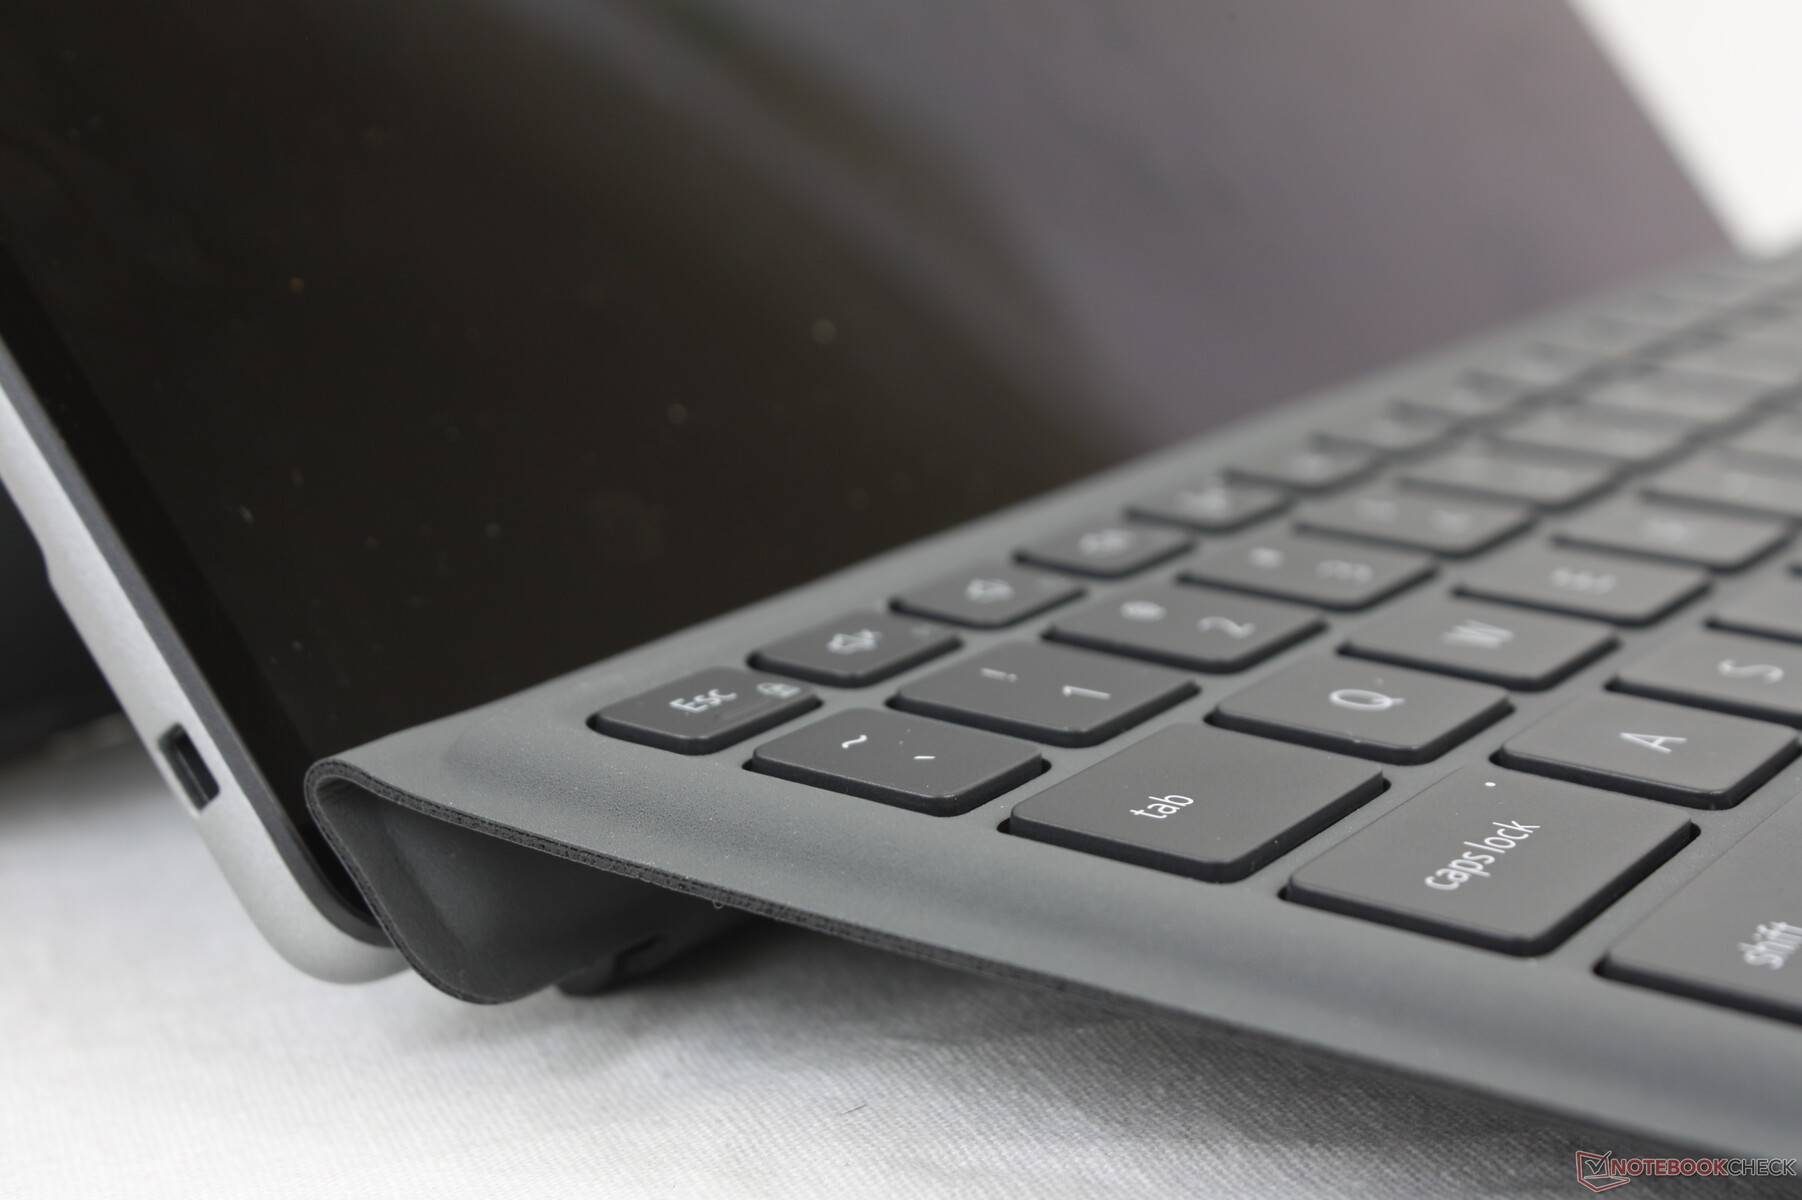
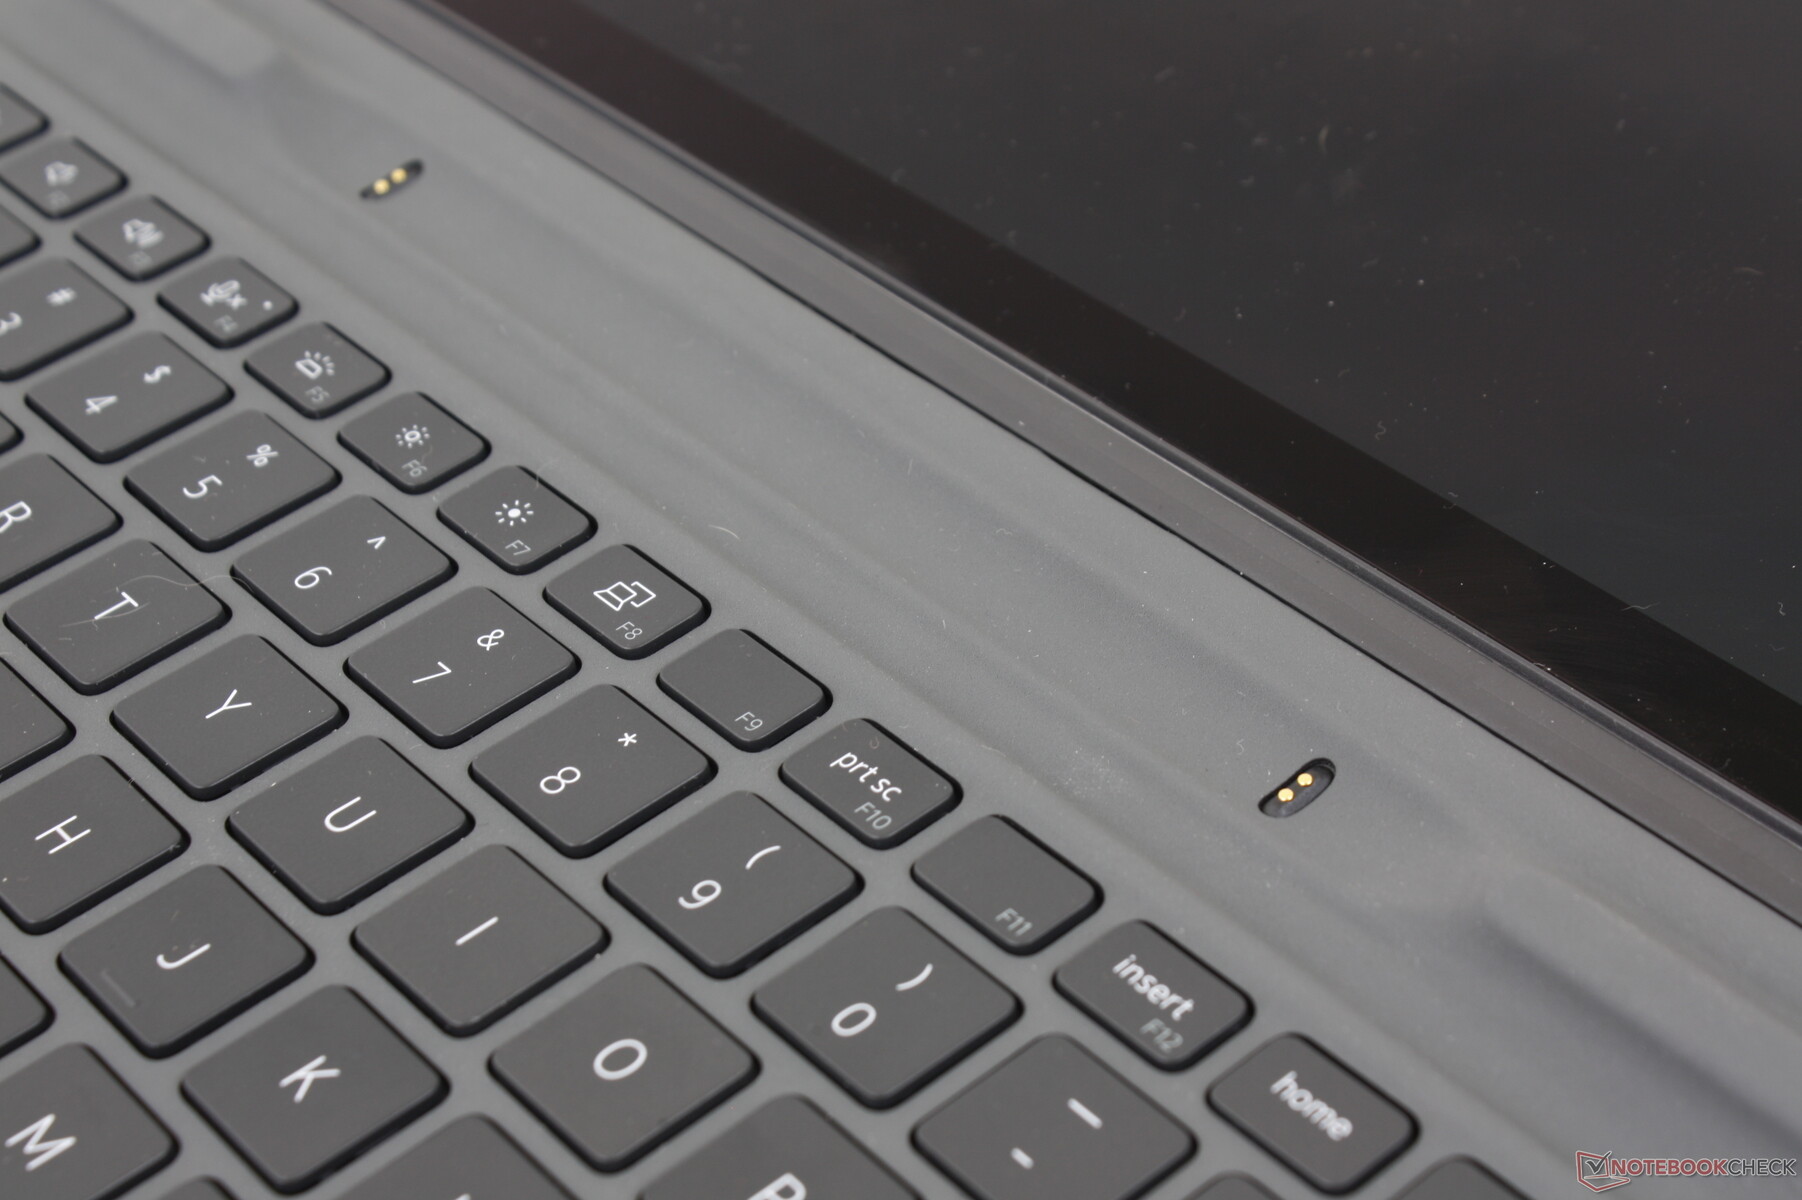
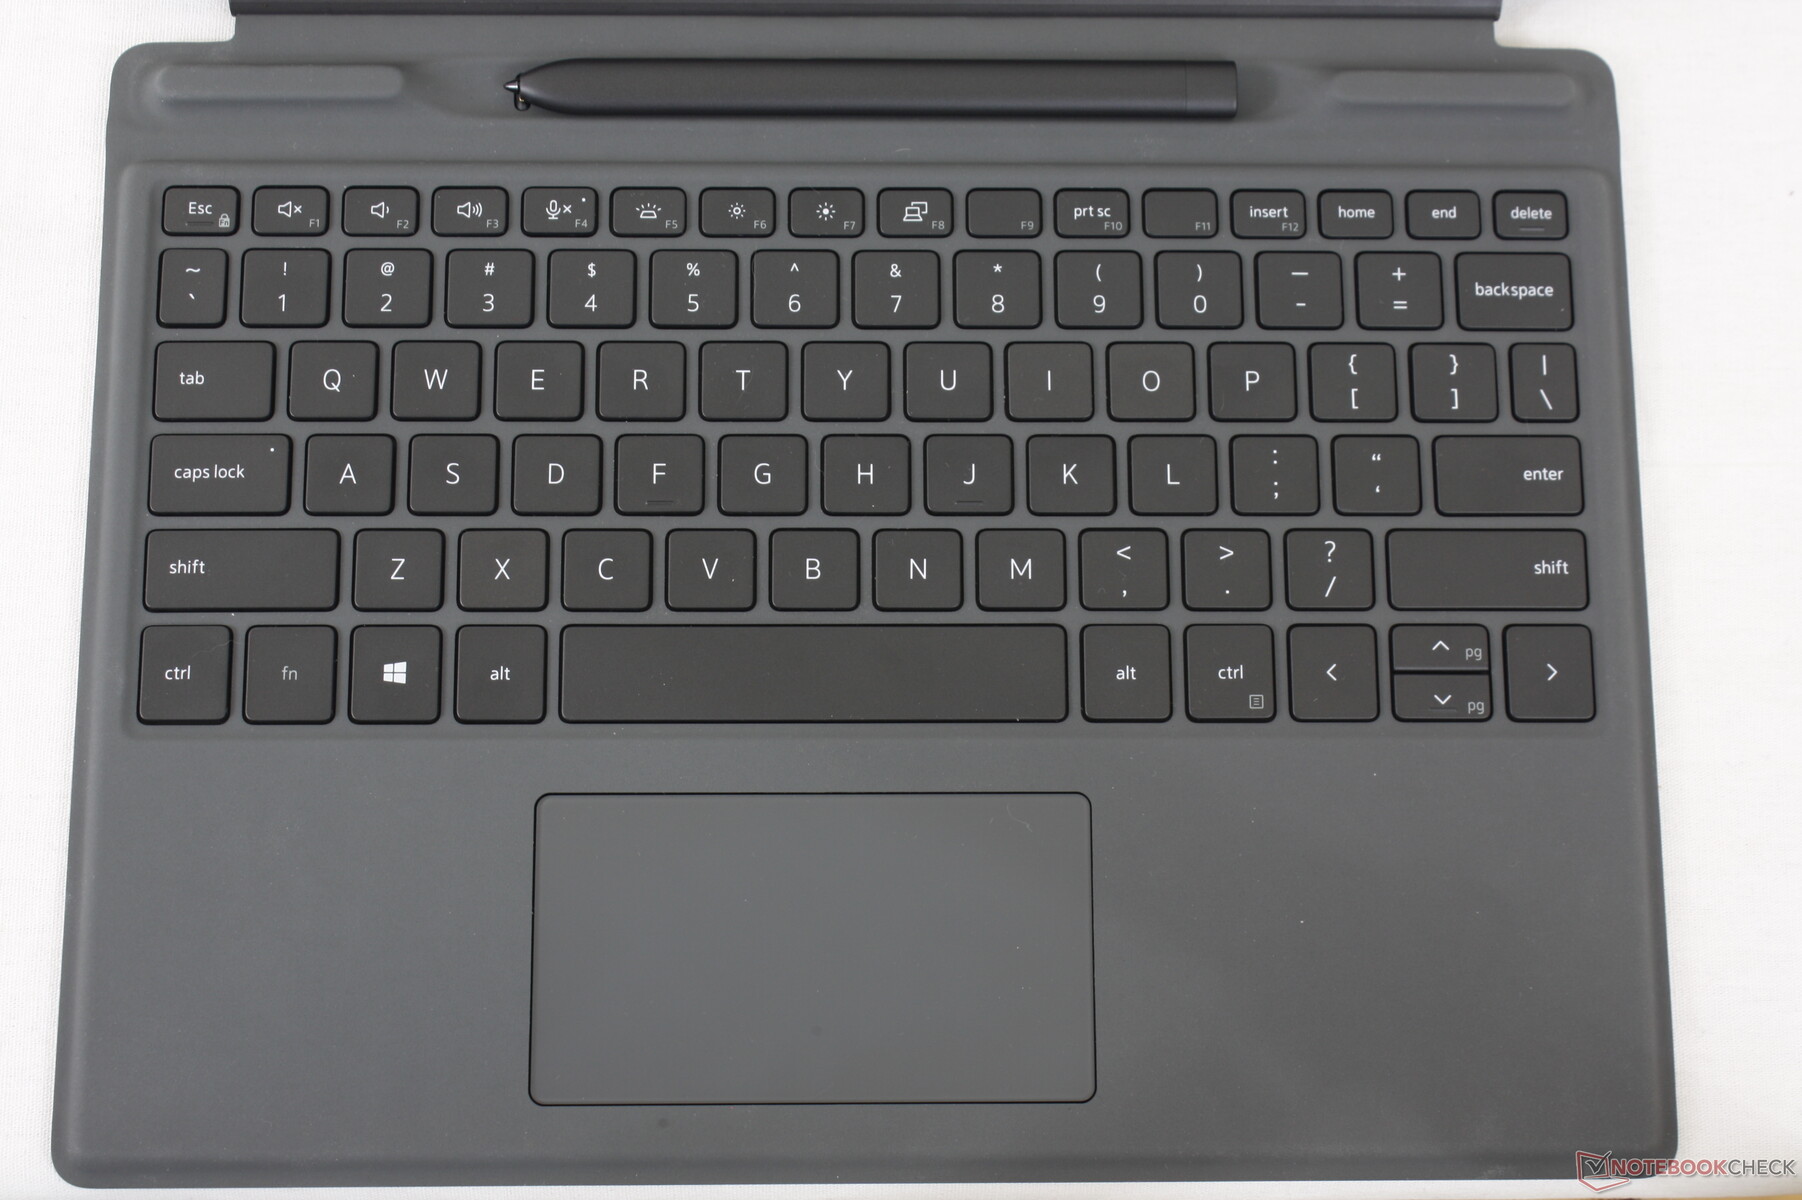
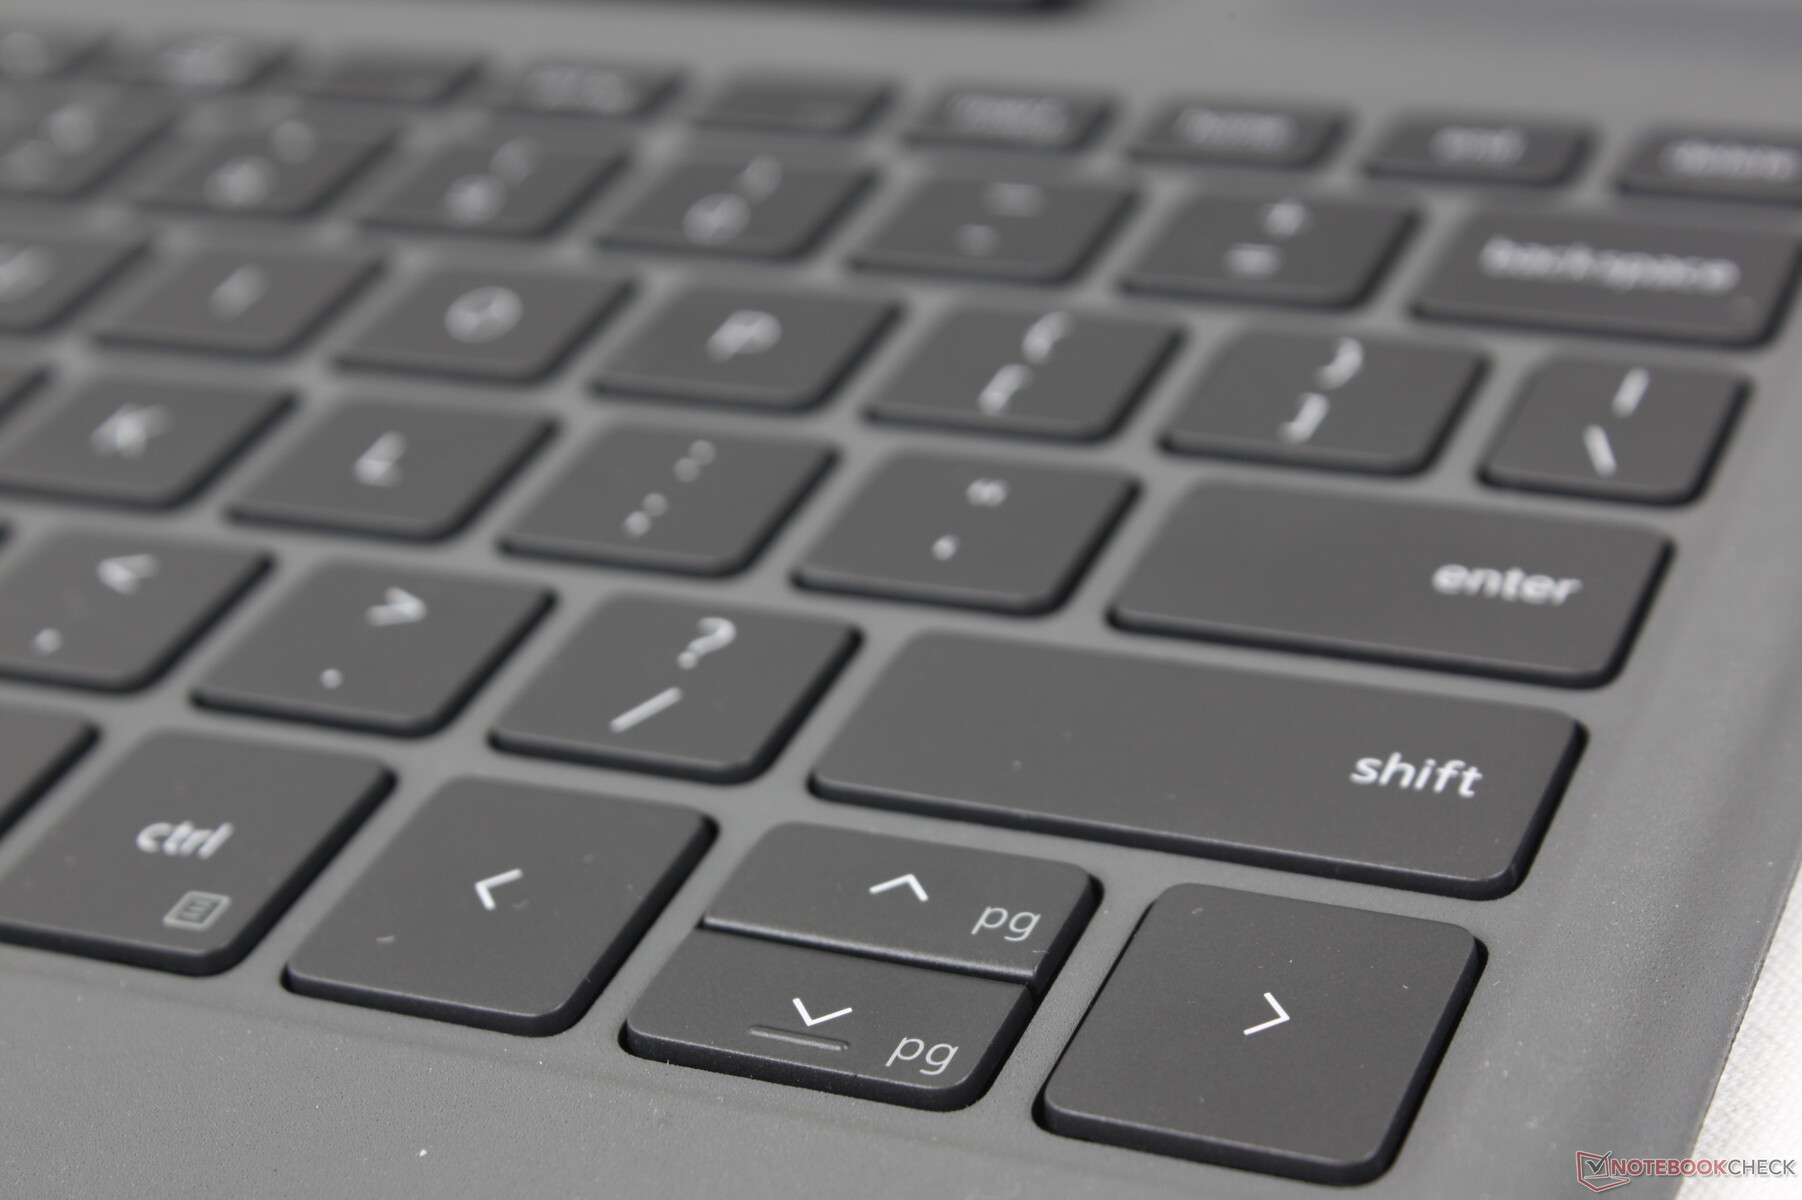
The typing experience on tablets with detachable keyboards has always been subpar or just average at best. The keyboard deck is usually thin and more susceptible to flexing than a standard laptop keyboard which causes key feedback and travel to be softer and shallower, respectively. The Latitude 7320 detachable keyboard doesn't do anything to address these drawbacks and so it doesn't feel noticeably better or worse than typing on a Surface Pro folio keyboard. It's fine for messaging and emails, but you'd be better off with a Latitude 7320 clamshell or convertible for longer typing sessions.
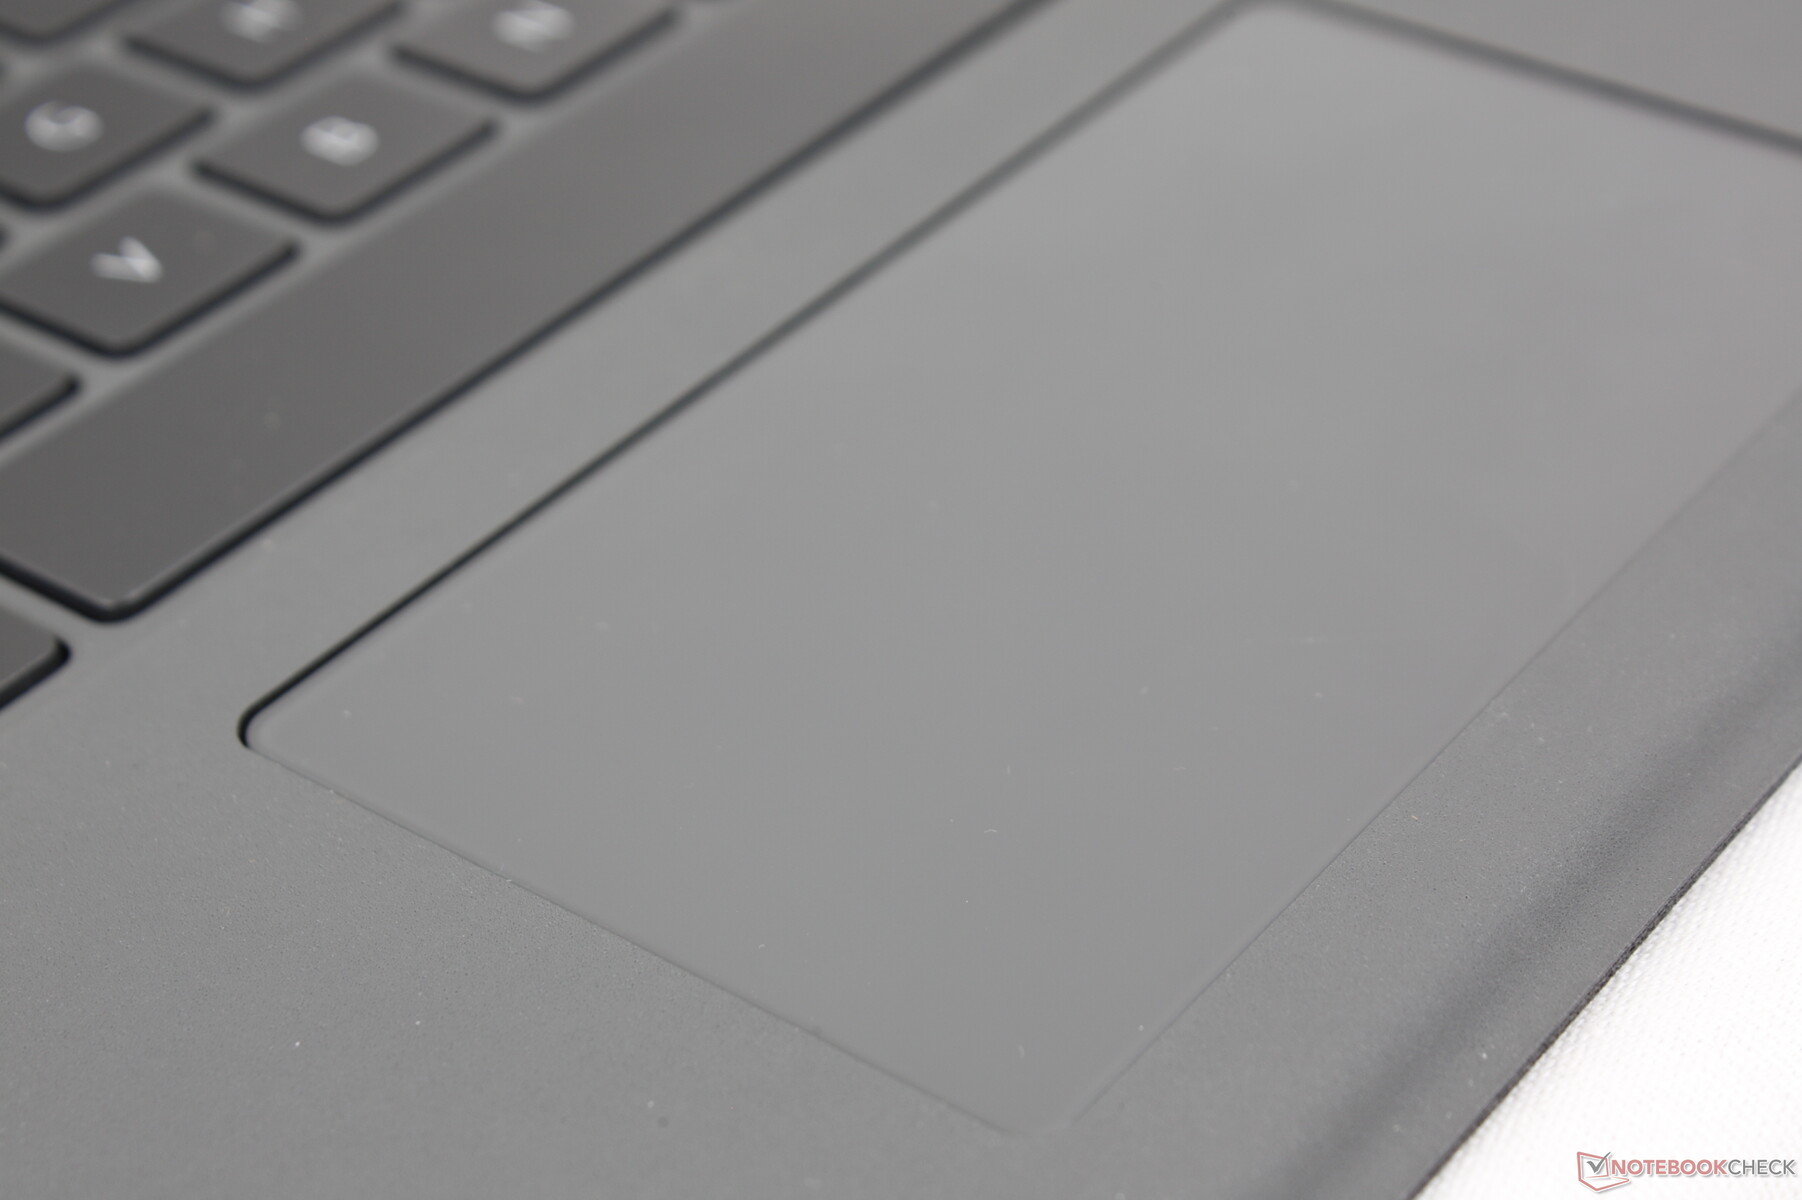
Touchpad
The Precision clickpad is relatively small compared to the larger clickpad on the XPS 13 (10 x 5.5 cm vs. 11.2 x 6.5 cm). Its texture is completely smooth save for just a bit of sticking when gliding at very slow speeds for more accurate control. Basic cursor movements and multi-touch inputs are otherwise reliable if not cramped.
Clicking on the surface returns a shallow and somewhat spongy click. Clatter is quiet as a result, but we would have preferred feedback to be firmer.
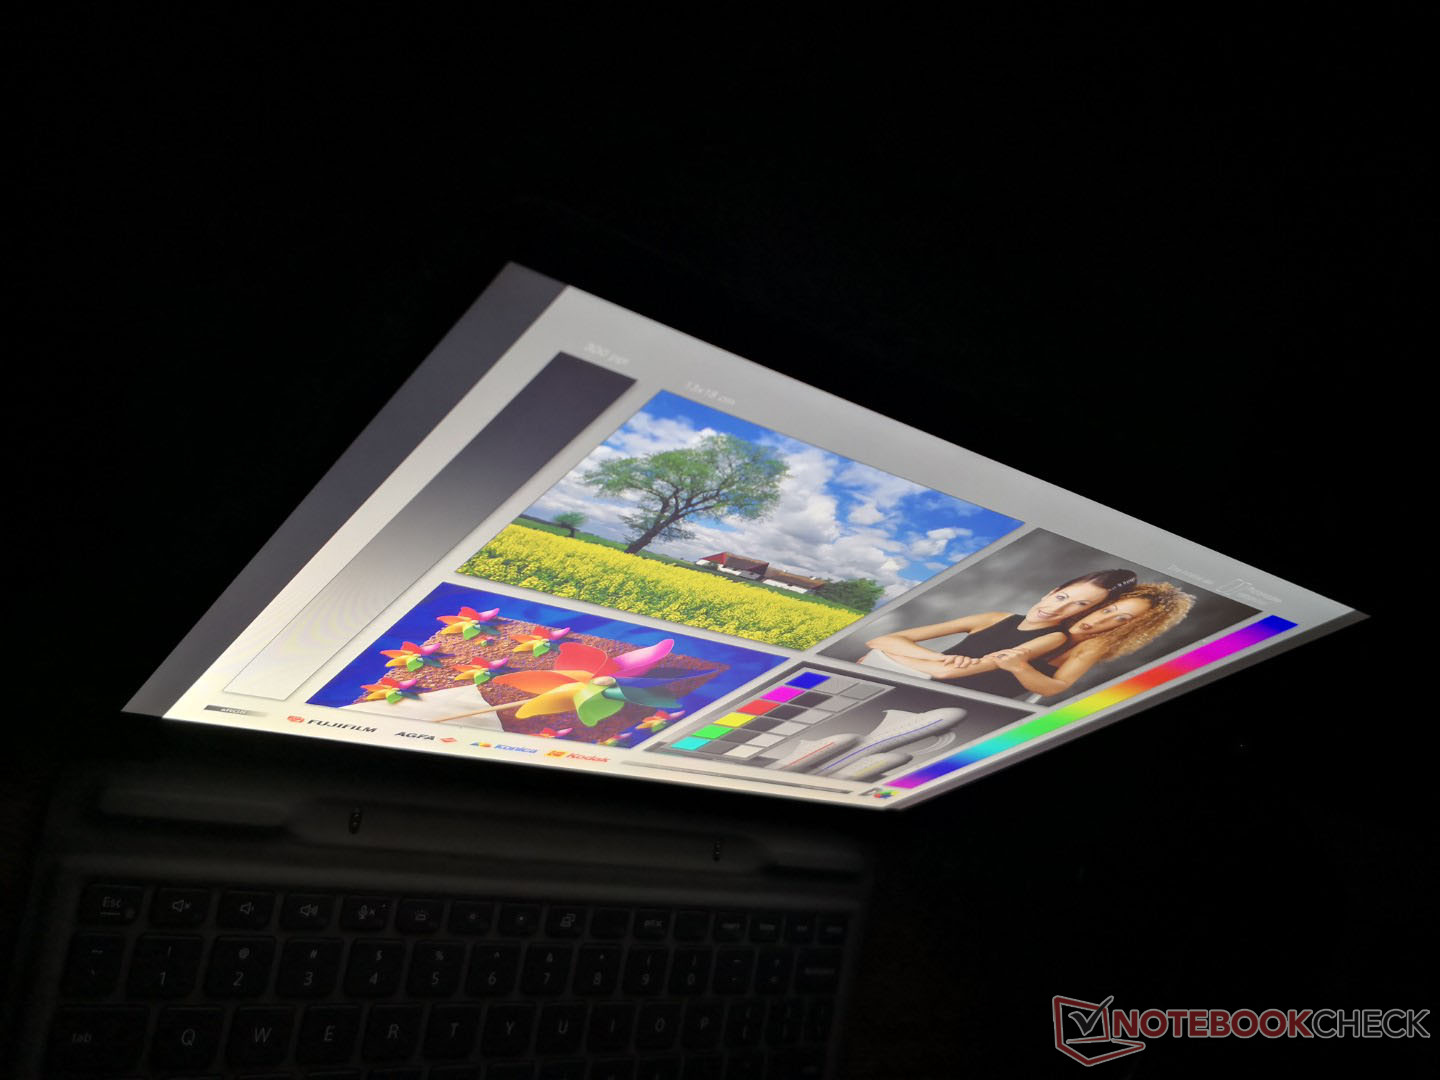
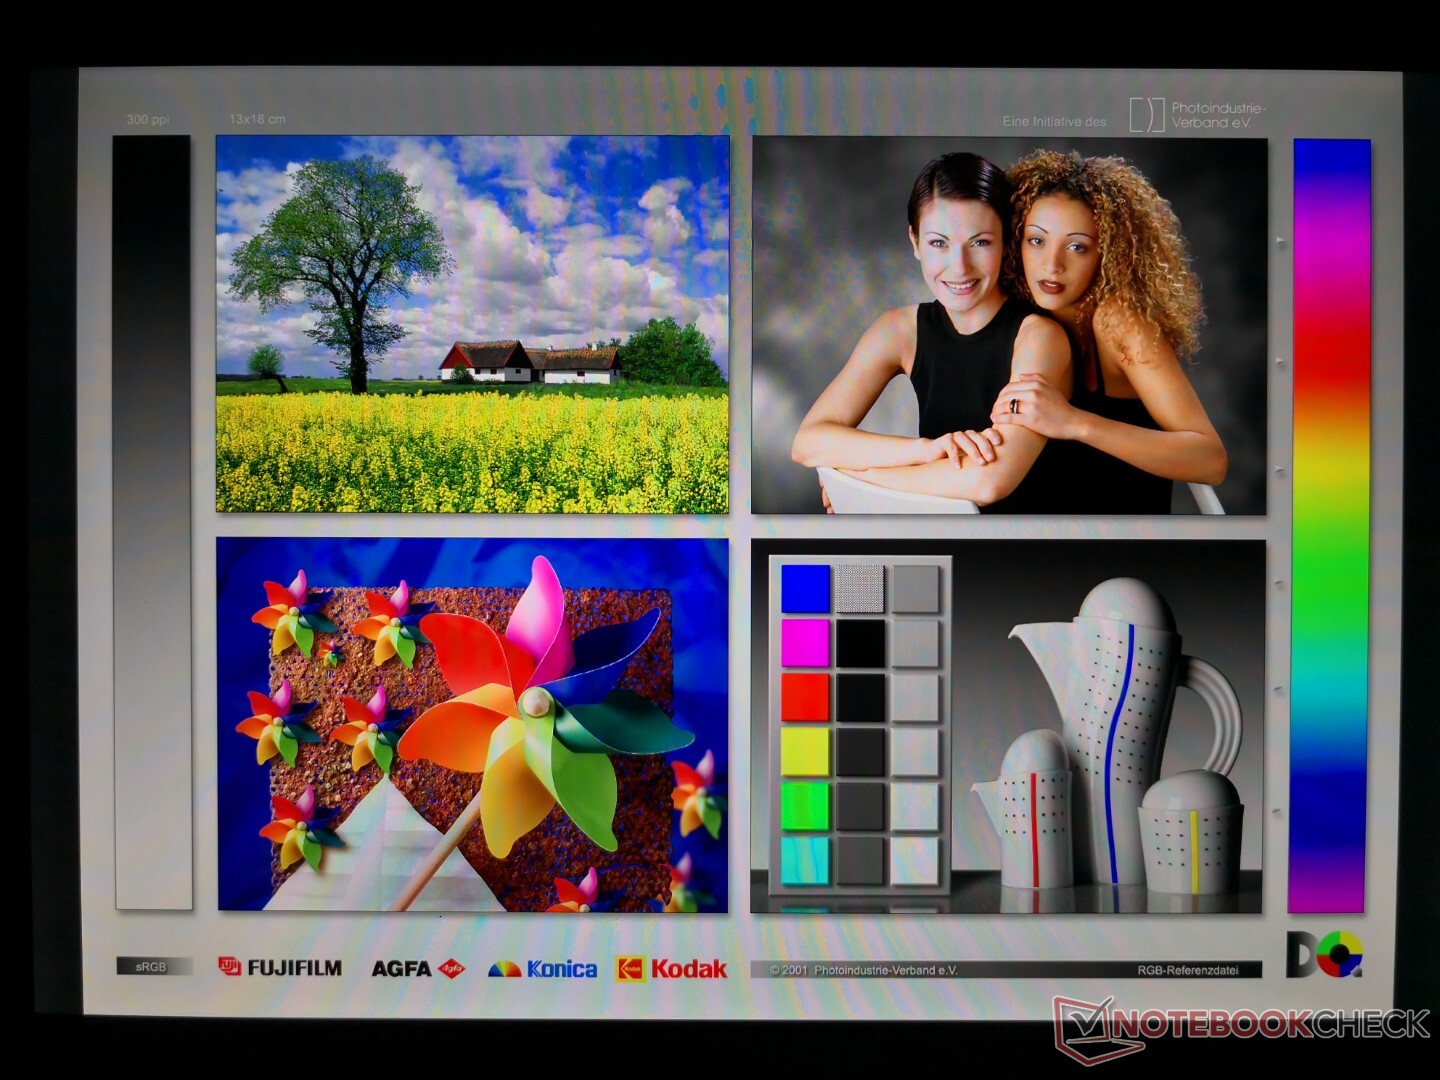
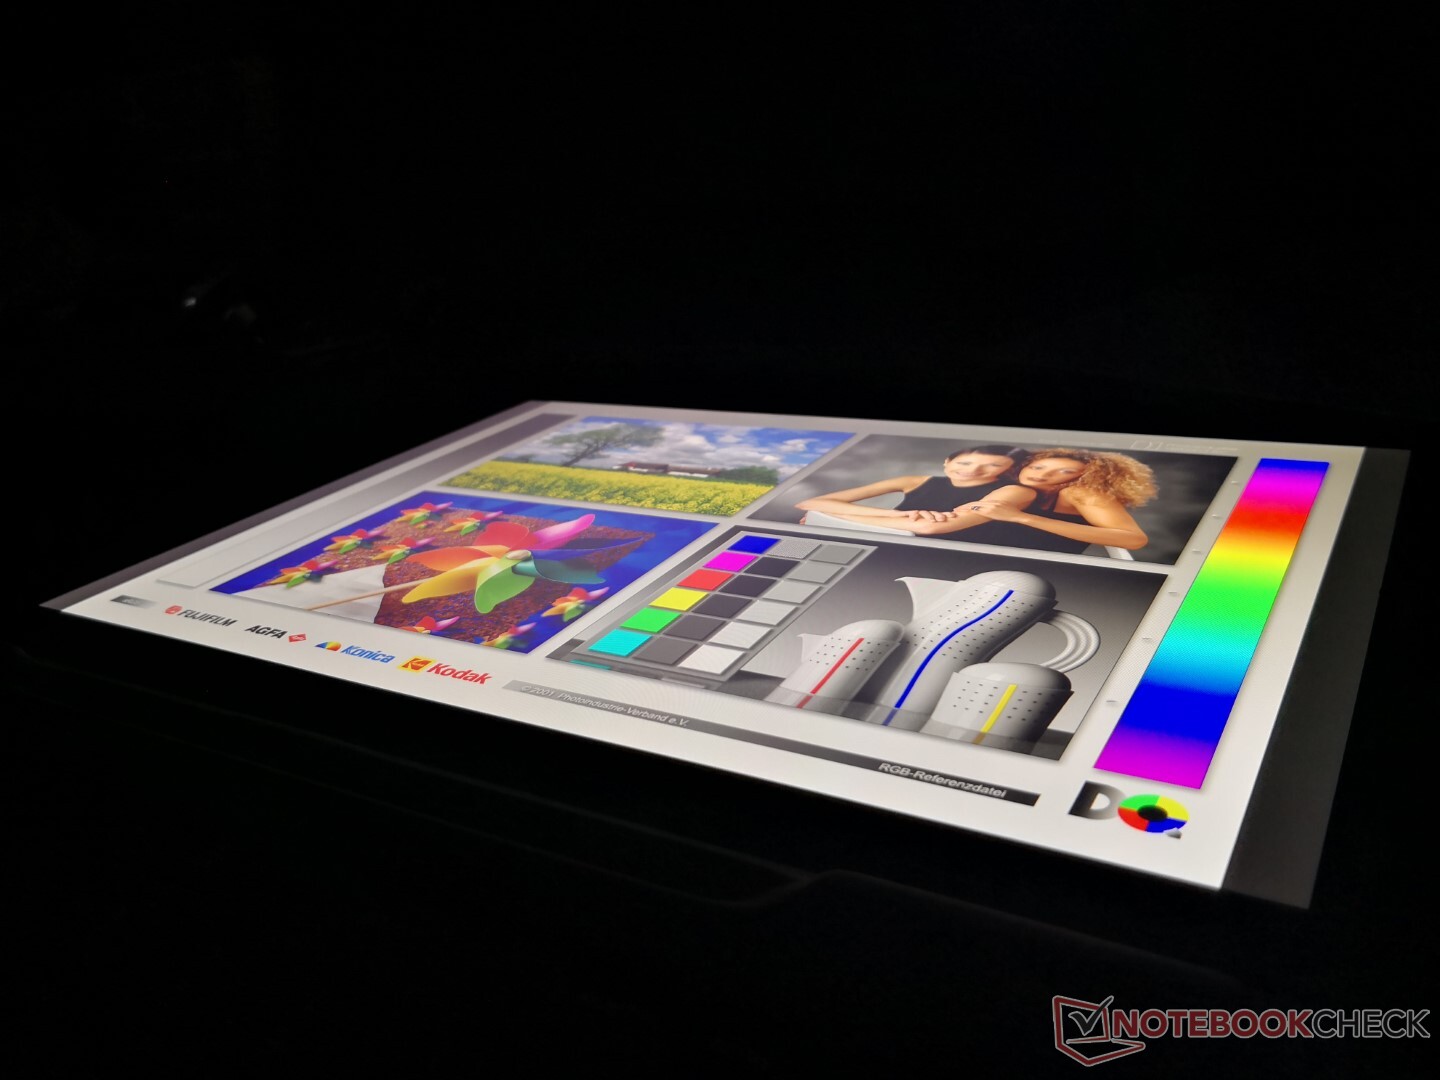
Display — Big And Bright
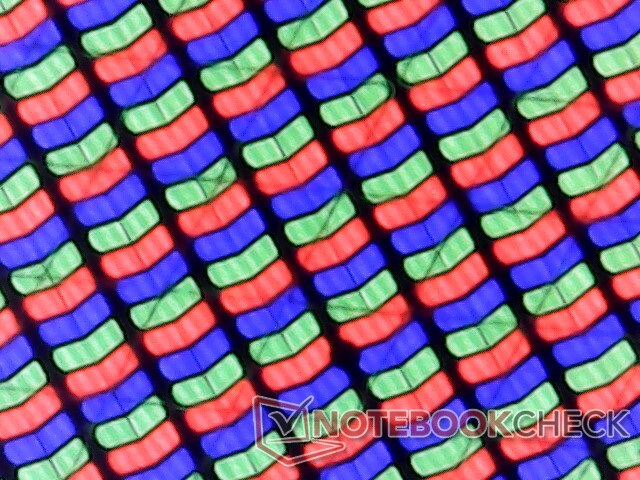
The 3:2 Sharp LQ130N1 IPS panel is the first to appear on our database. Its attributes are most similar to the 16:10 Sharp LQ134N1 panel on the XPS 13 7390 2-in-1 including the full sRGB coverage, bright 500+ nit backlight, and high ~1500:1 contrast ratio. Black-white and gray-gray response times remain slow and so ghosting is noticeable. Thankfully, this generally isn't an issue for browsing and video playback purposes.
ComfortView Plus is included to reduce blue light emissions and eyestrain similar to the latest XPS laptops. The feature works without impacting colors.
| |||||||||||||||||||||||||
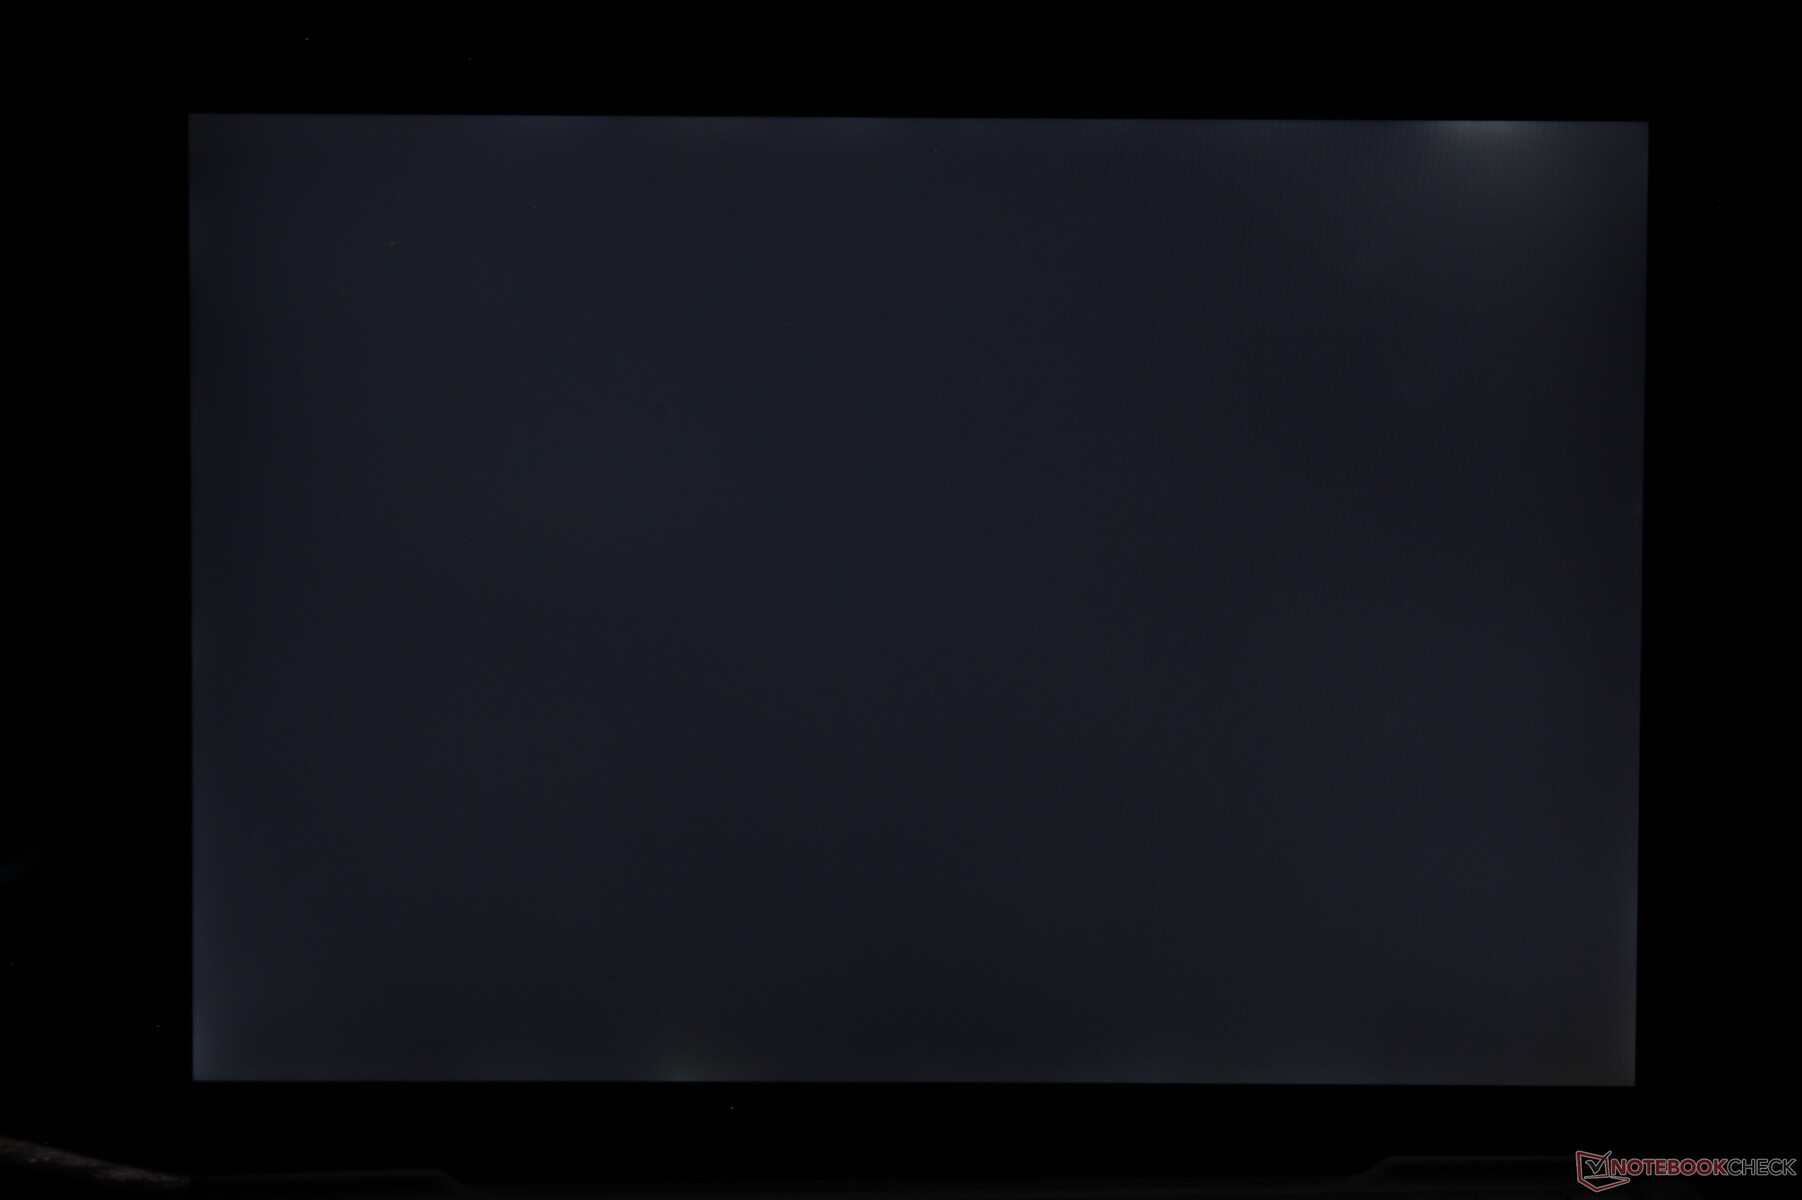
Brightness Distribution: 93 %
Center on Battery: 521.8 cd/m²
Contrast: 1491:1 (Black: 0.35 cd/m²)
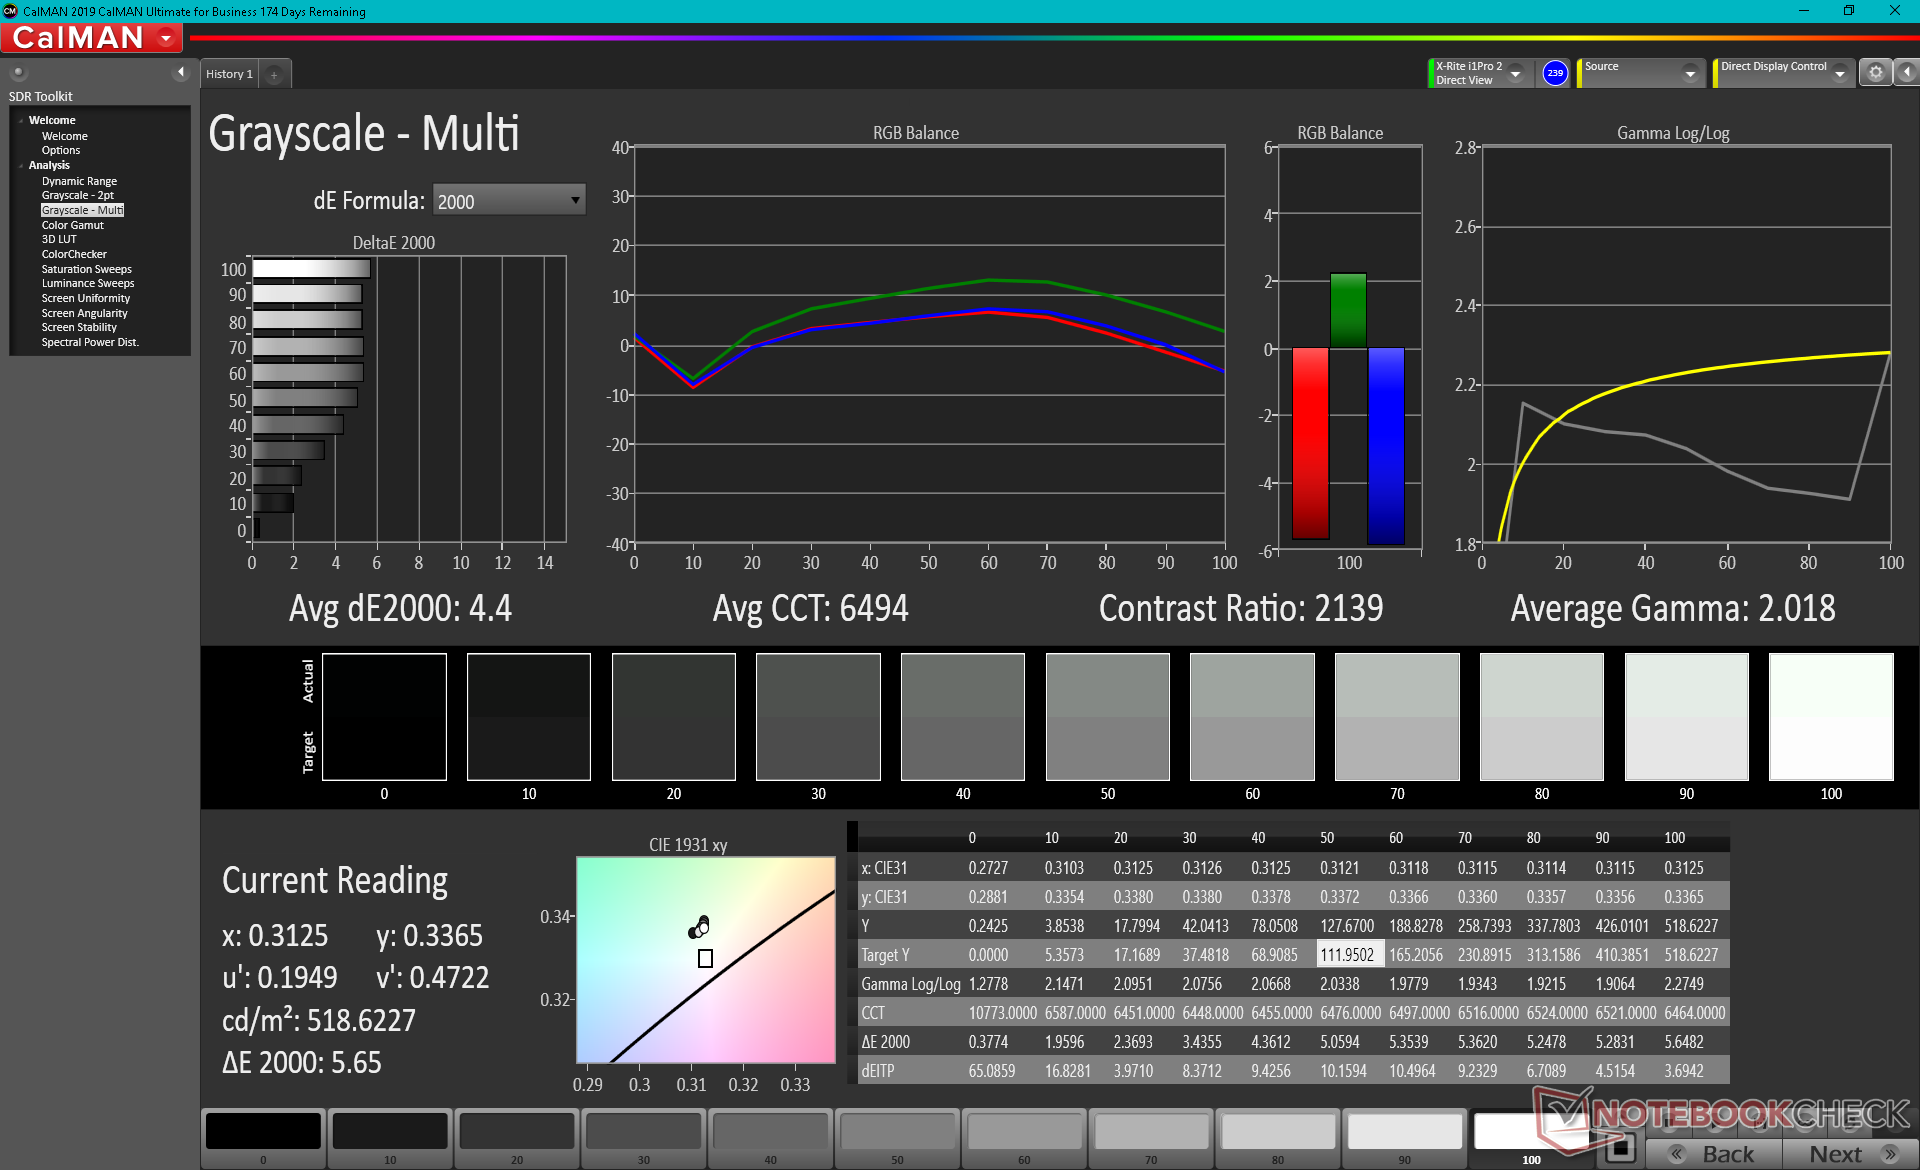
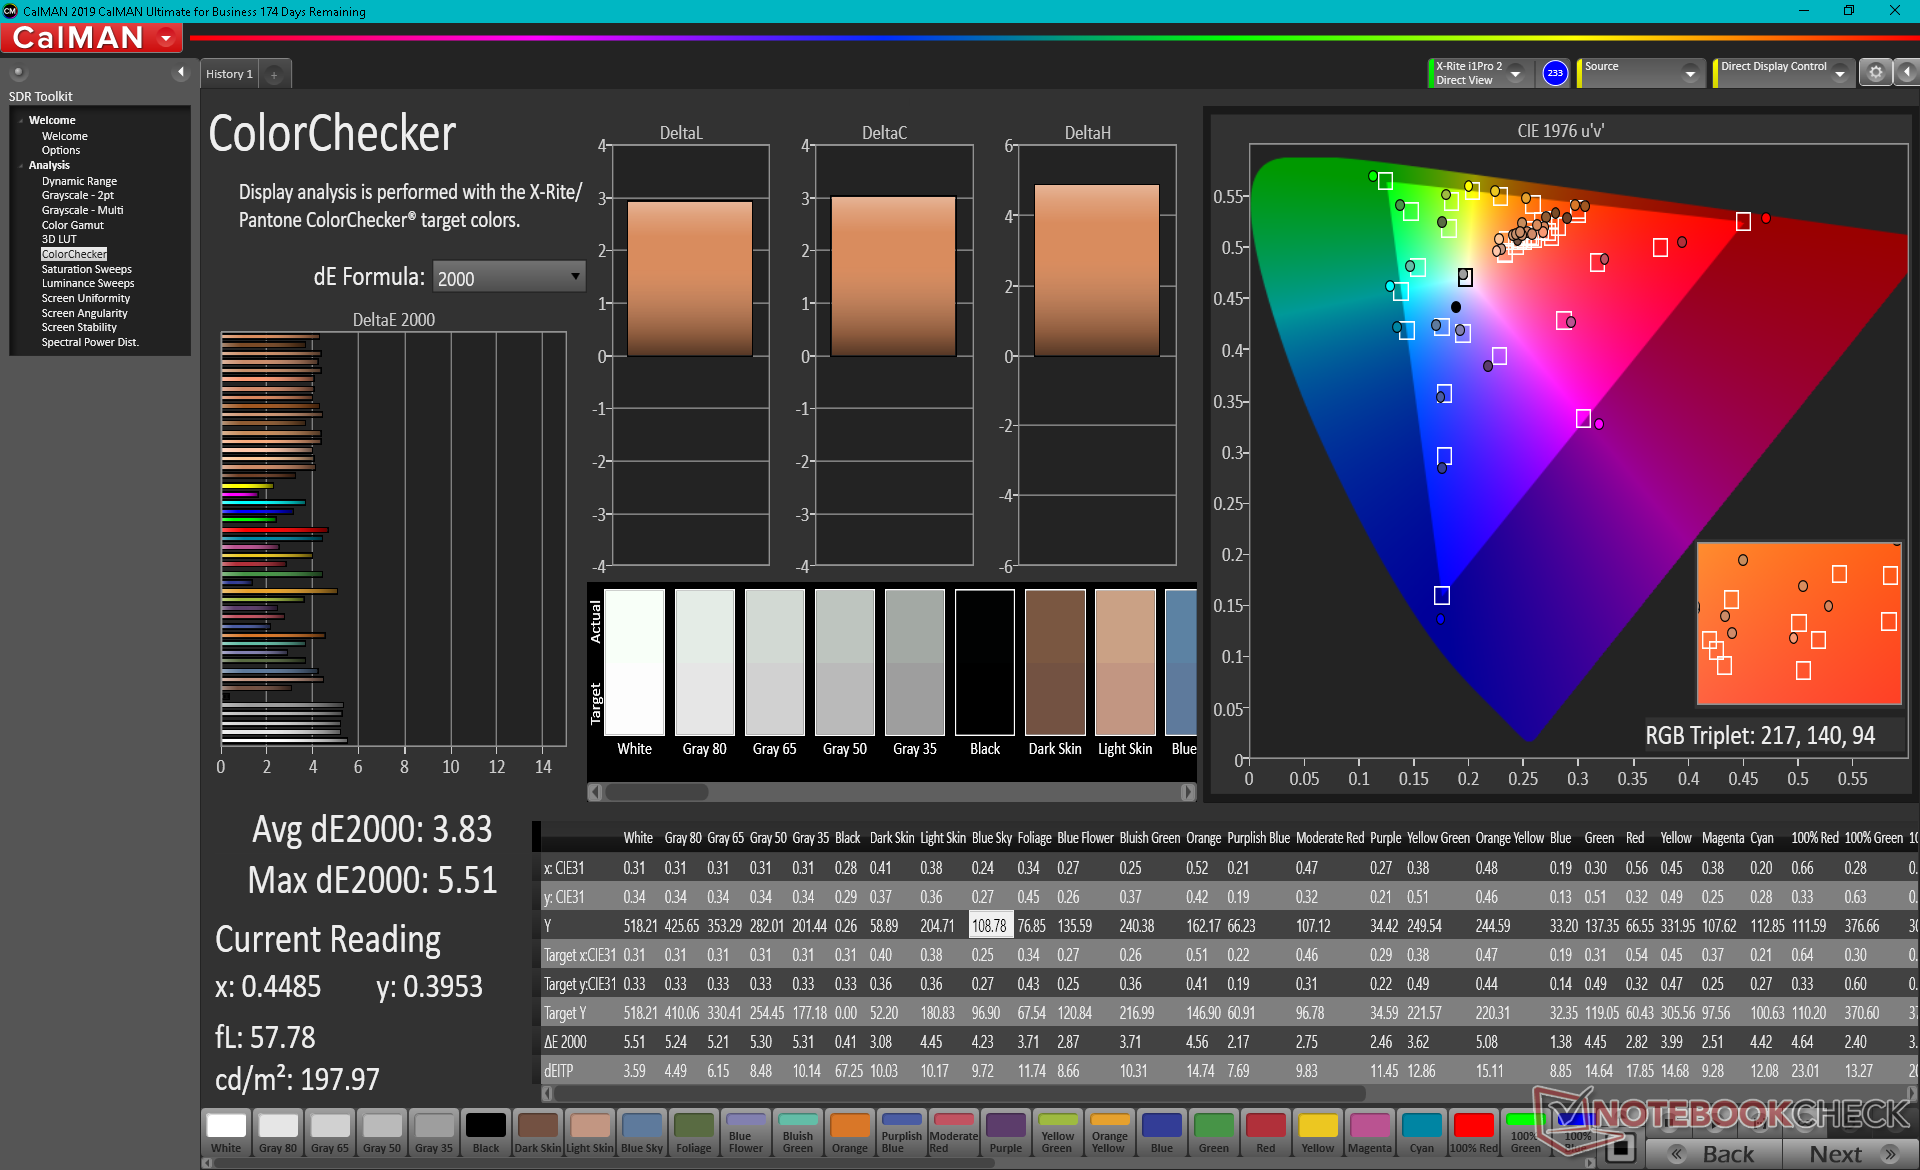
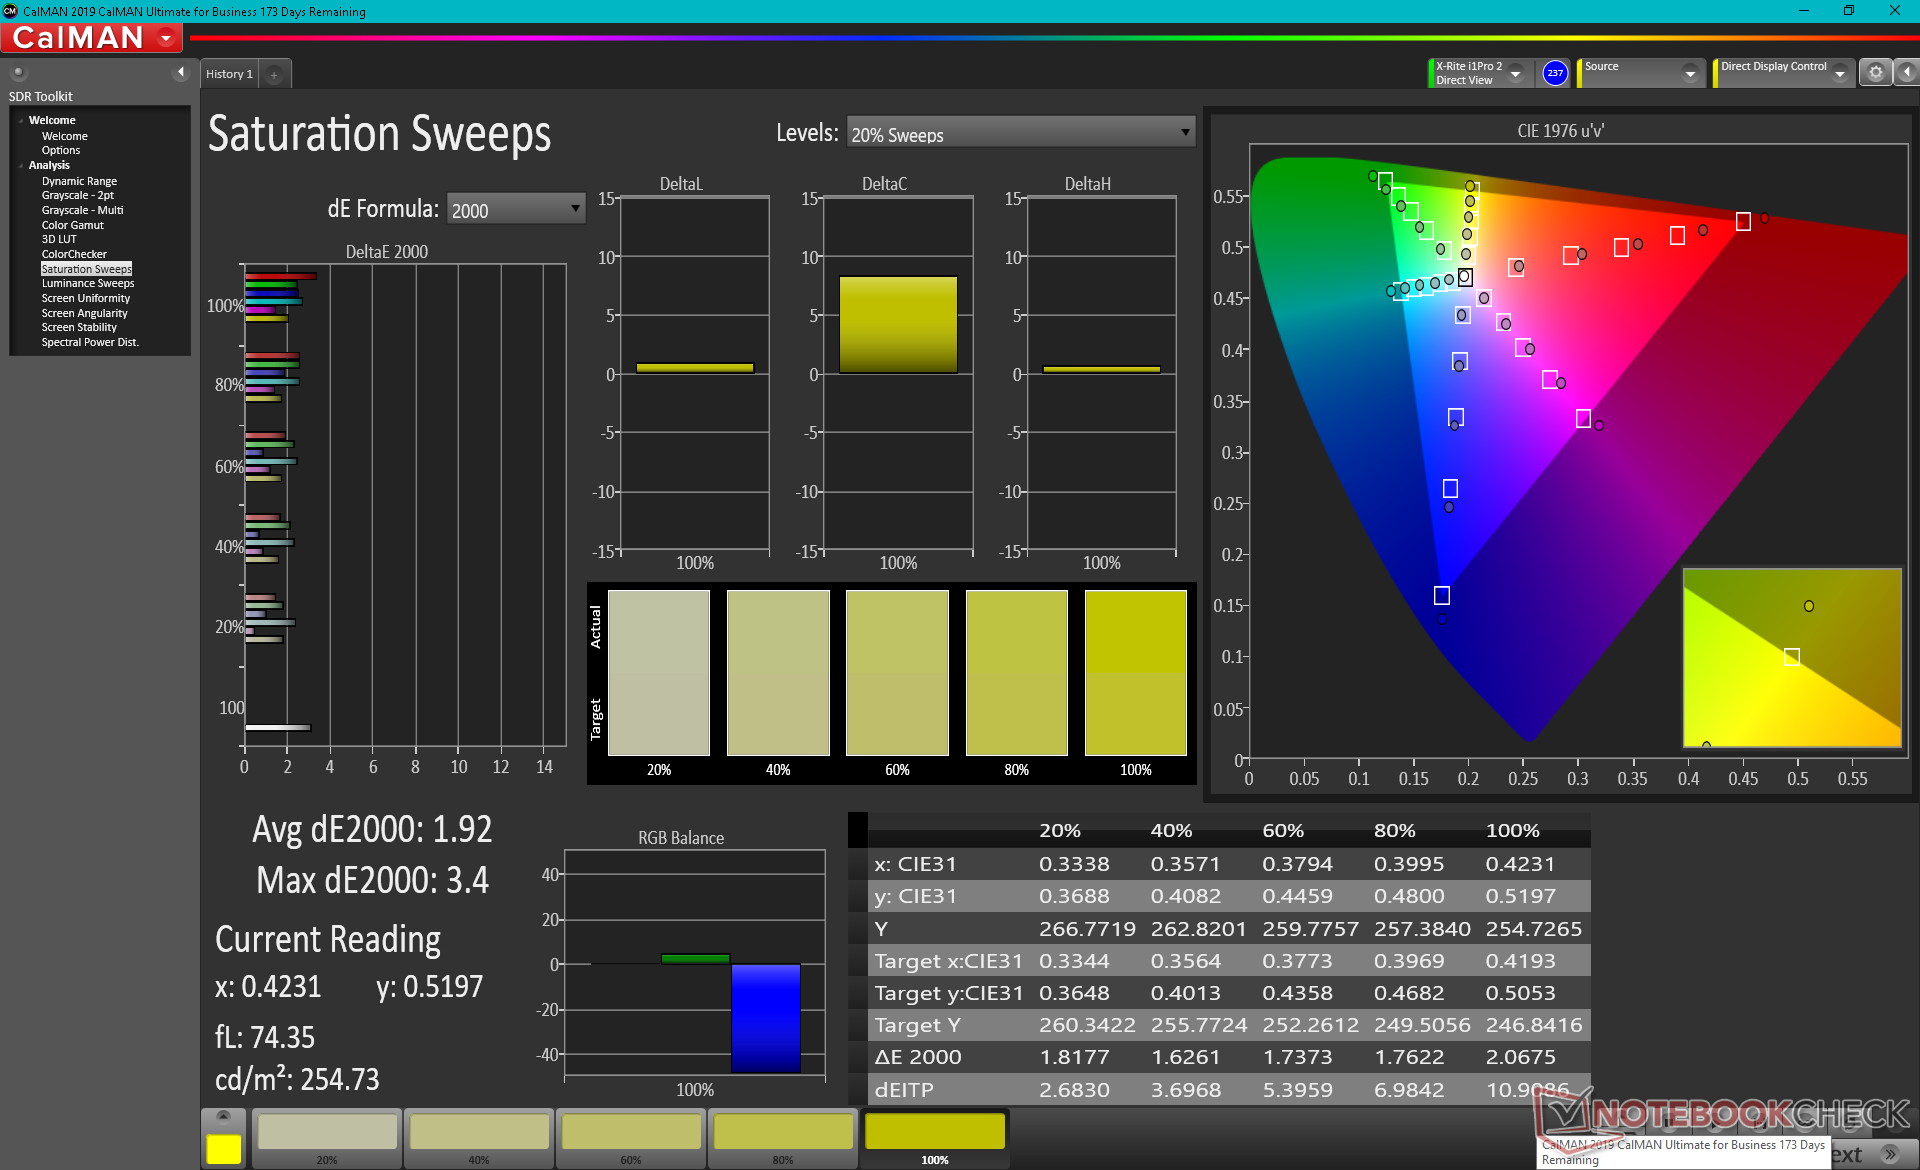
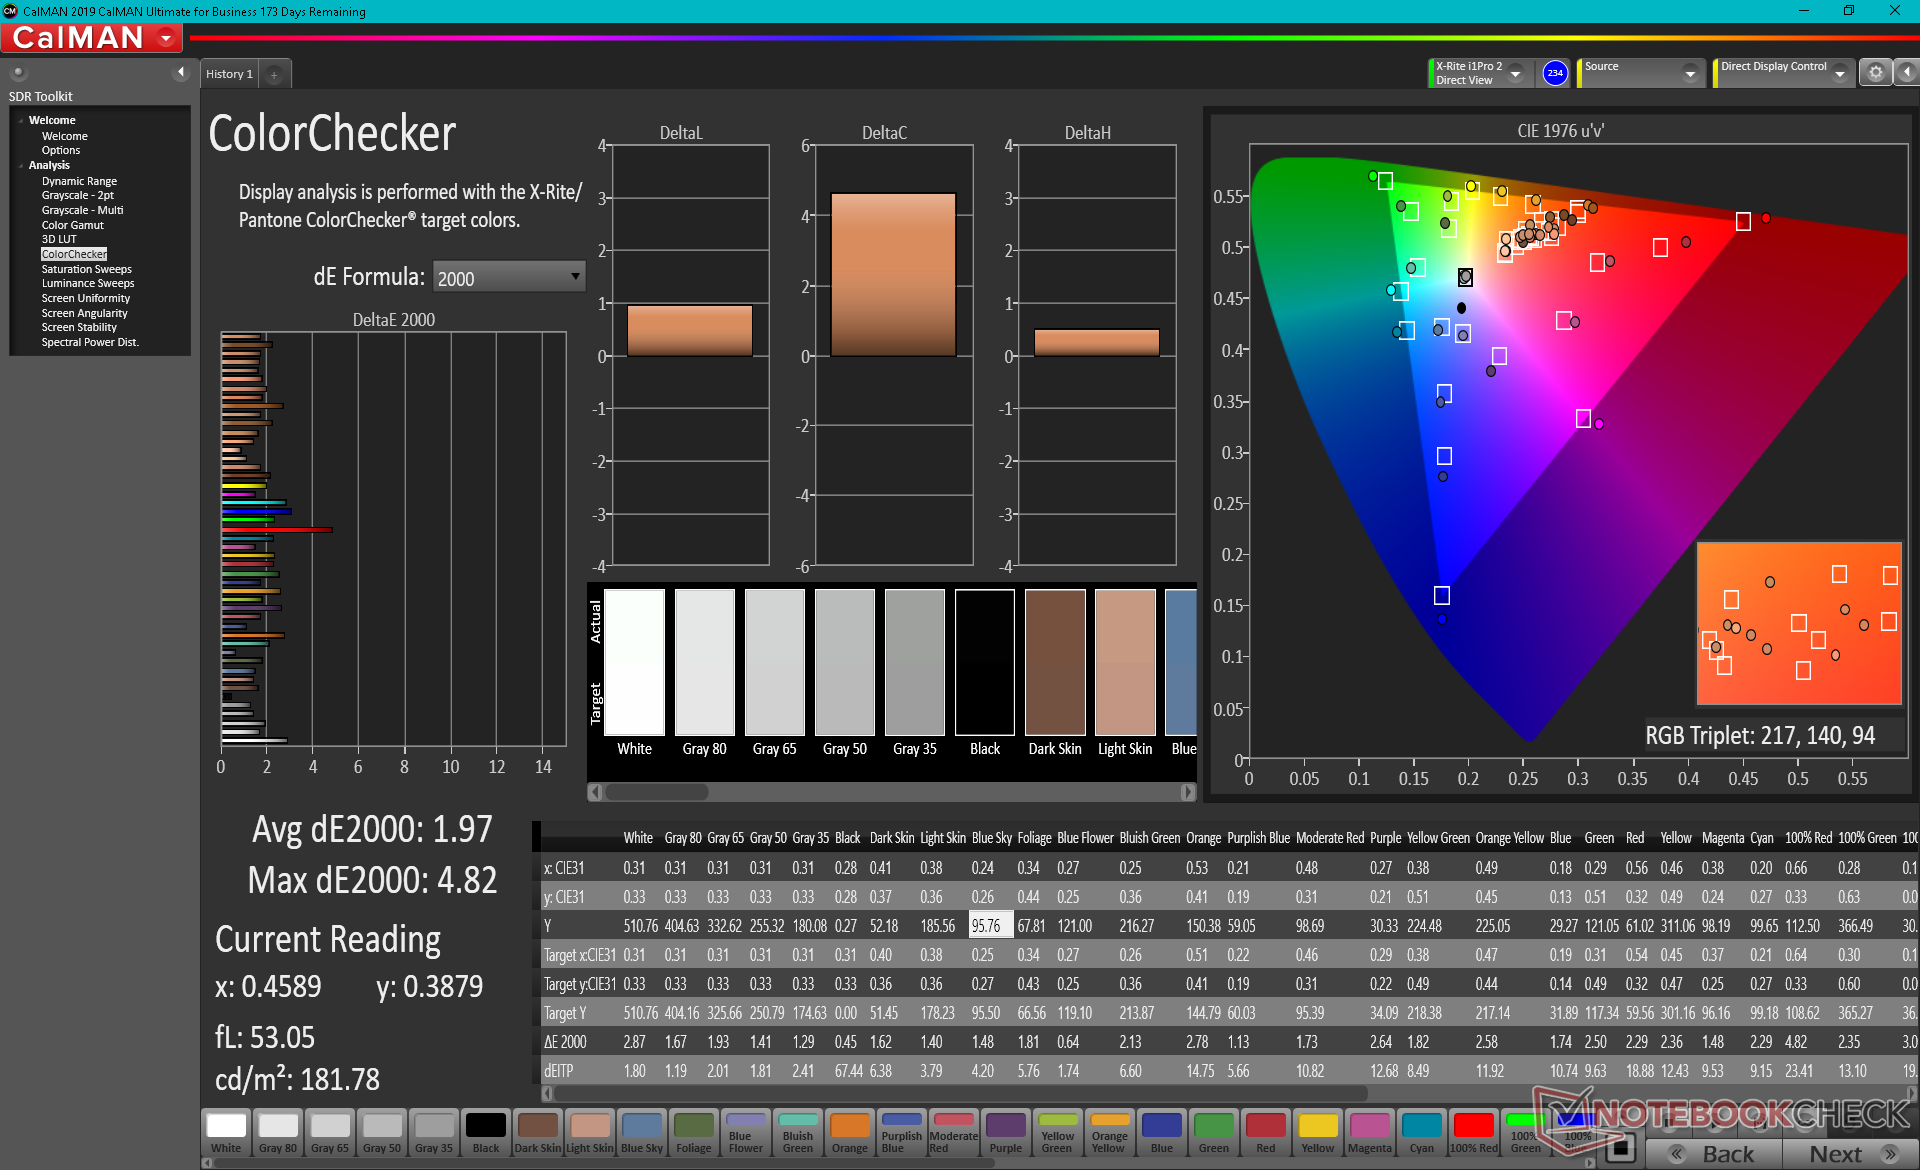
ΔE ColorChecker Calman: 3.83 | ∀{0.5-29.43 Ø4.73}
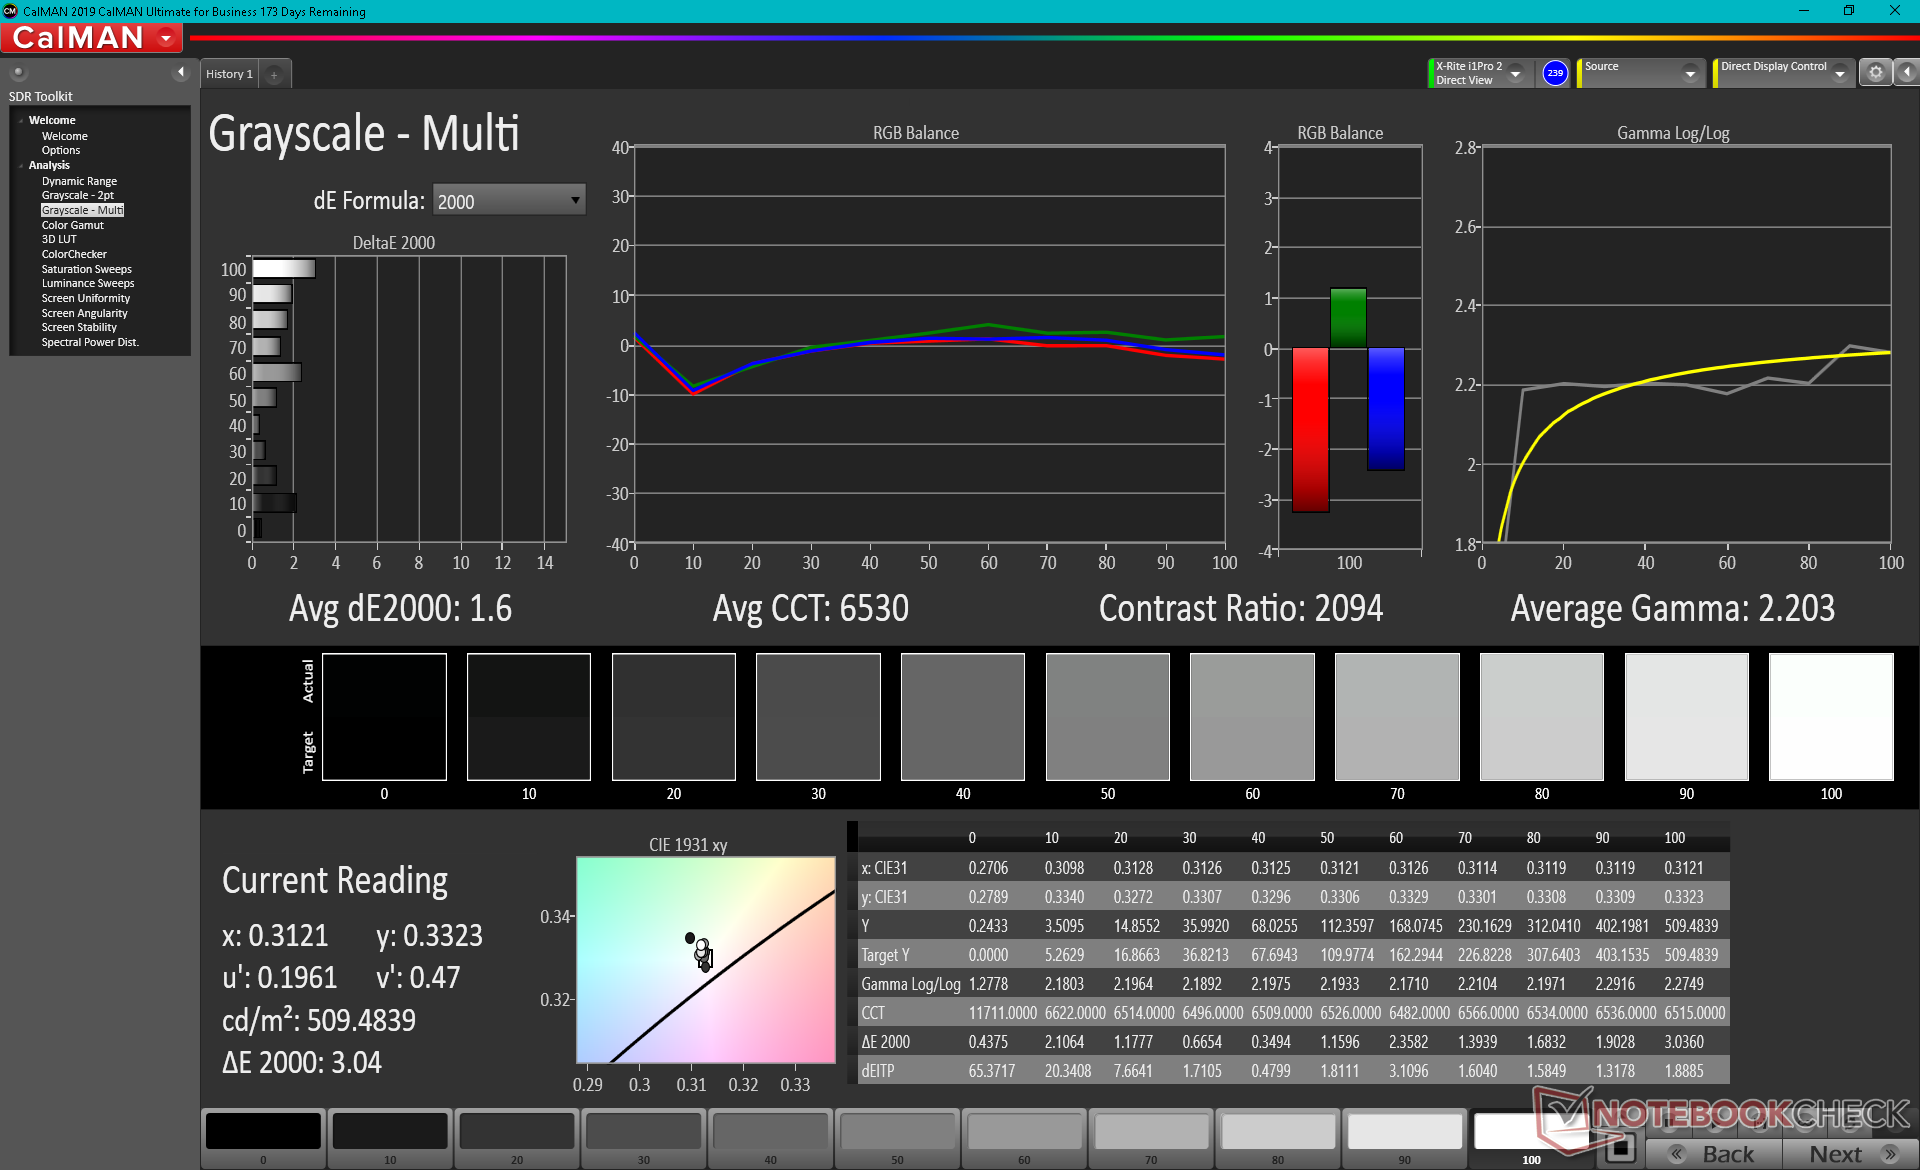
calibrated: 1.97
ΔE Greyscale Calman: 4.4 | ∀{0.09-98 Ø4.97}
78.4% AdobeRGB 1998 (Argyll 3D)
100% sRGB (Argyll 3D)
79.5% Display P3 (Argyll 3D)
Gamma: 2.02
CCT: 6494 K
| Dell Latitude 13 7320 Detachable, i7-1180G7 Sharp LQ130N1, IPS, 13", 1920x1280 | Microsoft Surface Pro 7 Plus LG Philips LP123WQ332684, IPS, 12.3", 2736x1824 | Lenovo ThinkPad X12 20UVS03G00 N123NCA-GS1, a-Si IPS LED, 12.3", 1920x1280 | Dell XPS 13 7390 2-in-1 Core i7 Sharp LQ134N1, IPS, 13.4", 1920x1200 | Lenovo Yoga Duet 7 13IML05-82AS000WGE CSOT T3 LEN8290, IPS, 13", 2160x1350 | |
|---|---|---|---|---|---|
| Display | -10% | -10% | -7% | -8% | |
| Display P3 Coverage (%) | 79.5 | 66.9 -16% | 67 -16% | 69.9 -12% | 68.9 -13% |
| sRGB Coverage (%) | 100 | 96.7 -3% | 99.2 -1% | 99.2 -1% | 98.2 -2% |
| AdobeRGB 1998 Coverage (%) | 78.4 | 69.1 -12% | 68.8 -12% | 71.5 -9% | 71.1 -9% |
| Response Times | 2% | -15% | 11% | 6% | |
| Response Time Grey 50% / Grey 80% * (ms) | 53.2 ? | 50.8 ? 5% | 63.2 ? -19% | 47.6 ? 11% | 58 ? -9% |
| Response Time Black / White * (ms) | 32.8 ? | 33.6 ? -2% | 36 ? -10% | 29.2 ? 11% | 26 ? 21% |
| PWM Frequency (Hz) | 2451 ? | 199.2 ? | 2500 ? | ||
| Screen | 16% | 32% | 15% | -10% | |
| Brightness middle (cd/m²) | 521.8 | 408 -22% | 419 -20% | 549.8 5% | 450 -14% |
| Brightness (cd/m²) | 504 | 425 -16% | 406 -19% | 520 3% | 411 -18% |
| Brightness Distribution (%) | 93 | 85 -9% | 94 1% | 86 -8% | 83 -11% |
| Black Level * (cd/m²) | 0.35 | 0.34 3% | 0.23 34% | 0.39 -11% | 0.22 37% |
| Contrast (:1) | 1491 | 1200 -20% | 1822 22% | 1410 -5% | 2045 37% |
| Colorchecker dE 2000 * | 3.83 | 1.5 61% | 1.1 71% | 2.12 45% | 4.15 -8% |
| Colorchecker dE 2000 max. * | 5.51 | 2.5 55% | 2.2 60% | 3.66 34% | 11.49 -109% |
| Colorchecker dE 2000 calibrated * | 1.97 | 1.4 29% | 0.5 75% | 1.37 30% | 1.09 45% |
| Greyscale dE 2000 * | 4.4 | 1.6 64% | 1.5 66% | 2.6 41% | 6.66 -51% |
| Gamma | 2.02 109% | 2.05 107% | 2.06 107% | 2.3 96% | 2.42 91% |
| CCT | 6494 100% | 6432 101% | 6524 100% | 6884 94% | 6043 108% |
| Color Space (Percent of AdobeRGB 1998) (%) | 63.7 | 62.8 | 65.4 | 65 | |
| Color Space (Percent of sRGB) (%) | 96.8 | 99.2 | 99.7 | 98 | |
| Total Average (Program / Settings) | 3% /
8% | 2% /
17% | 6% /
10% | -4% /
-7% |
* ... smaller is better
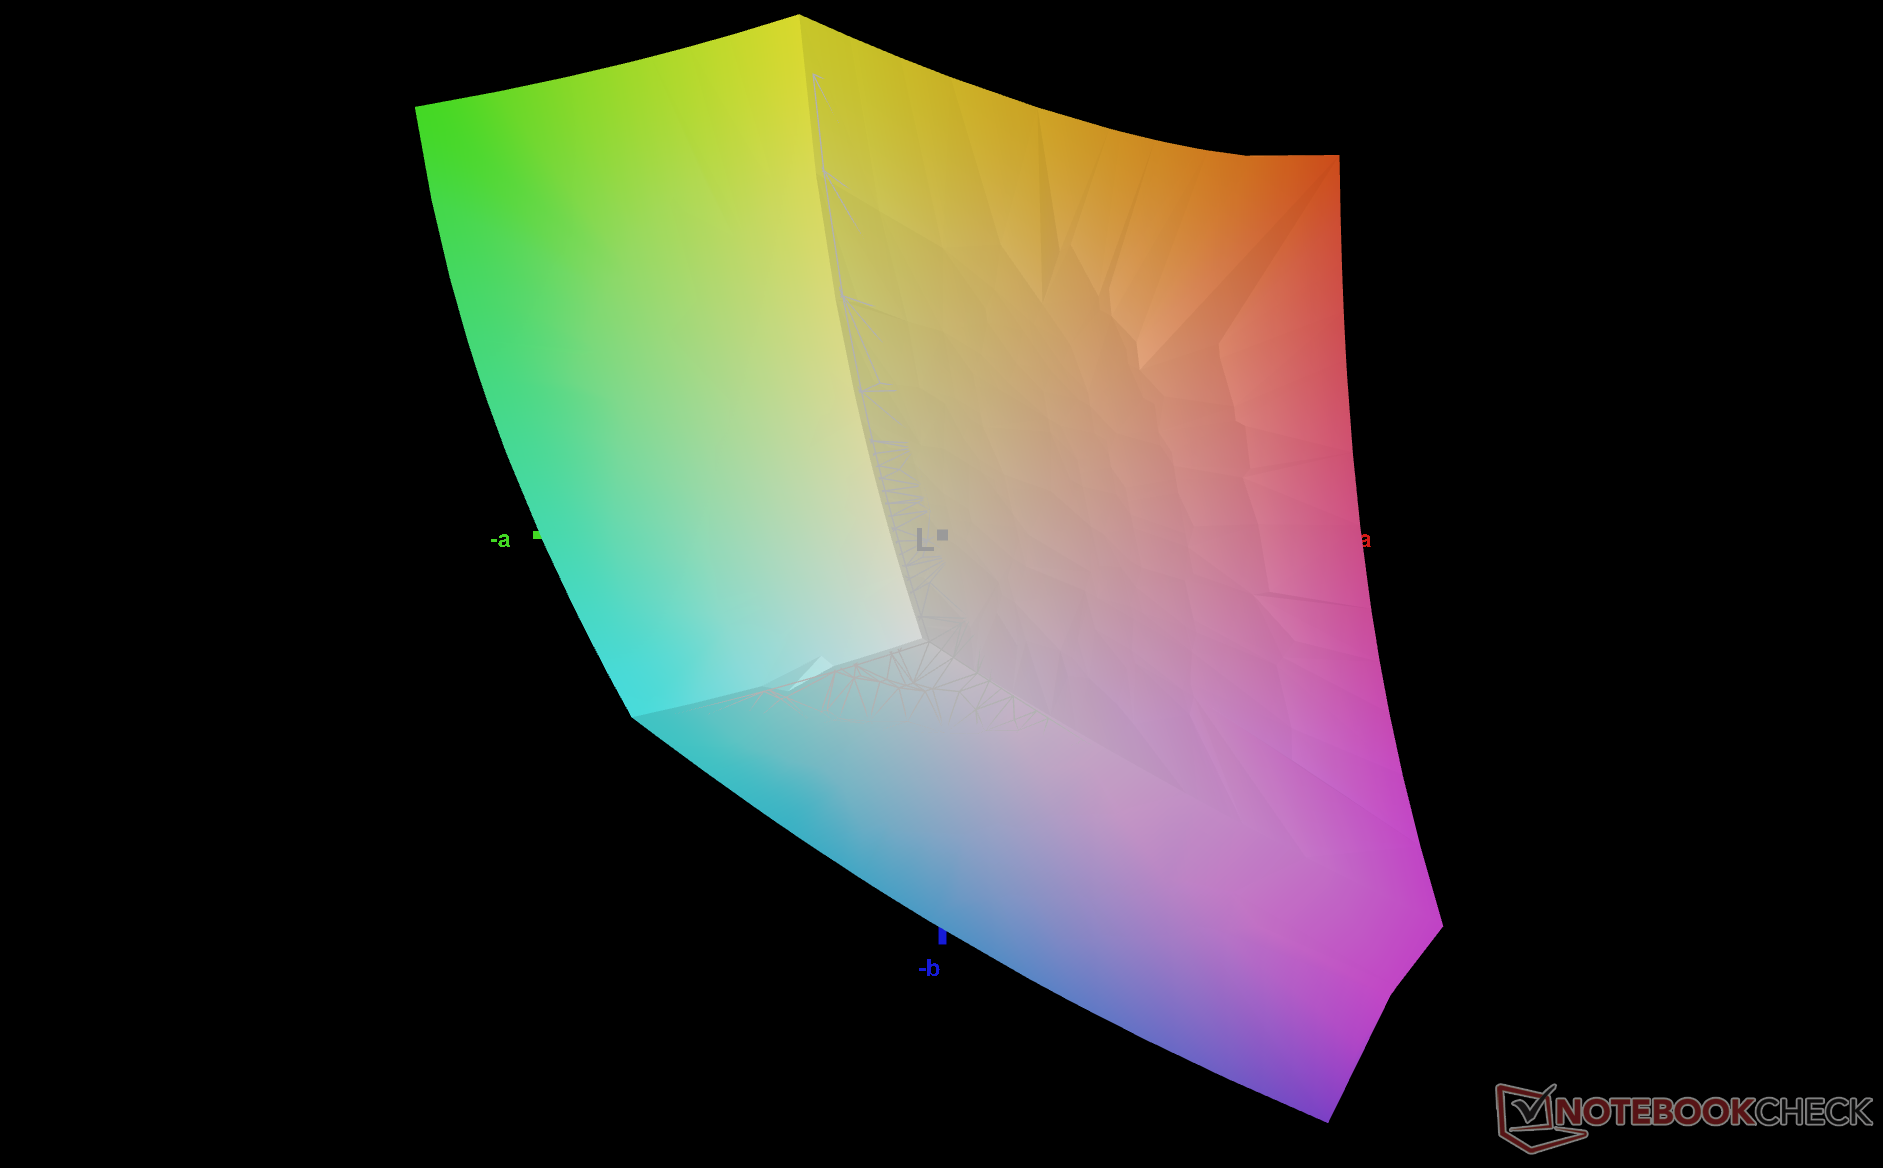
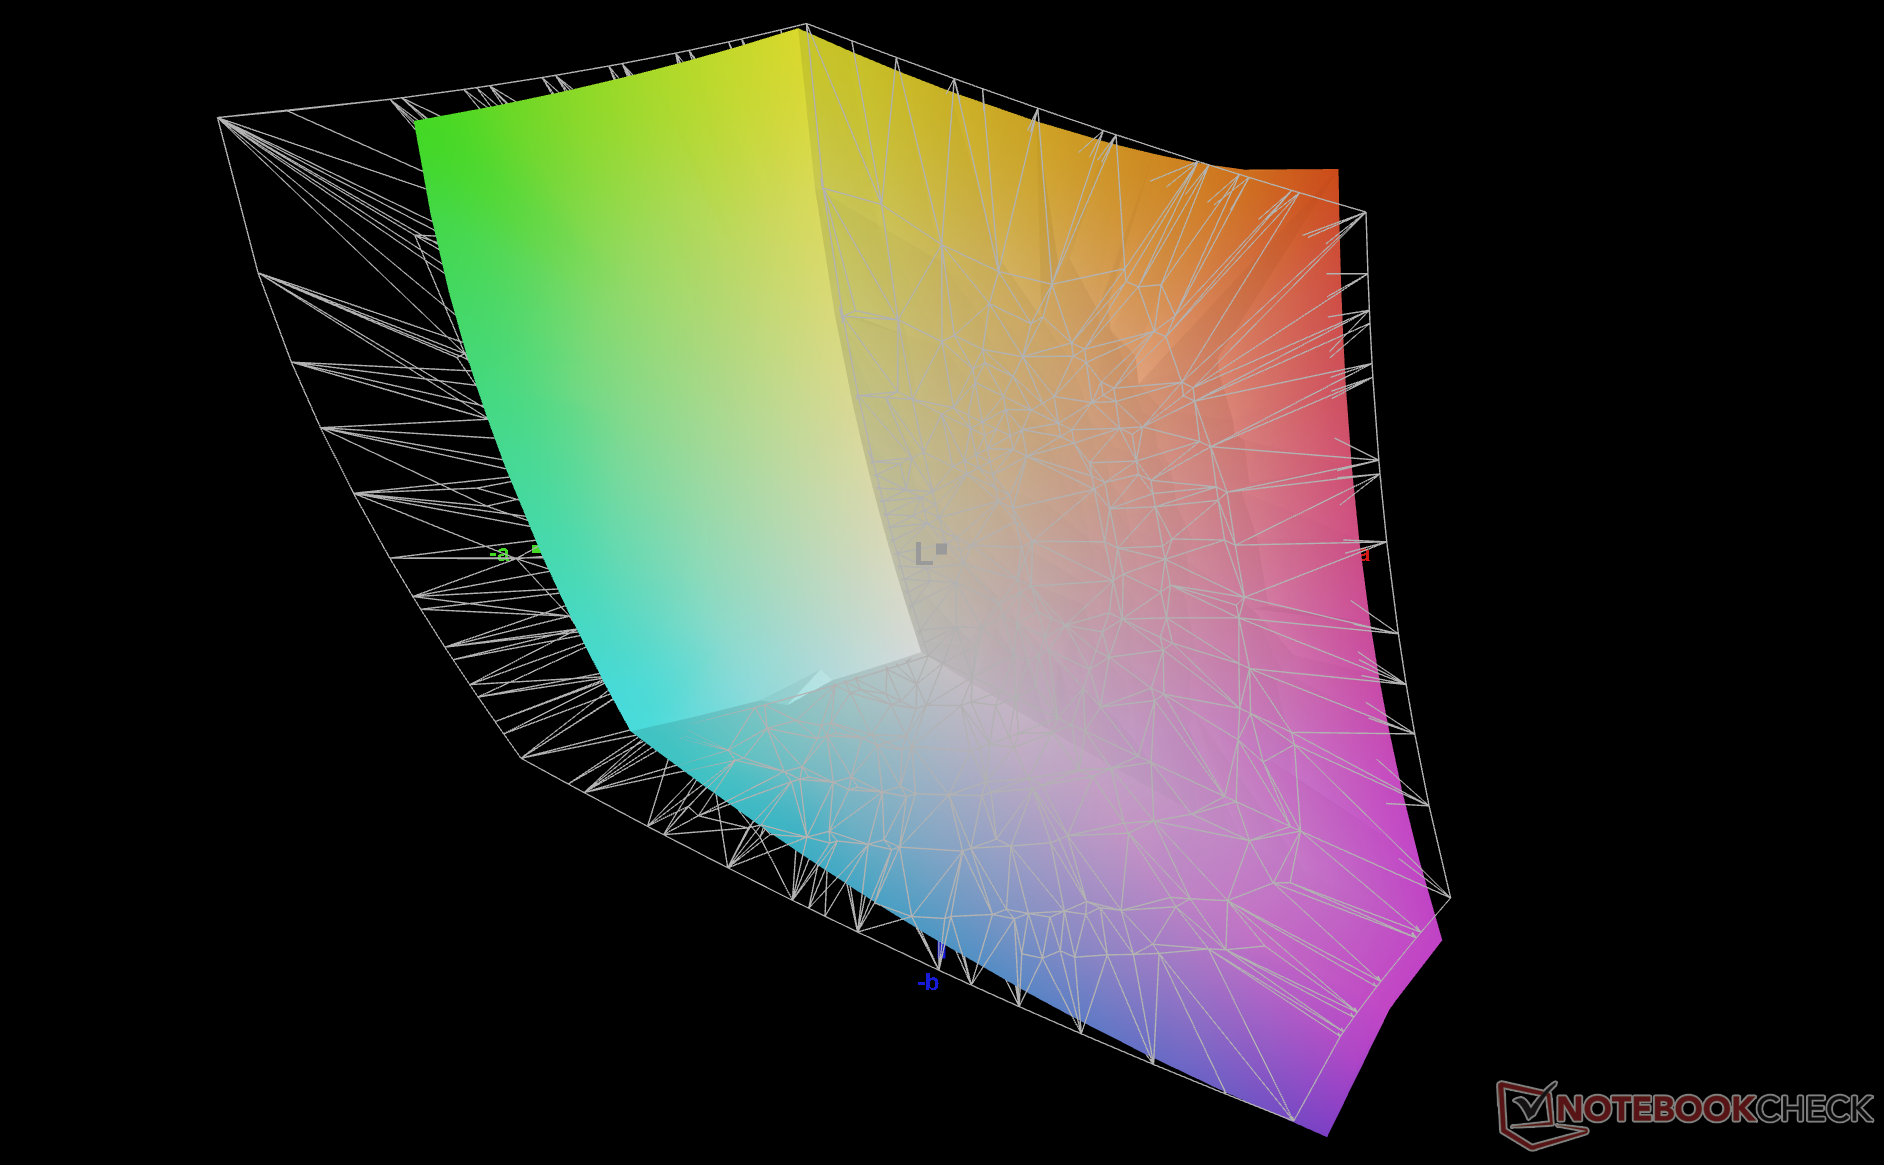
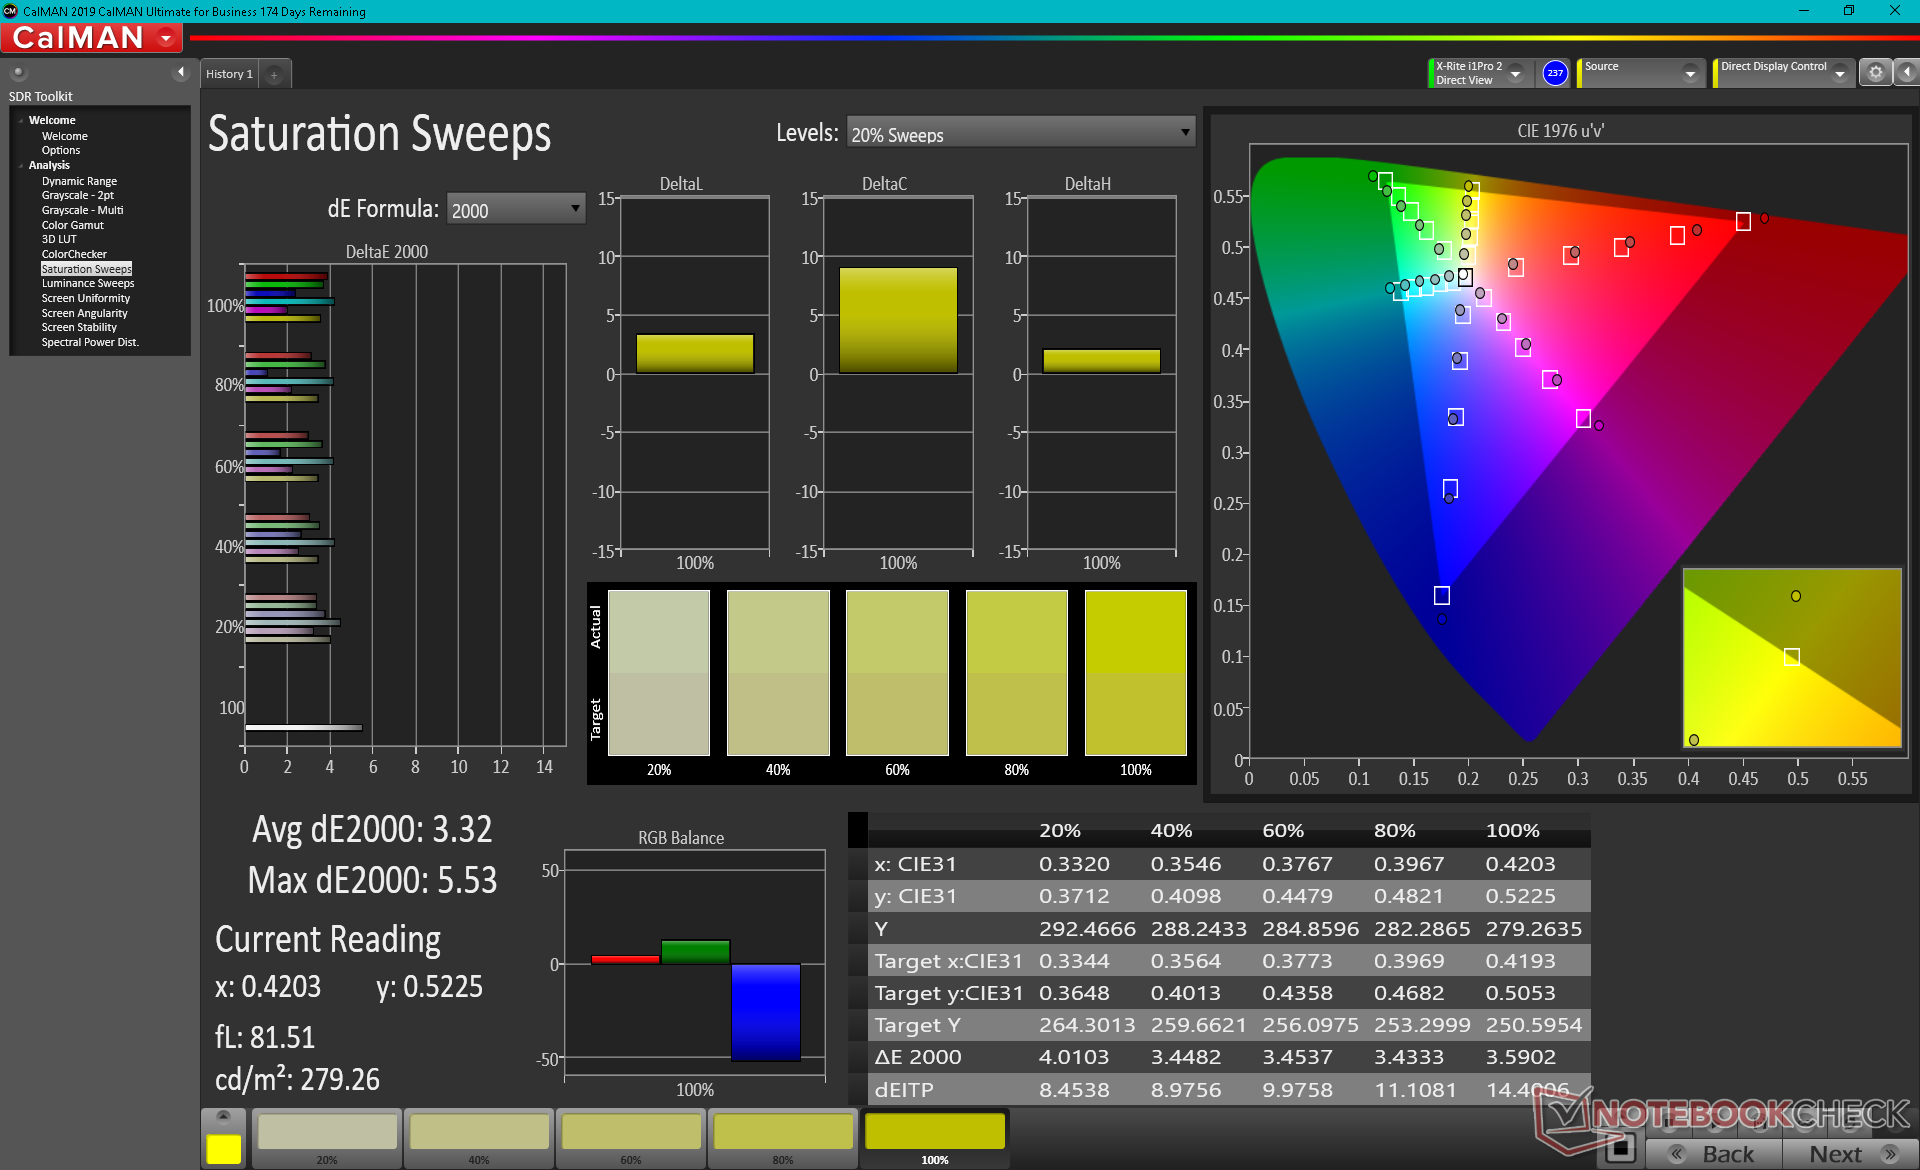
Colors are decent out of the box, but they could be more accurate given the full sRGB coverage of the panel. Calibrating the panel ourselves would result in better grayscale (DeltaE 4.4 to 1.6) and colors (DeltaE 3.83 to 1.97) and a more desirable gamma of 2.2.
Display Response Times
| ↔ Response Time Black to White | ||
|---|---|---|
| 32.8 ms ... rise ↗ and fall ↘ combined | ↗ 16.4 ms rise | 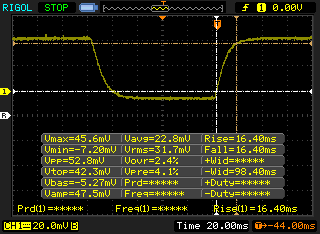 |
| ↘ 16.4 ms fall | ||
| The screen shows slow response rates in our tests and will be unsatisfactory for gamers. In comparison, all tested devices range from 0.1 (minimum) to 240 (maximum) ms. » 88 % of all devices are better. This means that the measured response time is worse than the average of all tested devices (19.9 ms). | ||
| ↔ Response Time 50% Grey to 80% Grey | ||
| 53.2 ms ... rise ↗ and fall ↘ combined | ↗ 26.4 ms rise | 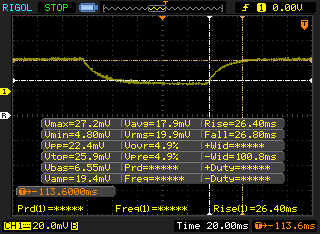 |
| ↘ 26.8 ms fall | ||
| The screen shows slow response rates in our tests and will be unsatisfactory for gamers. In comparison, all tested devices range from 0.165 (minimum) to 636 (maximum) ms. » 90 % of all devices are better. This means that the measured response time is worse than the average of all tested devices (31.1 ms). | ||
Screen Flickering / PWM (Pulse-Width Modulation)
| Screen flickering / PWM detected | 2451 Hz | ≤ 42 % brightness setting | 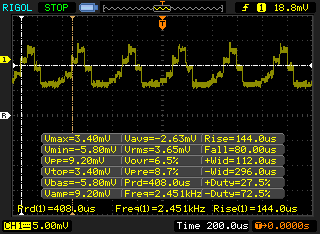 |
The display backlight flickers at 2451 Hz (worst case, e.g., utilizing PWM) Flickering detected at a brightness setting of 42 % and below. There should be no flickering or PWM above this brightness setting. The frequency of 2451 Hz is quite high, so most users sensitive to PWM should not notice any flickering. In comparison: 52 % of all tested devices do not use PWM to dim the display. If PWM was detected, an average of 7784 (minimum: 5 - maximum: 343500) Hz was measured. | |||
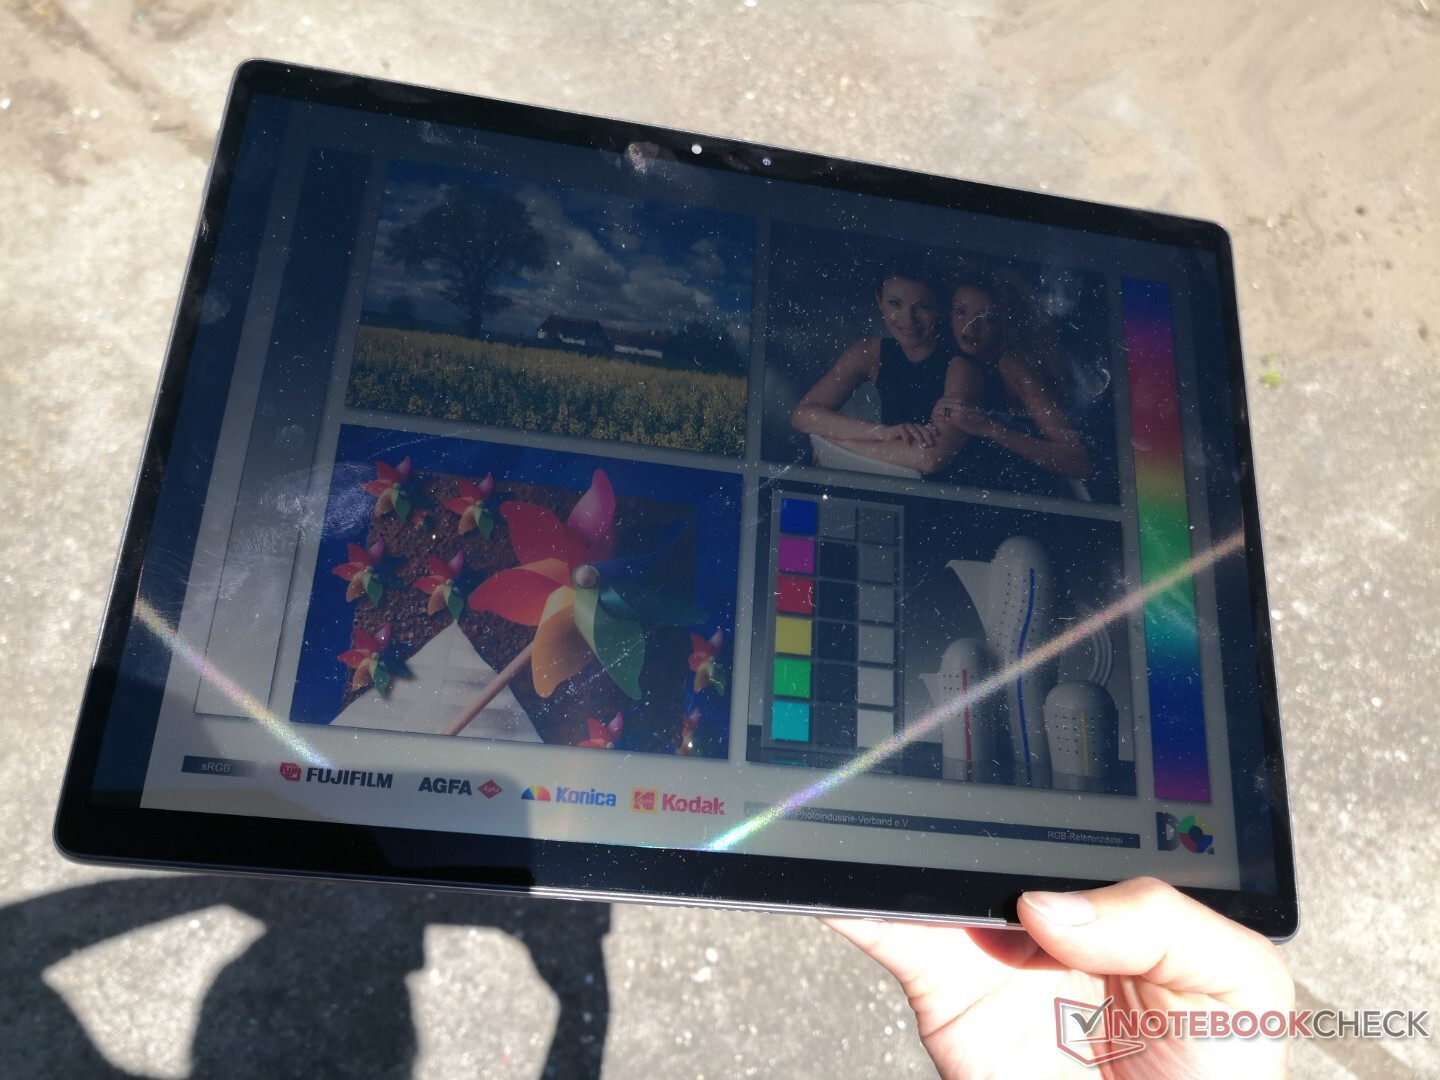
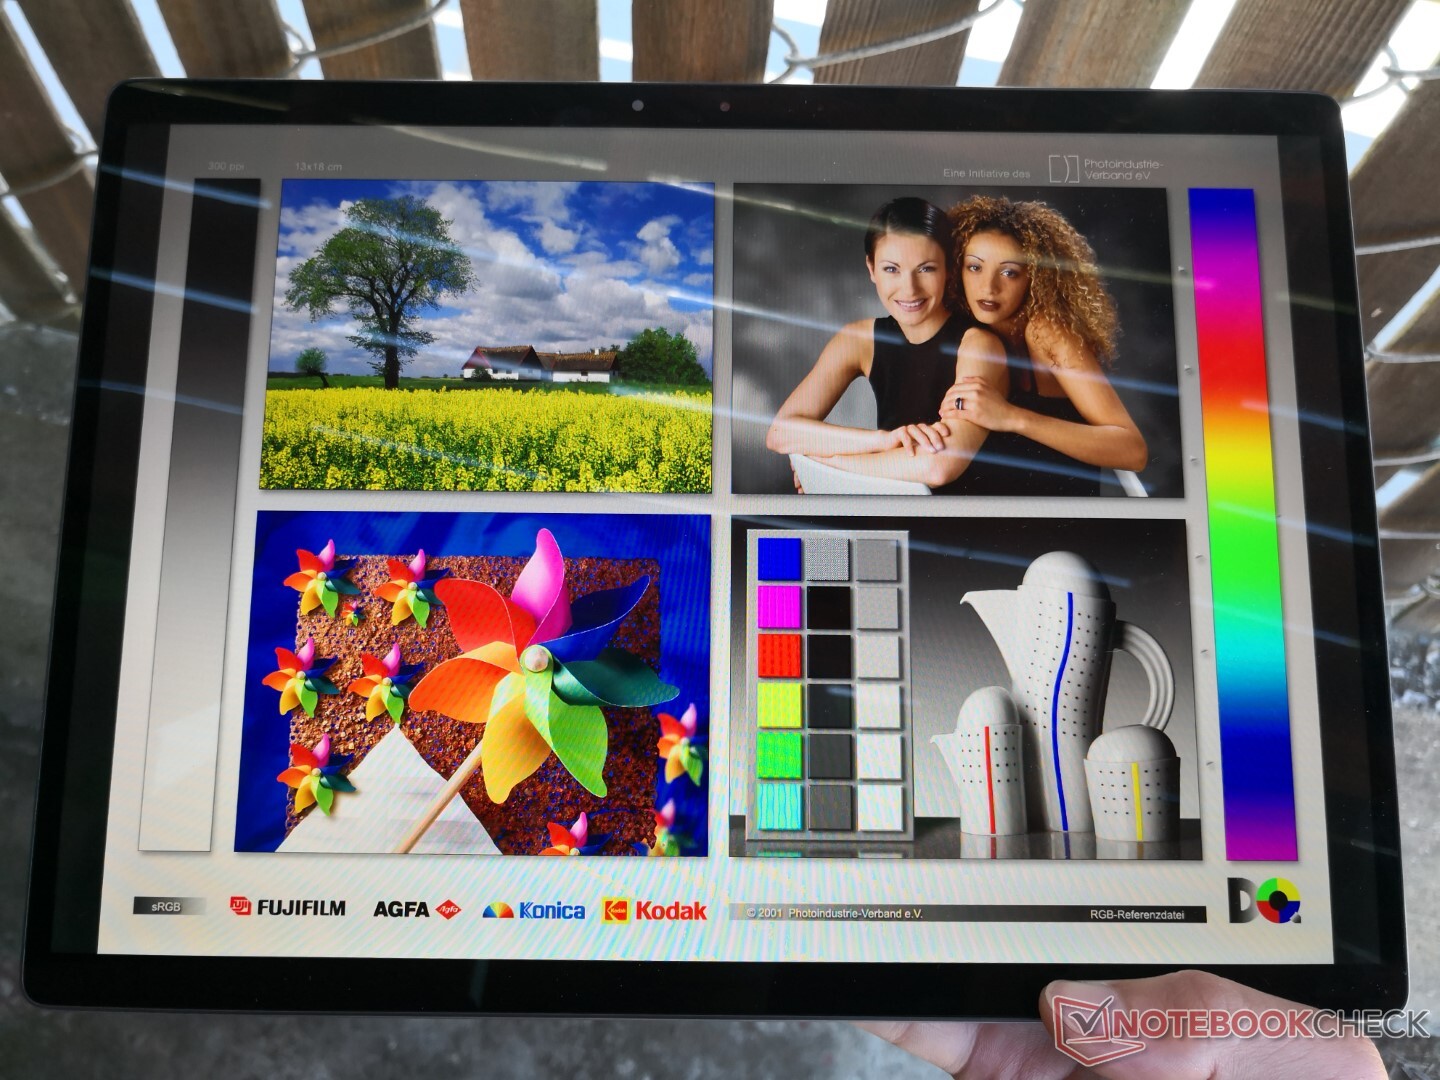
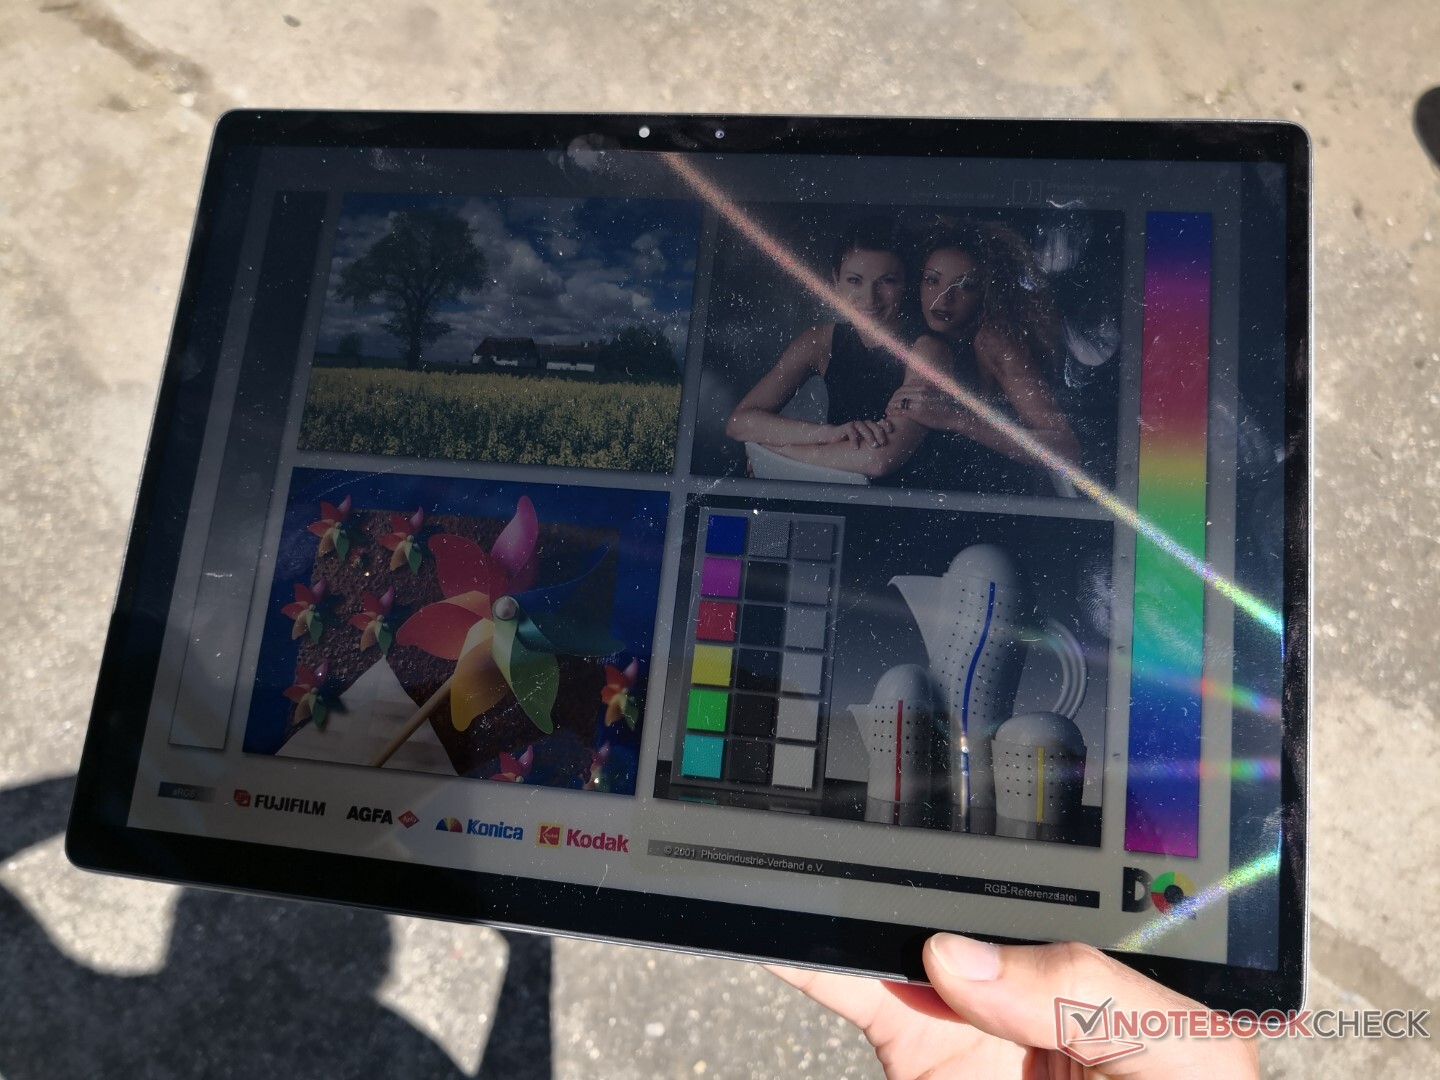
Outdoor visibility is great when under shade. A bit of glare is always present which is to be expected from the super-glossy touchscreen. Keep in mind that maximum brightness will automatically drop from 521.8 nits to just 438.9 nits because the Intel Display Power Savings feature is enabled by default. Disabling this feature through Intel Graphics Command Center prevents this drop in brightness. You're going to want to squeeze every nit possible from the backlight for the most comfortable viewing experience when outdoors.
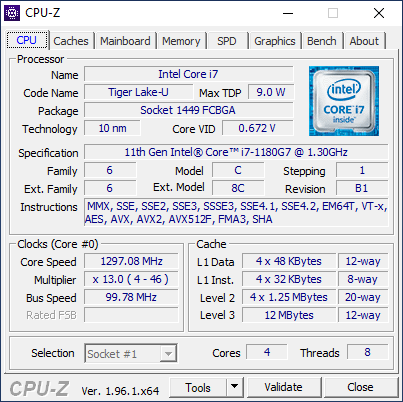
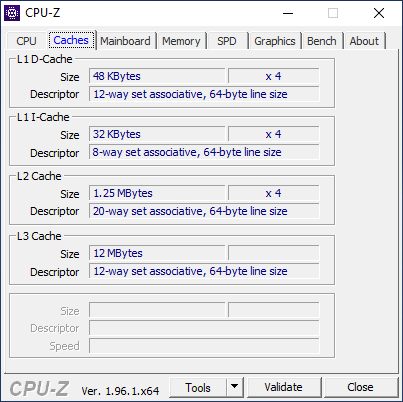
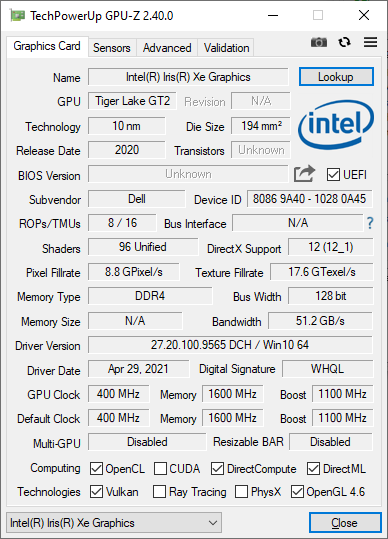
Performance — 11th Gen Tiger Lake-U
Users can configure with the Core i3-1110G4, Core i5-1130G7, Core i5-1140G7, or Core i7-1180G7 with vPro in contrast to the usual Core i3-1115G4, Core i5-1135G7 or Core i7-1165G7 options on most other Tiger Lake-U PCs. The Core ix-xxx0 SKUs have much slower clock rates than the Core ix-xxx5 SKUs. Our Core i7-1180G7, for example, has a base clock rate of 2.2 GHz compared to 3.0 GHz on the Core i7-1165G7. We suspect that the small form factor of the Latitude 7320 detachable prohibited Dell from using the faster Core i7-1165G7 or i7-1185G7.
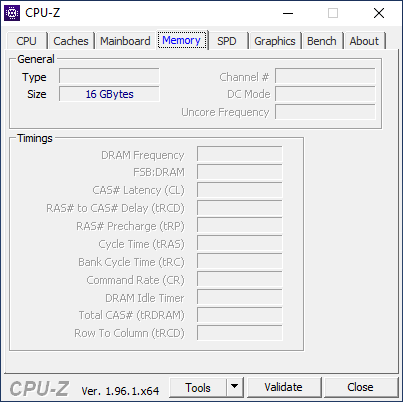
Intel Iris Xe comes standard on all SKUs except for the lowest-end Core i3 option. We recommend avoiding the Core i3 SKU anyway due to its very low 4 GB of non-upgradeable RAM.
Our unit was set to Ultra Performance mode via Dell Power Manager prior to running any performance benchmarks below for the highest possible scores. Owners should definitely become familiar with the pre-installed Dell apps and their settings. Dell Optimizer, for example, is where users can toggle the proximity sensor to prevent the tablet from automatically sleeping.
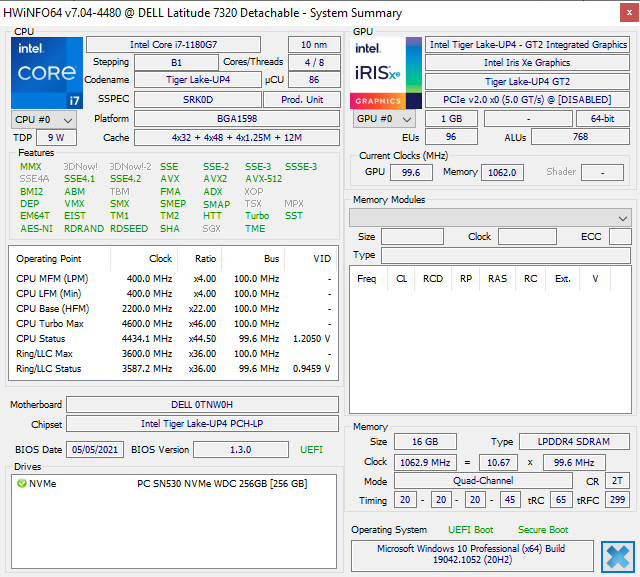
Processor — Core i7-1180G7 Is Very Different From The Core i7-1185G7
Raw multi-thread performance is almost 40 percent slower than the average Core i7-1185G7 given the aforementioned significant clock rate differences between them. Performance is therefore in between the Core i5-1035G1 and Core i5-1135G7 as found on the Surface Go and Surface Pro 7 Plus, respectively. Single-thread performance remains excellent and on par with other Tiger Lake-U CPUs.
The Latitude 7320 Detachable benefits very little from CPU Turbo Boost much like on most other tablets. Running CineBench R15 xT in a loop shows flat results with no long-lasting performance boost during the early minutes of the test.
Cinebench R23: Multi Core | Single Core
Cinebench R15: CPU Multi 64Bit | CPU Single 64Bit
Blender: v2.79 BMW27 CPU
7-Zip 18.03: 7z b 4 -mmt1 | 7z b 4
Geekbench 5.5: Single-Core | Multi-Core
HWBOT x265 Benchmark v2.2: 4k Preset
LibreOffice : 20 Documents To PDF
R Benchmark 2.5: Overall mean
| Cinebench R23 / Multi Core | |
| Lenovo IdeaPad Flex 5 14ALC05 82HU002YUS | |
| Lenovo IdeaPad Flex 5 14ALC05-82HU006NGE | |
| Average Intel Core i7-1185G7 (3610 - 6383, n=24) | |
| Microsoft Surface Pro 7 Plus | |
| Dell Latitude 13 7320 Detachable, i7-1180G7 | |
| Average Intel Core i7-1180G7 (n=1) | |
| Lenovo ThinkPad X12 20UVS03G00 | |
| Cinebench R23 / Single Core | |
| Average Intel Core i7-1185G7 (1251 - 1532, n=24) | |
| Microsoft Surface Pro 7 Plus | |
| Dell Latitude 13 7320 Detachable, i7-1180G7 | |
| Average Intel Core i7-1180G7 (n=1) | |
| Lenovo IdeaPad Flex 5 14ALC05 82HU002YUS | |
| Lenovo IdeaPad Flex 5 14ALC05-82HU006NGE | |
| Lenovo ThinkPad X12 20UVS03G00 | |
| Geekbench 5.5 / Single-Core | |
| Dell Latitude 13 7320 Detachable, i7-1180G7 | |
| Average Intel Core i7-1180G7 (n=1) | |
| Average Intel Core i7-1185G7 (1398 - 1626, n=21) | |
| Lenovo ThinkPad X12 20UVS03G00 | |
| Microsoft Surface Pro 7 Plus | |
| Lenovo IdeaPad Flex 5 14ALC05 82HU002YUS | |
| Asus VivoBook Flip 14 TM420IA | |
| Microsoft Surface Laptop Go Core i5 | |
| Lenovo IdeaPad Flex 5 14ALC05-82HU006NGE | |
| HP Envy x360 13-ay0010nr | |
| Lenovo Yoga Duet 7 13IML05-82AS000WGE | |
| Geekbench 5.5 / Multi-Core | |
| Lenovo IdeaPad Flex 5 14ALC05 82HU002YUS | |
| Lenovo IdeaPad Flex 5 14ALC05-82HU006NGE | |
| Average Intel Core i7-1185G7 (4620 - 5944, n=21) | |
| Asus VivoBook Flip 14 TM420IA | |
| Dell Latitude 13 7320 Detachable, i7-1180G7 | |
| Average Intel Core i7-1180G7 (n=1) | |
| Microsoft Surface Pro 7 Plus | |
| Lenovo ThinkPad X12 20UVS03G00 | |
| HP Envy x360 13-ay0010nr | |
| Microsoft Surface Laptop Go Core i5 | |
| Lenovo Yoga Duet 7 13IML05-82AS000WGE | |
| HWBOT x265 Benchmark v2.2 / 4k Preset | |
| Lenovo IdeaPad Flex 5 14ALC05 82HU002YUS | |
| Lenovo IdeaPad Flex 5 14ALC05-82HU006NGE | |
| Asus VivoBook Flip 14 TM420IA | |
| HP Envy x360 13-ay0010nr | |
| Average Intel Core i7-1185G7 (5.02 - 8.13, n=27) | |
| Dell XPS 13 7390 2-in-1 Core i7 | |
| Microsoft Surface Pro 7 Plus | |
| Dell Latitude 13 7320 Detachable, i7-1180G7 | |
| Average Intel Core i7-1180G7 (n=1) | |
| Microsoft Surface Laptop Go Core i5 | |
| Lenovo ThinkPad X12 20UVS03G00 | |
| Dell XPS 13 7390 2-in-1 Core i3 | |
| Lenovo Yoga Duet 7 13IML05-82AS000WGE | |
| LibreOffice / 20 Documents To PDF | |
| Lenovo Yoga Duet 7 13IML05-82AS000WGE | |
| Lenovo IdeaPad Flex 5 14ALC05-82HU006NGE | |
| Microsoft Surface Laptop Go Core i5 | |
| HP Envy x360 13-ay0010nr | |
| Lenovo ThinkPad X12 20UVS03G00 | |
| Lenovo IdeaPad Flex 5 14ALC05 82HU002YUS | |
| Microsoft Surface Pro 7 Plus | |
| Asus VivoBook Flip 14 TM420IA | |
| Average Intel Core i7-1185G7 (41.3 - 61.7, n=26) | |
| Dell Latitude 13 7320 Detachable, i7-1180G7 | |
| Average Intel Core i7-1180G7 (n=1) | |
| R Benchmark 2.5 / Overall mean | |
| Lenovo Yoga Duet 7 13IML05-82AS000WGE | |
| Lenovo ThinkPad X12 20UVS03G00 | |
| Microsoft Surface Laptop Go Core i5 | |
| Microsoft Surface Pro 7 Plus | |
| Dell Latitude 13 7320 Detachable, i7-1180G7 | |
| Average Intel Core i7-1180G7 (n=1) | |
| Lenovo IdeaPad Flex 5 14ALC05-82HU006NGE | |
| HP Envy x360 13-ay0010nr | |
| Asus VivoBook Flip 14 TM420IA | |
| Lenovo IdeaPad Flex 5 14ALC05 82HU002YUS | |
| Average Intel Core i7-1185G7 (0.55 - 0.615, n=27) | |
Cinebench R23: Multi Core | Single Core
Cinebench R15: CPU Multi 64Bit | CPU Single 64Bit
Blender: v2.79 BMW27 CPU
7-Zip 18.03: 7z b 4 -mmt1 | 7z b 4
Geekbench 5.5: Single-Core | Multi-Core
HWBOT x265 Benchmark v2.2: 4k Preset
LibreOffice : 20 Documents To PDF
R Benchmark 2.5: Overall mean
* ... smaller is better
System Performance
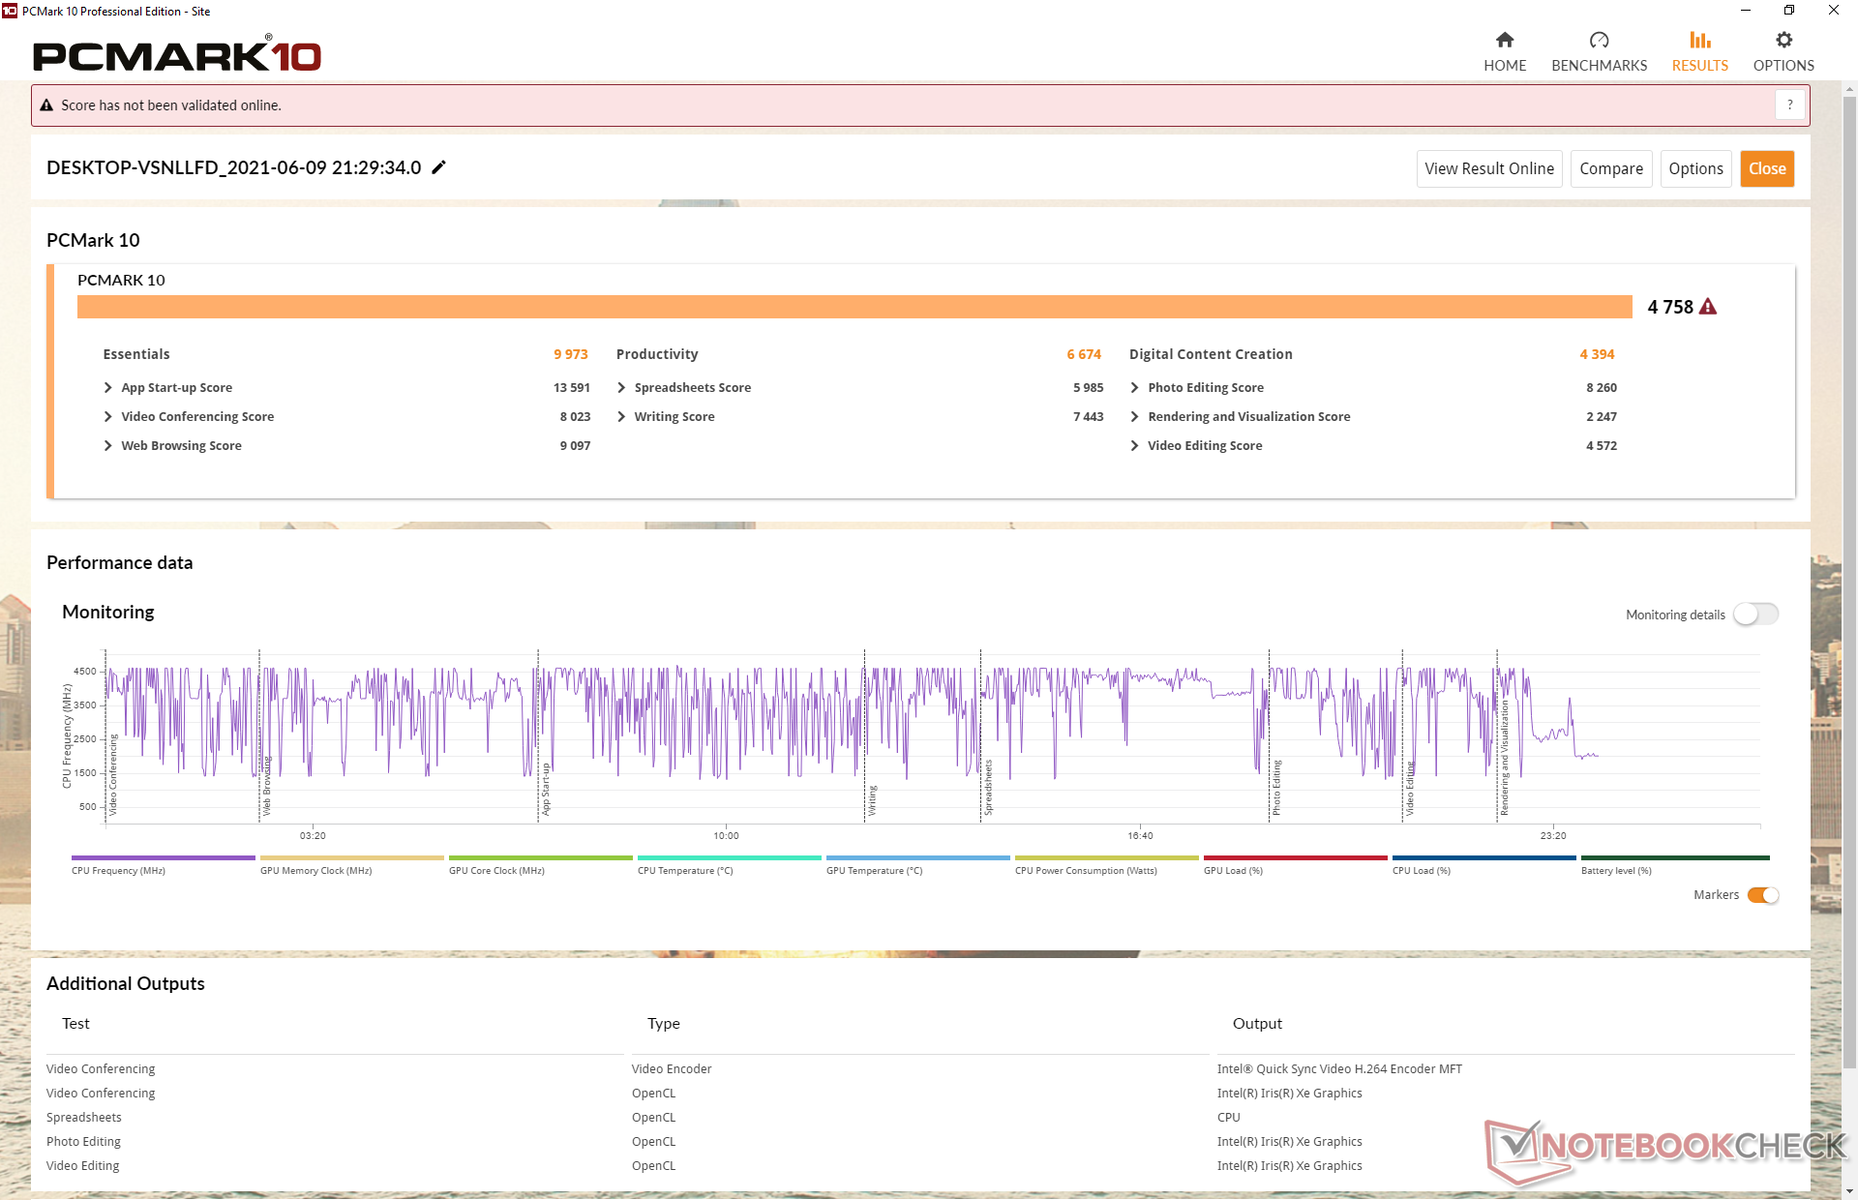
| PCMark 10 Score | 4758 points | |
Help | ||
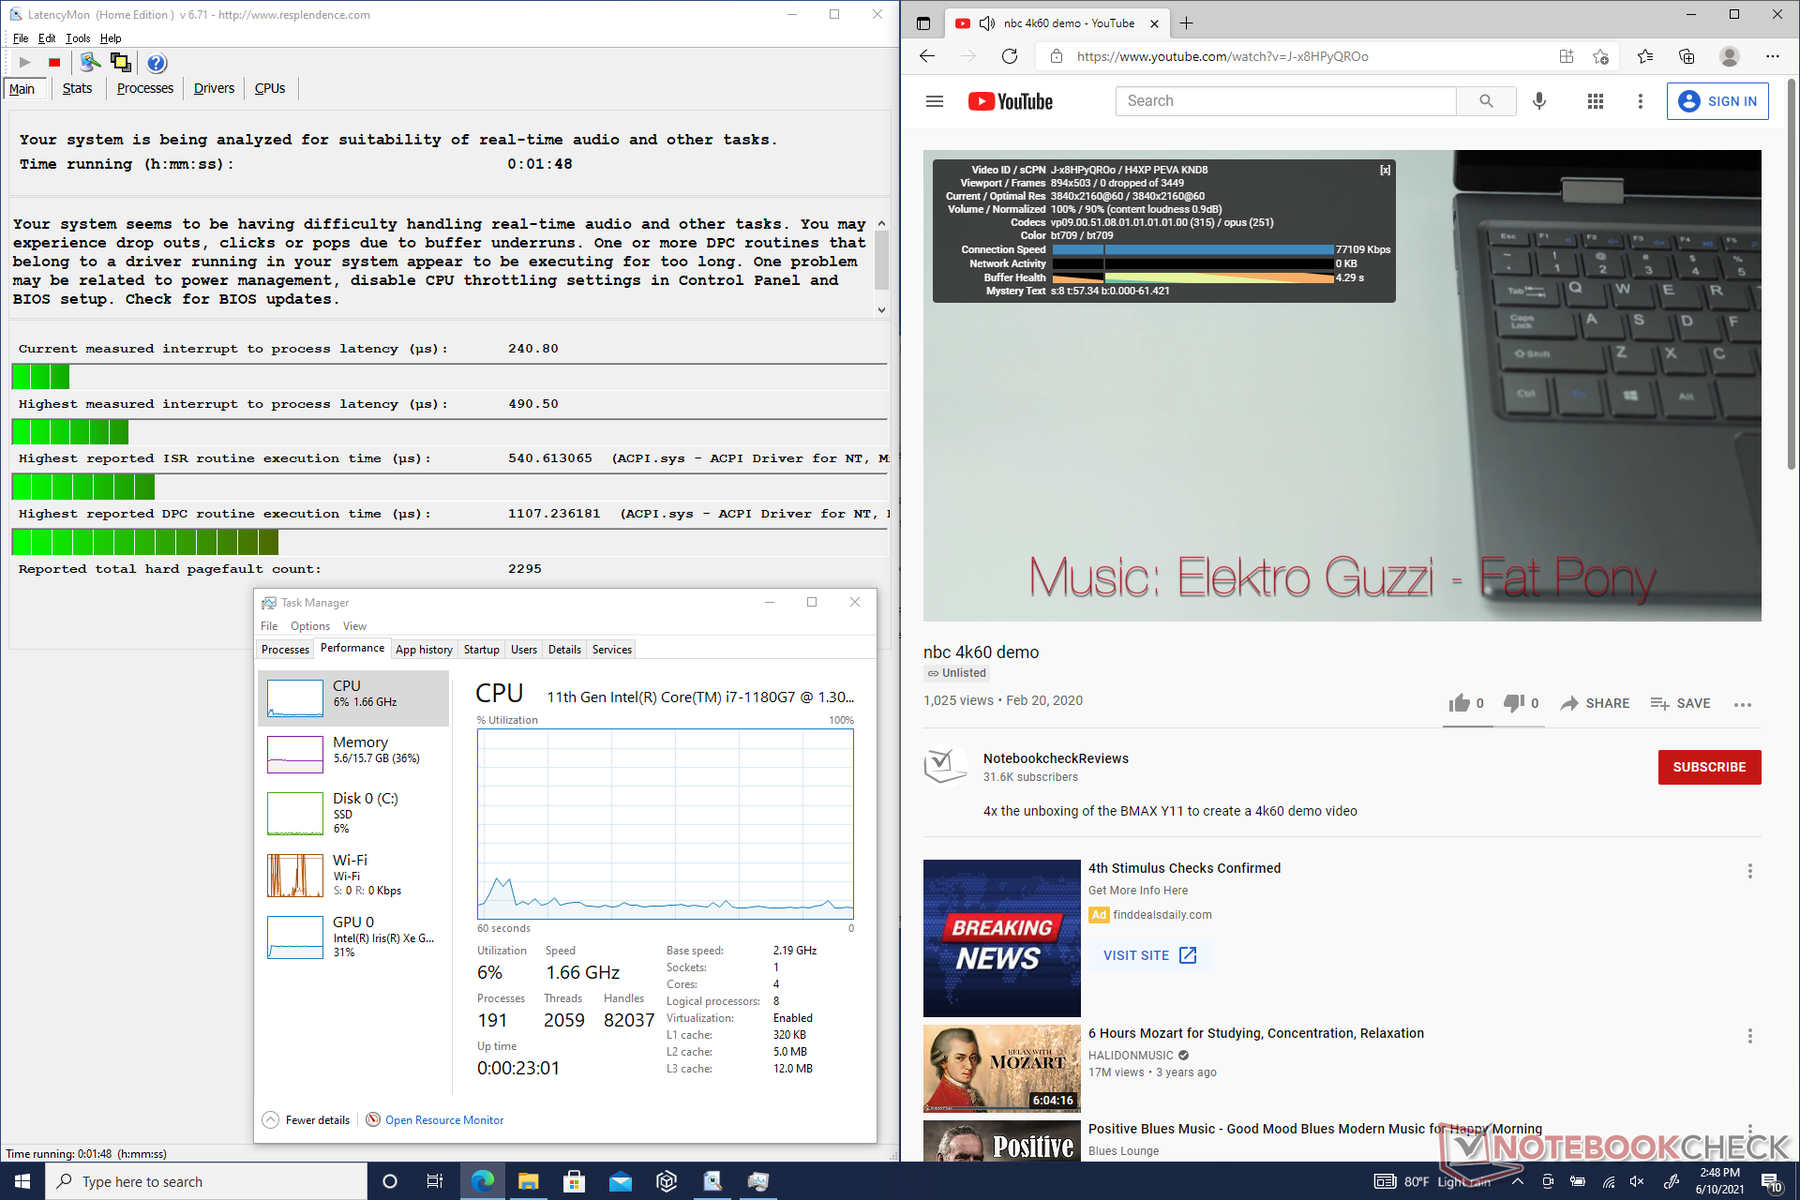
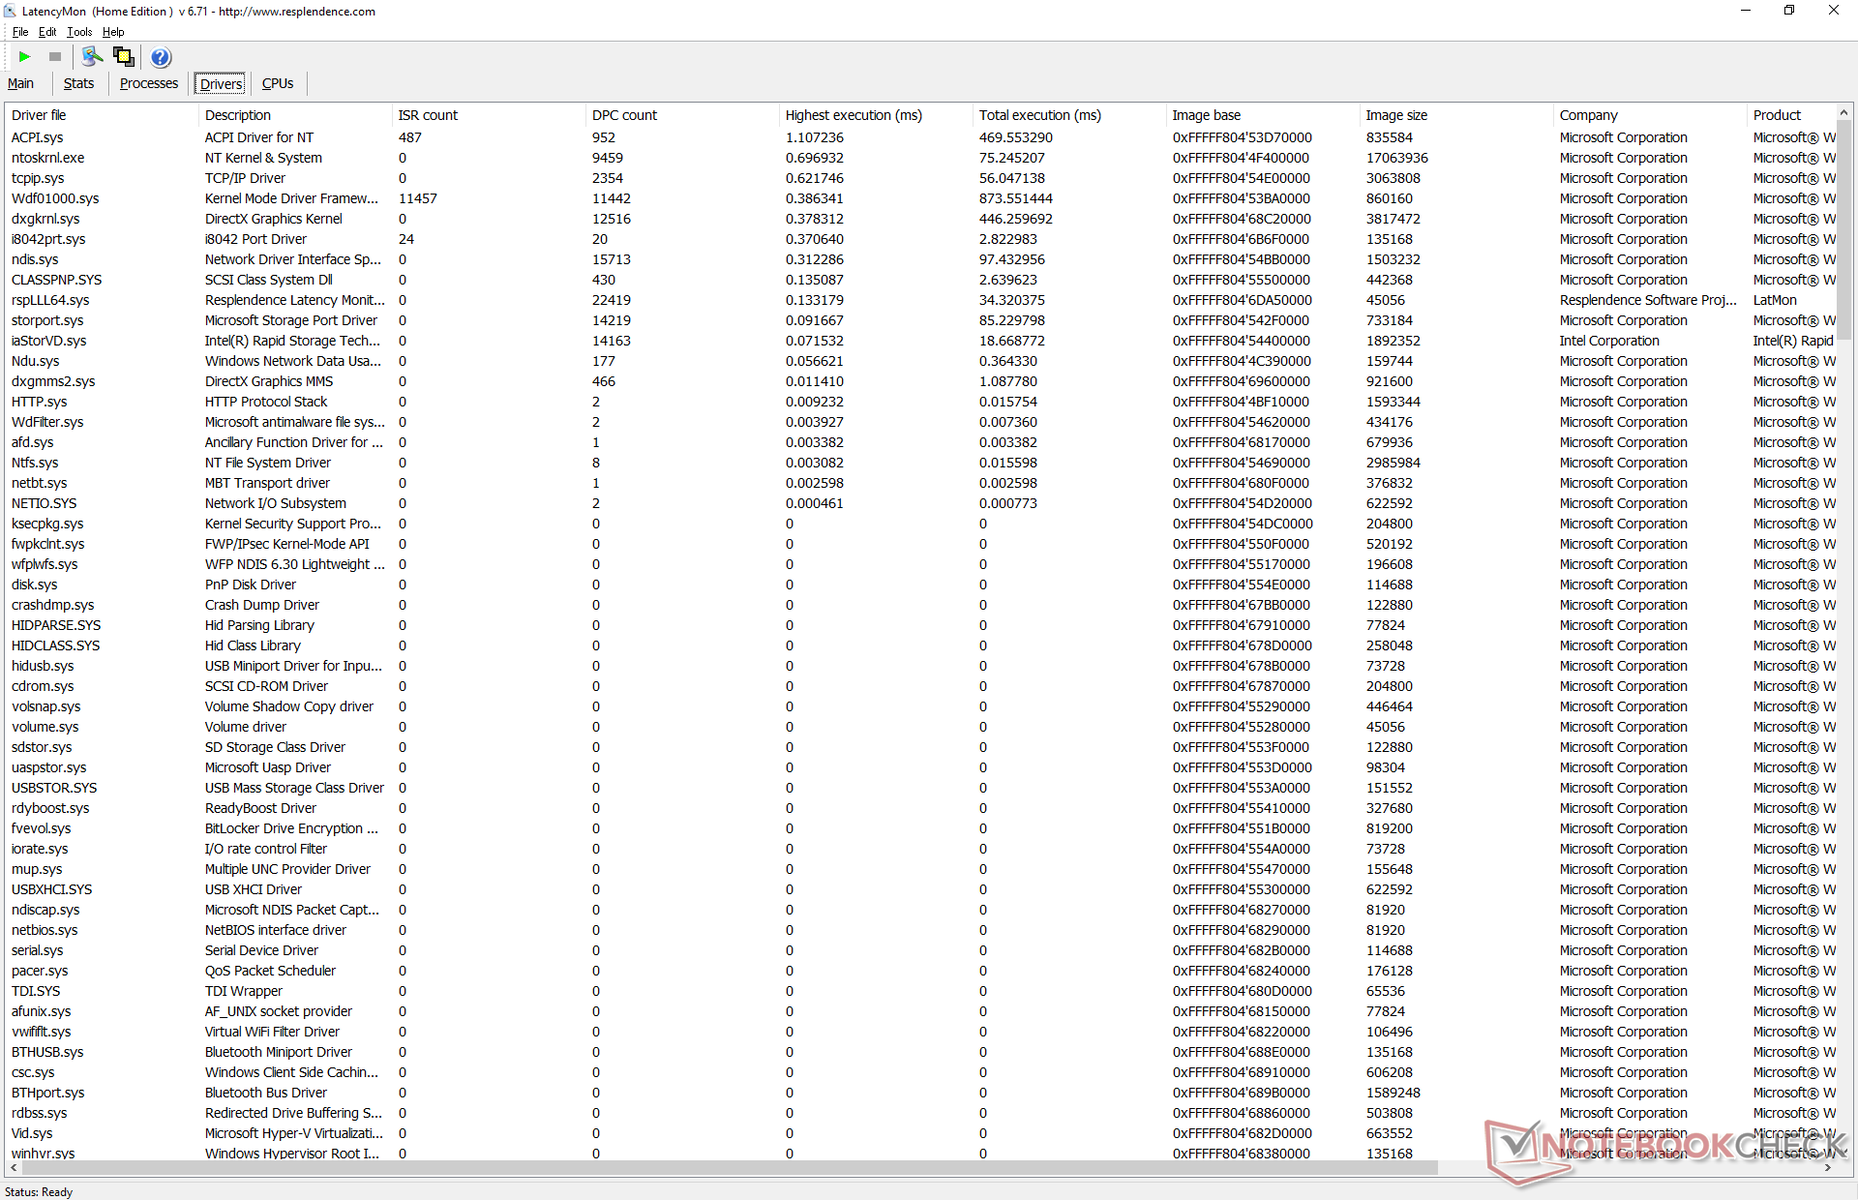
DPC Latency
LatencyMon shows just minor DPC latency issues when opening multiple browser tabs on our homepage. 4K video playback at 60 FPS is otherwise smooth with low CPU and GPU utilization and no dropped frames.
| DPC Latencies / LatencyMon - interrupt to process latency (max), Web, Youtube, Prime95 | |
| Lenovo Yoga Duet 7 13IML05-82AS000WGE | |
| Dell Latitude 13 7320 Detachable, i7-1180G7 | |
| Lenovo ThinkPad X12 20UVS03G00 | |
| Microsoft Surface Pro 7 Plus | |
* ... smaller is better
Storage Devices
Available options include 128 GB NVMe PCIe up to 1 TB all with self encryption (SED). Dell uses the shorter M.2 2230 form factor instead of the usual 2280 likely to save on space and weight. Upgrading the drive yourself is therefore possible albeit not as user-friendly as on a laptop. Our test unit comes with a mid-range 256 GB Western Digital SN530 with sequential read and write rates of about 2500 MB/s and 1000 MB/s, respectively.
| Dell Latitude 13 7320 Detachable, i7-1180G7 WDC PC SN530 SDBPMPZ-265G | Microsoft Surface Pro 7 Plus Samsung PM991 MZ9LQ256HBJQ | Lenovo ThinkPad X12 20UVS03G00 Toshiba BG4 KBG40ZNT512G | Dell XPS 13 7390 2-in-1 Core i7 Toshiba BG4 KBG40ZPZ512G | Lenovo Yoga Duet 7 13IML05-82AS000WGE Lenovo UMIS RPJTJ256MEE1OWX | |
|---|---|---|---|---|---|
| AS SSD | 104% | 20% | 76% | 66% | |
| Seq Read (MB/s) | 1918 | 1725 -10% | 1760 -8% | 1801 -6% | 1629 -15% |
| Seq Write (MB/s) | 357.6 | 931 160% | 761 113% | 1125 215% | 694 94% |
| 4K Read (MB/s) | 38.97 | 50.1 29% | 47.68 22% | 39.7 2% | 47.87 23% |
| 4K Write (MB/s) | 195.5 | 136.9 -30% | 176 -10% | 67 -66% | 107 -45% |
| 4K-64 Read (MB/s) | 390.9 | 870 123% | 581 49% | 1253 221% | 411 5% |
| 4K-64 Write (MB/s) | 103.9 | 762 633% | 118.5 14% | 209 101% | 377 263% |
| Access Time Read * (ms) | 0.122 | 0.279 -129% | 0.155 -27% | 0.069 43% | 0.068 44% |
| Access Time Write * (ms) | 0.189 | 0.028 85% | 0.188 1% | 0.625 -231% | 0.035 81% |
| Score Read (Points) | 622 | 1093 76% | 805 29% | 1472 137% | 614 -1% |
| Score Write (Points) | 335 | 992 196% | 371 11% | 388 16% | 550 64% |
| Score Total (Points) | 1209 | 2616 116% | 1551 28% | 2583 114% | 1441 19% |
| Copy ISO MB/s (MB/s) | 858 | 1174 37% | 1293 51% | 1074 25% | |
| Copy Program MB/s (MB/s) | 239.9 | 262.8 10% | 560 133% | 532 122% | |
| Copy Game MB/s (MB/s) | 214.3 | 562 162% | 927 333% | 730 241% | |
| CrystalDiskMark 5.2 / 6 | 0% | -28% | 10% | 7% | |
| Write 4K (MB/s) | 177.5 | 165.3 -7% | 72.8 -59% | 106.7 -40% | 118 -34% |
| Read 4K (MB/s) | 47.45 | 42.95 -9% | 26.35 -44% | 49.94 5% | 53 12% |
| Write Seq (MB/s) | 971 | 955 -2% | 823 -15% | 1223 26% | 1208 24% |
| Read Seq (MB/s) | 1544 | 867 -44% | 1169 -24% | 1801 17% | 1625 5% |
| Write 4K Q32T1 (MB/s) | 295.3 | 423.5 43% | 112.6 -62% | 325.3 10% | 431 46% |
| Read 4K Q32T1 (MB/s) | 394.1 | 479.2 22% | 327.2 -17% | 551 40% | 356 -10% |
| Write Seq Q32T1 (MB/s) | 977 | 1060 8% | 1039 6% | 1224 25% | 1278 31% |
| Read Seq Q32T1 (MB/s) | 2482 | 2251 -9% | 2176 -12% | 2350 -5% | 1949 -21% |
| Total Average (Program / Settings) | 52% /
66% | -4% /
-0% | 43% /
52% | 37% /
44% |
* ... smaller is better

Disk Throttling: DiskSpd Read Loop, Queue Depth 8
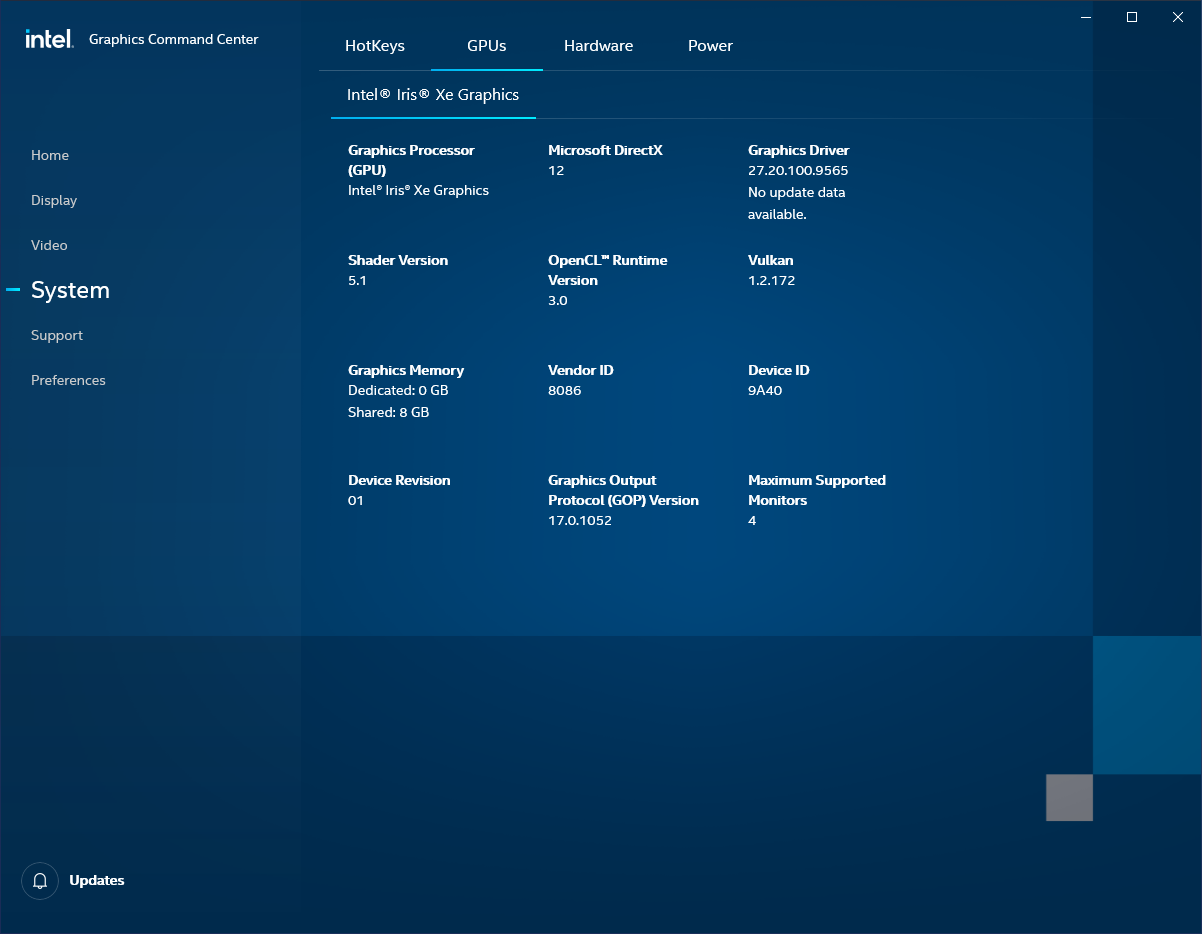
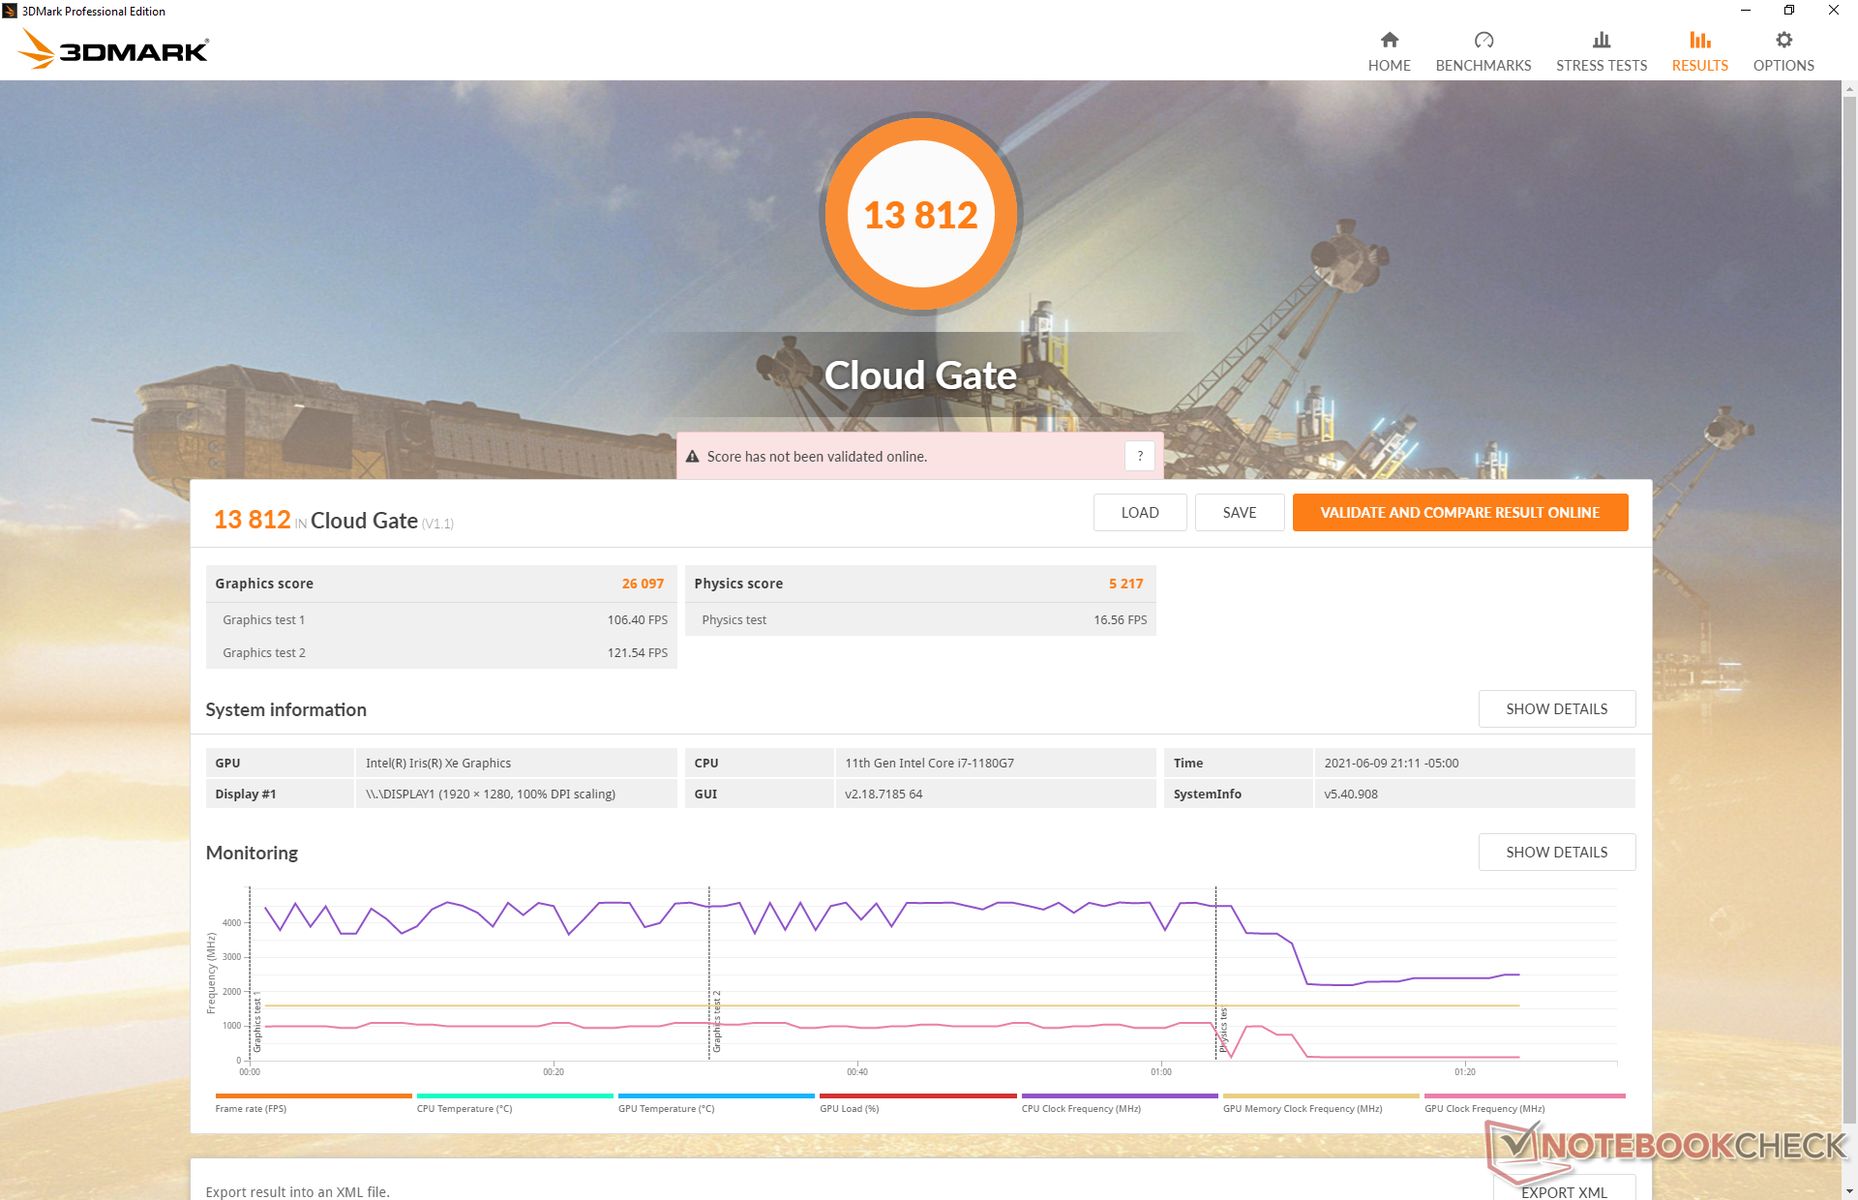
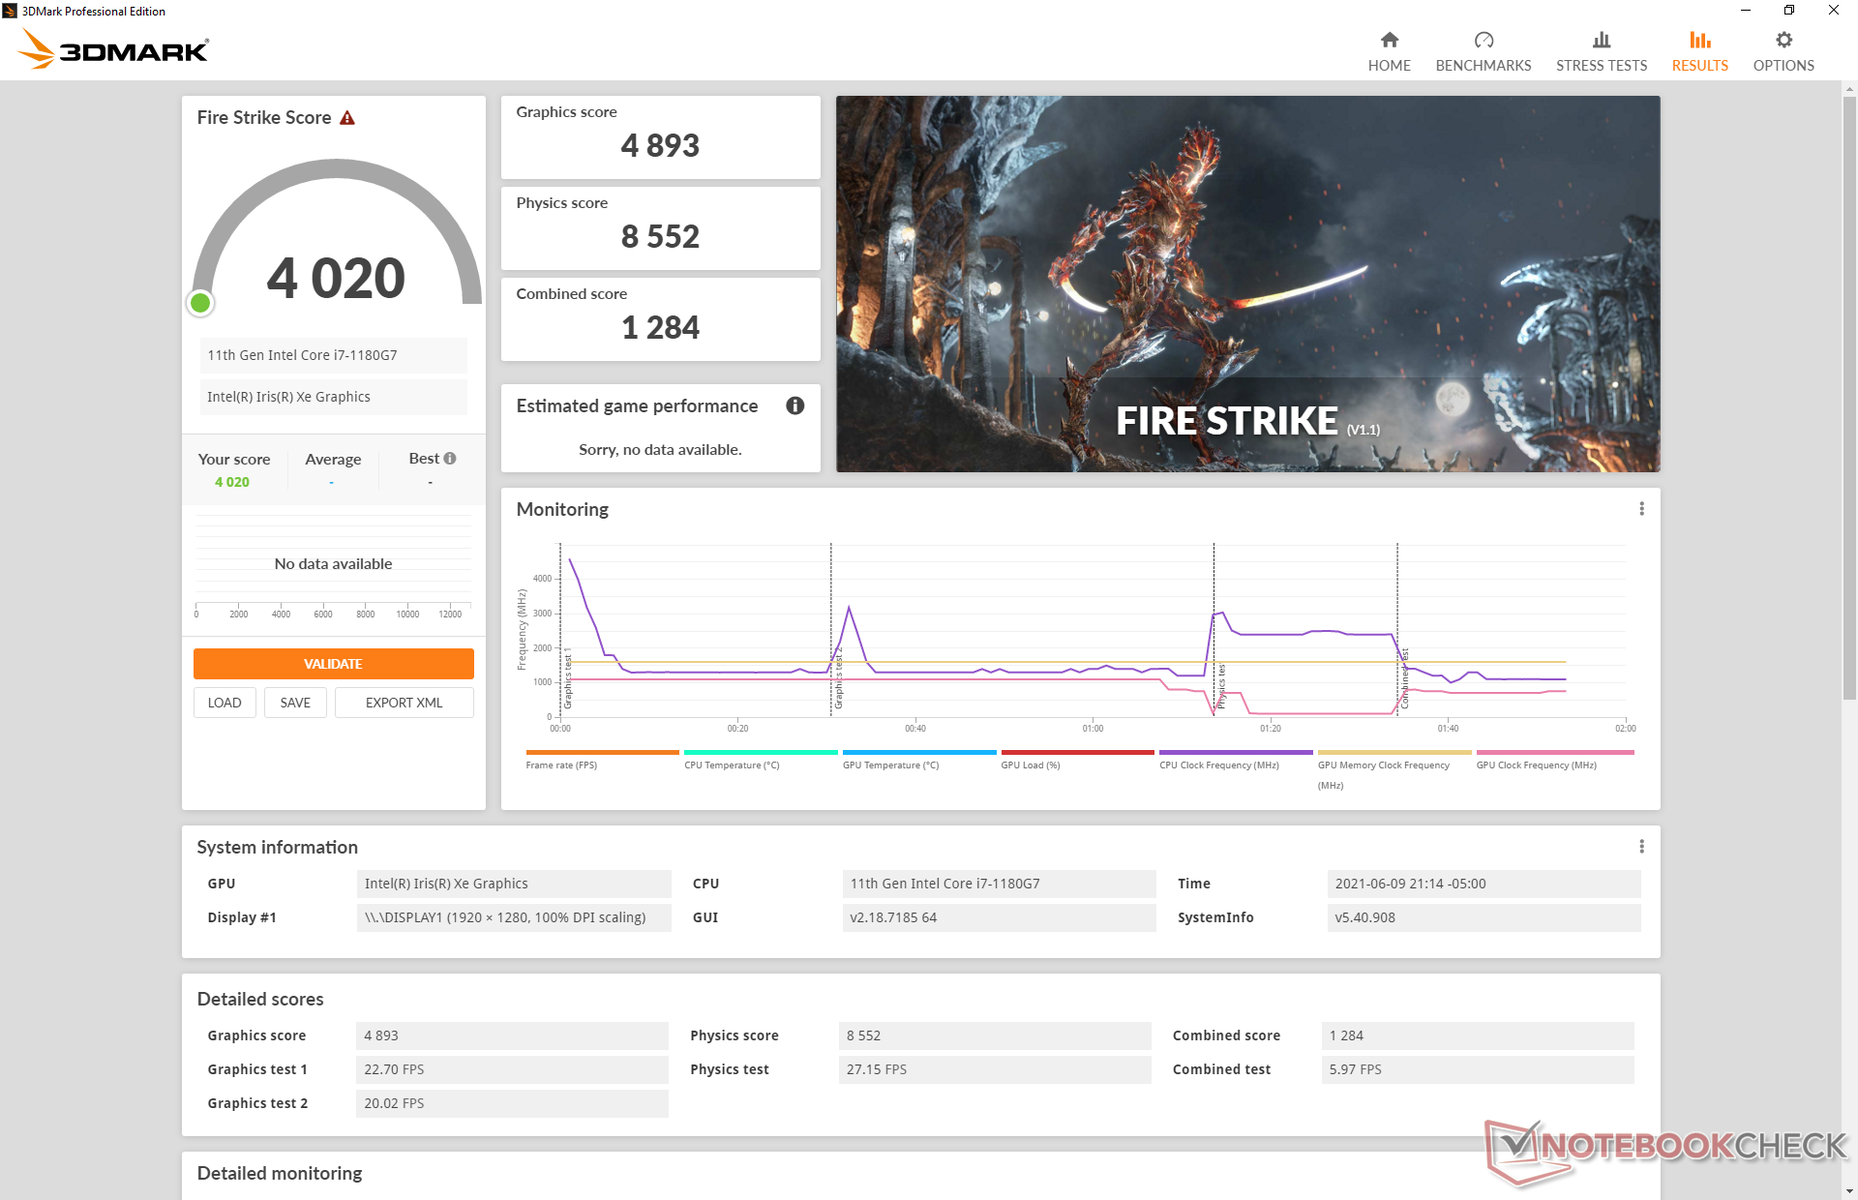
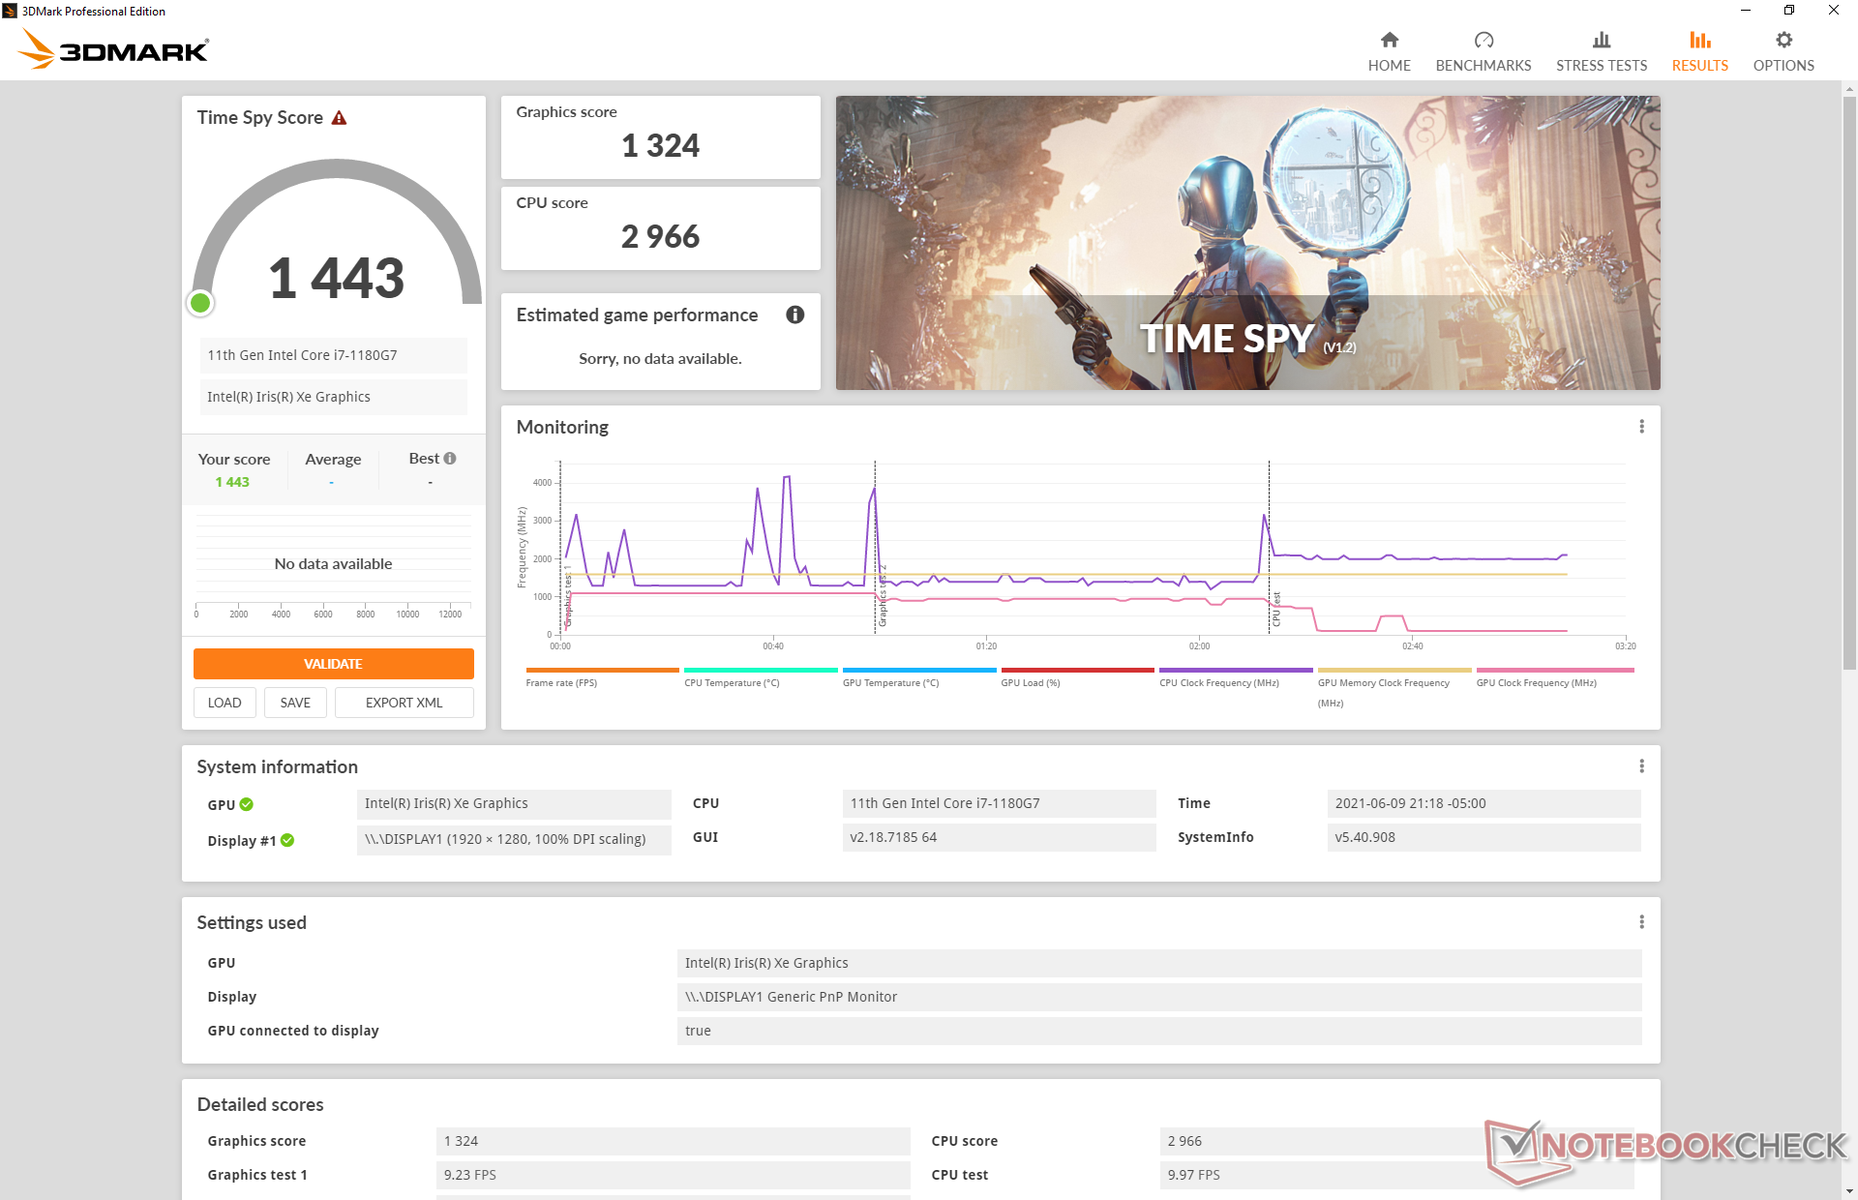
GPU Performance — Iris Xe Makes All The Difference
Graphics performance is excellent with results that are just slightly behind the average Iris Xe 96 EUs in our database which is to be expected considering the slower Core i7-1180G7 CPU. Users upgrading from older Intel generation CPUs will see marked improvements over the usual UHD Graphics or even last year's Iris Plus. The GeForce MX series is still better and more consistent for gaming, but gaming isn't a focus for the Latitude.
If you plan on playing fast-moving games like Rocket League or Fortnite, then we recommend connecting an external monitor. The internal display suffers from noticeable ghosting due to its slow response times which impacts the visual experience.
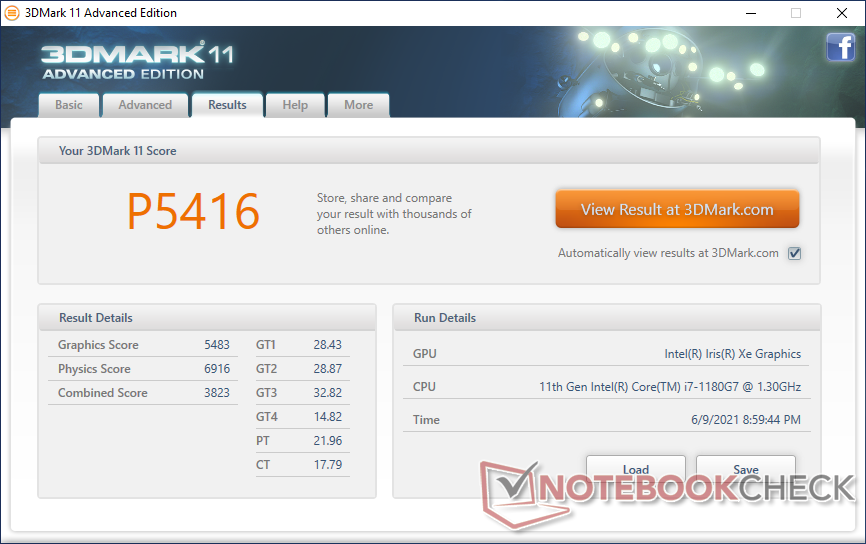
| 3DMark 11 Performance | 5416 points | |
| 3DMark Cloud Gate Standard Score | 13812 points | |
| 3DMark Fire Strike Score | 4020 points | |
| 3DMark Time Spy Score | 1443 points | |
Help | ||
| low | med. | high | ultra | |
|---|---|---|---|---|
| GTA V (2015) | 64.1 | 58.2 | 21 | 9.75 |
| The Witcher 3 (2015) | 80.3 | 53.3 | 30.1 | 13.8 |
| Dota 2 Reborn (2015) | 76.9 | 50.9 | 36.8 | 35.1 |
| Final Fantasy XV Benchmark (2018) | 32.3 | 18.2 | 13.5 | |
| X-Plane 11.11 (2018) | 20.6 | 27.7 | 25.5 |
Emissions
System Noise
Fan noise is louder than most Windows tablets especially if you want to exploit the high graphics performance of the Latitude 7320 detachable. Running 3DMark 06 for just 90 seconds is enough to bump the fan noise up to almost 38 dB(A) while a full-on game like Witcher 3 will cause fan noise to be even louder at 42 dB(A). These levels are more typical of an Ultrabook under load than a tablet which is perhaps not surprising given that the GPU here is as powerful as a Core i7 Tiger Lake-U laptop.
Owners can limit fan noise (and therefore performance) by toggling the fan features via Dell Power Manager. Most users will want to remain on Optimized or Quiet mode for basic workloads like web browsing or video streaming.
Keep in mind that the Surface Pro 7 Core i3 and Core i5 SKUs are completely silent while the Core i7 SKU has an internal fan. In contrast, all Latitude 7320 detachable SKUs have an internal fan.
| Dell Latitude 13 7320 Detachable, i7-1180G7 Iris Xe G7 96EUs, i7-1180G7, WDC PC SN530 SDBPMPZ-265G | Microsoft Surface Pro 7 Plus Iris Xe G7 80EUs, i5-1135G7, Samsung PM991 MZ9LQ256HBJQ | Lenovo ThinkPad X12 20UVS03G00 Iris Xe G7 96EUs, i7-1160G7, Toshiba BG4 KBG40ZNT512G | Dell XPS 13 7390 2-in-1 Core i7 Iris Plus Graphics G7 (Ice Lake 64 EU), i7-1065G7, Toshiba BG4 KBG40ZPZ512G | Lenovo Yoga Duet 7 13IML05-82AS000WGE UHD Graphics 620, i5-10210U, Lenovo UMIS RPJTJ256MEE1OWX | |
|---|---|---|---|---|---|
| Noise | 6% | -5% | 9% | ||
| off / environment * (dB) | 25.3 | 25.1 1% | 28.1 -11% | 25.4 -0% | |
| Idle Minimum * (dB) | 25.4 | 25.1 1% | 28.1 -11% | 25.4 -0% | |
| Idle Average * (dB) | 25.4 | 25.1 1% | 28.1 -11% | 25.4 -0% | |
| Idle Maximum * (dB) | 25.4 | 26 -2% | 28.1 -11% | 25.4 -0% | |
| Load Average * (dB) | 37.7 | 34.6 8% | 31.7 16% | 30 20% | |
| Witcher 3 ultra * (dB) | 42 | 34.6 18% | 43.4 -3% | ||
| Load Maximum * (dB) | 42.1 | 37 12% | 43.4 -3% | 27.5 35% |
* ... smaller is better
Noise level
| Idle |
| 25.4 / 25.4 / 25.4 dB(A) |
| Load |
| 37.7 / 42.1 dB(A) |
 | ||
30 dB silent 40 dB(A) audible 50 dB(A) loud |
||
min: | ||
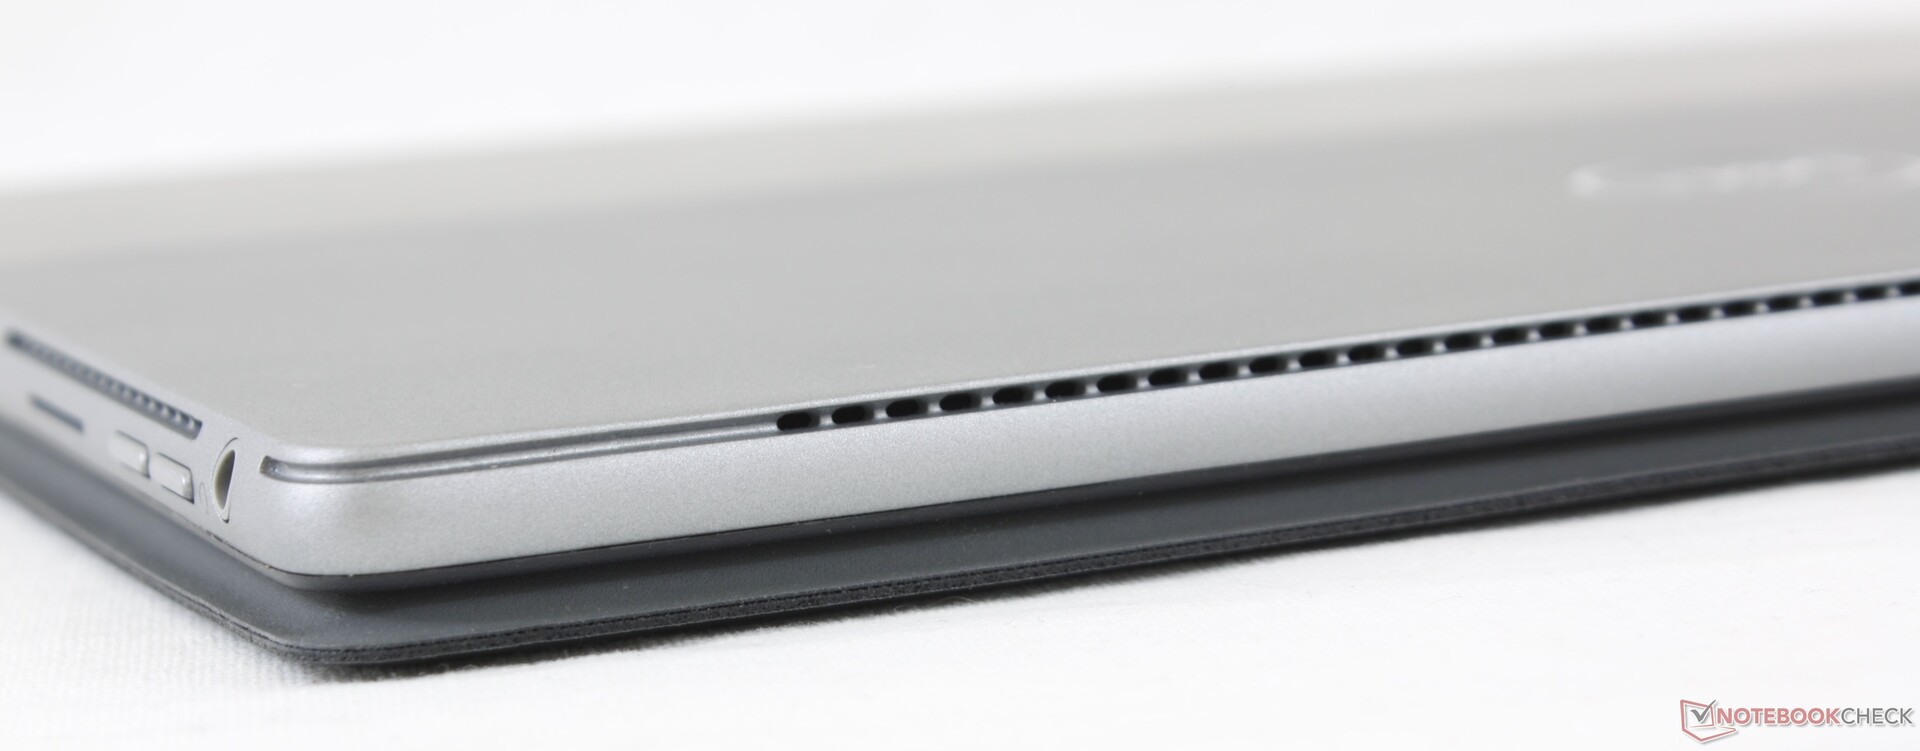
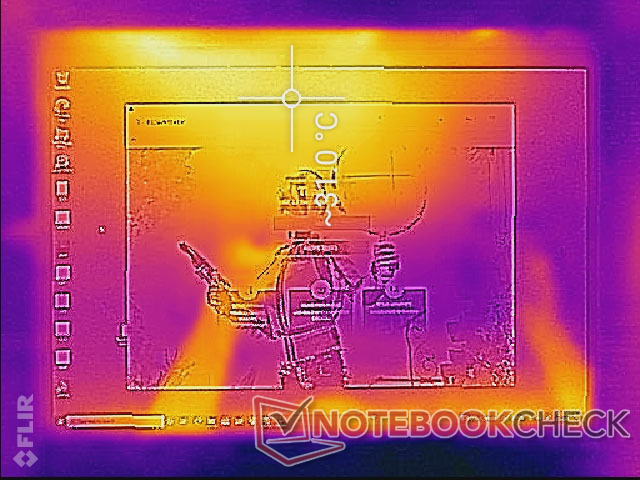
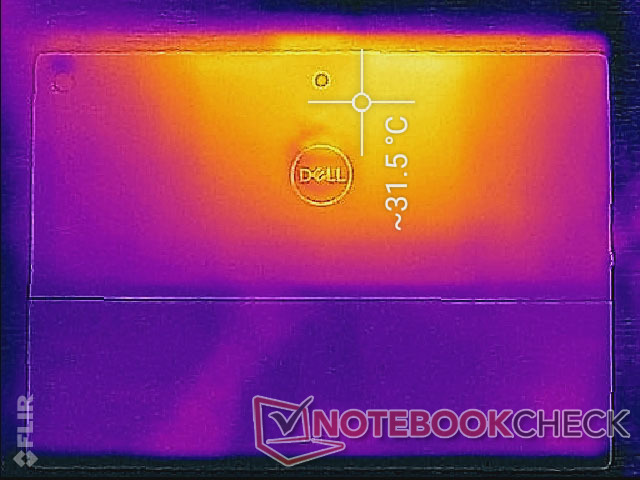
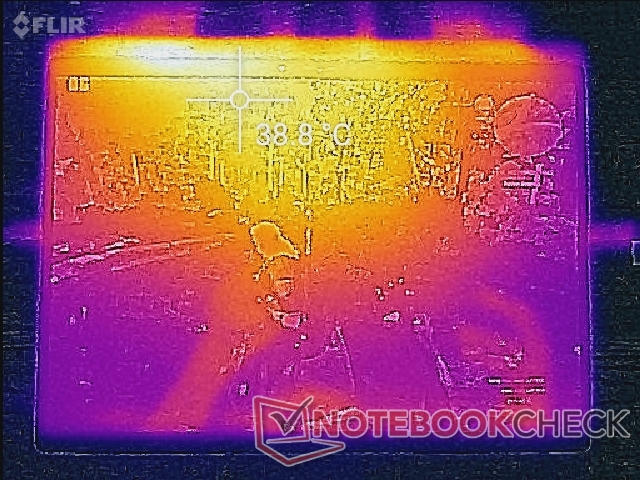
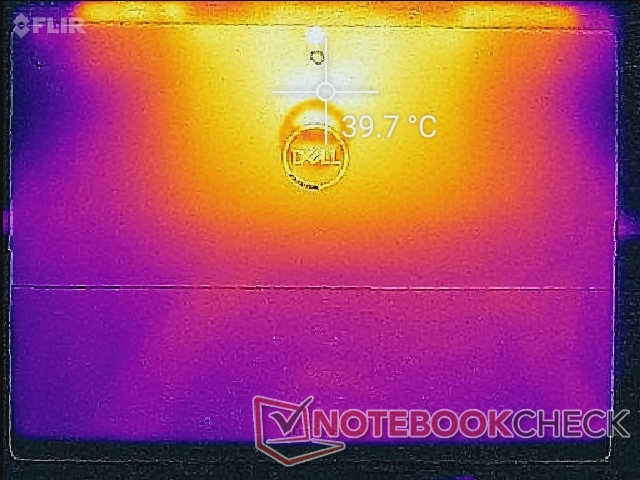
Temperature
Surface temperature development is largely symmetrical with the hot spot nearest the top center. When running high loads like games, the hot spot can be as warm as 40 C compared to 44 C or 45 C on the Surface Pro 7 or Yoga Duet 7.
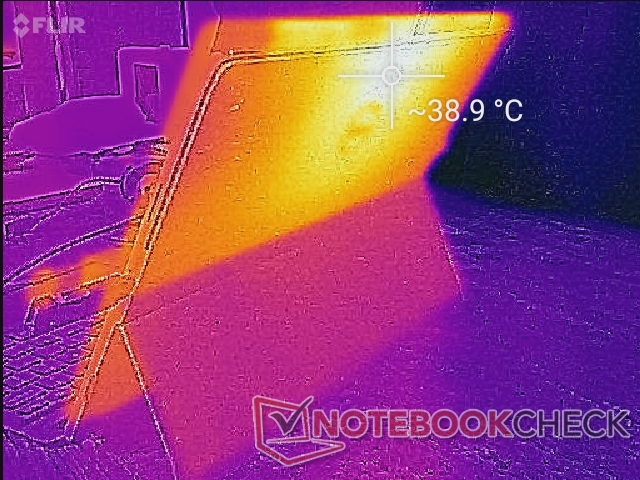
(+) The maximum temperature on the upper side is 38.8 °C / 102 F, compared to the average of 35.4 °C / 96 F, ranging from 19.6 to 60 °C for the class Convertible.
(±) The bottom heats up to a maximum of 40 °C / 104 F, compared to the average of 36.9 °C / 98 F
(+) In idle usage, the average temperature for the upper side is 29.6 °C / 85 F, compared to the device average of 30.3 °C / 87 F.
(+) The palmrests and touchpad are cooler than skin temperature with a maximum of 29.4 °C / 84.9 F and are therefore cool to the touch.
(±) The average temperature of the palmrest area of similar devices was 28 °C / 82.4 F (-1.4 °C / -2.5 F).
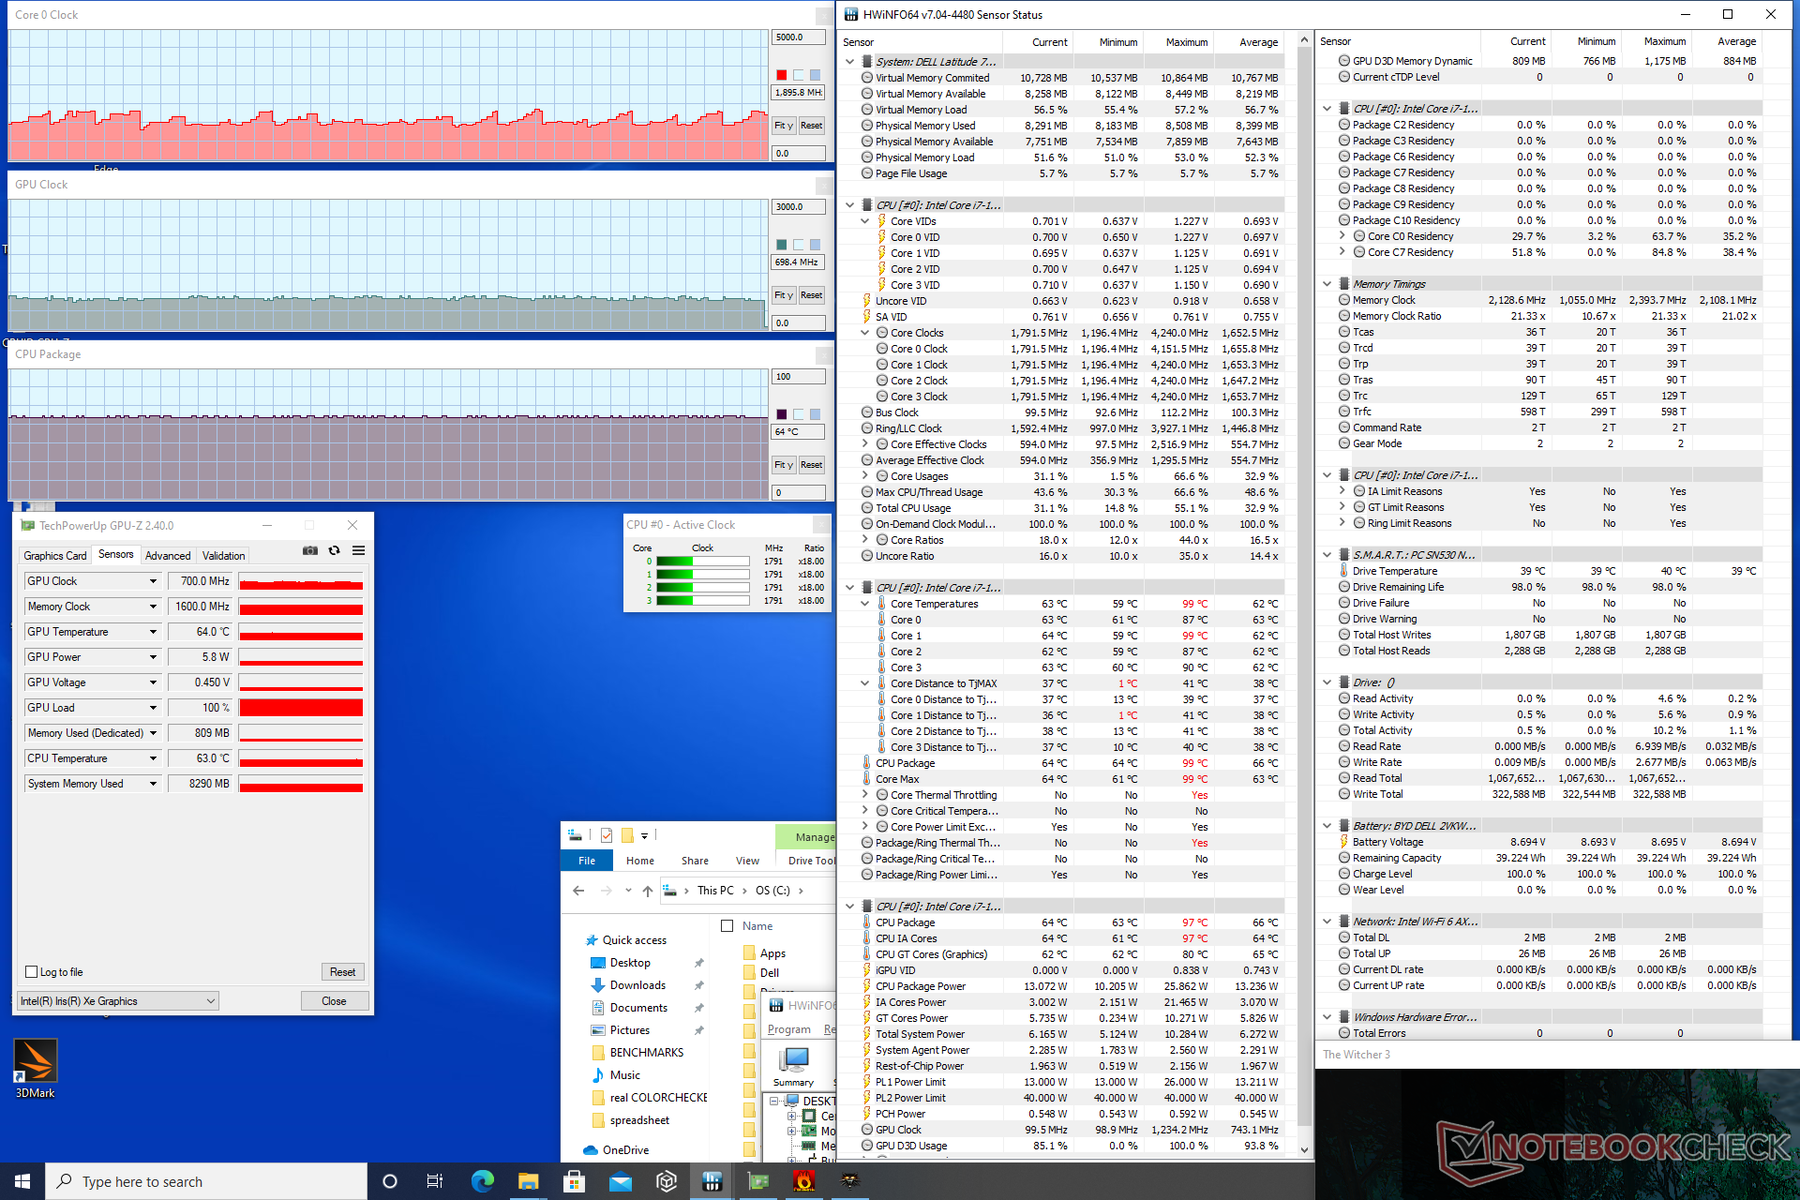
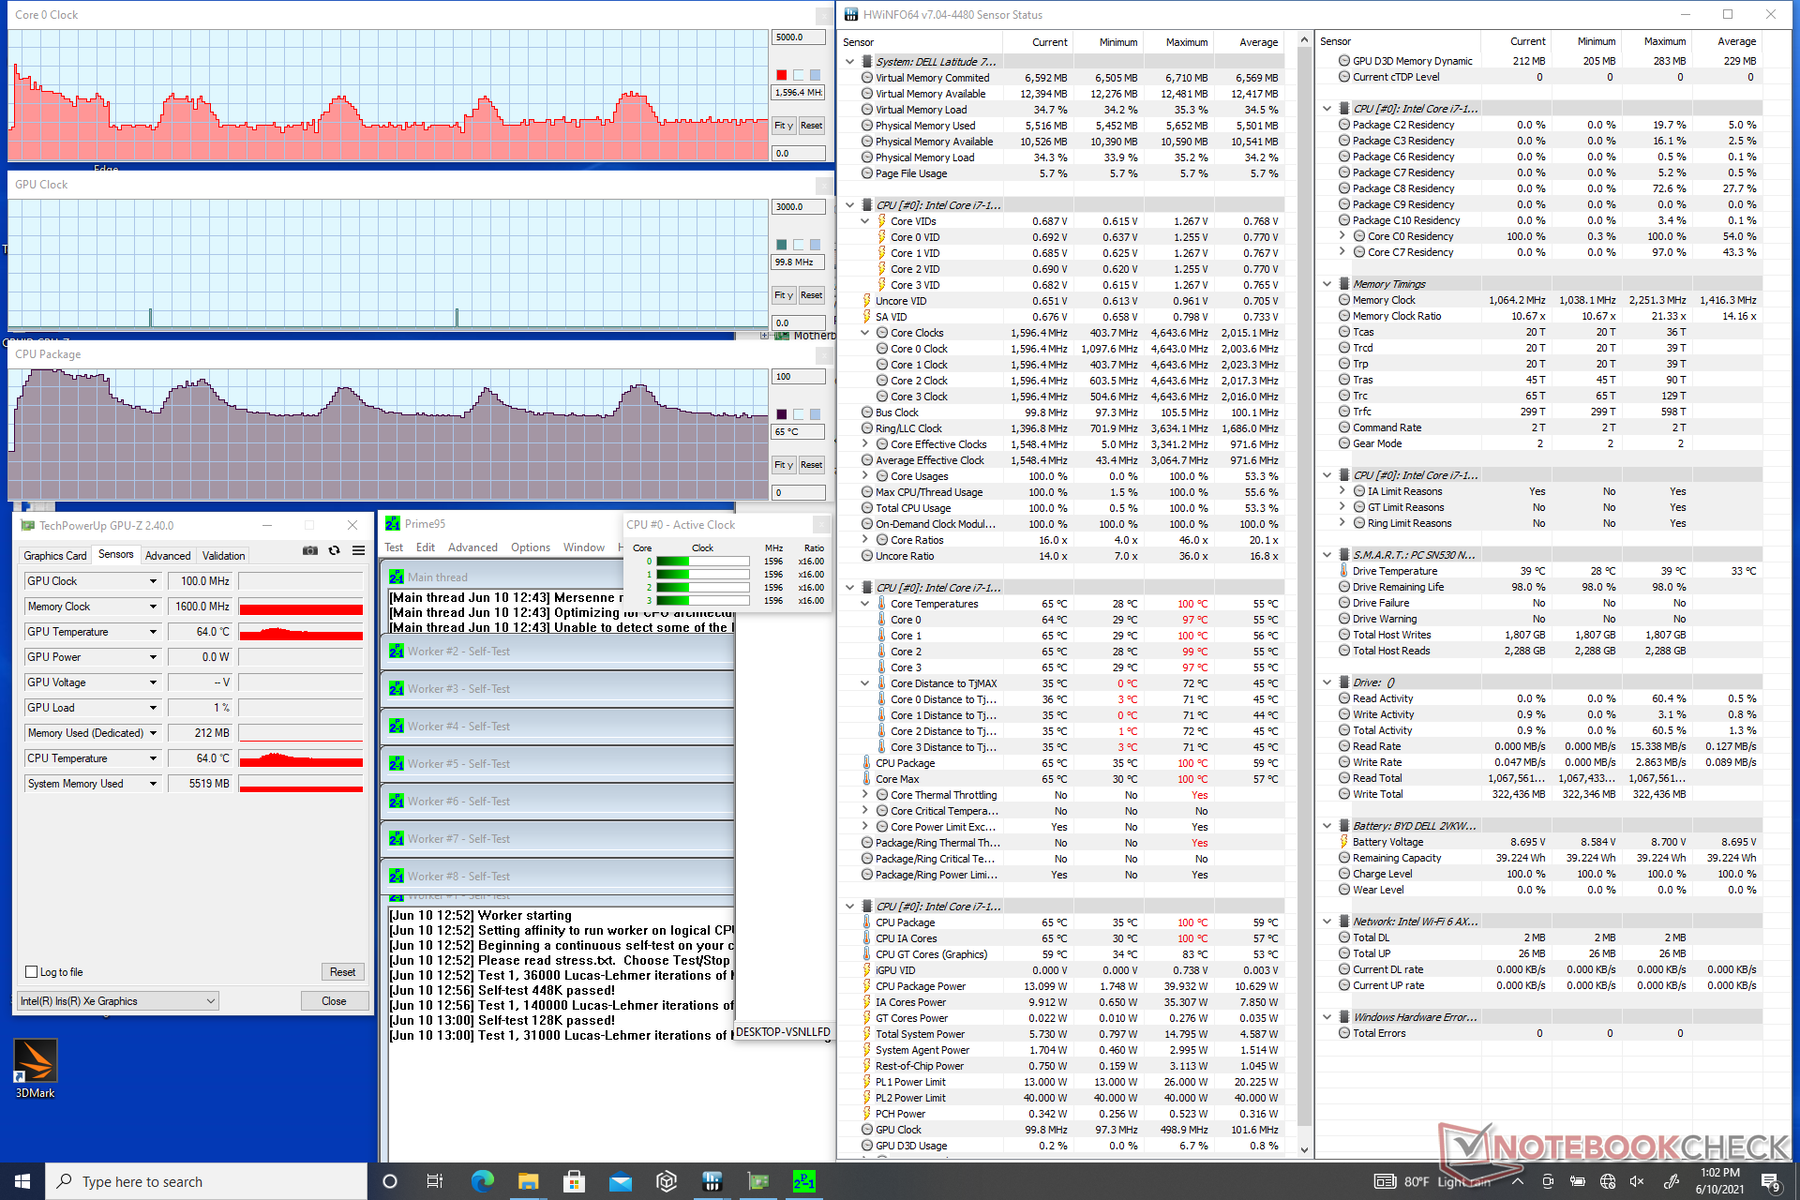
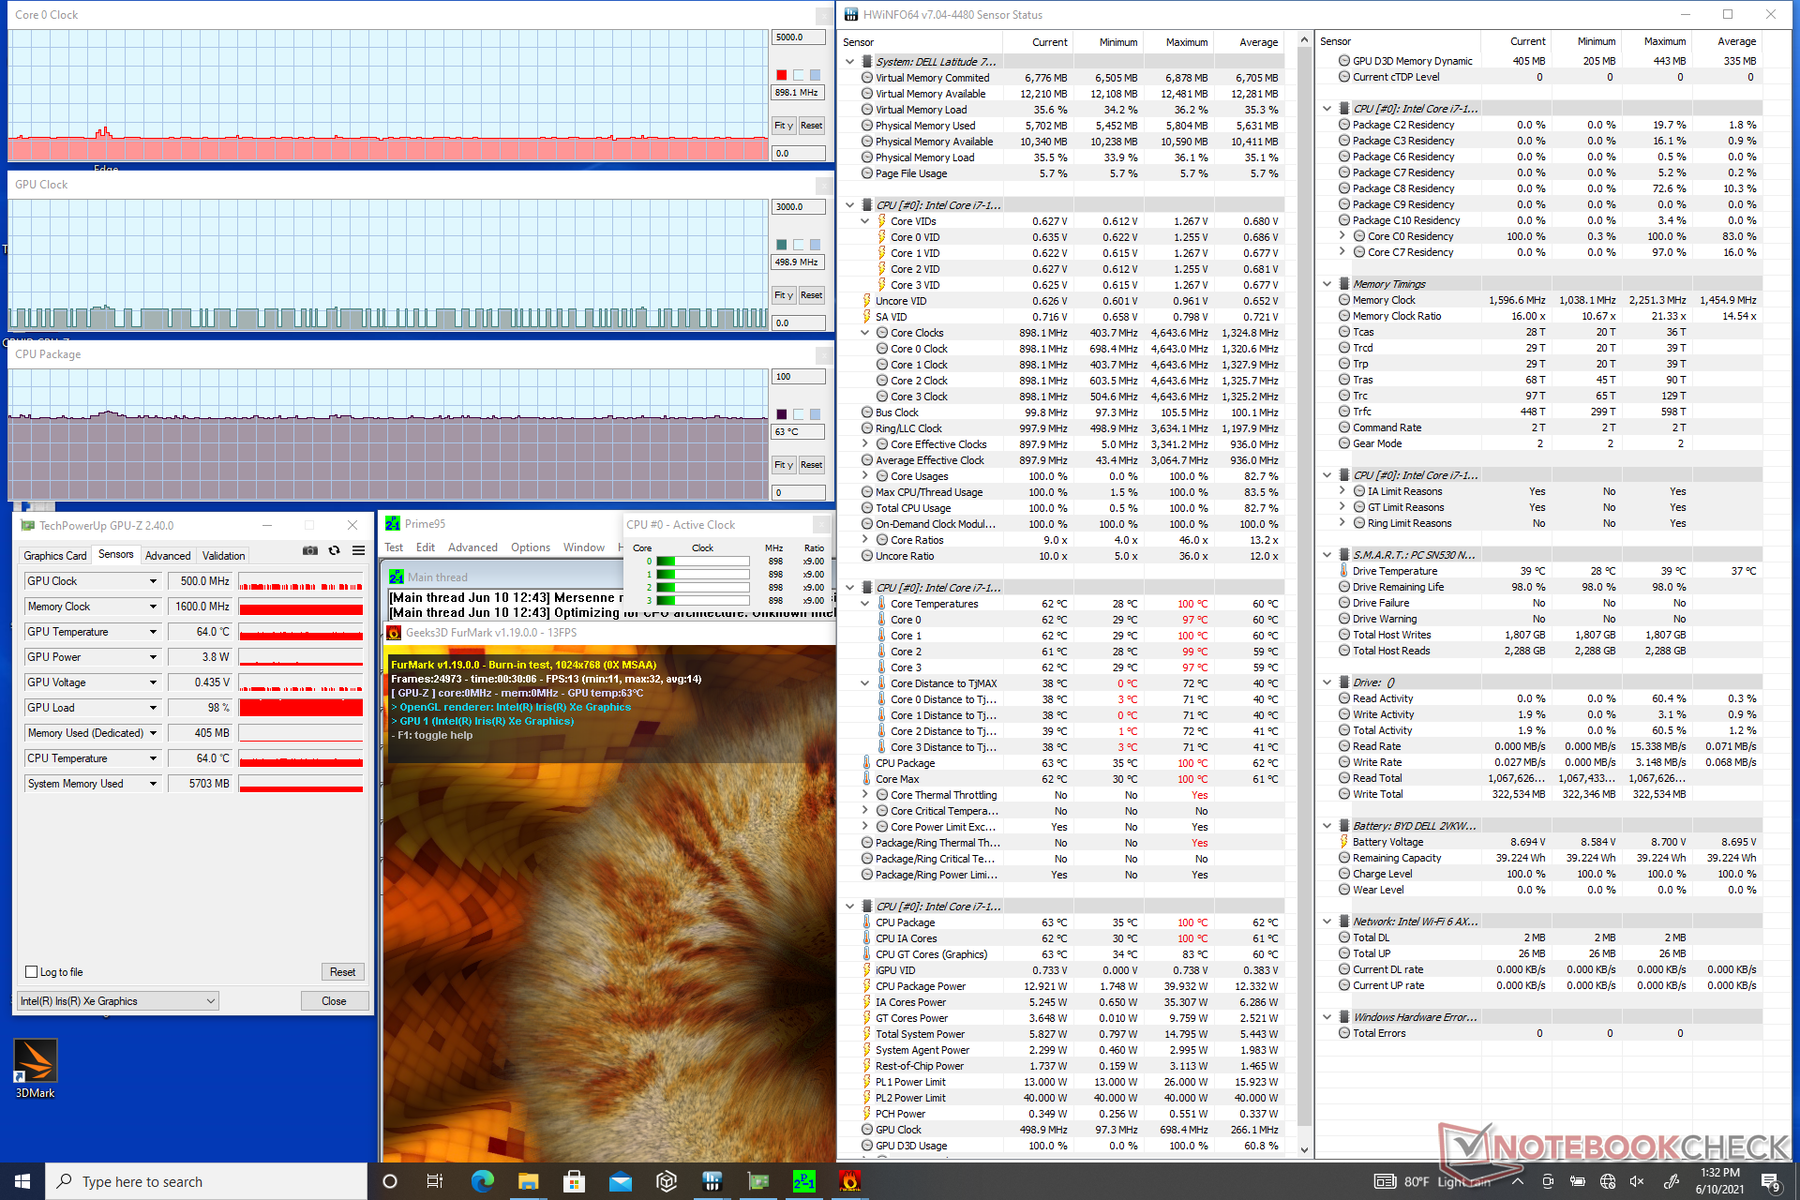
Stress Test
When running Prime95 to stress the CPU, clock rates would boost to 3.7 GHz for just the first one or two seconds. CPU temperature would eventually reach 100 C a few seconds later accompanied by a drop in clock rate to 2.1 GHz. After a few more minutes, CPU clock rates and temperature would cycle indefinitely between 1.1 GHz to 2.5 GHz and 65 C to 87 C, respectively.
When running high loads like games, CPU temperature would stabilize at 64 C to be much cooler than on the slower Ice Lake-powered Latitude 7390 2-in-1 under similar conditions.
Running on batteries will limit graphics performance. A 3DMark 11 test on battery power would return Physics and Graphics scores of 8192 and 3805 points, respectively, compared to 6916 and 5483 points when on mains.
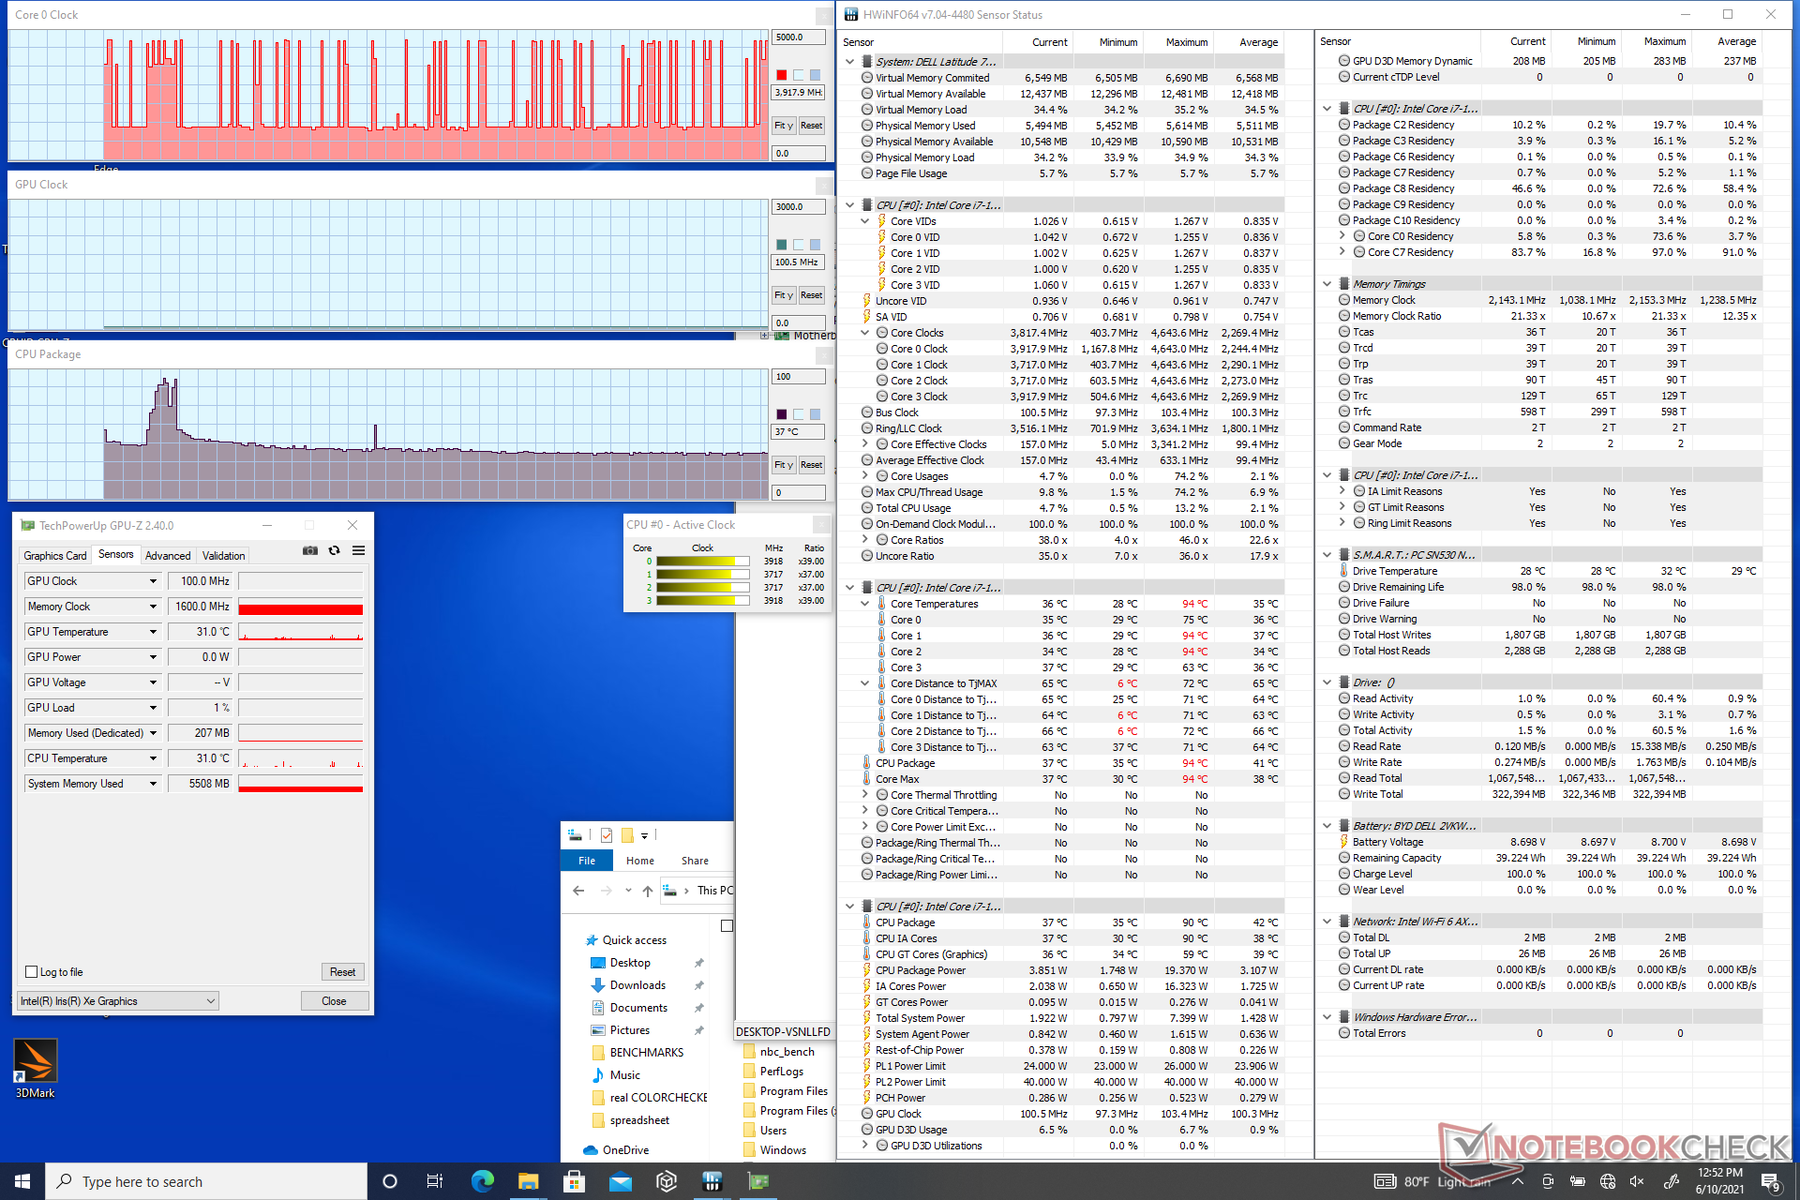
| CPU Clock (GHz) | GPU Clock (MHz) | Average CPU Temperature (°C) | |
| System Idle | -- | -- | 37 |
| Prime95 Stress | 1.1 - 2.5 | -- | 65 - 87 |
| Prime95 + FurMark Stress | 0.9 | 100 - 500 | 63 |
| Witcher 3 Stress | 1.4 - 1.9 | 698 | 64 |
Speakers
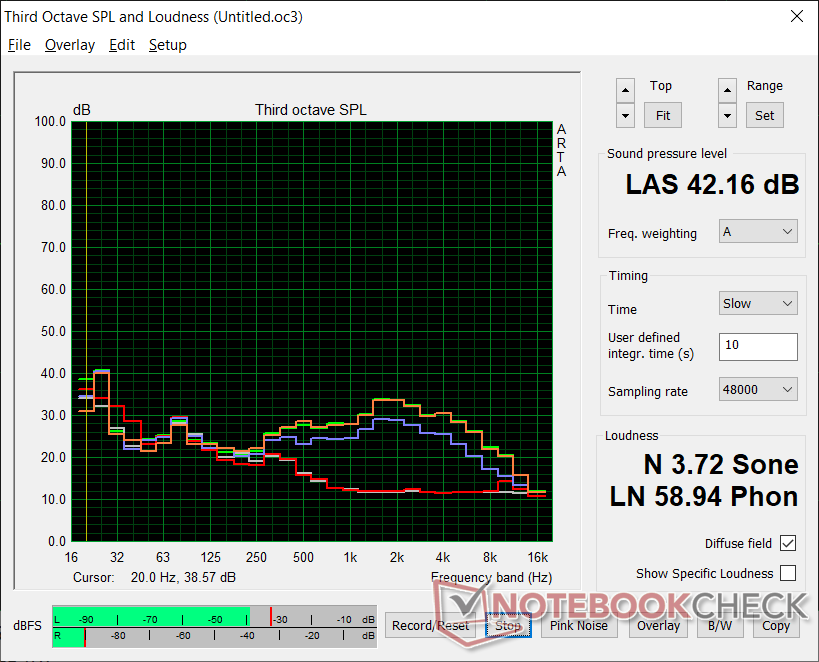
Audio quality is better than expected. While speakers on tablets tend to be tinny, the speakers on the Latitude detachable are more balanced to be closer to the speakers on an Ultrabook.


Dell Latitude 13 7320 Detachable, i7-1180G7 audio analysis
(±) | speaker loudness is average but good (77.7 dB)
Bass 100 - 315 Hz
(±) | reduced bass - on average 11.6% lower than median
(±) | linearity of bass is average (11.7% delta to prev. frequency)
Mids 400 - 2000 Hz
(+) | balanced mids - only 2.7% away from median
(+) | mids are linear (4% delta to prev. frequency)
Highs 2 - 16 kHz
(+) | balanced highs - only 3.2% away from median
(+) | highs are linear (5.2% delta to prev. frequency)
Overall 100 - 16.000 Hz
(+) | overall sound is linear (14% difference to median)
Compared to same class
» 20% of all tested devices in this class were better, 4% similar, 76% worse
» The best had a delta of 6%, average was 20%, worst was 57%
Compared to all devices tested
» 16% of all tested devices were better, 4% similar, 80% worse
» The best had a delta of 4%, average was 24%, worst was 134%
Apple MacBook 12 (Early 2016) 1.1 GHz audio analysis
(+) | speakers can play relatively loud (83.6 dB)
Bass 100 - 315 Hz
(±) | reduced bass - on average 11.3% lower than median
(±) | linearity of bass is average (14.2% delta to prev. frequency)
Mids 400 - 2000 Hz
(+) | balanced mids - only 2.4% away from median
(+) | mids are linear (5.5% delta to prev. frequency)
Highs 2 - 16 kHz
(+) | balanced highs - only 2% away from median
(+) | highs are linear (4.5% delta to prev. frequency)
Overall 100 - 16.000 Hz
(+) | overall sound is linear (10.2% difference to median)
Compared to same class
» 7% of all tested devices in this class were better, 2% similar, 91% worse
» The best had a delta of 5%, average was 18%, worst was 53%
Compared to all devices tested
» 5% of all tested devices were better, 1% similar, 94% worse
» The best had a delta of 4%, average was 24%, worst was 134%
Energy Management — High Efficiency Thanks To Intel
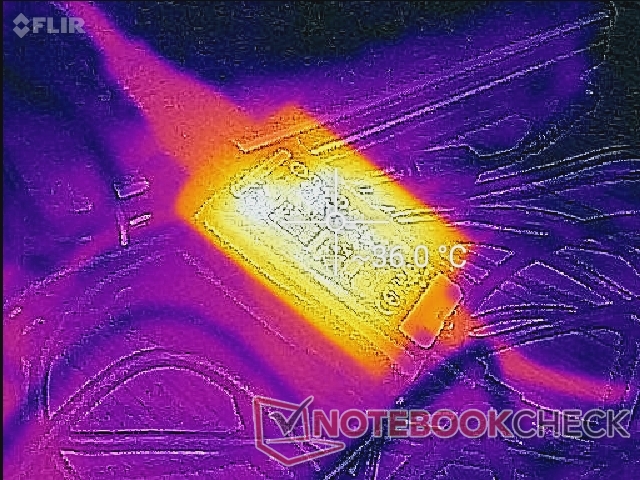
Power Consumption
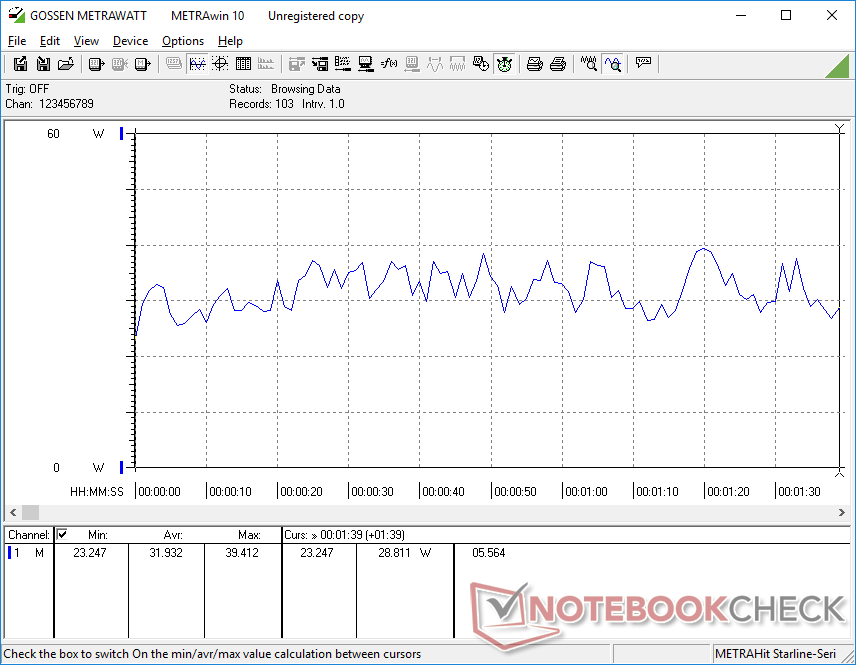
Idling on desktop consumes between 2 W and 6 W depending on the brightness setting to be more power efficient than most other Windows tablets. The Surface Pro 7 would consume almost two times more power than our Dell under these conditions despite its smaller 12.3-inch screen size.
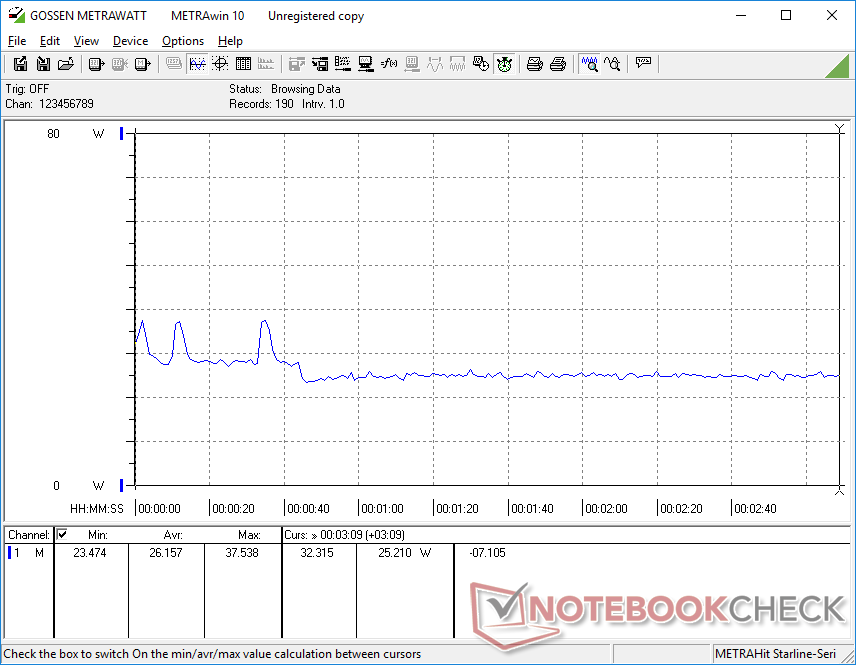
Power consumption when running high loads like games is around 26 W to 32 W compared to 43 W on the Latitude 7390 2-in-1. Impressively, our Latitude 7320 detachable draws 30 percent less power while providing 50 to 60 percent faster raw graphics performance.
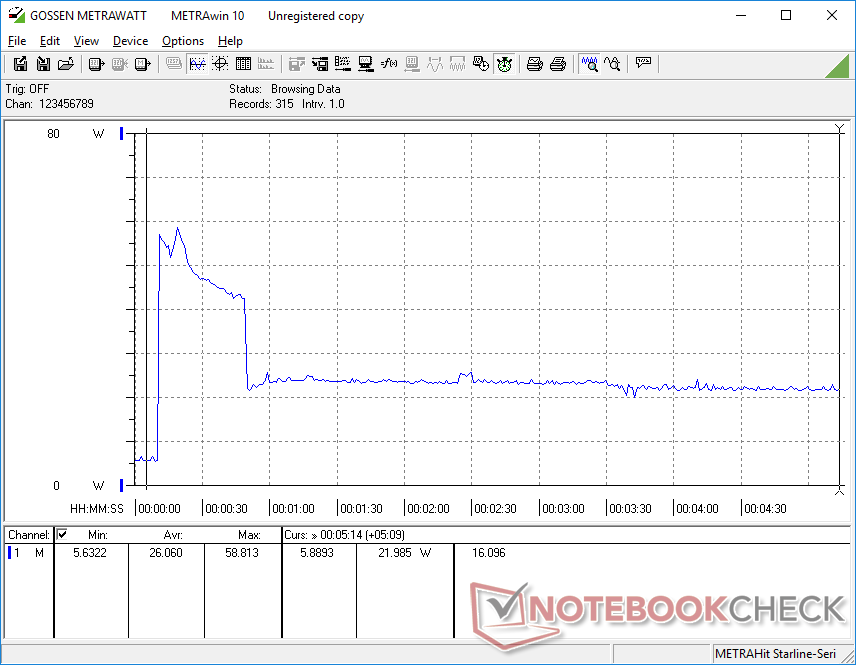
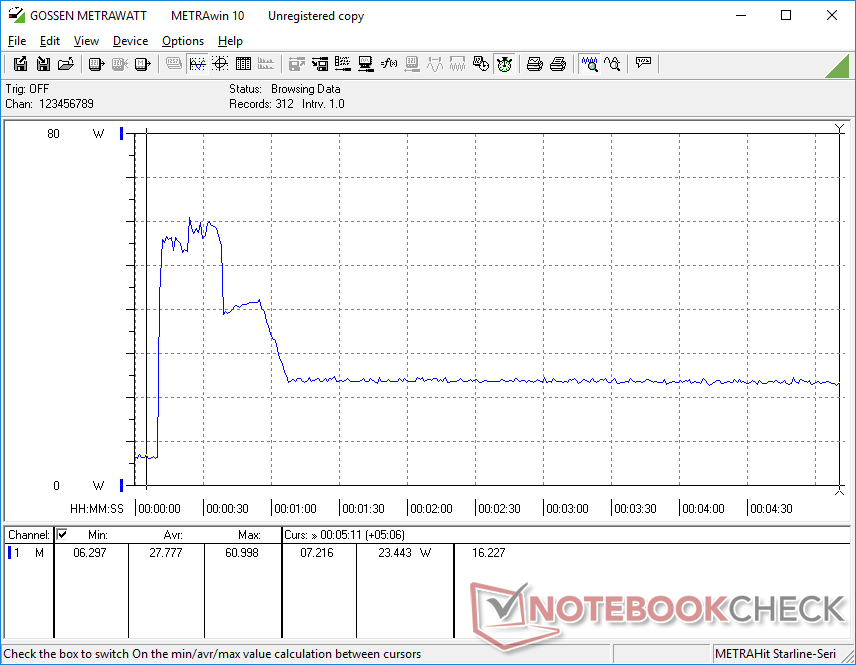
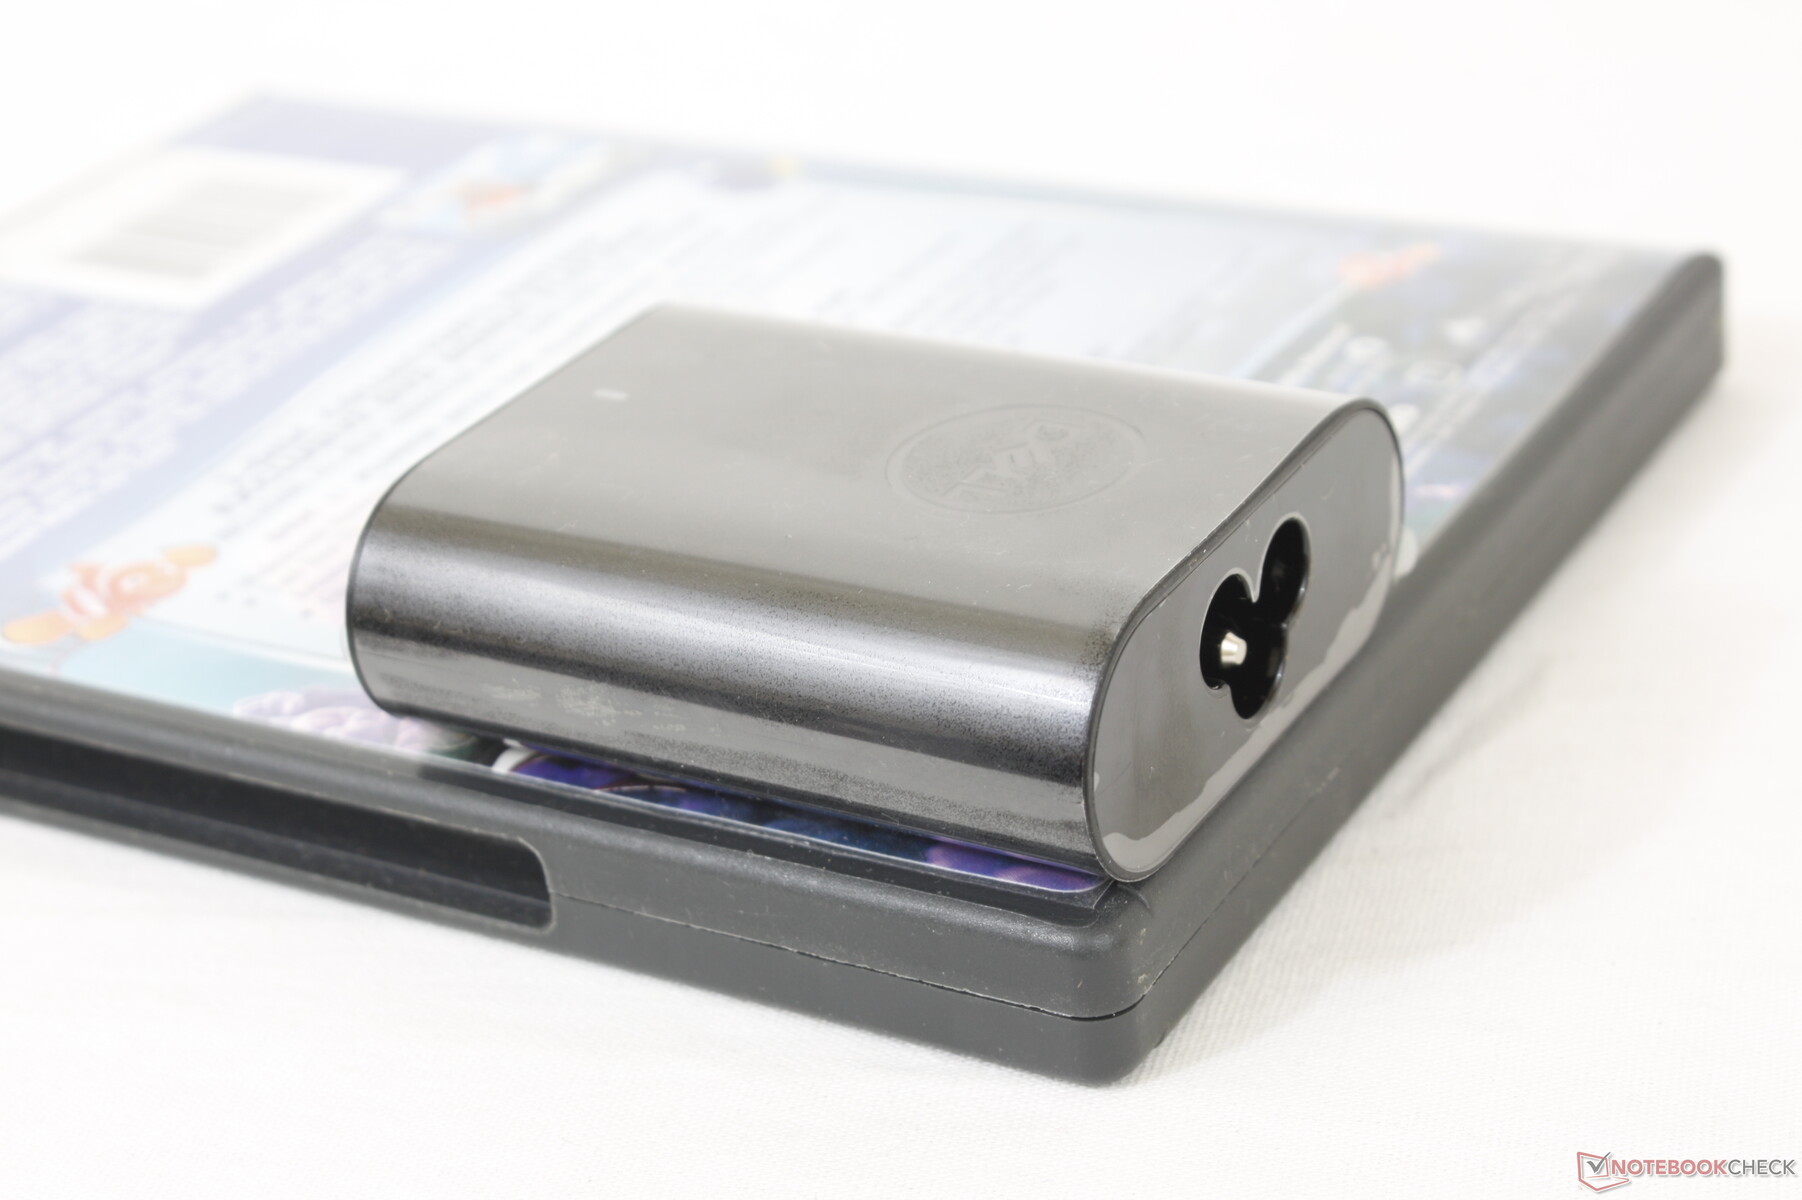
We're able to measure a maximum draw of 61 W from the small (~6.5 x 5.5 x 2.2 cm) 60 W when the CPU is at 100 percent utilization. This rate lasts for only a couple of seconds due to thermal limitations much like what we observed in our Stress Test section above.
| Off / Standby | |
| Idle | |
| Load |
|
Key:
min: | |
| Dell Latitude 13 7320 Detachable, i7-1180G7 i7-1180G7, Iris Xe G7 96EUs, WDC PC SN530 SDBPMPZ-265G, IPS, 1920x1280, 13" | Microsoft Surface Pro 7 Plus i5-1135G7, Iris Xe G7 80EUs, Samsung PM991 MZ9LQ256HBJQ, IPS, 2736x1824, 12.3" | Lenovo ThinkPad X12 20UVS03G00 i7-1160G7, Iris Xe G7 96EUs, Toshiba BG4 KBG40ZNT512G, a-Si IPS LED, 1920x1280, 12.3" | Dell XPS 13 7390 2-in-1 Core i7 i7-1065G7, Iris Plus Graphics G7 (Ice Lake 64 EU), Toshiba BG4 KBG40ZPZ512G, IPS, 1920x1200, 13.4" | Lenovo Yoga Duet 7 13IML05-82AS000WGE i5-10210U, UHD Graphics 620, Lenovo UMIS RPJTJ256MEE1OWX, IPS, 2160x1350, 13" | |
|---|---|---|---|---|---|
| Power Consumption | -63% | -22% | -19% | 2% | |
| Idle Minimum * (Watt) | 2.5 | 5.5 -120% | 4 -60% | 2.6 -4% | 3.1 -24% |
| Idle Average * (Watt) | 4.8 | 9.1 -90% | 5.9 -23% | 5.3 -10% | 5.7 -19% |
| Idle Maximum * (Watt) | 6 | 10.8 -80% | 8.3 -38% | 7 -17% | 8.7 -45% |
| Load Average * (Watt) | 31.9 | 39.2 -23% | 30.1 6% | 43.1 -35% | 20.5 36% |
| Witcher 3 ultra * (Watt) | 26.2 | 30.8 -18% | 43.1 -65% | ||
| Load Maximum * (Watt) | 61 | 62.5 -2% | 59 3% | 49 20% | 22.6 63% |
* ... smaller is better
Battery Life — Small Battery, Long Runtimes
Runtimes are longer than many other Windows tablets even after factoring in the small 40 Wh battery. In fact, we're able to record just over 11 hours of real-world WLAN use to be 3 hours longer than on the Surface Pro 7 Plus.
Charging from empty to full capacity takes two full hours or about half an hour longer than most Ultrabooks.
| Dell Latitude 13 7320 Detachable, i7-1180G7 i7-1180G7, Iris Xe G7 96EUs, 40 Wh | Microsoft Surface Pro 7 Plus i5-1135G7, Iris Xe G7 80EUs, 48.9 Wh | Lenovo ThinkPad X12 20UVS03G00 i7-1160G7, Iris Xe G7 96EUs, 42 Wh | Dell XPS 13 7390 2-in-1 Core i7 i7-1065G7, Iris Plus Graphics G7 (Ice Lake 64 EU), 51 Wh | Lenovo Yoga Duet 7 13IML05-82AS000WGE i5-10210U, UHD Graphics 620, 39 Wh | |
|---|---|---|---|---|---|
| Battery runtime | 12% | -15% | -18% | -24% | |
| Reader / Idle (h) | 17.7 | 13.6 -23% | 12.8 -28% | ||
| WiFi v1.3 (h) | 11 | 8.1 -26% | 8.2 -25% | 9 -18% | 8.7 -21% |
| Load (h) | 2.1 | 3.9 86% | 2 -5% | 1.6 -24% |
Pros
Cons
Verdict — Minimalist Design, Maximum Productivity
If you're looking for a Windows tablet without having to settle for a Microsoft Surface Pro, then the Dell Latitude 13 7320 detachable is worth considering. Its main selling point is the larger and brighter 13-inch screen compared to only 12.3-inch on the Surface Pro 7 all while being nearly identical in overall dimensions. The Dell model benefits from higher power efficiency and longer battery life as well to be better for traveling. Office users will appreciate its two Thunderbolt 4 ports that will surely come in handy for docking purposes whereas most other tablets would typically come with only one USB-C port.
Easily the best Windows detachable from Dell thus far. The narrow bezels, bright 500-nit touchscreen, and double Thunderbolt 4 ports help distinguish the Latitude 13 7320 from other Windows tablets.
Potential buyers should be aware of the relatively loud fan noise when running demanding loads and that raw CPU performance from the Core i7-1180G7 is just slightly below the Core i5-1135G7. New owners should also check the rigidity of the kickstand to make sure it's not loose. The Latitude 13 7320 detachable is noticeably more expensive than the Surface Pro 7, but it comes with plenty more features both inside and out to help make up the difference.
Price and availability
Dell Latitude 13 7320 Detachable, i7-1180G7
- 06/13/2021 v7 (old)
Allen Ngo
Price comparison
