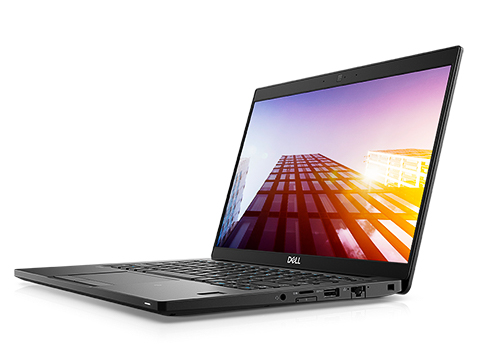
Dell Latitude 7390 (i5-8350U, SSD 256 GB) Laptop Review

The new Dell Latitude 7390 is a mobile business notebook of the upper price range in the popular 13-inch format and also a successor of the Latitude 13 7380, which we only tested in December of last year. At the time of testing, you can purchase the current configuration in the Dell shop for 1379 Euros (~$1706; the Latitude 7390 starts at $1199 in the US). It is driven by the Intel Core i5-8350U quad-core accompanied by 8 GB of RAM. The graphics are handled by the Intel HD Graphics 620 processor GPU, and the storage solution is a 256-GB SSD.
The Latitude scores with a complete security package that differentiates itself from the bulk of business notebooks by a smart card slot and is rounded off by Windows 10 Pro with Bitlocker. The subnotebook weighs 1.3 kg (~2.9 lb) and its Full HD IPS display has a resolution of 1920x1080 pixels. You can see an overview of the basic configurations offered by Dell here. Under the same label, Dell also carries a series of convertibles (2-in-1) that share many characteristics of the non-convertibles. As always, you can modify the equipment details in the Dell Configurator.
In addition to the predecessor, we have included a compact 14-inch and two 13-inch devices from our list of the Top 10 subnotebooks, one of which is a convertible. As with the Latitude 7390, all the laptop in the test are of the upper price range and target mobile business users. The following are included in our test:
- Dell Latitude 13 7380 (predecessor)
- HP EliteBook x360 1030 G2 (13.3-inch convertible)
- Toshiba Portege X30-D (13.3-inch)
- Asus ZenBook UX3430UQ-GV012T (14-inch)
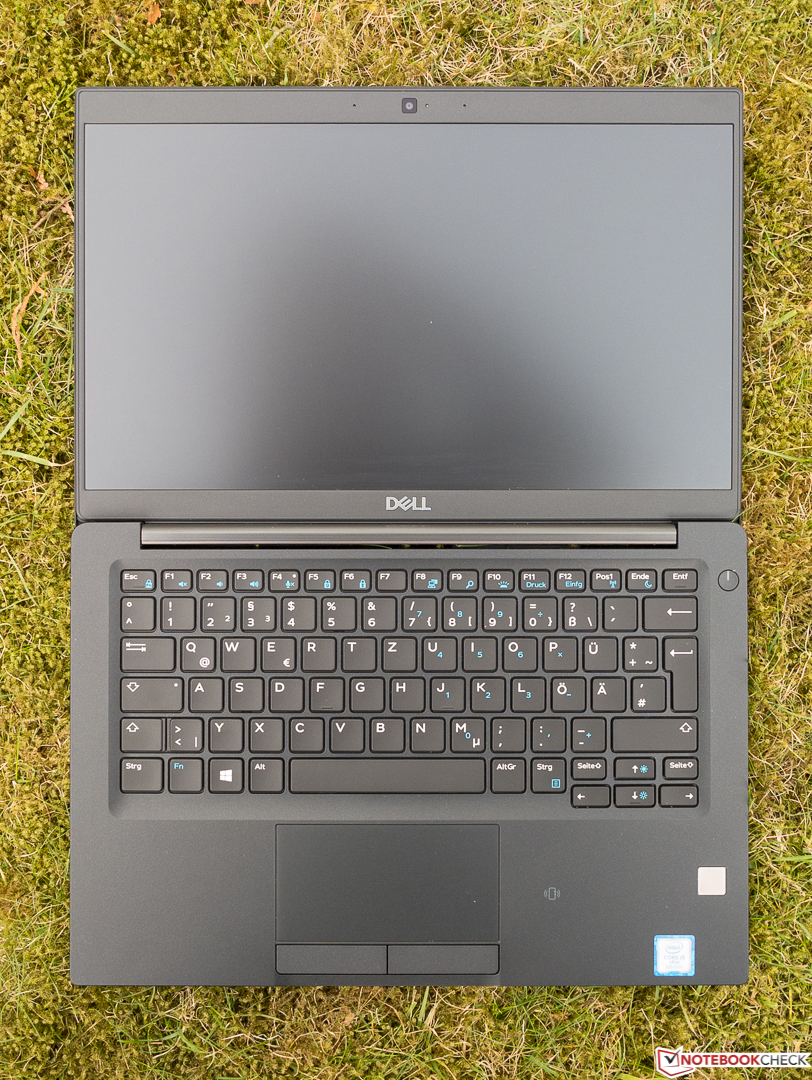
Case: simple, sturdy, and non-slip surface
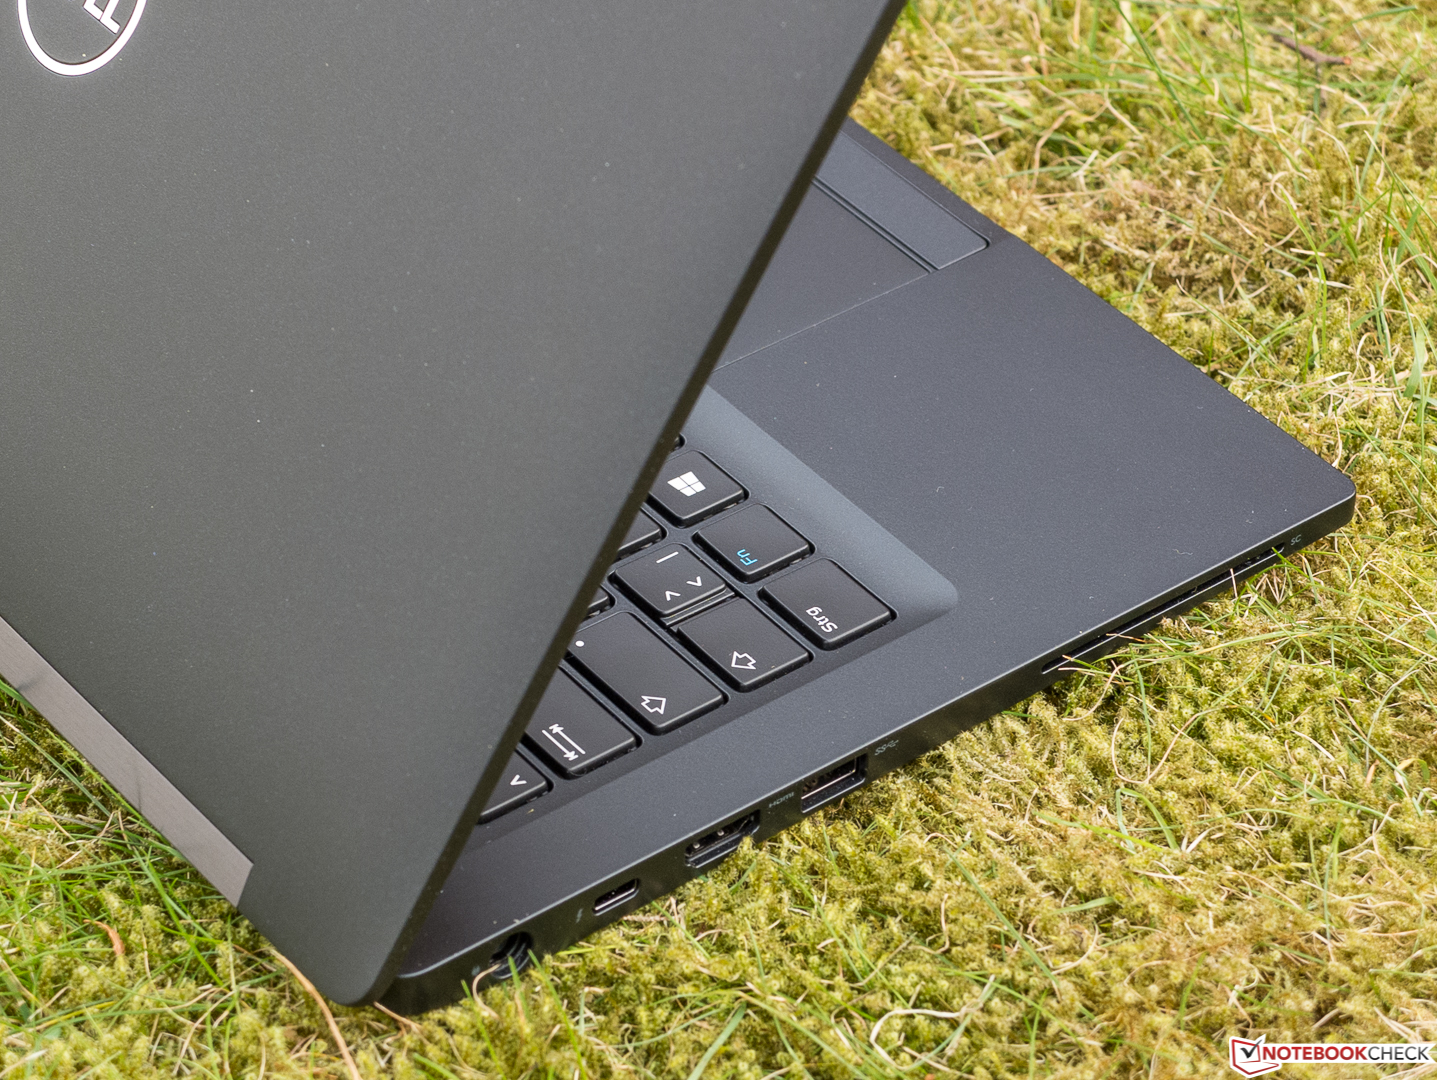
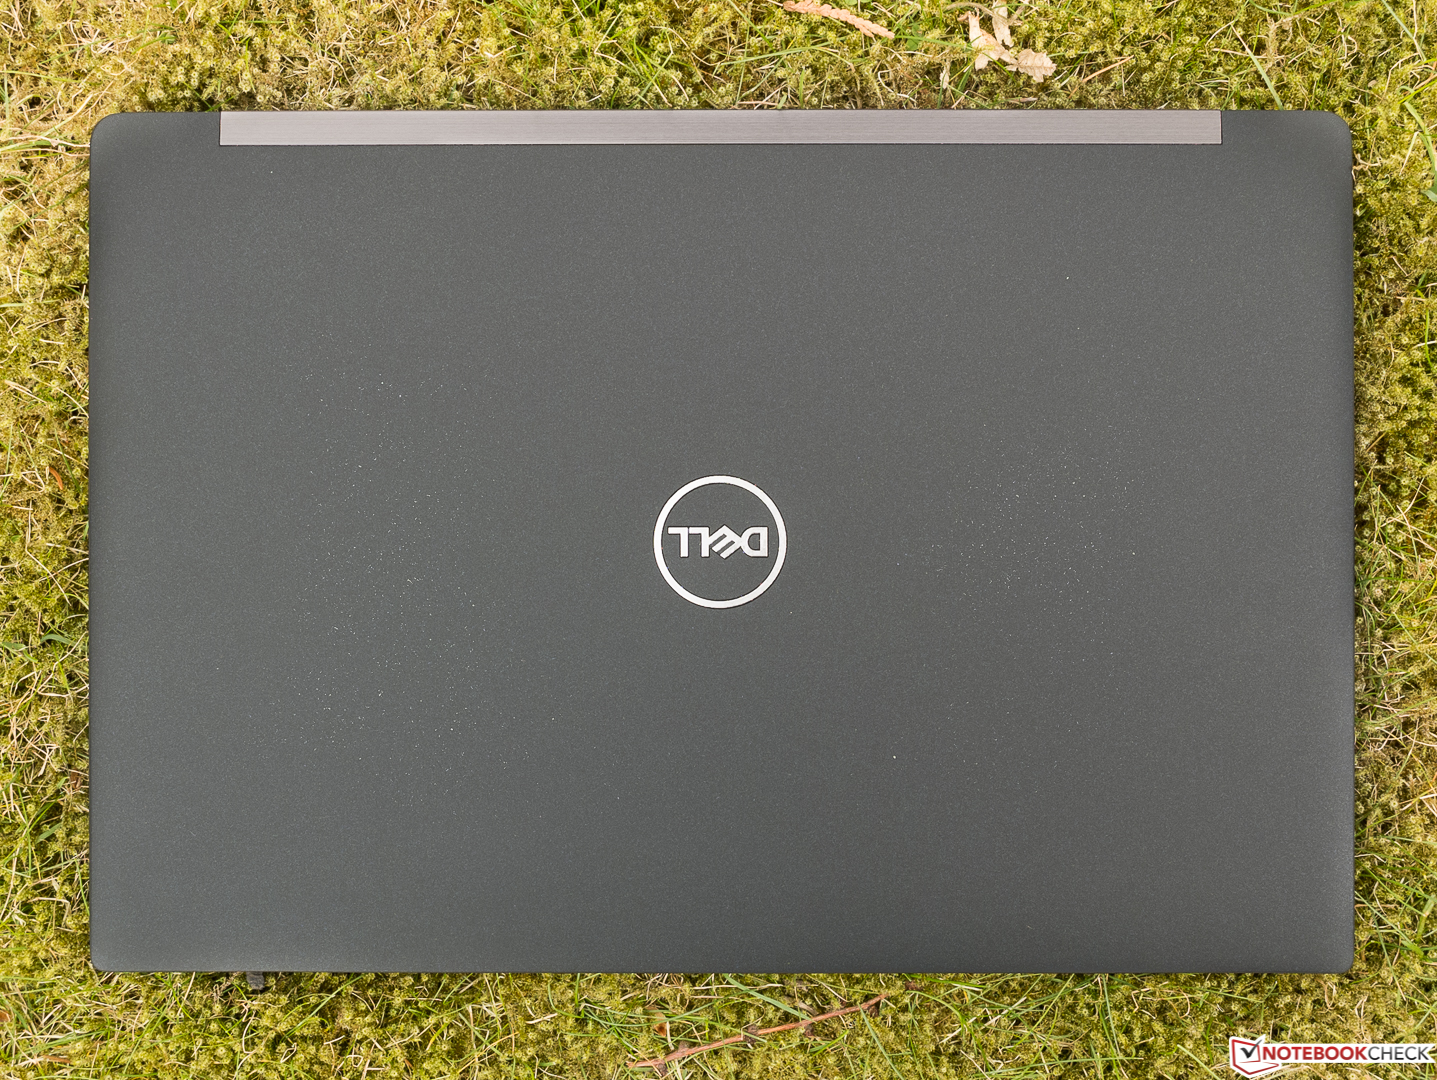
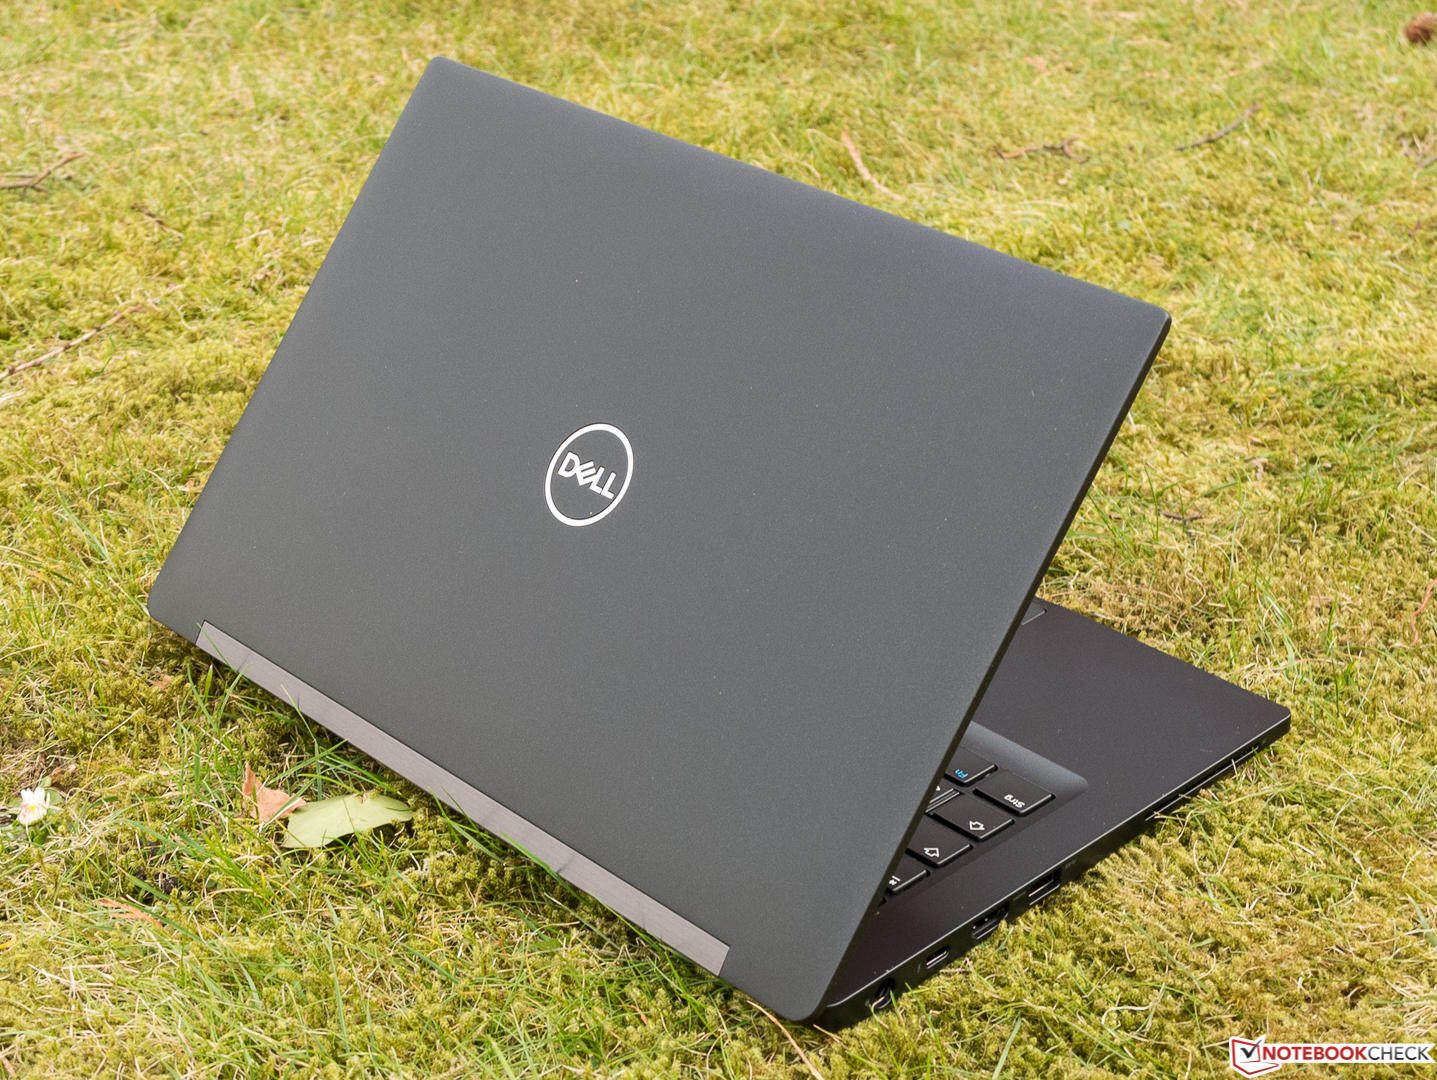
The case, which is almost completely matte black and wedge-shaped tapering towards the front, appears almost generic in its elegant simplicity. Apart from the Dell logo, a color contrasted stripe at the bottom edge of the back, the On/Off button, and perhaps the hinge, there are hardly any visual accents. We especially liked the non-slip, almost rubberized surfaces of the base and the back of the lid. While fingerprints were visible, they did not stand out too much. On its page on the 7390, Dell speaks about "high-quality materials such as a magnesium alloy."
Even with the use of slightly more force, the base can only be twisted to a very limited extent while it merely produces some quiet creaking. The lid is unusually robust and also turns out to be pressure resistant. Single-handed opening becomes a problem, but on the other hand, the lid wobbles only minimally and briefly. The Dell Latitude 13 7930 can be opened to slightly more than 180°, and from about 135° the back is raised by the lid, which does not help the skid resistance.
In terms of its flawless workmanship, the 7930 does full justice to its high price. The device appears high-quality, solid, and despite (or because of) its simplicity, even representative. Let us put it this way: It will not take long for somebody who knows a little about notebooks to see the price level of the Dell.
Compared to the predecessor, the Latitude 13 7380, the weight and footprint have hardly changed, and a few millimeters were shaved off the thickness. At about 1 kg (2.2 lb), Toshiba is presenting the lightest laptop in this test, and all the other candidates weigh about 1.3 kg (~2.9 lb). At the same time, the Portégé X30-D together with the 14-inch device from Asus which has exactly the same thickness (both 15.9 mm, ~0.63 in) take up the most space on the desk. In terms of its footprint, the HP Convertible is between them and mainly scores with its very low height of only 14.9 mm (~0.58 in).
Equipment: smart card for more security
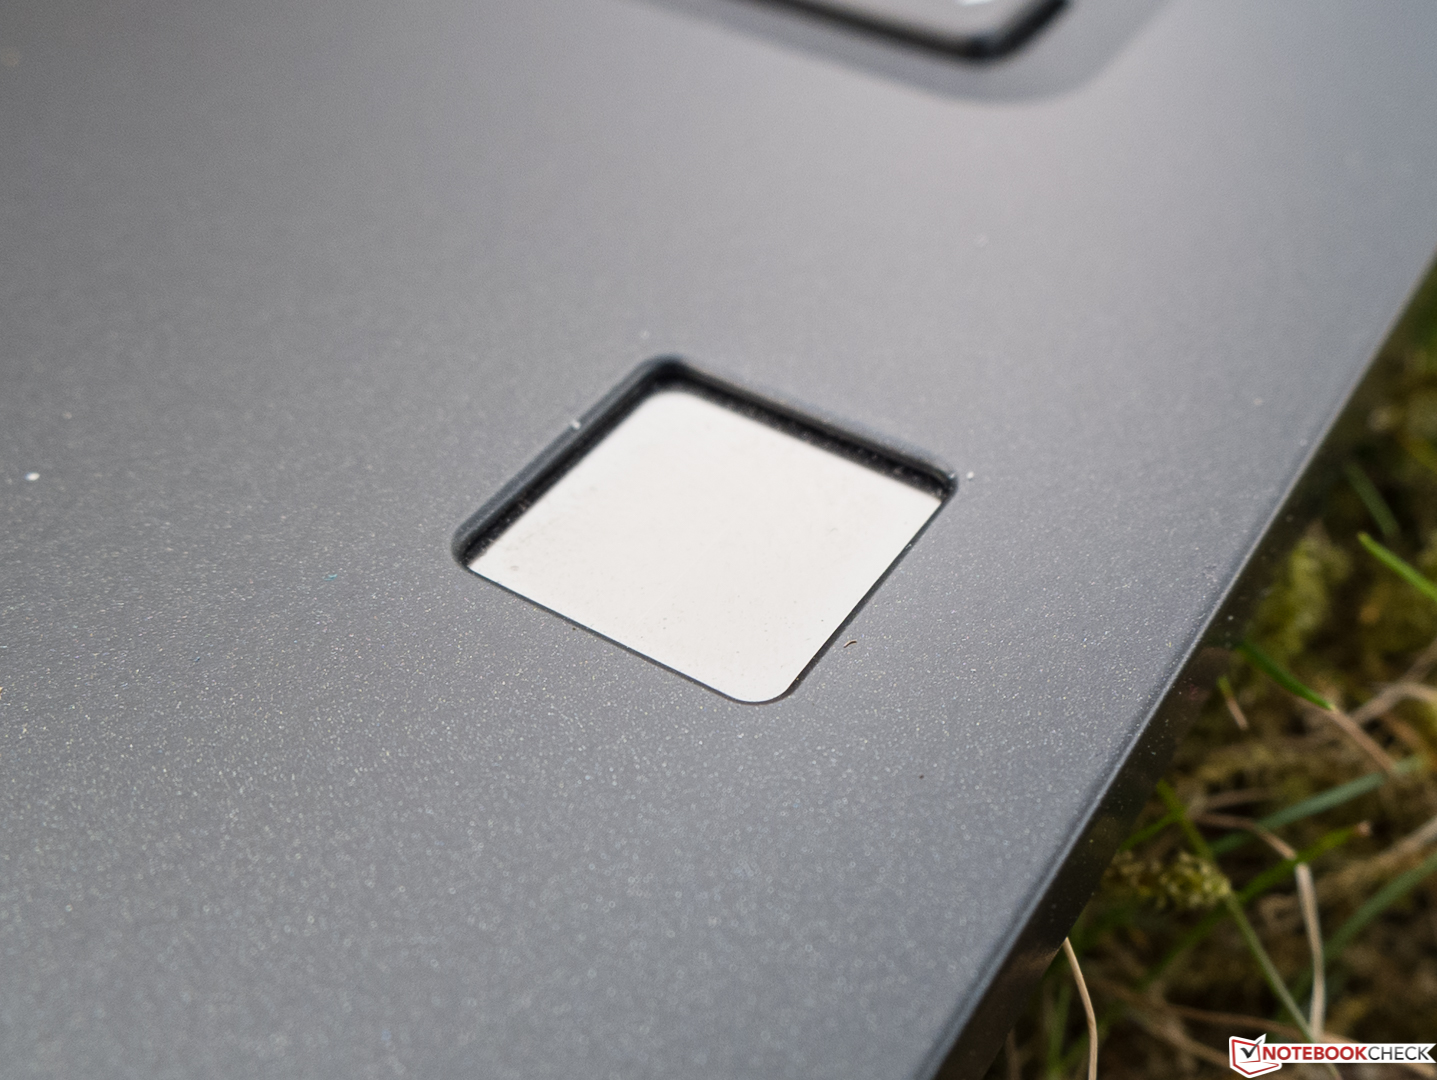
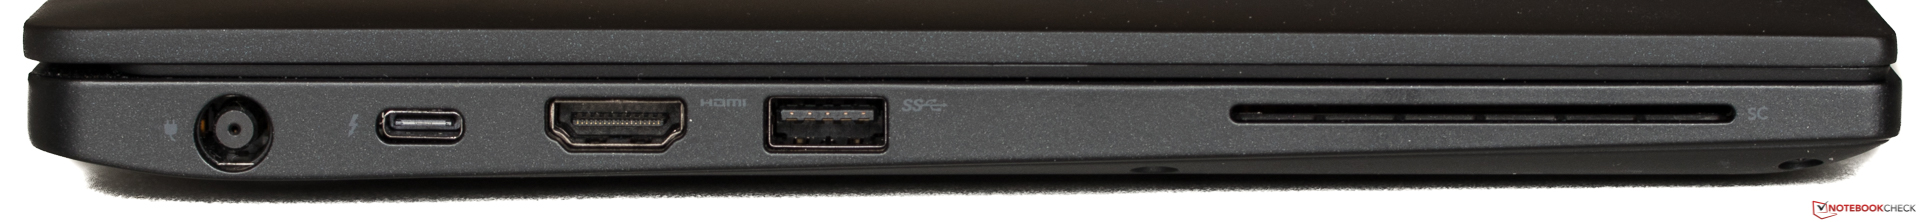
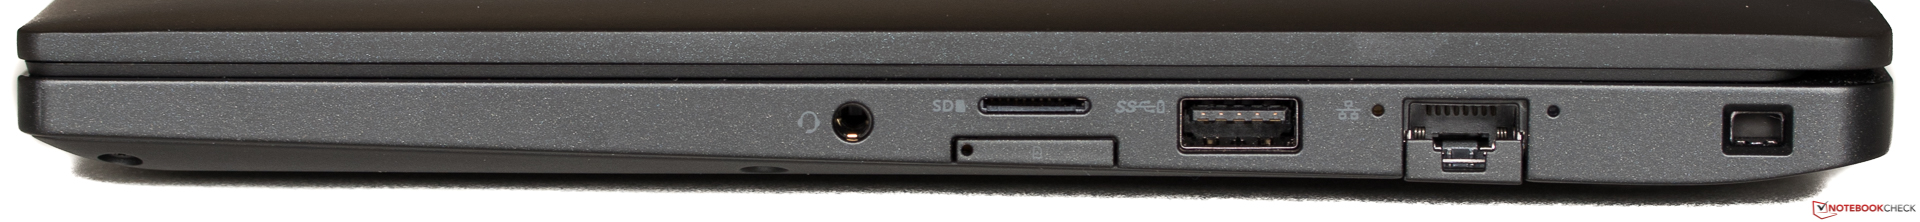
While the Dell Latitude 7390 is distinguished by its solid connection equipment, you look in vain for highlights such as Thunderbolt 3. In addition to two USB 3.1 Gen1 connections, there are also a USB Type-C connection with DisplayPort, Ethernet, a slot for microSD cards, and a micro-SIM tray for the optional WLAN module, which was unoccupied in our test unit. You do not see a slot for a smart card often nowadays. Dell has succeeded in distributing the connections ergonomically in the rear areas of the sides, and only the smart card slot is in the front on the left side.
SD Card Reader
Unlike the card reader of the predecessor, that of the new Dell 7390 is connected via PCIe and therefore shows very good transfer rates which in our test were barely 30% behind the fastest card reader in our database. With their USB-3.0 connection, the predecessor and the Toshiba do not even manage half that speed, and the Asus ZenBook with its lame USB-2.0 speeds is simply annoying to everyone and not just photographers. Unfortunately you are limited to microSD, and therefore can only use microSD cards (with an SD adapter if necessary) in your camera as well. We performed our measurements with our Toshiba Exceria Pro M501 reference microSD card.
| SD Card Reader | |
| average JPG Copy Test (av. of 3 runs) | |
| Dell Latitude 7390 (Toshiba Exceria Pro M501) | |
| Dell Latitude 13 7380 (Toshiba Exceria Pro SDXC 64 GB UHS-II) | |
| Toshiba Portege X30-D (PT274U-01N001) (Toshiba Exceria Pro M401) | |
| Average of class Office (19.8 - 198.5, n=22, last 2 years) | |
| Asus Zenbook UX3430UQ-GV012T (Toshiba Exceria Pro SDXC 64 GB UHS-II) | |
| maximum AS SSD Seq Read Test (1GB) | |
| Dell Latitude 7390 (Toshiba Exceria Pro M501) | |
| Toshiba Portege X30-D (PT274U-01N001) (Toshiba Exceria Pro M401) | |
| Dell Latitude 13 7380 (Toshiba Exceria Pro SDXC 64 GB UHS-II) | |
| Average of class Office (27.4 - 249, n=21, last 2 years) | |
| Asus Zenbook UX3430UQ-GV012T | |
Communication
Dell is using the tried and tested but no longer new Intel Wireless AC-8265 WLAN module. The module integrates Bluetooth 4.2, and achieves a maximum gross data rate of 867 MBit/s, thanks to MIMO 2x2 in the 5-GHz band. If you assume an unavoidable overhead of perhaps 200 MBit/s, the Dell 7930 achieves a good result in the competition during receiving which is mostly more important. However, during sending it is weaker, as with most of the competitors. For 87.10 Euros (~$108) extra (at the time of testing), you can add the Dell Wireless Qualcomm Snapdragon X7 LTE-A (DW5811E) WWAN module. NFC is also implemented.
Security
Finally, you get the complete security package here: From TPM 2.0 up to the fingerprint sensor, smart card, and Bitlocker hard-drive encryption via Windows 10 Pro, everything that the mobile business user could wish for is included. Unfortunately, the fingerprint reader is recessed too deep in the case, so that it gave us some problems during the setup. It also does not always unlock the Dell notebook reliably, and may need several attempts.
Accessories
Apart from the mandatory power supply, you can only find the safety instructions and a Quick Start Guide in the simple box. Dell does not offer any accessories that are specifically designed for the Latitude 7390.
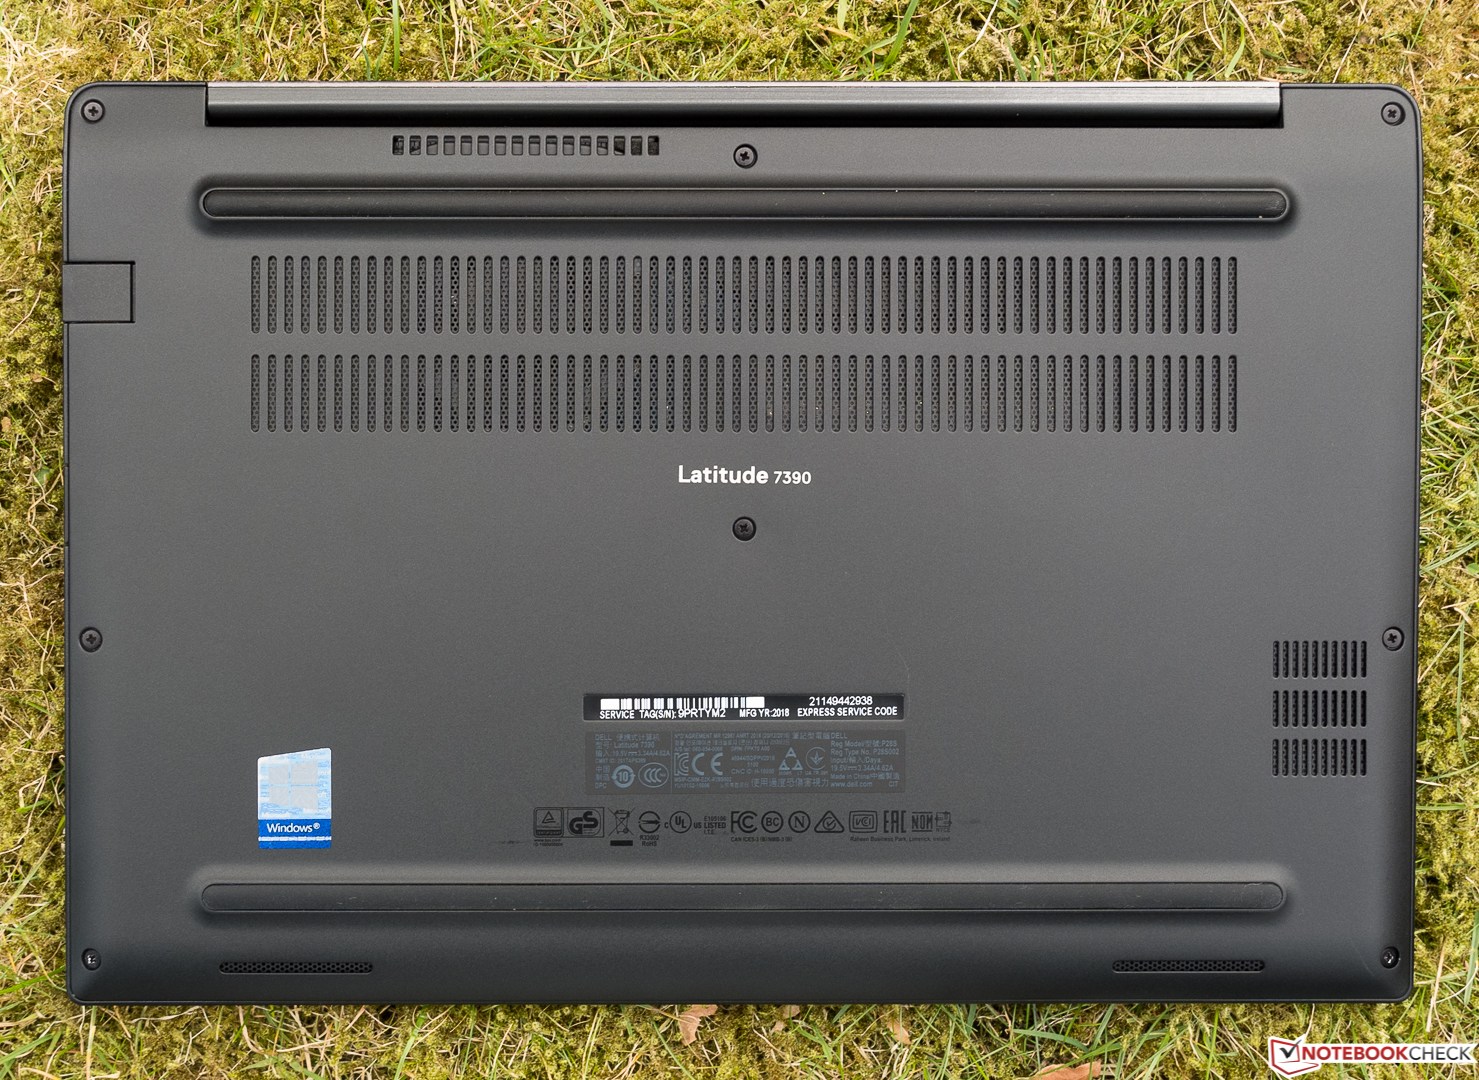
Maintenance
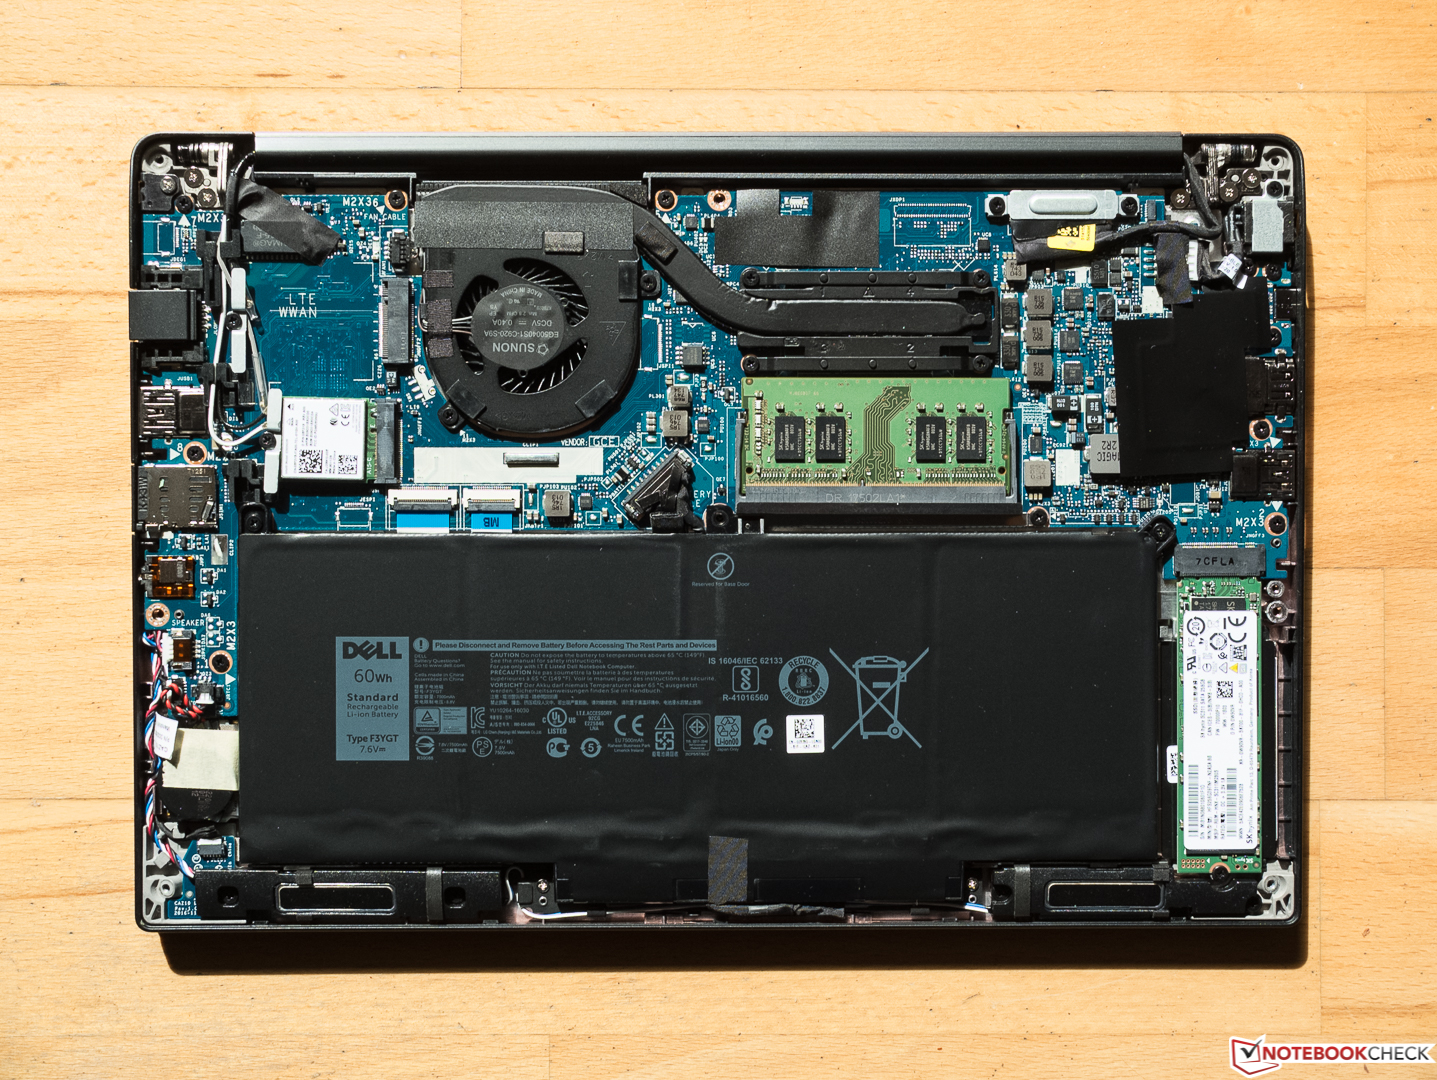
There is no maintenance hatch, and the battery is not accessible from the outside. However the disassembly, which might void the warranty, can be performed without any problems, since you only need to remove the base plate which is secured with 8 Philips screws. You get access to the storage, fan, battery, and the three M.2 expansion slots, one of which is occupied with the SSD and another with the WLAN module, while the one for the WWAN is left empty.
Warranty
Dell delivers the Latitude 7390 with a three-year standard manufacturer's warranty. Dell Support will first try to resolve the problem via remote maintenance and hotline on the next business day. If that does not help, you need to send the laptop to a repair center certified by Dell. You can find out about the fee-based warranty extension options here.
Please see our Guarantees, Return Policies and Warranties FAQ for country-specific information.
Input Devices: high-quality haptics and a few quirks
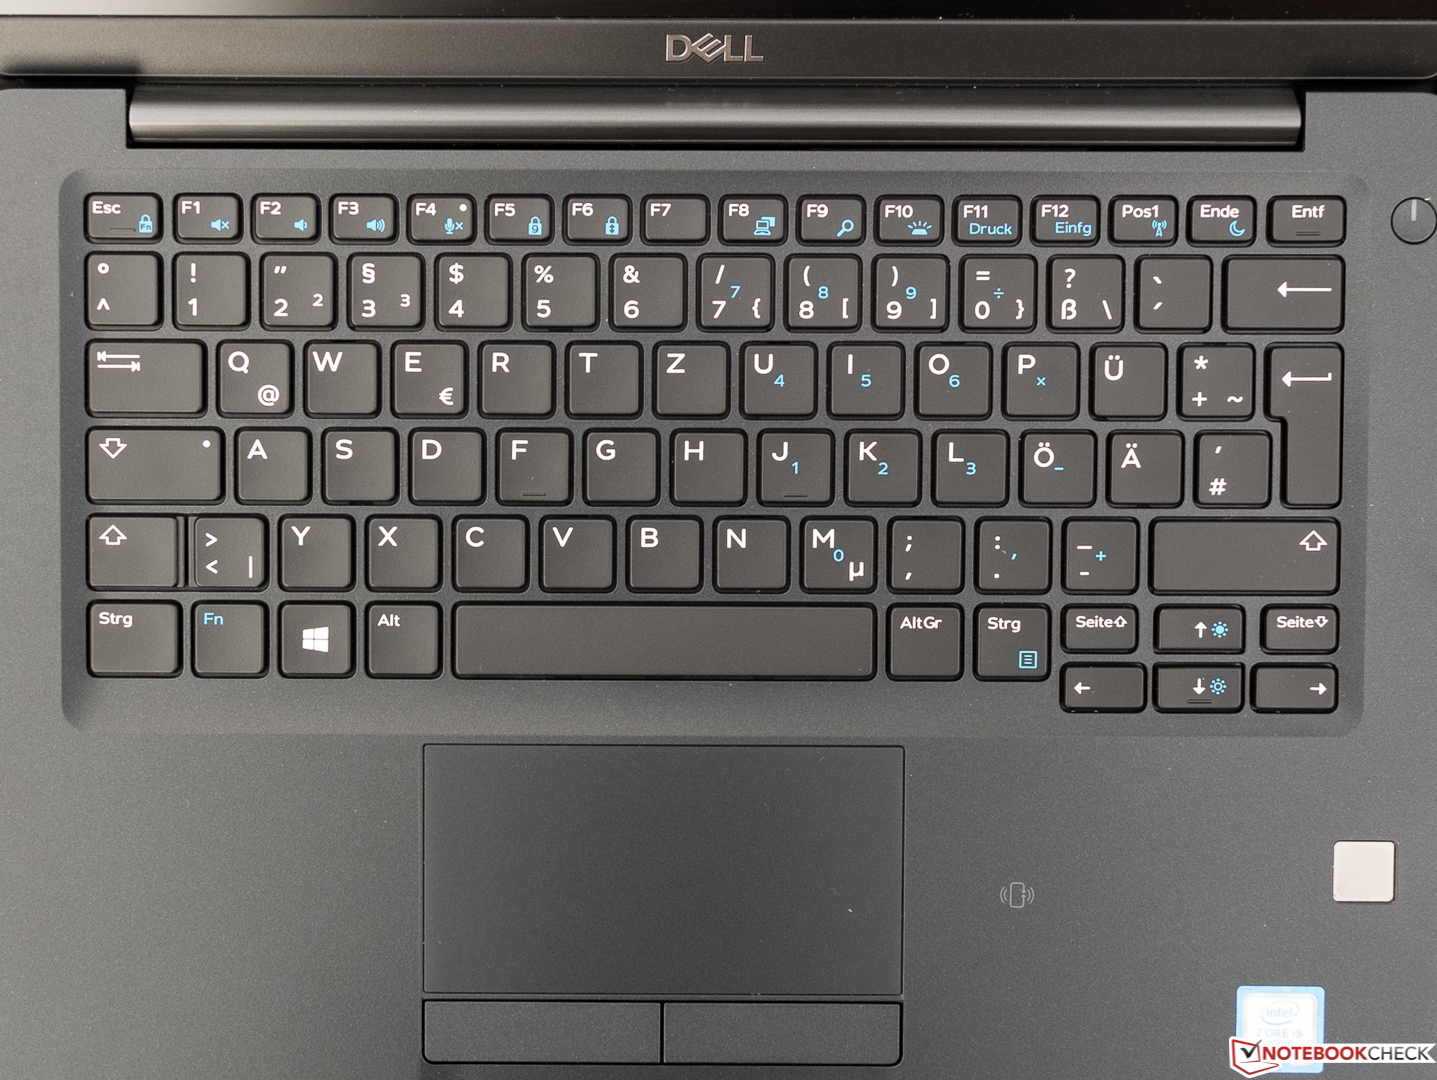
Keyboard
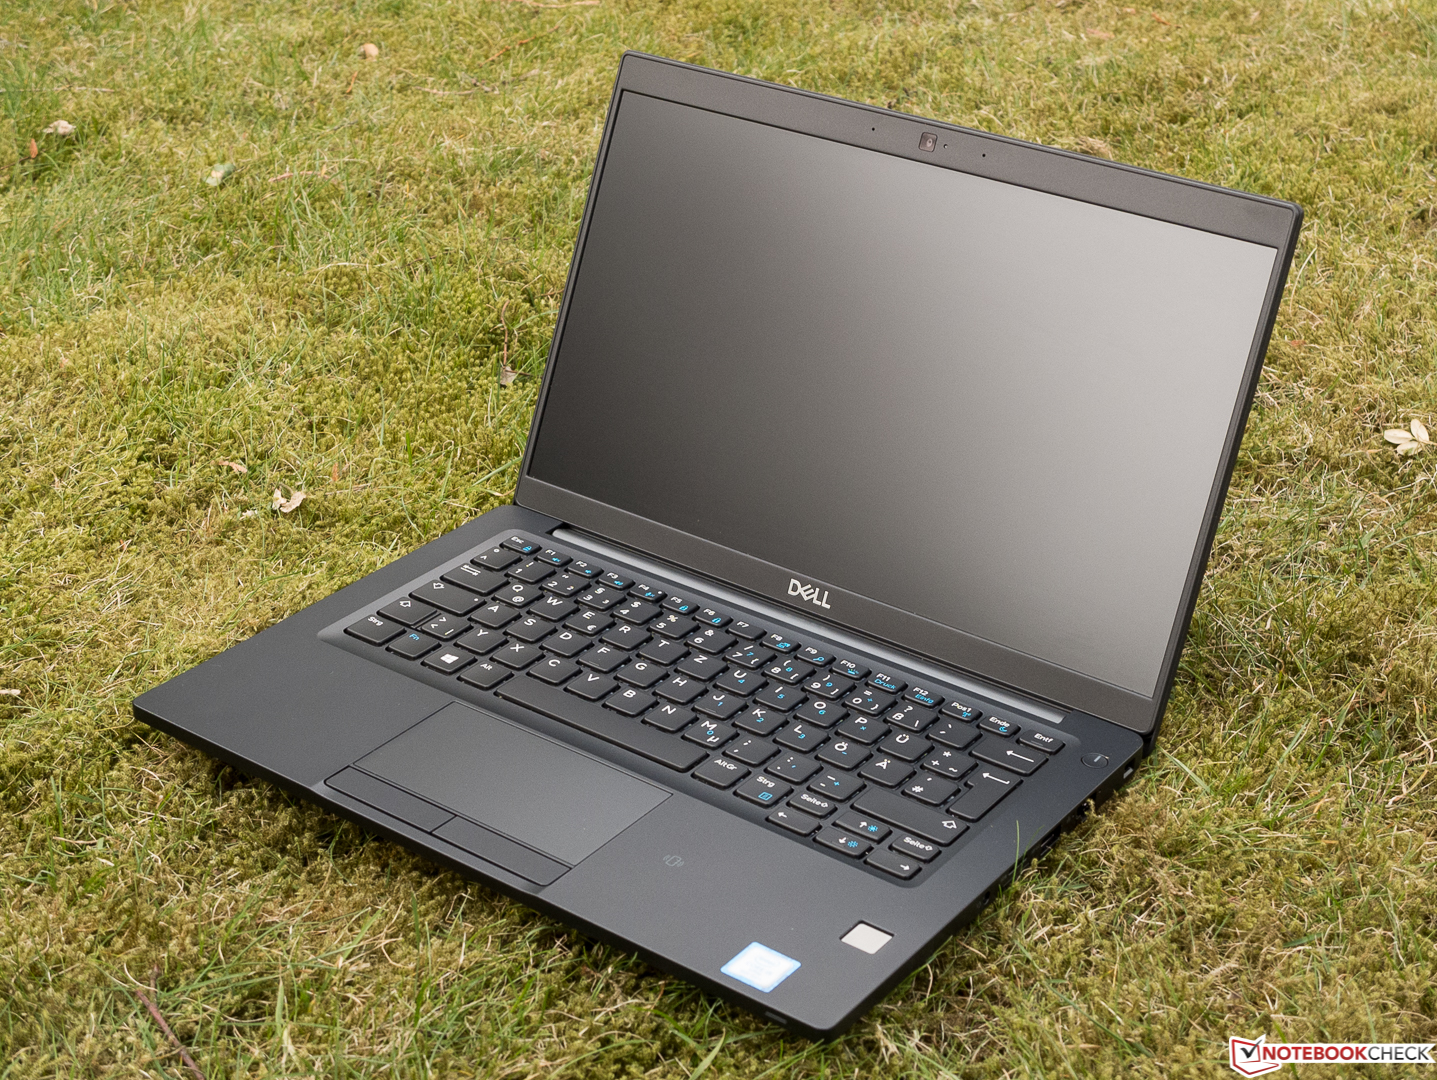
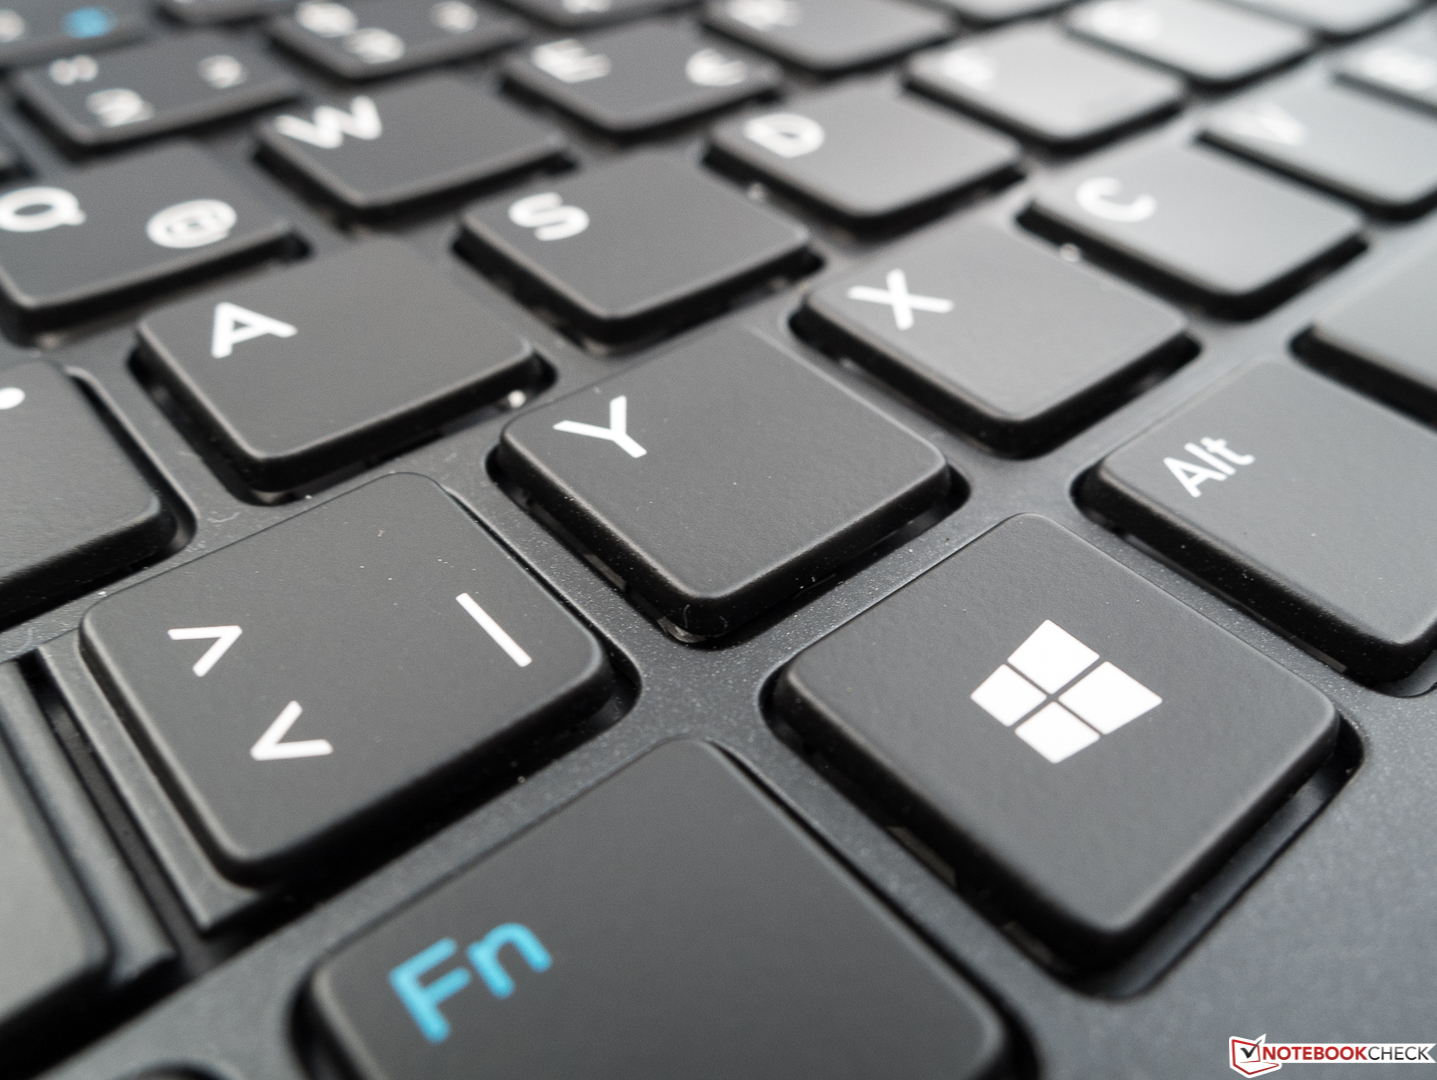
With its predominantly high-quality ThinkPad keyboards, Lenovo has set yardsticks to which other manufacturers have to be compared again and again. With the Latitude 7930 at last, Dell has succeeded in partially countering this in the opinion of the tester. However, the keyboard turned out relatively small by about 2 cm (~0.8 in) in the width compared to a standard desktop keyboard, which is reflected in the Return key being too small, for example. Otherwise, the tester had no problems with the sizes and distances of the keys, although some 10-finger desktop movements might feel a little cramped. There are hardly any peculiarities in the layout, only the Page Up and Page Down keys have moved into the key block with the half-sized Arrow keys. The Escape key also serves as Fn-Lock key and could have therefore used its own status-LED, which is only limited to the F4 (i.e. microphone on/off) and Shift Lock keys.
The ergonomically labeled, regular size keys have a slightly concave shape, but all the other keys appear flat. With an easily noticeable pressure point and short stroke, the keys are only slightly cushioned, which accommodates the tastes of the tester. In terms of its satisfying typing experience and high-quality haptic feel, the keyboard is in no way inferior to a good ThinkPad keyboard. We might have said the same for the subdued noise level during typing, but unfortunately Dell has messed up with the frequently-used Space bar, whose clattering is really noisy compared to the other keys.
Touchpad
The conventional touchpad is large with physically separated keys. The surface is roughened minimally, which ensures easy sliding of even moist fingers. However, it does not react to initial input at the very top edge. The mouse pointer can be moved with pixel accuracy, and fast (but not extremely fast) movements are followed well. You can configure gestures of up to four fingers with the aid of the Windows configuration settings, and there is also a Dell driver menu where some legacy functions can be controlled.
Unfortunately, the two replacement mouse keys make a rattly and cheap impression, the pressure point is only acceptable, and the acoustic feedback is almost missing completely.
Display: high contrast and no PWM/CABC
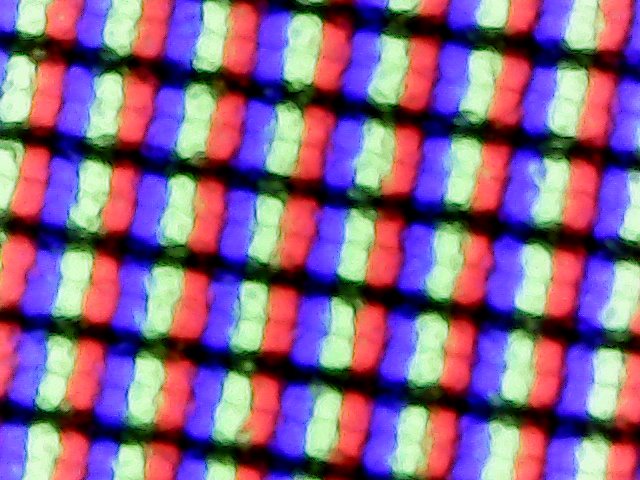
Dell is using a matte IPS panel with a Full HD resolution (13.3 inches, 165 PPI), which should ensure that even users with sharp eyes should not see a pixelated image at close distance. The very good brightness is surpassed by the Toshiba and particularly the Asus, while the HP turns out too dark for a convertible in its price range.
The 92% brightness distribution is good and will be reflected in a black image that appears homogeneous and saturated overall. However, in very dark image content, you can notice clear beginnings of screen bleeding towards the edges. None of the candidates use PWM, and the manufacturer has also done without CABC in Dell Latitude 13. Although Dell lists some alternative displays on a specification sheet, these are not available in the laptop configurator.
| |||||||||||||||||||||||||
Brightness Distribution: 92 %
Center on Battery: 332 cd/m²
Contrast: 1316:1 (Black: 0.25 cd/m²)
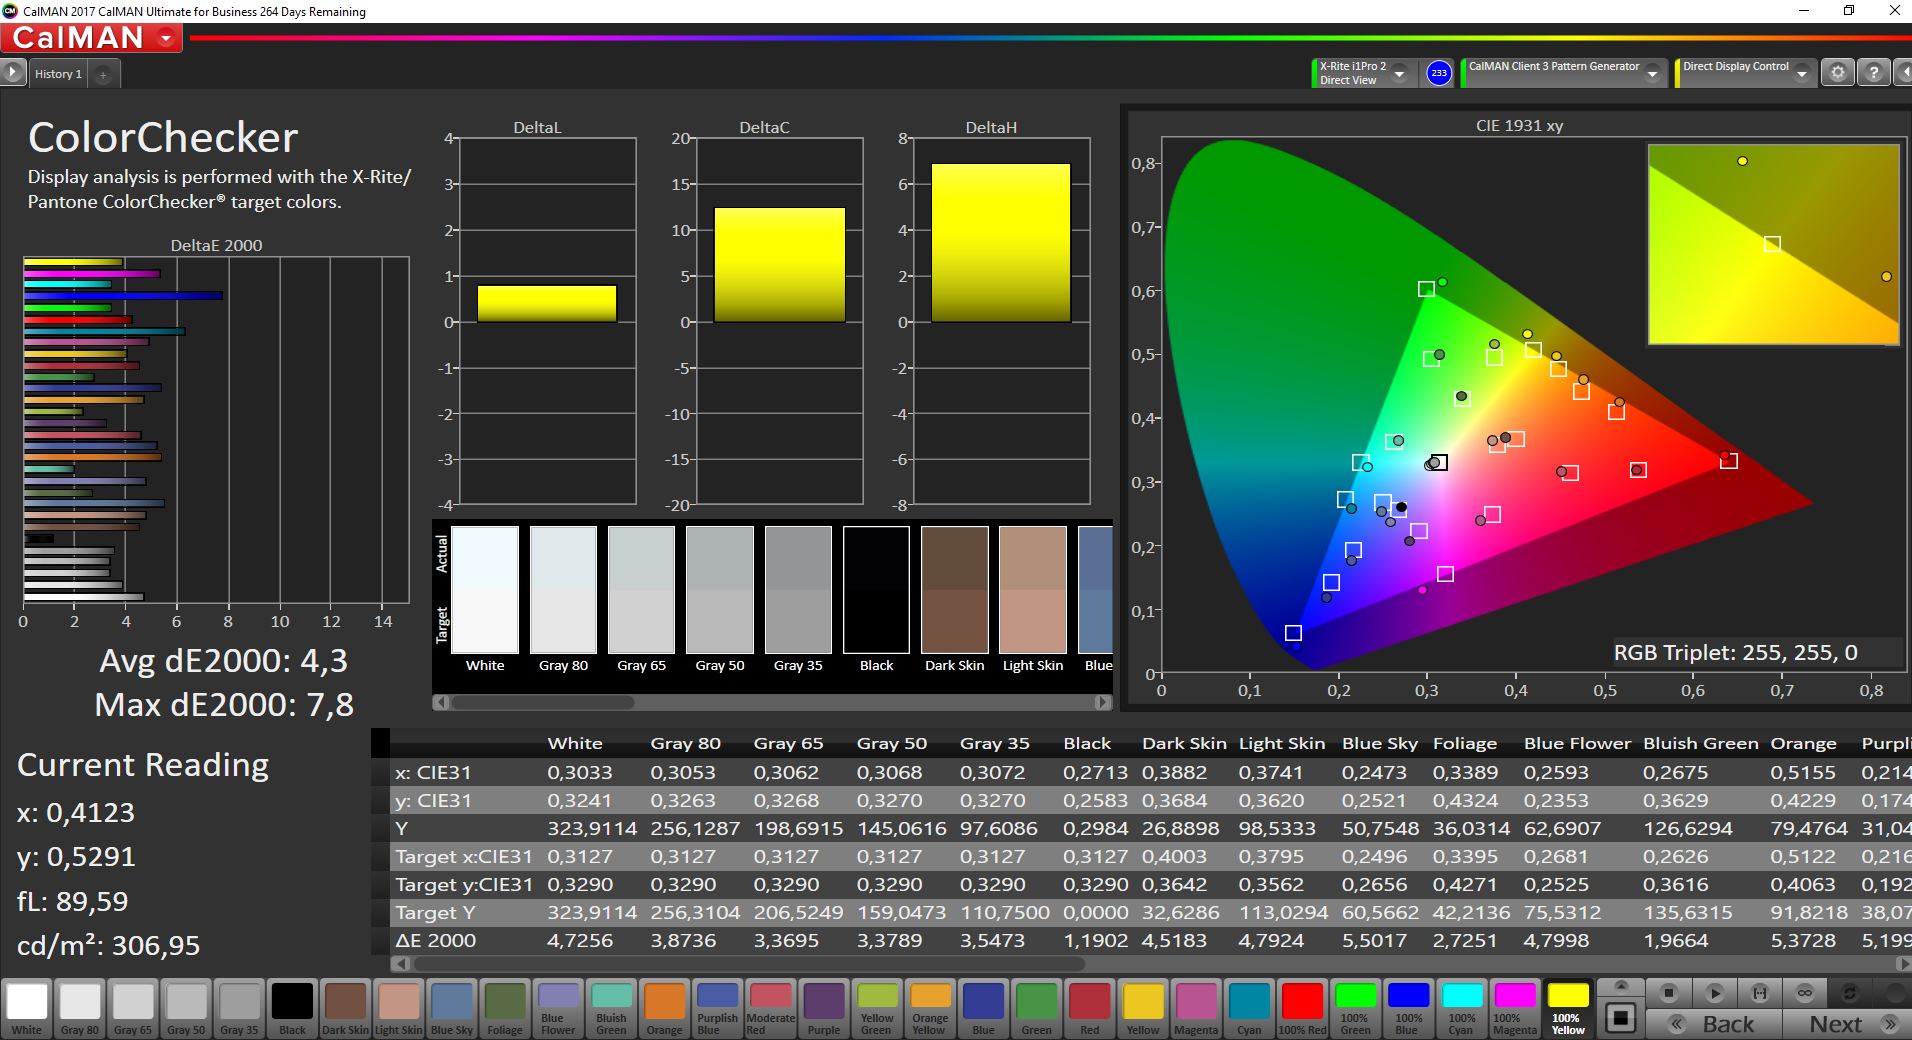
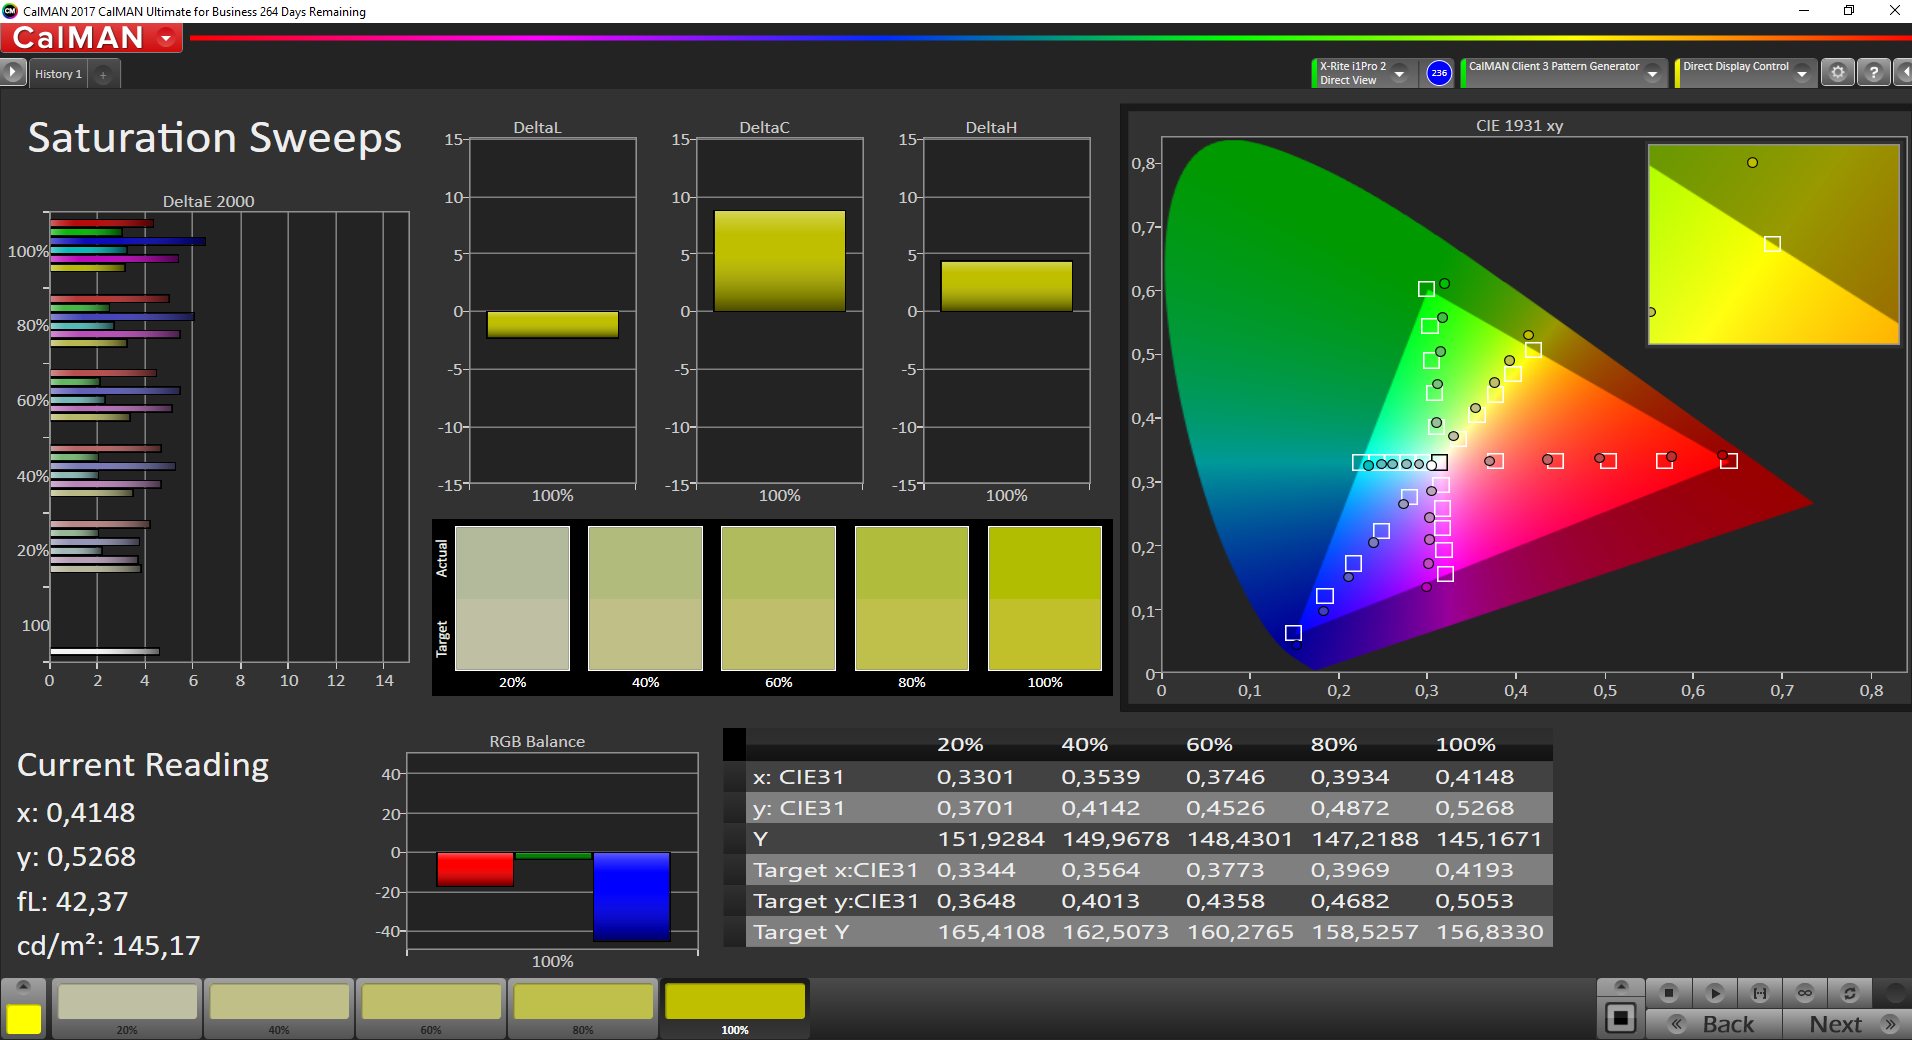
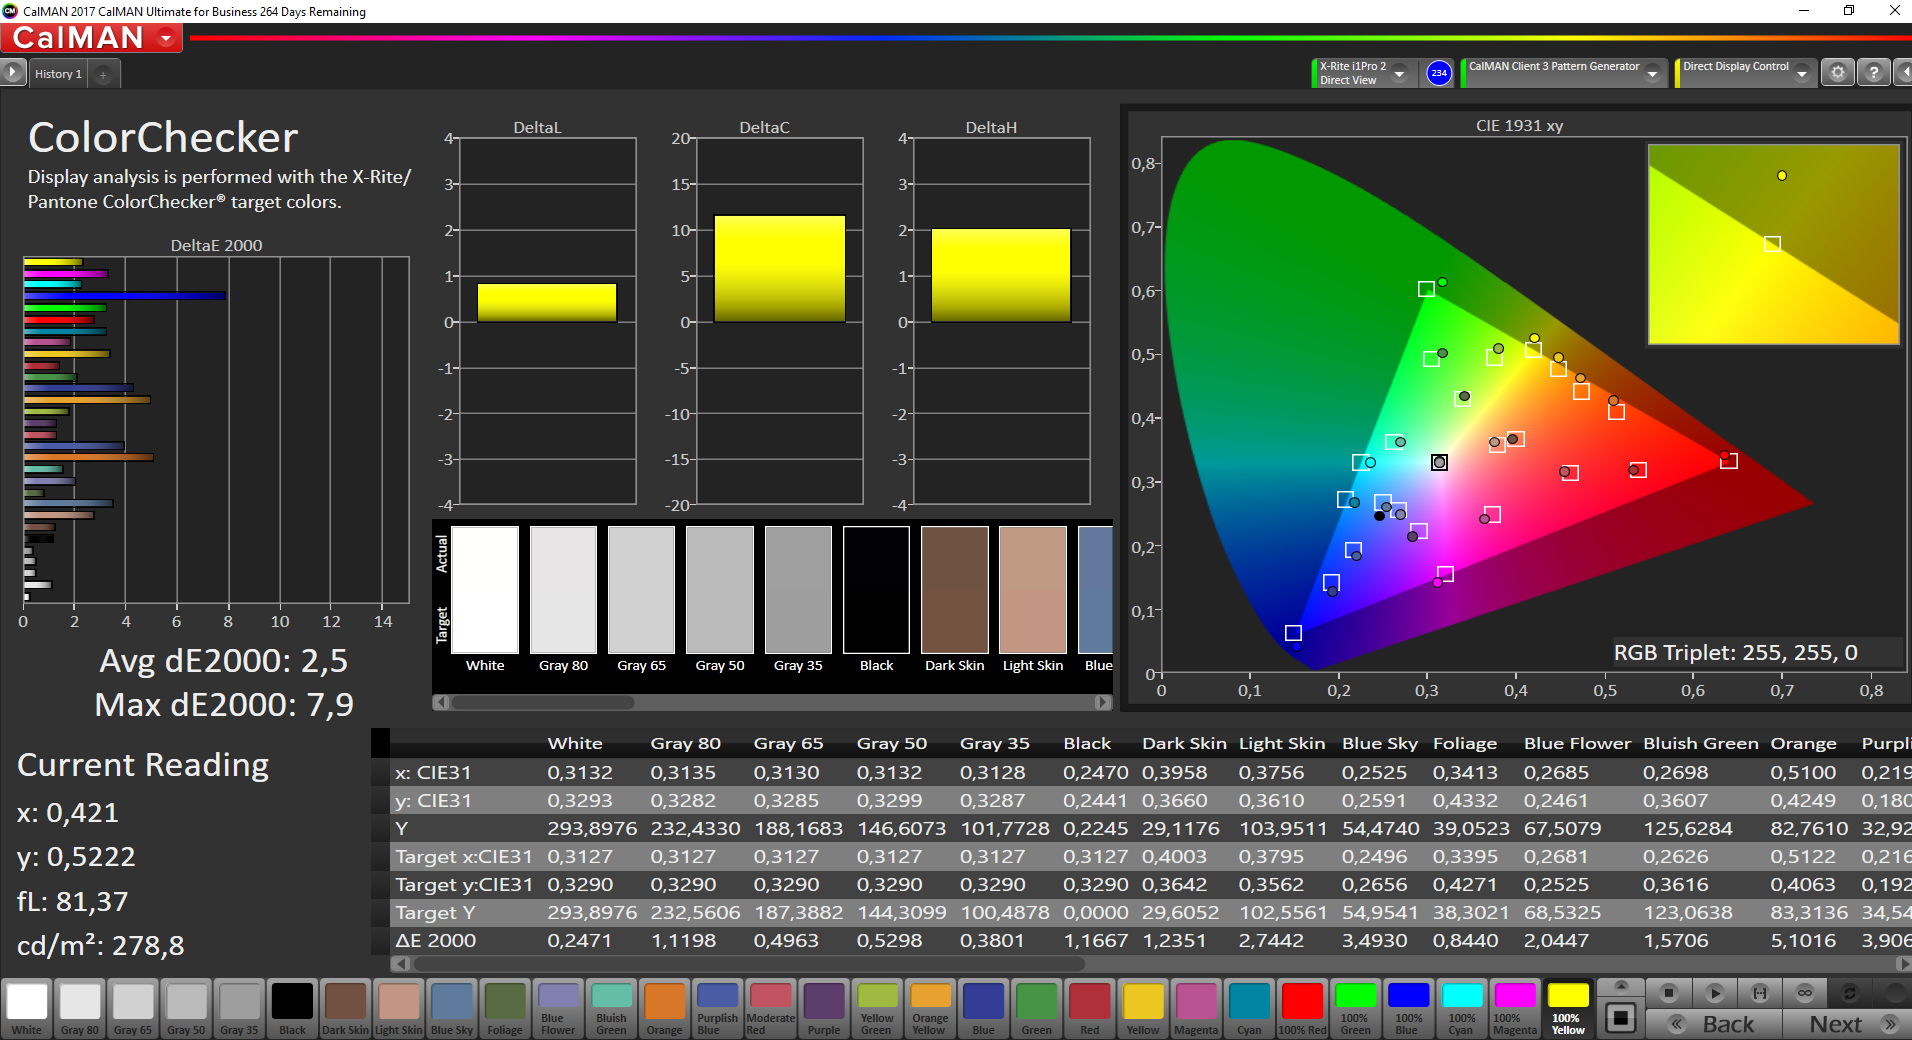
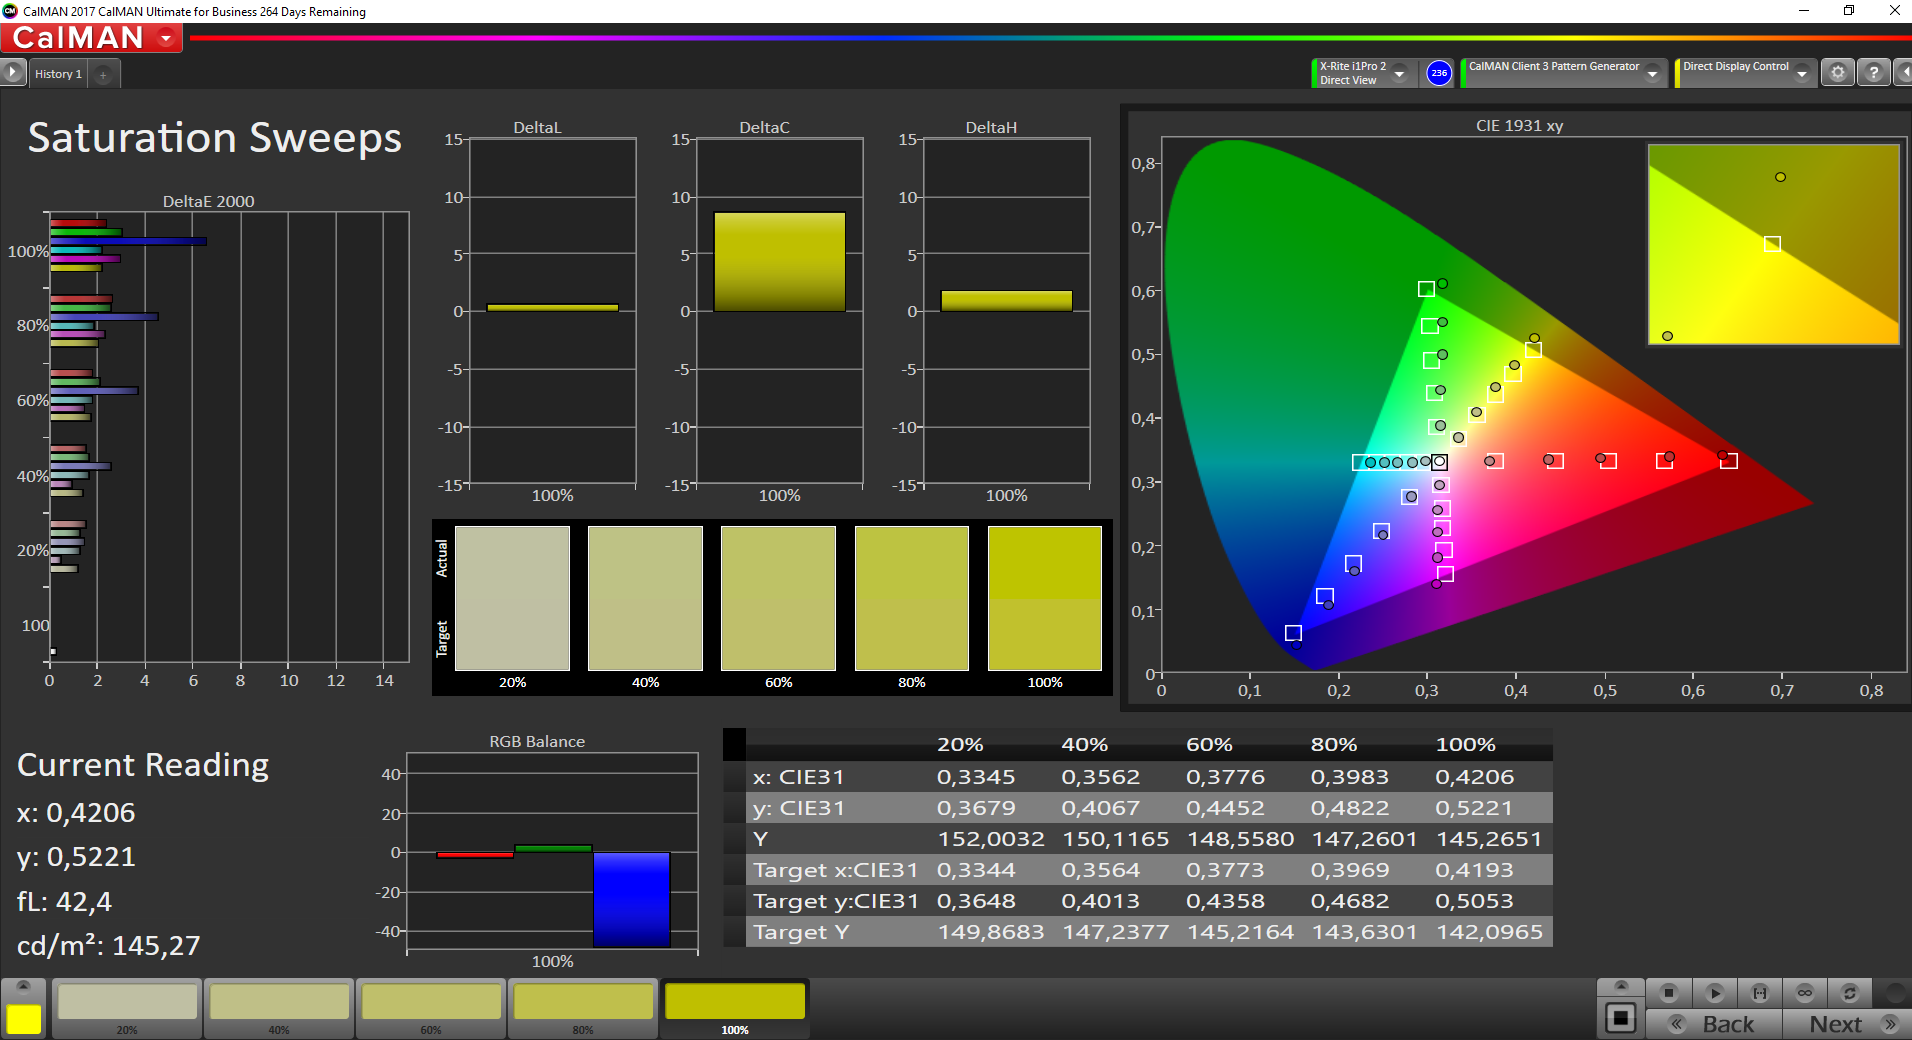
ΔE ColorChecker Calman: 4.3 | ∀{0.5-29.43 Ø4.71}
calibrated: 2.5
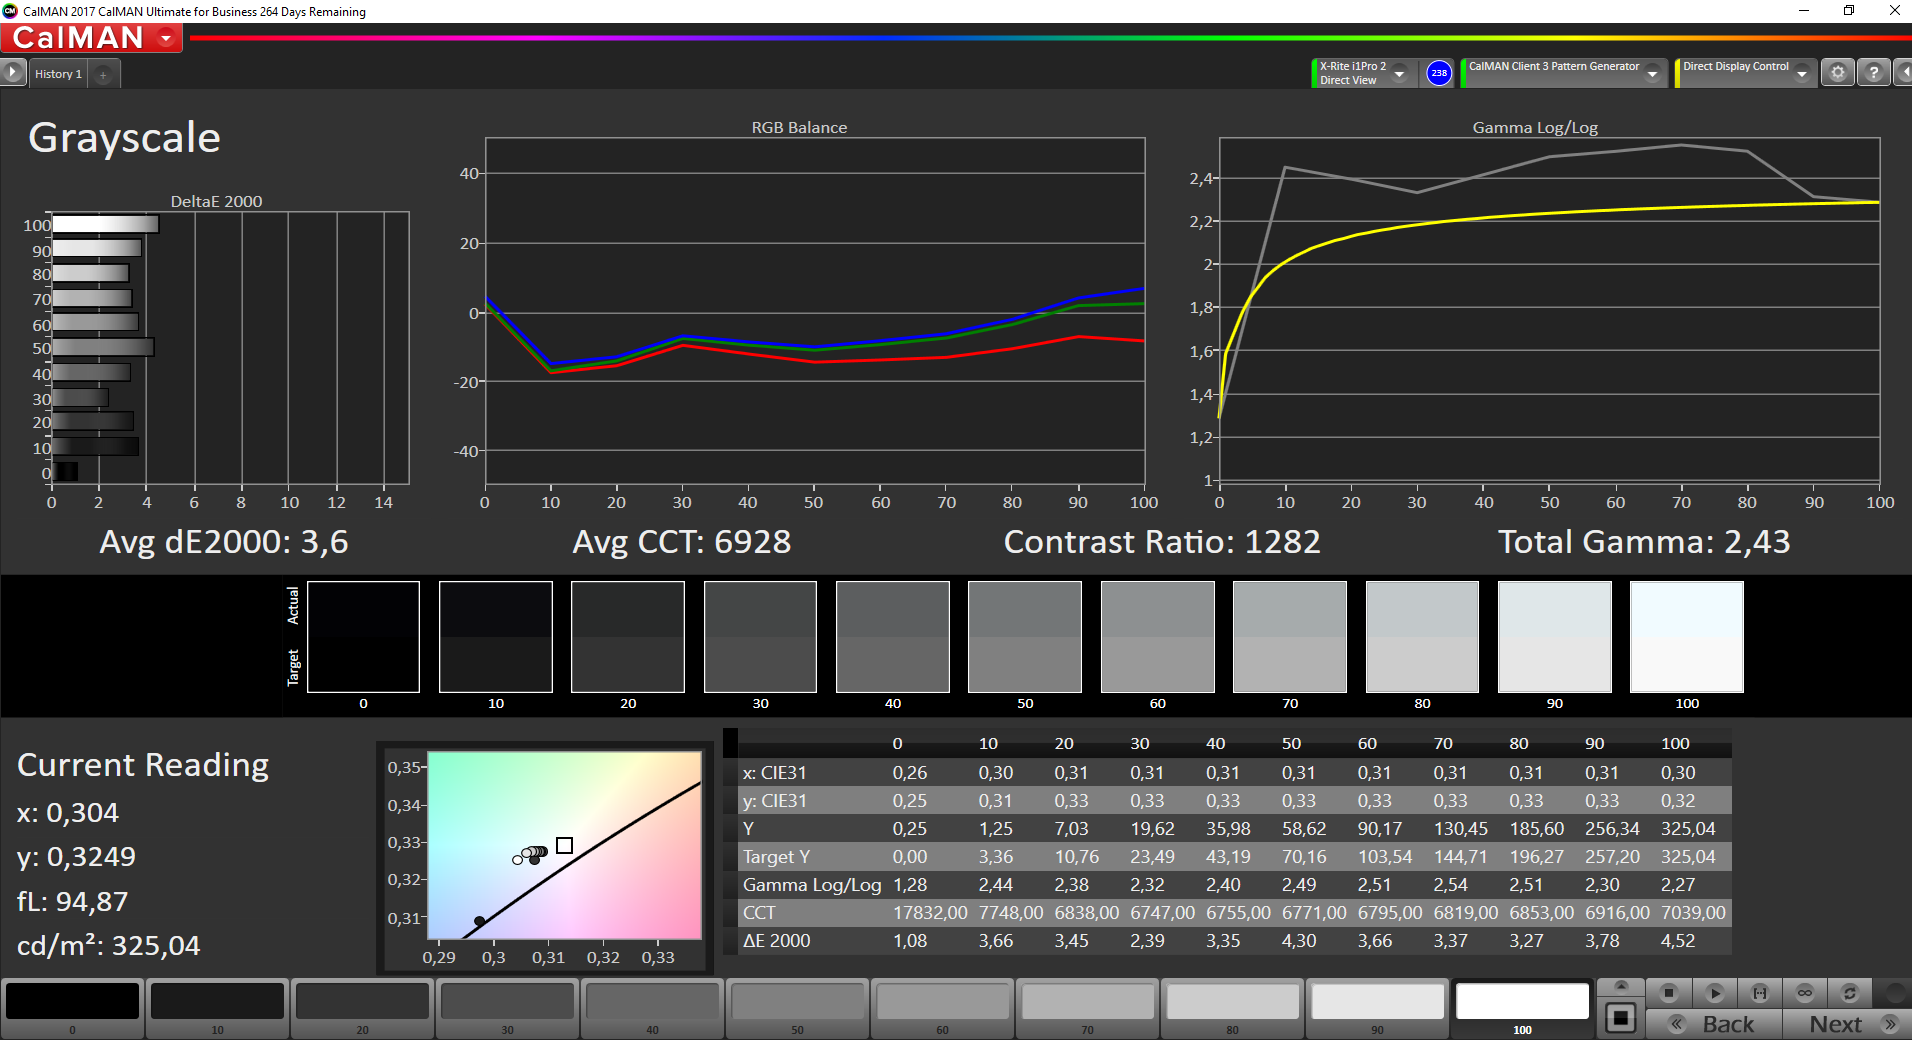
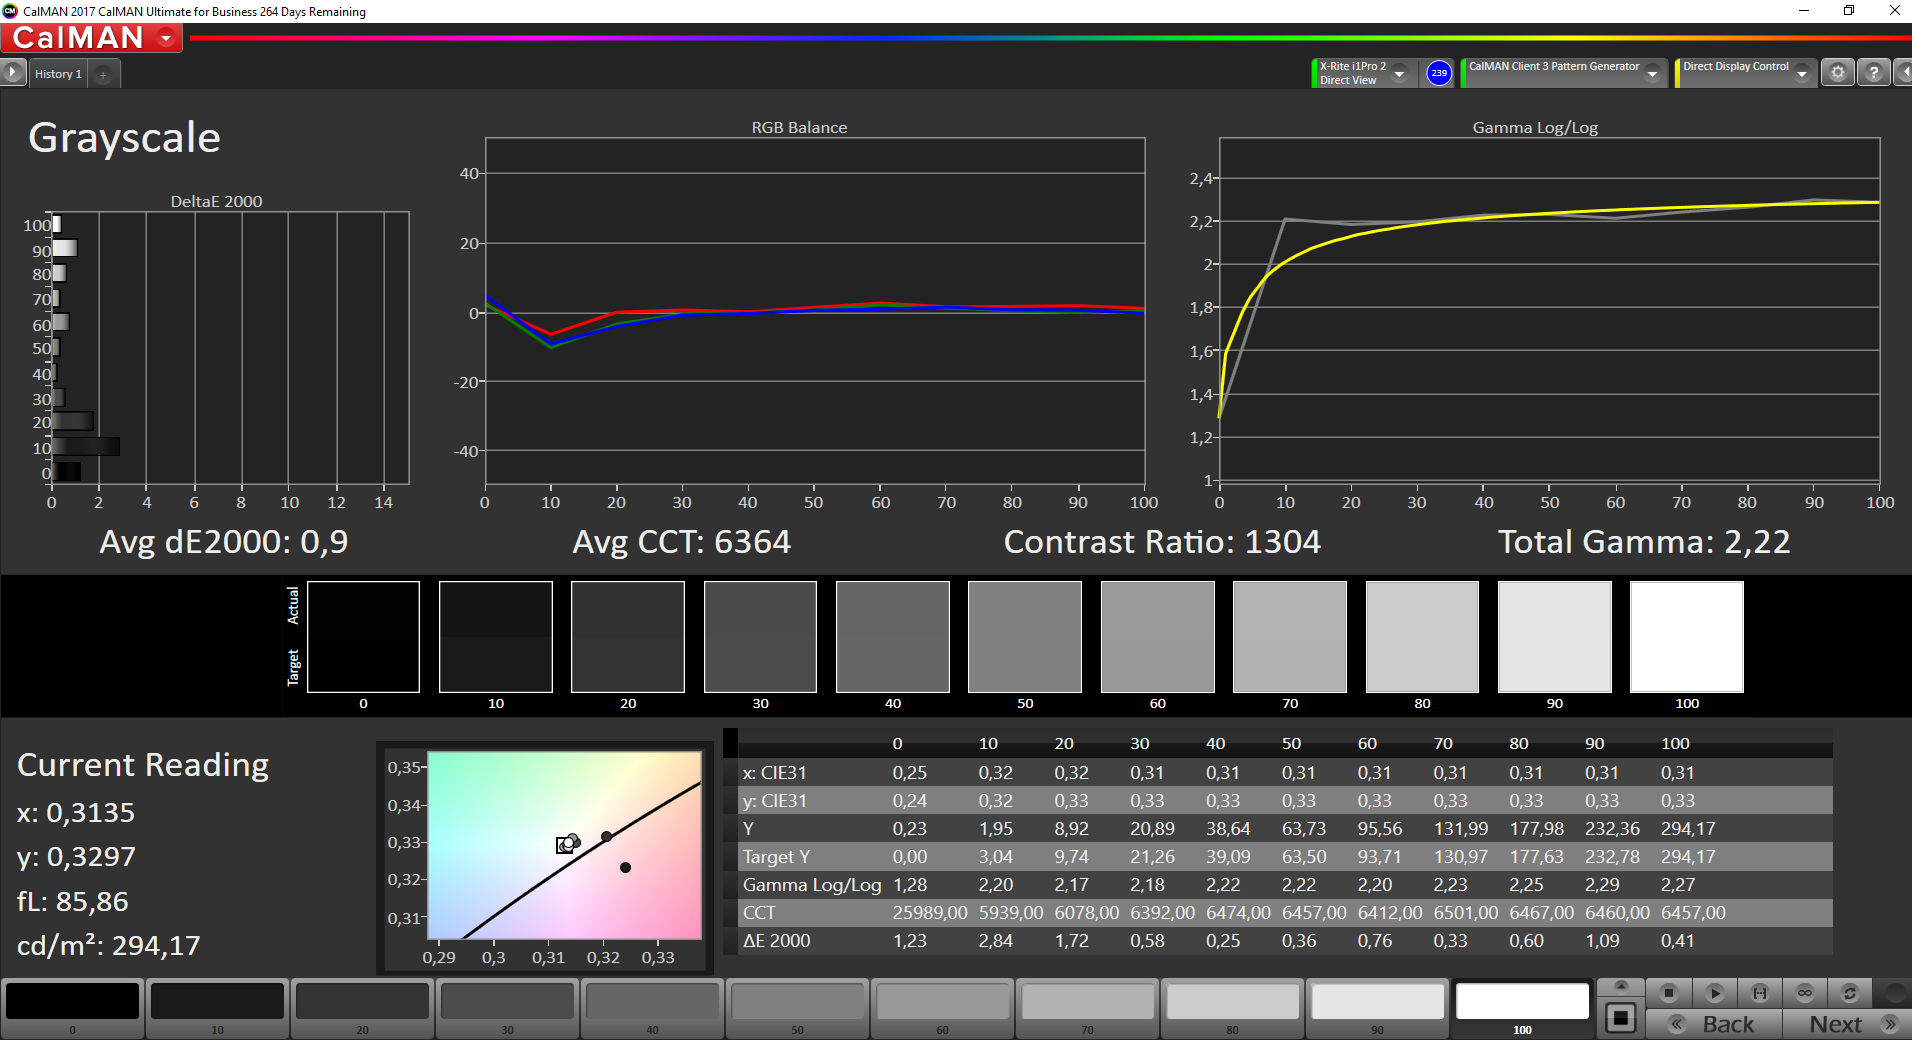
ΔE Greyscale Calman: 3.6 | ∀{0.09-98 Ø4.96}
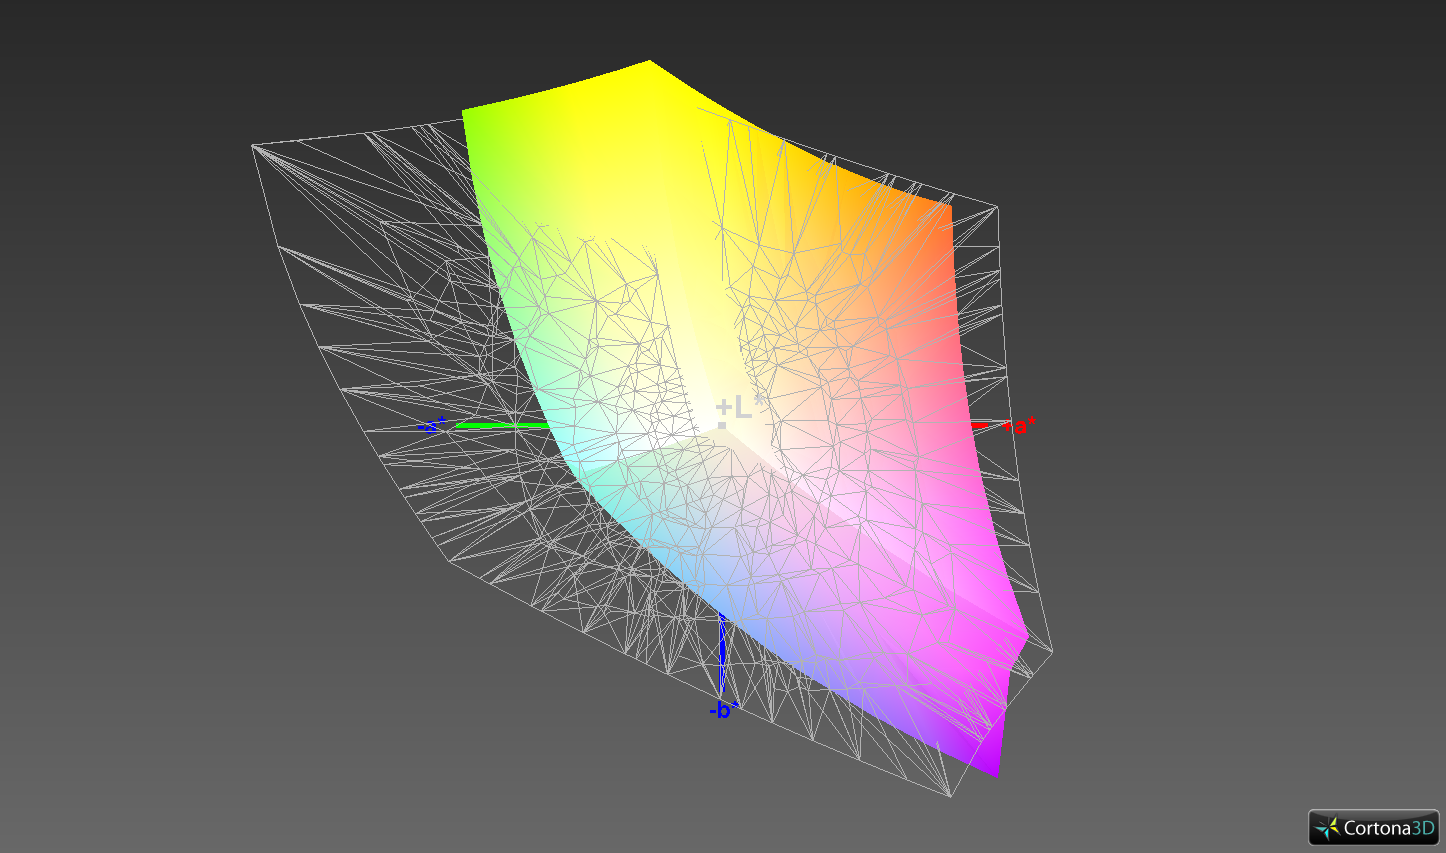
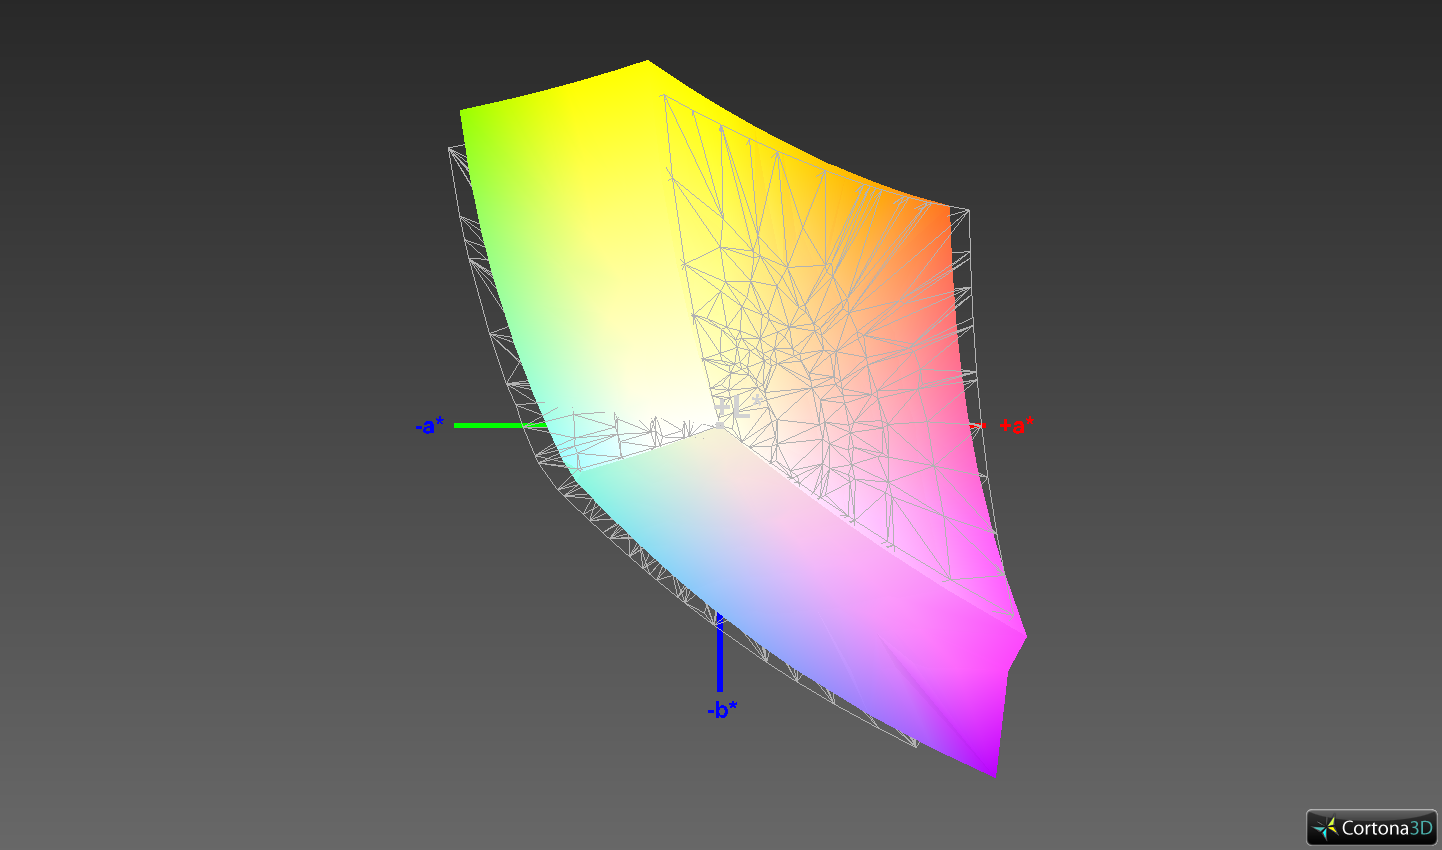
90.6% sRGB (Argyll 1.6.3 3D)
59.1% AdobeRGB 1998 (Argyll 1.6.3 3D)
65.9% AdobeRGB 1998 (Argyll 3D)
90.8% sRGB (Argyll 3D)
65.1% Display P3 (Argyll 3D)
Gamma: 2.43
CCT: 6928 K
| Dell Latitude 7390 AU Optronics AUO462D / B133HAN [DELL P/N:F7VDJ], , 1920x1080, 13.3" | Asus Zenbook UX3430UQ-GV012T Chi Mei CMN14D2 / N140HCE-EN1, , 1920x1080, 14" | HP EliteBook x360 1030 G2 CMN1374, , 1920x1080, 13.3" | Toshiba Portege X30-D (PT274U-01N001) Toshiba TOS508F, , 1920x1080, 13.3" | Dell Latitude 13 7380 LGD0589, , 1920x1080, 13.3" | |
|---|---|---|---|---|---|
| Display | 6% | -1% | 2% | 1% | |
| Display P3 Coverage (%) | 65.1 | 67.1 3% | 65.5 1% | 66.4 2% | 65.5 1% |
| sRGB Coverage (%) | 90.8 | 98.7 9% | 88.8 -2% | 93.5 3% | 91.8 1% |
| AdobeRGB 1998 Coverage (%) | 65.9 | 69.3 5% | 64.9 -2% | 66.6 1% | 65.8 0% |
| Response Times | 19% | 5% | 21% | 23% | |
| Response Time Grey 50% / Grey 80% * (ms) | 48.8 ? | 40 ? 18% | 55.2 ? -13% | 36.8 ? 25% | 34 ? 30% |
| Response Time Black / White * (ms) | 35.2 ? | 28 ? 20% | 27.2 ? 23% | 29.6 ? 16% | 29.6 ? 16% |
| PWM Frequency (Hz) | |||||
| Screen | 1% | -19% | 7% | -25% | |
| Brightness middle (cd/m²) | 329 | 353 7% | 262 -20% | 332.6 1% | 317 -4% |
| Brightness (cd/m²) | 316 | 366 16% | 256 -19% | 323 2% | 295 -7% |
| Brightness Distribution (%) | 92 | 88 -4% | 83 -10% | 86 -7% | 87 -5% |
| Black Level * (cd/m²) | 0.25 | 0.34 -36% | 0.25 -0% | 0.28 -12% | 0.3 -20% |
| Contrast (:1) | 1316 | 1038 -21% | 1048 -20% | 1188 -10% | 1057 -20% |
| Colorchecker dE 2000 * | 4.3 | 2.88 33% | 5.13 -19% | 2.6 40% | 6.3 -47% |
| Colorchecker dE 2000 max. * | 7.8 | 6.61 15% | 9.46 -21% | 6.7 14% | 10.4 -33% |
| Colorchecker dE 2000 calibrated * | 2.5 | ||||
| Greyscale dE 2000 * | 3.6 | 4.24 -18% | 6.23 -73% | 2.5 31% | 7.8 -117% |
| Gamma | 2.43 91% | 2.38 92% | 2.45 90% | 2.12 104% | 1.81 122% |
| CCT | 6928 94% | 7380 88% | 6413 101% | 6720 97% | 7120 91% |
| Color Space (Percent of AdobeRGB 1998) (%) | 59.1 | 64 8% | 57.84 -2% | 62 5% | 61 3% |
| Color Space (Percent of sRGB) (%) | 90.6 | 99 9% | 88.57 -2% | 94 4% | 92 2% |
| Total Average (Program / Settings) | 9% /
4% | -5% /
-12% | 10% /
8% | -0% /
-13% |
* ... smaller is better
Even though the manufacturers have continually managed to improve the black values of their panels for the last few years, the 0.25 cd/m² of our Dell Latitude can still be called a top value, which together with the very good brightness results in an excellent contrast ratio of 1316:1. However, none of the competitors in the test need to be ashamed, and even the relatively (!) dark HP convertible is still above 1000:1 due to its exemplary black value.
The color accuracy looks good in the state of delivery. The Delta-E values are very close to the optimum of 3 or less, where the human eye cannot perceive any differences anymore. The ZenBook UX3430UQ and the Portégé X30-D also deserve the same praise, but the predecessor and the EliteBook x360 do not. We would have almost recommended it for image processing at amateur level, but a coverage of the small sRGB standard color space of only 90.6% prevented this. Only the Asus ZenBook receives this honor at 99%.
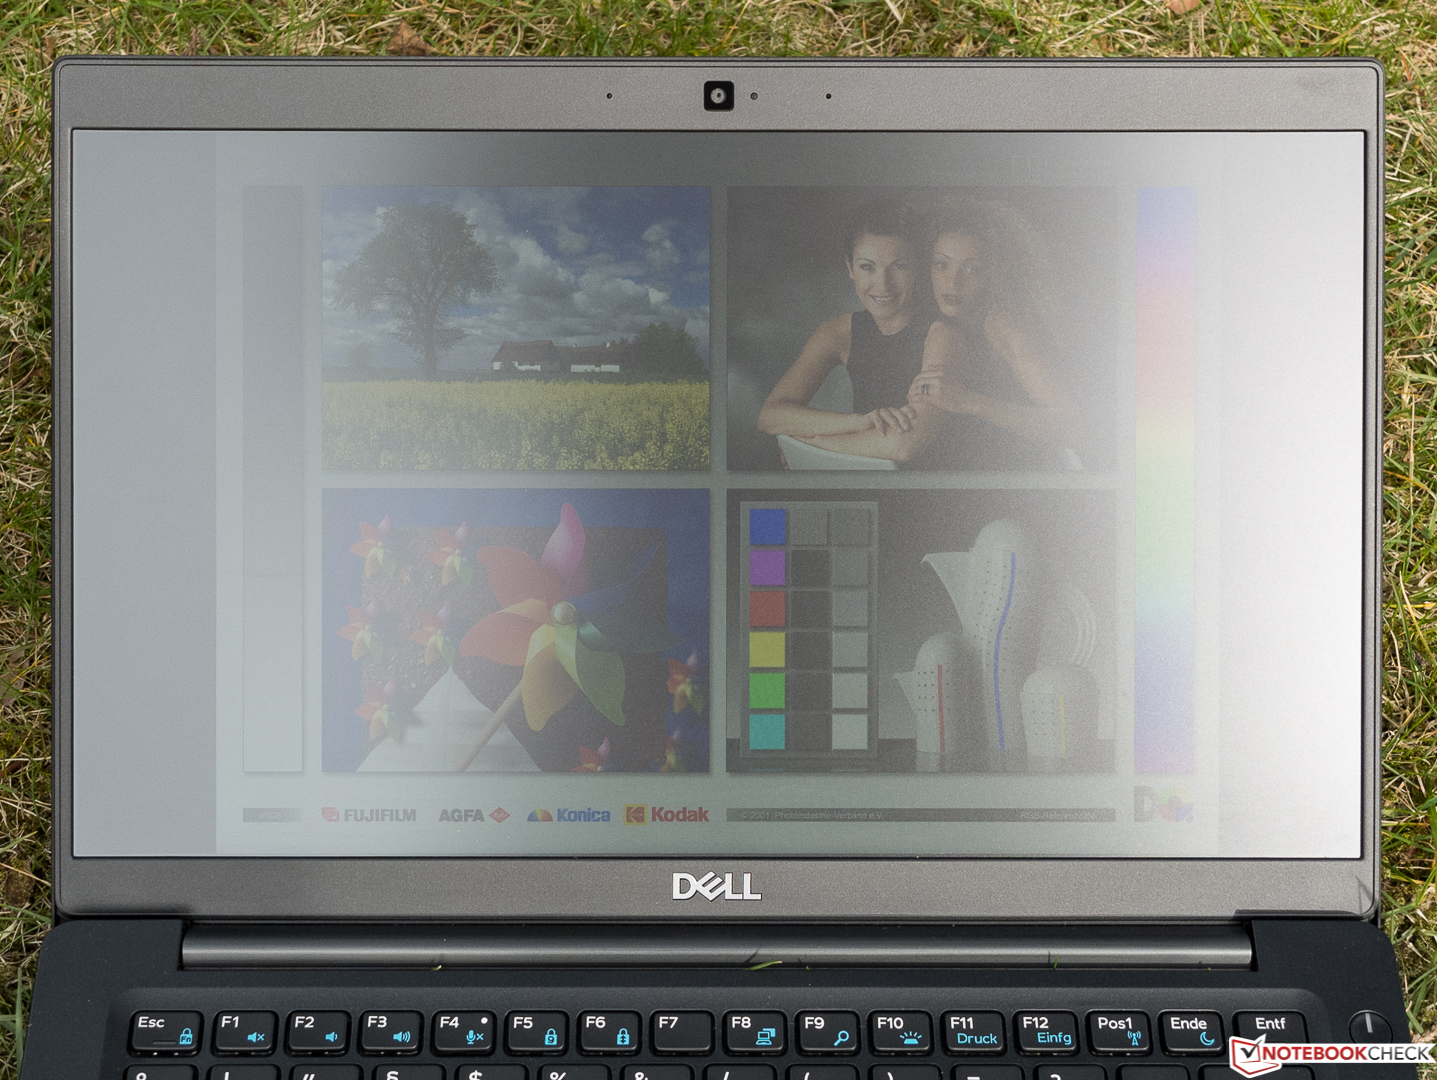
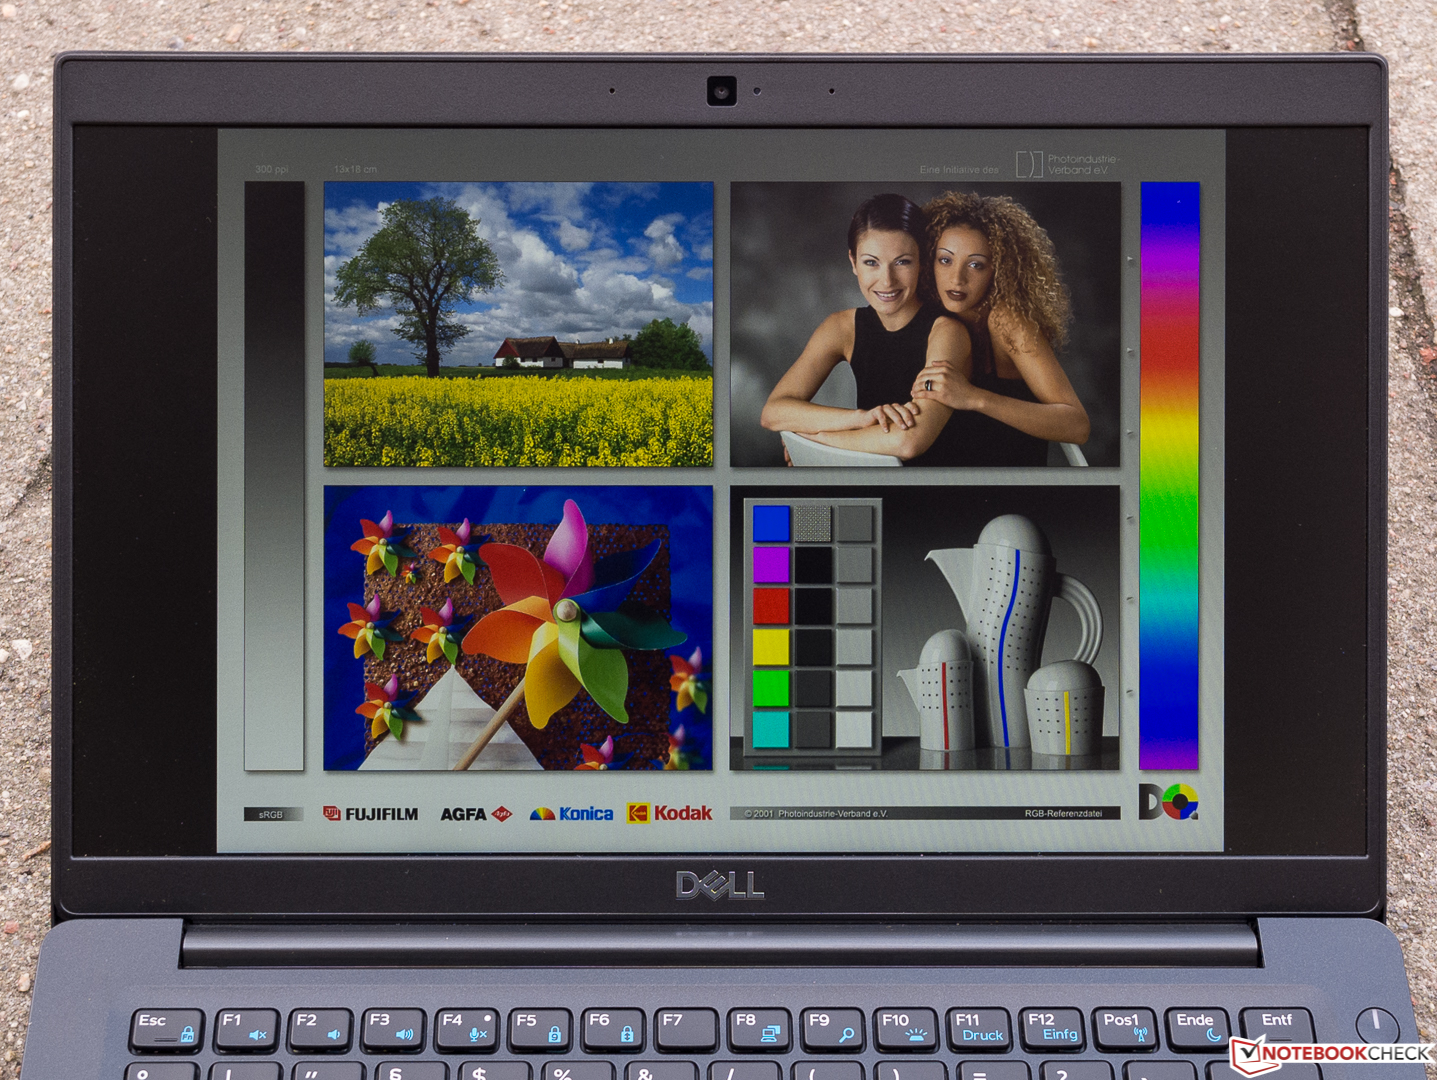
As you can see in the picture on the left, despite its decent brightness, the matte display has its problems to shine through, if it is pointed towards the bright (but cloudy) sky. The picture on the right represents a best-case scenario with a house entry in the back. In our experience, even on sunny days it should be sufficient to look for a shady place in order to get some ergonomic contrast.
Display Response Times
| ↔ Response Time Black to White | ||
|---|---|---|
| 35.2 ms ... rise ↗ and fall ↘ combined | ↗ 21.2 ms rise | 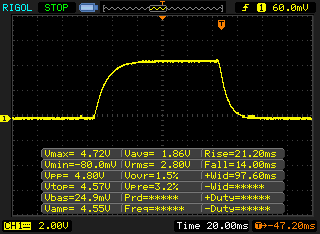 |
| ↘ 14 ms fall | ||
| The screen shows slow response rates in our tests and will be unsatisfactory for gamers. In comparison, all tested devices range from 0.1 (minimum) to 240 (maximum) ms. » 93 % of all devices are better. This means that the measured response time is worse than the average of all tested devices (19.8 ms). | ||
| ↔ Response Time 50% Grey to 80% Grey | ||
| 48.8 ms ... rise ↗ and fall ↘ combined | ↗ 24.8 ms rise | 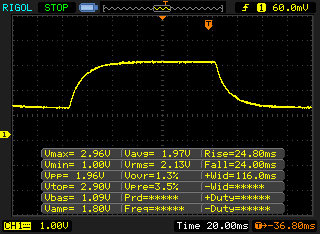 |
| ↘ 24 ms fall | ||
| The screen shows slow response rates in our tests and will be unsatisfactory for gamers. In comparison, all tested devices range from 0.165 (minimum) to 636 (maximum) ms. » 84 % of all devices are better. This means that the measured response time is worse than the average of all tested devices (31 ms). | ||
Screen Flickering / PWM (Pulse-Width Modulation)
| Screen flickering / PWM not detected | 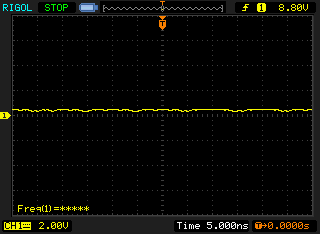 | ||
In comparison: 52 % of all tested devices do not use PWM to dim the display. If PWM was detected, an average of 7757 (minimum: 5 - maximum: 343500) Hz was measured. | |||
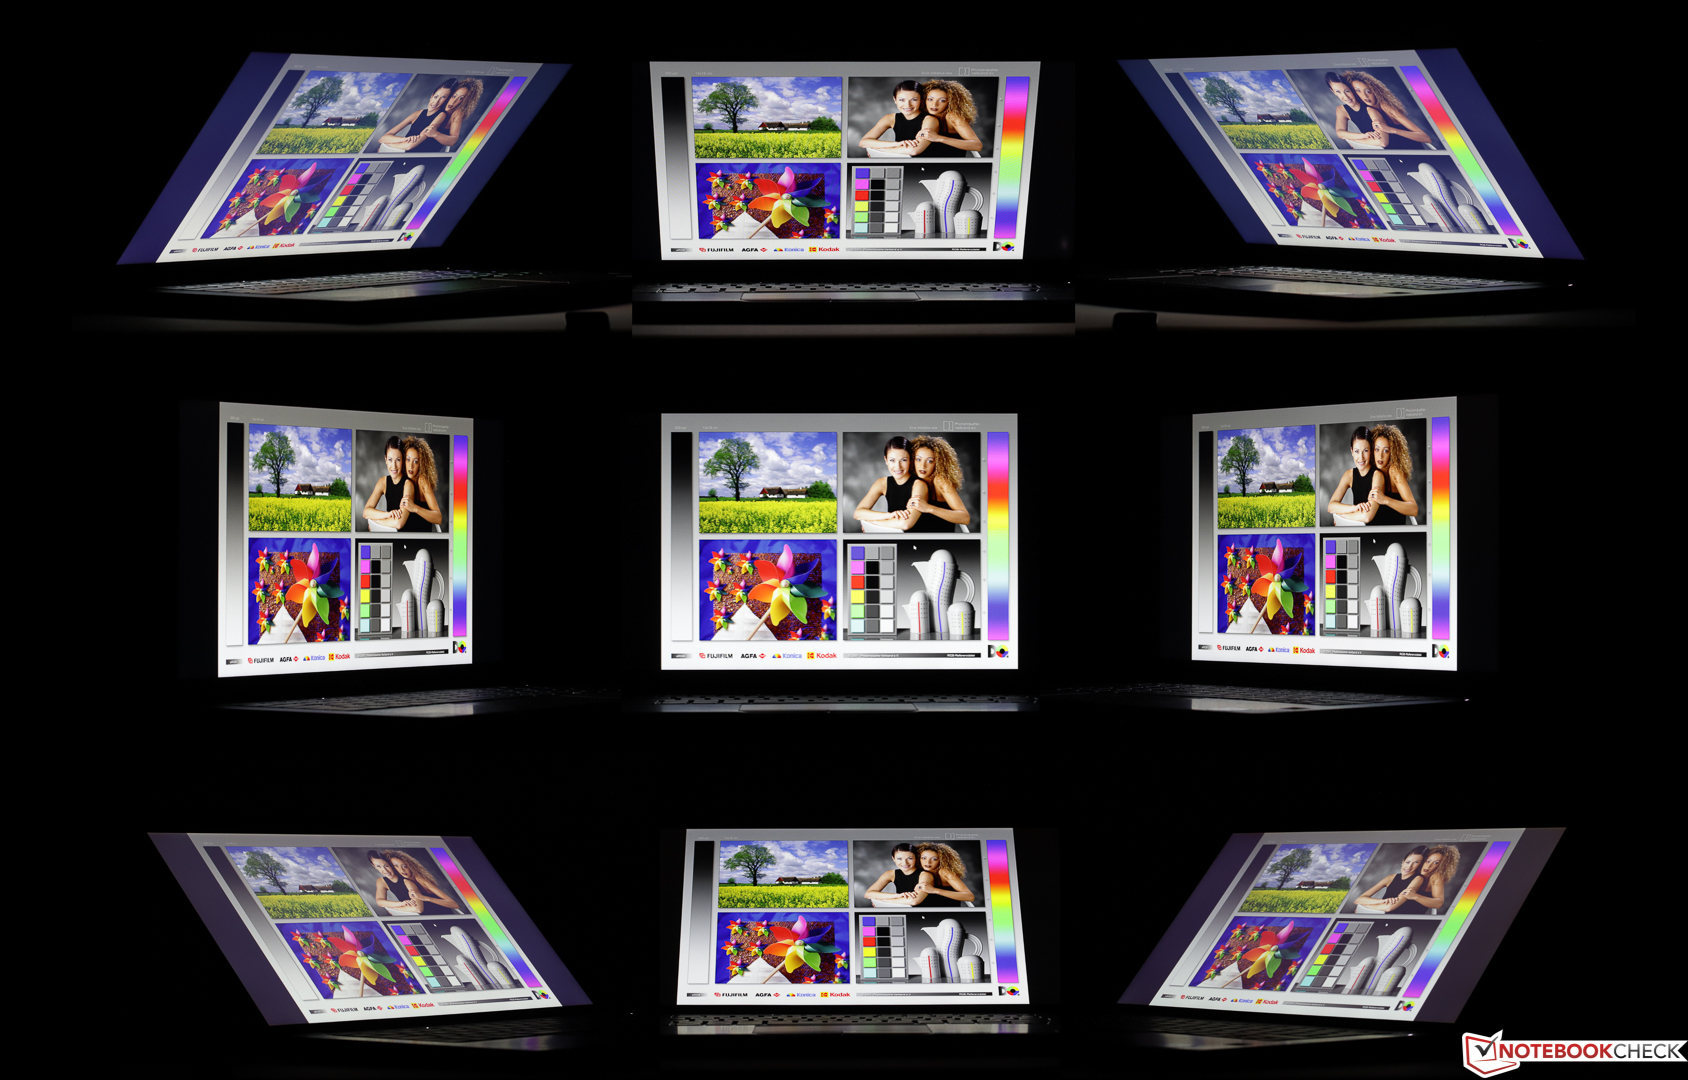
In terms of the viewing angle stability, the Dell 7390 ranges far ahead. Even though the loss of brightness and contrast that cannot be avoided completely are noticeable at steeper viewing angles from about 40°, they remain within tight limits in angles that are less steep. If you look at the display from the top, the effects occur earlier.
Performance: four cores and SSD
Processor
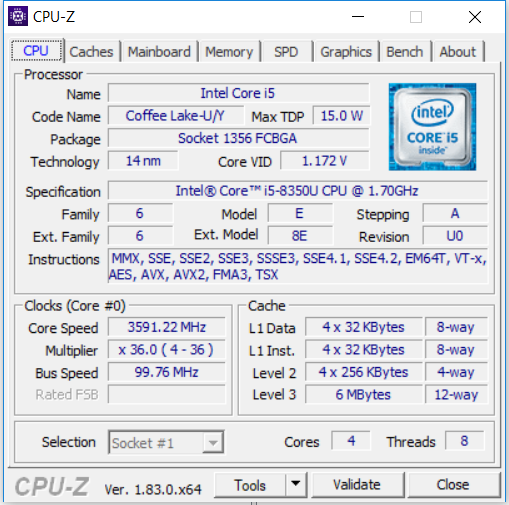
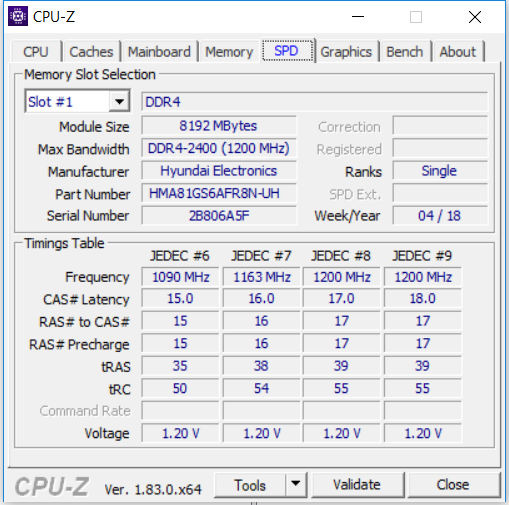
The ULV Core i5-8350U quad-core with a 15-watt TDP comes from Intel's current Kaby Lake Refresh generation and brings a basic clock speed of 1.7 GHz, which can be increased up to 3.6 GHz via Turbo. This is the nominally fastest i5 CPU of this series. Its predecessor is the i5-7300U (2.6 - 3.5 GHz), which has only two physical cores, but still masters Hyper-Threading similar to the newer chip. In addition to the Intel UHD Graphics 620 GPU, the processor also integrates a DDR4 storage controller and handles the encoding and decoding of H.265 video material in the hardware. According to Intel, there should be a performance increase of about 40% compared to the bygone Kaby Lake chips of the first generation. Unlike the smaller i5-8250U model, the i5-8350U masters Intel's vPro technology.
The usual office tasks are demanding too little of the CPU, one of the older and potentially more economical dual cores would have been sufficient for that. However, anyone needing to use more demanding software that is designed to run well in parallel cores, such as the Adobe Premiere Pro video processing software, would definitely benefit from the additional cores.
When all four cores are fully utilized, the processor quickly hits its TDP limit, which is typical for the new ULV quad-cores. While during the first run through our Cinebench loop it achieved 625 points due to a good Turbo utilization, a very good for this CPU, in the second round the performance dropped to 572 points and then continued to drop further down to 546 points, until finally leveling out to 580 points after seven runs. Accordingly, we observed a significantly varying Turbo utilization here. In battery operation, the multicore performance was not reduced.
System Performance
Subjectively, everything is running smoothly and we did not expect anything else. Programs start up quickly, a cold start takes only a few seconds, and even escalating multitasking does not cause any stutters in the 7390.
Despite their differing configurations, the PCMark-8 scores of the test subnotebooks show no differences worth mentioning, so it should be similar with their subjective performance. Neither being the only device with a PCIe SSD nor with a quad-core in the test lead to the corresponding devices being able to stand out. Apparently the old PCMark 8 does not scale well at this high level anymore. The fact that our Latitude 7390 has a relatively weak showing here might be due to the single channel RAM and the comparatively slow SSD.
| PCMark 8 Home Score Accelerated v2 | 3600 points | |
| PCMark 8 Work Score Accelerated v2 | 4768 points | |
| PCMark 10 Score | 3577 points | |
Help | ||
Storage Solution
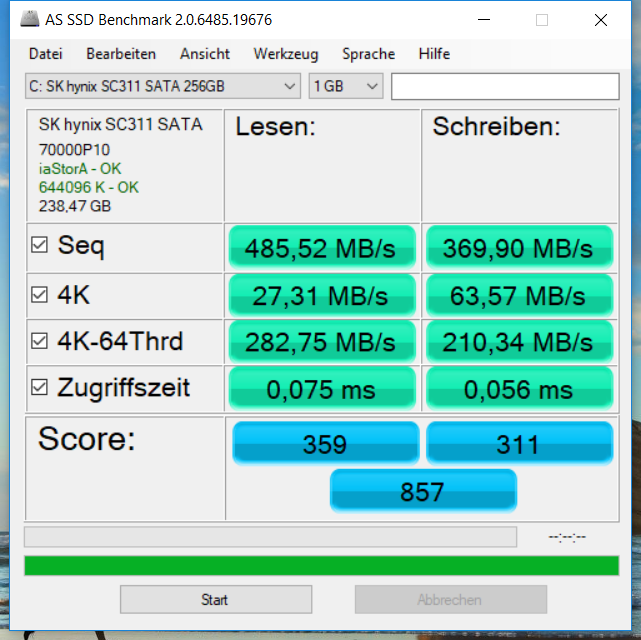
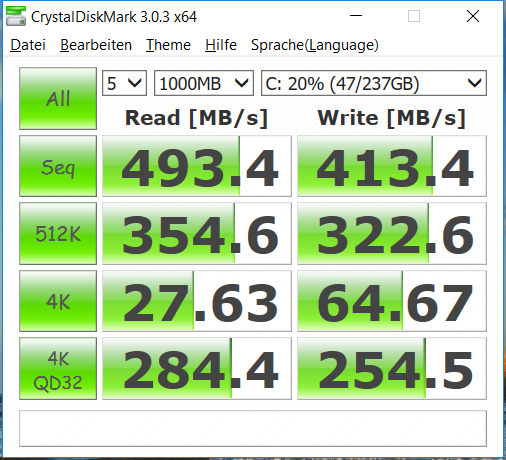
In our model, Dell uses a Hynix M.2 SSD with a 256 GB capacity which is connected via SATA III. According to AS SSD, the performance turns out absolutely typical for the aging connector. The SATA-III limit of almost 500 MB/s is only reached during sequential reads, and the performance while reading small, distributed 4K blocks, which is important during OS and program starts, is only mediocre. The less important write speed comes in behind many comparable SSDs, which contributes to the overall score not being particularly high. In our test field, only the Samsung SSD in the Toshiba Portégé which is connected via PCIe can decisively move ahead. However, subjectively this should still only become noticeable to a very limited extent.
| Dell Latitude 7390 SK hynix SC311 M.2 | Asus Zenbook UX3430UQ-GV012T SanDisk SD8SN8U512G1002 | HP EliteBook x360 1030 G2 Sandisk SD8TN8U-256G-1006 | Toshiba Portege X30-D (PT274U-01N001) Samsung PM961 MZVLW256HEHP | Average SK hynix SC311 M.2 | |
|---|---|---|---|---|---|
| CrystalDiskMark 3.0 | 5% | -1% | 129% | 1% | |
| Read Seq (MB/s) | 493.4 | 500 1% | 467.1 -5% | 1270 157% | 494 ? 0% |
| Write Seq (MB/s) | 413.4 | 457.4 11% | 443.6 7% | 1213 193% | 401 ? -3% |
| Read 512 (MB/s) | 354.6 | 345.6 -3% | 312.3 -12% | 858 142% | 365 ? 3% |
| Write 512 (MB/s) | 322.6 | 415 29% | 372.5 15% | 763 137% | 323 ? 0% |
| Read 4k (MB/s) | 27.63 | 28.34 3% | 29.43 7% | 40.9 48% | 27.2 ? -2% |
| Write 4k (MB/s) | 64.7 | 56.8 -12% | 56.5 -13% | 143.6 122% | 68.3 ? 6% |
| Read 4k QD32 (MB/s) | 284.4 | 311.3 9% | 311.3 9% | 626 120% | 284 ? 0% |
| Write 4k QD32 (MB/s) | 254.5 | 251.1 -1% | 225.2 -12% | 536 111% | 267 ? 5% |

Graphics Card
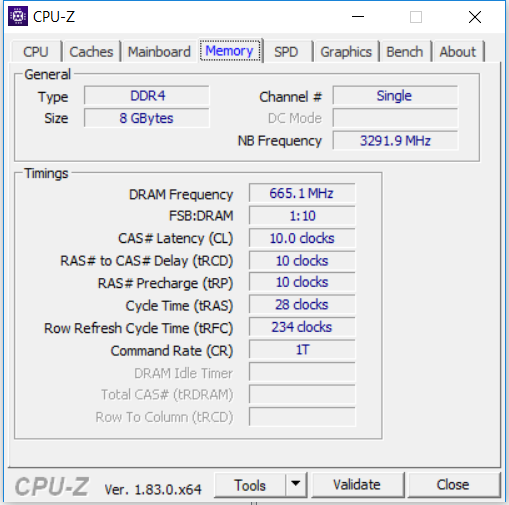
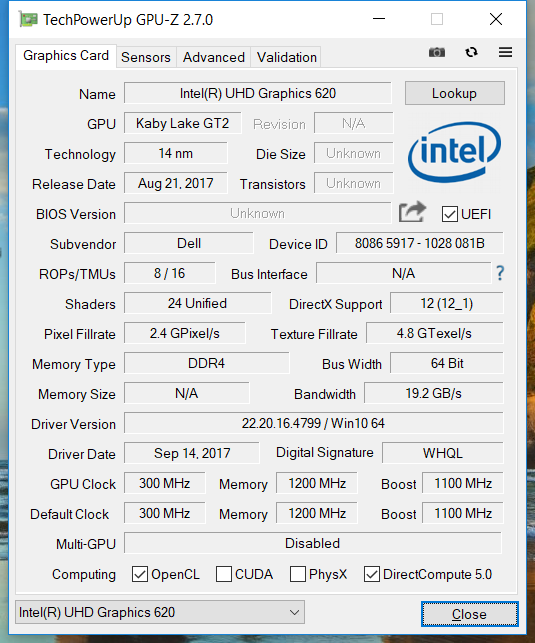
For the details on the processor graphics, which was merely renamed from Intel HD Graphics 620 to UHD Graphics 620 and does not have its own storage, we refer to our corresponding article on the GPU with numerous benchmarks. In the Latitude 7390, the maximum clock speed is 1100 MHz. Intel's HD graphics clearly benefits from faster dual-channel RAM. Even though the built-in storage is fast, it only runs in single-channel mode.
In our test field, the performance of all the respective 620 graphics cores remains at a similar level, with the UHD 620 in our test unit comfortably remaining in the middle of the field. Compared to all the UHD-620 GPUs in our database, the performance turns out slightly below average. In battery operation, the Cloud-Gate score of 3DMark 2013 is still 7551 points (in mains operation: 8104 points).
| 3DMark 11 Performance | 1755 points | |
| 3DMark Cloud Gate Standard Score | 7618 points | |
| 3DMark Fire Strike Score | 901 points | |
Help | ||
Gaming Performance
The GPU is not suitable for the current and/or graphically more demanding 3D games. For example, even in the lowest settings at 1024x768 pixels, the mighty "Rise of the Tomb Raider" from 2016 does not run smoothly, not to mention the current segment of the "Final Fantasy" series. Things are different in the quite current, but graphically less demanding "Farming Simulator 2017," where the limits are only reached in high settings in Full HD. What is generally possible are (older) isometric games such as "Diablo III" or "StarCraft II," which can also be played in high presets.
| low | med. | high | ultra | |
|---|---|---|---|---|
| Rise of the Tomb Raider (2016) | 19.6 | |||
| Farming Simulator 17 (2016) | 51.2 | 19.7 | ||
| Final Fantasy XV Benchmark (2018) | 8.8 |
Emissions: quiet and cool
Noise Emissions
During idle operation, the fan remains turned off, and the occasional load spikes such as those occurring while surfing do not change this. So we can immediately proceed to the stress test: After Prime95 and FurMark were started, it took almost 15 seconds before the fan started running quietly.
Continuing, the increase of the fan speed occurred with delays and in distinct steps. After about two minutes, the maximum noise level was reached, presenting itself as a bright whirring that was not too annoying. In a quiet room, it was still audible from a distance of about 5 meters (~16 ft). After reducing the load, the fan continued to run at high speeds for a quite a long time.
A frequent problem in current Dell systems is the electronic noises or coil whine. While this problem is not very pronounced in the Latitude 7390, slight electronic noises at 29.7 dB(A) do occur particularly under load.
Noise level
| Idle |
| 29.5 / 29.5 / 29.5 dB(A) |
| Load |
| 32.4 / 39.9 dB(A) |
 | ||
30 dB silent 40 dB(A) audible 50 dB(A) loud |
||
min: | ||
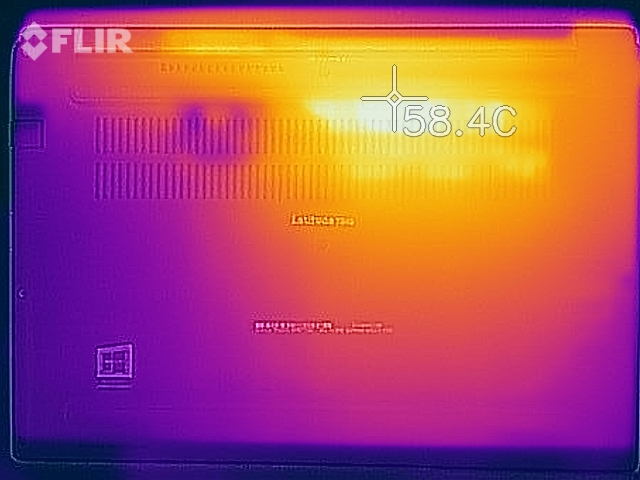
Temperature
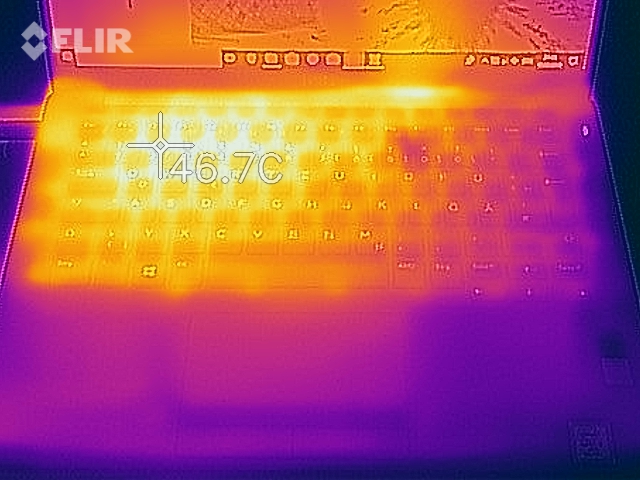
During high constant load, having the Dell Latitude 7390 on your lap can become uncomfortable, since up to 55 °C (131 °F) can be reached at the bottom. However, this is also a scenario that is rare. While idling or under low, sporadic loads, we measured only a few degrees above room temperature. So usually it will remain cool in the office.
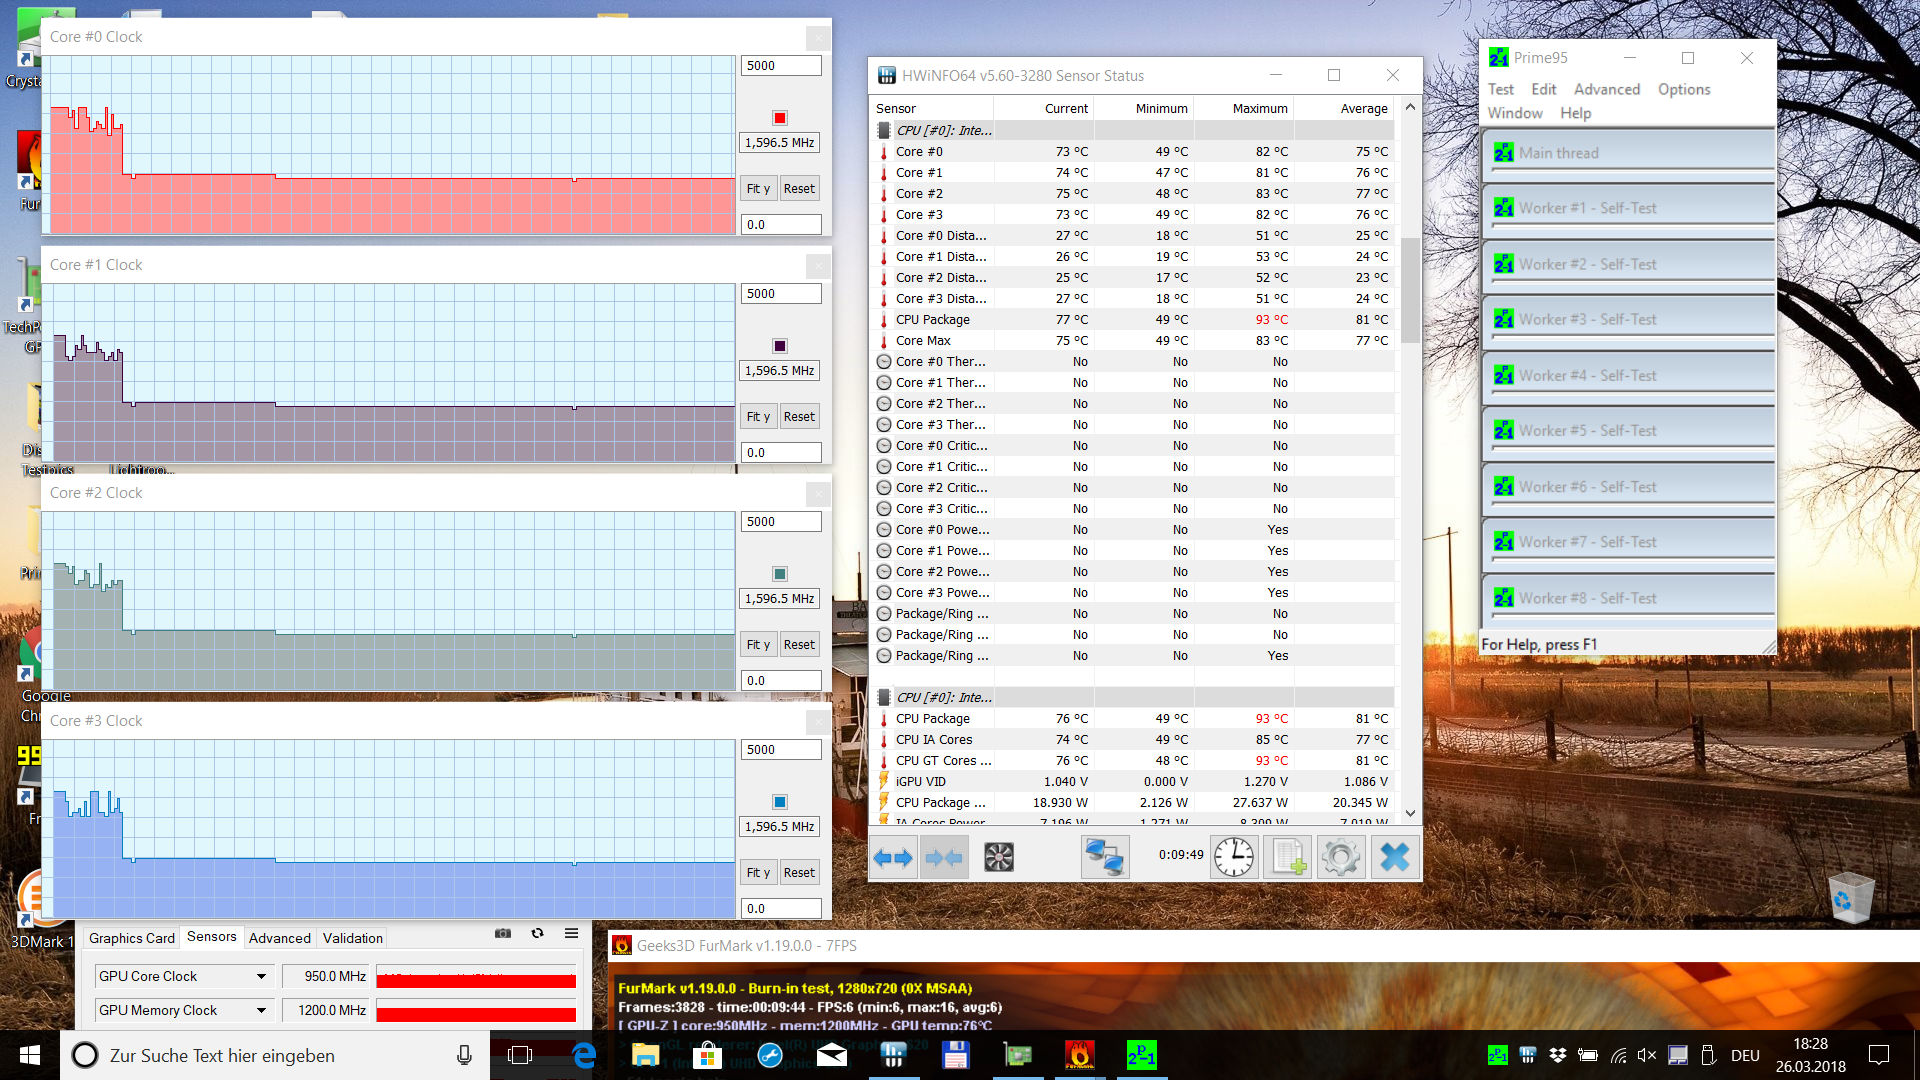
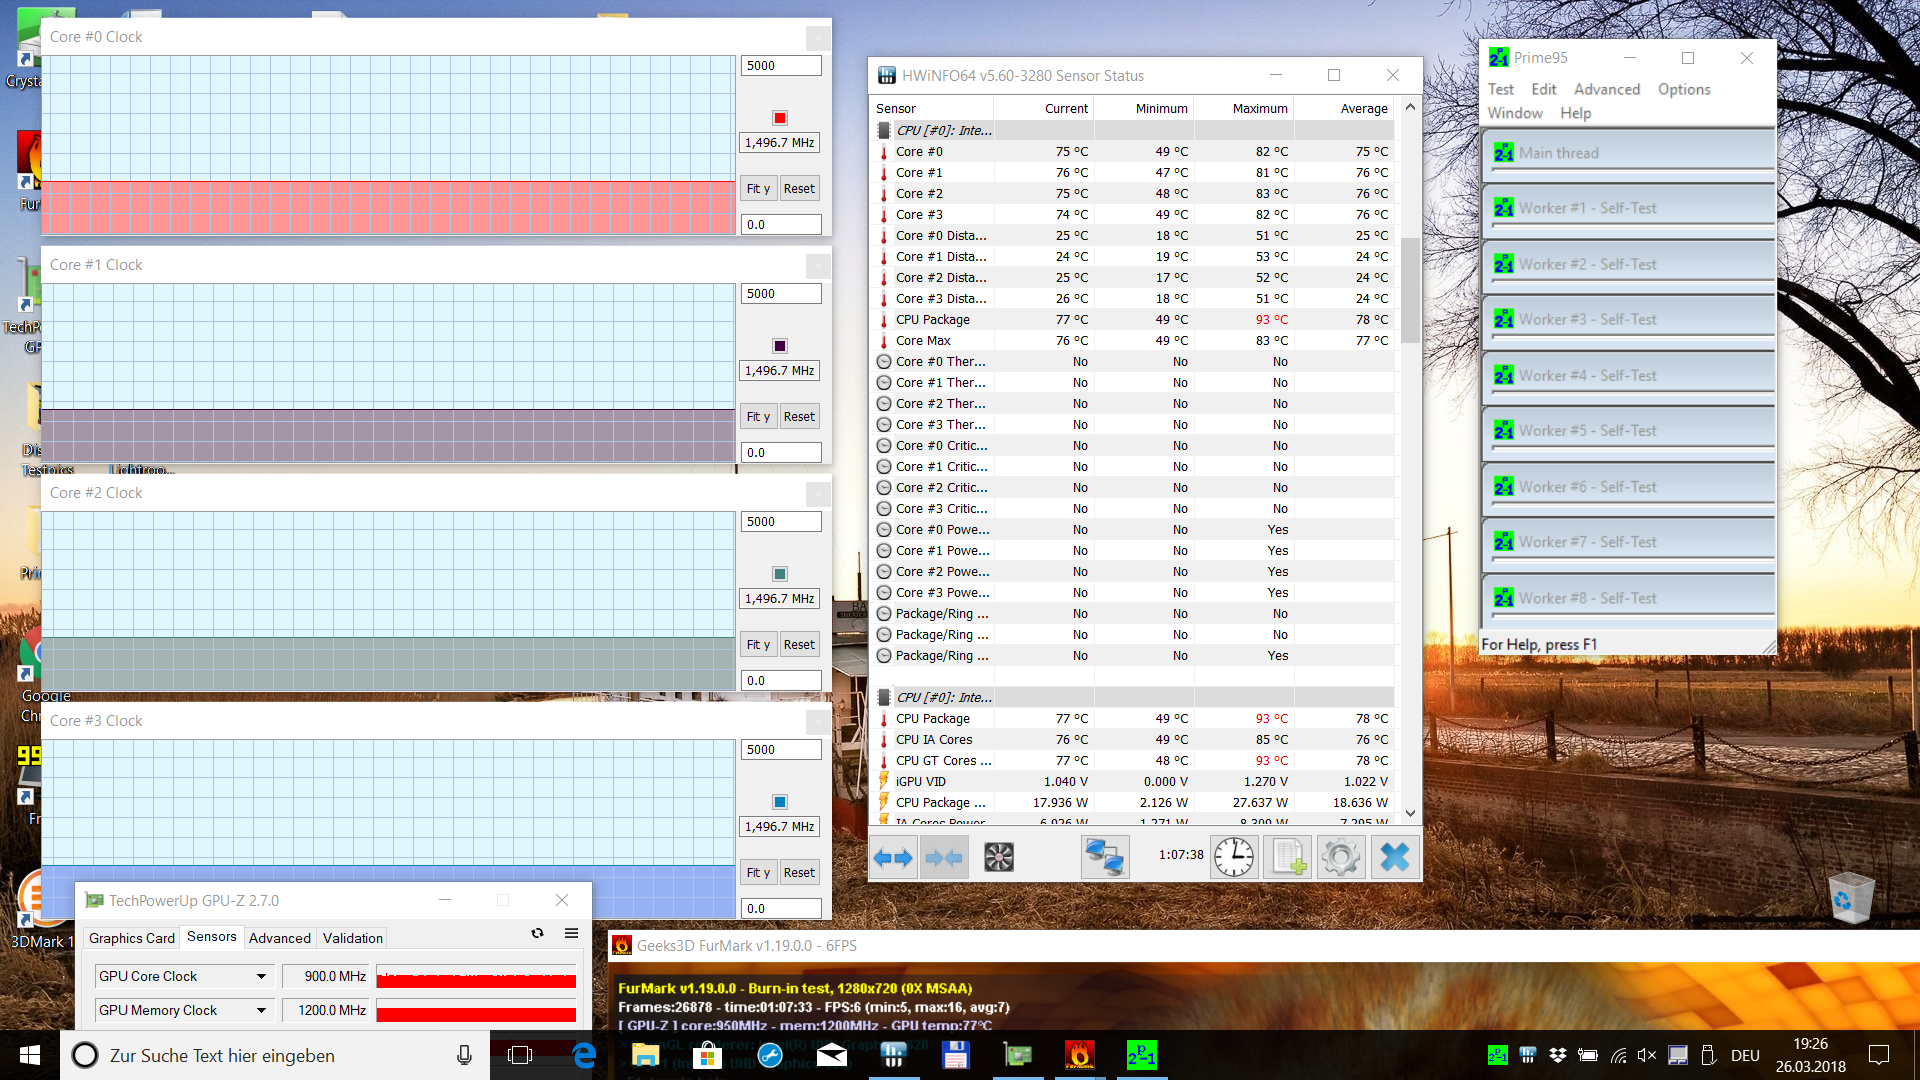
In the beginning of our stress test with Prime95 and FurMark, the CPU cores were still operating in their Turbo range, while the GPU speeds were varying around 950 MHz. However, the speeds quickly dropped to the basic clock speed of 1.7 GHz, and even that could not be maintained for long. Towards the end, the clock speeds remained constant at 1.5 GHz and the GPU at 900 MHz or slightly below. So we were observing mild throttling in this scenario which is not very relevant in practice.
(±) The maximum temperature on the upper side is 43.1 °C / 110 F, compared to the average of 34.3 °C / 94 F, ranging from 21.2 to 62.5 °C for the class Office.
(-) The bottom heats up to a maximum of 55.2 °C / 131 F, compared to the average of 36.8 °C / 98 F
(+) In idle usage, the average temperature for the upper side is 23.1 °C / 74 F, compared to the device average of 29.5 °C / 85 F.
(+) The palmrests and touchpad are cooler than skin temperature with a maximum of 28.4 °C / 83.1 F and are therefore cool to the touch.
(±) The average temperature of the palmrest area of similar devices was 27.5 °C / 81.5 F (-0.9 °C / -1.6 F).
Speakers
We are going through our music test as usual, with the presets as in the delivery state and a maximum volume which is decent here. While the sound system handles airy pop fairly well, it presents a very mid-centric, tinny, hollow, and in parts sharp sound image without any trace of bass and with very little dynamics and spaciousness. It is simply just obnoxious. If there are several high-pitched instruments, the ability to differentiate between them suffers significantly. At least there are no major distortions or volume variations. The voices in movies also sound slightly unnatural, but are still easily understandable.
Dell Latitude 7390 audio analysis
(+) | speakers can play relatively loud (83.1 dB)
Bass 100 - 315 Hz
(-) | nearly no bass - on average 22.5% lower than median
(±) | linearity of bass is average (10.7% delta to prev. frequency)
Mids 400 - 2000 Hz
(±) | higher mids - on average 5% higher than median
(+) | mids are linear (4.7% delta to prev. frequency)
Highs 2 - 16 kHz
(±) | higher highs - on average 5.8% higher than median
(+) | highs are linear (6% delta to prev. frequency)
Overall 100 - 16.000 Hz
(±) | linearity of overall sound is average (20.7% difference to median)
Compared to same class
» 48% of all tested devices in this class were better, 10% similar, 42% worse
» The best had a delta of 7%, average was 21%, worst was 53%
Compared to all devices tested
» 56% of all tested devices were better, 8% similar, 36% worse
» The best had a delta of 4%, average was 23%, worst was 134%
Asus Zenbook UX3430UQ-GV012T audio analysis
(±) | speaker loudness is average but good (75 dB)
Bass 100 - 315 Hz
(-) | nearly no bass - on average 18.9% lower than median
(±) | linearity of bass is average (12.2% delta to prev. frequency)
Mids 400 - 2000 Hz
(+) | balanced mids - only 3.4% away from median
(+) | mids are linear (6.9% delta to prev. frequency)
Highs 2 - 16 kHz
(+) | balanced highs - only 2.7% away from median
(+) | highs are linear (5% delta to prev. frequency)
Overall 100 - 16.000 Hz
(±) | linearity of overall sound is average (20.4% difference to median)
Compared to same class
» 65% of all tested devices in this class were better, 8% similar, 26% worse
» The best had a delta of 5%, average was 18%, worst was 53%
Compared to all devices tested
» 54% of all tested devices were better, 8% similar, 38% worse
» The best had a delta of 4%, average was 23%, worst was 134%
HP EliteBook x360 1030 G2 audio analysis
(+) | speakers can play relatively loud (86.3 dB)
Analysis not possible as minimum curve is missing or too high
Toshiba Portege X30-D (PT274U-01N001) audio analysis
(±) | speaker loudness is average but good (77 dB)
Bass 100 - 315 Hz
(-) | nearly no bass - on average 16.7% lower than median
(±) | linearity of bass is average (14.2% delta to prev. frequency)
Mids 400 - 2000 Hz
(+) | balanced mids - only 2.6% away from median
(+) | mids are linear (6.8% delta to prev. frequency)
Highs 2 - 16 kHz
(+) | balanced highs - only 3.5% away from median
(±) | linearity of highs is average (9.3% delta to prev. frequency)
Overall 100 - 16.000 Hz
(±) | linearity of overall sound is average (19.7% difference to median)
Compared to same class
» 41% of all tested devices in this class were better, 7% similar, 51% worse
» The best had a delta of 7%, average was 21%, worst was 53%
Compared to all devices tested
» 50% of all tested devices were better, 7% similar, 43% worse
» The best had a delta of 4%, average was 23%, worst was 134%
Dell Latitude 13 7380 audio analysis
(-) | not very loud speakers (70.9 dB)
Bass 100 - 315 Hz
(±) | reduced bass - on average 12.8% lower than median
(±) | linearity of bass is average (12.8% delta to prev. frequency)
Mids 400 - 2000 Hz
(+) | balanced mids - only 1.9% away from median
(±) | linearity of mids is average (7.2% delta to prev. frequency)
Highs 2 - 16 kHz
(+) | balanced highs - only 4.5% away from median
(±) | linearity of highs is average (12.1% delta to prev. frequency)
Overall 100 - 16.000 Hz
(±) | linearity of overall sound is average (22.8% difference to median)
Compared to same class
» 63% of all tested devices in this class were better, 8% similar, 29% worse
» The best had a delta of 7%, average was 21%, worst was 53%
Compared to all devices tested
» 68% of all tested devices were better, 5% similar, 27% worse
» The best had a delta of 4%, average was 23%, worst was 134%
Frequency comparison (checkboxes selectable!)
Power Management: inconspicuous consumption
Power Consumption
It should be obvious that the Core i5-8350U with its four physical cores uses more power overall than the Kaby Lake dual-cores of the competitors. In general and here as well, this becomes particularly noticeable under load. However, we are surprised that despite its GeForce 940MX, the Asus uses significantly less power during maximum load than the Latitude 7390. While the Portégé stands out again with a much too high consumption in the three idle scenarios, it is the most efficient during load. Overall, we can attest our test unit with a power consumption that is inconspicuous.
In the beginning of the stress test (max load), we measured a power consumption of up to 67.4 watts for 4 seconds, which nominally exceeds the capacity of the 65-Watt power supply, but makes no difference in practice.
| Off / Standby | |
| Idle | |
| Load |
|
Key:
min: | |
| Dell Latitude 7390 i5-8350U, UHD Graphics 620, SK hynix SC311 M.2, IPS, 1920x1080, 13.3" | Asus Zenbook UX3430UQ-GV012T i7-7500U, GeForce 940MX, SanDisk SD8SN8U512G1002, IPS, 1920x1080, 14" | HP EliteBook x360 1030 G2 i5-7300U, HD Graphics 620, Sandisk SD8TN8U-256G-1006, IPS, 1920x1080, 13.3" | Toshiba Portege X30-D (PT274U-01N001) i7-7600U, HD Graphics 620, Samsung PM961 MZVLW256HEHP, IPS, 1920x1080, 13.3" | Dell Latitude 13 7380 i7-7600U, HD Graphics 620, Samsung PM961 MZVLW256HEHP, IPS, 1920x1080, 13.3" | |
|---|---|---|---|---|---|
| Power Consumption | 4% | 7% | -11% | 11% | |
| Idle Minimum * (Watt) | 2.34 | 2.6 -11% | 3.2 -37% | 4.6 -97% | 3.2 -37% |
| Idle Average * (Watt) | 5.6 | 5.9 -5% | 5.5 2% | 7.6 -36% | 5.5 2% |
| Idle Maximum * (Watt) | 6.5 | 6.25 4% | 6.5 -0% | 8.2 -26% | 6.1 6% |
| Load Average * (Watt) | 43 | 42 2% | 29.7 31% | 23.8 45% | 29.5 31% |
| Load Maximum * (Watt) | 67.4 | 46 32% | 41.3 39% | 28 58% | 32 53% |
* ... smaller is better
Battery Life
Due to technical difficulties, we were unable to run the practically relevant WLAN test this time and therefore needed to rely on other tests of the battery life (How we test). In the idle test, the Latitude 7390 achieves an outstanding result lasting almost 28 hours, which is almost exactly the same as the predecessor with a battery of similar capacity. The HP EliteBook x360 has 5% less battery capacity, but remains behind the test unit by 16% in the idle test, and 12% in the H.264 test.
That the battery life under load turns out considerably shorter than in most dual-core competitors with their weaker batteries can be traced back to the additional consumption of the four cores of the i5-8350U in this load state as discussed above. From the overall results and our experience, we can say with high probability that the WLAN runtime should be above 10 hours as in the predecessor. With that, most users should be able to get through the day safely.
| Dell Latitude 7390 i5-8350U, UHD Graphics 620, 60 Wh | Asus Zenbook UX3430UQ-GV012T i7-7500U, GeForce 940MX, 50 Wh | HP EliteBook x360 1030 G2 i5-7300U, HD Graphics 620, 57 Wh | Toshiba Portege X30-D (PT274U-01N001) i7-7600U, HD Graphics 620, 48 Wh | Dell Latitude 13 7380 i7-7600U, HD Graphics 620, 60 Wh | Average of class Office | |
|---|---|---|---|---|---|---|
| Battery runtime | -8% | 48% | -7% | 28% | 11% | |
| Reader / Idle (h) | 27.7 | 21.5 -22% | 23.1 -17% | 15 -46% | 26.6 -4% | 24.5 ? -12% |
| H.264 (h) | 12.5 | 11 -12% | 15.5 ? 24% | |||
| Load (h) | 1.5 | 1.6 7% | 4.1 173% | 2 33% | 2.4 60% | 1.808 ? 21% |
| WiFi v1.3 (h) | 8.8 | 10.5 | 7.2 | 10.5 | 13.2 ? |
Verdict
Pros
Cons
With the new Latitude 7390, Dell has done almost everything right. For a not so expensive 1400 Euros (~$1732) for the model we tested, you receive a rounded package with only a few weaknesses.
We should mention here the slightly small but otherwise mostly successful keyboard, the mediocre mouse key replacements, the lack of Thunderbolt 3, and the noisy Space key. It is a minor design misstep that the lid raises the base from an opening angle above about 135°. The only thing we really did not like was the obnoxious sound and the sub-optimal fingerprint sensor.
Not only are the points on the "Pro" list more numerous, but mostly also more important. Even though with its i5-8350U, the Latitude is a little bit of overkill for office tasks, since the battery life is still on a high level, we say that more power can never hurt. The simply designed but high-quality case, the good to very good input devices, the complete security equipment, the sensible connections, the high-contrast display, Windows 10 Pro, and last not least the 3 years of warranty together with the quiet operation deserve a clear purchase recommendation.
Dell Latitude 7390
- 04/05/2018 v6 (old)
Sven Kloevekorn
Price comparison
