Dell Latitude 7330 Rugged Extreme review: One of the best 13-inch rugged laptops
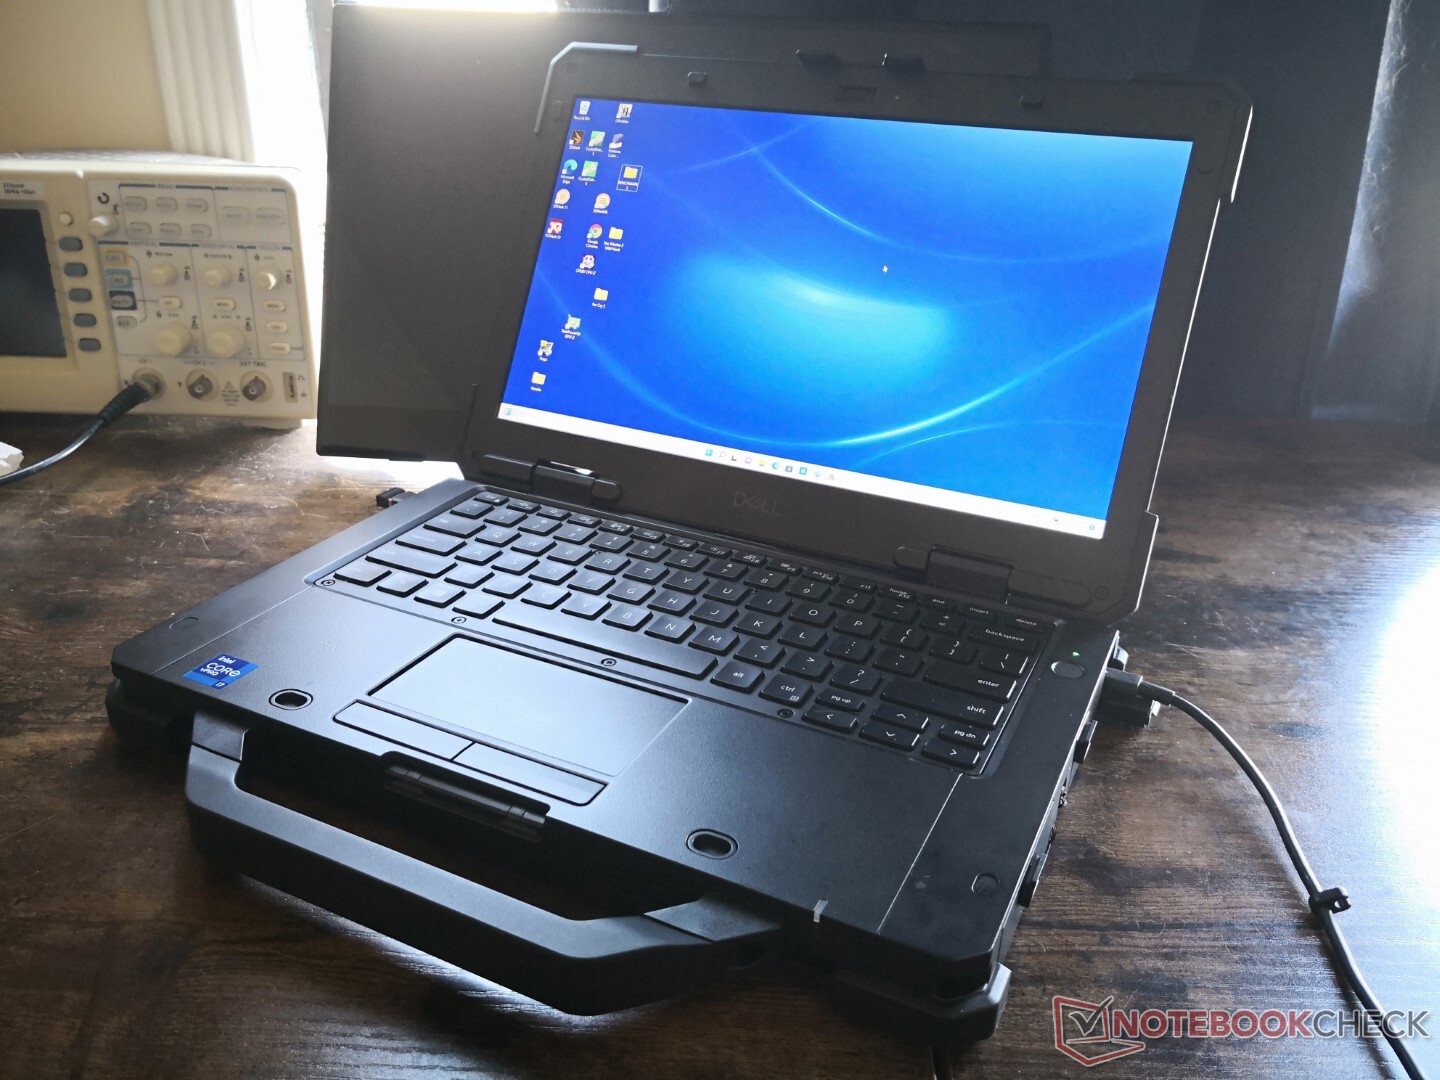
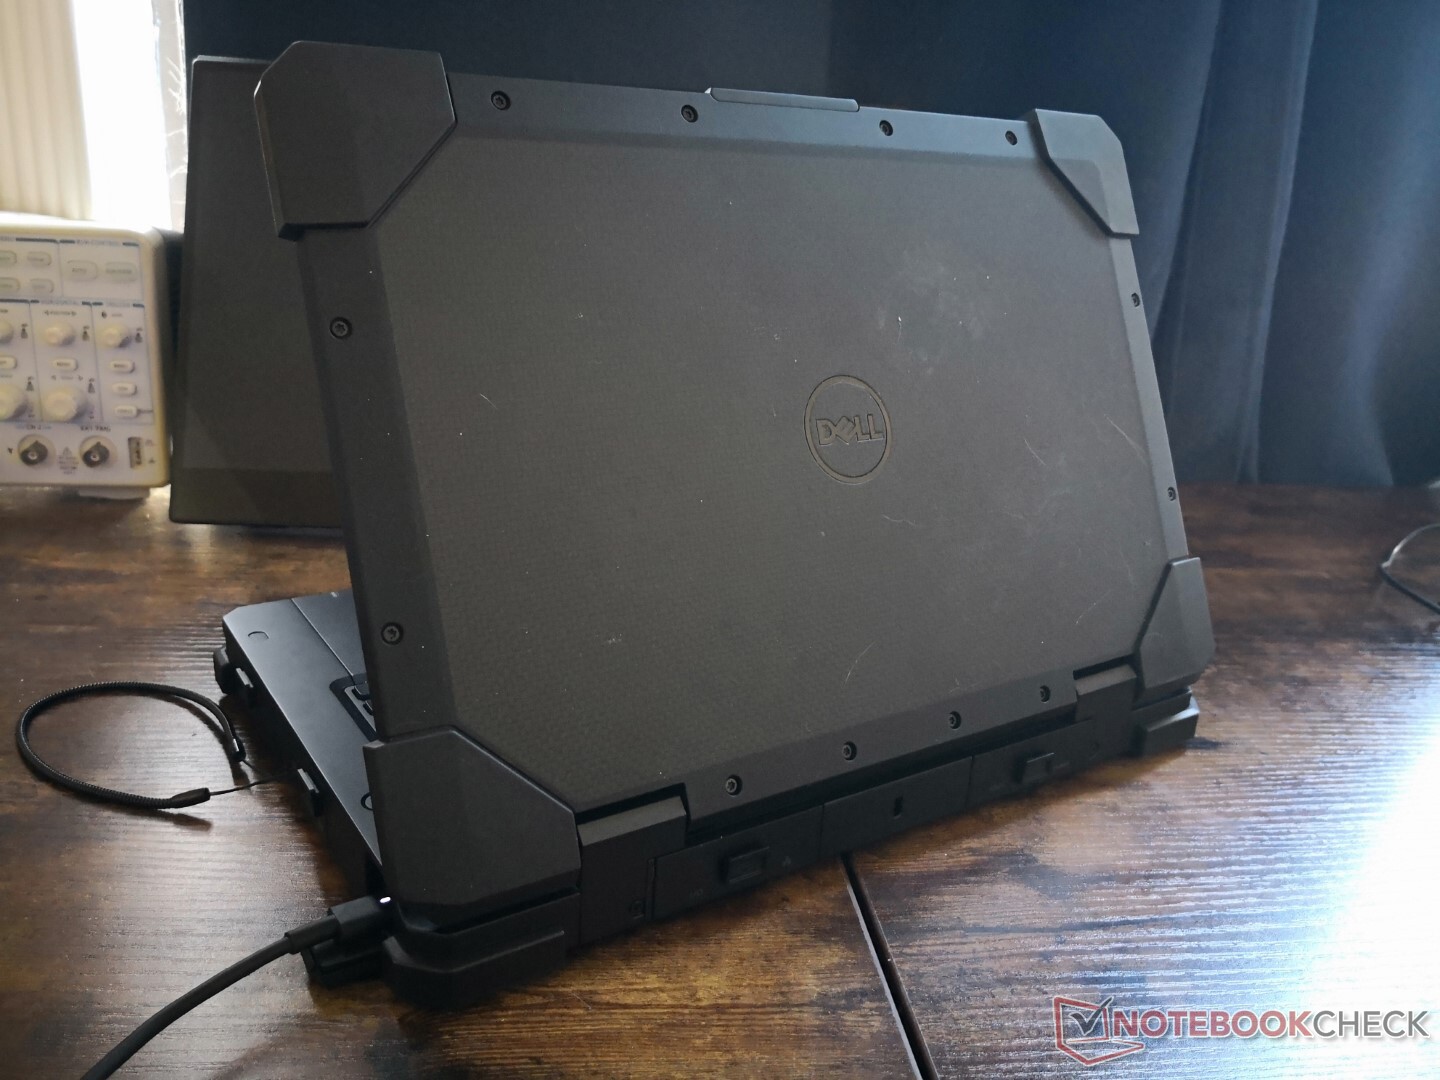
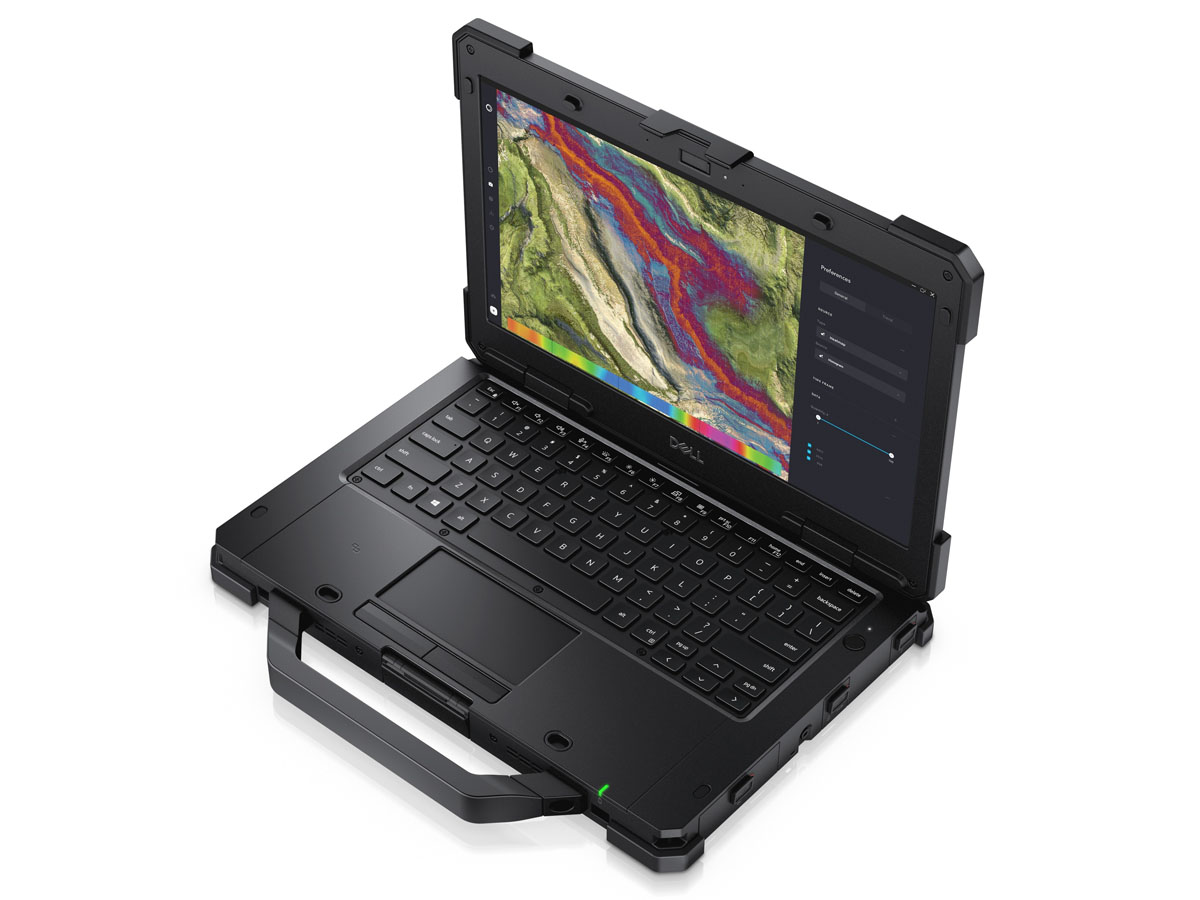
The Latitude 7330 Rugged Extreme is one of the very few — if not only — 13.3-inch rugged clamshell laptops from Dell. It borrows heavily from the existing 14-inch and 15-inch Latitude rugged models but for a smaller and more compact 13-inch form factor.
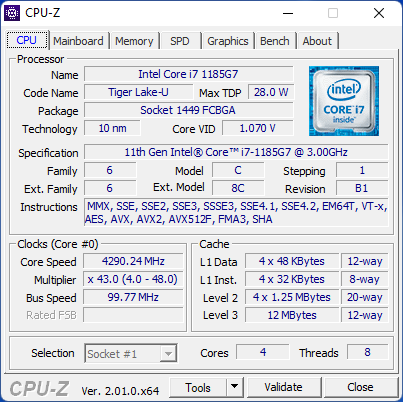
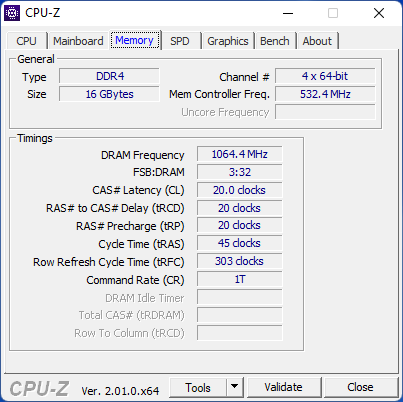
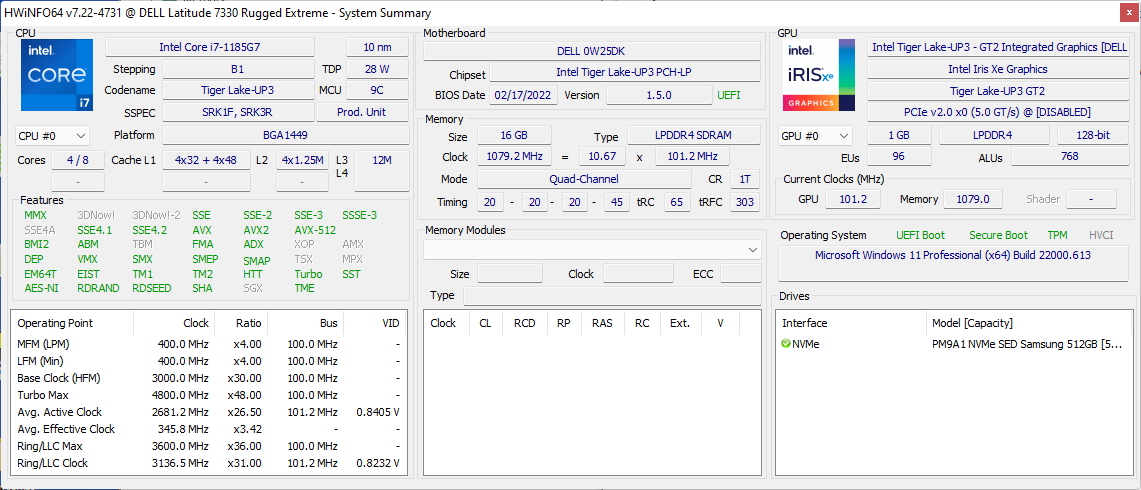
As with most other rugged laptops, the Latitude 7330 Rugged Extreme is available in a very wide variety of configurations as detailed by the product page here. Our specific unit comes with the Core i7-1185G7 vPro CPU, 16 GB LPDDR4x-4266 RAM, and 512 GB Samsung PM9A1 NVMe SSD retails for about $5300 USD. All SKUs come with 11th gen Intel U-series CPUs and the same 1400-nit 1080p IPS panel at the moment.
Direct competitors include other 13.3-inch rugged laptops like the Getac B360 or 14-inch alternatives like the Durabook S14I or Panasonic Toughbook FZ-55 MK2.
More Dell reviews:
Potential Competitors in Comparison
Rating | Date | Model | Weight | Height | Size | Resolution | Price |
|---|---|---|---|---|---|---|---|
v (old) | 04 / 2022 | Dell Latitude 7330 Rugged Extreme i7-1185G7, Iris Xe G7 96EUs | 2.7 kg | 36.5 mm | 13.30" | 1920x1080 | |
| 84.3 % v6 (old) | 03 / 2019 | Dell Latitude 7424 Rugged Extreme i7-8650U, Radeon RX 540 | 3.5 kg | 59.3 mm | 14.00" | 1920x1080 | |
| 89.2 % v6 (old) | 03 / 2019 | Dell Latitude 5420 Rugged-P85G i7-8650U, Radeon RX 540 | 2.8 kg | 32.9 mm | 14.00" | 1920x1080 | |
| 82.4 % v7 (old) | 12 / 2021 | Acer Enduro Urban N3 EUN314 i7-1165G7, Iris Xe G7 96EUs | 1.8 kg | 21.95 mm | 14.00" | 1920x1080 | |
| 83.9 % v7 (old) | 09 / 2021 | Panasonic Toughbook FZ-55 MK2 i7-1185G7, Iris Xe G7 96EUs | 2.3 kg | 33 mm | 14.00" | 1920x1080 | |
v (old) | 04 / 2021 | Durabook S14I i7-1165G7, Iris Xe G7 96EUs | 3 kg | 38.1 mm | 14.00" | 1920x1080 |
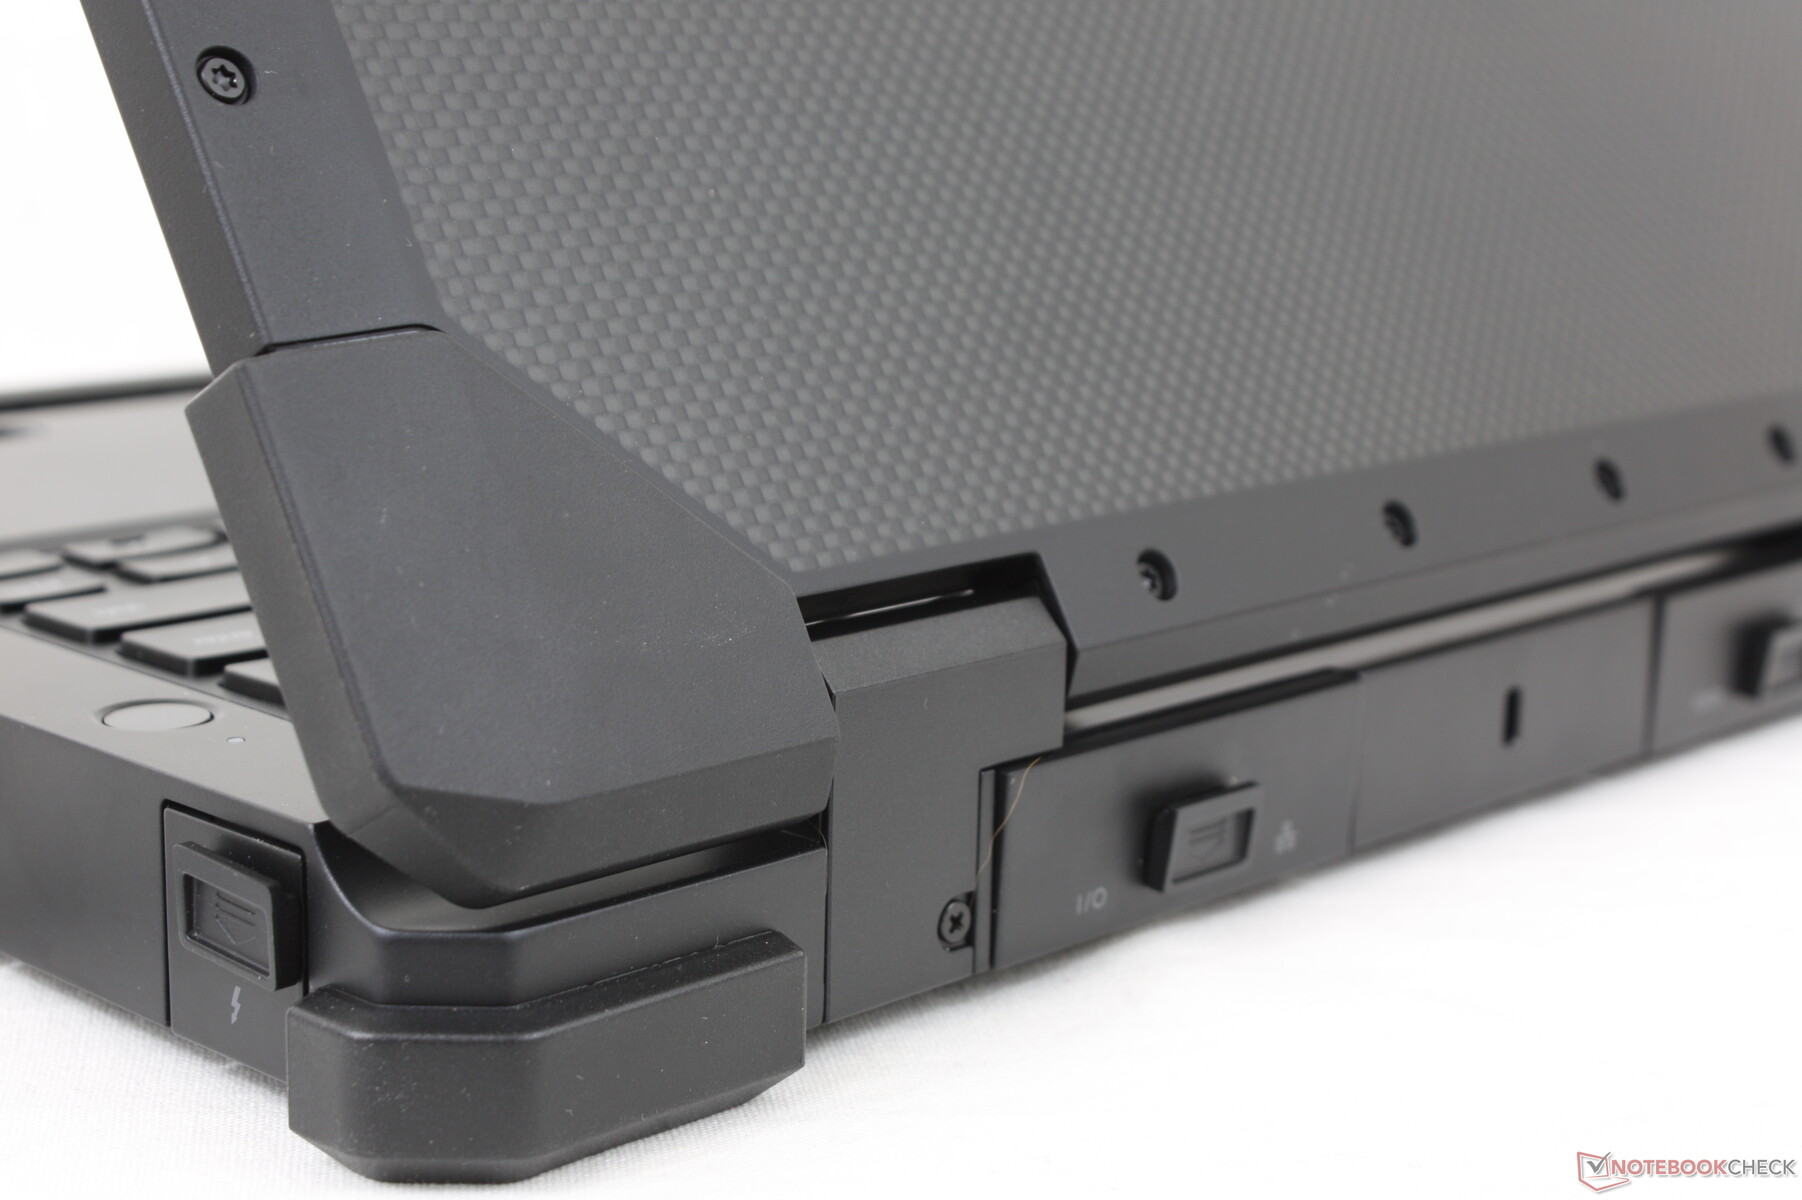
Case
In terms of size and weight, the Dell model is noticeably smaller than the 14-inch Getac B360 or Panasonic Toughbook FZ-55 MK2 and yet it is heavier than either model. The sheer density of the Latitude 7330 Rugged Extreme shouldn't be understated.
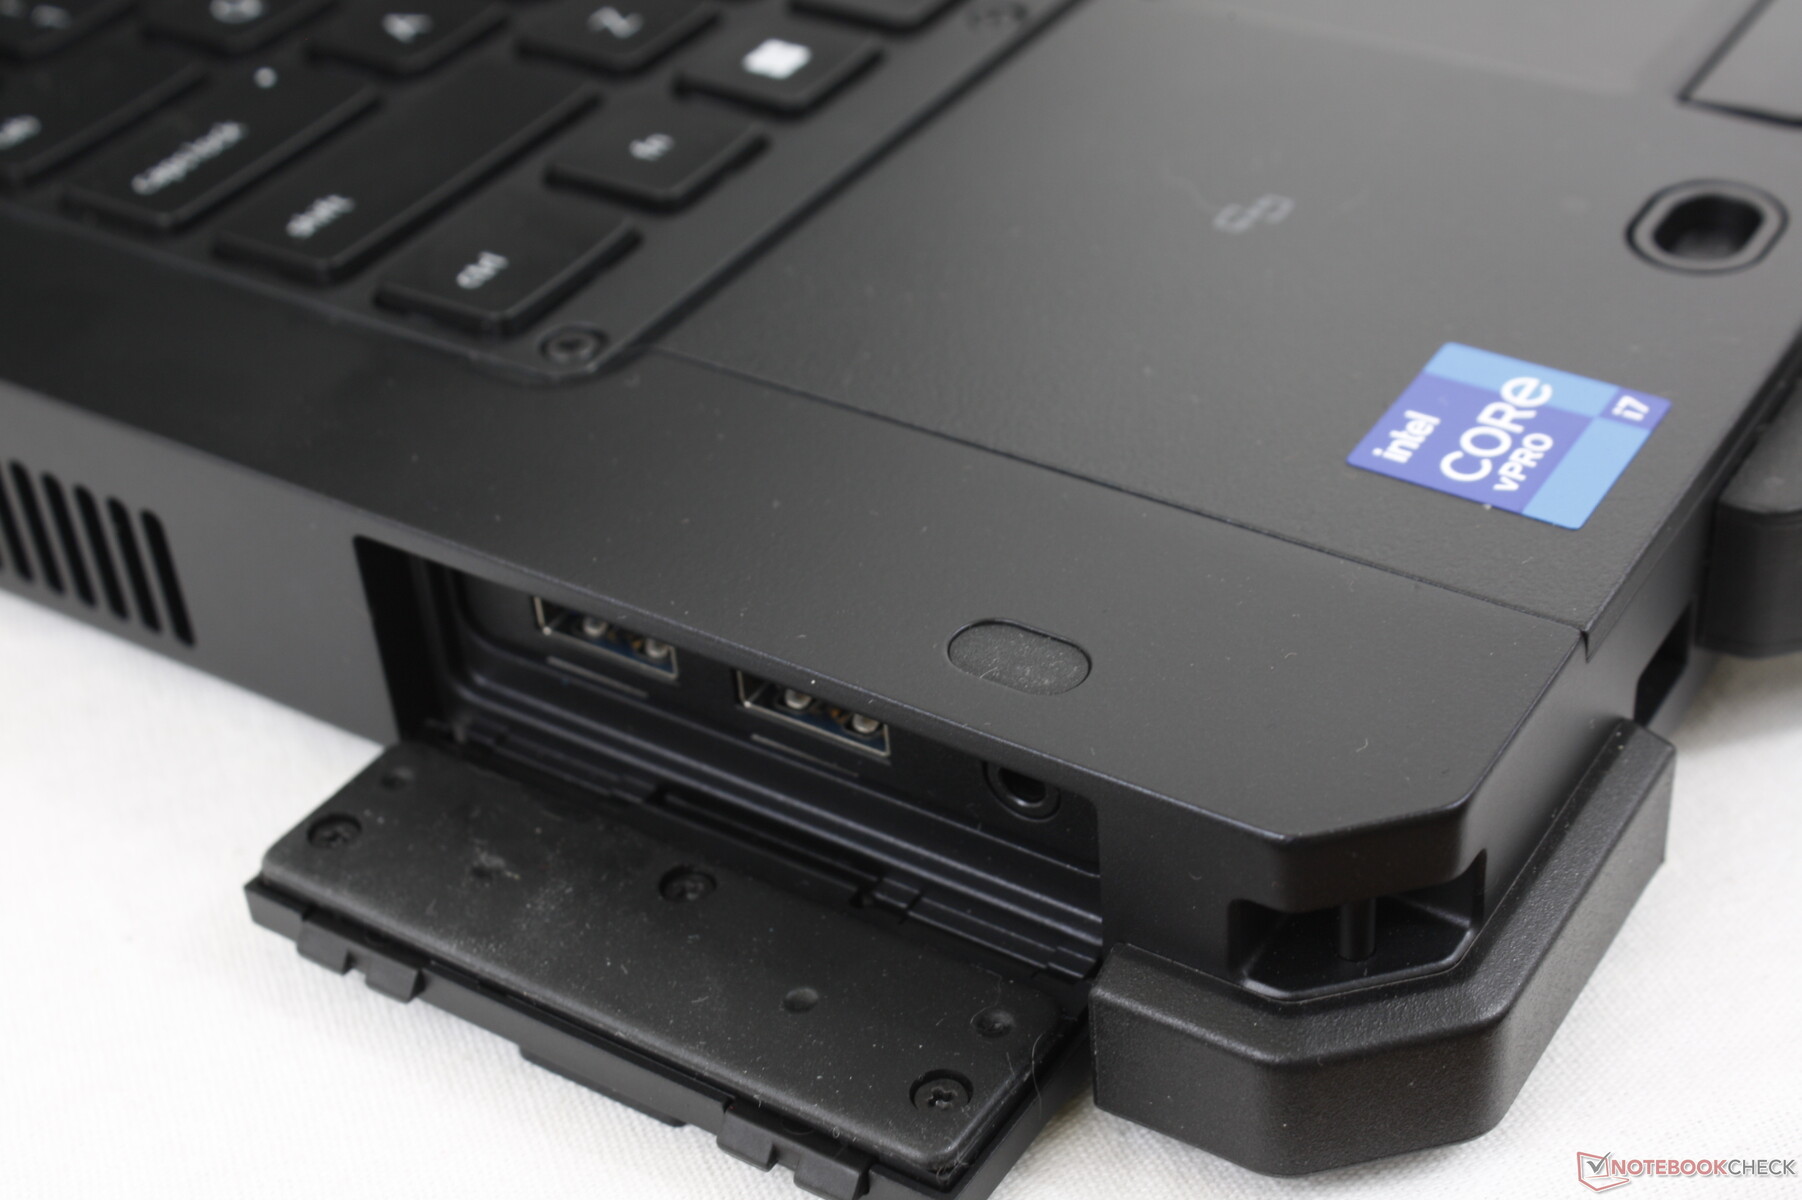
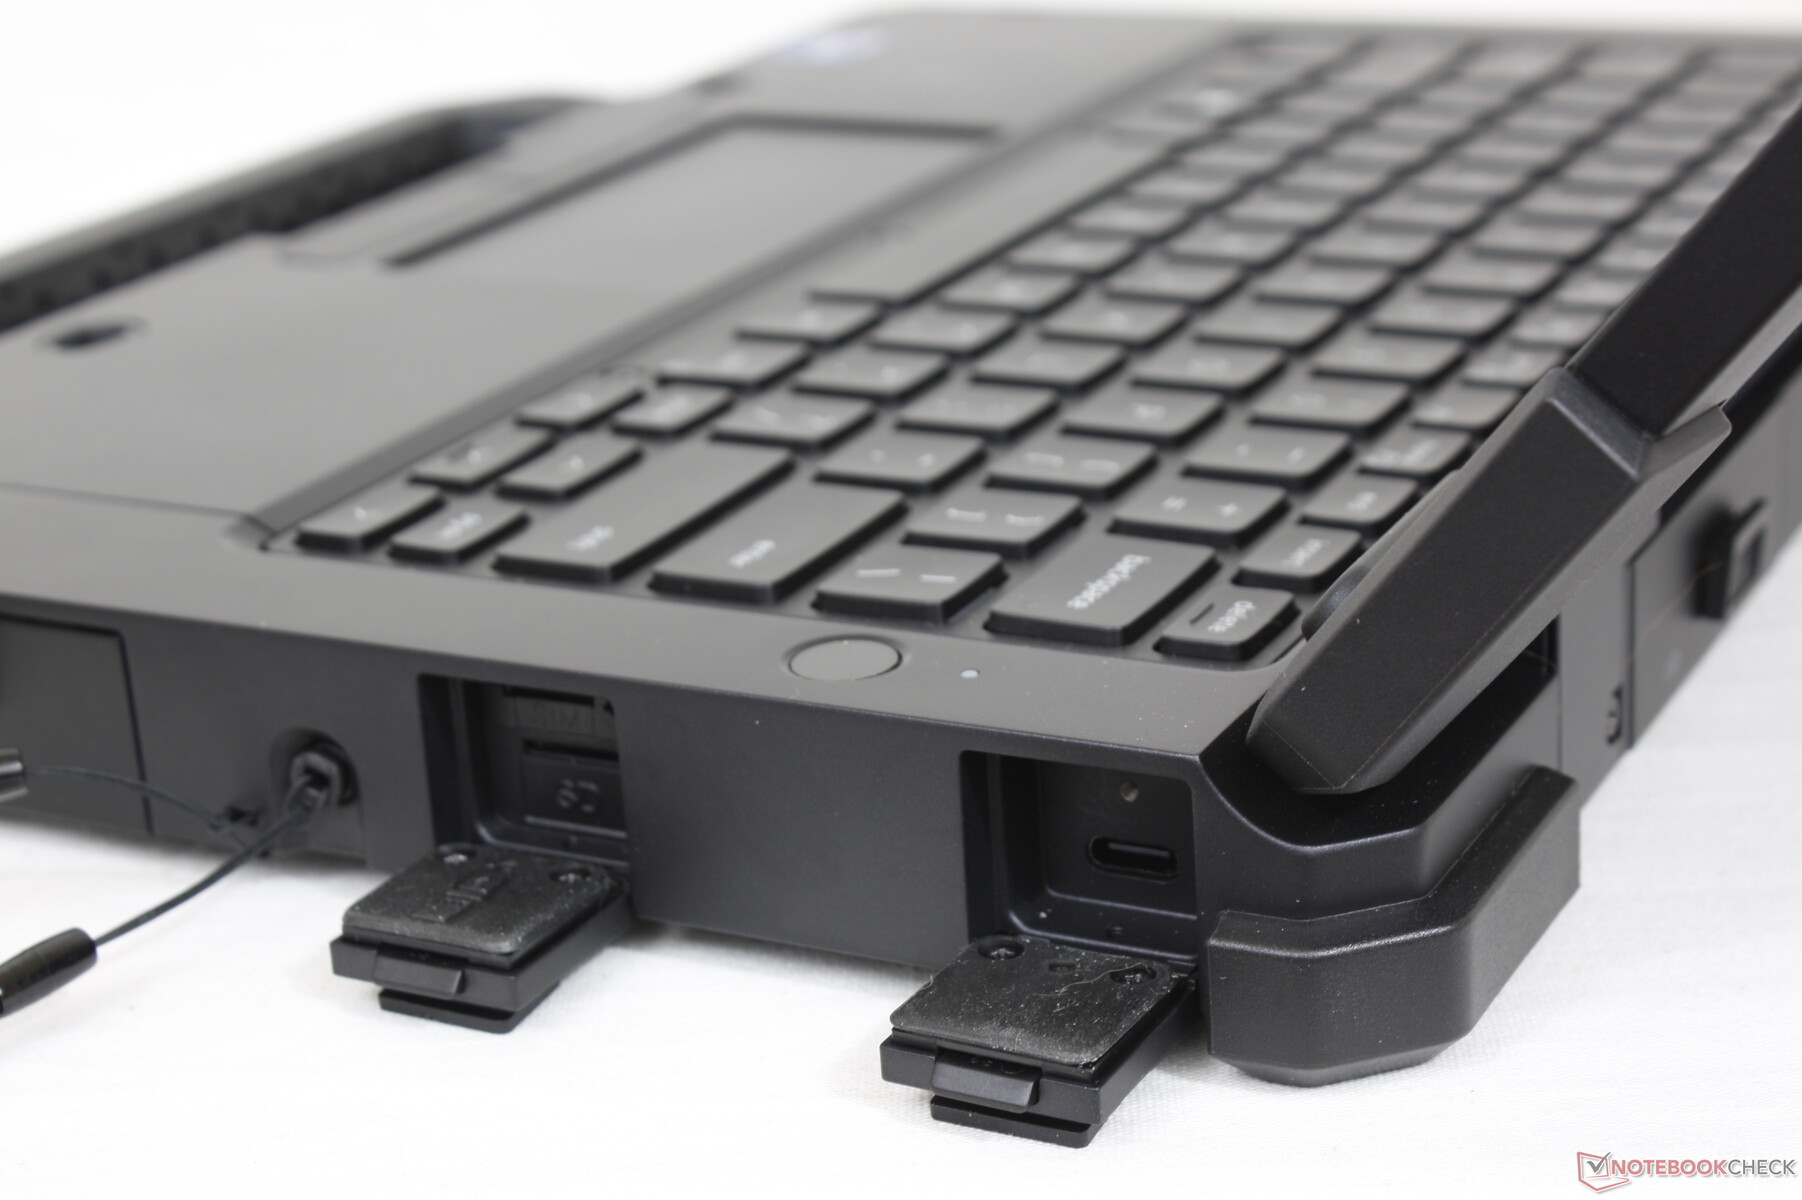
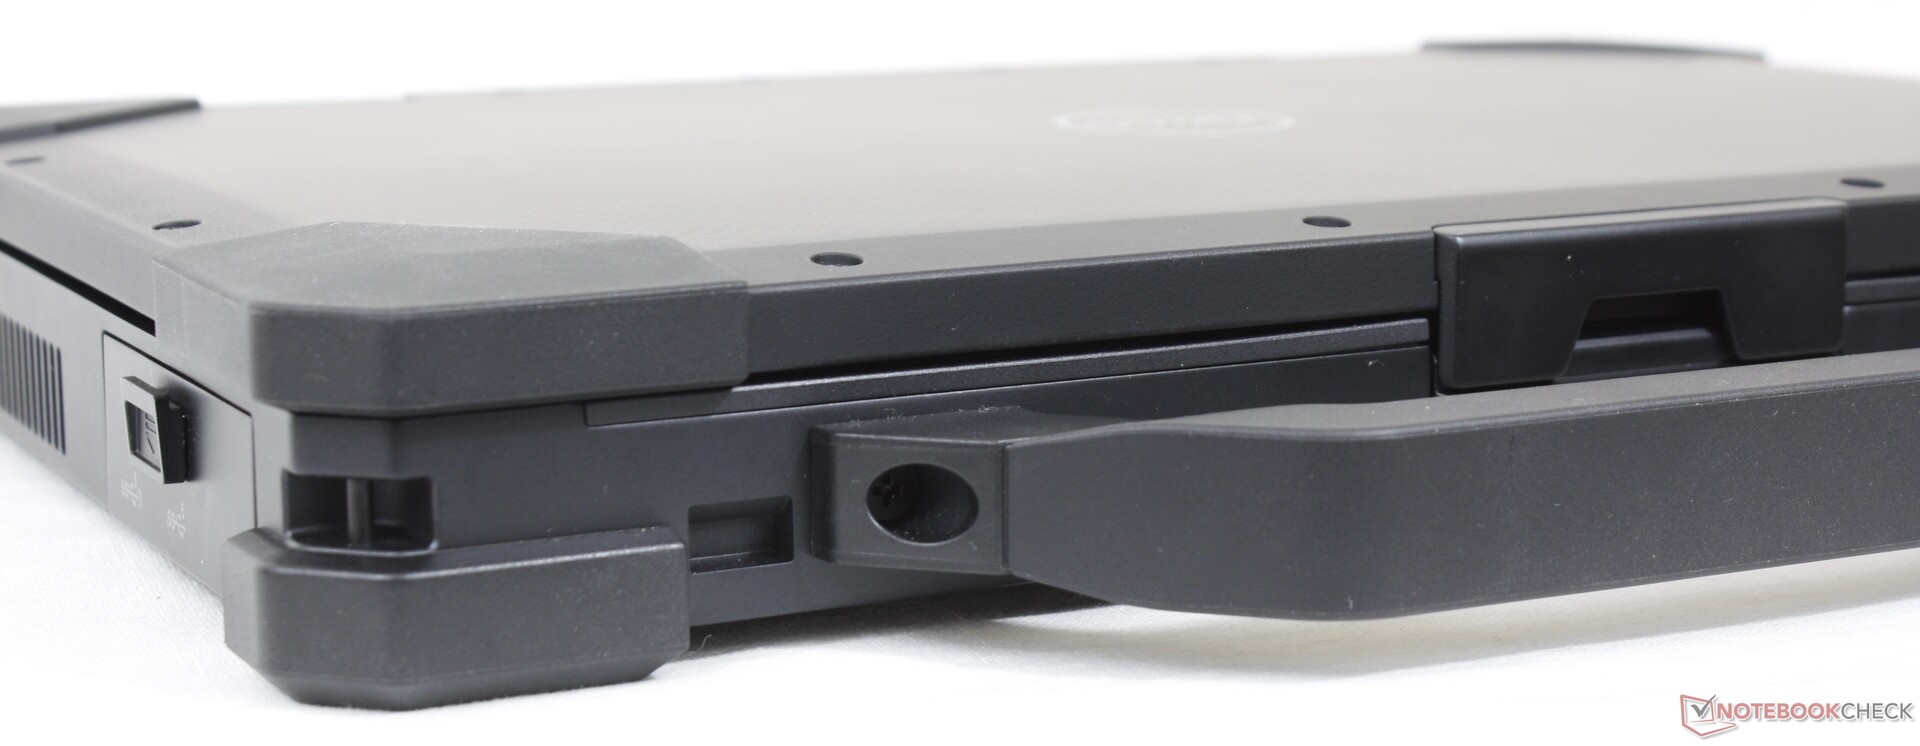
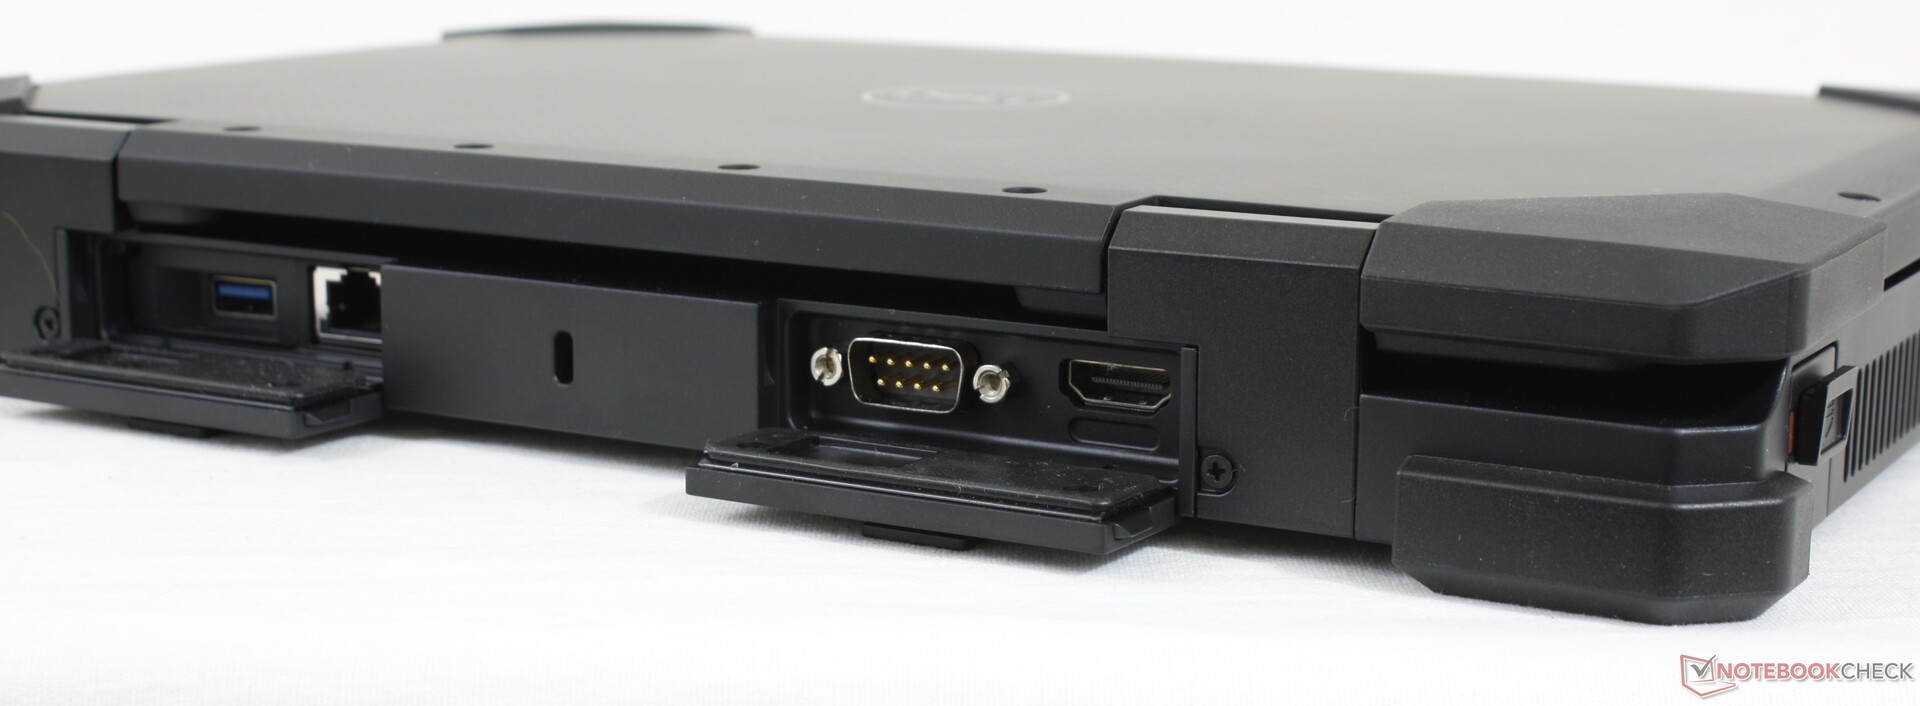
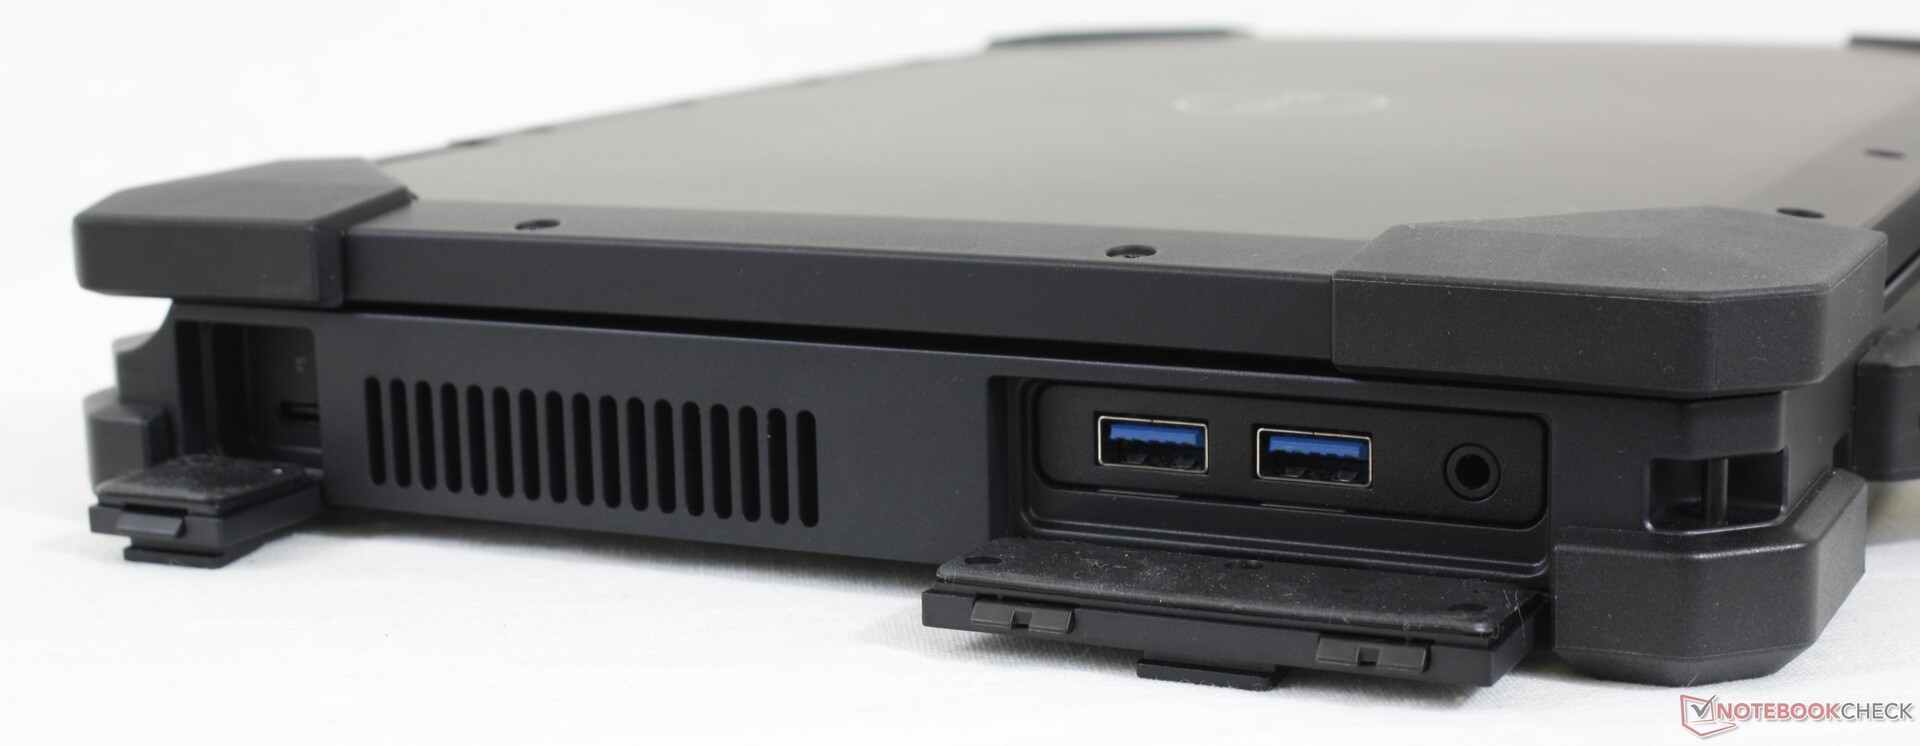
Connectivity
Port options are plentiful with many that are optional including the Smart Card and Express Card readers. Unlike the Getac B360, however, there is no VGA port, DVD reader, or storage bay caddy.
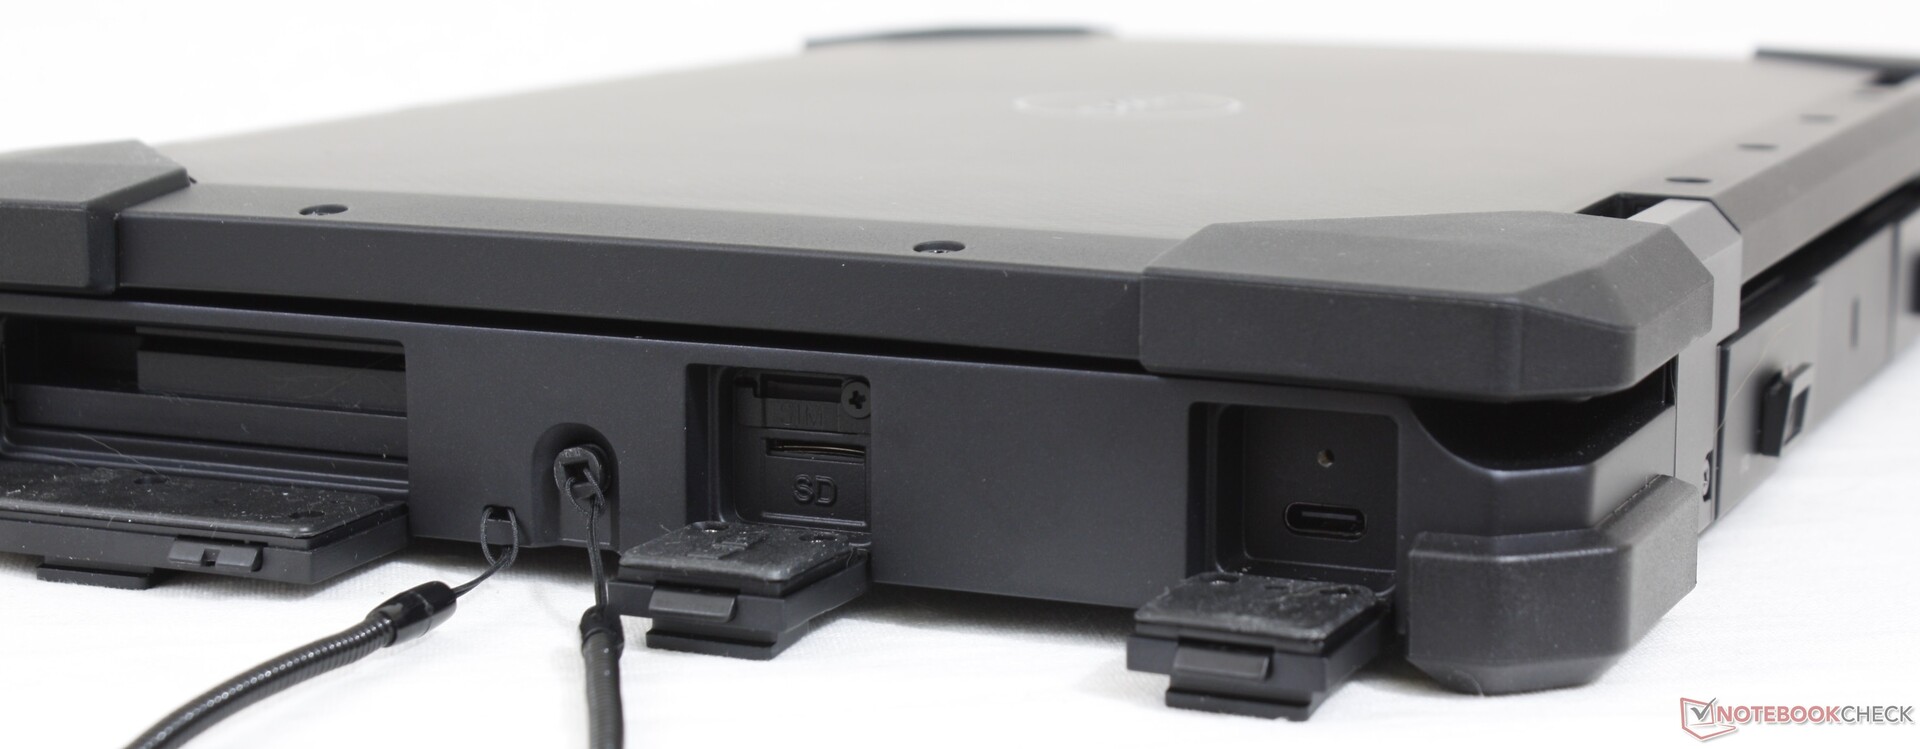
SD Card Reader
Transfer rates from the integrated spring-loaded MicroSD reader are significantly faster than on most other rugged devices. Keep in mind that the MicroSD card must be inserted into the unit upside-down.
Accessing the reader can be especially difficult for users with larger hands since it is recessed so behind a thick cover along the right edge.
| SD Card Reader | |
| average JPG Copy Test (av. of 3 runs) | |
| Dell Latitude 5420 Rugged-P85G (Toshiba Exceria Pro SDXC 64 GB UHS-II) | |
| Dell Latitude 7424 Rugged Extreme (Toshiba Exceria Pro SDXC 64 GB UHS-II) | |
| Dell Latitude 7330 Rugged Extreme (AV Pro V60) | |
| Fujitsu LifeBook U7310 (Toshiba Exceria Pro SDXC 64 GB UHS-II) | |
| Lenovo ThinkPad P15s Gen1-20T4000JGE (Toshiba Exceria Pro M501 64 GB UHS-II) | |
| Panasonic Toughbook FZ-55 MK2 (AV Pro V60) | |
| Acer Enduro Urban N3 EUN314 (AV Pro V60) | |
| Durabook S14I (Angelbird 128GB AV Pro UHS-II) | |
| maximum AS SSD Seq Read Test (1GB) | |
| Dell Latitude 5420 Rugged-P85G (Toshiba Exceria Pro SDXC 64 GB UHS-II) | |
| Dell Latitude 7424 Rugged Extreme (Toshiba Exceria Pro SDXC 64 GB UHS-II) | |
| Dell Latitude 7330 Rugged Extreme (AV Pro V60) | |
| Panasonic Toughbook FZ-55 MK2 (AV Pro V60) | |
| Fujitsu LifeBook U7310 (Toshiba Exceria Pro SDXC 64 GB UHS-II) | |
| Lenovo ThinkPad P15s Gen1-20T4000JGE (Toshiba Exceria Pro M501 64 GB UHS-II) | |
| Durabook S14I (Angelbird 128GB AV Pro UHS-II) | |
| Acer Enduro Urban N3 EUN314 (AV Pro V60) | |
Communication
The Intel AX210 is optional for Wi-Fi 6 connectivity. Users can also configure with the Qualcomm SDX55 or Snapdragon X20 for WAN connectivity.
Webcam
A 2.1 MP webcam with manual privacy shutter comes standard instead of the usual 1 MP sensor. Windows Hello is supported as well.


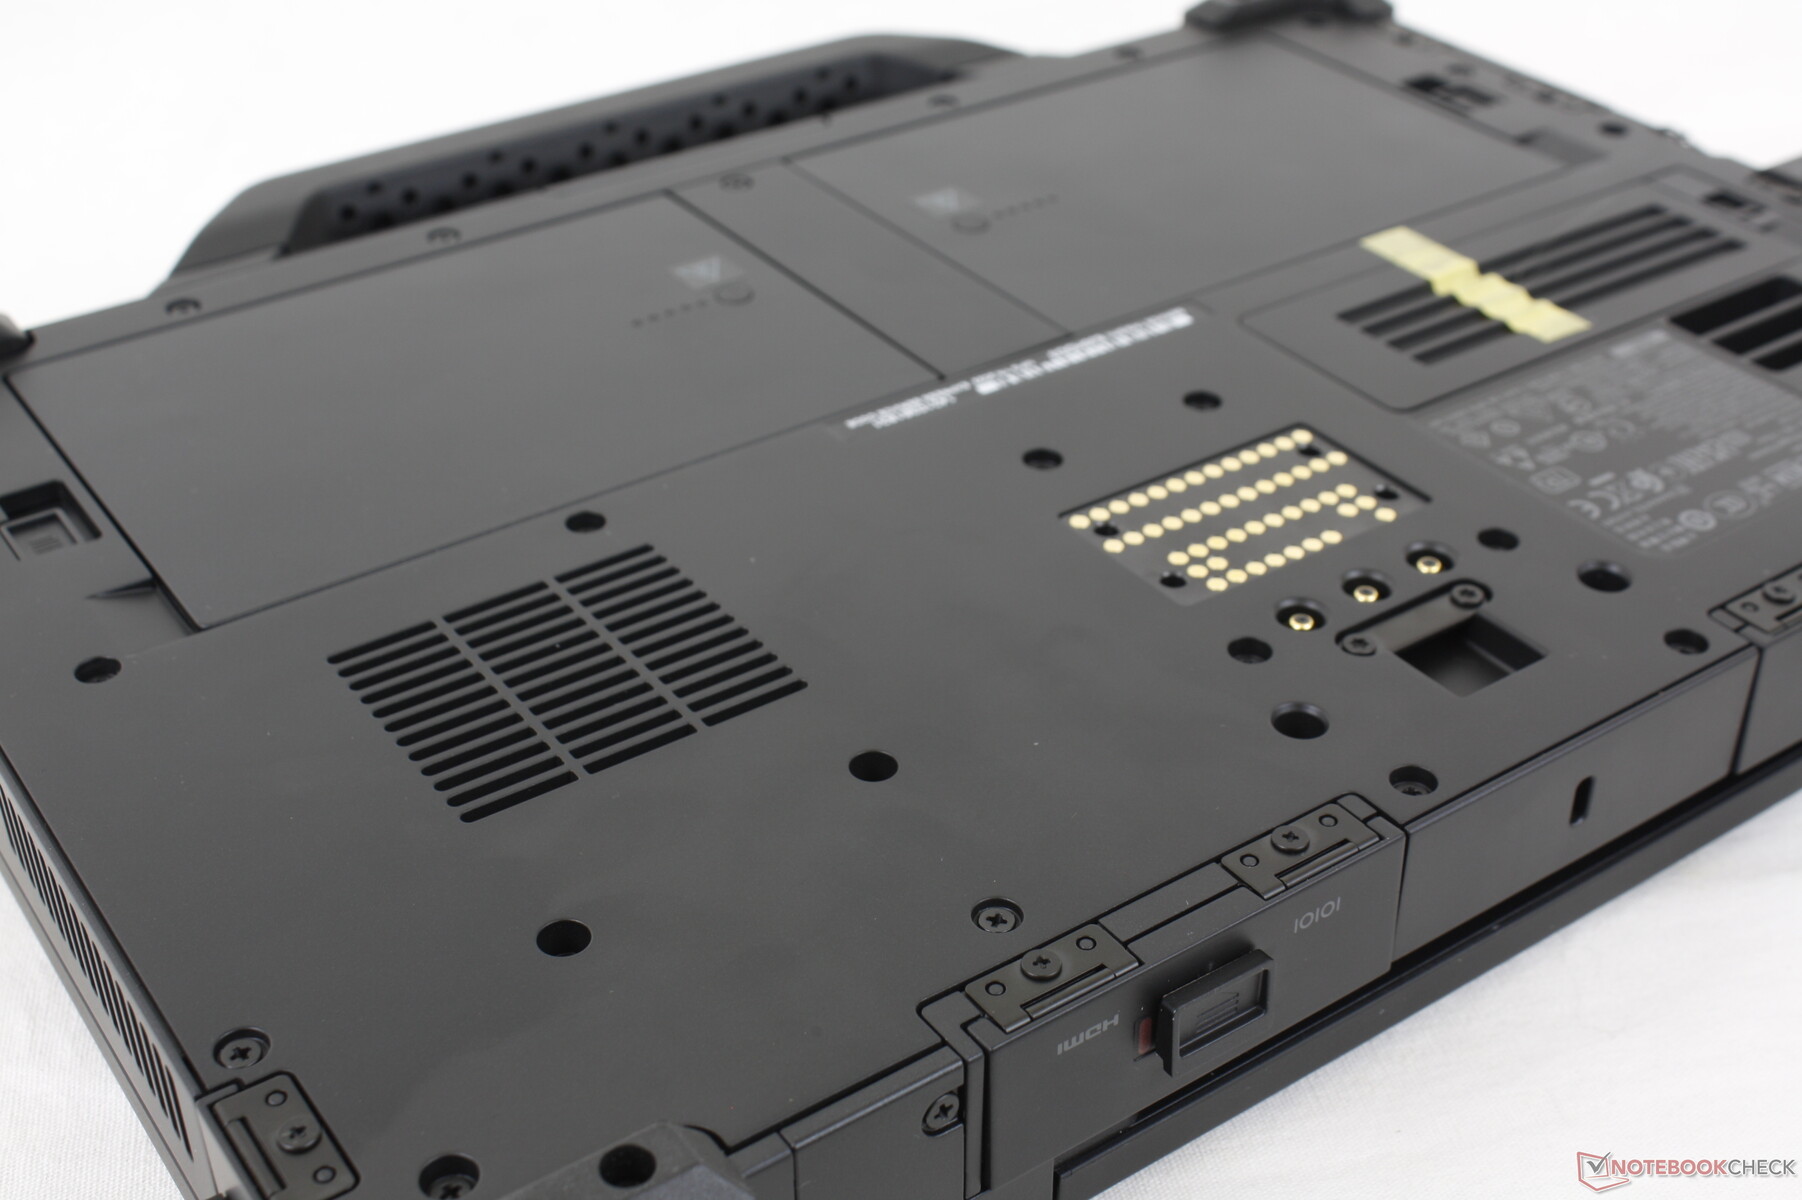
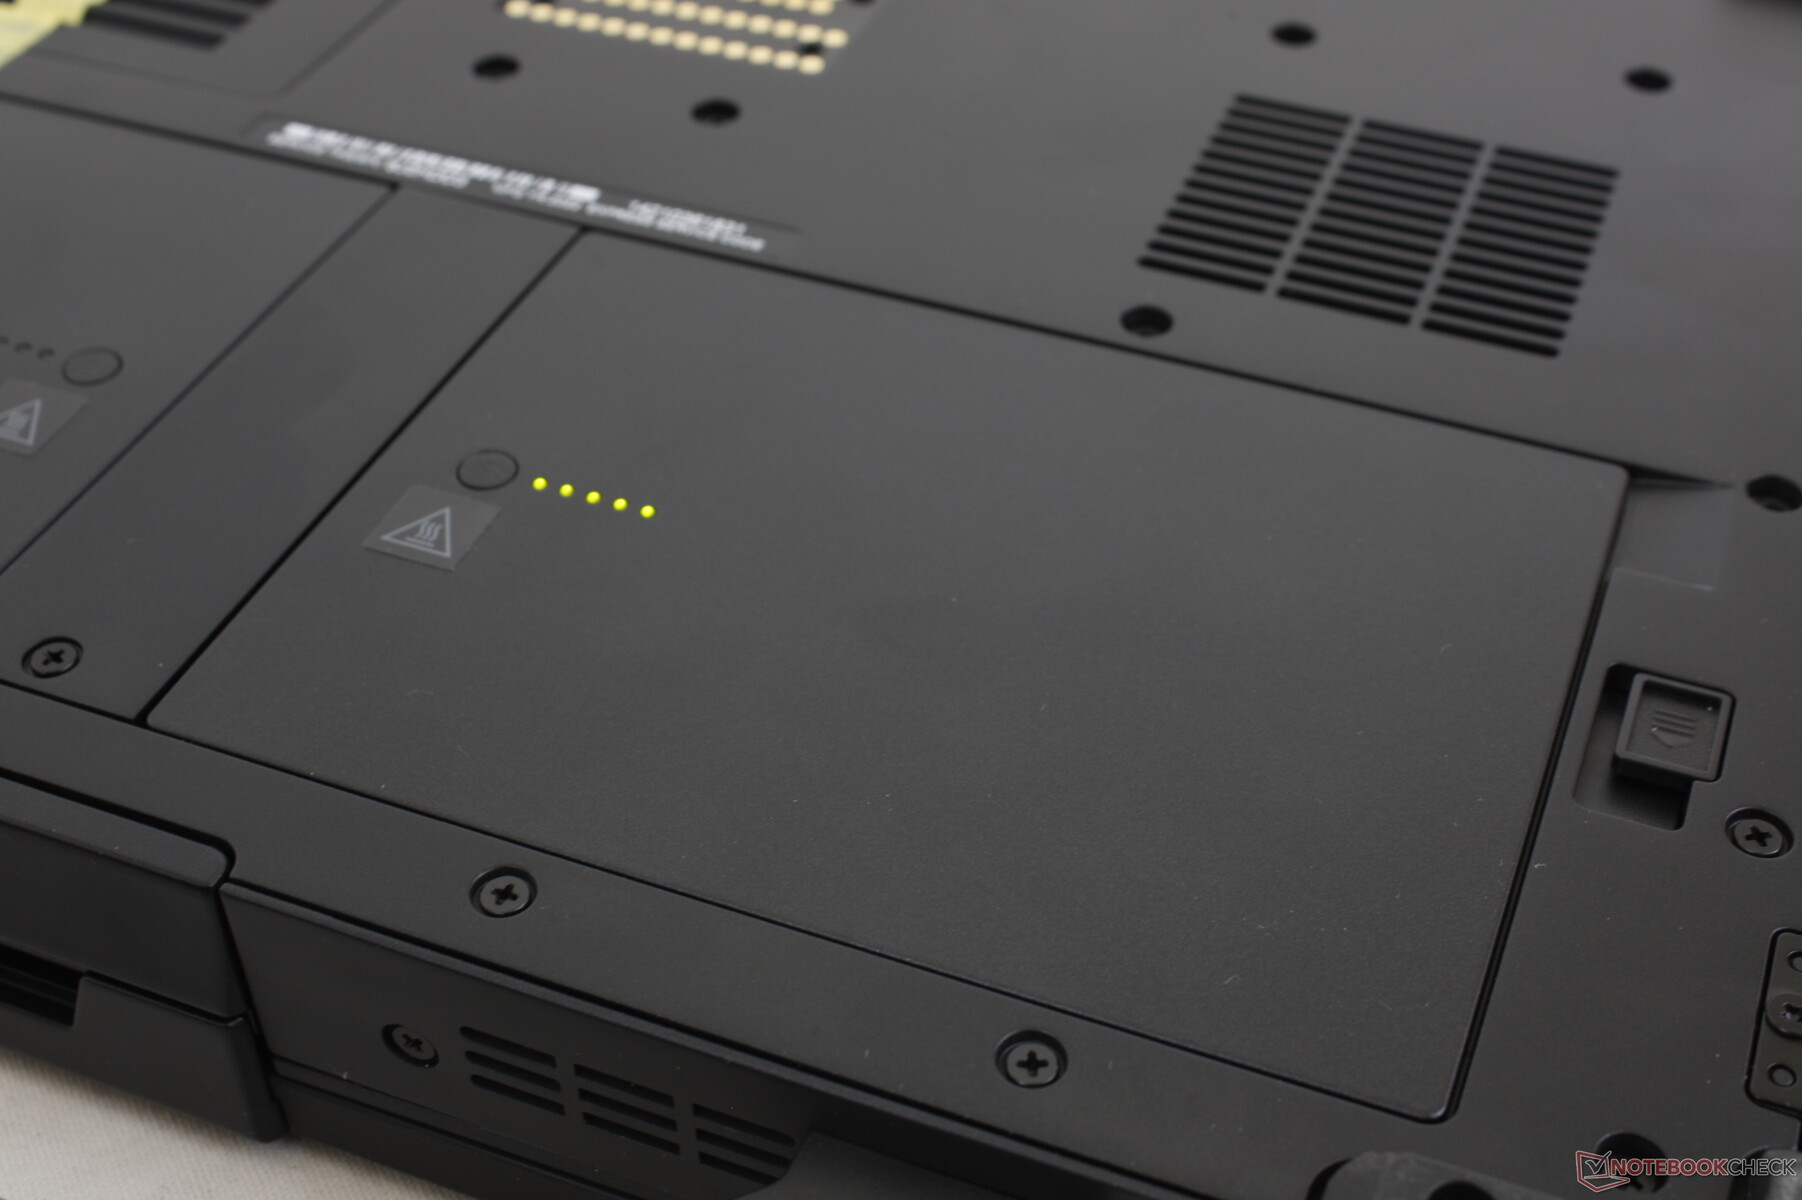
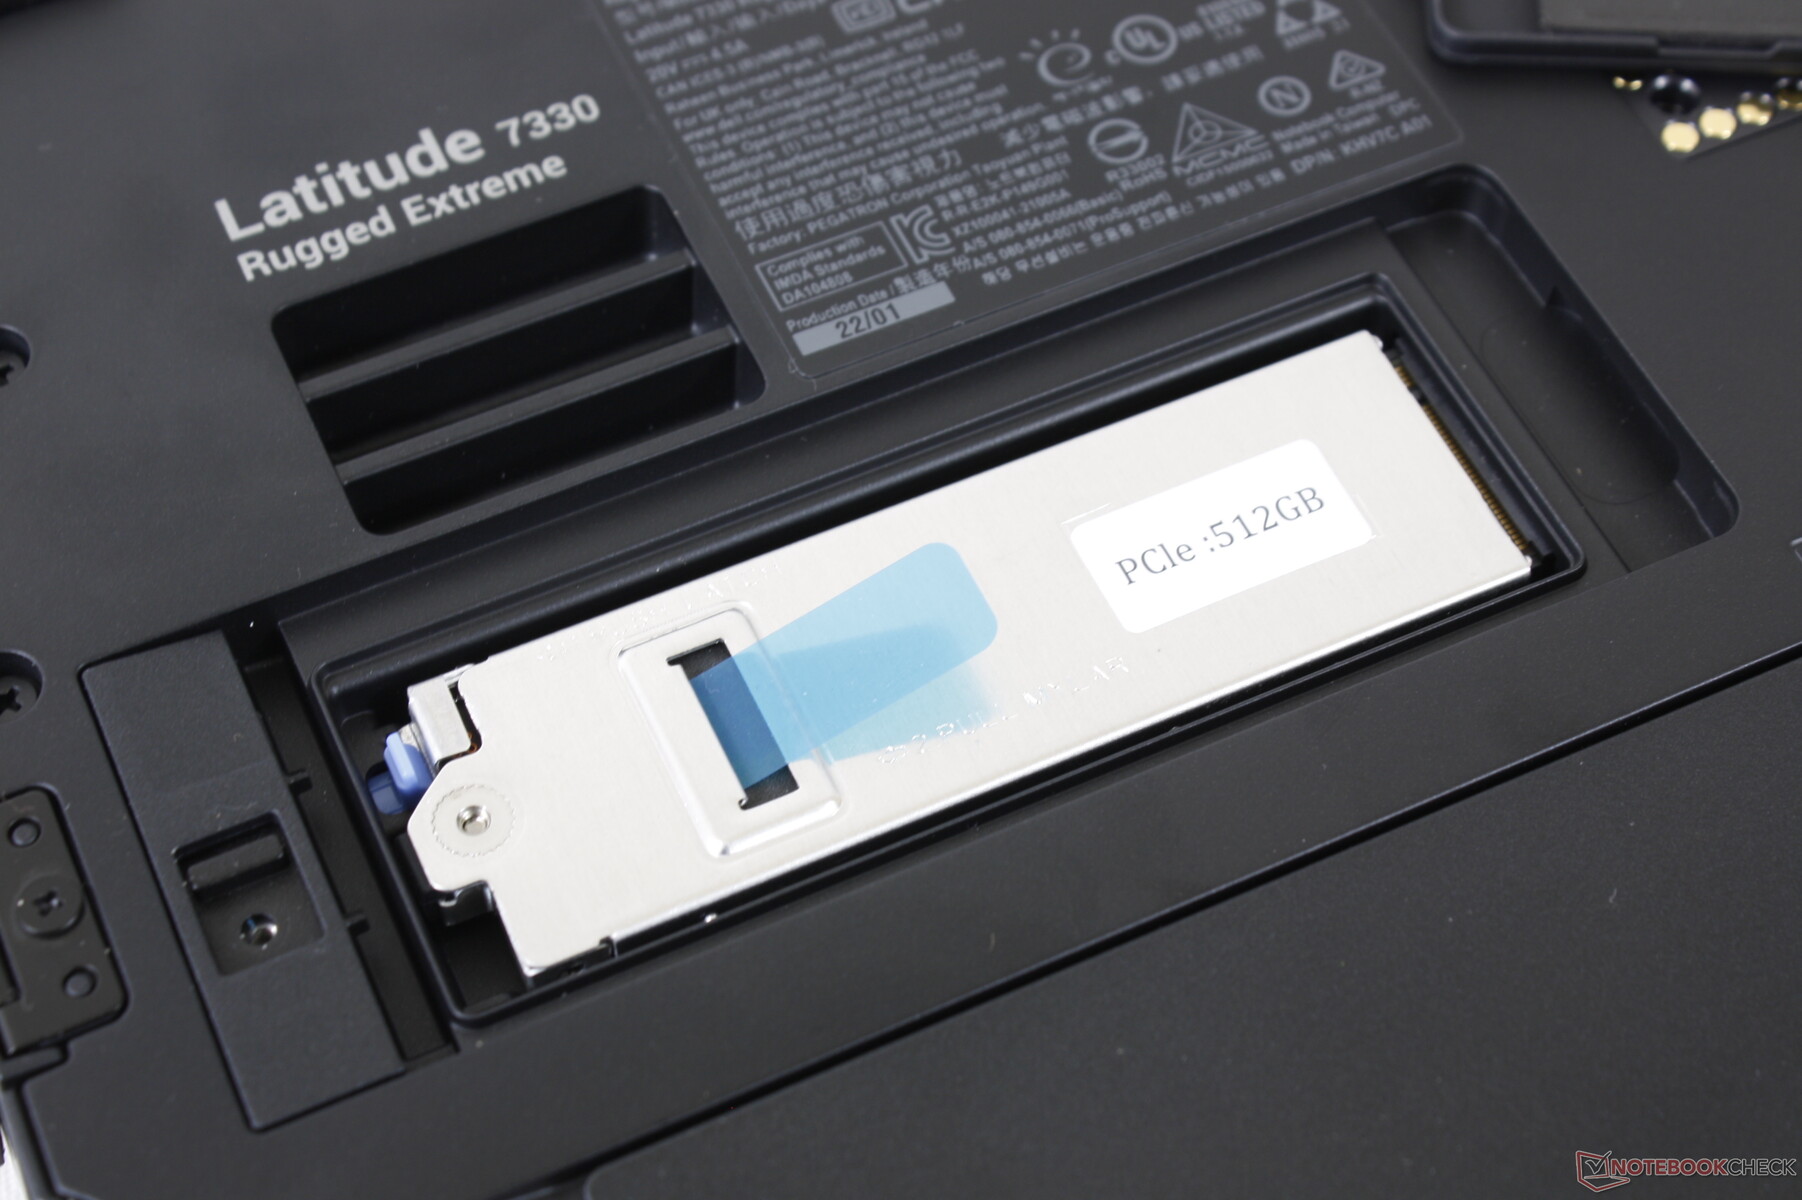
Maintenance
The bottom panel is relatively easy to remove so long as you have the patience to unscrew its two dozen plus Philips screws. There will be little reason to do in most scenarios so since RAM is soldered and the single storage bay is already accessible via a small hatch.
Accessories and Warranty
Optional accessories are available to exploit the proprietary docking pins on the bottom of the unit. A three-year limited manufacturer warranty comes standard.
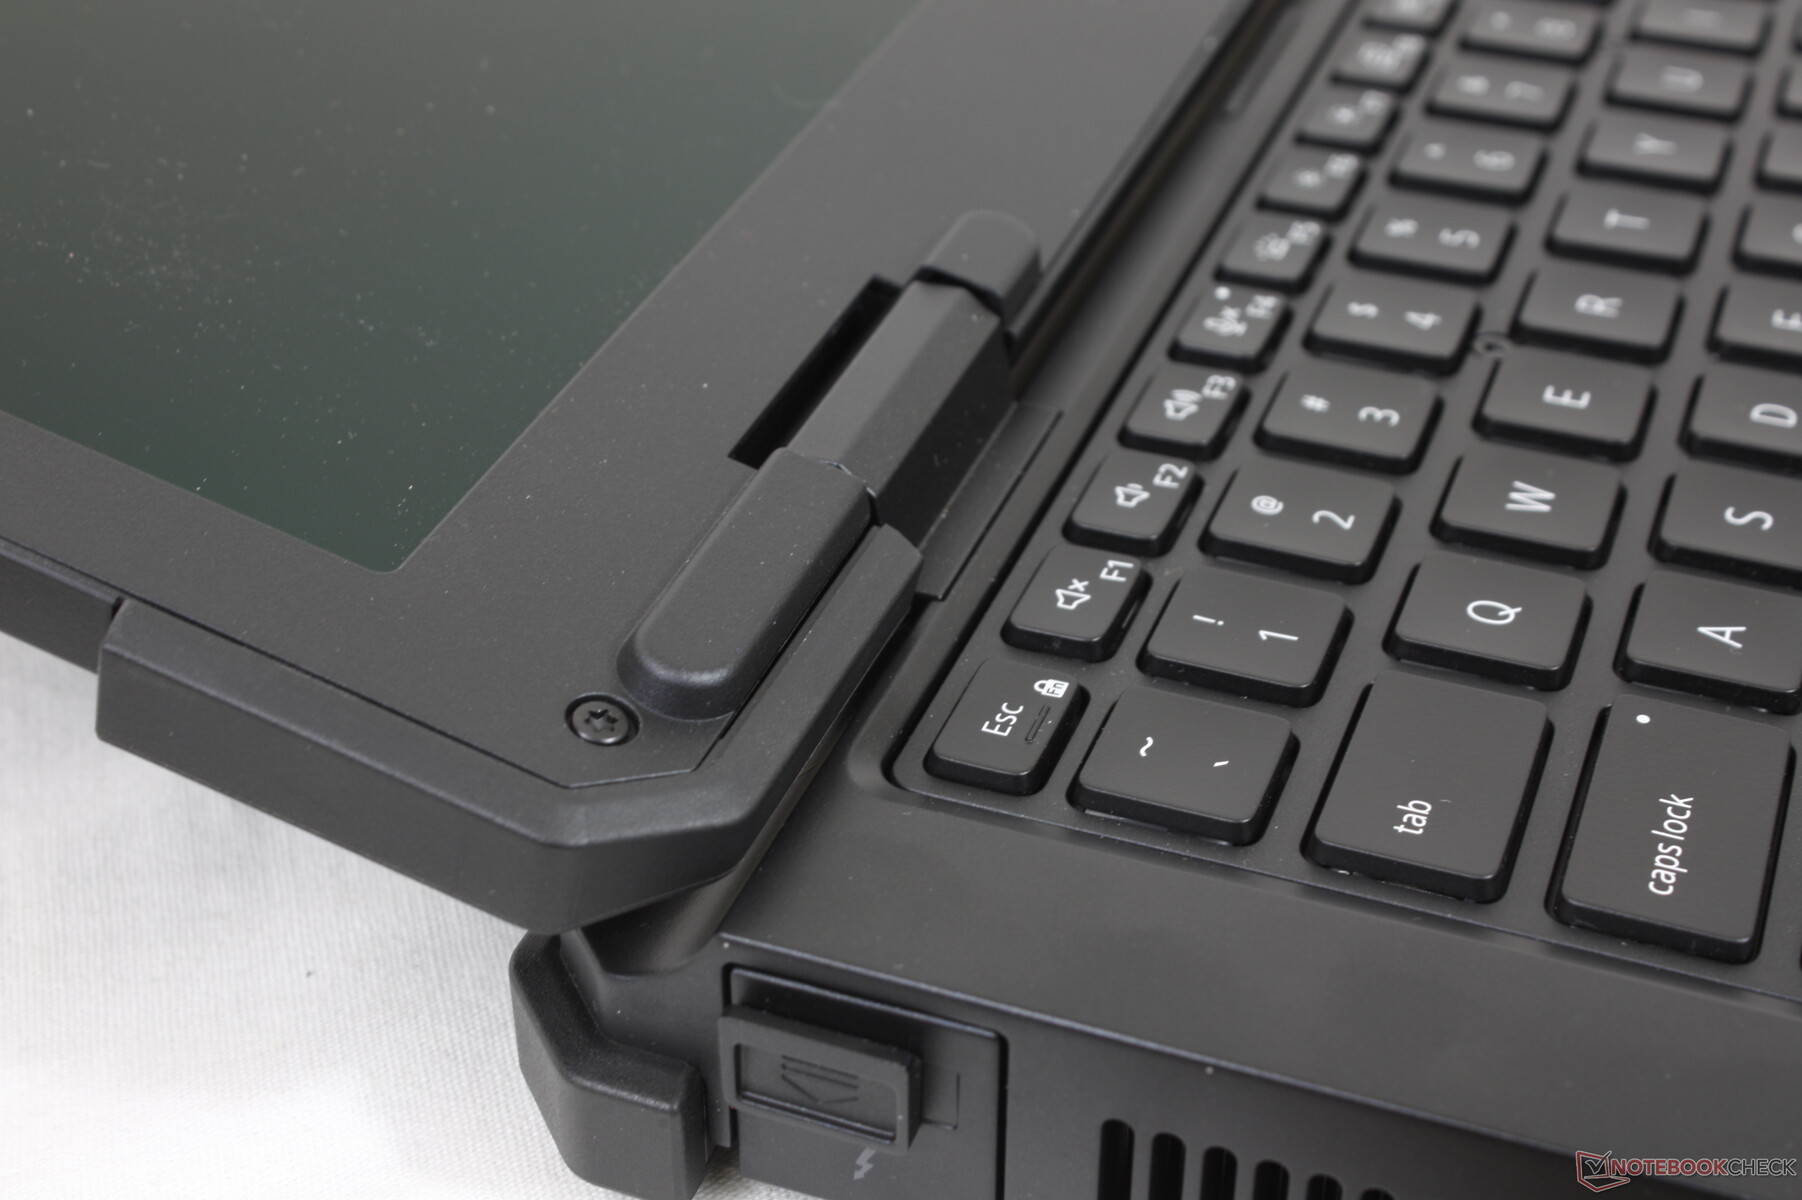
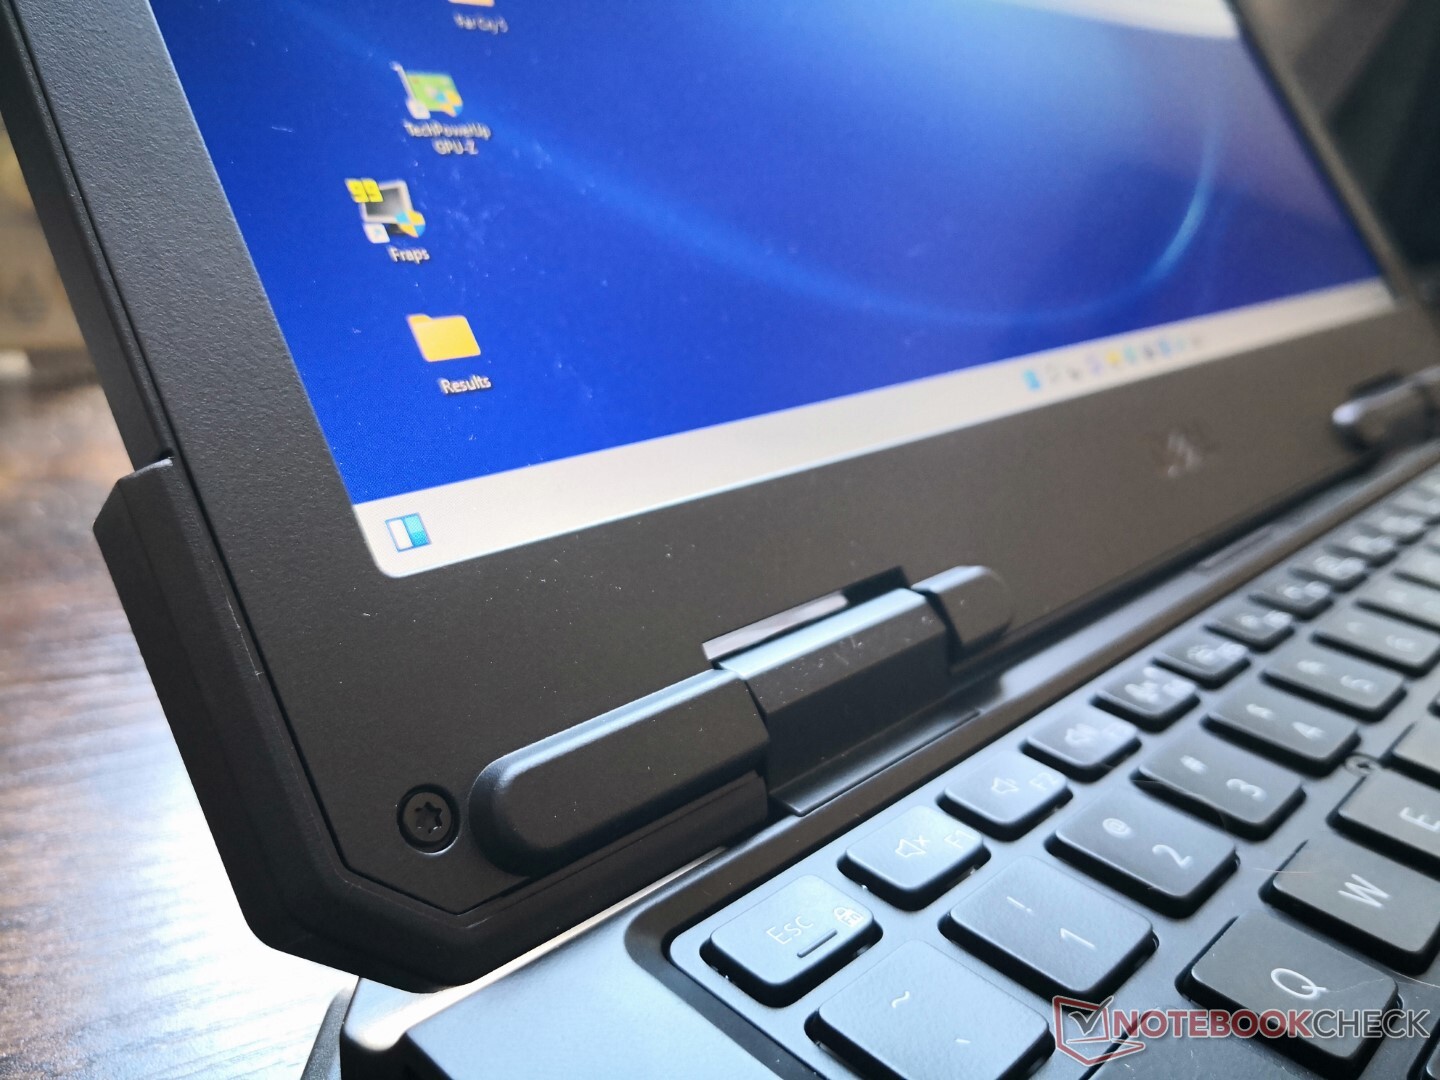
Input Devices
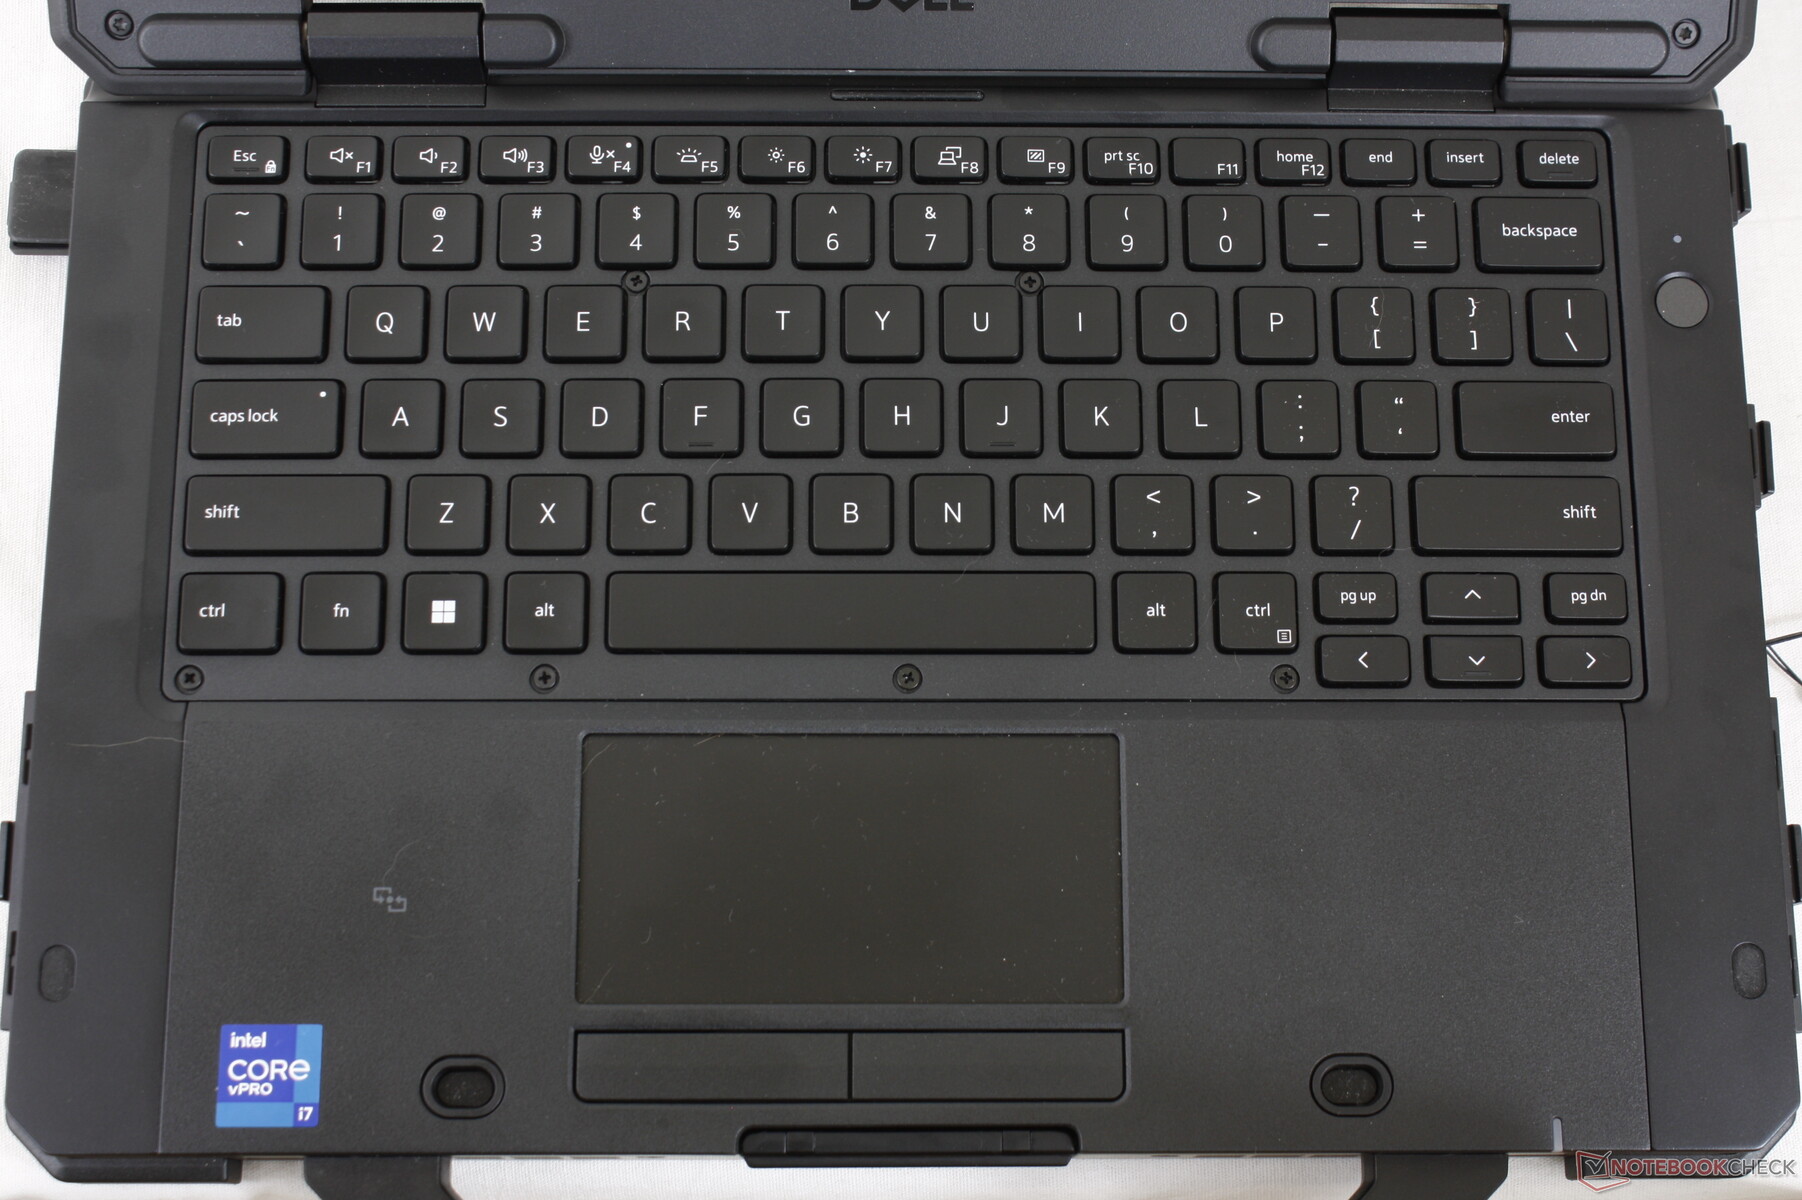
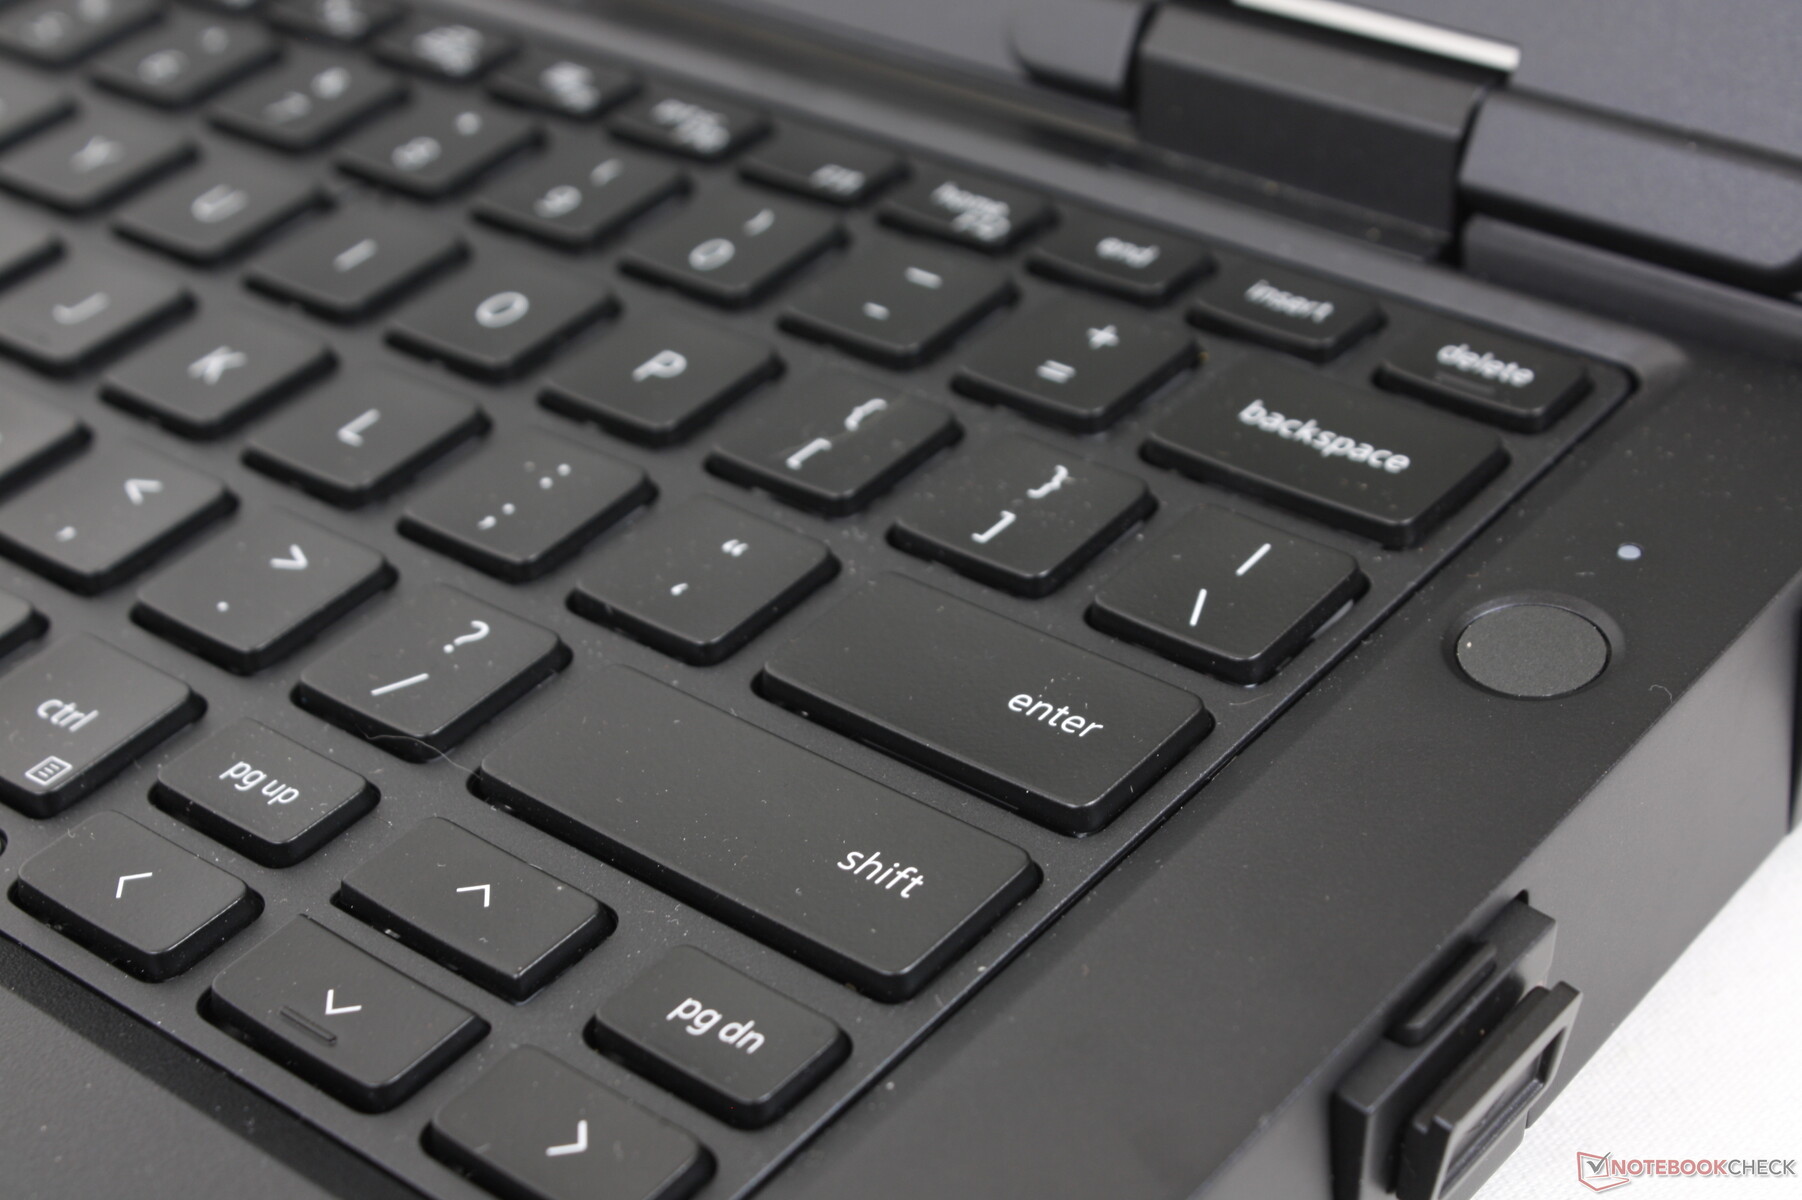
Keyboard
When compared to the keyboard on the Getac B360 series, the keyboard on the Dell is slightly softer and quieter but not necessarily less comfortable to type on. Users may prefer having quieter keys depending on the usage scenario. We do prefer the red backlight on the B360, however, as it is a bit easier on the eyes over the white backlight of the Dell.
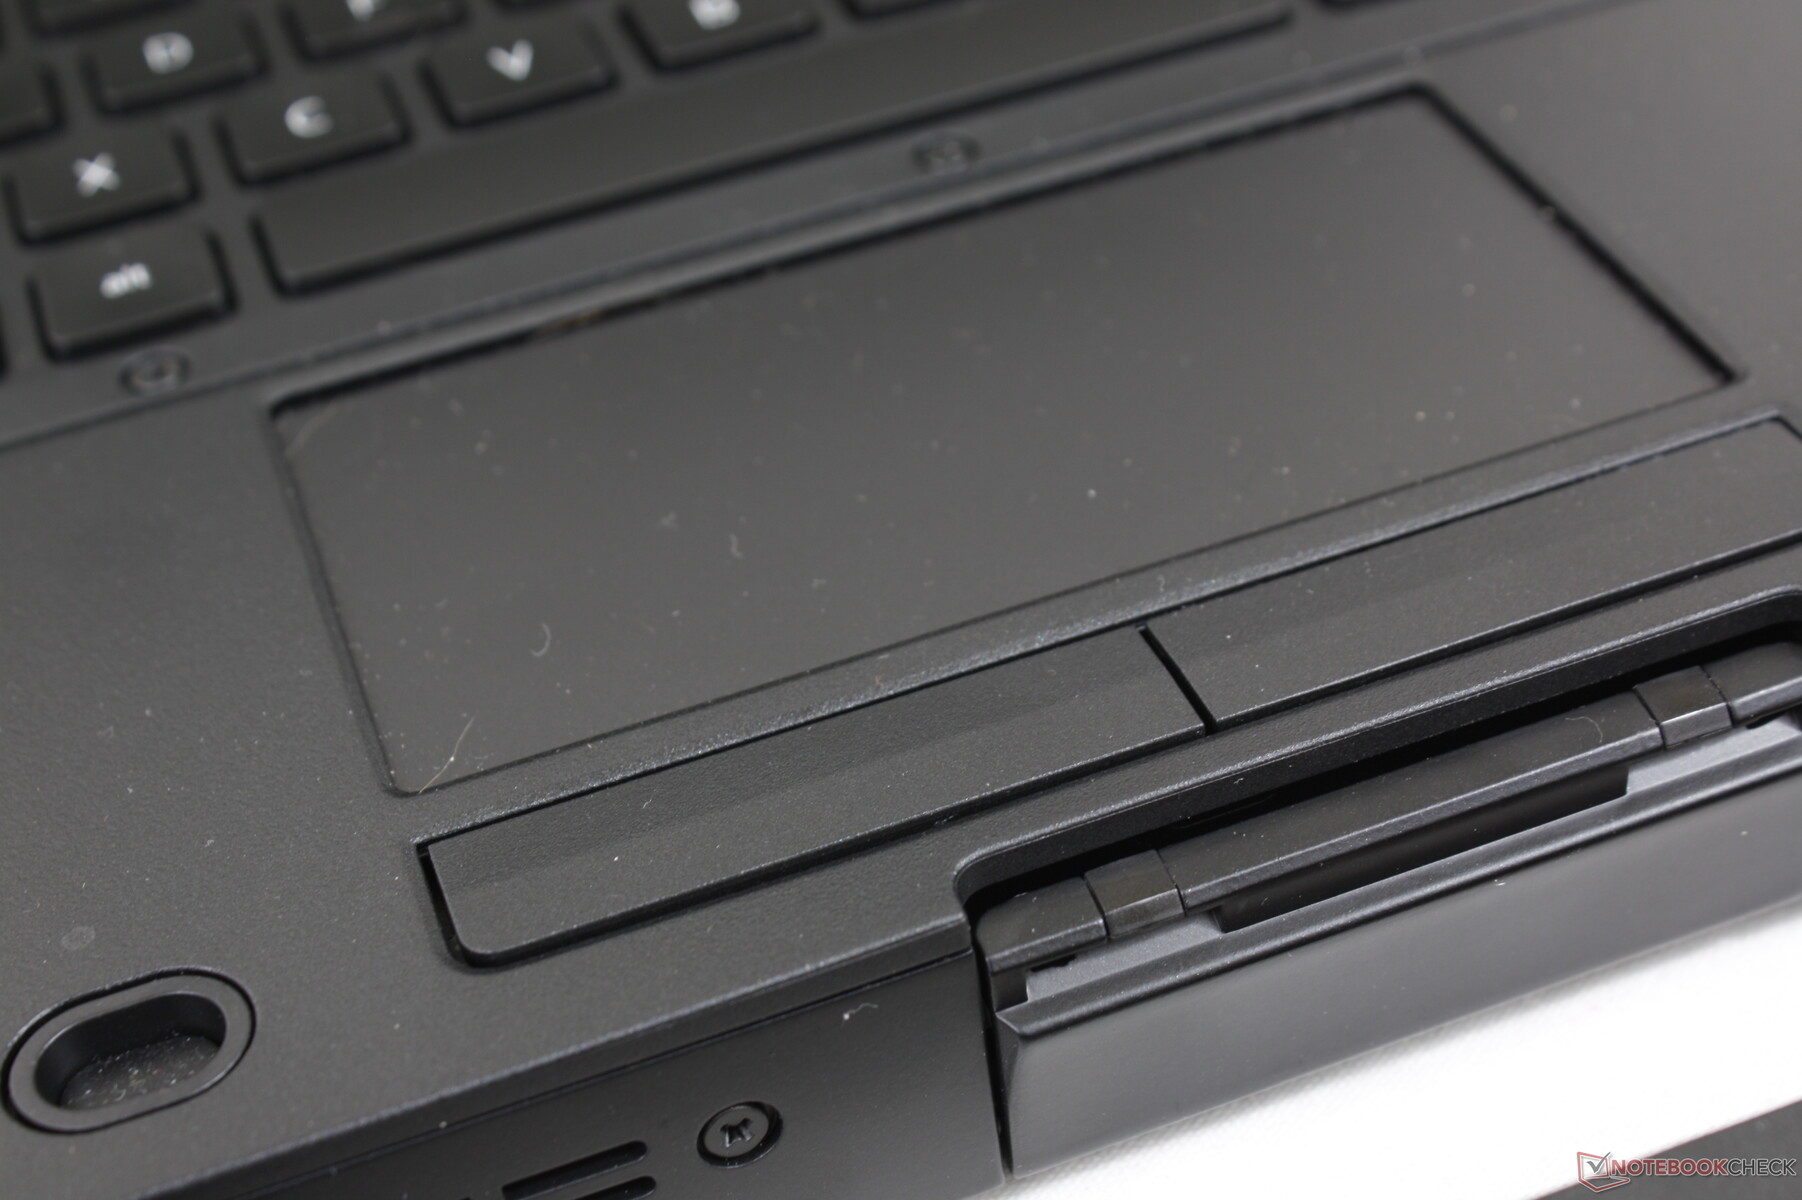
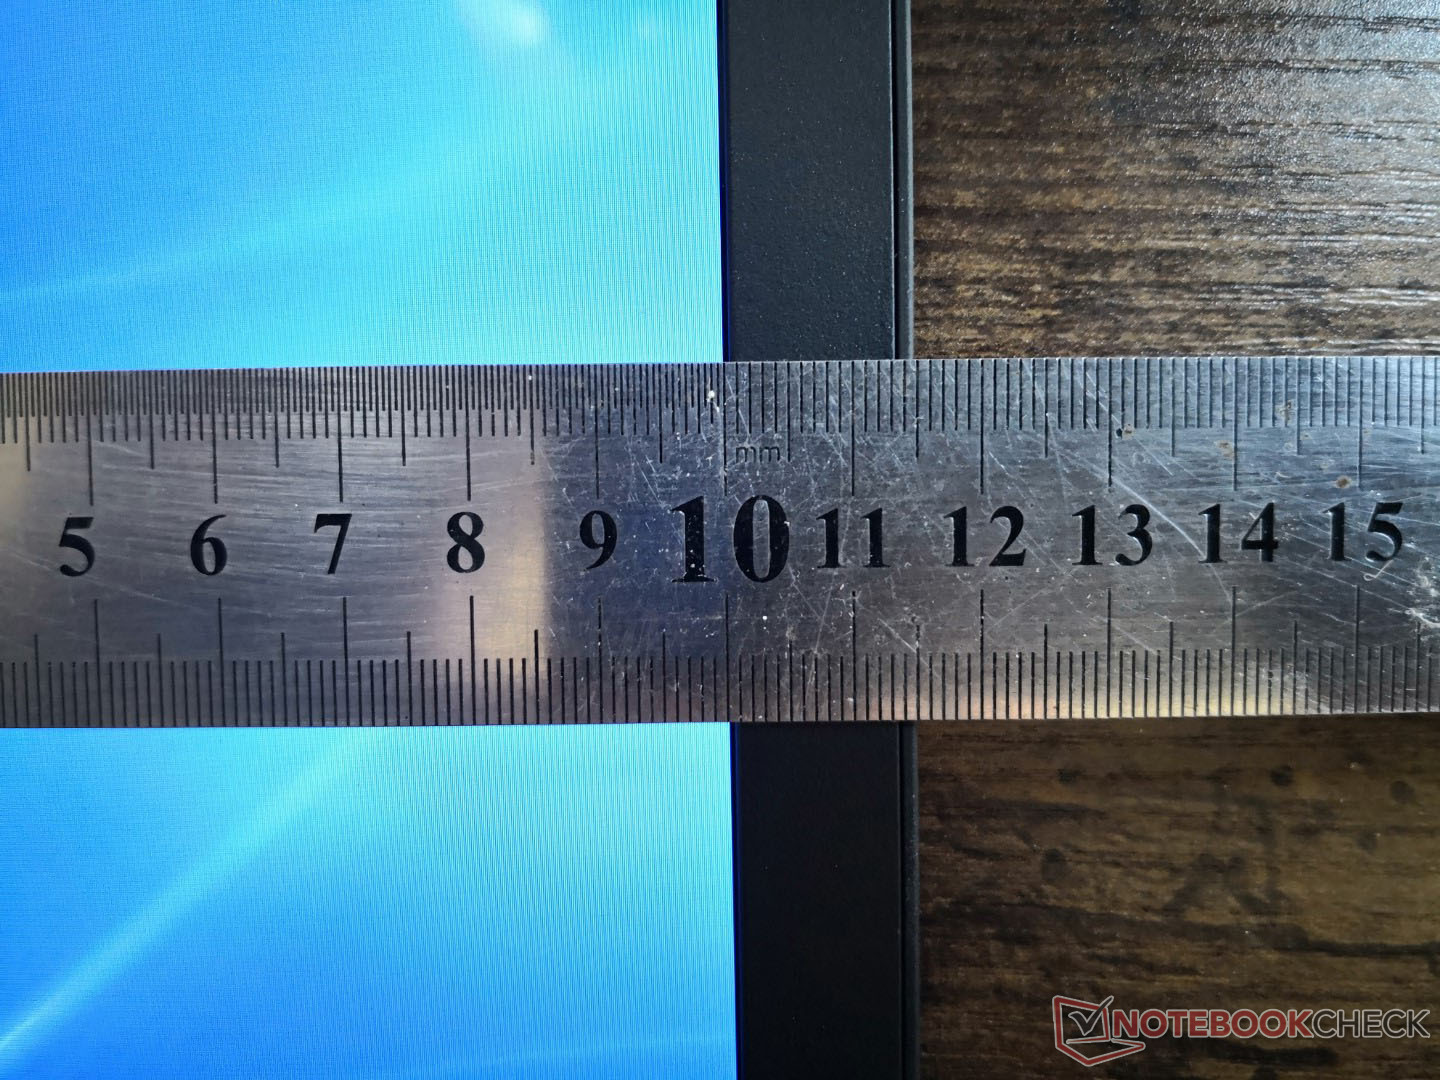
Touchpad
The trackpad is reasonably sized at 10 x 5 cm vs. 9.3 x 5.3 cm on the Getac B360. Though traction is smooth, cursor control is jumpy since the trackpad has been designed to recognize glove inputs as well. We recommend pressing more firmly on the trackpad surface to reduce the jumping.

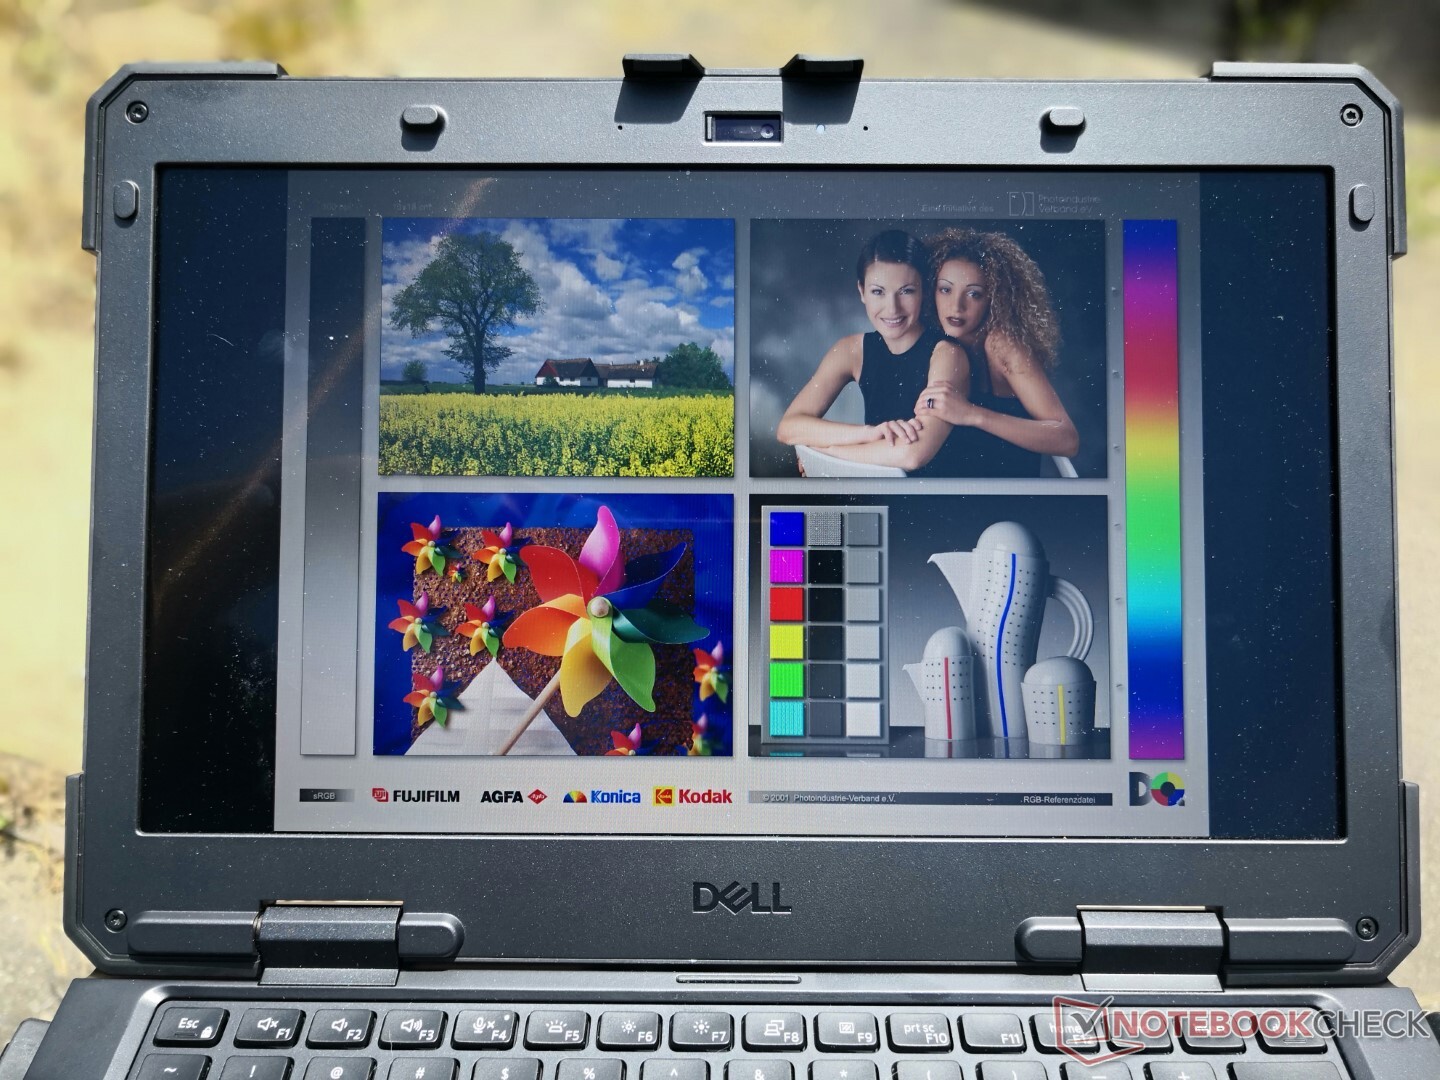
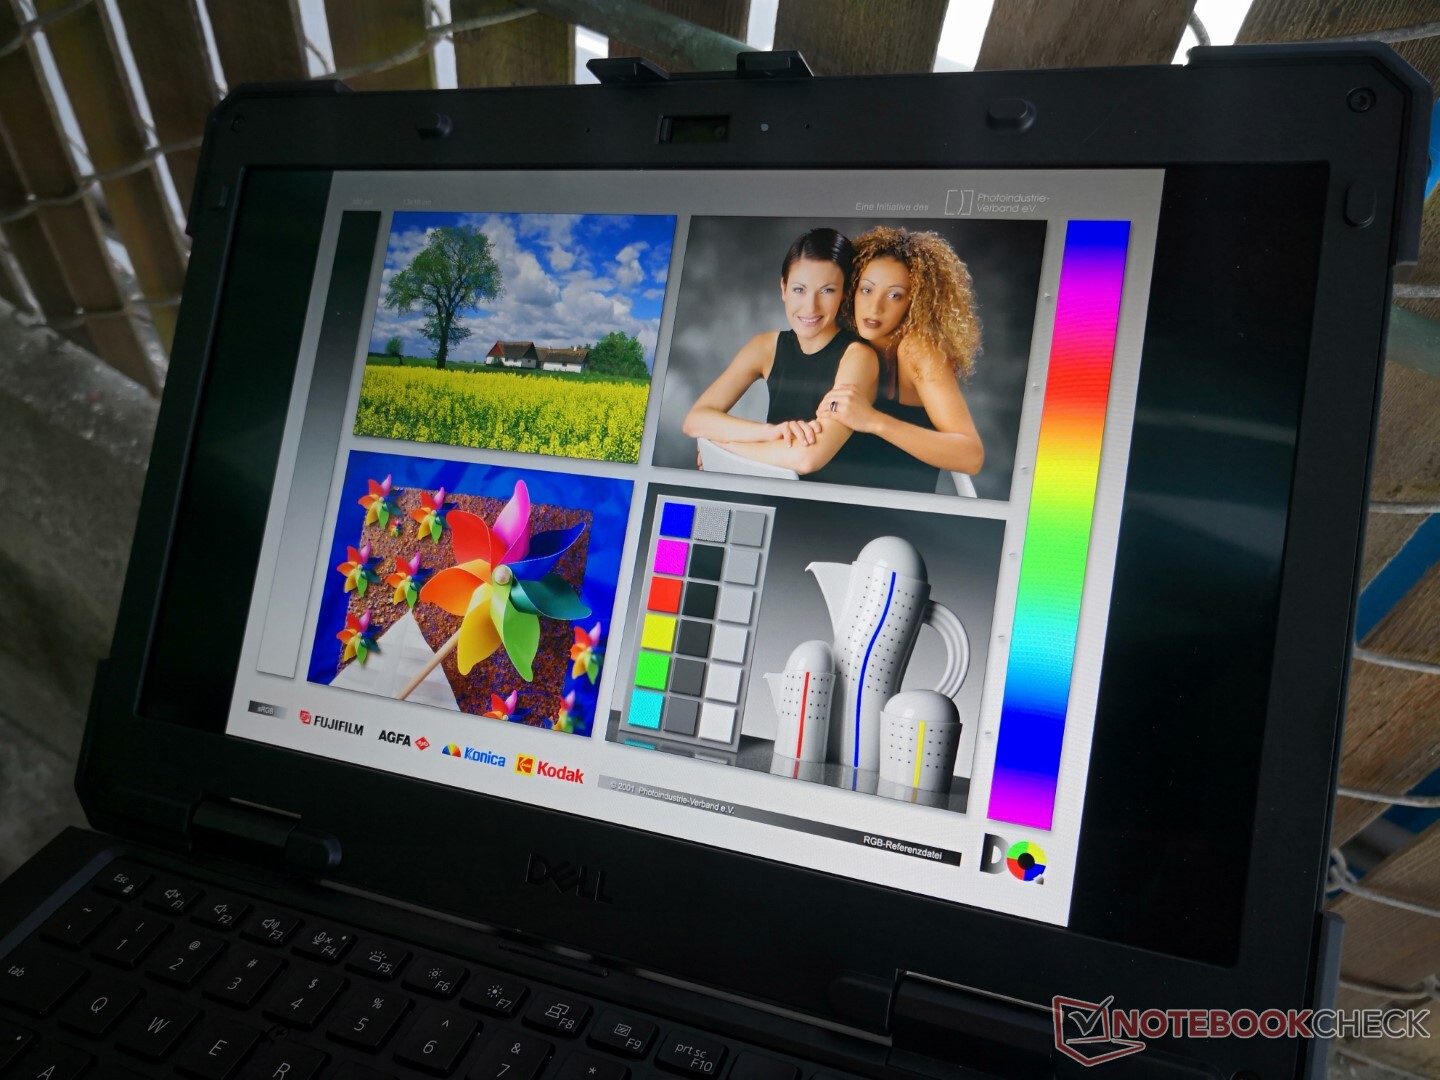
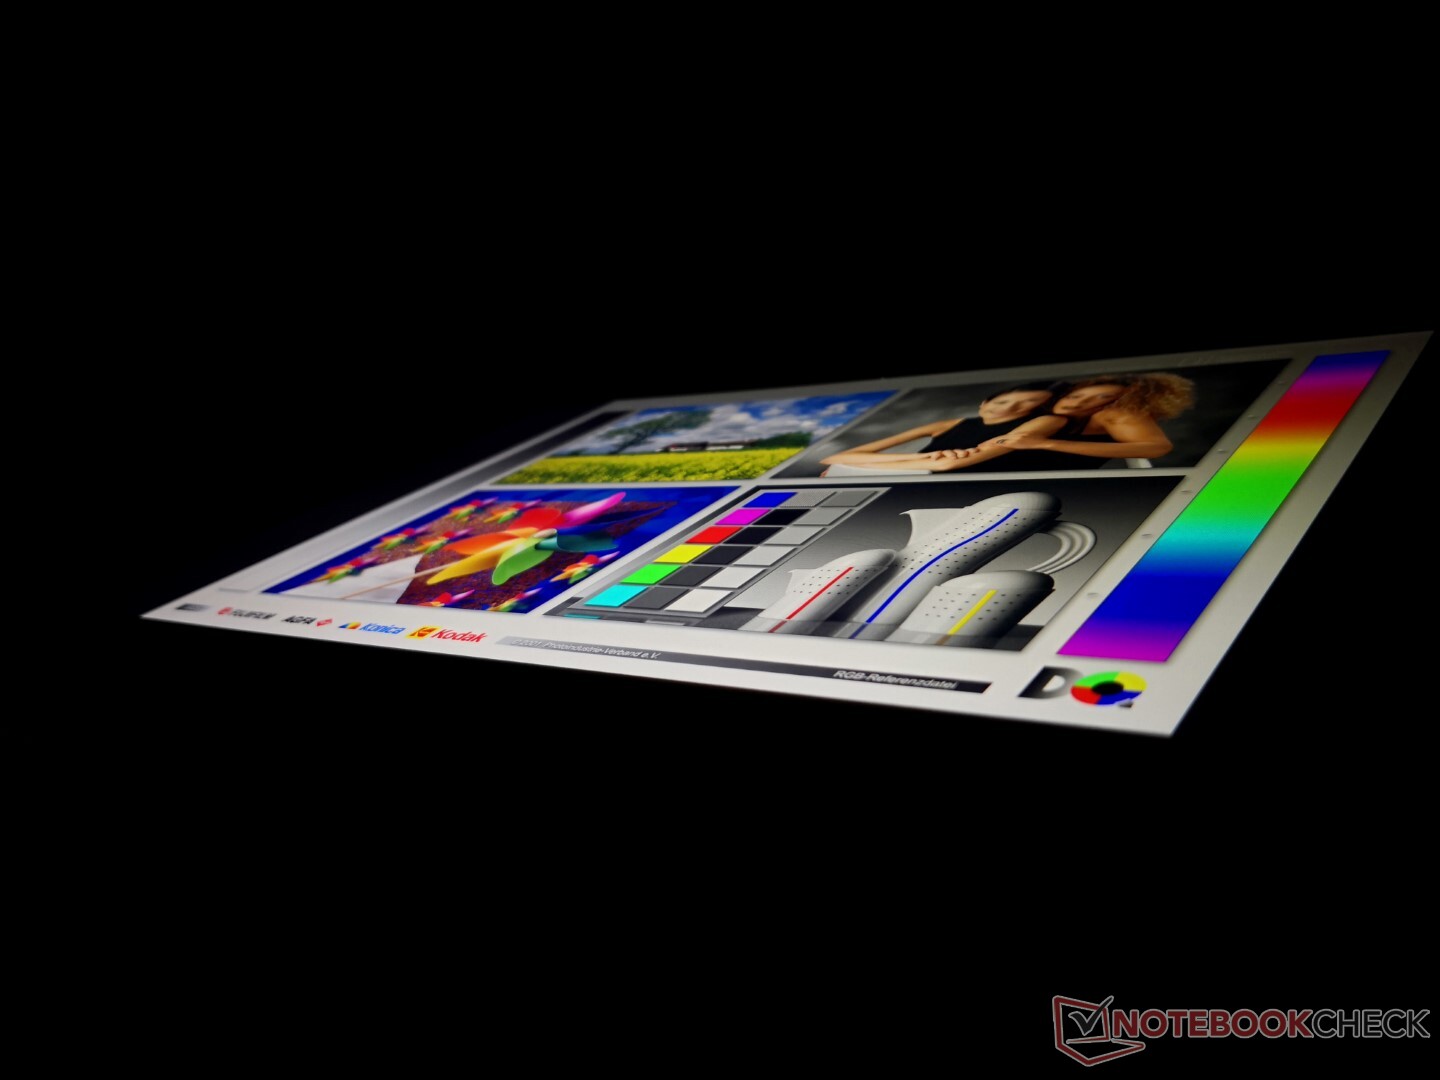
Display
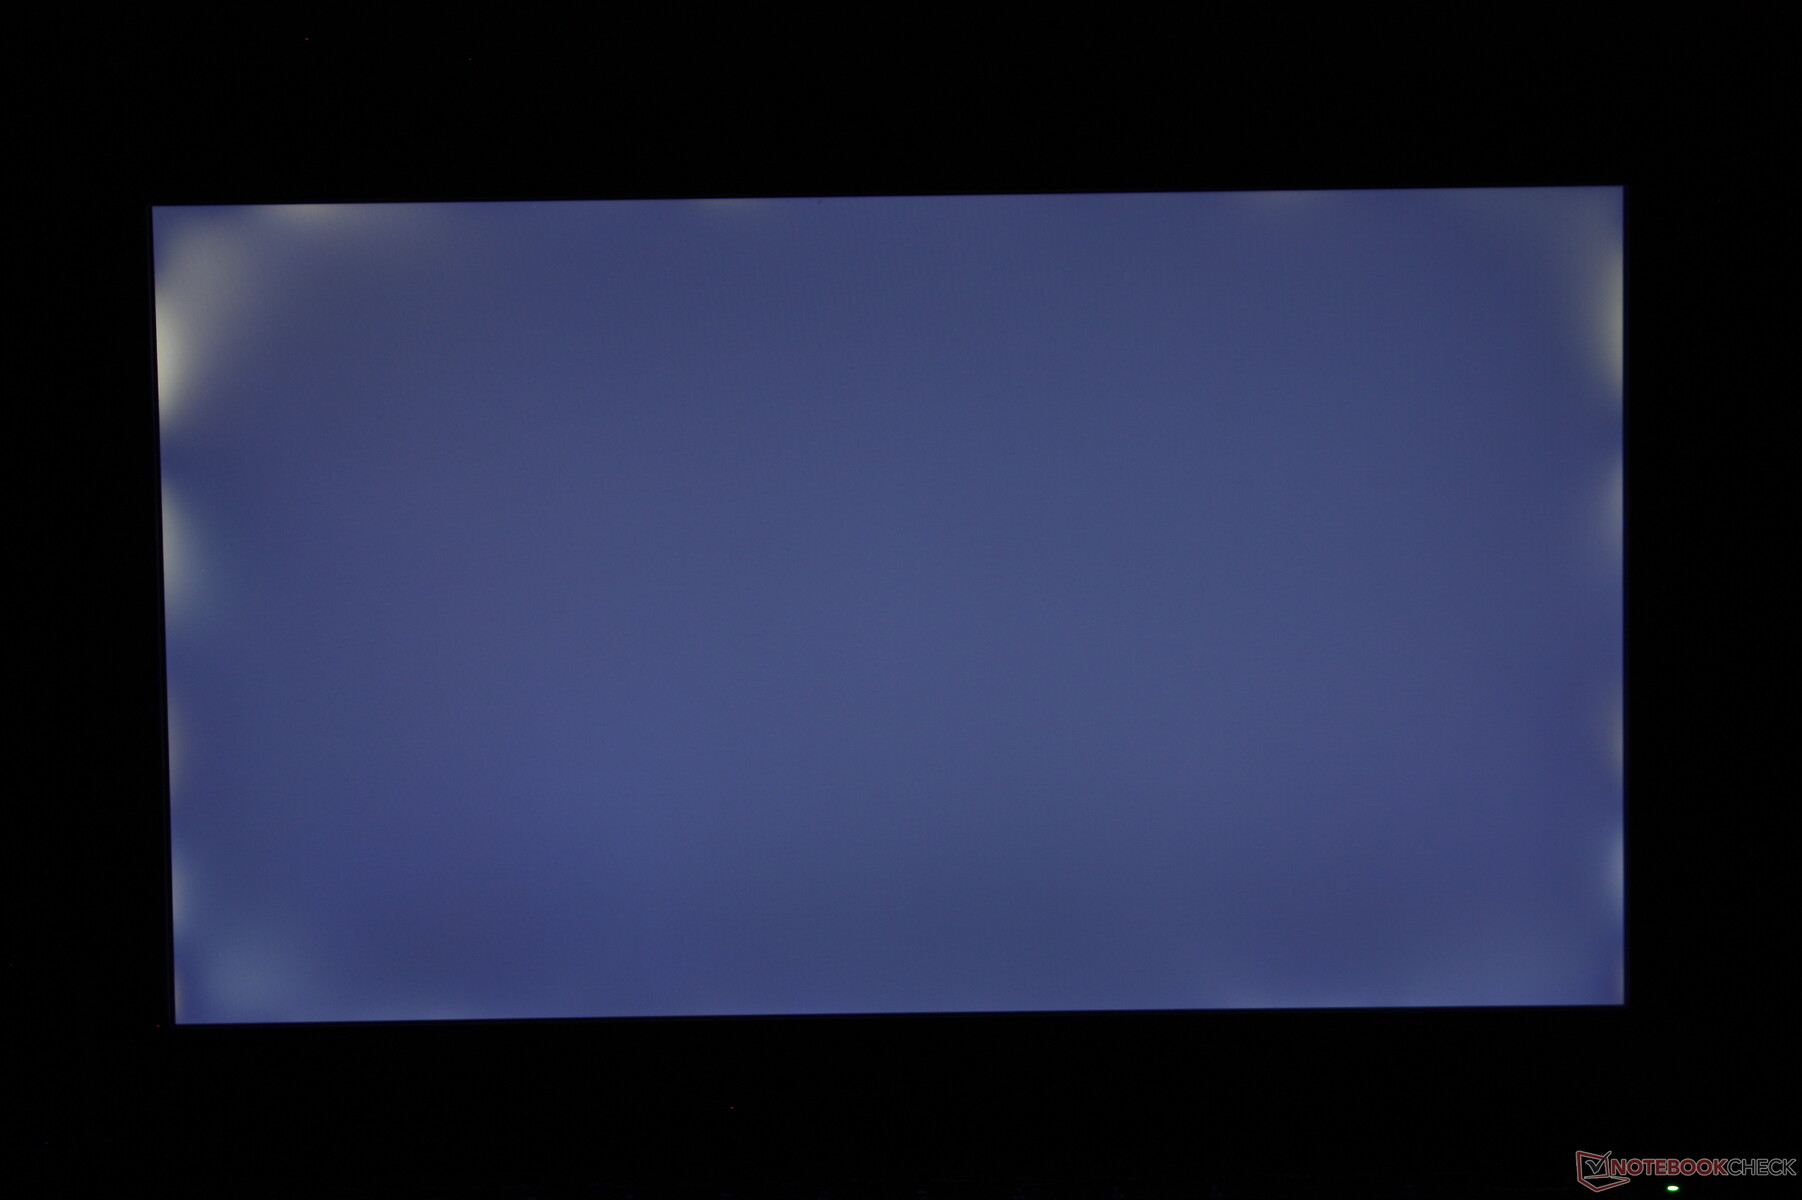
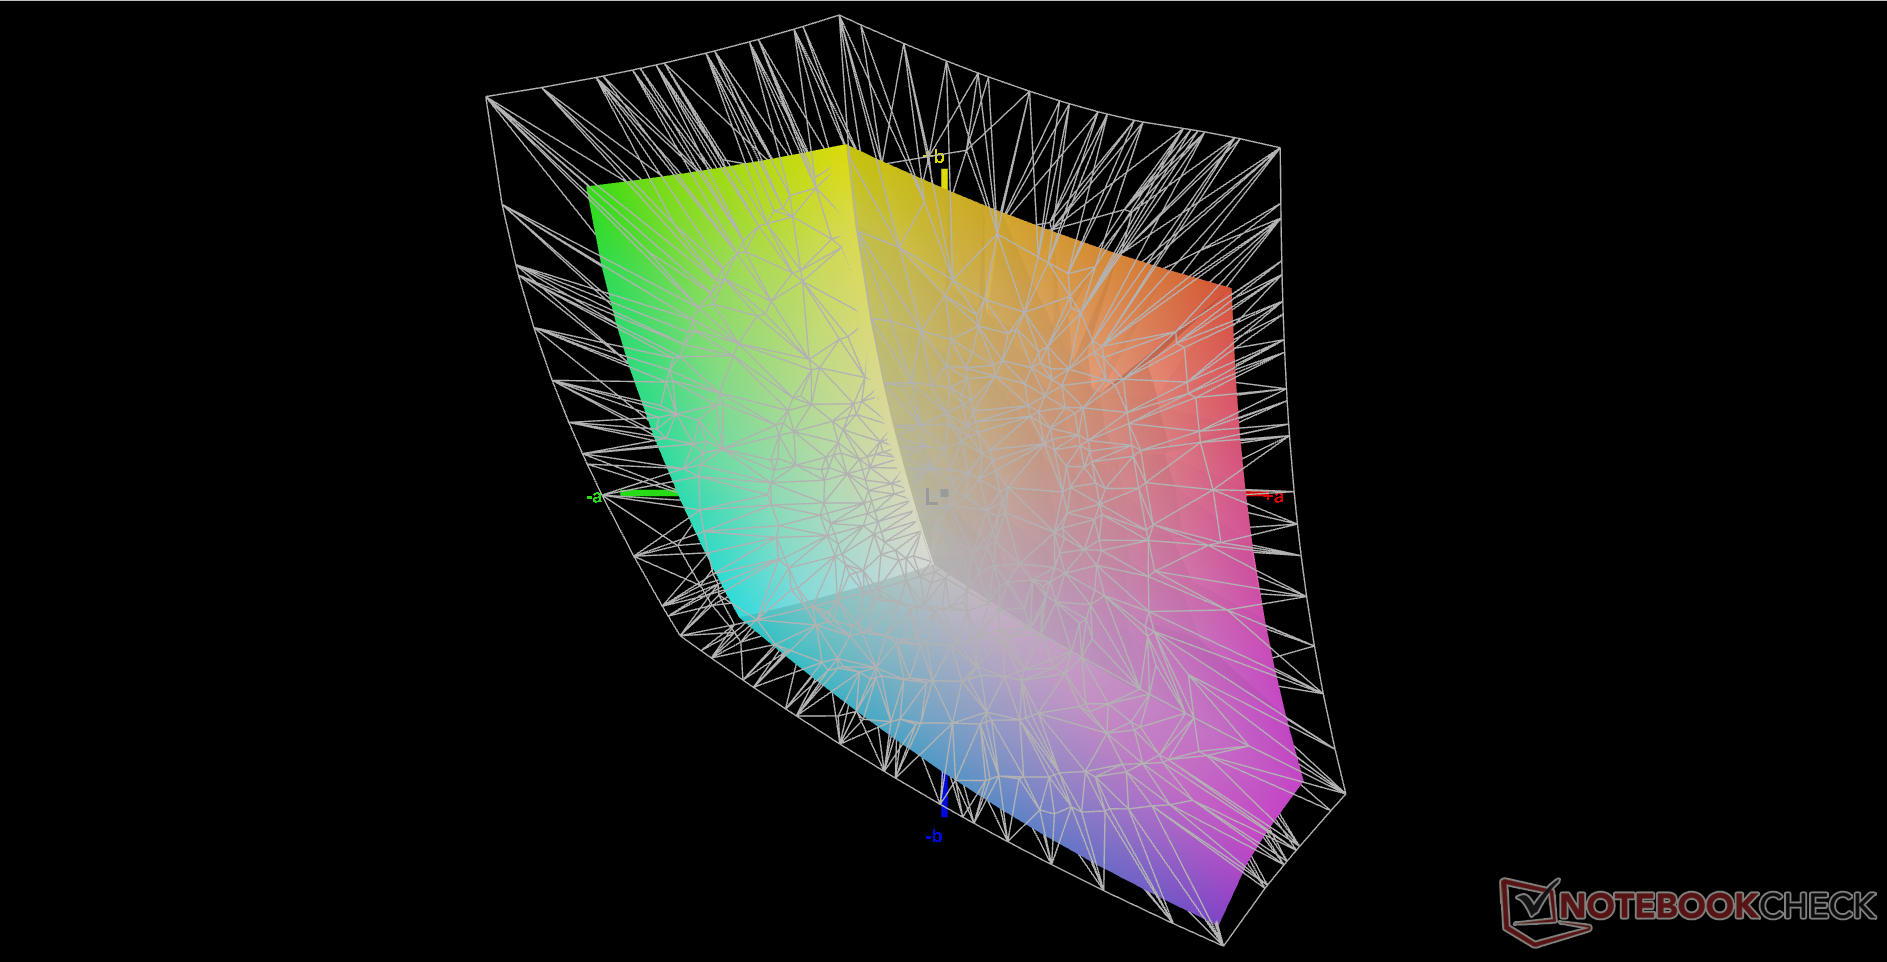
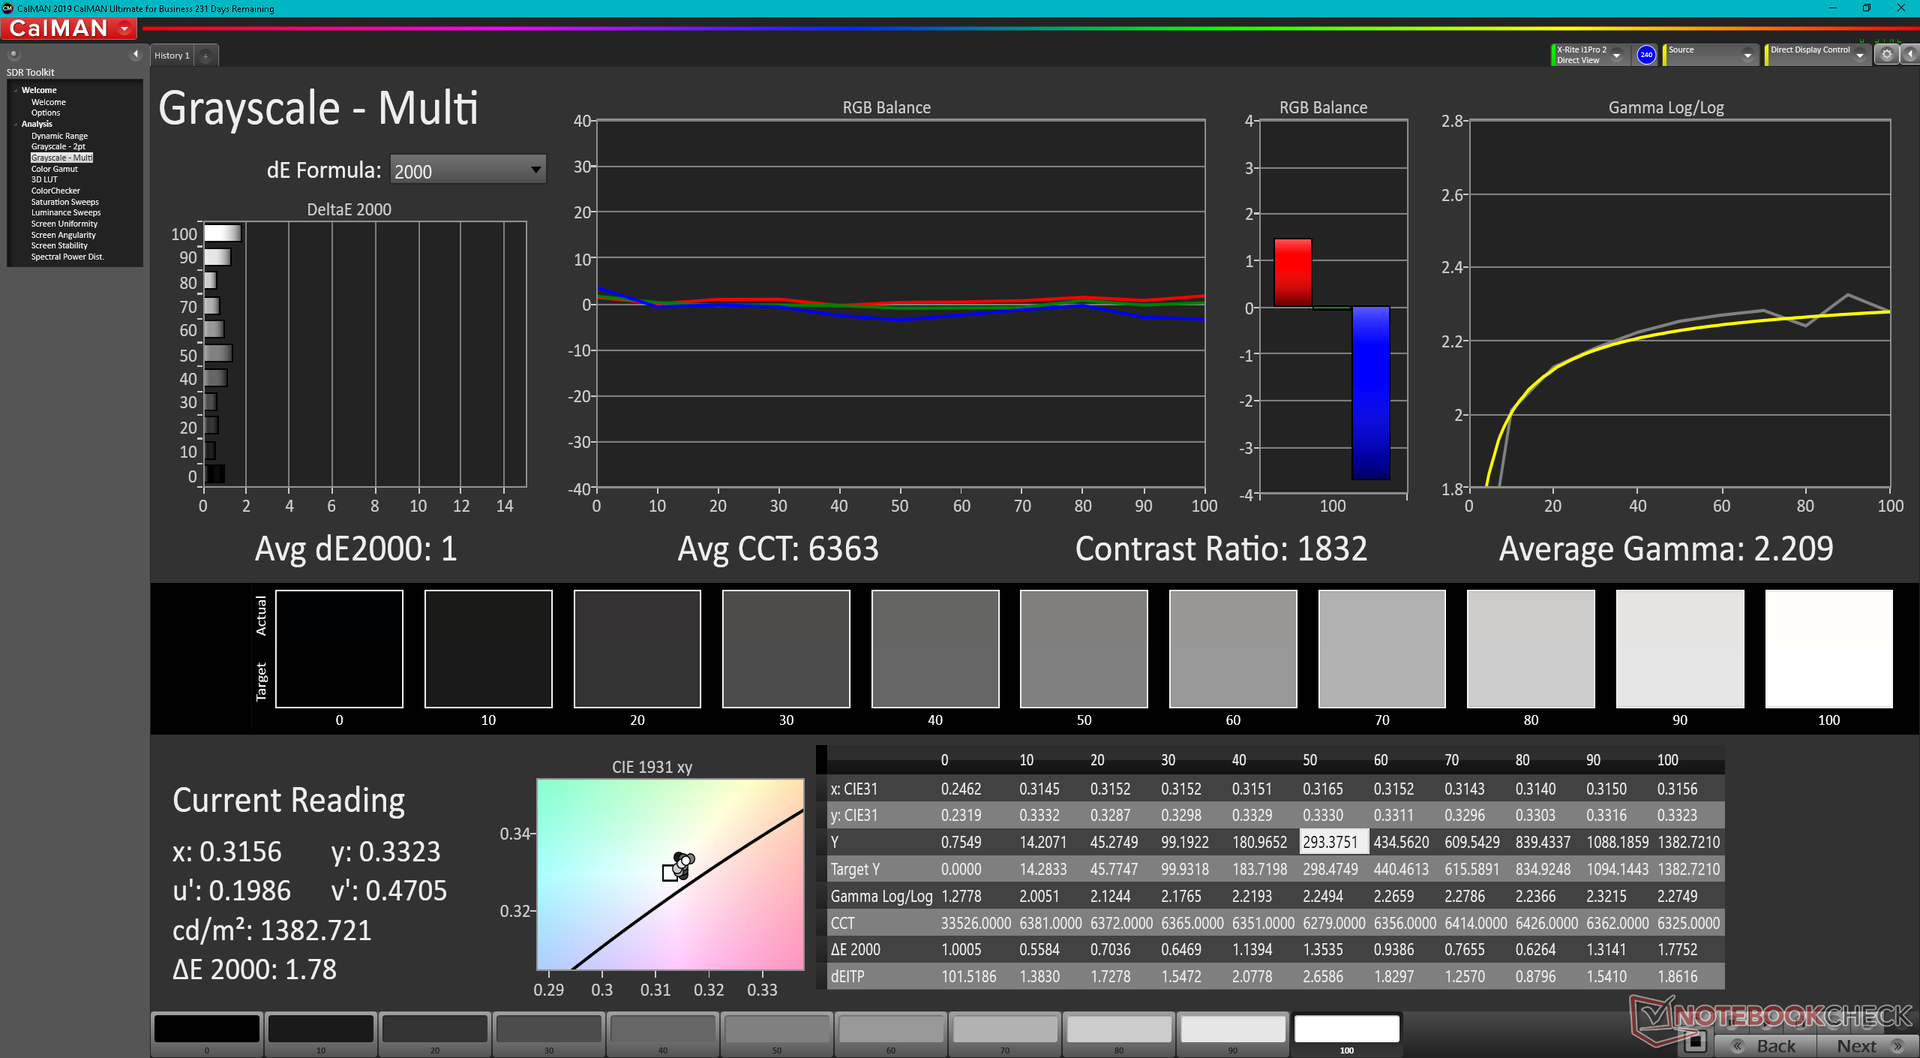
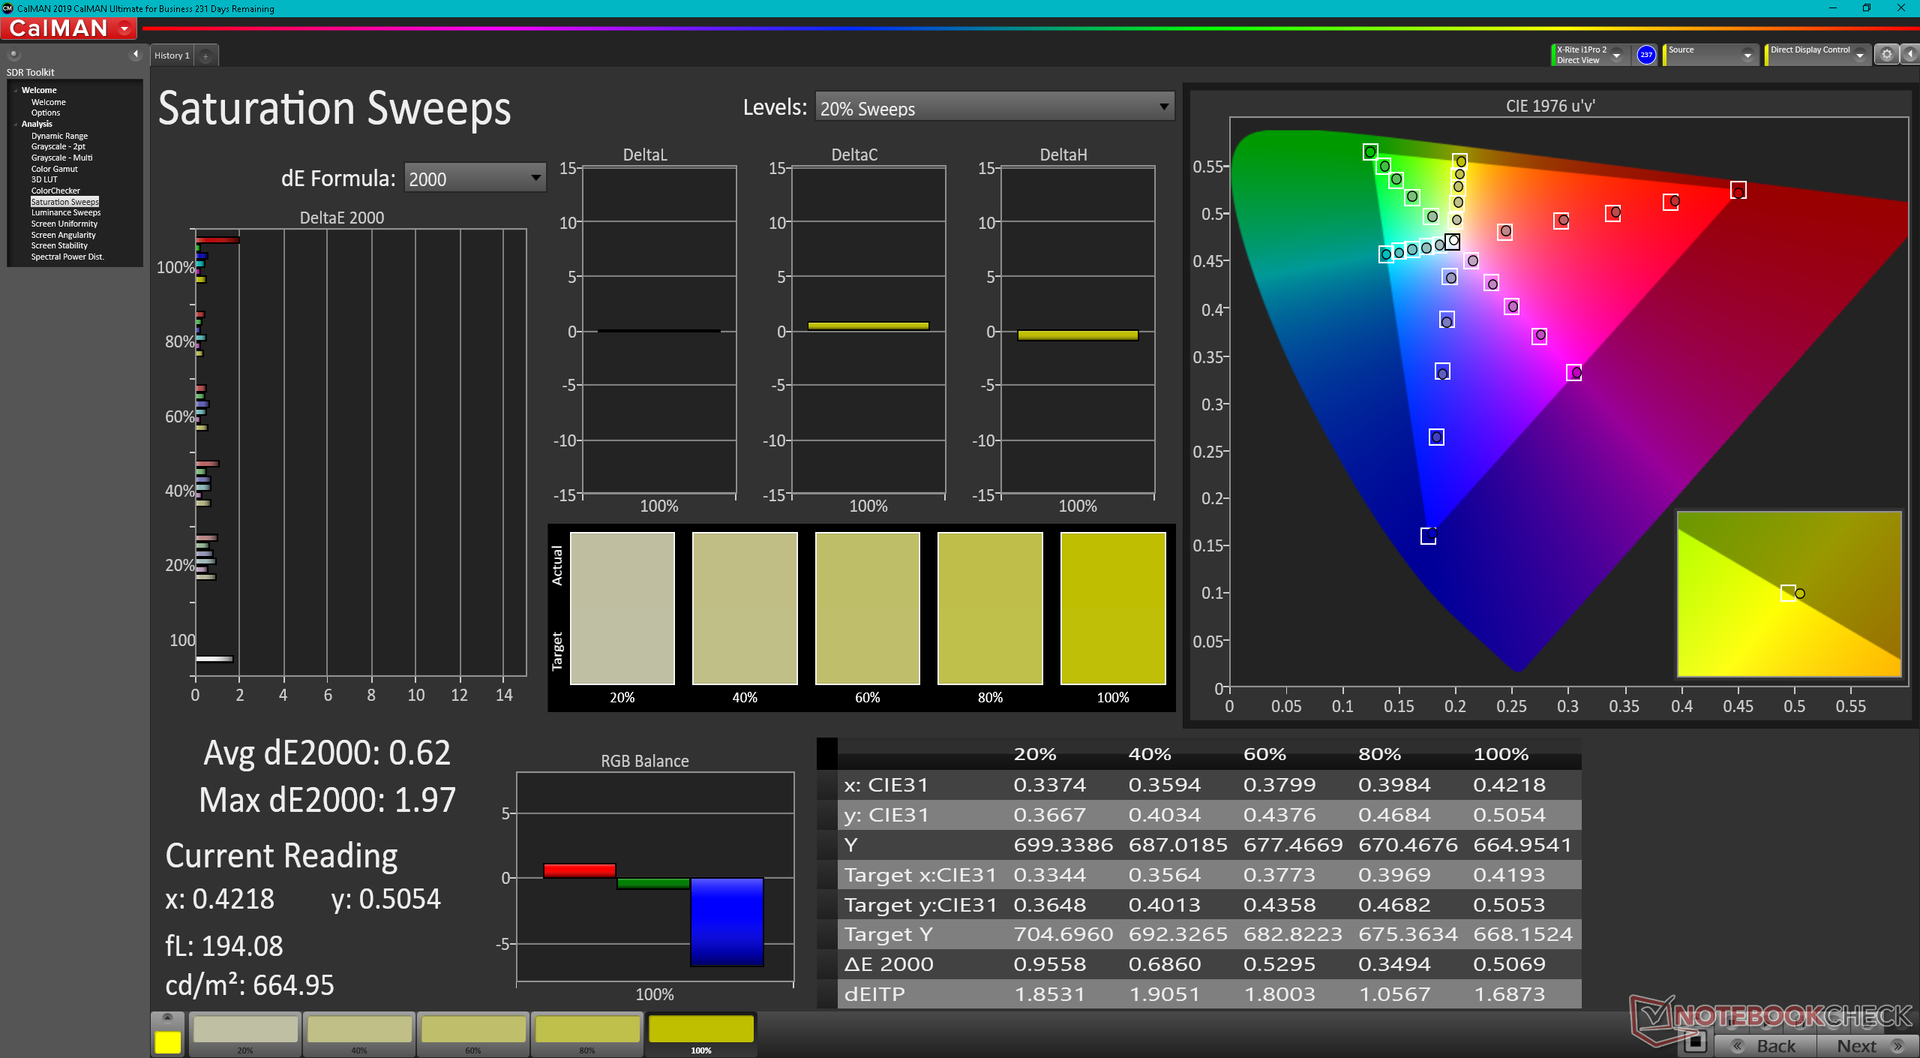
The Latitude 7330 Rugged Extreme uses the same 1080p Sharp LQ133M1 IPS panel as found on the years-old 2016 XPS 13 9350 or Latitude 13 7370. Though this may sound like a bad thing, this particular panel is better than the average panel on most other rugged laptops. The Panasonic Toughbook FZ-55 MK2, Durabook S14I, or Getac B360, for example, all use panels with significantly narrower gamut and thus noticeably shallower colors. This is one of the few rugged models to offer a 1400-nit display, deep contrast of over 1500:1, and full sRGB coverage all in one. We also appreciate the lack of PWM unlike on many other rugged devices.
The most significant drawback to this panel is its very slow black-white and gray-gray response times meaning that ghosting is very noticeable. This thankfully won't be an issue for slower-moving applications like browsers or picture editors.

| |||||||||||||||||||||||||
Brightness Distribution: 84 %
Center on Battery: 1414.1 cd/m²
Contrast: 1704:1 (Black: 0.83 cd/m²)
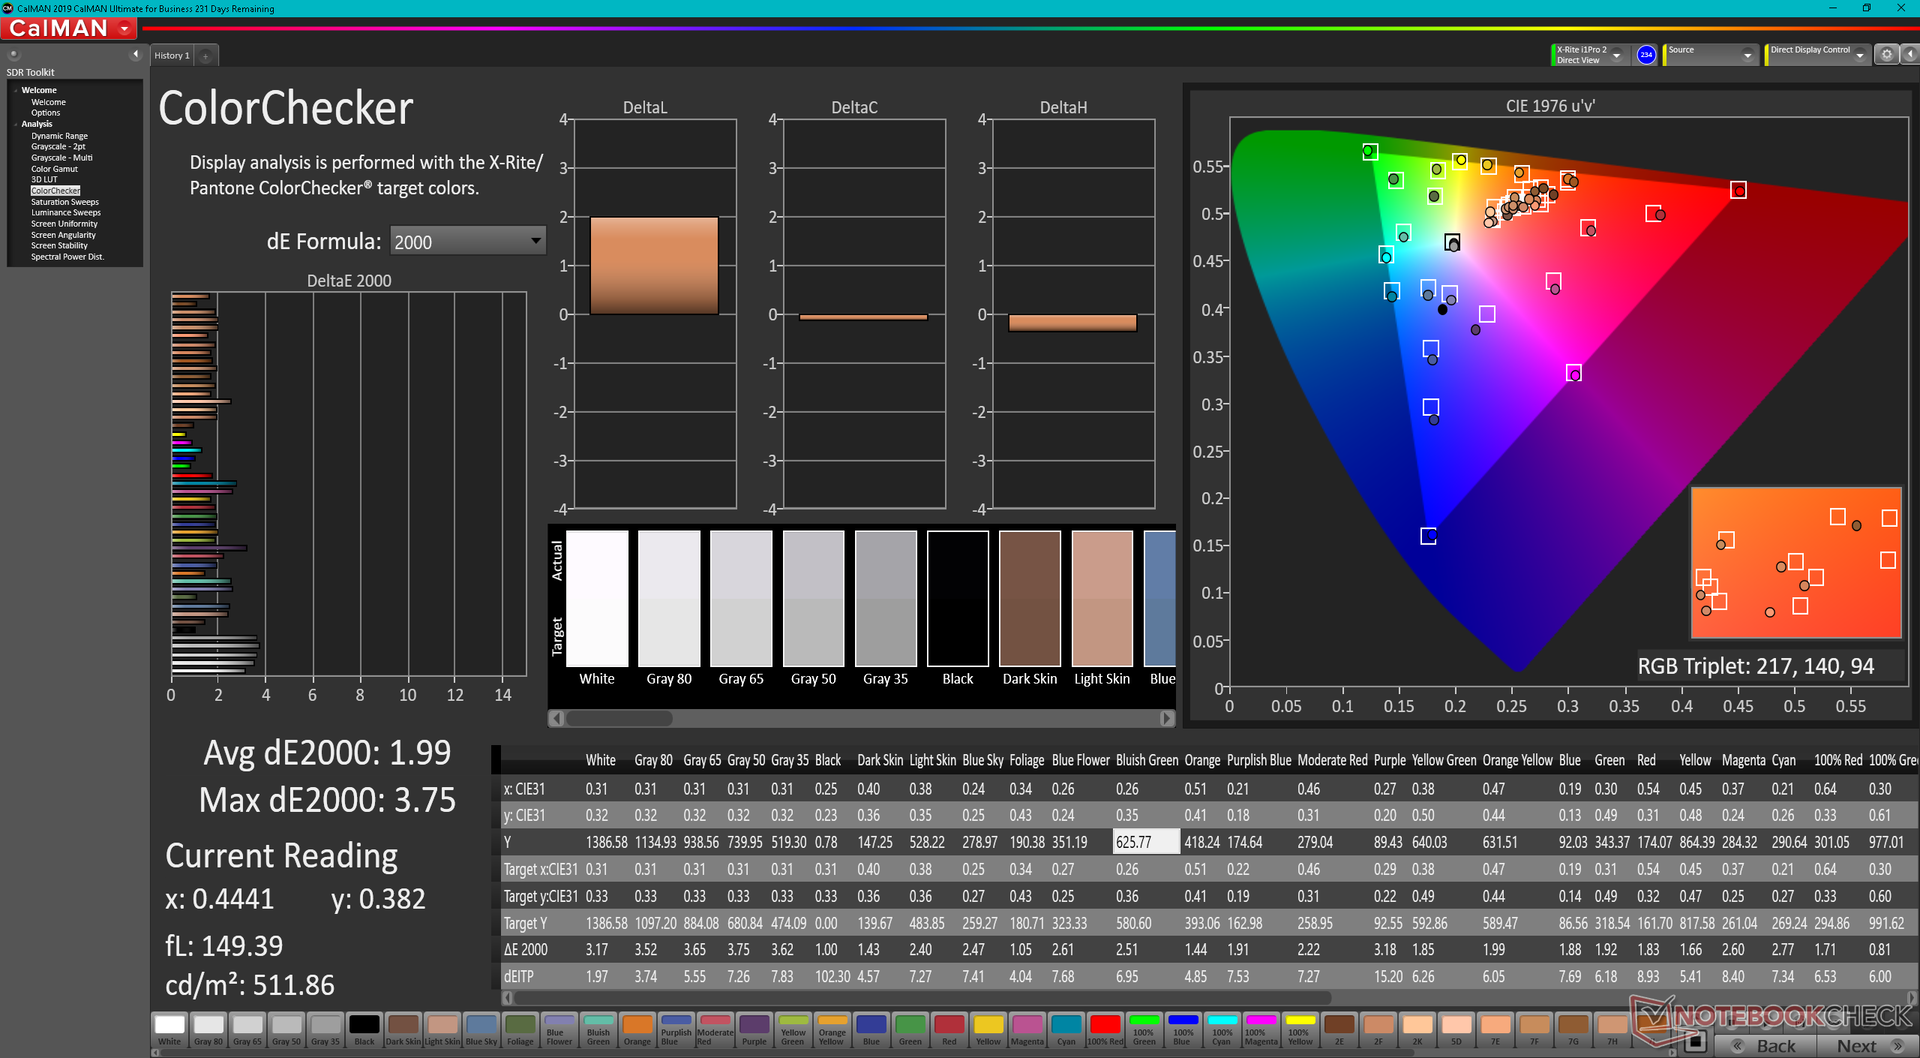
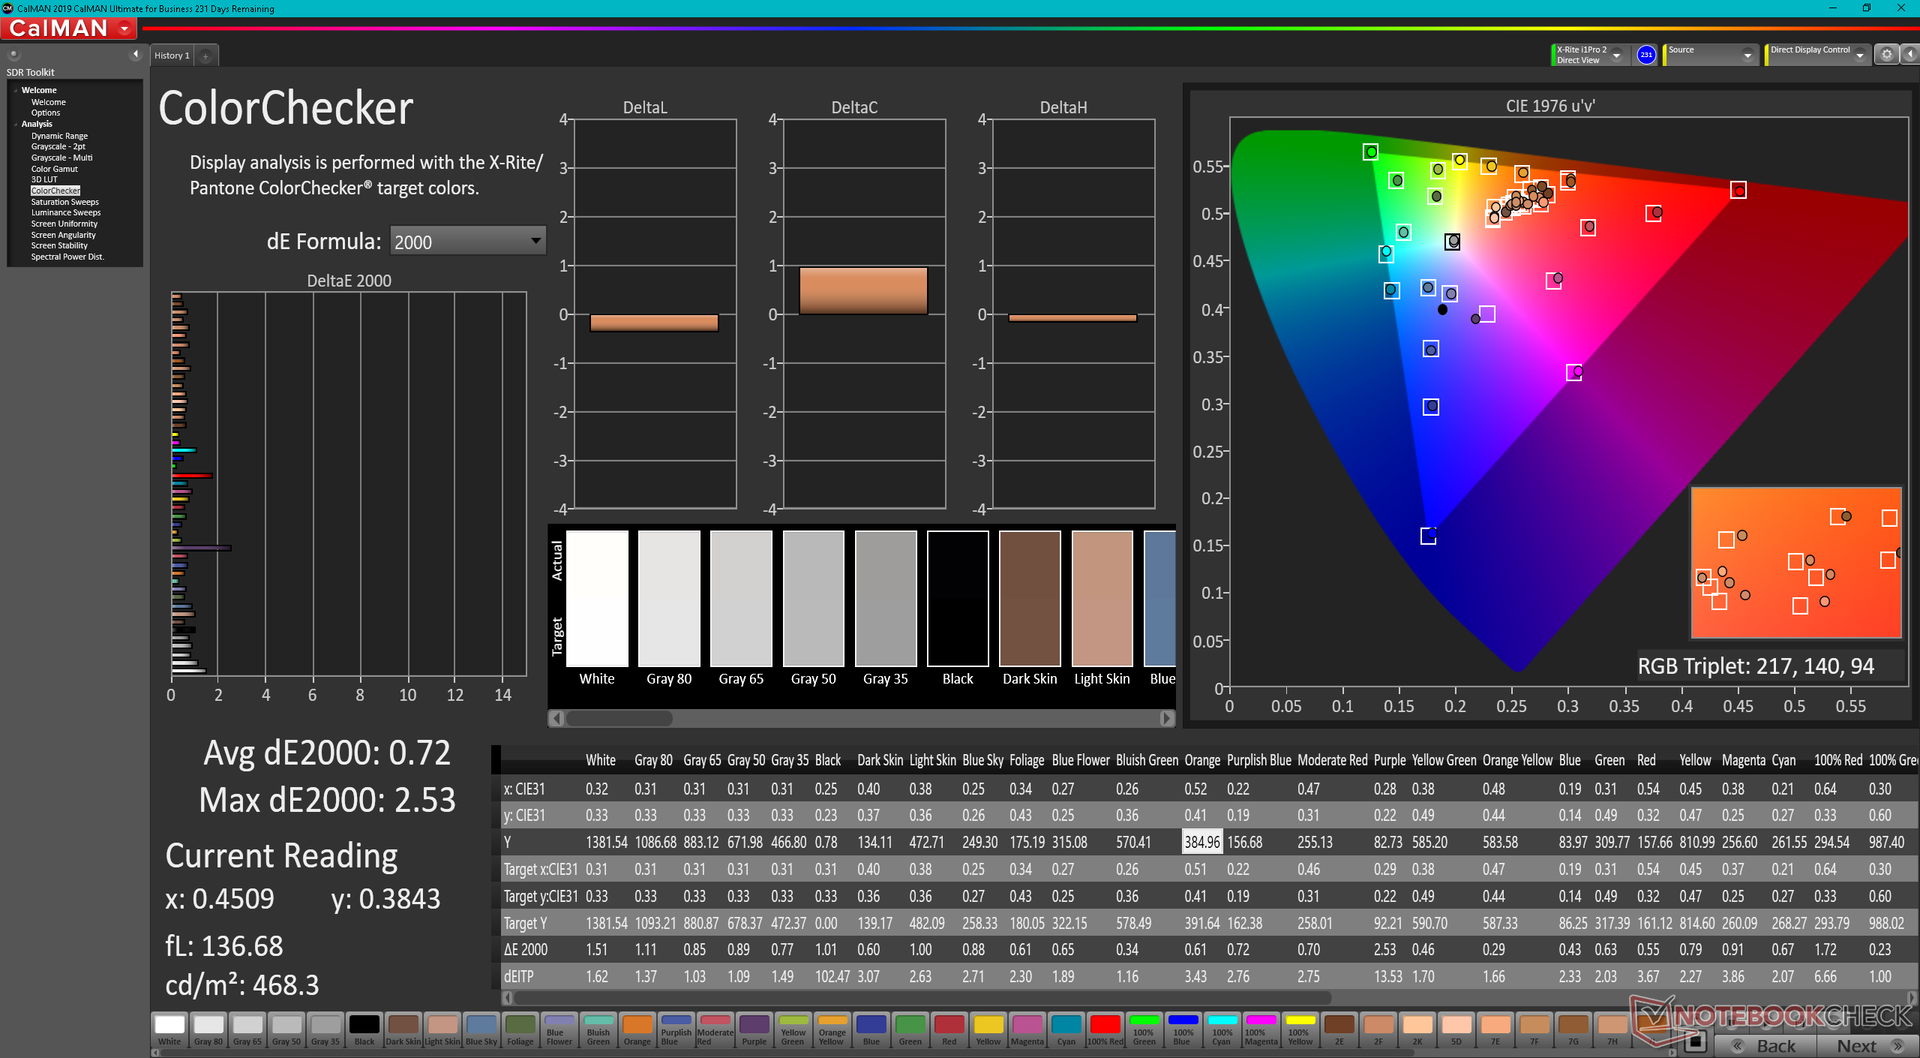
ΔE ColorChecker Calman: 1.99 | ∀{0.5-29.43 Ø4.71}
calibrated: 0.72
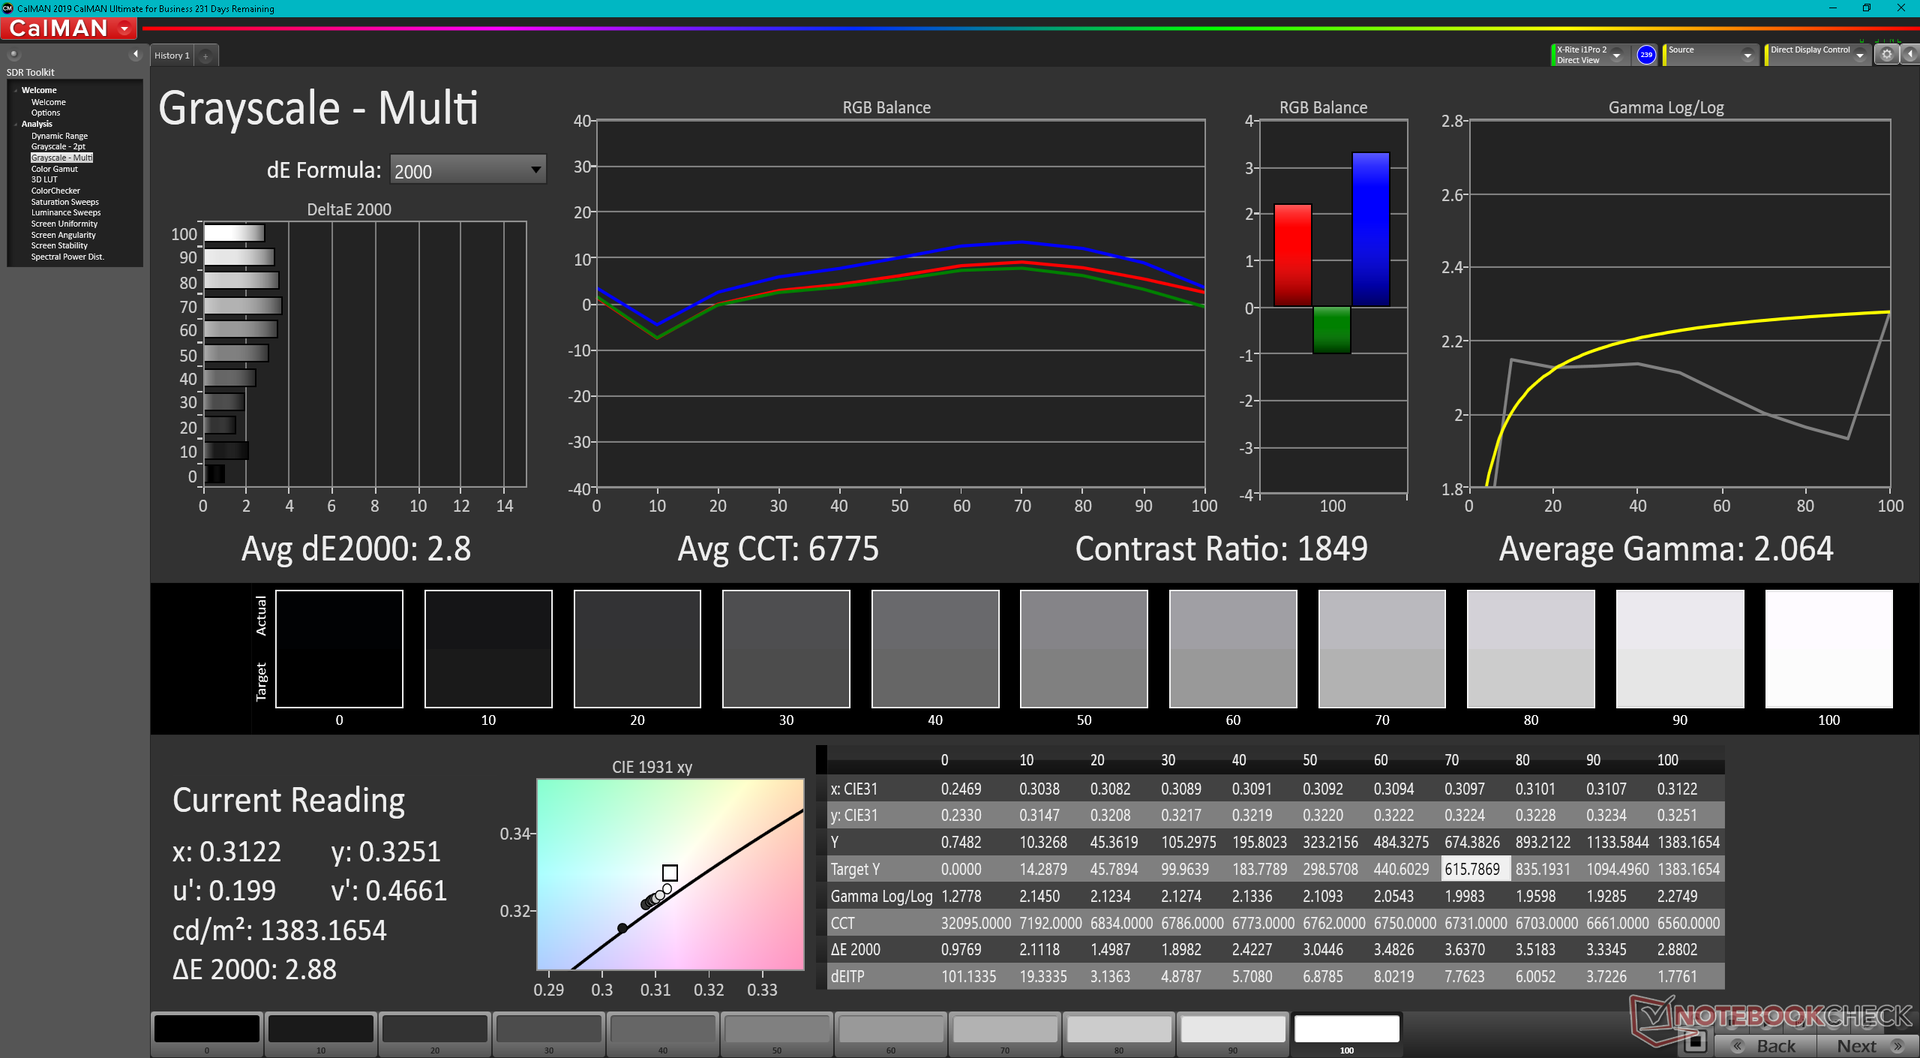
ΔE Greyscale Calman: 2.8 | ∀{0.09-98 Ø4.96}
69% AdobeRGB 1998 (Argyll 3D)
98.2% sRGB (Argyll 3D)
67.1% Display P3 (Argyll 3D)
Gamma: 2.06
CCT: 6775 K
| Dell Latitude 7330 Rugged Extreme Sharp LQ133M1, IPS, 1920x1080, 13.3" | Dell Latitude 7424 Rugged Extreme AU Optronics AUO523D, IPS, 1920x1080, 14" | Dell Latitude 5420 Rugged-P85G AU Optronics AUO523D, IPS, 1920x1080, 14" | Acer Enduro Urban N3 EUN314 XR140EA6T, IPS, 1920x1080, 14" | Panasonic Toughbook FZ-55 MK2 InfoVision M140NWF5 R3, IPS, 1920x1080, 14" | Durabook S14I KD140N0730A01, TN, 1920x1080, 14" | |
|---|---|---|---|---|---|---|
| Display | -2% | -7% | -5% | -48% | -34% | |
| Display P3 Coverage (%) | 67.1 | 65.3 -3% | 62.5 -7% | 63.5 -5% | 34.8 -48% | 43.55 -35% |
| sRGB Coverage (%) | 98.2 | 96.9 -1% | 92.4 -6% | 91.9 -6% | 52.2 -47% | 65.4 -33% |
| AdobeRGB 1998 Coverage (%) | 69 | 67.3 -2% | 64.2 -7% | 65.5 -5% | 36 -48% | 45 -35% |
| Response Times | 11% | 15% | 21% | 46% | 66% | |
| Response Time Grey 50% / Grey 80% * (ms) | 74.4 ? | 62.8 ? 16% | 68 ? 9% | 56 ? 25% | 28.4 ? 62% | 30.4 ? 59% |
| Response Time Black / White * (ms) | 42.4 ? | 40 ? 6% | 33.6 ? 21% | 35.2 ? 17% | 30 ? 29% | 11.8 ? 72% |
| PWM Frequency (Hz) | 763 | 735 ? | 1000 ? | 685 ? | 304.9 ? | |
| Screen | -71% | -75% | -97% | -99% | -232% | |
| Brightness middle (cd/m²) | 1414.1 | 844 -40% | 1111.7 -21% | 487.8 -66% | 1061.1 -25% | 1180.7 -17% |
| Brightness (cd/m²) | 1282 | 793 -38% | 1026 -20% | 464 -64% | 997 -22% | 1102 -14% |
| Brightness Distribution (%) | 84 | 88 5% | 80 -5% | 89 6% | 76 -10% | 89 6% |
| Black Level * (cd/m²) | 0.83 | 0.54 35% | 0.81 2% | 0.48 42% | 0.7 16% | 1.91 -130% |
| Contrast (:1) | 1704 | 1563 -8% | 1372 -19% | 1016 -40% | 1516 -11% | 618 -64% |
| Colorchecker dE 2000 * | 1.99 | 4.8 -141% | 3.83 -92% | 6.51 -227% | 4.64 -133% | 13.45 -576% |
| Colorchecker dE 2000 max. * | 3.75 | 11.88 -217% | 7.85 -109% | 11.36 -203% | 20.92 -458% | 22.52 -501% |
| Colorchecker dE 2000 calibrated * | 0.72 | 1.15 -60% | 2.98 -314% | 1.77 -146% | 2.52 -250% | 3.19 -343% |
| Greyscale dE 2000 * | 2.8 | 7.6 -171% | 5.6 -100% | 7.8 -179% | 2.8 -0% | 15.4 -450% |
| Gamma | 2.06 107% | 2.334 94% | 2.306 95% | 2.28 96% | 2.08 106% | 1.97 112% |
| CCT | 6775 96% | 6546 99% | 7676 85% | 8102 80% | 6364 102% | 21134 31% |
| Color Space (Percent of AdobeRGB 1998) (%) | 62 | 59 | 41.6 | |||
| Color Space (Percent of sRGB) (%) | 97 | 93 | 65.5 | |||
| Total Average (Program / Settings) | -21% /
-44% | -22% /
-48% | -27% /
-61% | -34% /
-68% | -67% /
-147% |
* ... smaller is better
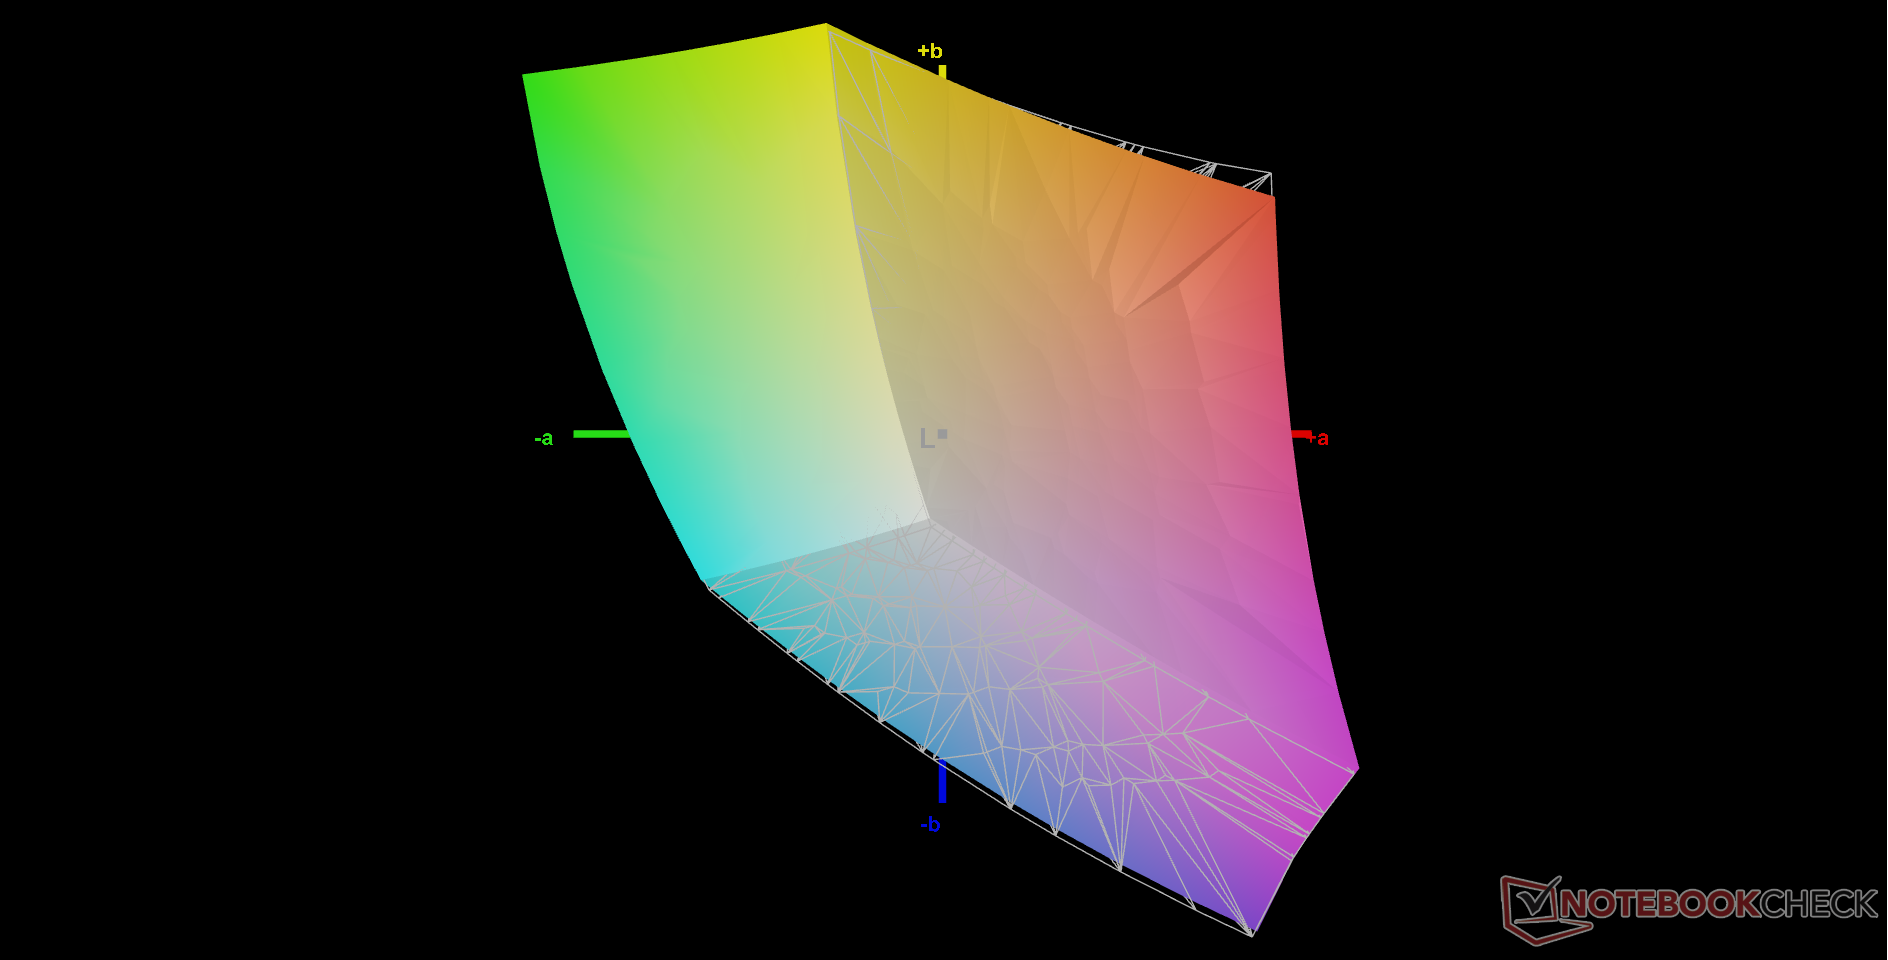
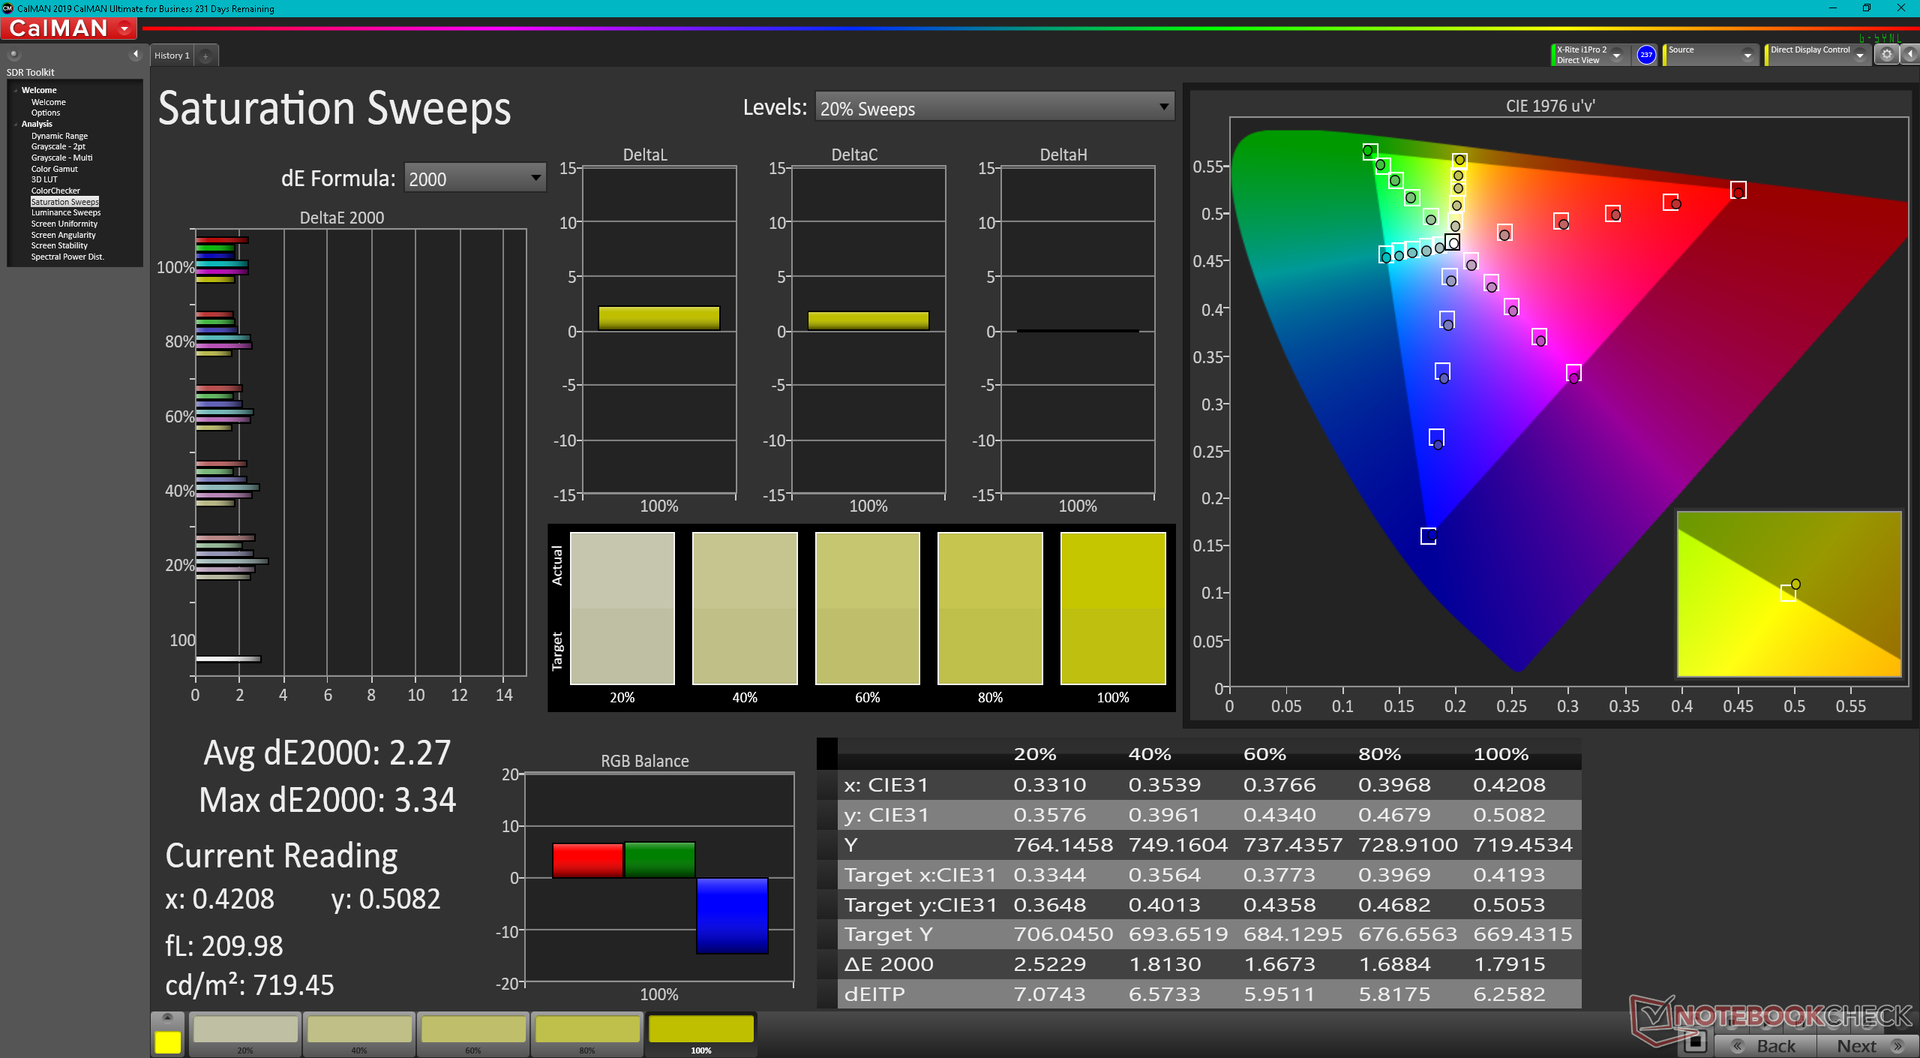
The panel is already well-calibrated out of the box and so and end-user calibration is not as necessary. Calibrating the panel ourselves anyway would decrease average grayscale and color DeltaE values even more from 2.8 and 1.99 to just 1.0 and 0.72, respectively.
Display Response Times
| ↔ Response Time Black to White | ||
|---|---|---|
| 42.4 ms ... rise ↗ and fall ↘ combined | ↗ 20.4 ms rise | 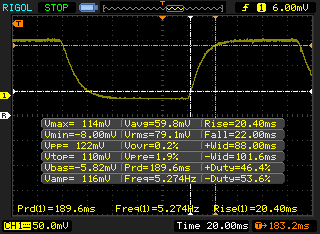 |
| ↘ 22 ms fall | ||
| The screen shows slow response rates in our tests and will be unsatisfactory for gamers. In comparison, all tested devices range from 0.1 (minimum) to 240 (maximum) ms. » 98 % of all devices are better. This means that the measured response time is worse than the average of all tested devices (19.8 ms). | ||
| ↔ Response Time 50% Grey to 80% Grey | ||
| 74.4 ms ... rise ↗ and fall ↘ combined | ↗ 37.6 ms rise | 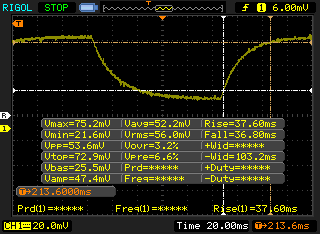 |
| ↘ 36.8 ms fall | ||
| The screen shows slow response rates in our tests and will be unsatisfactory for gamers. In comparison, all tested devices range from 0.165 (minimum) to 636 (maximum) ms. » 99 % of all devices are better. This means that the measured response time is worse than the average of all tested devices (31 ms). | ||
Screen Flickering / PWM (Pulse-Width Modulation)
| Screen flickering / PWM not detected | 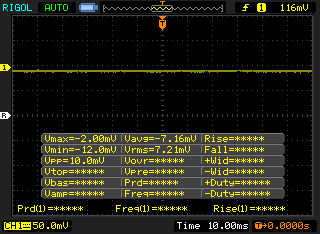 | ||
In comparison: 52 % of all tested devices do not use PWM to dim the display. If PWM was detected, an average of 7757 (minimum: 5 - maximum: 343500) Hz was measured. | |||


Performance
Testing Conditions
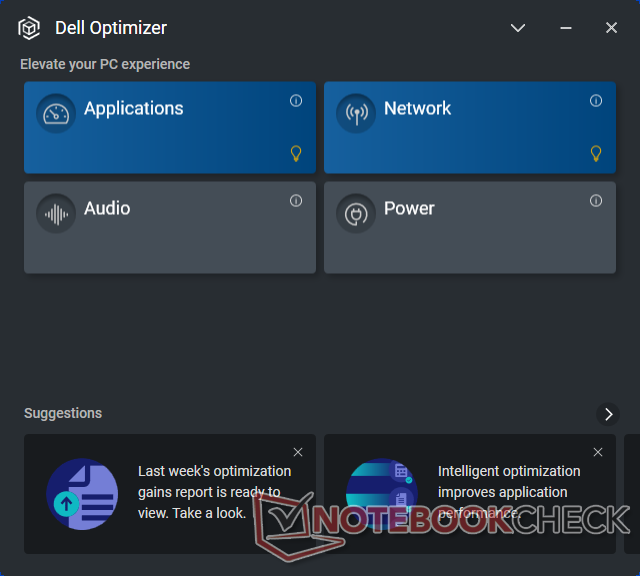
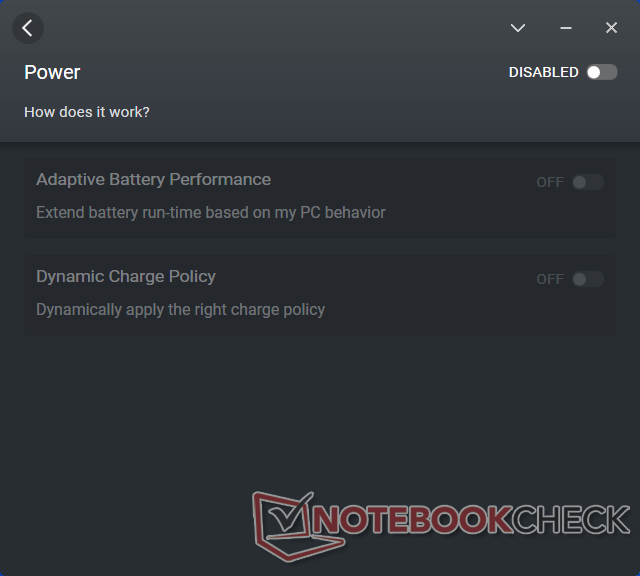
Our unit was set to Performance mode and Ultra Performance mode via Windows and Dell Power Manager, respectively, prior to running any benchmarks below. We highly recommend users become familiar with the pre-installed Power Manager and Optimizer applications as some features of the laptop can only be toggled through these software.

Processor
Raw CPU performance is excellent with results that are within just a few percentage point of the average Core i7-1185G7 in our database. Performance sustainability is also good as scores do not dip over time when running CineBench R15 xT in a loop.
Keep in mind that the Core i7-1185G7 performs similarly to the less expensive Core i7-1165G7. If vPro is unimportant, then the Core i7-1165G7 can provide essentially the same experience.
Cinebench R15 Multi Loop
Cinebench R20: CPU (Multi Core) | CPU (Single Core)
Cinebench R23: Multi Core | Single Core
Blender: v2.79 BMW27 CPU
7-Zip 18.03: 7z b 4 | 7z b 4 -mmt1
Geekbench 5.5: Multi-Core | Single-Core
HWBOT x265 Benchmark v2.2: 4k Preset
LibreOffice : 20 Documents To PDF
R Benchmark 2.5: Overall mean
| Cinebench R15 / CPU Multi 64Bit | |
| Average Intel Core i7-1185G7 (617 - 1066, n=32) | |
| Acer Enduro Urban N3 EUN314 | |
| Dell Latitude 7330 Rugged Extreme | |
| Panasonic Toughbook FZ-55 MK2 | |
| Lenovo ThinkPad P15s Gen1-20T4000JGE | |
| Getac B360 | |
| Durabook S14I | |
| Fujitsu LifeBook U7310 | |
| Dell Latitude 7424 Rugged Extreme | |
| Dell Latitude 5420 Rugged-P85G | |
| Cinebench R15 / CPU Single 64Bit | |
| Dell Latitude 7330 Rugged Extreme | |
| Panasonic Toughbook FZ-55 MK2 | |
| Average Intel Core i7-1185G7 (168 - 230, n=27) | |
| Acer Enduro Urban N3 EUN314 | |
| Durabook S14I | |
| Lenovo ThinkPad P15s Gen1-20T4000JGE | |
| Getac B360 | |
| Fujitsu LifeBook U7310 | |
| Dell Latitude 5420 Rugged-P85G | |
| Dell Latitude 7424 Rugged Extreme | |
| Cinebench R20 / CPU (Multi Core) | |
| Dell Latitude 7330 Rugged Extreme | |
| Panasonic Toughbook FZ-55 MK2 | |
| Average Intel Core i7-1185G7 (1425 - 2493, n=28) | |
| Acer Enduro Urban N3 EUN314 | |
| Lenovo ThinkPad P15s Gen1-20T4000JGE | |
| Getac B360 | |
| Durabook S14I | |
| Fujitsu LifeBook U7310 | |
| Cinebench R20 / CPU (Single Core) | |
| Dell Latitude 7330 Rugged Extreme | |
| Average Intel Core i7-1185G7 (489 - 593, n=28) | |
| Acer Enduro Urban N3 EUN314 | |
| Panasonic Toughbook FZ-55 MK2 | |
| Durabook S14I | |
| Lenovo ThinkPad P15s Gen1-20T4000JGE | |
| Getac B360 | |
| Fujitsu LifeBook U7310 | |
| Cinebench R23 / Multi Core | |
| Dell Latitude 7330 Rugged Extreme | |
| Average Intel Core i7-1185G7 (3610 - 6383, n=24) | |
| Panasonic Toughbook FZ-55 MK2 | |
| Acer Enduro Urban N3 EUN314 | |
| Getac B360 | |
| Durabook S14I | |
| Cinebench R23 / Single Core | |
| Dell Latitude 7330 Rugged Extreme | |
| Average Intel Core i7-1185G7 (1251 - 1532, n=24) | |
| Panasonic Toughbook FZ-55 MK2 | |
| Acer Enduro Urban N3 EUN314 | |
| Durabook S14I | |
| Getac B360 | |
| Blender / v2.79 BMW27 CPU | |
| Fujitsu LifeBook U7310 | |
| Durabook S14I | |
| Lenovo ThinkPad P15s Gen1-20T4000JGE | |
| Getac B360 | |
| Average Intel Core i7-1185G7 (478 - 745, n=28) | |
| Panasonic Toughbook FZ-55 MK2 | |
| Acer Enduro Urban N3 EUN314 | |
| Dell Latitude 7330 Rugged Extreme | |
| 7-Zip 18.03 / 7z b 4 | |
| Acer Enduro Urban N3 EUN314 | |
| Dell Latitude 7330 Rugged Extreme | |
| Panasonic Toughbook FZ-55 MK2 | |
| Average Intel Core i7-1185G7 (18812 - 27693, n=27) | |
| Getac B360 | |
| Lenovo ThinkPad P15s Gen1-20T4000JGE | |
| Durabook S14I | |
| Fujitsu LifeBook U7310 | |
| 7-Zip 18.03 / 7z b 4 -mmt1 | |
| Dell Latitude 7330 Rugged Extreme | |
| Acer Enduro Urban N3 EUN314 | |
| Panasonic Toughbook FZ-55 MK2 | |
| Durabook S14I | |
| Average Intel Core i7-1185G7 (3678 - 5507, n=27) | |
| Lenovo ThinkPad P15s Gen1-20T4000JGE | |
| Getac B360 | |
| Fujitsu LifeBook U7310 | |
| Geekbench 5.5 / Multi-Core | |
| Dell Latitude 7330 Rugged Extreme | |
| Average Intel Core i7-1185G7 (4620 - 5944, n=21) | |
| Acer Enduro Urban N3 EUN314 | |
| Getac B360 | |
| Lenovo ThinkPad P15s Gen1-20T4000JGE | |
| Durabook S14I | |
| Fujitsu LifeBook U7310 | |
| Geekbench 5.5 / Single-Core | |
| Dell Latitude 7330 Rugged Extreme | |
| Acer Enduro Urban N3 EUN314 | |
| Average Intel Core i7-1185G7 (1398 - 1626, n=21) | |
| Durabook S14I | |
| Getac B360 | |
| Lenovo ThinkPad P15s Gen1-20T4000JGE | |
| Fujitsu LifeBook U7310 | |
| HWBOT x265 Benchmark v2.2 / 4k Preset | |
| Dell Latitude 7330 Rugged Extreme | |
| Panasonic Toughbook FZ-55 MK2 | |
| Acer Enduro Urban N3 EUN314 | |
| Average Intel Core i7-1185G7 (5.02 - 8.13, n=27) | |
| Getac B360 | |
| Lenovo ThinkPad P15s Gen1-20T4000JGE | |
| Durabook S14I | |
| Fujitsu LifeBook U7310 | |
| LibreOffice / 20 Documents To PDF | |
| Lenovo ThinkPad P15s Gen1-20T4000JGE | |
| Acer Enduro Urban N3 EUN314 | |
| Fujitsu LifeBook U7310 | |
| Average Intel Core i7-1185G7 (41.3 - 61.7, n=26) | |
| Dell Latitude 7330 Rugged Extreme | |
| Panasonic Toughbook FZ-55 MK2 | |
| Durabook S14I | |
| R Benchmark 2.5 / Overall mean | |
| Fujitsu LifeBook U7310 | |
| Getac B360 | |
| Lenovo ThinkPad P15s Gen1-20T4000JGE | |
| Durabook S14I | |
| Average Intel Core i7-1185G7 (0.55 - 0.615, n=27) | |
| Acer Enduro Urban N3 EUN314 | |
| Panasonic Toughbook FZ-55 MK2 | |
| Dell Latitude 7330 Rugged Extreme | |
* ... smaller is better
AIDA64: FP32 Ray-Trace | FPU Julia | CPU SHA3 | CPU Queen | FPU SinJulia | FPU Mandel | CPU AES | CPU ZLib | FP64 Ray-Trace | CPU PhotoWorxx
| Performance rating | |
| Dell Latitude 7330 Rugged Extreme | |
| Acer Enduro Urban N3 EUN314 | |
| Average Intel Core i7-1185G7 | |
| Panasonic Toughbook FZ-55 MK2 | |
| Durabook S14I | |
| AIDA64 / FP32 Ray-Trace | |
| Dell Latitude 7330 Rugged Extreme | |
| Acer Enduro Urban N3 EUN314 | |
| Average Intel Core i7-1185G7 (5621 - 7453, n=20) | |
| Panasonic Toughbook FZ-55 MK2 | |
| Durabook S14I | |
| AIDA64 / FPU Julia | |
| Dell Latitude 7330 Rugged Extreme | |
| Acer Enduro Urban N3 EUN314 | |
| Panasonic Toughbook FZ-55 MK2 | |
| Average Intel Core i7-1185G7 (23248 - 32614, n=20) | |
| Durabook S14I | |
| AIDA64 / CPU SHA3 | |
| Dell Latitude 7330 Rugged Extreme | |
| Acer Enduro Urban N3 EUN314 | |
| Average Intel Core i7-1185G7 (1530 - 2209, n=20) | |
| Panasonic Toughbook FZ-55 MK2 | |
| Durabook S14I | |
| AIDA64 / CPU Queen | |
| Dell Latitude 7330 Rugged Extreme | |
| Acer Enduro Urban N3 EUN314 | |
| Durabook S14I | |
| Panasonic Toughbook FZ-55 MK2 | |
| Average Intel Core i7-1185G7 (44677 - 52815, n=20) | |
| AIDA64 / FPU SinJulia | |
| Dell Latitude 7330 Rugged Extreme | |
| Acer Enduro Urban N3 EUN314 | |
| Panasonic Toughbook FZ-55 MK2 | |
| Average Intel Core i7-1185G7 (3870 - 5027, n=20) | |
| Durabook S14I | |
| AIDA64 / FPU Mandel | |
| Dell Latitude 7330 Rugged Extreme | |
| Acer Enduro Urban N3 EUN314 | |
| Panasonic Toughbook FZ-55 MK2 | |
| Average Intel Core i7-1185G7 (14584 - 19594, n=20) | |
| Durabook S14I | |
| AIDA64 / CPU AES | |
| Dell Latitude 7330 Rugged Extreme | |
| Acer Enduro Urban N3 EUN314 | |
| Durabook S14I | |
| Average Intel Core i7-1185G7 (33002 - 76826, n=20) | |
| Panasonic Toughbook FZ-55 MK2 | |
| AIDA64 / CPU ZLib | |
| Dell Latitude 7330 Rugged Extreme | |
| Acer Enduro Urban N3 EUN314 | |
| Average Intel Core i7-1185G7 (258 - 412, n=22) | |
| Panasonic Toughbook FZ-55 MK2 | |
| Durabook S14I | |
| AIDA64 / FP64 Ray-Trace | |
| Dell Latitude 7330 Rugged Extreme | |
| Acer Enduro Urban N3 EUN314 | |
| Panasonic Toughbook FZ-55 MK2 | |
| Average Intel Core i7-1185G7 (2821 - 4094, n=20) | |
| Durabook S14I | |
| AIDA64 / CPU PhotoWorxx | |
| Dell Latitude 7330 Rugged Extreme | |
| Average Intel Core i7-1185G7 (22349 - 43701, n=20) | |
| Acer Enduro Urban N3 EUN314 | |
| Panasonic Toughbook FZ-55 MK2 | |
| Durabook S14I | |
System Performance
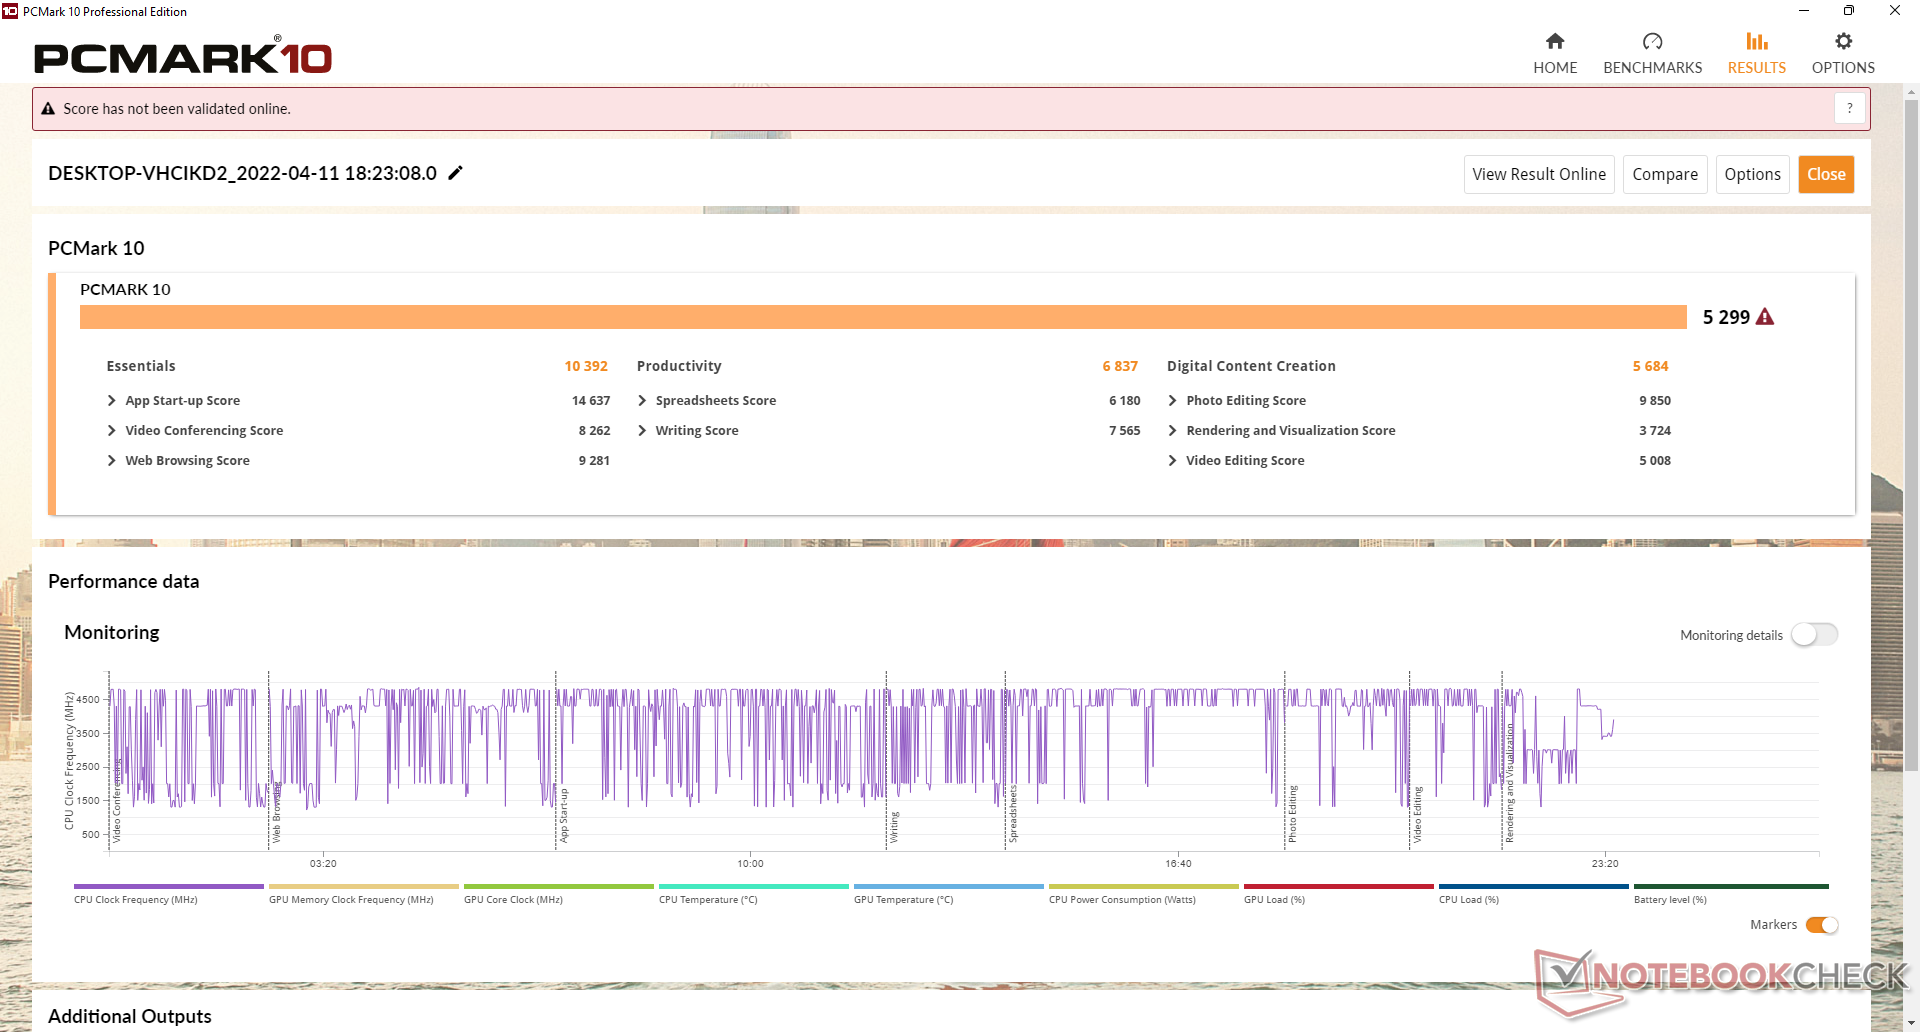
PCMark results are consistently higher than on the Panasonic Toughbook FZ-55 MK2 which comes with the same processor as our Dell unit. It's recommended to configure with dual-channel RAM if possible or else graphics performance will suffer.
| PCMark 10 / Score | |
| Dell Latitude 7330 Rugged Extreme | |
| Panasonic Toughbook FZ-55 MK2 | |
| Durabook S14I | |
| Acer Enduro Urban N3 EUN314 | |
| Dell Latitude 7424 Rugged Extreme | |
| Dell Latitude 5420 Rugged-P85G | |
| PCMark 10 / Essentials | |
| Dell Latitude 7330 Rugged Extreme | |
| Panasonic Toughbook FZ-55 MK2 | |
| Durabook S14I | |
| Acer Enduro Urban N3 EUN314 | |
| Dell Latitude 7424 Rugged Extreme | |
| Dell Latitude 5420 Rugged-P85G | |
| PCMark 10 / Productivity | |
| Dell Latitude 7424 Rugged Extreme | |
| Dell Latitude 5420 Rugged-P85G | |
| Durabook S14I | |
| Dell Latitude 7330 Rugged Extreme | |
| Panasonic Toughbook FZ-55 MK2 | |
| Acer Enduro Urban N3 EUN314 | |
| PCMark 10 Score | 5299 points | |
Help | ||
| AIDA64 / Memory Copy | |
| Dell Latitude 7330 Rugged Extreme | |
| Average Intel Core i7-1185G7 (36515 - 68450, n=20) | |
| Acer Enduro Urban N3 EUN314 | |
| Panasonic Toughbook FZ-55 MK2 | |
| Durabook S14I | |
| AIDA64 / Memory Read | |
| Dell Latitude 7330 Rugged Extreme | |
| Average Intel Core i7-1185G7 (38394 - 64291, n=20) | |
| Acer Enduro Urban N3 EUN314 | |
| Panasonic Toughbook FZ-55 MK2 | |
| Durabook S14I | |
| AIDA64 / Memory Write | |
| Dell Latitude 7330 Rugged Extreme | |
| Average Intel Core i7-1185G7 (37684 - 66873, n=20) | |
| Acer Enduro Urban N3 EUN314 | |
| Panasonic Toughbook FZ-55 MK2 | |
| Durabook S14I | |
| AIDA64 / Memory Latency | |
| Dell Latitude 7330 Rugged Extreme | |
| Average Intel Core i7-1185G7 (78.3 - 117, n=22) | |
| Acer Enduro Urban N3 EUN314 | |
| Panasonic Toughbook FZ-55 MK2 | |
| Durabook S14I | |
* ... smaller is better
DPC Latency
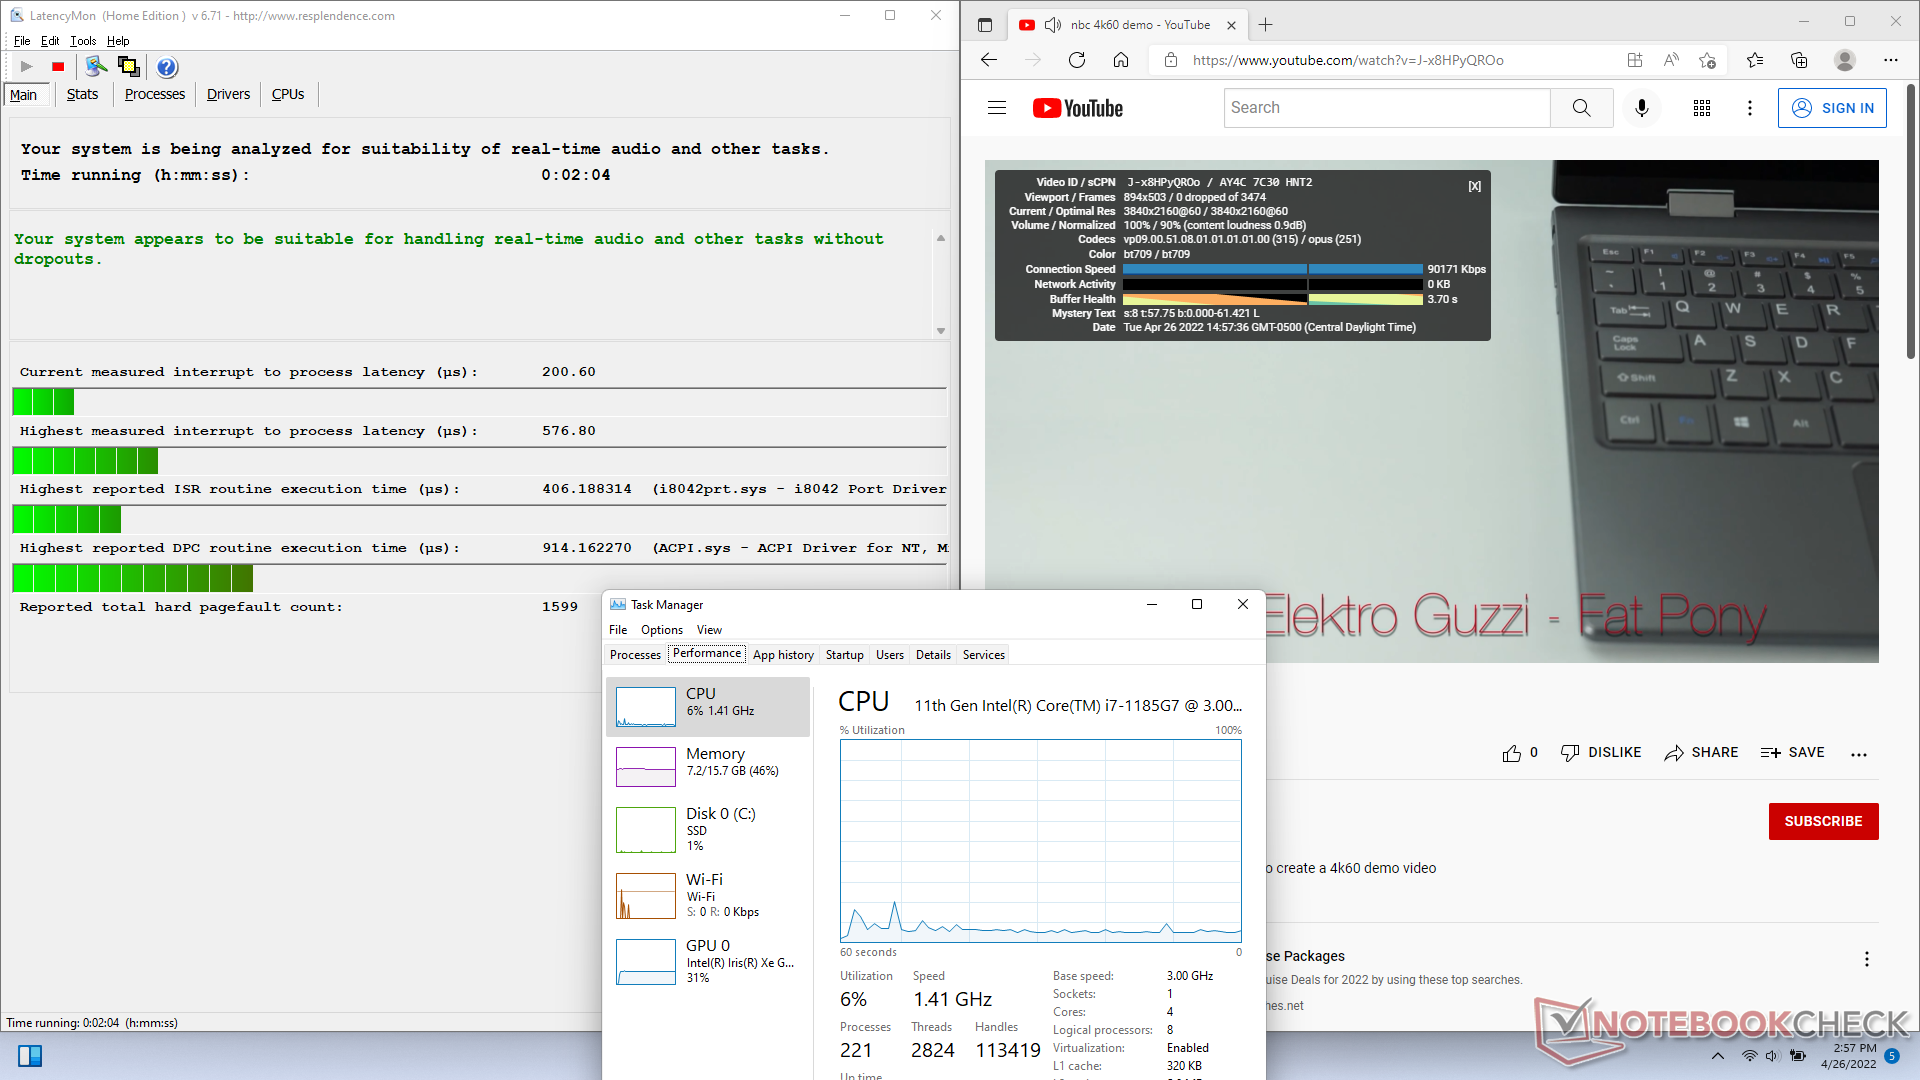
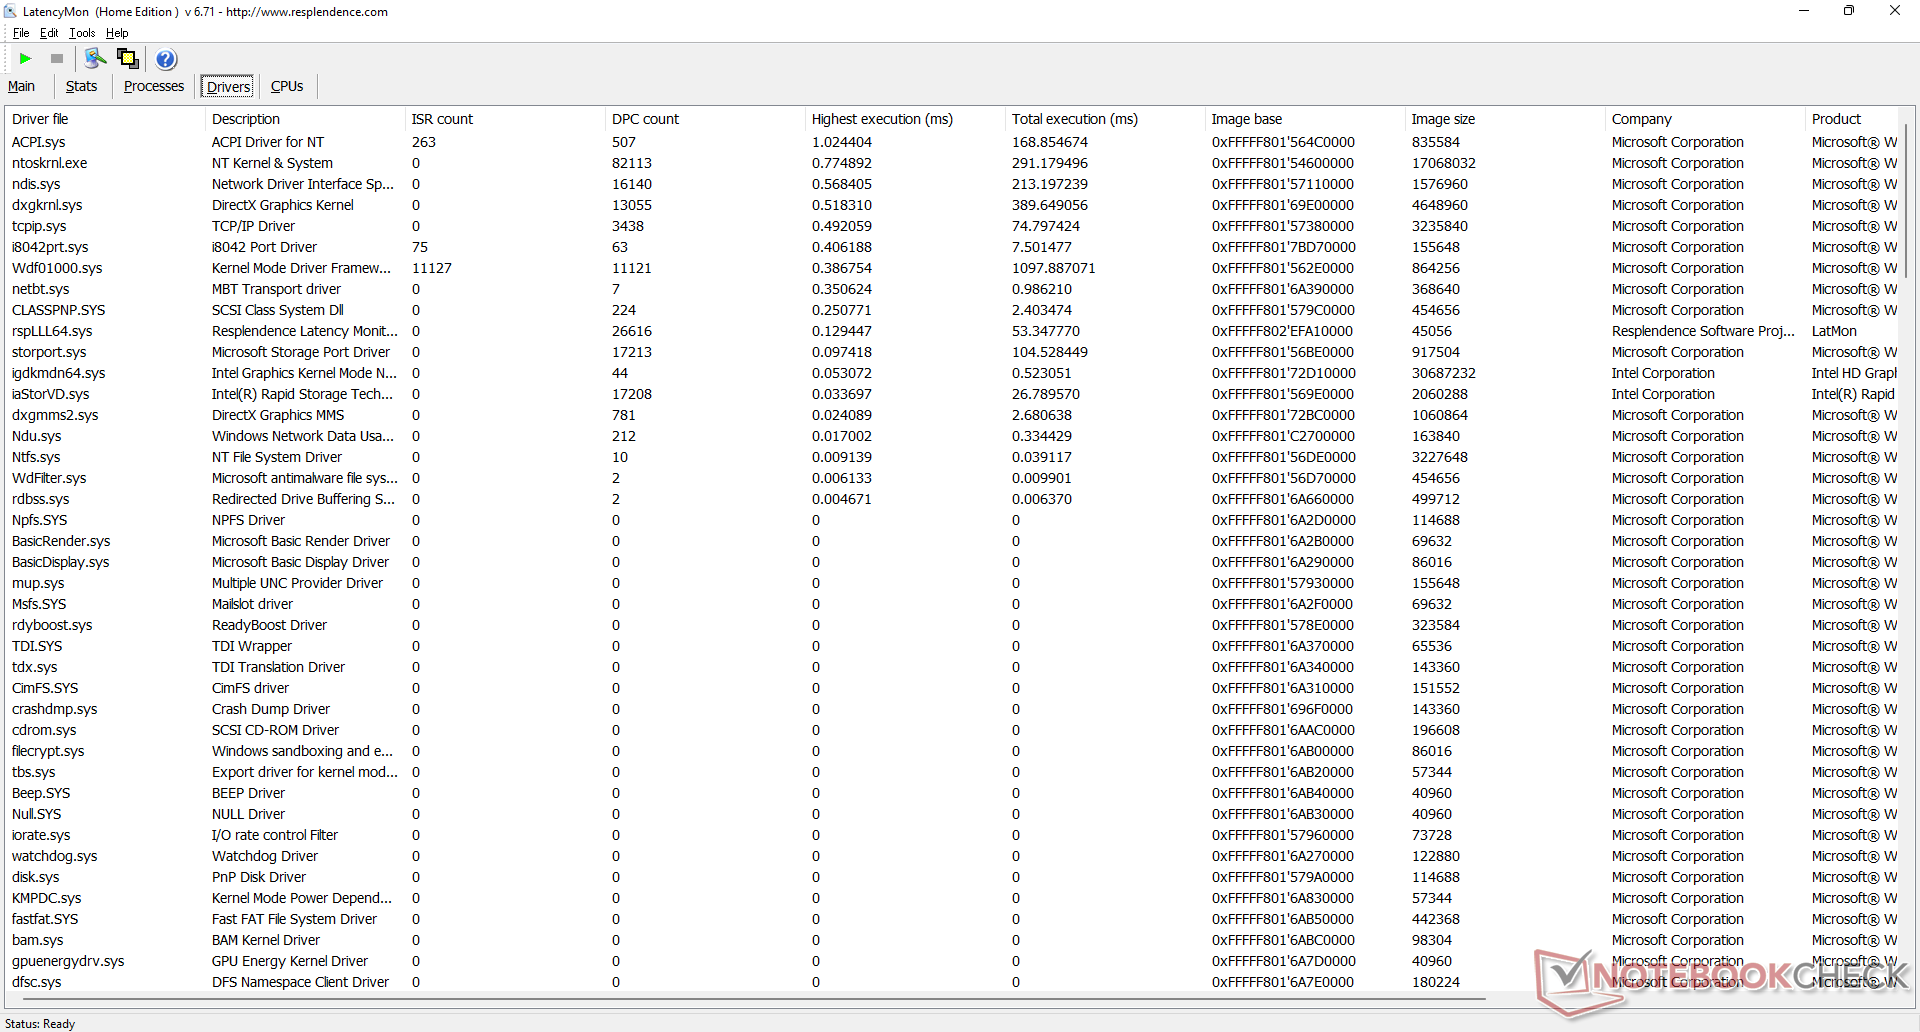
LatencyMon reveals no latency issues when opening multiple tabs of our homepage. 4K video playback at 60 FPS is also smooth with no recorded dropped frames.
| DPC Latencies / LatencyMon - interrupt to process latency (max), Web, Youtube, Prime95 | |
| Acer Enduro Urban N3 EUN314 | |
| Panasonic Toughbook FZ-55 MK2 | |
| Durabook S14I | |
| Dell Latitude 7330 Rugged Extreme | |
* ... smaller is better
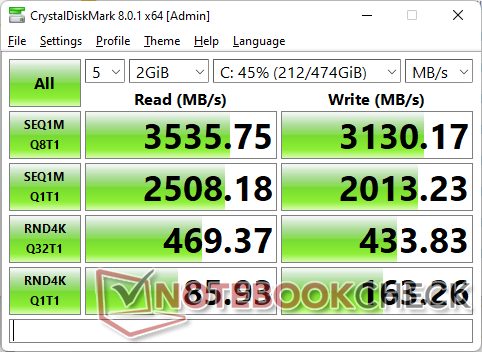
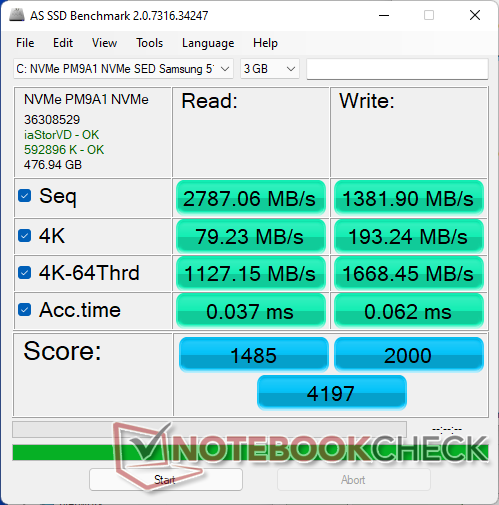
Storage Devices
The system supports just one internal M.2 2280 drive whereas the multiple drives on the Getac B360 can be quickly swapped without any tools. Our particular test unit shipped with a Samsung PM9A1 SED NVMe SSD, but standard not self-encrypted options are also available. Performance is excellent with no performance throttling even though raw transfer rates aren't as fast as a standard non-SED consumer drive.

| Drive Performance rating - Percent | |
| Dell Latitude 7330 Rugged Extreme | |
| Acer Enduro Urban N3 EUN314 | |
| Durabook S14I | |
| Dell Latitude 5420 Rugged-P85G -8! | |
| Dell Latitude 7424 Rugged Extreme -8! | |
| Panasonic Toughbook FZ-55 MK2 | |
* ... smaller is better
Disk Throttling: DiskSpd Read Loop, Queue Depth 8
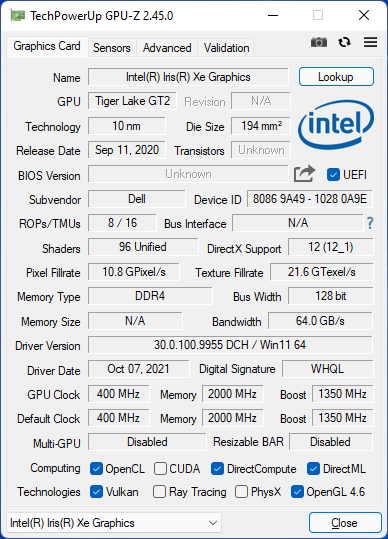
GPU Performance
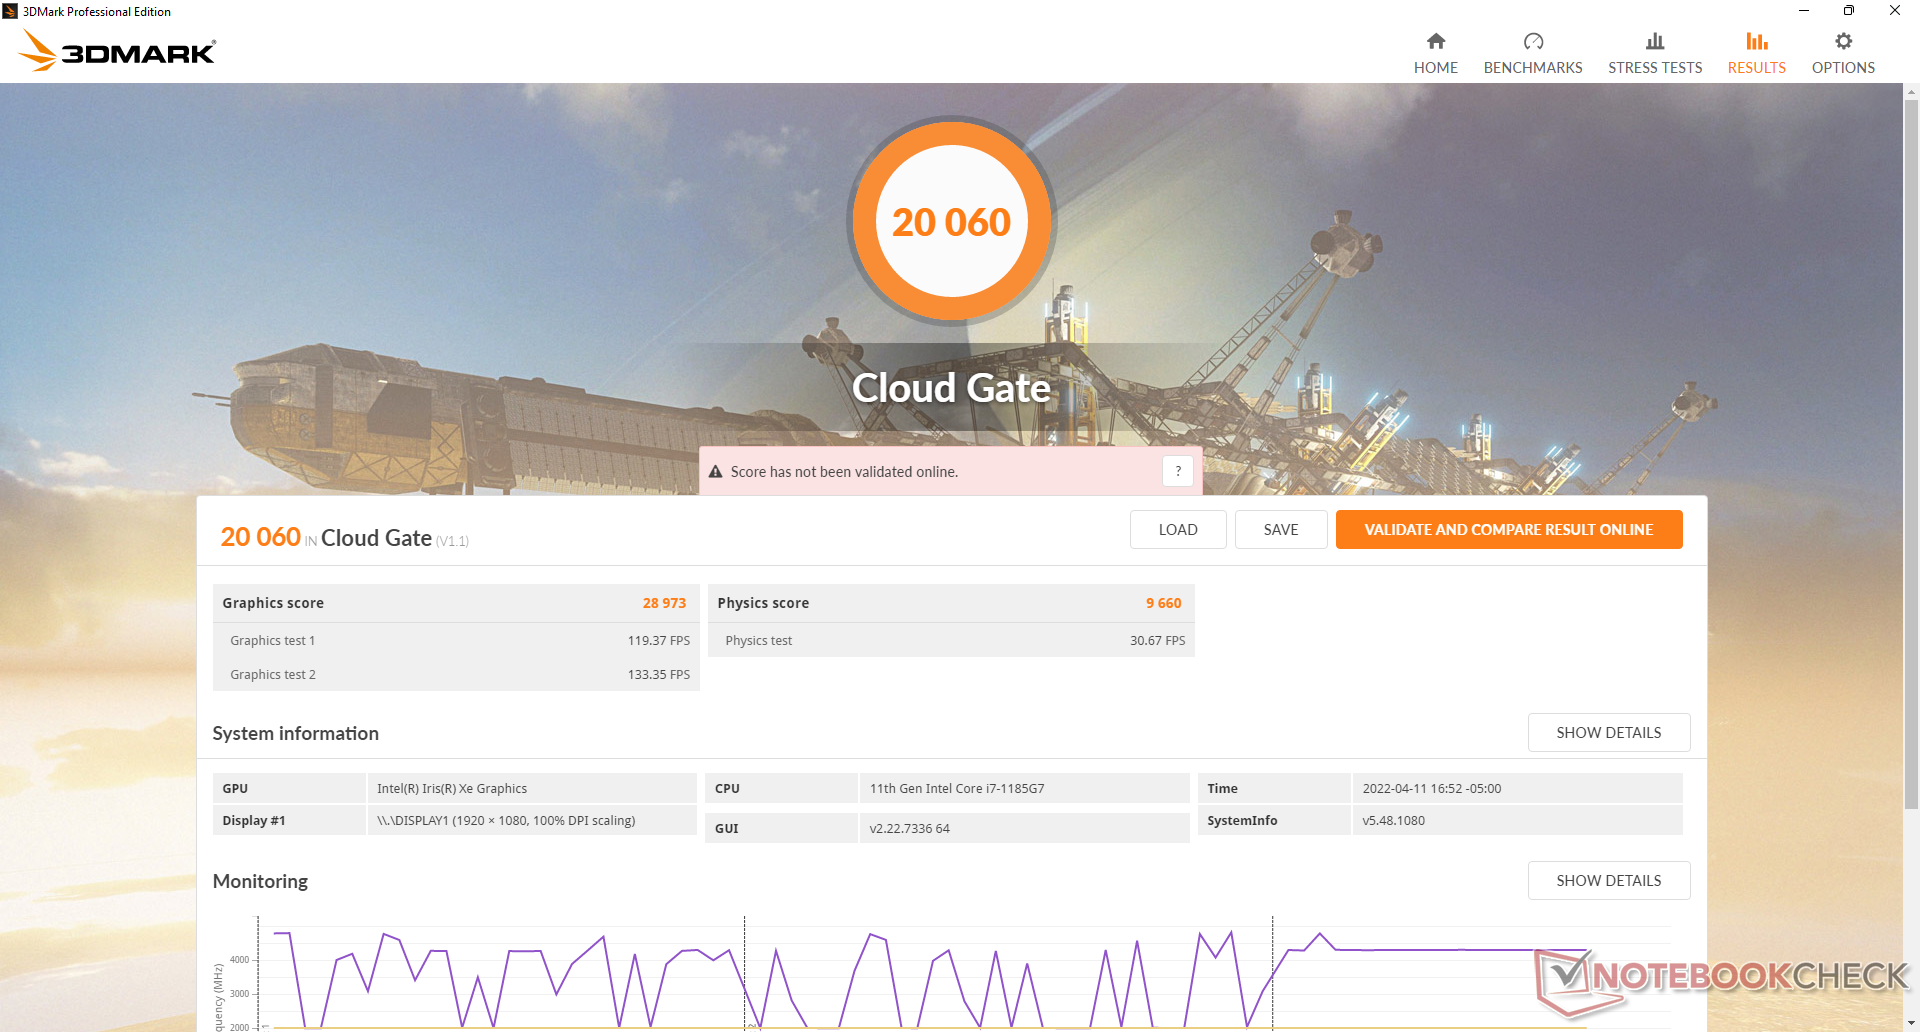
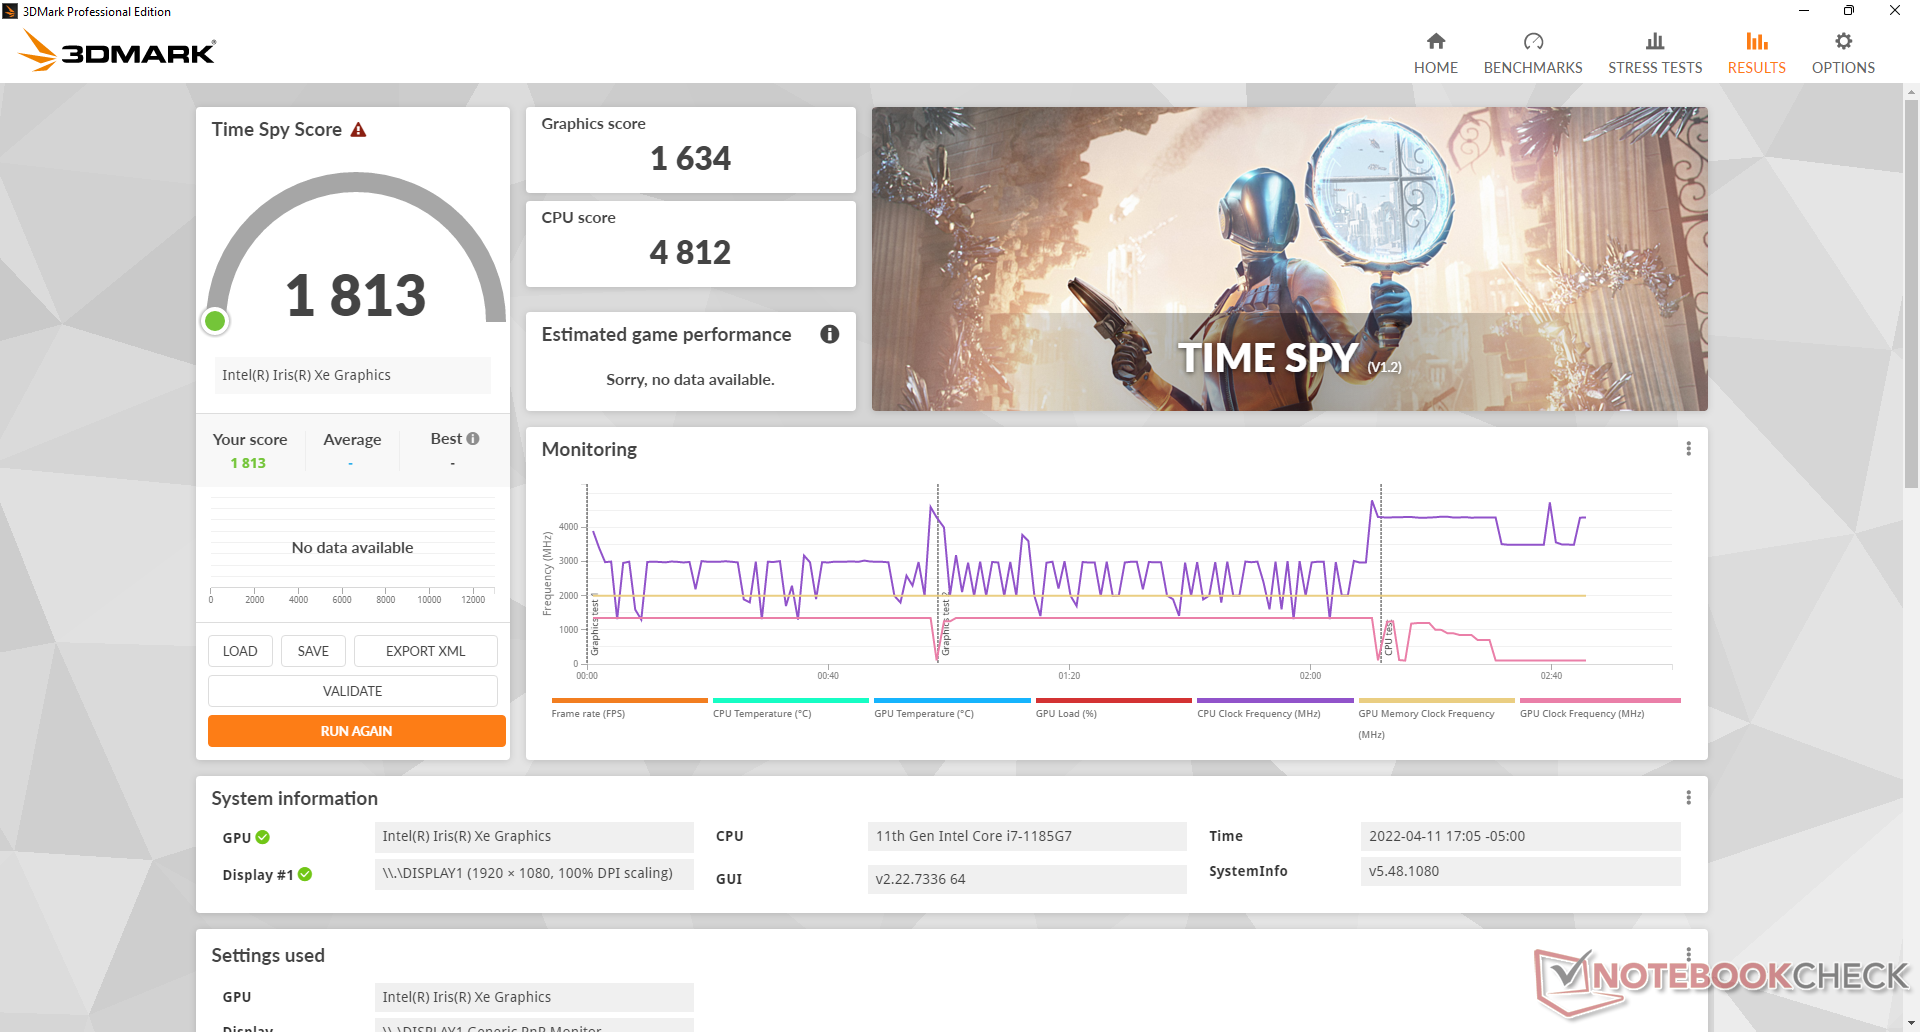
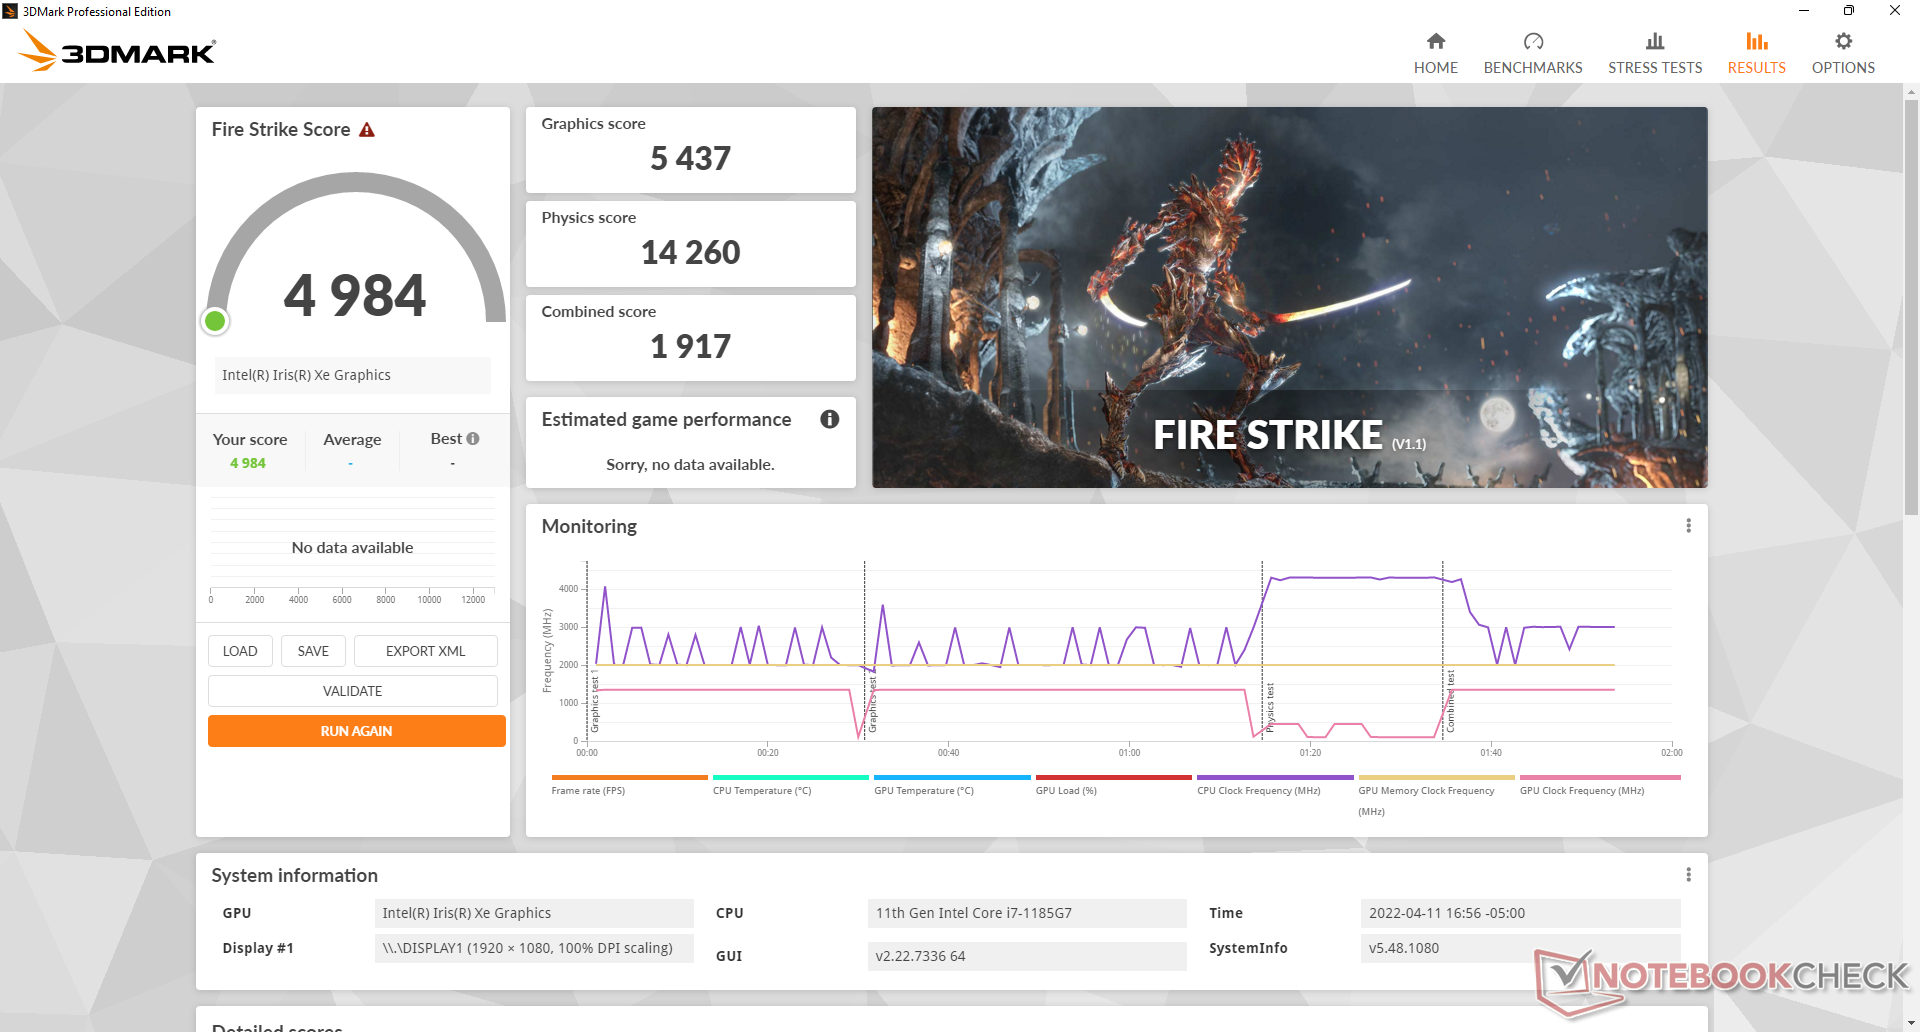
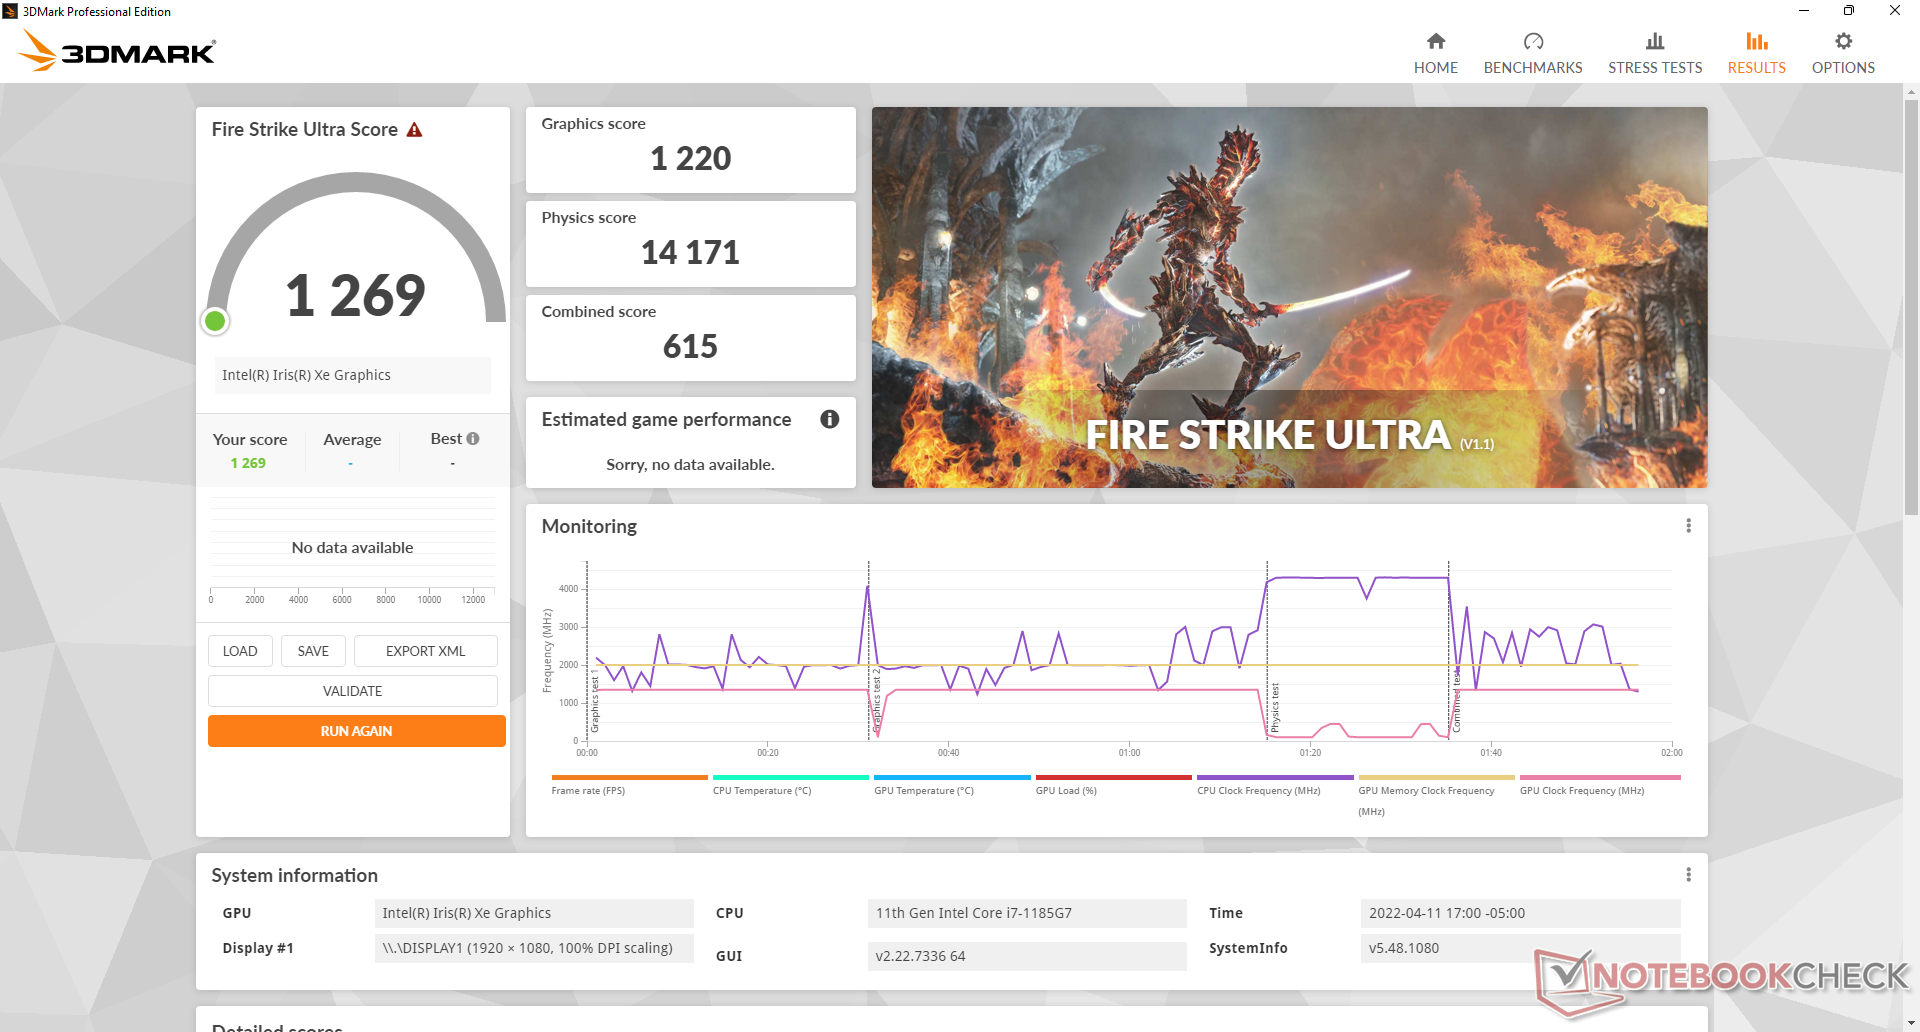
Graphics performance is excellent at about 10 to 15 percent faster than the average laptop in our database equipped with the same integrated Iris Xe 96 EUs GPU. Performance is even consistently faster than some older discrete GPUs like the Radeon RX 540.
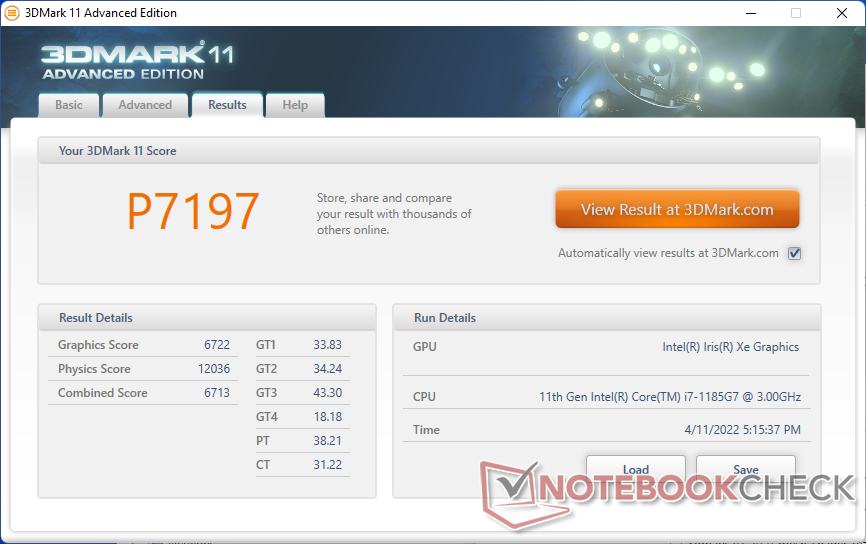
| 3DMark 11 Performance | 7197 points | |
| 3DMark Cloud Gate Standard Score | 20060 points | |
| 3DMark Fire Strike Score | 4984 points | |
| 3DMark Time Spy Score | 1813 points | |
Help | ||
Witcher 3 FPS Chart
| low | med. | high | ultra | |
|---|---|---|---|---|
| The Witcher 3 (2015) | 99.3 | 65.3 | 34.3 | 15.8 |
| Dota 2 Reborn (2015) | 115.6 | 108.5 | 65 | 57.3 |
| Final Fantasy XV Benchmark (2018) | 46.8 | 26.2 | 26.2 | |
| X-Plane 11.11 (2018) | 27.5 | 25.3 | 22 |
Emissions
System Noise
Fan noise is quiet since the model is using the same U-series CPU as found on much thinner consumer laptops like the Dell XPS 13. We're able to record a maximum of just 36 dB(A) when running Prime95 to be quieter than many other rugged alternatives.
Noise level
| Idle |
| 23.1 / 23.1 / 23.1 dB(A) |
| Load |
| 28 / 36.2 dB(A) |
 | ||
30 dB silent 40 dB(A) audible 50 dB(A) loud |
||
min: | ||
| Dell Latitude 7330 Rugged Extreme Iris Xe G7 96EUs, i7-1185G7 | Dell Latitude 7424 Rugged Extreme Radeon RX 540, i7-8650U, SK Hynix PC401 512GB M.2 (HFS512GD9TNG) | Dell Latitude 5420 Rugged-P85G Radeon RX 540, i7-8650U, SK hynix PC401 NVMe 500 GB | Acer Enduro Urban N3 EUN314 Iris Xe G7 96EUs, i7-1165G7, Samsung PM991 MZVLQ1T0HALB | Panasonic Toughbook FZ-55 MK2 Iris Xe G7 96EUs, i7-1185G7, Toshiba KIOXIA KBG4AZNV512G M.2 2280 OPAL | Durabook S14I Iris Xe G7 96EUs, i7-1165G7, UDinfo M2P M2P80DE512GBAEP | |
|---|---|---|---|---|---|---|
| Noise | -21% | -18% | -5% | -4% | -17% | |
| off / environment * (dB) | 22.9 | 28.6 -25% | 28.3 -24% | 23.8 -4% | 23.8 -4% | 25.2 -10% |
| Idle Minimum * (dB) | 23.1 | 28.6 -24% | 28.3 -23% | 24.1 -4% | 24 -4% | 25.2 -9% |
| Idle Average * (dB) | 23.1 | 28.6 -24% | 28.3 -23% | 24.1 -4% | 24 -4% | 25.2 -9% |
| Idle Maximum * (dB) | 23.1 | 28.6 -24% | 28.3 -23% | 24.1 -4% | 24 -4% | 34.5 -49% |
| Load Average * (dB) | 28 | 32.9 -18% | 29.9 -7% | 27.9 -0% | 26.7 5% | 34.5 -23% |
| Witcher 3 ultra * (dB) | 31.2 | 35.7 -14% | ||||
| Load Maximum * (dB) | 36.2 | 39 -8% | 38 -5% | 38.6 -7% | 41.7 -15% | 36.2 -0% |
* ... smaller is better
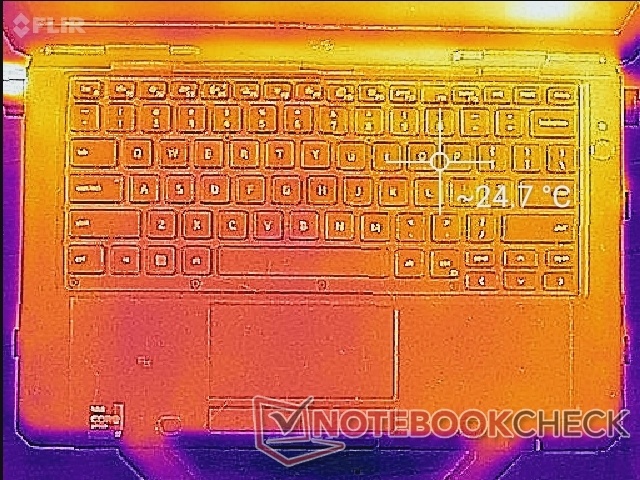
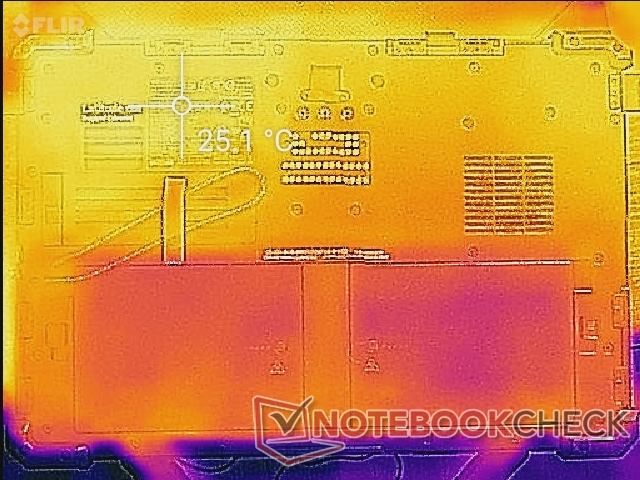
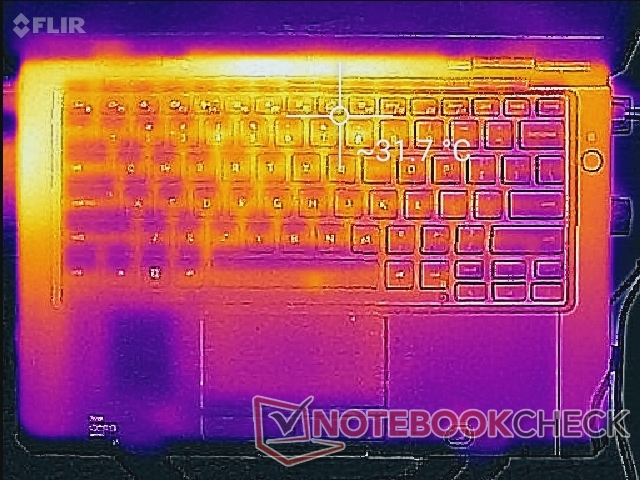
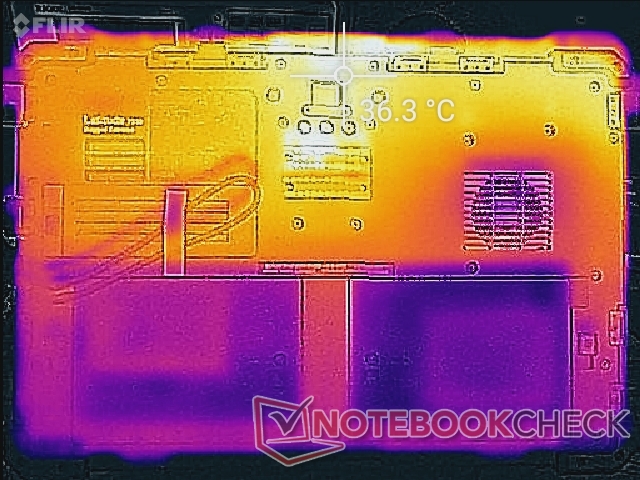
Temperature
Surface temperatures are never uncomfortably warm since you have a larger-than-usual chassis for an ULV U-series CPU. We're able to record hot spots of only 31 C and 36 C on the top and bottom surfaces, respectively, compared to 37 C and 46 C on the Acer Enduro Urban N3.
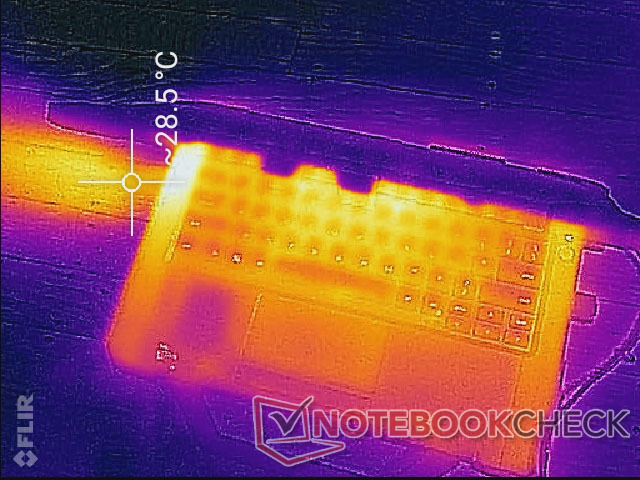
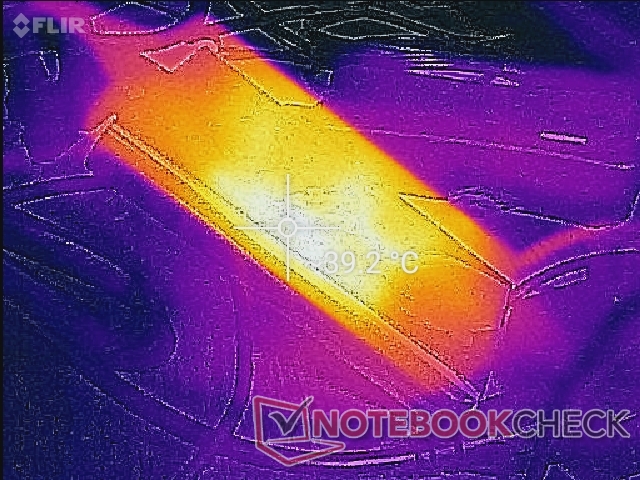
(+) The maximum temperature on the upper side is 34.6 °C / 94 F, compared to the average of 36.9 °C / 98 F, ranging from 24.7 to 57 °C for the class .
(+) The bottom heats up to a maximum of 36.6 °C / 98 F, compared to the average of 38.5 °C / 101 F
(+) In idle usage, the average temperature for the upper side is 24.3 °C / 76 F, compared to the device average of 31.9 °C / 89 F.
(+) The palmrests and touchpad are cooler than skin temperature with a maximum of 26 °C / 78.8 F and are therefore cool to the touch.
(+) The average temperature of the palmrest area of similar devices was 29.6 °C / 85.3 F (+3.6 °C / 6.5 F).
| Dell Latitude 7330 Rugged Extreme Intel Core i7-1185G7, Intel Iris Xe Graphics G7 96EUs | Dell Latitude 7424 Rugged Extreme Intel Core i7-8650U, AMD Radeon RX 540 | Dell Latitude 5420 Rugged-P85G Intel Core i7-8650U, AMD Radeon RX 540 | Acer Enduro Urban N3 EUN314 Intel Core i7-1165G7, Intel Iris Xe Graphics G7 96EUs | Panasonic Toughbook FZ-55 MK2 Intel Core i7-1185G7, Intel Iris Xe Graphics G7 96EUs | Durabook S14I Intel Core i7-1165G7, Intel Iris Xe Graphics G7 96EUs | |
|---|---|---|---|---|---|---|
| Heat | -21% | -23% | -15% | -20% | -19% | |
| Maximum Upper Side * (°C) | 34.6 | 41.6 -20% | 42.2 -22% | 37.8 -9% | 36.2 -5% | 36.4 -5% |
| Maximum Bottom * (°C) | 36.6 | 47.6 -30% | 42 -15% | 45.8 -25% | 42.2 -15% | 38.6 -5% |
| Idle Upper Side * (°C) | 24.8 | 28.6 -15% | 31.6 -27% | 26.4 -6% | 31 -25% | 32.6 -31% |
| Idle Bottom * (°C) | 25.2 | 30.2 -20% | 31.8 -26% | 30.2 -20% | 34 -35% | 33.8 -34% |
* ... smaller is better
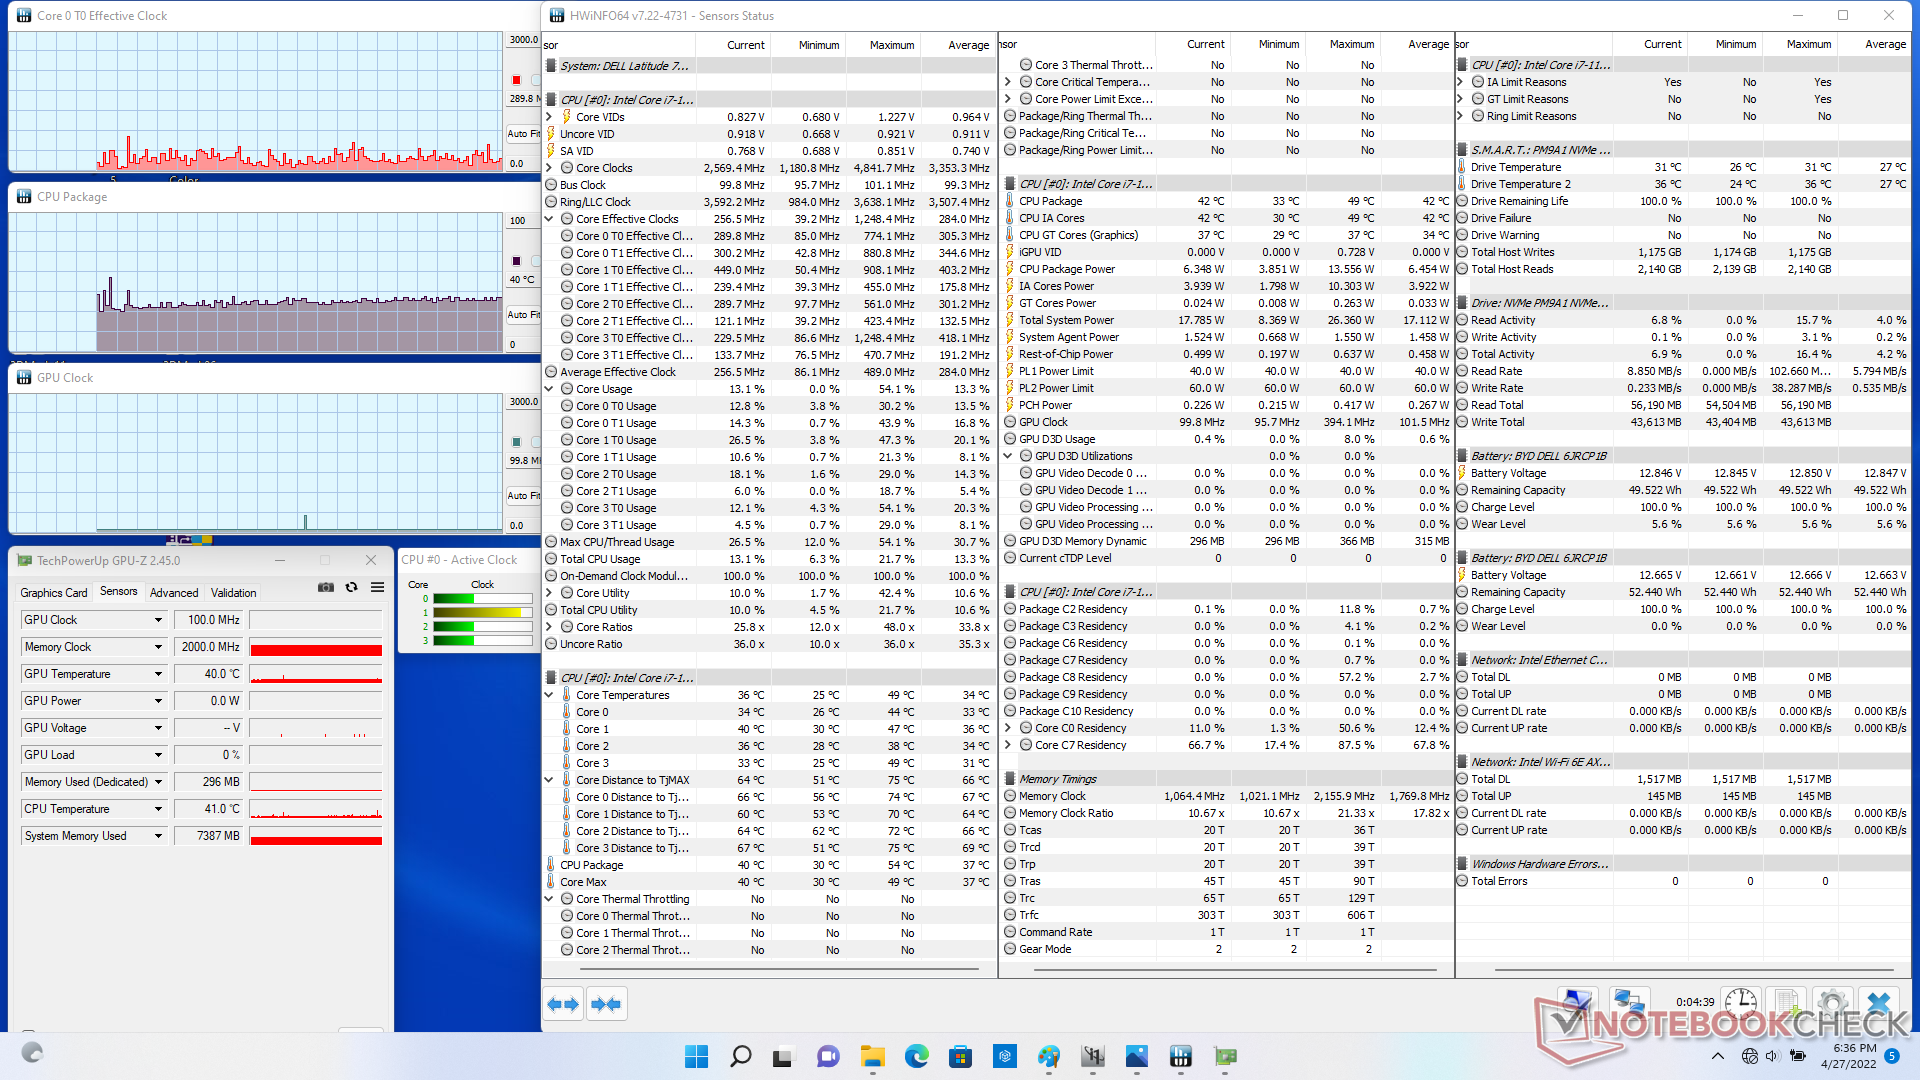
Stress Test
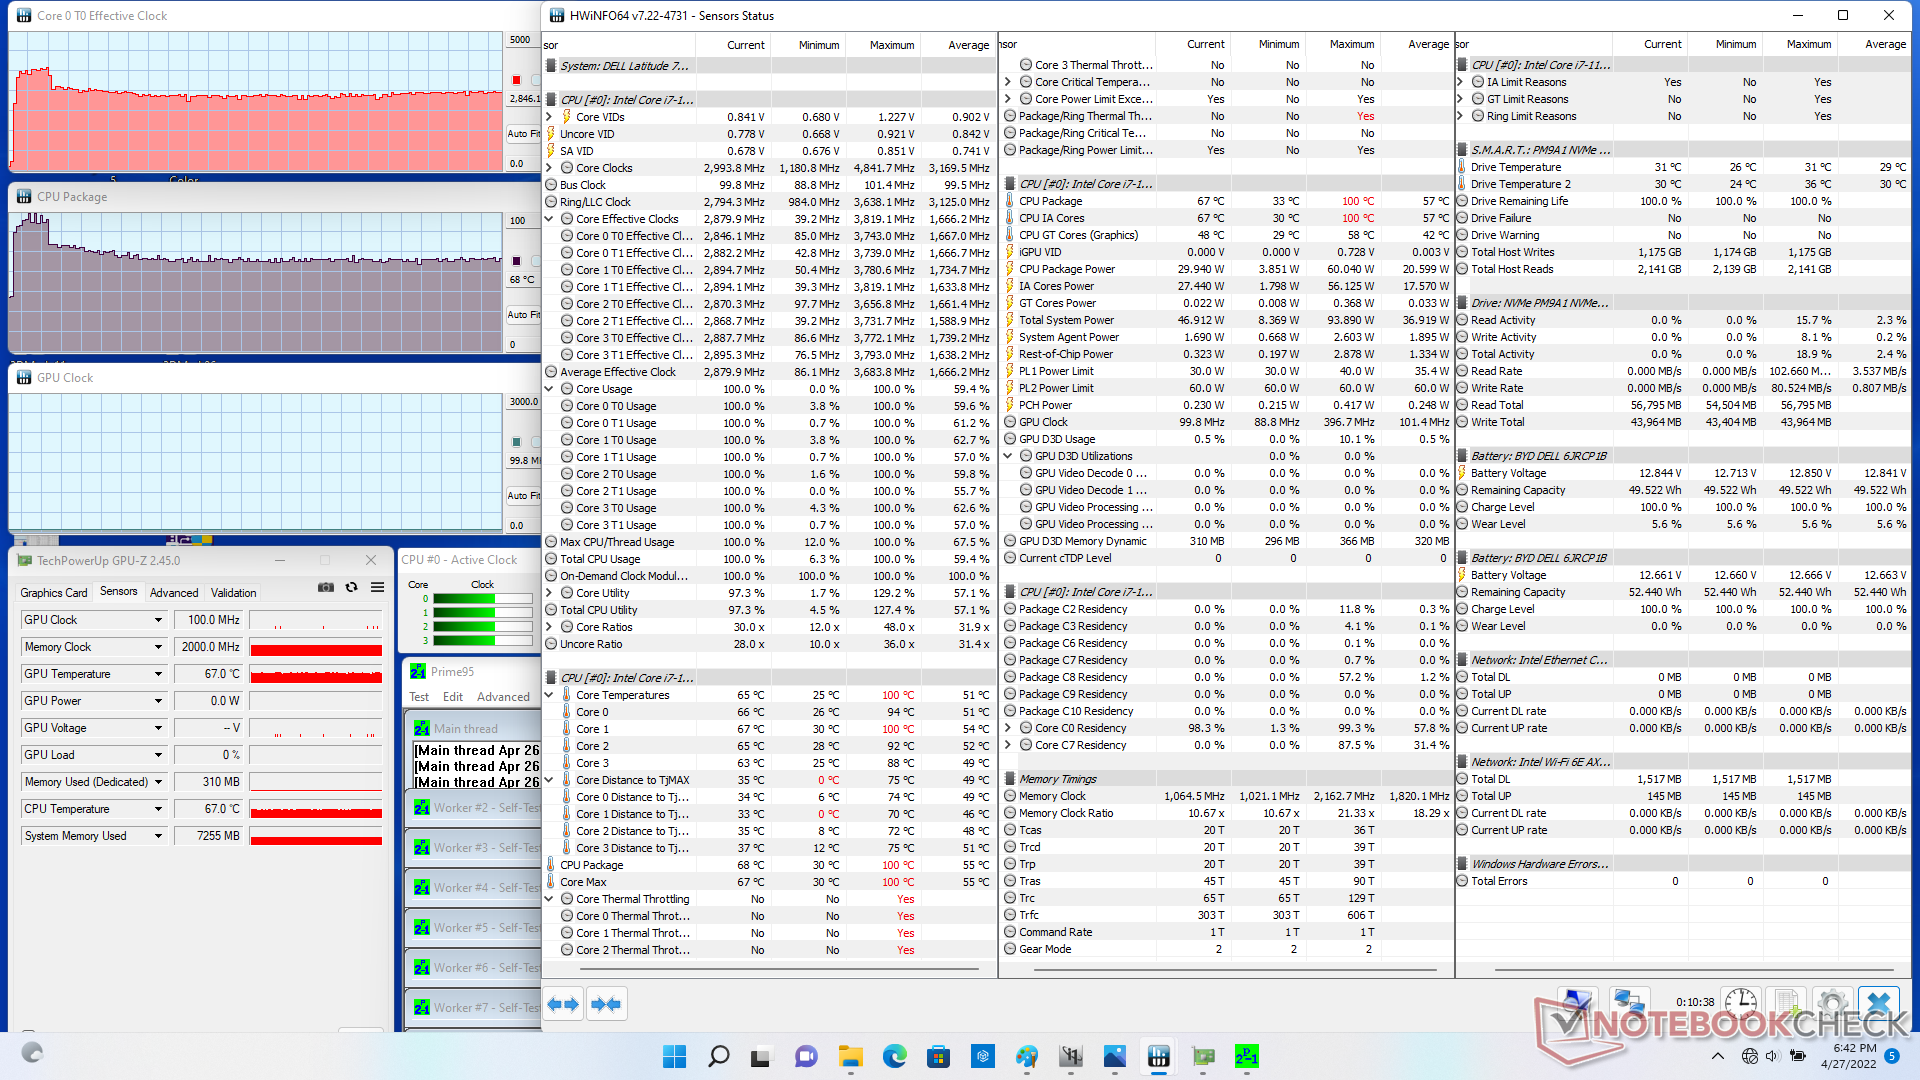
When under Prime95 stress, the CPU would boost to 3.7 GHz for a few seconds and at a core temperature of 100 C. Clock rates would then quickly fall and stabilize at 2.8 GHz in order to maintain a cooler core temperature of 68 C. Running this same test on the Panasonic Toughbook FZ-55 MK2 would result in similar CPU clock rates but a warmer core temperature of 81 C.
Running on battery power unfortunately limits performance. A 3DMark 11 test on batteries would return Physics and Graphics scores of 8010 and 3501 points, respectively, compared to 12036 and 6722 points when on mains.
| CPU Clock (GHz) | GPU Clock (MHz) | Average CPU Temperature (°C) | |
| System Idle | -- | -- | 40 |
| Prime95 Stress | 2.8 | -- | 68 |
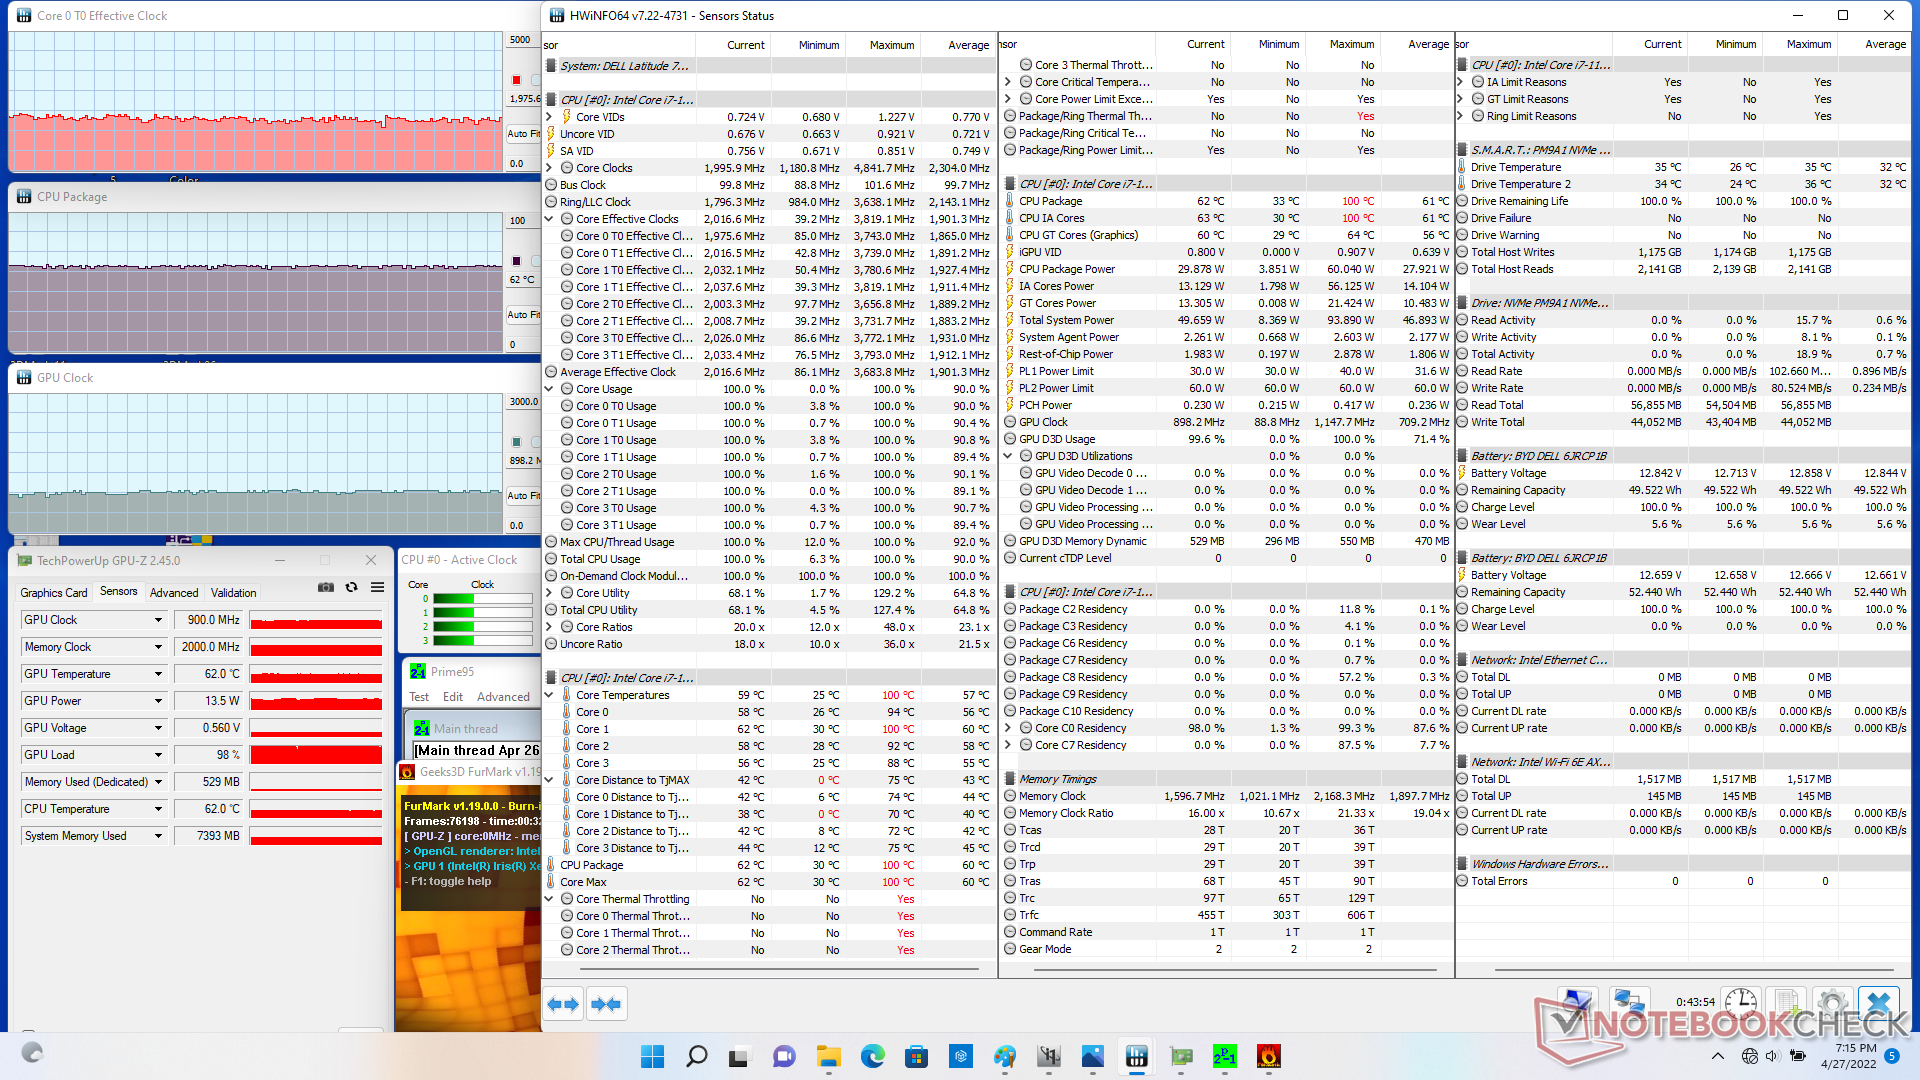
| Prime95 + FurMark Stress | ~2.0 | 900 | 62 |
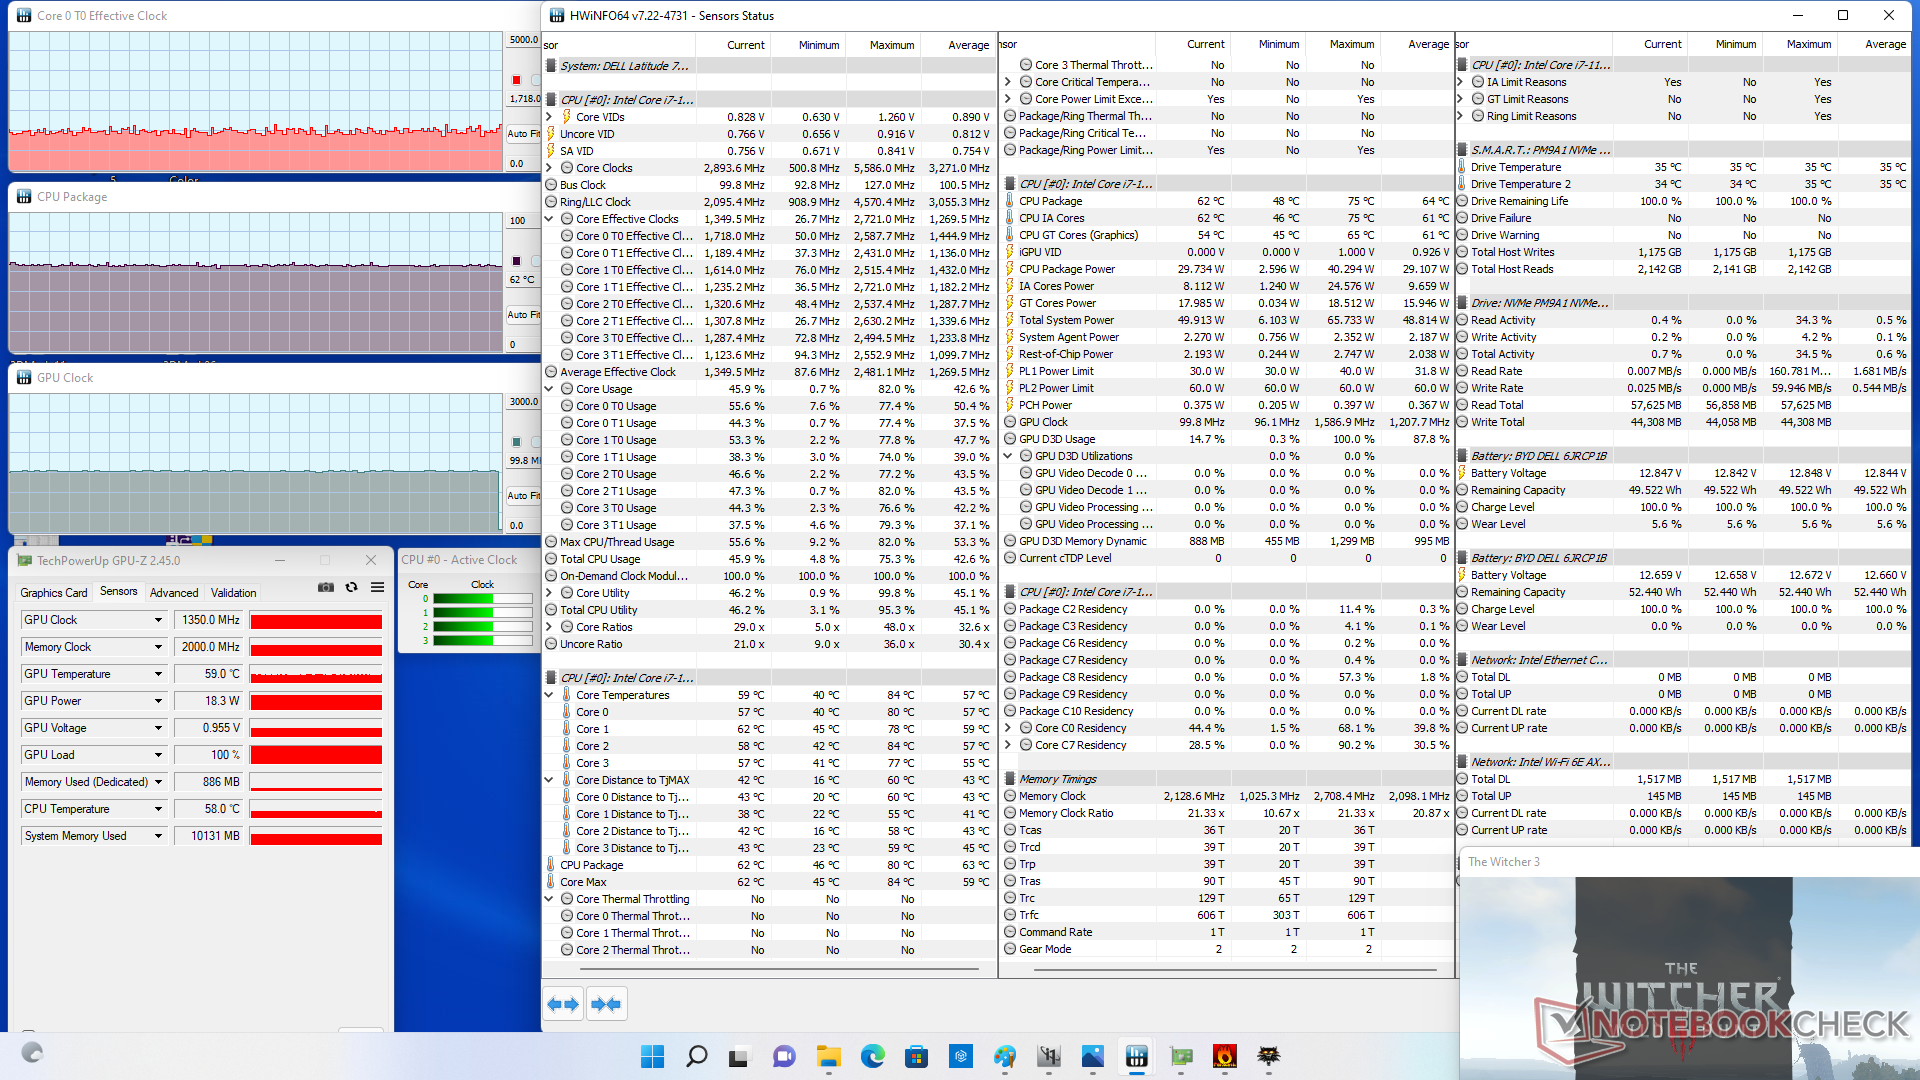
| Witcher 3 Stress | ~1.7 | 1350 | 62 |
Speakers
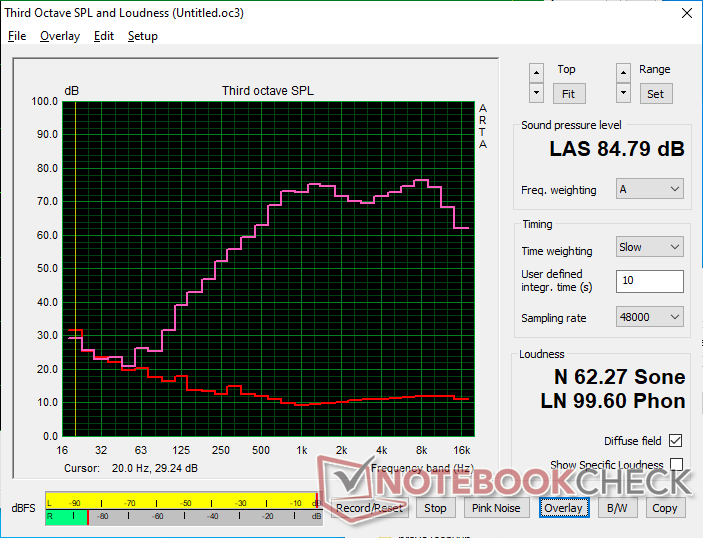
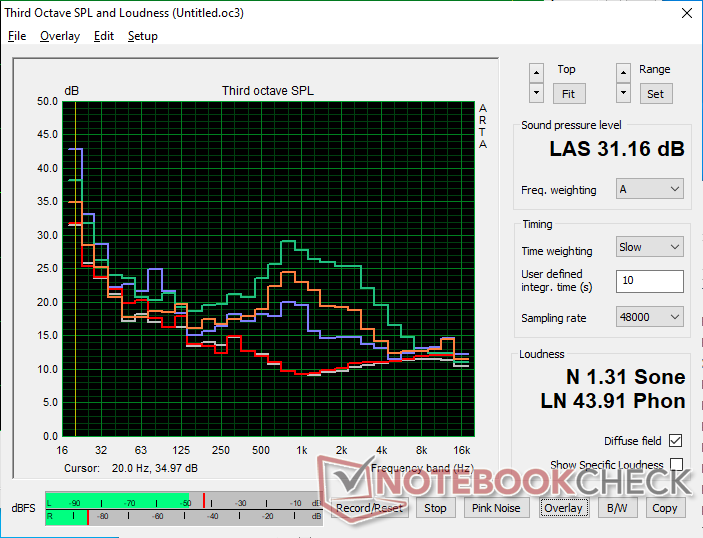
Dell Latitude 7330 Rugged Extreme audio analysis
(+) | speakers can play relatively loud (84.8 dB)
Bass 100 - 315 Hz
(-) | nearly no bass - on average 24.8% lower than median
(±) | linearity of bass is average (8.8% delta to prev. frequency)
Mids 400 - 2000 Hz
(+) | balanced mids - only 4.6% away from median
(+) | mids are linear (5.1% delta to prev. frequency)
Highs 2 - 16 kHz
(+) | balanced highs - only 3.2% away from median
(+) | highs are linear (2.7% delta to prev. frequency)
Overall 100 - 16.000 Hz
(±) | linearity of overall sound is average (16.5% difference to median)
Compared to same class
» 28% of all tested devices in this class were better, 6% similar, 66% worse
» The best had a delta of 4%, average was 23%, worst was 134%
Compared to all devices tested
» 28% of all tested devices were better, 6% similar, 66% worse
» The best had a delta of 4%, average was 23%, worst was 134%
Apple MacBook Pro 16 2021 M1 Pro audio analysis
(+) | speakers can play relatively loud (84.7 dB)
Bass 100 - 315 Hz
(+) | good bass - only 3.8% away from median
(+) | bass is linear (5.2% delta to prev. frequency)
Mids 400 - 2000 Hz
(+) | balanced mids - only 1.3% away from median
(+) | mids are linear (2.1% delta to prev. frequency)
Highs 2 - 16 kHz
(+) | balanced highs - only 1.9% away from median
(+) | highs are linear (2.7% delta to prev. frequency)
Overall 100 - 16.000 Hz
(+) | overall sound is linear (4.6% difference to median)
Compared to same class
» 0% of all tested devices in this class were better, 0% similar, 100% worse
» The best had a delta of 5%, average was 17%, worst was 45%
Compared to all devices tested
» 0% of all tested devices were better, 0% similar, 100% worse
» The best had a delta of 4%, average was 23%, worst was 134%
Energy Management
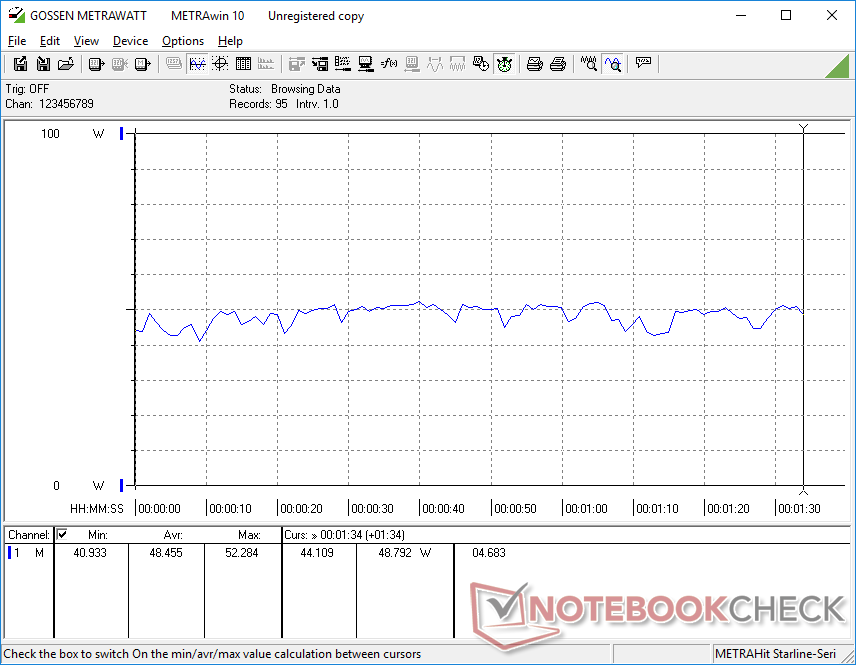
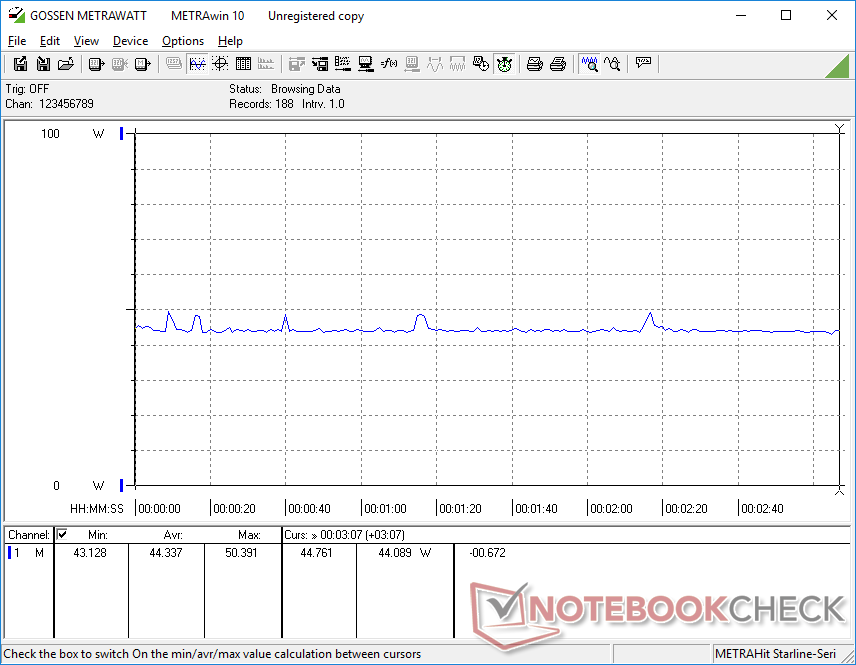
Power Consumption
Idling on desktop demands about 4 W if on the lowest brightness setting or up to 12 W if the brightness is set to maximum. Running higher loads equivalent to games will demand around 45 W to be just slightly higher than most other laptops running on the same 11th gen Intel U-series CPU. Note that power consumption is significantly lower than on the older Dell Latitude 7424 Rugged Extreme powered by the Radeon RX 540 GPU even though our Latitude 7330 Rugged Extreme is able to provide up to 40 percent faster graphics.
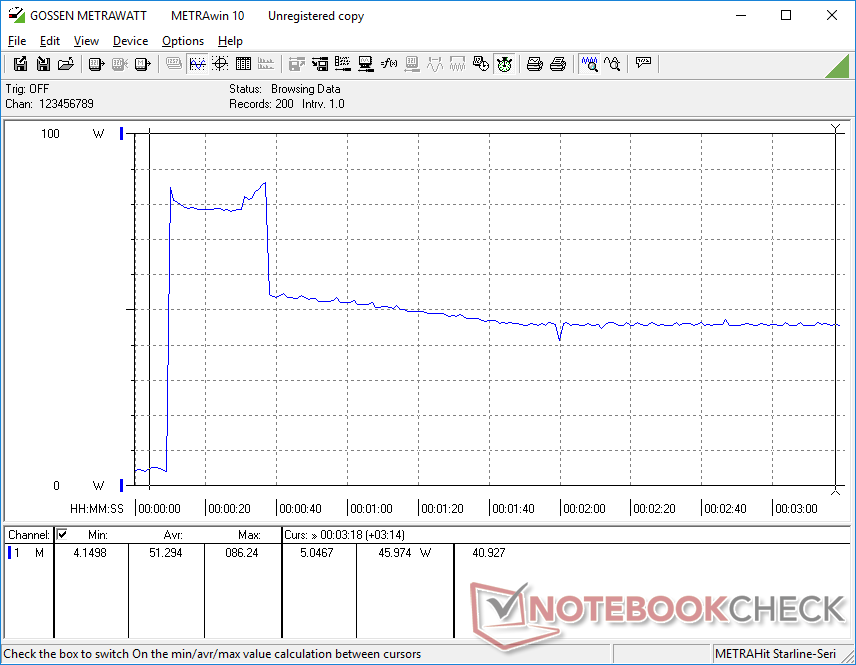
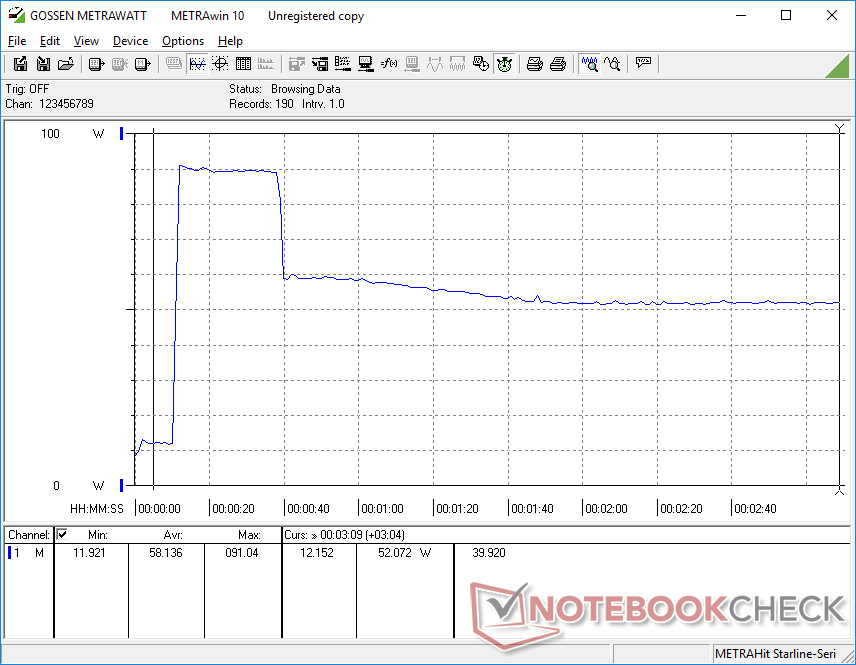
We're able to record a maximum draw of 91 W from the small-medium (~13 x 6.5 x 2.3 cm) 90 W USB-C AC adapter when running Prime95+FurMark simultaneously. This rate is only temporary as shown by our screenshots below likely due to thermal limitations.
| Off / Standby | |
| Idle | |
| Load |
|
Key:
min: | |
| Dell Latitude 7330 Rugged Extreme i7-1185G7, Iris Xe G7 96EUs, , IPS, 1920x1080, 13.3" | Dell Latitude 7424 Rugged Extreme i7-8650U, Radeon RX 540, SK Hynix PC401 512GB M.2 (HFS512GD9TNG), IPS, 1920x1080, 14" | Dell Latitude 5420 Rugged-P85G i7-8650U, Radeon RX 540, SK hynix PC401 NVMe 500 GB, IPS, 1920x1080, 14" | Acer Enduro Urban N3 EUN314 i7-1165G7, Iris Xe G7 96EUs, Samsung PM991 MZVLQ1T0HALB, IPS, 1920x1080, 14" | Panasonic Toughbook FZ-55 MK2 i7-1185G7, Iris Xe G7 96EUs, Toshiba KIOXIA KBG4AZNV512G M.2 2280 OPAL, IPS, 1920x1080, 14" | Durabook S14I i7-1165G7, Iris Xe G7 96EUs, UDinfo M2P M2P80DE512GBAEP, TN, 1920x1080, 14" | |
|---|---|---|---|---|---|---|
| Power Consumption | -38% | -25% | 27% | 6% | -22% | |
| Idle Minimum * (Watt) | 4.1 | 6.5 -59% | 4.8 -17% | 3.8 7% | 3.5 15% | 6.8 -66% |
| Idle Average * (Watt) | 11.7 | 15.1 -29% | 13.6 -16% | 8 32% | 10.4 11% | 16.4 -40% |
| Idle Maximum * (Watt) | 11.8 | 16.1 -36% | 13.8 -17% | 8.7 26% | 10.5 11% | 16.9 -43% |
| Load Average * (Watt) | 48.5 | 70.5 -45% | 67.8 -40% | 34.6 29% | 45.4 6% | 39.2 19% |
| Witcher 3 ultra * (Watt) | 44.3 | 68.1 -54% | 69.1 -56% | 35.4 20% | 43 3% | |
| Load Maximum * (Watt) | 91 | 95.2 -5% | 93.5 -3% | 45.4 50% | 99.3 -9% | 73.1 20% |
* ... smaller is better
Power Consumption Witcher 3 / Stresstest
Power Consumption external Monitor
Battery Life
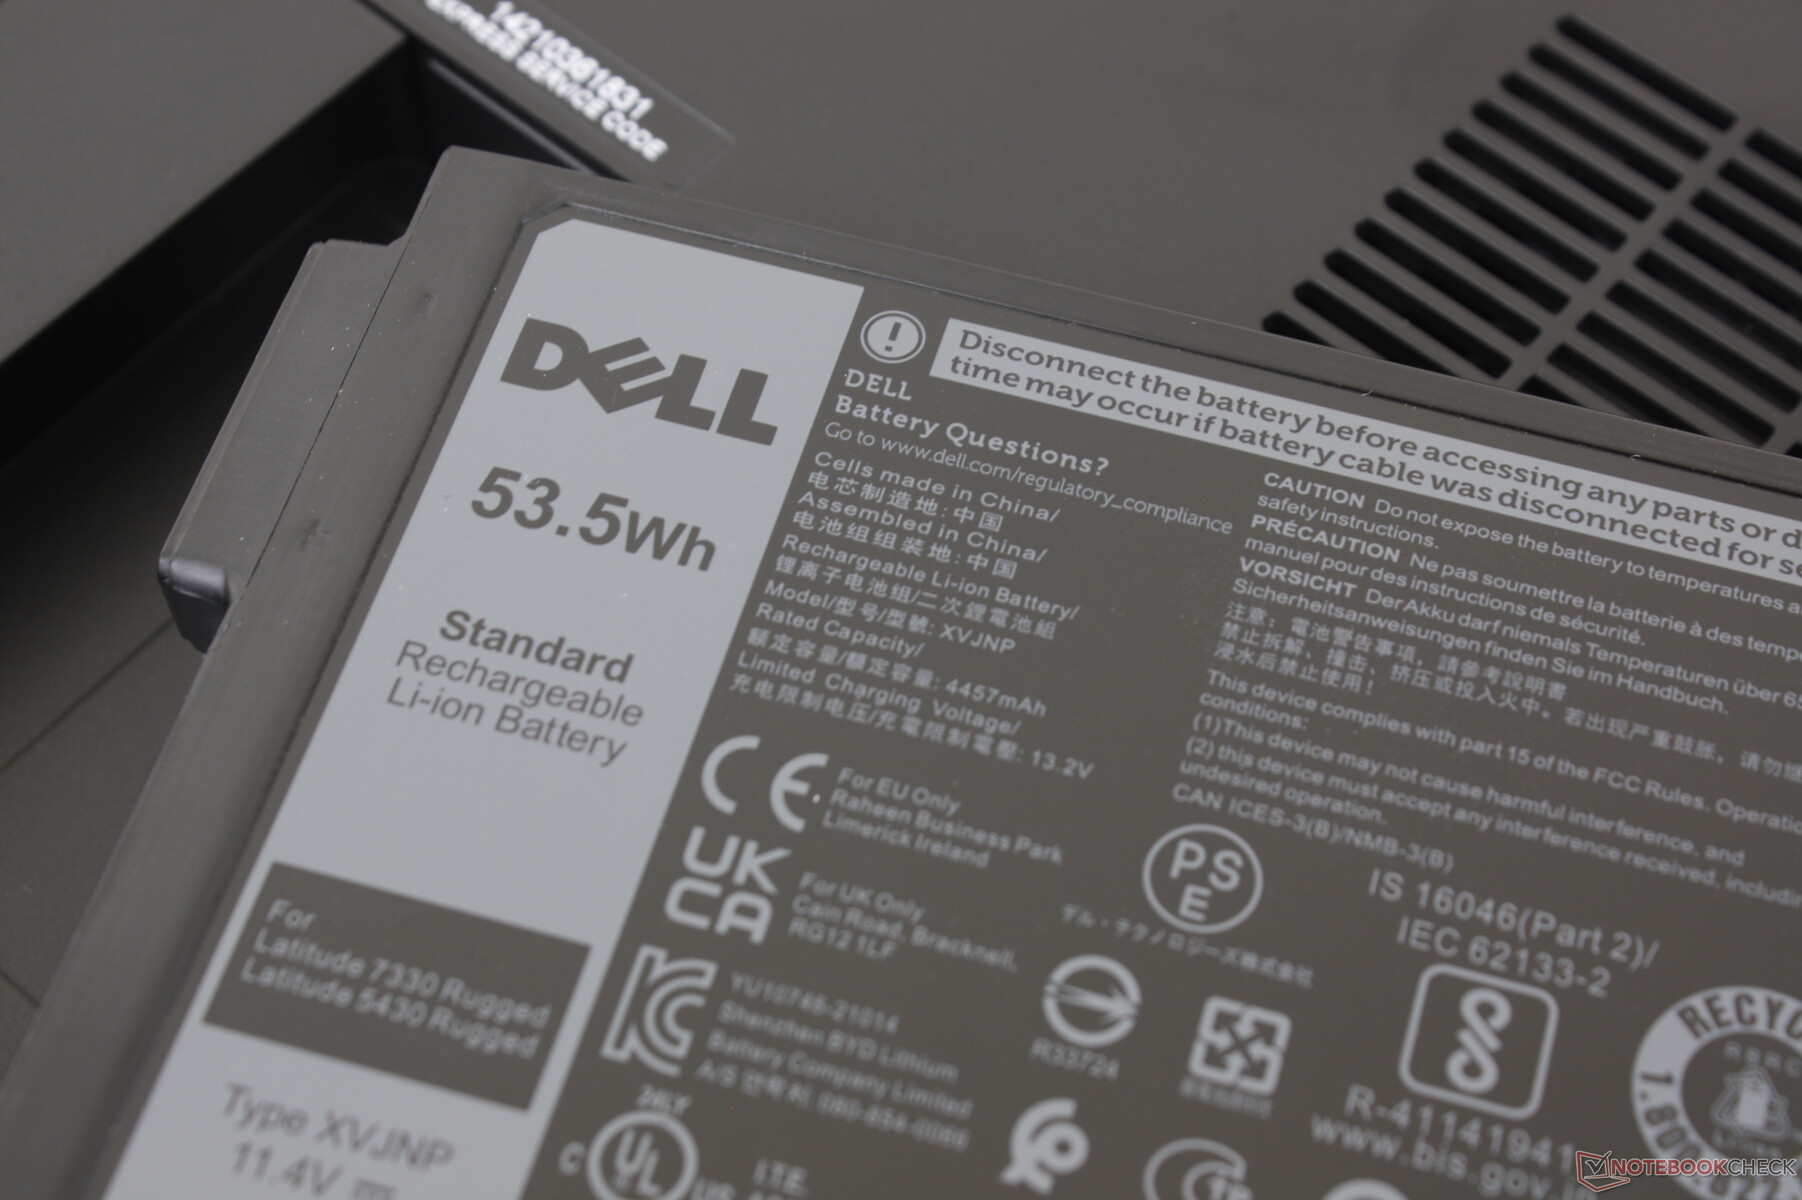
Expect real-world WLAN runtimes of almost 18 hours at 150-nit display brightness when both 53.5 Wh batteries are installed. Users can run on just one battery pack to reduce weight if desired. Charging from empty to full capacity is relatively slow at over 3 hours, however, compared to half that on most consumer-based Ultrabooks.
| Dell Latitude 7330 Rugged Extreme i7-1185G7, Iris Xe G7 96EUs, 107 Wh | Dell Latitude 7424 Rugged Extreme i7-8650U, Radeon RX 540, 102 Wh | Dell Latitude 5420 Rugged-P85G i7-8650U, Radeon RX 540, 102 Wh | Acer Enduro Urban N3 EUN314 i7-1165G7, Iris Xe G7 96EUs, 50.3 Wh | Panasonic Toughbook FZ-55 MK2 i7-1185G7, Iris Xe G7 96EUs, 71 Wh | Durabook S14I i7-1165G7, Iris Xe G7 96EUs, 50 Wh | |
|---|---|---|---|---|---|---|
| Battery runtime | -35% | -10% | -64% | -24% | -69% | |
| WiFi v1.3 (h) | 18 | 11.7 -35% | 16.2 -10% | 6.4 -64% | 13.6 -24% | 5.5 -69% |
| Load (h) | 2.7 | 3.2 | ||||
| Reader / Idle (h) | 31.4 |
Pros
Cons
Verdict
The Latitude 7330 Rugged Extreme serves as a standard for what other rugged laptops should be like. CPU performance is high and unthrottled, runtimes are very long, the USB-C AC adapter is universal, the SD card reader is extremely fast, and fan noise is almost always quiet. The integrated GPU in particular has made older discrete GPUs like the Radeon RX 540 obsolete.
A noteworthy characteristic of the model is its high quality IPS touchscreen. It's uncommon to find a rugged laptop with full sRGB coverage, almost no graininess issues, relatively deep contrast, lack of PWM, and well-calibrated colors right out of the box. Even if color accuracy isn't a priority, users will likely still appreciate how good the display looks considering the competition.
Drawbacks are mostly minor. The MicroSD slot is difficult to access, ghosting is prevalent, and the keyboard backlight is only white with no other color options. The model is also heavier than many 14-inch rugged laptops and so users shouldn't expect the Latitude 7330 Rugged Extreme to be lighter just because it's a smaller form factor. We would love to see more hot-swappable accessories a la the Getac B360 for more versatility.
Price and Availability
Dell is currently shipping its Latitude 7330 Rugged Extreme model in all configurations with a starting price of $4350 USD.
Price comparison
