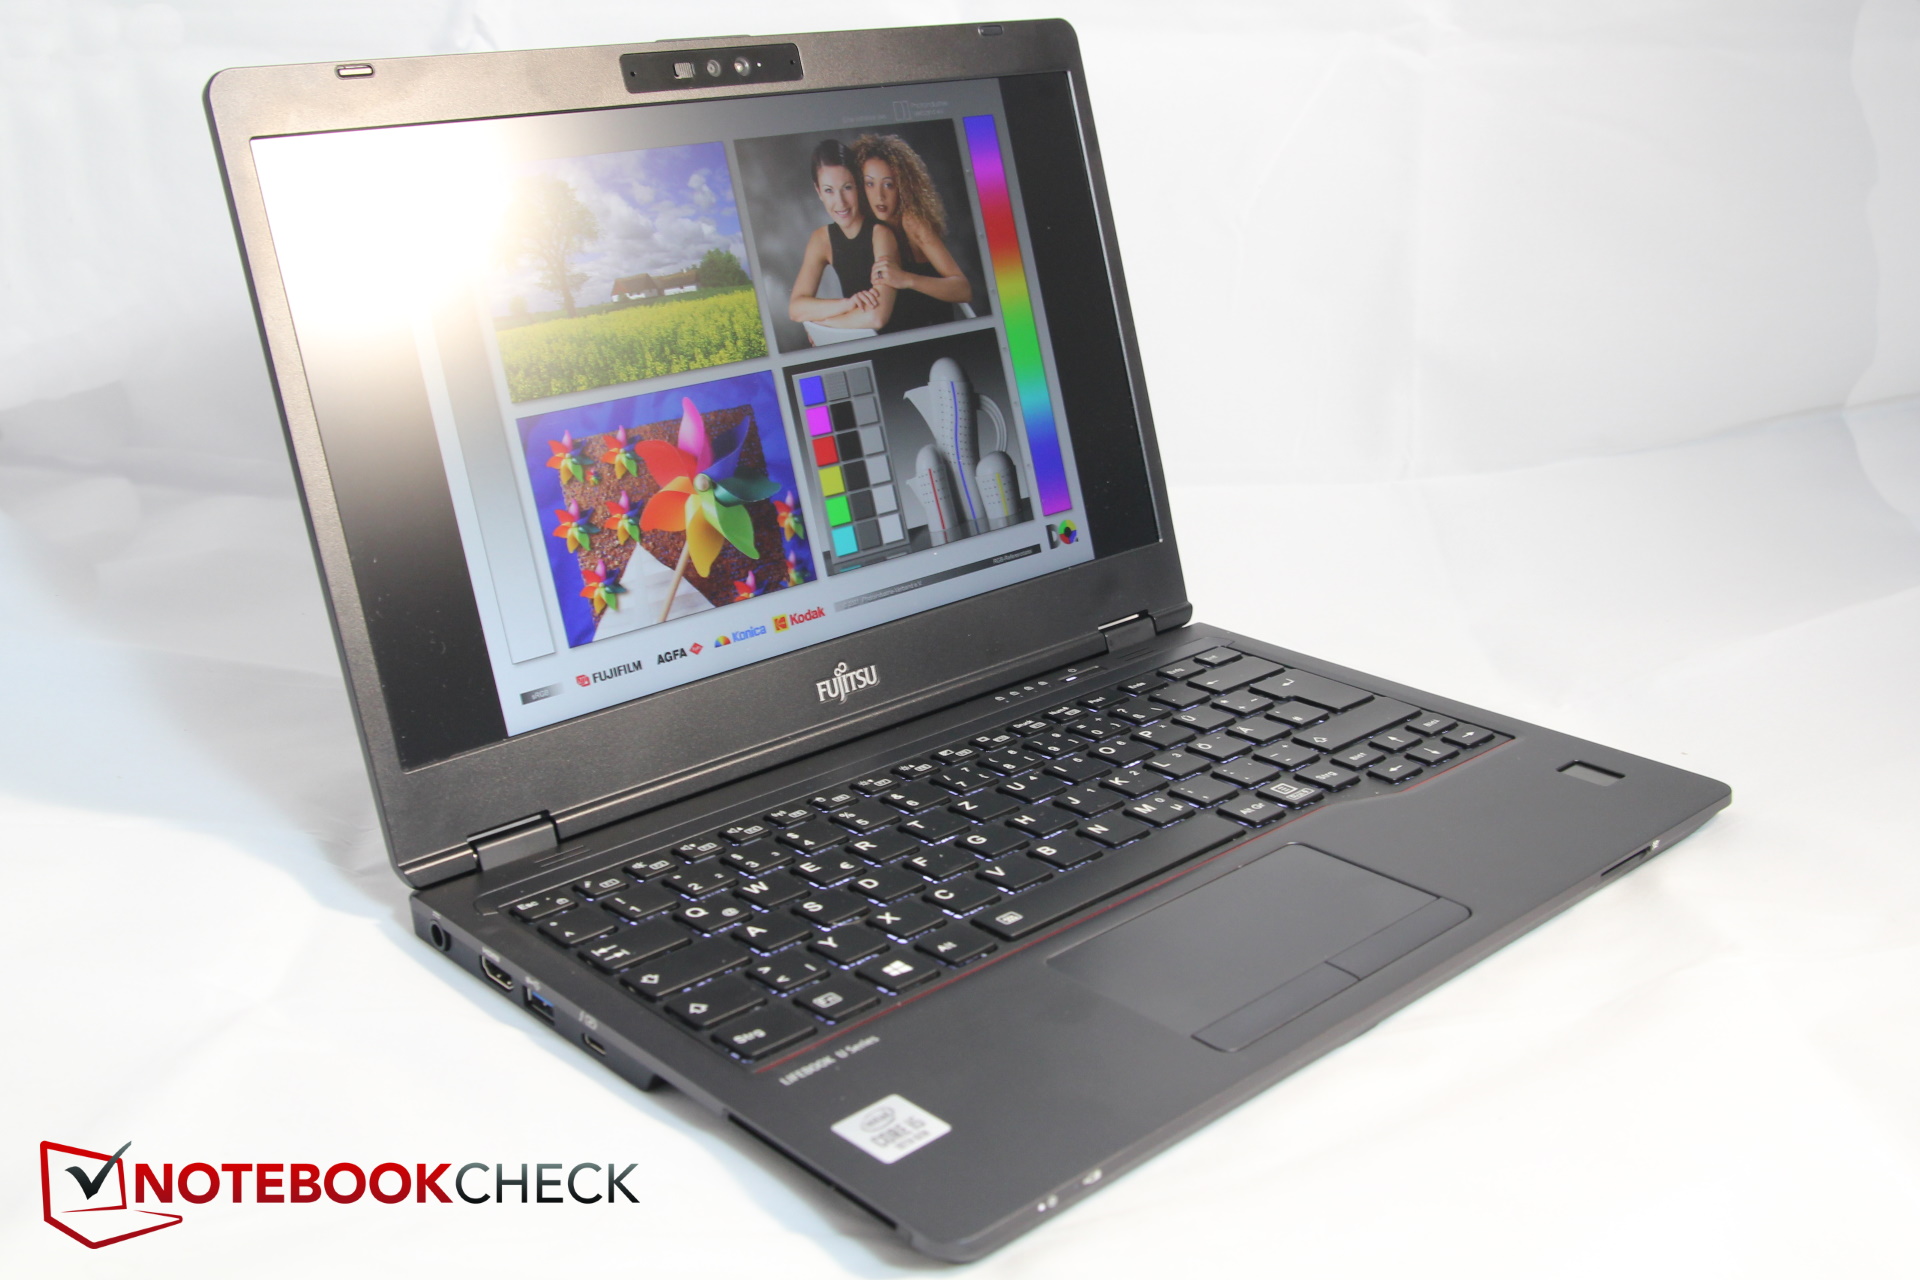
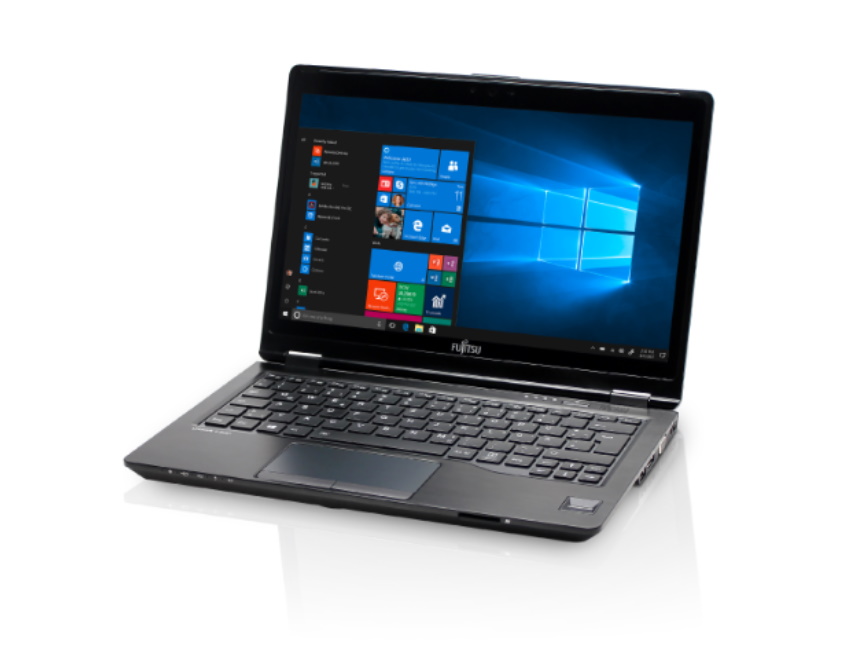
Fujitsu LifeBook U7310 Laptop Review: Good 13-inch business laptop without performance ambitions, but with unique selling point
The LifeBook series addresses itself to mobile business customers, and also the 13.3-inch large U7310 offers various safety functions and is particularly suitable for working, writing and mobile employment (keyword SIM slot with LTE support). We compare it to the 13-inch and business competition listed below.
Rating | Date | Model | Weight | Height | Size | Resolution | Price |
|---|---|---|---|---|---|---|---|
| 86.7 % v7 (old) | 11 / 2020 | Fujitsu LifeBook U7310 i5-10210U, UHD Graphics 620 | 1.2 kg | 19 mm | 13.30" | 1920x1080 | |
| 88 % v7 (old) | 08 / 2020 | Lenovo ThinkPad X13-20T20033GE i5-10210U, UHD Graphics 620 | 1.3 kg | 16.9 mm | 13.30" | 1920x1080 | |
| 89.5 % v7 (old) | 08 / 2020 | Lenovo ThinkPad X13-20UGS00800 R7 PRO 4750U, Vega 7 | 1.3 kg | 16.9 mm | 13.30" | 1920x1080 | |
| 86 % v7 (old) | 06 / 2020 | HP EliteBook 735 G6 7KN29EA R5 PRO 3500U, Vega 8 | 1.5 kg | 17.7 mm | 13.30" | 1920x1080 | |
| 83.7 % v7 (old) | 07 / 2020 | Fujitsu Lifebook U939 i5 i5-8265U, UHD Graphics 620 | 900 g | 15 mm | 13.30" | 1920x1080 | |
| 83.8 % v7 (old) | 07 / 2020 | Samsung Galaxy Book Ion 13.3 i5-10210U, UHD Graphics 620 | 970 g | 12.9 mm | 13.30" | 1920x1080 |
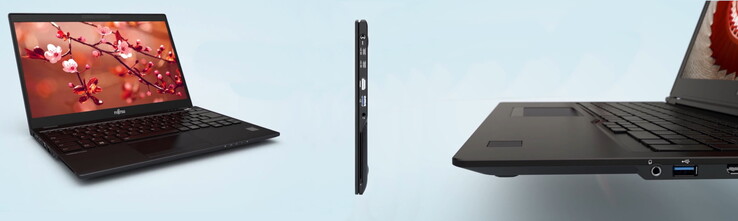
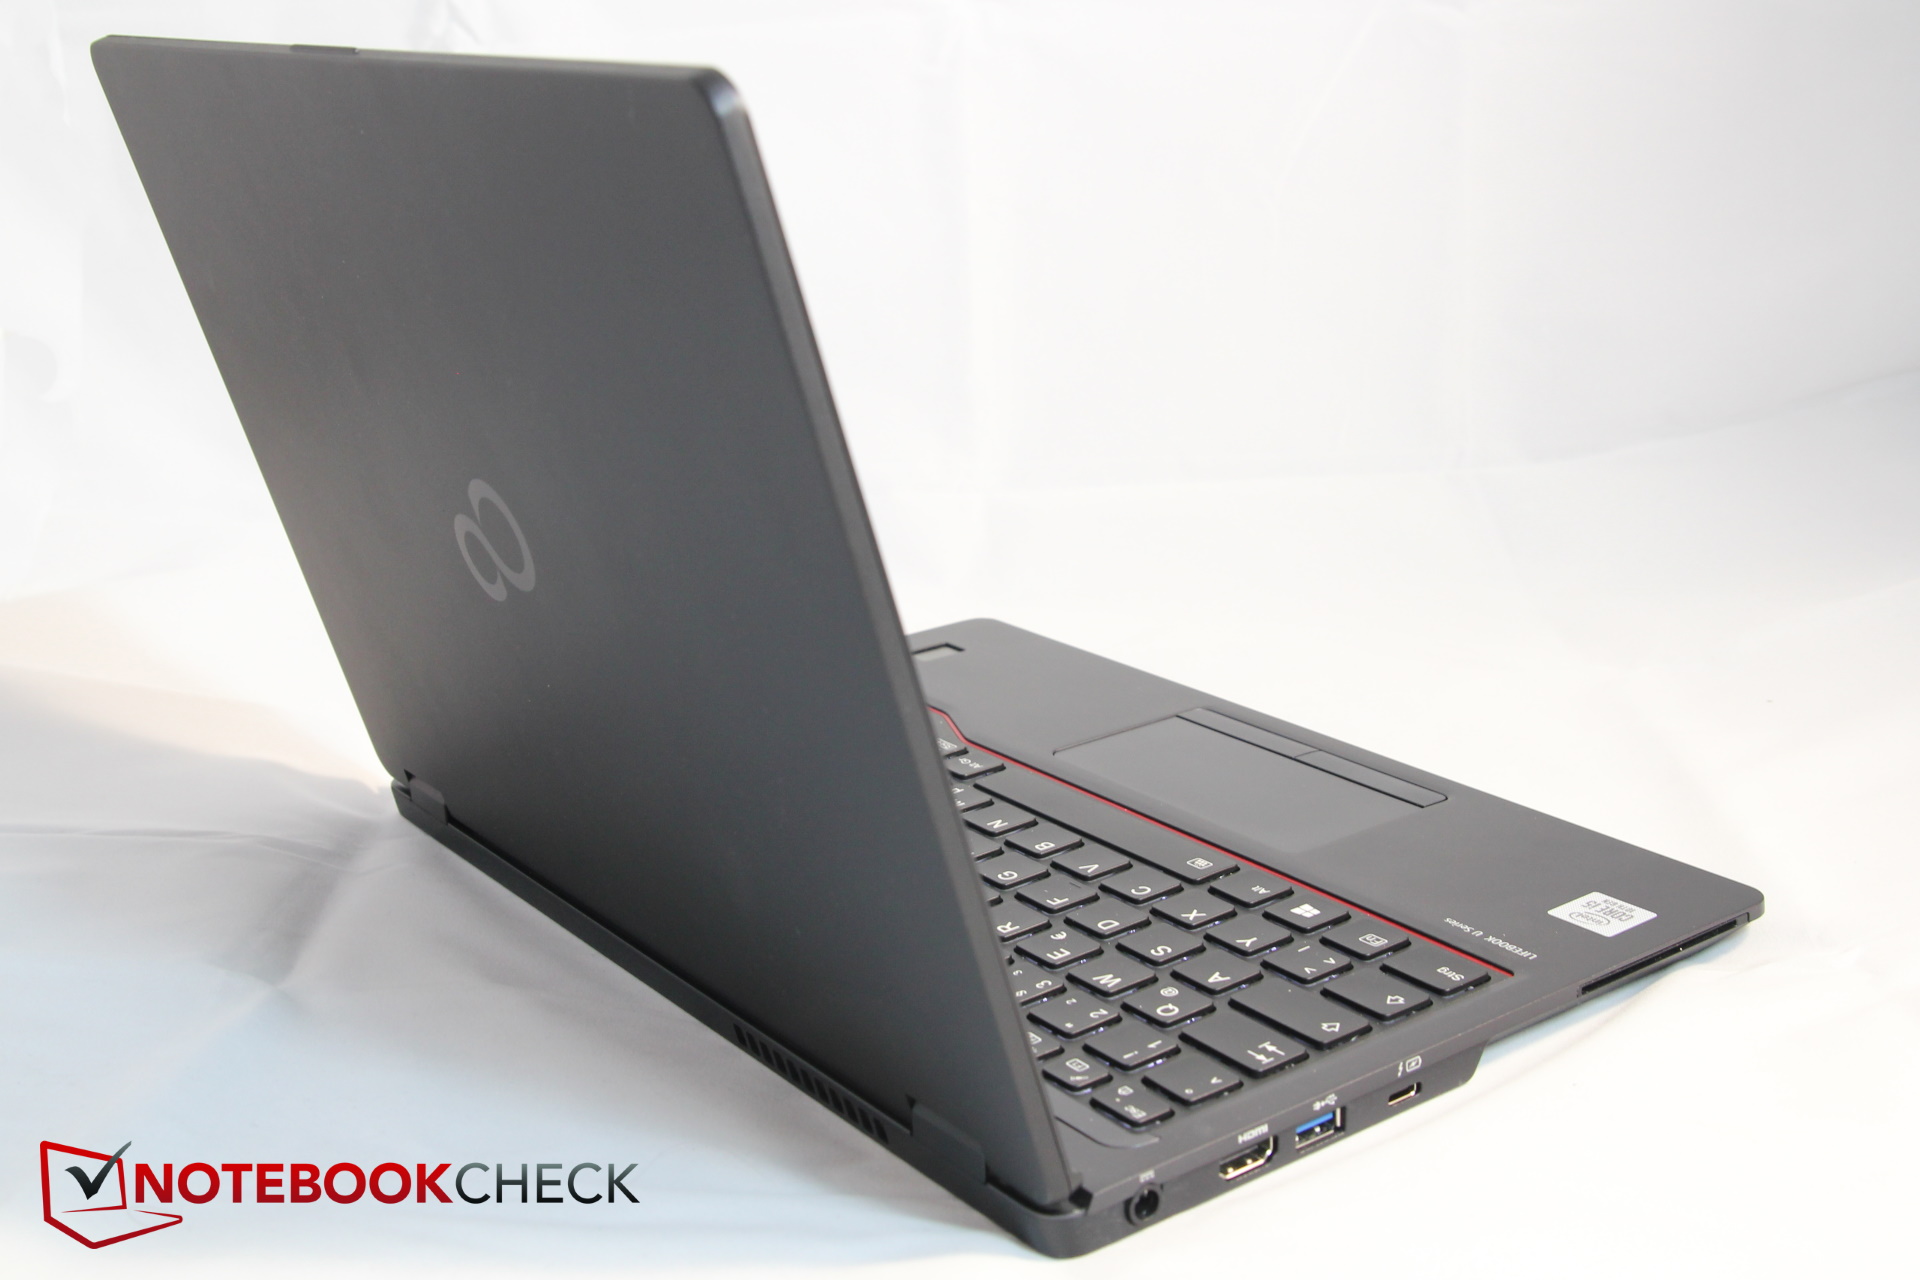
Case, Equipment - Exchangeable battery and maintenance cover
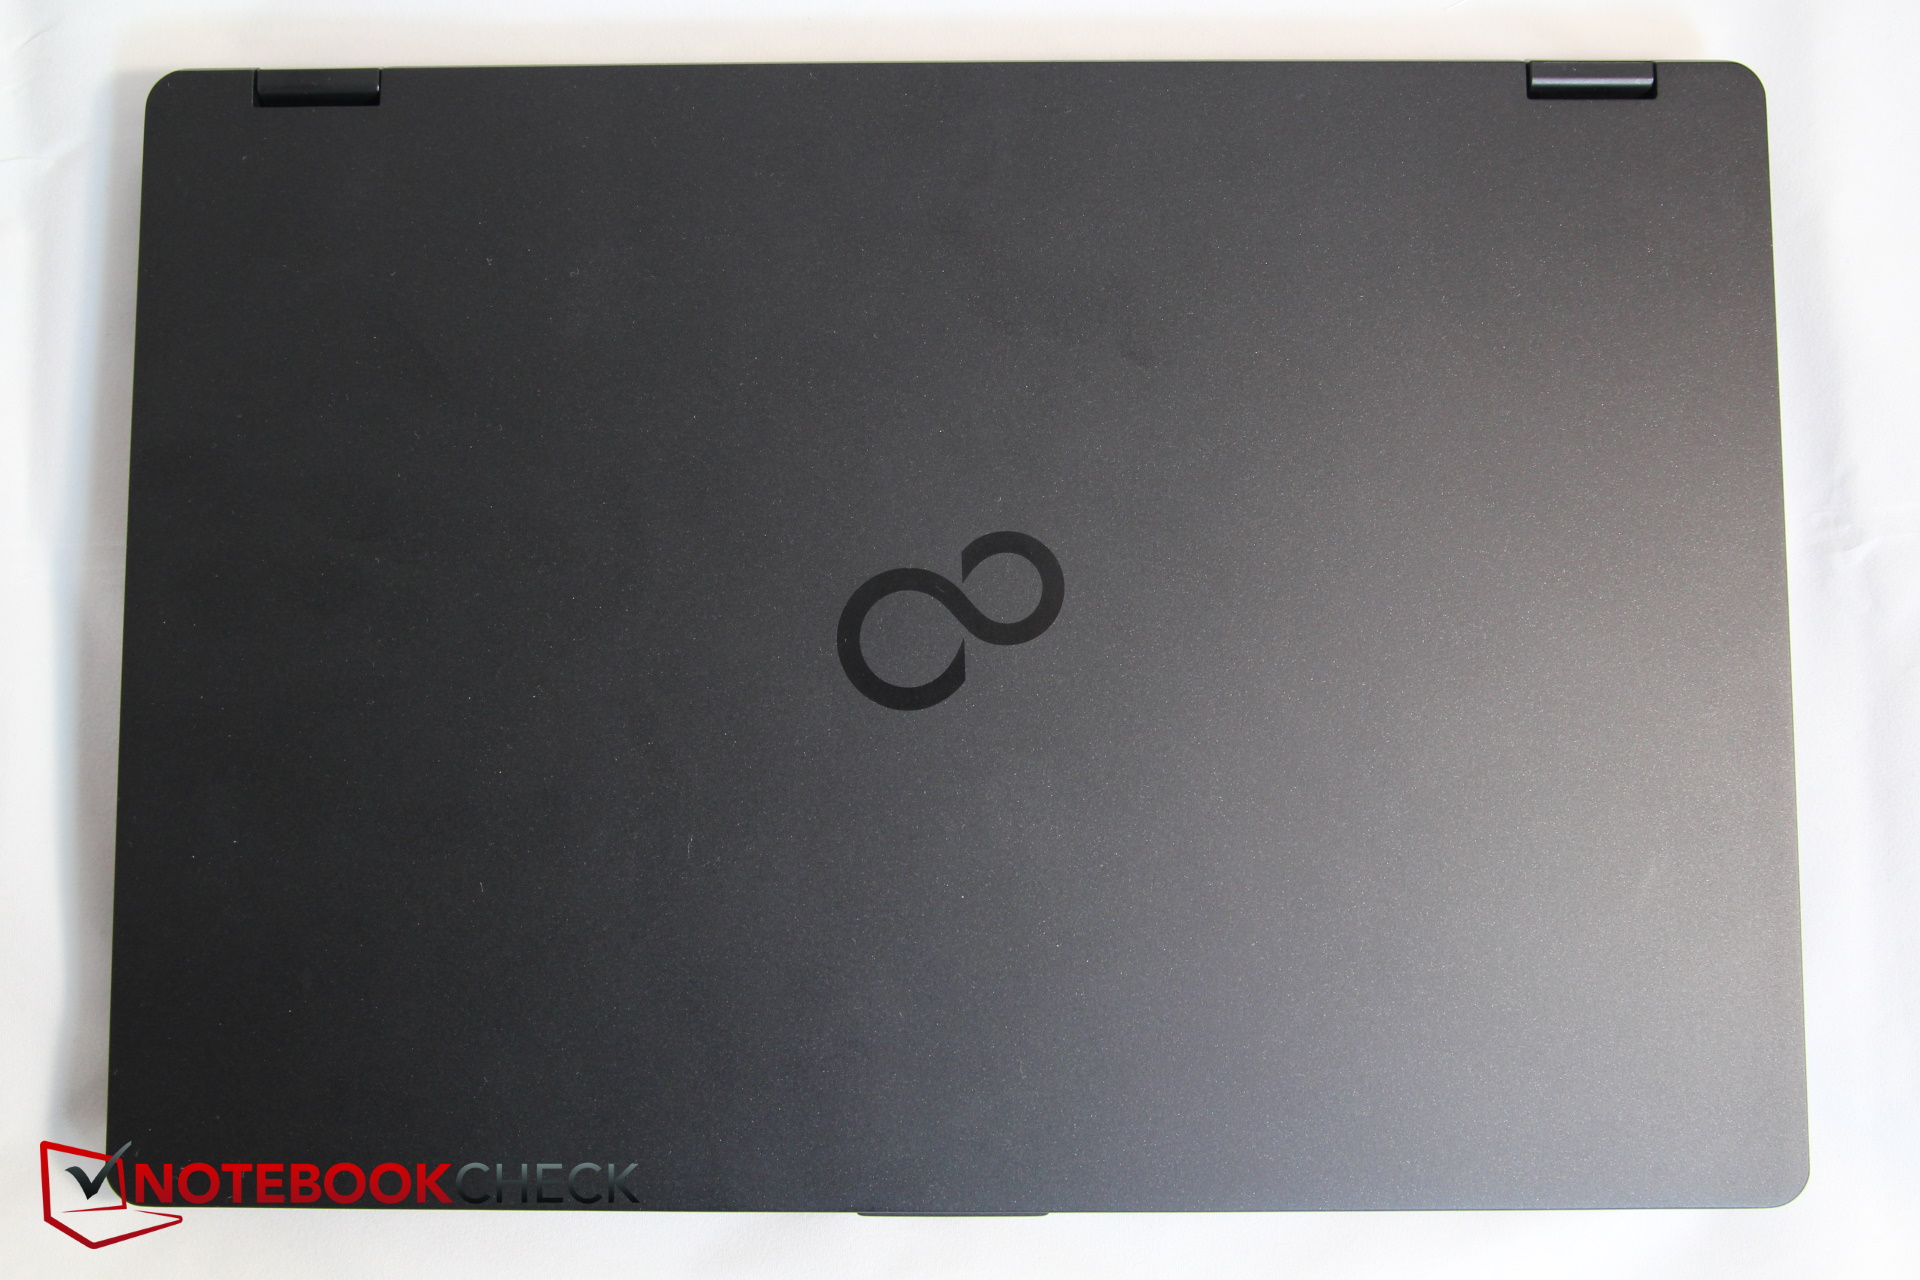
The housing is made of a mix of plastic, aluminum and magnesium. The former decorates the underside, the display edges and the keyboard insert, while the base unit with the palm rests is made of a mix of aluminum and magnesium.
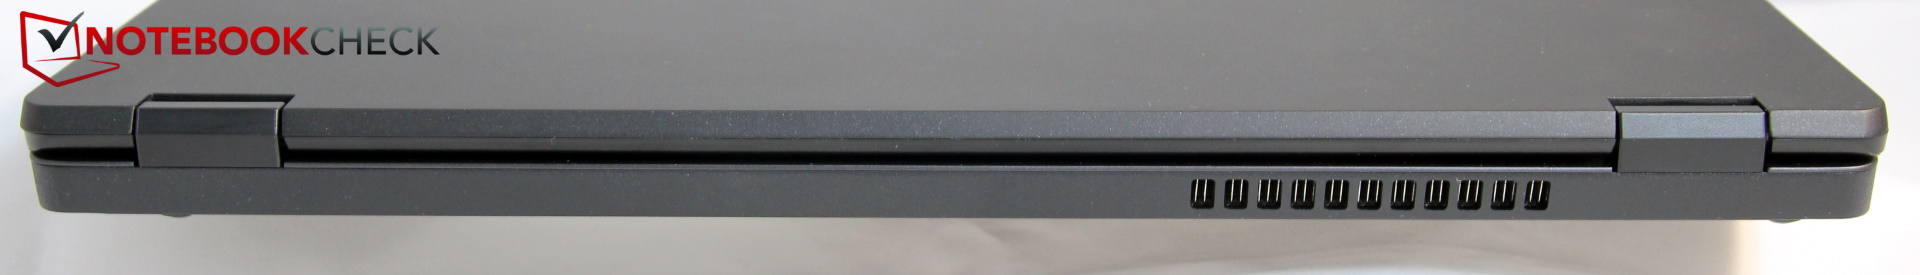
The base makes a stable impression and the hinges are also of sufficient strength. The display lid cracks when bent, and it can be opened by just over 180 degrees. The workmanship is good, but unfortunately the right mouse button rattles and the AC port for the power plug wobbles.
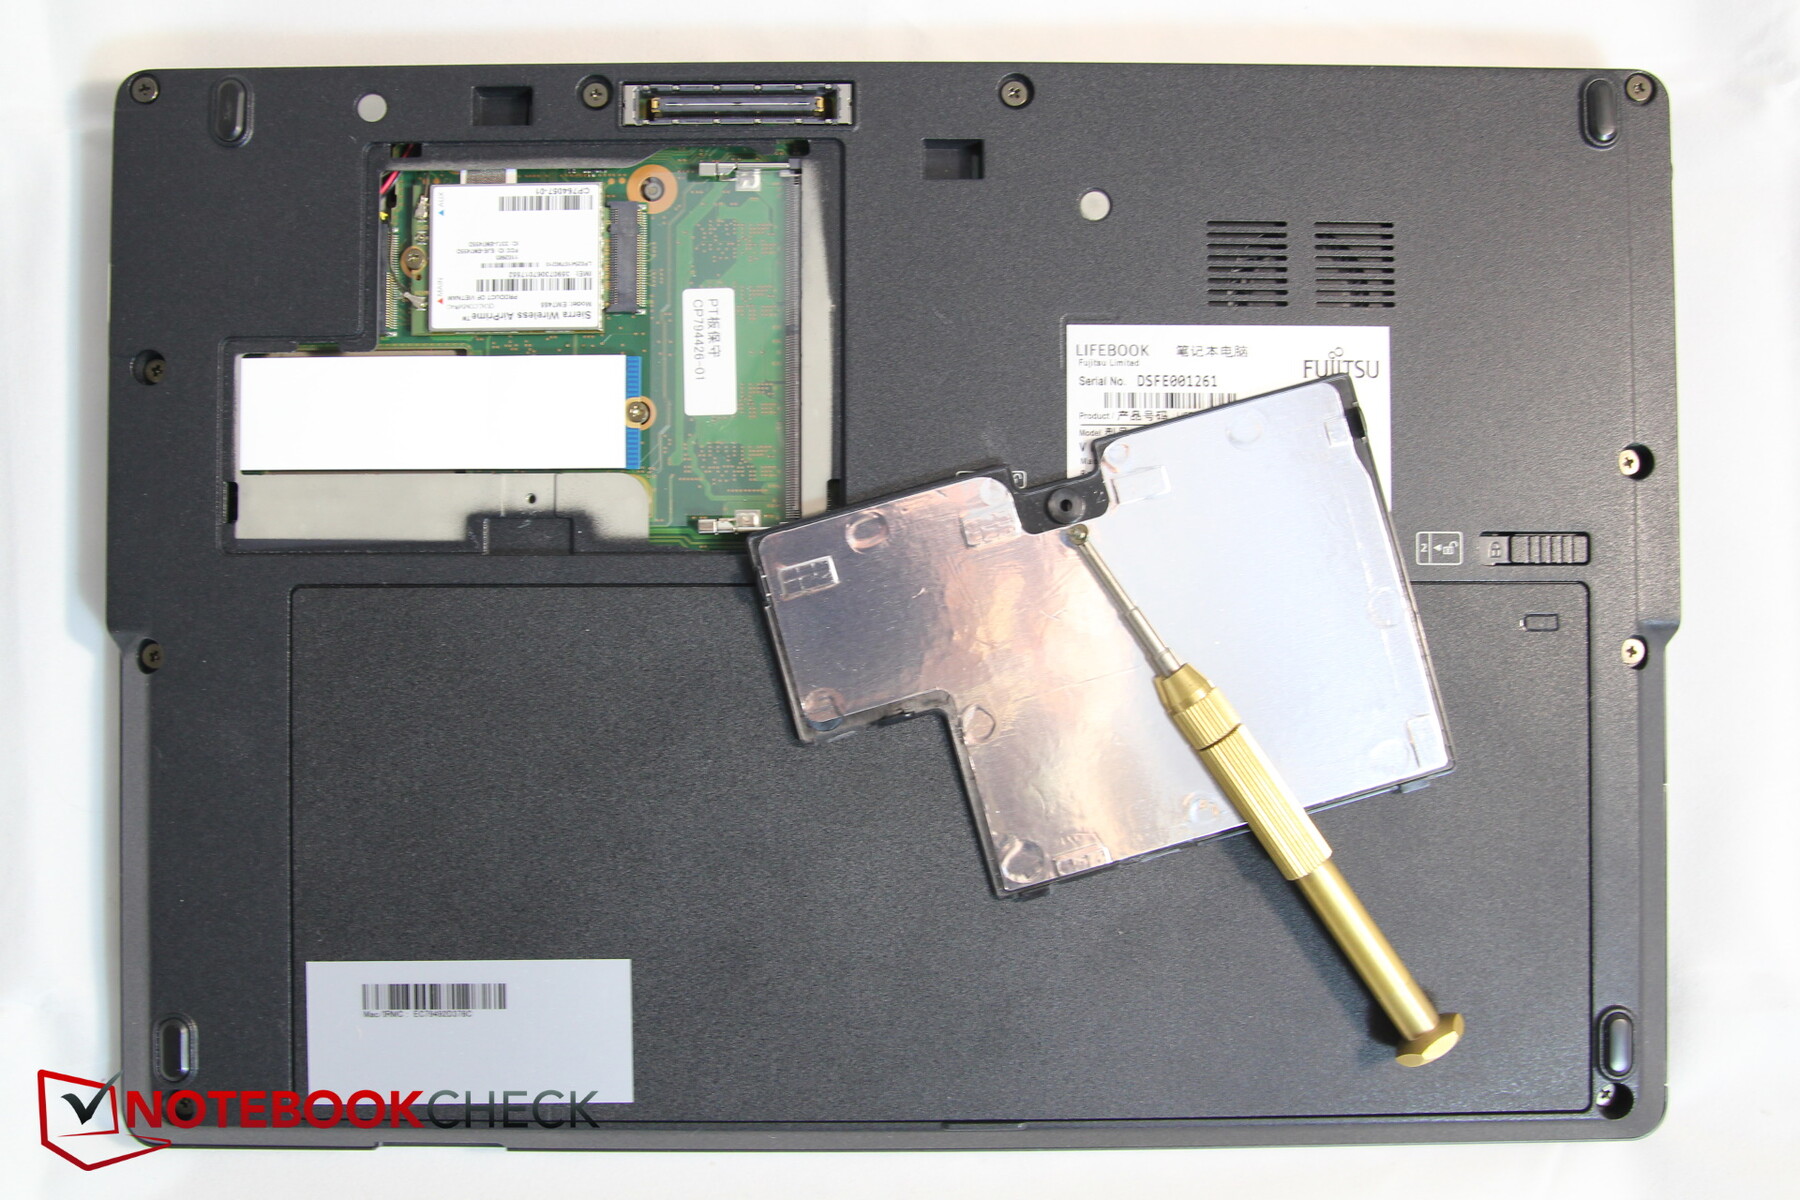
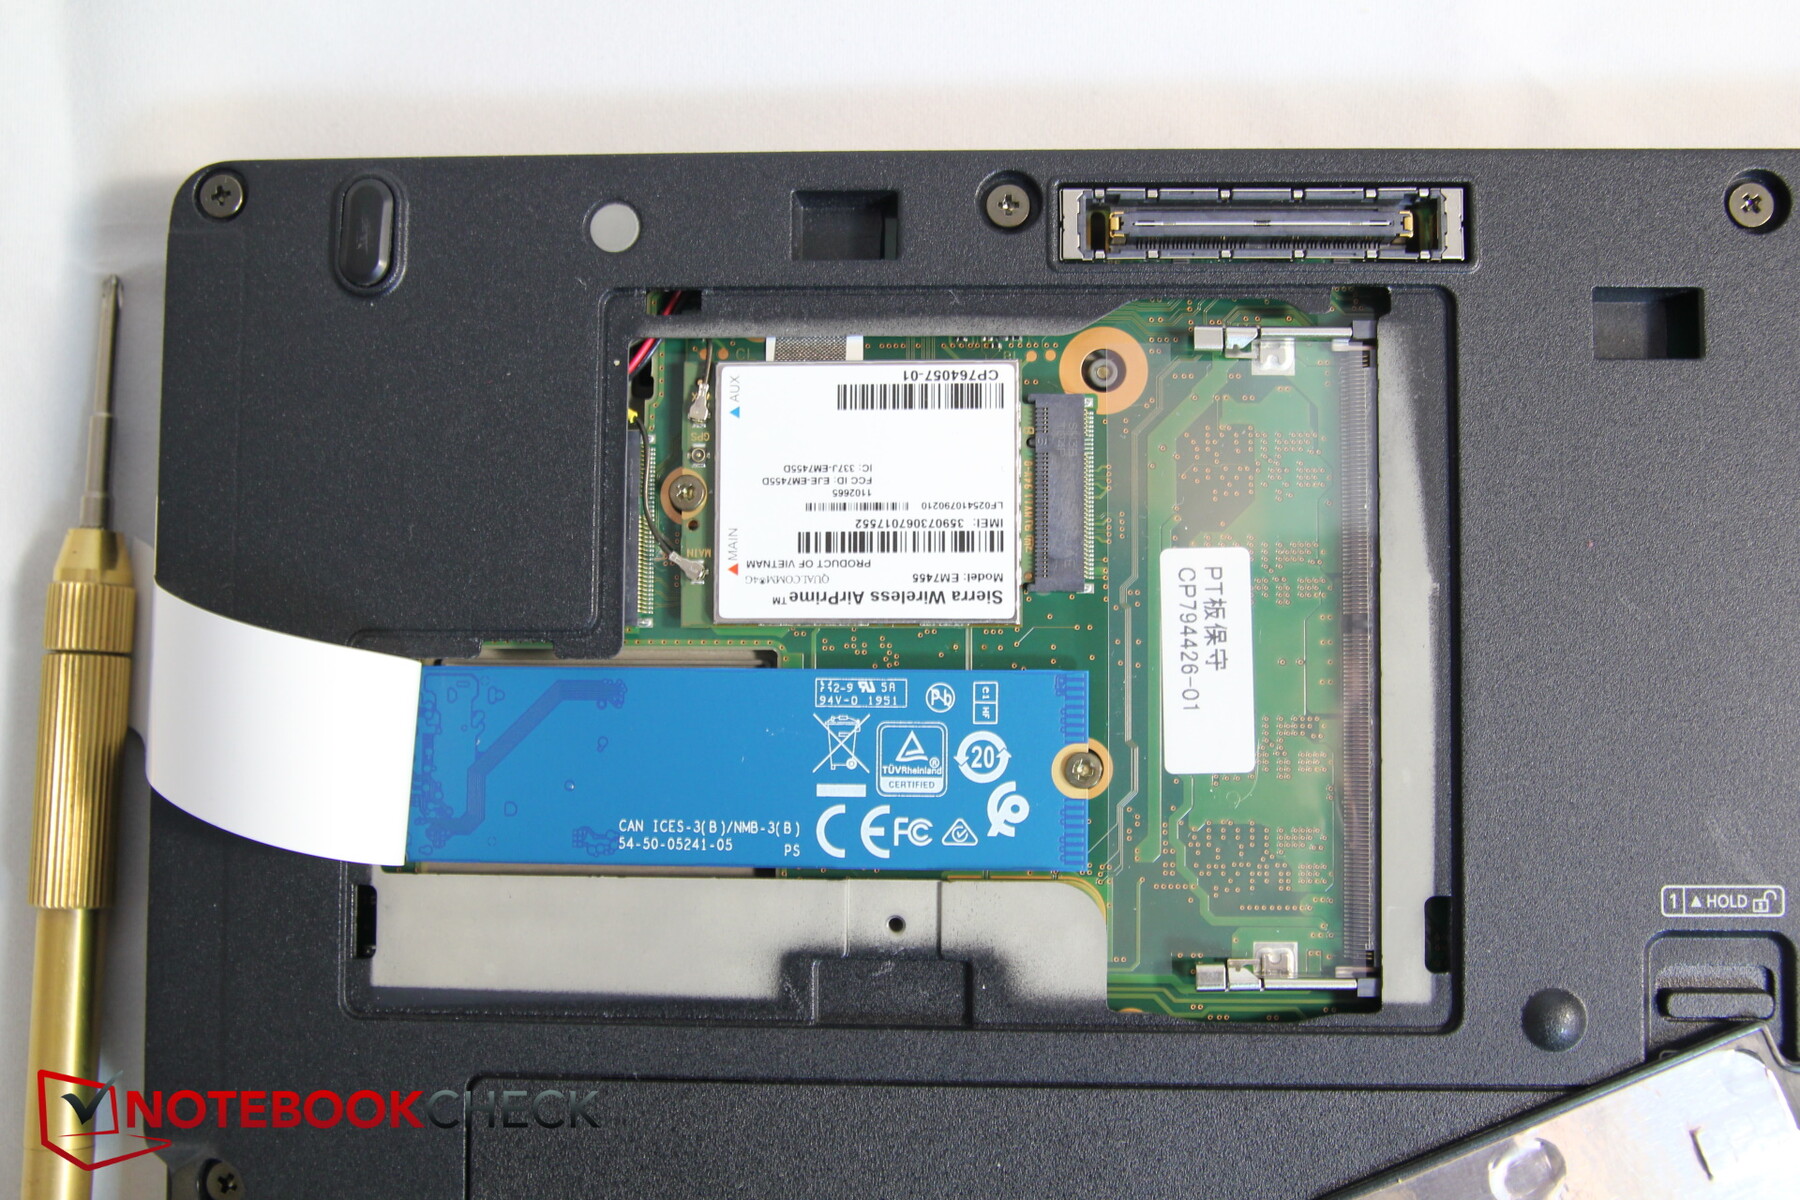
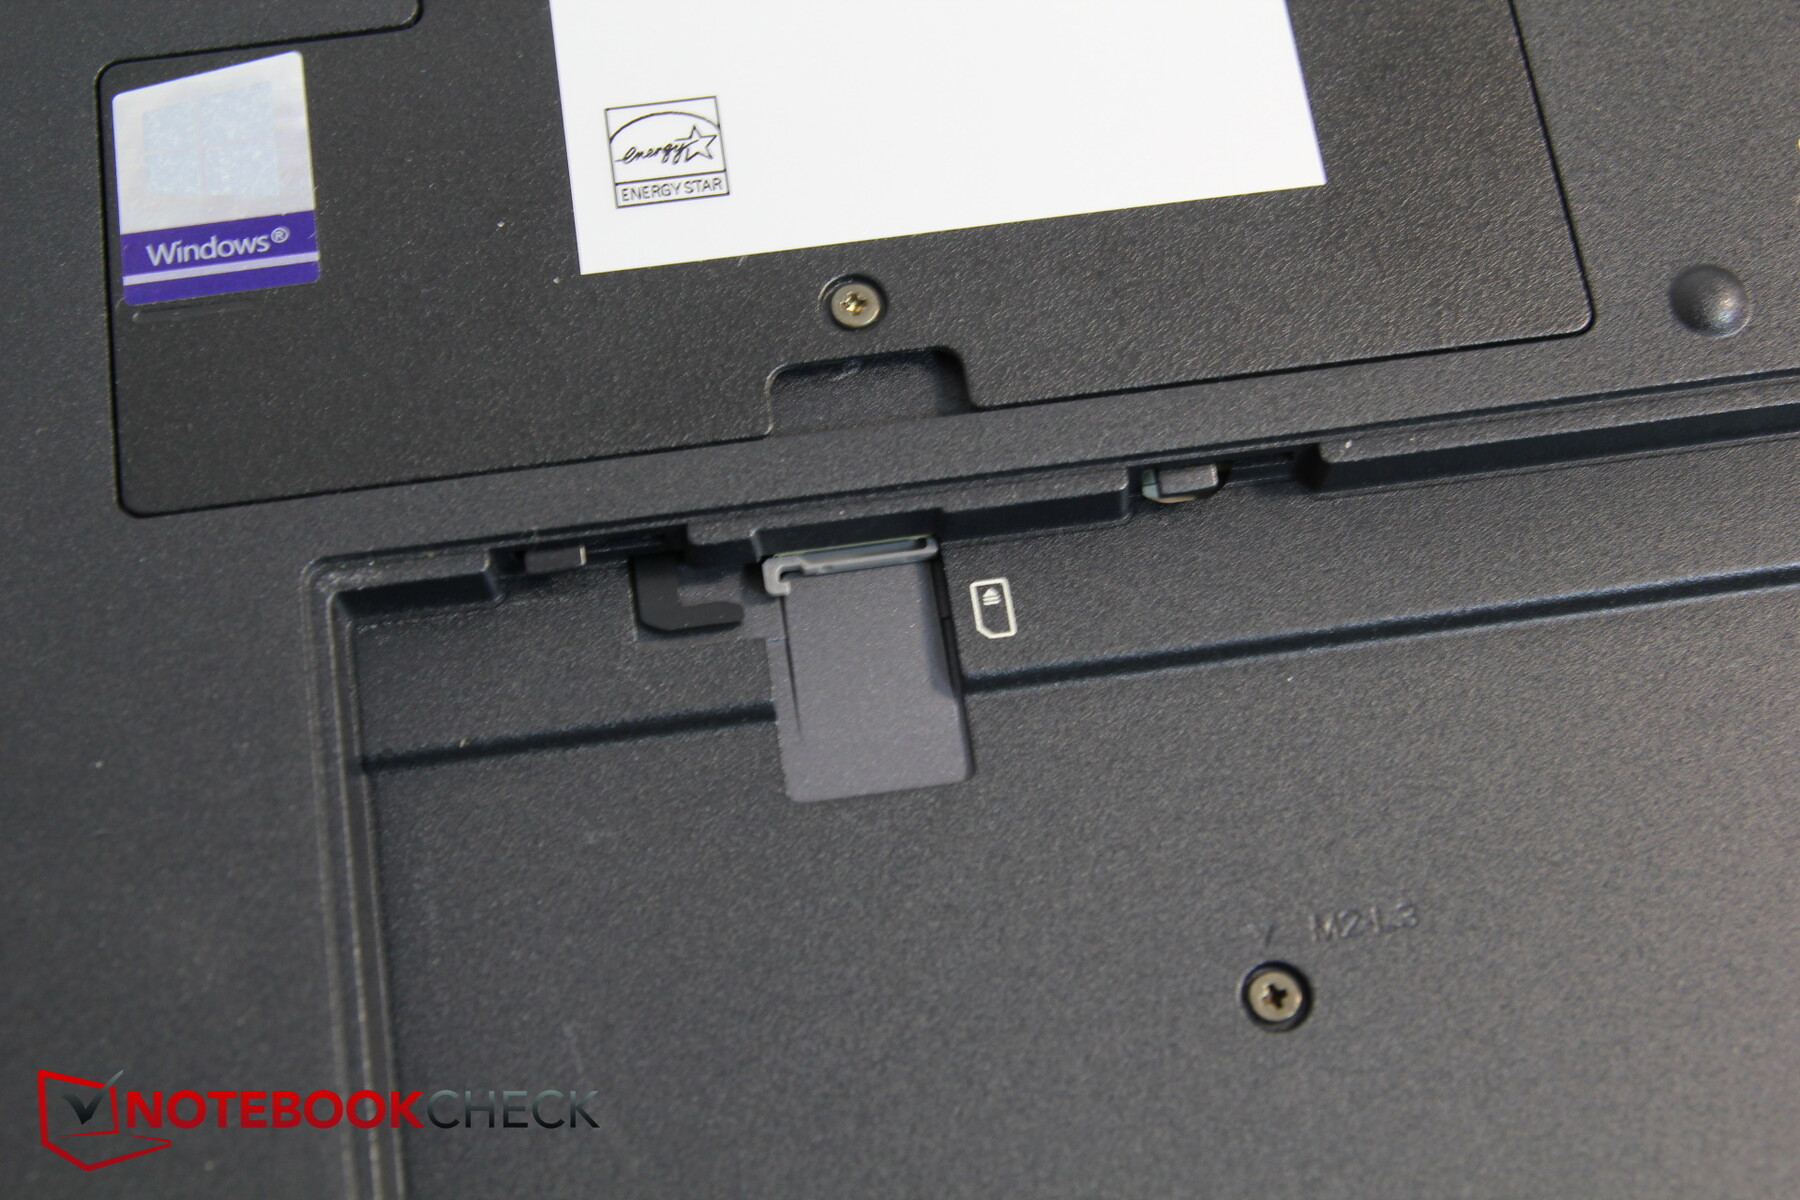
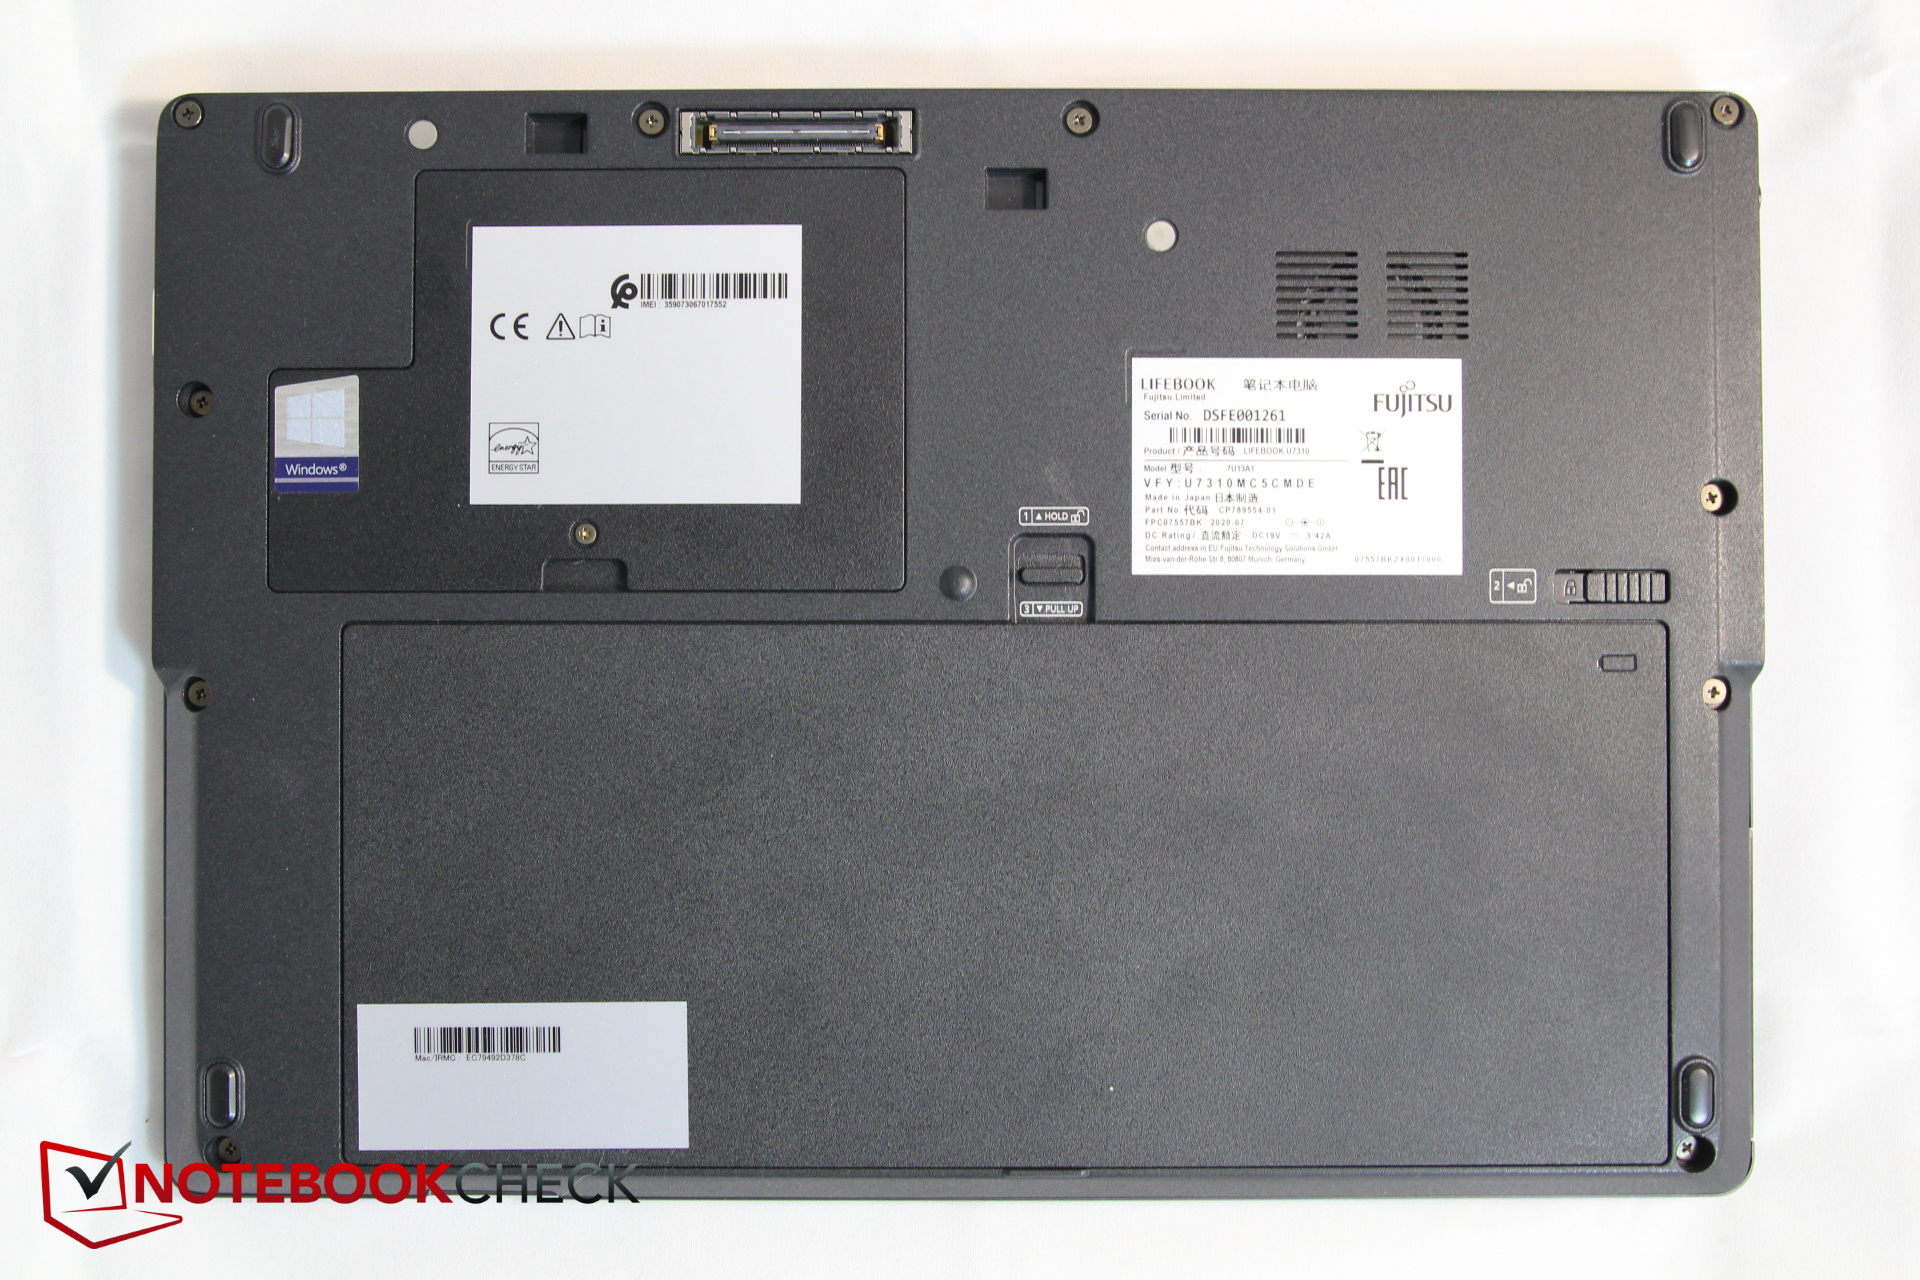
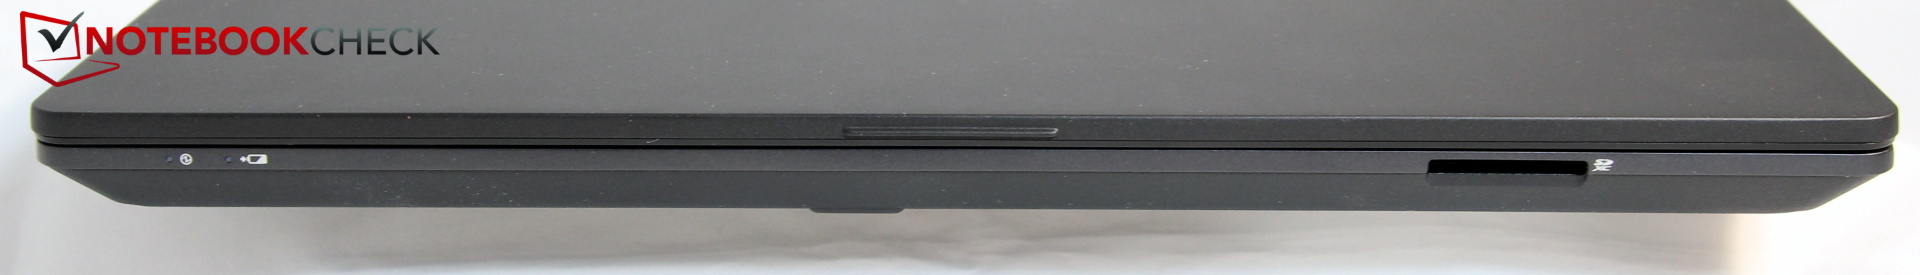
On the bottom side there is a docking port and a removable battery with 60 Wh - a real rarity nowadays and possibly a buying argument. There is also a maintenance hatch with access to the memory. The SIM slot is also hidden under the battery. To the right of the touchpad there is either a fingerprint sensor or a palm-vein sensor.
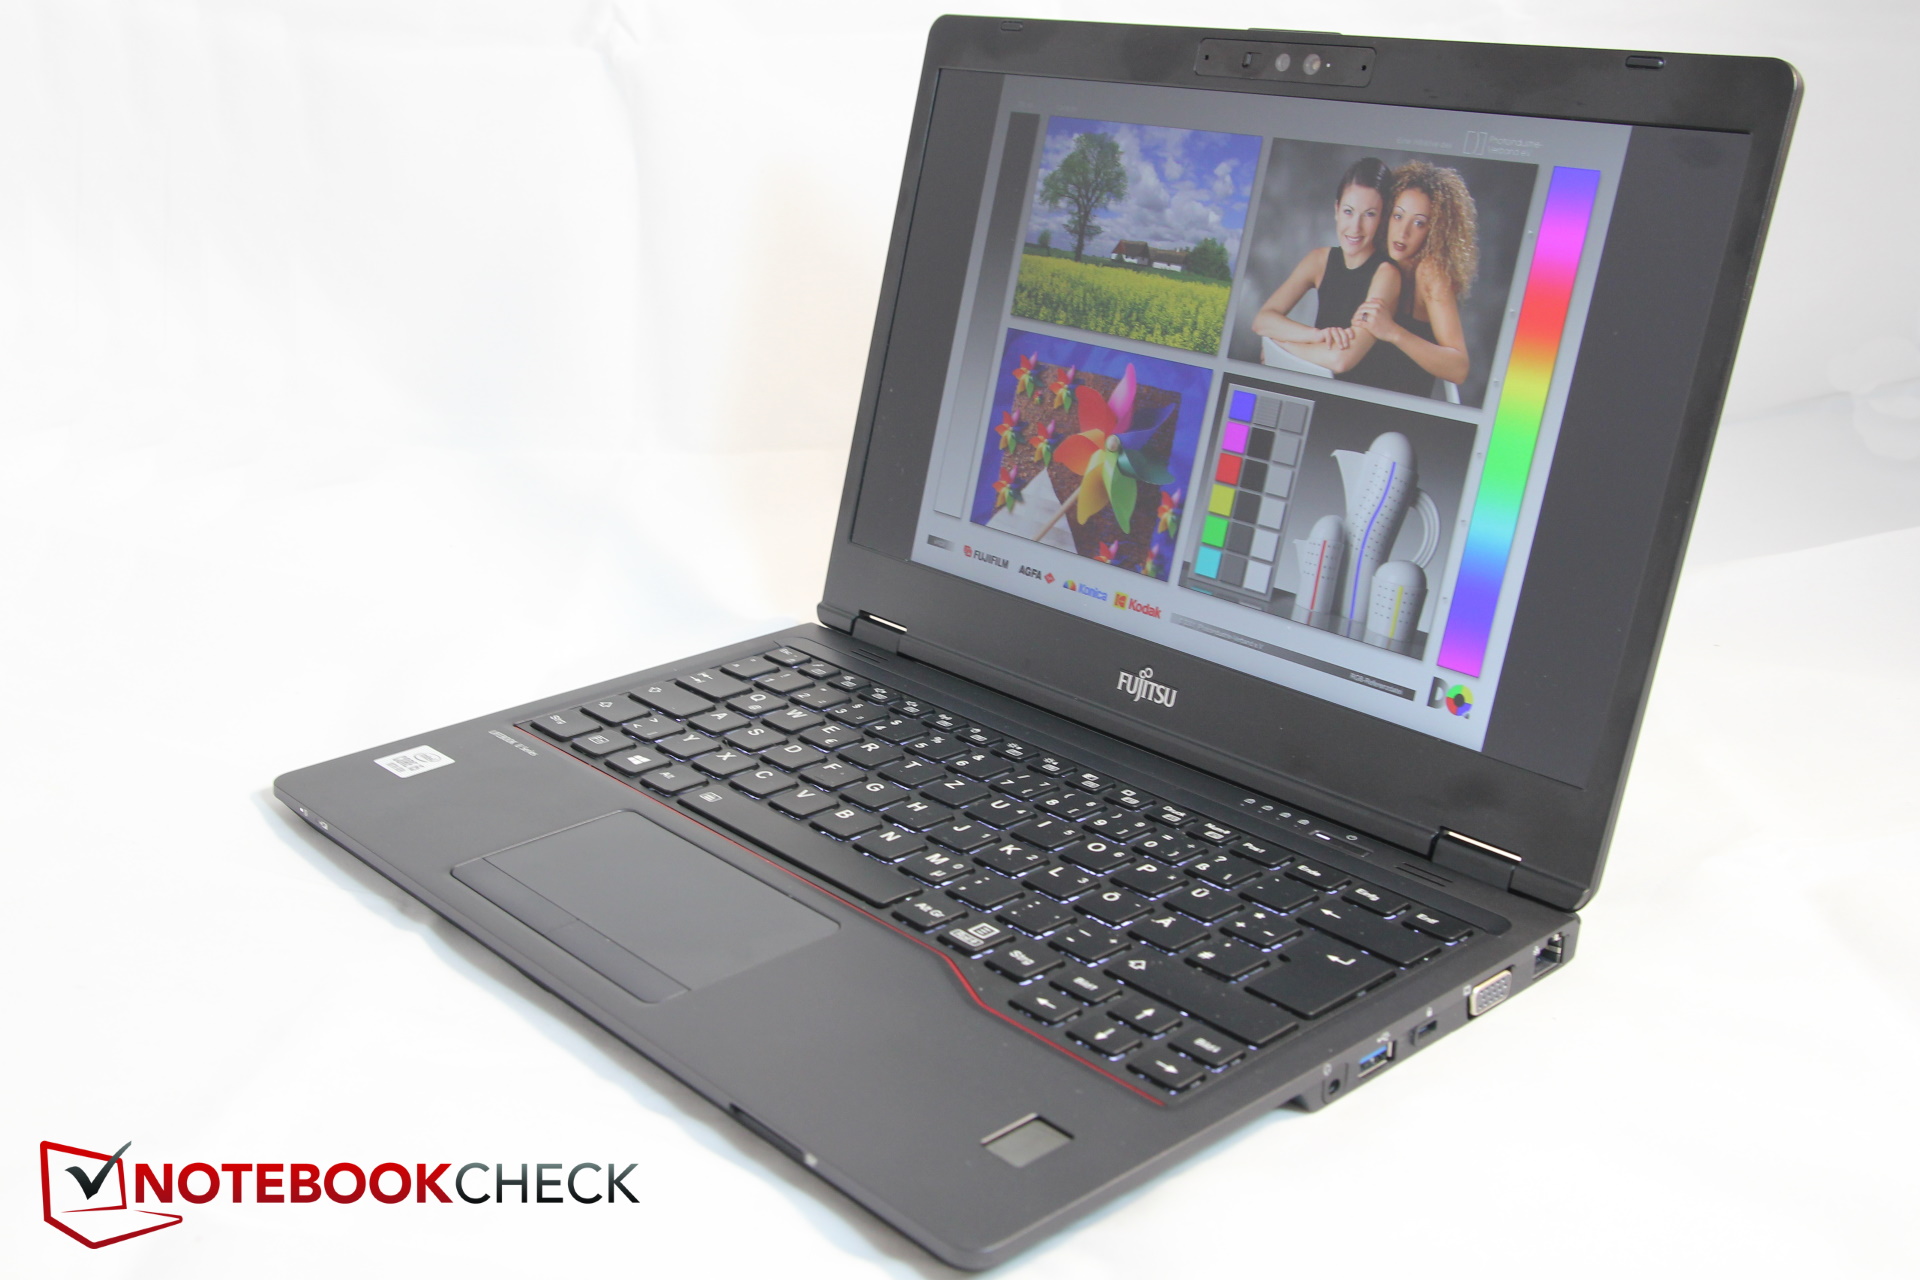
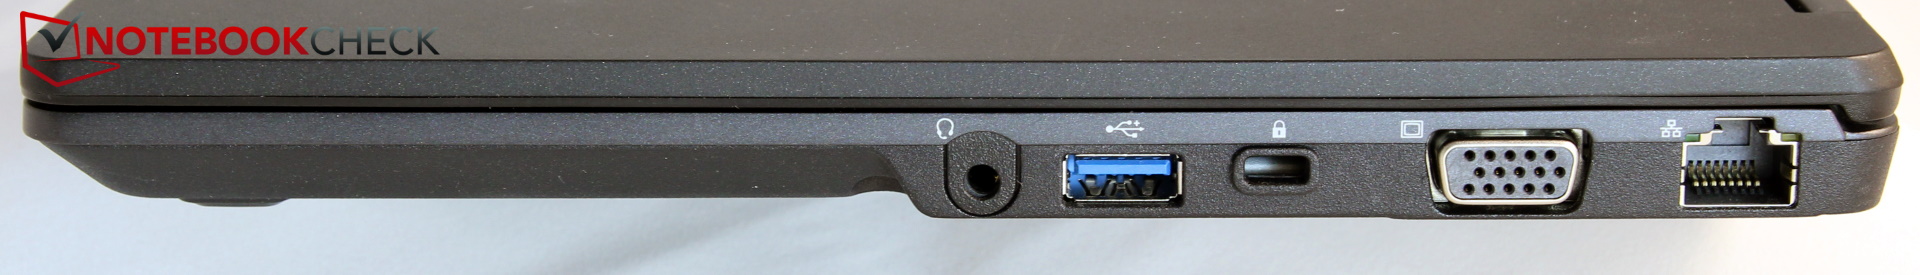
Connection equipment
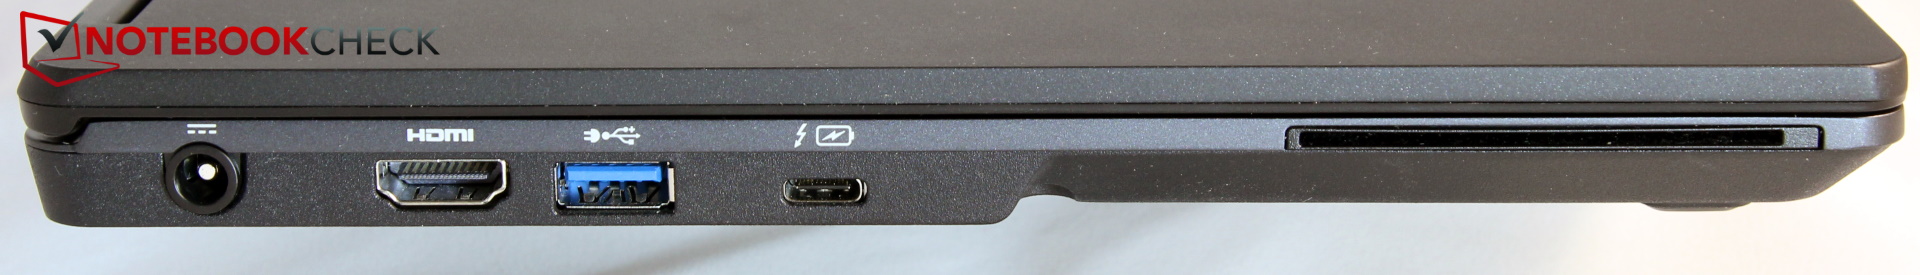
The U7310 has three USB ports, one supports Thunderbolt 3, and the device can alternatively be charged via USB-C port (also supports DisplayPort), and besides HDMI, there's even an old VGA port installed. A LAN slot is also available, and while business customers might be happy about the smartcard slot, others should be satisfied with the full-fledged SD card reader on the front.
The connections usually have enough space to each other, and only HDMI and USB-A are located quite close to each other on the left side and right-handers might find the LAN and VGA connection on the right side (but far back) suboptimal.
| SD Card Reader | |
| average JPG Copy Test (av. of 3 runs) | |
| Fujitsu LifeBook U7310 (Toshiba Exceria Pro SDXC 64 GB UHS-II) | |
| Samsung Galaxy Book Ion 13.3 (Toshiba Exceria Pro M501 microSDXC 64GB) | |
| Lenovo ThinkPad X13-20UGS00800 (Toshiba Exceria Pro M501 64 GB UHS-II) | |
| Average of class Office (19.8 - 198.5, n=22, last 2 years) | |
| Lenovo ThinkPad X13-20T20033GE (Toshiba Exceria Pro M501 64 GB UHS-II) | |
| maximum AS SSD Seq Read Test (1GB) | |
| Samsung Galaxy Book Ion 13.3 (Toshiba Exceria Pro M501 microSDXC 64GB) | |
| Fujitsu LifeBook U7310 (Toshiba Exceria Pro SDXC 64 GB UHS-II) | |
| Lenovo ThinkPad X13-20UGS00800 (Toshiba Exceria Pro M501 64 GB UHS-II) | |
| Average of class Office (27.4 - 249, n=21, last 2 years) | |
| Lenovo ThinkPad X13-20T20033GE (Toshiba Exceria Pro M501 64 GB UHS-II) | |


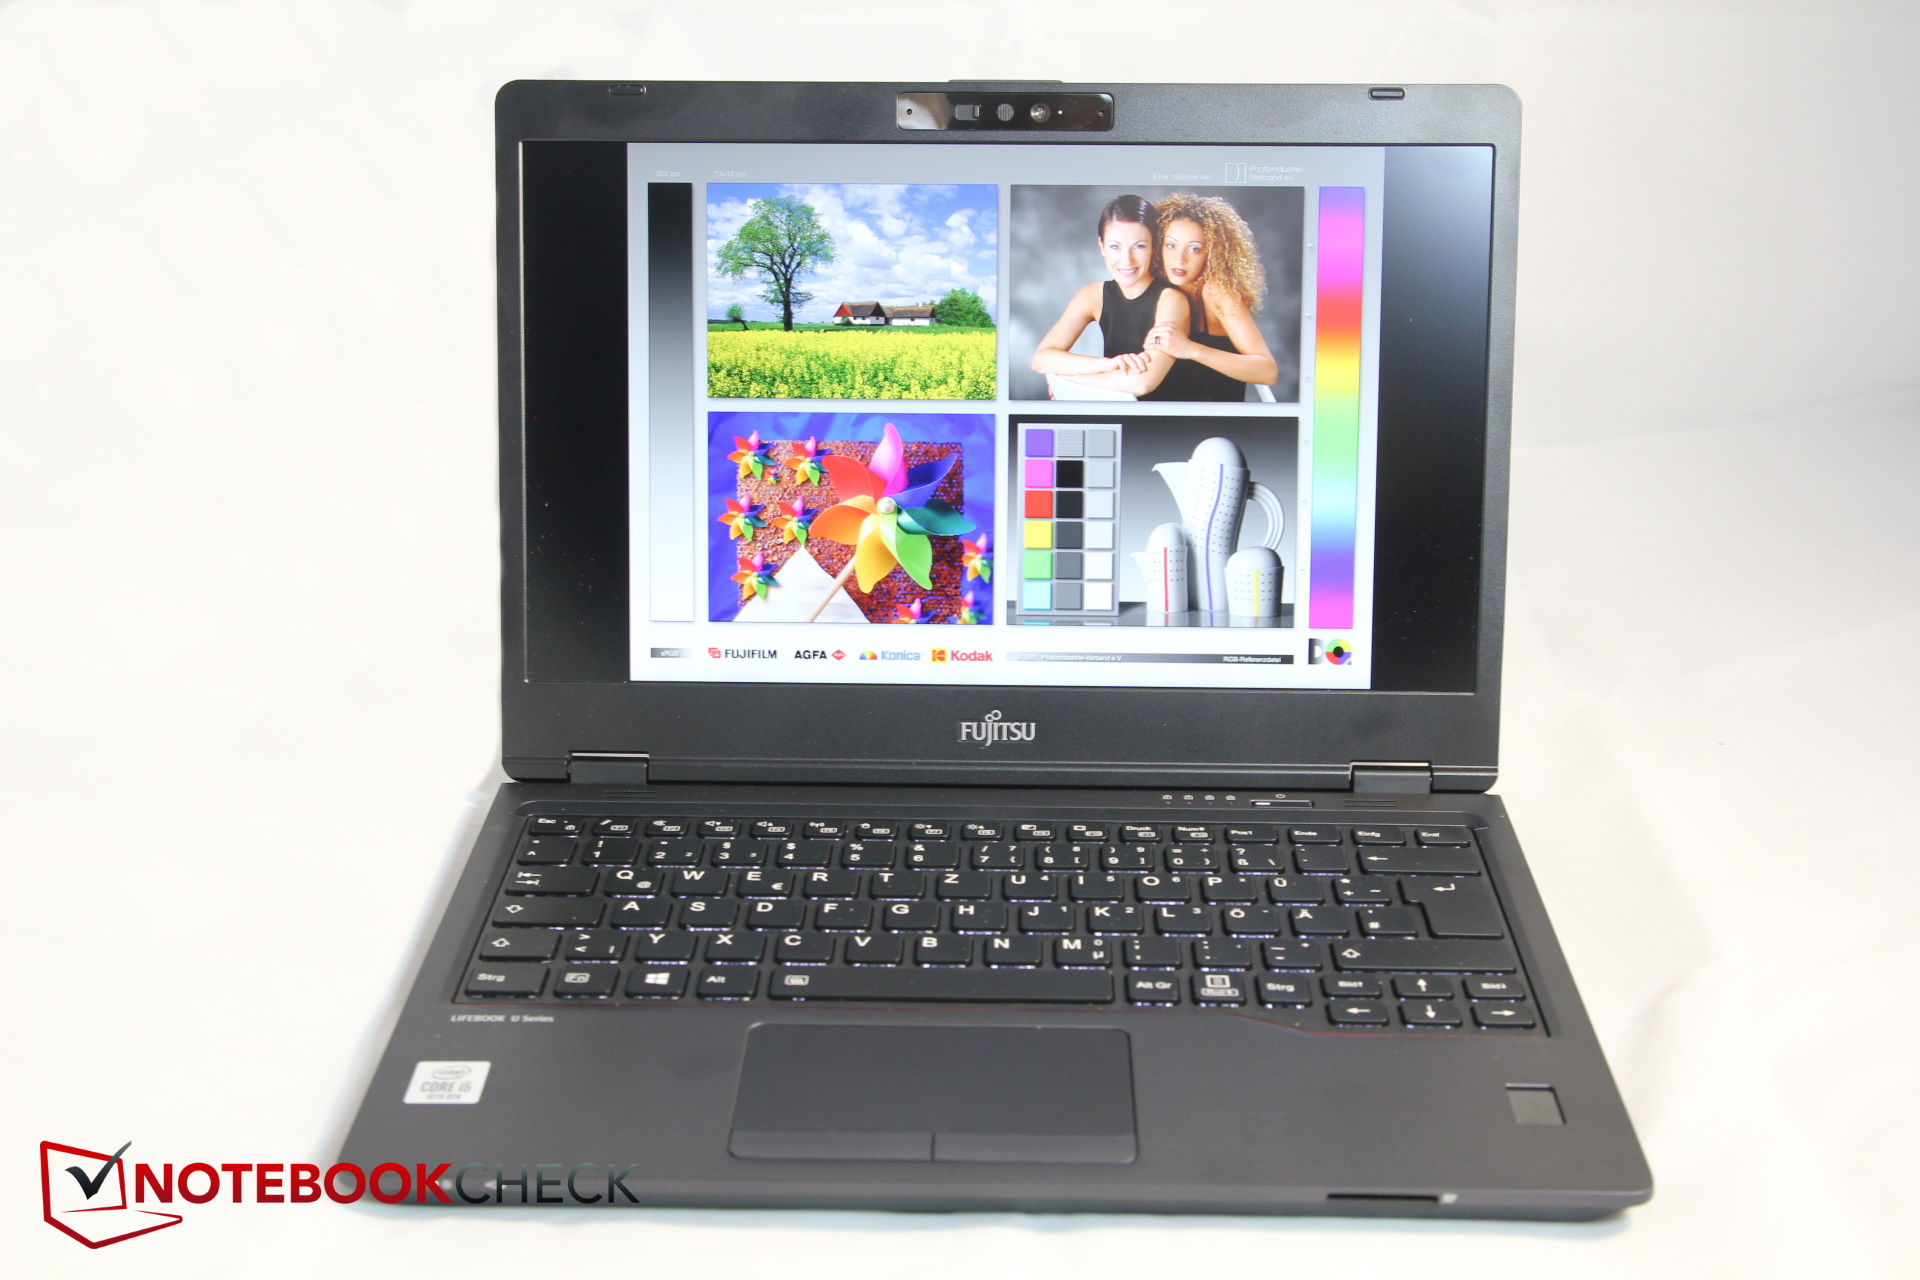
Input devices - Good keyboard, rattling mouse button
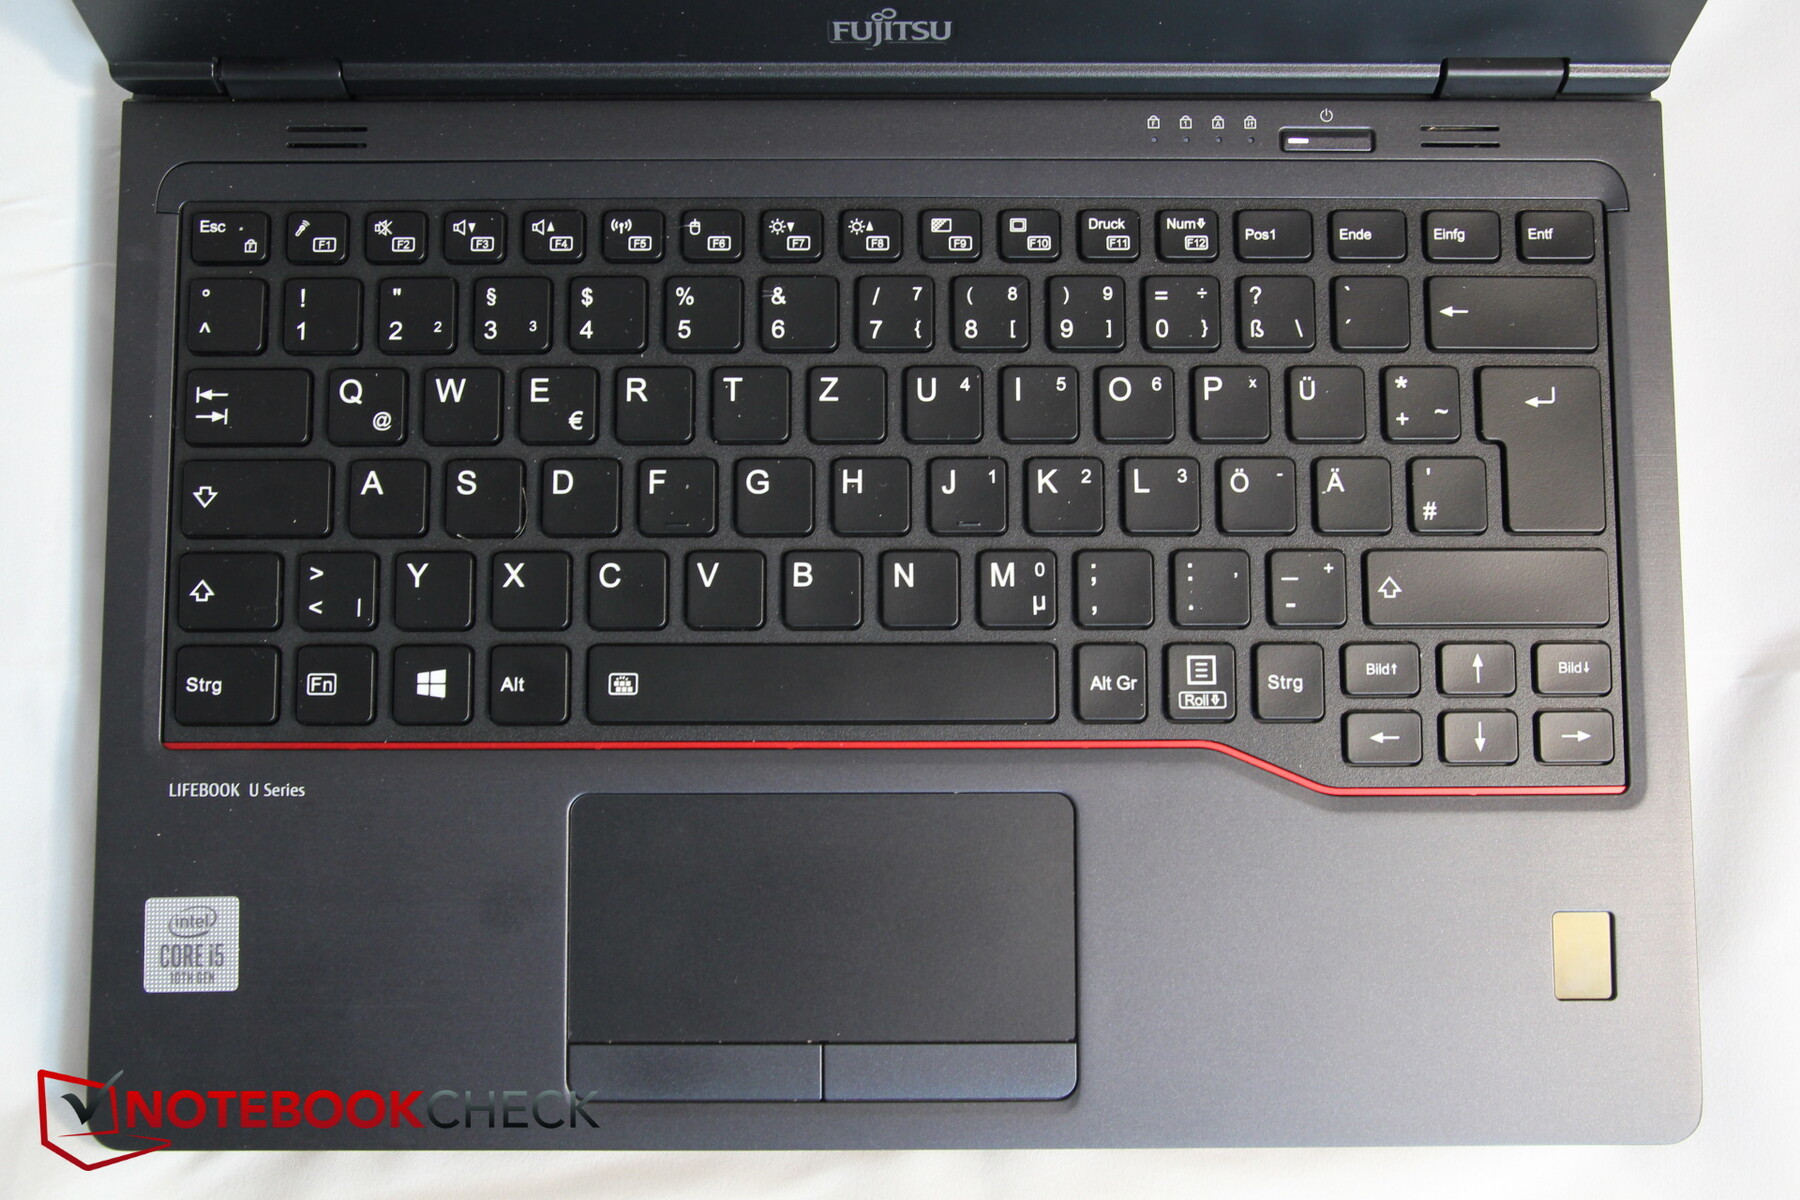
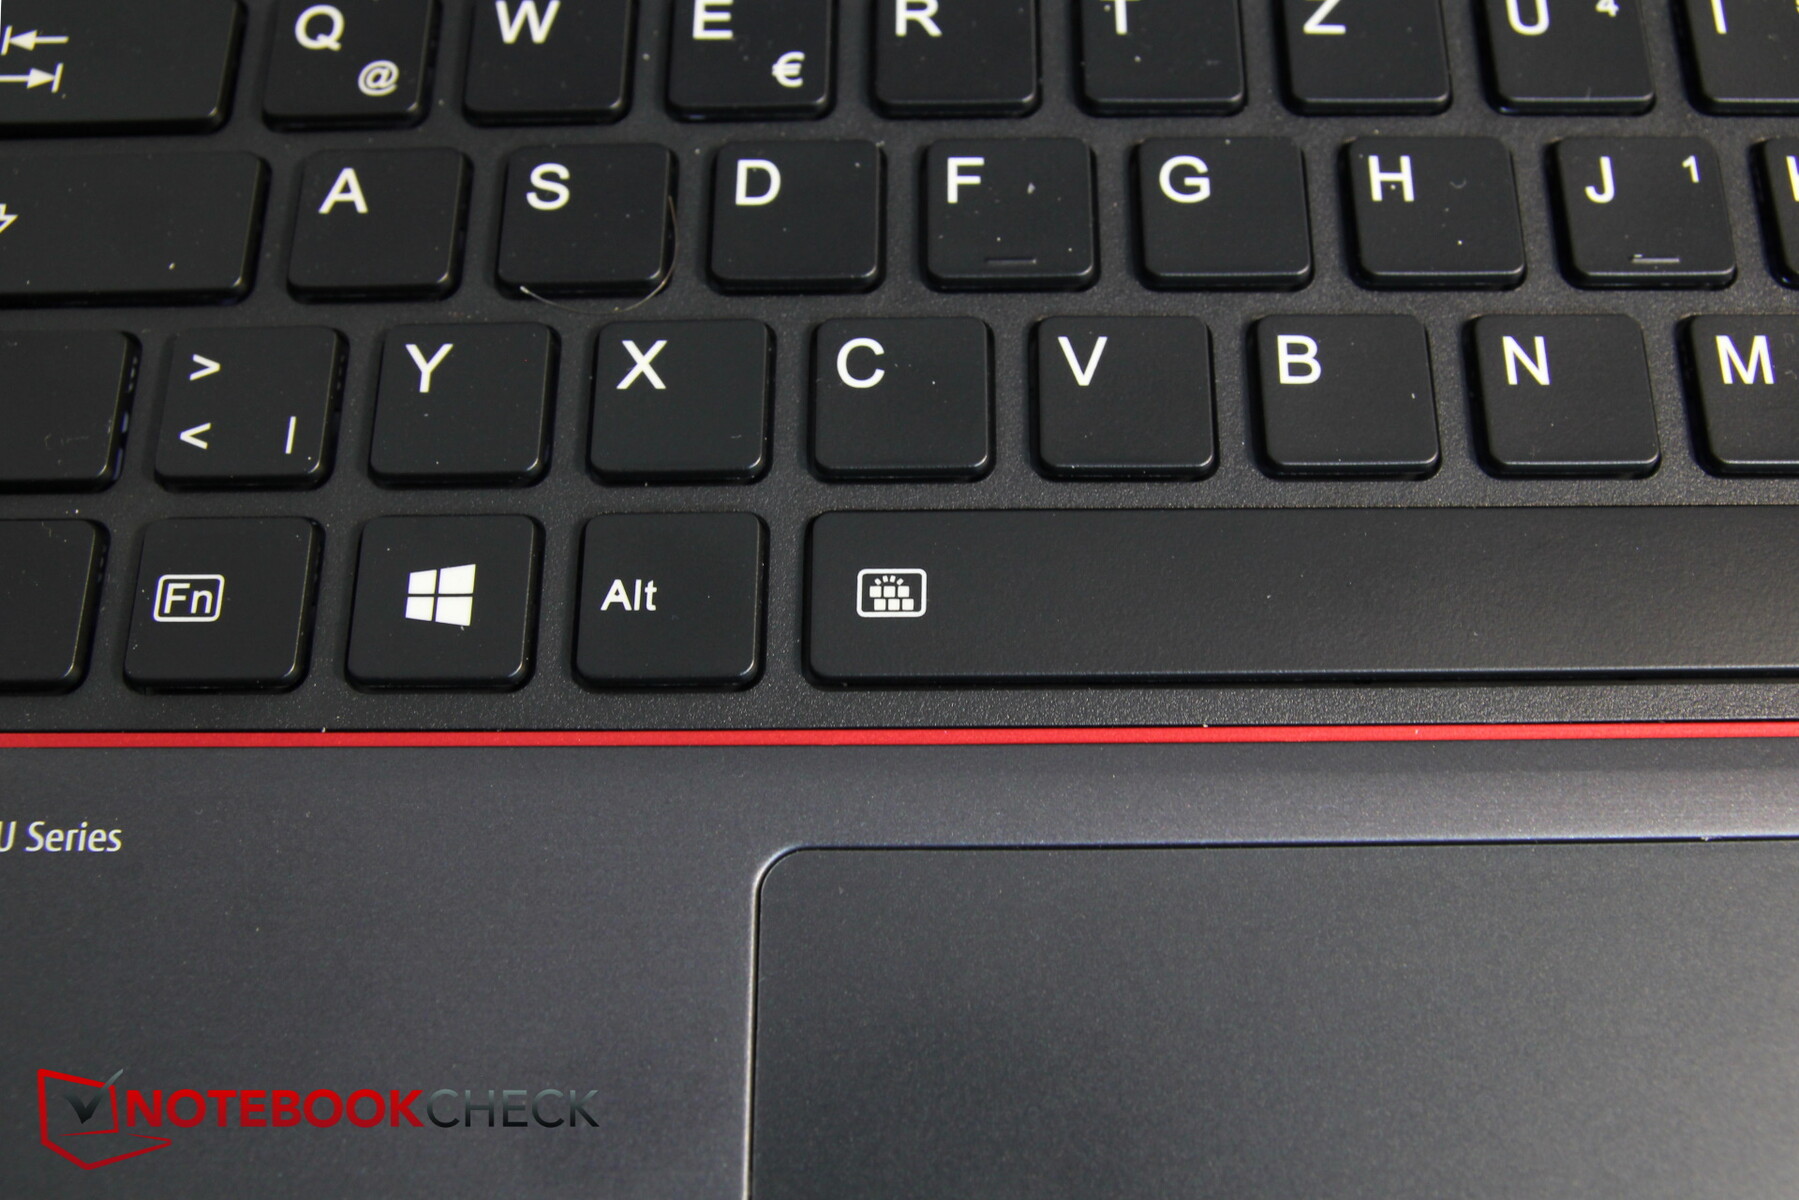
Fujitsu relies on a pleasantly soft keyboard with a longer stroke and good feedback. The keys themselves are quite small (~1.45 cm) but have enough space between them. After a short time, writing on them is very successful and fun. The typing volume is okay.
The layout is functional, the F- and arrow keys are a bit smaller again, but at least the latter have their own place. The power switch is located separately on the right above the keys. The two-stage backlighting that was actually present did not work at all. The spacebar has a corresponding icon, but it could not be activated despite the Fn key over several combination attempts.
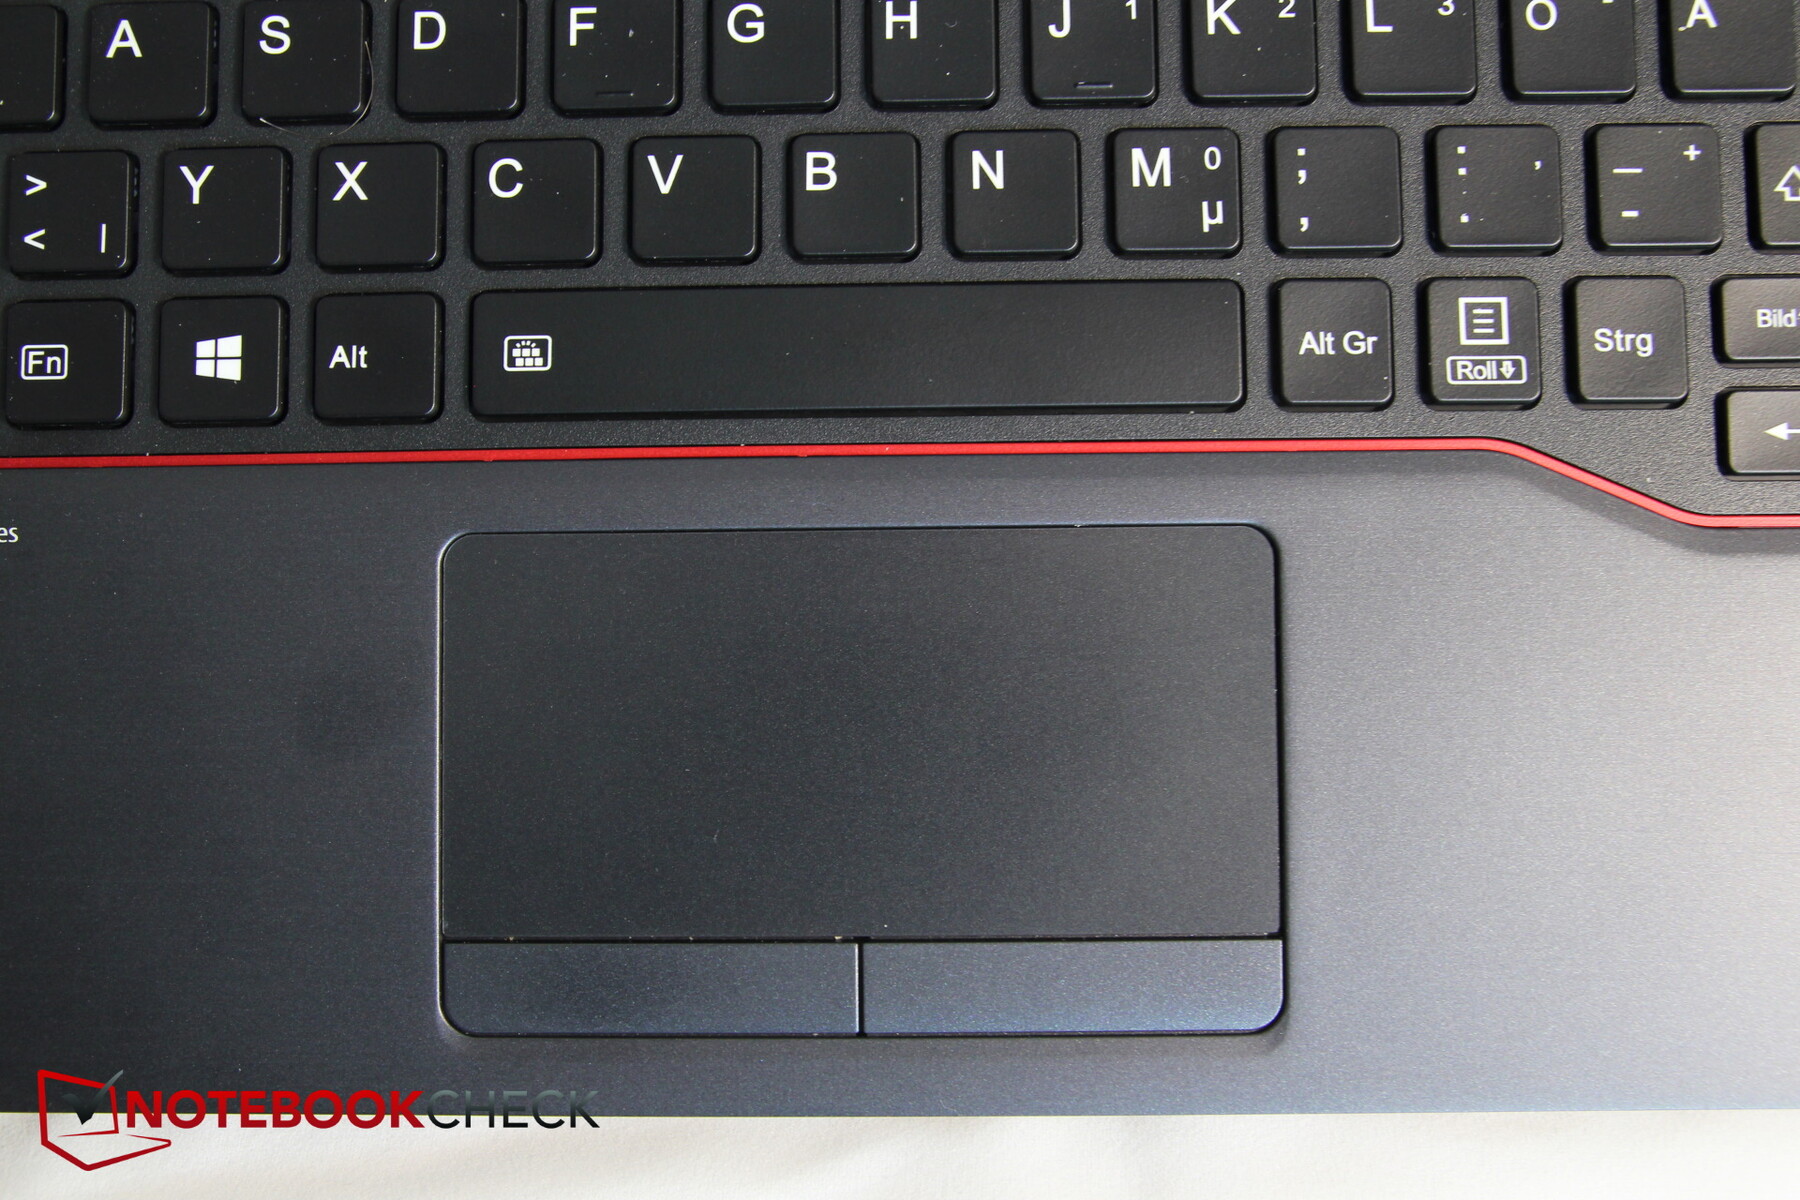
The touchpad is a bit small (9.8 x 4.8 cm), but it has dedicated mouse buttons, of which the right one rattles unsightly. The clicking noises are very quiet, and the gliding behavior of the pad is good, only at very low speeds it can stall a bit.
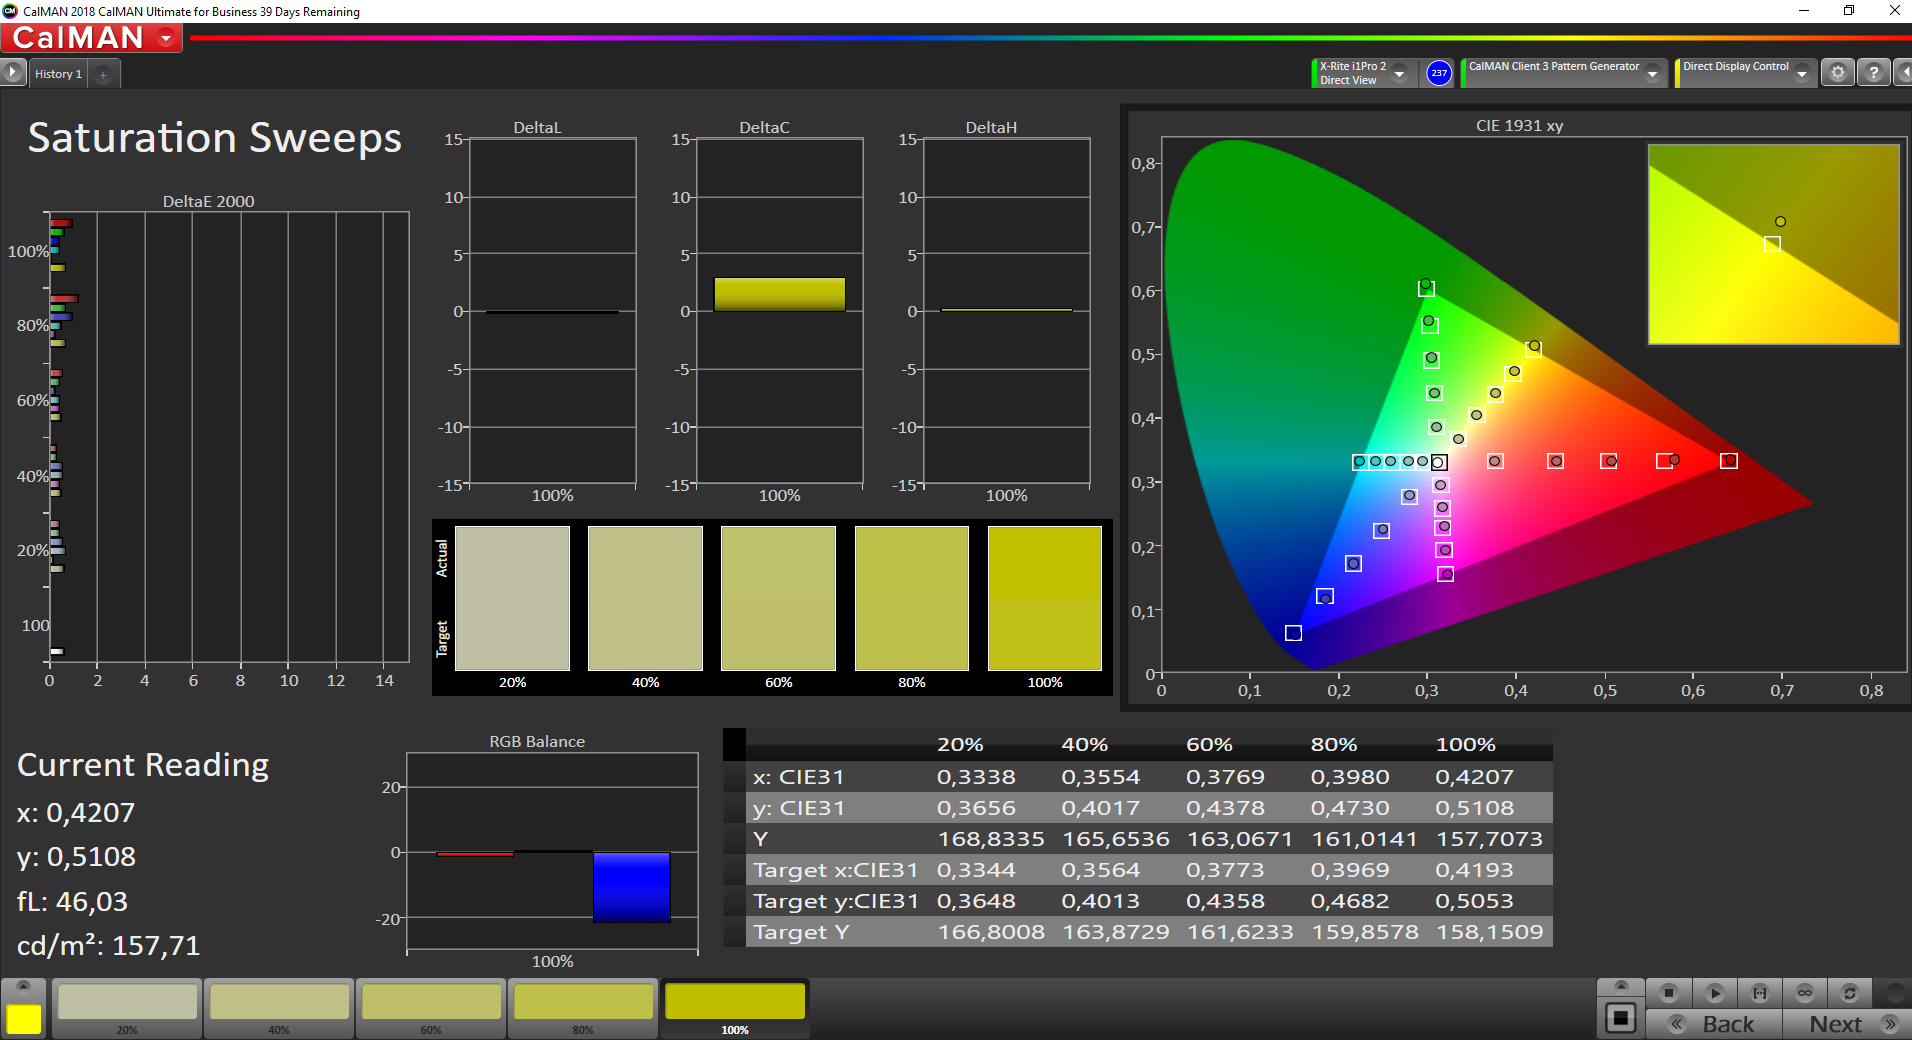
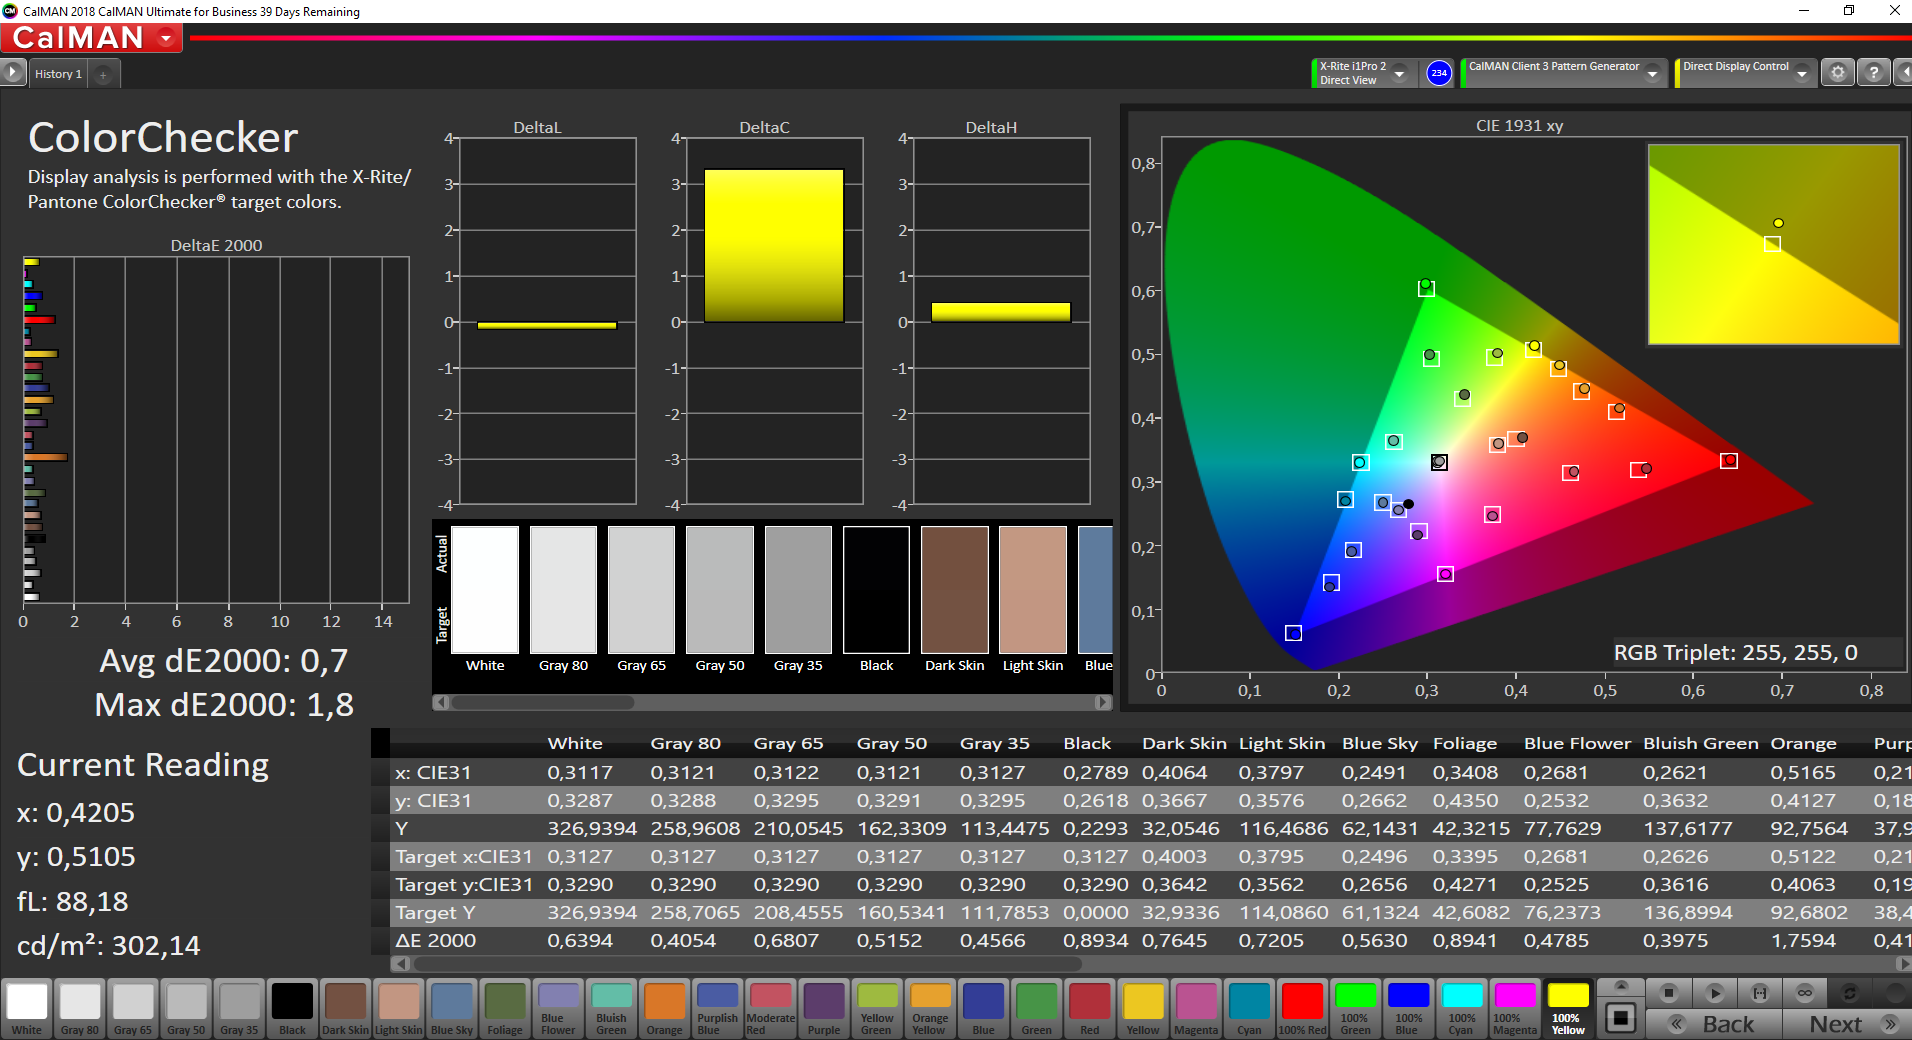
Display - Ordinary display of the Fujitsu LifeBook
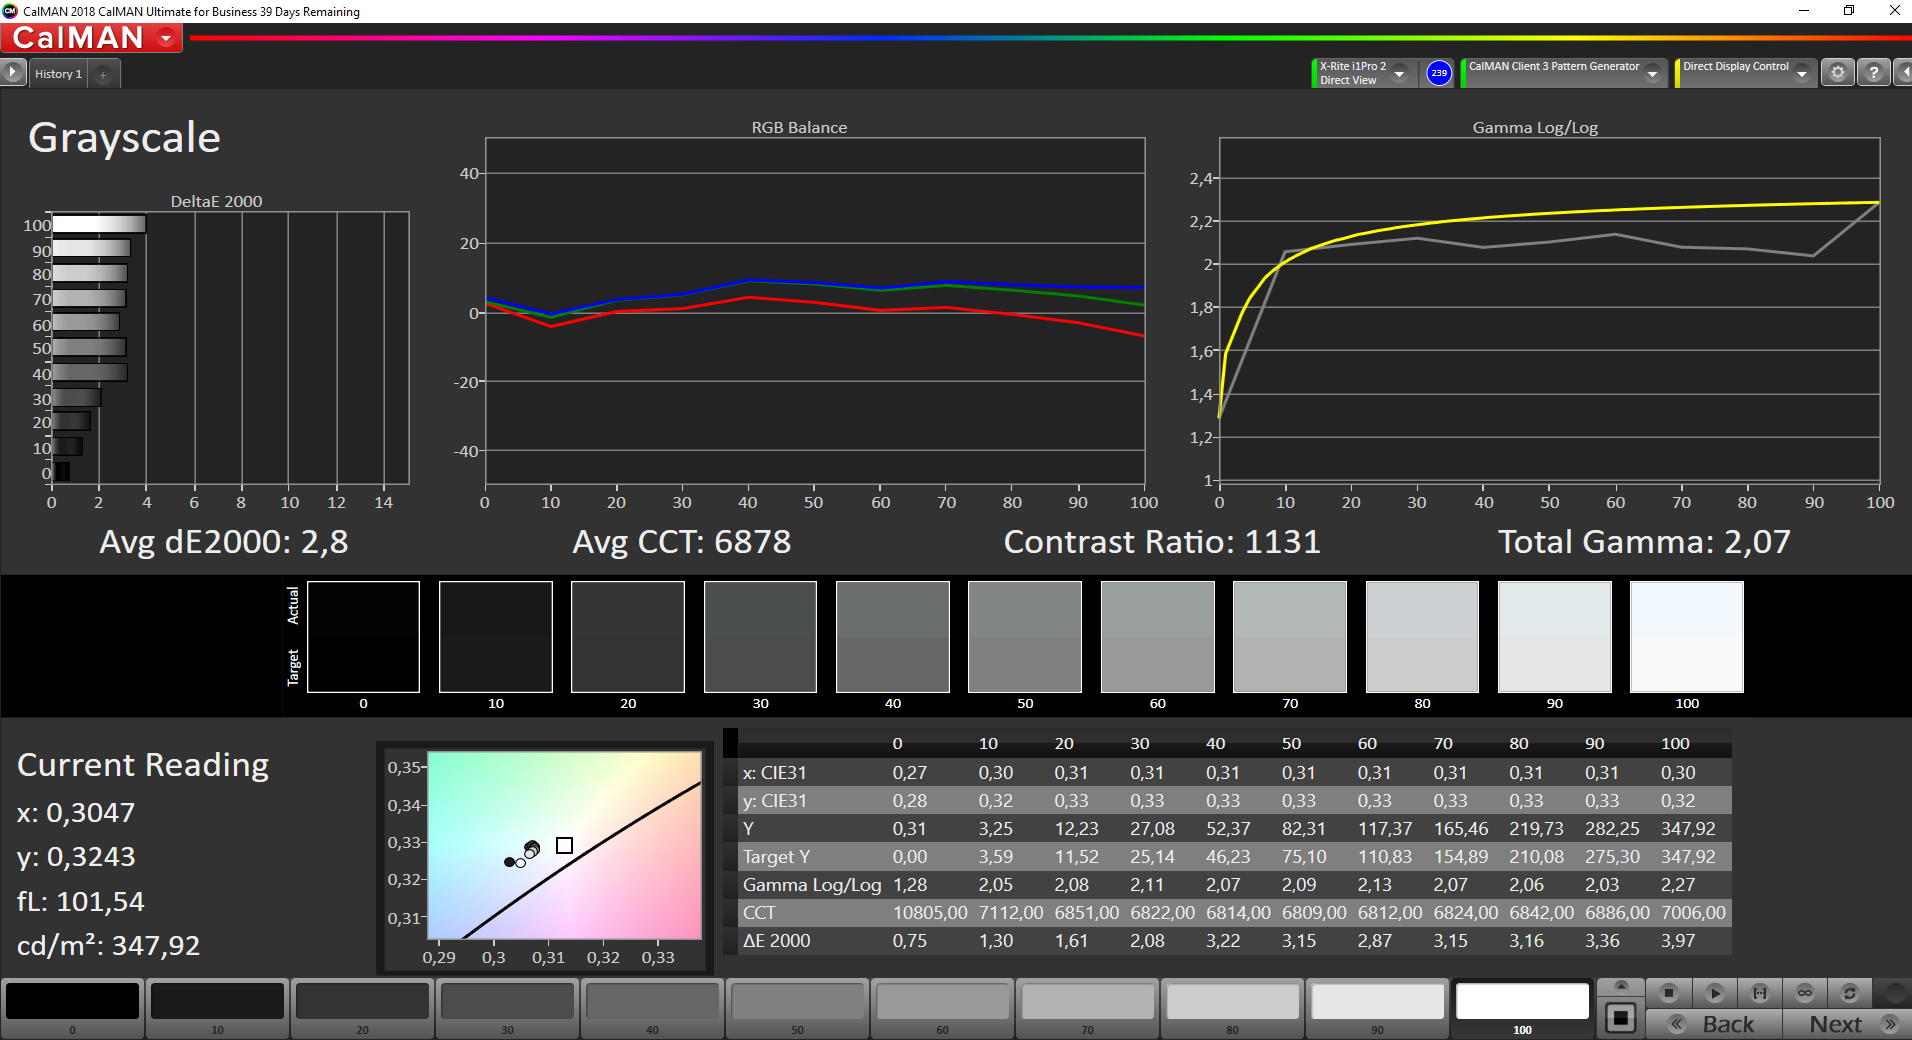
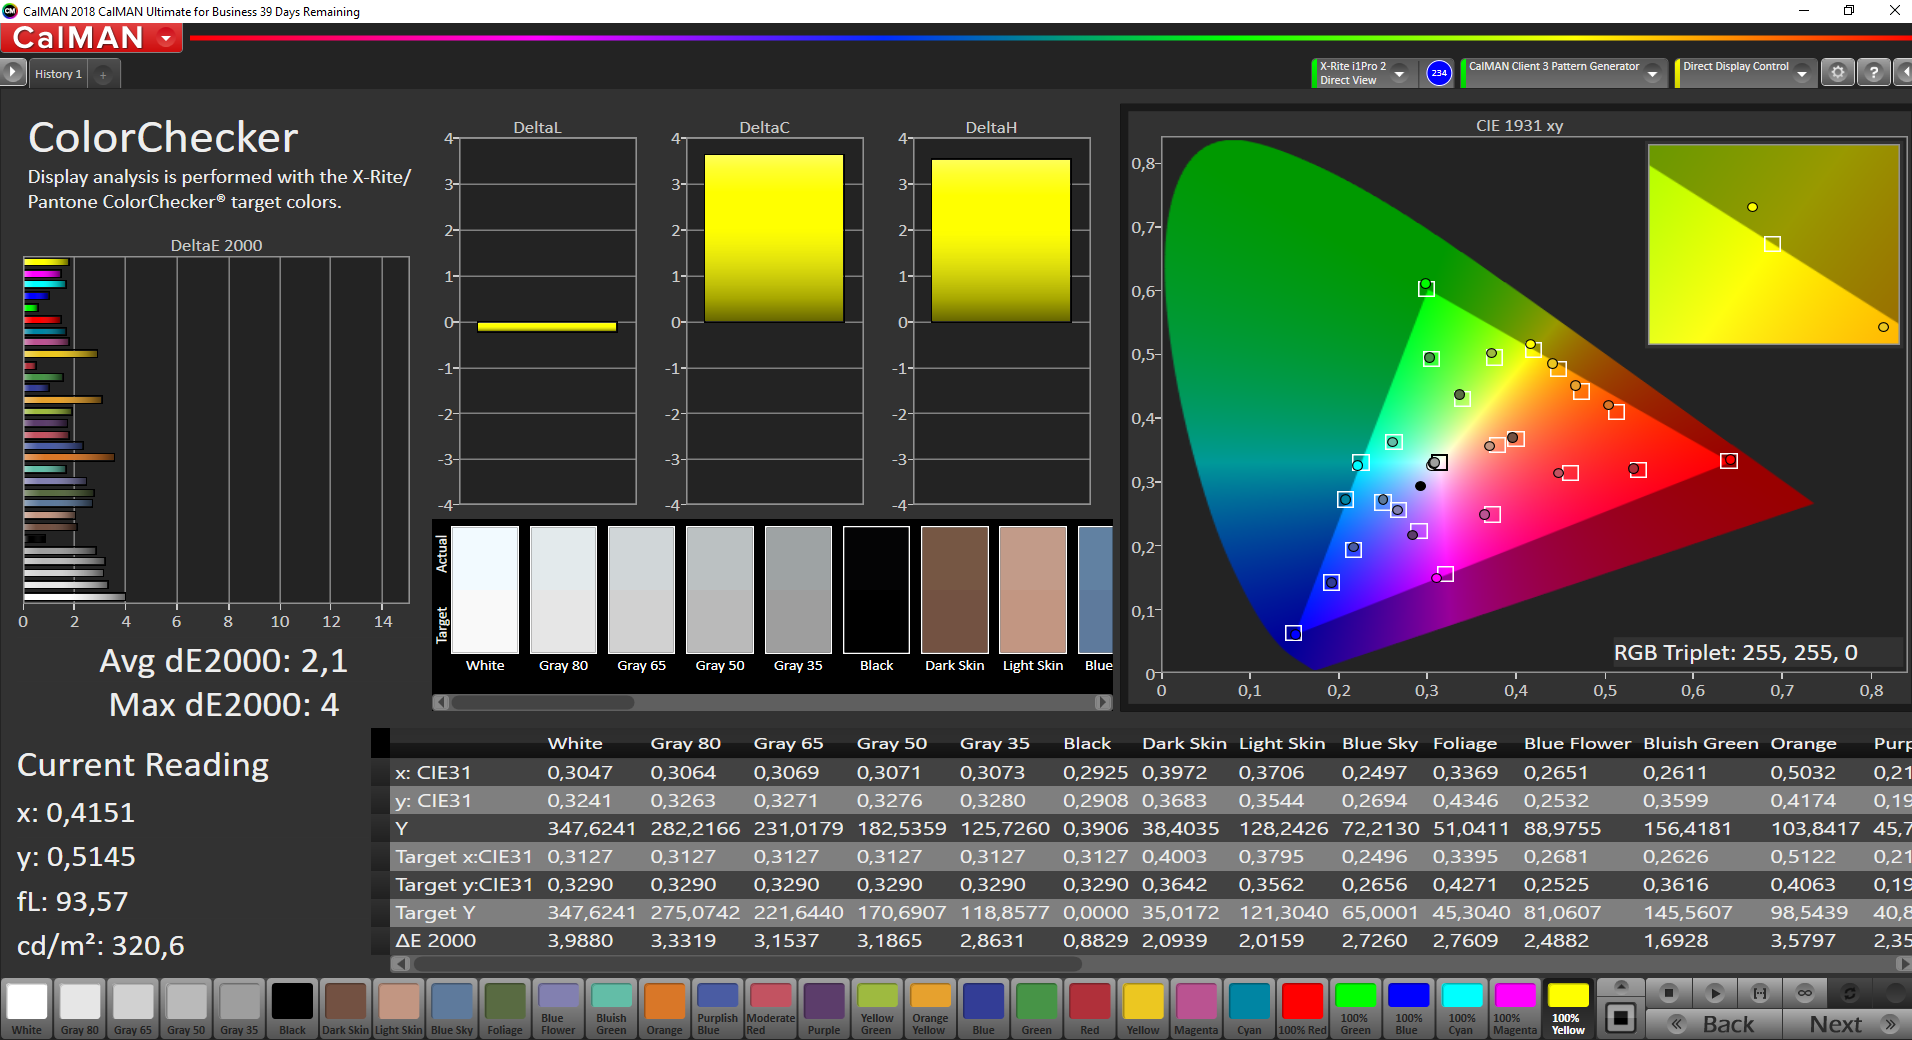
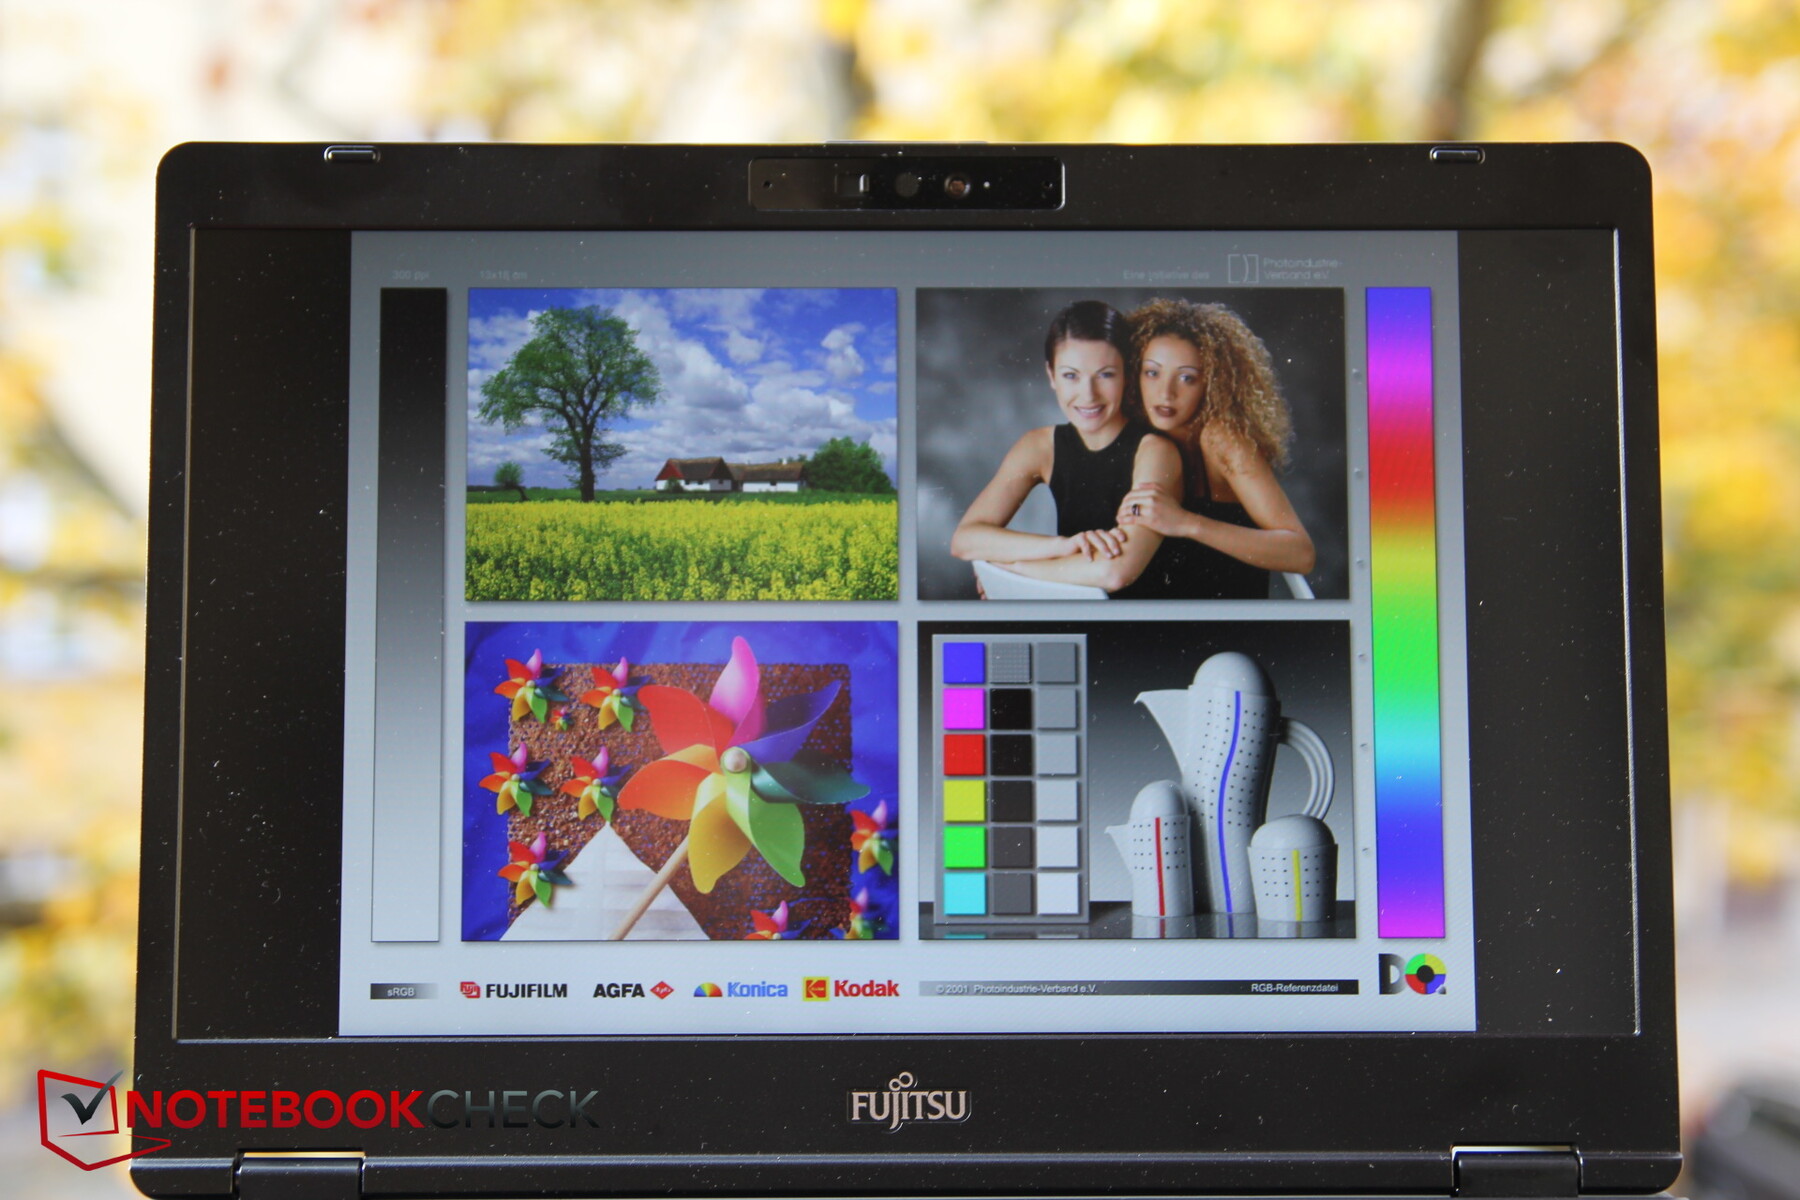
The matte Chi-Mei panel scored good but not outstanding values in the test: an average brightness of 341 nits is okay, and the illumination is very good at 92%. Contrast and black level should be better, though; the competition has advantages here. The display is already well calibrated at the factory and has fairly high color-space coverage (sRGB: full, AdobeRGB: 63.6%).


| |||||||||||||||||||||||||
Brightness Distribution: 92 %
Center on Battery: 349 cd/m²
Contrast: 1123:1 (Black: 0.31 cd/m²)
ΔE ColorChecker Calman: 2.1 | ∀{0.5-29.43 Ø4.72}
calibrated: 0.7
ΔE Greyscale Calman: 2.8 | ∀{0.09-98 Ø4.97}
99.5% sRGB (Argyll 1.6.3 3D)
63.6% AdobeRGB 1998 (Argyll 1.6.3 3D)
69.7% AdobeRGB 1998 (Argyll 3D)
99.5% sRGB (Argyll 3D)
67.4% Display P3 (Argyll 3D)
Gamma: 2.07
CCT: 6878 K
| Fujitsu LifeBook U7310 Chi Mei N133HCE-EN2 (CMN1388), IPS, 1920x1080, 13.3" | Lenovo ThinkPad X13-20T20033GE Lenovo B133HAK01.1, IPS, 1920x1080, 13.3" | Lenovo ThinkPad X13-20UGS00800 B133HAK01.1, IPS LED, 1920x1080, 13.3" | HP EliteBook 735 G6 7KN29EA CMN139E, IPS LED, 1920x1080, 13.3" | Fujitsu Lifebook U939 i5 Sharp SHP14BD, IPS, 1920x1080, 13.3" | Samsung Galaxy Book Ion 13.3 BOE087A, IPS (QLED), 1920x1080, 13.3" | |
|---|---|---|---|---|---|---|
| Display | -3% | -5% | -38% | -4% | ||
| Display P3 Coverage (%) | 67.4 | 66 -2% | 64.8 -4% | 41.53 -38% | 65.3 -3% | |
| sRGB Coverage (%) | 99.5 | 96.2 -3% | 95.6 -4% | 61.7 -38% | 95 -5% | |
| AdobeRGB 1998 Coverage (%) | 69.7 | 67.2 -4% | 65.7 -6% | 43 -38% | 66 -5% | |
| Response Times | -29% | -36% | -4% | -33% | -21% | |
| Response Time Grey 50% / Grey 80% * (ms) | 37.6 ? | 52.8 ? -40% | 56.8 ? -51% | 38 ? -1% | 55.2 ? -47% | 47 ? -25% |
| Response Time Black / White * (ms) | 24.8 ? | 29.2 ? -18% | 30 ? -21% | 26.4 ? -6% | 29.6 ? -19% | 29 ? -17% |
| PWM Frequency (Hz) | 26040 | 211.9 ? | ||||
| Screen | -51% | -44% | -131% | -44% | -16% | |
| Brightness middle (cd/m²) | 348 | 359 3% | 331 -5% | 294 -16% | 384 10% | 467 34% |
| Brightness (cd/m²) | 341 | 342 0% | 315 -8% | 277 -19% | 362 6% | 437 28% |
| Brightness Distribution (%) | 92 | 90 -2% | 90 -2% | 87 -5% | 90 -2% | 88 -4% |
| Black Level * (cd/m²) | 0.31 | 0.21 32% | 0.21 32% | 0.18 42% | 0.31 -0% | 0.29 6% |
| Contrast (:1) | 1123 | 1710 52% | 1576 40% | 1633 45% | 1239 10% | 1610 43% |
| Colorchecker dE 2000 * | 2.1 | 6.7 -219% | 6.1 -190% | 6.8 -224% | 4.8 -129% | 4.73 -125% |
| Colorchecker dE 2000 max. * | 4 | 10.9 -173% | 10 -150% | 23.8 -495% | 9.4 -135% | 6.07 -52% |
| Colorchecker dE 2000 calibrated * | 0.7 | 1.3 -86% | 1.2 -71% | 4.8 -586% | 1.4 -100% | |
| Greyscale dE 2000 * | 2.8 | 7.4 -164% | 6.3 -125% | 5.9 -111% | 6.6 -136% | 4.33 -55% |
| Gamma | 2.07 106% | 2.85 77% | 2.77 79% | 1.96 112% | 2.2 100% | 2.34 94% |
| CCT | 6878 95% | 6309 103% | 6938 94% | 6979 93% | 7999 81% | 6954 93% |
| Color Space (Percent of AdobeRGB 1998) (%) | 63.6 | 61.7 -3% | 60.7 -5% | 39.6 -38% | 61.2 -4% | |
| Color Space (Percent of sRGB) (%) | 99.5 | 95.9 -4% | 95.4 -4% | 61.5 -38% | 95 -5% | |
| Total Average (Program / Settings) | -28% /
-39% | -28% /
-36% | -58% /
-98% | -27% /
-35% | -19% /
-17% |
* ... smaller is better
Display Response Times
| ↔ Response Time Black to White | ||
|---|---|---|
| 24.8 ms ... rise ↗ and fall ↘ combined | ↗ 14.4 ms rise | 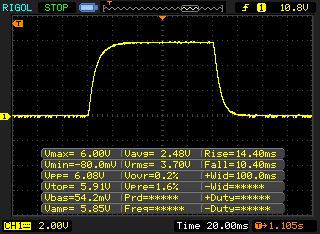 |
| ↘ 10.4 ms fall | ||
| The screen shows good response rates in our tests, but may be too slow for competitive gamers. In comparison, all tested devices range from 0.1 (minimum) to 240 (maximum) ms. » 58 % of all devices are better. This means that the measured response time is worse than the average of all tested devices (19.8 ms). | ||
| ↔ Response Time 50% Grey to 80% Grey | ||
| 37.6 ms ... rise ↗ and fall ↘ combined | ↗ 18.8 ms rise | 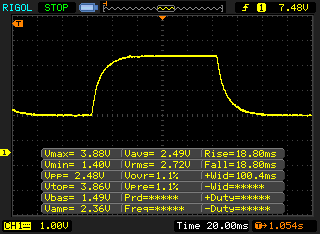 |
| ↘ 18.8 ms fall | ||
| The screen shows slow response rates in our tests and will be unsatisfactory for gamers. In comparison, all tested devices range from 0.165 (minimum) to 636 (maximum) ms. » 55 % of all devices are better. This means that the measured response time is worse than the average of all tested devices (31 ms). | ||
Screen Flickering / PWM (Pulse-Width Modulation)
| Screen flickering / PWM not detected |  | ||
In comparison: 52 % of all tested devices do not use PWM to dim the display. If PWM was detected, an average of 7750 (minimum: 5 - maximum: 343500) Hz was measured. | |||
Outdoors, the matte surface eliminates disturbing reflections, and the brightness is sufficient for shady areas. The colors could be a little more saturated.
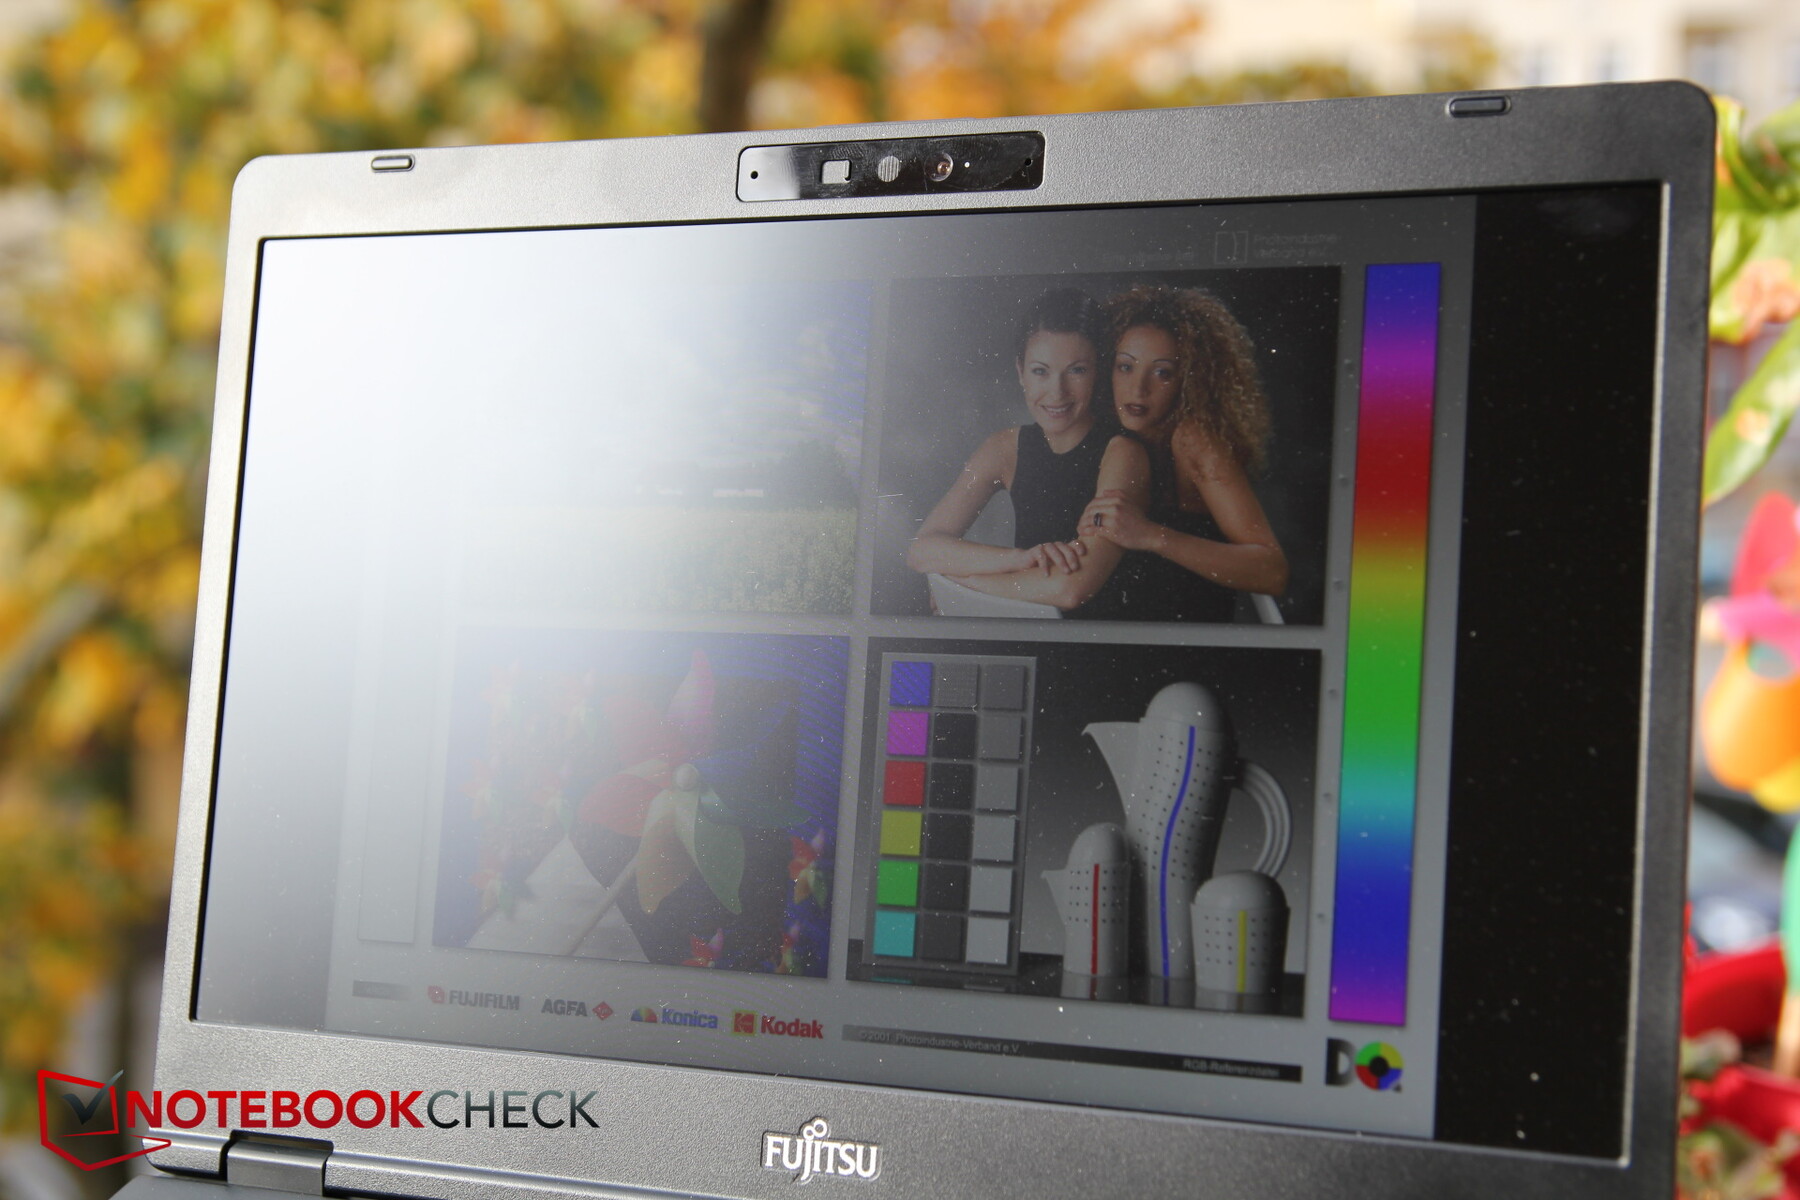
The IPS display is less stable in viewing angles than other IPS panels, and brightness is quickly lost when viewing at an angle. Fujitsu also offers an optional ePrivacy filter. At the touch of a button, the lateral viewing-angle stability is greatly reduced so that third parties cannot read the screen.

Performance - LifeBook with weak vital signs
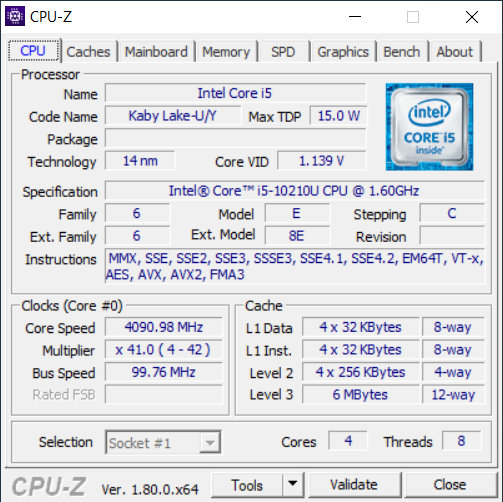
Fujitsu uses Comet Lake with the Intel Core i5-10210U, and the rather weak GPU (UHD Graphics 620) is integrated into the processor. In addition there is 8 GB RAM (expandable, one slot free) and 256 GB SSD main memory. The LifeBook U7310 is not a high-performance athlete but is designed for secure and economical office use for business customers.
Processor
There are five CPU options in total, and the Intel Core i5-10210U installed here represents the second-weakest configuration. The top model has a built-in i7-10610U. The i5-10210U from the 10th Intel generation theoretically clocks between 1.6 and 4.2 GHz (4 cores maximum 3.9 GHz).
In the Cinebench tests, the CPU in the LifeBook performs below its capabilities. The ThinkPad X13 with the same CPU is about 30 to 50% faster (multithread)! Compared to the average i5-10210U from our database it is missing 14 to 27%. The AMD competition is off and running anyway. In the loop for 30 minutes it shows that the performance is constant and does not show the typical drop after the first few runs, just because the performance level is set very low. In battery mode the performance does not decrease significantly.
Cinebench R15: CPU Single 64Bit | CPU Multi 64Bit
Blender: v2.79 BMW27 CPU
7-Zip 18.03: 7z b 4 -mmt1 | 7z b 4
Geekbench 5.5: Single-Core | Multi-Core
HWBOT x265 Benchmark v2.2: 4k Preset
LibreOffice : 20 Documents To PDF
R Benchmark 2.5: Overall mean
| Cinebench R20 / CPU (Single Core) | |
| Average of class Office (345 - 816, n=72, last 2 years) | |
| Lenovo ThinkPad X13-20UGS00800 | |
| Samsung Galaxy Book Ion 13.3 | |
| Fujitsu LifeBook U7310 | |
| Average Intel Core i5-10210U (322 - 428, n=30) | |
| Fujitsu Lifebook U939 i5 | |
| HP EliteBook 735 G6 7KN29EA | |
| Lenovo ThinkPad X13-20T20033GE | |
| Cinebench R20 / CPU (Multi Core) | |
| Average of class Office (648 - 8840, n=72, last 2 years) | |
| Lenovo ThinkPad X13-20UGS00800 | |
| Lenovo ThinkPad X13-20T20033GE | |
| HP EliteBook 735 G6 7KN29EA | |
| Average Intel Core i5-10210U (722 - 1820, n=30) | |
| Samsung Galaxy Book Ion 13.3 | |
| Fujitsu LifeBook U7310 | |
| Fujitsu Lifebook U939 i5 | |
| Cinebench R15 / CPU Single 64Bit | |
| Average of class Office (99.5 - 312, n=74, last 2 years) | |
| Lenovo ThinkPad X13-20UGS00800 | |
| Lenovo ThinkPad X13-20T20033GE | |
| Average Intel Core i5-10210U (134 - 174, n=35) | |
| Samsung Galaxy Book Ion 13.3 | |
| Fujitsu LifeBook U7310 | |
| Fujitsu Lifebook U939 i5 | |
| HP EliteBook 735 G6 7KN29EA | |
| Cinebench R15 / CPU Multi 64Bit | |
| Average of class Office (250 - 3380, n=74, last 2 years) | |
| Lenovo ThinkPad X13-20UGS00800 | |
| Lenovo ThinkPad X13-20T20033GE | |
| HP EliteBook 735 G6 7KN29EA | |
| Average Intel Core i5-10210U (320 - 790, n=35) | |
| Fujitsu Lifebook U939 i5 | |
| Fujitsu LifeBook U7310 | |
| Samsung Galaxy Book Ion 13.3 | |
| Blender / v2.79 BMW27 CPU | |
| Samsung Galaxy Book Ion 13.3 | |
| Fujitsu Lifebook U939 i5 | |
| Fujitsu LifeBook U7310 | |
| Average Intel Core i5-10210U (585 - 1339, n=24) | |
| HP EliteBook 735 G6 7KN29EA | |
| Lenovo ThinkPad X13-20T20033GE | |
| Lenovo ThinkPad X13-20UGS00800 | |
| Average of class Office (158 - 1940, n=73, last 2 years) | |
| 7-Zip 18.03 / 7z b 4 -mmt1 | |
| Average of class Office (3387 - 6469, n=74, last 2 years) | |
| Lenovo ThinkPad X13-20UGS00800 | |
| Lenovo ThinkPad X13-20T20033GE | |
| Fujitsu LifeBook U7310 | |
| Samsung Galaxy Book Ion 13.3 | |
| Average Intel Core i5-10210U (3504 - 4467, n=24) | |
| Fujitsu Lifebook U939 i5 | |
| HP EliteBook 735 G6 7KN29EA | |
| 7-Zip 18.03 / 7z b 4 | |
| Average of class Office (7098 - 76886, n=74, last 2 years) | |
| Lenovo ThinkPad X13-20UGS00800 | |
| Lenovo ThinkPad X13-20T20033GE | |
| Average Intel Core i5-10210U (10920 - 21679, n=24) | |
| HP EliteBook 735 G6 7KN29EA | |
| Fujitsu Lifebook U939 i5 | |
| Samsung Galaxy Book Ion 13.3 | |
| Fujitsu LifeBook U7310 | |
| Geekbench 5.5 / Single-Core | |
| Average of class Office (811 - 2148, n=70, last 2 years) | |
| Lenovo ThinkPad X13-20UGS00800 | |
| Lenovo ThinkPad X13-20T20033GE | |
| Samsung Galaxy Book Ion 13.3 | |
| Average Intel Core i5-10210U (949 - 1133, n=27) | |
| Fujitsu Lifebook U939 i5 | |
| Fujitsu LifeBook U7310 | |
| HP EliteBook 735 G6 7KN29EA | |
| Geekbench 5.5 / Multi-Core | |
| Average of class Office (1483 - 16999, n=70, last 2 years) | |
| Lenovo ThinkPad X13-20UGS00800 | |
| Lenovo ThinkPad X13-20T20033GE | |
| Samsung Galaxy Book Ion 13.3 | |
| Average Intel Core i5-10210U (2079 - 4256, n=27) | |
| Fujitsu Lifebook U939 i5 | |
| Fujitsu LifeBook U7310 | |
| HP EliteBook 735 G6 7KN29EA | |
| HWBOT x265 Benchmark v2.2 / 4k Preset | |
| Average of class Office (2.21 - 26, n=73, last 2 years) | |
| Lenovo ThinkPad X13-20UGS00800 | |
| Lenovo ThinkPad X13-20T20033GE | |
| Average Intel Core i5-10210U (2.36 - 6.28, n=24) | |
| Fujitsu Lifebook U939 i5 | |
| Fujitsu LifeBook U7310 | |
| Samsung Galaxy Book Ion 13.3 | |
| HP EliteBook 735 G6 7KN29EA | |
| LibreOffice / 20 Documents To PDF | |
| HP EliteBook 735 G6 7KN29EA | |
| Average Intel Core i5-10210U (49.6 - 80.3, n=18) | |
| Fujitsu Lifebook U939 i5 | |
| Lenovo ThinkPad X13-20UGS00800 | |
| Average of class Office (39.9 - 102.3, n=73, last 2 years) | |
| Lenovo ThinkPad X13-20T20033GE | |
| Fujitsu LifeBook U7310 | |
| Samsung Galaxy Book Ion 13.3 | |
| R Benchmark 2.5 / Overall mean | |
| HP EliteBook 735 G6 7KN29EA | |
| Average Intel Core i5-10210U (0.658 - 0.901, n=24) | |
| Fujitsu Lifebook U939 i5 | |
| Fujitsu LifeBook U7310 | |
| Samsung Galaxy Book Ion 13.3 | |
| Lenovo ThinkPad X13-20T20033GE | |
| Lenovo ThinkPad X13-20UGS00800 | |
| Average of class Office (0.4098 - 0.888, n=73, last 2 years) | |
* ... smaller is better
System Performance
System performance is also below expectations, with laptops with the same CPU/GPU performing about 8% faster on average. The equally equipped ThinkPad X13 is about 13% faster than the Fujitsu.
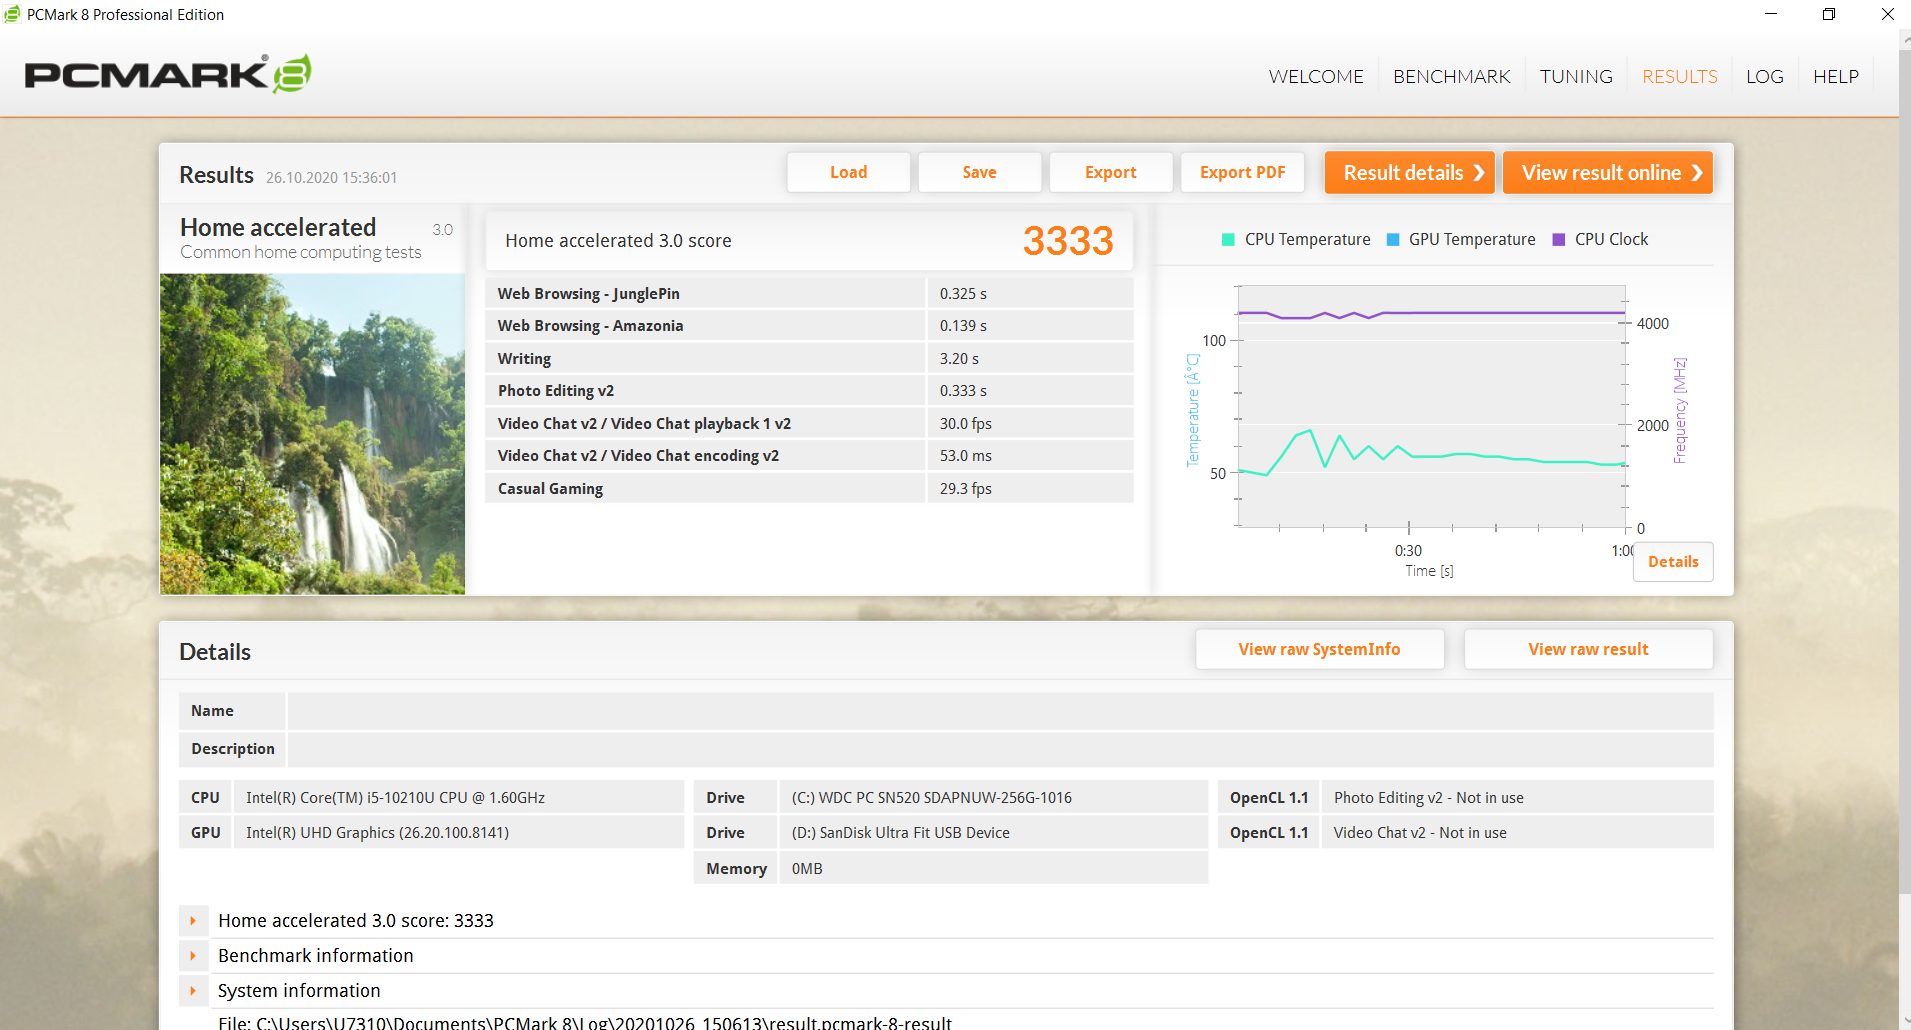
| PCMark 8 Home Score Accelerated v2 | 3333 points | |
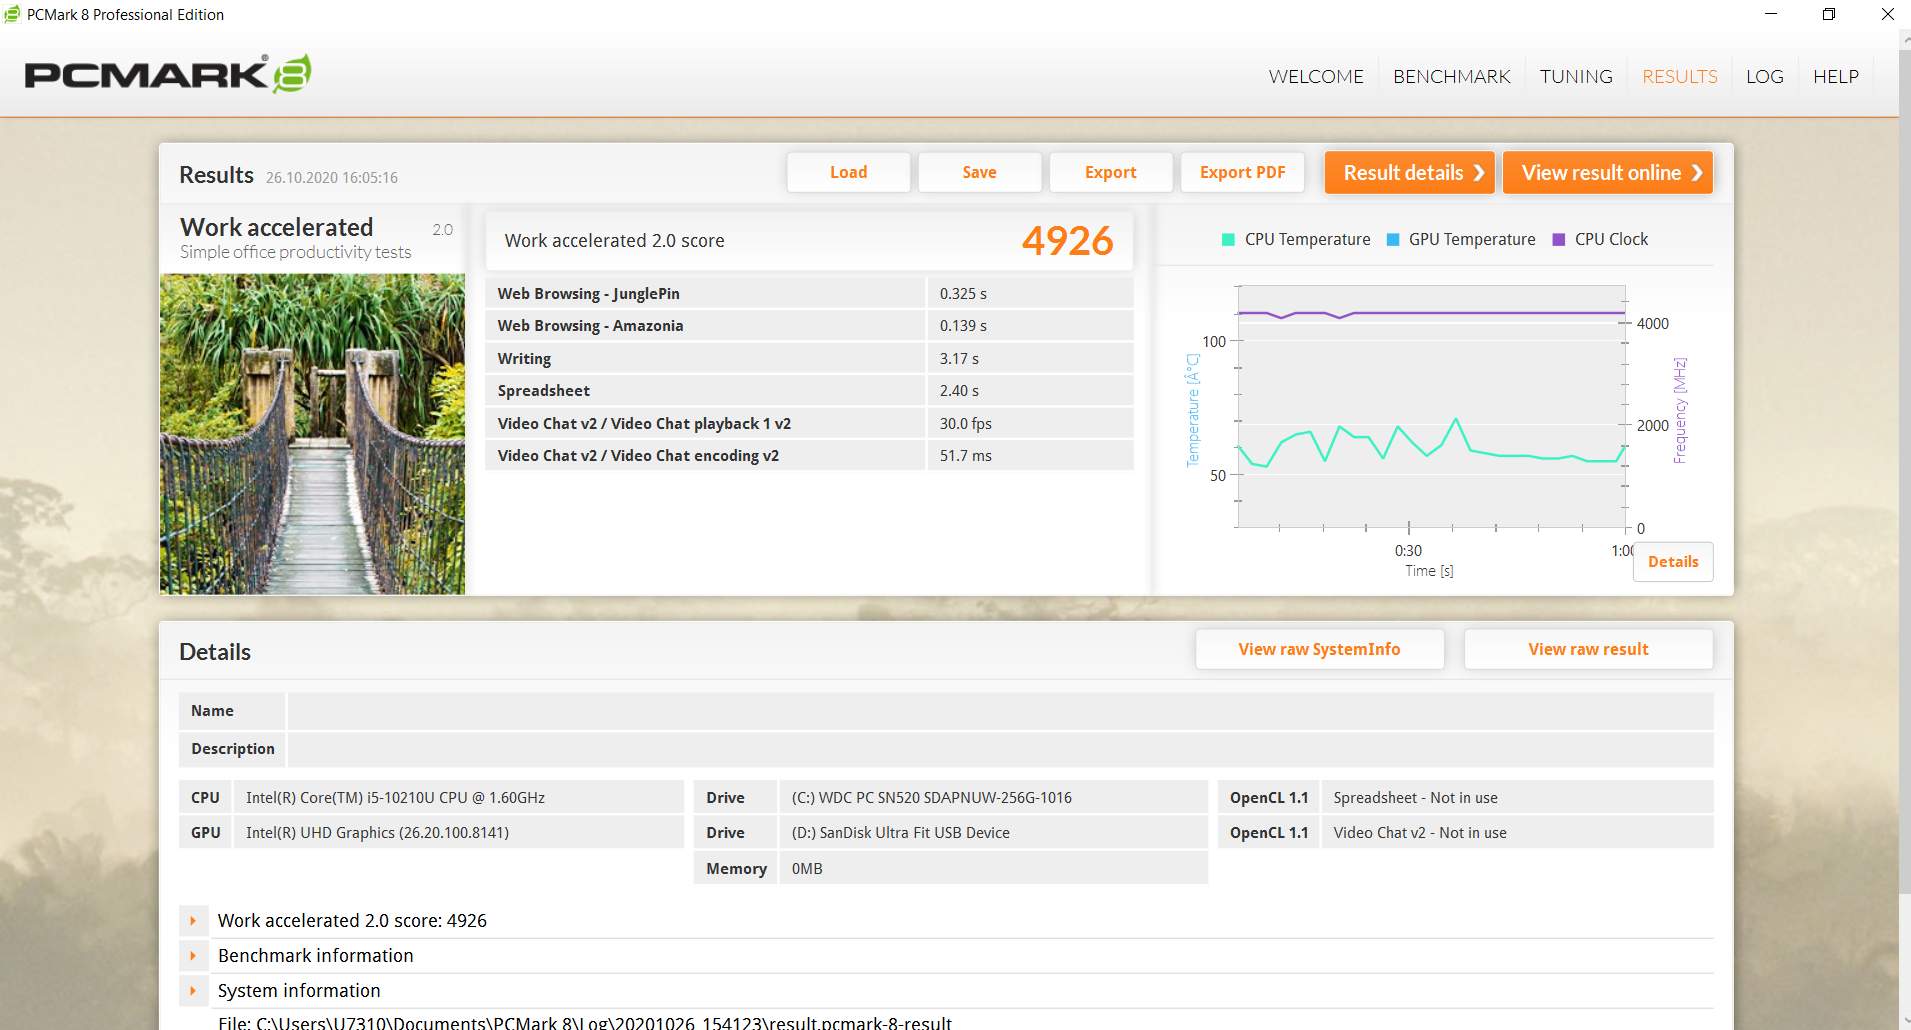
| PCMark 8 Work Score Accelerated v2 | 4926 points | |
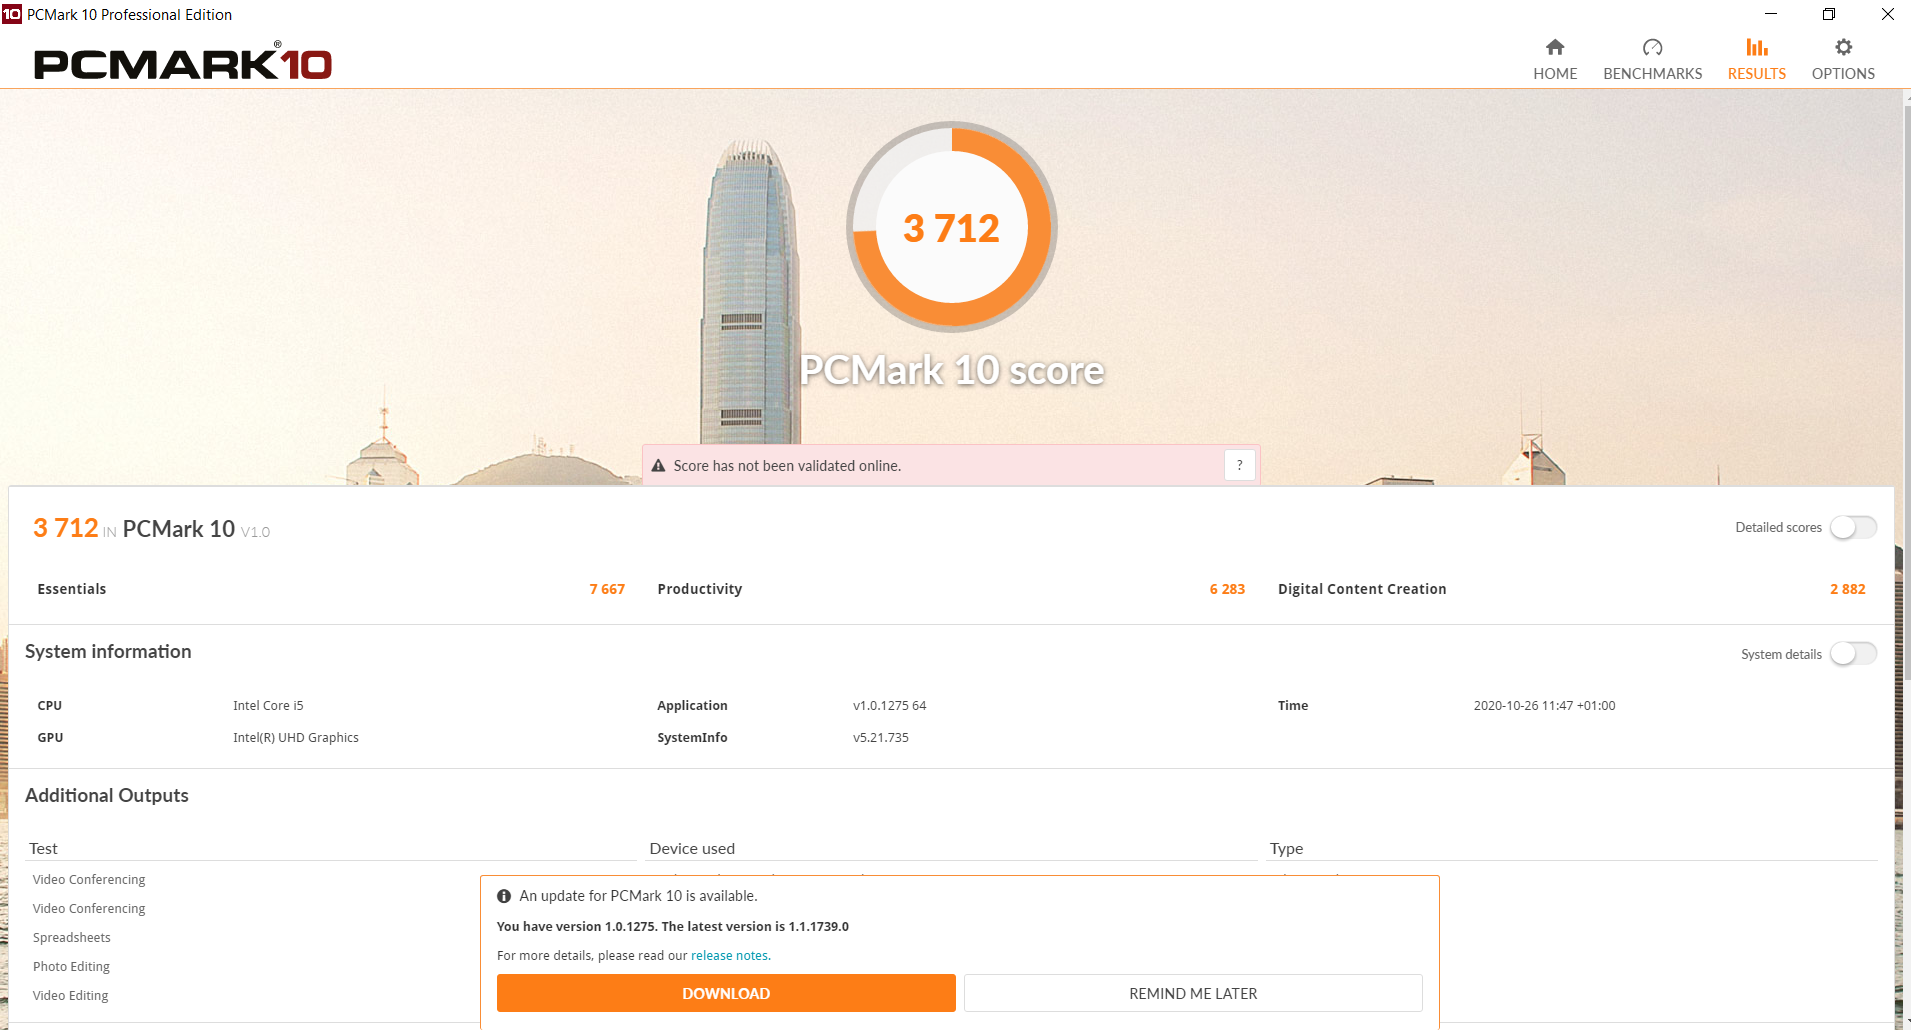
| PCMark 10 Score | 3712 points | |
Help | ||
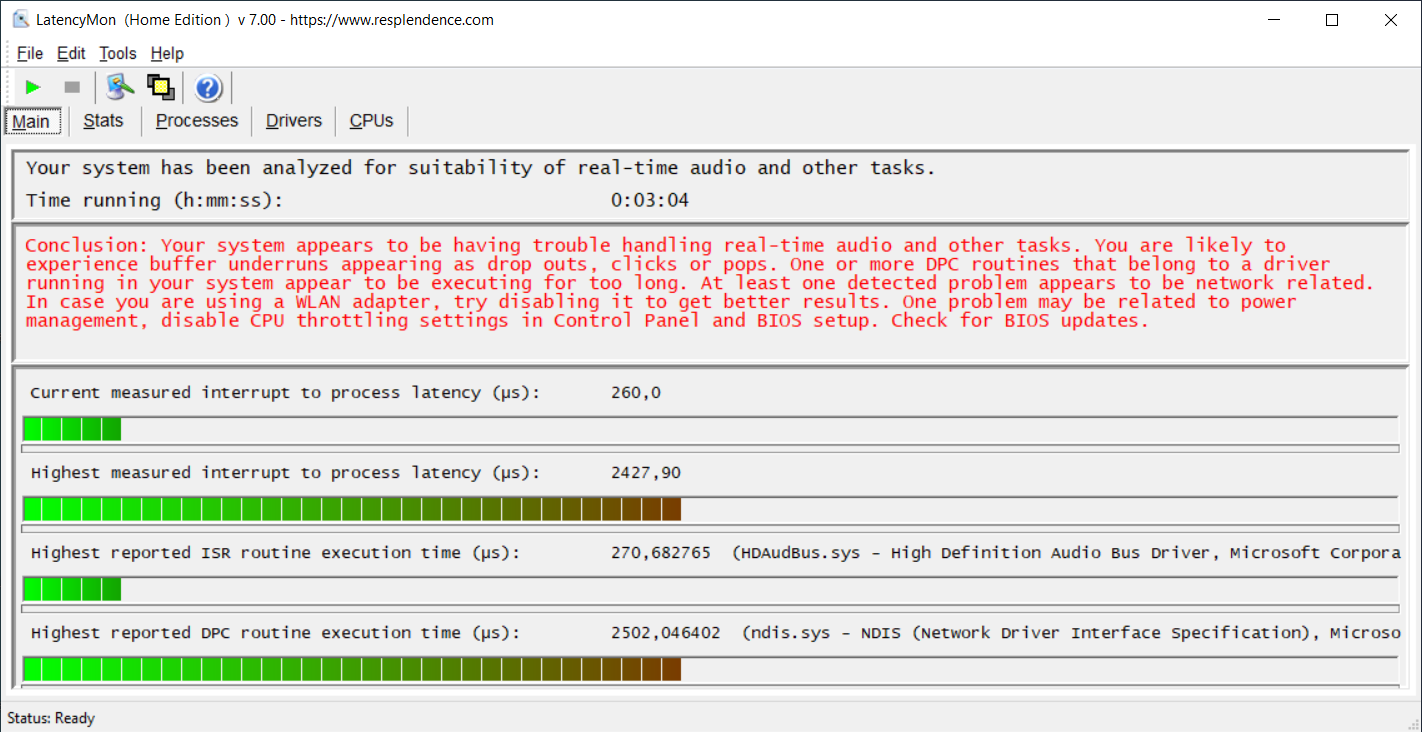
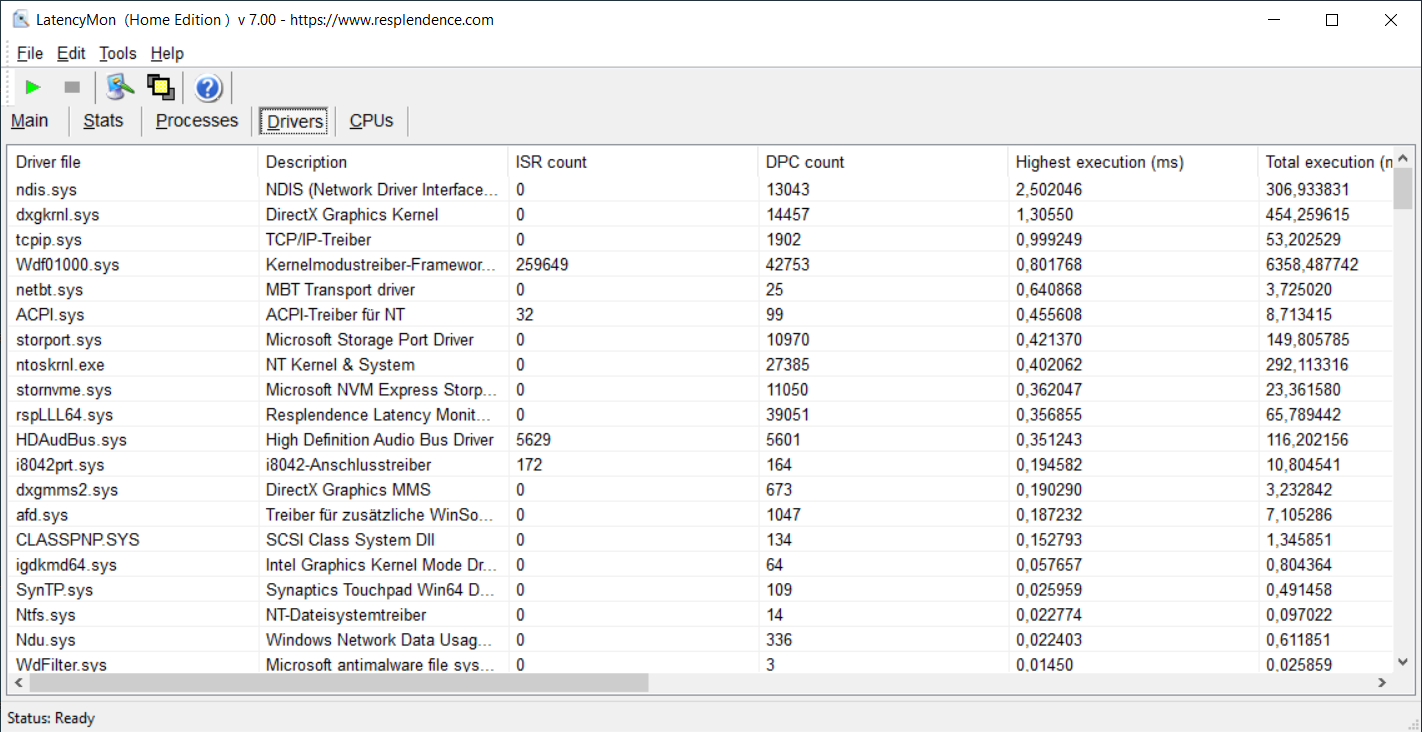
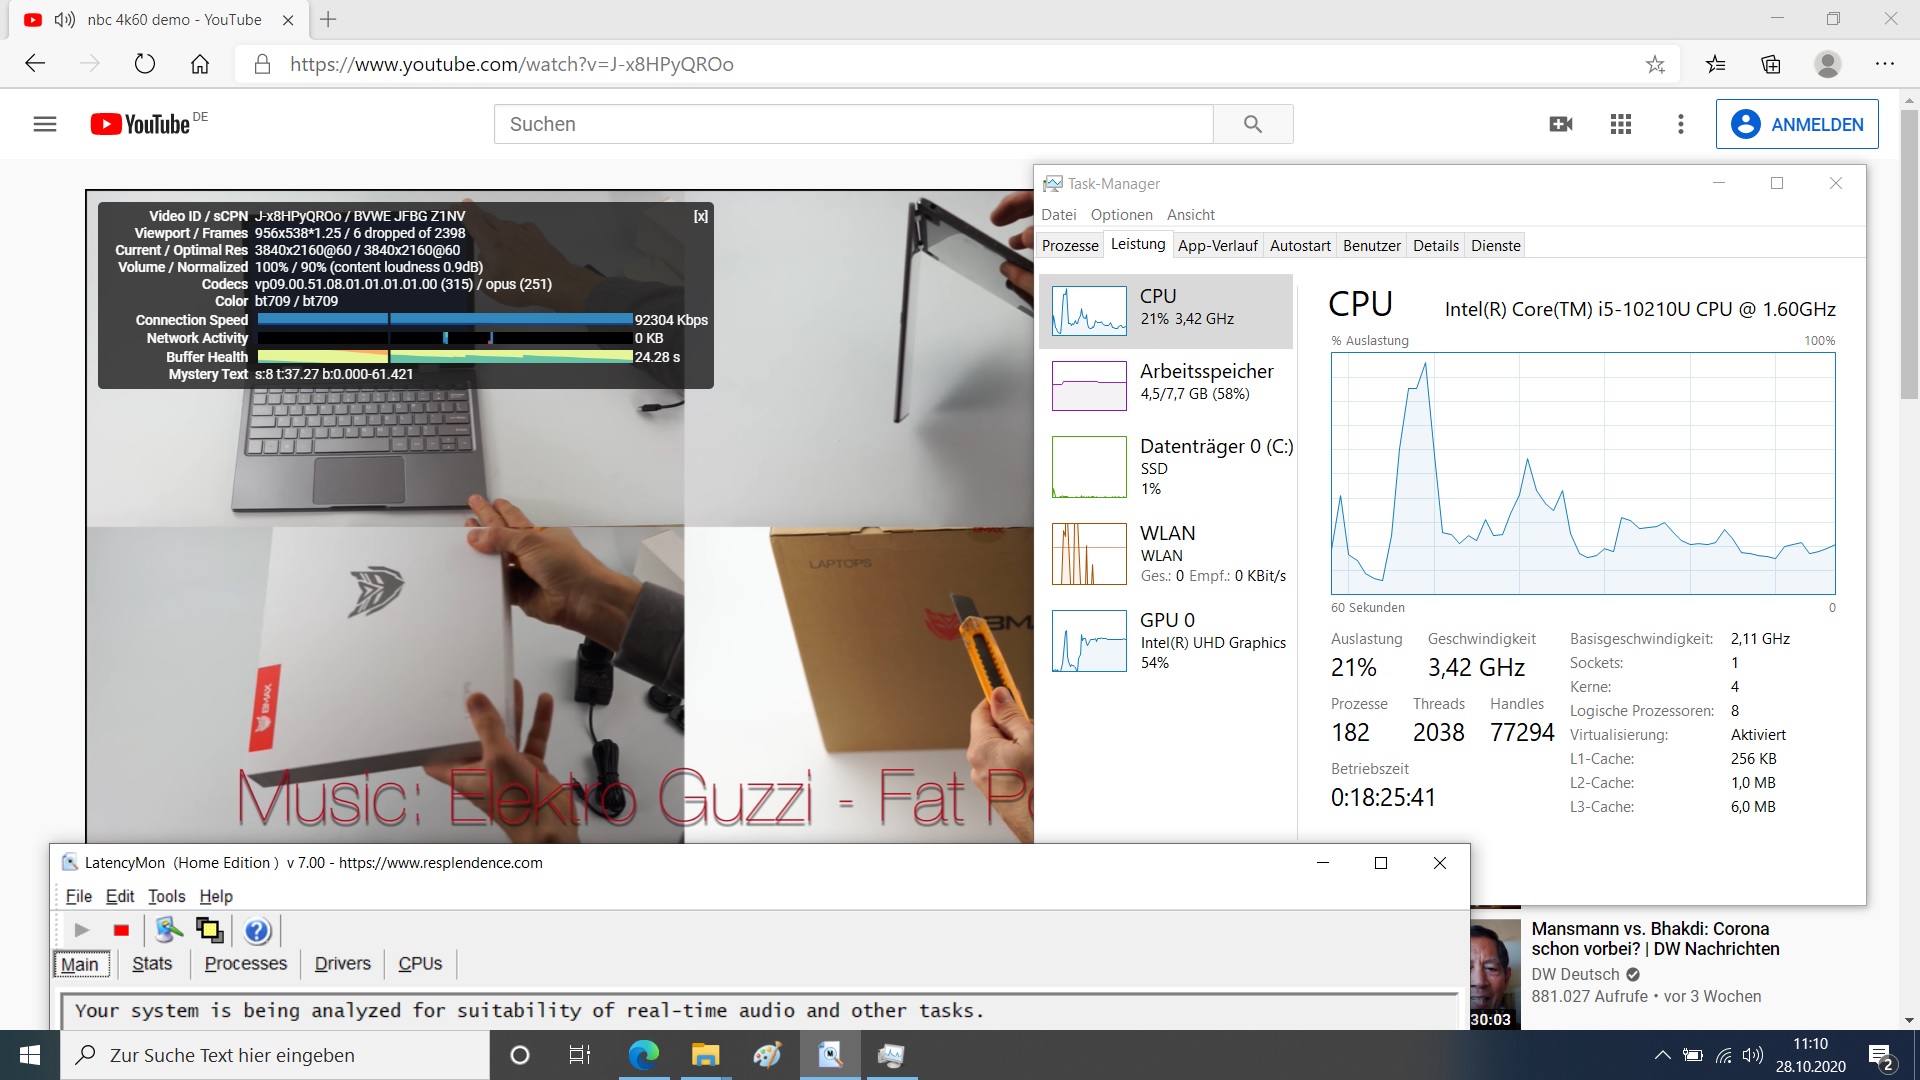
DPC latencies
There were no problems while browsing, but latencies occurred when playing our 4K/60Hz YouTube video. Several drivers seem to slow down the system, including two network drivers and a DirectX driver. There were 12 dropped frames during video playback.
| DPC Latencies / LatencyMon - interrupt to process latency (max), Web, Youtube, Prime95 | |
| Fujitsu LifeBook U7310 | |
| Lenovo ThinkPad X13-20UGS00800 | |
| Samsung Galaxy Book Ion 13.3 | |
| Lenovo ThinkPad X13-20T20033GE | |
* ... smaller is better
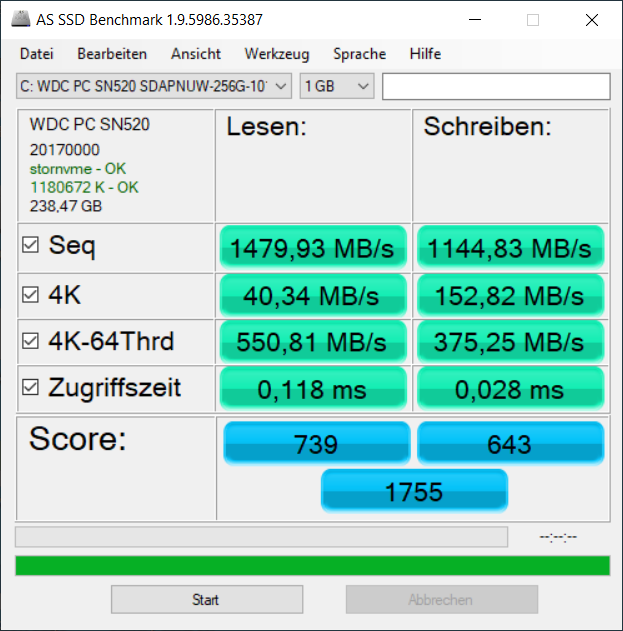
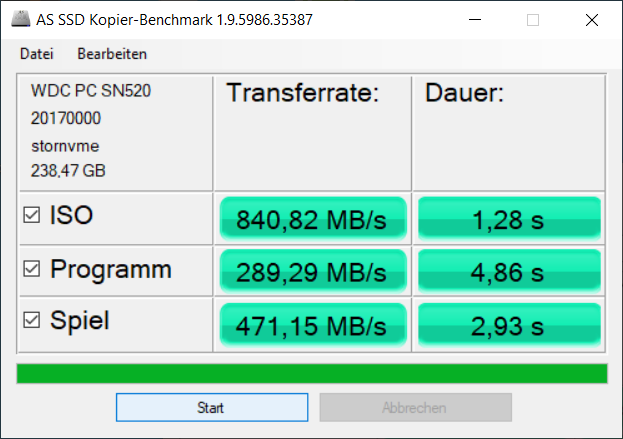
Mass Storage
In our SSD/HDD benchmark list, Western Digital's 256 GB SSD is only ranked 130th and cannot keep up with the Samsung drives in most competitors, which are almost twice as fast.
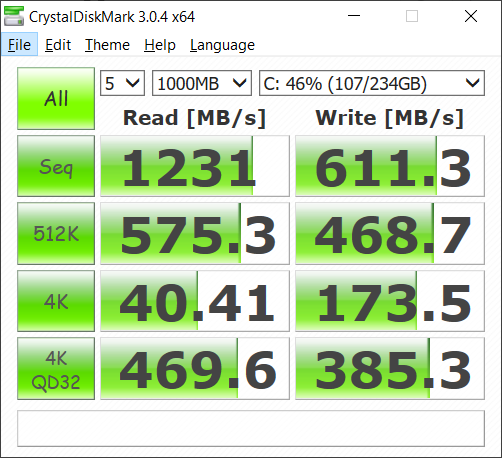
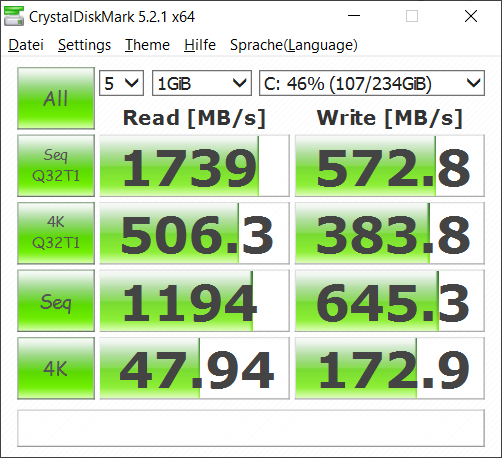
| Fujitsu LifeBook U7310 WDC PC SN520 SDAPNUW-256G | Lenovo ThinkPad X13-20T20033GE Samsung SSD PM981a MZVLB512HBJQ | Lenovo ThinkPad X13-20UGS00800 Samsung SSD PM981a MZVLB512HBJQ | HP EliteBook 735 G6 7KN29EA WDC PC SN520 SDAPNUW-256G | Fujitsu Lifebook U939 i5 Samsung SSD PM981 MZVLB512HAJQ | Samsung Galaxy Book Ion 13.3 Samsung SSD PM981a MZVLB256HBHQ | Average WDC PC SN520 SDAPNUW-256G | Average of class Office | |
|---|---|---|---|---|---|---|---|---|
| CrystalDiskMark 5.2 / 6 | 98% | 96% | 7% | 62% | 92% | 9% | 170% | |
| Write 4K (MB/s) | 172.9 | 131.1 -24% | 95.7 -45% | 116 -33% | 159 -8% | 159.6 -8% | 118.5 ? -31% | 153.5 ? -11% |
| Read 4K (MB/s) | 47.94 | 45.48 -5% | 37.47 -22% | 39.81 -17% | 48.12 0% | 48.22 1% | 42 ? -12% | 73.3 ? 53% |
| Write Seq (MB/s) | 645 | 2042 217% | 2032 215% | 1300 102% | 1657 157% | 2343 263% | 1123 ? 74% | 2454 ? 280% |
| Read Seq (MB/s) | 1194 | 2259 89% | 2207 85% | 803 -33% | 1522 27% | 2184 83% | 1208 ? 1% | 3229 ? 170% |
| Write 4K Q32T1 (MB/s) | 383.8 | 429.1 12% | 517 35% | 187.6 -51% | 349.2 -9% | 342.2 -11% | 324 ? -16% | 428 ? 12% |
| Read 4K Q32T1 (MB/s) | 506 | 370.7 -27% | 387 -24% | 305.9 -40% | 452.2 -11% | 485.4 -4% | 322 ? -36% | 513 ? 1% |
| Write Seq Q32T1 (MB/s) | 573 | 2963 417% | 2977 420% | 1299 127% | 1941 239% | 2354 311% | 1091 ? 90% | 4083 ? 613% |
| Read Seq Q32T1 (MB/s) | 1739 | 3564 105% | 3556 104% | 1741 0% | 3510 102% | 3555 104% | 1729 ? -1% | 6007 ? 245% |
| AS SSD | 80% | 86% | -19% | 89% | 25% | 2% | 128% | |
| Seq Read (MB/s) | 1479 | 2714 84% | 2553 73% | 1499 1% | 2677 81% | 2980 101% | 1362 ? -8% | 4305 ? 191% |
| Seq Write (MB/s) | 1144 | 1374 20% | 1406 23% | 1172 2% | 1819 59% | 2175 90% | 976 ? -15% | 2766 ? 142% |
| 4K Read (MB/s) | 40.34 | 51.2 27% | 48.53 20% | 35.42 -12% | 53.7 33% | 52.8 31% | 37.3 ? -8% | 57.8 ? 43% |
| 4K Write (MB/s) | 152.8 | 135.7 -11% | 119.6 -22% | 77.2 -49% | 145.8 -5% | 147.8 -3% | 109.8 ? -28% | 162.9 ? 7% |
| 4K-64 Read (MB/s) | 551 | 962 75% | 808 47% | 463.6 -16% | 1202 118% | 542 -2% | 560 ? 2% | 965 ? 75% |
| 4K-64 Write (MB/s) | 375.3 | 1420 278% | 1846 392% | 413.3 10% | 1290 244% | 282.4 -25% | 479 ? 28% | 1632 ? 335% |
| Access Time Read * (ms) | 0.118 | 0.043 64% | 0.062 47% | 0.133 -13% | 0.044 63% | 0.077 35% | 0.1046 ? 11% | 0.08504 ? 28% |
| Access Time Write * (ms) | 0.028 | 0.028 -0% | 0.031 -11% | 0.049 -75% | 0.026 7% | 0.025 11% | 0.03554 ? -27% | 0.05931 ? -112% |
| Score Read (Points) | 739 | 1284 74% | 1112 50% | 649 -12% | 1523 106% | 893 21% | 733 ? -1% | 1453 ? 97% |
| Score Write (Points) | 643 | 1693 163% | 2107 228% | 608 -5% | 1618 152% | 648 1% | 687 ? 7% | 2071 ? 222% |
| Score Total (Points) | 1755 | 3579 104% | 3742 113% | 1582 -10% | 3887 121% | 1974 12% | 1787 ? 2% | 4202 ? 139% |
| Copy ISO MB/s (MB/s) | 841 | 1395 66% | 1249 49% | 990 ? 18% | 2533 ? 201% | |||
| Copy Program MB/s (MB/s) | 289.3 | 491.8 70% | 53.5 -82% | 368 ? 27% | 788 ? 172% | |||
| Copy Game MB/s (MB/s) | 471.1 | 948 101% | 201.3 -57% | 592 ? 26% | 1643 ? 249% | |||
| Total Average (Program / Settings) | 89% /
87% | 91% /
89% | -6% /
-10% | 76% /
78% | 59% /
53% | 6% /
5% | 149% /
143% |
* ... smaller is better

Continuous read: DiskSpd Read Loop, Queue Depth 8
Graphics card
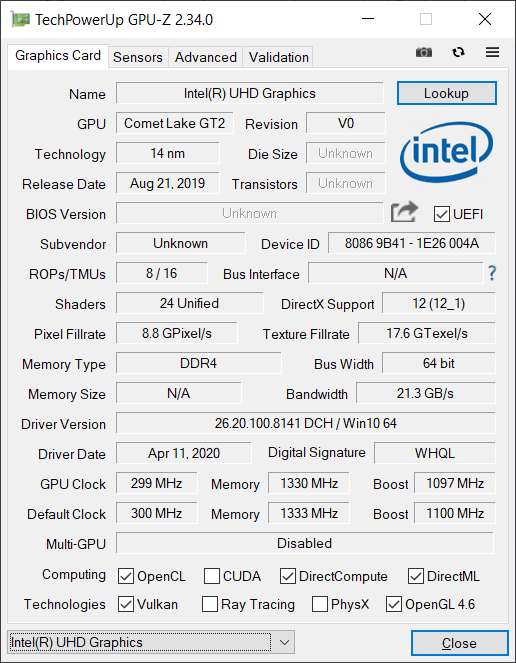
The integrated Intel UHD Graphics 620 has gotten a bit long in the tooth. It is sufficient for an office laptop, but games are only possible with very old or undemanding titles. The integrated GPUs of the AMD competition set themselves apart here, but also Intel has much better models to offer.
Even in the synthetic 3DMark tests, Fujitsu can't tap the potential of its hardware and performs between 5 and 16% worse than the average with the same CPU/GPU. Accordingly, the ThinkPad X13 with the same CPU/GPU is always significantly faster.
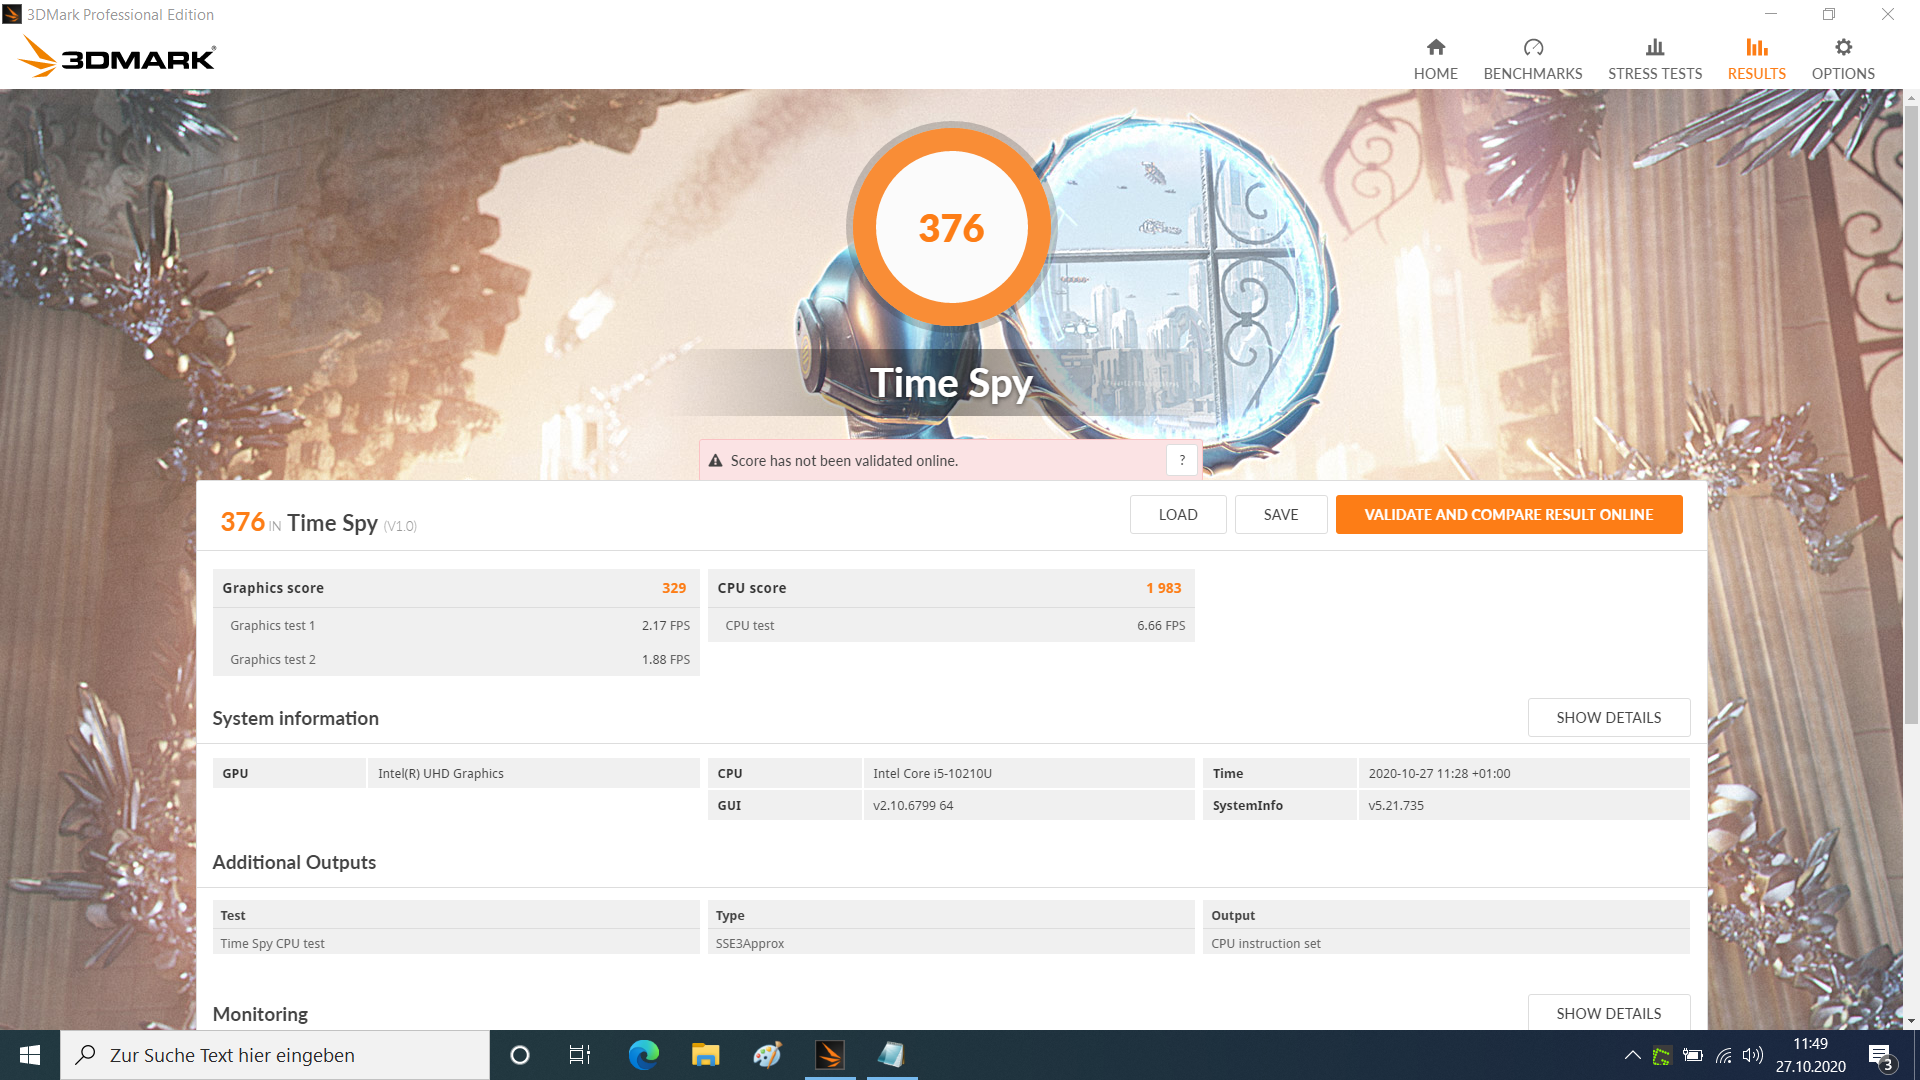
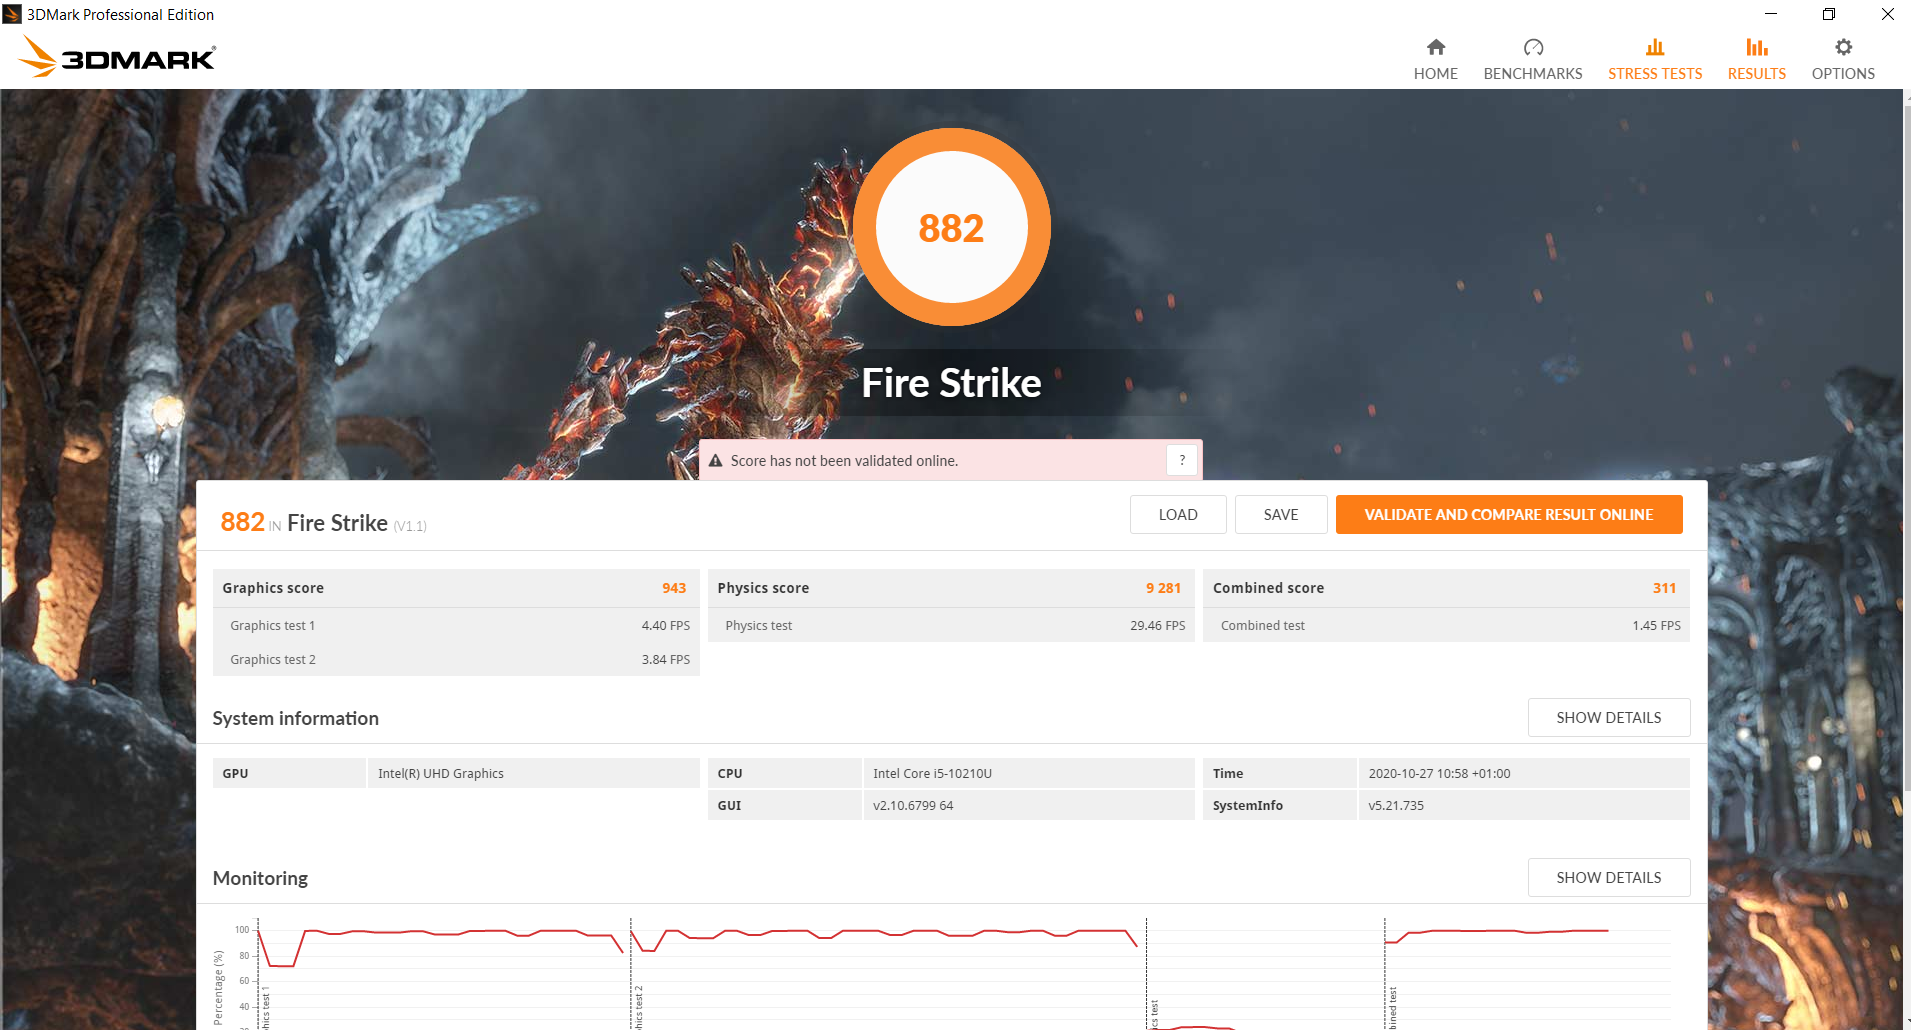
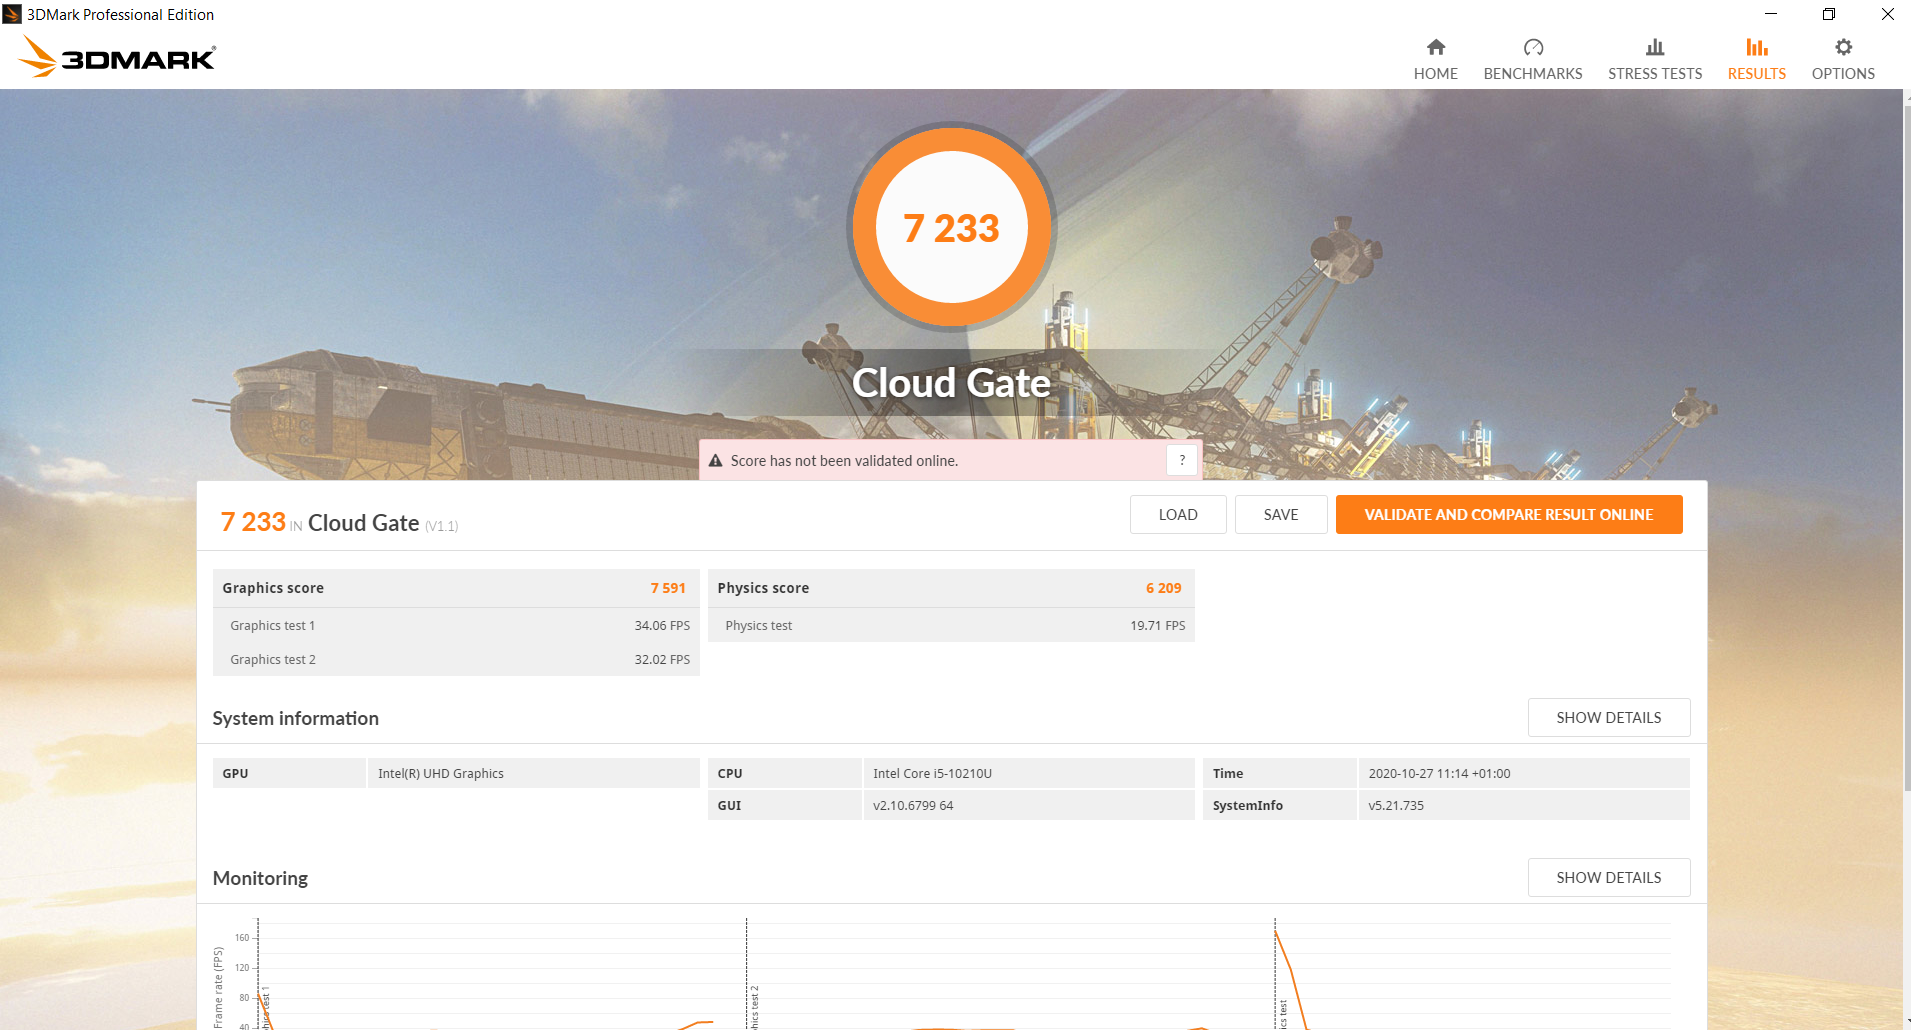

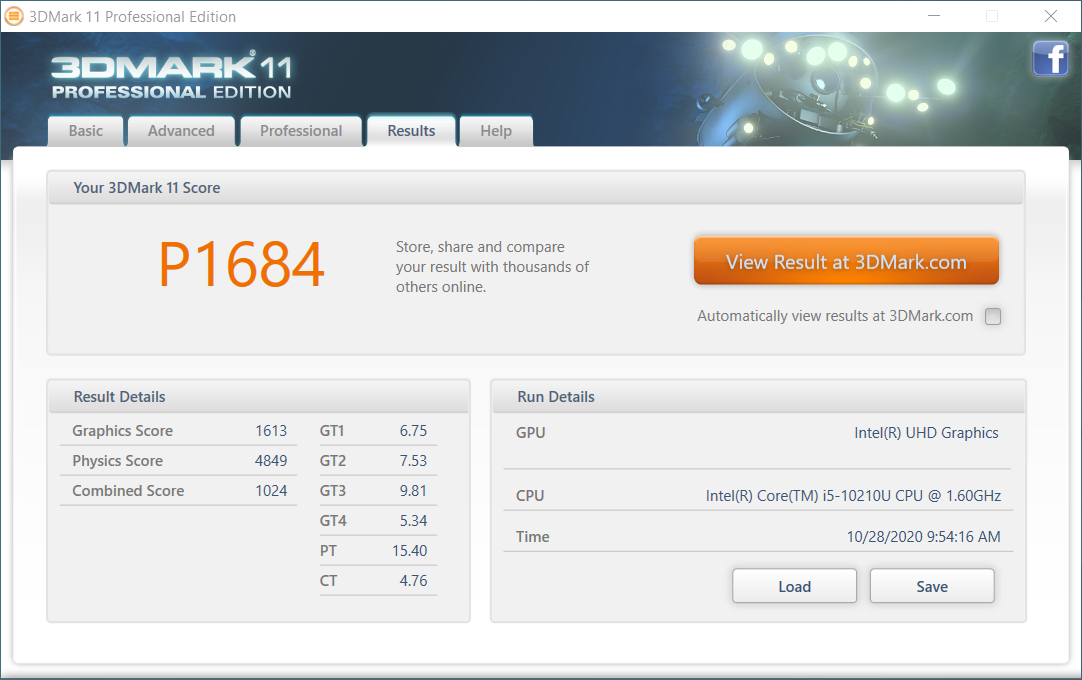
| 3DMark 11 Performance | 1715 points | |
| 3DMark Cloud Gate Standard Score | 7233 points | |
| 3DMark Fire Strike Score | 882 points | |
| 3DMark Time Spy Score | 376 points | |
Help | ||
| low | med. | high | ultra | |
|---|---|---|---|---|
| The Witcher 3 (2015) | 9.6 | |||
| Dota 2 Reborn (2015) | 58.2 | 30.6 | 15.5 | 13.7 |
| X-Plane 11.11 (2018) | 20 | 13.5 | 12 |
Emissions & Energy
Noise emissions
All competitors operate here at about the same level. In idle, the fans are mostly idle anyway and even under stress, the fans are hardly audible. Our test model has slight volume advantages under maximum load due to the strong throttling. The noise level of the AMD Ryzen competition is impressive, which performs much better, but remains similarly quiet.
Noise level
| Idle |
| 29.4 / 29.4 / 30 dB(A) |
| Load |
| 30.6 / 30.6 dB(A) |
 | ||
30 dB silent 40 dB(A) audible 50 dB(A) loud |
||
min: | ||
| Fujitsu LifeBook U7310 UHD Graphics 620, i5-10210U, WDC PC SN520 SDAPNUW-256G | Lenovo ThinkPad X13-20T20033GE UHD Graphics 620, i5-10210U, Samsung SSD PM981a MZVLB512HBJQ | Lenovo ThinkPad X13-20UGS00800 Vega 7, R7 PRO 4750U, Samsung SSD PM981a MZVLB512HBJQ | HP EliteBook 735 G6 7KN29EA Vega 8, R5 PRO 3500U, WDC PC SN520 SDAPNUW-256G | Fujitsu Lifebook U939 i5 UHD Graphics 620, i5-8265U, Samsung SSD PM981 MZVLB512HAJQ | Samsung Galaxy Book Ion 13.3 UHD Graphics 620, i5-10210U, Samsung SSD PM981a MZVLB256HBHQ | |
|---|---|---|---|---|---|---|
| Noise | -2% | 0% | -5% | -4% | -9% | |
| off / environment * (dB) | 29.4 | 29.3 -0% | 29.1 1% | 29.6 -1% | 29.8 -1% | 30.7 -4% |
| Idle Minimum * (dB) | 29.4 | 29.3 -0% | 29.1 1% | 29.6 -1% | 29.8 -1% | 30.7 -4% |
| Idle Average * (dB) | 29.4 | 29.3 -0% | 29.1 1% | 29.6 -1% | 29.8 -1% | 30.7 -4% |
| Idle Maximum * (dB) | 30 | 29.3 2% | 29.1 3% | 30.9 -3% | 29.8 1% | 30.7 -2% |
| Load Average * (dB) | 30.6 | 30.7 -0% | 31.1 -2% | 33.9 -11% | 31.7 -4% | 36.6 -20% |
| Load Maximum * (dB) | 30.6 | 34 -11% | 31.8 -4% | 33.9 -11% | 36.3 -19% | 36.3 -19% |
| Witcher 3 ultra * (dB) | 35.8 |
* ... smaller is better
Temperature
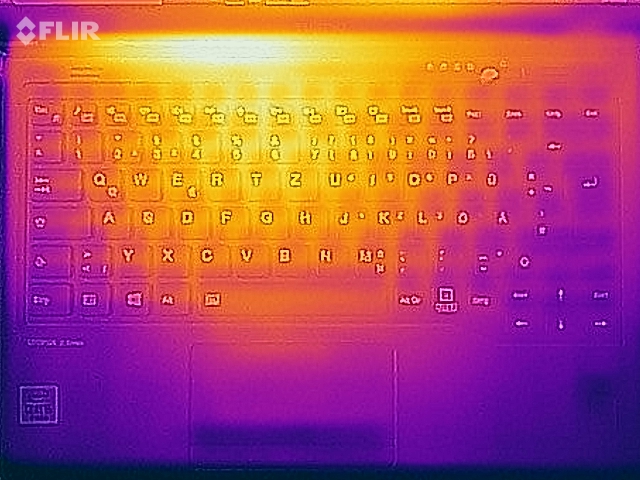
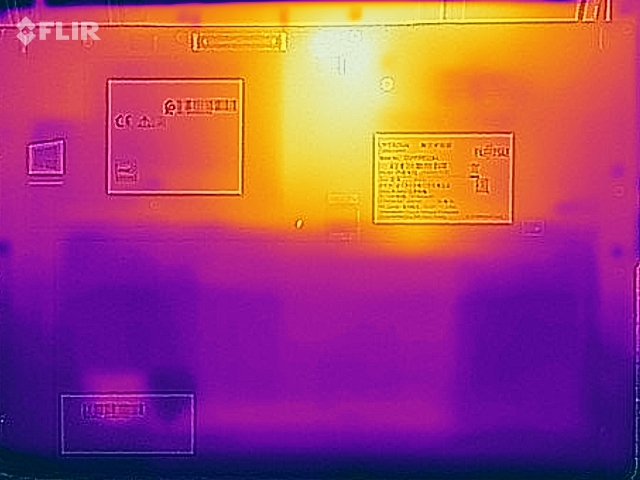
Under maximum load, the underside in the rear, central area can heat up to 42 °C. Overall, the U7310 is one of the coolest units in the test under load, and the throttling must have advantages. The palm rests always stay pleasantly cool, even under stress.
(+) The maximum temperature on the upper side is 36.3 °C / 97 F, compared to the average of 34.3 °C / 94 F, ranging from 21.2 to 62.5 °C for the class Office.
(±) The bottom heats up to a maximum of 42 °C / 108 F, compared to the average of 36.8 °C / 98 F
(+) In idle usage, the average temperature for the upper side is 23.4 °C / 74 F, compared to the device average of 29.5 °C / 85 F.
(+) The palmrests and touchpad are cooler than skin temperature with a maximum of 27.1 °C / 80.8 F and are therefore cool to the touch.
(±) The average temperature of the palmrest area of similar devices was 27.5 °C / 81.5 F (+0.4 °C / 0.7 F).
| Fujitsu LifeBook U7310 UHD Graphics 620, i5-10210U, WDC PC SN520 SDAPNUW-256G | Lenovo ThinkPad X13-20T20033GE UHD Graphics 620, i5-10210U, Samsung SSD PM981a MZVLB512HBJQ | Lenovo ThinkPad X13-20UGS00800 Vega 7, R7 PRO 4750U, Samsung SSD PM981a MZVLB512HBJQ | HP EliteBook 735 G6 7KN29EA Vega 8, R5 PRO 3500U, WDC PC SN520 SDAPNUW-256G | Fujitsu Lifebook U939 i5 UHD Graphics 620, i5-8265U, Samsung SSD PM981 MZVLB512HAJQ | Samsung Galaxy Book Ion 13.3 UHD Graphics 620, i5-10210U, Samsung SSD PM981a MZVLB256HBHQ | |
|---|---|---|---|---|---|---|
| Heat | -12% | -6% | -13% | -12% | -10% | |
| Maximum Upper Side * (°C) | 36.3 | 48.4 -33% | 44.8 -23% | 39.5 -9% | 46.3 -28% | 41.8 -15% |
| Maximum Bottom * (°C) | 42 | 43.8 -4% | 42.1 -0% | 41.8 -0% | 44.9 -7% | 43 -2% |
| Idle Upper Side * (°C) | 23.9 | 25.2 -5% | 24.1 -1% | 28.5 -19% | 25.8 -8% | 26.6 -11% |
| Idle Bottom * (°C) | 24.8 | 25.7 -4% | 25.1 -1% | 30.6 -23% | 25.8 -4% | 27.2 -10% |
* ... smaller is better
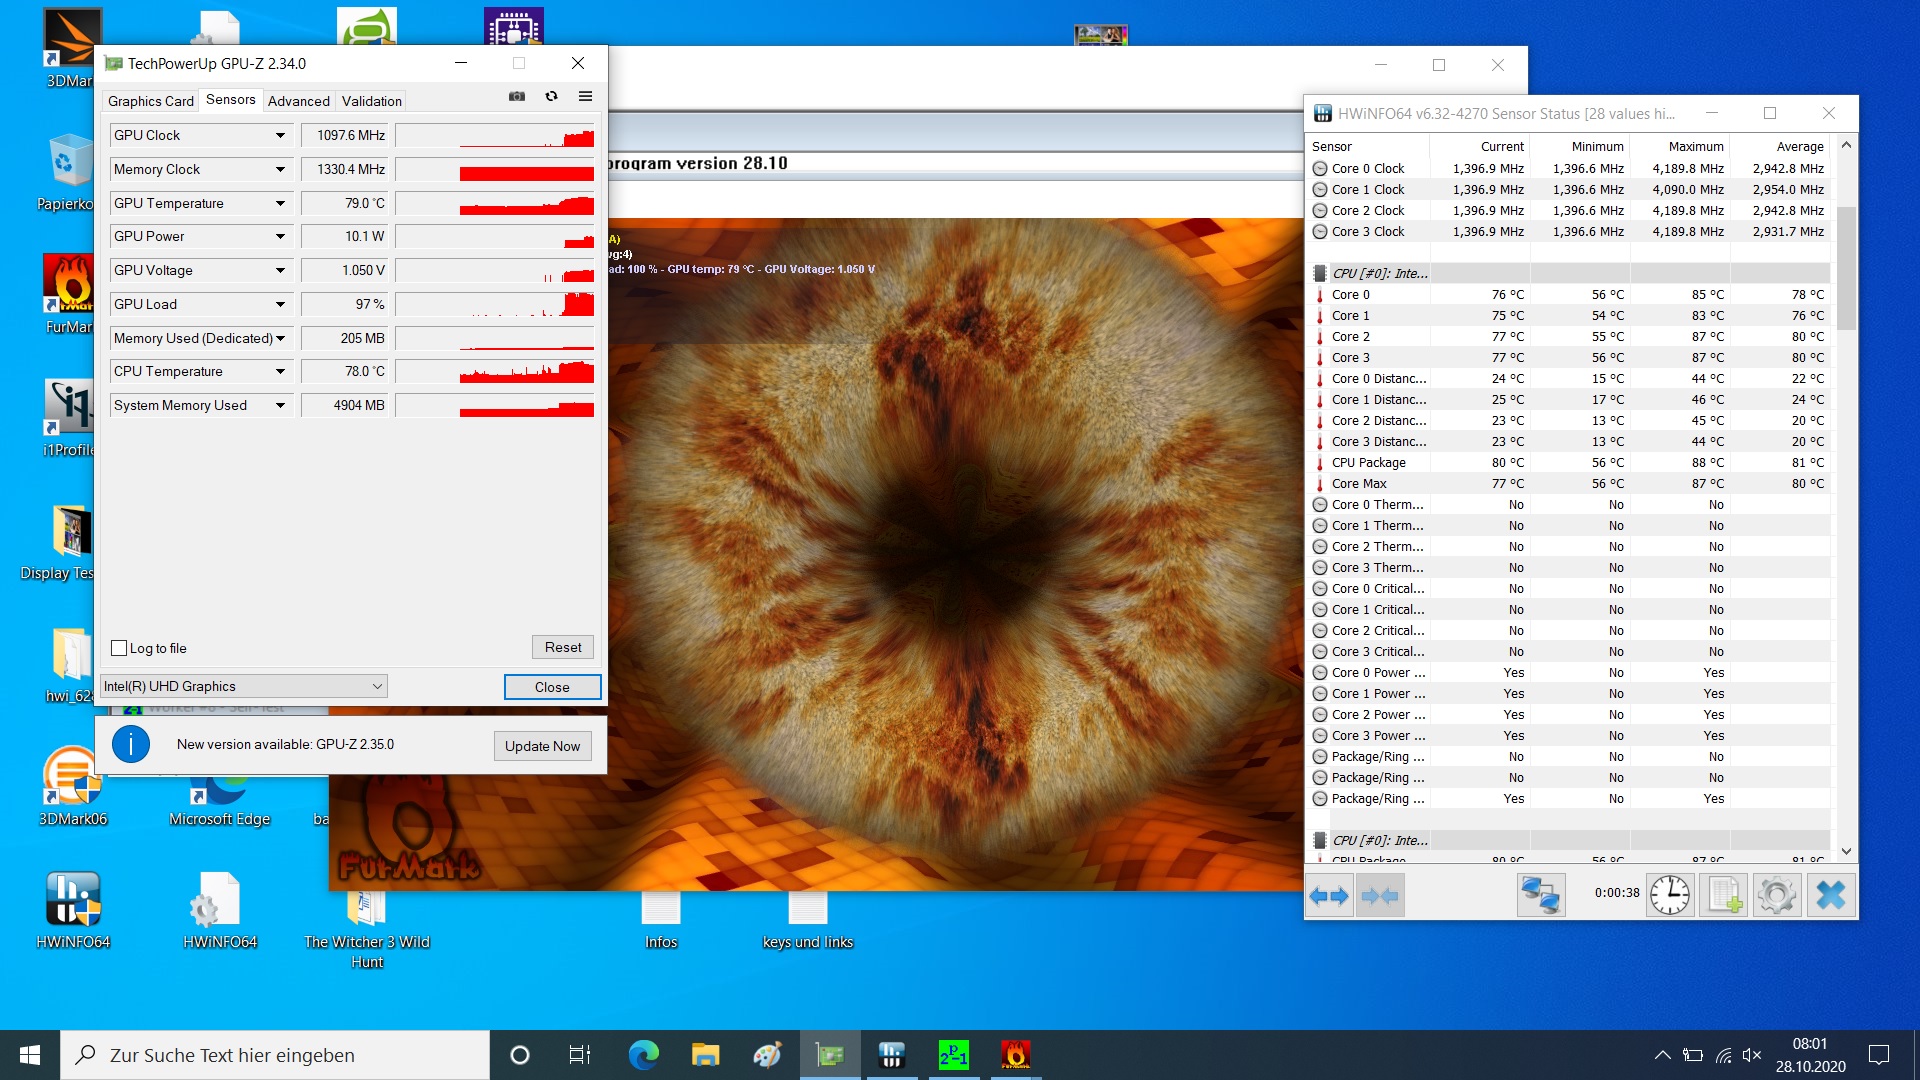
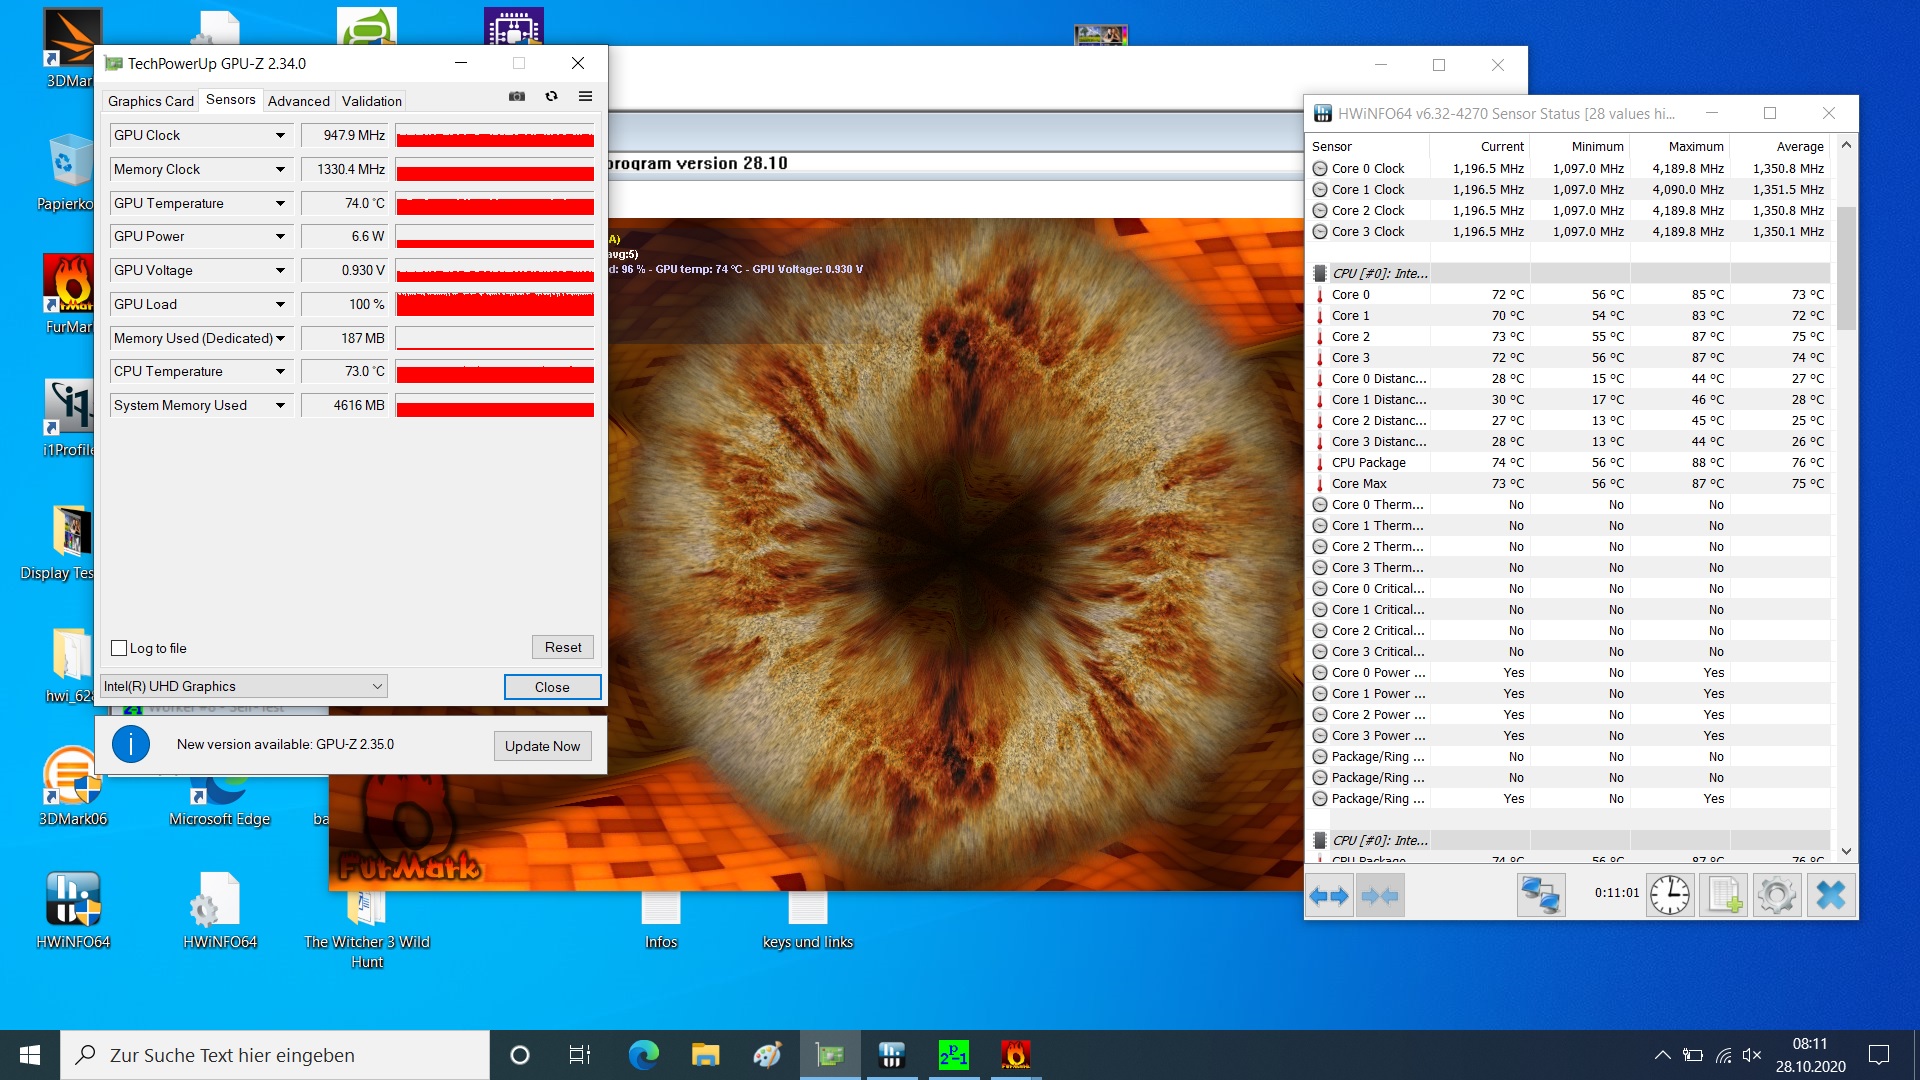
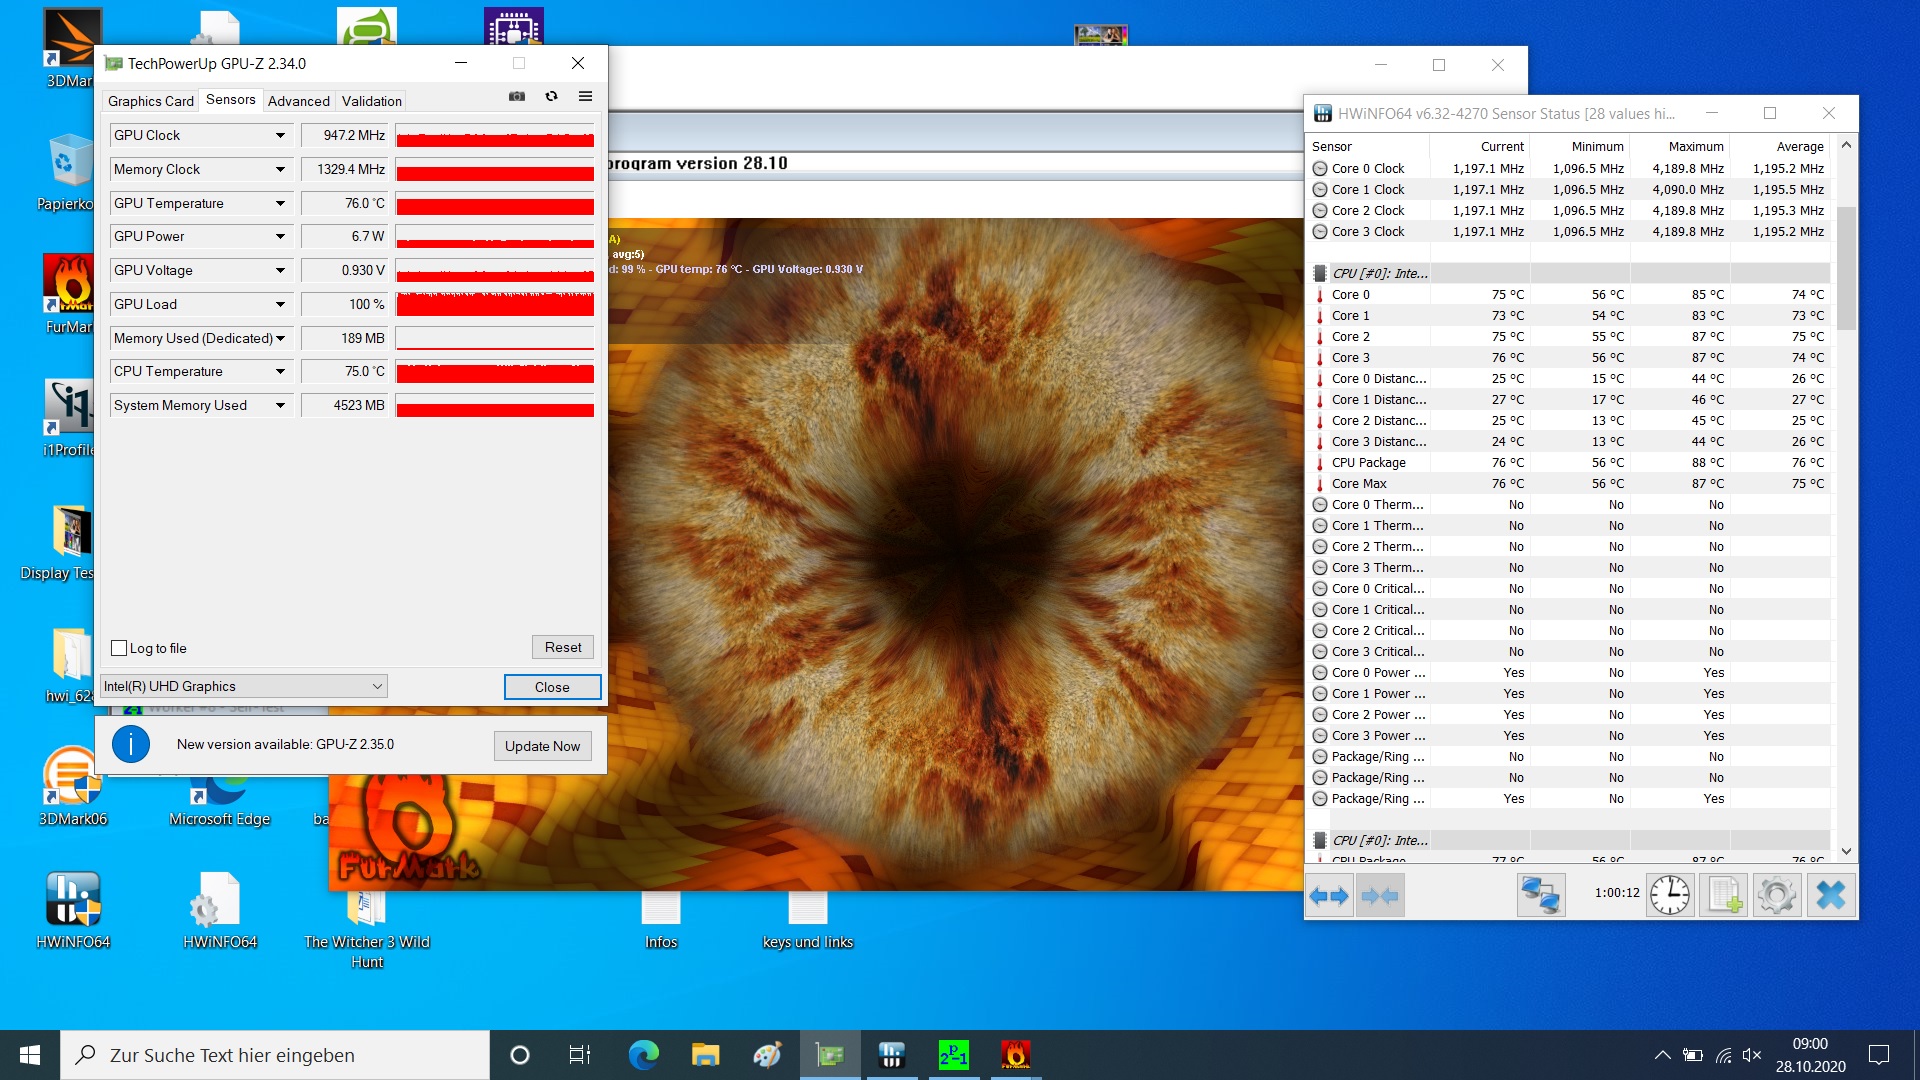
In the stress test, the cores clock at over 3 GHz for a few seconds and then quickly drop to just 1.3 GHz. After 10 minutes with Prime95 and Furmark, they drop further to 1.2 GHz, well below the base clock of 1.6 GHz. The core temperatures rise up to 87 °C, then the throttling sets in, then they level off at around 74 °C, an extremely relaxed value, where Fujitsu obviously puts quietness and coolness before high performance - for an office device probably not the worst decision.
Speakers
Of course, loudspeakers do not really come into their own in a 13-inch housing. According to our values they should be louder and of course have hardly any bass. We therefore recommend connecting external audio devices. In addition to HDMI and USB, a combined jack slot is available for this purpose, the quality of which is perfectly acceptable.
Fujitsu LifeBook U7310 audio analysis
(-) | not very loud speakers (71.4 dB)
Bass 100 - 315 Hz
(-) | nearly no bass - on average 21.3% lower than median
(±) | linearity of bass is average (9.9% delta to prev. frequency)
Mids 400 - 2000 Hz
(±) | higher mids - on average 5.1% higher than median
(±) | linearity of mids is average (7.3% delta to prev. frequency)
Highs 2 - 16 kHz
(+) | balanced highs - only 3.1% away from median
(±) | linearity of highs is average (10.2% delta to prev. frequency)
Overall 100 - 16.000 Hz
(±) | linearity of overall sound is average (27.9% difference to median)
Compared to same class
» 87% of all tested devices in this class were better, 3% similar, 10% worse
» The best had a delta of 7%, average was 21%, worst was 53%
Compared to all devices tested
» 85% of all tested devices were better, 3% similar, 12% worse
» The best had a delta of 4%, average was 23%, worst was 134%
Apple MacBook 12 (Early 2016) 1.1 GHz audio analysis
(+) | speakers can play relatively loud (83.6 dB)
Bass 100 - 315 Hz
(±) | reduced bass - on average 11.3% lower than median
(±) | linearity of bass is average (14.2% delta to prev. frequency)
Mids 400 - 2000 Hz
(+) | balanced mids - only 2.4% away from median
(+) | mids are linear (5.5% delta to prev. frequency)
Highs 2 - 16 kHz
(+) | balanced highs - only 2% away from median
(+) | highs are linear (4.5% delta to prev. frequency)
Overall 100 - 16.000 Hz
(+) | overall sound is linear (10.2% difference to median)
Compared to same class
» 7% of all tested devices in this class were better, 2% similar, 91% worse
» The best had a delta of 5%, average was 18%, worst was 53%
Compared to all devices tested
» 5% of all tested devices were better, 1% similar, 94% worse
» The best had a delta of 4%, average was 23%, worst was 134%
Energy consumption
In idle and for smaller tasks, the U7310 consumes relatively little. But under load, and especially under very high load, the device consumes far too much, given its severely limited performance, and even the considerably more powerful AMD laptops are then even more economical.
| Off / Standby | |
| Idle | |
| Load |
|
Key:
min: | |
| Fujitsu LifeBook U7310 UHD Graphics 620, i5-10210U, WDC PC SN520 SDAPNUW-256G | Lenovo ThinkPad X13-20T20033GE UHD Graphics 620, i5-10210U, Samsung SSD PM981a MZVLB512HBJQ | Lenovo ThinkPad X13-20UGS00800 Vega 7, R7 PRO 4750U, Samsung SSD PM981a MZVLB512HBJQ | HP EliteBook 735 G6 7KN29EA Vega 8, R5 PRO 3500U, WDC PC SN520 SDAPNUW-256G | Fujitsu Lifebook U939 i5 UHD Graphics 620, i5-8265U, Samsung SSD PM981 MZVLB512HAJQ | Samsung Galaxy Book Ion 13.3 UHD Graphics 620, i5-10210U, Samsung SSD PM981a MZVLB256HBHQ | |
|---|---|---|---|---|---|---|
| Power Consumption | -8% | -42% | -36% | -12% | -5% | |
| Idle Minimum * (Watt) | 2.9 | 2.9 -0% | 6 -107% | 5.6 -93% | 3.1 -7% | 2.2 24% |
| Idle Average * (Watt) | 5.3 | 5.6 -6% | 8.9 -68% | 8.1 -53% | 5.9 -11% | 5.9 -11% |
| Idle Maximum * (Watt) | 7.1 | 8.9 -25% | 11.3 -59% | 9.6 -35% | 9.2 -30% | 8.9 -25% |
| Load Average * (Watt) | 30.7 | 30.1 2% | 34.2 -11% | 34.3 -12% | 35.8 -17% | 46 -50% |
| Load Maximum * (Watt) | 55.3 | 61.3 -11% | 37.2 33% | 48.6 12% | 51.9 6% | 34 39% |
| Witcher 3 ultra * (Watt) | 25.5 |
* ... smaller is better
Battery life
The battery life is actually good in the class average (between 8 and 11 hours in the WLAN test, depending on brightness), but is put in perspective again in view of the large battery. Although the U7310 with its 60 Wh battery lasts longest in comparison, the ThinkPad, for example, has only a 48 Wh battery, and with maximum brightness in the WLAN test, it has virtually the same runtime.
Pros
Cons
Verdict
Everything about the Fujitsu LifeBook U7310 is designed for quiet, cool and secure office operation. In itself this is a good decision, but Fujitsu may be taking things a bit too far and sacrificing too much performance.
The U7310 has some plus points or even unique selling points on its side, like the removable battery, the maintenance cover, the optional palm vein sensor, the SIM slot and the full-fledged SD card reader.
Business customers get a good working laptop with many security features, but users who also want to run graphics applications will probably be disappointed with the performance of the Fujitsu. In everyday office life, however, this is unlikely to be a problem - the small quality flaws such as the rattling right mouse button or the wobbling power plug, on the other hand, are a problem - especially at a price of well over 1,000 Euros (~$1,188). Also annoying are the driver problems and the resulting latencies and dropped frames during YouTube video playback.
The LifeBook U7310 is a quiet, cool business laptop with useful security features and a removable battery. To achieve this, however, Fujitsu severely limits the performance, and there are also slight flaws in the workmanship.
Fujitsu LifeBook U7310
- 10/29/2020 v7 (old)
Christian Hintze
Price comparison

