HP EliteBook 735 G6 laptop review: Despite AMD Picasso, not necessarily a bad choice
HP was one of the first manufacturers to use AMD processors in laptops to a large extent. At the core of HP's AMD portfolio was the EliteBook 700 series for enterprise customers. The EliteBook 700 series will be integrated into the EliteBook 800 series this year, which shows: With the AMD Ryzen 4000 series, AMD processors have finally reached the laptop mainstream.
We are not reviewing any EliteBooks with the new CPUs today as these models are not yet available. Instead, we will take a look at one of the last models in the HP EliteBook 700 series, the HP EliteBook 735 G6. This is the AMD version of the HP EliteBook 830 G6, which is powered by AMD Ryzen 3000 CPUs. Apart from the Ryzen 5 processor, the other key features of this configuration are as follows: 256 GB of SSD storage, 8 GB of RAM and an IPS display with Full HD resolution. With this configuration, the HP EliteBook 735 G6 costs around 1,380 Euros (~$1,558).
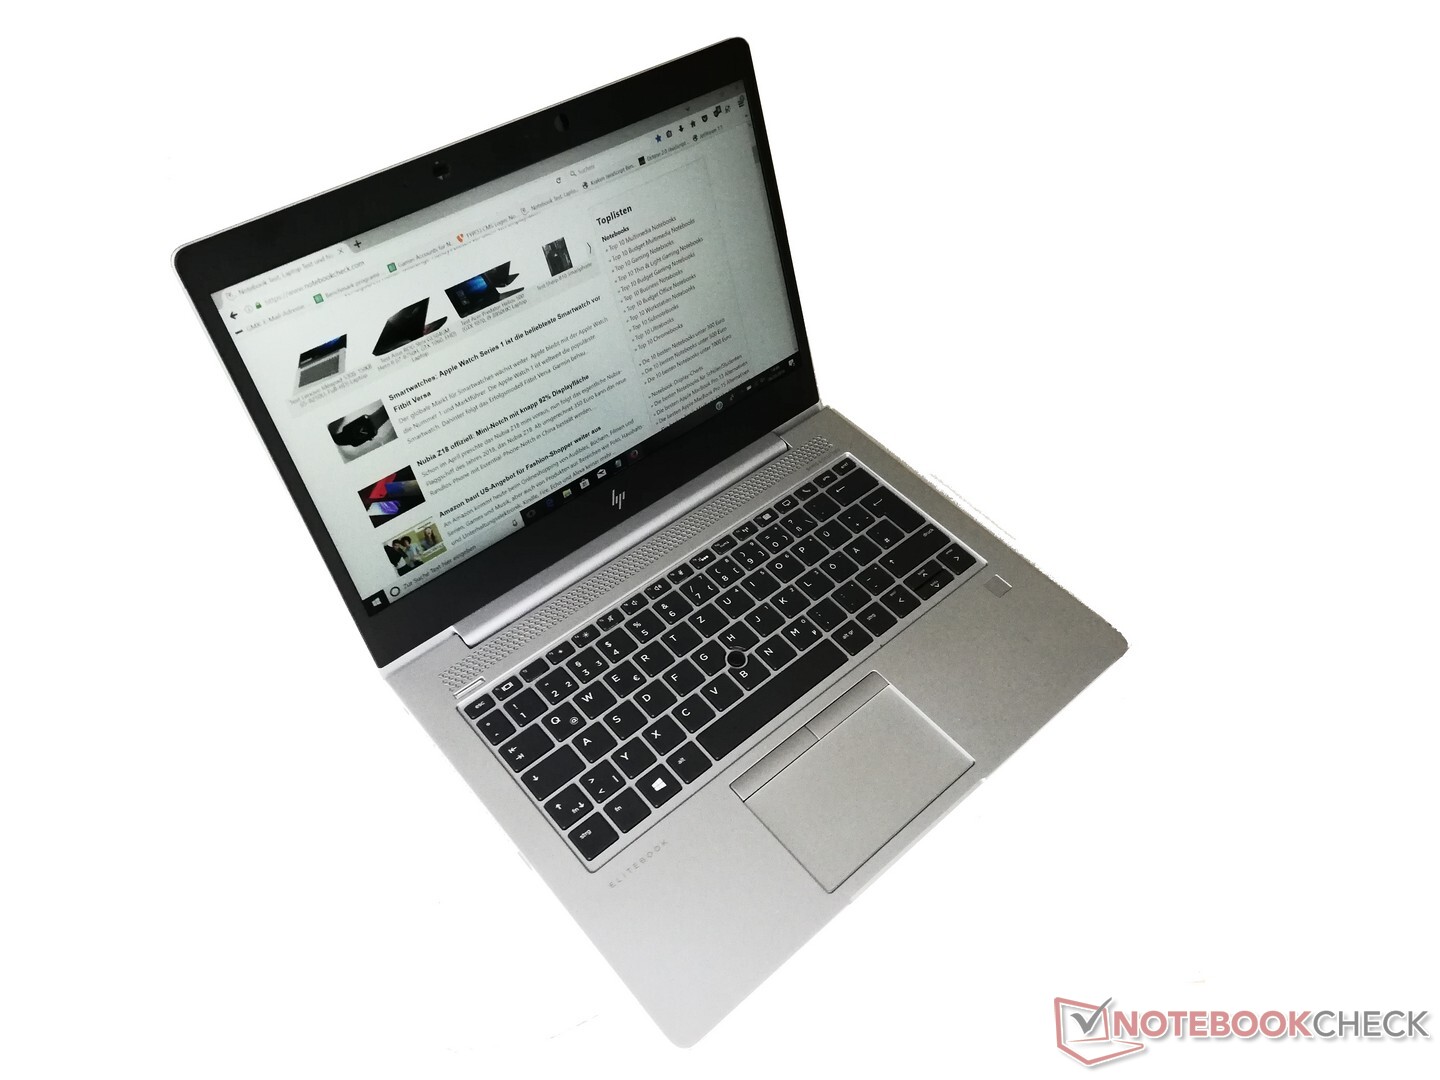
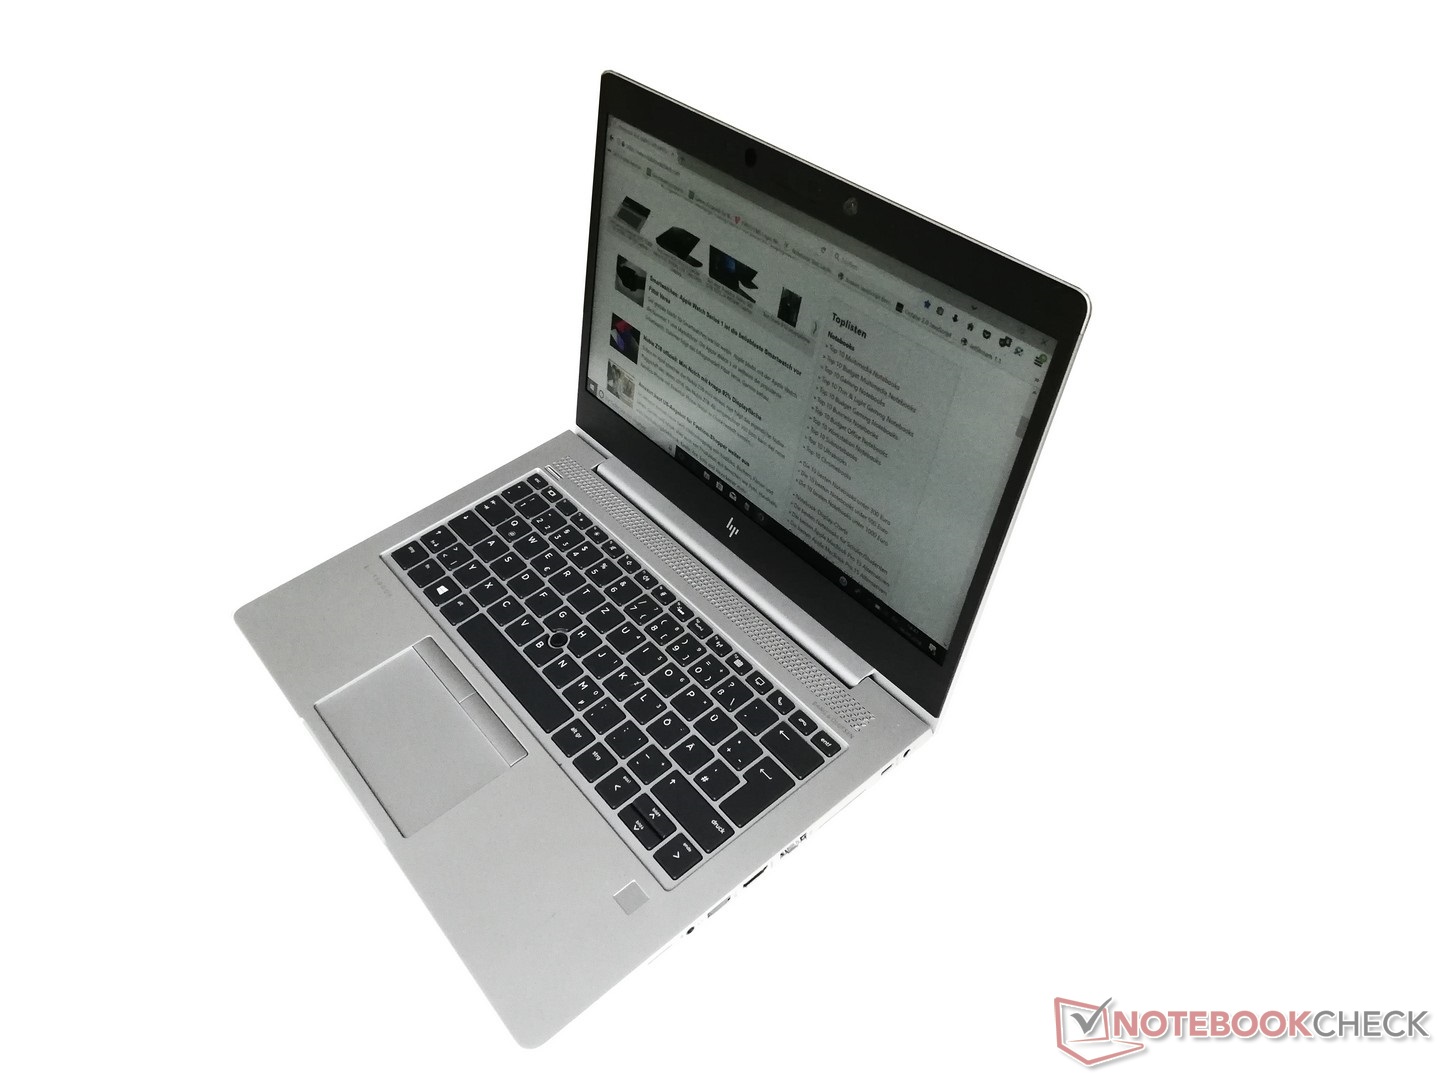
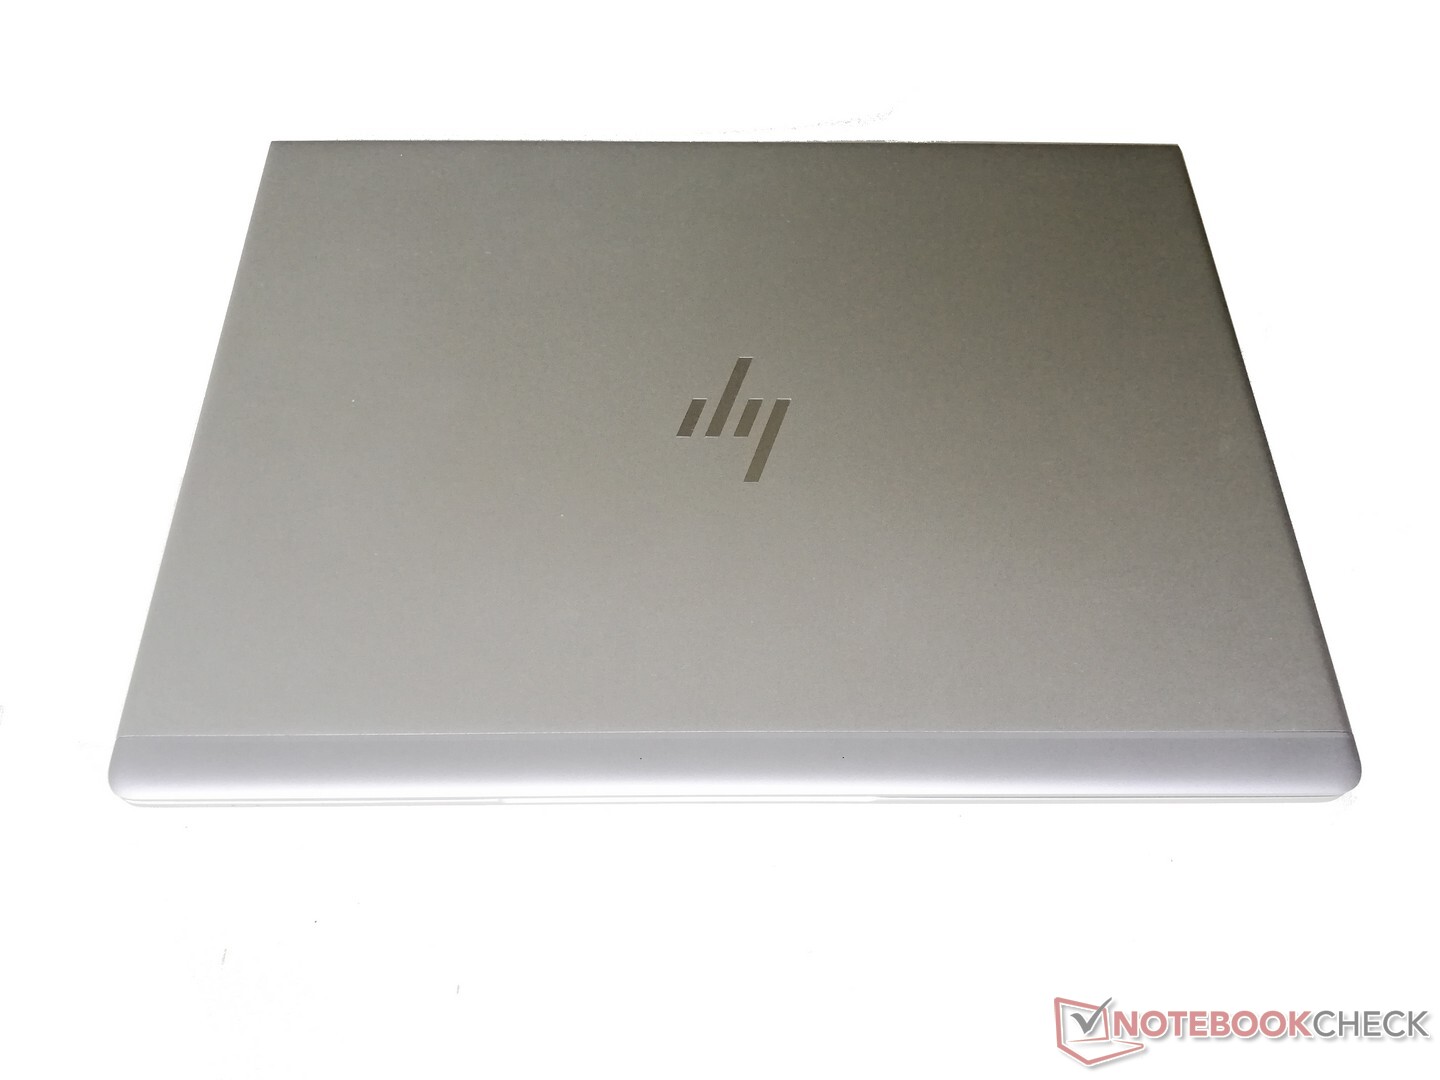
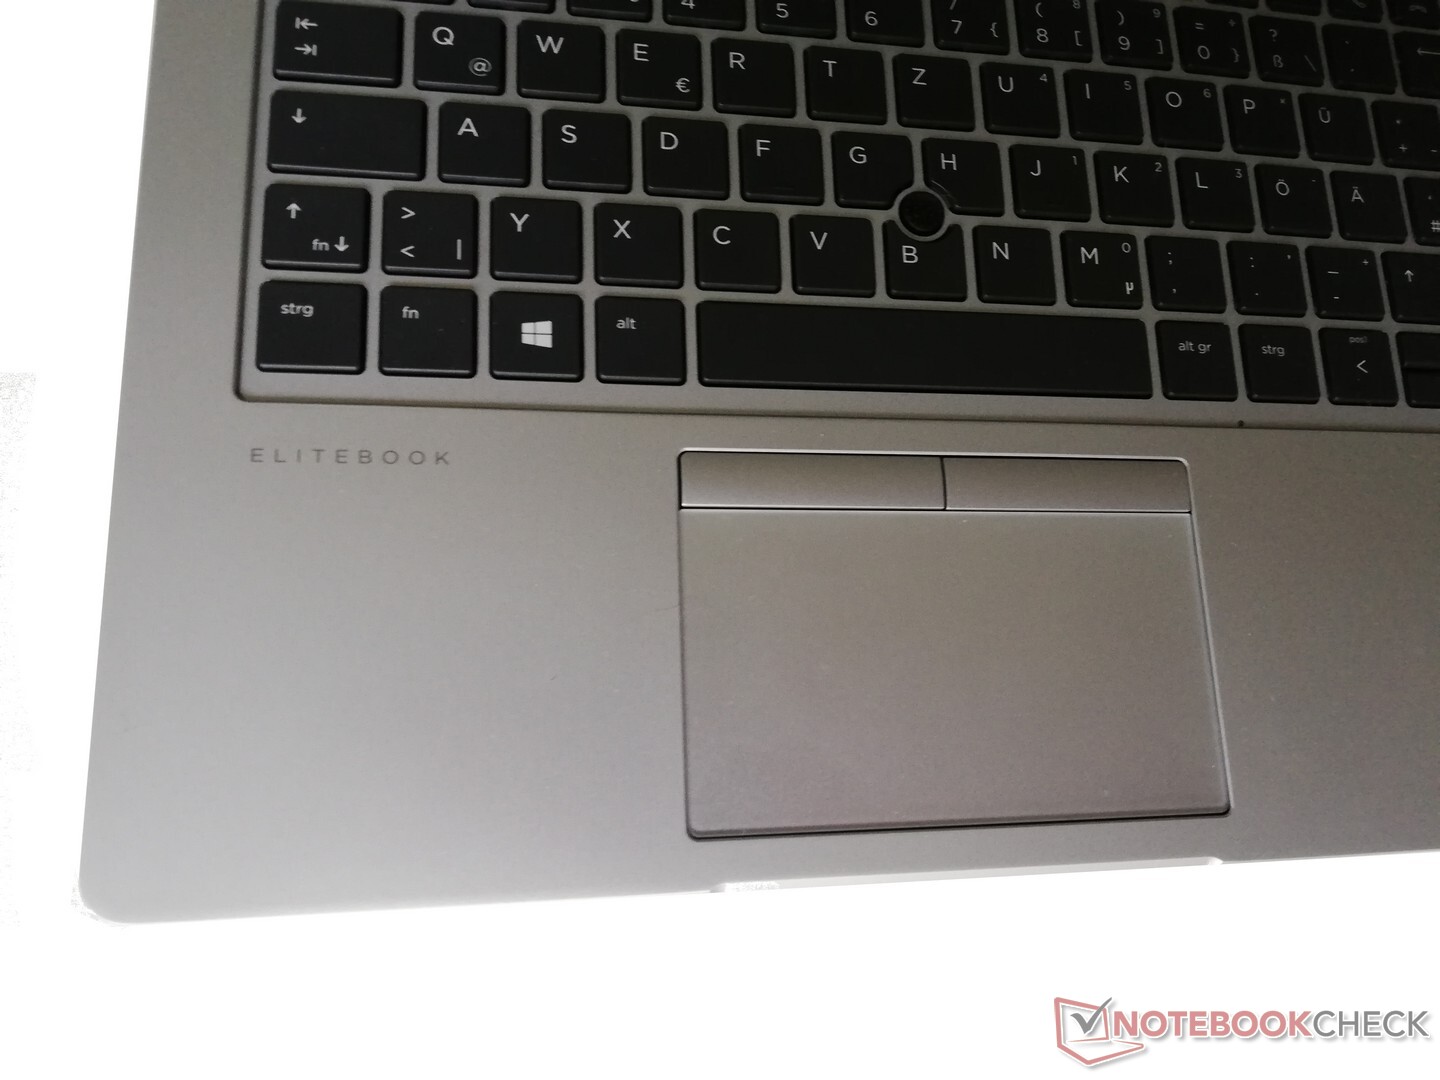
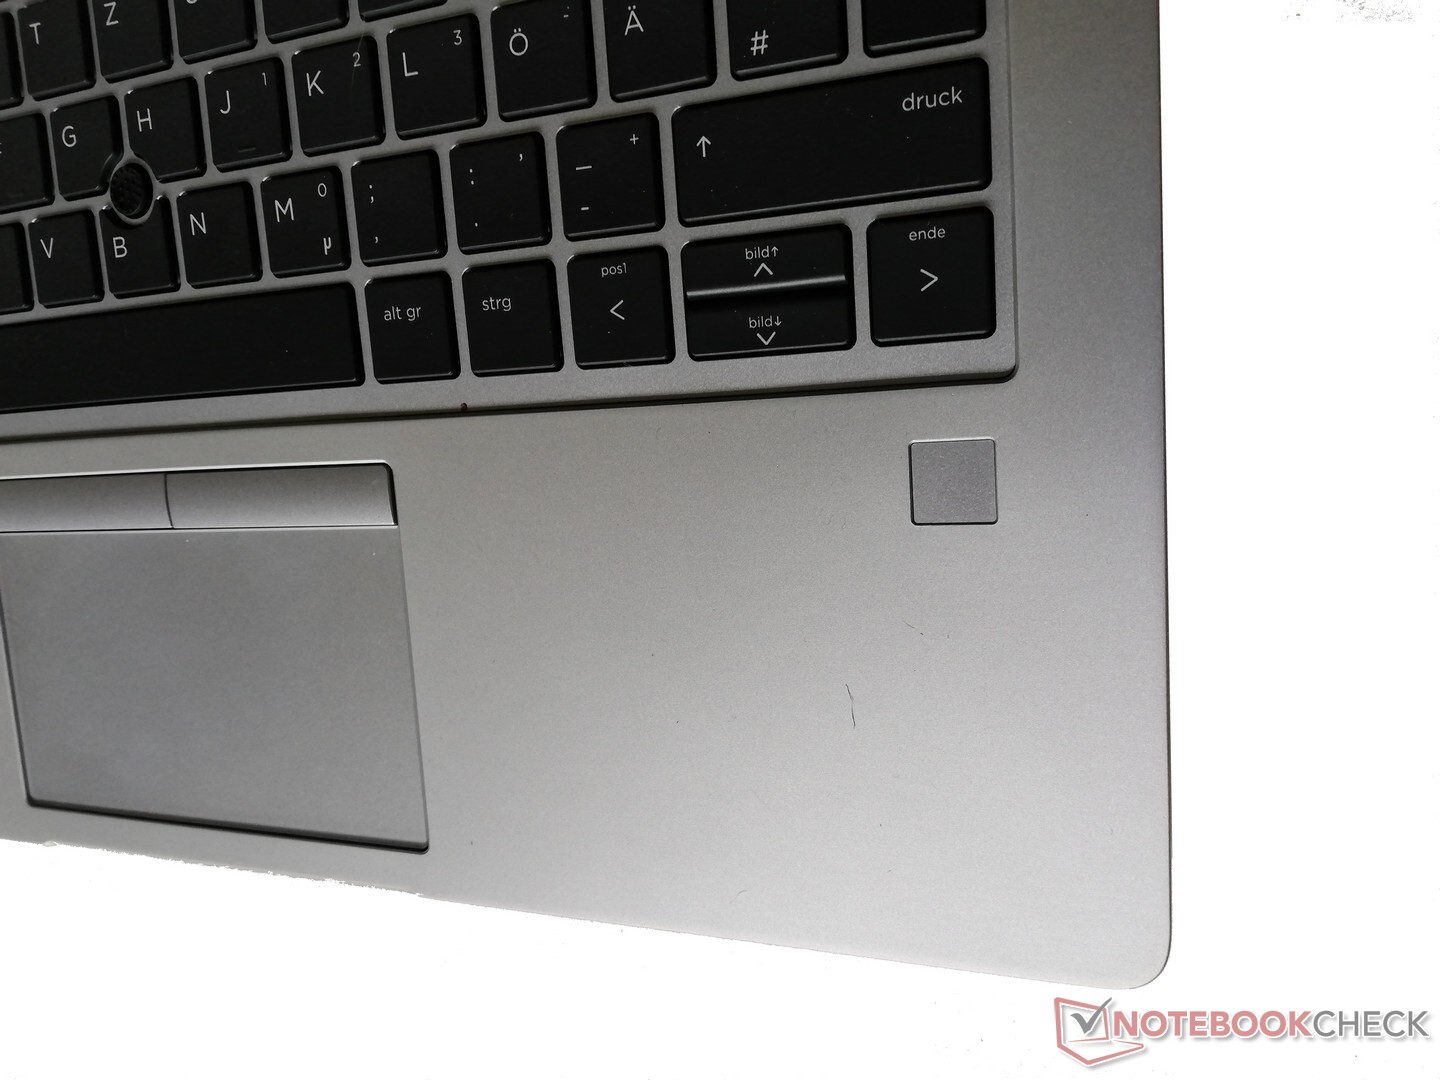
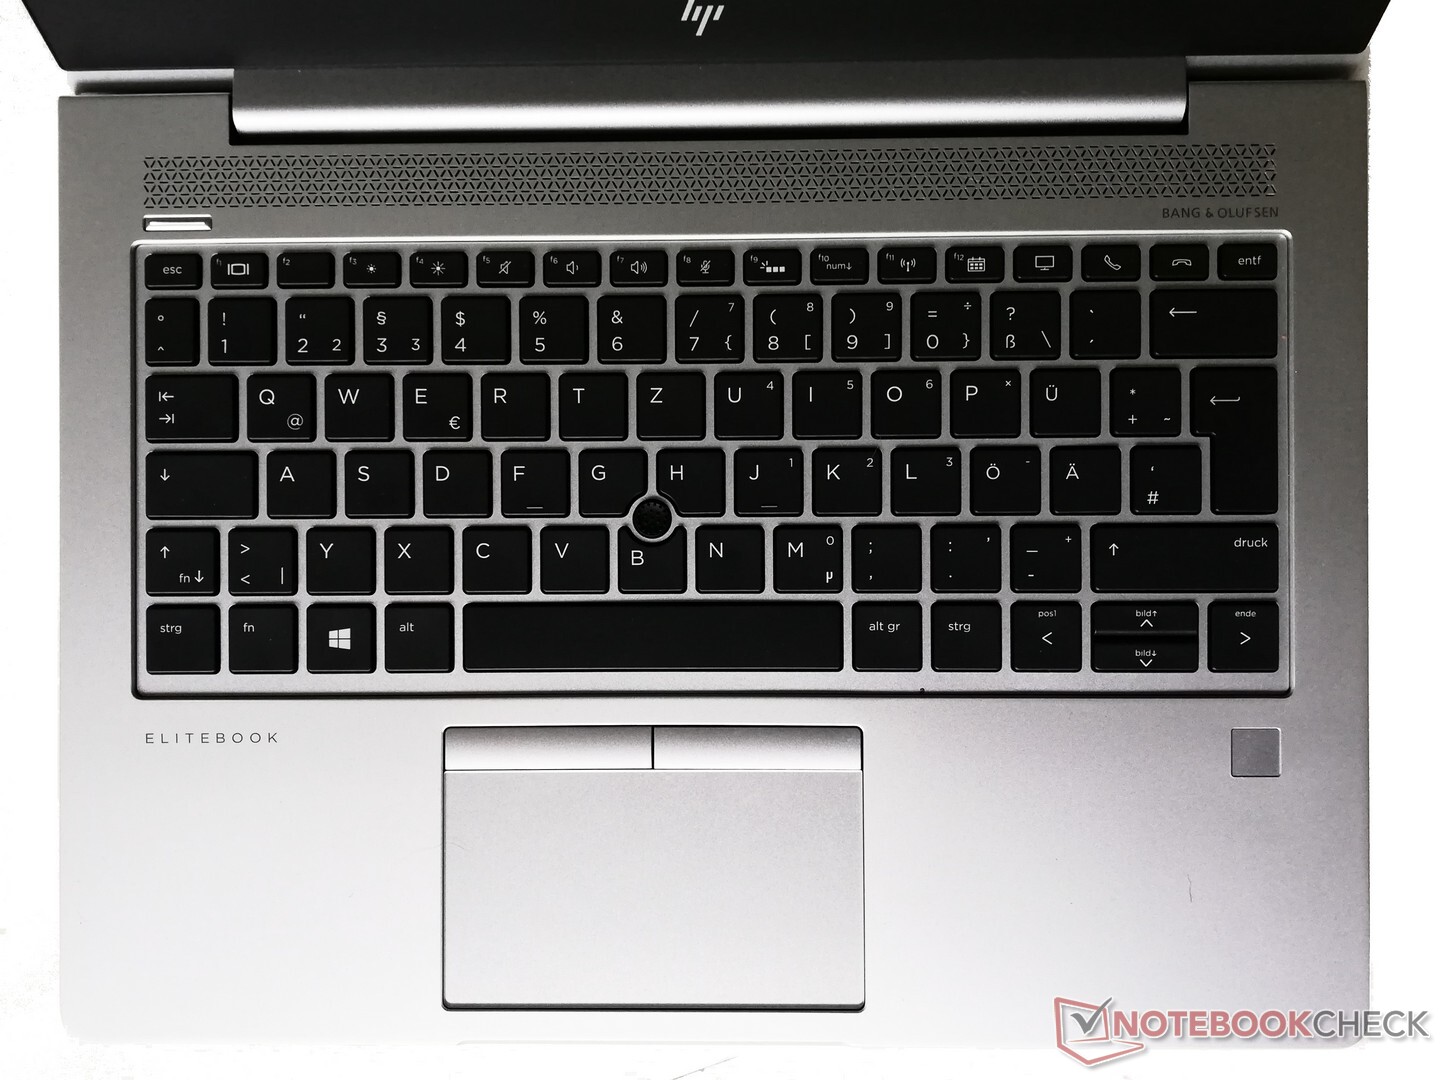
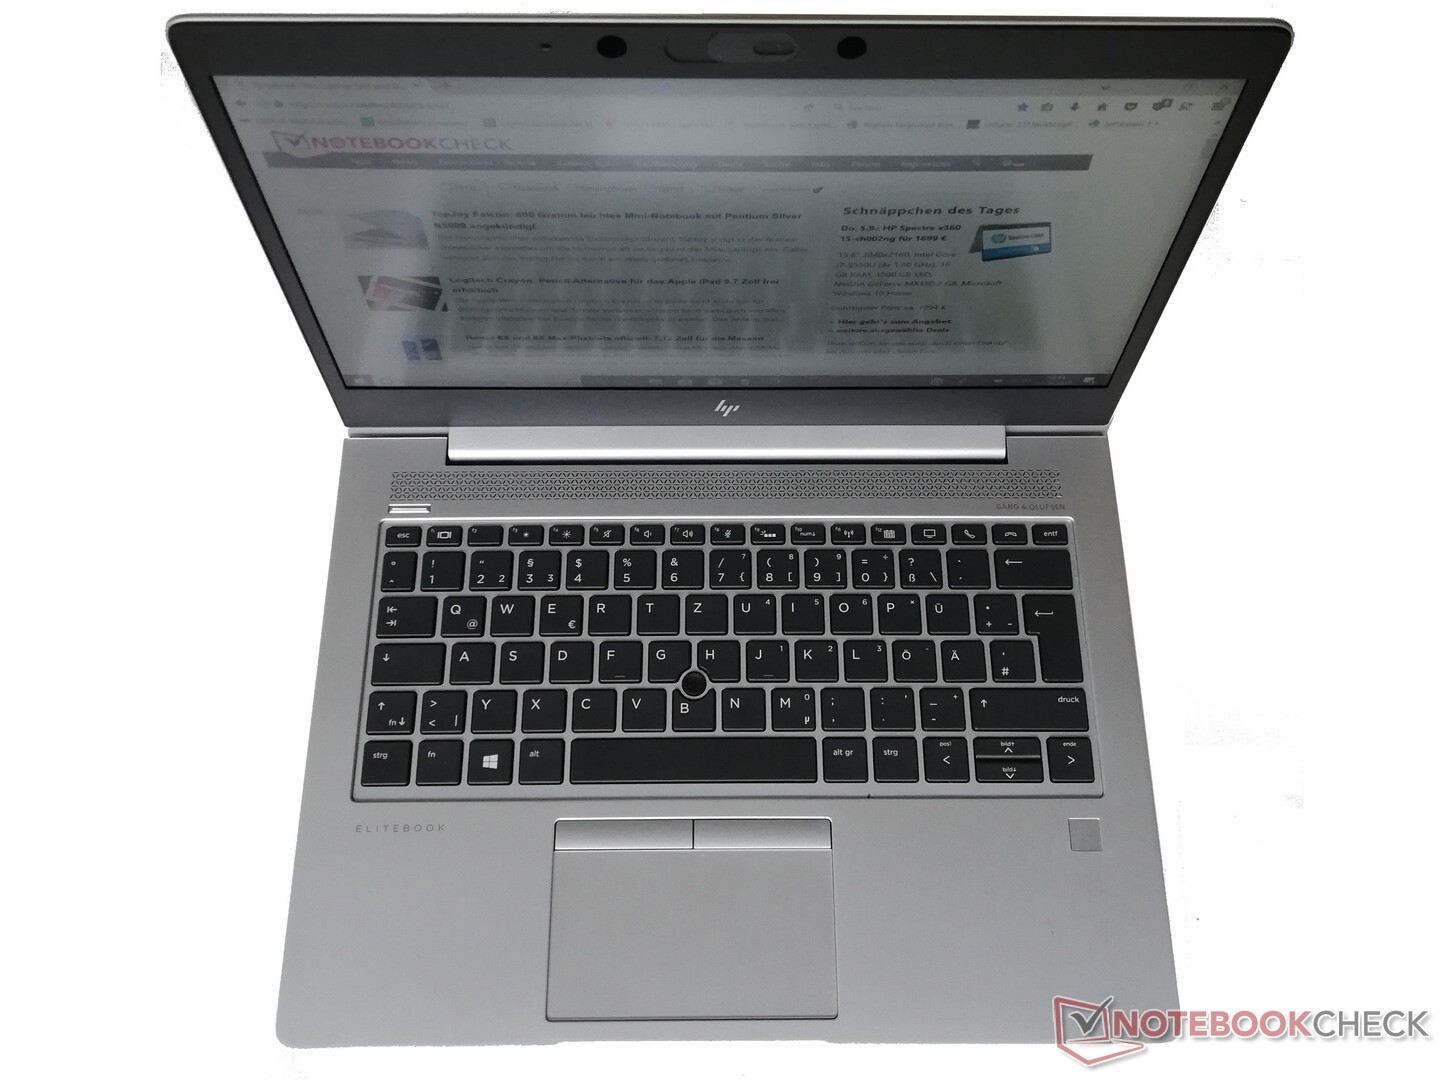
The HP EliteBook 735 G6's biggest competitor is the Lenovo ThinkPad X395, which is also an AMD Ryzen 3000 laptop. Apart from that, we naturally also compare the HP laptop with the older HP EliteBook 735 G5 and the Dell Latitude 7300 as another business subnotebook. Because HP hasn't made any changes to the design compared to the HP EliteBook 735 G5, we'll skip the topics regarding the case, connectivity and input devices and go straight to the display.
Rating | Date | Model | Weight | Height | Size | Resolution | Price |
|---|---|---|---|---|---|---|---|
| 86 % v7 (old) | 06 / 2020 | HP EliteBook 735 G6 7KN29EA R5 PRO 3500U, Vega 8 | 1.5 kg | 17.7 mm | 13.30" | 1920x1080 | |
| 88.8 % v7 (old) | 10 / 2019 | Lenovo ThinkPad X395 R3 PRO 3300U, Vega 6 | 1.3 kg | 16.9 mm | 13.30" | 1920x1080 | |
| 86.4 % v6 (old) | 09 / 2018 | HP EliteBook 735 G5 3UN62EA R7 2700U, Vega 10 | 1.3 kg | 17 mm | 13.30" | 1920x1080 | |
| 86.8 % v7 (old) | 09 / 2019 | Dell Latitude 7300-P99G i7-8665U, UHD Graphics 620 | 1.4 kg | 18.45 mm | 13.30" | 1920x1080 |


Webcam


EliteBook 735 G6 with dim display
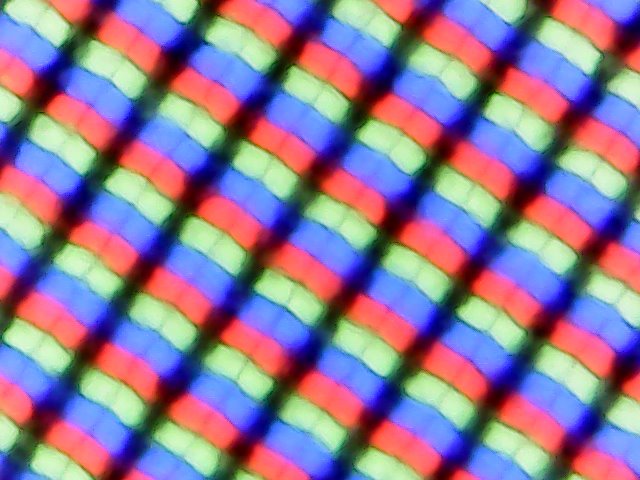
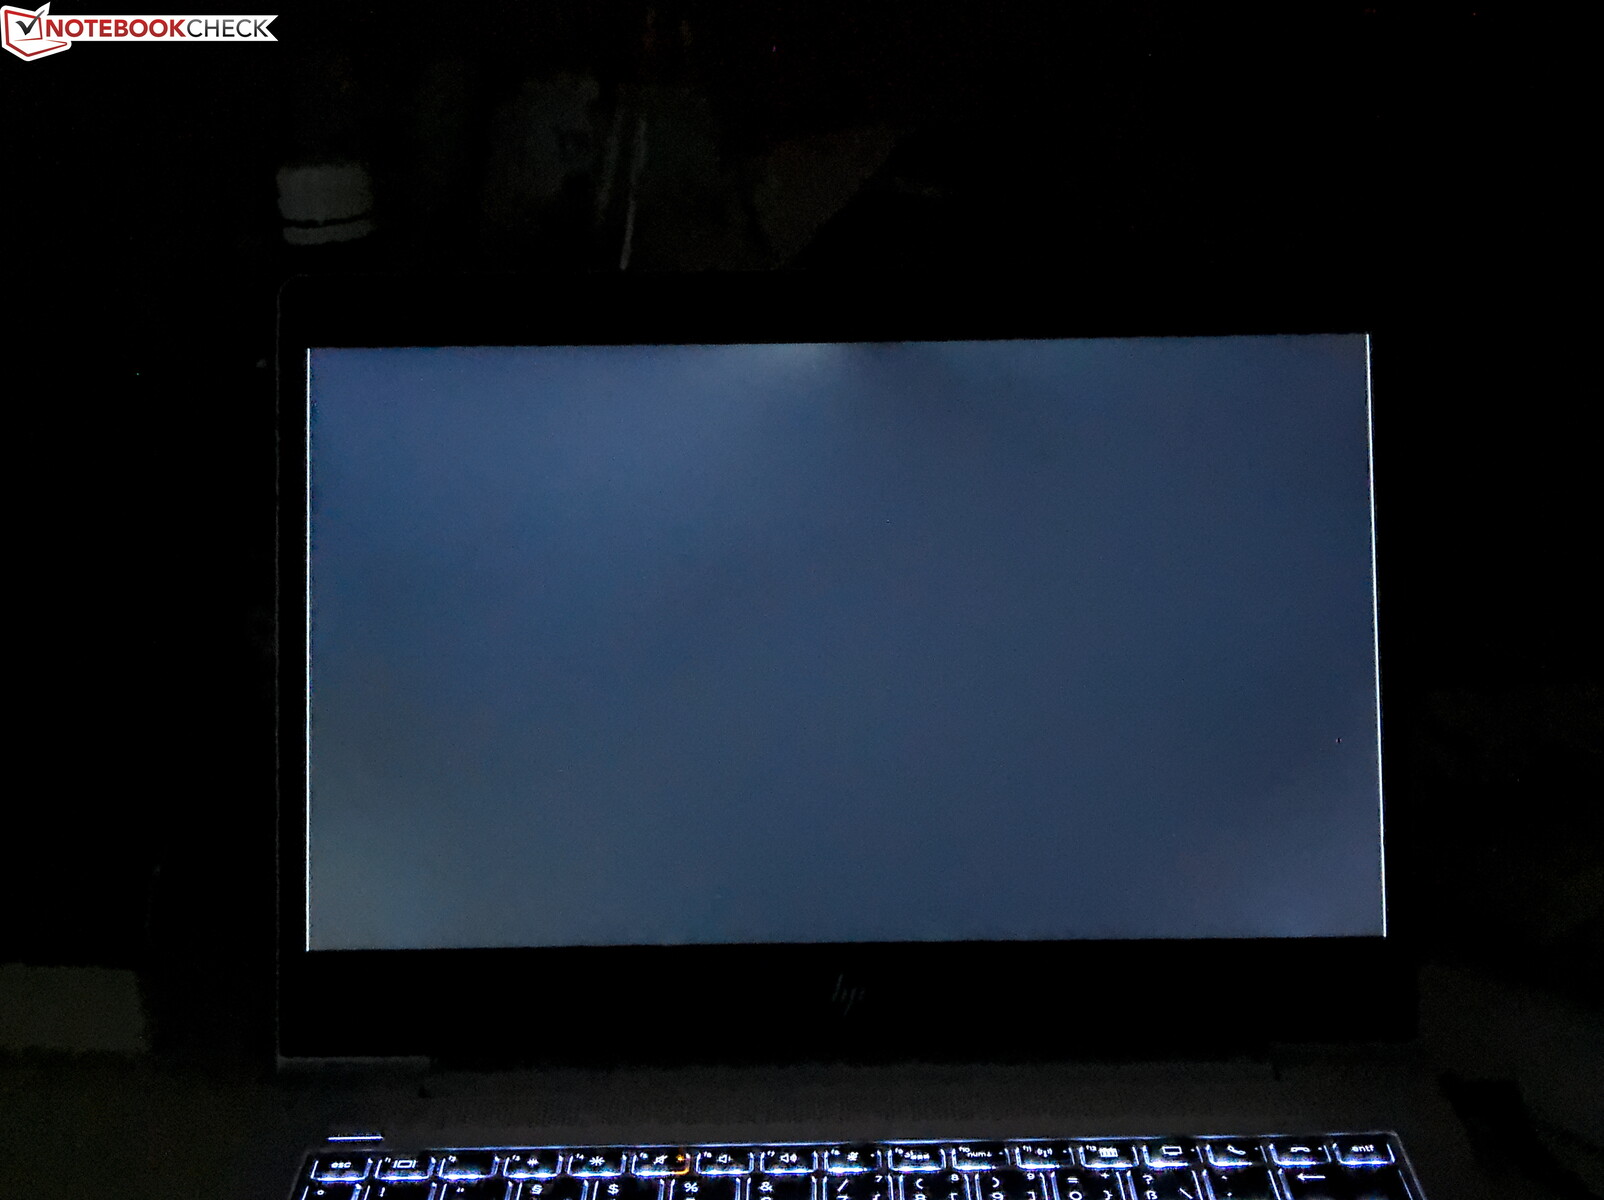
HP offers a range of different display options in its EliteBook business laptops. The HP EliteBook 735 G6 is no exception here. A display with a brightness value of 250 cd/m² is available as the base configuration. This brightness also offers the On-Cell Touch option. A 400 cd/m² panel is available as the next better option. The brightest display supports HP's SureView Privacy function and is supposed to offer an extremely high brightness value of 1000 cd/m². All used panels have a diagonal size of 13.3 inches, a resolution of 1920x1080 (Full HD) and a matte surface. In addition, all installed screens are IPS LCDs.
Unfortunately, we are testing the base variant. At an average brightness of 276 cd/m², our measurements show that the display at least exceeds the stated brightness value (250 cd/m²). The competitors from Lenovo and Dell are better positioned here.
| |||||||||||||||||||||||||
Brightness Distribution: 87 %
Center on Battery: 295 cd/m²
Contrast: 1633:1 (Black: 0.18 cd/m²)
ΔE ColorChecker Calman: 6.8 | ∀{0.5-29.43 Ø4.71}
calibrated: 4.8
ΔE Greyscale Calman: 5.9 | ∀{0.09-98 Ø4.96}
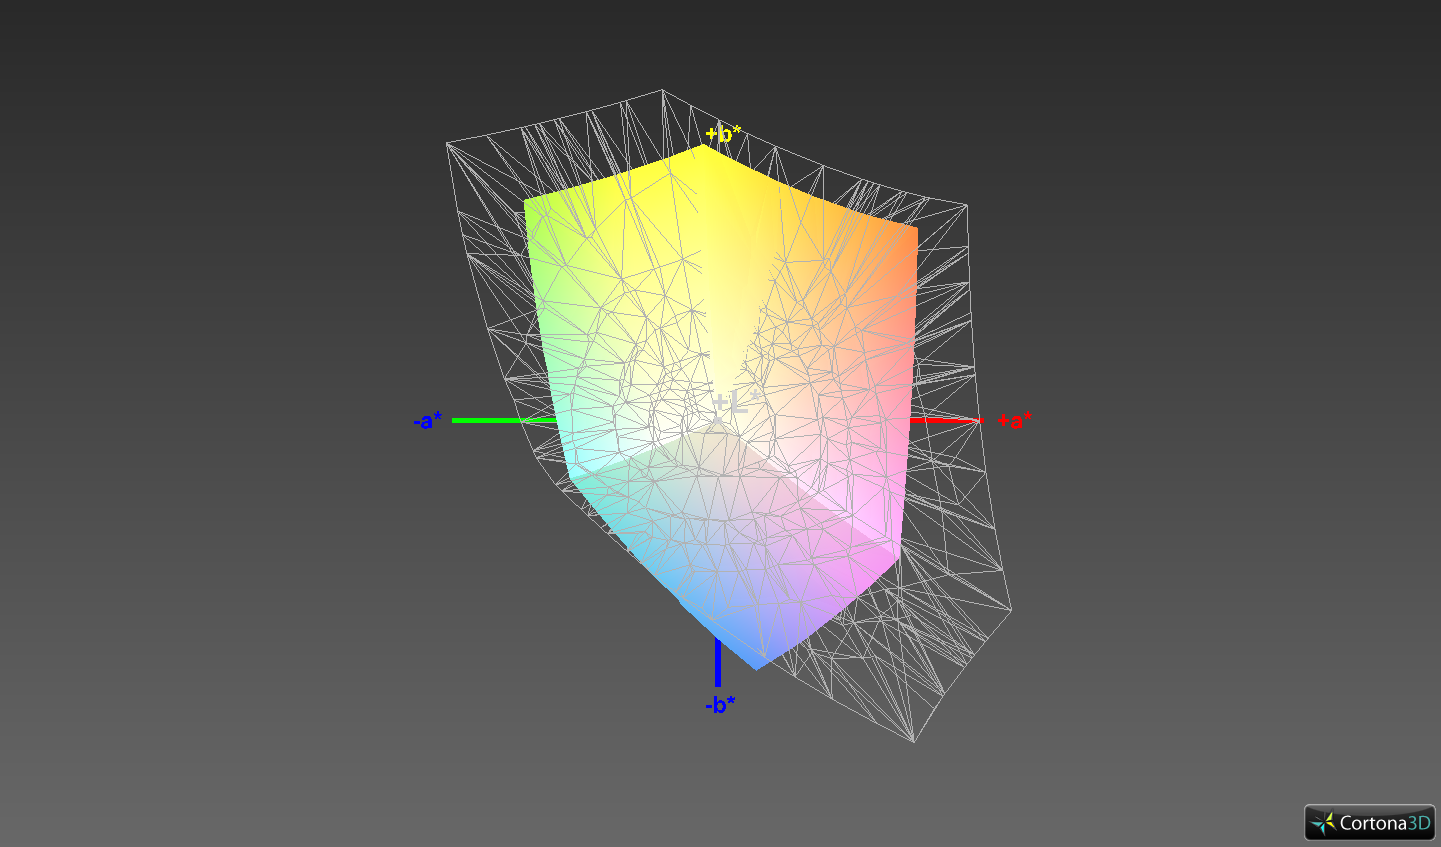
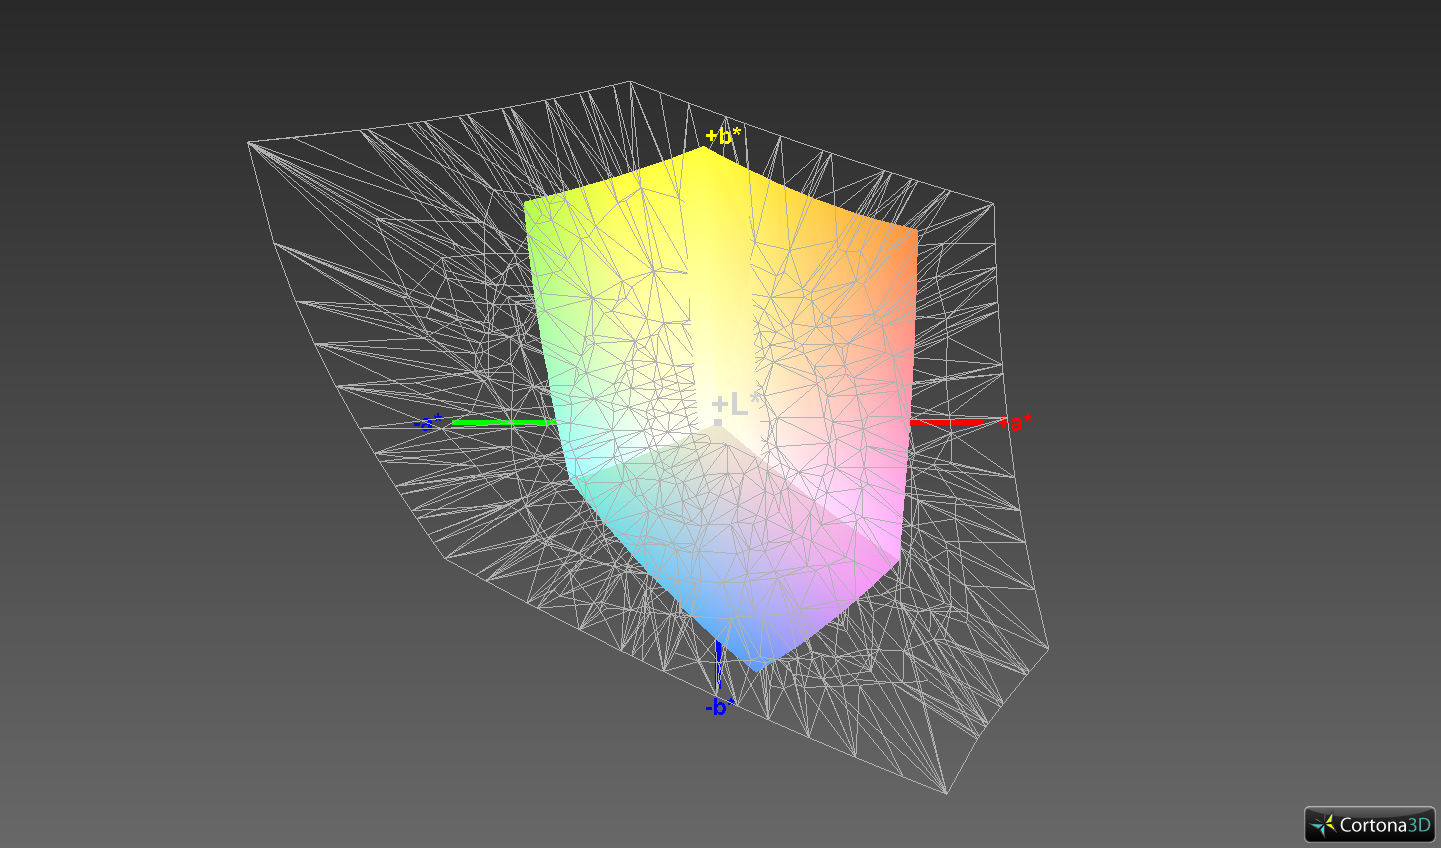
61.5% sRGB (Argyll 1.6.3 3D)
39.6% AdobeRGB 1998 (Argyll 1.6.3 3D)
43% AdobeRGB 1998 (Argyll 3D)
61.7% sRGB (Argyll 3D)
41.53% Display P3 (Argyll 3D)
Gamma: 1.96
CCT: 6979 K
| HP EliteBook 735 G6 7KN29EA CMN139E, IPS LED, 1920x1080, 13.3" | Lenovo ThinkPad X395 LP133WF7-SPB1, IPS, 1920x1080, 13.3" | HP EliteBook 735 G5 3UN62EA BOE074A, IPS, 1920x1080, 13.3" | Dell Latitude 7300-P99G B133HAK, IPS LED, 1920x1080, 13.3" | |
|---|---|---|---|---|
| Display | 54% | 64% | 52% | |
| Display P3 Coverage (%) | 41.53 | 64.1 54% | 71.1 71% | 64.6 56% |
| sRGB Coverage (%) | 61.7 | 95.2 54% | 96.3 56% | 91.5 48% |
| AdobeRGB 1998 Coverage (%) | 43 | 65.8 53% | 71.4 66% | 65.5 52% |
| Response Times | -33% | -9% | -3% | |
| Response Time Grey 50% / Grey 80% * (ms) | 38 ? | 55 ? -45% | 42 ? -11% | 39 ? -3% |
| Response Time Black / White * (ms) | 26.4 ? | 32 ? -21% | 28 ? -6% | 27 ? -2% |
| PWM Frequency (Hz) | 26040 | 20500 ? | ||
| Screen | 38% | 20% | 10% | |
| Brightness middle (cd/m²) | 294 | 356 21% | 464 58% | 341 16% |
| Brightness (cd/m²) | 277 | 336 21% | 426 54% | 306 10% |
| Brightness Distribution (%) | 87 | 88 1% | 85 -2% | 79 -9% |
| Black Level * (cd/m²) | 0.18 | 0.16 11% | 0.42 -133% | 0.31 -72% |
| Contrast (:1) | 1633 | 2225 36% | 1105 -32% | 1100 -33% |
| Colorchecker dE 2000 * | 6.8 | 3.6 47% | 4.49 34% | 6.43 5% |
| Colorchecker dE 2000 max. * | 23.8 | 5.5 77% | 8.77 63% | 10.33 57% |
| Colorchecker dE 2000 calibrated * | 4.8 | 1.11 77% | 1.27 74% | 2.36 51% |
| Greyscale dE 2000 * | 5.9 | 4.7 20% | 6.44 -9% | 6.9 -17% |
| Gamma | 1.96 112% | 2.92 75% | 2.41 91% | 2.23 99% |
| CCT | 6979 93% | 6222 104% | 6922 94% | 8338 78% |
| Color Space (Percent of AdobeRGB 1998) (%) | 39.6 | 61 54% | 63 59% | 59 49% |
| Color Space (Percent of sRGB) (%) | 61.5 | 96 56% | 96 56% | 91 48% |
| Total Average (Program / Settings) | 20% /
32% | 25% /
25% | 20% /
16% |
* ... smaller is better
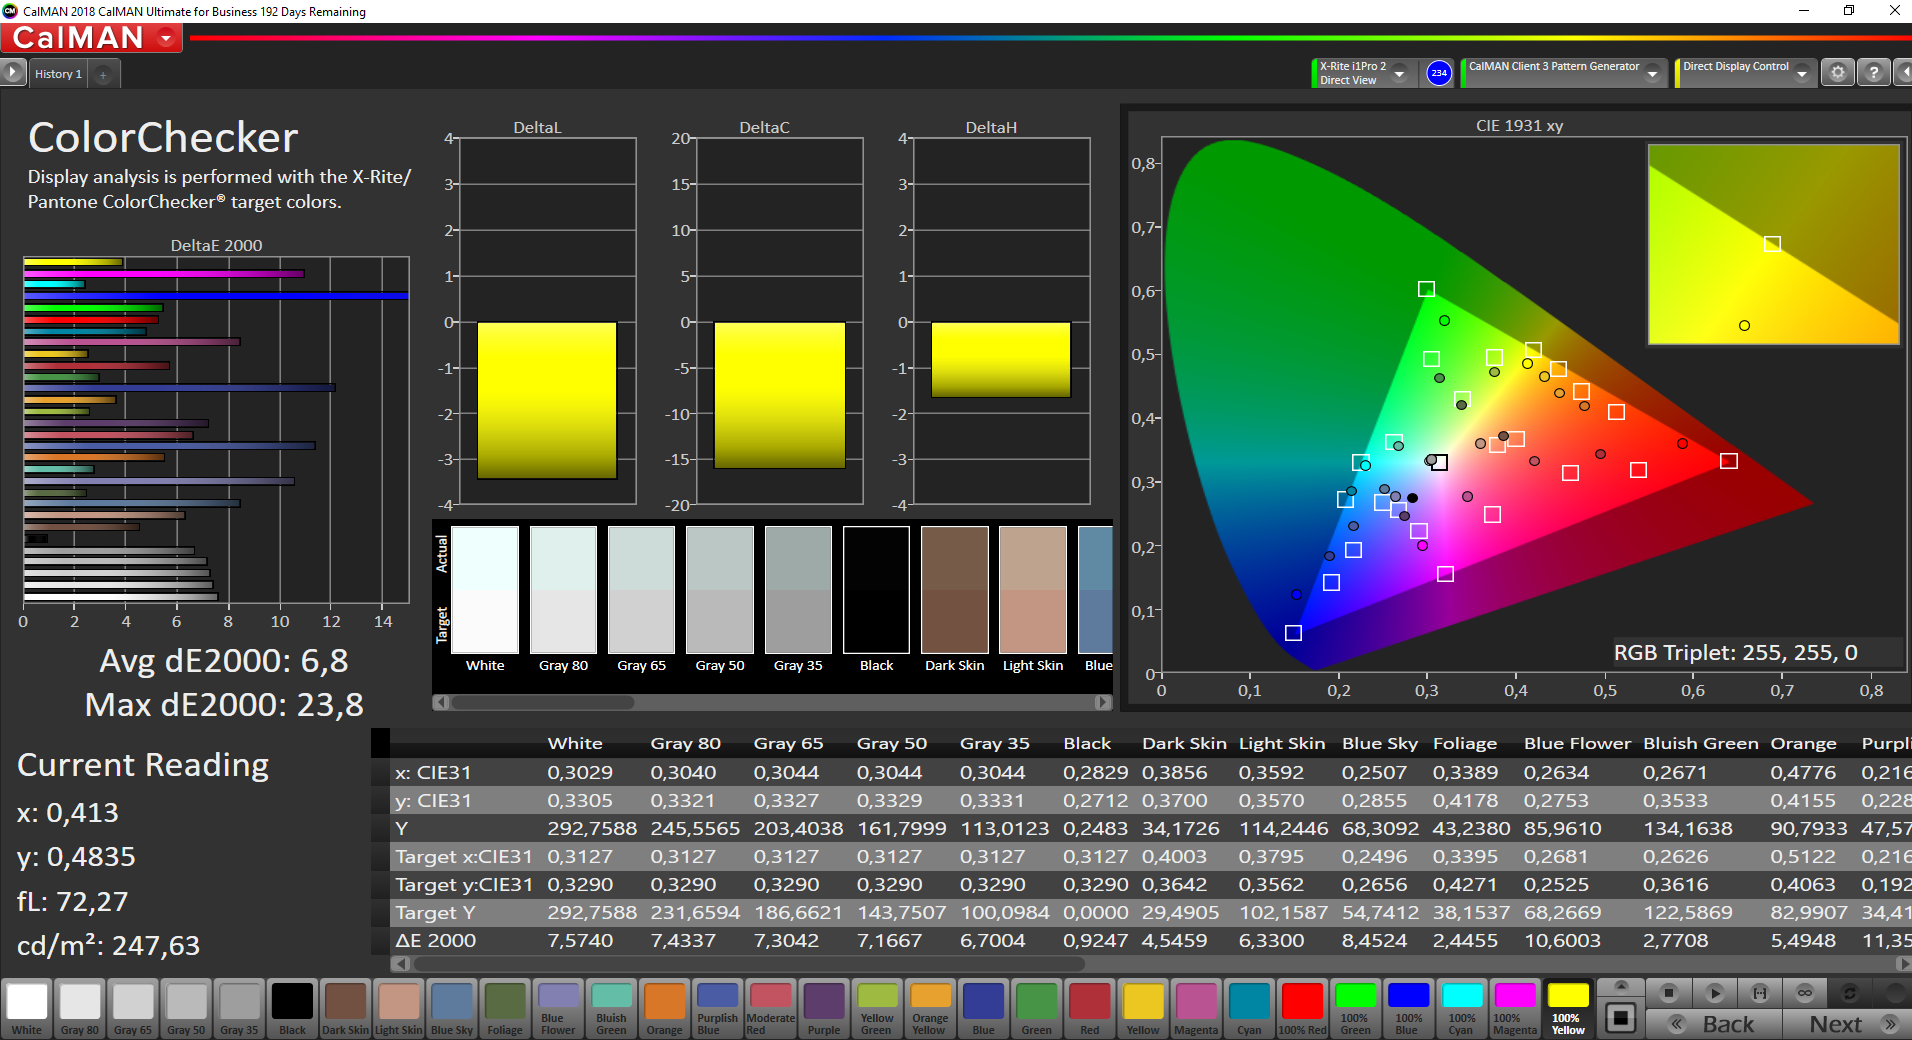
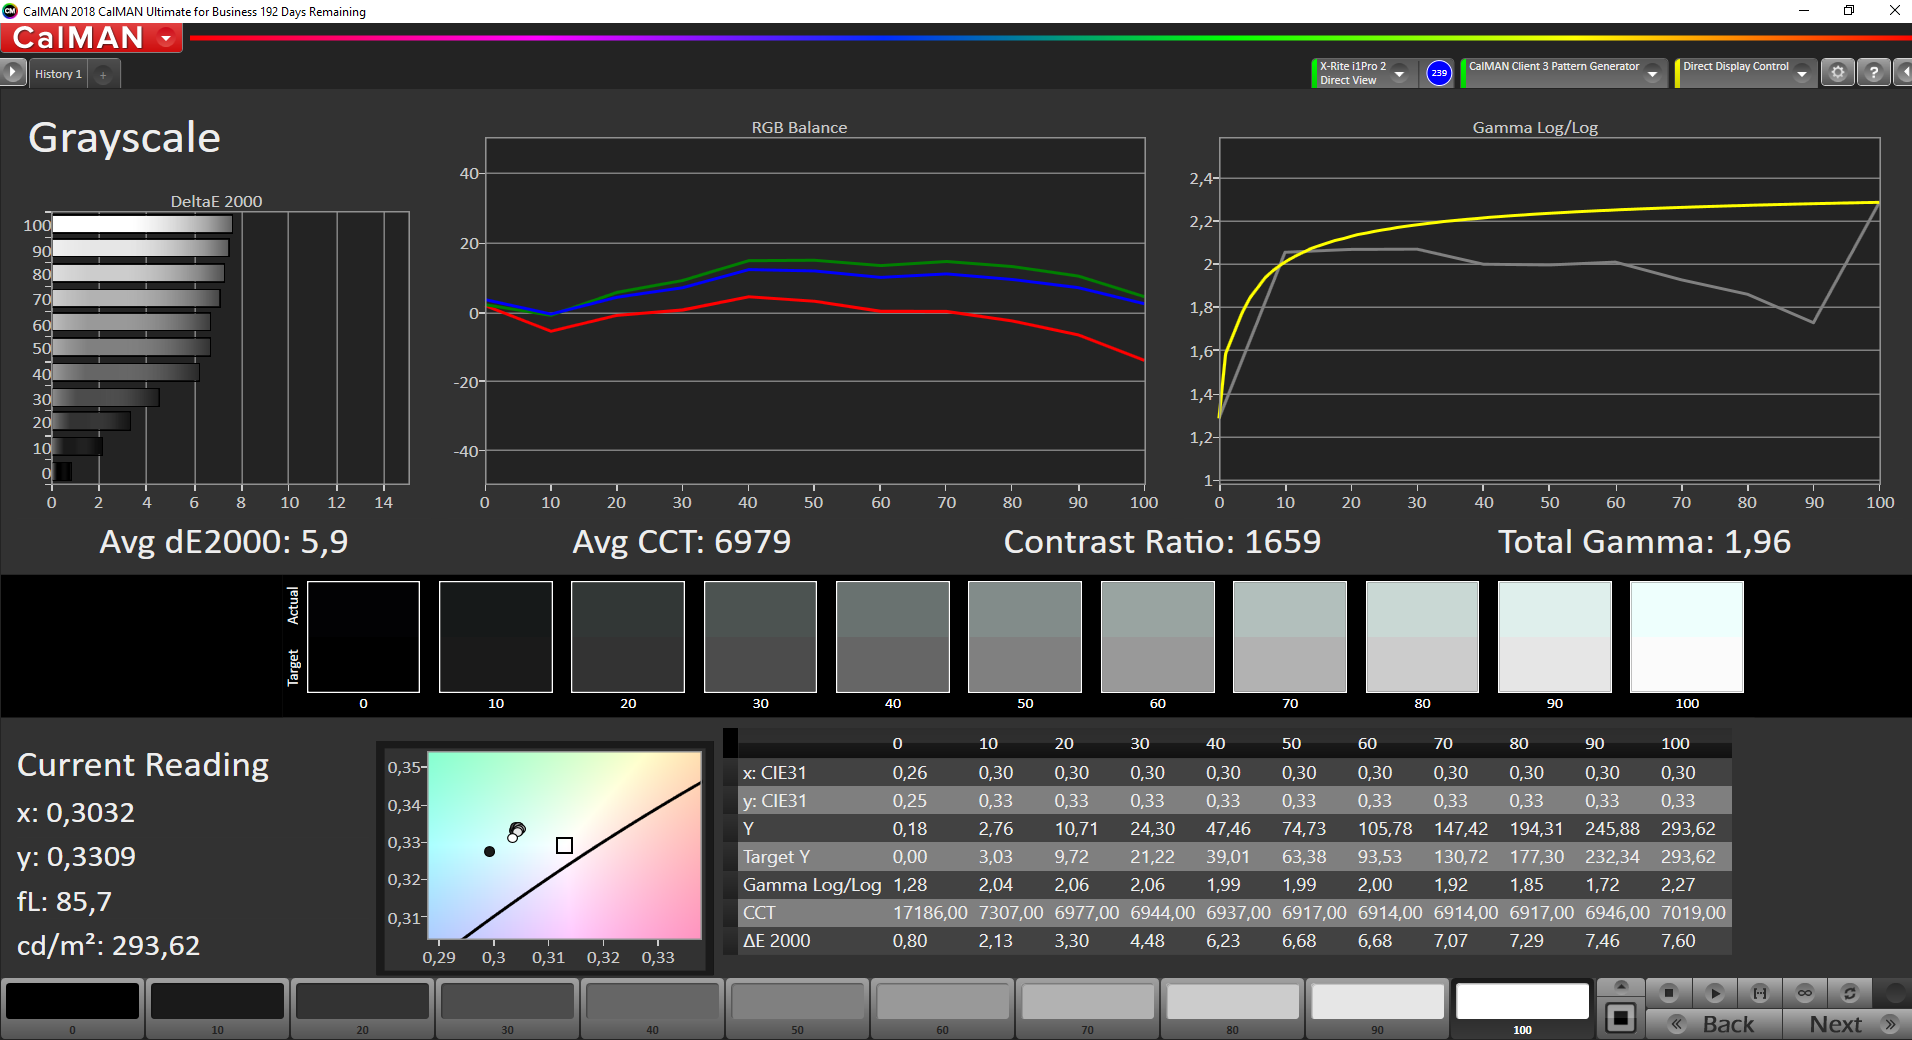
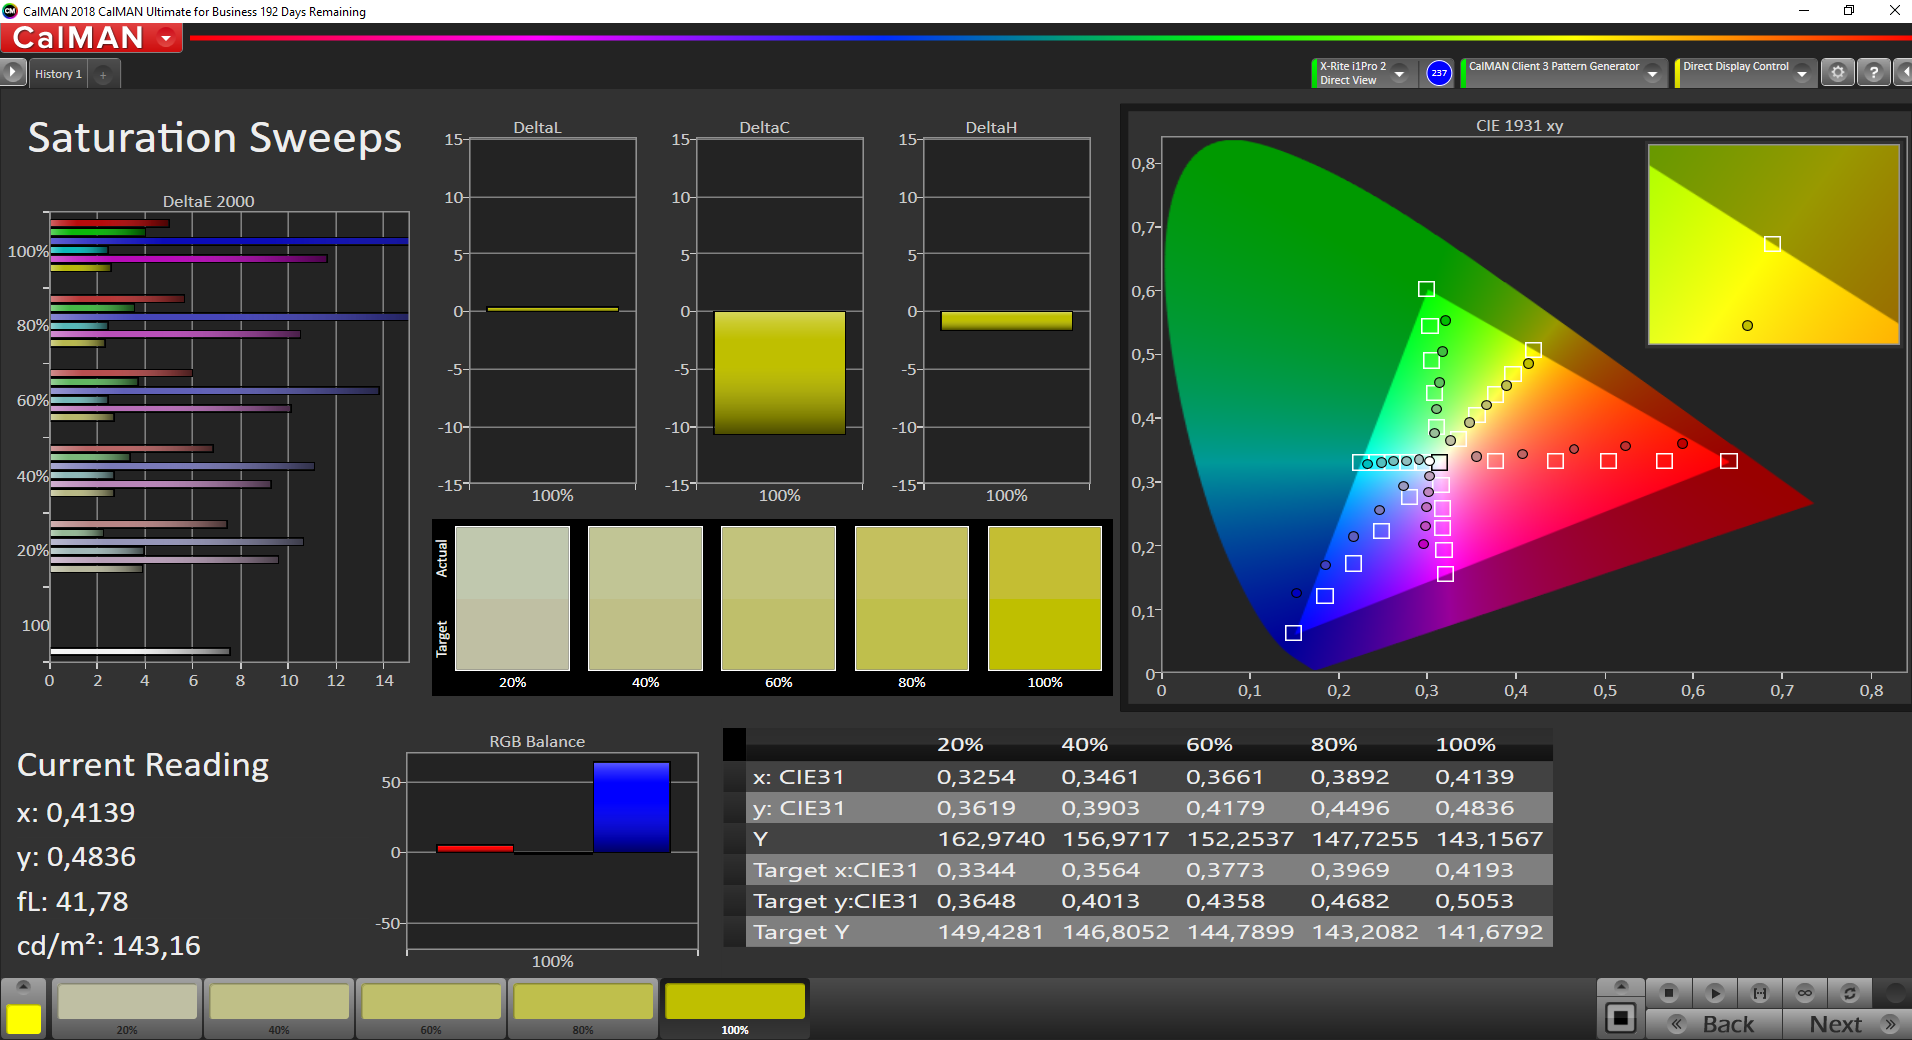
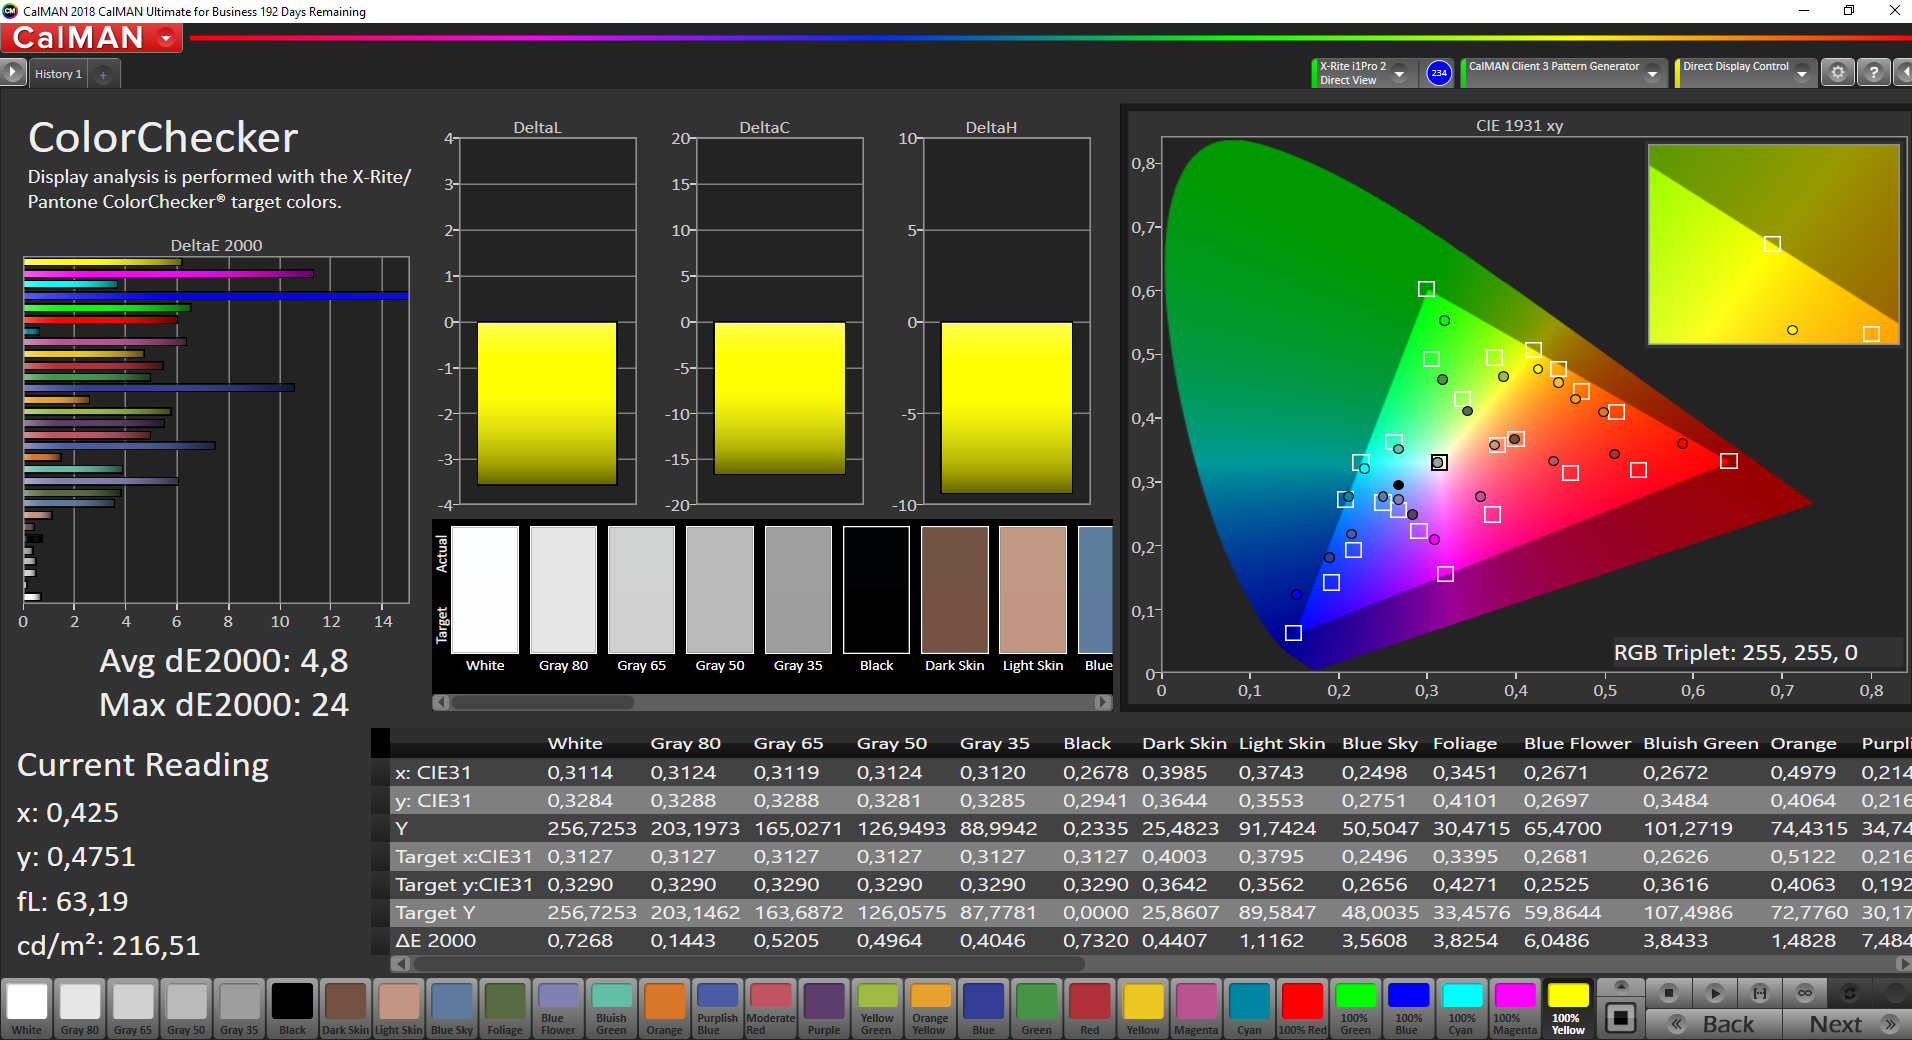
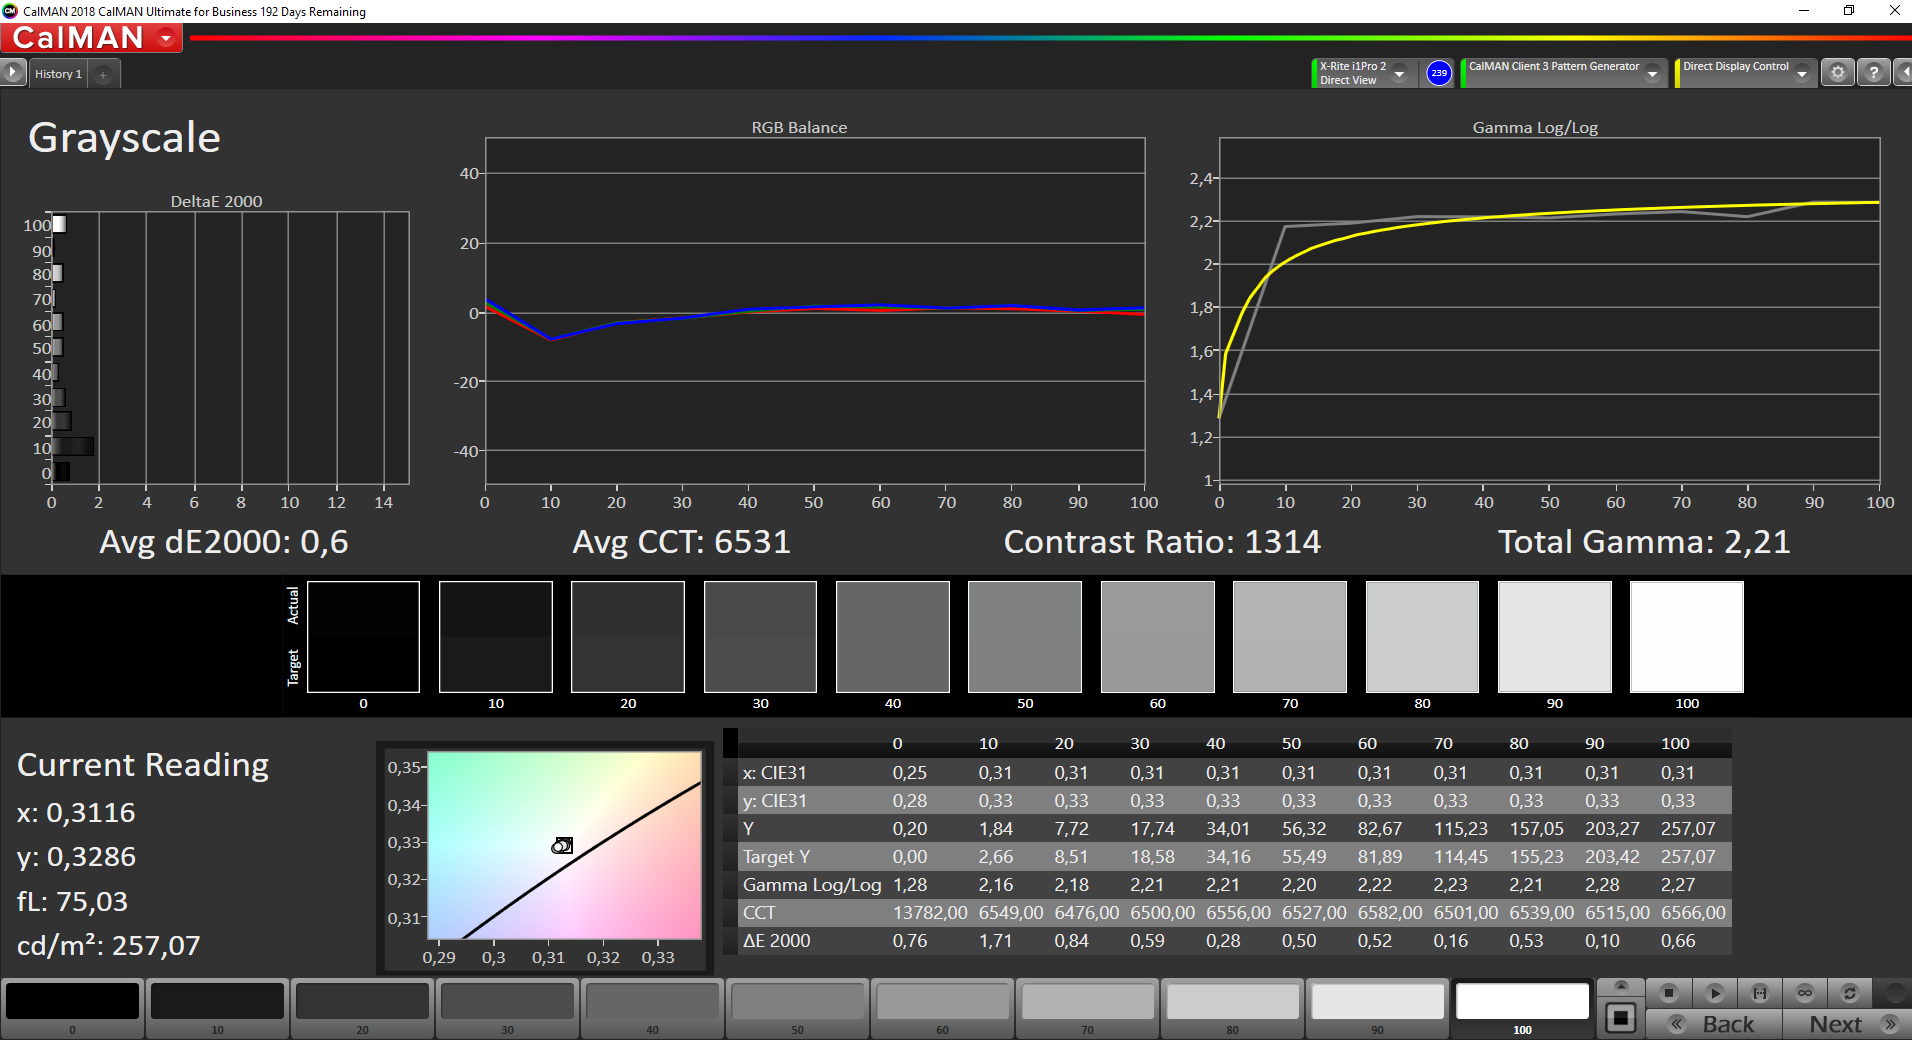
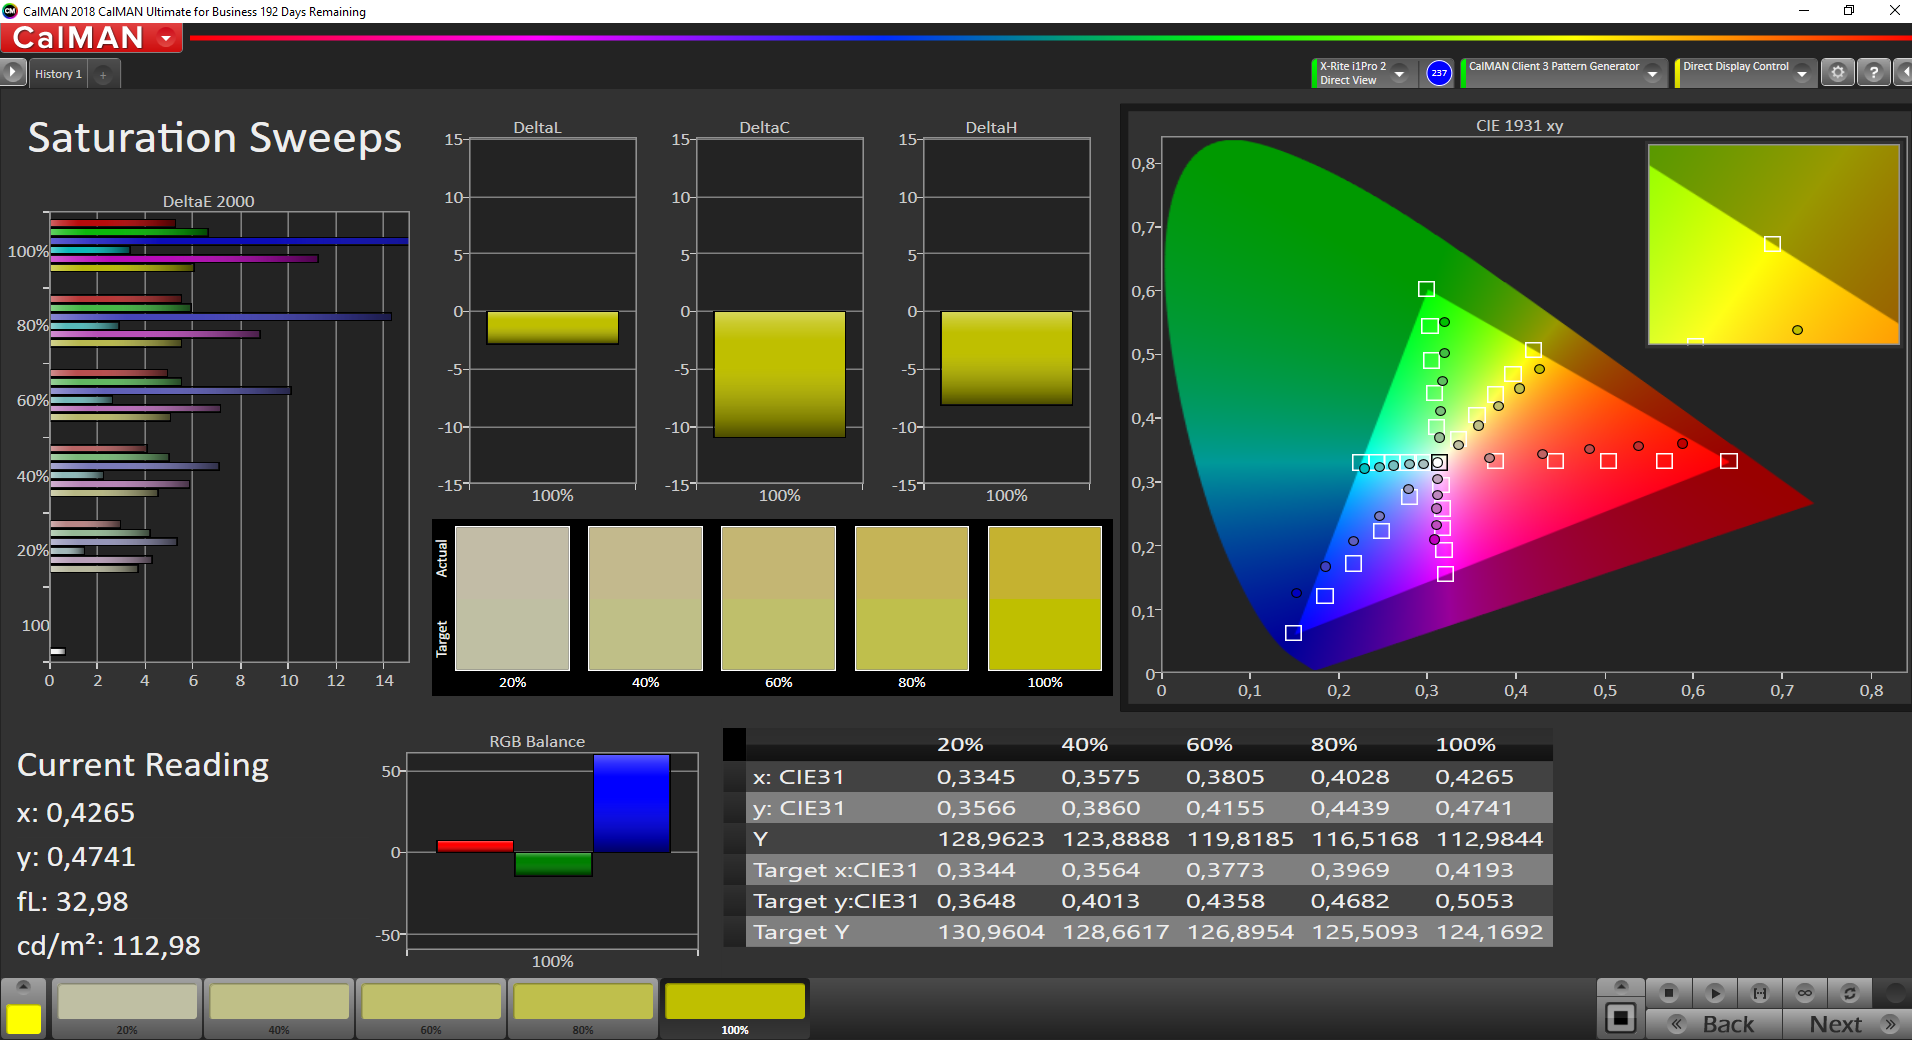
Out of the box, the colors on the display are a little cold. This can be changed through calibration using the CalMAN software and the X-Rite i1 Pro 2 colorimeter, whereby the deviations in the saturation remain. We can't criticize the contrast value. Only the Lenovo ThinkPad X395 is able to outperform a contrast of 1633:1.
The low color-space coverage (61.5%) of this display is one of its defining characteristics, since the 400 cd/m² display and the SureView monitor should deliver better results in this area.
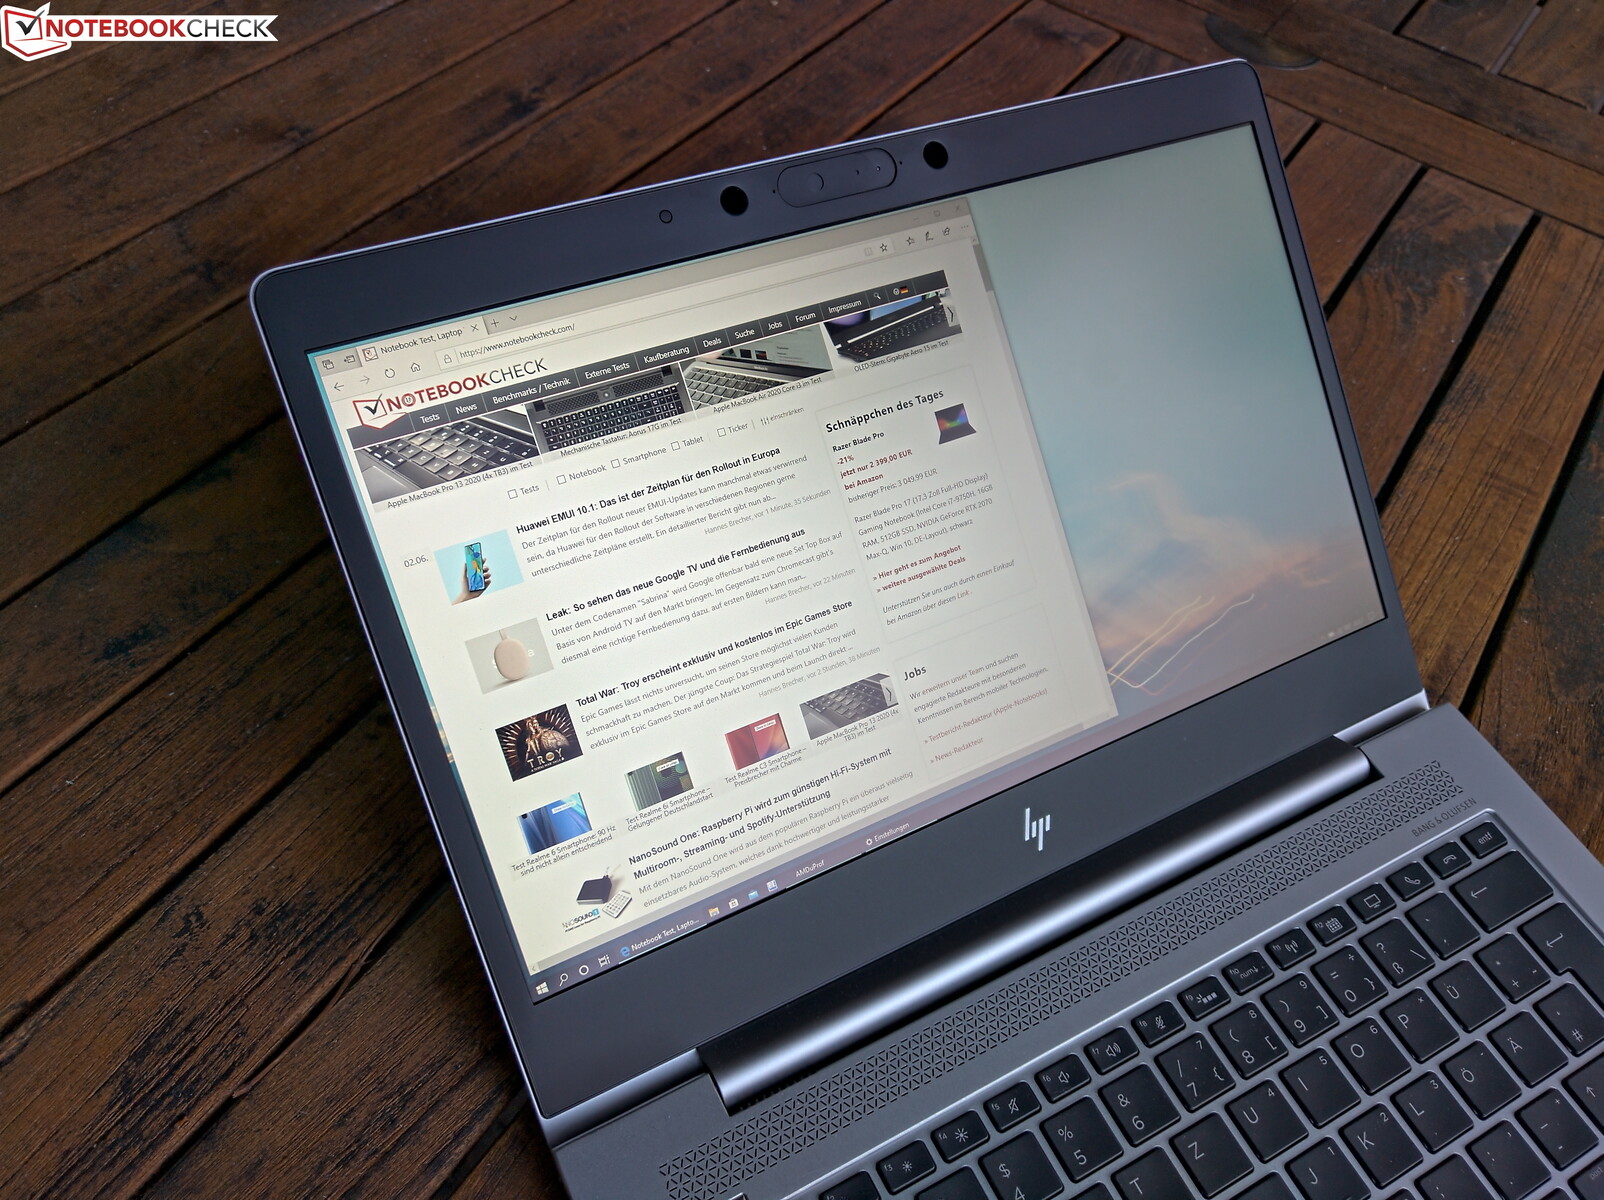
You can use the HP EliteBook outdoors, but the matte 250 cd/m² display is only just bright enough for use in the shade. If you want to use the HP laptop outdoors more often, you should choose a different LCD option.
Display Response Times
| ↔ Response Time Black to White | ||
|---|---|---|
| 26.4 ms ... rise ↗ and fall ↘ combined | ↗ 14.8 ms rise | 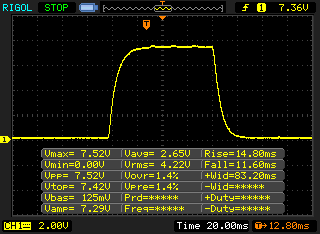 |
| ↘ 11.6 ms fall | ||
| The screen shows relatively slow response rates in our tests and may be too slow for gamers. In comparison, all tested devices range from 0.1 (minimum) to 240 (maximum) ms. » 66 % of all devices are better. This means that the measured response time is worse than the average of all tested devices (19.8 ms). | ||
| ↔ Response Time 50% Grey to 80% Grey | ||
| 38 ms ... rise ↗ and fall ↘ combined | ↗ 20 ms rise | 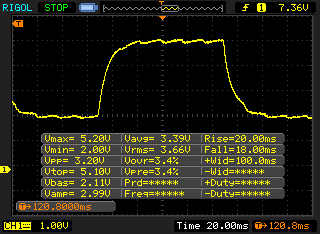 |
| ↘ 18 ms fall | ||
| The screen shows slow response rates in our tests and will be unsatisfactory for gamers. In comparison, all tested devices range from 0.165 (minimum) to 636 (maximum) ms. » 55 % of all devices are better. This means that the measured response time is worse than the average of all tested devices (30.9 ms). | ||
Screen Flickering / PWM (Pulse-Width Modulation)
| Screen flickering / PWM detected | 26040 Hz | 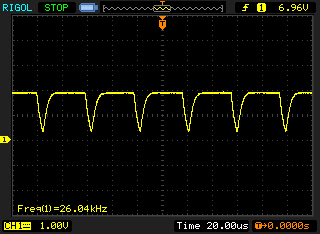 | |
The display backlight flickers at 26040 Hz (worst case, e.g., utilizing PWM) . The frequency of 26040 Hz is quite high, so most users sensitive to PWM should not notice any flickering. In comparison: 52 % of all tested devices do not use PWM to dim the display. If PWM was detected, an average of 7744 (minimum: 5 - maximum: 343500) Hz was measured. | |||
There is nothing wrong with the viewing-angle stability, whereby it has to be mentioned that the typical IPS-glow effect is present in this panel.

Performance: Hardly any changes compared to the predecessor
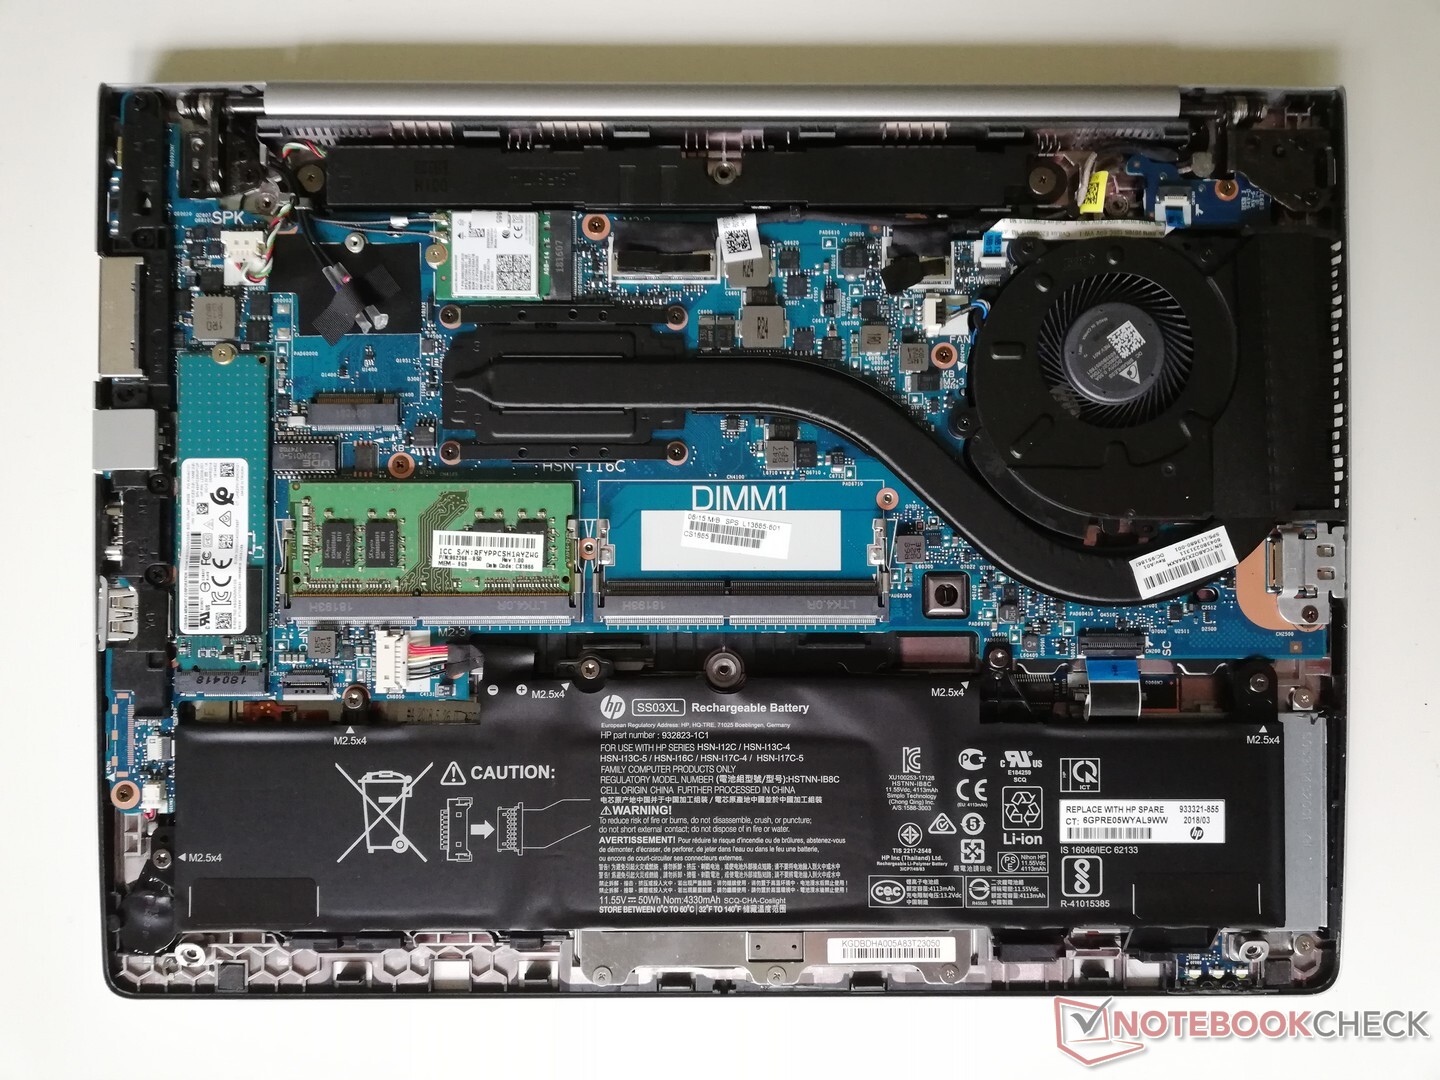
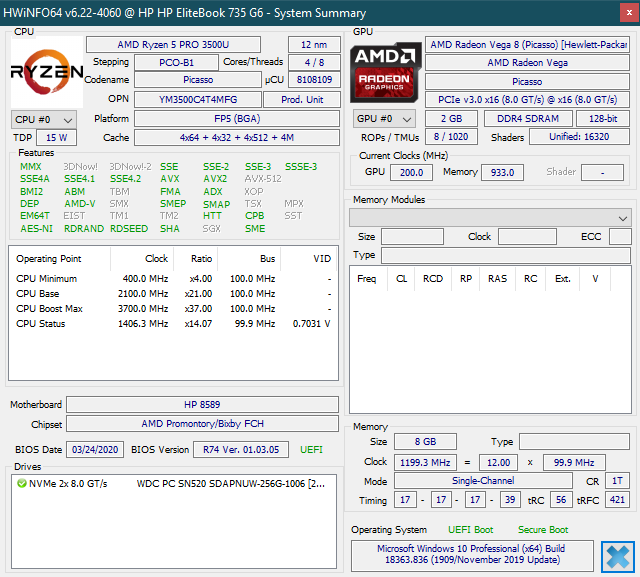
Three different APUs are offered by HP in the EliteBook 735 G6: The AMD Ryzen 3 3300U (including Vega 6), the Ryzen 5 3500U (including Vega 8) and the older Ryzen 7 Pro 2700U (including Vega 10). Two SO-DIMM slots are available for the RAM; a maximum of 64 GB of DDR4 2400 memory is possible. A single M.2 2280 SSD is used as storage device.
Processor
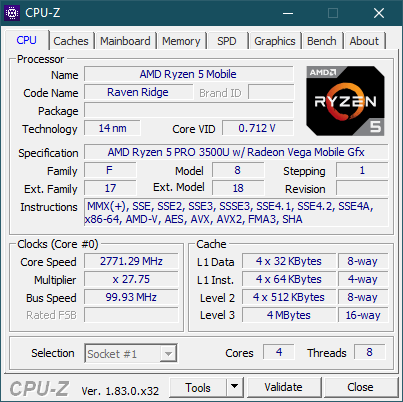
The AMD Ryzen 5 3500U is a quad-core processor of the "Picasso" series. The four cores have a maximum clock rate of 3.7 GHz and a base speed of 2.1 GHz. Because it is a U-series processor, this CPU has a typical maximum consumption of 15 watts. Comparisons to other processors are possible with our CPU comparison list.
In the Cinebench multi-core test, the AMD Ryzen processor can consume up to 25 watts, which results in a clock speed of 3 GHz with four CPU cores. After a short time, the clock rate drops to around 2.6 GHz, at which the processor still consumes about 18 watts. The CPU temperature initially oscillates at about 80 °C (~176 °F) (25-watt power limit) and then settles at about 70 °C (~158 °F) (18-watt power limit).
The EliteBook 735 G5 predecessor model was only slightly slower; the same goes for the Dell Latitude 7300. On the other hand, there is a larger performance difference compared to the Lenovo ThinkPad X395, resulting in an advantage for the EliteBook.
We couldn't determine a performance limitation on battery power.
Cinebench R20: CPU (Multi Core) | CPU (Single Core)
Blender: v2.79 BMW27 CPU
7-Zip 18.03: 7z b 4 -mmt1 | 7z b 4
Geekbench 5.5: Single-Core | Multi-Core
HWBOT x265 Benchmark v2.2: 4k Preset
LibreOffice : 20 Documents To PDF
R Benchmark 2.5: Overall mean
| Cinebench R15 / CPU Multi 64Bit | |
| Average of class Subnotebook (327 - 3345, n=56, last 2 years) | |
| Dell Latitude 7300-P99G | |
| HP EliteBook 735 G5 3UN62EA | |
| HP EliteBook 735 G6 7KN29EA | |
| Average AMD Ryzen 5 PRO 3500U (611 - 637, n=2) | |
| Lenovo ThinkPad X395 | |
| Cinebench R15 / CPU Single 64Bit | |
| Average of class Subnotebook (72.4 - 322, n=56, last 2 years) | |
| Dell Latitude 7300-P99G | |
| HP EliteBook 735 G5 3UN62EA | |
| Average AMD Ryzen 5 PRO 3500U (140 - 144, n=2) | |
| HP EliteBook 735 G6 7KN29EA | |
| Lenovo ThinkPad X395 | |
| Cinebench R20 / CPU (Multi Core) | |
| Average of class Subnotebook (579 - 8541, n=56, last 2 years) | |
| Average AMD Ryzen 5 PRO 3500U (1328 - 1349, n=2) | |
| HP EliteBook 735 G6 7KN29EA | |
| Dell Latitude 7300-P99G | |
| Cinebench R20 / CPU (Single Core) | |
| Average of class Subnotebook (128 - 832, n=56, last 2 years) | |
| Dell Latitude 7300-P99G | |
| Average AMD Ryzen 5 PRO 3500U (354 - 369, n=2) | |
| HP EliteBook 735 G6 7KN29EA | |
| Blender / v2.79 BMW27 CPU | |
| HP EliteBook 735 G6 7KN29EA | |
| Average AMD Ryzen 5 PRO 3500U (786 - 805, n=2) | |
| Average of class Subnotebook (159 - 2271, n=57, last 2 years) | |
| 7-Zip 18.03 / 7z b 4 -mmt1 | |
| Average of class Subnotebook (2643 - 6699, n=58, last 2 years) | |
| Average AMD Ryzen 5 PRO 3500U (3432 - 3516, n=2) | |
| HP EliteBook 735 G6 7KN29EA | |
| 7-Zip 18.03 / 7z b 4 | |
| Average of class Subnotebook (11668 - 77867, n=56, last 2 years) | |
| Average AMD Ryzen 5 PRO 3500U (15910 - 16531, n=2) | |
| HP EliteBook 735 G6 7KN29EA | |
| Geekbench 5.5 / Single-Core | |
| Average of class Subnotebook (726 - 2224, n=49, last 2 years) | |
| HP EliteBook 735 G6 7KN29EA | |
| Average AMD Ryzen 5 PRO 3500U (n=1) | |
| Geekbench 5.5 / Multi-Core | |
| Average of class Subnotebook (2557 - 17218, n=49, last 2 years) | |
| HP EliteBook 735 G6 7KN29EA | |
| Average AMD Ryzen 5 PRO 3500U (n=1) | |
| HWBOT x265 Benchmark v2.2 / 4k Preset | |
| Average of class Subnotebook (0.97 - 25.1, n=56, last 2 years) | |
| Average AMD Ryzen 5 PRO 3500U (3.36 - 3.6, n=2) | |
| HP EliteBook 735 G6 7KN29EA | |
| LibreOffice / 20 Documents To PDF | |
| HP EliteBook 735 G6 7KN29EA | |
| Average AMD Ryzen 5 PRO 3500U (n=1) | |
| Average of class Subnotebook (39.9 - 220, n=55, last 2 years) | |
| R Benchmark 2.5 / Overall mean | |
| HP EliteBook 735 G6 7KN29EA | |
| Average AMD Ryzen 5 PRO 3500U (n=1) | |
| Average of class Subnotebook (0.4024 - 1.456, n=57, last 2 years) | |
* ... smaller is better
System performance
There isn't really anything to criticize in terms of the system performance in everyday use, even if the HP laptop partly scores below average in the PCMark benchmarks.
| PCMark 8 Home Score Accelerated v2 | 3311 points | |
| PCMark 8 Work Score Accelerated v2 | 4558 points | |
| PCMark 10 Score | 3389 points | |
Help | ||
DPC latency
The HP laptop has some problems with DPC latencies, which can be traced back to the network driver. With the network disabled, it could be possible to avoid DPC dropouts.
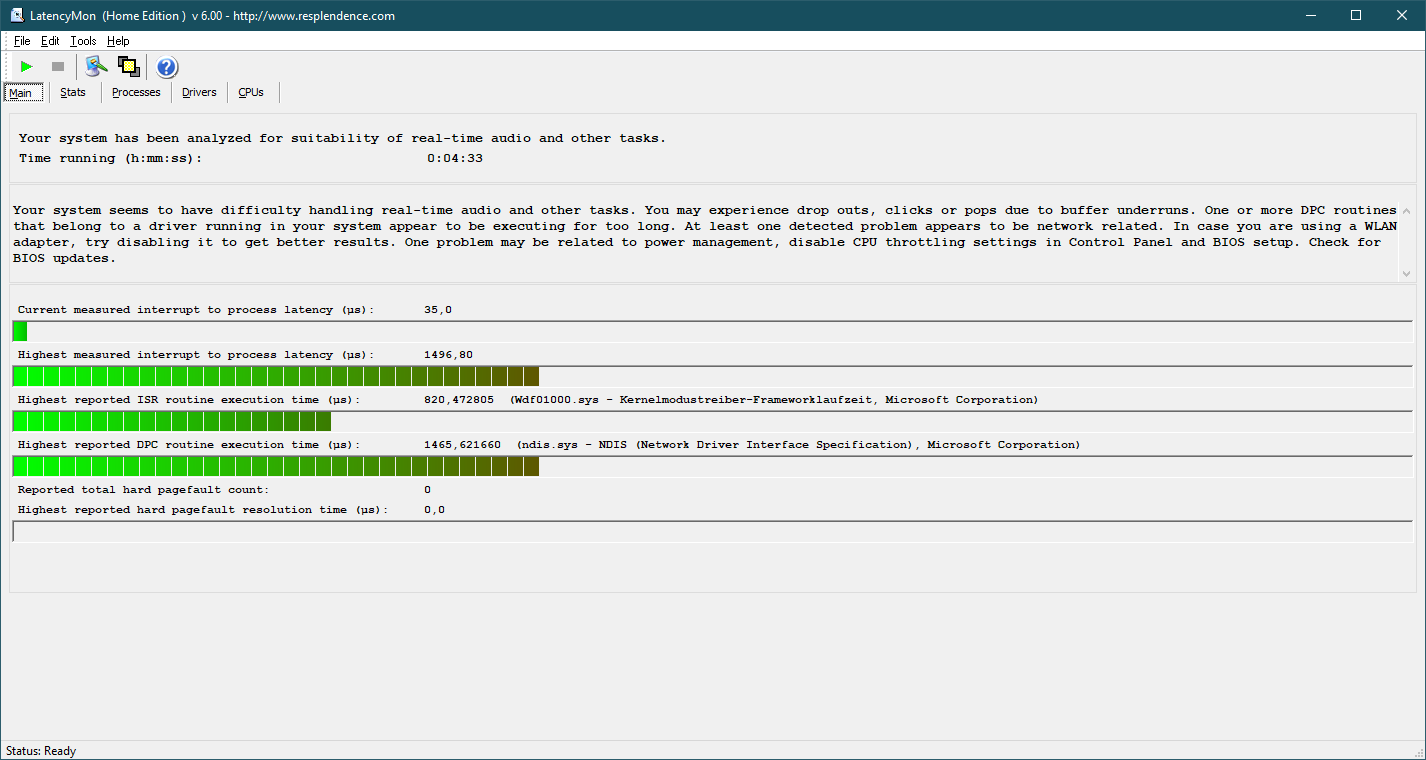
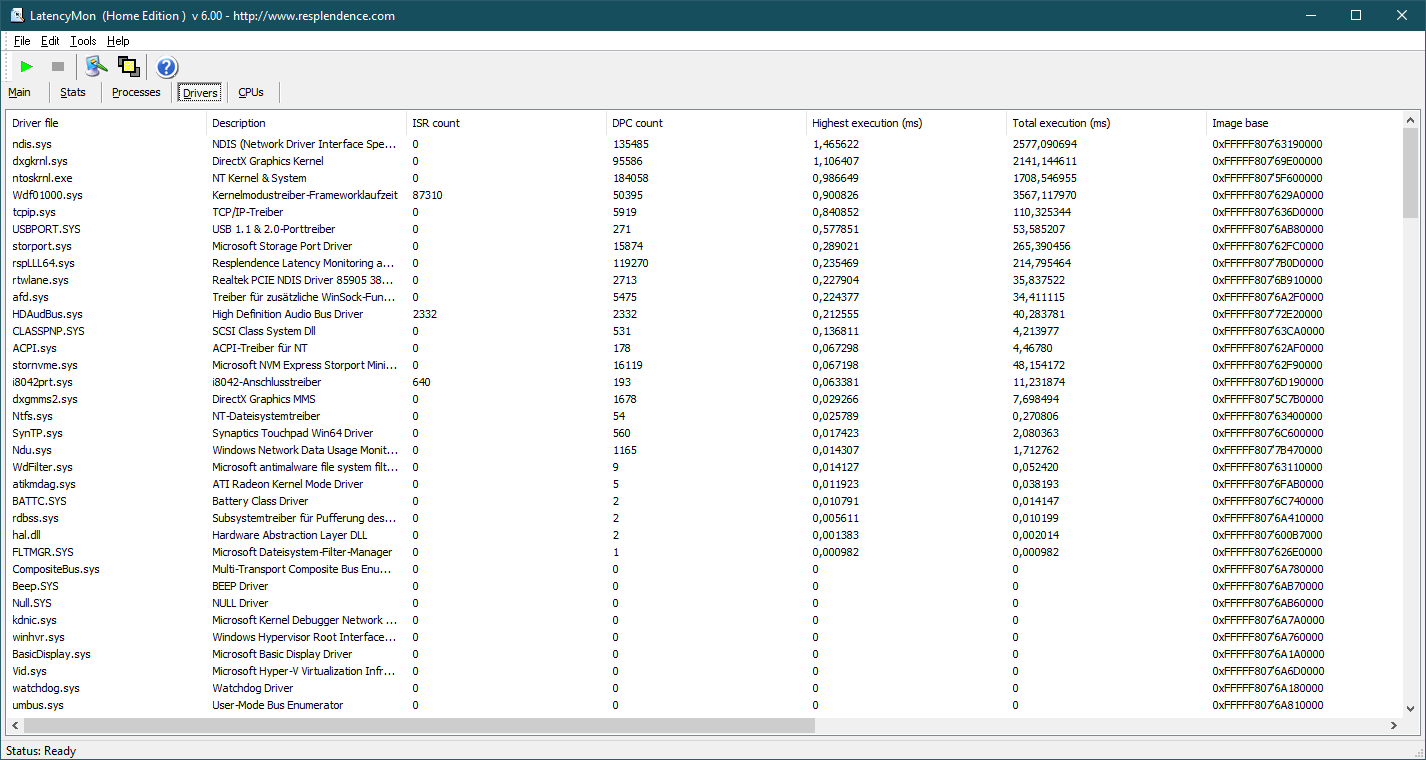
| DPC Latencies / LatencyMon - interrupt to process latency (max), Web, Youtube, Prime95 | |
| HP EliteBook 735 G6 7KN29EA | |
* ... smaller is better
Storage
The Western Digital SSD in the M.2 2280 format has a capacity of 256 GB. It is a PCIe NVMe SSD, but it only appears to comply with the PCIe 3.0 x2 standard. In comparison to the Samsung SSDs of Lenovo's and Dell's competitor devices, the SSD from Western Digital is significantly slower, which should only have minor effects on everyday performance, though.
| HP EliteBook 735 G6 7KN29EA WDC PC SN520 SDAPNUW-256G | Lenovo ThinkPad X395 Samsung SSD PM981a MZVLB256HBHQ | HP EliteBook 735 G5 3UN62EA Toshiba KBG30ZMV256G | Dell Latitude 7300-P99G Samsung SSD PM981 MZVLB512HAJQ | Average WDC PC SN520 SDAPNUW-256G | |
|---|---|---|---|---|---|
| CrystalDiskMark 5.2 / 6 | 60% | -7% | 89% | 13% | |
| Write 4K (MB/s) | 116 | 129.4 12% | 97.3 -16% | 141.1 22% | 118.5 ? 2% |
| Read 4K (MB/s) | 39.81 | 41.6 4% | 44.58 12% | 46.37 16% | 42 ? 6% |
| Write Seq (MB/s) | 1300 | 2334 80% | 883 -32% | 1994 53% | 1123 ? -14% |
| Read Seq (MB/s) | 803 | 2151 168% | 1050 31% | 2275 183% | 1208 ? 50% |
| Write 4K Q32T1 (MB/s) | 187.6 | 234 25% | 167.3 -11% | 493.3 163% | 324 ? 73% |
| Read 4K Q32T1 (MB/s) | 305.9 | 325.7 6% | 337.4 10% | 429 40% | 322 ? 5% |
| Write Seq Q32T1 (MB/s) | 1299 | 2348 81% | 789 -39% | 2992 130% | 1091 ? -16% |
| Read Seq Q32T1 (MB/s) | 1741 | 3563 105% | 1606 -8% | 3562 105% | 1729 ? -1% |

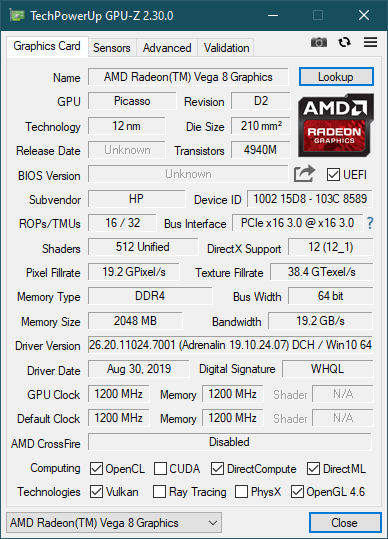
Graphics card
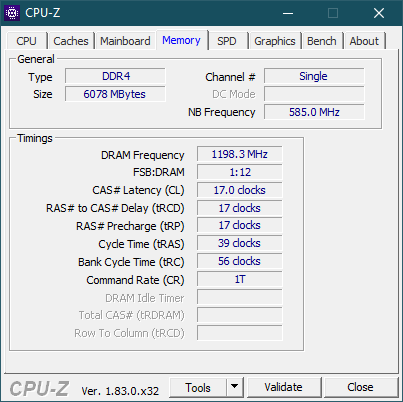
The integrated graphics chip is the AMD Radeon RX Vega 8; due to it lacking dedicated RAM, the Vega GPU needs to use the system's memory. Performance is negatively affected by the fact that the RAM in the EliteBook 735 G6 only runs in single-channel mode. This is the reason why the Vega 8 in the HP laptop lags behind the Vega 6 of the Lenovo ThinkPad X395, and it explains why the Vega 8 also achieves better results on average.
At least you can improve the performance very easily by installing a RAM module in the free SO-DIMM slot. This should also provide better results in games, even if this naturally doesn't turn the EliteBook into a gaming laptop. But it's definitely suitable for older titles.
The GPU can also make full use of its performance capabilities on battery power.
| 3DMark 11 Performance | 3007 points | |
| 3DMark Cloud Gate Standard Score | 9703 points | |
| 3DMark Fire Strike Score | 1662 points | |
| 3DMark Time Spy Score | 643 points | |
Help | ||
Gaming performance
| low | med. | high | ultra | |
|---|---|---|---|---|
| The Witcher 3 (2015) | 30.4 | 19.5 | ||
| Dota 2 Reborn (2015) | 64.5 | 50.7 | 27.7 | 25.5 |
| X-Plane 11.11 (2018) | 21 | 16.4 | 14.4 | |
| Shadow of the Tomb Raider (2018) | 24 | |||
| Total War: Three Kingdoms (2019) | 26.8 |
Emissions: HP laptop is cool and quiet
Noise emissions
The fan in the HP EliteBook 735 G6 remains unobtrusive. It sometimes starts up in idle usage, but it remains barely audible. The fan only gets slightly louder under load. We couldn't detect any coil whine.
Noise level
| Idle |
| 29.6 / 29.6 / 30.9 dB(A) |
| Load |
| 33.9 / 33.9 dB(A) |
 | ||
30 dB silent 40 dB(A) audible 50 dB(A) loud |
||
min: | ||
Temperature
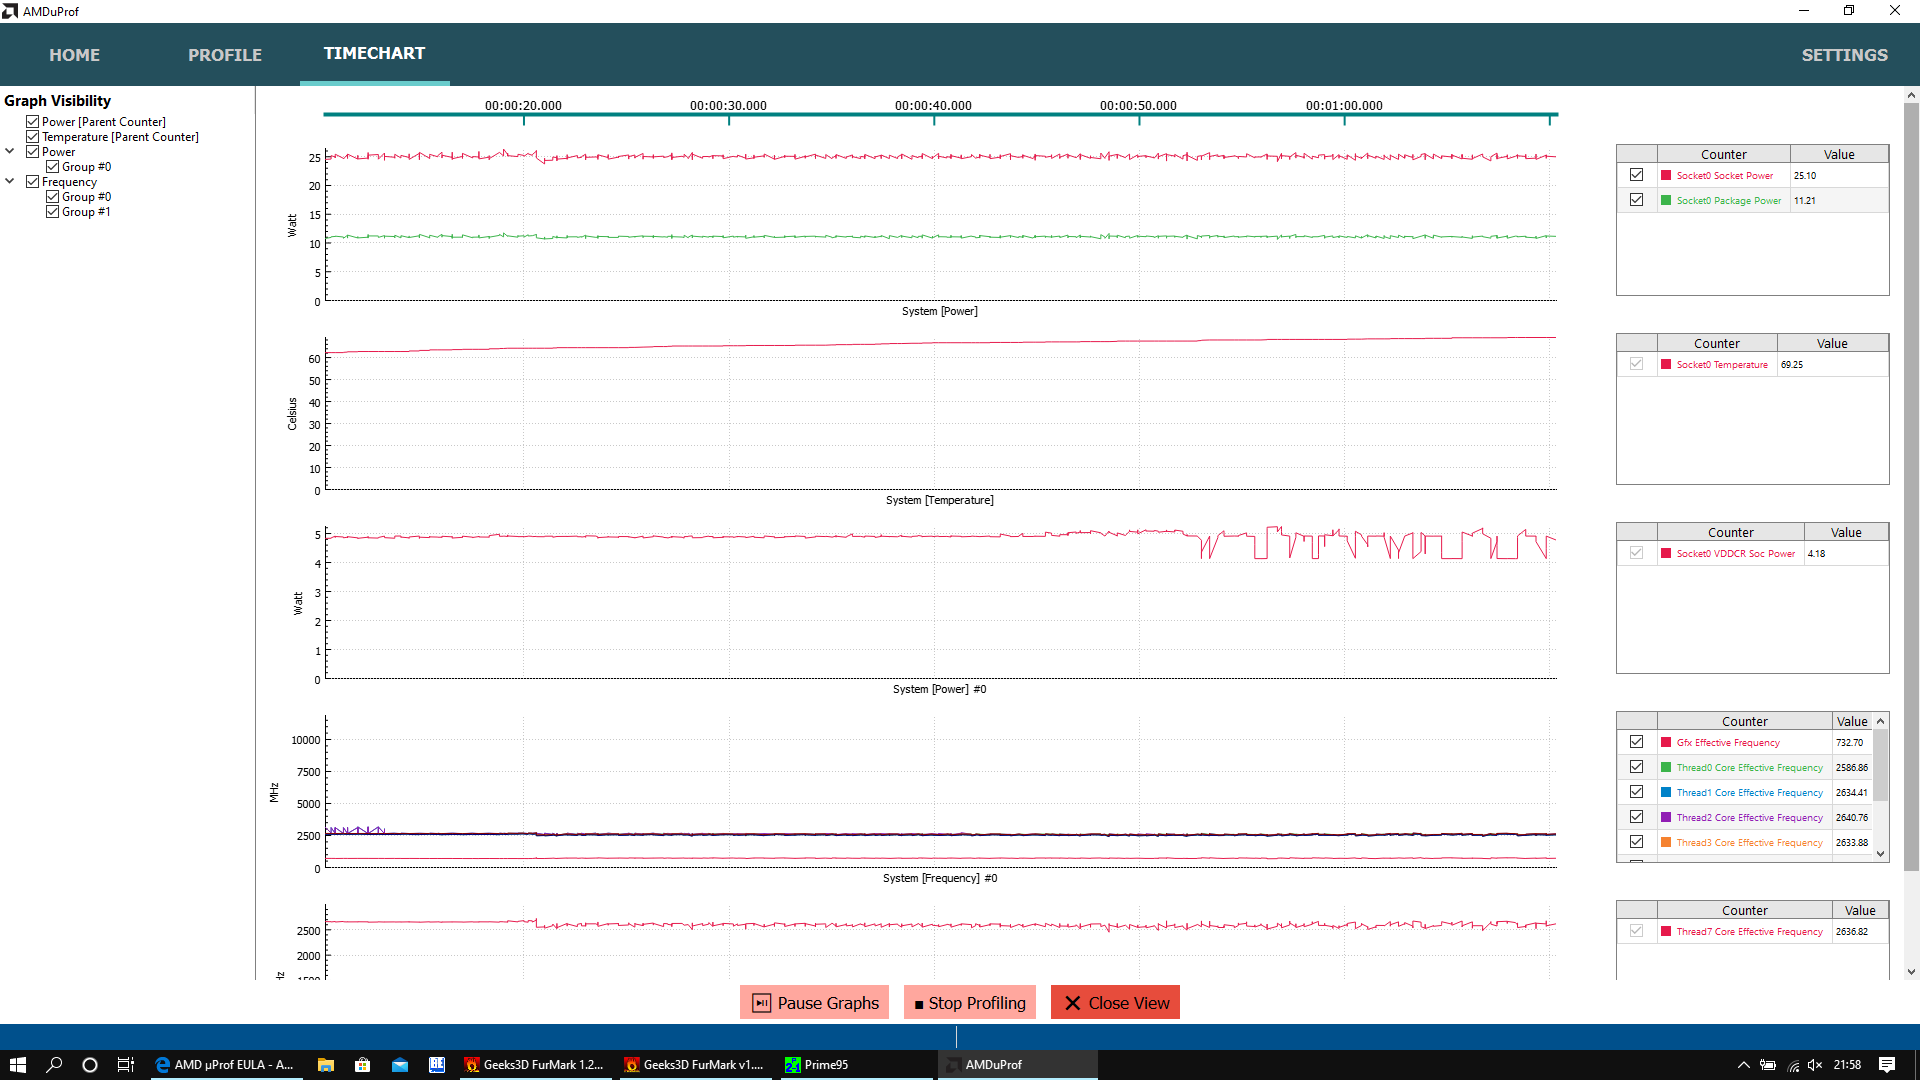
Even under load, the HP EliteBook 735 G6 hardly gets more than lukewarm. The maximum measured temperature is 41.8 °C (~107 °F), which is a completely harmless value.
The AMD processor can initially consume 25 watts in the stress test with Prime95 and FurMark. After a short time, the CPU/GPU consumption drops to around 17 watts, with which the CPU clock rates are approximately 1.7 GHz, and the CPU temperatures reach around 65 °C (~149 °F). The AMD EliteBook maintains this performance level until the end of the test. Throttling in everyday use shouldn't be a problem with the EliteBook 735 G6.
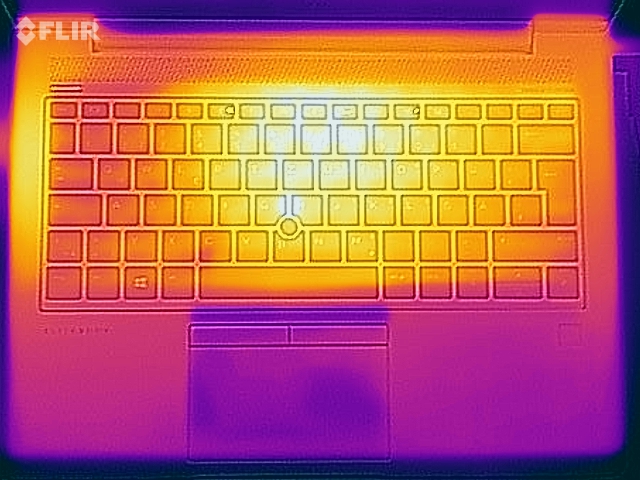
(+) The maximum temperature on the upper side is 39.5 °C / 103 F, compared to the average of 35.9 °C / 97 F, ranging from 21.4 to 59 °C for the class Subnotebook.
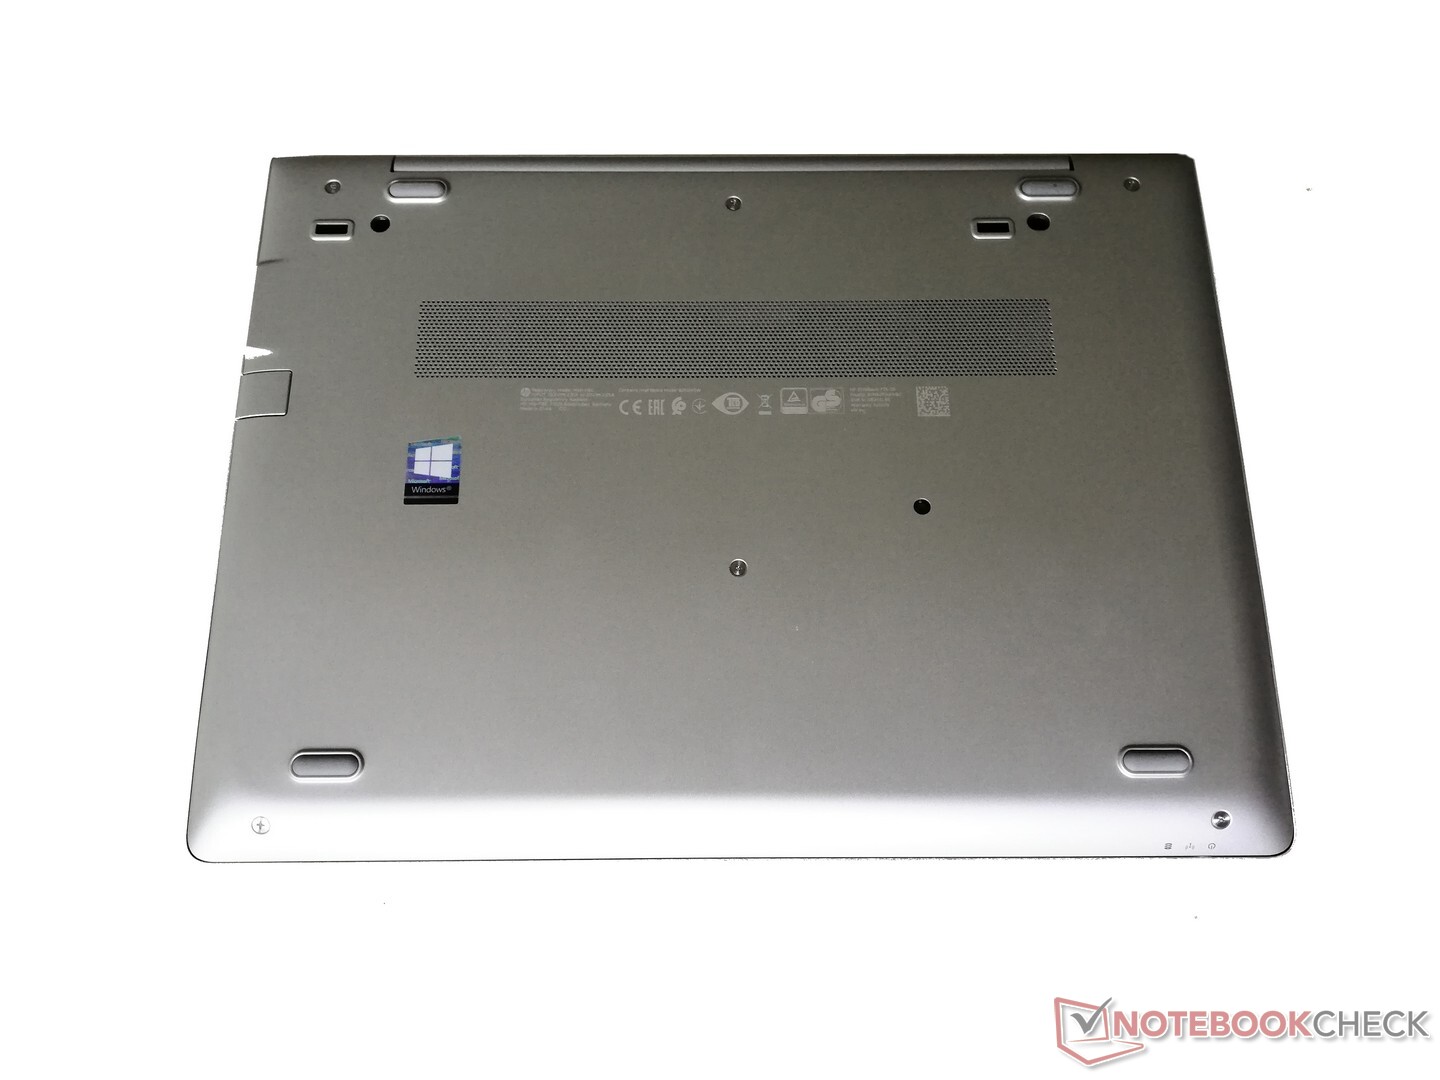
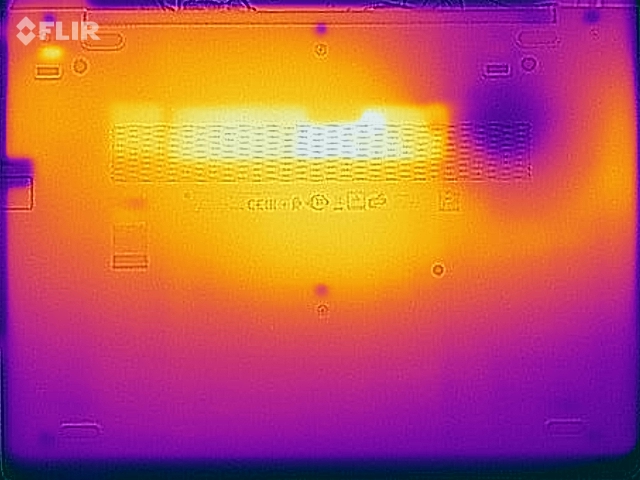
(±) The bottom heats up to a maximum of 41.8 °C / 107 F, compared to the average of 39.2 °C / 103 F
(+) In idle usage, the average temperature for the upper side is 27.7 °C / 82 F, compared to the device average of 30.8 °C / 87 F.
(+) The palmrests and touchpad are cooler than skin temperature with a maximum of 29.7 °C / 85.5 F and are therefore cool to the touch.
(±) The average temperature of the palmrest area of similar devices was 28.2 °C / 82.8 F (-1.5 °C / -2.7 F).
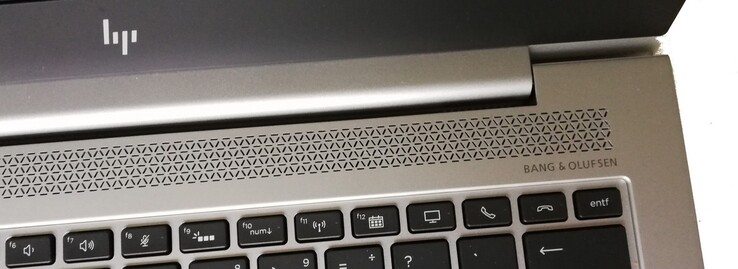
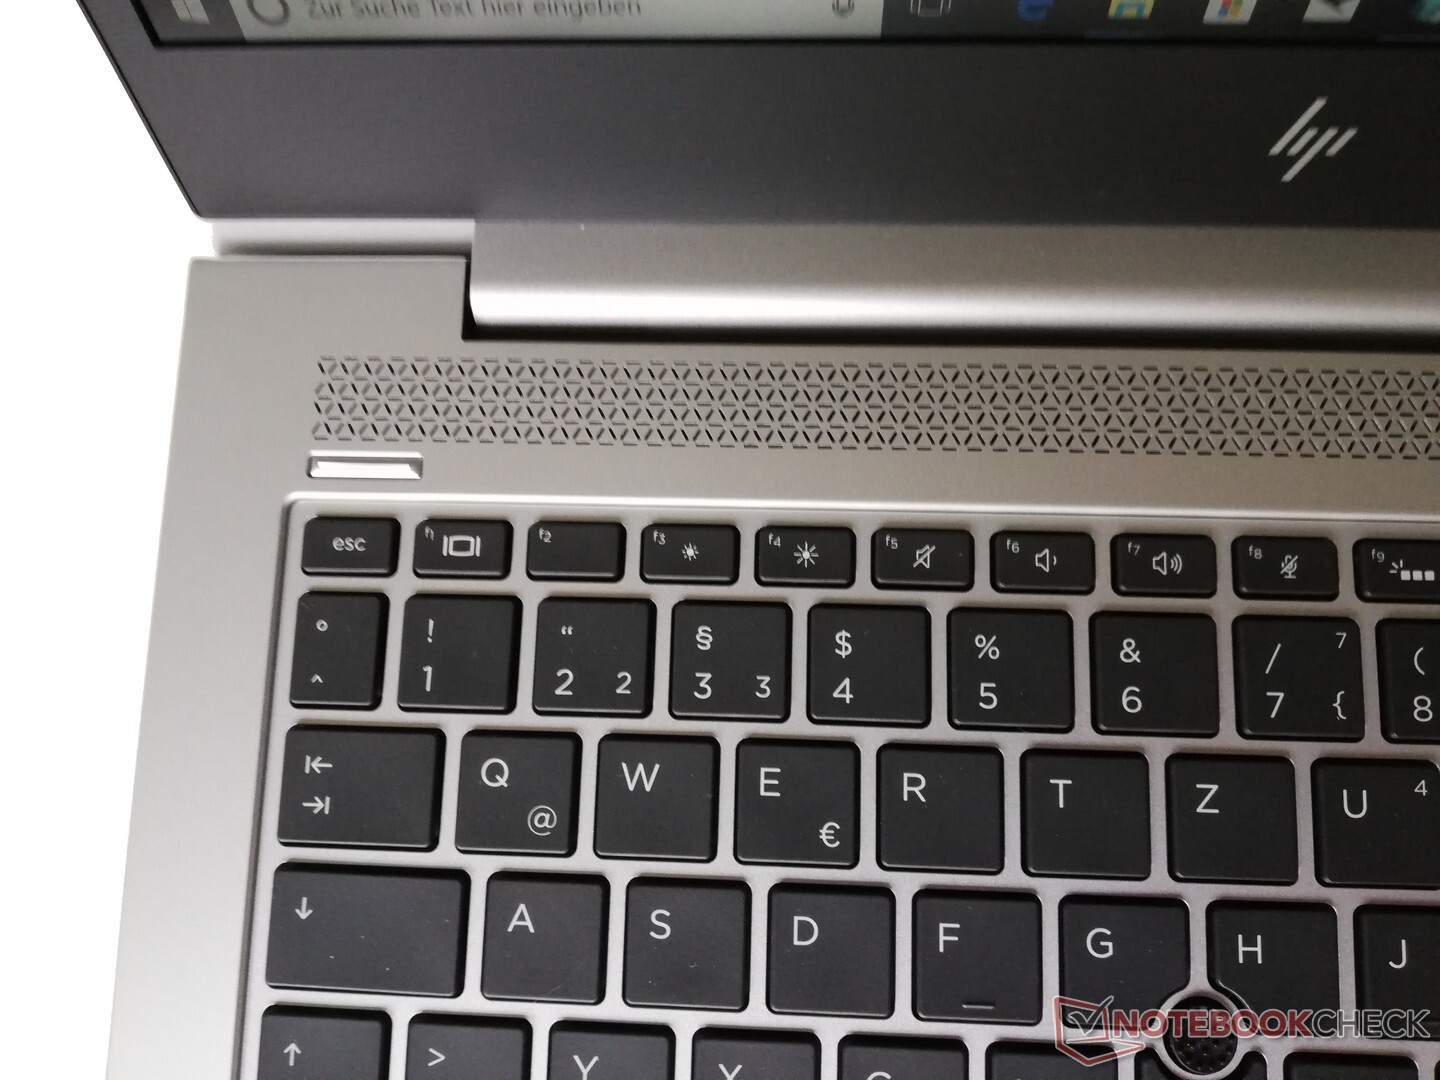
Speakers
The stereo speakers placed above the keyboard produce a good sound. They could be a bit louder, but that's nitpicking for laptop speakers. Listening to a little music is definitely possible with these speakers. Alternatively, you can naturally also use the HP laptop's perfectly functioning combo audio port.
HP EliteBook 735 G6 7KN29EA audio analysis
(±) | speaker loudness is average but good (73 dB)
Bass 100 - 315 Hz
(±) | reduced bass - on average 14.4% lower than median
(±) | linearity of bass is average (10.8% delta to prev. frequency)
Mids 400 - 2000 Hz
(+) | balanced mids - only 2.3% away from median
(+) | mids are linear (5.5% delta to prev. frequency)
Highs 2 - 16 kHz
(+) | balanced highs - only 1.6% away from median
(+) | highs are linear (4.2% delta to prev. frequency)
Overall 100 - 16.000 Hz
(±) | linearity of overall sound is average (16.9% difference to median)
Compared to same class
» 44% of all tested devices in this class were better, 8% similar, 49% worse
» The best had a delta of 5%, average was 18%, worst was 53%
Compared to all devices tested
» 30% of all tested devices were better, 8% similar, 62% worse
» The best had a delta of 4%, average was 23%, worst was 134%
Lenovo ThinkPad X395 audio analysis
(-) | not very loud speakers (71 dB)
Bass 100 - 315 Hz
(-) | nearly no bass - on average 18.8% lower than median
(±) | linearity of bass is average (12.6% delta to prev. frequency)
Mids 400 - 2000 Hz
(+) | balanced mids - only 4.2% away from median
(±) | linearity of mids is average (11.9% delta to prev. frequency)
Highs 2 - 16 kHz
(+) | balanced highs - only 2.2% away from median
(+) | highs are linear (6.6% delta to prev. frequency)
Overall 100 - 16.000 Hz
(±) | linearity of overall sound is average (20.5% difference to median)
Compared to same class
» 66% of all tested devices in this class were better, 7% similar, 26% worse
» The best had a delta of 5%, average was 18%, worst was 53%
Compared to all devices tested
» 54% of all tested devices were better, 8% similar, 38% worse
» The best had a delta of 4%, average was 23%, worst was 134%
Energy management as the Achilles heel of the HP EliteBook 735 G6
Energy consumption
HP seems to have some catching up to do in terms of energy consumption, since the HP EliteBook 735 G6 consumes more than the competition from Dell and Lenovo. At least: An improvement is measurable in comparison to the EliteBook 735 G5 predecessor.
The peak load of 48.6 watts exceeds the power adapter's capacity. But since the consumption quickly stabilizes at an average of 34.3 watts, this isn't a problem.
| Off / Standby | |
| Idle | |
| Load |
|
Key:
min: | |
| HP EliteBook 735 G6 7KN29EA R5 PRO 3500U, Vega 8, WDC PC SN520 SDAPNUW-256G, IPS LED, 1920x1080, 13.3" | Lenovo ThinkPad X395 R3 PRO 3300U, Vega 6, Samsung SSD PM981a MZVLB256HBHQ, IPS, 1920x1080, 13.3" | HP EliteBook 735 G5 3UN62EA R7 2700U, Vega 10, Toshiba KBG30ZMV256G, IPS, 1920x1080, 13.3" | Dell Latitude 7300-P99G i7-8665U, UHD Graphics 620, Samsung SSD PM981 MZVLB512HAJQ, IPS LED, 1920x1080, 13.3" | Average AMD Radeon RX Vega 8 (Ryzen 2000/3000) | Average of class Subnotebook | |
|---|---|---|---|---|---|---|
| Power Consumption | 14% | -9% | 8% | -4% | 2% | |
| Idle Minimum * (Watt) | 5.6 | 4 29% | 5.5 2% | 2.5 55% | 5.68 ? -1% | 3.73 ? 33% |
| Idle Average * (Watt) | 8.1 | 6.3 22% | 9.4 -16% | 6.6 19% | 8.75 ? -8% | 6.57 ? 19% |
| Idle Maximum * (Watt) | 9.6 | 9.3 3% | 11.6 -21% | 8.7 9% | 10.1 ? -5% | 7.93 ? 17% |
| Load Average * (Watt) | 34.3 | 34 1% | 39 -14% | 35.4 -3% | 37.8 ? -10% | 42.1 ? -23% |
| Load Maximum * (Watt) | 48.6 | 42 14% | 45.6 6% | 68.1 -40% | 46.2 ? 5% | 65.1 ? -34% |
* ... smaller is better
Battery life
Although nothing has changed in the battery capacity in comparison to the previous model, HP gets more out of the 50 Wh battery in the newer EliteBook. In the practical Wi-Fi test with a 150 cd/m² brightness, the EliteBook 735 G5 lasts about 33% less than the newer EliteBook 735 G6. However, analogous to the power consumption rates, the HP laptop is clearly inferior to the competition: Both the Lenovo ThinkPad X395 and the Dell Latitude 7300 achieved a result of just under 11 h in the Wi-Fi test, while the EliteBook only lasted just over 8 h.
| HP EliteBook 735 G6 7KN29EA R5 PRO 3500U, Vega 8, 50 Wh | Lenovo ThinkPad X395 R3 PRO 3300U, Vega 6, 48 Wh | HP EliteBook 735 G5 3UN62EA R7 2700U, Vega 10, 50 Wh | Dell Latitude 7300-P99G i7-8665U, UHD Graphics 620, 60 Wh | Average of class Subnotebook | |
|---|---|---|---|---|---|
| Battery runtime | 33% | -33% | 32% | 70% | |
| WiFi v1.3 (h) | 8.2 | 10.9 33% | 5.5 -33% | 10.8 32% | 13.9 ? 70% |
| Reader / Idle (h) | 18.4 | 9.2 | 26.4 ? | ||
| H.264 (h) | 10.3 | 11.1 | 15.3 ? | ||
| Load (h) | 3.8 | 1.4 | 1.9 | 2.04 ? |
Pros
Cons
Verdict
The HP EliteBook 735 G6 is not a big update compared to its predecessor. The biggest difference is the newer Ryzen 3000 CPUs of the Picasso series. In terms of performance, the new CPUs are not a real improvement, but the battery life has improved significantly in return. The fact that this is still not a real advantage is due to the competition still being clearly ahead in this area.
The other strengths of the HP EliteBook 735 G5 remain in the successor; in particular, the high-quality and stable aluminum case and the good speakers are to be mentioned here. The connectivity is also convincing, except for the missing SD card reader. This is especially an advantage in comparison to the already presented successor model, the HP EliteBook 835 G7, because the latter lacks both an RJ45 Ethernet port and a side docking port. A weak point of the HP EliteBook 735 G6 is the display, at least in the base configuration. It's recommended to go for the 400 cd/m² panel at the least here.
Although it's already outdated, the HP EliteBook 735 G6 can still be a good work device in 2020.
Should one still buy the EliteBook 735 G6 now? We make a recommendation with limitations. If CPU performance is a high priority, you should probably go for the for the EliteBook 835 G7 successor without a doubt. If, on the other hand, you already have an existing HP side dock on your desk at home, or if you often need RJ45 Ethernet, then the EliteBook 735 G6 can definitely still be worth buying - especially if the price goes down over the next weeks.
HP EliteBook 735 G6 7KN29EA
- 06/10/2020 v7 (old)
Benjamin Herzig
Price comparison

