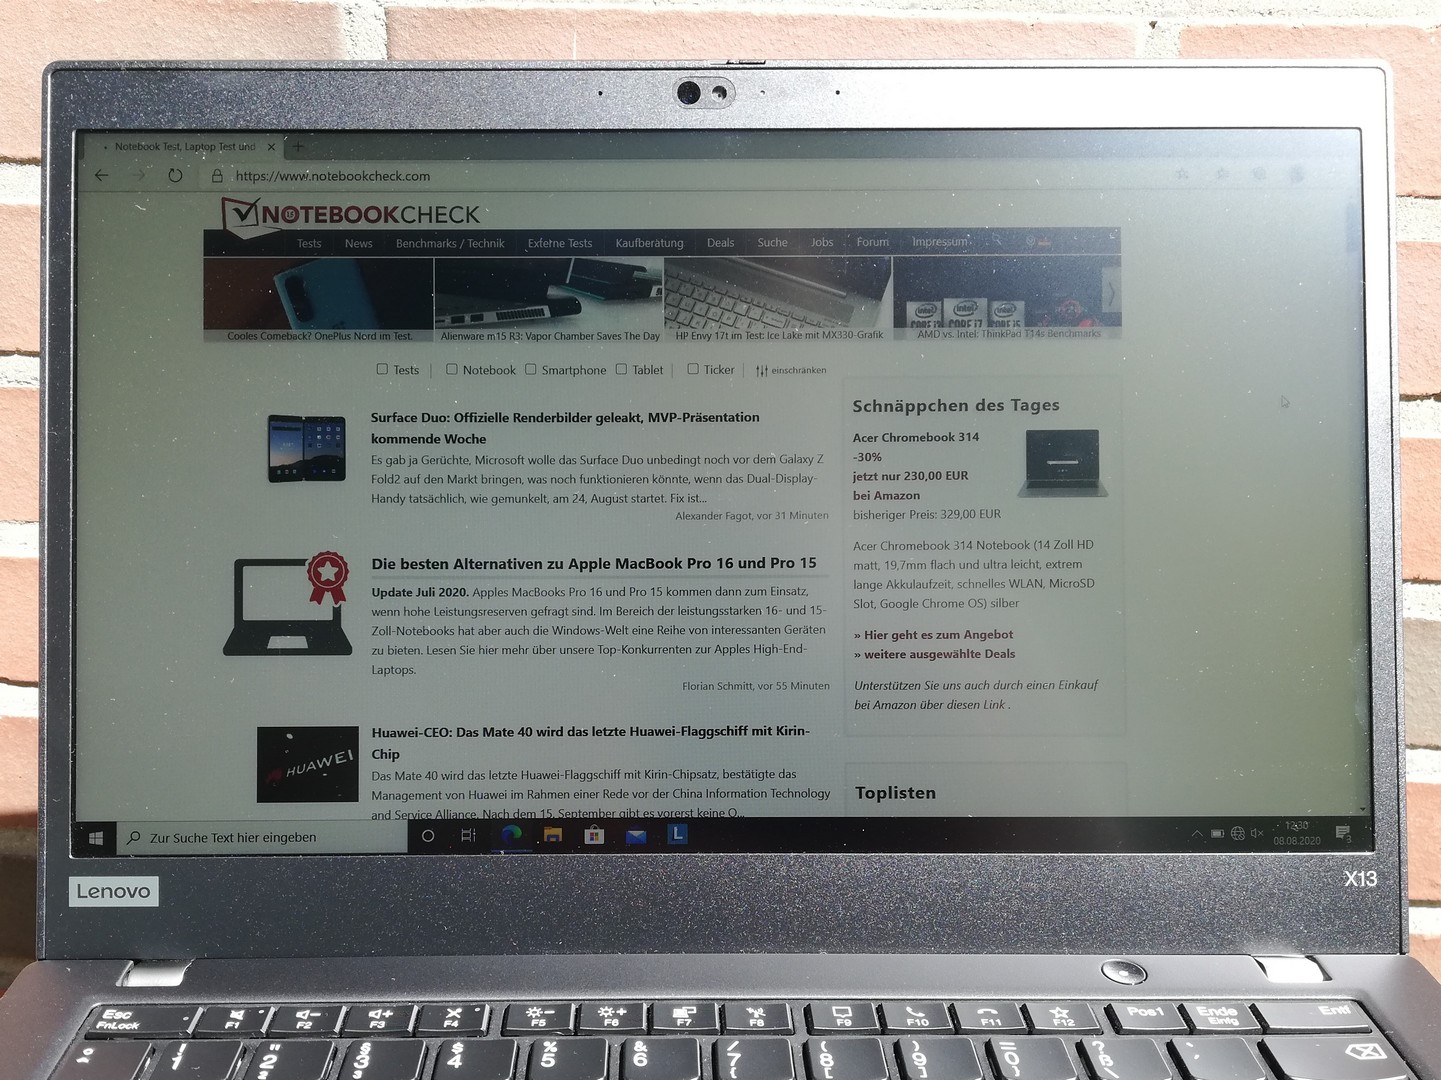
Lenovo ThinkPad X13 Laptop Review: small, light, and 4G compatible

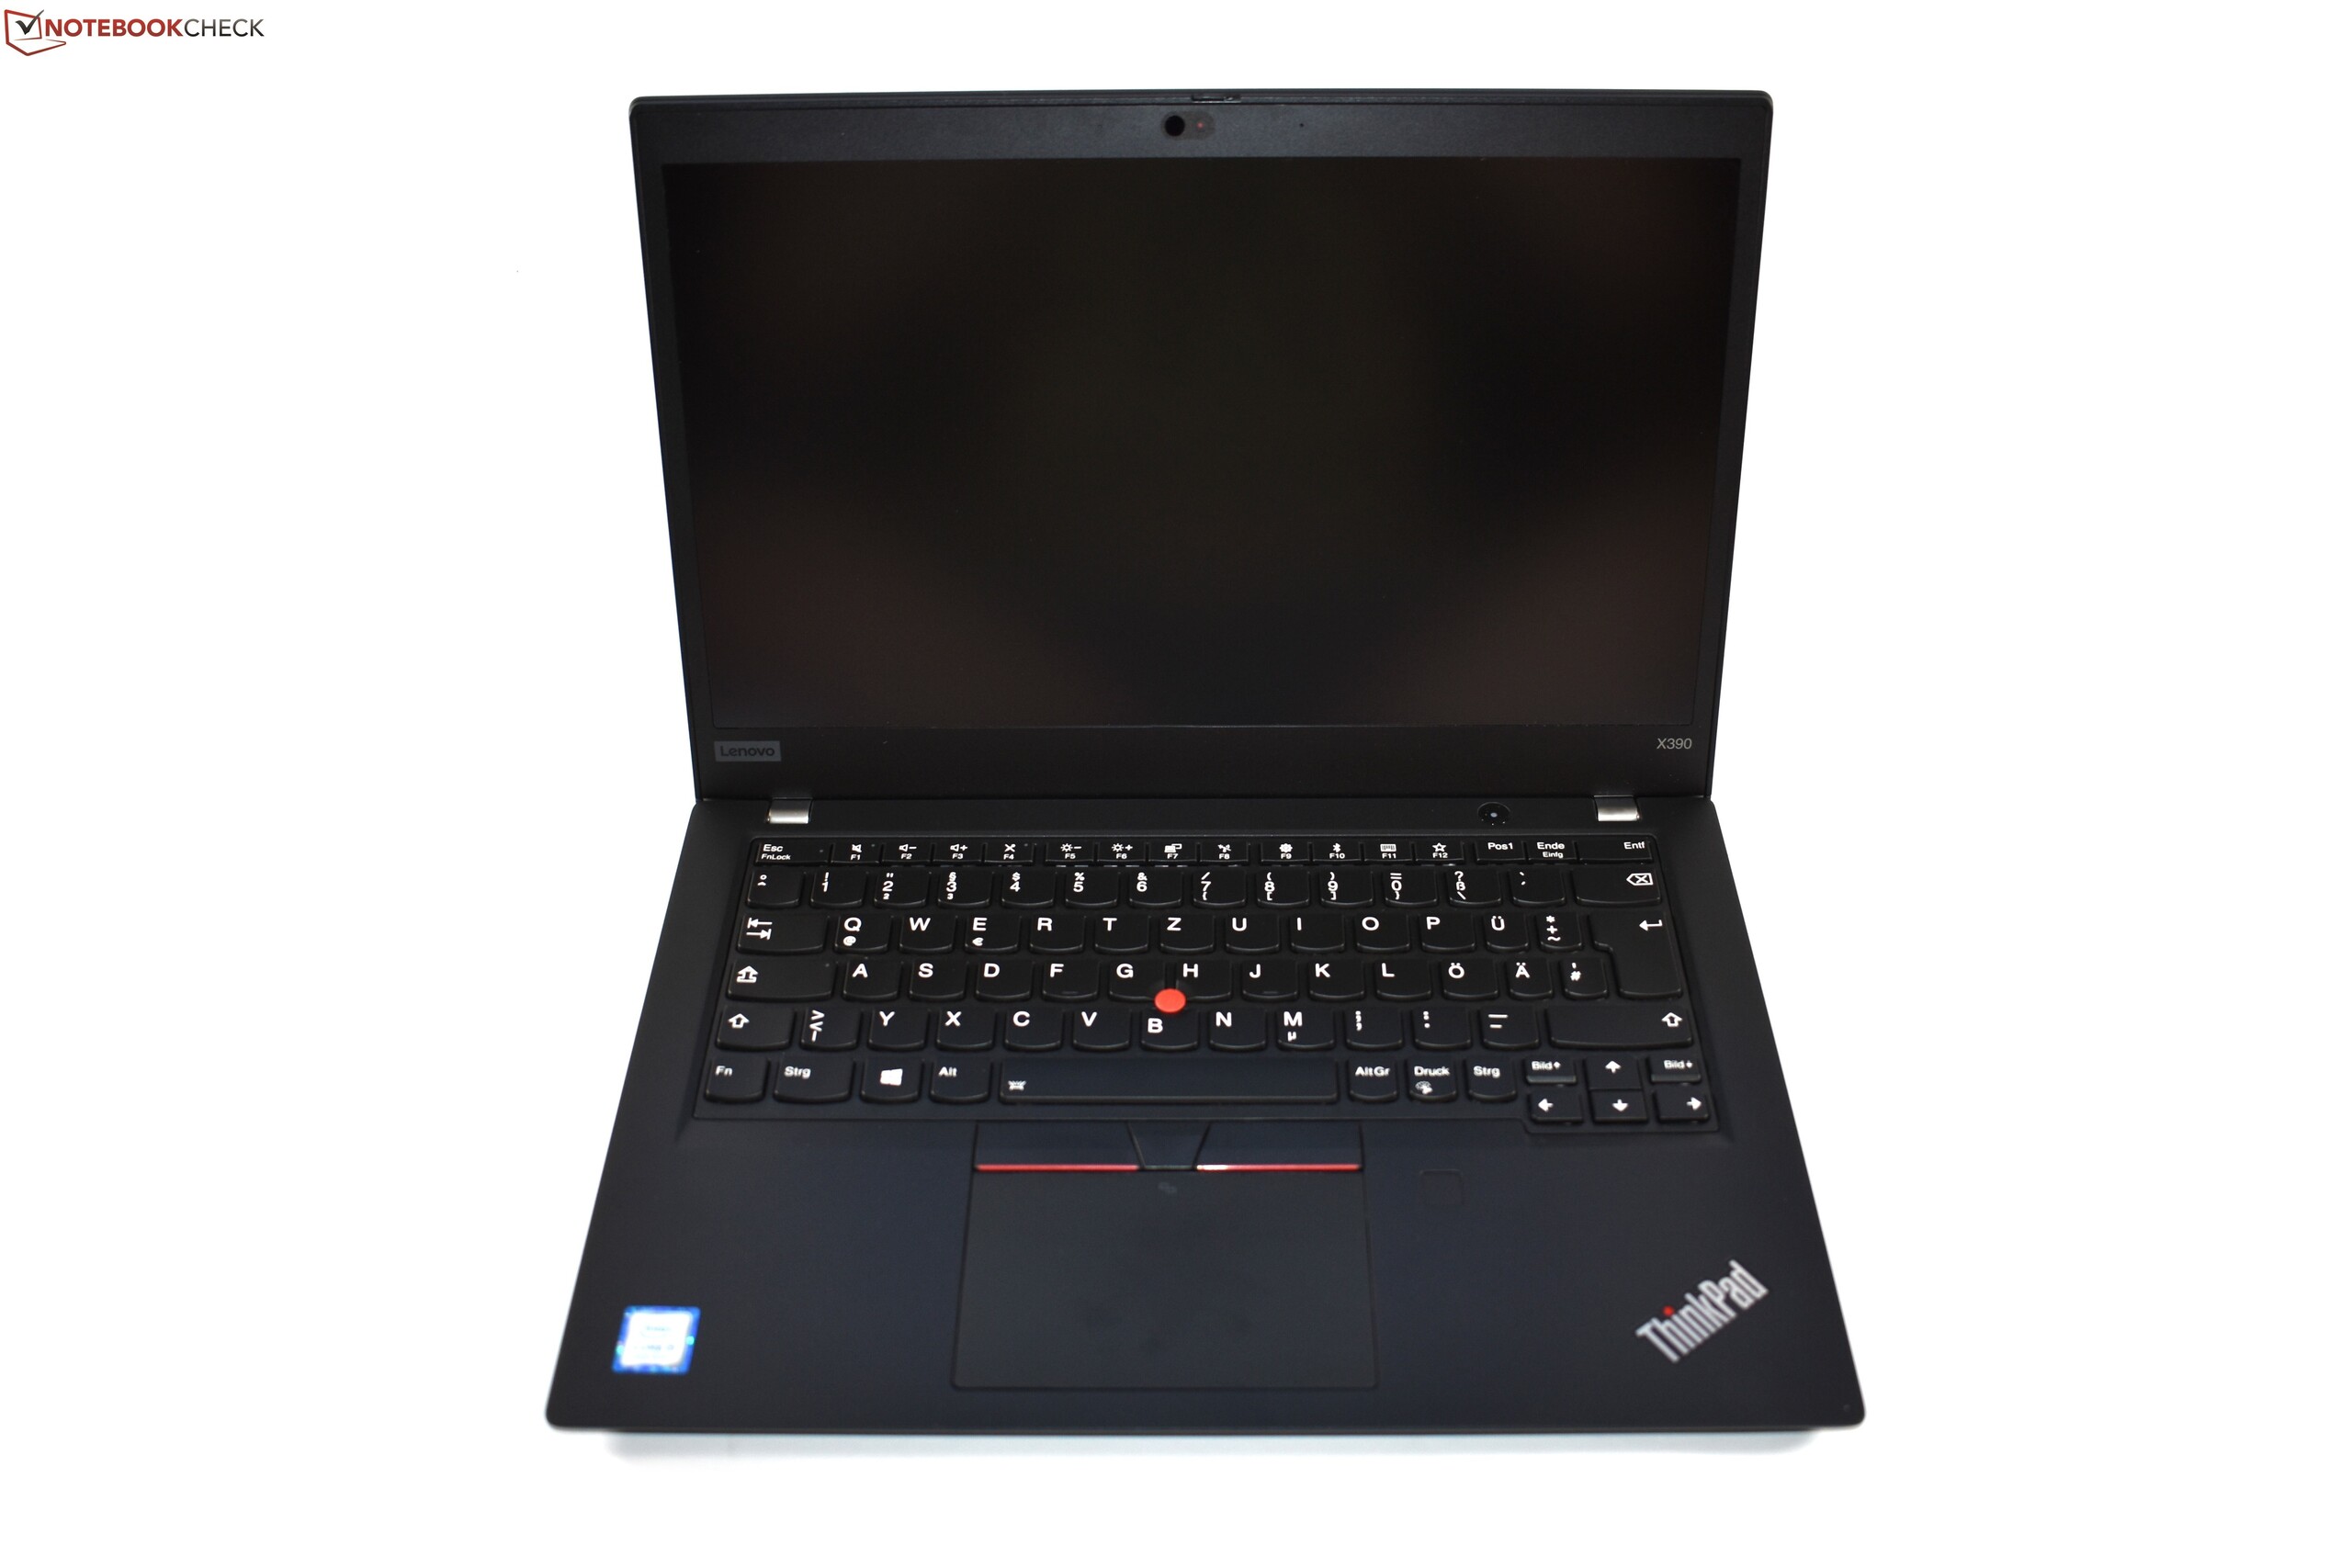
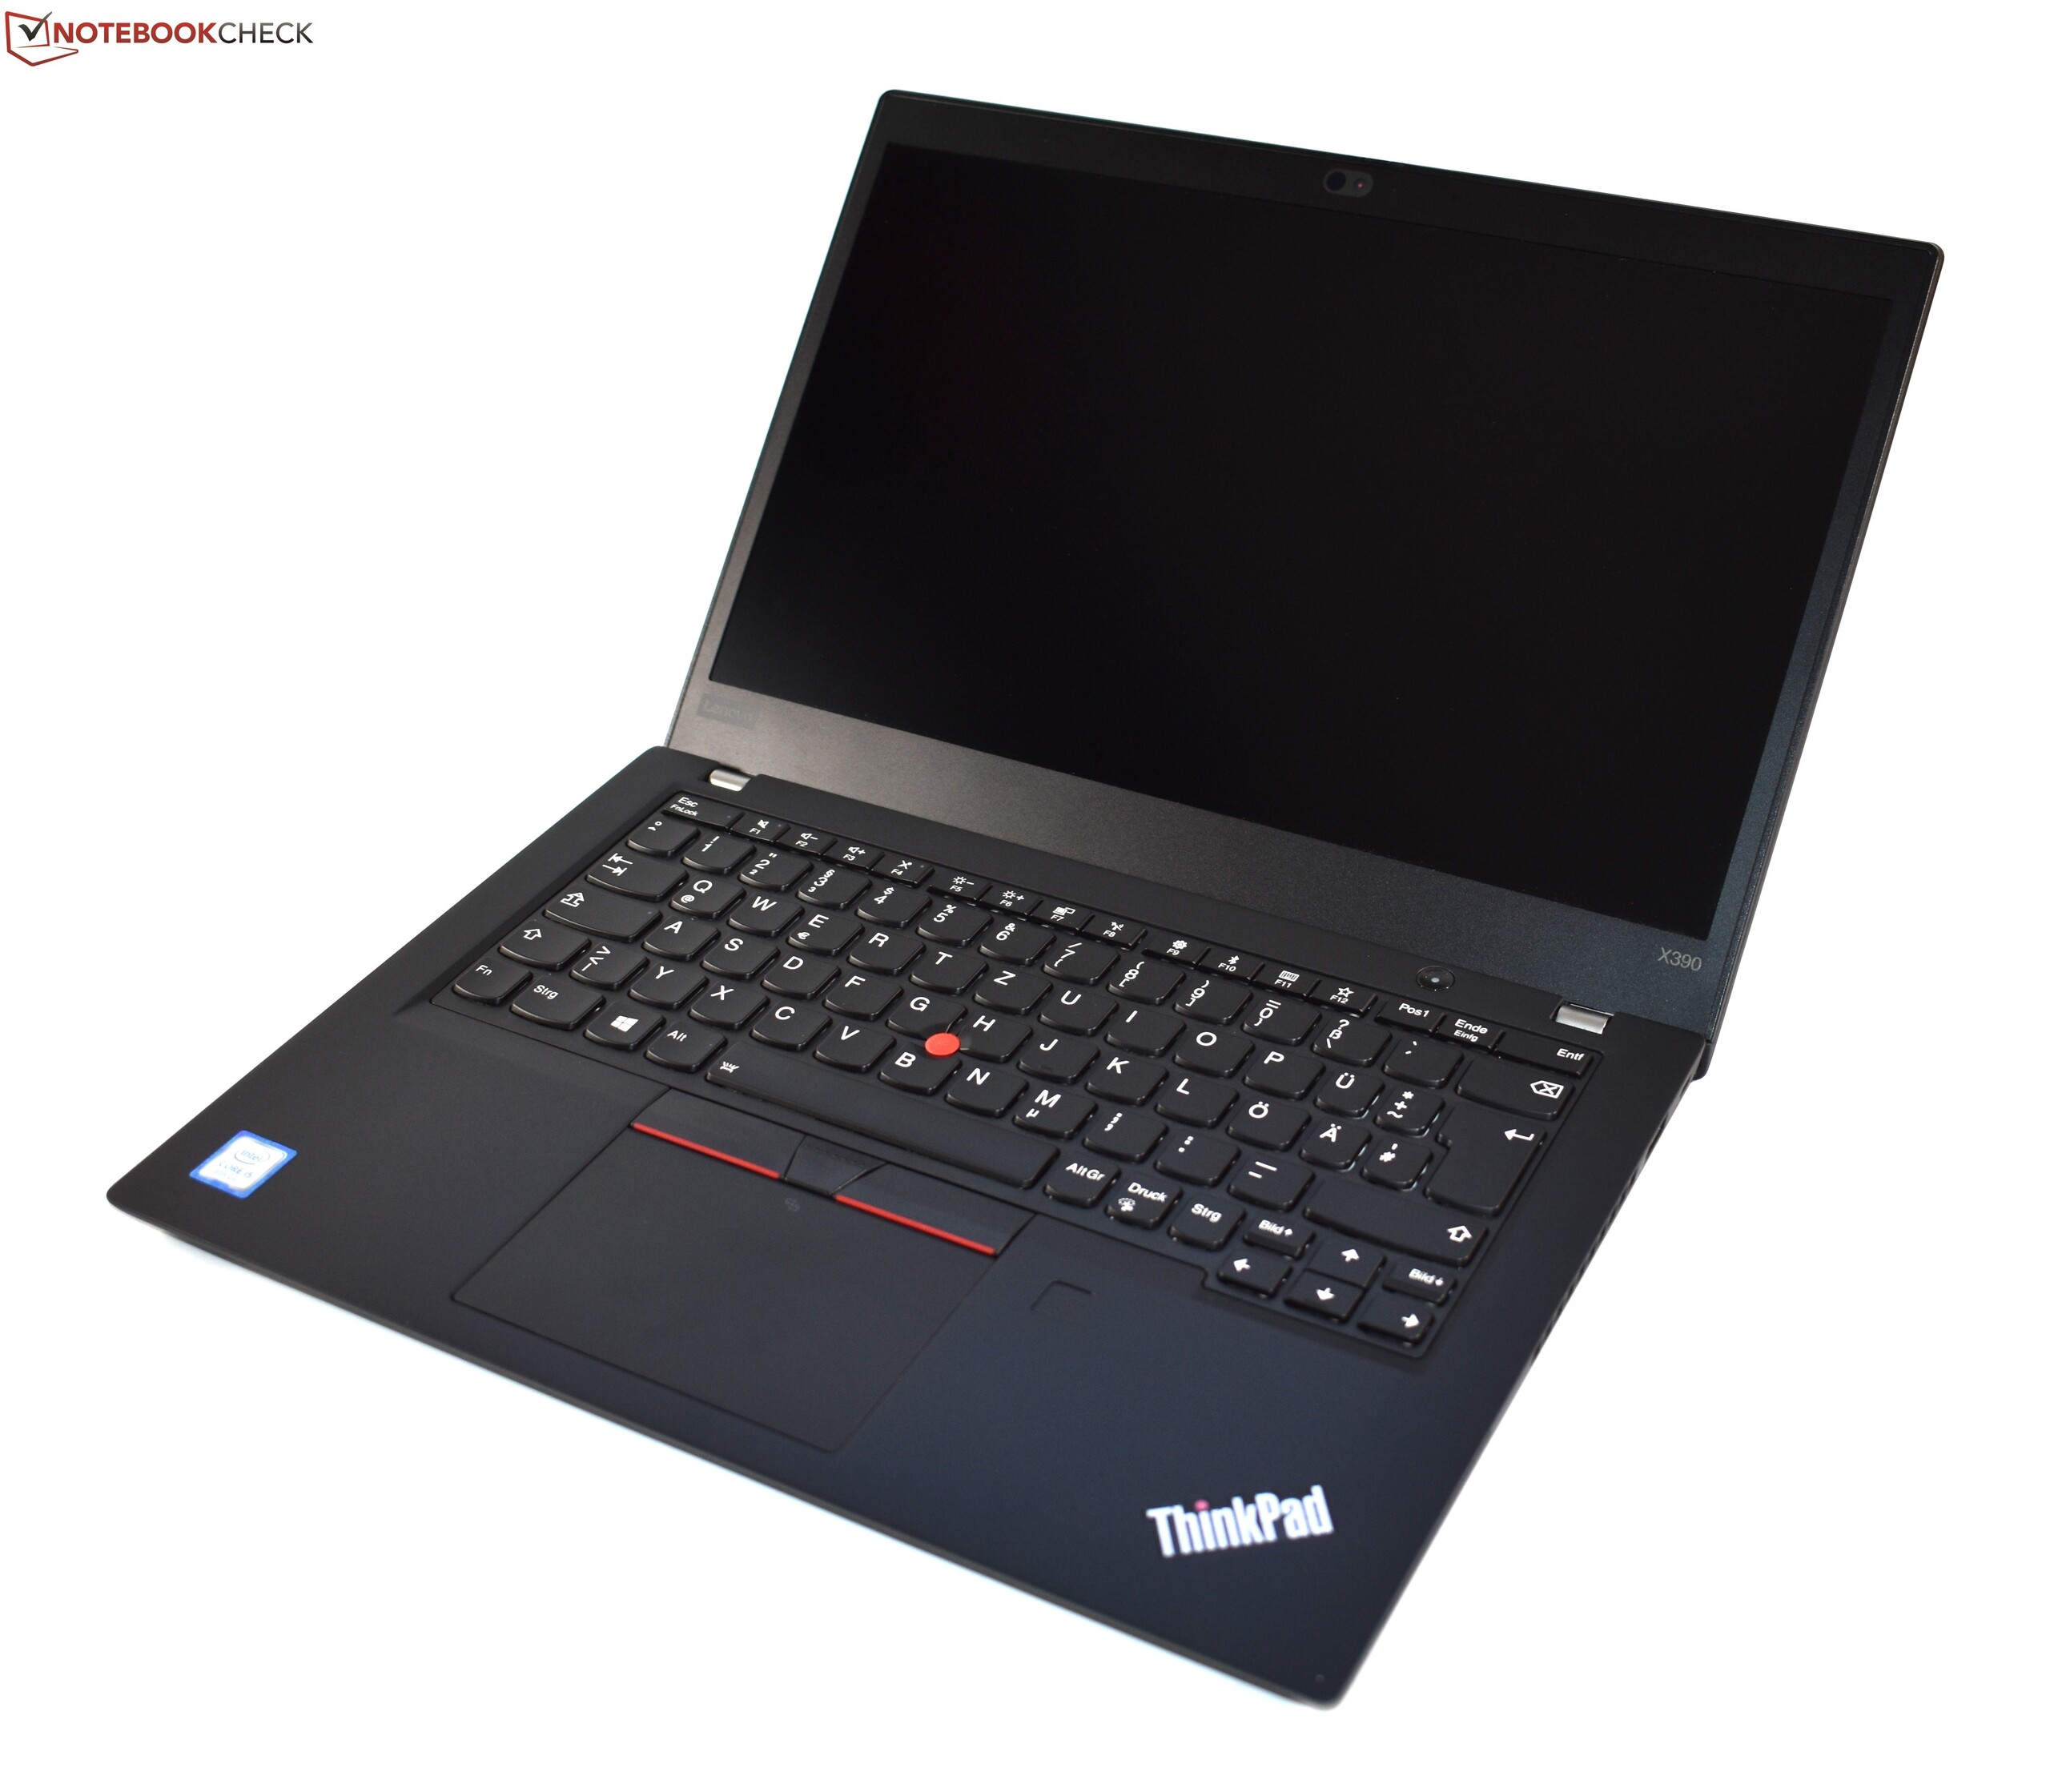
With the ThinkPad X13, Lenovo switched to Intel's Comet Lake generation. However, this is the biggest innovation that comes with the changed name. For more information on the case, the input devices, and the speakers, please refer to the review of the structurally identical Lenovo ThinkPad X390.
Our current test model must not only compete with its predecessor, but also with similarly equipped competing devices. These devices are listed in the table below, but more laptops from our database can be added to the comparison in each section.
Rating | Date | Model | Weight | Height | Size | Resolution | Price |
|---|---|---|---|---|---|---|---|
| 88 % v7 (old) | 08 / 2020 | Lenovo ThinkPad X13-20T20033GE i5-10210U, UHD Graphics 620 | 1.3 kg | 16.9 mm | 13.30" | 1920x1080 | |
| 90.3 % v6 (old) | 05 / 2019 | Lenovo ThinkPad X390-20Q1S02M00 i5-8265U, UHD Graphics 620 | 1.3 kg | 16.9 mm | 13.30" | 1920x1080 | |
| 88.8 % v7 (old) | 03 / 2020 | Dell XPS 13 9300 i5 FHD i5-1035G1, UHD Graphics G1 (Ice Lake 32 EU) | 1.2 kg | 14.8 mm | 13.40" | 1920x1200 | |
| 85.1 % v7 (old) | 05 / 2020 | Dynabook Portege X30L-G1331 i5-10210U, UHD Graphics 620 | 859 g | 17.9 mm | 13.30" | 1920x1080 | |
| 87.4 % v7 (old) | 06 / 2020 | Huawei MateBook X Pro 2020 i7 i7-10510U, GeForce MX250 | 1.3 kg | 14.6 mm | 13.90" | 3000x2000 |
Case - Sturdy and compact 13-inch laptop
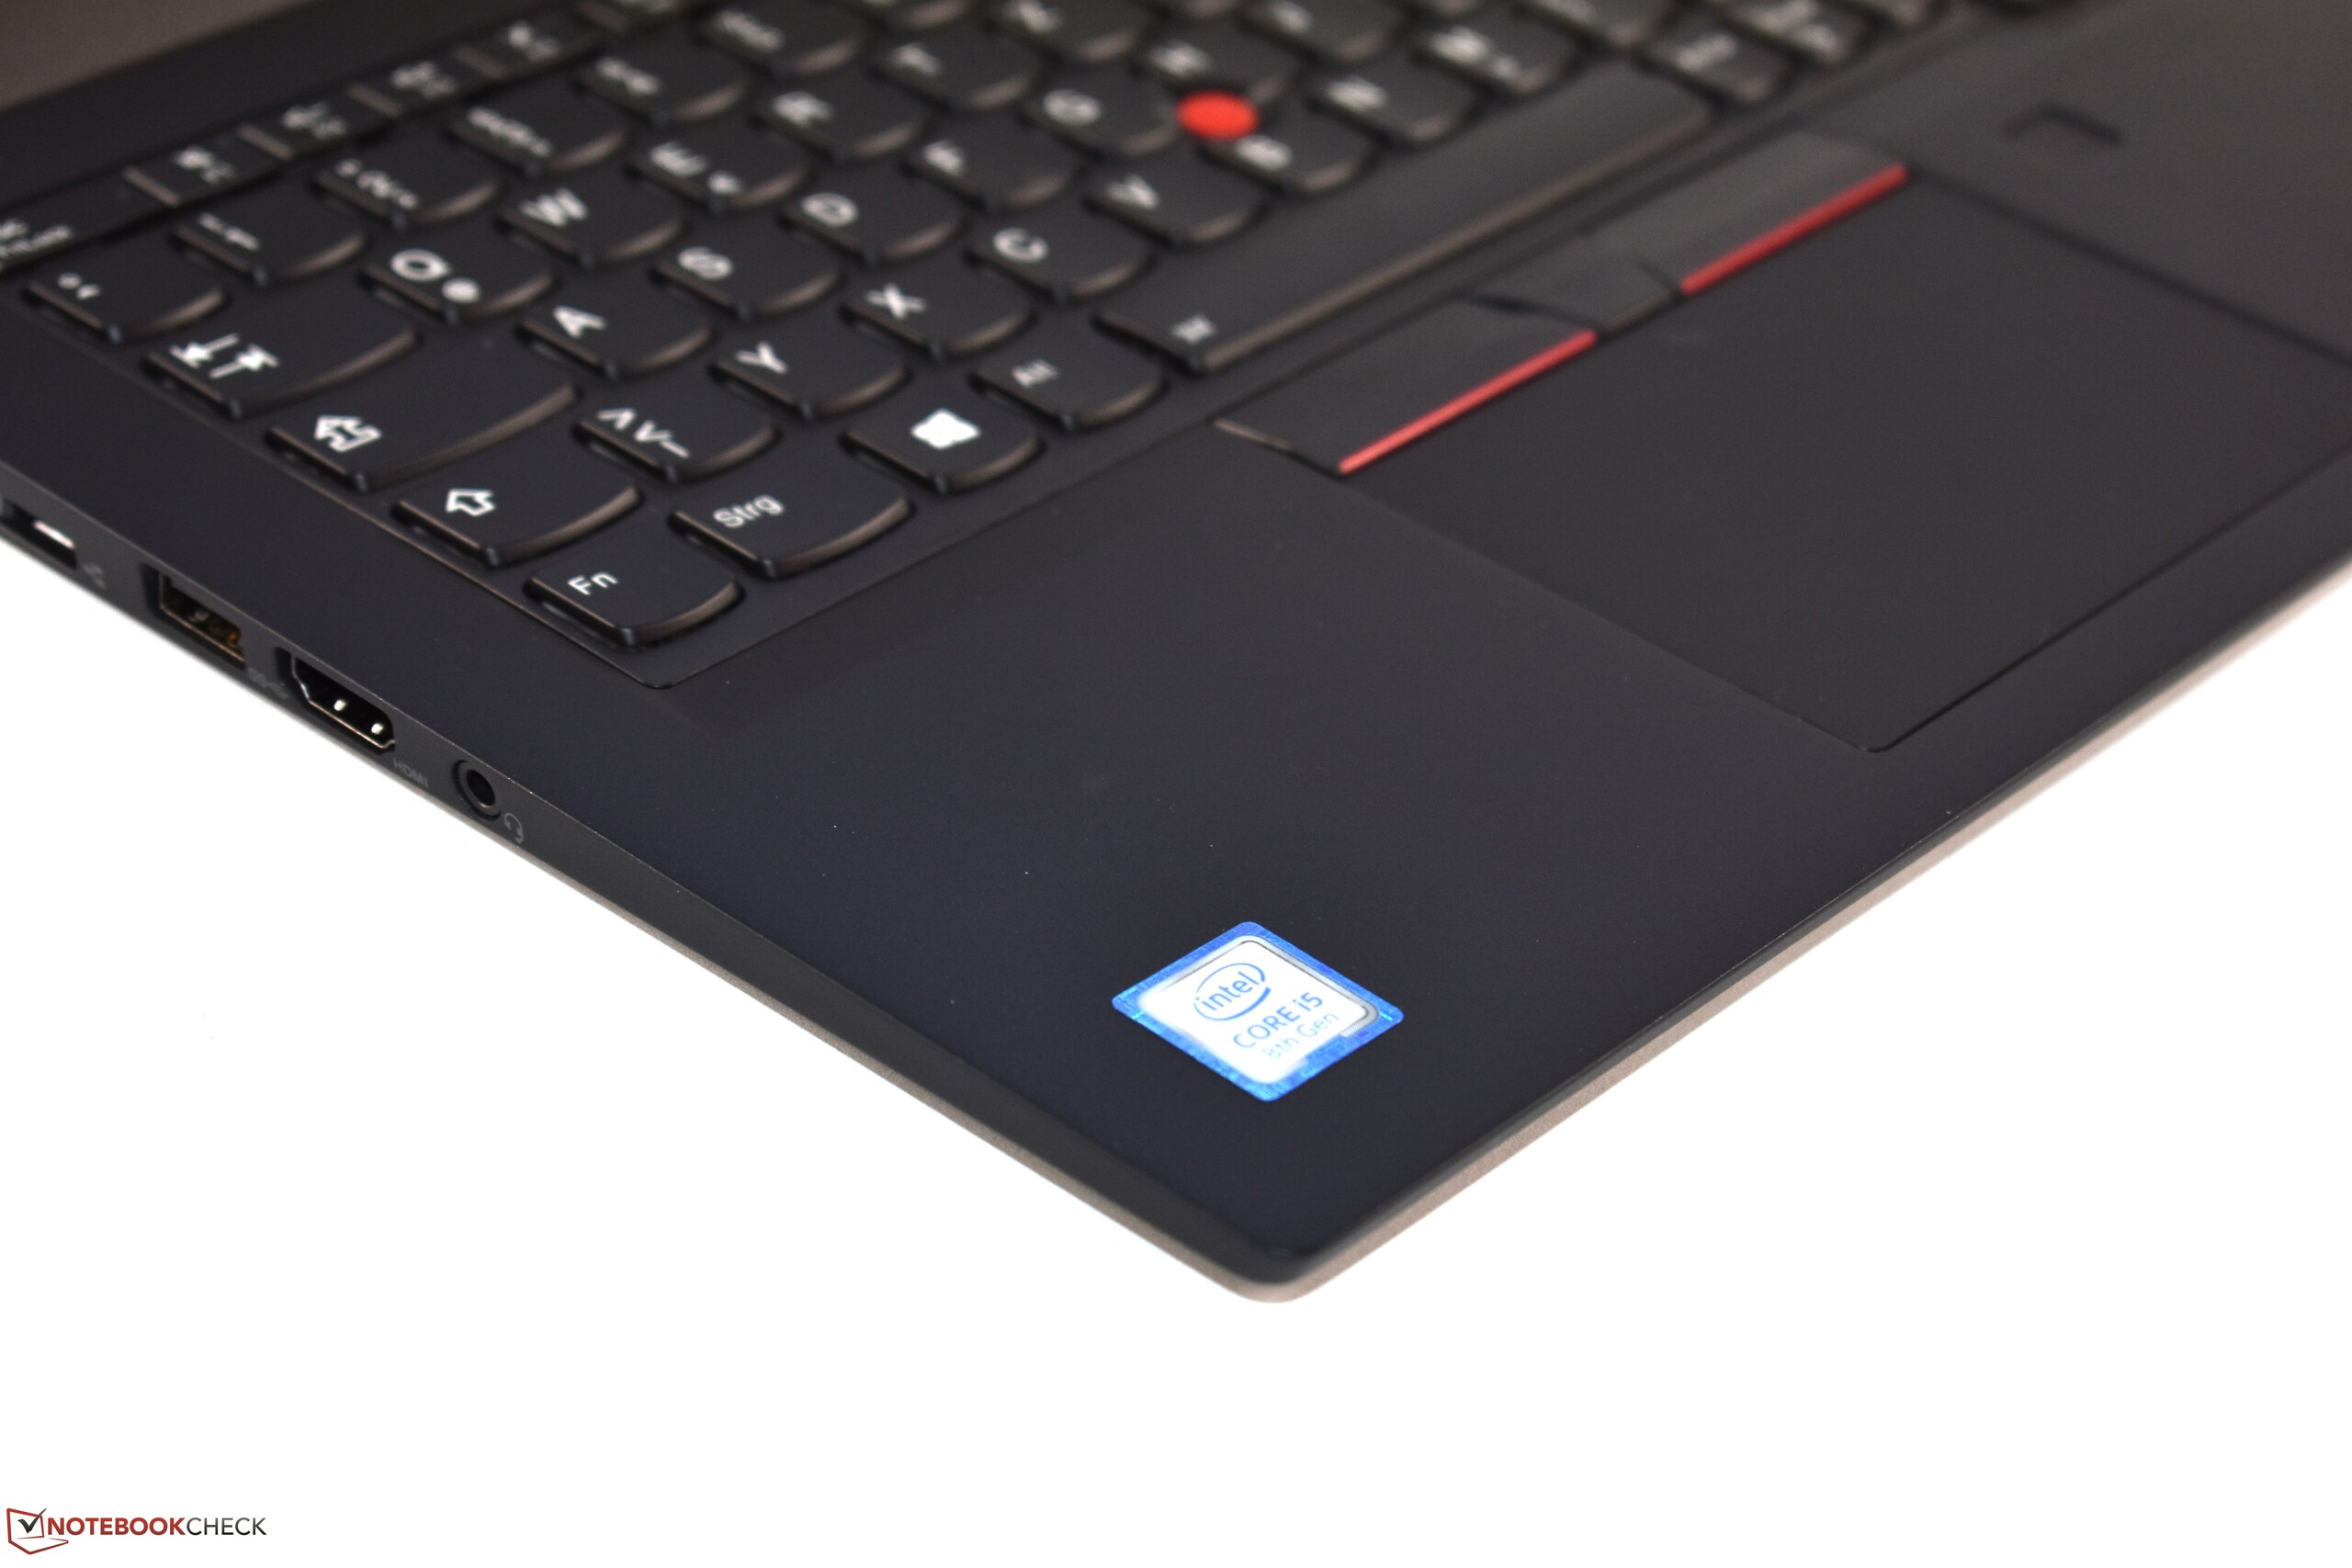
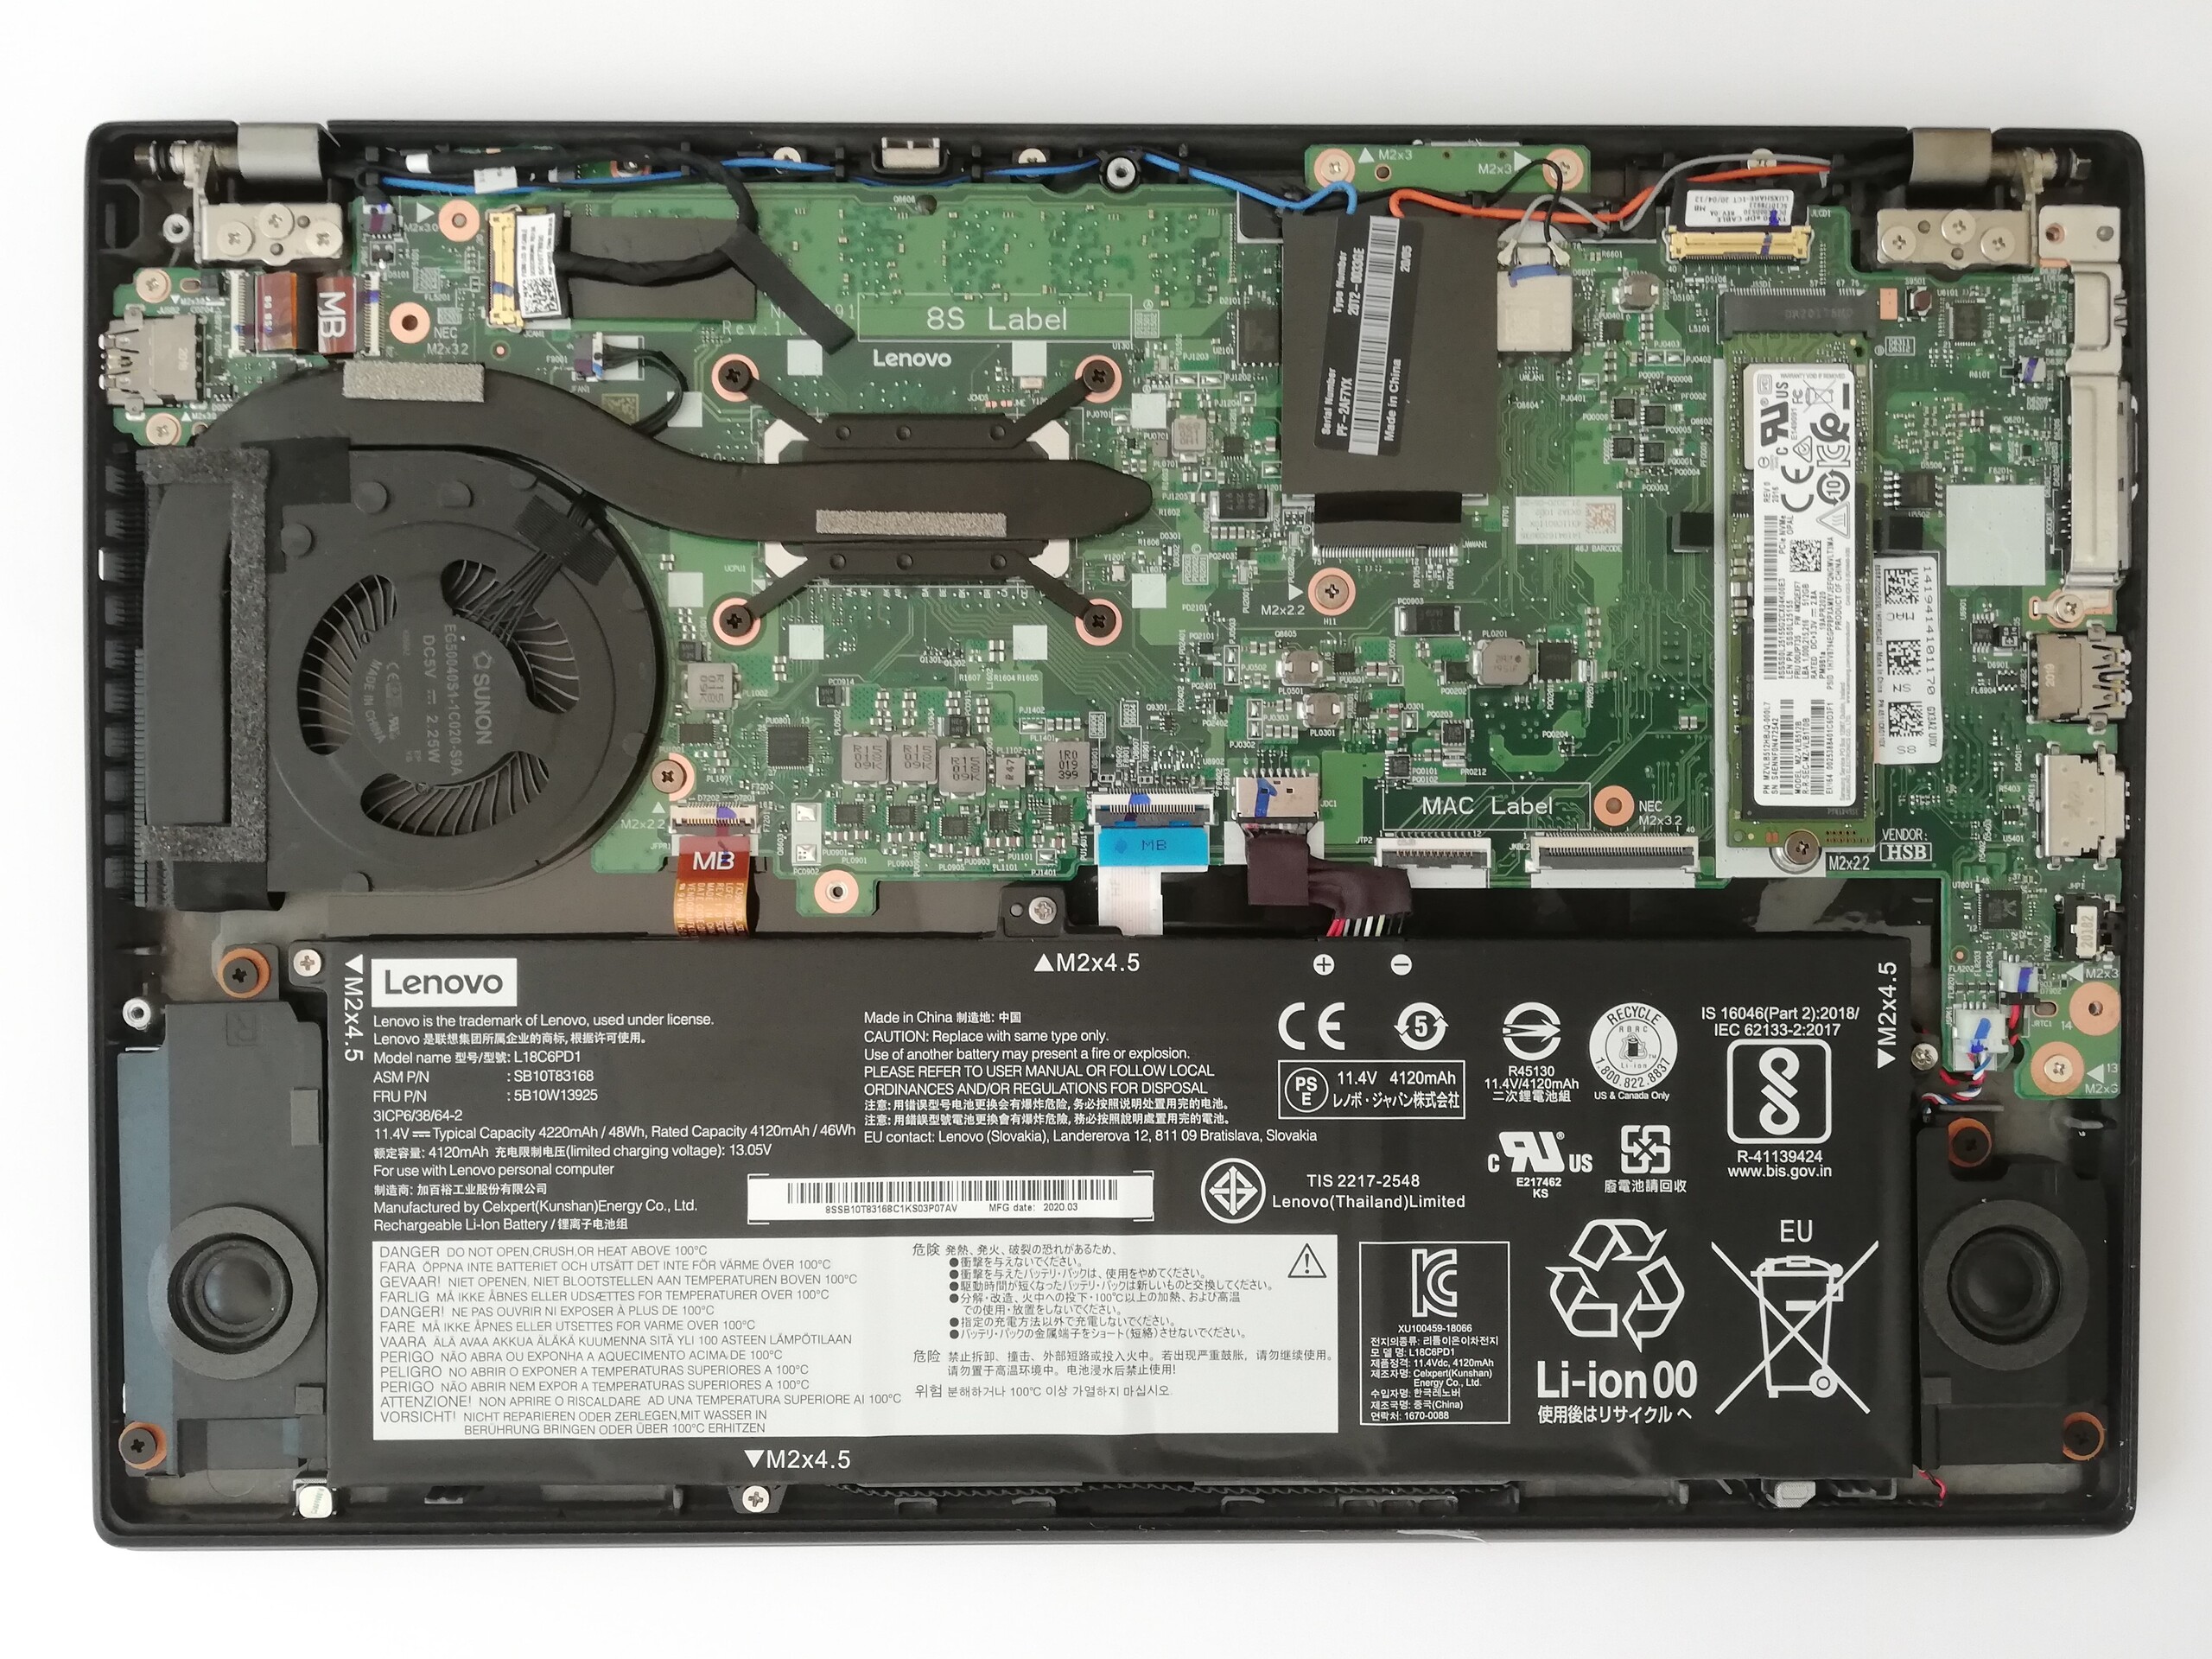
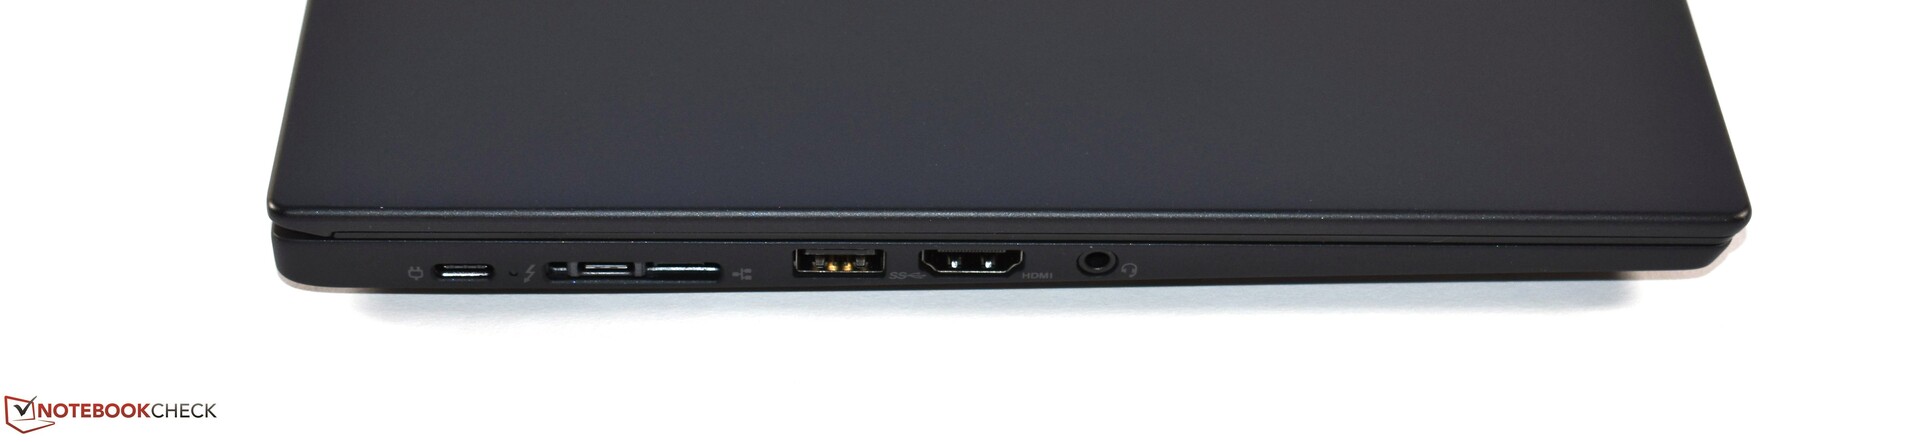
Features - Mobile laptop with Thunderbolt 3
The connectivity of the Lenovo ThinkPad X13 also remains mostly unchanged. However, the USB Type-C port and Thunderbolt 3 port (2x PCIe lanes with a top speed of 20 Gbit/s), both of which can also be used to charge the laptop, are new and impressive.
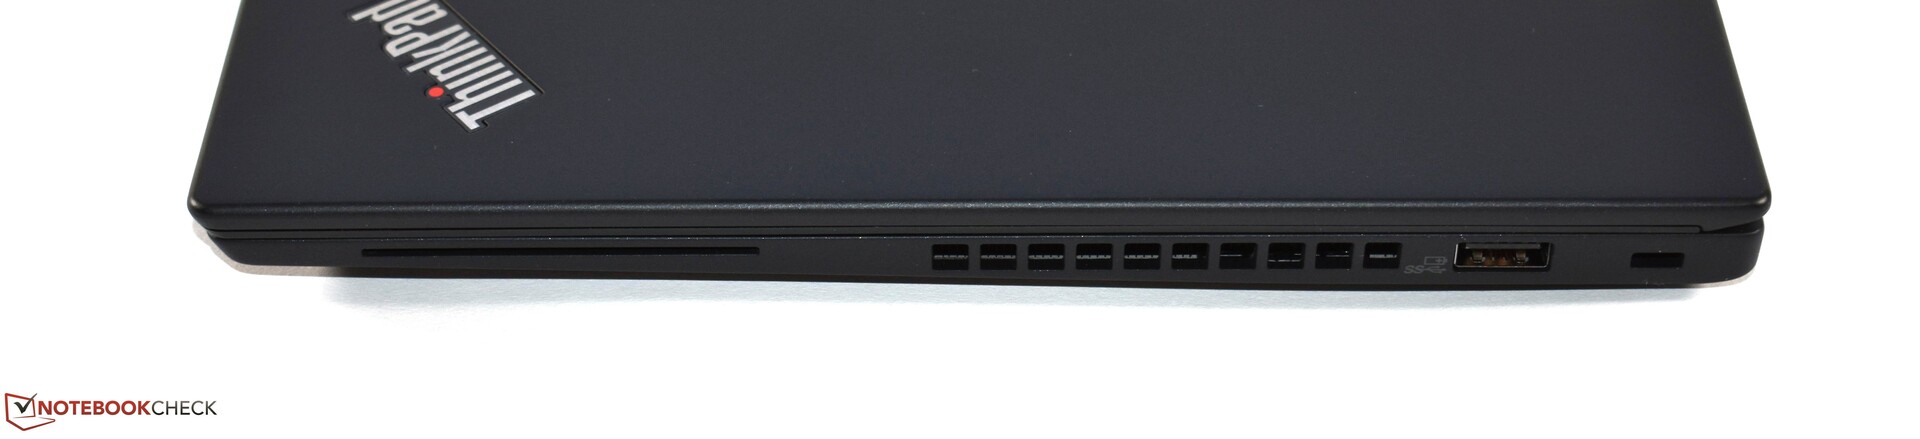
MicroSD card reader
The microSD card reader is on the back of the Lenovo ThinkPad X13 and can only be opened with a SIM needle. The test with our Toshiba Exceria Pro M501 reference memory card shows that the read and write speeds are now significantly lower than they were on the ThinkPad X390. With write speeds of 37.3 MB/s and read speeds of 52.1 MB/s, the microSD card reader is now up to 53% slower.
| SD Card Reader | |
| average JPG Copy Test (av. of 3 runs) | |
| Dell XPS 13 9300 i5 FHD (Toshiba Exceria Pro M501 64 GB UHS-II) | |
| Lenovo ThinkPad X390-20Q1S02M00 (Toshiba Exceria Pro M501) | |
| Dynabook Portege X30L-G1331 (Toshiba Exceria Pro M501 64 GB UHS-II) | |
| Average of class Office (22.4 - 198.5, n=22, last 2 years) | |
| Lenovo ThinkPad X13-20T20033GE (Toshiba Exceria Pro M501 64 GB UHS-II) | |
| maximum AS SSD Seq Read Test (1GB) | |
| Dell XPS 13 9300 i5 FHD (Toshiba Exceria Pro M501 64 GB UHS-II) | |
| Lenovo ThinkPad X390-20Q1S02M00 (Toshiba Exceria Pro M501) | |
| Dynabook Portege X30L-G1331 (Toshiba Exceria Pro M501 64 GB UHS-II) | |
| Average of class Office (27.4 - 249, n=20, last 2 years) | |
| Lenovo ThinkPad X13-20T20033GE (Toshiba Exceria Pro M501 64 GB UHS-II) | |
Communication
The Lenovo ThinkPad X13 can establish wireless connections using WiFi 6 and Bluetooth 5.0. An integrated LTE modem is also available at an additional cost. With our Netgear Nighthawk AX12 reference router, the 13-inch laptop achieves very good download speeds of 1,573 Mbit/s. This means that the X13 leads in our test field in download speeds, but when it comes to upload speeds, it falls back into the middle of our test field. That said, with an average upload speed of 756 Mbit/s, the ThinkPad X13 still has fast WLAN speeds and does better than its predecessor.
Webcam
The webcam of the Lenovo ThinkPad X13 takes pictures with the widespread but very low 0.9MP quality. This quality is just about sufficient for video conferences in well-lit rooms.
As our test chart shows, scenes captured by the webcam are a bit blurry, and details are only moderately recognizable. The ColorChecker Passport also reveals that colors in the webcam's photos are usually too bright, though gray and black tones appear darker than they should be.


Display - Full HD with strong colors

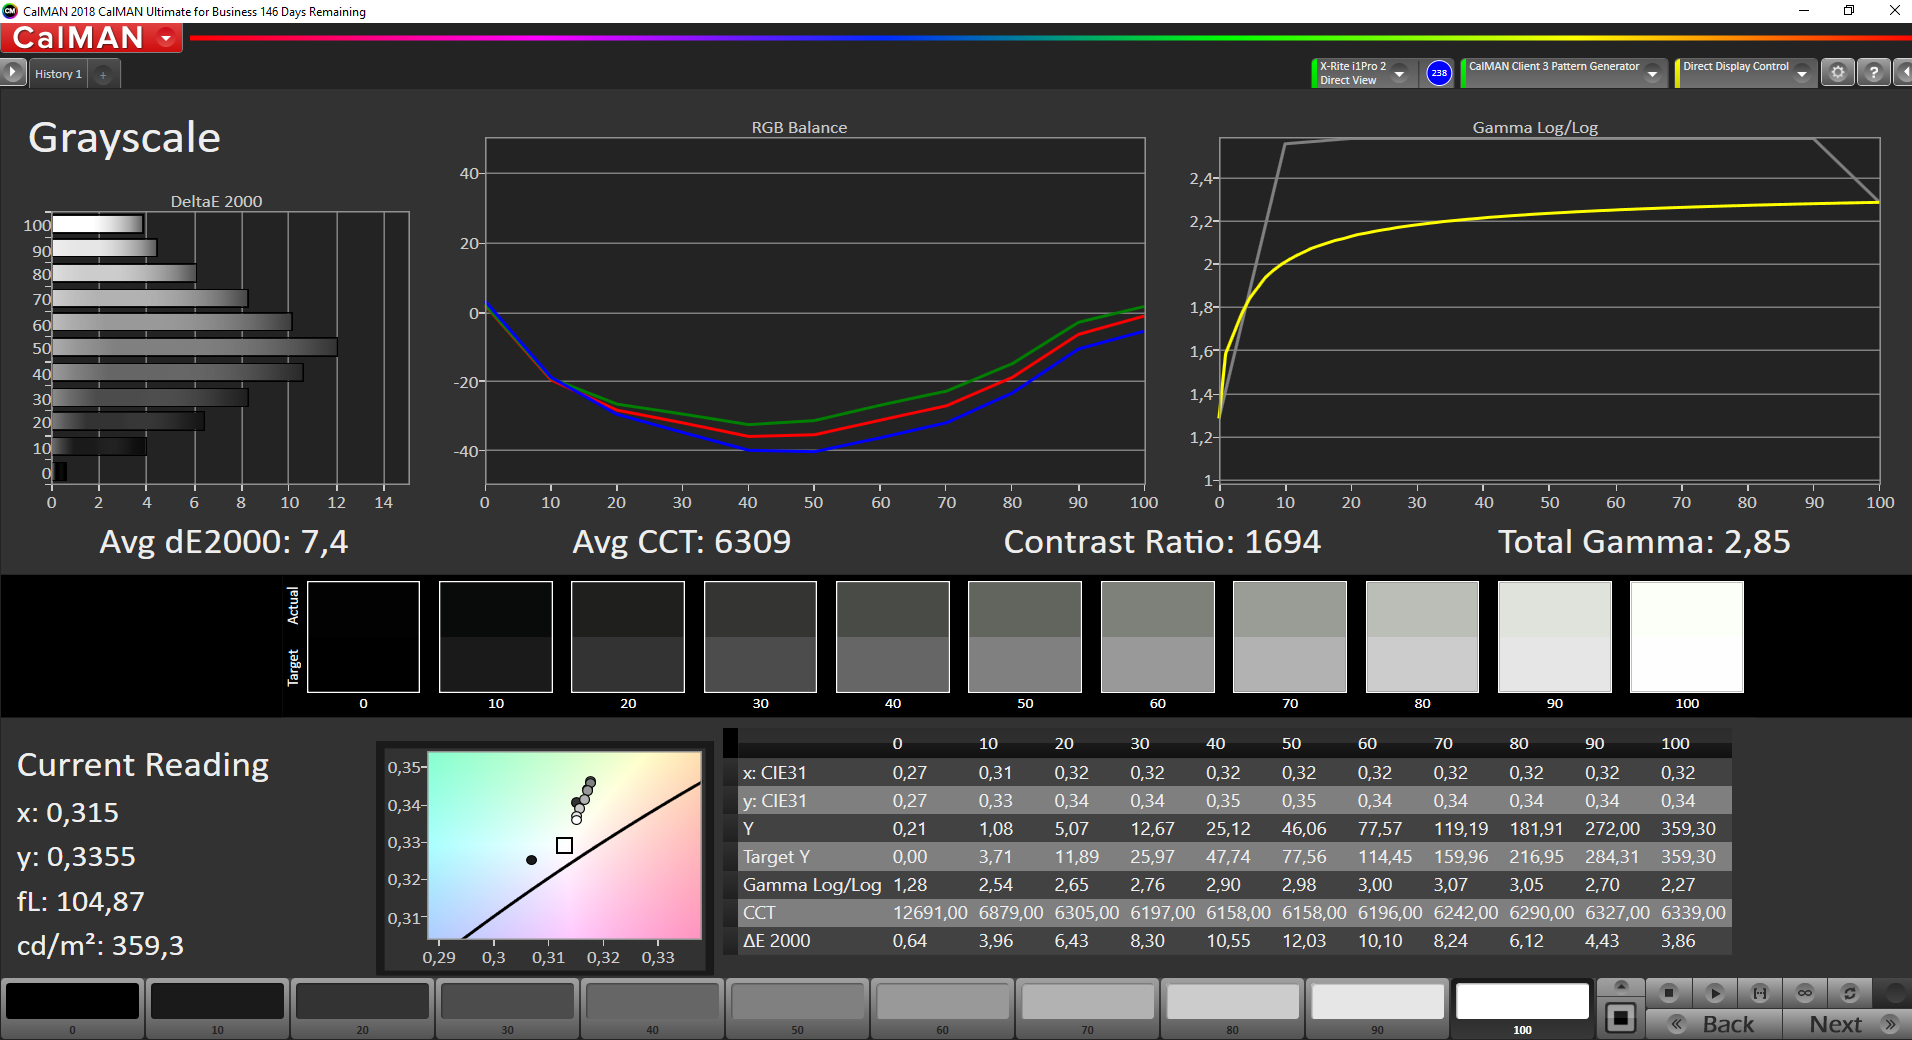
Lenovo uses a 13.3-inch IPS panel with a resolution of 1920x1080 in the ThinkPad X13 we used for our test. With a maximum brightness of 359 cd/m², it is not as bright as the display of the previous model and cannot keep up with the competing devices we selected. The illumination of 90% is on par with comparable laptops.
According to our measurements, Lenovo does not use PWM for brightness control, so users with sensitive eyes do not have to worry about difficulties using this laptop.
| |||||||||||||||||||||||||
Brightness Distribution: 90 %
Center on Battery: 360 cd/m²
Contrast: 1710:1 (Black: 0.21 cd/m²)
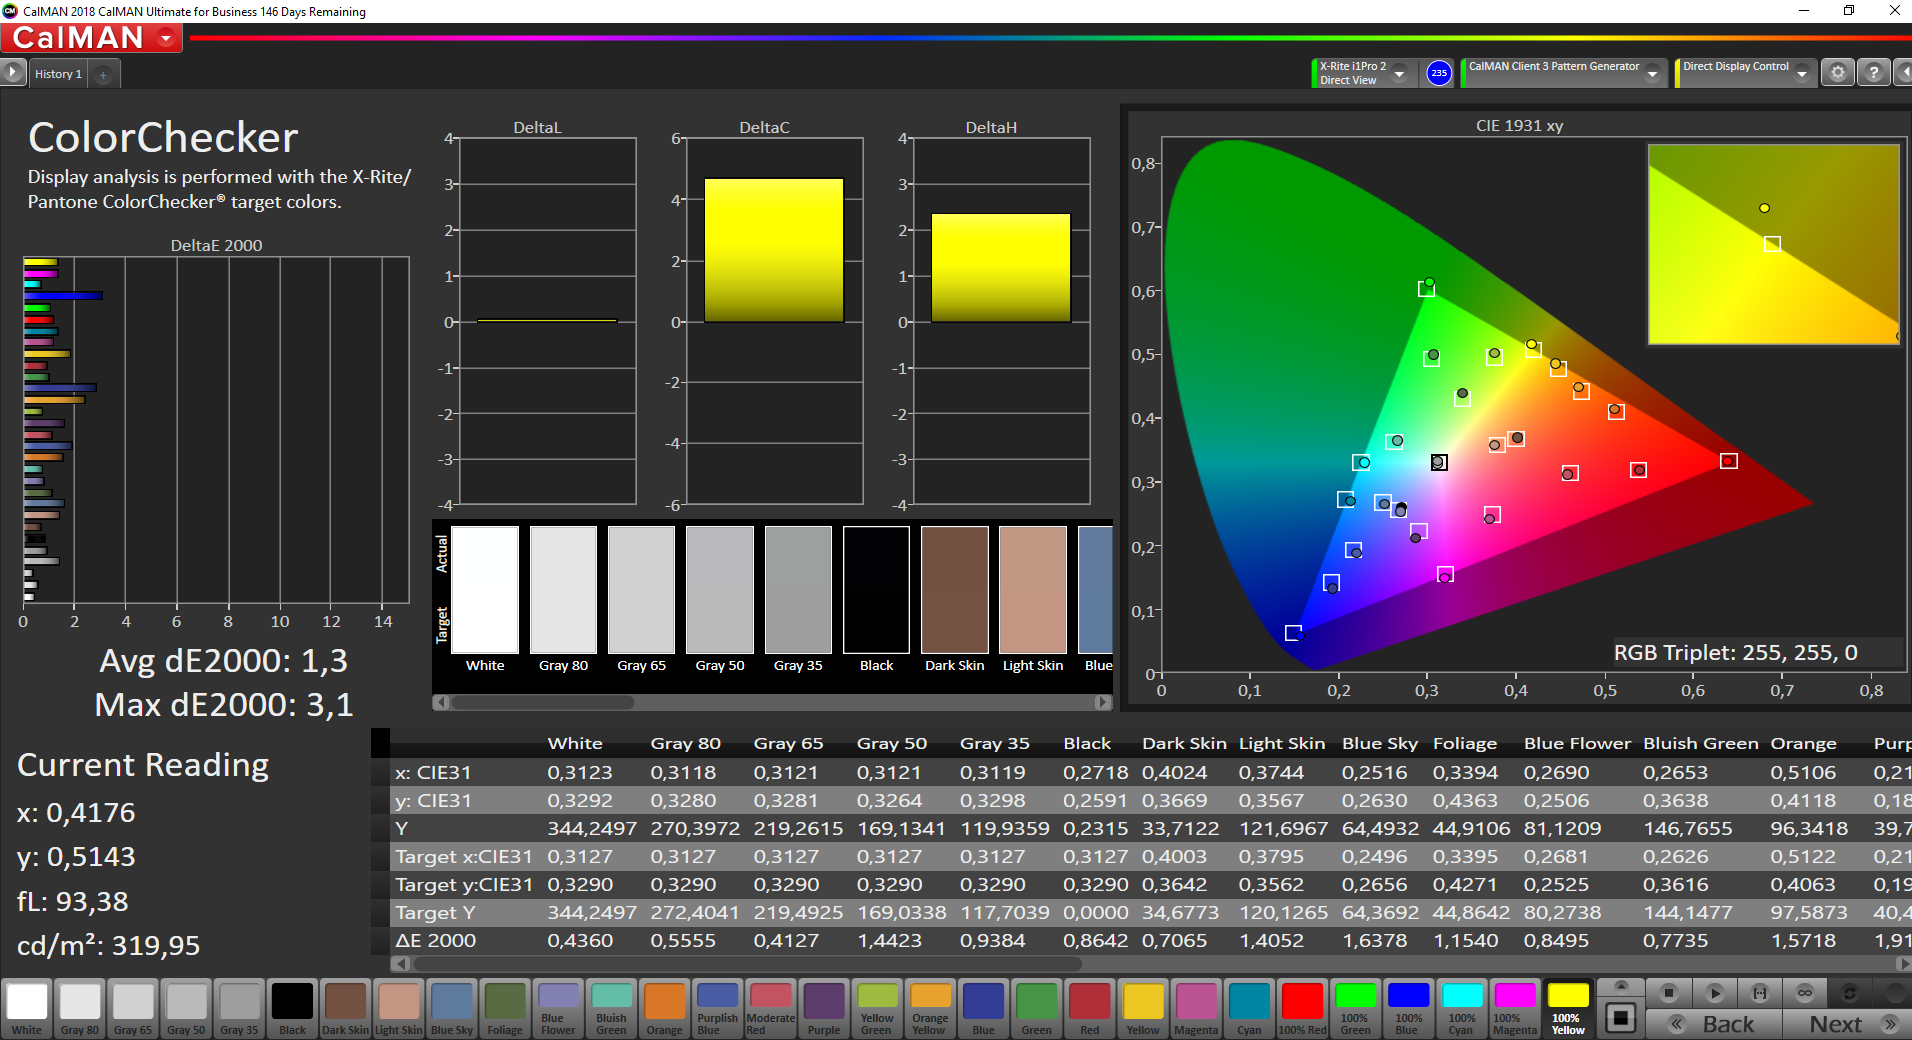
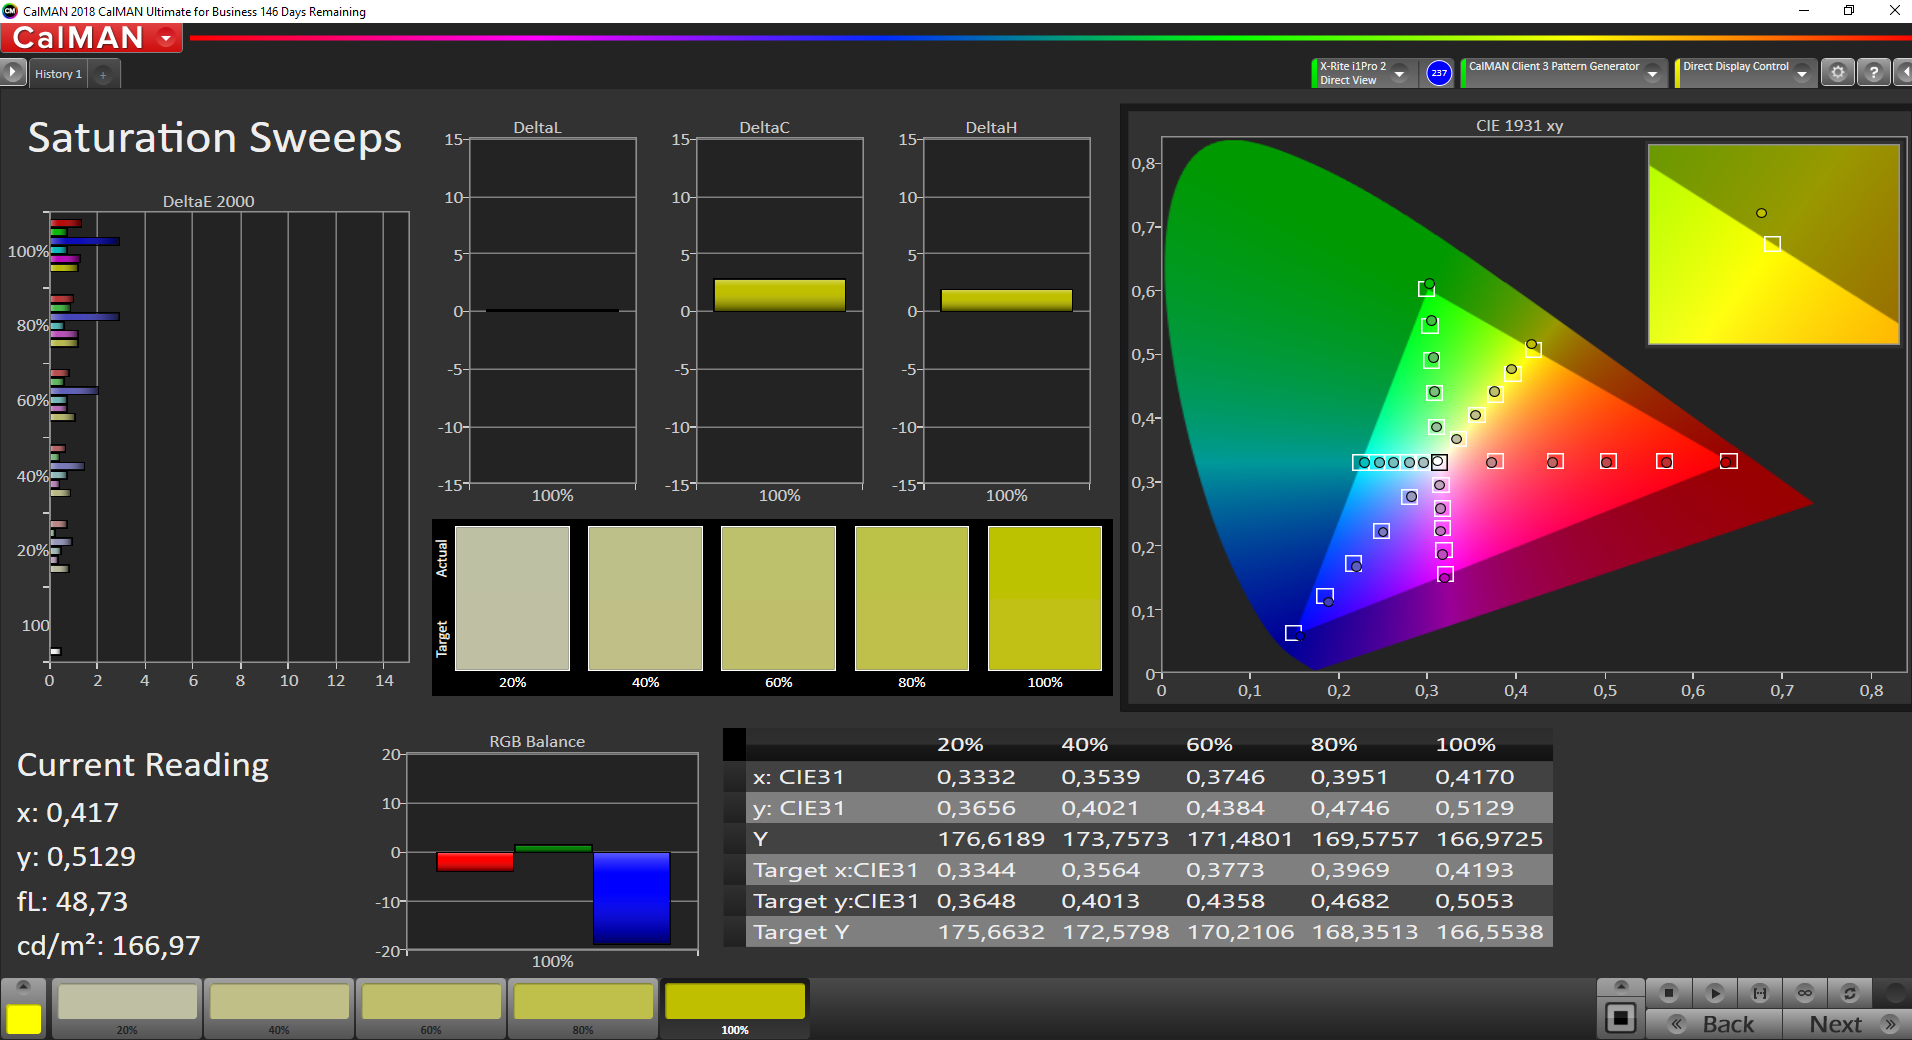
ΔE ColorChecker Calman: 6.7 | ∀{0.5-29.43 Ø4.73}
calibrated: 1.3
ΔE Greyscale Calman: 7.4 | ∀{0.09-98 Ø4.97}
95.9% sRGB (Argyll 1.6.3 3D)
61.7% AdobeRGB 1998 (Argyll 1.6.3 3D)
67.2% AdobeRGB 1998 (Argyll 3D)
96.2% sRGB (Argyll 3D)
66% Display P3 (Argyll 3D)
Gamma: 2.85
CCT: 6309 K
| Lenovo ThinkPad X13-20T20033GE Lenovo B133HAK01.1, IPS, 1920x1080, 13.3" | Lenovo ThinkPad X390-20Q1S02M00 LP133WF7-SPB1, IPS LED, 1920x1080, 13.3" | Dell XPS 13 9300 i5 FHD SHP14CB, IPS, 1920x1200, 13.4" | Dynabook Portege X30L-G1331 Toshiba TOS508F, IPS, 1920x1080, 13.3" | Huawei MateBook X Pro 2020 i7 JDI LPM139M422A, LTPS, 3000x2000, 13.9" | |
|---|---|---|---|---|---|
| Display | -1% | 7% | 1% | 2% | |
| Display P3 Coverage (%) | 66 | 65.3 -1% | 71.5 8% | 66.9 1% | 66.6 1% |
| sRGB Coverage (%) | 96.2 | 95.9 0% | 99.4 3% | 97.6 1% | 99.4 3% |
| AdobeRGB 1998 Coverage (%) | 67.2 | 66.6 -1% | 73.5 9% | 67.8 1% | 68.6 2% |
| Response Times | -13% | -14% | -13% | 1% | |
| Response Time Grey 50% / Grey 80% * (ms) | 52.8 ? | 57.6 ? -9% | 60 ? -14% | 54.8 ? -4% | 49.6 ? 6% |
| Response Time Black / White * (ms) | 29.2 ? | 34 ? -16% | 33.2 ? -14% | 35.6 ? -22% | 30.8 ? -5% |
| PWM Frequency (Hz) | 2500 ? | 23810 ? | 29070 ? | ||
| Screen | 18% | 21% | 16% | 30% | |
| Brightness middle (cd/m²) | 359 | 356 -1% | 619 72% | 482 34% | 557 55% |
| Brightness (cd/m²) | 342 | 336 -2% | 591 73% | 452 32% | 532 56% |
| Brightness Distribution (%) | 90 | 88 -2% | 91 1% | 91 1% | 87 -3% |
| Black Level * (cd/m²) | 0.21 | 0.16 24% | 0.35 -67% | 0.4 -90% | 0.33 -57% |
| Contrast (:1) | 1710 | 2225 30% | 1769 3% | 1205 -30% | 1688 -1% |
| Colorchecker dE 2000 * | 6.7 | 3.6 46% | 3 55% | 1.85 72% | 1.4 79% |
| Colorchecker dE 2000 max. * | 10.9 | 5.5 50% | 8.2 25% | 3.08 72% | 2.5 77% |
| Colorchecker dE 2000 calibrated * | 1.3 | 1.1 15% | 1 23% | 1.2 8% | 0.7 46% |
| Greyscale dE 2000 * | 7.4 | 4.7 36% | 5.2 30% | 2 73% | 2 73% |
| Gamma | 2.85 77% | 2.48 89% | 2.14 103% | 2.1 105% | 2.14 103% |
| CCT | 6309 103% | 6374 102% | 6340 103% | 6822 95% | 6689 97% |
| Color Space (Percent of AdobeRGB 1998) (%) | 61.7 | 61.3 -1% | 66.9 8% | 62.5 1% | 62.5 1% |
| Color Space (Percent of sRGB) (%) | 95.9 | 95.7 0% | 99.3 4% | 97.7 2% | 99.5 4% |
| Total Average (Program / Settings) | 1% /
11% | 5% /
14% | 1% /
10% | 11% /
21% |
* ... smaller is better
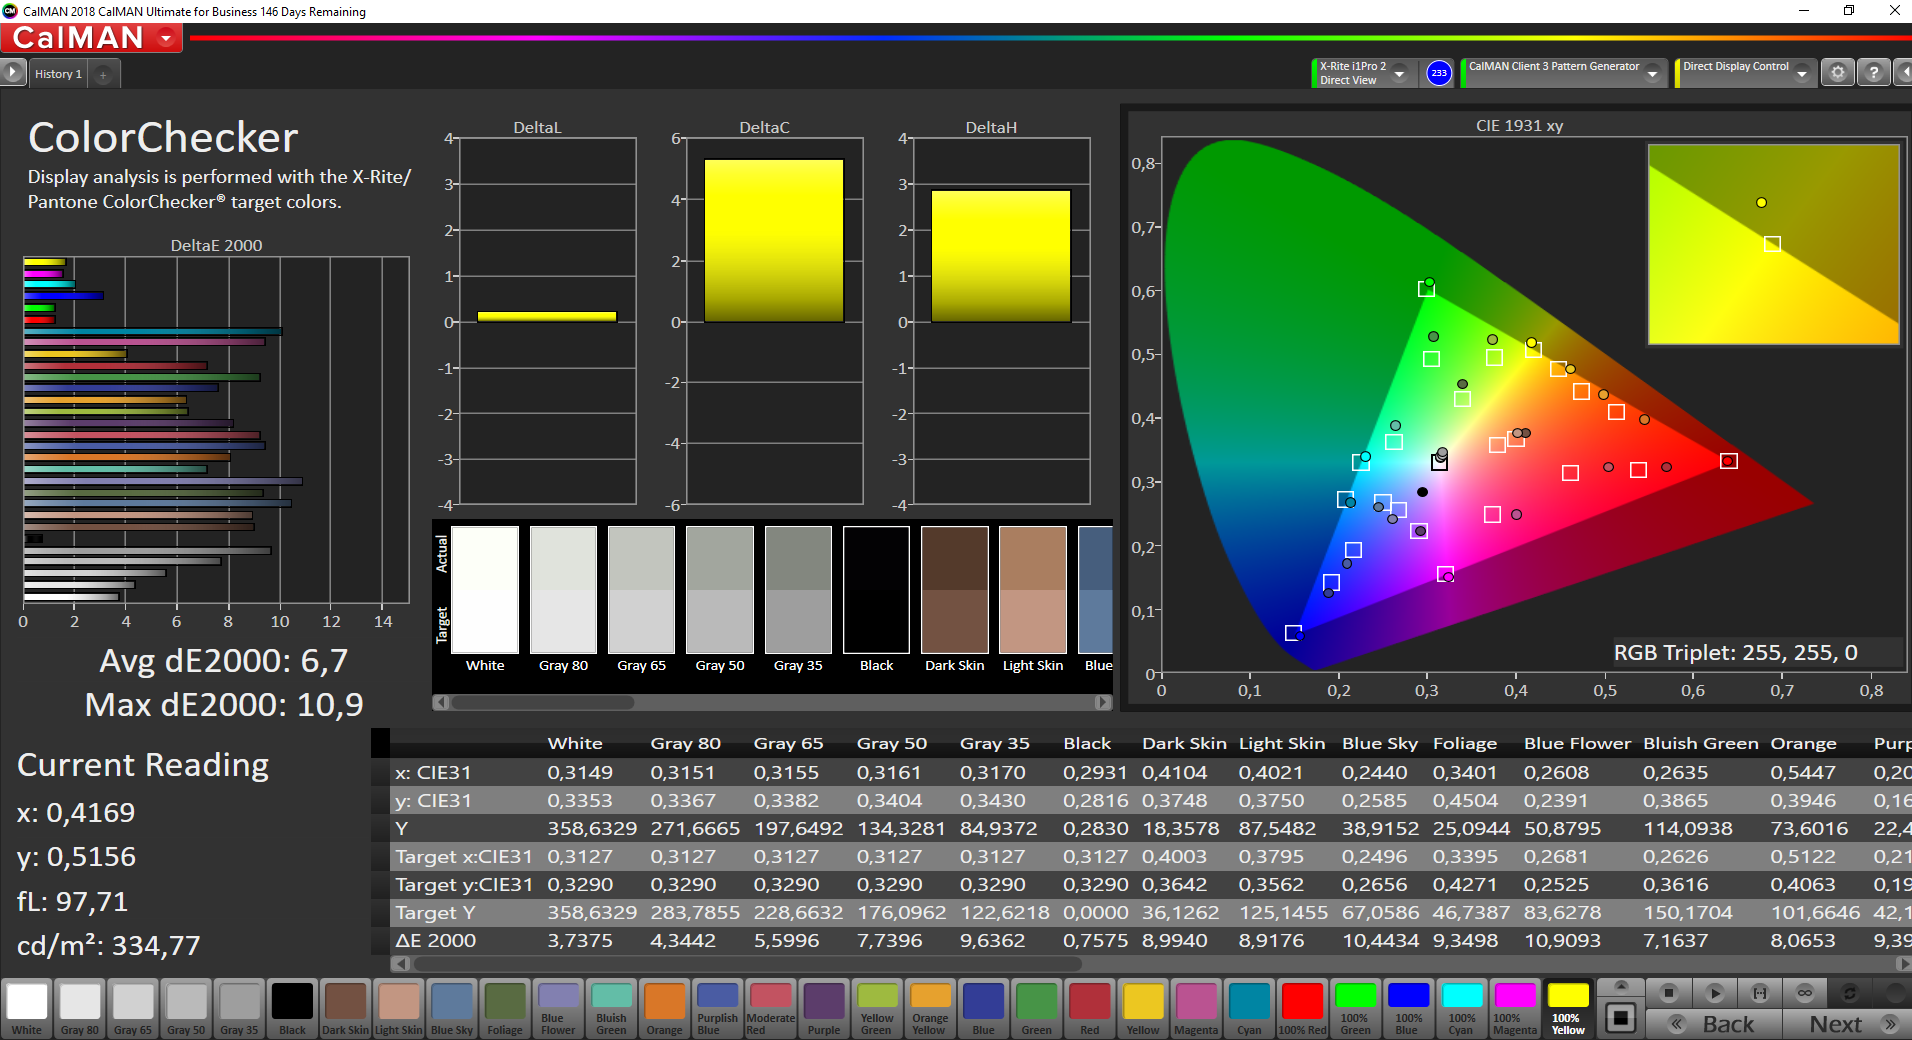
With a color space coverage of 95.5% (sRGB) and 61.7% (AdobeRGB), the Lenovo ThinkPad X13's coverage is not excellent, but it is still very good. Since the display also has a decent contrast ratio of 1710:1 and a good black value of 0.21 cd/m², colors appear very rich, and black tones look deep.
The CalMAN analysis also shows that the display has an increased Delta-E-2000 deviation of 10.9 ex-works when compared to its predecessor. This deficiency can be addressed with calibration. The corresponding ICC file can be downloaded from the window above; the link is at the bottom of the list right next to the display brightness distribution graphic.
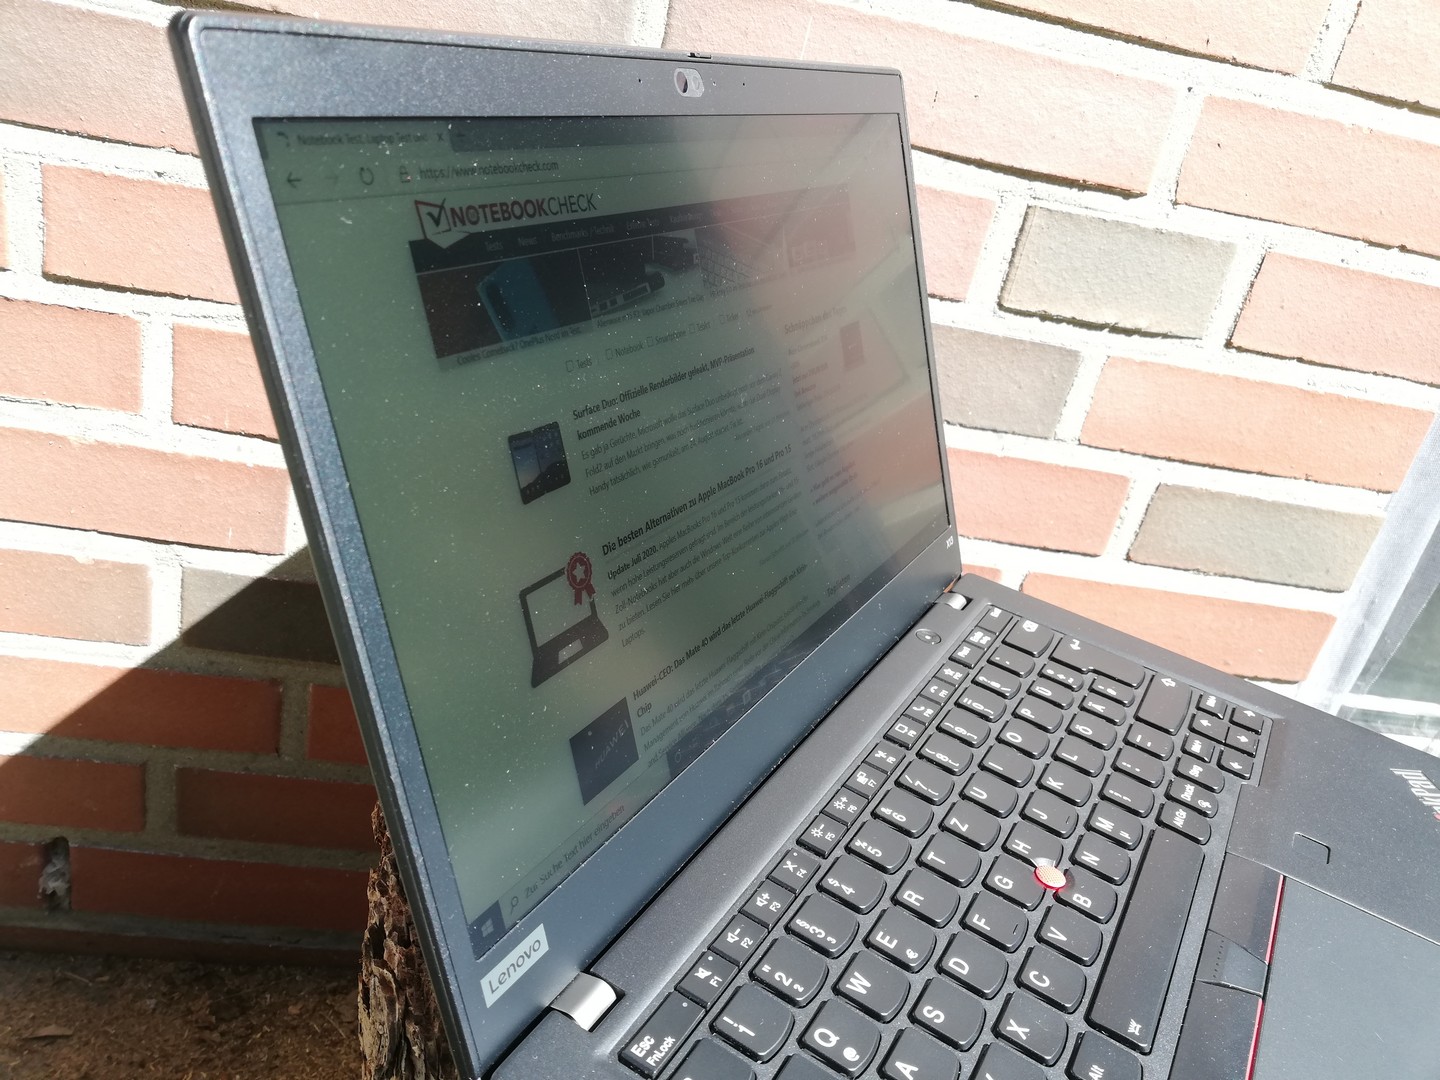
The Lenovo ThinkPad X13 can be used outdoors. With its matte screen, the display's brightness is sufficient to display image content legibly even in direct sunlight.
Display Response Times
| ↔ Response Time Black to White | ||
|---|---|---|
| 29.2 ms ... rise ↗ and fall ↘ combined | ↗ 16.8 ms rise | 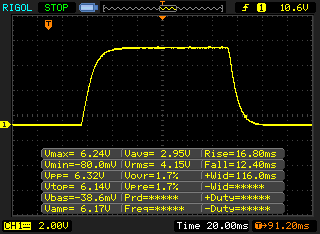 |
| ↘ 12.4 ms fall | ||
| The screen shows relatively slow response rates in our tests and may be too slow for gamers. In comparison, all tested devices range from 0.1 (minimum) to 240 (maximum) ms. » 78 % of all devices are better. This means that the measured response time is worse than the average of all tested devices (19.9 ms). | ||
| ↔ Response Time 50% Grey to 80% Grey | ||
| 52.8 ms ... rise ↗ and fall ↘ combined | ↗ 26 ms rise | 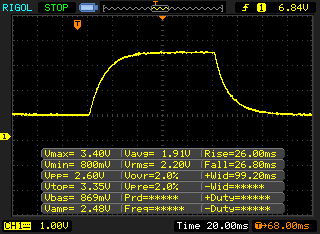 |
| ↘ 26.8 ms fall | ||
| The screen shows slow response rates in our tests and will be unsatisfactory for gamers. In comparison, all tested devices range from 0.165 (minimum) to 636 (maximum) ms. » 89 % of all devices are better. This means that the measured response time is worse than the average of all tested devices (31.1 ms). | ||
Screen Flickering / PWM (Pulse-Width Modulation)
| Screen flickering / PWM not detected | 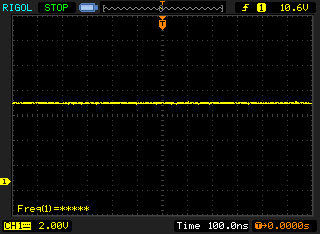 | ||
In comparison: 52 % of all tested devices do not use PWM to dim the display. If PWM was detected, an average of 7798 (minimum: 5 - maximum: 343500) Hz was measured. | |||
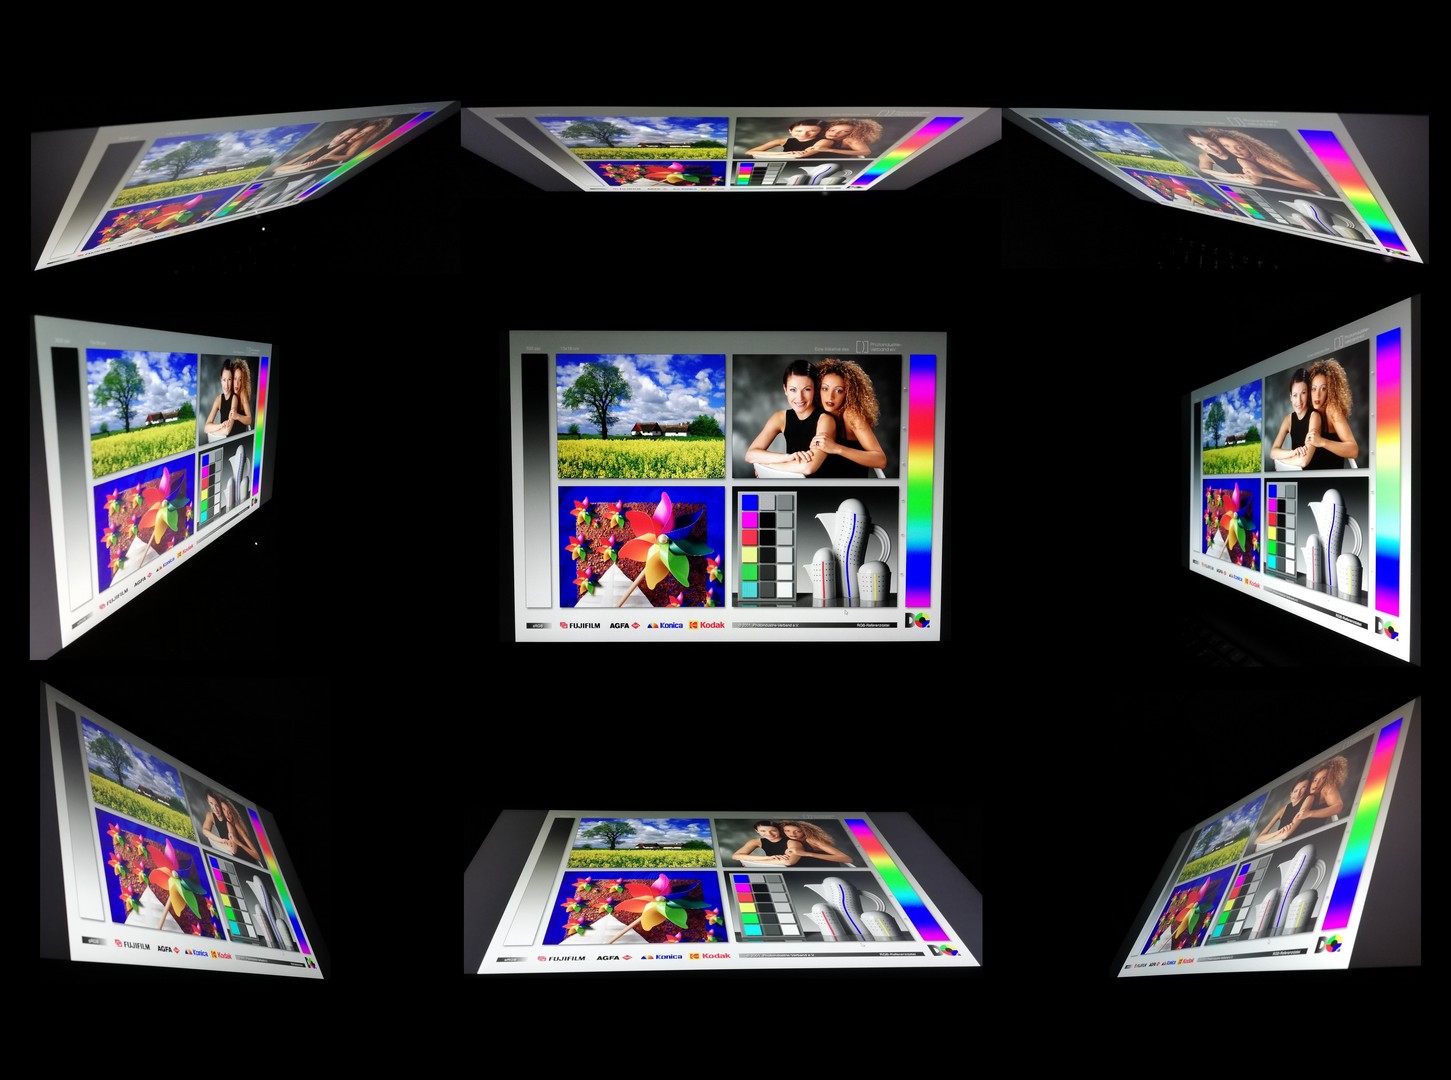
The ThinkPad X13's IPS panel has very stable viewing angles. Image content can be viewed from almost any angle without being distorted or displayed with inaccurate colors.
Performance - Stuck at Whiskey Lake level
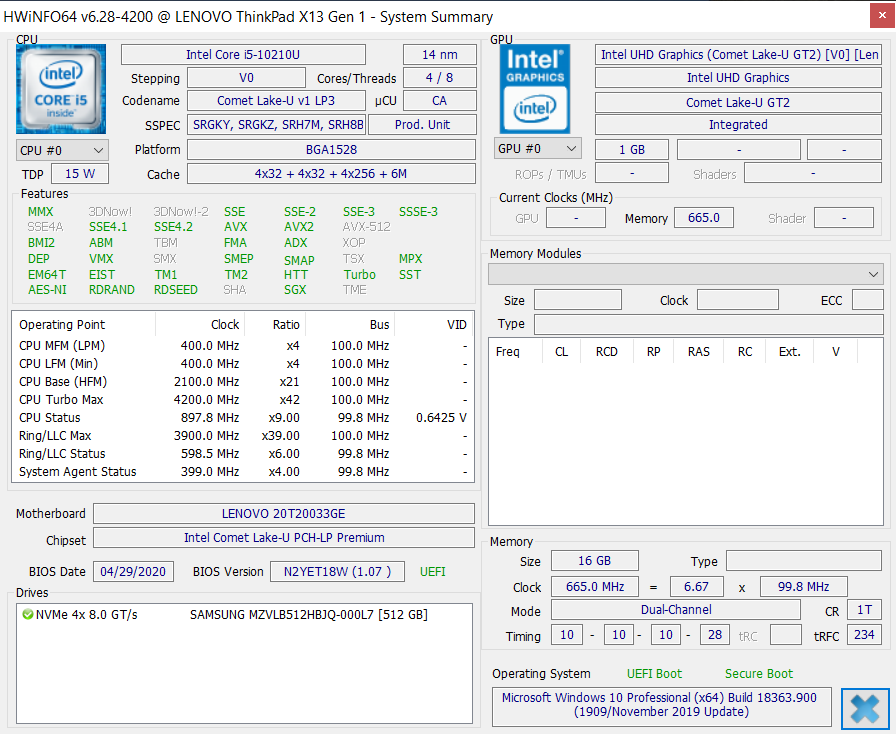
The Lenovo ThinkPad X13 is aimed at mobile business users. The performance is suitable for a wide range of office applications, and it can even be used for simple image editing. Prospective buyers can choose between different hardware configurations; our test model with an Intel Core i5-10210U and a 256 GB SSD alongside 16 GB of RAM is the medium configuration. Lenovo also offers an AMD version of the X13.

Processor
The Intel Core i5-10210U installed in the laptop is a quad-core processor from the Comet Lake generation and has clock rates between 1.6 and 4.2 GHz. Compared to the Whiskey Lake generation, which includes the Intel Core i5-8265U in the Lenovo ThinkPad X390, it is possible to achieve a higher turbo clock rate. How long this can be maintained, however, depends largely on the cooling system.
Our Cinebench R15 long-term test shows that the Core i5-10210U in the ThinkPad X13 briefly achieves very high multi-core performance, which is well above the peak performance of the Core i5-8265U. However, the performance drops sharply immediately afterwards to the level of the ThinkPad X390's Intel's Core i5-8265U. As a result, switching from the X390 to the X13 will result in nothing more than a brief increase in CPU performance.
Cinebench R15: CPU Single 64Bit | CPU Multi 64Bit
Blender: v2.79 BMW27 CPU
7-Zip 18.03: 7z b 4 -mmt1 | 7z b 4
Geekbench 5.5: Single-Core | Multi-Core
HWBOT x265 Benchmark v2.2: 4k Preset
LibreOffice : 20 Documents To PDF
R Benchmark 2.5: Overall mean
| Cinebench R20 / CPU (Single Core) | |
| Average of class Office (345 - 816, n=72, last 2 years) | |
| Dell XPS 13 9300 i5 FHD | |
| Dynabook Portege X30L-G1331 | |
| Average Intel Core i5-10210U (322 - 428, n=30) | |
| Huawei MateBook X Pro 2020 i7 | |
| Lenovo ThinkPad X13-20T20033GE | |
| Cinebench R20 / CPU (Multi Core) | |
| Average of class Office (648 - 8840, n=72, last 2 years) | |
| Dell XPS 13 9300 i5 FHD | |
| Lenovo ThinkPad X13-20T20033GE | |
| Average Intel Core i5-10210U (722 - 1820, n=30) | |
| Dynabook Portege X30L-G1331 | |
| Huawei MateBook X Pro 2020 i7 | |
| Cinebench R15 / CPU Single 64Bit | |
| Average of class Office (99.5 - 312, n=74, last 2 years) | |
| Huawei MateBook X Pro 2020 i7 | |
| Lenovo ThinkPad X13-20T20033GE | |
| Dell XPS 13 9300 i5 FHD | |
| Dynabook Portege X30L-G1331 | |
| Average Intel Core i5-10210U (134 - 174, n=35) | |
| Lenovo ThinkPad X390-20Q1S02M00 | |
| Cinebench R15 / CPU Multi 64Bit | |
| Average of class Office (250 - 3380, n=74, last 2 years) | |
| Lenovo ThinkPad X13-20T20033GE | |
| Lenovo ThinkPad X390-20Q1S02M00 | |
| Dell XPS 13 9300 i5 FHD | |
| Dell XPS 13 9300 i5 FHD | |
| Average Intel Core i5-10210U (320 - 790, n=35) | |
| Huawei MateBook X Pro 2020 i7 | |
| Dynabook Portege X30L-G1331 | |
| Blender / v2.79 BMW27 CPU | |
| Huawei MateBook X Pro 2020 i7 | |
| Dynabook Portege X30L-G1331 | |
| Average Intel Core i5-10210U (585 - 1339, n=24) | |
| Dell XPS 13 9300 i5 FHD | |
| Lenovo ThinkPad X13-20T20033GE | |
| Average of class Office (158 - 1940, n=73, last 2 years) | |
| 7-Zip 18.03 / 7z b 4 -mmt1 | |
| Average of class Office (3387 - 6469, n=74, last 2 years) | |
| Huawei MateBook X Pro 2020 i7 | |
| Dynabook Portege X30L-G1331 | |
| Lenovo ThinkPad X13-20T20033GE | |
| Average Intel Core i5-10210U (3504 - 4467, n=24) | |
| Dell XPS 13 9300 i5 FHD | |
| 7-Zip 18.03 / 7z b 4 | |
| Average of class Office (7098 - 76886, n=75, last 2 years) | |
| Dell XPS 13 9300 i5 FHD | |
| Lenovo ThinkPad X13-20T20033GE | |
| Average Intel Core i5-10210U (10920 - 21679, n=24) | |
| Huawei MateBook X Pro 2020 i7 | |
| Dynabook Portege X30L-G1331 | |
| Geekbench 5.5 / Single-Core | |
| Average of class Office (811 - 2128, n=71, last 2 years) | |
| Dell XPS 13 9300 i5 FHD | |
| Dynabook Portege X30L-G1331 | |
| Lenovo ThinkPad X13-20T20033GE | |
| Average Intel Core i5-10210U (949 - 1133, n=27) | |
| Huawei MateBook X Pro 2020 i7 | |
| Geekbench 5.5 / Multi-Core | |
| Average of class Office (1483 - 16999, n=71, last 2 years) | |
| Dell XPS 13 9300 i5 FHD | |
| Lenovo ThinkPad X13-20T20033GE | |
| Dynabook Portege X30L-G1331 | |
| Average Intel Core i5-10210U (2079 - 4256, n=27) | |
| Huawei MateBook X Pro 2020 i7 | |
| HWBOT x265 Benchmark v2.2 / 4k Preset | |
| Average of class Office (2.21 - 26, n=73, last 2 years) | |
| Lenovo ThinkPad X13-20T20033GE | |
| Average Intel Core i5-10210U (2.36 - 6.28, n=24) | |
| Dell XPS 13 9300 i5 FHD | |
| Dynabook Portege X30L-G1331 | |
| Huawei MateBook X Pro 2020 i7 | |
| LibreOffice / 20 Documents To PDF | |
| Average Intel Core i5-10210U (49.6 - 80.3, n=18) | |
| Dynabook Portege X30L-G1331 | |
| Average of class Office (41.5 - 102.3, n=73, last 2 years) | |
| Huawei MateBook X Pro 2020 i7 | |
| Lenovo ThinkPad X13-20T20033GE | |
| R Benchmark 2.5 / Overall mean | |
| Average Intel Core i5-10210U (0.658 - 0.901, n=24) | |
| Dell XPS 13 9300 i5 FHD | |
| Lenovo ThinkPad X13-20T20033GE | |
| Dynabook Portege X30L-G1331 | |
| Huawei MateBook X Pro 2020 i7 | |
| Average of class Office (0.4098 - 0.888, n=73, last 2 years) | |
* ... smaller is better
System Performance
In the PCMark 10 for system performance benchmark, the ThinkPad X13 with Intel's Core i5-10210U took a good second place in our test field. The results are slightly better than the average of other laptops we tested with this hardware configuration, so users can expect smooth system operation. Programs and folders are opened without delay, and there were no micro stutters or similar issues in our tests.
Our CPU benchmark list below shows what performance other laptops achieved in this test.
| PCMark 8 Home Score Accelerated v2 | 3789 points | |
| PCMark 8 Work Score Accelerated v2 | 5114 points | |
| PCMark 10 Score | 4184 points | |
Help | ||
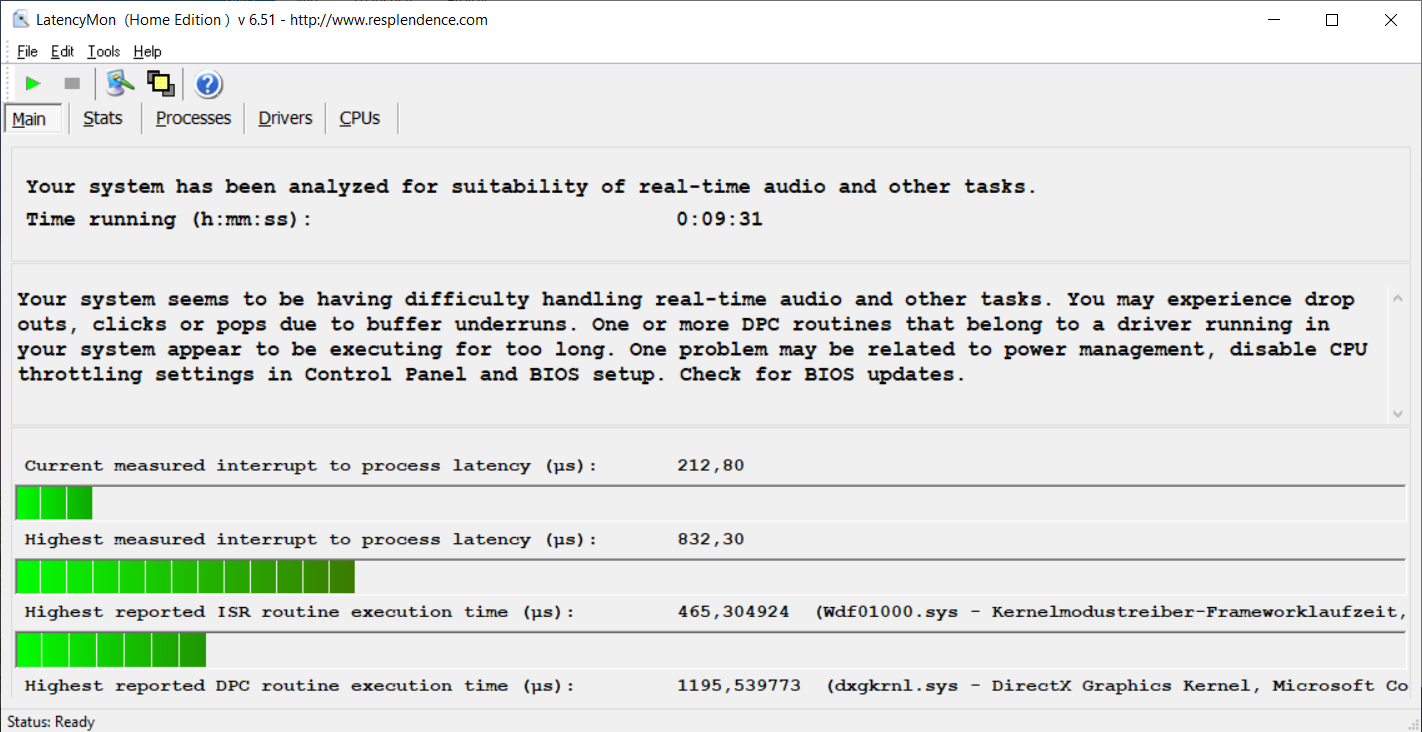
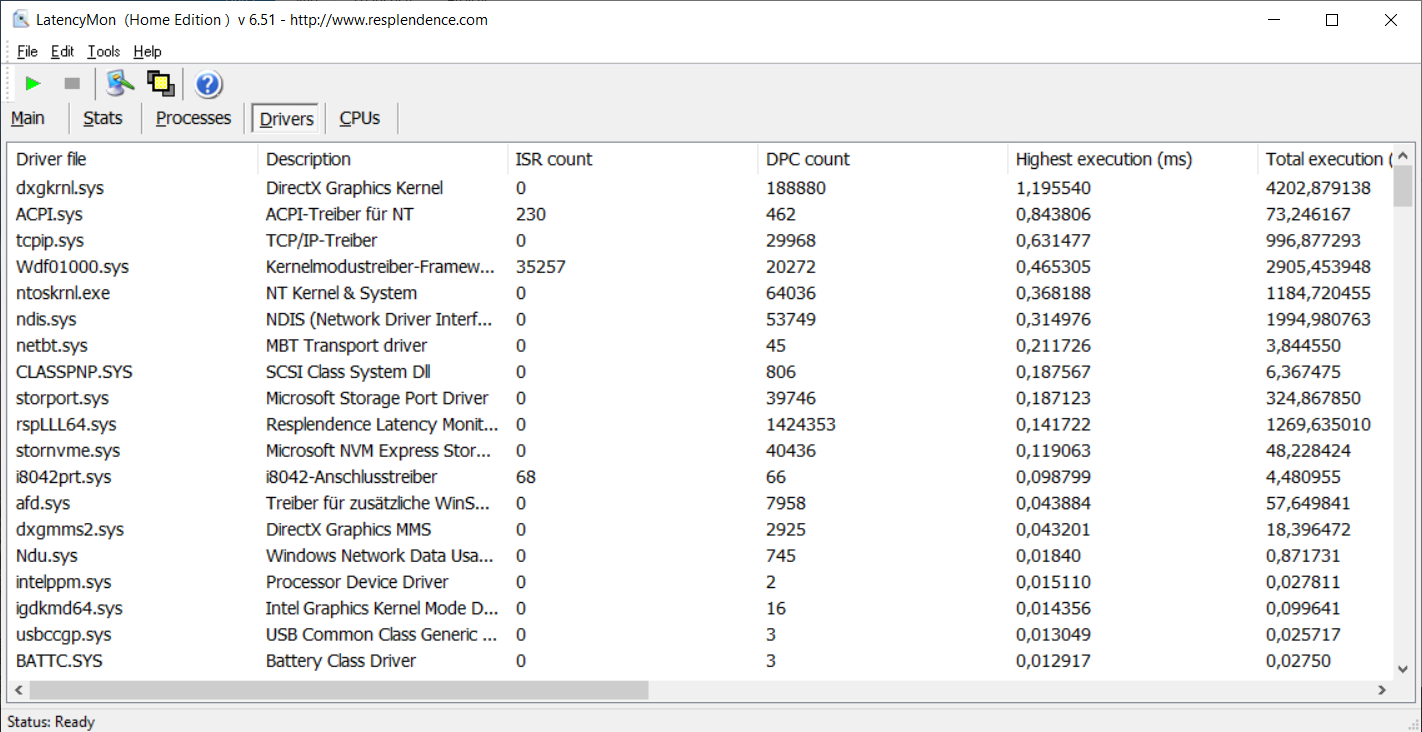
DPC latencies
The Lenovo ThinkPad X13 showed increased DPC latencies in our test, which can lead to interruptions in real-time applications.
| DPC Latencies / LatencyMon - interrupt to process latency (max), Web, Youtube, Prime95 | |
| Dynabook Portege X30L-G1331 | |
| Dell XPS 13 9300 i5 FHD | |
| Lenovo ThinkPad X13-20T20033GE | |
* ... smaller is better
Mass storage
Lenovo installed a 512 GB SSD from Samsung in the ThinkPad X13, but it performs a little slower than average in our storage benchmarks when compared to other laptops. However, the differences are minimal, so users will still benefit from the SSD's very good read and write speeds.
Our HDD/SSD benchmark list shows what performance other storage devices were able to achieve in our tests.
| Lenovo ThinkPad X13-20T20033GE Samsung SSD PM981a MZVLB512HBJQ | Lenovo ThinkPad X390-20Q1S02M00 Intel SSD Pro 7600p SSDPEKKF512G8L | Dell XPS 13 9300 i5 FHD Toshiba XG6 KXG60ZNV512G | Dynabook Portege X30L-G1331 Samsung SSD PM981a MZVLB512HBJQ | Huawei MateBook X Pro 2020 i7 Samsung PM981a MZVLB1T0HBLR | Average Samsung SSD PM981a MZVLB512HBJQ | |
|---|---|---|---|---|---|---|
| CrystalDiskMark 5.2 / 6 | -12% | -8% | 3% | 7% | 5% | |
| Write 4K (MB/s) | 131.1 | 120.7 -8% | 121.9 -7% | 164.1 25% | 165.6 26% | 140.8 ? 7% |
| Read 4K (MB/s) | 45.48 | 58.5 29% | 50 10% | 49.34 8% | 50.2 10% | 48.6 ? 7% |
| Write Seq (MB/s) | 2042 | 1491 -27% | 1497 -27% | 1777 -13% | 1905 -7% | 2106 ? 3% |
| Read Seq (MB/s) | 2259 | 2760 22% | 2111 -7% | 1752 -22% | 1669 -26% | 2099 ? -7% |
| Write 4K Q32T1 (MB/s) | 429.1 | 237.5 -45% | 365.9 -15% | 401.1 -7% | 474.6 11% | 451 ? 5% |
| Read 4K Q32T1 (MB/s) | 370.7 | 336.1 -9% | 384.6 4% | 498.7 35% | 508 37% | 482 ? 30% |
| Write Seq Q32T1 (MB/s) | 2963 | 1512 -49% | 2748 -7% | 2988 1% | 3007 1% | 2903 ? -2% |
| Read Seq Q32T1 (MB/s) | 3564 | 3154 -12% | 3119 -12% | 3544 -1% | 3556 0% | 3511 ? -1% |
| Write 4K Q8T8 (MB/s) | 1065 | 914 ? | ||||
| Read 4K Q8T8 (MB/s) | 891 | 1017 ? | ||||
| AS SSD | -2% | -20% | 1% | 26% | 2% | |
| Seq Read (MB/s) | 2714 | 2689 -1% | 2328 -14% | 2067 -24% | 2737 1% | 2412 ? -11% |
| Seq Write (MB/s) | 1374 | 1462 6% | 1137 -17% | 2444 78% | 2530 84% | 1983 ? 44% |
| 4K Read (MB/s) | 51.2 | 63.8 25% | 48.07 -6% | 55.8 9% | 54 5% | 53.1 ? 4% |
| 4K Write (MB/s) | 135.7 | 139.8 3% | 120.6 -11% | 124.6 -8% | 152.5 12% | 131.1 ? -3% |
| 4K-64 Read (MB/s) | 962 | 865 -10% | 899 -7% | 1601 66% | 2011 109% | 1201 ? 25% |
| 4K-64 Write (MB/s) | 1420 | 1041 -27% | 1220 -14% | 1696 19% | 1260 -11% | 1726 ? 22% |
| Access Time Read * (ms) | 0.043 | 0.037 14% | 0.085 -98% | 0.048 -12% | 0.066 -53% | 0.05525 ? -28% |
| Access Time Write * (ms) | 0.028 | 0.024 14% | 0.033 -18% | 0.091 -225% | 0.024 14% | 0.05394 ? -93% |
| Score Read (Points) | 1284 | 1198 -7% | 1180 -8% | 1864 45% | 2339 82% | 1495 ? 16% |
| Score Write (Points) | 1693 | 1328 -22% | 1455 -14% | 2065 22% | 1666 -2% | 2055 ? 21% |
| Score Total (Points) | 3579 | 3095 -14% | 3189 -11% | 4908 37% | 5191 45% | 4303 ? 20% |
| Total Average (Program / Settings) | -7% /
-6% | -14% /
-15% | 2% /
2% | 17% /
18% | 4% /
3% |
* ... smaller is better

Continuous reading performance: DiskSpd Read Loop, Queue Depth 8
Graphics Card
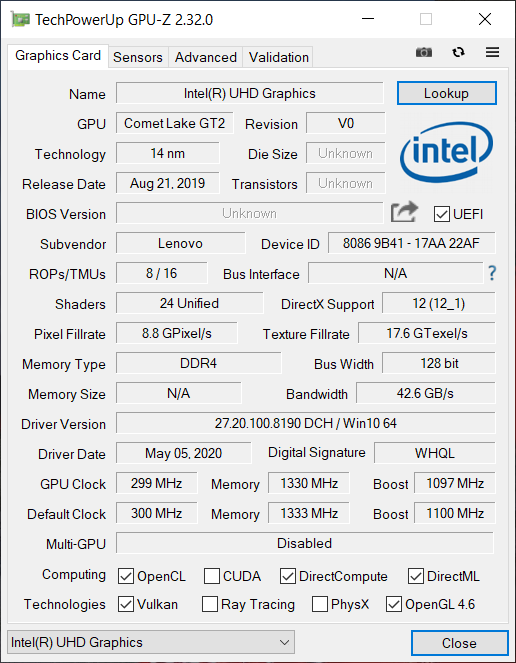
An Intel UHD Graphics 620 is responsible for displaying the Lenovo ThinkPad X13's graphical content. This integrated GPU is only suitable for simple graphical applications, but it benefits from a dual-channel RAM configuration, which we used in our test configuration. The Lenovo laptop achieves an above-average result in the 3DMark benchmarks, but it has to admit defeat to the integrated UHD Graphics G1 of the Dell XPS 13 9300, which holds the first place position in our test field.
You can see how Intel's UHD Graphics 620 fares in comparison to other graphics cards in our GPU benchmark list.
| 3DMark 11 Performance | 2117 points | |
| 3DMark Fire Strike Score | 1210 points | |
| 3DMark Time Spy Score | 483 points | |
Help | ||
Gaming Performance
Intel's UHD Graphics 620 is only suitable for simple or older games. The performance is not sufficient for complex 3D titles. Of all the games we tested, only Dota 2 Reborn could be played with a smooth FPS, but this was only possible when not using Full HD resolution or high graphical settings.
The gaming performance that can be expected from Intel's UHD Graphics 620 when playing various games is shown in our GPU games list.
| low | med. | high | ultra | |
|---|---|---|---|---|
| The Witcher 3 (2015) | 17.9 | |||
| Dota 2 Reborn (2015) | 83.7 | 51.4 | 22.6 | 19.9 |
| Final Fantasy XV Benchmark (2018) | 11.49 | |||
| X-Plane 11.11 (2018) | 13.2 | 15.9 | 14.4 | |
| Far Cry 5 (2018) | 16 |
Emissions - A quiet laptop with good speakers
Noise levels
The Lenovo ThinkPad X13 cannot be heard when it is idling or being used in office mode. The fans start to produce a hissing noise when the laptop is under heavy load, but this can be suppressed quite well by background noise since the fan noise is only 34 dB(A) loud at a maximum.
We could not detect any other background noise emissions like coil whine from our test device.
Noise level
| Idle |
| 29.3 / 29.3 / 29.3 dB(A) |
| Load |
| 30.7 / 34 dB(A) |
 | ||
30 dB silent 40 dB(A) audible 50 dB(A) loud |
||
min: | ||
Temperature
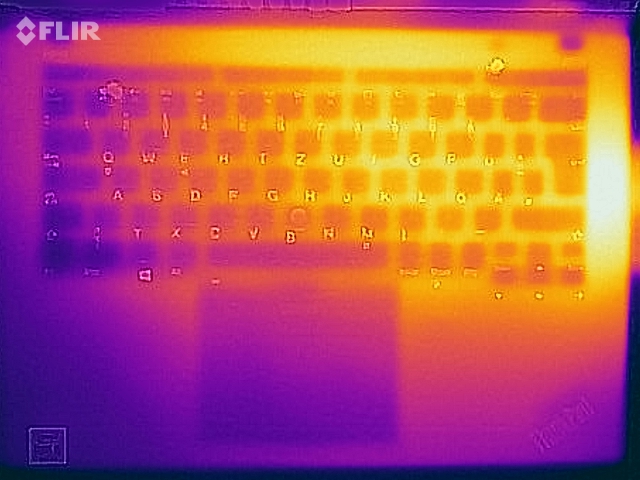
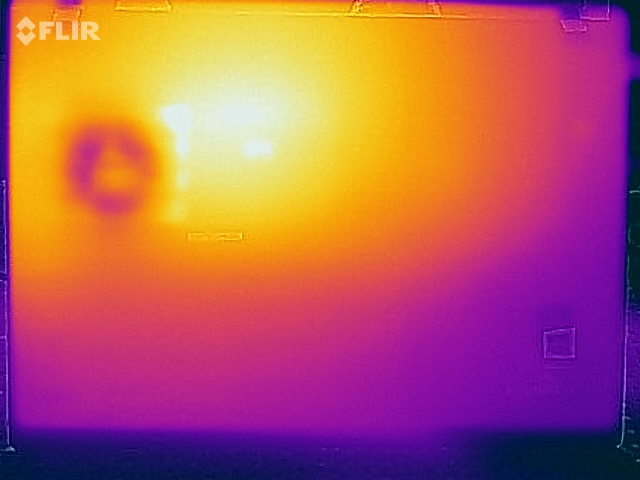
Our measurements show that the ThinkPad X13 can reach surface temperatures of up to 48.4 °C (119.12 °F) when under load. Since the warmest point is on the top of the device and the palm rests only heat up moderately, the 13-inch laptop can be used comfortably even when the device is under load.
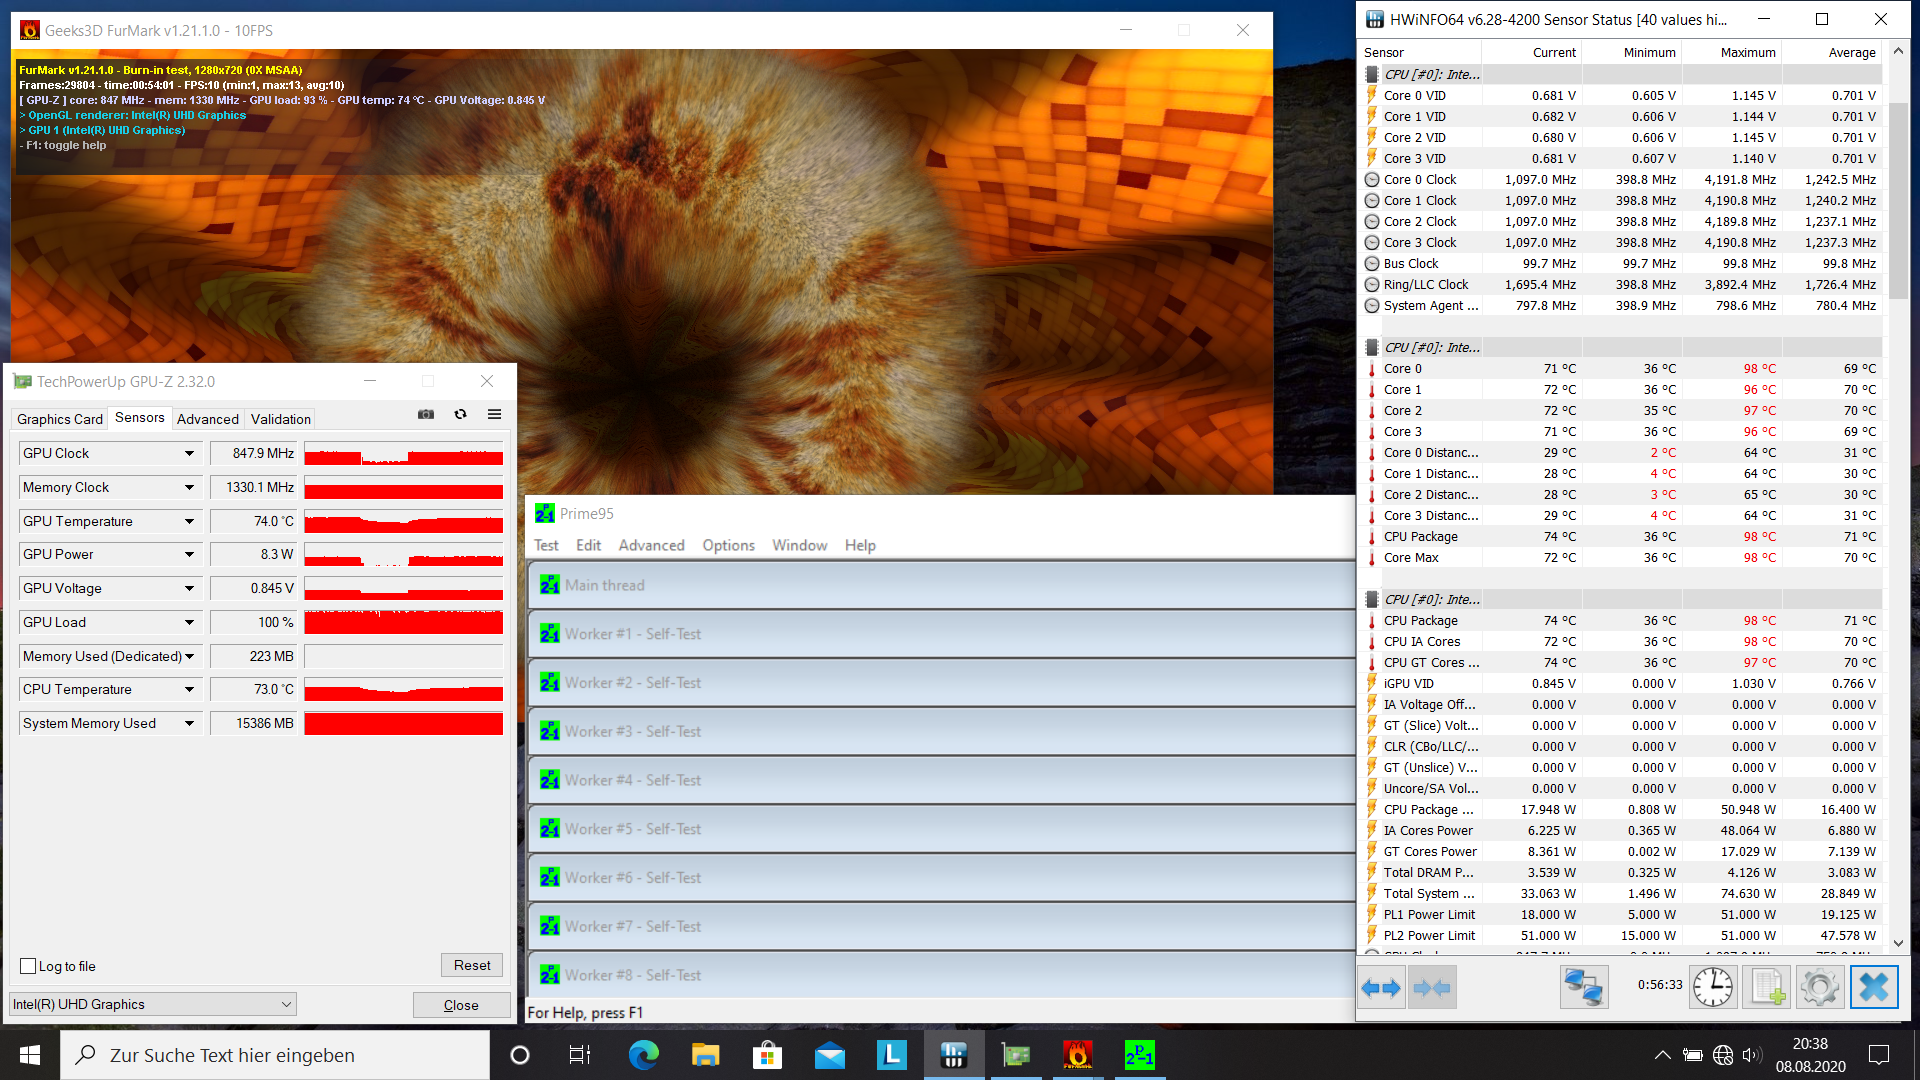
During our approximately one hour stress test, the temperatures inside the Lenovo laptop briefly rose to 98 °C (208.4 °F), with the clock rates also briefly falling to 400 MHz. But for the most part, the fans were able to keep the temperature at an average of 70 °C (158 °F) and the CPU clock speed at 1.2 GHz. That said, our CPU's frequency was only slightly above 1 GHz at the end of the test, so it was working at below its base clock speed. Since a scenario like the one in our stress test will almost never occur in typical use, though, users do not have to expect throttling due to high temperatures.
(-) The maximum temperature on the upper side is 48.4 °C / 119 F, compared to the average of 34.3 °C / 94 F, ranging from 21.2 to 62.5 °C for the class Office.
(±) The bottom heats up to a maximum of 43.8 °C / 111 F, compared to the average of 36.8 °C / 98 F
(+) In idle usage, the average temperature for the upper side is 24.4 °C / 76 F, compared to the device average of 29.5 °C / 85 F.
(+) The palmrests and touchpad are reaching skin temperature as a maximum (35.9 °C / 96.6 F) and are therefore not hot.
(-) The average temperature of the palmrest area of similar devices was 27.5 °C / 81.5 F (-8.4 °C / -15.1 F).
Speaker
Lenovo ThinkPad X13-20T20033GE audio analysis
(±) | speaker loudness is average but good (74.6 dB)
Bass 100 - 315 Hz
(-) | nearly no bass - on average 17.9% lower than median
(±) | linearity of bass is average (13.2% delta to prev. frequency)
Mids 400 - 2000 Hz
(+) | balanced mids - only 4.6% away from median
(+) | mids are linear (4.4% delta to prev. frequency)
Highs 2 - 16 kHz
(+) | balanced highs - only 2.6% away from median
(±) | linearity of highs is average (7% delta to prev. frequency)
Overall 100 - 16.000 Hz
(±) | linearity of overall sound is average (23.8% difference to median)
Compared to same class
» 68% of all tested devices in this class were better, 8% similar, 24% worse
» The best had a delta of 7%, average was 21%, worst was 53%
Compared to all devices tested
» 71% of all tested devices were better, 6% similar, 22% worse
» The best had a delta of 4%, average was 24%, worst was 134%
Energy management - The Comet-Lake CPU improves the battery life
Energy use
The power consumption of the ThinkPad X13 is on par with other laptops that use similar hardware. Compared to the ThinkPad X390, the lower average power consumption under load is noticeable.
The charger supplied can be connected to the Lenovo laptop via the USB Type-C port and has an output of 65 watts.
| Off / Standby | |
| Idle | |
| Load |
|
Key:
min: | |
| Lenovo ThinkPad X13-20T20033GE i5-10210U, UHD Graphics 620, Samsung SSD PM981a MZVLB512HBJQ, IPS, 1920x1080, 13.3" | Lenovo ThinkPad X390-20Q1S02M00 i5-8265U, UHD Graphics 620, Intel SSD Pro 7600p SSDPEKKF512G8L, IPS LED, 1920x1080, 13.3" | Dell XPS 13 9300 i5 FHD i5-1035G1, UHD Graphics G1 (Ice Lake 32 EU), Toshiba XG6 KXG60ZNV512G, IPS, 1920x1200, 13.4" | Dynabook Portege X30L-G1331 i5-10210U, UHD Graphics 620, Samsung SSD PM981a MZVLB512HBJQ, IPS, 1920x1080, 13.3" | Huawei MateBook X Pro 2020 i7 i7-10510U, GeForce MX250, Samsung PM981a MZVLB1T0HBLR, LTPS, 3000x2000, 13.9" | Average Intel UHD Graphics 620 | Average of class Office | |
|---|---|---|---|---|---|---|---|
| Power Consumption | -13% | -8% | 6% | -43% | -9% | -25% | |
| Idle Minimum * (Watt) | 2.9 | 3.4 -17% | 3.4 -17% | 2.8 3% | 4.3 -48% | 3.81 ? -31% | 4.4 ? -52% |
| Idle Average * (Watt) | 5.6 | 5.6 -0% | 6 -7% | 4.9 12% | 8.5 -52% | 6.94 ? -24% | 7.32 ? -31% |
| Idle Maximum * (Watt) | 8.9 | 8.7 2% | 10.2 -15% | 9 -1% | 12 -35% | 8.75 ? 2% | 8.56 ? 4% |
| Load Average * (Watt) | 30.1 | 43.6 -45% | 36.6 -22% | 31.2 -4% | 54.8 -82% | 35 ? -16% | 42.5 ? -41% |
| Load Maximum * (Watt) | 61.3 | 65 -6% | 49.3 20% | 49.4 19% | 61.5 -0% | 47.5 ? 23% | 64.1 ? -5% |
| Witcher 3 ultra * (Watt) | 47.1 |
* ... smaller is better
Battery life
The Lenovo ThinkPad X13 achieved a runtime of 9 hours and 19 minutes in our practical WLAN test. This means that it can easily last a full work day without needing to be charged, so users do not need to carry their charger with them. Compared to the ThinkPad X390, the X13 lasted an hour longer.
The laptop's quick charging function can be used with the included 65-watt charger. With this feature, the battery can be fully recharged after about an hour and a half.
| Lenovo ThinkPad X13-20T20033GE i5-10210U, UHD Graphics 620, 48 Wh | Lenovo ThinkPad X390-20Q1S02M00 i5-8265U, UHD Graphics 620, 48 Wh | Dell XPS 13 9300 i5 FHD i5-1035G1, UHD Graphics G1 (Ice Lake 32 EU), 52 Wh | Dynabook Portege X30L-G1331 i5-10210U, UHD Graphics 620, 42 Wh | Huawei MateBook X Pro 2020 i7 i7-10510U, GeForce MX250, 57.4 Wh | Average of class Office | |
|---|---|---|---|---|---|---|
| Battery runtime | -14% | 25% | -11% | 1% | 11% | |
| H.264 (h) | 11.7 | 12.7 9% | 14.4 23% | 11.9 2% | 15 ? 28% | |
| WiFi v1.3 (h) | 9.3 | 8.3 -11% | 11.7 26% | 8.3 -11% | 10.4 12% | 12.9 ? 39% |
| Load (h) | 2.7 | 1.6 -41% | 3.4 26% | 2.4 -11% | 1.807 ? -33% |
Pros
Cons
Verdict - Known strengths in a known design

The Lenovo ThinkPad X13 showed its strengths in our test: a high-quality case combined with good input devices and a decent battery life. With its 13.3-inch display, the small laptop is well suited for active users. However, the ThinkPad X390, the X13's predecessor, has already shown us these strengths - so these are not advantages of the new laptop. Those lie elsewhere.
The Lenovo ThinkPad X13 with an Intel Core i5 processor is more energy efficient than its predecessor, but offers only slightly more performance.
The X13 has better battery life thanks to its more energy-efficient CPU. The new CPU delivers good performance during everyday use, but it quickly drops to the level of the Intel Core i5-8265U in the ThinkPad X390 when under constant load. The system performance of the new laptop is a bit higher overall, but users should not expect a performance increase of more than 10%. As a result, we do not recommend owners of the ThinkPad X390 make the switch to the X13, and if you do not need to maximize battery life and system performance, you might be able to save some money by just buying the previous model.
Lenovo ThinkPad X13-20T20033GE
- 08/13/2020 v7 (old)
Mike Wobker
Price comparison
