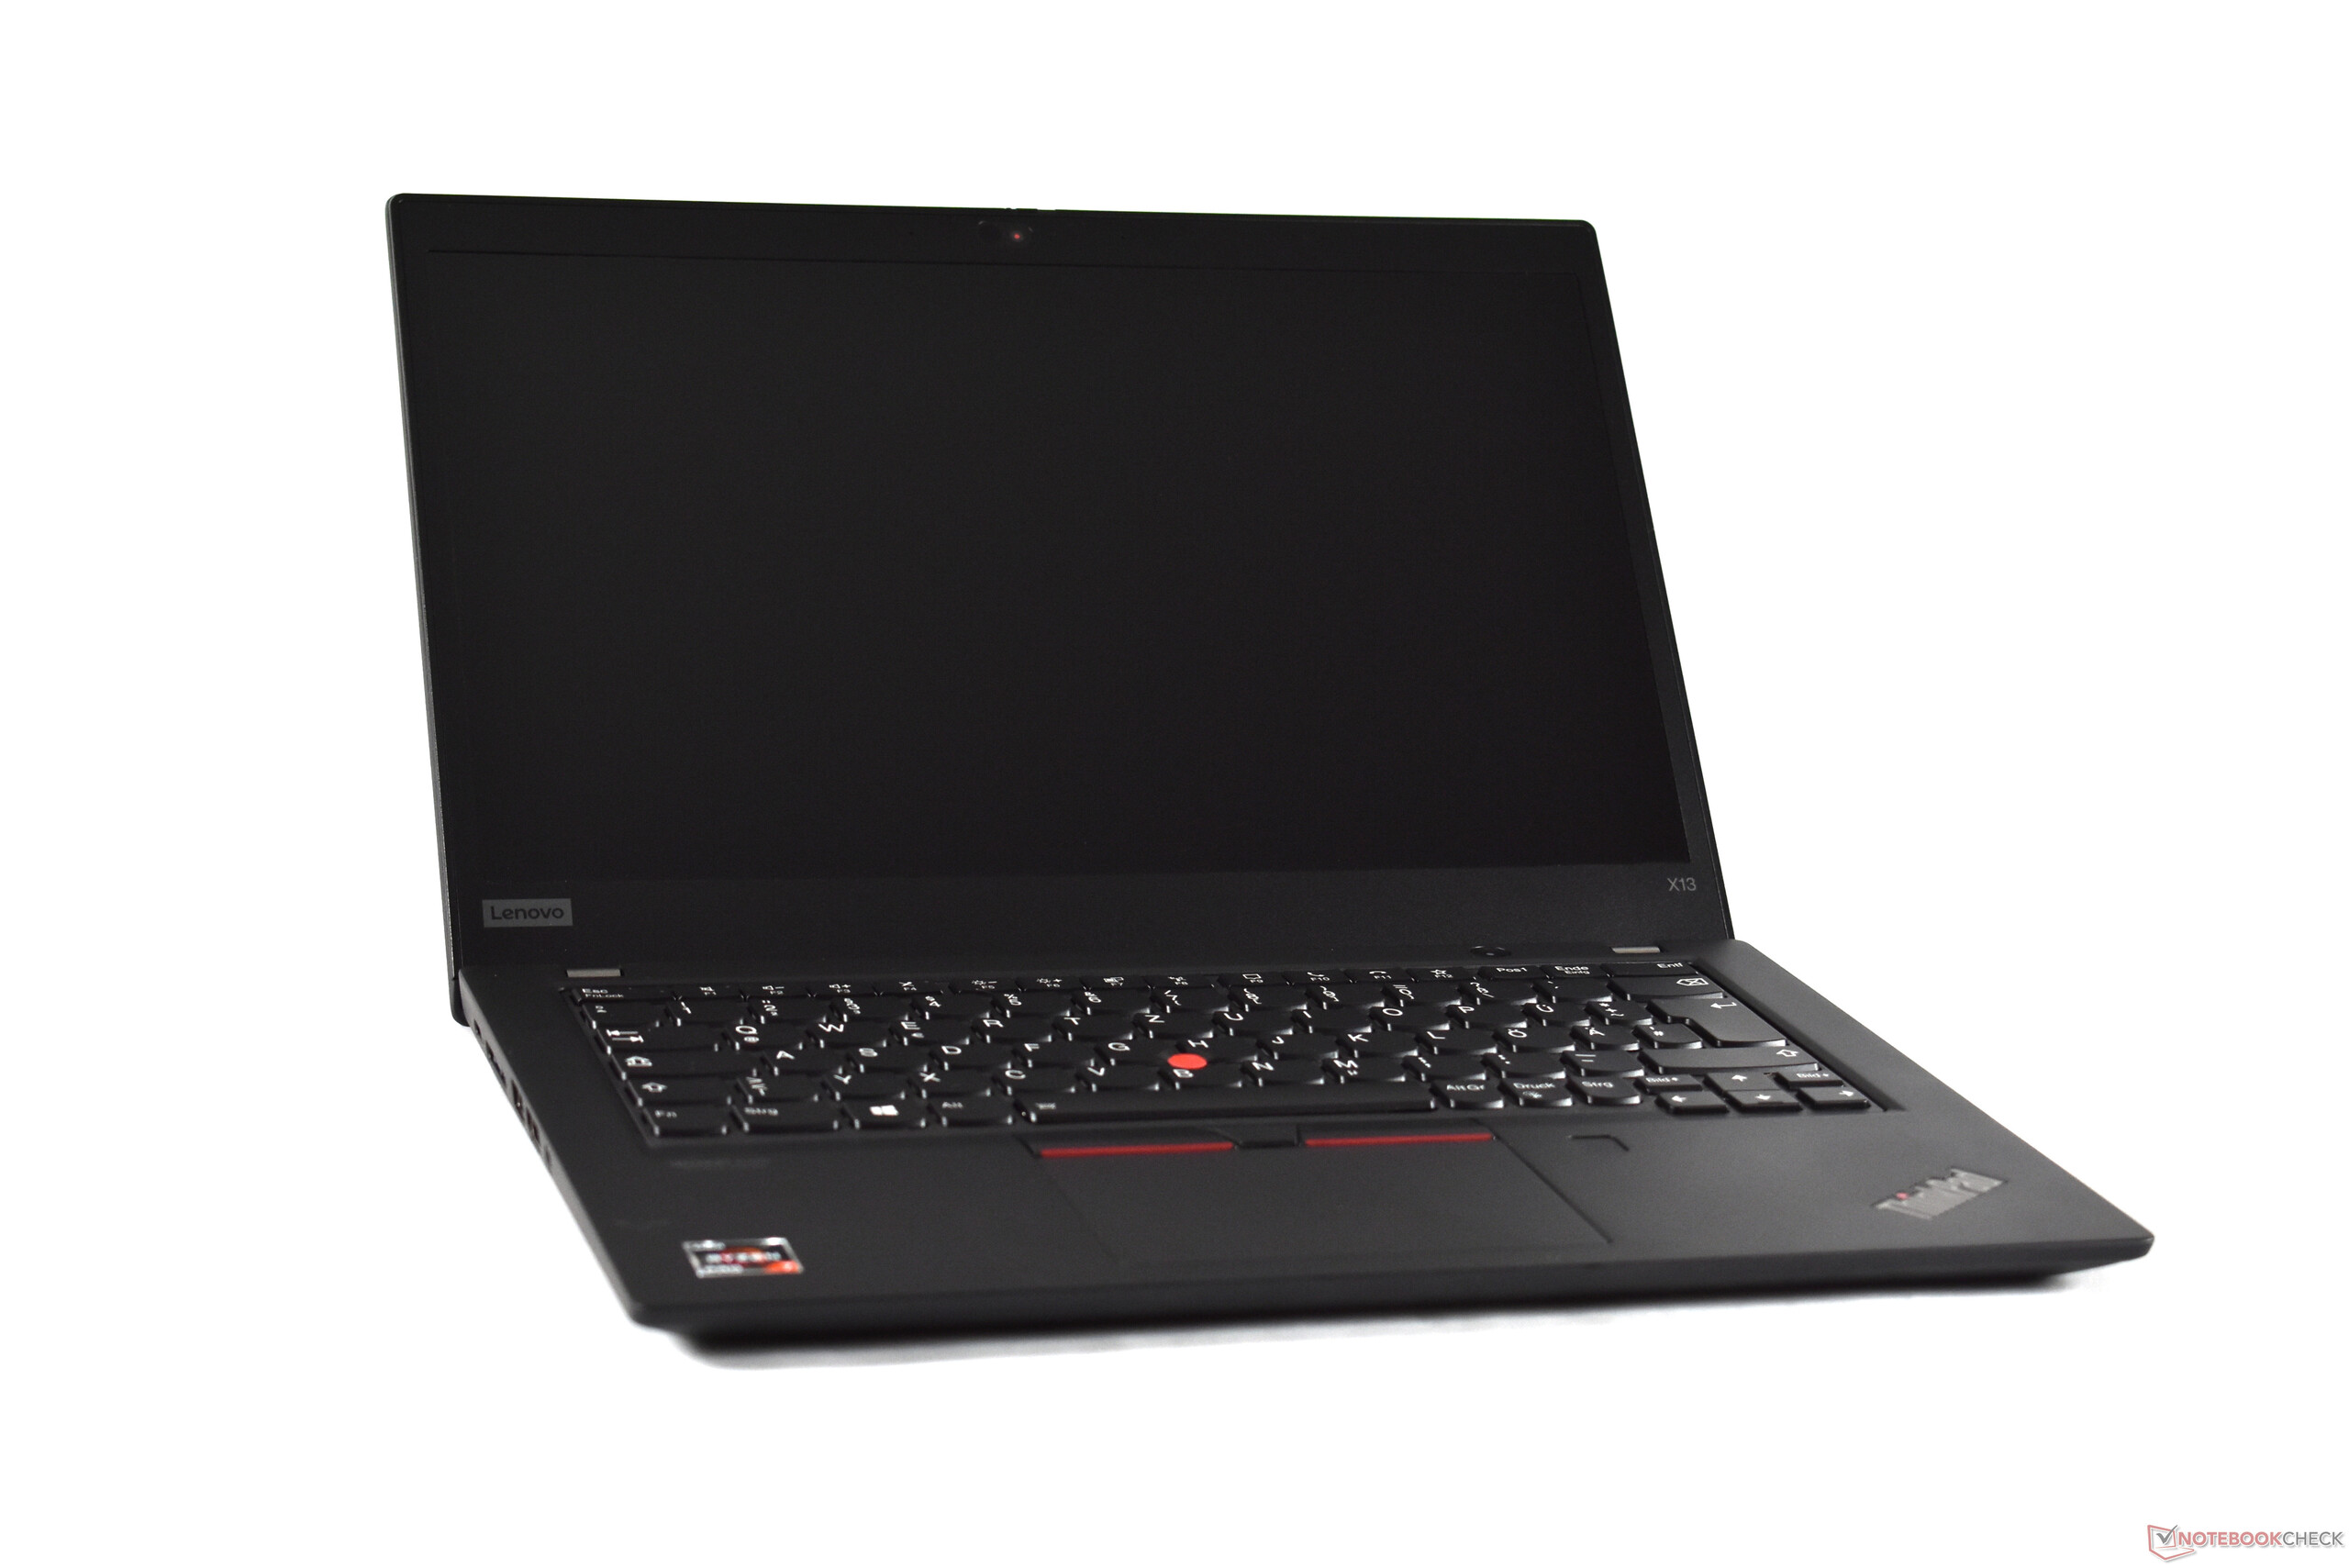
Lenovo ThinkPad X13 Gen 1 review: With AMD Renoir the fastest 13-inch ThinkPad laptop
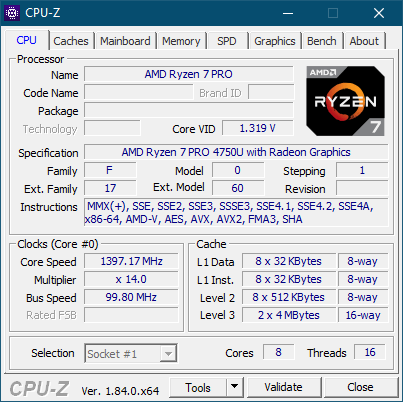
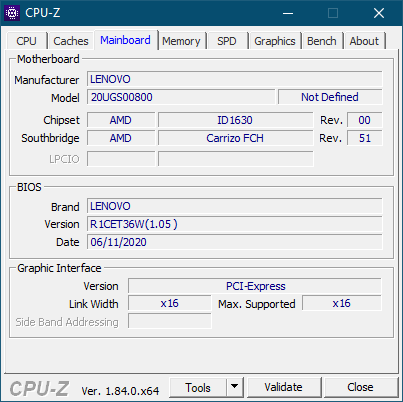
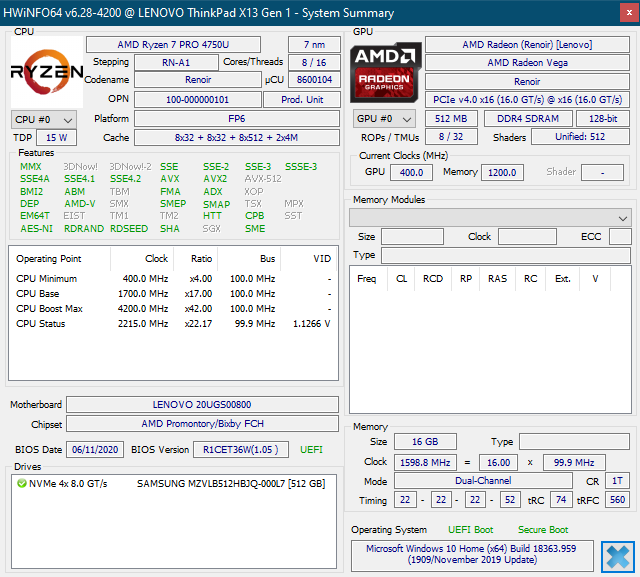
In the past, the labor division in the Lenovo ThinkPad lineup was clear-cut: Workers who mostly stayed inside the office got a T-series ThinkPad. Employees working away from the office frequently were given an X ThinkPad, the smallest and lightest ThinkPad laptops. Though the division is less clear now, the ThinkPad X series is still the most compact. The newest model of this series is called Lenovo ThinkPad X13 Gen 1. It is powered either by Intel Comet-Lake or AMD Ryzen 4000, codenamed "Renoir". Today's review sample of the ThinkPad X13 Gen 1 with the model number 20UGS00800 contains the AMD Ryzen Pro 7 4750U, 16 GB RAM, a 512 GB SSD and an FHD IPS screen. This model is a special education model without Windows. It costs 999 Euros (~$1,186).
As comparison devices, compact business laptops from other manufacturers are appropriate, like the Dell Latitude 7310. Apart from that, we also compare the Lenovo X13 with the predecessor Lenovo ThinkPad X395, the slightly bigger Lenovo ThinkPad T14s with AMD CPUs and the ThinkPad X13 Gen 1 with Intel chips.
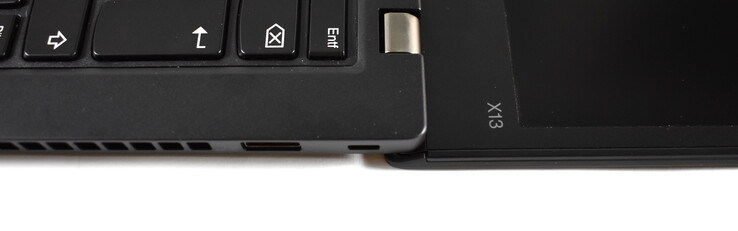
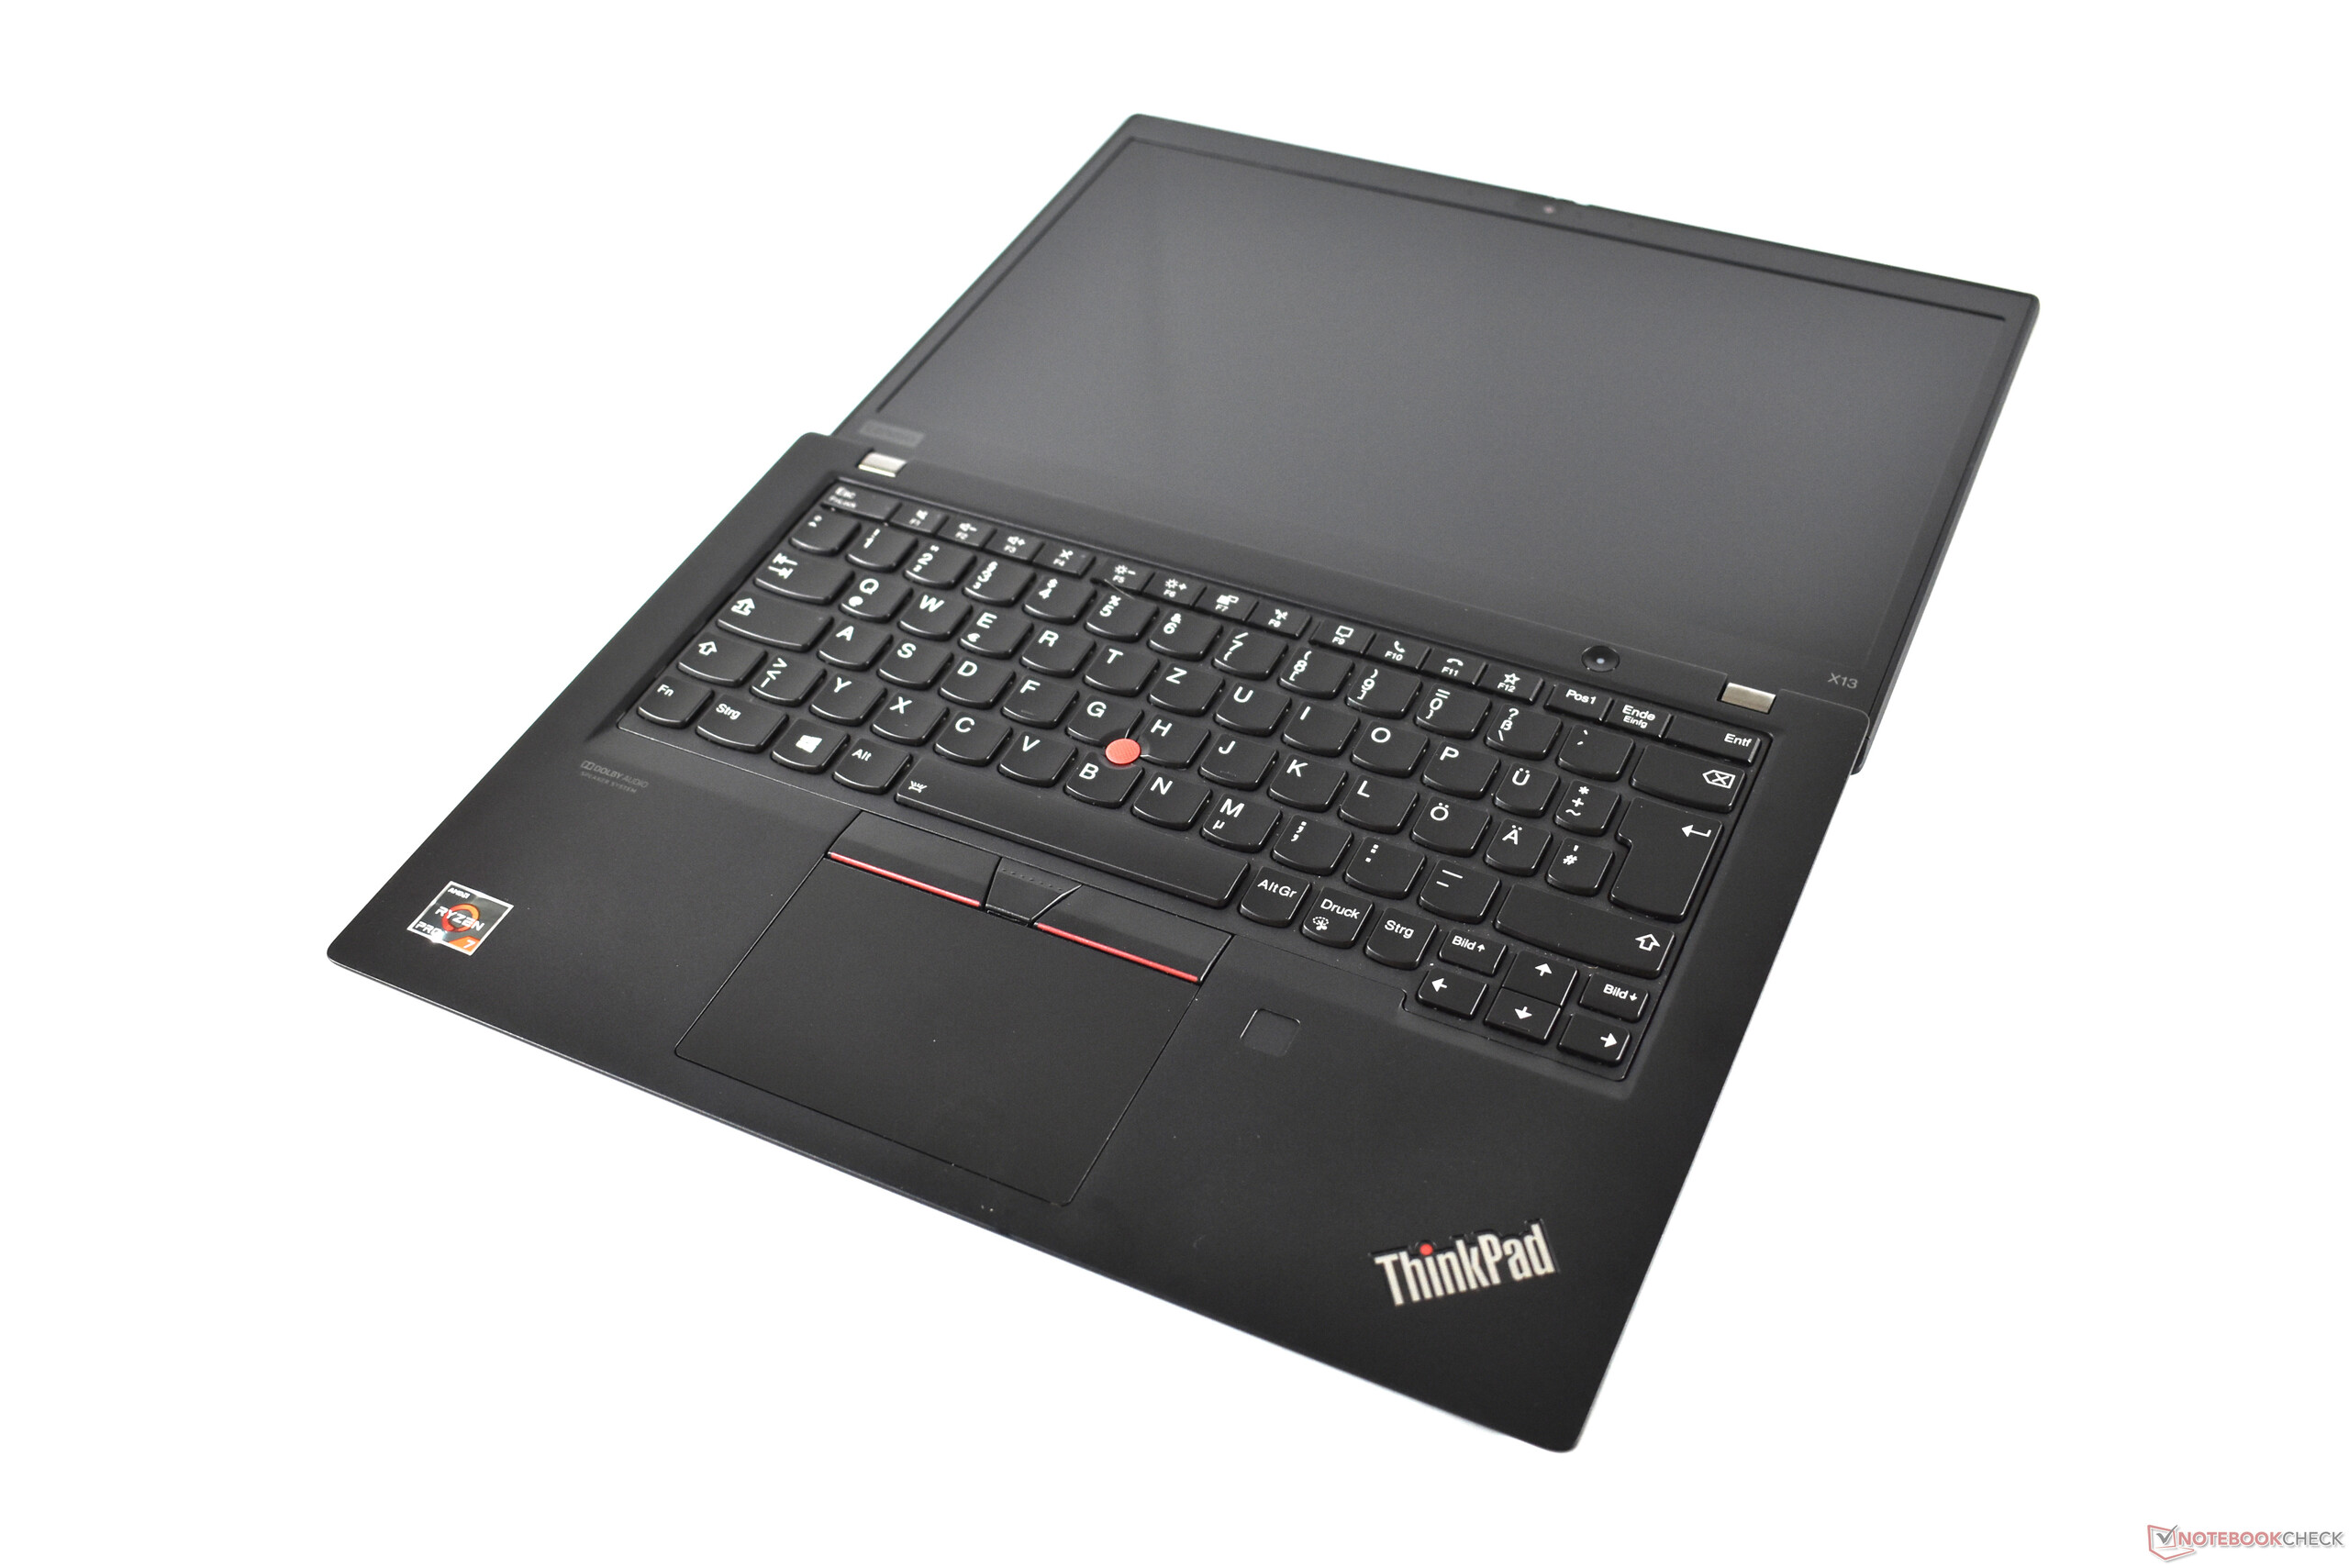
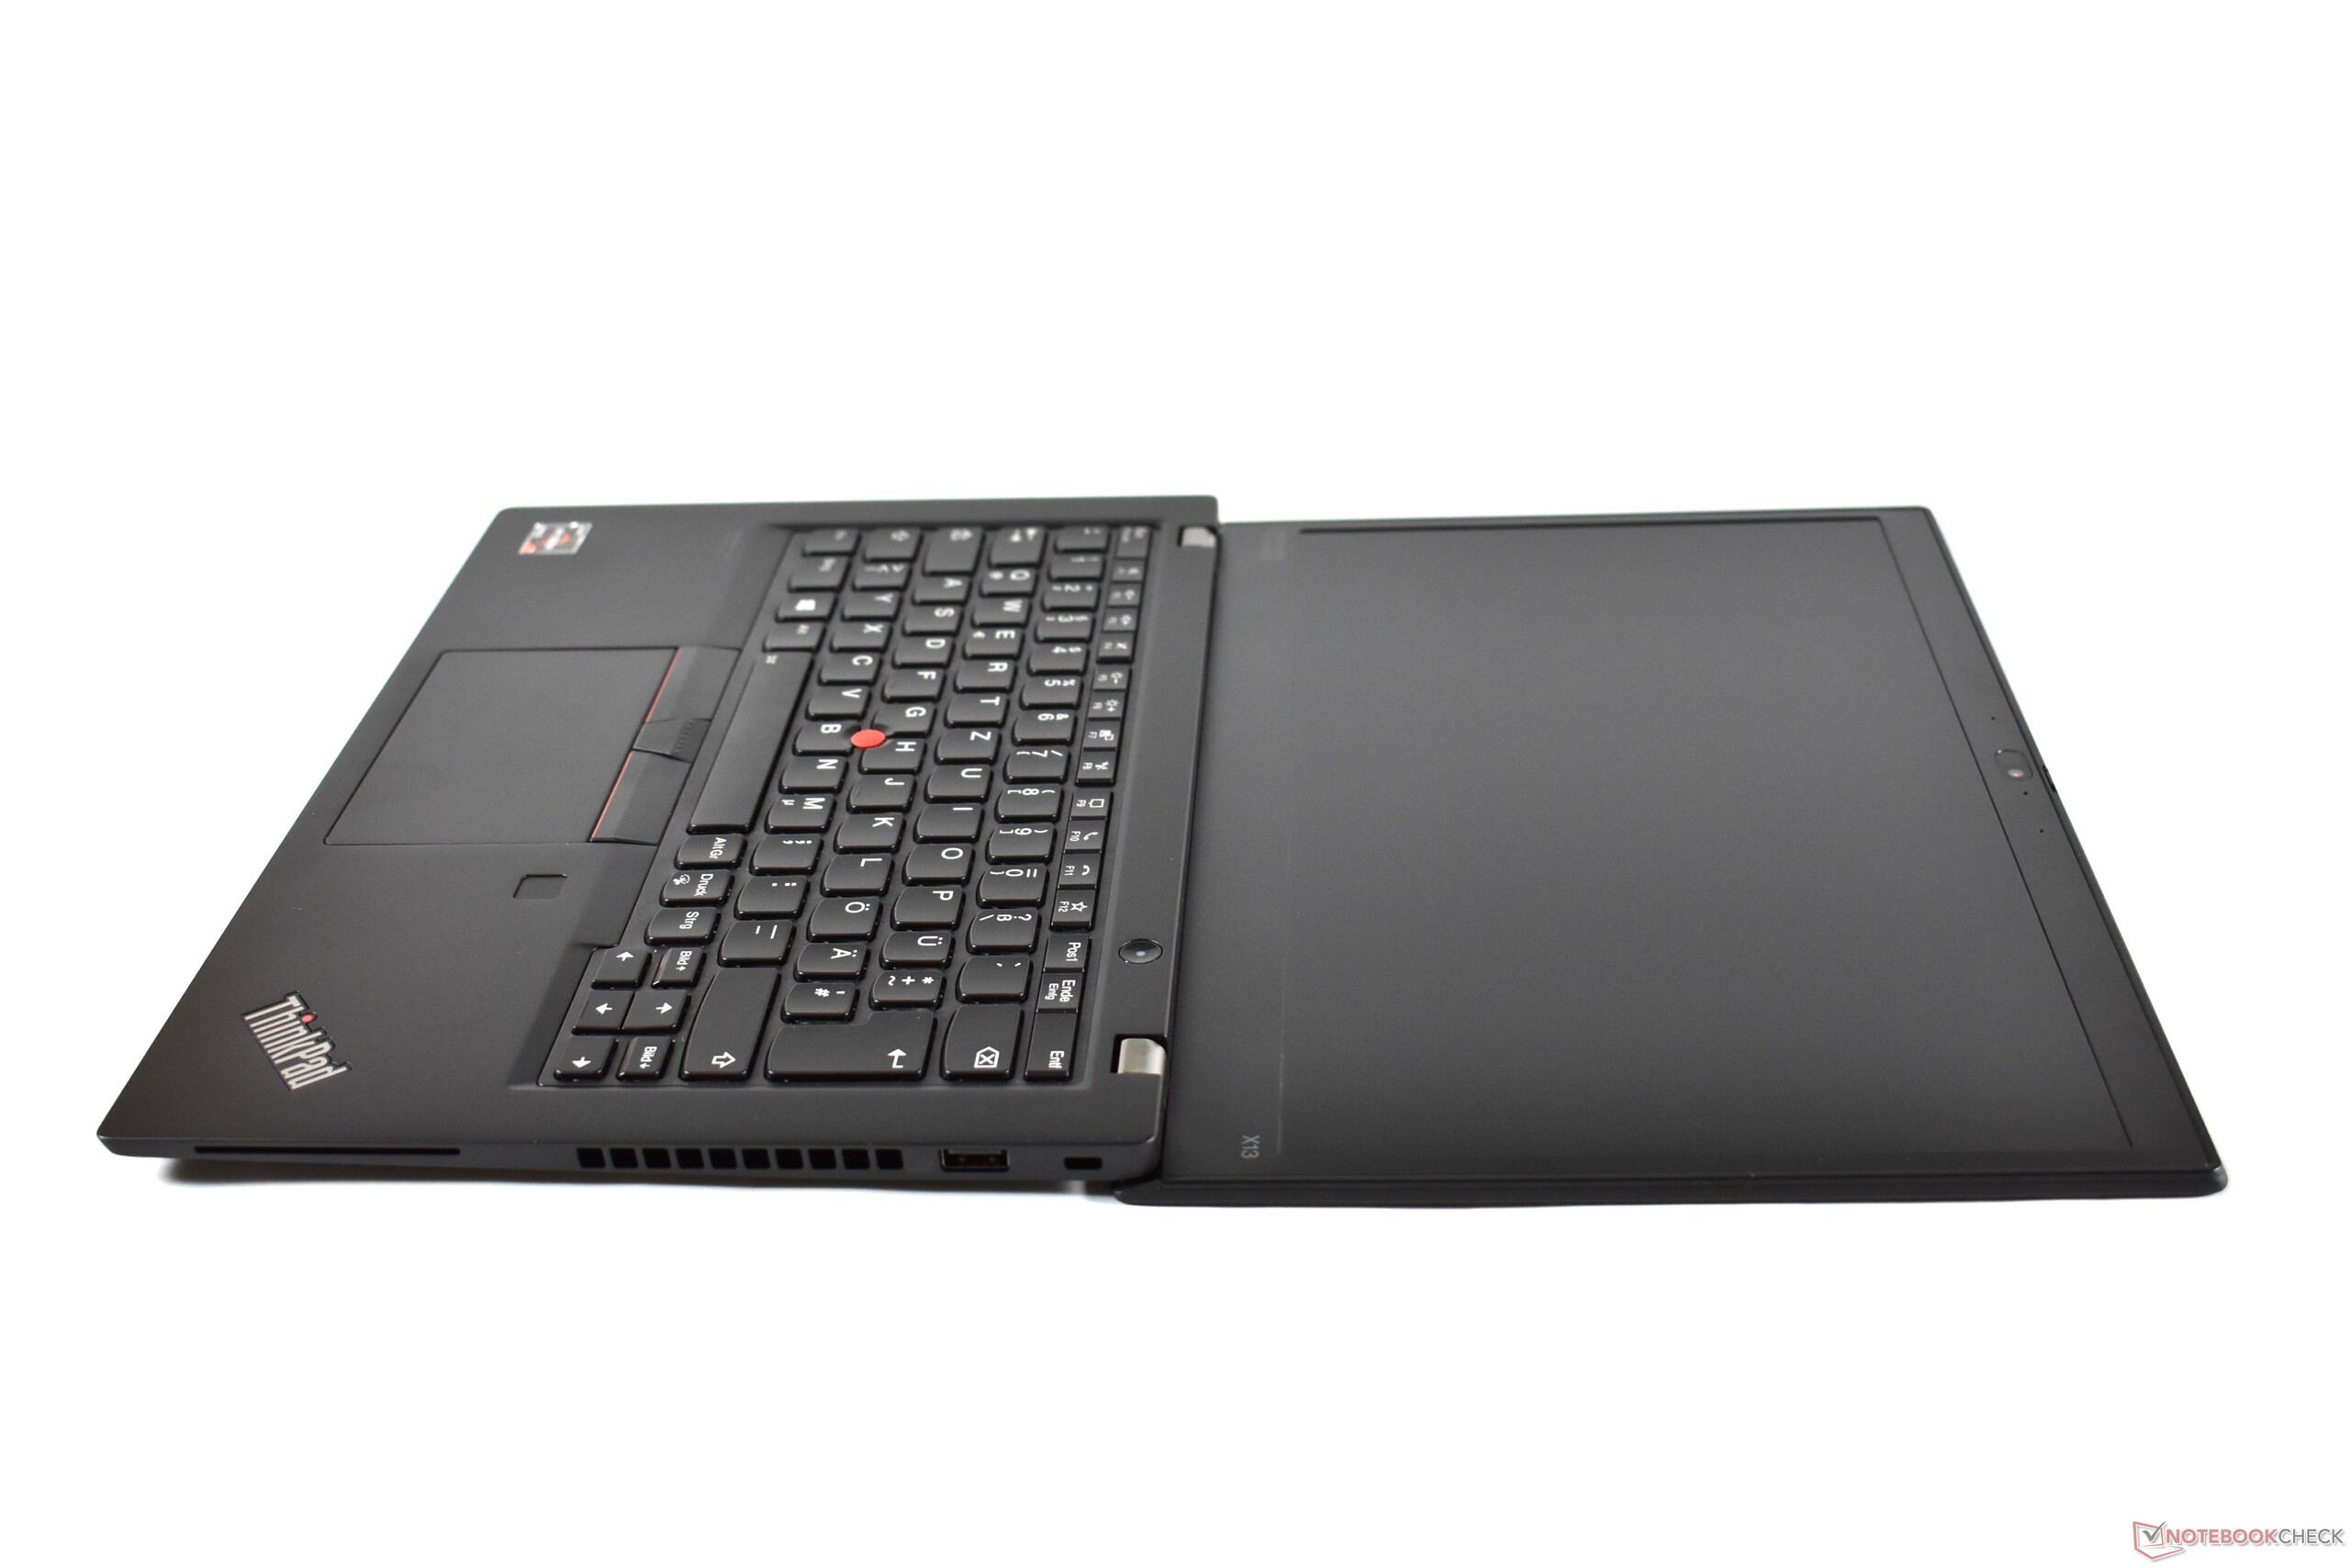
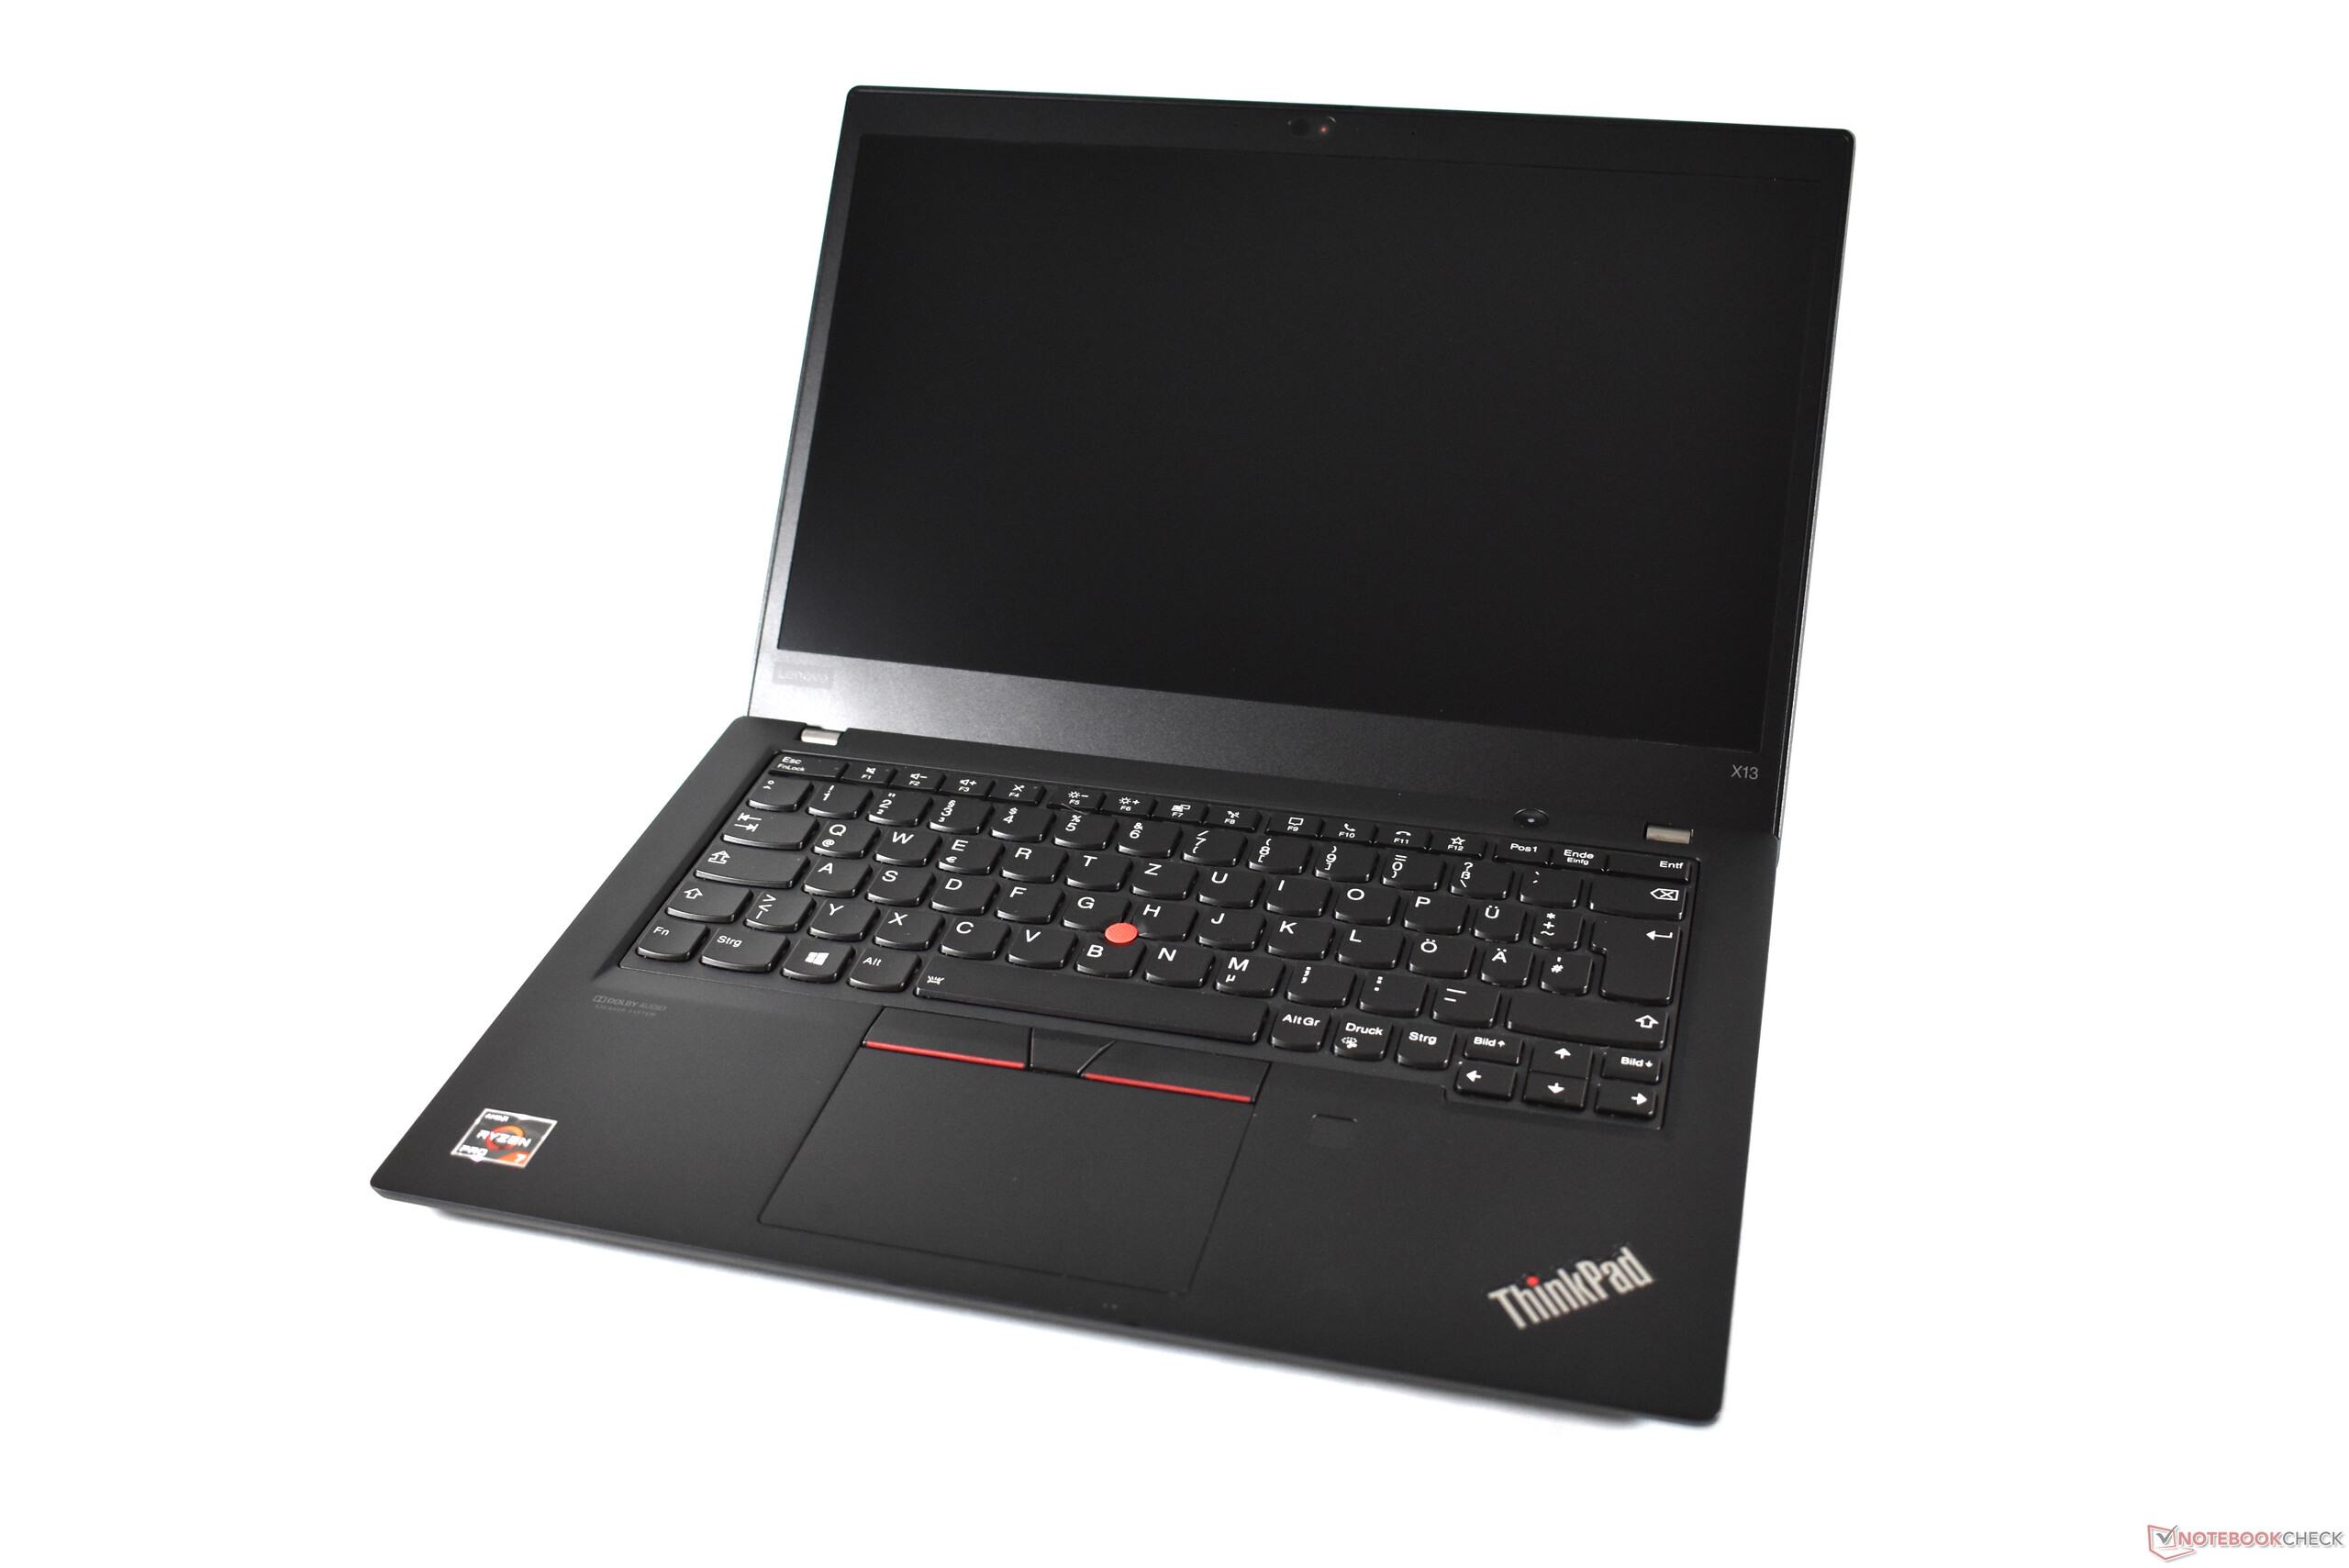
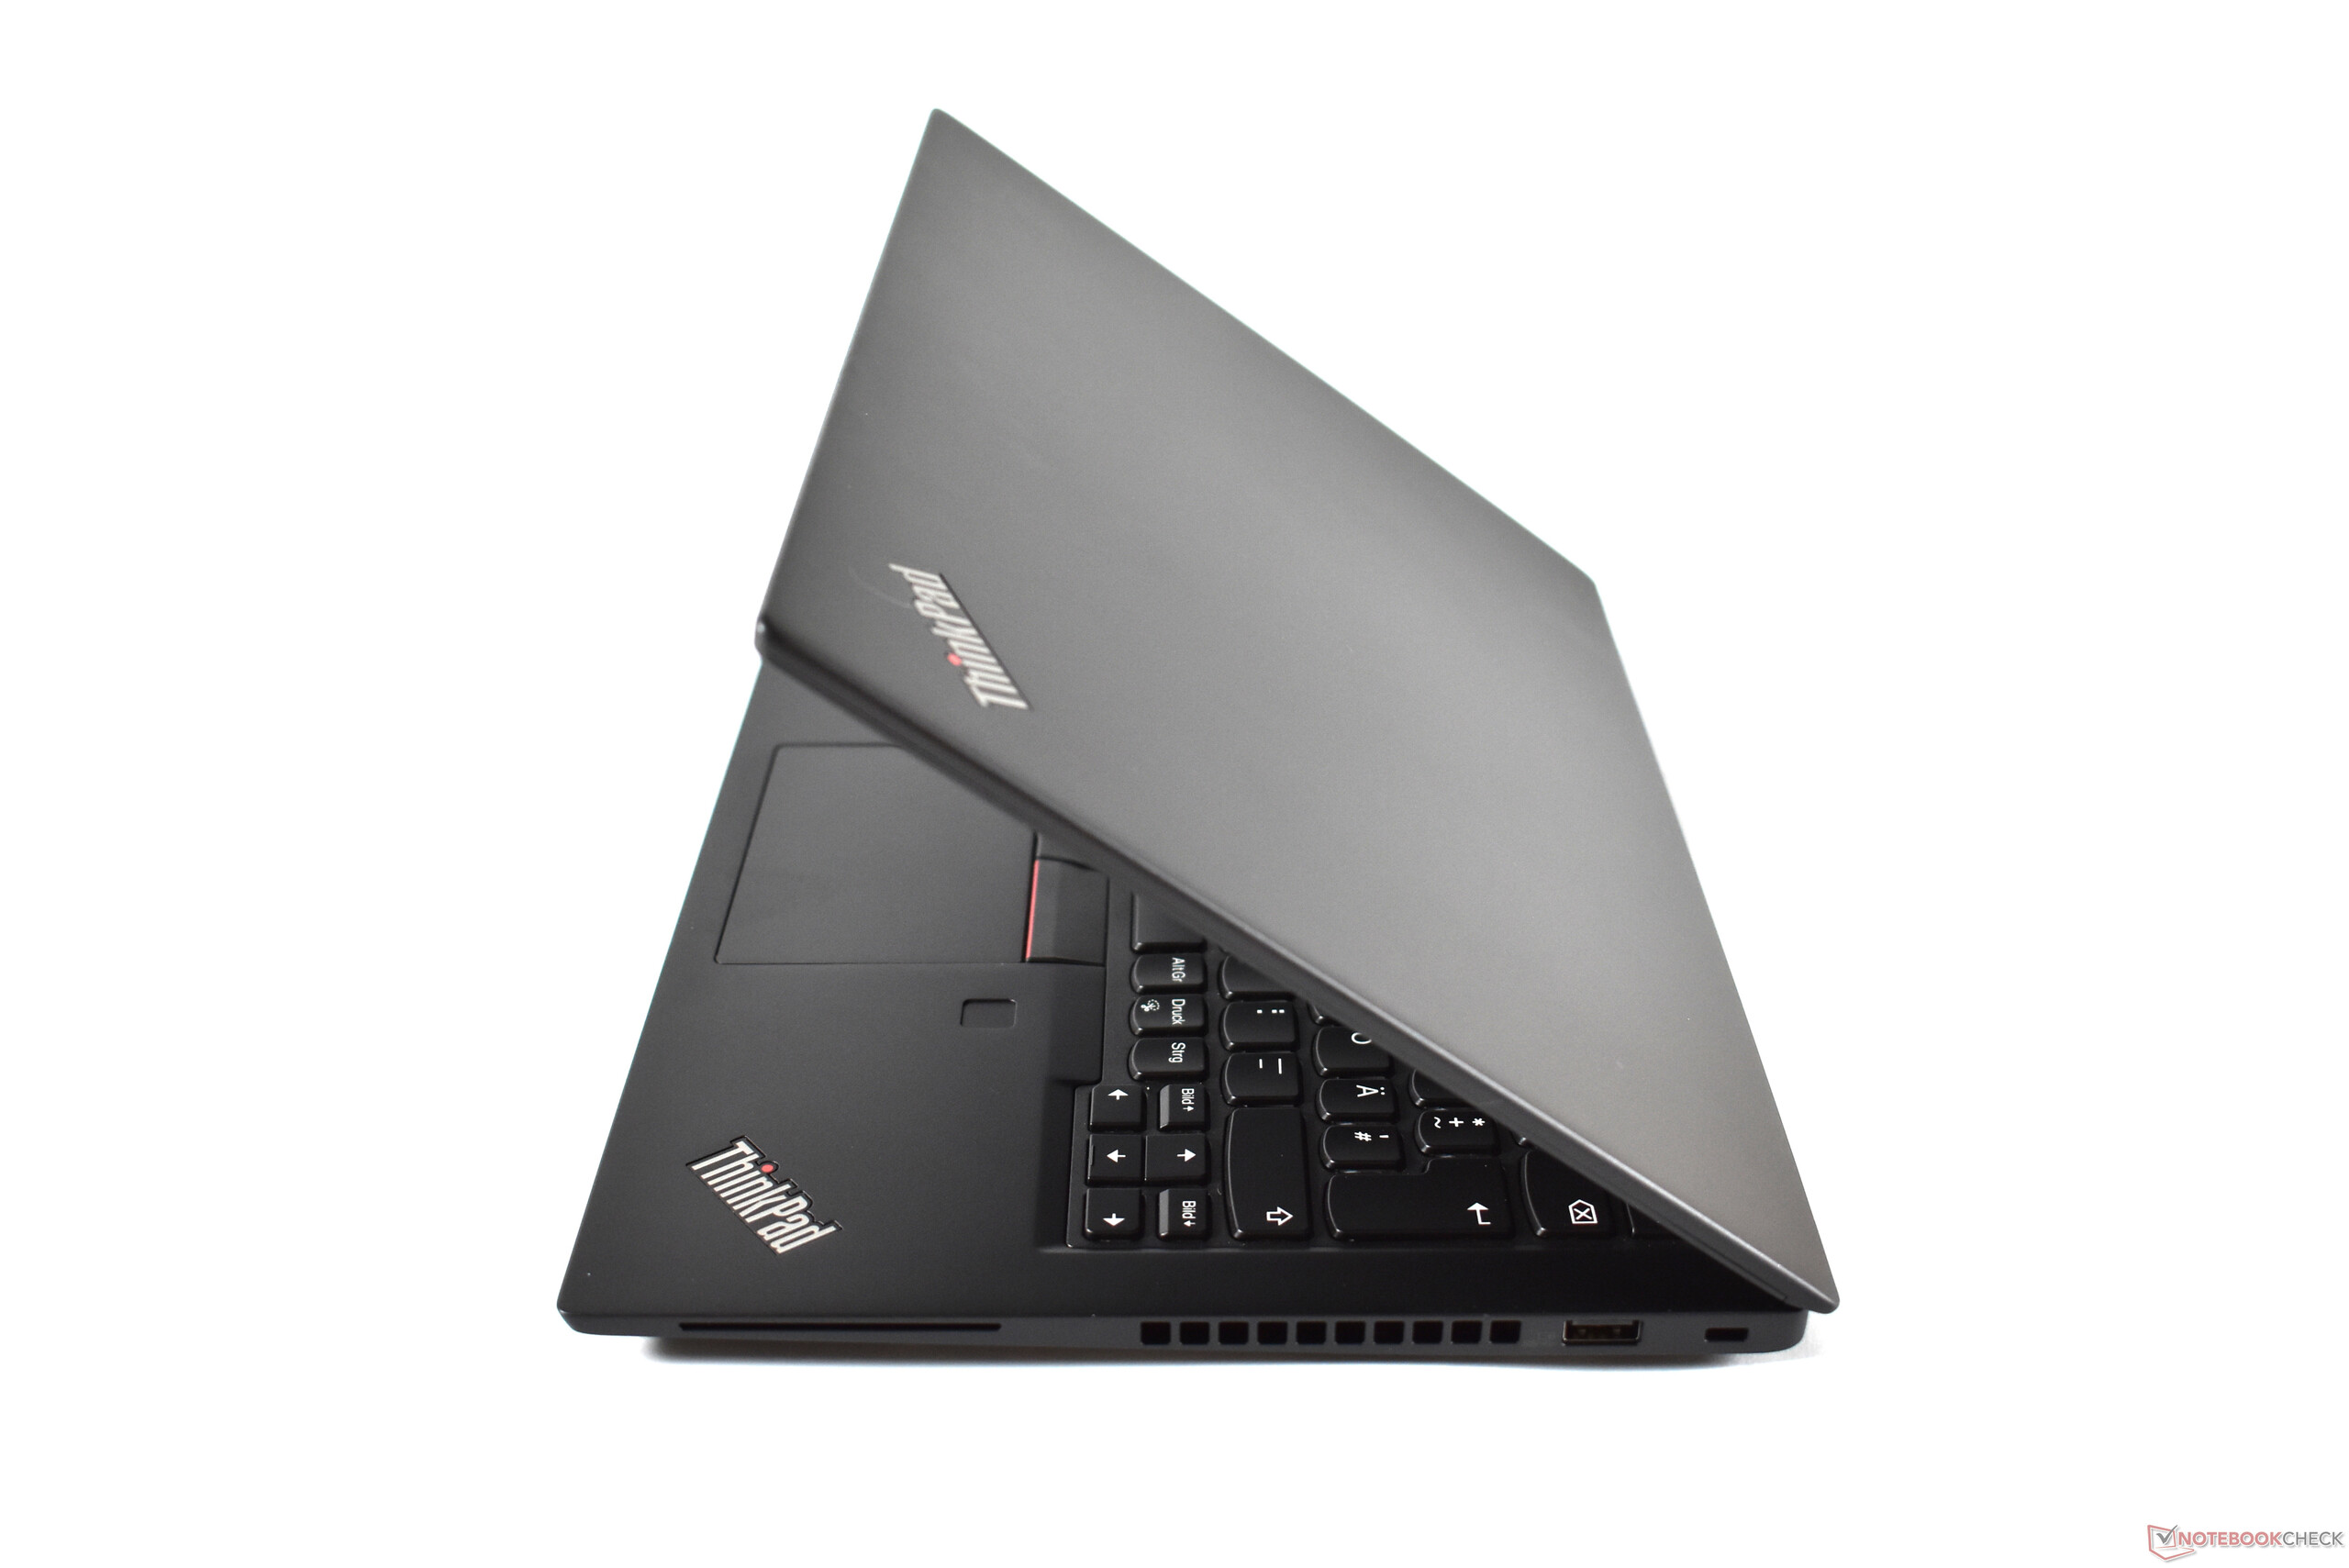
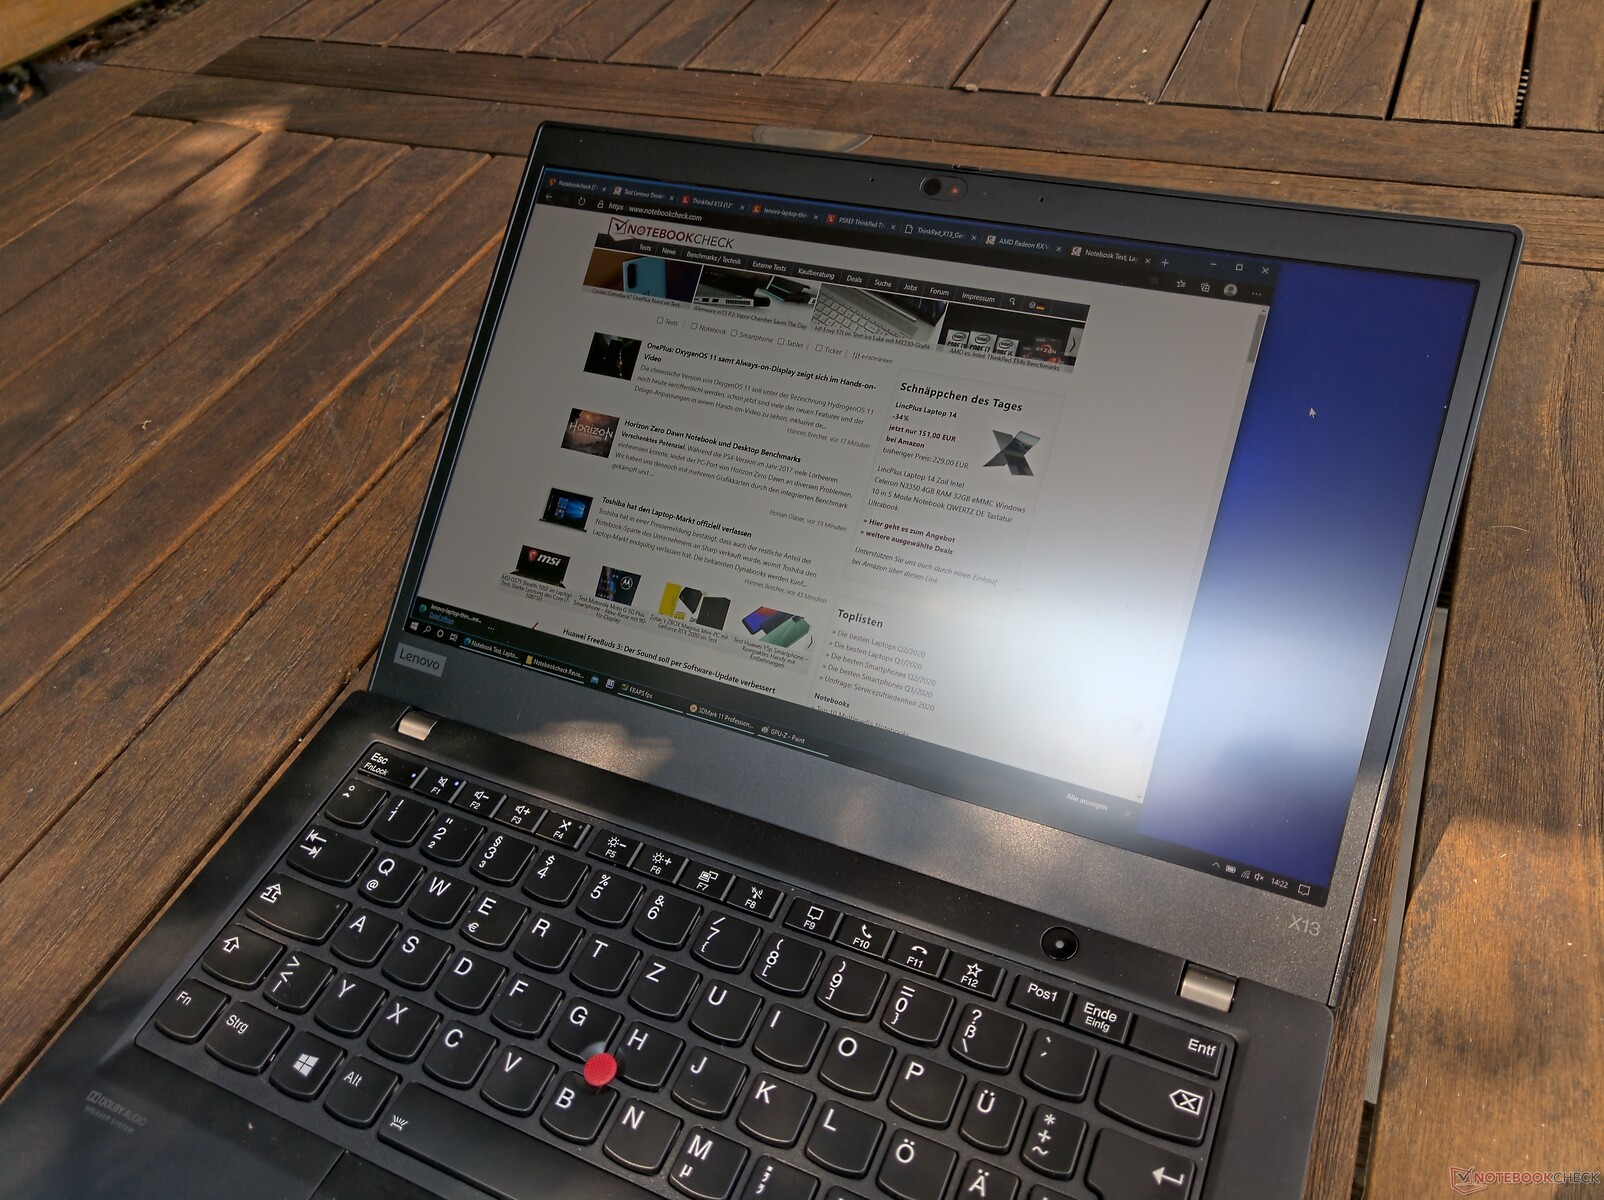
Since Lenovo is re-using the design of the Lenovo ThinkPad X390/X395 without changes, this review is an update that skips the description of the design and focuses on the screen and internals. For details on the design, look no further than the detailed Lenovo ThinkPad X390 review.
Rating | Date | Model | Weight | Height | Size | Resolution | Price |
|---|---|---|---|---|---|---|---|
| 89.5 % v7 (old) | 08 / 2020 | Lenovo ThinkPad X13-20UGS00800 R7 PRO 4750U, Vega 7 | 1.3 kg | 16.9 mm | 13.30" | 1920x1080 | |
| 88.8 % v7 (old) | 10 / 2019 | Lenovo ThinkPad X395 R3 PRO 3300U, Vega 6 | 1.3 kg | 16.9 mm | 13.30" | 1920x1080 | |
| 89.4 % v7 (old) | 07 / 2020 | Dell Latitude 7310 i7-10610U, UHD Graphics 620 | 1.2 kg | 18.3 mm | 13.30" | 1920x1080 | |
| 90.5 % v7 (old) | 08 / 2020 | Lenovo ThinkPad T14s-20UJS00K00 R7 PRO 4750U, Vega 7 | 1.3 kg | 16.1 mm | 14.00" | 1920x1080 | |
| 88 % v7 (old) | 08 / 2020 | Lenovo ThinkPad X13-20T20033GE i5-10210U, UHD Graphics 620 | 1.3 kg | 16.9 mm | 13.30" | 1920x1080 |
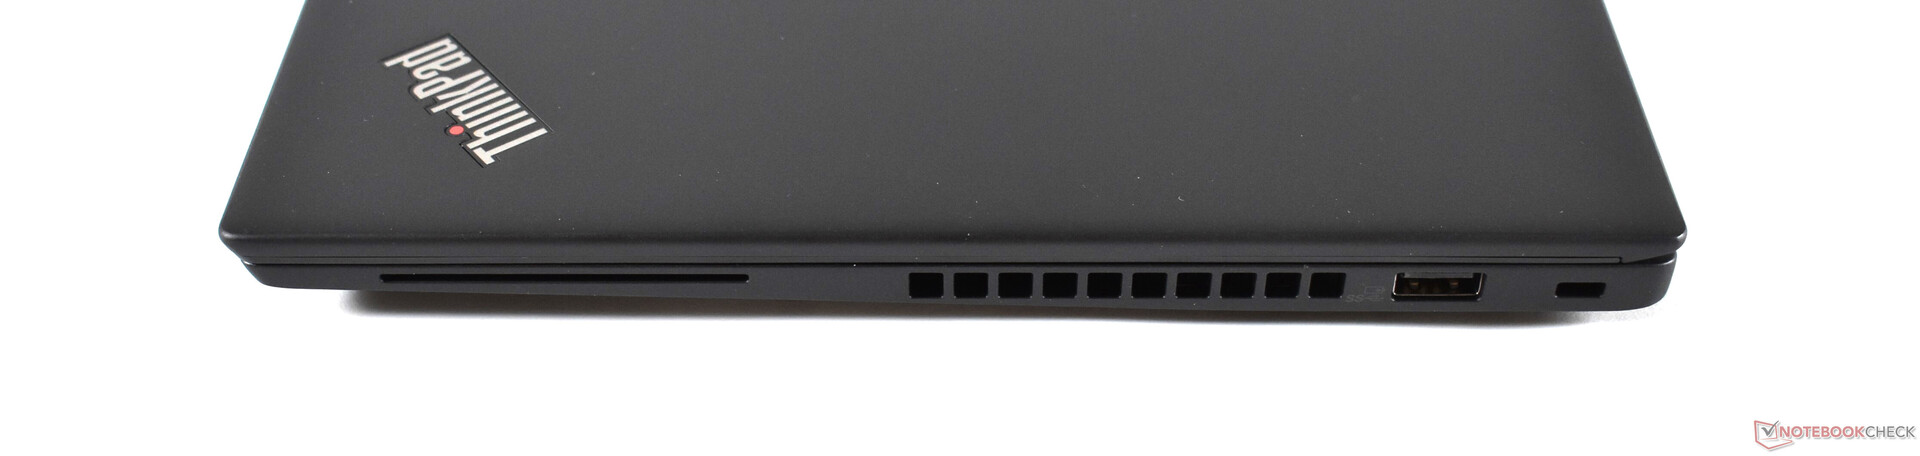
| SD Card Reader | |
| average JPG Copy Test (av. of 3 runs) | |
| Dell Latitude 7310 (Toshiba Exceria Pro M501 64 GB UHS-II) | |
| Lenovo ThinkPad T14s-20UJS00K00 (Toshiba Exceria Pro M501 64 GB UHS-II) | |
| Average of class Subnotebook (23.7 - 188, n=9, last 2 years) | |
| Lenovo ThinkPad X13-20UGS00800 (Toshiba Exceria Pro M501 64 GB UHS-II) | |
| Lenovo ThinkPad X395 | |
| Lenovo ThinkPad X13-20T20033GE (Toshiba Exceria Pro M501 64 GB UHS-II) | |
| maximum AS SSD Seq Read Test (1GB) | |
| Dell Latitude 7310 (Toshiba Exceria Pro M501 64 GB UHS-II) | |
| Average of class Subnotebook (24.9 - 195, n=8, last 2 years) | |
| Lenovo ThinkPad X395 | |
| Lenovo ThinkPad T14s-20UJS00K00 (Toshiba Exceria Pro M501 64 GB UHS-II) | |
| Lenovo ThinkPad X13-20UGS00800 (Toshiba Exceria Pro M501 64 GB UHS-II) | |
| Lenovo ThinkPad X13-20T20033GE (Toshiba Exceria Pro M501 64 GB UHS-II) | |


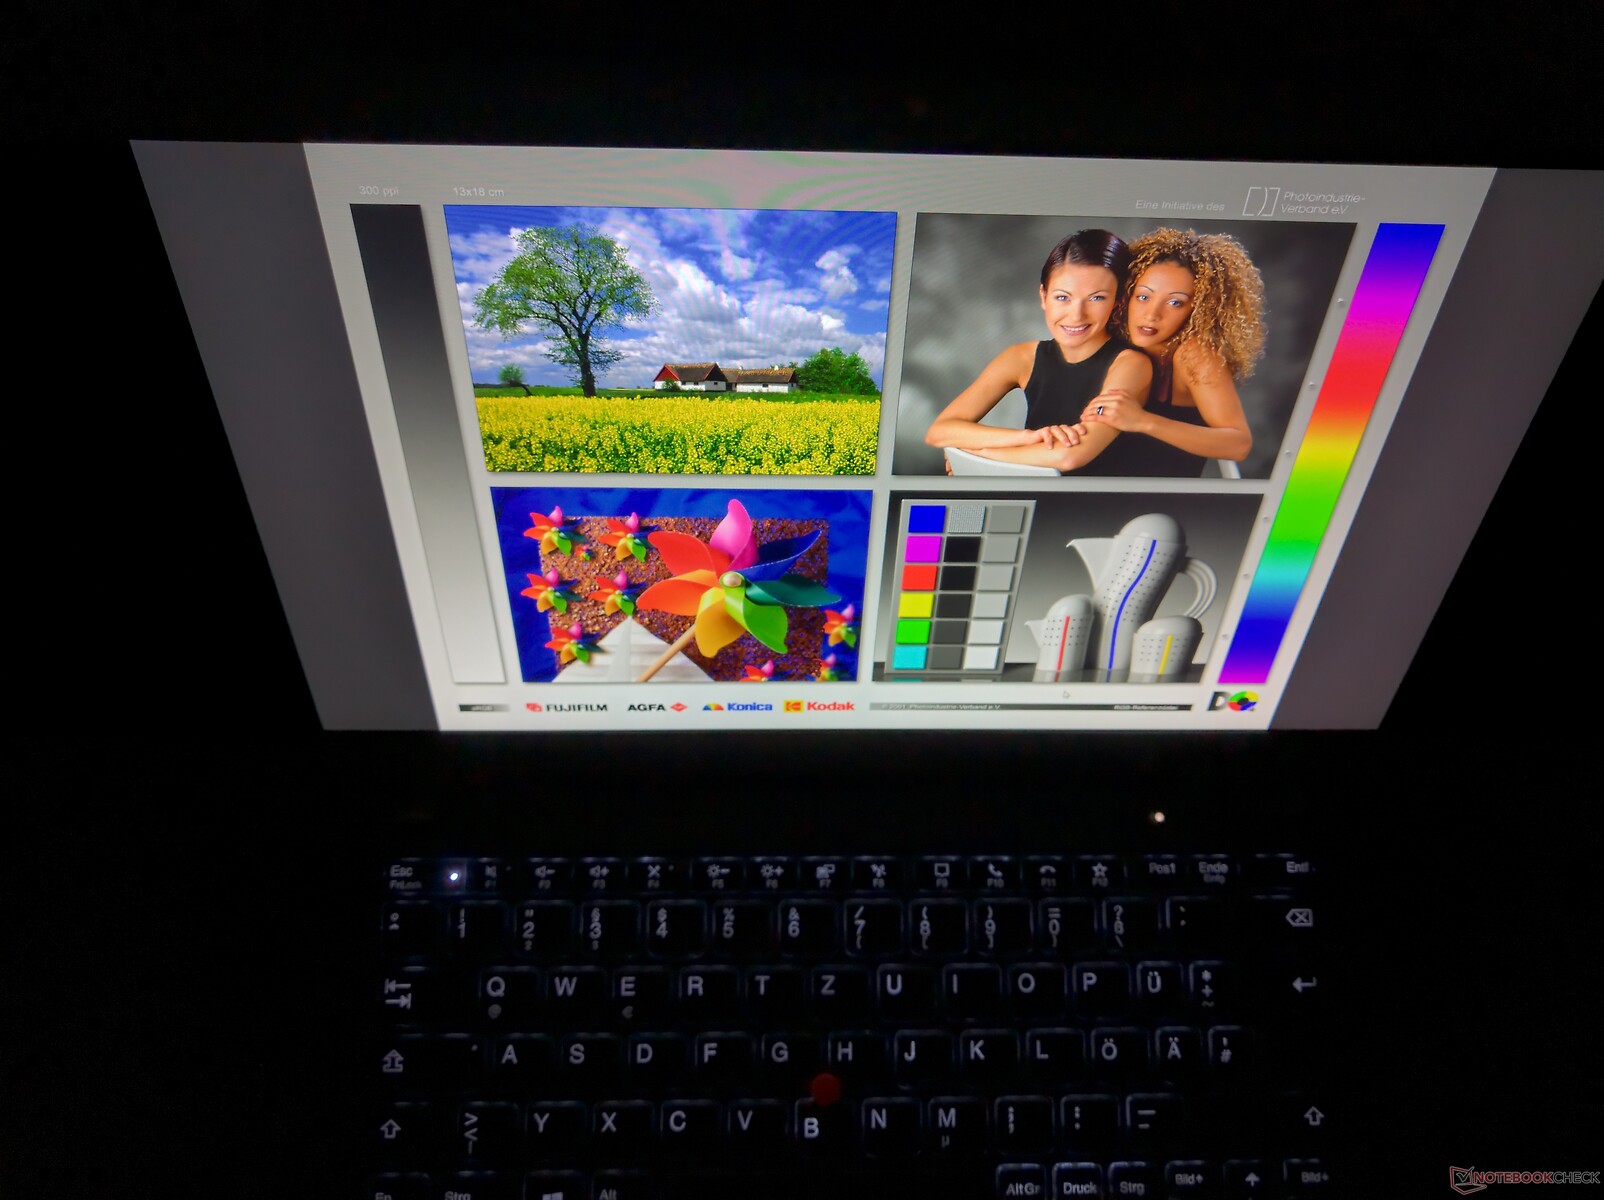
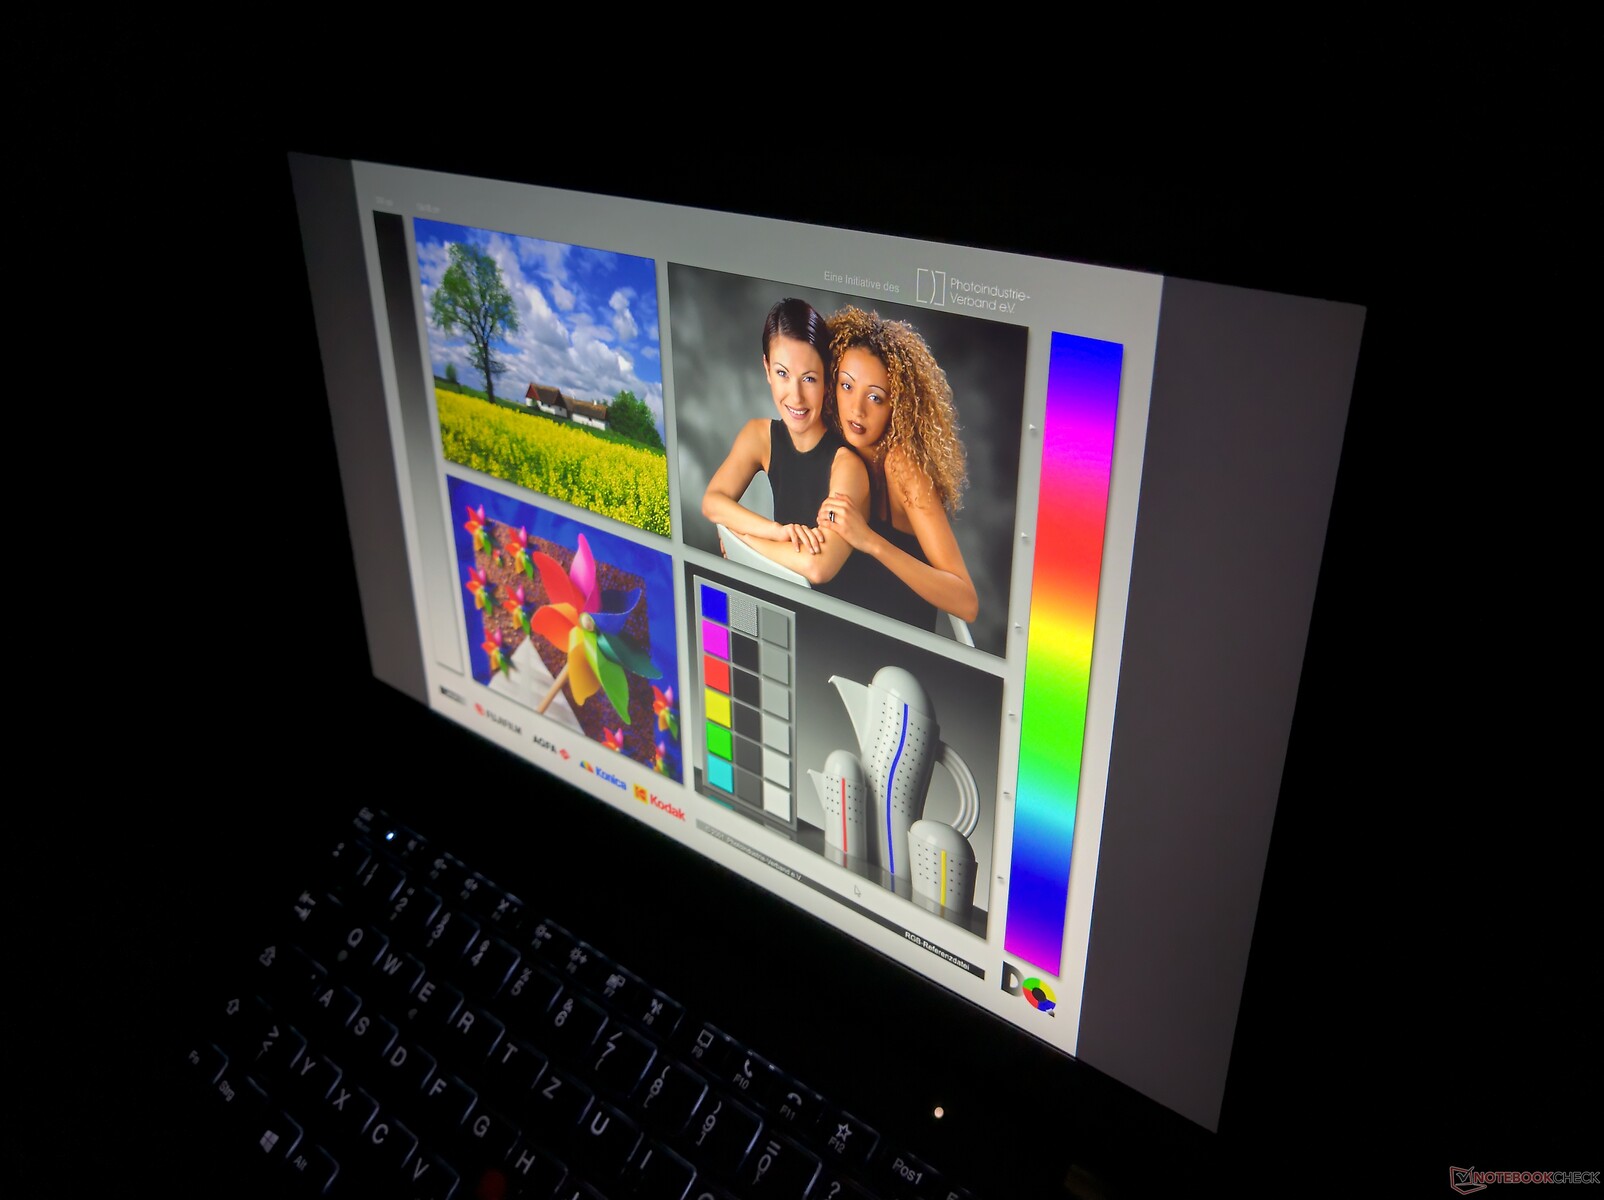
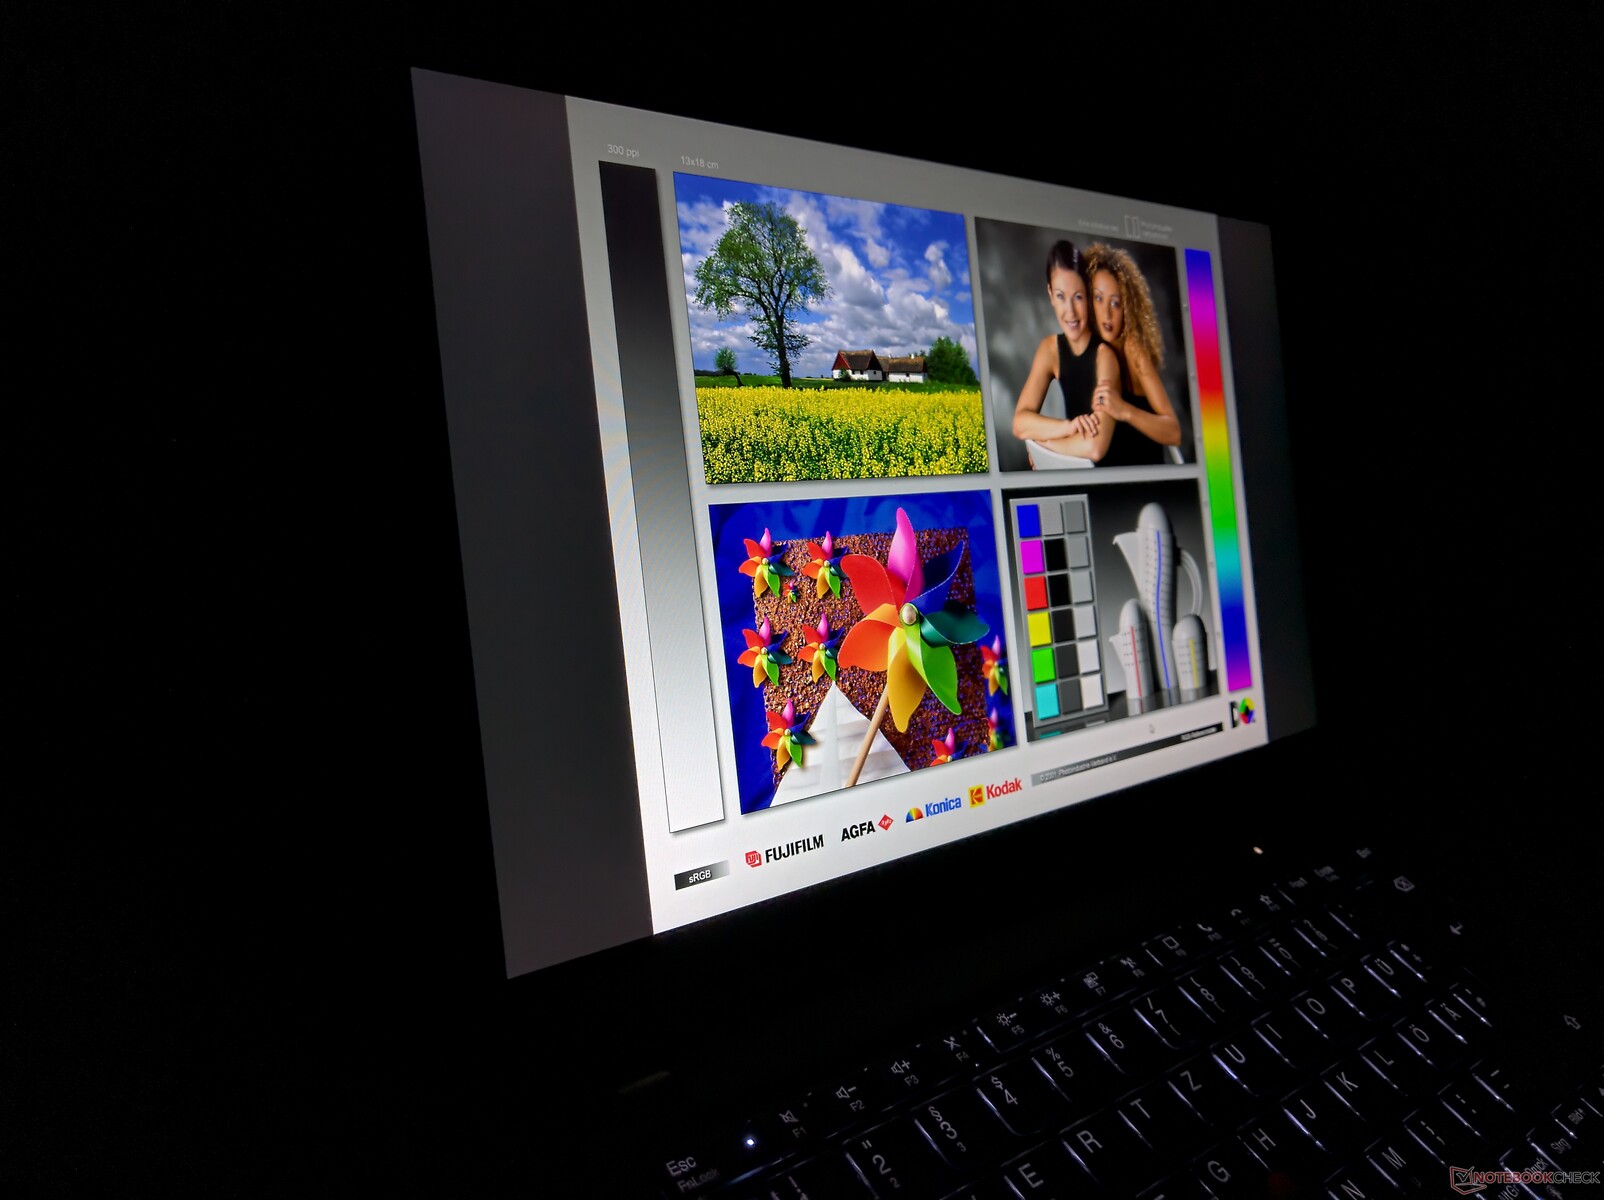
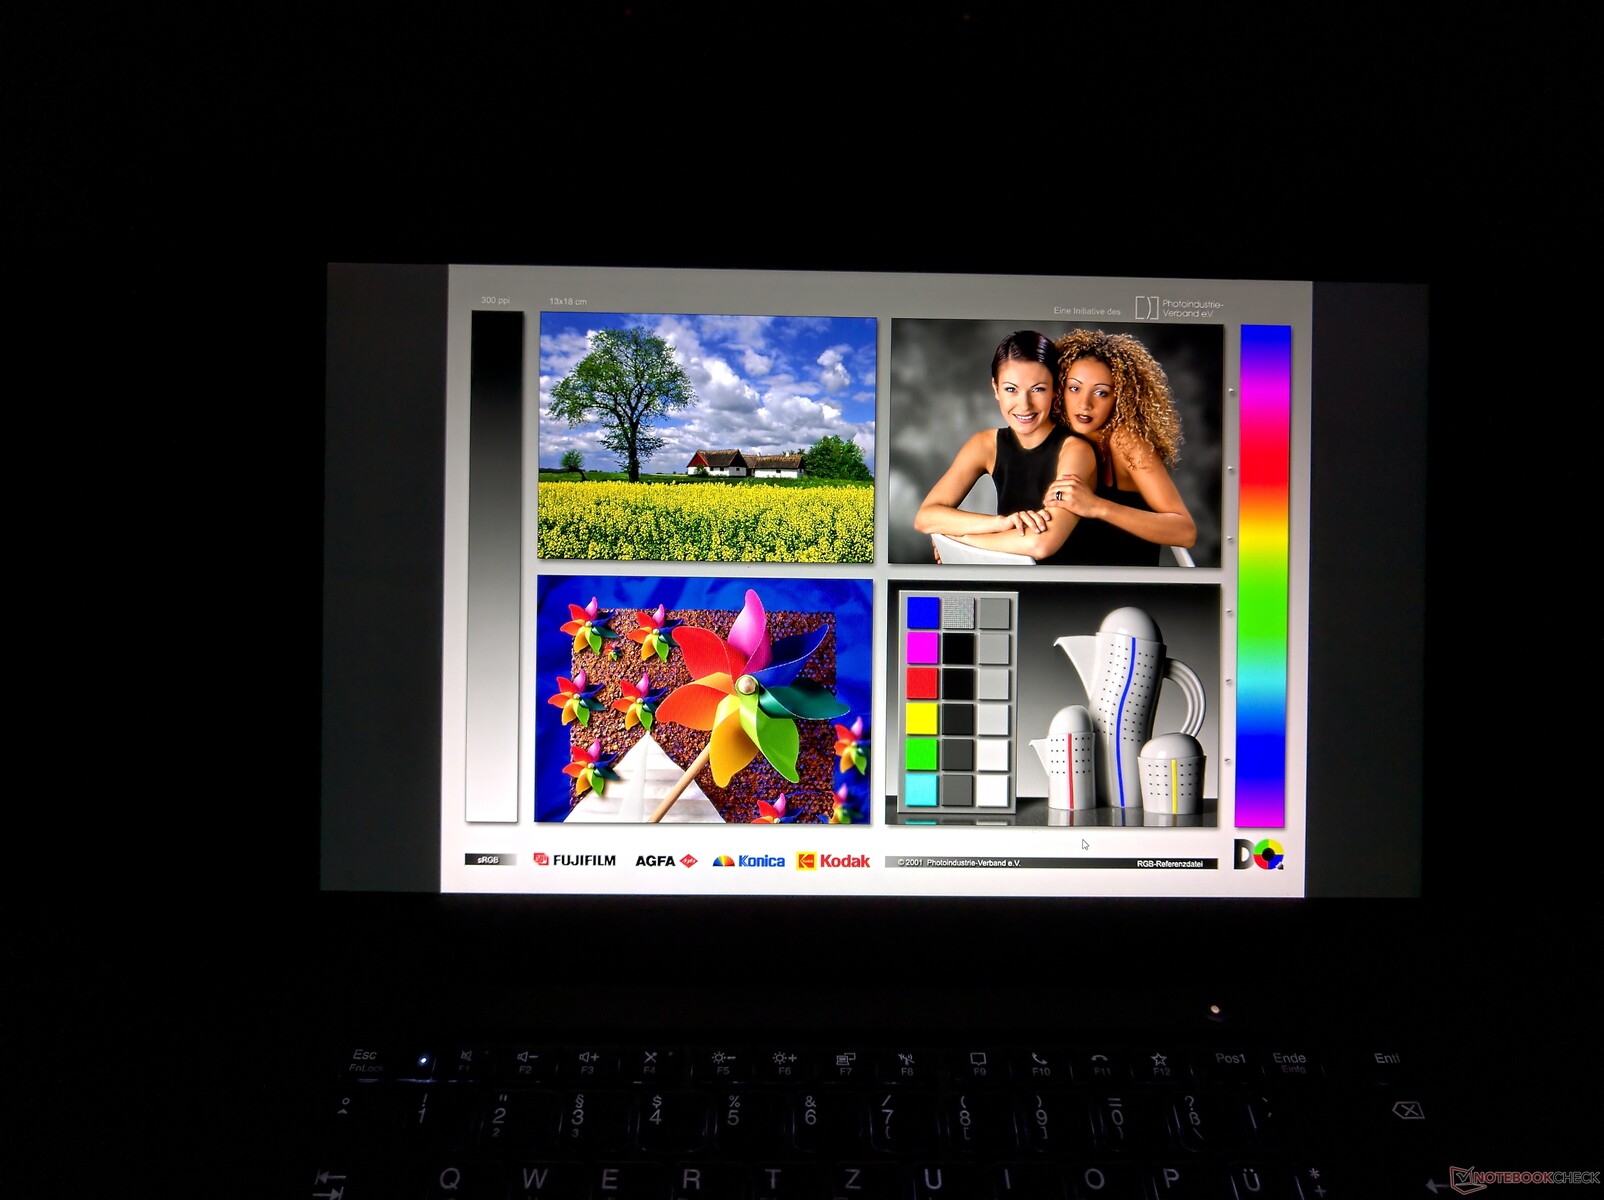
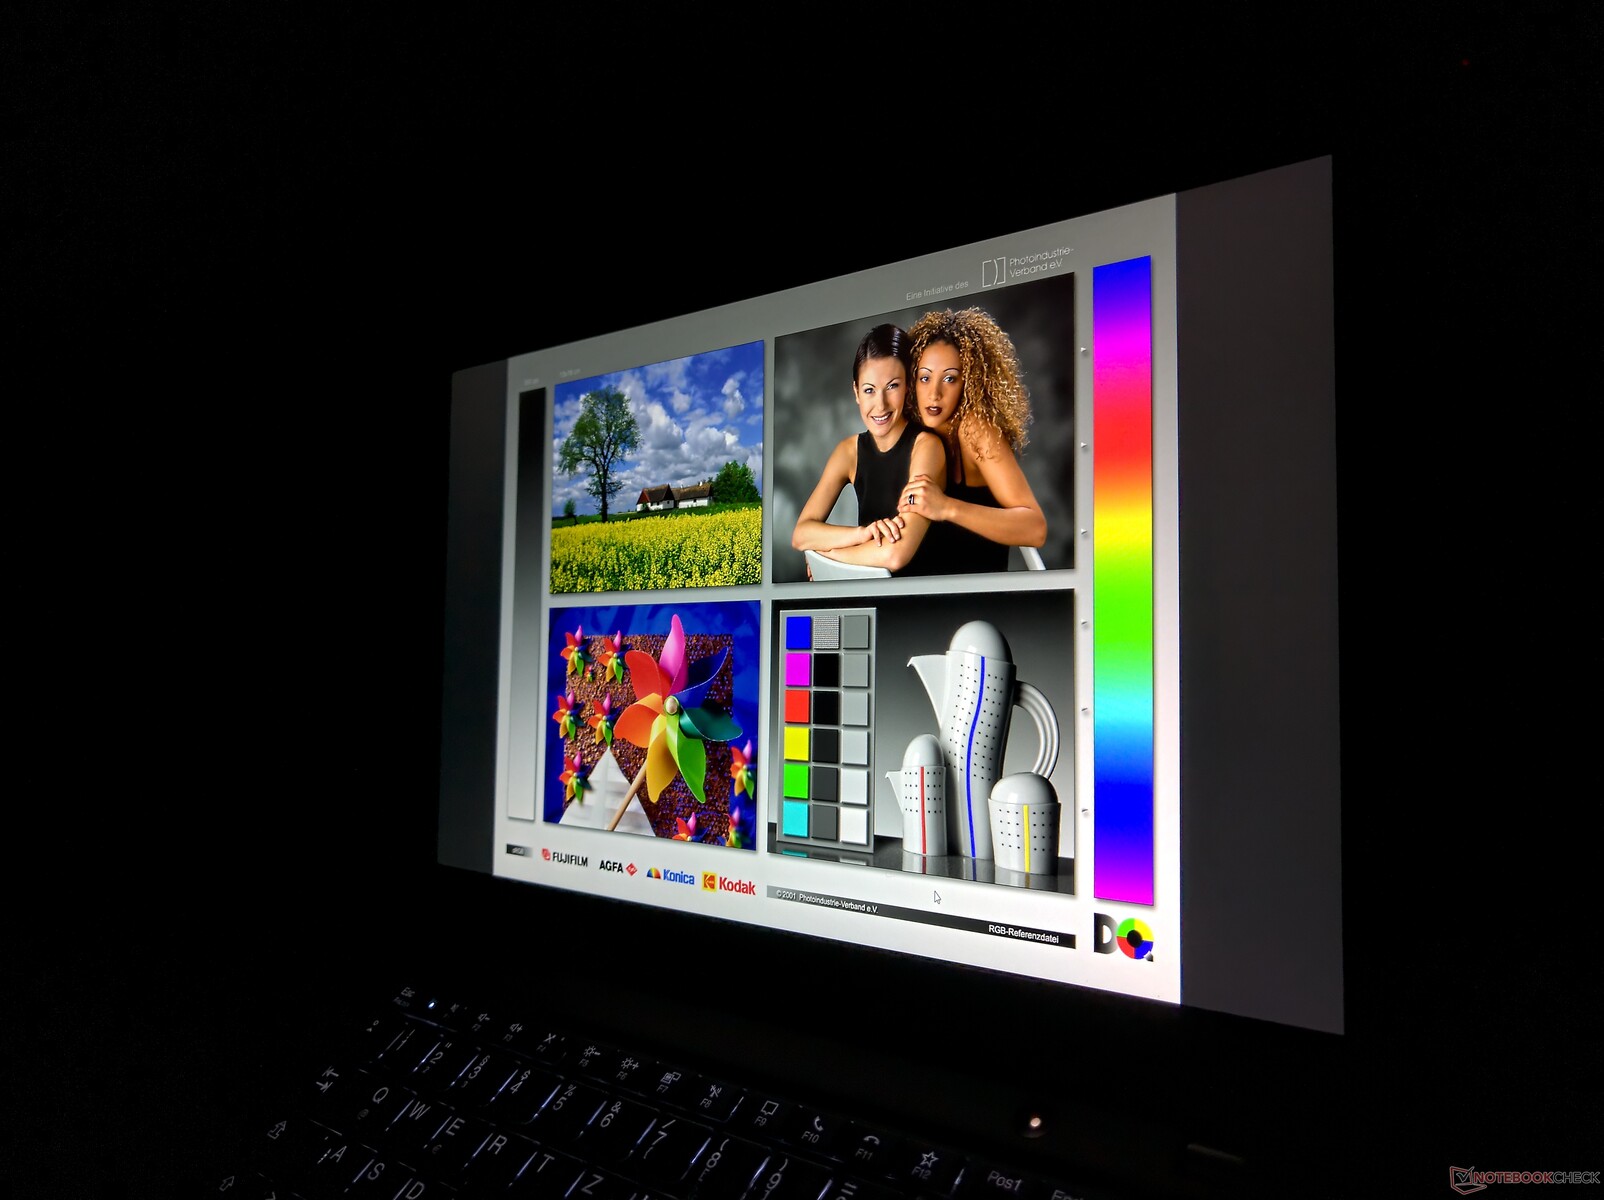
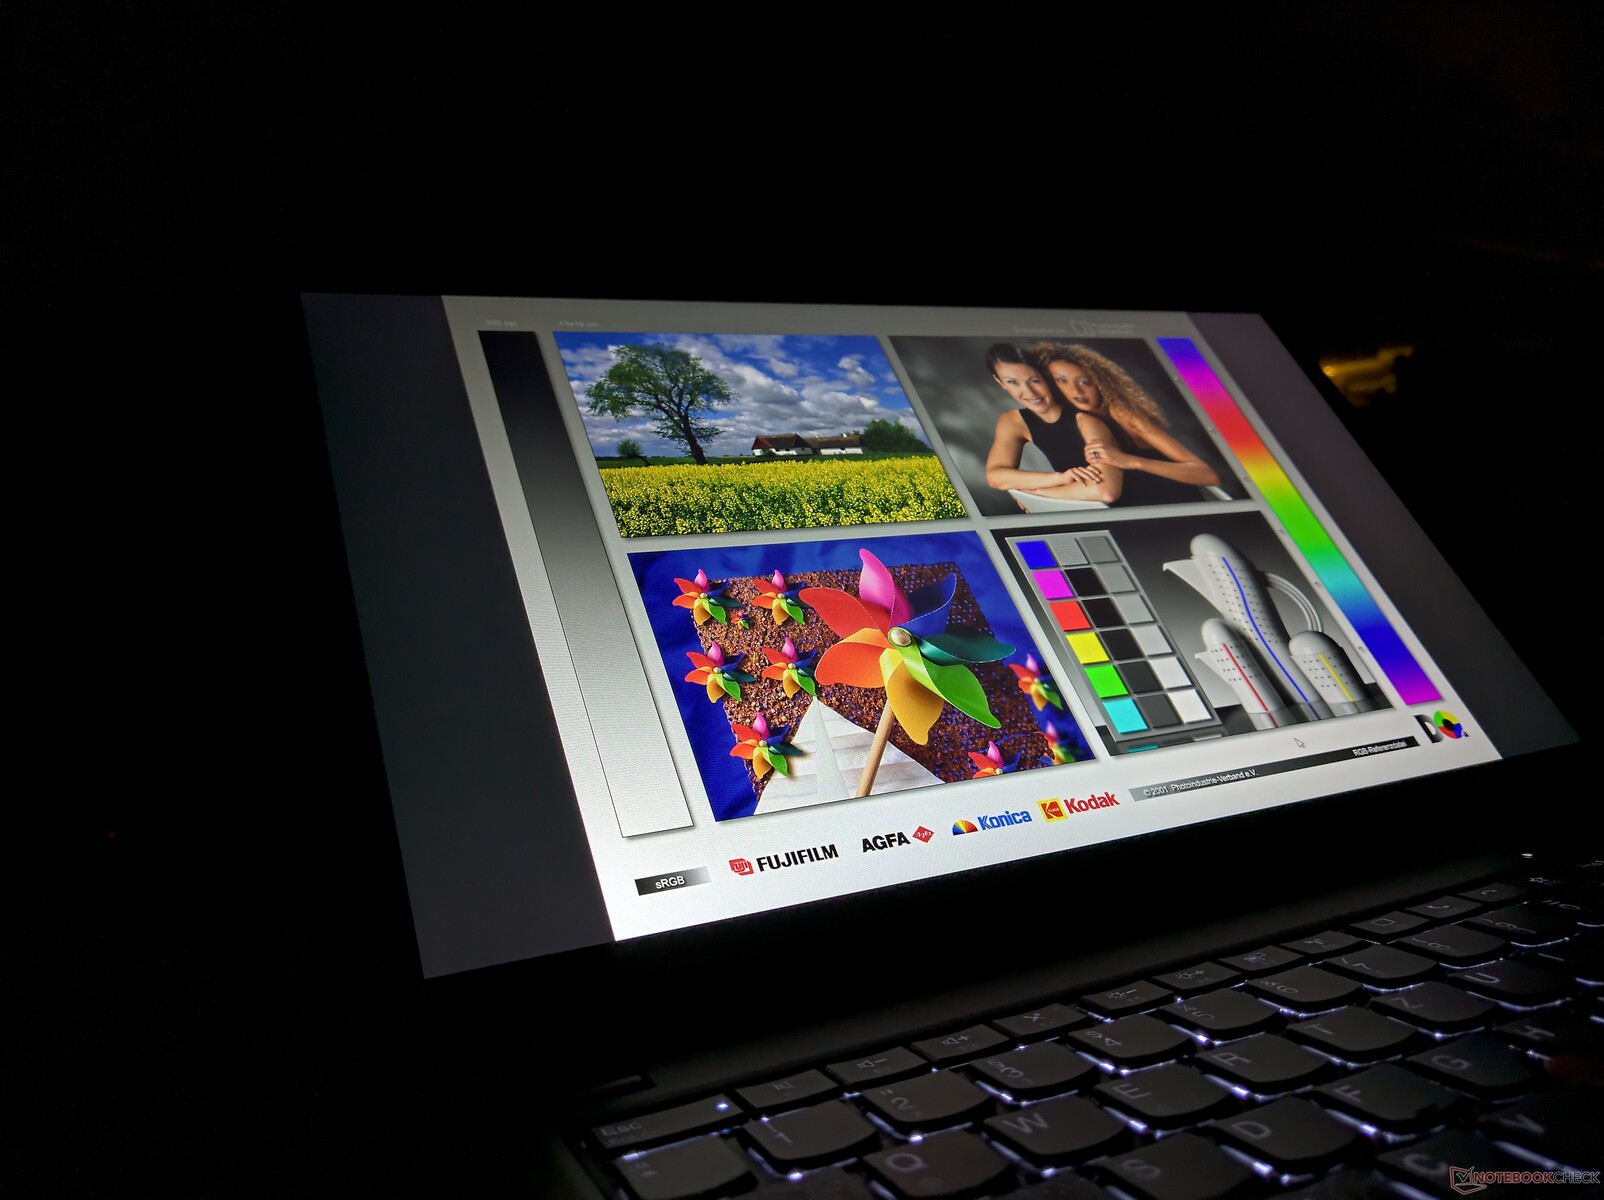
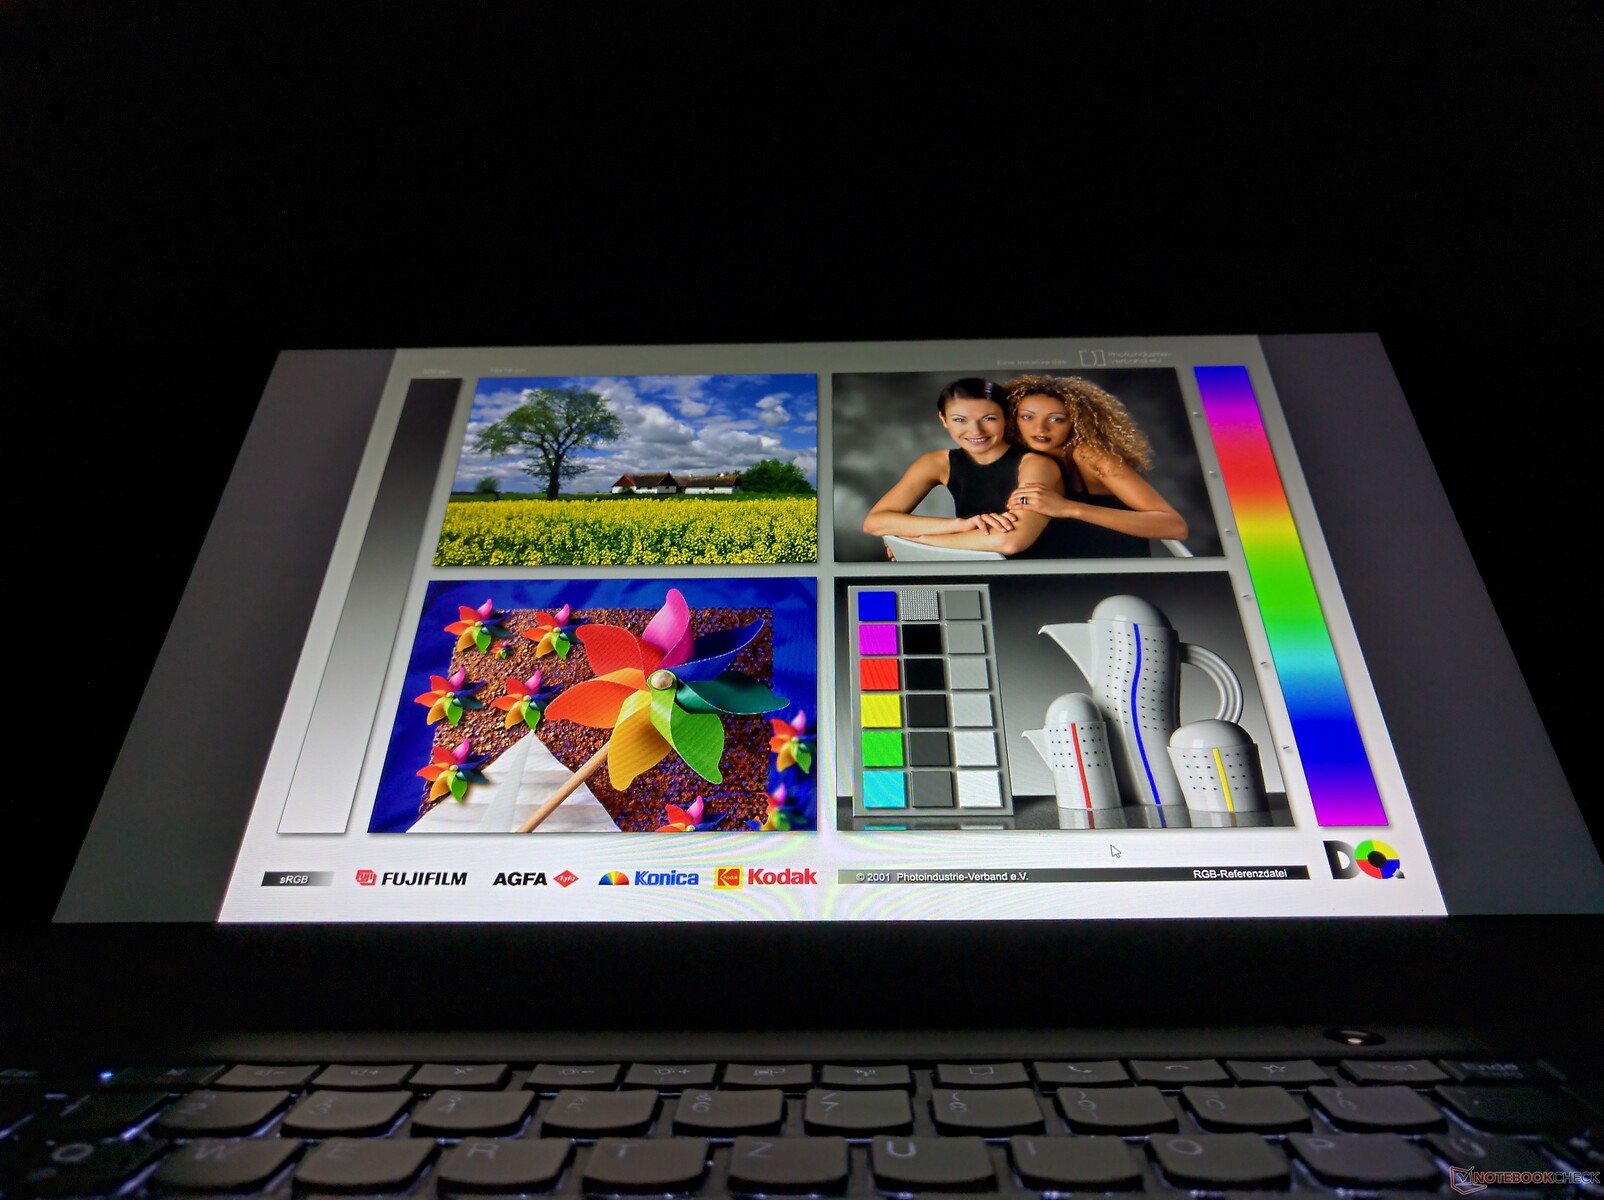
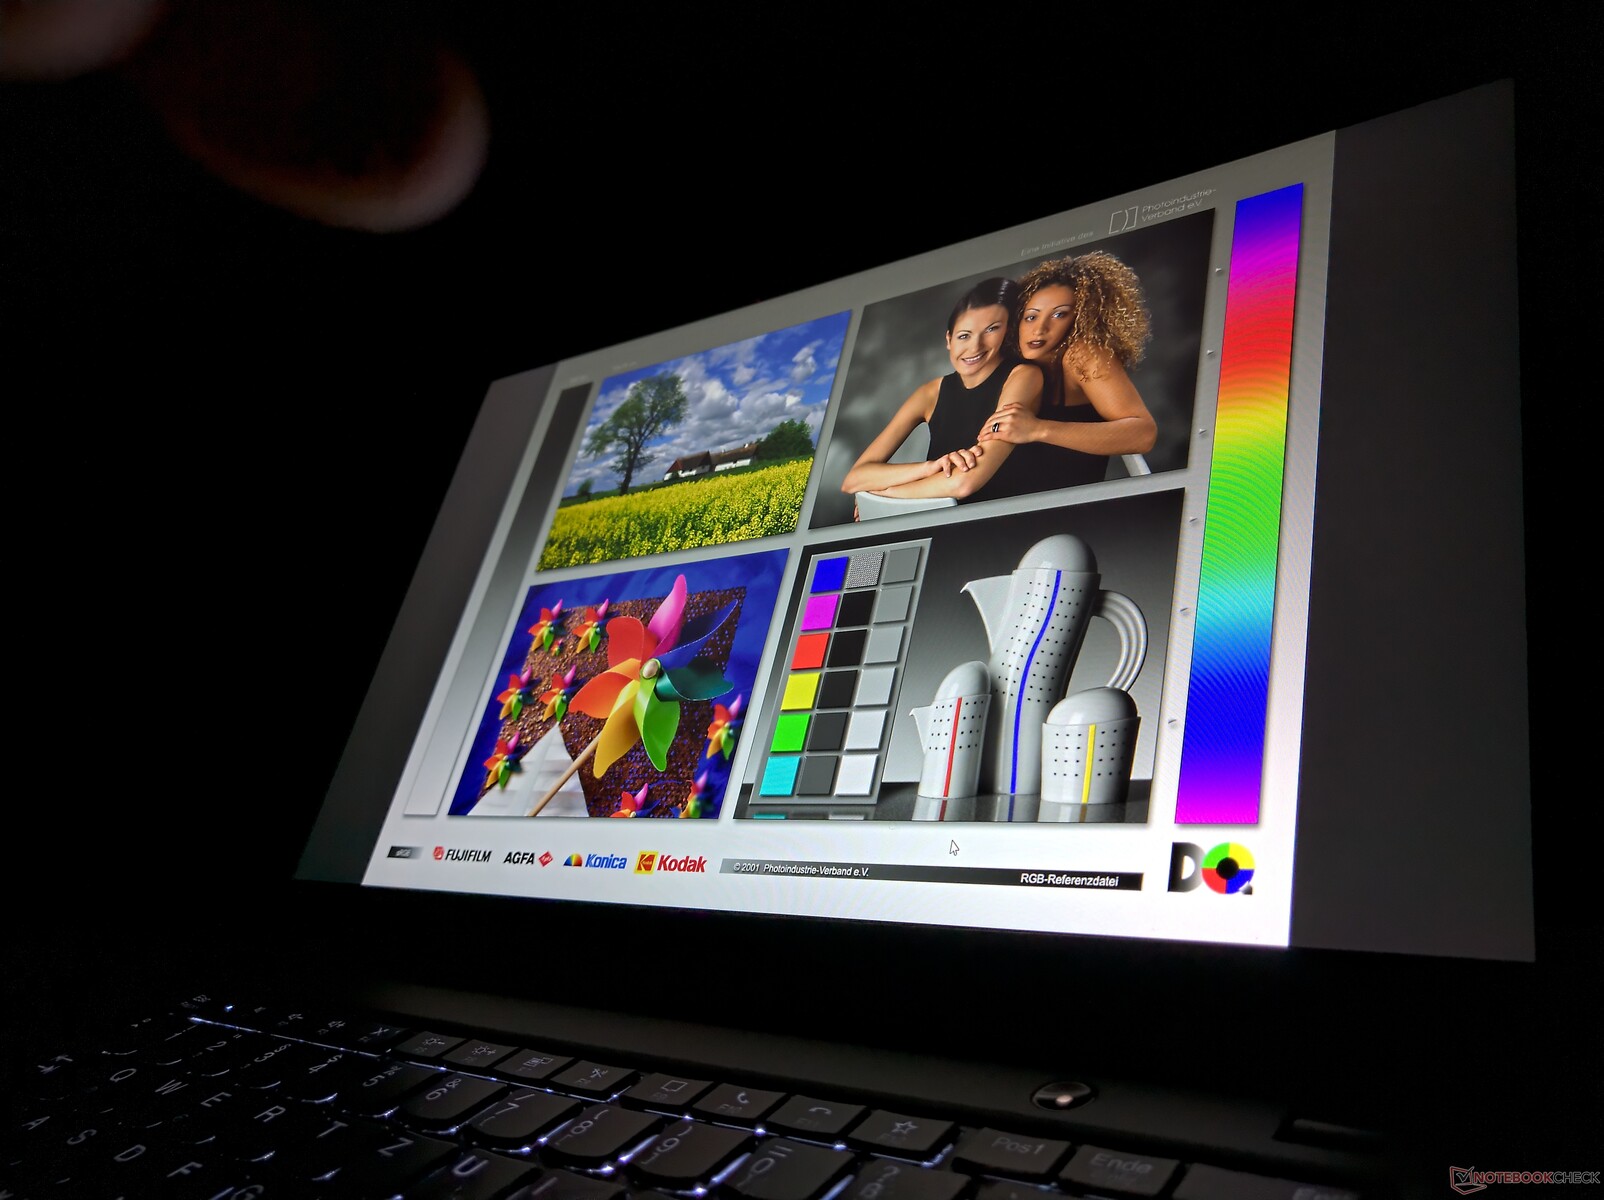
Matte FHD display in the AMD ThinkPad X13
Like the predecessor ThinkPad X395, the Lenovo ThinkPad X13 Gen 1 uses a 13.3-inch screen instead of a 12-inch panel like many past X-series ThinkPads. There is a choice from four matte 16:9 LCDs. The brighter ePrivacy option is new. Unlike with the T series, there is no low power option:
- HD (1366x768) TN, 250 cd/m²
- FHD (1920x1080) IPS, 300 cd/m², 72% NTSC
- FHD IPS, 300 cd/m², On-Cell-Touch, 72% NTSC
- FHD IPS, 500 cd/m², Privacy Guard, 72% NTSC
The test sample contains the regular FHD LCD without touch. The AUO panel used here effortlessly manages to fulfill the promised 300 cd/m², as it has an average brightness of 315 cd/m². Still, the panel is darker than the other laptops used for comparison. The difference is biggest compared with the ThinkPad T14s with the brighter low power screen. Interestingly, the ThinkPad X13 with Intel CPUs uses the same LCD panel, which is 30 cd/m² brighter. This serves as a nice example of the variance in quality from panel to panel.
| |||||||||||||||||||||||||
Brightness Distribution: 90 %
Center on Battery: 331 cd/m²
Contrast: 1576:1 (Black: 0.21 cd/m²)
ΔE ColorChecker Calman: 6.1 | ∀{0.5-29.43 Ø4.72}
calibrated: 1.2
ΔE Greyscale Calman: 6.3 | ∀{0.09-98 Ø4.97}
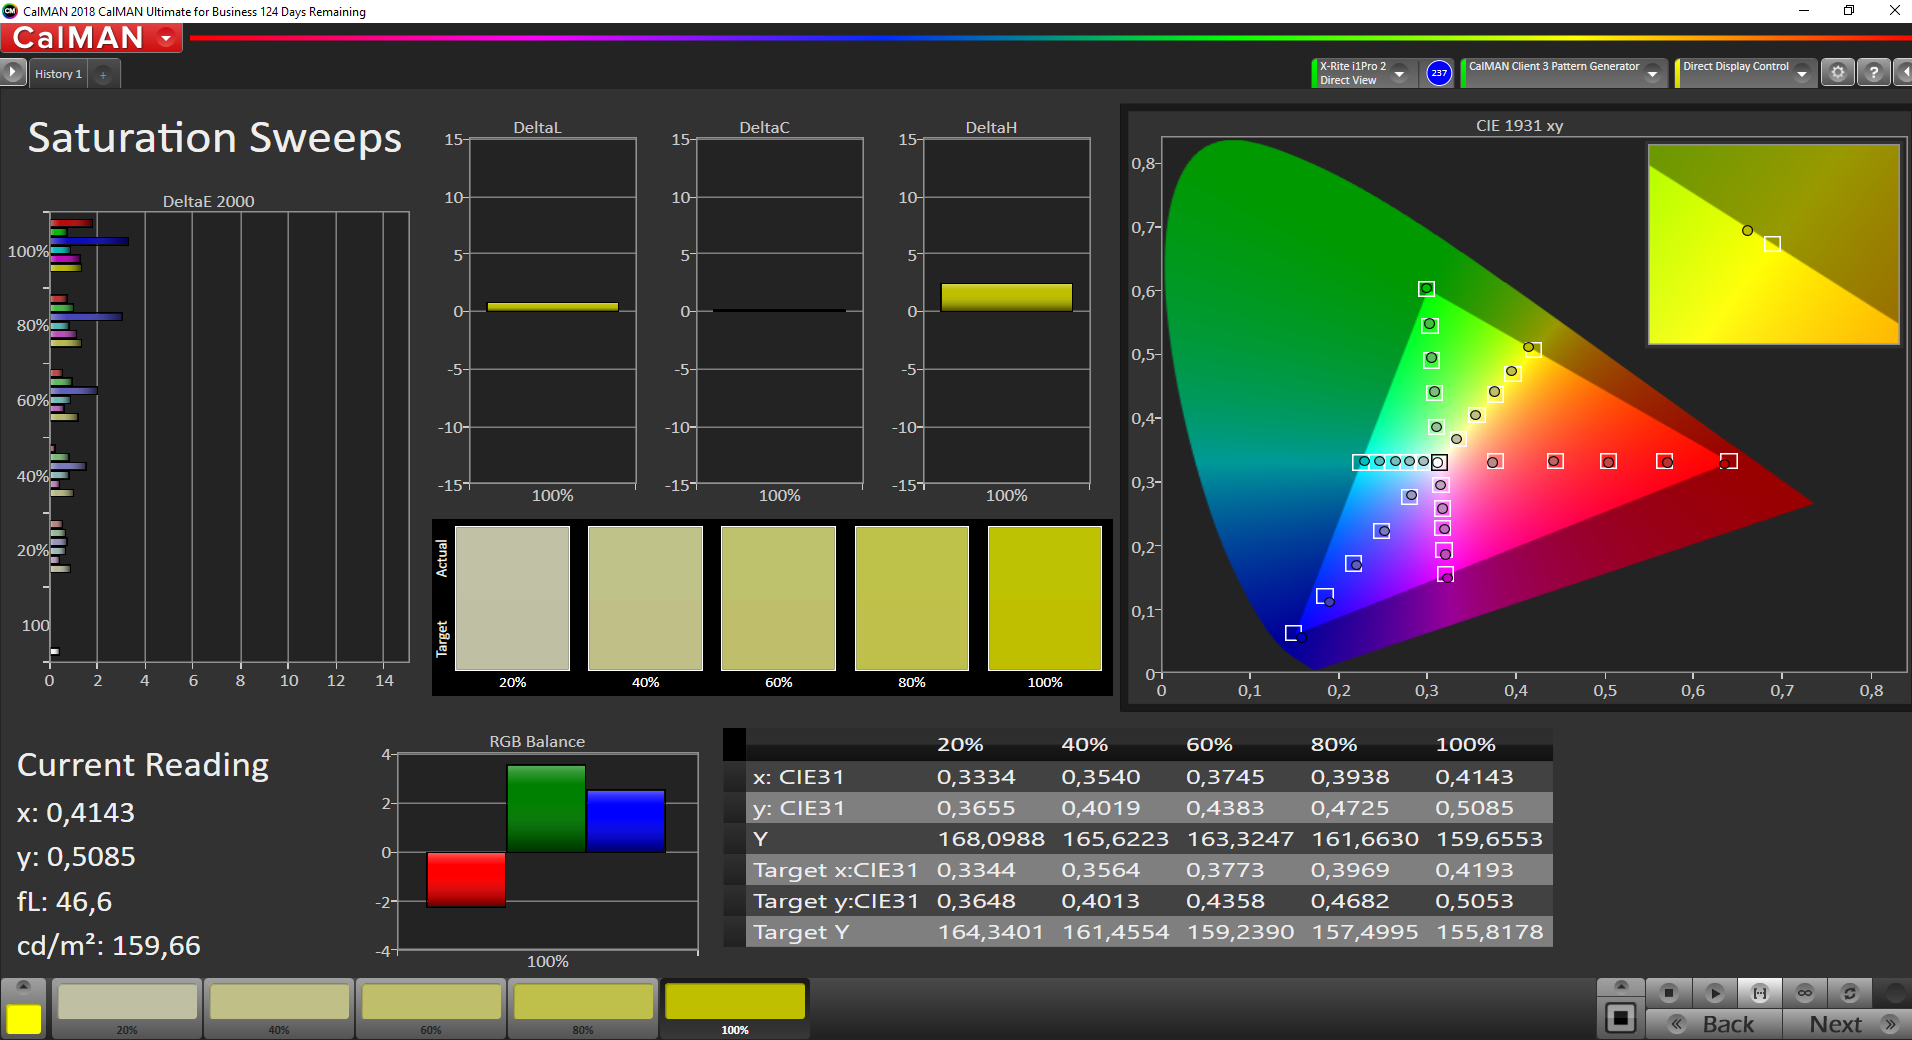
95.4% sRGB (Argyll 1.6.3 3D)
60.7% AdobeRGB 1998 (Argyll 1.6.3 3D)
65.7% AdobeRGB 1998 (Argyll 3D)
95.6% sRGB (Argyll 3D)
64.8% Display P3 (Argyll 3D)
Gamma: 2.77
CCT: 6938 K
| Lenovo ThinkPad X13-20UGS00800 B133HAK01.1, IPS LED, 1920x1080, 13.3" | Lenovo ThinkPad X395 LP133WF7-SPB1, IPS, 1920x1080, 13.3" | Dell Latitude 7310 AU Optronics B133HAN, IPS, 1920x1080, 13.3" | Lenovo ThinkPad T14s-20UJS00K00 N140HCG-GQ2, IPS , 1920x1080, 14" | Lenovo ThinkPad X13-20T20033GE Lenovo B133HAK01.1, IPS, 1920x1080, 13.3" | |
|---|---|---|---|---|---|
| Display | -0% | 8% | 3% | 2% | |
| Display P3 Coverage (%) | 64.8 | 64.1 -1% | 71.8 11% | 66.8 3% | 66 2% |
| sRGB Coverage (%) | 95.6 | 95.2 0% | 99.3 4% | 97.9 2% | 96.2 1% |
| AdobeRGB 1998 Coverage (%) | 65.7 | 65.8 0% | 72.4 10% | 69 5% | 67.2 2% |
| Response Times | -2% | 16% | 46% | 5% | |
| Response Time Grey 50% / Grey 80% * (ms) | 56.8 ? | 55 ? 3% | 40.8 ? 28% | 32.4 ? 43% | 52.8 ? 7% |
| Response Time Black / White * (ms) | 30 ? | 32 ? -7% | 28.8 ? 4% | 15.2 ? 49% | 29.2 ? 3% |
| PWM Frequency (Hz) | 26040 ? | ||||
| Screen | 18% | 16% | 19% | -1% | |
| Brightness middle (cd/m²) | 331 | 356 8% | 332.7 1% | 404 22% | 359 8% |
| Brightness (cd/m²) | 315 | 336 7% | 329 4% | 371 18% | 342 9% |
| Brightness Distribution (%) | 90 | 88 -2% | 89 -1% | 88 -2% | 90 0% |
| Black Level * (cd/m²) | 0.21 | 0.16 24% | 0.25 -19% | 0.34 -62% | 0.21 -0% |
| Contrast (:1) | 1576 | 2225 41% | 1331 -16% | 1188 -25% | 1710 9% |
| Colorchecker dE 2000 * | 6.1 | 3.6 41% | 2.15 65% | 1.4 77% | 6.7 -10% |
| Colorchecker dE 2000 max. * | 10 | 5.5 45% | 3.89 61% | 3.2 68% | 10.9 -9% |
| Colorchecker dE 2000 calibrated * | 1.2 | 1.11 7% | 1.09 9% | 0.8 33% | 1.3 -8% |
| Greyscale dE 2000 * | 6.3 | 4.7 25% | 2.5 60% | 1.6 75% | 7.4 -17% |
| Gamma | 2.77 79% | 2.92 75% | 2.3 96% | 2.13 103% | 2.85 77% |
| CCT | 6938 94% | 6222 104% | 6347 102% | 6480 100% | 6309 103% |
| Color Space (Percent of AdobeRGB 1998) (%) | 60.7 | 61 0% | 64.1 6% | 63 4% | 61.7 2% |
| Color Space (Percent of sRGB) (%) | 95.4 | 96 1% | 99.4 4% | 97.9 3% | 95.9 1% |
| Total Average (Program / Settings) | 5% /
12% | 13% /
14% | 23% /
20% | 2% /
0% |
* ... smaller is better
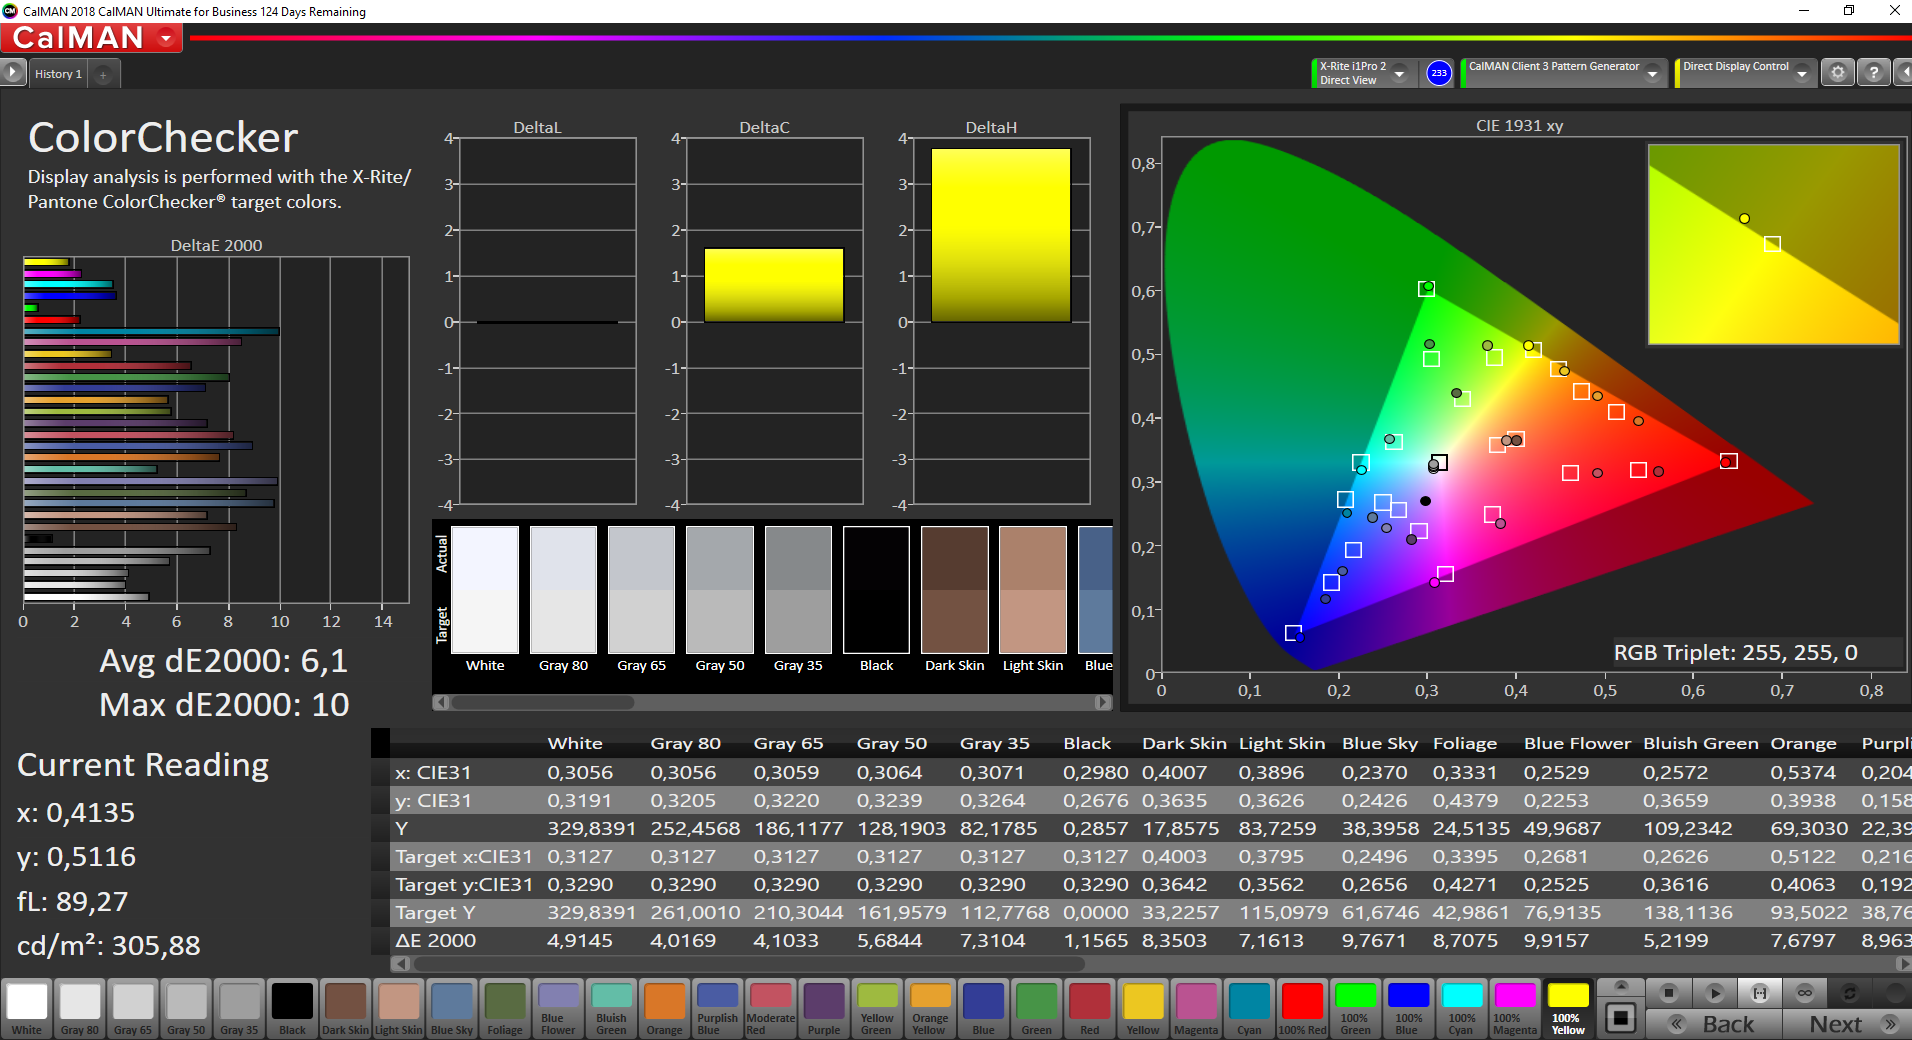
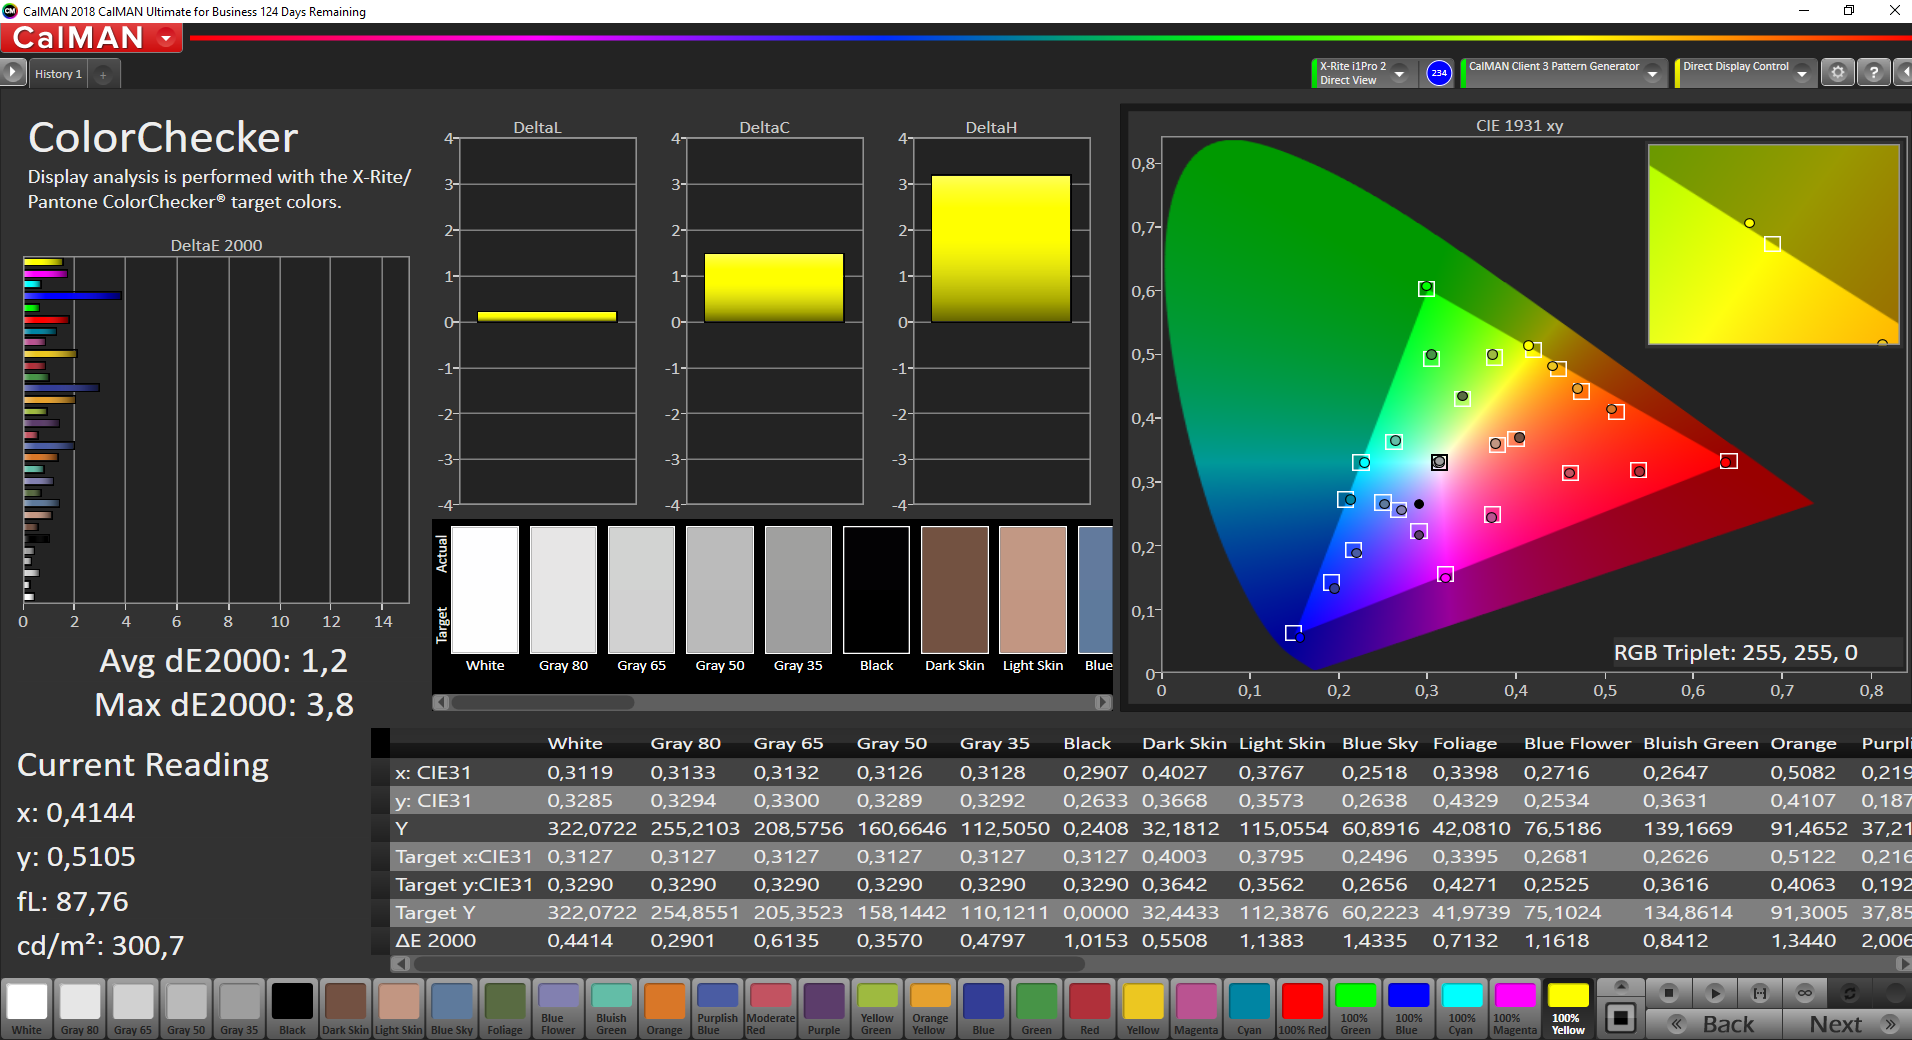
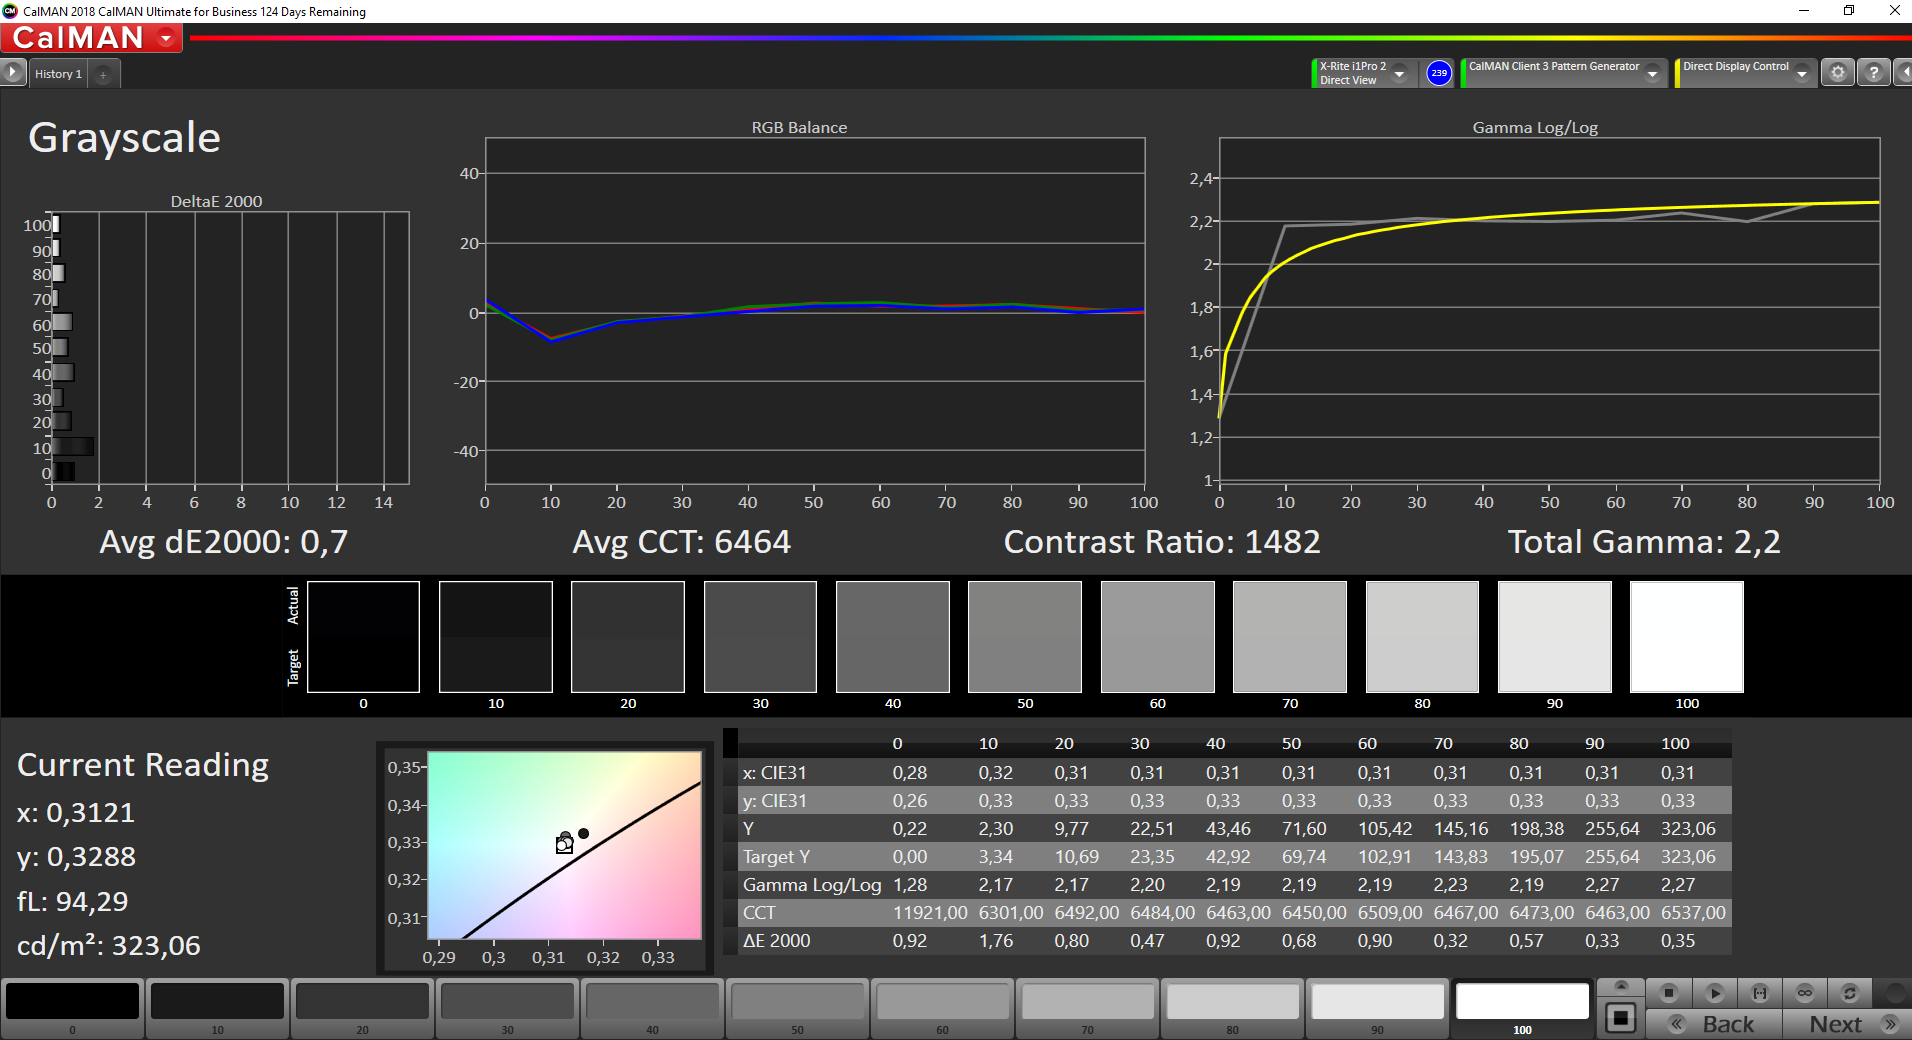
The deviations from the ideal in terms of colors, grayscale and saturation are quite noticeable ex-factory. With CalMAN and the X-Rite i1Pro2, we were able to enhance the color accuracy very nicely. The panel has the necessary potential, as the contrast value of 1576:1 is good.
Colors are displayed saturated, which is also due to the sRGB gamut coverage of 95%. Some photo-editing "on the go" should be possible with the Lenovo ThinkPad X13 Gen 1.
Outdoors, the Lenovo ThinkPad X13 is usable, due to the brightness of 315 cd/m² and the matte screen surface. This is only true for shadowy places though. If one works outside more often, the variant with the 500 cd/m² screen might be the better choice.
Display Response Times
| ↔ Response Time Black to White | ||
|---|---|---|
| 30 ms ... rise ↗ and fall ↘ combined | ↗ 16.8 ms rise | 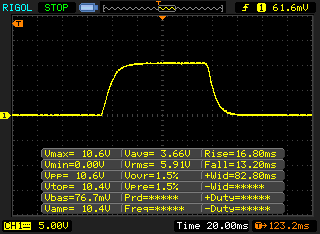 |
| ↘ 13.2 ms fall | ||
| The screen shows slow response rates in our tests and will be unsatisfactory for gamers. In comparison, all tested devices range from 0.1 (minimum) to 240 (maximum) ms. » 80 % of all devices are better. This means that the measured response time is worse than the average of all tested devices (19.8 ms). | ||
| ↔ Response Time 50% Grey to 80% Grey | ||
| 56.8 ms ... rise ↗ and fall ↘ combined | ↗ 29.2 ms rise | 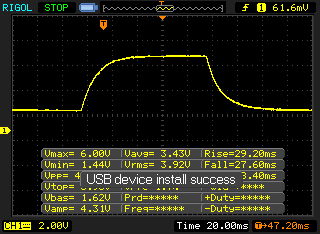 |
| ↘ 27.6 ms fall | ||
| The screen shows slow response rates in our tests and will be unsatisfactory for gamers. In comparison, all tested devices range from 0.165 (minimum) to 636 (maximum) ms. » 94 % of all devices are better. This means that the measured response time is worse than the average of all tested devices (31 ms). | ||
Screen Flickering / PWM (Pulse-Width Modulation)
| Screen flickering / PWM not detected | 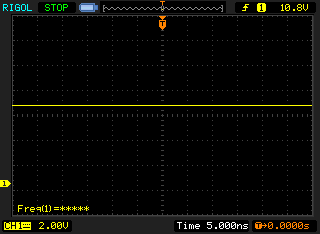 | ||
In comparison: 52 % of all tested devices do not use PWM to dim the display. If PWM was detected, an average of 7747 (minimum: 5 - maximum: 343500) Hz was measured. | |||
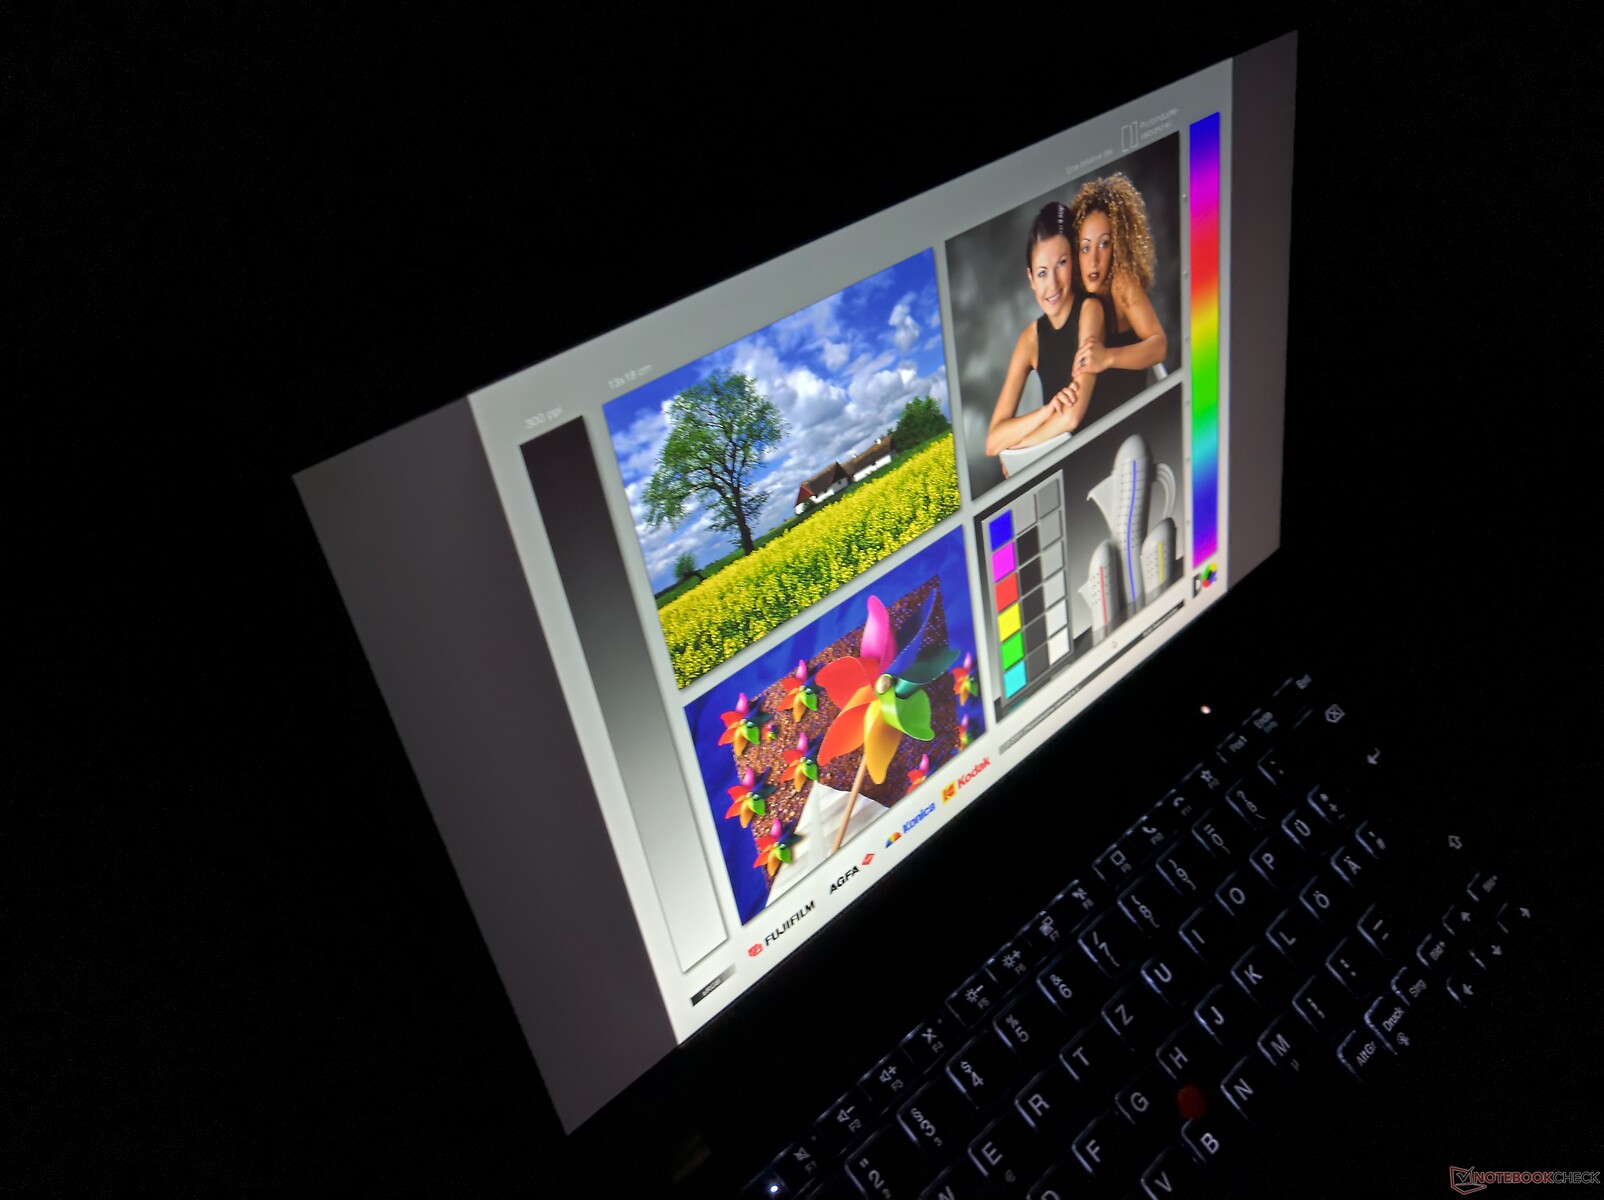
There is nothing to complain about when it comes to the viewing-angle stability of the IPS screen.
Performance: There has never been a compact ThinkPad laptop this fast
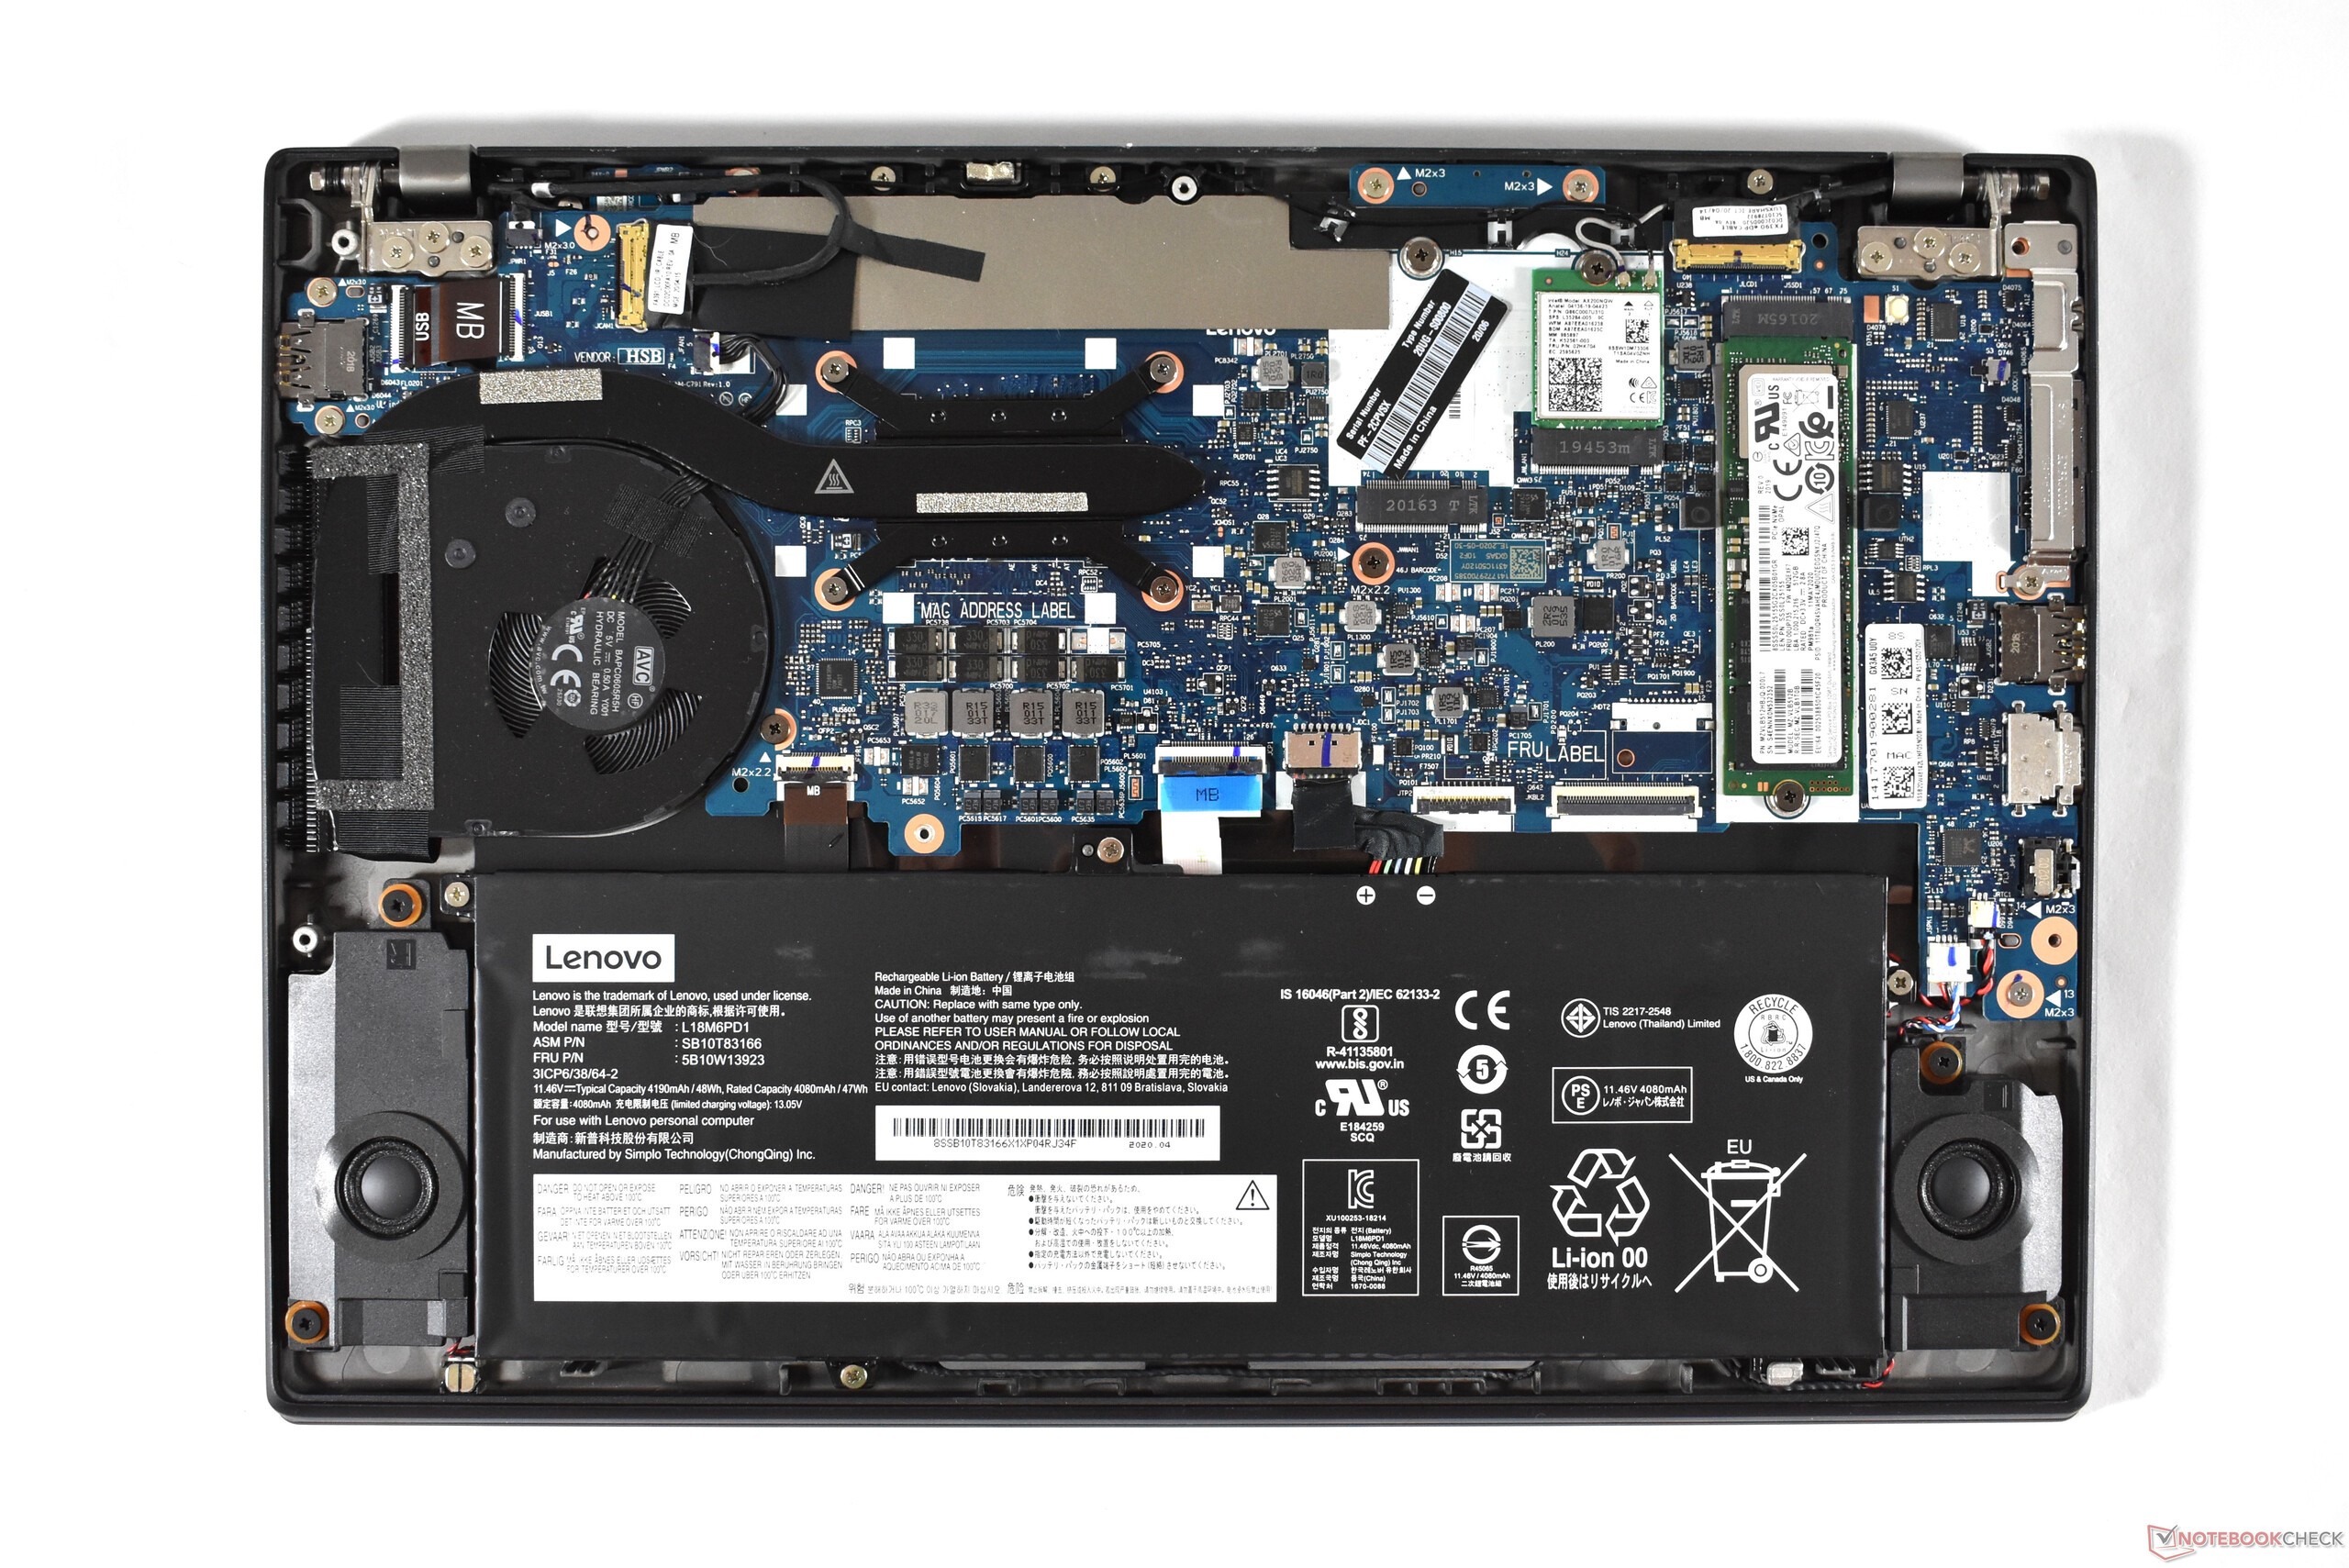
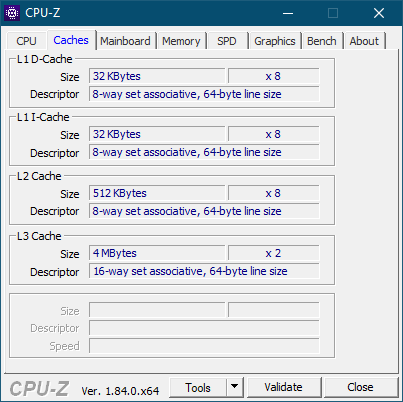
There are three AMD Renoir CPUs available in the ThinkPad X13 Gen 1: the AMD Ryzen 3 Pro 4450U, the AMD Ryzen 5 Pro 4650U and the AMD Ryzen 7 Pro 4750U. Part of the package is a corresponding AMD iGPU: the Radeon RX Vega 5, the Radeon RX Vega 6 and the Radeon RX Vega 7. Memory is soldered with 8, 16 or 32 GB DDR4-3200 RAM. 32 GB is only available with the Ryzen 7 models, while Ryzen 3 variants are only sold with 8 GB. For storage, there is a single M.2 2280 slot.
Processor
The AMD Ryzen 7 Pro 4750U is the strongest processor of the Ryzen Pro series for business laptops. The octa-core processor has a TDP of 15 W and clock-rates of 1.7 to 4.1 GHz. Unlike the consumer processor AMD Ryzen 7 4700U, the 4750U has Hyper-Threading technology with 16 threads. For additional comparisons, we recommend our CPU comparison list.
The performance advantage of the Ryzen 7 Pro 4750U is most visible in the multicore category. Though the ThinkPad X13 cannot keep up its performance level indefinitely, it is twice as fast as the Intel ThinkPad X13 in the Cinbench R15 loop. The difference is even greater compared with the predecessor ThinkPad X395. The Lenovo ThinkPad X13 AMD is clearly the fastest ThinkPad subnotebook yet. If compared with the bigger 14-inch class however, the Lenovo ThinkPad T14s AMD has the edge with its roomier chassis.
There was no performance limitation in battery mode.
Cinebench R15: CPU Multi 64Bit | CPU Single 64Bit
Blender: v2.79 BMW27 CPU
7-Zip 18.03: 7z b 4 -mmt1 | 7z b 4
Geekbench 5.5: Single-Core | Multi-Core
HWBOT x265 Benchmark v2.2: 4k Preset
LibreOffice : 20 Documents To PDF
R Benchmark 2.5: Overall mean
| Cinebench R20 / CPU (Multi Core) | |
| Average of class Subnotebook (579 - 8541, n=57, last 2 years) | |
| Average AMD Ryzen 7 PRO 4750U (2935 - 3302, n=5) | |
| Lenovo ThinkPad T14s-20UJS00K00 | |
| Lenovo ThinkPad X13-20UGS00800 | |
| Lenovo ThinkPad X13-20T20033GE | |
| Lenovo ThinkPad T14-20S1S06B00 | |
| Lenovo ThinkPad X1 Carbon 2020-20UAS04T00 | |
| Dell Latitude 7310 | |
| Cinebench R20 / CPU (Single Core) | |
| Average of class Subnotebook (128 - 832, n=57, last 2 years) | |
| Lenovo ThinkPad X13-20UGS00800 | |
| Average AMD Ryzen 7 PRO 4750U (461 - 479, n=5) | |
| Lenovo ThinkPad T14s-20UJS00K00 | |
| Lenovo ThinkPad X1 Carbon 2020-20UAS04T00 | |
| Dell Latitude 7310 | |
| Lenovo ThinkPad T14-20S1S06B00 | |
| Lenovo ThinkPad X13-20T20033GE | |
| Cinebench R15 / CPU Multi 64Bit | |
| Average of class Subnotebook (327 - 3345, n=57, last 2 years) | |
| Average AMD Ryzen 7 PRO 4750U (1287 - 1417, n=5) | |
| Lenovo ThinkPad T14s-20UJS00K00 | |
| Lenovo ThinkPad X13-20UGS00800 | |
| Lenovo ThinkPad X1 Carbon 2020-20UAS04T00 | |
| Lenovo ThinkPad X13-20T20033GE | |
| Lenovo ThinkPad T14-20S1S06B00 | |
| Dell Latitude 7310 | |
| Lenovo ThinkPad X395 | |
| Cinebench R15 / CPU Single 64Bit | |
| Average of class Subnotebook (72.4 - 322, n=57, last 2 years) | |
| Lenovo ThinkPad X13-20UGS00800 | |
| Lenovo ThinkPad X1 Carbon 2020-20UAS04T00 | |
| Average AMD Ryzen 7 PRO 4750U (180 - 184, n=5) | |
| Lenovo ThinkPad T14s-20UJS00K00 | |
| Dell Latitude 7310 | |
| Lenovo ThinkPad X13-20T20033GE | |
| Lenovo ThinkPad T14-20S1S06B00 | |
| Lenovo ThinkPad X395 | |
| Blender / v2.79 BMW27 CPU | |
| Lenovo ThinkPad T14-20S1S06B00 | |
| Dell Latitude 7310 | |
| Lenovo ThinkPad X1 Carbon 2020-20UAS04T00 | |
| Lenovo ThinkPad X13-20T20033GE | |
| Lenovo ThinkPad X13-20UGS00800 | |
| Average of class Subnotebook (159 - 2271, n=58, last 2 years) | |
| Lenovo ThinkPad T14s-20UJS00K00 | |
| Average AMD Ryzen 7 PRO 4750U (340 - 403, n=5) | |
| 7-Zip 18.03 / 7z b 4 -mmt1 | |
| Average of class Subnotebook (2643 - 6699, n=59, last 2 years) | |
| Dell Latitude 7310 | |
| Lenovo ThinkPad X1 Carbon 2020-20UAS04T00 | |
| Lenovo ThinkPad T14s-20UJS00K00 | |
| Lenovo ThinkPad X13-20UGS00800 | |
| Average AMD Ryzen 7 PRO 4750U (4413 - 4467, n=5) | |
| Lenovo ThinkPad X13-20T20033GE | |
| Lenovo ThinkPad T14-20S1S06B00 | |
| 7-Zip 18.03 / 7z b 4 | |
| Average of class Subnotebook (11668 - 77867, n=57, last 2 years) | |
| Average AMD Ryzen 7 PRO 4750U (37081 - 42173, n=5) | |
| Lenovo ThinkPad T14s-20UJS00K00 | |
| Lenovo ThinkPad X13-20UGS00800 | |
| Lenovo ThinkPad X1 Carbon 2020-20UAS04T00 | |
| Lenovo ThinkPad X13-20T20033GE | |
| Lenovo ThinkPad T14-20S1S06B00 | |
| Dell Latitude 7310 | |
| Geekbench 5.5 / Single-Core | |
| Average of class Subnotebook (726 - 2224, n=48, last 2 years) | |
| Dell Latitude 7310 | |
| Lenovo ThinkPad X1 Carbon 2020-20UAS04T00 | |
| Lenovo ThinkPad X13-20UGS00800 | |
| Lenovo ThinkPad T14s-20UJS00K00 | |
| Average AMD Ryzen 7 PRO 4750U (1117 - 1157, n=5) | |
| Lenovo ThinkPad X13-20T20033GE | |
| Lenovo ThinkPad T14-20S1S06B00 | |
| Geekbench 5.5 / Multi-Core | |
| Average of class Subnotebook (2557 - 17218, n=48, last 2 years) | |
| Lenovo ThinkPad T14s-20UJS00K00 | |
| Average AMD Ryzen 7 PRO 4750U (5456 - 6609, n=5) | |
| Lenovo ThinkPad X13-20UGS00800 | |
| Lenovo ThinkPad X13-20T20033GE | |
| Lenovo ThinkPad X1 Carbon 2020-20UAS04T00 | |
| Dell Latitude 7310 | |
| Lenovo ThinkPad T14-20S1S06B00 | |
| HWBOT x265 Benchmark v2.2 / 4k Preset | |
| Average of class Subnotebook (0.97 - 25.1, n=57, last 2 years) | |
| Lenovo ThinkPad T14s-20UJS00K00 | |
| Average AMD Ryzen 7 PRO 4750U (8.33 - 10.3, n=5) | |
| Lenovo ThinkPad X13-20UGS00800 | |
| Lenovo ThinkPad X1 Carbon 2020-20UAS04T00 | |
| Lenovo ThinkPad X13-20T20033GE | |
| Dell Latitude 7310 | |
| Lenovo ThinkPad T14-20S1S06B00 | |
| LibreOffice / 20 Documents To PDF | |
| Average AMD Ryzen 7 PRO 4750U (58.4 - 73.4, n=5) | |
| Lenovo ThinkPad T14s-20UJS00K00 | |
| Lenovo ThinkPad T14-20S1S06B00 | |
| Lenovo ThinkPad X13-20UGS00800 | |
| Average of class Subnotebook (39.9 - 220, n=56, last 2 years) | |
| Dell Latitude 7310 | |
| Lenovo ThinkPad X13-20T20033GE | |
| Lenovo ThinkPad X1 Carbon 2020-20UAS04T00 | |
| R Benchmark 2.5 / Overall mean | |
| Lenovo ThinkPad T14-20S1S06B00 | |
| Lenovo ThinkPad X13-20T20033GE | |
| Lenovo ThinkPad X1 Carbon 2020-20UAS04T00 | |
| Dell Latitude 7310 | |
| Lenovo ThinkPad T14s-20UJS00K00 | |
| Average AMD Ryzen 7 PRO 4750U (0.61 - 0.621, n=5) | |
| Lenovo ThinkPad X13-20UGS00800 | |
| Average of class Subnotebook (0.4024 - 1.456, n=58, last 2 years) | |
* ... smaller is better
System performance
The ThinkPad X13 AMD delivers a convincing everyday performance and lands far in front of the X395.
| PCMark 8 Home Score Accelerated v2 | 4349 points | |
| PCMark 8 Work Score Accelerated v2 | 5573 points | |
| PCMark 10 Score | 4956 points | |
Help | ||
DPC latencies
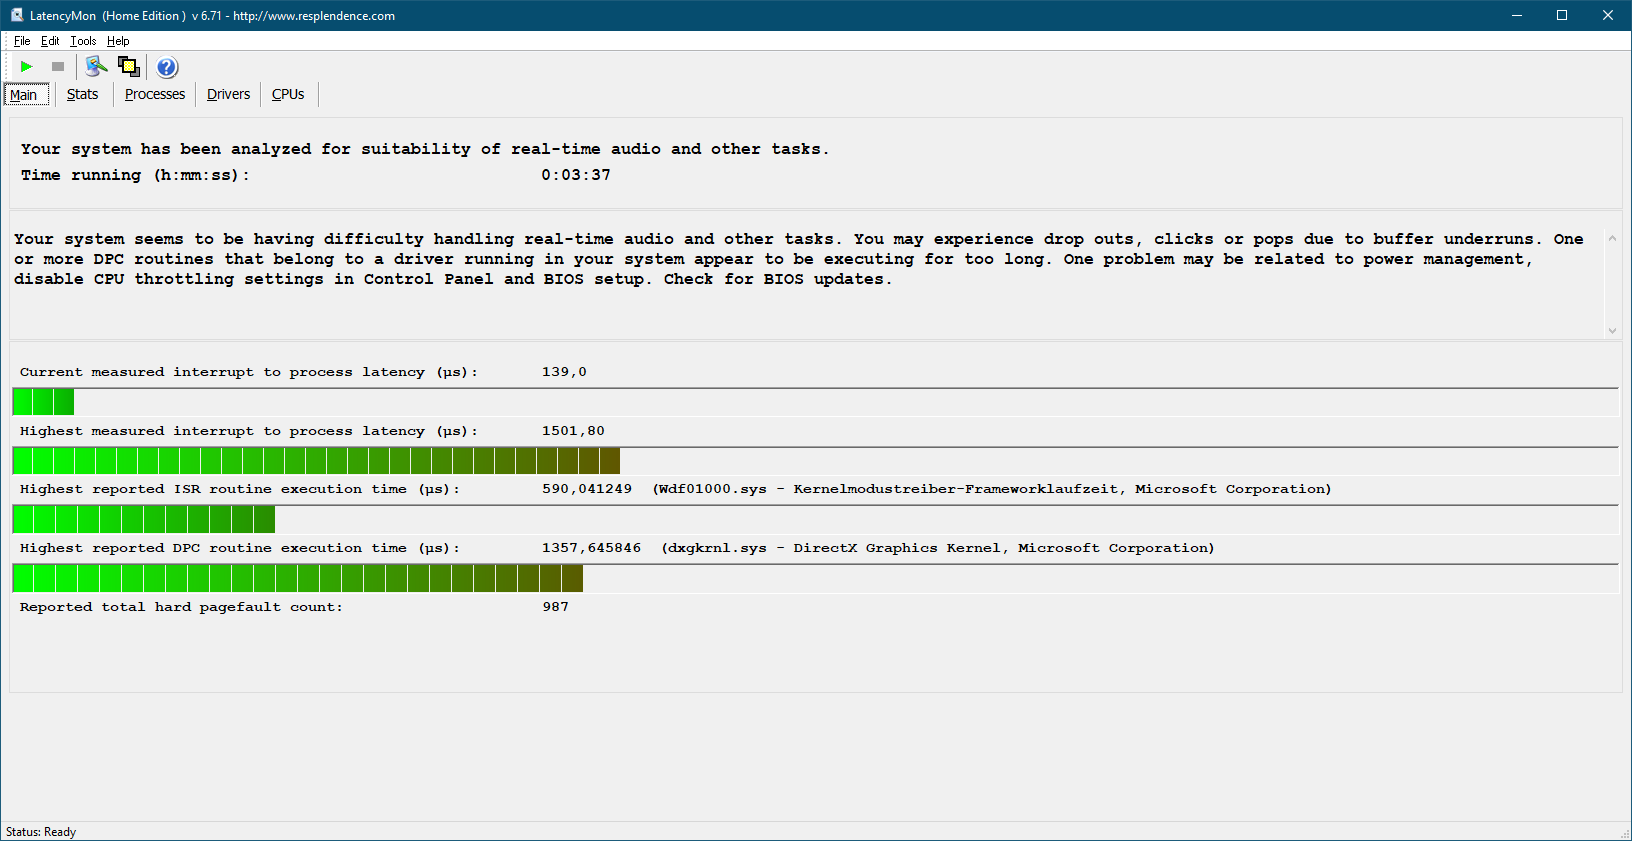
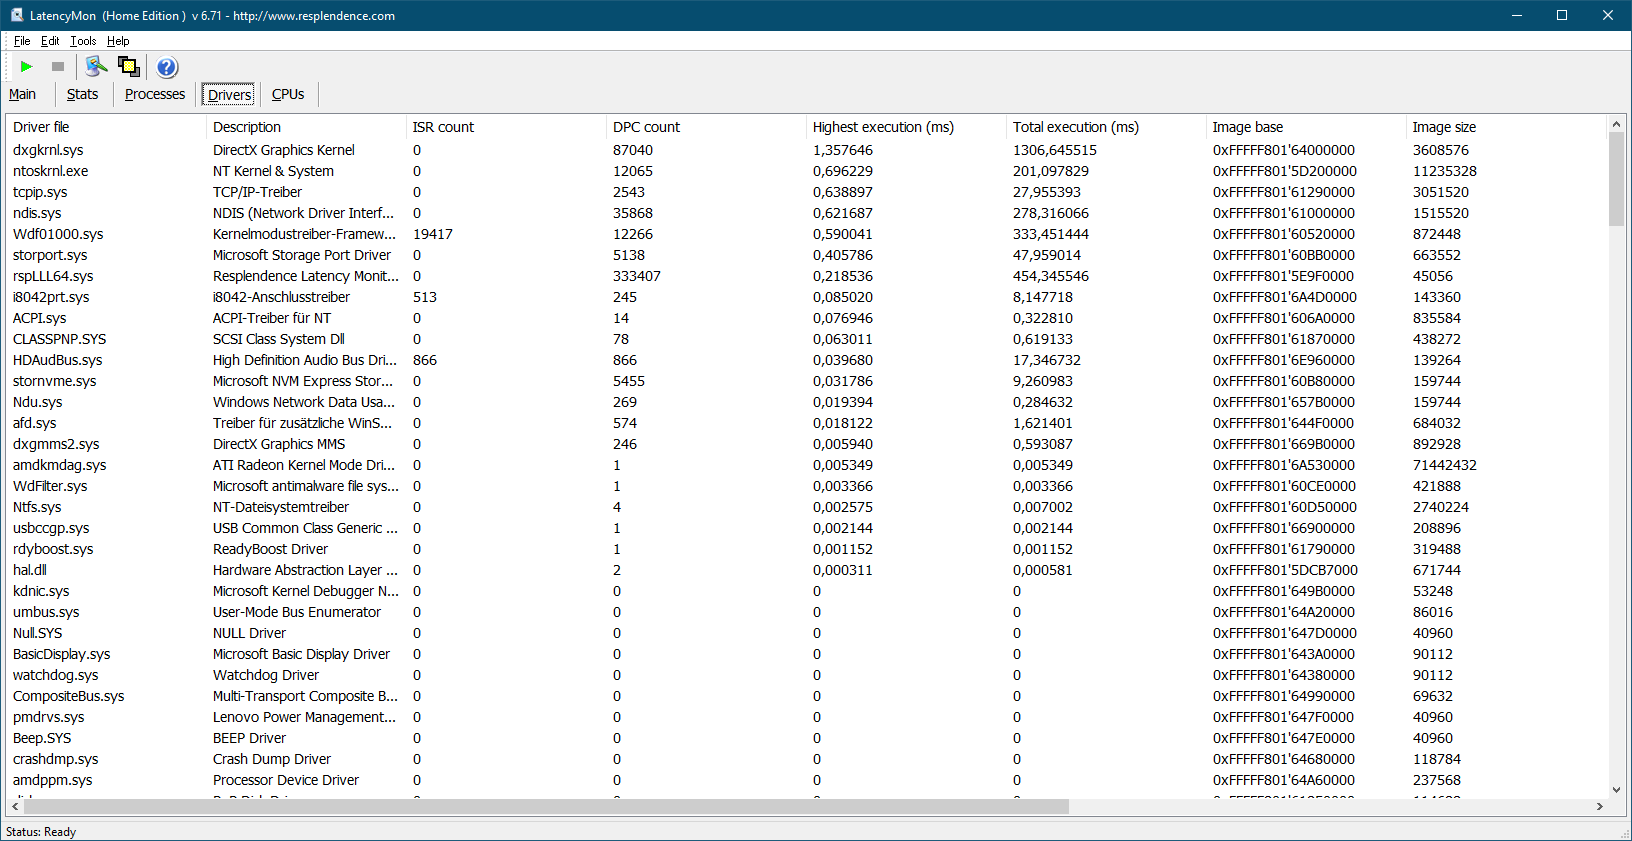
| DPC Latencies / LatencyMon - interrupt to process latency (max), Web, Youtube, Prime95 | |
| Lenovo ThinkPad X13-20UGS00800 | |
* ... smaller is better
Storage
The Samsung PM981a is a very fast PCIe NVMe SSD in the M.2 2280 format, which is used by many OEMs. Its performance is great in the benchmarks. In our review sample, the OEM SSD has a capacity of 512 GB.
| Lenovo ThinkPad X13-20UGS00800 Samsung SSD PM981a MZVLB512HBJQ | Lenovo ThinkPad X395 Samsung SSD PM981a MZVLB256HBHQ | Dell Latitude 7310 Samsung SSD PM981a MZVLB512HBJQ | Lenovo ThinkPad X13-20T20033GE Samsung SSD PM981a MZVLB512HBJQ | Average Samsung SSD PM981a MZVLB512HBJQ | |
|---|---|---|---|---|---|
| CrystalDiskMark 5.2 / 6 | -4% | 9% | 5% | 11% | |
| Write 4K (MB/s) | 95.7 | 129.4 35% | 135.2 41% | 131.1 37% | 140.8 ? 47% |
| Read 4K (MB/s) | 37.47 | 41.6 11% | 50.7 35% | 45.48 21% | 48.6 ? 30% |
| Write Seq (MB/s) | 2032 | 2334 15% | 2155 6% | 2042 0% | 2106 ? 4% |
| Read Seq (MB/s) | 2207 | 2151 -3% | 2504 13% | 2259 2% | 2099 ? -5% |
| Write 4K Q32T1 (MB/s) | 517 | 234 -55% | 395.6 -23% | 429.1 -17% | 451 ? -13% |
| Read 4K Q32T1 (MB/s) | 387 | 325.7 -16% | 394.5 2% | 370.7 -4% | 482 ? 25% |
| Write Seq Q32T1 (MB/s) | 2977 | 2348 -21% | 2987 0% | 2963 0% | 2903 ? -2% |
| Read Seq Q32T1 (MB/s) | 3556 | 3563 0% | 3564 0% | 3564 0% | 3511 ? -1% |

Continuous load reading: DiskSpd Read Loop, Queue Depth 8
GPU
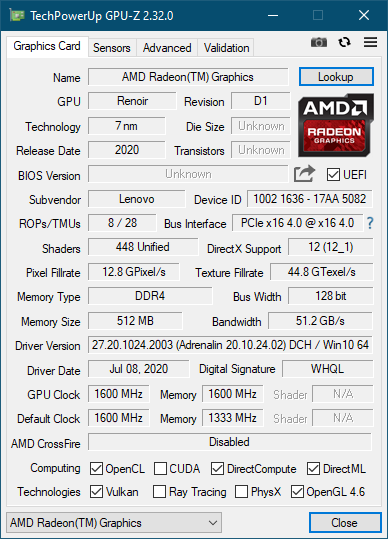
The GPU part of the AMD Ryzen 7 Pro 4750U is the AMD Radeon RX Vega 7. It is the strongest iGPU available in the recent AMD ThinkPads, as the Ryzen 8 4800U with the Radeon RX Vega 8 is not available in any ThinkPad laptop.
In the 3DMark benchmarks, the GPU can max out its potential very well, because the memory in the Lenovo ThinkPad X13 Gen 1 runs in dual-channel-mode. An even better result would be possible if Lenovo used faster LPDDR4X memory. Like with the CPU performance, the bigger Lenovo ThinkPad T14s is slightly faster, while the Intel models cannot compare. The Nvidia GPU of the ThinkPad T15 is still faster, but the ThinkPad X13 AMD is not very far behind.
For older games, the AMD GPU is well versed. More recent titles are playable as well, but only with lower graphics details and resolution.
The GPU performance is not throttled when no charger is attached.
| 3DMark 11 Performance | 4897 points | |
| 3DMark Cloud Gate Standard Score | 18790 points | |
| 3DMark Fire Strike Score | 2720 points | |
| 3DMark Time Spy Score | 1082 points | |
Help | ||
| low | med. | high | ultra | |
|---|---|---|---|---|
| The Witcher 3 (2015) | 56.1 | 17.6 | ||
| Dota 2 Reborn (2015) | 90.5 | 69.9 | 42.2 | 39.5 |
| X-Plane 11.11 (2018) | 37.2 | 28.5 | 25.6 | |
| Shadow of the Tomb Raider (2018) | 44.4 | 17 | ||
| Total War: Three Kingdoms (2019) | 49.3 | 15 |
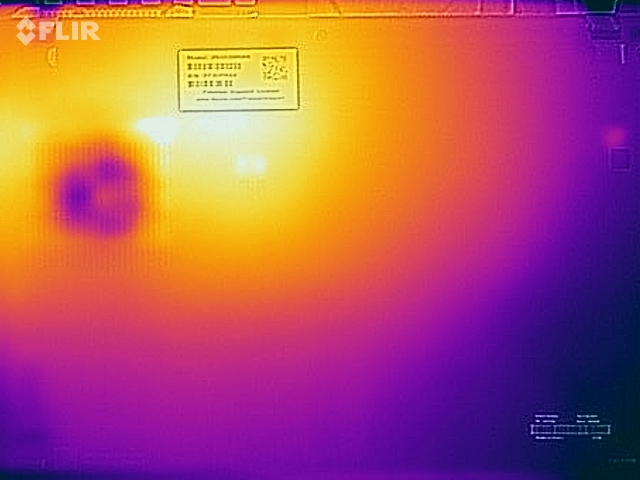
Emissions: ThinkPad X13 Gen 1 stays cool & quiet
Noise
The fan stays completely quiet while idling. Under load, the cooling system of the Lenovo ThinkPad X13 Gen 1 gets activated, but the fan still only runs at 31.8 dB(a).
We could not detect coil whine with this Lenovo laptop.
Noise level
| Idle |
| 29.1 / 29.1 / 29.1 dB(A) |
| Load |
| 31.1 / 31.8 dB(A) |
 | ||
30 dB silent 40 dB(A) audible 50 dB(A) loud |
||
min: | ||
Temperatures
Users do not have to bear extremely high outer temperatures with the ThinkPad X13 Gen 1 AMD, as we measured 44.8 °C at the most. That is a way off from the critical 50 °C point. Slightly negative: The palm rest gets a little bit hot on the right side.
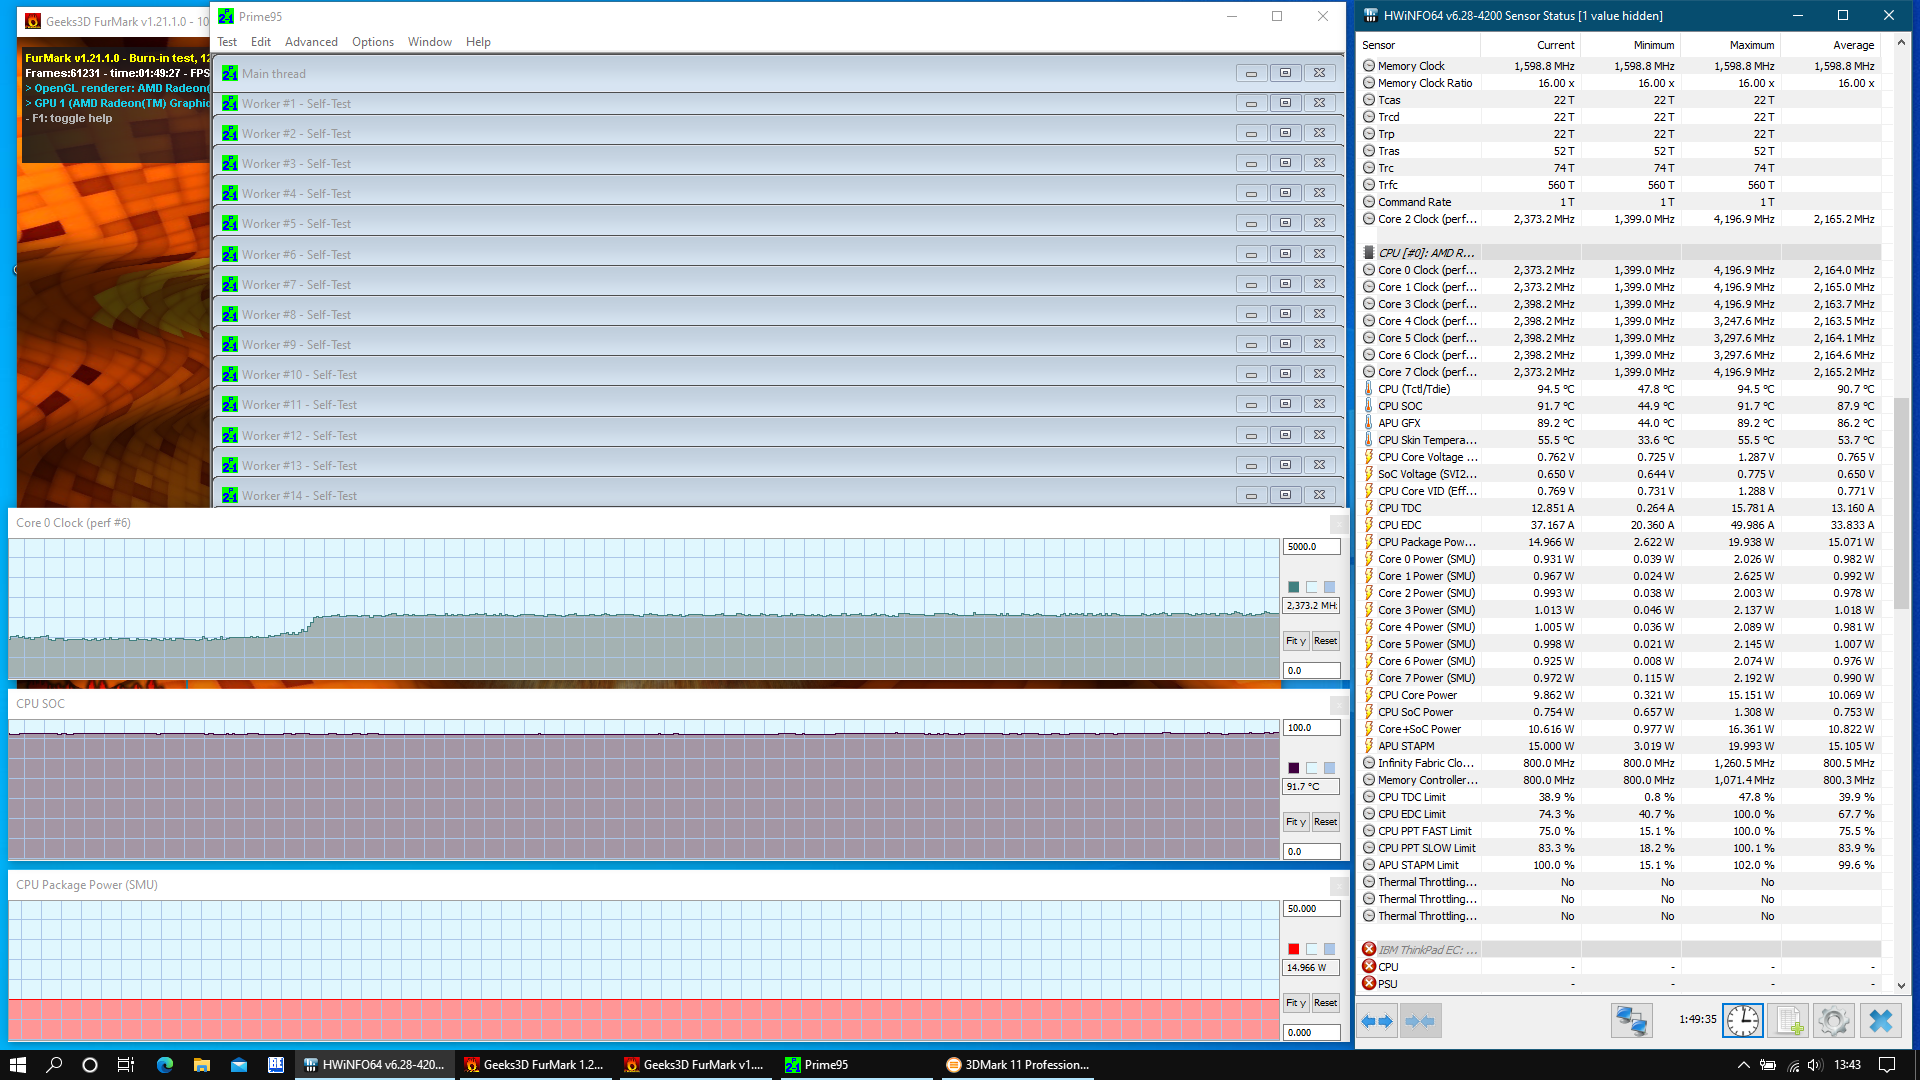
In the stress test with Prime95 and FurMark the limits of the cooling system become visible. The Lenovo X13 can consume 15 W under combined GPU and CPU load. The CPU temperatures sit at 90 °C, while the CPU is limited to 1.5 GHz. This throttling should not be a huge issue in everyday use though, since the 3DMark 11 test scores a normal result immediately after the stress test.
(±) The maximum temperature on the upper side is 44.8 °C / 113 F, compared to the average of 35.9 °C / 97 F, ranging from 21.4 to 59 °C for the class Subnotebook.
(±) The bottom heats up to a maximum of 42.1 °C / 108 F, compared to the average of 39.2 °C / 103 F
(+) In idle usage, the average temperature for the upper side is 23.8 °C / 75 F, compared to the device average of 30.8 °C / 87 F.
(+) The palmrests and touchpad are reaching skin temperature as a maximum (34.2 °C / 93.6 F) and are therefore not hot.
(-) The average temperature of the palmrest area of similar devices was 28.2 °C / 82.8 F (-6 °C / -10.8 F).

Speakers
The 1 W stereo speakers are good enough for video conferencing. For music, they would have to be louder, as the bass is missing and the higher frequencies are also not well balanced. A better audio output is available though the combo-audio port.
Lenovo ThinkPad X13-20UGS00800 audio analysis
(±) | speaker loudness is average but good (74.8 dB)
Bass 100 - 315 Hz
(-) | nearly no bass - on average 16.7% lower than median
(-) | bass is not linear (17.5% delta to prev. frequency)
Mids 400 - 2000 Hz
(+) | balanced mids - only 3.8% away from median
(+) | mids are linear (3.1% delta to prev. frequency)
Highs 2 - 16 kHz
(+) | balanced highs - only 3% away from median
(±) | linearity of highs is average (8.9% delta to prev. frequency)
Overall 100 - 16.000 Hz
(±) | linearity of overall sound is average (22.1% difference to median)
Compared to same class
» 75% of all tested devices in this class were better, 6% similar, 19% worse
» The best had a delta of 5%, average was 18%, worst was 53%
Compared to all devices tested
» 64% of all tested devices were better, 6% similar, 30% worse
» The best had a delta of 4%, average was 23%, worst was 134%
Apple MacBook 12 (Early 2016) 1.1 GHz audio analysis
(+) | speakers can play relatively loud (83.6 dB)
Bass 100 - 315 Hz
(±) | reduced bass - on average 11.3% lower than median
(±) | linearity of bass is average (14.2% delta to prev. frequency)
Mids 400 - 2000 Hz
(+) | balanced mids - only 2.4% away from median
(+) | mids are linear (5.5% delta to prev. frequency)
Highs 2 - 16 kHz
(+) | balanced highs - only 2% away from median
(+) | highs are linear (4.5% delta to prev. frequency)
Overall 100 - 16.000 Hz
(+) | overall sound is linear (10.2% difference to median)
Compared to same class
» 7% of all tested devices in this class were better, 2% similar, 90% worse
» The best had a delta of 5%, average was 18%, worst was 53%
Compared to all devices tested
» 5% of all tested devices were better, 1% similar, 94% worse
» The best had a delta of 4%, average was 23%, worst was 134%
Energy management: The Achilles heel of the ThinkPad X13 AMD?
Power consumption
The power consumption of the Lenovo ThinkPad X13 AMD is notably poor when compared to the Intel model. This is especially true while the machine is idling. Maybe, the drivers of the AMD model are not as well optimized, or the octa-core chip just consumes more.
| Off / Standby | |
| Idle | |
| Load |
|
Key:
min: | |
| Lenovo ThinkPad X13-20UGS00800 R7 PRO 4750U, Vega 7, Samsung SSD PM981a MZVLB512HBJQ, IPS LED, 1920x1080, 13.3" | Lenovo ThinkPad X395 R3 PRO 3300U, Vega 6, Samsung SSD PM981a MZVLB256HBHQ, IPS, 1920x1080, 13.3" | Dell Latitude 7310 i7-10610U, UHD Graphics 620, Samsung SSD PM981a MZVLB512HBJQ, IPS, 1920x1080, 13.3" | Lenovo ThinkPad X13-20T20033GE i5-10210U, UHD Graphics 620, Samsung SSD PM981a MZVLB512HBJQ, IPS, 1920x1080, 13.3" | Average AMD Radeon RX Vega 7 | Average of class Subnotebook | |
|---|---|---|---|---|---|---|
| Power Consumption | 14% | 16% | 11% | 0% | -1% | |
| Idle Minimum * (Watt) | 6 | 4 33% | 2.7 55% | 2.9 52% | 4.79 ? 20% | 3.76 ? 37% |
| Idle Average * (Watt) | 8.9 | 6.3 29% | 4.4 51% | 5.6 37% | 7.72 ? 13% | 6.54 ? 27% |
| Idle Maximum * (Watt) | 11.3 | 9.3 18% | 4.8 58% | 8.9 21% | 9.12 ? 19% | 7.89 ? 30% |
| Load Average * (Watt) | 34.2 | 34 1% | 33.4 2% | 30.1 12% | 38.4 ? -12% | 42 ? -23% |
| Load Maximum * (Watt) | 37.2 | 42 -13% | 69.7 -87% | 61.3 -65% | 51.7 ? -39% | 64.8 ? -74% |
* ... smaller is better
Battery life
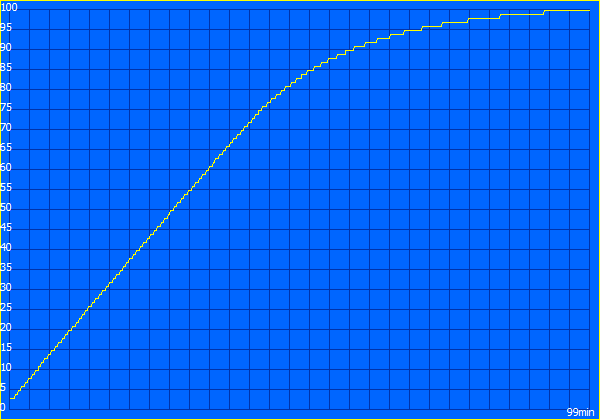
The battery capacity remains smaller than other recent ThinkPad laptops at just 48 Wh. The same was true for the ThinkPad X395, which still performed better in our battery tests. Eight hours and 42 minutes is not a terrible result for the ThinkPad X13 AMD, but the predecessor was 25% better (nearly 11 hours).
| Lenovo ThinkPad X13-20UGS00800 R7 PRO 4750U, Vega 7, 48 Wh | Lenovo ThinkPad X395 R3 PRO 3300U, Vega 6, 48 Wh | Dell Latitude 7310 i7-10610U, UHD Graphics 620, 52 Wh | Lenovo ThinkPad T14s-20UJS00K00 R7 PRO 4750U, Vega 7, 57 Wh | Lenovo ThinkPad X13-20T20033GE i5-10210U, UHD Graphics 620, 48 Wh | Average of class Subnotebook | |
|---|---|---|---|---|---|---|
| Battery runtime | 67% | 33% | 39% | 43% | 59% | |
| H.264 (h) | 8.3 | 10.3 24% | 13.2 59% | 11.7 41% | 15.4 ? 86% | |
| WiFi v1.3 (h) | 8.7 | 10.9 25% | 12.6 45% | 10.2 17% | 9.3 7% | 14 ? 61% |
| Load (h) | 1.5 | 3.8 153% | 1.8 20% | 2.1 40% | 2.7 80% | 1.969 ? 31% |
| Reader / Idle (h) | 18.4 | 37.4 | 28.6 ? |
Pros
Cons
Verdict

Ryzen 4000 is currently winning market share for AMD in the laptop space. In this endeavor, the business segment probably plays an important role. A traditional compact subnotebook like the Lenovo ThinkPad X13 Gen 1 can be a great asset in the struggle for the enterprise market.
As Lenovo keeps the tried and tested design of the Lenovo ThinkPad X390 / X395, the AMD Renoir CPU with eight cores is clearly the star of this show. No other ThinkPad laptop with a 13.3-inch screen offers such a fast processor. The Intel version of the X13 and the Dell Latitude 7310 are far away from being competitive with the ThinkPad X13 AMD. The same is true for the GPU performance, which is almost good enough to compete with low-end dGPUs.
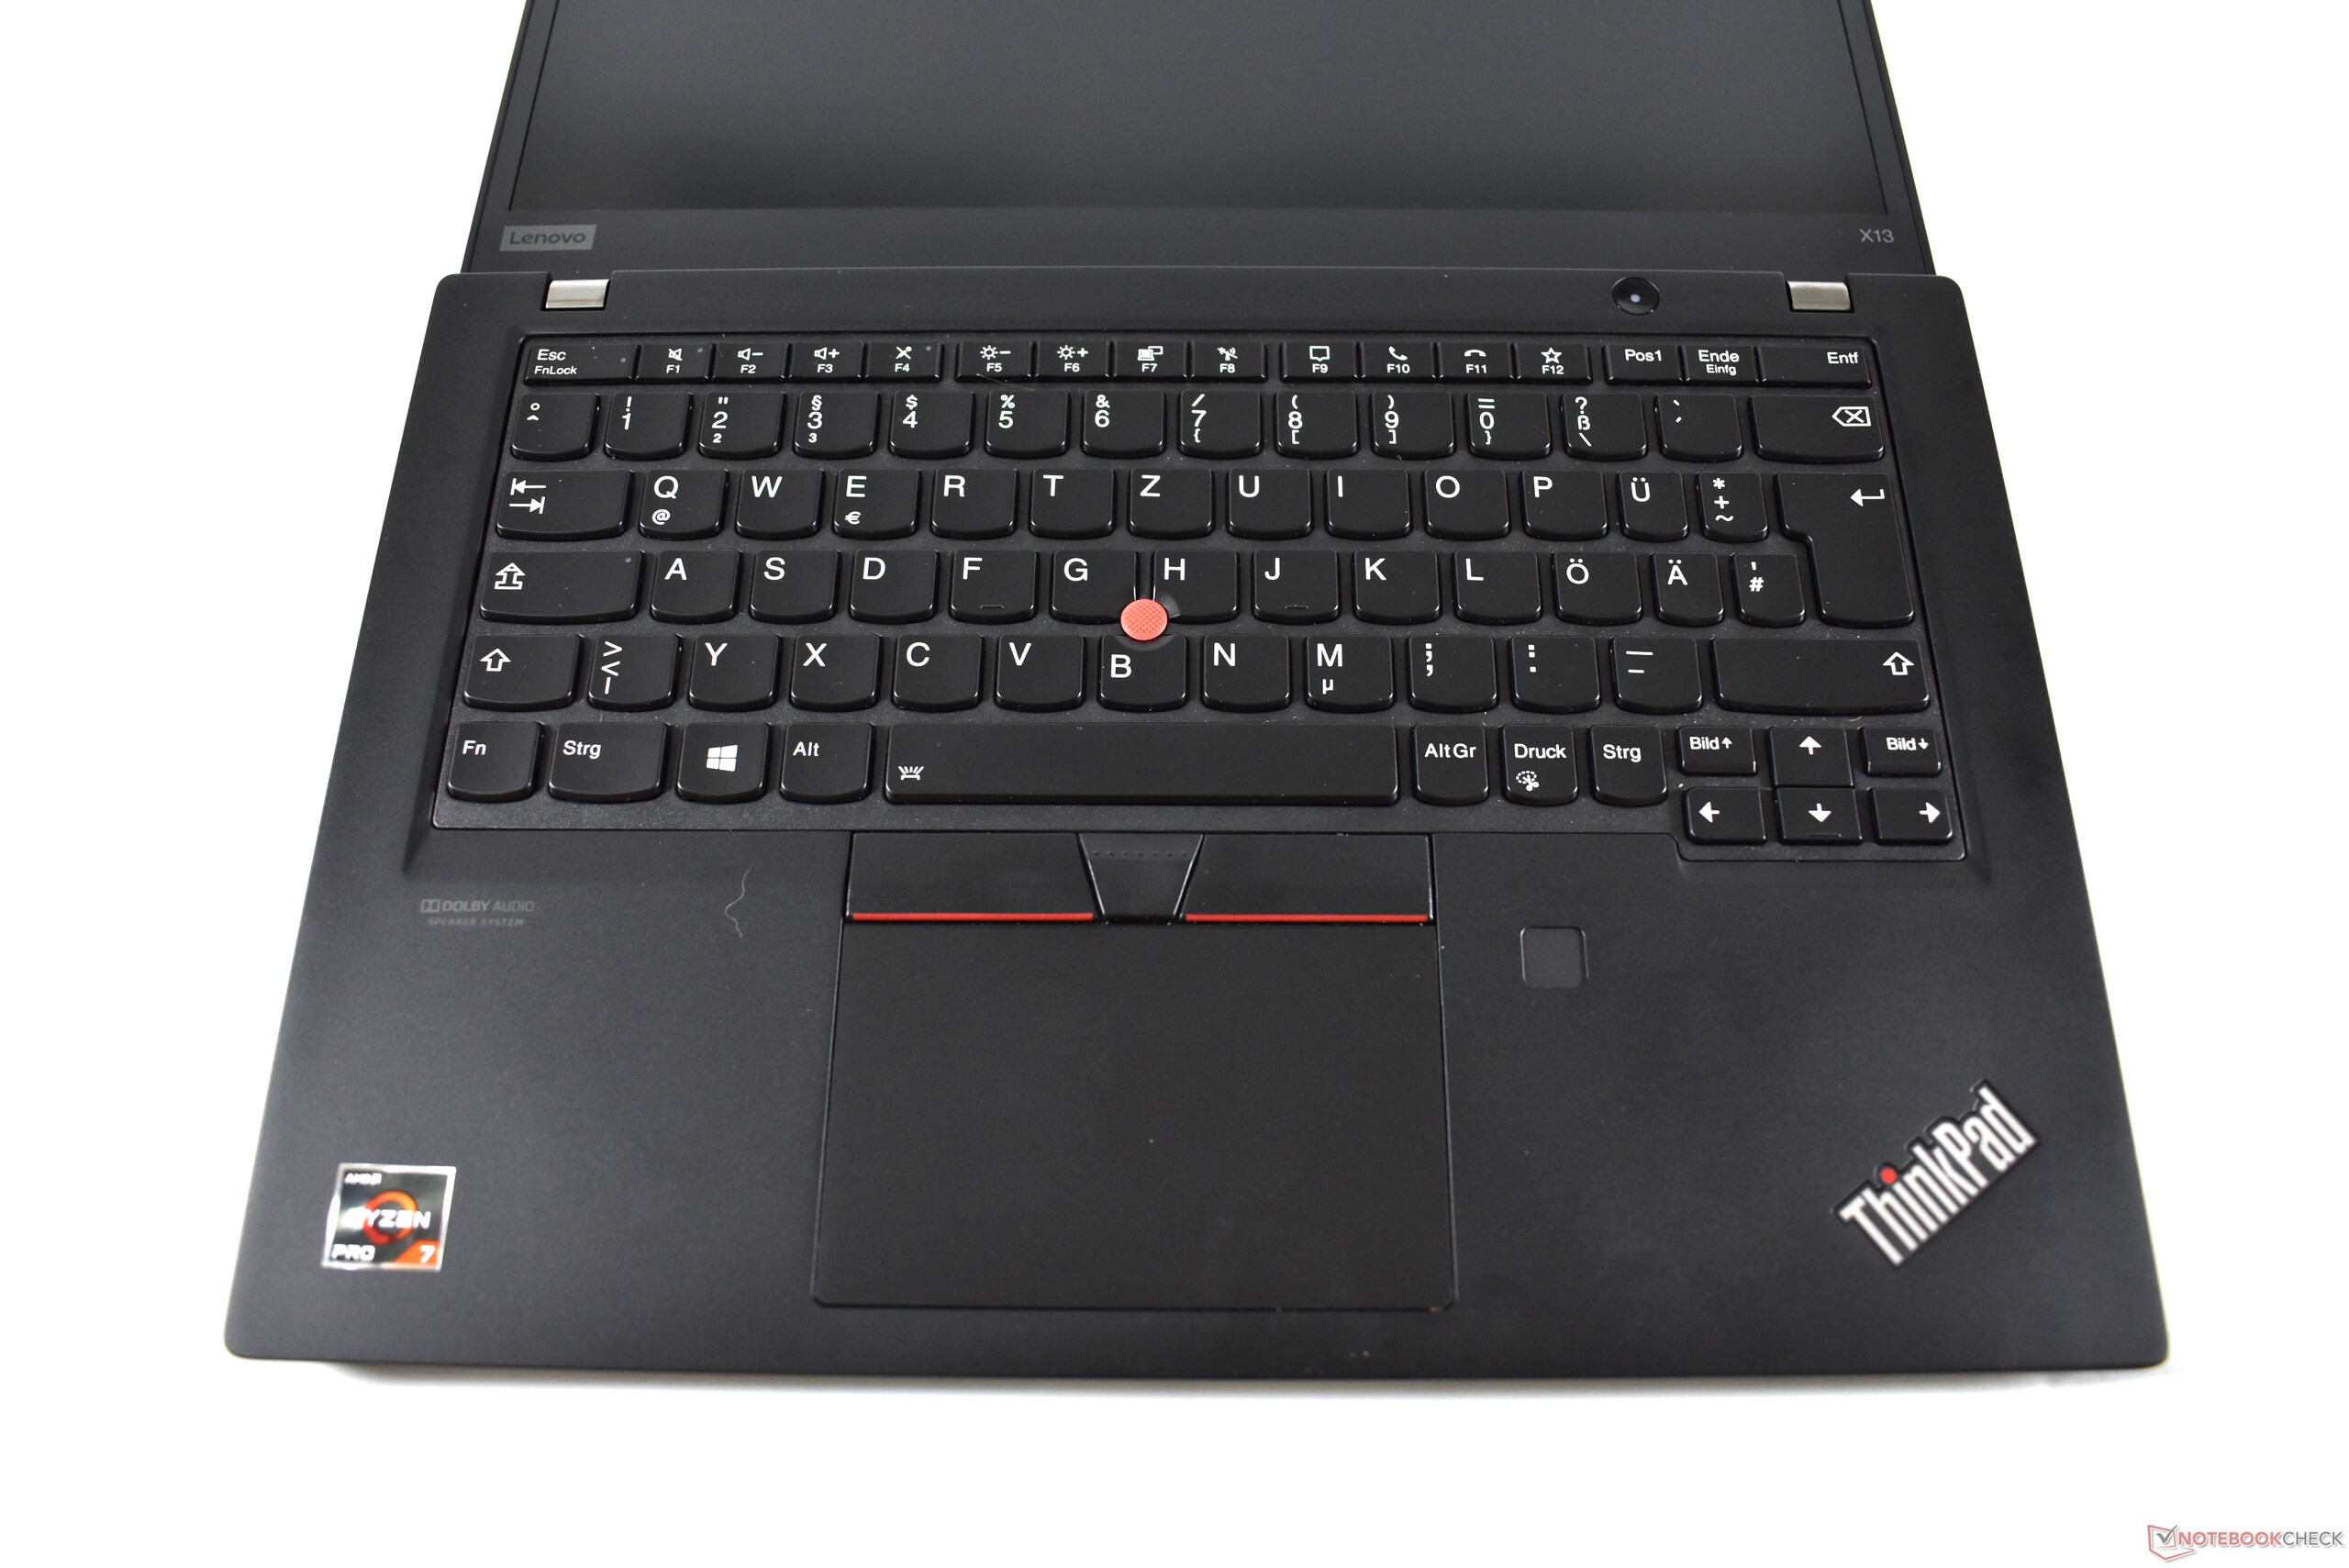
Despite the great level of performance, the ThinkPad X13 Gen 1 runs cool and quiet. Other strengths of this Lenovo X13 include the ThinkPad input devices, the amount of ports on the small chassis, the good, matte screen and the robust magnesium case. Compared with the ThinkPad X395, Wi-Fi 6 is notable as a gain.
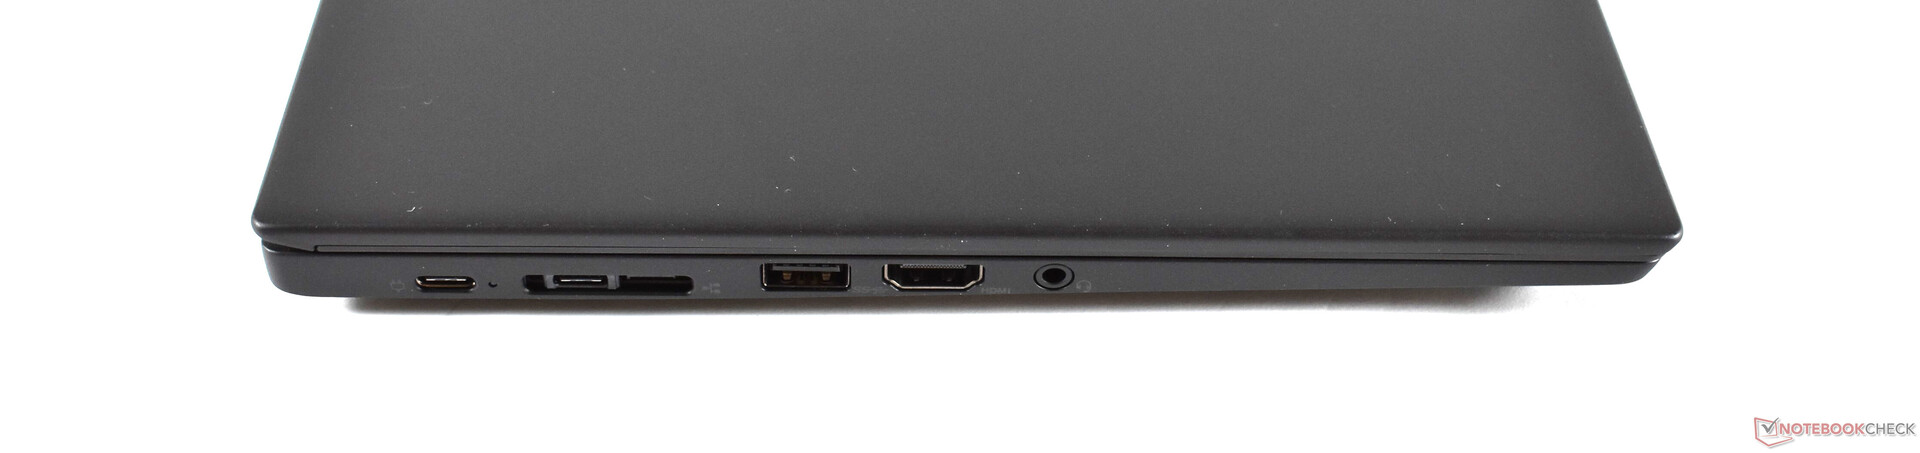
Meanwhile, most of the problems are taken over straight from the preceding model, like the hard to reach microSD slot or the soldered RAM. Compared with the ThinkPad T14s Gen 1, the X13 has an easily replaceable keyboard but worse battery life and the keyboard is smaller in size. Speaking of the battery life: Aside from the missing Thunderbolt 3 port, this is one of the only small disadvantages compared to the Intel ThinkPad X13.
Subnotebook with a punch: There are not many compact laptops that can offer a similar performance as the ThinkPad X13 Gen 1. The biggest competitors are the bigger ThinkPad cousins and the HP EliteBook 835 G7.
We can recommend the Lenovo ThinkPad X13 Gen 1 with AMD Ryzen 4000 wholeheartedly. If one is searching for a 13.3-inch laptop, there are not many choices that offer the same level of performance. One problem may be the competition with the slightly bigger Lenovo ThinkPad T14s Gen 1 with AMD CPUs. For most users, the T14s could be the better choice.
Lenovo ThinkPad X13-20UGS00800
- 08/13/2020 v7 (old)
Benjamin Herzig
Price comparison
