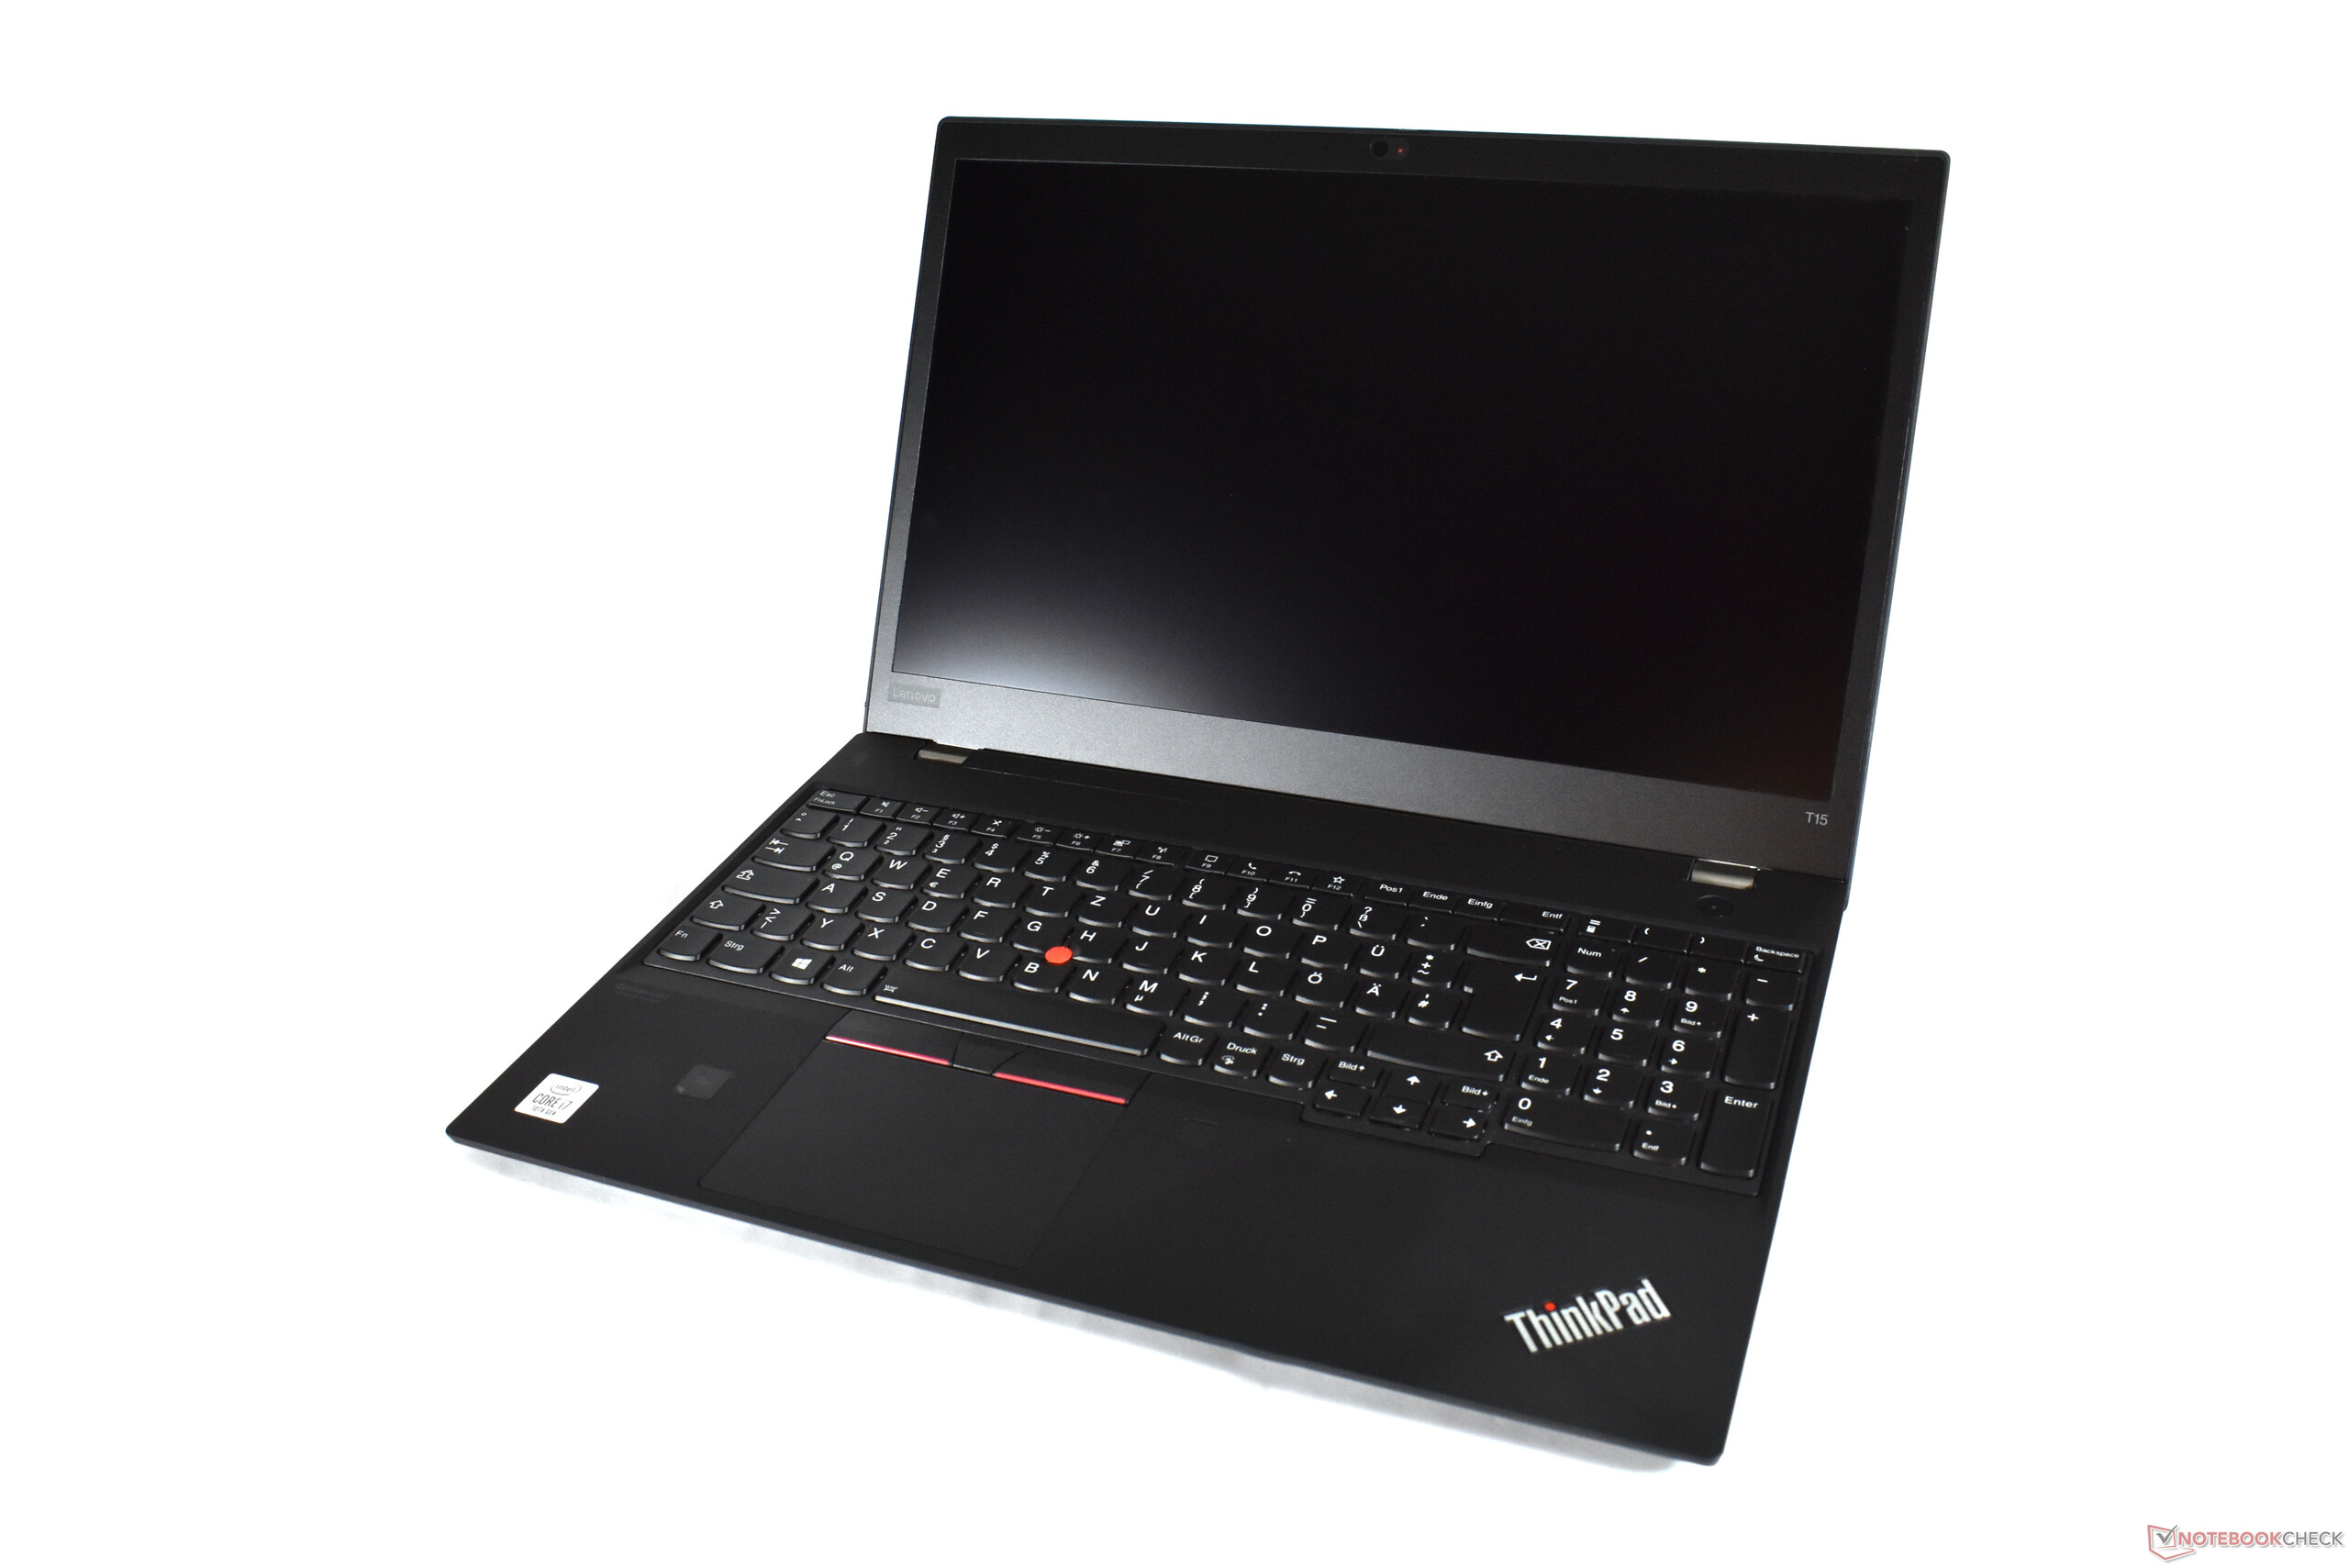
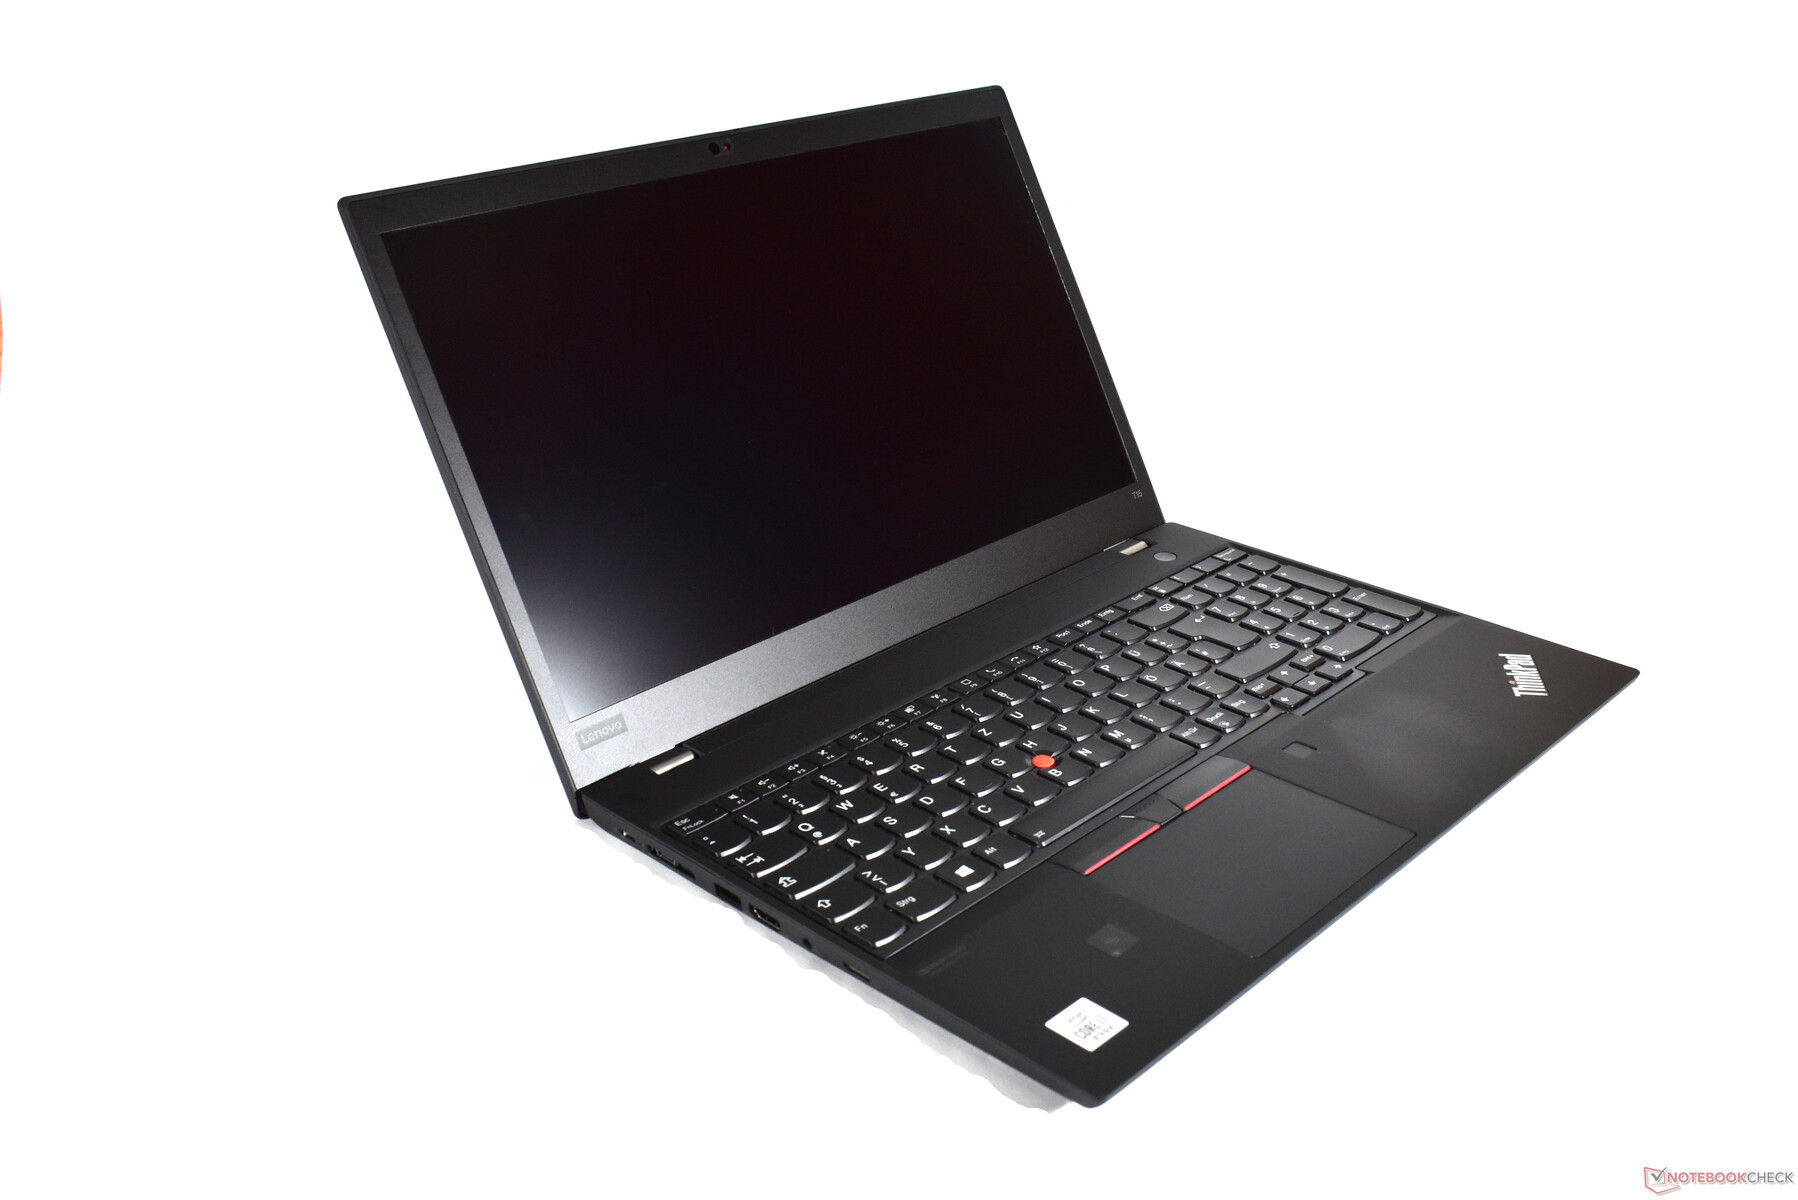
Lenovo ThinkPad T15 Gen 1 Laptop Review: Foiled by lack of AMD option

With its current 2020 generation of ThinkPad laptops Lenovo does not differentiate model numbers between AMD and Intel SKUs any longer. In other words: The Lenovo ThinkPad T14 Gen 1 and Lenovo ThinkPad T14s Gen 1 are both available with AMD and Intel CPUs. Notice how the largest T-series ThinkPad is suspiciously missing from that list? That’s because unlike its smaller siblings the ThinkPad T15 Gen 1 remains an Intel-exclusive, and AMD-equipped 15-inch ThinkPad models are only available in the ThinkPad E15 Gen 2 or ThinkPad L15 Gen 1 variety.
However, said budget ThinkPads lack the optional 4K UHD display, which is only available on the more expensive ThinkPad T15 that we have in review today. Our review unit comes with an Intel Core i7 CPU, an Nvidia GPU, 1 TB of SSD storage, 16 GB of RAM, and the aforementioned 4K/UHD display. At the time of writing, this particular high-end SKU sold for around 1,600 Euros (~$1,854) without a Windows license exclusively through the Lenovo Campus program. The model available to the general public is limited to just 512 GB of SSD storage but features a 4G/LTE modem in return, and it sold for slightly over 2,000 Euros (~$2,317) at the time of writing.
Competitors include the ThinkPad T590, the ThinkPad E15, and the HP ProBook 455 G7 with AMD Ryzen 4000. Given that the update from last generation’s model is rather minor, this review is an update to last year’s extensive Lenovo ThinkPad T590 review.
Rating | Date | Model | Weight | Height | Size | Resolution | Price |
|---|---|---|---|---|---|---|---|
| 87.2 % v7 (old) | 07 / 2020 | Lenovo ThinkPad T15 Gen1-20S7S02U00 i7-10510U, GeForce MX330 | 1.8 kg | 19.95 mm | 15.60" | 3840x2160 | |
| 87.2 % v7 (old) | 09 / 2019 | Lenovo ThinkPad T590-20N40009GE i7-8565U, GeForce MX250 | 1.8 kg | 19.95 mm | 15.60" | 3840x2160 | |
| 82.1 % v7 (old) | 03 / 2020 | Lenovo ThinkPad E15 20RD0011GE i7-10510U, Radeon RX 640 | 1.8 kg | 18.9 mm | 15.60" | 1920x1080 | |
| 82.6 % v7 (old) | 07 / 2020 | HP ProBook 455 G7-175W8EA R7 4700U, Vega 7 | 1.8 kg | 19 mm | 15.60" | 1920x1080 |

| SD Card Reader | |
| average JPG Copy Test (av. of 3 runs) | |
| Lenovo ThinkPad T15 Gen1-20S7S02U00 (Toshiba Exceria Pro M501 64 GB UHS-II) | |
| HP ProBook 455 G7-175W8EA (Toshiba Exceria Pro SDXC 64 GB UHS-II) | |
| Average of class Office (22.4 - 198.5, n=22, last 2 years) | |
| maximum AS SSD Seq Read Test (1GB) | |
| Lenovo ThinkPad T15 Gen1-20S7S02U00 (Toshiba Exceria Pro M501 64 GB UHS-II) | |
| HP ProBook 455 G7-175W8EA (Toshiba Exceria Pro SDXC 64 GB UHS-II) | |
| Average of class Office (27.4 - 249, n=20, last 2 years) | |


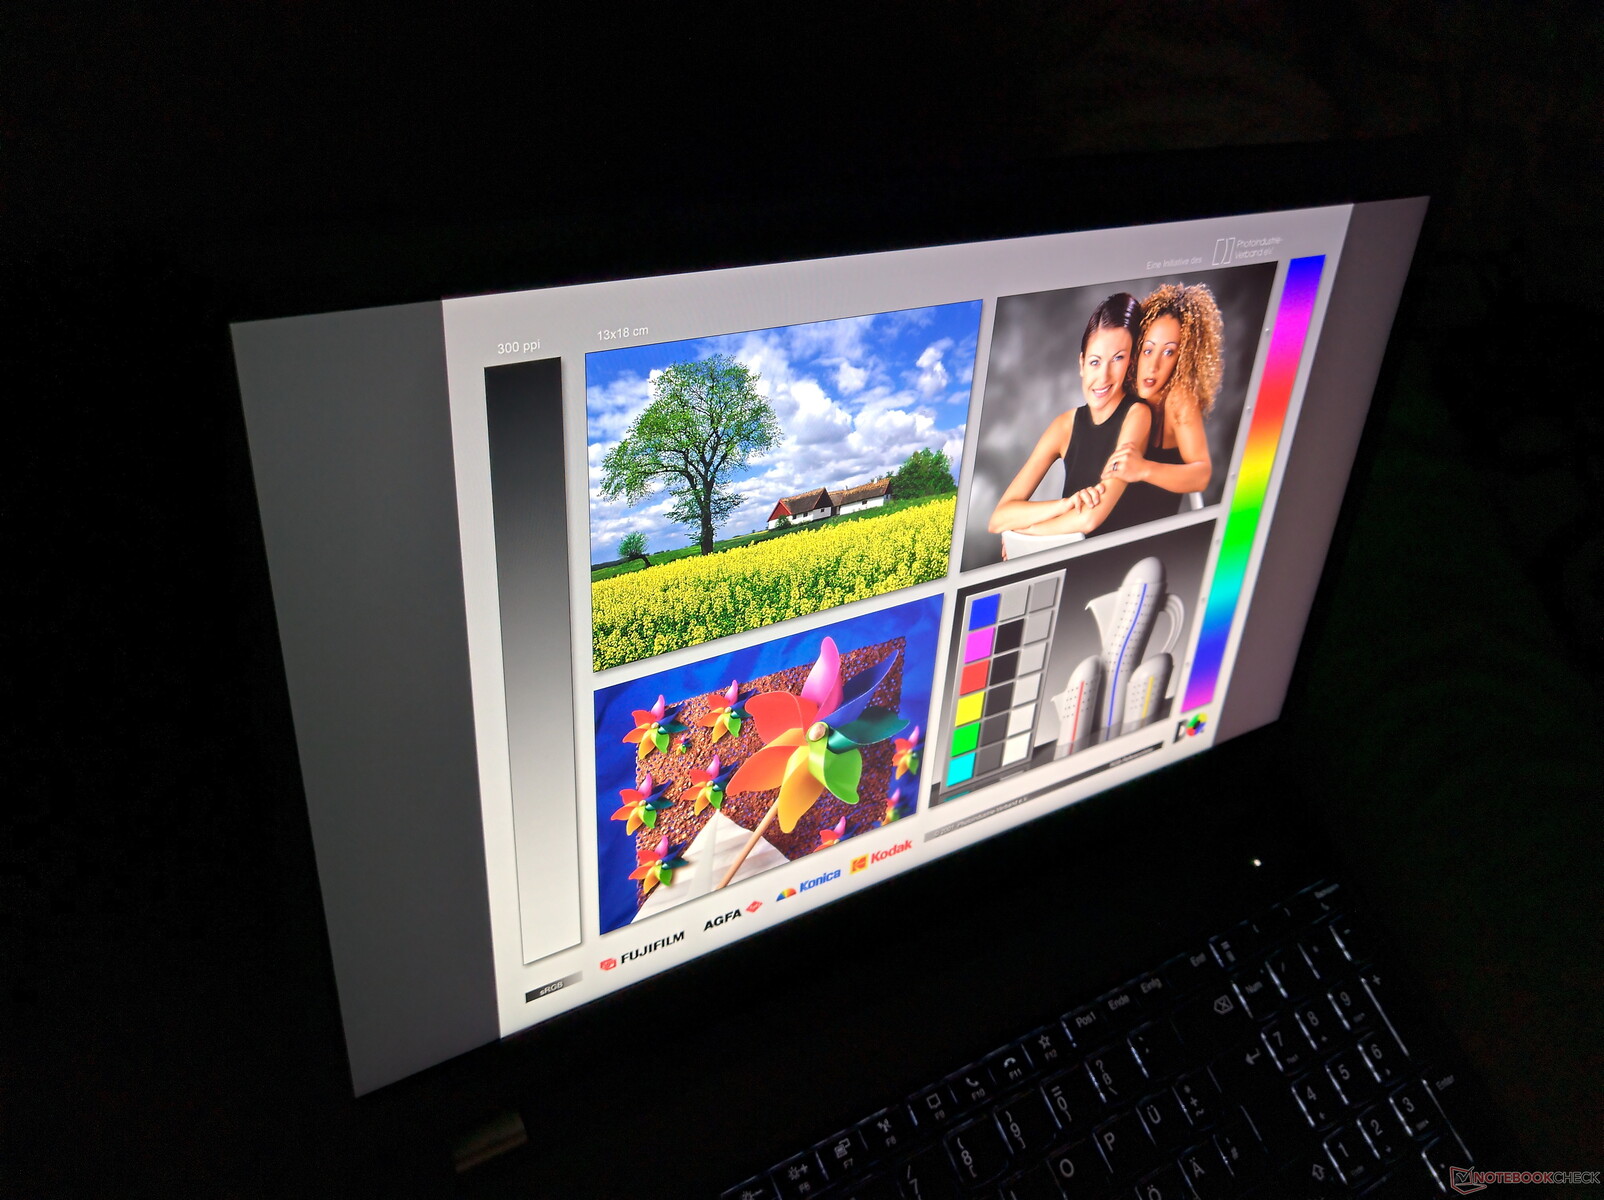
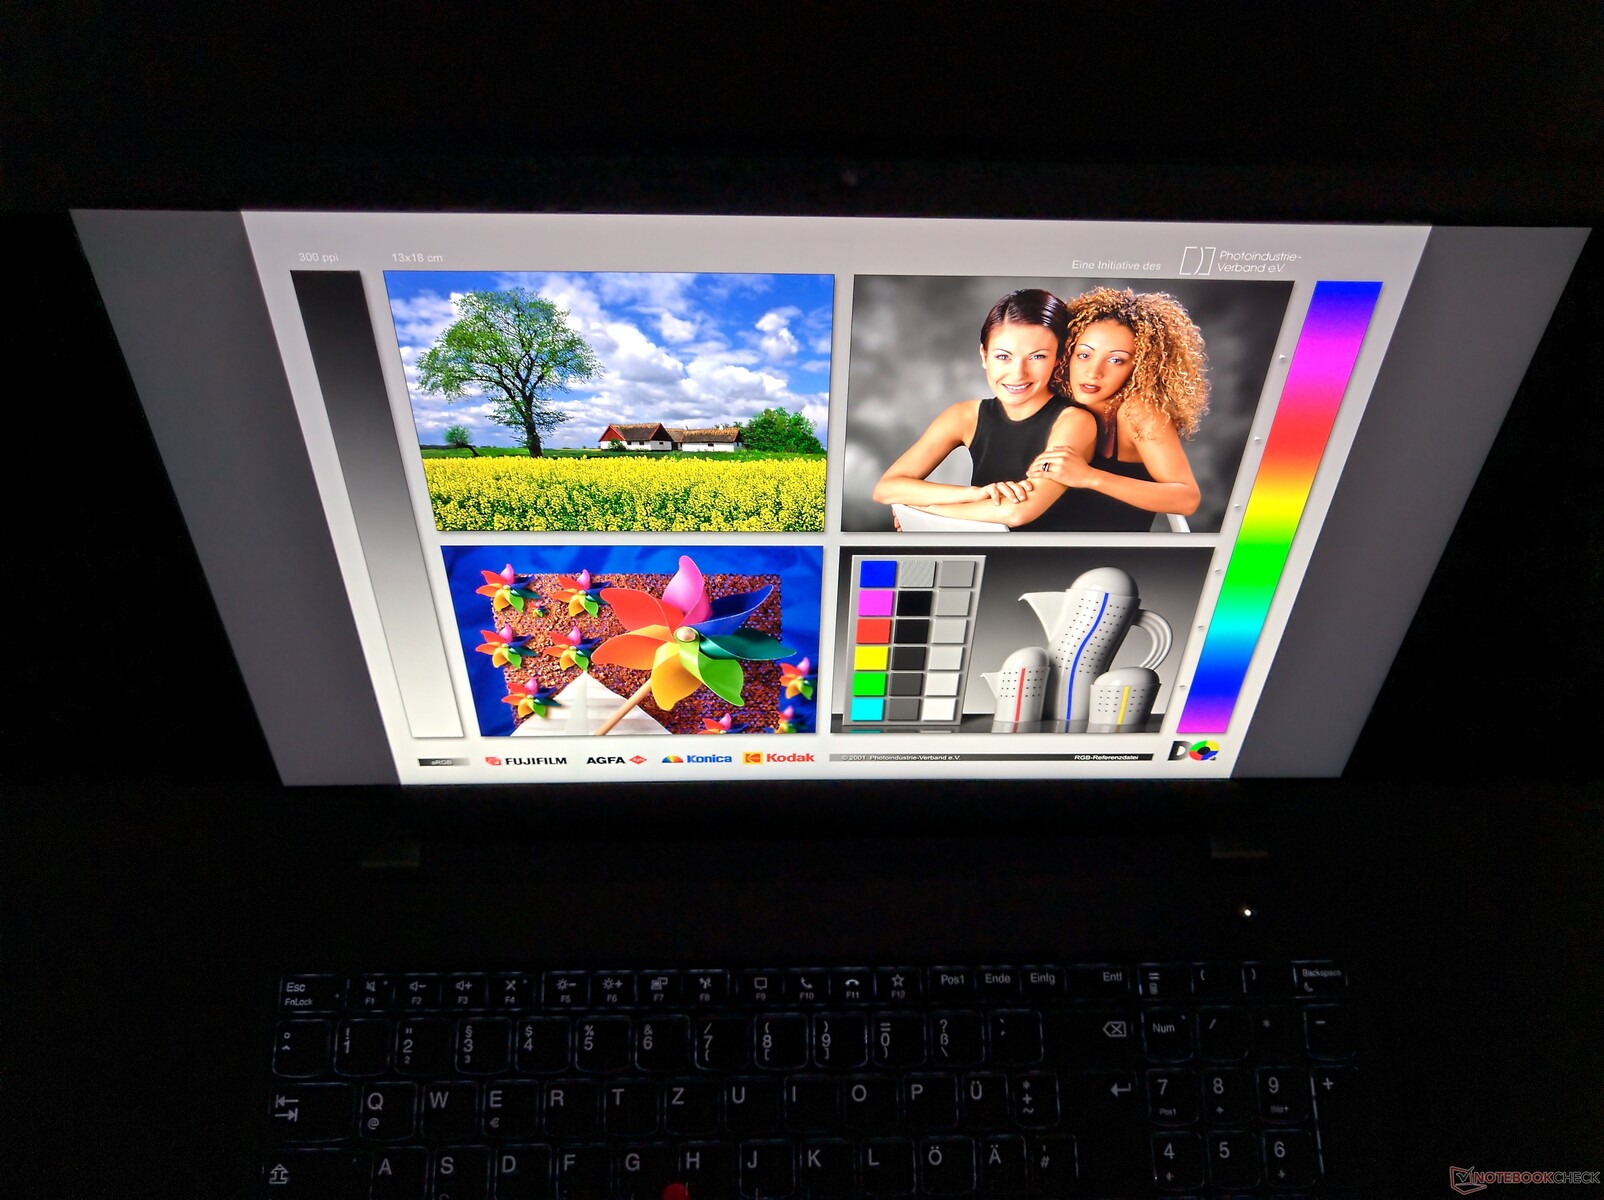
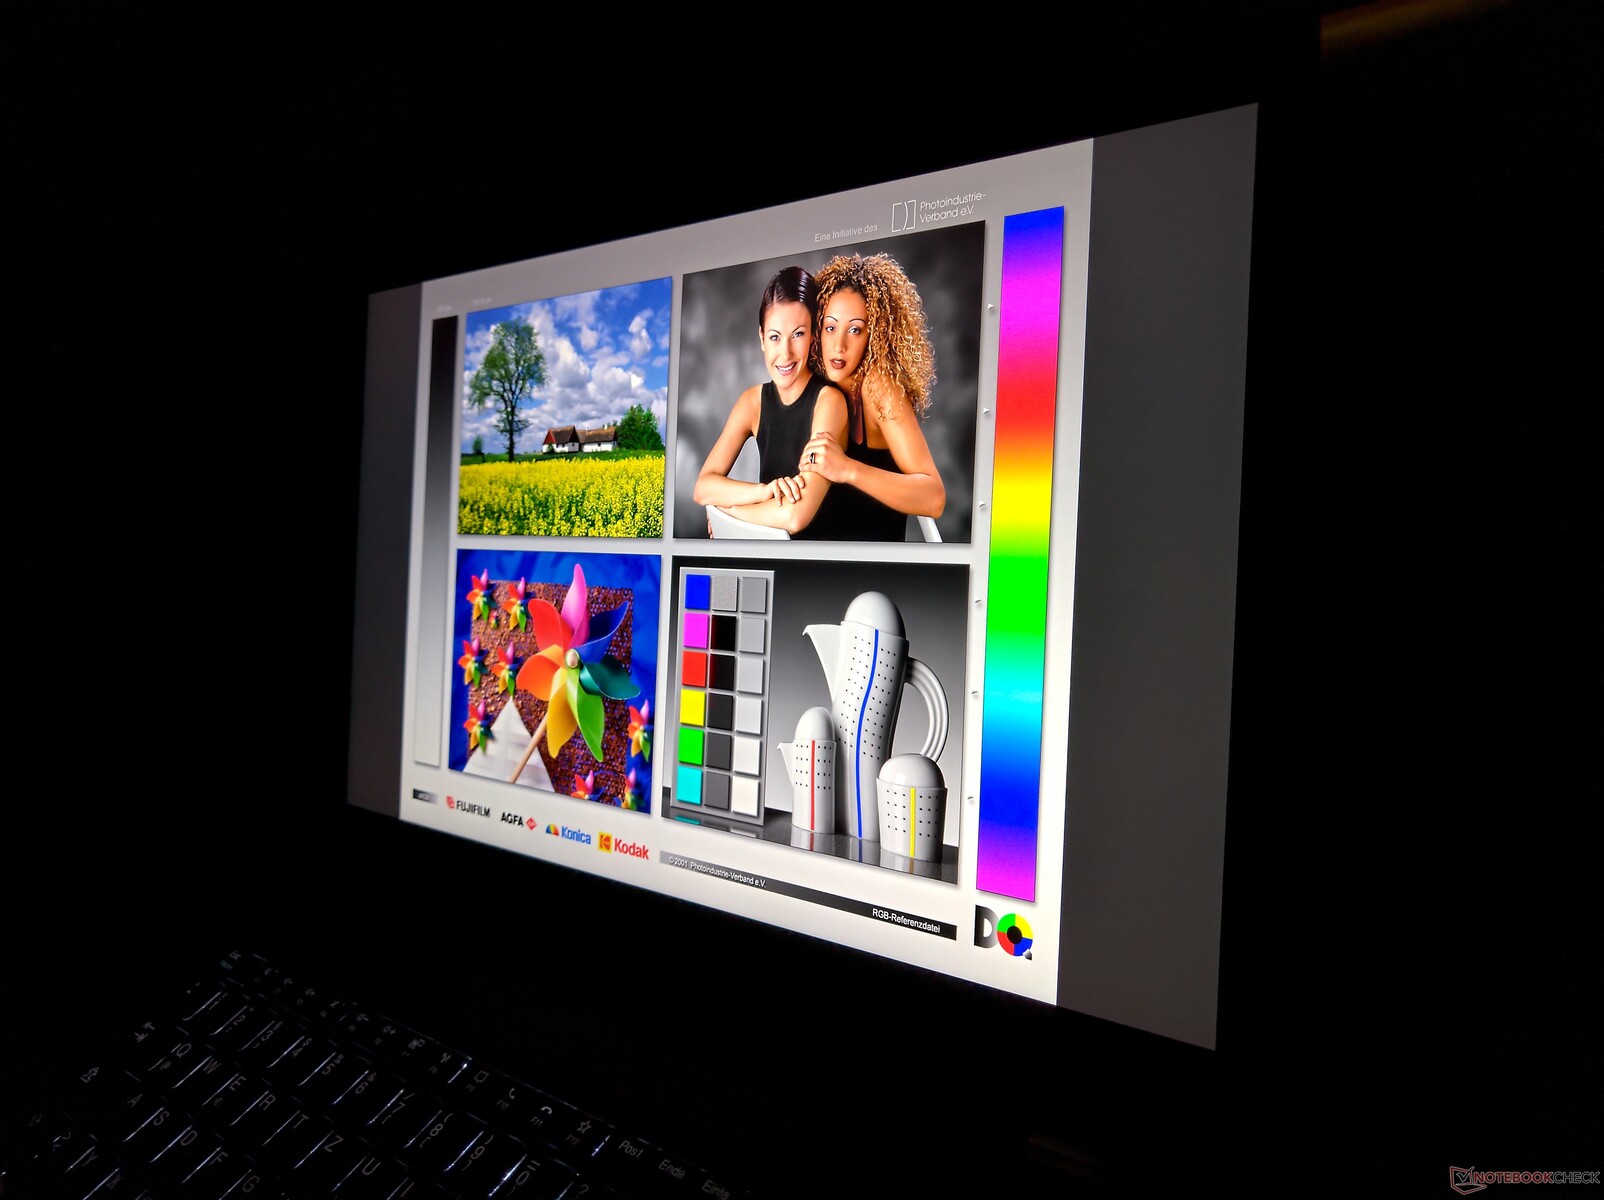
4K UHD Display: The ThinkPad T15’s Highlight
The matte 15.6-inch 4K UHD display running at a native resolution of 3840x2160 is undoubtedly the ThinkPad T15’s highlight. The FHD (1920x1080) display options are virtually identical to those in the ThinkPad E15 and ThinkPad L15. Those lower-resolution displays, available both with and without touch, feature a lower maximum brightness (250 nits) as well as lower color-space coverage (45% NTSC). If you are interested in higher-quality FHD displays in a ThinkPad, your two choices are the ThinkPad X1 Extreme and the ThinkPad P15 Gen 1.
According to Lenovo, the 4K UHD display in the T15 is supposed to be twice as bright, and our review model was able to make good on that promise. The panel, which we already encountered in the T590, managed an average maximum brightness of 501 nits – twice as much as the more affordable ThinkPad E15 or ProBook 455 G7.
| |||||||||||||||||||||||||
Brightness Distribution: 91 %
Center on Battery: 494 cd/m²
Contrast: 1397:1 (Black: 0.35 cd/m²)
ΔE ColorChecker Calman: 3 | ∀{0.5-29.43 Ø4.73}
calibrated: 0.8
ΔE Greyscale Calman: 4 | ∀{0.09-98 Ø4.97}
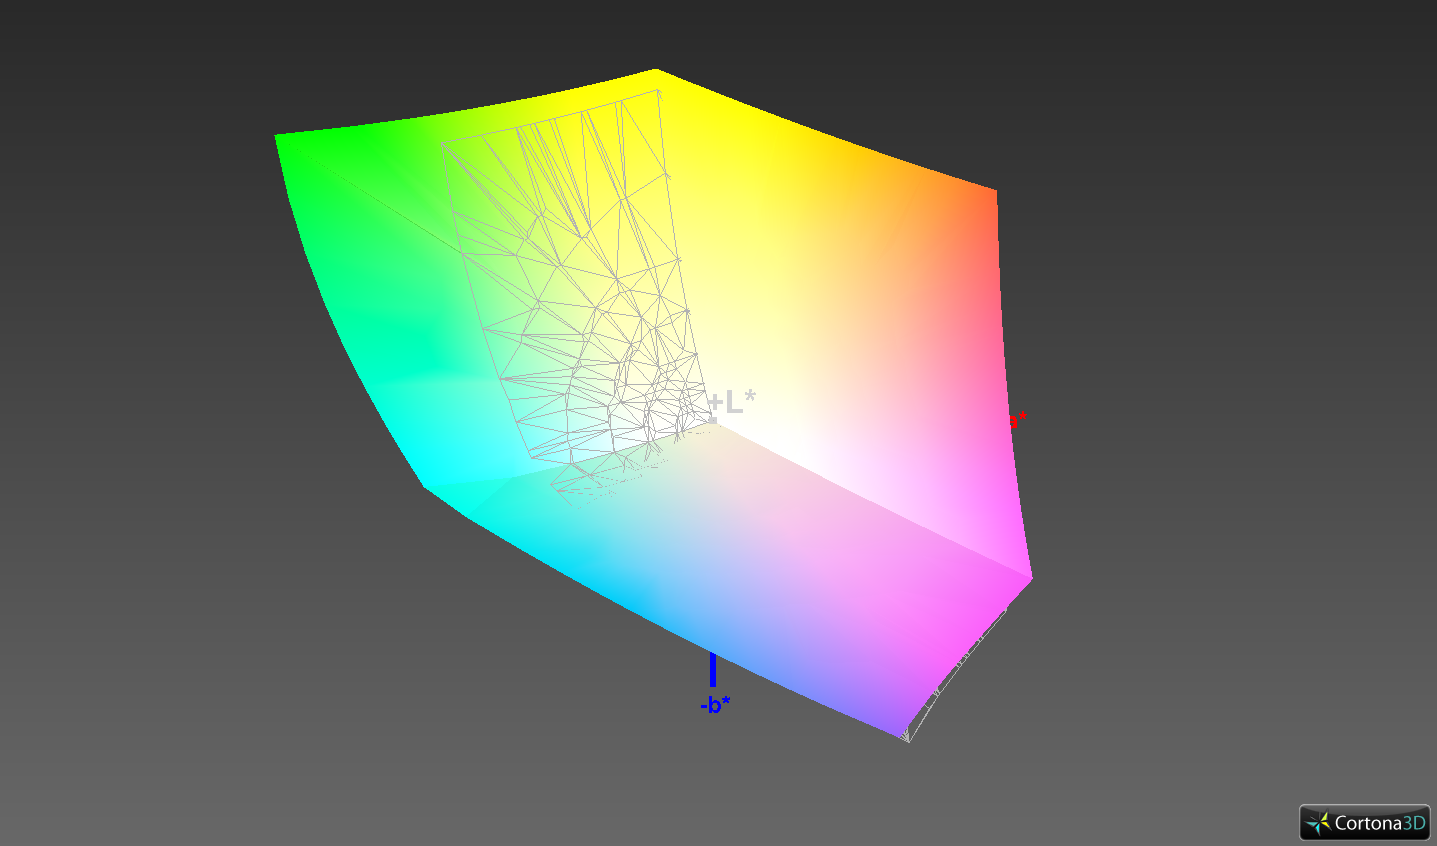
98.1% sRGB (Argyll 1.6.3 3D)
84.7% AdobeRGB 1998 (Argyll 1.6.3 3D)
95.5% AdobeRGB 1998 (Argyll 3D)
98.1% sRGB (Argyll 3D)
80.7% Display P3 (Argyll 3D)
Gamma: 2.24
CCT: 7400 K
| Lenovo ThinkPad T15 Gen1-20S7S02U00 NE156QUM-N66, IPS LED, 3840x2160, 15.6" | Lenovo ThinkPad T590-20N40009GE NE156QUM-N66, IPS, 3840x2160, 15.6" | Lenovo ThinkPad E15 20RD0011GE NV156FHM-N48, IPS LED, 1920x1080, 15.6" | HP ProBook 455 G7-175W8EA AUO, B156HW02, IPS, 1920x1080, 15.6" | |
|---|---|---|---|---|
| Display | -1% | -49% | -51% | |
| Display P3 Coverage (%) | 80.7 | 80.2 -1% | 40.25 -50% | 37.92 -53% |
| sRGB Coverage (%) | 98.1 | 97.8 0% | 57.7 -41% | 57.1 -42% |
| AdobeRGB 1998 Coverage (%) | 95.5 | 95 -1% | 41.59 -56% | 39.18 -59% |
| Response Times | -21% | -43% | -9% | |
| Response Time Grey 50% / Grey 80% * (ms) | 42 ? | 48.4 ? -15% | 49.6 ? -18% | 41 ? 2% |
| Response Time Black / White * (ms) | 21.6 ? | 27.2 ? -26% | 36 ? -67% | 26 ? -20% |
| PWM Frequency (Hz) | 1250 ? | |||
| Screen | 3% | -126% | -86% | |
| Brightness middle (cd/m²) | 489 | 531 9% | 283 -42% | 282 -42% |
| Brightness (cd/m²) | 501 | 523 4% | 258 -49% | 264 -47% |
| Brightness Distribution (%) | 91 | 96 5% | 81 -11% | 88 -3% |
| Black Level * (cd/m²) | 0.35 | 0.37 -6% | 0.22 37% | 0.19 46% |
| Contrast (:1) | 1397 | 1435 3% | 1286 -8% | 1484 6% |
| Colorchecker dE 2000 * | 3 | 2.5 17% | 7.9 -163% | 5.56 -85% |
| Colorchecker dE 2000 max. * | 5.1 | 4.4 14% | 23.6 -363% | 19.07 -274% |
| Colorchecker dE 2000 calibrated * | 0.8 | 1 -25% | 5.8 -625% | 4.5 -463% |
| Greyscale dE 2000 * | 4 | 3.5 12% | 6.6 -65% | 3.57 11% |
| Gamma | 2.24 98% | 2.31 95% | 2.18 101% | 2.61 84% |
| CCT | 7400 88% | 7189 90% | 5735 113% | 6895 94% |
| Color Space (Percent of AdobeRGB 1998) (%) | 84.7 | 84.3 0% | 37 -56% | 36 -57% |
| Color Space (Percent of sRGB) (%) | 98.1 | 97.7 0% | 57.1 -42% | 57 -42% |
| Total Average (Program / Settings) | -6% /
-1% | -73% /
-101% | -49% /
-70% |
* ... smaller is better
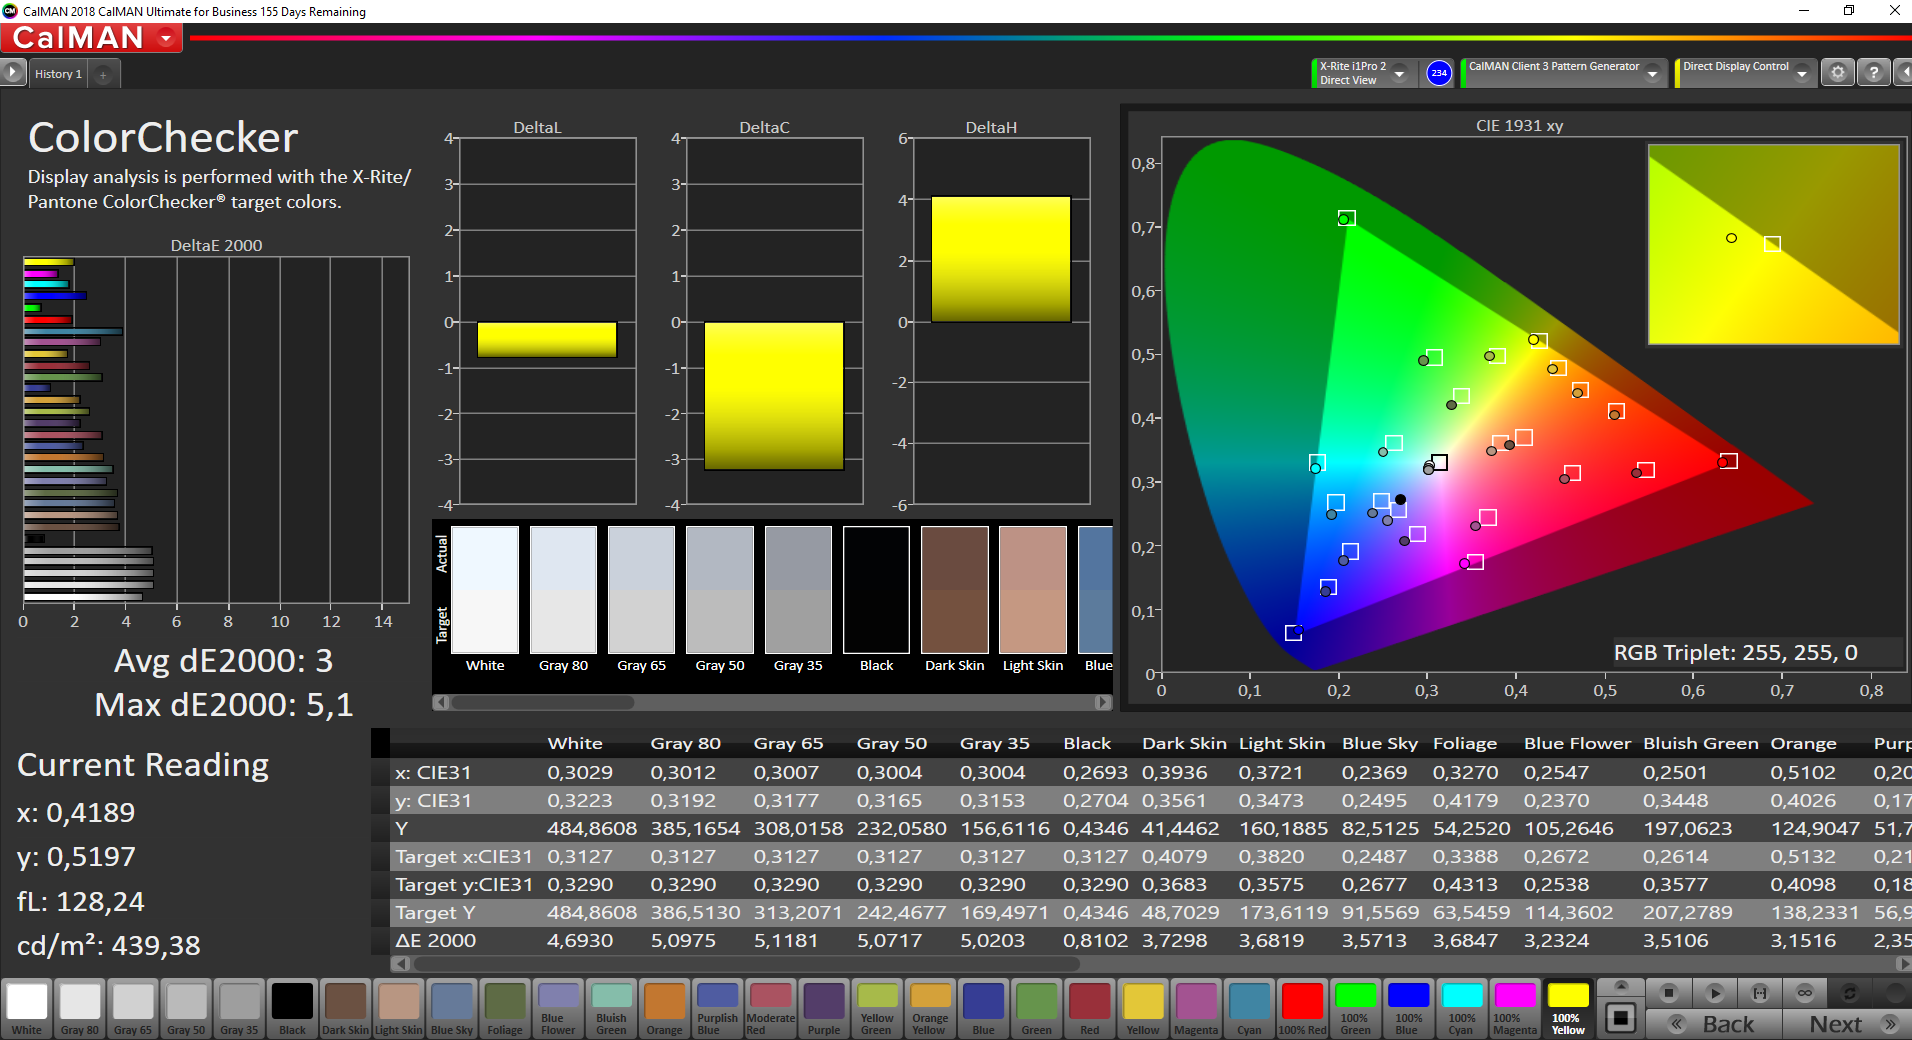
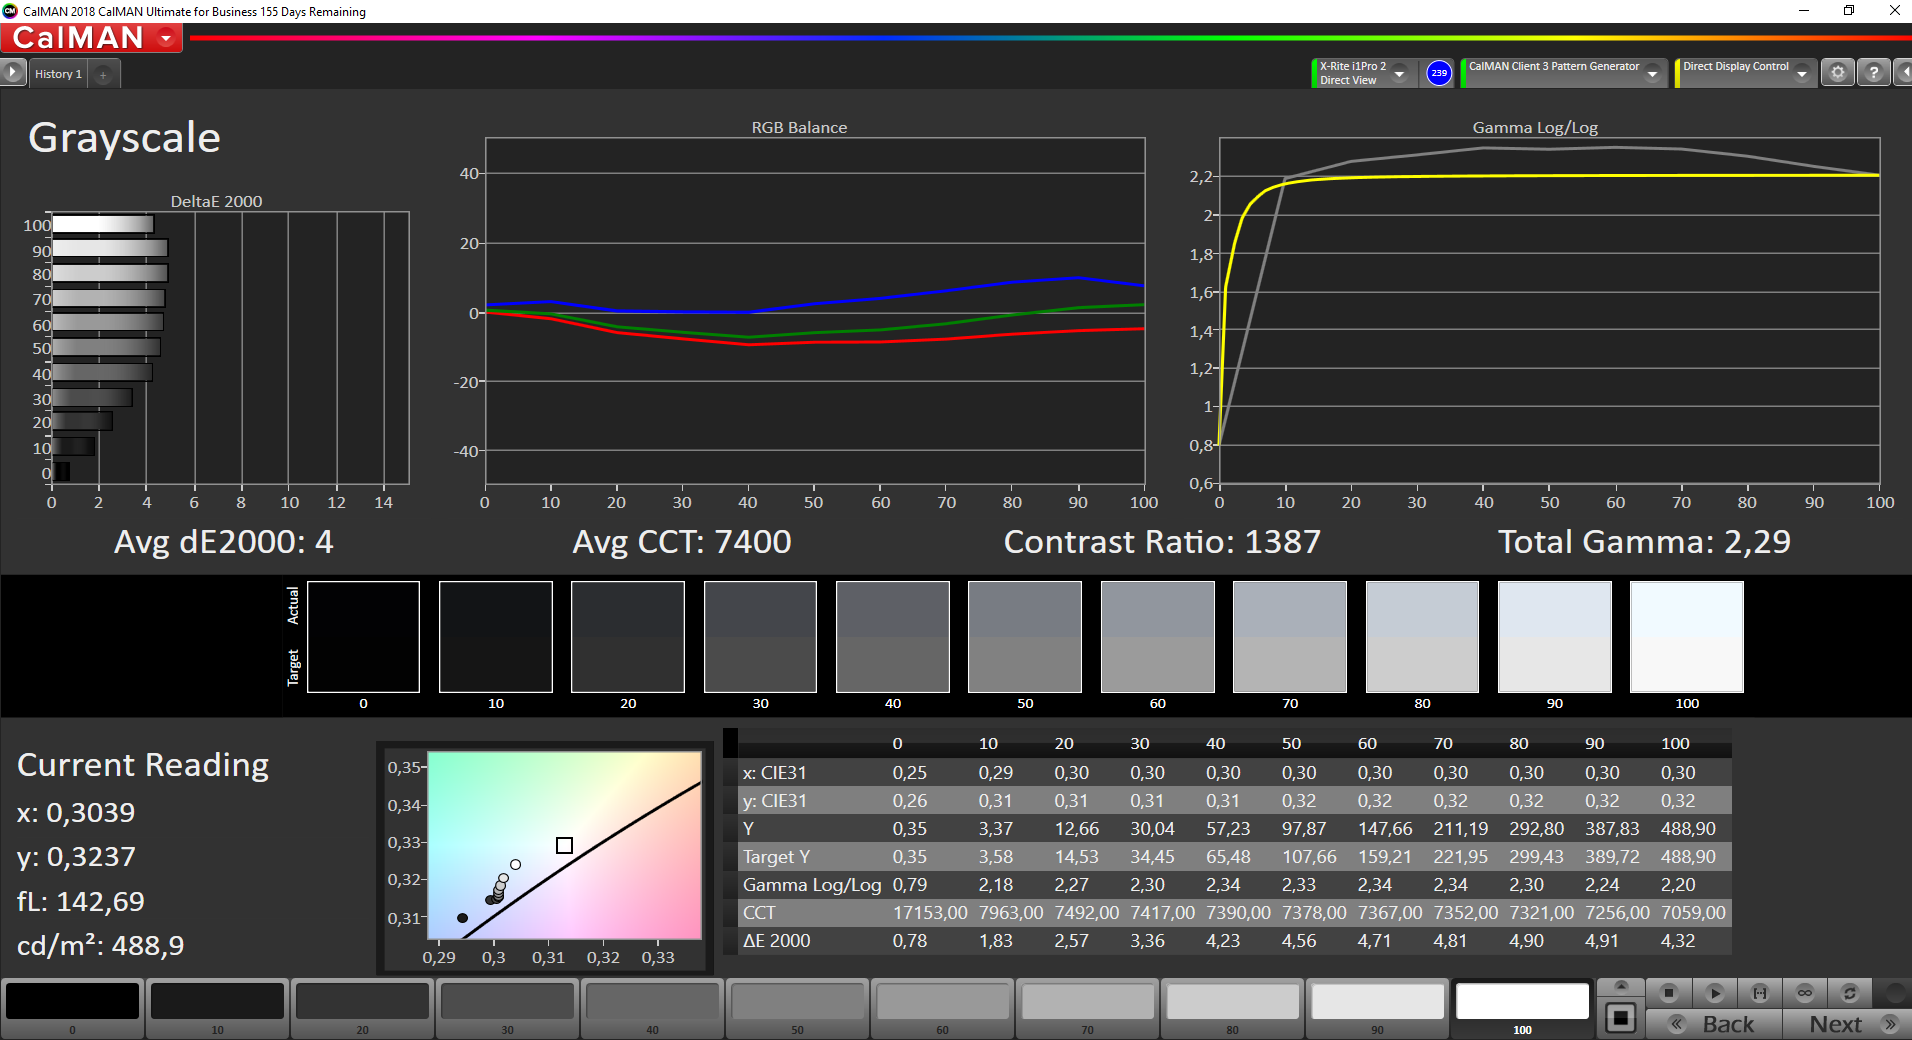
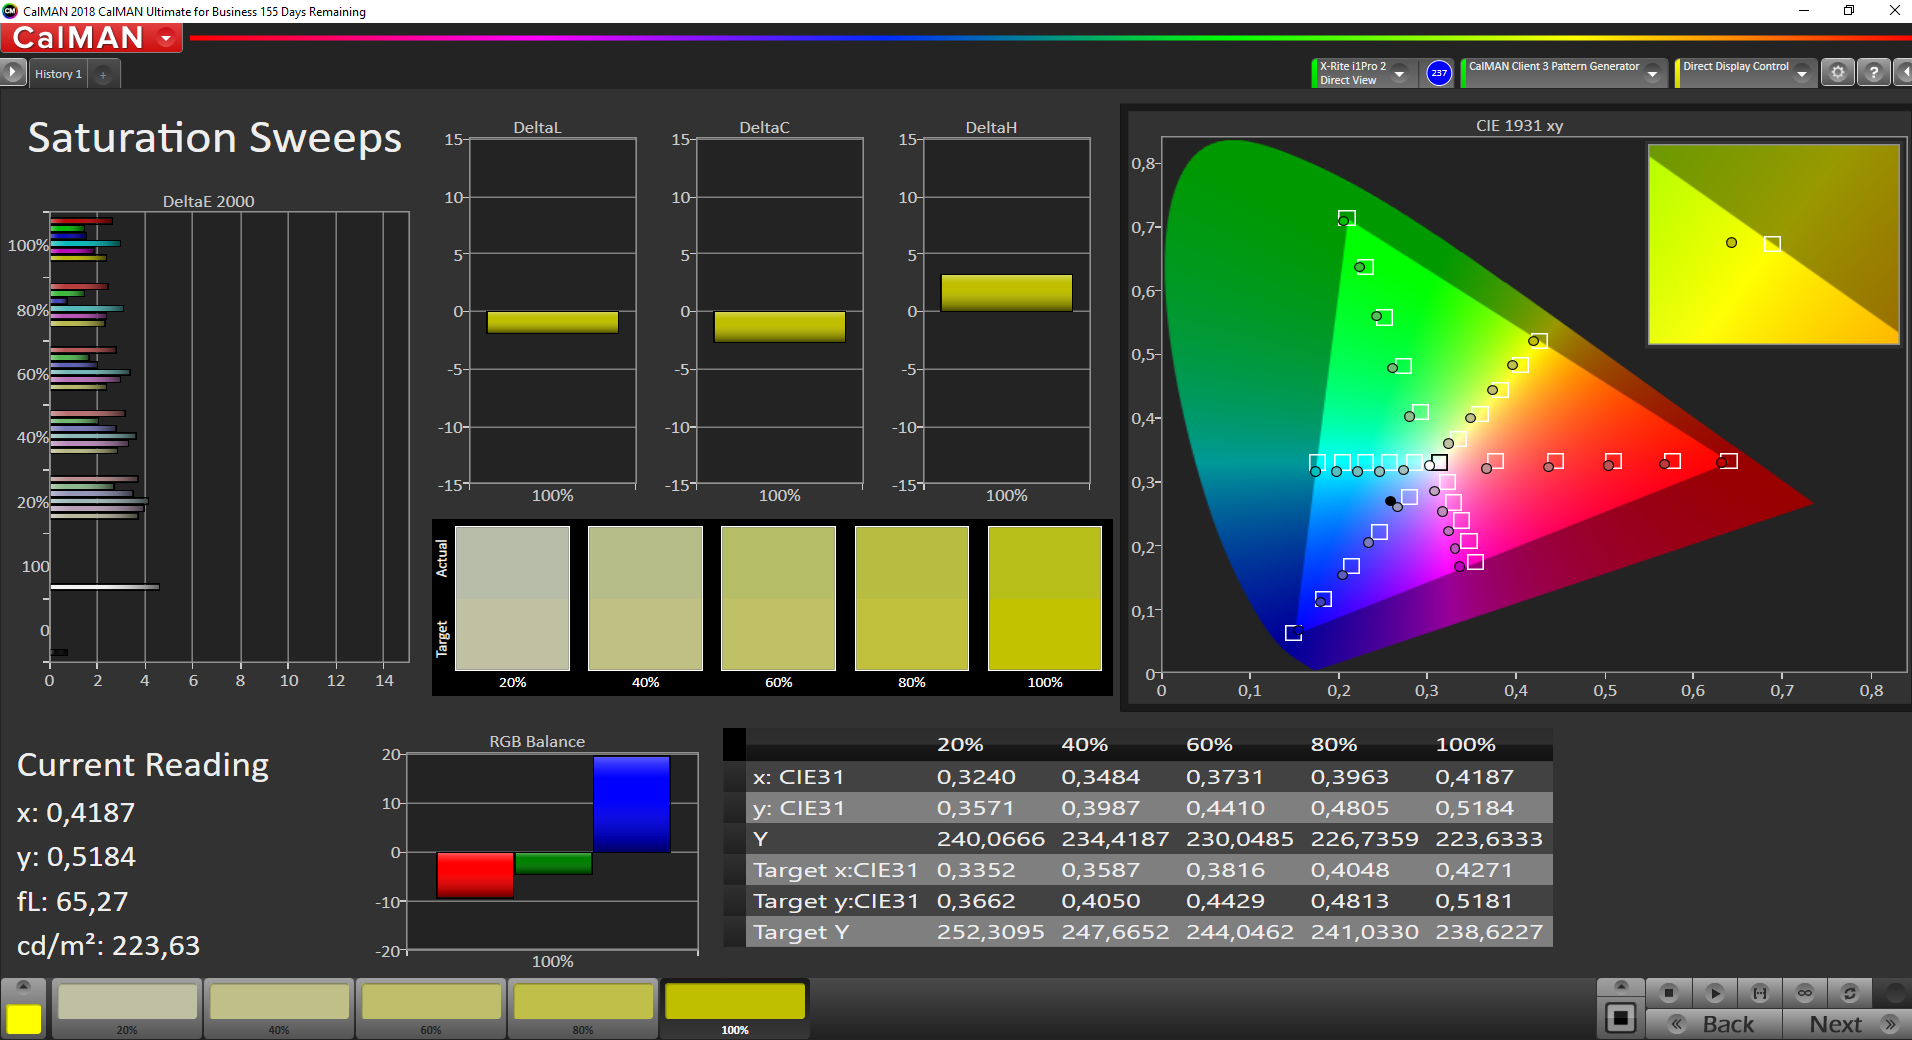
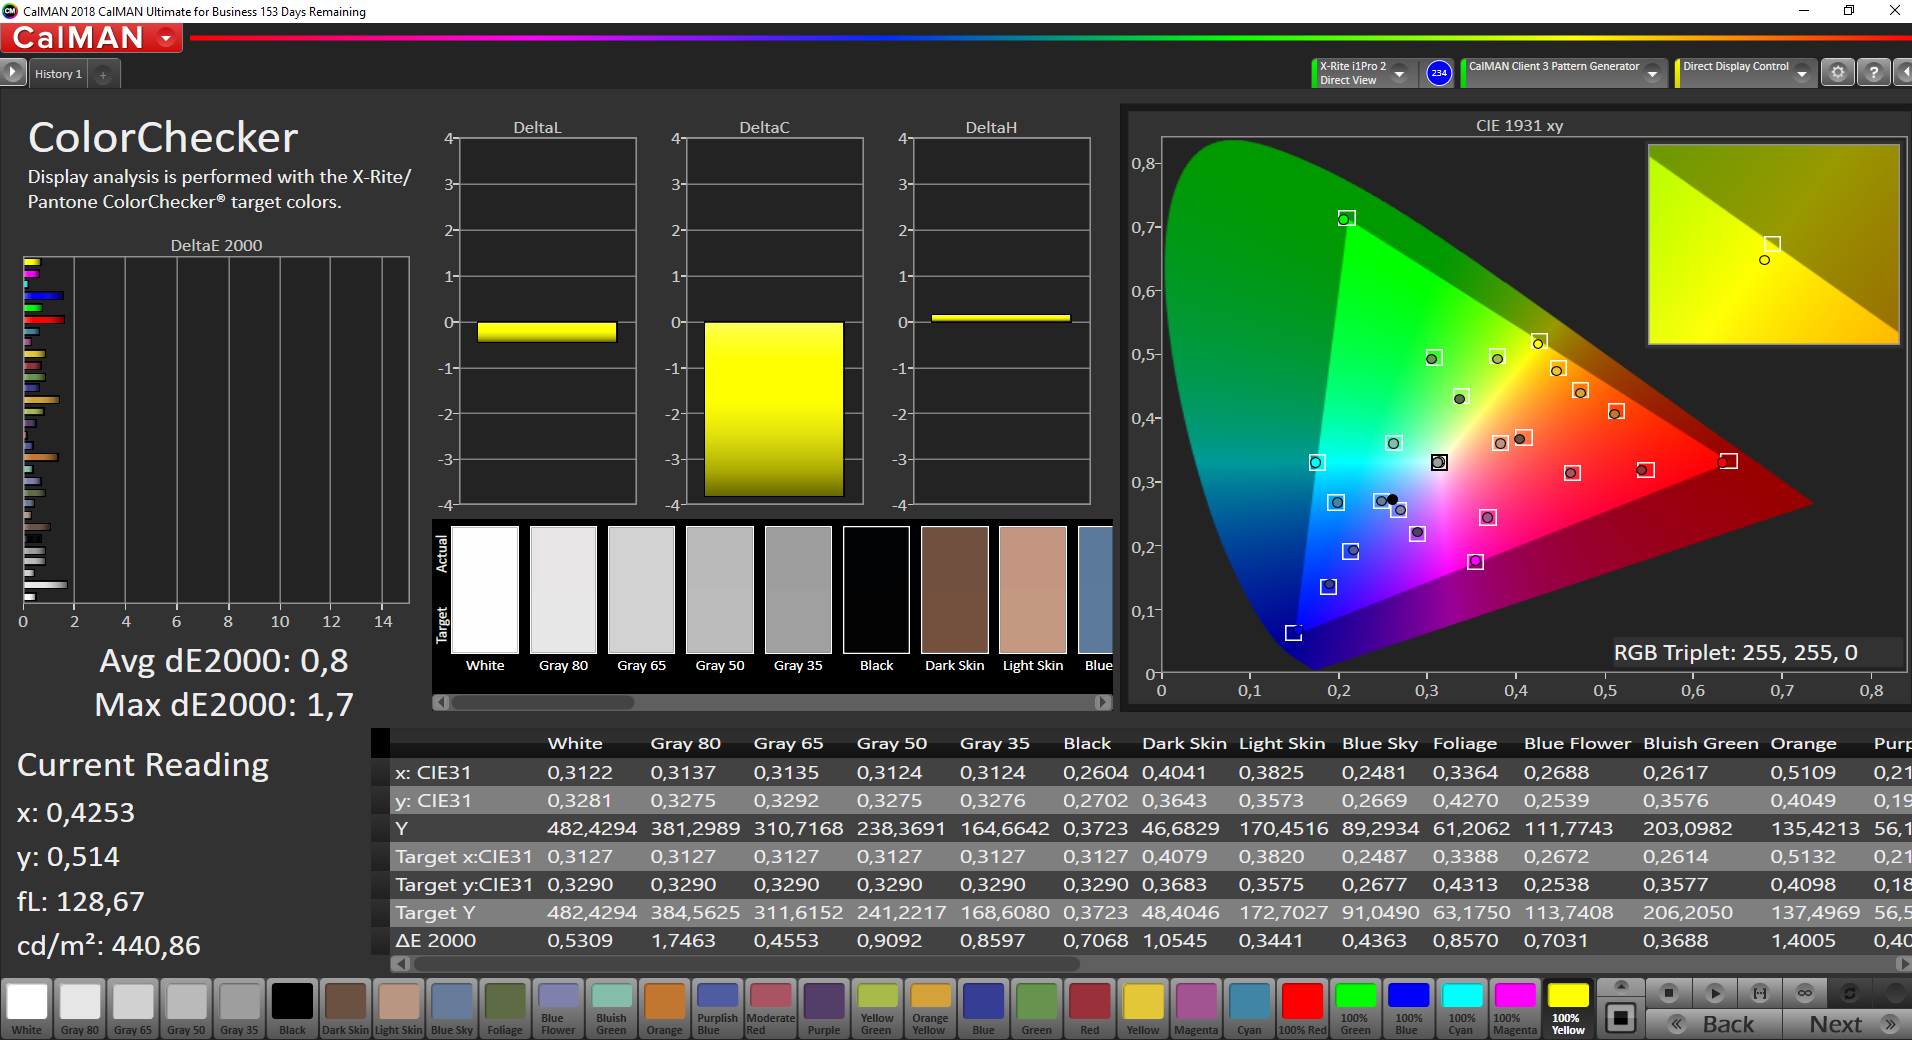

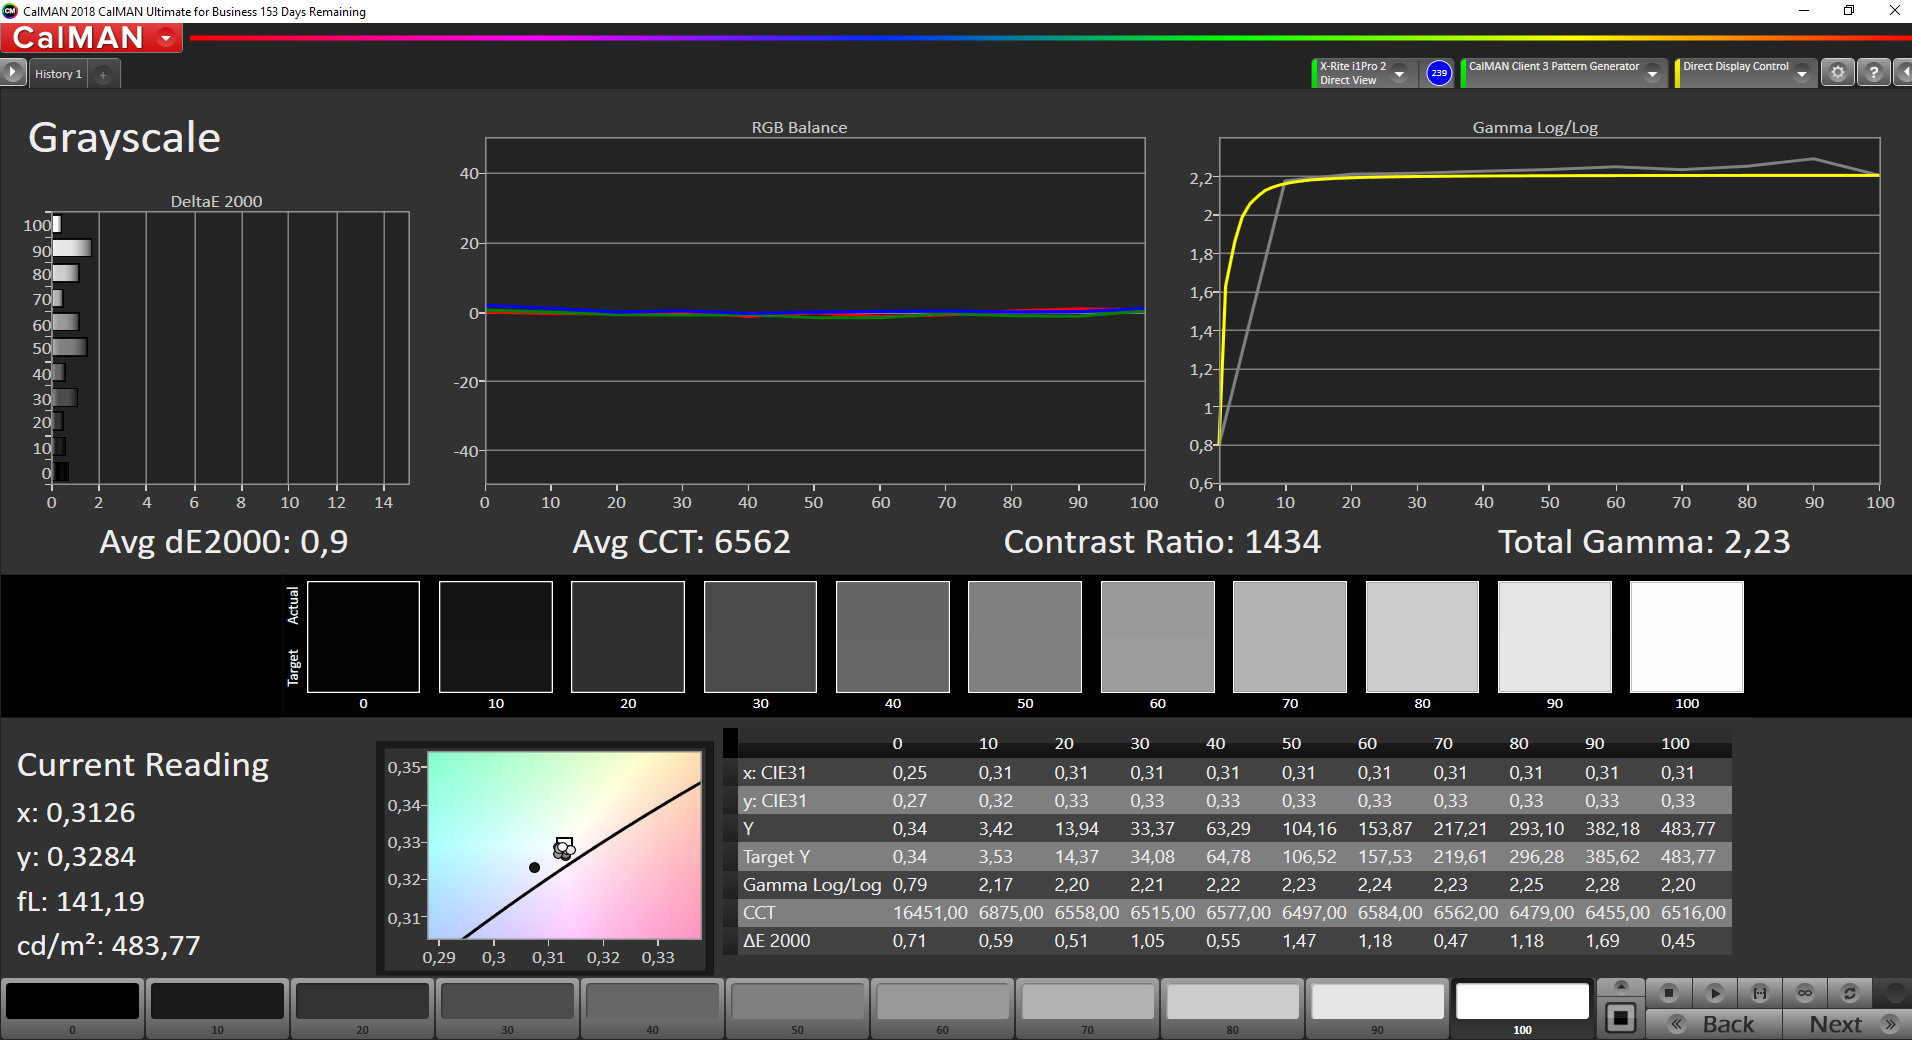
Colors, which are determined by using an X-Rite i1 Pro 2 Colorimeter in combination with CalMAN, are too cool by default. This, fortunately, can be easily rectified through calibration. Colors pop thanks to the panel’s high brightness but the panel’s black level of 0.37 nits is not quite perfect. Nevertheless, the resulting contrast ratio of 1,397:1 is more than just adequate, and color representation in games and movies can be further improved via HDR.
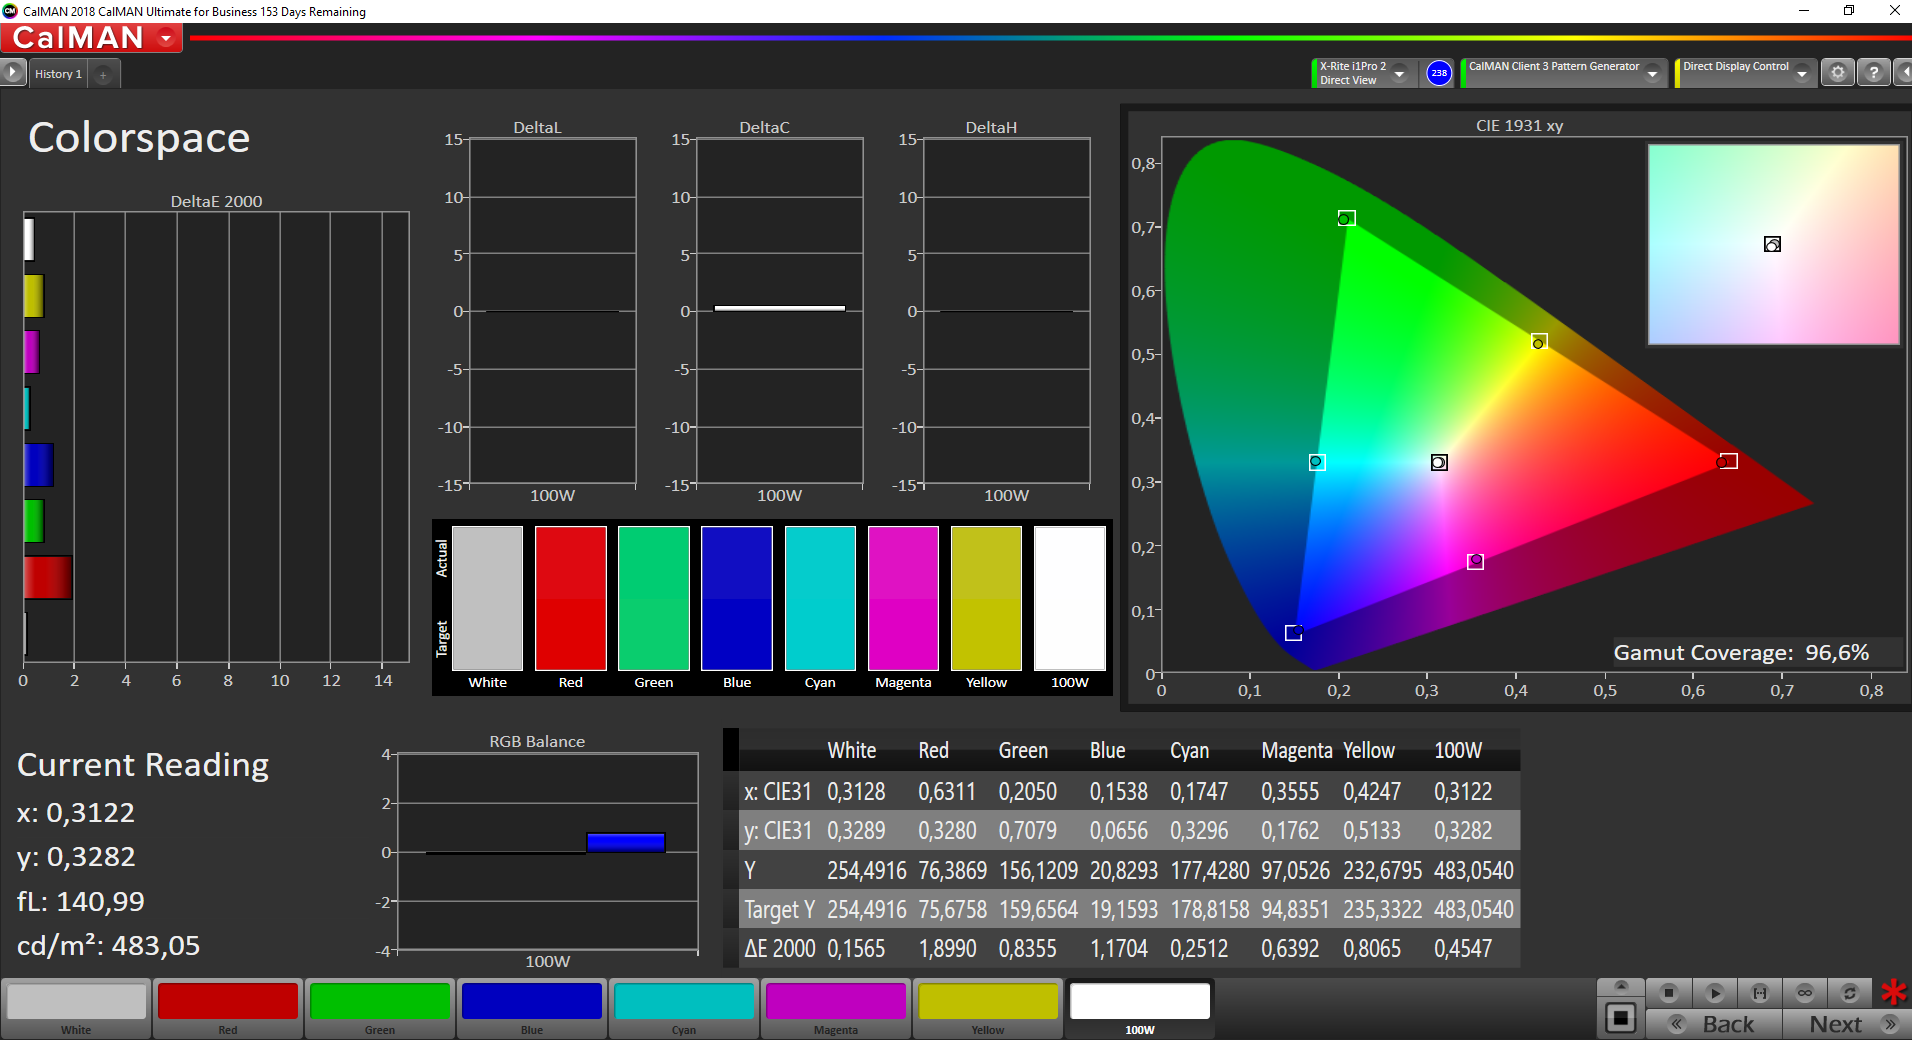
Color-space coverage is one of this particular display’s strengths. It manages to cover sRGB almost entirely, and AdobeRGB very well overall. The difference between the 84.7% of AdobeRGB coverage we determined and Lenovo’s claims can be explained with different test methods. Using CalMAN in 2D mode results in an AdobeRGB coverage of 96.6%.

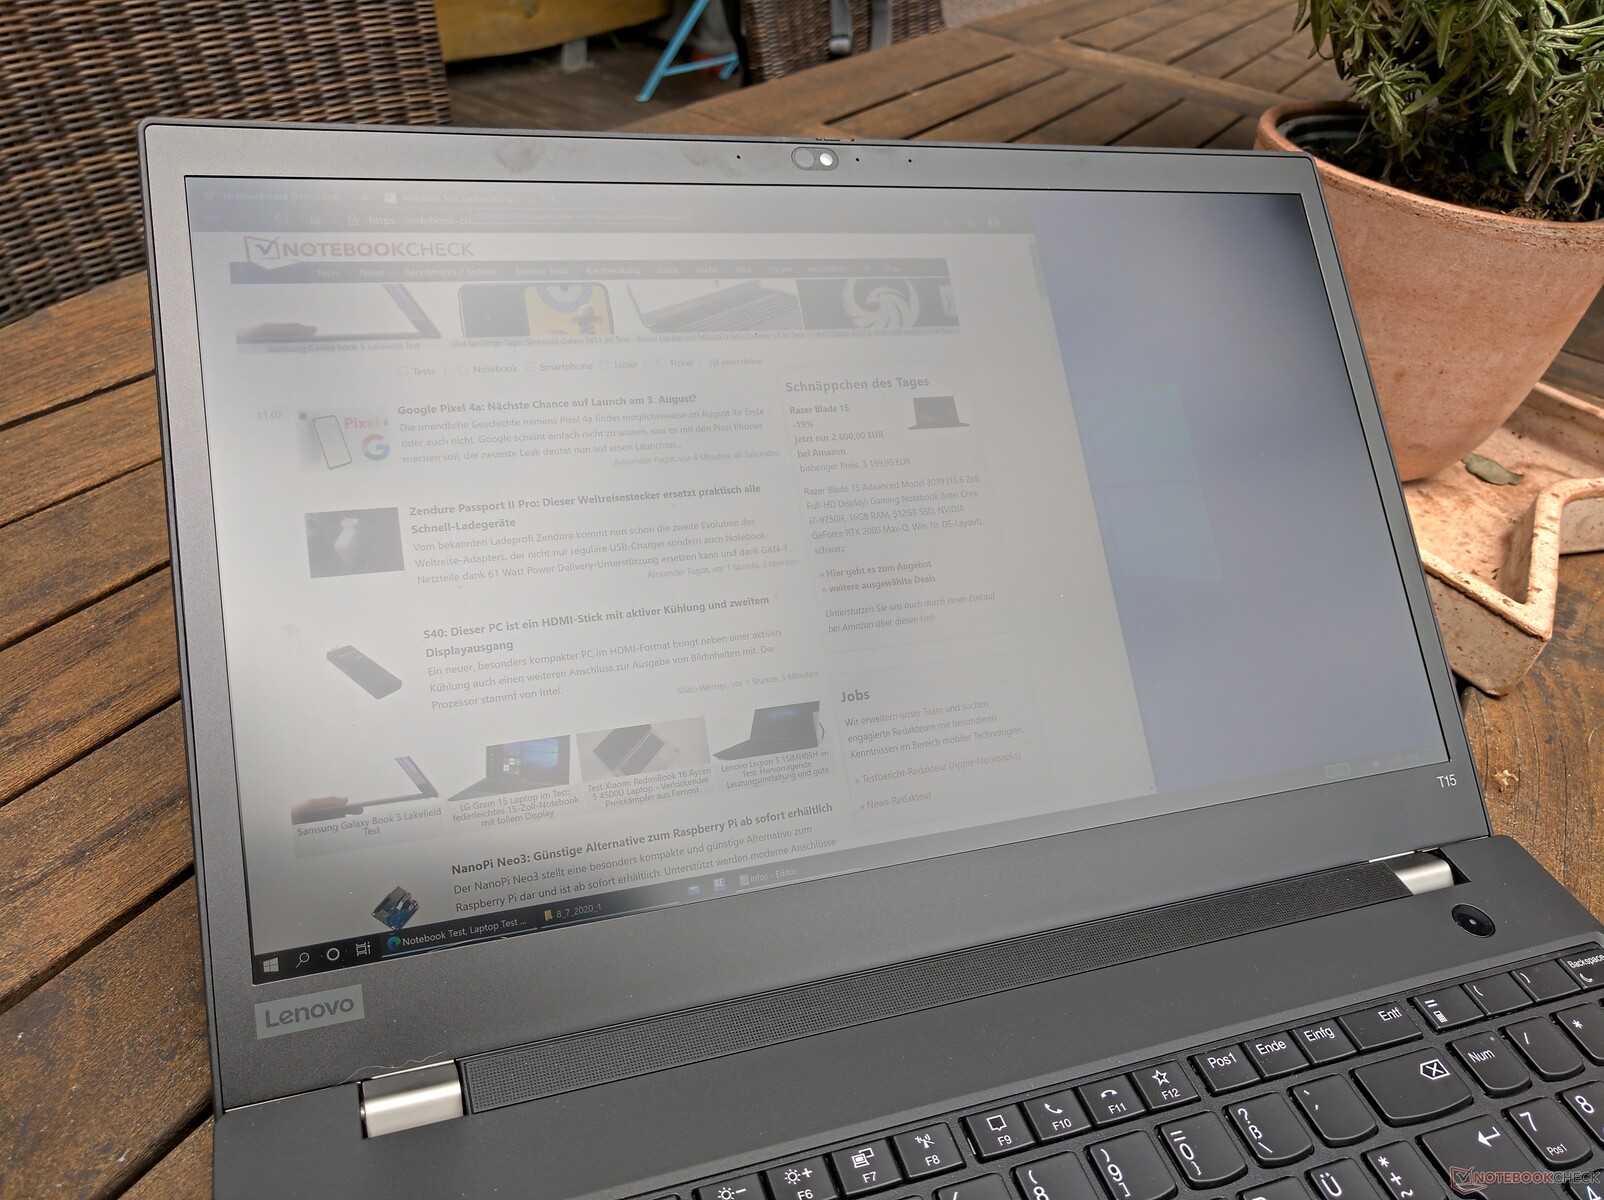
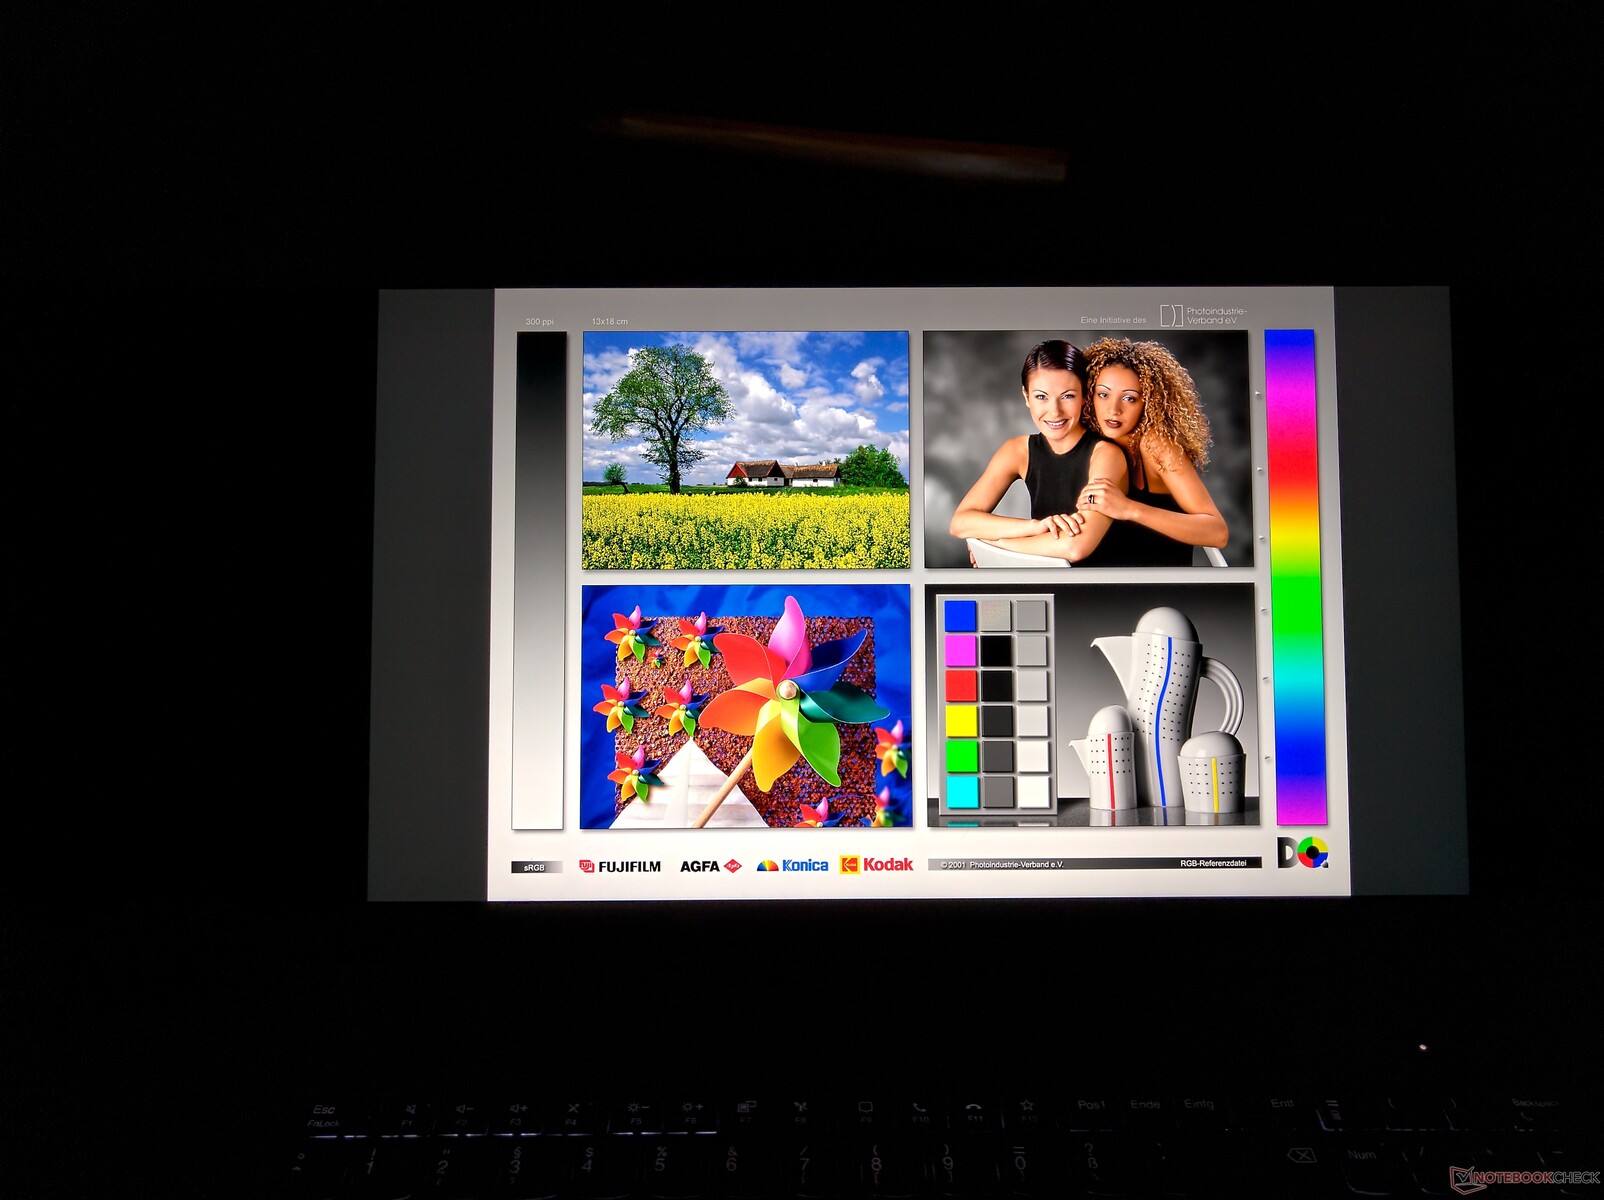
Thanks to its matte surface coating and its high brightness the display was very well usable outdoors. However, direct sunlight should still be avoided.
Display Response Times
| ↔ Response Time Black to White | ||
|---|---|---|
| 21.6 ms ... rise ↗ and fall ↘ combined | ↗ 10 ms rise | 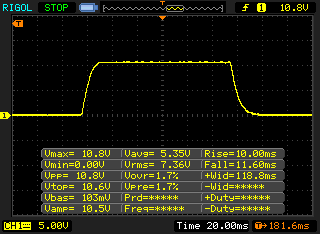 |
| ↘ 11.6 ms fall | ||
| The screen shows good response rates in our tests, but may be too slow for competitive gamers. In comparison, all tested devices range from 0.1 (minimum) to 240 (maximum) ms. » 48 % of all devices are better. This means that the measured response time is similar to the average of all tested devices (19.9 ms). | ||
| ↔ Response Time 50% Grey to 80% Grey | ||
| 42 ms ... rise ↗ and fall ↘ combined | ↗ 21.2 ms rise | 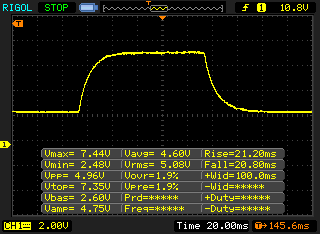 |
| ↘ 20.8 ms fall | ||
| The screen shows slow response rates in our tests and will be unsatisfactory for gamers. In comparison, all tested devices range from 0.165 (minimum) to 636 (maximum) ms. » 67 % of all devices are better. This means that the measured response time is worse than the average of all tested devices (31.1 ms). | ||
Screen Flickering / PWM (Pulse-Width Modulation)
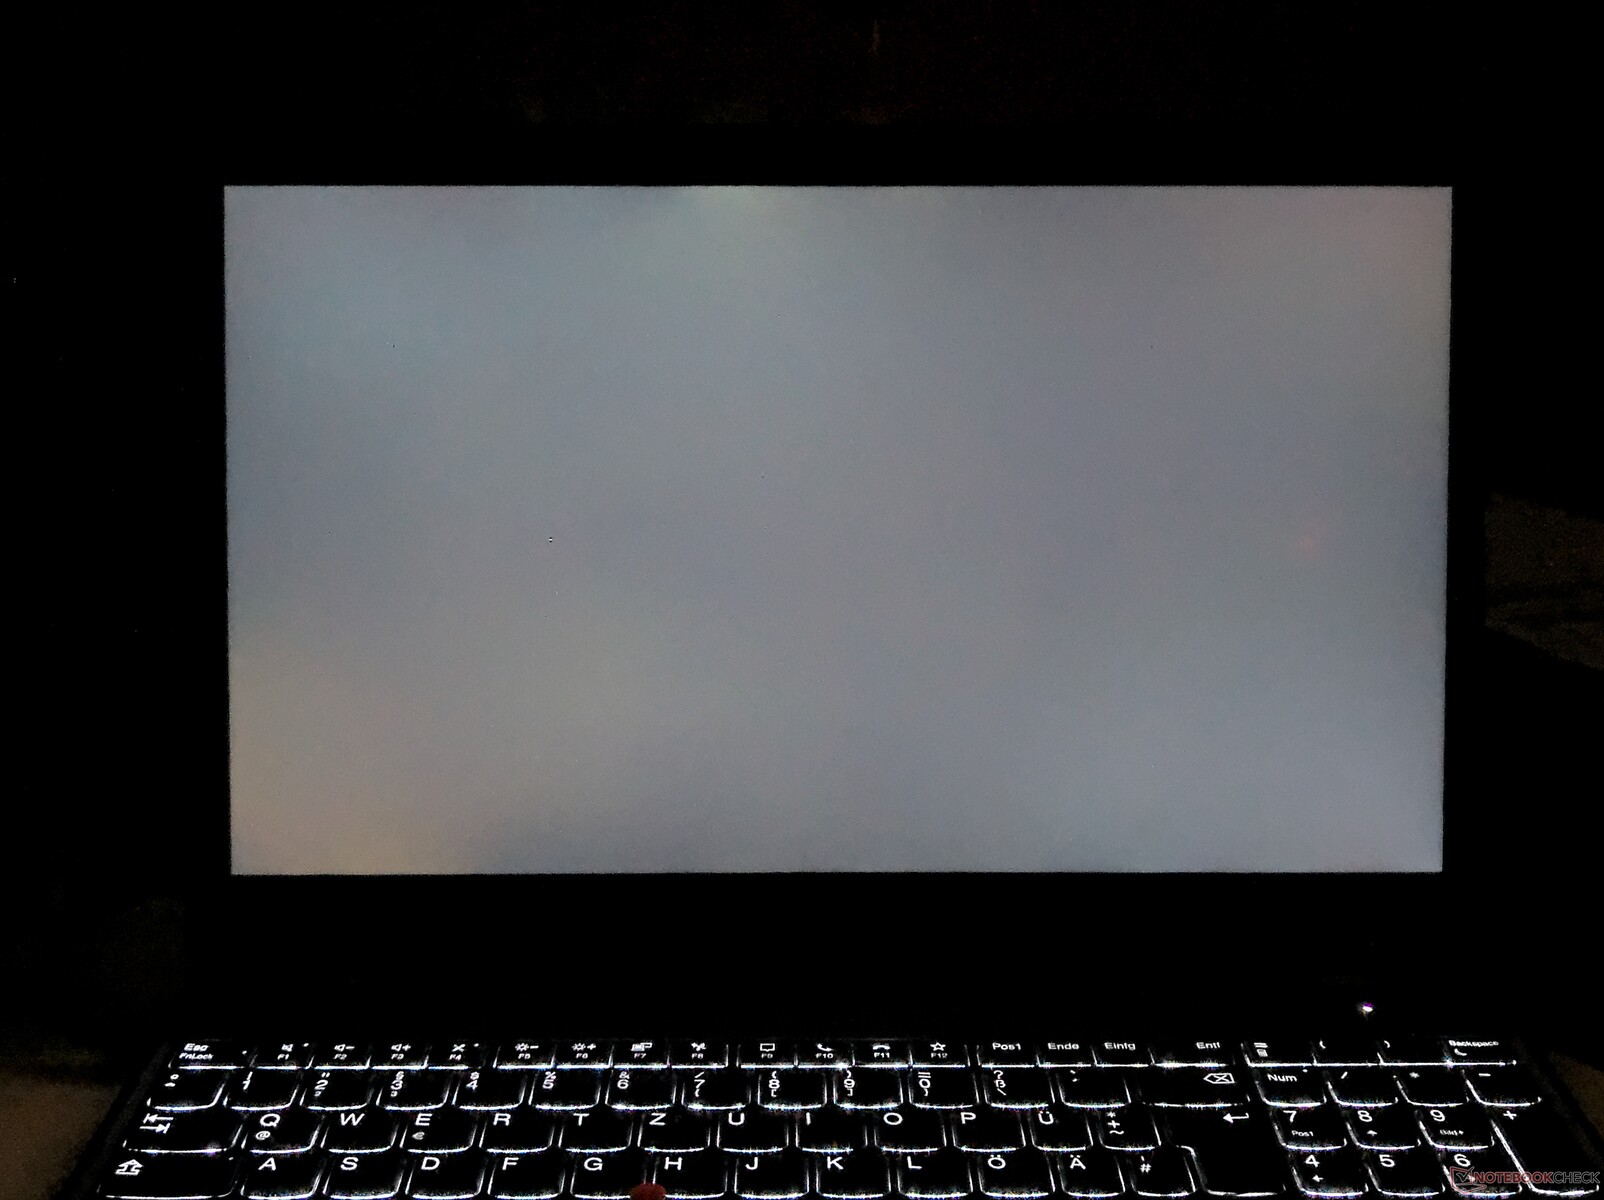
| Screen flickering / PWM not detected | 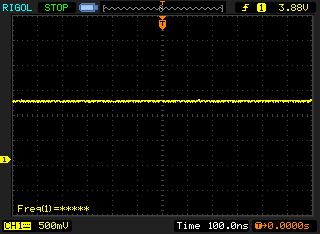 | ||
In comparison: 52 % of all tested devices do not use PWM to dim the display. If PWM was detected, an average of 7798 (minimum: 5 - maximum: 343500) Hz was measured. | |||
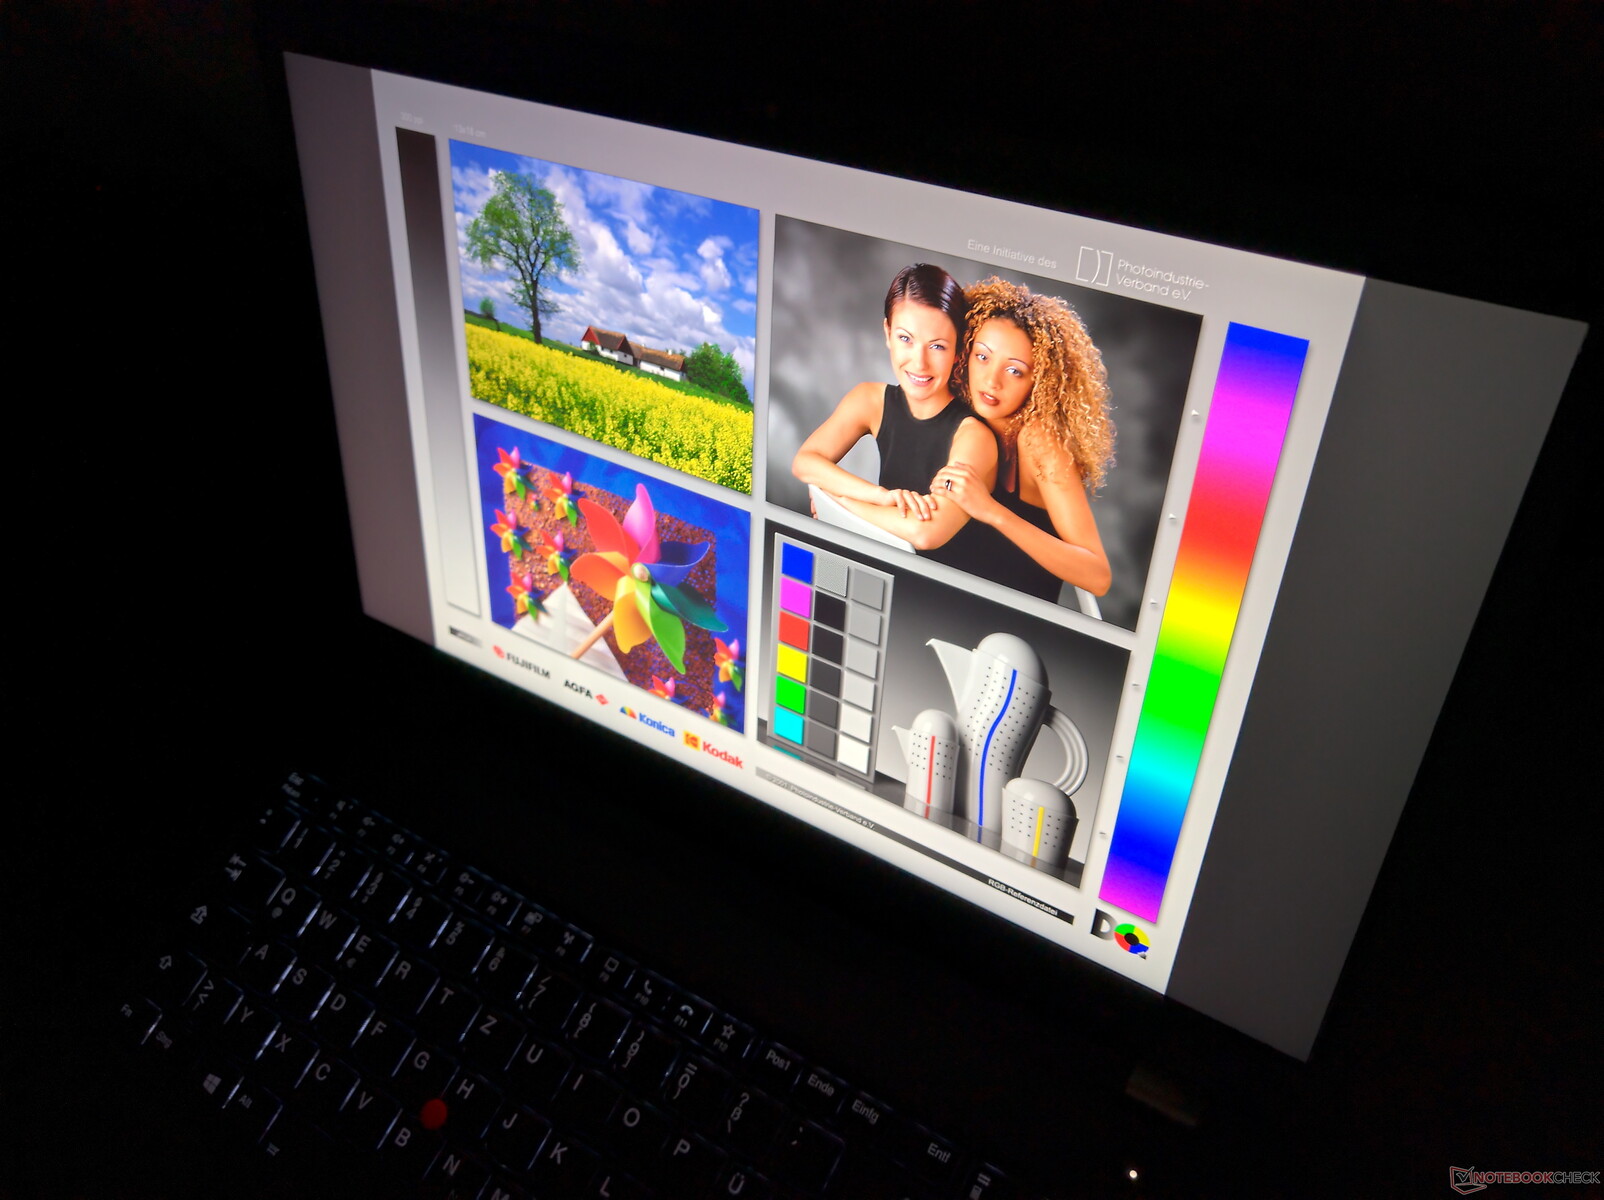
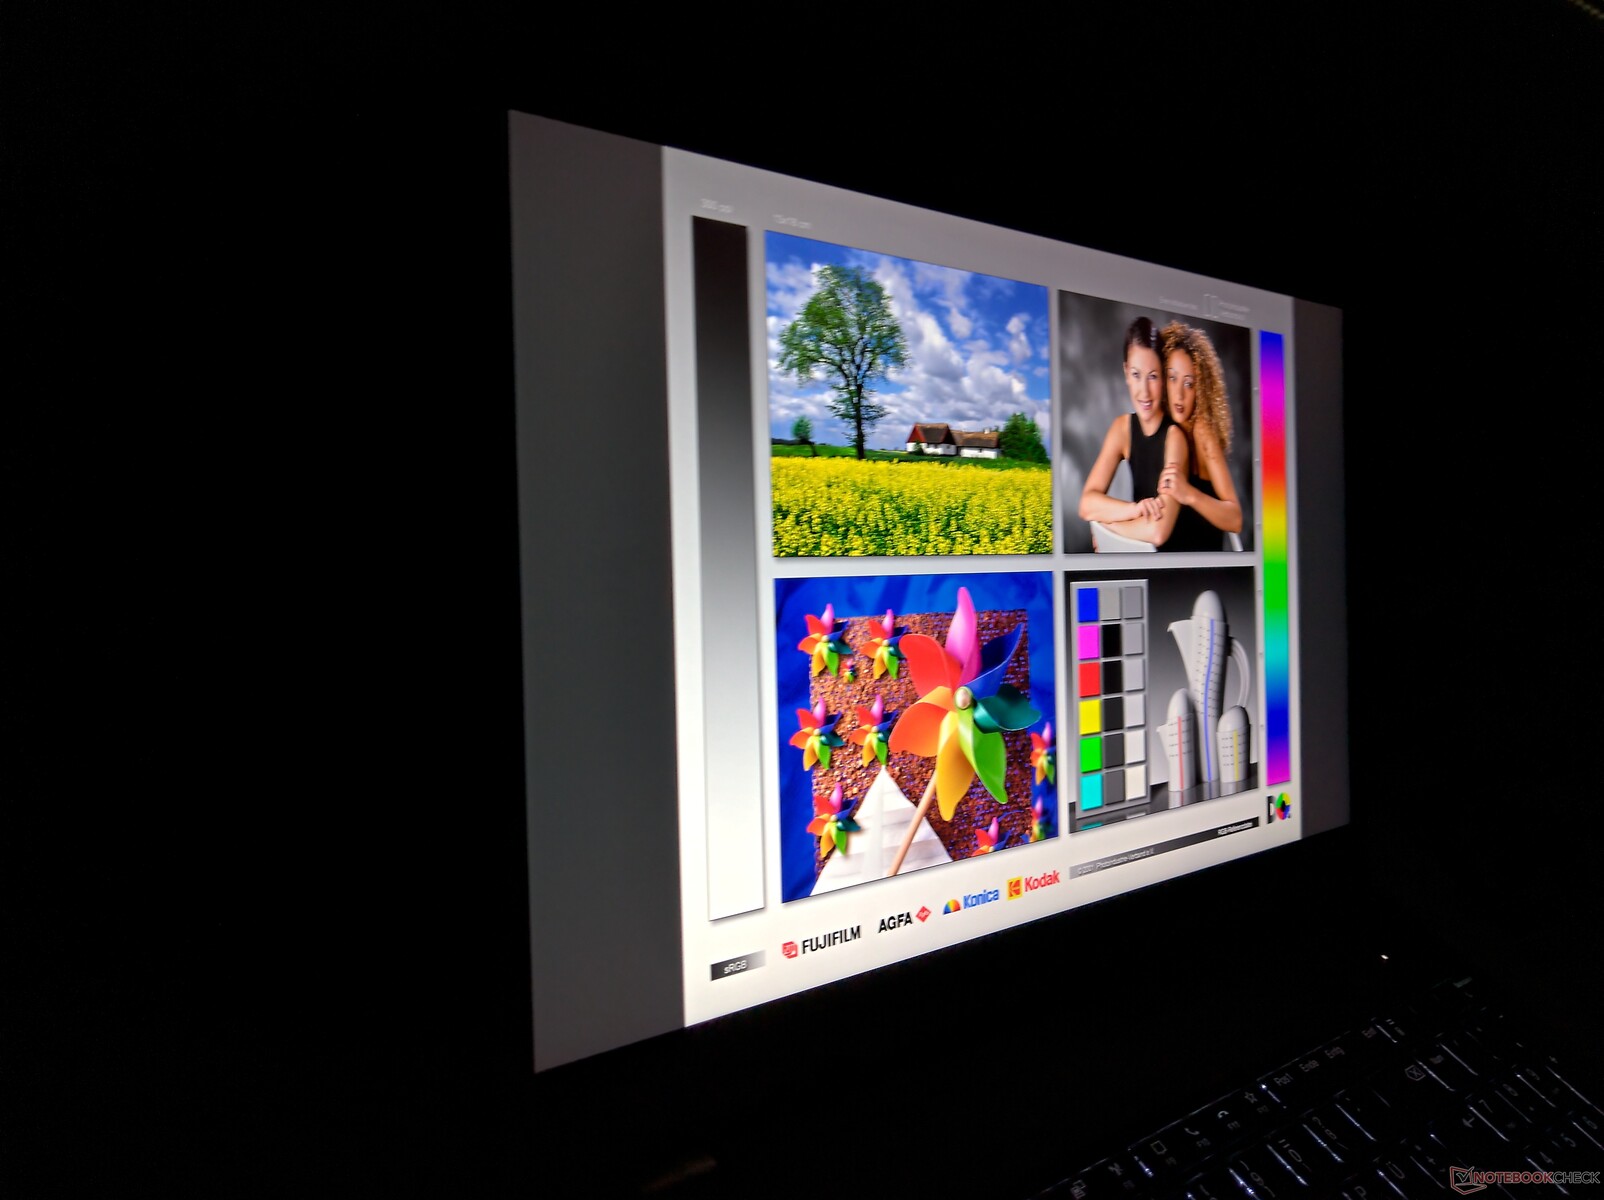
Viewing angles of this 4K/UHD display were impeccable.
CPU performance is decent, but worse than Renoir
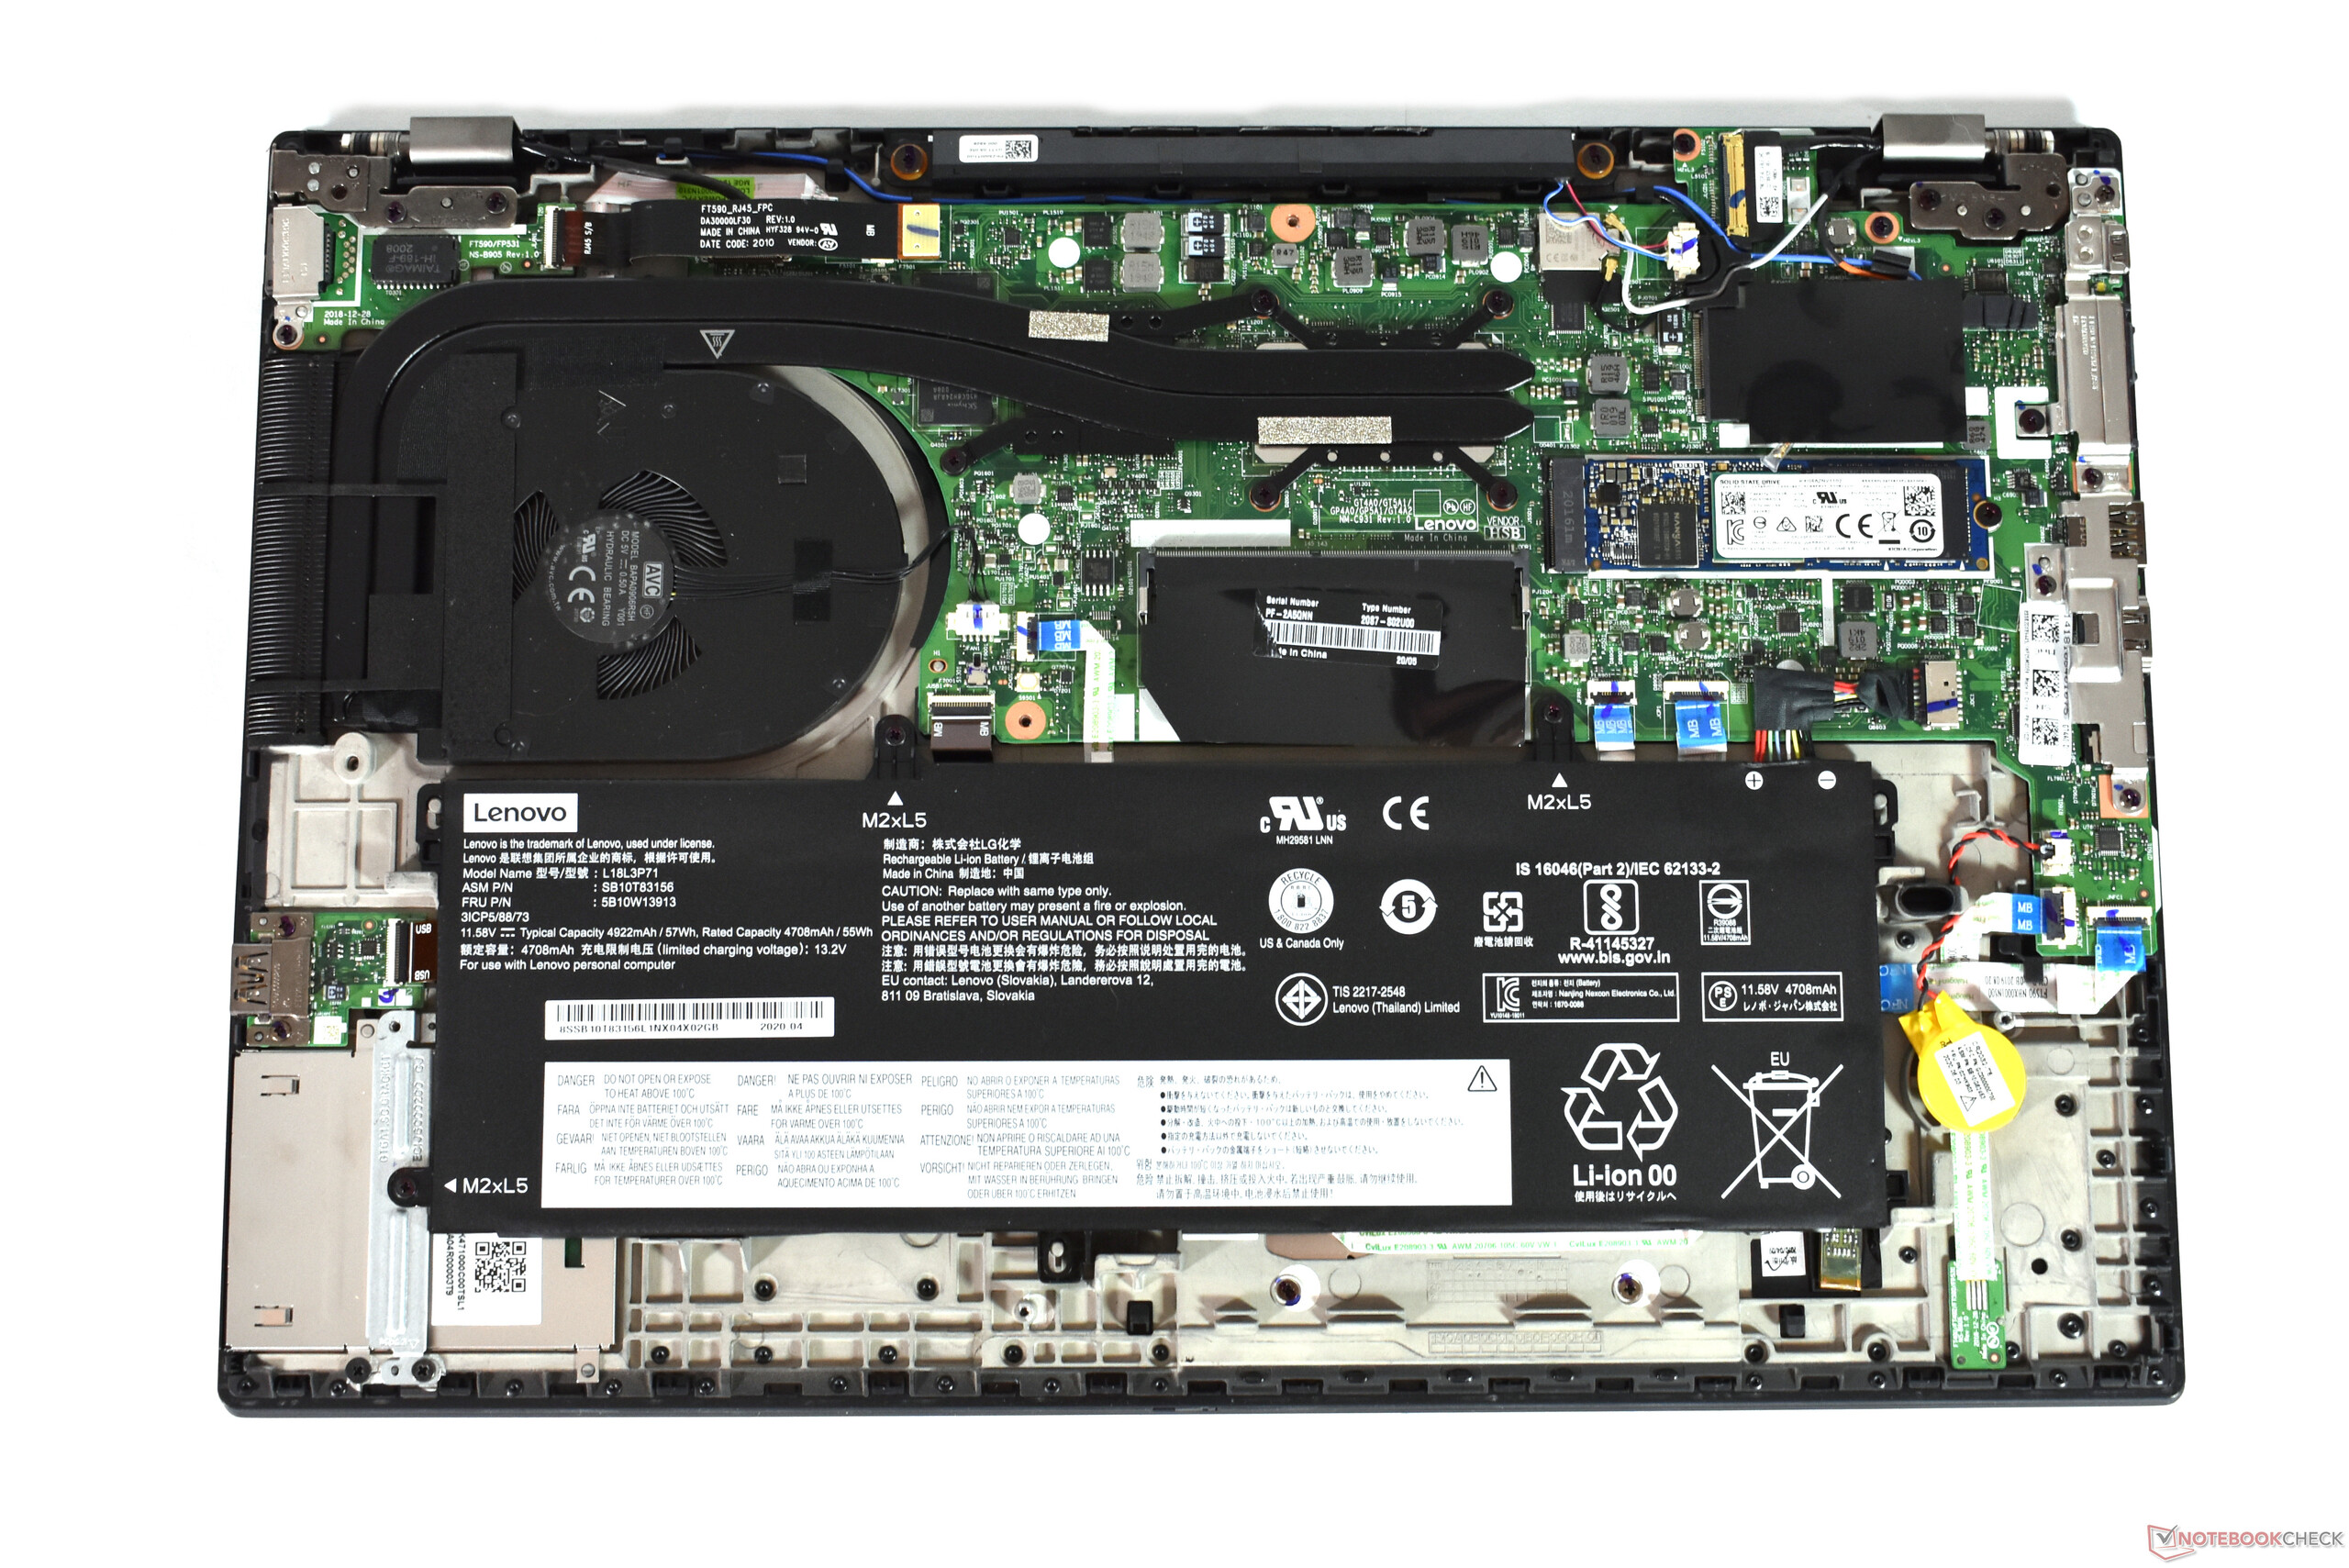
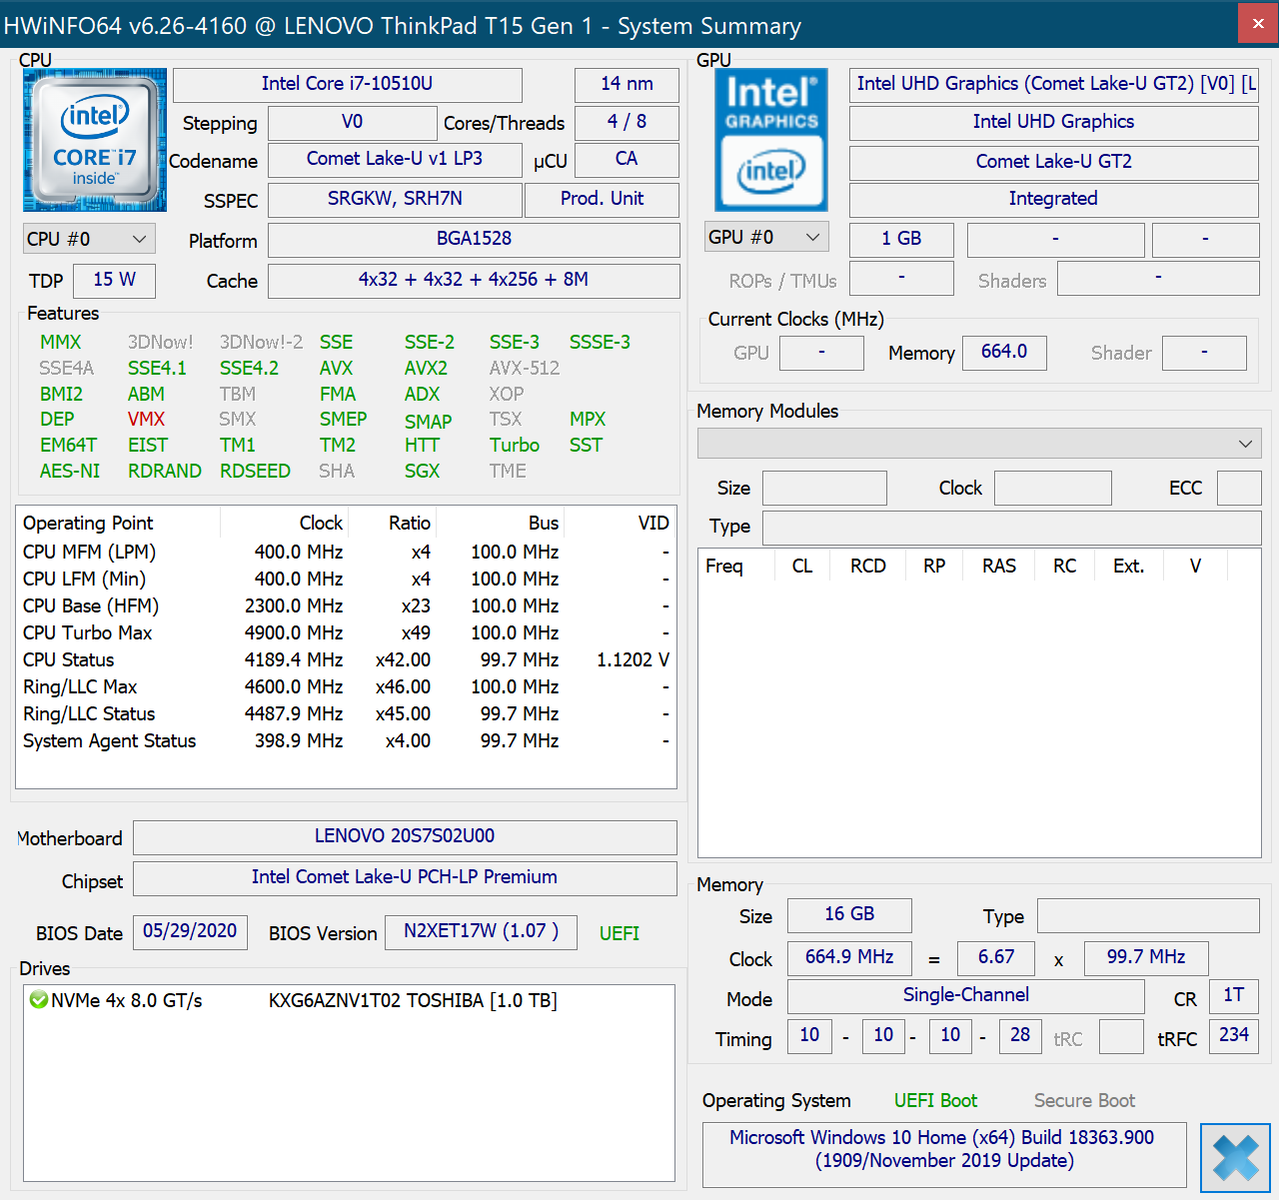
The ThinkPad T15 Gen 1 is currently available with four different quad-core CPUs made by Intel: Core i5-10210U, i5-10310U, i7-10510U, and i7-10610U. Hexa-core models featuring the i7-10710U and i7-10810U are expected to become available in the near future. In addition to the integrated Intel UHD Graphics 620 the T15 can also be equipped with an Nvidia GeForce MX330. Either 8 or 16 GB of DDR4-2666 RAM is soldered onto the motherboard, which can be further expanded via a single SO-DIMM module. Our review unit’s slot was not populated, which means this particular model can take up to 48 GB of RAM. The T15 features a single slot for M.2-2280 or M.2-2242 SSDs.
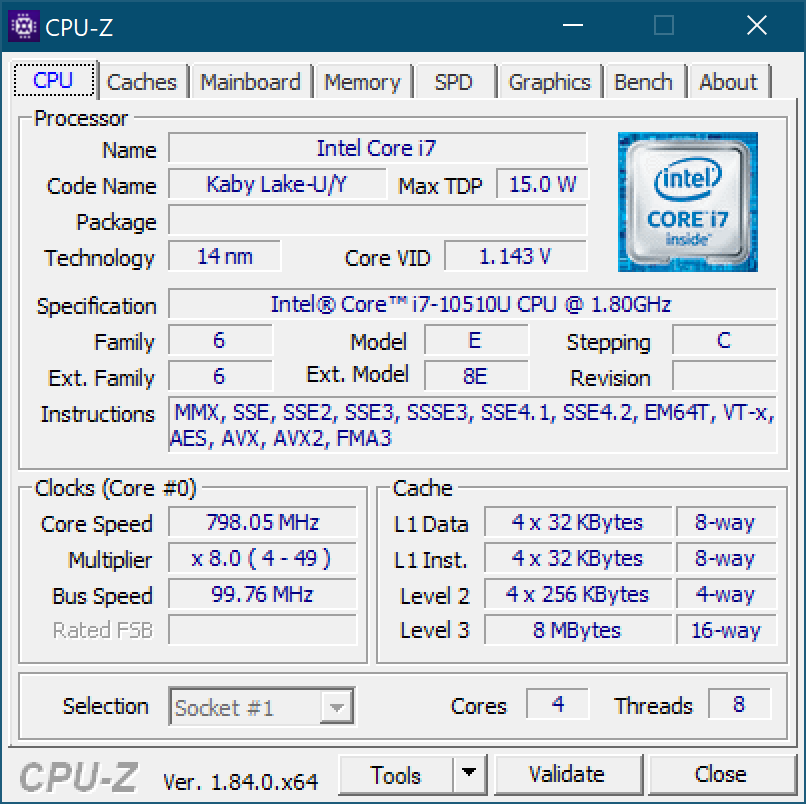
Processor
The Core i7-10510U is a quad-core processor that runs at clock speeds of between 1.8 and 4.8 GHz. As indicated, this U-class processor has a nominal TDP of 15 W. Find out how this CPU compares to others in our CPU comparison list.
In CineBench, the CPU was at first allowed to consume up to 45 W, which was lowered to 25 W and a resulting clock speed of 3.3 GHz after 30 seconds. The CPU remained at this level throughout our CineBench loop with temperatures slowly rising.
Performance was decent for a current Intel U-class CPU. However, considering the AMD Ryzen 4000’s performance advantage over Intel’s current lineup this does not mean much, as can be seen when comparing the T15’s results to the HP ProBook 455 G7. If you are looking for ultimate CPU performance, the ThinkPad T15 and its lack of AMD option is not the best choice.
We found no performance throttling on battery.
Cinebench R20: CPU (Multi Core) | CPU (Single Core)
Blender: v2.79 BMW27 CPU
7-Zip 18.03: 7z b 4 -mmt1 | 7z b 4
Geekbench 5.5: Single-Core | Multi-Core
HWBOT x265 Benchmark v2.2: 4k Preset
LibreOffice : 20 Documents To PDF
R Benchmark 2.5: Overall mean
| Cinebench R15 / CPU Multi 64Bit | |
| Average of class Office (250 - 3380, n=74, last 2 years) | |
| HP ProBook 455 G7-175W8EA | |
| Lenovo ThinkPad T15 Gen1-20S7S02U00 | |
| Lenovo ThinkPad T590-20N4002VGE | |
| Average Intel Core i7-10510U (482 - 856, n=45) | |
| Lenovo ThinkPad E15 20RD0011GE | |
| Cinebench R15 / CPU Single 64Bit | |
| Average of class Office (99.5 - 312, n=74, last 2 years) | |
| Lenovo ThinkPad T590-20N4002VGE | |
| Lenovo ThinkPad T15 Gen1-20S7S02U00 | |
| HP ProBook 455 G7-175W8EA | |
| Average Intel Core i7-10510U (113 - 202, n=42) | |
| Lenovo ThinkPad E15 20RD0011GE | |
| Cinebench R20 / CPU (Multi Core) | |
| Average of class Office (648 - 8840, n=72, last 2 years) | |
| HP ProBook 455 G7-175W8EA | |
| Lenovo ThinkPad T15 Gen1-20S7S02U00 | |
| Lenovo ThinkPad T590-20N4002VGE | |
| Average Intel Core i7-10510U (1015 - 1897, n=38) | |
| Lenovo ThinkPad E15 20RD0011GE | |
| Cinebench R20 / CPU (Single Core) | |
| Average of class Office (345 - 816, n=72, last 2 years) | |
| Lenovo ThinkPad T15 Gen1-20S7S02U00 | |
| Lenovo ThinkPad T590-20N4002VGE | |
| HP ProBook 455 G7-175W8EA | |
| Lenovo ThinkPad E15 20RD0011GE | |
| Average Intel Core i7-10510U (362 - 497, n=37) | |
| Blender / v2.79 BMW27 CPU | |
| Lenovo ThinkPad E15 20RD0011GE | |
| Average Intel Core i7-10510U (628 - 1051, n=31) | |
| Lenovo ThinkPad T590-20N4002VGE | |
| Lenovo ThinkPad T15 Gen1-20S7S02U00 | |
| HP ProBook 455 G7-175W8EA | |
| Average of class Office (158 - 1940, n=73, last 2 years) | |
| 7-Zip 18.03 / 7z b 4 -mmt1 | |
| Average of class Office (3387 - 6469, n=74, last 2 years) | |
| Lenovo ThinkPad T590-20N4002VGE | |
| Lenovo ThinkPad T15 Gen1-20S7S02U00 | |
| Lenovo ThinkPad E15 20RD0011GE | |
| Average Intel Core i7-10510U (3747 - 4981, n=31) | |
| HP ProBook 455 G7-175W8EA | |
| 7-Zip 18.03 / 7z b 4 | |
| Average of class Office (7098 - 76886, n=75, last 2 years) | |
| HP ProBook 455 G7-175W8EA | |
| Lenovo ThinkPad T590-20N4002VGE | |
| Lenovo ThinkPad T15 Gen1-20S7S02U00 | |
| Average Intel Core i7-10510U (12196 - 21298, n=31) | |
| Lenovo ThinkPad E15 20RD0011GE | |
| Geekbench 5.5 / Single-Core | |
| Average of class Office (811 - 2128, n=71, last 2 years) | |
| Lenovo ThinkPad T15 Gen1-20S7S02U00 | |
| Lenovo ThinkPad E15 20RD0011GE | |
| Average Intel Core i7-10510U (977 - 1287, n=31) | |
| HP ProBook 455 G7-175W8EA | |
| Geekbench 5.5 / Multi-Core | |
| Average of class Office (1483 - 16999, n=71, last 2 years) | |
| HP ProBook 455 G7-175W8EA | |
| Lenovo ThinkPad T15 Gen1-20S7S02U00 | |
| Average Intel Core i7-10510U (2474 - 4484, n=31) | |
| Lenovo ThinkPad E15 20RD0011GE | |
| HWBOT x265 Benchmark v2.2 / 4k Preset | |
| Average of class Office (2.21 - 26, n=73, last 2 years) | |
| HP ProBook 455 G7-175W8EA | |
| Lenovo ThinkPad T590-20N4002VGE | |
| Lenovo ThinkPad T15 Gen1-20S7S02U00 | |
| Average Intel Core i7-10510U (3.41 - 6.04, n=31) | |
| Lenovo ThinkPad E15 20RD0011GE | |
| LibreOffice / 20 Documents To PDF | |
| HP ProBook 455 G7-175W8EA | |
| Average Intel Core i7-10510U (50.7 - 77.8, n=27) | |
| Average of class Office (41.5 - 102.3, n=73, last 2 years) | |
| Lenovo ThinkPad T15 Gen1-20S7S02U00 | |
| R Benchmark 2.5 / Overall mean | |
| Average Intel Core i7-10510U (0.637 - 0.81, n=28) | |
| Lenovo ThinkPad E15 20RD0011GE | |
| HP ProBook 455 G7-175W8EA | |
| Lenovo ThinkPad T15 Gen1-20S7S02U00 | |
| Average of class Office (0.4098 - 0.888, n=73, last 2 years) | |
* ... smaller is better
System Performance
The 4K/UHD display had a noticeable detrimental effect on our PCMark benchmark results. Nevertheless, the T15 felt smooth and snappy in everyday use.
| PCMark 8 Home Score Accelerated v2 | 2971 points | |
| PCMark 8 Work Score Accelerated v2 | 4456 points | |
| PCMark 10 Score | 3861 points | |
Help | ||
DPC Latencies
Unfortunately, the ThinkPad T15 suffers from DPC latencies, which are caused by the network driver according to LatencyMon. Our YouTube test proved that this can be a real issue as it dropped frames consistently throughout the test.
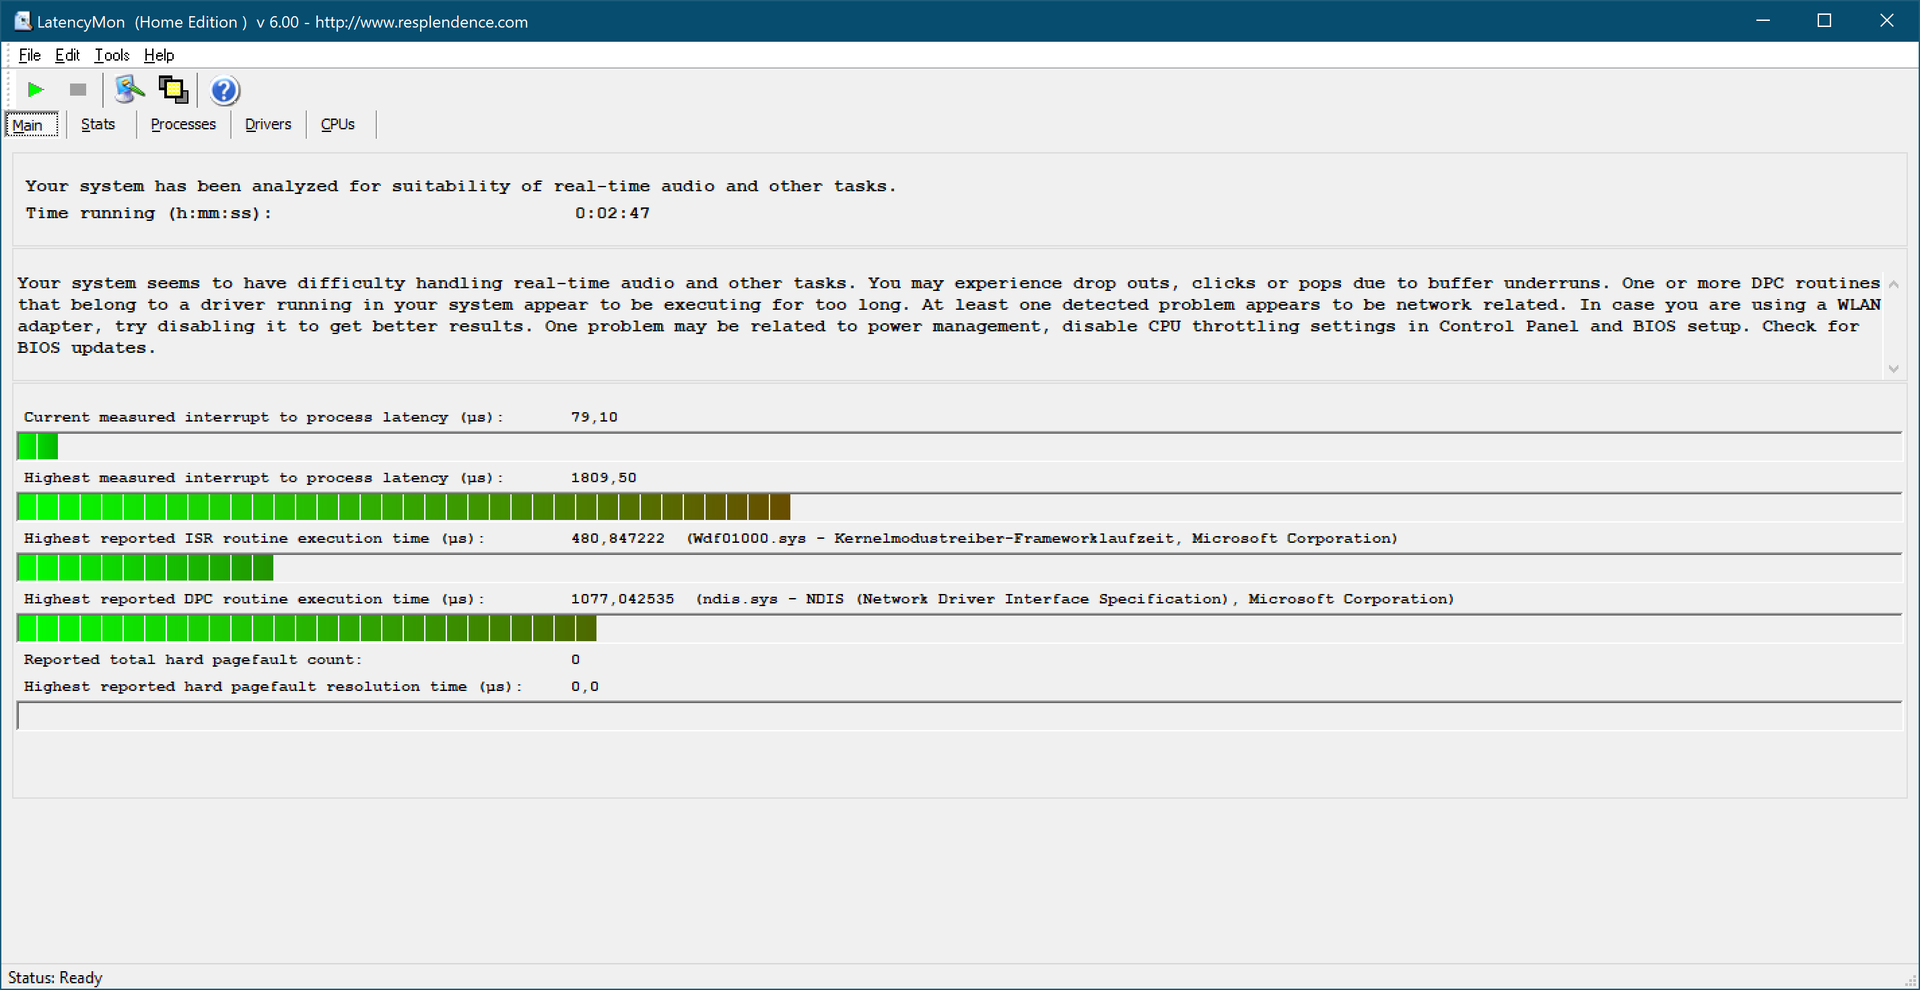
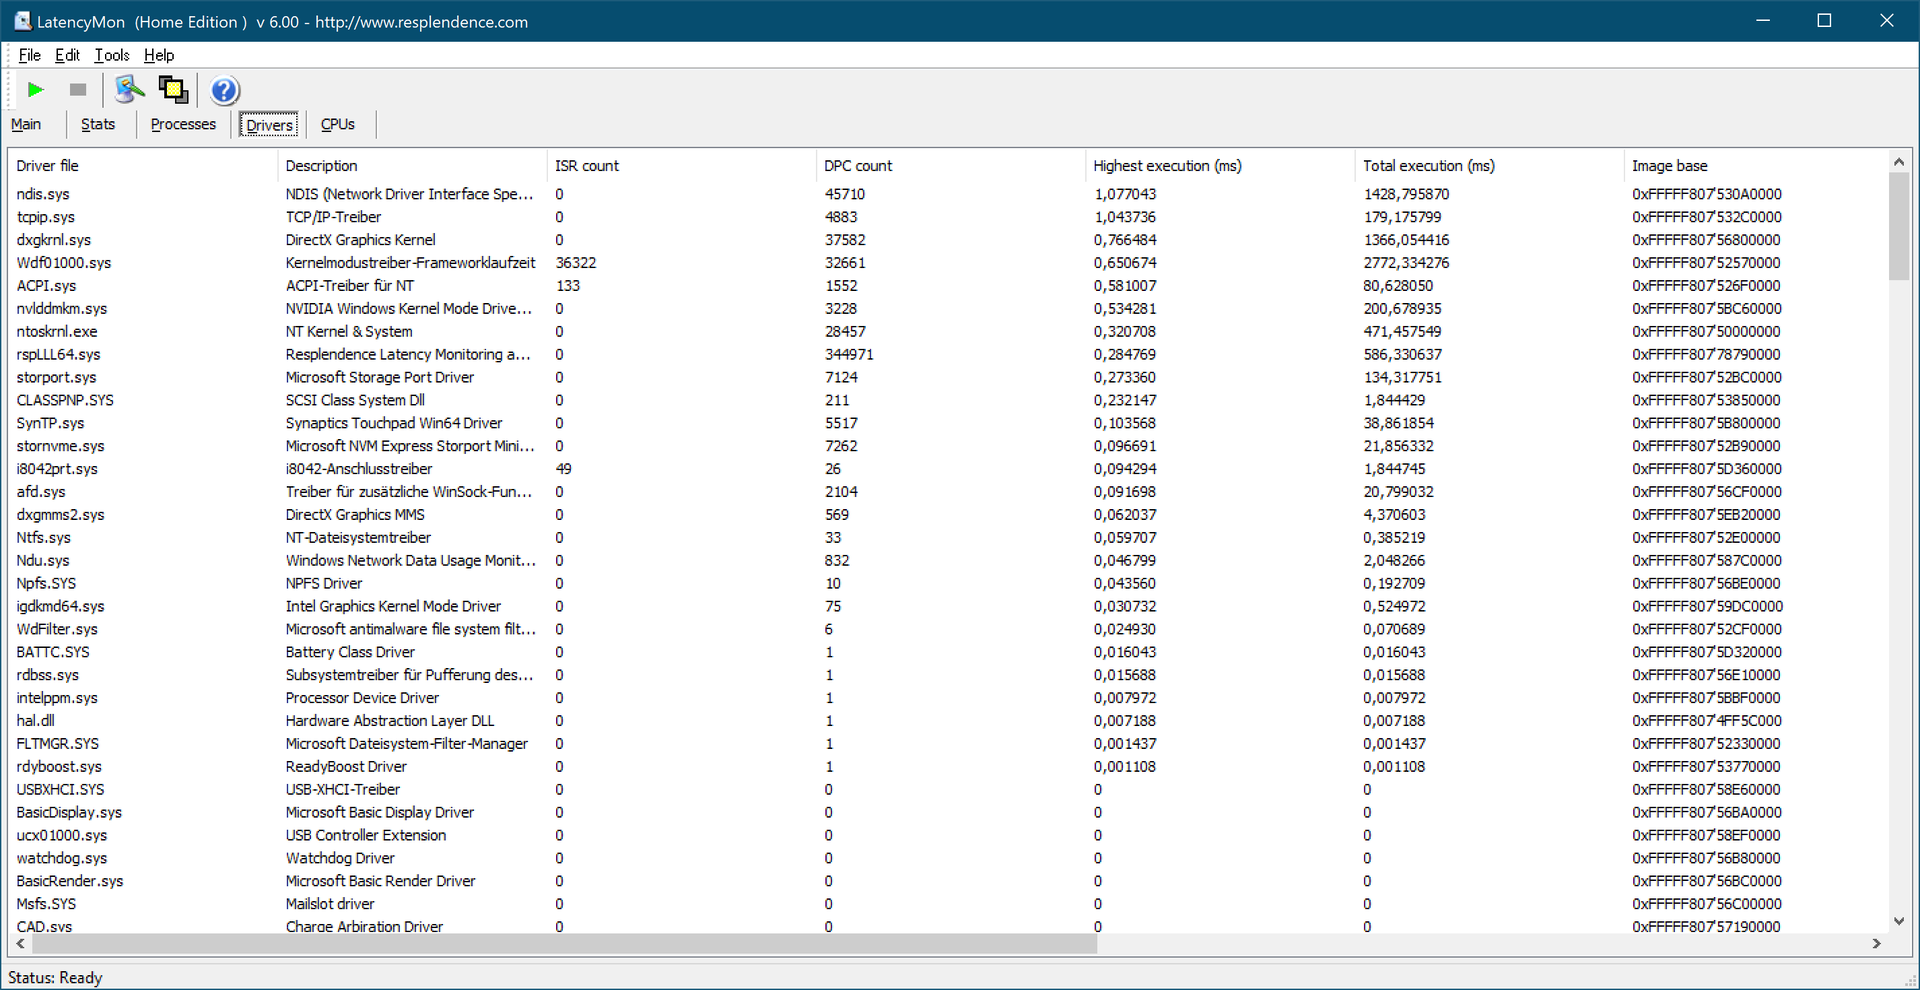
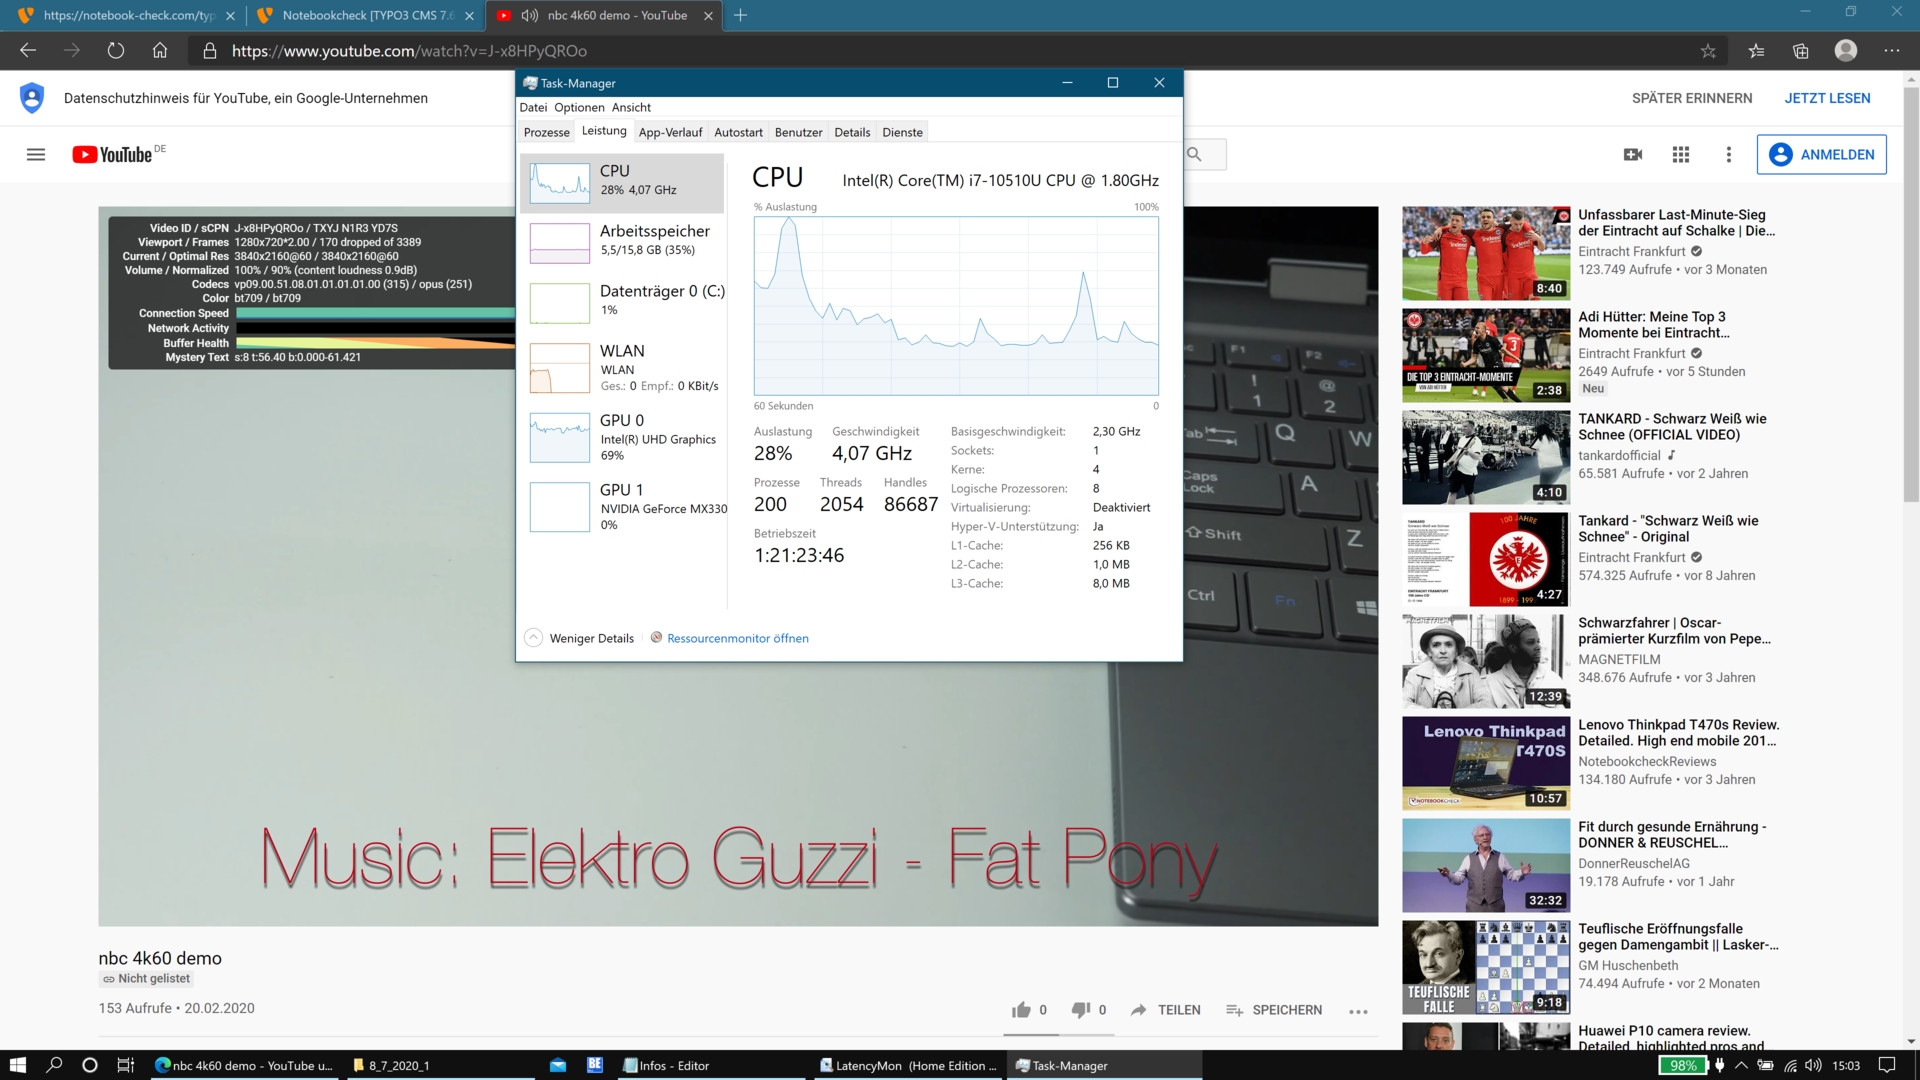
| DPC Latencies / LatencyMon - interrupt to process latency (max), Web, Youtube, Prime95 | |
| Lenovo ThinkPad T15 Gen1-20S7S02U00 | |
* ... smaller is better
Storage Devices
Our ThinkPad T15 Gen 1 review unit featured a 1 TB large M.2 SSD made by Toshiba. The XG6 PCIe NVMe SSD performed faster than all of our 512-GB comparison SSDs across the board.
| Lenovo ThinkPad T15 Gen1-20S7S02U00 Toshiba XG6 KXG6AZNV1T02 | Lenovo ThinkPad E15 20RD0011GE Samsung PM991 MZALQ512HALU | HP ProBook 455 G7-175W8EA Samsung PM991 MZVLQ512HALU | Lenovo ThinkPad T590-20N4002VGE Toshiba XG6 KXG60ZNV512G | Average Toshiba XG6 KXG6AZNV1T02 | |
|---|---|---|---|---|---|
| CrystalDiskMark 5.2 / 6 | -15% | -26% | -8% | 9% | |
| Write 4K (MB/s) | 159.1 | 144.4 -9% | 141.9 -11% | 126.2 -21% | 162.2 ? 2% |
| Read 4K (MB/s) | 55.6 | 52.3 -6% | 37.25 -33% | 48.93 -12% | 54.8 ? -1% |
| Write Seq (MB/s) | 1435 | 946 -34% | 998 -30% | 1345 -6% | 1745 ? 22% |
| Read Seq (MB/s) | 1435 | 1608 12% | 1233 -14% | 1373 -4% | 1941 ? 35% |
| Write 4K Q32T1 (MB/s) | 512 | 592 16% | 338.4 -34% | 383.8 -25% | 493 ? -4% |
| Read 4K Q32T1 (MB/s) | 541 | 397.7 -26% | 431.1 -20% | 434.8 -20% | 542 ? 0% |
| Write Seq Q32T1 (MB/s) | 2682 | 1364 -49% | 1367 -49% | 2966 11% | 2961 ? 10% |
| Read Seq Q32T1 (MB/s) | 2902 | 2301 -21% | 2355 -19% | 3230 11% | 3190 ? 10% |

Sustained Read Performance: DiskSpd Read Loop, Queue Depth 8
GPU Performance
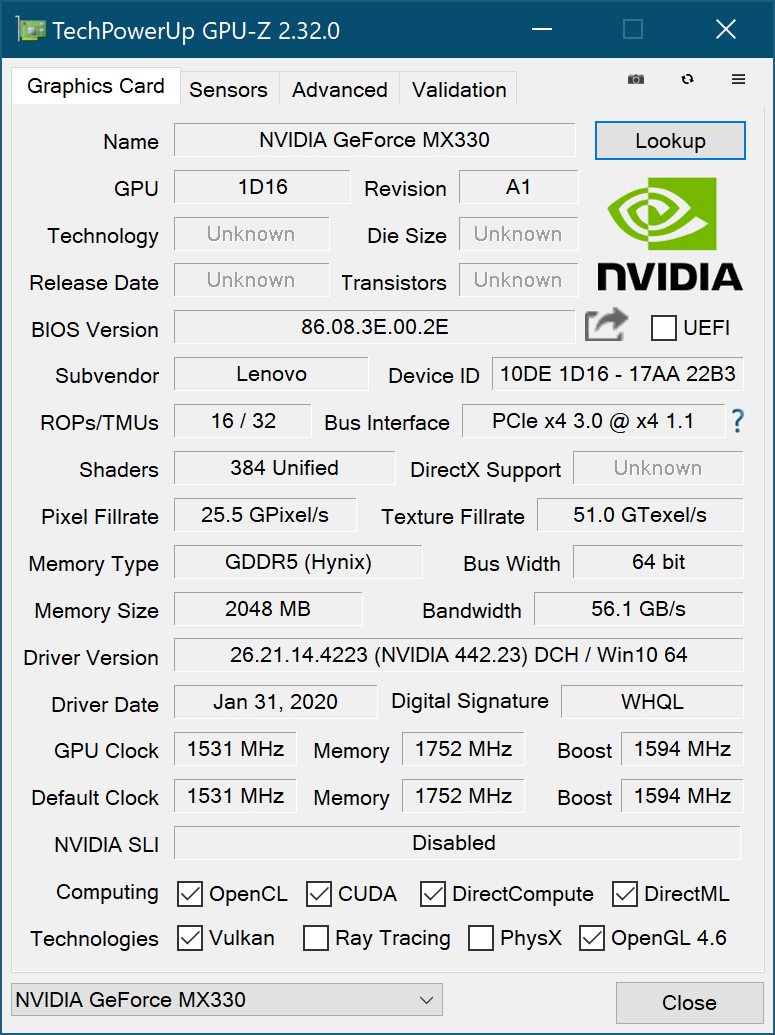
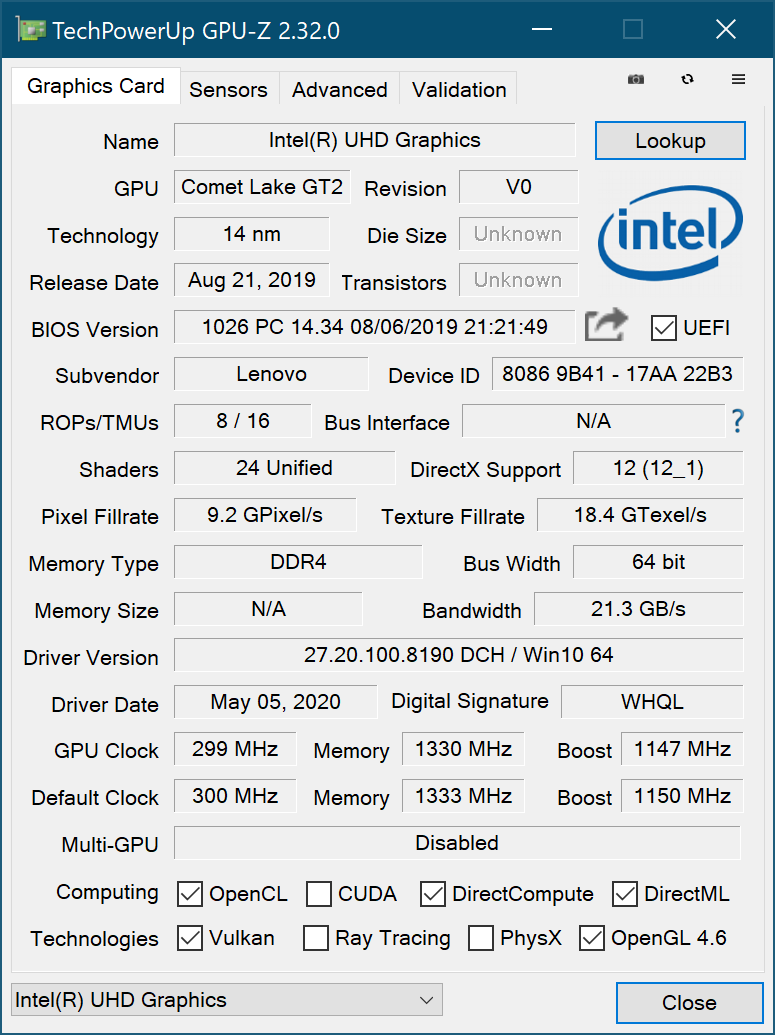
The Nvidia GeForce MX330 is Nvidia’s current low-end GPU based on the older Pascal architecture, and it is practically identical to the Nvidia GeForce MX250 found in the ThinkPad T590. It features the same number of shaders (384), the same 64-bit memory interface, the same 2 GB of GDDR5 memory, and virtually the same clock speeds.
The T15 performed slightly better in the older 3DMark 11 benchmarks but worse in more recent versions of 3DMark. While it performed faster than AMD’s integrated RX Vega 7 GPU the difference was only really worth mentioning when compared to the single-channel RAM model of HP’s ProBook 455 G7. In dual-channel configurations, such as Acer’s Swift 3, AMD’s Renoir GPU is practically just as fast.
We found no performance throttling on battery.
| 3DMark 11 Performance | 4898 points | |
| 3DMark Cloud Gate Standard Score | 12137 points | |
| 3DMark Fire Strike Score | 3308 points | |
| 3DMark Time Spy Score | 1178 points | |
Help | ||
Gaming Performance
Older games will run decently well on Nvidia’s GeForce MX300 in reduced details. Even current games can be enjoyed smoothly in minimum details and low resolutions. 4K/UHD gaming is definitely a no-go. GPU performance was consistent under load.
| The Witcher 3 - 1366x768 Medium Graphics & Postprocessing | |
| Average of class Office (44.7 - 63.9, n=4, last 2 years) | |
| Lenovo ThinkPad E15 20RD0011GE | |
| Lenovo ThinkPad T590-20N4002VGE | |
| Average NVIDIA GeForce MX330 (34.2 - 37, n=2) | |
| Lenovo ThinkPad T15 Gen1-20S7S02U00 | |
| low | med. | high | ultra | 4K | |
|---|---|---|---|---|---|
| The Witcher 3 (2015) | 64.7 | 34.2 | 19.9 | 12 | |
| Dota 2 Reborn (2015) | 116 | 107 | 53.9 | 38.2 | 21.9 |
| X-Plane 11.11 (2018) | 33.4 | 47.3 | 35.9 | 18.1 | |
| Shadow of the Tomb Raider (2018) | 52.4 | 17.1 | |||
| Total War: Three Kingdoms (2019) | 52.9 | 16.1 |
Emissions: Lenovo’s laptop gets hot but remains quiet
Noise Emissions
The fan was quieter than on its predecessor, just like on the smaller ThinkPad T14. When idle it was completely off, and if it ever does turn on it only knows a single level of noise.
We experienced coil whine during some of our benchmarks and suspect the SSD to be the culprit.
Noise level
| Idle |
| 29.4 / 29.4 / 29.4 dB(A) |
| Load |
| 34.2 / 34.2 dB(A) |
 | ||
30 dB silent 40 dB(A) audible 50 dB(A) loud |
||
min: | ||
Temperature
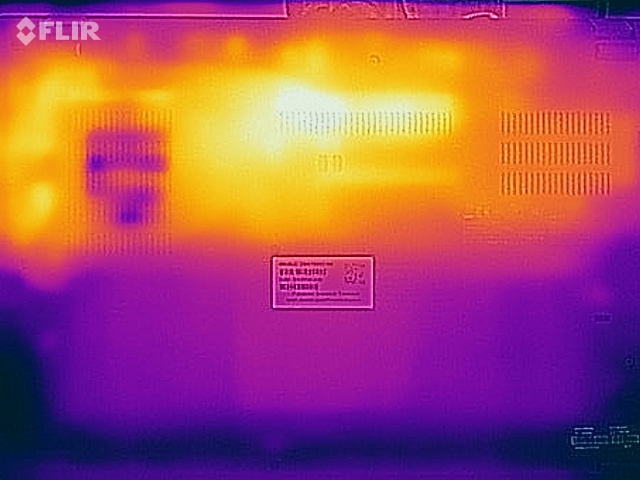
Temperatures remained below 60 °C, unlike on the smaller ThinkPad T14. However, we found a single hotspot of up to 59 °C under load at the bottom, which is definitely beyond comfortable. All things considered, surface temperatures were less of an issue than on the smaller T14, most likely due to the T15’s better cooling solution.
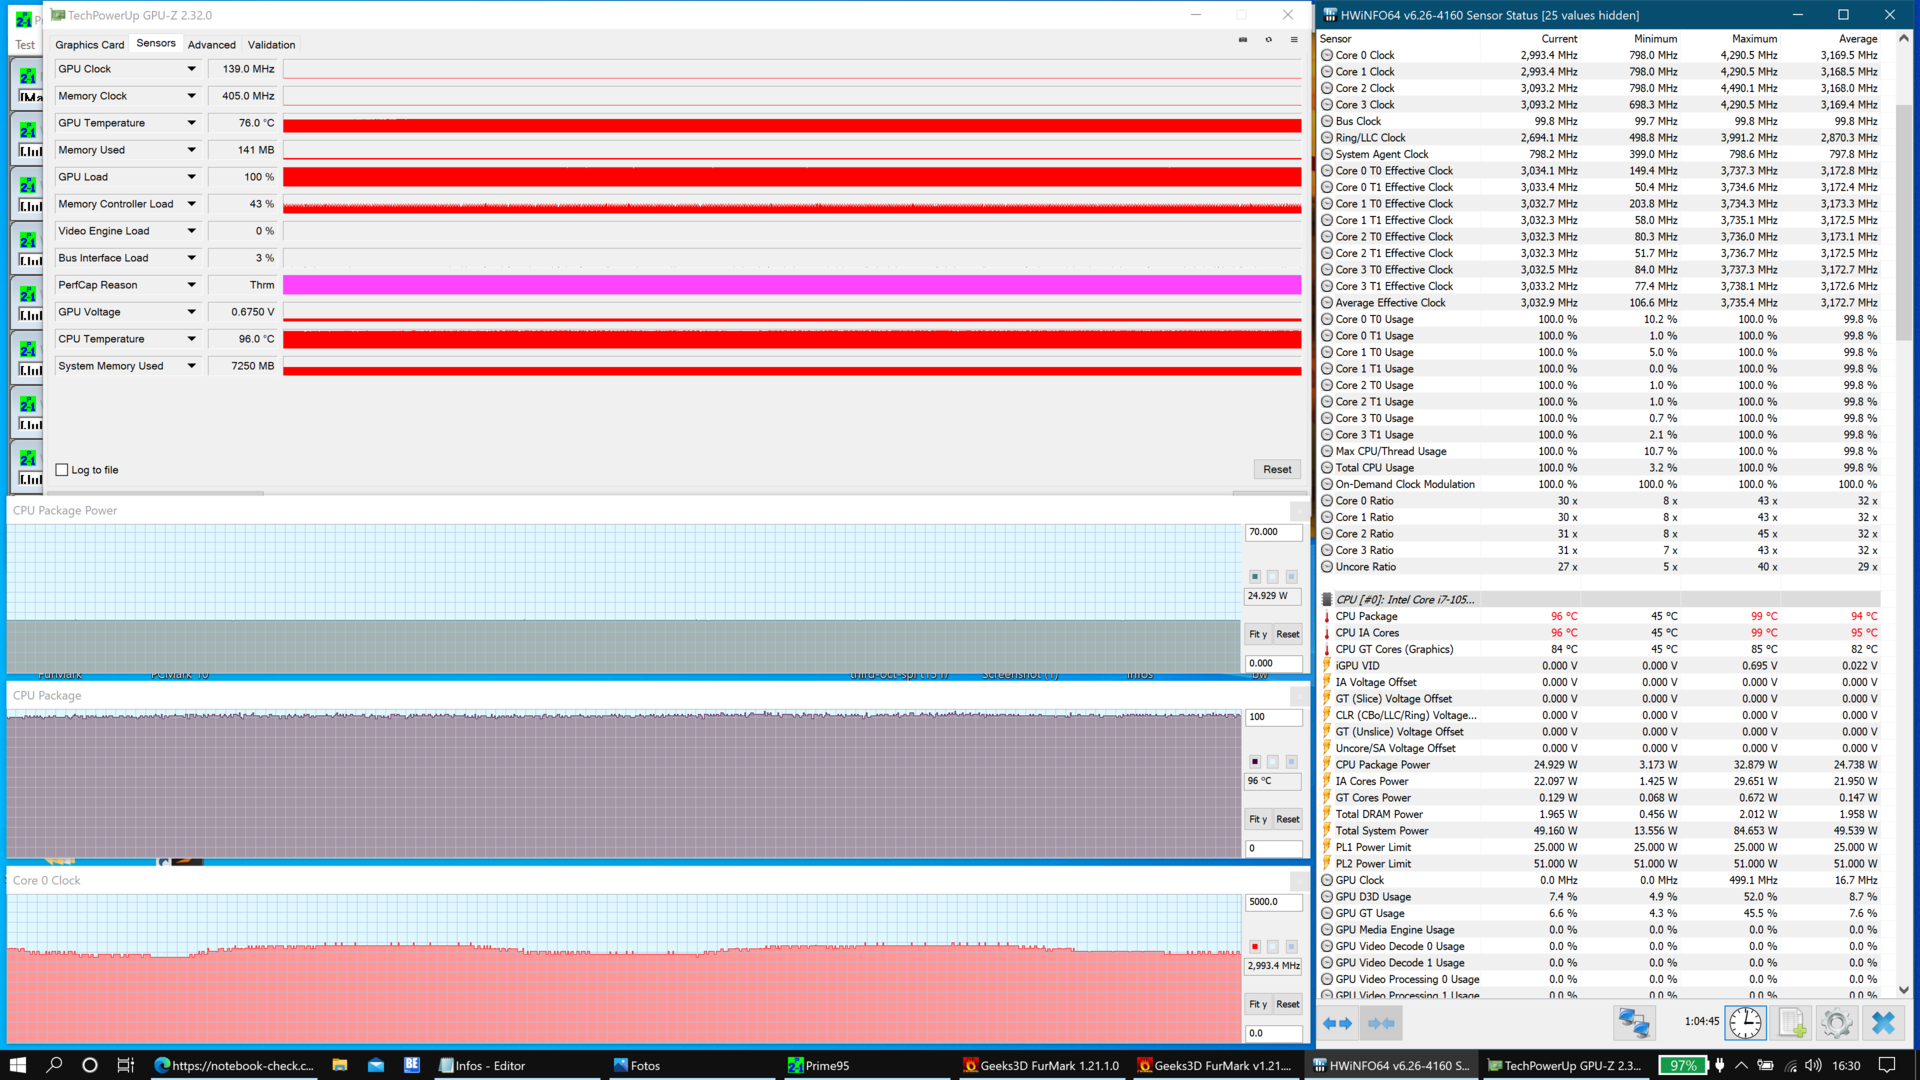
Running our stress test with Prime95 and FurMark simultaneously proved that the ThinkPad T15’s cooler was capable of handling high and consistent simultaneous CPU and GPU load without any issues. The CPU was allowed to consume up to 25 W throughout the test, resulting in temperatures of up to 90 °C. The GPU had to throttle at the same time. This throttling under extreme circumstances should have absolutely no effect on everyday use. Running 3DMark 11 immediately following our stress test produced identical results.
(±) The maximum temperature on the upper side is 42.6 °C / 109 F, compared to the average of 34.3 °C / 94 F, ranging from 21.2 to 62.5 °C for the class Office.
(-) The bottom heats up to a maximum of 59.2 °C / 139 F, compared to the average of 36.8 °C / 98 F
(+) In idle usage, the average temperature for the upper side is 23.7 °C / 75 F, compared to the device average of 29.5 °C / 85 F.
(±) Playing The Witcher 3, the average temperature for the upper side is 36.4 °C / 98 F, compared to the device average of 29.5 °C / 85 F.
(+) The palmrests and touchpad are cooler than skin temperature with a maximum of 31.2 °C / 88.2 F and are therefore cool to the touch.
(-) The average temperature of the palmrest area of similar devices was 27.5 °C / 81.5 F (-3.7 °C / -6.7 F).

Speakers
The speakers remained unchanged from last year’s ThinkPad T590. This means that they still lack bass and volume. The audio combo port worked flawlessly and is much better suited for listening to music.
Lenovo ThinkPad T15 Gen1-20S7S02U00 audio analysis
(-) | not very loud speakers (71.1 dB)
Bass 100 - 315 Hz
(-) | nearly no bass - on average 16% lower than median
(±) | linearity of bass is average (11.7% delta to prev. frequency)
Mids 400 - 2000 Hz
(±) | higher mids - on average 5.4% higher than median
(+) | mids are linear (6.8% delta to prev. frequency)
Highs 2 - 16 kHz
(+) | balanced highs - only 3% away from median
(+) | highs are linear (3.9% delta to prev. frequency)
Overall 100 - 16.000 Hz
(±) | linearity of overall sound is average (24.9% difference to median)
Compared to same class
» 73% of all tested devices in this class were better, 7% similar, 19% worse
» The best had a delta of 7%, average was 21%, worst was 53%
Compared to all devices tested
» 76% of all tested devices were better, 5% similar, 19% worse
» The best had a delta of 4%, average was 24%, worst was 134%
Lenovo ThinkPad T590-20N4002VGE audio analysis
(-) | not very loud speakers (70.9 dB)
Bass 100 - 315 Hz
(-) | nearly no bass - on average 16% lower than median
(±) | linearity of bass is average (7.9% delta to prev. frequency)
Mids 400 - 2000 Hz
(+) | balanced mids - only 4.3% away from median
(±) | linearity of mids is average (8.7% delta to prev. frequency)
Highs 2 - 16 kHz
(+) | balanced highs - only 4.4% away from median
(+) | highs are linear (6.5% delta to prev. frequency)
Overall 100 - 16.000 Hz
(±) | linearity of overall sound is average (25.5% difference to median)
Compared to same class
» 78% of all tested devices in this class were better, 6% similar, 16% worse
» The best had a delta of 7%, average was 21%, worst was 53%
Compared to all devices tested
» 78% of all tested devices were better, 4% similar, 17% worse
» The best had a delta of 4%, average was 24%, worst was 134%
Energy Management: Inefficient ThinkPad due to 4K Display
Power Consumption
Power consumption remained identical to last year’s ThinkPad T590, which is not particularly surprising considering the overall almost identical hardware. Power consumption remained very high due to the 4K/UHD display.
Despite its high average power consumption of 66 W under load the 65 W power supply should be sufficient for powering the device. At the end of our stress test, our power meter read just 54 W.
| Off / Standby | |
| Idle | |
| Load |
|
Key:
min: | |
| Lenovo ThinkPad T15 Gen1-20S7S02U00 i7-10510U, GeForce MX330, Toshiba XG6 KXG6AZNV1T02, IPS LED, 3840x2160, 15.6" | Lenovo ThinkPad T590-20N40009GE i7-8565U, GeForce MX250, WDC PC SN720 SDAQNTW-512G, IPS, 3840x2160, 15.6" | Lenovo ThinkPad E15 20RD0011GE i7-10510U, Radeon RX 640, Samsung PM991 MZALQ512HALU, IPS LED, 1920x1080, 15.6" | HP ProBook 455 G7-175W8EA R7 4700U, Vega 7, Samsung PM991 MZVLQ512HALU, IPS, 1920x1080, 15.6" | Average NVIDIA GeForce MX330 | Average of class Office | |
|---|---|---|---|---|---|---|
| Power Consumption | 2% | 30% | 35% | -7% | 27% | |
| Idle Minimum * (Watt) | 4.3 | 4.3 -0% | 3.2 26% | 3.8 12% | 5.2 ? -21% | 4.4 ? -2% |
| Idle Average * (Watt) | 13.8 | 12.4 10% | 6.8 51% | 7.7 44% | 13.4 ? 3% | 7.32 ? 47% |
| Idle Maximum * (Watt) | 16.2 | 16.2 -0% | 9.5 41% | 10.5 35% | 14.9 ? 8% | 8.56 ? 47% |
| Load Average * (Watt) | 66 | 65.6 1% | 44 33% | 32 52% | 69.4 ? -5% | 42.5 ? 36% |
| Witcher 3 ultra * (Watt) | 53 | |||||
| Load Maximum * (Watt) | 67.4 | 69.5 -3% | 66.4 1% | 45.4 33% | 82.3 ? -22% | 64.1 ? 5% |
* ... smaller is better
Battery Life
Despite its identical 57 Wh battery when compared to the ThinkPad T590 the ThinkPad T15 Gen 1 managed to run longer in our Wi-Fi test. We suspect this may be due to the newer version of the Edge browser. Overall, battery life remains a sore point at less than 7 hours due to the 4K/UHD display. Running this particular display on full brightness will slice battery life in half.
| Lenovo ThinkPad T15 Gen1-20S7S02U00 i7-10510U, GeForce MX330, 57 Wh | Lenovo ThinkPad T590-20N40009GE i7-8565U, GeForce MX250, 57 Wh | Lenovo ThinkPad E15 20RD0011GE i7-10510U, Radeon RX 640, 45 Wh | HP ProBook 455 G7-175W8EA R7 4700U, Vega 7, 45 Wh | Average of class Office | |
|---|---|---|---|---|---|
| Battery runtime | 14% | 31% | 13% | 73% | |
| H.264 (h) | 8.1 | 10.4 28% | 6.7 -17% | 15 ? 85% | |
| WiFi v1.3 (h) | 7.1 | 6.1 -14% | 7.5 6% | 7.6 7% | 12.9 ? 82% |
| Load (h) | 1.2 | 1.7 42% | 1.9 58% | 1.8 50% | 1.807 ? 51% |
Pros
Cons
Verdict
The Lenovo ThinkPad T15 Gen 1 is the only 2020-generation ThinkPad that cannot be equipped with AMD’s Ryzen 4000-series CPU. Accordingly, we have a very hard time recommending this particular model considering that the more affordable ThinkPad E15 and ThinkPad L15 with AMD Renoir perform so much better.
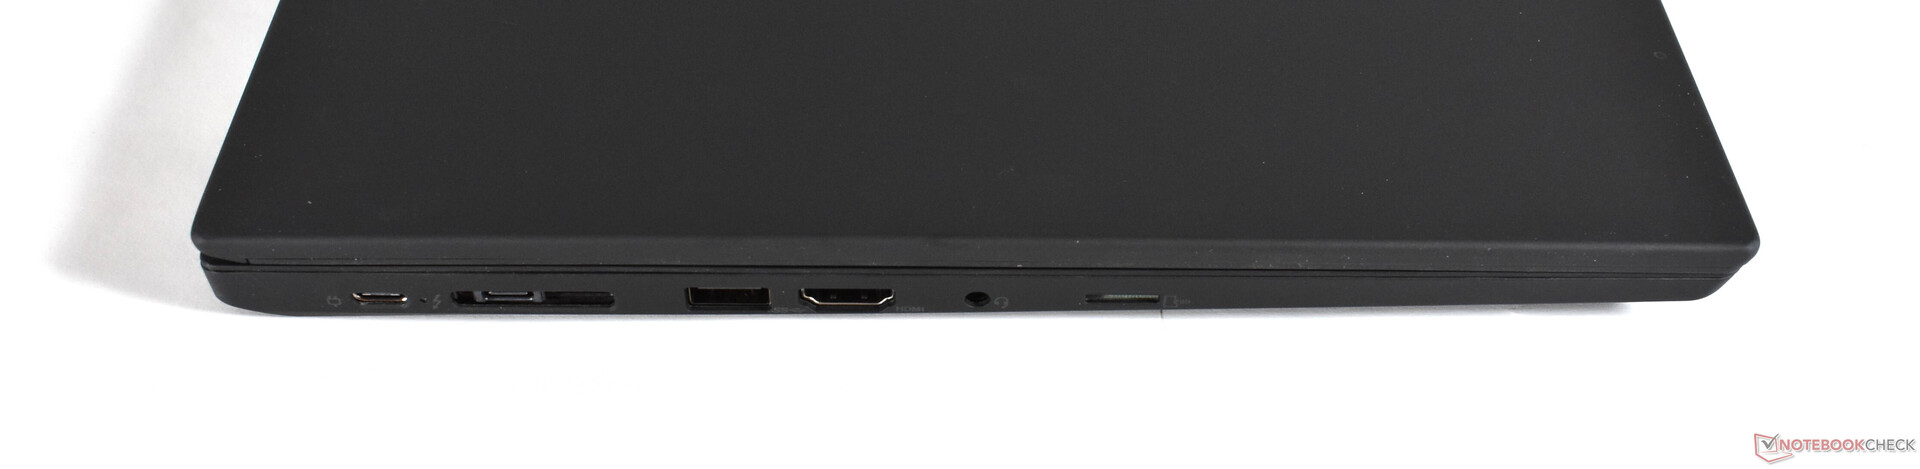
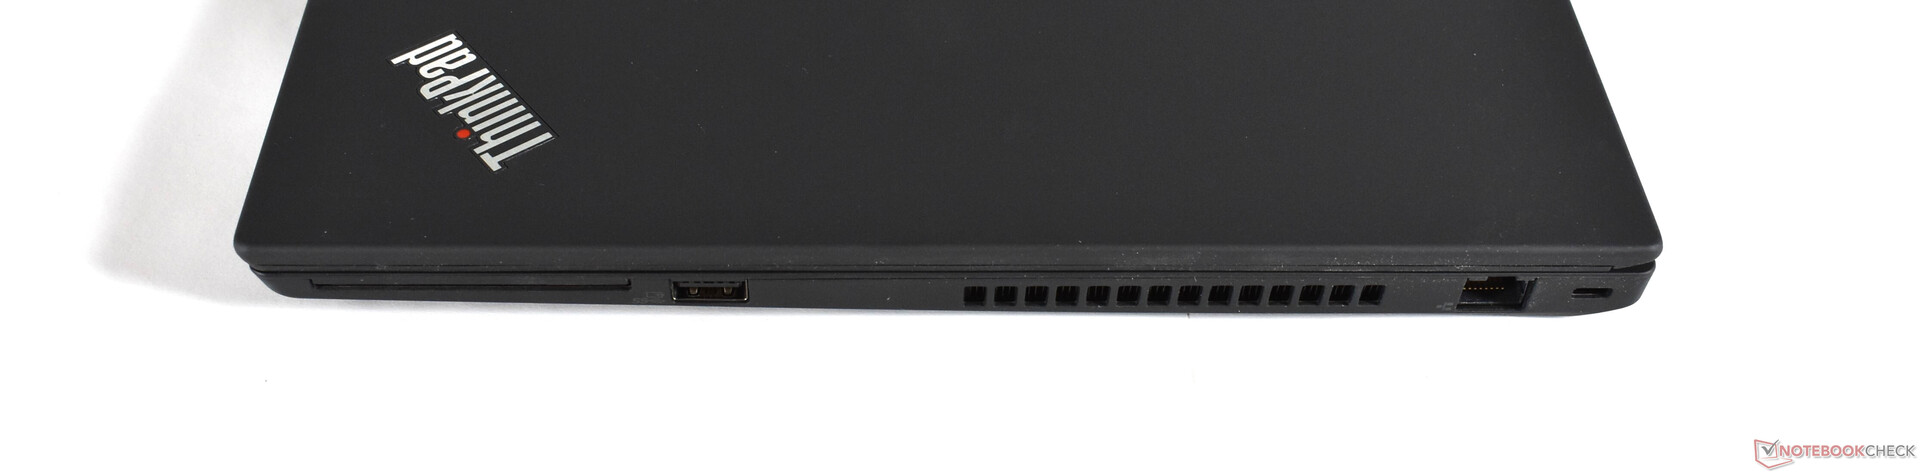
True, the ThinkPad T15 features excellent input devices and a wide variety of ports, but so do its more affordable siblings. Except for of course Thunderbolt 3, which is not available on those models. Another T15 exclusive is the 4K/UHD display, a high-end panel in almost every single way.
Its only downside, if you will, is its high power consumption resulting in below average battery life. In addition, temperatures were fairly high on this particular SKU but the fan was very quiet in return. Wi-Fi 6 support is foiled by high DPC latencies. Otherwise, the T15’s strengths and weaknesses are identical to the ThinkPad T590.
The Lenovo ThinkPad T15 Gen 1 is somewhat lost in the undefined space between price-performance ratio and quality. The lack of AMD option will make this a much less desirable alternative.
In and of itself the T15 is a great business laptop, no doubt about it. However, more affordable laptops equipped with Ryzen 4000 will offer a much higher level of performance. If you insist on a 4K/UHD panel and Thunderbolt 3 you may want to take a look at the Lenovo ThinkPad X1 Extreme Gen 2 instead.
Lenovo ThinkPad T15 Gen1-20S7S02U00
- 07/16/2020 v7 (old)
Benjamin Herzig
Price comparison

