Reviews for the Intel Core i7-10610U processor
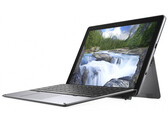
Dell Latitude 12 7210 2-in-1 in review: Comet Lake provides better battery life
Dell's Surface Pro competitor offers quiet to silent operation, low heat emissions, and a touchscreen display in the 3:2 format. The latter responds to touch input performed with the fingers as well as with the separately available Dell Premium Active Pen.
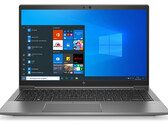
Intel Core i7-10610U, UHD Graphics 620, 12.3", 850 gHP ZBook Firefly 14 G7 in review: Mobile workstation with pointless Sure View privacy filter
Remote work, home office, and the like are probably the buzzwords of the year. Hardware for professionals, in particular, has to adapt to the new work conditions, and ultra-thin workstations like the ZBook Firefly 14 come in handy here. But do these mobile powerhouses really offer enough performance for professional users?
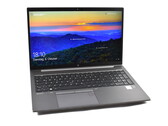
Intel Core i7-10610U, NVIDIA Quadro P520, 14", 1.4 kgHP ZBook Firefly 15 G7 laptop review: Already outdated by Intel Comet Lake and Nvidia Pascal even without a successor
Different name, revised design. HP wants to make its ultrabook workstations of the ZBook Firefly series more attractive with this recipe. But as a result, the American manufacturer is slowed down by the chosen processor and graphics chip, because they're both outdated. Pity, since the ZBook Firefly 15 G7 is actually a good mobile workstation for light CAD tasks.
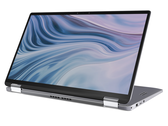
Intel Core i7-10610U, NVIDIA Quadro P520, 15.6", 1.8 kgDell Latitude 14 9410 2-in-1 Convertible Review: A Latitude 7400 At Heart
Last year's Latitude 7400 2-in-1 was already excellent, so why mess with a good thing? The Latitude 9410 2-in-1 doesn't bring anything new from a visual standpoint, but some users might appreciate the newer Comet Lake-U CPU options and Wi-Fi 6 connectivity.
Intel Core i7-10610U, UHD Graphics 620, 14", 1.5 kgDell Latitude 7310 Core i7 Laptop Review: Better Looks, Same Performance
The Latitude 7310 is all about the core office experience with no distracting auxiliary features or options. However, a brighter screen and some faster graphics wouldn't hurt, either.
Intel Core i7-10610U, UHD Graphics 620, 13.3", 1.2 kgDell Latitude 7410: Intel UHD Graphics 620, 14.00", 1.4 kg
Review » Dell Latitude 7410 Laptop Review: The Lenovo X1 Carbon Has Met Its Match
Dell Latitude 15 5510-YKY1M: Intel UHD Graphics 620, 15.60", 1.8 kg
External Review » Dell Latitude 15 5510-YKY1M
HP EliteBook x360 1030 G7-26K00US: Intel UHD Graphics 620, 13.30", 1.2 kg
External Review » HP EliteBook x360 1030 G7-26K00US
Dell Latitude 12 7210 2-in-1: Intel UHD Graphics 620, 12.30", 0.9 kg
External Review » Dell Latitude 12 7210 2-in-1
Dell Latitude 14 5420, i7-10610U: Intel UHD Graphics 620, 14.00", 1.4 kg
External Review » Dell Latitude 14 5420, i7-10610U
HP Elite c1030, i7-10610U: Intel UHD Graphics 620, 13.50", 1.3 kg
External Review » HP Elite c1030, i7-10610U
HP EliteBook 840 G7, i7-10610U: Intel UHD Graphics 620, 14.00", 1.2 kg
External Review » HP EliteBook 840 G7, i7-10610U
Lenovo ThinkPad P15s Gen1-20T40008GE: NVIDIA Quadro P520, 15.60"
External Review » Lenovo ThinkPad P15s Gen1-20T40008GE
HP ZBook Firefly 15 G7: NVIDIA Quadro P520, 15.60", 1.8 kg
External Review » HP ZBook Firefly 15 G7
Dell Latitude 14 9410 2-in-1 P110G: Intel UHD Graphics 620, 14.00", 1.5 kg
External Review » Dell Latitude 14 9410 2-in-1 P110G
Dell Latitude 14 5410, i7-10610U: Intel UHD Graphics 620, 14.00", 1.5 kg
External Review » Dell Latitude 14 5410, i7-10610U
HP ZBook Firefly 14 G7, i7-10610U, Quadro P520: NVIDIA Quadro P520, 14.00", 1.3 kg
External Review » HP ZBook Firefly 14 G7, i7-10610U, Quadro P520
Lenovo ThinkPad X1 Yoga 2020-20UB000NUS: Intel UHD Graphics 620, 14.00", 1.4 kg
External Review » Lenovo ThinkPad X1 Yoga 2020-20UB000NUS
HP Pro c640 Chromebook, i7-10610U: Intel UHD Graphics 620, 14.00", 1.5 kg
External Review » HP Pro c640 Chromebook, i7-10610U
Fujitsu LifeBook U9310X, i7-10610U: Intel UHD Graphics 620, 13.30", 1 kg
External Review » Fujitsu LifeBook U9310X, i7-10610U
Lenovo ThinkPad X1 Carbon G8, Core i7-10610U: Intel UHD Graphics 620, 14.00", 1.1 kg
External Review » Lenovo ThinkPad X1 Carbon G8, Core i7-10610U
Dell Latitude 14 9410-40DHN 2-in-1: Intel UHD Graphics 620, 14.00", 1.4 kg
External Review » Dell Latitude 14 9410-40DHN 2-in-1
Dell Latitude 7410: Intel UHD Graphics 620, 14.00", 1.4 kg
External Review » Dell Latitude 7410
Acer Chromebook Spin 13 CP713-2W-76P2: Intel UHD Graphics 620, 13.50", 1.4 kg
External Review » Acer Chromebook Spin 13 CP713-2W-76P2
Dell Latitude 7310: Intel UHD Graphics 620, 13.30", 1.2 kg
External Review » Dell Latitude 7310
Dell Latitude 12 7210 2-in-1: Intel UHD Graphics 620, 12.30", 0.9 kg
» Dell's Surface Pro 7 competitor ranges from quiet to silent
HP ZBook Firefly 15 G7: NVIDIA Quadro P520, 15.60", 1.8 kg
» HP ZBook Firefly 15 G7: Even new designs can't save Comet Lake laptops
Dell Latitude 14 9410 2-in-1 P110G: Intel UHD Graphics 620, 14.00", 1.5 kg
» Dell Latitude 9410 2-in-1 or HP EliteBook x360? One factor might be the deal breaker
Dell Latitude 7310: Intel UHD Graphics 620, 13.30", 1.2 kg
» Older Dell Latitude 7300 Core i7 runs just as fast as the newer Latitude 7310 Core i7
Dell Latitude 7410: Intel UHD Graphics 620, 14.00", 1.4 kg
» Dell Latitude 7410 vs. Latitude 7400: Is Newer Really Better?