Reviews for the Intel Core i5-1155G7 processor
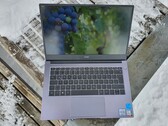
Huawei MateBook D 14 (2022) laptop review: Unibody for beginners
A unibody design in an entry-level notebook is what the MateBook D 14 offers, which also boasts internal values such as a long battery life, high system performance and quiet operation. All key aspects fit the bill for an office laptop, but there are some weaknesses in the details.
Intel Core i5-1155G7, Iris Xe G7 80EUs, 14", 1.4 kgHuawei MateBook D 15 (2022) review: A laptop reminiscent of the MacBook Pro
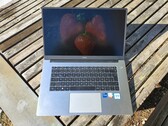
With the MateBook D 15 (2022), Huawei is offering a premium and compact 15.6-inch, office laptop with a MacBook-style design. With 16 GB of RAM, low emissions despite high-level system performance and long battery life, plenty of qualities are on offer. However, in terms of connectivity and display it becomes clear we are dealing with a budget laptop, therefore, the price is crucial.
Intel Core i5-1155G7, Iris Xe G7 80EUs, 15.6", 1.6 kgIntel Core i5-1155G7 debut: VAIO SX12 laptop review
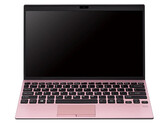
Just because you're small doesn't mean you can't perform like the big boys. The 12.5-inch Vaio SX12 may be tiny when compared to the usual 13-inch or 15-inch Ultrabook, but its 11th gen processor and FHD IPS display are just as fast and capable.
Intel Core i5-1155G7, Iris Xe G7 80EUs, 12.5", 892 gAcer Aspire Lite 15 AL15-51M: Intel Iris Xe Graphics G7 80EUs, 15.60", 1.6 kg
External Review » Acer Aspire Lite 15 AL15-51M
Infinix INBook Y2 Plus: Intel Iris Xe Graphics G7 80EUs, 15.60", 1.8 kg
External Review » Infinix INBook Y2 Plus
Huawei MateBook D 14 2023, 53013PKG: Intel Iris Xe Graphics G7 80EUs, 14.00", 1.4 kg
External Review » Huawei MateBook D 14 2023, 53013PKG
HP Pavilion 14-dv1013ns: Intel Iris Xe Graphics G7 80EUs, 14.00", 1.4 kg
External Review » HP Pavilion 14-dv1013ns
Infinix INBook X2, i5-1155G7: Intel Iris Xe Graphics G7 80EUs, 14.00", 1.2 kg
External Review » Infinix INBook X2, i5-1155G7
HP 15s-fq4008ns: Intel Iris Xe Graphics G7 80EUs, 15.60", 1.7 kg
External Review » HP 15s-fq4008ns
Lenovo IdeaPad 3 15ITL6, i5-1155G7: Intel Iris Xe Graphics G7 80EUs, 15.60", 1.7 kg
External Review » Lenovo IdeaPad 3 15ITL6, i5-1155G7
Huawei Matebook D 15 2022, i5-1155G7: Intel Iris Xe Graphics G7 80EUs, 15.60", 1.6 kg
External Review » Huawei Matebook D 15 2022, i5-1155G7
HP 14s-dq4000ns: Intel Iris Xe Graphics G7 80EUs, 14.00", 1.5 kg
External Review » HP 14s-dq4000ns
HP 17-cn1006ns: Intel Iris Xe Graphics G7 80EUs, 17.30", 2.1 kg
External Review » HP 17-cn1006ns
HP 17-cn1012ns: Intel Iris Xe Graphics G7 80EUs, 17.30", 2.1 kg
External Review » HP 17-cn1012ns
Acer Aspire Vero AV15-51-522W: Intel Iris Xe Graphics G7 80EUs, 15.60", 1.8 kg
External Review » Acer Aspire Vero AV15-51-522W
HP 15s-fq4085ns: Intel Iris Xe Graphics G7 80EUs, 15.60", 1.7 kg
External Review » HP 15s-fq4085ns
MSI Modern 14 B11MOU-1060XES: Intel Iris Xe Graphics G7 80EUs, 14.00", 1.3 kg
External Review » MSI Modern 14 B11MOU-1060XES
MSI Modern 15 A11MU-682XE: Intel Iris Xe Graphics G7 80EUs, 15.60", 1.6 kg
External Review » MSI Modern 15 A11MU-682XE
HP 15s-fq4040ns: Intel Iris Xe Graphics G7 80EUs, 15.60", 1.7 kg
External Review » HP 15s-fq4040ns
HP Pavilion 14-dv1000ns: Intel Iris Xe Graphics G7 80EUs, 14.00", 1.4 kg
External Review » HP Pavilion 14-dv1000ns
MSI Modern 14 B11MOU-689XES: Intel Iris Xe Graphics G7 80EUs, 14.00", 1.3 kg
External Review » MSI Modern 14 B11MOU-689XES
Acer Aspire Vero AV15-51-58JC: Intel Iris Xe Graphics G7 80EUs, 15.60", 1.8 kg
External Review » Acer Aspire Vero AV15-51-58JC
HP Pavilion x360 14-dy1002ns: Intel Iris Xe Graphics G7 80EUs, 14.00", 1.5 kg
External Review » HP Pavilion x360 14-dy1002ns
Acer Aspire Vero AV15-51-55K2: Intel Iris Xe Graphics G7 80EUs, 15.60", 1.8 kg
External Review » Acer Aspire Vero AV15-51-55K2
HP 15s-fq4004ns: Intel Iris Xe Graphics G7 80EUs, 15.60", 1.7 kg
External Review » HP 15s-fq4004ns
HP Pavilion x360 14-dy1001ns: Intel Iris Xe Graphics G7 80EUs, 14.00", 1.5 kg
External Review » HP Pavilion x360 14-dy1001ns
Asus ExpertBook B7 Flip B7402FEA-L90074R: Intel Iris Xe Graphics G7 80EUs, 14.00", 1.5 kg
External Review » Asus ExpertBook B7 Flip B7402FEA-L90074R
MSI Modern 14 B11MOU-852VN: Intel Iris Xe Graphics G7 80EUs, 14.00", 1.3 kg
External Review » MSI Modern 14 B11MOU-852VN
Acer Aspire Vero AV15-51-55CG: Intel Iris Xe Graphics G7 80EUs, 15.60", 1.8 kg
External Review » Acer Aspire Vero AV15-51-55CG
VAIO SX14 VJS144X0711S: Intel Iris Xe Graphics G7 80EUs, 14.00", 1.1 kg
External Review » VAIO SX14 VJS144X0711S
Huawei MateBook D 14 2023, 53013PKG: Intel Iris Xe Graphics G7 80EUs, 14.00", 1.4 kg
» Huawei MateBook D 14 reviewed: Quiet office laptop with long battery life in a unibody design
VAIO SX12 VJS124X1011P: Intel Iris Xe Graphics G7 80EUs, 12.50", 0.9 kg
» Intel Core i5-1155G7 outperforms the Core i7-1165G7: 12-inch Vaio SX12 comes with the performance of a 15-inch Ultrabook