Intel Core i5-1155G7 debut: VAIO SX12 laptop review
There are plenty of Ultrabooks to choose from in the 13- to 15-inch range. Once you move down to 12 inches or smaller, however, options become much more narrower especially if you want a standard clamshell laptop with the same Core U-series processor as found on the larger models. The Vaio SX12 is one of the few 12.5-inch laptops equipped with 11th gen Intel Tiger Lake-U series CPUs for a performance level more akin to a full-fledged Ultrabook instead of a typical subnotebook.
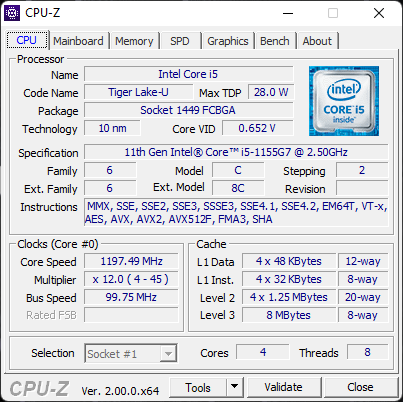
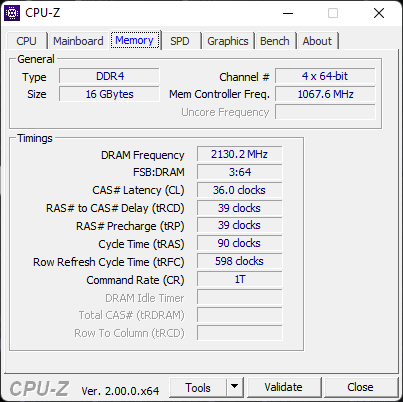
Our configuration in review includes the Core i5-1155G7 CPU and 512 GB NVMe SSE for approximately $1300 USD retail. Users may configure with the higher-end Core i7-1195G7 with 1 TB storage instead, but all configurations otherwise come with no discrete graphics and the same 16 GB LPDDR4x-4266 RAM and 1080p non-touch IPS display. There are not many alternatives to the SX12 since 12-inch subnotebooks are uncommon, but the Surface Laptop Go, Lenovo ThinkPad A285, or the Dell latitude 5200 series can be seen as competitors.
More Vaio reviews:
Potential Competitors in Comparison
Rating | Date | Model | Weight | Height | Size | Resolution | Price |
|---|---|---|---|---|---|---|---|
| 86.3 % v7 (old) | 04 / 2022 | VAIO SX12 VJS124X1011P i5-1155G7, Iris Xe G7 80EUs | 892 g | 17.8 mm | 12.50" | 1920x1080 | |
| 84 % v6 (old) | 05 / 2019 | VAIO A12-92993 i7-8500Y, UHD Graphics 615 | 1.1 kg | 24 mm | 12.50" | 1920x1080 | |
| 87.2 % v7 (old) | 11 / 2021 | VAIO SX14 VJS144X0111K i7-1195G7, Iris Xe G7 96EUs | 1.1 kg | 17.9 mm | 14.00" | 1920x1080 | |
| 85.3 % v7 (old) | 03 / 2022 | Huawei MateBook E Core i5 i5-1130G7, Iris Xe G7 80EUs | 719 g | 7.99 mm | 12.60" | 2560x1600 | |
| 89.1 % v7 (old) | 09 / 2019 | Dell Latitude 7200 i5-8365U, UHD Graphics 620 | 1.2 kg | 9.35 mm | 12.30" | 1920x1280 | |
| 88.1 % v7 (old) | 10 / 2020 | Dell XPS 13 9310 Core i7 FHD i7-1165G7, Iris Xe G7 96EUs | 1.3 kg | 14.8 mm | 13.40" | 1920x1200 |
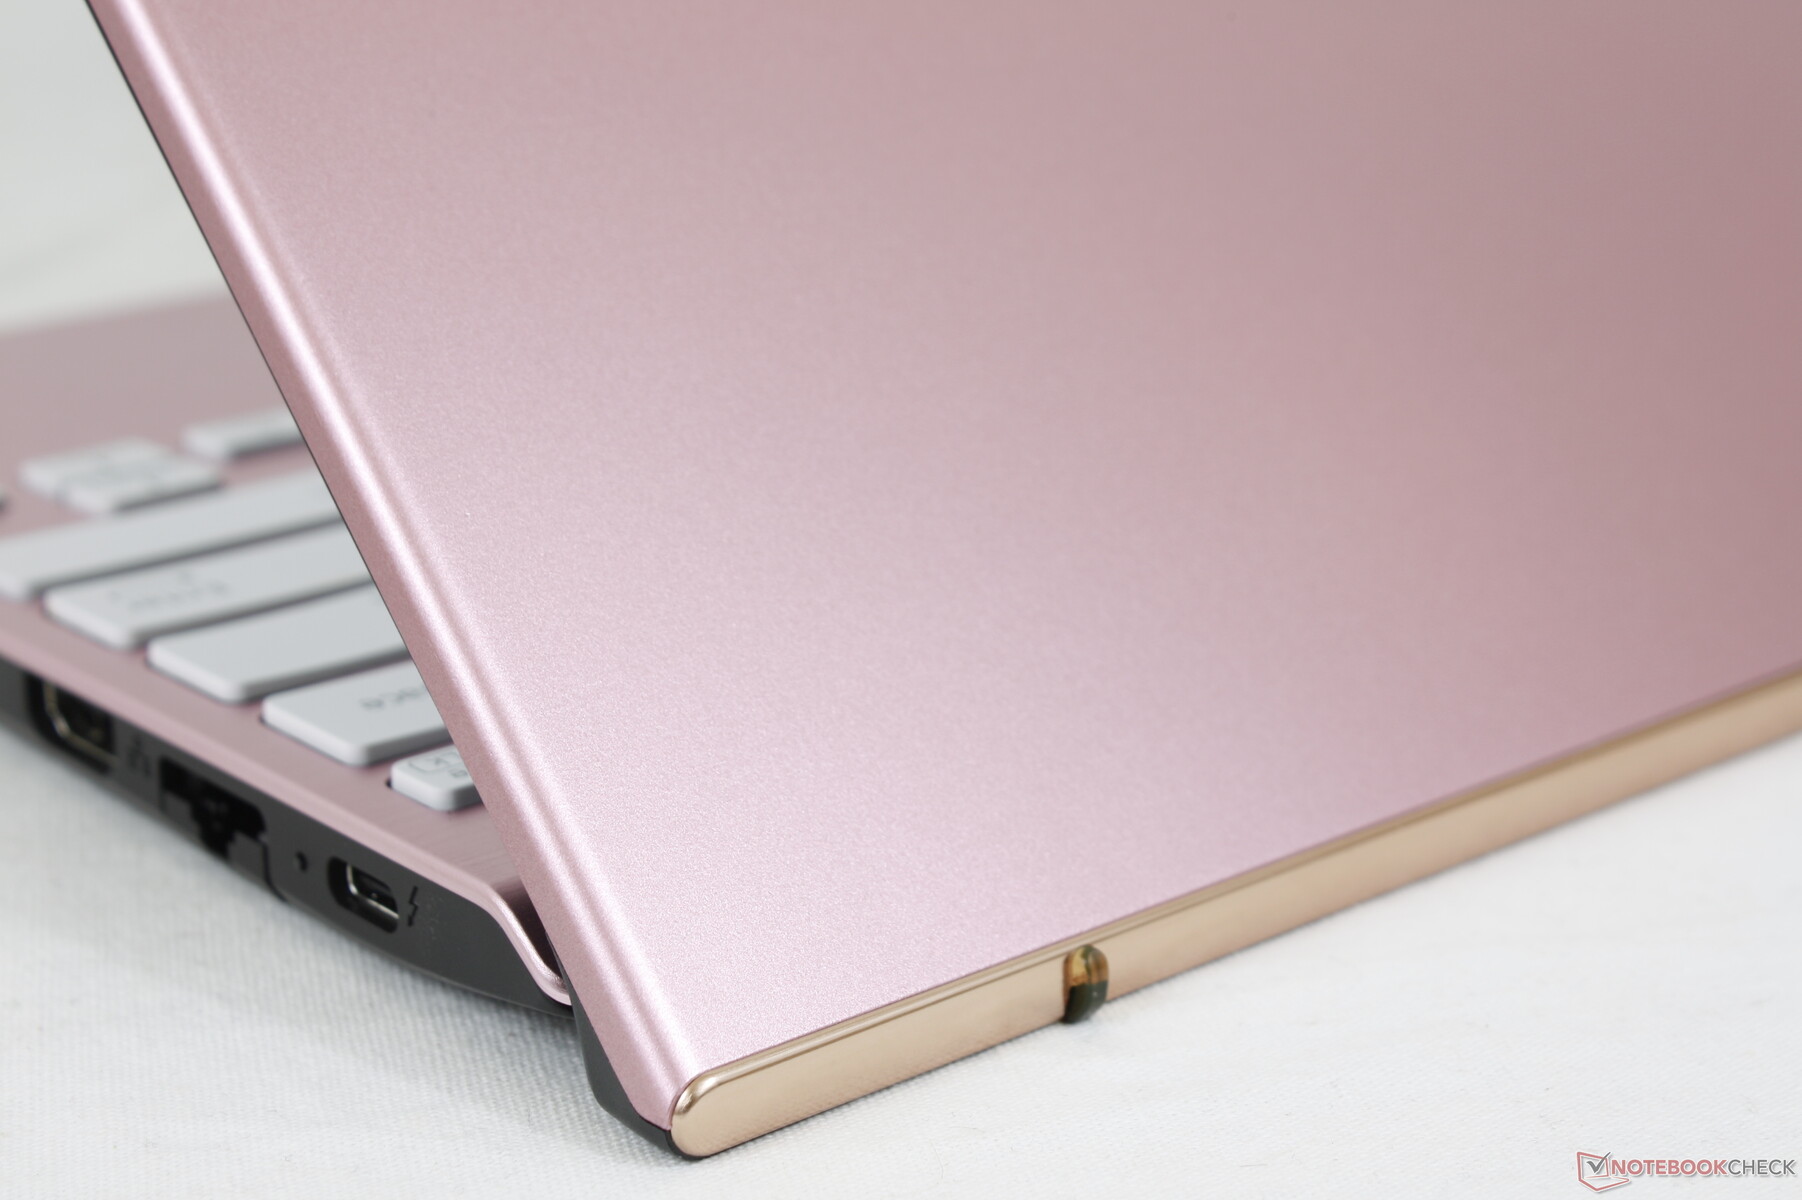
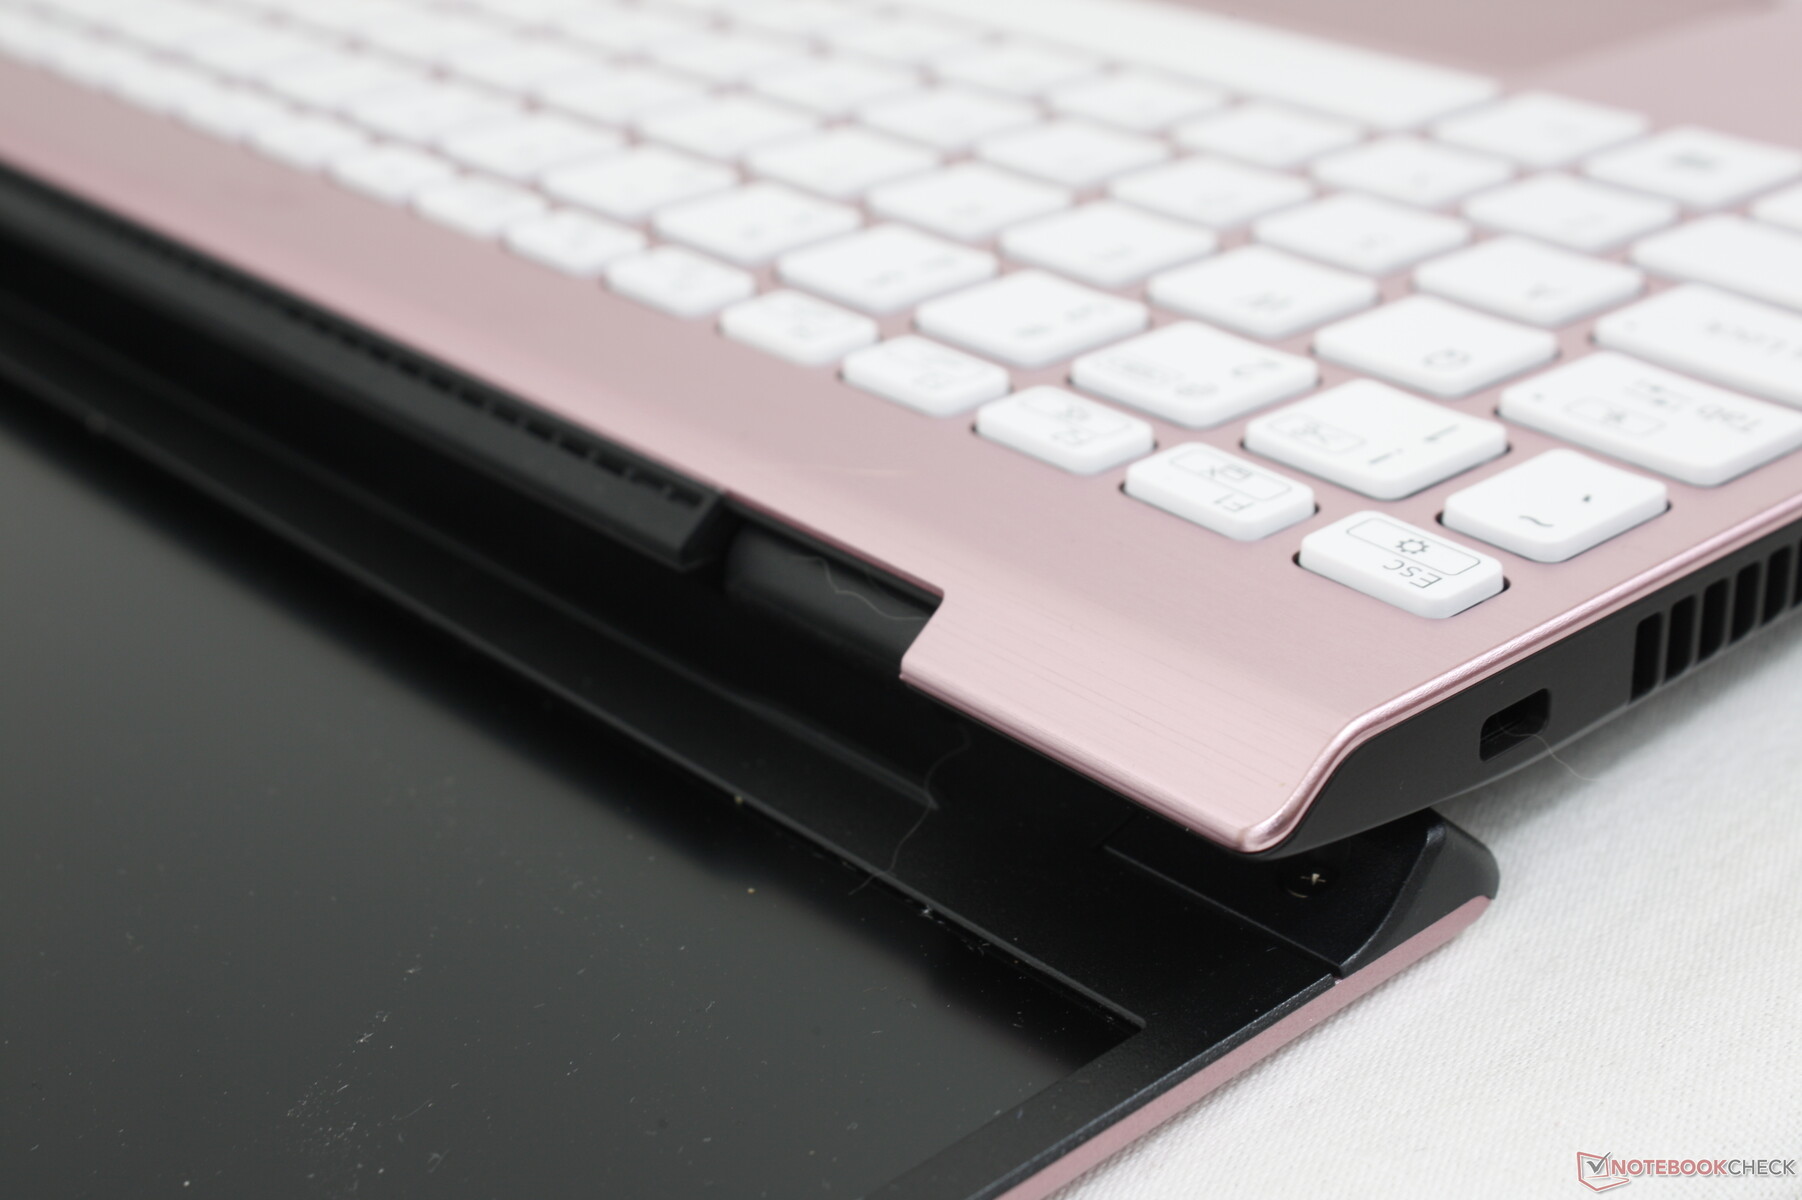
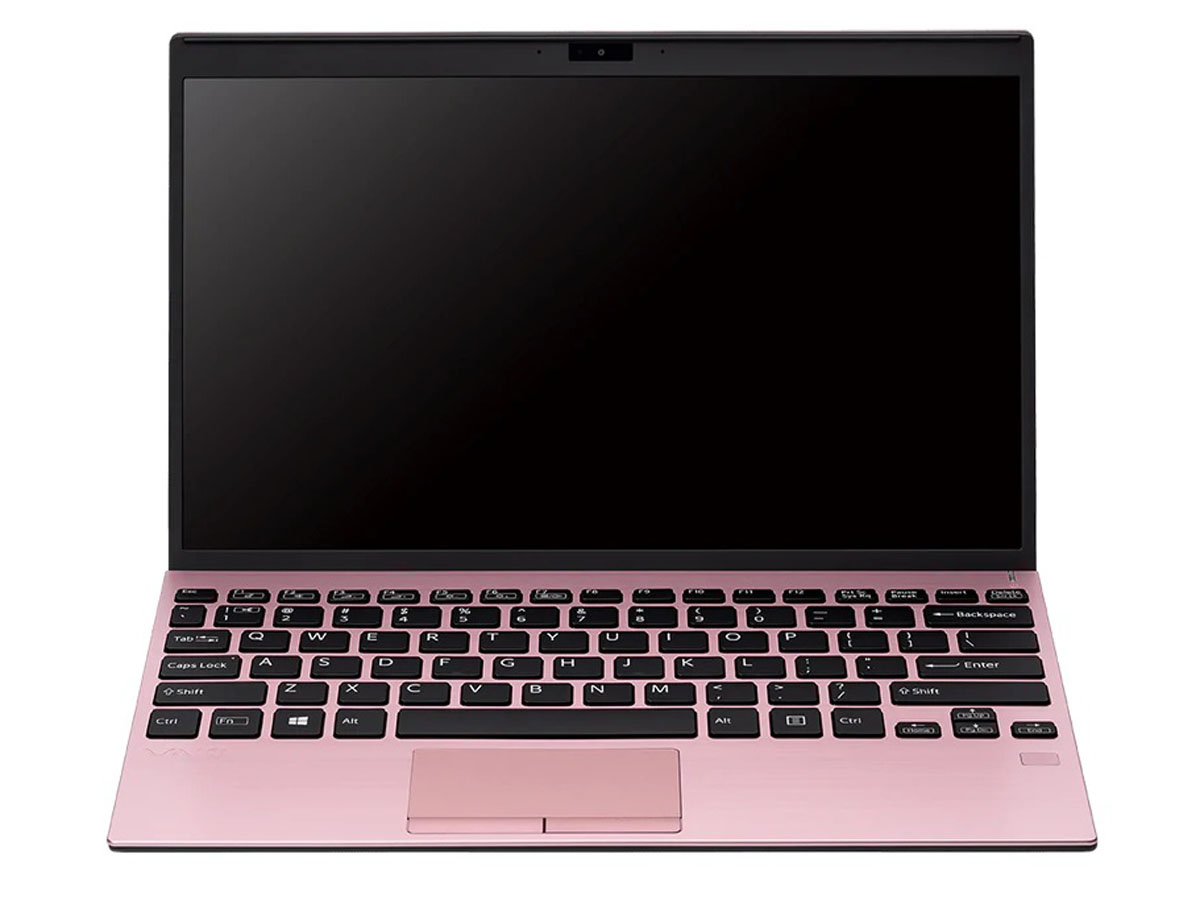
Case — Under 2 Pounds
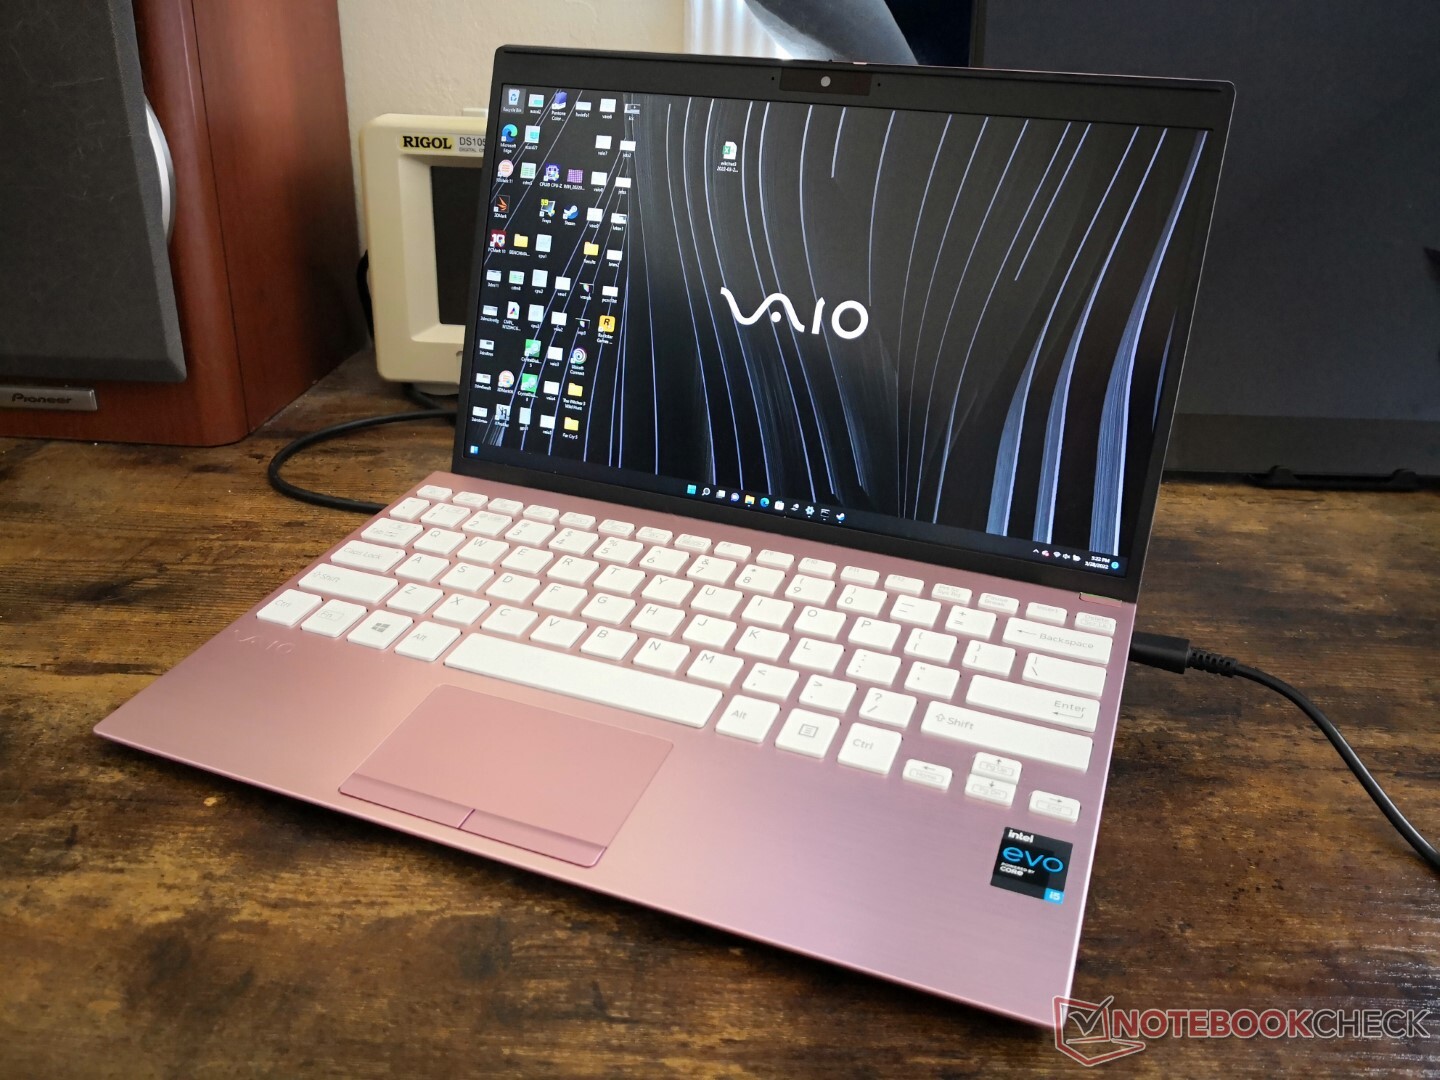
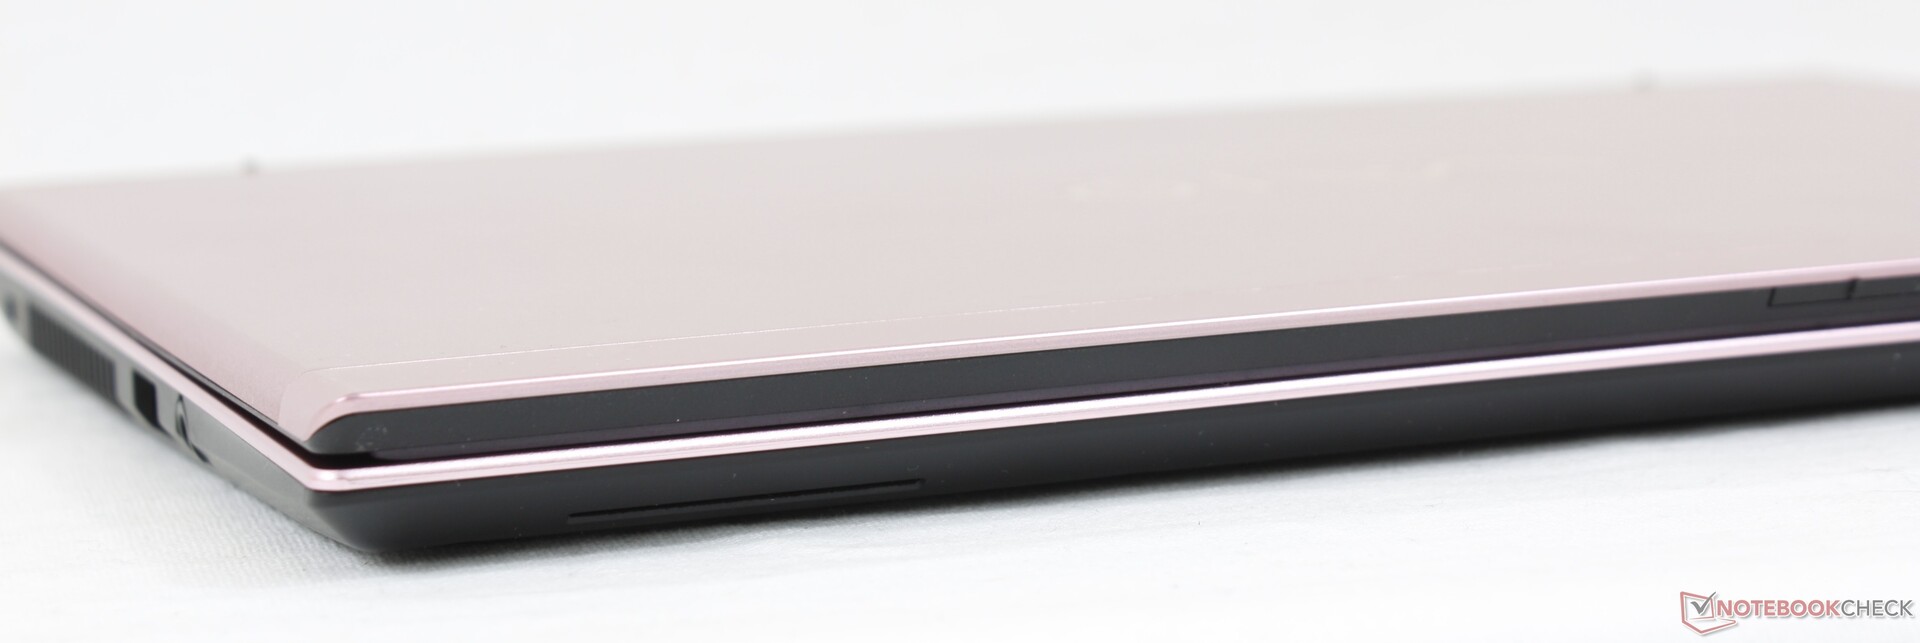
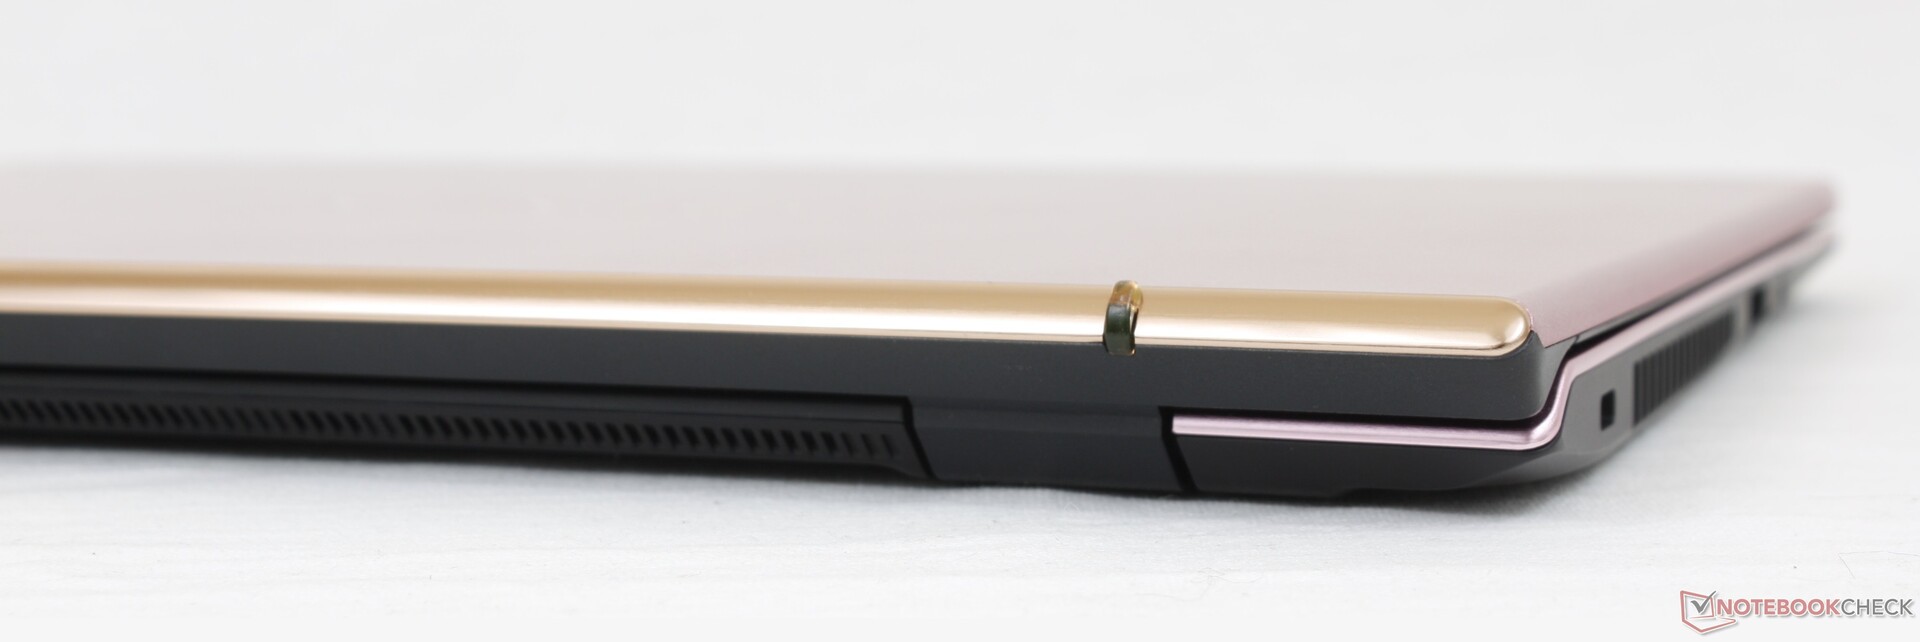
The SX12 utilizes similar thin metal materials as on the SX14 for a similar look and feel. Thus, the model prioritizes low weight over chassis rigidity in a similar manner to the Dynabook Portege X30L, Samsung Galaxy Book Pro, or LG Gram series. Pushing down on the keyboard center or outer lid, for example, would cause their surfaces to visibly flex more so than on the heavier XPS 13 or Razer Blade Stealth. This is especially true of the lid which lacks Gorilla Glass reinforcement. Nonetheless, the model was designed with this flexing in mind and so any minor warping or twisting will not necessarily cause any damage. It still feels and looks like a luxury unit even if it's not nearly as sound or unyielding as most other high-end Ultrabooks.
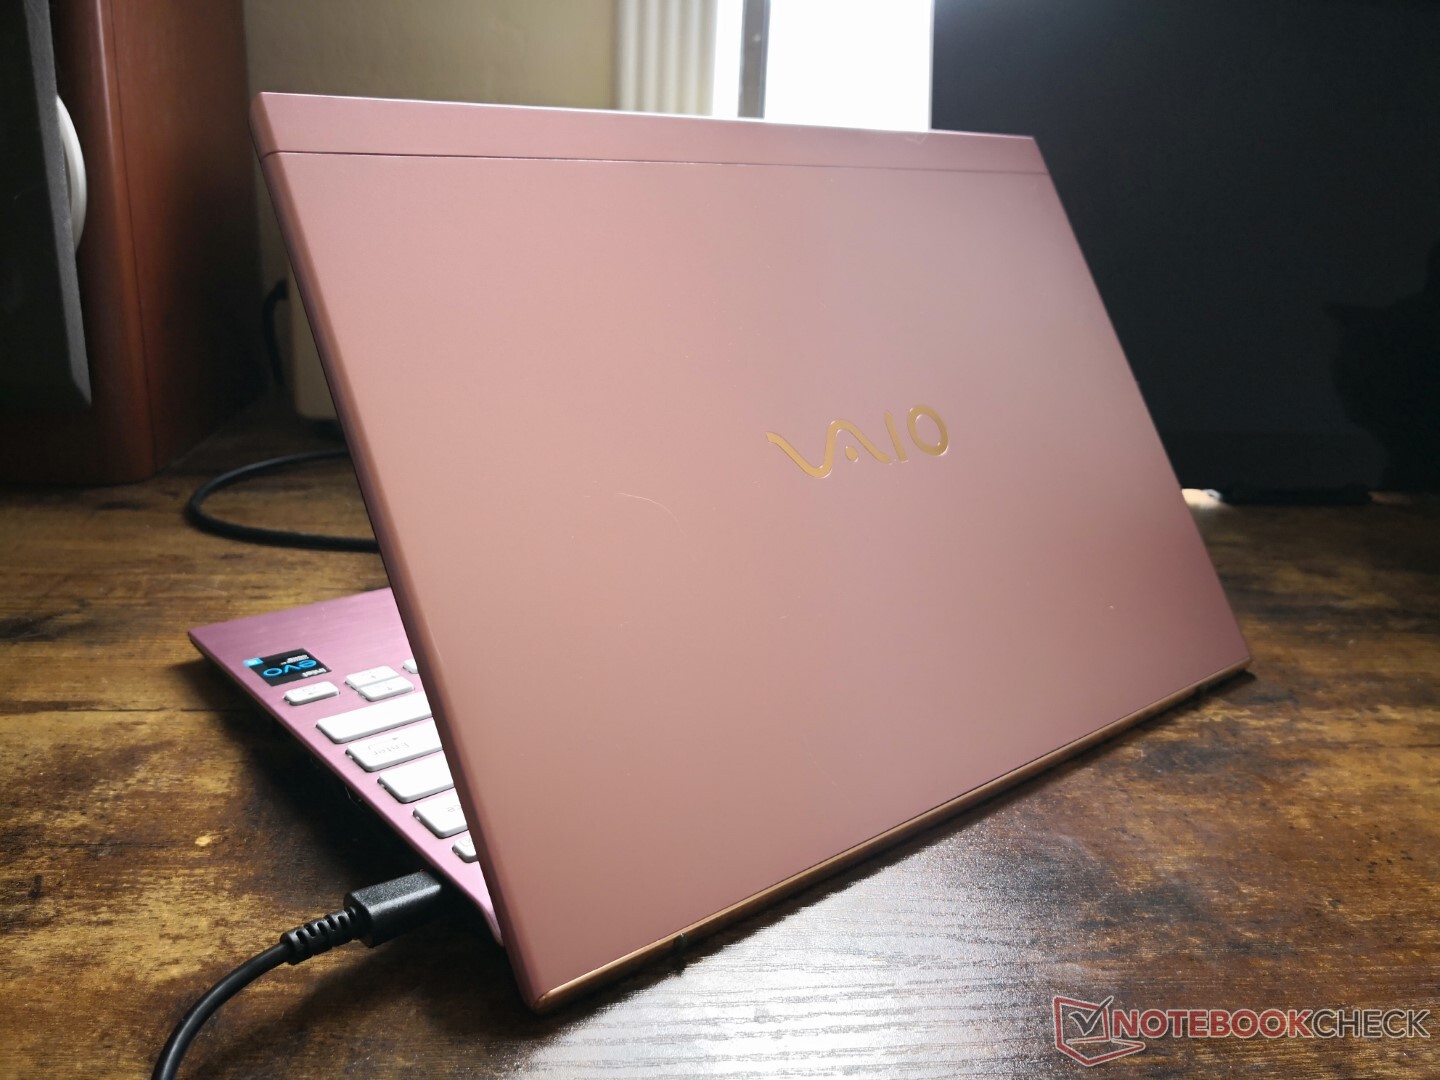
At just under 900 g, the SX12 is unsurprisingly much more portable than most other laptops. Its overall size is bigger than expected, however, as even the XPS 13 is smaller in volume despite its larger 13.3-inch screen size. The thin chassis skeleton of the SX12 is likely responsible for both the low weight and high susceptibility to flexing as noted above.
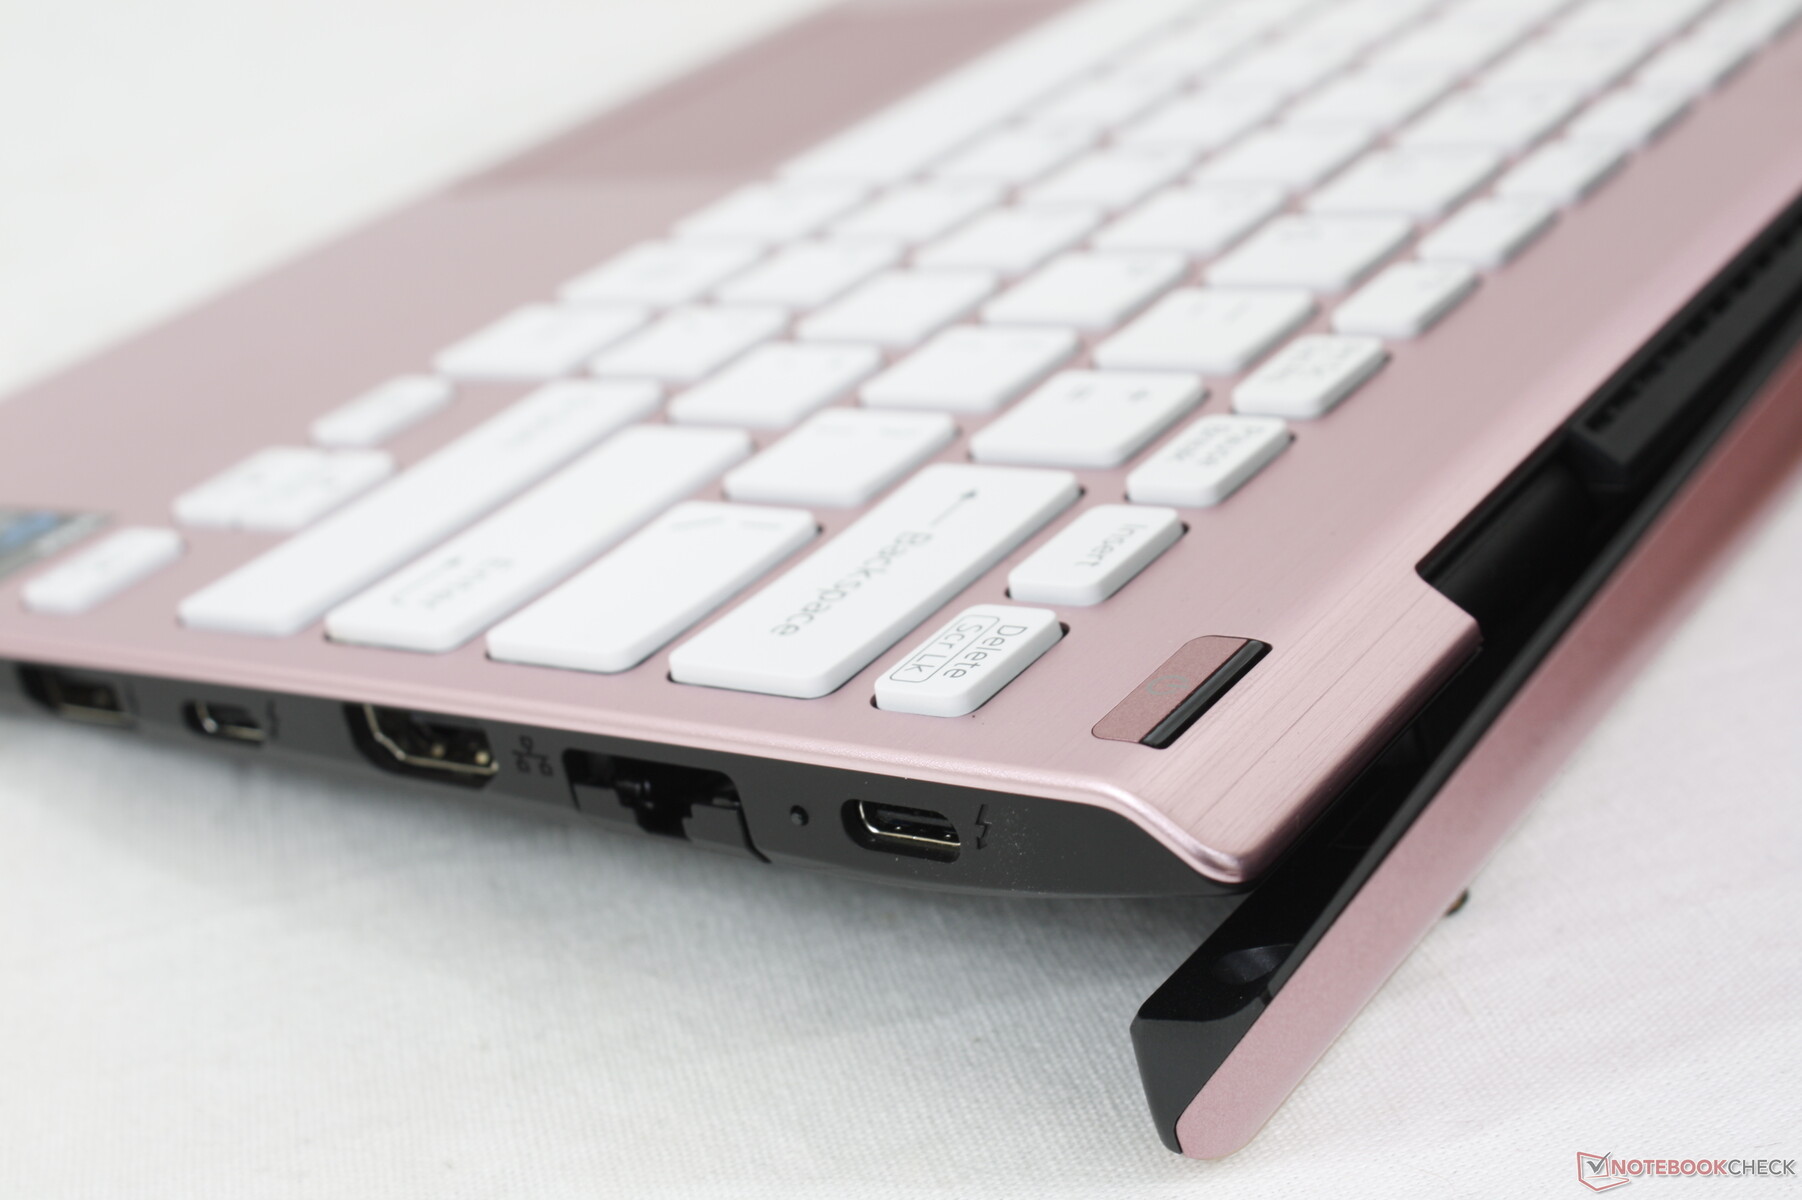
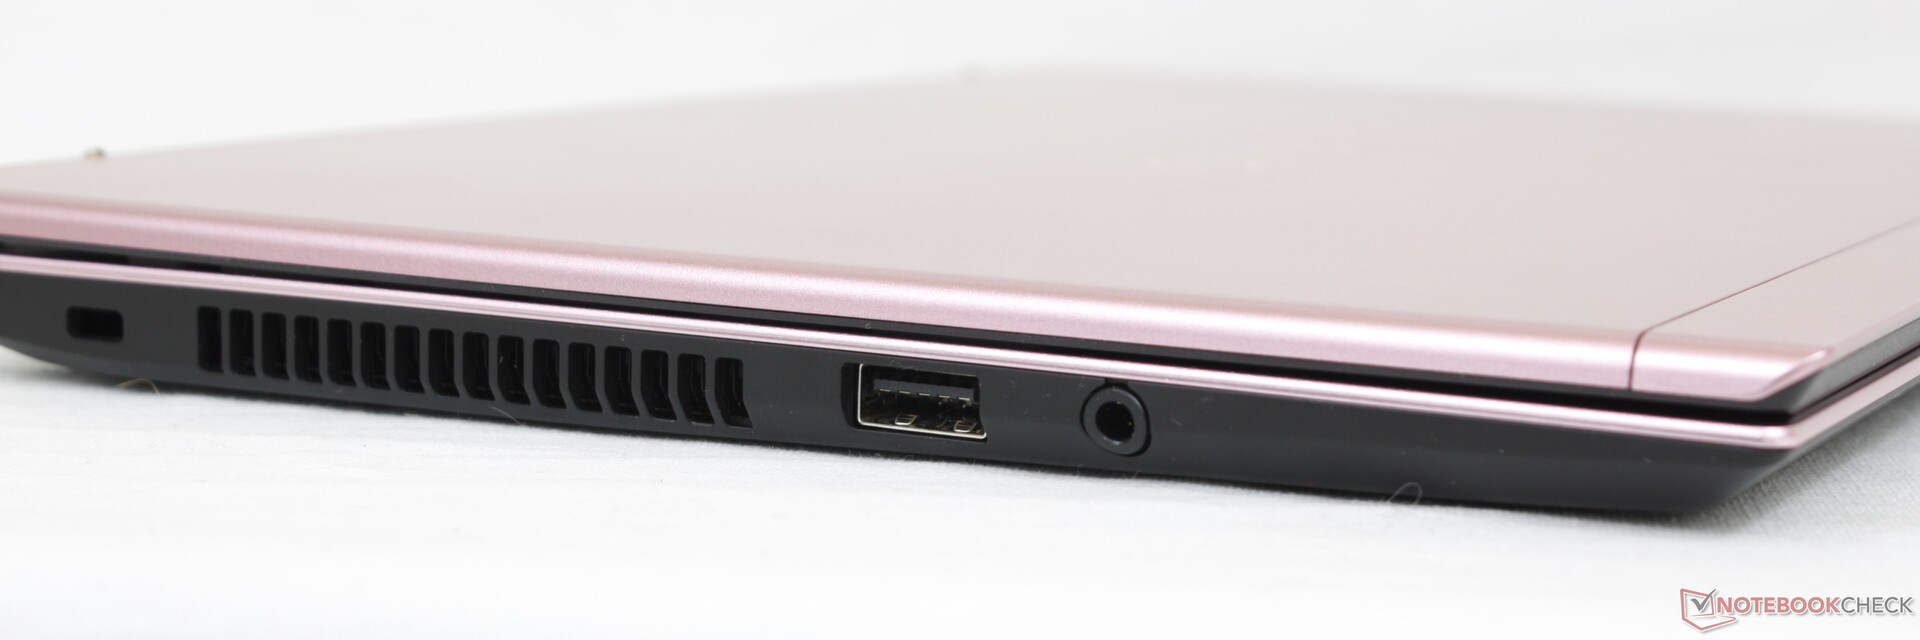
Connectivity — Lots of Options
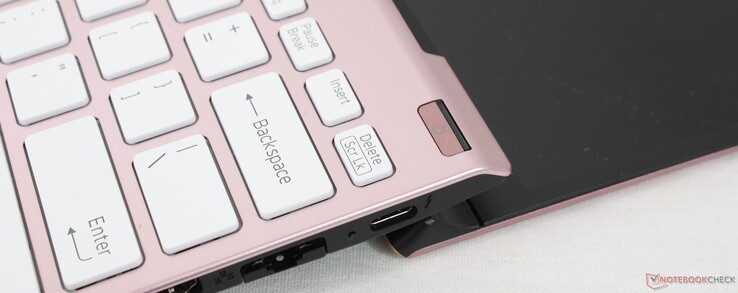
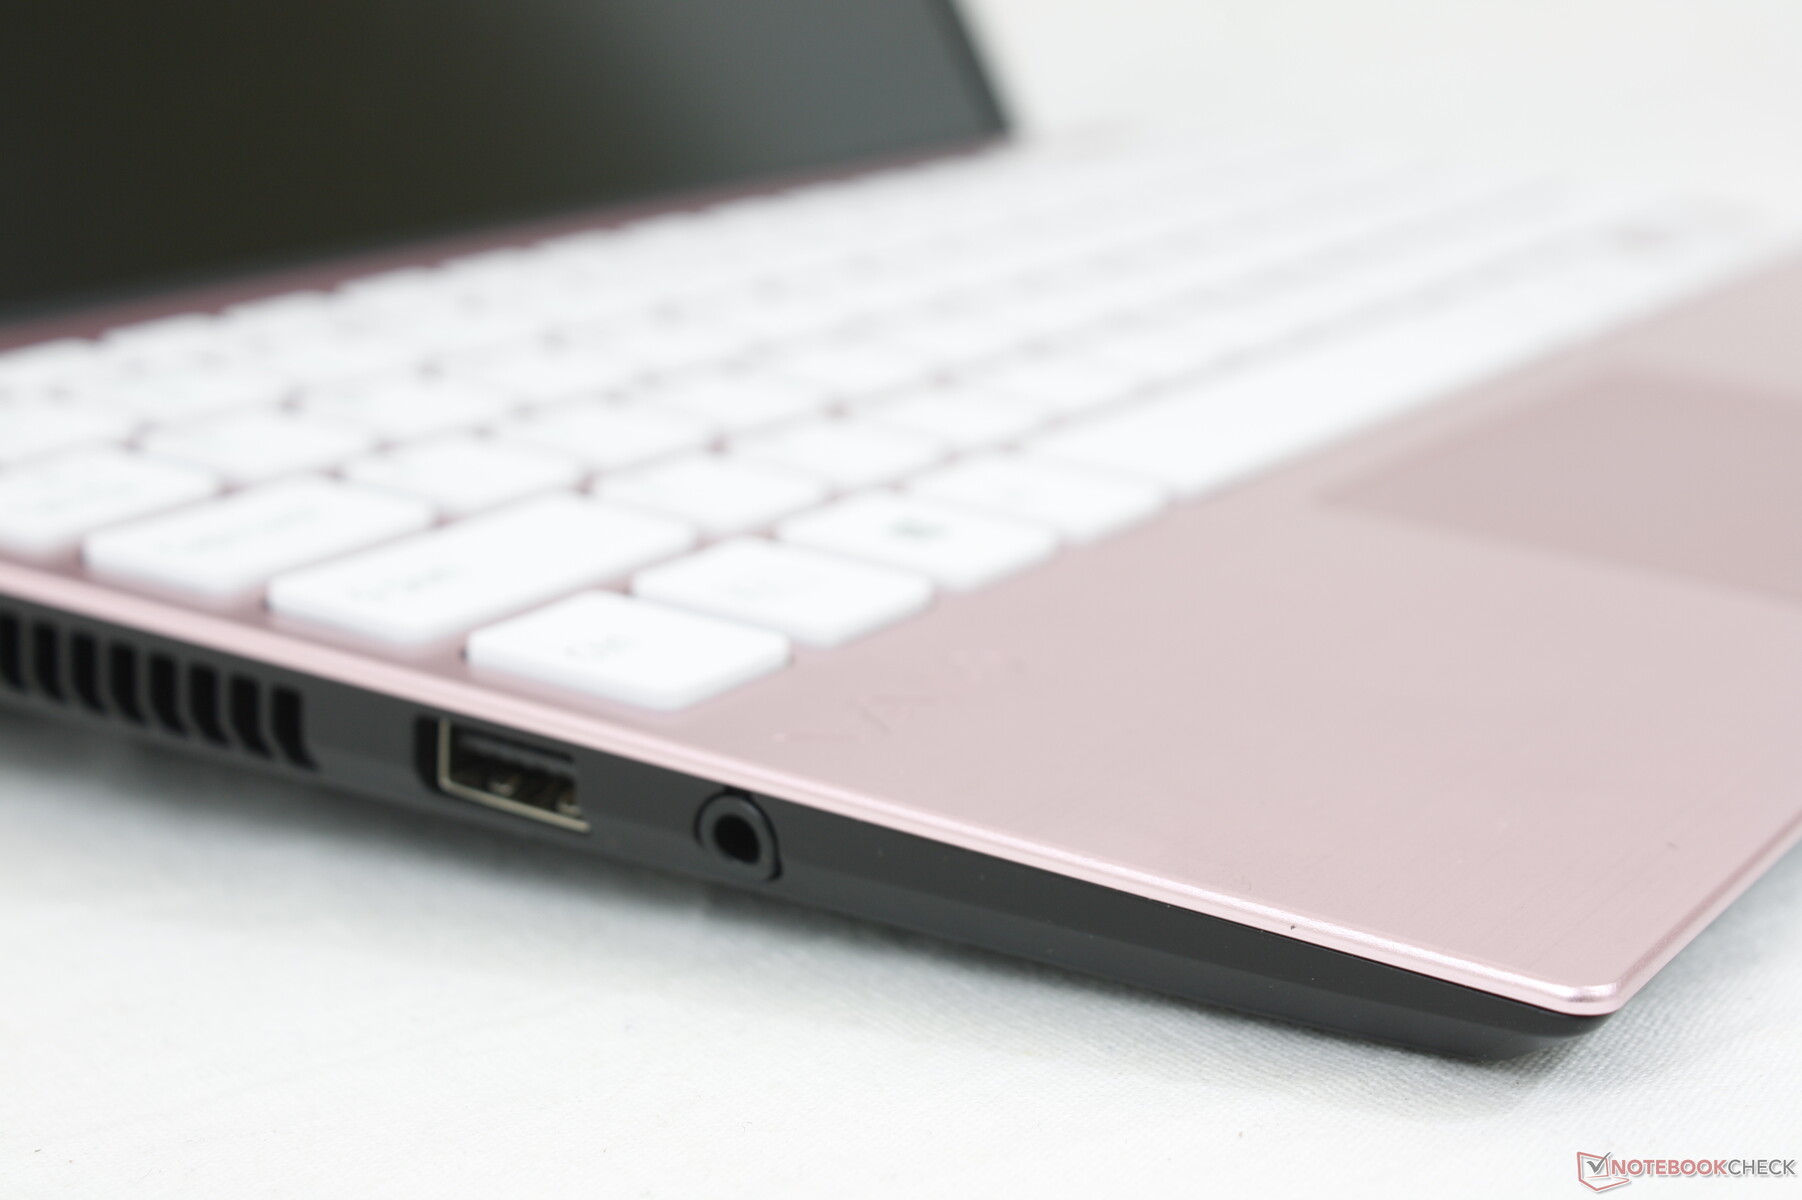
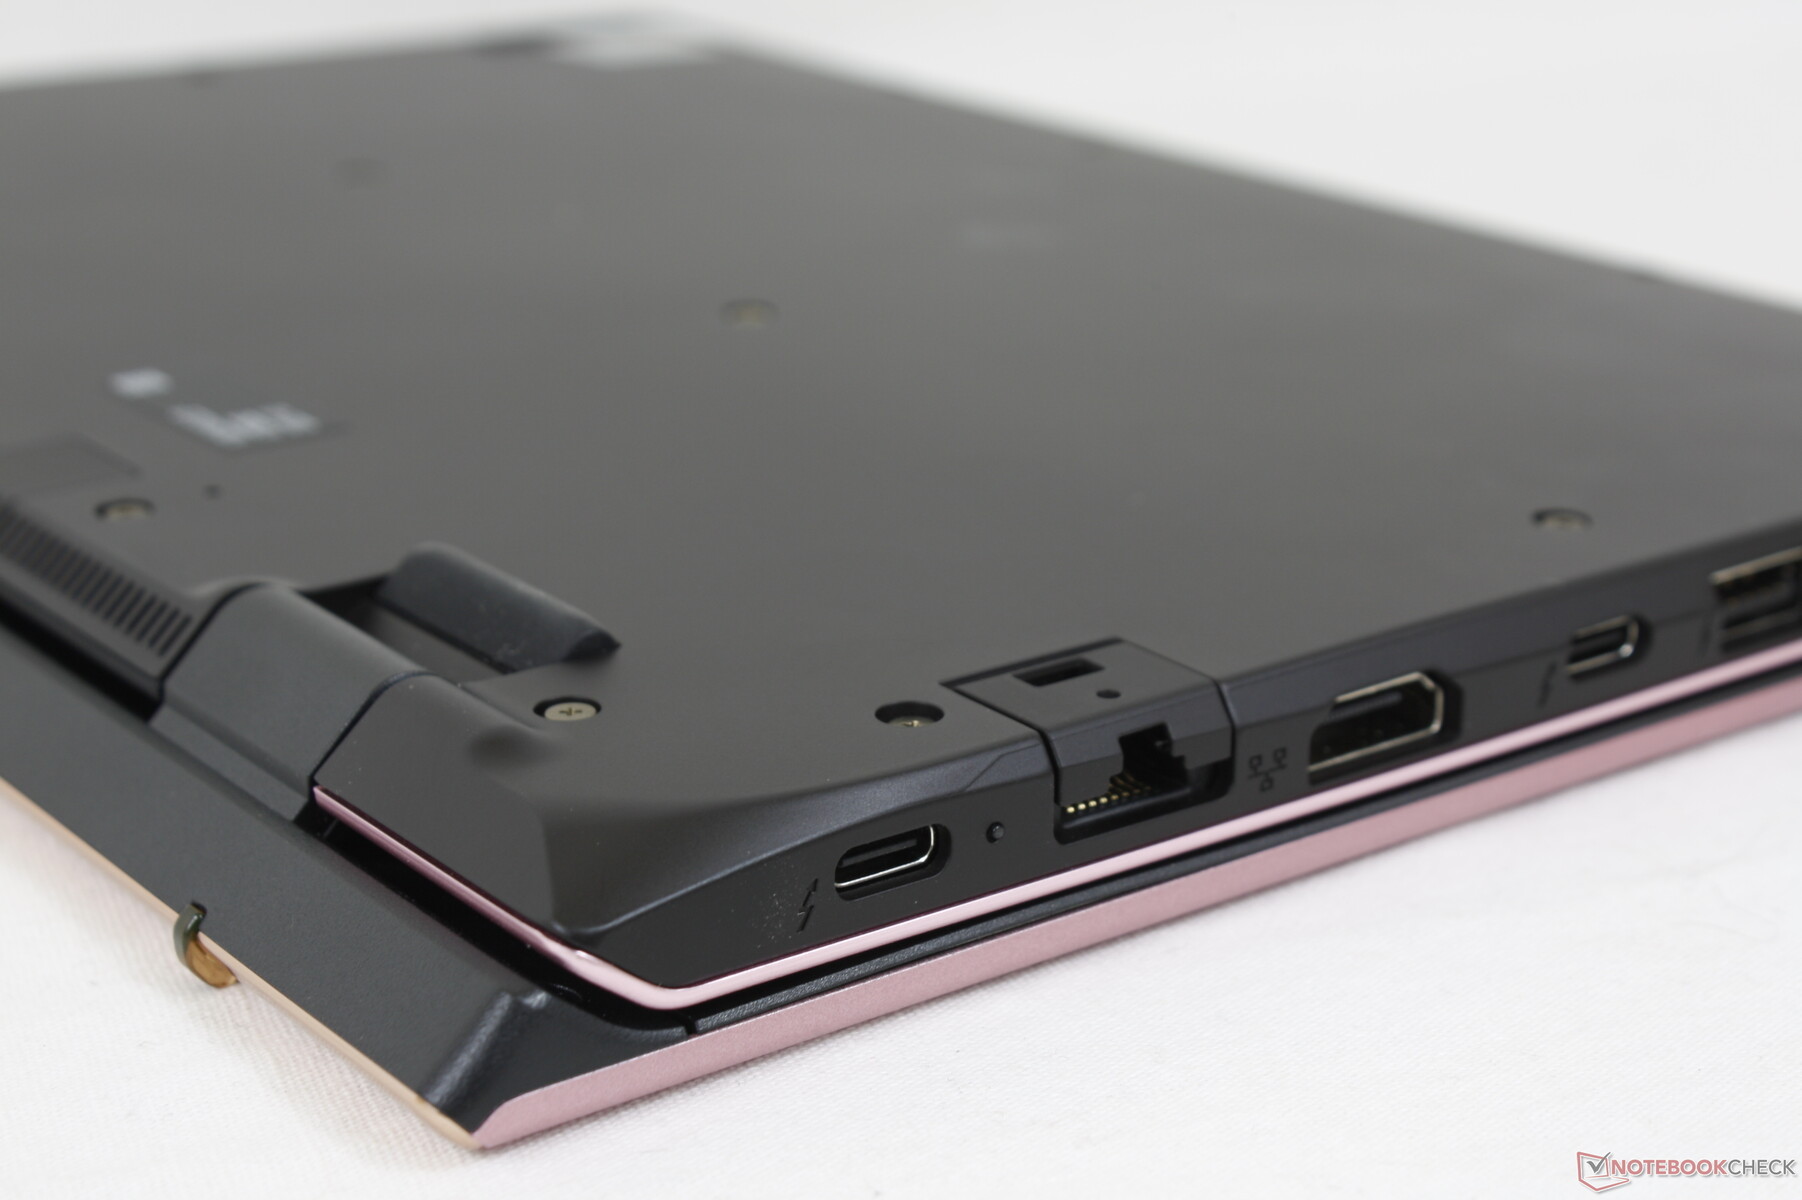
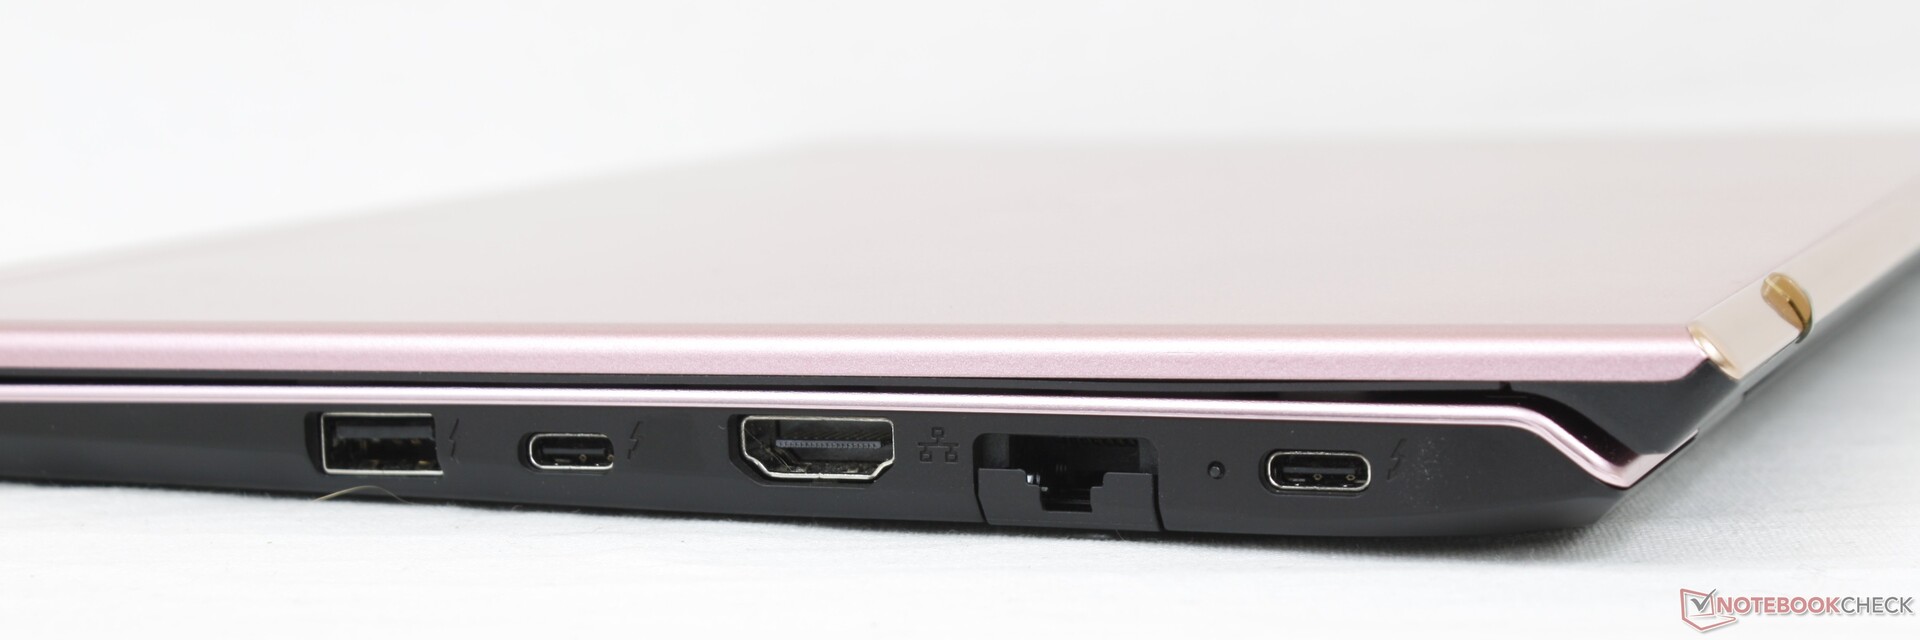
Port options are identical to the larger SX14 despite their size and weight differences. The model even manages to integrate a RJ-45 port which is a rarity on Ultrabooks these days. Most ports are located along the right edge, however, which can be annoying when using an external mouse because of all the protruding cables.
Communication
Webcam
The integrated camera is 1080p unlike on most other laptops where 720p is the norm. IR comes standard for Windows Hello support and there is a physical privacy slider shutter as well.


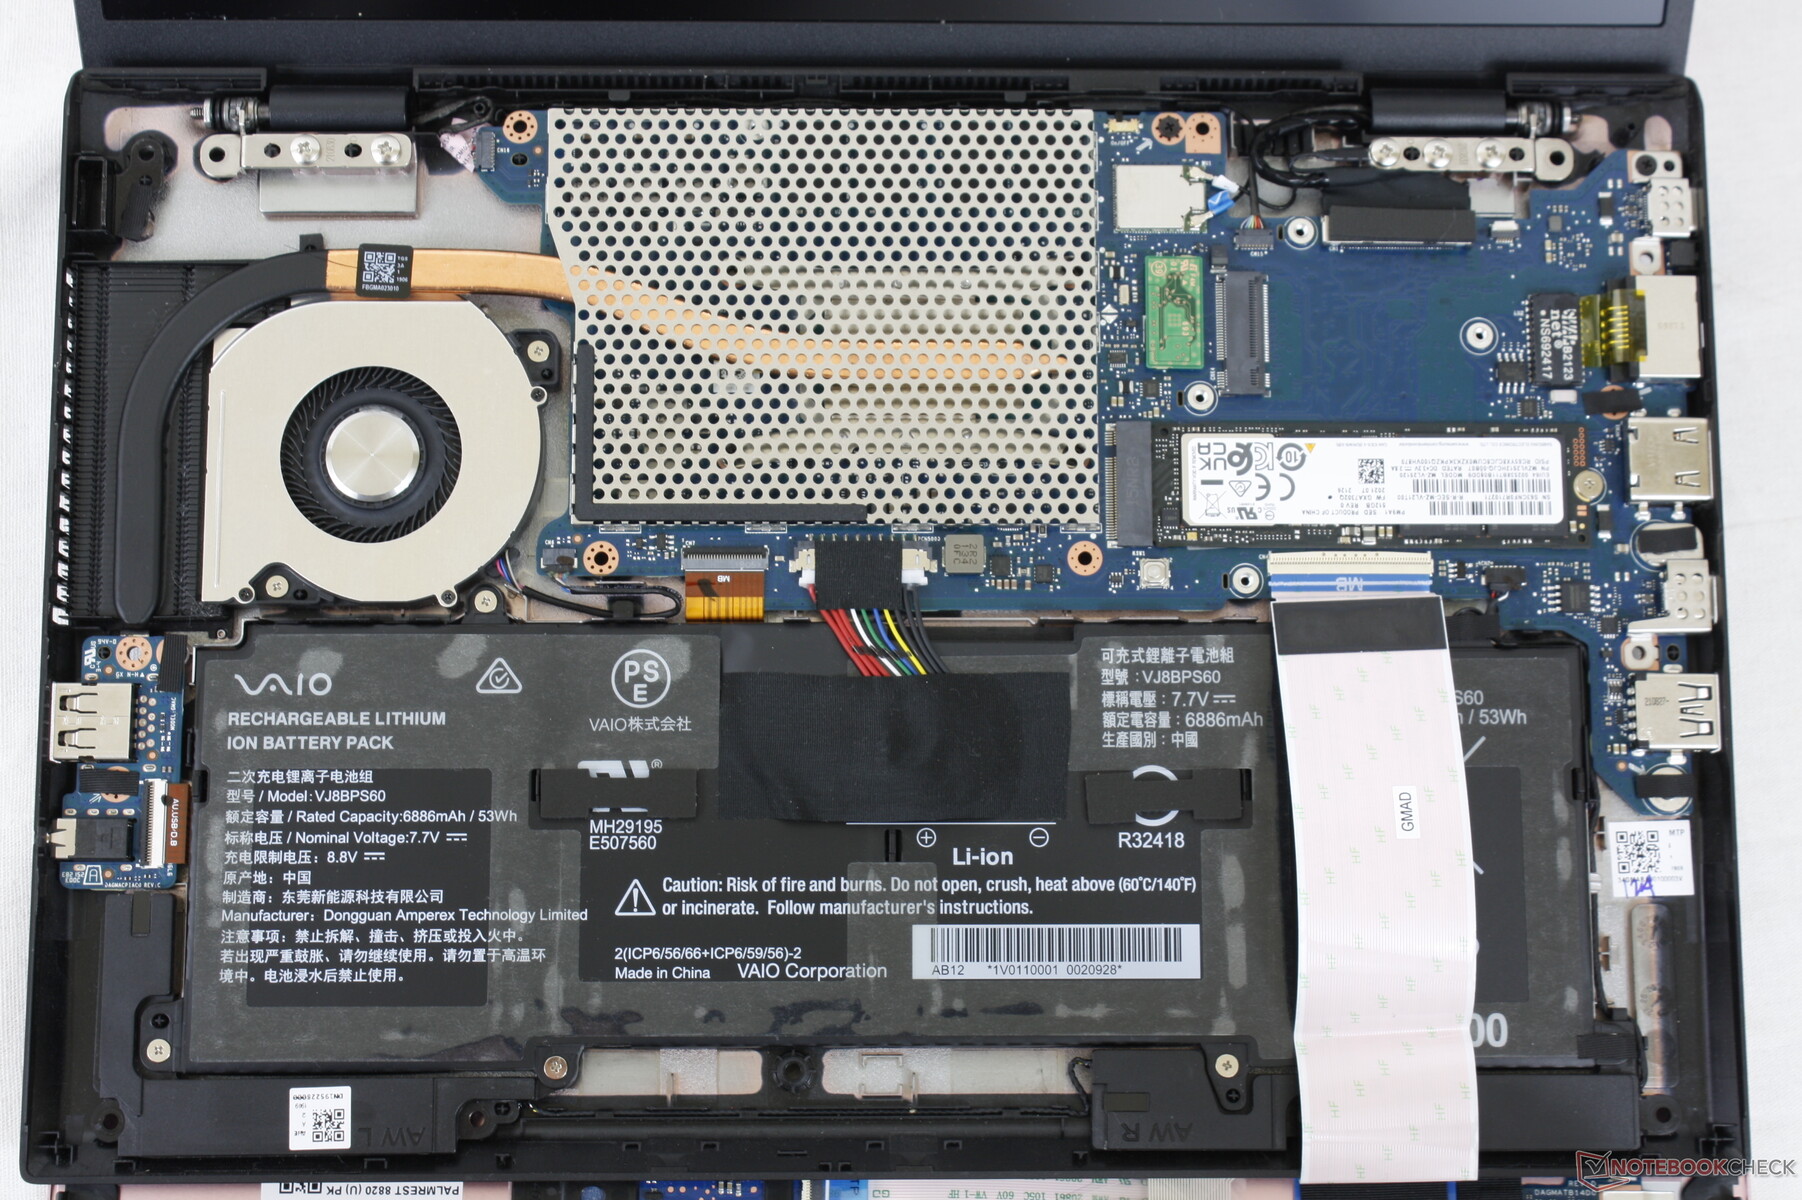
Maintenance
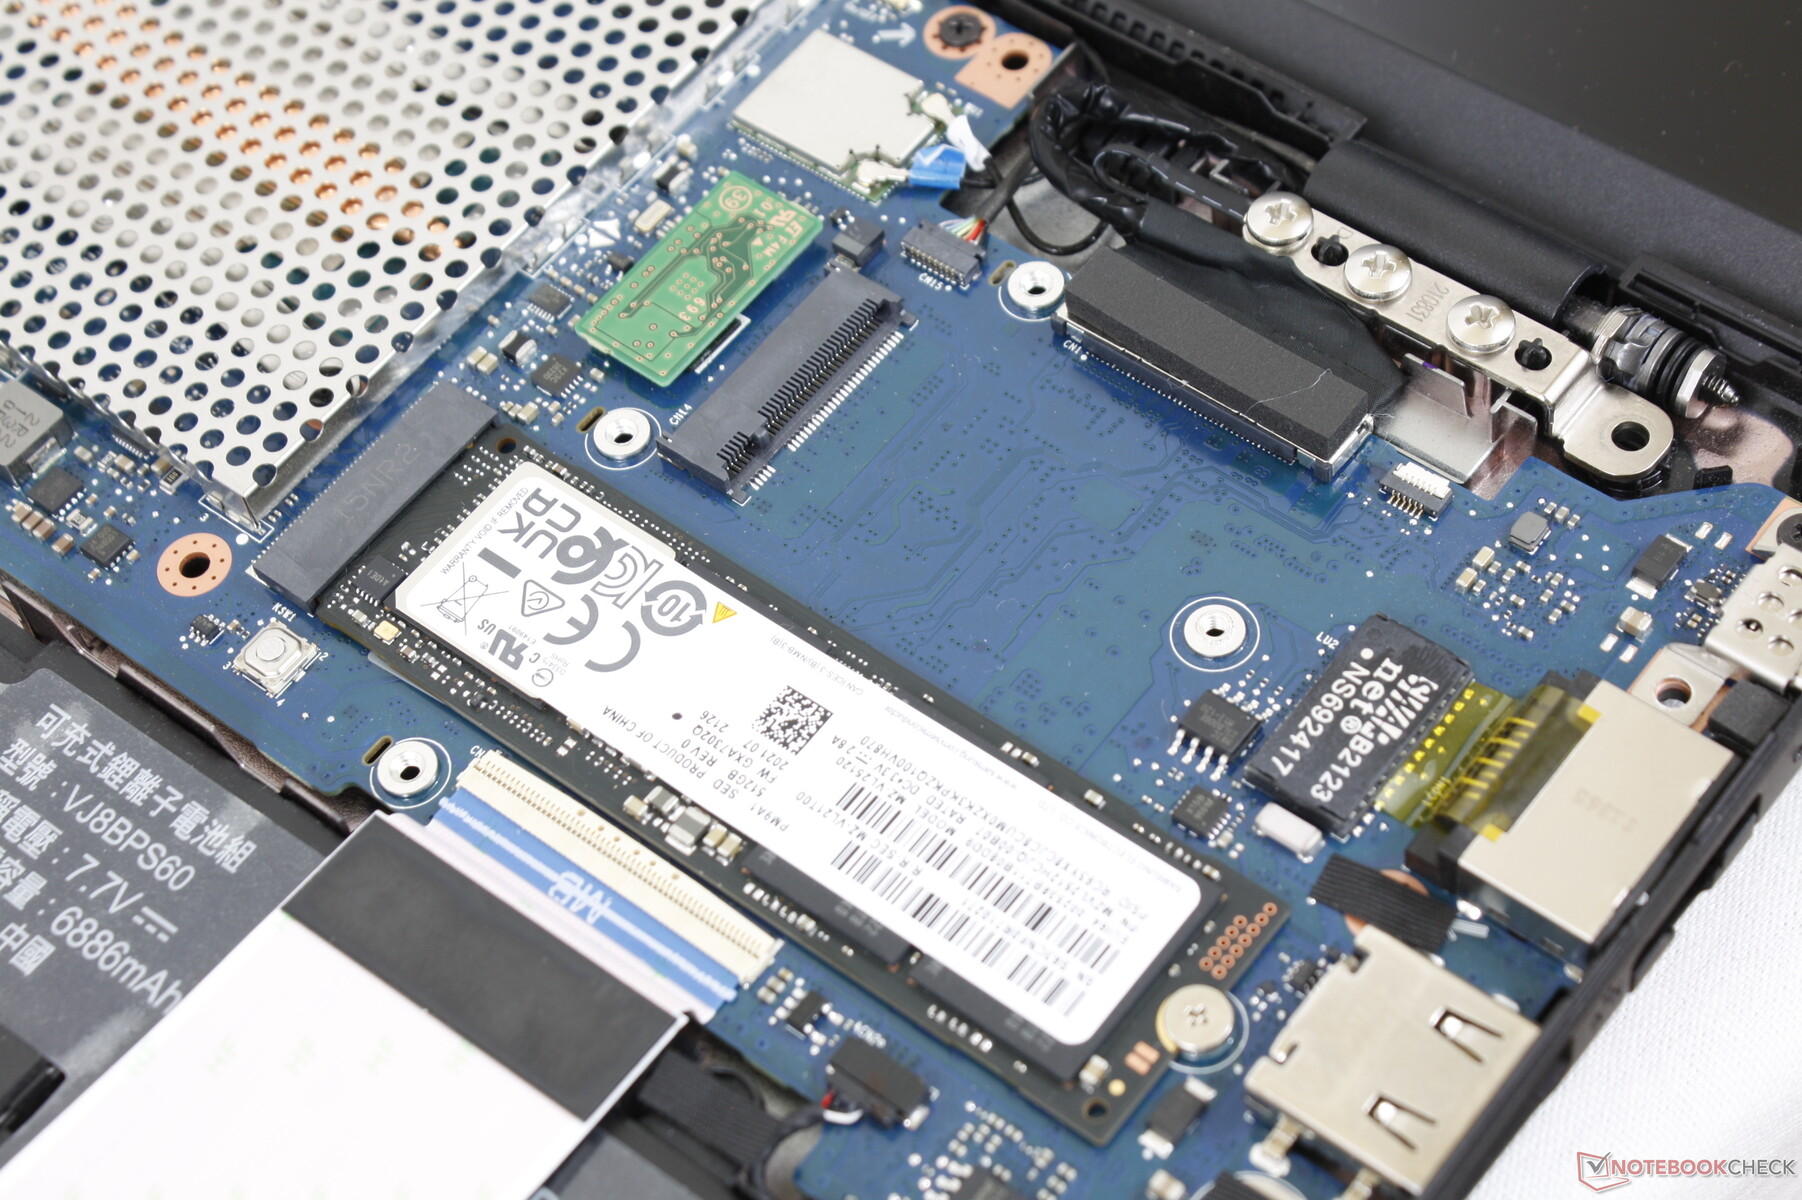
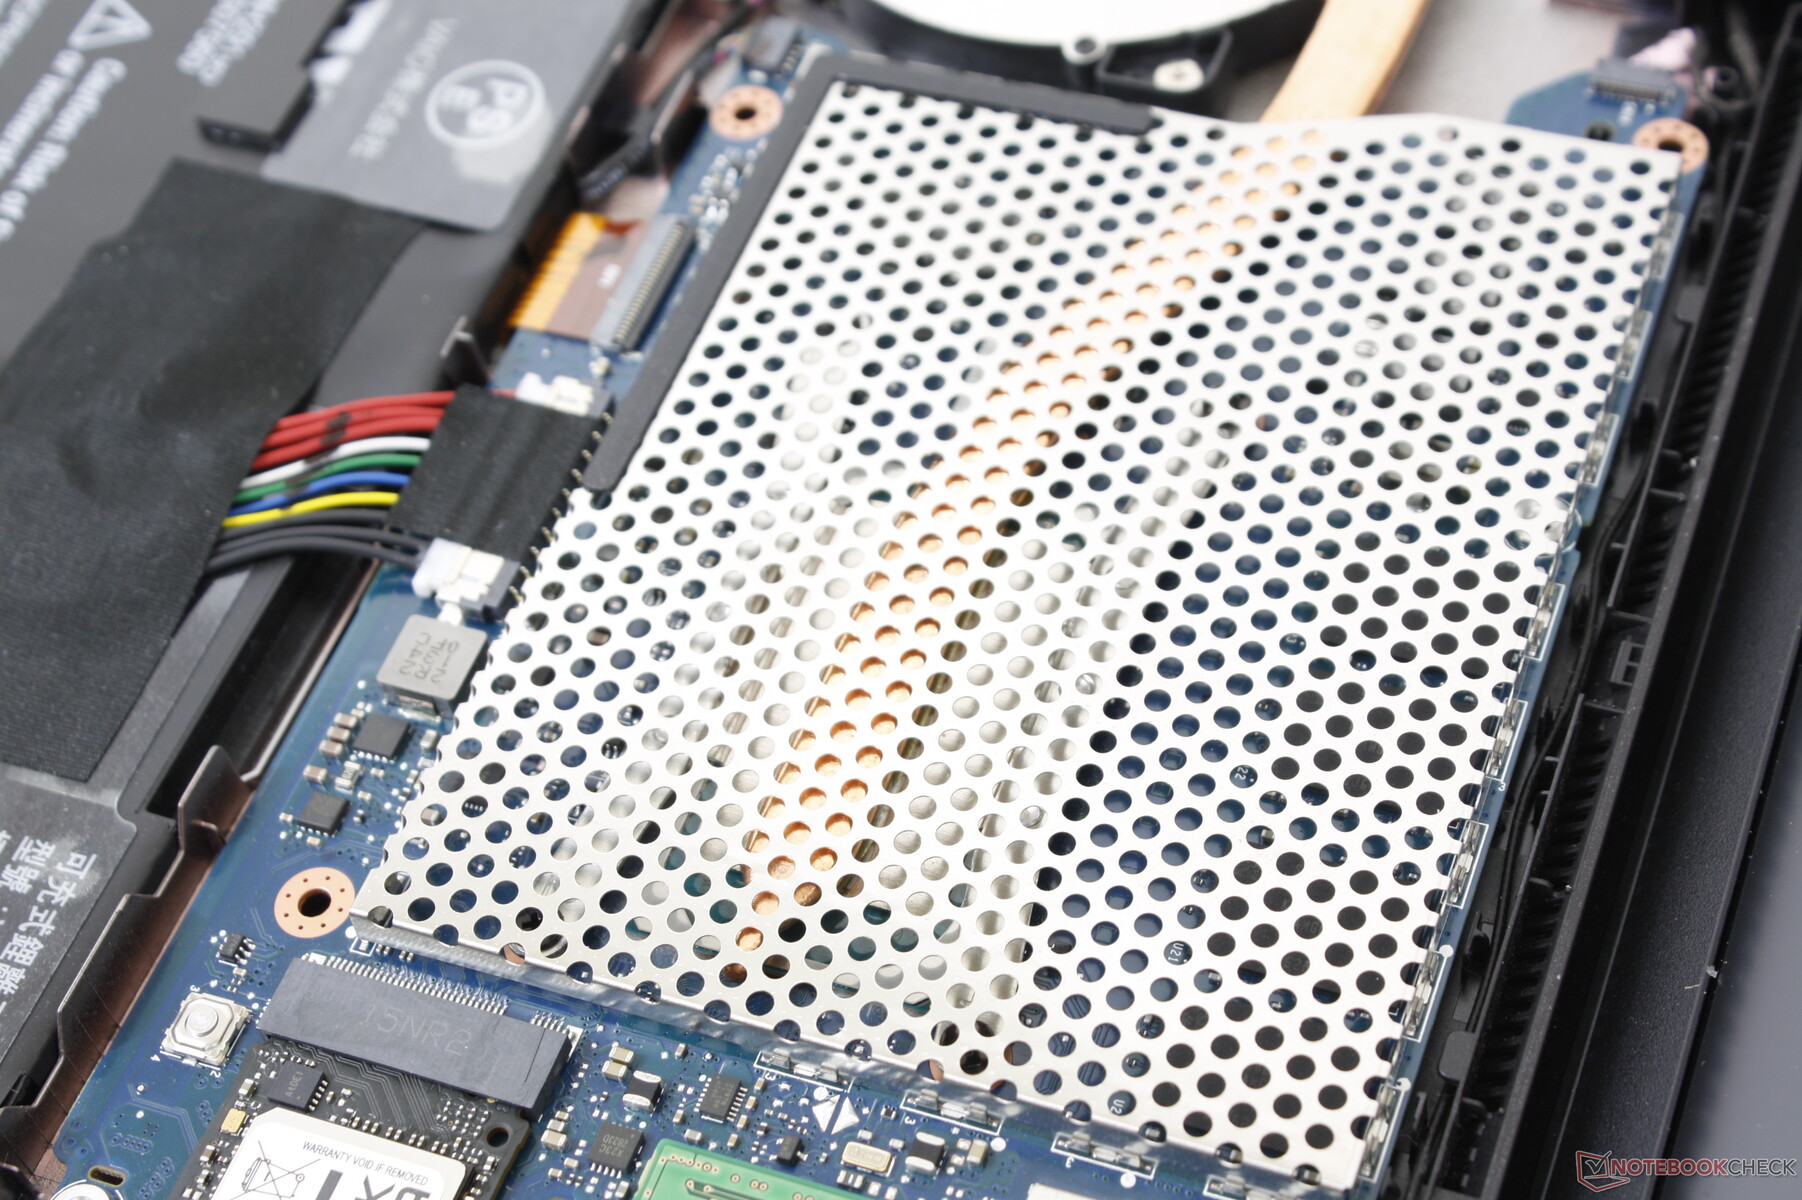
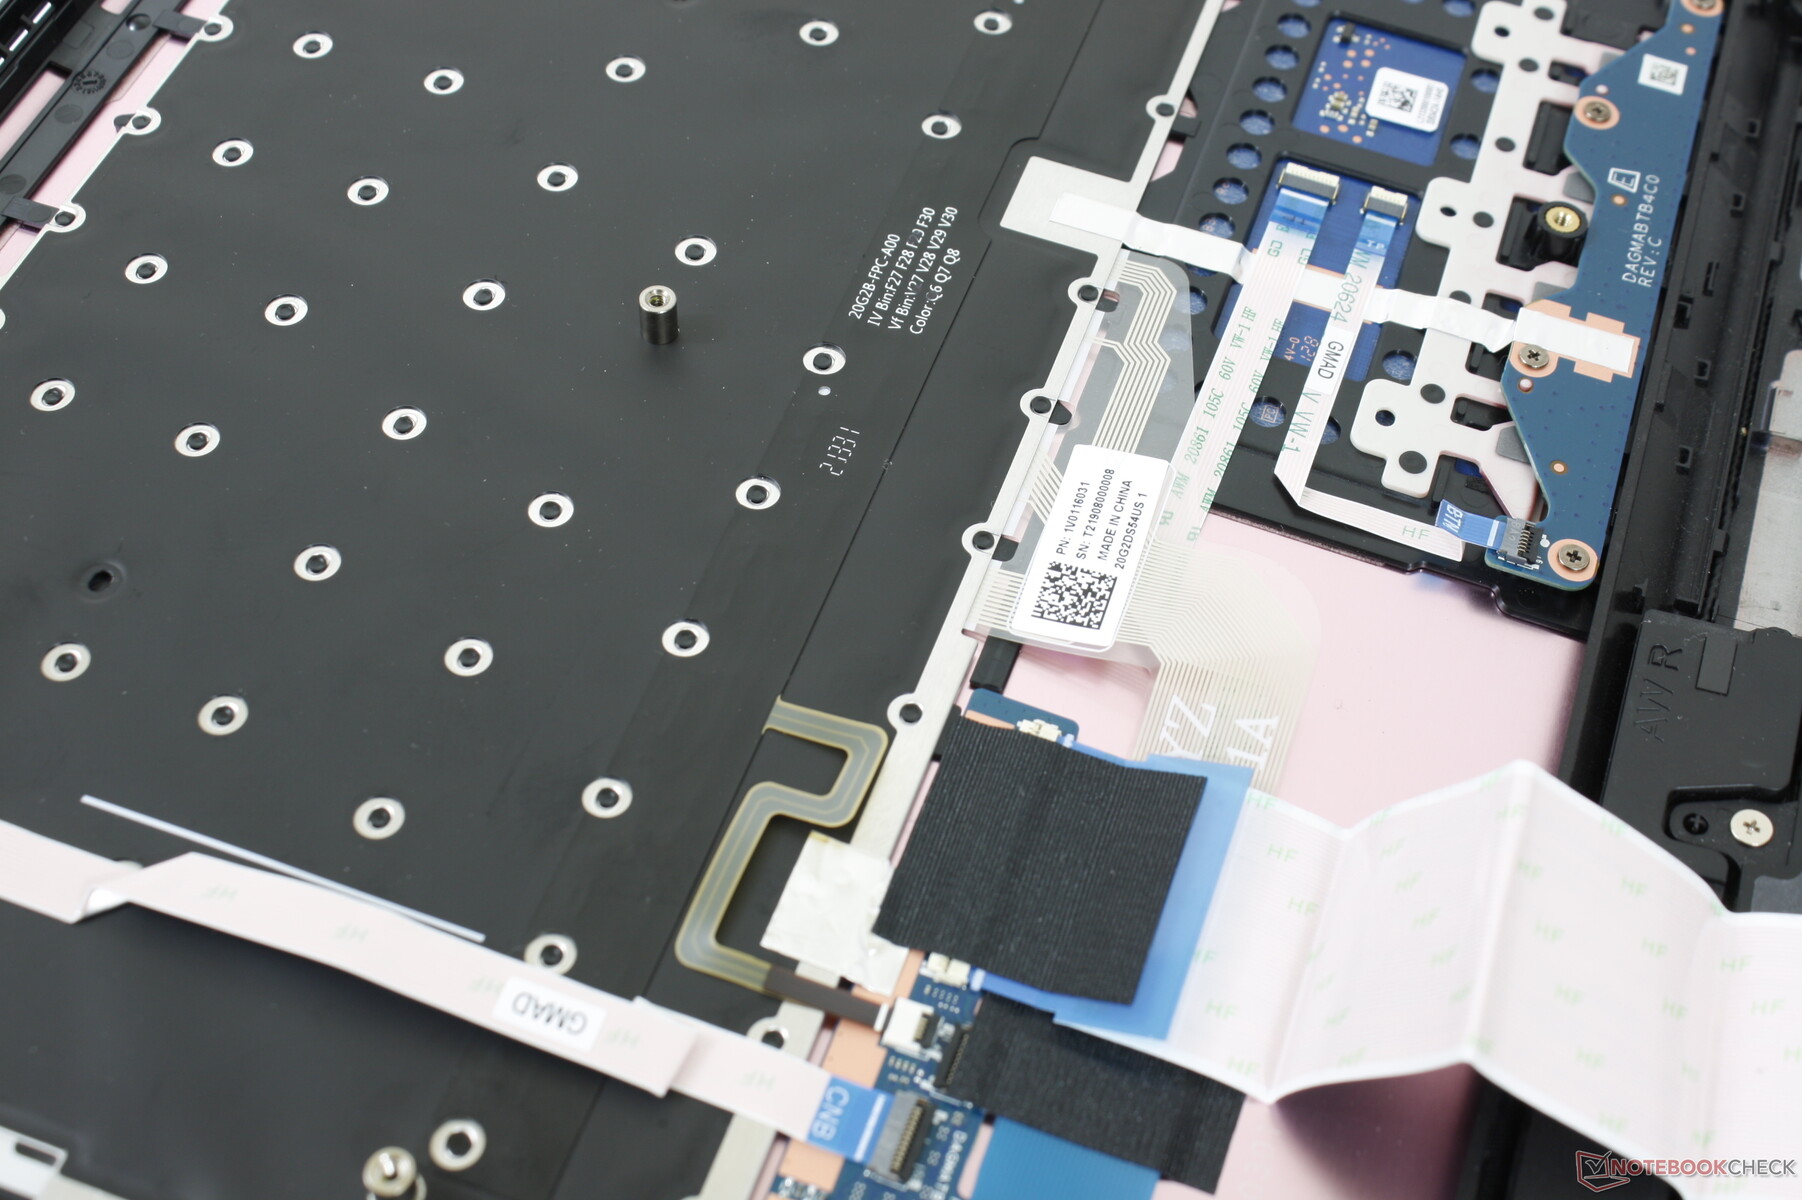
Accessing the internals is relatively easy as it requires only a Philips screwdriver and a sharp edge. Unlike most other laptops, users must remove the keyboard deck instead of the bottom cover for any servicing.
Accessories and Warranty
There are no extras in the box other than the AC adapter and paperwork. The usual one-year limited warranty applies.
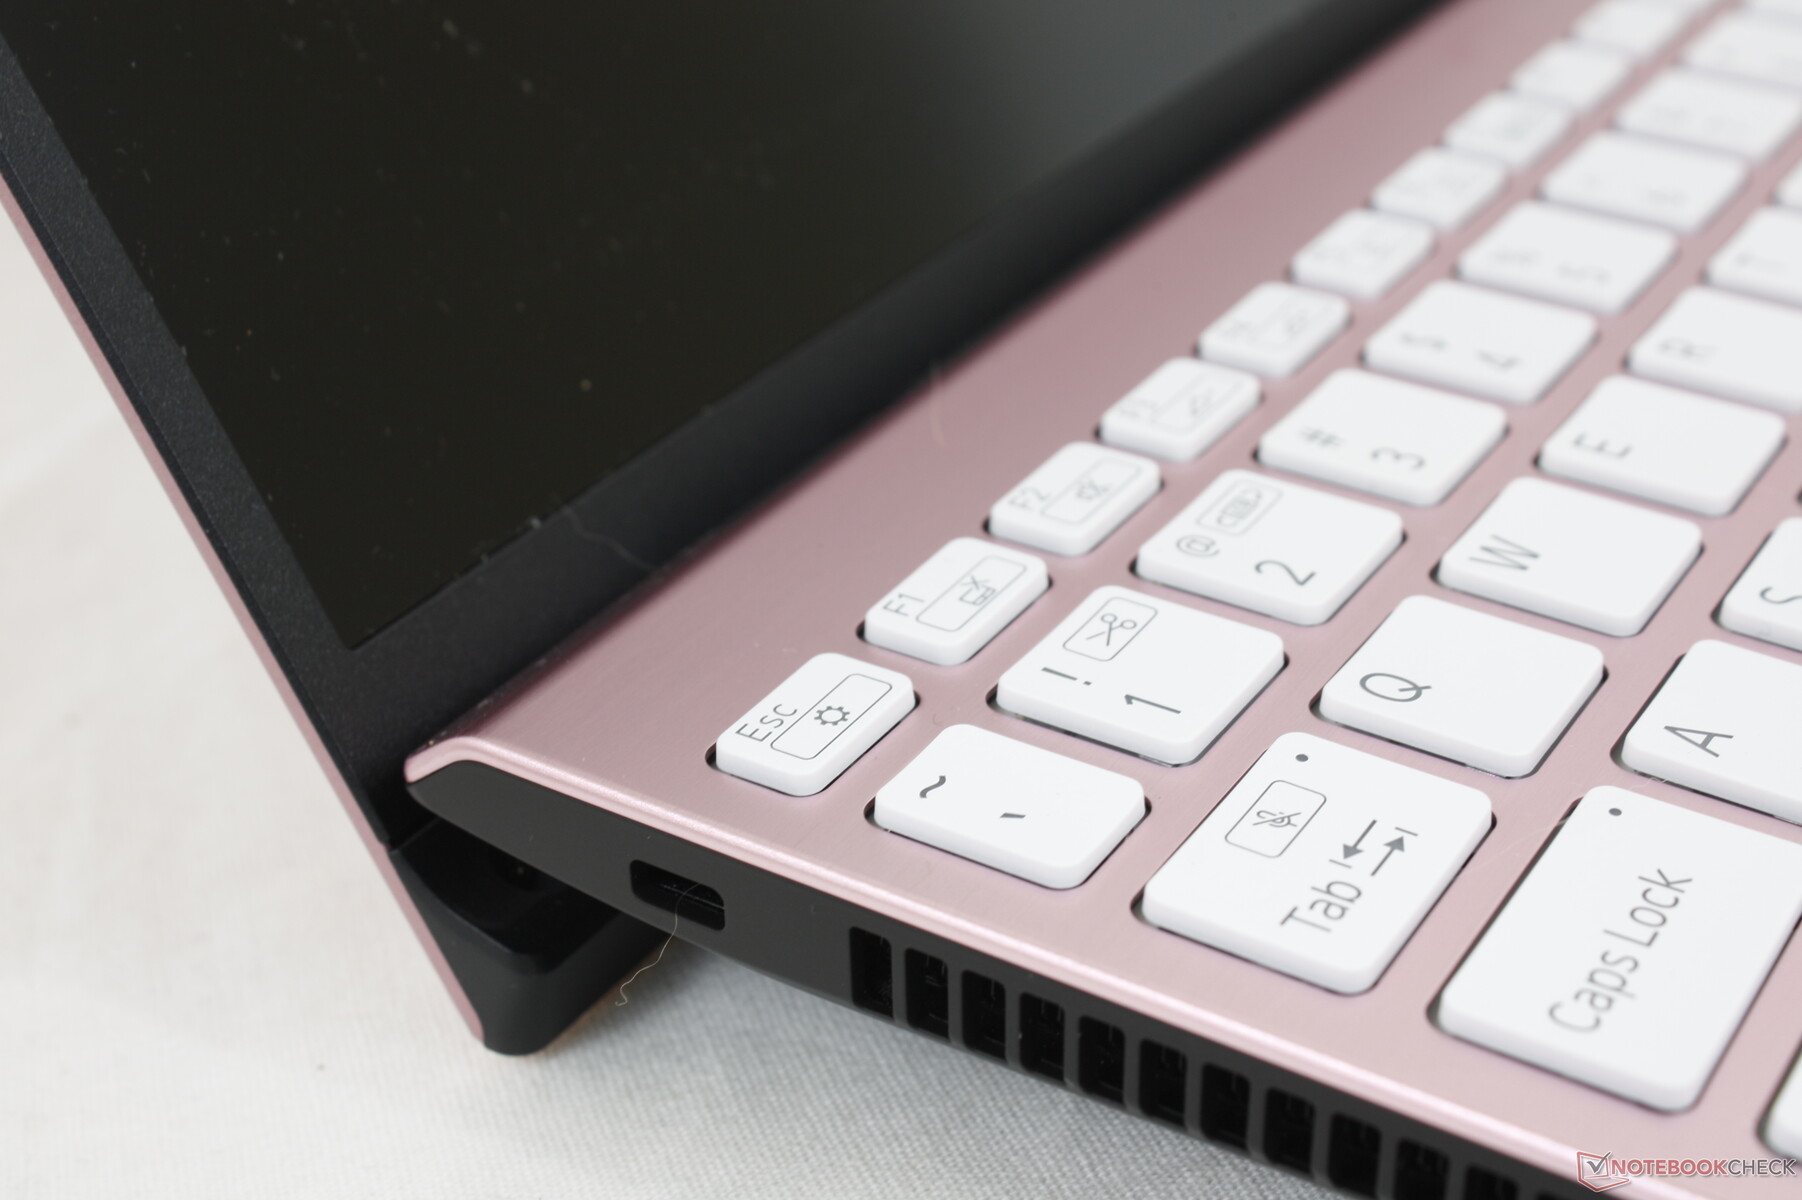
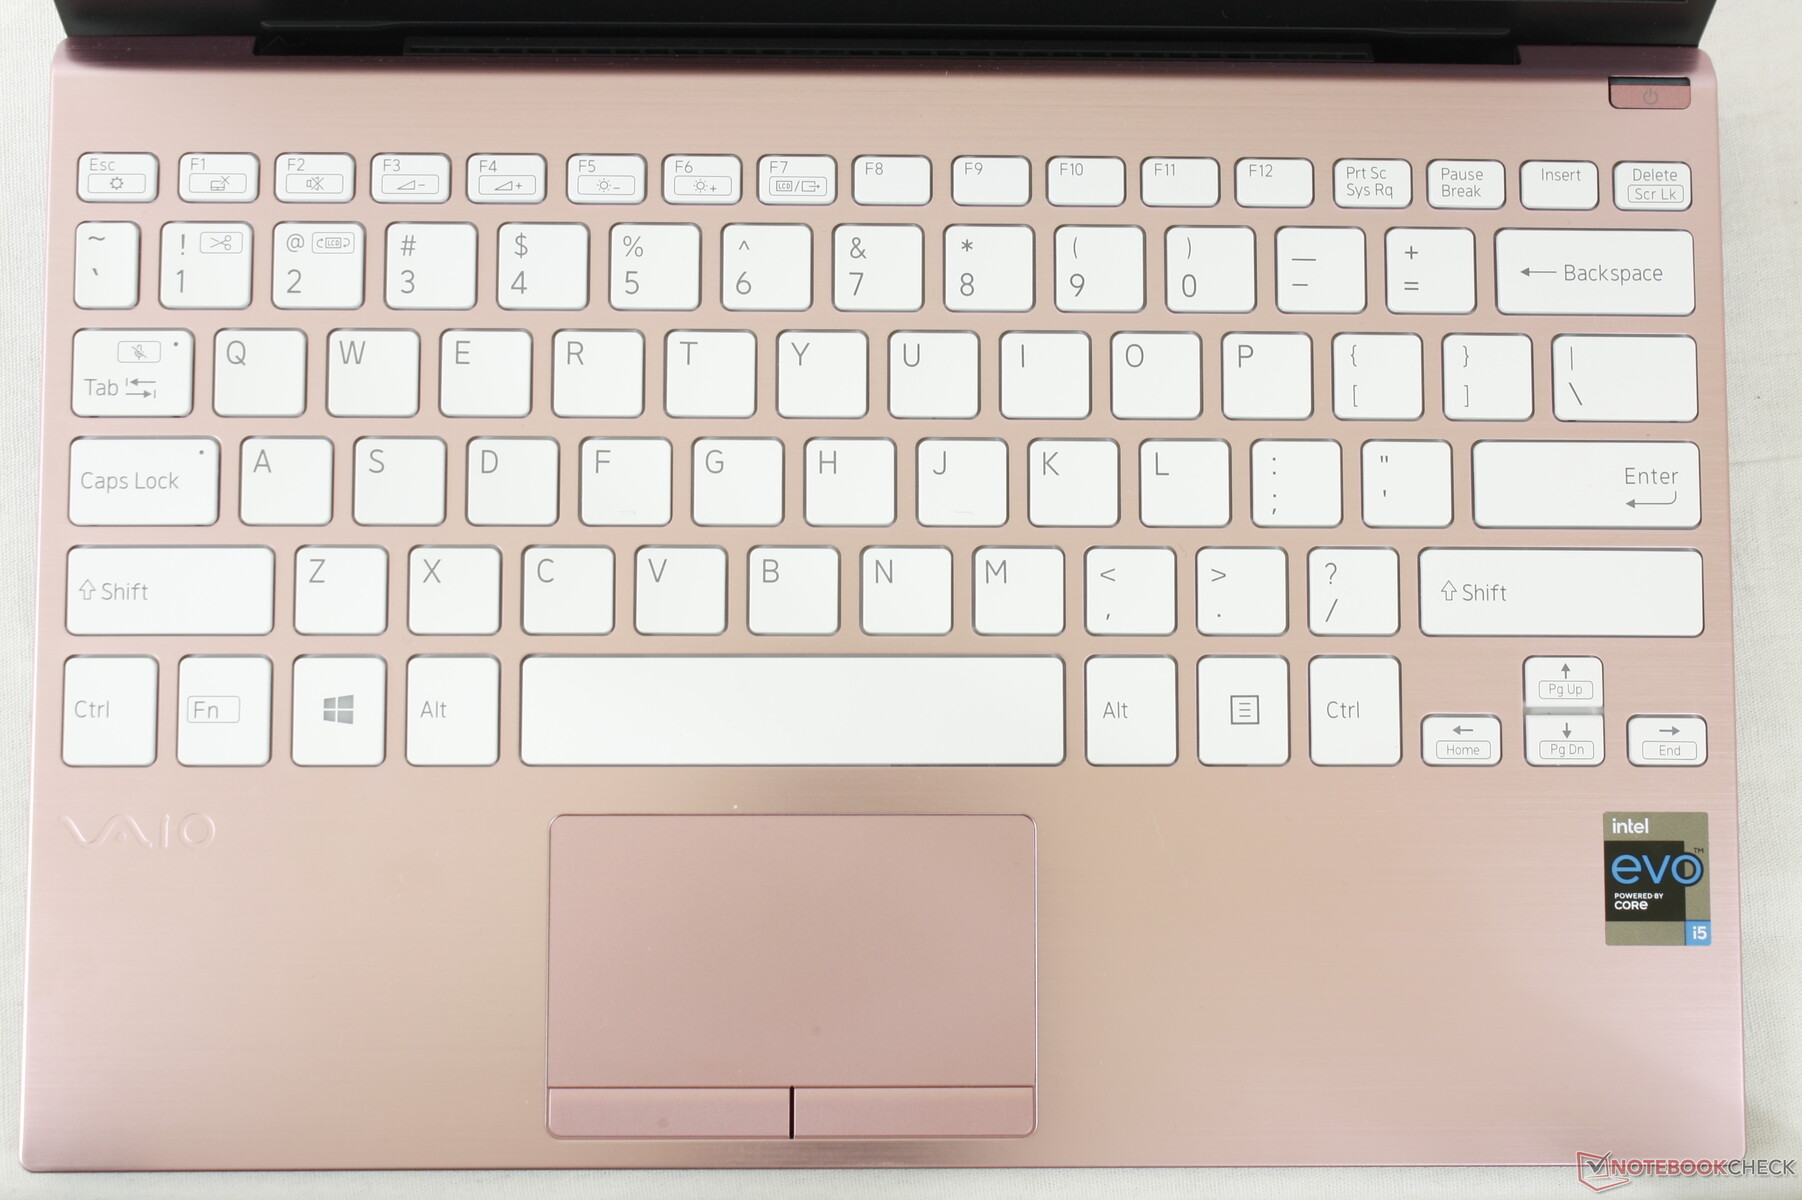
Input Devices — Spacious, But Could Be Better
Keyboard
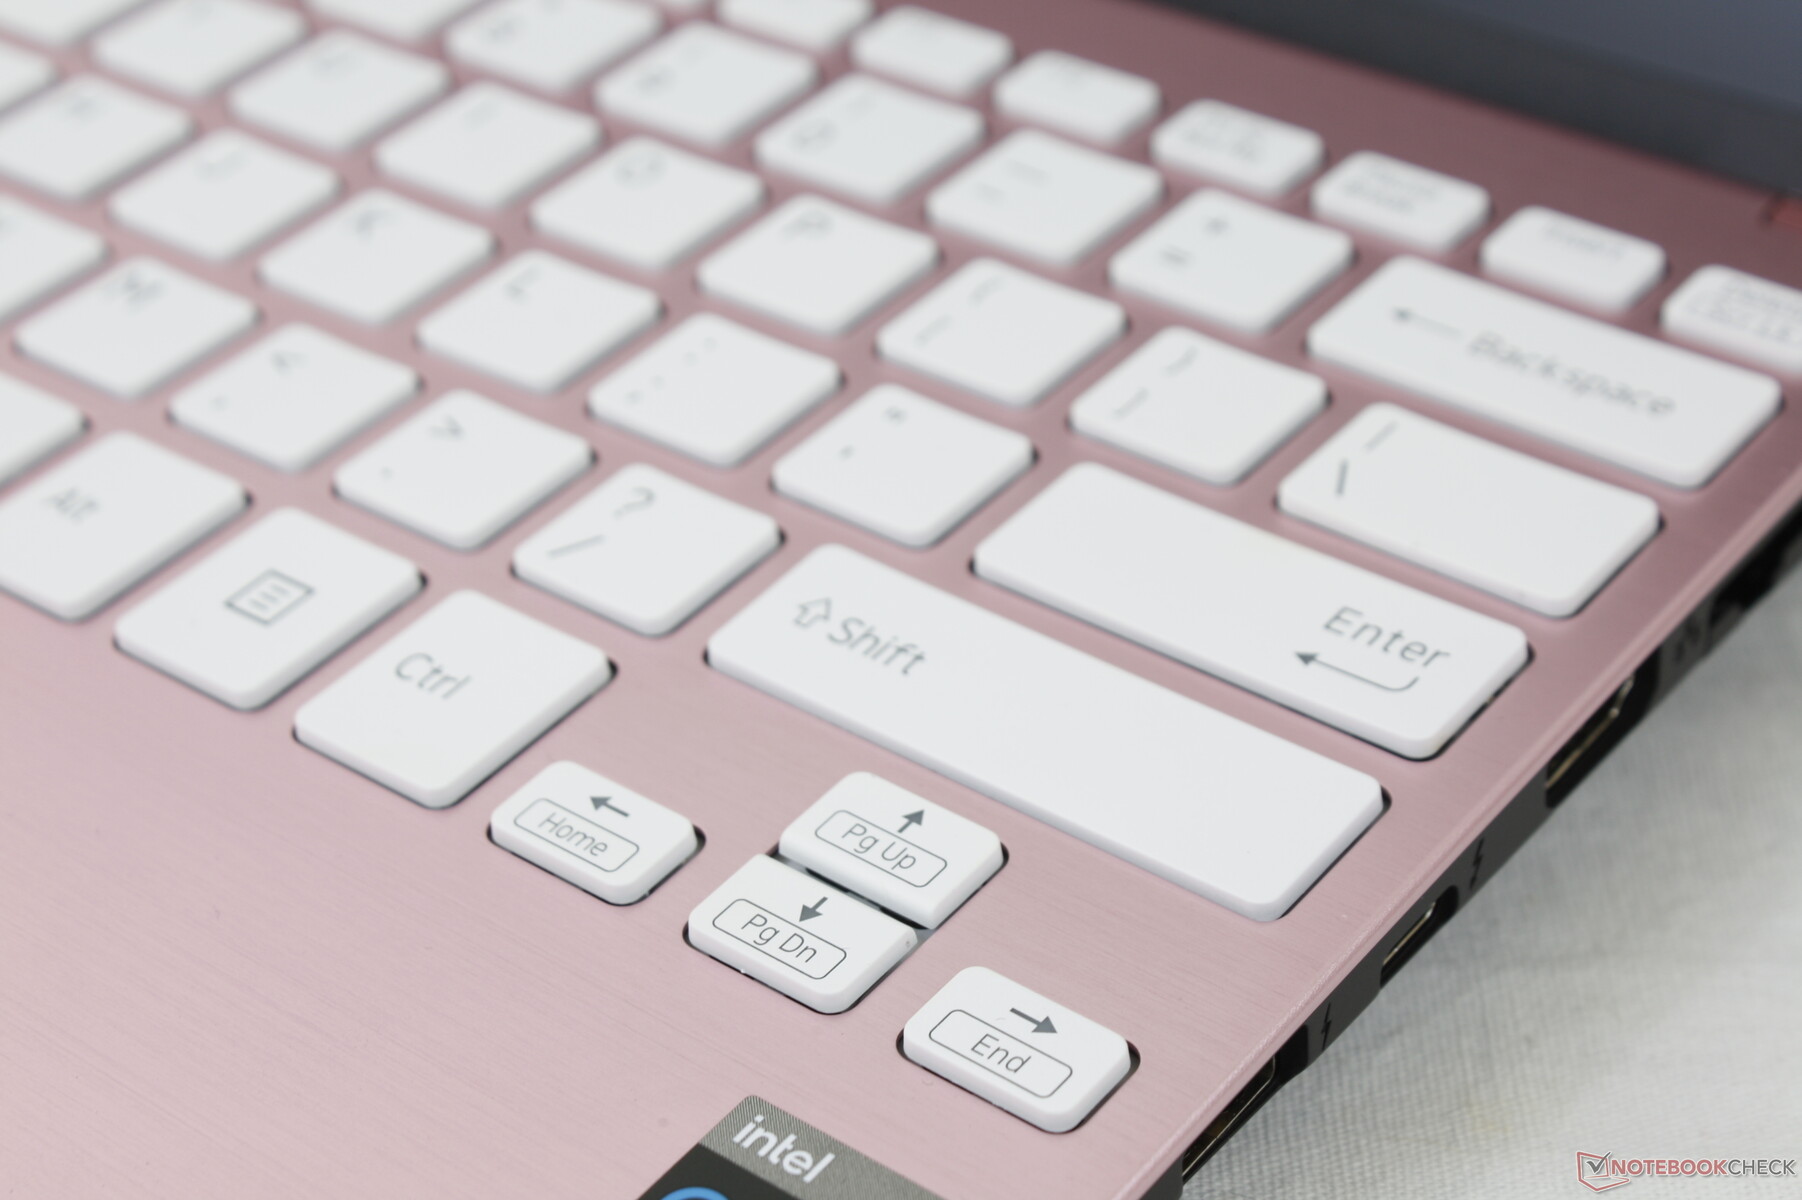
The keyboard is more comfortable for typing than we initially expected from a 12-inch form factor. The keys are reasonably sized and with feedback in between that of the softer XPS 13 and crisper Spectre 13 keys. Clatter is slightly louder as a result which we don't really mind.
Keep in mind that the keyboard keys on the pink and white laptop color options are white whereas the keys are black on the silver, black, and dark blue laptop color options. Since the keyboard backlight is also white, the white keys can be hard to identify because they contrast poorly together. This was perhaps an oversight during development as a different keyboard backlight color would have avoided this problem.
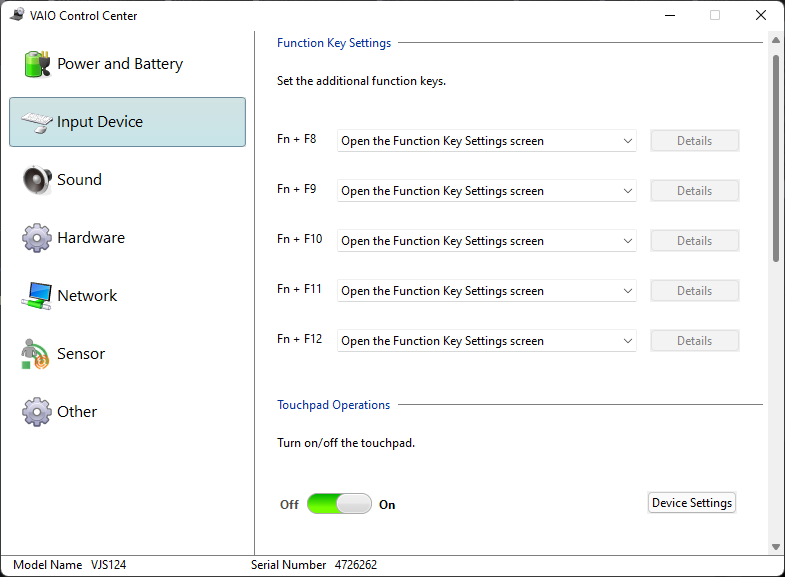
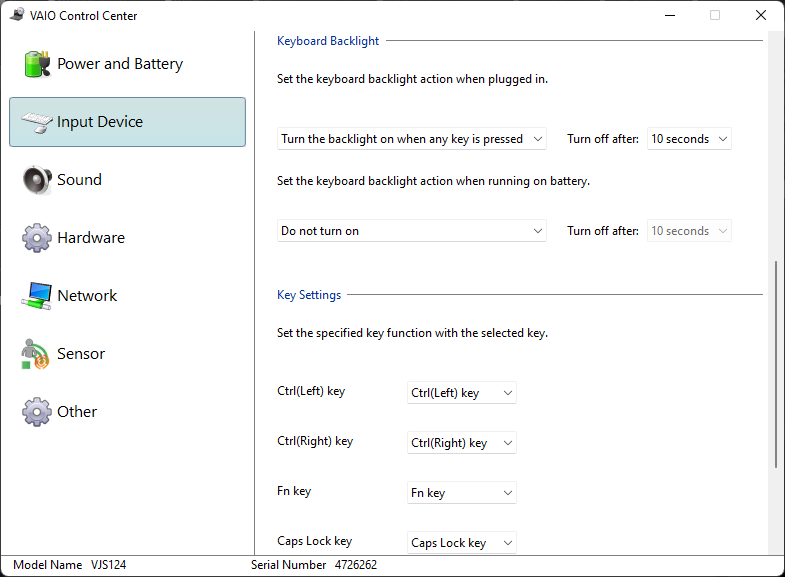
Annoyingly, the keyboard backlight can only be controlled via the Vaio Control Center software and not by any hotkeys.
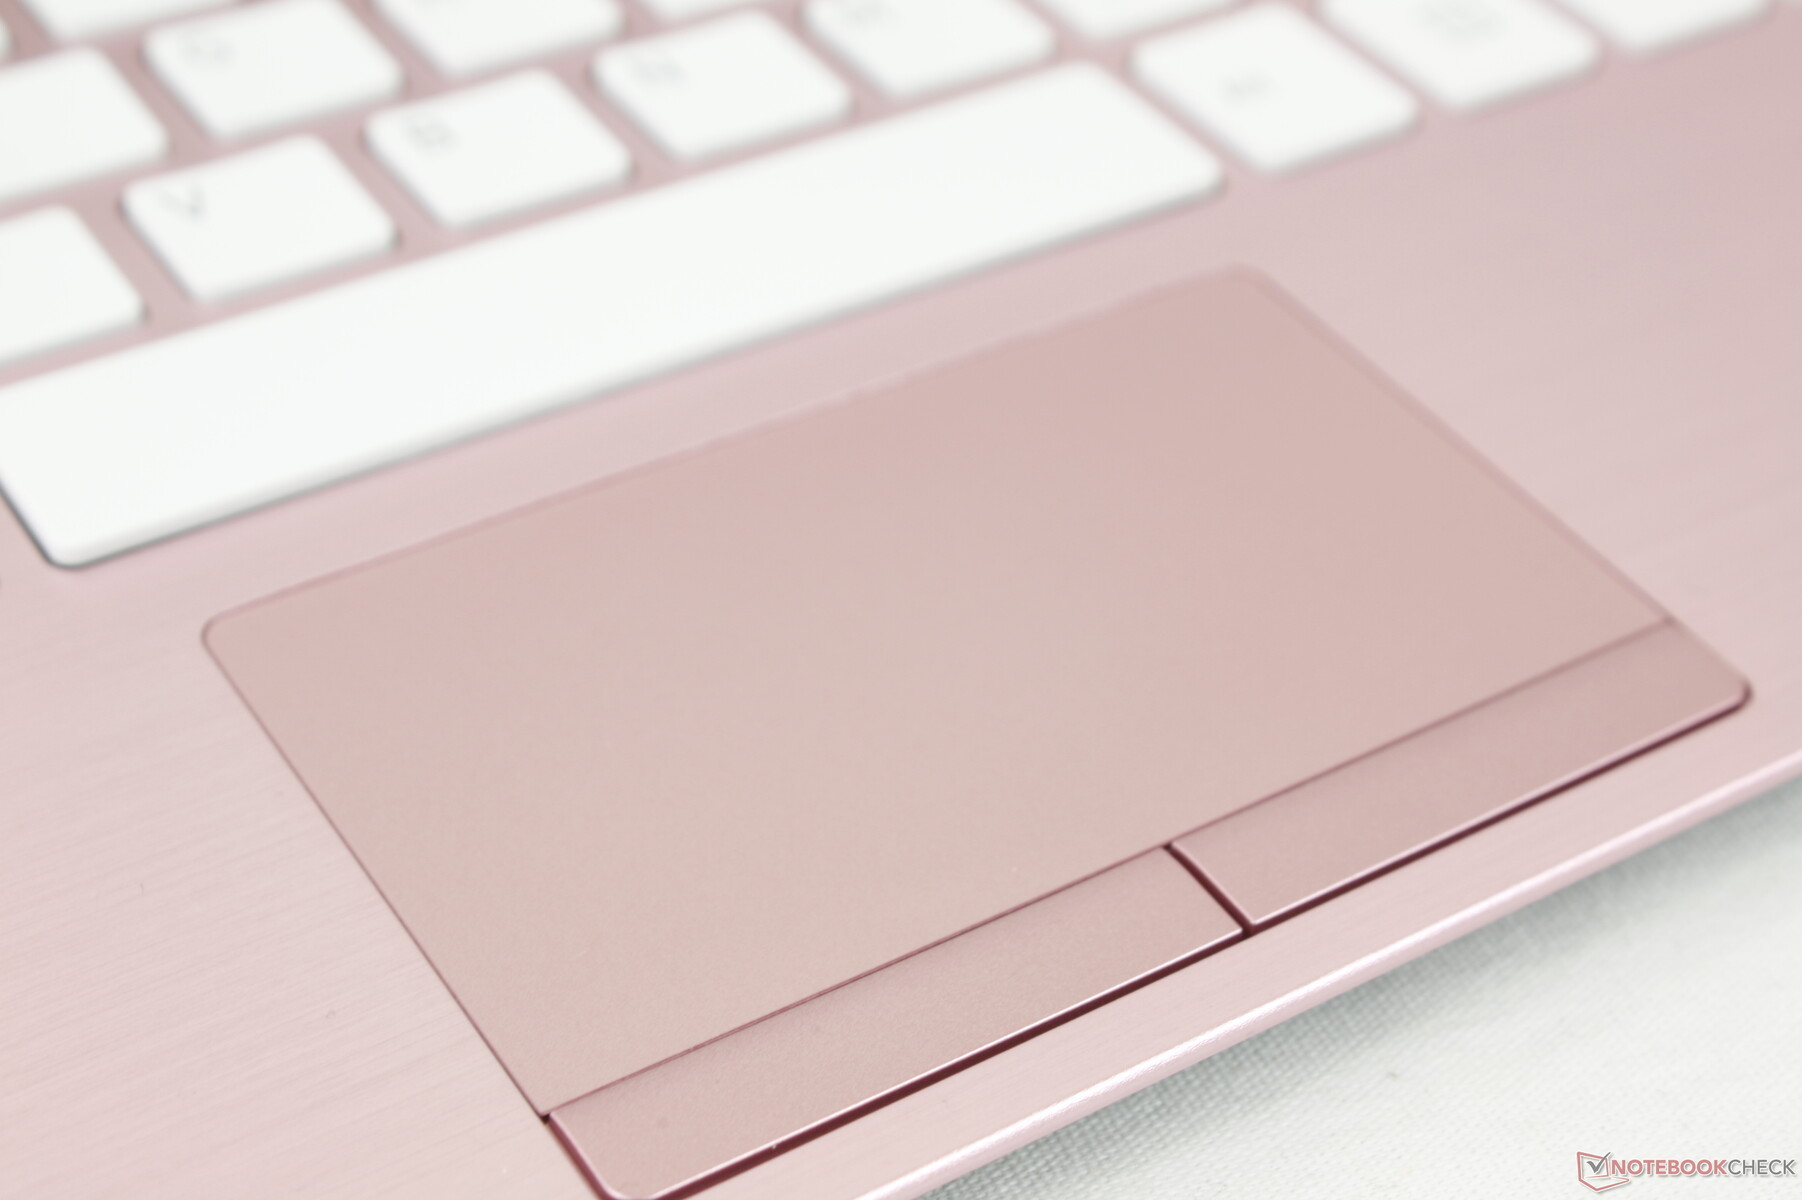
Touchpad
The Precision touchpad is expectedly small at just 8.2 x 4.5 cm. Its surface is otherwise smooth and reliable with only a bit of sticking when gliding at slower speeds to aid in precision. Meanwhile, the dedicated mouse buttons make drag-and-drop actions easier to perform when compared to most clickpads with no dedicated buttons at all. Unfortunately, the buttons here are shallow with relatively weak and ununiform feedback; clicking on the buttons along their respective edges have spongier feedback than if clicking near their centers.

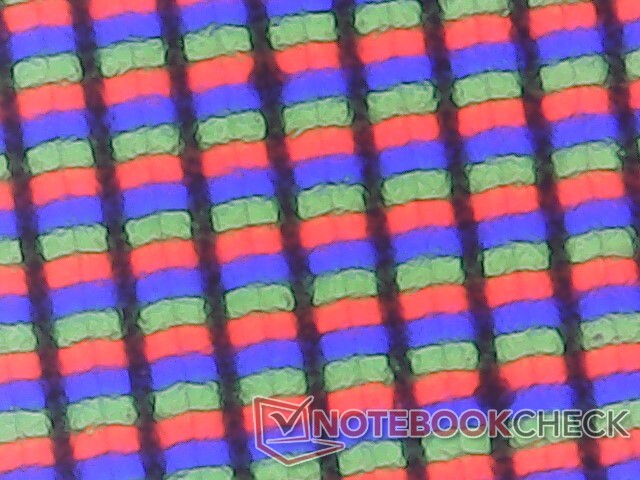
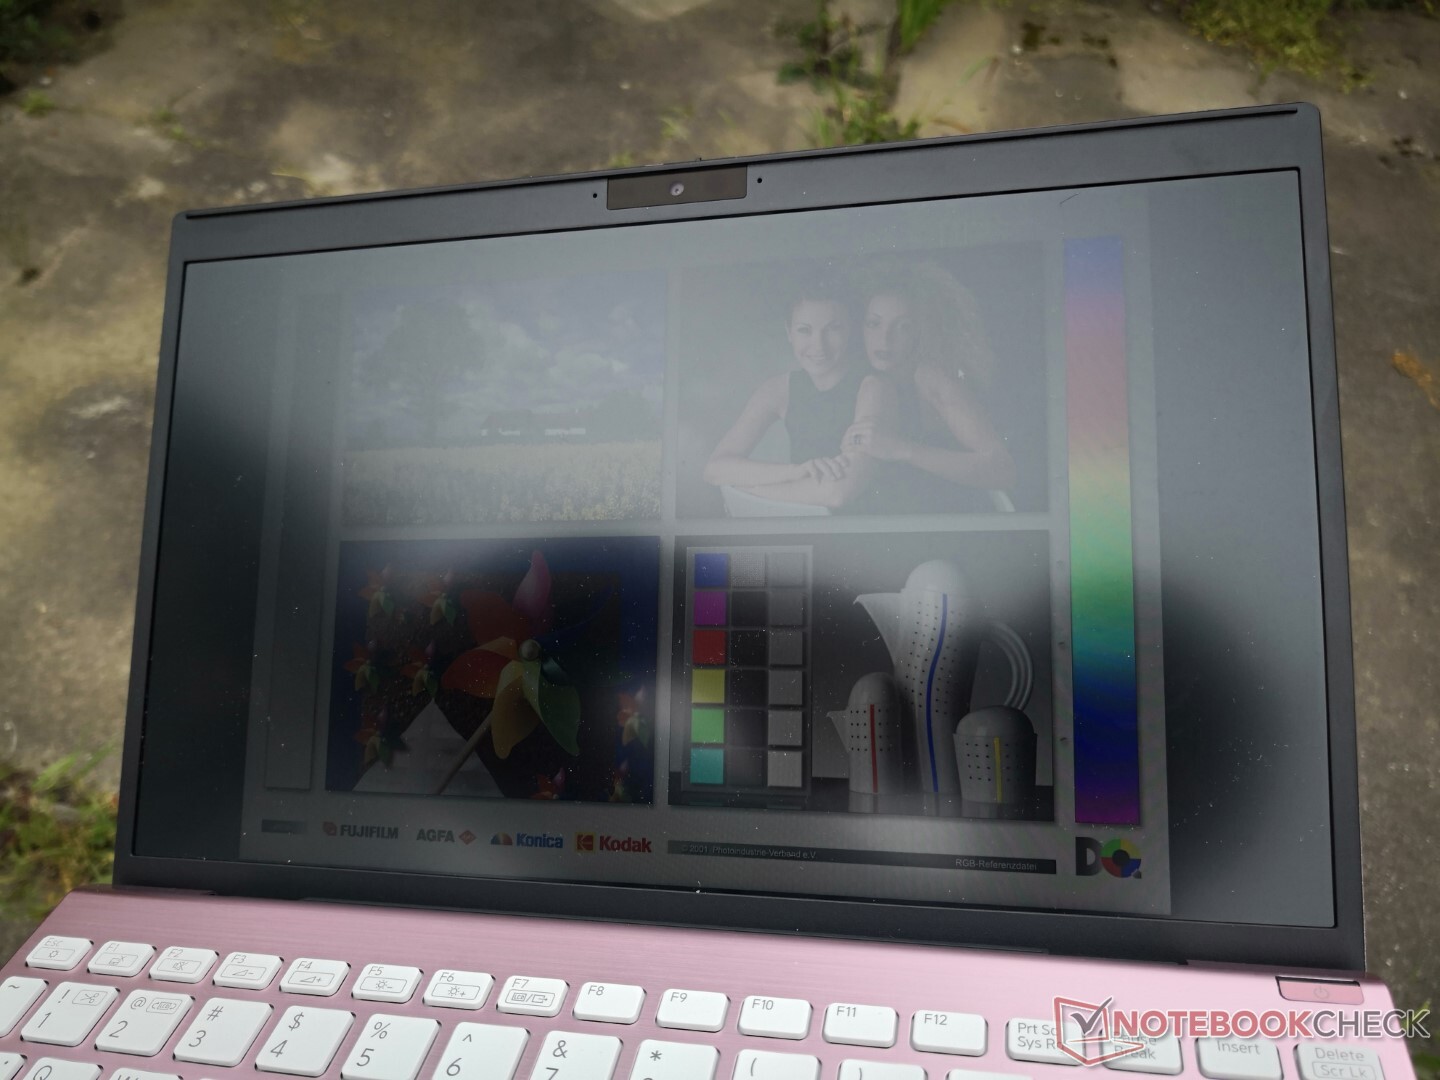
Display — High Quality 12.5-inch Panel
The Chi Mei N125HCG-GQ1 IPS panel is the first to appear in our database. It's one of the very few 12.5-inch panels with full sRGB coverage and a very deep contrast ratio relative to other IPS displays. The main drawbacks are the slow black-white and gray-gray response times which aren't unexpected given that the SX12 is not a gaming machine. Nonetheless, expect some noticeable ghosting during most scenarios.
| |||||||||||||||||||||||||
Brightness Distribution: 90 %
Center on Battery: 384.8 cd/m²
Contrast: 2138:1 (Black: 0.18 cd/m²)
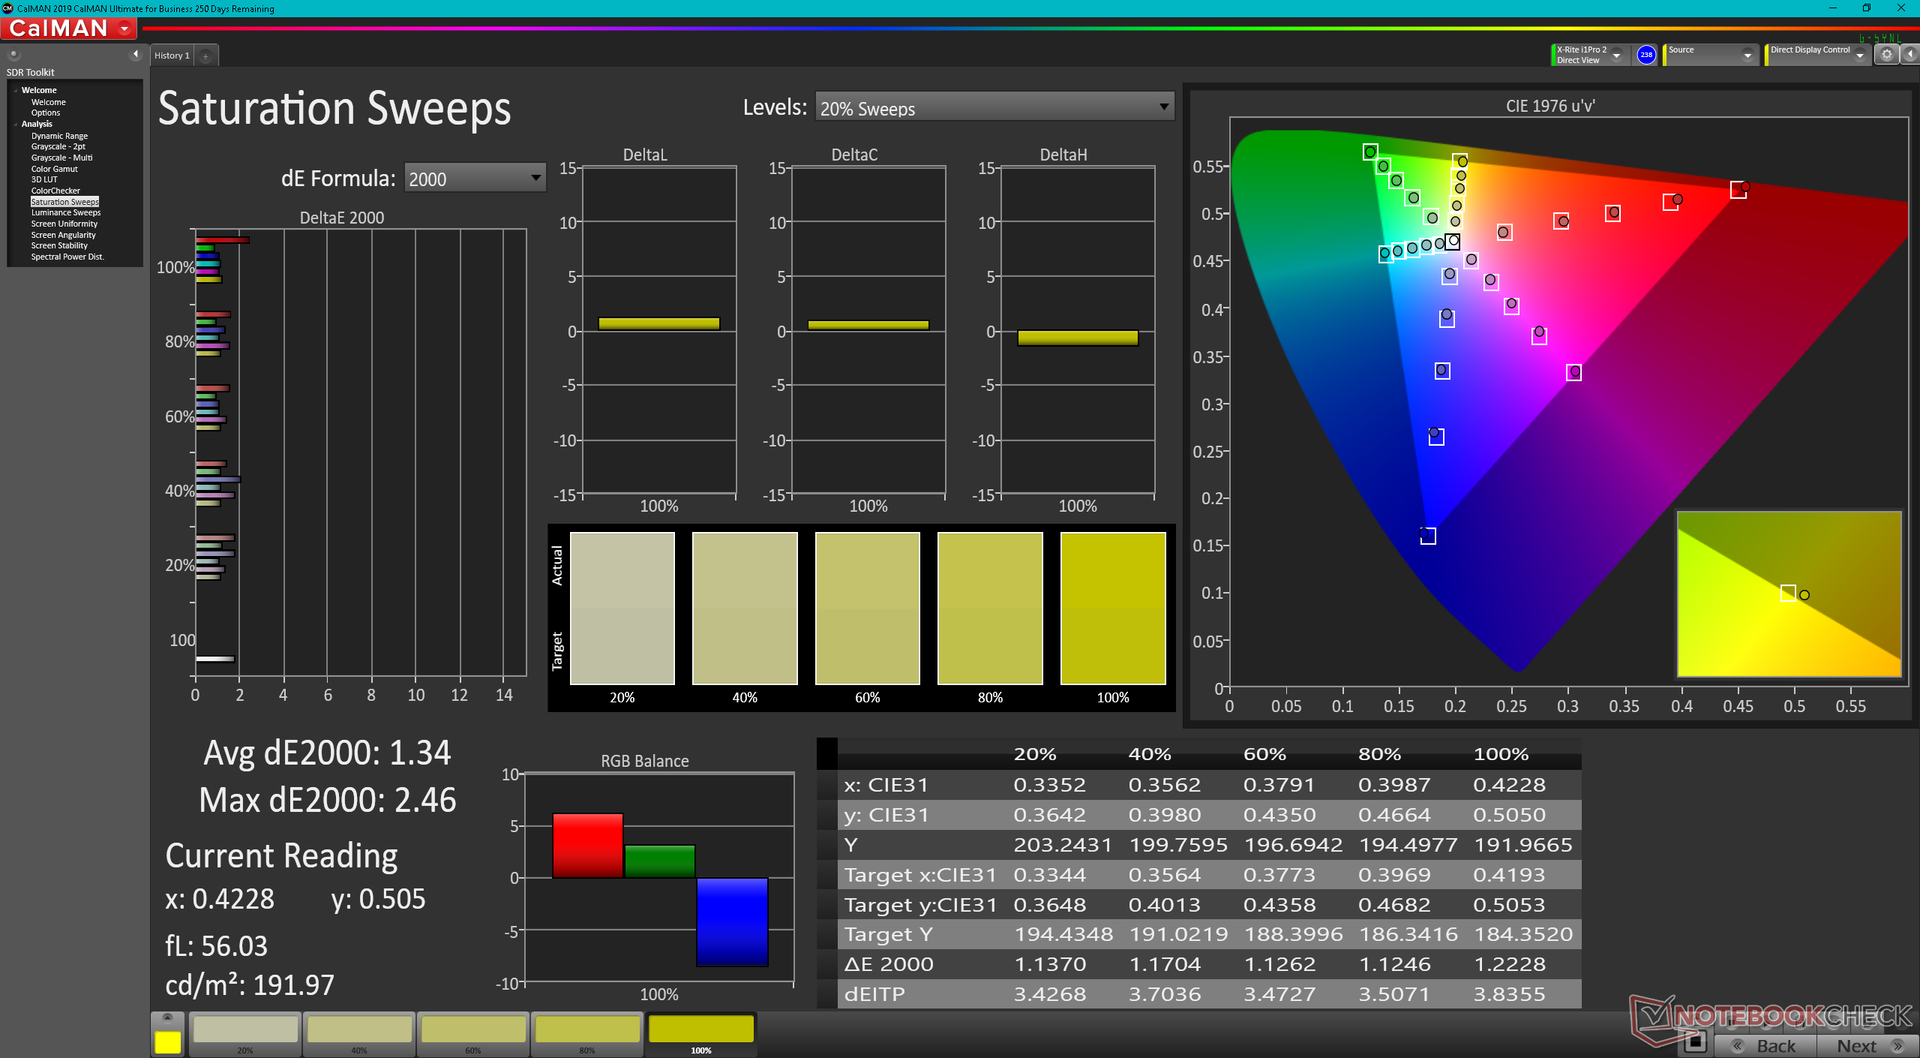
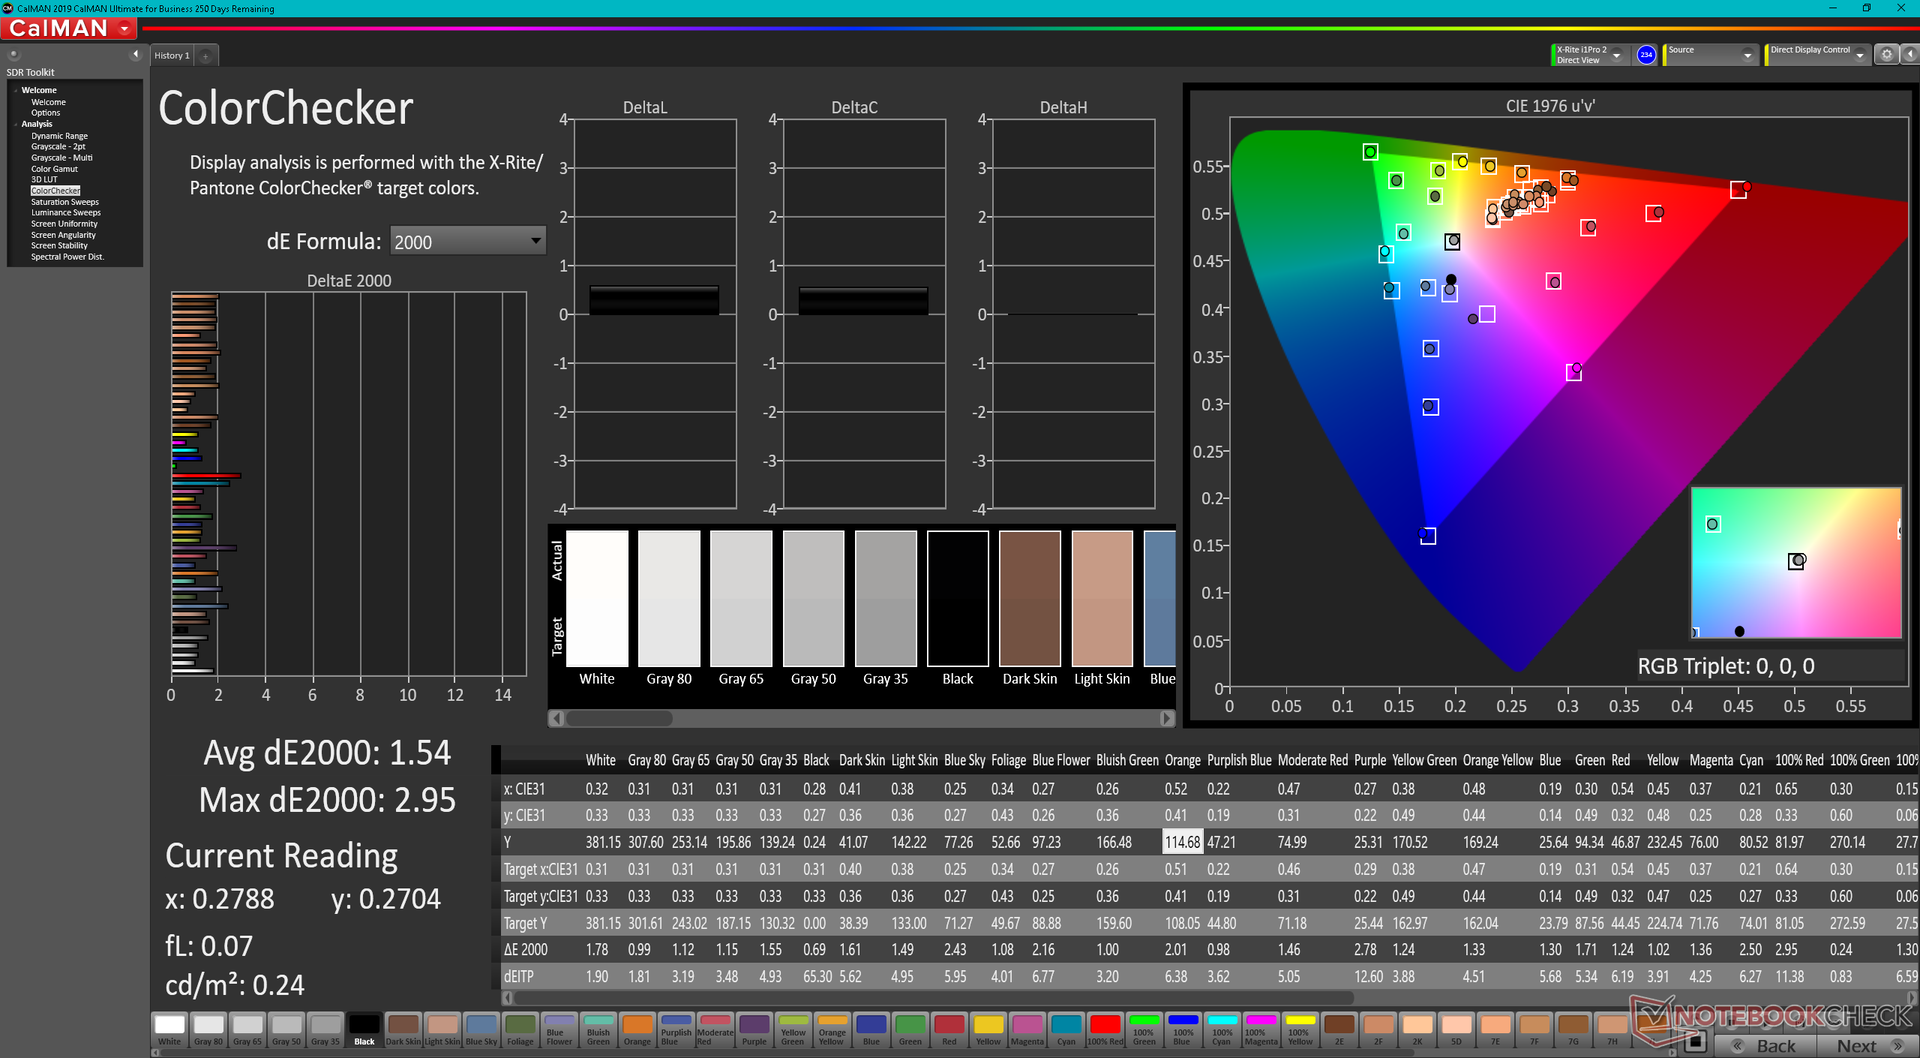
ΔE ColorChecker Calman: 1.54 | ∀{0.5-29.43 Ø4.72}
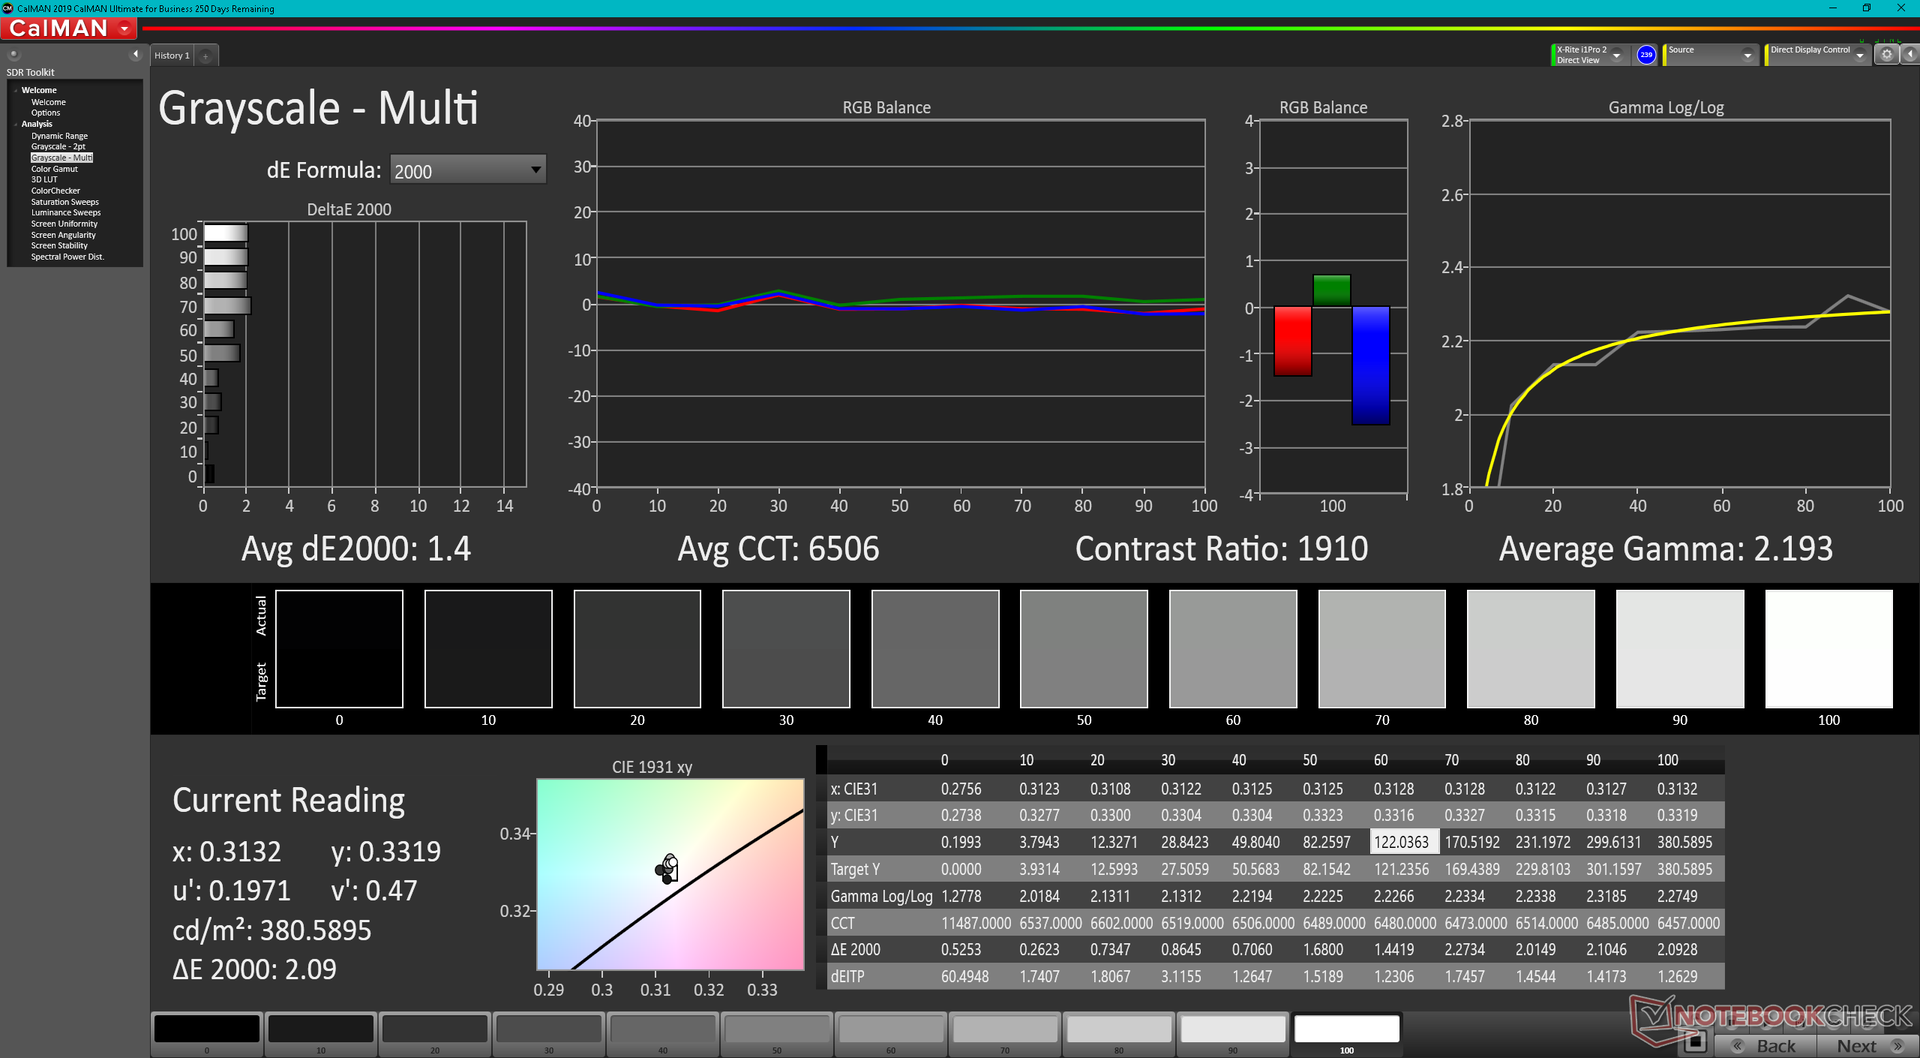
calibrated: 0.96
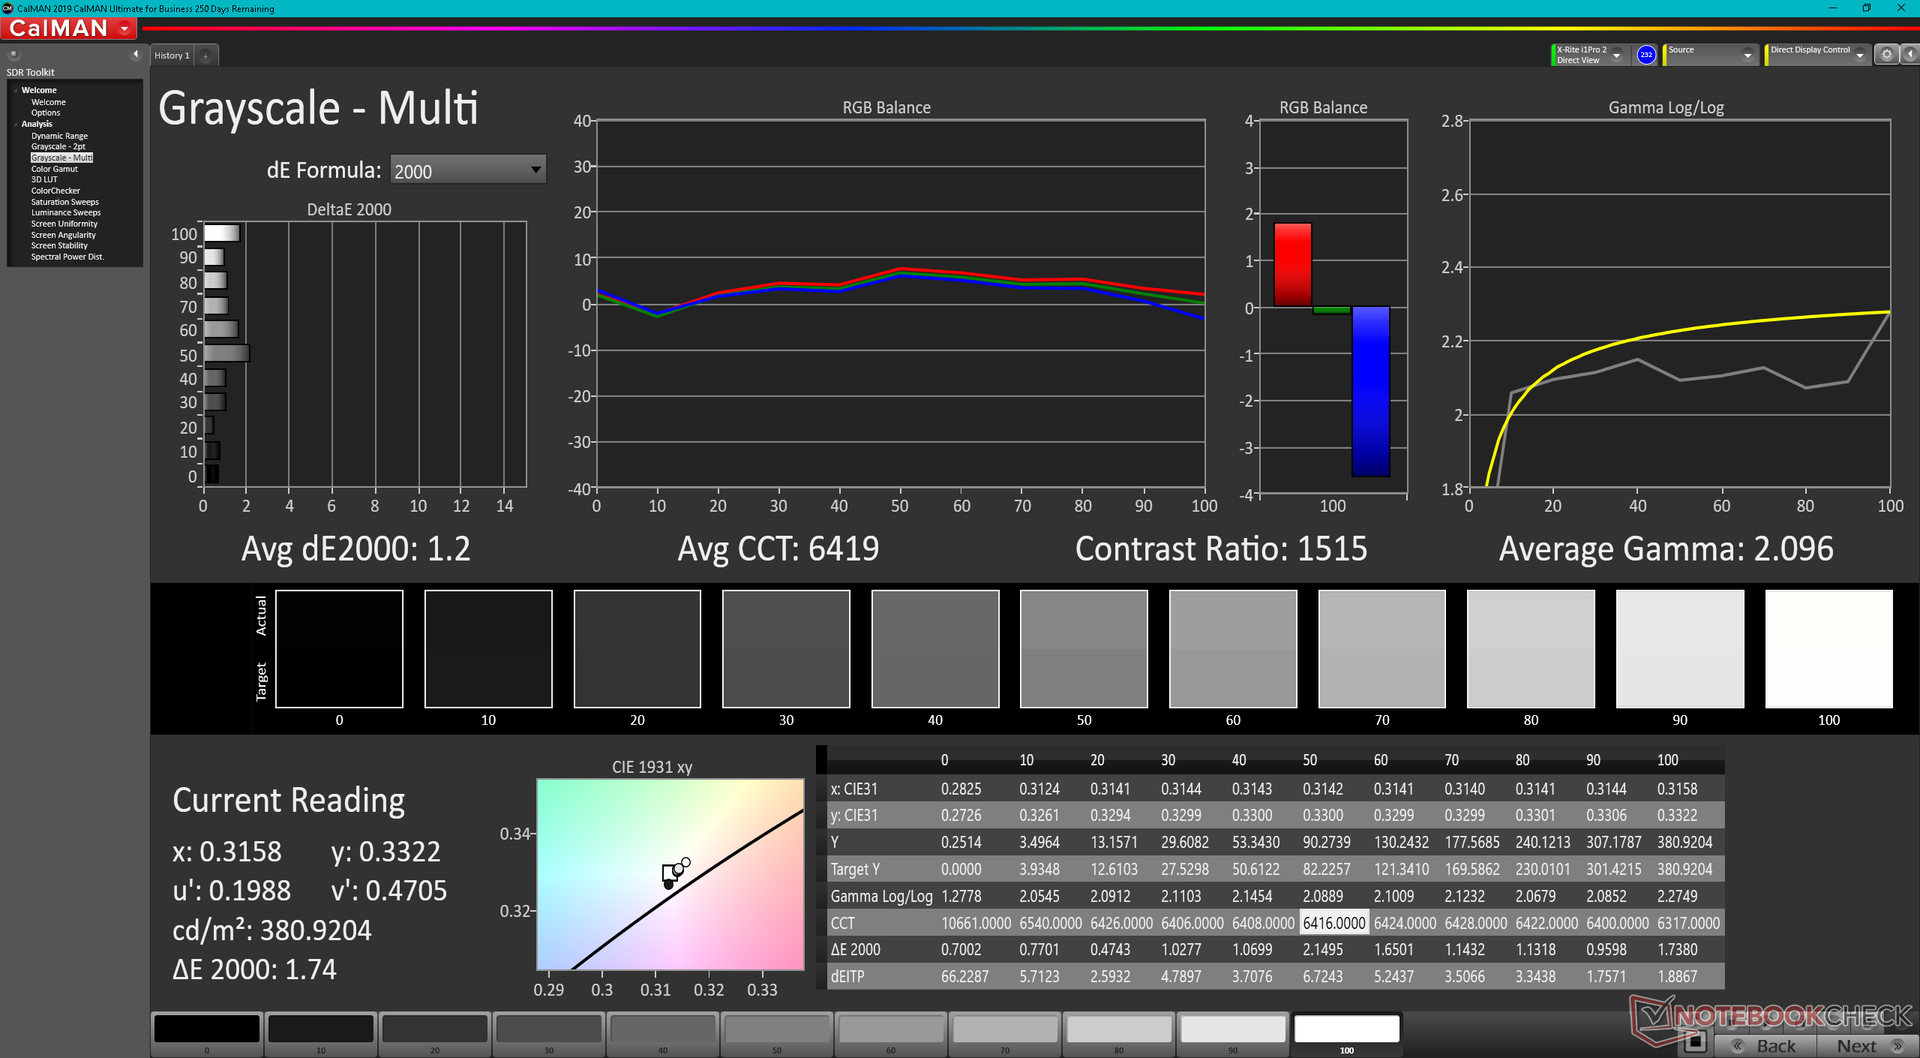
ΔE Greyscale Calman: 1.2 | ∀{0.09-98 Ø4.97}
69.4% AdobeRGB 1998 (Argyll 3D)
99.2% sRGB (Argyll 3D)
67.6% Display P3 (Argyll 3D)
Gamma: 2.1
CCT: 6419 K
| VAIO SX12 VJS124X1011P Chi Mei N125HCG-GQ1, IPS, 1920x1080, 12.5" | VAIO A12-92993 InfoVision IVO04E6, IPS, 1920x1080, 12.5" | VAIO SX14 VJS144X0111K Sharp LQ140M1JW55, IPS, 1920x1080, 14" | Huawei MateBook E Core i5 EDOC660, OLED, 2560x1600, 12.6" | Dell Latitude 7200 SHP14A3 LQ123N1, IPS LED, 1920x1280, 12.3" | Dell XPS 13 9310 Core i7 FHD Sharp LQ134N1, IPS, 1920x1200, 13.4" | |
|---|---|---|---|---|---|---|
| Display | -31% | -2% | 18% | 4% | 3% | |
| Display P3 Coverage (%) | 67.6 | 46 -32% | 66.8 -1% | 99.9 48% | 71.6 6% | 70.9 5% |
| sRGB Coverage (%) | 99.2 | 69.3 -30% | 97.7 -2% | 100 1% | 99.5 0% | 99.1 0% |
| AdobeRGB 1998 Coverage (%) | 69.4 | 47.52 -32% | 67.9 -2% | 72.9 5% | 72.6 5% | 72.9 5% |
| Response Times | 20% | -1% | 93% | 15% | 17% | |
| Response Time Grey 50% / Grey 80% * (ms) | 60 ? | 52.8 ? 12% | 54 ? 10% | 4 ? 93% | 52 ? 13% | 52 ? 13% |
| Response Time Black / White * (ms) | 41.6 ? | 30.4 ? 27% | 46.4 ? -12% | 3.2 ? 92% | 34.8 ? 16% | 33.2 ? 20% |
| PWM Frequency (Hz) | 990 ? | 60.2 ? | 1645 ? | 2475 ? | ||
| Screen | -102% | -48% | 18% | -18% | -73% | |
| Brightness middle (cd/m²) | 384.8 | 315 -18% | 373.4 -3% | 399 4% | 401 4% | 543.3 41% |
| Brightness (cd/m²) | 361 | 294 -19% | 376 4% | 407 13% | 385 7% | 524 45% |
| Brightness Distribution (%) | 90 | 89 -1% | 88 -2% | 94 4% | 88 -2% | 92 2% |
| Black Level * (cd/m²) | 0.18 | 0.21 -17% | 0.23 -28% | 0.28 -56% | 0.38 -111% | |
| Contrast (:1) | 2138 | 1500 -30% | 1623 -24% | 1432 -33% | 1430 -33% | |
| Colorchecker dE 2000 * | 1.54 | 4.4 -186% | 2.99 -94% | 1 35% | 1.8 -17% | 3.02 -96% |
| Colorchecker dE 2000 max. * | 2.95 | 7.1 -141% | 5.29 -79% | 1.6 46% | 3.4 -15% | 7.61 -158% |
| Colorchecker dE 2000 calibrated * | 0.96 | 2.9 -202% | 0.49 49% | 1.1 -15% | 1.23 -28% | |
| Greyscale dE 2000 * | 1.2 | 4.8 -300% | 4.3 -258% | 1.1 8% | 1.6 -33% | 5 -317% |
| Gamma | 2.1 105% | 2.02 109% | 2.02 109% | 2.14 103% | 2.14 103% | 2.02 109% |
| CCT | 6419 101% | 7307 89% | 6537 99% | 6434 101% | 6702 97% | 6550 99% |
| Color Space (Percent of AdobeRGB 1998) (%) | 44 | 66.6 | 66.8 | |||
| Color Space (Percent of sRGB) (%) | 69.5 | 99.4 | 99.6 | |||
| Total Average (Program / Settings) | -38% /
-69% | -17% /
-32% | 43% /
32% | 0% /
-9% | -18% /
-44% |
* ... smaller is better
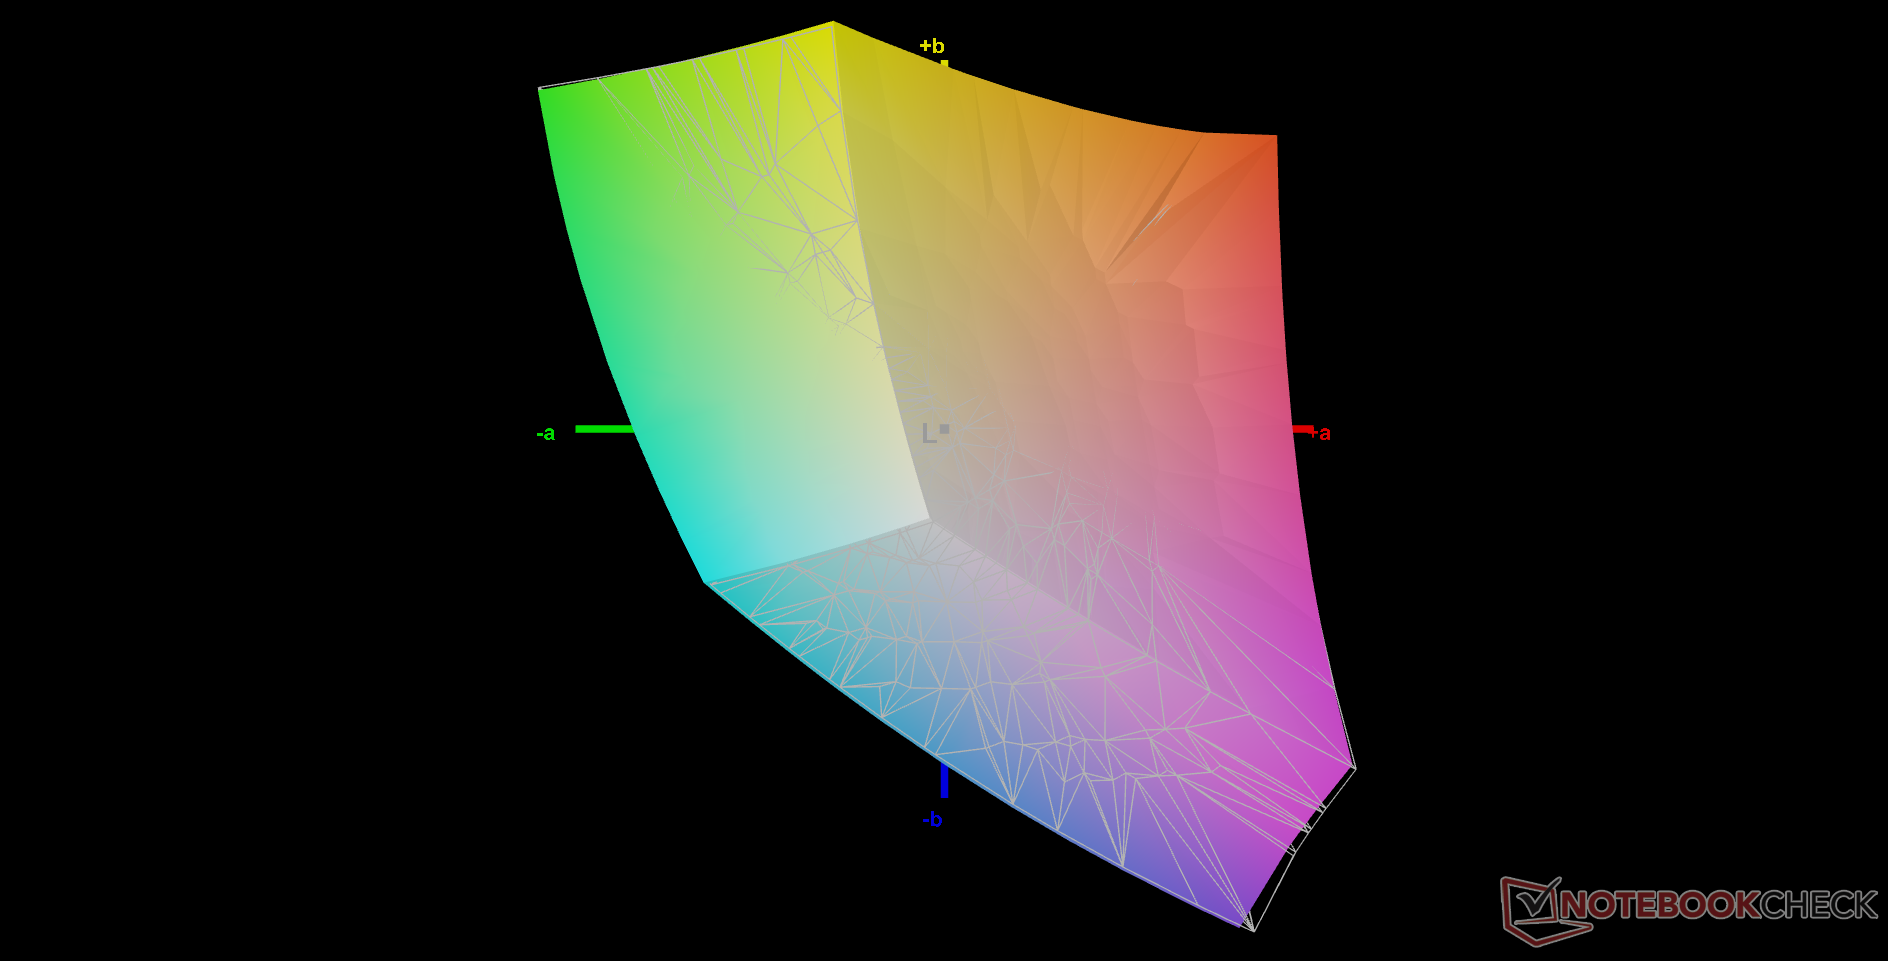
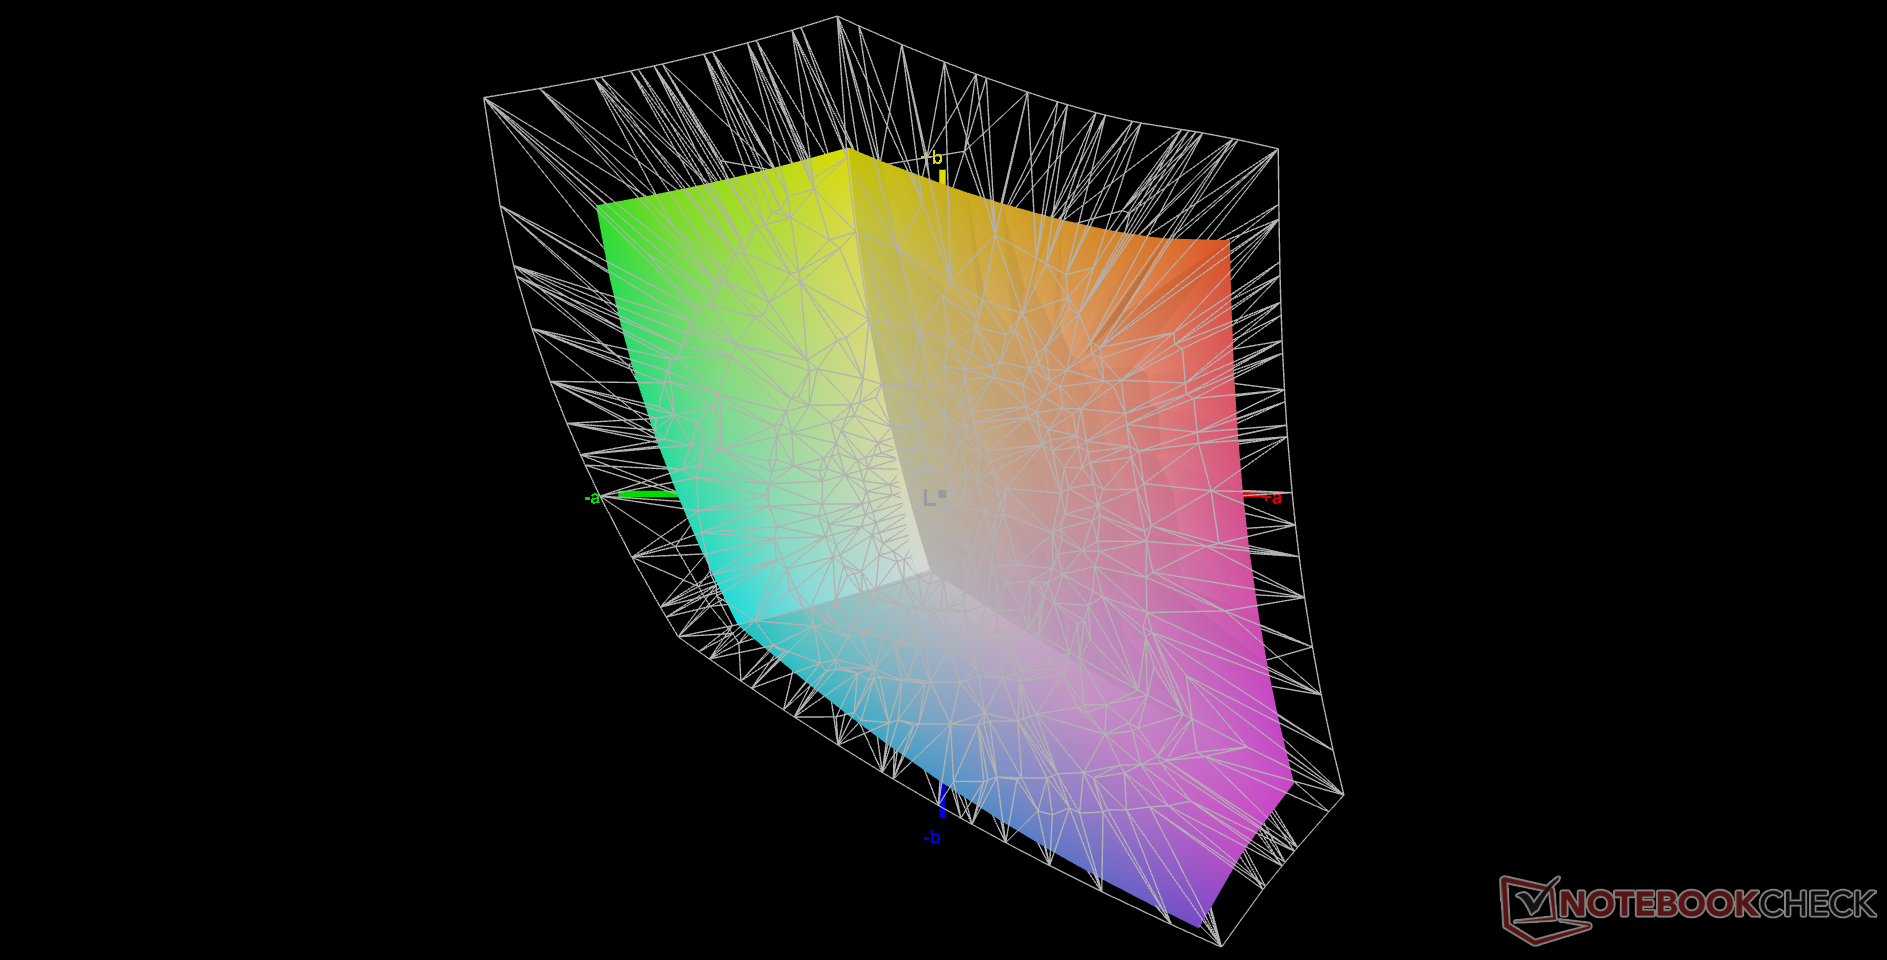
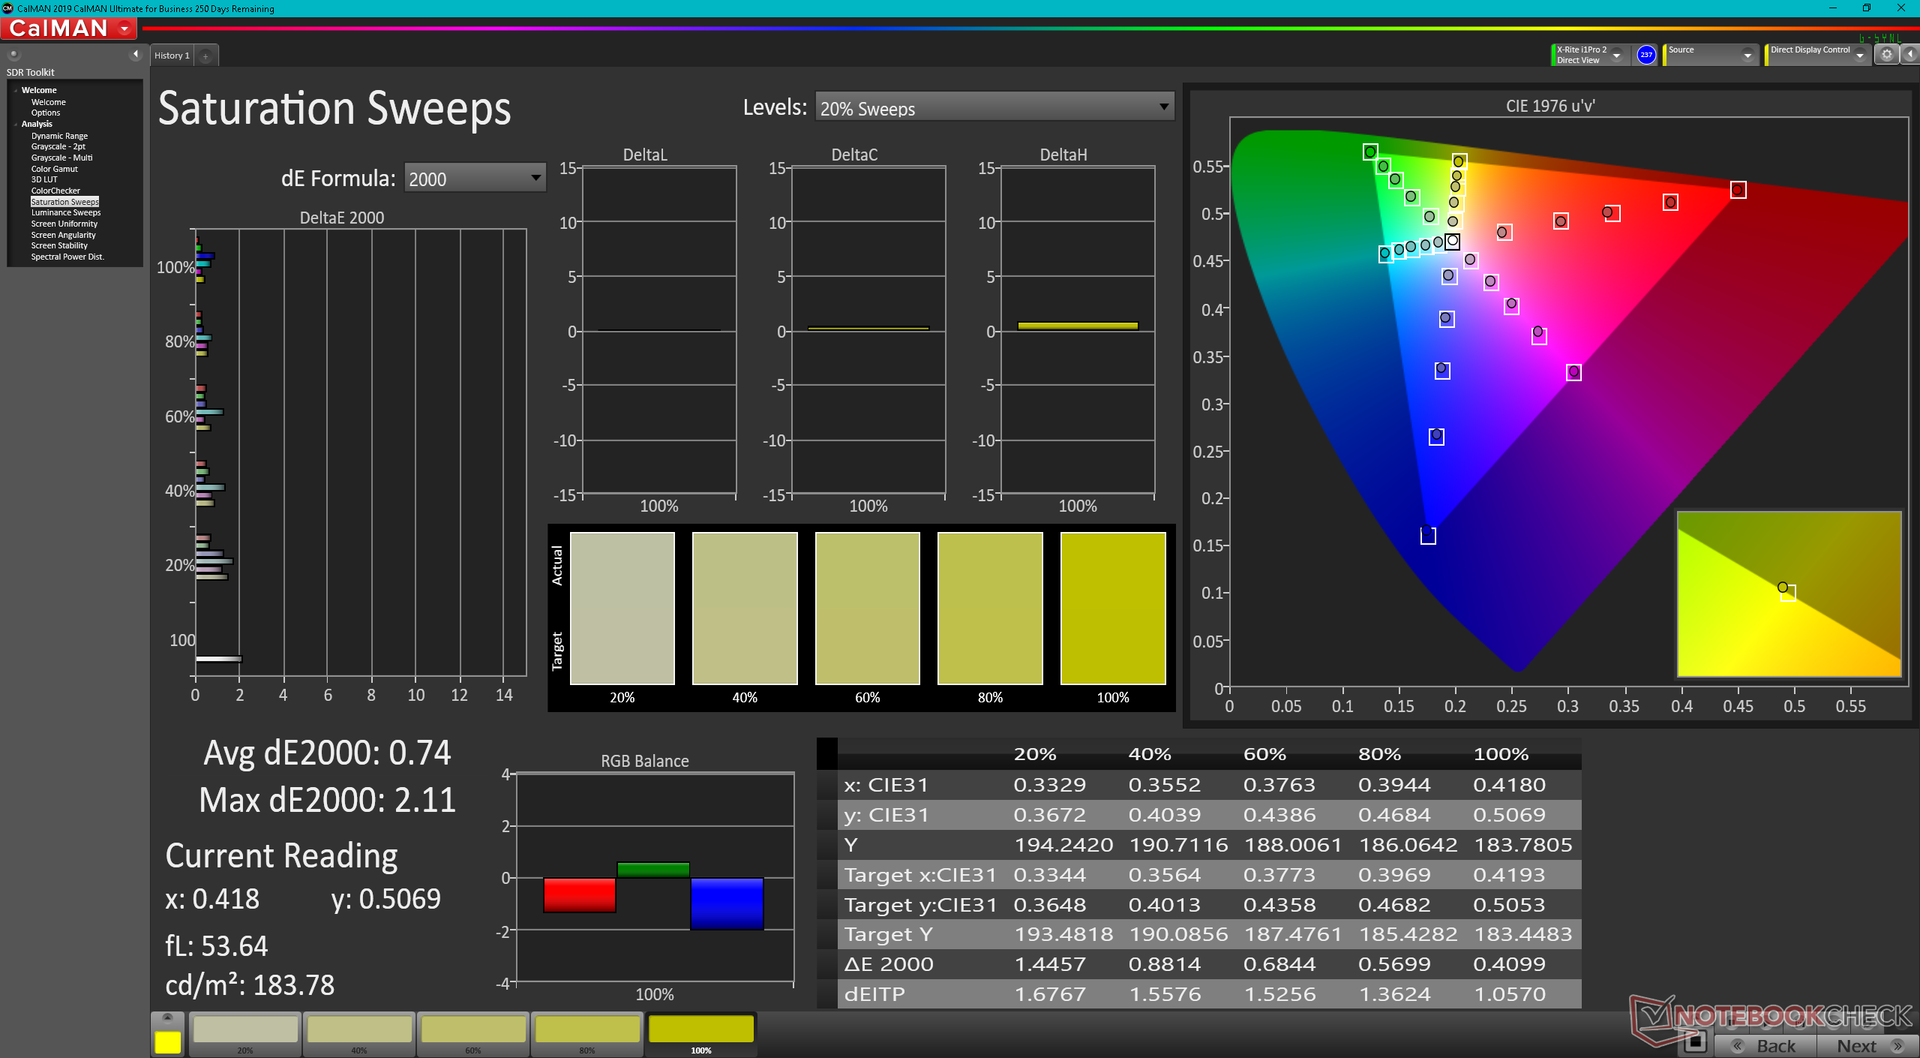
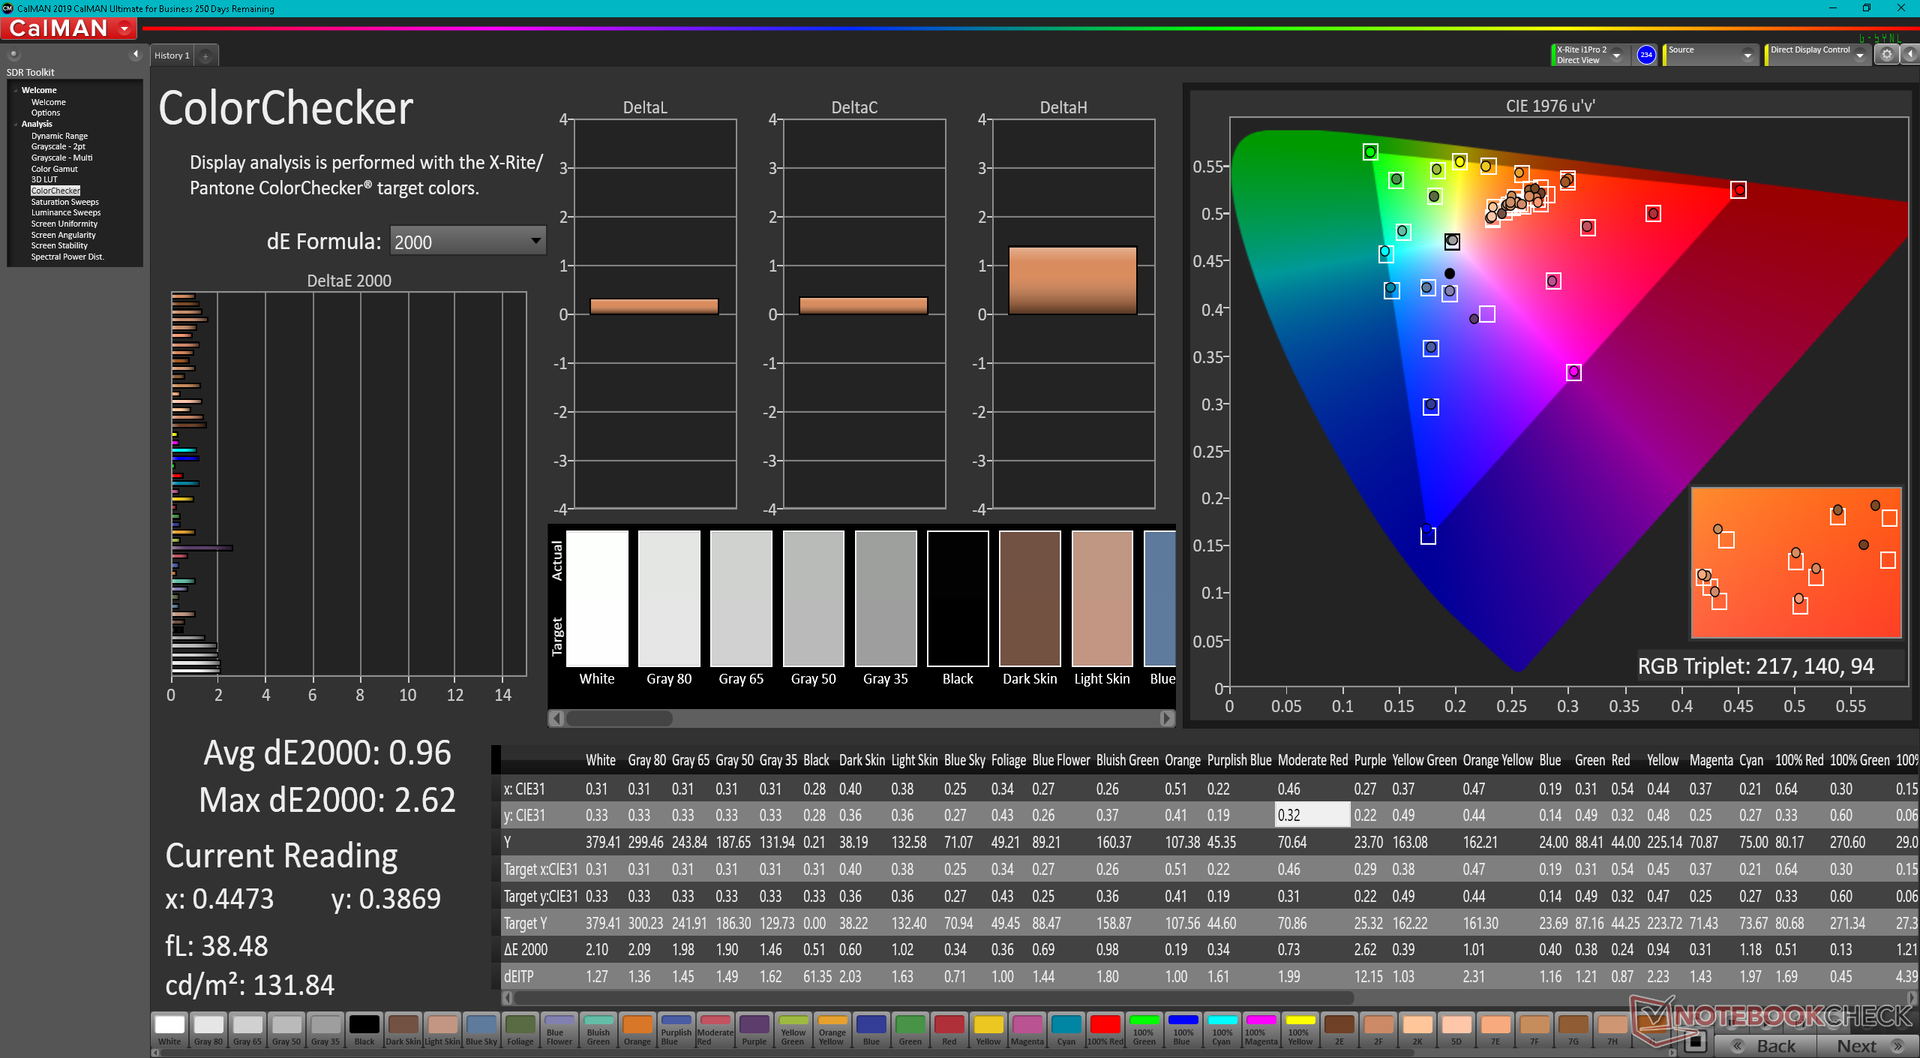
The display is already well-calibrated out of the box as shown by our CalMAN results below. Average grayscale and color DeltaE values are just 1.2 and 1.54, respectively, to be fit for most graphics editing if sRGB coverage is priority. Our own calibration with an X-Rite colorimeter would only improve color accuracy just marginally.
Display Response Times
| ↔ Response Time Black to White | ||
|---|---|---|
| 41.6 ms ... rise ↗ and fall ↘ combined | ↗ 19.6 ms rise | 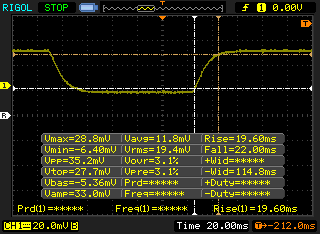 |
| ↘ 22 ms fall | ||
| The screen shows slow response rates in our tests and will be unsatisfactory for gamers. In comparison, all tested devices range from 0.1 (minimum) to 240 (maximum) ms. » 98 % of all devices are better. This means that the measured response time is worse than the average of all tested devices (19.8 ms). | ||
| ↔ Response Time 50% Grey to 80% Grey | ||
| 60 ms ... rise ↗ and fall ↘ combined | ↗ 28.8 ms rise | 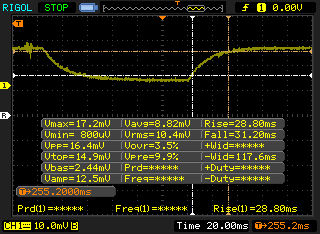 |
| ↘ 31.2 ms fall | ||
| The screen shows slow response rates in our tests and will be unsatisfactory for gamers. In comparison, all tested devices range from 0.165 (minimum) to 636 (maximum) ms. » 96 % of all devices are better. This means that the measured response time is worse than the average of all tested devices (31 ms). | ||
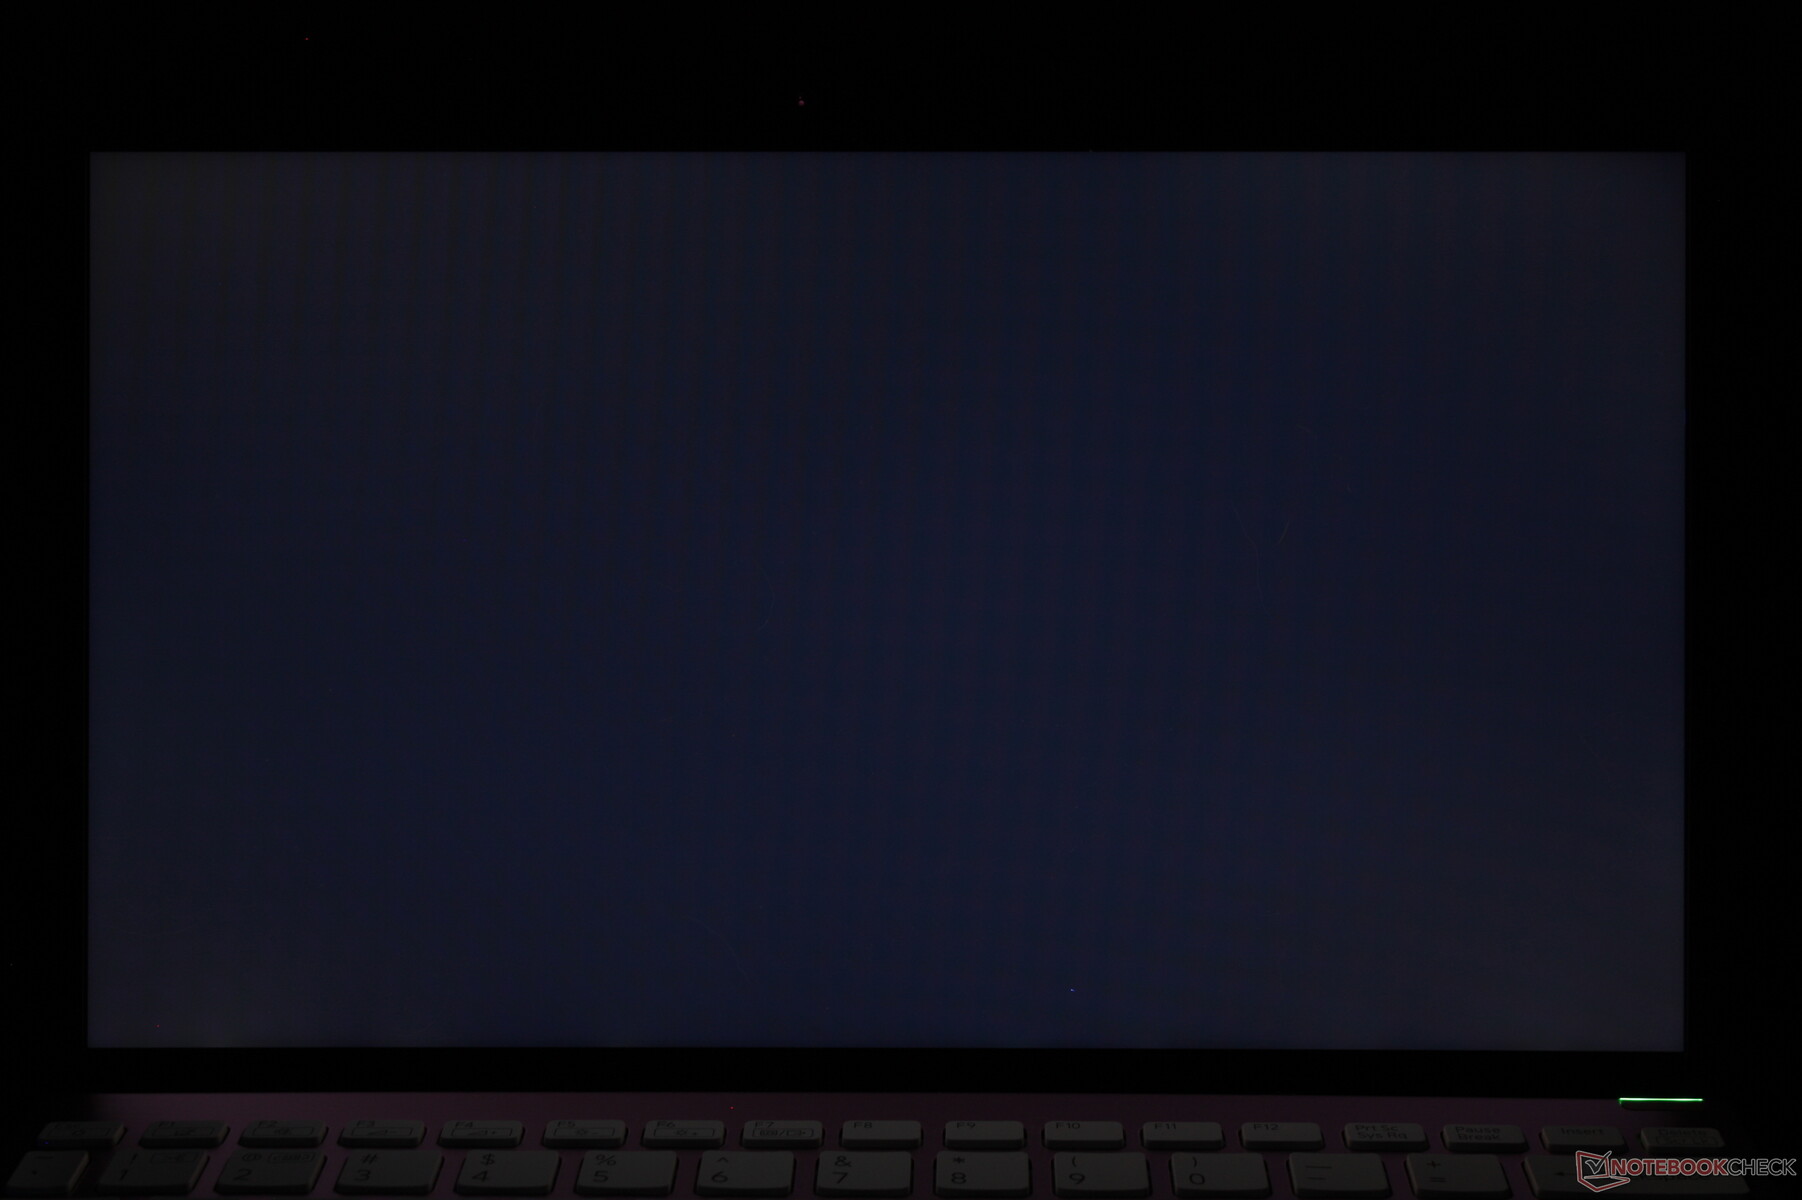
Screen Flickering / PWM (Pulse-Width Modulation)
| Screen flickering / PWM not detected |  | ||
In comparison: 52 % of all tested devices do not use PWM to dim the display. If PWM was detected, an average of 7750 (minimum: 5 - maximum: 343500) Hz was measured. | |||
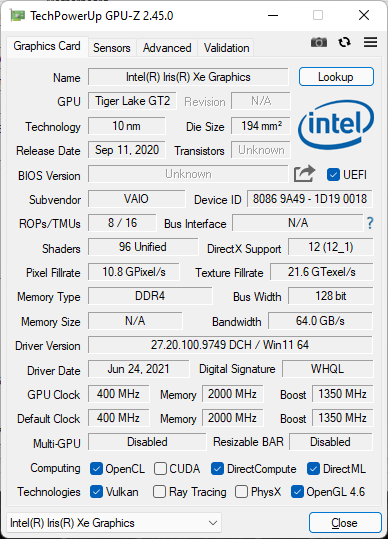
Performance — Small Size, Big Performance
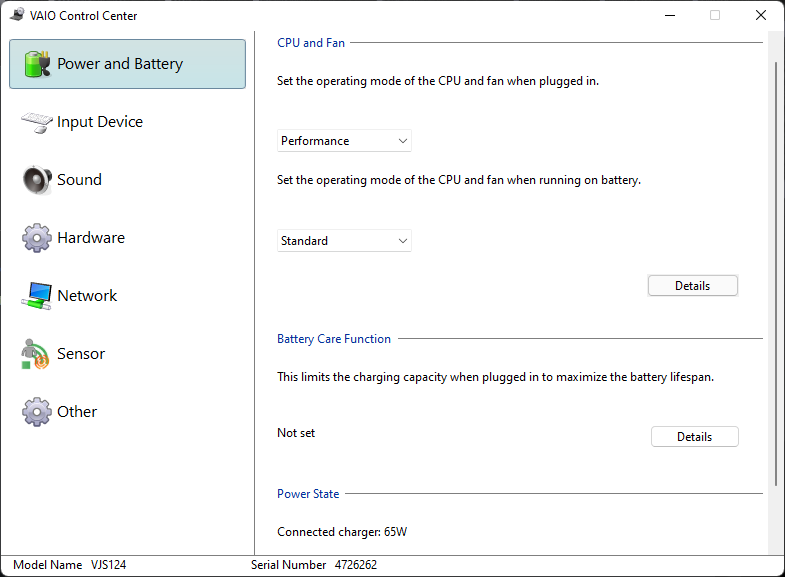
Testing Conditions
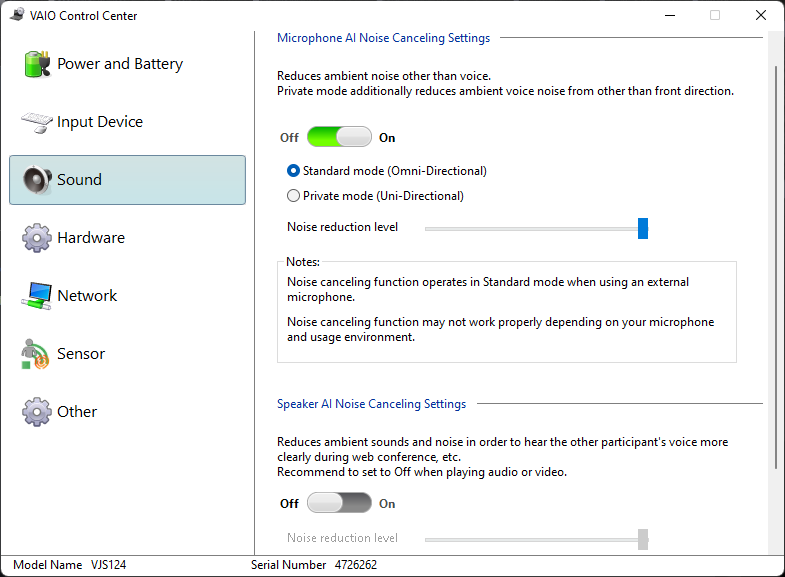
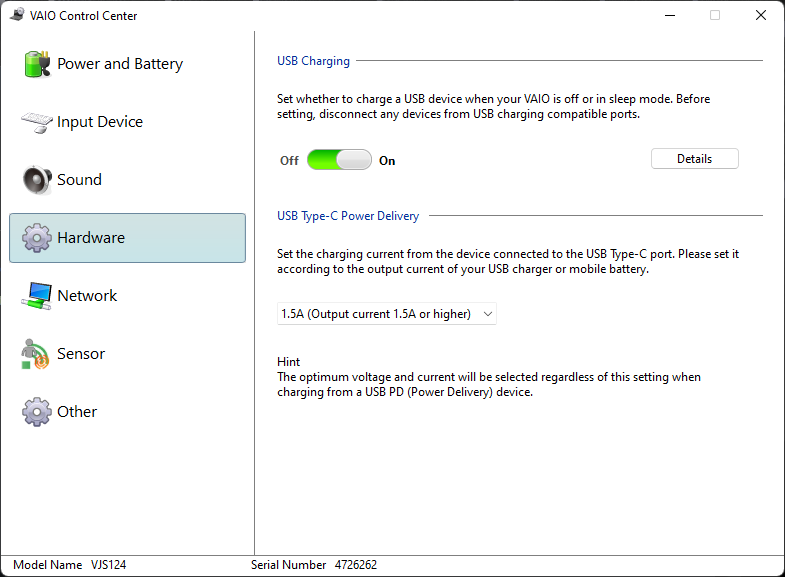
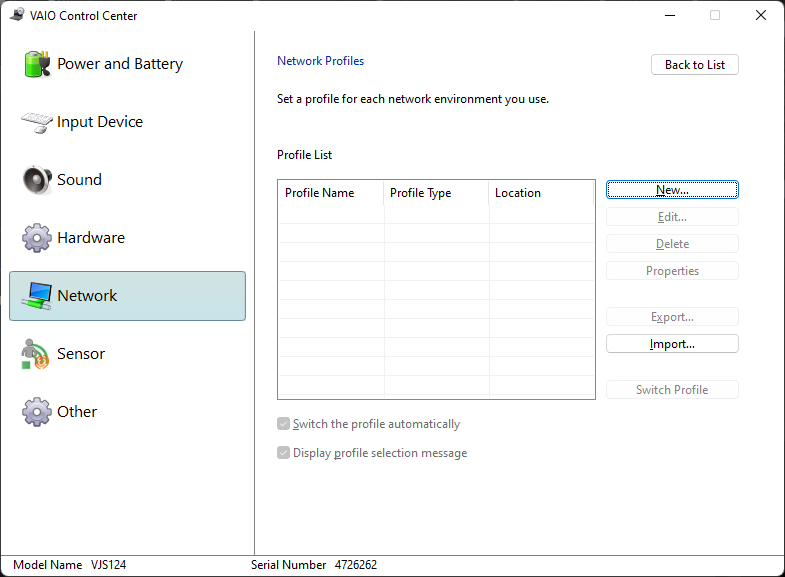
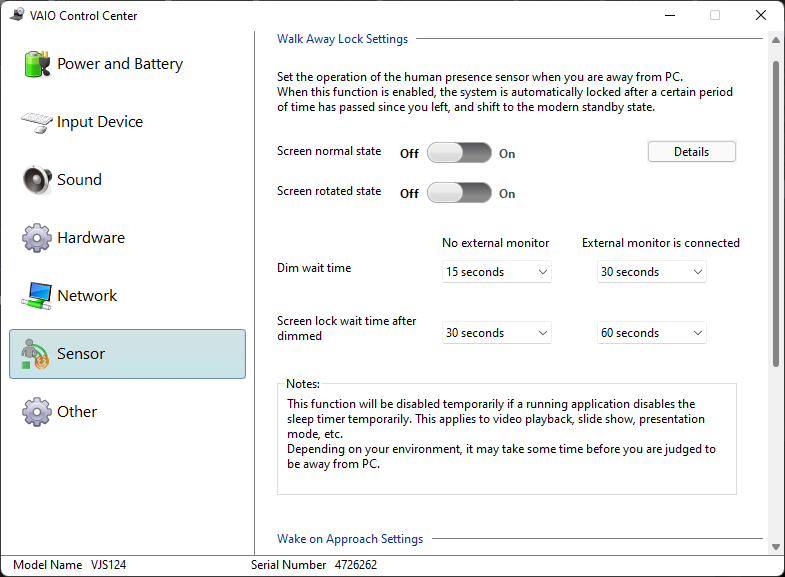
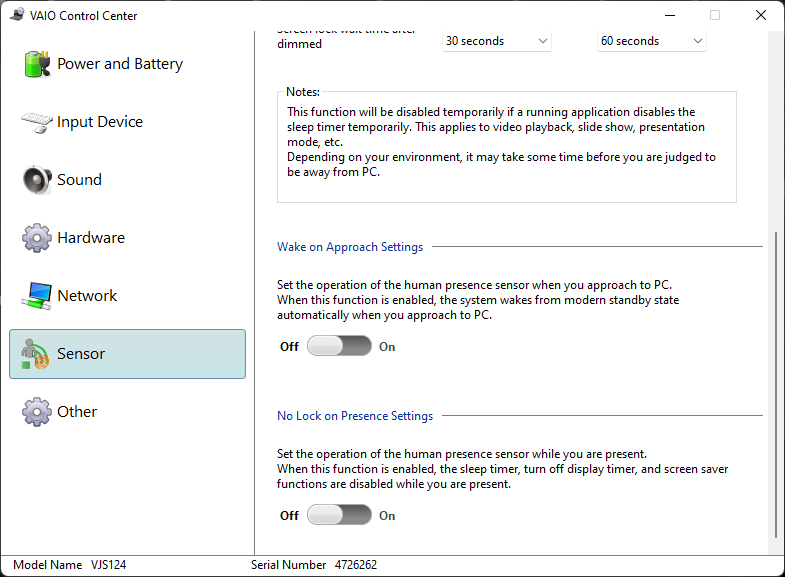
Our unit was set to Performance mode via the pre-installed Vaio Control Center software for the highest possible benchmark scores. Owners should become familiar with this software as key features are toggled here including the keyboard backlight behavior, Function key shortcuts, IR camera sensor, and more.
Processor
CPU performance from the uncommon Core i5-1155G7 is impressive with results that are 20 percent faster than the average laptop in our database with the Core i5-1135G7. In fact, the CPU here is able to outperform many other laptops with the supposedly faster Core i7-1165G7 including the Samsung Galaxy Book Pro 15.
Interestingly, performance would dip during the start of our CineBench R15 xT loop test before recovering thereafter as shown by our graph below.
Cinebench R15 Multi Loop
Cinebench R23: Multi Core | Single Core
Cinebench R15: CPU Multi 64Bit | CPU Single 64Bit
Blender: v2.79 BMW27 CPU
7-Zip 18.03: 7z b 4 | 7z b 4 -mmt1
Geekbench 5.5: Multi-Core | Single-Core
HWBOT x265 Benchmark v2.2: 4k Preset
LibreOffice : 20 Documents To PDF
R Benchmark 2.5: Overall mean
| Cinebench R20 / CPU (Multi Core) | |
| Lenovo ThinkPad L15 G2 AMD | |
| Dell XPS 13 7390 Core i7-10710U | |
| Average Intel Core i5-1155G7 (2123 - 2273, n=3) | |
| VAIO SX12 VJS124X1011P | |
| Microsoft Surface Pro 8, i7-1185G7 | |
| Asus ExpertBook B5 Flip B5302FEA | |
| Dynabook Portégé X30W-J-10K | |
| Average Intel Core i5-1135G7 (979 - 2382, n=62) | |
| Dell XPS 13 9300 i5 FHD | |
| HP Elite Dragonfly Max | |
| Asus ZenBook 13 UX325JA | |
| Lenovo ThinkPad X13 Yoga 20SX0004GE | |
| Cinebench R20 / CPU (Single Core) | |
| Microsoft Surface Pro 8, i7-1185G7 | |
| Dynabook Portégé X30W-J-10K | |
| VAIO SX12 VJS124X1011P | |
| HP Elite Dragonfly Max | |
| Average Intel Core i5-1155G7 (521 - 551, n=3) | |
| Lenovo ThinkPad L15 G2 AMD | |
| Asus ExpertBook B5 Flip B5302FEA | |
| Average Intel Core i5-1135G7 (375 - 527, n=62) | |
| Dell XPS 13 7390 Core i7-10710U | |
| Asus ZenBook 13 UX325JA | |
| Dell XPS 13 9300 i5 FHD | |
| Lenovo ThinkPad X13 Yoga 20SX0004GE | |
| Cinebench R23 / Multi Core | |
| Lenovo ThinkPad L15 G2 AMD | |
| Microsoft Surface Pro 8, i7-1185G7 | |
| Average Intel Core i5-1155G7 (5471 - 5791, n=3) | |
| VAIO SX12 VJS124X1011P | |
| Asus ExpertBook B5 Flip B5302FEA | |
| Dynabook Portégé X30W-J-10K | |
| Average Intel Core i5-1135G7 (2786 - 6136, n=55) | |
| HP Elite Dragonfly Max | |
| Cinebench R23 / Single Core | |
| Microsoft Surface Pro 8, i7-1185G7 | |
| Dynabook Portégé X30W-J-10K | |
| VAIO SX12 VJS124X1011P | |
| Average Intel Core i5-1155G7 (1362 - 1446, n=3) | |
| HP Elite Dragonfly Max | |
| Lenovo ThinkPad L15 G2 AMD | |
| Asus ExpertBook B5 Flip B5302FEA | |
| Average Intel Core i5-1135G7 (1062 - 1373, n=53) | |
| Cinebench R15 / CPU Multi 64Bit | |
| Lenovo ThinkPad L15 G2 AMD | |
| Dell XPS 13 7390 Core i7-10710U | |
| Microsoft Surface Pro 8, i7-1185G7 | |
| Asus ExpertBook B5 Flip B5302FEA | |
| Average Intel Core i5-1155G7 (858 - 928, n=3) | |
| VAIO SX12 VJS124X1011P | |
| Average Intel Core i5-1135G7 (431 - 941, n=65) | |
| Dynabook Portégé X30W-J-10K | |
| Asus ZenBook 13 UX325JA | |
| Dell XPS 13 9300 i5 FHD | |
| Dell XPS 13 9300 i5 FHD | |
| HP Elite Dragonfly Max | |
| Lenovo ThinkPad X13 Yoga 20SX0004GE | |
| Cinebench R15 / CPU Single 64Bit | |
| Microsoft Surface Pro 8, i7-1185G7 | |
| Lenovo ThinkPad L15 G2 AMD | |
| Dynabook Portégé X30W-J-10K | |
| Average Intel Core i5-1155G7 (210 - 211, n=3) | |
| VAIO SX12 VJS124X1011P | |
| Asus ExpertBook B5 Flip B5302FEA | |
| Average Intel Core i5-1135G7 (141.4 - 205, n=61) | |
| Asus ZenBook 13 UX325JA | |
| Dell XPS 13 7390 Core i7-10710U | |
| Lenovo ThinkPad X13 Yoga 20SX0004GE | |
| HP Elite Dragonfly Max | |
| Dell XPS 13 9300 i5 FHD | |
| Blender / v2.79 BMW27 CPU | |
| Asus ZenBook 13 UX325JA | |
| Lenovo ThinkPad X13 Yoga 20SX0004GE | |
| Dell XPS 13 9300 i5 FHD | |
| HP Elite Dragonfly Max | |
| Average Intel Core i5-1135G7 (499 - 1044, n=60) | |
| Dynabook Portégé X30W-J-10K | |
| Asus ExpertBook B5 Flip B5302FEA | |
| Dell XPS 13 7390 Core i7-10710U | |
| Microsoft Surface Pro 8, i7-1185G7 | |
| Average Intel Core i5-1155G7 (536 - 566, n=3) | |
| VAIO SX12 VJS124X1011P | |
| Lenovo ThinkPad L15 G2 AMD | |
| 7-Zip 18.03 / 7z b 4 | |
| Lenovo ThinkPad L15 G2 AMD | |
| Dell XPS 13 7390 Core i7-10710U | |
| Average Intel Core i5-1155G7 (24862 - 25203, n=3) | |
| VAIO SX12 VJS124X1011P | |
| Microsoft Surface Pro 8, i7-1185G7 | |
| Asus ExpertBook B5 Flip B5302FEA | |
| Dynabook Portégé X30W-J-10K | |
| Average Intel Core i5-1135G7 (14745 - 24873, n=62) | |
| HP Elite Dragonfly Max | |
| Dell XPS 13 9300 i5 FHD | |
| Lenovo ThinkPad X13 Yoga 20SX0004GE | |
| Asus ZenBook 13 UX325JA | |
| 7-Zip 18.03 / 7z b 4 -mmt1 | |
| Lenovo ThinkPad L15 G2 AMD | |
| Microsoft Surface Pro 8, i7-1185G7 | |
| HP Elite Dragonfly Max | |
| Dynabook Portégé X30W-J-10K | |
| VAIO SX12 VJS124X1011P | |
| Average Intel Core i5-1155G7 (4603 - 4949, n=3) | |
| Asus ExpertBook B5 Flip B5302FEA | |
| Average Intel Core i5-1135G7 (3924 - 4921, n=62) | |
| Lenovo ThinkPad X13 Yoga 20SX0004GE | |
| Dell XPS 13 7390 Core i7-10710U | |
| Asus ZenBook 13 UX325JA | |
| Dell XPS 13 9300 i5 FHD | |
| Geekbench 5.5 / Multi-Core | |
| Microsoft Surface Pro 8, i7-1185G7 | |
| Average Intel Core i5-1155G7 (5654 - 5825, n=3) | |
| VAIO SX12 VJS124X1011P | |
| Dynabook Portégé X30W-J-10K | |
| HP Elite Dragonfly Max | |
| Lenovo ThinkPad L15 G2 AMD | |
| Average Intel Core i5-1135G7 (3475 - 5472, n=58) | |
| Asus ZenBook 13 UX325JA | |
| Asus ExpertBook B5 Flip B5302FEA | |
| Dell XPS 13 9300 i5 FHD | |
| Lenovo ThinkPad X13 Yoga 20SX0004GE | |
| Geekbench 5.5 / Single-Core | |
| Microsoft Surface Pro 8, i7-1185G7 | |
| HP Elite Dragonfly Max | |
| Dynabook Portégé X30W-J-10K | |
| VAIO SX12 VJS124X1011P | |
| Average Intel Core i5-1155G7 (1461 - 1480, n=3) | |
| Average Intel Core i5-1135G7 (1147 - 1428, n=58) | |
| Asus ExpertBook B5 Flip B5302FEA | |
| Lenovo ThinkPad L15 G2 AMD | |
| Asus ZenBook 13 UX325JA | |
| Dell XPS 13 9300 i5 FHD | |
| Lenovo ThinkPad X13 Yoga 20SX0004GE | |
| HWBOT x265 Benchmark v2.2 / 4k Preset | |
| Lenovo ThinkPad L15 G2 AMD | |
| VAIO SX12 VJS124X1011P | |
| Average Intel Core i5-1155G7 (7.13 - 7.55, n=3) | |
| Microsoft Surface Pro 8, i7-1185G7 | |
| Dynabook Portégé X30W-J-10K | |
| Dell XPS 13 7390 Core i7-10710U | |
| Average Intel Core i5-1135G7 (3.57 - 7.6, n=57) | |
| Asus ExpertBook B5 Flip B5302FEA | |
| HP Elite Dragonfly Max | |
| Lenovo ThinkPad X13 Yoga 20SX0004GE | |
| Dell XPS 13 9300 i5 FHD | |
| Asus ZenBook 13 UX325JA | |
| LibreOffice / 20 Documents To PDF | |
| Lenovo ThinkPad X13 Yoga 20SX0004GE | |
| Average Intel Core i5-1135G7 (44.2 - 62.9, n=60) | |
| Asus ExpertBook B5 Flip B5302FEA | |
| VAIO SX12 VJS124X1011P | |
| Average Intel Core i5-1155G7 (51.4 - 52.7, n=3) | |
| Asus ZenBook 13 UX325JA | |
| Microsoft Surface Pro 8, i7-1185G7 | |
| Dynabook Portégé X30W-J-10K | |
| Lenovo ThinkPad L15 G2 AMD | |
| HP Elite Dragonfly Max | |
| R Benchmark 2.5 / Overall mean | |
| Dell XPS 13 9300 i5 FHD | |
| Asus ZenBook 13 UX325JA | |
| Lenovo ThinkPad X13 Yoga 20SX0004GE | |
| Average Intel Core i5-1135G7 (0.619 - 0.727, n=59) | |
| Asus ExpertBook B5 Flip B5302FEA | |
| VAIO SX12 VJS124X1011P | |
| Average Intel Core i5-1155G7 (0.605 - 0.616, n=3) | |
| HP Elite Dragonfly Max | |
| Dynabook Portégé X30W-J-10K | |
| Microsoft Surface Pro 8, i7-1185G7 | |
| Lenovo ThinkPad L15 G2 AMD | |
* ... smaller is better
AIDA64: FP32 Ray-Trace | FPU Julia | CPU SHA3 | CPU Queen | FPU SinJulia | FPU Mandel | CPU AES | CPU ZLib | FP64 Ray-Trace | CPU PhotoWorxx
| Performance rating | |
| VAIO SX12 VJS124X1011P | |
| Average Intel Core i5-1155G7 | |
| VAIO SX14 VJS144X0111K | |
| Huawei MateBook E Core i5 | |
| Dynabook Portégé X40-G-10K | |
| AIDA64 / FP32 Ray-Trace | |
| VAIO SX12 VJS124X1011P | |
| Average Intel Core i5-1155G7 (7146 - 8007, n=3) | |
| VAIO SX14 VJS144X0111K | |
| Dynabook Portégé X40-G-10K | |
| Huawei MateBook E Core i5 | |
| AIDA64 / FPU Julia | |
| VAIO SX12 VJS124X1011P | |
| Average Intel Core i5-1155G7 (31134 - 33150, n=3) | |
| VAIO SX14 VJS144X0111K | |
| Dynabook Portégé X40-G-10K | |
| Huawei MateBook E Core i5 | |
| AIDA64 / CPU SHA3 | |
| VAIO SX12 VJS124X1011P | |
| Average Intel Core i5-1155G7 (2078 - 2201, n=3) | |
| VAIO SX14 VJS144X0111K | |
| Huawei MateBook E Core i5 | |
| Dynabook Portégé X40-G-10K | |
| AIDA64 / CPU Queen | |
| Average Intel Core i5-1155G7 (52180 - 52265, n=3) | |
| VAIO SX12 VJS124X1011P | |
| VAIO SX14 VJS144X0111K | |
| Dynabook Portégé X40-G-10K | |
| Huawei MateBook E Core i5 | |
| AIDA64 / FPU SinJulia | |
| VAIO SX12 VJS124X1011P | |
| Average Intel Core i5-1155G7 (4936 - 5001, n=3) | |
| VAIO SX14 VJS144X0111K | |
| Dynabook Portégé X40-G-10K | |
| Huawei MateBook E Core i5 | |
| AIDA64 / FPU Mandel | |
| VAIO SX12 VJS124X1011P | |
| Average Intel Core i5-1155G7 (18707 - 19716, n=3) | |
| VAIO SX14 VJS144X0111K | |
| Huawei MateBook E Core i5 | |
| Dynabook Portégé X40-G-10K | |
| AIDA64 / CPU AES | |
| VAIO SX12 VJS124X1011P | |
| Average Intel Core i5-1155G7 (73655 - 76866, n=3) | |
| Huawei MateBook E Core i5 | |
| VAIO SX14 VJS144X0111K | |
| Dynabook Portégé X40-G-10K | |
| AIDA64 / CPU ZLib | |
| VAIO SX12 VJS124X1011P | |
| Average Intel Core i5-1155G7 (407 - 425, n=3) | |
| VAIO SX14 VJS144X0111K | |
| Dynabook Portégé X40-G-10K | |
| Huawei MateBook E Core i5 | |
| AIDA64 / FP64 Ray-Trace | |
| VAIO SX12 VJS124X1011P | |
| Average Intel Core i5-1155G7 (3886 - 4211, n=3) | |
| VAIO SX14 VJS144X0111K | |
| Dynabook Portégé X40-G-10K | |
| Huawei MateBook E Core i5 | |
| AIDA64 / CPU PhotoWorxx | |
| VAIO SX12 VJS124X1011P | |
| Average Intel Core i5-1155G7 (33302 - 39951, n=3) | |
| VAIO SX14 VJS144X0111K | |
| Huawei MateBook E Core i5 | |
| Dynabook Portégé X40-G-10K | |
System Performance
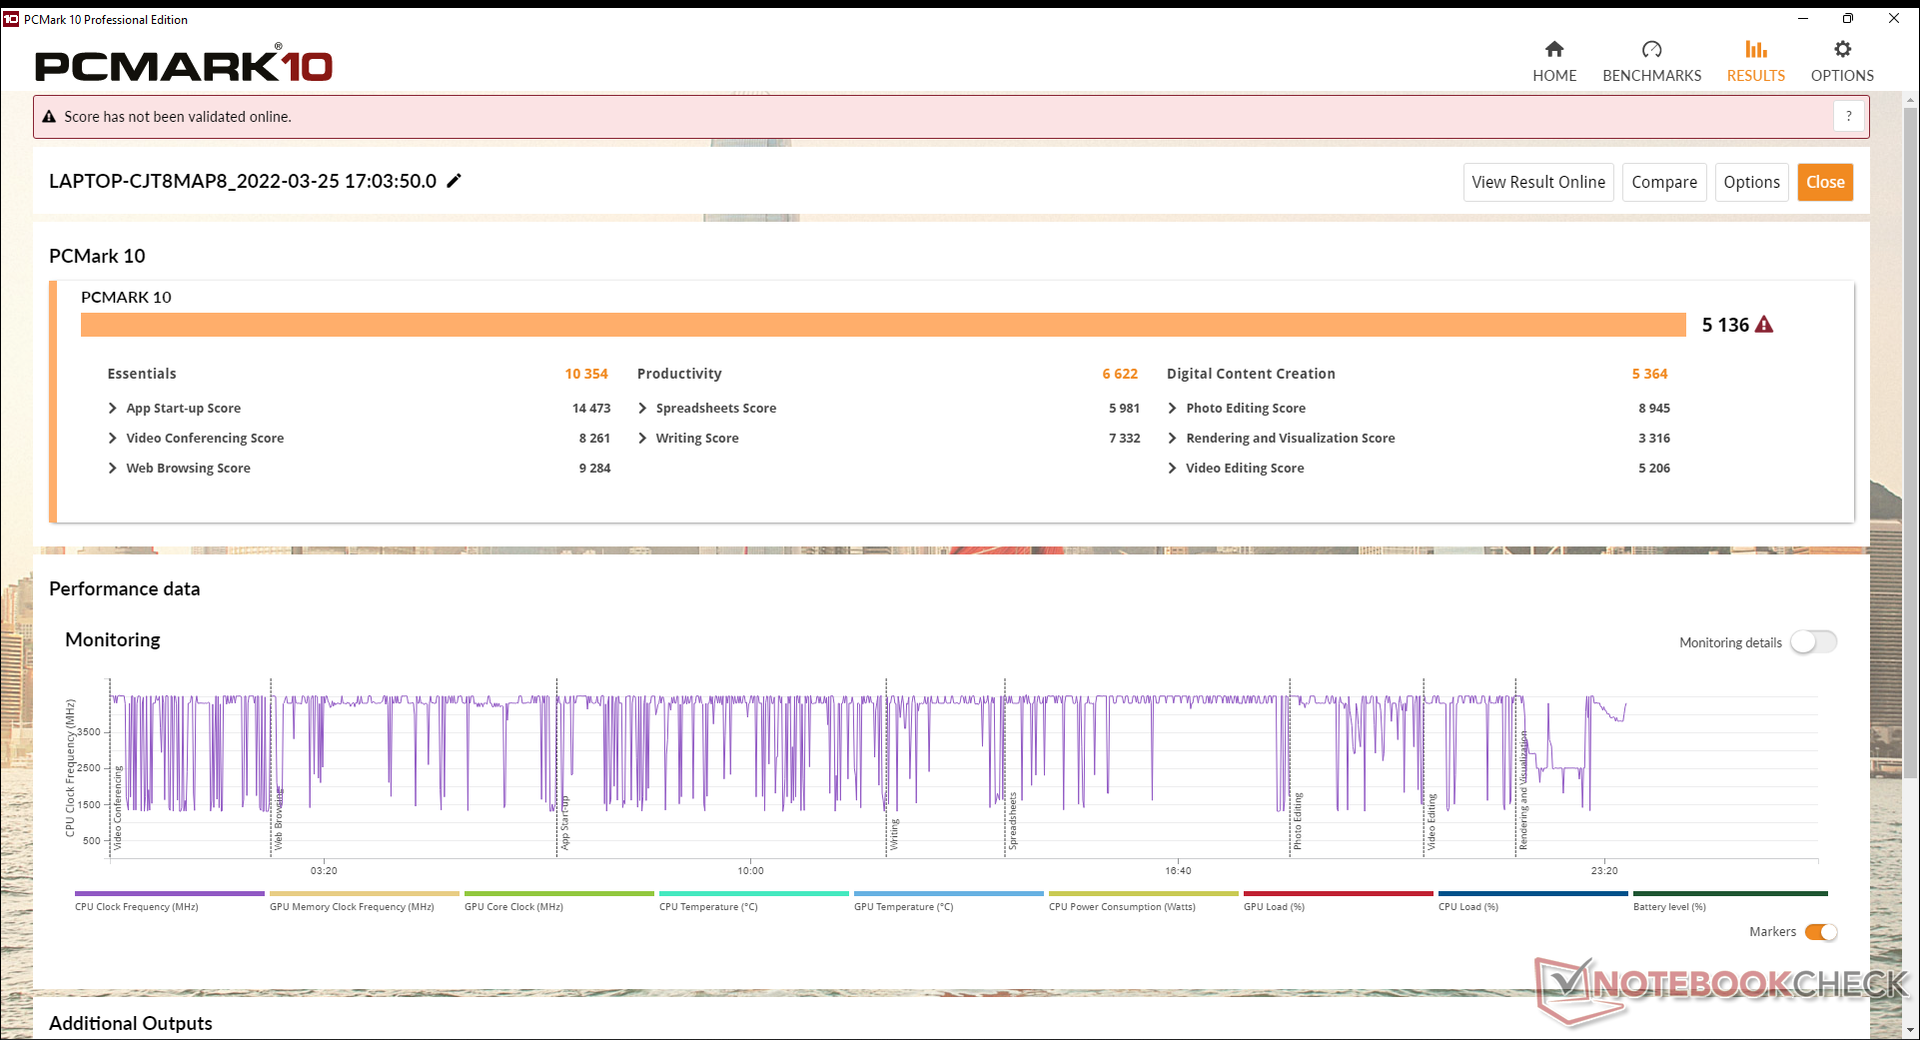
PCMark 10 results are comparable to the larger SX14 and other high-end Ultrabooks with similar 12th gen series Intel CPUs and PCIe4 x4 NVMe SSDs. We experienced no peculiar software or hardware issues during our time with the test unit.
CrossMark: Overall | Productivity | Creativity | Responsiveness
| PCMark 10 / Score | |
| VAIO SX12 VJS124X1011P | |
| VAIO SX14 VJS144X0111K | |
| Average Intel Core i5-1155G7, Intel Iris Xe Graphics G7 80EUs (5095 - 5136, n=3) | |
| Dell XPS 13 9310 Core i7 FHD | |
| Huawei MateBook E Core i5 | |
| Dynabook Portégé X40-G-10K | |
| VAIO A12-92993 | |
| PCMark 10 / Essentials | |
| VAIO SX14 VJS144X0111K | |
| VAIO SX12 VJS124X1011P | |
| Average Intel Core i5-1155G7, Intel Iris Xe Graphics G7 80EUs (9853 - 10354, n=3) | |
| Dell XPS 13 9310 Core i7 FHD | |
| Huawei MateBook E Core i5 | |
| Dynabook Portégé X40-G-10K | |
| VAIO A12-92993 | |
| PCMark 10 / Productivity | |
| Dell XPS 13 9310 Core i7 FHD | |
| VAIO SX14 VJS144X0111K | |
| VAIO SX12 VJS124X1011P | |
| Average Intel Core i5-1155G7, Intel Iris Xe Graphics G7 80EUs (6549 - 6622, n=3) | |
| VAIO A12-92993 | |
| Dynabook Portégé X40-G-10K | |
| Huawei MateBook E Core i5 | |
| PCMark 10 / Digital Content Creation | |
| Average Intel Core i5-1155G7, Intel Iris Xe Graphics G7 80EUs (5364 - 5583, n=3) | |
| VAIO SX12 VJS124X1011P | |
| VAIO SX14 VJS144X0111K | |
| Dell XPS 13 9310 Core i7 FHD | |
| Huawei MateBook E Core i5 | |
| Dynabook Portégé X40-G-10K | |
| VAIO A12-92993 | |
| CrossMark / Overall | |
| Average Intel Core i5-1155G7, Intel Iris Xe Graphics G7 80EUs (1381 - 1395, n=2) | |
| Huawei MateBook E Core i5 | |
| CrossMark / Productivity | |
| Average Intel Core i5-1155G7, Intel Iris Xe Graphics G7 80EUs (1442 - 1449, n=2) | |
| Huawei MateBook E Core i5 | |
| CrossMark / Creativity | |
| Average Intel Core i5-1155G7, Intel Iris Xe Graphics G7 80EUs (1309 - 1330, n=2) | |
| Huawei MateBook E Core i5 | |
| CrossMark / Responsiveness | |
| Average Intel Core i5-1155G7, Intel Iris Xe Graphics G7 80EUs (1426 - 1439, n=2) | |
| Huawei MateBook E Core i5 | |
| PCMark 10 Score | 5136 points | |
Help | ||
| AIDA64 / Memory Copy | |
| VAIO SX12 VJS124X1011P | |
| VAIO SX14 VJS144X0111K | |
| Huawei MateBook E Core i5 | |
| Dell Latitude 7200 | |
| AIDA64 / Memory Read | |
| VAIO SX12 VJS124X1011P | |
| Huawei MateBook E Core i5 | |
| VAIO SX14 VJS144X0111K | |
| Dell Latitude 7200 | |
| AIDA64 / Memory Write | |
| VAIO SX12 VJS124X1011P | |
| VAIO SX14 VJS144X0111K | |
| Huawei MateBook E Core i5 | |
| Dell Latitude 7200 | |
| AIDA64 / Memory Latency | |
| Dell Latitude 7200 | |
| VAIO SX14 VJS144X0111K | |
| VAIO SX12 VJS124X1011P | |
| Huawei MateBook E Core i5 | |
* ... smaller is better
DPC Latency
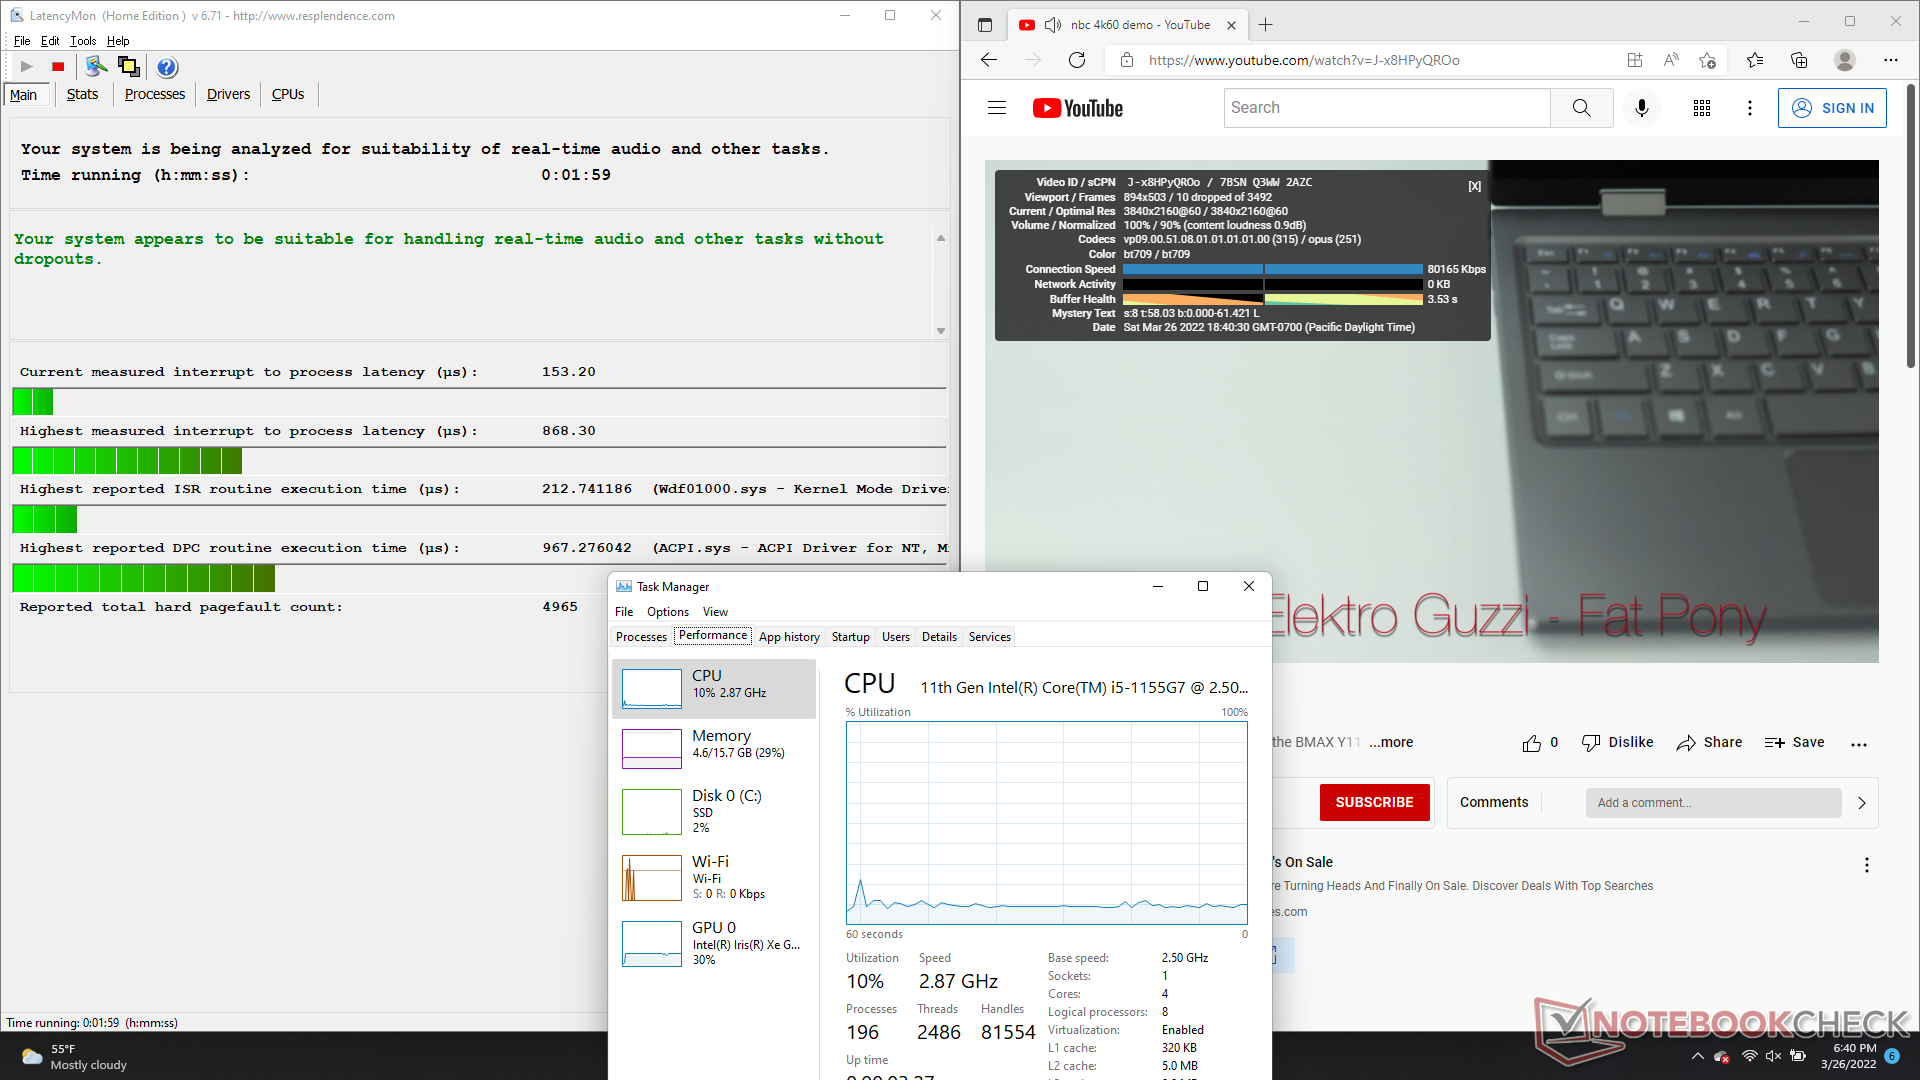
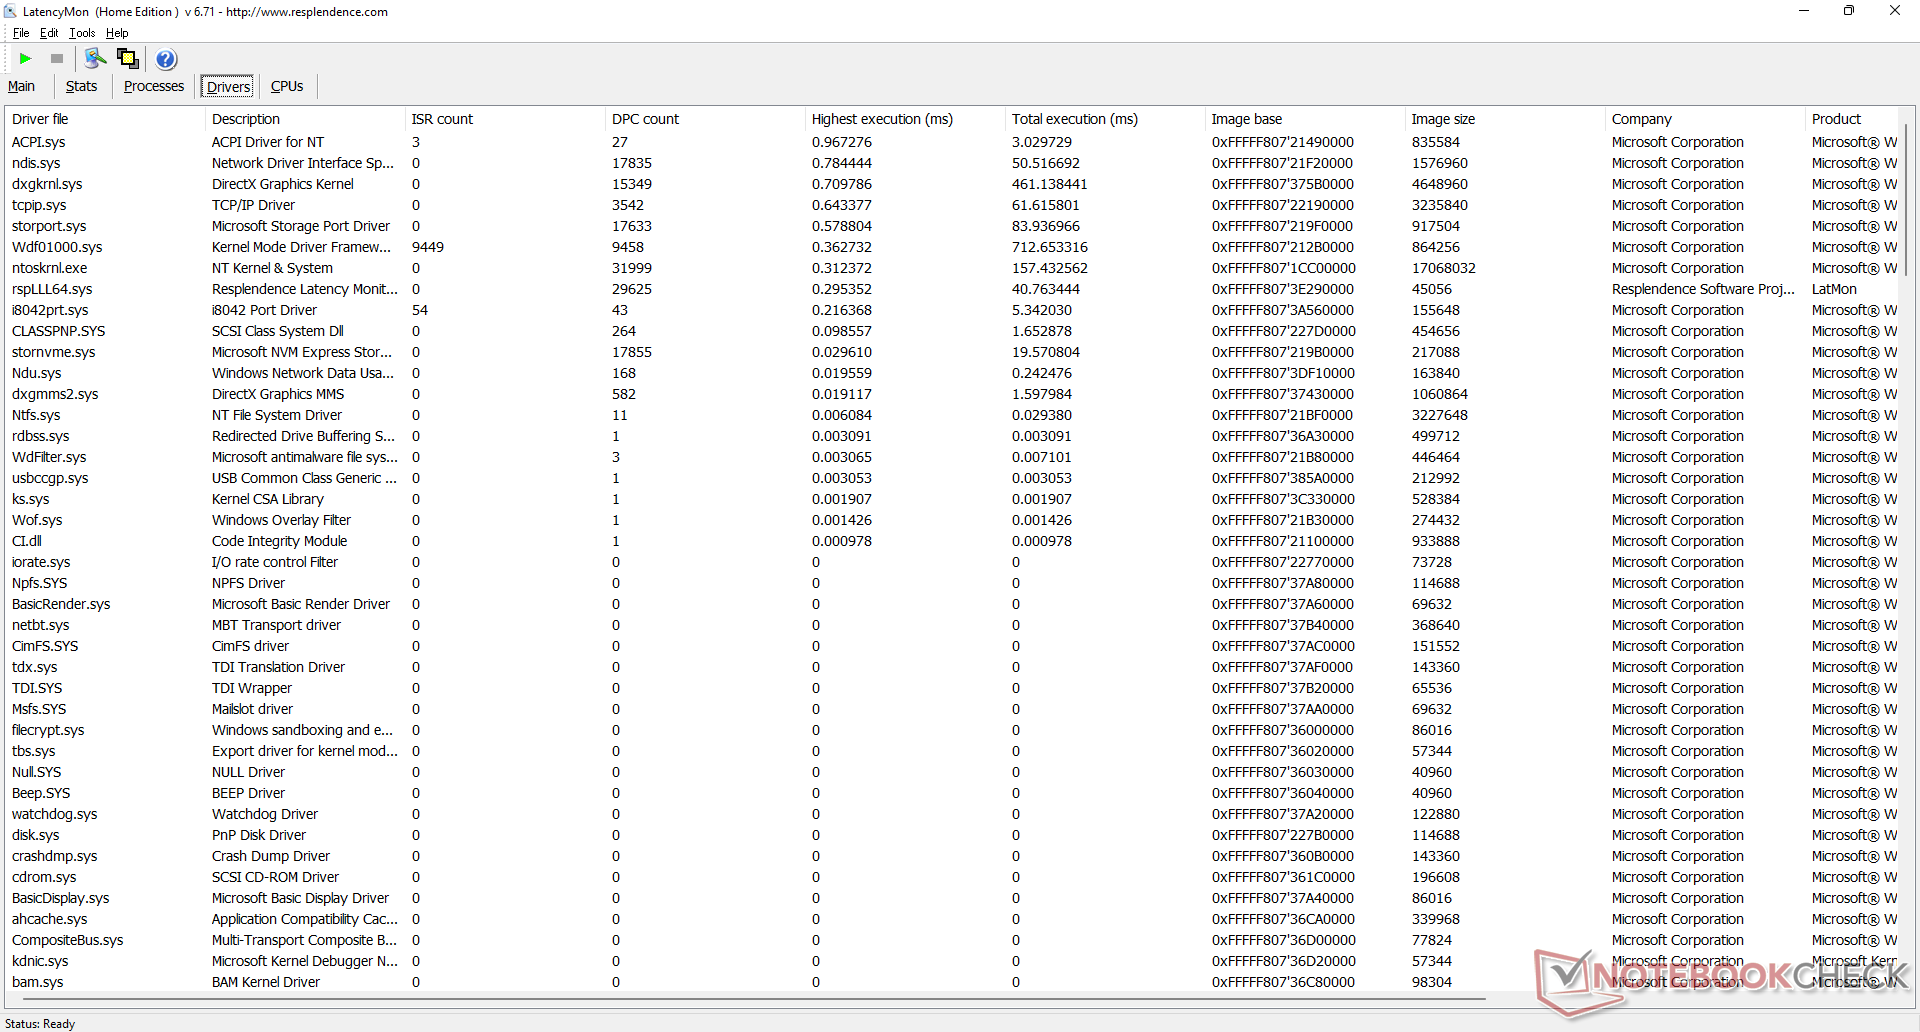
LatencyMon shows no DPC issues when opening multiple tabs on our homepage. 4K video playback at 60 FPS is nearly perfect with just 10 dropped frames during our minute-long video test.
| DPC Latencies / LatencyMon - interrupt to process latency (max), Web, Youtube, Prime95 | |
| Dynabook Portégé X40-G-10K | |
| VAIO SX14 VJS144X0111K | |
| Dell XPS 13 9310 Core i7 FHD | |
| Huawei MateBook E Core i5 | |
| VAIO SX12 VJS124X1011P | |
* ... smaller is better
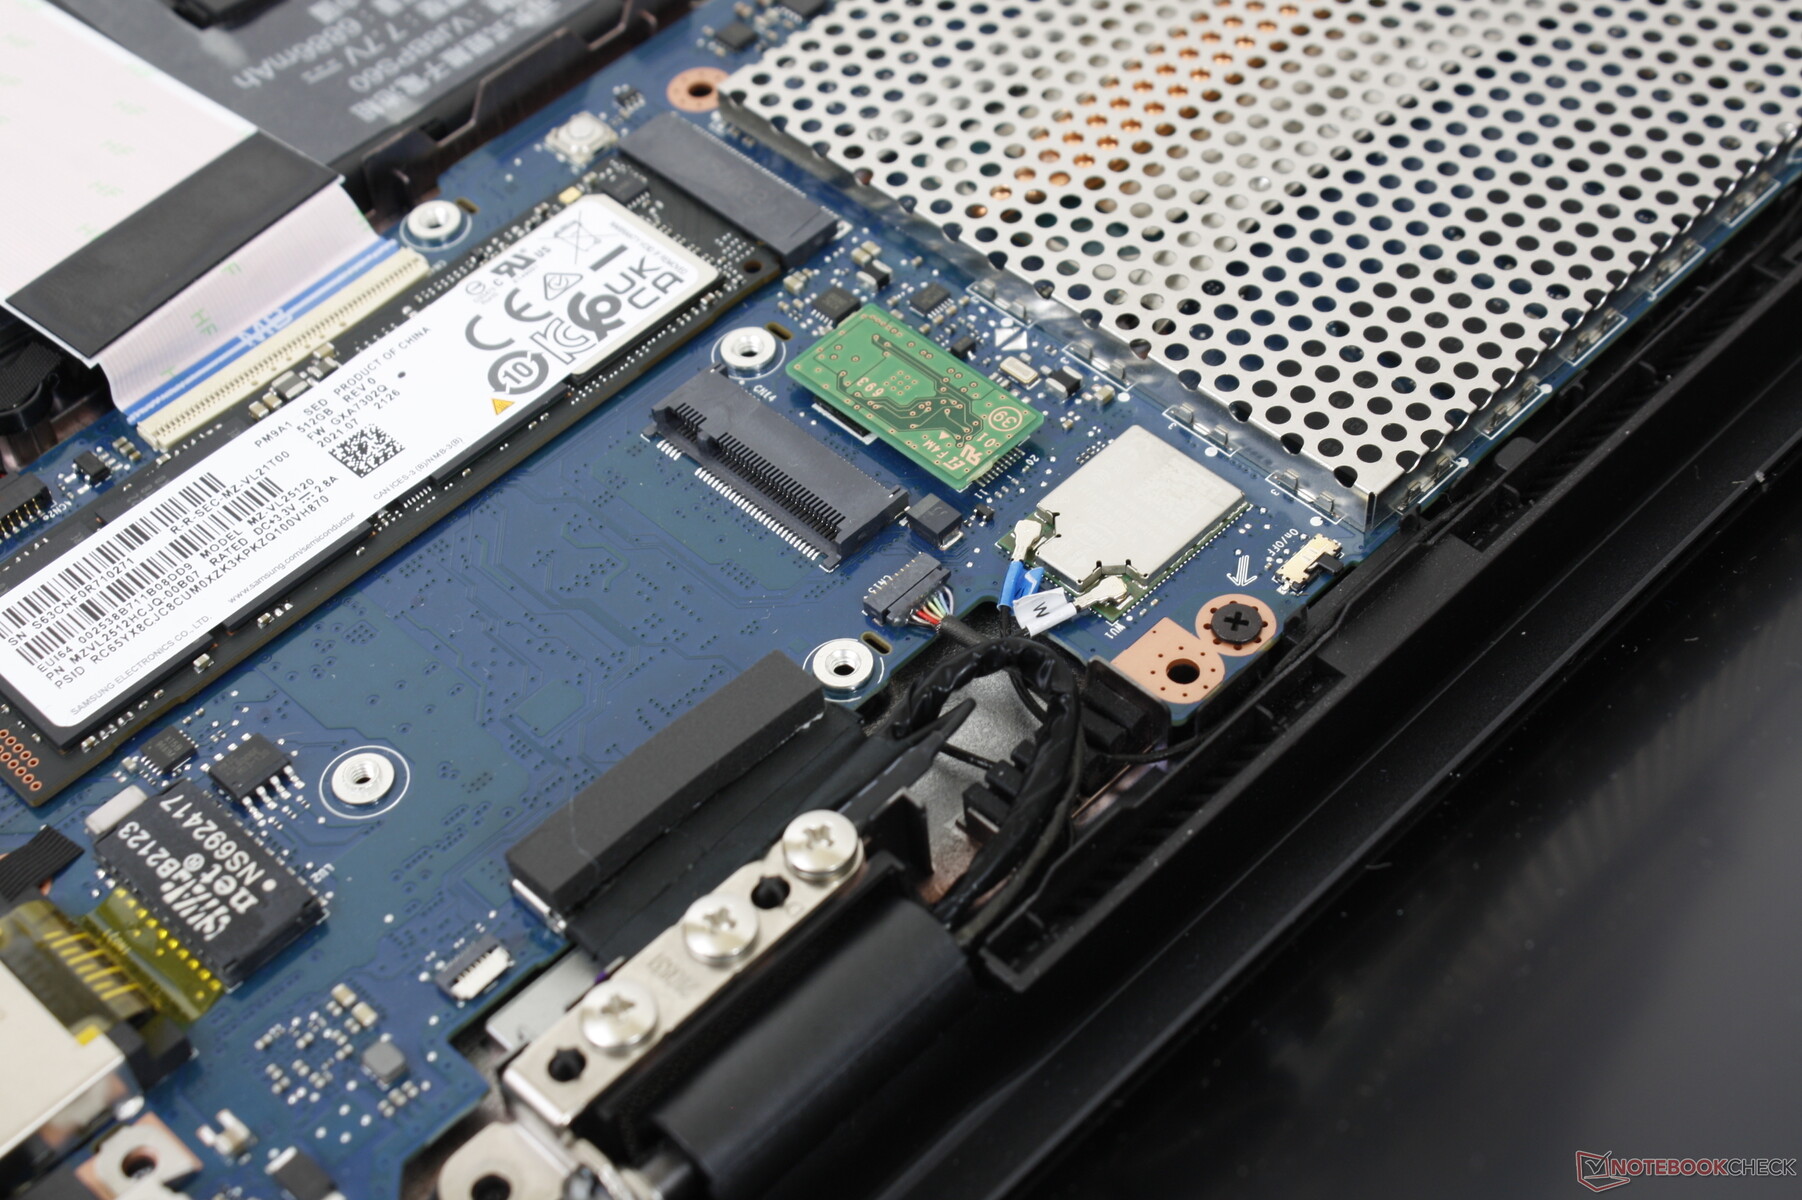
Storage Devices — PCIe4 x4 Support
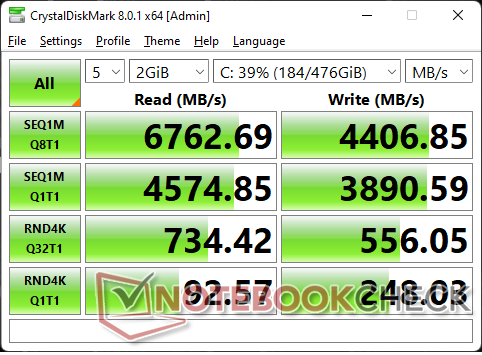
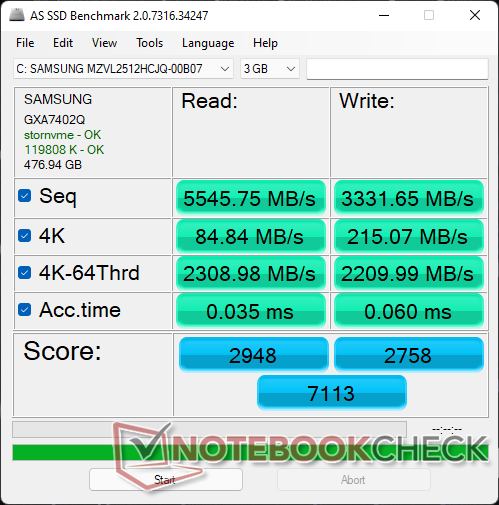
Our unit comes configured with a 512 GB Samsung PM9A1 which is one of the fastest consumer-based PCIe4 x4 NVMe SSDs currently available. Perhaps more impressively, the drive can maintain its very high transfer rates for extended periods when under our DiskSpd loop test despite the small chassis size.

| Drive Performance rating - Percent | |
| VAIO SX12 VJS124X1011P | |
| VAIO SX14 VJS144X0111K | |
| Huawei MateBook E Core i5 | |
| VAIO A12-92993 -8! | |
| Dynabook Portégé X40-G-10K | |
| Dell XPS 13 9310 Core i7 FHD | |
* ... smaller is better
Disk Throttling: DiskSpd Read Loop, Queue Depth 8
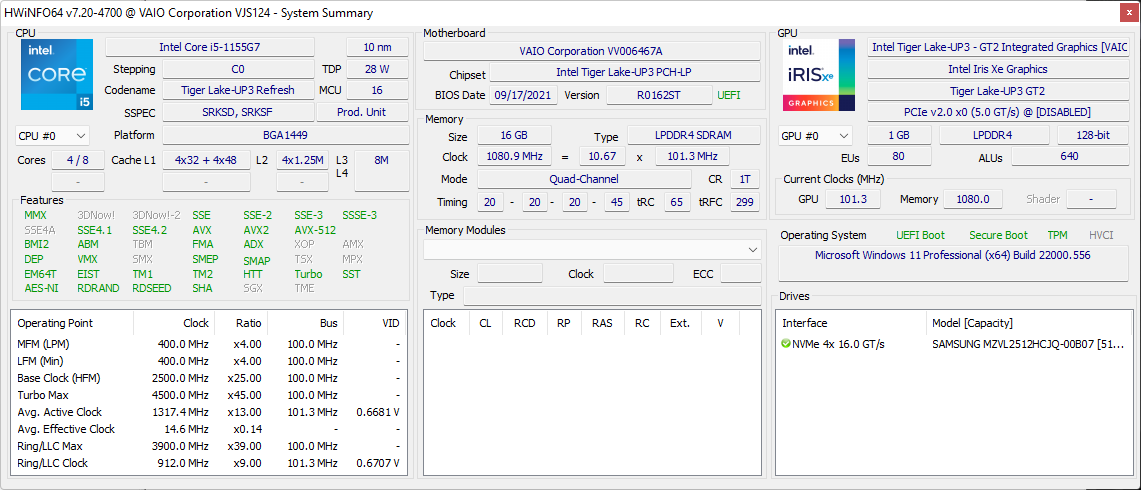
GPU Performance — Iris Xe With Dual-Channel RAM
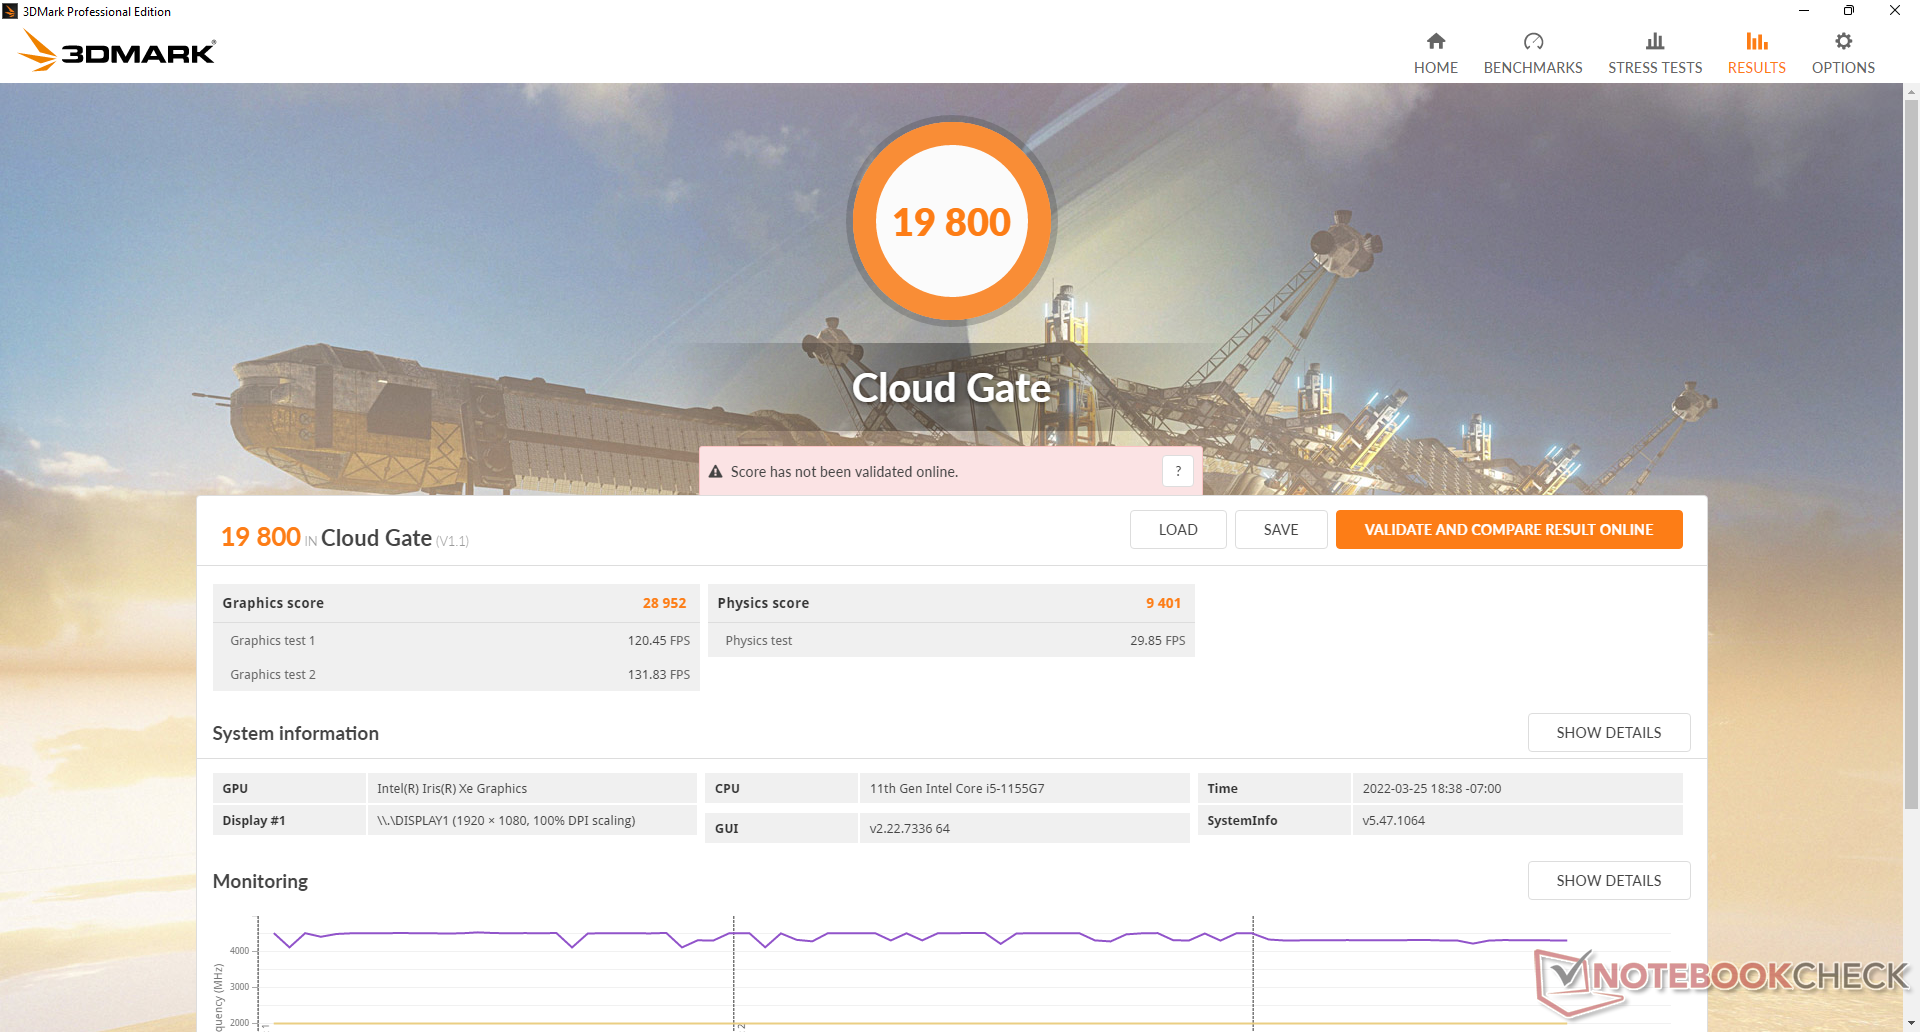
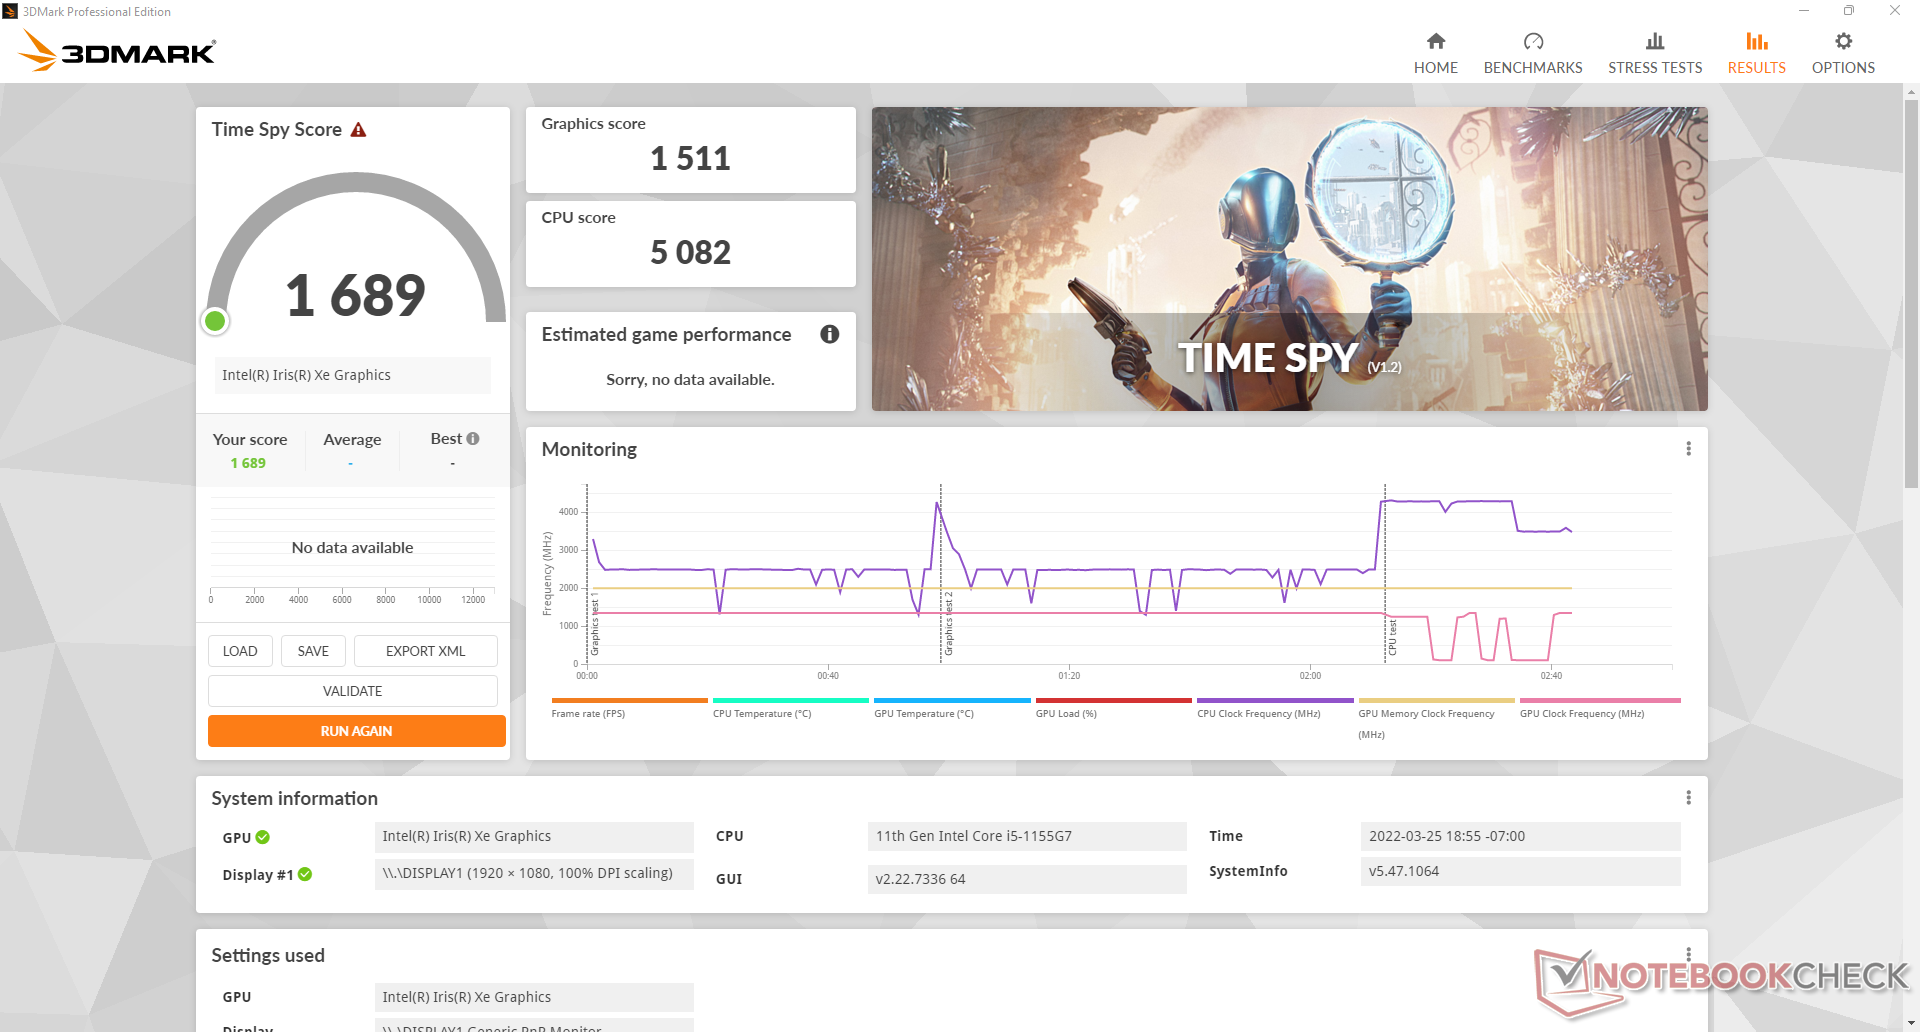
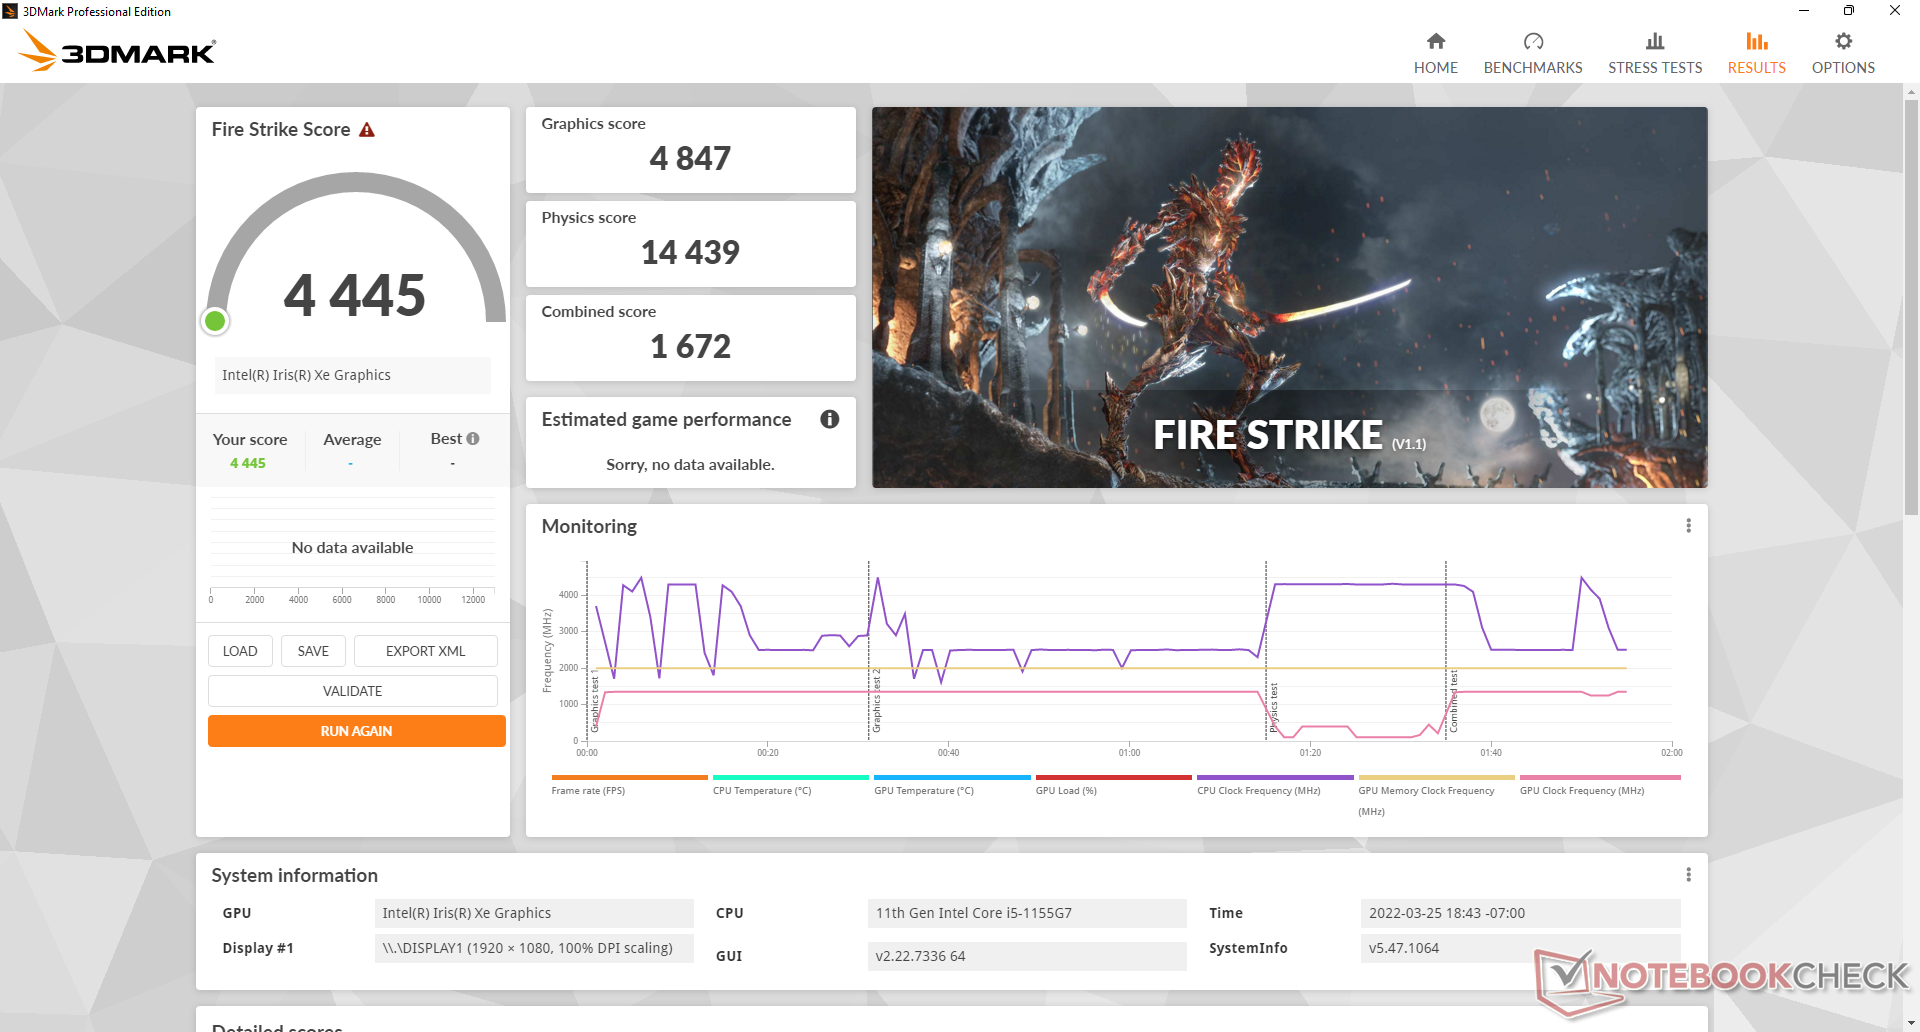
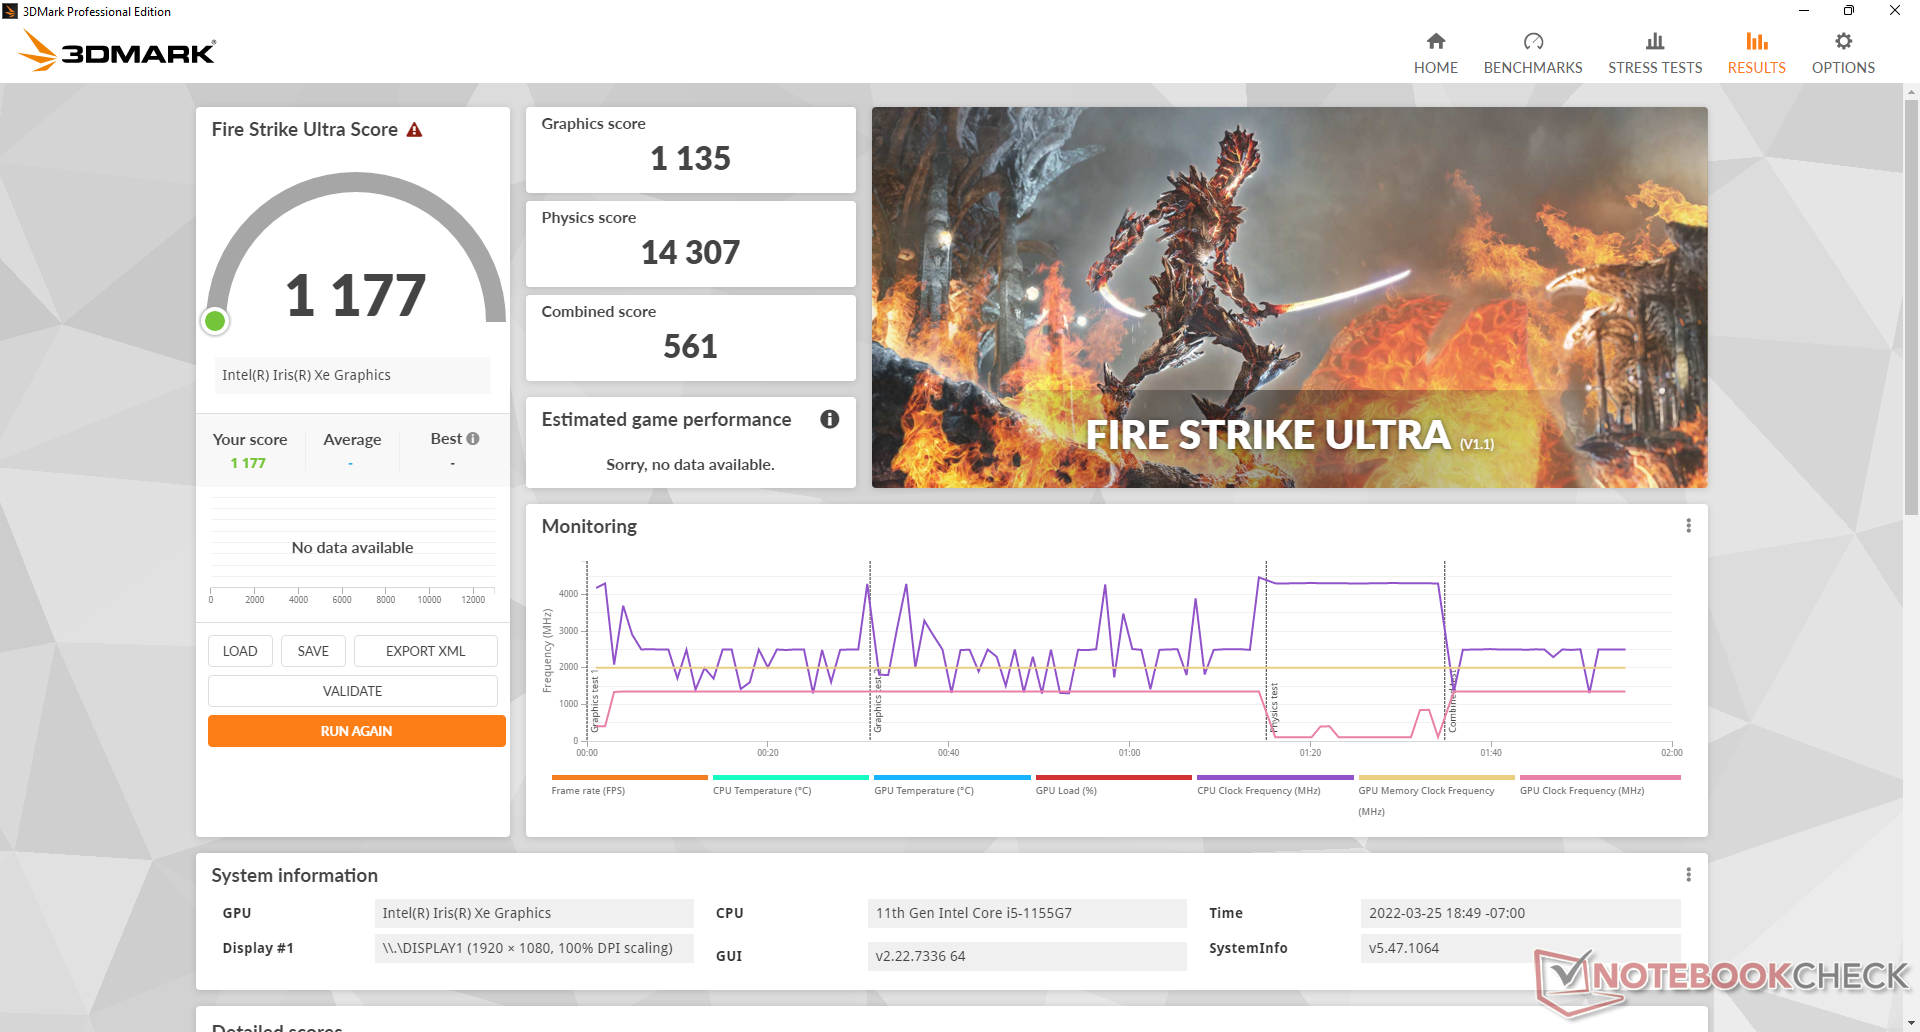
Graphics performance is excellent with 3DMark results that are 30 to 35 percent higher than the average laptop with the same integrated Iris Xe 80 EUs GPU. The faster results can be partly attributed to the 16 GB of dual-channel RAM as many 11th gen Intel Core i5 laptops would typically come with single-channel RAM instead. Upgrading to the Core i7 SKU with Iris Xe 96 EUs graphics is expected to improve GPU performance by about 15 percent over our Core i5 configuration.
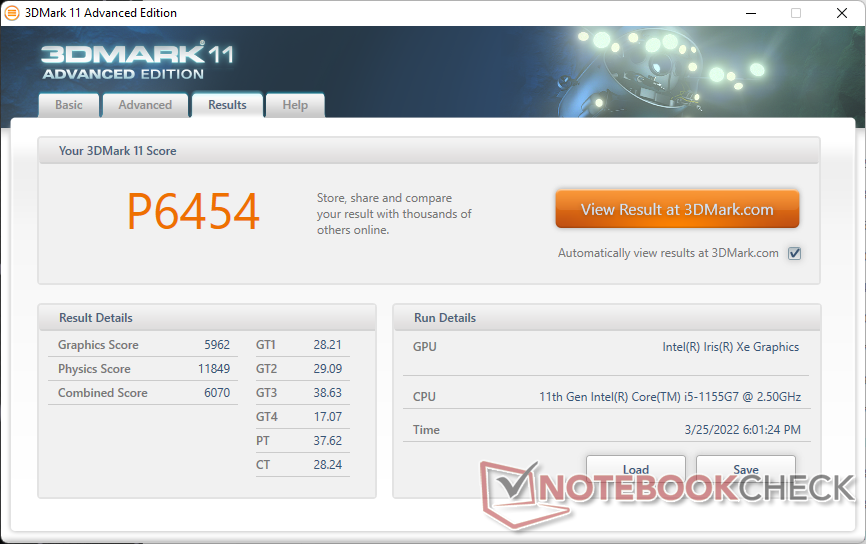
| 3DMark 11 Performance | 6454 points | |
| 3DMark Cloud Gate Standard Score | 19800 points | |
| 3DMark Fire Strike Score | 4445 points | |
| 3DMark Time Spy Score | 1689 points | |
Help | ||
Witcher 3 FPS Chart
| low | med. | high | ultra | |
|---|---|---|---|---|
| GTA V (2015) | 104 | 90.5 | 29.5 | 11.3 |
| The Witcher 3 (2015) | 87.3 | 55.1 | 31.6 | 14.9 |
| Dota 2 Reborn (2015) | 109 | 116 | 57 | 50.4 |
| Final Fantasy XV Benchmark (2018) | 41.8 | 23.2 | 16.5 | |
| X-Plane 11.11 (2018) | 44.8 | 40.4 | 36.3 | |
| Far Cry 5 (2018) | 55 | 27 | 25 | 24 |
| Strange Brigade (2018) | 77.2 | 35.5 | 28.8 | 23.6 |
Emissions
System Noise — Louder Than Your Typical Subnotebook
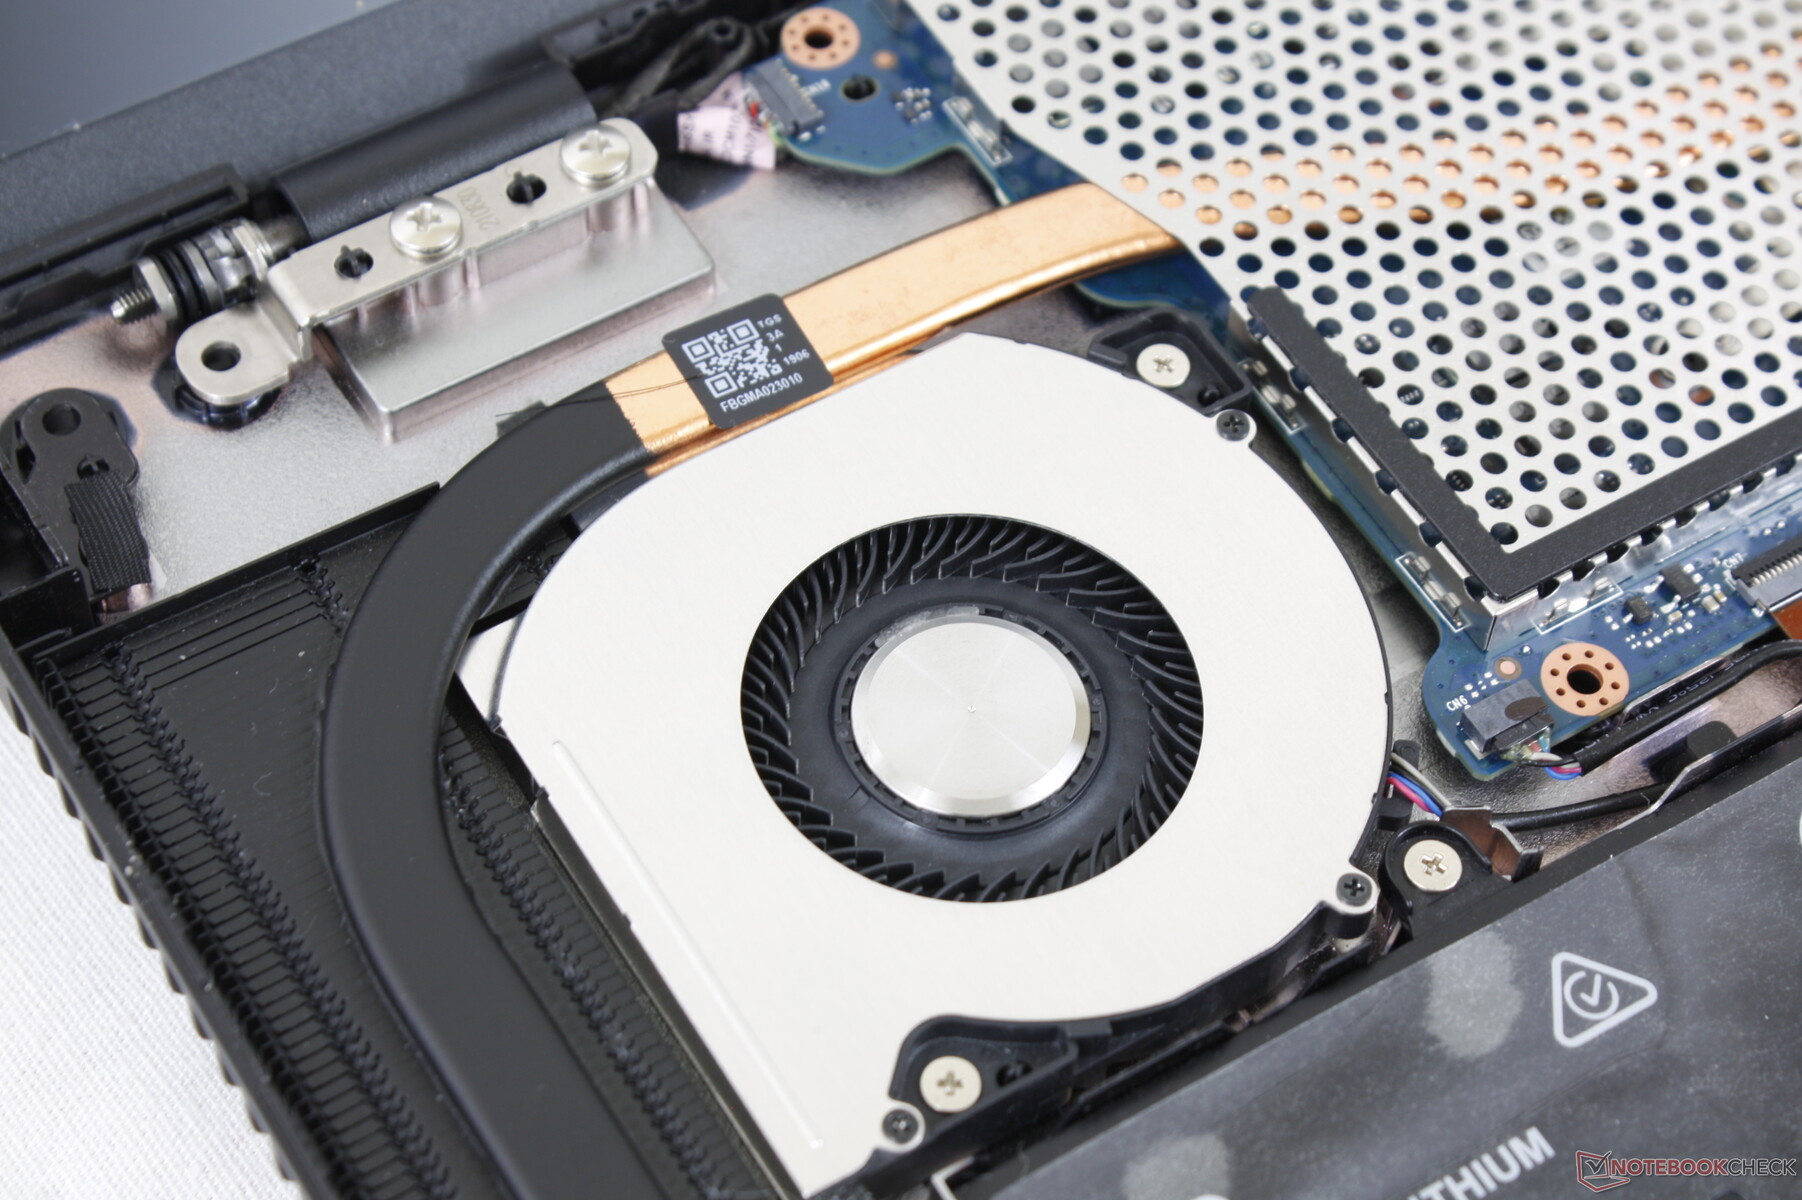
Fan noise is louder and more noticeable when compared to other Ultrabooks with similar Core U-series CPUs. We suspect that the smaller form factor and smaller cooling solution of the SX12 necessitated a more active fan in order to keep temperatures in check. Expect the fan to be almost always active as a result albeit never too bothersome when web browsing or video streaming.
Running higher loads like games will induce the fan to louder RPMs rather quickly. When running Witcher 3, for example, the system can be as loud as some gaming laptops at around 46 dB(A).
Noise level
| Idle |
| 30.7 / 30.8 / 30.8 dB(A) |
| Load |
| 48.3 / 50.3 dB(A) |
 | ||
30 dB silent 40 dB(A) audible 50 dB(A) loud |
||
min: | ||
| VAIO SX12 VJS124X1011P Iris Xe G7 80EUs, i5-1155G7, Samsung PM9A1 MZVL2512HCJQ | VAIO SX14 VJS144X0111K Iris Xe G7 96EUs, i7-1195G7, Samsung PM9A1 MZVL22T0HBLB | Huawei MateBook E Core i5 Iris Xe G7 80EUs, i5-1130G7, Silicon Motion PCIe-8 SSD | Dell XPS 13 9310 Core i7 FHD Iris Xe G7 96EUs, i7-1165G7, Micron 2300 512GB MTFDHBA512TDV | Dynabook Portégé X40-G-10K UHD Graphics 620, i5-10210U, Samsung SSD PM981a MZVLB256HBHQ | |
|---|---|---|---|---|---|
| Noise | 7% | 24% | 19% | 20% | |
| off / environment * (dB) | 23.2 | 23.8 -3% | 24.3 -5% | 25.7 -11% | 25.2 -9% |
| Idle Minimum * (dB) | 30.7 | 24.3 21% | 24.3 21% | 25.7 16% | 25.2 18% |
| Idle Average * (dB) | 30.8 | 24.3 21% | 24.3 21% | 25.7 17% | 25.2 18% |
| Idle Maximum * (dB) | 30.8 | 31.3 -2% | 24.3 21% | 25.9 16% | 25.2 18% |
| Load Average * (dB) | 48.3 | 36.6 24% | 28.6 41% | 26.2 46% | 24.2 50% |
| Witcher 3 ultra * (dB) | 46.4 | 49.6 -7% | 30.7 34% | 36.5 21% | |
| Load Maximum * (dB) | 50.3 | 51.5 -2% | 32.4 36% | 36.6 27% | 37.6 25% |
* ... smaller is better
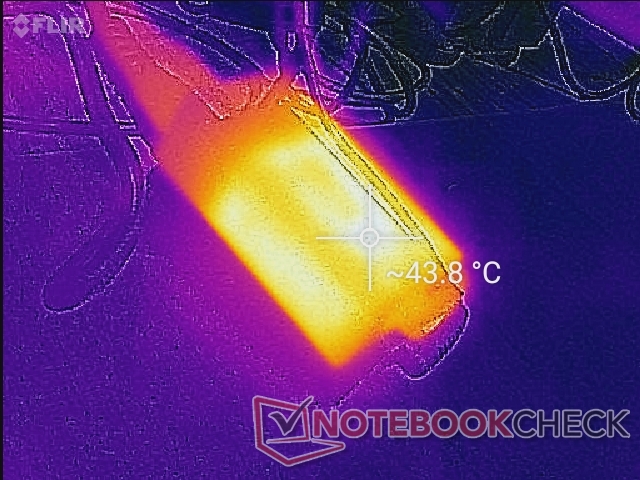
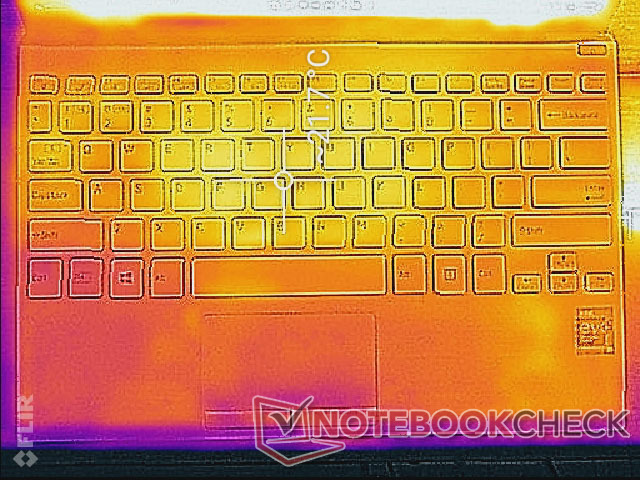
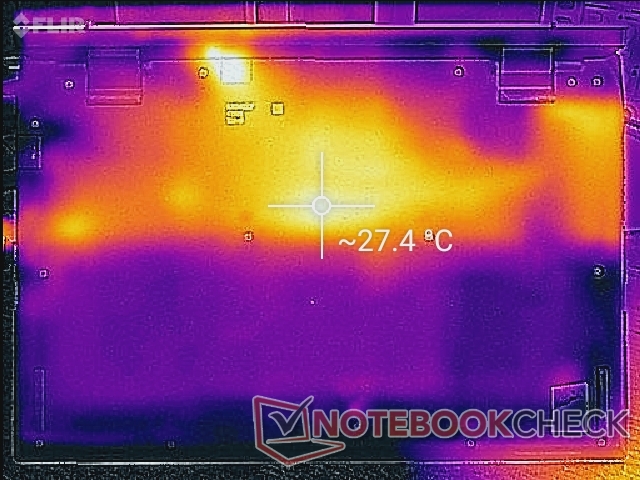
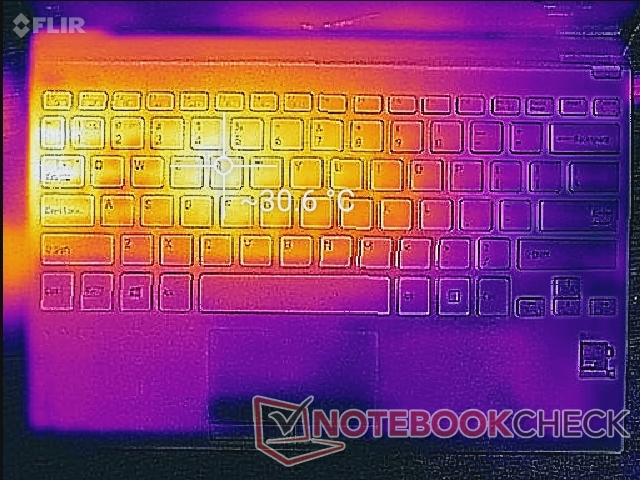
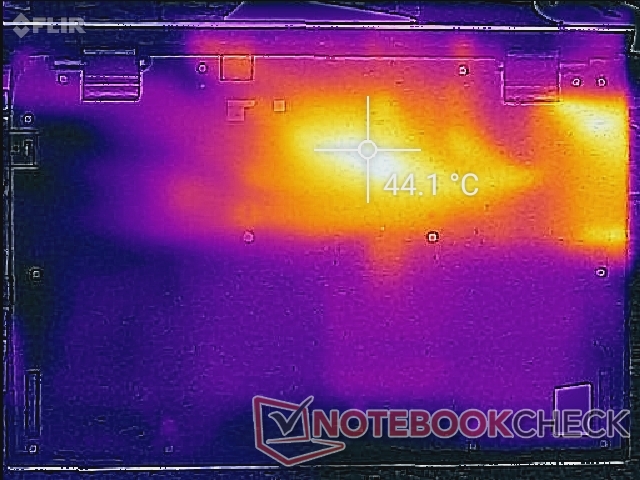
Temperature — Never Too Hot
Surface temperatures are cool across the board during low processing loads. When running higher loads, hot spots can be up to 31 C and 45 C on the top and bottom, respectively, as shown by the temperature maps below. In comparison, the XPS 13 would be much warmer at over 45 C on each side when subjected to similar conditions.
Note that the left half of the laptop will always be warmer than the right half due to how the cooling solution is positioned inside.
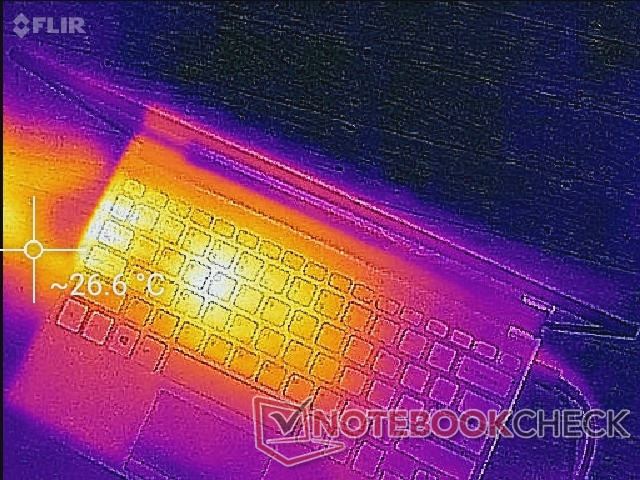
(+) The maximum temperature on the upper side is 30.4 °C / 87 F, compared to the average of 35.9 °C / 97 F, ranging from 21.4 to 59 °C for the class Subnotebook.
(±) The bottom heats up to a maximum of 44.4 °C / 112 F, compared to the average of 39.2 °C / 103 F
(+) In idle usage, the average temperature for the upper side is 21 °C / 70 F, compared to the device average of 30.8 °C / 87 F.
(+) The palmrests and touchpad are cooler than skin temperature with a maximum of 23.4 °C / 74.1 F and are therefore cool to the touch.
(+) The average temperature of the palmrest area of similar devices was 28.2 °C / 82.8 F (+4.8 °C / 8.7 F).
| VAIO SX12 VJS124X1011P Intel Core i5-1155G7, Intel Iris Xe Graphics G7 80EUs | VAIO A12-92993 Intel Core i7-8500Y, Intel UHD Graphics 615 | VAIO SX14 VJS144X0111K Intel Core i7-1195G7, Intel Iris Xe Graphics G7 96EUs | Huawei MateBook E Core i5 Intel Core i5-1130G7, Intel Iris Xe Graphics G7 80EUs | Dell XPS 13 9310 Core i7 FHD Intel Core i7-1165G7, Intel Iris Xe Graphics G7 96EUs | |
|---|---|---|---|---|---|
| Heat | -14% | -7% | -11% | -12% | |
| Maximum Upper Side * (°C) | 30.4 | 42.4 -39% | 36.2 -19% | 40.5 -33% | 46.2 -52% |
| Maximum Bottom * (°C) | 44.4 | 47.1 -6% | 50.2 -13% | 41.6 6% | 46 -4% |
| Idle Upper Side * (°C) | 21.8 | 26.6 -22% | 21.4 2% | 26.2 -20% | 22 -1% |
| Idle Bottom * (°C) | 28 | 24.9 11% | 27.8 1% | 27.4 2% | 25 11% |
* ... smaller is better
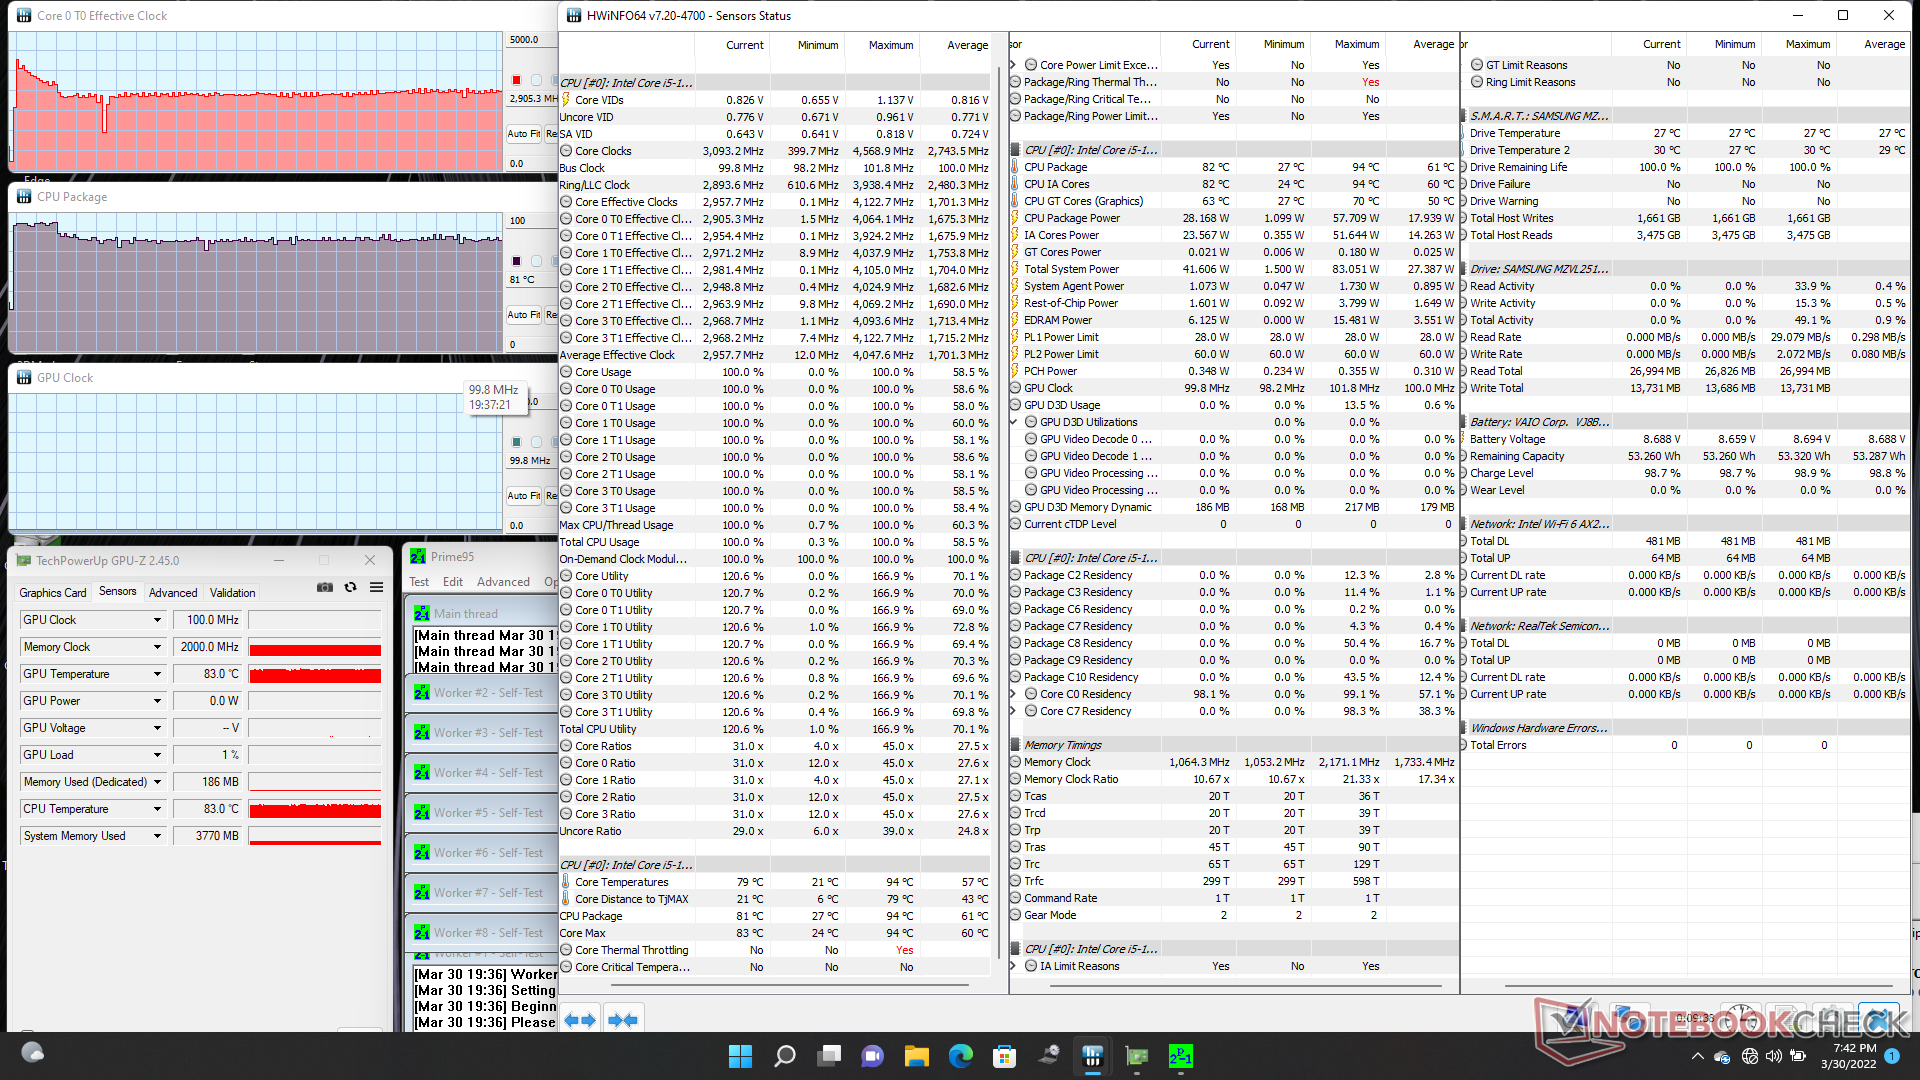
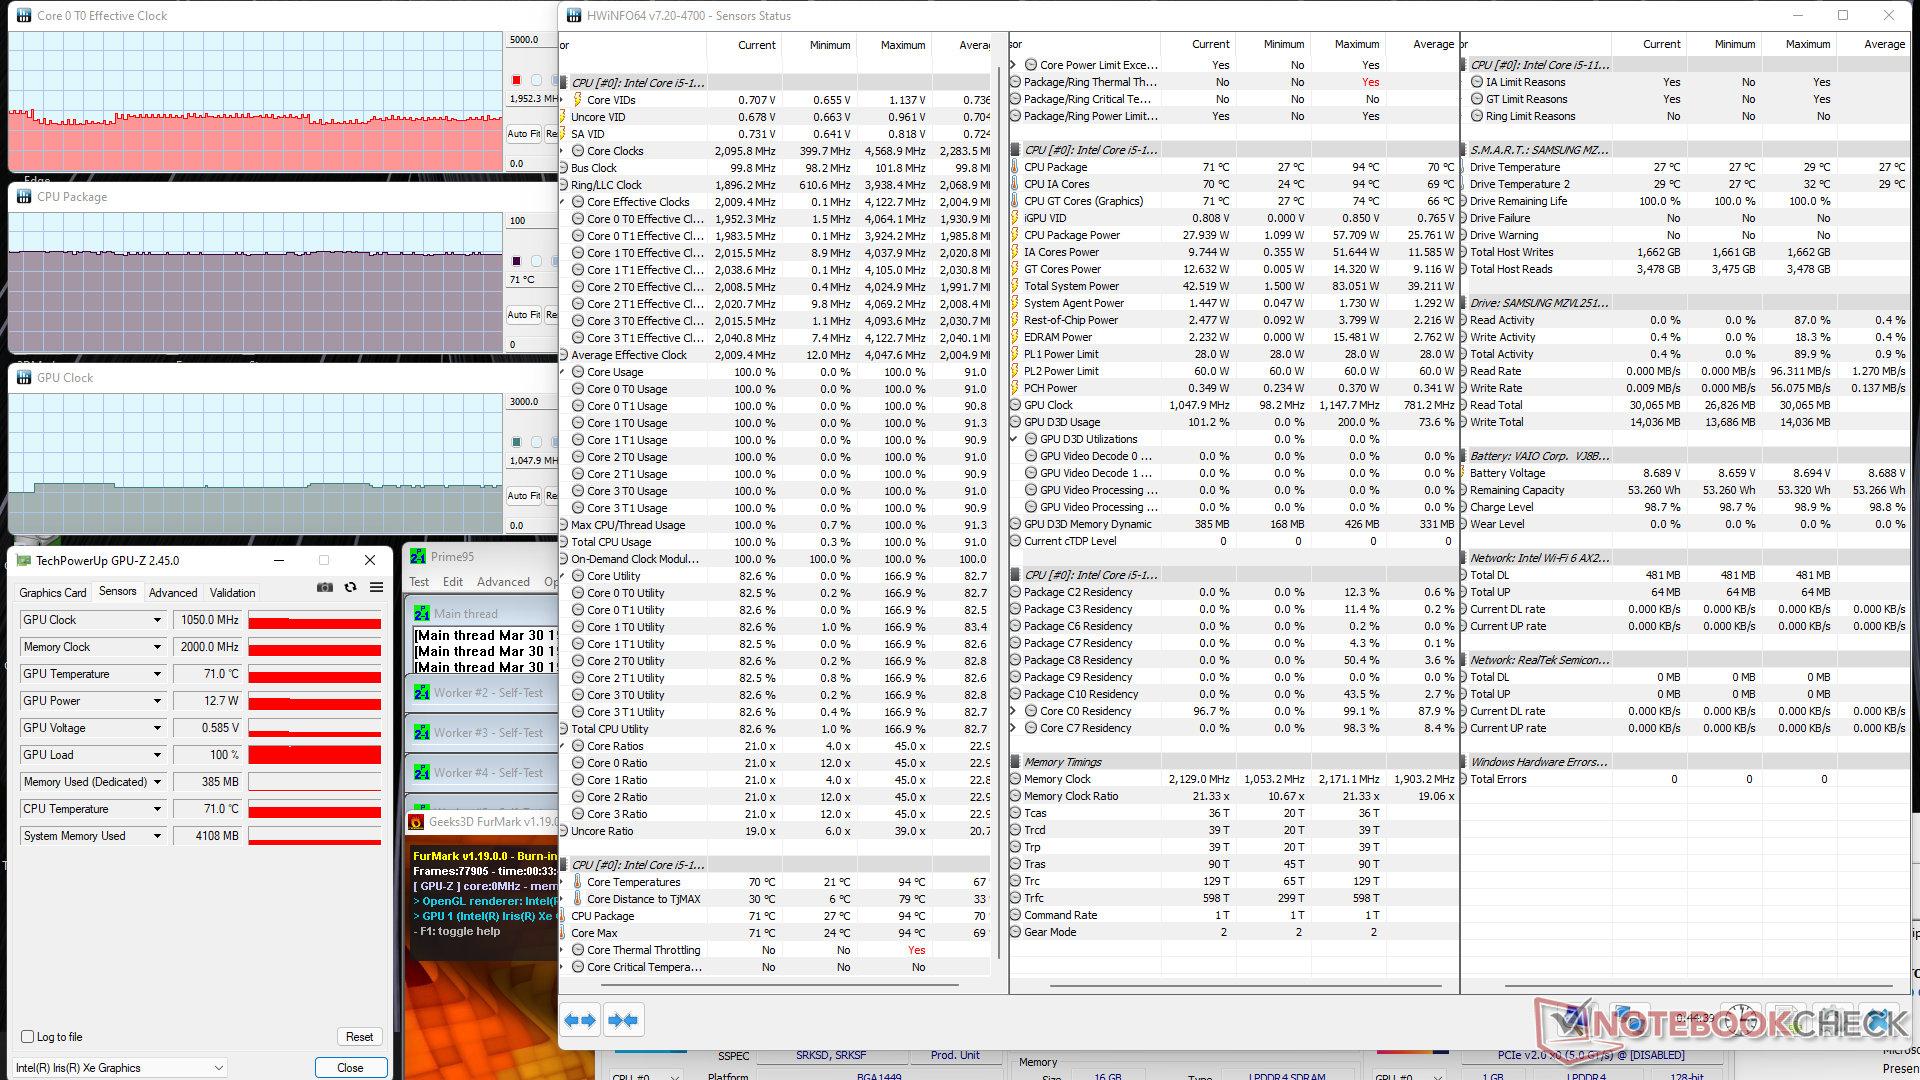
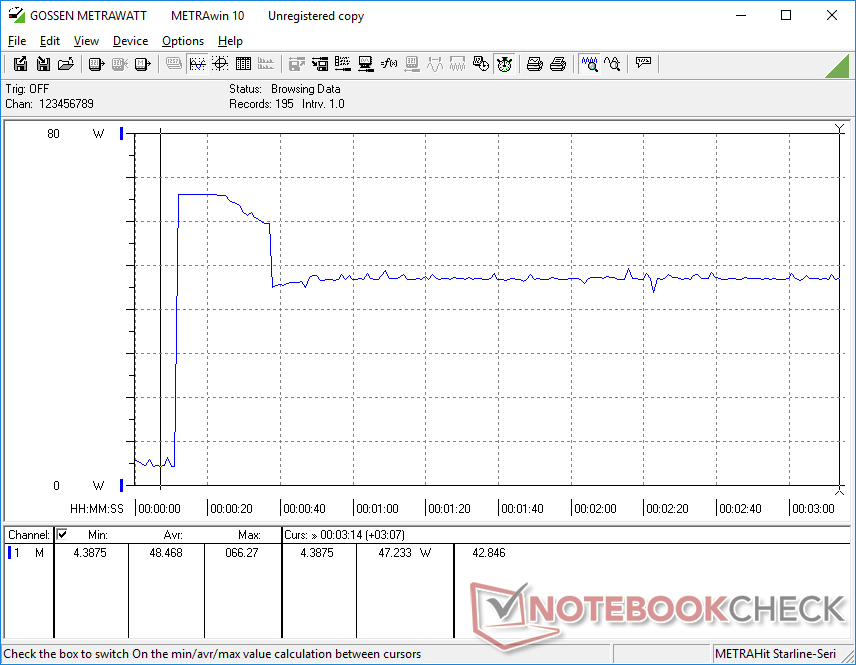
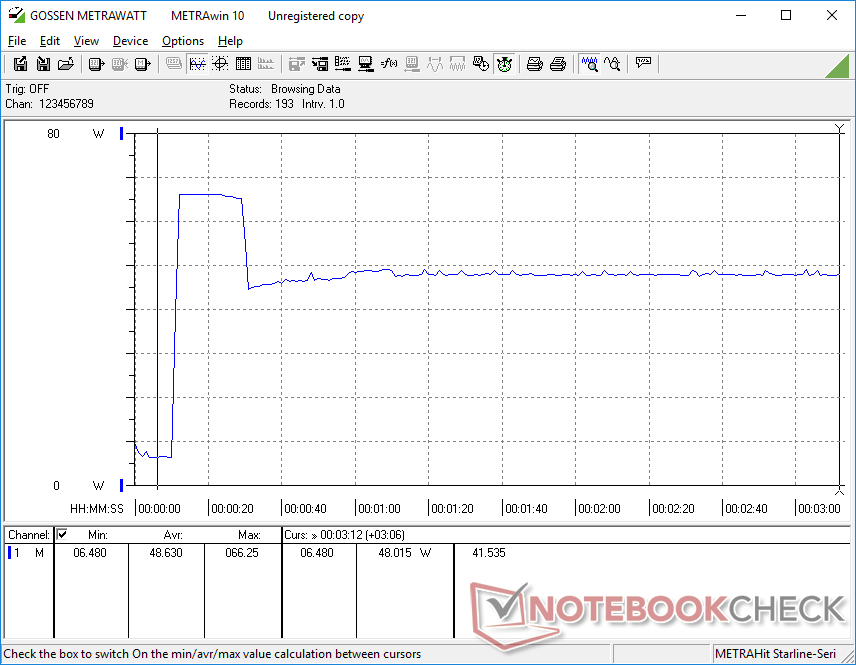
Stress Test
When running Prime95 to stress the CPU, clock rates and temperature would boost to 4.1 GHz and 92 C almost immediately before falling down to the 3.2 to 3.6 GHz range for the next 30 seconds. Clock rates and temperature would eventually stabilize at 2.9 GHz and 81 C, respectively, as shown by our screenshot below. CPU package power can be as high as 58 W during the start of the stress test before stabilizing at 28 W.
When running high loads like games, the processor would stabilize at 71 C compared to the low 60 C range when on the XPS 13 or 74 C on the larger SX14.
Running on battery power will not limit performance. A 3DMark 11 test on batteries would return Physics and Graphics scores of 11800 and 5896 points, respectively, compared to 11849 and 5962 points when on mains.
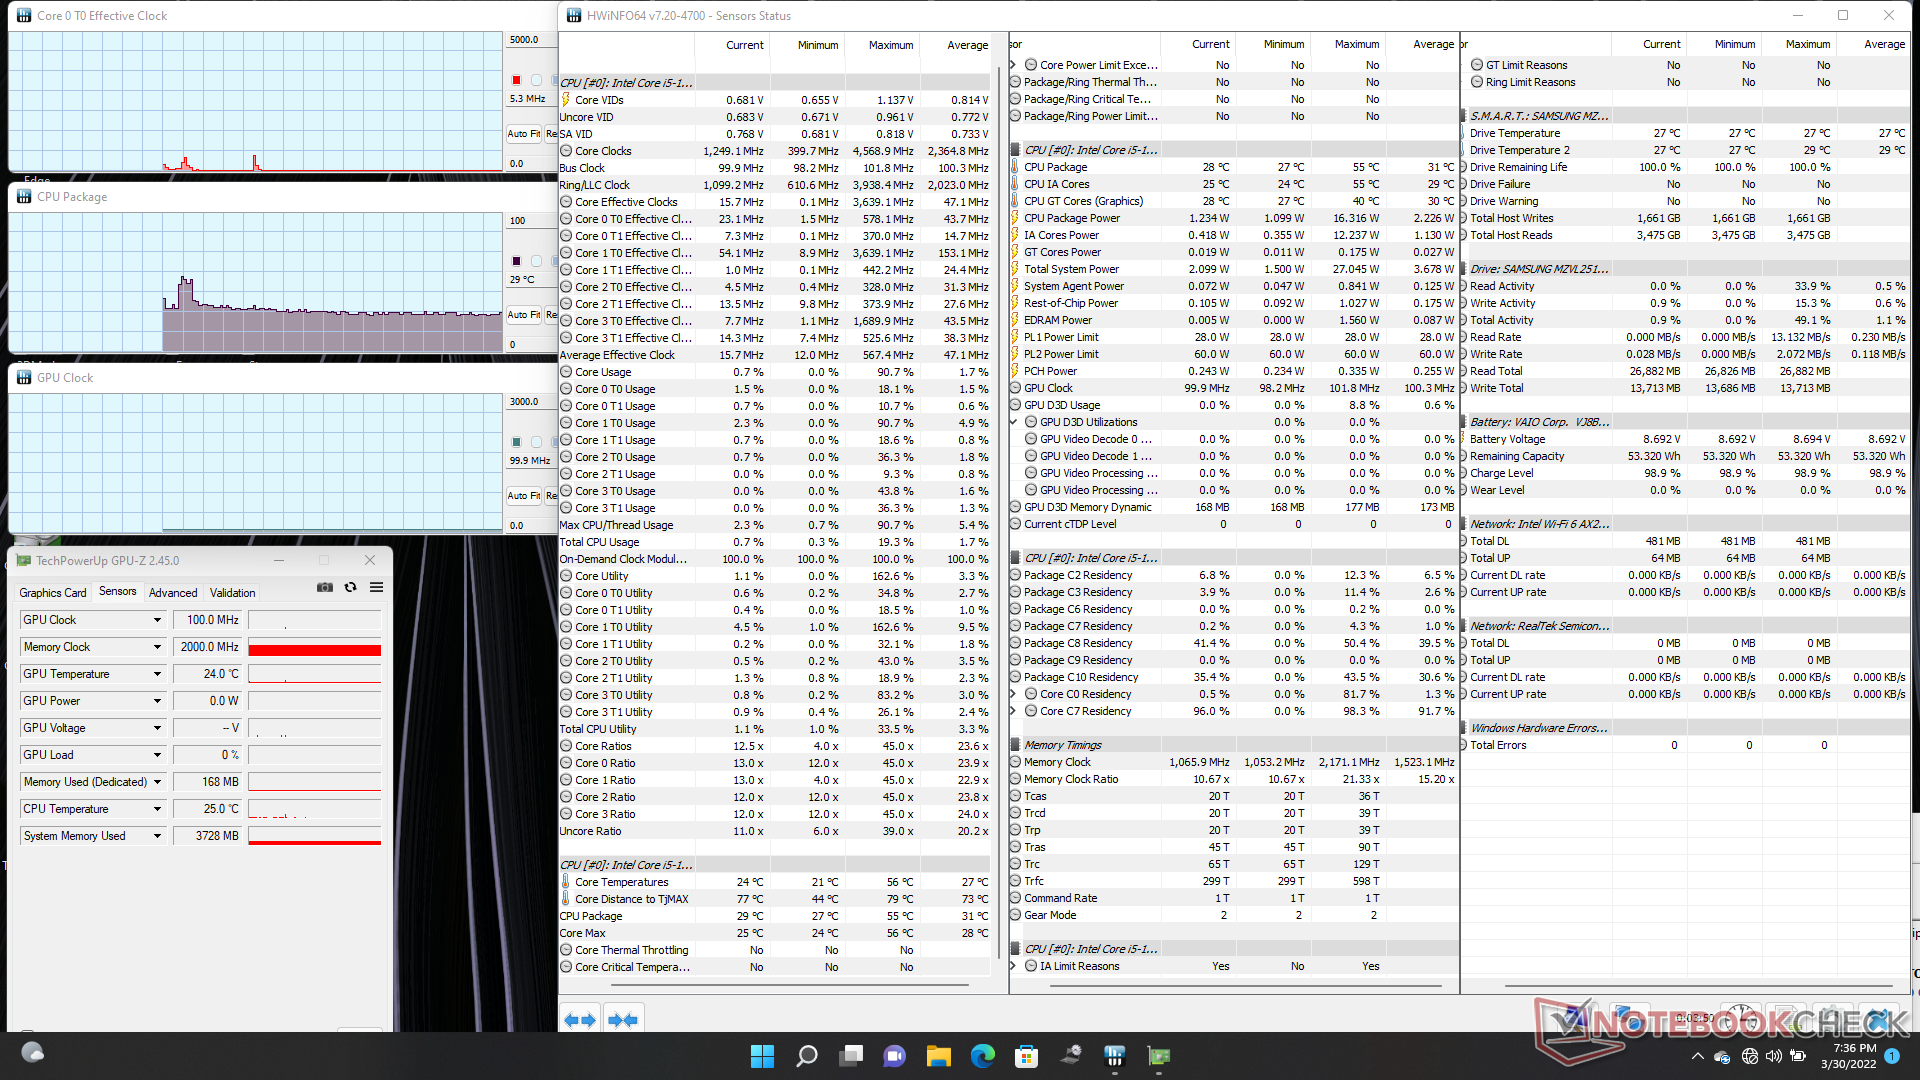
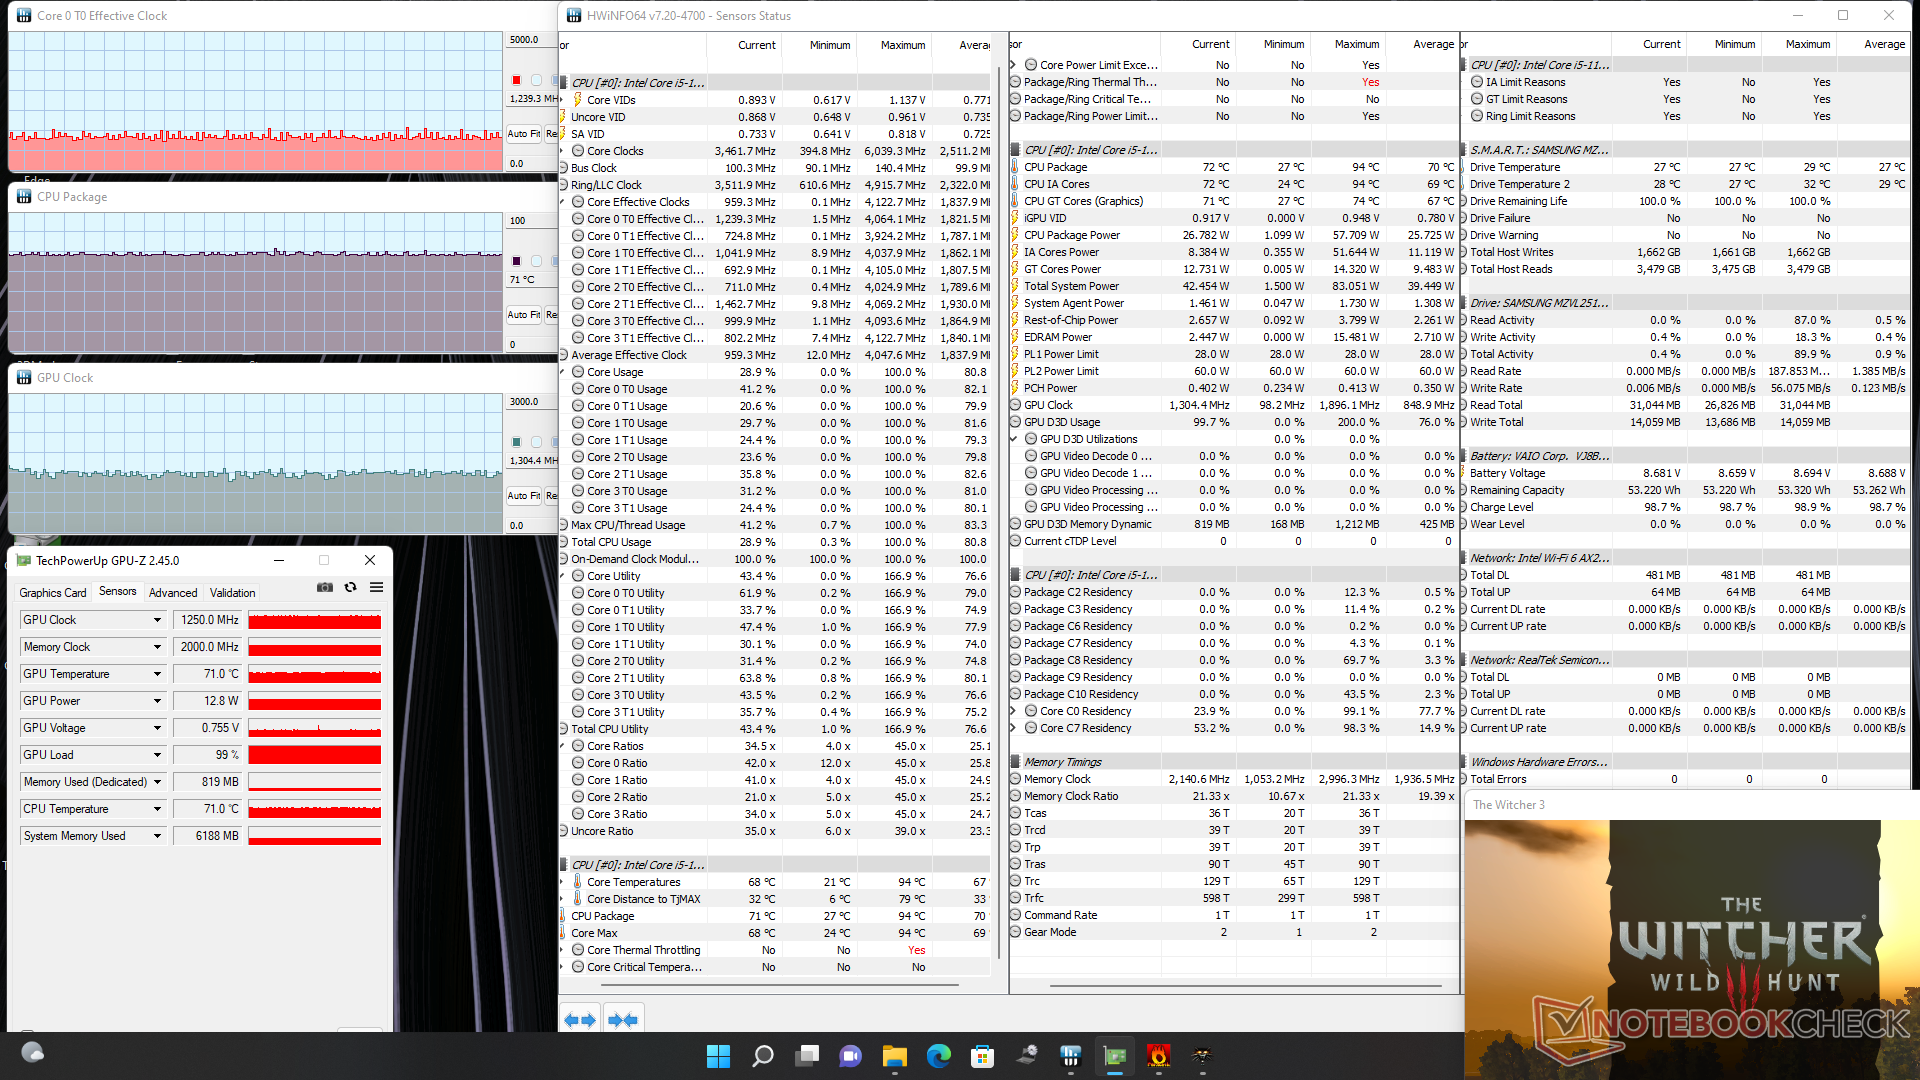
| CPU Clock (GHz) | GPU Clock (MHz) | Average CPU Temperature (°C) | |
| System Idle | -- | -- | 29 |
| Prime95 Stress | 2.9 | -- | 81 |
| Prime95 + FurMark Stress | 1.9 | 1050 | 71 |
| Witcher 3 Stress | 1.2 | 1250 | 71 |
Speakers
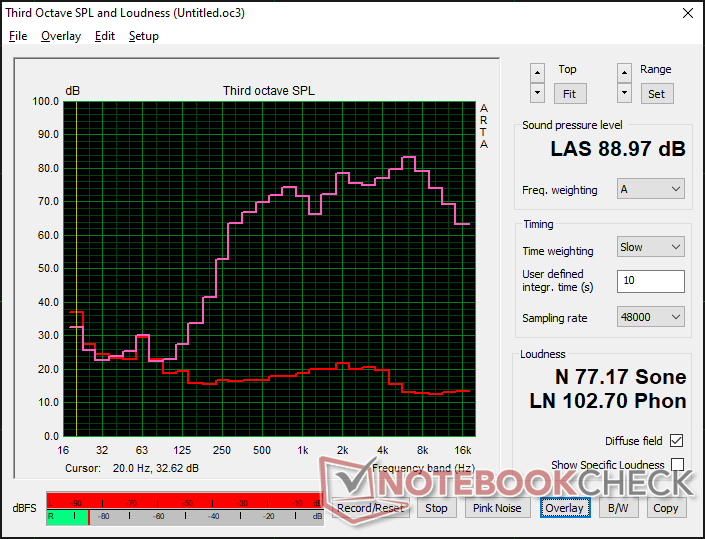
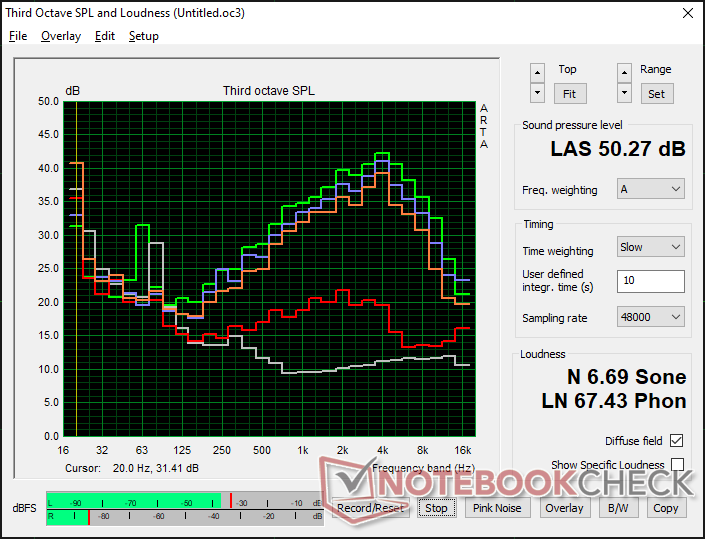
VAIO SX12 VJS124X1011P audio analysis
(+) | speakers can play relatively loud (89 dB)
Bass 100 - 315 Hz
(-) | nearly no bass - on average 31.5% lower than median
(±) | linearity of bass is average (12.5% delta to prev. frequency)
Mids 400 - 2000 Hz
(+) | balanced mids - only 2.8% away from median
(±) | linearity of mids is average (7.1% delta to prev. frequency)
Highs 2 - 16 kHz
(±) | higher highs - on average 5.9% higher than median
(+) | highs are linear (5.4% delta to prev. frequency)
Overall 100 - 16.000 Hz
(±) | linearity of overall sound is average (20.7% difference to median)
Compared to same class
» 67% of all tested devices in this class were better, 7% similar, 25% worse
» The best had a delta of 5%, average was 18%, worst was 53%
Compared to all devices tested
» 56% of all tested devices were better, 8% similar, 36% worse
» The best had a delta of 4%, average was 23%, worst was 134%
Apple MacBook Pro 16 2021 M1 Pro audio analysis
(+) | speakers can play relatively loud (84.7 dB)
Bass 100 - 315 Hz
(+) | good bass - only 3.8% away from median
(+) | bass is linear (5.2% delta to prev. frequency)
Mids 400 - 2000 Hz
(+) | balanced mids - only 1.3% away from median
(+) | mids are linear (2.1% delta to prev. frequency)
Highs 2 - 16 kHz
(+) | balanced highs - only 1.9% away from median
(+) | highs are linear (2.7% delta to prev. frequency)
Overall 100 - 16.000 Hz
(+) | overall sound is linear (4.6% difference to median)
Compared to same class
» 0% of all tested devices in this class were better, 0% similar, 100% worse
» The best had a delta of 5%, average was 17%, worst was 45%
Compared to all devices tested
» 0% of all tested devices were better, 0% similar, 100% worse
» The best had a delta of 4%, average was 23%, worst was 134%
Energy Management
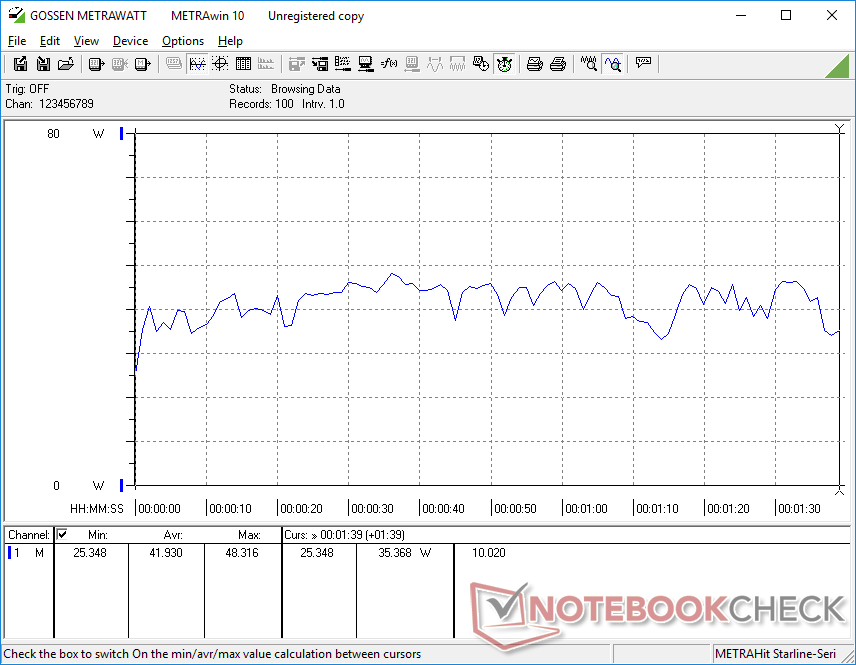
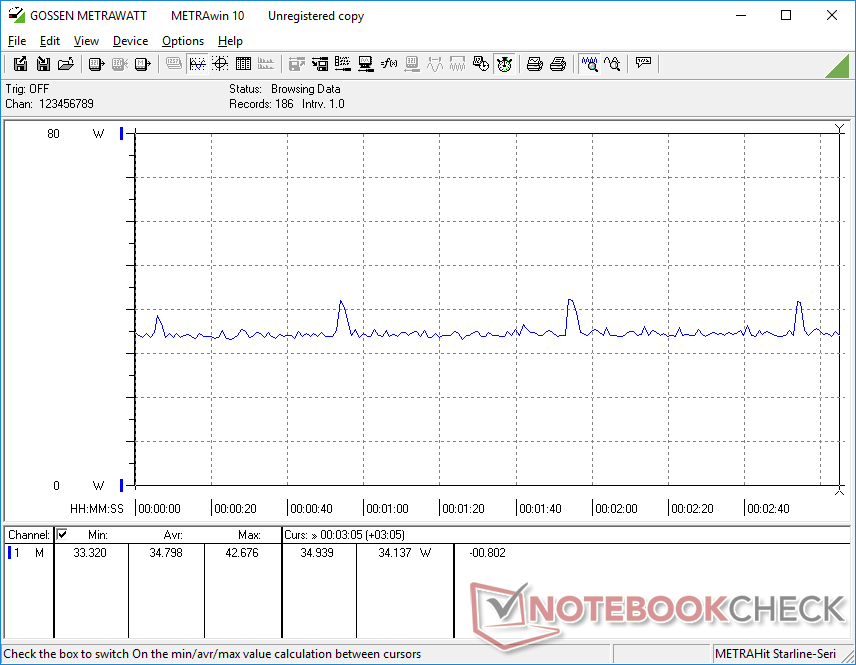
Power Consumption — A Demanding Little Guy
Overall consumption is not unlike the larger XPS 13 since the SX12 uses a similar-class CPU. When running higher loads likes games, the SX12 can be 2x more demanding than the Vaio A12 albeit with an 8x boost to raw graphics performance for significantly higher performance-per-watt. Similar performance-per-watt advantages can also be drawn to the Dynabook Portégé X40 powered by an older Comet Lake-U processor.
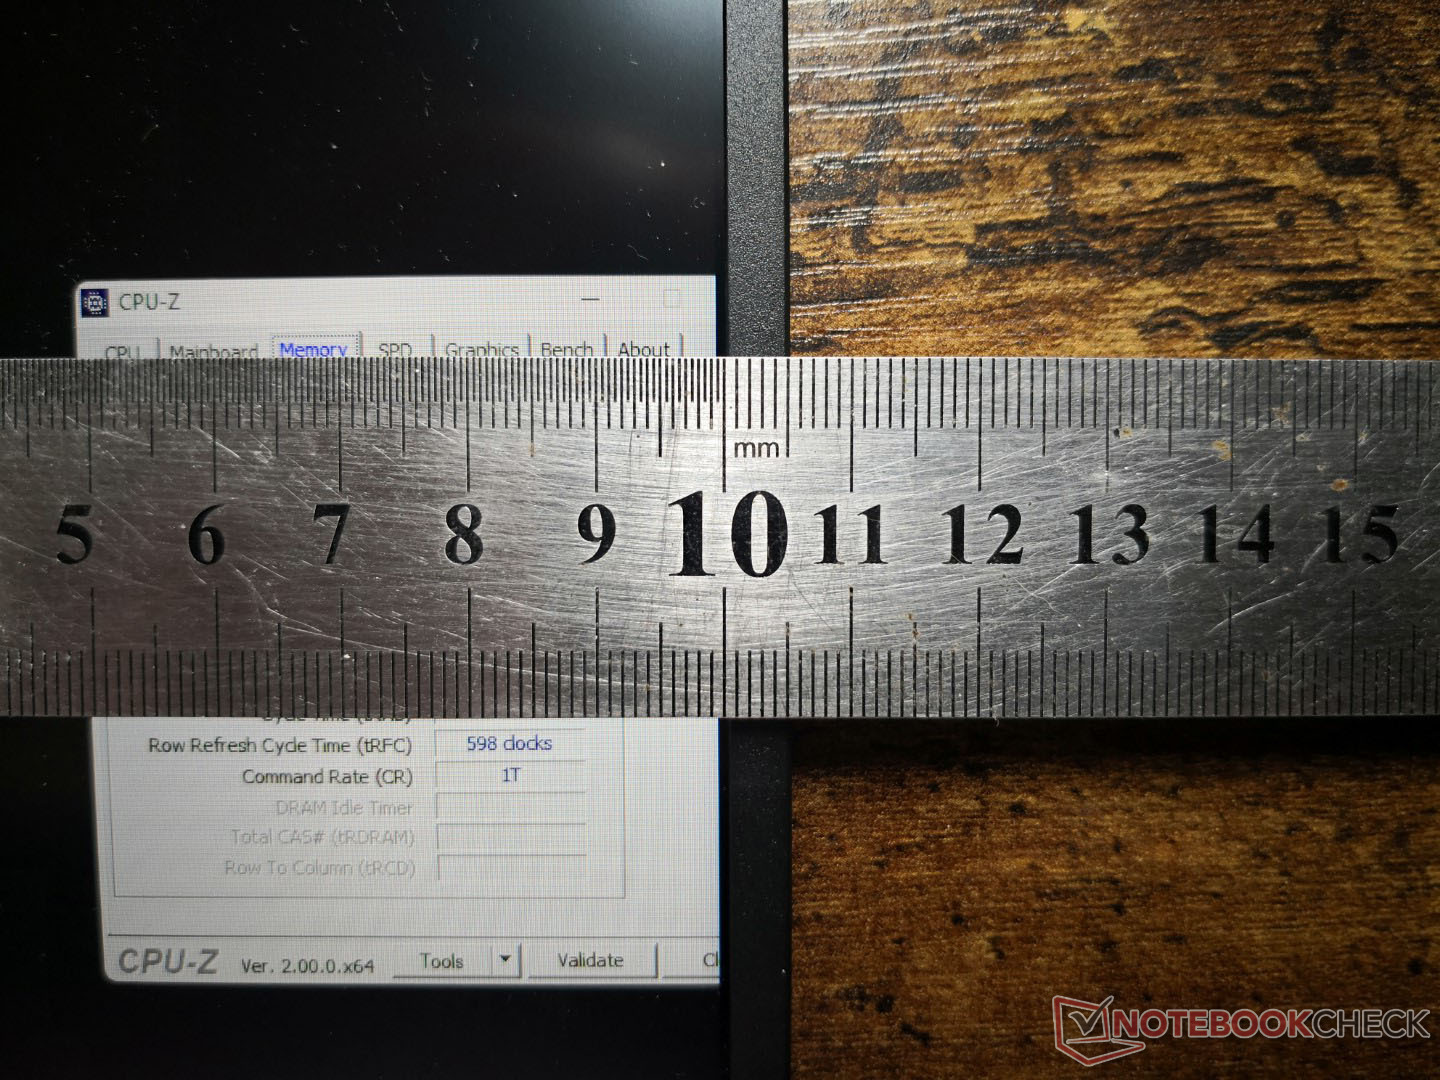
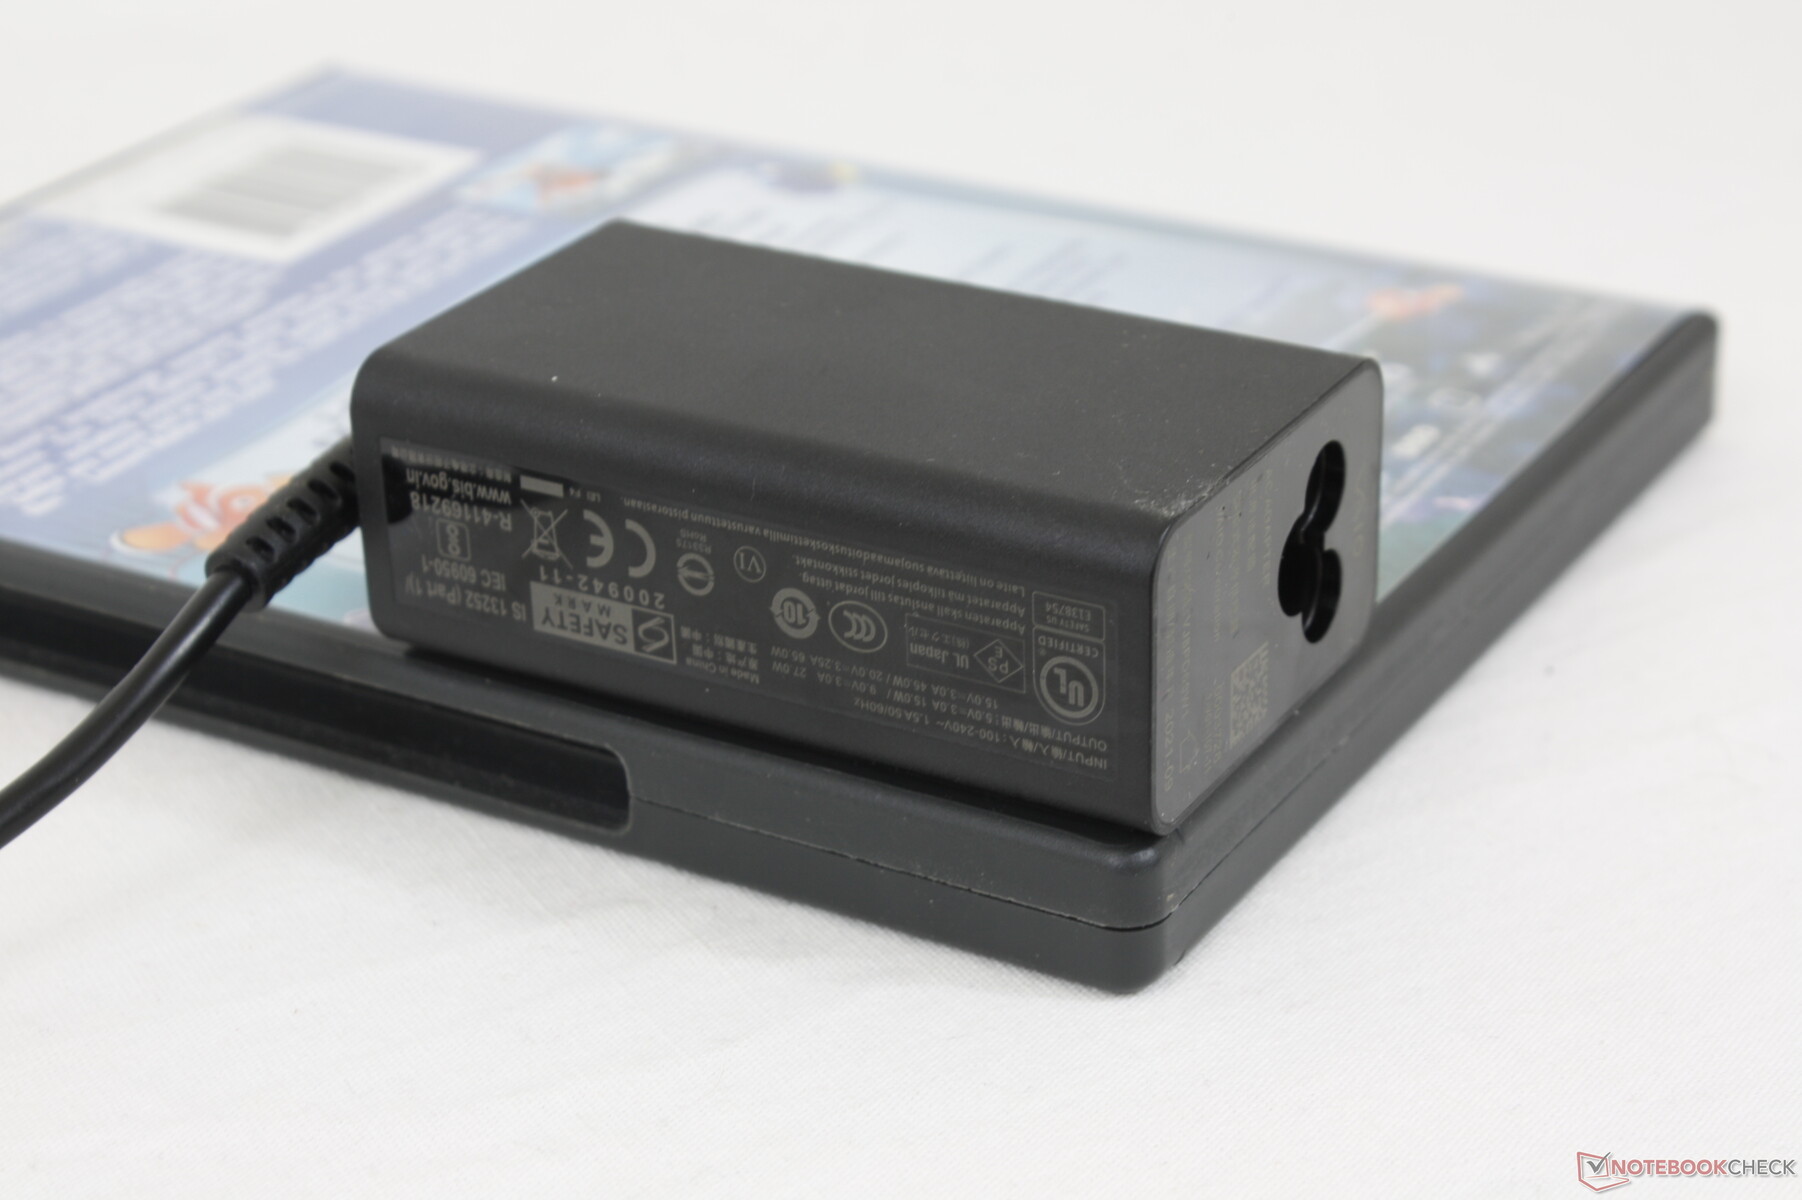
We're able to measure a maximum draw of 66.3 W from the small (~7.8 x 4.4 x 2.8 cm) 65 W AC adapter. We appreciate the high capacity adapter since many other Ultrabooks like the XPS 13 would typically ship with a less capable 45 W adapter. The Turbo Boost potential is subsequently higher on the Vaio even if it's only temporary.
| Off / Standby | |
| Idle | |
| Load |
|
Key:
min: | |
| VAIO SX12 VJS124X1011P i5-1155G7, Iris Xe G7 80EUs, Samsung PM9A1 MZVL2512HCJQ, IPS, 1920x1080, 12.5" | VAIO A12-92993 i7-8500Y, UHD Graphics 615, Samsung SSD PM981 MZVLB512HAJQ, IPS, 1920x1080, 12.5" | VAIO SX14 VJS144X0111K i7-1195G7, Iris Xe G7 96EUs, Samsung PM9A1 MZVL22T0HBLB, IPS, 1920x1080, 14" | Huawei MateBook E Core i5 i5-1130G7, Iris Xe G7 80EUs, Silicon Motion PCIe-8 SSD, OLED, 2560x1600, 12.6" | Dell XPS 13 9310 Core i7 FHD i7-1165G7, Iris Xe G7 96EUs, Micron 2300 512GB MTFDHBA512TDV, IPS, 1920x1200, 13.4" | Dynabook Portégé X40-G-10K i5-10210U, UHD Graphics 620, Samsung SSD PM981a MZVLB256HBHQ, IPS, 1920x1080, 14" | |
|---|---|---|---|---|---|---|
| Power Consumption | 8% | -60% | -13% | 1% | -25% | |
| Idle Minimum * (Watt) | 3 | 4.4 -47% | 3.3 -10% | 5.5 -83% | 3.9 -30% | 2.7 10% |
| Idle Average * (Watt) | 5.8 | 6.5 -12% | 13.9 -140% | 8.9 -53% | 5.9 -2% | 11.2 -93% |
| Idle Maximum * (Watt) | 6.4 | 7.1 -11% | 15.9 -148% | 9.5 -48% | 6.3 2% | 11.8 -84% |
| Load Average * (Watt) | 41.9 | 20.2 52% | 54 -29% | 26.6 37% | 39.7 5% | 38 9% |
| Witcher 3 ultra * (Watt) | 34.8 | 46.6 -34% | 20.6 41% | 34.8 -0% | ||
| Load Maximum * (Watt) | 66.3 | 28 58% | 66 -0% | 48.5 27% | 47.5 28% | 43.6 34% |
* ... smaller is better
Power Consumption Witcher 3 / Stresstest
Power Consumption external Monitor
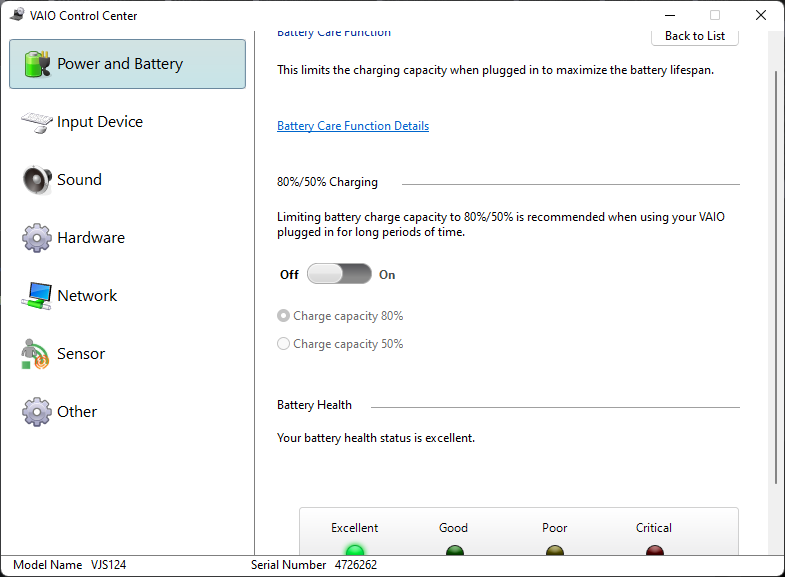
Battery Life
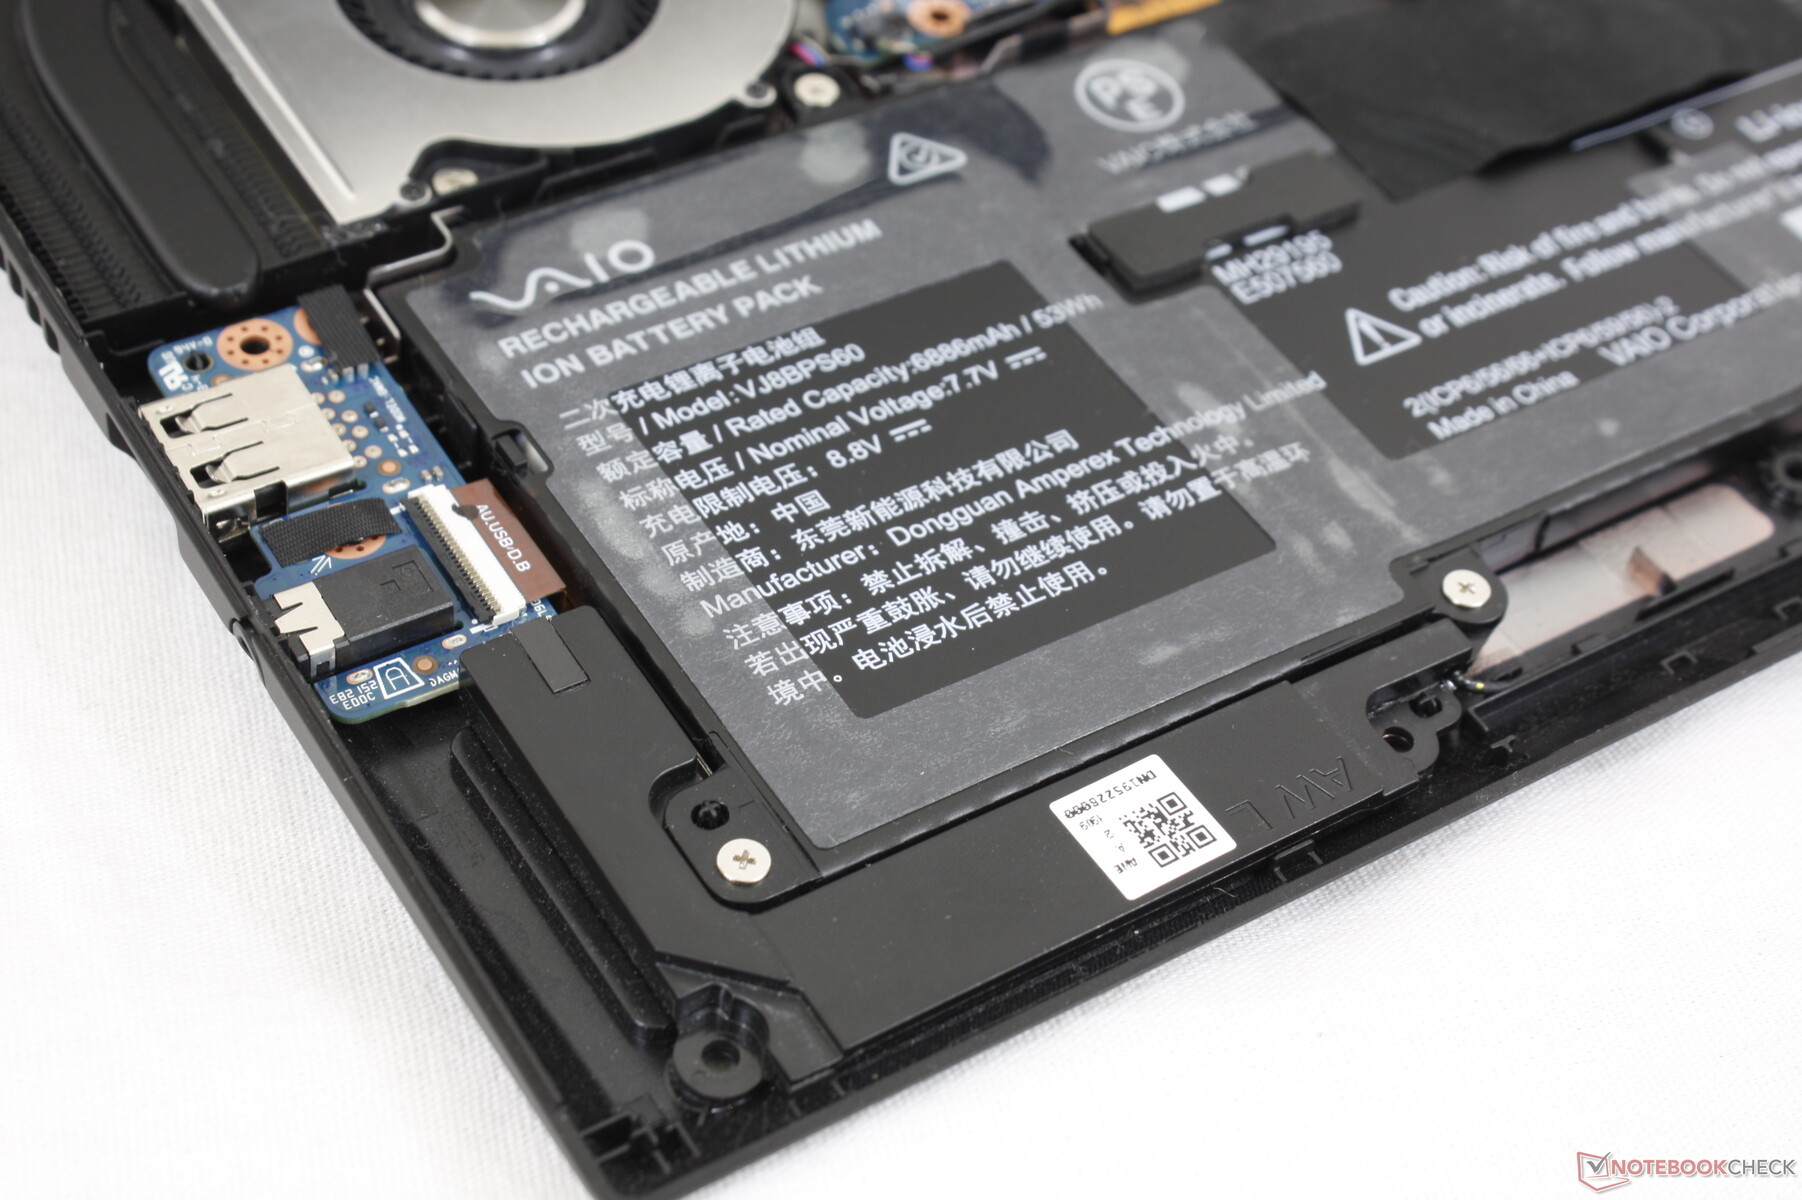
The 54 Wh internal battery is relatively large for a 12.5-inch form factor. Battery life is consequently very long at 13 hours of real-world WLAN use. Charging from empty to full capacity is much slower than expected, however, at 3 full hours compared to half that on most other Ultrabooks.
| VAIO SX12 VJS124X1011P i5-1155G7, Iris Xe G7 80EUs, 53 Wh | VAIO A12-92993 i7-8500Y, UHD Graphics 615, 23.4 Wh | VAIO SX14 VJS144X0111K i7-1195G7, Iris Xe G7 96EUs, 53 Wh | Huawei MateBook E Core i5 i5-1130G7, Iris Xe G7 80EUs, 42 Wh | Dell Latitude 7200 i5-8365U, UHD Graphics 620, 38 Wh | Dell XPS 13 9310 Core i7 FHD i7-1165G7, Iris Xe G7 96EUs, 52 Wh | |
|---|---|---|---|---|---|---|
| Battery runtime | -42% | -24% | 3% | -21% | 20% | |
| Reader / Idle (h) | 33.4 | 8.6 -74% | 34.1 2% | 30 -10% | ||
| WiFi v1.3 (h) | 13.4 | 7.2 -46% | 8.9 -34% | 6.1 -54% | 7 -48% | 11 -18% |
| Load (h) | 1.7 | 1.6 -6% | 1 -41% | 2.7 59% | 1.8 6% | 3.2 88% |
| H.264 (h) | 3.7 | 6.2 | 8.2 |
Pros
Cons
Verdict — Small With A Big Heart
The SX12 is full of surprises when compared to other subnotebooks of its size class. It has a brighter, fuller sRGB IPS display, proper Core U-series CPU with good Turbo Boost sustainability, loud internal speakers, roomy keyboard, larger battery capacity, and a wider variety of port options than most. The model successfully integrates nearly every core feature we've come to expect from a larger 13-inch or 15-inch Ultrabook onto a super-lightweight 12-inch form factor without cutting any major corners along the way.
Don't let its small size fool you. The SX12 can perform just as fast as the big boys and with many of the same features as well.
The main drawback to the system is its loud fan noise relative to other Ultrabooks. Since the chassis is so small and lightweight, the internal fan must compensate by running both louder and more often. Owners will definitely take notice if they plan on playing games or running other demanding loads on the relatively powerful processor.
Other drawbacks are the white backlight against the white keycaps and somewhat poor rigidity of the lid. You can't expect the chassis to be as strong as a Dell XPS, HP Spectre, or Razer Blade Stealth when it's significantly lighter and more portable. This can be considered a minor disadvantage considering how much the laptop has to offer in almost every other aspect.
Price and Availability
The Vaio SX12 is currently available directly from the manufacturer starting at $1300 USD for our configuration as reviewed.
VAIO SX12 VJS124X1011P
- 04/02/2022 v7 (old)
Allen Ngo
Price comparison
