VAIO FE14 laptop review: Avoid the Core i5-1235U and get the Core i7-1255U
Unlike the higher-end Vaio SX series, the super-thin Vaio Z series, or the tablet Vaio A series, the Vaio FE series is a budget to midrange option for a wider market appeal. The FE series currently comes in 14.1-inch FE14 and 15.6-inch FE15 models to choose from.
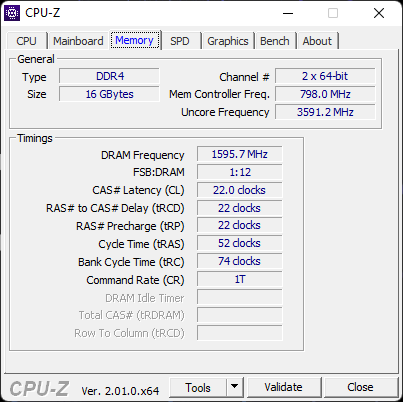
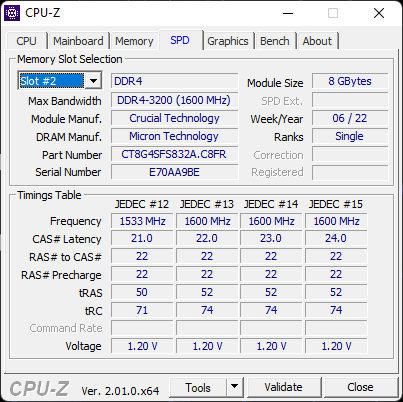
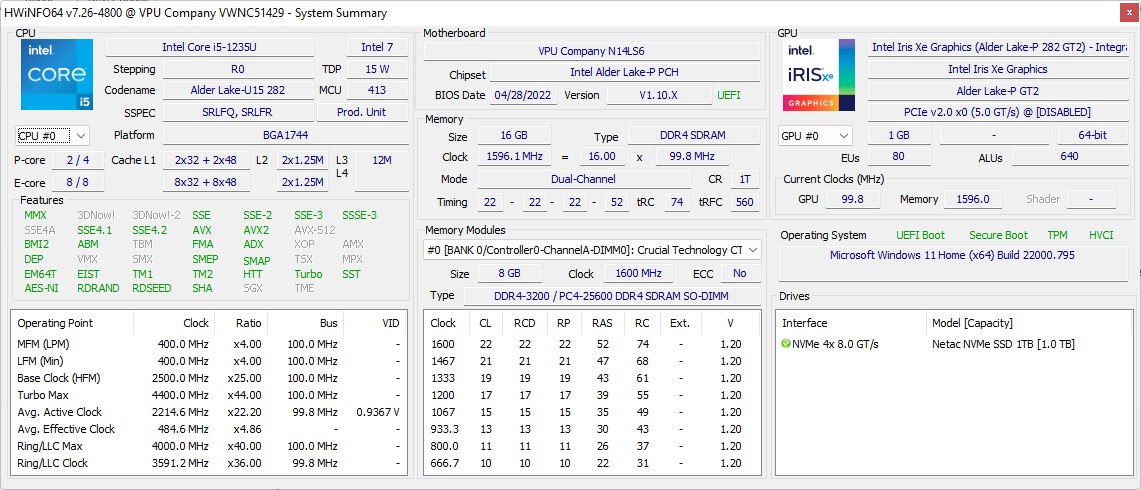
Our model in review in the FE14 equipped with the latest Intel 12th gen Core i5-1235U CPU. The rest of the system is fairly typical for its $700 USD price range including the 1080p IPS display, integrated Iris Xe graphics, and 16 GB of RAM. A higher-end configuration is available with the faster Core i7-1255U.
Competitors in this space include other budget to midrange 14-inch laptops like the Gateway Ultra Slim 14.1, Dell Inspiron 14 7420, Lenovo IdeaPad 3 14, or the Asus VivoBook S14.
More Vaio reviews:
Potential Competitors in Comparison
Rating | Date | Model | Weight | Height | Size | Resolution | Price |
|---|---|---|---|---|---|---|---|
| 82 % v7 (old) | 07 / 2022 | VAIO FE 14.1 VWNC51429-SL i5-1235U, Iris Xe G7 80EUs | 1.6 kg | 19.8 mm | 14.10" | 1920x1080 | |
| 87.2 % v7 (old) | 11 / 2021 | VAIO SX14 VJS144X0111K i7-1195G7, Iris Xe G7 96EUs | 1.1 kg | 17.9 mm | 14.00" | 1920x1080 | |
| 78 % v7 (old) | 07 / 2022 | Gateway Ultra Slim 14.1 GWTC51427 i5-1235U, Iris Xe G7 80EUs | 1.6 kg | 20.3 mm | 14.10" | 1920x1080 | |
| 83.7 % v7 (old) | 06 / 2022 | Dell Inspiron 14 7420 2-in-1 i7-1255U, Iris Xe G7 96EUs | 1.6 kg | 17.86 mm | 14.00" | 1920x1200 | |
| 79.2 % v7 (old) | 06 / 2022 | Lenovo IdeaPad 3 14ITL6 82H700CCGE Celeron 6305, UHD Graphics Xe G4 48EUs | 1.4 kg | 19.9 mm | 14.00" | 1920x1080 | |
| 81.5 % v7 (old) | 12 / 2021 | Acer Swift 1 SF114-34-P6U1 Pentium N6000, UHD Graphics (Jasper Lake 32 EU) | 1.3 kg | 14.95 mm | 14.00" | 1920x1080 |
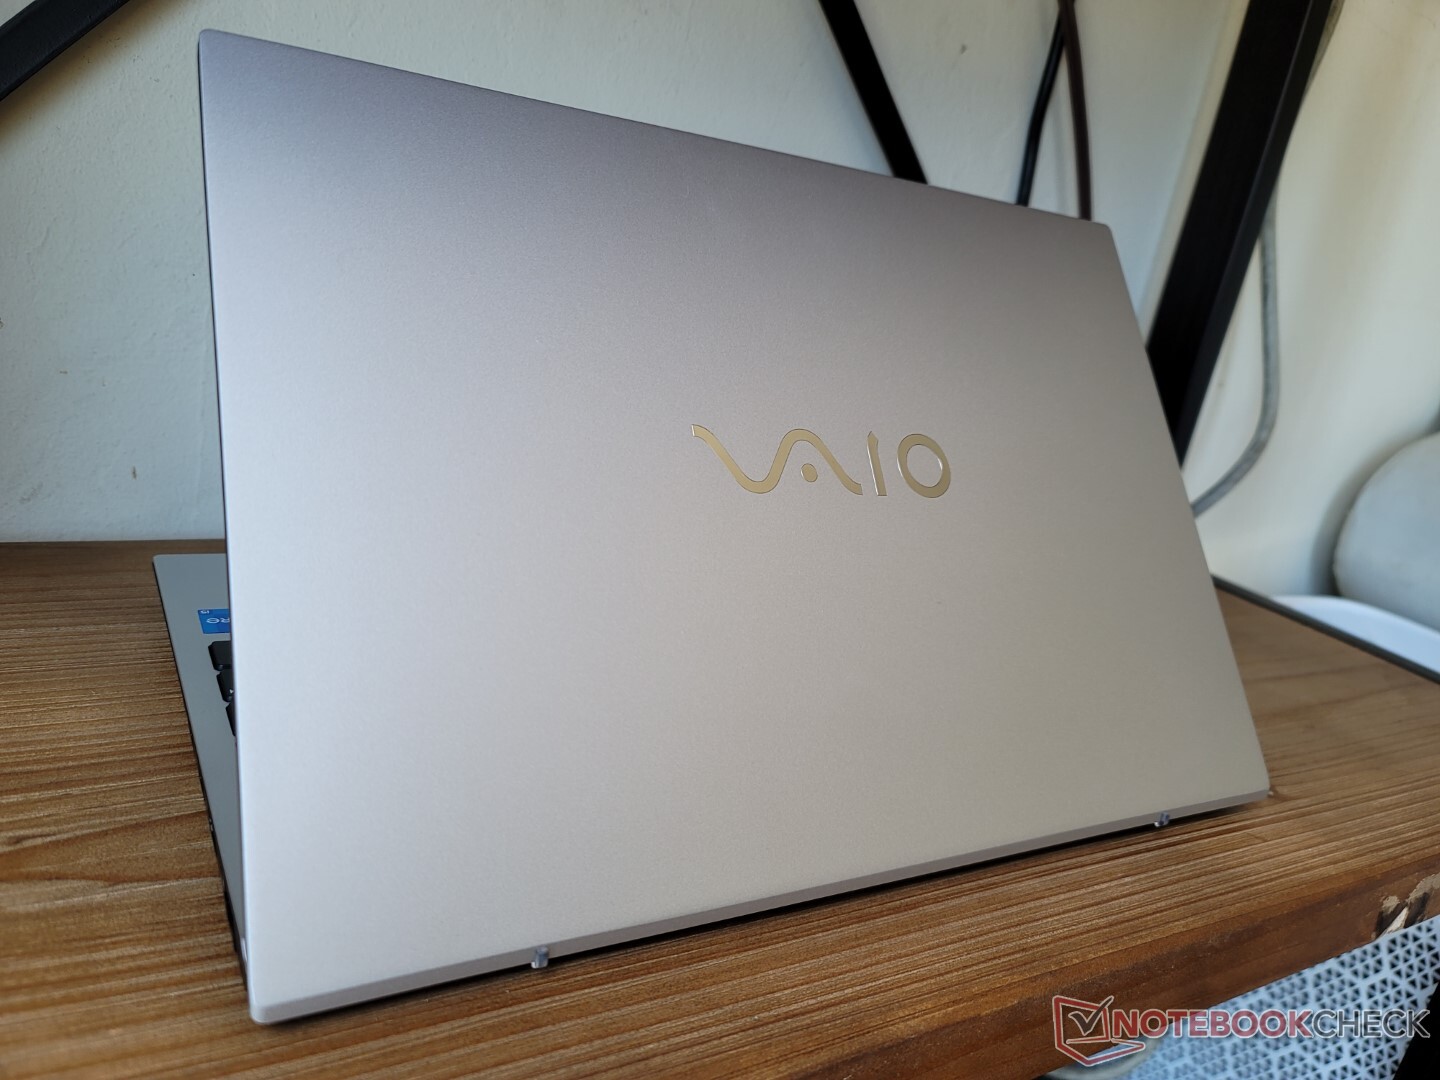
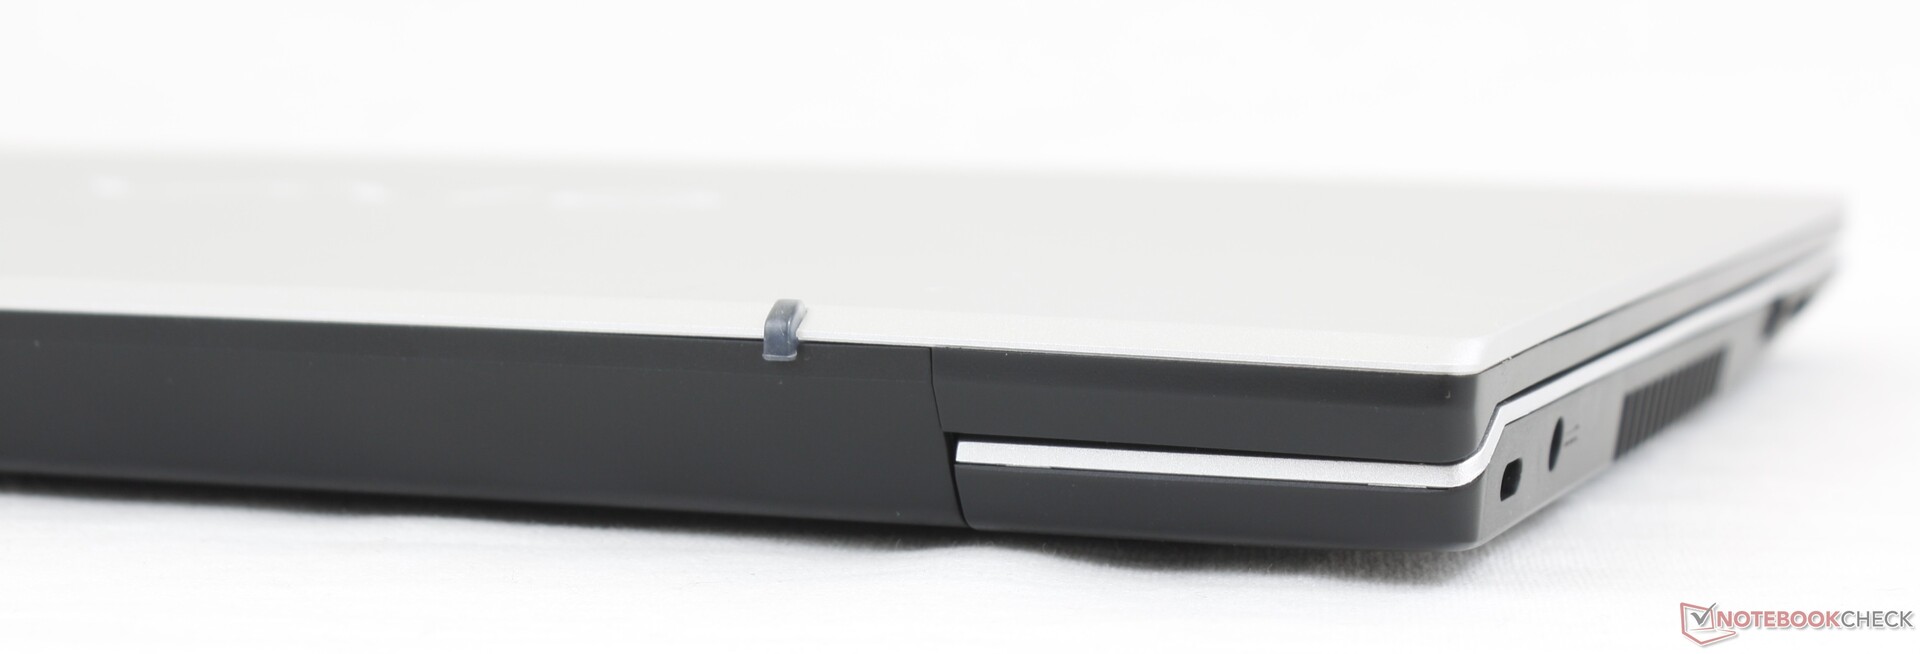
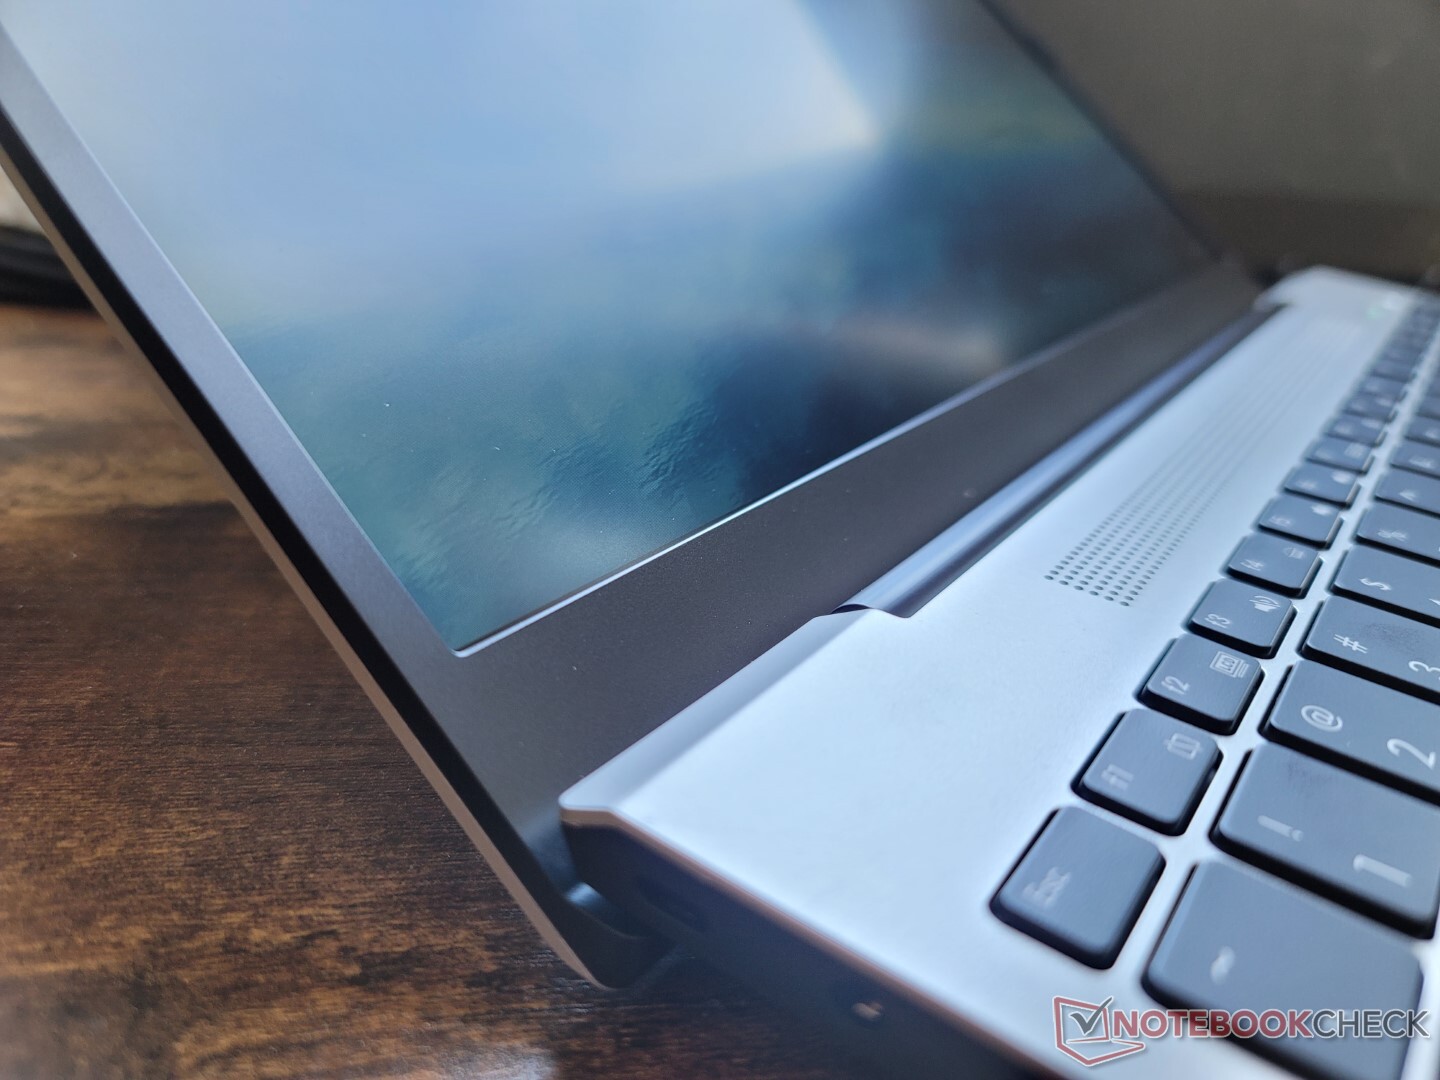
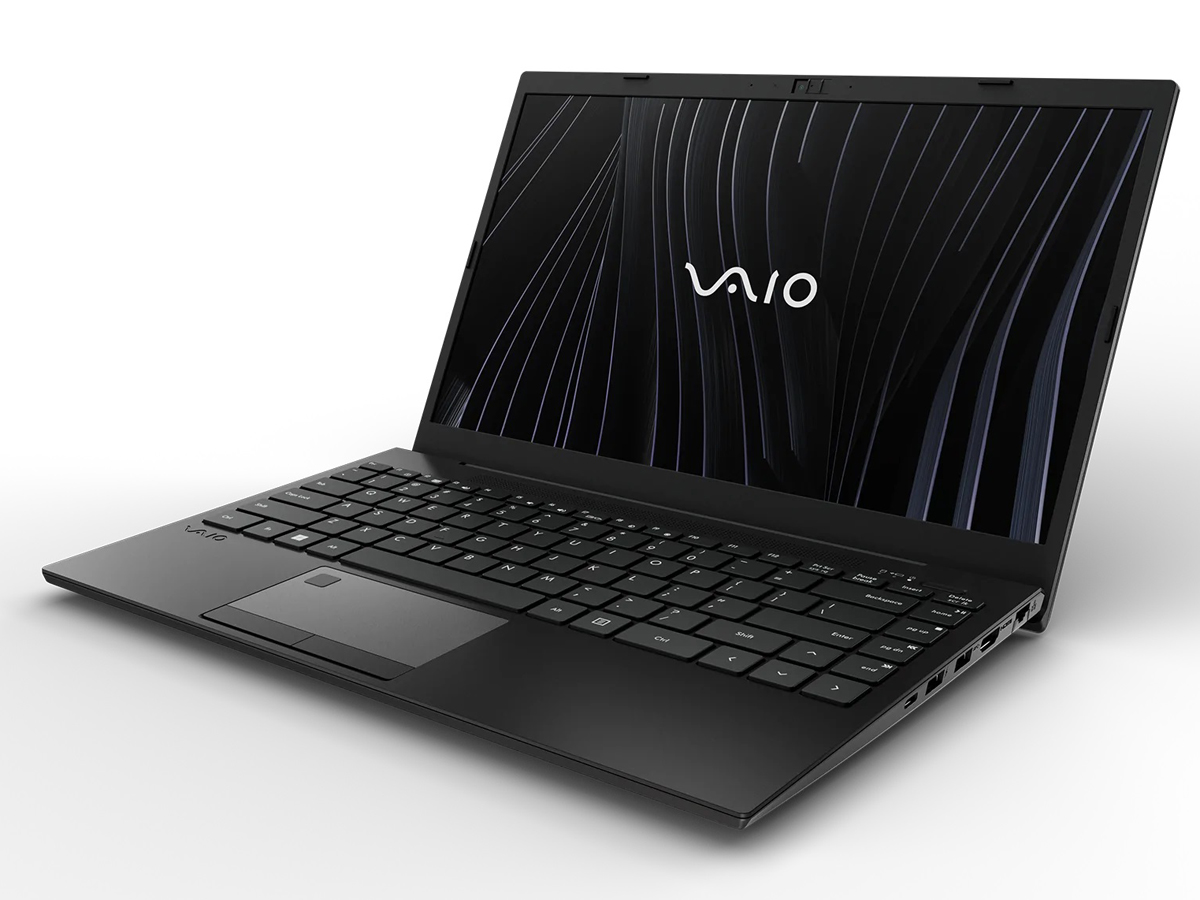
Case — Down-to-Earth Looks
Unlike the sleek and shiny SX12, the FE14 is a more traditional budget design that's on a similar visual level to a Lenovo IdeaPad or Asus Vivobook. In terms of chassis rigidity, however, our test unit would exhibit more warping and creaking than we would like even for an inexpensive model. Twisting the corners of the base would result in audible creaking and applying pressure on the palm rests or keyboard center would visibly warp the surface. The competing HP Pavilion 14 feels more strongly designed in comparison.
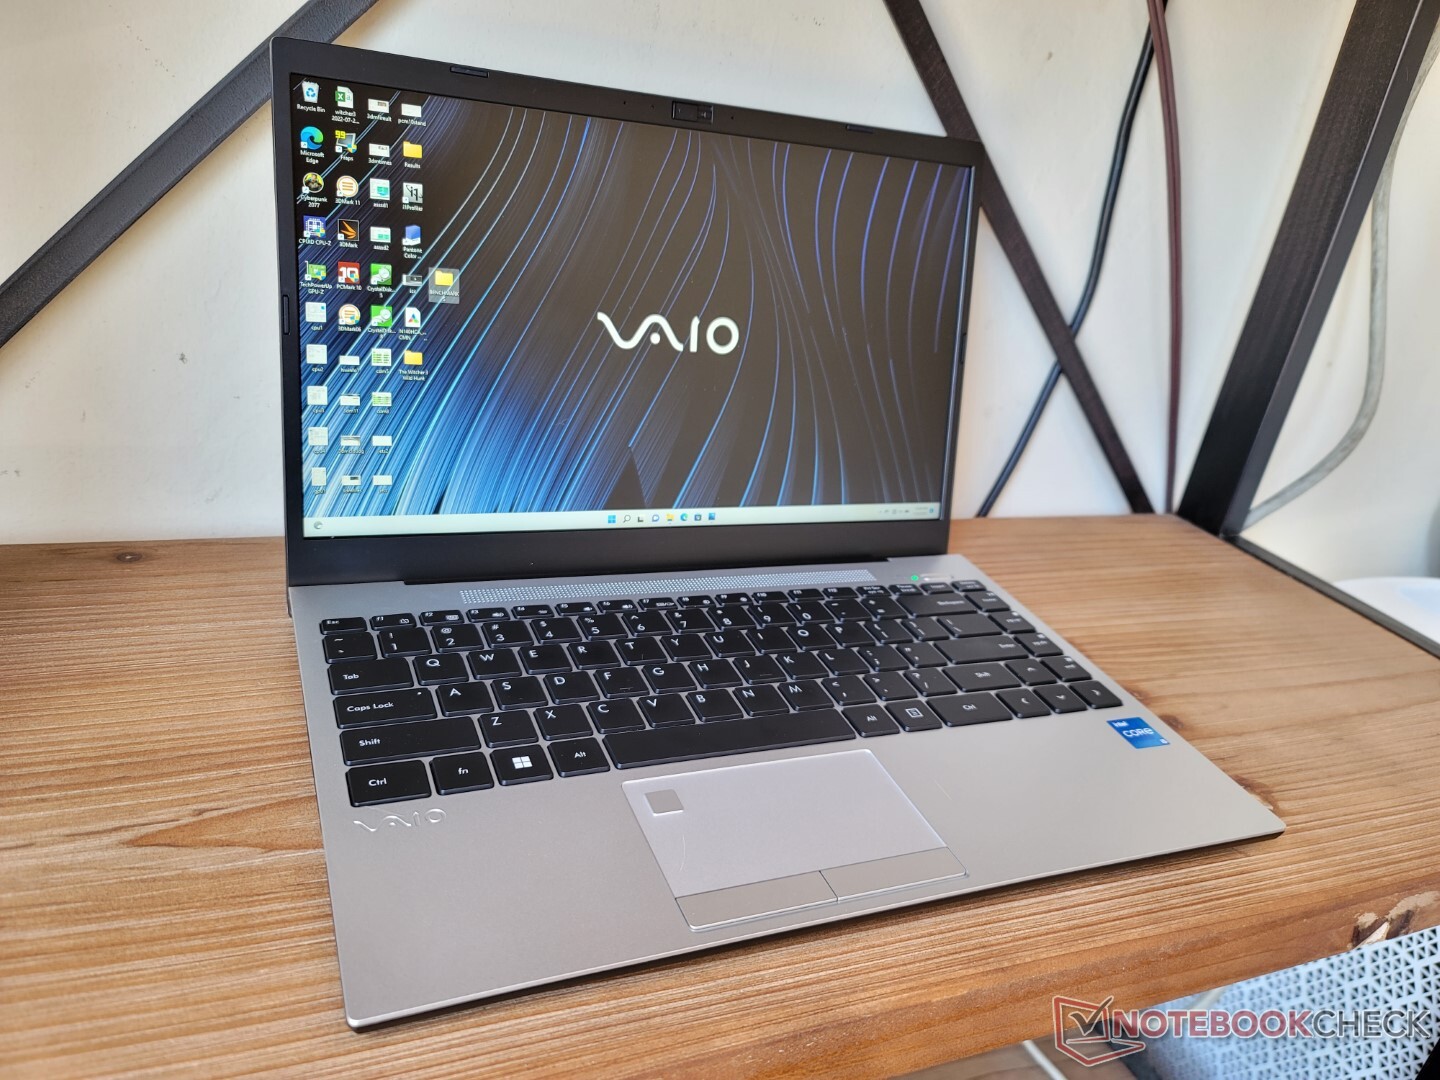
The FE14 is large and heavy when compared to pricier flagship 14-inch laptops like the Vaio SX14 or Asus Zenbook 14 series, but it is otherwise pretty standard when compared to other budget laptops like the Lenovo IdeaPad 3 14 or Gateway Ultra Slim 14.1. We do wish it could be lighter though as the 1.6 kg weight is as heavy as many 15.6-inch Ultrabooks.
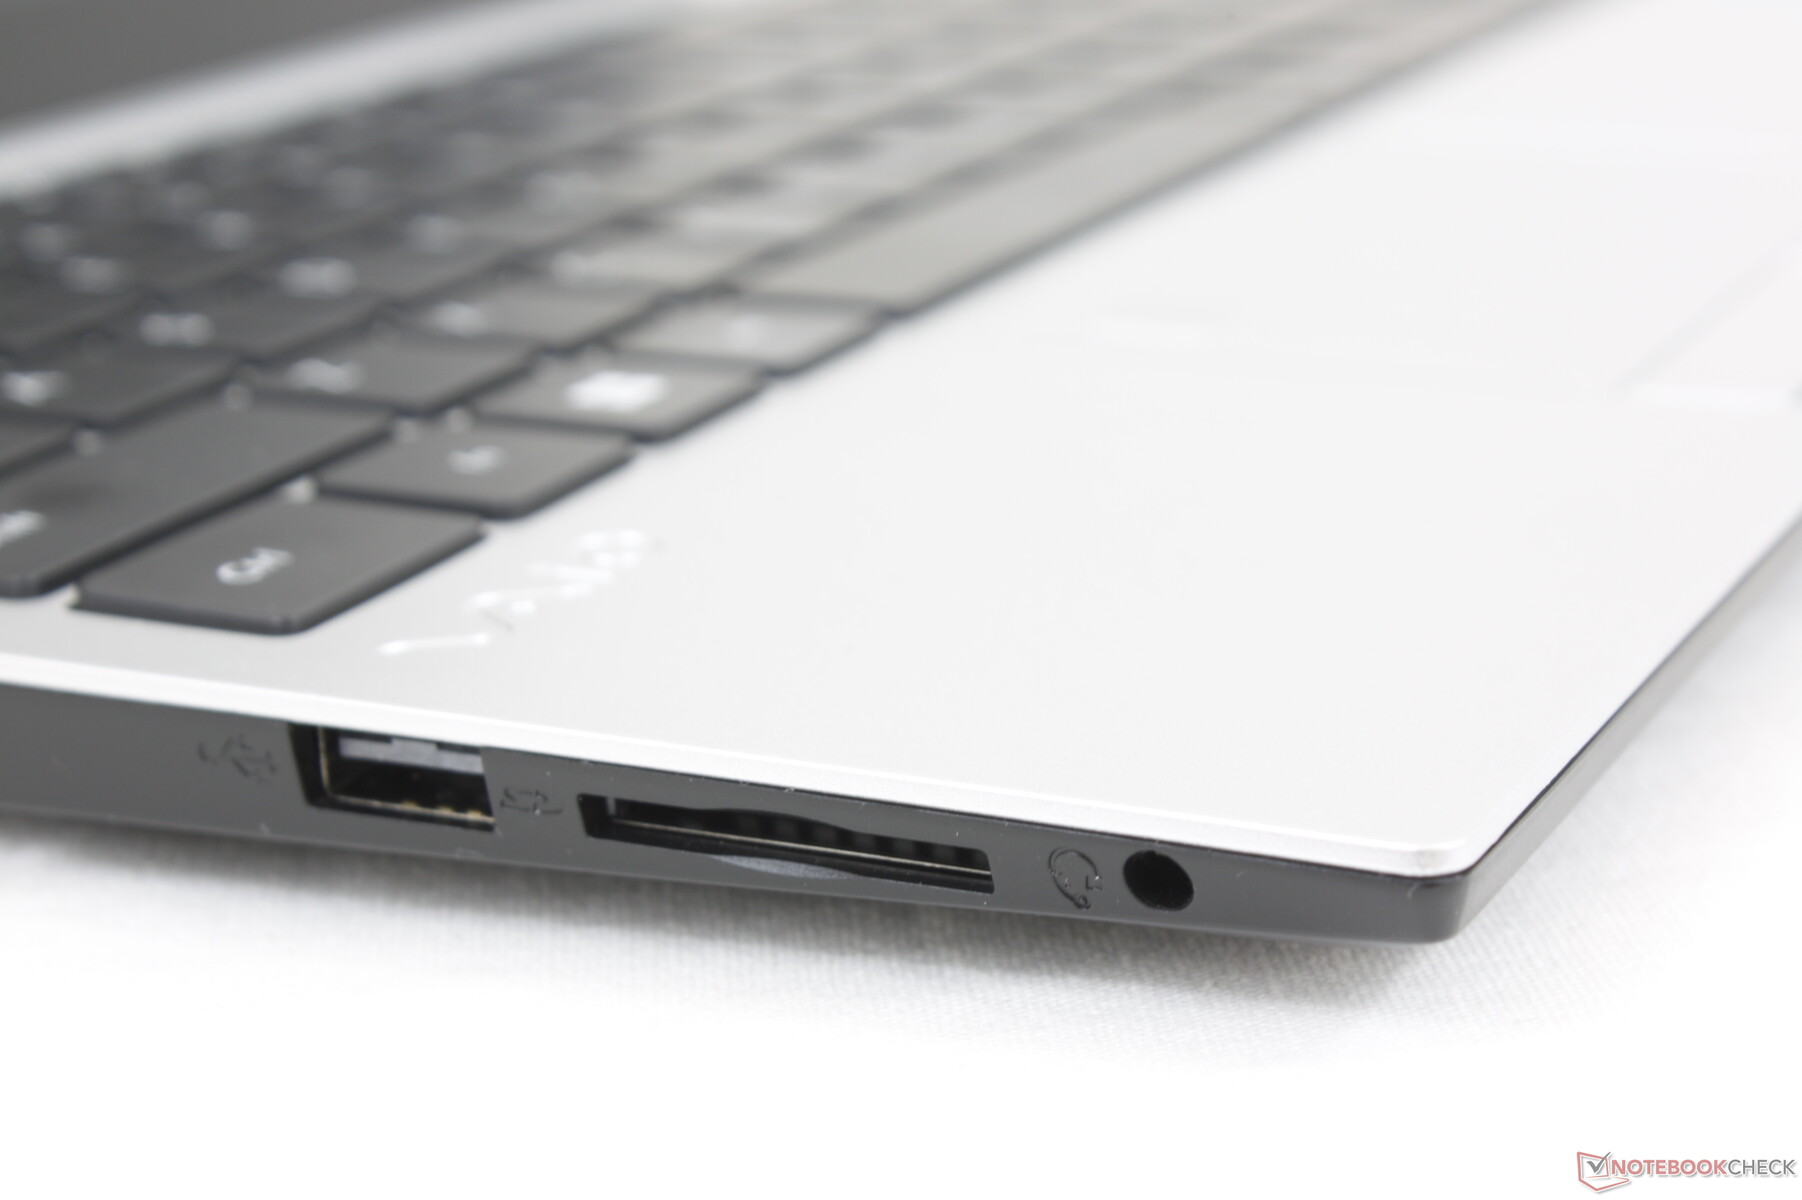
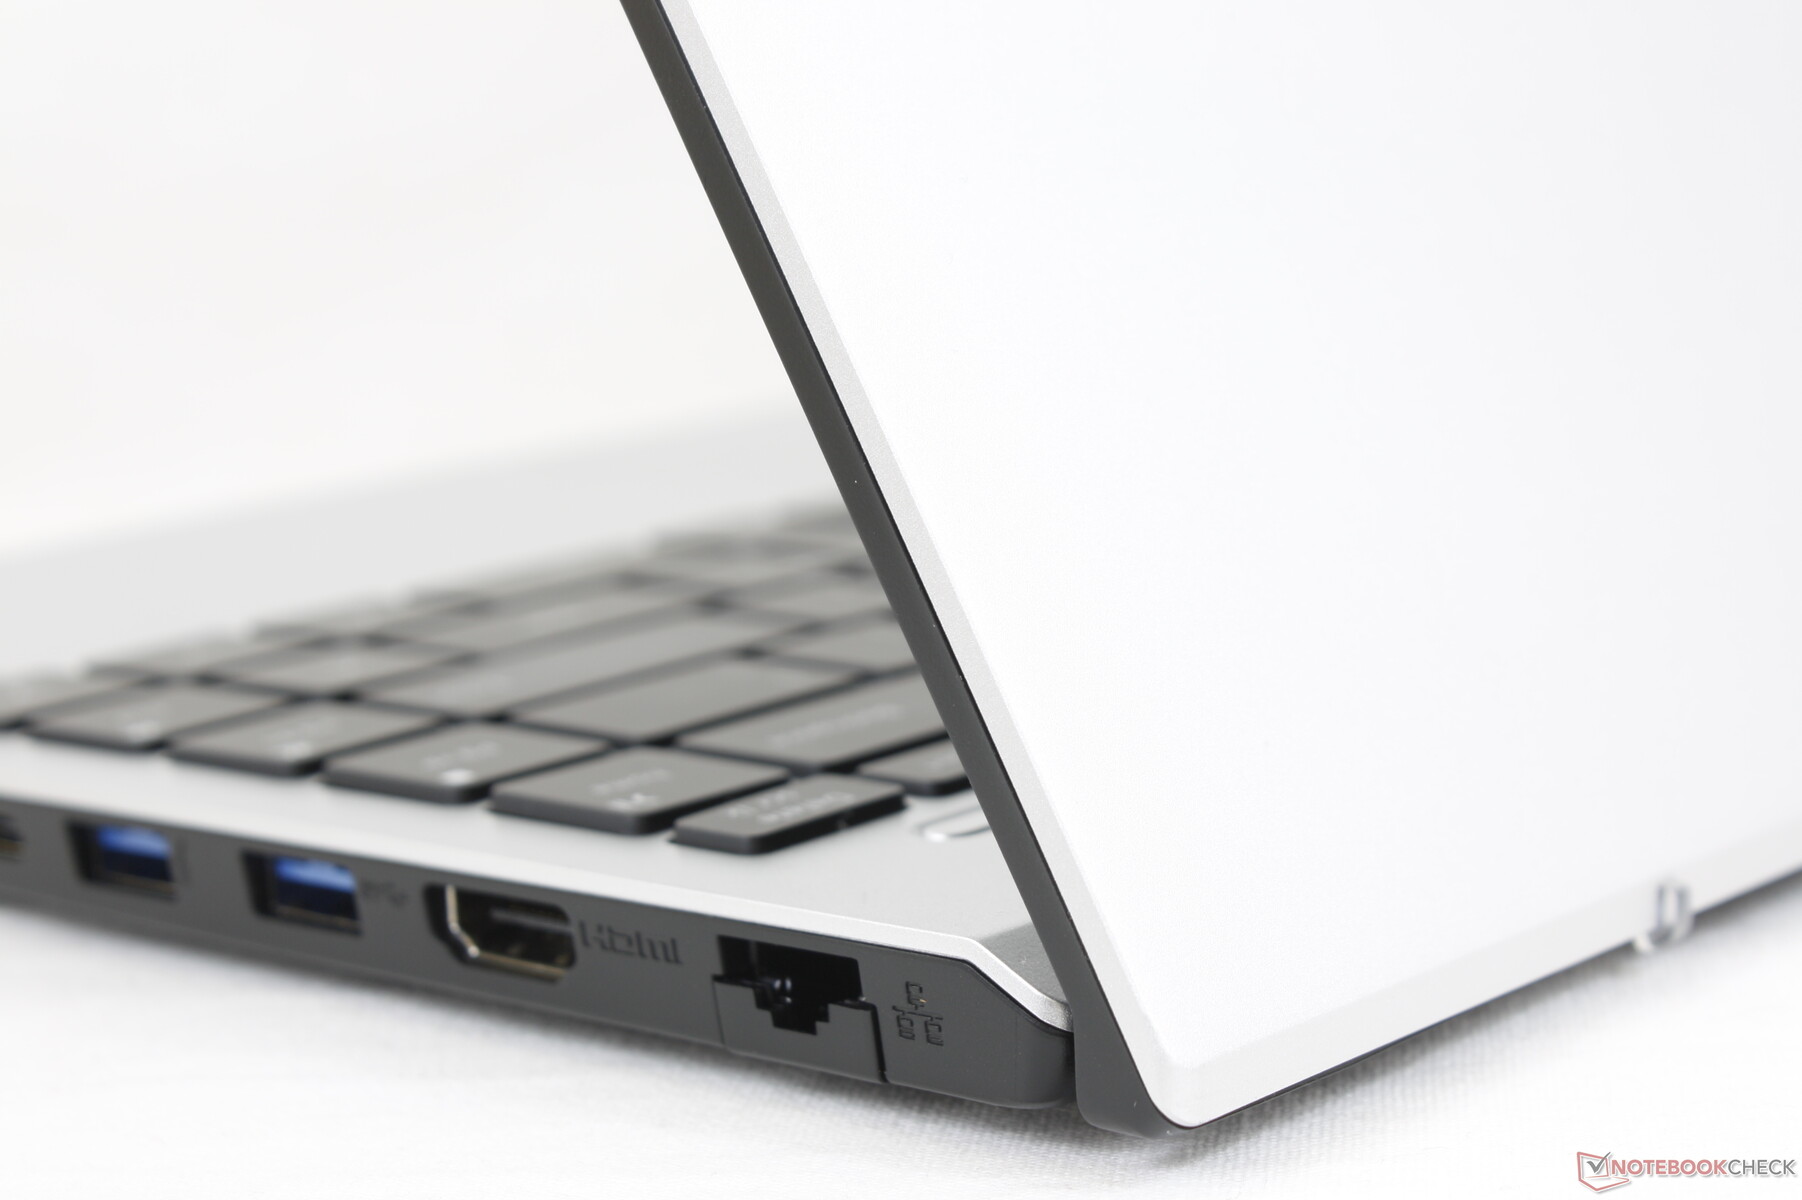
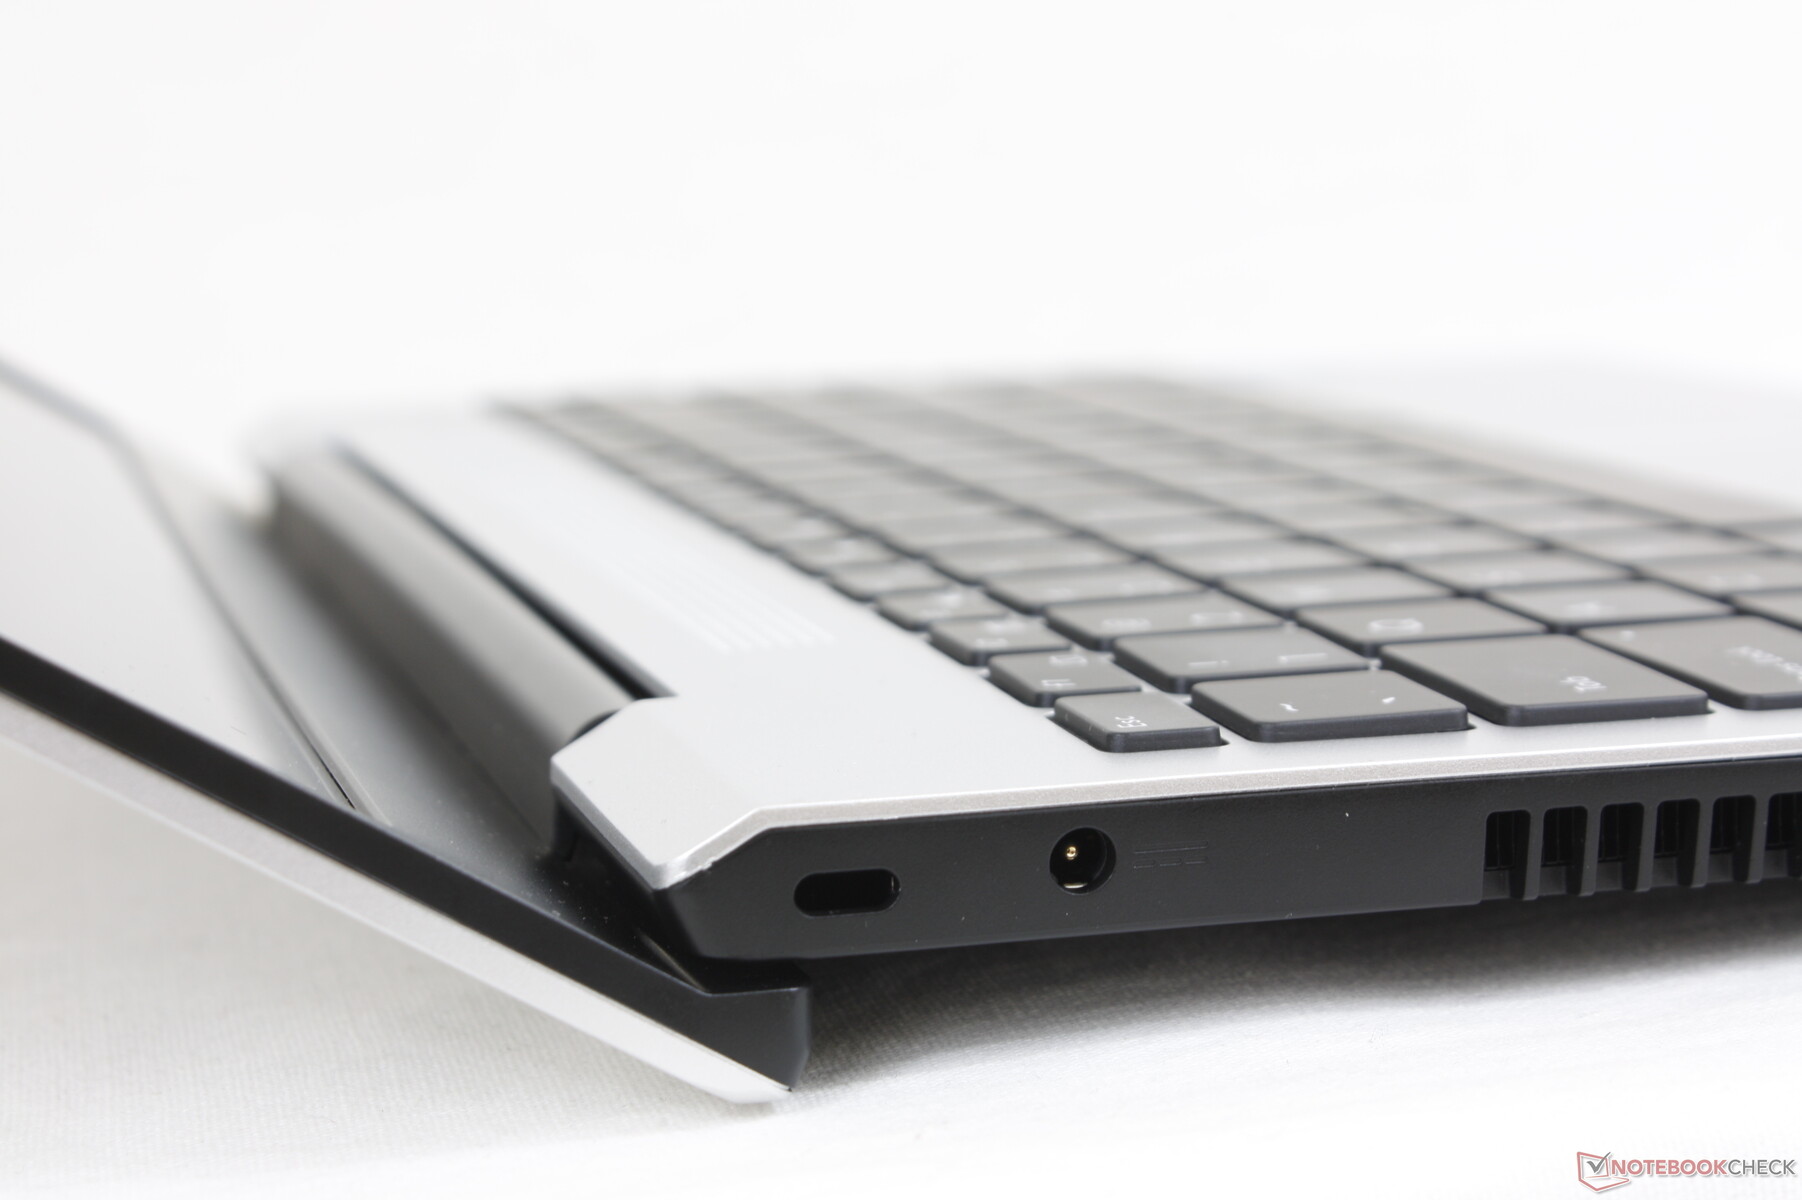
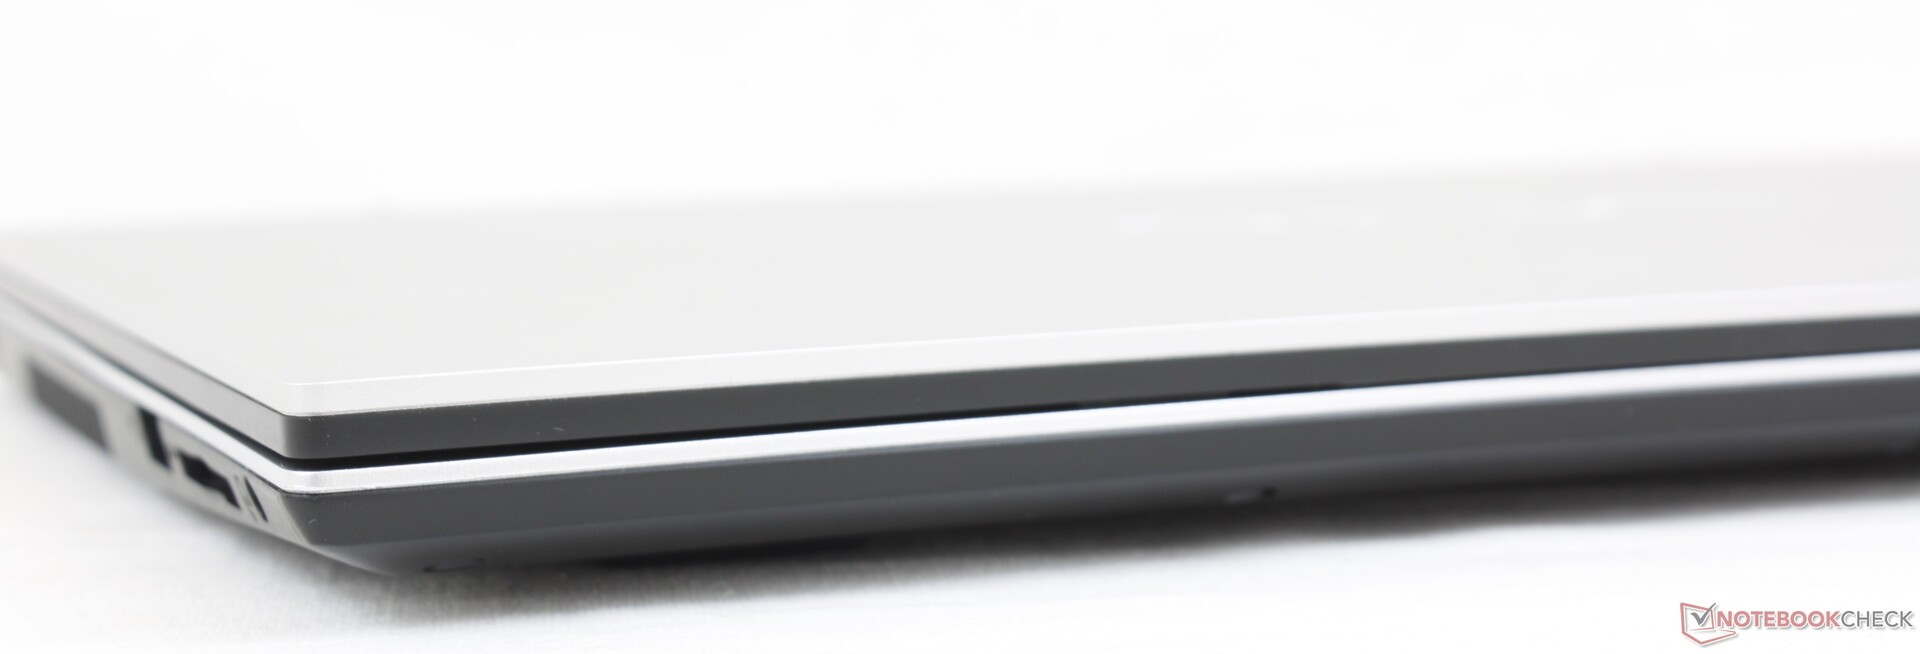
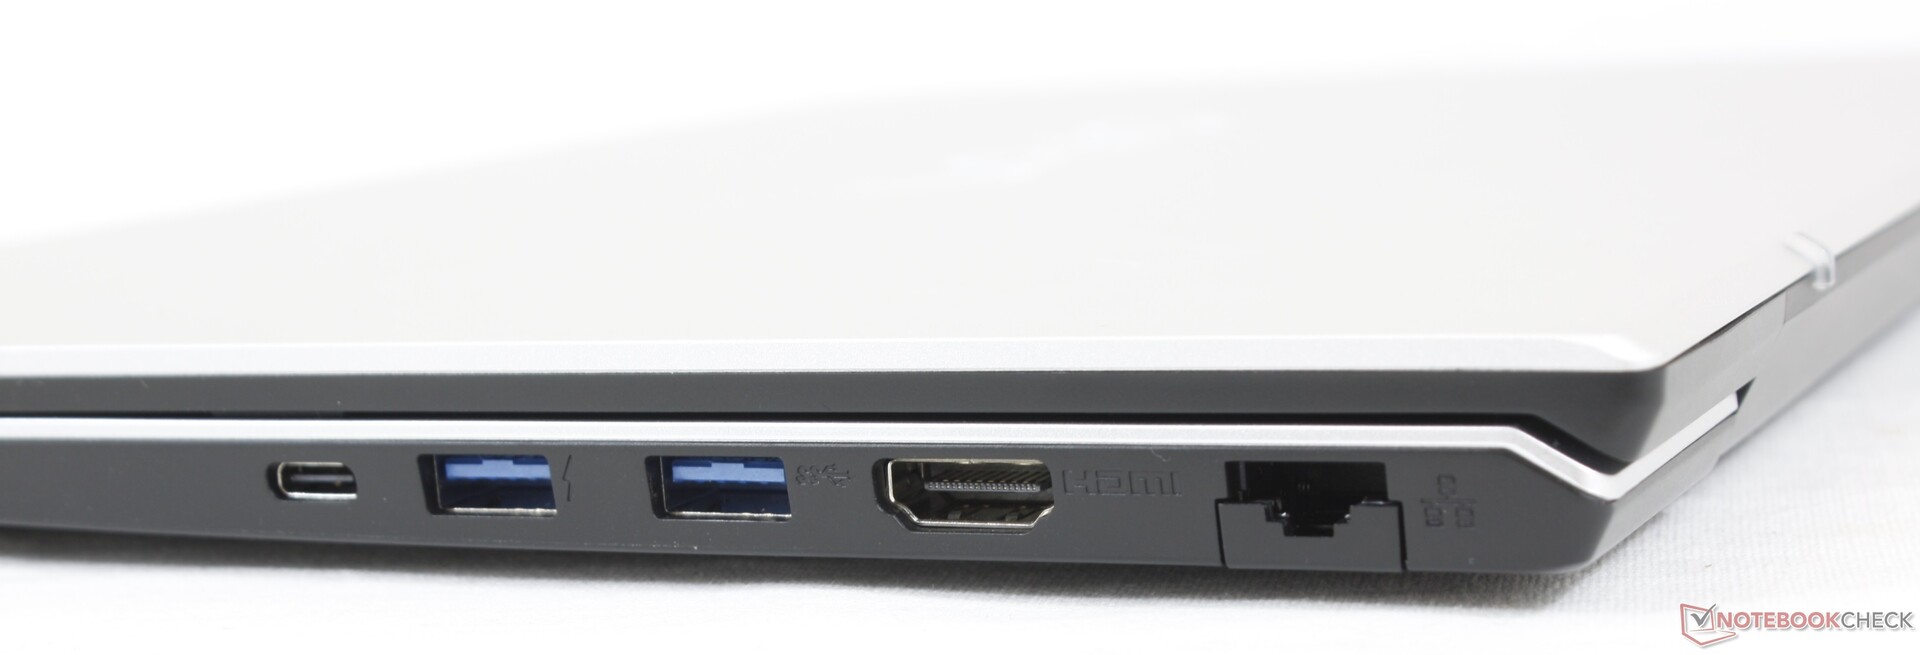
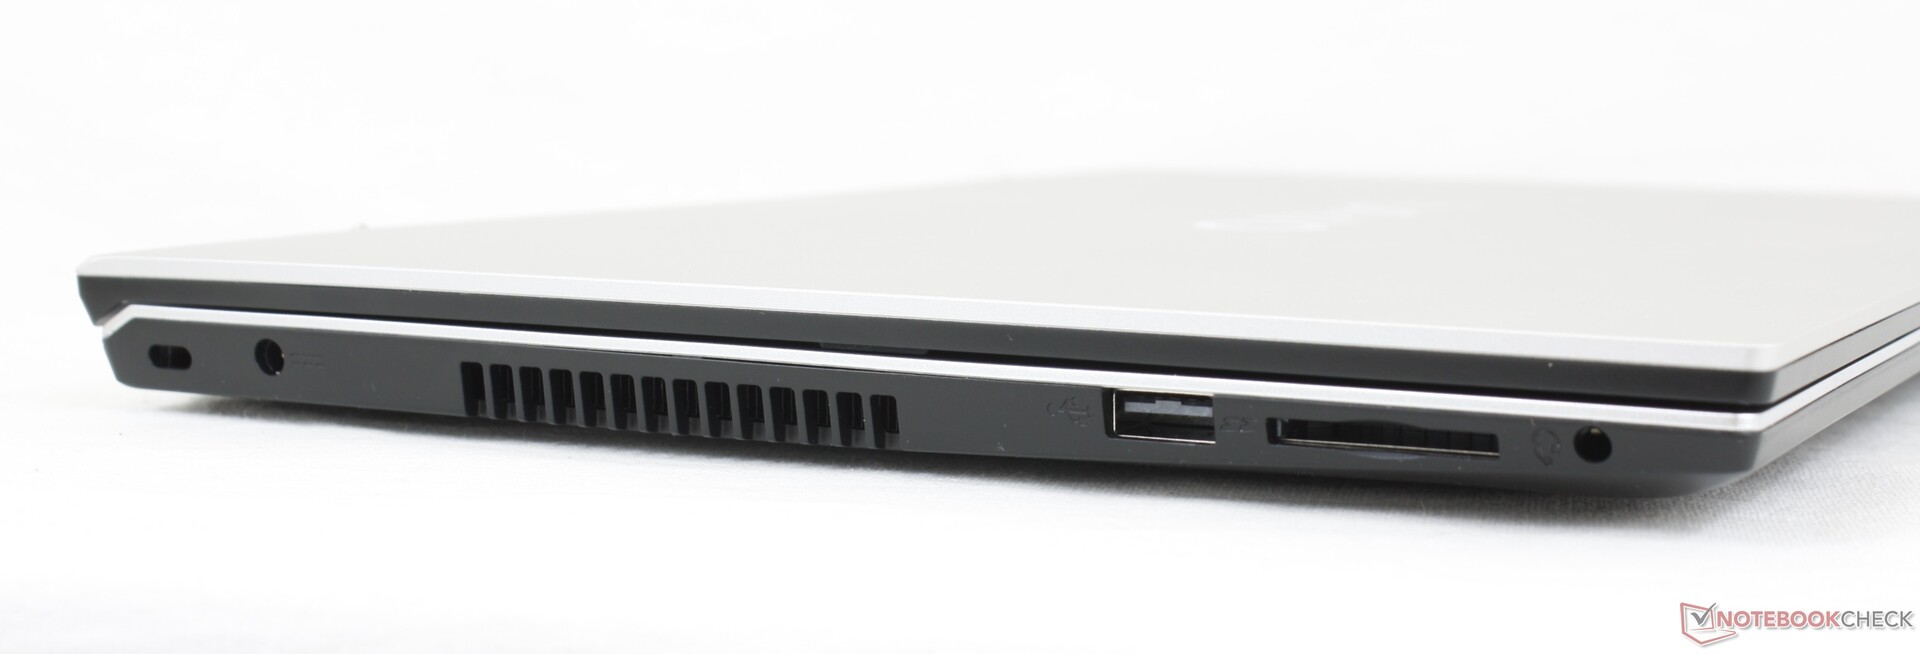
Connectivity — No Thunderbolt Support
There is a healthy selection of integrated ports including 3x USB-A and even a gigabit RJ-45 port. However, it's baffling that the manufacturer continues to integrate a proprietary AC adapter barrel port when most other Ultrabooks of this size have already made the full transition to USB-C charging. We would have preferred two USB-C ports instead of one USB-C and one AC adapter barrel port.
Thunderbolt is not supported. USB-C charging and DisplayPort over USB-C, however, are both supported.
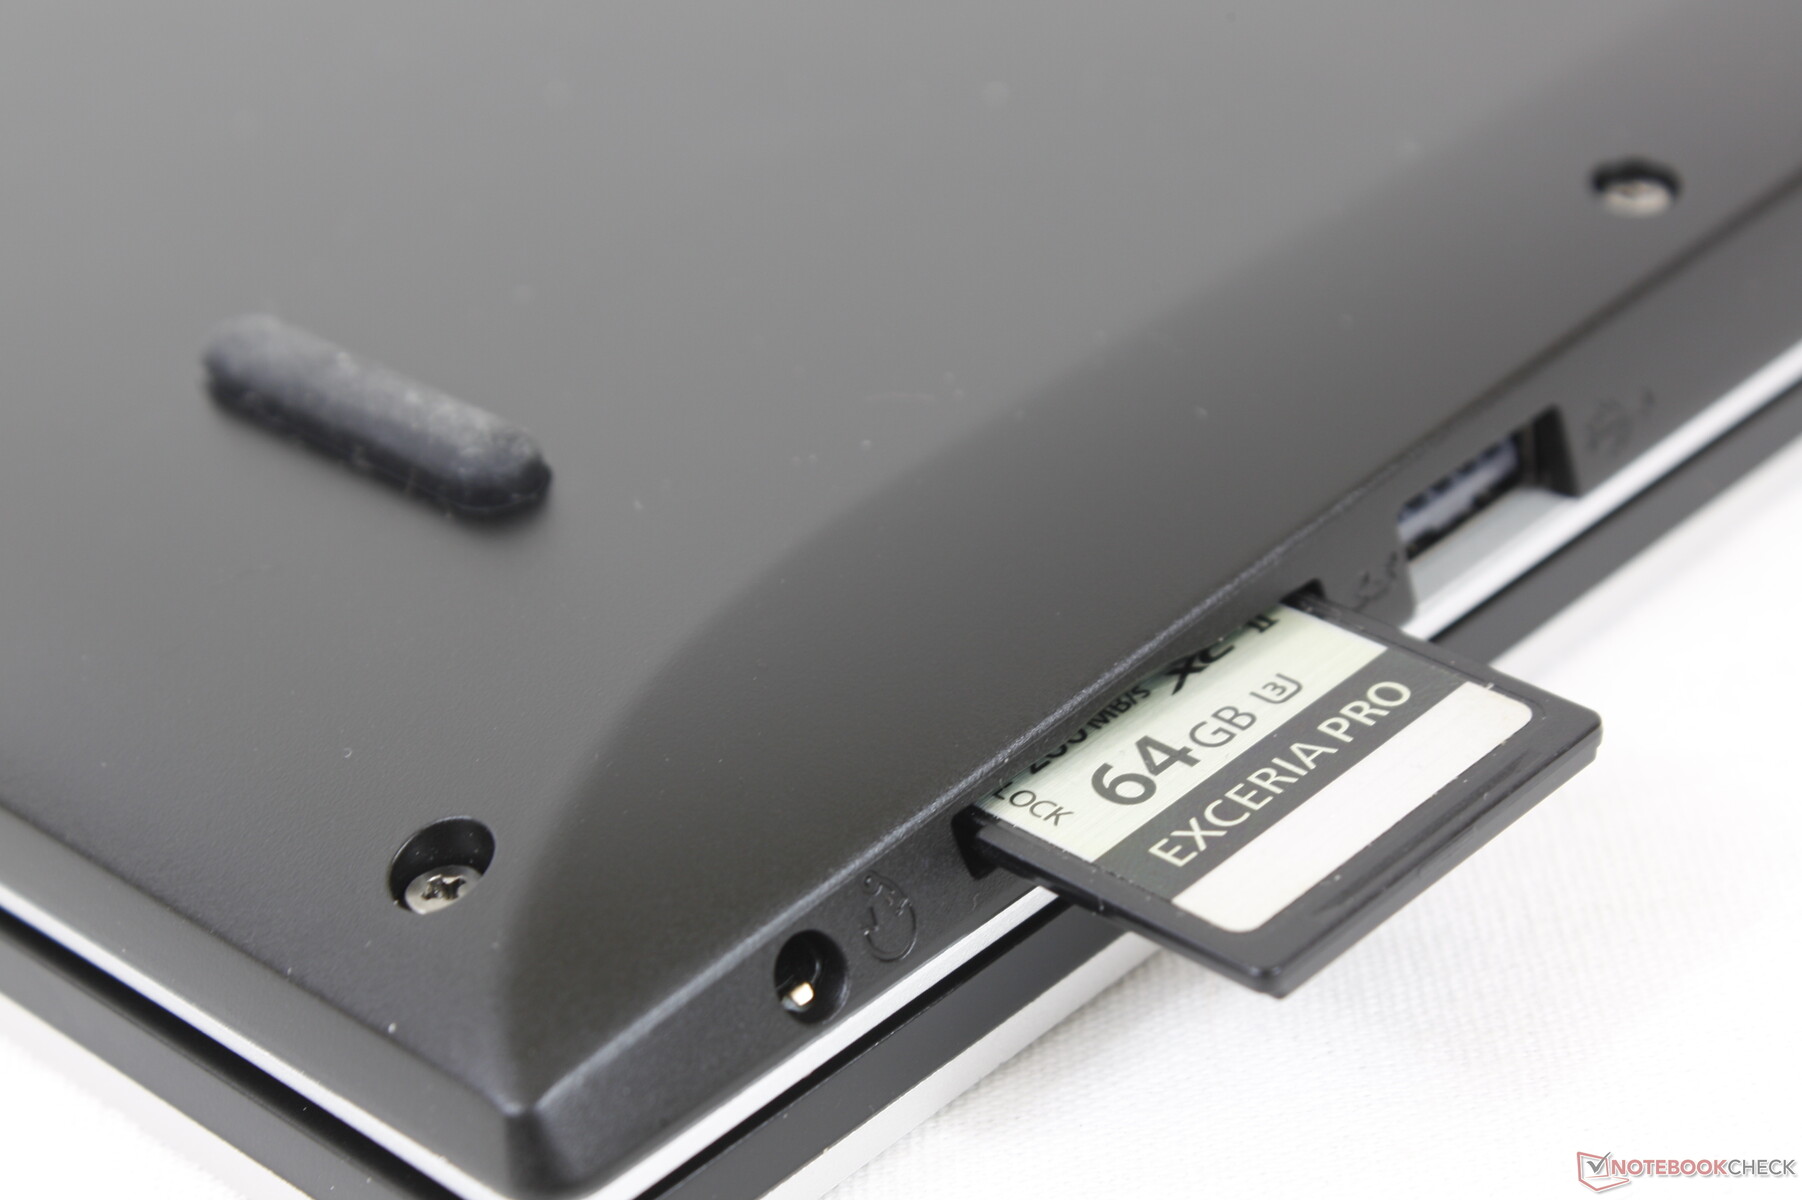
SD Card Reader
The integrated SD reader is slow at just 17 MB/s. Transferring 1 GB of pictures from our UHS-II card to desktop takes almost a full minute. Additionally, SD cards must be inserted upside-down and two-thirds of the card protrudes from the edge even when fully inserted which makes it unsafe to transport without first removing the card.
| SD Card Reader | |
| average JPG Copy Test (av. of 3 runs) | |
| Gateway Ultra Slim 14.1 GWTC51427 (AV Pro V60) | |
| Dell Inspiron 14 7420 2-in-1 (Toshiba Exceria Pro SDXC 64 GB UHS-II) | |
| Lenovo IdeaPad 3 14ITL6 82H700CCGE (AV Pro SD microSD 128 GB V60) | |
| VAIO FE 14.1 VWNC51429-SL (Toshiba Exceria Pro SDXC 64 GB UHS-II) | |
| maximum AS SSD Seq Read Test (1GB) | |
| Lenovo IdeaPad 3 14ITL6 82H700CCGE (AV Pro SD microSD 128 GB V60) | |
| Dell Inspiron 14 7420 2-in-1 (Toshiba Exceria Pro SDXC 64 GB UHS-II) | |
| Gateway Ultra Slim 14.1 GWTC51427 (AV Pro V60) | |
| VAIO FE 14.1 VWNC51429-SL (Toshiba Exceria Pro SDXC 64 GB UHS-II) | |
Communication
The Intel AX201 comes standard for Wi-Fi 6 and Bluetooth 5.2 connectivity. We experienced consistent transfer rates when paired to our Asus test router. Wi-Fi 6E is not supported.
| Networking | |
| iperf3 transmit AX12 | |
| VAIO SX14 VJS144X0111K | |
| Acer Swift 1 SF114-34-P6U1 | |
| iperf3 receive AX12 | |
| Acer Swift 1 SF114-34-P6U1 | |
| VAIO SX14 VJS144X0111K | |
| iperf3 receive AXE11000 | |
| VAIO FE 14.1 VWNC51429-SL | |
| Gateway Ultra Slim 14.1 GWTC51427 | |
| iperf3 transmit AXE11000 | |
| VAIO FE 14.1 VWNC51429-SL | |
| Gateway Ultra Slim 14.1 GWTC51427 | |
Webcam
The system integrates a 2 MP webcam instead of the more typical 1 MP for a sharper picture. Color, however, is poor and overly purple in our tests.
A physical shutter is present for camera privacy. IR is not available and so Windows Hello is not supported.


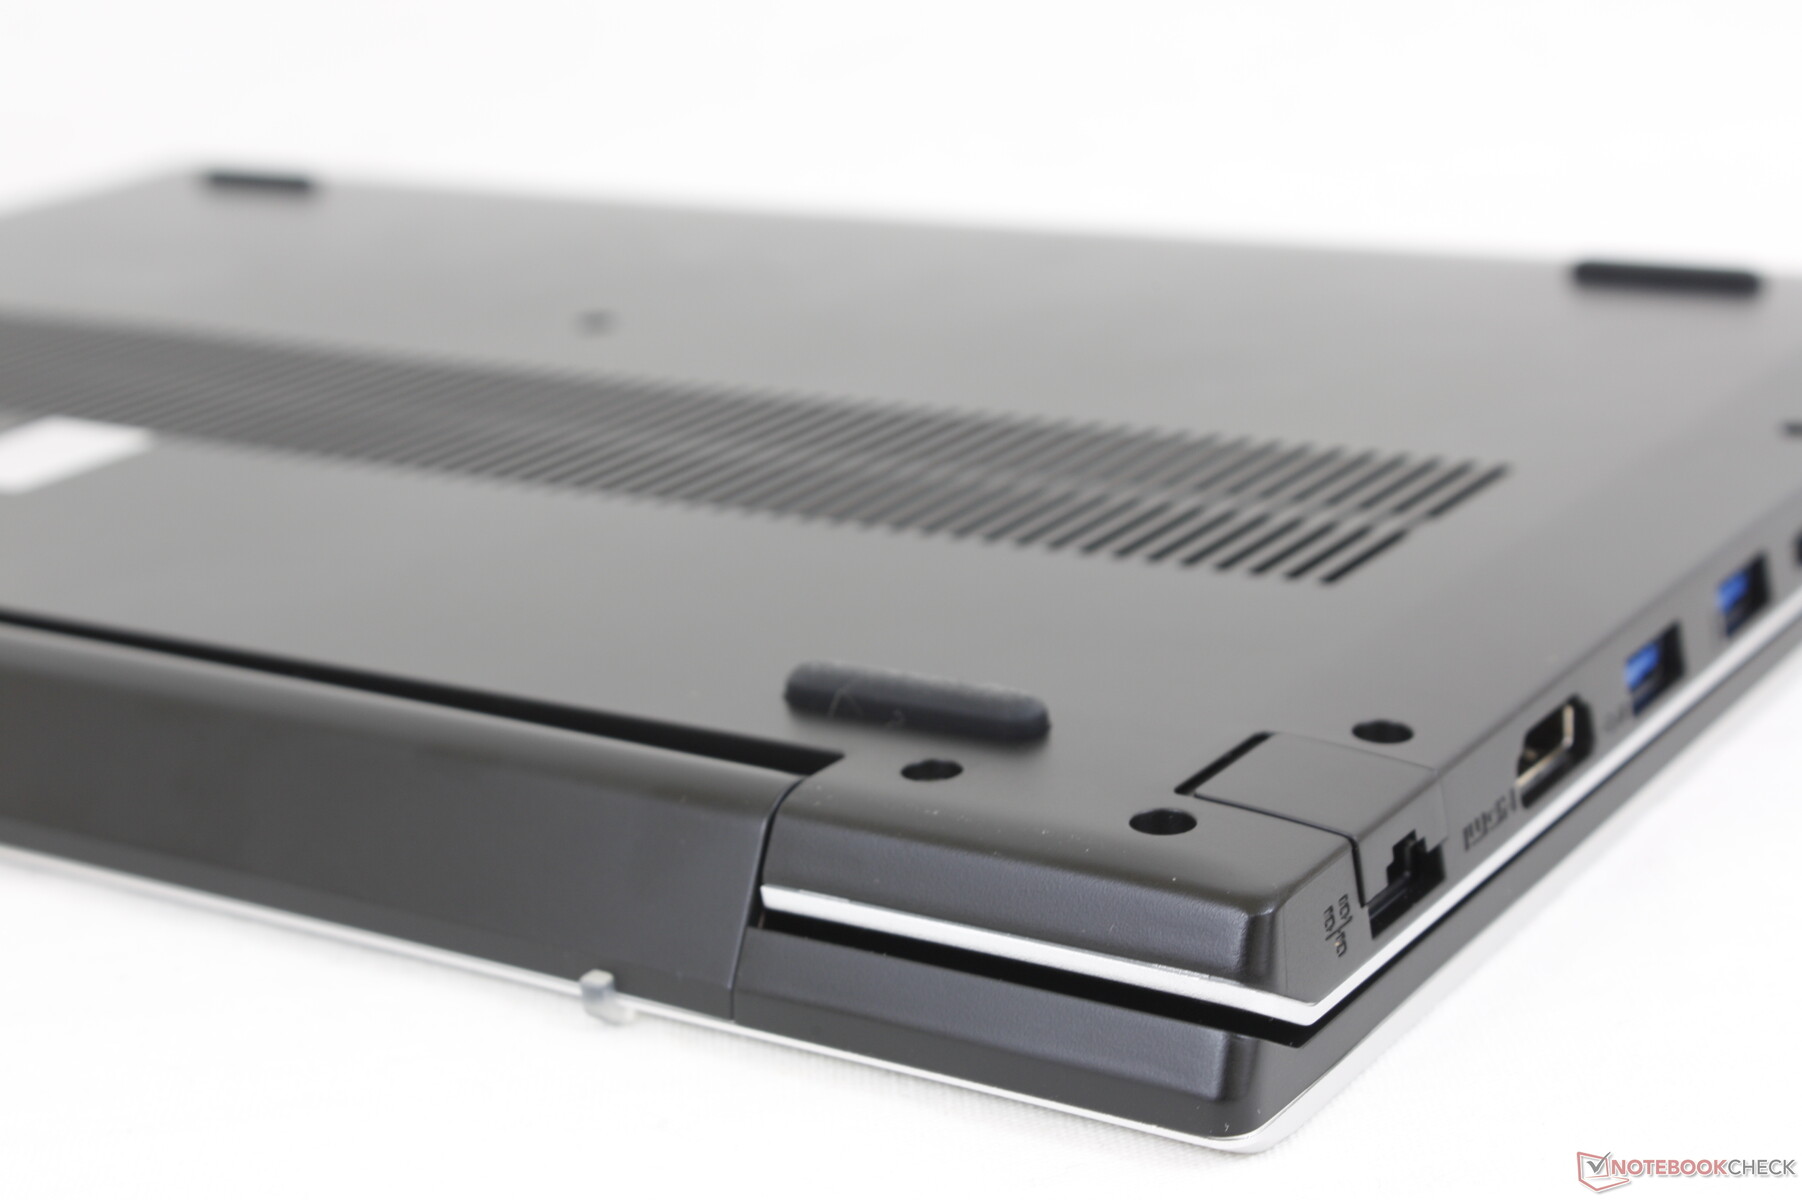
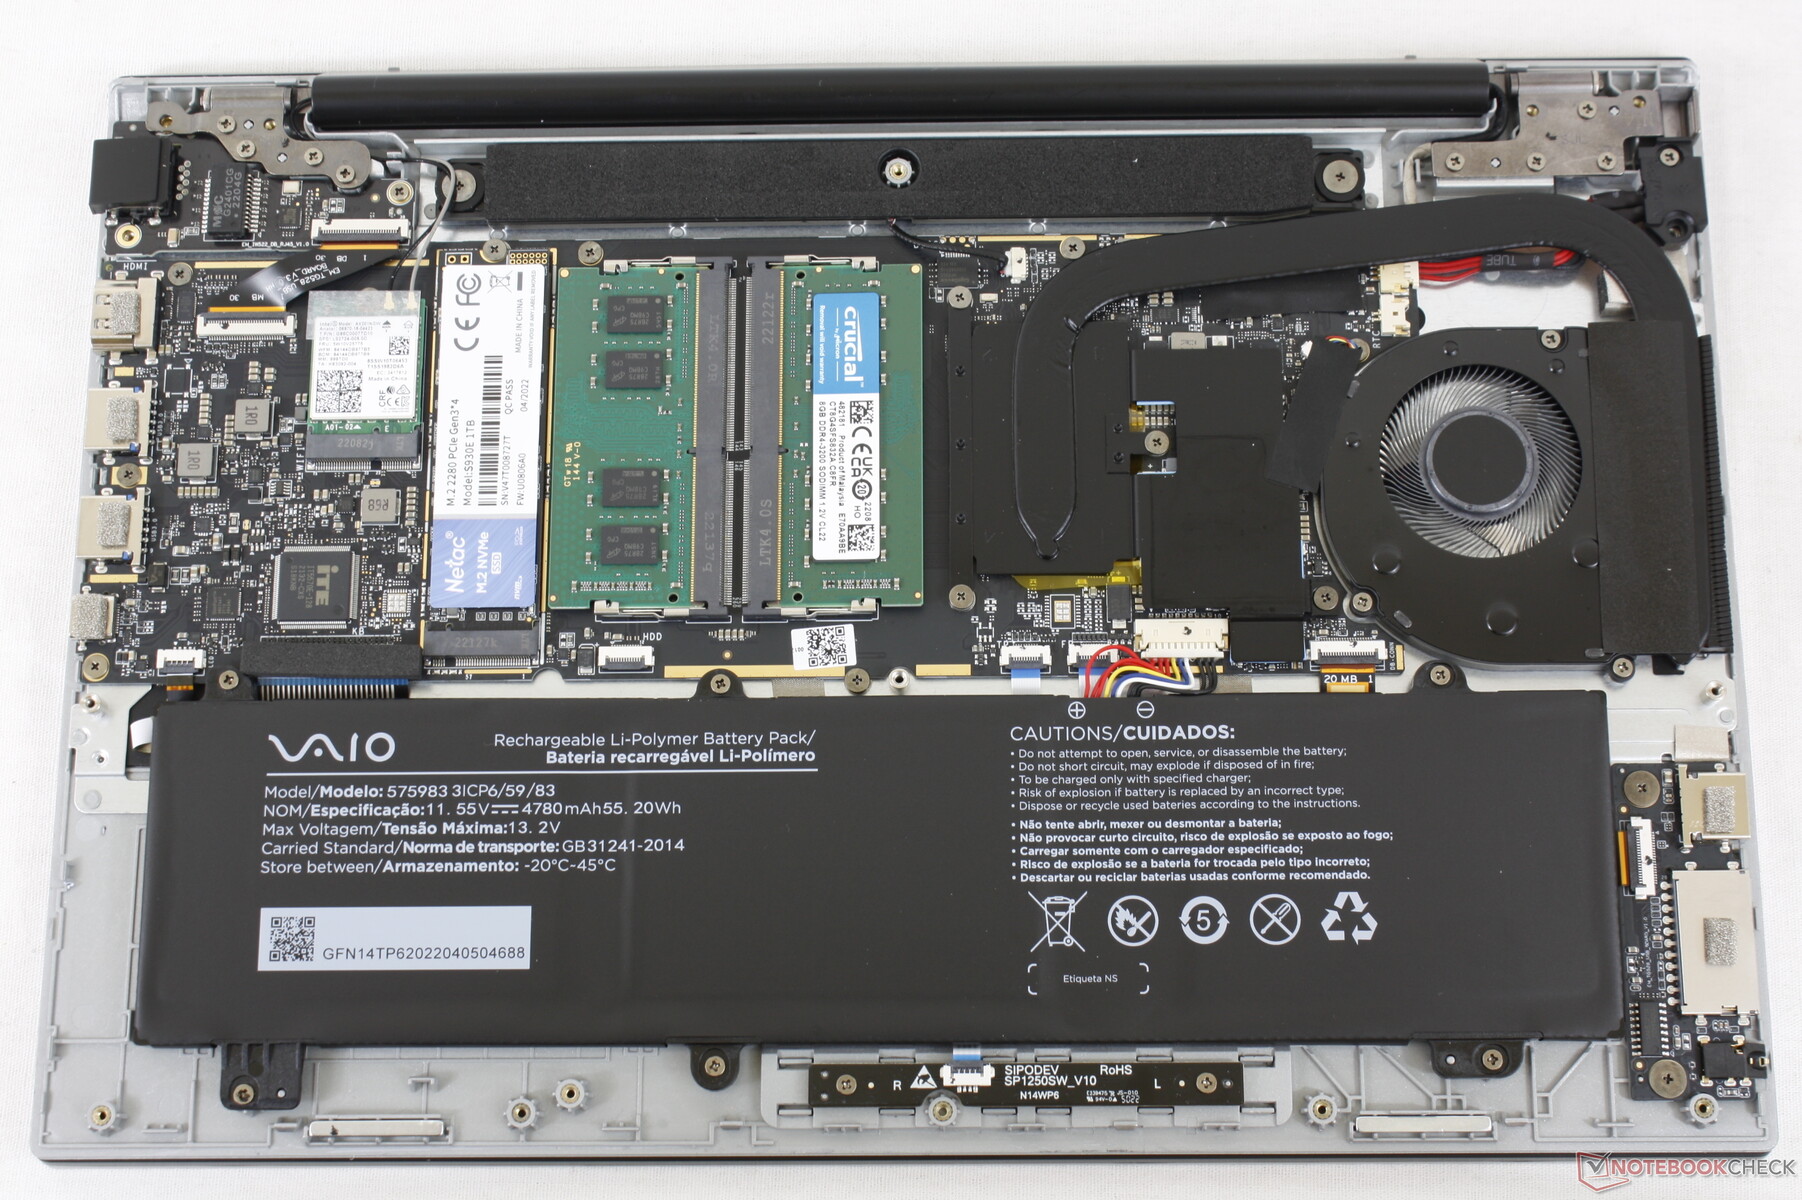
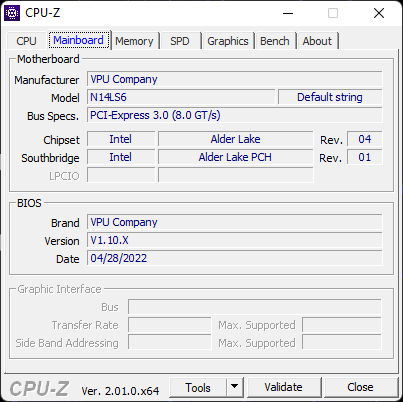
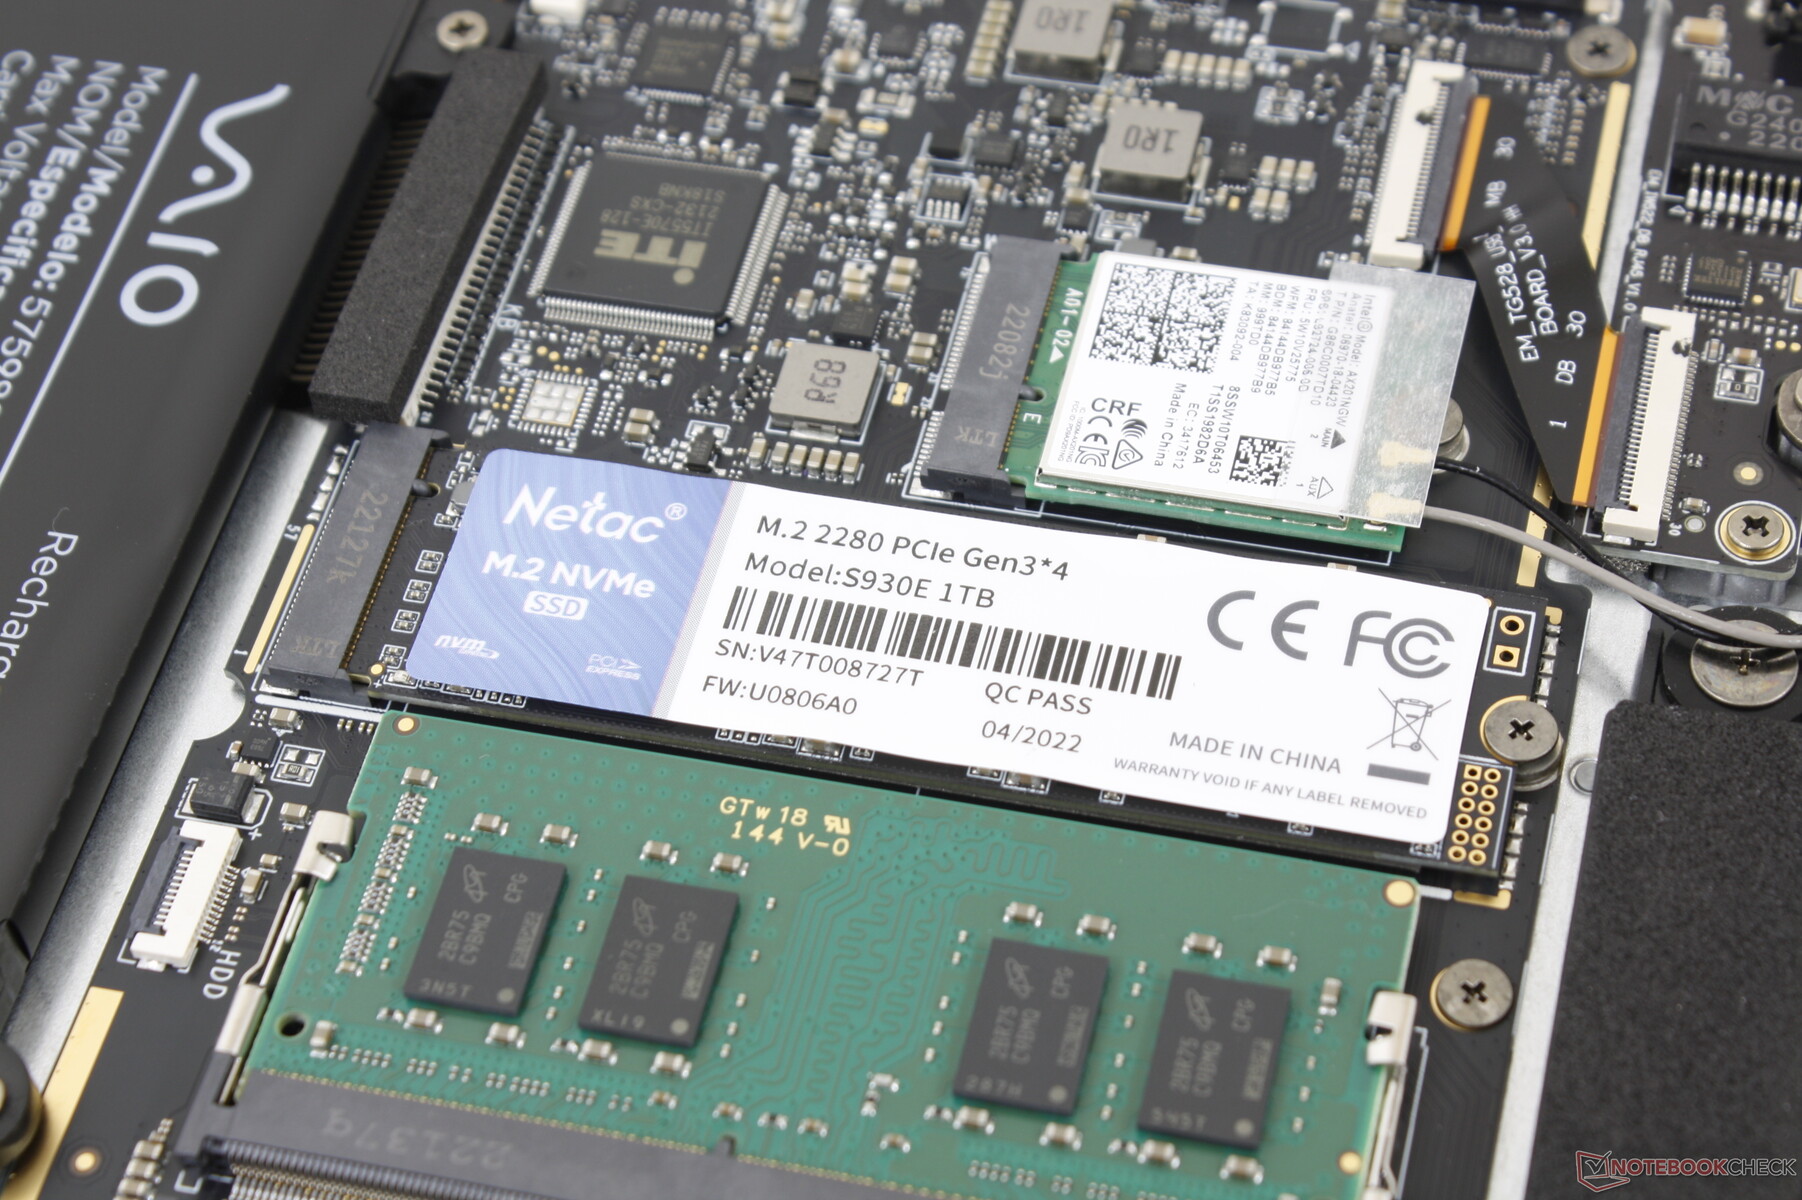
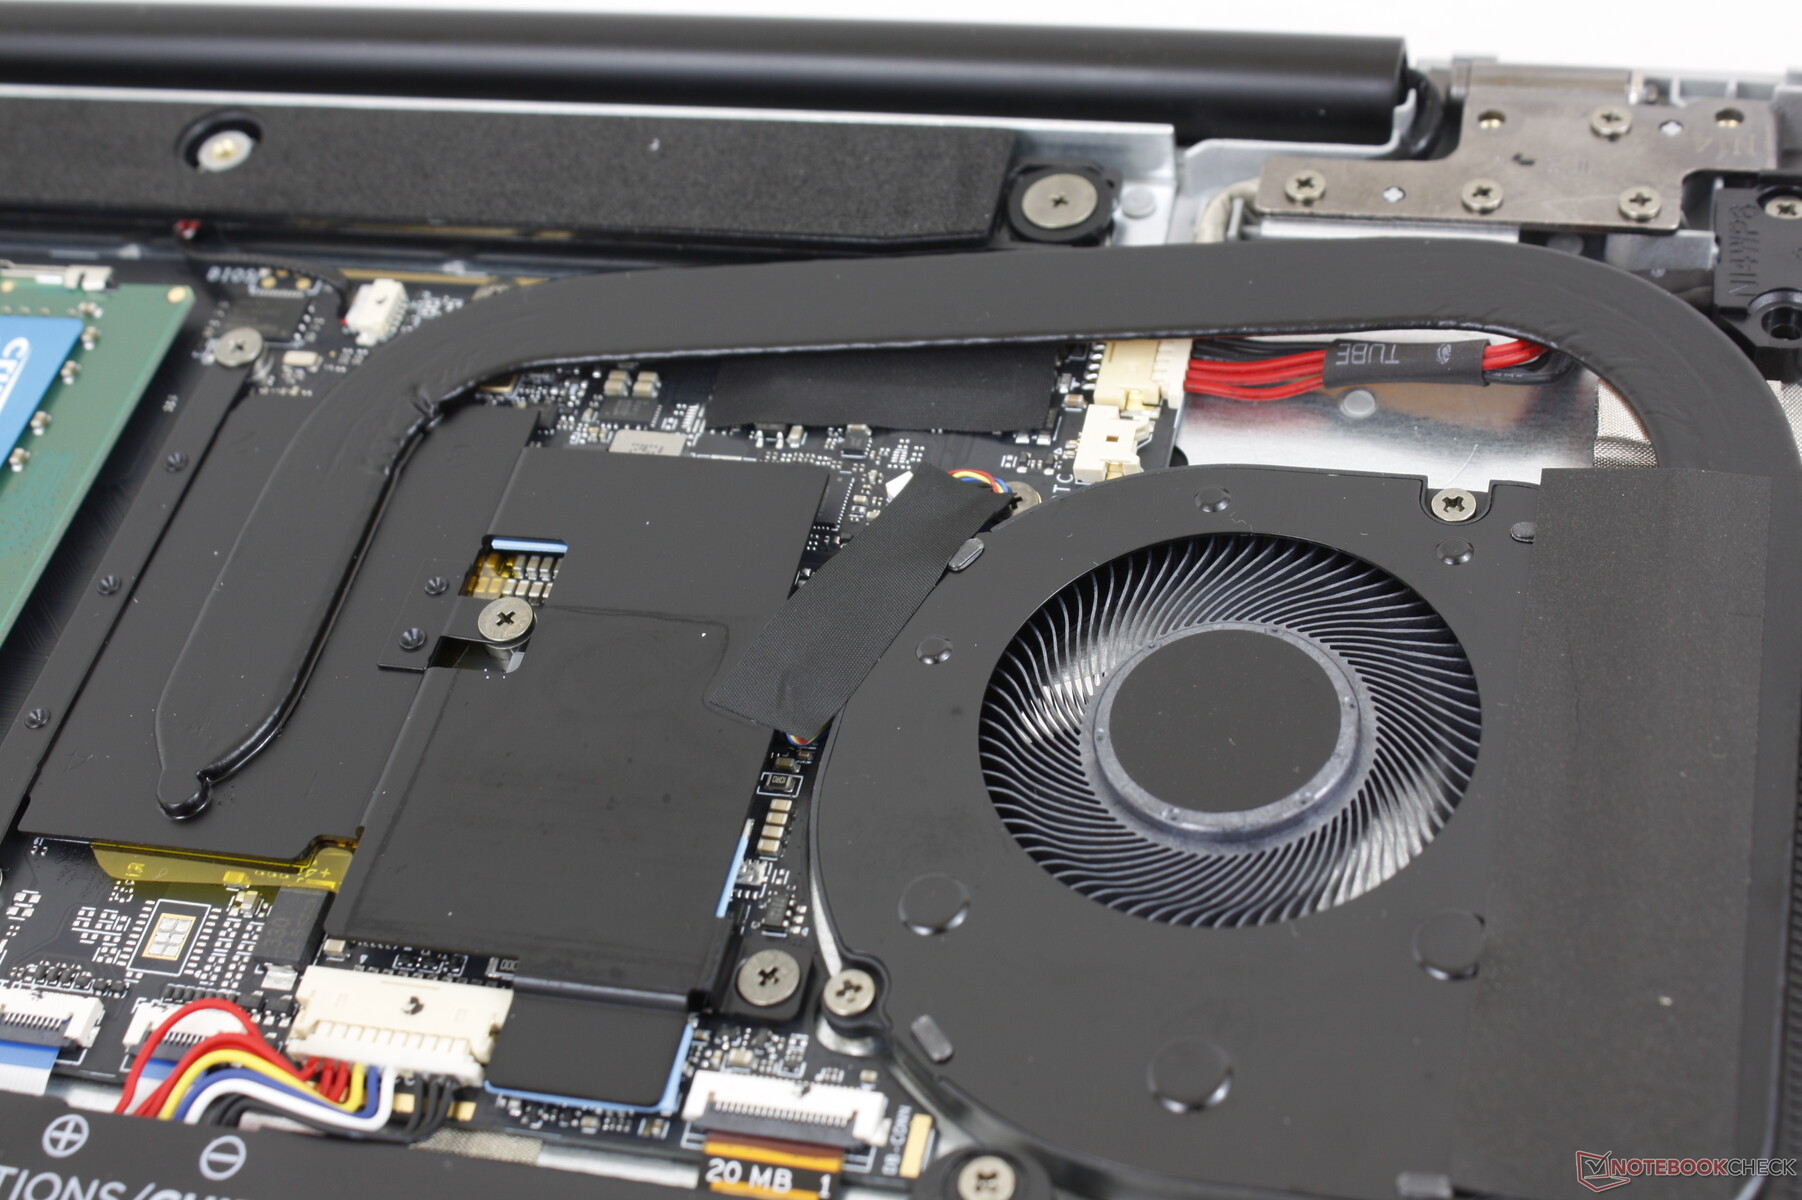
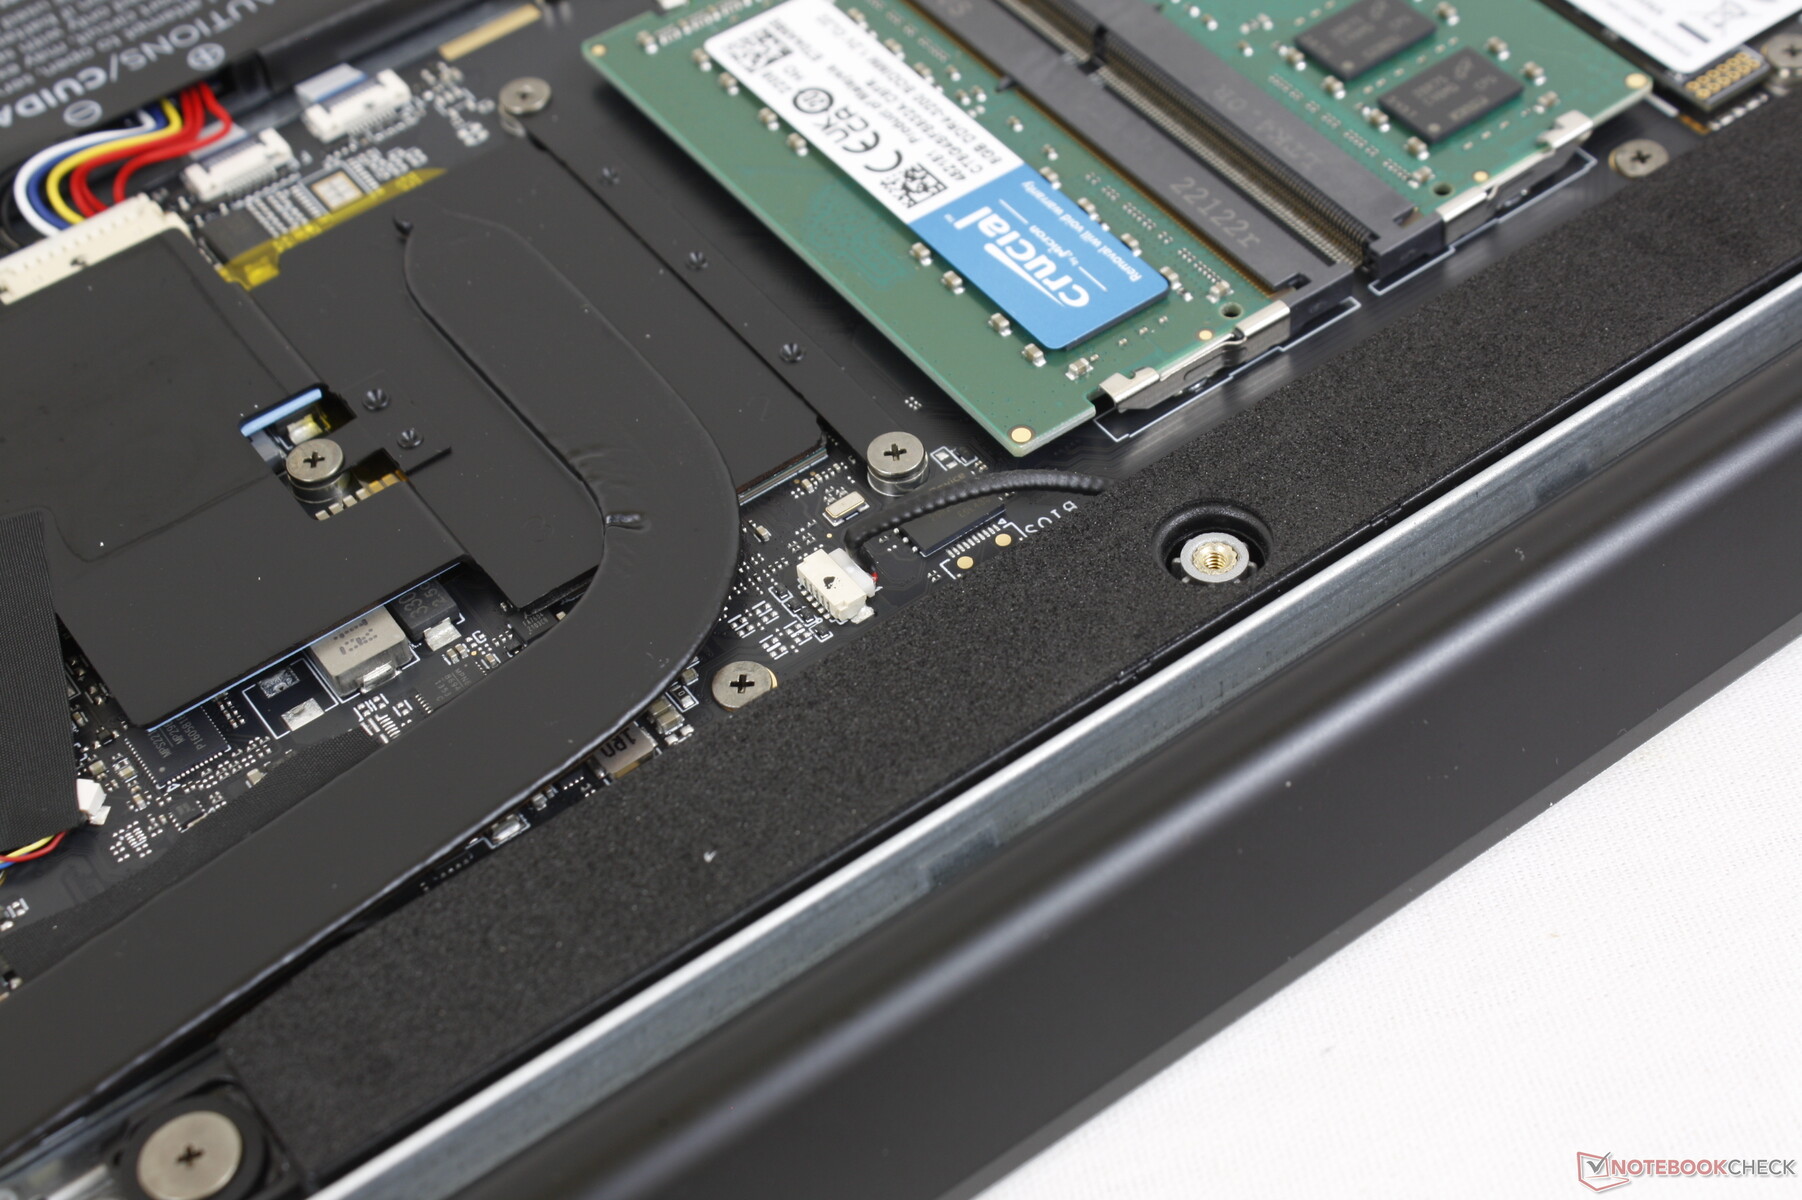
Maintenance
The bottom panel is secured by 15 Philips screws. While the screws themselves are easy to remove, the panel is actually very difficult as one of its corners can easily become stuck to the RJ-45 port. It's a poor design that makes simple upgrades like RAM or storage much harder than it should be.
Accessories and Warranty
There are no extras in the box other than the AC adapter and paperwork. A standard one-year limited warranty applies if purchased in the US.
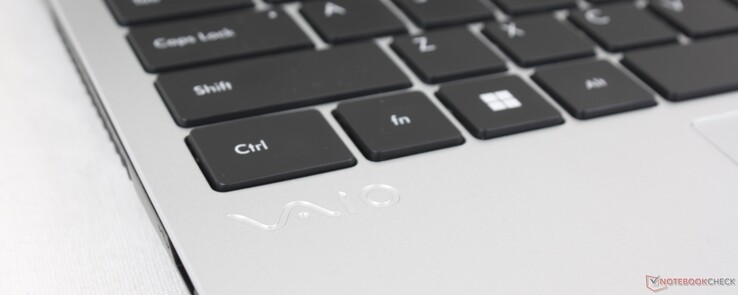
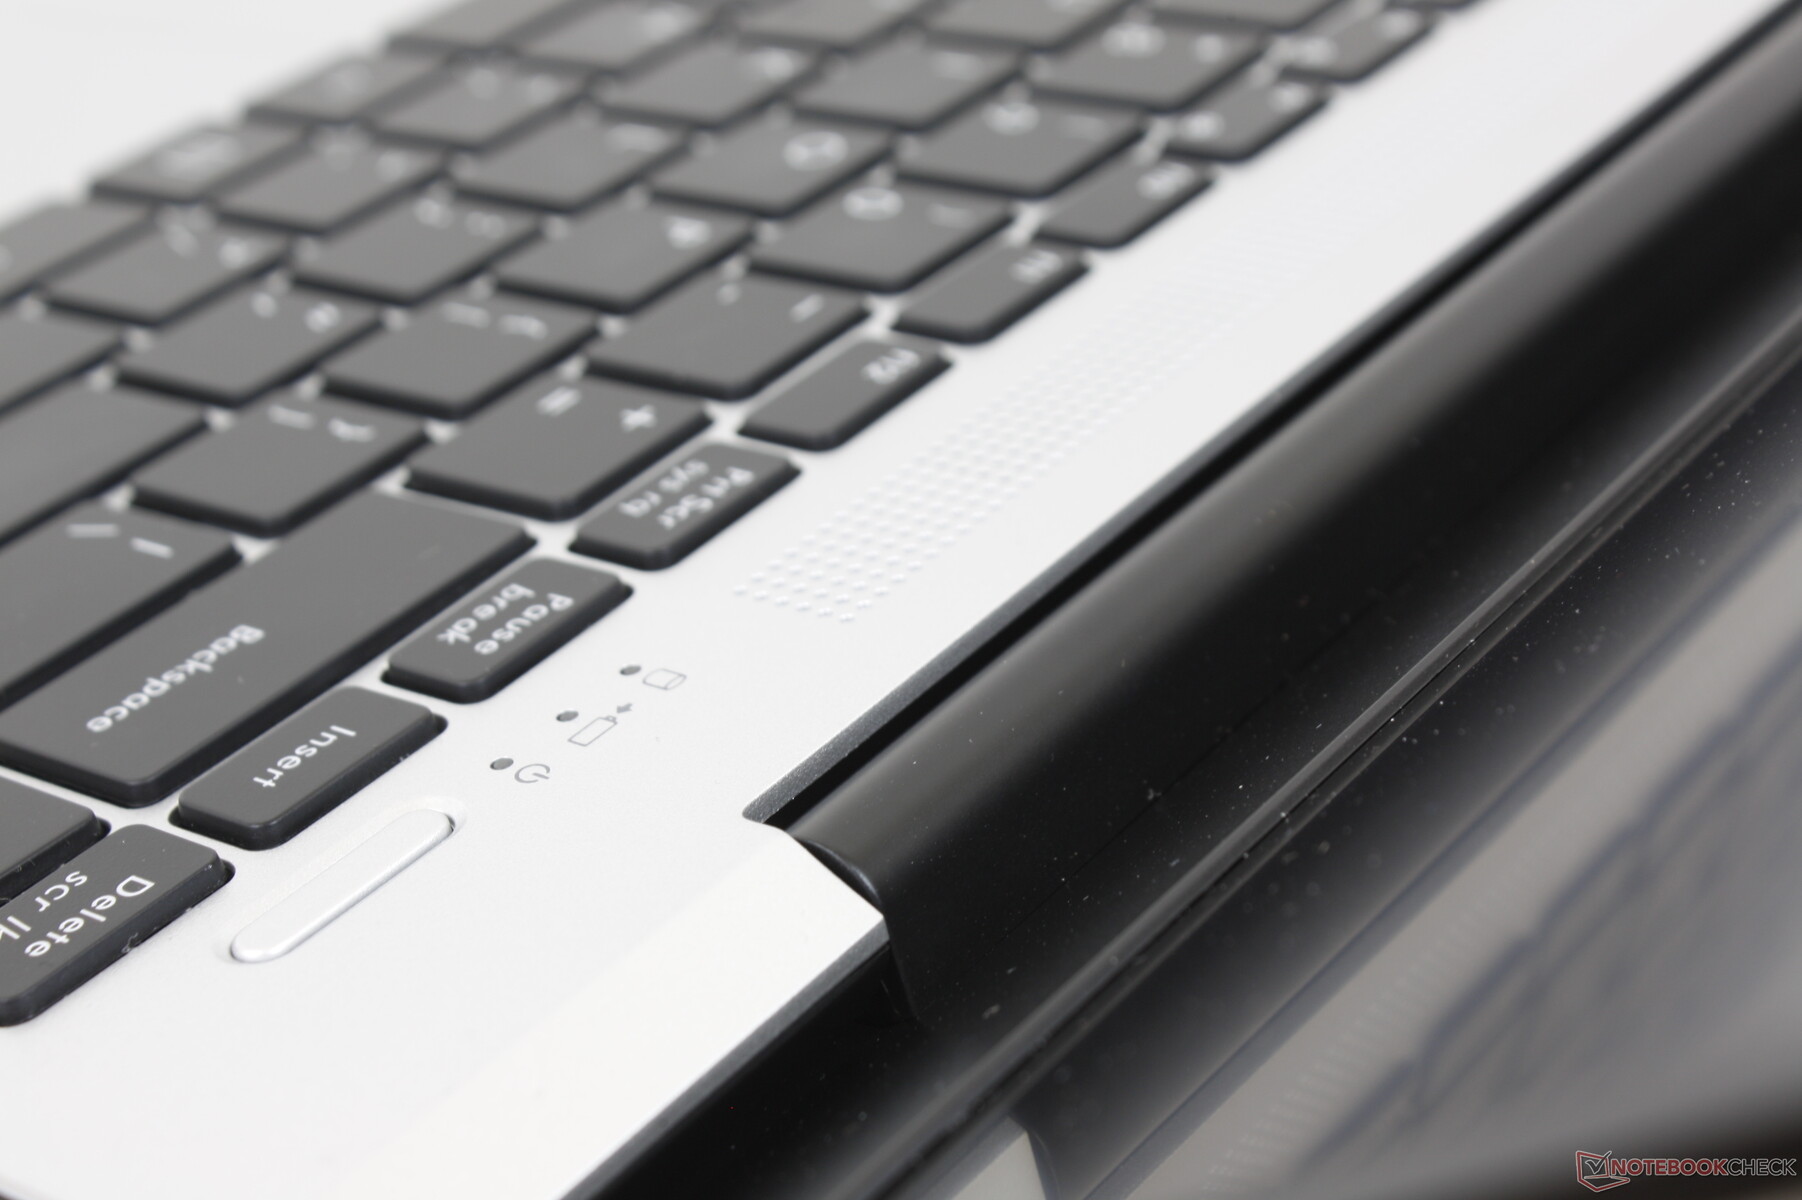
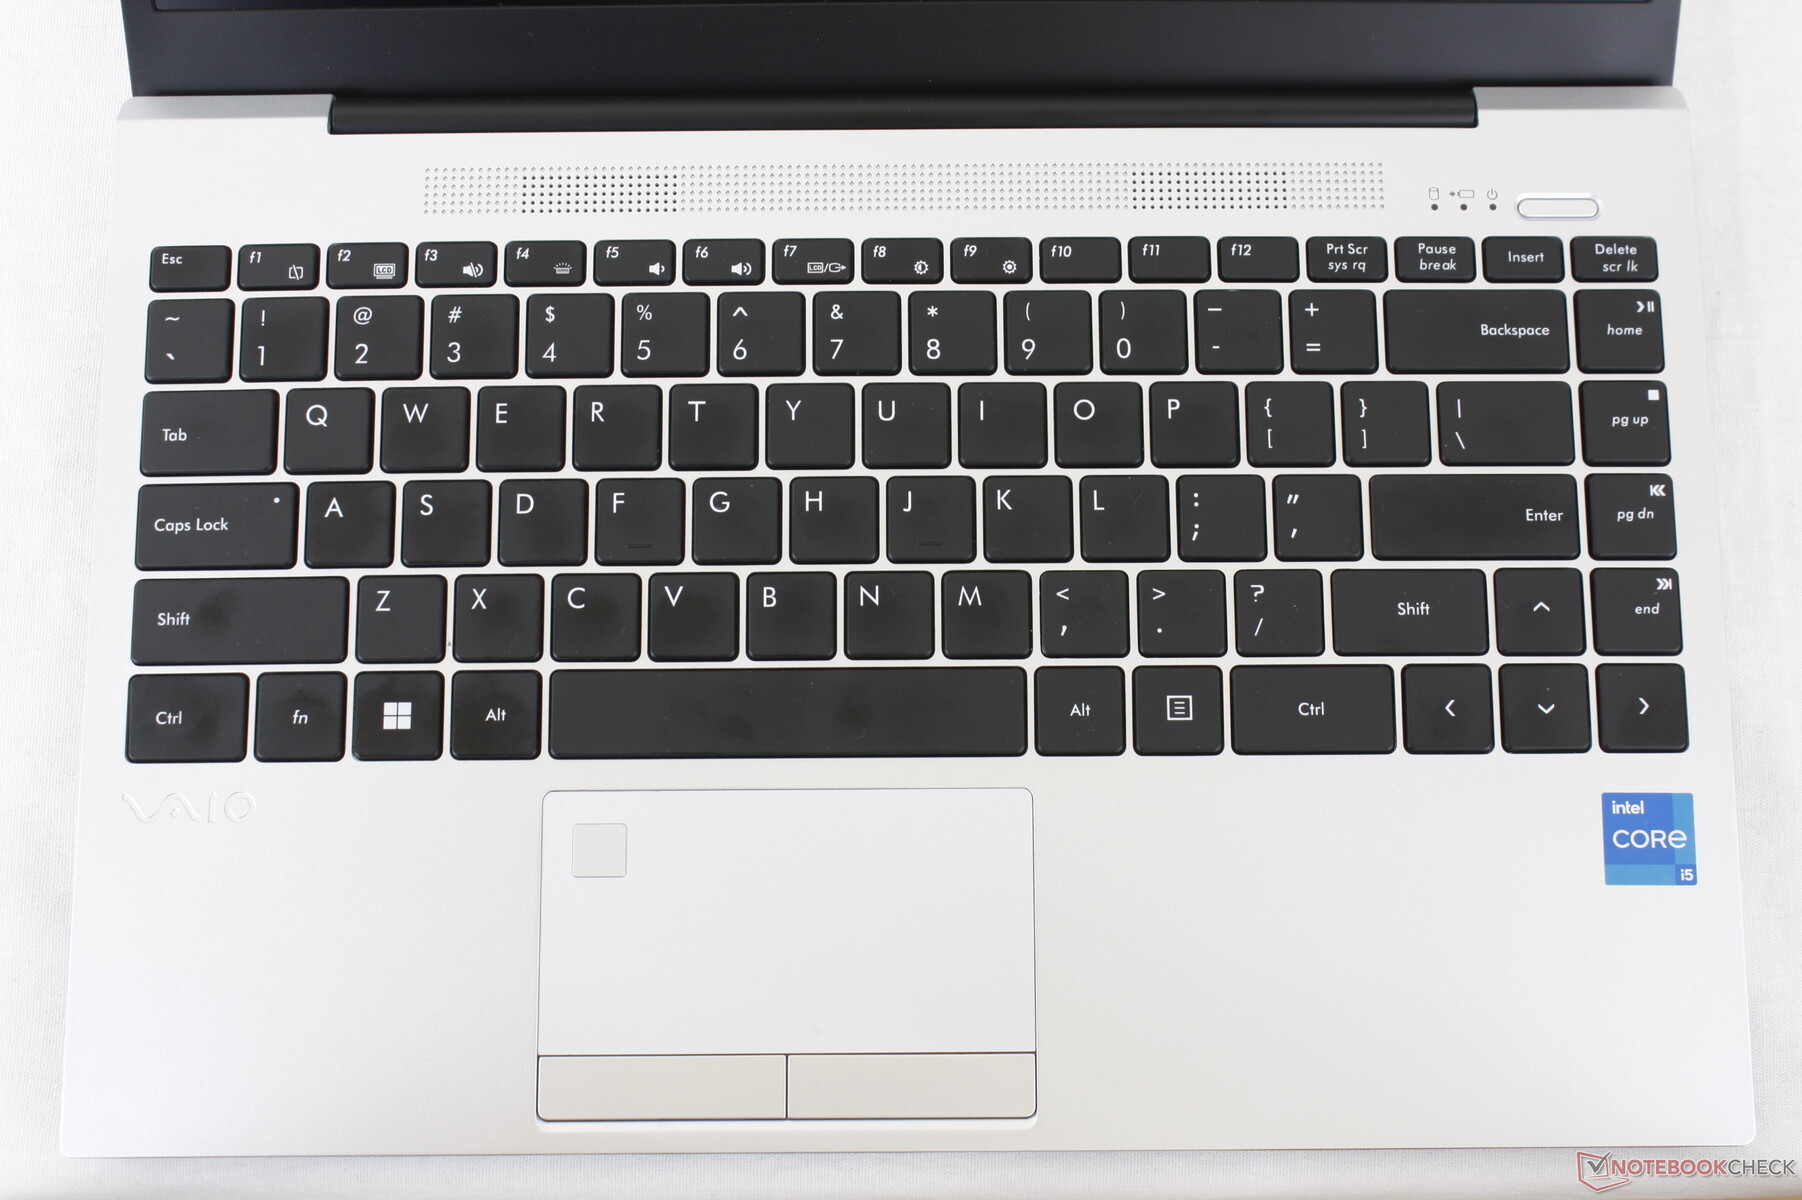
Input Devices — Surprisingly Comfortable
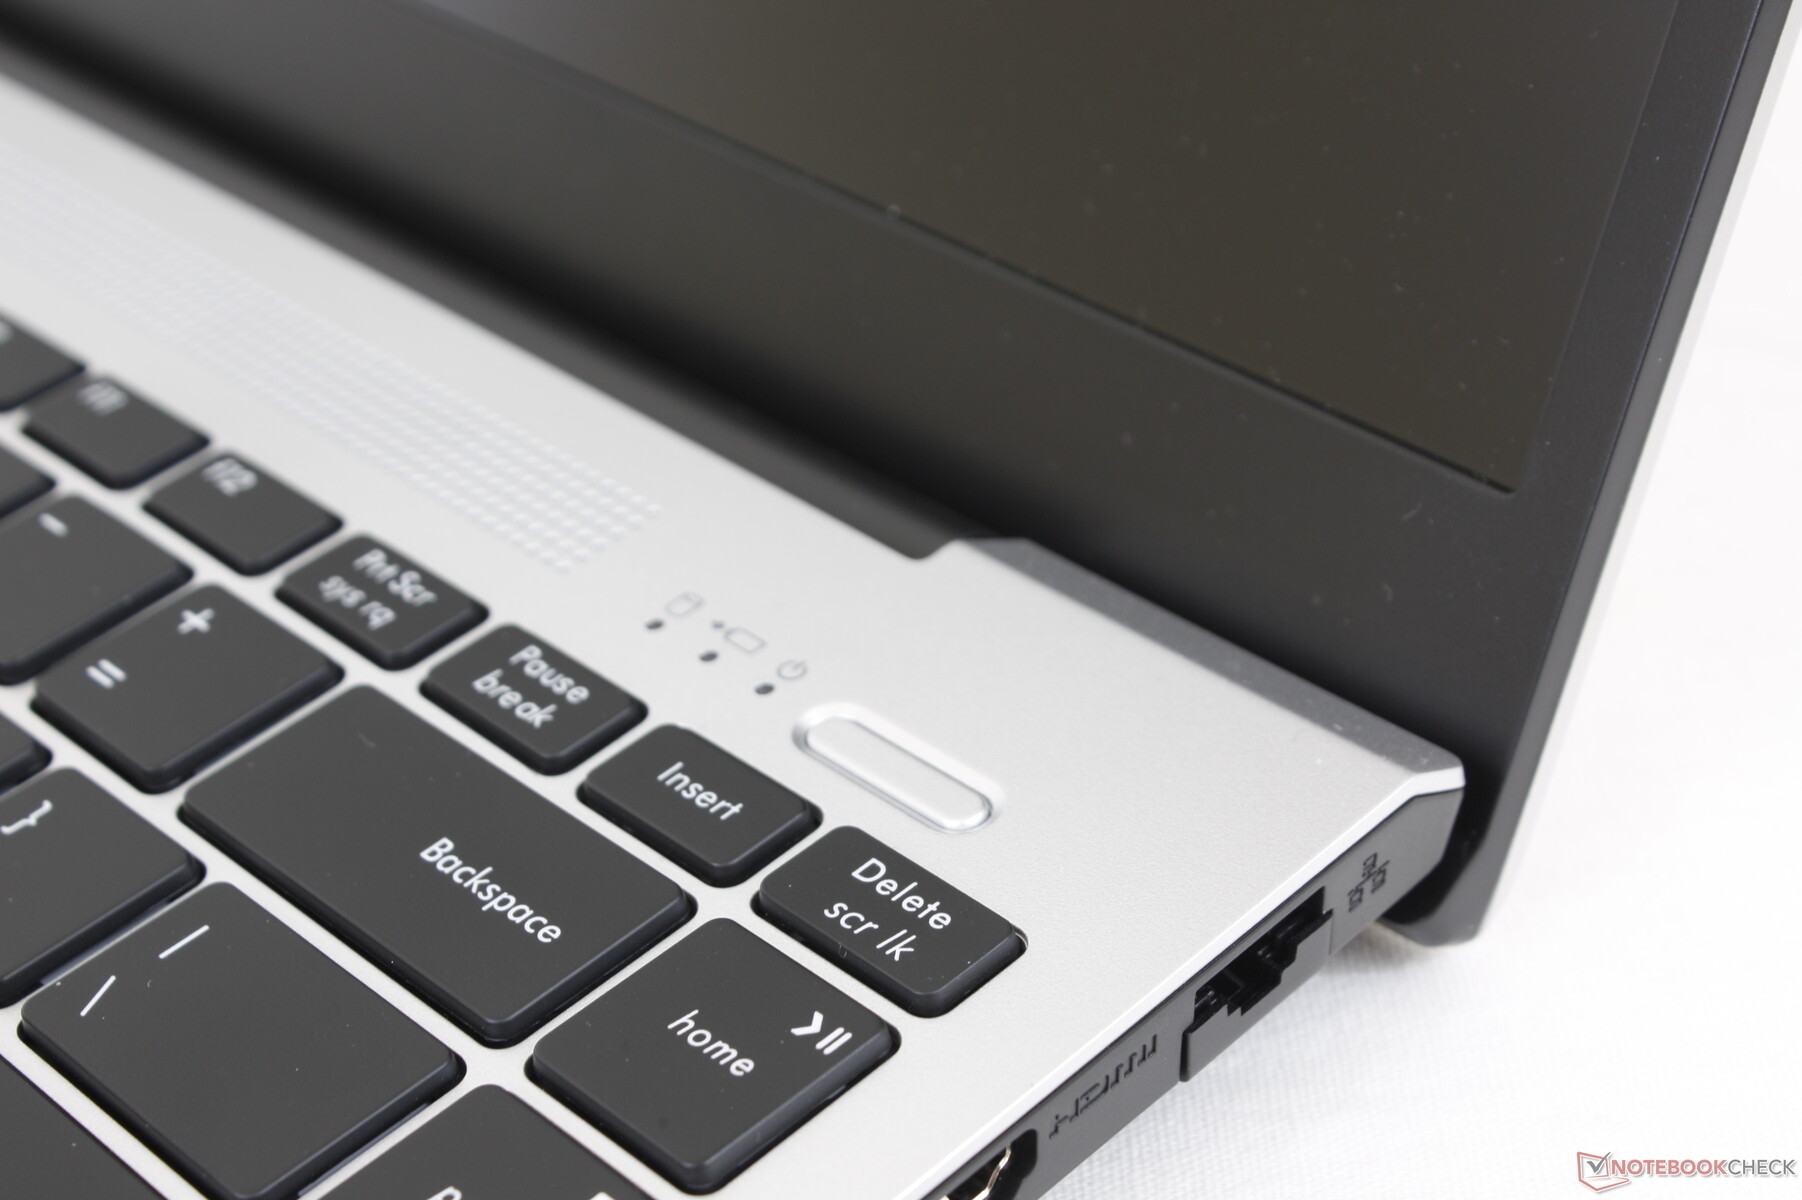
Keyboard
We find the typing experience to be excellent as the keys have a sharp, uniform feedback that's stronger than on most other budget to midrange Ultrabooks like the Lenovo IdeaPad or Asus VivoBook series. The downside is that clatter is louder and higher-pitched as a direct result of having keys that aren't as spongy.
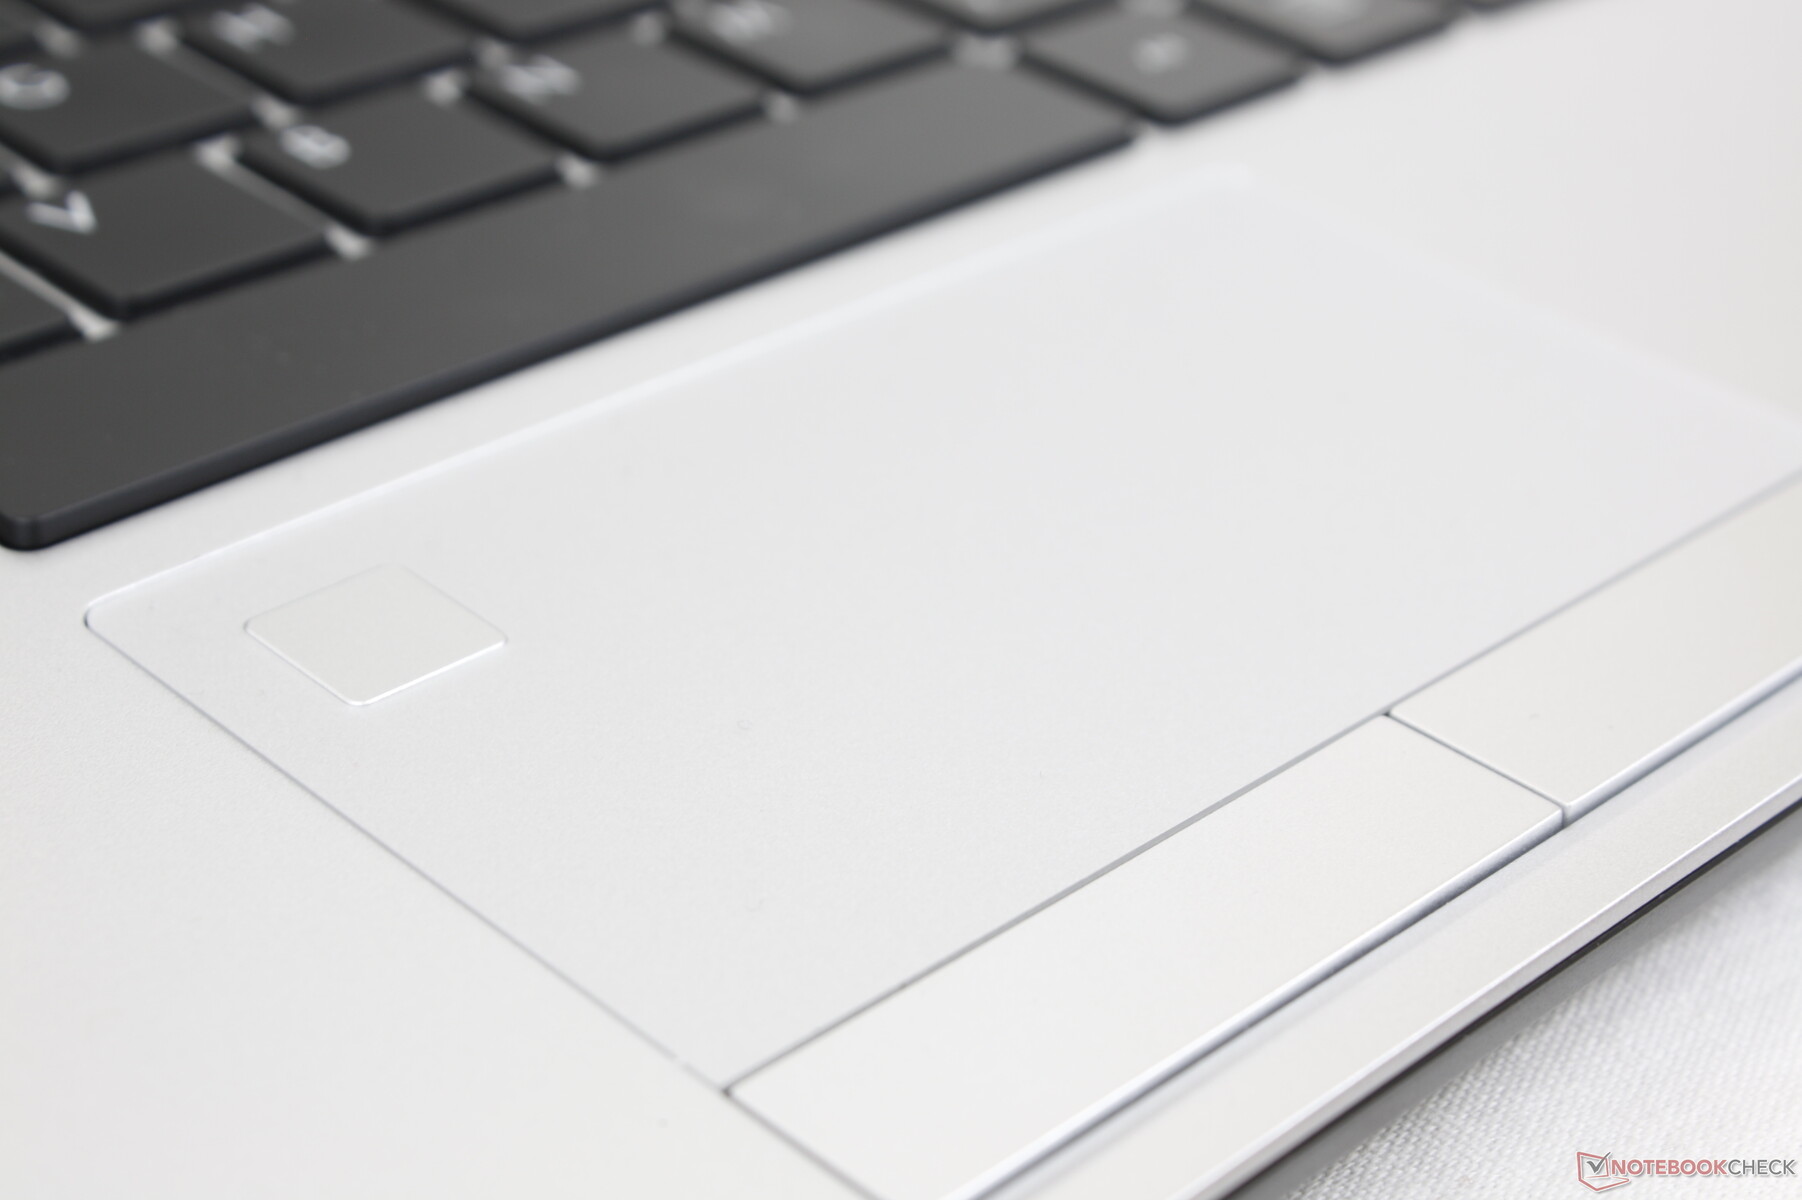
Touchpad
The touchpad is small at just 9.5 x 5 cm compared to 11.5 x 8 cm on the Dell Inspiron 14 7420 2-in-1. Usable surface area for cursor control is even smaller since the top left corner is reserved for the fingerprint reader. Gliding properties are otherwise reliable even if it's slightly stickier than we would like.
The FE14 is one of the few 14-inch laptops to still utilize dedicated mouse buttons which are responsible for the small size of the touchpad. Feedback is clicky and satisfying for easier drag-and-drop actions compared to most other touchpads with no dedicated mouse buttons. Even so, scrolling and multi-touch inputs feel cramped.


Display — Decent On A Budget
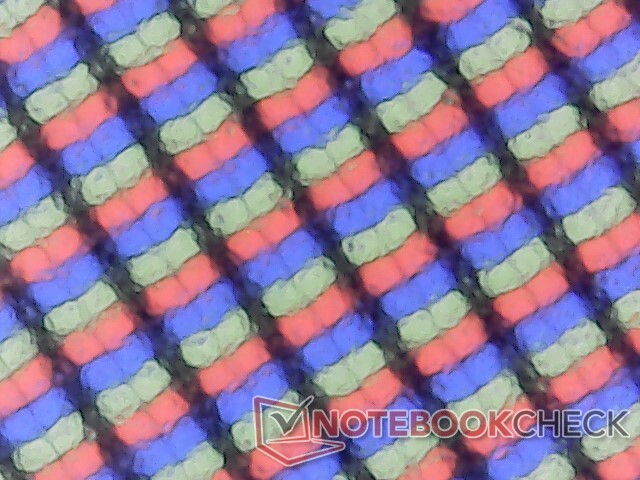
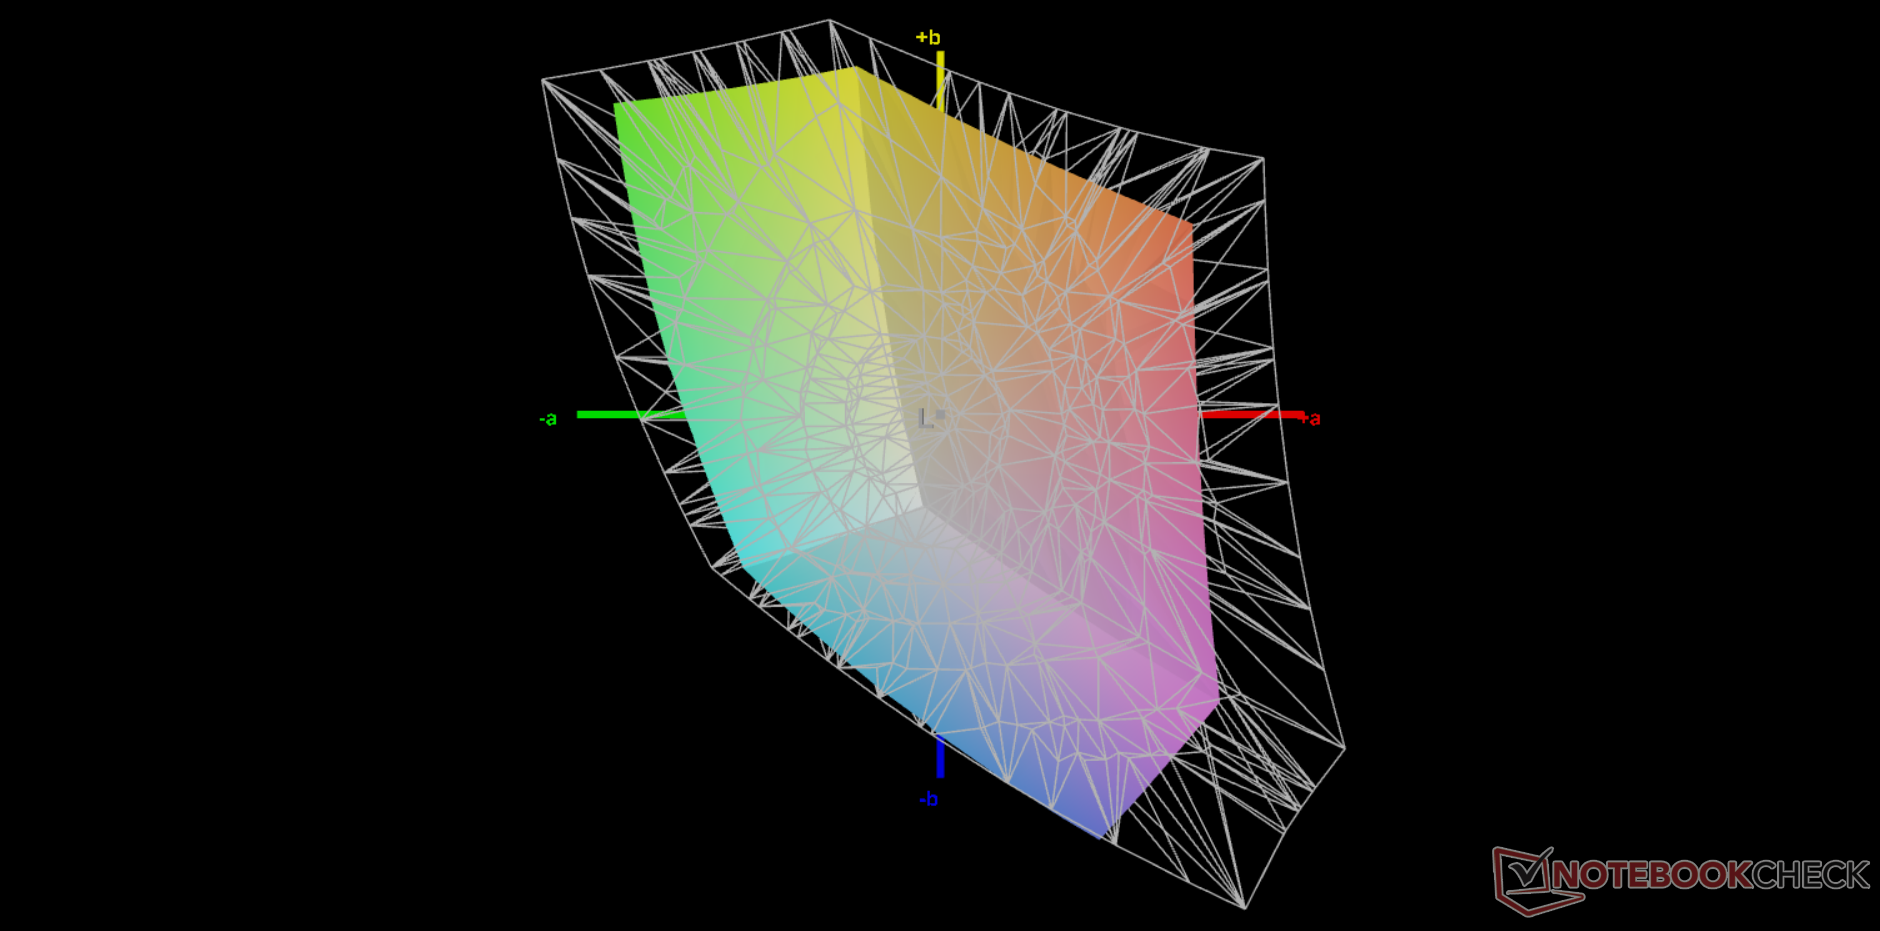
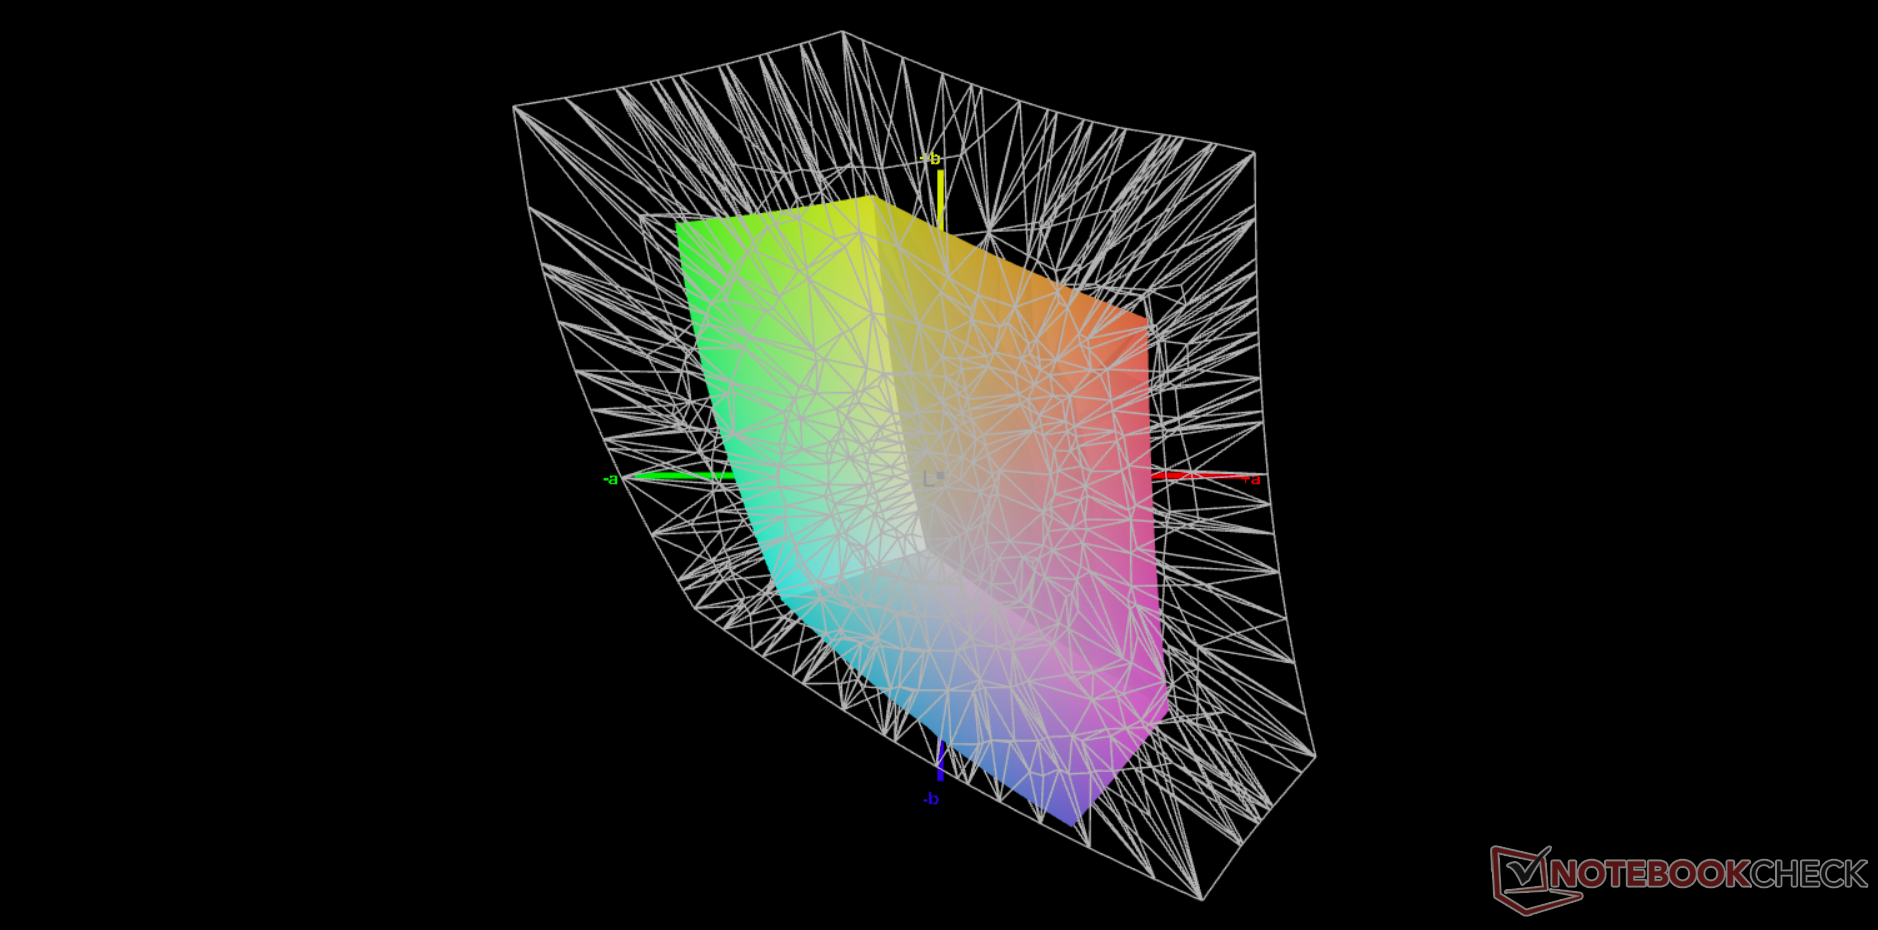
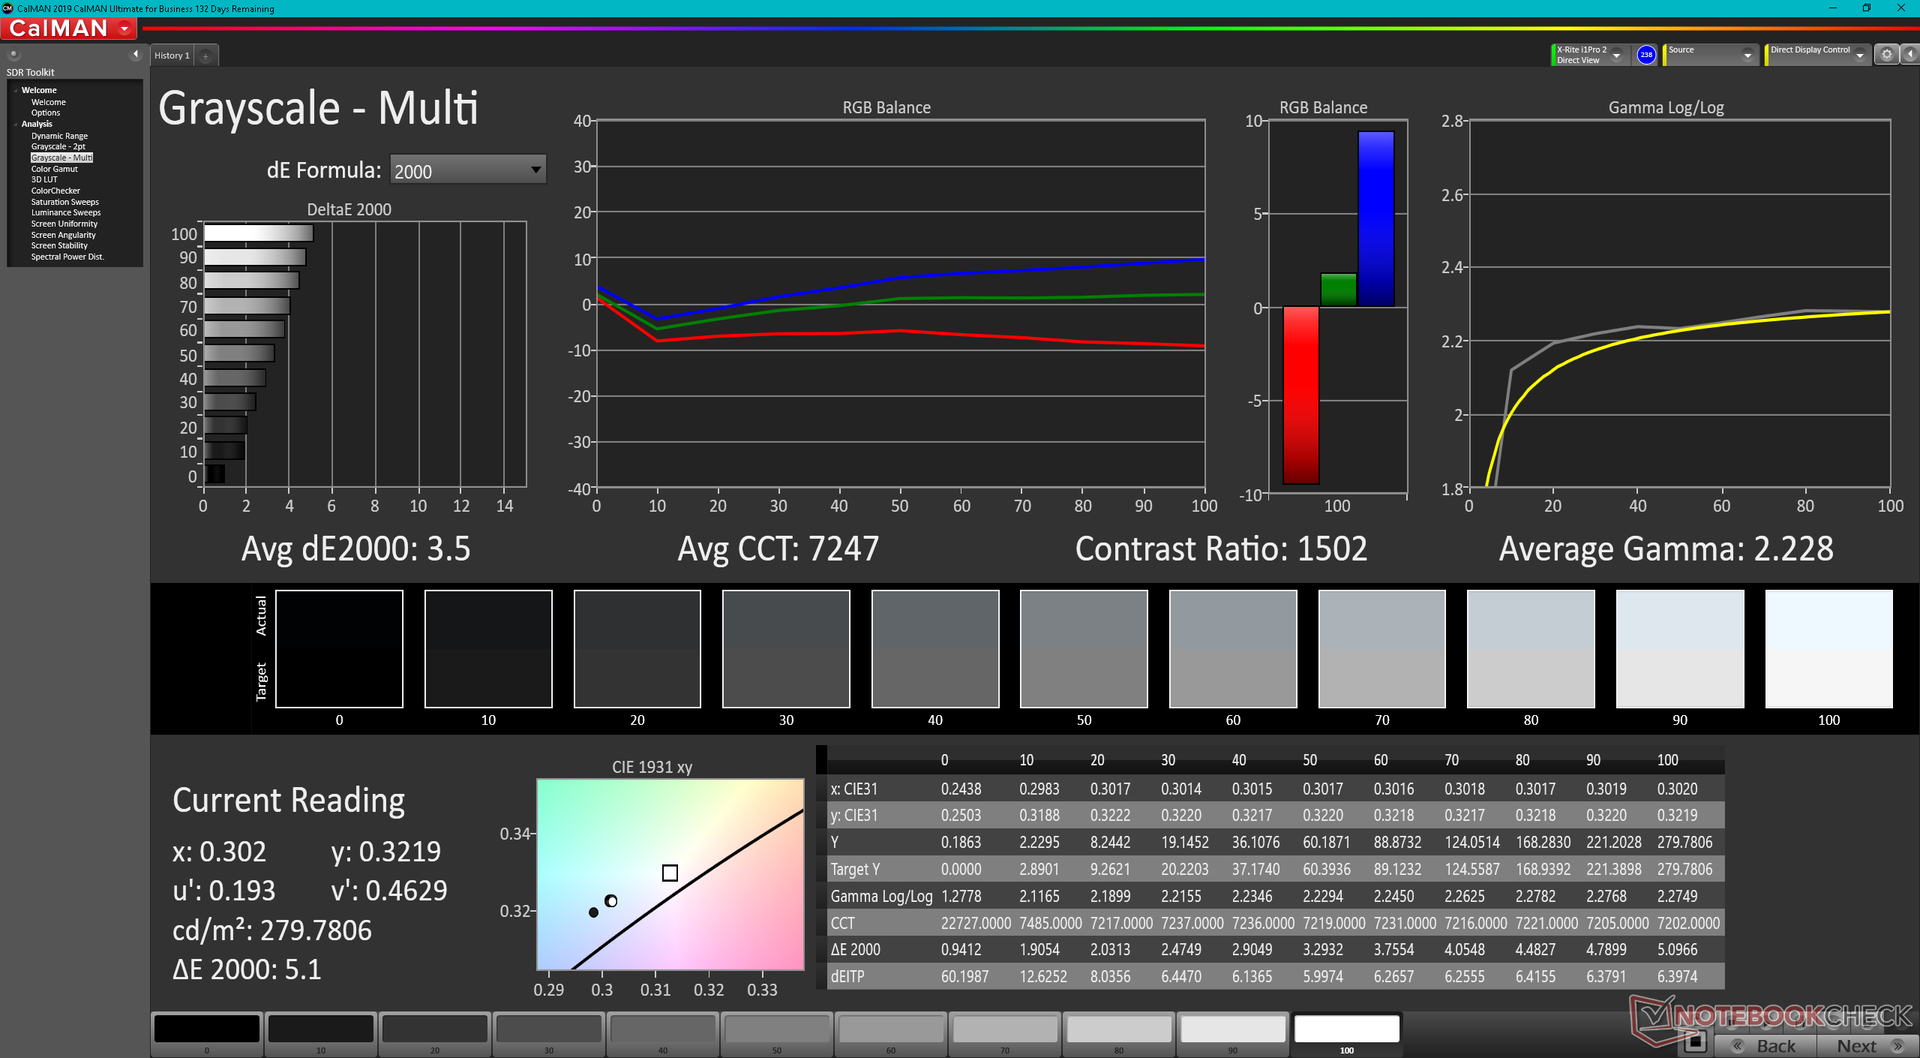
Our Vaio FE14 utilizes a similar IPS panel from Chi Mei as found on the Latitude 14 5420 or Lenovo ThinkBook 14 (N140HCA-EAD vs. N140HCA-EAC). This is a budget panel due to its narrow 69 percent sRGB color space and average response times. Meanwhile, both contrast and brightness are decent relative to other budget to midrange Ultrabooks. Overall picture quality is a step down from what you get on the pricier VAIO SX14, but it's still very good for the price.
| |||||||||||||||||||||||||
Brightness Distribution: 87 %
Center on Battery: 278.1 cd/m²
Contrast: 1030:1 (Black: 0.27 cd/m²)
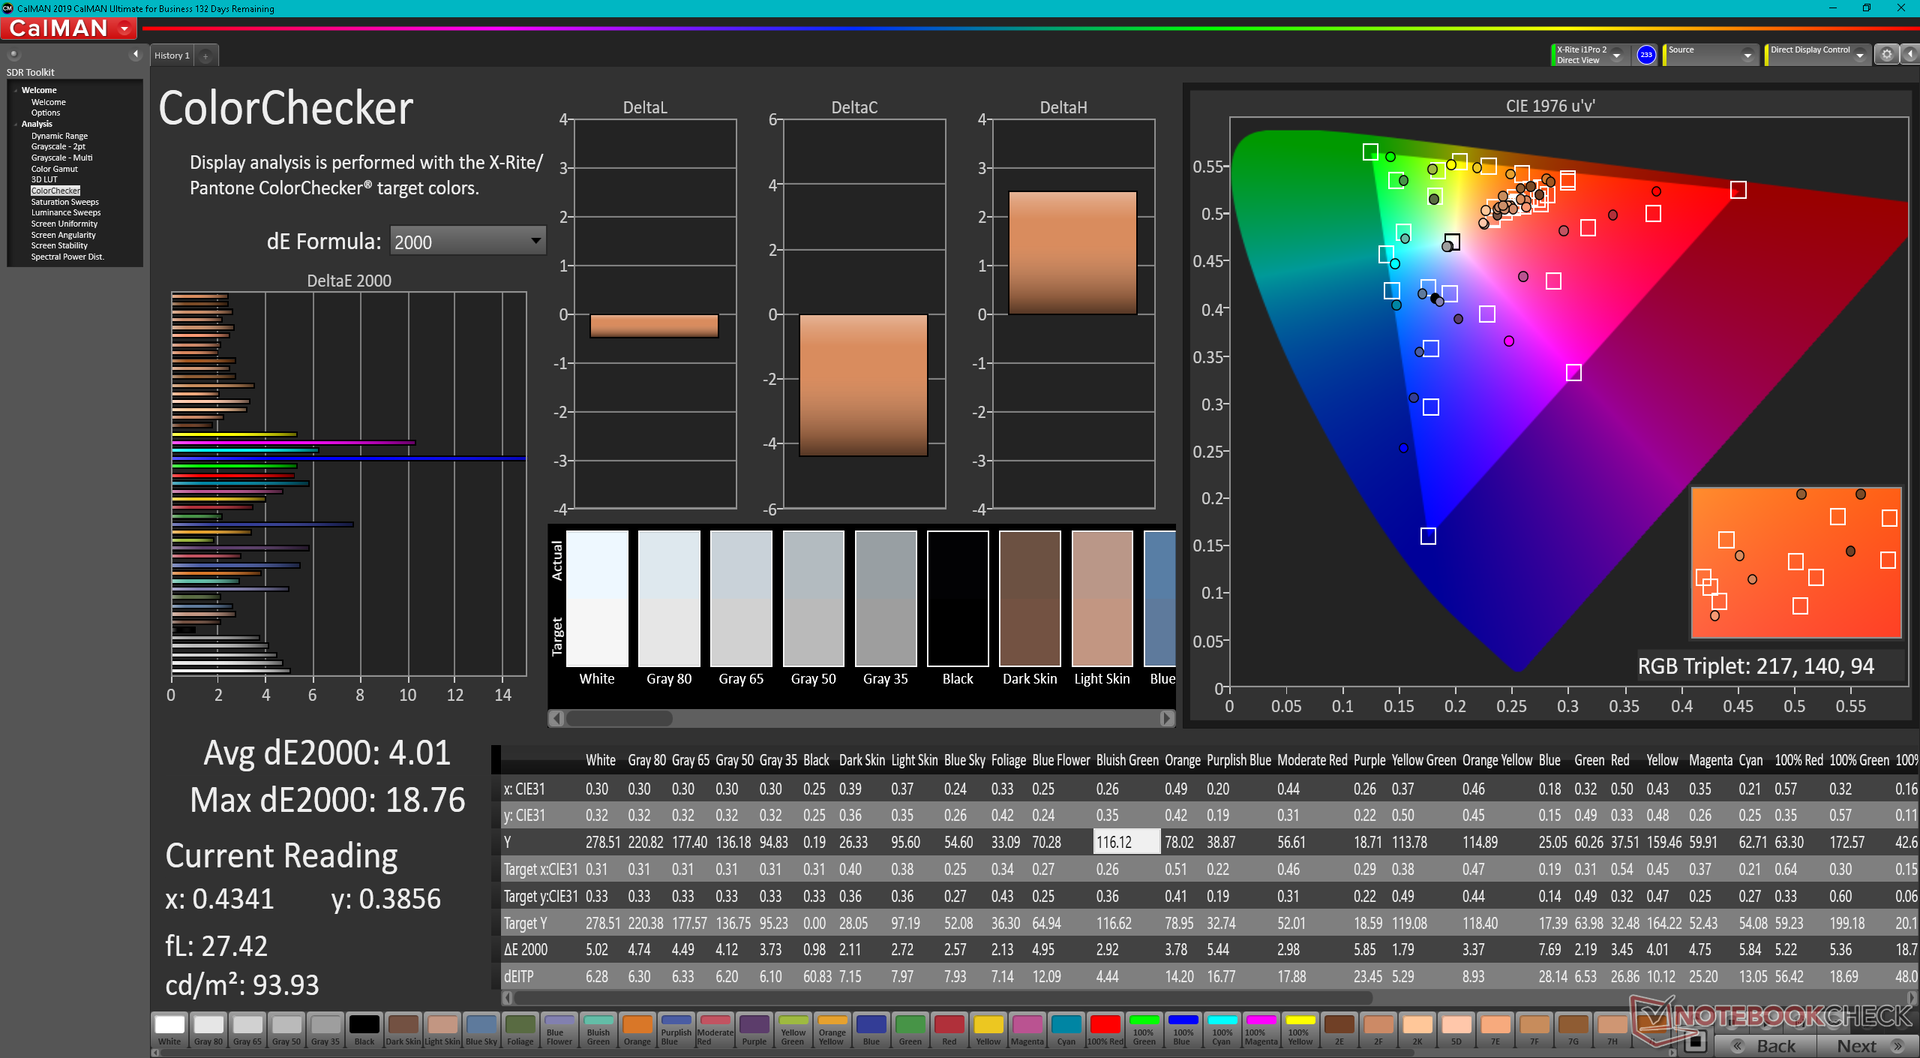
ΔE ColorChecker Calman: 4.01 | ∀{0.5-29.43 Ø4.73}
calibrated: 3.12
ΔE Greyscale Calman: 3.5 | ∀{0.09-98 Ø4.97}
47.2% AdobeRGB 1998 (Argyll 3D)
68.6% sRGB (Argyll 3D)
45.7% Display P3 (Argyll 3D)
Gamma: 2.23
CCT: 7247 K
| VAIO FE 14.1 VWNC51429-SL Chi Mei N140HCA-EAD, IPS, 1920x1080, 14.1" | VAIO SX14 VJS144X0111K Sharp LQ140M1JW55, IPS, 1920x1080, 14" | Gateway Ultra Slim 14.1 GWTC51427 BOE CQ NV140FHM-N48, IPS, 1920x1080, 14.1" | Dell Inspiron 14 7420 2-in-1 BOE NV14N42, IPS, 1920x1200, 14" | Lenovo IdeaPad 3 14ITL6 82H700CCGE AU Optronics B140HAN04.E, IPS, 1920x1080, 14" | Acer Swift 1 SF114-34-P6U1 Chi Mei N140HCA-EAC, IPS, 1920x1080, 14" | |
|---|---|---|---|---|---|---|
| Display | 44% | -9% | -16% | -20% | -9% | |
| Display P3 Coverage (%) | 45.7 | 66.8 46% | 41.4 -9% | 38.6 -16% | 36.6 -20% | 41.4 -9% |
| sRGB Coverage (%) | 68.6 | 97.7 42% | 61.8 -10% | 56.2 -18% | 54.7 -20% | 61.8 -10% |
| AdobeRGB 1998 Coverage (%) | 47.2 | 67.9 44% | 42.8 -9% | 39.9 -15% | 37.8 -20% | 42.9 -9% |
| Response Times | -59% | -10% | 25% | -13% | 24% | |
| Response Time Grey 50% / Grey 80% * (ms) | 34.8 ? | 54 ? -55% | 36.4 ? -5% | 27.2 ? 22% | 44 ? -26% | 29 ? 17% |
| Response Time Black / White * (ms) | 28.4 ? | 46.4 ? -63% | 32.4 ? -14% | 20.8 ? 27% | 28 ? 1% | 20 ? 30% |
| PWM Frequency (Hz) | 25250 ? | 25000 ? | ||||
| Screen | 35% | -16% | -23% | -15% | -3% | |
| Brightness middle (cd/m²) | 278.1 | 373.4 34% | 213.9 -23% | 269.4 -3% | 368 32% | 295 6% |
| Brightness (cd/m²) | 256 | 376 47% | 208 -19% | 260 2% | 332 30% | 265 4% |
| Brightness Distribution (%) | 87 | 88 1% | 82 -6% | 89 2% | 83 -5% | 85 -2% |
| Black Level * (cd/m²) | 0.27 | 0.23 15% | 0.21 22% | 0.41 -52% | 0.47 -74% | 0.31 -15% |
| Contrast (:1) | 1030 | 1623 58% | 1019 -1% | 657 -36% | 783 -24% | 952 -8% |
| Colorchecker dE 2000 * | 4.01 | 2.99 25% | 6.97 -74% | 6.53 -63% | 6.14 -53% | 5.43 -35% |
| Colorchecker dE 2000 max. * | 18.76 | 5.29 72% | 18.69 -0% | 19.76 -5% | 17.76 5% | 9.51 49% |
| Colorchecker dE 2000 calibrated * | 3.12 | 0.49 84% | 2 36% | 3.13 -0% | ||
| Greyscale dE 2000 * | 3.5 | 4.3 -23% | 6.2 -77% | 5.4 -54% | 4.44 -27% | 4.19 -20% |
| Gamma | 2.23 99% | 2.02 109% | 2.16 102% | 2.05 107% | 2.73 81% | 2.11 104% |
| CCT | 7247 90% | 6537 99% | 8084 80% | 6007 108% | 5979 109% | 7084 92% |
| Total Average (Program / Settings) | 7% /
23% | -12% /
-14% | -5% /
-15% | -16% /
-15% | 4% /
-0% |
* ... smaller is better
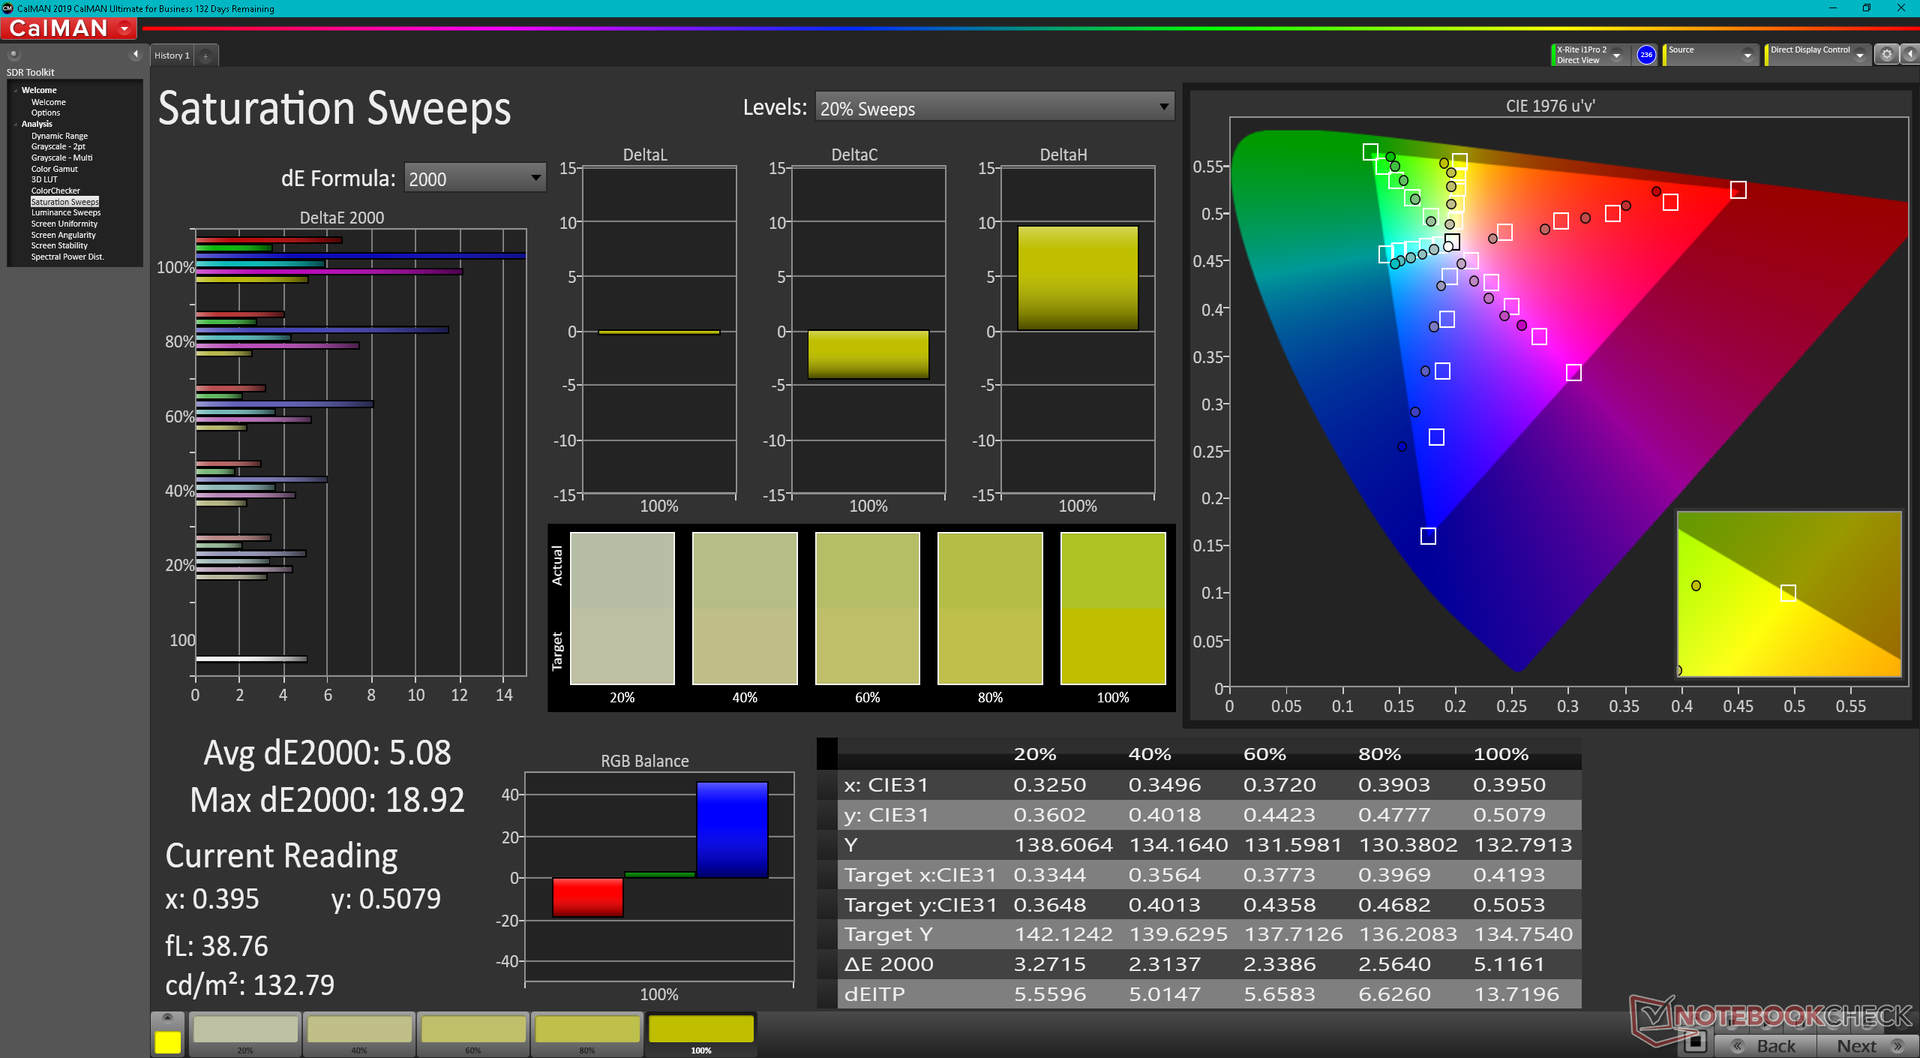
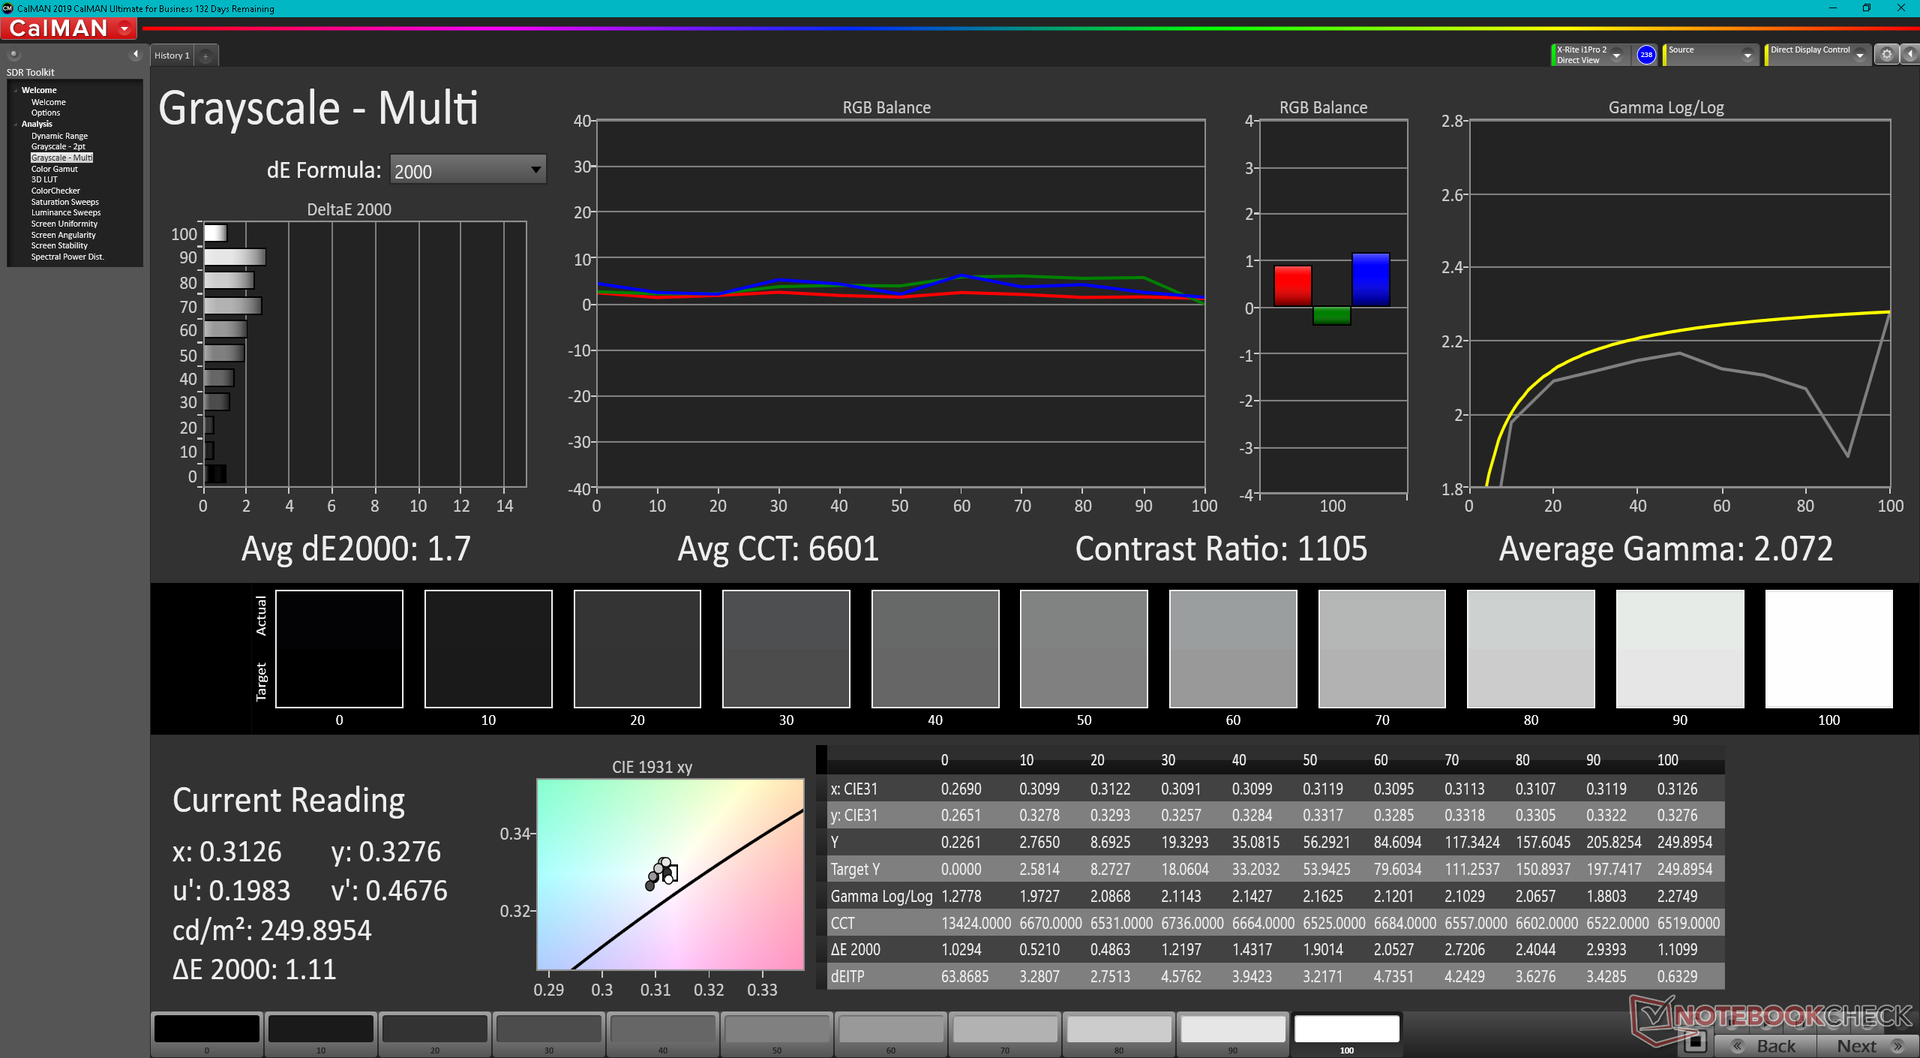
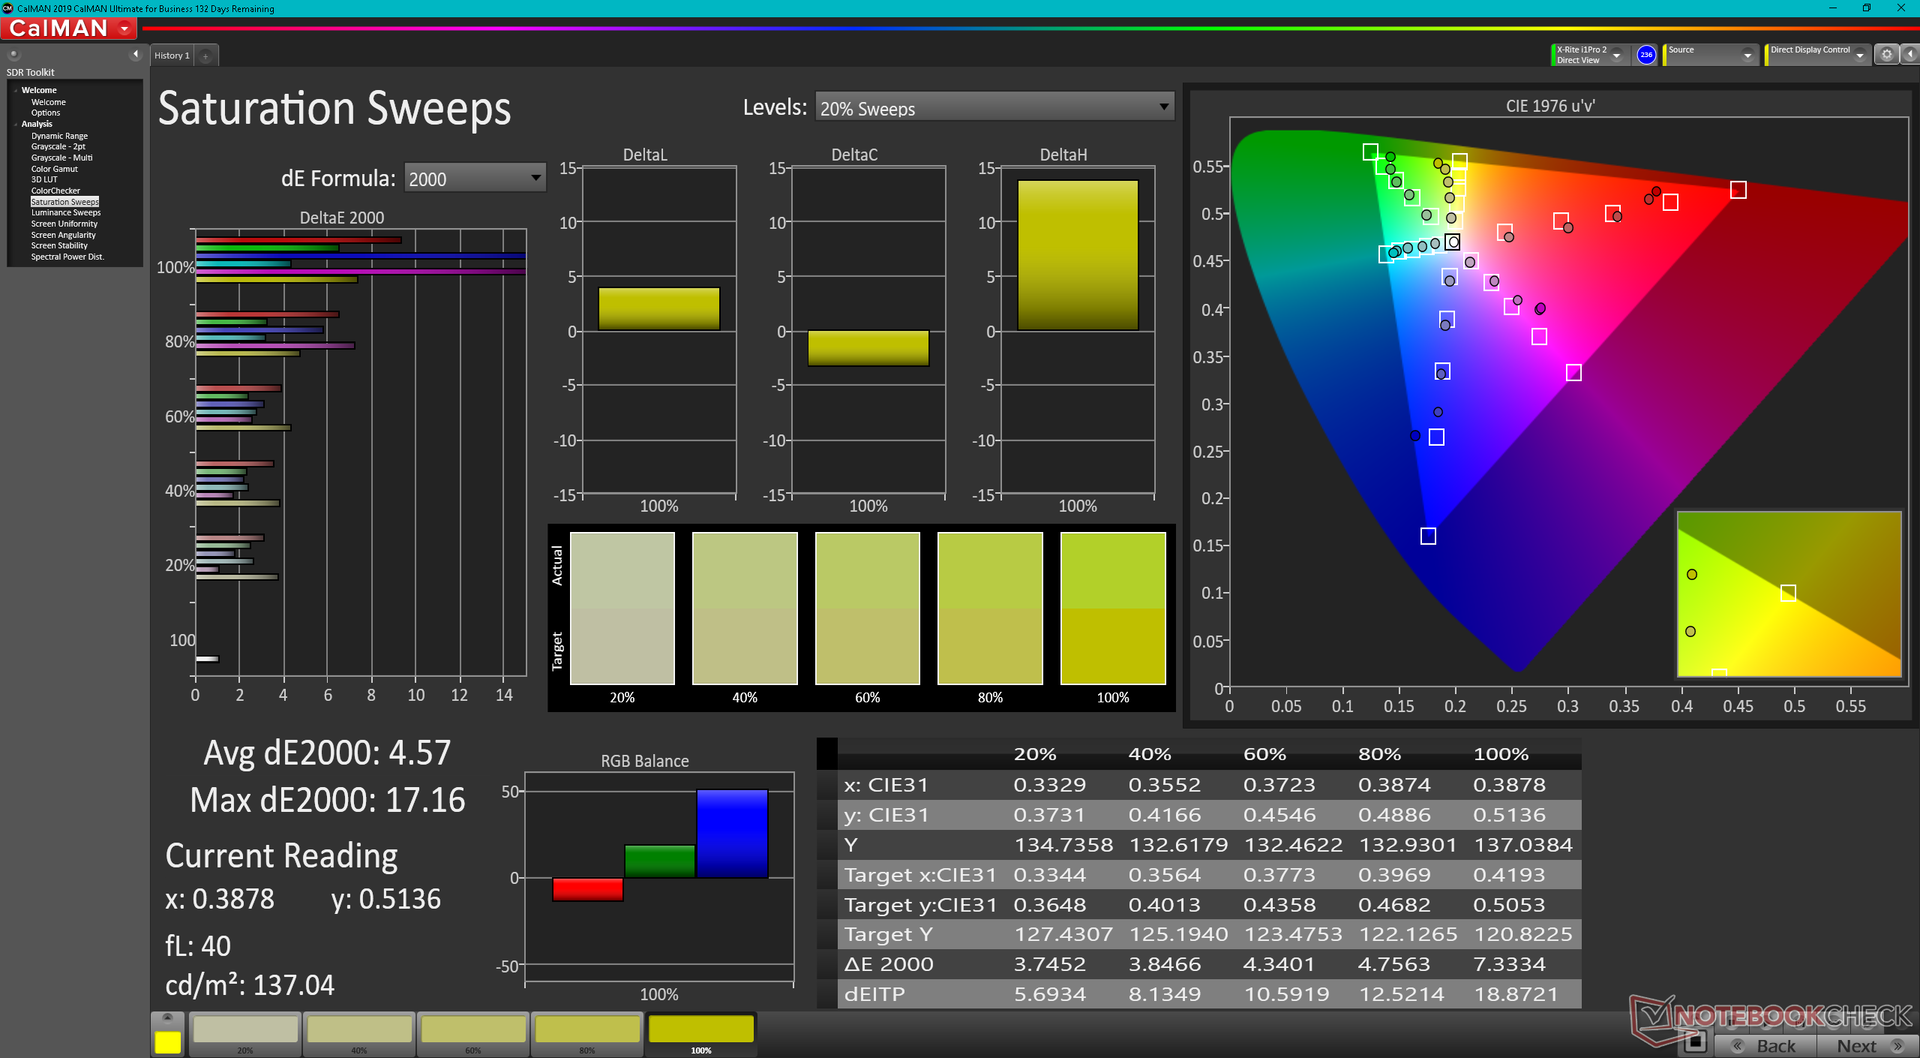
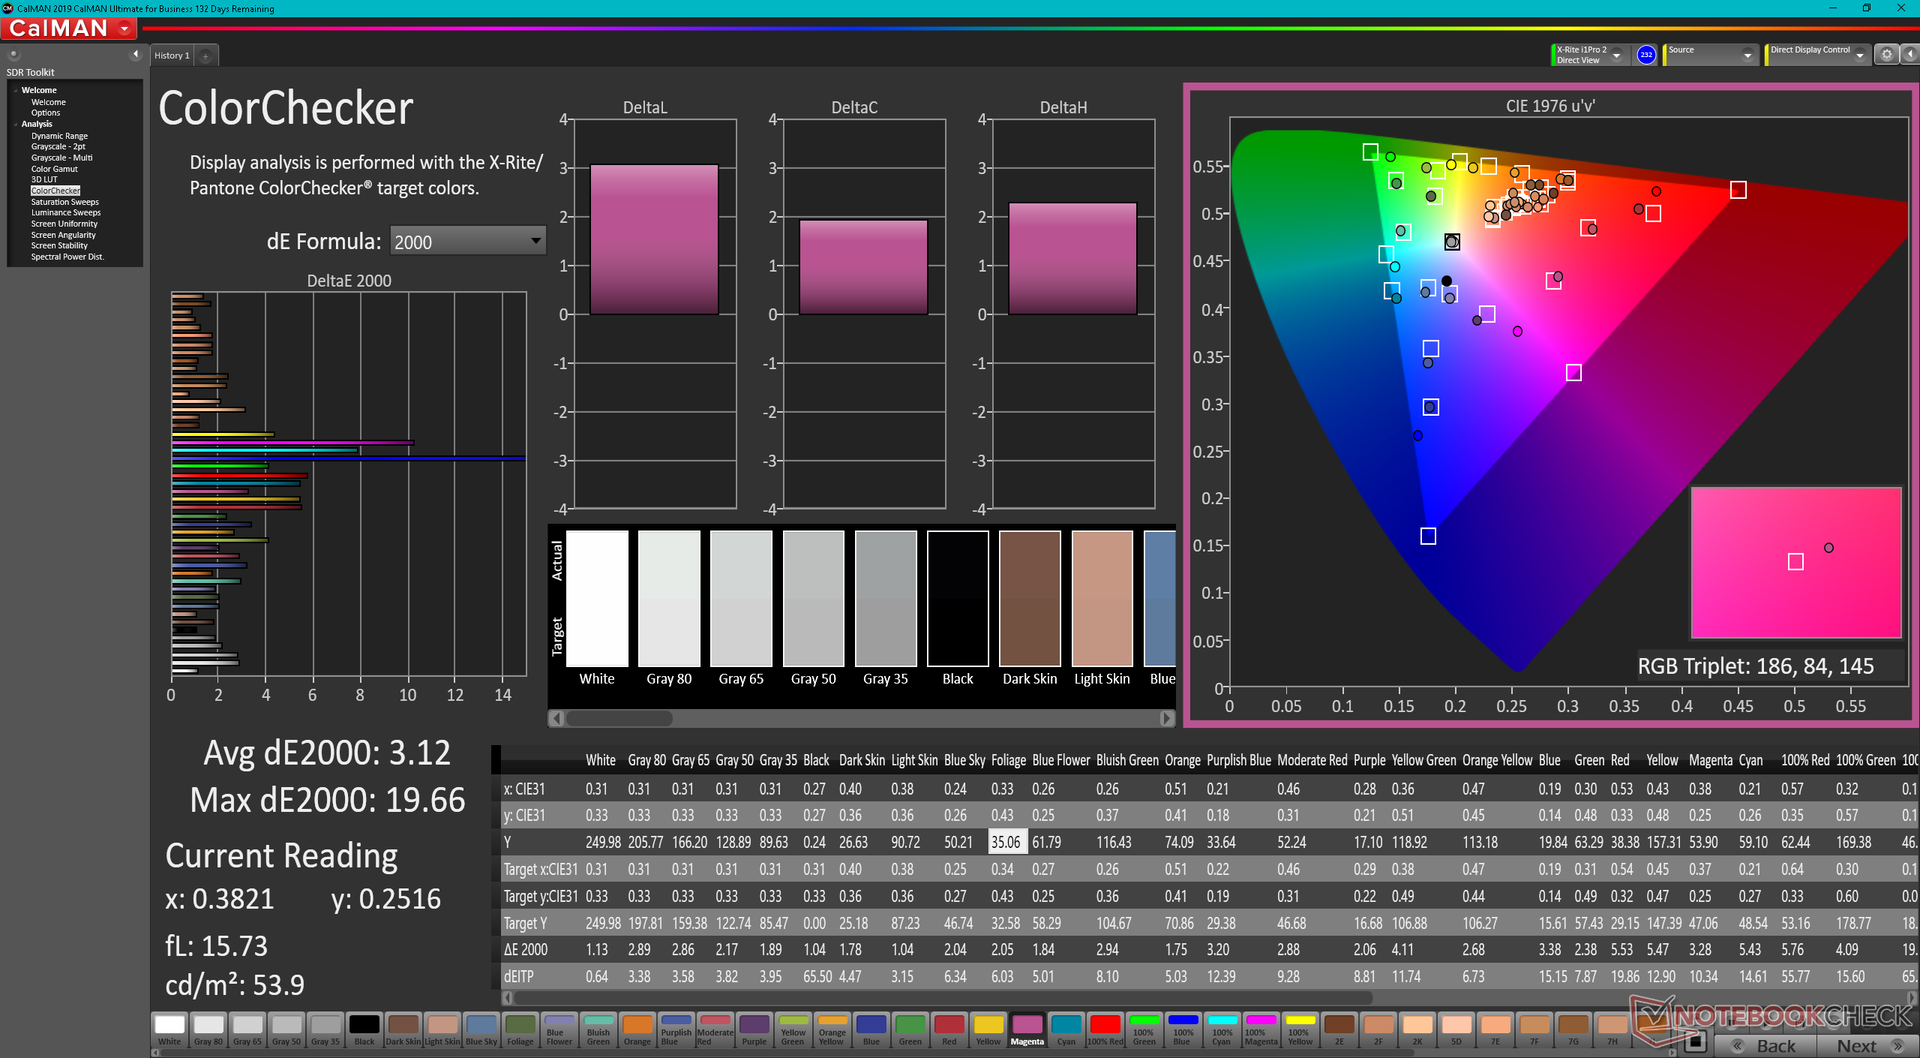
Color temperature is slightly too cool at ~7200 leading to higher average DeltaE values. Once properly calibrated, average grayscale and color deltaE values can be as low as 1.7 and 3.12, respectively. Blue and magenta colors are significantly more inaccurate than the other tested colors as shown by our CalMAN measurements below.
Display Response Times
| ↔ Response Time Black to White | ||
|---|---|---|
| 28.4 ms ... rise ↗ and fall ↘ combined | ↗ 16.4 ms rise | 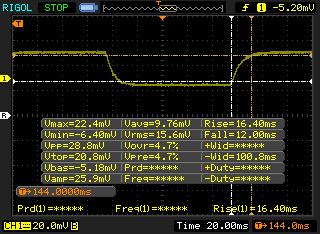 |
| ↘ 12 ms fall | ||
| The screen shows relatively slow response rates in our tests and may be too slow for gamers. In comparison, all tested devices range from 0.1 (minimum) to 240 (maximum) ms. » 75 % of all devices are better. This means that the measured response time is worse than the average of all tested devices (19.9 ms). | ||
| ↔ Response Time 50% Grey to 80% Grey | ||
| 34.8 ms ... rise ↗ and fall ↘ combined | ↗ 17.6 ms rise | 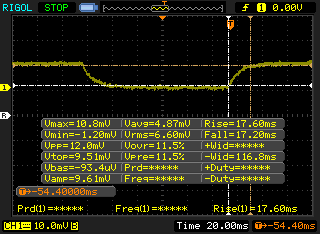 |
| ↘ 17.2 ms fall | ||
| The screen shows slow response rates in our tests and will be unsatisfactory for gamers. In comparison, all tested devices range from 0.165 (minimum) to 636 (maximum) ms. » 48 % of all devices are better. This means that the measured response time is worse than the average of all tested devices (31.1 ms). | ||
Screen Flickering / PWM (Pulse-Width Modulation)
| Screen flickering / PWM detected | 25250 Hz | ≤ 24 % brightness setting |  |
The display backlight flickers at 25250 Hz (worst case, e.g., utilizing PWM) Flickering detected at a brightness setting of 24 % and below. There should be no flickering or PWM above this brightness setting. The frequency of 25250 Hz is quite high, so most users sensitive to PWM should not notice any flickering. In comparison: 52 % of all tested devices do not use PWM to dim the display. If PWM was detected, an average of 7794 (minimum: 5 - maximum: 343500) Hz was measured. | |||

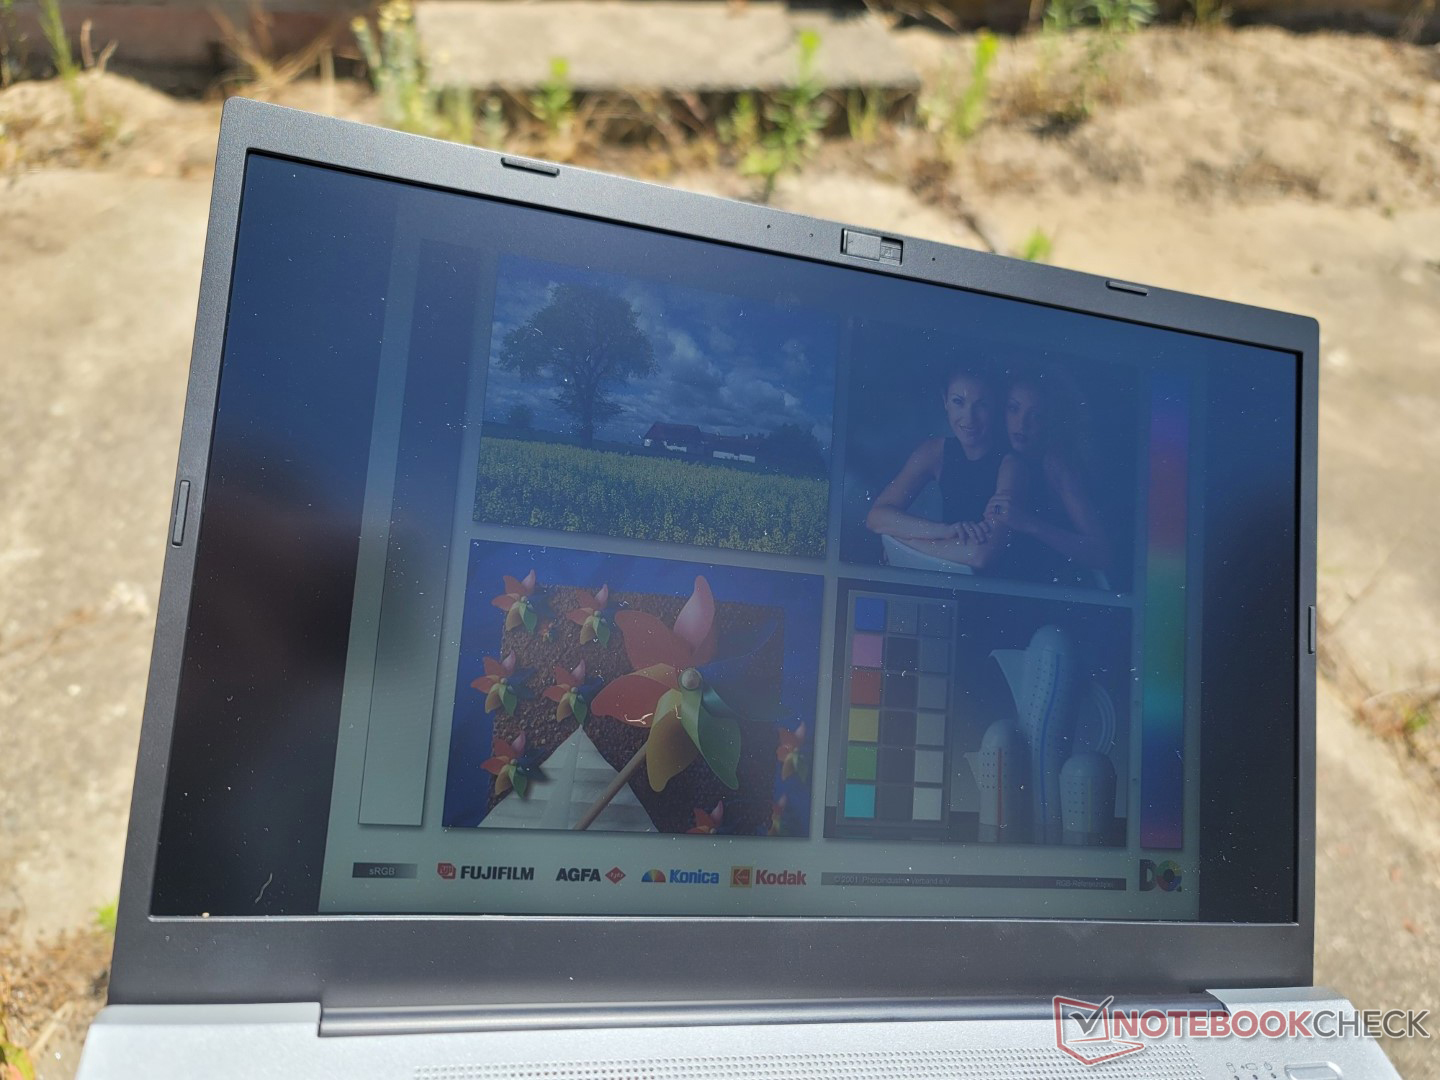
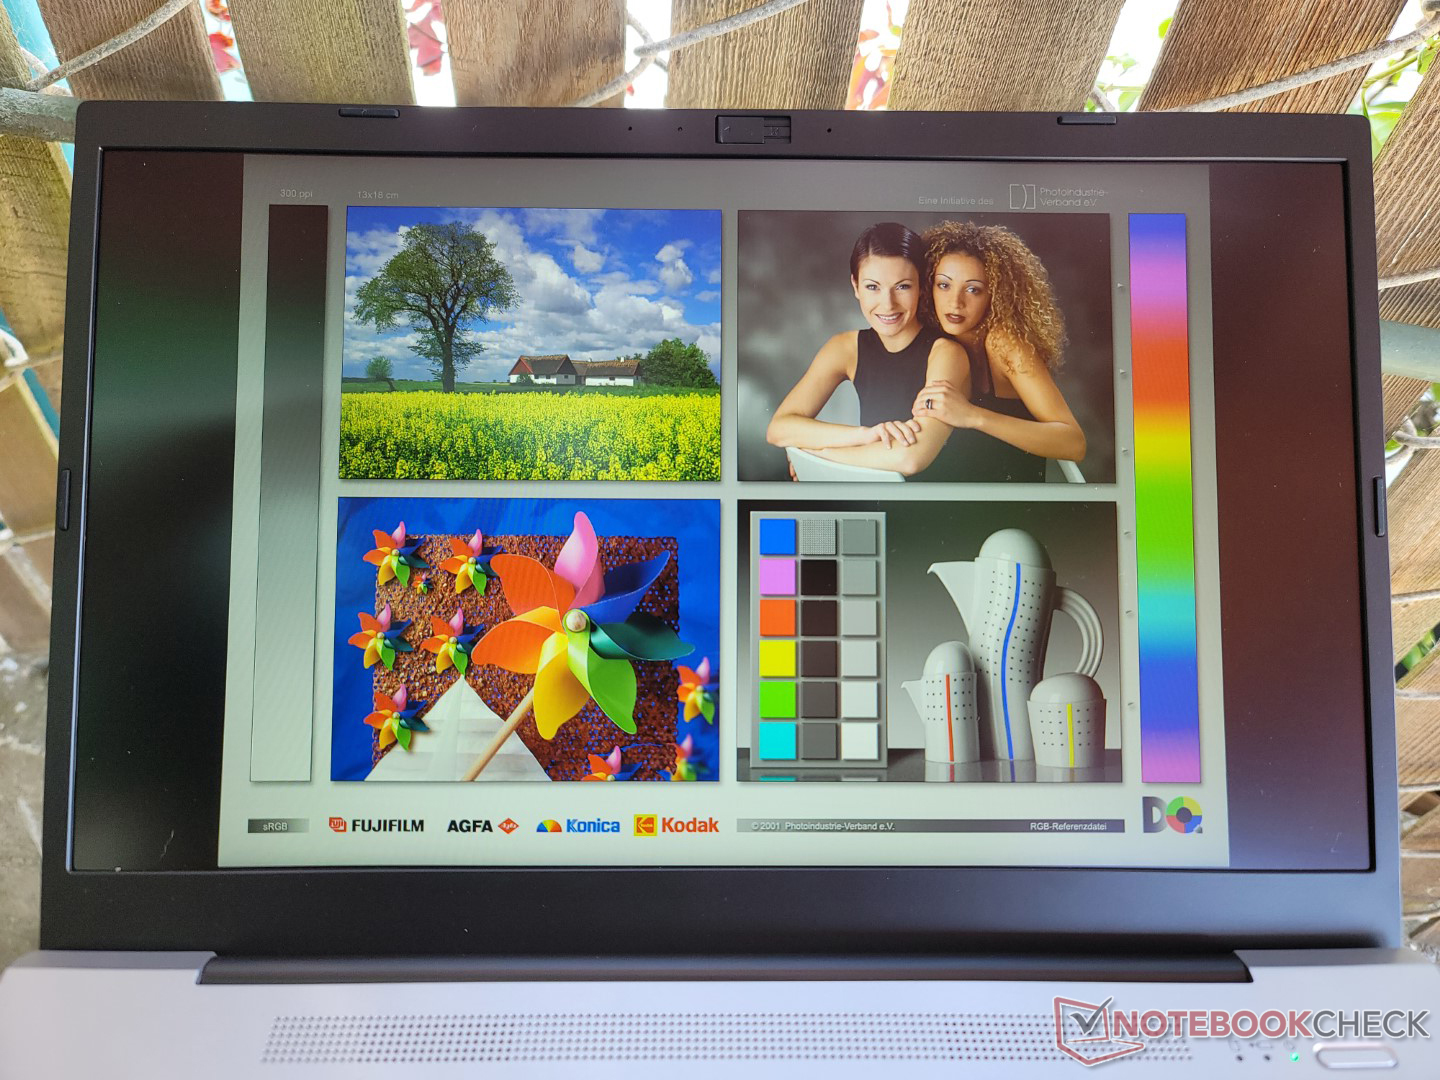
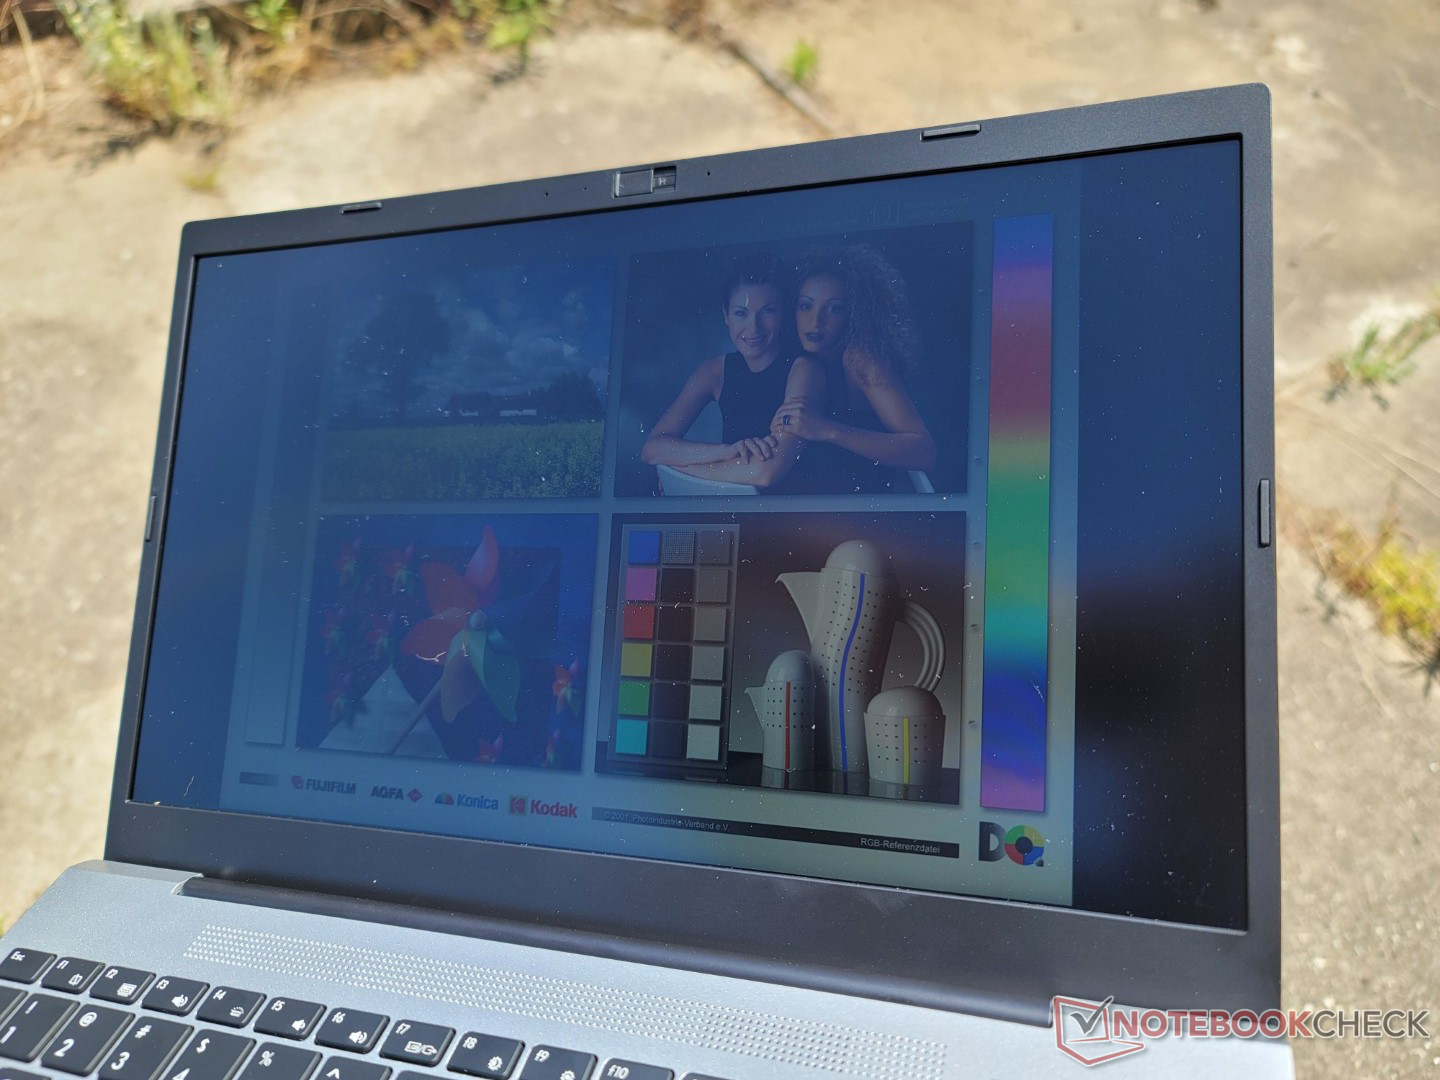
Outdoor visibility is limited as the display isn't bright enough to overcome most natural lighting. Images would wash out almost completely on a bright or sunny day. The matte overlay helps to reduce glare for a better viewing experience when under shade.

Performance — Core i5-1235U Configuration
Testing Conditions
We set our unit to Performance via Windows prior to running any benchmarks below. There does not appear to be any pre-installed Vaio-specific command center software.
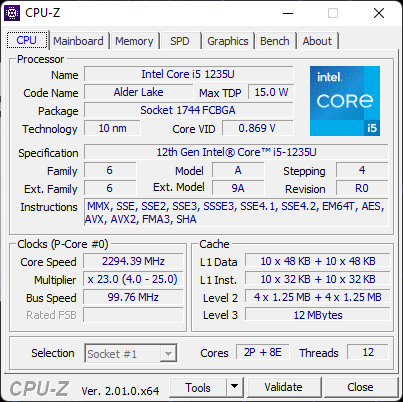
Processor
Overall CPU performance is very close to the previous generation Core i5-1135G7. In fact, multi-thread results are nearly equal to the LG Gram 14T90P while being just 10 percent ahead in single-thread benchmarks. Users may want to consider upgrading to the Core i7-1255U configuration which can offer roughly 60 percent faster multi-thread performance over the Core i5-1235U based on our experience with the Dell Inspiron 14 7420 2-in-1. Otherwise, the i5-1235U can be considered disappointing as it doesn't offer very much over 11th gen Tiger Lake-U.
Cinebench R15 Multi Loop
Cinebench R23: Multi Core | Single Core
Cinebench R15: CPU Multi 64Bit | CPU Single 64Bit
Blender: v2.79 BMW27 CPU
7-Zip 18.03: 7z b 4 | 7z b 4 -mmt1
Geekbench 5.5: Multi-Core | Single-Core
HWBOT x265 Benchmark v2.2: 4k Preset
LibreOffice : 20 Documents To PDF
R Benchmark 2.5: Overall mean
Cinebench R23: Multi Core | Single Core
Cinebench R15: CPU Multi 64Bit | CPU Single 64Bit
Blender: v2.79 BMW27 CPU
7-Zip 18.03: 7z b 4 | 7z b 4 -mmt1
Geekbench 5.5: Multi-Core | Single-Core
HWBOT x265 Benchmark v2.2: 4k Preset
LibreOffice : 20 Documents To PDF
R Benchmark 2.5: Overall mean
* ... smaller is better
AIDA64: FP32 Ray-Trace | FPU Julia | CPU SHA3 | CPU Queen | FPU SinJulia | FPU Mandel | CPU AES | CPU ZLib | FP64 Ray-Trace | CPU PhotoWorxx
| Performance rating | |
| VAIO SX14 VJS144X0111K | |
| Average Intel Core i5-1235U | |
| Dell Inspiron 14 7420 2-in-1 | |
| VAIO FE 14.1 VWNC51429-SL | |
| Gateway Ultra Slim 14.1 GWTC51427 | |
| Acer Swift 1 SF114-34-P6U1 | |
| Lenovo IdeaPad 3 14ITL6 82H700CCGE | |
| AIDA64 / FP32 Ray-Trace | |
| VAIO SX14 VJS144X0111K | |
| Average Intel Core i5-1235U (3078 - 7457, n=8) | |
| Dell Inspiron 14 7420 2-in-1 | |
| VAIO FE 14.1 VWNC51429-SL | |
| Gateway Ultra Slim 14.1 GWTC51427 | |
| Lenovo IdeaPad 3 14ITL6 82H700CCGE | |
| Acer Swift 1 SF114-34-P6U1 | |
| AIDA64 / FPU Julia | |
| VAIO SX14 VJS144X0111K | |
| Average Intel Core i5-1235U (15838 - 37760, n=8) | |
| VAIO FE 14.1 VWNC51429-SL | |
| Dell Inspiron 14 7420 2-in-1 | |
| Gateway Ultra Slim 14.1 GWTC51427 | |
| Lenovo IdeaPad 3 14ITL6 82H700CCGE | |
| Acer Swift 1 SF114-34-P6U1 | |
| AIDA64 / CPU SHA3 | |
| VAIO SX14 VJS144X0111K | |
| Average Intel Core i5-1235U (978 - 2072, n=8) | |
| Dell Inspiron 14 7420 2-in-1 | |
| VAIO FE 14.1 VWNC51429-SL | |
| Gateway Ultra Slim 14.1 GWTC51427 | |
| Acer Swift 1 SF114-34-P6U1 | |
| Lenovo IdeaPad 3 14ITL6 82H700CCGE | |
| AIDA64 / CPU Queen | |
| Dell Inspiron 14 7420 2-in-1 | |
| Average Intel Core i5-1235U (45680 - 62404, n=8) | |
| VAIO FE 14.1 VWNC51429-SL | |
| Gateway Ultra Slim 14.1 GWTC51427 | |
| VAIO SX14 VJS144X0111K | |
| Acer Swift 1 SF114-34-P6U1 | |
| Lenovo IdeaPad 3 14ITL6 82H700CCGE | |
| AIDA64 / FPU SinJulia | |
| VAIO SX14 VJS144X0111K | |
| Dell Inspiron 14 7420 2-in-1 | |
| Average Intel Core i5-1235U (3099 - 4644, n=8) | |
| Gateway Ultra Slim 14.1 GWTC51427 | |
| VAIO FE 14.1 VWNC51429-SL | |
| Acer Swift 1 SF114-34-P6U1 | |
| Lenovo IdeaPad 3 14ITL6 82H700CCGE | |
| AIDA64 / FPU Mandel | |
| VAIO SX14 VJS144X0111K | |
| Average Intel Core i5-1235U (8046 - 18819, n=8) | |
| Dell Inspiron 14 7420 2-in-1 | |
| VAIO FE 14.1 VWNC51429-SL | |
| Gateway Ultra Slim 14.1 GWTC51427 | |
| Lenovo IdeaPad 3 14ITL6 82H700CCGE | |
| Acer Swift 1 SF114-34-P6U1 | |
| AIDA64 / CPU AES | |
| VAIO SX14 VJS144X0111K | |
| Average Intel Core i5-1235U (23386 - 67140, n=8) | |
| Dell Inspiron 14 7420 2-in-1 | |
| VAIO FE 14.1 VWNC51429-SL | |
| Gateway Ultra Slim 14.1 GWTC51427 | |
| Acer Swift 1 SF114-34-P6U1 | |
| Lenovo IdeaPad 3 14ITL6 82H700CCGE | |
| AIDA64 / CPU ZLib | |
| Dell Inspiron 14 7420 2-in-1 | |
| Average Intel Core i5-1235U (329 - 633, n=8) | |
| VAIO SX14 VJS144X0111K | |
| Gateway Ultra Slim 14.1 GWTC51427 | |
| VAIO FE 14.1 VWNC51429-SL | |
| Acer Swift 1 SF114-34-P6U1 | |
| Lenovo IdeaPad 3 14ITL6 82H700CCGE | |
| AIDA64 / FP64 Ray-Trace | |
| VAIO SX14 VJS144X0111K | |
| Average Intel Core i5-1235U (1670 - 3928, n=8) | |
| Dell Inspiron 14 7420 2-in-1 | |
| VAIO FE 14.1 VWNC51429-SL | |
| Gateway Ultra Slim 14.1 GWTC51427 | |
| Lenovo IdeaPad 3 14ITL6 82H700CCGE | |
| Acer Swift 1 SF114-34-P6U1 | |
| AIDA64 / CPU PhotoWorxx | |
| VAIO SX14 VJS144X0111K | |
| Average Intel Core i5-1235U (15933 - 41909, n=8) | |
| VAIO FE 14.1 VWNC51429-SL | |
| Dell Inspiron 14 7420 2-in-1 | |
| Gateway Ultra Slim 14.1 GWTC51427 | |
| Lenovo IdeaPad 3 14ITL6 82H700CCGE | |
| Acer Swift 1 SF114-34-P6U1 | |
System Performance
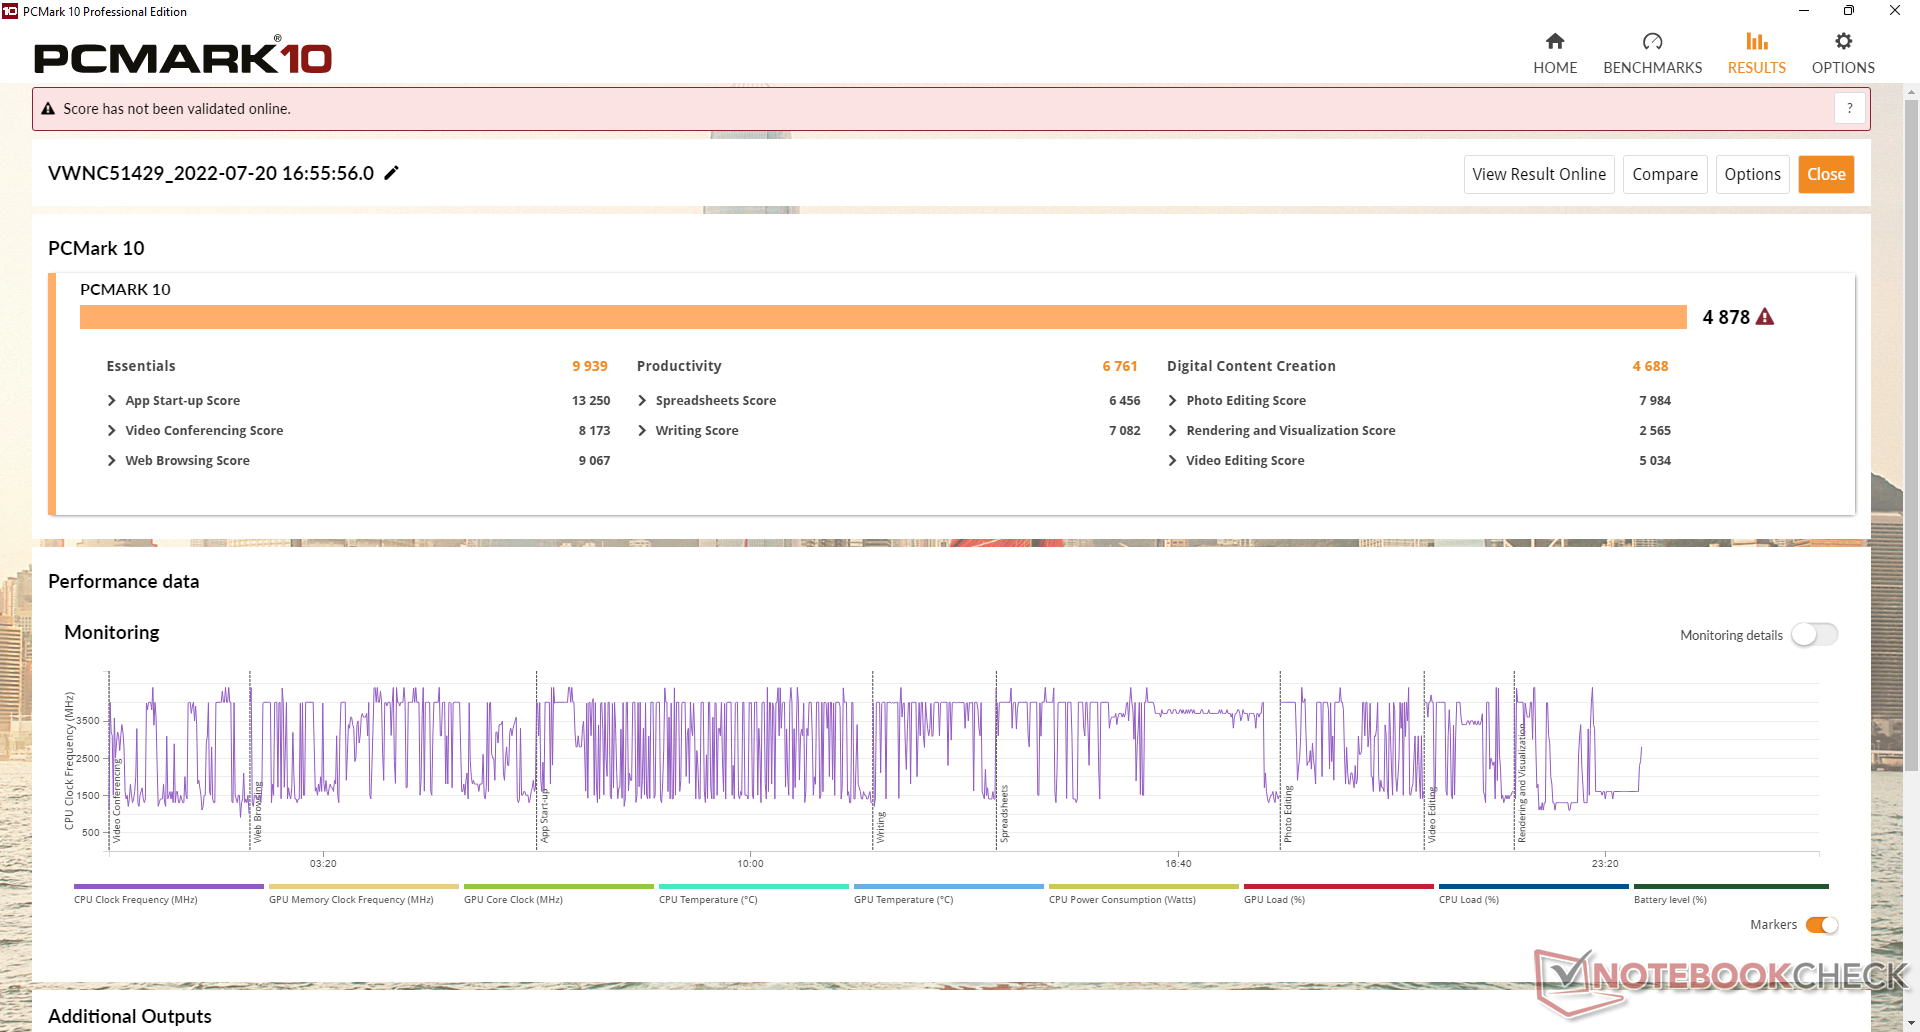
PCMark 10 results are slightly behind the more expensive VAIO SX14 but otherwise similar to the Gateway Ultra Slim 14.1. Interestingly, CrossMark results are closer to the Dell Inspiron 14 7420 2-in-1 and its Core i7-1255U CPU rather than the aforementioned Gateway.
CrossMark: Overall | Productivity | Creativity | Responsiveness
| PCMark 10 / Score | |
| Dell Inspiron 14 7420 2-in-1 | |
| VAIO SX14 VJS144X0111K | |
| Average Intel Core i5-1235U, Intel Iris Xe Graphics G7 80EUs (4528 - 5543, n=8) | |
| VAIO FE 14.1 VWNC51429-SL | |
| Gateway Ultra Slim 14.1 GWTC51427 | |
| Acer Swift 1 SF114-34-P6U1 | |
| Lenovo IdeaPad 3 14ITL6 82H700CCGE | |
| PCMark 10 / Essentials | |
| VAIO SX14 VJS144X0111K | |
| Dell Inspiron 14 7420 2-in-1 | |
| VAIO FE 14.1 VWNC51429-SL | |
| Average Intel Core i5-1235U, Intel Iris Xe Graphics G7 80EUs (9143 - 11273, n=8) | |
| Gateway Ultra Slim 14.1 GWTC51427 | |
| Acer Swift 1 SF114-34-P6U1 | |
| Lenovo IdeaPad 3 14ITL6 82H700CCGE | |
| PCMark 10 / Productivity | |
| VAIO FE 14.1 VWNC51429-SL | |
| Average Intel Core i5-1235U, Intel Iris Xe Graphics G7 80EUs (6440 - 7354, n=8) | |
| VAIO SX14 VJS144X0111K | |
| Dell Inspiron 14 7420 2-in-1 | |
| Gateway Ultra Slim 14.1 GWTC51427 | |
| Acer Swift 1 SF114-34-P6U1 | |
| Lenovo IdeaPad 3 14ITL6 82H700CCGE | |
| PCMark 10 / Digital Content Creation | |
| Dell Inspiron 14 7420 2-in-1 | |
| VAIO SX14 VJS144X0111K | |
| Average Intel Core i5-1235U, Intel Iris Xe Graphics G7 80EUs (4220 - 5839, n=8) | |
| Gateway Ultra Slim 14.1 GWTC51427 | |
| VAIO FE 14.1 VWNC51429-SL | |
| Lenovo IdeaPad 3 14ITL6 82H700CCGE | |
| Acer Swift 1 SF114-34-P6U1 | |
| CrossMark / Overall | |
| VAIO FE 14.1 VWNC51429-SL | |
| Dell Inspiron 14 7420 2-in-1 | |
| Average Intel Core i5-1235U, Intel Iris Xe Graphics G7 80EUs (983 - 1644, n=8) | |
| Gateway Ultra Slim 14.1 GWTC51427 | |
| Lenovo IdeaPad 3 14ITL6 82H700CCGE | |
| Acer Swift 1 SF114-34-P6U1 | |
| CrossMark / Productivity | |
| Dell Inspiron 14 7420 2-in-1 | |
| VAIO FE 14.1 VWNC51429-SL | |
| Average Intel Core i5-1235U, Intel Iris Xe Graphics G7 80EUs (1026 - 1676, n=8) | |
| Gateway Ultra Slim 14.1 GWTC51427 | |
| Lenovo IdeaPad 3 14ITL6 82H700CCGE | |
| Acer Swift 1 SF114-34-P6U1 | |
| CrossMark / Creativity | |
| VAIO FE 14.1 VWNC51429-SL | |
| Dell Inspiron 14 7420 2-in-1 | |
| Average Intel Core i5-1235U, Intel Iris Xe Graphics G7 80EUs (1032 - 1618, n=8) | |
| Gateway Ultra Slim 14.1 GWTC51427 | |
| Acer Swift 1 SF114-34-P6U1 | |
| Lenovo IdeaPad 3 14ITL6 82H700CCGE | |
| CrossMark / Responsiveness | |
| VAIO FE 14.1 VWNC51429-SL | |
| Average Intel Core i5-1235U, Intel Iris Xe Graphics G7 80EUs (746 - 1867, n=8) | |
| Dell Inspiron 14 7420 2-in-1 | |
| Gateway Ultra Slim 14.1 GWTC51427 | |
| Lenovo IdeaPad 3 14ITL6 82H700CCGE | |
| Acer Swift 1 SF114-34-P6U1 | |
| PCMark 10 Score | 4878 points | |
Help | ||
| AIDA64 / Memory Copy | |
| VAIO SX14 VJS144X0111K | |
| Average Intel Core i5-1235U (24653 - 61921, n=8) | |
| VAIO FE 14.1 VWNC51429-SL | |
| Dell Inspiron 14 7420 2-in-1 | |
| Gateway Ultra Slim 14.1 GWTC51427 | |
| Acer Swift 1 SF114-34-P6U1 | |
| Lenovo IdeaPad 3 14ITL6 82H700CCGE | |
| AIDA64 / Memory Read | |
| VAIO SX14 VJS144X0111K | |
| Average Intel Core i5-1235U (24441 - 66108, n=8) | |
| VAIO FE 14.1 VWNC51429-SL | |
| Dell Inspiron 14 7420 2-in-1 | |
| Gateway Ultra Slim 14.1 GWTC51427 | |
| Lenovo IdeaPad 3 14ITL6 82H700CCGE | |
| Acer Swift 1 SF114-34-P6U1 | |
| AIDA64 / Memory Write | |
| VAIO SX14 VJS144X0111K | |
| Average Intel Core i5-1235U (25156 - 75808, n=8) | |
| VAIO FE 14.1 VWNC51429-SL | |
| Dell Inspiron 14 7420 2-in-1 | |
| Gateway Ultra Slim 14.1 GWTC51427 | |
| Acer Swift 1 SF114-34-P6U1 | |
| Lenovo IdeaPad 3 14ITL6 82H700CCGE | |
| AIDA64 / Memory Latency | |
| Lenovo IdeaPad 3 14ITL6 82H700CCGE | |
| VAIO SX14 VJS144X0111K | |
| VAIO FE 14.1 VWNC51429-SL | |
| Average Intel Core i5-1235U (76.3 - 119, n=8) | |
| Acer Swift 1 SF114-34-P6U1 | |
| Dell Inspiron 14 7420 2-in-1 | |
| Gateway Ultra Slim 14.1 GWTC51427 | |
* ... smaller is better
DPC Latency
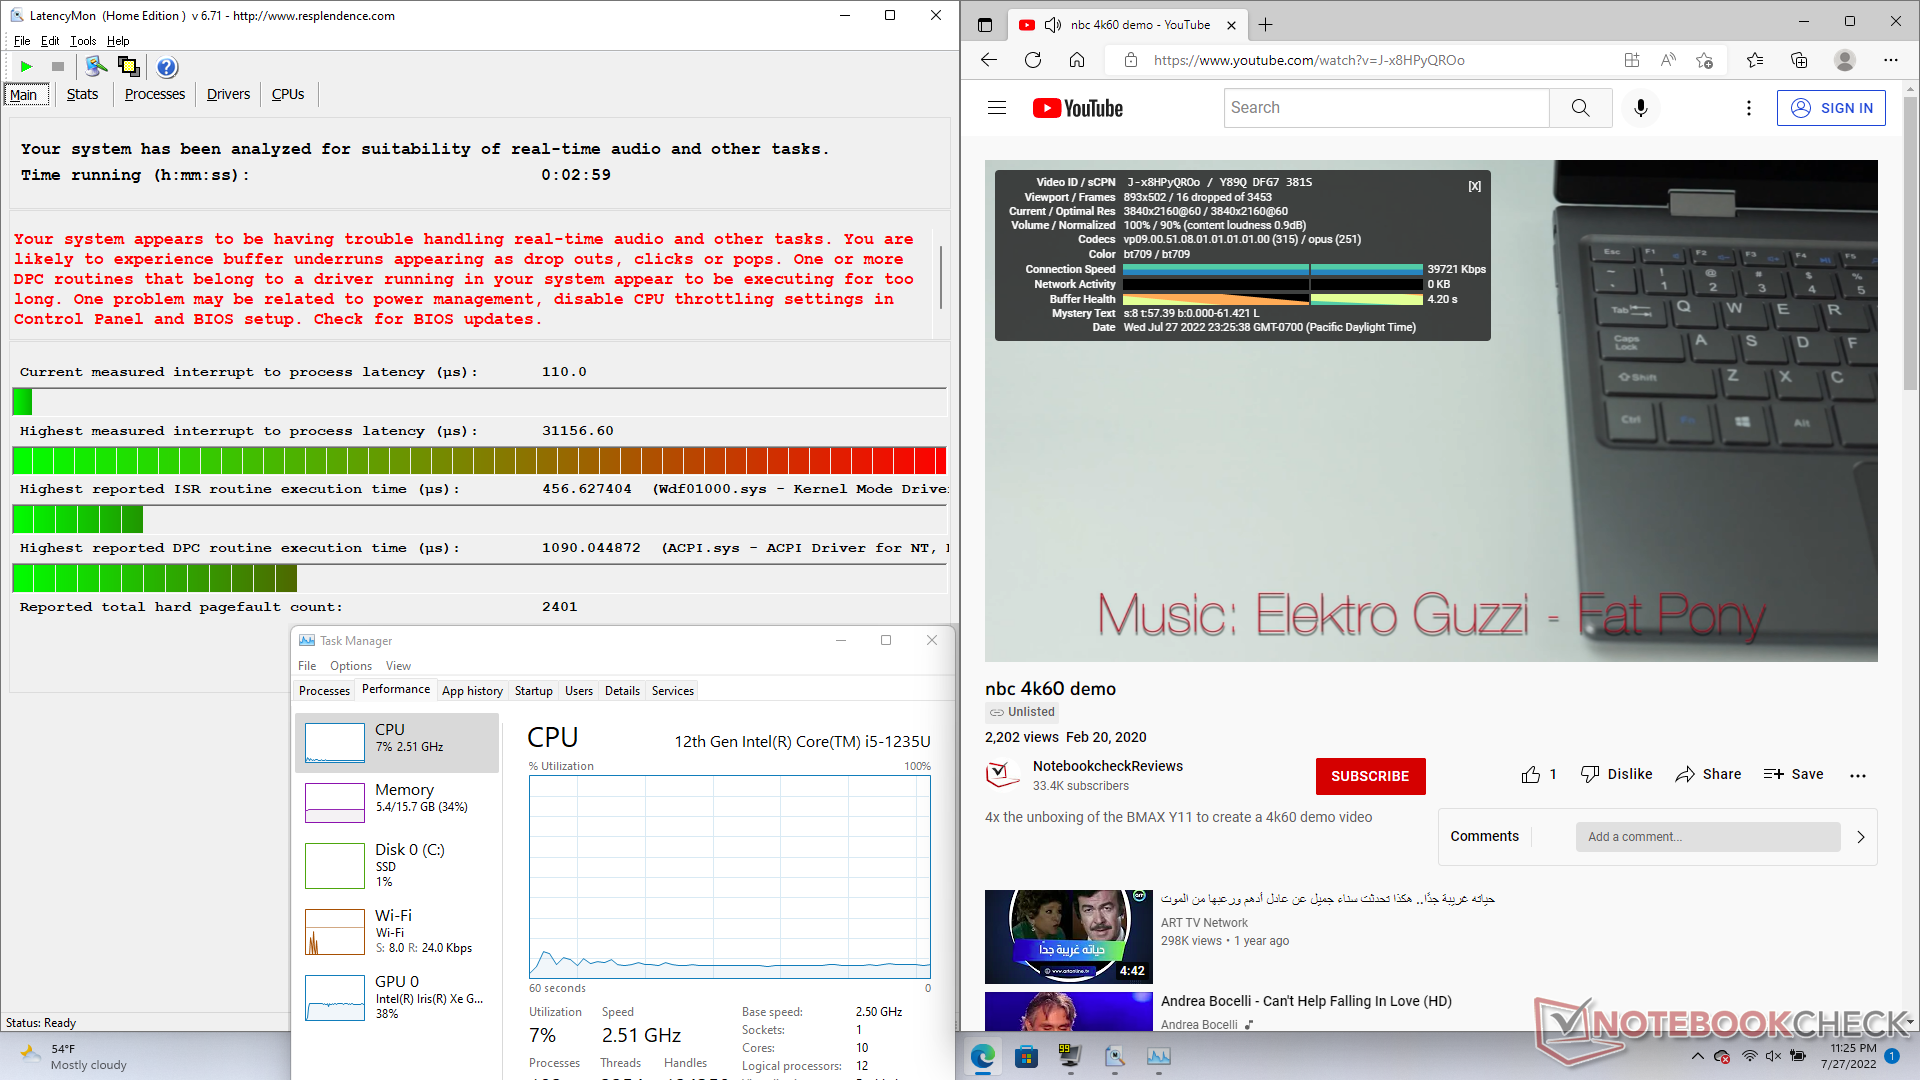
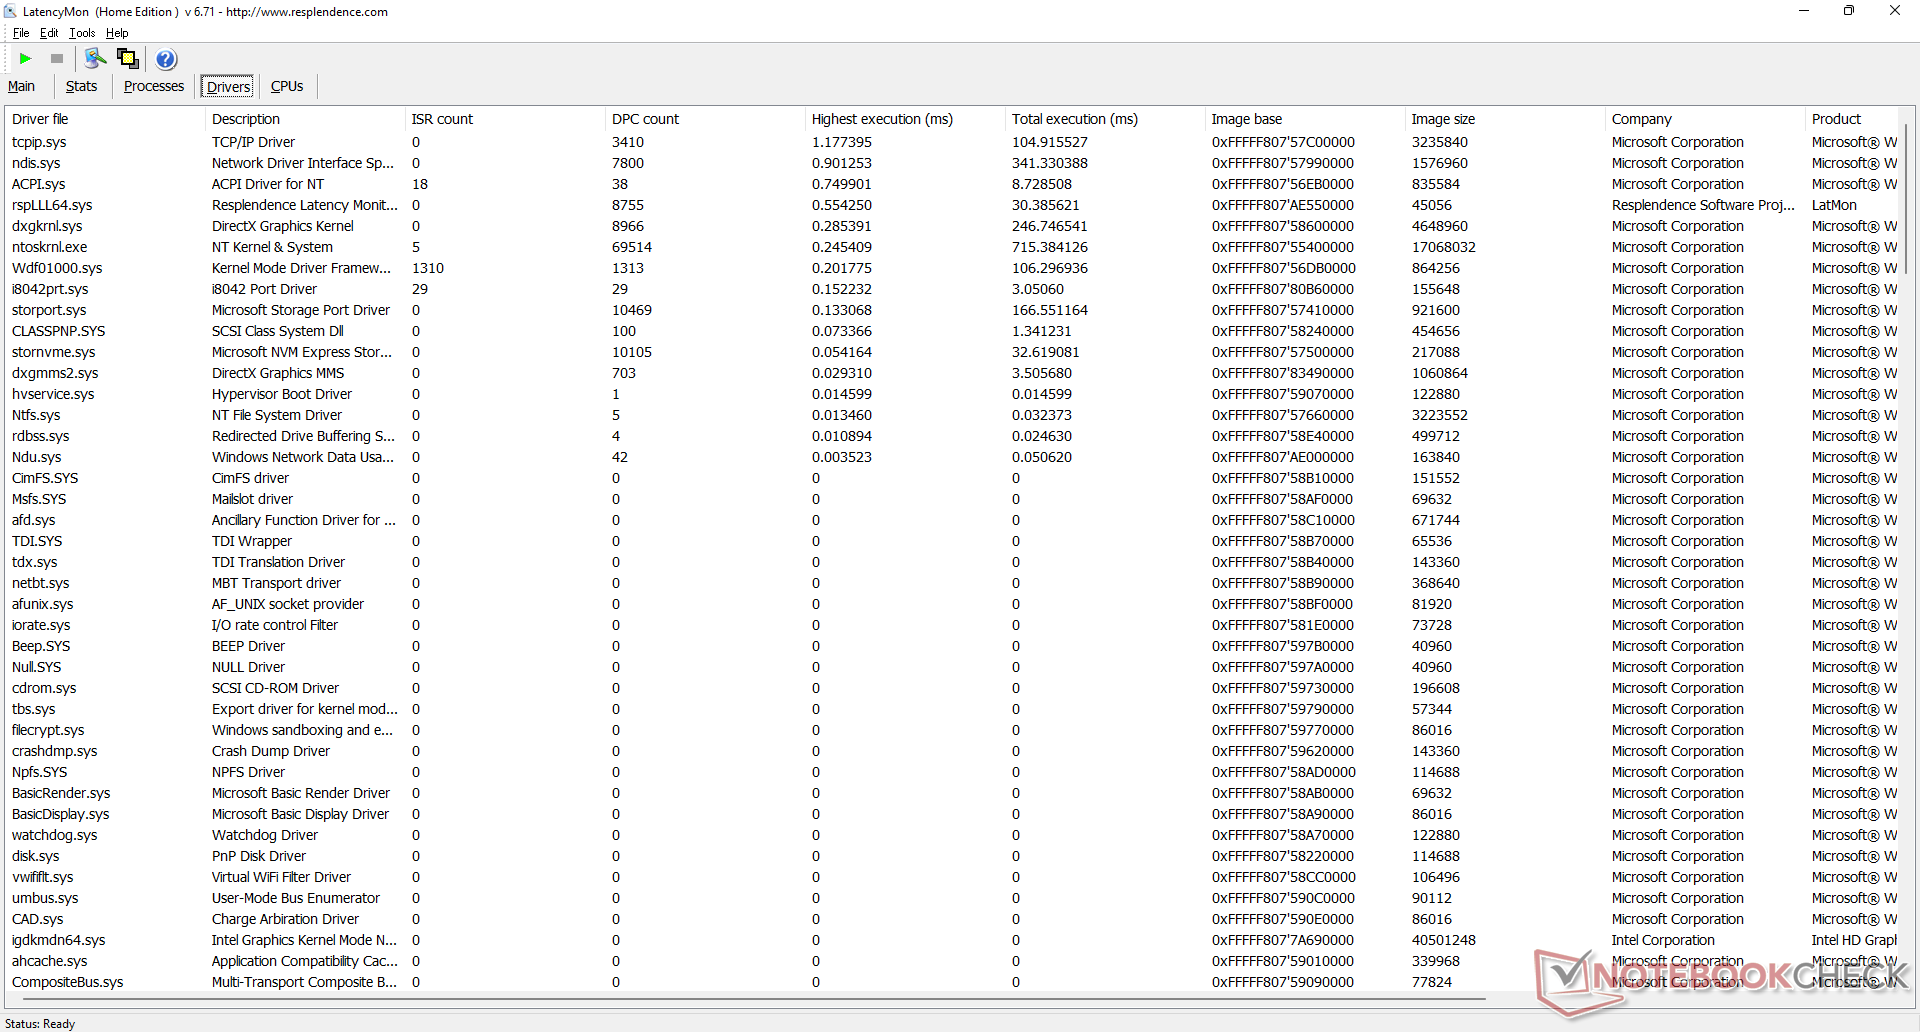
LatencyMon reveals acute DPC issues when opening multiple browser tabs on our homepage or when playing back 4K video at 60 FPS. Consequently, we recorded 16 dropped frames during our minute-long video test when it should be 0.
| DPC Latencies / LatencyMon - interrupt to process latency (max), Web, Youtube, Prime95 | |
| VAIO FE 14.1 VWNC51429-SL | |
| Gateway Ultra Slim 14.1 GWTC51427 | |
| Acer Swift 1 SF114-34-P6U1 | |
| Lenovo IdeaPad 3 14ITL6 82H700CCGE | |
| VAIO SX14 VJS144X0111K | |
| Dell Inspiron 14 7420 2-in-1 | |
* ... smaller is better
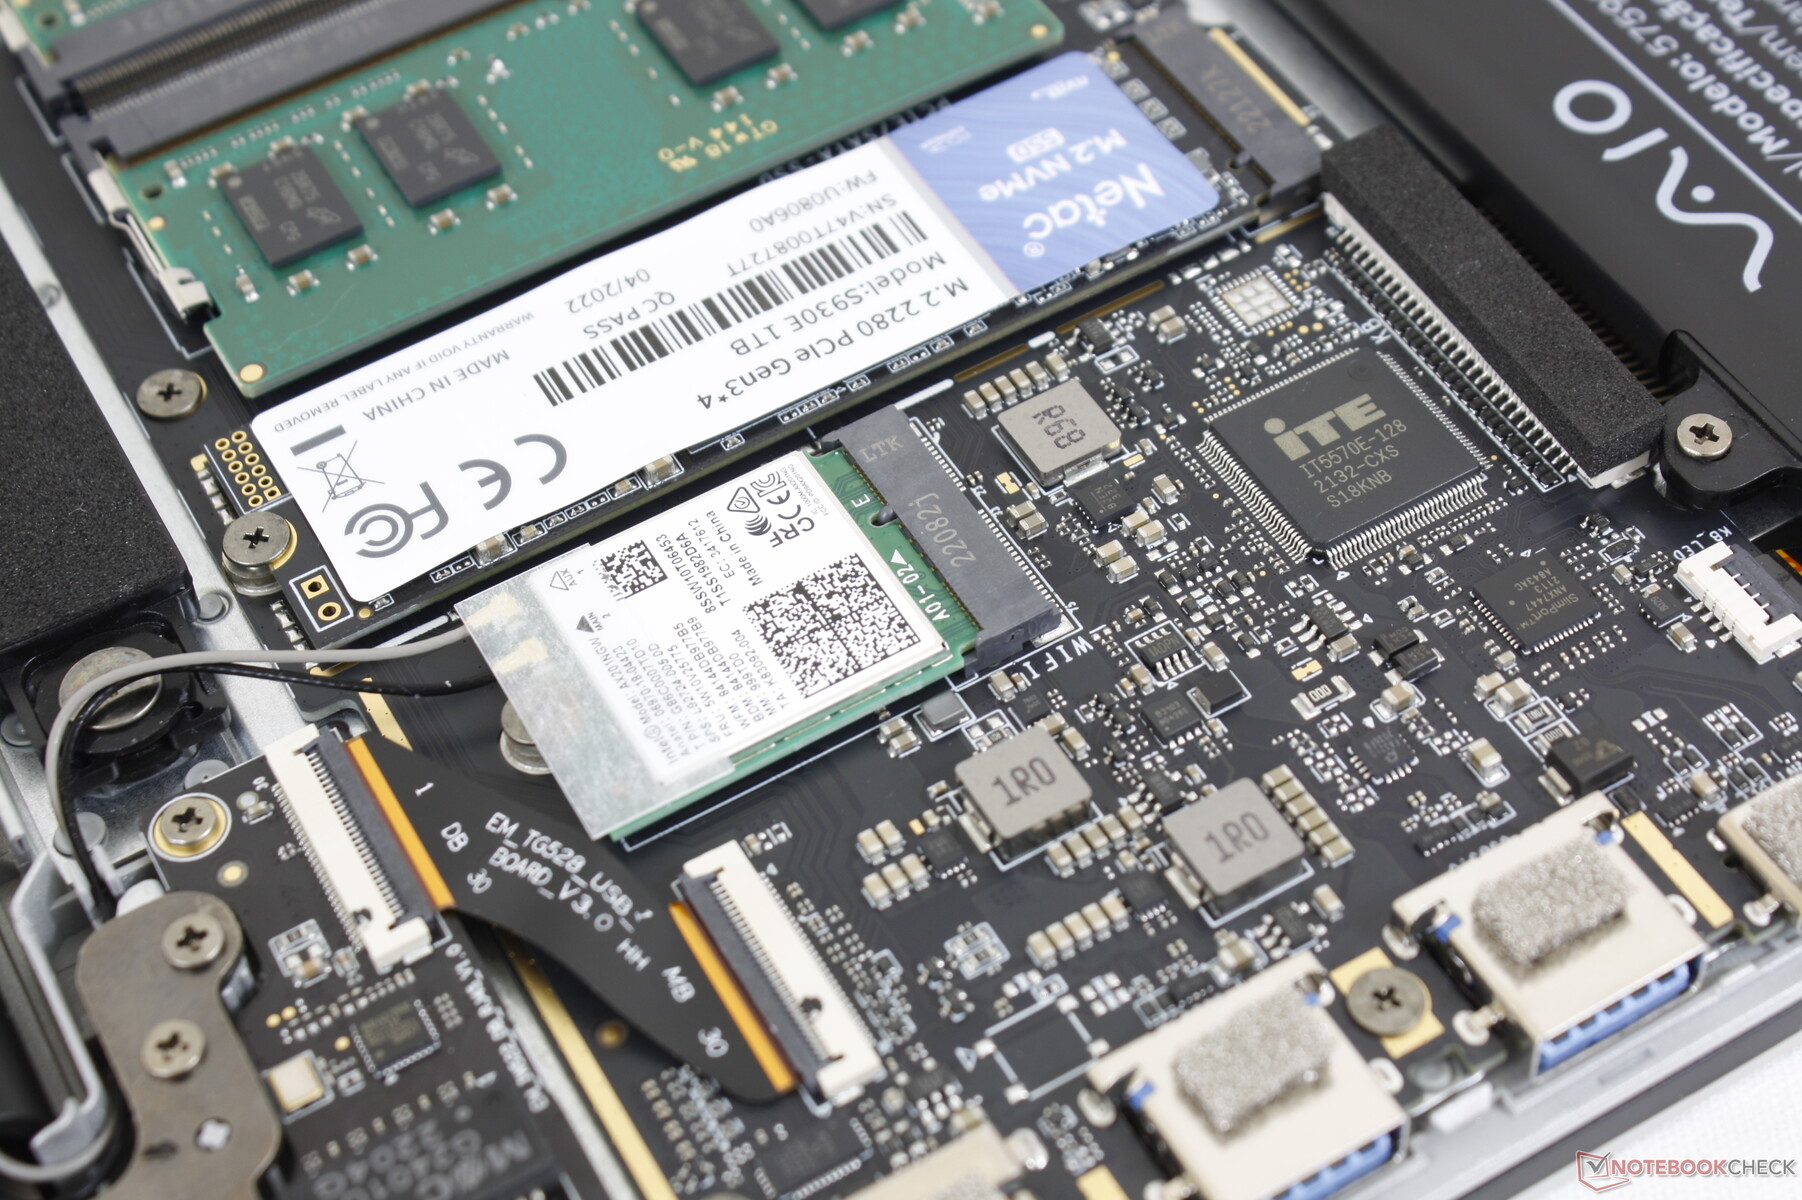
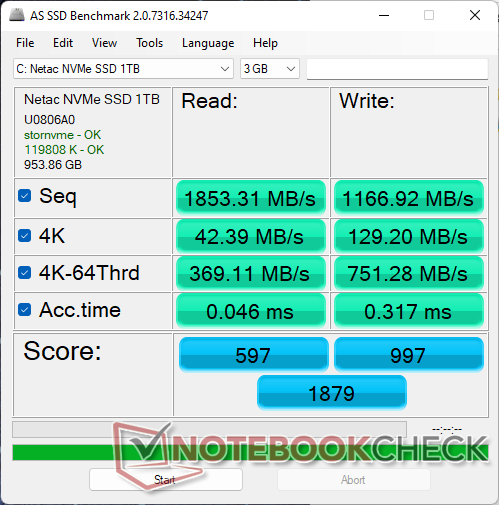
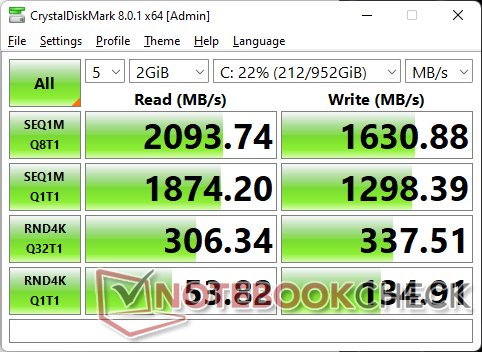
Storage Devices — No Secondary Bays
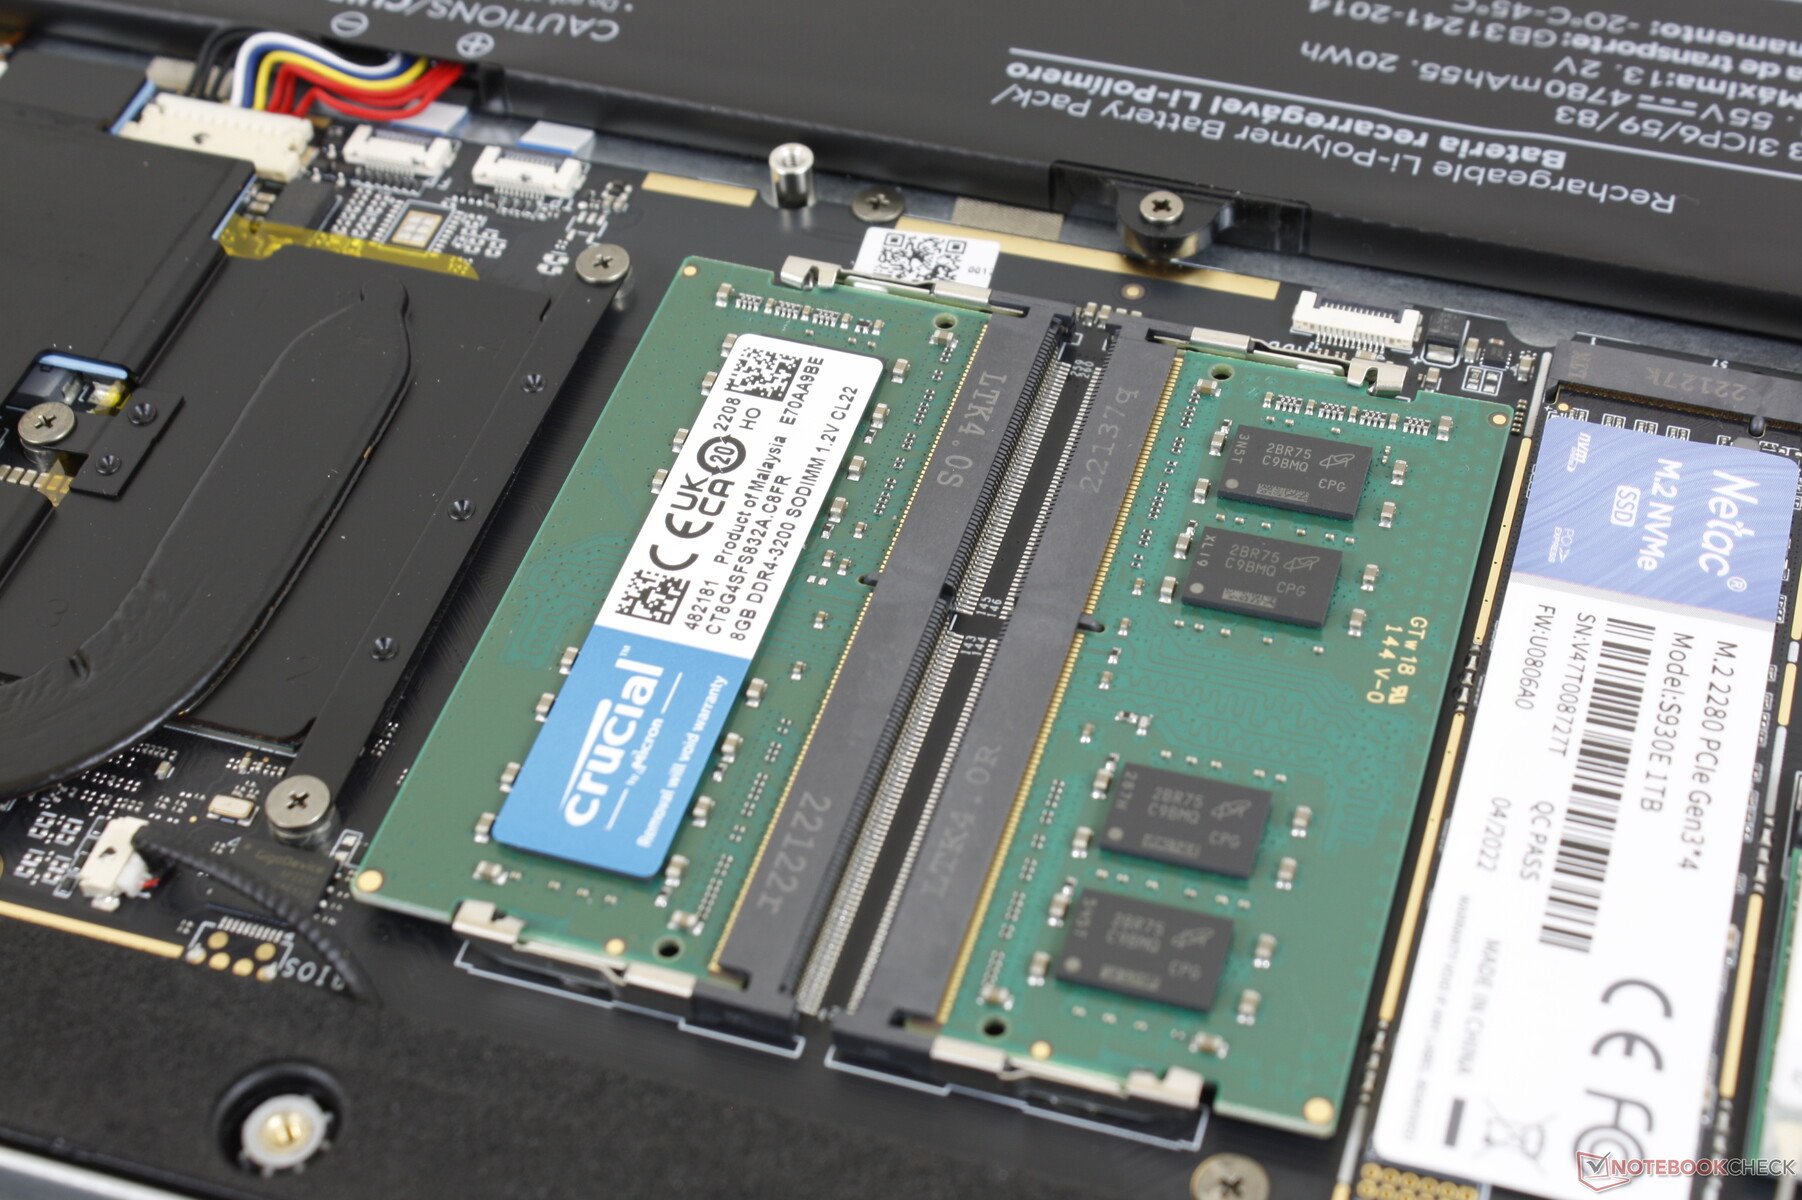
Our unit includes a budget-midrange 1 TB PCIe3 x4 NVMe SSD from Netac offering sequential read and write rates of about 2000 MB/s and 1100 MB/s, respectively. Pricier drives like the Samsung PM981a tend to have faster transfer rates approaching 3000 MB/s. When considering the target audience of the FE14, however, the Netac is more than sufficient in terms of speed.

* ... smaller is better
Disk Throttling: DiskSpd Read Loop, Queue Depth 8
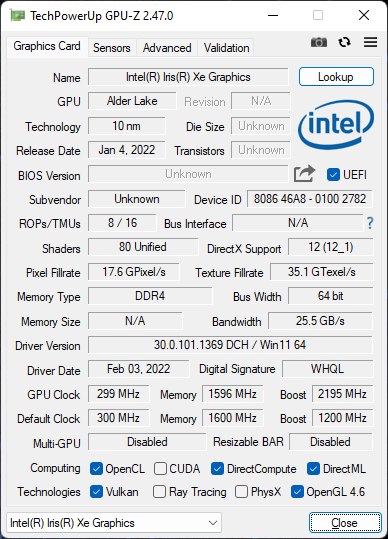
GPU Performance — Iris Xe 80 EUs
Graphics performance is relatively poor at 10 to 15 percent slower than the average laptop in our database equipped with the same integrated Iris Xe 80 EUs GPU. Upgrading to the Iris Xe 96 EUs can offer 20 to 40 percent faster performance if graphics power is a concern.
Gaming performance is even poorer at about 20 to 30 percent slower than expected. Our unit appears to have issues maintaining consistent frame rates as well when idling on Witcher 3 as shown by our graph below. Frame rates would consistently dip from the 45 FPS range down to the 30 FPS range for seemingly no reason. This is definitely not the configuration to get even for casual gaming purposes.
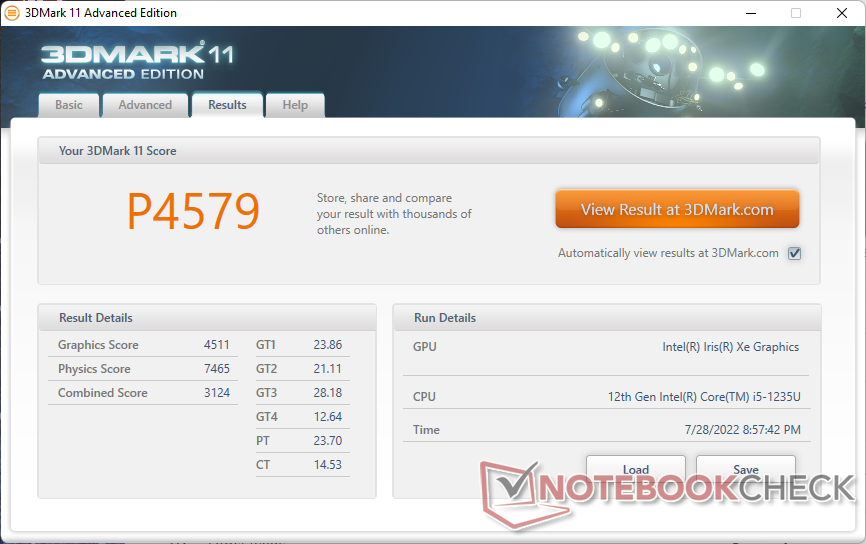
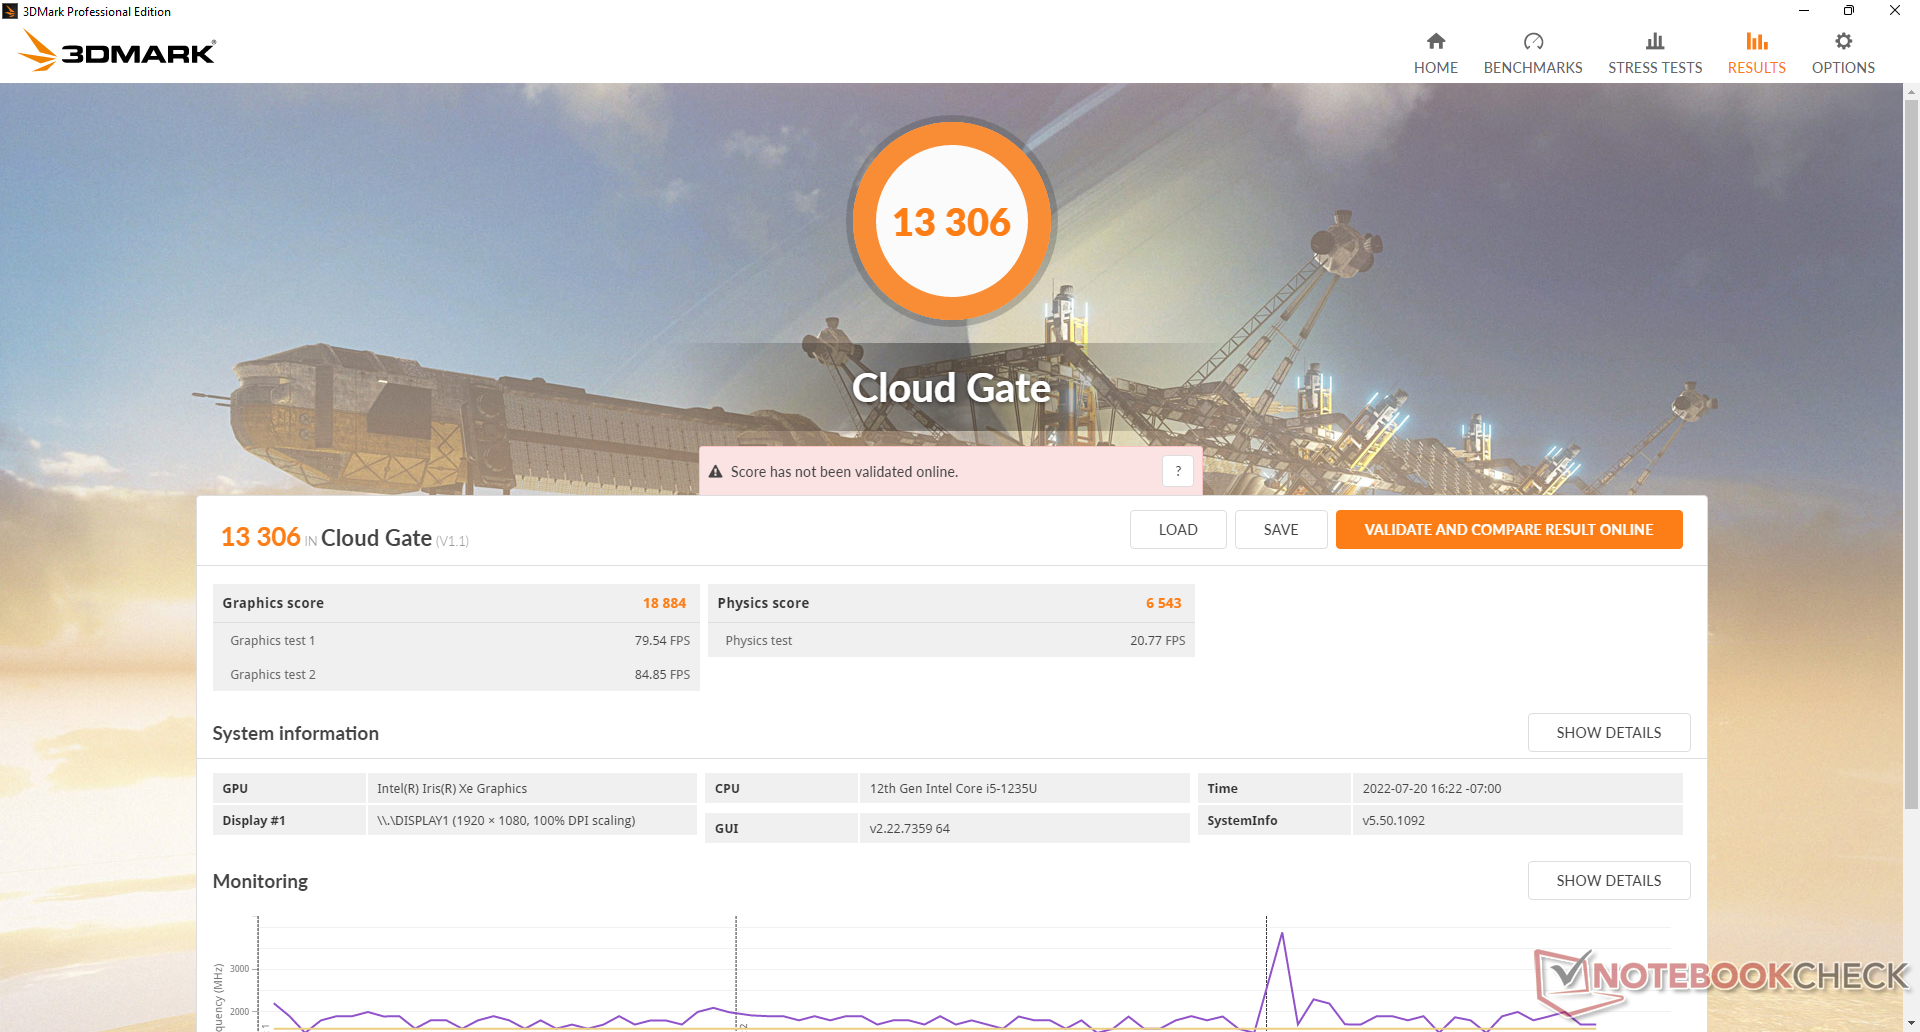
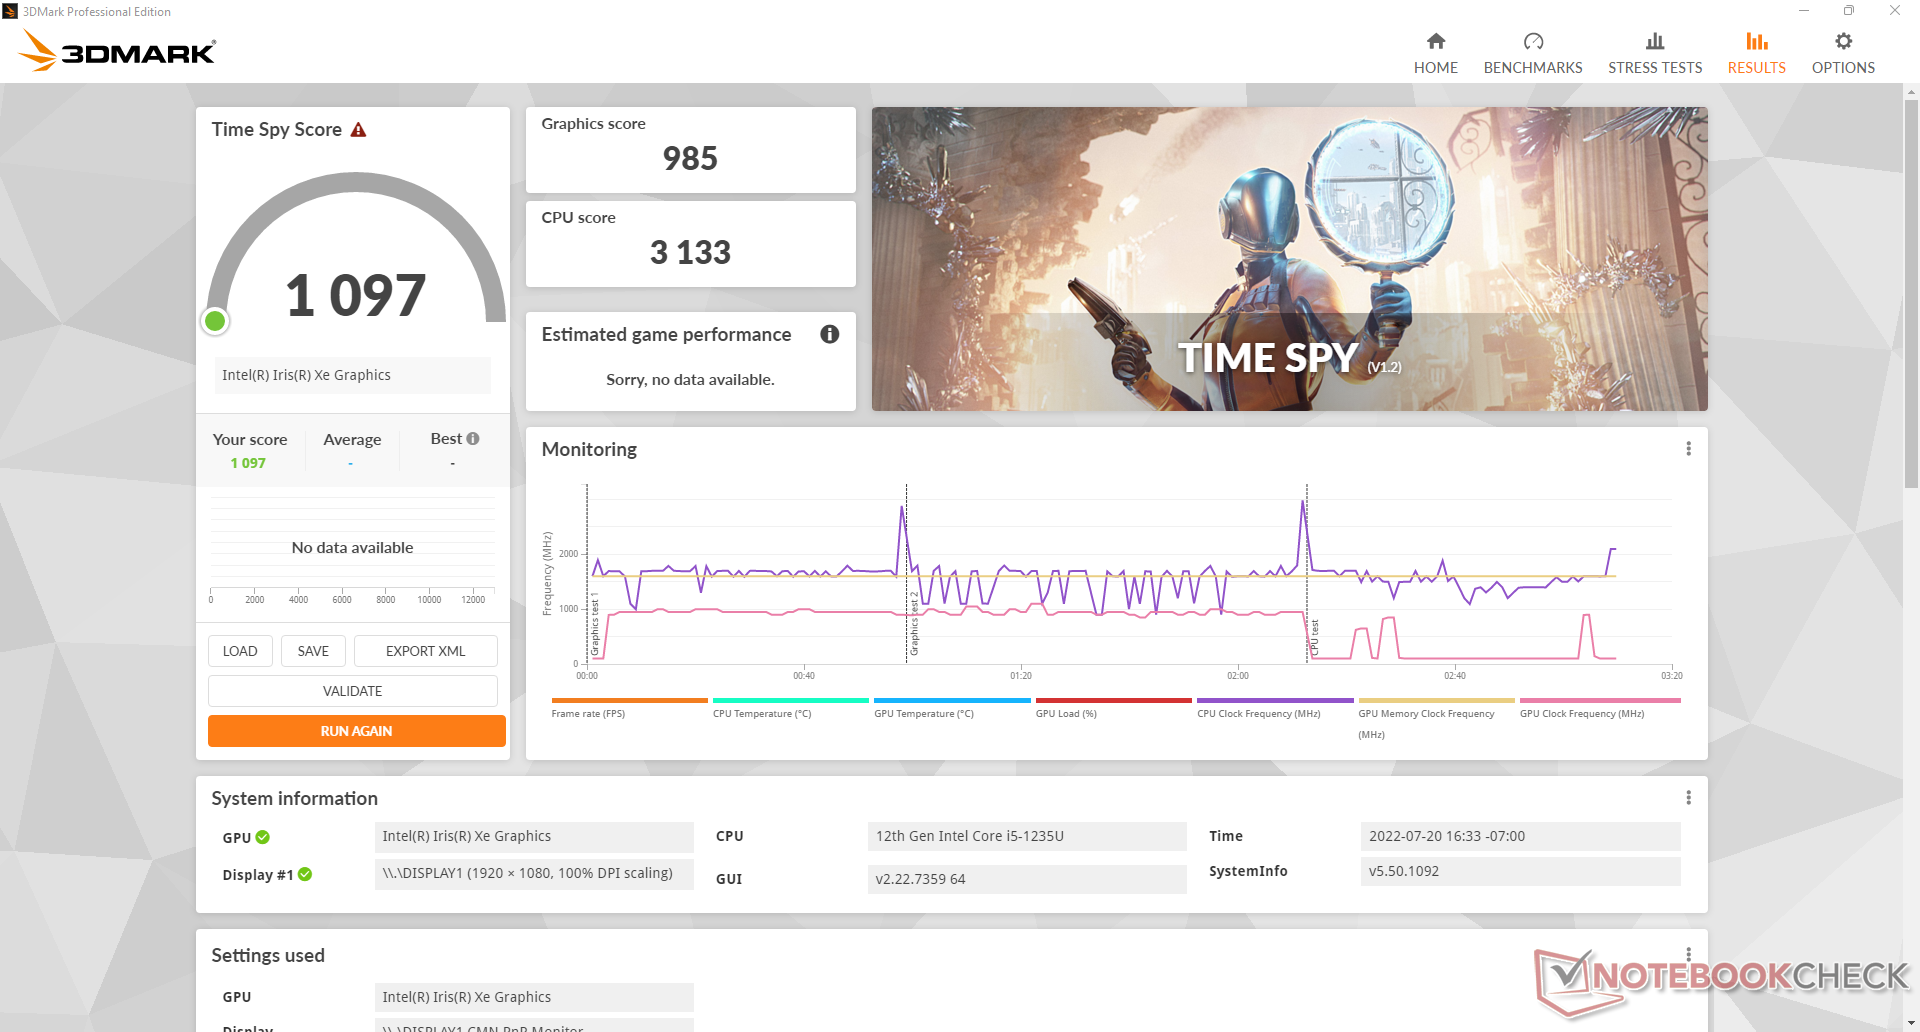
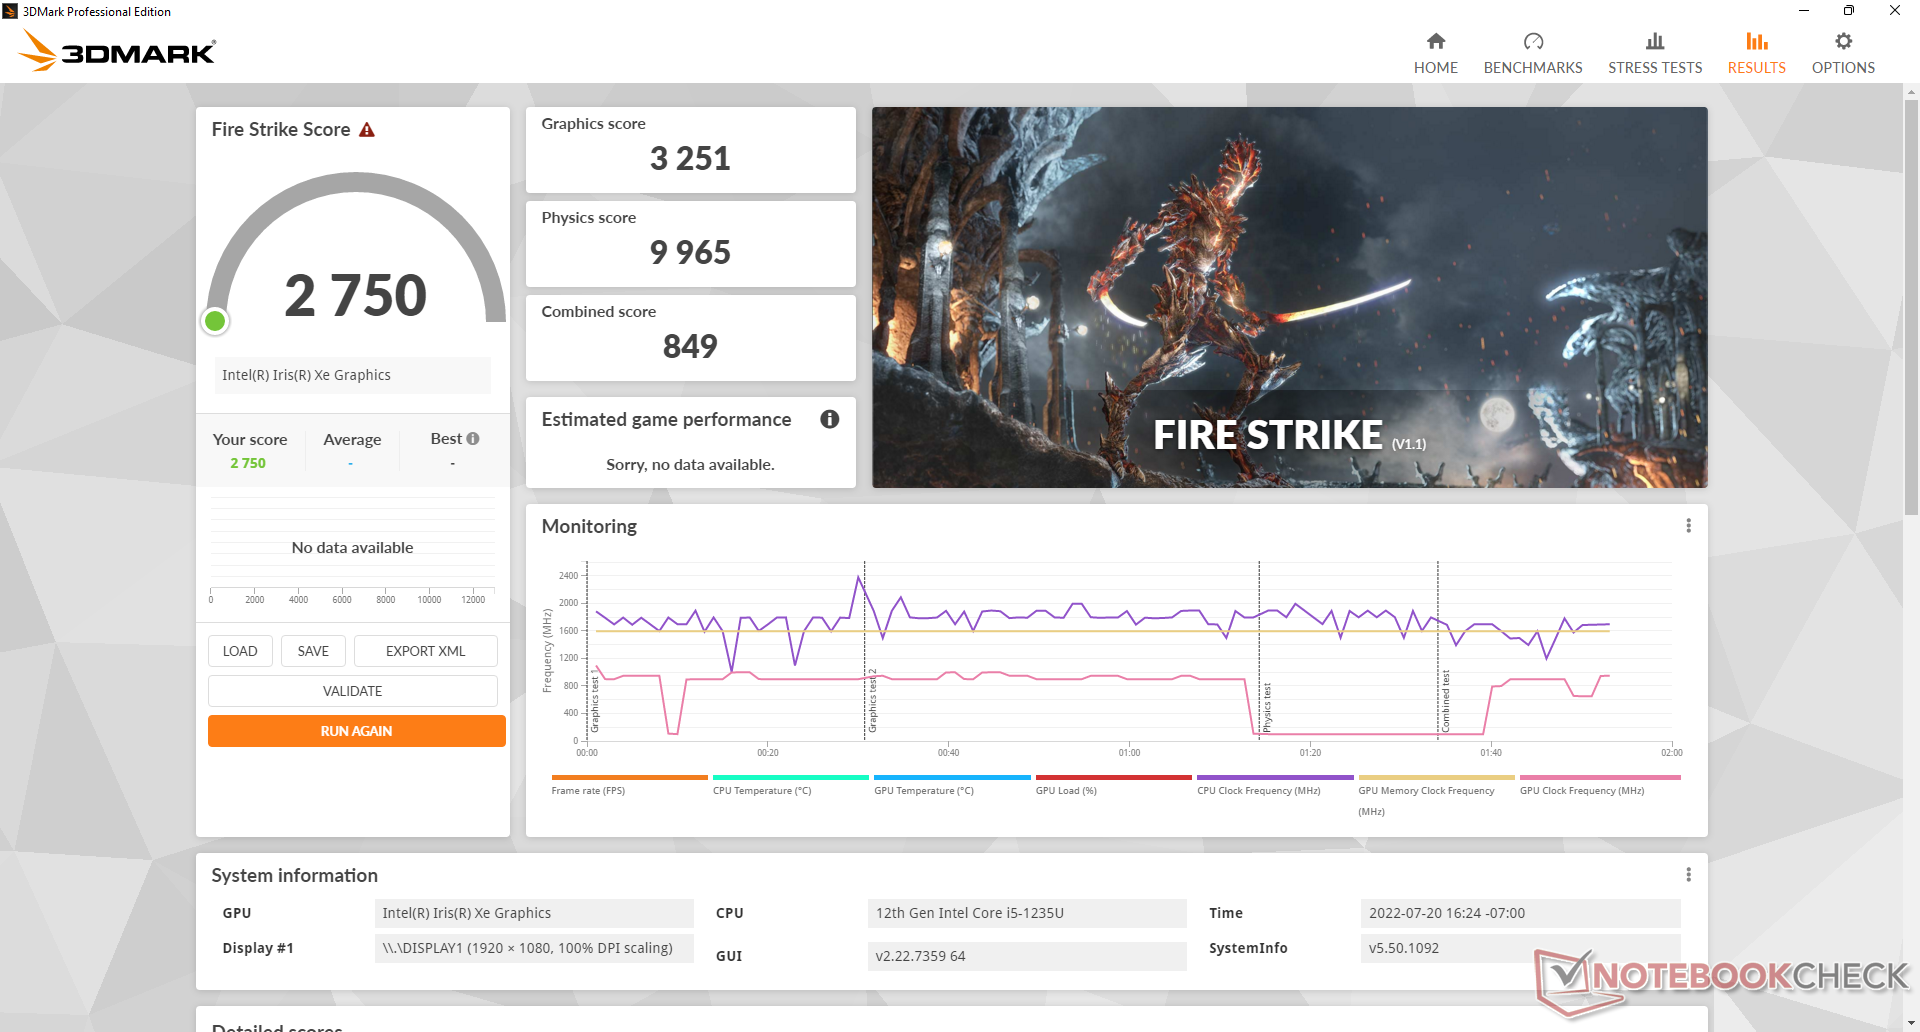
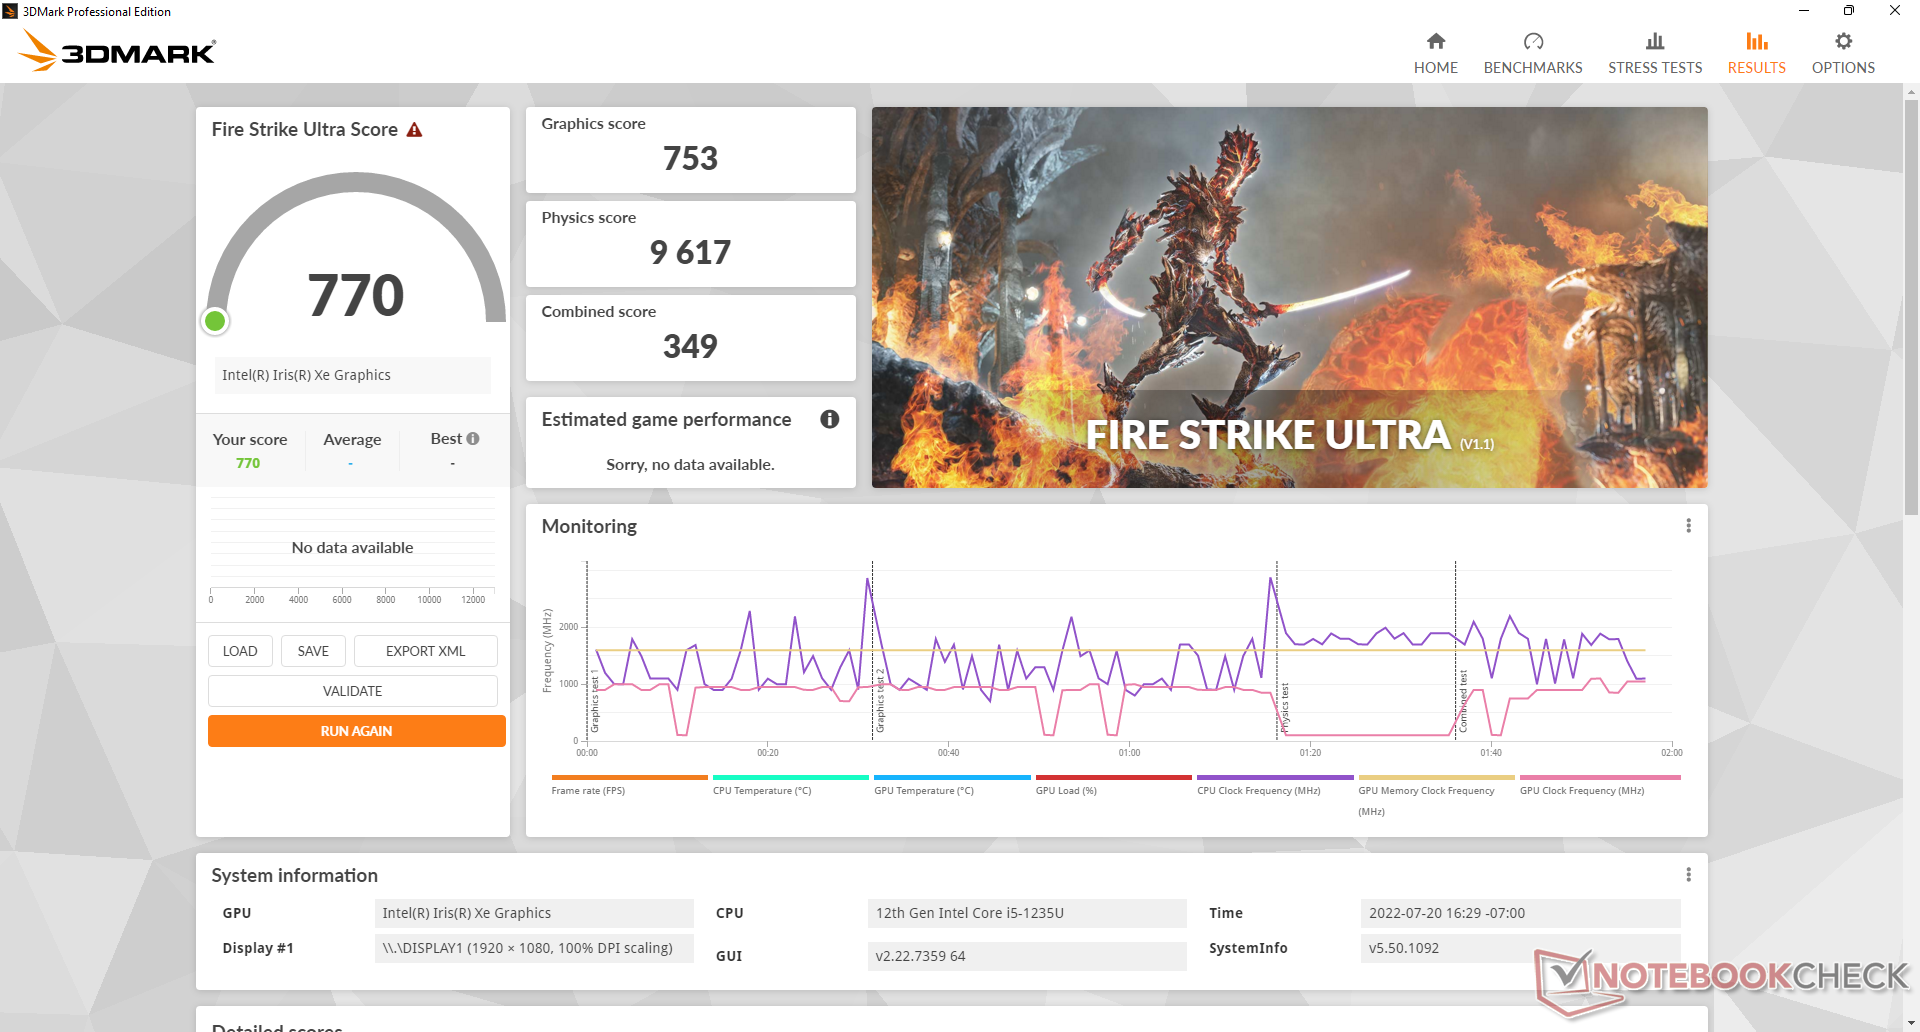
| 3DMark 11 Performance | 4579 points | |
| 3DMark Cloud Gate Standard Score | 13306 points | |
| 3DMark Fire Strike Score | 2750 points | |
| 3DMark Time Spy Score | 1097 points | |
Help | ||
| Cyberpunk 2077 1.6 - 1920x1080 Low Preset | |
| Dell Inspiron 14 7420 2-in-1 | |
| Average Intel Iris Xe Graphics G7 80EUs (9.1 - 17.8, n=7) | |
| VAIO FE 14.1 VWNC51429-SL | |
Witcher 3 FPS Chart
| low | med. | high | ultra | |
|---|---|---|---|---|
| GTA V (2015) | 50 | 46.2 | 11.9 | 5.69 |
| The Witcher 3 (2015) | 41.8 | 26.5 | 14.7 | 8.4 |
| Dota 2 Reborn (2015) | 84.8 | 57.5 | 34.1 | 31.2 |
| Final Fantasy XV Benchmark (2018) | 21.8 | 13.5 | 9.48 | |
| X-Plane 11.11 (2018) | 37.5 | 26.3 | 24.1 | |
| Strange Brigade (2018) | 50.9 | 22.3 | 18.5 | 15.4 |
| Cyberpunk 2077 1.6 (2022) | 9.1 |
Emissions
System Noise — Pretty Quiet
Fan noise is quieter than many other 14-inch Ultrabooks. Running the first benchmark scene of 3DMark 06, for example, would result in a fan noise of just under 29 dB(A) against a silent background of 24 dB(A). In comparison, the VAIO SX14 or Gateway Ultra Slim 14.1 would be in the upper 30 dB(A) range when under similar conditions. Higher loads like games will bring fan noise to its maximum of 37 dB(A) which is still quieter than on many competitors by quite the margin.
Noise level
| Idle |
| 23.8 / 23.8 / 23.8 dB(A) |
| Load |
| 28.6 / 37.3 dB(A) |
 | ||
30 dB silent 40 dB(A) audible 50 dB(A) loud |
||
min: | ||
| VAIO FE 14.1 VWNC51429-SL Iris Xe G7 80EUs, i5-1235U, Netac S930E 1TB | VAIO SX14 VJS144X0111K Iris Xe G7 96EUs, i7-1195G7, Samsung PM9A1 MZVL22T0HBLB | Gateway Ultra Slim 14.1 GWTC51427 Iris Xe G7 80EUs, i5-1235U, W800S W800SHMQ 512GB SSD | Dell Inspiron 14 7420 2-in-1 Iris Xe G7 96EUs, i7-1255U, WDC PC SN530 SDBPMPZ-512G | Acer TravelMate P6 TMP614P-52-724G Iris Xe G7 96EUs, i7-1185G7, SK Hynix BC711 HFM512GD3JX016N | |
|---|---|---|---|---|---|
| Noise | -19% | -7% | -7% | -9% | |
| off / environment * (dB) | 23.8 | 23.8 -0% | 23.1 3% | 23.1 3% | 25.4 -7% |
| Idle Minimum * (dB) | 23.8 | 24.3 -2% | 23.3 2% | 24.7 -4% | 25.4 -7% |
| Idle Average * (dB) | 23.8 | 24.3 -2% | 23.3 2% | 24.7 -4% | 25.4 -7% |
| Idle Maximum * (dB) | 23.8 | 31.3 -32% | 23.3 2% | 24.7 -4% | 25.4 -7% |
| Load Average * (dB) | 28.6 | 36.6 -28% | 39.7 -39% | 27.7 3% | 38 -33% |
| Witcher 3 ultra * (dB) | 37.1 | 49.6 -34% | 40.5 -9% | 45.1 -22% | |
| Load Maximum * (dB) | 37.3 | 51.5 -38% | 40.7 -9% | 45.1 -21% | 35.2 6% |
* ... smaller is better
Temperature
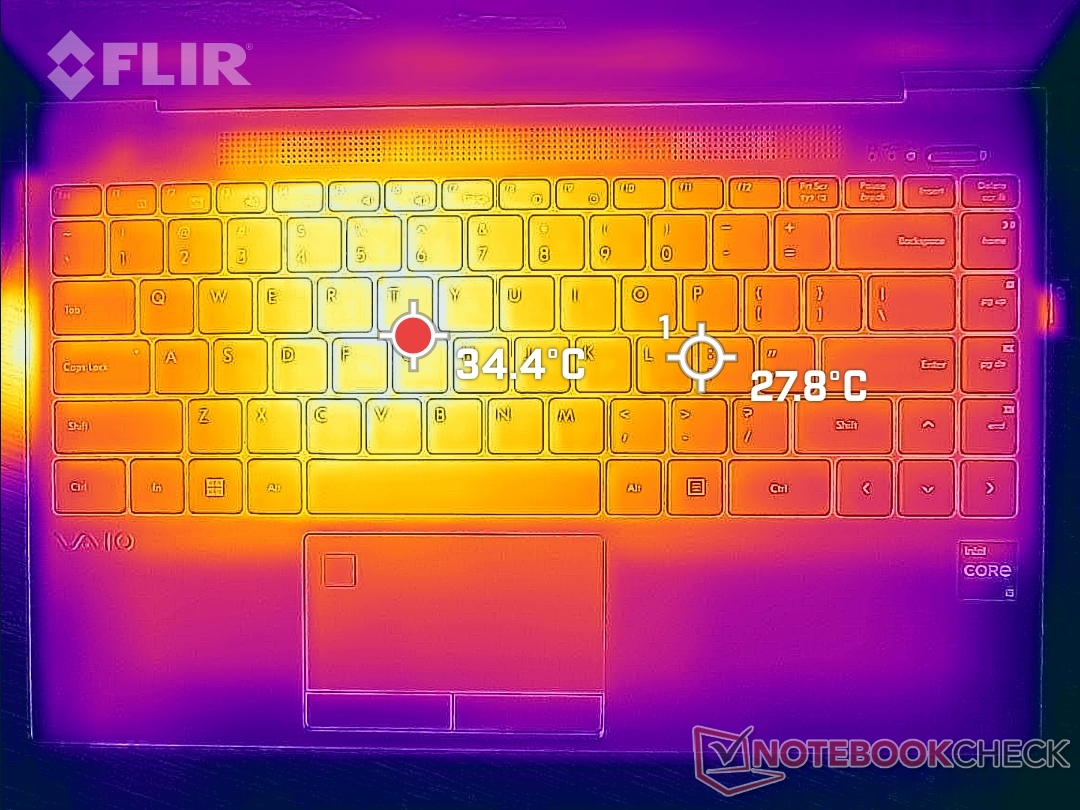
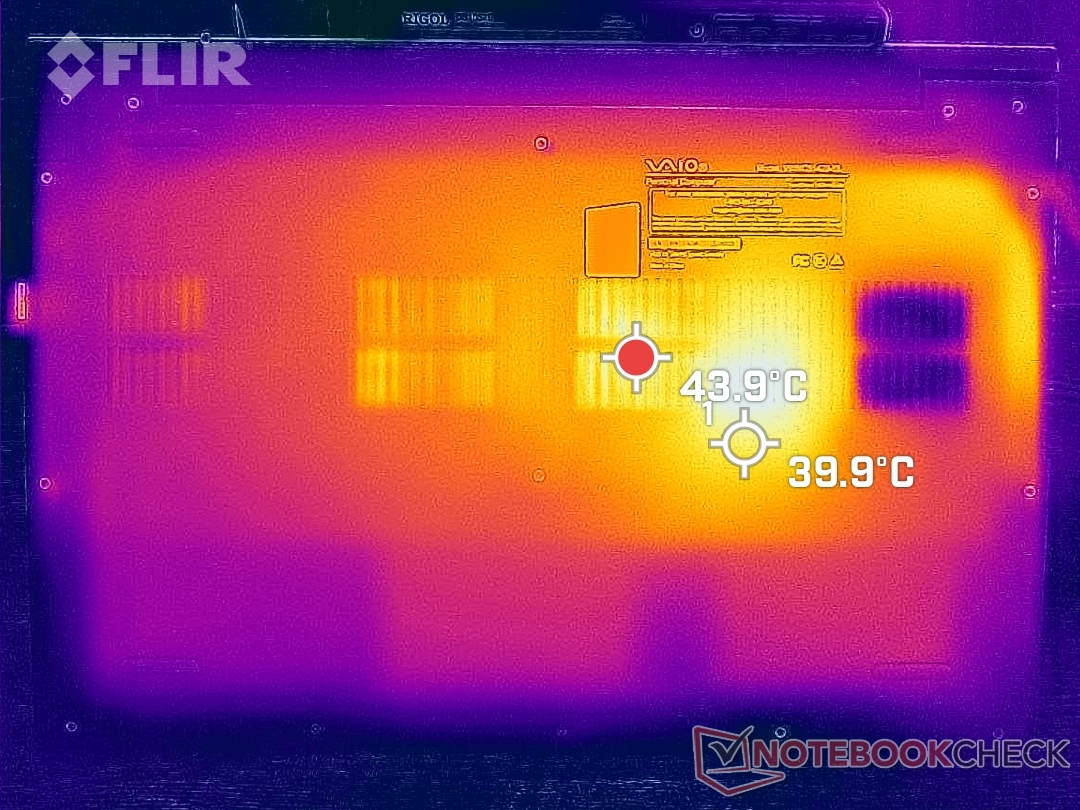
The very center of the keyboard is the hot spot on the Vaio FE which is generally not ideal. Fortunately, the system doesn't get all that warm and so the hot spot is never uncomfortable to the touch. We're able to record a hot spot of just 34 C to 35 C on the G key when running demanding loads for over an hour.
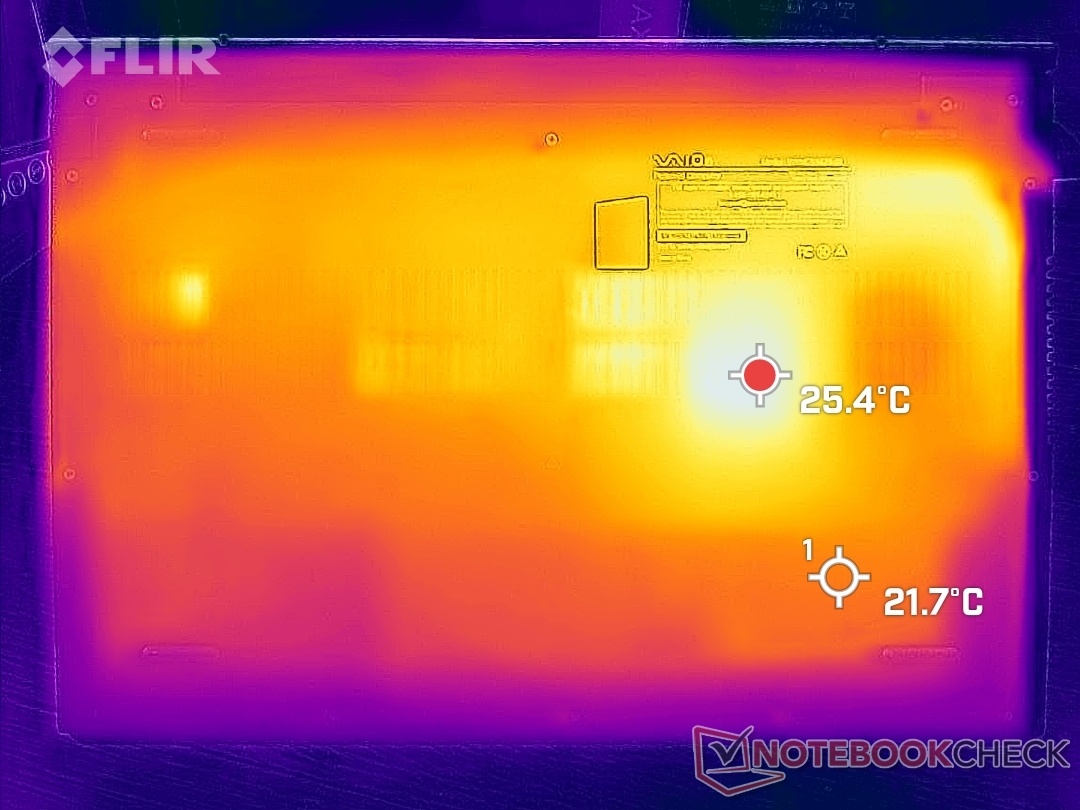
The bottom surface can become much warmer at almost 40 C compared to 49 C on the Vaio SX14 or 32 C on the Gateway Ultra Slim 14.1.
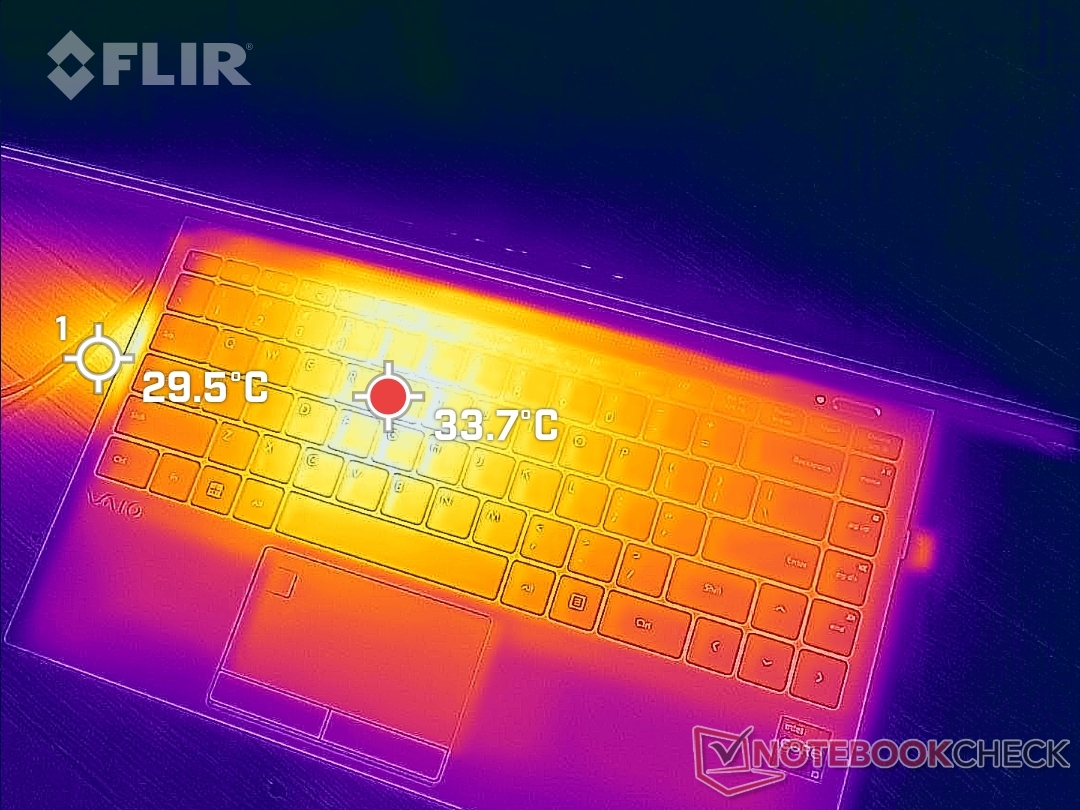
(+) The maximum temperature on the upper side is 34.4 °C / 94 F, compared to the average of 36.8 °C / 98 F, ranging from 21 to 71 °C for the class Multimedia.
(±) The bottom heats up to a maximum of 42 °C / 108 F, compared to the average of 39.1 °C / 102 F
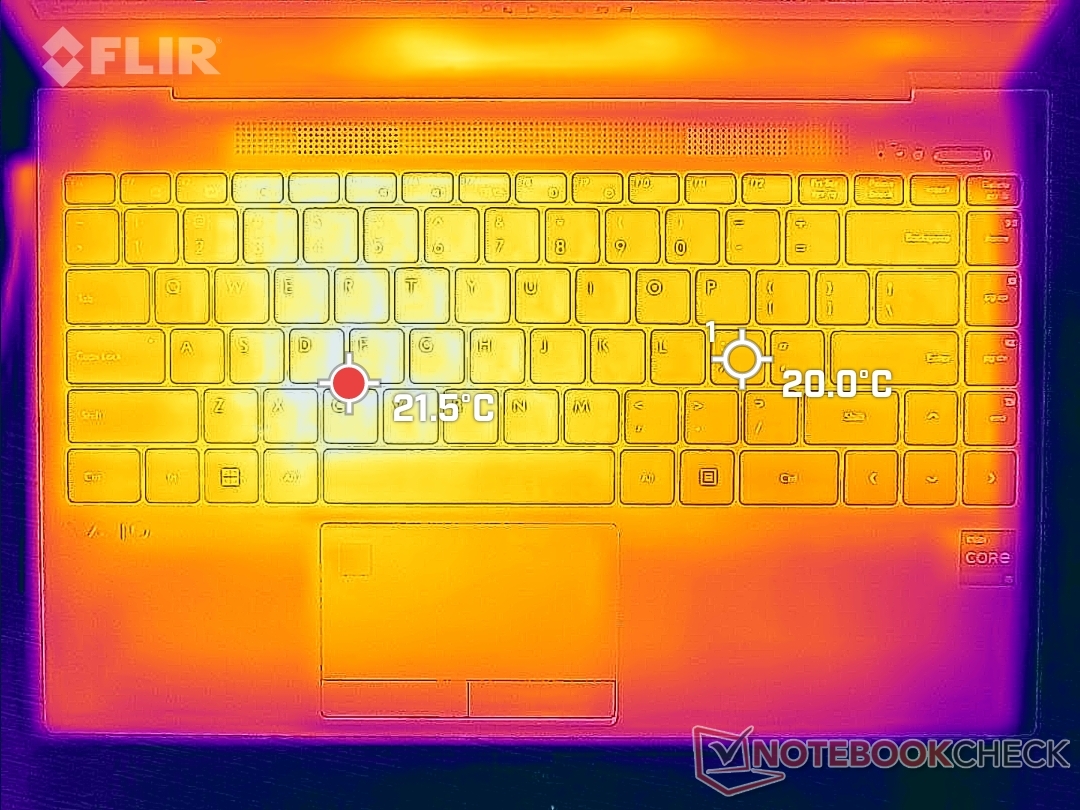
(+) In idle usage, the average temperature for the upper side is 20.3 °C / 69 F, compared to the device average of 31.3 °C / 88 F.
(+) The palmrests and touchpad are cooler than skin temperature with a maximum of 24.2 °C / 75.6 F and are therefore cool to the touch.
(+) The average temperature of the palmrest area of similar devices was 28.7 °C / 83.7 F (+4.5 °C / 8.1 F).
| VAIO FE 14.1 VWNC51429-SL Intel Core i5-1235U, Intel Iris Xe Graphics G7 80EUs | VAIO SX14 VJS144X0111K Intel Core i7-1195G7, Intel Iris Xe Graphics G7 96EUs | Gateway Ultra Slim 14.1 GWTC51427 Intel Core i5-1235U, Intel Iris Xe Graphics G7 80EUs | Dell Inspiron 14 7420 2-in-1 Intel Core i7-1255U, Intel Iris Xe Graphics G7 96EUs | Lenovo IdeaPad 3 14ITL6 82H700CCGE Intel Celeron 6305, Intel UHD Graphics Xe G4 48EUs | Acer Swift 1 SF114-34-P6U1 Intel Pentium Silver N6000, Intel UHD Graphics (Jasper Lake 32 EU) | |
|---|---|---|---|---|---|---|
| Heat | -9% | -4% | -15% | -24% | -16% | |
| Maximum Upper Side * (°C) | 34.4 | 36.2 -5% | 36.2 -5% | 38.2 -11% | 38.6 -12% | 38.9 -13% |
| Maximum Bottom * (°C) | 42 | 50.2 -20% | 32.2 23% | 45.6 -9% | 41 2% | 43.3 -3% |
| Idle Upper Side * (°C) | 21.6 | 21.4 1% | 26.4 -22% | 27.4 -27% | 32.6 -51% | 28.5 -32% |
| Idle Bottom * (°C) | 25.2 | 27.8 -10% | 28.4 -13% | 28.4 -13% | 33.9 -35% | 29.6 -17% |
* ... smaller is better
Stress Test
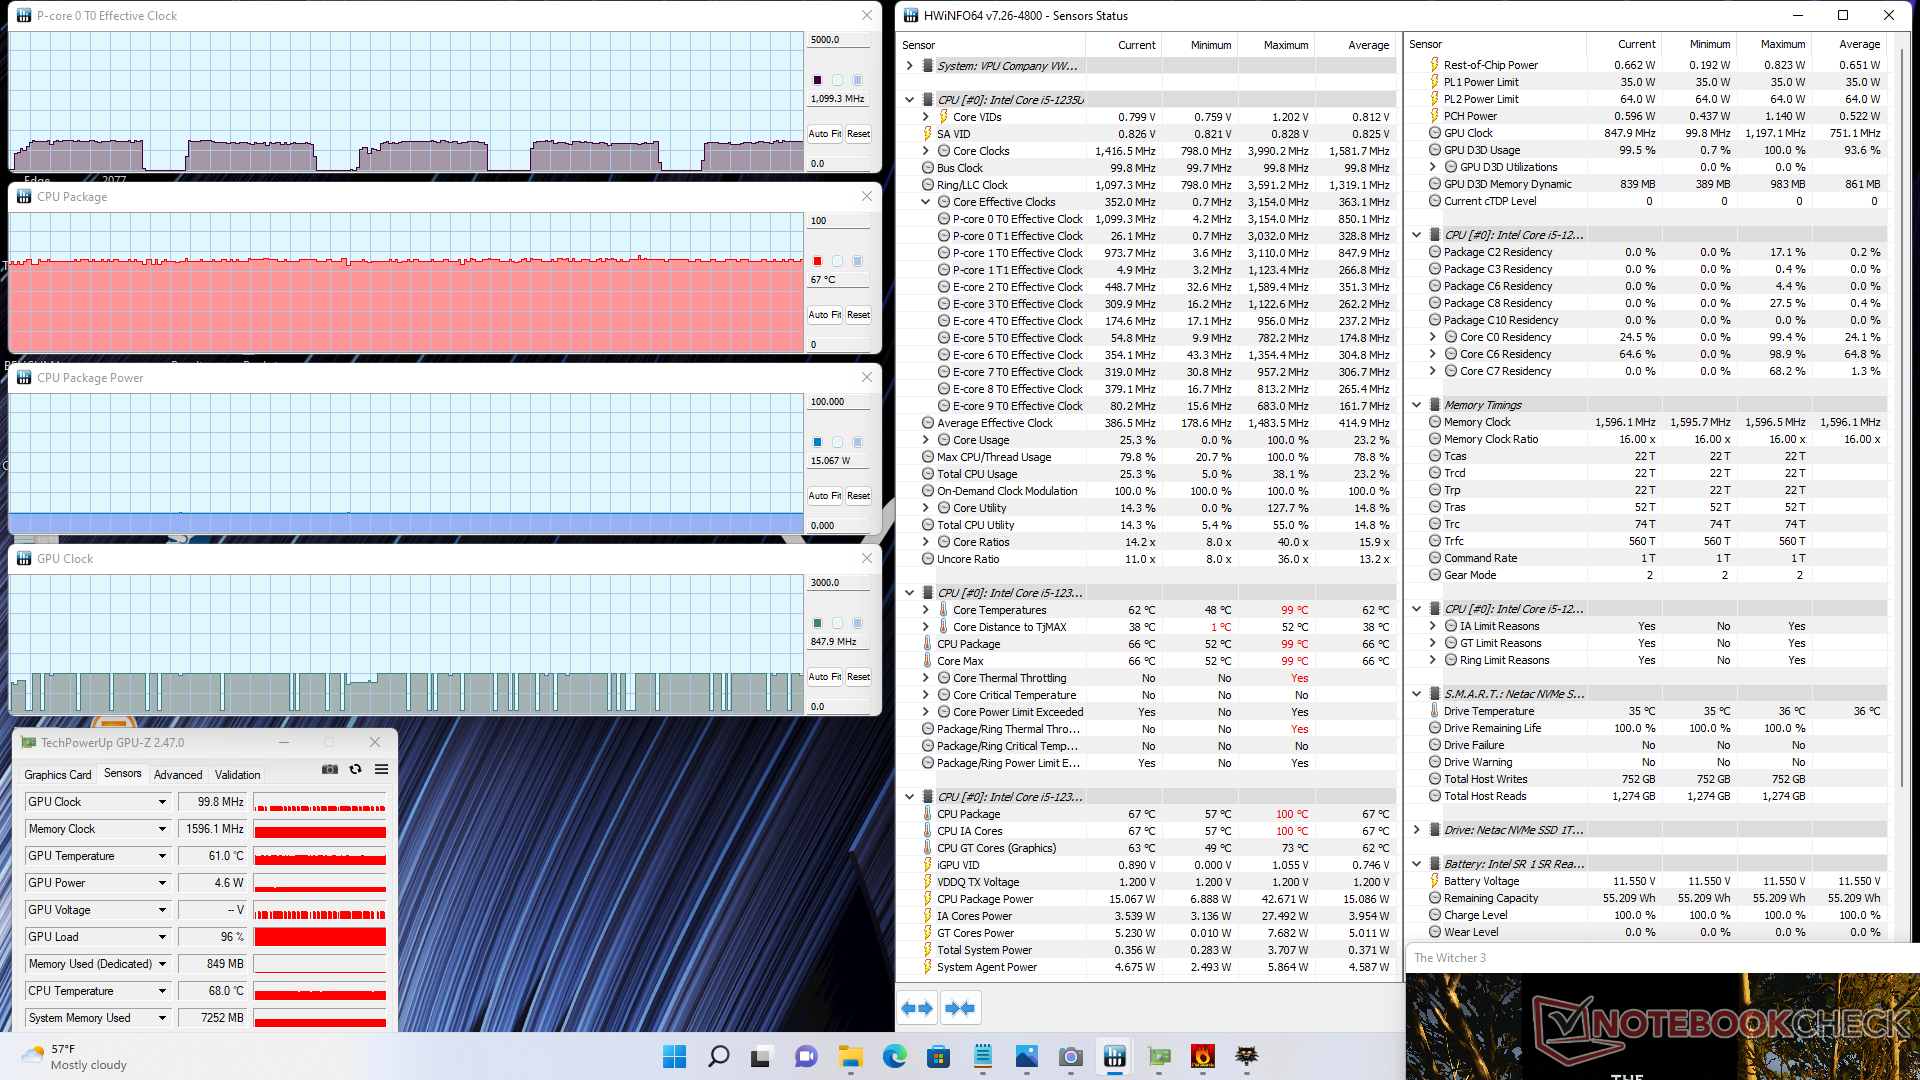
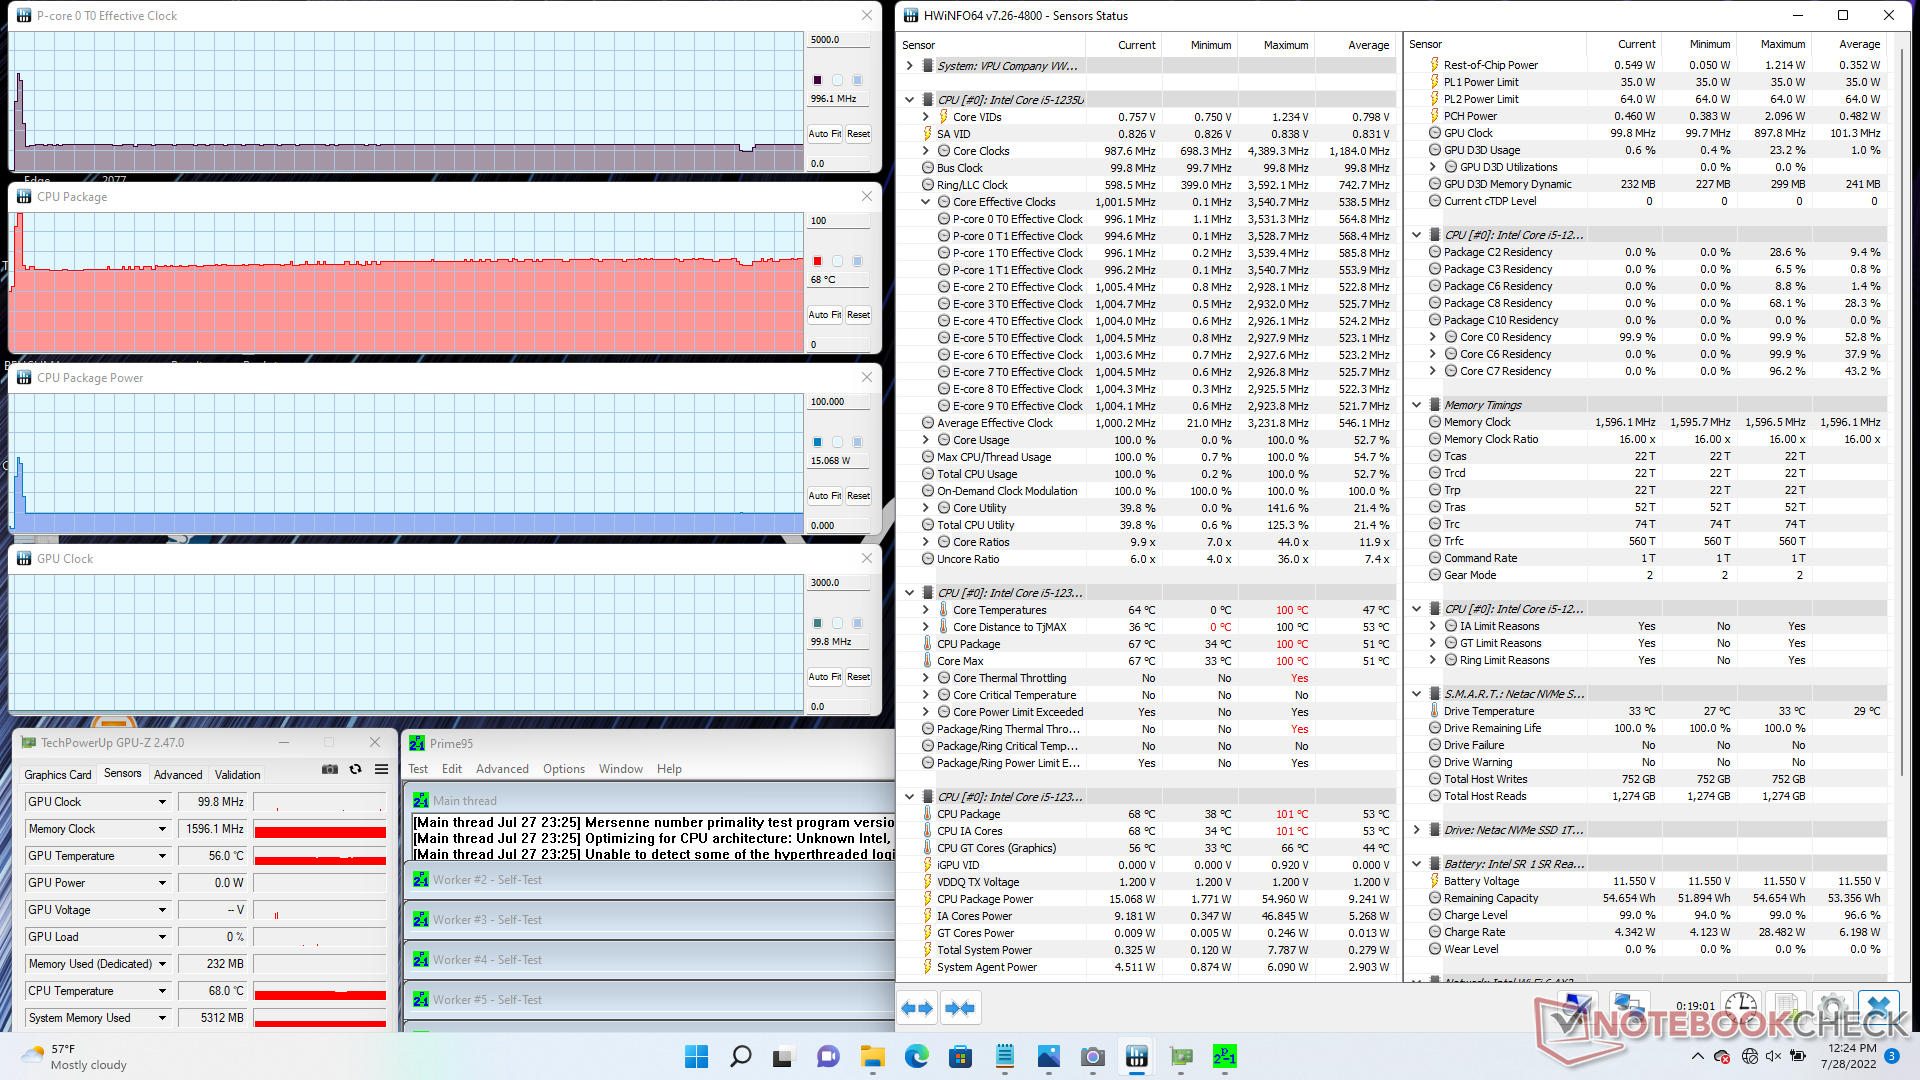
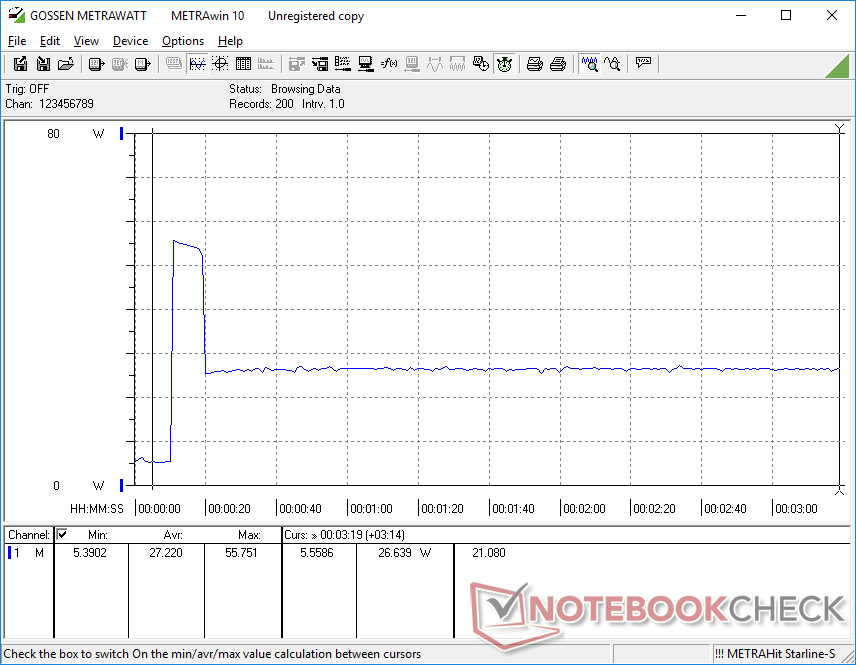
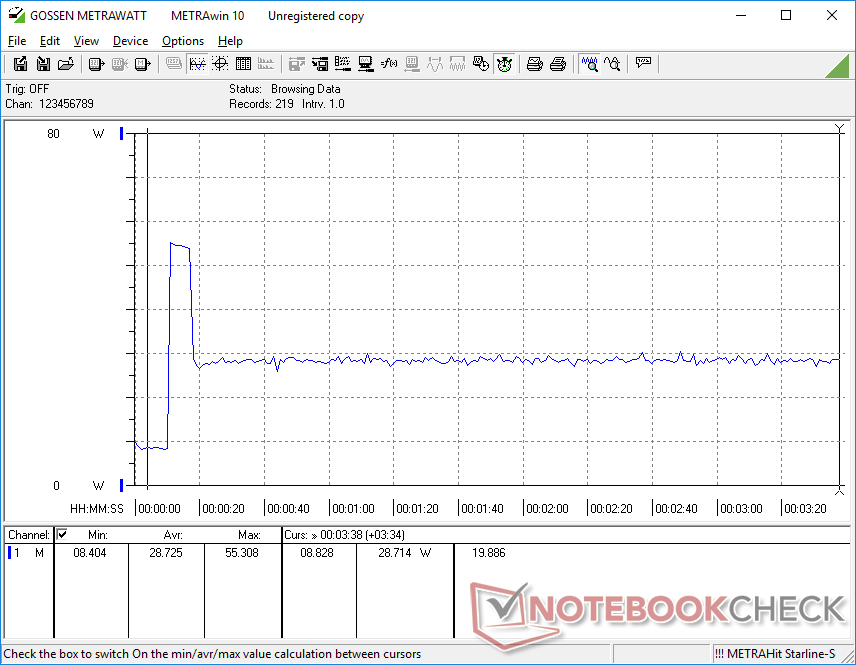
When running Prime95 to stress the CPU, clock rates and board power draw would boost to 3.5 GHz and 55 W, respectively, for only the first couple of seconds until core temperature reaches 100 C. Thereafter, clock rates and board power draw would drop to ~850 MHz and 15 W, respectively, in order to maintain a cooler core temperature of just under 70 C. The quick and steep decline in performance when running demanding loads correlates with our power consumption findings below to show that the FE14 is unable to sustain high Turbo Boost clock rates for long periods.
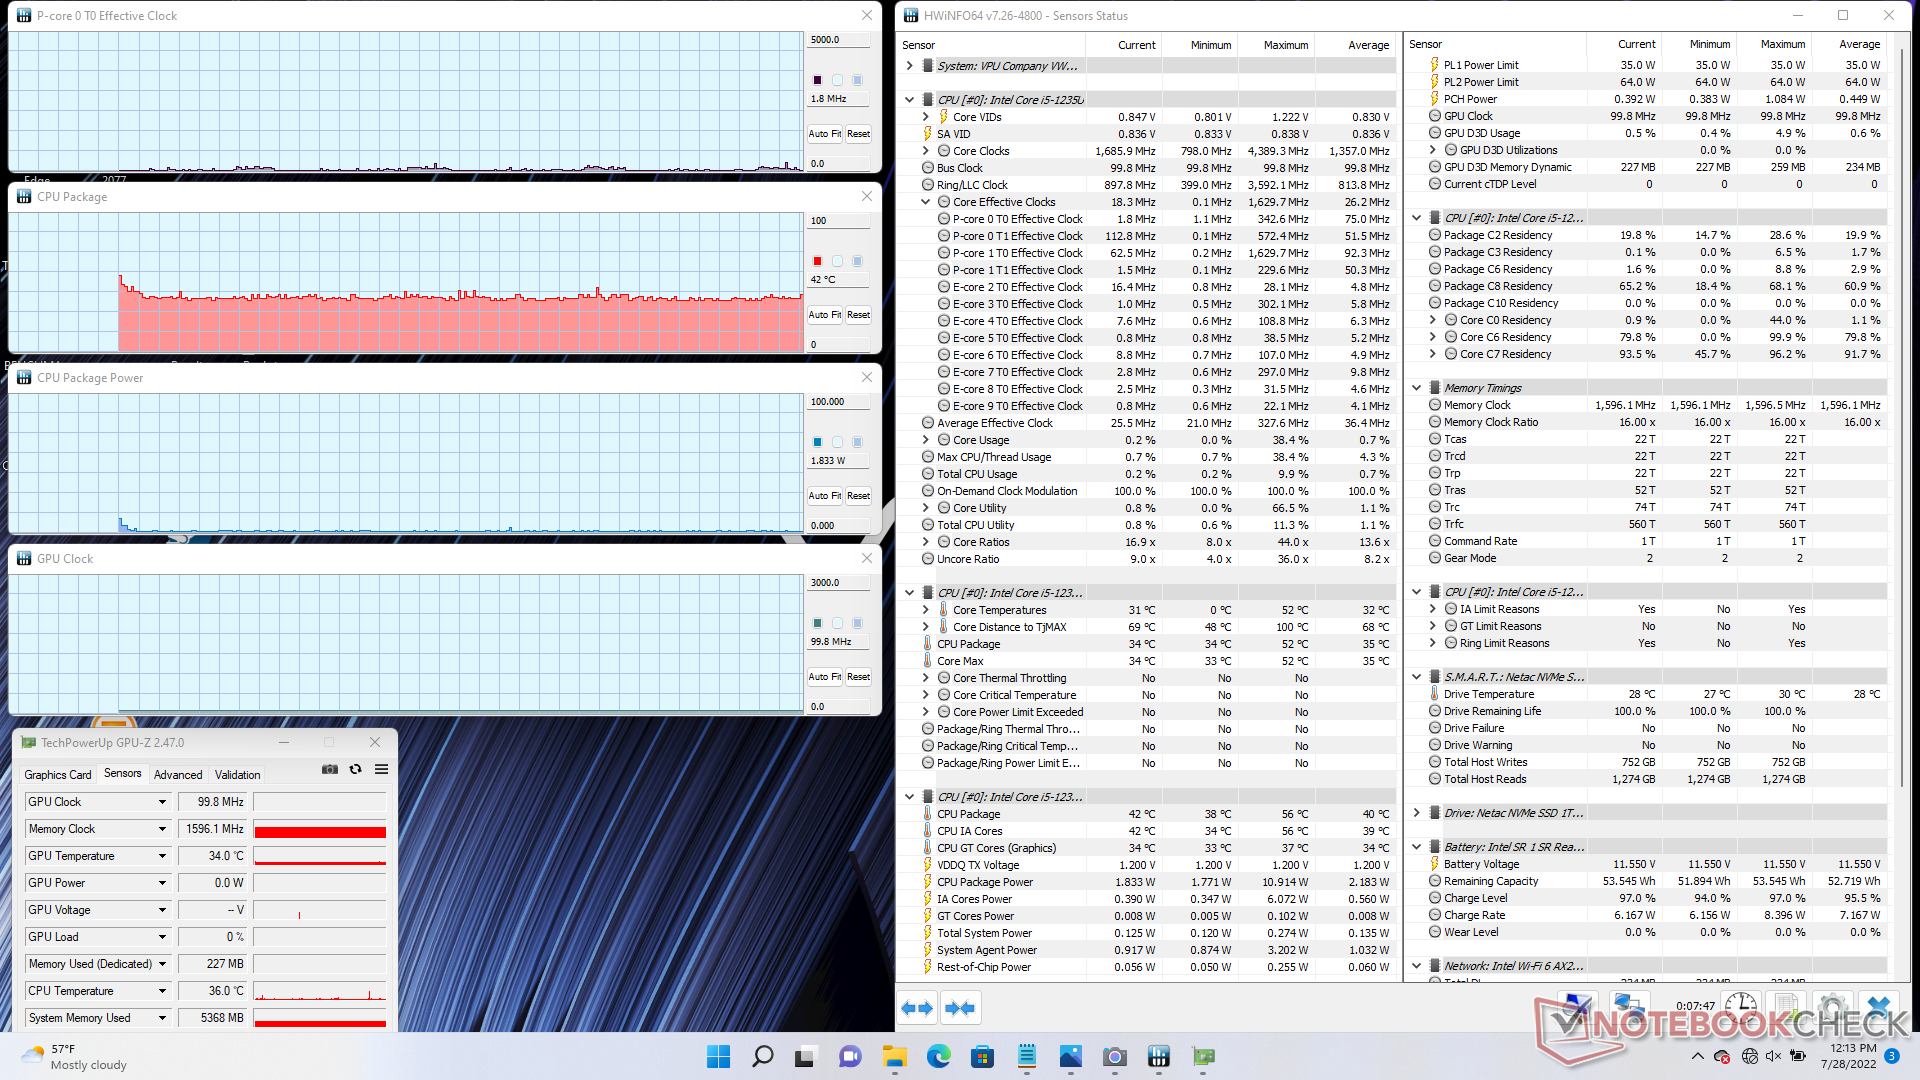
When running Witcher 3 to represent high loads, GPU clock rate and temperature would stabilize at 848 MHz and 67 C, respectively, compared to 1000 MHz and 54 C on the Gateway Ultra Slim 14.1 under similar conditions. Our Vaio is running both slower and warmer than on the Gateway even though both are utilizing the same Core i5-1235U CPU.
Running on battery power does not limit performance. A 3DMark 11 test on batteries would return roughly the same scores.
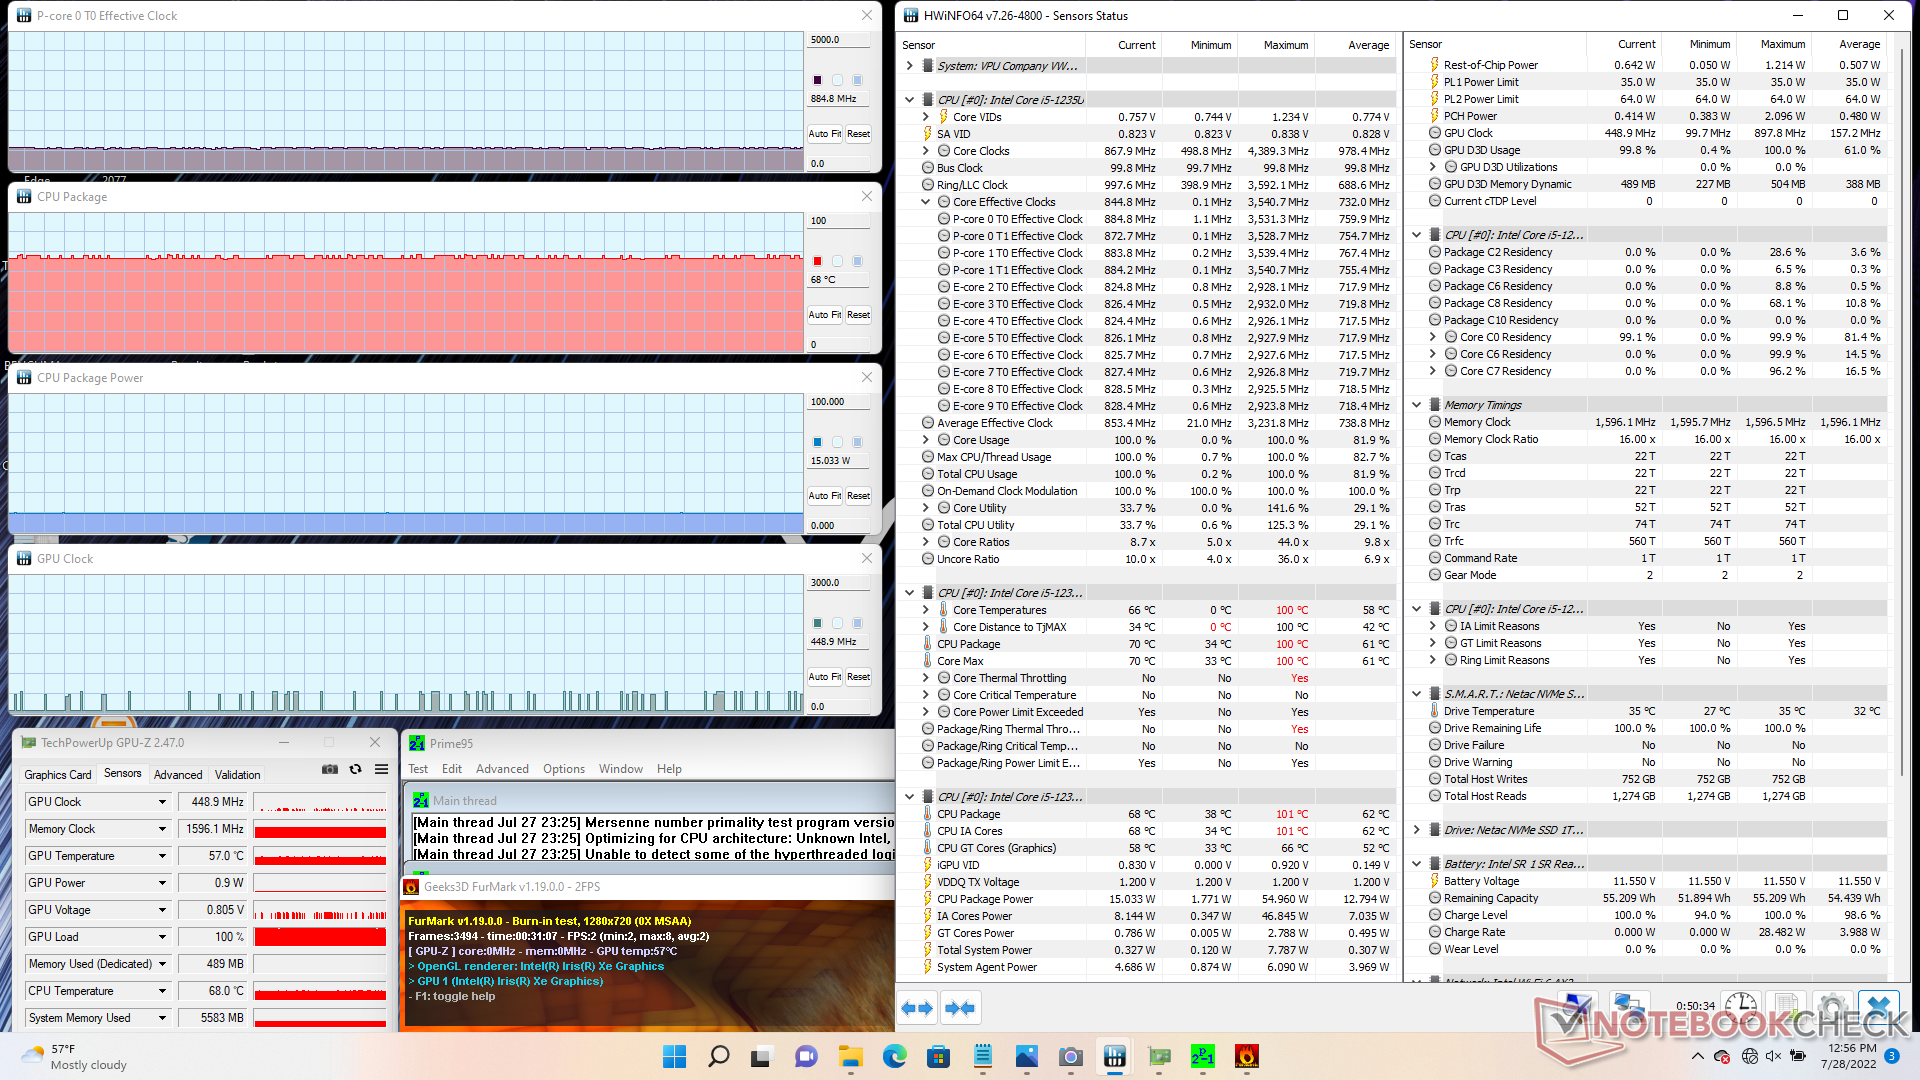
| CPU Clock (GHz) | GPU Clock (MHz) | Average CPU Temperature (°C) | |
| System Idle | -- | -- | 42 |
| Prime95 Stress | 1.0 | -- | 69 |
| Prime95 + FurMark Stress | 0.8 | 449 | 69 |
| Witcher 3 Stress | 1.1 | 848 | 67 |
Speakers
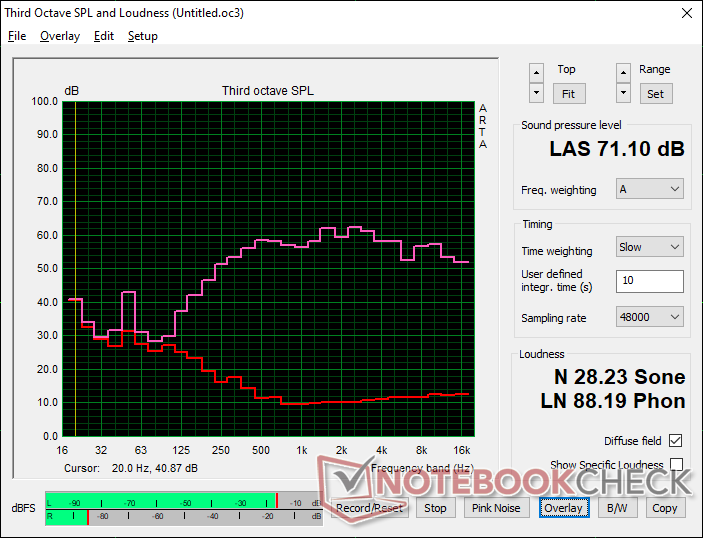
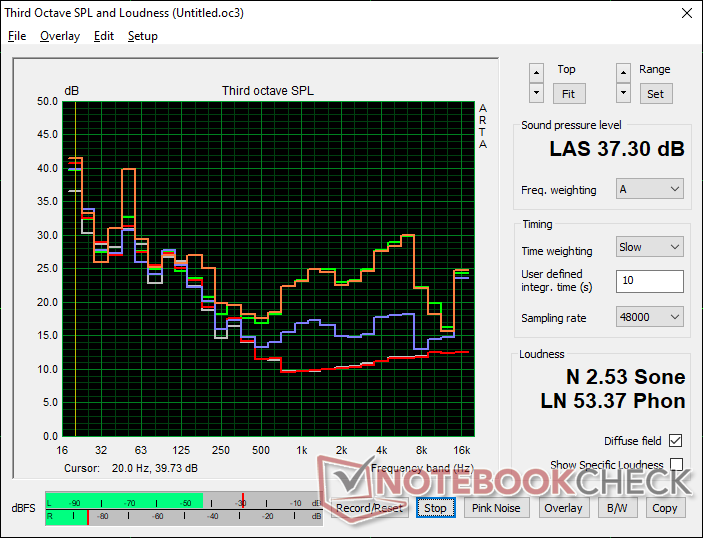
VAIO FE 14.1 VWNC51429-SL audio analysis
(-) | not very loud speakers (71.1 dB)
Bass 100 - 315 Hz
(±) | reduced bass - on average 13.2% lower than median
(±) | linearity of bass is average (9.3% delta to prev. frequency)
Mids 400 - 2000 Hz
(+) | balanced mids - only 1.8% away from median
(+) | mids are linear (4.3% delta to prev. frequency)
Highs 2 - 16 kHz
(+) | balanced highs - only 2.7% away from median
(+) | highs are linear (5.7% delta to prev. frequency)
Overall 100 - 16.000 Hz
(+) | overall sound is linear (14.5% difference to median)
Compared to same class
» 34% of all tested devices in this class were better, 4% similar, 61% worse
» The best had a delta of 5%, average was 17%, worst was 45%
Compared to all devices tested
» 18% of all tested devices were better, 4% similar, 78% worse
» The best had a delta of 4%, average was 24%, worst was 134%
Apple MacBook Pro 16 2021 M1 Pro audio analysis
(+) | speakers can play relatively loud (84.7 dB)
Bass 100 - 315 Hz
(+) | good bass - only 3.8% away from median
(+) | bass is linear (5.2% delta to prev. frequency)
Mids 400 - 2000 Hz
(+) | balanced mids - only 1.3% away from median
(+) | mids are linear (2.1% delta to prev. frequency)
Highs 2 - 16 kHz
(+) | balanced highs - only 1.9% away from median
(+) | highs are linear (2.7% delta to prev. frequency)
Overall 100 - 16.000 Hz
(+) | overall sound is linear (4.6% difference to median)
Compared to same class
» 0% of all tested devices in this class were better, 0% similar, 100% worse
» The best had a delta of 5%, average was 17%, worst was 45%
Compared to all devices tested
» 0% of all tested devices were better, 0% similar, 100% worse
» The best had a delta of 4%, average was 24%, worst was 134%
Energy Management
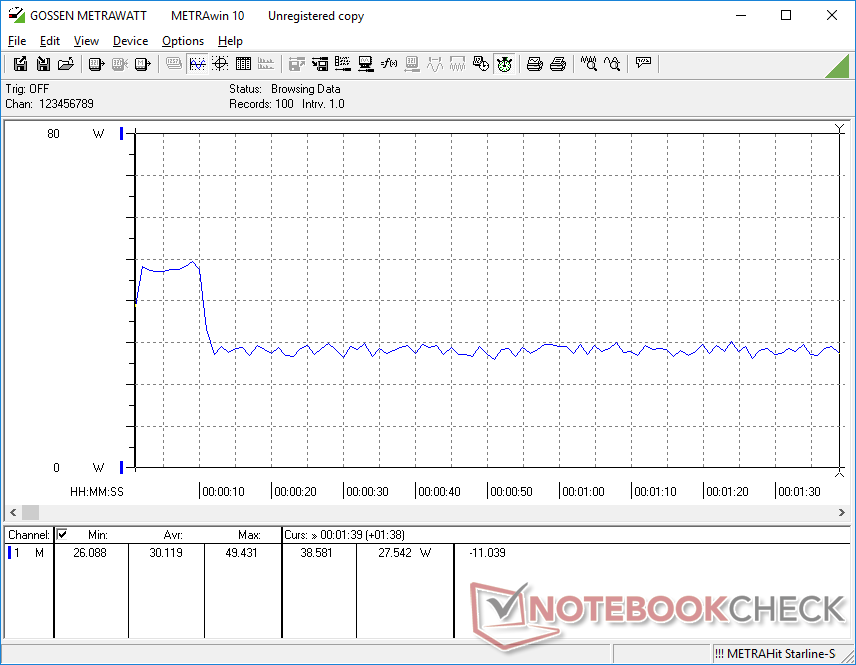
Power Consumption — Excellent For An Alder Lake CPU
Power consumption is very close to what we recorded on the Gateway Ultra Slim 14.1 since both models utilize the same processor. The Inspiron 14 7420 2-in-1 uses the much faster Core i7-1255U, but it is also much more demanding by about 45 percent when running CPU-heavy tasks.
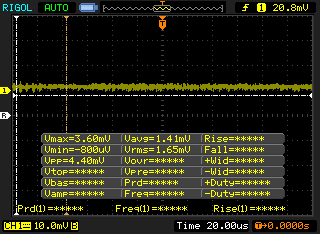
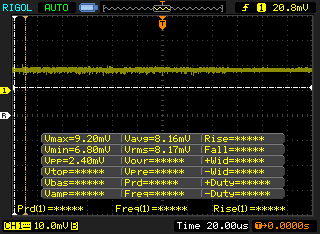
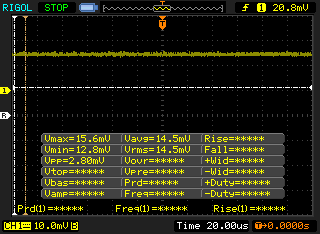
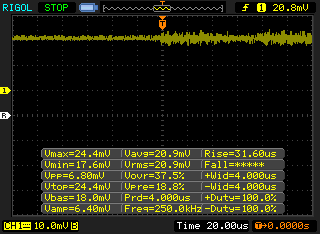
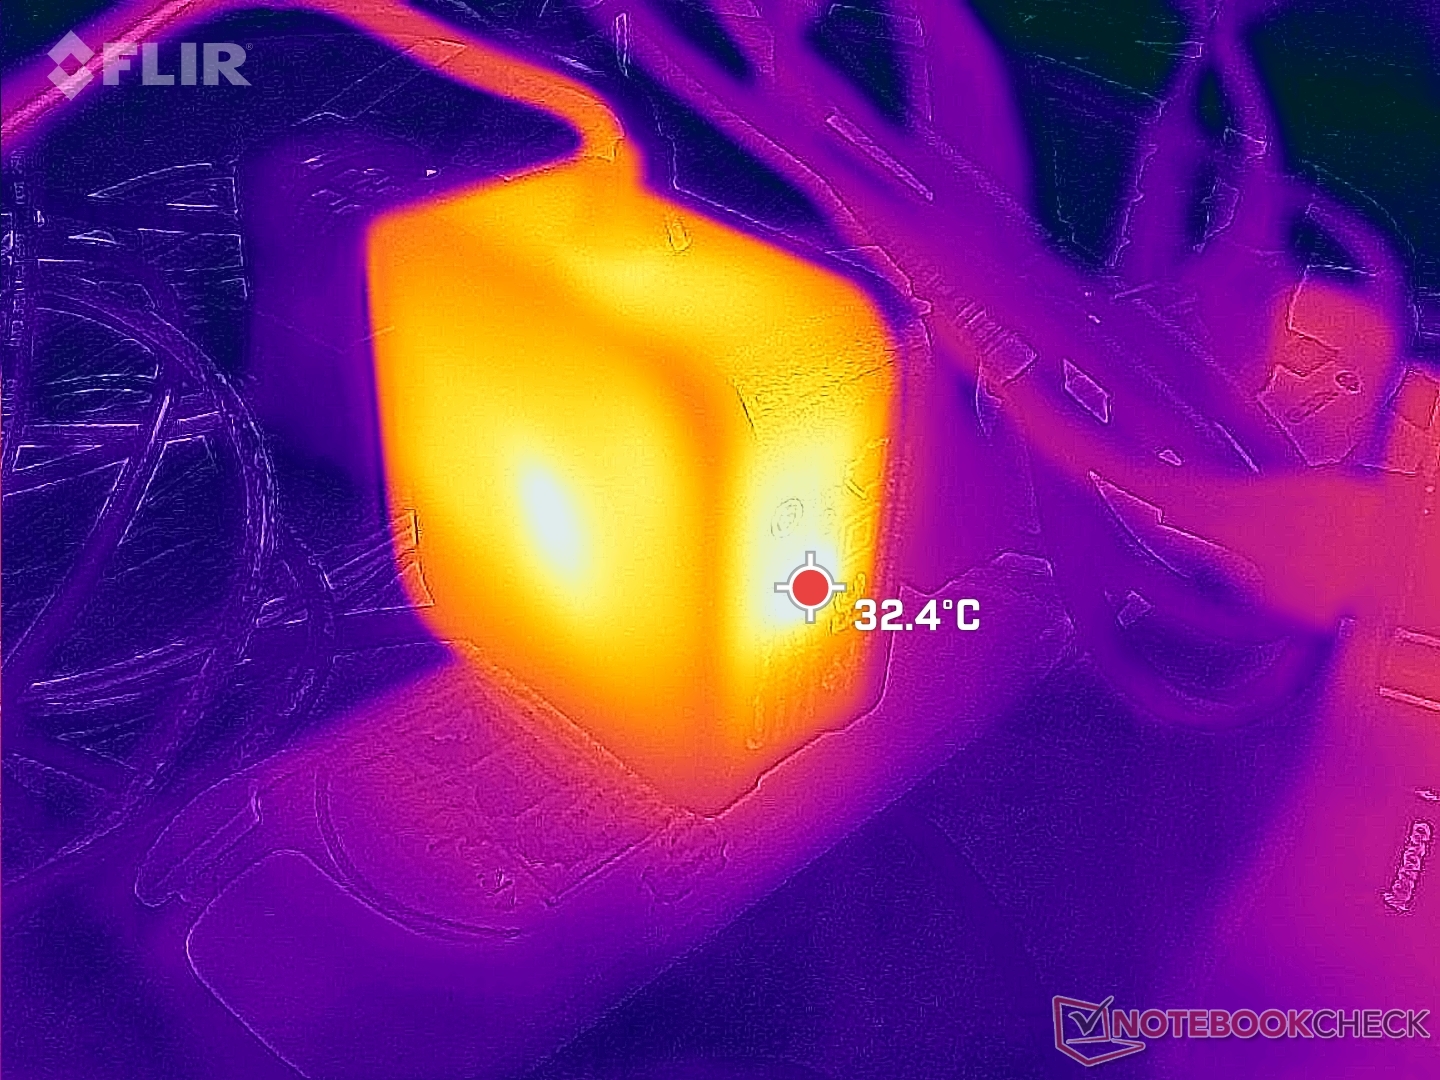
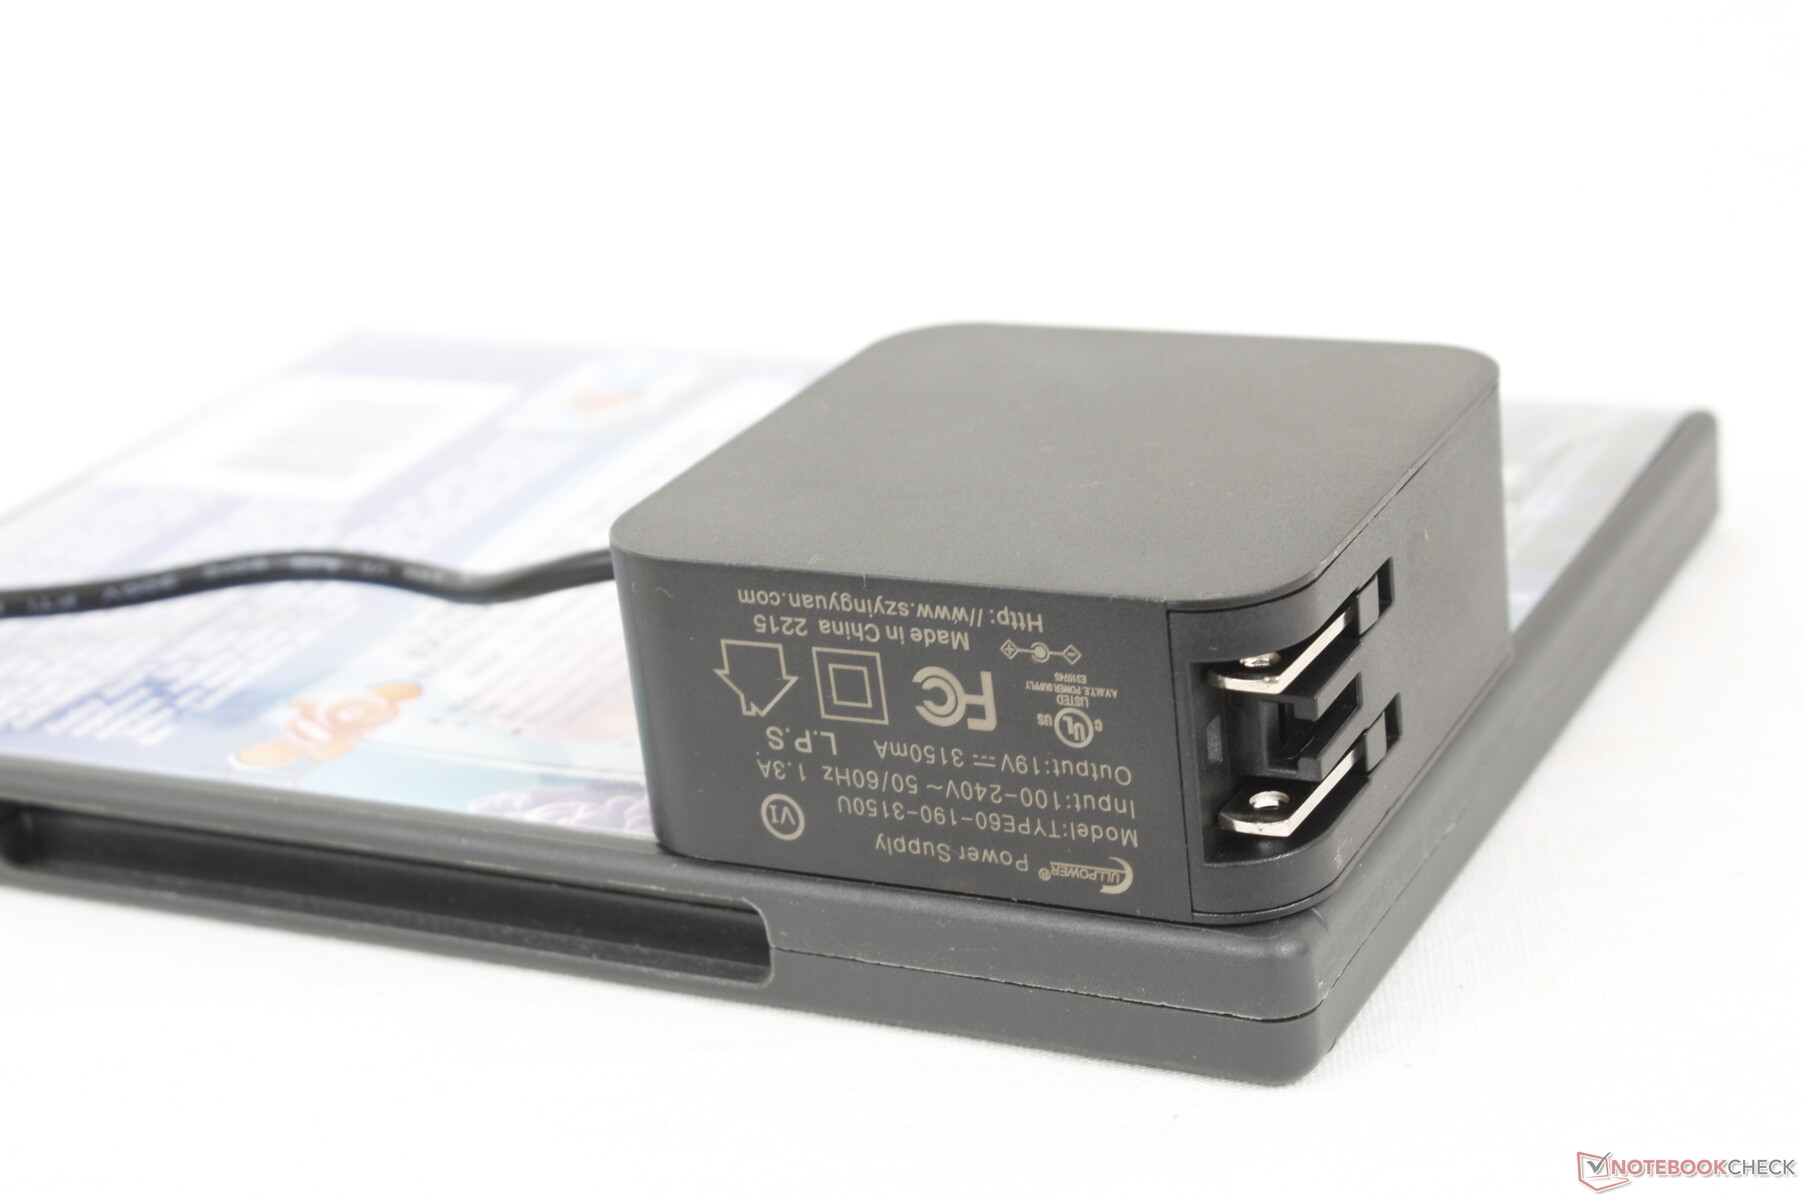
We're able to record a maximum draw of 56 W from the small (~6.5 x 6.5 x 3 cm) 60 W AC adapter when running extreme loads. However, this rate is only temporary as shown by the screenshots below due to the limited Turbo Boost potential of the model. Users can expect consumption to be around 29 W when running most stressful scenarios.
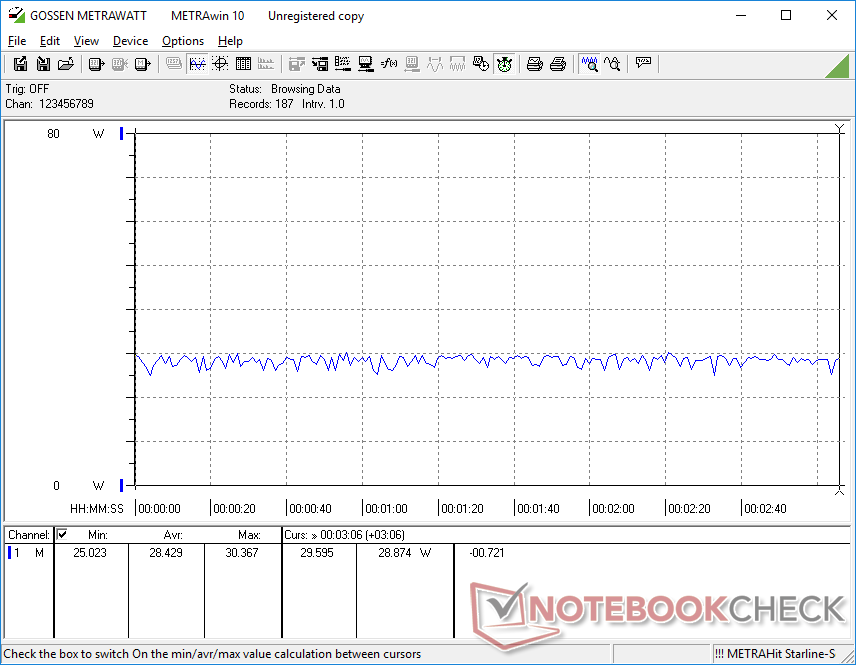
| Off / Standby | |
| Idle | |
| Load |
|
Key:
min: | |
| VAIO FE 14.1 VWNC51429-SL i5-1235U, Iris Xe G7 80EUs, Netac S930E 1TB, IPS, 1920x1080, 14.1" | VAIO SX14 VJS144X0111K i7-1195G7, Iris Xe G7 96EUs, Samsung PM9A1 MZVL22T0HBLB, IPS, 1920x1080, 14" | Gateway Ultra Slim 14.1 GWTC51427 i5-1235U, Iris Xe G7 80EUs, W800S W800SHMQ 512GB SSD, IPS, 1920x1080, 14.1" | Dell Inspiron 14 7420 2-in-1 i7-1255U, Iris Xe G7 96EUs, WDC PC SN530 SDBPMPZ-512G, IPS, 1920x1200, 14" | Lenovo IdeaPad 3 14ITL6 82H700CCGE Celeron 6305, UHD Graphics Xe G4 48EUs, SK Hynix BC711 HFM128GD3HX015N, IPS, 1920x1080, 14" | Acer Swift 1 SF114-34-P6U1 Pentium N6000, UHD Graphics (Jasper Lake 32 EU), 128 GB eMMC Flash, IPS, 1920x1080, 14" | |
|---|---|---|---|---|---|---|
| Power Consumption | -67% | 4% | -34% | 6% | 47% | |
| Idle Minimum * (Watt) | 3.5 | 3.3 6% | 3.5 -0% | 5.2 -49% | 3.7 -6% | 2.4 31% |
| Idle Average * (Watt) | 5.7 | 13.9 -144% | 5 12% | 8.2 -44% | 7.1 -25% | 4.1 28% |
| Idle Maximum * (Watt) | 7.9 | 15.9 -101% | 7.7 3% | 9.9 -25% | 8.2 -4% | 4.7 41% |
| Load Average * (Watt) | 30.1 | 54 -79% | 32 -6% | 44.4 -48% | 26 14% | 13.6 55% |
| Witcher 3 ultra * (Watt) | 28.4 | 46.6 -64% | 30.2 -6% | 35 -23% | 24.3 14% | 14.3 50% |
| Load Maximum * (Watt) | 55.8 | 66 -18% | 45.7 18% | 62.5 -12% | 31.4 44% | 12.1 78% |
* ... smaller is better
Power Consumption Witcher 3 / Stresstest
Power Consumption external Monitor
Battery Life
Runtimes are respectable at just over 8 hours of real-world WLAN usage on a full charge to be comparable to the VAIO SX14 or Gateway Ultra Slim 14.1. Charging from empty to full capacity takes about 90 minutes.
The system can be recharged via USB-C if you happen to lose or forget to bring the proprietary barrel charger during trips.
| VAIO FE 14.1 VWNC51429-SL i5-1235U, Iris Xe G7 80EUs, 55 Wh | VAIO SX14 VJS144X0111K i7-1195G7, Iris Xe G7 96EUs, 53 Wh | Gateway Ultra Slim 14.1 GWTC51427 i5-1235U, Iris Xe G7 80EUs, 51 Wh | Dell Inspiron 14 7420 2-in-1 i7-1255U, Iris Xe G7 96EUs, 54 Wh | Lenovo IdeaPad 3 14ITL6 82H700CCGE Celeron 6305, UHD Graphics Xe G4 48EUs, 38 Wh | |
|---|---|---|---|---|---|
| Battery runtime | 39% | -16% | 5% | -11% | |
| Reader / Idle (h) | 13.2 | 34.1 158% | 15.9 20% | ||
| WiFi v1.3 (h) | 8.1 | 8.9 10% | 6.8 -16% | 7.6 -6% | 7.2 -11% |
| Load (h) | 2.1 | 1 -52% | 2.1 0% |
Pros
Cons
Verdict — Starting To Show Its Age
The Vaio FE14 feels like a laptop stuck in the past. While we understand it's supposed to be an affordable model, that doesn't mean it should still be carrying features that are deprecated by today's standards. More specifically, the FE14 should make the full transition to USB-C charging and have a fingerprint-enabled Power button instead of a fingerprint reader occupying valuable space on the already small touchpad. The similarly-priced Lenovo IdeaPad 5 Pro 14 or Asus Vivobook 14 series are stronger options in this regard and they're also more easy to service as well.
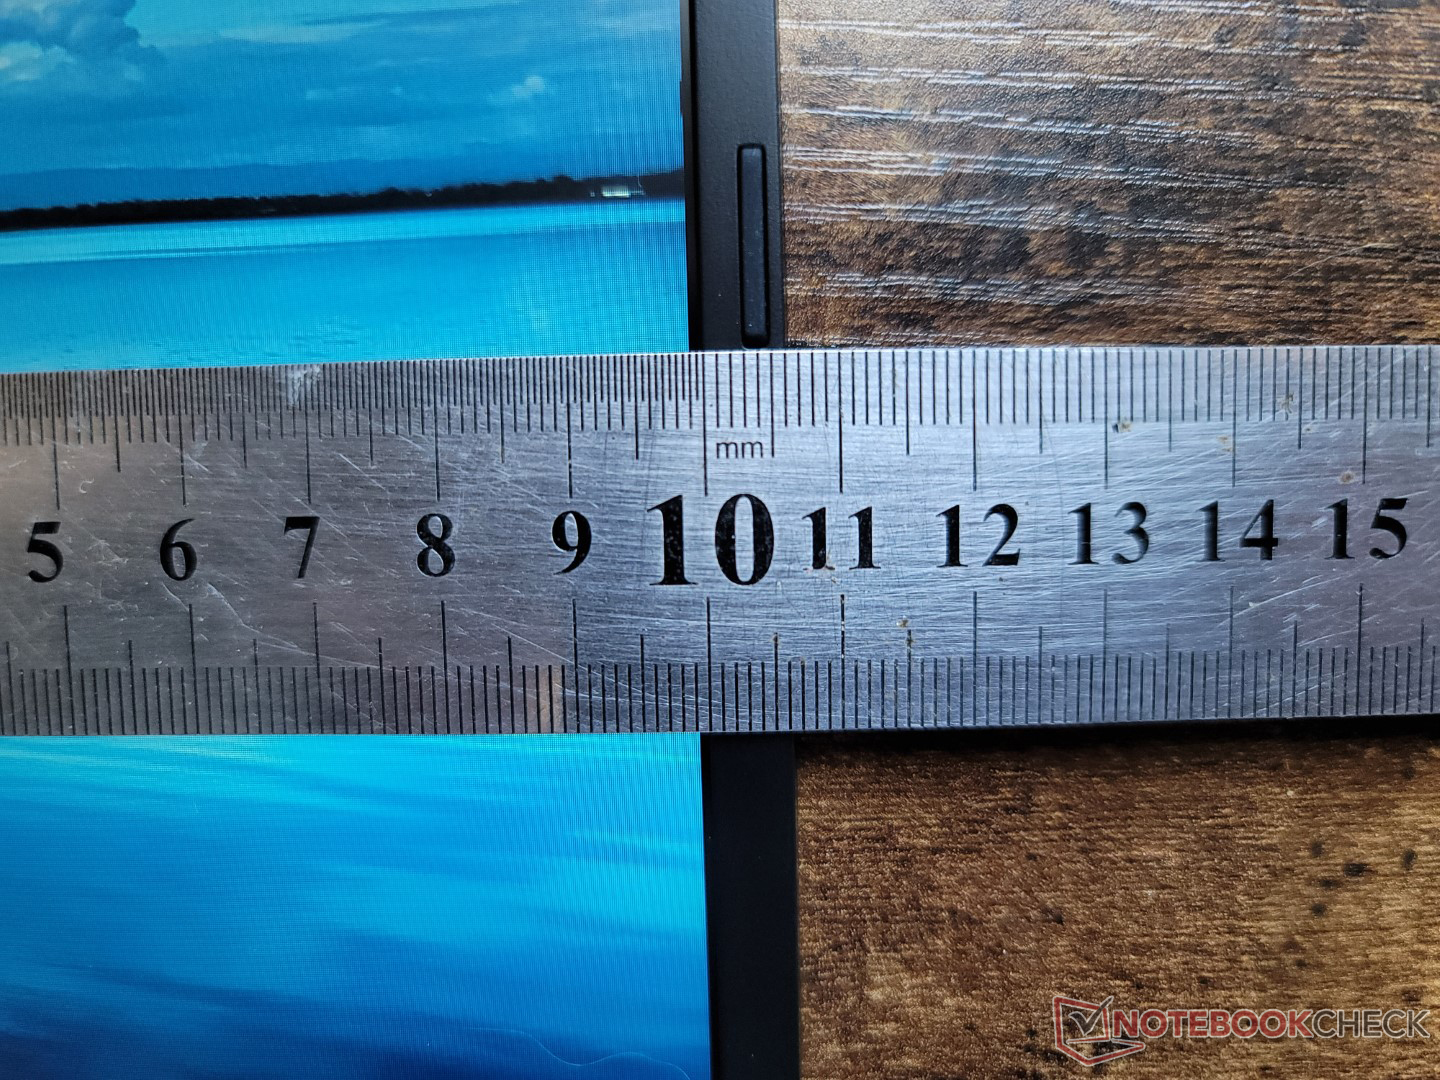
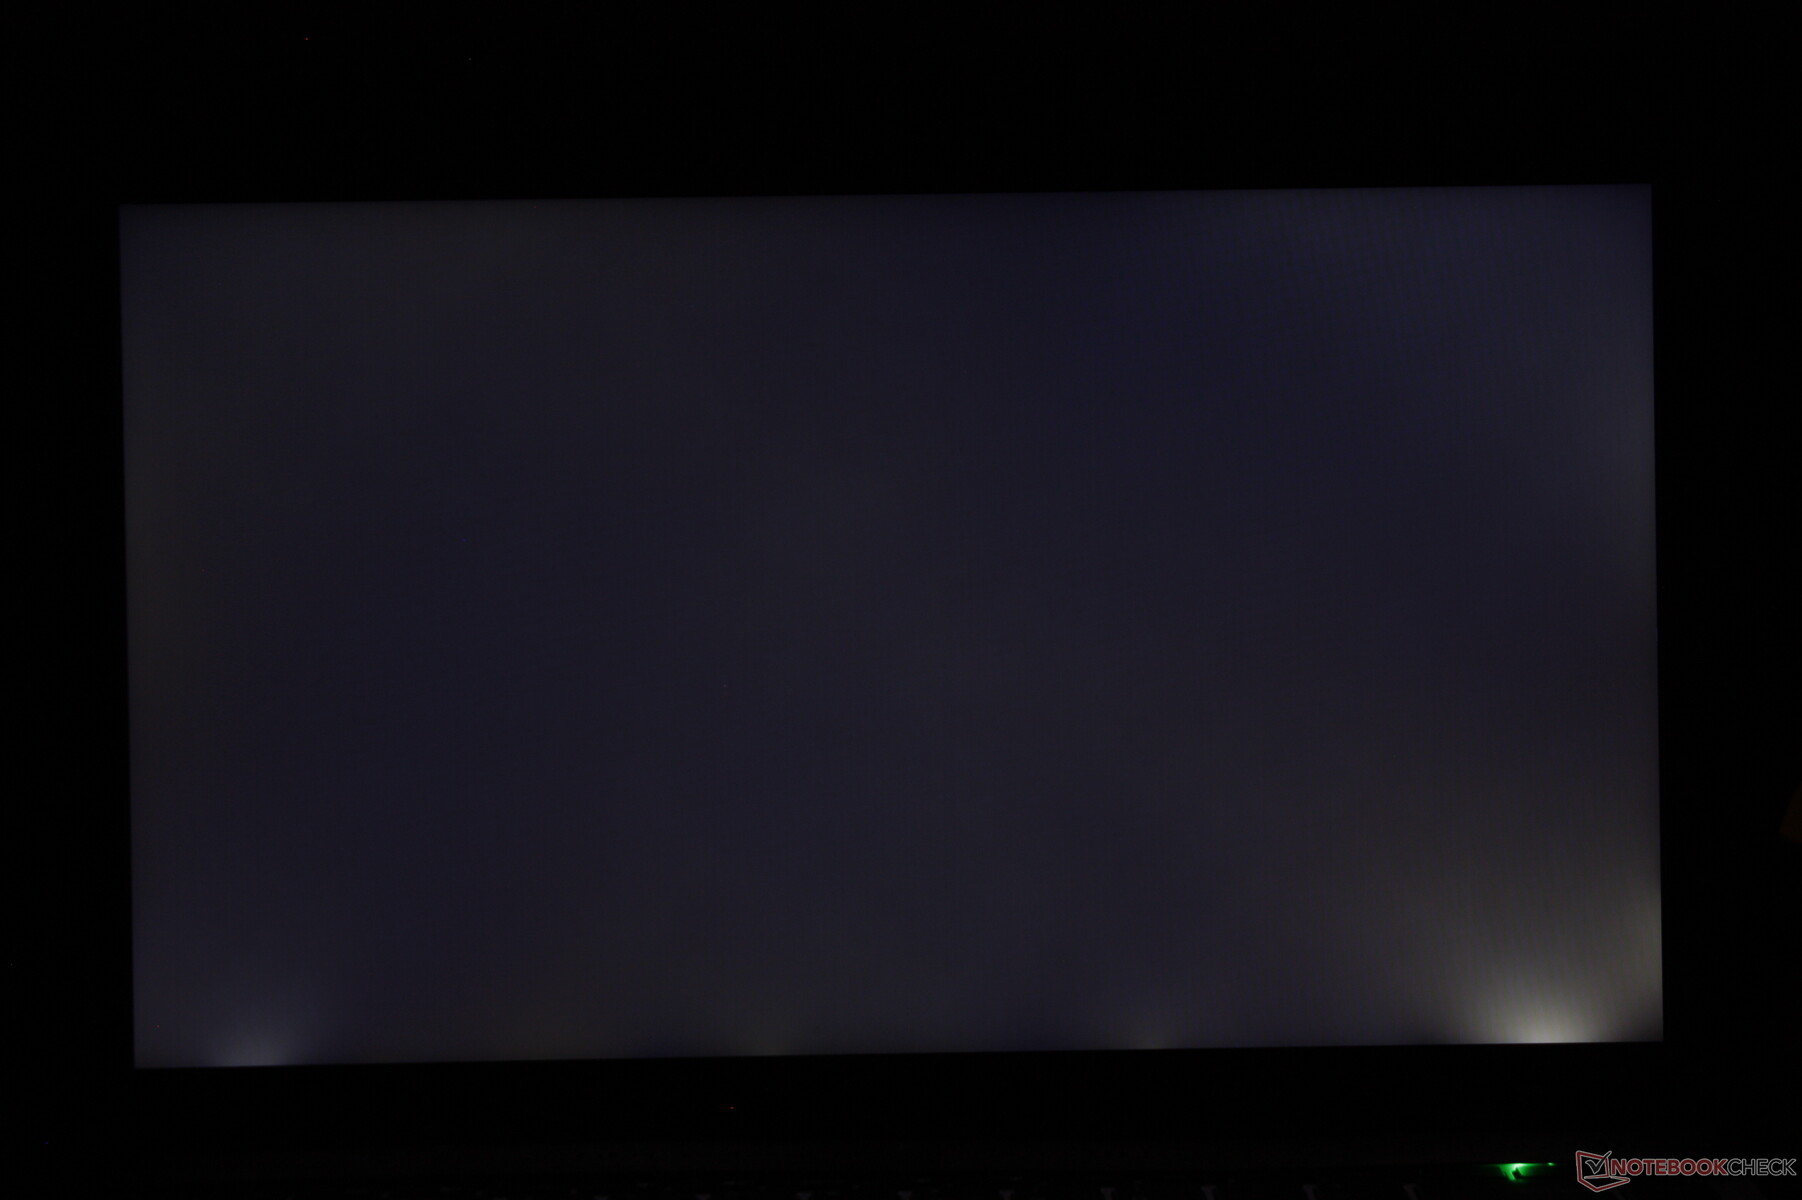
There are additional minor complaints that add up. The upside-down SD card reader, weak speakers, noticeable screen bleeding, and acute DPC issues all negatively impact the user experience.
The Vaio FE14 may be carrying the latest Intel CPUs, but the chassis could use some major updates to be more up to par with competing budget-to-midrange Ultrabooks.
As for the processor, the Core i5-1235U performs so closely to the Core i5-1135G7 that buyers can save money by opting for the last generation CPU configuration and not lose out on any significant performance gains. Otherwise, we recommend considering the much faster Core i7-1255U configuration instead if a 12th gen CPU is a must.
The Vaio does a few things well in its defense including the comfortable keyboard and wide range of ports options considering the price. However, there's no doubt that there's a lot of room for improvement.
Price and Availability
Walmart is currently shipping the Vaio FE14 with the Core i5-1235U CPU and 8 GB RAM for $700 USD or 16 GB RAM for $800. The Core i7-1255U version is also shipping for $950.
VAIO FE 14.1 VWNC51429-SL
- 07/30/2022 v7 (old)
Allen Ngo
Price comparison
