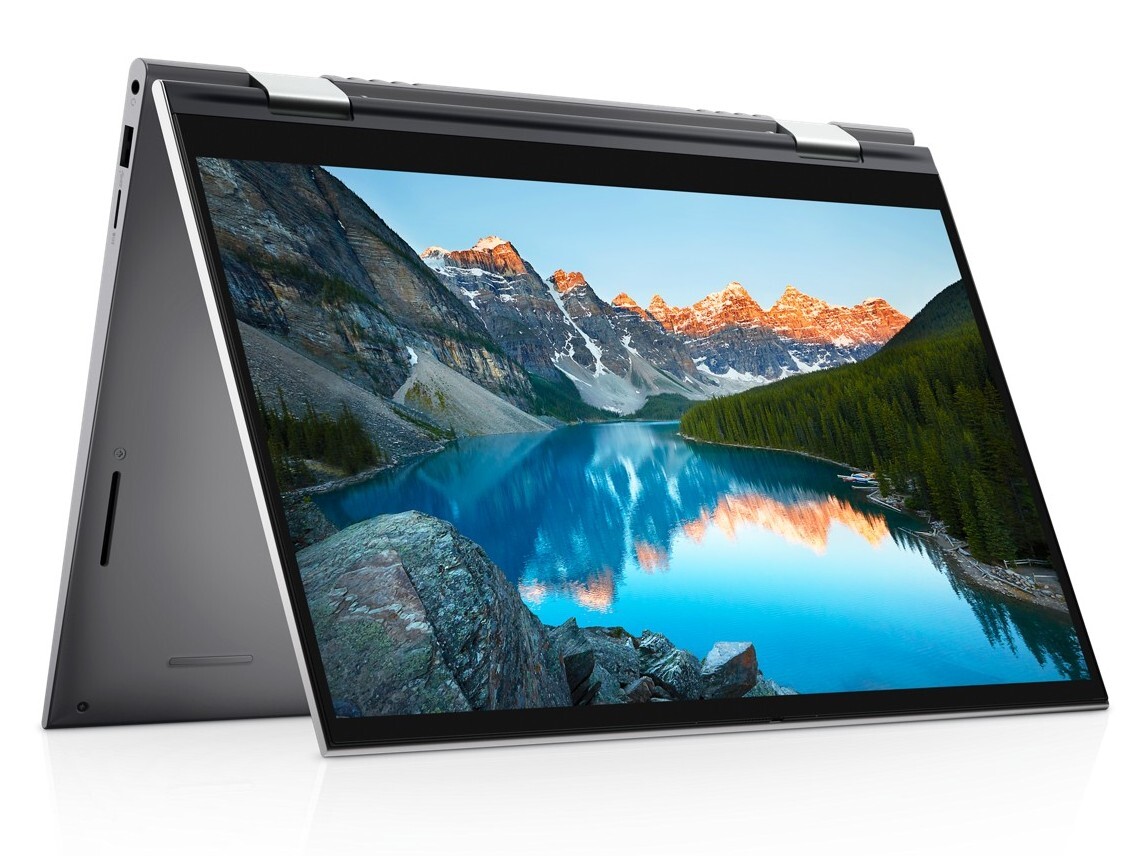
Dell Inspiron 14 7400 7415 2-in-1 Review: High performance on a budget
Whereas Latitude and XPS models cater toward prosumers or business users, the Inspiron series targets home users, students, and general audiences with tighter budgets in mind. Models would range from the very inexpensive Inspiron 3000 series up to the mid-range Inspiron 5000 to 7000 series.
Our unit here is the 14-inch Inspiron 14 7415 2-in-1 retailing for around $900 to $1000 USD. Though it may sound like a regular Inspiron 14 7400 clamshell but with 360-degree hinges, its physical design and features are actually very different as our review below will show. SKUs range from the AMD Ryzen 5 5500U CPU with 8 GB of RAM up to the Ryzen 7 5700U with 16 GB of RAM while the 16:9 14-inch 1080p touchscreen remains fixed across all options. Intel 11th gen Tiger Lake options are also available via the Inspiron 14 5410 2-in-1 which shares the same chassis.
Competitors in this space include other affordable 14-inch convertible laptops like the HP Pavilion x360 14, Lenovo IdeaPad Flex 5 14, Acer Spin 3, or the Asus VivoBook Flip 14.
More Dell reviews:
potential competitors in comparison
Rating | Date | Model | Weight | Height | Size | Resolution | Price |
|---|---|---|---|---|---|---|---|
| 82.9 % v7 (old) | 09 / 2021 | Dell Inspiron 14 7400 7415 2-in-1 R7 5700U, Vega 8 | 1.5 kg | 17.95 mm | 14.00" | 1920x1080 | |
| 81.8 % v7 (old) | 07 / 2021 | HP Pavilion x360 14-dy0157ng i5-1135G7, Iris Xe G7 80EUs | 1.5 kg | 19.9 mm | 14.00" | 1920x1080 | |
| 84.3 % v7 (old) | 03 / 2021 | Dell Inspiron 14 7400-VY8JW i7-1165G7, GeForce MX350 | 1.3 kg | 17 mm | 14.50" | 2560x1600 | |
| 82.3 % v7 (old) | 05 / 2021 | Lenovo IdeaPad Flex 5 14ALC05-82HU006NGE R5 5500U, Vega 7 | 1.5 kg | 21.4 mm | 14.00" | 1920x1080 | |
| 84.2 % v7 (old) | 03 / 2021 | Acer Spin 3 SP314-54N-56S5 i5-1035G4, Iris Plus Graphics G4 (Ice Lake 48 EU) | 1.5 kg | 16 mm | 14.00" | 1920x1080 | |
| 80.7 % v7 (old) | 08 / 2020 | Asus VivoBook Flip 14 TM420IA R7 4700U, Vega 7 | 1.6 kg | 18.2 mm | 14.00" | 1920x1080 |
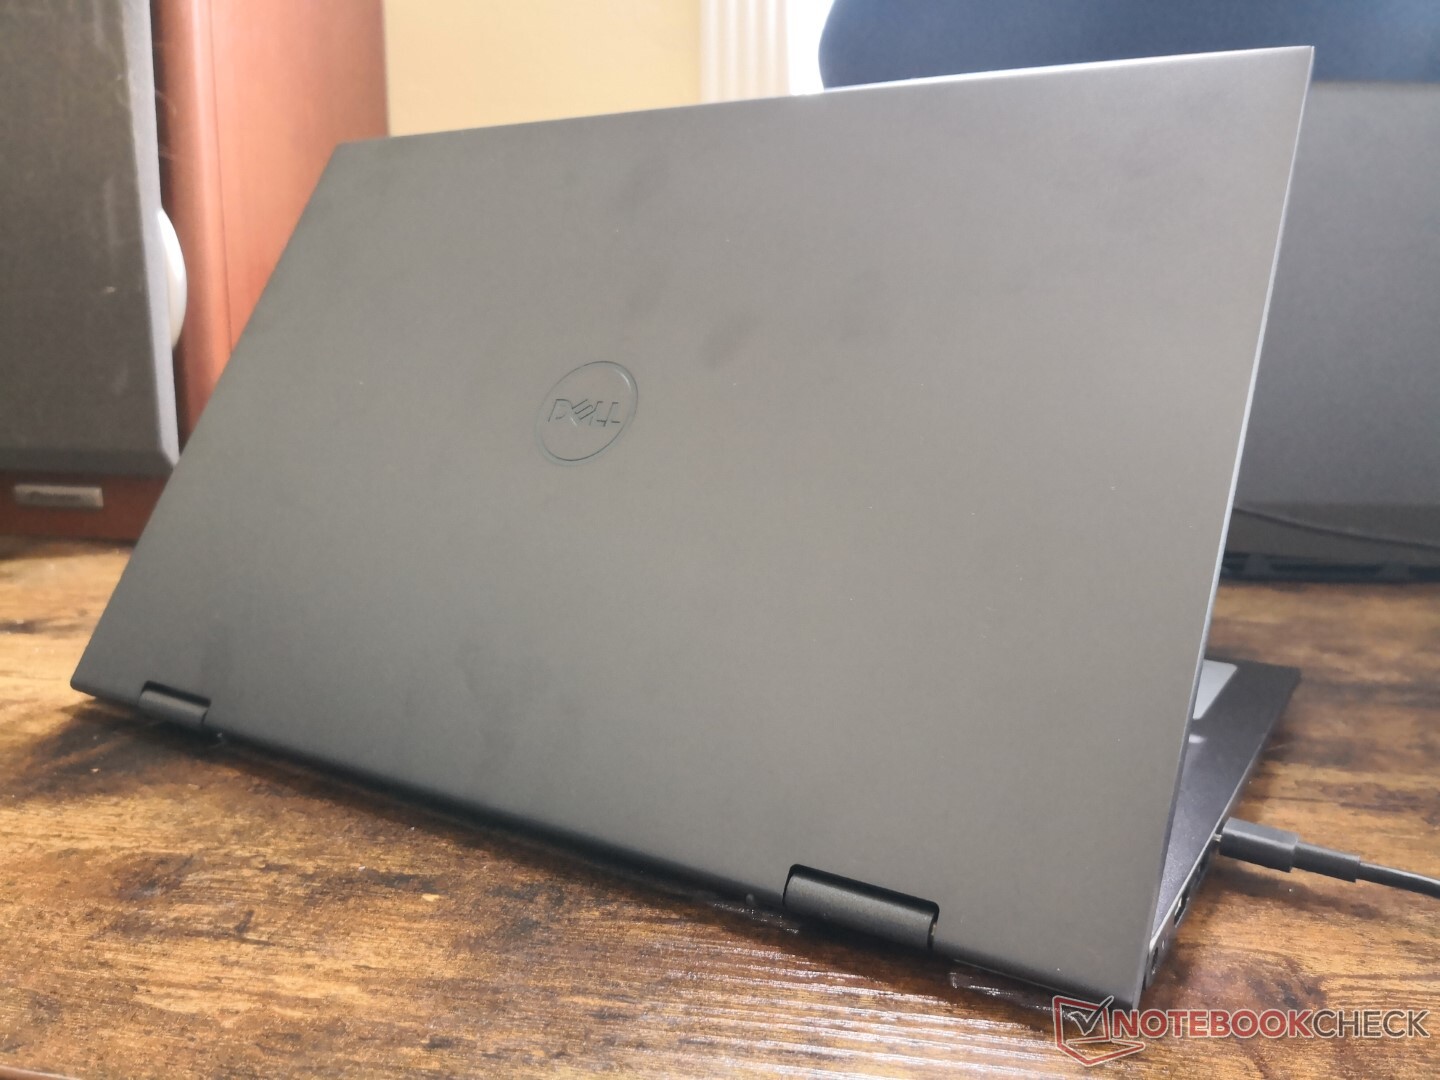
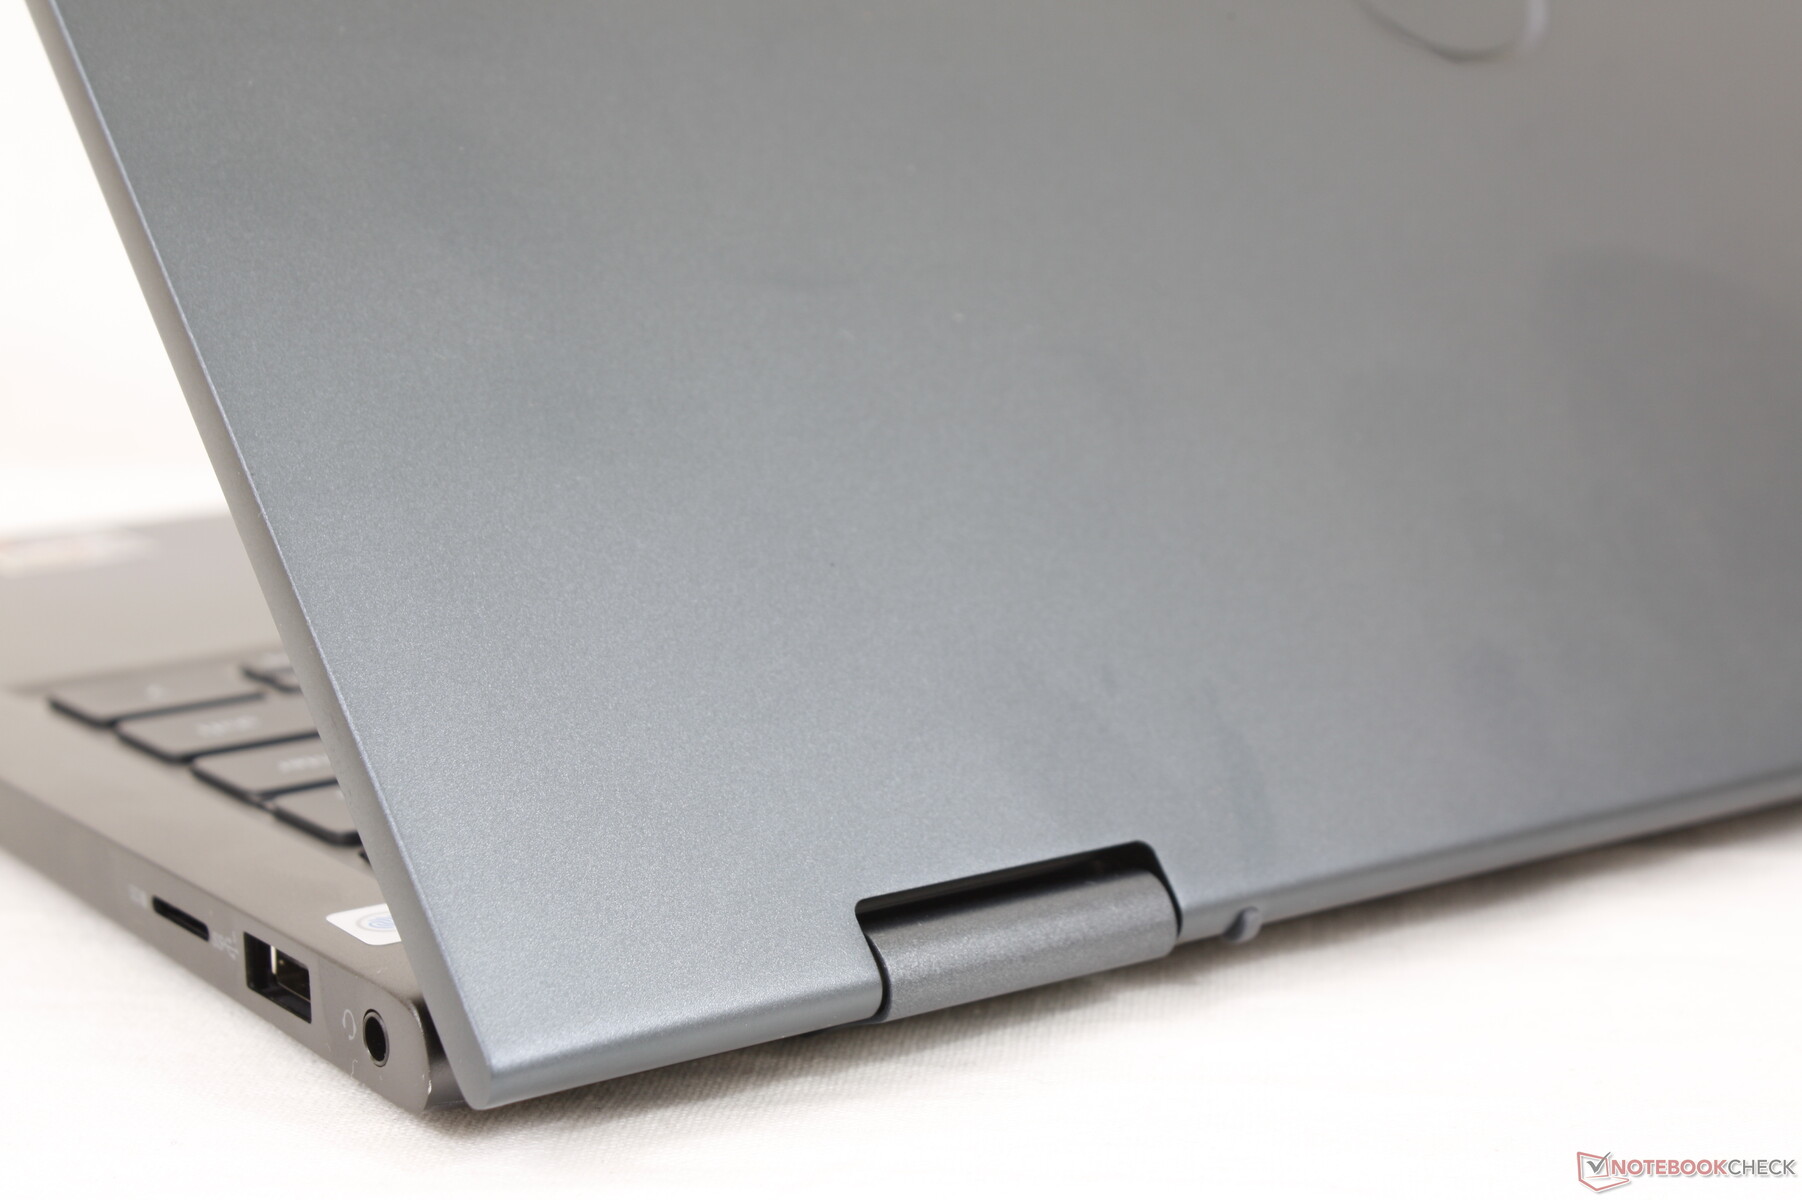
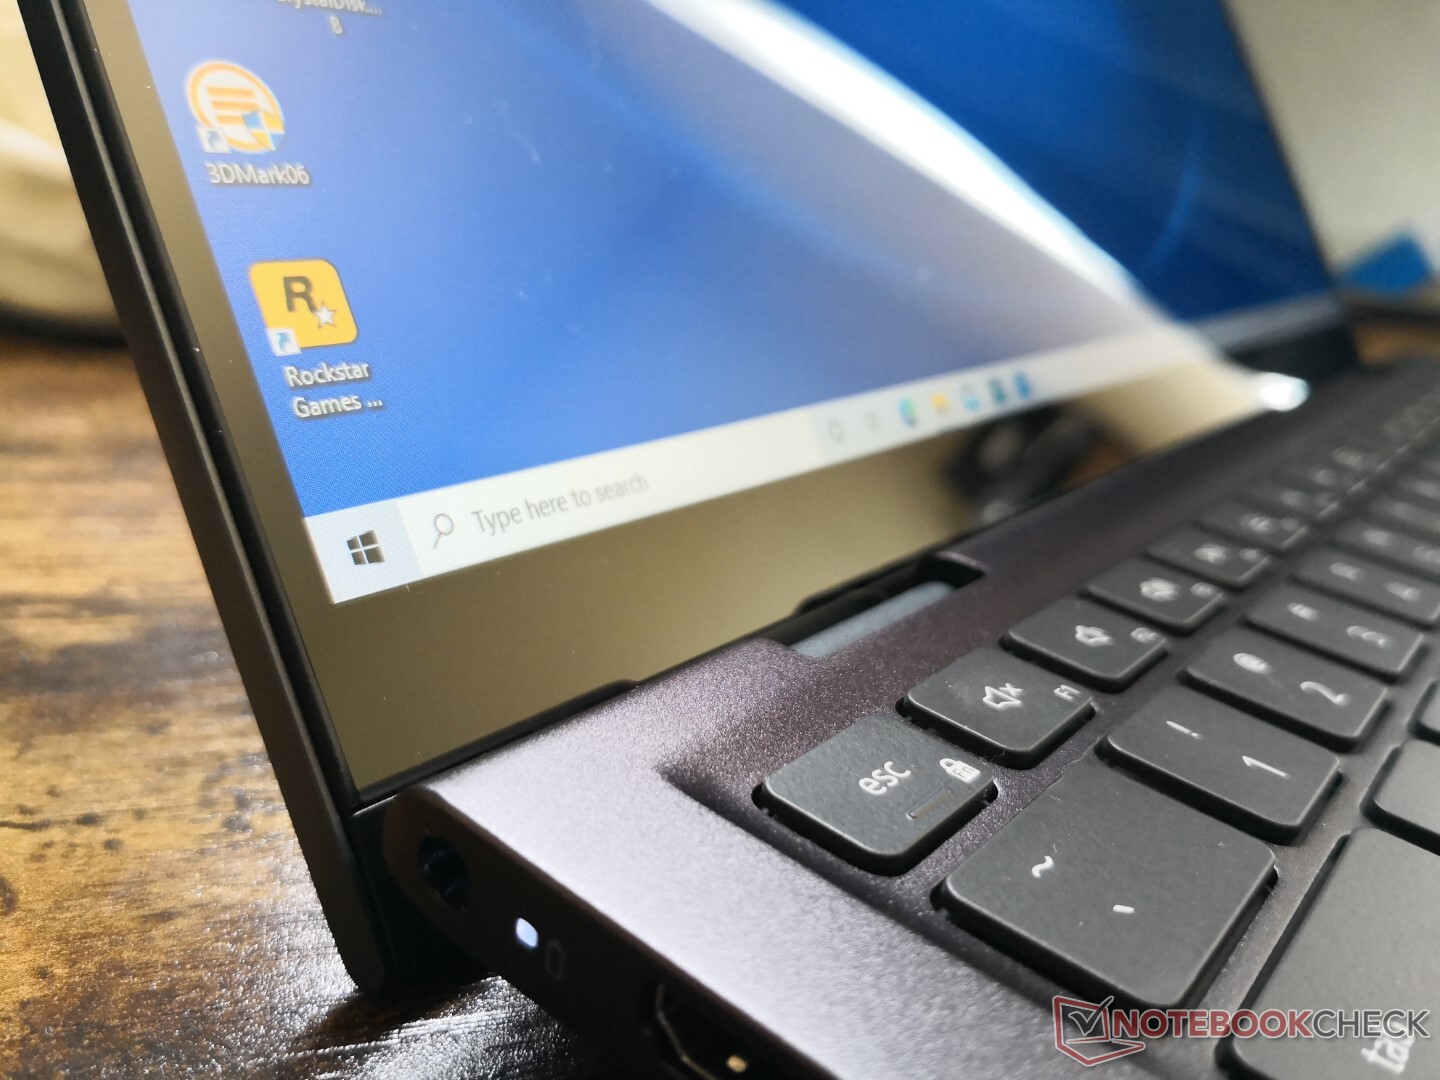
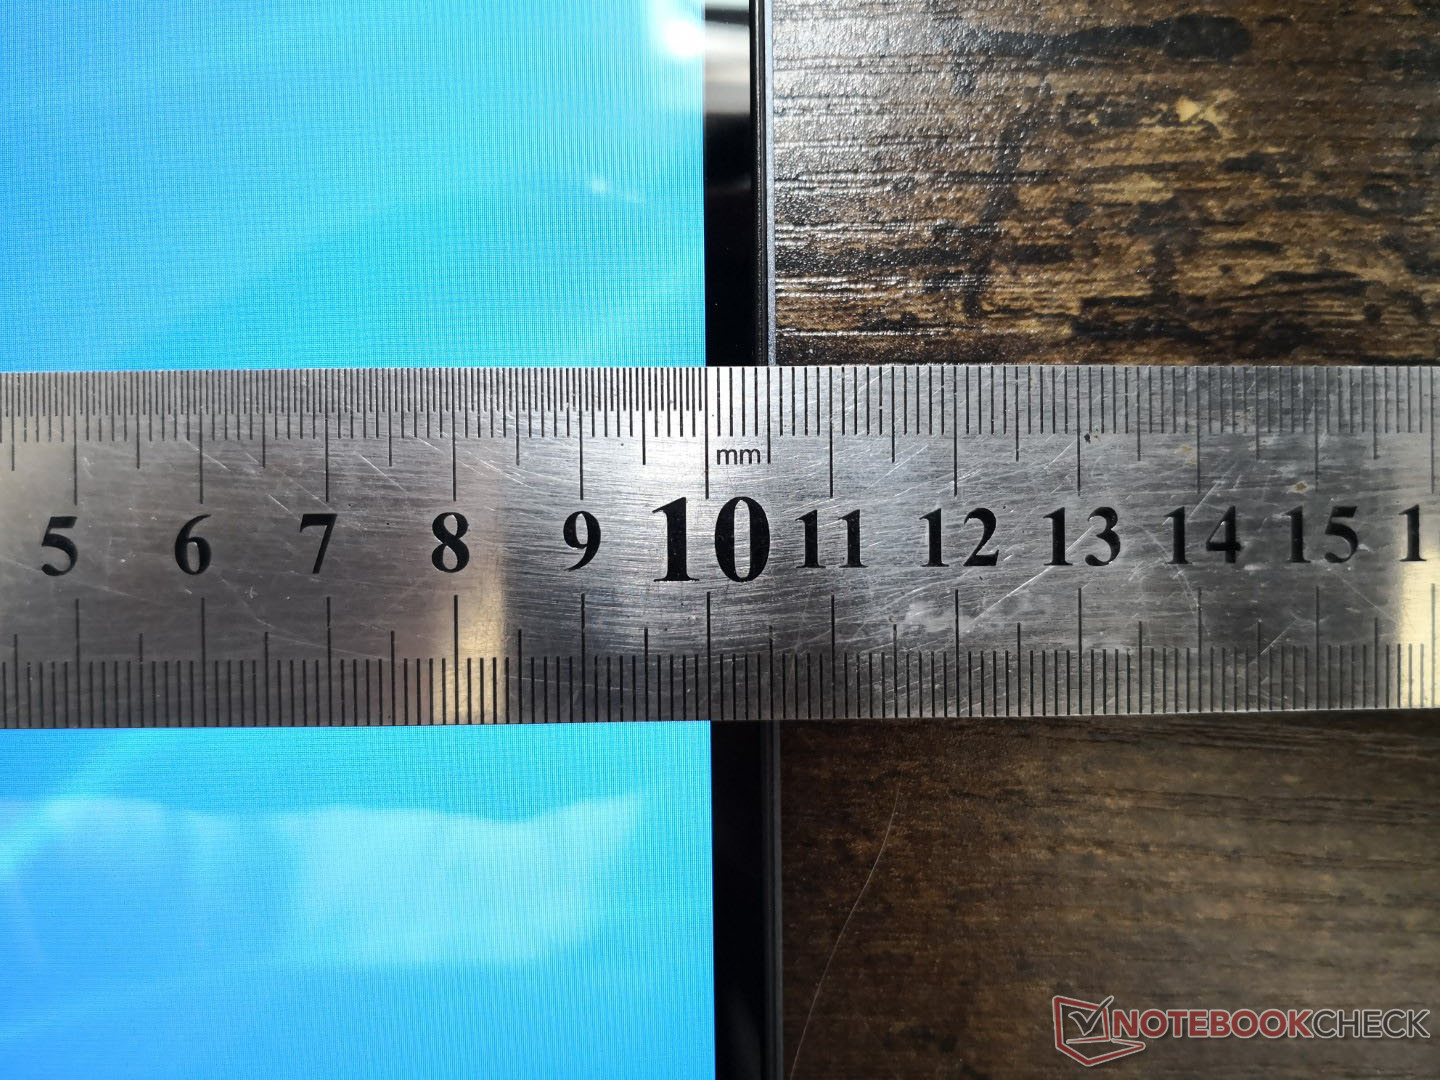
Case — Looks Like a Professional Latitude
The chassis is a combination of aluminum and plastic with a fairly high-end visual design especially when compared to other inexpensive convertibles like the HP Pavilion x360 14 or Lenovo IdeaPad Flex 5. Chassis rigidity, however, is a few steps short from pricier laptops like the Latitude 7400 2-in-1 or HP Spectre x360 13. The lid and base, for example, flex more readily from their corners while the skeleton feels much thinner than the materials used for Latitude or Spectre systems. Even so, the Inspiron 14 7415 is still one of the better-looking and better-feeling models in its budget category.
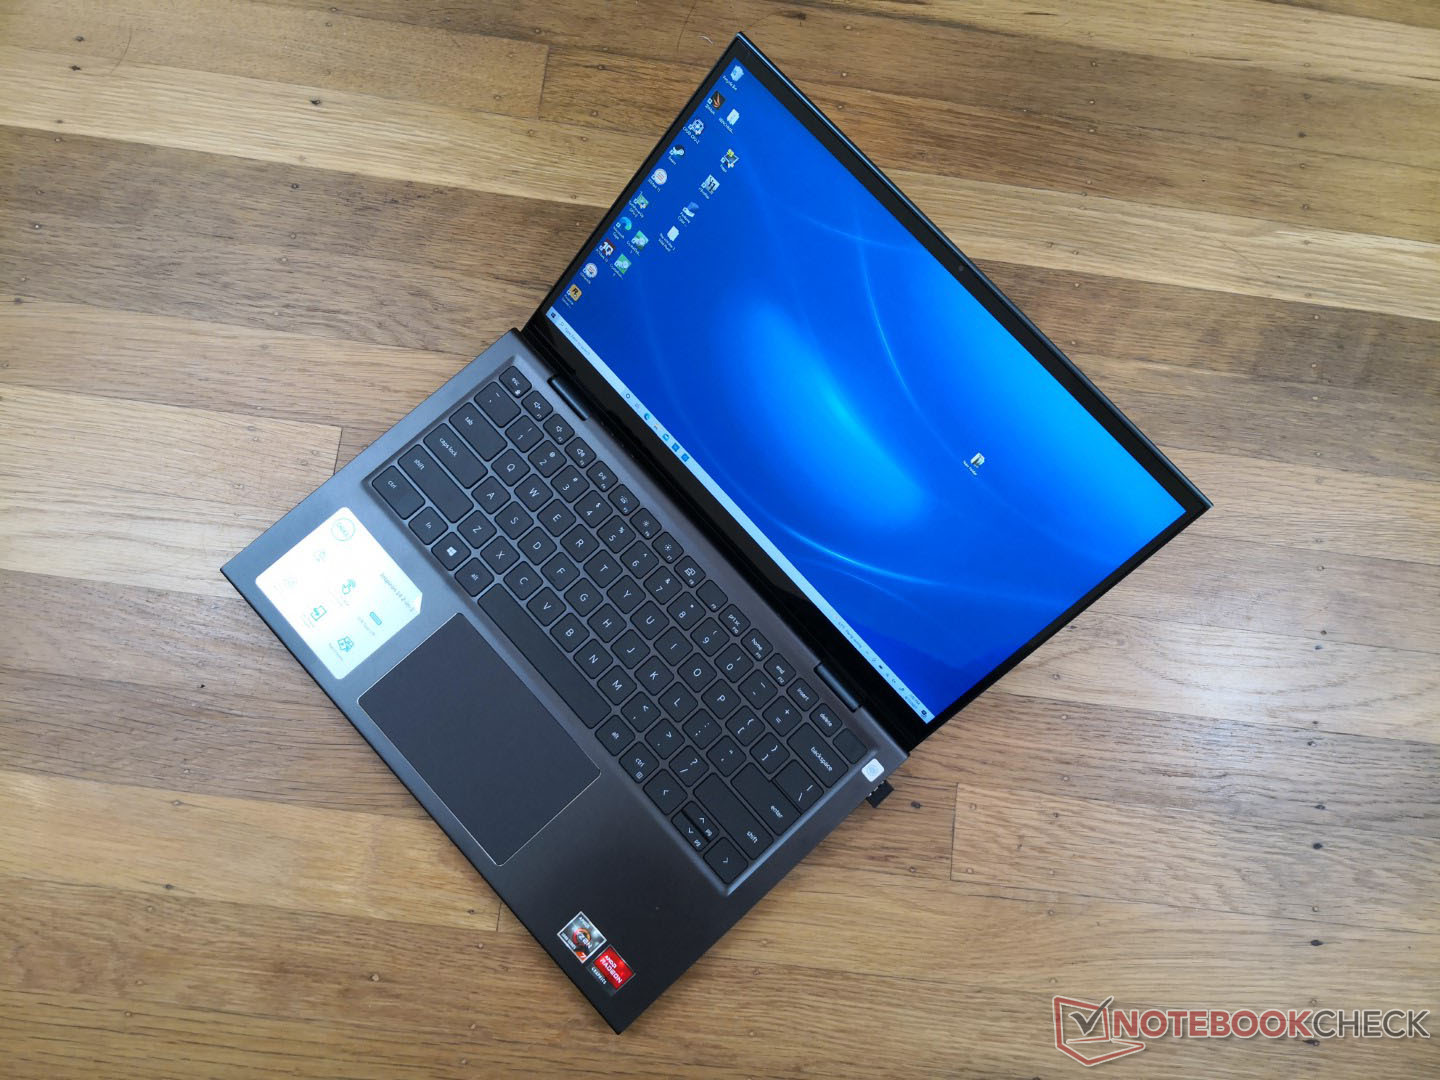
Chassis size is slightly smaller than many competitors while being just as heavy for a denser feel. The IdeaPad Flex 5 14, VivoBook Flip 14 and Acer Spin 3 SP314 all have thicker bezels and are therefore larger in size, for example, but all four models otherwise weigh about the same.
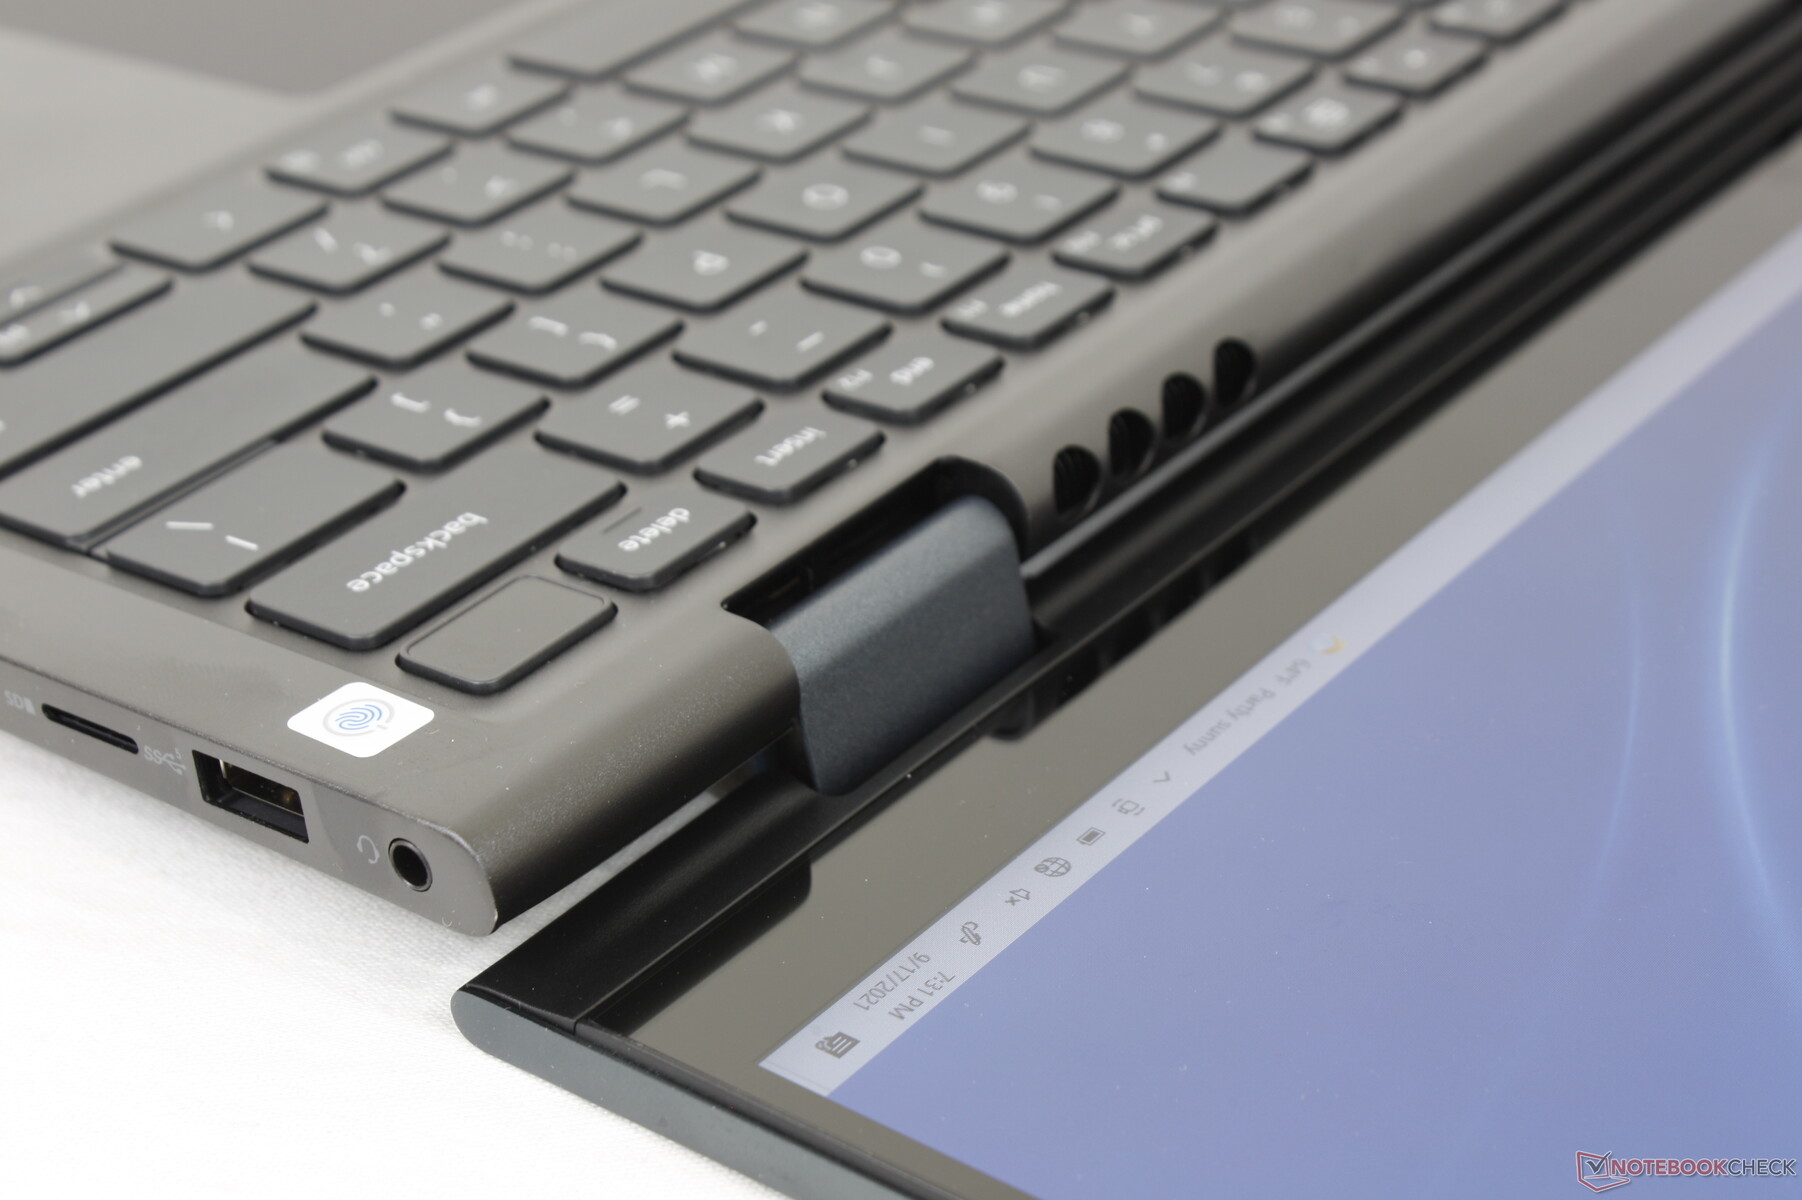
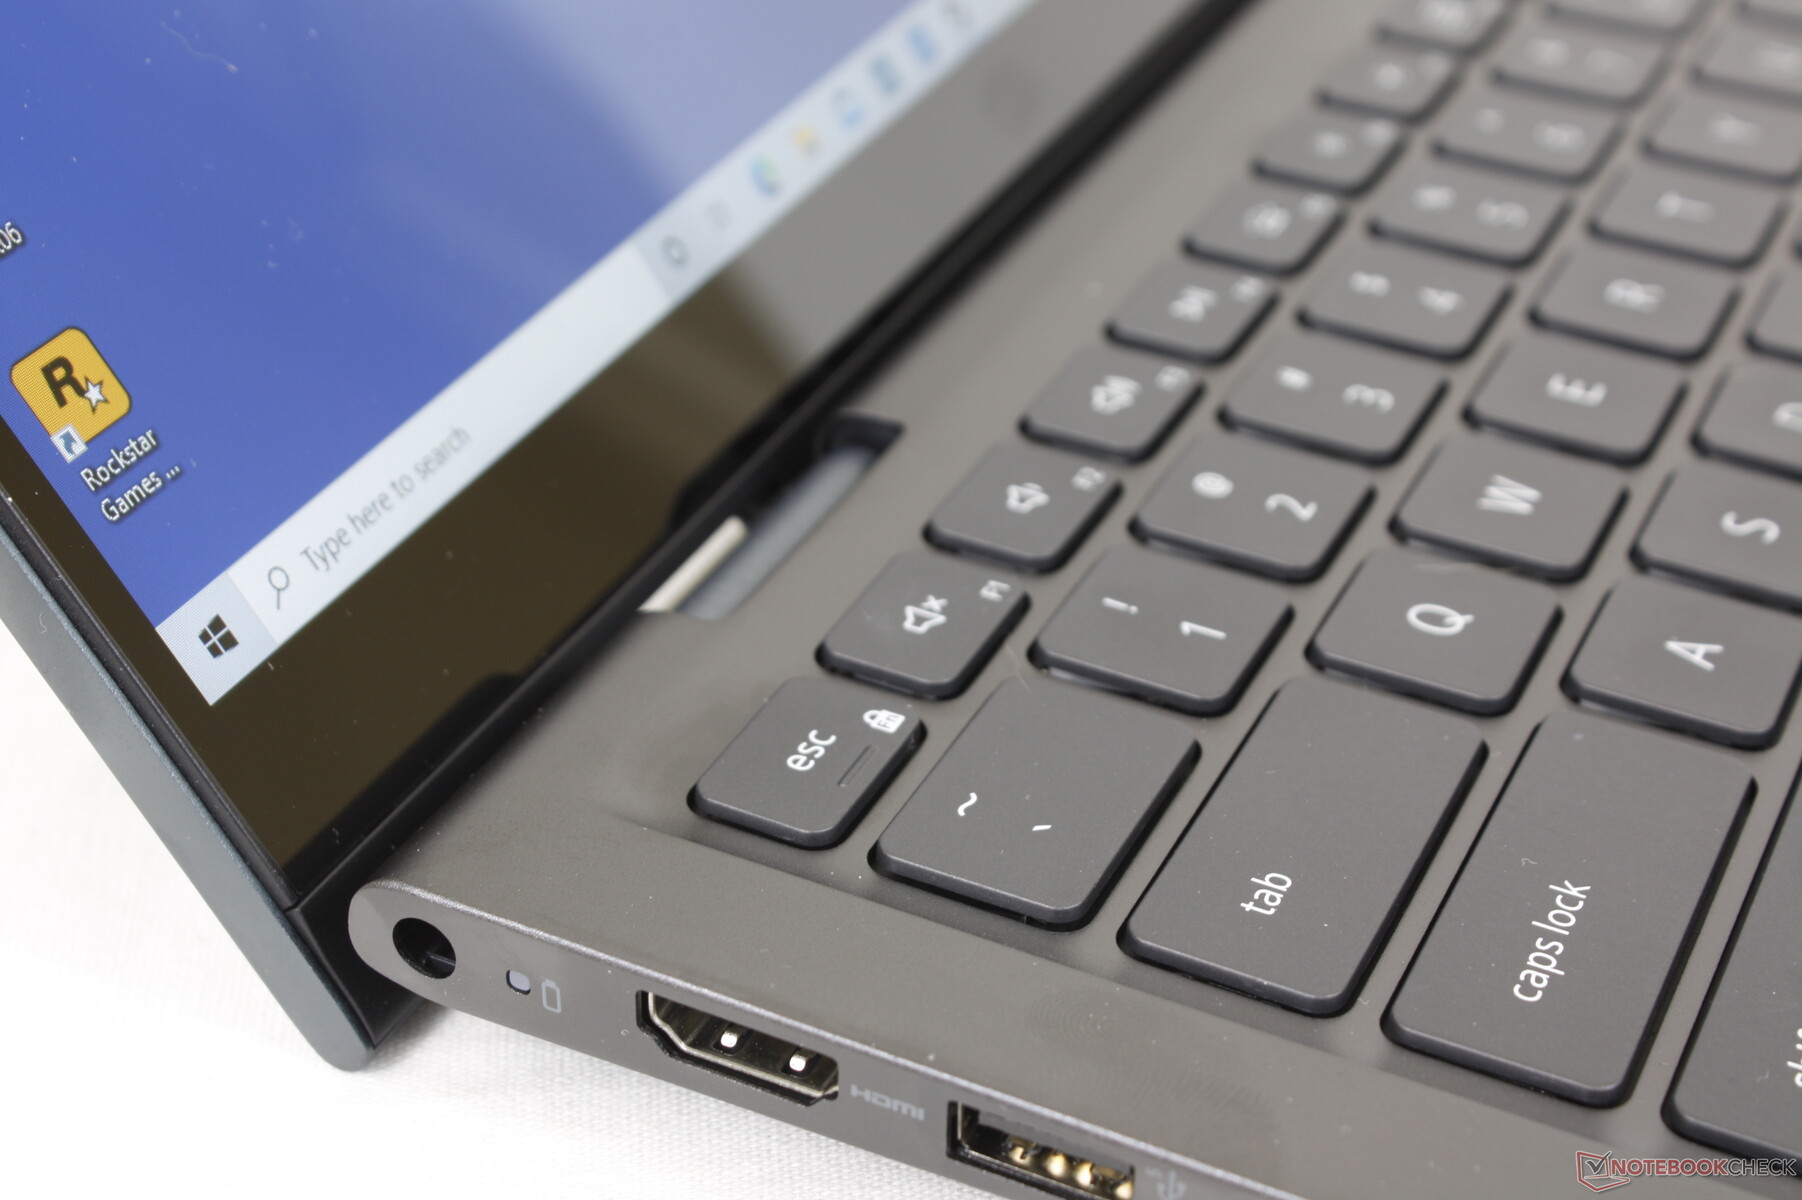
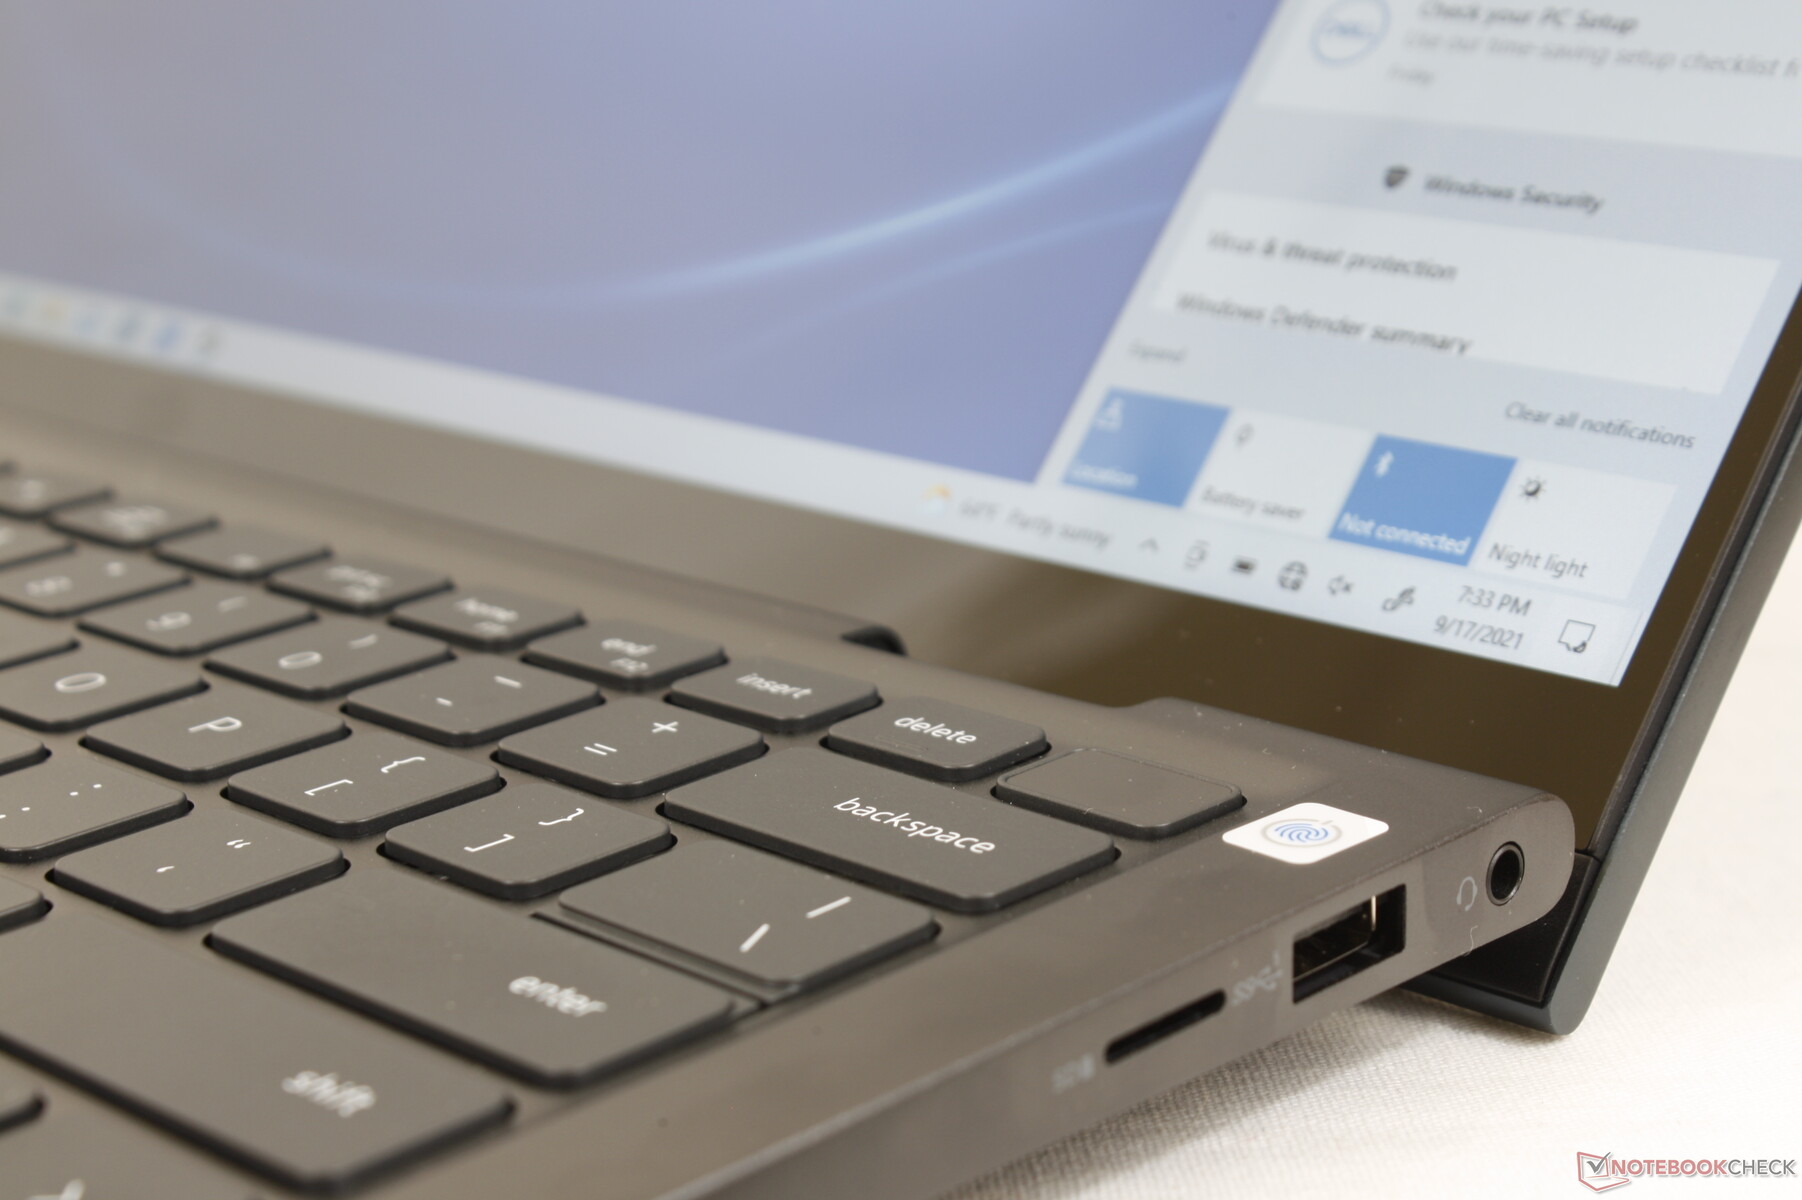
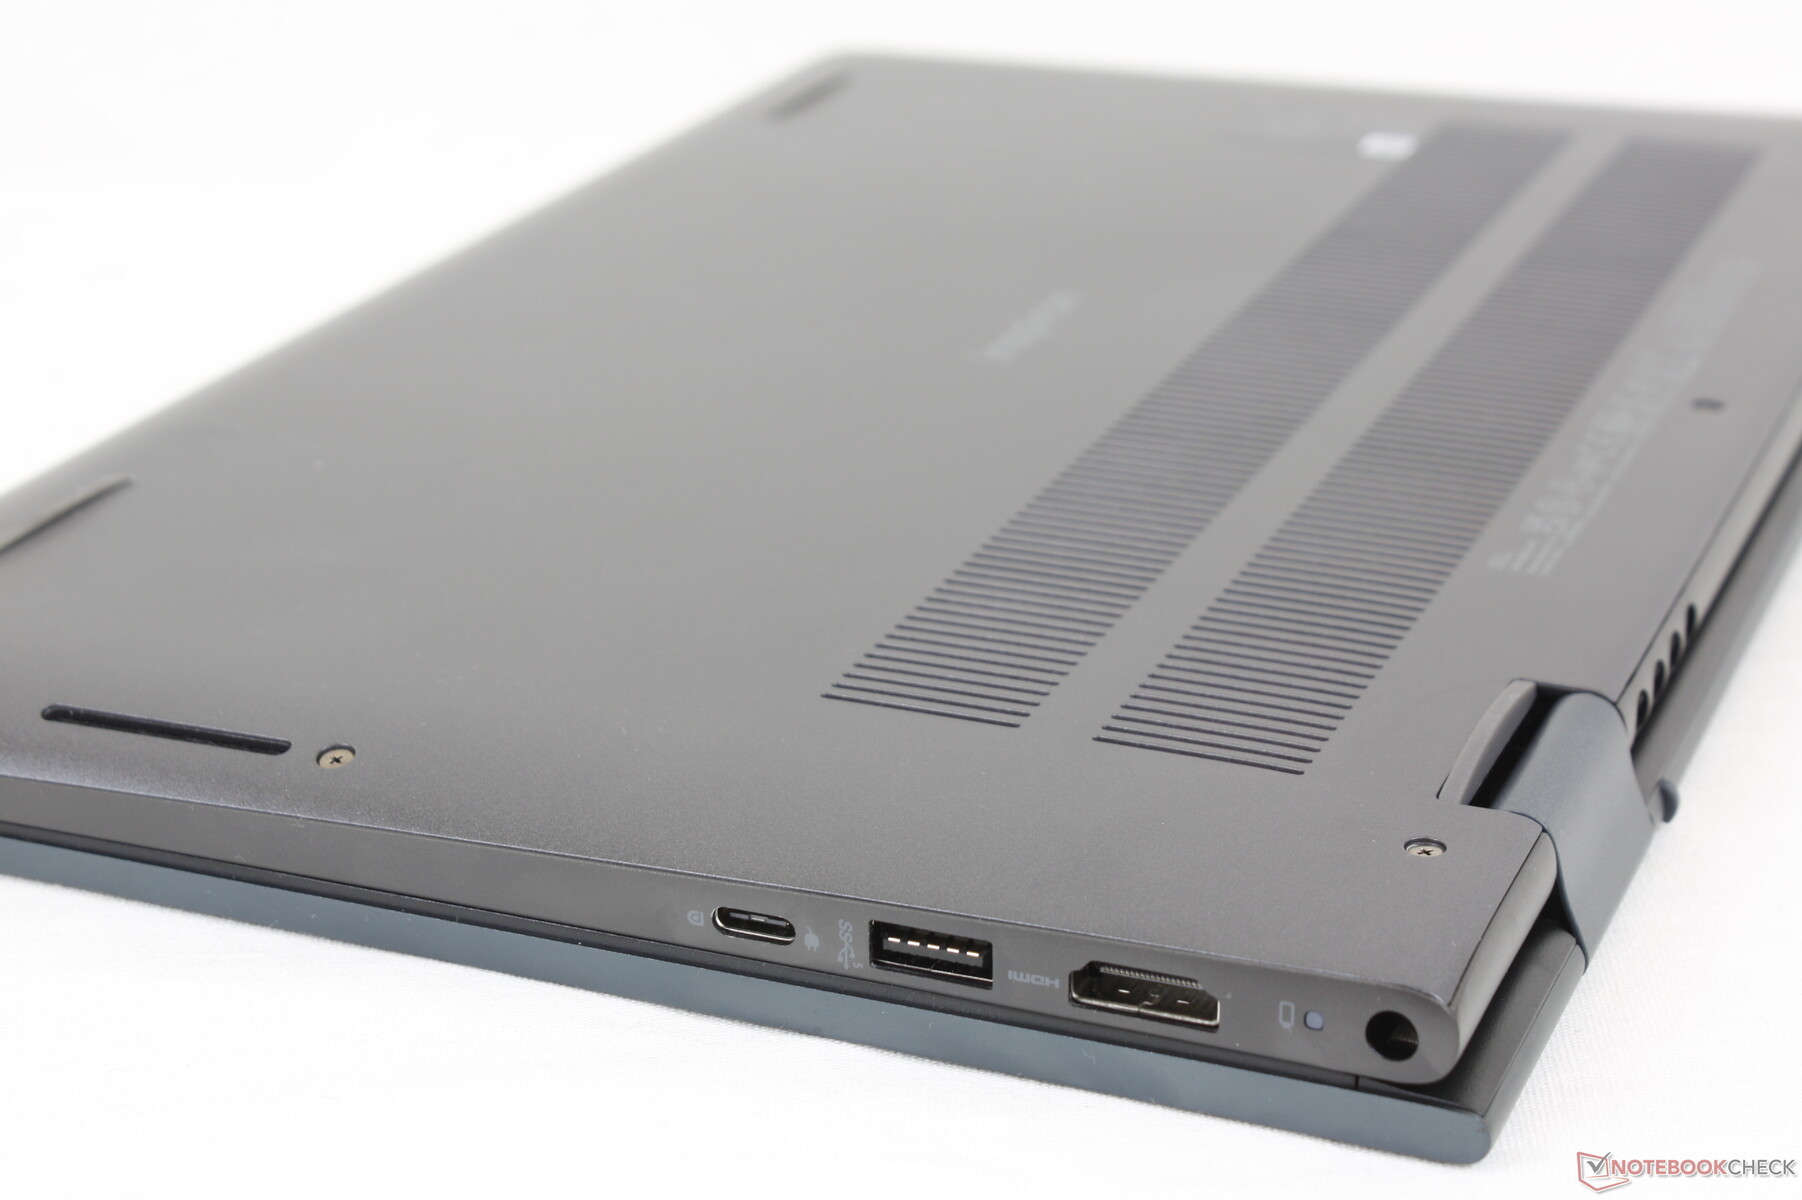
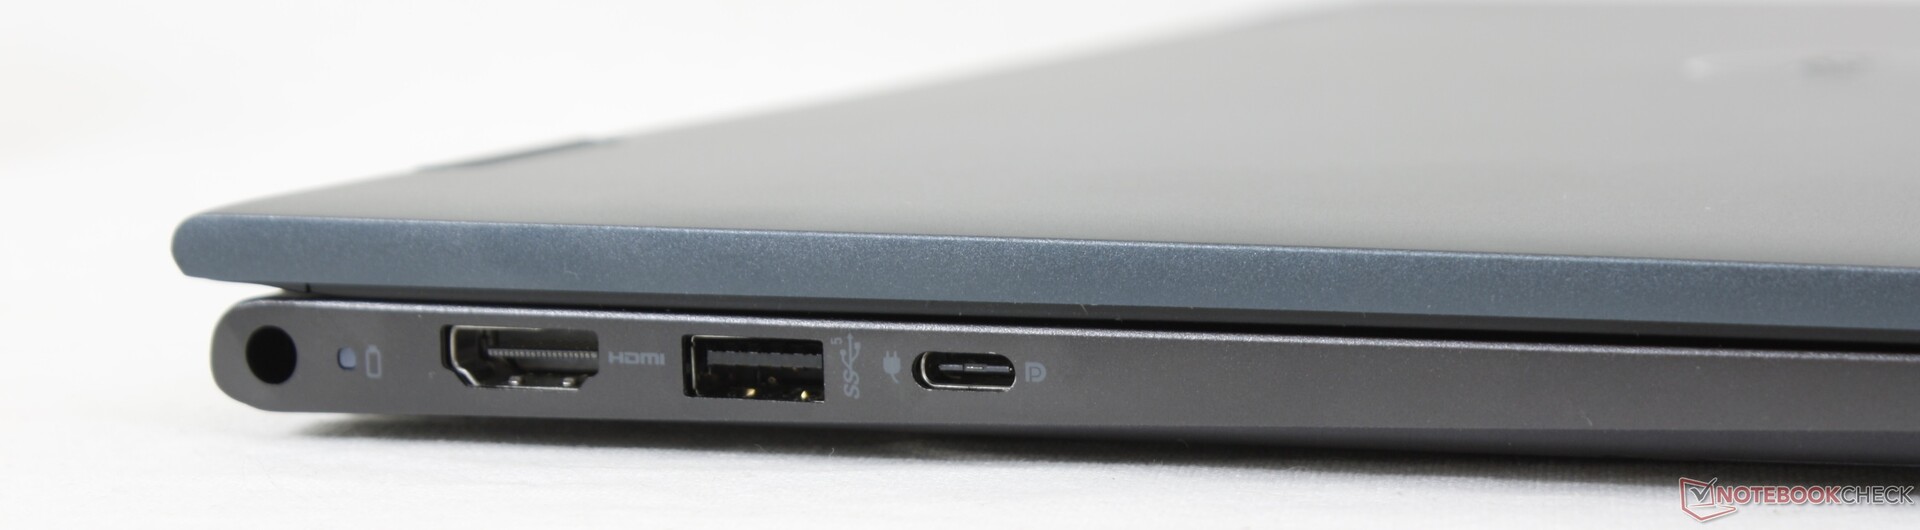
Connectivity — No Thunderbolt For You
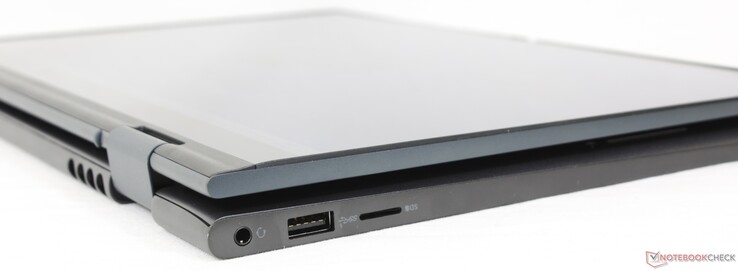
Port options are physically identical to the Inspiron 14 7400 albeit slightly rearranged. The USB-C port here does not support Thunderbolt as per usual for an AMD-based laptop, but it at least supports DisplayPort and Power Delivery for connecting external monitors and USB-C AC adapters, respectively. We would have preferred at least one more USB-C port even if it had meant dropping the proprietary barrel AC adapter port altogether.
Thunderbolt is not supported as Dell wants users to upgrade to a Latitude or XPS for such advanced features. Even the Intel-powered Inspiron 14 5410 2-in-1 version includes no Thunderbolt support.
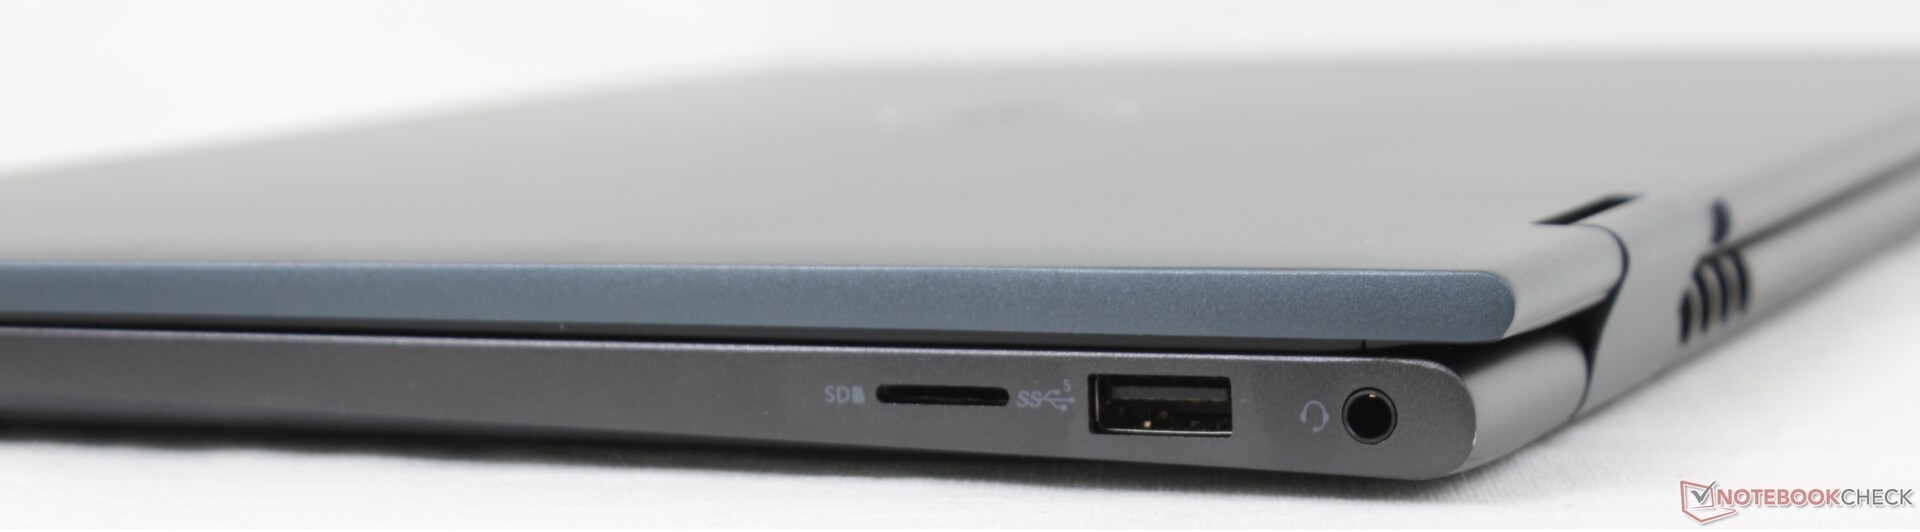
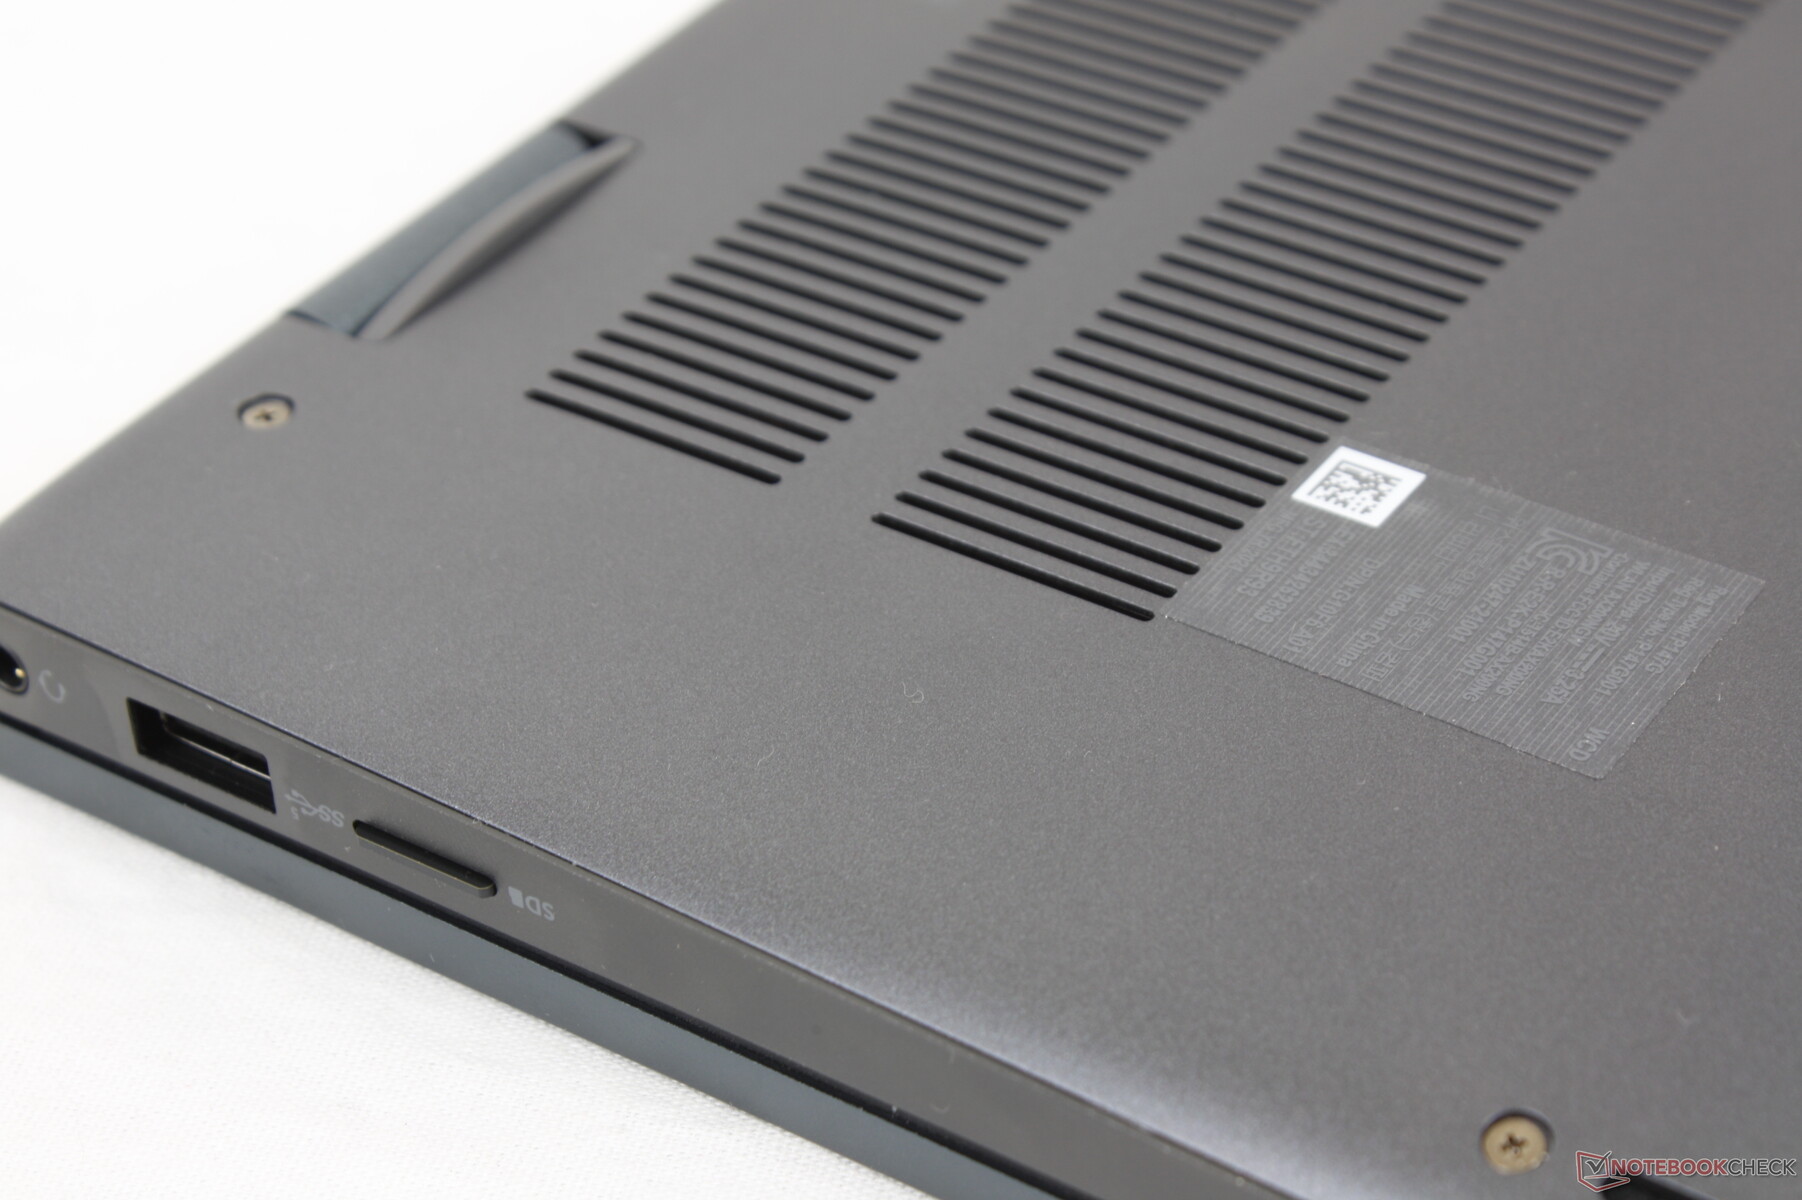
SD Card Reader
Transfer rates from the spring-loaded MicroSD reader is slow. Moving 1 GB of photos from our UHS-II test card to desktop takes about 38 seconds compared to less than half that on the HP Pavilion x360 14.
| SD Card Reader | |
| average JPG Copy Test (av. of 3 runs) | |
| Lenovo IdeaPad Flex 5 14ALC05-82HU006NGE (Toshiba Exceria Pro SDXC 64 GB UHS-II) | |
| HP Pavilion x360 14-dy0157ng (Toshiba Exceria Pro M501 microSDXC 64GB) | |
| Asus VivoBook Flip 14 TM420IA (Toshiba Exceria Pro M501 microSDXC 64GB) | |
| Acer Spin 3 SP314-54N-56S5 (Toshiba Exceria Pro M501 microSDXC 64GB) | |
| Dell Inspiron 14 7400 7415 2-in-1 (AV Pro V60) | |
| Dell Inspiron 14 7400-VY8JW (Toshiba Exceria Pro M501 microSDXC 64GB) | |
| maximum AS SSD Seq Read Test (1GB) | |
| Lenovo IdeaPad Flex 5 14ALC05-82HU006NGE (Toshiba Exceria Pro SDXC 64 GB UHS-II) | |
| HP Pavilion x360 14-dy0157ng (Toshiba Exceria Pro M501 microSDXC 64GB) | |
| Asus VivoBook Flip 14 TM420IA (Toshiba Exceria Pro M501 microSDXC 64GB) | |
| Dell Inspiron 14 7400 7415 2-in-1 (AV Pro V60) | |
| Acer Spin 3 SP314-54N-56S5 (Toshiba Exceria Pro M501 microSDXC 64GB) | |
| Dell Inspiron 14 7400-VY8JW (Toshiba Exceria Pro M501 microSDXC 64GB) | |
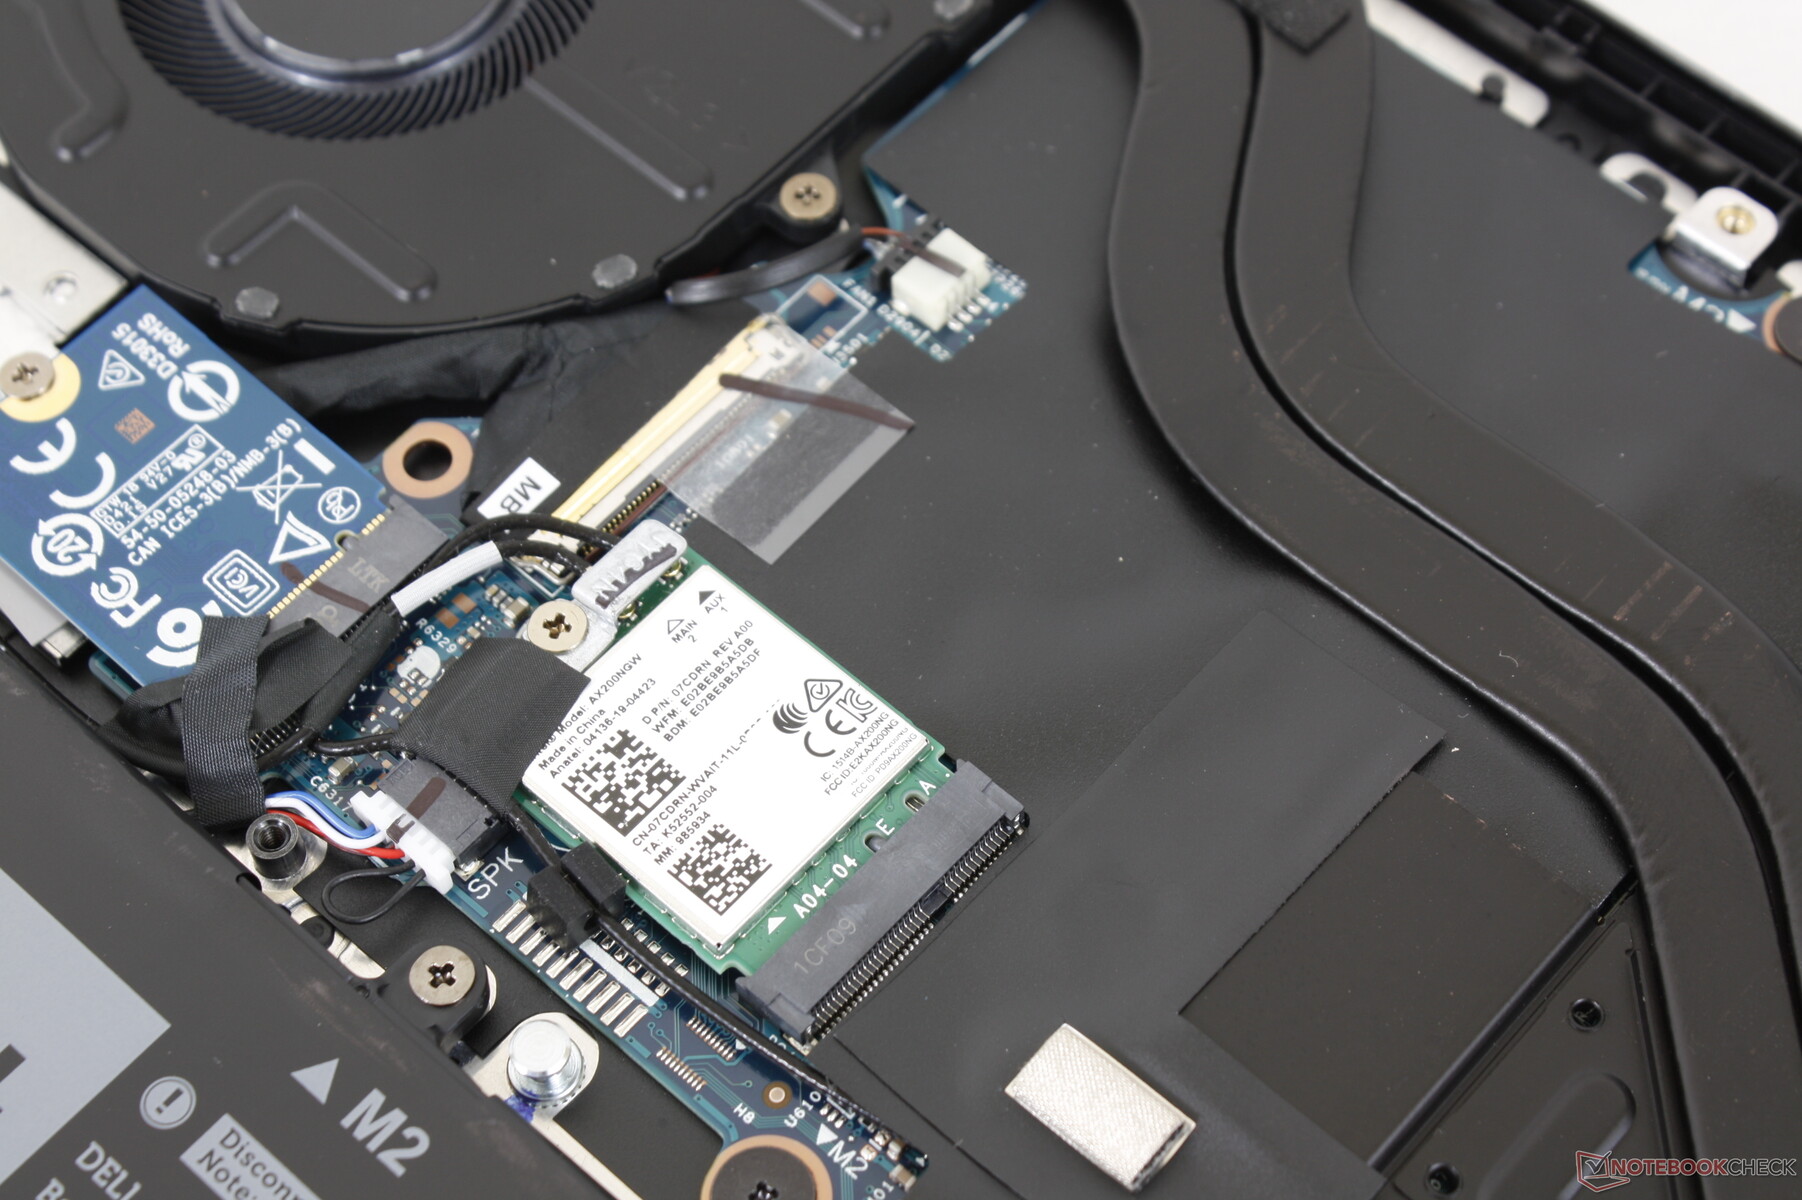
Communication — Wi-Fi 6 Comes Standard
Webcam — Shutter with no Windows Hello Support


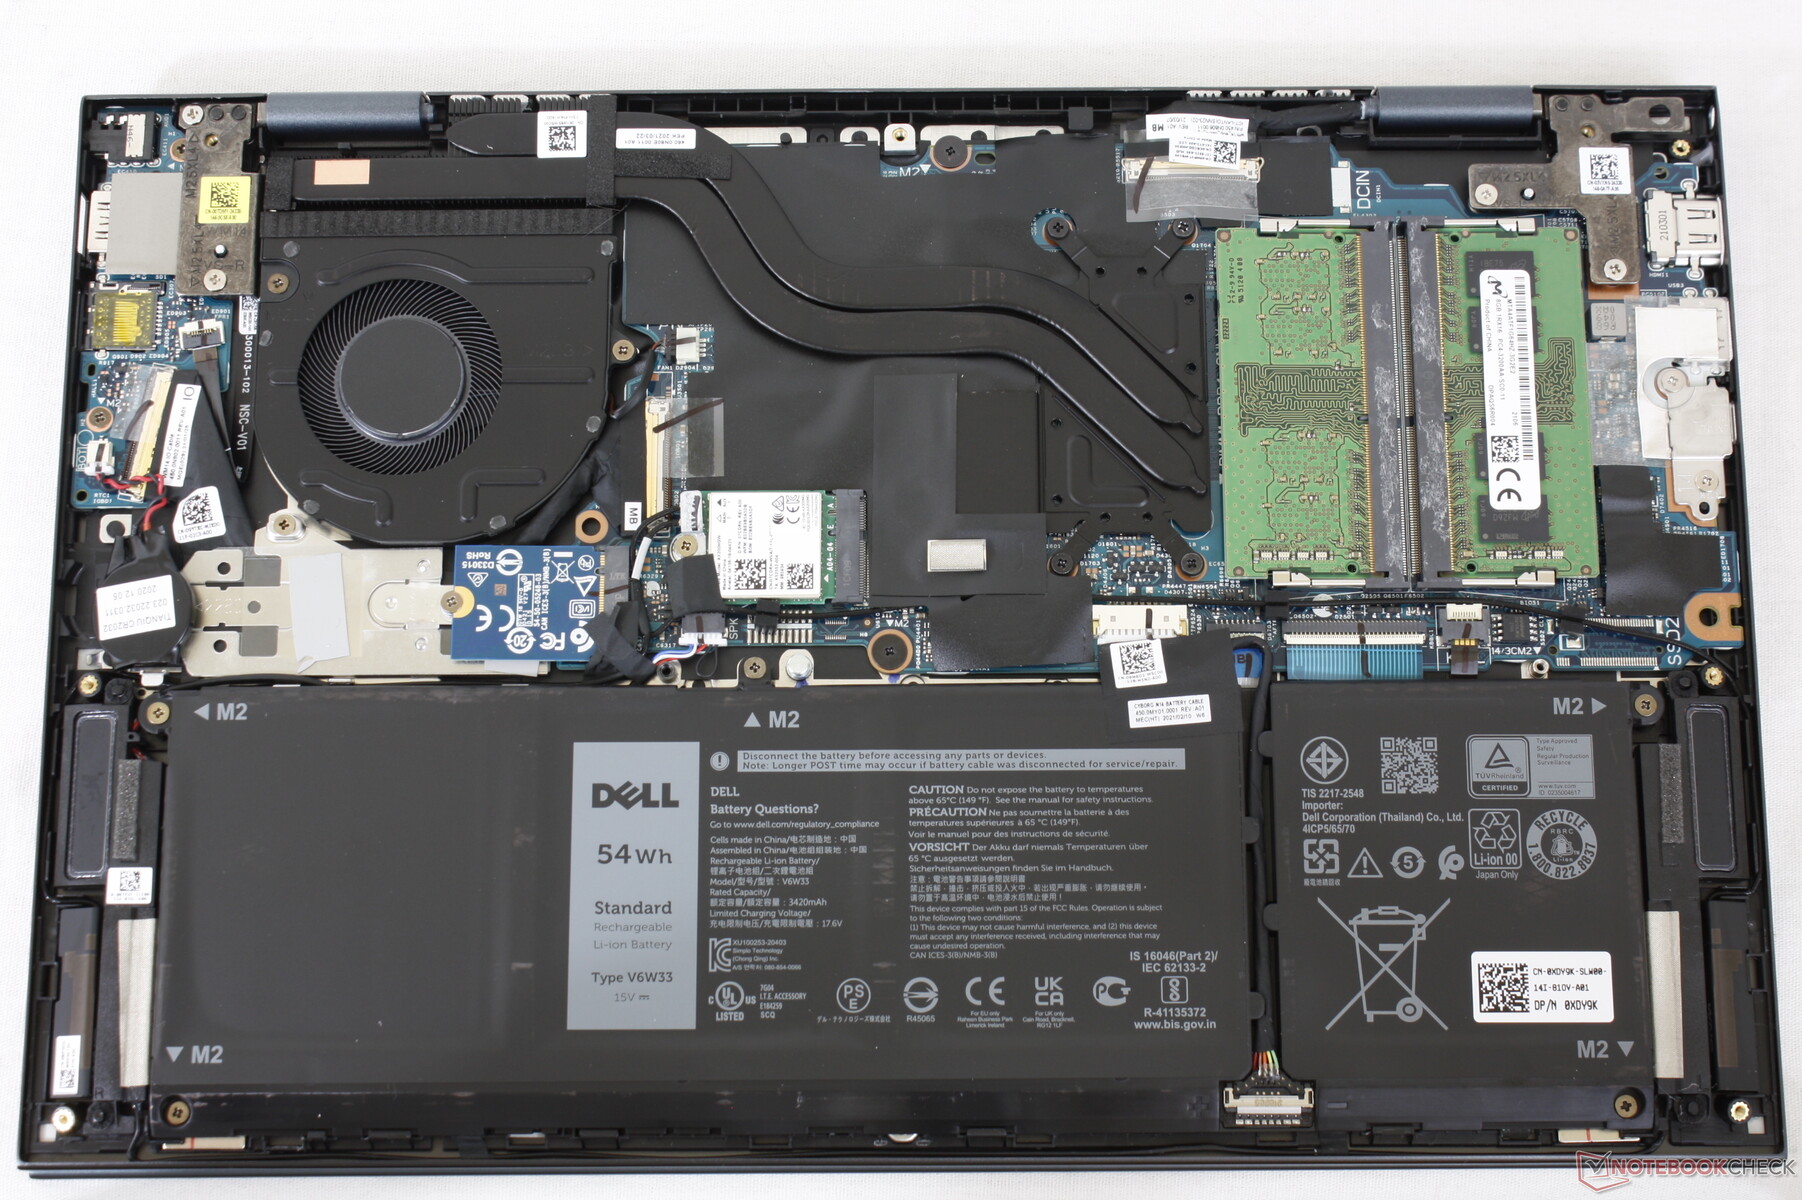
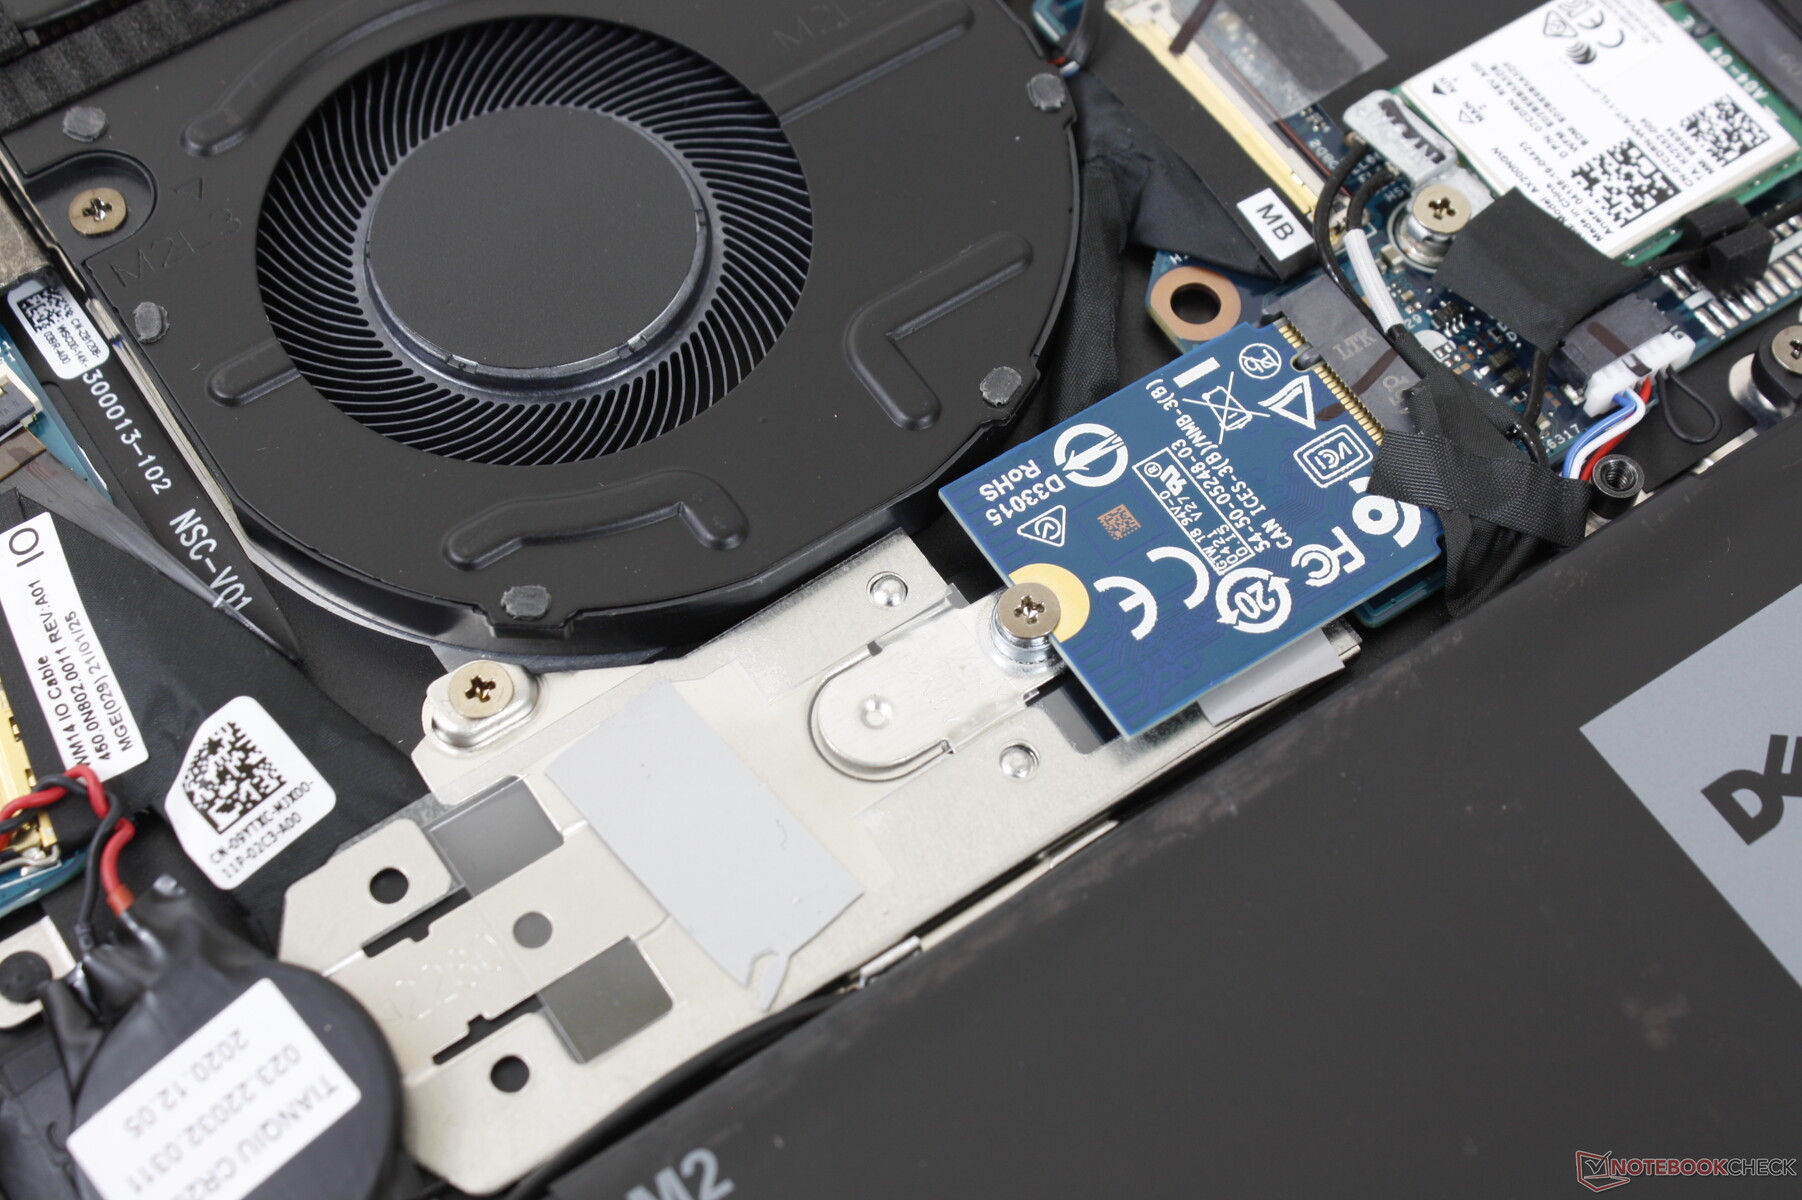
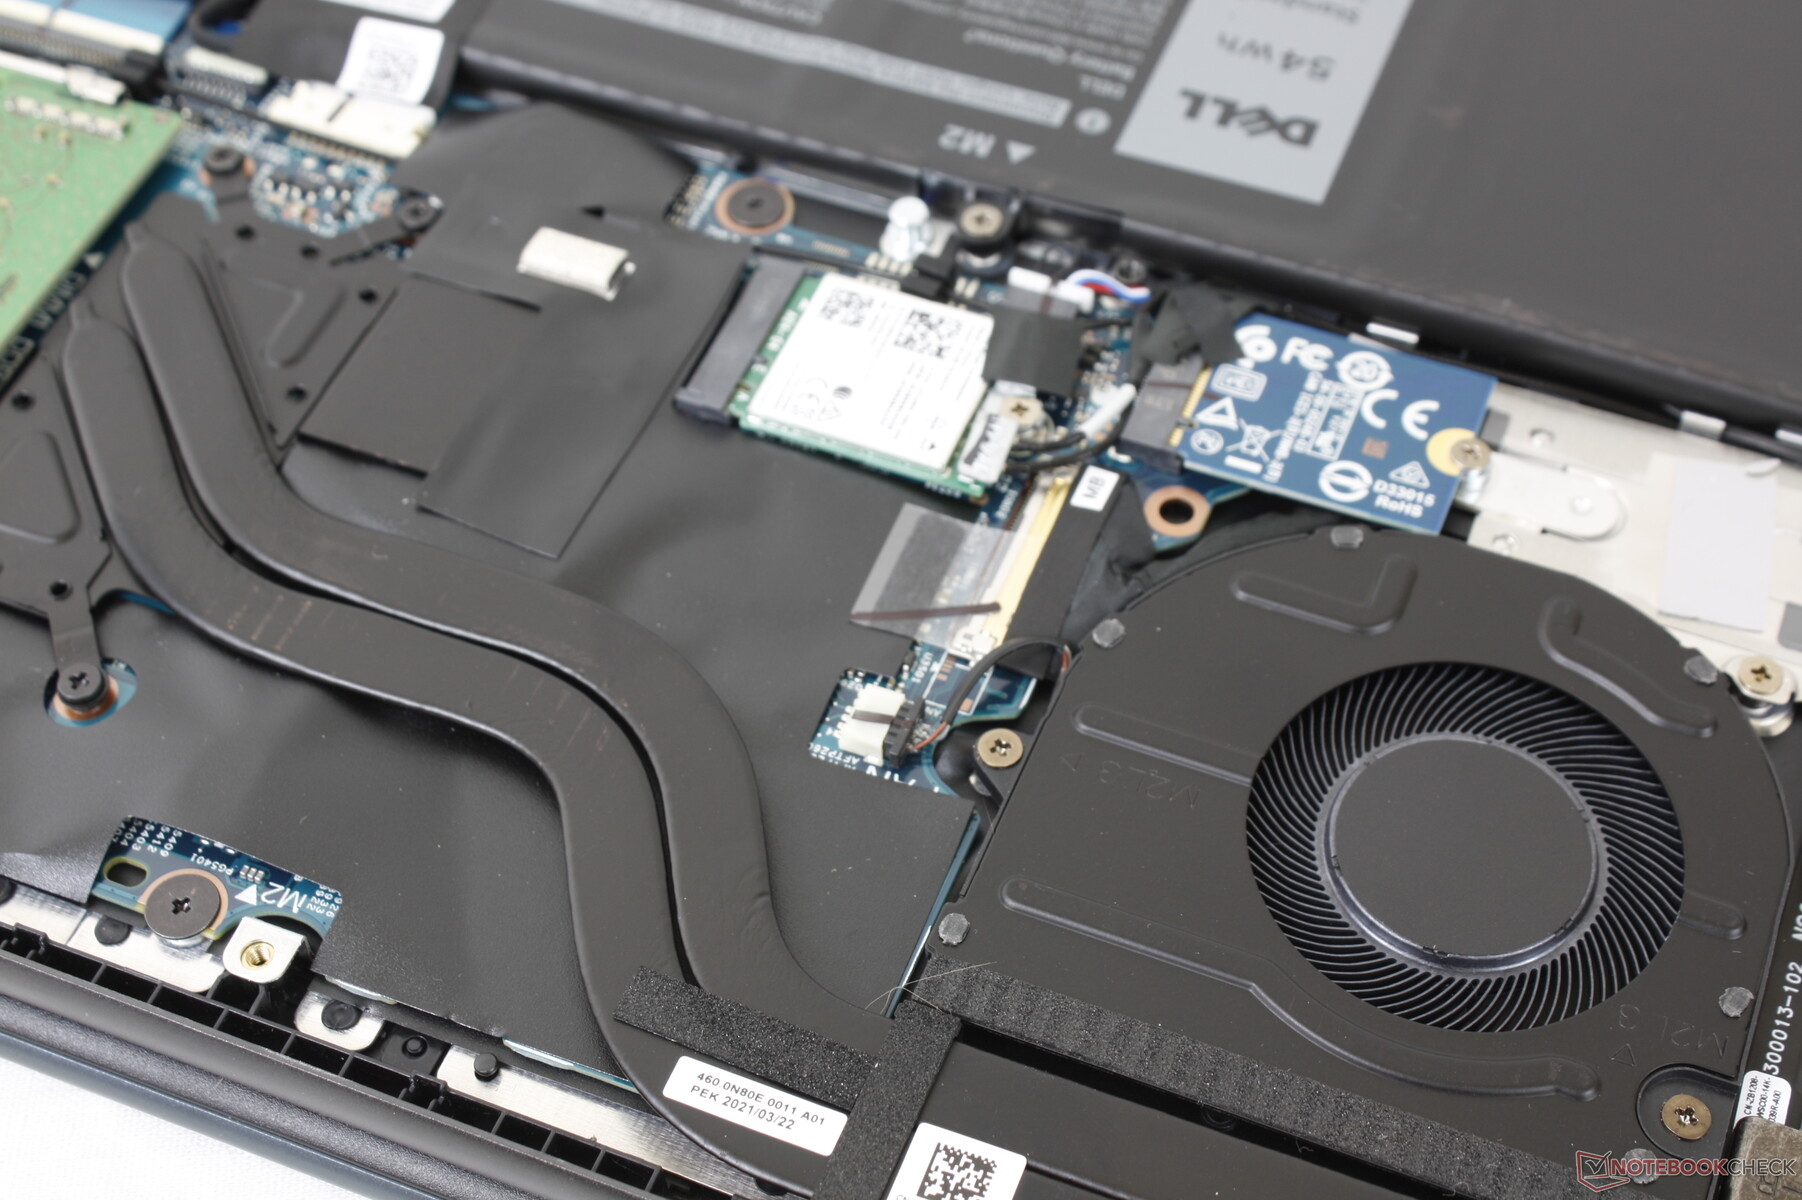
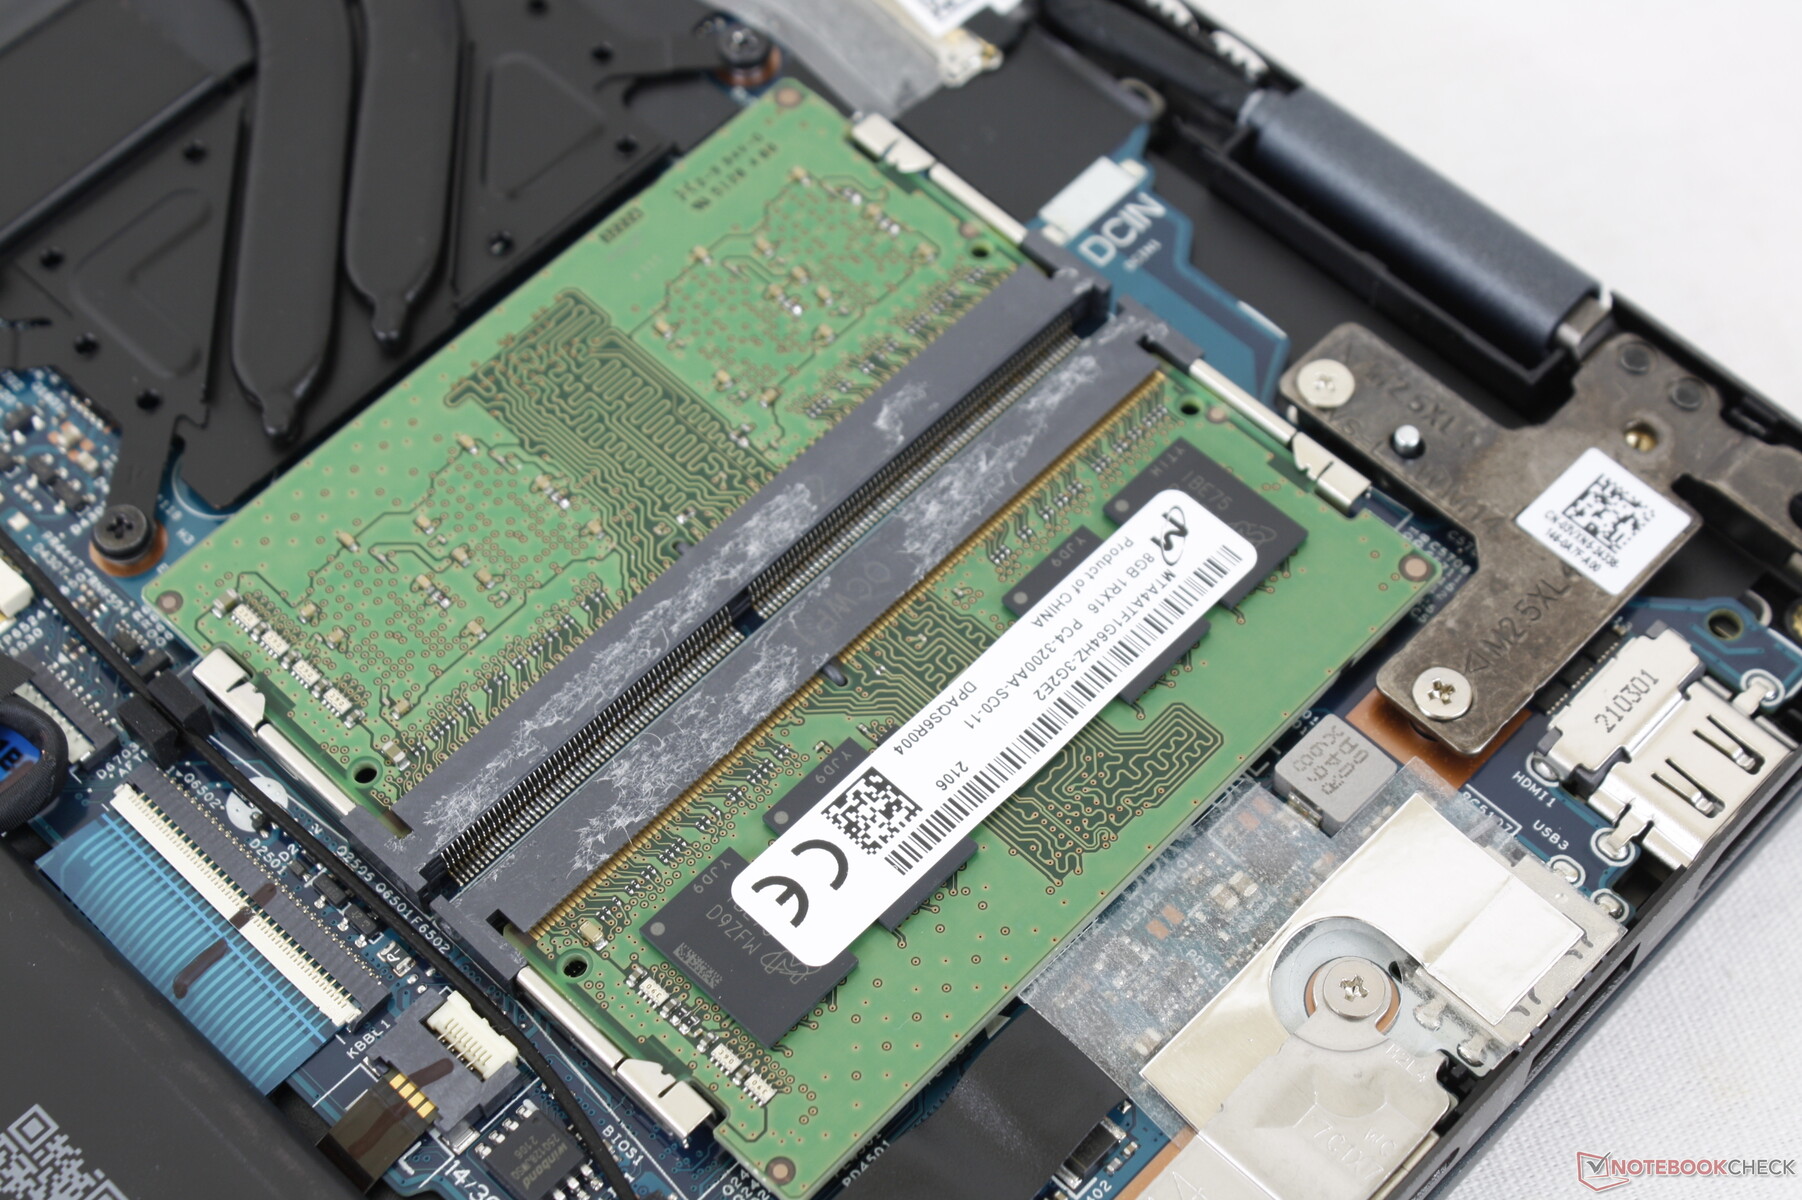
Maintenance — Easy Servicing
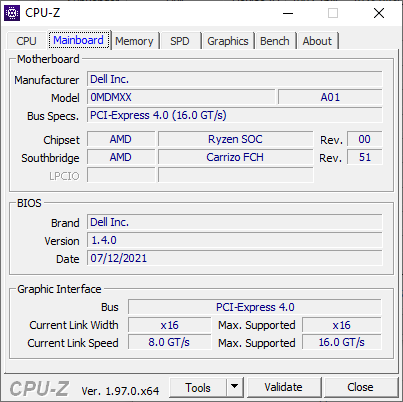
The bottom panel can be easily removed with just a Philips screwdriver to reveal the 2x SODIMM slots, M.2 PCIe SSD, and WLAN. We appreciate that the Inspiron is easy to service if needed which isn't usually the case for inexpensive convertible laptops.
Accessories and Warranty
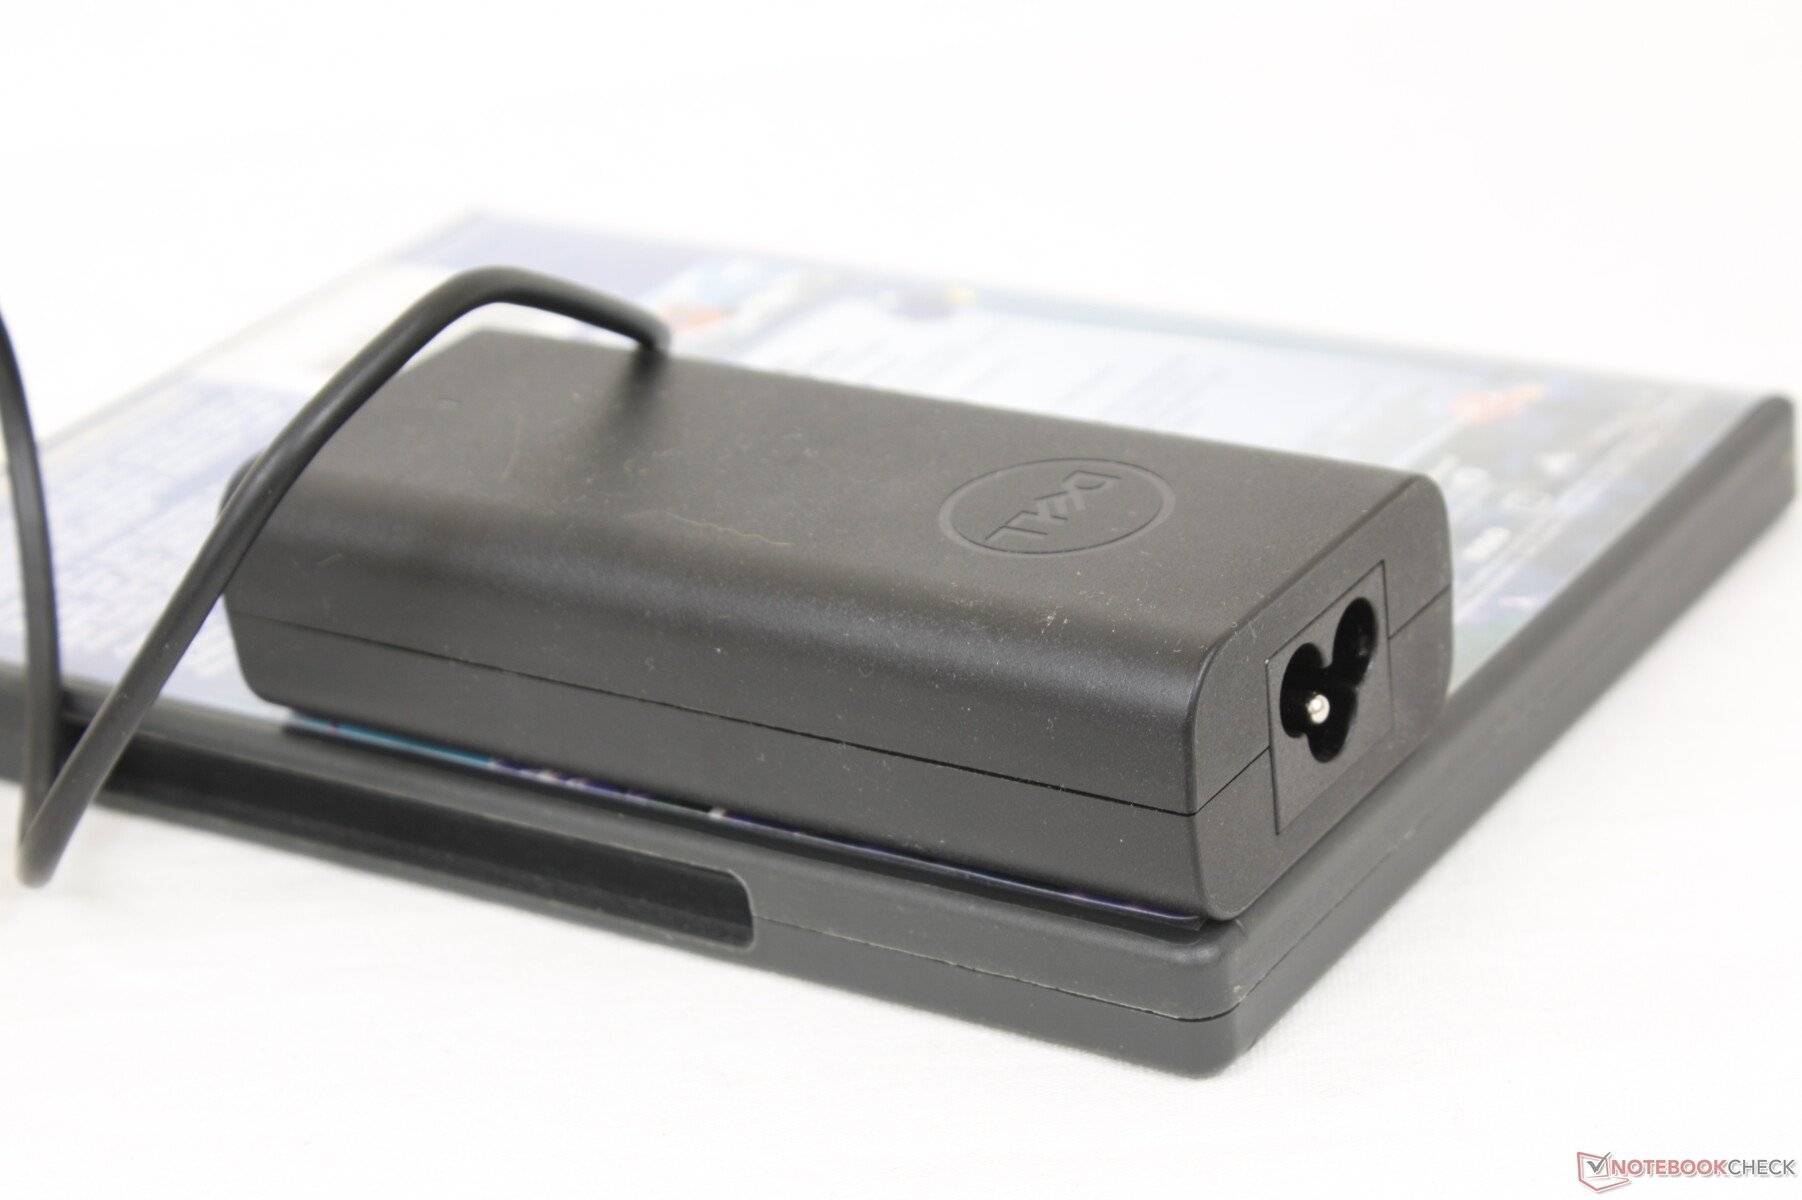
There are no extras in the box other than the AC adapter and paperwork. Our packaging comes with a USB-C AC adapter by default, but users may have the option to receive a proprietary barrel adapter instead since the laptop can support either.
The standard one-year limited manufacturer warranty applies.
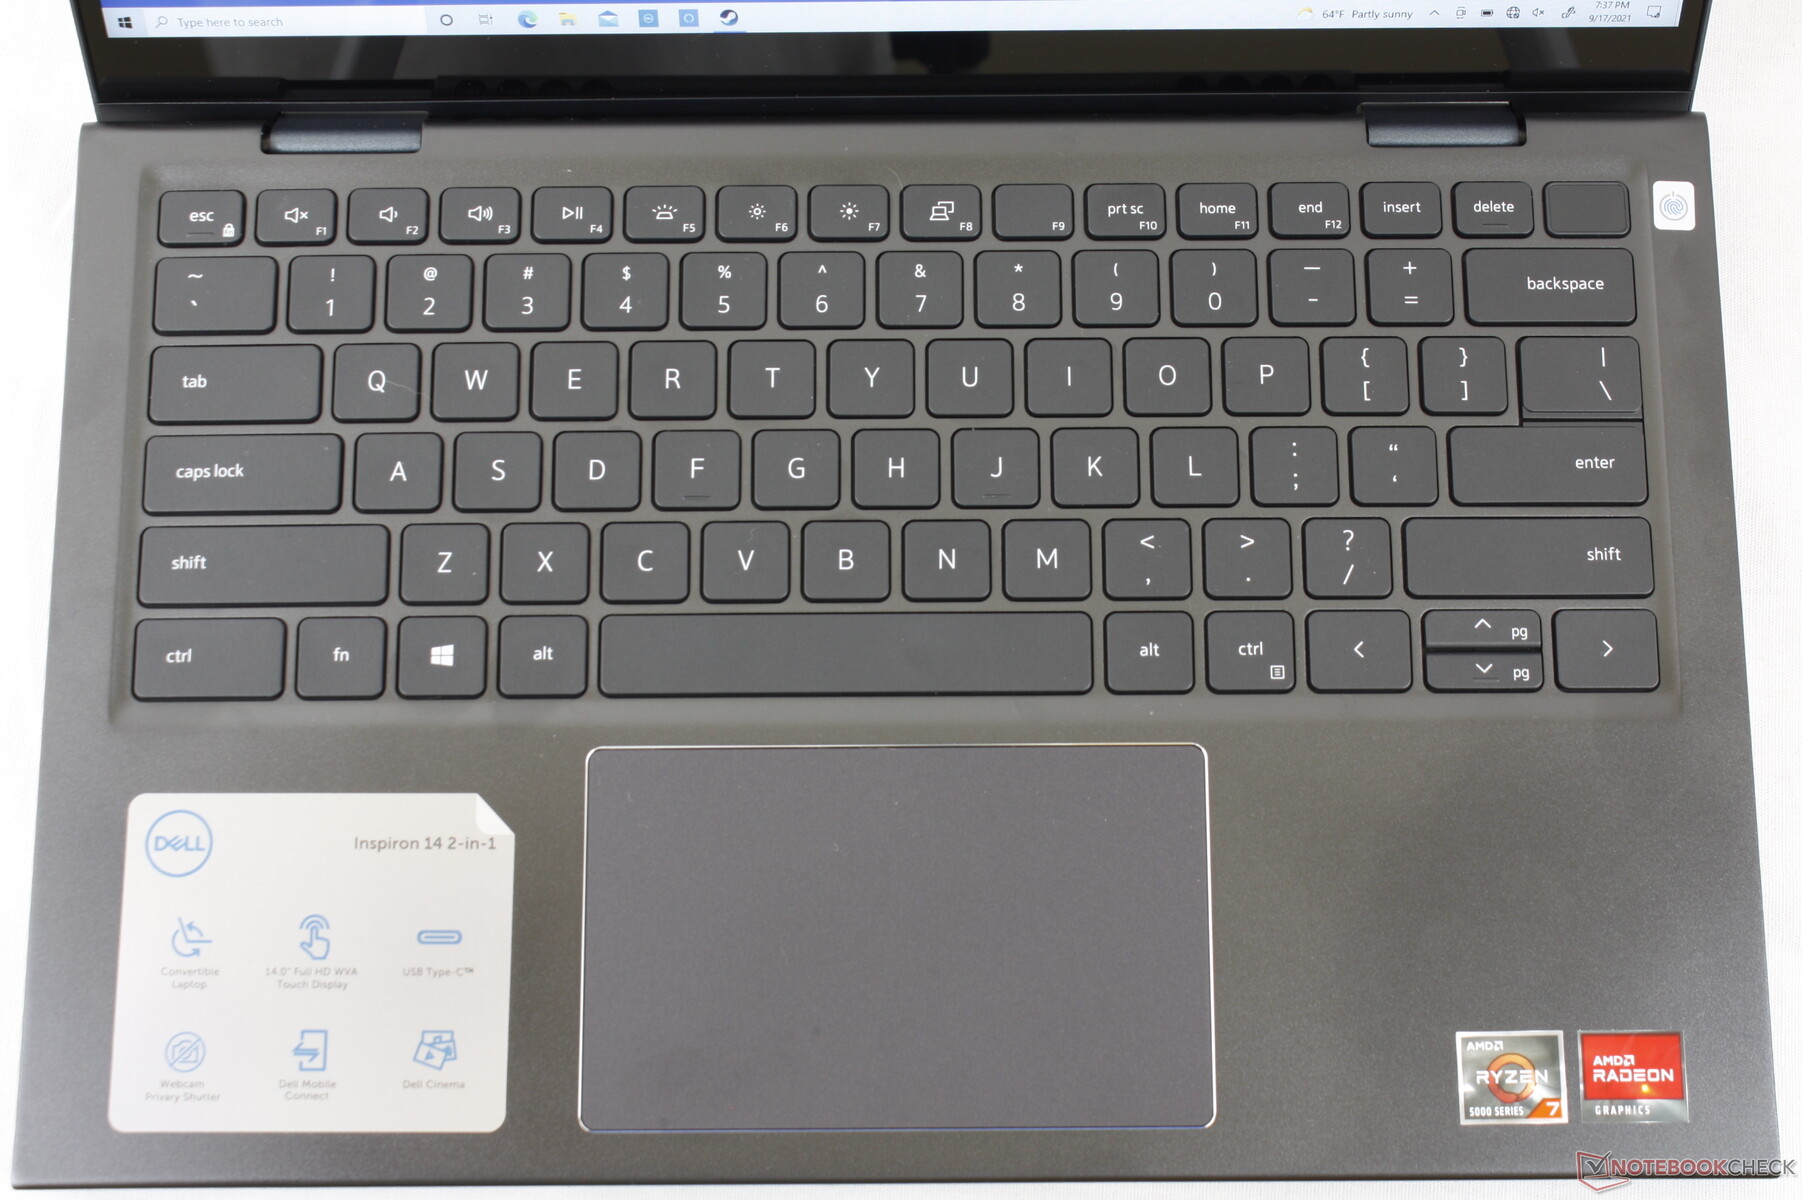
Input Devices — Standard Ultrabook Fair
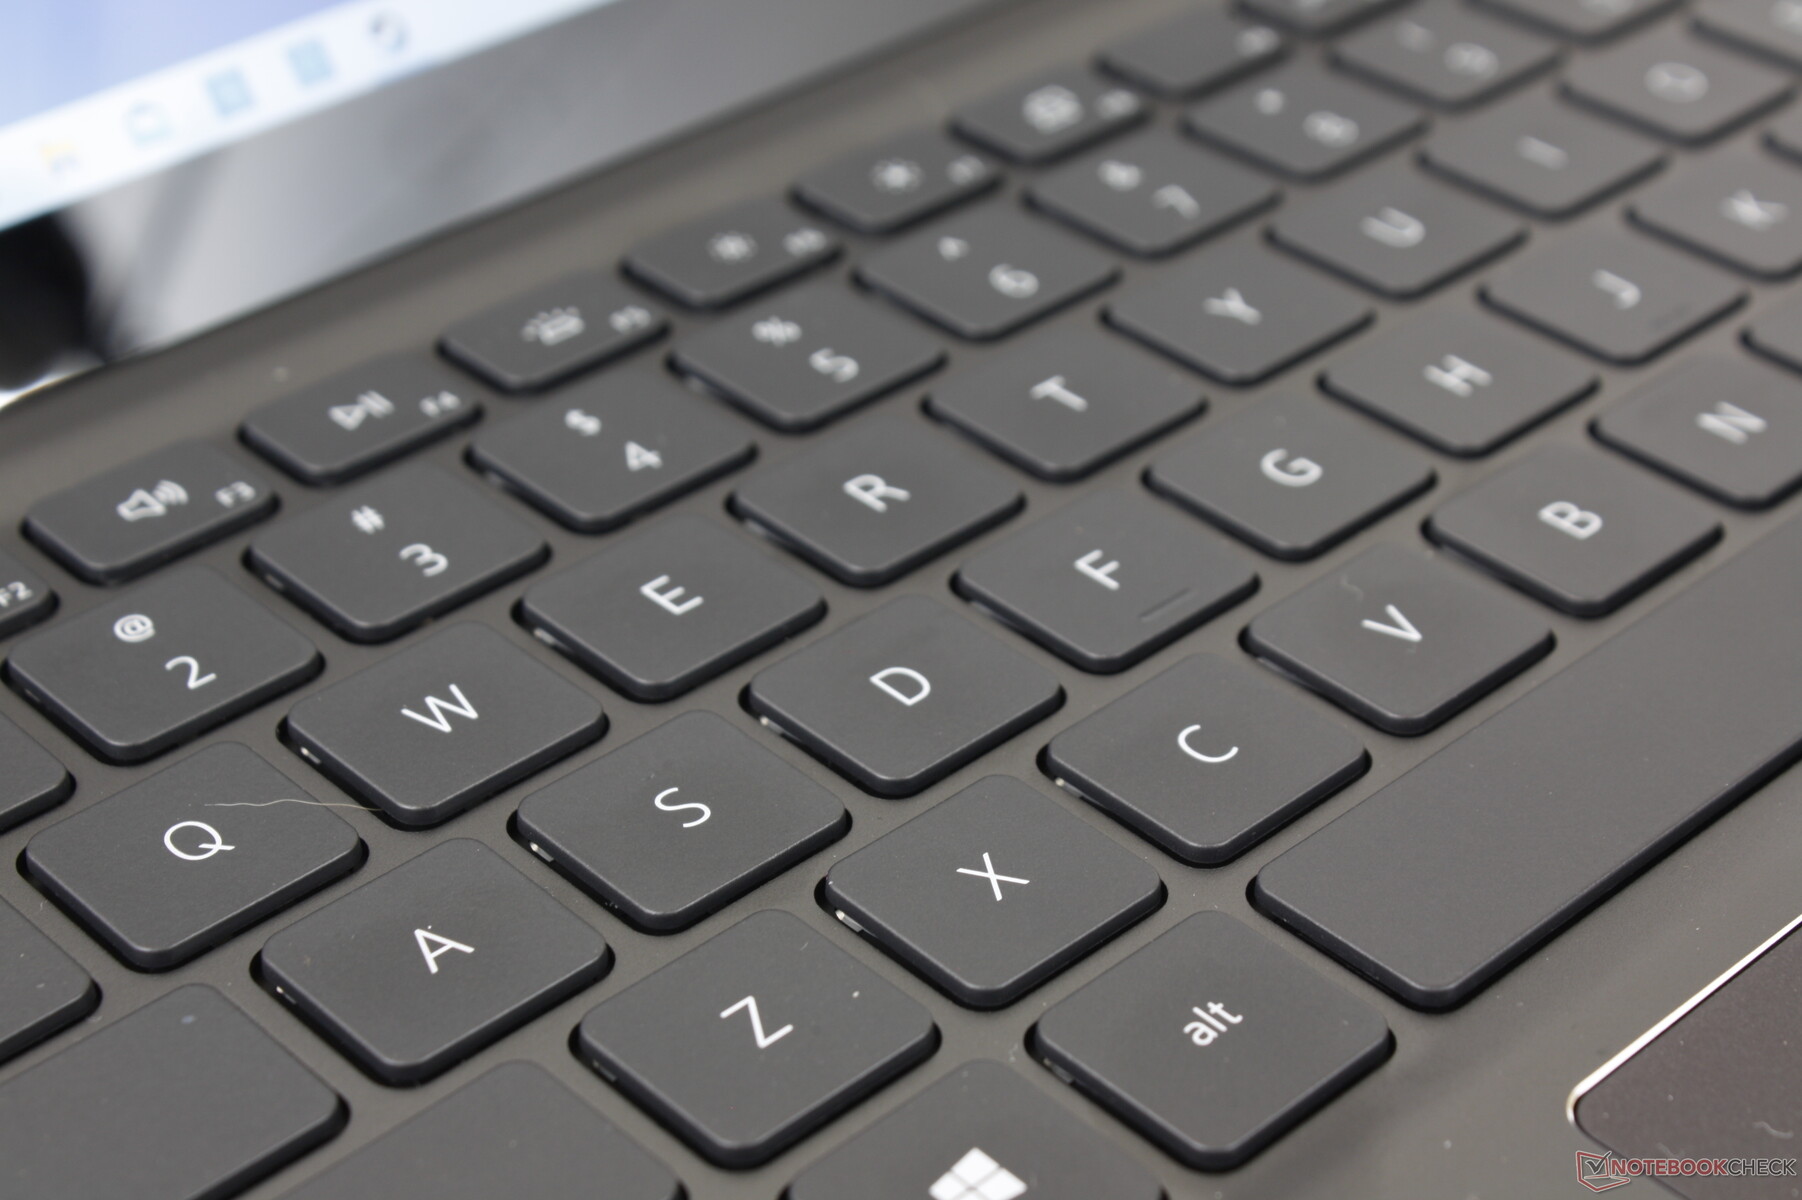
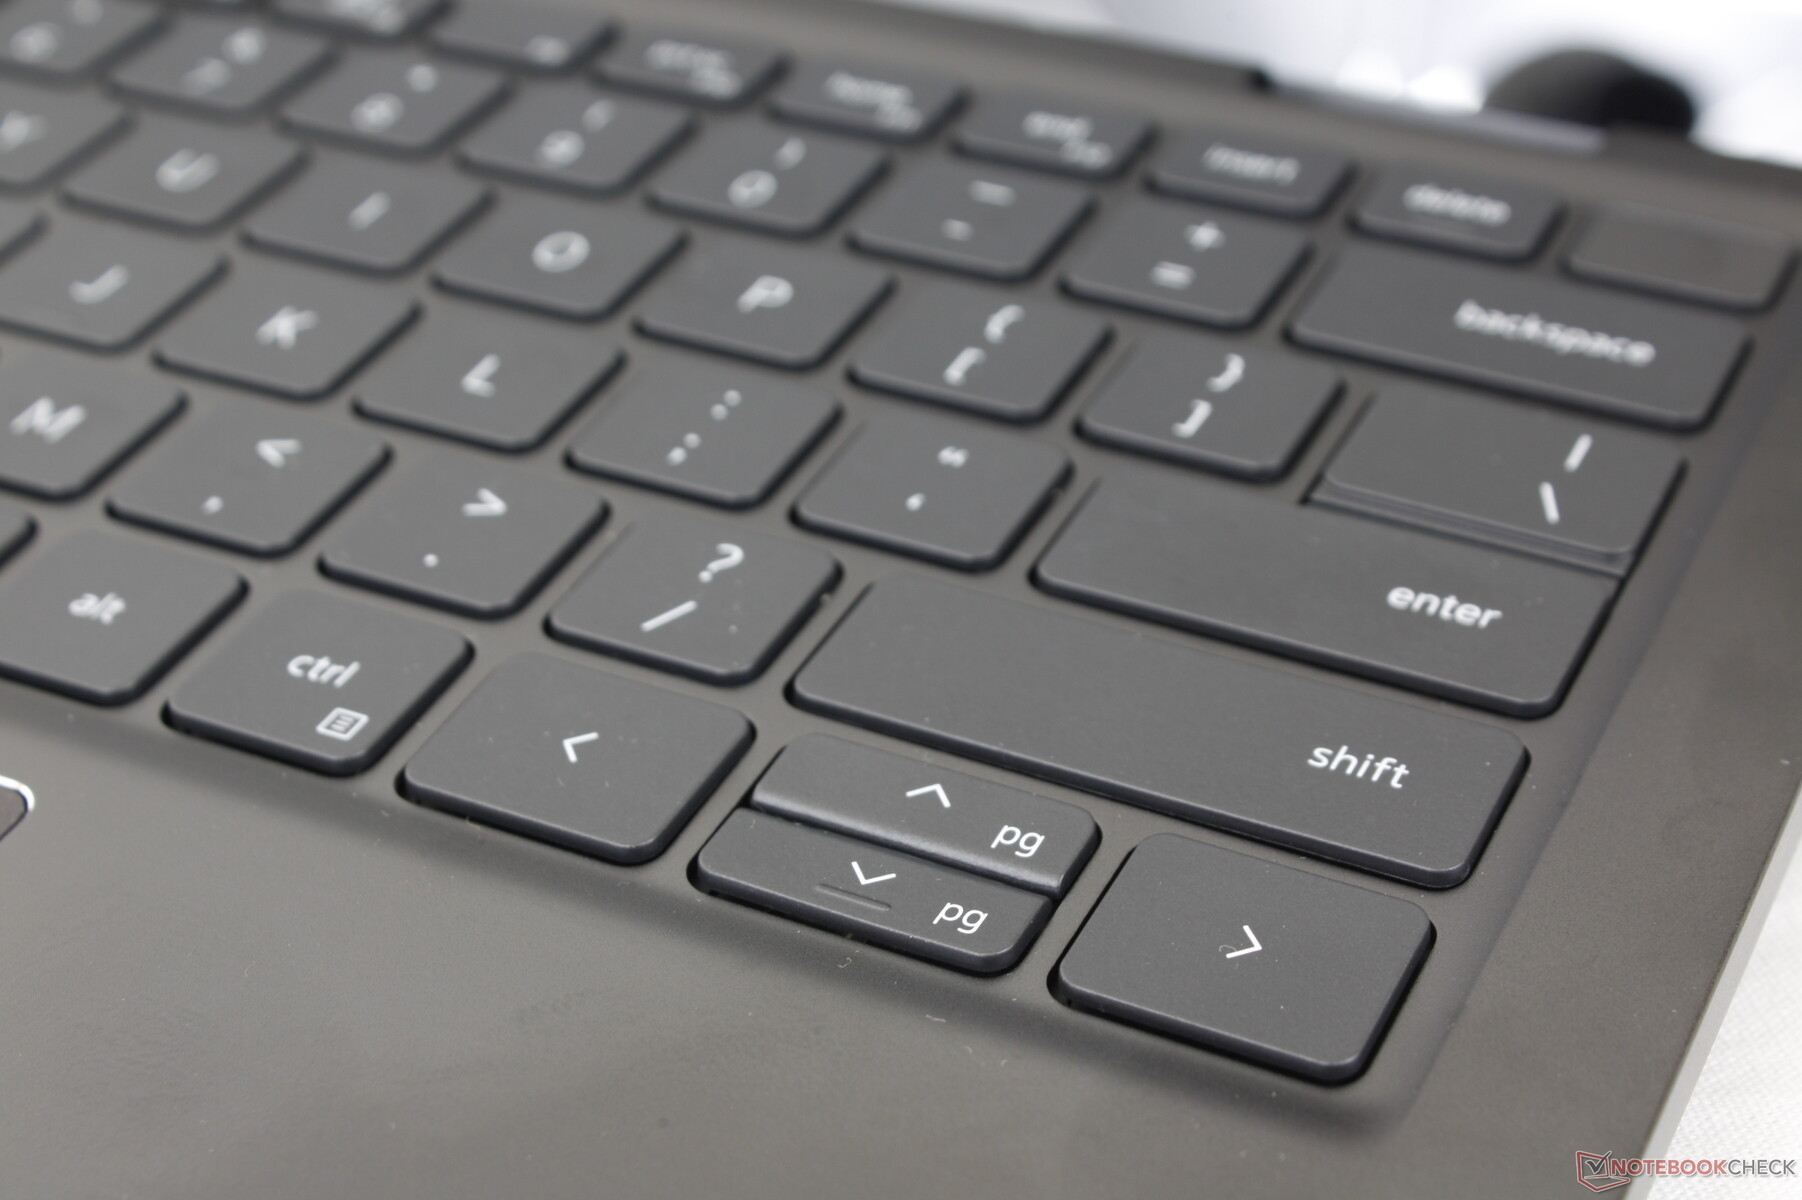
Keyboard
The keys are typical of a budget Ultrabook with their relatively soft feedback and shallow travel especially when compared to the firmer and crisper keys of a pricier Latitude, EliteBook, or ThinkPad. The Space and Enter keys in particular are quieter than usual which some typists might not appreciate. Otherwise, the typing experience is not dissimilar to laptops like the VivoBook or IdeaPad.
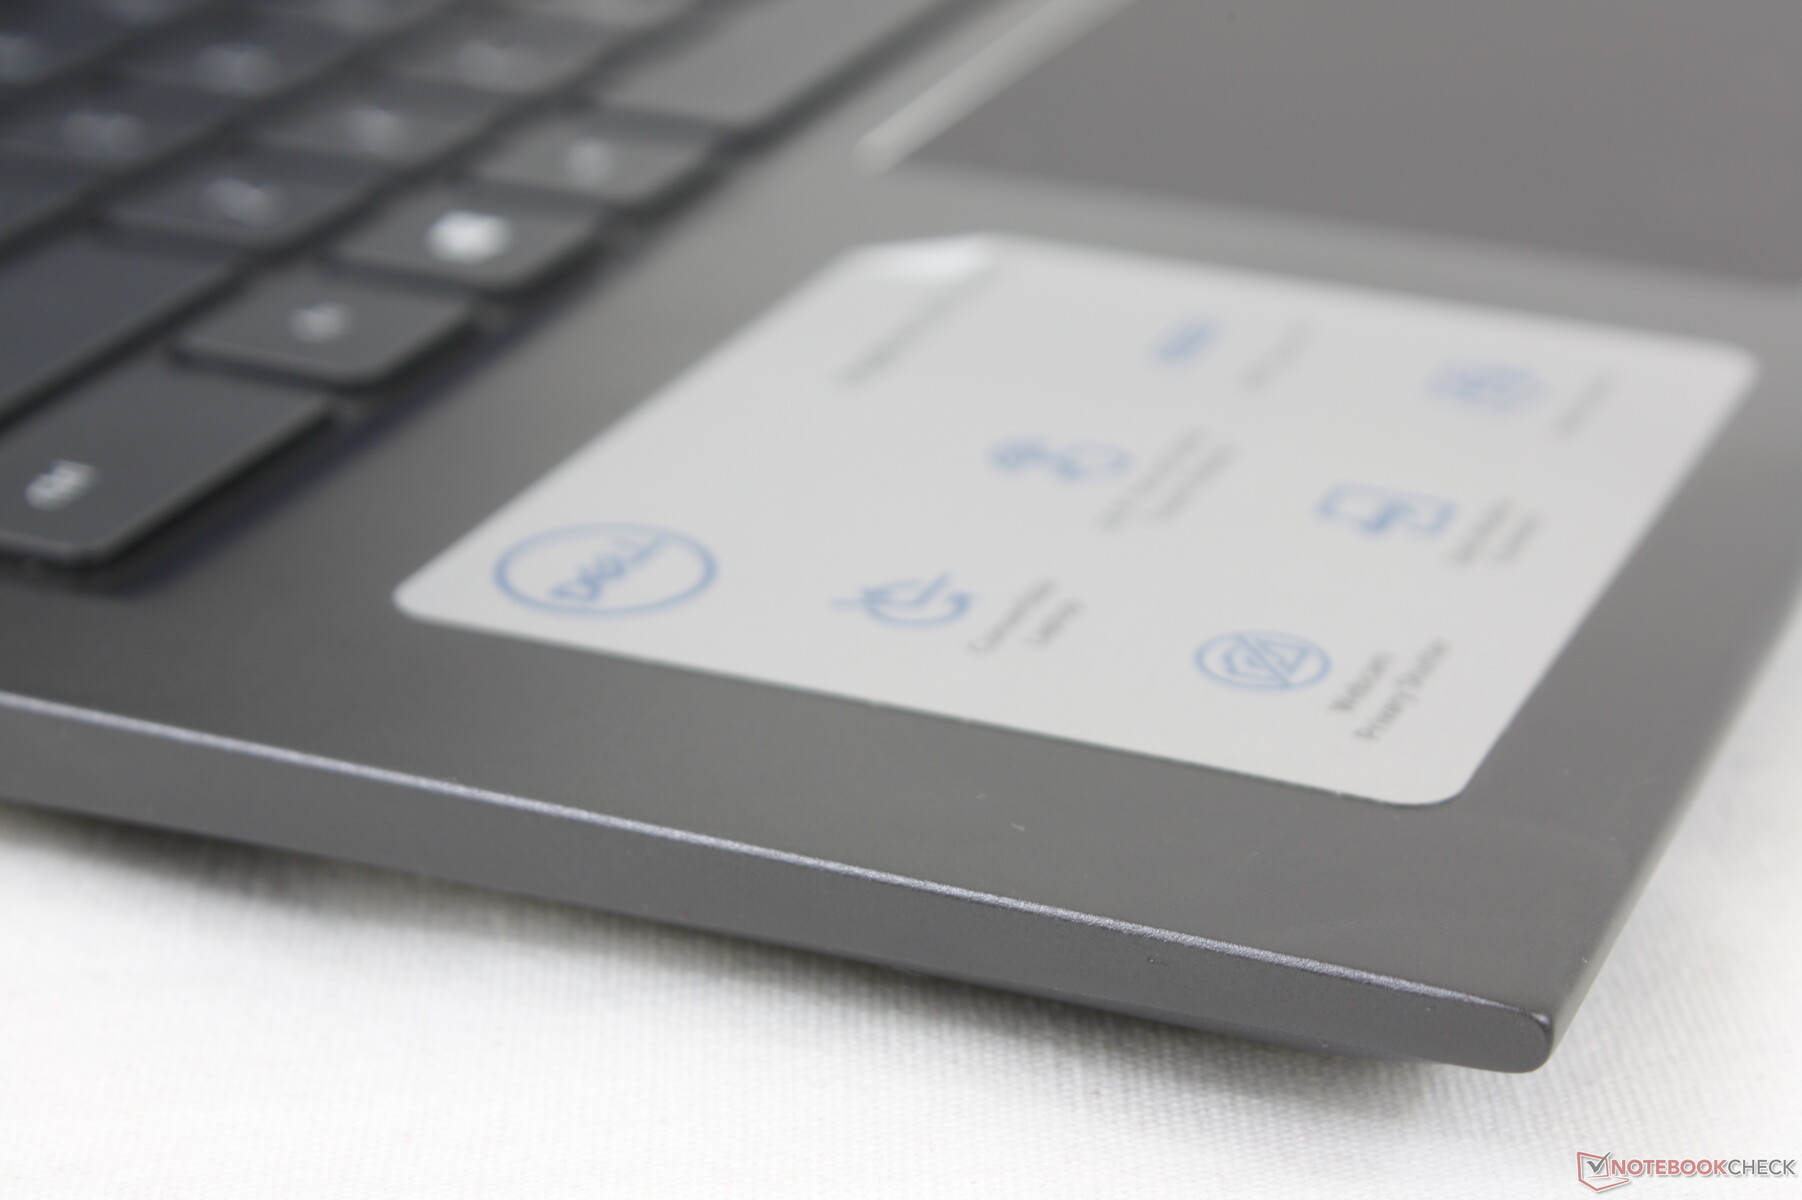
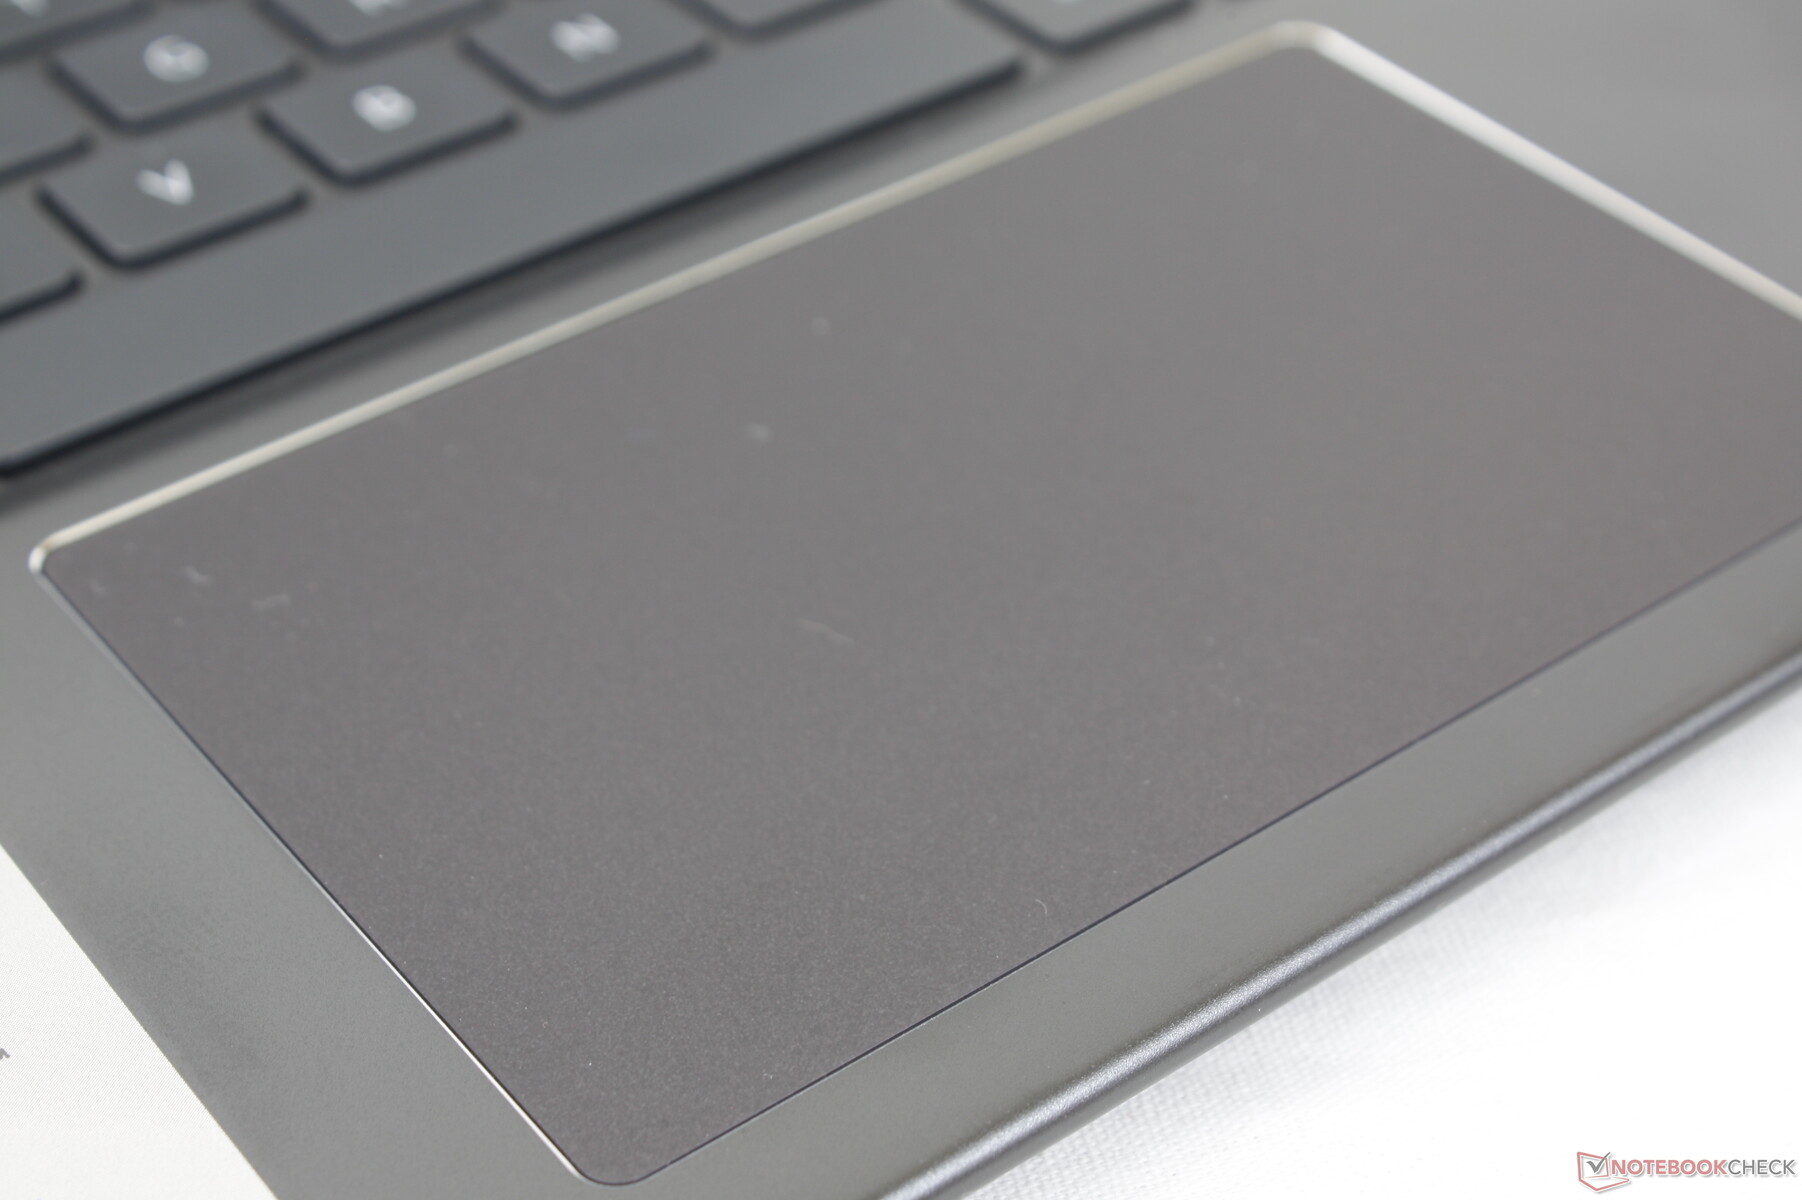
Touchpad
The Precision clickpad is larger than the clickpad on the pricier Dell latitude 14 9410 2-in-1 (11.5 x 7 cm vs. 10.5 x 6 cm) for easier multi-touch inputs. Cursor control is reliable no matter the speed, but the smooth surface can feel moderately sticky if gliding at slower speeds. Clicking on the clickpad is spongy and requires more force than we would like which can feel tiring on the finger after a while.
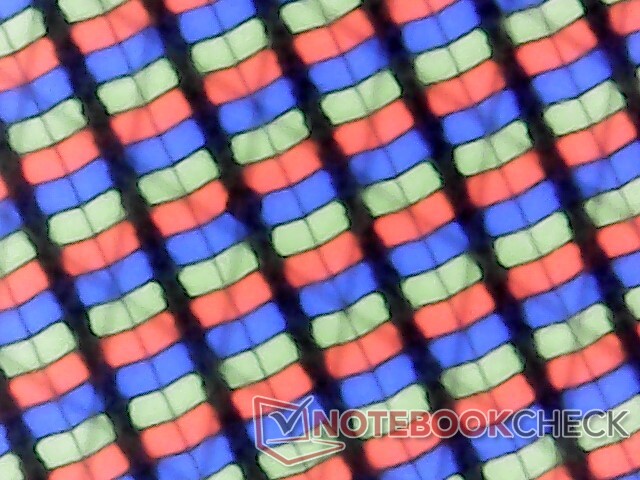
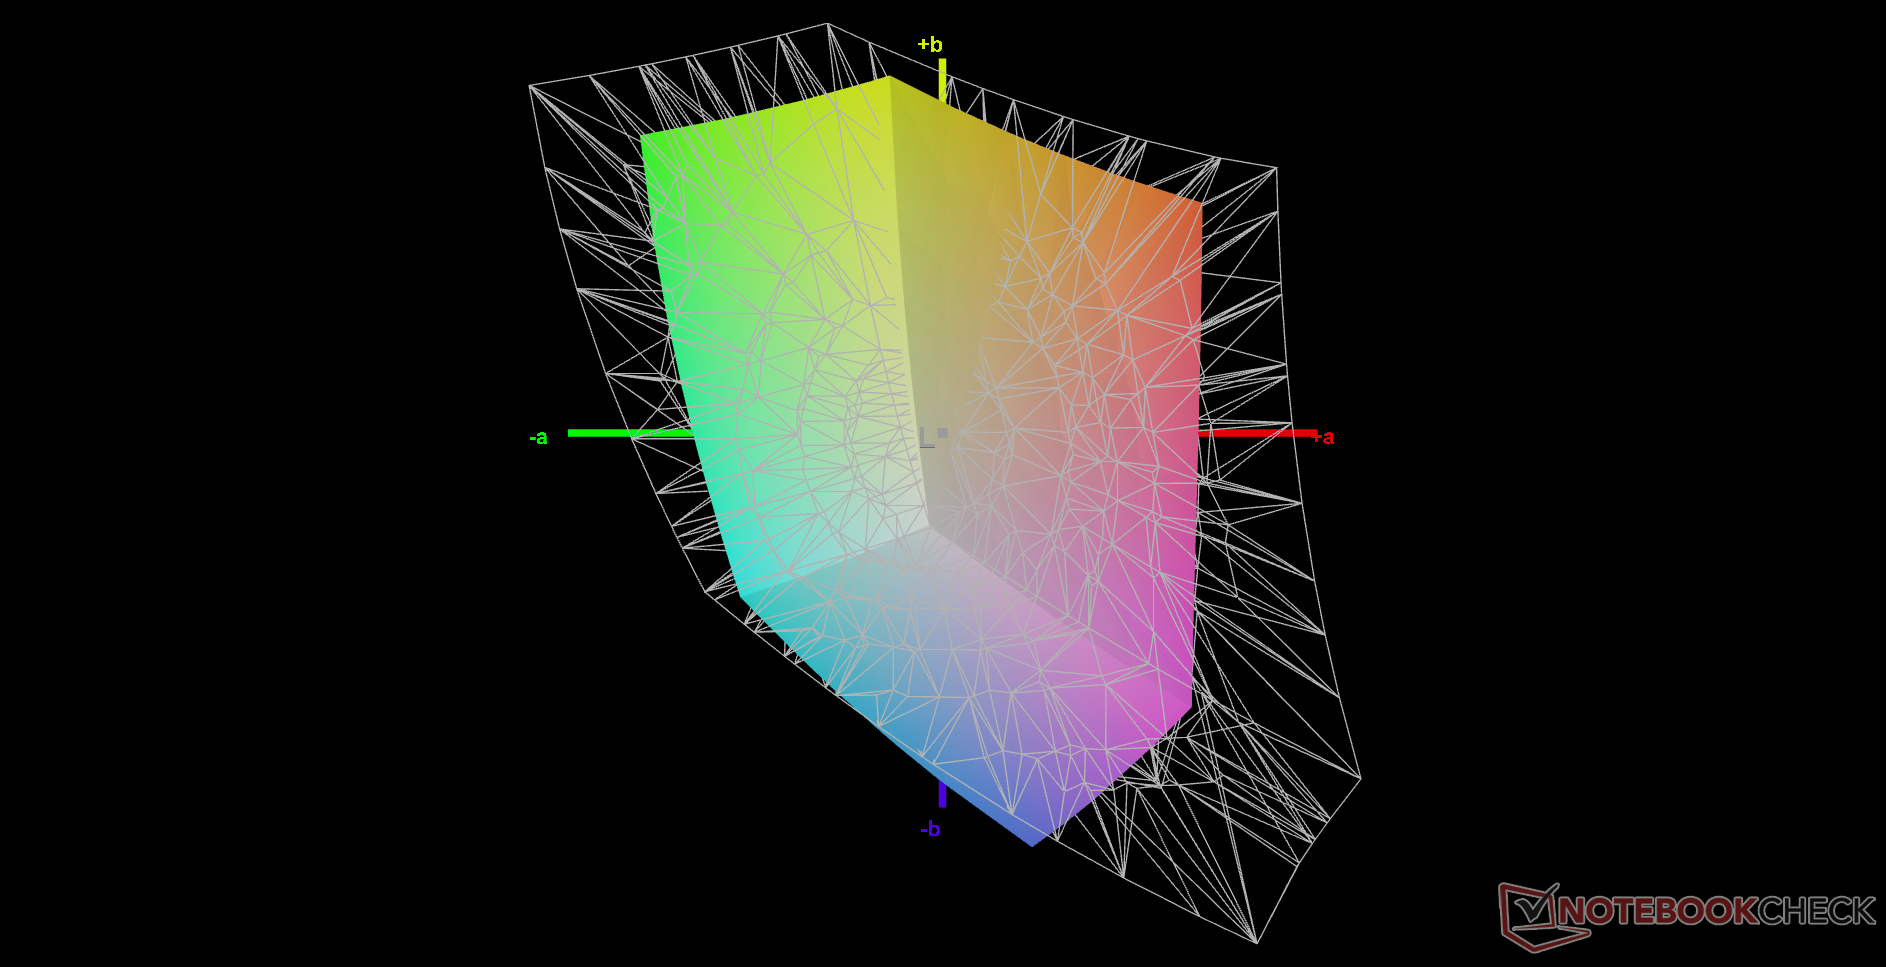
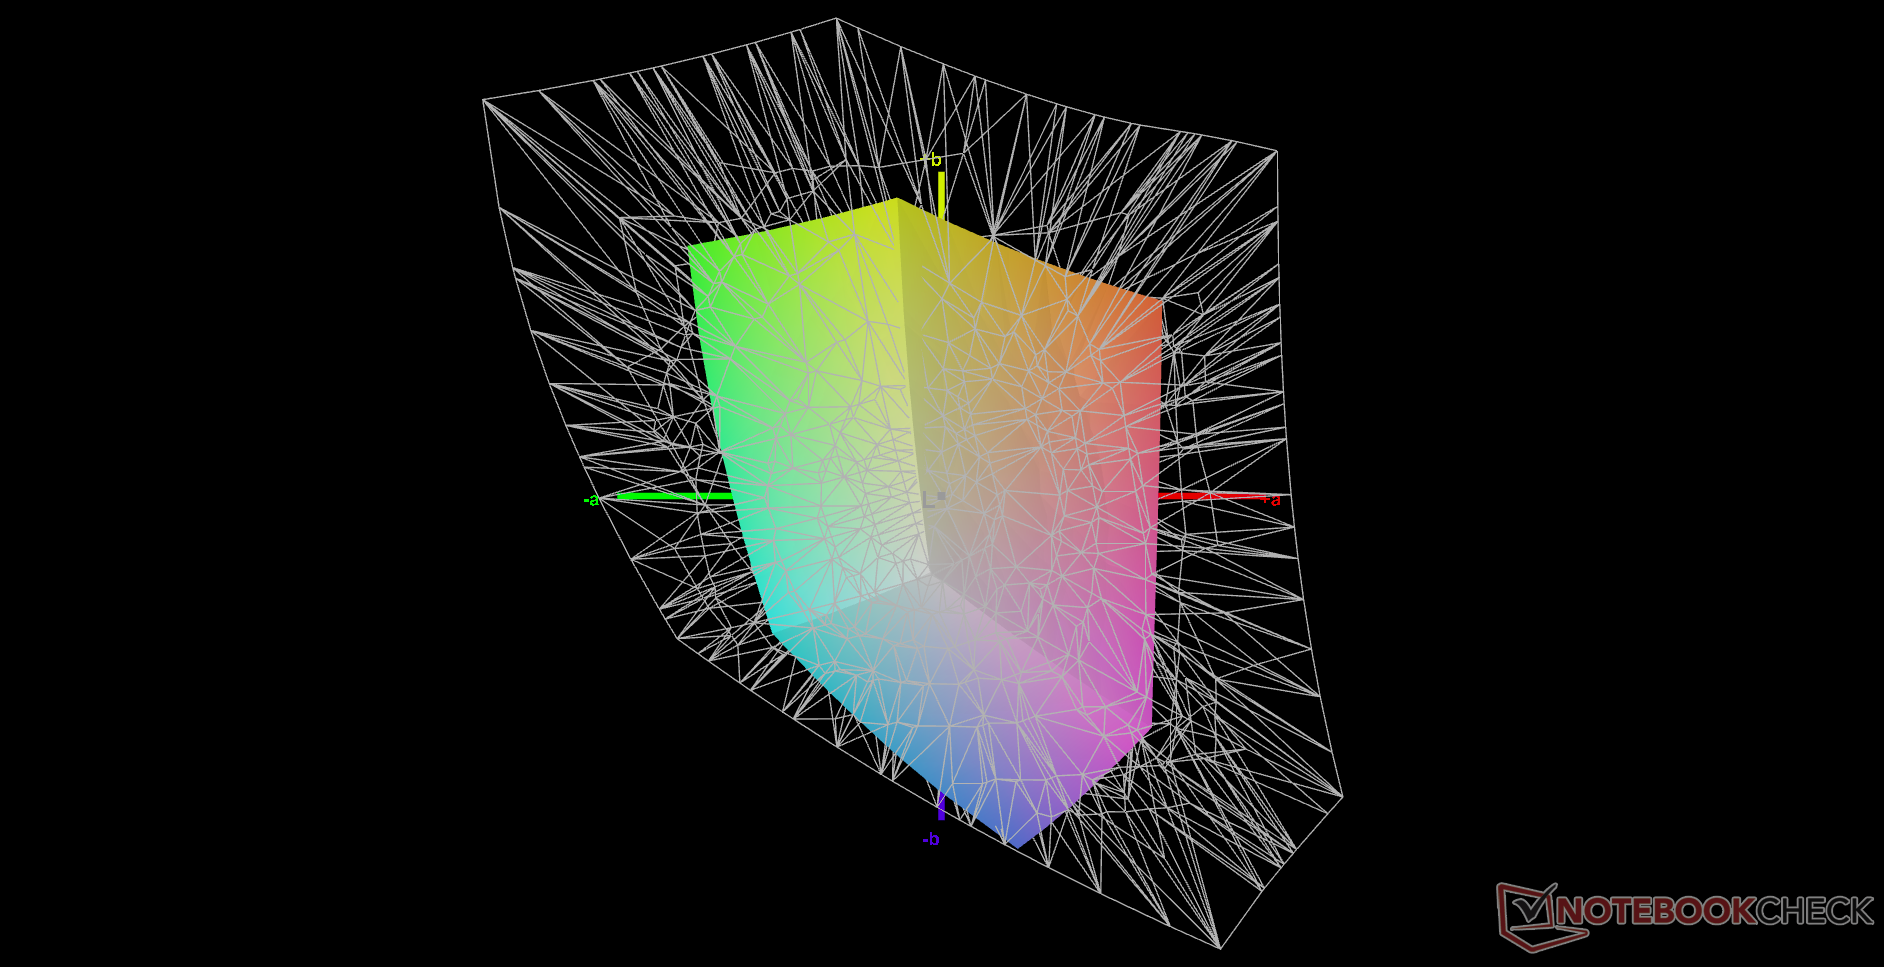
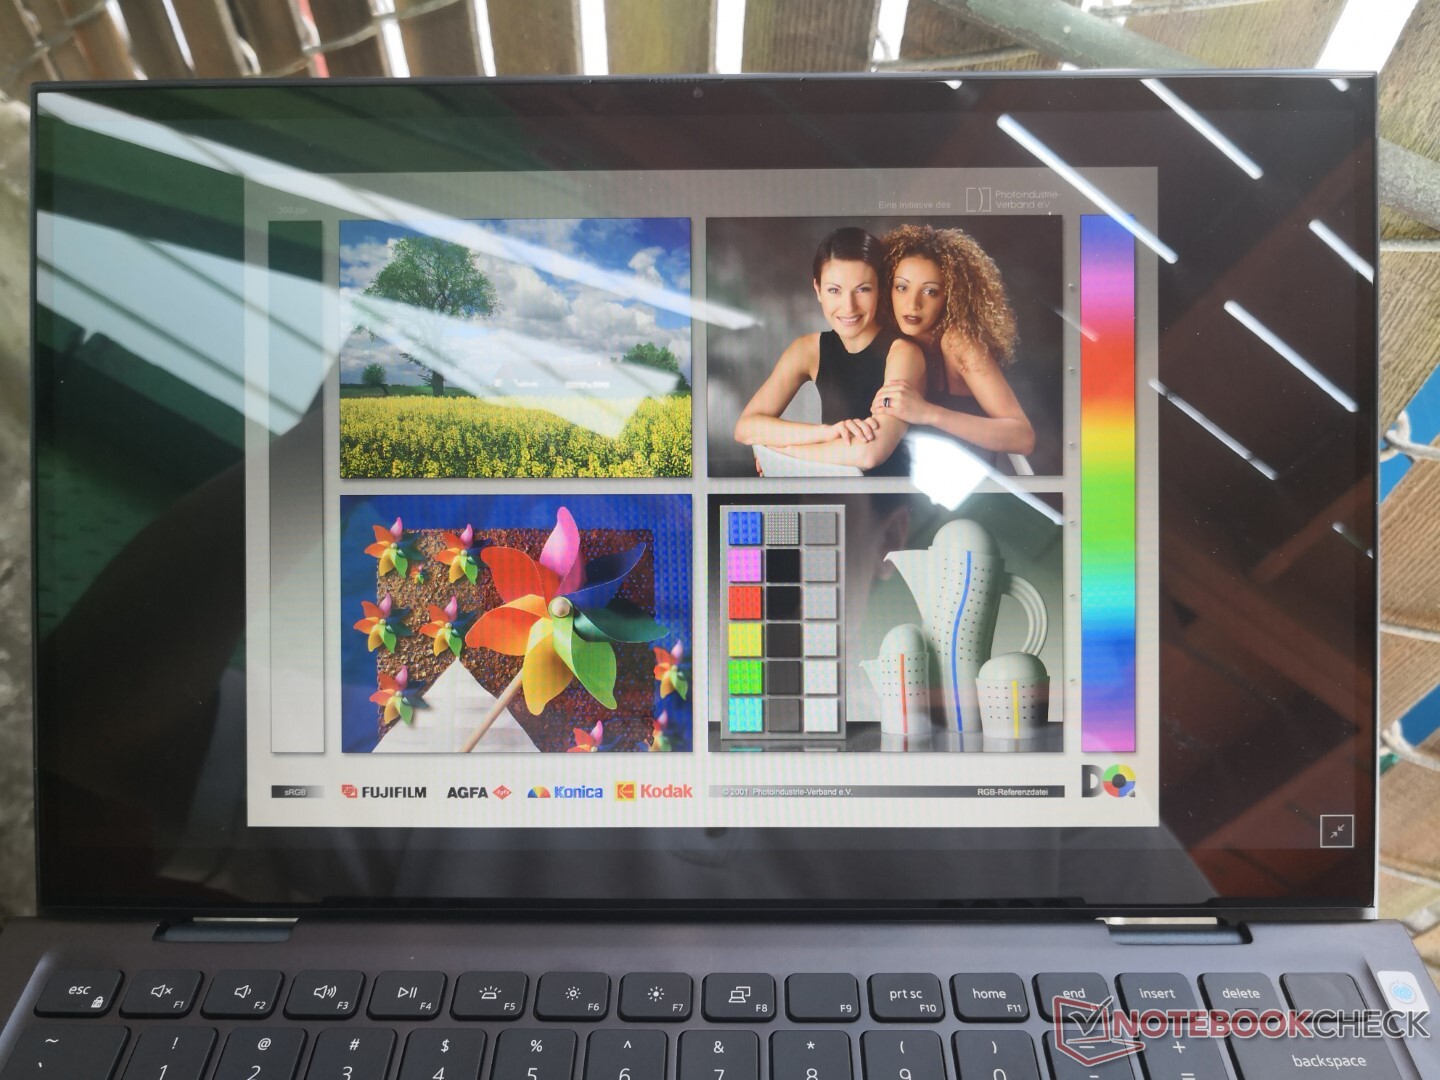
Display — Limited sRGB Coverage
Dell uses the same Chi Mei 140HCA IPS panel for its Inspiron 14 3493 and Inspiron 14 7415 2-in-1. This is unfortunately a budget panel as exemplified by its limited color range, average contrast ratio, and average response times. Though competing models like the HP Pavilion x360 or Asus VivoBook Flip have similar attributes, it's too bad that the Inspiron 7415 2-in-1 doesn't come with the same panel as found on the Inspiron 14 7400 which offers much deeper colors, higher native resolution, and faster response times for less ghosting.
| |||||||||||||||||||||||||
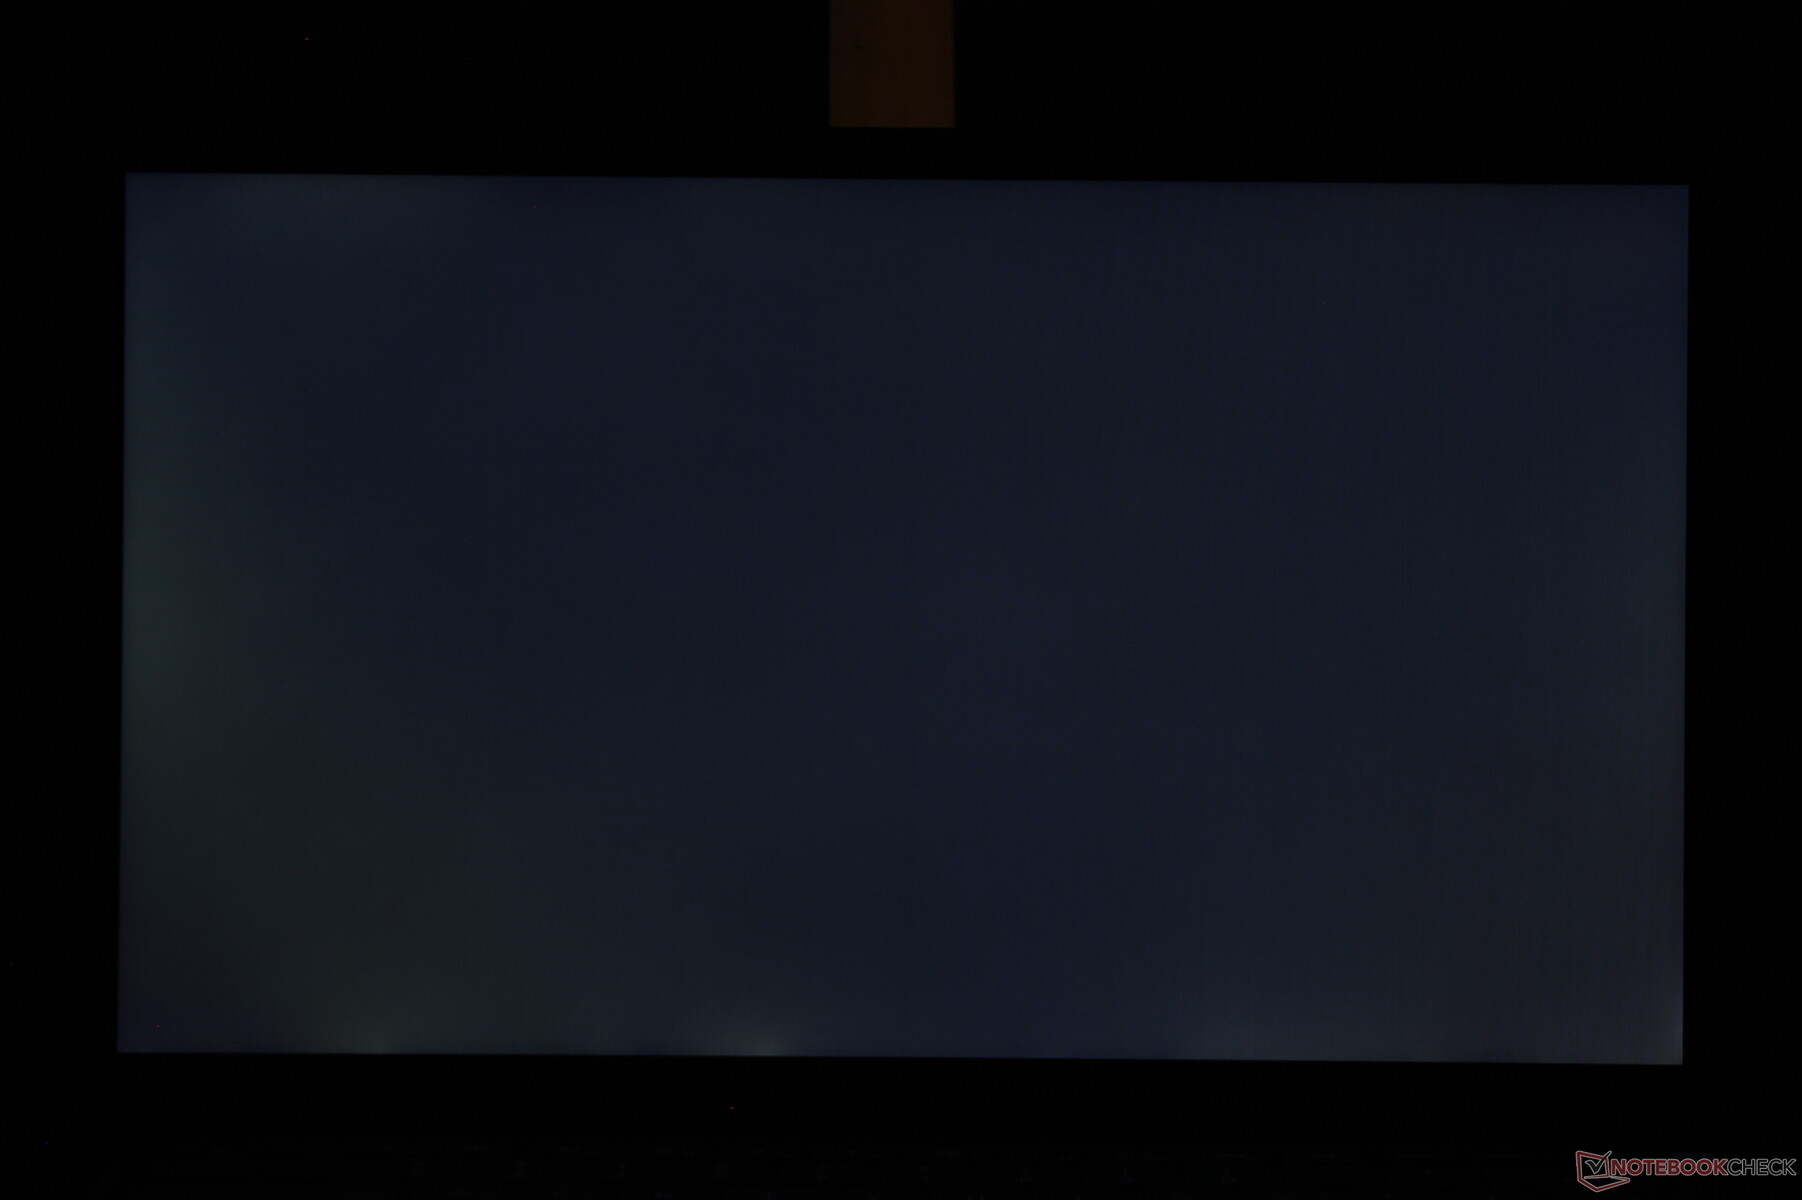
Brightness Distribution: 84 %
Center on Battery: 262.7 cd/m²
Contrast: 710:1 (Black: 0.37 cd/m²)
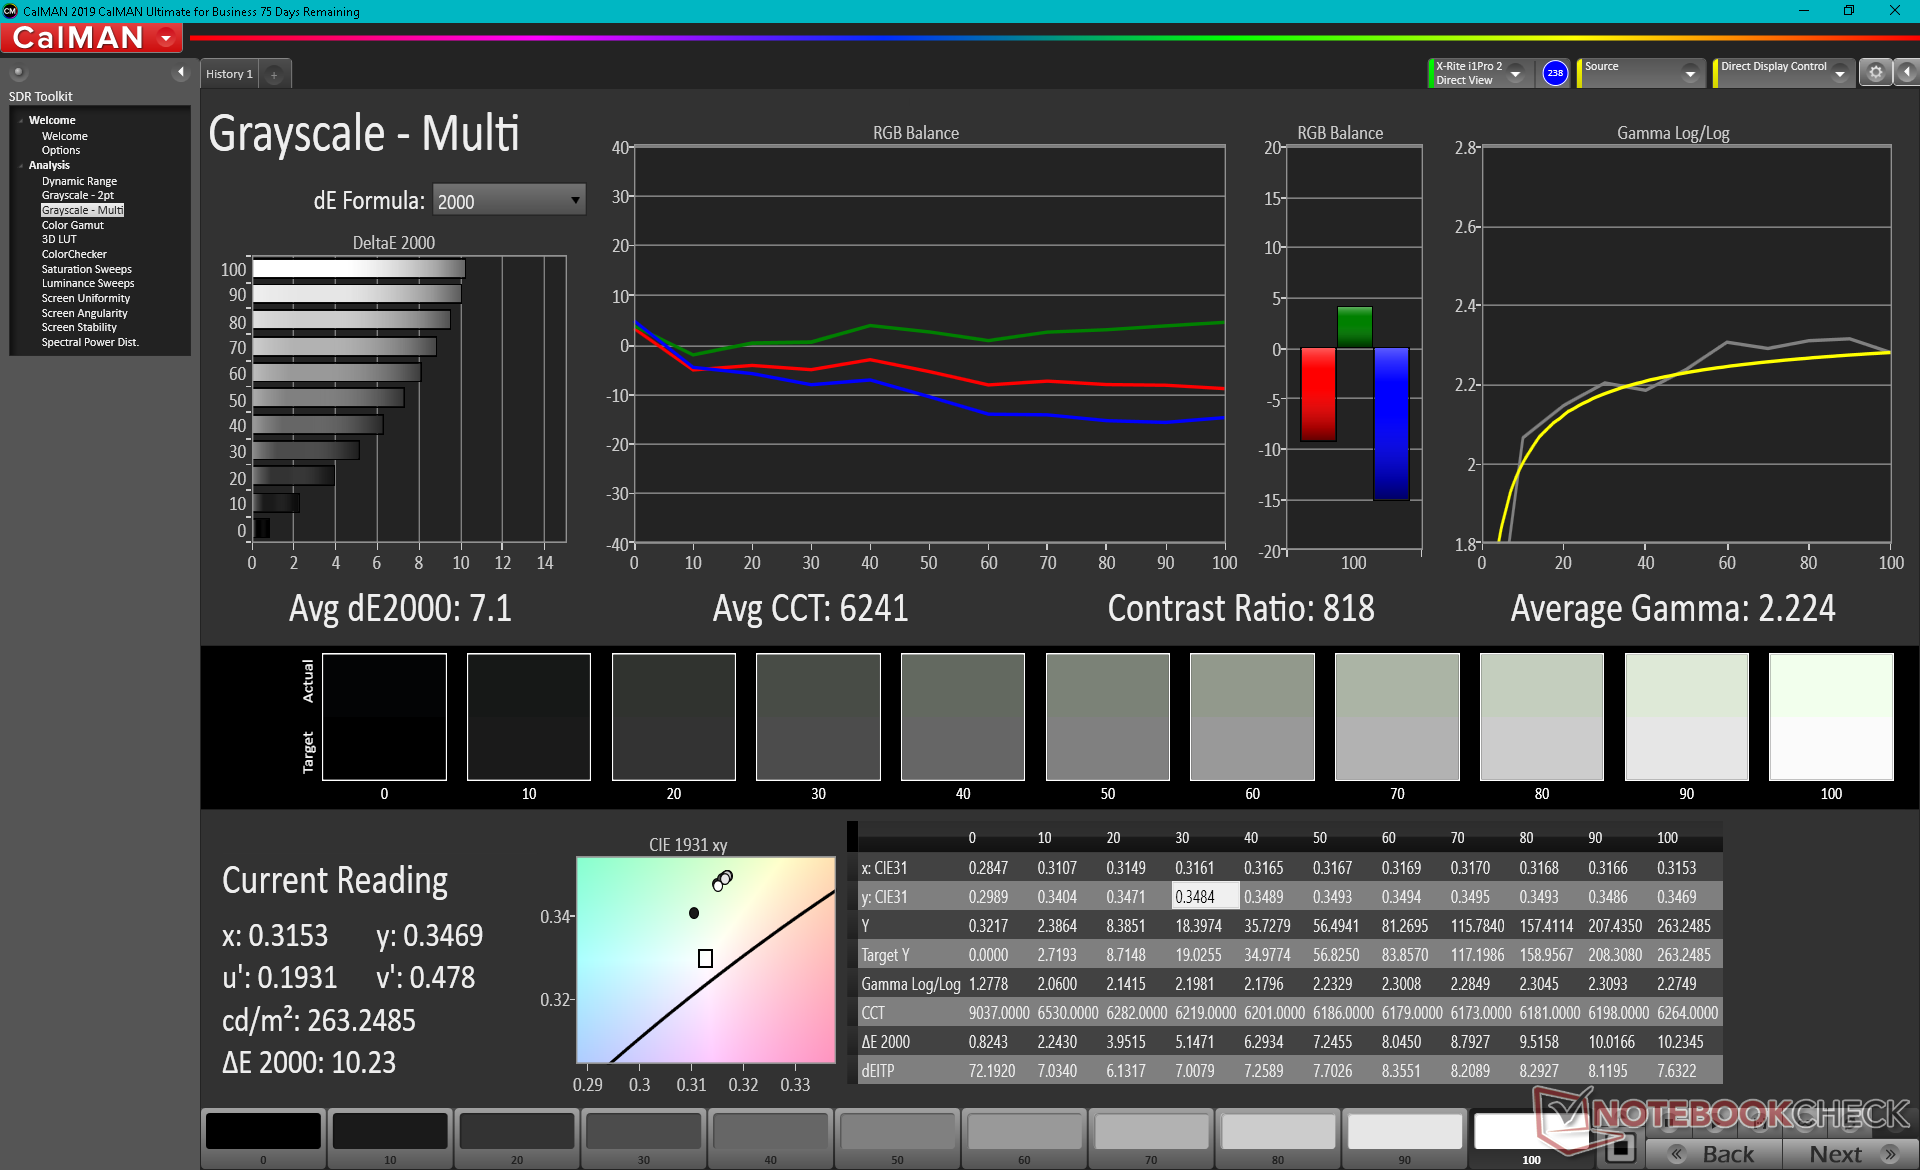
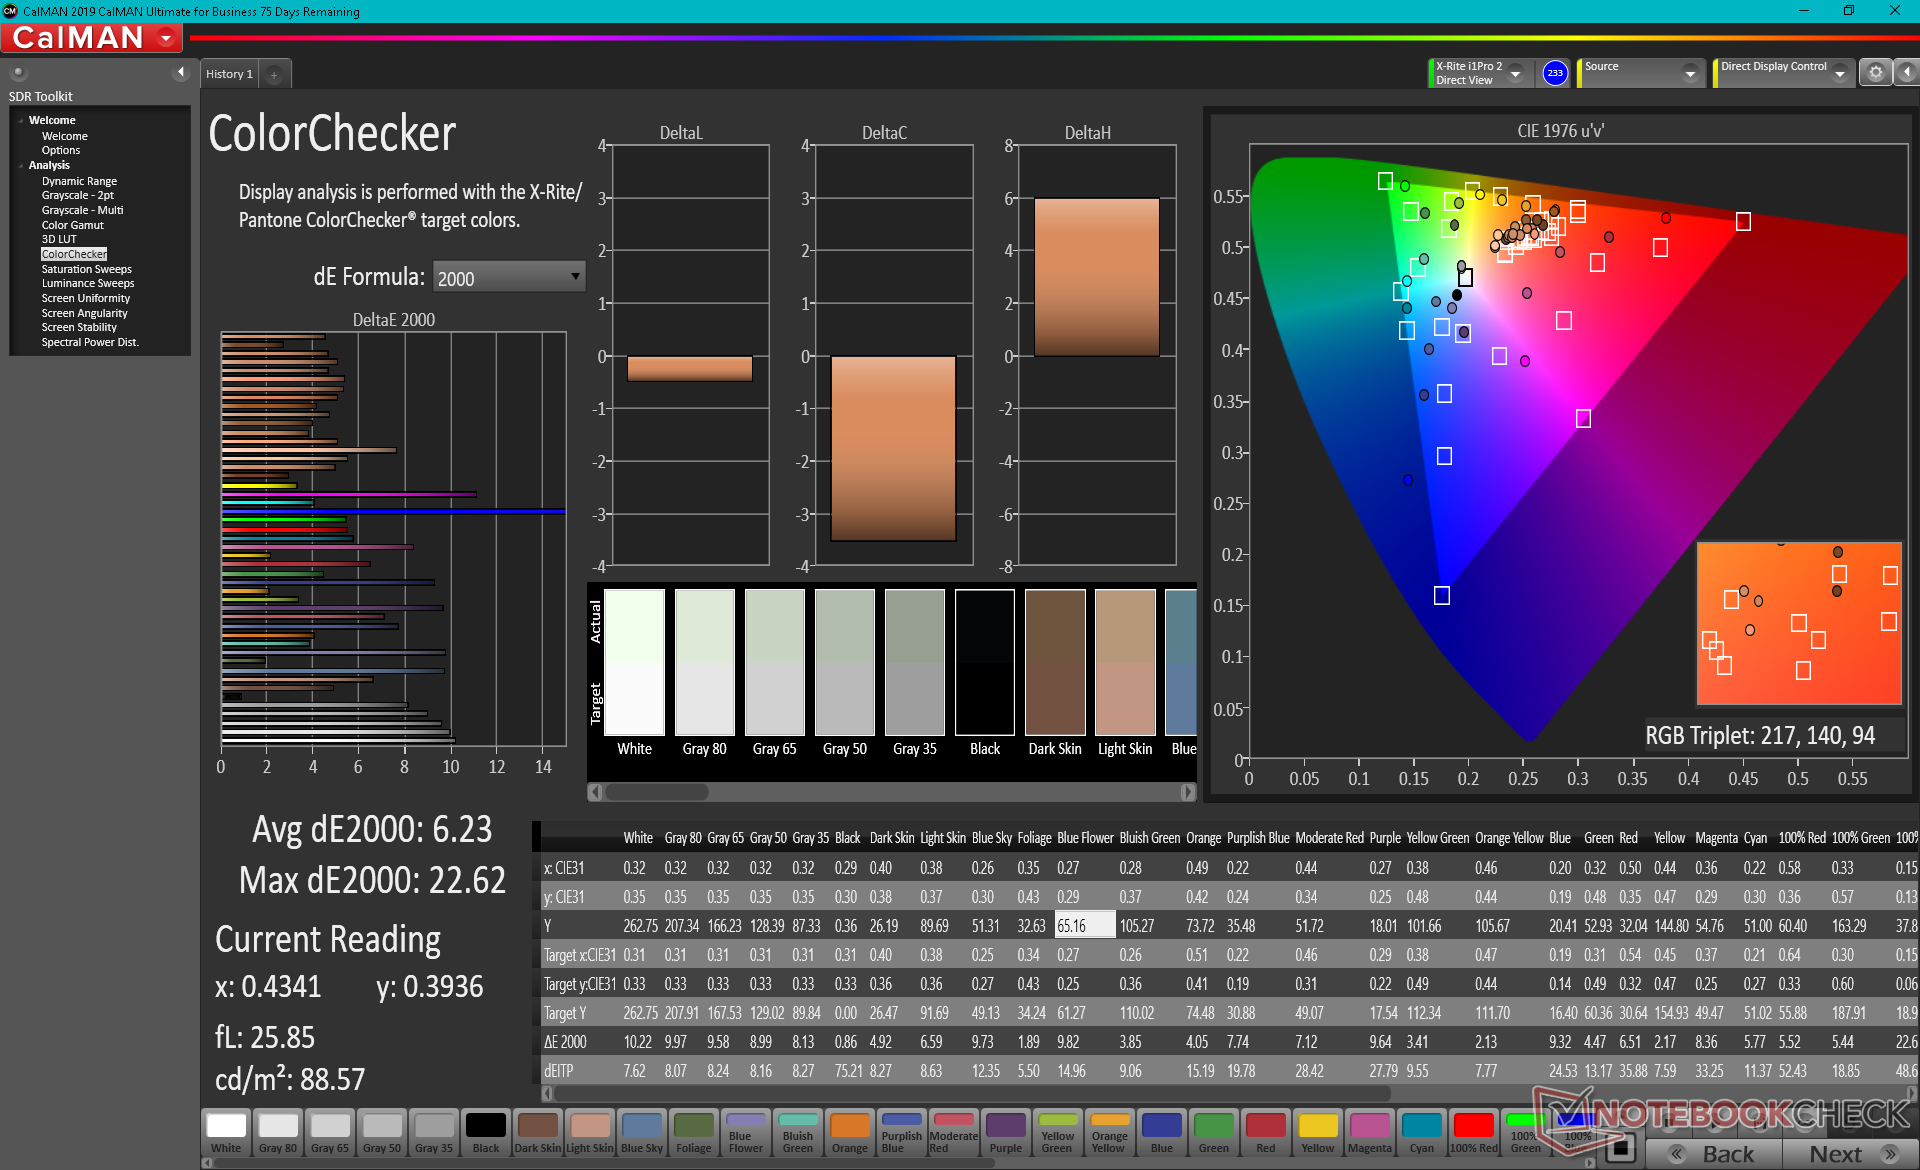
ΔE ColorChecker Calman: 6.23 | ∀{0.5-29.43 Ø4.71}
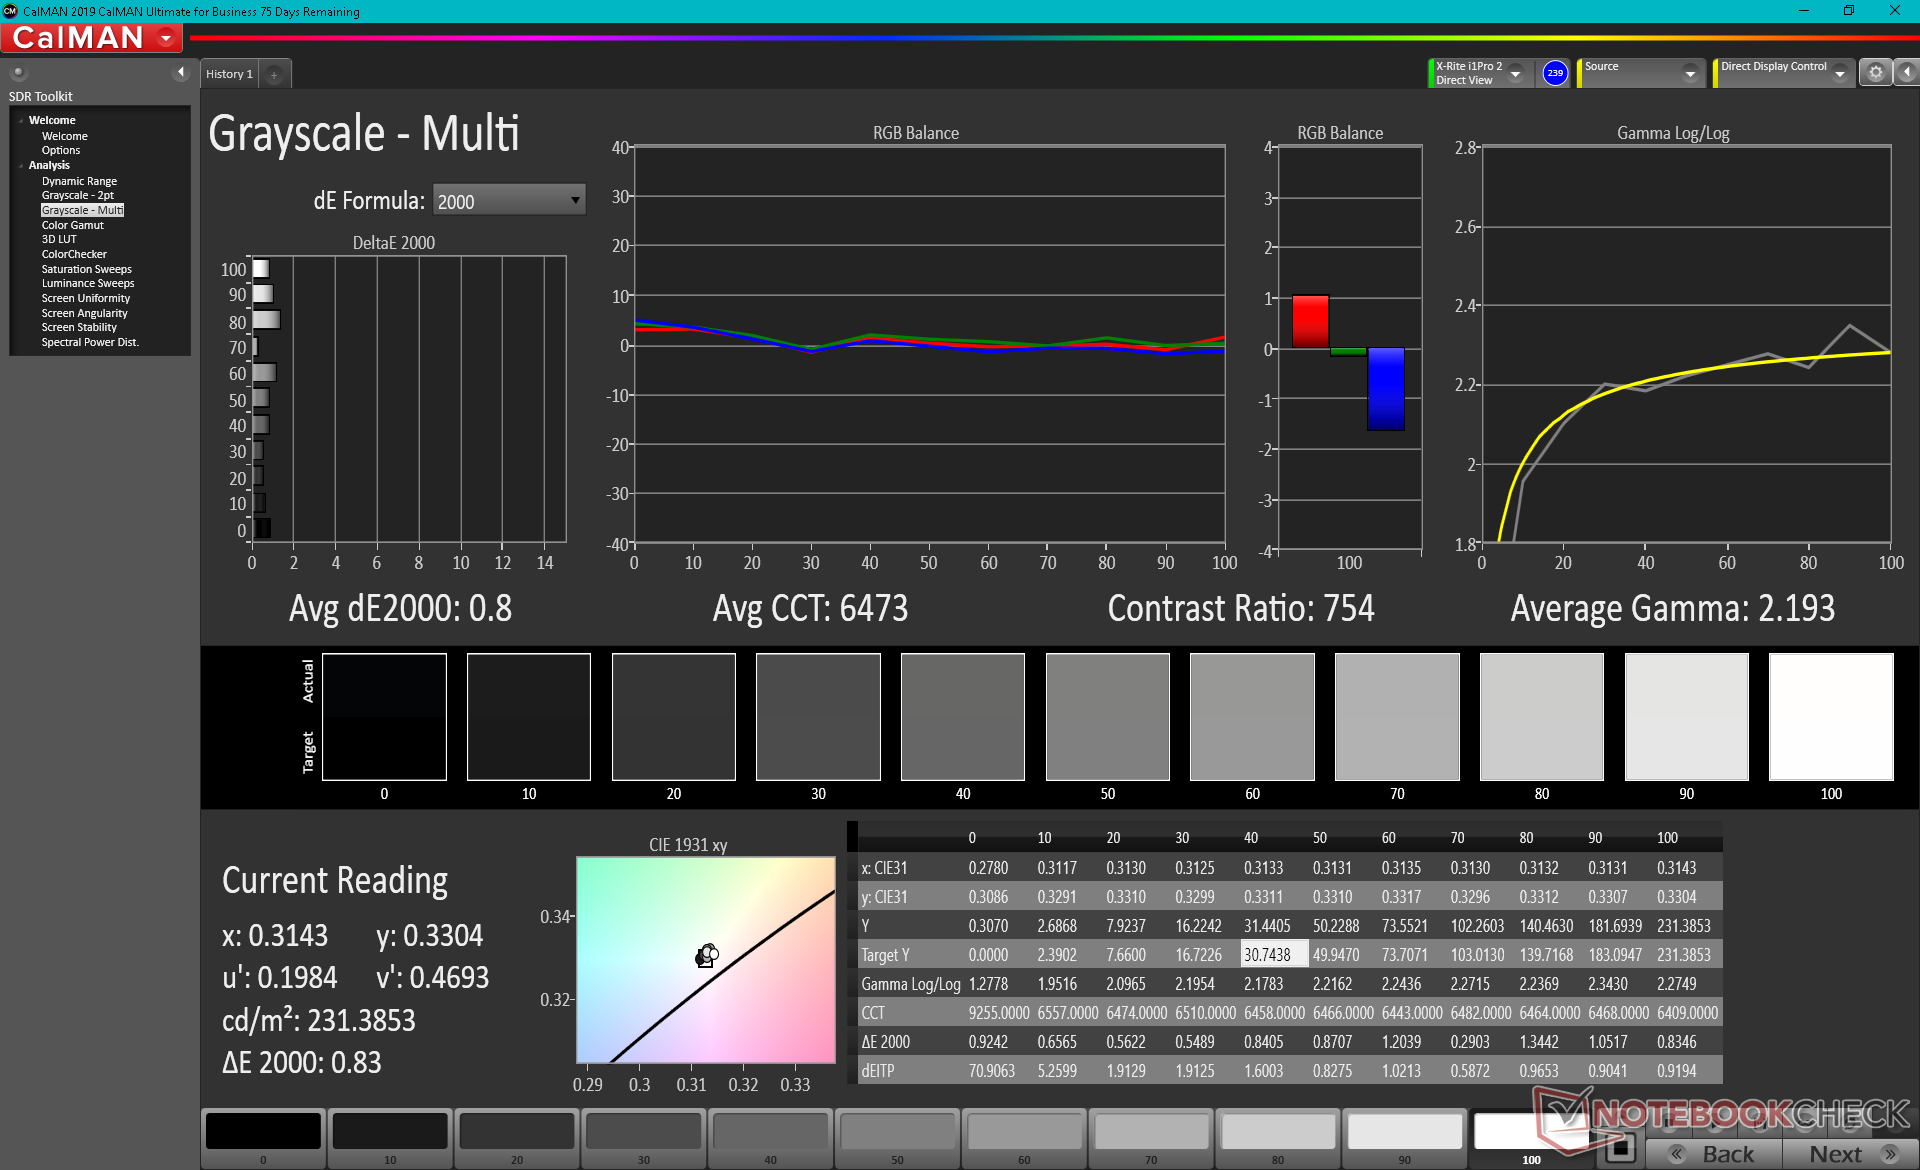
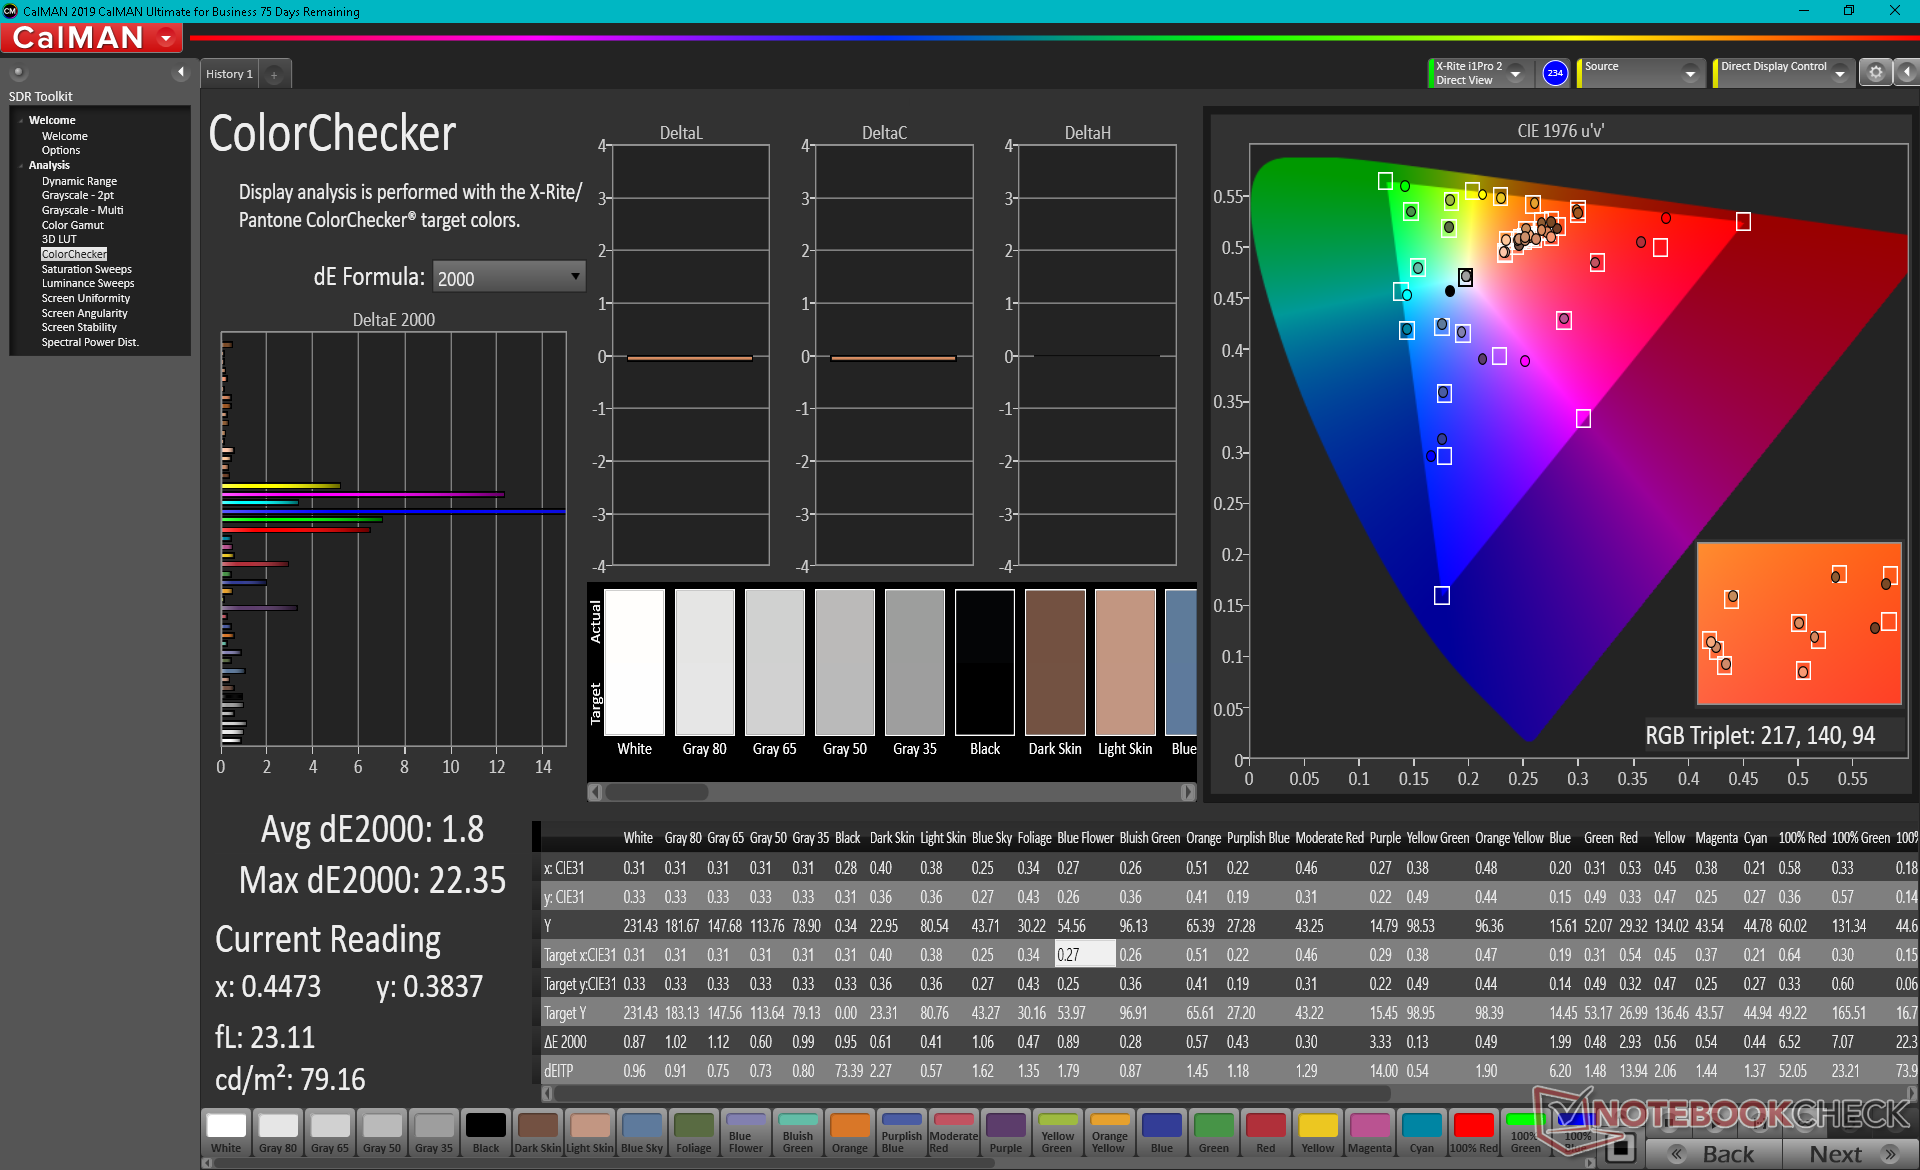
calibrated: 1.8
ΔE Greyscale Calman: 7.1 | ∀{0.09-98 Ø4.96}
44% AdobeRGB 1998 (Argyll 3D)
63.1% sRGB (Argyll 3D)
42.5% Display P3 (Argyll 3D)
Gamma: 2.22
CCT: 6241 K
| Dell Inspiron 14 7400 7415 2-in-1 Chi Mei 140HCA, IPS, 14", 1920x1080 | HP Pavilion x360 14-dy0157ng Chi Mei N140HCA-E5B, IPS, 14", 1920x1080 | Dell Inspiron 14 7400-VY8JW Chi Mei CMN1411, IPS, 14.5", 2560x1600 | Lenovo IdeaPad Flex 5 14ALC05-82HU006NGE 5D10S39642 LCD MODULE W 81X1, IPS, 14", 1920x1080 | Acer Spin 3 SP314-54N-56S5 BOE081D, IPS, 14", 1920x1080 | Asus VivoBook Flip 14 TM420IA BOE NV140FHM-N49, IPS, 14", 1920x1080 | |
|---|---|---|---|---|---|---|
| Display | 0% | 54% | -3% | -8% | -5% | |
| Display P3 Coverage (%) | 42.5 | 42.7 0% | 65.8 55% | 41.24 -3% | 39.25 -8% | 40.47 -5% |
| sRGB Coverage (%) | 63.1 | 63.7 1% | 97.4 54% | 61.4 -3% | 58.2 -8% | 60 -5% |
| AdobeRGB 1998 Coverage (%) | 44 | 44.2 0% | 67.9 54% | 42.67 -3% | 40.55 -8% | 41.81 -5% |
| Response Times | 5% | 23% | 12% | 21% | -18% | |
| Response Time Grey 50% / Grey 80% * (ms) | 28.8 ? | 32 ? -11% | 29 ? -1% | 30 ? -4% | 29 ? -1% | 36.4 ? -26% |
| Response Time Black / White * (ms) | 27.6 ? | 22 ? 20% | 15 ? 46% | 20 ? 28% | 16 ? 42% | 30.4 ? -10% |
| PWM Frequency (Hz) | 1000 ? | |||||
| Screen | 51% | 35% | 28% | 43% | -7% | |
| Brightness middle (cd/m²) | 262.7 | 269 2% | 360 37% | 243 -7% | 271 3% | 272.5 4% |
| Brightness (cd/m²) | 245 | 241 -2% | 327 33% | 221 -10% | 272 11% | 260 6% |
| Brightness Distribution (%) | 84 | 82 -2% | 83 -1% | 79 -6% | 92 10% | 88 5% |
| Black Level * (cd/m²) | 0.37 | 0.11 70% | 0.45 -22% | 0.16 57% | 0.19 49% | 0.42 -14% |
| Contrast (:1) | 710 | 2445 244% | 800 13% | 1519 114% | 1426 101% | 649 -9% |
| Colorchecker dE 2000 * | 6.23 | 5.68 9% | 2.04 67% | 6.03 3% | 4.24 32% | 4.65 25% |
| Colorchecker dE 2000 max. * | 22.62 | 9.61 58% | 4.69 79% | 9.21 59% | 6.38 72% | 17.78 21% |
| Colorchecker dE 2000 calibrated * | 1.8 | 0.92 49% | 4.34 -141% | |||
| Greyscale dE 2000 * | 7.1 | 4.95 30% | 2.84 60% | 6.4 10% | 2.51 65% | 4.4 38% |
| Gamma | 2.22 99% | 2.17 101% | 2.34 94% | 2.41 91% | 2.25 98% | 2.2 100% |
| CCT | 6241 104% | 6628 98% | 6360 102% | 6342 102% | 6812 95% | 6984 93% |
| Color Space (Percent of AdobeRGB 1998) (%) | 44.2 | 62 | 39 | 37 | 38.4 | |
| Color Space (Percent of sRGB) (%) | 63.7 | 97 | 61 | 58 | 59.8 | |
| Total Average (Program / Settings) | 19% /
32% | 37% /
37% | 12% /
18% | 19% /
28% | -10% /
-8% |
* ... smaller is better
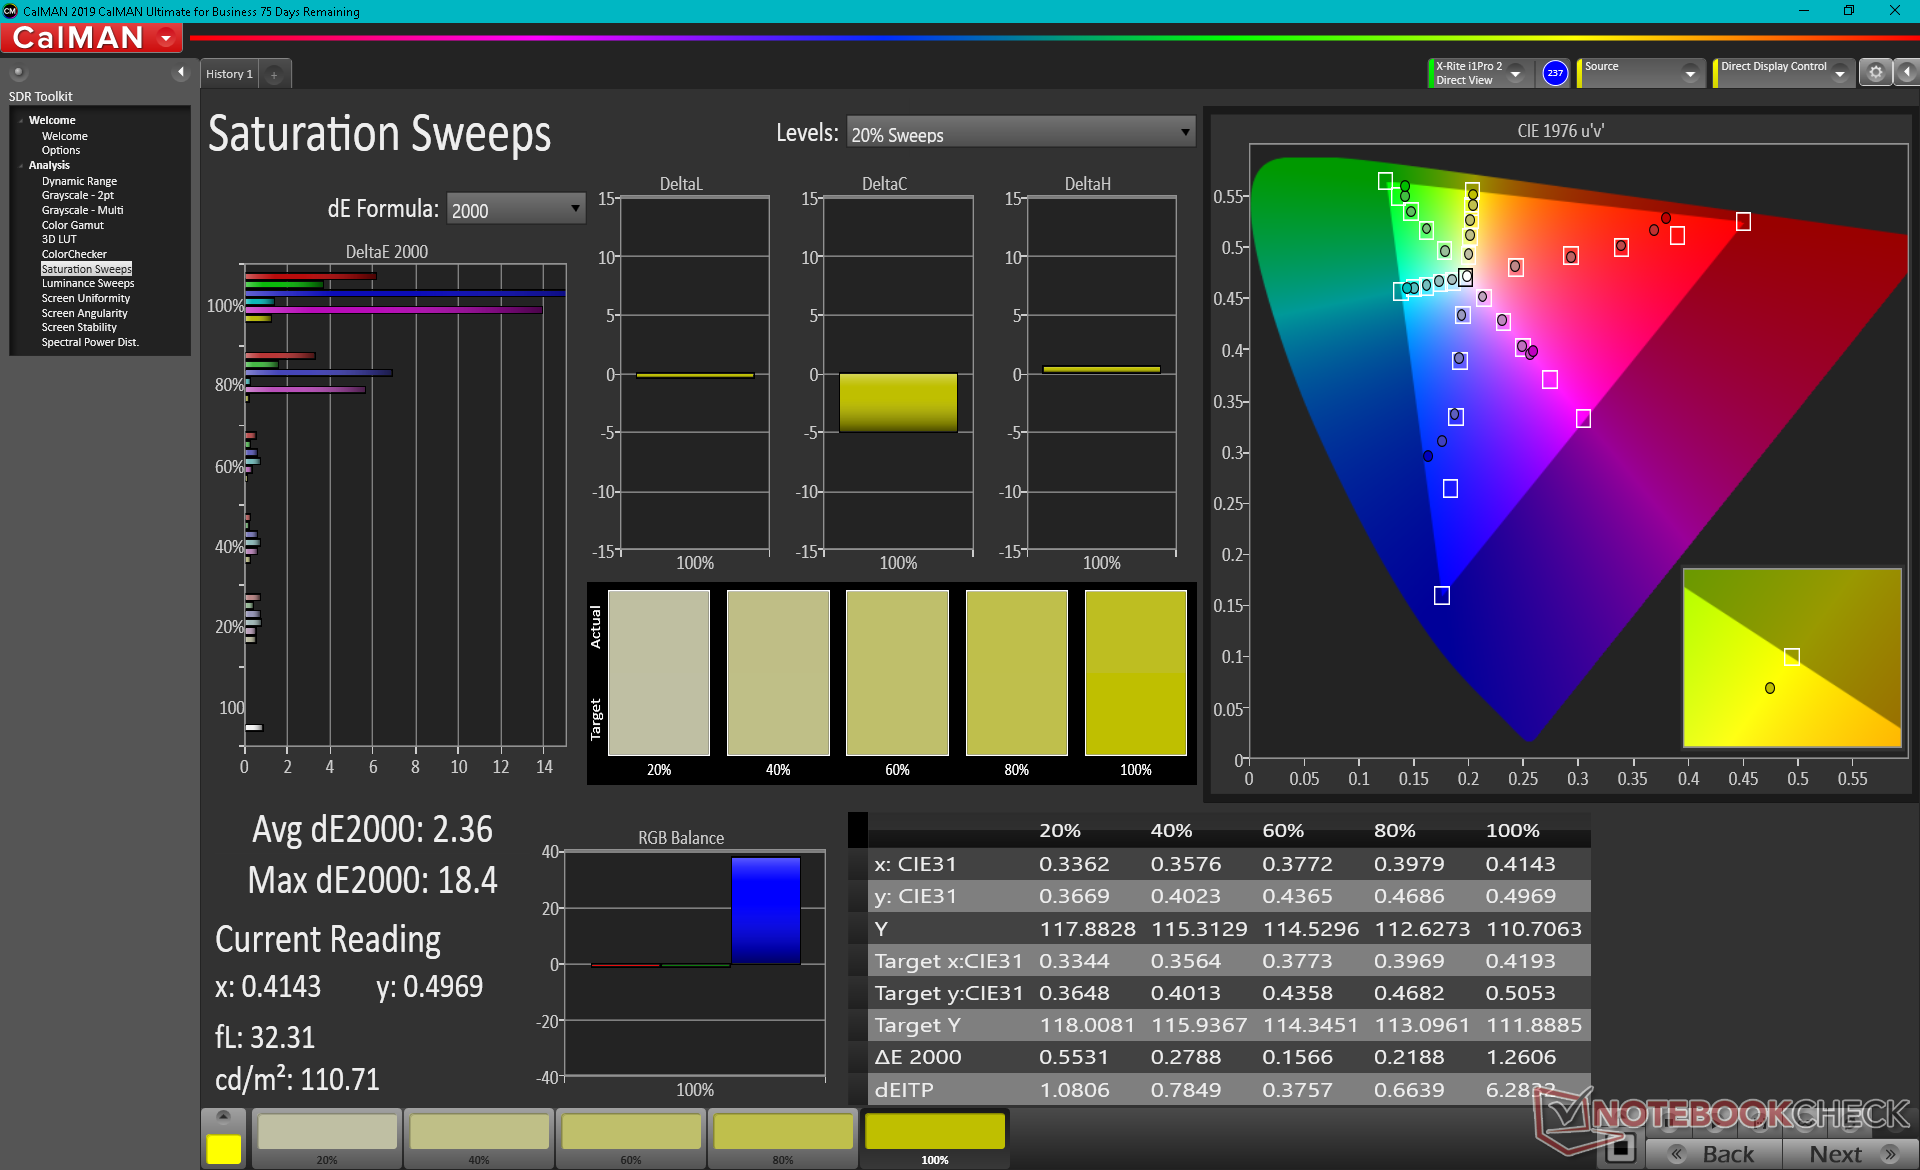
The display covers just 63 percent of sRGB compared to >90 percent on most pricier mid-range to higher-end Ultrabooks or convertibles like the MSI Summit E13 Flip. Even the Inspiron 14 7400 clamshell comes with a 1600p display option with nearly full sRGB coverage.
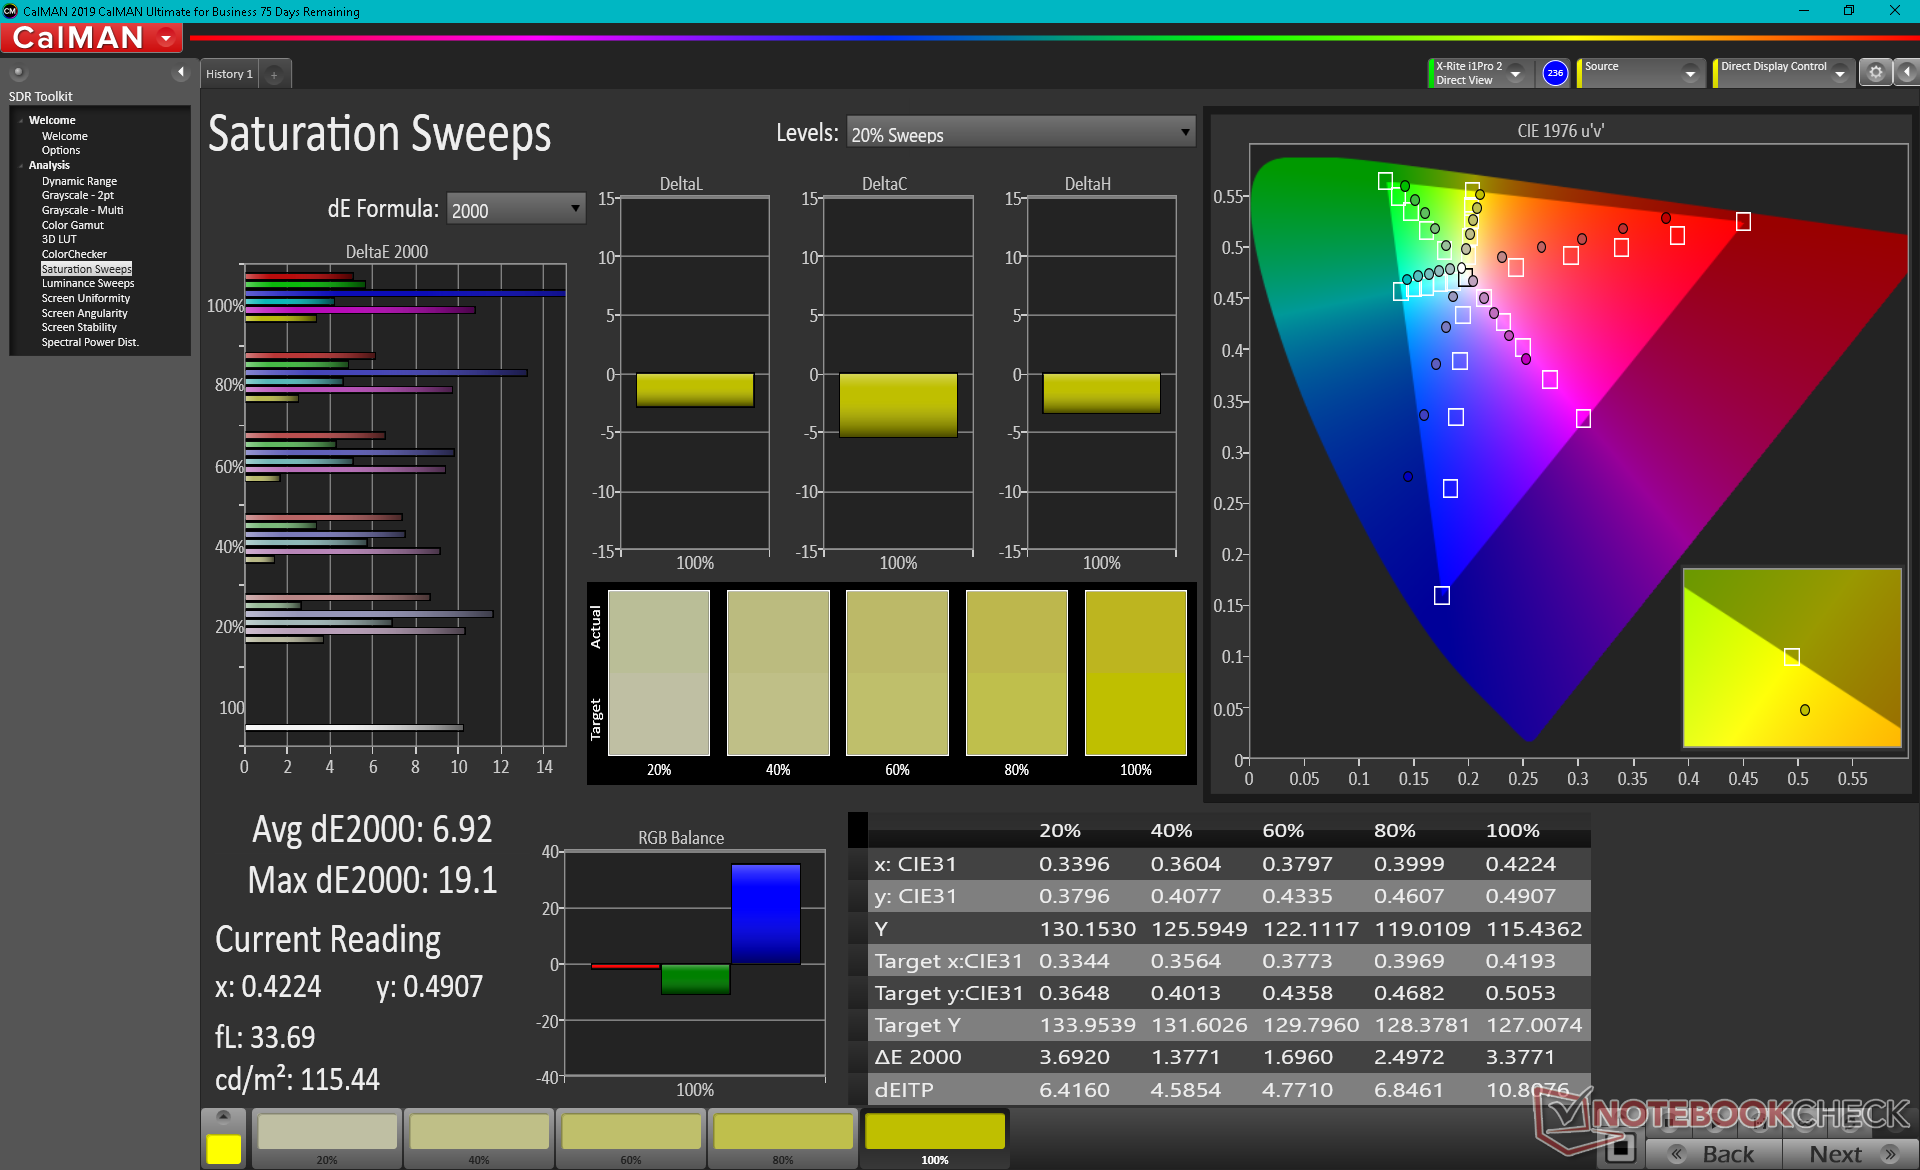
Color temperature is too warm out of the box for inaccurate grayscale and colors. Fortunately, this is an easy fix when properly calibrated as average grayscale and color DeltaE values would drop to just 0.8 and 1.8, respectively, after calibration. Note that higher saturation levels are still poorly represented due to the limited color space of the panel as mentioned above.
Display Response Times
| ↔ Response Time Black to White | ||
|---|---|---|
| 27.6 ms ... rise ↗ and fall ↘ combined | ↗ 16 ms rise | 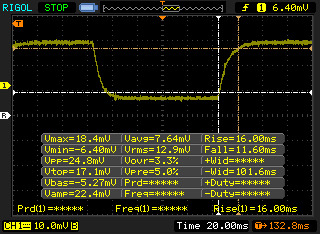 |
| ↘ 11.6 ms fall | ||
| The screen shows relatively slow response rates in our tests and may be too slow for gamers. In comparison, all tested devices range from 0.1 (minimum) to 240 (maximum) ms. » 70 % of all devices are better. This means that the measured response time is worse than the average of all tested devices (19.8 ms). | ||
| ↔ Response Time 50% Grey to 80% Grey | ||
| 28.8 ms ... rise ↗ and fall ↘ combined | ↗ 16.4 ms rise | 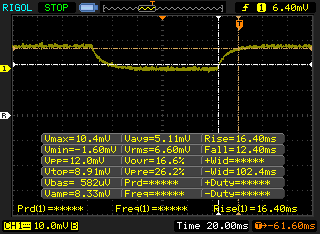 |
| ↘ 12.4 ms fall | ||
| The screen shows relatively slow response rates in our tests and may be too slow for gamers. In comparison, all tested devices range from 0.165 (minimum) to 636 (maximum) ms. » 39 % of all devices are better. This means that the measured response time is similar to the average of all tested devices (31 ms). | ||
Screen Flickering / PWM (Pulse-Width Modulation)
| Screen flickering / PWM not detected | 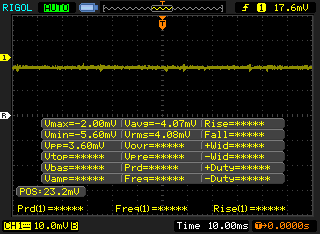 | ||
In comparison: 52 % of all tested devices do not use PWM to dim the display. If PWM was detected, an average of 7754 (minimum: 5 - maximum: 343500) Hz was measured. | |||
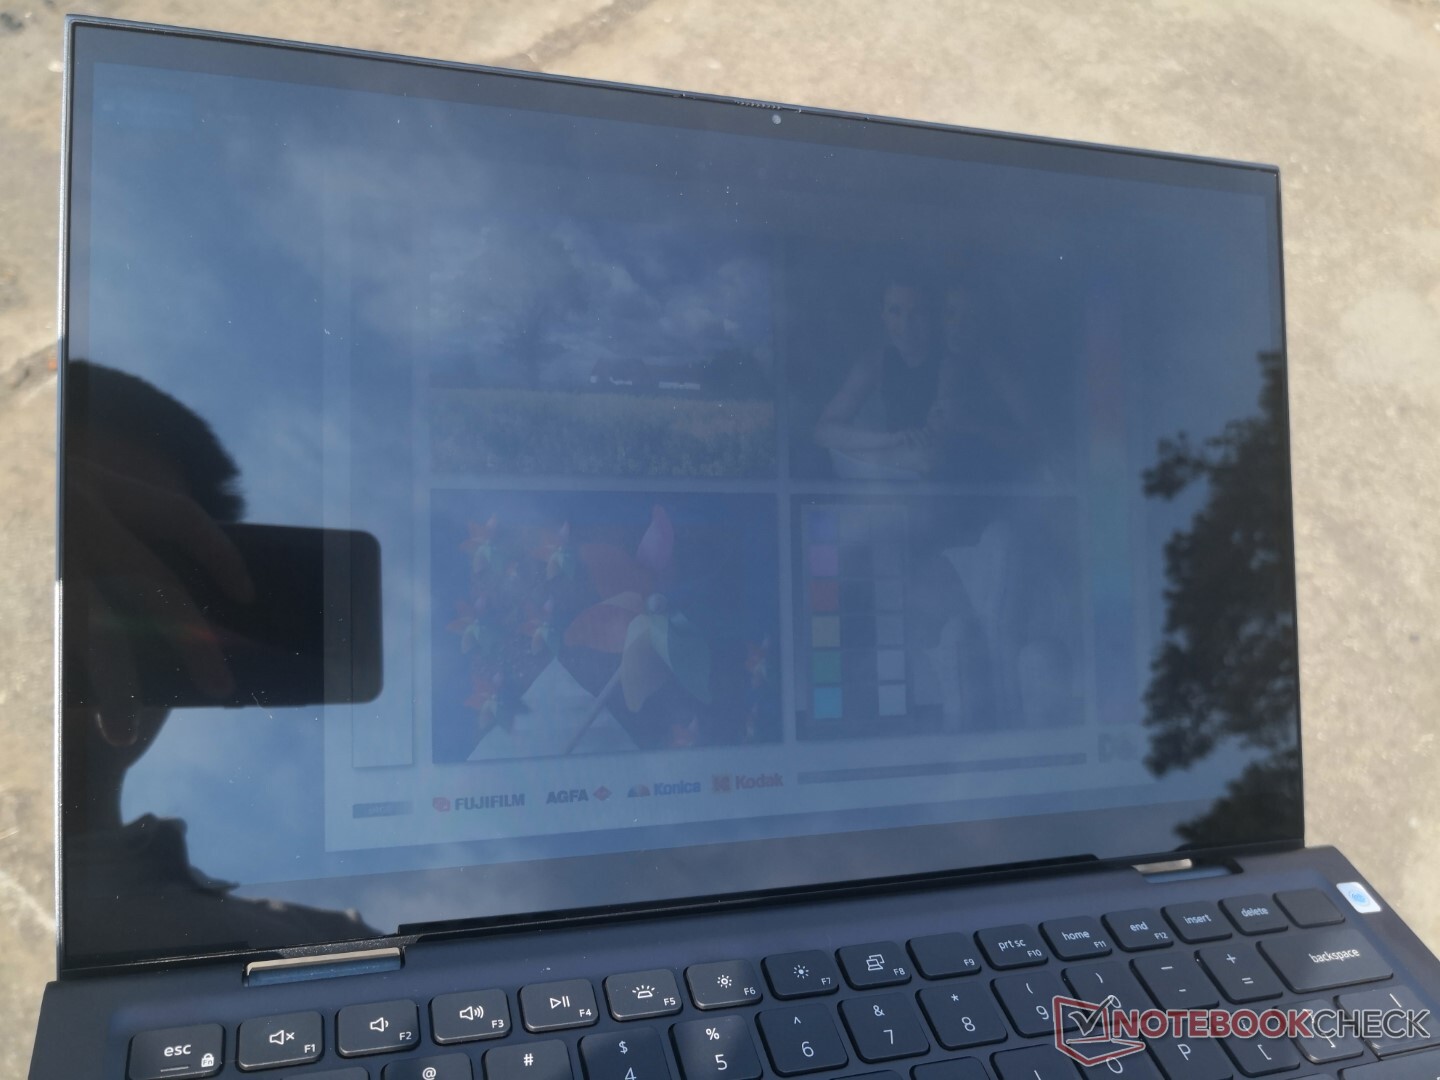
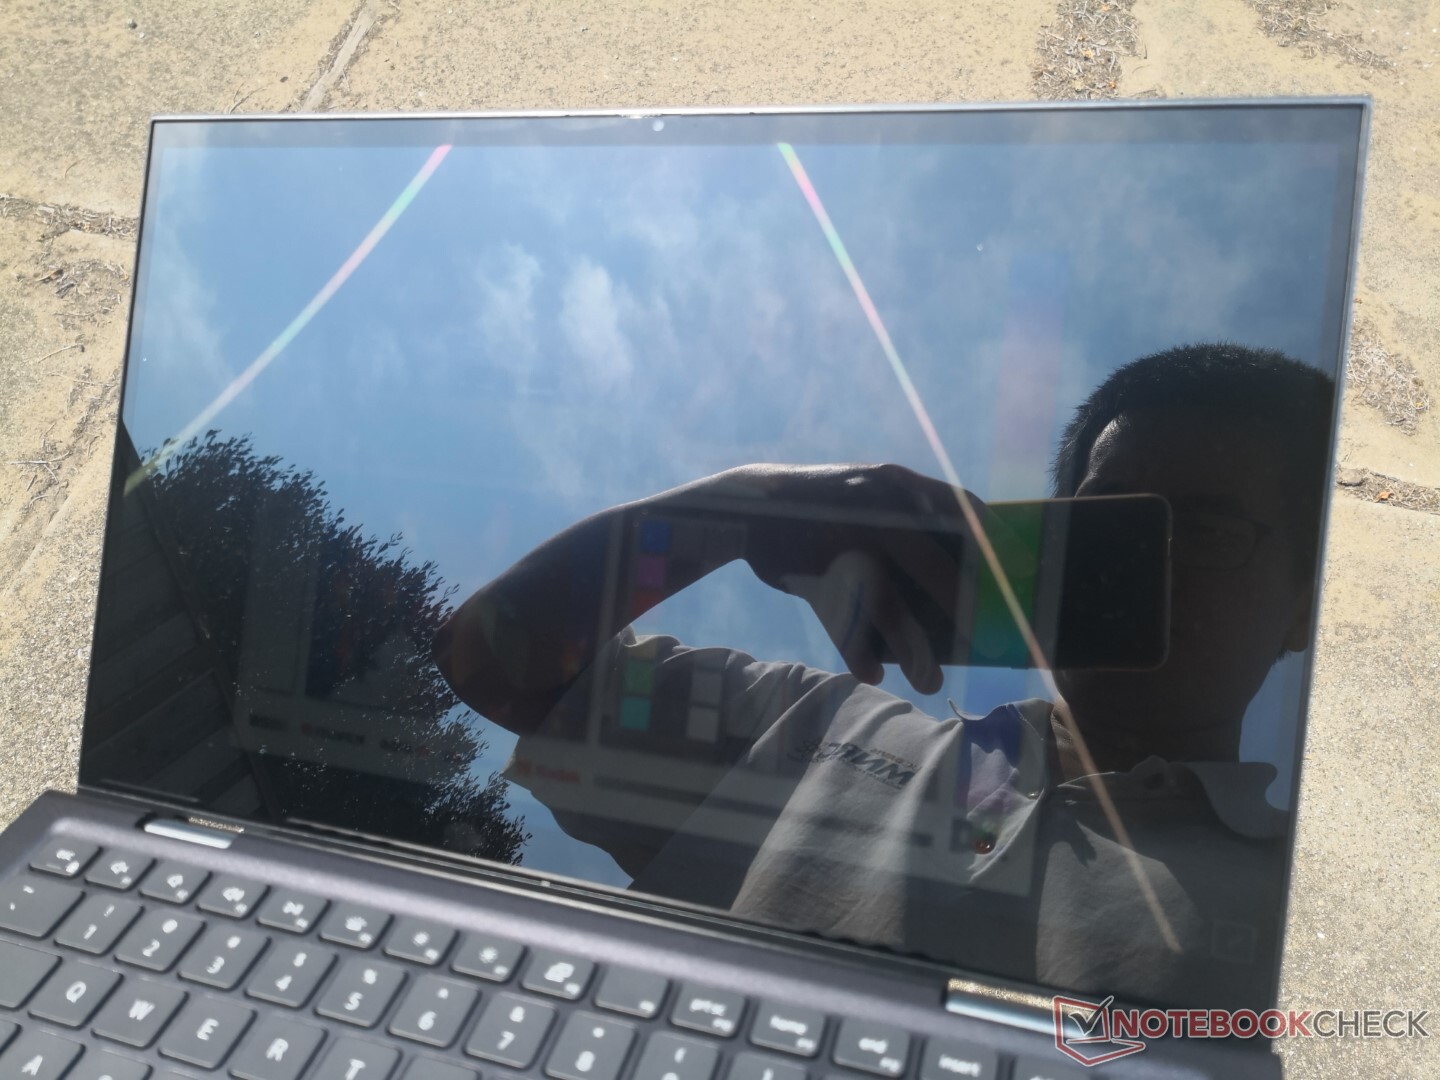
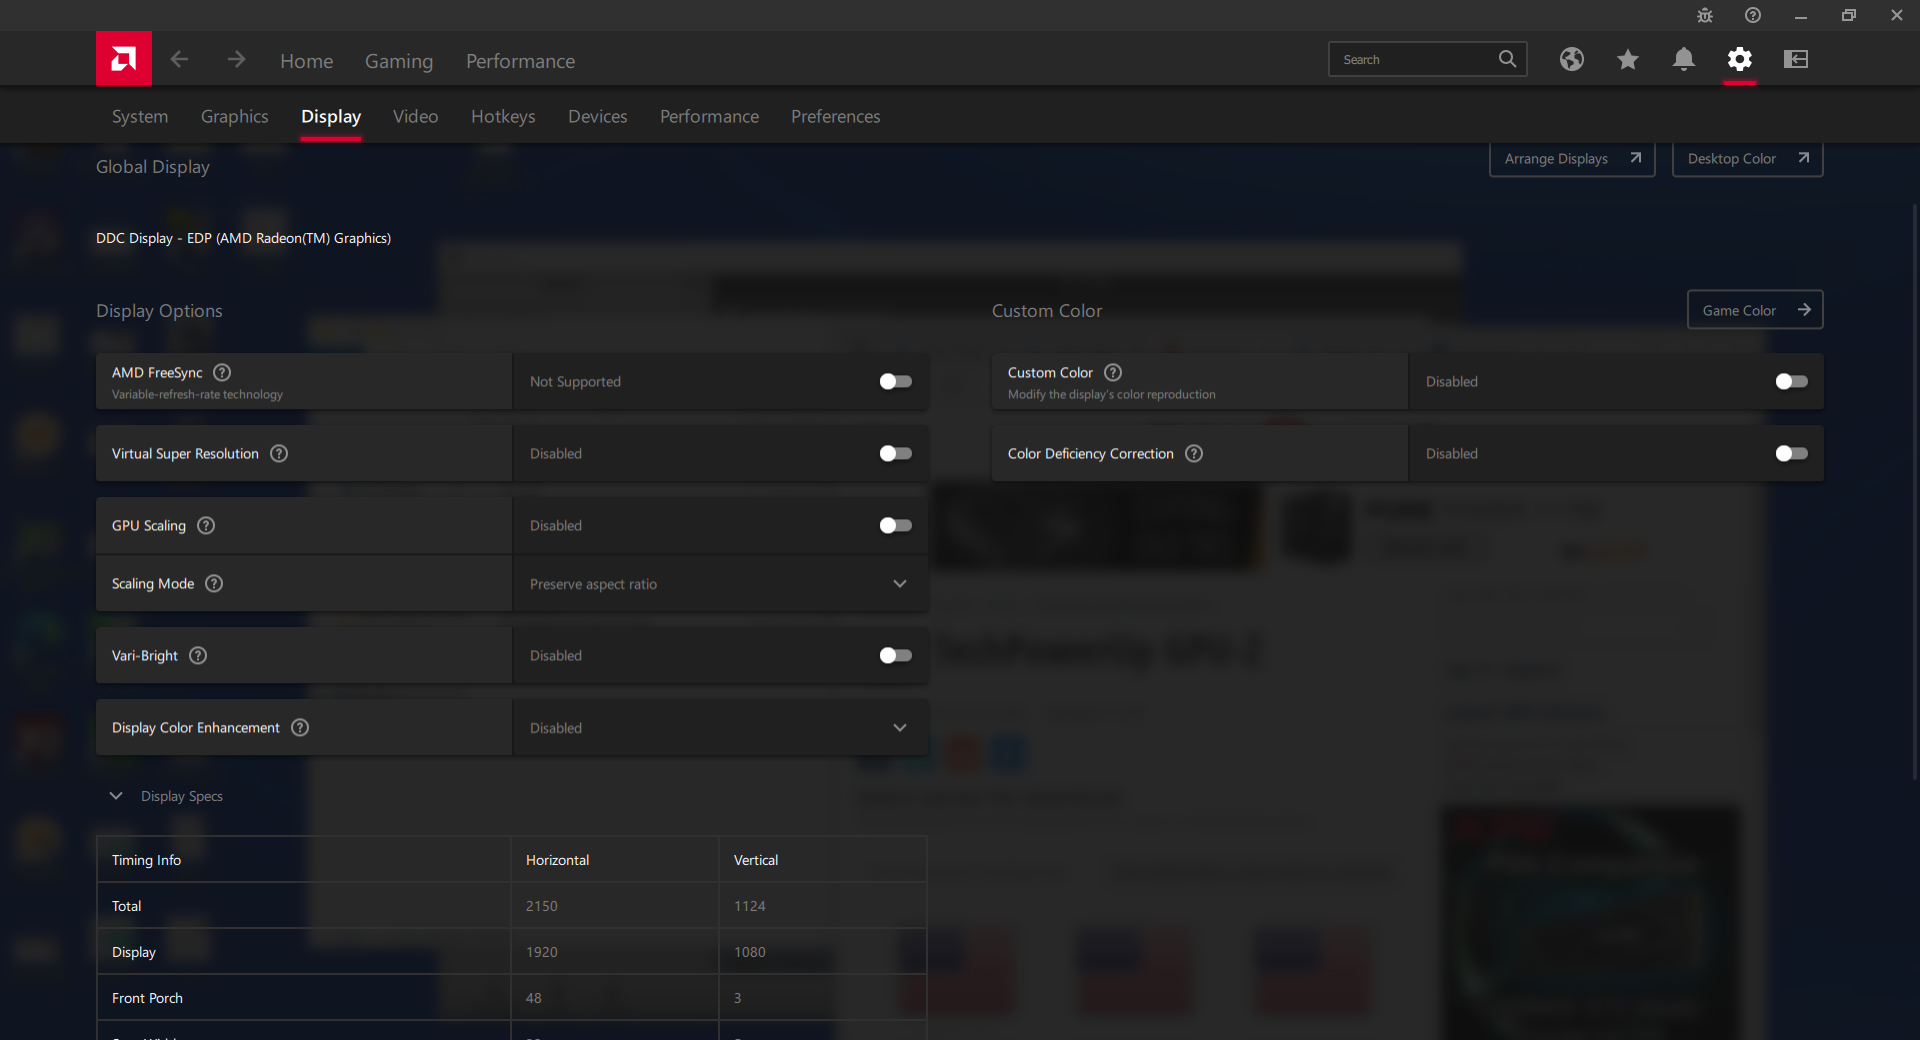
There will almost always be some glare when outdoors due to the glossy overlay and relatively dim backlight. Be sure to disable AMD Vari-Bright via the Radeon software or else maximum brightness will automatically drop when running on battery power. Users may want to consider the XPS 2-in-1 for its brighter display if outdoor visibility is a concern.
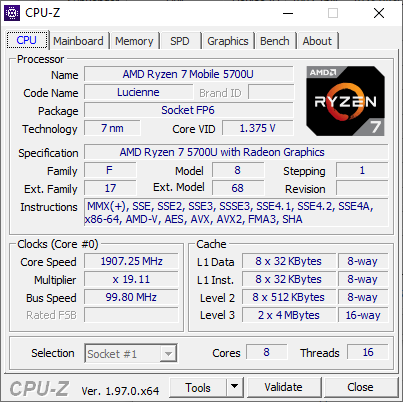
Performance
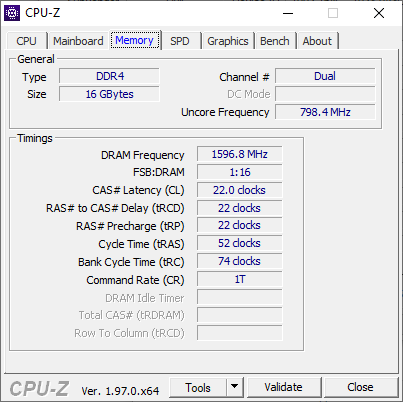
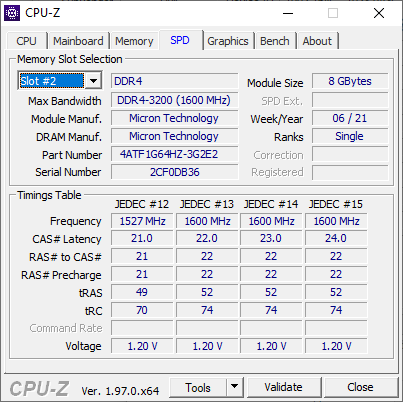
Users have the option between a 6-core Ryzen 5 5500U or 8-core Ryzen 7 5700U both with integrated Radeon RX graphics. Alternatively, Intel Tiger Lake-U options are available via the visually identical Inspiron 14 5410 2-in-1 series albeit at higher starting prices. We appreciate that all SKUs from Dell come with dual-channel RAM as single-channel RAM would have heavily affected graphics performance.
Our unit was set to High Performance mode prior to running any benchmarks below for the highest possible scores.
Processor
Multi-thread performance can be up to 15 percent slower than the average laptop in our database equipped with the same Ryzen 7 5700U CPU. The Lenovo IdeaPad Flex 5, for example, is able to sustain faster clock rates and thus faster raw performance than our Dell unit even though it comes with the same processor. The Inspiron 14 7415 is still extremely fast despite the slightly disappointing multi-thread performance.
Opting for the lesser Ryzen 5 5500U may bring up to 20 percent slower multi-thread performance than our Ryzen 7 configuration.
Cinebench R15 Multi Loop
Cinebench R23: Multi Core | Single Core
Cinebench R15: CPU Multi 64Bit | CPU Single 64Bit
Blender: v2.79 BMW27 CPU
7-Zip 18.03: 7z b 4 -mmt1 | 7z b 4
Geekbench 5.5: Single-Core | Multi-Core
HWBOT x265 Benchmark v2.2: 4k Preset
LibreOffice : 20 Documents To PDF
R Benchmark 2.5: Overall mean
Cinebench R23: Multi Core | Single Core
Cinebench R15: CPU Multi 64Bit | CPU Single 64Bit
Blender: v2.79 BMW27 CPU
7-Zip 18.03: 7z b 4 -mmt1 | 7z b 4
Geekbench 5.5: Single-Core | Multi-Core
HWBOT x265 Benchmark v2.2: 4k Preset
LibreOffice : 20 Documents To PDF
R Benchmark 2.5: Overall mean
* ... smaller is better
System Performance
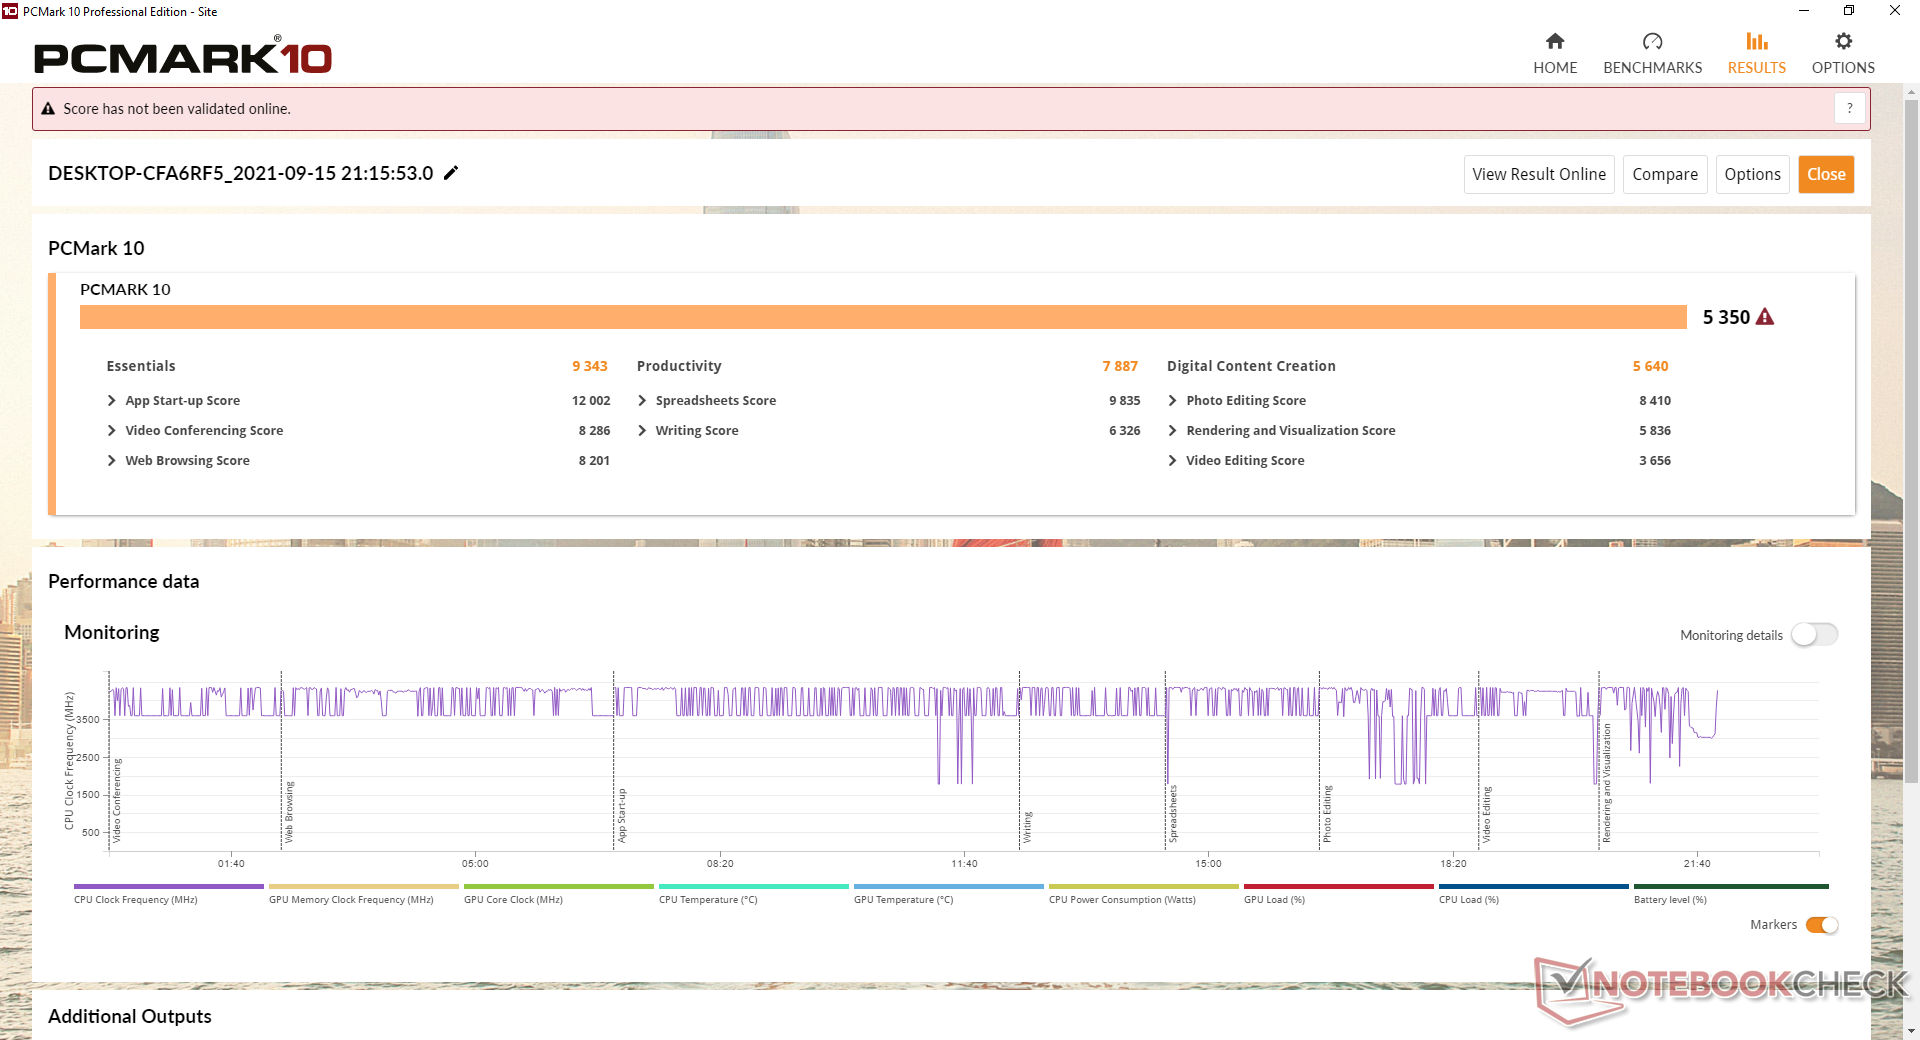
PCMark benchmarks are generally higher than many competing systems particularly in Digital Content Creation where graphics performance is key. However, expect a lot of pop-up notifications from all the various pre-installed Dell applications during the first few days of use.
| PCMark 10 / Score | |
| Dell Inspiron 14 7400 7415 2-in-1 | |
| Asus VivoBook Flip 14 TM420IA | |
| Average AMD Ryzen 7 5700U, AMD Radeon RX Vega 8 (Ryzen 4000/5000) (4325 - 5518, n=15) | |
| Lenovo IdeaPad Flex 5 14ALC05-82HU006NGE | |
| Dell Inspiron 14 7400-VY8JW | |
| HP Pavilion x360 14-dy0157ng | |
| Acer Spin 3 SP314-54N-56S5 | |
| PCMark 10 / Essentials | |
| HP Pavilion x360 14-dy0157ng | |
| Asus VivoBook Flip 14 TM420IA | |
| Dell Inspiron 14 7400 7415 2-in-1 | |
| Lenovo IdeaPad Flex 5 14ALC05-82HU006NGE | |
| Average AMD Ryzen 7 5700U, AMD Radeon RX Vega 8 (Ryzen 4000/5000) (8025 - 10091, n=15) | |
| Acer Spin 3 SP314-54N-56S5 | |
| Dell Inspiron 14 7400-VY8JW | |
| PCMark 10 / Productivity | |
| Dell Inspiron 14 7400-VY8JW | |
| Asus VivoBook Flip 14 TM420IA | |
| Dell Inspiron 14 7400 7415 2-in-1 | |
| Average AMD Ryzen 7 5700U, AMD Radeon RX Vega 8 (Ryzen 4000/5000) (7001 - 8457, n=15) | |
| Lenovo IdeaPad Flex 5 14ALC05-82HU006NGE | |
| HP Pavilion x360 14-dy0157ng | |
| Acer Spin 3 SP314-54N-56S5 | |
| PCMark 10 / Digital Content Creation | |
| Dell Inspiron 14 7400 7415 2-in-1 | |
| Average AMD Ryzen 7 5700U, AMD Radeon RX Vega 8 (Ryzen 4000/5000) (3738 - 5964, n=15) | |
| Asus VivoBook Flip 14 TM420IA | |
| Lenovo IdeaPad Flex 5 14ALC05-82HU006NGE | |
| Dell Inspiron 14 7400-VY8JW | |
| HP Pavilion x360 14-dy0157ng | |
| Acer Spin 3 SP314-54N-56S5 | |
| PCMark 10 Score | 5350 points | |
Help | ||
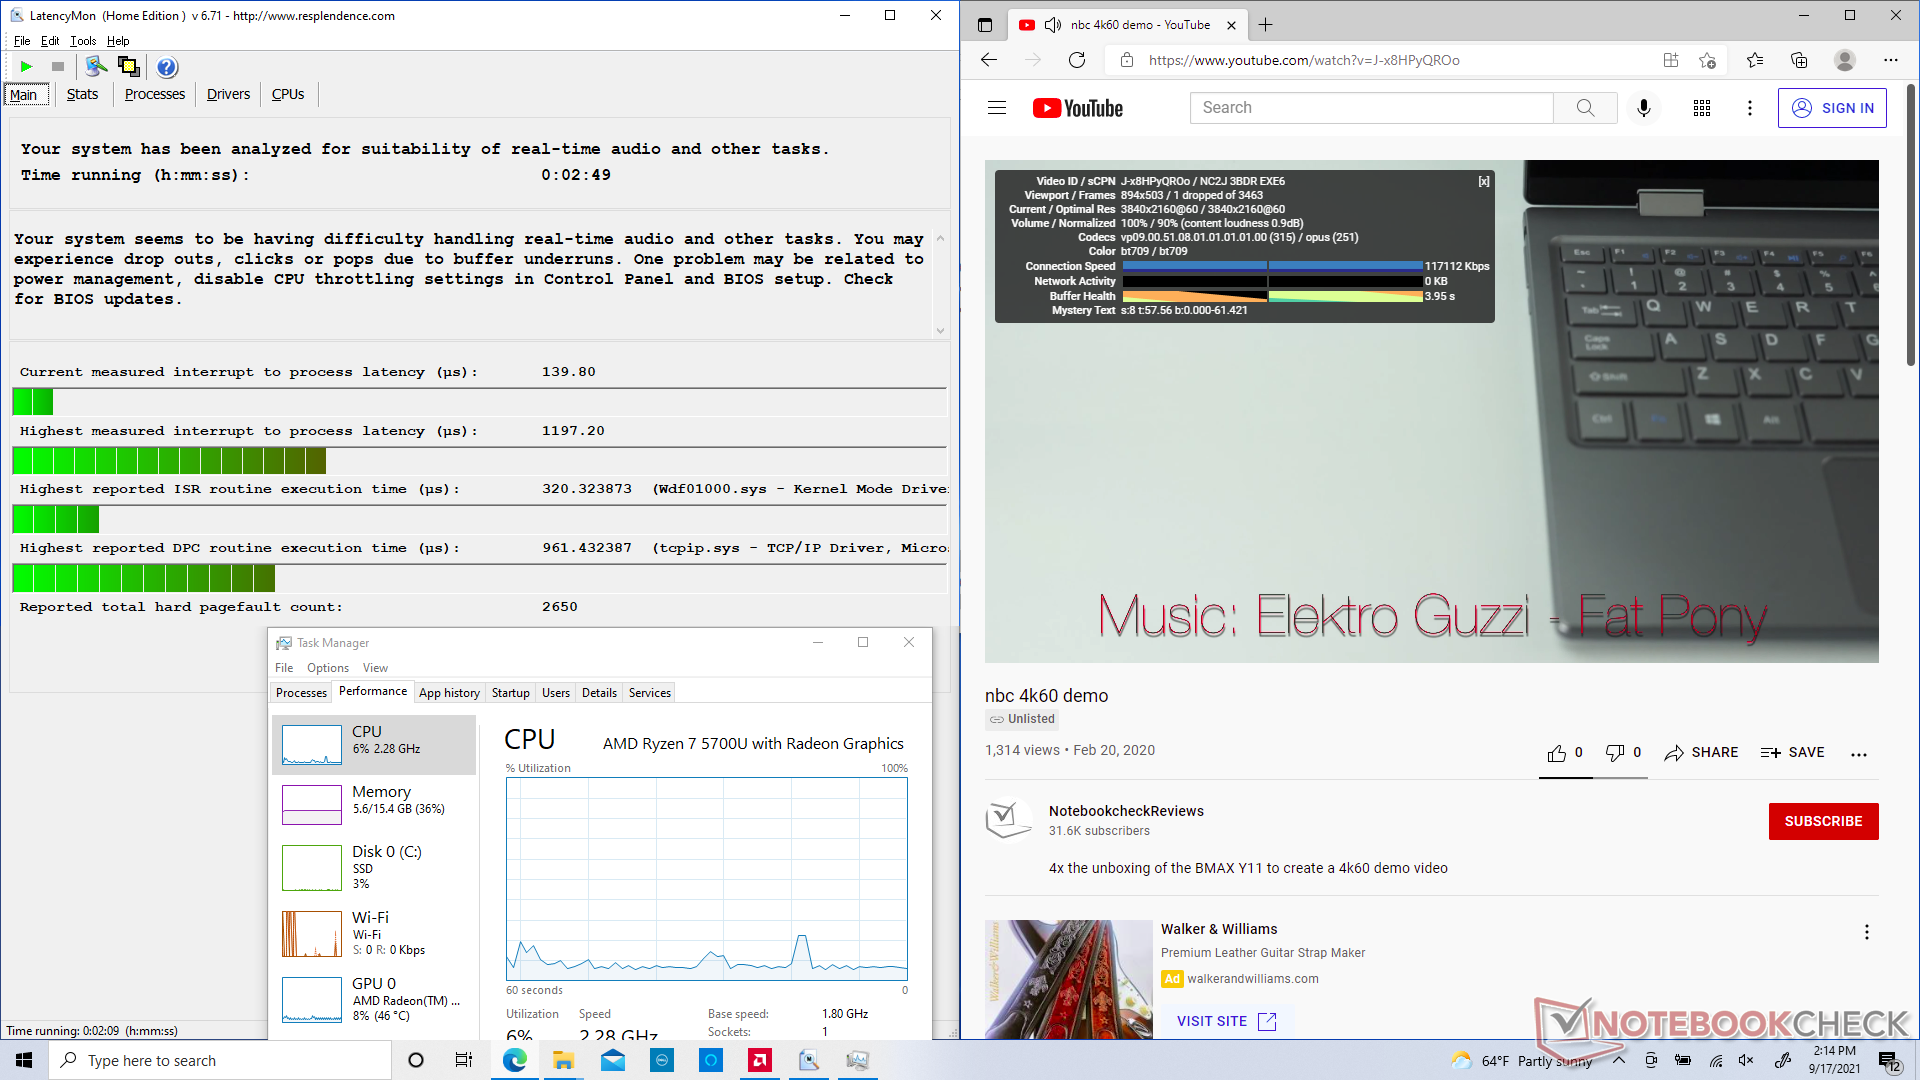
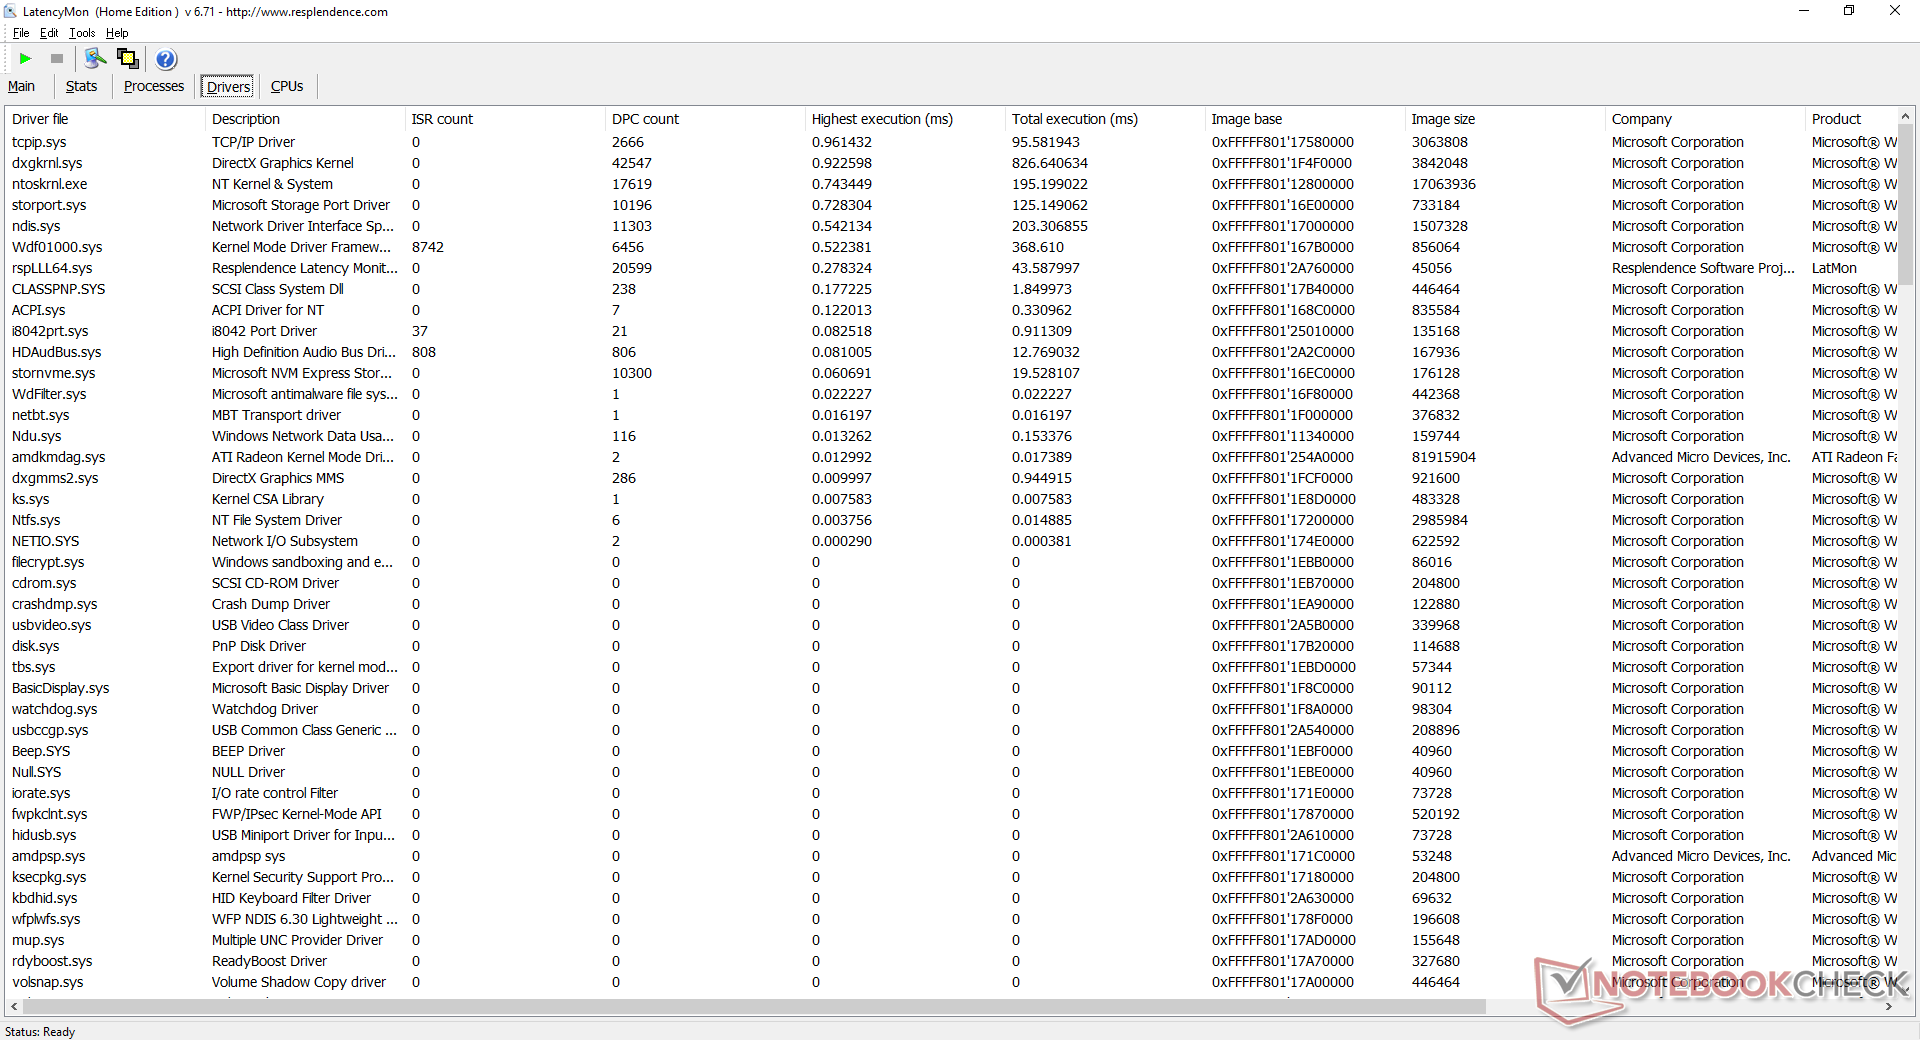
DPC Latency
LatencyMon reveals minor DPC latency issues when opening multiple browser tabs on our homepage and when running Prime95 stress. 4K video playback at 60 FPS is otherwise smooth with just one dropped frame during our minute-long test video.
| DPC Latencies / LatencyMon - interrupt to process latency (max), Web, Youtube, Prime95 | |
| Lenovo IdeaPad Flex 5 14ALC05-82HU006NGE | |
| Dell Inspiron 14 7400-VY8JW | |
| Dell Inspiron 14 7400 7415 2-in-1 | |
| HP Pavilion x360 14-dy0157ng | |
| Acer Spin 3 SP314-54N-56S5 | |
| Asus VivoBook Flip 14 TM420IA | |
* ... smaller is better
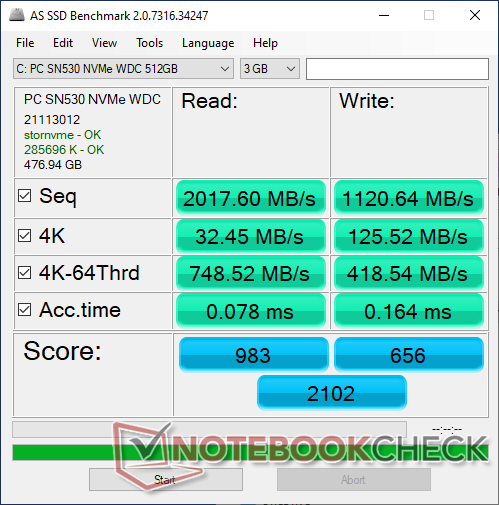
Storage Devices
The Inspiron comes with a mid-range WD SN530 NVMe SSD. Sequential read and write rates top out at 2400 MB/s and 1750 MB/s, respectively, compared to over 3000 MB/s each on the higher-end Samsung PM981a. Our test unit appears to have issues reaching the maximum transfer rates of the drive when running DiskSpd Read in a loop as shown by the graph below. Transfer rates would first top out at only 500 MB/s before steadily climbing to the 2400 MB/s range instead of providing the full 2400 MB/s for the entire duration.

| Dell Inspiron 14 7400 7415 2-in-1 WDC PC SN530 SDBPTPZ-512G | HP Pavilion x360 14-dy0157ng Toshiba KBG40ZNV512G | Dell Inspiron 14 7400-VY8JW Samsung PM981a MZVLB1T0HBLR | Lenovo IdeaPad Flex 5 14ALC05-82HU006NGE Micron 2210 MTFDHBA512QFD | Acer Spin 3 SP314-54N-56S5 SK hynix BC511 HFM256GDJTNI-82A0 | Asus VivoBook Flip 14 TM420IA Samsung PM991 MZVLQ512HALU | |
|---|---|---|---|---|---|---|
| AS SSD | 30% | 97% | 18% | -7% | 10% | |
| Seq Read (MB/s) | 2018 | 2027 0% | 2891 43% | 2011 0% | 1871 -7% | 1397 -31% |
| Seq Write (MB/s) | 1121 | 1057 -6% | 1398 25% | 1080 -4% | 703 -37% | 783 -30% |
| 4K Read (MB/s) | 32.45 | 52.7 62% | 56.1 73% | 55.2 70% | 45.97 42% | 48.08 48% |
| 4K Write (MB/s) | 125.5 | 133.5 6% | 138.4 10% | 127 1% | 119.3 -5% | 134.6 7% |
| 4K-64 Read (MB/s) | 749 | 1257 68% | 1137 52% | 589 -21% | 614 -18% | 835 11% |
| 4K-64 Write (MB/s) | 418.5 | 736 76% | 1904 355% | 976 133% | 367.1 -12% | 734 75% |
| Access Time Read * (ms) | 0.078 | 0.068 13% | 0.052 33% | 0.117 -50% | 0.084 -8% | 0.081 -4% |
| Access Time Write * (ms) | 0.164 | 0.182 -11% | 0.022 87% | 0.053 68% | 0.038 77% | 0.084 49% |
| Score Read (Points) | 983 | 1512 54% | 1482 51% | 845 -14% | 847 -14% | 1022 4% |
| Score Write (Points) | 656 | 975 49% | 2183 233% | 1211 85% | 557 -15% | 947 44% |
| Score Total (Points) | 2102 | 3221 53% | 4359 107% | 2460 17% | 1792 -15% | 2474 18% |
| Copy ISO MB/s (MB/s) | 1136 | 1564 38% | 982 -14% | 1168 3% | 1212 7% | |
| Copy Program MB/s (MB/s) | 544 | 569 5% | 566 4% | 459.8 -15% | 374.3 -31% | |
| Copy Game MB/s (MB/s) | 1082 | 1184 9% | 838 -23% | 283 -74% | 829 -23% | |
| CrystalDiskMark 5.2 / 6 | 17% | 21% | -6% | -10% | -9% | |
| Write 4K (MB/s) | 121 | 201.5 67% | 127 5% | 98.5 -19% | 165.2 37% | 121.2 0% |
| Read 4K (MB/s) | 44.08 | 56.3 28% | 42.72 -3% | 52.6 19% | 55 25% | 49.91 13% |
| Write Seq (MB/s) | 1728 | 1485 -14% | 2025 17% | 1149 -34% | 1015 -41% | 1090 -37% |
| Read Seq (MB/s) | 1758 | 1624 -8% | 2205 25% | 1872 6% | 1125 -36% | 1533 -13% |
| Write 4K Q32T1 (MB/s) | 376.6 | 505 34% | 465 23% | 370.6 -2% | 423.6 12% | 393.3 4% |
| Read 4K Q32T1 (MB/s) | 405.6 | 620 53% | 376.4 -7% | 507 25% | 483.8 19% | 406 0% |
| Write Seq Q32T1 (MB/s) | 1844 | 1520 -18% | 3020 64% | 1154 -37% | 648 -65% | 1225 -34% |
| Read Seq Q32T1 (MB/s) | 2477 | 2246 -9% | 3478 40% | 2248 -9% | 1802 -27% | 2277 -8% |
| Total Average (Program / Settings) | 24% /
25% | 59% /
65% | 6% /
9% | -9% /
-8% | 1% /
3% |
* ... smaller is better

Disk Throttling: DiskSpd Read Loop, Queue Depth 8
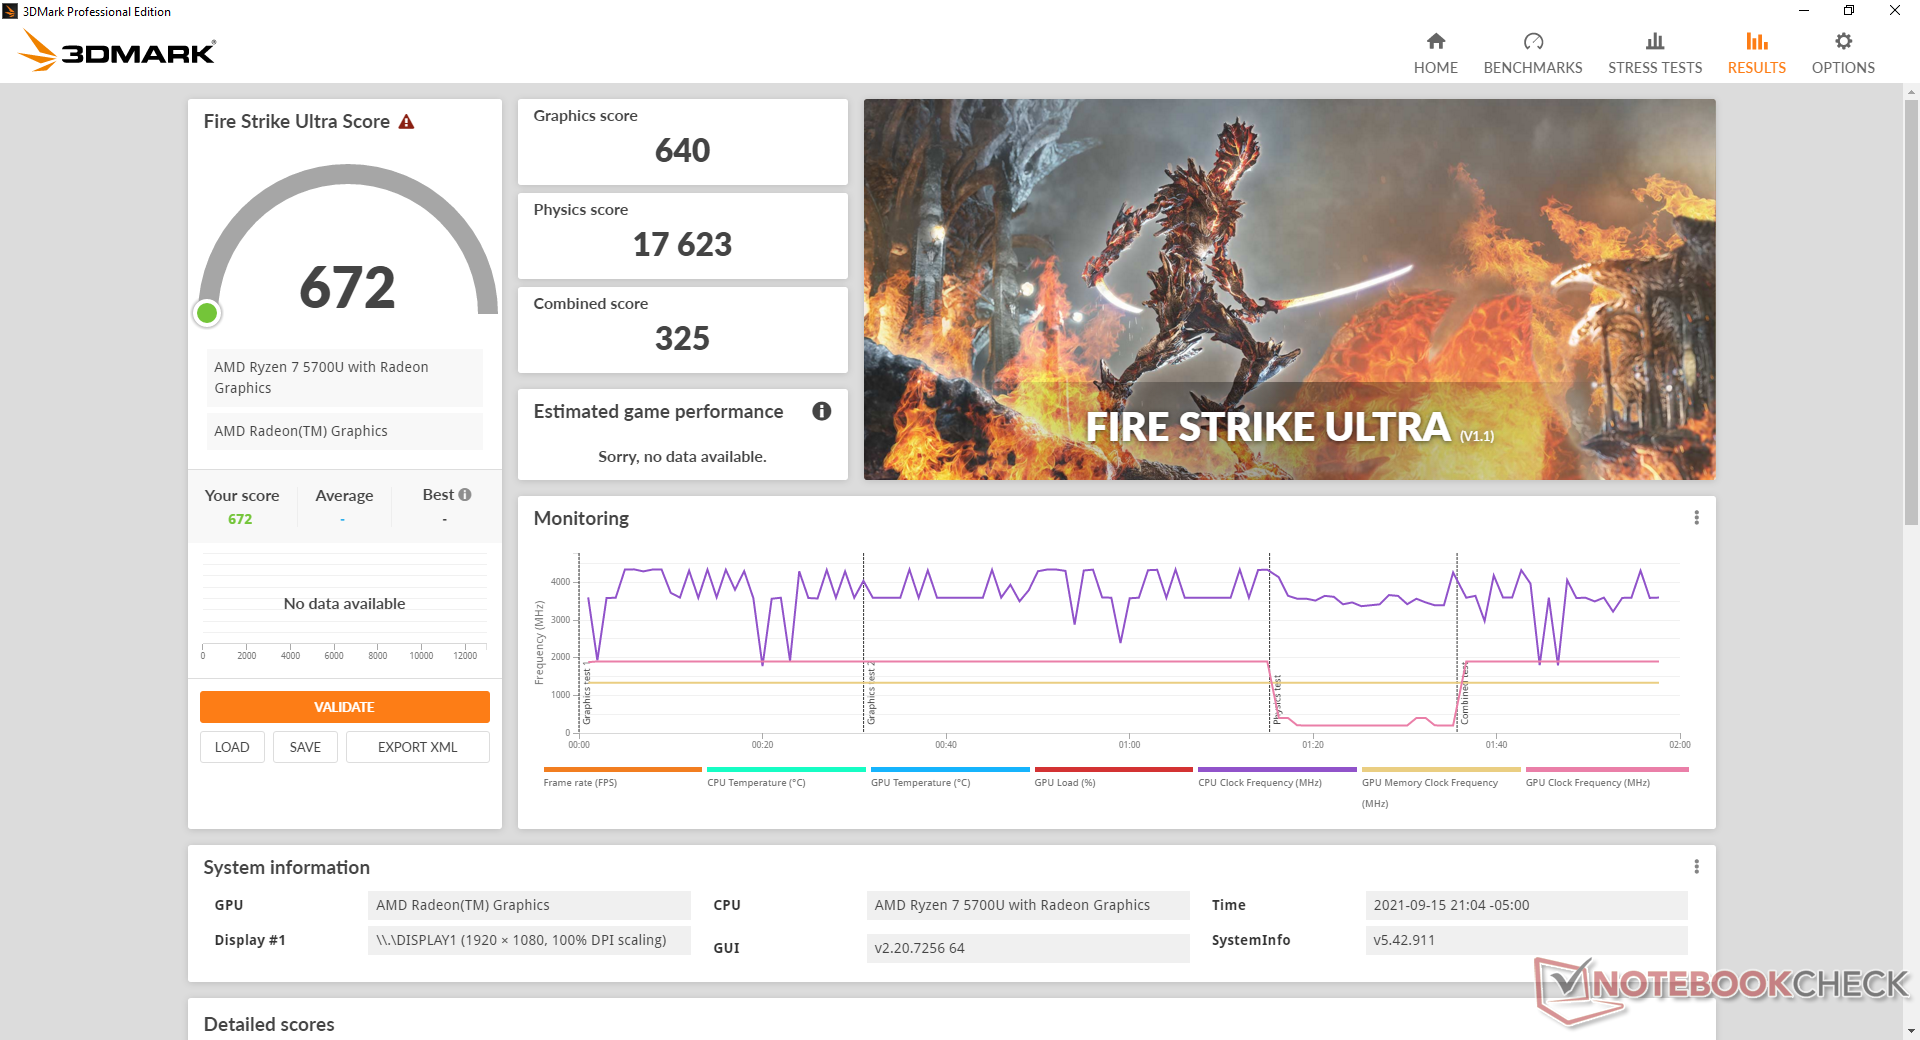
GPU Performance
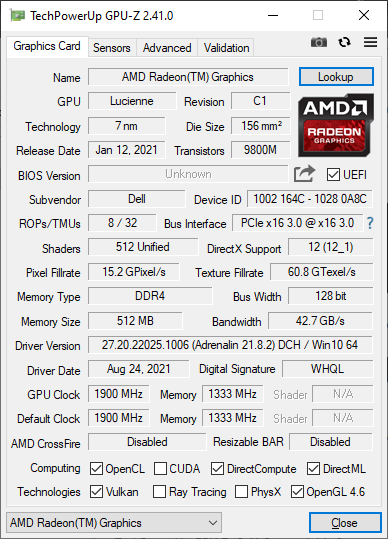
Much like the slightly underperforming processor, the integrated GPU is also performing slower than expected. 3DMark results are about 15 percent slower than the average laptop in our database equipped with the same Radeon RX Vega 8 GPU. It's still fast enough to play most games on low to medium settings including DOTA 2 and Fortnite, but it's a couple of steps below the competing Iris Xe Graphics G7 that's found on most higher-end Ultrabooks these days. Opting for the Intel version of our Inspiron will mean sacrificing some processor performance for higher graphics performance.
Graphics performance could be more consistent. When idling on Witcher 3 at low settings for an hour, frame rates would be as high as 60 FPS during the start of the test before fluctuating to the low 50 and high 50 FPS range over time as shown by our graph below.
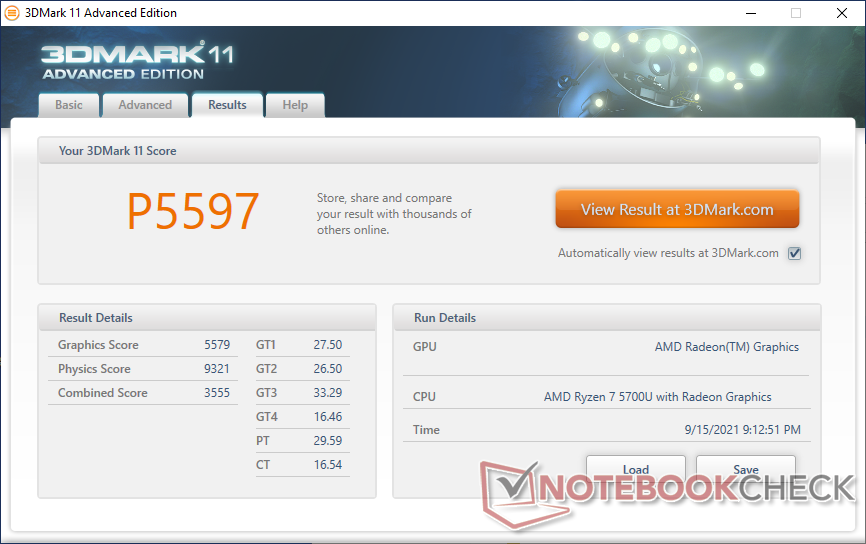
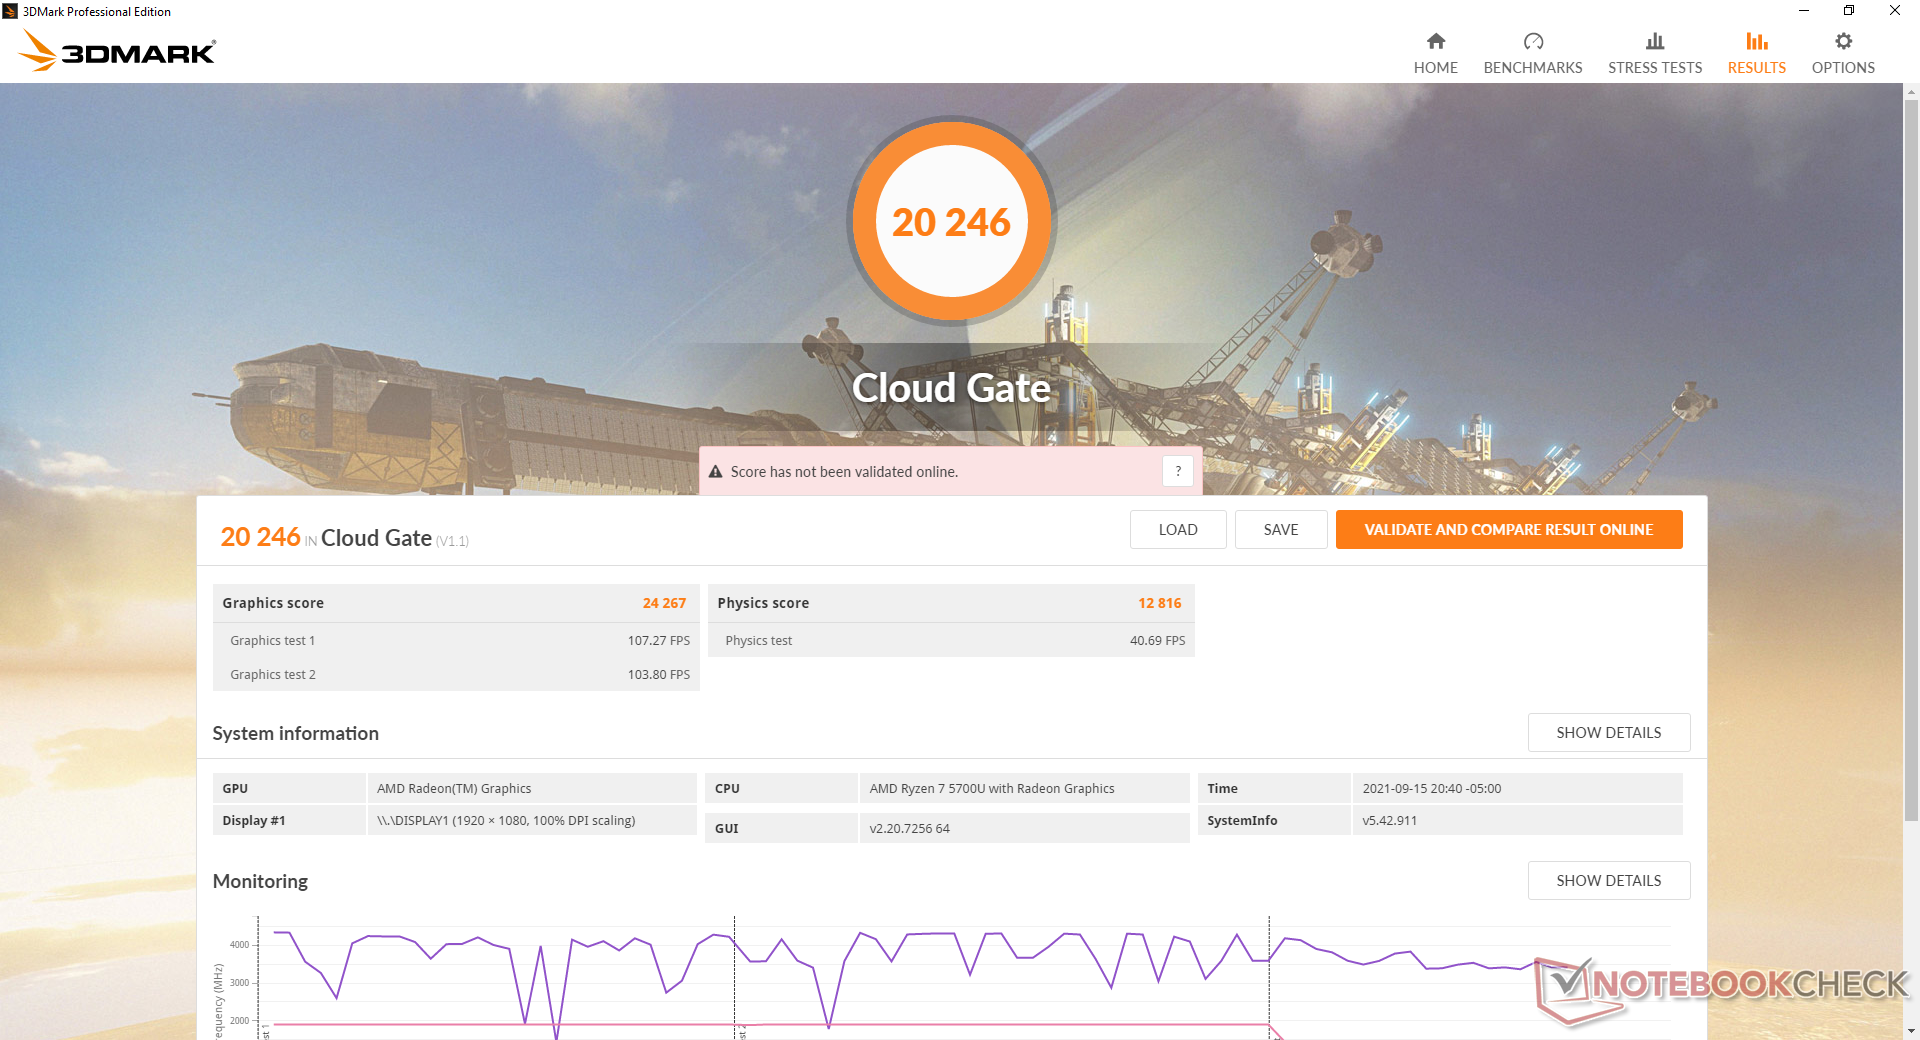
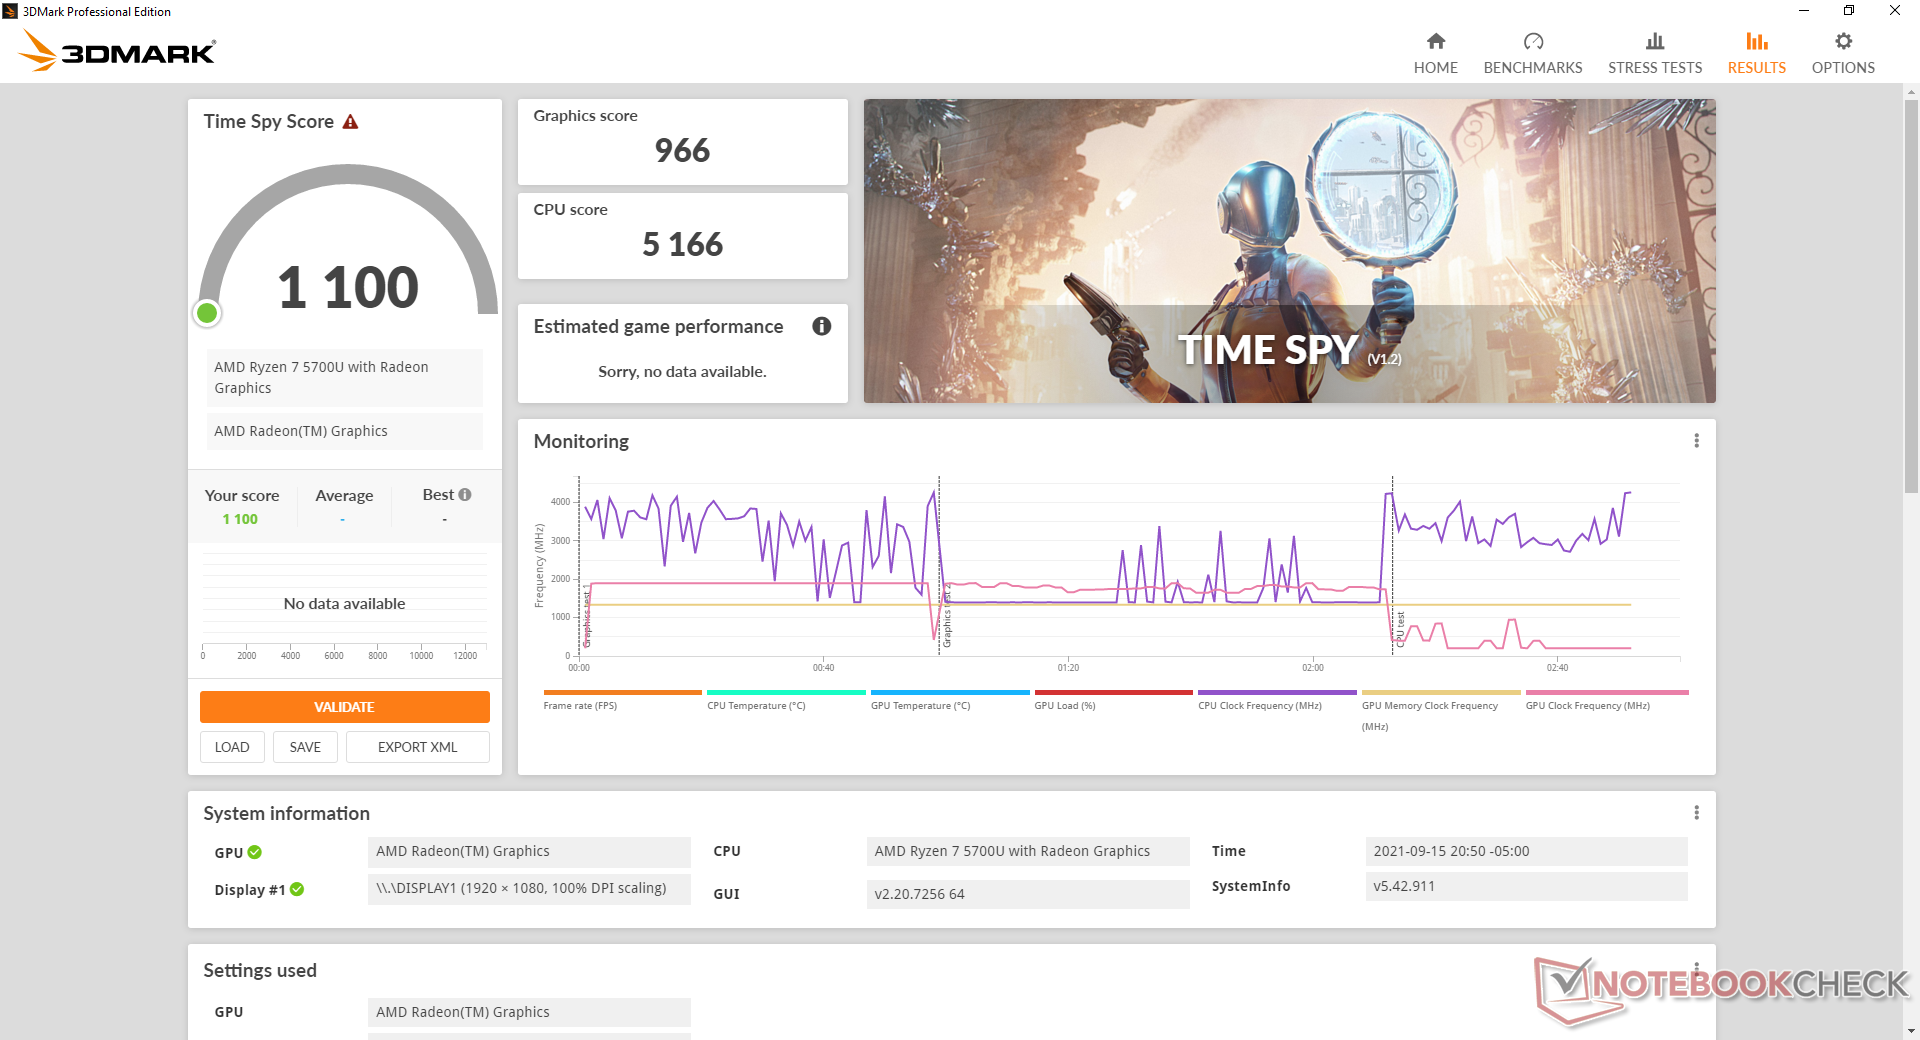
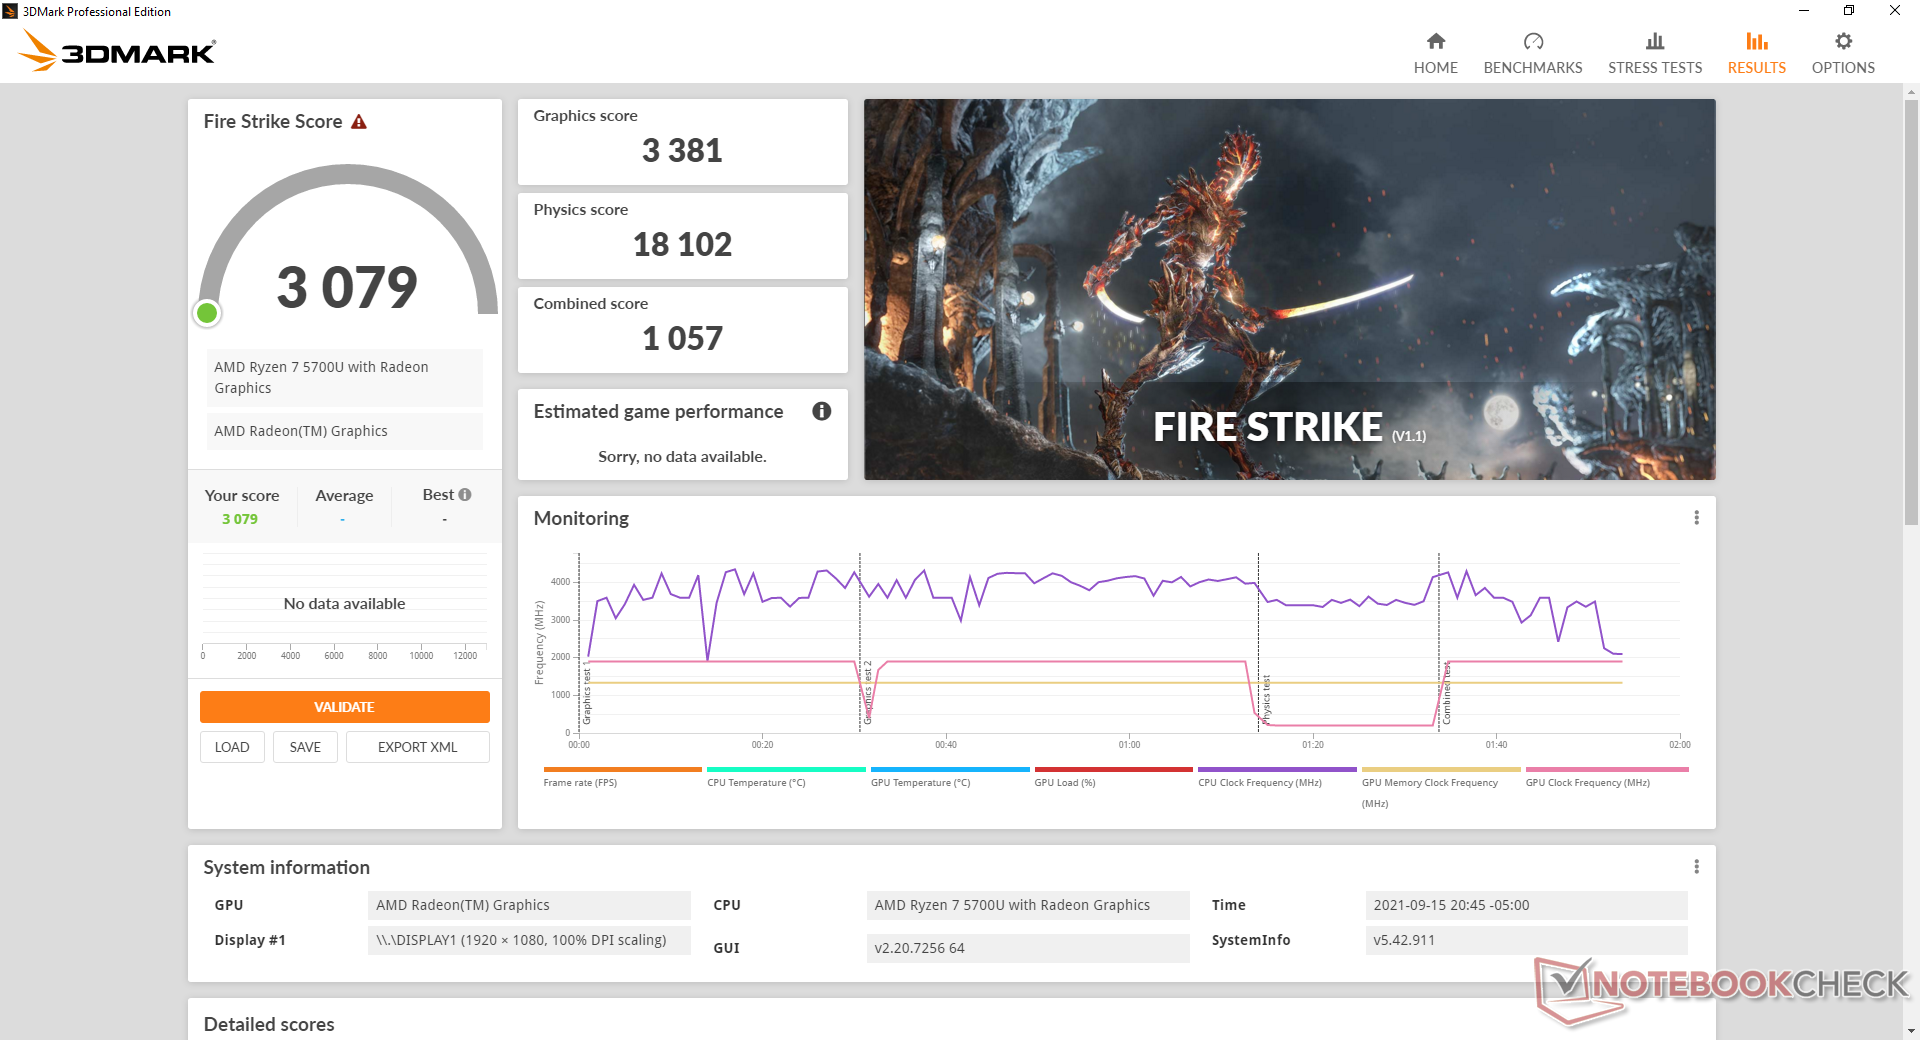
| 3DMark 11 Performance | 5597 points | |
| 3DMark Cloud Gate Standard Score | 20246 points | |
| 3DMark Fire Strike Score | 3079 points | |
| 3DMark Time Spy Score | 1100 points | |
Help | ||
Witcher 3 FPS Chart
| low | med. | high | ultra | |
|---|---|---|---|---|
| GTA V (2015) | 87.2 | 76.5 | 23.9 | 9.42 |
| The Witcher 3 (2015) | 62.1 | 20.8 | 13.2 | |
| Dota 2 Reborn (2015) | 94.5 | 75.3 | 46.9 | 43 |
| Final Fantasy XV Benchmark (2018) | 31.9 | 16.3 | 11.7 | |
| X-Plane 11.11 (2018) | 37.3 | 30.8 | 26.6 | |
| Far Cry 5 (2018) | 40 | 17 | 16 | 15 |
| Strange Brigade (2018) | 75.6 | 29.7 | 24.9 | 21 |
Emissions
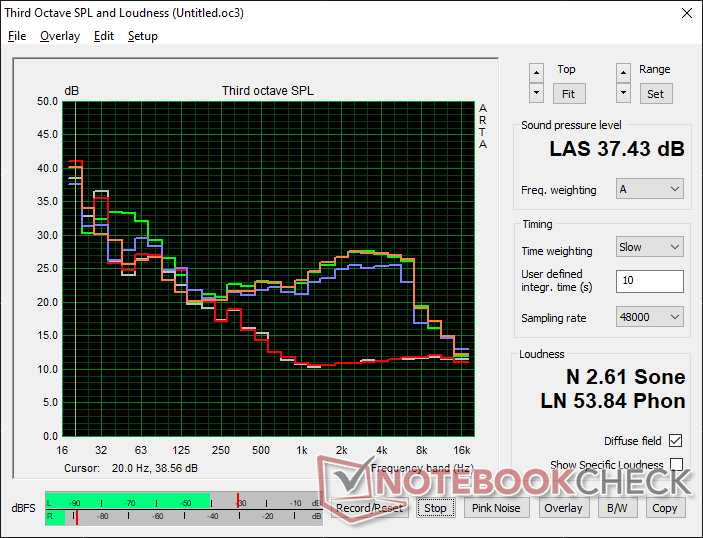
System Noise — High-Pitched Fan Noise
Fan noise is almost unnoticeable during low loads like browsing or video streaming at only 26.4 or 27.1 dB(A) against a silent background of 24.3 dB(A). When running the first benchmark scene of 3DMark 06, fan noise would top out at 35.7 dB(A) to be much quieter than the Dell Inspiron 14 7400 or Lenovo IdeaPad Flex 5. Fan noise when gaming is only a bit louder at 37.5 dB(A).
Unfortunately, the fan is high-pitched when running at higher RPMs which makes it more noticeable than it should be despite the relatively low fan noise overall.
| Dell Inspiron 14 7400 7415 2-in-1 Vega 8, R7 5700U, WDC PC SN530 SDBPTPZ-512G | HP Pavilion x360 14-dy0157ng Iris Xe G7 80EUs, i5-1135G7, Toshiba KBG40ZNV512G | Dell Inspiron 14 7400-VY8JW GeForce MX350, i7-1165G7, Samsung PM981a MZVLB1T0HBLR | Lenovo IdeaPad Flex 5 14ALC05-82HU006NGE Vega 7, R5 5500U, Micron 2210 MTFDHBA512QFD | Acer Spin 3 SP314-54N-56S5 Iris Plus Graphics G4 (Ice Lake 48 EU), i5-1035G4, SK hynix BC511 HFM256GDJTNI-82A0 | Asus VivoBook Flip 14 TM420IA Vega 7, R7 4700U, Samsung PM991 MZVLQ512HALU | |
|---|---|---|---|---|---|---|
| Noise | -7% | -16% | -10% | 1% | -10% | |
| off / environment * (dB) | 24.3 | 27 -11% | 27.6 -14% | 25.6 -5% | 24.9 -2% | 27.1 -12% |
| Idle Minimum * (dB) | 24.3 | 27 -11% | 27.6 -14% | 25.6 -5% | 24.9 -2% | 27.1 -12% |
| Idle Average * (dB) | 24.3 | 27 -11% | 27.6 -14% | 25.6 -5% | 24.9 -2% | 27.1 -12% |
| Idle Maximum * (dB) | 24.3 | 27 -11% | 27.6 -14% | 25.6 -5% | 26 -7% | 27.1 -12% |
| Load Average * (dB) | 35.7 | 38.3 -7% | 43.8 -23% | 43.3 -21% | 32.6 9% | 35 2% |
| Witcher 3 ultra * (dB) | 37.5 | 43.7 -17% | 41.3 -10% | |||
| Load Maximum * (dB) | 37.3 | 33.2 11% | 43.8 -17% | 43.6 -17% | 32.8 12% | 41.3 -11% |
* ... smaller is better
Noise level
| Idle |
| 24.3 / 24.3 / 24.3 dB(A) |
| Load |
| 35.7 / 37.3 dB(A) |
 | ||
30 dB silent 40 dB(A) audible 50 dB(A) loud |
||
min: | ||
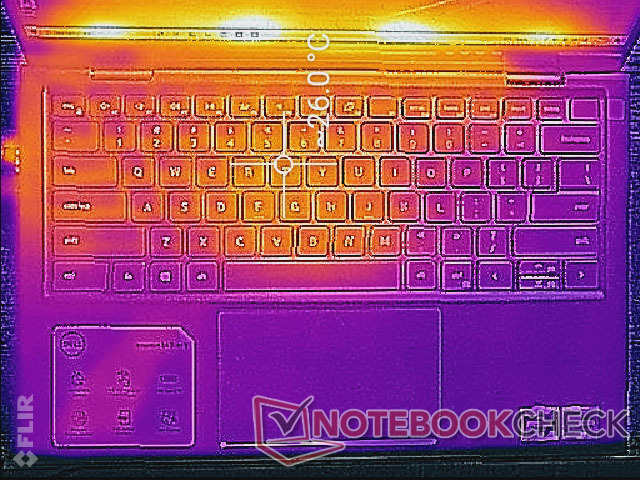
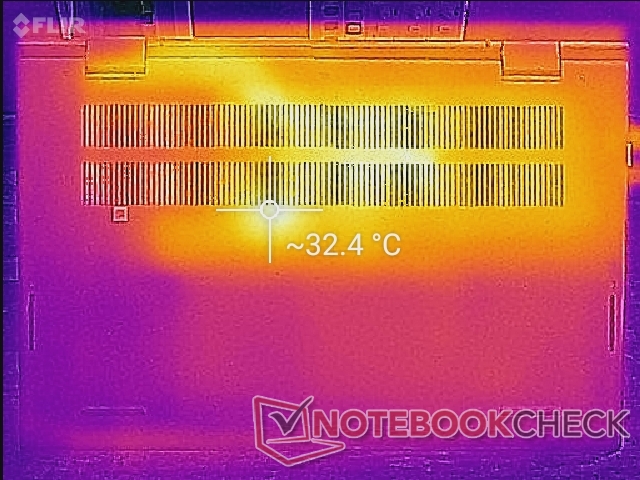
Temperature
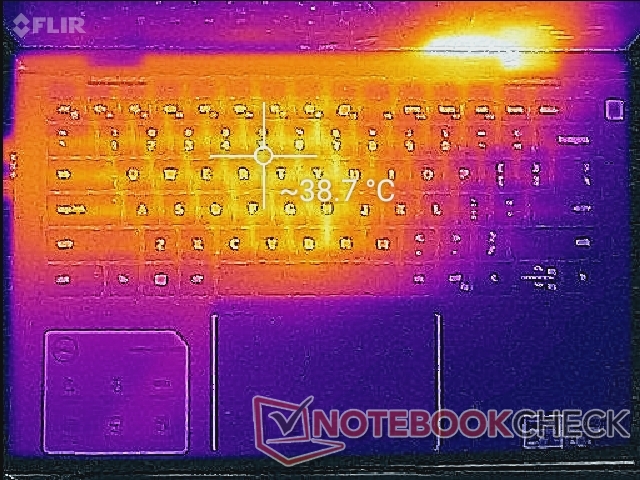
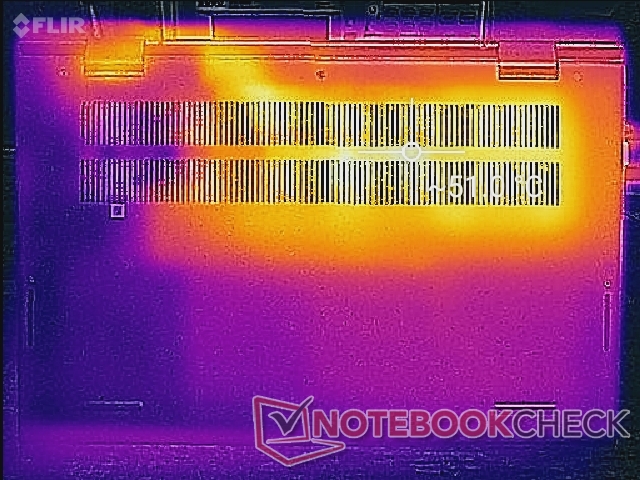
Surface temperatures are significantly cooler than what we recorded on the Inspiron 14 7400 clamshell. Hot spots on the top and bottom surfaces on our convertible would reach 40 C and 51 C, respectively, compared to 58 C on each side of the Inspiron 14 7400 when running similar demanding loads for long periods. Even so, the system still runs slightly warmer than some competing models like the Lenovo IdeaPad Flex 5 or Acer Spin 3 SP314 where hot spots tend to top out at the cooler 40 C to 45 C range instead.
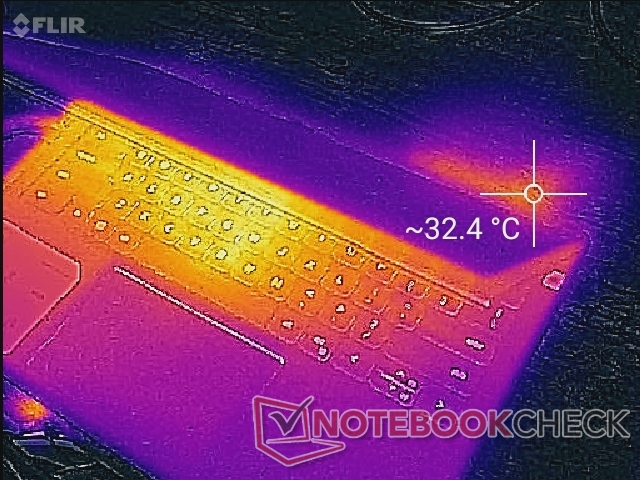
(+) The maximum temperature on the upper side is 39.4 °C / 103 F, compared to the average of 35.4 °C / 96 F, ranging from 19.6 to 60 °C for the class Convertible.
(-) The bottom heats up to a maximum of 51 °C / 124 F, compared to the average of 36.9 °C / 98 F
(+) In idle usage, the average temperature for the upper side is 24.7 °C / 76 F, compared to the device average of 30.3 °C / 87 F.
(+) The palmrests and touchpad are cooler than skin temperature with a maximum of 27.8 °C / 82 F and are therefore cool to the touch.
(±) The average temperature of the palmrest area of similar devices was 28 °C / 82.4 F (+0.2 °C / 0.4 F).
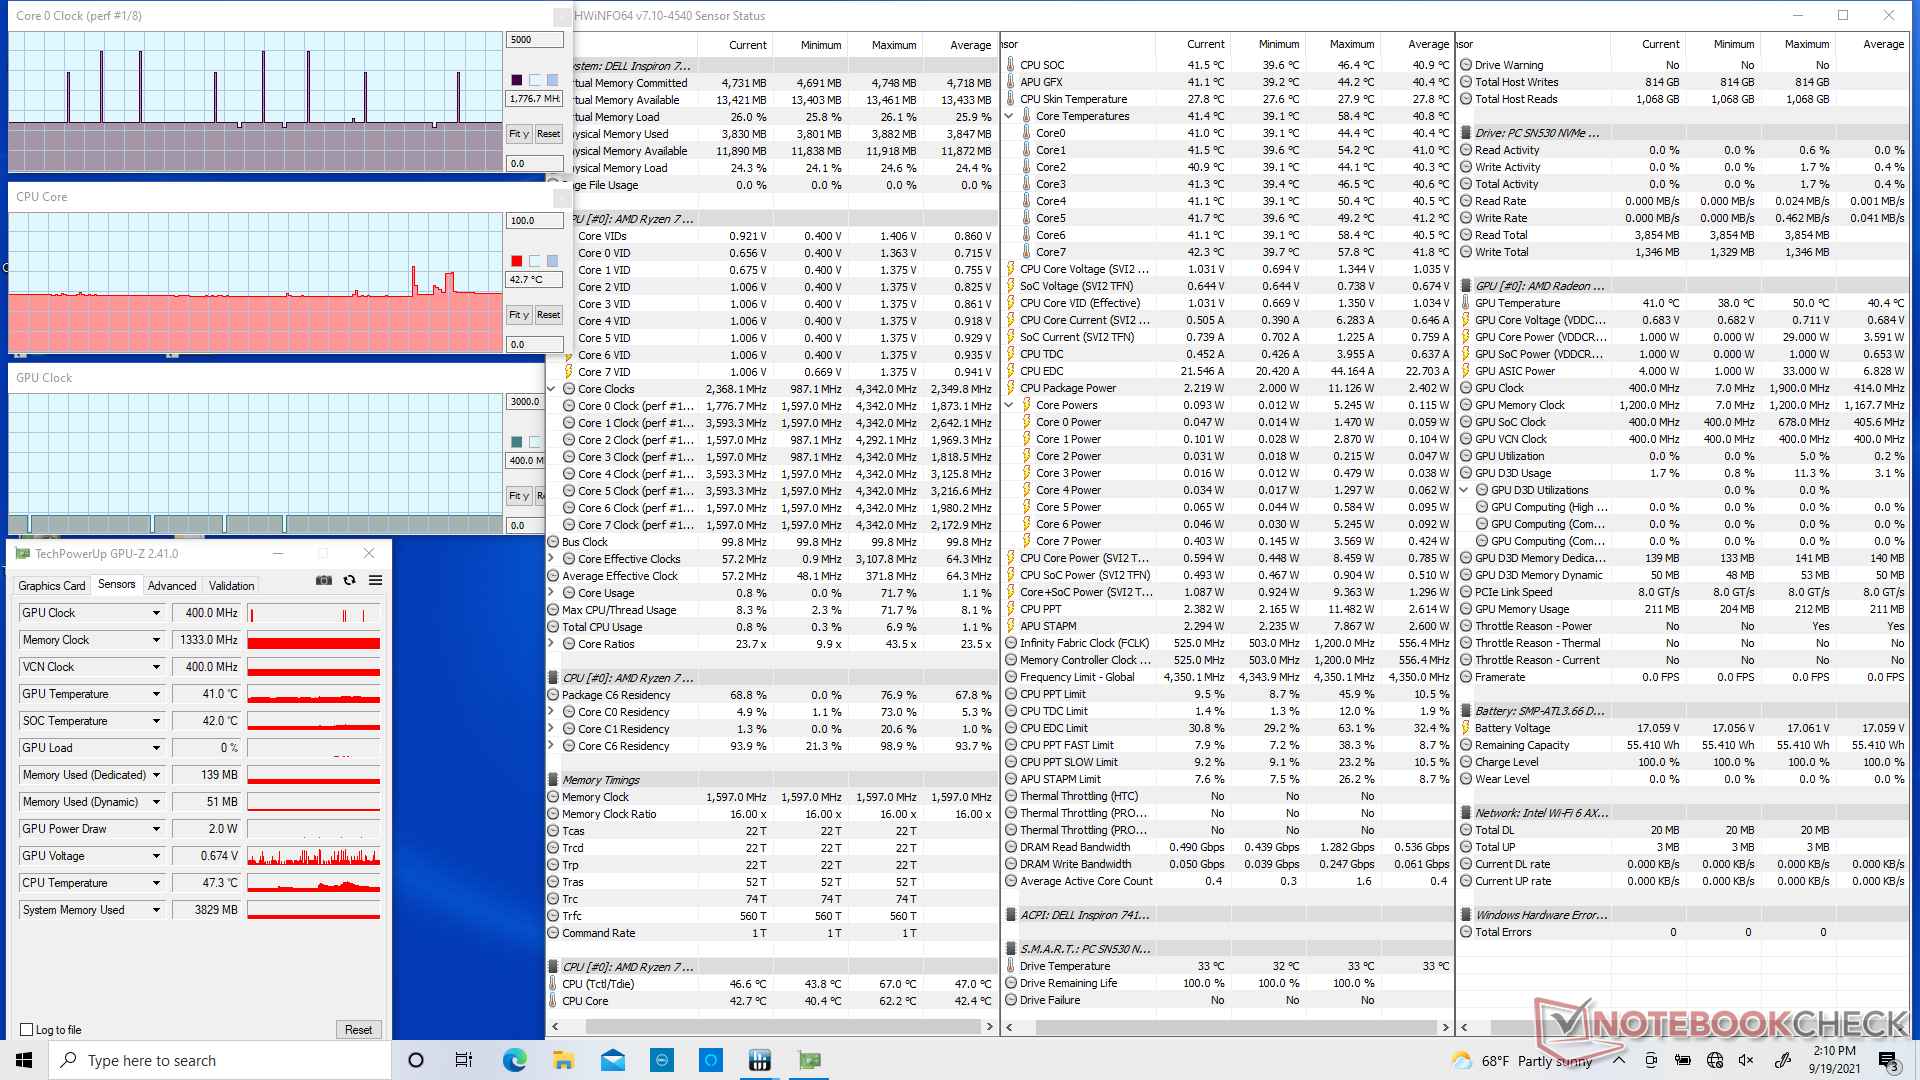
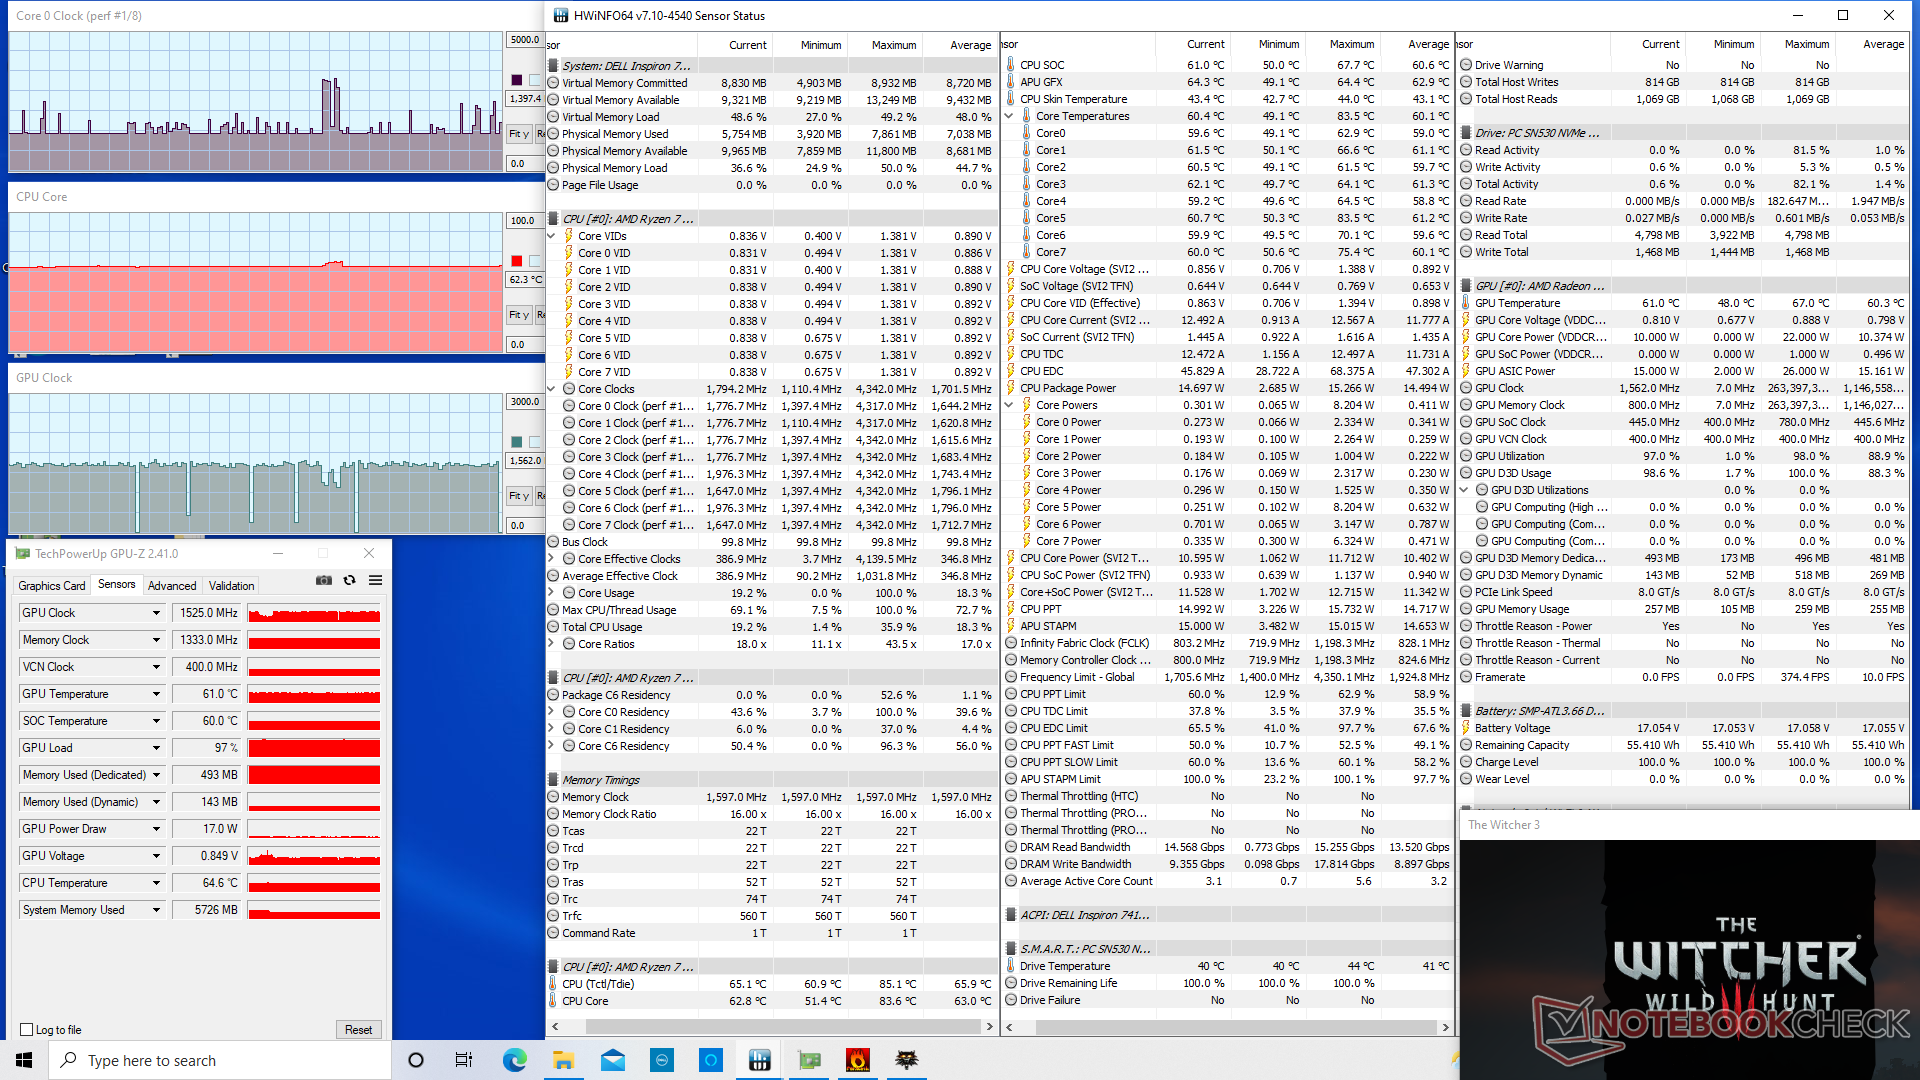
Stress Test
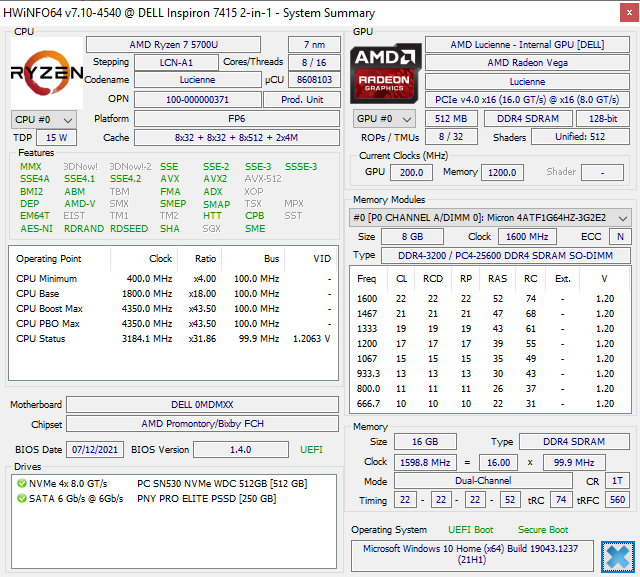
When running Prime95, the CPU would boost to 3.8 GHz for just the first second or so before dropping to 3.4 GHz and 90 C for the next couple of minutes. Clock rates and temperature would eventually drop further before stabilizing at 2.7 GHz and 69 C, respectively, as shown by the screenshot below. Turbo Boost sustainability is therefore decent but nowhere near what the Ryzen 7 5700U is capable of at higher TDP levels.
GPU clock rates and temperature would stabilize at around 1525 MHz and 62 C when running Witcher 3 compared to 1900 MHz and 69 C on the HP Envy x360 15 which uses the same Ryzen 7 5700U processor.
Running on battery power will not limit performance. A 3DMark 11 run on batteries would return Physics and Graphics scores of 9853 and 5436 points, respectively, compared to 9321 and 5579 points when on mains.
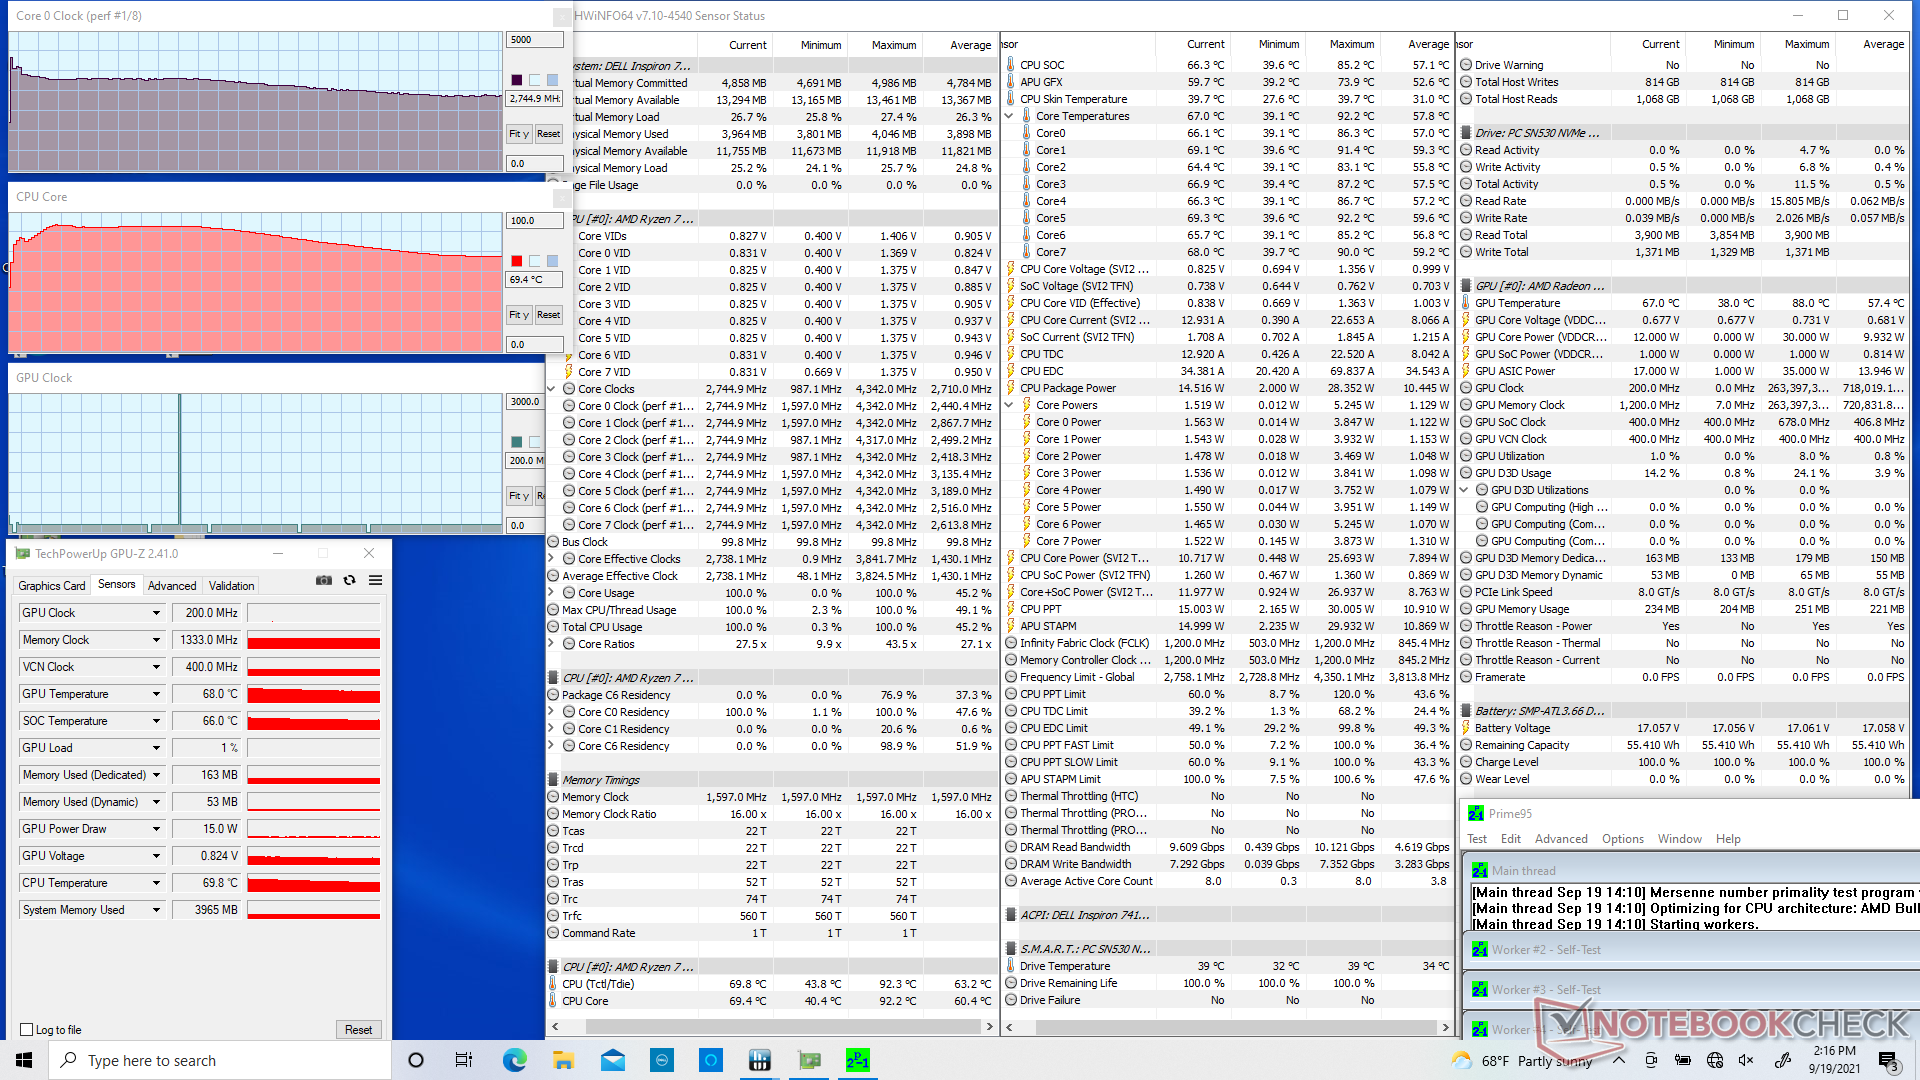
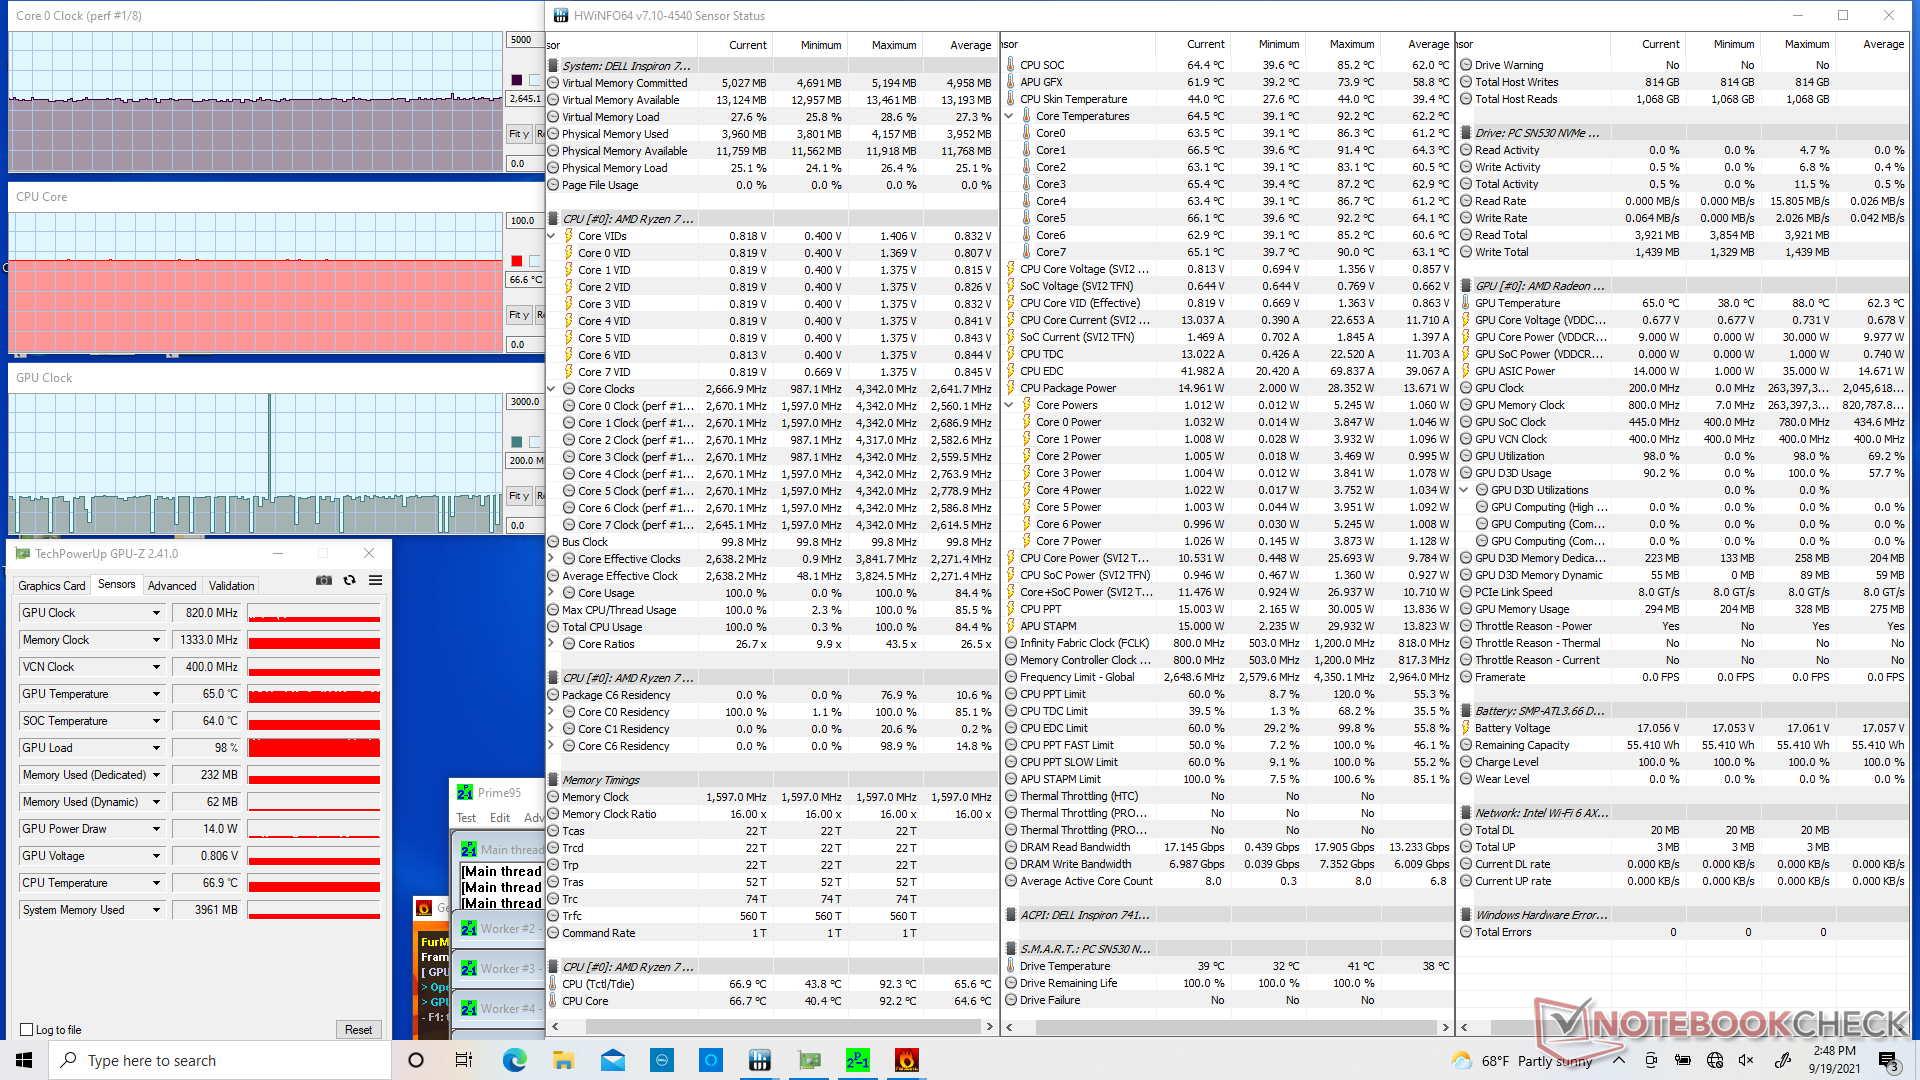
| CPU Clock (GHz) | GPU Clock (MHz) | Average CPU Temperature (°C) | |
| System Idle | -- | -- | 43 |
| Prime95 Stress | 2.7 | -- | 69 |
| Prime95 + FurMark Stress | 2.6 | 820 | 67 |
| Witcher 3 Stress | ~1.4 | ~1525 | 62 |
Speakers
 located near front corners. Higher volume settings will cause the base to vibrate which can feel distracting")

Dell Inspiron 14 7400 7415 2-in-1 audio analysis
(±) | speaker loudness is average but good (80.6 dB)
Bass 100 - 315 Hz
(±) | reduced bass - on average 10.7% lower than median
(±) | linearity of bass is average (13.3% delta to prev. frequency)
Mids 400 - 2000 Hz
(+) | balanced mids - only 2.6% away from median
(+) | mids are linear (4.6% delta to prev. frequency)
Highs 2 - 16 kHz
(+) | balanced highs - only 1.9% away from median
(+) | highs are linear (4.2% delta to prev. frequency)
Overall 100 - 16.000 Hz
(+) | overall sound is linear (10.1% difference to median)
Compared to same class
» 6% of all tested devices in this class were better, 2% similar, 92% worse
» The best had a delta of 6%, average was 20%, worst was 57%
Compared to all devices tested
» 5% of all tested devices were better, 2% similar, 94% worse
» The best had a delta of 4%, average was 23%, worst was 134%
Apple MacBook 12 (Early 2016) 1.1 GHz audio analysis
(+) | speakers can play relatively loud (83.6 dB)
Bass 100 - 315 Hz
(±) | reduced bass - on average 11.3% lower than median
(±) | linearity of bass is average (14.2% delta to prev. frequency)
Mids 400 - 2000 Hz
(+) | balanced mids - only 2.4% away from median
(+) | mids are linear (5.5% delta to prev. frequency)
Highs 2 - 16 kHz
(+) | balanced highs - only 2% away from median
(+) | highs are linear (4.5% delta to prev. frequency)
Overall 100 - 16.000 Hz
(+) | overall sound is linear (10.2% difference to median)
Compared to same class
» 7% of all tested devices in this class were better, 2% similar, 90% worse
» The best had a delta of 5%, average was 18%, worst was 53%
Compared to all devices tested
» 5% of all tested devices were better, 1% similar, 94% worse
» The best had a delta of 4%, average was 23%, worst was 134%
Energy Management
Power Consumption
Idling on desktop draws just 4 W to 8 W to be in line with most other subnotebooks these days. When running higher loads like games, consumption would be in between the Core i5-powered HP Pavilion x360 14 and Core i7-powered XPG Xenia 14 or Framework 13.5. Multi-thread processor performance and graphics performance are slower and faster, respectively, than the 11th gen Intel Core U-series meaning performance-per-watt can be lower or higher depending on the workload.
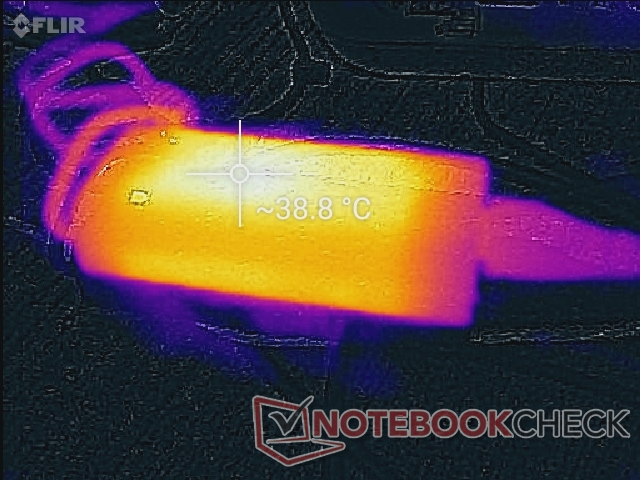
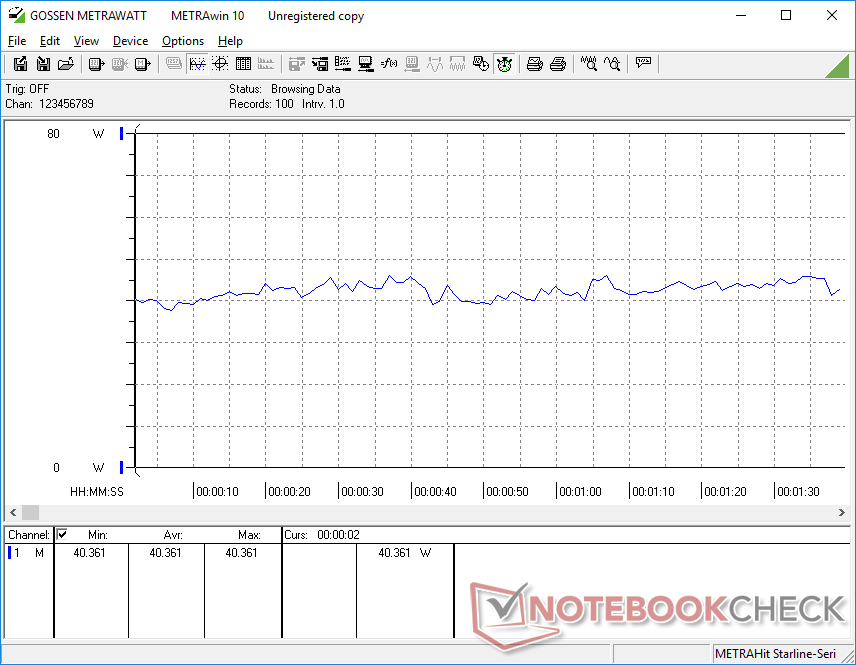
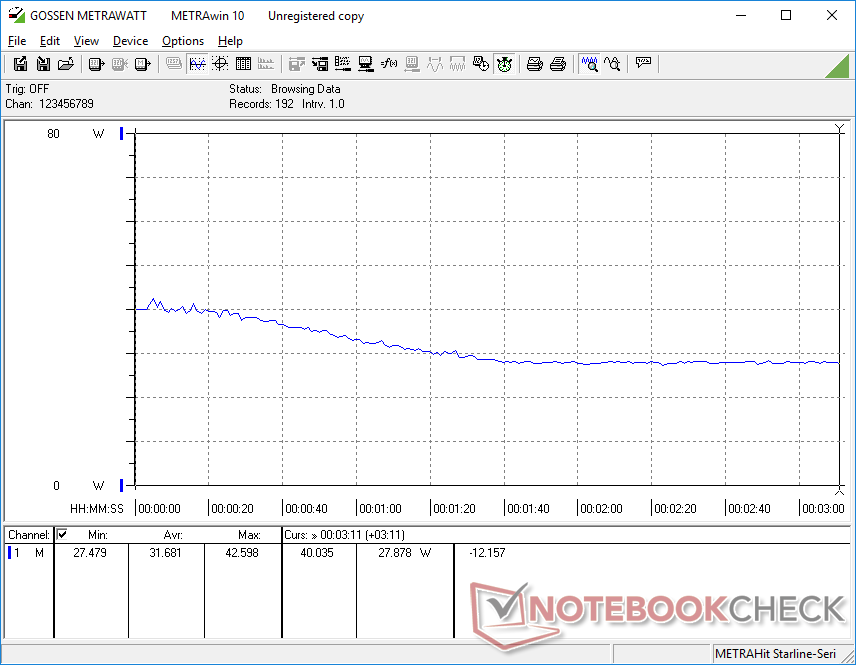
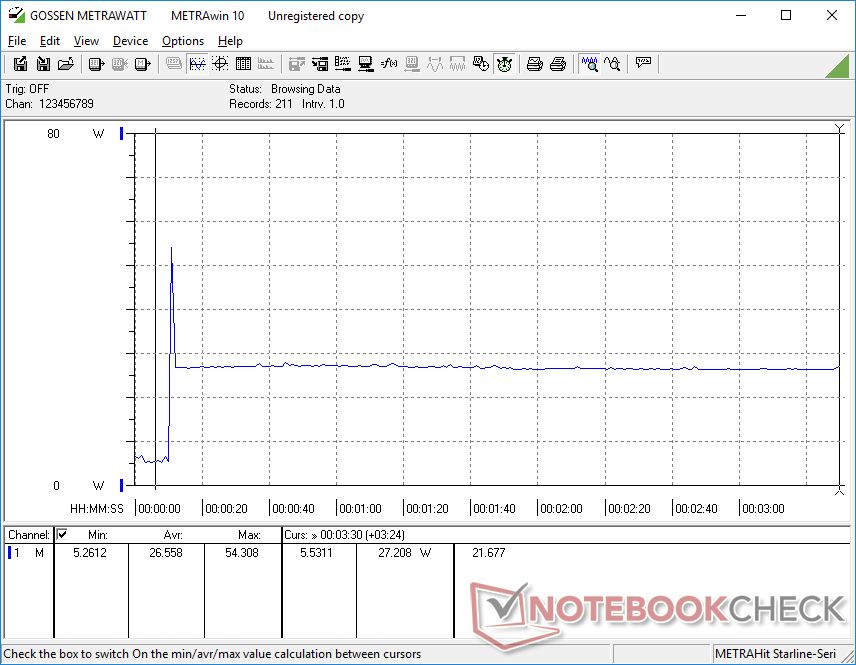
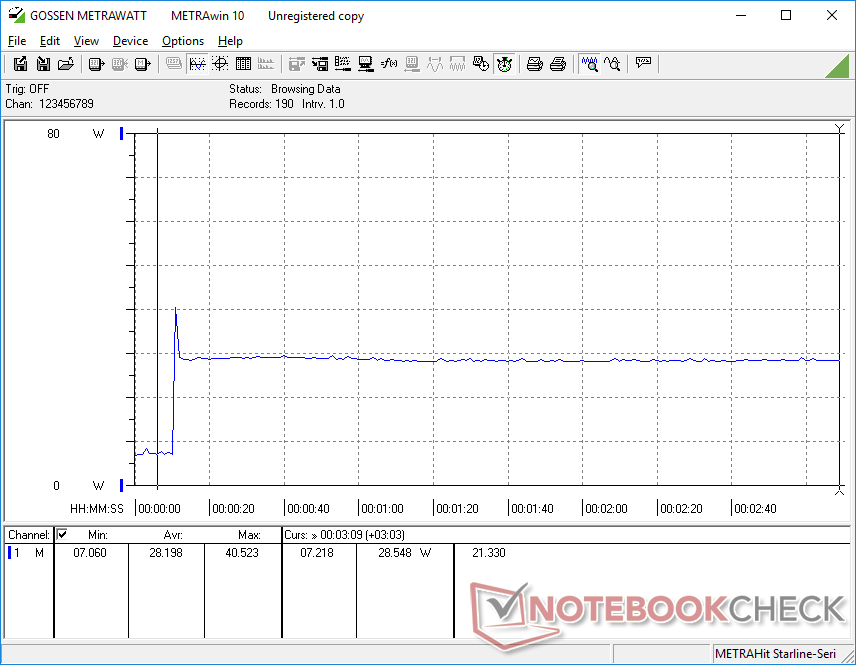
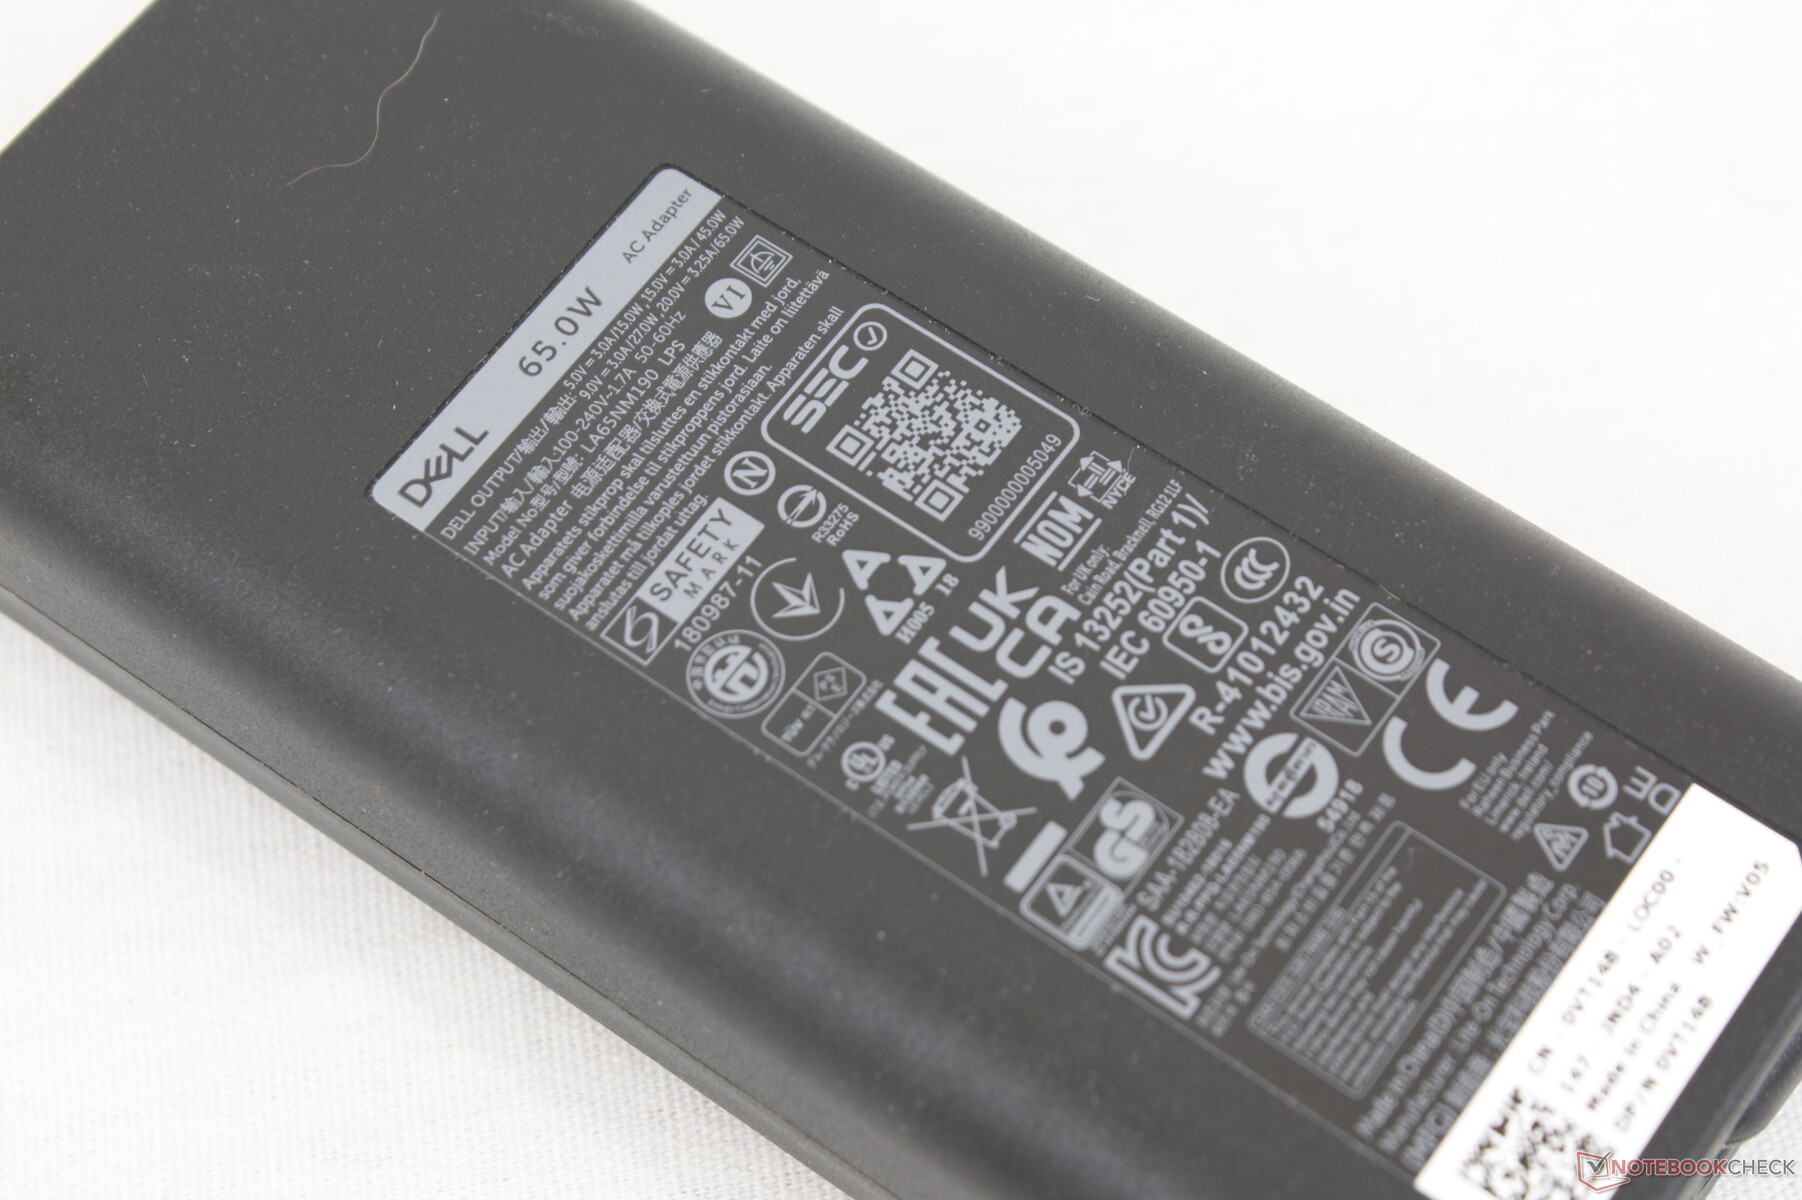
We're able to record a temporary maximum of 54.3 W from the small (~11.2 x 5 x 2.8 cm) AC adapter when running extreme loads. When running Witcher 3, power consumption would start out high at around 40 W before steadily declining to as low as 30 W over time.
| Off / Standby | |
| Idle | |
| Load |
|
Key:
min: | |
| Dell Inspiron 14 7400 7415 2-in-1 R7 5700U, Vega 8, WDC PC SN530 SDBPTPZ-512G, IPS, 1920x1080, 14" | HP Pavilion x360 14-dy0157ng i5-1135G7, Iris Xe G7 80EUs, Toshiba KBG40ZNV512G, IPS, 1920x1080, 14" | Dell Inspiron 14 7400-VY8JW i7-1165G7, GeForce MX350, Samsung PM981a MZVLB1T0HBLR, IPS, 2560x1600, 14.5" | Lenovo IdeaPad Flex 5 14ALC05-82HU006NGE R5 5500U, Vega 7, Micron 2210 MTFDHBA512QFD, IPS, 1920x1080, 14" | Acer Spin 3 SP314-54N-56S5 i5-1035G4, Iris Plus Graphics G4 (Ice Lake 48 EU), SK hynix BC511 HFM256GDJTNI-82A0, IPS, 1920x1080, 14" | Asus VivoBook Flip 14 TM420IA R7 4700U, Vega 7, Samsung PM991 MZVLQ512HALU, IPS, 1920x1080, 14" | |
|---|---|---|---|---|---|---|
| Power Consumption | 13% | -15% | -12% | 9% | 6% | |
| Idle Minimum * (Watt) | 4.5 | 4 11% | 3.1 31% | 5.6 -24% | 3.4 24% | 4 11% |
| Idle Average * (Watt) | 6.5 | 6.7 -3% | 7.3 -12% | 6.5 -0% | 6 8% | 6.4 2% |
| Idle Maximum * (Watt) | 7.1 | 8.2 -15% | 9 -27% | 7 1% | 7.9 -11% | 7 1% |
| Load Average * (Watt) | 40.4 | 29.6 27% | 47 -16% | 45.4 -12% | 39.6 2% | 34.6 14% |
| Witcher 3 ultra * (Watt) | 31.7 | 29.6 7% | 46 -45% | 45.4 -43% | 35 -10% | |
| Load Maximum * (Watt) | 54.3 | 26.7 51% | 65.4 -20% | 50 8% | 41 24% | 45.1 17% |
* ... smaller is better
Power Consumption Witcher 3 / Stresstest
Battery Life — Good for a Full Day
Runtimes are excellent at almost 11 hours of real-world WLAN use from the decently-sized 54 Wh battery. Results are several hours longer than what we recorded on the competing HP Pavilion x360 14 or Acer Spin 3 SP314 while being on par with the Lenovo IdeaPad Flex 5. SKUs with the smaller 41 Wh battery are available for a lower starting weight.
Charging from empty to full capacity takes about two hours.
| Dell Inspiron 14 7400 7415 2-in-1 R7 5700U, Vega 8, 54 Wh | HP Pavilion x360 14-dy0157ng i5-1135G7, Iris Xe G7 80EUs, 43 Wh | Dell Inspiron 14 7400-VY8JW i7-1165G7, GeForce MX350, 52 Wh | Lenovo IdeaPad Flex 5 14ALC05-82HU006NGE R5 5500U, Vega 7, 52.5 Wh | Acer Spin 3 SP314-54N-56S5 i5-1035G4, Iris Plus Graphics G4 (Ice Lake 48 EU), 48 Wh | Asus VivoBook Flip 14 TM420IA R7 4700U, Vega 7, 42 Wh | |
|---|---|---|---|---|---|---|
| Battery runtime | -23% | -32% | -23% | -29% | -26% | |
| Reader / Idle (h) | 18.6 | 17.7 -5% | 13.9 -25% | 14 -25% | ||
| WiFi v1.3 (h) | 10.8 | 7.1 -34% | 7.3 -32% | 11.8 9% | 7.5 -31% | 8 -26% |
| Load (h) | 2.3 | 1.6 -30% | 1.1 -52% | 1.6 -30% | ||
| Witcher 3 ultra (h) | 1.7 |
Pros
Cons
Verdict — Solid Fundamentals
There are a handful of inexpensive convertibles to choose from other than our Dell Inspiron 14 including the Asus VivoBook Flip 14, Acer Spin 3 SP314, Lenovo IdeaPad Flex 5, or HP Pavilion x360 14. Key advantages of the Dell are its ease of serviceability for users who like to install their own RAM or storage and stronger, potentially longer-lasting chassis and hinges when compared to the more budget look and feel of the aforementioned alternatives.
Solid basics with a strong chassis and powerful processor. There are no huge surprises which is completely acceptable for a budget convertible.
The limited colors of the touchscreen are a bummer especially since the AMD processor is powerful enough for the occasional picture editing. However, this is a drawback shared between other inexpensive 14-inch convertibles as well.
The Acer Spin 3 continues to be one of the very few (if not only) budget 14-inch convertible to support Thunderbolt for users who can't live without the feature.
Dell Inspiron 14 7400 7415 2-in-1
- 12/05/2021 v7 (old)
Allen Ngo
Price comparison
