Almost an XPS 16: Dell Inspiron 16 Plus 7610 laptop review
The Inspiron family is probably Dell's biggest and most wide-ranging family of consumer PCs. It consists of the budget 3000 series up to the higher-end 7000 series in all screen sizes from 13 inches up to 17 inches. The latest Inspiron 16 is notable for being the first 16-inch model in the family equipped with certain features not found on other models as originally announced back in April.
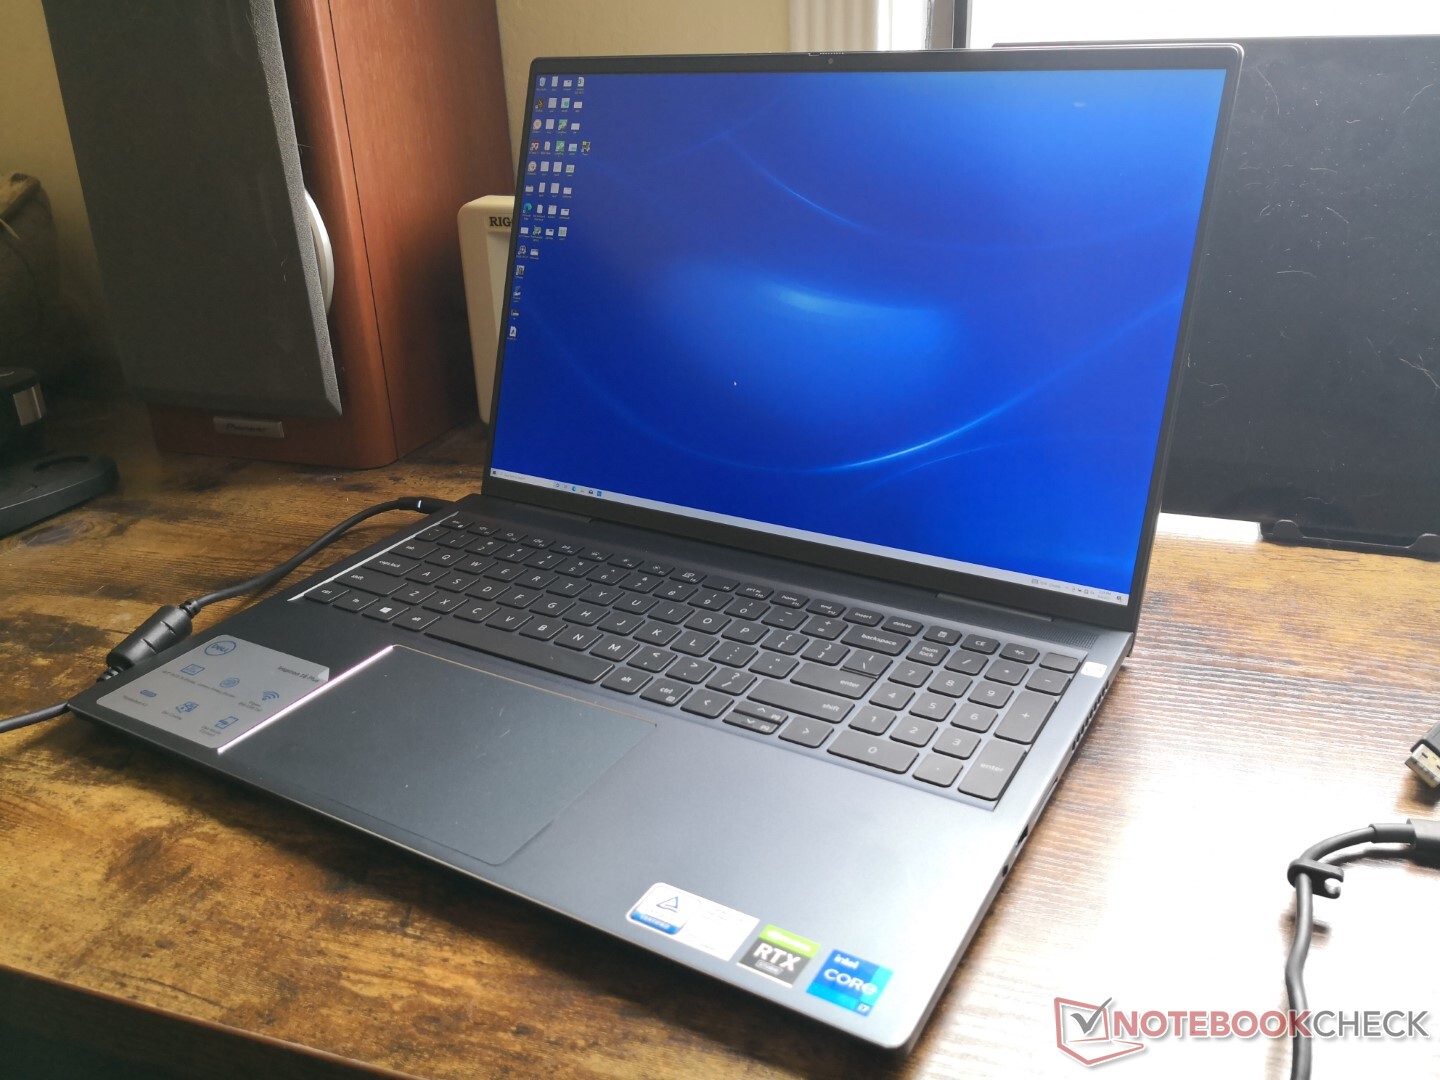
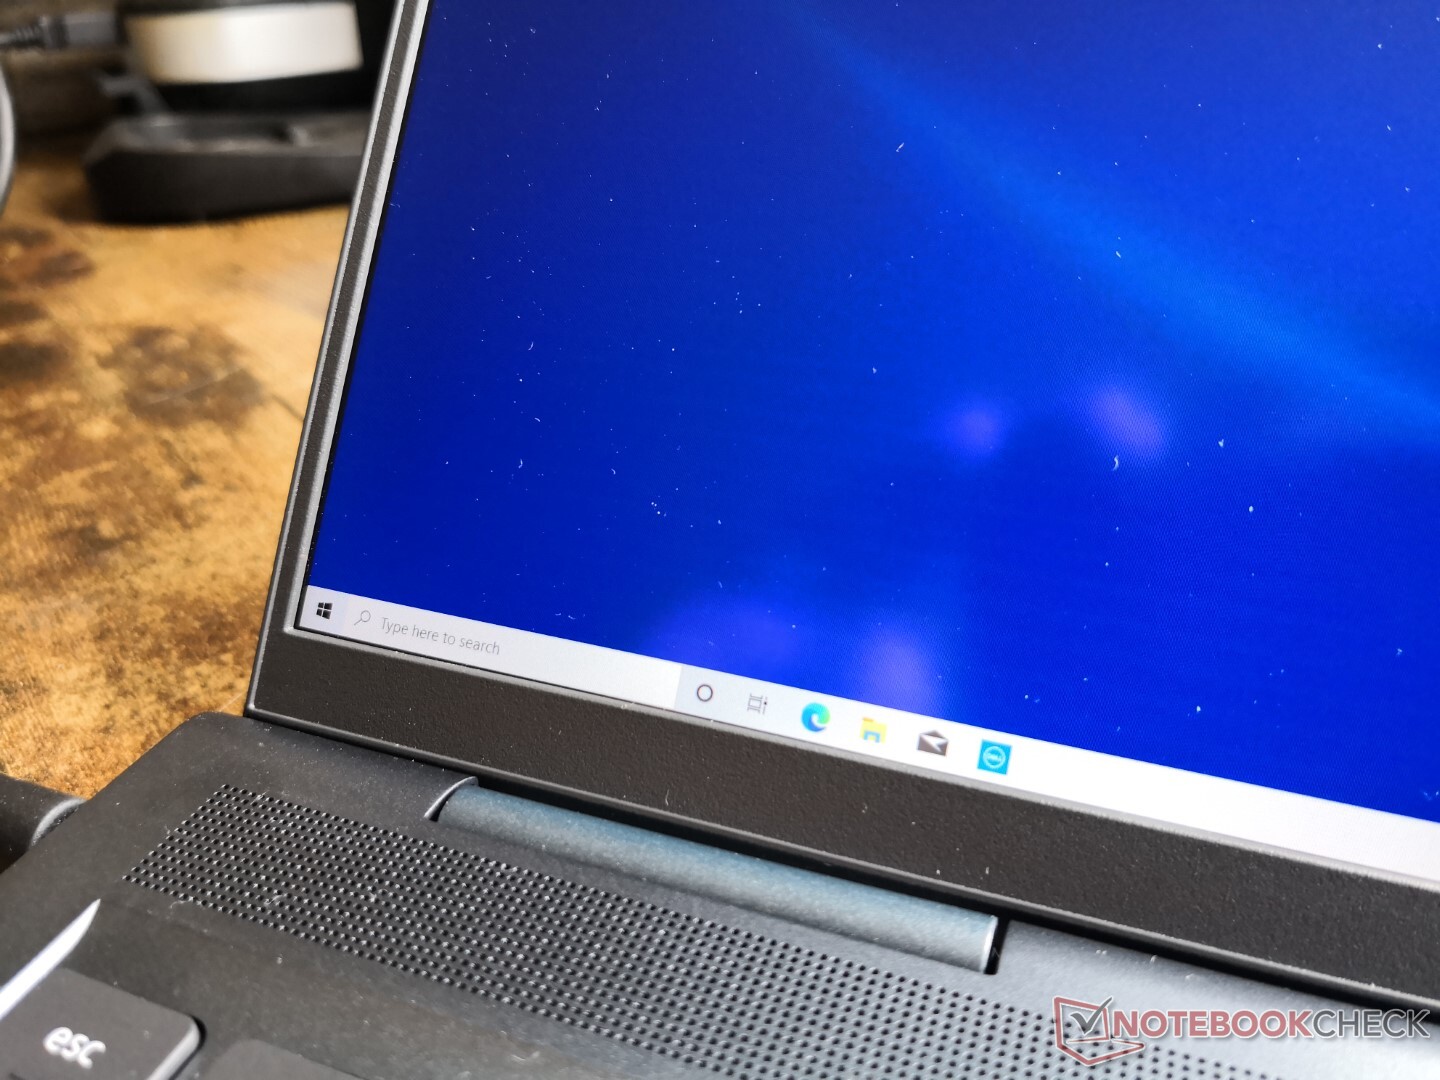
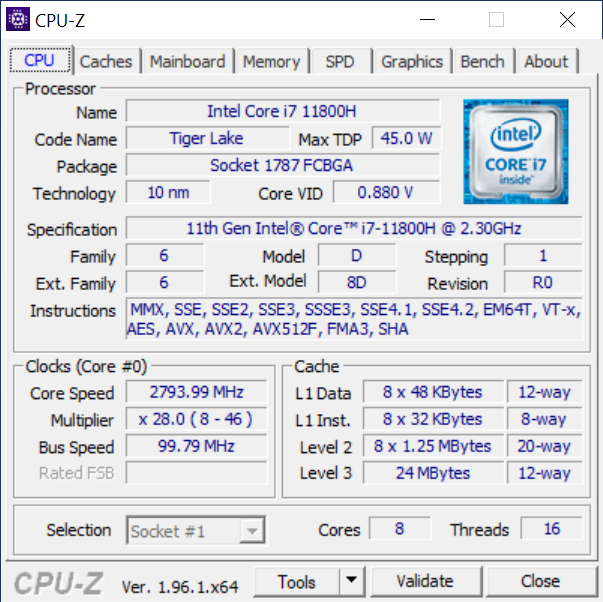
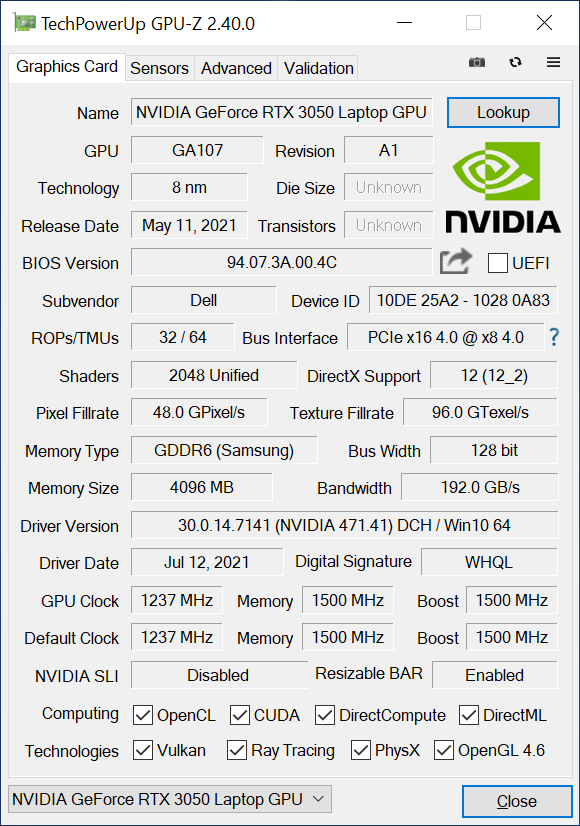
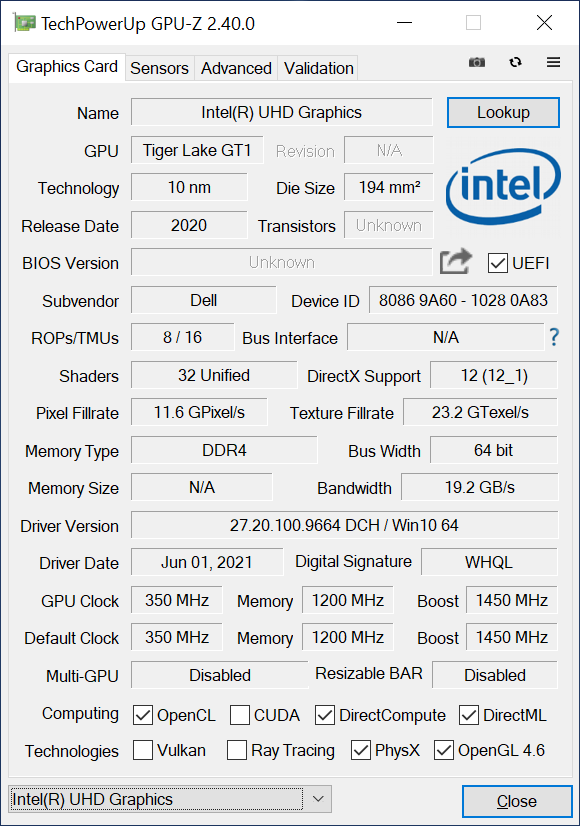
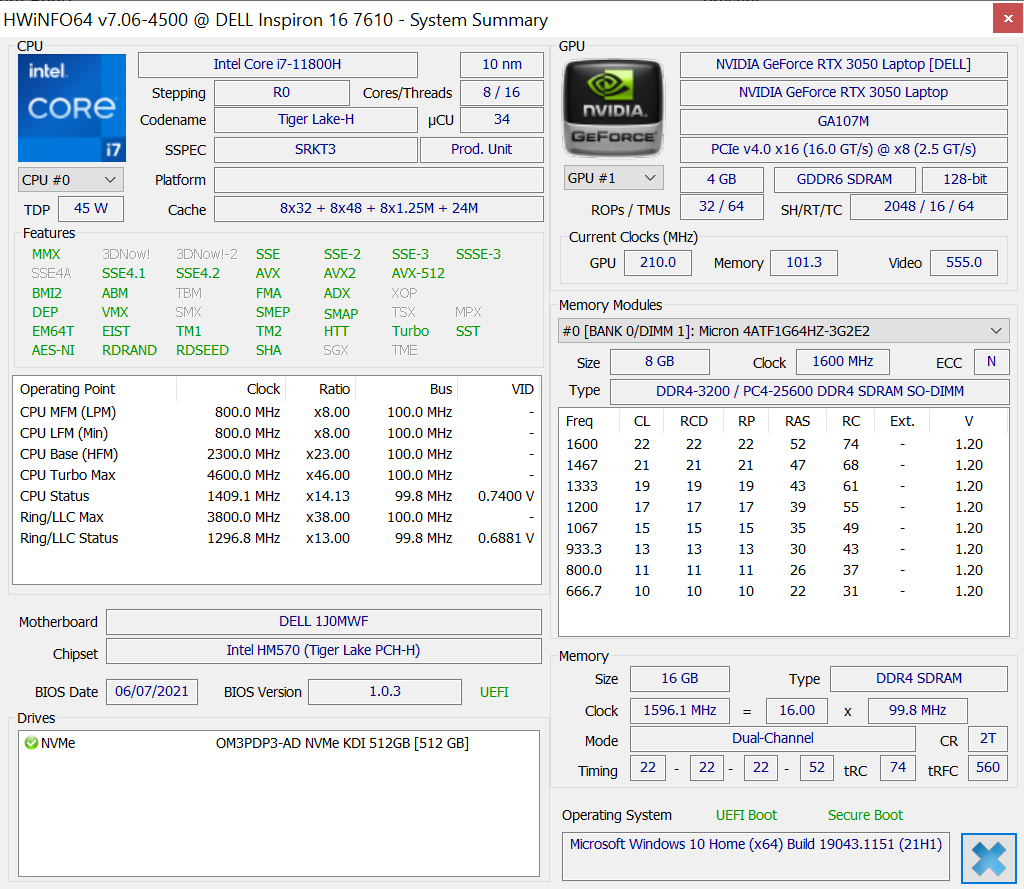
Our test unit is a higher-end configuration of the Inspiron 16 7610 with the 11th gen Intel Core i7-11800H CPU, GeForce RTX 3050 graphics for approximately $1150 USD. Other SKUs are available with the lesser Core i5-11400H or integrated UHD Graphics instead, but all options come with the same 16.0-inch 16:10 3K display and Mist Blue chassis color. The system is marketed as an Nvidia Studio machine for content creation to contrast the gaming-centric G series or prosumer XPS series.
Direct competitors include other 16-inch multimedia laptops like the LG Gram 16, Honor MagicBook Pro, or the MacBook Pro 16.
More Dell reviews:
potential competitors in comparison
Rating | Date | Model | Weight | Height | Size | Resolution | Price |
|---|---|---|---|---|---|---|---|
| 86.7 % v7 (old) | 08 / 2021 | Dell Inspiron 16 Plus 7610 i7-11800H, GeForce RTX 3050 4GB Laptop GPU | 2 kg | 18.99 mm | 16.00" | 3072x1920 | |
| 87.4 % v7 (old) | 08 / 2021 | Lenovo Legion 5 Pro 16ACH6H (82JQ001PGE) R7 5800H, GeForce RTX 3070 Laptop GPU | 2.6 kg | 26.85 mm | 16.00" | 2560x1600 | |
| 85.6 % v7 (old) | 07 / 2021 | Asus ROG Zephyrus M16 GU603H i9-11900H, GeForce RTX 3070 Laptop GPU | 2 kg | 20 mm | 16.00" | 2560x1600 | |
| 86.3 % v7 (old) | 06 / 2021 | LG Gram 16 (2021) i7-1165G7, Iris Xe G7 96EUs | 1.2 kg | 16.8 mm | 16.00" | 2560x1600 | |
| 79.9 % v7 (old) | 08 / 2020 | HP Pavilion Gaming 16-a0242ng i5-10300H, GeForce GTX 1650 Ti Mobile | 2.2 kg | 23.5 mm | 16.10" | 1920x1080 | |
| 82.4 % v7 (old) | 01 / 2021 | Dell Inspiron 15 7000 7506 2-in-1 Black Edition i7-1165G7, Xe MAX | 1.9 kg | 17.94 mm | 15.60" | 3840x2160 |
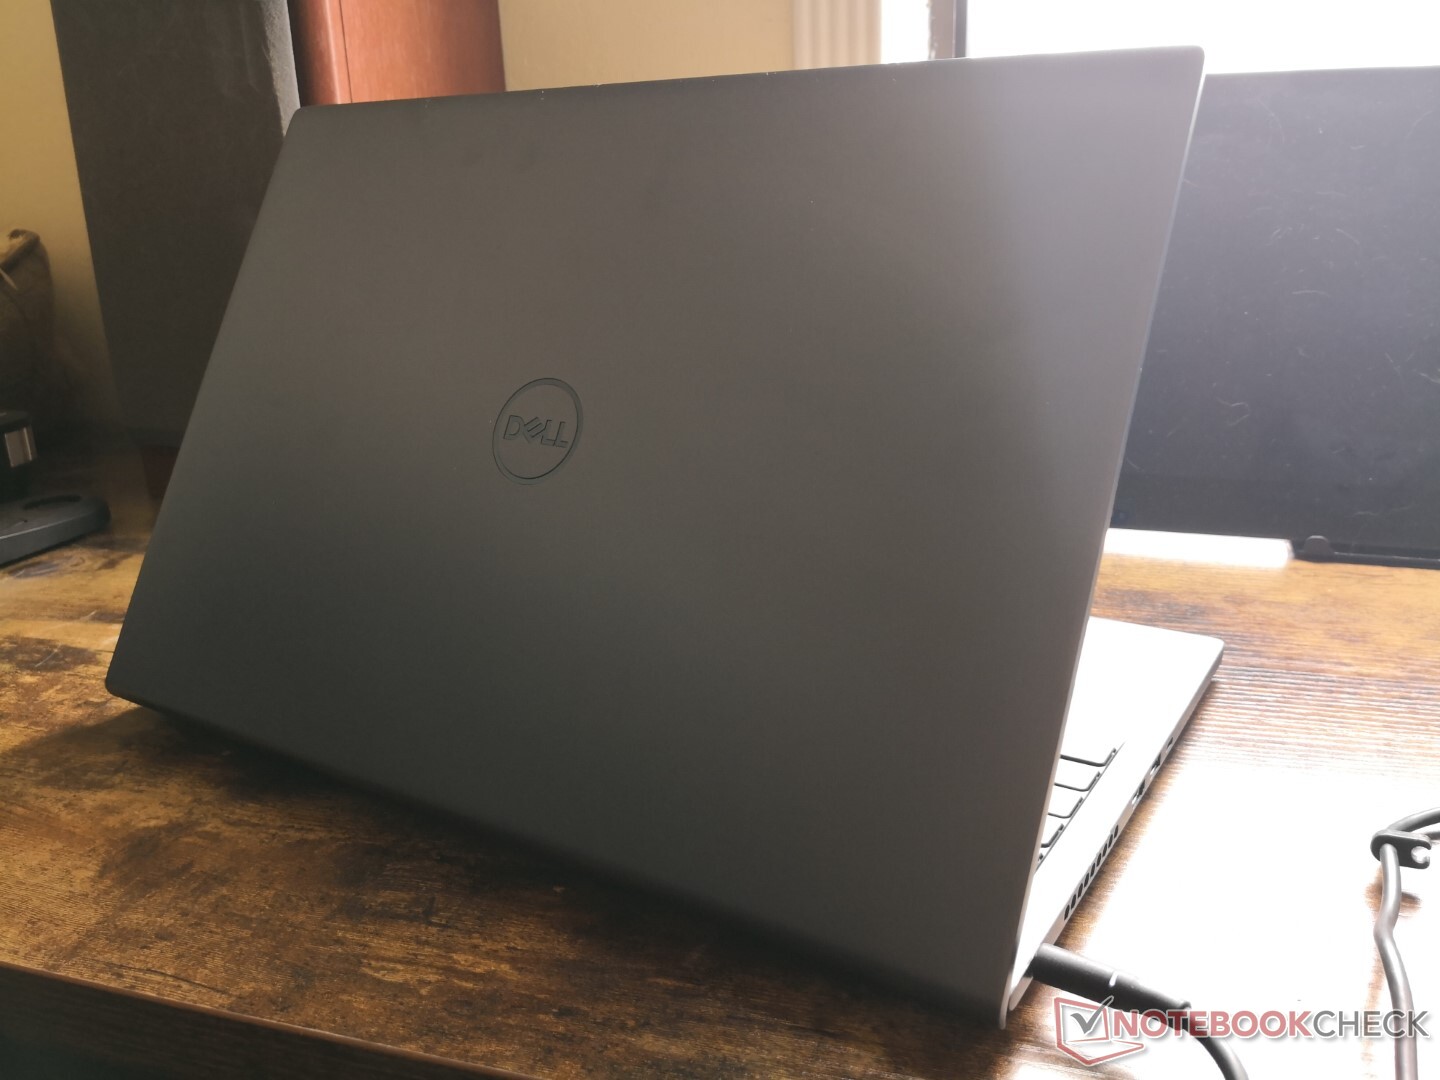
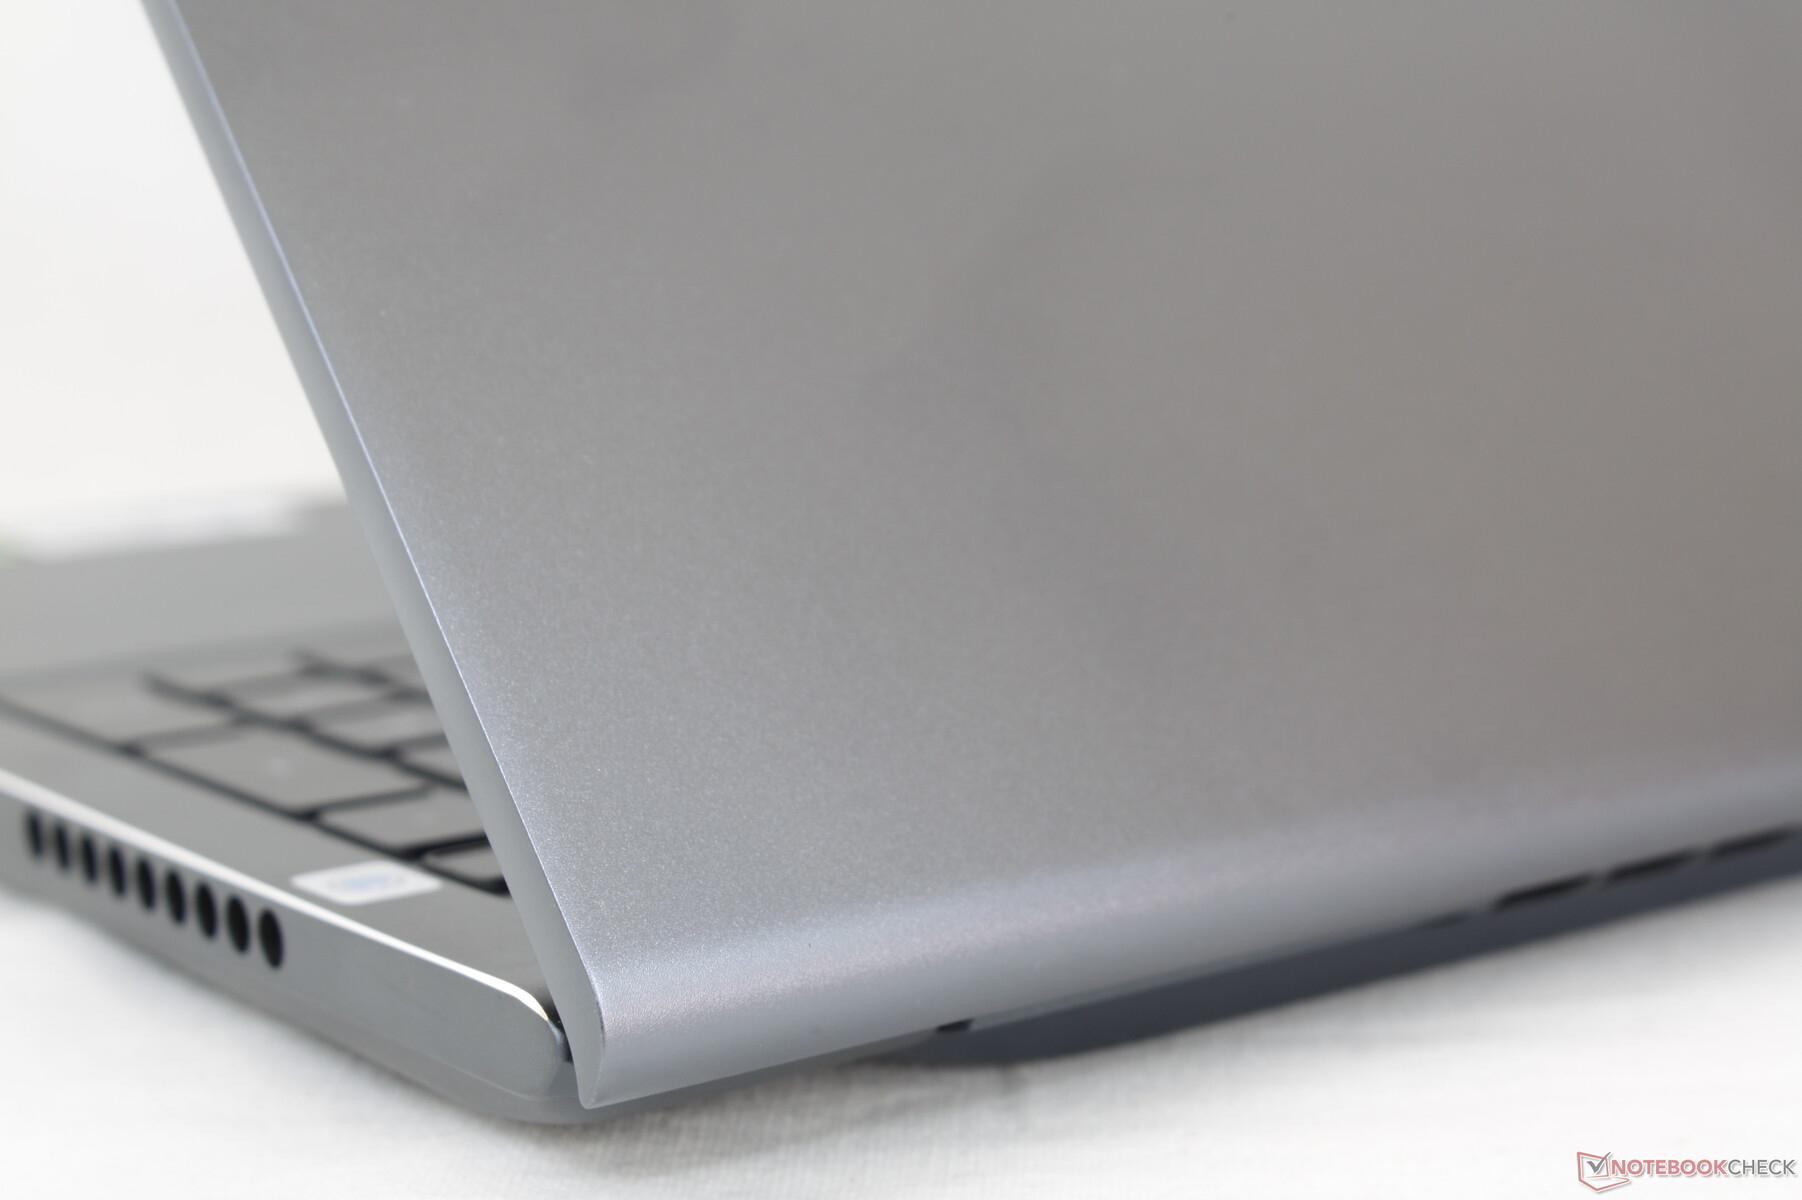
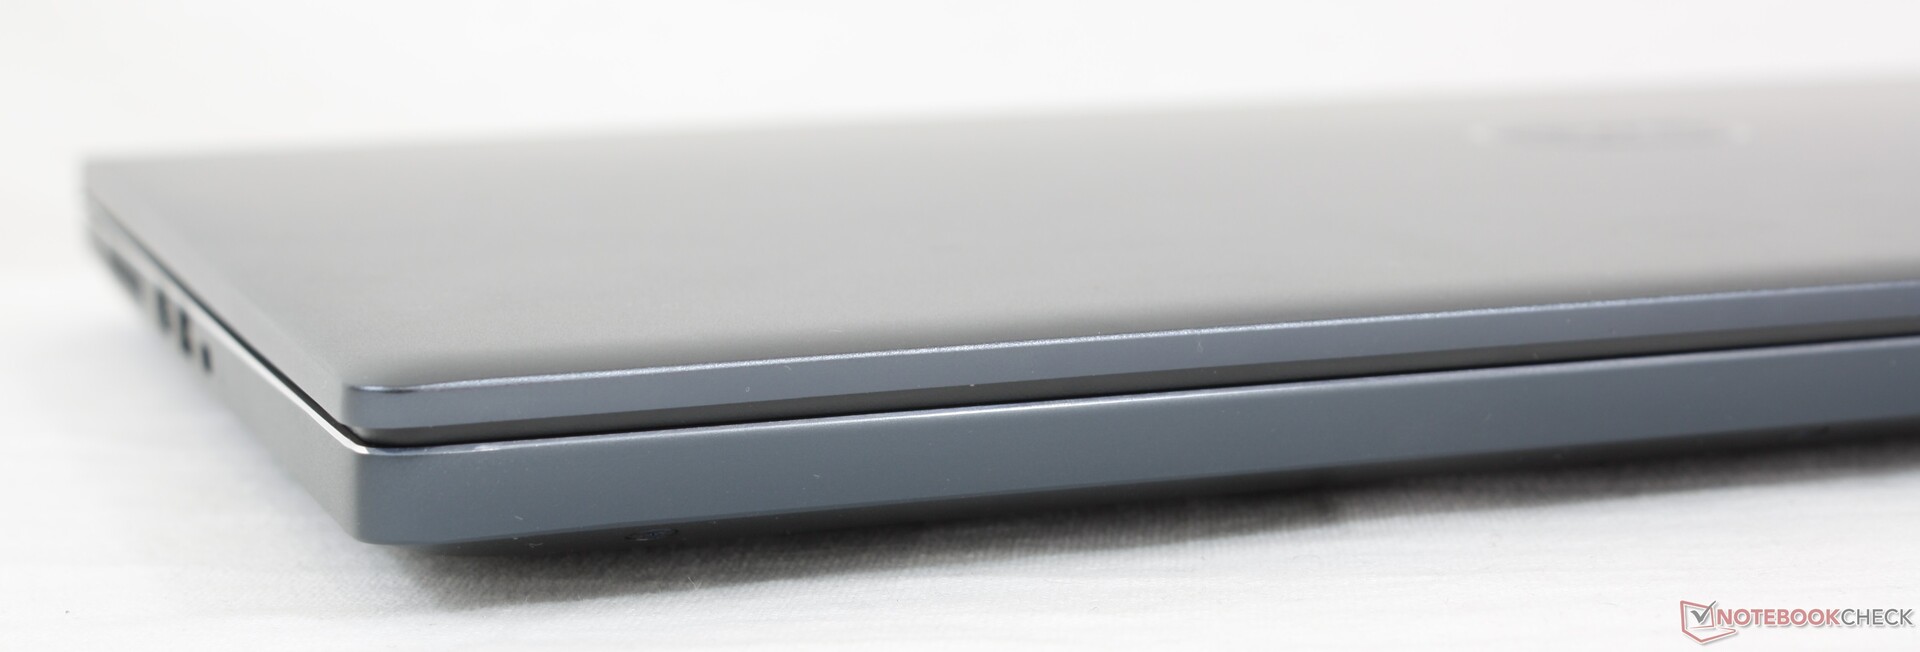
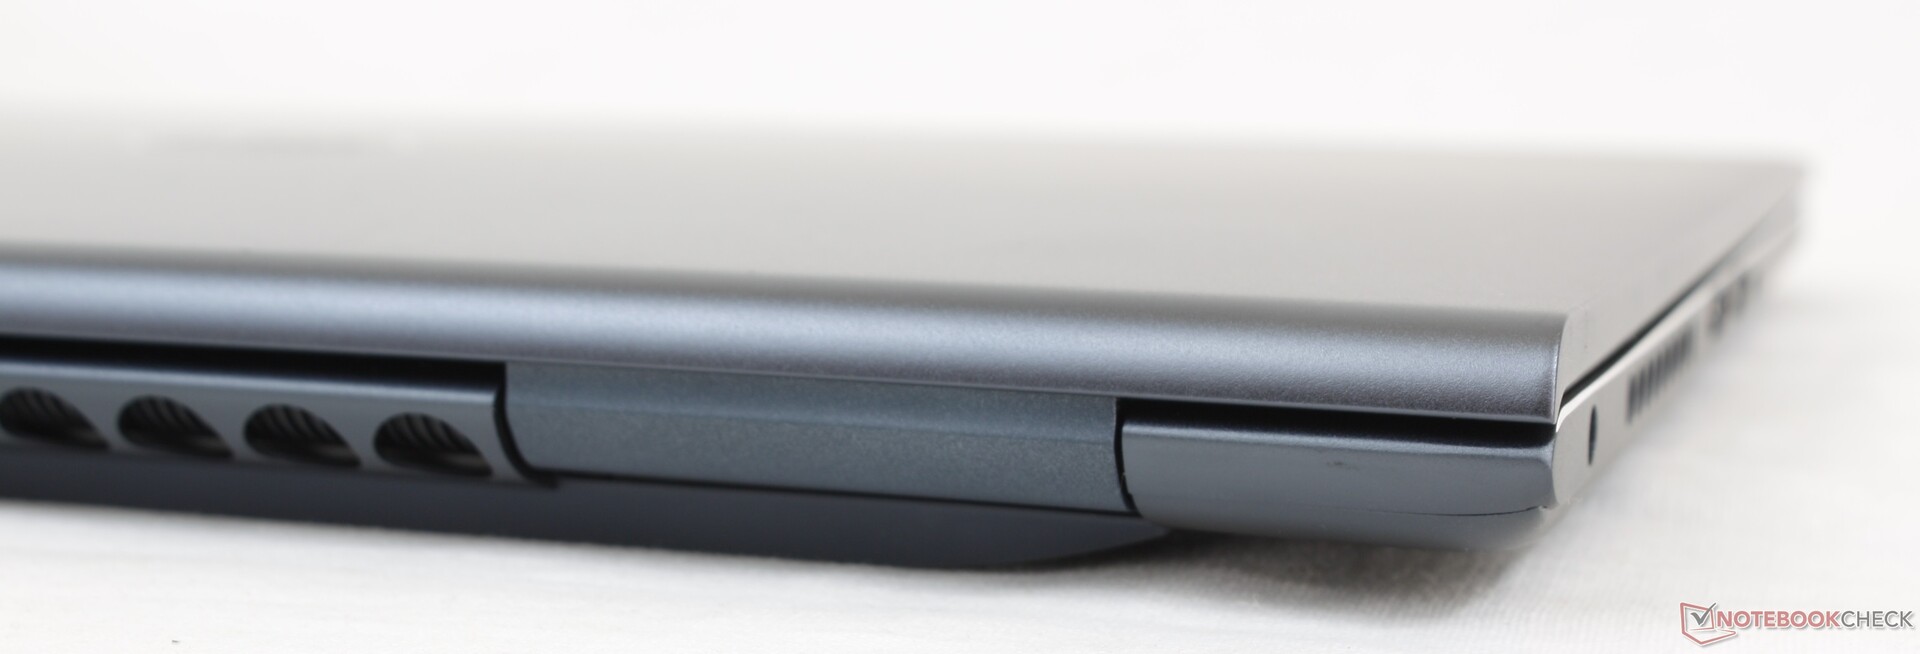
Case — Strong and Heavy
The system appears to be a new design not derived from any existing Inspiron 15 or 17 models. The current Inspiron 15, for example, utilizes hinges that lift the base at an angle with no overt ventilation grilles along the sides or rear. In contrast, the all metal Inspiron 16 has more traditional hinges with visible ventilation grilles all around. The chassis and lid are more rigid and of better quality than any Inspiron 15 we've tested thus far. It's weakest on the outer lid where we don't recommend stacking any heavy books.
The solid build comes at the cost of weight as the Inspiron 16 is heavier than the already hefty XPS 15. When compared to other 16-inch models, the system is very close to the more powerful Asus Zephyrus M16 while being smaller and lighter than the Pavilion Gaming 16.
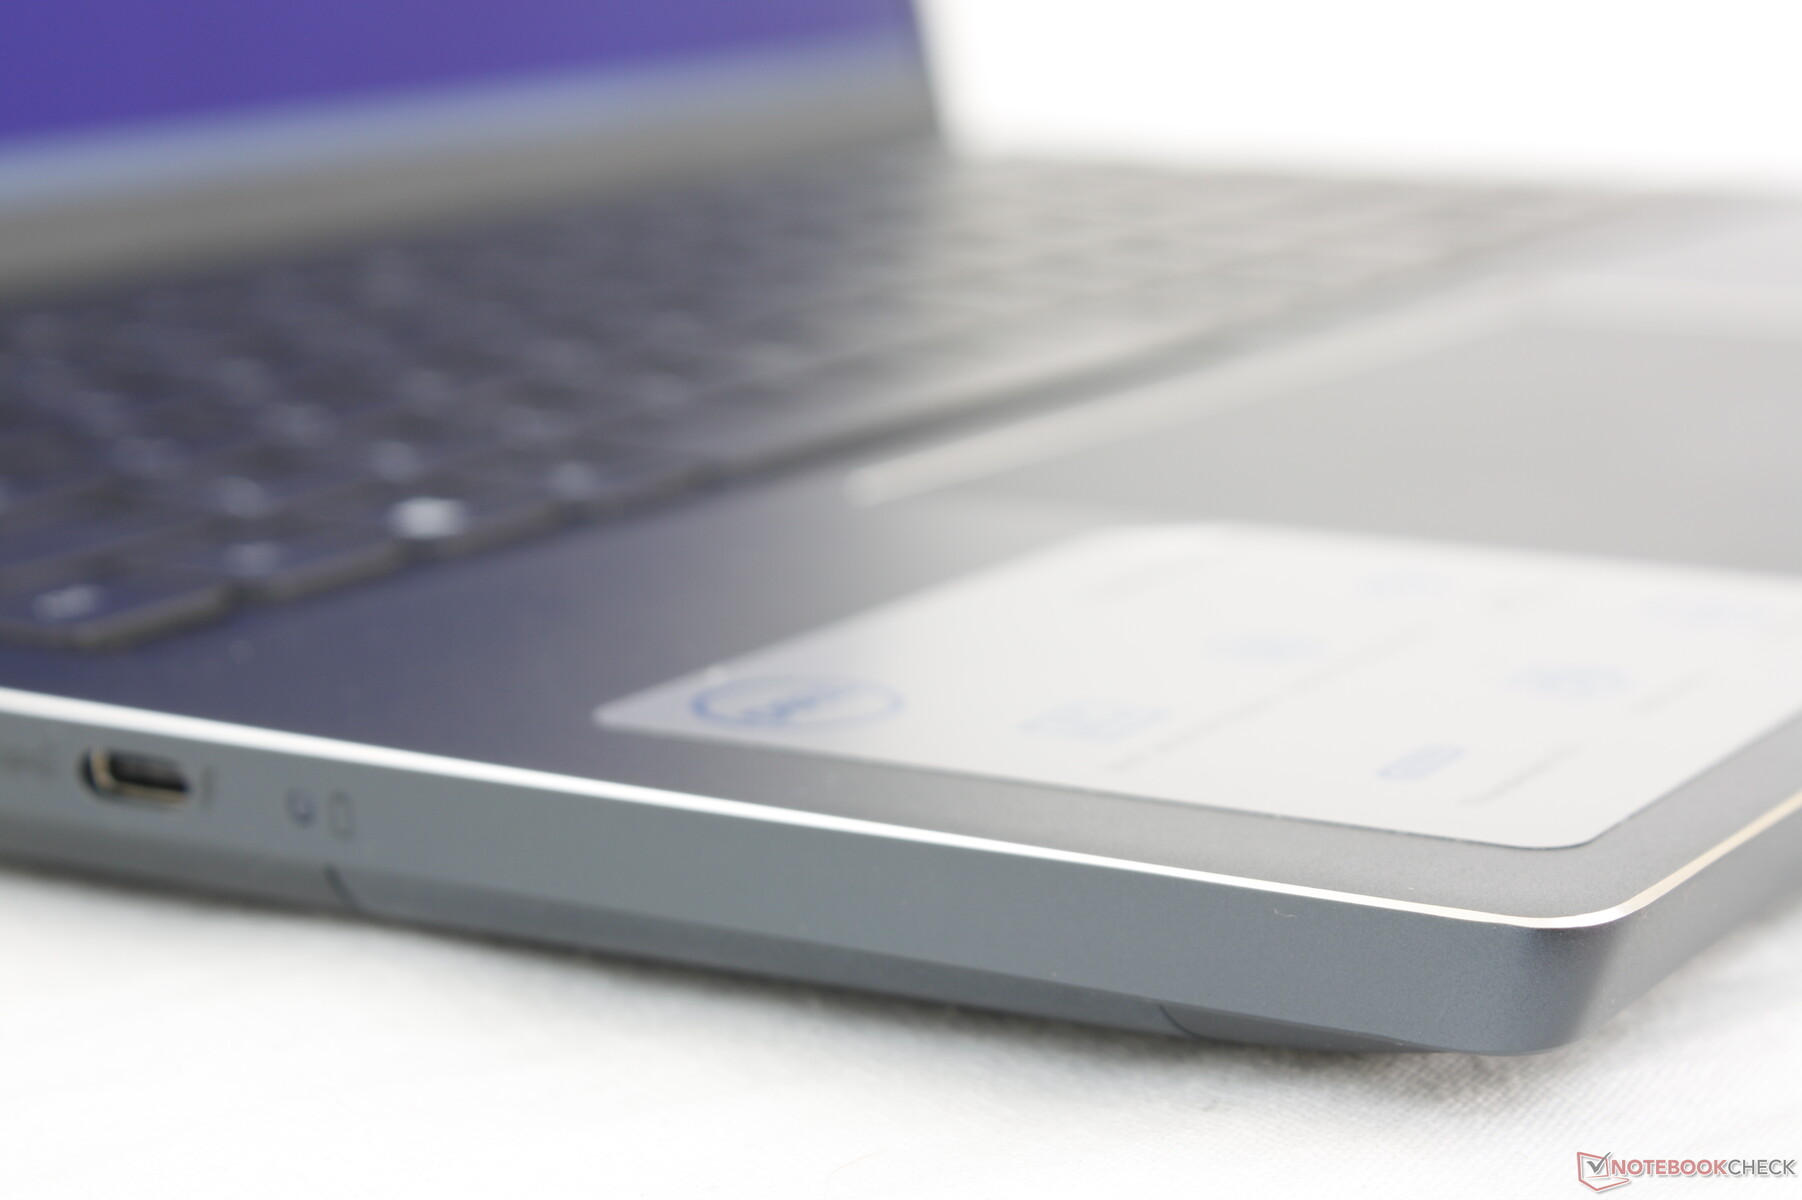
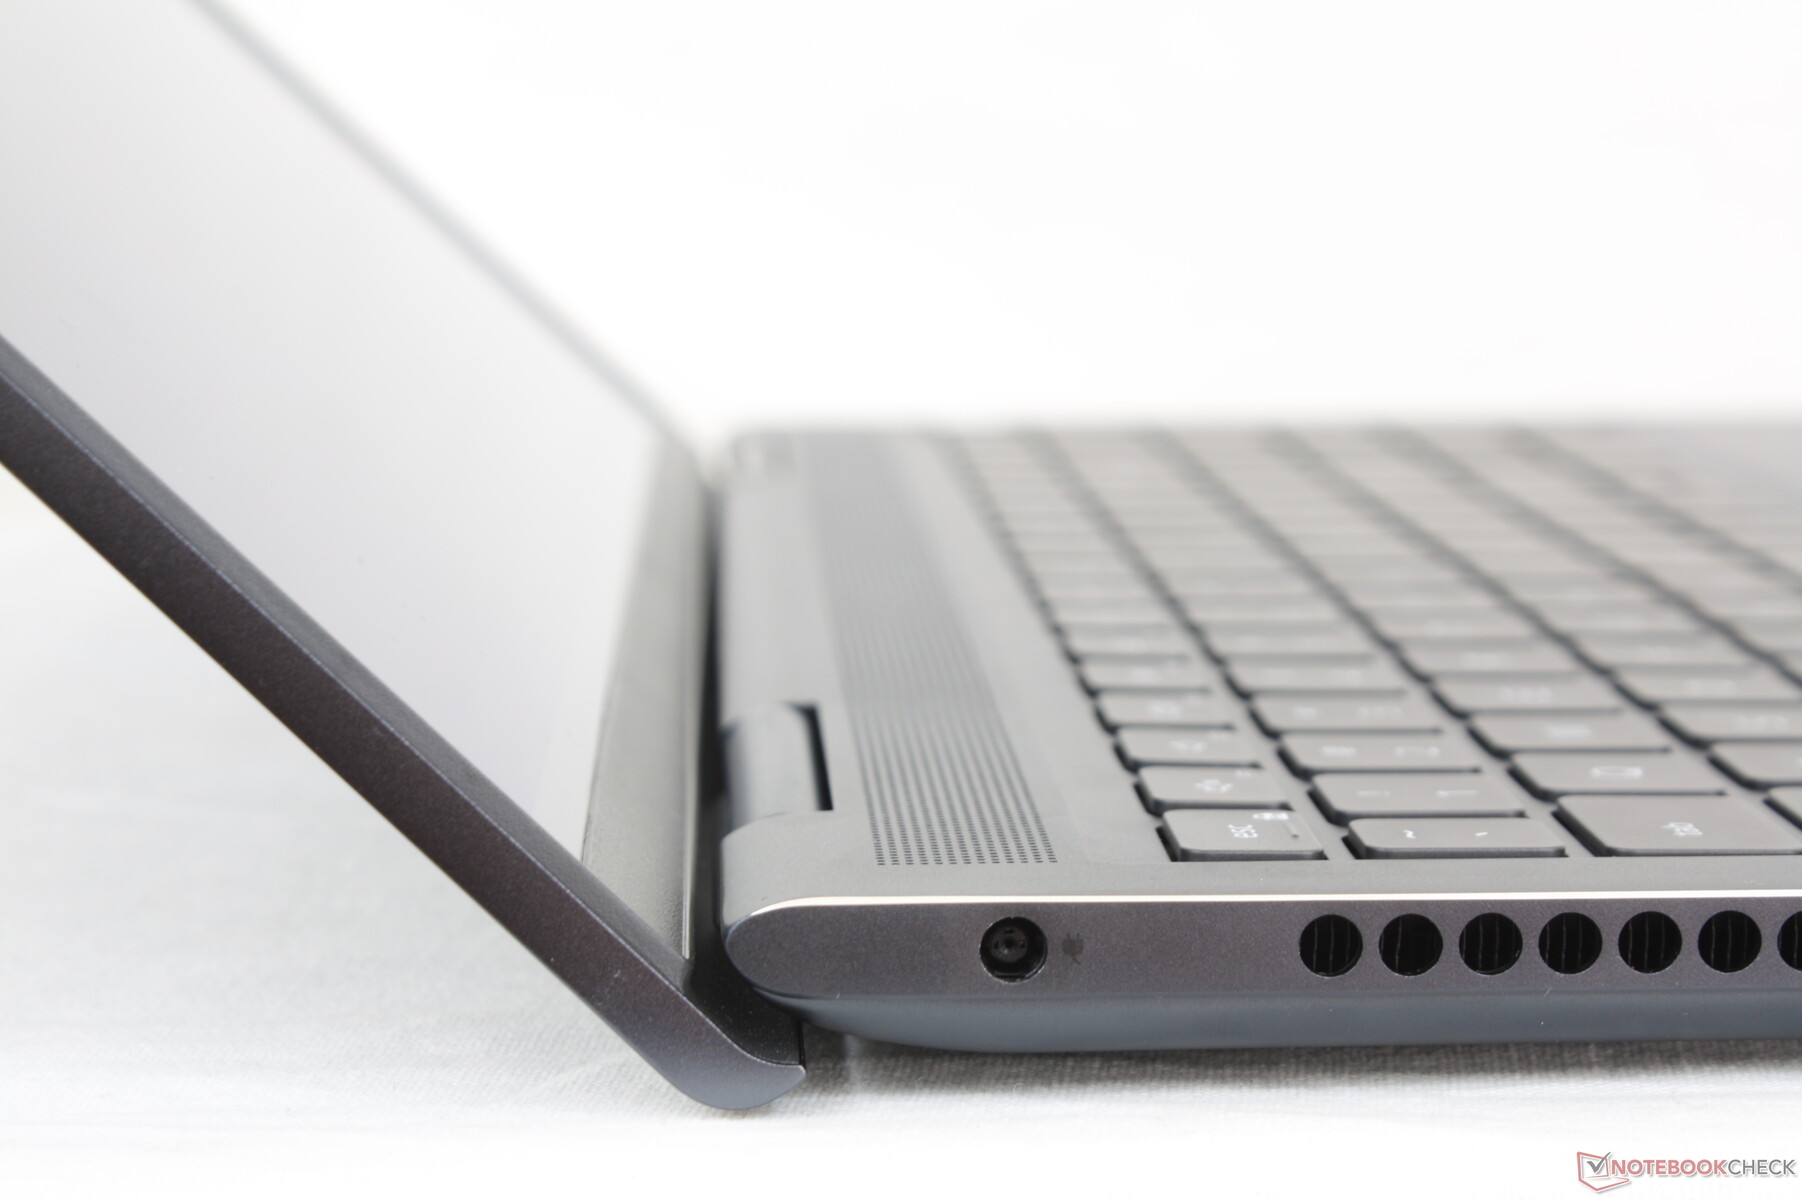
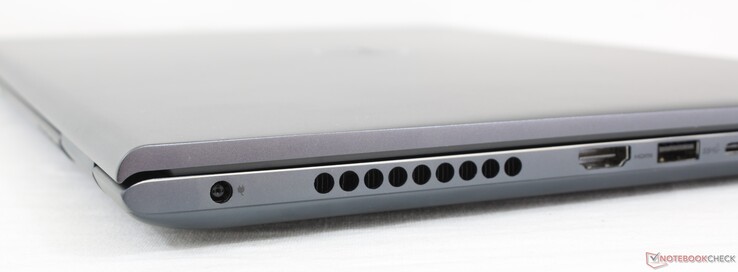
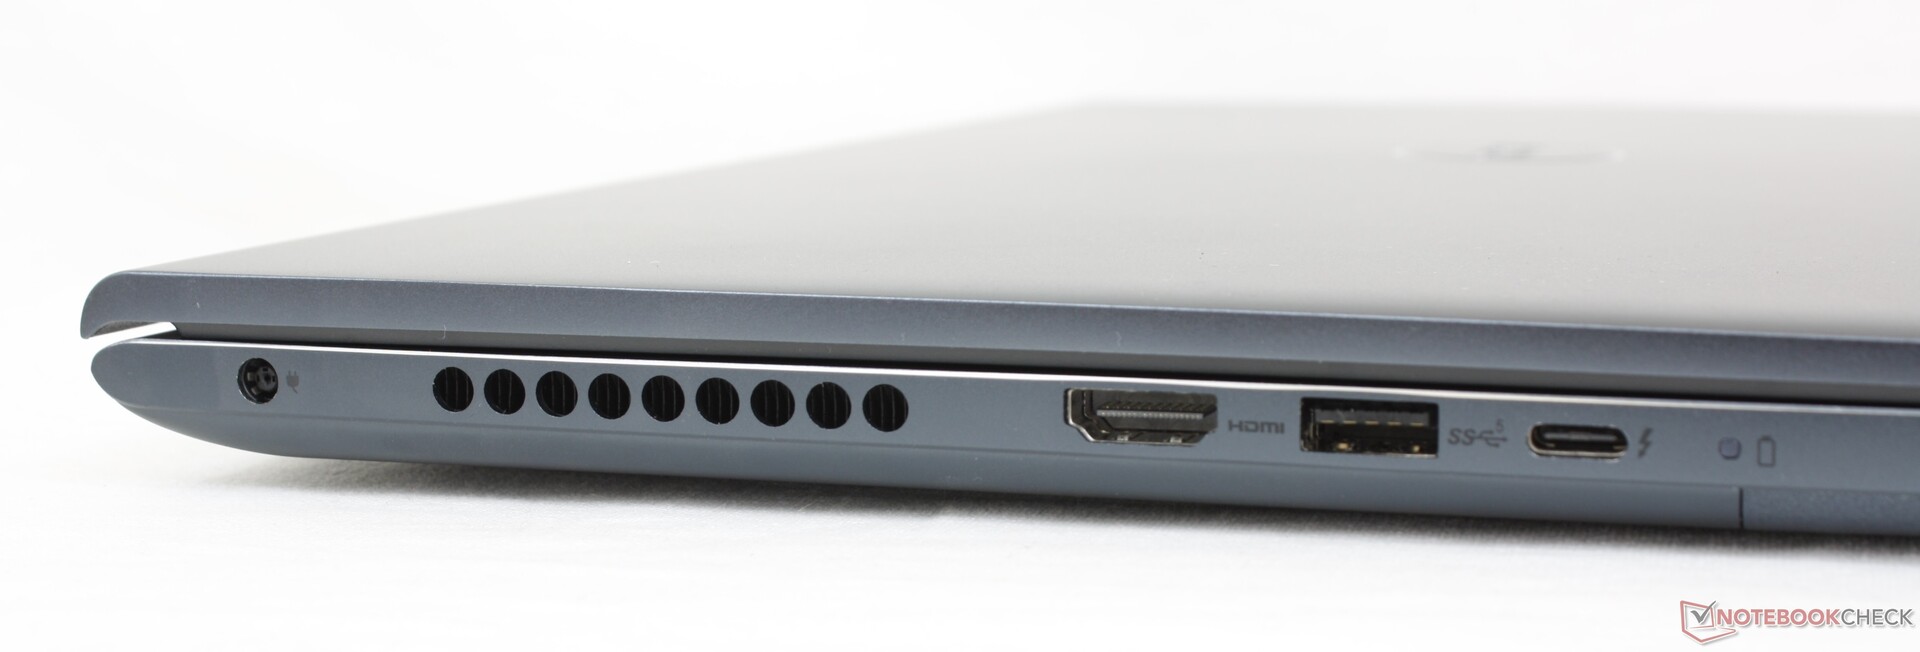
Connectivity — A Little Bit of Everything
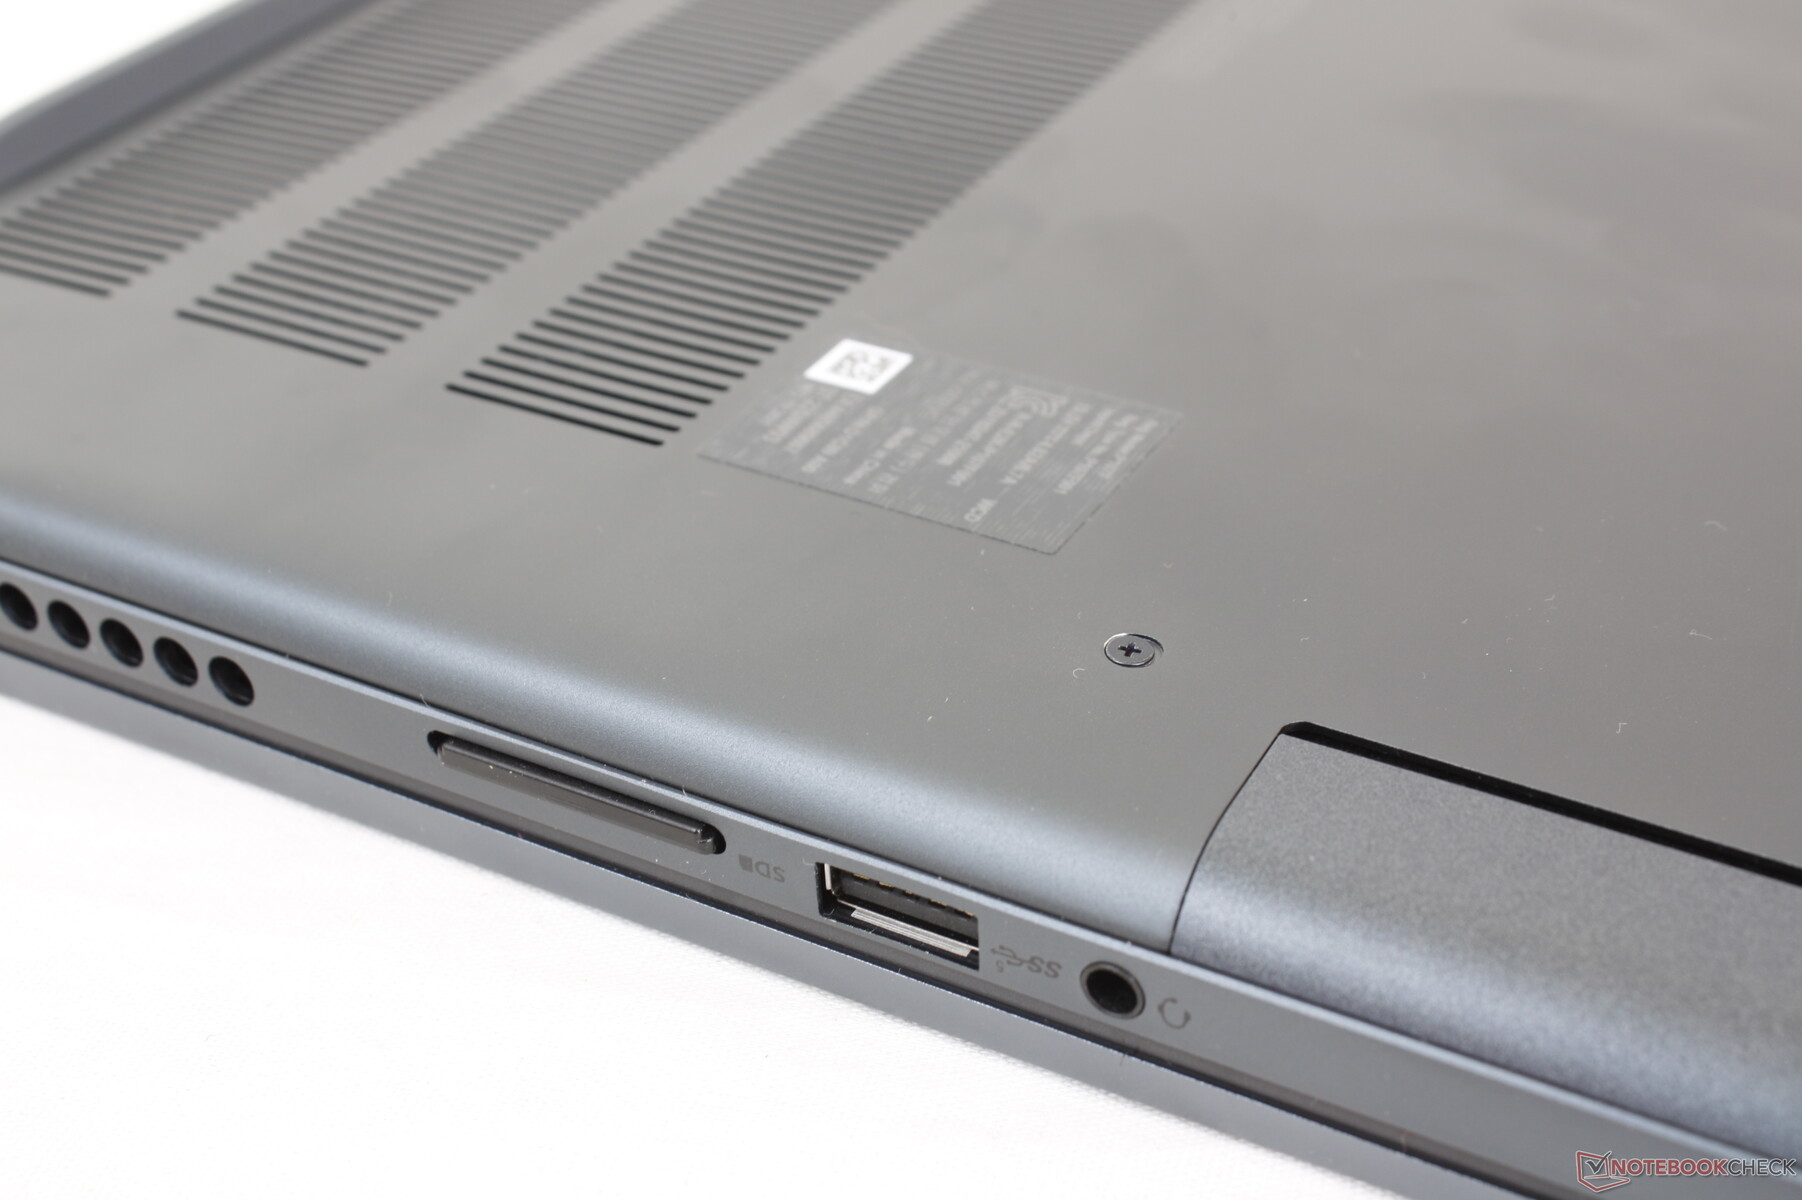
Port options are similar to the Inspiron 15 7506 2-in-1 but with two minor differences: the MicroSD reader has been upgraded to full size while the positioning of the ports is slightly different due to the new ventilation grilles. The ports are more varied here unlike on the XPS lineup where USB-C ports have priority over everything else.
It's worth noting that we experienced an issue where neither of the two USB-A ports could recognize our external SSD. Connecting our drive to the USB-C port, however, would show no problems at all. We recommend checking the USB-A ports immediately after purchasing for any potential issues.
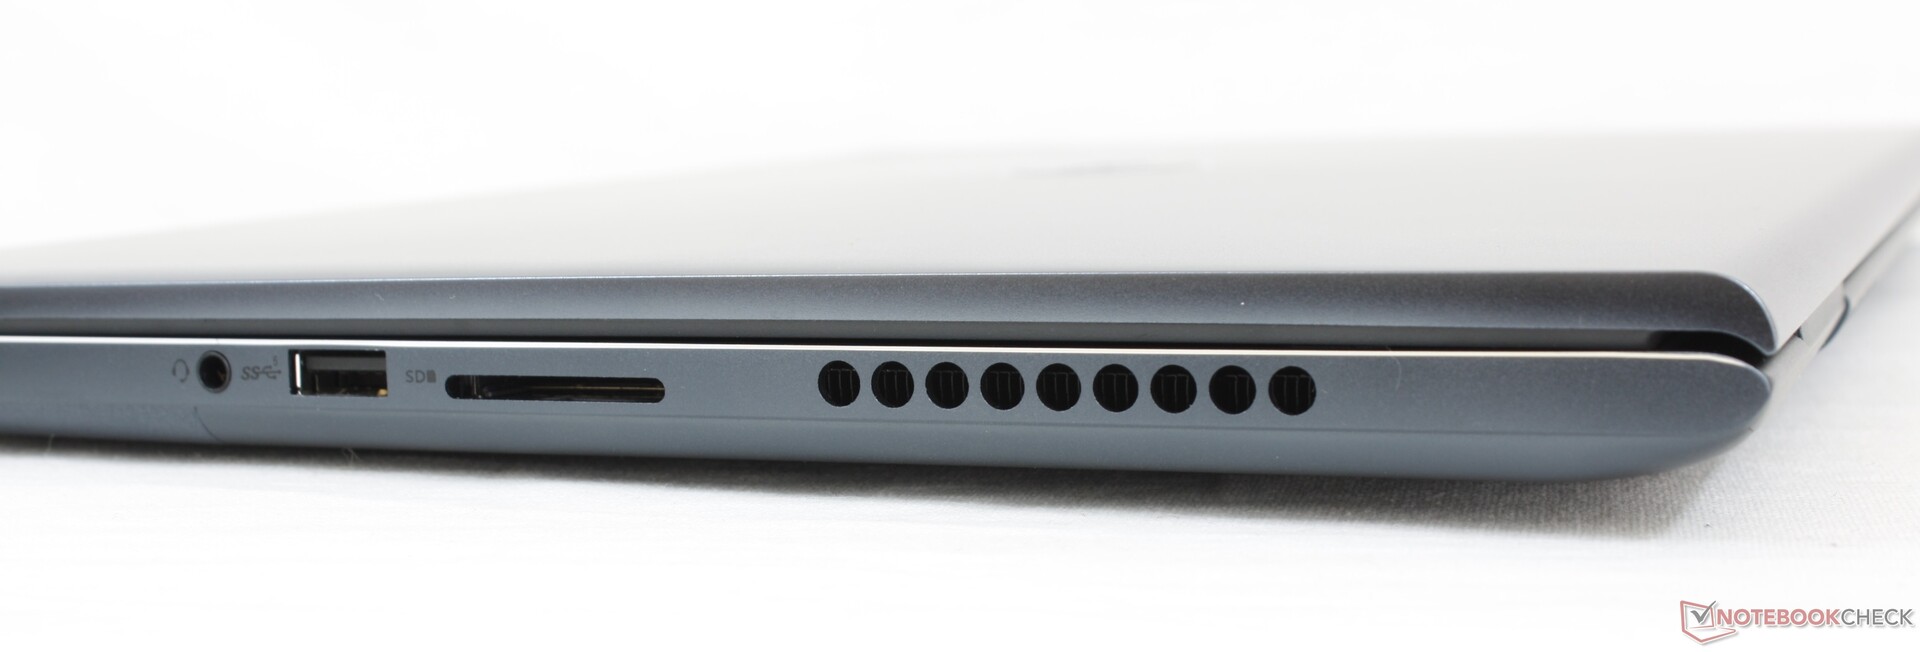
SD Card Reader
Transfer rates from the spring-loaded SD reader are very slow. Moving 1 GB of pictures from our UHS-II test card to desktop takes over 50 seconds compared to just 6 seconds on the XPS 15.
| SD Card Reader | |
| average JPG Copy Test (av. of 3 runs) | |
| Asus ROG Zephyrus M16 GU603H (AV PRO microSD 128 GB V60) | |
| LG Gram 16 (2021) (Toshiba Exceria Pro M501 microSDXC 64GB) | |
| HP Pavilion Gaming 16-a0242ng (Toshiba Exceria Pro SDXC 64 GB UHS-II) | |
| Dell Inspiron 15 7000 7506 2-in-1 Black Edition (Toshiba Exceria Pro M501 microSDXC 32GB) | |
| Dell Inspiron 16 Plus 7610 (AV PRO microSD 128 GB V60) | |
| maximum AS SSD Seq Read Test (1GB) | |
| Asus ROG Zephyrus M16 GU603H (AV PRO microSD 128 GB V60) | |
| LG Gram 16 (2021) (Toshiba Exceria Pro M501 microSDXC 64GB) | |
| HP Pavilion Gaming 16-a0242ng (Toshiba Exceria Pro SDXC 64 GB UHS-II) | |
| Dell Inspiron 15 7000 7506 2-in-1 Black Edition (Toshiba Exceria Pro M501 microSDXC 32GB) | |
| Dell Inspiron 16 Plus 7610 (AV PRO microSD 128 GB V60) | |
Communication
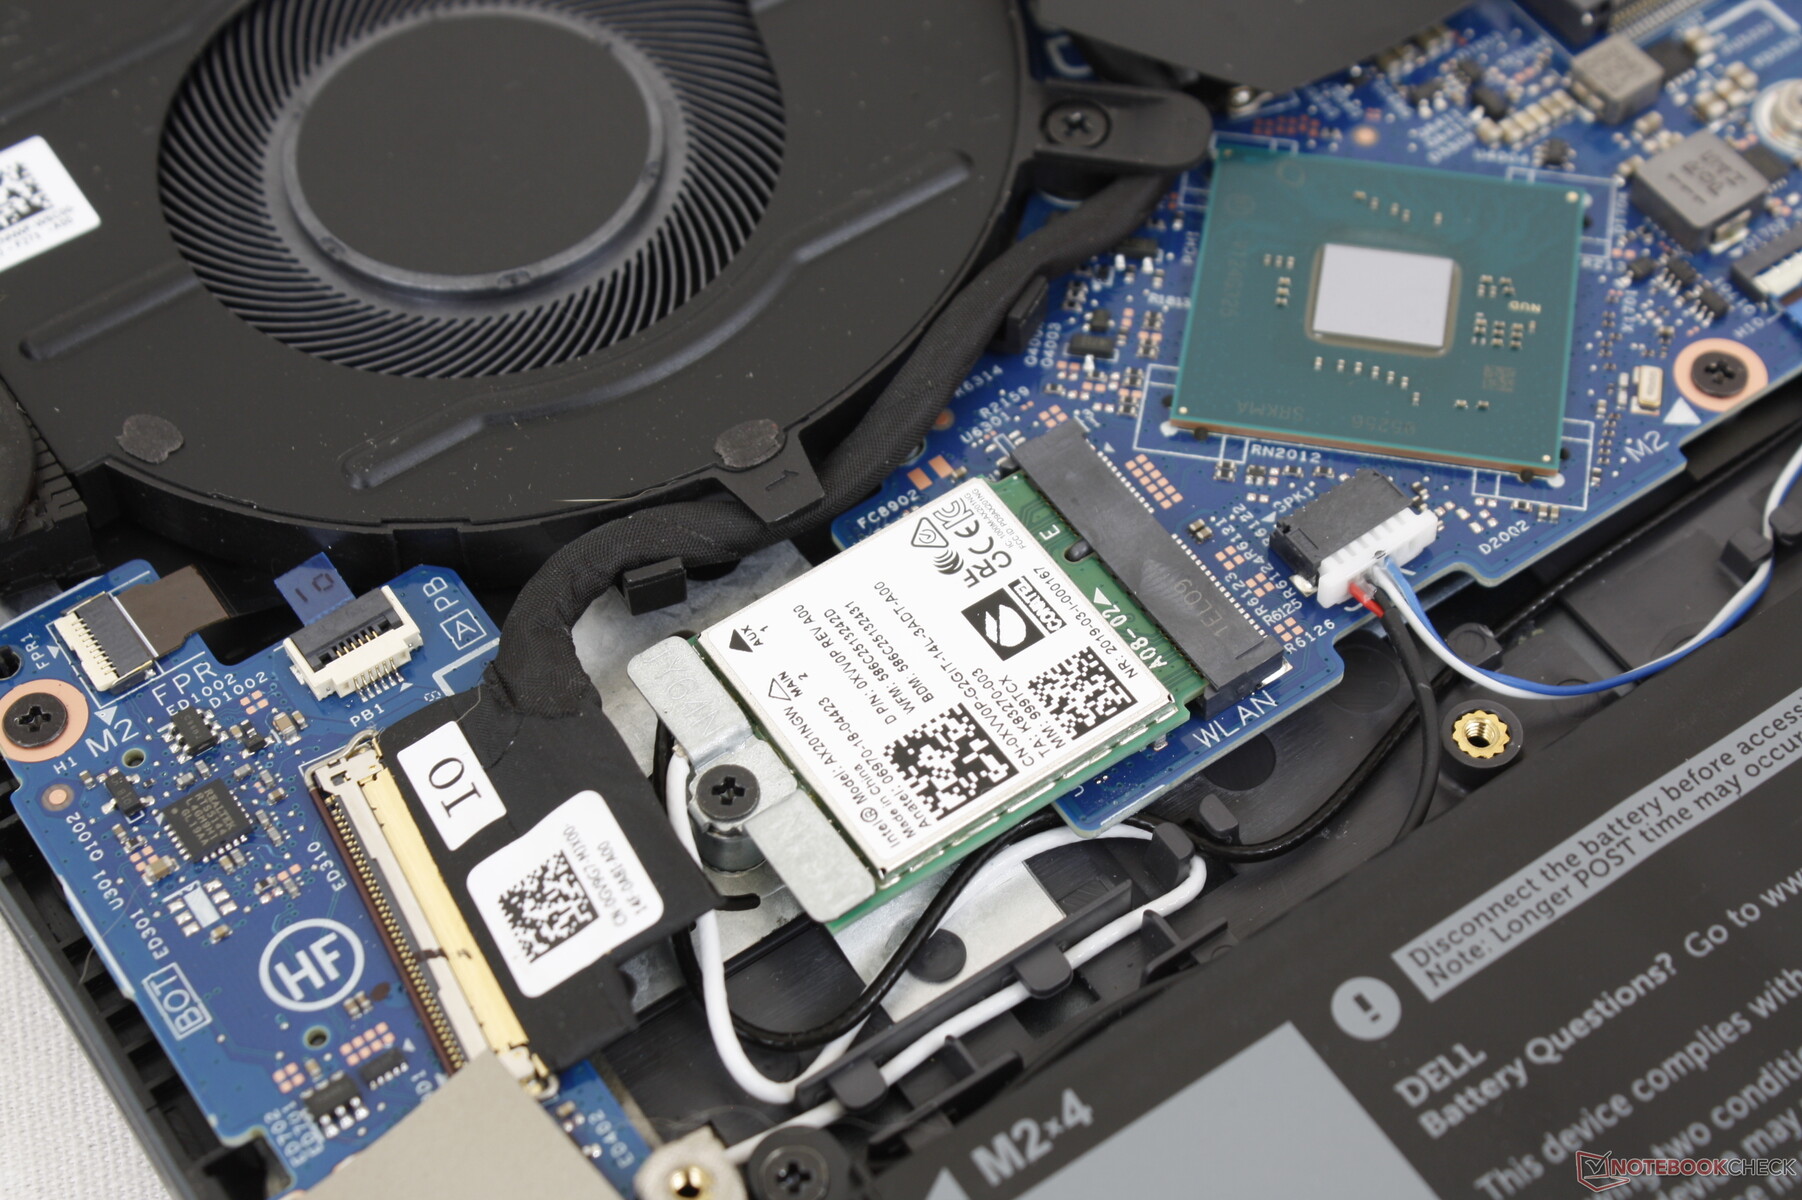
The Intel AX201 comes standard for Wi-Fi 6 and Bluetooth 5.1 connectivity. We experienced no issues when paired to our Netgear RAX200 test router.
Webcam
The camera is the standard 1 MP or 720p quality that we are all familiar with on most laptops. Though it integrates a manual shutter, it does not include IR or Windows Hello capabilities.


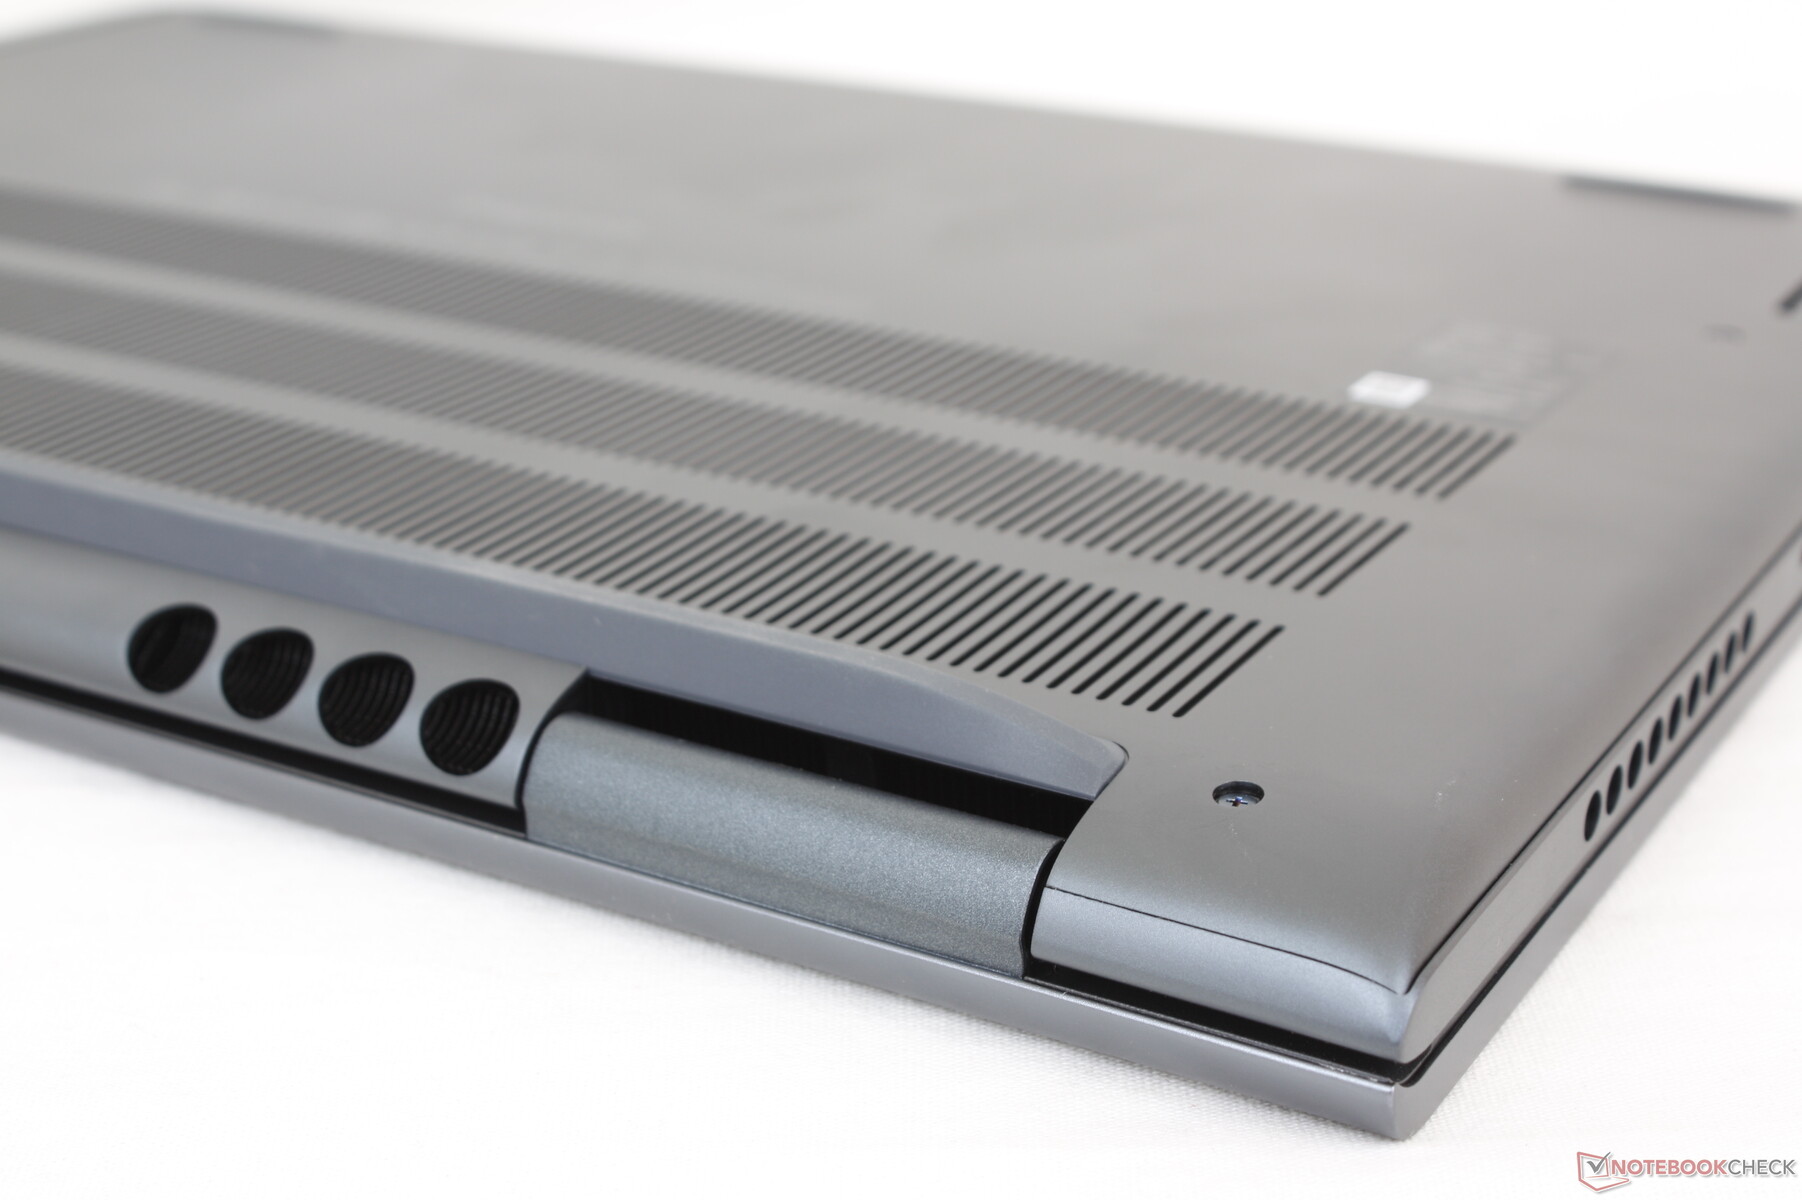
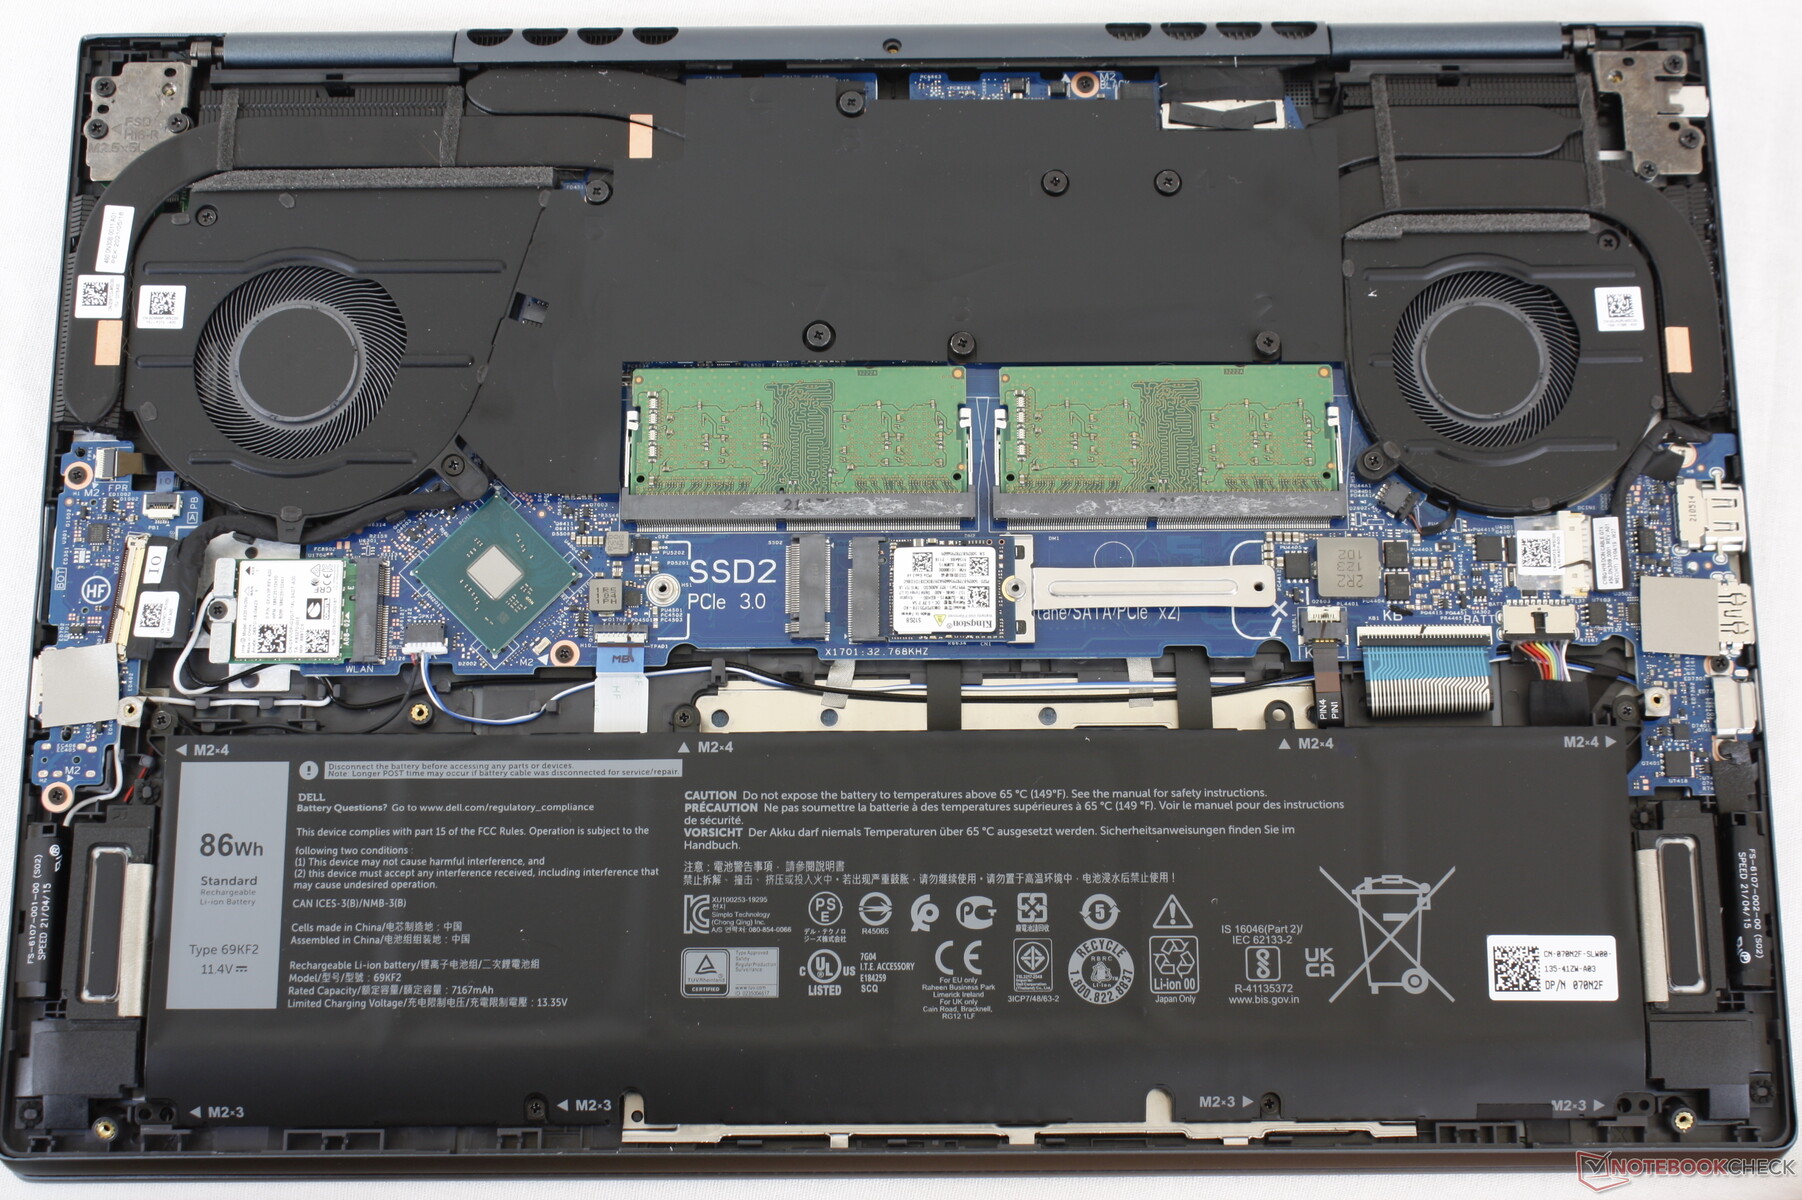
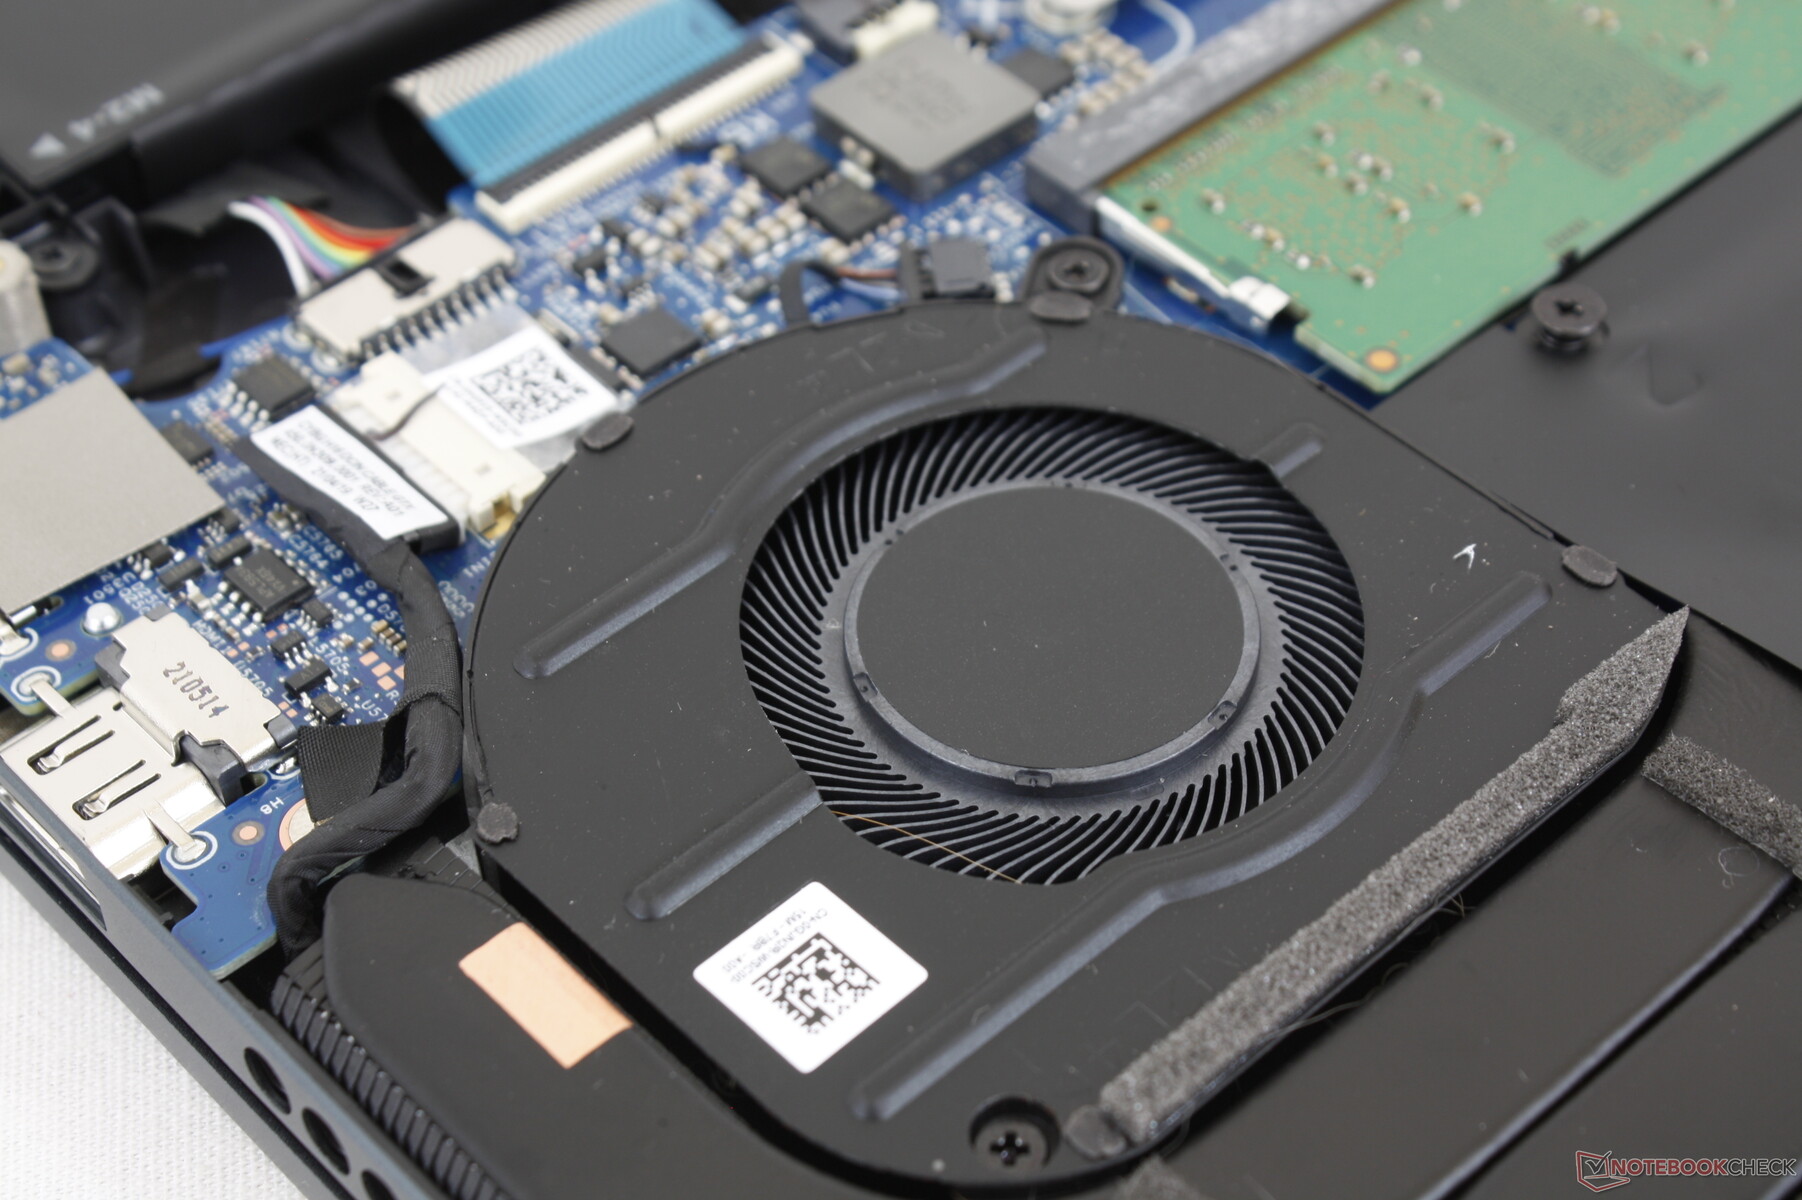
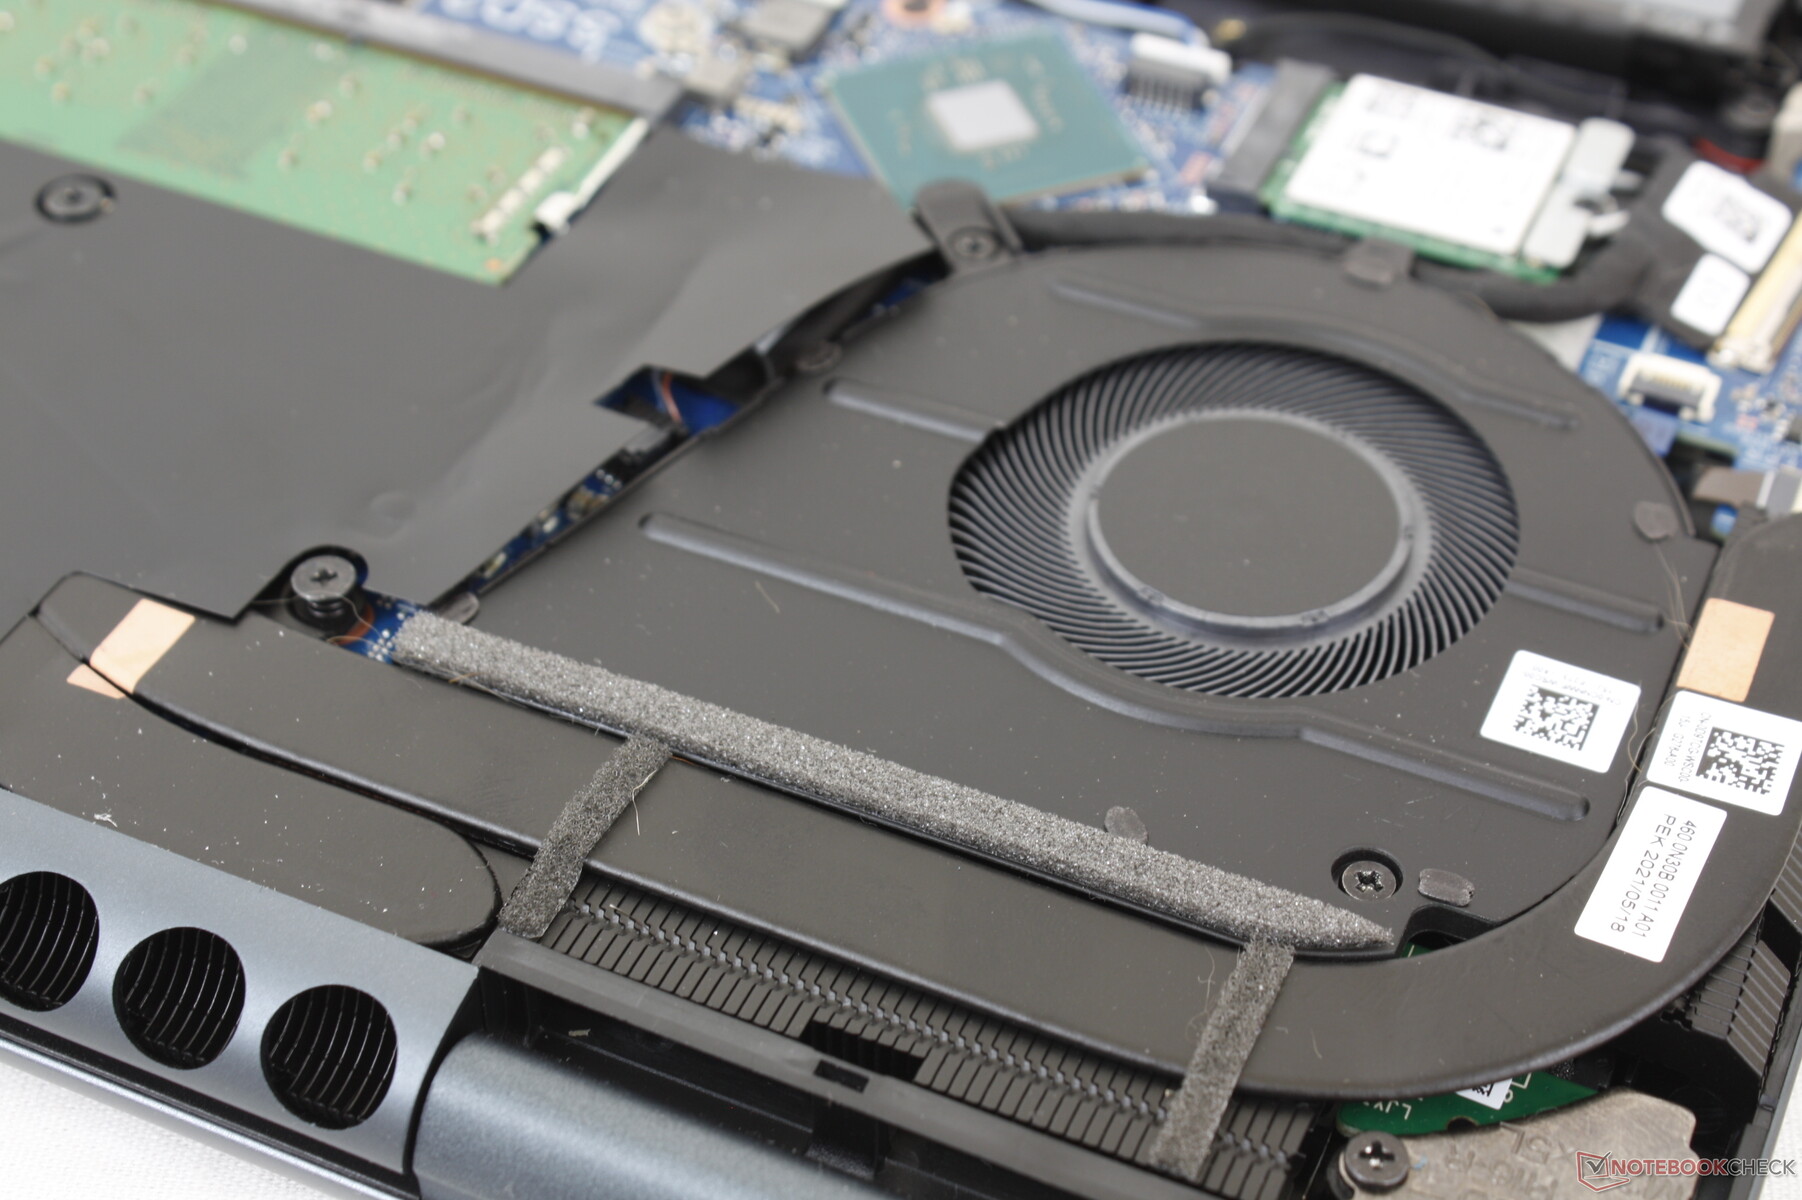
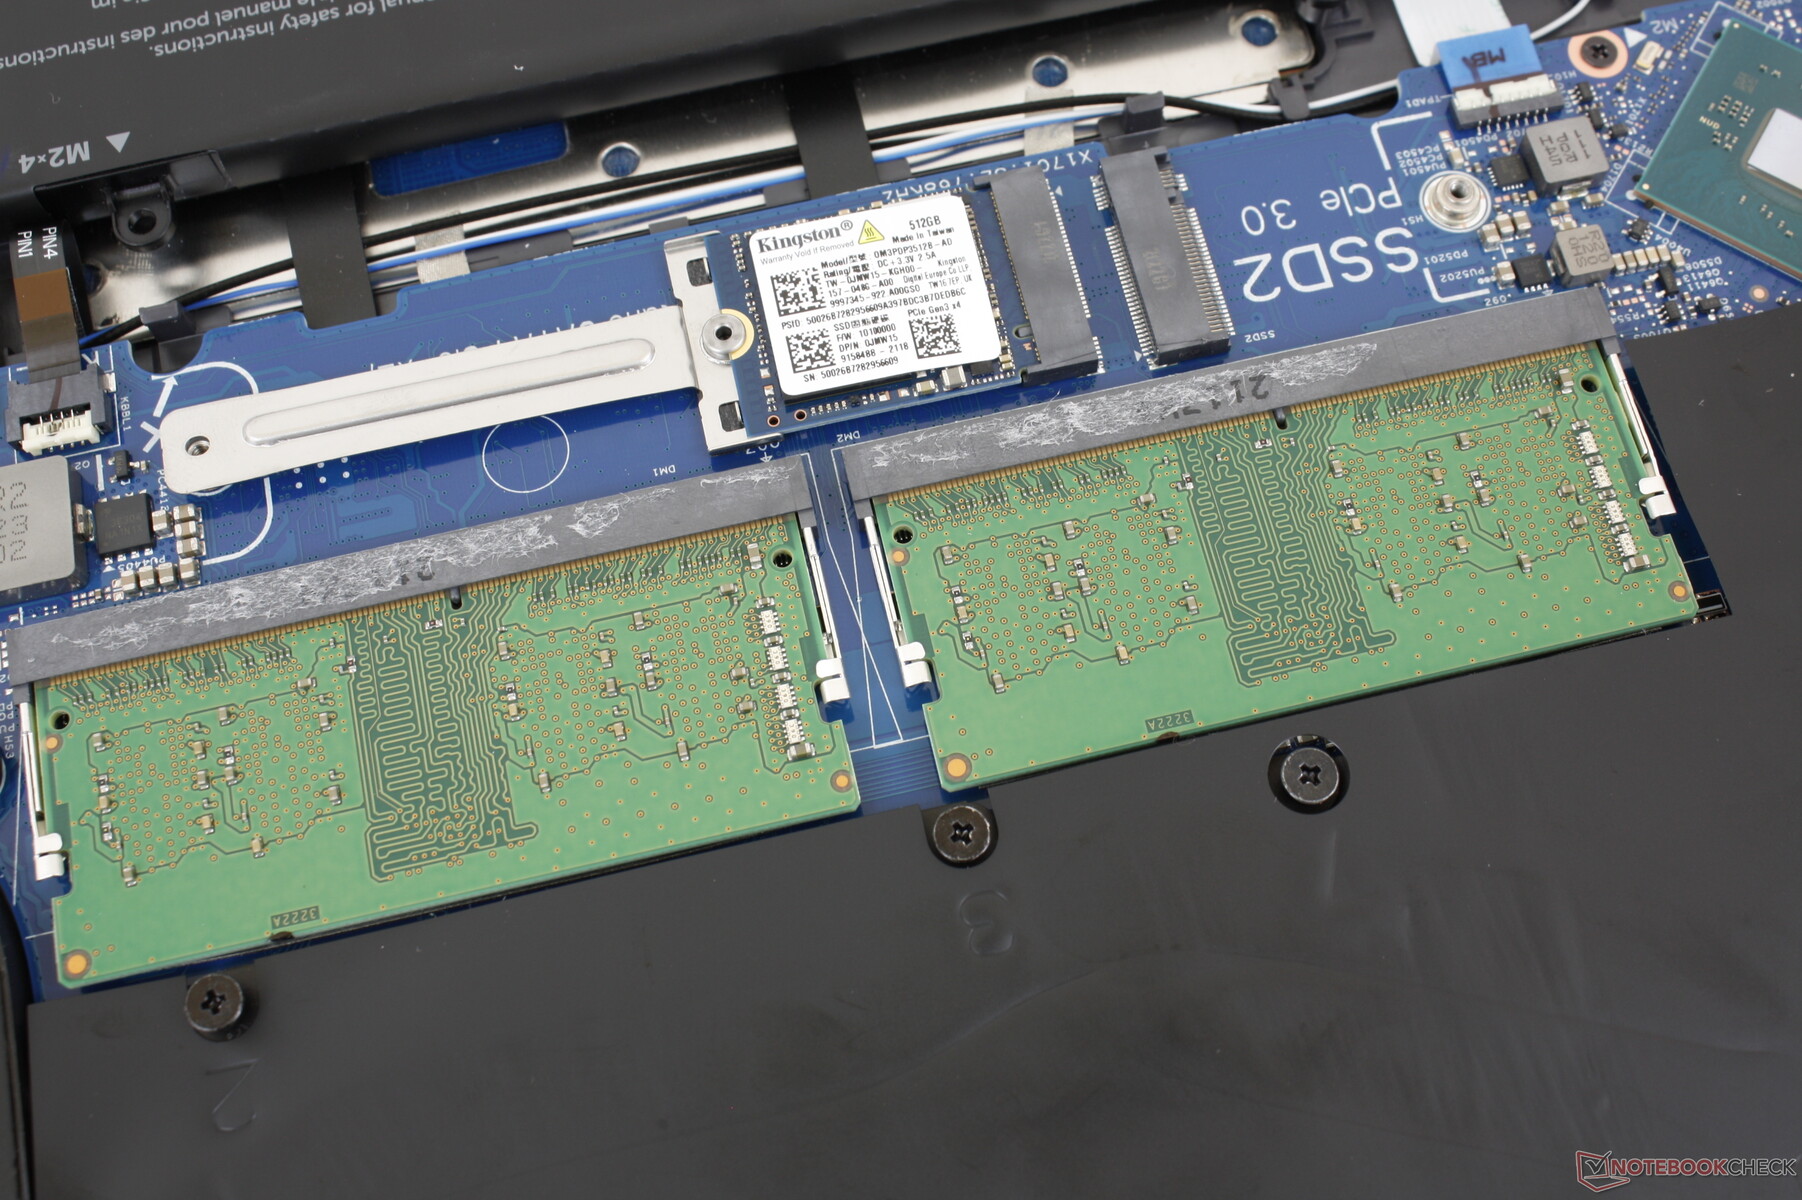
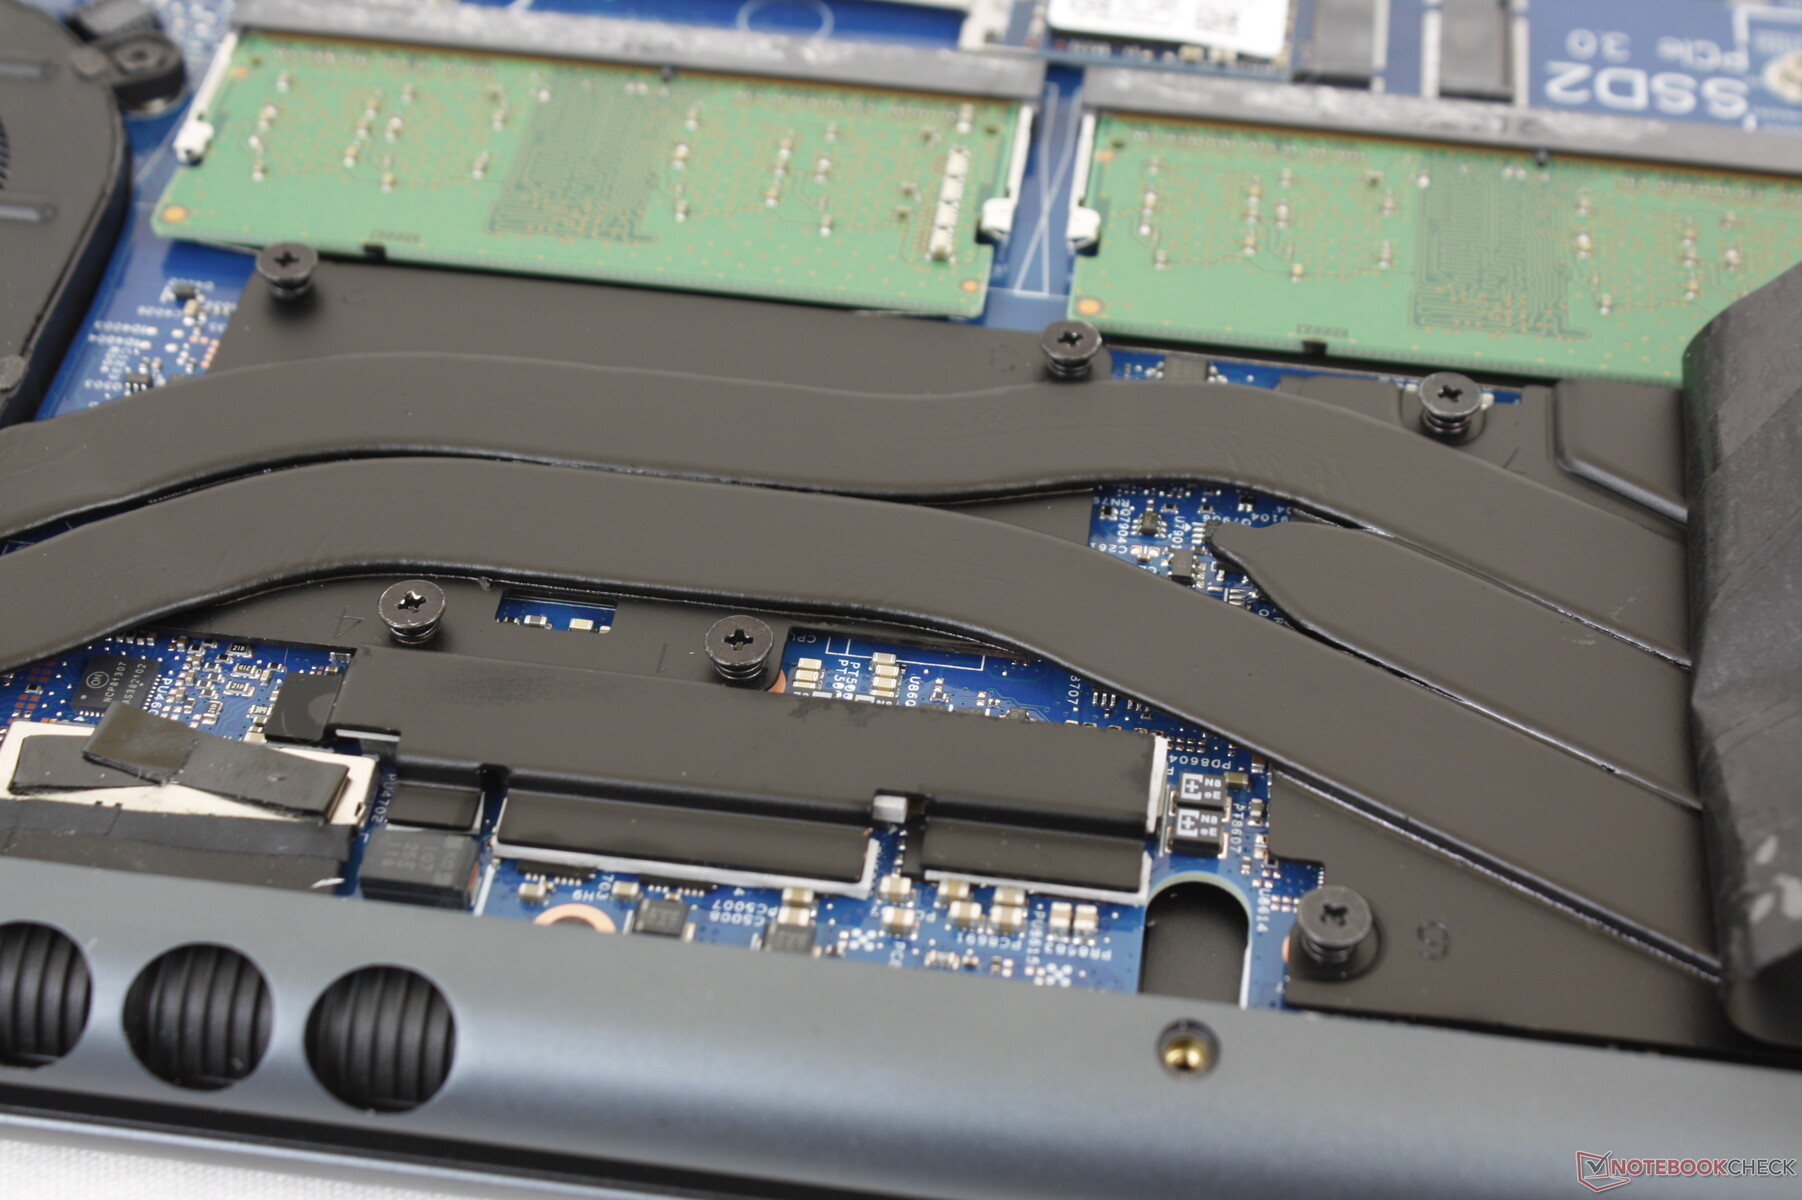
Maintenance — Easy Upgrades
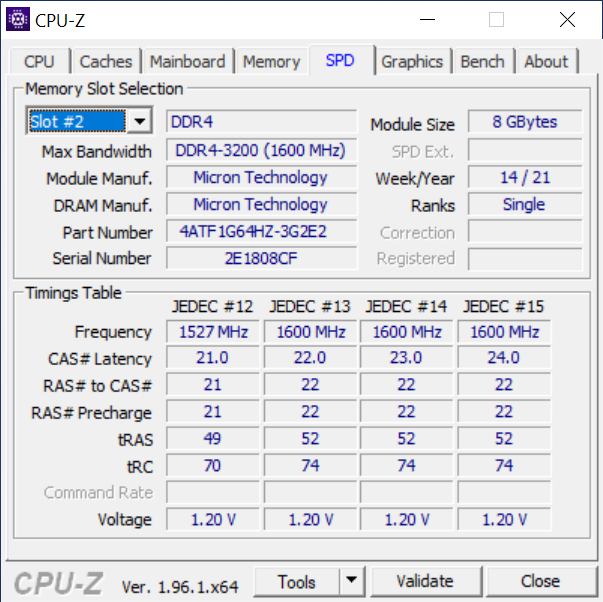
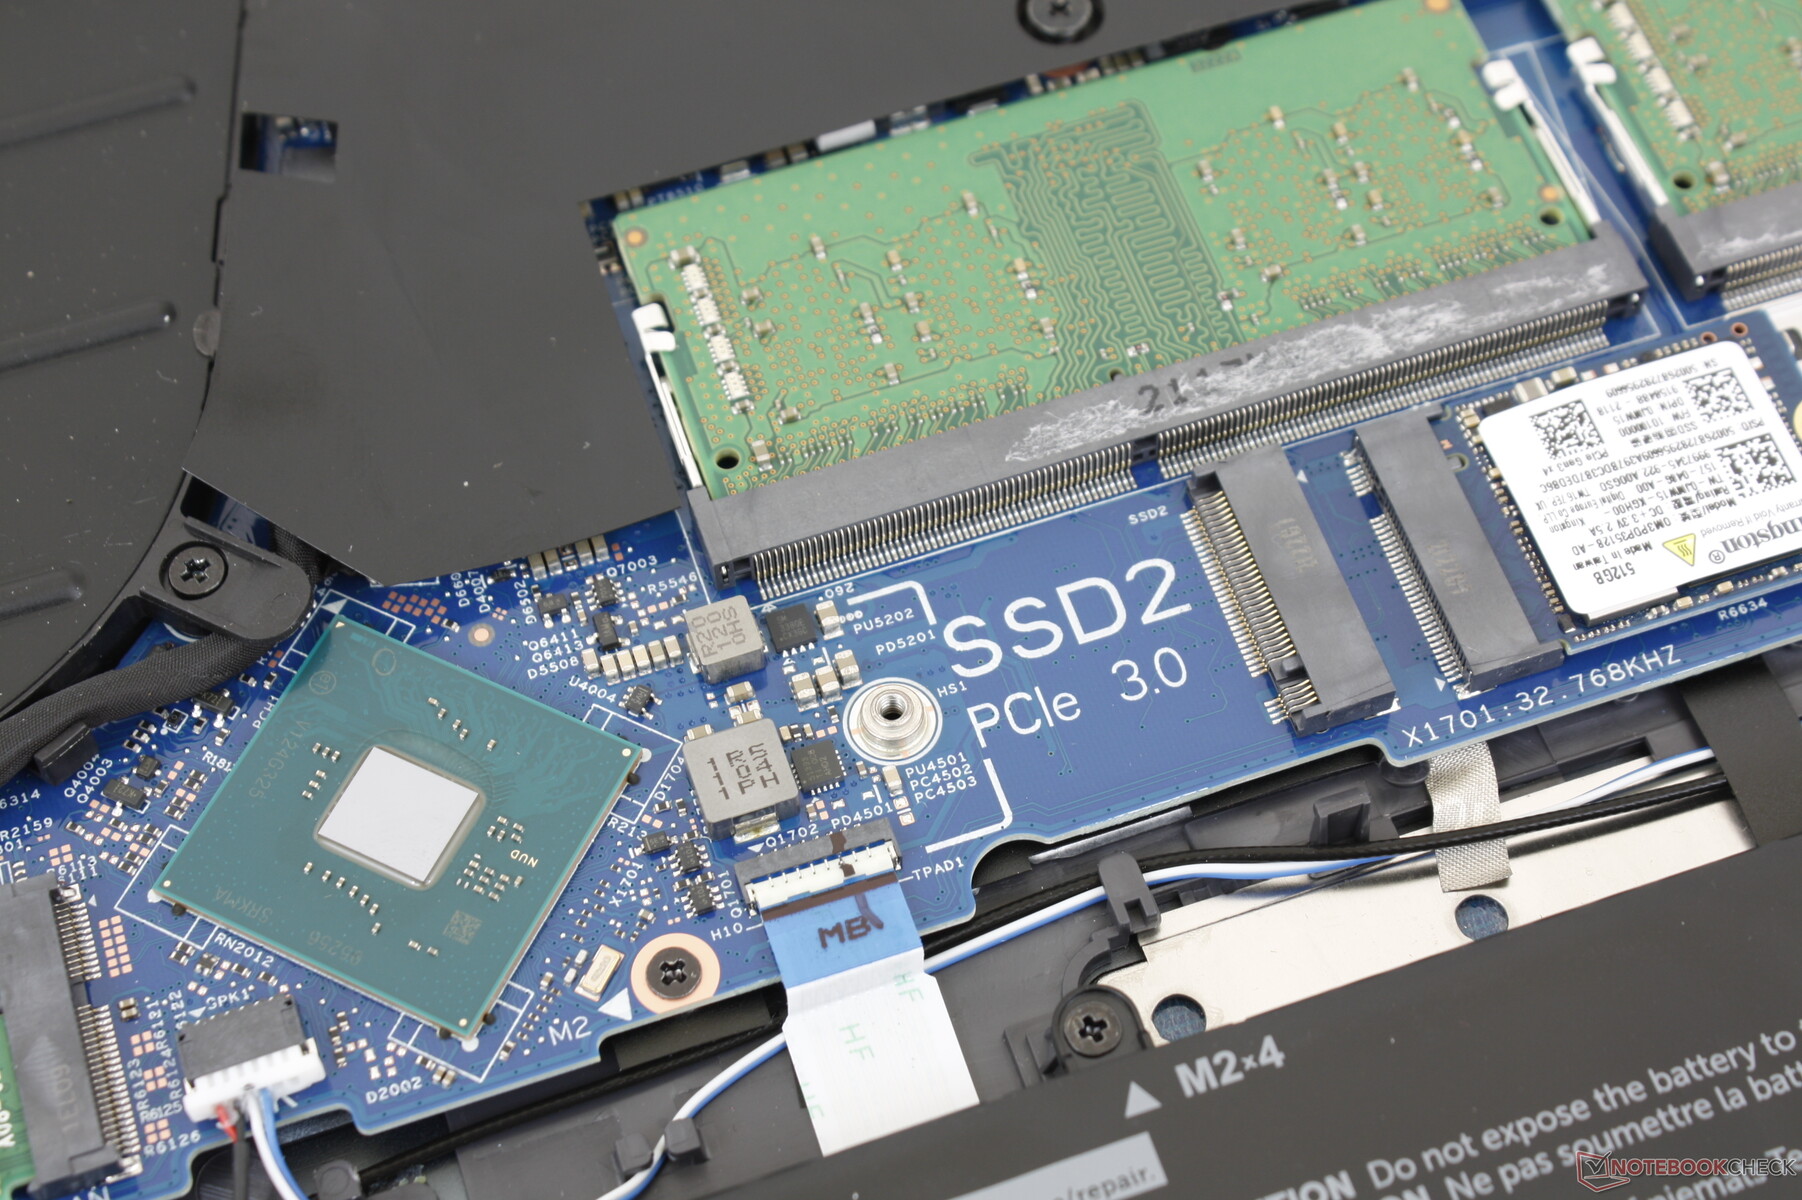
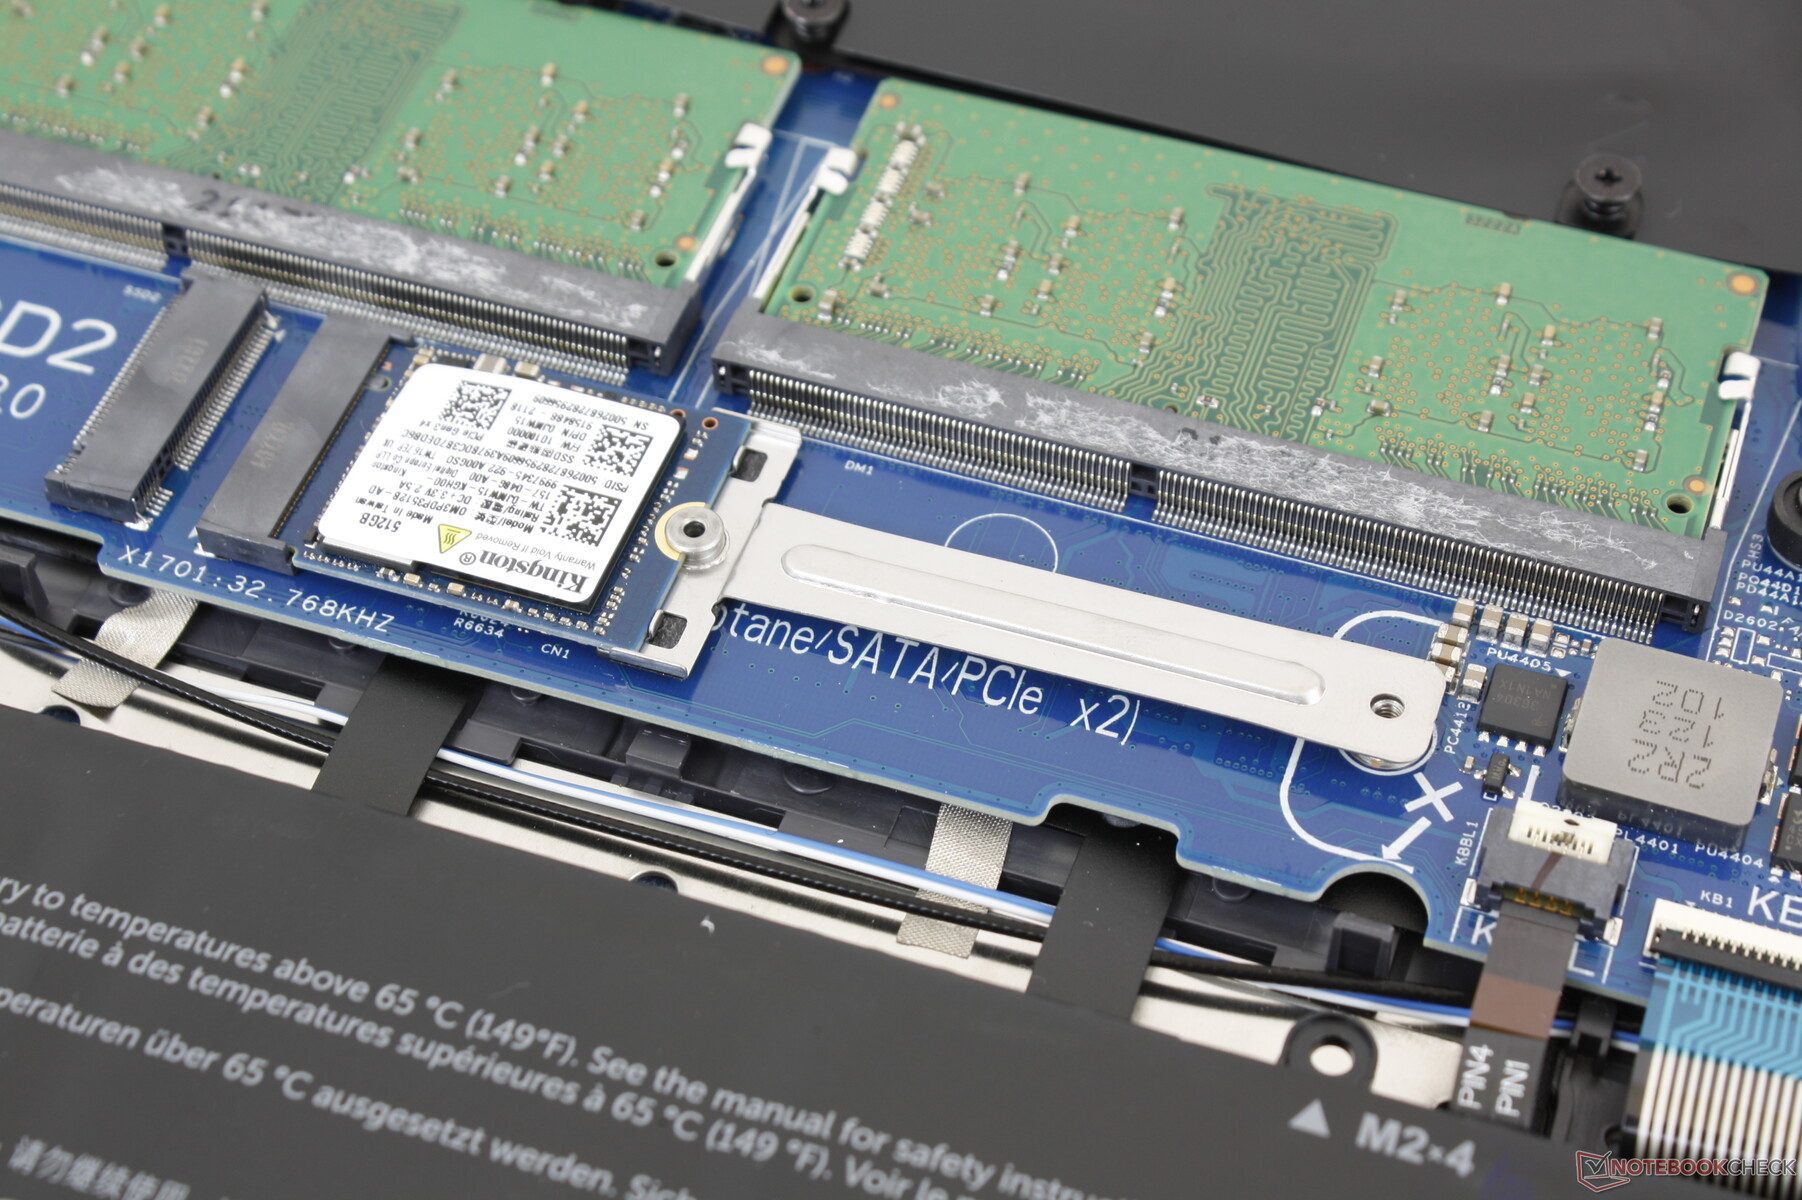
The bottom panel requires a Philips screwdriver, sharp edge, and some patience to open since the rear can be tricky to detach. Once inside, users will have direct access to two SODIMM slots, two M.2 storage bays, and the removable WLAN module.
Accessories and Warranty
There are no extras in the box beyond the barrel AC adapter and paperwork. The standard one-year limited warranty applies with extension options if purchased directly from Dell.
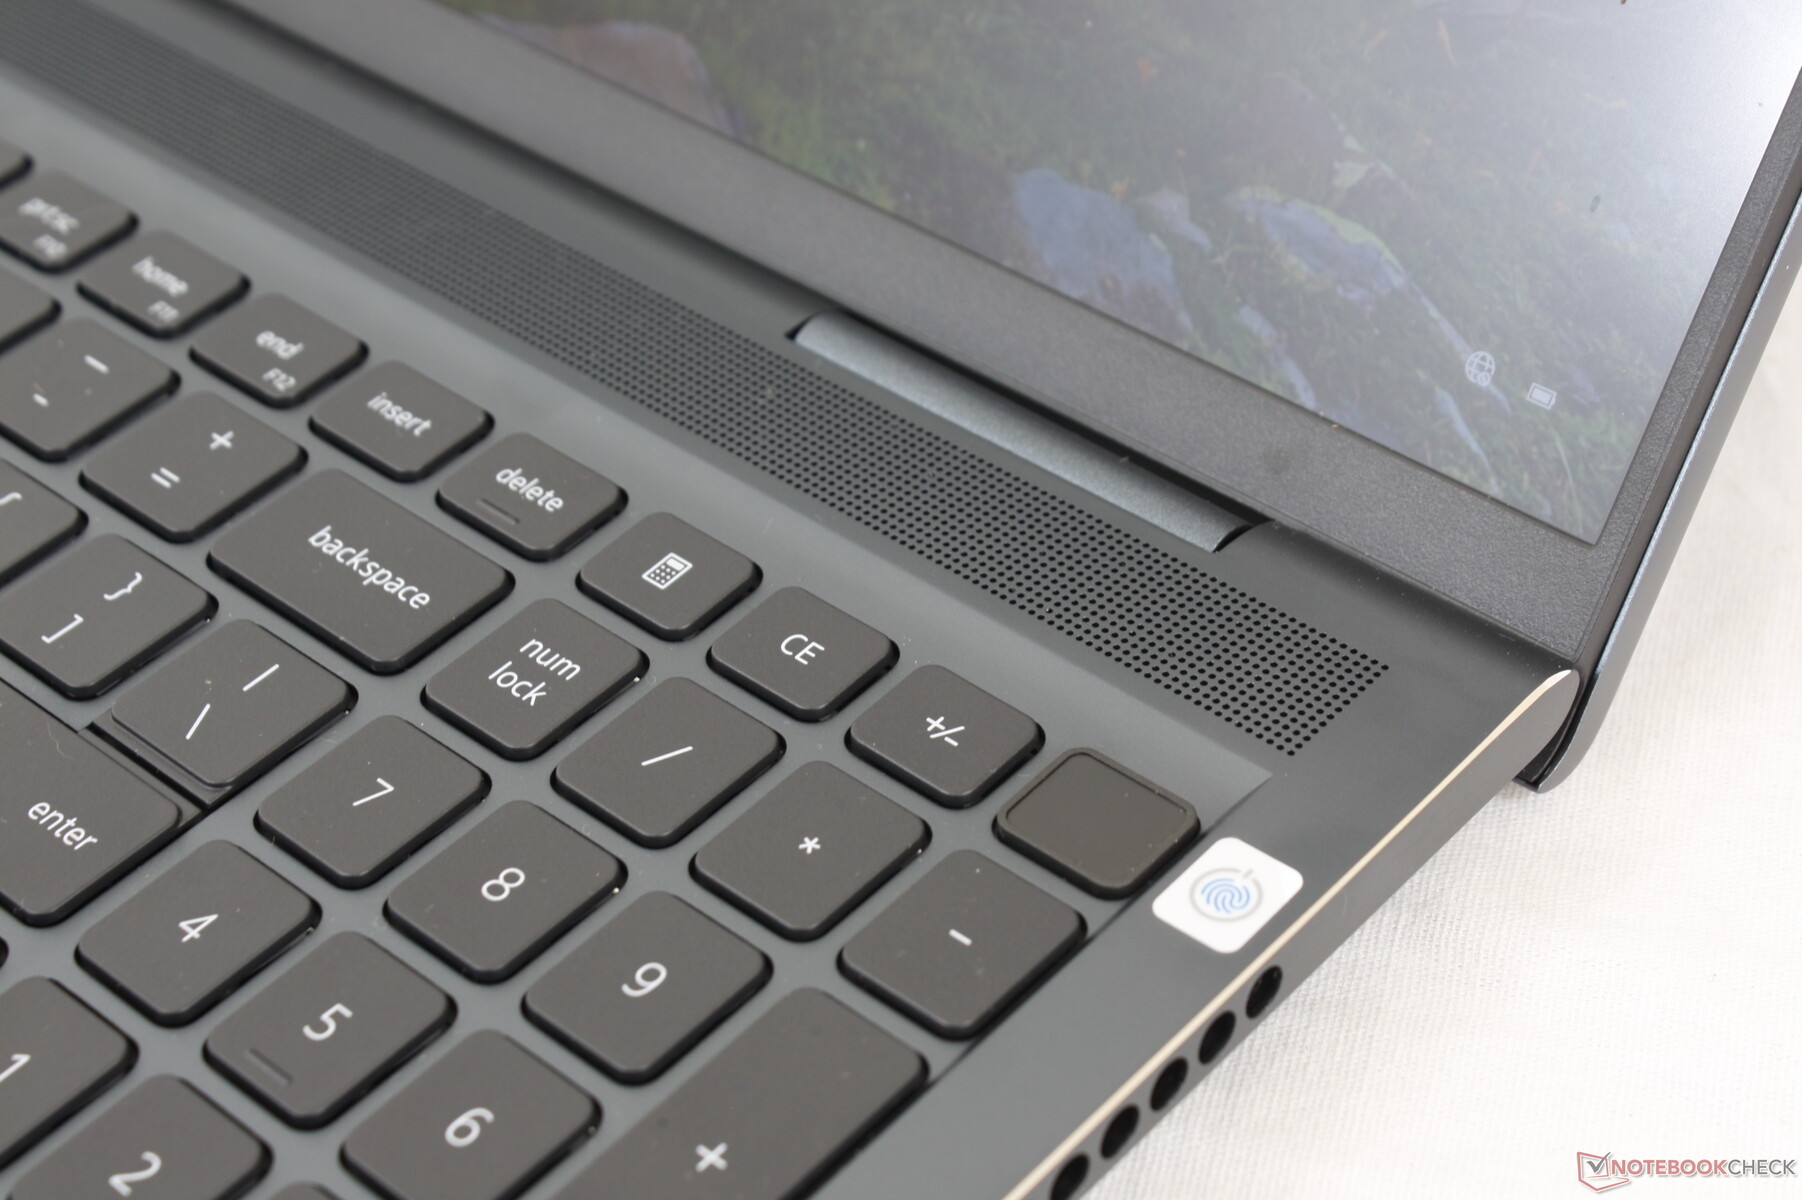
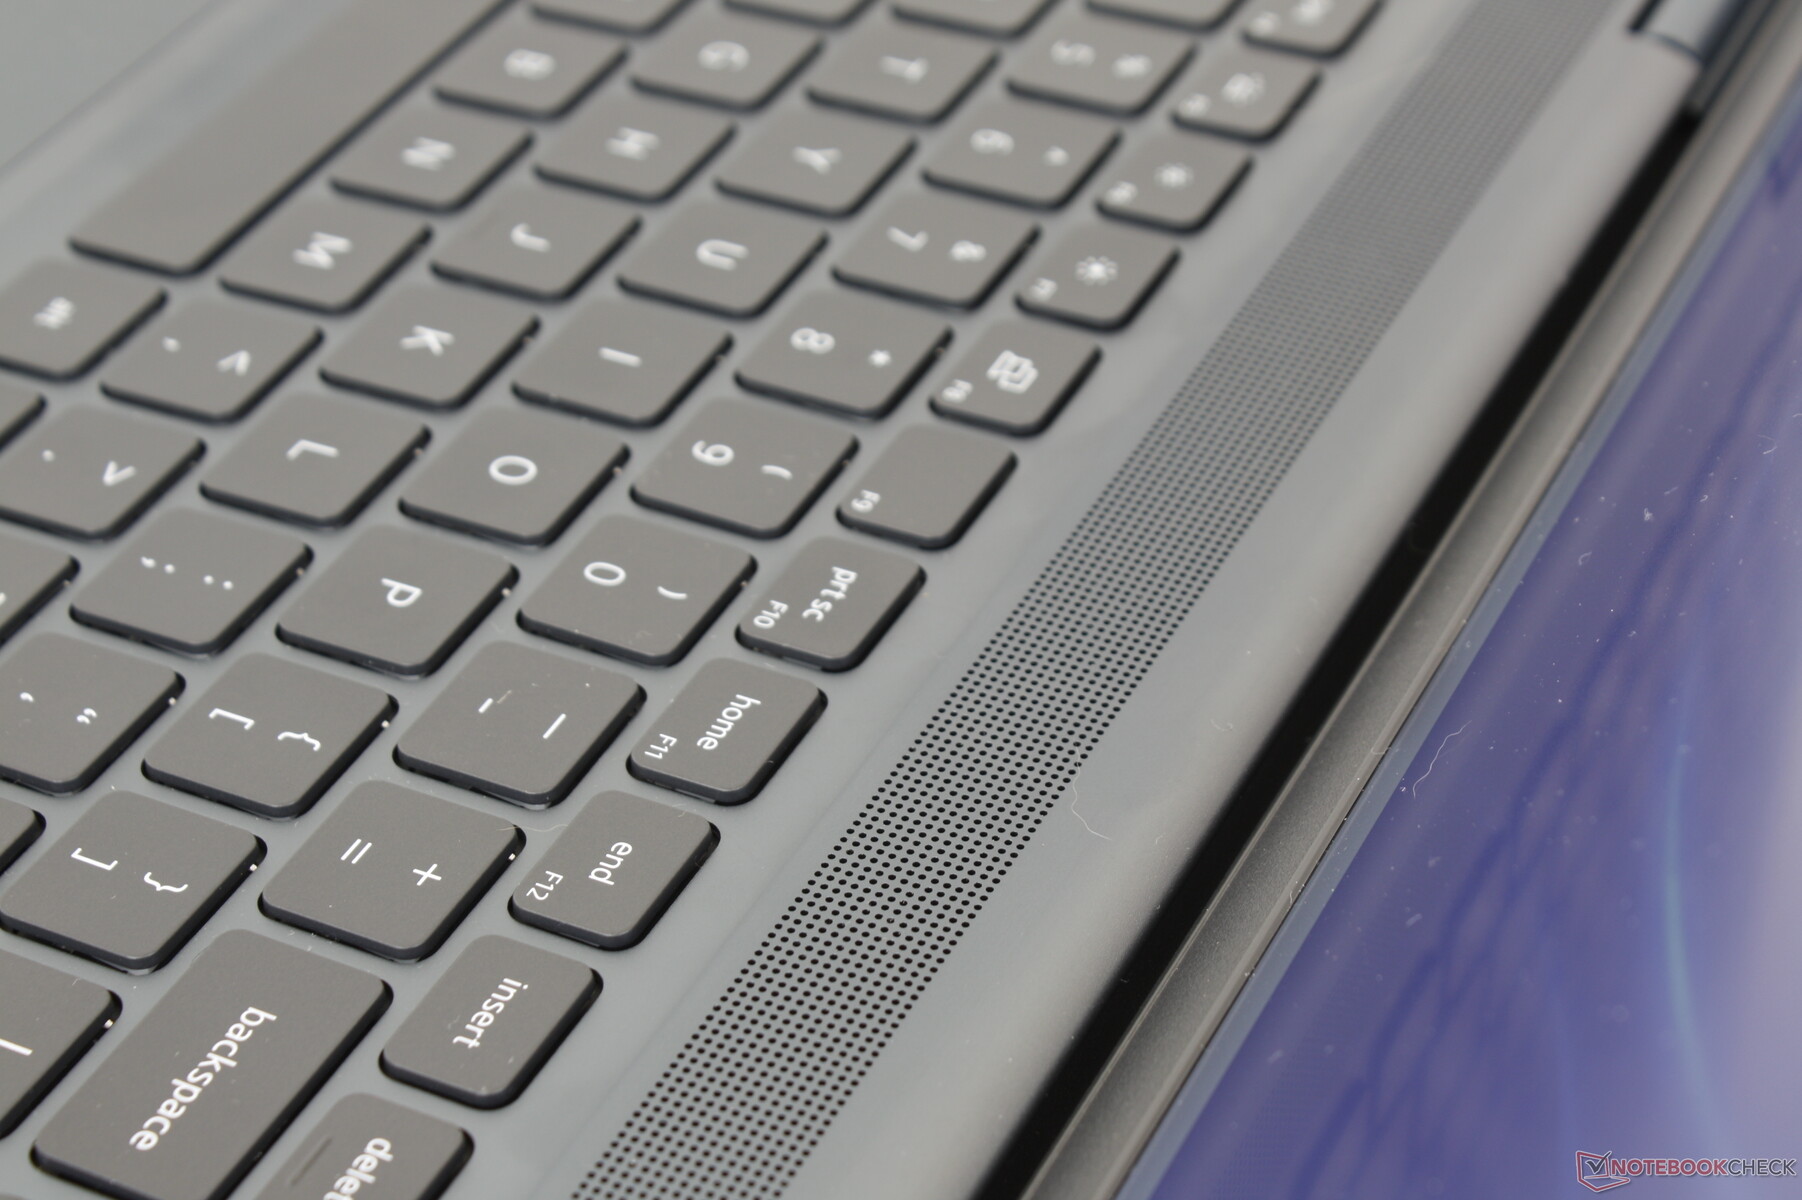
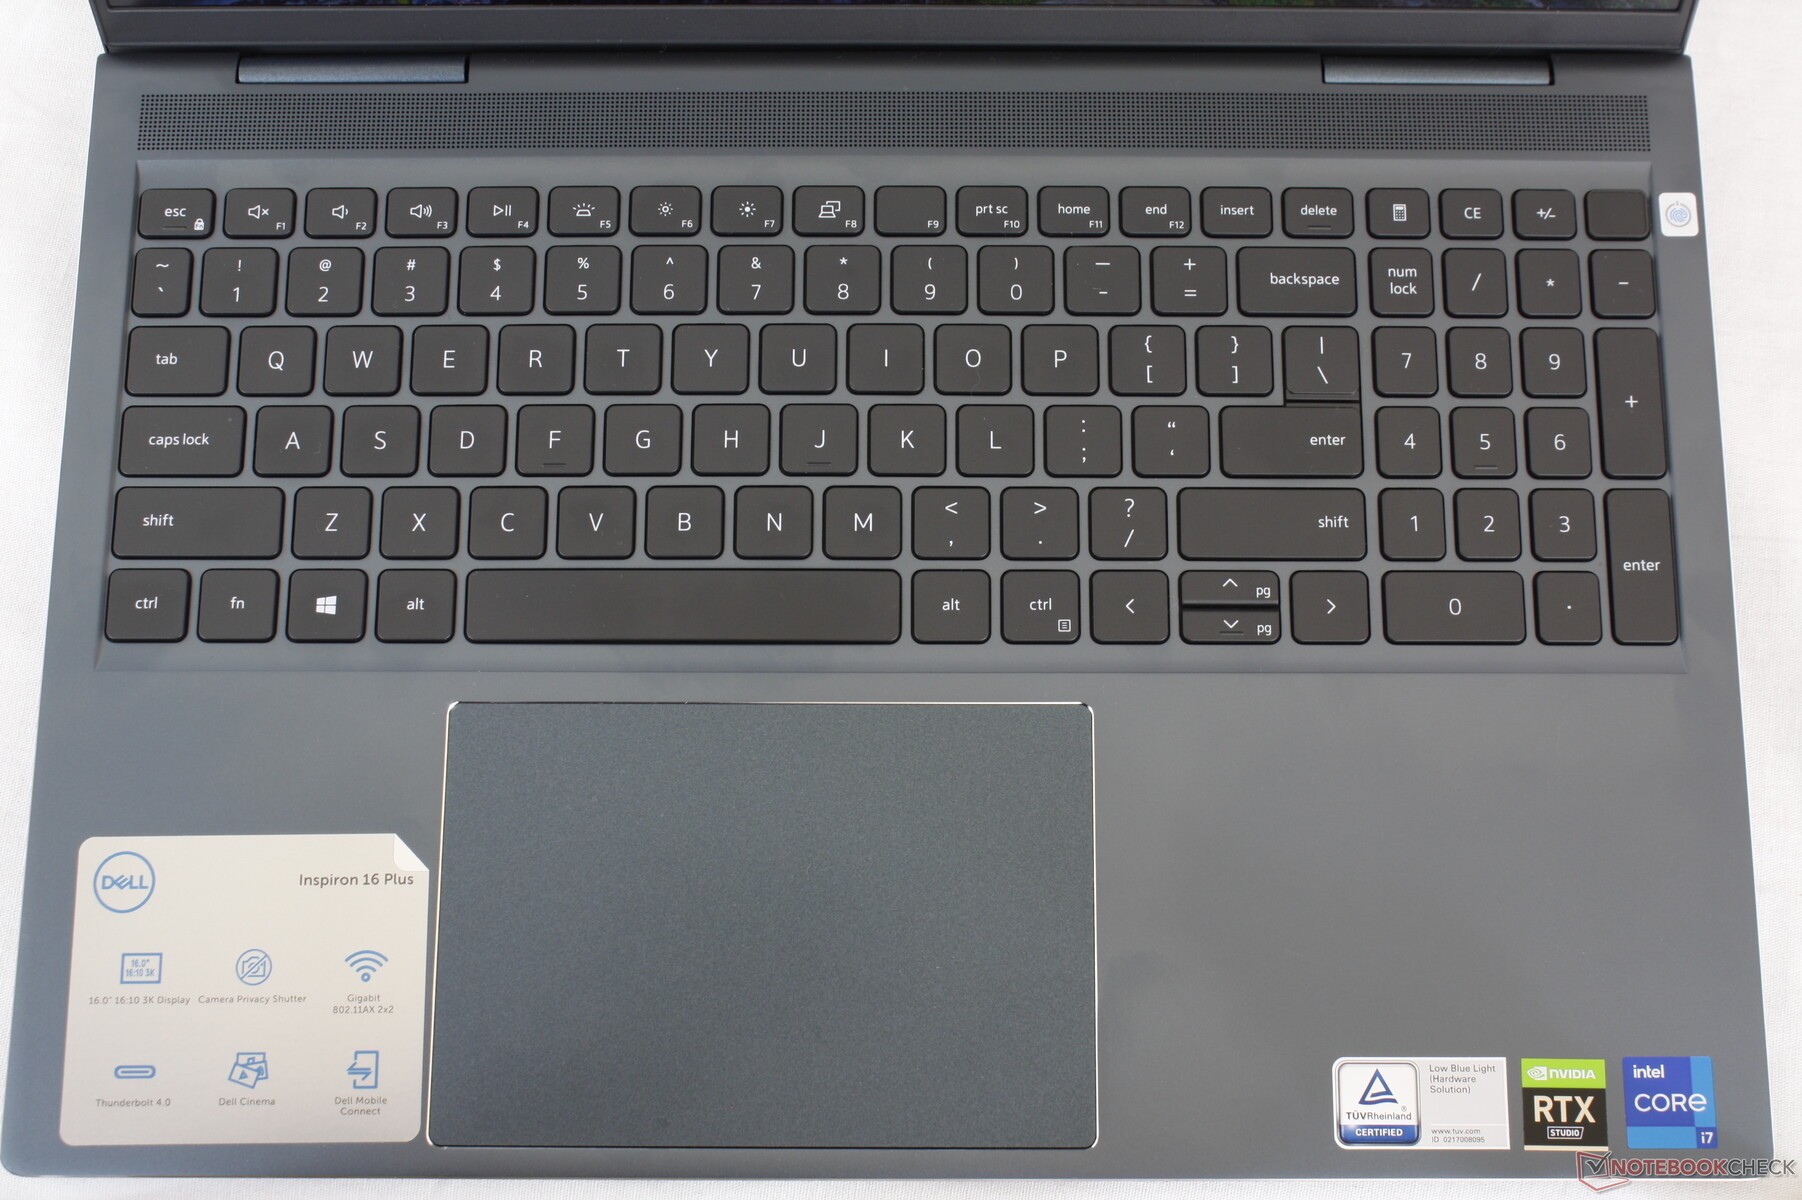
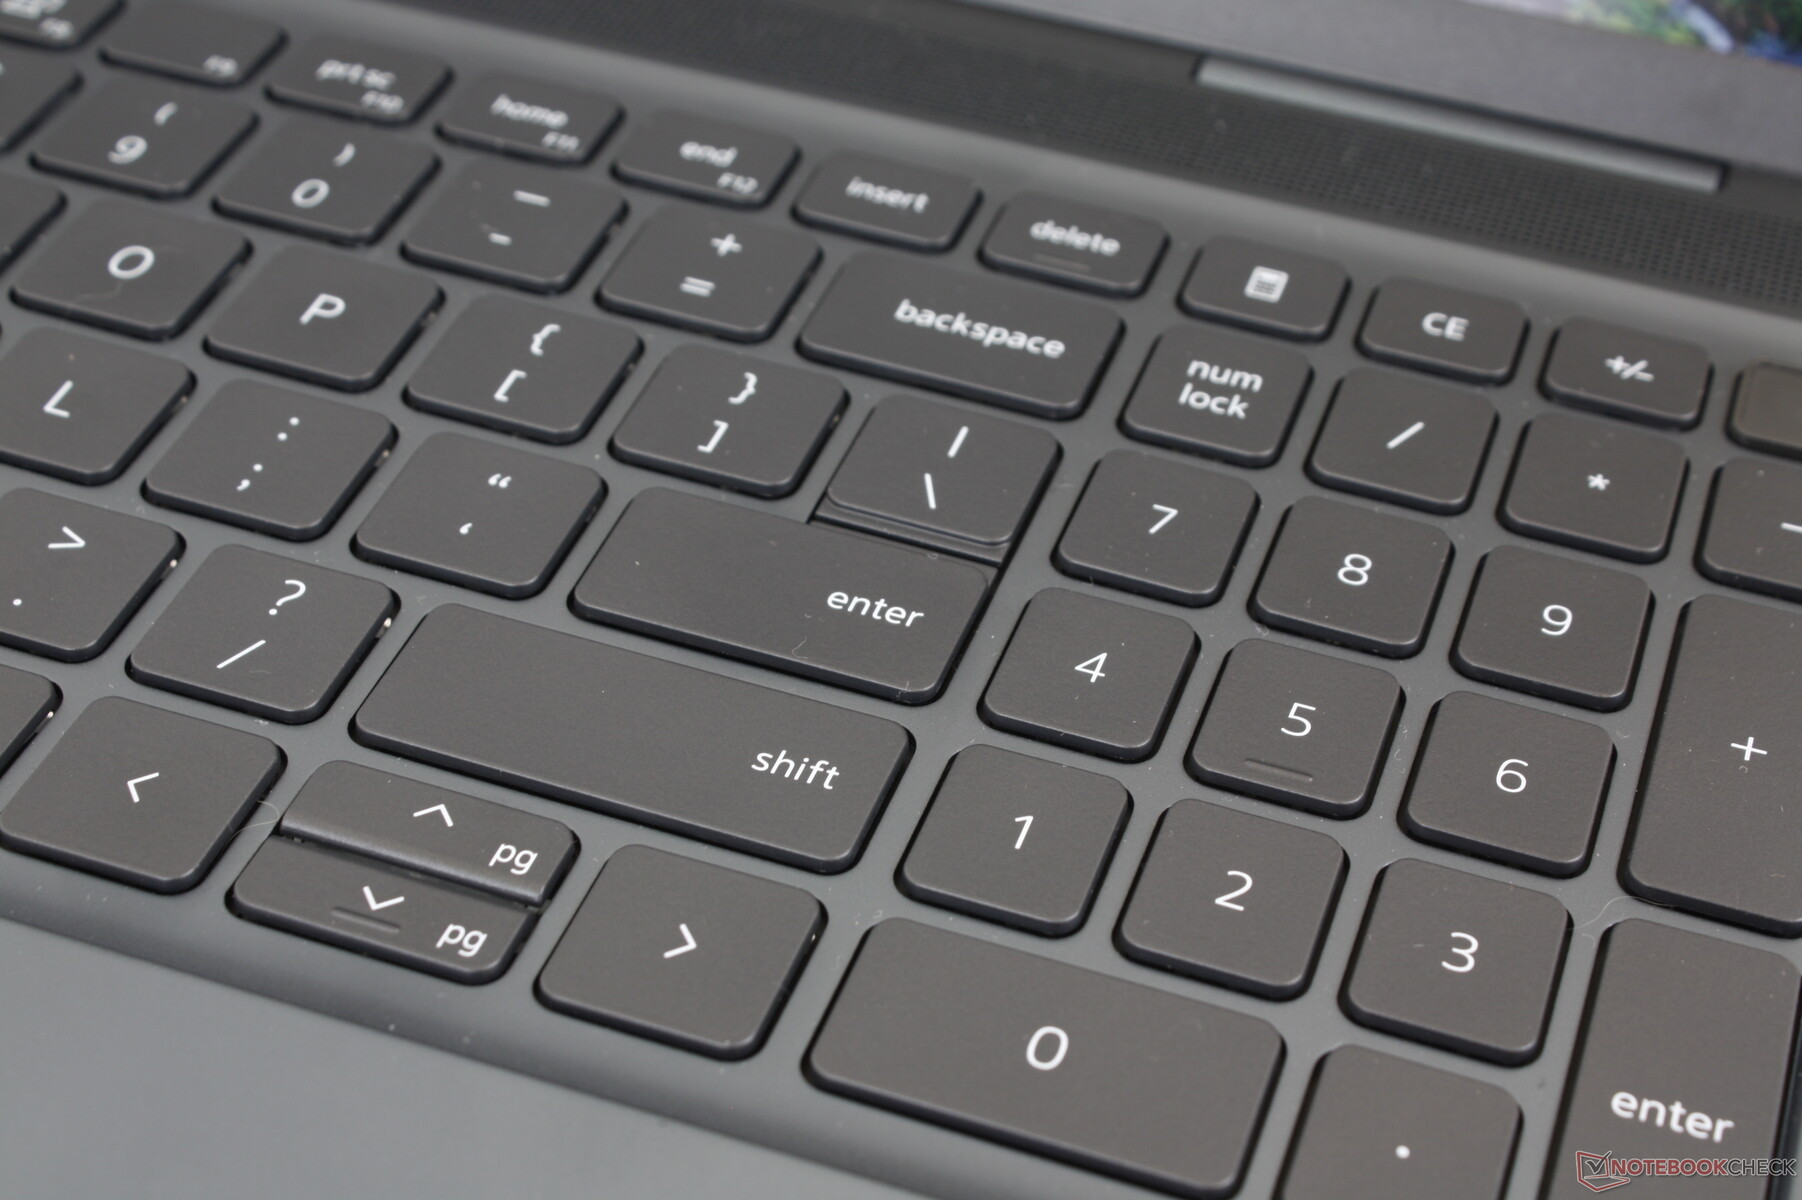
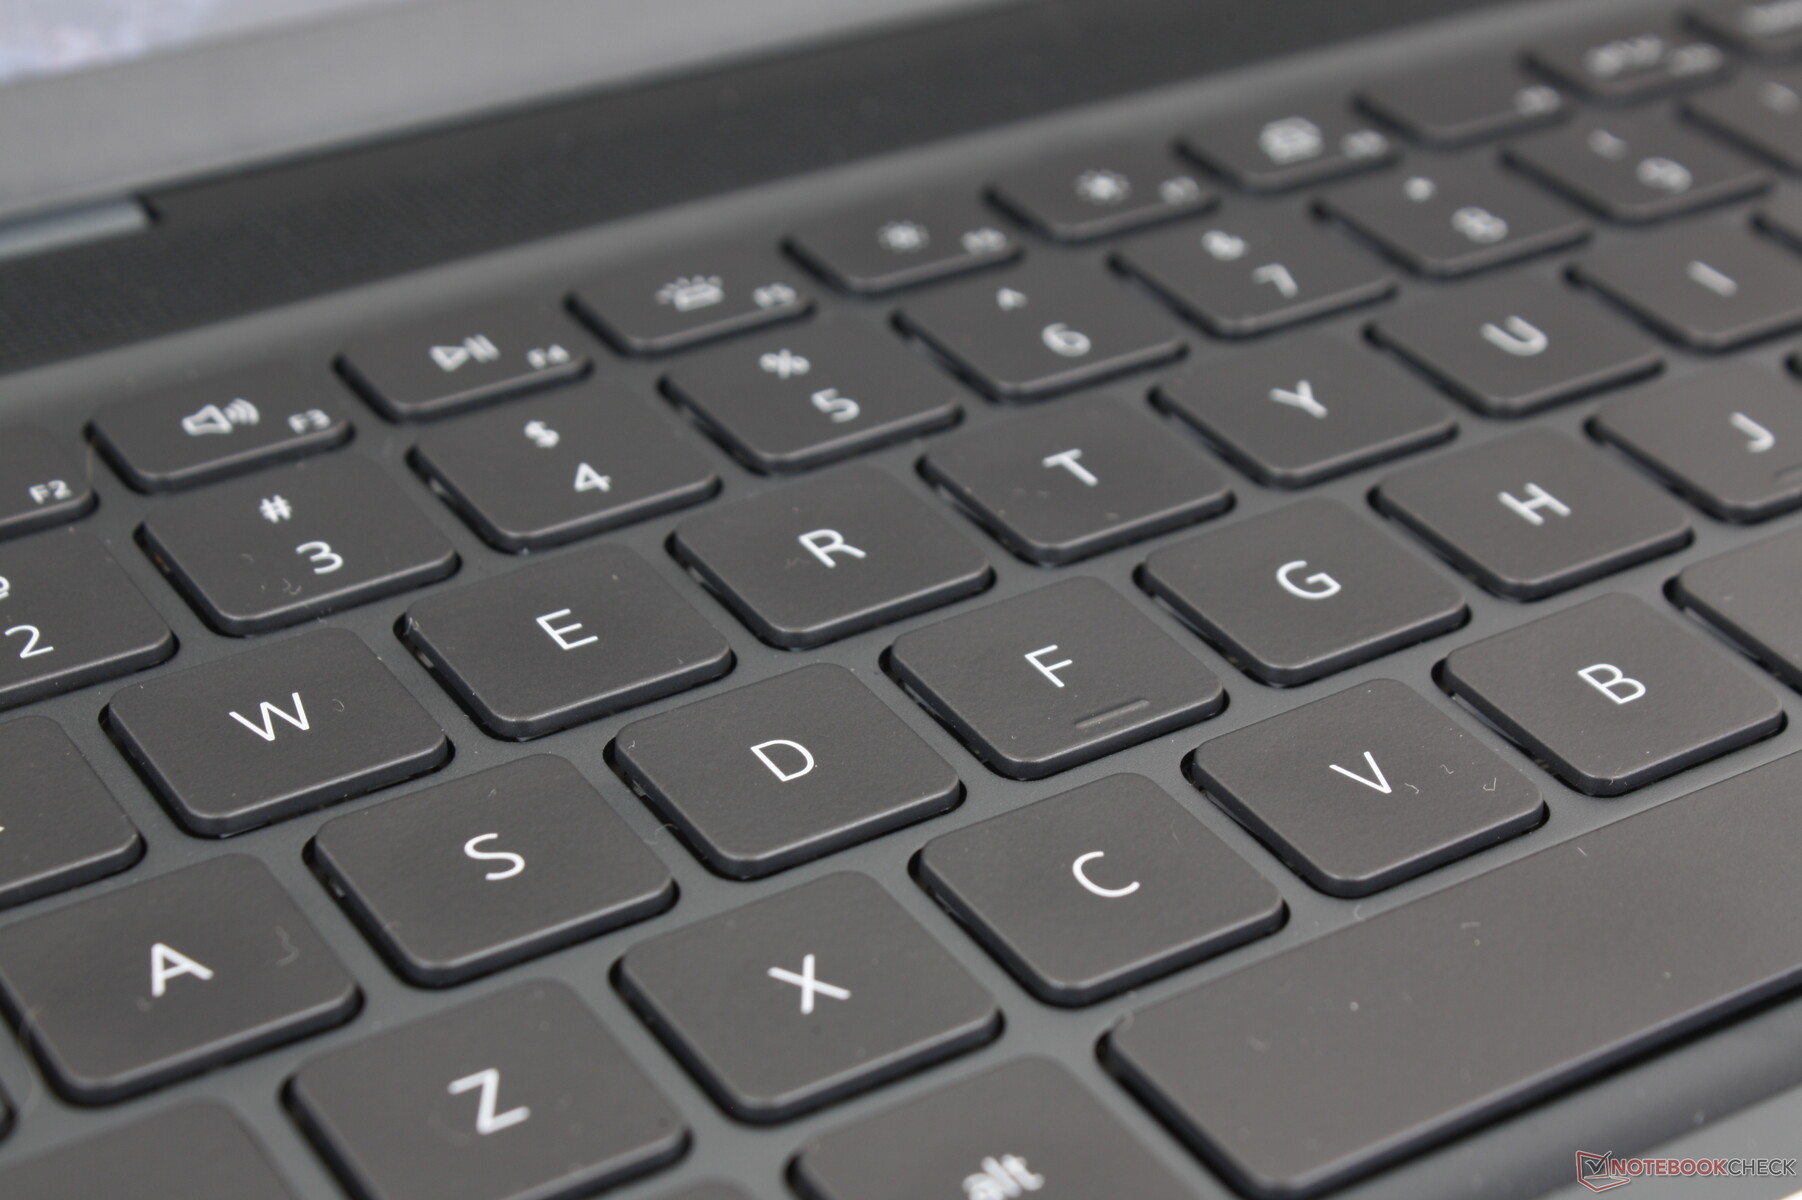
Input Devices — Quiet but Shallow
Keyboard
We find the typing experience to be a mixed bag. While the keys have crisper and more satisfying feedback when compared to the XPS series, travel is too shallow and light. Deeper travel much like on the HP Envy or Spectre laptops would have made the Inspiron keys even better and less like a typical Ultrabook.
A two-level white backlight comes standard to illuminate all keys and symbols save for the optional fingerprint-enabled power button. It's not as bright as most other backlit keyboards, but it's good enough in darkened environments.
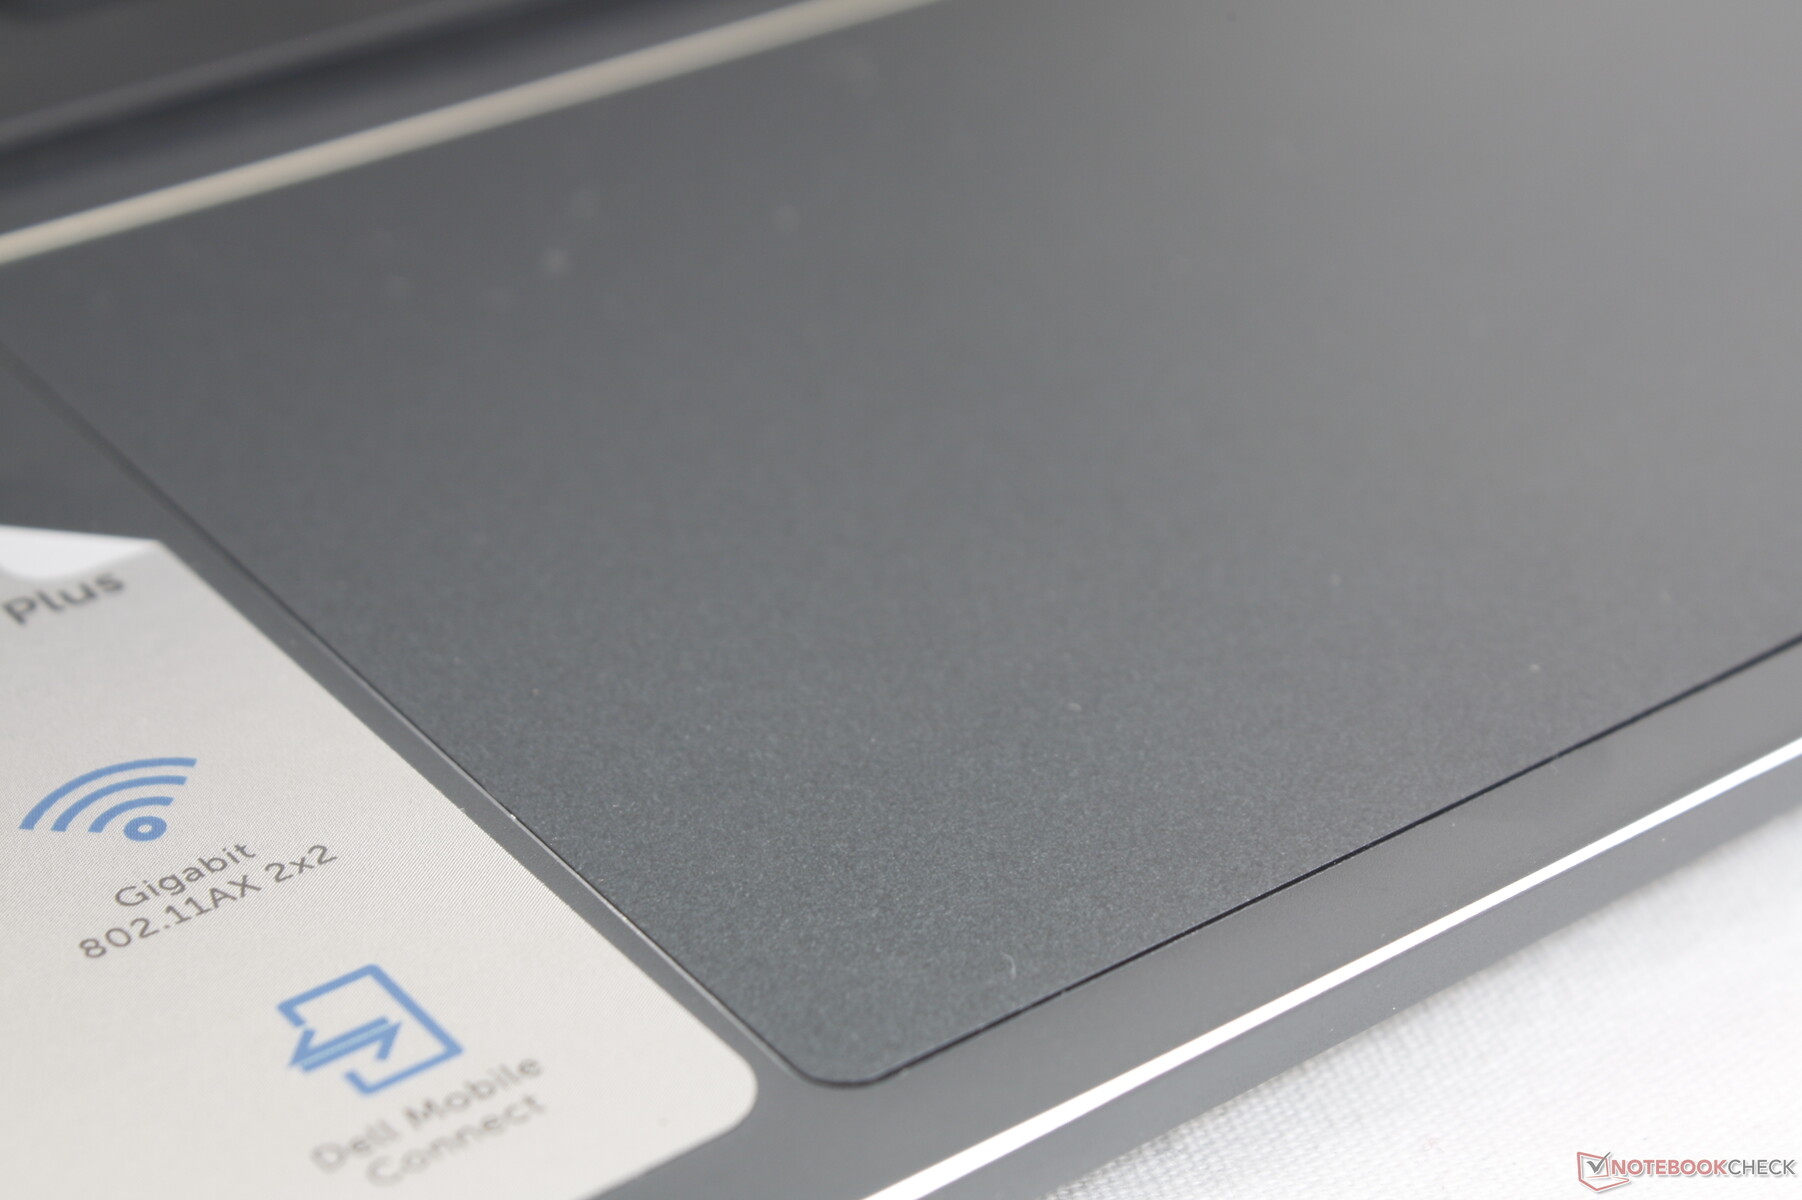
Touchpad
The clickpad is larger than the clickpad on the older Inspiron 15 7506 (13.5 x 9 cm vs. 11.5 x 8 cm) for easier multi-touch inputs. Gliding on the smooth surface is reliable with only a bit of sticking at slower speeds for more accurate cursor control. Unfortunately, clicking on the clickpad is spongy and with unsatisfying feedback.
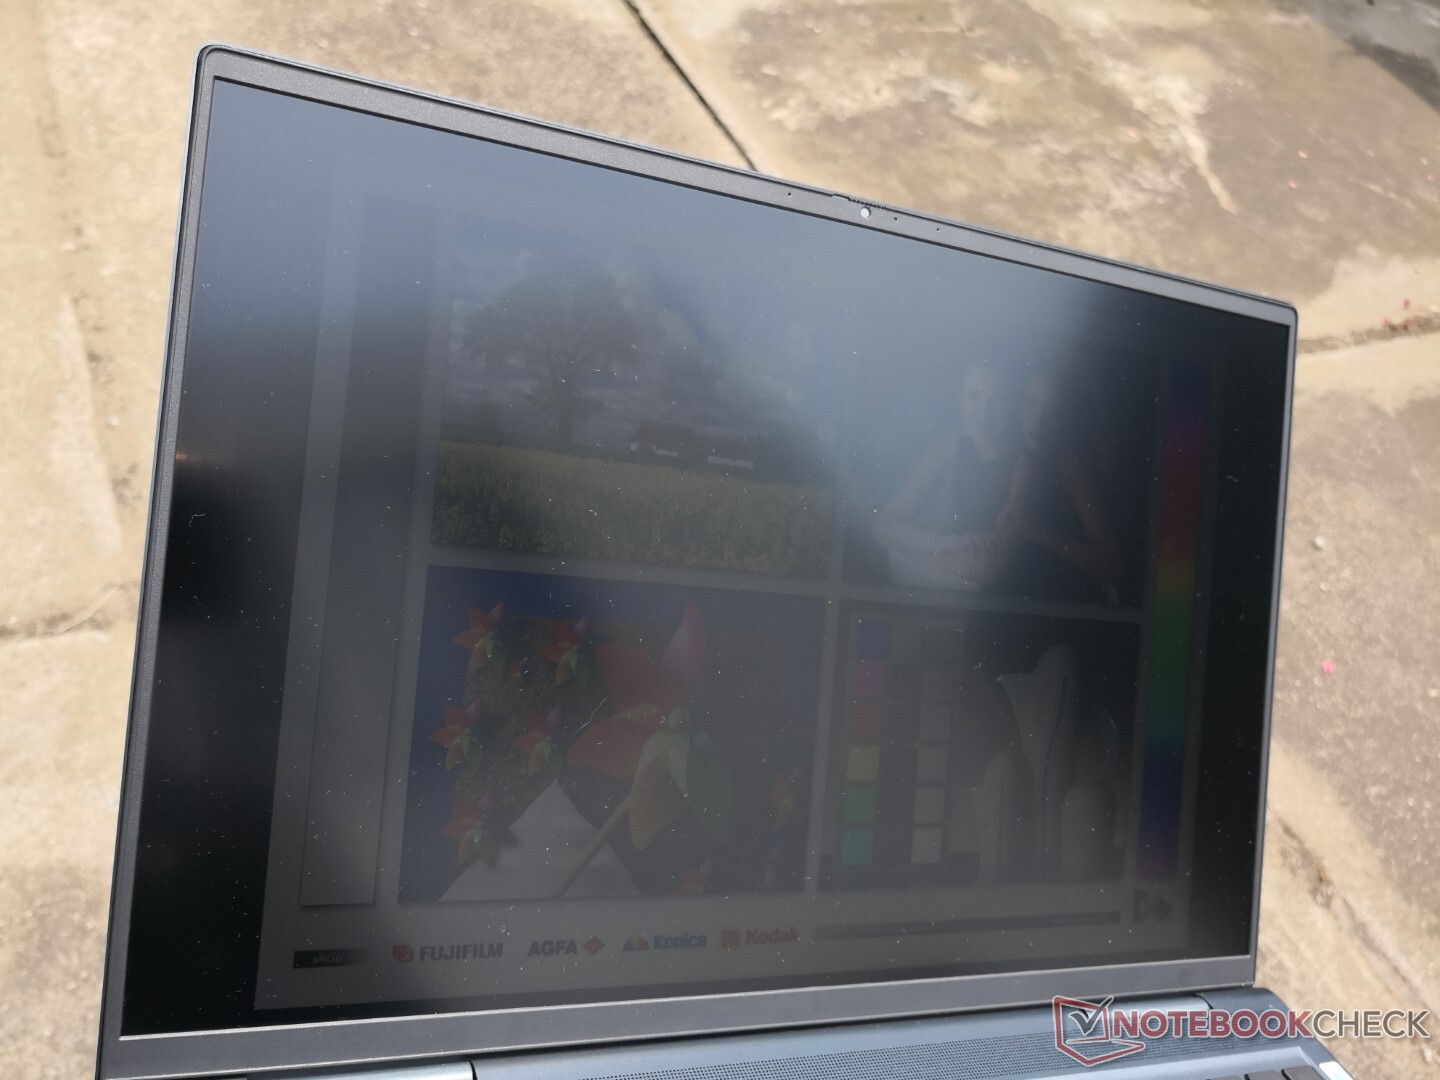
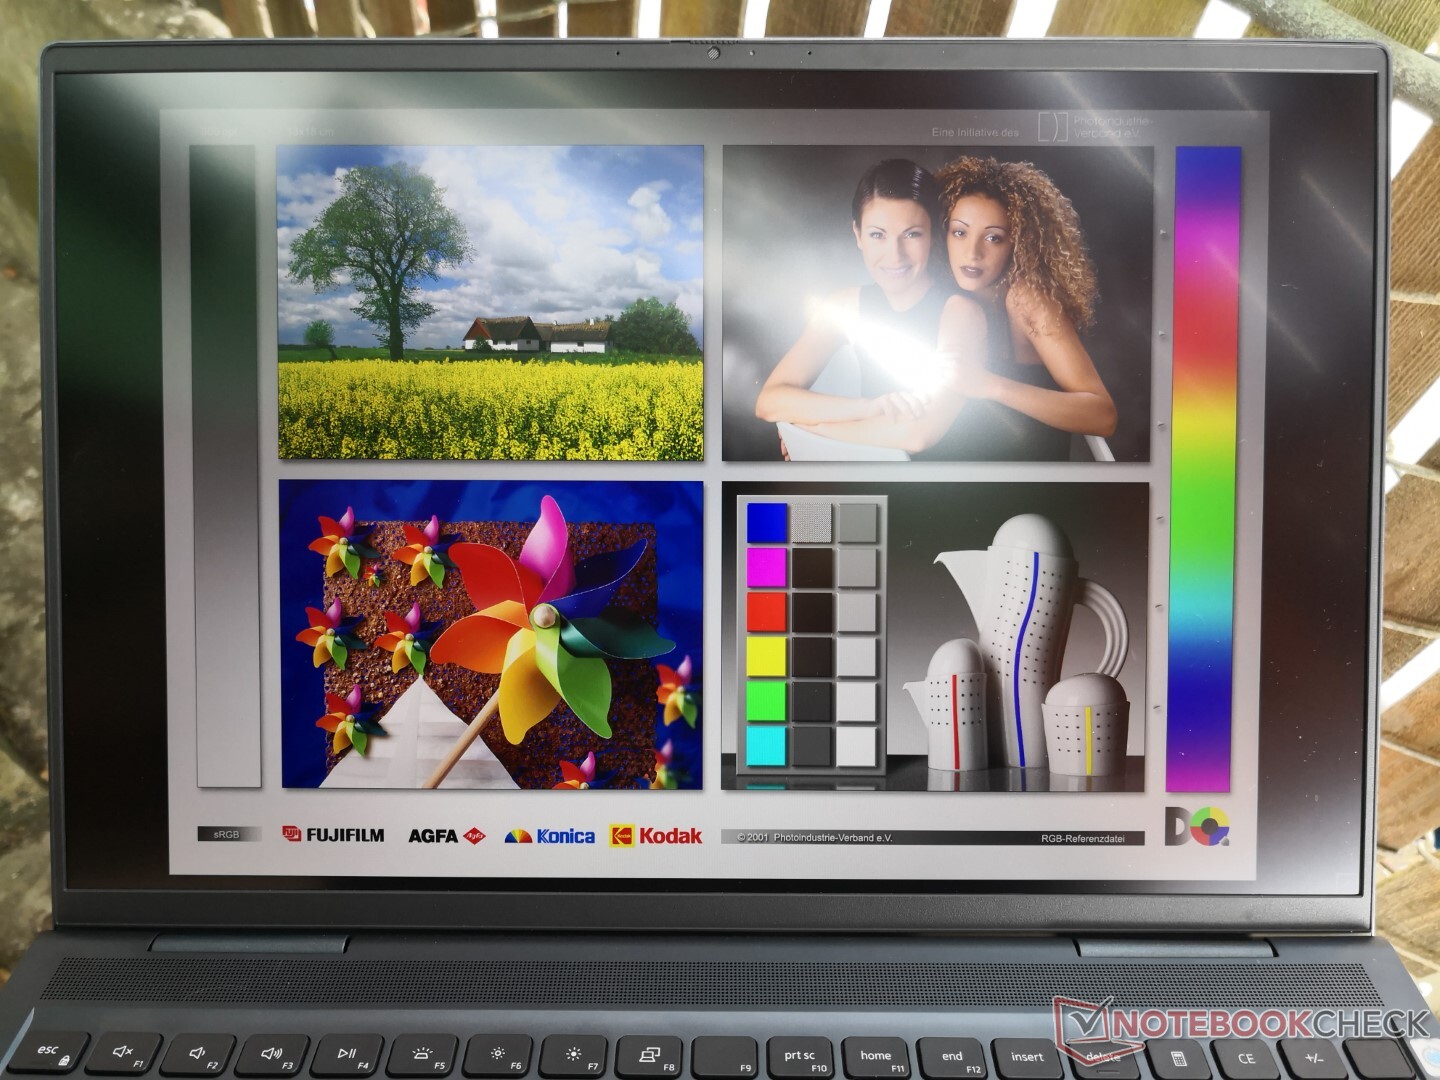
Display — Good Colors, OK Brightness, Slow Response Times
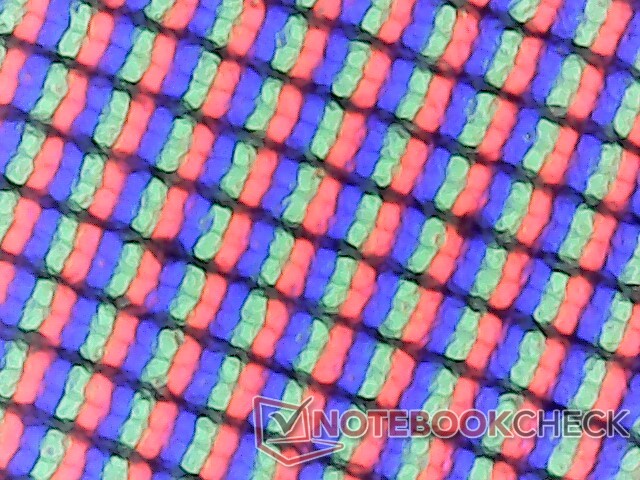
The model utilizes an AU Optronics B160QAN 3K IPS panel that can be found on no other laptop as of this writing. It does, however, share the same native resolution as the display on the MacBook Pro 16. PPI is almost as dense as a 4K panel meaning most users will still want to adjust the font scaling for easier readability.
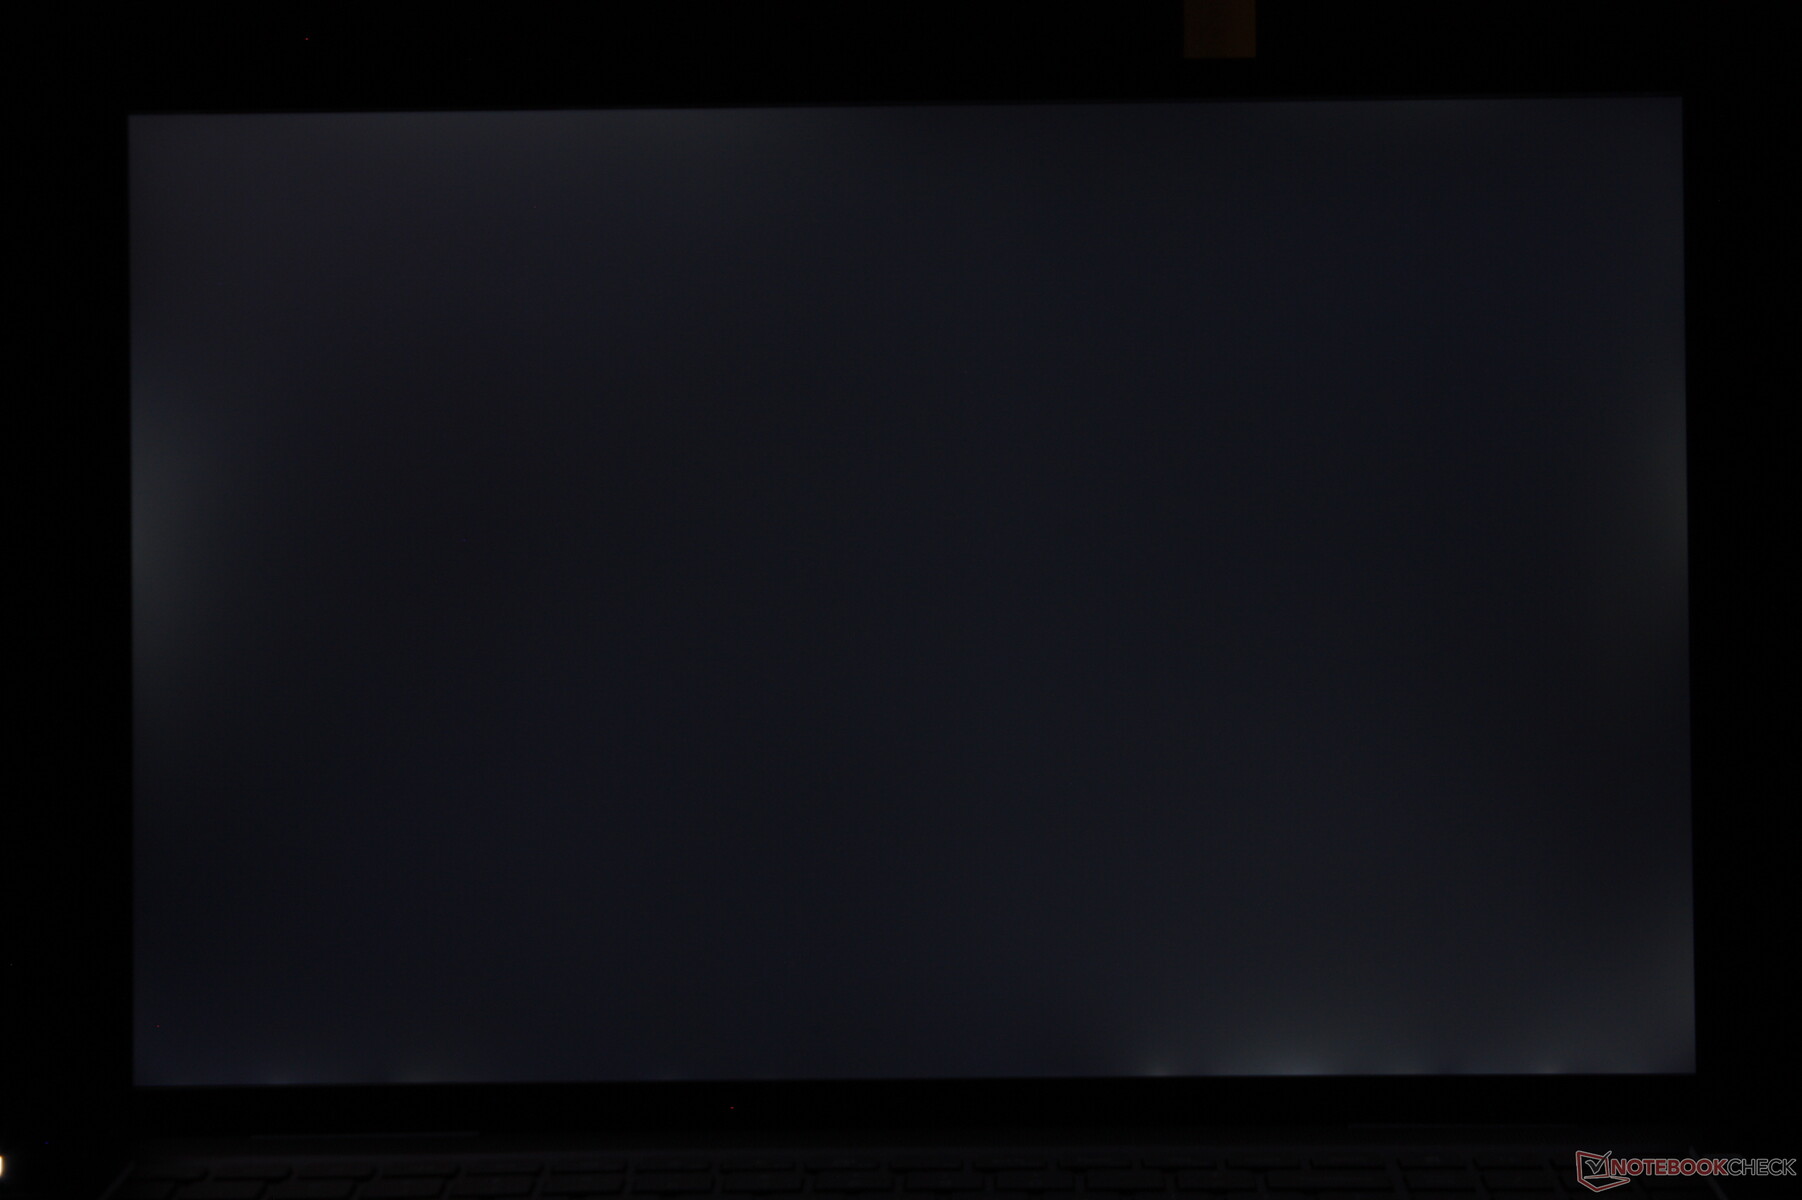
Display quality is excellent with a contrast ratio approaching 1500:1. However, its slow response times are the key distinguishing factor separating the Inspiron 16 from "pure" 16-inch gaming laptops like the Asus ROG Zephyrus M16 where response times are significantly faster.

| |||||||||||||||||||||||||
Brightness Distribution: 87 %
Center on Battery: 296.8 cd/m²
Contrast: 1413:1 (Black: 0.21 cd/m²)
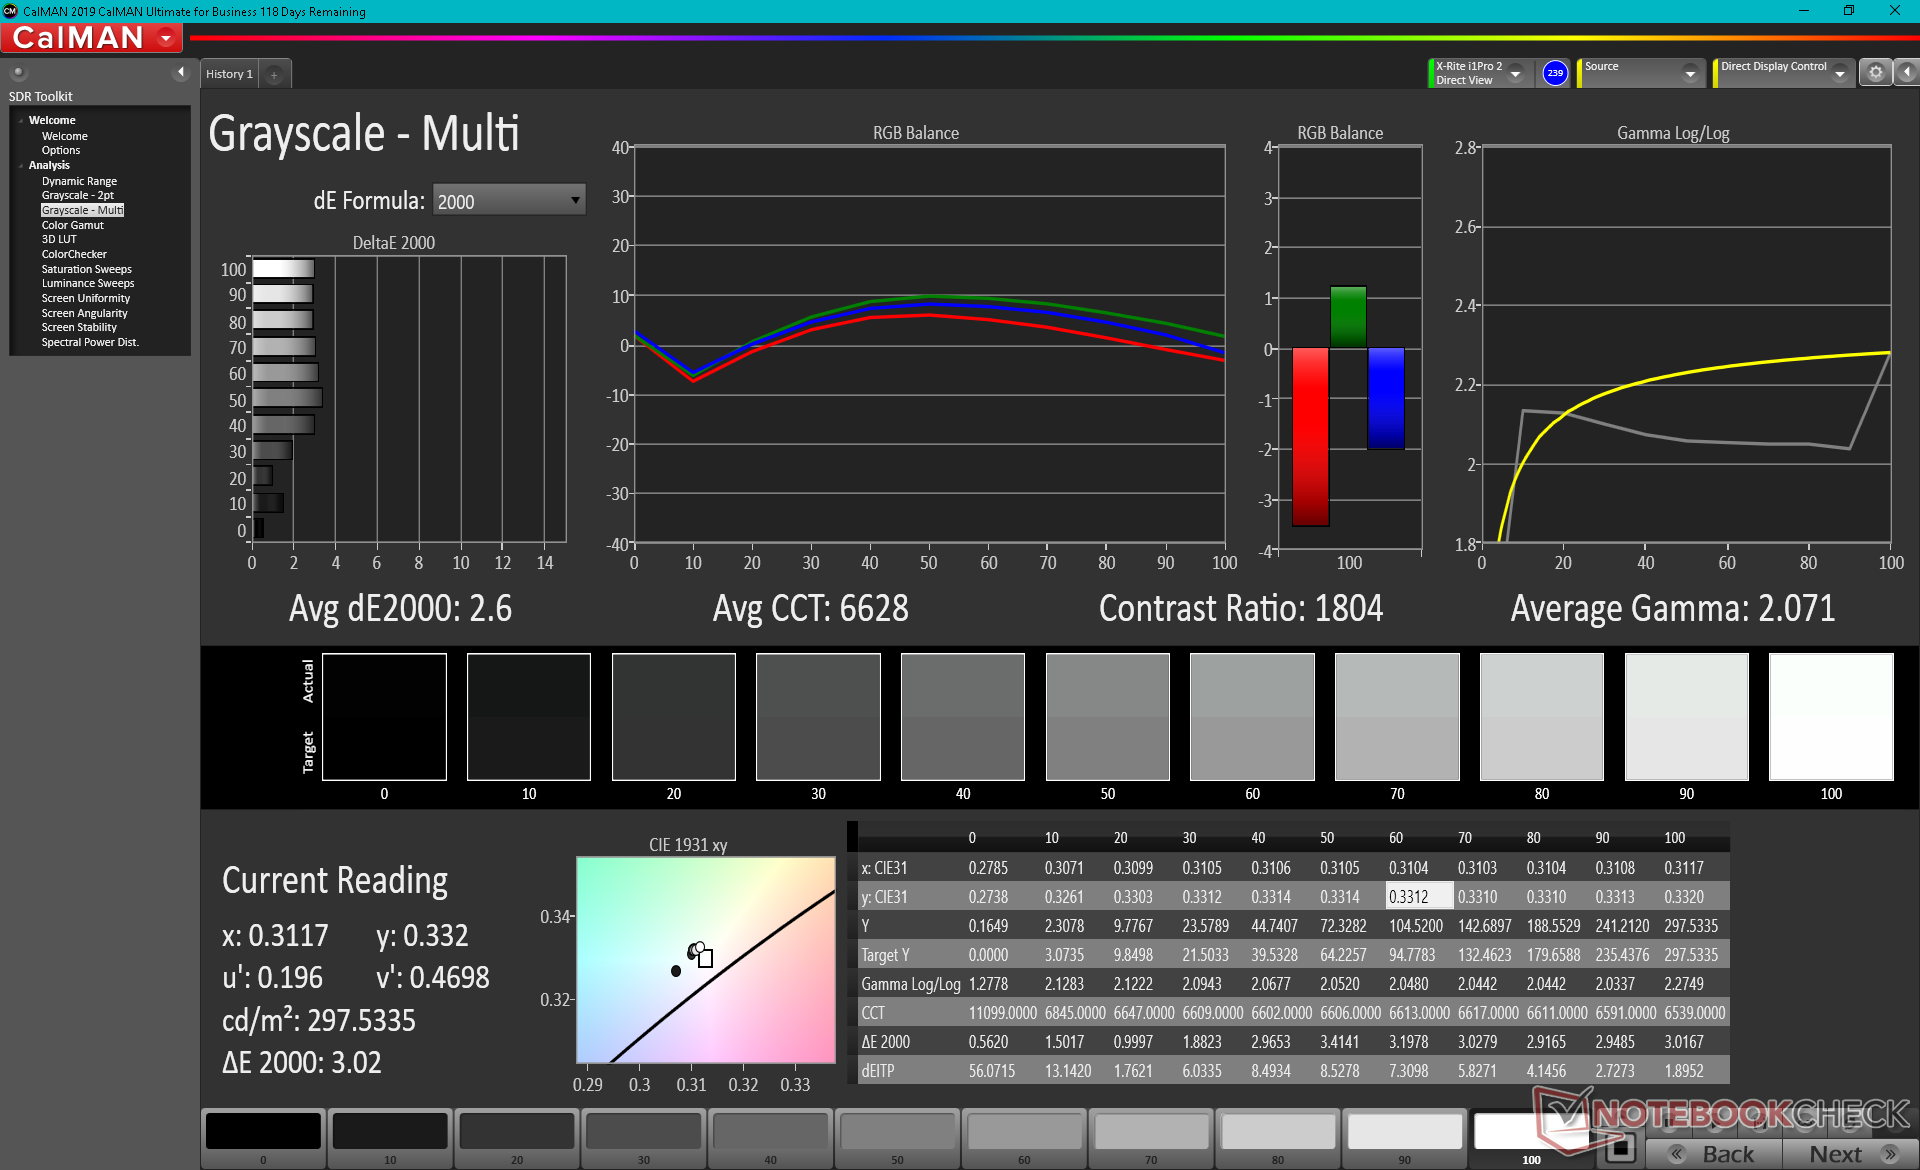
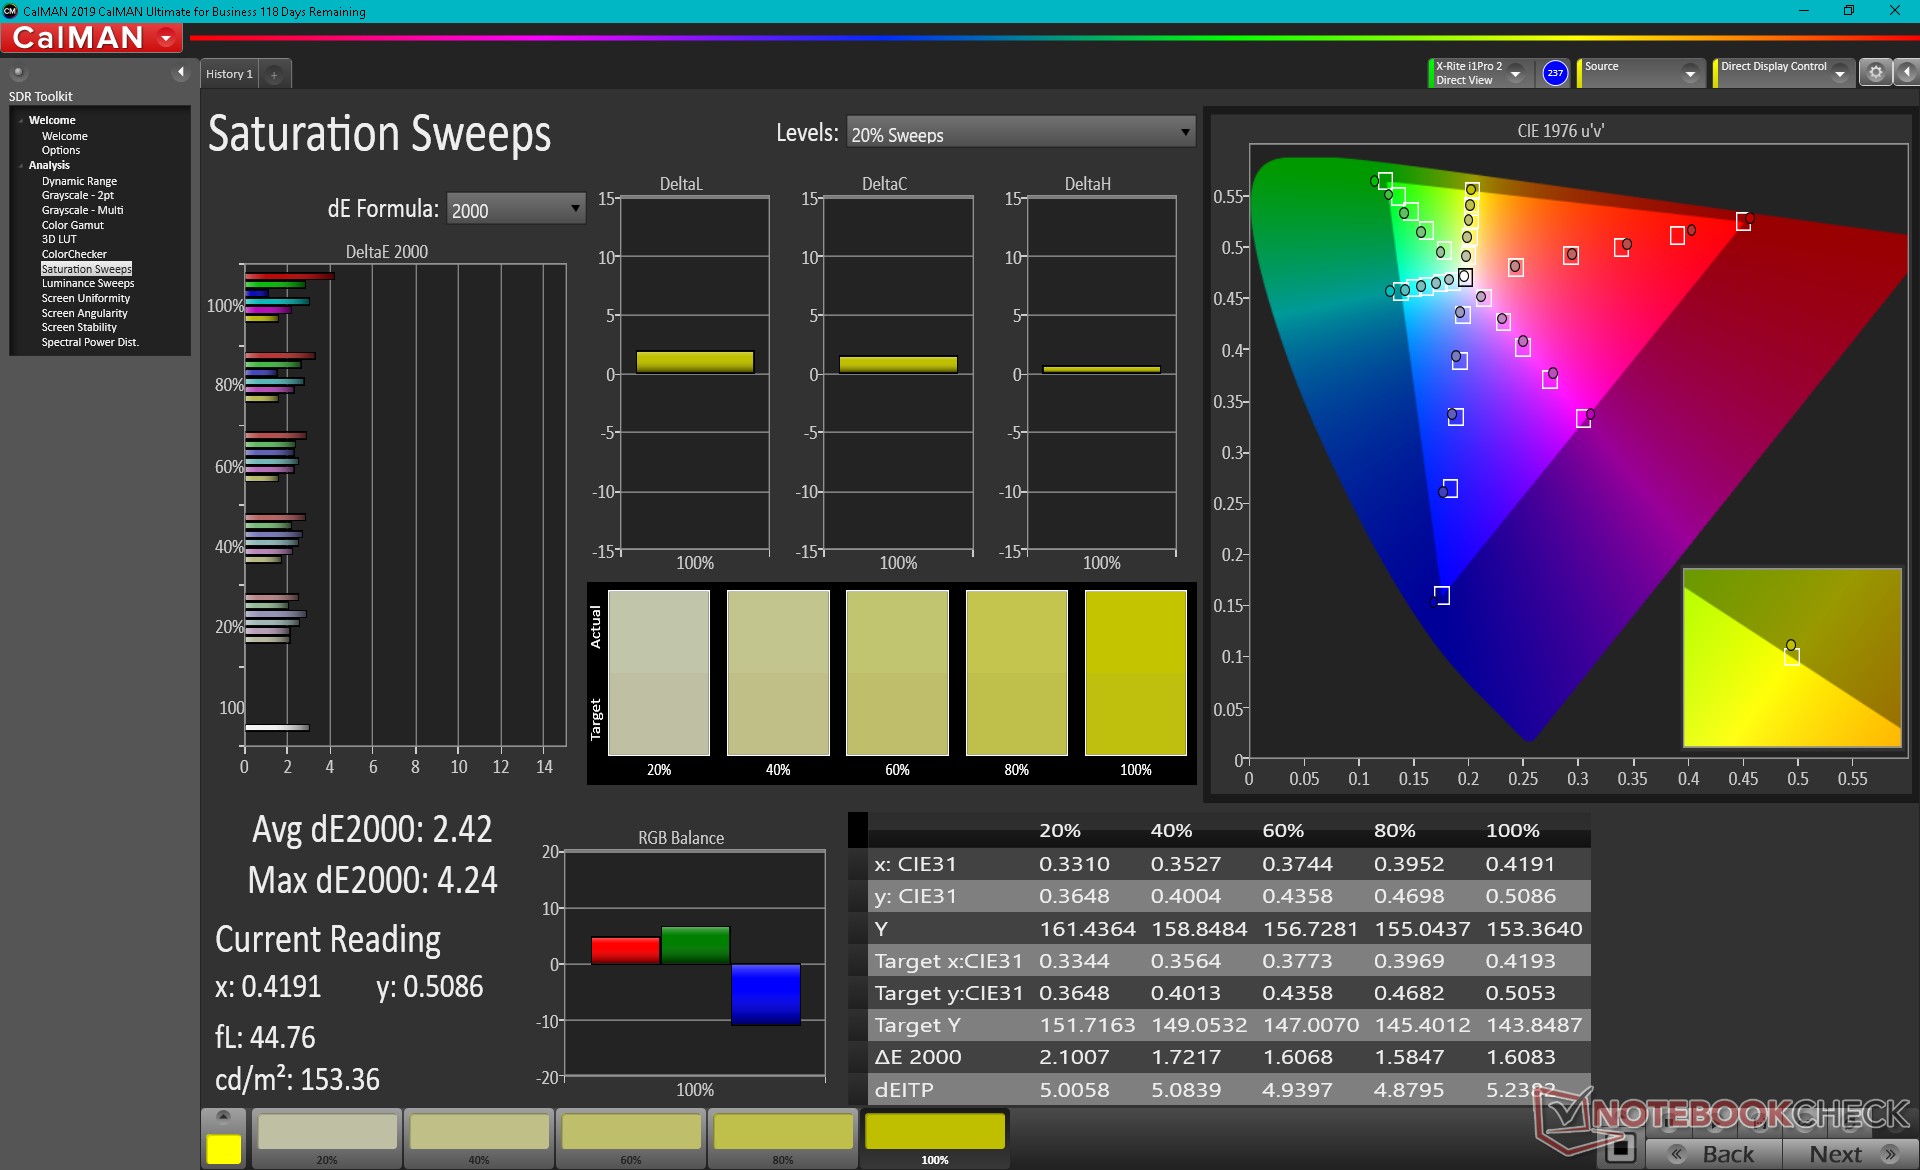
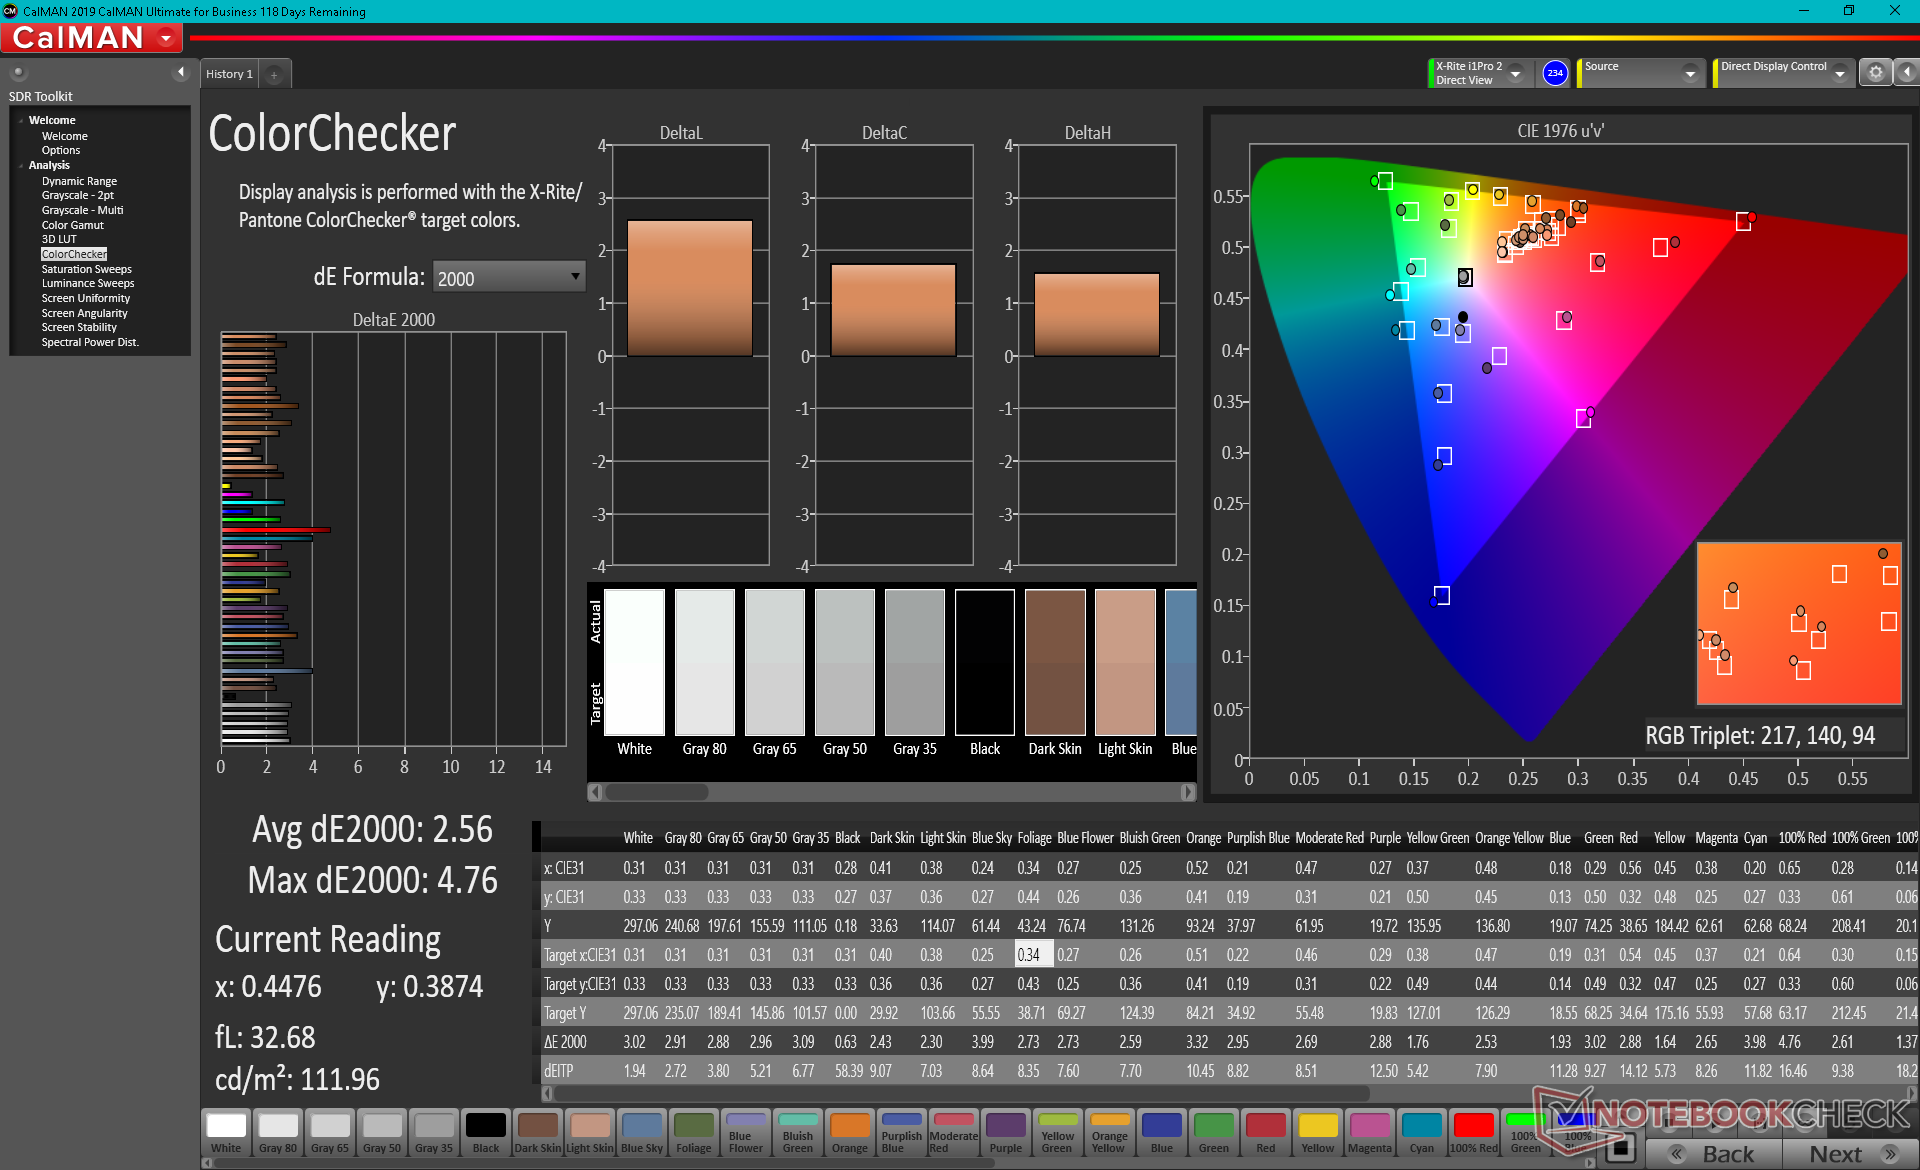
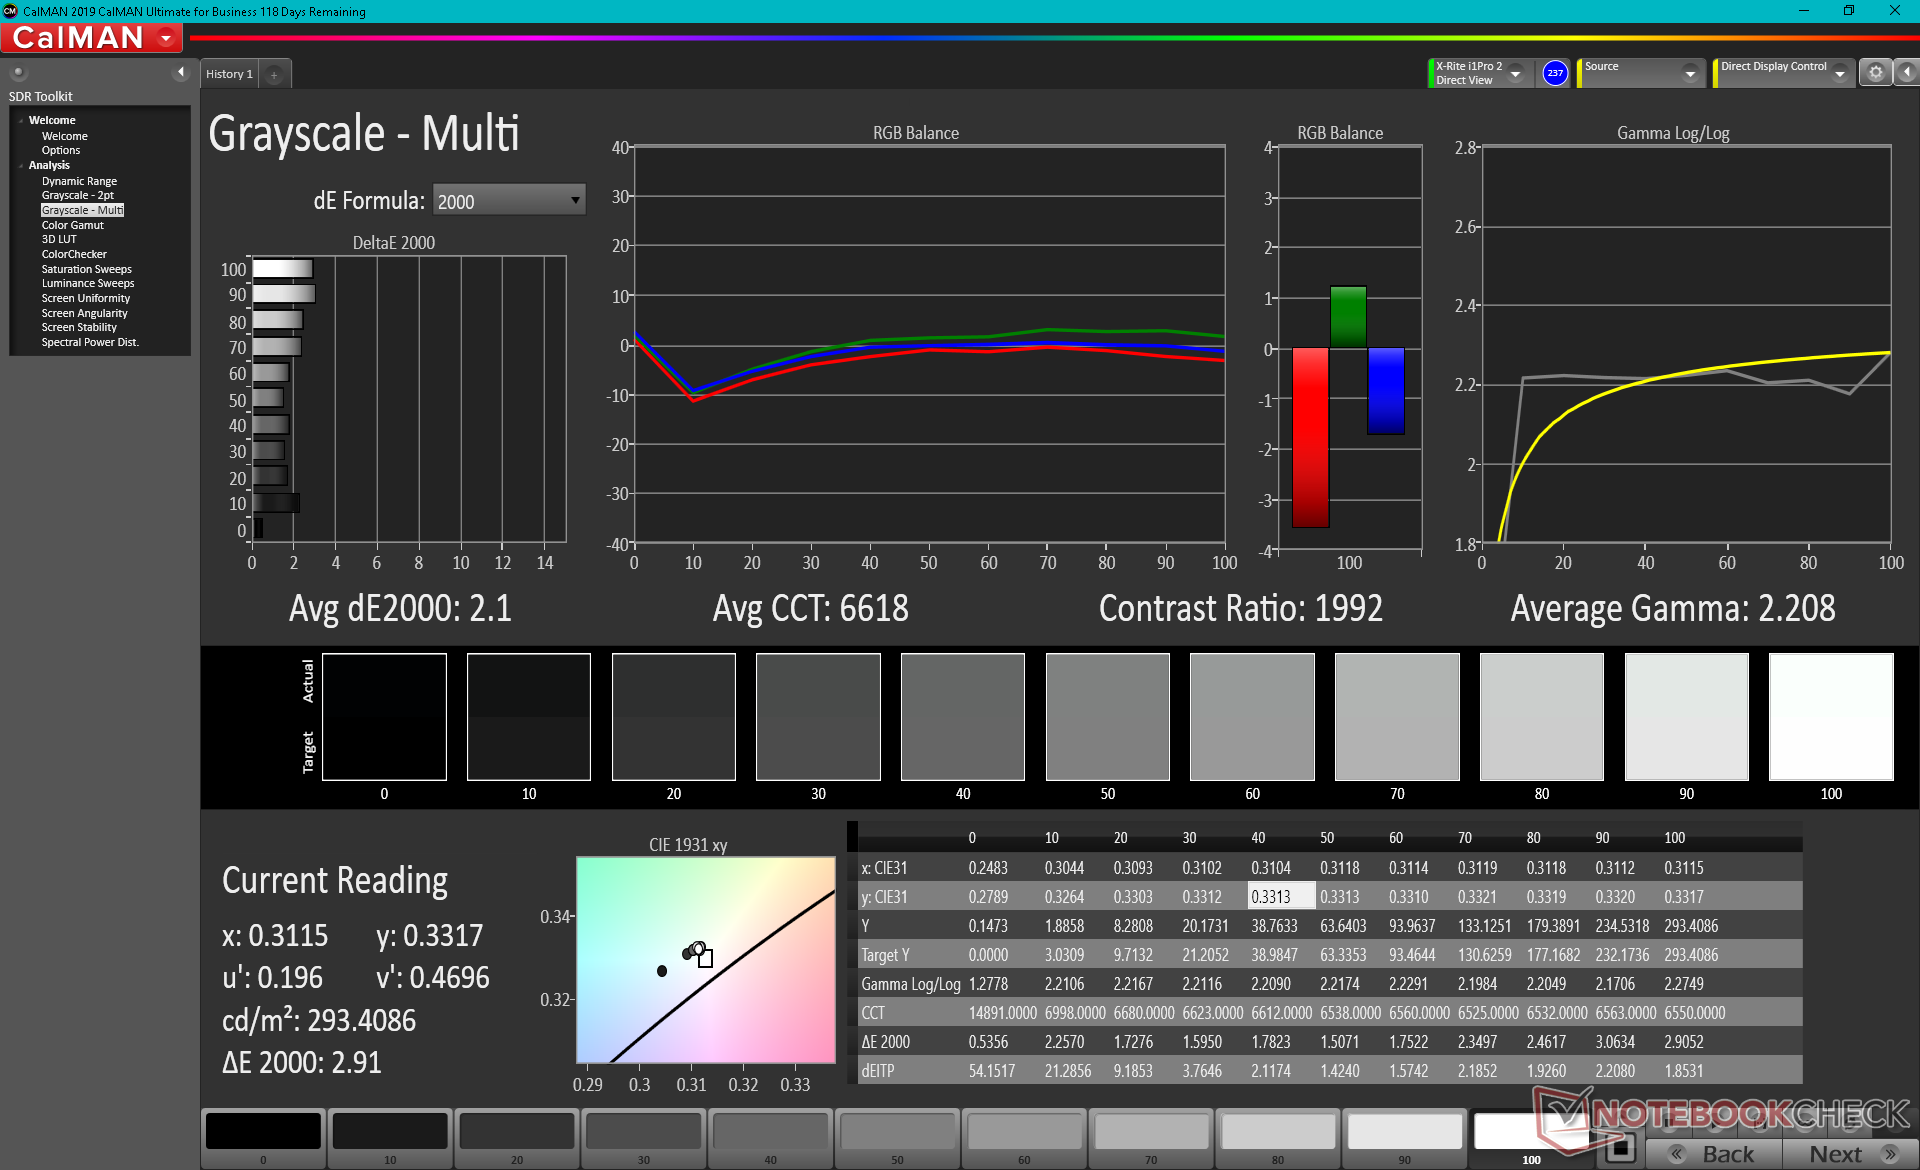
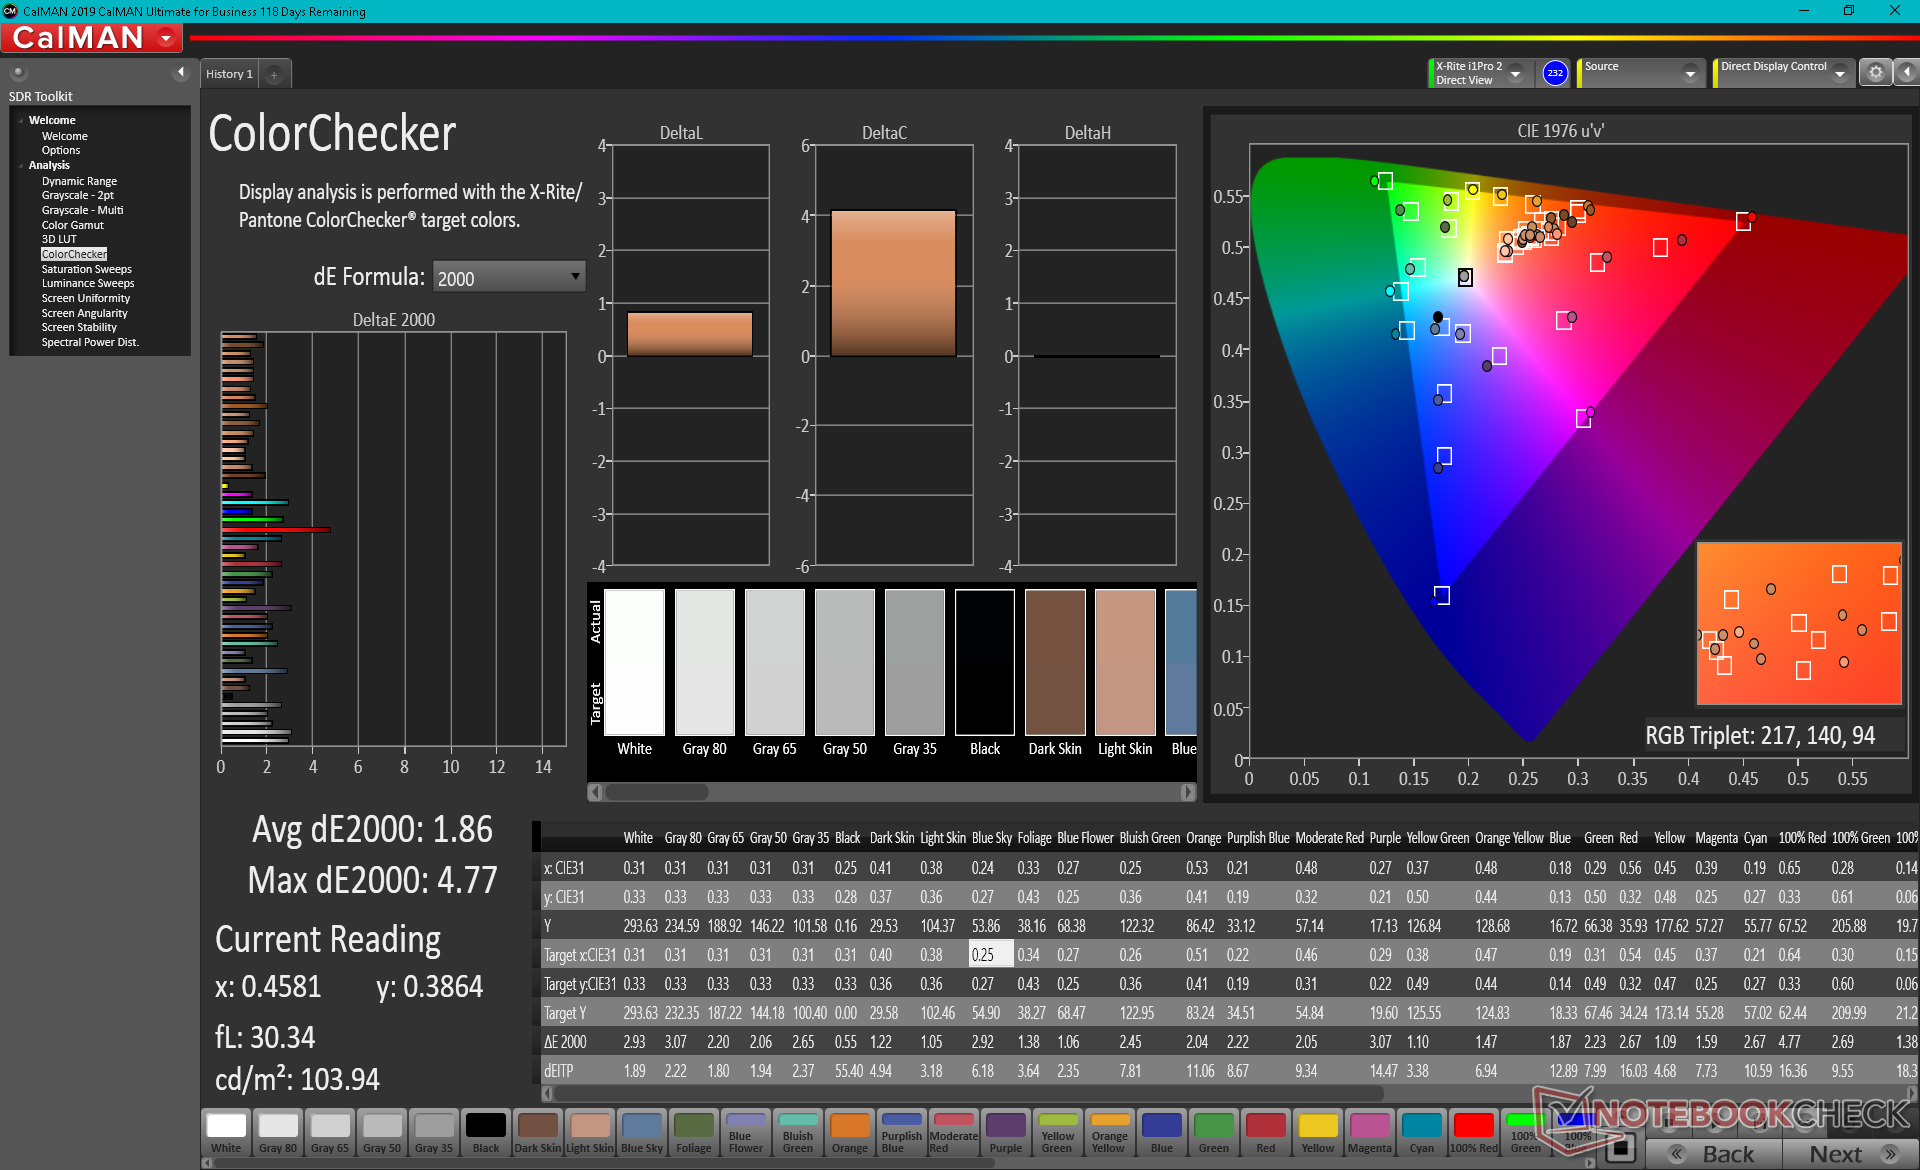
ΔE ColorChecker Calman: 2.56 | ∀{0.5-29.43 Ø4.71}
calibrated: 1.86
ΔE Greyscale Calman: 2.6 | ∀{0.09-98 Ø4.96}
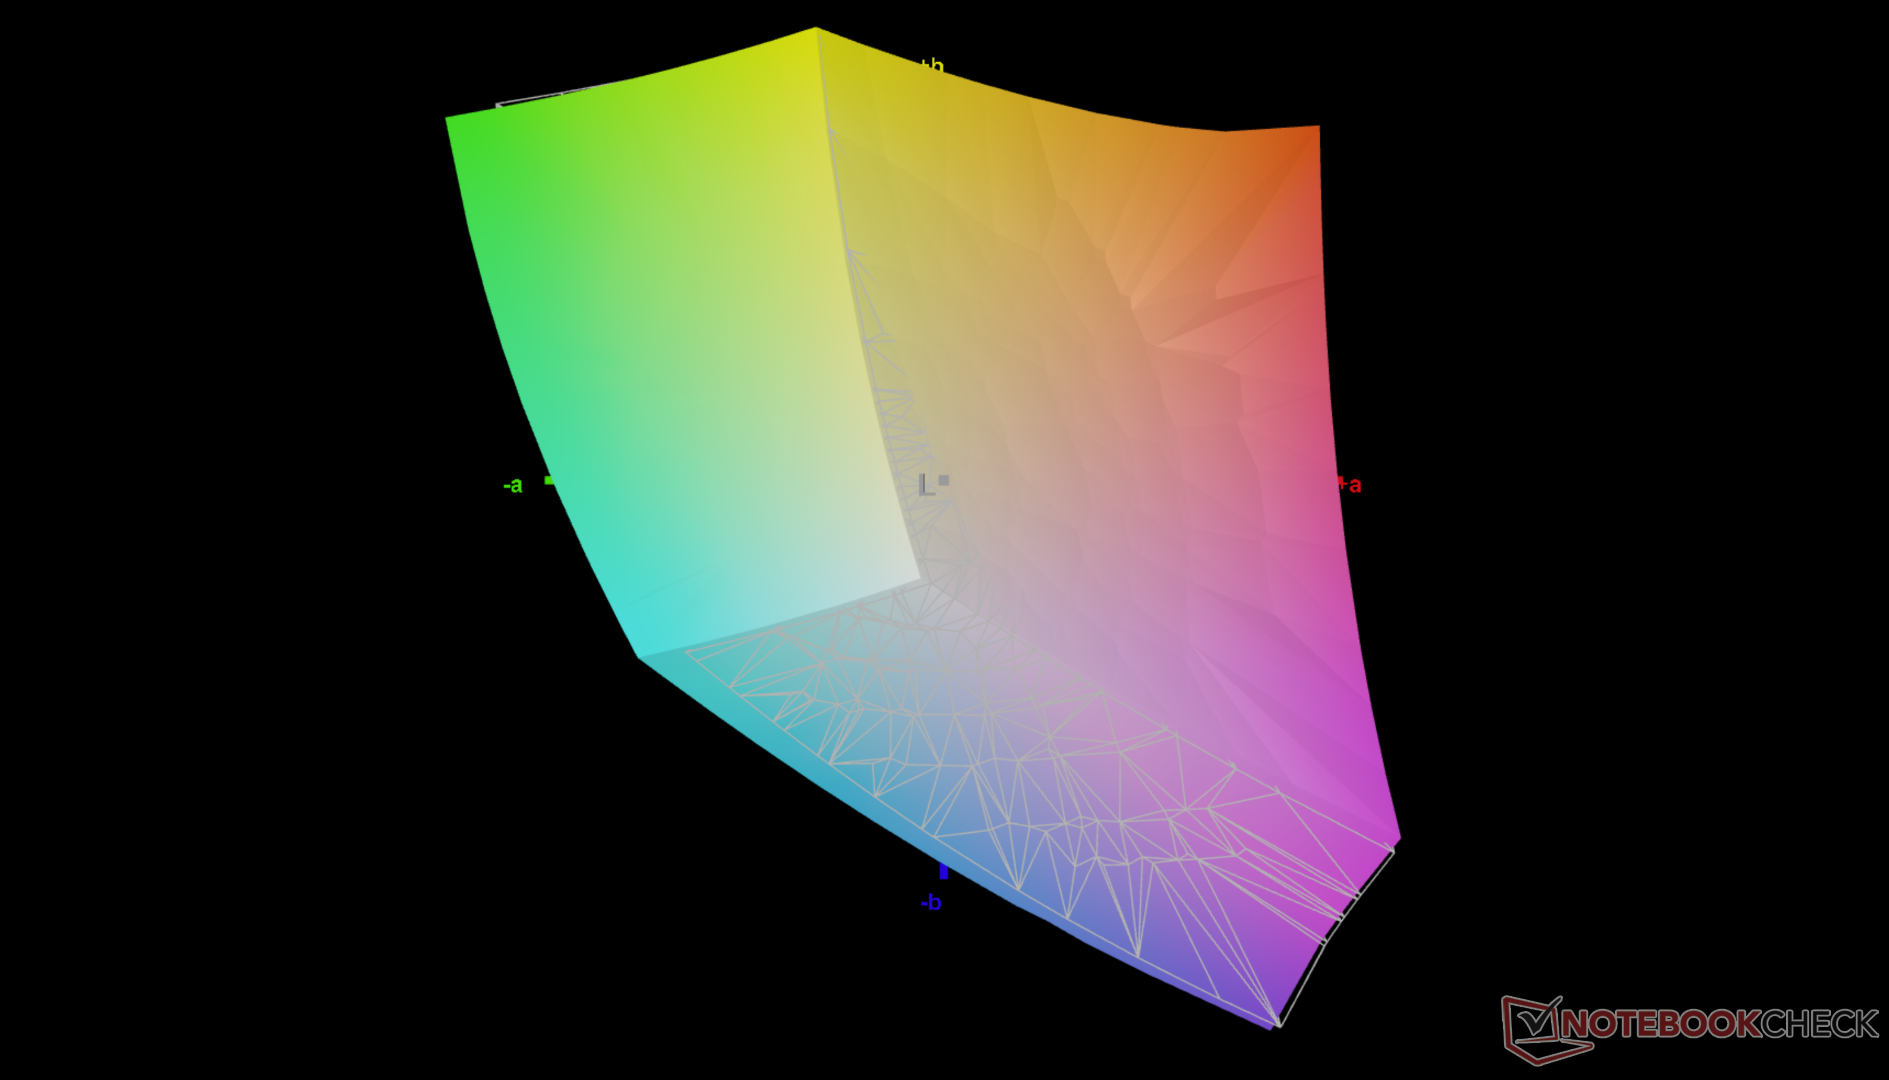
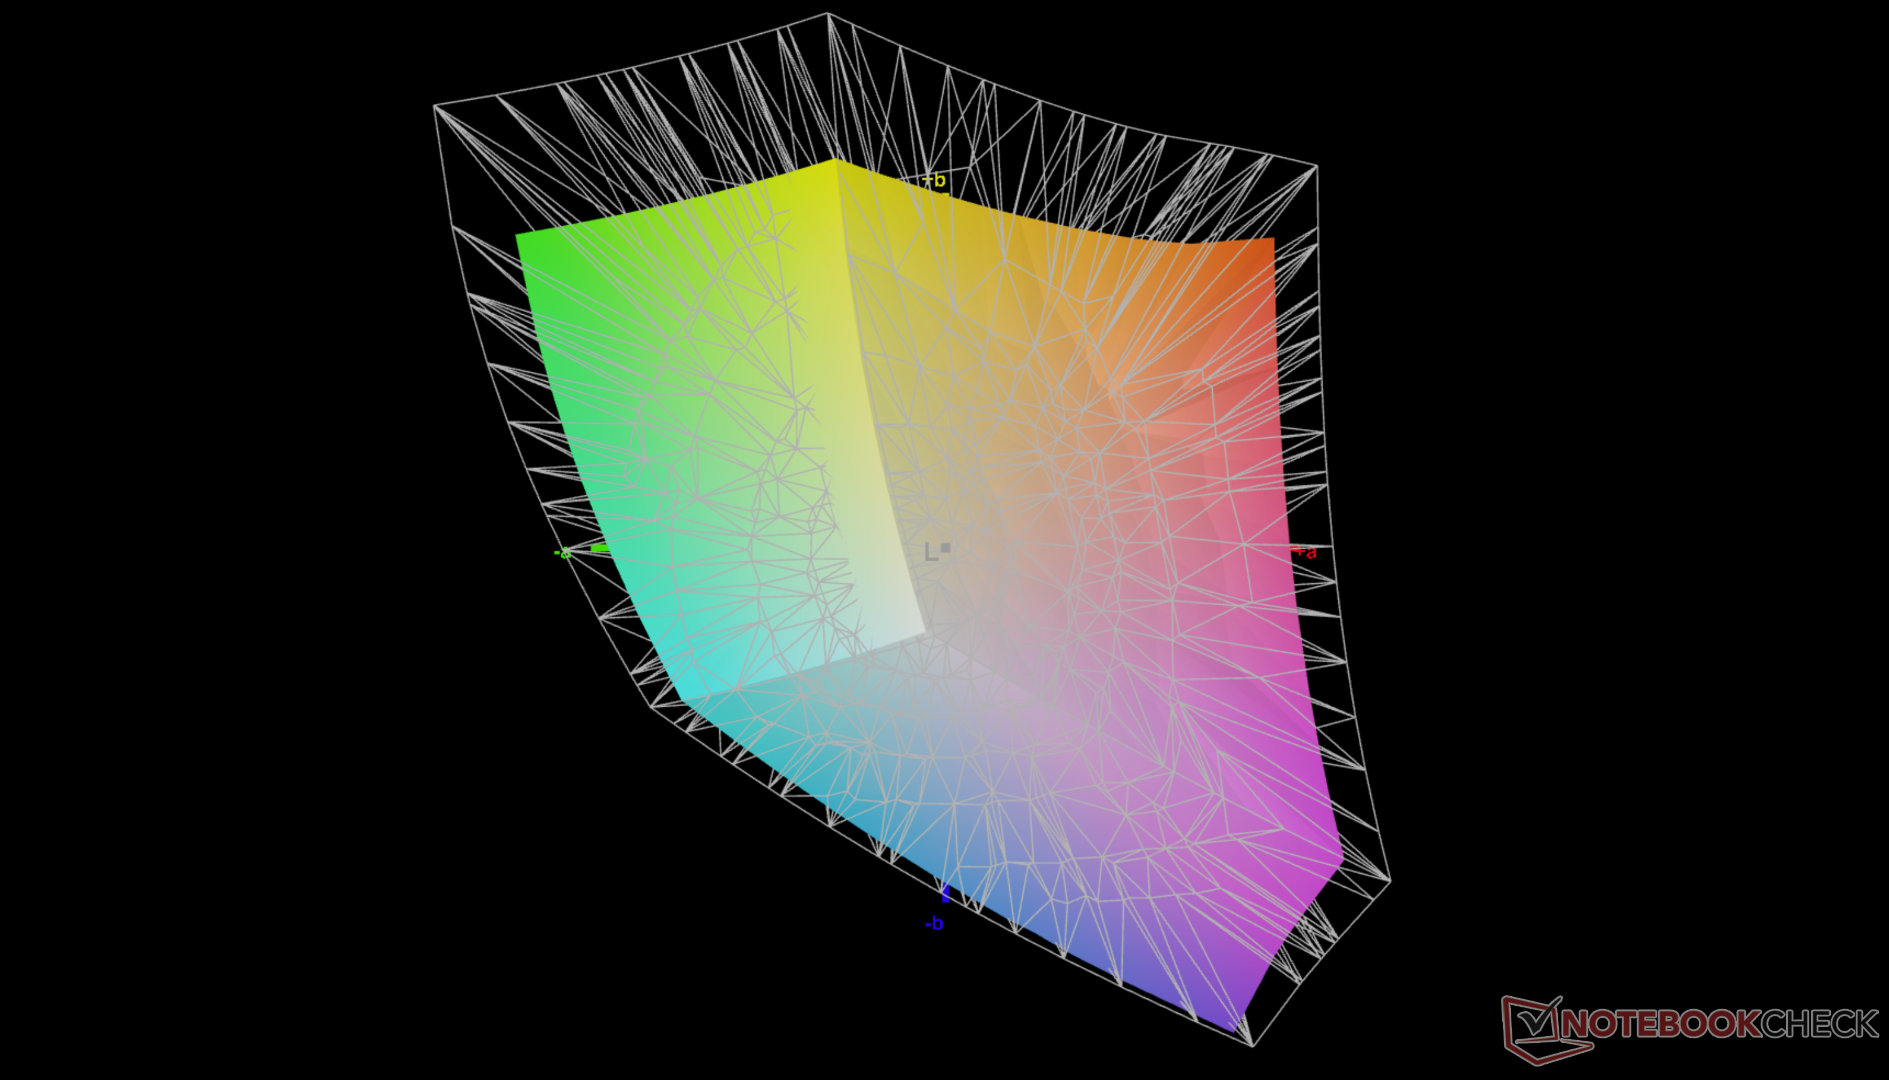
75.8% AdobeRGB 1998 (Argyll 3D)
99.4% sRGB (Argyll 3D)
74.1% Display P3 (Argyll 3D)
Gamma: 2.07
CCT: 6628 K
| Dell Inspiron 16 Plus 7610 AU Optronics B160QAN, IPS, 16", 3072x1920 | Lenovo Legion 5 Pro 16ACH6H (82JQ001PGE) CSOT T3 MNG007DA1-1, IPS, 16", 2560x1600 | Asus ROG Zephyrus M16 GU603H AU Optronics AUOC199, IPS, 16", 2560x1600 | LG Gram 16 (2021) LG Philips LP160WQ1-SPA1, IPS, 16", 2560x1600 | HP Pavilion Gaming 16-a0242ng BOE08F6, IPS, 16.1", 1920x1080 | Dell Inspiron 15 7000 7506 2-in-1 Black Edition AU Optronics B156ZAN, IPS, 15.6", 3840x2160 | |
|---|---|---|---|---|---|---|
| Display | -2% | 13% | -43% | -1% | ||
| Display P3 Coverage (%) | 74.1 | 95.8 29% | 40.42 -45% | 74.3 0% | ||
| sRGB Coverage (%) | 99.4 | 99 0% | 99.8 0% | 60.7 -39% | 99 0% | |
| AdobeRGB 1998 Coverage (%) | 75.8 | 73 -4% | 83.8 11% | 41.77 -45% | 74.6 -2% | |
| Response Times | 84% | 87% | 29% | 15% | -2% | |
| Response Time Grey 50% / Grey 80% * (ms) | 49.2 ? | 9.2 ? 81% | 4.8 ? 90% | 44 ? 11% | 43.2 ? 12% | 55.2 ? -12% |
| Response Time Black / White * (ms) | 36.8 ? | 4.8 87% | 6 ? 84% | 20 ? 46% | 30.4 ? 17% | 34 ? 8% |
| PWM Frequency (Hz) | ||||||
| Screen | 11% | -21% | -45% | -20% | -39% | |
| Brightness middle (cd/m²) | 296.8 | 551 86% | 448 51% | 331 12% | 319 7% | 303.8 2% |
| Brightness (cd/m²) | 292 | 523 79% | 446 53% | 309 6% | 306 5% | 296 1% |
| Brightness Distribution (%) | 87 | 88 1% | 86 -1% | 88 1% | 91 5% | 93 7% |
| Black Level * (cd/m²) | 0.21 | 0.54 -157% | 0.48 -129% | 0.22 -5% | 0.18 14% | 0.24 -14% |
| Contrast (:1) | 1413 | 1020 -28% | 933 -34% | 1505 7% | 1772 25% | 1266 -10% |
| Colorchecker dE 2000 * | 2.56 | 1.8 30% | 2.76 -8% | 4.64 -81% | 4 -56% | 4.58 -79% |
| Colorchecker dE 2000 max. * | 4.76 | 2.53 47% | 7.09 -49% | 9.82 -106% | 11.18 -135% | 9.4 -97% |
| Colorchecker dE 2000 calibrated * | 1.86 | 1.66 11% | 2.86 -54% | 3.16 -70% | 3.52 -89% | 2.17 -17% |
| Greyscale dE 2000 * | 2.6 | 1.85 29% | 3.1 -19% | 6.9 -165% | 1.53 41% | 6.4 -146% |
| Gamma | 2.07 106% | 2.3 96% | 2.153 102% | 2.34 94% | 2.39 92% | 2.3 96% |
| CCT | 6628 98% | 6338 103% | 6826 95% | 7904 82% | 6533 99% | 7414 88% |
| Color Space (Percent of AdobeRGB 1998) (%) | 72.81 | 87 | 75.1 | 38 | 66.7 | |
| Color Space (Percent of sRGB) (%) | 99.41 | 100 | 100 | 60 | 99 | |
| Total Average (Program / Settings) | 31% /
20% | 33% /
-1% | -1% /
-22% | -16% /
-20% | -14% /
-26% |
* ... smaller is better
Color space encompasses sRGB entirely to satisfy most amateur graphic artists. Other multimedia laptops like the ZenBook Pro series offer wider AdobeRGB or DCI-P3 colors that the Inspiron 16 cannot yet deliver.
Our X-Rite colorimeter reveals a well-calibrated display out of the box with average grayscale and color deltaE values of just 2.6 and 2.56, respectively. There is room for improvement, however, as our own calibration attempt would improve both deltaE values just slightly to 2.1 and 1.86.

Display Response Times
| ↔ Response Time Black to White | ||
|---|---|---|
| 36.8 ms ... rise ↗ and fall ↘ combined | ↗ 20.8 ms rise | 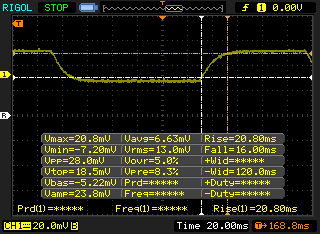 |
| ↘ 16 ms fall | ||
| The screen shows slow response rates in our tests and will be unsatisfactory for gamers. In comparison, all tested devices range from 0.1 (minimum) to 240 (maximum) ms. » 95 % of all devices are better. This means that the measured response time is worse than the average of all tested devices (19.8 ms). | ||
| ↔ Response Time 50% Grey to 80% Grey | ||
| 49.2 ms ... rise ↗ and fall ↘ combined | ↗ 24.8 ms rise | 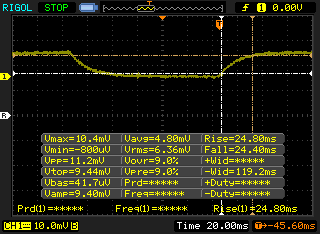 |
| ↘ 24.4 ms fall | ||
| The screen shows slow response rates in our tests and will be unsatisfactory for gamers. In comparison, all tested devices range from 0.165 (minimum) to 636 (maximum) ms. » 85 % of all devices are better. This means that the measured response time is worse than the average of all tested devices (30.9 ms). | ||
Screen Flickering / PWM (Pulse-Width Modulation)
| Screen flickering / PWM not detected | 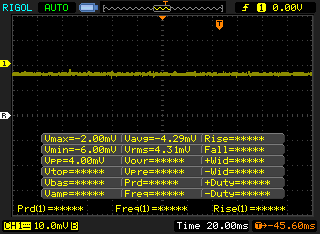 | ||
In comparison: 52 % of all tested devices do not use PWM to dim the display. If PWM was detected, an average of 7744 (minimum: 5 - maximum: 343500) Hz was measured. | |||
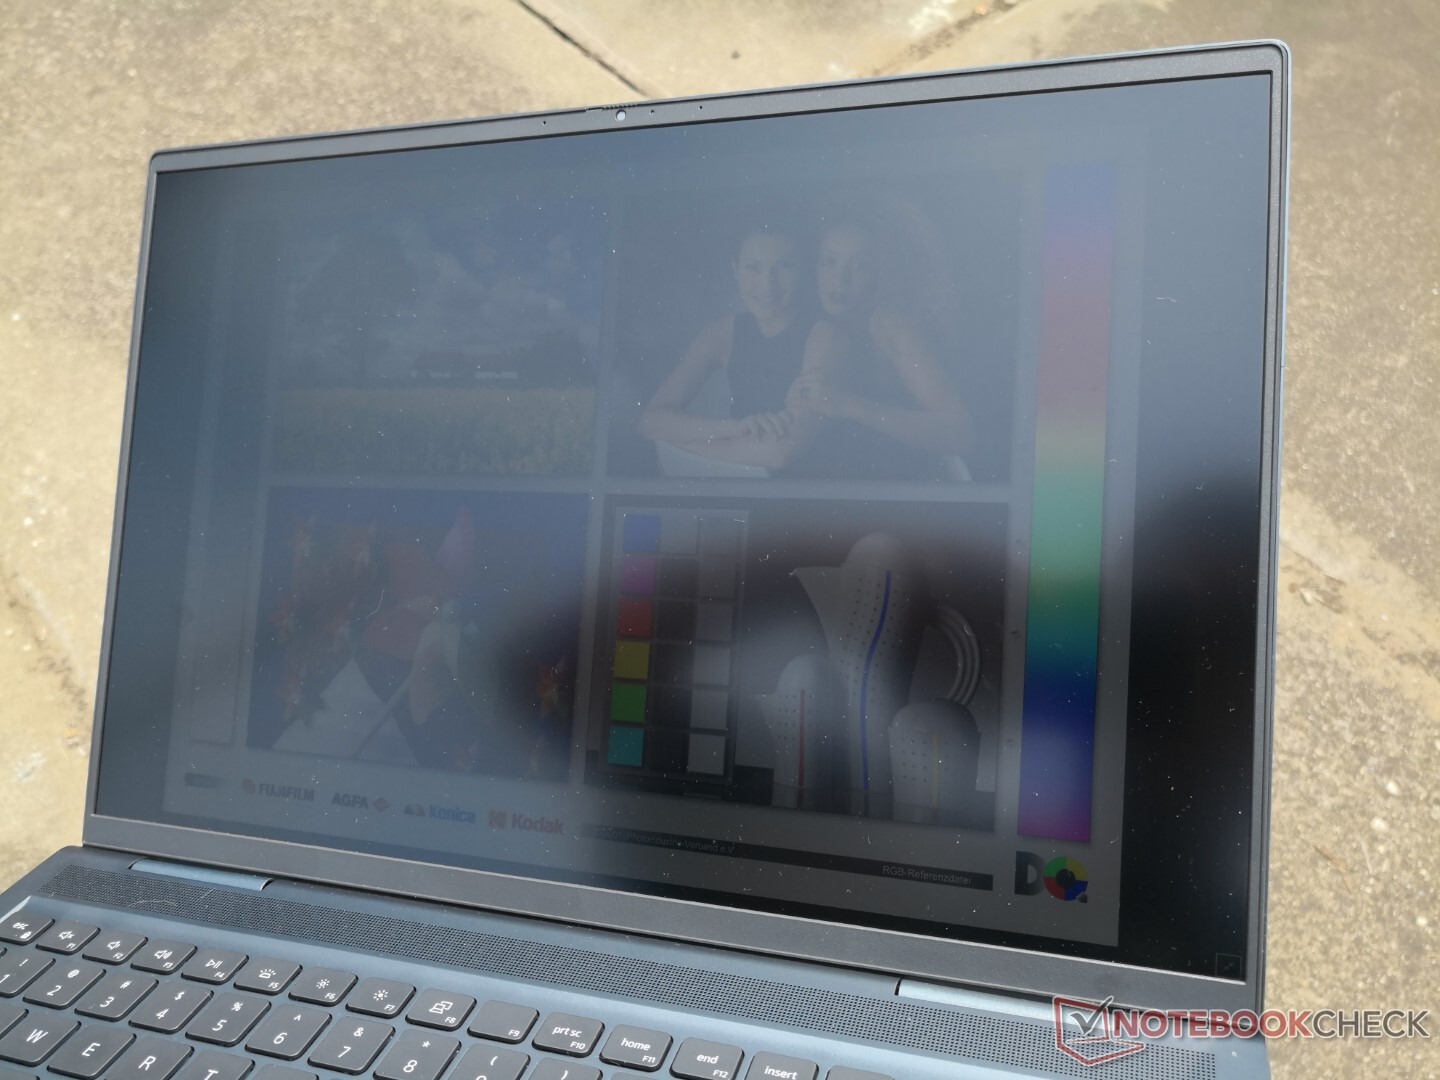
Outdoor visibility is below average and similar to many 15.6-inch gaming laptops since most models in the category target the same 300-nit panel brightness. The Asus ROG Zephyrus M16, MacBook Pro 16, or Lenovo Legion 5 Pro are each noticeably brighter if outdoor viewing is important.

Performance — Powered by Intel Core H
Intel Tiger Lake-H CPUs come standard while the GeForce RTX 3050 or RTX 3060 are optional. The Inspiron 16 is a quasi-XPS laptop since it carries similar CPU and GPU options sans the top-end Core i9. There are no AMD SKUs as of this writing.
Resizable Bar and Optimus 1.0 are included if configured with an Nvidia GPU.
Processor
CPU performance could have been better as CineBench multi-thread results are 11 to 16 percent slower than the average laptop equipped with the same Core i7-11800H processor. This deficit means most laptops with the older AMD Ryzen 7 4800H can outperform our Dell. Even so, it's still a step up from the previous generation Core i7-10870H by about 10 to 15 percent. Single-thread performance is otherwise excellent and where we expect it to be.
Opting for the lower-end Core i5-11400H configuration instead of our i7-11800H will incur a performance deficit of about 10 to 20 percent.
Cinebench R15 Multi Loop
Cinebench R23: Multi Core | Single Core
Cinebench R15: CPU Multi 64Bit | CPU Single 64Bit
Blender: v2.79 BMW27 CPU
7-Zip 18.03: 7z b 4 -mmt1 | 7z b 4
Geekbench 5.5: Single-Core | Multi-Core
HWBOT x265 Benchmark v2.2: 4k Preset
LibreOffice : 20 Documents To PDF
R Benchmark 2.5: Overall mean
| Cinebench R23 / Multi Core | |
| Average Intel Core i7-11800H (6508 - 14088, n=48) | |
| Schenker XMG Core 15 Ampere | |
| Dell Inspiron 16 Plus 7610 | |
| Gigabyte Aero 15 OLED XC | |
| Razer Blade 15 Advanced Model Early 2021 | |
| Acer Aspire Nitro 5 AN515-55-57GF | |
| Cinebench R23 / Single Core | |
| Dell Inspiron 16 Plus 7610 | |
| Average Intel Core i7-11800H (1386 - 1522, n=45) | |
| Schenker XMG Core 15 Ampere | |
| Gigabyte Aero 15 OLED XC | |
| Razer Blade 15 Advanced Model Early 2021 | |
| Acer Aspire Nitro 5 AN515-55-57GF | |
| HWBOT x265 Benchmark v2.2 / 4k Preset | |
| Asus ROG Zephyrus M16 GU603H | |
| Average Intel Core i7-11800H (7.38 - 17.4, n=46) | |
| Schenker XMG Core 15 Ampere | |
| Asus TUF Gaming A15 FA506QR-AZ061T | |
| Dell Inspiron 16 Plus 7610 | |
| Gigabyte Aero 15 OLED XC | |
| Razer Blade 15 Advanced Model Early 2021 | |
| Asus ProArt StudioBook Pro 15 W500G5T | |
| Acer Aspire Nitro 5 AN515-55-57GF | |
* ... smaller is better
System Performance
PCMark 10 results are generally higher than laptops with older 10th gen Core-H CPUs such as the Asus ROG Zephyrus M15. The differences are especially pronounced when compared to laptops powered by Core U-series CPUs.
| PCMark 10 / Score | |
| Asus ROG Zephyrus M16 GU603H | |
| Lenovo Legion 5 Pro 16ACH6H (82JQ001PGE) | |
| Dell Inspiron 16 Plus 7610 | |
| Average Intel Core i7-11800H, NVIDIA GeForce RTX 3050 4GB Laptop GPU (n=1) | |
| Dell Inspiron 15 7000 7506 2-in-1 Black Edition | |
| LG Gram 16 (2021) | |
| HP Pavilion Gaming 16-a0242ng | |
| PCMark 10 / Essentials | |
| Asus ROG Zephyrus M16 GU603H | |
| LG Gram 16 (2021) | |
| Dell Inspiron 16 Plus 7610 | |
| Average Intel Core i7-11800H, NVIDIA GeForce RTX 3050 4GB Laptop GPU (n=1) | |
| Dell Inspiron 15 7000 7506 2-in-1 Black Edition | |
| Lenovo Legion 5 Pro 16ACH6H (82JQ001PGE) | |
| HP Pavilion Gaming 16-a0242ng | |
| PCMark 10 / Productivity | |
| Asus ROG Zephyrus M16 GU603H | |
| Lenovo Legion 5 Pro 16ACH6H (82JQ001PGE) | |
| Dell Inspiron 16 Plus 7610 | |
| Average Intel Core i7-11800H, NVIDIA GeForce RTX 3050 4GB Laptop GPU (n=1) | |
| HP Pavilion Gaming 16-a0242ng | |
| LG Gram 16 (2021) | |
| Dell Inspiron 15 7000 7506 2-in-1 Black Edition | |
| PCMark 10 / Digital Content Creation | |
| Asus ROG Zephyrus M16 GU603H | |
| Lenovo Legion 5 Pro 16ACH6H (82JQ001PGE) | |
| Dell Inspiron 16 Plus 7610 | |
| Average Intel Core i7-11800H, NVIDIA GeForce RTX 3050 4GB Laptop GPU (n=1) | |
| Dell Inspiron 15 7000 7506 2-in-1 Black Edition | |
| HP Pavilion Gaming 16-a0242ng | |
| LG Gram 16 (2021) | |
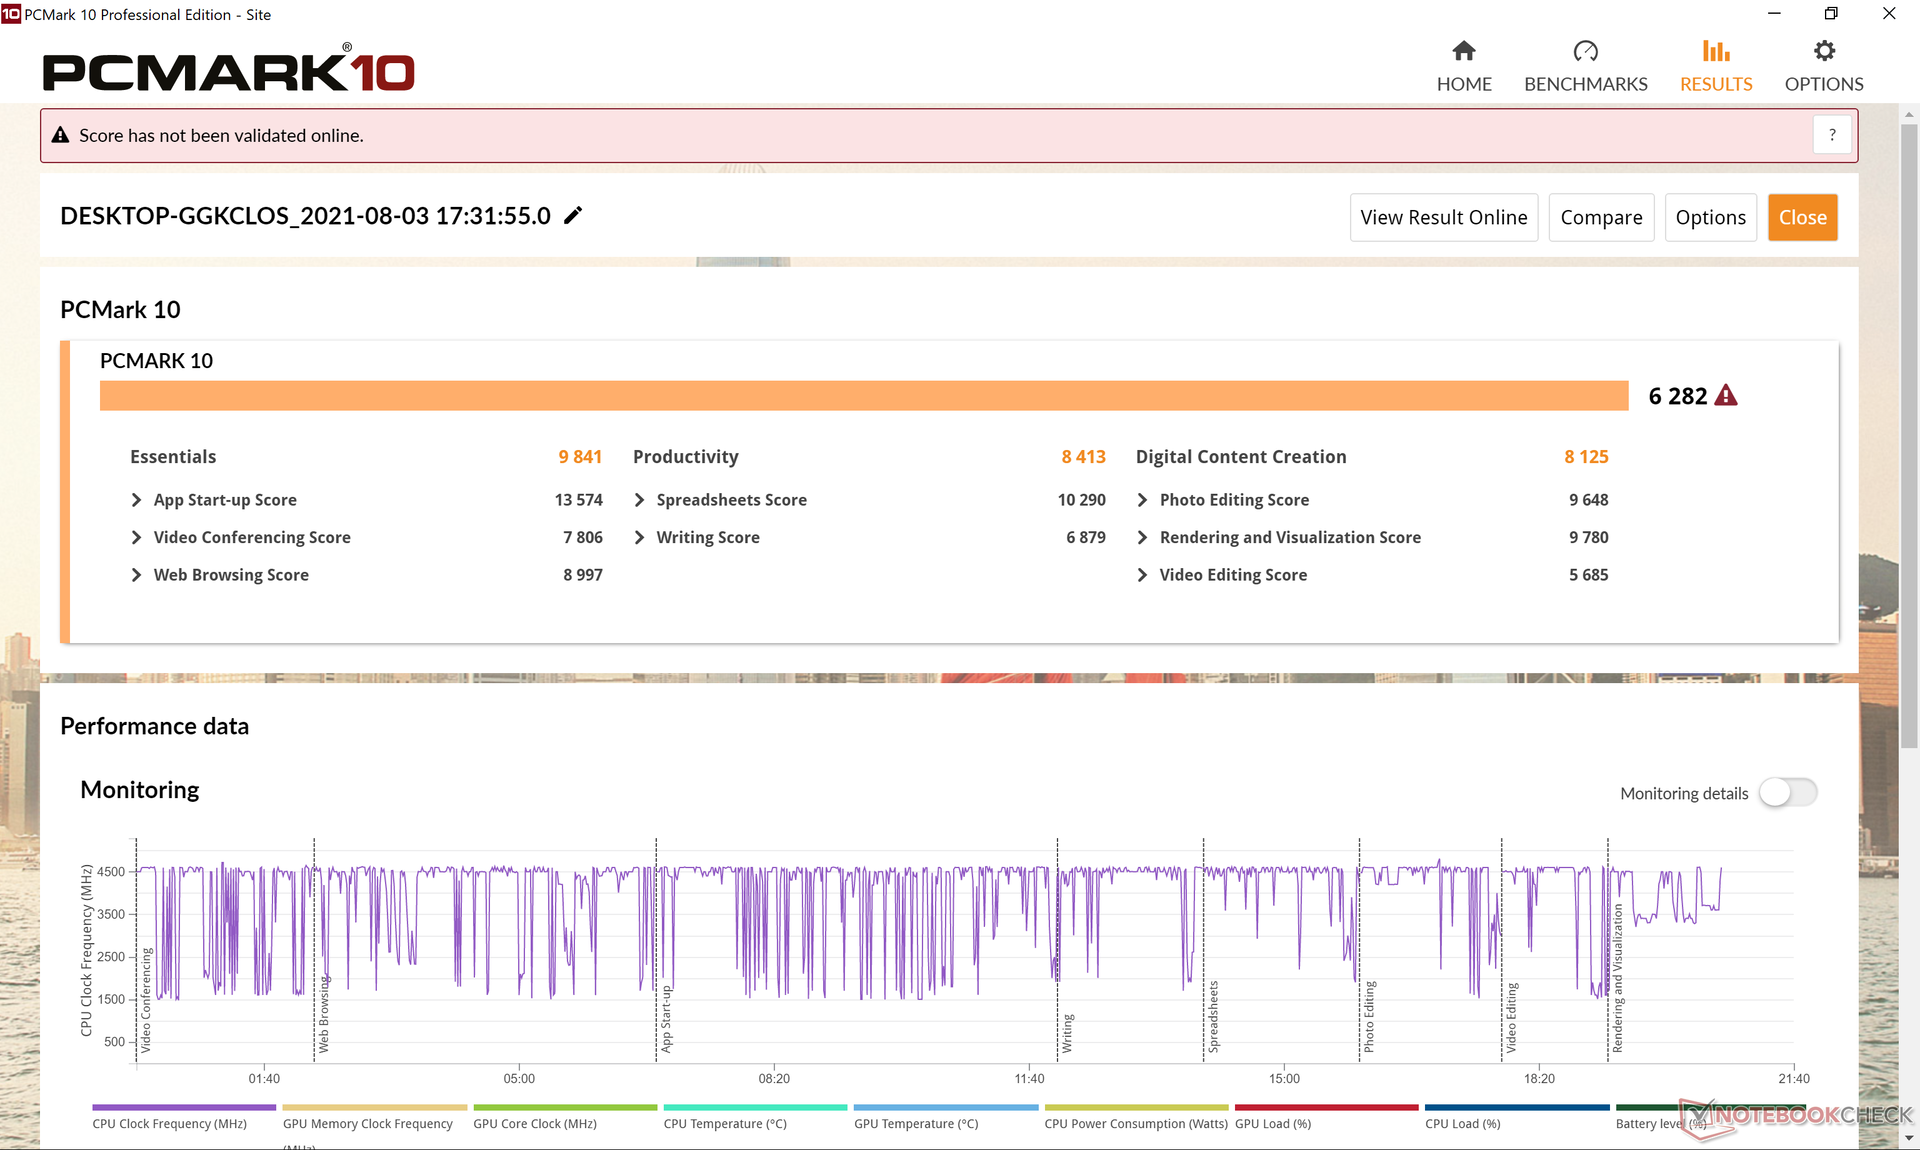
| PCMark 10 Score | 6282 points | |
Help | ||
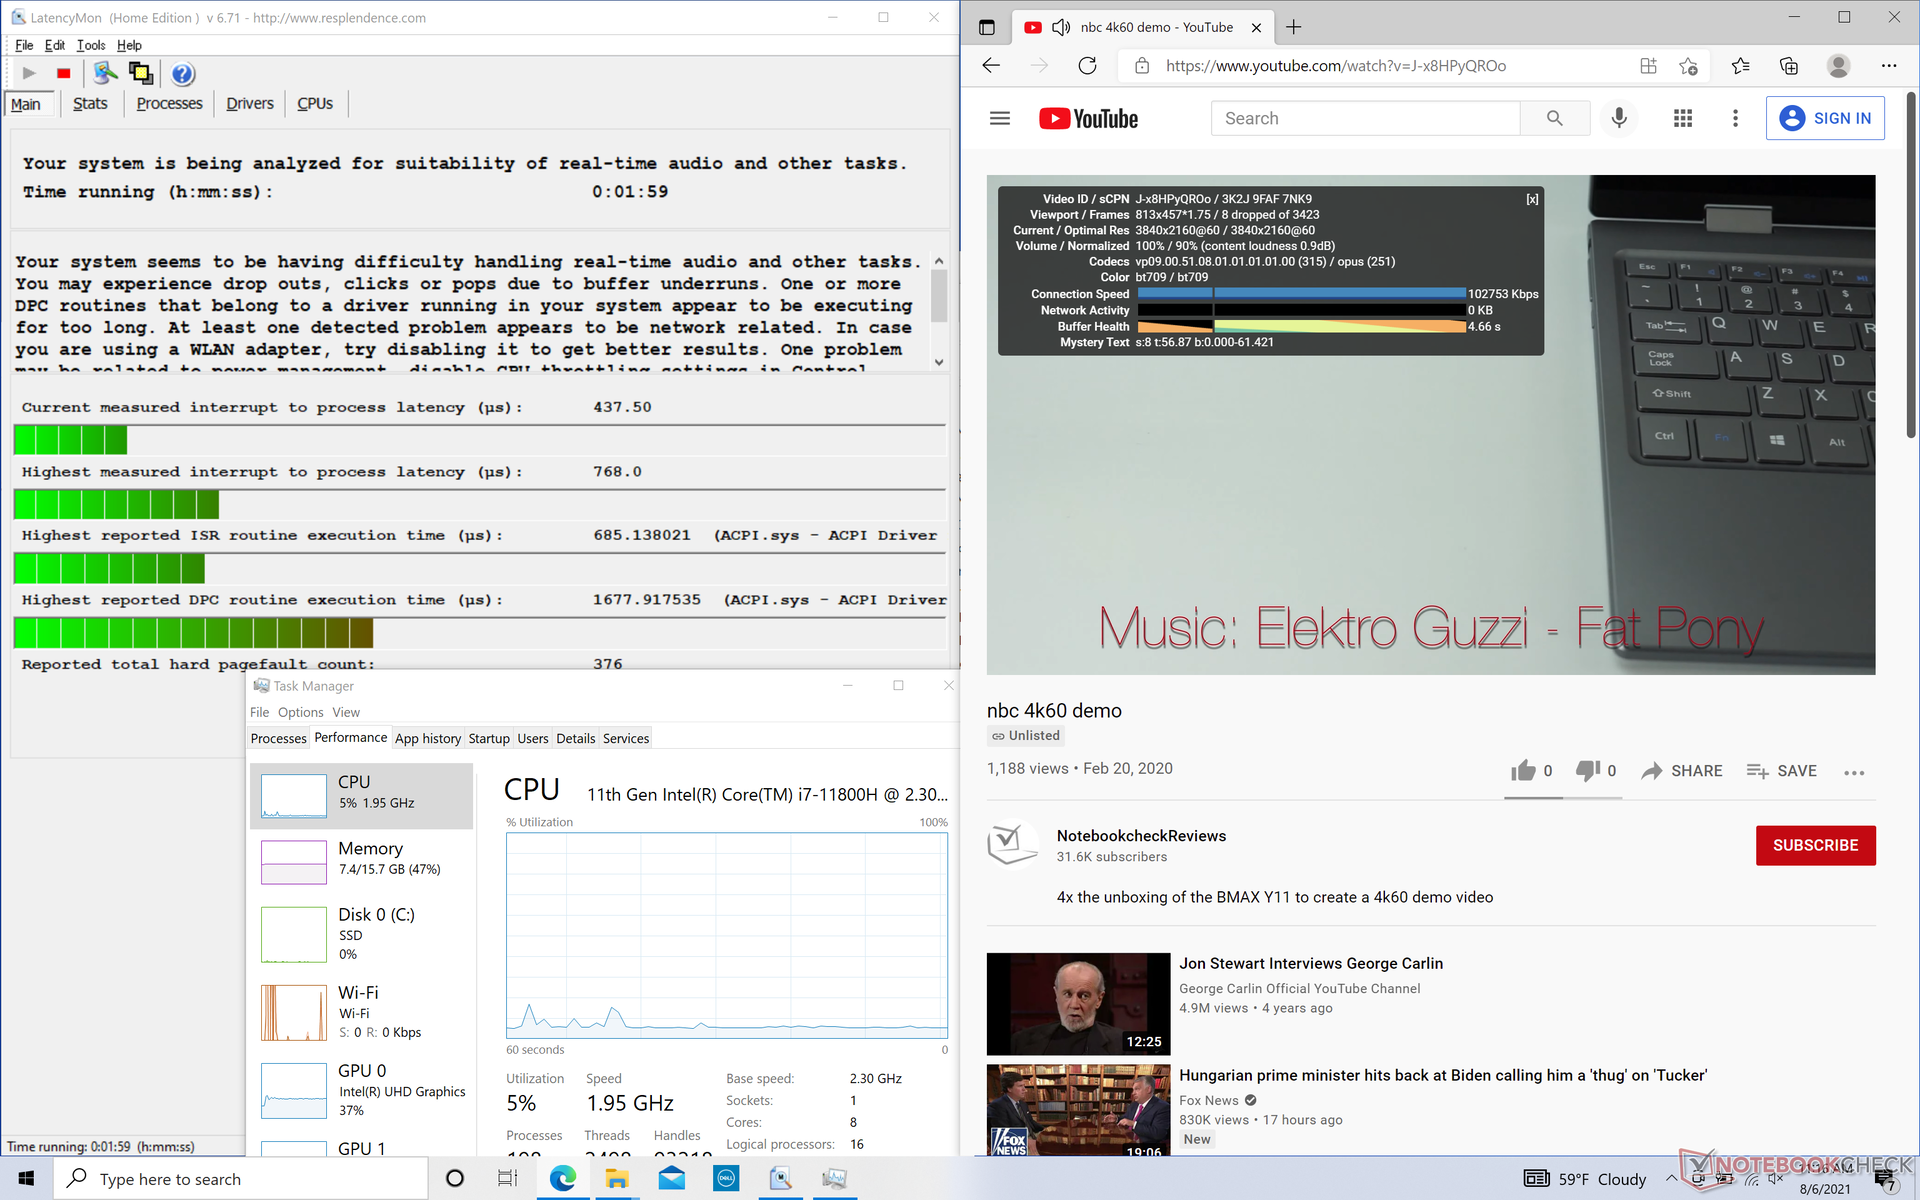
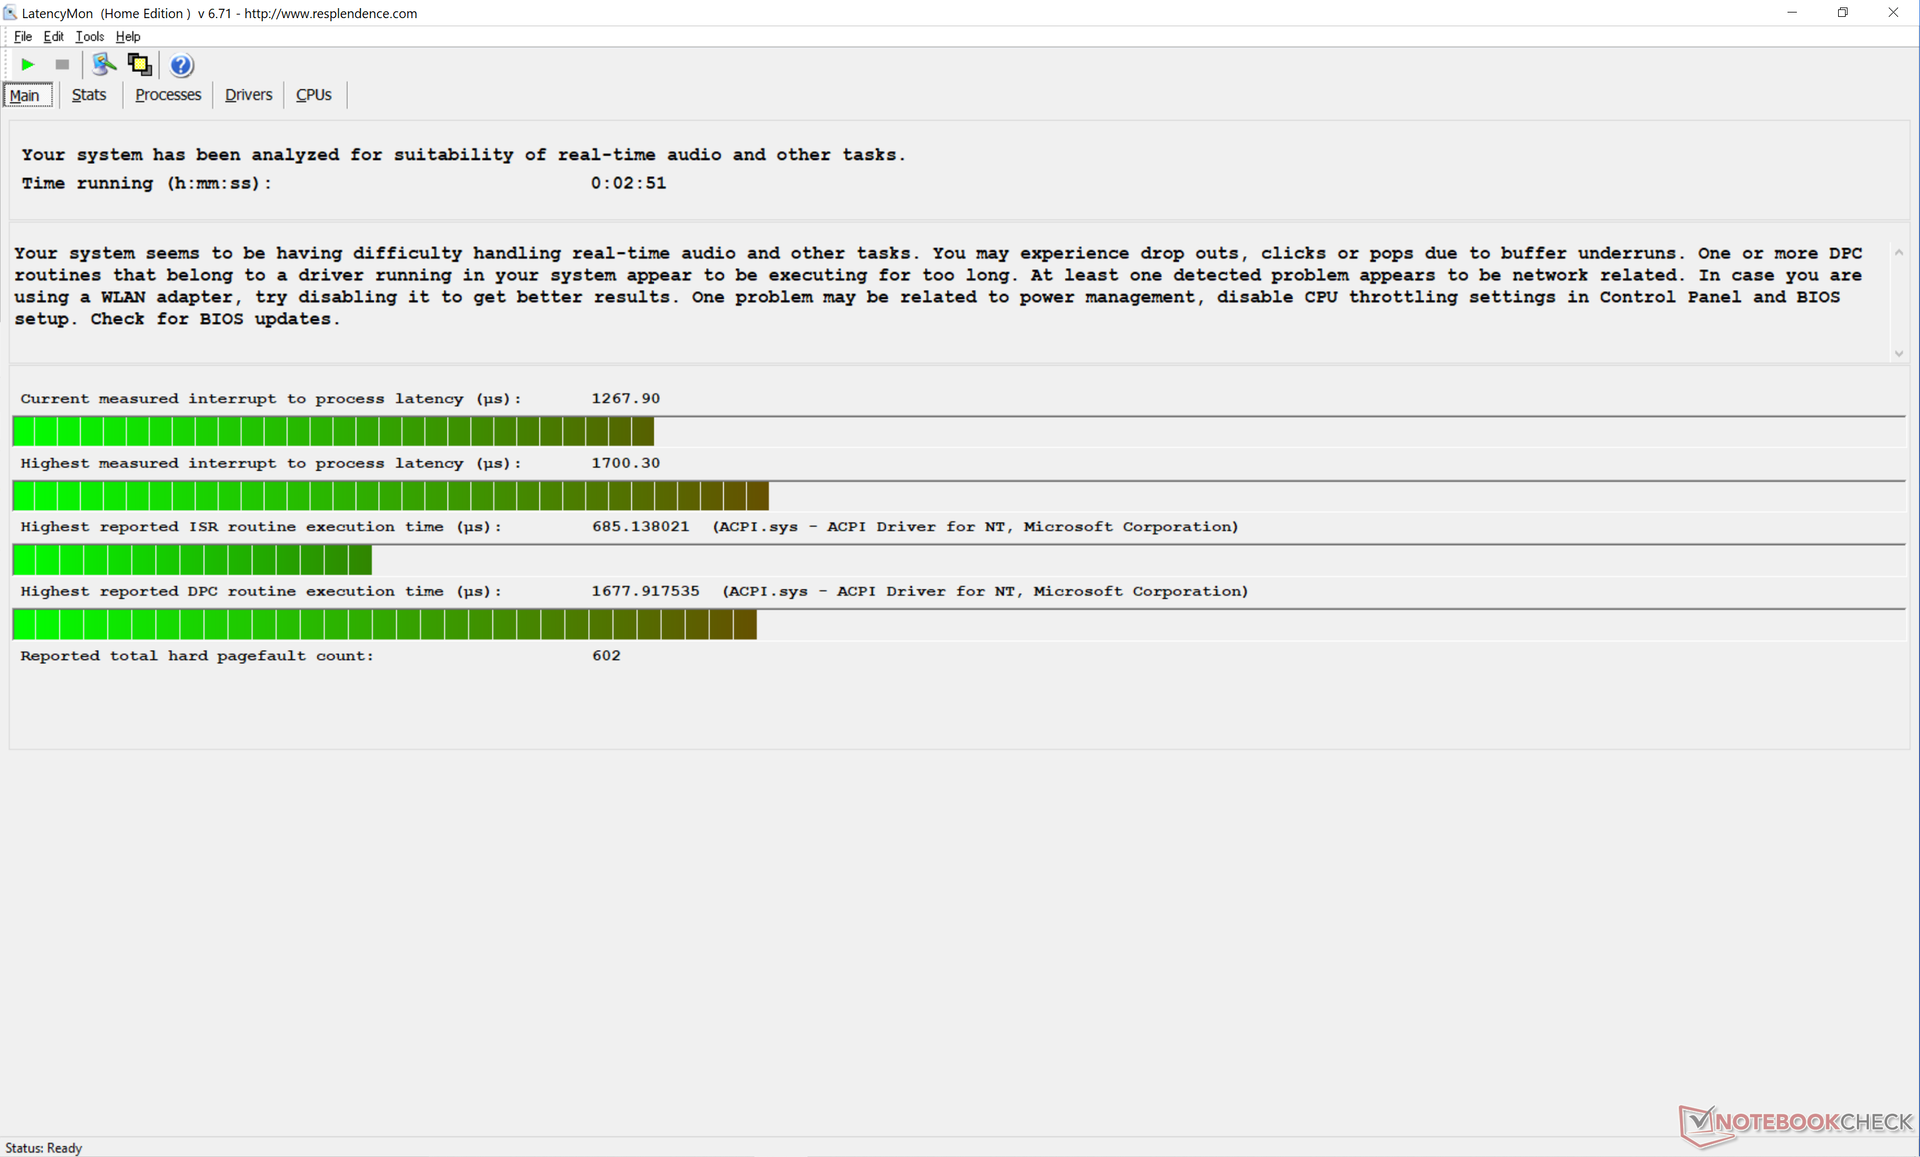
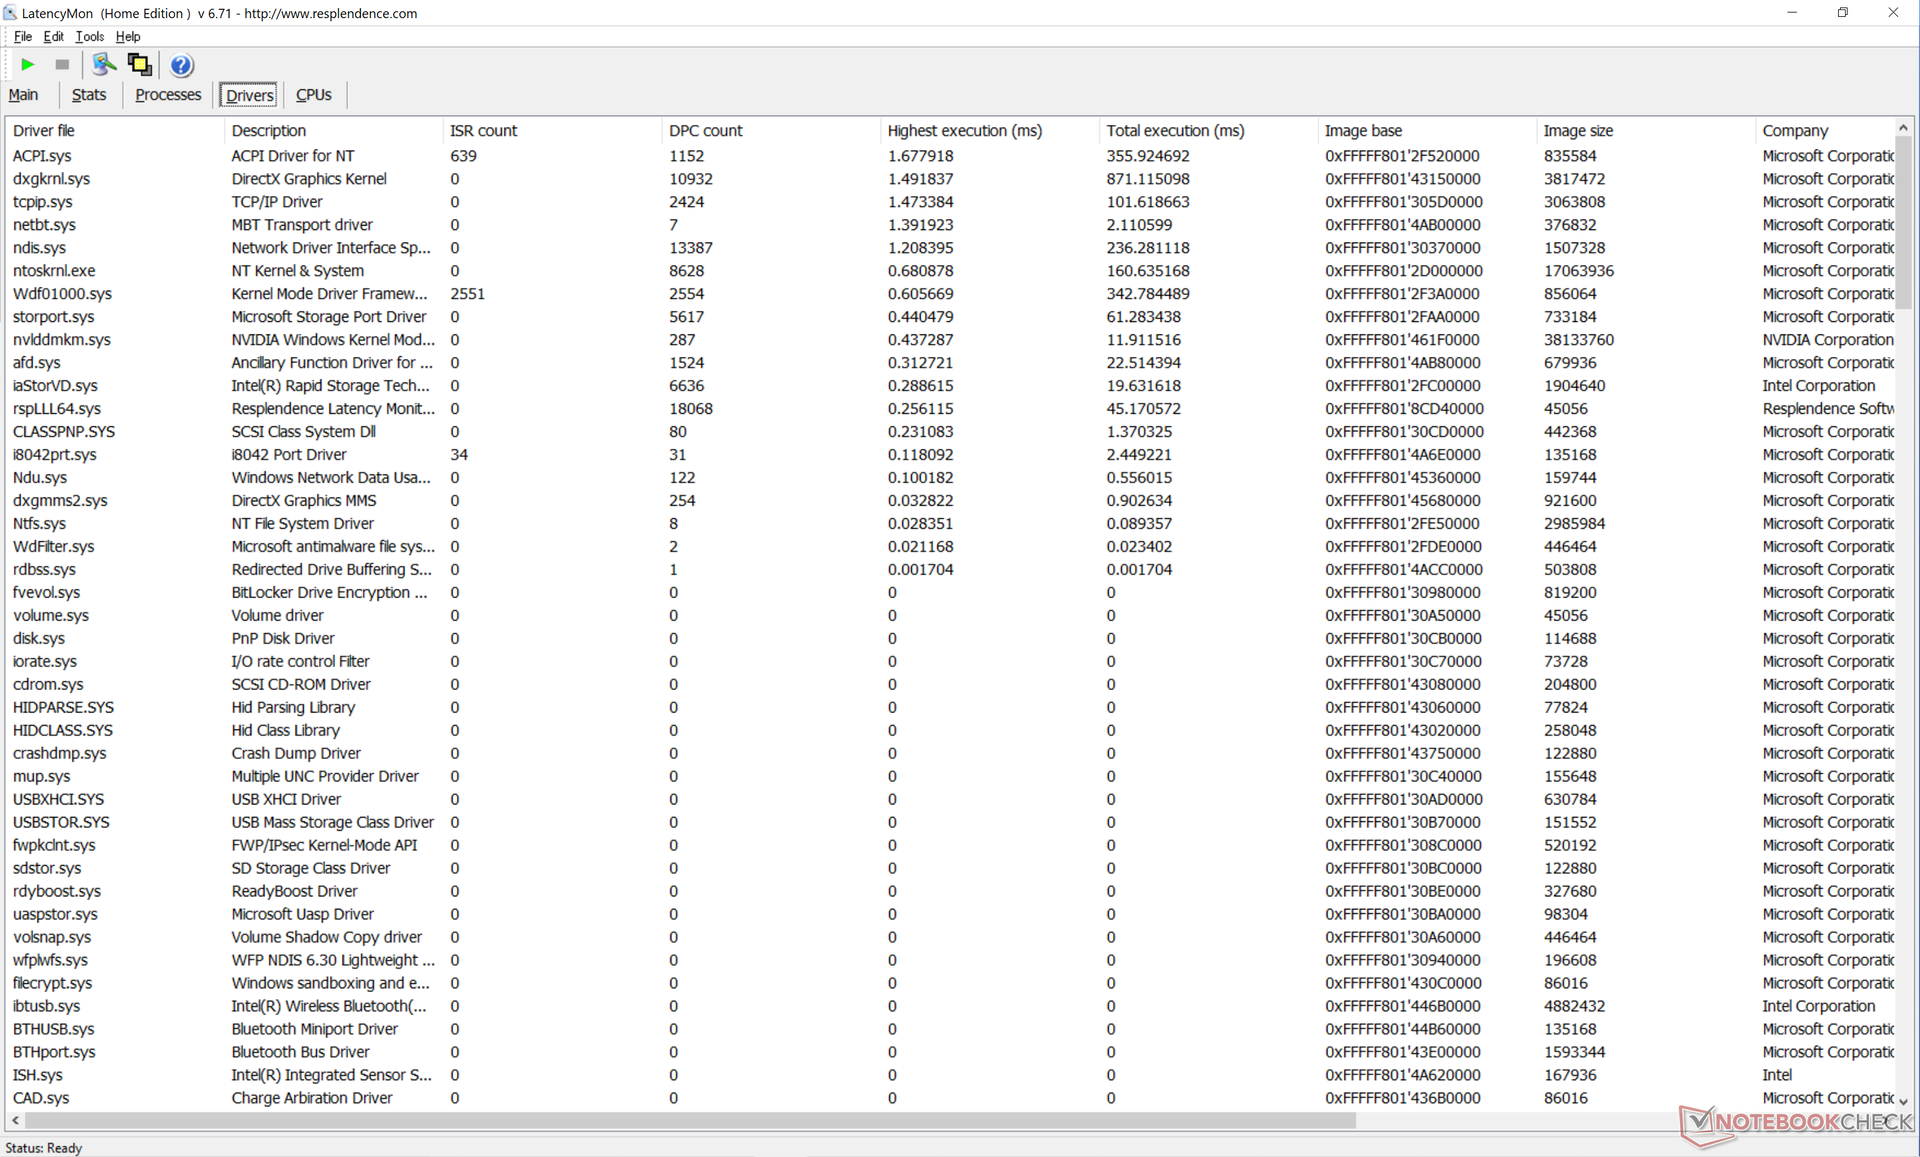
DPC Latency
LatencyMon reveals DPC Latency issues when opening multiple tabs on our homepage or when running Prime95 stress. 4K video playback at 60 FPS is also not flawless as we're able to record 8 dropped frames during our 60-second video.
| DPC Latencies / LatencyMon - interrupt to process latency (max), Web, Youtube, Prime95 | |
| HP Pavilion Gaming 16-a0242ng | |
| Dell Inspiron 16 Plus 7610 | |
| Lenovo Legion 5 Pro 16ACH6H (82JQ001PGE) | |
| Asus ROG Zephyrus M16 GU603H | |
| LG Gram 16 (2021) | |
| Dell Inspiron 15 7000 7506 2-in-1 Black Edition | |
* ... smaller is better
Storage Devices — Two Internal Drives
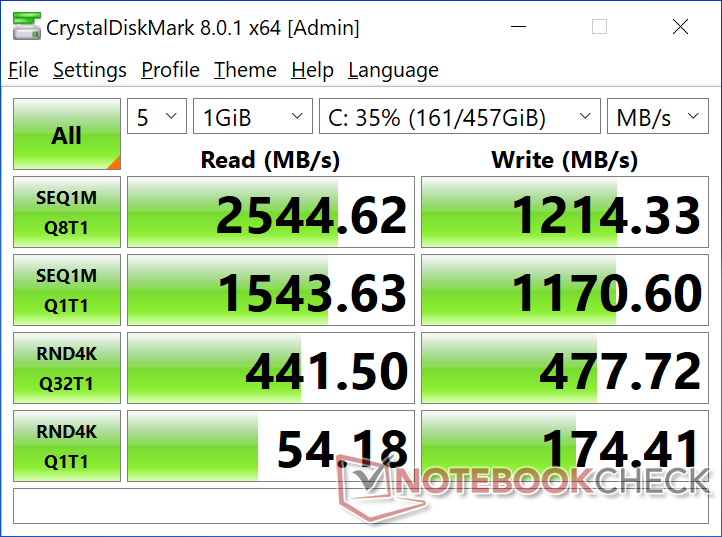
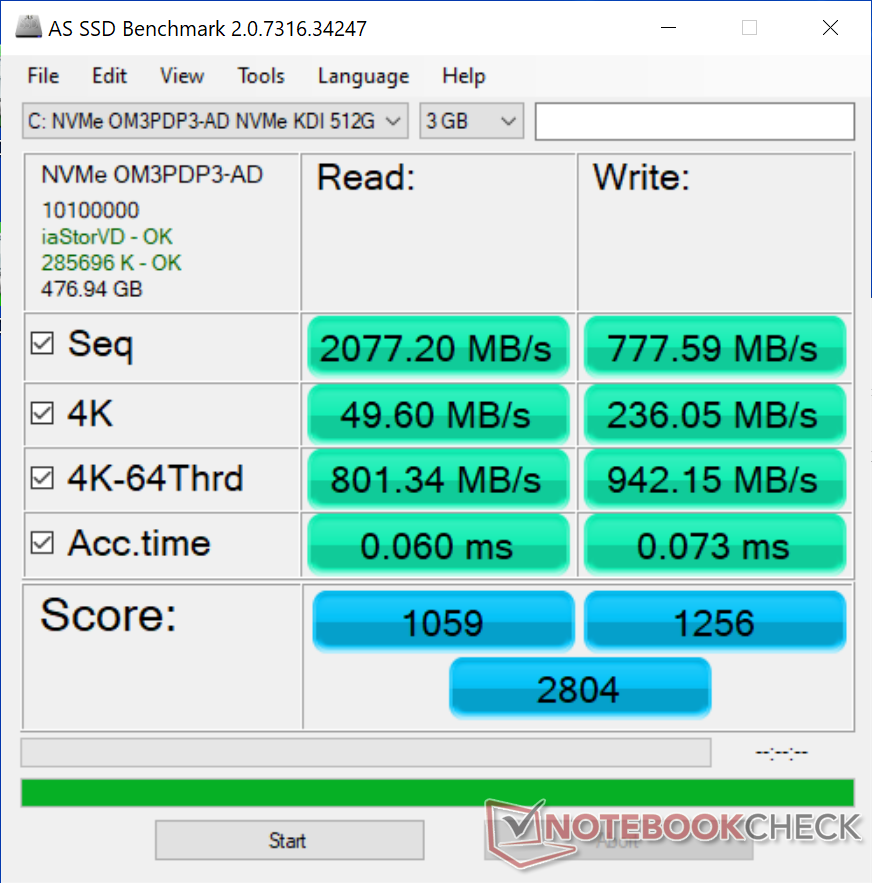
Our test unit comes with an uncommon Kingston OM3PDP3-AD NVMe SSD. Performance is fairly average at up to half that of the Micron 2300 in the XPS 15 9510. It's difficult to predict what drives the retail units will ship with as Dell sources from multiple SSD suppliers including Samsung, Micron, Western Digital, Toshiba, and apparently Kingston.
Users can install up to two internal drives, but at least one must be in the smaller 2230 form factor.
| Dell Inspiron 16 Plus 7610 Kingston OM3PDP3512B | Lenovo Legion 5 Pro 16ACH6H (82JQ001PGE) WDC PC SN730 SDBPNTY-1T00 | LG Gram 16 (2021) SK Hynix PC601 1TB HFS001TD9TNG | HP Pavilion Gaming 16-a0242ng Intel SSD 660p SSDPEKNW512G8 | Dell Inspiron 15 7000 7506 2-in-1 Black Edition Micron 2300 1TB MTFDHBA1T0TDV | |
|---|---|---|---|---|---|
| AS SSD | -28% | 57% | -23% | 31% | |
| Seq Read (MB/s) | 2077 | 2695 30% | 2808 35% | 1438 -31% | 1910 -8% |
| Seq Write (MB/s) | 778 | 2384 206% | 2345 201% | 905 16% | 2795 259% |
| 4K Read (MB/s) | 49.6 | 29.75 -40% | 50.2 1% | 50.3 1% | 50.5 2% |
| 4K Write (MB/s) | 236.1 | 52 -78% | 138.6 -41% | 111.7 -53% | 103.8 -56% |
| 4K-64 Read (MB/s) | 801 | 1193 49% | 1584 98% | 324 -60% | 1485 85% |
| 4K-64 Write (MB/s) | 942 | 1107 18% | 1687 79% | 729 -23% | 1820 93% |
| Access Time Read * (ms) | 0.06 | 0.136 -127% | 0.035 42% | 0.105 -75% | 0.056 7% |
| Access Time Write * (ms) | 0.073 | 0.36 -393% | 0.028 62% | 0.047 36% | 0.282 -286% |
| Score Read (Points) | 1059 | 1493 41% | 1915 81% | 518 -51% | 1727 63% |
| Score Write (Points) | 1256 | 1397 11% | 2060 64% | 931 -26% | 2203 75% |
| Score Total (Points) | 2804 | 3636 30% | 4934 76% | 1707 -39% | 4863 73% |
| Copy ISO MB/s (MB/s) | 1028 | 1007 -2% | 1852 80% | 1145 11% | 1892 84% |
| Copy Program MB/s (MB/s) | 794 | 43.11 -95% | 704 -11% | 602 -24% | 649 -18% |
| Copy Game MB/s (MB/s) | 987 | 621 -37% | 1329 35% | 929 -6% | 1558 58% |
| CrystalDiskMark 5.2 / 6 | 13% | 49% | 51% | ||
| Write 4K (MB/s) | 176.8 | 89.9 -49% | 204.2 15% | 111.4 -37% | |
| Read 4K (MB/s) | 52.3 | 30.98 -41% | 47.14 -10% | 53.4 2% | |
| Write Seq (MB/s) | 1170 | 2521 115% | 2598 122% | ||
| Read Seq (MB/s) | 1557 | 1748 12% | 2308 48% | ||
| Write 4K Q32T1 (MB/s) | 471.5 | 371.6 -21% | 669 42% | 644 37% | |
| Read 4K Q32T1 (MB/s) | 437.9 | 470.6 7% | 760 74% | 665 52% | |
| Write Seq Q32T1 (MB/s) | 1214 | 3065 152% | 2513 107% | 3147 159% | |
| Read Seq Q32T1 (MB/s) | 2549 | 3370 32% | 3452 35% | 3242 27% | |
| Write 4K Q8T8 (MB/s) | 1619 | ||||
| Read 4K Q8T8 (MB/s) | 1670 | ||||
| Total Average (Program / Settings) | -8% /
-15% | 53% /
54% | -23% /
-23% | 41% /
38% |
* ... smaller is better

Disk Throttling: DiskSpd Read Loop, Queue Depth 8
GPU Performance — Up to 65 W TGP
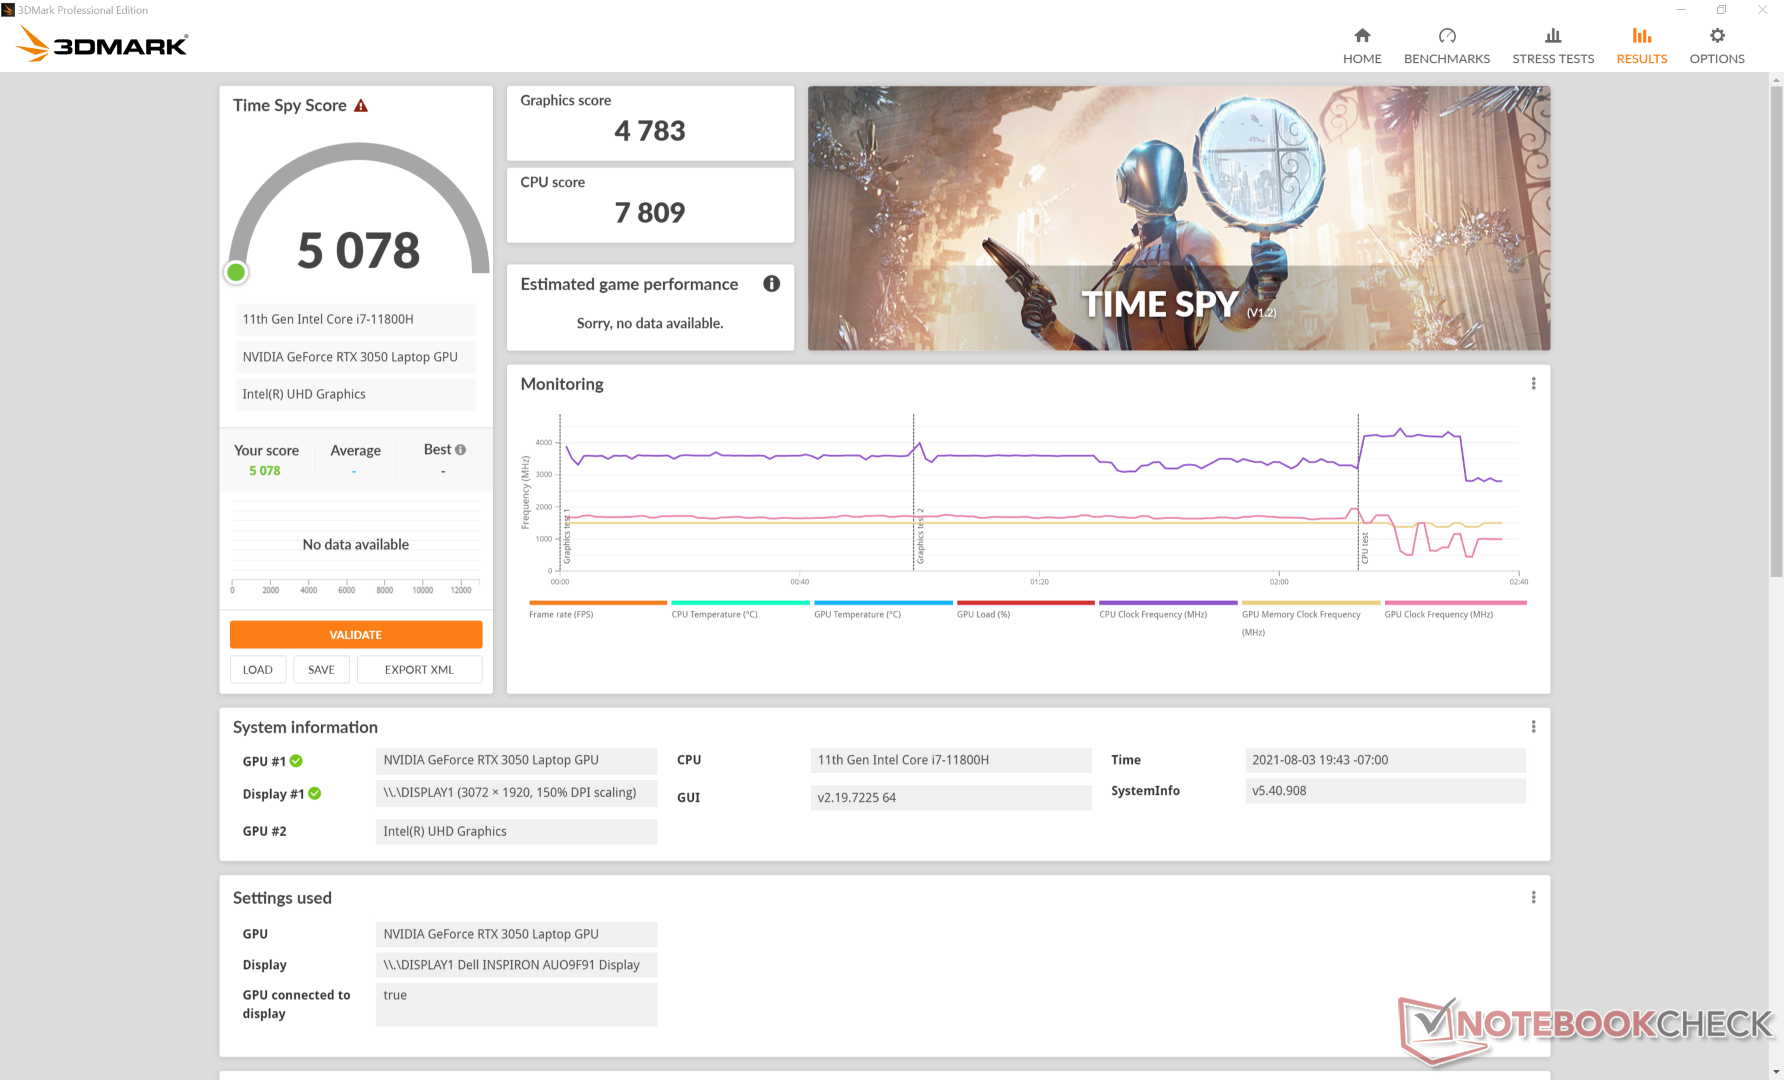
Graphics performance is somewhat disappointing. While we weren't expecting anything close to the more expensive RTX 3060, our RTX 3050 can't even outperform the GTX 1660 Ti in most cases. The 40 percent drop in performance when compared to the RTX 3060 is enough to put it below older and cheaper laptops running on the GTX 1660 Ti or RTX 2060.
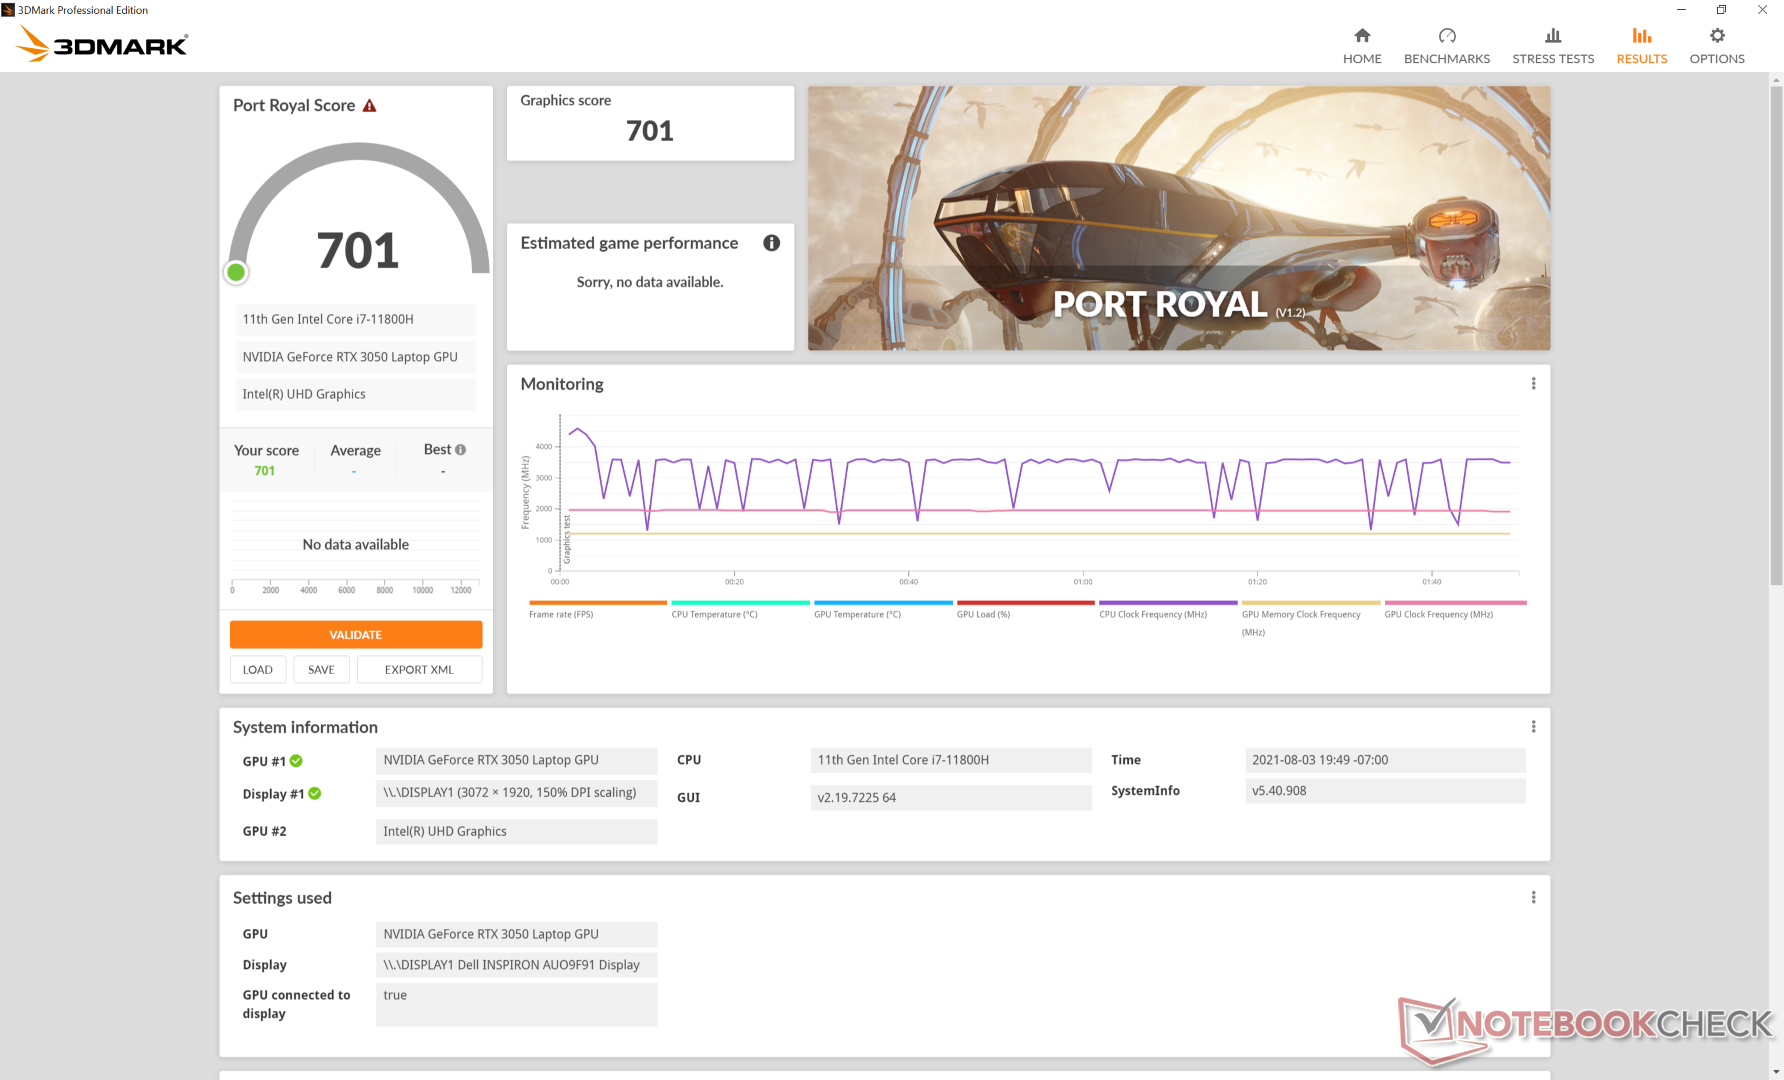
Additionally, our 3DMark Port Royal score is unusually low at just 701 points even after updating drivers and the benchmark to their respective latest versions. We've reached out to Dell to see if this could be a bug.
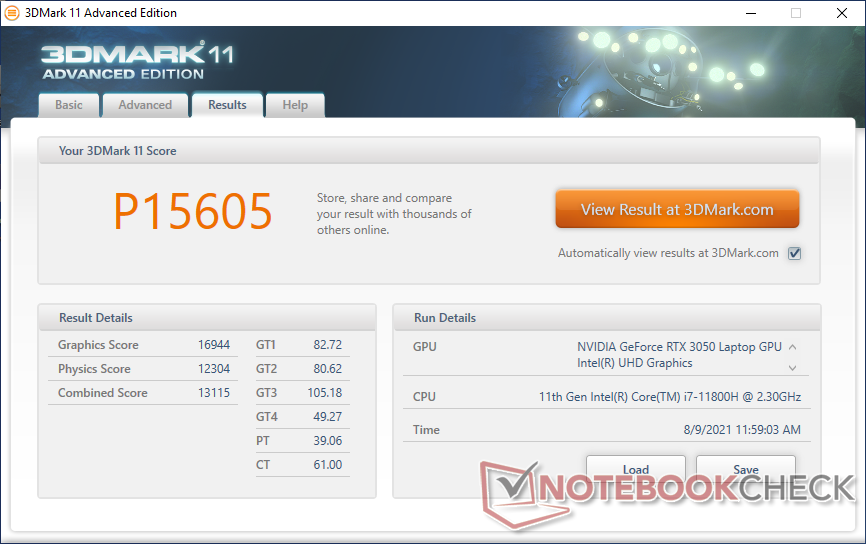
| 3DMark 11 Performance | 15605 points | |
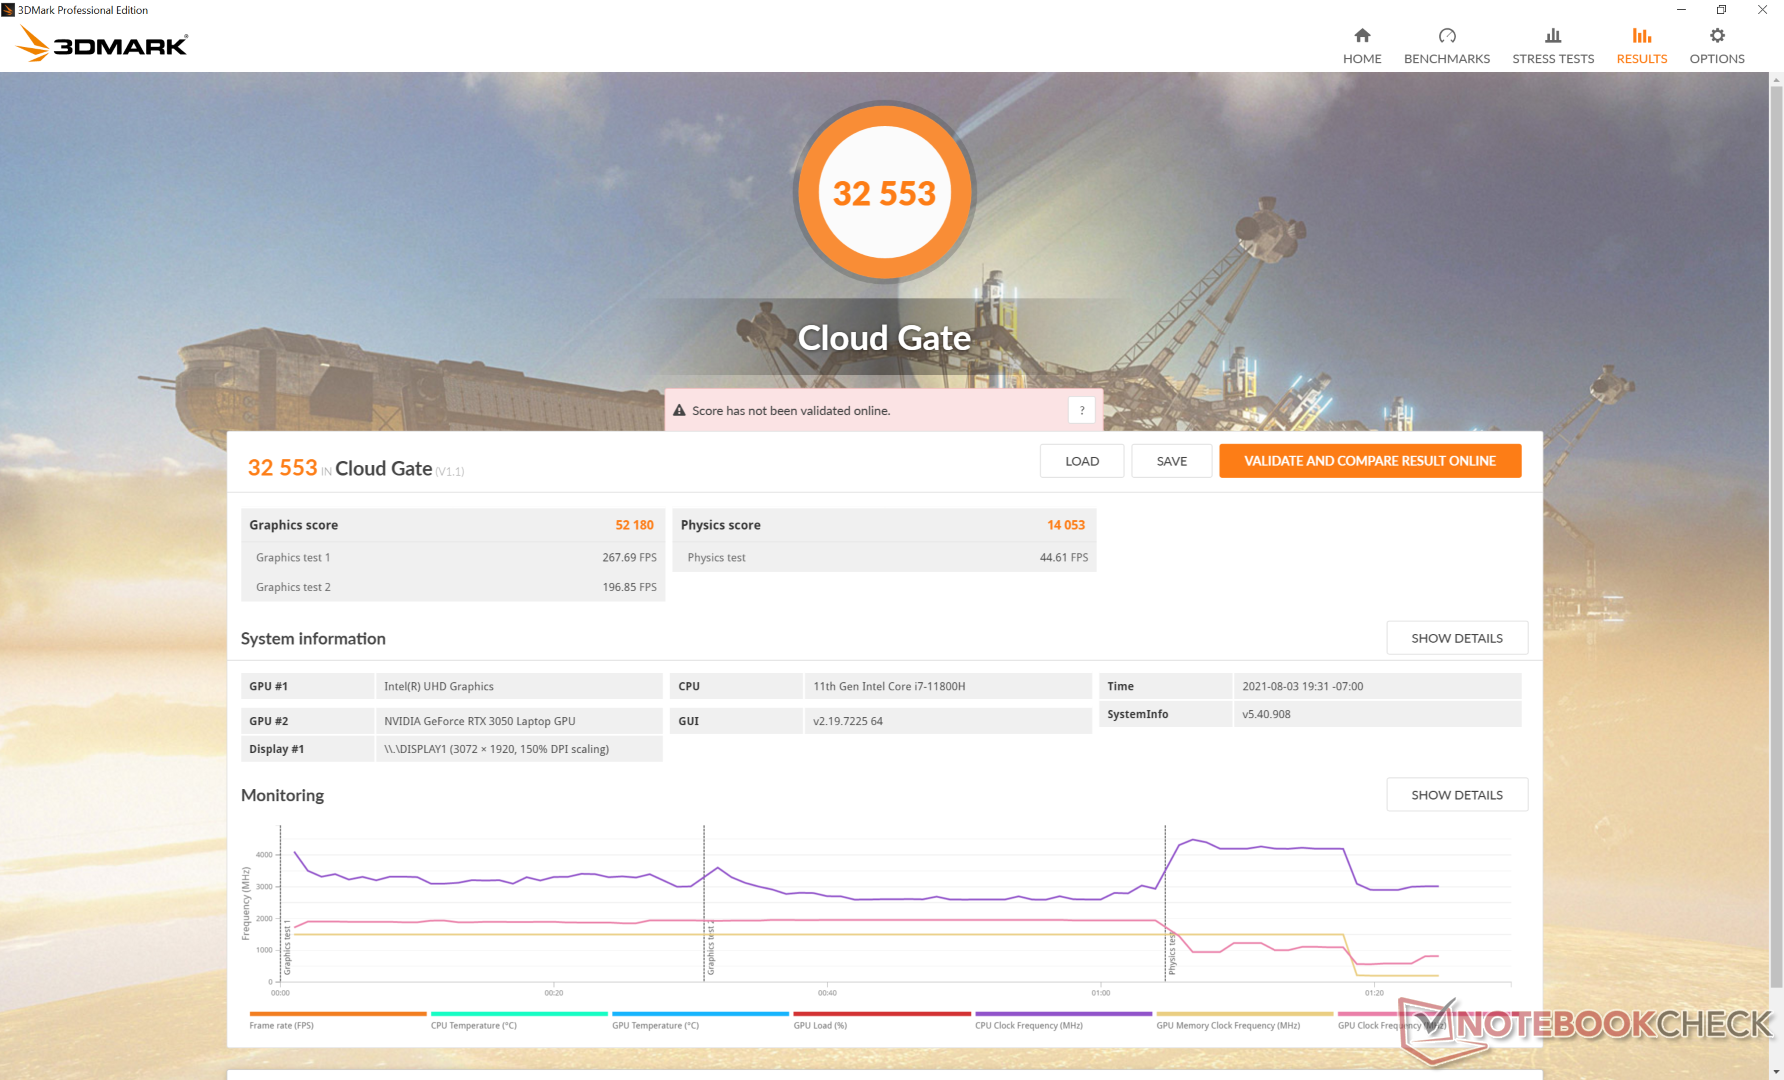
| 3DMark Cloud Gate Standard Score | 32553 points | |
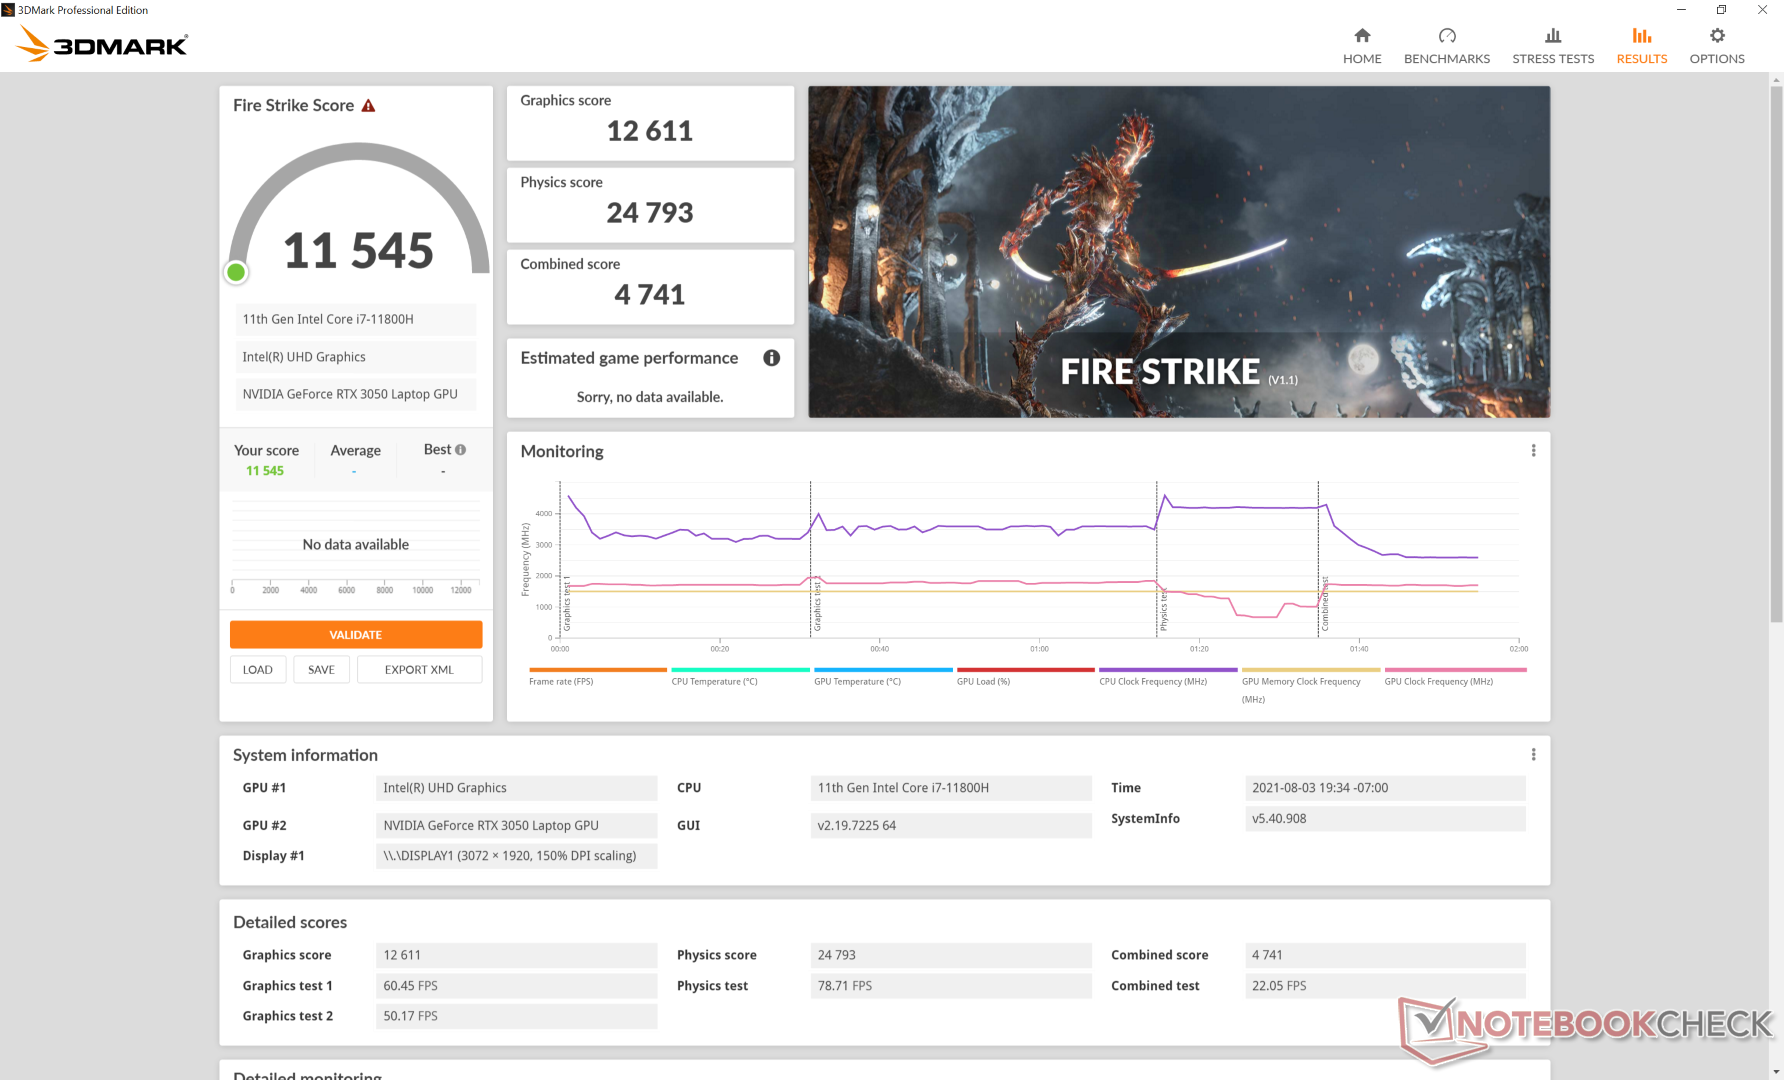
| 3DMark Fire Strike Score | 11545 points | |
| 3DMark Time Spy Score | 5078 points | |
Help | ||
Gaming Performance
The Inspiron 16 Plus wasn't built for gaming, but it's still a gaming-capable machine at 1080p settings nonetheless. You're going to want to connect an external monitor to avoid the noticeable ghosting of the internal display.
Witcher 3 FPS Chart
| low | med. | high | ultra | QHD | |
|---|---|---|---|---|---|
| GTA V (2015) | 179 | 174 | 131 | 68.3 | 48.9 |
| The Witcher 3 (2015) | 248.5 | 153.9 | 92.1 | 51.6 | |
| Dota 2 Reborn (2015) | 162 | 142 | 135 | 125 | |
| Final Fantasy XV Benchmark (2018) | 117 | 69.6 | 50.1 | 36.5 | |
| X-Plane 11.11 (2018) | 119 | 101 | 76.2 | ||
| Far Cry 5 (2018) | 138 | 88 | 80 | 74 | 51 |
| Strange Brigade (2018) | 274 | 125 | 101 | 87 | 63.4 |
| Shadow of the Tomb Raider (2018) | 118 | 81 | 71 | 61 | 39 |
| Far Cry New Dawn (2019) | 118 | 83 | 77 | 66 | 52 |
| Metro Exodus (2019) | 123 | 62.2 | 45.8 | 36.5 | 28.6 |
| The Division 2 (2019) | 132 | 77 | 66 | 50 | 32 |
| Borderlands 3 (2019) | 111.7 | 69.2 | 49.4 | 34.9 | 22.5 |
| GRID 2019 (2019) | 181 | 108 | 104 | 43 | 27 |
| Gears Tactics (2020) | 253 | 122 | 81 | 58 | 38 |
| F1 2020 (2020) | 218 | 134 | 113 | 81 | 59 |
| Horizon Zero Dawn (2020) | 99 | 75 | 62 | 56 | 46 |
| Watch Dogs Legion (2020) | 80 | 71 | 60 | 26 | 19 |
| Dirt 5 (2020) | 141 | 66 | 51 | 40 | 34 |
| Assassin´s Creed Valhalla (2020) | 99 | 56 | 36 | 27 | 24 |
| Immortals Fenyx Rising (2020) | 106 | 71 | 57 | 53 | 39 |
| Hitman 3 (2021) | 159.4 | 100.7 | 86.9 | 79.9 | 49.1 |
| F1 2021 (2021) | 186 | 130 | 110 | 52 | 36 |
Emissions
System Noise
The fans in the Inspiron 16 are quite adept at remaining silent or quiet for long periods. For example, fan noise doesn't become noticeable when running 3DMark 06 until after 40 seconds into the benchmark. Once the fans ramp up, however, the system will become loud very quickly at almost 50 dB(A) to be similar to many gaming laptops.
Fan noise will typically top out at just 33 dB(A) temporarily during less demanding activities like browsing or video streaming. Pulsing occurs albeit infrequently.
| Dell Inspiron 16 Plus 7610 GeForce RTX 3050 4GB Laptop GPU, i7-11800H, Kingston OM3PDP3512B | Asus ROG Zephyrus M16 GU603H GeForce RTX 3070 Laptop GPU, i9-11900H, Samsung PM9A1 MZVL22T0HBLB | LG Gram 16 (2021) Iris Xe G7 96EUs, i7-1165G7, SK Hynix PC601 1TB HFS001TD9TNG | HP Pavilion Gaming 16-a0242ng GeForce GTX 1650 Ti Mobile, i5-10300H, Intel SSD 660p SSDPEKNW512G8 | Dell Inspiron 15 7000 7506 2-in-1 Black Edition Xe MAX, i7-1165G7, Micron 2300 1TB MTFDHBA1T0TDV | |
|---|---|---|---|---|---|
| Noise | -18% | 7% | -16% | -6% | |
| off / environment * (dB) | 24.4 | 25 -2% | 26 -7% | 25 -2% | 27.3 -12% |
| Idle Minimum * (dB) | 24.4 | 25 -2% | 26 -7% | 25 -2% | 27.3 -12% |
| Idle Average * (dB) | 24.4 | 31 -27% | 26 -7% | 33 -35% | 27.3 -12% |
| Idle Maximum * (dB) | 24.4 | 42 -72% | 26 -7% | 42 -72% | 27.3 -12% |
| Load Average * (dB) | 48.3 | 48 1% | 30.8 36% | 48 1% | 47.4 2% |
| Witcher 3 ultra * (dB) | 48.9 | 52 -6% | 46 6% | 47.4 3% | |
| Load Maximum * (dB) | 48.9 | 56 -15% | 31.1 36% | 54 -10% | 47.5 3% |
* ... smaller is better
Noise level
| Idle |
| 24.4 / 24.4 / 24.4 dB(A) |
| Load |
| 48.3 / 48.9 dB(A) |
 | ||
30 dB silent 40 dB(A) audible 50 dB(A) loud |
||
min: | ||
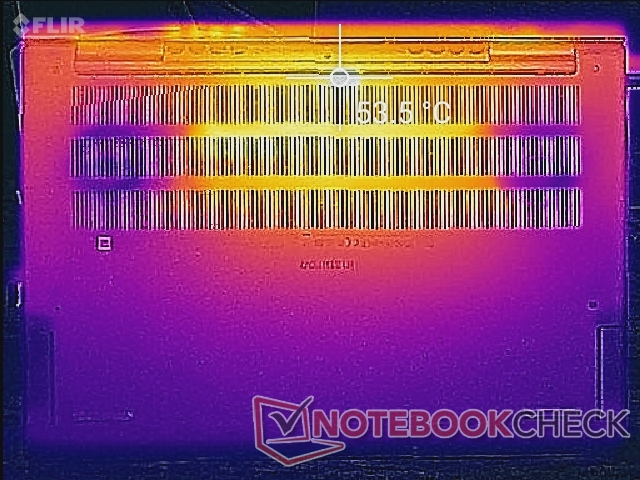
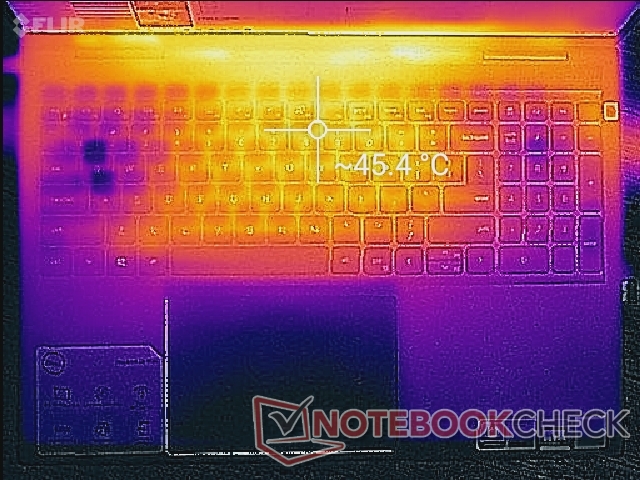
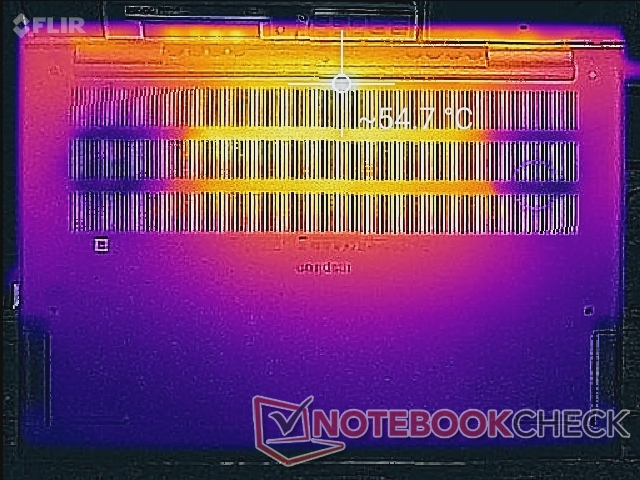
Temperature — Almost Always Warm
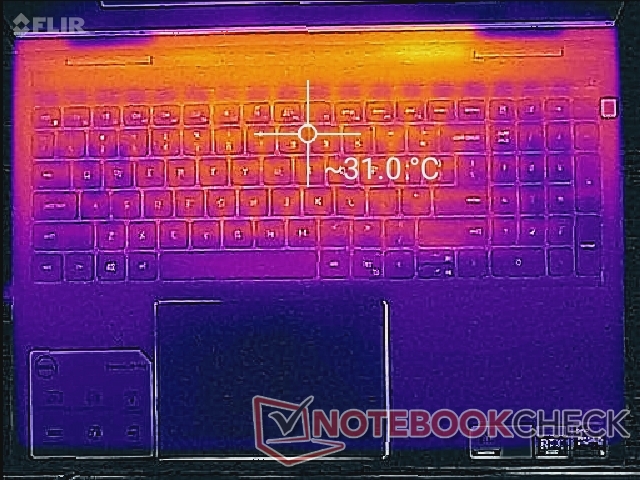
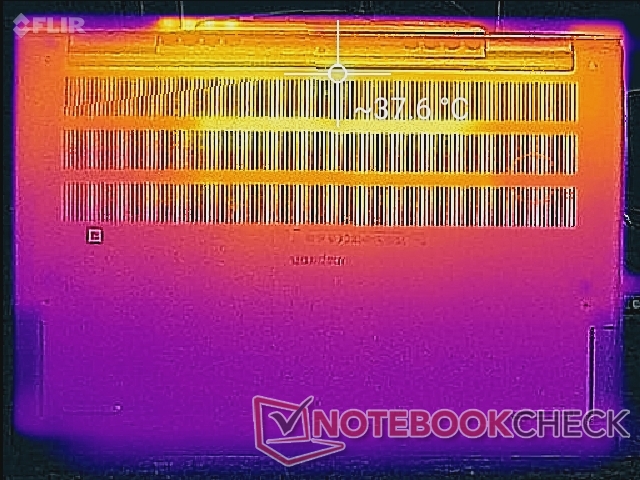
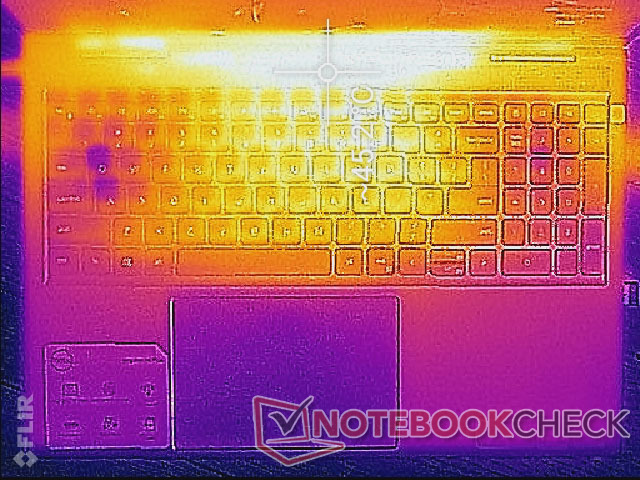
Surface temperatures are on the warm side likely due to the lethargic fans mentioned above. For example, hot spots on the top and bottom can be as warm as 31 C and 38 C, respectively, when simply idling on desktop with no running applications. If gaming, the keyboard center can be up to 45 C which is similar to what we observed on the Pavilion Gaming 16. The ventilation grilles on the Inspiron 16 are larger and more numerous when compared to slower Core U-powered laptops like the LG Gram 16.
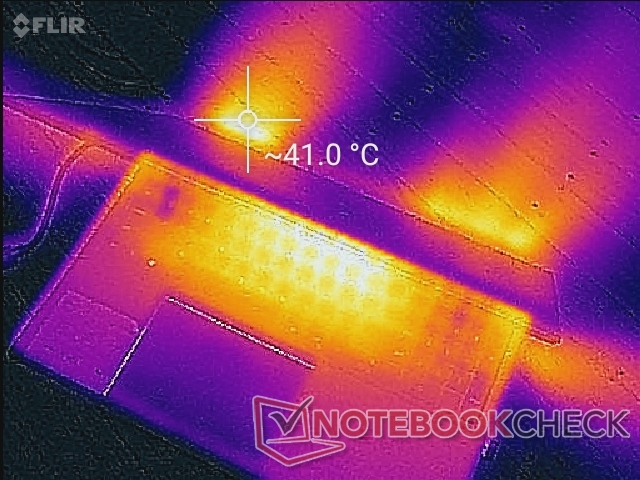
(-) The maximum temperature on the upper side is 46.4 °C / 116 F, compared to the average of 36.8 °C / 98 F, ranging from 21 to 71 °C for the class Multimedia.
(-) The bottom heats up to a maximum of 54.8 °C / 131 F, compared to the average of 39.1 °C / 102 F
(+) In idle usage, the average temperature for the upper side is 28.3 °C / 83 F, compared to the device average of 31.3 °C / 88 F.
(±) Playing The Witcher 3, the average temperature for the upper side is 35.4 °C / 96 F, compared to the device average of 31.3 °C / 88 F.
(+) The palmrests and touchpad are cooler than skin temperature with a maximum of 29 °C / 84.2 F and are therefore cool to the touch.
(±) The average temperature of the palmrest area of similar devices was 28.7 °C / 83.7 F (-0.3 °C / -0.5 F).
Stress Test
When stressed under Prime95, clock rates would boost to 4.1 GHz for just a second or two before immediately hitting a core temperature of 100 C. Clock rates would then fall to the 2.4 to 3.2 GHz range in order to maintain a more reasonable temperature of 83 C.
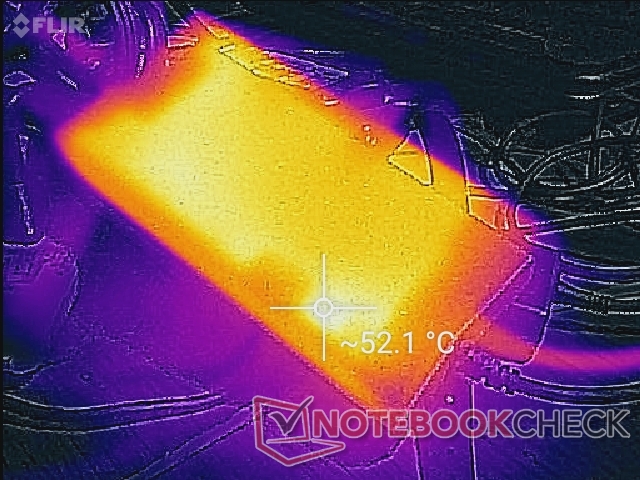
When running Witcher 3 to represent real-world gaming stress, the CPU and GPU would stabilize at 63 C and 69 C, respectively, compared to 61 C and 72 C on the thicker and louder MSI GF65 with the older GTX 1660 Ti. The GPU board power draw would also plateau at 49 W instead of the 65 W TGP maximum that the board is capable of. Only when running FurMark would the GPU board draw reach over 60 W.
Running on battery power will limit graphics performance. A 3DMark 11 test on batteries would return Physics and Graphics scores of 12832 and 10938 points, respectively, compared to 12304 and 16944 points when on mains.
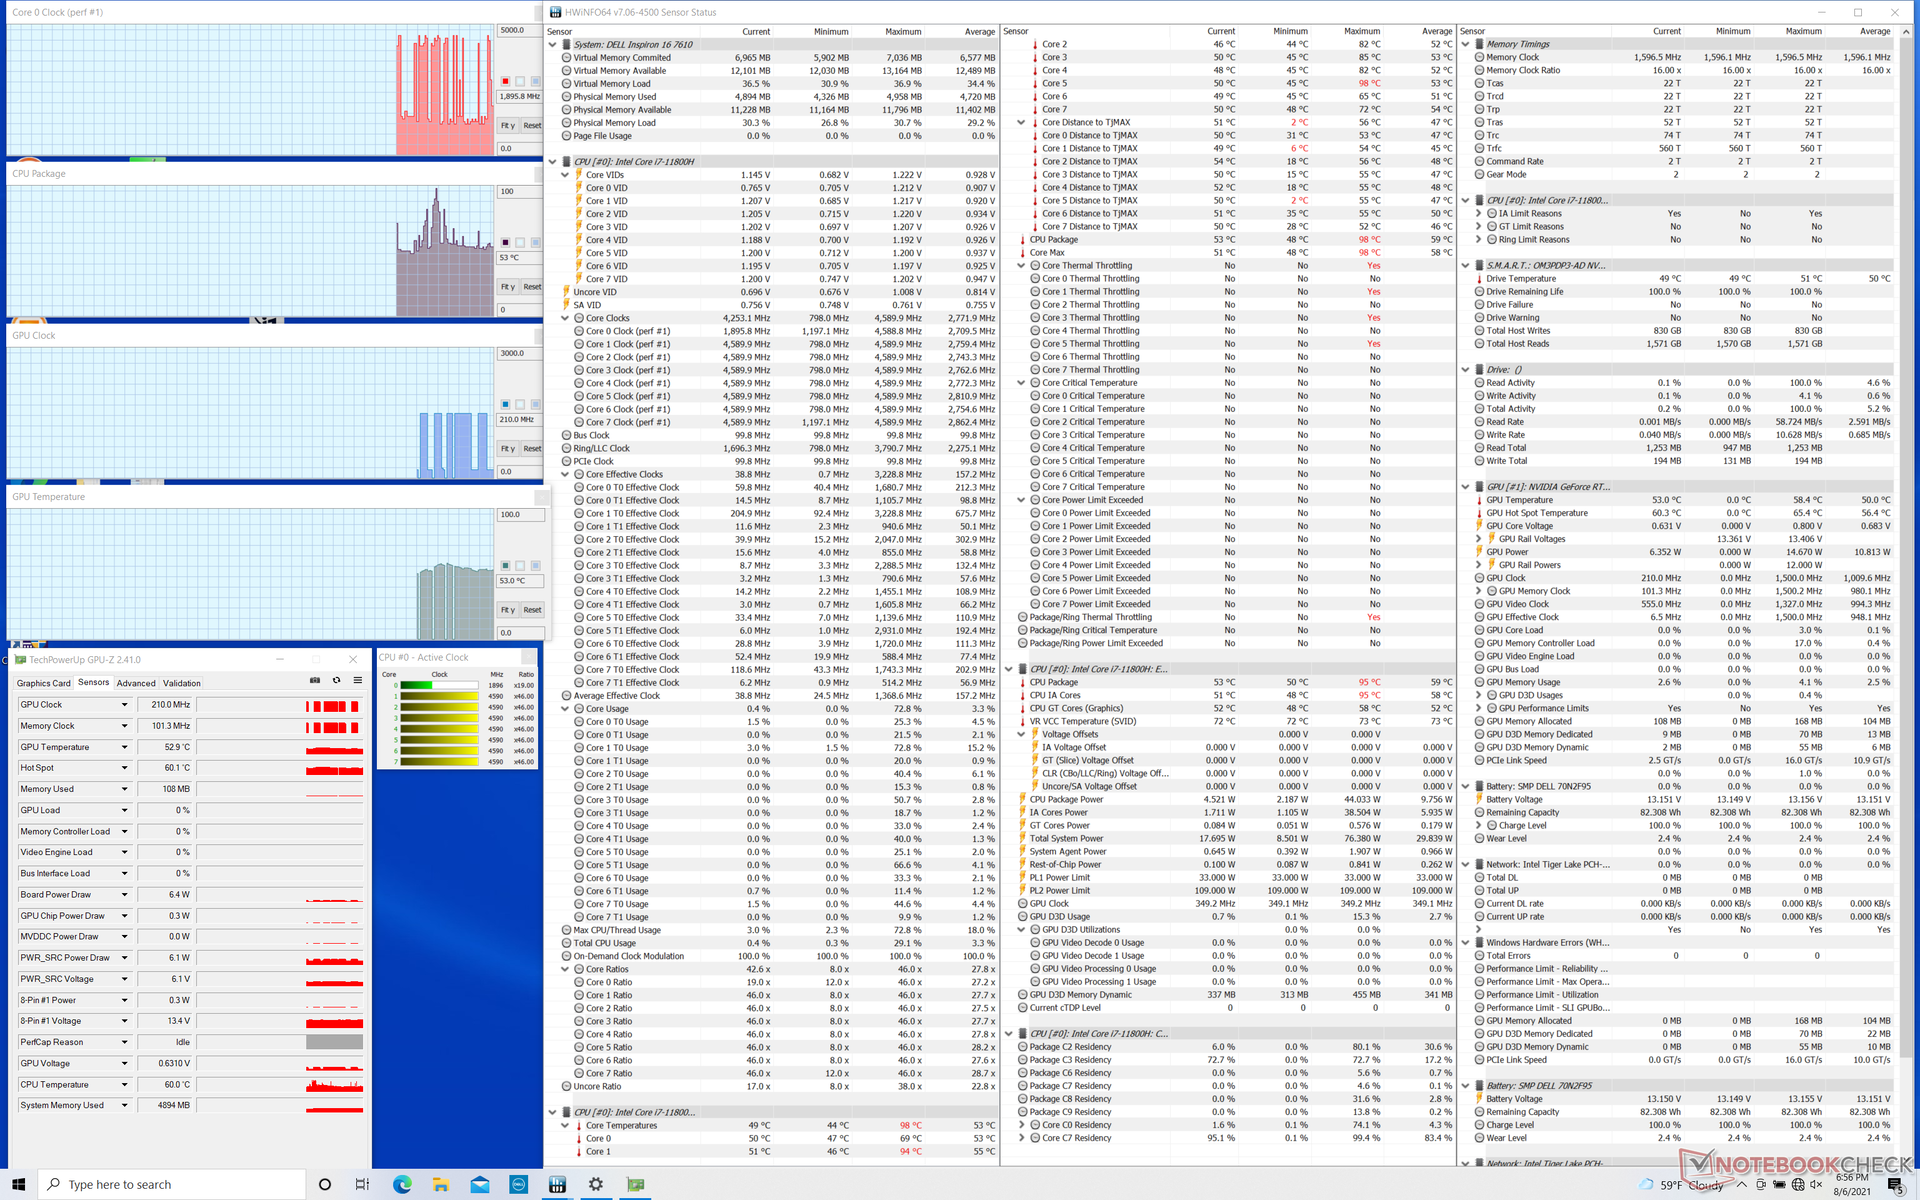
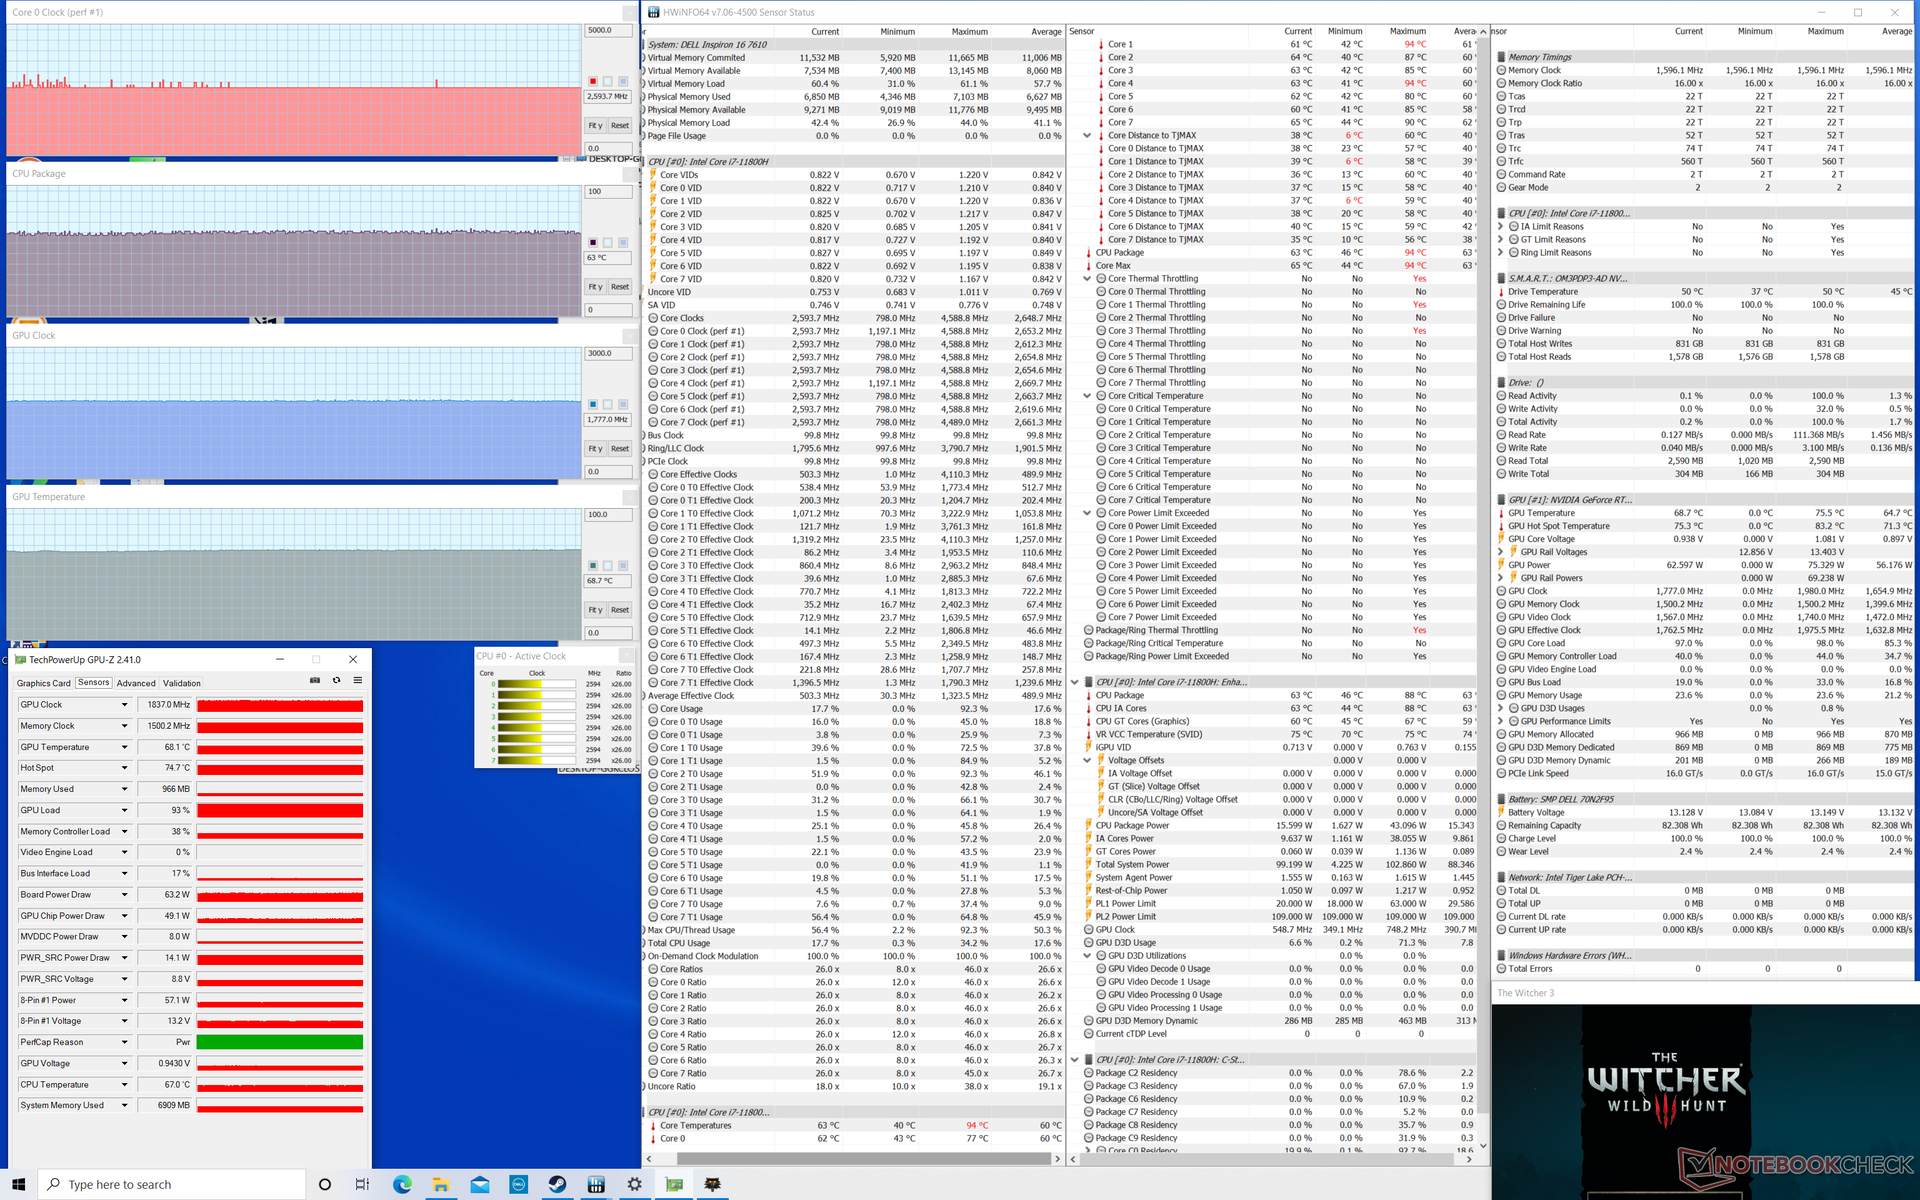
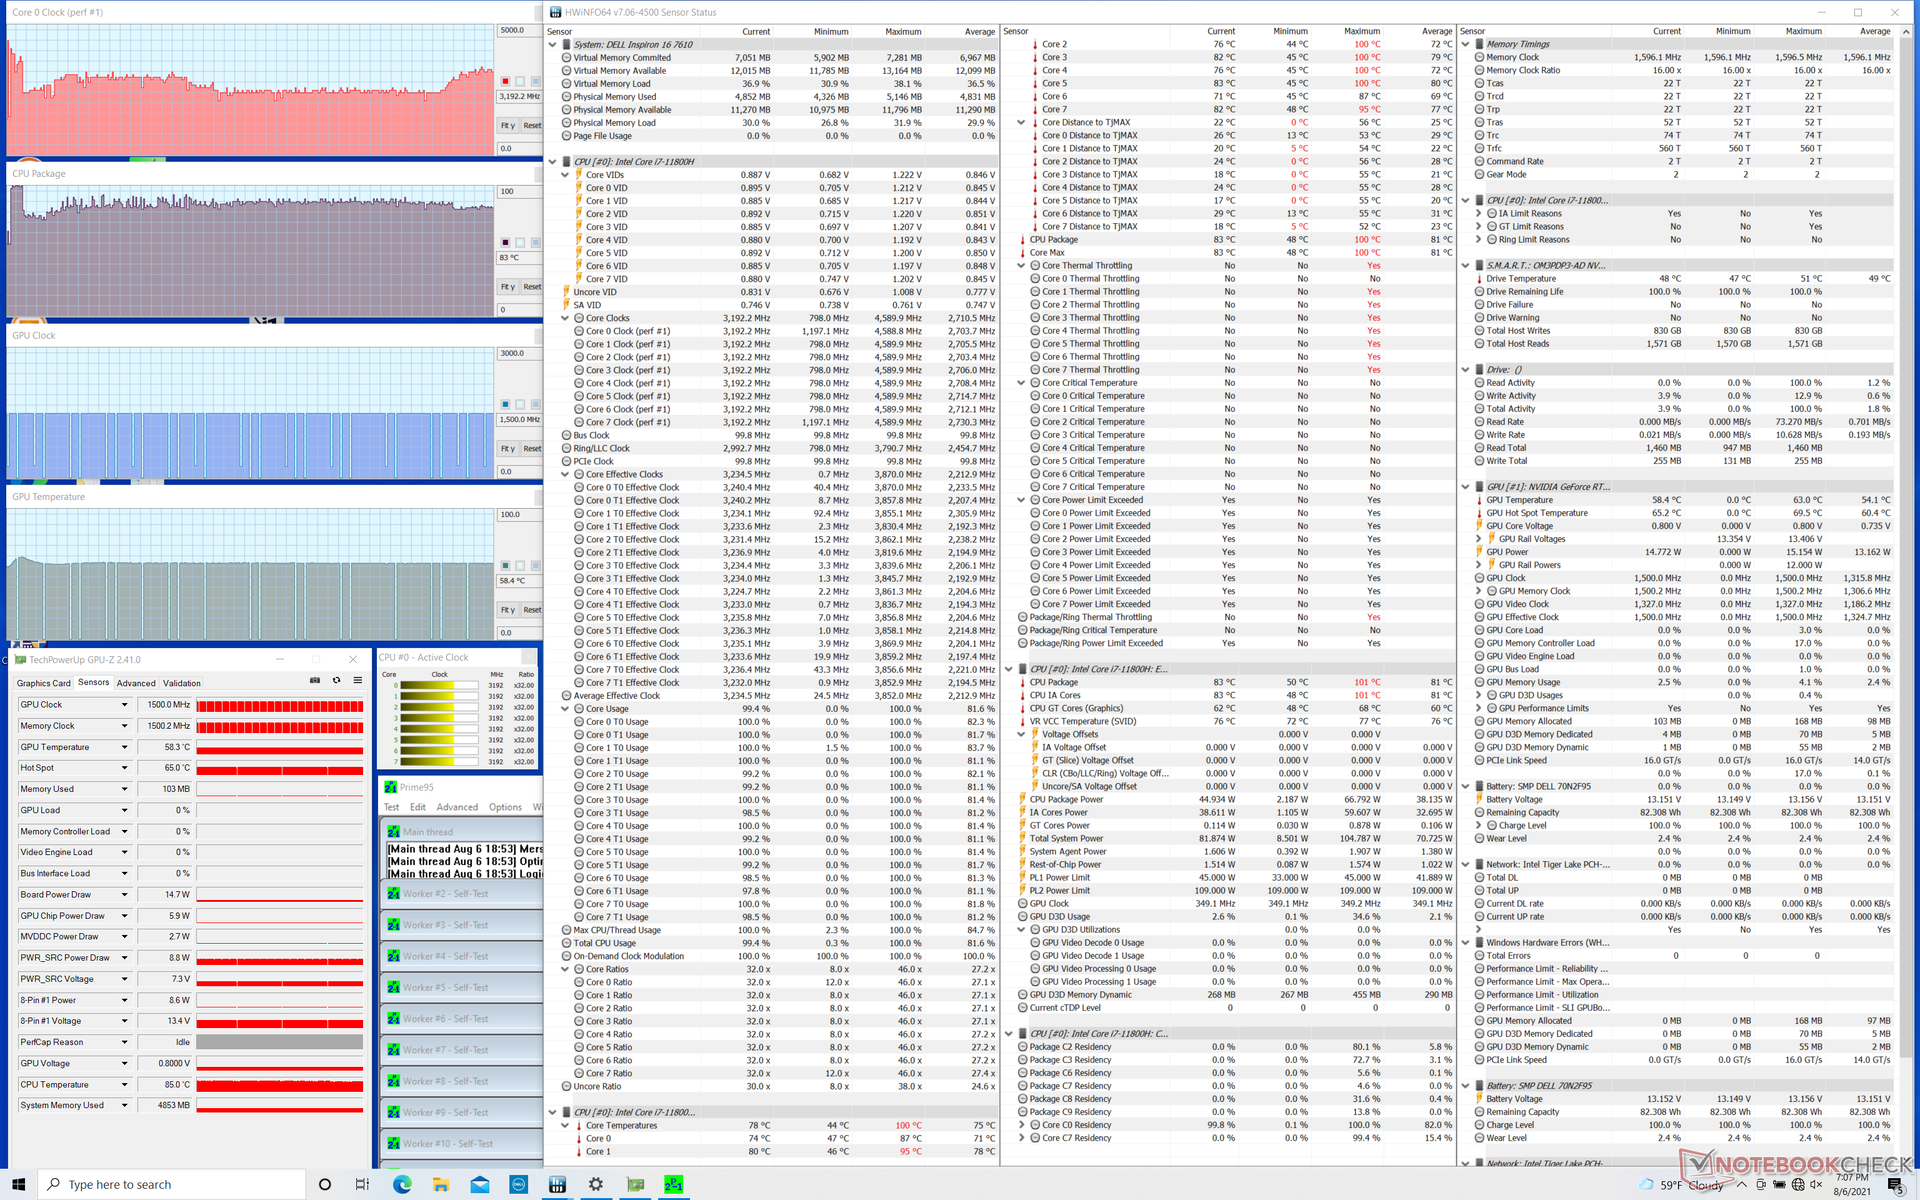
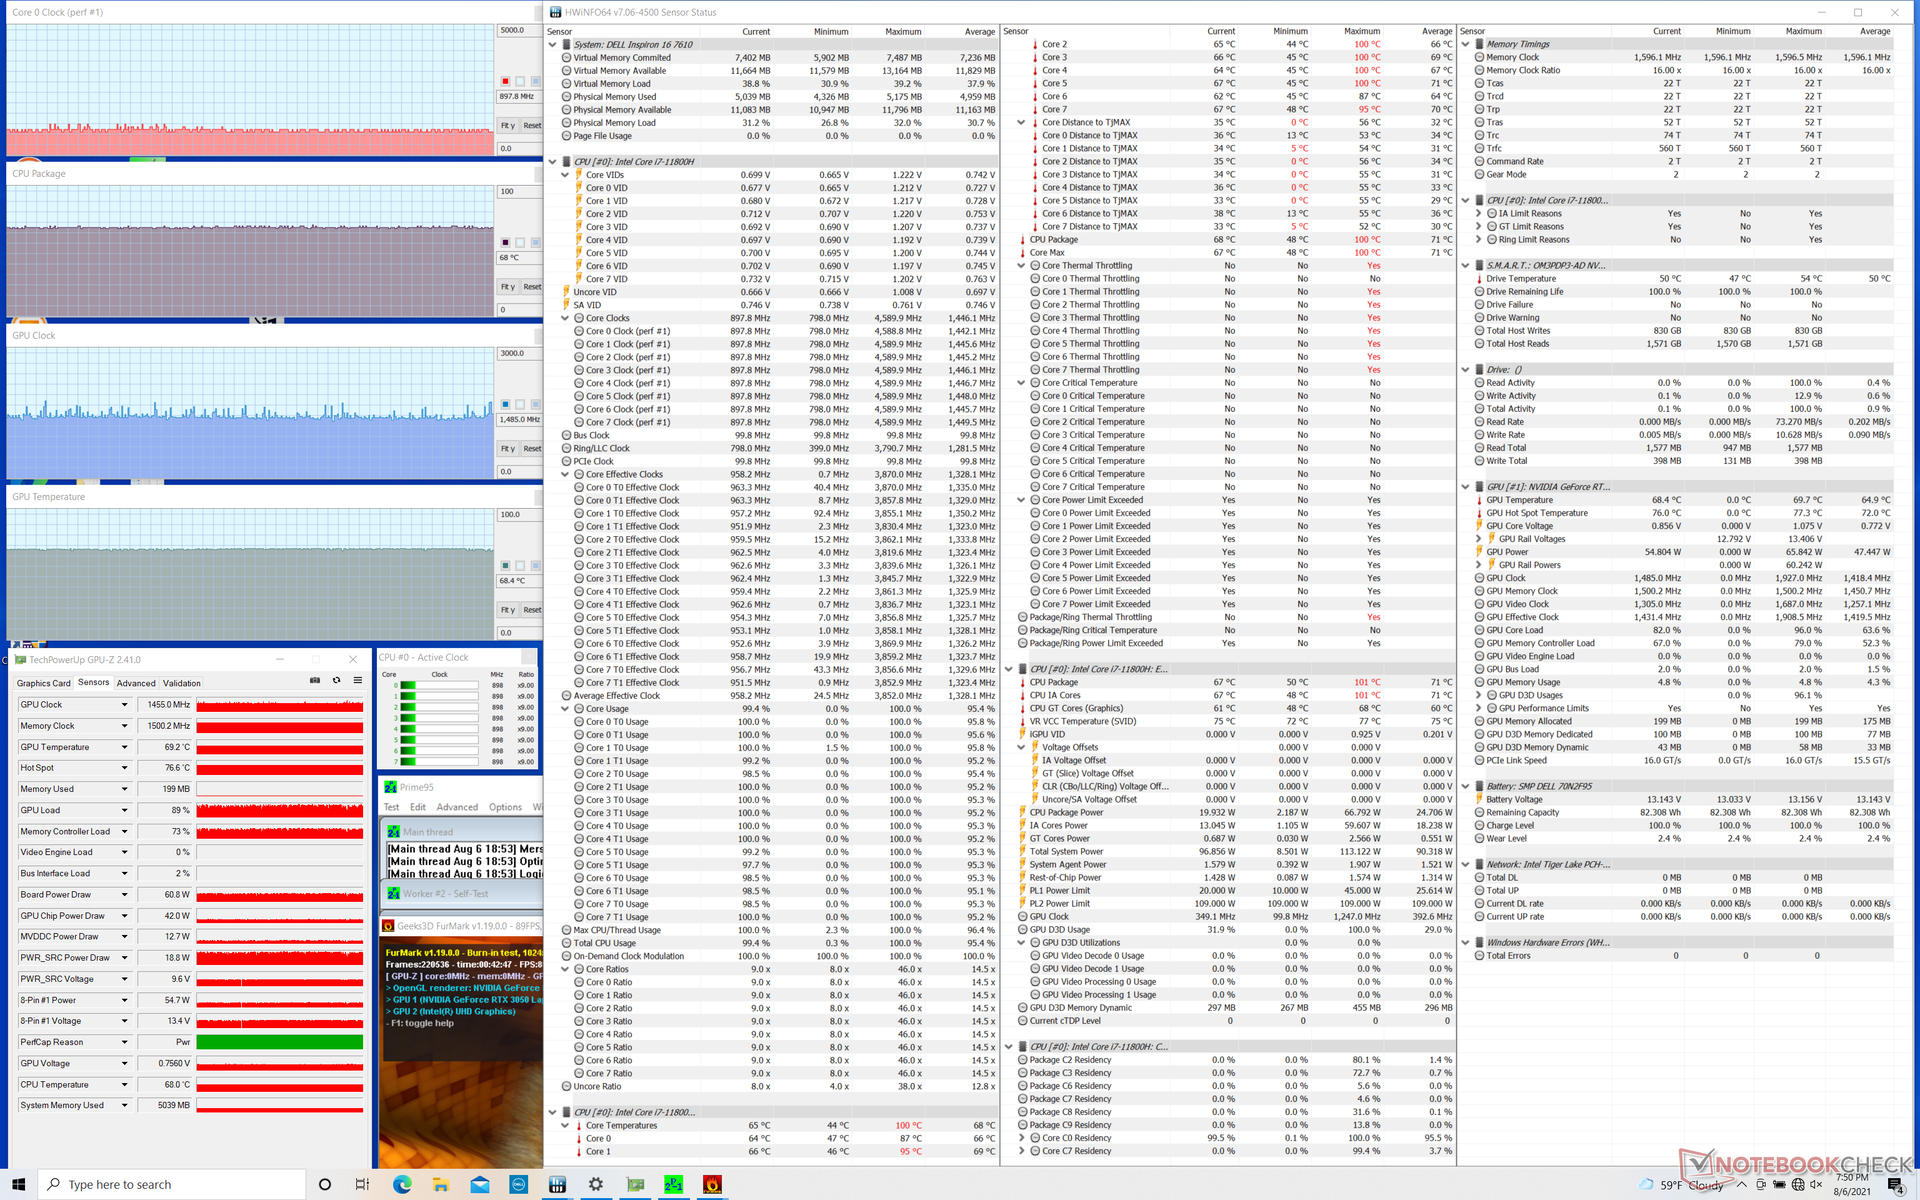
| CPU Clock (GHz) | GPU Clock (MHz) | Average CPU Temperature (°C) | Average GPU Temperature (°C) | |
| System Idle | -- | -- | 53 | 53 |
| Prime95 Stress | 2.4 - 3.2 | -- | 83 | 58 |
| Prime95 + FurMark Stress | 0.9 - 1.0 | 1455 | 68 | 68 |
| Witcher 3 Stress | 2.6 | 1837 | 63 | 69 |
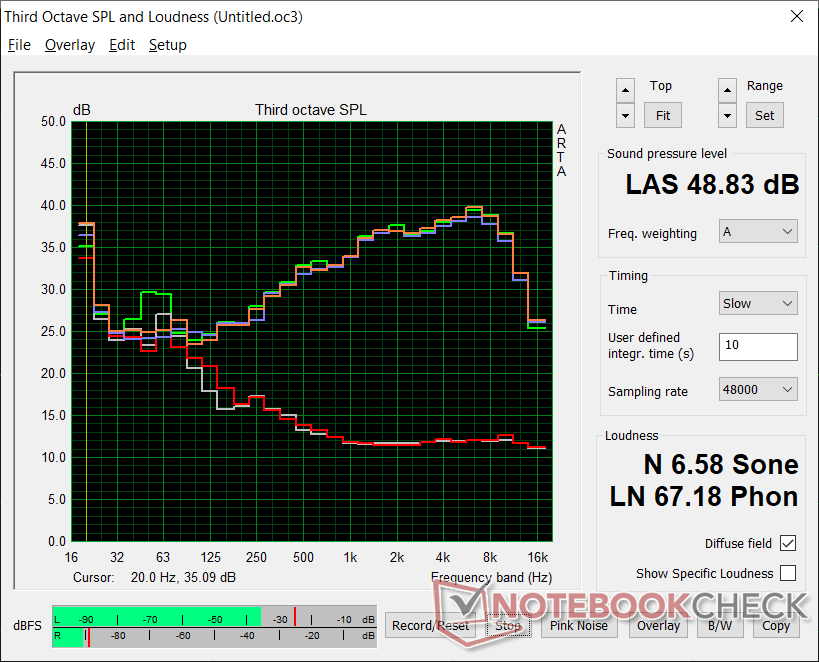
Speakers — On the Weaker Side
Audio quality from the integrated speakers isn't so hot. Maximum volume is decent, but bass is poor. Our pink noise graph shows roll-off at around 500 Hz and a sound pressure level of only 75 dB. Other laptops tend to have louder speakers or better bass reproduction like the XPG Xenia Xe or Envy x360 15, respectively.


Dell Inspiron 16 Plus 7610 audio analysis
(±) | speaker loudness is average but good (75.3 dB)
Bass 100 - 315 Hz
(±) | reduced bass - on average 14.4% lower than median
(±) | linearity of bass is average (8.4% delta to prev. frequency)
Mids 400 - 2000 Hz
(±) | higher mids - on average 5.6% higher than median
(±) | linearity of mids is average (7.9% delta to prev. frequency)
Highs 2 - 16 kHz
(+) | balanced highs - only 3.9% away from median
(±) | linearity of highs is average (7.2% delta to prev. frequency)
Overall 100 - 16.000 Hz
(±) | linearity of overall sound is average (19.3% difference to median)
Compared to same class
» 62% of all tested devices in this class were better, 8% similar, 30% worse
» The best had a delta of 5%, average was 17%, worst was 45%
Compared to all devices tested
» 47% of all tested devices were better, 8% similar, 46% worse
» The best had a delta of 4%, average was 23%, worst was 134%
Apple MacBook 12 (Early 2016) 1.1 GHz audio analysis
(+) | speakers can play relatively loud (83.6 dB)
Bass 100 - 315 Hz
(±) | reduced bass - on average 11.3% lower than median
(±) | linearity of bass is average (14.2% delta to prev. frequency)
Mids 400 - 2000 Hz
(+) | balanced mids - only 2.4% away from median
(+) | mids are linear (5.5% delta to prev. frequency)
Highs 2 - 16 kHz
(+) | balanced highs - only 2% away from median
(+) | highs are linear (4.5% delta to prev. frequency)
Overall 100 - 16.000 Hz
(+) | overall sound is linear (10.2% difference to median)
Compared to same class
» 7% of all tested devices in this class were better, 2% similar, 90% worse
» The best had a delta of 5%, average was 18%, worst was 53%
Compared to all devices tested
» 5% of all tested devices were better, 1% similar, 94% worse
» The best had a delta of 4%, average was 23%, worst was 134%
Energy Management
Power Consumption
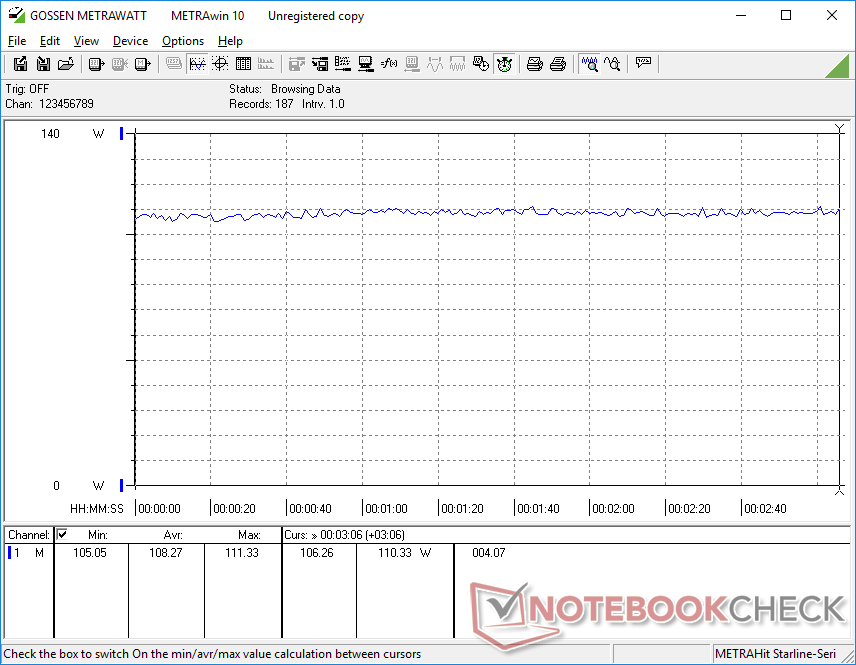
Idling on desktop at the lowest brightness setting and power profile would consume just over 7 W to be a bit more than expected. The LG Gram 16 and Pavilion Gaming 16, for example, would be as low as 3 W to 4 W each when under similar conditions.
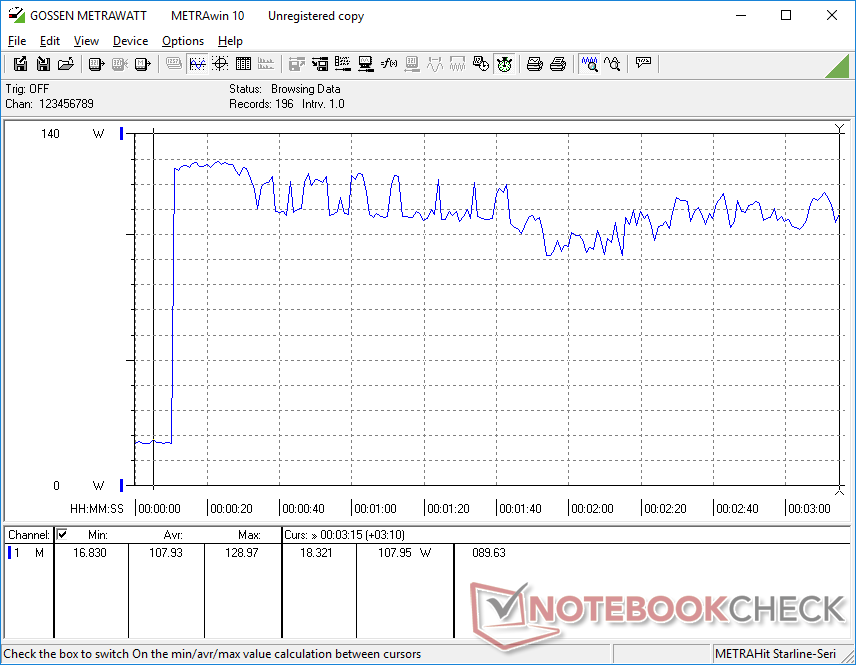
The efficiency of the system starts to shine when running higher loads like games. Running Witcher 3, for example, would consume about 108 W compared to 143 W on the Asus ROG Zephyrus M15 equipped with the last generation 12 nm GTX 1660 Ti. Performance-per-watt is a bit higher on our Dell despite the fact that it's consistently slower than most GTX 1660 Ti laptops in terms of graphics performance.
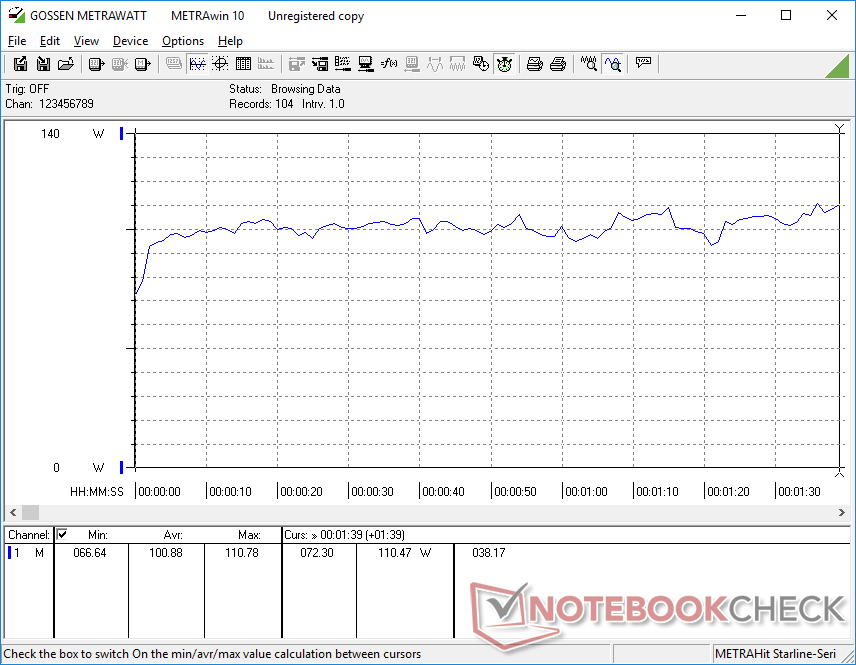
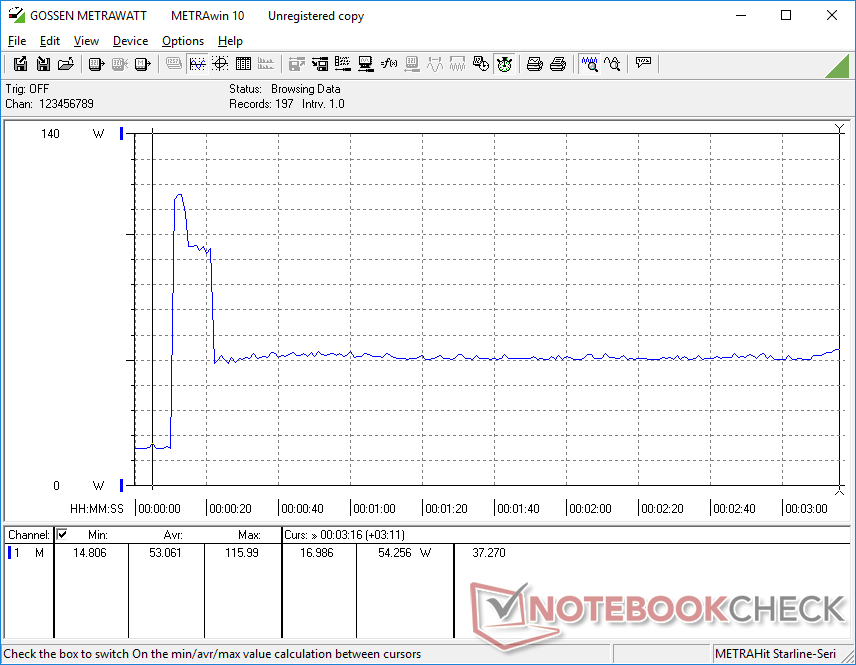
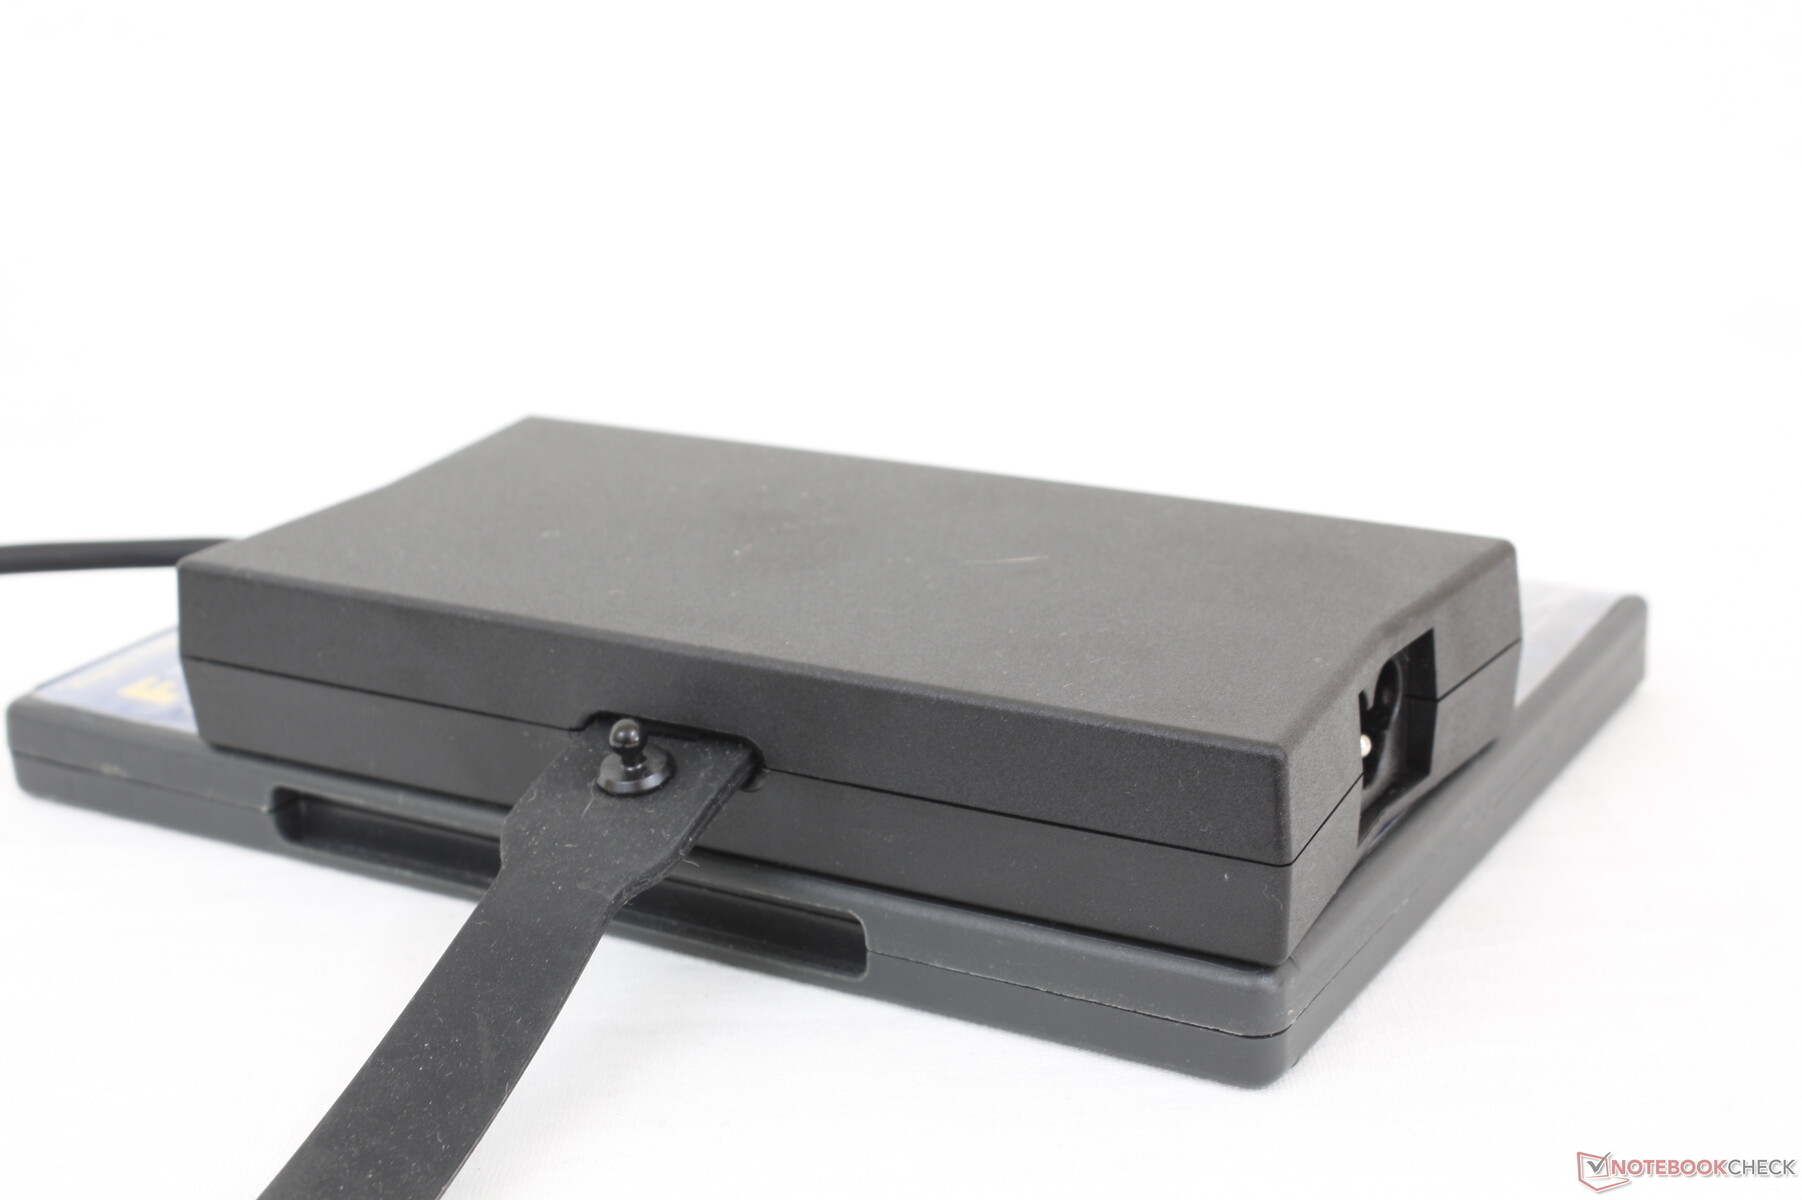
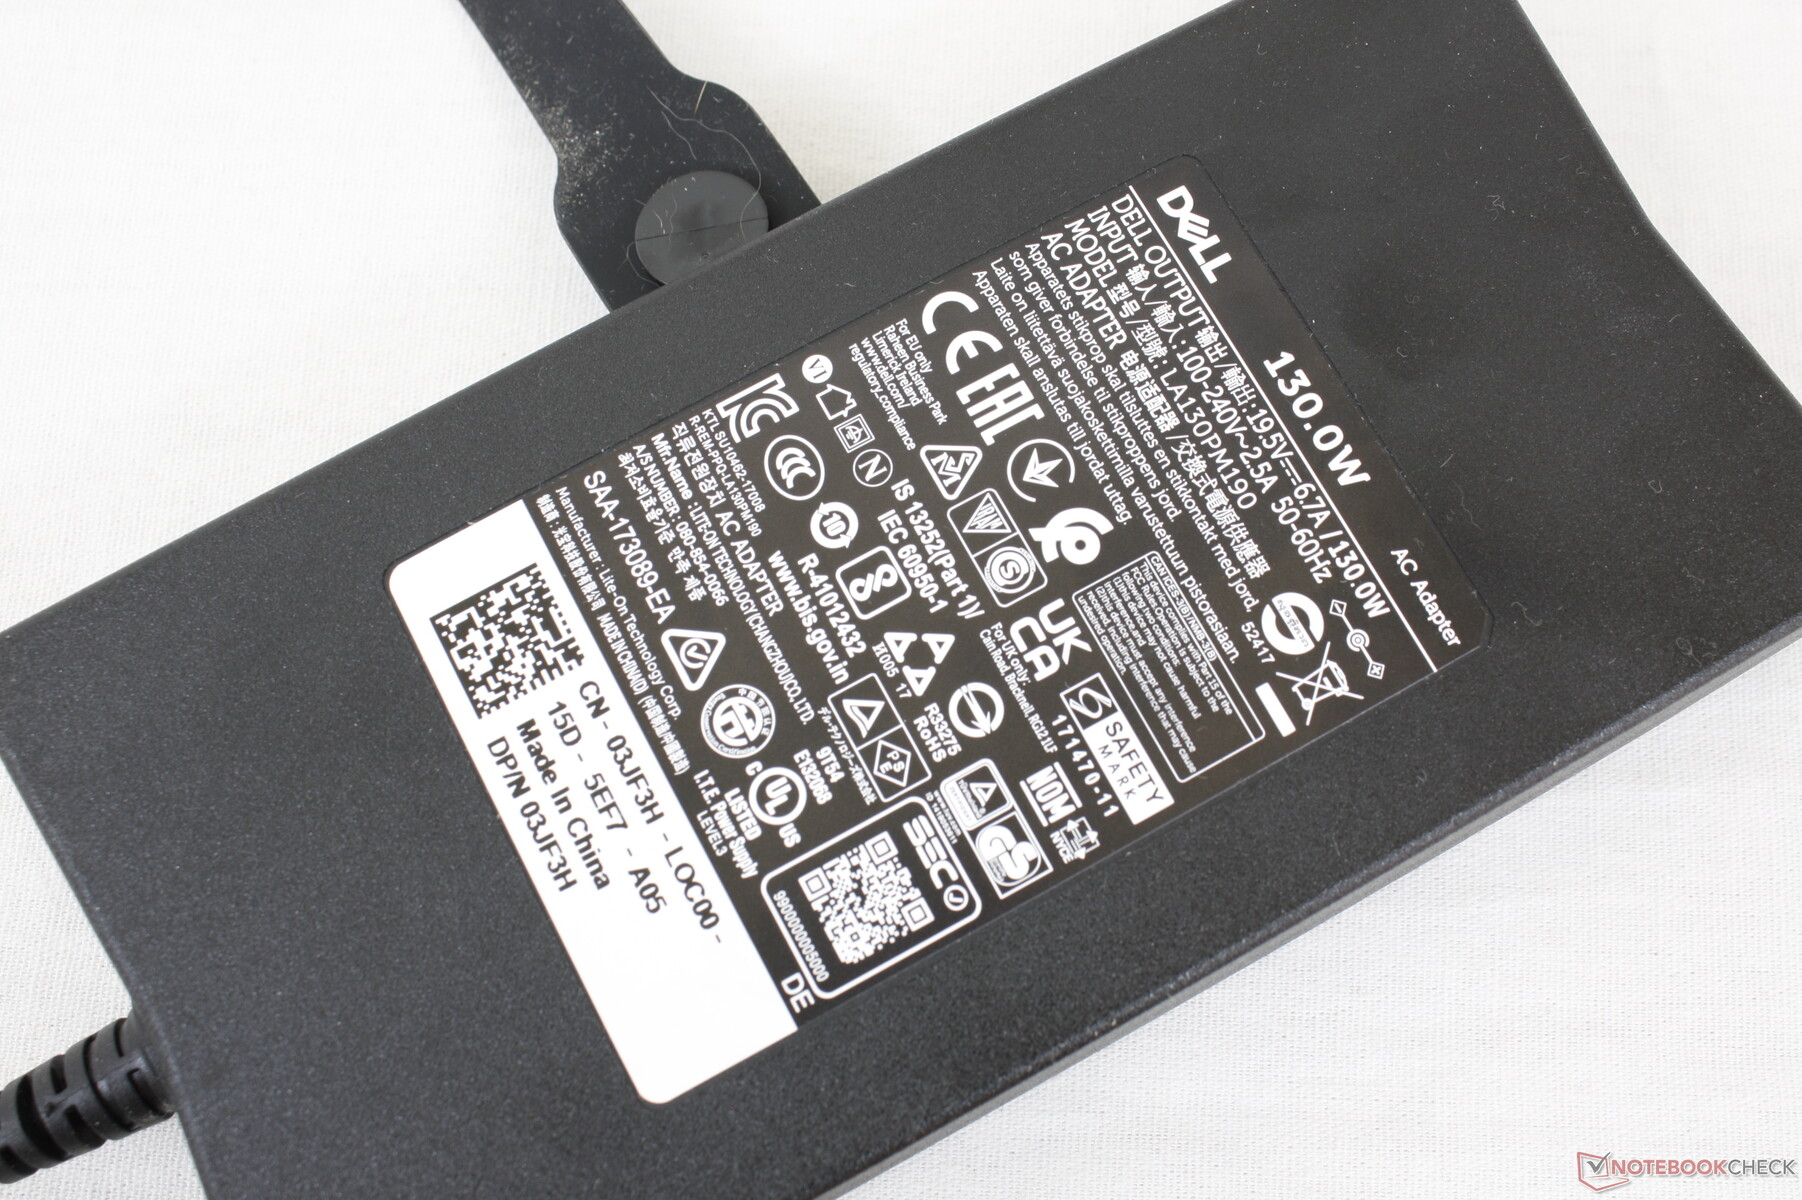
We're able to record a maximum draw of 129 W from the medium-sized (~15.3 x 7.5 x 2.6 cm) 130 W AC adapter when running extreme loads. The rate is only temporary and lasting for just a few seconds at most as shown by the graph below. There is enough headroom to charge the battery and run demanding loads simultaneously.
| Off / Standby | |
| Idle | |
| Load |
|
Key:
min: | |
| Dell Inspiron 16 Plus 7610 i7-11800H, GeForce RTX 3050 4GB Laptop GPU, Kingston OM3PDP3512B, IPS, 3072x1920, 16" | Asus ROG Zephyrus M16 GU603H i9-11900H, GeForce RTX 3070 Laptop GPU, Samsung PM9A1 MZVL22T0HBLB, IPS, 2560x1600, 16" | LG Gram 16 (2021) i7-1165G7, Iris Xe G7 96EUs, SK Hynix PC601 1TB HFS001TD9TNG, IPS, 2560x1600, 16" | HP Pavilion Gaming 16-a0242ng i5-10300H, GeForce GTX 1650 Ti Mobile, Intel SSD 660p SSDPEKNW512G8, IPS, 1920x1080, 16.1" | Dell Inspiron 15 7000 7506 2-in-1 Black Edition i7-1165G7, Xe MAX, Micron 2300 1TB MTFDHBA1T0TDV, IPS, 3840x2160, 15.6" | |
|---|---|---|---|---|---|
| Power Consumption | -53% | 46% | 19% | 23% | |
| Idle Minimum * (Watt) | 7.7 | 11 -43% | 3.8 51% | 3 61% | 4 48% |
| Idle Average * (Watt) | 10.7 | 20 -87% | 9 16% | 7 35% | 15.5 -45% |
| Idle Maximum * (Watt) | 16.8 | 30 -79% | 11.3 33% | 18 -7% | 16.2 4% |
| Load Average * (Watt) | 100.39 | 111 -11% | 35.2 65% | 86 14% | 49.7 50% |
| Witcher 3 ultra * (Watt) | 108 | 156 -44% | 82 24% | 52.2 52% | |
| Load Maximum * (Watt) | 129 | 197 -53% | 43.5 66% | 144 -12% | 92.7 28% |
* ... smaller is better
Power Consumption Witcher 3 / Stresstest
Battery Life — Large 86 Wh Capacity
Runtimes are long at almost 10 hours of real-world WLAN use to coincide with the large 86 Wh battery. The LG Gram 16 can last for several hours longer since it runs on slower hardware with no Nvidia GPU.
Charging from empty to full capacity takes two full hours. Users can also charge with third-party USB-C adapters, but the charging rate will slow significantly when compared to the proprietary 130 W barrel charger that comes with the laptop.
| Dell Inspiron 16 Plus 7610 i7-11800H, GeForce RTX 3050 4GB Laptop GPU, 86 Wh | Lenovo Legion 5 Pro 16ACH6H (82JQ001PGE) R7 5800H, GeForce RTX 3070 Laptop GPU, 80 Wh | Asus ROG Zephyrus M16 GU603H i9-11900H, GeForce RTX 3070 Laptop GPU, 90 Wh | LG Gram 16 (2021) i7-1165G7, Iris Xe G7 96EUs, 80 Wh | HP Pavilion Gaming 16-a0242ng i5-10300H, GeForce GTX 1650 Ti Mobile, 52 Wh | Dell Inspiron 15 7000 7506 2-in-1 Black Edition i7-1165G7, Xe MAX, 68 Wh | |
|---|---|---|---|---|---|---|
| Battery runtime | -55% | -36% | 43% | -25% | -11% | |
| Reader / Idle (h) | 20.5 | 9.1 -56% | 13.3 -35% | 28.6 40% | 16.5 -20% | 25 22% |
| WiFi v1.3 (h) | 9.9 | 7 -29% | 7.7 -22% | 15.7 59% | 8.3 -16% | 9.7 -2% |
| Load (h) | 3.3 | 0.7 -79% | 1.6 -52% | 4.3 30% | 2 -39% | 1.6 -52% |
Pros
Cons
Verdict — Great Looks, Meh Performance
Visually, the Inspiron 16 is the best-looking model in its family. The bezels are narrower than expected considering the power-hungry processors inside while the weighty metal chassis helps give a sense of tactile quality approaching that of the pricier XPS 15. Port options are generous, servicing is relatively easy, and the matte 3K display tops it all off for a great first showing.
The Inspiron 16 Plus 7610 is a great looking system with plenty of ports and upgrade options, but it could use some performance tweaks for power-hungry content creators and multimedia users.
Things don't look as rosy from a performance perspective. Both the processor and GPU aren't as fast as we were expecting when compared to other models with the same or similar options. The Asus TUF F15 with the same Core i7-11800H CPU runs 25 percent faster while the MSI Stealth 15M with older RTX 2060 graphics will perform better than our RTX 3050 in most scenarios. Even the two-year old HP Gaming Pavilion 15 with GTX 1660 Ti graphics can match or edge out our Dell in graphics power. Interested users may want to consider the RTX 3060 configuration instead for longer legs. A brighter display to match the MacBook Pro 16 or Legion 5 Pro also wouldn't hurt for users on-the-go.
Price and availability
Online availability is limited at the time of writing. Amazon is currently offering just one SKU at the moment for $989 USD. Users can purchase directly from Dell instead for more configurable options.
Dell Inspiron 16 Plus 7610
- 08/11/2021 v7 (old)
Allen Ngo
Price comparison
